Embed Size (px)
Citation preview
CHAPTER 2Elementary and Secondary Education
This chapter contains a variety of statistics on public andprivate elementary and secondary education. Data are pre-sented for enrollments, teachers and other school staff,schools, dropouts, achievement, school violence, and reve-nues and expenditures. These data are derived from surveys,censuses, and administrative data collections conducted bythe National Center for Education Statistics (NCES) andother public and private organizations. The informationranges from counts of students and schools to state gradua-tion requirements.
EnrollmentsPublic elementary and secondary school enrollment rose
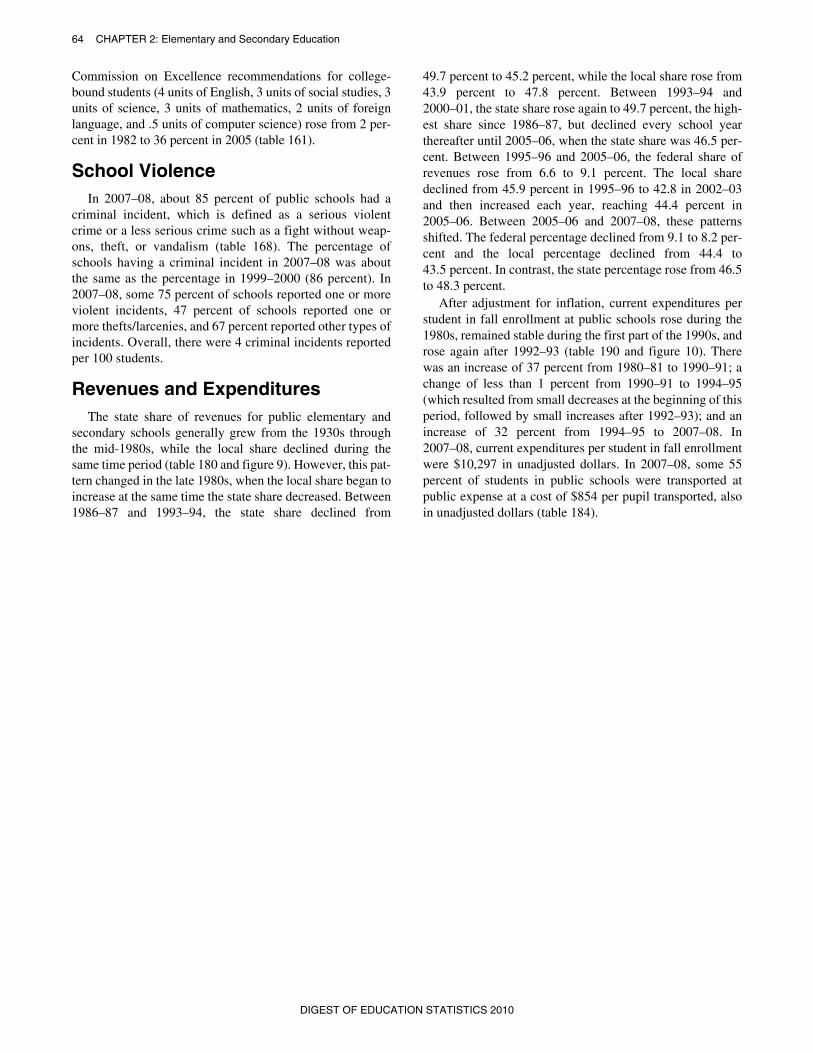
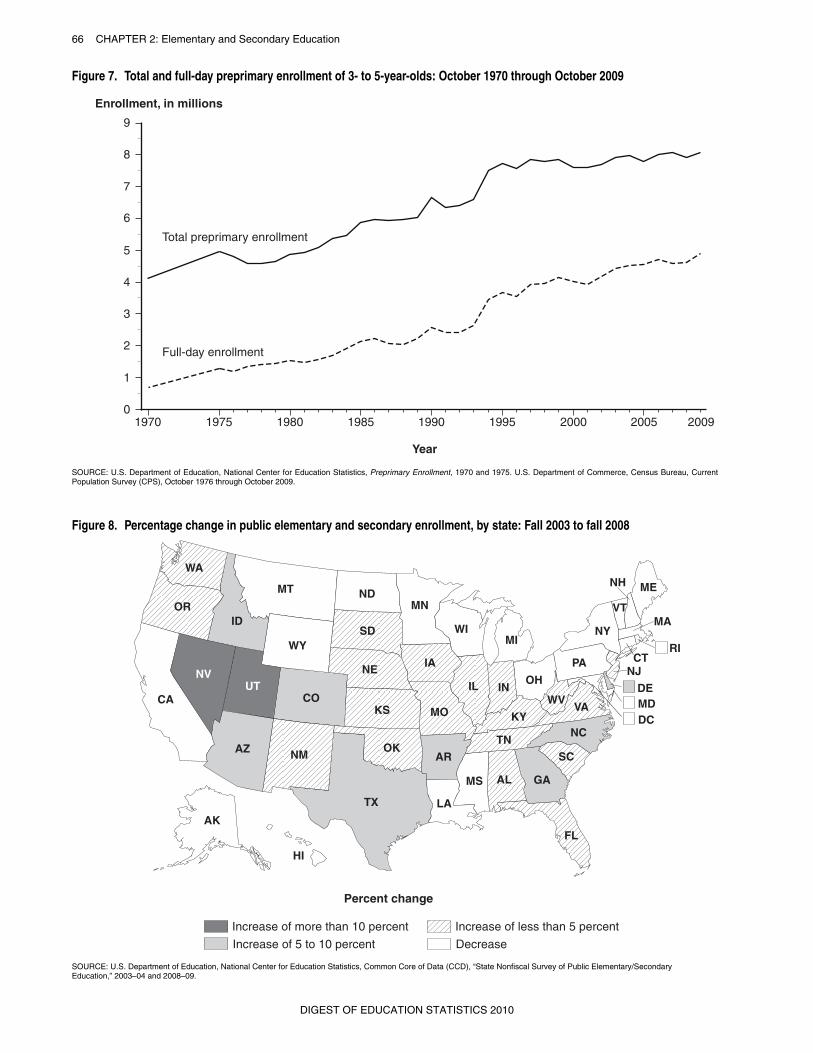
from 48.5 million in 2003 to 49.3 million in 2008 (an increaseof 1 percent), but enrollment at the elementary and secondarylevels increased at different rates (table 39 and figure 6). Pub-lic elementary enrollment (prekindergarten through grade 8)was 0.2 percent higher in 2008 (34.3 million) than in 2003(34.2 million), while public secondary enrollment was 4 per-cent higher in 2008 (15.0 million) than in 2003 (14.3 mil-lion). Enrollments in private elementary and secondaryschools decreased by an estimated 2 percent between 2003and 2008, from 6.1 million to 6.0 million (table 3).
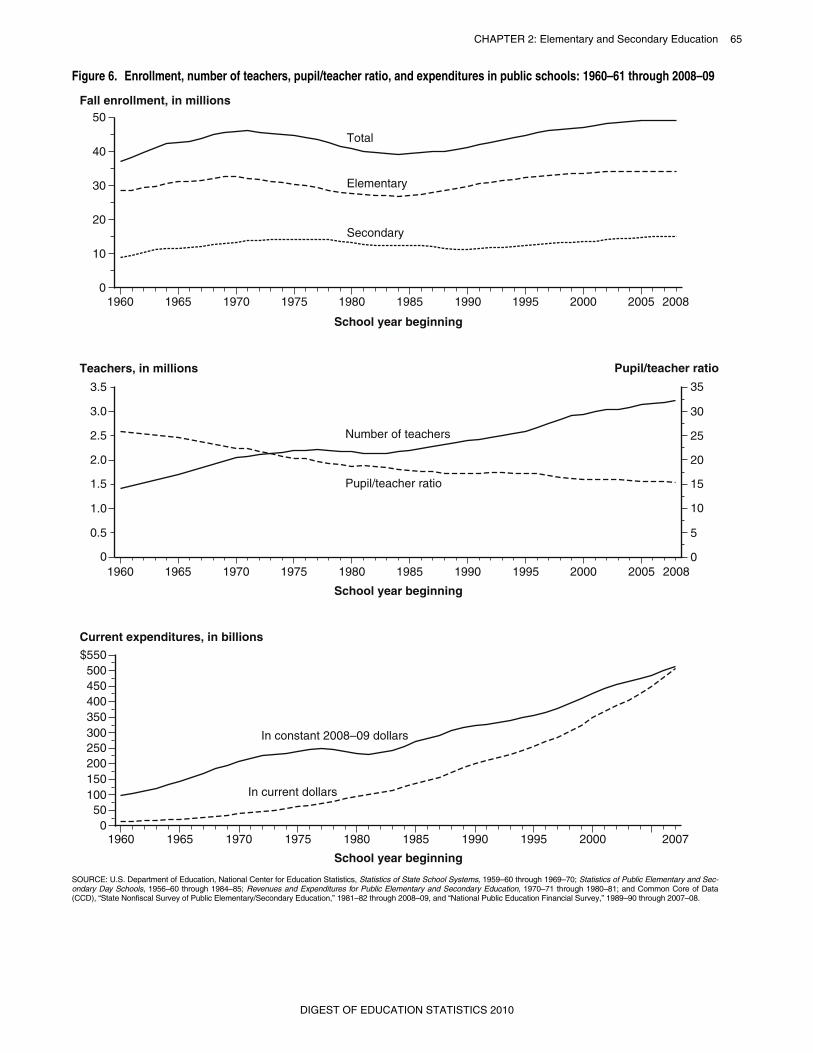
In 2009, about 63 percent of 3- to 5-year-olds were enrolledin preprimary education (nursery school and kindergarten),similar to the proportion in 2000 (table 52 and figure 7). How-ever, the percentage of children in full-day programs increasedfrom 2000 to 2009. In 2009, about 61 percent of the childrenenrolled in preprimary education attended a full-day prepri-mary program, compared with 53 percent in 2000.
A higher percentage of 4-year-old children (57 percent)were cared for primarily in center-based programs during theday in 2005–06 than were cared for in home-based settingsby their parents (20 percent), in home-based settings by rela-tives (13 percent), or in home-based settings by nonrelatives(8 percent) (table 55). There were differences in the averagequality of care children received in these settings. A higher
percentage of children in Head Start and other center-basedprograms (35 percent) received high-quality care than thosein home-based relative and nonrelative care (9 percent),according to the ratings of trained observers (table 56).
The Individuals with Disabilities Education Act (IDEA),enacted in 1975, mandates that children and youth ages 3–21with disabilities be provided a free and appropriate publicschool education. The percentage of total public school enroll-ment that represents children served by federally supportedspecial education programs increased from 8.3 percent to13.2 percent between 1976–77 and 2008–09 (table 45). Muchof this overall increase can be attributed to a rise in the per-centage of students identified as having specific learning dis-abilities from 1976–77 (1.8 percent) to 1990–91 (5.2 percent).The overall percentage of students being served in programsfor those with disabilities decreased between 2003–04(13.7 percent) and 2008–09 (13.2 percent). However, therewere different patterns of change in the percentages servedwith some specific conditions between 2003–04 and 2008–09.The percentage of children identified as having other healthimpairments (limited strength, vitality, or alertness due tochronic or acute health problems such as a heart condition,tuberculosis, rheumatic fever, nephritis, asthma, sickle cellanemia, hemophilia, epilepsy, lead poisoning, leukemia, ordiabetes) rose from 1.0 to 1.3 percent of total public schoolenrollment; the percentage with autism rose from 0.3 to 0.7percent; and the percentage with developmental delays rosefrom 0.6 to 0.7 percent. The percentage of children with spe-cific learning disabilities declined from 5.8 percent to 5.0 per-cent of total public school enrollment during this period. In fall2008, some 95 percent of 6- to 21-year-old students with dis-abilities were served in regular schools; 3 percent were servedin a separate school for students with disabilities; 1 percentwere placed in regular private schools by their parents; andless than 1 percent each were served in one of the followingenvironments: in a separate residential facility, homebound orin a hospital, or in a correctional facility (table 46).
DIGEST OF EDUCATION STATISTICS 2010 59
60 CHAPTER 2: Elementary and Secondary Education
Teachers and Other School StaffDuring the 1970s and early 1980s, public school enroll-
ment decreased, while the number of teachers generallyincreased. For public schools, the number of pupils perteacher—that is, the pupil/teacher ratio1—declined from22.3 in 1970 to 17.9 in 1985 (table 68 and figure 6). After1985, the public school pupil/teacher ratio continued todecline, reaching 17.2 in 1989. After a period of relative sta-bility during the late 1980s through the mid-1990s, the ratiodeclined from 17.3 in 1995 to 16.0 in 2000. Decreases havecontinued since then, and the public school pupil/teacherratio was 15.3 in 2008. By comparison, the pupil/teacherratio for private schools was estimated at 13.1 in 2008. Theaverage class size in 2007–08 was 20.0 pupils for public ele-mentary schools and 23.4 pupils for public secondaryschools (table 71).
In 2007–08, some 76 percent of public school teacherswere female, 44 percent were under age 40, and 52 percenthad a master’s or higher degree (table 72). Compared withpublic school teachers, a lower percentage of private schoolteachers were female (74 percent), were under age 40 (39percent), and had a master’s or higher degree (38 percent).
Public school principals tend to be older and have moreadvanced credentials than public school teachers. In2007–08, some 19 percent of public school principals wereunder age 40, and 99 percent of public school principals hada master’s or higher degree (table 89). A lower percentage ofprincipals than of teachers were female: about 50 percent ofpublic school principals were female, compared with 76 per-cent of teachers.
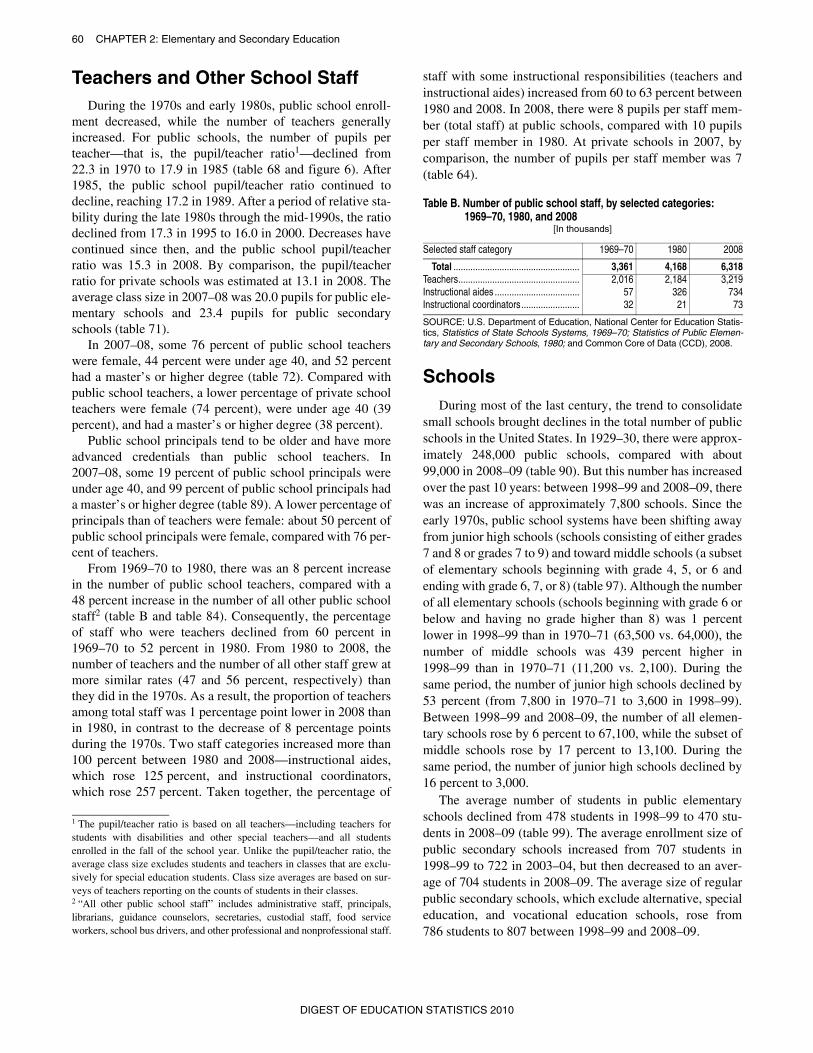
From 1969–70 to 1980, there was an 8 percent increasein the number of public school teachers, compared with a48 percent increase in the number of all other public schoolstaff2 (table B and table 84). Consequently, the percentageof staff who were teachers declined from 60 percent in1969–70 to 52 percent in 1980. From 1980 to 2008, thenumber of teachers and the number of all other staff grew atmore similar rates (47 and 56 percent, respectively) thanthey did in the 1970s. As a result, the proportion of teachersamong total staff was 1 percentage point lower in 2008 thanin 1980, in contrast to the decrease of 8 percentage pointsduring the 1970s. Two staff categories increased more than100 percent between 1980 and 2008—instructional aides,which rose 125 percent, and instructional coordinators,which rose 257 percent. Taken together, the percentage of
1 The pupil/teacher ratio is based on all teachers—including teachers forstudents with disabilities and other special teachers—and all studentsenrolled in the fall of the school year. Unlike the pupil/teacher ratio, theaverage class size excludes students and teachers in classes that are exclu-sively for special education students. Class size averages are based on sur-veys of teachers reporting on the counts of students in their classes. 2 “All other public school staff” includes administrative staff, principals,librarians, guidance counselors, secretaries, custodial staff, food serviceworkers, school bus drivers, and other professional and nonprofessional staff.
staff with some instructional responsibilities (teachers andinstructional aides) increased from 60 to 63 percent between1980 and 2008. In 2008, there were 8 pupils per staff mem-ber (total staff) at public schools, compared with 10 pupilsper staff member in 1980. At private schools in 2007, bycomparison, the number of pupils per staff member was 7(table 64).
Schools During most of the last century, the trend to consolidate
small schools brought declines in the total number of publicschools in the United States. In 1929–30, there were approx-imately 248,000 public schools, compared with about99,000 in 2008–09 (table 90). But this number has increasedover the past 10 years: between 1998–99 and 2008–09, therewas an increase of approximately 7,800 schools. Since theearly 1970s, public school systems have been shifting awayfrom junior high schools (schools consisting of either grades7 and 8 or grades 7 to 9) and toward middle schools (a subsetof elementary schools beginning with grade 4, 5, or 6 andending with grade 6, 7, or 8) (table 97). Although the numberof all elementary schools (schools beginning with grade 6 orbelow and having no grade higher than 8) was 1 percentlower in 1998–99 than in 1970–71 (63,500 vs. 64,000), thenumber of middle schools was 439 percent higher in1998–99 than in 1970–71 (11,200 vs. 2,100). During thesame period, the number of junior high schools declined by53 percent (from 7,800 in 1970–71 to 3,600 in 1998–99).Between 1998–99 and 2008–09, the number of all elemen-tary schools rose by 6 percent to 67,100, while the subset ofmiddle schools rose by 17 percent to 13,100. During thesame period, the number of junior high schools declined by16 percent to 3,000.
The average number of students in public elementaryschools declined from 478 students in 1998–99 to 470 stu-dents in 2008–09 (table 99). The average enrollment size ofpublic secondary schools increased from 707 students in1998–99 to 722 in 2003–04, but then decreased to an aver-age of 704 students in 2008–09. The average size of regularpublic secondary schools, which exclude alternative, specialeducation, and vocational education schools, rose from786 students to 807 between 1998–99 and 2008–09.
Table B. Number of public school staff, by selected categories: 1969–70, 1980, and 2008
[In thousands]
Selected staff category 1969–70 1980 2008
Total .................................................... 3,361 4,168 6,318Teachers.................................................. 2,016 2,184 3,219Instructional aides ................................... 57 326 734Instructional coordinators........................ 32 21 73
SOURCE: U.S. Department of Education, National Center for Education Statis-tics, Statistics of State Schools Systems, 1969–70; Statistics of Public Elemen-tary and Secondary Schools, 1980; and Common Core of Data (CCD), 2008.
DIGEST OF EDUCATION STATISTICS 2010
CHAPTER 2: Elementary and Secondary Education 61
High School Graduates and Dropouts
About 3,252,000 high school students are expected tograduate during the 2010–11 school year (table 110), includ-ing 2,937,000 public school graduates and 315,000 privateschool graduates. High school graduates include only recip-ients of diplomas, not recipients of equivalency credentials.The 2010–11 projection of high school graduates is lowerthan the record-high projection of 3,319,000 graduates for2008–09, but exceeds the high point during the baby boomera in 1975–76, when 3,142,000 students earned diplomas.In 2007–08, an estimated 74.7 percent of public high schoolstudents graduated on time—that is, received a diploma4 years after beginning their freshman year (table 112).
The number of General Educational Development (GED)credentials issued by the states to GED test passers rose from330,000 in 1977 to 487,000 in 2000 (table 114). A recordnumber of 648,000 GED credentials were issued in 2001. In2002, there were revisions to the GED test and to the datareporting procedures. In 2001, test takers were required tosuccessfully complete all five components of the GED orelse begin the five-part series again with the new test thatwas introduced in 2002. Prior to 2002, reporting was basedon summary data from the states on the number of GED cre-dentials issued. As of 2002, reporting has been based onindividual GED candidate- and test-level records collectedby the GED Testing Service. In 2009, some 448,000 passedthe GED tests, up from 330,000 in 2002, the first year of thenew test series.3
The percentage of dropouts among 16- to 24-year-oldshas shown some decreases over the past 20 years. This per-centage, known as the status dropout rate, includes all peo-ple in the 16- to 24-year-old age group who are not enrolledin school and who have not completed a high school pro-gram, regardless of when they left school. (People who leftschool but went on to receive a GED credential are nottreated as dropouts.) Between 1989 and 2009, the statusdropout rate declined from 12.6 to 8.1 percent (table 115).Although the status dropout rate declined for both Blacksand Hispanics during this period, their rates (9.3 and 17.6percent, respectively) remained higher than the rate forWhites (5.2 percent) in 2009. This measure is based on thecivilian noninstitutionalized population, which excludespeople in prisons, people in the military, and other peoplenot living in households.
AchievementMost of the student performance data in the Digest are
drawn from the National Assessment of Educational Prog-ress (NAEP). The NAEP assessments have been conducted
3 Information on changes in GED test series and reporting is based on the2003 edition of Who Passed the GED Tests?, by the GED Testing Service ofthe American Council on Education, as well as communication with staff ofthe GED Testing Service.
using three basic designs: the national main NAEP, stateNAEP, and long-term trend NAEP. The main NAEP reportscurrent information for the nation and specific geographicregions of the country. The assessment program includesstudents drawn from both public and nonpublic schools andreports results for student achievement at grades 4, 8, and12. The main NAEP assessments follow the frameworksdeveloped by the National Assessment Governing Boardand use the latest advances in assessment methodology.Because the assessment items reflect curricula associatedwith specific grade levels, the main NAEP uses samples ofstudents at those grade levels.
Since 1990, NAEP assessments have also been con-ducted at the state level. Each participating state receivesassessment results that report on the performance of studentsin that state. In its content, the state assessment is identical tothe assessment conducted nationally. From 1990 through2001, the national sample was a subset of the combined sam-ple of students assessed in each participating state alongwith an additional sample from the states that did not partic-ipate in the state assessment. For mathematics and readingassessments since 2002, a combined sample of publicschools has been selected for both 4th- and 8th-grade stateand national NAEP.
NAEP long-term trend assessments are designed to giveinformation on the changes in the basic achievement levelof America’s youth since the early 1970s. They are admin-istered nationally and report student performance in readingand mathematics at ages 9, 13, and 17. Measuring long-term trends of student achievement requires the precisereplication of past procedures. For example, students ofspecific ages are sampled in order to maintain consistencywith the original sample design. Similarly, the long-termtrend instrument does not evolve based on changes in cur-ricula or in educational practices. The differences in proce-dures between the main NAEP and the long-term trendNAEP mean that their results cannot be compared directly.
Reading
Reported on a scale of 0 to 500, NAEP long-term trendresults in reading are available for 12 assessment yearsgoing back to the first in 1971. The average reading score for9-year-olds was higher in 2008 than in all previous assess-ment years, increasing 4 points since 2004 and 12 points incomparison to 1971 (table 124). While the average score for13-year-olds in 2008 was higher than in both 2004 and 1971,it was not significantly different from the scores in someassessment years in between. The average reading score for17-year-olds was higher in 2008 than in 2004 but was notsignificantly different from the score in 1971.
White, Black, and Hispanic 9-, 13-, and 17-year-olds allhad higher average reading scores in 2008 than they did in thefirst assessment year (which is 1975 for Hispanic studentsbecause separate data for Hispanics were not collected in1971). At age 9, White, Black, and Hispanic students scoredhigher in 2008, on average, than in any previous assessment
DIGEST OF EDUCATION STATISTICS 2010
62 CHAPTER 2: Elementary and Secondary Education
year. In comparison to 2004, average reading scores werehigher in 2008 for White students at all three ages, for Blackstudents at ages 9 and 13, and for Hispanic students at age 9.Reading results for 2008 continued to show gaps in scoresbetween White and Black students (ranging from 21 to 29points, depending on age) and between White and Hispanicstudents (ranging from 21 to 26 points). From 2004 to 2008,no significant changes were seen in these reading score gaps.However, the White-Black reading gap was smaller in 2008than in 1971 at all three ages, and the White-Hispanic readinggap narrowed at ages 9 and 17 in comparison to 1975.
In 2008, female students continued to have higher averagereading scores than male students at all three ages. The gapbetween male and female 9-year-olds was 7 points in 2008;this was not significantly different from the gap in 2004 butwas narrower than the gap in 1971. The 8-point gender gapfor 13-year-olds in 2008 was not significantly different fromthe gaps in either 2004 or 1971. At age 17, the 11-point gapbetween males and females in 2008 was not significantly dif-ferent from the gaps in any of the previous assessment years.
The main NAEP assessment data were first collected in1992 and are reported on a scale of 0 to 500. From 2007 to2009, there were no measurable changes in average read-ing scores for 4th-grade males and females or for 4th-gradestudents from any of the five racial/ethnic groups (table125). From 1992 to 2009, male 4th-graders’ average read-ing scores increased from 213 to 218 and female 4th-grad-ers’ scores increased from 221 to 224 (table 126). At grade4, the average reading scores in 2009 for White, Black,Hispanic, Asian/Pacific Islander, and American Indian/Alaska Native students were not measurably differentfrom their scores in 2007 (table 125). The 2009 readingscores for White, Black, and Hispanic students did, how-ever, remain higher than scores from assessment yearsprior to 2007. The 2009 average NAEP reading scale scorefor 8th-graders was 1 point higher than the 2007 score and4 points higher than the 1992 score, but the 2009 score wasnot always measurably different from the scores on theassessments given between 1994 and 2005. For 12th-grad-ers, the 2009 average reading score was 4 points lowerthan the score in 1992 but 2 points higher than the score in2005 (12th-graders were not assessed in 2007).
The 2009 main NAEP reading assessment of statesfound that the average reading proficiency of public school4th- and 8th-graders varied across participating jurisdic-tions (the 50 states, the Department of Defense overseas anddomestic schools, and the District of Columbia). For 4th-graders in public schools, the U.S. average score was 220,with average scores in participating jurisdictions rangingfrom 202 in the District of Columbia to 234 in Massachu-setts (table 129). For 8th-graders in public schools, the U.S.average score was 262, with average scores in participatingjurisdictions ranging from 242 in the District of Columbiato 274 in Massachusetts (table 130).
Mathematics
NAEP long-term trend mathematics results, reported on ascale of 0 to 500, are available for 11 assessment years,going back to the first in 1973. Average mathematics scoresfor 9- and 13-year-olds were higher in 2008 than in all pre-vious assessment years (table 140). The average score for9-year-olds in 2008 was 4 points higher than in 2004 and24 points higher than in 1973. For 13-year-olds, the averagescore in 2008 was 3 points higher than in 2004 (based onunrounded scores) and 15 points higher than in 1973. In con-trast, the average score for 17-year-olds in 2008 was not sig-nificantly different from the scores in 2004 and 1973.
White, Black, and Hispanic 9-, 13-, and 17-year-olds allhad higher average mathematics scores in 2008 than in1973. In comparison to 2004, average mathematics scoreswere higher in 2008 for White students at age 9. From 2004to 2008, there were no significant changes in scores for 9-,13-, and 17-year-old Black and Hispanic students or for 13-and 17-year-old White students. Mathematics results for2008 continued to show score gaps between White and His-panic students (ranging from 16 to 23 points, depending onage) and between White and Black students (ranging from26 to 28 points). Across all three age groups, neither theWhite-Black gap nor the White-Hispanic gap in mathemat-ics scores changed significantly from 2004 to 2008, butboth were smaller in 2008 than in 1973.
While there was no significant difference between theaverage mathematics scores of male and female 9-year-oldsin 2008, male students did score higher than female studentsat ages 13 and 17. At age 13, the 4-point gap between malesand females in 2008 was not significantly different whencompared to the gap in 2004, but it was larger than the gapin 1973. At age 17, the 5-point gender score gap in 2008was not significantly different from the gaps in previousassessment years.
On the main NAEP mathematics assessment, gains inaverage scores seen in earlier years continued from 2007 to2009 at grade 8 but not at grade 4. At grade 8, the averageNAEP mathematics score (reported on a scale of 0 to 500)increased 2 points from 2007 to 2009 and was higher in2009 than in any previous assessment year (table 146). Atgrade 4, the average score in 2009 was unchanged from thescore in 2007 but still higher than the scores in the sixassessment years from 1990 to 2005. From 2007 to 2009,no significant score changes occurred at grade 4 for malesor females or for any of the racial/ethnic groups. At grade 8,average scores increased from 2007 to 2009 for both maleand female students as well as for White, Black, Hispanic,and Asian/Pacific Islander students. For American Indian/Alaska Native 8th-graders, no measurable differences weredetected in average scores over the assessment years.Because of major changes to the grade 12 mathematicsassessment, results from 2005 and 2009 cannot be comparedwith results from earlier assessment years. For 12th-graders,the average mathematics score (reported on a scale of 0 to300) was 3 points higher in 2009 than in 2005. Average
DIGEST OF EDUCATION STATISTICS 2010
CHAPTER 2: Elementary and Secondary Education 63
scores increased from 2005 to 2009 for both male andfemale 12th-graders as well as for 12th-graders from all theracial/ethnic groups.
The 2009 main NAEP assessment of states found that theaverage mathematics proficiency of public school 4th- and8th-graders varied across participating jurisdictions (the50 states, the Department of Defense overseas and domesticschools, and the District of Columbia). For 4th-graders inpublic schools, the U.S. average score was 239, with averagescores in participating jurisdictions ranging from 219 in theDistrict of Columbia to 251 in New Hampshire and 252 inMassachusetts (table 143). For 8th-graders in public schools,the U.S. average score was 282, with average scores in par-ticipating jurisdictions ranging from 254 in the District ofColumbia to 299 in Massachusetts (table 144).
Science
NAEP has assessed the science abilities of students ingrades 4, 8, and 12 since 1996, using a separate scale of 0 to300 for each grade. From 1996 to 2005, the national average4th-grade science score increased from 147 to 151, therewas no measurable change in the 8th-grade score, and the12th-grade score decreased from 150 to 147 (table 148).Certain subgroups outperformed others in science in 2005.For example, males outperformed females at all threegrades. White students scored higher, on average, thanBlack and Hispanic students at all three grades in 2005. At4th grade, average scores were higher for White, Black,Hispanic, and Asian/Pacific Islander students in 2005 thanin 1996. At 8th grade, the average score for Black studentswas higher in 2005 than in 1996, but no measurableincreases occurred for other racial/ethnic groups from 1996to 2005. At 12th grade, there were no measurable changesin average scores for any racial/ethnic group when compar-ing results from 2005 with those from 1996. Asian/PacificIslander 4th-graders’ results from 2000 are not includedbecause reporting standards were not met.
Skills of Young Children
In addition to student performance data available throughNAEP, the Digest presents data from other surveys to pro-vide additional perspectives on student achievement. Differ-ences among demographic groups in the acquisition ofcognitive skills have been demonstrated at relatively earlyages in the Early Childhood Longitudinal Survey, BirthCohort (ECLS-B) (tables 119, 120, and 121).
In 2003–04, about 64 percent of 2-year-olds demon-strated proficiency in expressive vocabulary, which mea-sured toddlers’ ability to communicate using gestures,words, and sentences (table 119). The percentage of 2-year-olds demonstrating expressive vocabulary was higher forfemales (69 percent) than for males (59 percent). Also, ahigher percentage of White (71 percent) and Asian (62 per-cent) 2-year-olds demonstrated expressive vocabulary thanof Black, Hispanic, or American Indian/Alaska Native 2-year-olds (56, 54, and 50 percent, respectively). The percentage
of 2-year-olds from families with high socioeconomic status(SES) who demonstrated expressive vocabulary (75 percent)was higher than the percentage of children from low-SESfamilies who did so (52 percent).
Patterns of differences were also observed by race/eth-nicity and SES for children at about 4 years of age (48 to 57months old) and at kindergarten entry. Average early read-ing scores were higher for White (27.4) and Asian (30.5)48- to 57-month-old children than for Black (22.9), His-panic (21.2), and American Indian/Alaska Native (20.1)children (table 120). Also, high-SES children (32.7) hadhigher average early reading scores than low-SES children(19.3) at this age. These same patterns were observedamong 48- to 57-month-old children with respect to aver-age mathematics scores. White (31.6) and Asian (34.7) 48-to 57-month-old children had higher mathematics scoresthan Black (26.9), Hispanic (26.2), and American Indian/Alaska Native children (23.2). High-SES 48- to 57-month-old children (36.2) had higher average mathematics scoresthan low-SES children (23.6). Similarly, among 5- and 6-year-olds entering kindergarten, average mathematics scoreswere higher for high-SES children (49.5) than for low-SESchildren (37.7) (table 121). White (45.5) and Asian (48.2)5- and 6-year-olds entering kindergarten had higher math-ematics scores than Black (39.8), Hispanic (39.6), andAmerican Indian/Alaska Native (36.2) children. Similarpatterns were observed for early reading skills among chil-dren entering kindergarten. White (45.1) and Asian (51.4)children had higher early reading scores at kindergartenentry than Black (40.2), Hispanic (38.4), and AmericanIndian/Alaska Native (36.2) children. High-SES children(51.2) had higher average early reading scores than low-SES children (35.0).
SAT Scores of College-Bound Seniors
The SAT (formerly known as the Scholastic AssessmentTest and the Scholastic Aptitude Test) is not designed as anindicator of student achievement, but rather as an aid forpredicting how well students will do in college. Between1998–99 and 2004–05, the mathematics SAT average scoreincreased by 9 points, but it declined by 4 points between2004–05 and 2009–10 (table 152). The critical readingaverage score in 2009–10 (501) was 4 points lower than in1998–99.
Coursetaking in High School
The average number of science and mathematics coursescompleted by public high school graduates increasedbetween 1982 and 2005. The average number of mathematicscourses (Carnegie units) completed in high school rose from2.6 in 1982 to 3.7 in 2005, and the number of science coursesrose from 2.2 to 3.3 (table 157). The average number ofcourses in career/technical areas completed by all highschool graduates was lower in 2005 (4.0 units) than in 1982(4.6 units). As a result of the increased academic course load,the percentage of students completing the 1983 National
DIGEST OF EDUCATION STATISTICS 2010
64 CHAPTER 2: Elementary and Secondary Education
Commission on Excellence recommendations for college-bound students (4 units of English, 3 units of social studies, 3units of science, 3 units of mathematics, 2 units of foreignlanguage, and .5 units of computer science) rose from 2 per-cent in 1982 to 36 percent in 2005 (table 161).
School ViolenceIn 2007–08, about 85 percent of public schools had a
criminal incident, which is defined as a serious violentcrime or a less serious crime such as a fight without weap-ons, theft, or vandalism (table 168). The percentage ofschools having a criminal incident in 2007–08 was aboutthe same as the percentage in 1999–2000 (86 percent). In2007–08, some 75 percent of schools reported one or moreviolent incidents, 47 percent of schools reported one ormore thefts/larcenies, and 67 percent reported other types ofincidents. Overall, there were 4 criminal incidents reportedper 100 students.
Revenues and ExpendituresThe state share of revenues for public elementary and
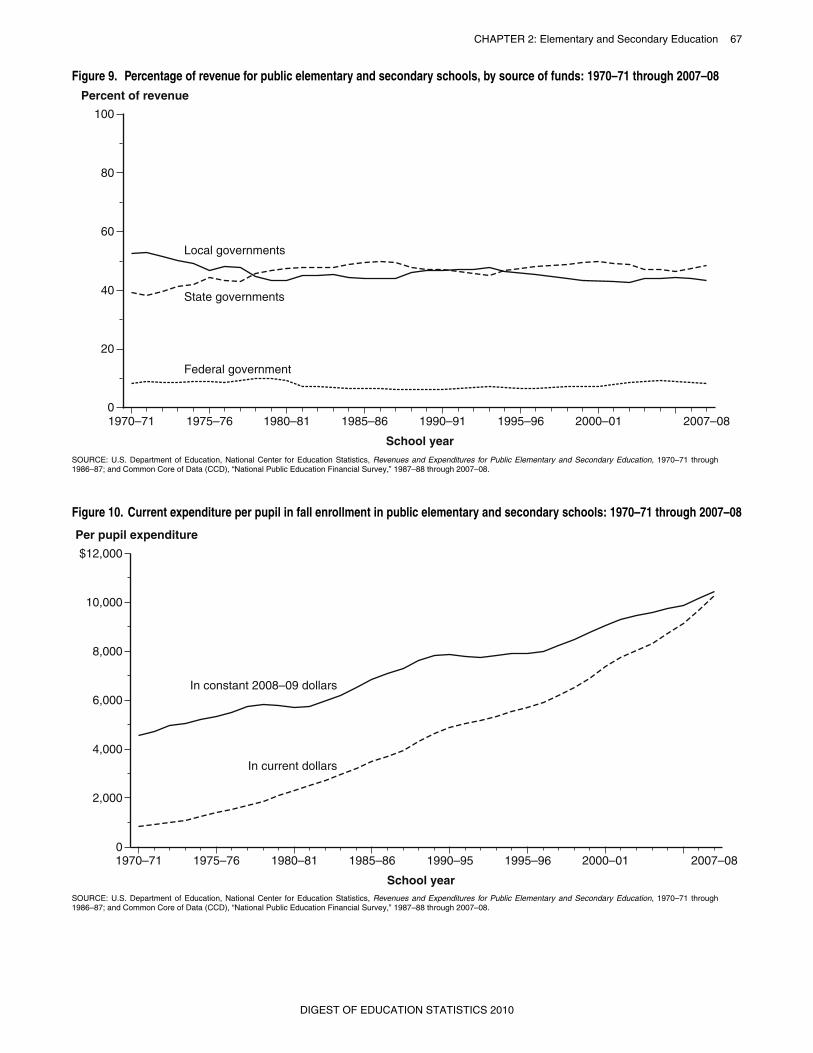
secondary schools generally grew from the 1930s throughthe mid-1980s, while the local share declined during thesame time period (table 180 and figure 9). However, this pat-tern changed in the late 1980s, when the local share began toincrease at the same time the state share decreased. Between1986–87 and 1993–94, the state share declined from
49.7 percent to 45.2 percent, while the local share rose from43.9 percent to 47.8 percent. Between 1993–94 and2000–01, the state share rose again to 49.7 percent, the high-est share since 1986–87, but declined every school yearthereafter until 2005–06, when the state share was 46.5 per-cent. Between 1995–96 and 2005–06, the federal share ofrevenues rose from 6.6 to 9.1 percent. The local sharedeclined from 45.9 percent in 1995–96 to 42.8 in 2002–03and then increased each year, reaching 44.4 percent in2005–06. Between 2005–06 and 2007–08, these patternsshifted. The federal percentage declined from 9.1 to 8.2 per-cent and the local percentage declined from 44.4 to43.5 percent. In contrast, the state percentage rose from 46.5to 48.3 percent.
After adjustment for inflation, current expenditures perstudent in fall enrollment at public schools rose during the1980s, remained stable during the first part of the 1990s, androse again after 1992–93 (table 190 and figure 10). Therewas an increase of 37 percent from 1980–81 to 1990–91; achange of less than 1 percent from 1990–91 to 1994–95(which resulted from small decreases at the beginning of thisperiod, followed by small increases after 1992–93); and anincrease of 32 percent from 1994–95 to 2007–08. In2007–08, current expenditures per student in fall enrollmentwere $10,297 in unadjusted dollars. In 2007–08, some 55percent of students in public schools were transported atpublic expense at a cost of $854 per pupil transported, alsoin unadjusted dollars (table 184).
DIGEST OF EDUCATION STATISTICS 2010
CHAPTER 2: Elementary and Secondary Education 65
Figure 6. Enrollment, number of teachers, pupil/teacher ratio, and expenditures in public schools: 1960–61 through 2008–09
1960 1965 1970 1975 1980
School year beginning
1985 1990 1995 2000 2005 20080
0.5
1.0
1.5
2.0
2.5
3.0
3.5
Number of teachers
Total
Elementary
Secondary
Pupil/teacher ratio
Teachers, in millions Pupil/teacher ratio
0
5
10
15
20
25
30
35
School year beginning
Fall enrollment, in millions
1960 1965 1970 1975 1980 1985 1990 1995 2000 2005 20080
10
20
30
40
50
School year beginning
Current expenditures, in billions
1960 1965 1970 1975 1980 1985 1990 1995 2000 20070
50100150200250300350
In constant 2008–09 dollars
In current dollars
400450500
$550
SOURCE: U.S. Department of Education, National Center for Education Statistics, Statistics of State School Systems, 1959–60 through 1969–70; Statistics of Public Elementary and Sec-ondary Day Schools, 1956–60 through 1984–85; Revenues and Expenditures for Public Elementary and Secondary Education, 1970–71 through 1980–81; and Common Core of Data(CCD), “State Nonfiscal Survey of Public Elementary/Secondary Education,” 1981–82 through 2008–09, and “National Public Education Financial Survey,” 1989–90 through 2007–08.
DIGEST OF EDUCATION STATISTICS 2010
66 CHAPTER 2: Elementary and Secondary Education
Figure 7. Total and full-day preprimary enrollment of 3- to 5-year-olds: October 1970 through October 2009
1970 1975 1980 1985 1990 1995 2000 2005 20090
1
2
3
4
5
6
Total preprimary enrollment
Full-day enrollment
7
8
9
Year
Enrollment, in millions
SOURCE: U.S. Department of Education, National Center for Education Statistics, Preprimary Enrollment, 1970 and 1975. U.S. Department of Commerce, Census Bureau, CurrentPopulation Survey (CPS), October 1976 through October 2009.
Figure 8. Percentage change in public elementary and secondary enrollment, by state: Fall 2003 to fall 2008
AK
WA
MT ND OR
ID
WY SD
UTCA
NV
COKS
NE
AZ NM OK
MN
IA
MO
AR
TNNC
LA
FL
MS AL GA
WI
IL
KY
INOH
WV
PA
NY
VA
ME
VT
NH
MA
CT
SC
MI
HI
RI
NJ
TX
DC MD DE
Increase of more than 10 percent
Increase of 5 to 10 percent
Increase of less than 5 percent
Decrease
Percent change
SOURCE: U.S. Department of Education, National Center for Education Statistics, Common Core of Data (CCD), “State Nonfiscal Survey of Public Elementary/Secondary Education,” 2003–04 and 2008–09.
DIGEST OF EDUCATION STATISTICS 2010
CHAPTER 2: Elementary and Secondary Education 67
Figure 9. Percentage of revenue for public elementary and secondary schools, by source of funds: 1970–71 through 2007–08 Percent of revenue
School year
1970–71 1975–76 1980–81 1985–86 1990–91 1995–96 2000–01 2007–080
20
40
60
80
Local governments
State governments
Federal government
100
SOURCE: U.S. Department of Education, National Center for Education Statistics, Revenues and Expenditures for Public Elementary and Secondary Education, 1970–71 through1986–87; and Common Core of Data (CCD), “National Public Education Financial Survey,” 1987–88 through 2007–08.
Figure 10. Current expenditure per pupil in fall enrollment in public elementary and secondary schools: 1970–71 through 2007–08
1970–71 1975–76 1980–81 1985–86 1990–95
School year
1995–96 2000–01 2007–080
2,000
4,000
6,000
8,000
10,000
$12,000
In constant 2008–09 dollars
In current dollars
Per pupil expenditure
SOURCE: U.S. Department of Education, National Center for Education Statistics, Revenues and Expenditures for Public Elementary and Secondary Education, 1970–71 through1986–87; and Common Core of Data (CCD), “National Public Education Financial Survey,” 1987–88 through 2007–08.
DIGEST OF EDUCATION STATISTICS 2010
68
CH
AP
TE
R 2
: Ele
me
nta
ry an
d S
eco
nd
ary E
du
catio
nE
nro
llme
nt
DIG
ES
T O
F E
DU
CA
TIO
N S
TA
TIS
TIC
S 2
01
0
nt
80 1989–90 1999–2000 2005–06 2006–07 2007–08
13 14 15 16 17 18
246,819 279,040 295,753 298,593 301,58044,947 52,811 53,265 53,397 53,419
18.2 18.9 18.0 17.9 17.7
40,543 46,857 49,113 49,316 49,29329,150 33,486 34,204 34,235 34,20511,393 13,371 14,909 15,081 15,087
16.4 16.8 16.6 16.5 16.390.2 88.7 92.2 92.4 92.328.1 28.5 30.4 30.6 30.6
2,320 2,544 2,816 2,892 3,000
37,799 43,807 45,932 46,133 46,1564 — 7,858 8,250 8,267 8,2614 — 94.3 — — 93.14 — 179.4 179.6 179.2 179.04 — 169.2 — — 166.6
2,986 3,819 4,151 4,187 4,214 — — — — —
126 137 156 154 158
2,860 3,6821 3,995 4,033 4,0564 — — — — —4 — — — — —4 — — — — —
$208,548 $372,944 $520,622 $555,711 $584,72912,701 27,098 47,554 47,151 47,70798,239 184,613 242,151 263,609 282,66397,608 161,233 230,917 244,951 254,359
6.1 7.3 9.1 8.5 8.247.1 49.5 46.5 47.4 48.346.8 43.2 44.4 44.1 43.5
$212,770 $381,838 $528,269 $562,195 $596,6107 188,229 7 323,889 7 449,131 7 476,814 7 506,827 7
17,781 43,357 57,375 62,863 65,7803,776 9,135 14,347 14,713 15,695
10 2,983 5,457 7,416 7,804 8,308
7 88.5 7 84.8 7 85.0 7 84.8 7 85.0 7
8.4 11.4 10.9 11.2 11.01.8 2.4 2.7 2.6 2.6
10 1.4 1.4 1.4 1.4 1.4
Enrollme
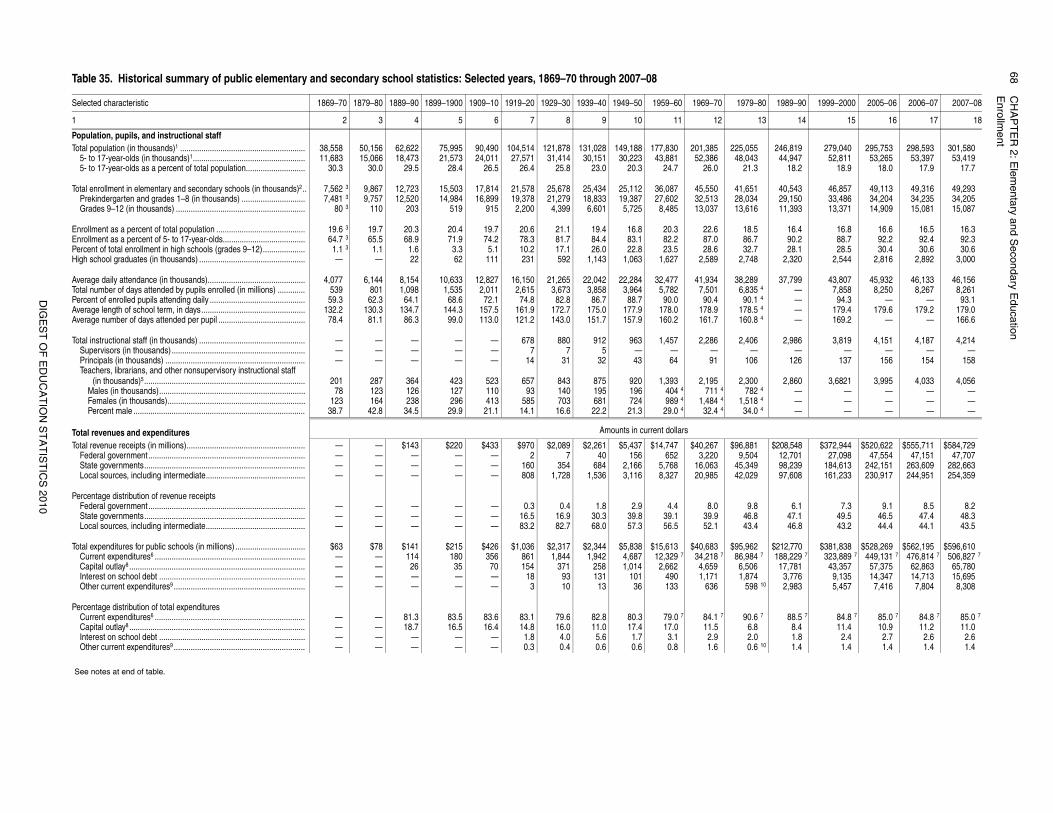
Table 35. Historical summary of public elementary and secondary school statistics: Selected years, 1869–70 through 2007–08
Selected characteristic 1869–70 1879–80 1889–90 1899–1900 1909–10 1919–20 1929–30 1939–40 1949–50 1959–60 1969–70 1979–
1 2 3 4 5 6 7 8 9 10 11 12
Population, pupils, and instructional staffTotal population (in thousands)1 ........................................................... 38,558 50,156 62,622 75,995 90,490 104,514 121,878 131,028 149,188 177,830 201,385 225,055
5- to 17-year-olds (in thousands)1..................................................... 11,683 15,066 18,473 21,573 24,011 27,571 31,414 30,151 30,223 43,881 52,386 48,0435- to 17-year-olds as a percent of total population............................ 30.3 30.0 29.5 28.4 26.5 26.4 25.8 23.0 20.3 24.7 26.0 21.3
Total enrollment in elementary and secondary schools (in thousands)2.. 7,562 3 9,867 12,723 15,503 17,814 21,578 25,678 25,434 25,112 36,087 45,550 41,651Prekindergarten and grades 1–8 (in thousands) .............................. 7,481 3 9,757 12,520 14,984 16,899 19,378 21,279 18,833 19,387 27,602 32,513 28,034Grades 9–12 (in thousands) ............................................................. 80 3 110 203 519 915 2,200 4,399 6,601 5,725 8,485 13,037 13,616
Enrollment as a percent of total population .......................................... 19.6 3 19.7 20.3 20.4 19.7 20.6 21.1 19.4 16.8 20.3 22.6 18.5Enrollment as a percent of 5- to 17-year-olds....................................... 64.7 3 65.5 68.9 71.9 74.2 78.3 81.7 84.4 83.1 82.2 87.0 86.7Percent of total enrollment in high schools (grades 9–12).................... 1.1 3 1.1 1.6 3.3 5.1 10.2 17.1 26.0 22.8 23.5 28.6 32.7High school graduates (in thousands) .................................................. — — 22 62 111 231 592 1,143 1,063 1,627 2,589 2,748
Average daily attendance (in thousands).............................................. 4,077 6,144 8,154 10,633 12,827 16,150 21,265 22,042 22,284 32,477 41,934 38,289Total number of days attended by pupils enrolled (in millions) ............. 539 801 1,098 1,535 2,011 2,615 3,673 3,858 3,964 5,782 7,501 6,835Percent of enrolled pupils attending daily ............................................. 59.3 62.3 64.1 68.6 72.1 74.8 82.8 86.7 88.7 90.0 90.4 90.1Average length of school term, in days................................................. 132.2 130.3 134.7 144.3 157.5 161.9 172.7 175.0 177.9 178.0 178.9 178.5Average number of days attended per pupil ......................................... 78.4 81.1 86.3 99.0 113.0 121.2 143.0 151.7 157.9 160.2 161.7 160.8
Total instructional staff (in thousands) .................................................. — — — — — 678 880 912 963 1,457 2,286 2,406Supervisors (in thousands) ............................................................... — — — — — 7 7 5 — — — —Principals (in thousands) .................................................................. — — — — — 14 31 32 43 64 91 106Teachers, librarians, and other nonsupervisory instructional staff
(in thousands)5............................................................................ 201 287 364 423 523 657 843 875 920 1,393 2,195 2,300Males (in thousands)..................................................................... 78 123 126 127 110 93 140 195 196 404 4 711 4 782Females (in thousands)................................................................. 123 164 238 296 413 585 703 681 724 989 4 1,484 4 1,518Percent male ................................................................................. 38.7 42.8 34.5 29.9 21.1 14.1 16.6 22.2 21.3 29.0 4 32.4 4 34.0
Total revenues and expenditures Amounts in current dollars
Total revenue receipts (in millions)........................................................ — — $143 $220 $433 $970 $2,089 $2,261 $5,437 $14,747 $40,267 $96,881Federal government .......................................................................... — — — — — 2 7 40 156 652 3,220 9,504State governments............................................................................ — — — — — 160 354 684 2,166 5,768 16,063 45,349Local sources, including intermediate............................................... — — — — — 808 1,728 1,536 3,116 8,327 20,985 42,029
Percentage distribution of revenue receiptsFederal government .......................................................................... — — — — — 0.3 0.4 1.8 2.9 4.4 8.0 9.8State governments............................................................................ — — — — — 16.5 16.9 30.3 39.8 39.1 39.9 46.8Local sources, including intermediate............................................... — — — — — 83.2 82.7 68.0 57.3 56.5 52.1 43.4
Total expenditures for public schools (in millions) ................................. $63 $78 $141 $215 $426 $1,036 $2,317 $2,344 $5,838 $15,613 $40,683 $95,962Current expenditures6 ....................................................................... — — 114 180 356 861 1,844 1,942 4,687 12,329 7 34,218 7 86,984Capital outlay8 ................................................................................... — — 26 35 70 154 371 258 1,014 2,662 4,659 6,506Interest on school debt ..................................................................... — — — — — 18 93 131 101 490 1,171 1,874Other current expenditures9 .............................................................. — — — — — 3 10 13 36 133 636 598
Percentage distribution of total expenditures Current expenditures6 ....................................................................... — — 81.3 83.5 83.6 83.1 79.6 82.8 80.3 79.0 7 84.1 7 90.6Capital outlay8 ................................................................................... — — 18.7 16.5 16.4 14.8 16.0 11.0 17.4 17.0 11.5 6.8Interest on school debt ..................................................................... — — — — — 1.8 4.0 5.6 1.7 3.1 2.9 2.0Other current expenditures9 .............................................................. — — — — — 0.3 0.4 0.6 0.6 0.8 1.6 0.6
See notes at end of table.
CH
AP
TE
R 2
: Ele
me
nta
ry an
d S
eco
nd
ary E
du
catio
n6
9E
nro
llme
nt
DIG
ES
T O
F E
DU
CA
TIO
N S
TA
TIS
TIC
S 2
01
0
secondary schools.ble to pupil costs, capital outlay, and interest on school debt.
length of term.epared by the Bureau of Labor Statistics, U.S. Department of
lished figures. Beginning in 1959–60, data include Alaska and
r Education Statistics, Annual Report of the United States Com-al Survey of Education in the United States, 1919–20 through1969–70; Statistics of Public Elementary and Secondary SchoolElementary and Secondary Education, FY 1980; Schools and–2000 and 2007–08; Common Core of Data (CCD), “State Non-89–90 through 2008–09, and “National Public Financial Survey,”ulations. Bureau of Economic Analysis, unpublished tabulations. ftp://ftp.bls.gov/pub/special.requests/lf/aat1.txt. (This table was
$31,367 $41,807 $49,086 $51,052 $52,80036,793 56,762 70,224 74,412 77,795
862 1,368 1,786 1,883 1,97819,449 29,953 38,119 40,293 41,1054,980 7,394 9,778 10,336 10,9815,550 8,592 11,340 12,017 12,746
127,000 190,793 245,447 260,796 268,577 — 41.22 — — 61.35 — 47.90 — — 71.21
$53,028 $53,010 $52,950 $53,683 $53,53762,200 71,973 75,753 78,247 78,881
1,457 1,735 1,927 1,980 2,00632,880 39,979 41,120 42,369 41,6798,418 9,375 10,548 10,868 11,1349,383 10,894 12,232 12,637 12,924
214,700 241,920 264,771 274,235 272,327 — 48.6 — — 62.2 — 56.5 — — 72.2
80 1989–90 1999–2000 2005–06 2006–07 2007–08
13 14 15 16 17 18
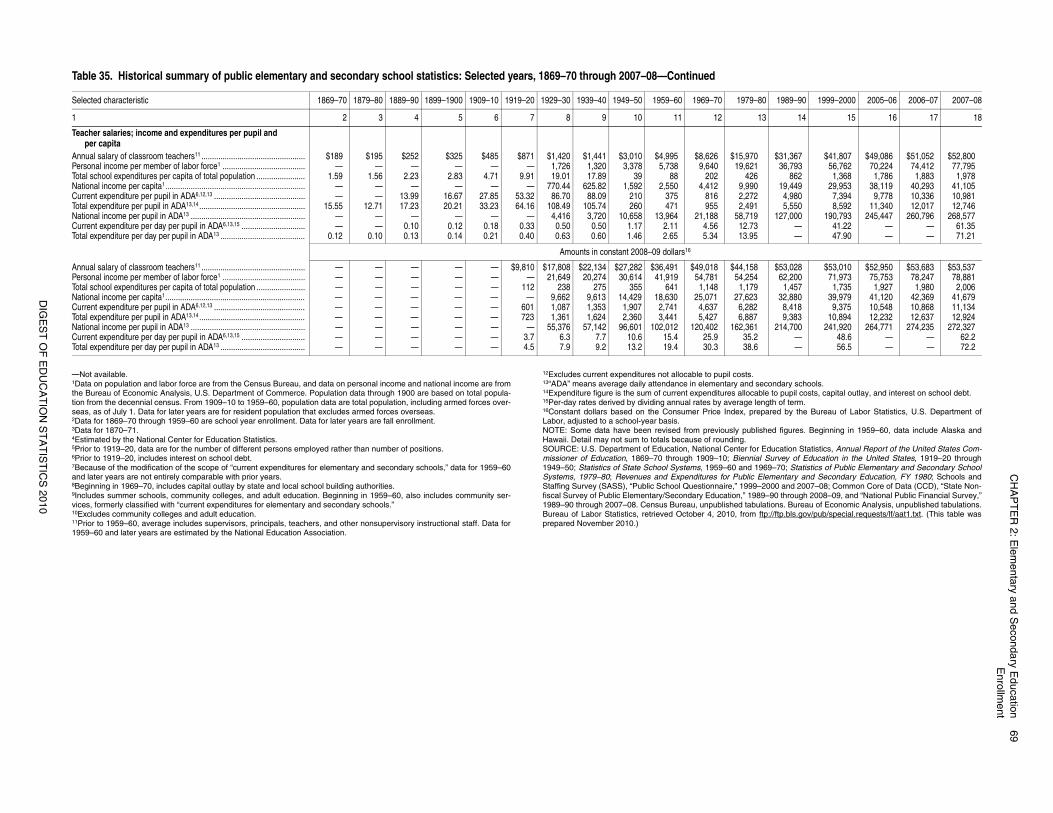
—Not available.1Data on population and labor force are from the Census Bureau, and data on personal income and national income are fromthe Bureau of Economic Analysis, U.S. Department of Commerce. Population data through 1900 are based on total popula-tion from the decennial census. From 1909–10 to 1959–60, population data are total population, including armed forces over-seas, as of July 1. Data for later years are for resident population that excludes armed forces overseas.2Data for 1869–70 through 1959–60 are school year enrollment. Data for later years are fall enrollment.3Data for 1870–71.4Estimated by the National Center for Education Statistics.5Prior to 1919–20, data are for the number of different persons employed rather than number of positions.6Prior to 1919–20, includes interest on school debt.7Because of the modification of the scope of “current expenditures for elementary and secondary schools,” data for 1959–60and later years are not entirely comparable with prior years.8Beginning in 1969–70, includes capital outlay by state and local school building authorities.9Includes summer schools, community colleges, and adult education. Beginning in 1959–60, also includes community ser-vices, formerly classified with “current expenditures for elementary and secondary schools.”10Excludes community colleges and adult education.11Prior to 1959–60, average includes supervisors, principals, teachers, and other nonsupervisory instructional staff. Data for1959–60 and later years are estimated by the National Education Association.
12Excludes current expenditures not allocable to pupil costs.13“ADA” means average daily attendance in elementary and 14Expenditure figure is the sum of current expenditures alloca15Per-day rates derived by dividing annual rates by average 16Constant dollars based on the Consumer Price Index, prLabor, adjusted to a school-year basis.NOTE: Some data have been revised from previously pubHawaii. Detail may not sum to totals because of rounding.SOURCE: U.S. Department of Education, National Center fomissioner of Education, 1869–70 through 1909–10; Bienni1949–50; Statistics of State School Systems, 1959–60 and Systems, 1979–80; Revenues and Expenditures for Public Staffing Survey (SASS), “Public School Questionnaire,” 1999fiscal Survey of Public Elementary/Secondary Education,” 191989–90 through 2007–08. Census Bureau, unpublished tabBureau of Labor Statistics, retrieved October 4, 2010, fromprepared November 2010.)
Teacher salaries; income and expenditures per pupil and per capita
Annual salary of classroom teachers11 ................................................. $189 $195 $252 $325 $485 $871 $1,420 $1,441 $3,010 $4,995 $8,626 $15,970Personal income per member of labor force1 ....................................... — — — — — — 1,726 1,320 3,378 5,738 9,640 19,621Total school expenditures per capita of total population ....................... 1.59 1.56 2.23 2.83 4.71 9.91 19.01 17.89 39 88 202 426National income per capita1.................................................................. — — — — — — 770.44 625.82 1,592 2,550 4,412 9,990Current expenditure per pupil in ADA6,12,13 ........................................... — — 13.99 16.67 27.85 53.32 86.70 88.09 210 375 816 2,272Total expenditure per pupil in ADA13,14.................................................. 15.55 12.71 17.23 20.21 33.23 64.16 108.49 105.74 260 471 955 2,491National income per pupil in ADA13 ...................................................... — — — — — — 4,416 3,720 10,658 13,964 21,188 58,719Current expenditure per day per pupil in ADA6,13,15 .............................. — — 0.10 0.12 0.18 0.33 0.50 0.50 1.17 2.11 4.56 12.73Total expenditure per day per pupil in ADA13 ........................................ 0.12 0.10 0.13 0.14 0.21 0.40 0.63 0.60 1.46 2.65 5.34 13.95
Amounts in constant 2008–09 dollars16
Annual salary of classroom teachers11 ................................................. — — — — — $9,810 $17,808 $22,134 $27,282 $36,491 $49,018 $44,158Personal income per member of labor force1 ....................................... — — — — — — 21,649 20,274 30,614 41,919 54,781 54,254Total school expenditures per capita of total population ....................... — — — — — 112 238 275 355 641 1,148 1,179National income per capita1.................................................................. — — — — — — 9,662 9,613 14,429 18,630 25,071 27,623Current expenditure per pupil in ADA6,12,13 ........................................... — — — — — 601 1,087 1,353 1,907 2,741 4,637 6,282Total expenditure per pupil in ADA13,14.................................................. — — — — — 723 1,361 1,624 2,360 3,441 5,427 6,887National income per pupil in ADA13 ...................................................... — — — — — — 55,376 57,142 96,601 102,012 120,402 162,361Current expenditure per day per pupil in ADA6,13,15 .............................. — — — — — 3.7 6.3 7.7 10.6 15.4 25.9 35.2Total expenditure per day per pupil in ADA13 ........................................ — — — — — 4.5 7.9 9.2 13.2 19.4 30.3 38.6
Table 35. Historical summary of public elementary and secondary school statistics: Selected years, 1869–70 through 2007–08—Continued
Selected characteristic 1869–70 1879–80 1889–90 1899–1900 1909–10 1919–20 1929–30 1939–40 1949–50 1959–60 1969–70 1979–
1 2 3 4 5 6 7 8 9 10 11 12
70
CH
AP
TE
R 2
: Ele
me
nta
ry an
d S
eco
nd
ary E
du
catio
nE
nro
llme
nt
DIG
ES
T O
F E
DU
CA
TIO
N S
TA
TIS
TIC
S 2
01
0
Fall 2008 Percentchange in
totalenrollment,
2003to 2008
Projectedfall 2009
enrollment
Projectedfall 2010
enrollmentTotal
Prekinder-garten tograde 81
Grades9 to 122
17 18 19 20 21 22
,265,572 34,285,564 14,980,008 1.5 49,312,000 49,386,000
745,668 528,078 217,590 2.0 743,000 742,000130,662 89,263 41,399 -2.4 128,000 127,000,087,817 771,749 316,068 7.5 1,131,000 1,159,000478,965 341,603 137,362 5.4 480,000 483,000,322,528 4,306,258 2,016,270 -1.4 6,366,000 6,367,000
818,443 580,304 238,139 8.0 816,000 824,000567,198 392,218 174,980 -1.7 559,000 554,000125,430 86,811 38,619 6.6 124,000 124,00068,681 50,779 17,902 -12.0 78,000 79,000
,631,020 1,849,295 781,725 1.7 2,679,000 2,692,000
,655,792 1,185,684 470,108 8.7 1,695,000 1,716,000179,478 125,910 53,568 -2.2 177,000 177,000275,051 193,554 81,497 9.1 281,000 286,000,119,707 1,479,195 640,512 0.9 2,095,000 2,084,000,046,147 730,021 316,126 3.5 1,042,000 1,040,000
487,559 335,566 151,993 1.3 478,000 476,000471,060 331,079 139,981 0.1 469,000 470,000670,030 472,204 197,826 1.0 682,000 683,000684,873 504,213 180,660 -5.9 677,000 675,000192,935 129,324 63,611 -4.5 190,000 186,000
843,861 576,473 267,388 -2.9 822,000 814,000958,910 666,538 292,372 -2.2 940,000 930,000,659,921 1,118,569 541,352 -5.6 1,630,000 1,601,000836,048 560,184 275,864 -0.8 828,000 826,000491,962 351,807 140,155 -0.3 491,000 488,000
917,871 635,411 282,460 1.3 906,000 903,000141,899 96,869 45,030 -4.4 141,000 141,000292,590 202,912 89,678 2.5 289,000 290,000433,371 308,328 125,043 12.4 451,000 461,000197,934 132,995 64,939 -4.6 194,000 192,000
,381,420 956,765 424,655 # 1,360,000 1,354,000330,245 231,415 98,830 2.2 332,000 334,000,740,592 1,843,080 897,512 -4.3 2,658,000 2,620,000,488,645 1,058,926 429,719 9.4 1,548,000 1,582,000
94,728 63,955 30,773 -7.3 93,000 92,000
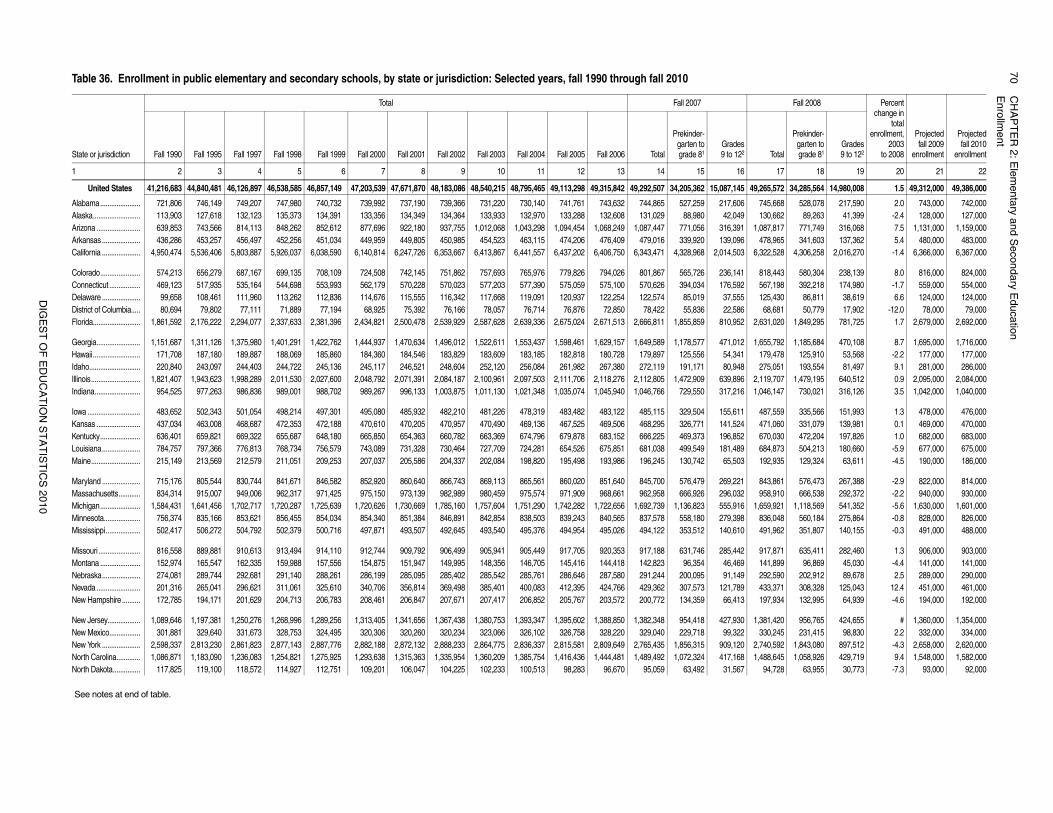
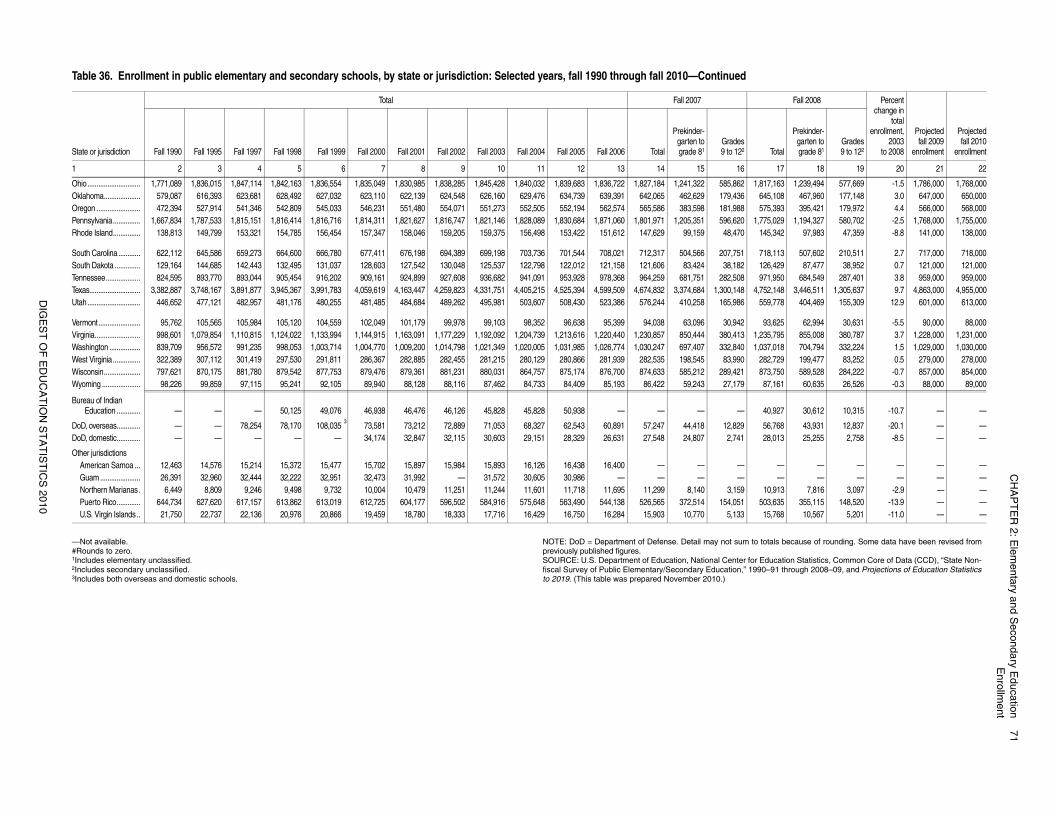
Table 36. Enrollment in public elementary and secondary schools, by state or jurisdiction: Selected years, fall 1990 through fall 2010
State or jurisdiction
Total Fall 2007
Fall 1990 Fall 1995 Fall 1997 Fall 1998 Fall 1999 Fall 2000 Fall 2001 Fall 2002 Fall 2003 Fall 2004 Fall 2005 Fall 2006 Total
Prekinder-garten tograde 81
Grades9 to 122
1 2 3 4 5 6 7 8 9 10 11 12 13 14 15 16
United States 41,216,683 44,840,481 46,126,897 46,538,585 46,857,149 47,203,539 47,671,870 48,183,086 48,540,215 48,795,465 49,113,298 49,315,842 49,292,507 34,205,362 15,087,145 49
Alabama...................... 721,806 746,149 749,207 747,980 740,732 739,992 737,190 739,366 731,220 730,140 741,761 743,632 744,865 527,259 217,606Alaska.......................... 113,903 127,618 132,123 135,373 134,391 133,356 134,349 134,364 133,933 132,970 133,288 132,608 131,029 88,980 42,049Arizona ........................ 639,853 743,566 814,113 848,262 852,612 877,696 922,180 937,755 1,012,068 1,043,298 1,094,454 1,068,249 1,087,447 771,056 316,391 1Arkansas ..................... 436,286 453,257 456,497 452,256 451,034 449,959 449,805 450,985 454,523 463,115 474,206 476,409 479,016 339,920 139,096California ..................... 4,950,474 5,536,406 5,803,887 5,926,037 6,038,590 6,140,814 6,247,726 6,353,667 6,413,867 6,441,557 6,437,202 6,406,750 6,343,471 4,328,968 2,014,503 6
Colorado...................... 574,213 656,279 687,167 699,135 708,109 724,508 742,145 751,862 757,693 765,976 779,826 794,026 801,867 565,726 236,141Connecticut ................. 469,123 517,935 535,164 544,698 553,993 562,179 570,228 570,023 577,203 577,390 575,059 575,100 570,626 394,034 176,592Delaware ..................... 99,658 108,461 111,960 113,262 112,836 114,676 115,555 116,342 117,668 119,091 120,937 122,254 122,574 85,019 37,555District of Columbia..... 80,694 79,802 77,111 71,889 77,194 68,925 75,392 76,166 78,057 76,714 76,876 72,850 78,422 55,836 22,586Florida.......................... 1,861,592 2,176,222 2,294,077 2,337,633 2,381,396 2,434,821 2,500,478 2,539,929 2,587,628 2,639,336 2,675,024 2,671,513 2,666,811 1,855,859 810,952 2
Georgia........................ 1,151,687 1,311,126 1,375,980 1,401,291 1,422,762 1,444,937 1,470,634 1,496,012 1,522,611 1,553,437 1,598,461 1,629,157 1,649,589 1,178,577 471,012 1Hawaii.......................... 171,708 187,180 189,887 188,069 185,860 184,360 184,546 183,829 183,609 183,185 182,818 180,728 179,897 125,556 54,341Idaho............................ 220,840 243,097 244,403 244,722 245,136 245,117 246,521 248,604 252,120 256,084 261,982 267,380 272,119 191,171 80,948Illinois........................... 1,821,407 1,943,623 1,998,289 2,011,530 2,027,600 2,048,792 2,071,391 2,084,187 2,100,961 2,097,503 2,111,706 2,118,276 2,112,805 1,472,909 639,896 2Indiana......................... 954,525 977,263 986,836 989,001 988,702 989,267 996,133 1,003,875 1,011,130 1,021,348 1,035,074 1,045,940 1,046,766 729,550 317,216 1
Iowa ............................. 483,652 502,343 501,054 498,214 497,301 495,080 485,932 482,210 481,226 478,319 483,482 483,122 485,115 329,504 155,611Kansas ........................ 437,034 463,008 468,687 472,353 472,188 470,610 470,205 470,957 470,490 469,136 467,525 469,506 468,295 326,771 141,524Kentucky...................... 636,401 659,821 669,322 655,687 648,180 665,850 654,363 660,782 663,369 674,796 679,878 683,152 666,225 469,373 196,852Louisiana..................... 784,757 797,366 776,813 768,734 756,579 743,089 731,328 730,464 727,709 724,281 654,526 675,851 681,038 499,549 181,489Maine........................... 215,149 213,569 212,579 211,051 209,253 207,037 205,586 204,337 202,084 198,820 195,498 193,986 196,245 130,742 65,503
Maryland ..................... 715,176 805,544 830,744 841,671 846,582 852,920 860,640 866,743 869,113 865,561 860,020 851,640 845,700 576,479 269,221Massachusetts............ 834,314 915,007 949,006 962,317 971,425 975,150 973,139 982,989 980,459 975,574 971,909 968,661 962,958 666,926 296,032Michigan...................... 1,584,431 1,641,456 1,702,717 1,720,287 1,725,639 1,720,626 1,730,669 1,785,160 1,757,604 1,751,290 1,742,282 1,722,656 1,692,739 1,136,823 555,916 1Minnesota.................... 756,374 835,166 853,621 856,455 854,034 854,340 851,384 846,891 842,854 838,503 839,243 840,565 837,578 558,180 279,398Mississippi................... 502,417 506,272 504,792 502,379 500,716 497,871 493,507 492,645 493,540 495,376 494,954 495,026 494,122 353,512 140,610
Missouri....................... 816,558 889,881 910,613 913,494 914,110 912,744 909,792 906,499 905,941 905,449 917,705 920,353 917,188 631,746 285,442Montana ...................... 152,974 165,547 162,335 159,988 157,556 154,875 151,947 149,995 148,356 146,705 145,416 144,418 142,823 96,354 46,469Nebraska..................... 274,081 289,744 292,681 291,140 288,261 286,199 285,095 285,402 285,542 285,761 286,646 287,580 291,244 200,095 91,149Nevada ........................ 201,316 265,041 296,621 311,061 325,610 340,706 356,814 369,498 385,401 400,083 412,395 424,766 429,362 307,573 121,789New Hampshire.......... 172,785 194,171 201,629 204,713 206,783 208,461 206,847 207,671 207,417 206,852 205,767 203,572 200,772 134,359 66,413
New Jersey.................. 1,089,646 1,197,381 1,250,276 1,268,996 1,289,256 1,313,405 1,341,656 1,367,438 1,380,753 1,393,347 1,395,602 1,388,850 1,382,348 954,418 427,930 1New Mexico................. 301,881 329,640 331,673 328,753 324,495 320,306 320,260 320,234 323,066 326,102 326,758 328,220 329,040 229,718 99,322New York ..................... 2,598,337 2,813,230 2,861,823 2,877,143 2,887,776 2,882,188 2,872,132 2,888,233 2,864,775 2,836,337 2,815,581 2,809,649 2,765,435 1,856,315 909,120 2North Carolina............. 1,086,871 1,183,090 1,236,083 1,254,821 1,275,925 1,293,638 1,315,363 1,335,954 1,360,209 1,385,754 1,416,436 1,444,481 1,489,492 1,072,324 417,168 1North Dakota............... 117,825 119,100 118,572 114,927 112,751 109,201 106,047 104,225 102,233 100,513 98,283 96,670 95,059 63,492 31,567
See notes at end of table.
CH
AP
TE
R 2
: Ele
me
nta
ry an
d S
eco
nd
ary E
du
catio
n7
1E
nro
llme
nt
DIG
ES
T O
F E
DU
CA
TIO
N S
TA
TIS
TIC
S 2
01
0
totals because of rounding. Some data have been revised from
r Education Statistics, Common Core of Data (CCD), “State Non-90–91 through 2008–09, and Projections of Education Statistics
,817,163 1,239,494 577,669 -1.5 1,786,000 1,768,000645,108 467,960 177,148 3.0 647,000 650,000575,393 395,421 179,972 4.4 566,000 568,000,775,029 1,194,327 580,702 -2.5 1,768,000 1,755,000145,342 97,983 47,359 -8.8 141,000 138,000
718,113 507,602 210,511 2.7 717,000 718,000126,429 87,477 38,952 0.7 121,000 121,000971,950 684,549 287,401 3.8 959,000 959,000,752,148 3,446,511 1,305,637 9.7 4,863,000 4,955,000559,778 404,469 155,309 12.9 601,000 613,000
93,625 62,994 30,631 -5.5 90,000 88,000,235,795 855,008 380,787 3.7 1,228,000 1,231,000,037,018 704,794 332,224 1.5 1,029,000 1,030,000282,729 199,477 83,252 0.5 279,000 278,000873,750 589,528 284,222 -0.7 857,000 854,00087,161 60,635 26,526 -0.3 88,000 89,000
40,927 30,612 10,315 -10.7 — —
56,768 43,931 12,837 -20.1 — —28,013 25,255 2,758 -8.5 — —
— — — — — —— — — — — —
10,913 7,816 3,097 -2.9 — —503,635 355,115 148,520 -13.9 — —15,768 10,567 5,201 -11.0 — —
Fall 2008 Percentchange in
totalenrollment,
2003to 2008
Projectedfall 2009
enrollment
Projectedfall 2010
enrollmentTotal
Prekinder-garten tograde 81
Grades9 to 122
17 18 19 20 21 22
—Not available.#Rounds to zero.1Includes elementary unclassified. 2Includes secondary unclassified. 3Includes both overseas and domestic schools.
NOTE: DoD = Department of Defense. Detail may not sum topreviously published figures.SOURCE: U.S. Department of Education, National Center fofiscal Survey of Public Elementary/Secondary Education,” 19to 2019. (This table was prepared November 2010.)
Ohio............................. 1,771,089 1,836,015 1,847,114 1,842,163 1,836,554 1,835,049 1,830,985 1,838,285 1,845,428 1,840,032 1,839,683 1,836,722 1,827,184 1,241,322 585,862 1Oklahoma.................... 579,087 616,393 623,681 628,492 627,032 623,110 622,139 624,548 626,160 629,476 634,739 639,391 642,065 462,629 179,436Oregon ........................ 472,394 527,914 541,346 542,809 545,033 546,231 551,480 554,071 551,273 552,505 552,194 562,574 565,586 383,598 181,988Pennsylvania............... 1,667,834 1,787,533 1,815,151 1,816,414 1,816,716 1,814,311 1,821,627 1,816,747 1,821,146 1,828,089 1,830,684 1,871,060 1,801,971 1,205,351 596,620 1Rhode Island............... 138,813 149,799 153,321 154,785 156,454 157,347 158,046 159,205 159,375 156,498 153,422 151,612 147,629 99,159 48,470
South Carolina............ 622,112 645,586 659,273 664,600 666,780 677,411 676,198 694,389 699,198 703,736 701,544 708,021 712,317 504,566 207,751South Dakota .............. 129,164 144,685 142,443 132,495 131,037 128,603 127,542 130,048 125,537 122,798 122,012 121,158 121,606 83,424 38,182Tennessee................... 824,595 893,770 893,044 905,454 916,202 909,161 924,899 927,608 936,682 941,091 953,928 978,368 964,259 681,751 282,508Texas............................ 3,382,887 3,748,167 3,891,877 3,945,367 3,991,783 4,059,619 4,163,447 4,259,823 4,331,751 4,405,215 4,525,394 4,599,509 4,674,832 3,374,684 1,300,148 4Utah............................. 446,652 477,121 482,957 481,176 480,255 481,485 484,684 489,262 495,981 503,607 508,430 523,386 576,244 410,258 165,986
Vermont....................... 95,762 105,565 105,984 105,120 104,559 102,049 101,179 99,978 99,103 98,352 96,638 95,399 94,038 63,096 30,942Virginia......................... 998,601 1,079,854 1,110,815 1,124,022 1,133,994 1,144,915 1,163,091 1,177,229 1,192,092 1,204,739 1,213,616 1,220,440 1,230,857 850,444 380,413 1Washington ................. 839,709 956,572 991,235 998,053 1,003,714 1,004,770 1,009,200 1,014,798 1,021,349 1,020,005 1,031,985 1,026,774 1,030,247 697,407 332,840 1West Virginia............... 322,389 307,112 301,419 297,530 291,811 286,367 282,885 282,455 281,215 280,129 280,866 281,939 282,535 198,545 83,990Wisconsin.................... 797,621 870,175 881,780 879,542 877,753 879,476 879,361 881,231 880,031 864,757 875,174 876,700 874,633 585,212 289,421Wyoming ..................... 98,226 99,859 97,115 95,241 92,105 89,940 88,128 88,116 87,462 84,733 84,409 85,193 86,422 59,243 27,179
Bureau of Indian Education ............. — — — 50,125 49,076 46,938 46,476 46,126 45,828 45,828 50,938 — — — —
DoD, overseas............. — — 78,254 78,170 108,0353
73,581 73,212 72,889 71,053 68,327 62,543 60,891 57,247 44,418 12,829DoD, domestic............. — — — — — 34,174 32,847 32,115 30,603 29,151 28,329 26,631 27,548 24,807 2,741
Other jurisdictionsAmerican Samoa ... 12,463 14,576 15,214 15,372 15,477 15,702 15,897 15,984 15,893 16,126 16,438 16,400 — — —Guam...................... 26,391 32,960 32,444 32,222 32,951 32,473 31,992 — 31,572 30,605 30,986 — — — —Northern Marianas. 6,449 8,809 9,246 9,498 9,732 10,004 10,479 11,251 11,244 11,601 11,718 11,695 11,299 8,140 3,159Puerto Rico............. 644,734 627,620 617,157 613,862 613,019 612,725 604,177 596,502 584,916 575,648 563,490 544,138 526,565 372,514 154,051U.S. Virgin Islands.. 21,750 22,737 22,136 20,976 20,866 19,459 18,780 18,333 17,716 16,429 16,750 16,284 15,903 10,770 5,133
Table 36. Enrollment in public elementary and secondary schools, by state or jurisdiction: Selected years, fall 1990 through fall 2010—Continued
State or jurisdiction
Total Fall 2007
Fall 1990 Fall 1995 Fall 1997 Fall 1998 Fall 1999 Fall 2000 Fall 2001 Fall 2002 Fall 2003 Fall 2004 Fall 2005 Fall 2006 Total
Prekinder-garten tograde 81
Grades9 to 122
1 2 3 4 5 6 7 8 9 10 11 12 13 14 15 16
72
CH
AP
TE
R 2
: Ele
me
nta
ry an
d S
eco
nd
ary E
du
catio
nE
nro
llme
nt
DIG
ES
T O
F E
DU
CA
TIO
N S
TA
TIS
TIC
S 2
01
0
Grades 9 through 12 and secondary ungraded
l Grade 9 Grade 10 Grade 11 Grade 12Secondary
ungraded
5 16 17 18 19 20
8 4,122,552 3,822,200 3,548,100 3,399,689 87,467
0 64,681 56,559 49,587 46,763 09 10,475 10,200 10,937 9,787 08 83,831 80,200 75,282 76,735 202 37,627 35,853 33,460 30,256 1660 539,167 509,157 489,207 476,156 2,583
9 63,779 60,554 57,870 55,936 00 47,216 44,485 42,536 40,743 09 11,755 9,953 8,791 8,120 02 6,334 4,390 3,723 3,444 115 217,105 207,296 189,619 167,705 0
8 143,933 124,006 106,038 96,131 08 16,079 13,889 12,187 11,326 877 21,686 20,874 20,111 18,826 02 178,106 168,476 146,134 147,796 06 84,538 81,245 77,354 72,989 0
3 38,048 38,116 37,779 38,050 01 37,354 35,662 33,803 32,267 8956 55,766 51,925 46,731 43,326 780 56,174 44,525 41,727 38,234 01 15,980 15,918 16,290 15,423 0
8 75,743 67,829 62,900 60,916 02 79,315 73,214 71,514 68,329 02 141,910 139,487 127,703 126,352 5,9004 66,019 67,634 68,009 74,202 05 40,518 36,784 31,327 28,288 3,238
0 75,220 71,882 69,092 66,266 00 11,890 11,326 11,144 10,670 08 23,137 22,496 21,799 22,246 03 41,768 34,224 25,712 23,330 99 17,244 16,260 16,016 15,419 0
5 107,770 104,922 99,293 97,515 15,1550 30,191 26,530 22,169 19,940 02 235,589 224,040 194,312 185,896 57,6759 131,515 111,292 98,188 88,724 03 7,687 7,856 7,622 7,608 0
9 160,269 143,494 139,384 134,522 08 48,896 45,894 43,091 38,798 4692 44,640 44,681 44,531 46,120 02 153,341 149,052 140,191 136,937 1,1819 13,614 12,203 10,833 10,709 0
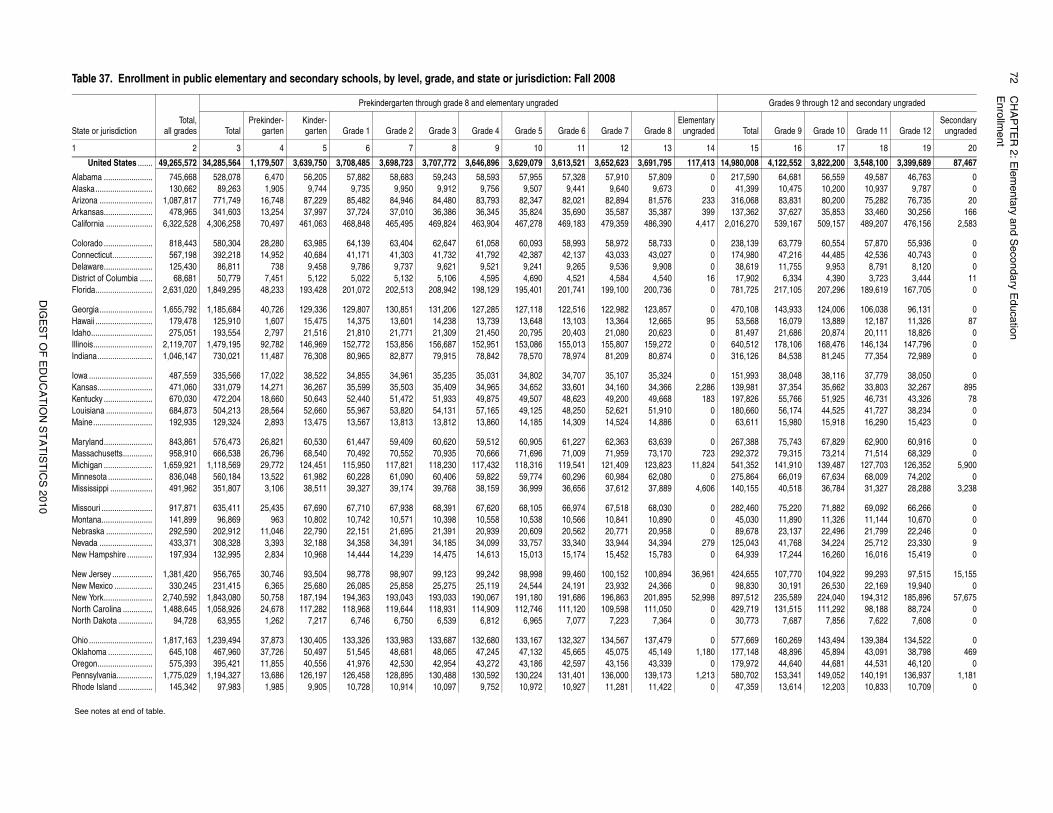
Table 37. Enrollment in public elementary and secondary schools, by level, grade, and state or jurisdiction: Fall 2008
State or jurisdictionTotal,
all grades
Prekindergarten through grade 8 and elementary ungraded
TotalPrekinder-
gartenKinder-garten Grade 1 Grade 2 Grade 3 Grade 4 Grade 5 Grade 6 Grade 7 Grade 8
Elementaryungraded Tota
1 2 3 4 5 6 7 8 9 10 11 12 13 14 1
United States ....... 49,265,572 34,285,564 1,179,507 3,639,750 3,708,485 3,698,723 3,707,772 3,646,896 3,629,079 3,613,521 3,652,623 3,691,795 117,413 14,980,00
Alabama ....................... 745,668 528,078 6,470 56,205 57,882 58,683 59,243 58,593 57,955 57,328 57,910 57,809 0 217,59Alaska........................... 130,662 89,263 1,905 9,744 9,735 9,950 9,912 9,756 9,507 9,441 9,640 9,673 0 41,39Arizona ......................... 1,087,817 771,749 16,748 87,229 85,482 84,946 84,480 83,793 82,347 82,021 82,894 81,576 233 316,06Arkansas....................... 478,965 341,603 13,254 37,997 37,724 37,010 36,386 36,345 35,824 35,690 35,587 35,387 399 137,36California ...................... 6,322,528 4,306,258 70,497 461,063 468,848 465,495 469,824 463,904 467,278 469,183 479,359 486,390 4,417 2,016,27
Colorado ....................... 818,443 580,304 28,280 63,985 64,139 63,404 62,647 61,058 60,093 58,993 58,972 58,733 0 238,13Connecticut................... 567,198 392,218 14,952 40,684 41,171 41,303 41,732 41,792 42,387 42,137 43,033 43,027 0 174,98Delaware....................... 125,430 86,811 738 9,458 9,786 9,737 9,621 9,521 9,241 9,265 9,536 9,908 0 38,61District of Columbia ...... 68,681 50,779 7,451 5,122 5,022 5,132 5,106 4,595 4,690 4,521 4,584 4,540 16 17,90Florida........................... 2,631,020 1,849,295 48,233 193,428 201,072 202,513 208,942 198,129 195,401 201,741 199,100 200,736 0 781,72
Georgia......................... 1,655,792 1,185,684 40,726 129,336 129,807 130,851 131,206 127,285 127,118 122,516 122,982 123,857 0 470,10Hawaii ........................... 179,478 125,910 1,607 15,475 14,375 13,601 14,238 13,739 13,648 13,103 13,364 12,665 95 53,56Idaho............................. 275,051 193,554 2,797 21,516 21,810 21,771 21,309 21,450 20,795 20,403 21,080 20,623 0 81,49Illinois............................ 2,119,707 1,479,195 92,782 146,969 152,772 153,856 156,687 152,951 153,086 155,013 155,807 159,272 0 640,51Indiana.......................... 1,046,147 730,021 11,487 76,308 80,965 82,877 79,915 78,842 78,570 78,974 81,209 80,874 0 316,12
Iowa .............................. 487,559 335,566 17,022 38,522 34,855 34,961 35,235 35,031 34,802 34,707 35,107 35,324 0 151,99Kansas.......................... 471,060 331,079 14,271 36,267 35,599 35,503 35,409 34,965 34,652 33,601 34,160 34,366 2,286 139,98Kentucky ....................... 670,030 472,204 18,660 50,643 52,440 51,472 51,933 49,875 49,507 48,623 49,200 49,668 183 197,82Louisiana ...................... 684,873 504,213 28,564 52,660 55,967 53,820 54,131 57,165 49,125 48,250 52,621 51,910 0 180,66Maine............................ 192,935 129,324 2,893 13,475 13,567 13,813 13,812 13,860 14,185 14,309 14,524 14,886 0 63,61
Maryland....................... 843,861 576,473 26,821 60,530 61,447 59,409 60,620 59,512 60,905 61,227 62,363 63,639 0 267,38Massachusetts.............. 958,910 666,538 26,796 68,540 70,492 70,552 70,935 70,666 71,696 71,009 71,959 73,170 723 292,37Michigan ....................... 1,659,921 1,118,569 29,772 124,451 115,950 117,821 118,230 117,432 118,316 119,541 121,409 123,823 11,824 541,35Minnesota ..................... 836,048 560,184 13,522 61,982 60,228 61,090 60,406 59,822 59,774 60,296 60,984 62,080 0 275,86Mississippi .................... 491,962 351,807 3,106 38,511 39,327 39,174 39,768 38,159 36,999 36,656 37,612 37,889 4,606 140,15
Missouri ........................ 917,871 635,411 25,435 67,690 67,710 67,938 68,391 67,620 68,105 66,974 67,518 68,030 0 282,46Montana........................ 141,899 96,869 963 10,802 10,742 10,571 10,398 10,558 10,538 10,566 10,841 10,890 0 45,03Nebraska ...................... 292,590 202,912 11,046 22,790 22,151 21,695 21,391 20,939 20,609 20,562 20,771 20,958 0 89,67Nevada ......................... 433,371 308,328 3,393 32,188 34,358 34,391 34,185 34,099 33,757 33,340 33,944 34,394 279 125,04New Hampshire ............ 197,934 132,995 2,834 10,968 14,444 14,239 14,475 14,613 15,013 15,174 15,452 15,783 0 64,93
New Jersey ................... 1,381,420 956,765 30,746 93,504 98,778 98,907 99,123 99,242 98,998 99,460 100,152 100,894 36,961 424,65New Mexico .................. 330,245 231,415 6,365 25,680 26,085 25,858 25,275 25,119 24,544 24,191 23,932 24,366 0 98,83New York....................... 2,740,592 1,843,080 50,758 187,194 194,363 193,043 193,033 190,067 191,180 191,686 196,863 201,895 52,998 897,51North Carolina .............. 1,488,645 1,058,926 24,678 117,282 118,968 119,644 118,931 114,909 112,746 111,120 109,598 111,050 0 429,71North Dakota ................ 94,728 63,955 1,262 7,217 6,746 6,750 6,539 6,812 6,965 7,077 7,223 7,364 0 30,77
Ohio .............................. 1,817,163 1,239,494 37,873 130,405 133,326 133,983 133,687 132,680 133,167 132,327 134,567 137,479 0 577,66Oklahoma ..................... 645,108 467,960 37,726 50,497 51,545 48,681 48,065 47,245 47,132 45,665 45,075 45,149 1,180 177,14Oregon.......................... 575,393 395,421 11,855 40,556 41,976 42,530 42,954 43,272 43,186 42,597 43,156 43,339 0 179,97Pennsylvania................. 1,775,029 1,194,327 13,686 126,197 126,458 128,895 130,488 130,592 130,224 131,401 136,000 139,173 1,213 580,70Rhode Island ................ 145,342 97,983 1,985 9,905 10,728 10,914 10,097 9,752 10,972 10,927 11,281 11,422 0 47,35
See notes at end of table.
CH
AP
TE
R 2
: Ele
me
nta
ry an
d S
eco
nd
ary E
du
catio
n7
3E
nro
llme
nt
DIG
ES
T O
F E
DU
CA
TIO
N S
TA
TIS
TIC
S 2
01
0
r Education Statistics, Common Core of Data (CCD), “State Non-08–09. (This table was prepared August 2010.)
1 64,674 55,294 47,354 43,189 02 10,580 10,357 9,184 8,831 01 78,675 74,858 68,562 65,306 07 389,217 332,620 303,492 280,308 09 39,511 38,991 38,989 37,818 0
1 7,754 7,574 7,783 7,520 07 106,252 97,466 89,892 87,177 04 87,546 83,254 81,508 79,916 02 23,730 20,966 19,642 18,914 02 71,676 69,408 71,339 71,799 06 7,027 7,029 6,359 6,111 0
5 3,106 2,771 2,346 2,092 0
7 3,881 3,362 3,059 2,535 08 930 731 613 484 0
— — — — —— — — — —
7 1,070 875 615 537 00 39,849 39,893 33,566 30,419 4,7931 1,856 1,253 1,036 1,056 0
Grades 9 through 12 and secondary ungraded
l Grade 9 Grade 10 Grade 11 Grade 12Secondary
ungraded
5 16 17 18 19 20
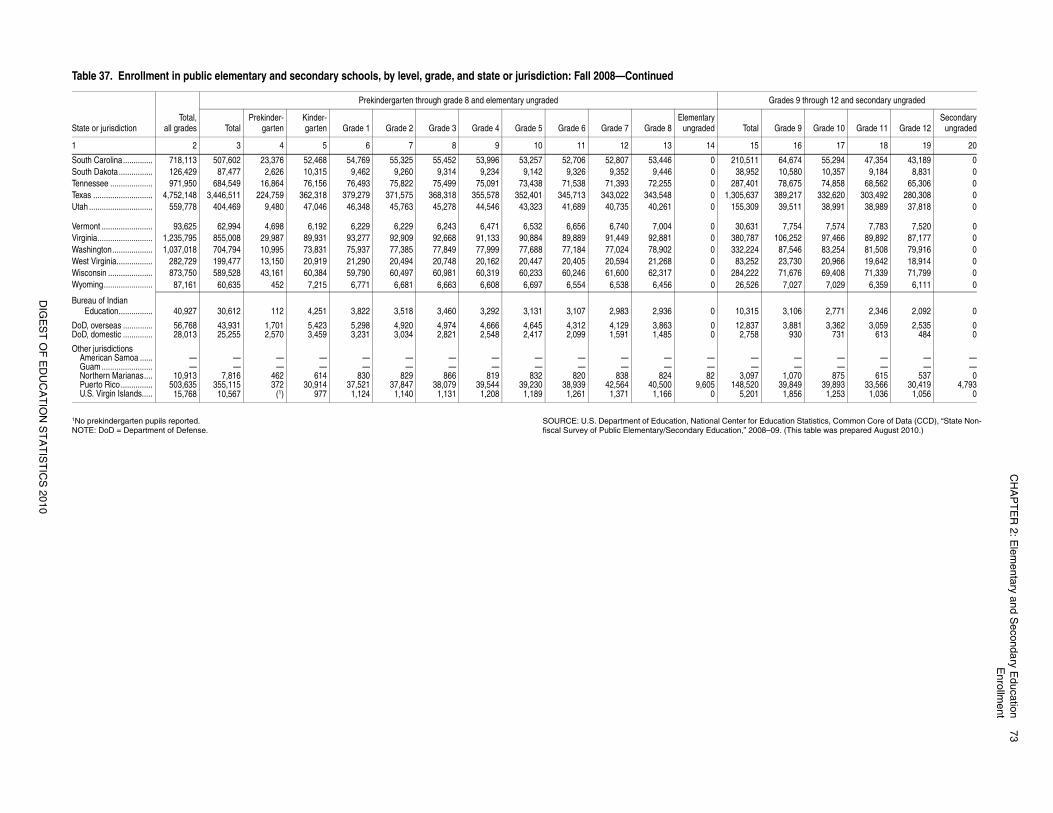
1No prekindergarten pupils reported. NOTE: DoD = Department of Defense.
SOURCE: U.S. Department of Education, National Center fofiscal Survey of Public Elementary/Secondary Education,” 20
South Carolina.............. 718,113 507,602 23,376 52,468 54,769 55,325 55,452 53,996 53,257 52,706 52,807 53,446 0 210,51South Dakota ................ 126,429 87,477 2,626 10,315 9,462 9,260 9,314 9,234 9,142 9,326 9,352 9,446 0 38,95Tennessee .................... 971,950 684,549 16,864 76,156 76,493 75,822 75,499 75,091 73,438 71,538 71,393 72,255 0 287,40Texas ............................ 4,752,148 3,446,511 224,759 362,318 379,279 371,575 368,318 355,578 352,401 345,713 343,022 343,548 0 1,305,63Utah .............................. 559,778 404,469 9,480 47,046 46,348 45,763 45,278 44,546 43,323 41,689 40,735 40,261 0 155,30
Vermont ........................ 93,625 62,994 4,698 6,192 6,229 6,229 6,243 6,471 6,532 6,656 6,740 7,004 0 30,63Virginia.......................... 1,235,795 855,008 29,987 89,931 93,277 92,909 92,668 91,133 90,884 89,889 91,449 92,881 0 380,78Washington................... 1,037,018 704,794 10,995 73,831 75,937 77,385 77,849 77,999 77,688 77,184 77,024 78,902 0 332,22West Virginia................. 282,729 199,477 13,150 20,919 21,290 20,494 20,748 20,162 20,447 20,405 20,594 21,268 0 83,25Wisconsin ..................... 873,750 589,528 43,161 60,384 59,790 60,497 60,981 60,319 60,233 60,246 61,600 62,317 0 284,22Wyoming....................... 87,161 60,635 452 7,215 6,771 6,681 6,663 6,608 6,697 6,554 6,538 6,456 0 26,52
Bureau of Indian Education................ 40,927 30,612 112 4,251 3,822 3,518 3,460 3,292 3,131 3,107 2,983 2,936 0 10,31
DoD, overseas .............. 56,768 43,931 1,701 5,423 5,298 4,920 4,974 4,666 4,645 4,312 4,129 3,863 0 12,83DoD, domestic .............. 28,013 25,255 2,570 3,459 3,231 3,034 2,821 2,548 2,417 2,099 1,591 1,485 0 2,75
Other jurisdictionsAmerican Samoa ...... — — — — — — — — — — — — — —Guam ........................ — — — — — — — — — — — — — —Northern Marianas.... 10,913 7,816 462 614 830 829 866 819 832 820 838 824 82 3,09Puerto Rico ............... 503,635 355,115 372 30,914 37,521 37,847 38,079 39,544 39,230 38,939 42,564 40,500 9,605 148,52U.S. Virgin Islands..... 15,768 10,567 (1) 977 1,124 1,140 1,131 1,208 1,189 1,261 1,371 1,166 0 5,20
Table 37. Enrollment in public elementary and secondary schools, by level, grade, and state or jurisdiction: Fall 2008—Continued
State or jurisdictionTotal,
all grades
Prekindergarten through grade 8 and elementary ungraded
TotalPrekinder-
gartenKinder-garten Grade 1 Grade 2 Grade 3 Grade 4 Grade 5 Grade 6 Grade 7 Grade 8
Elementaryungraded Tota
1 2 3 4 5 6 7 8 9 10 11 12 13 14 1
74
CH
AP
TE
R 2
: Ele
me
nta
ry an
d S
eco
nd
ary E
du
catio
nE
nro
llme
nt
DIG
ES
T O
F E
DU
CA
TIO
N S
TA
TIS
TIC
S 2
01
0
Grades 9 through 12 and secondary ungraded
l Grade 9 Grade 10 Grade 11 Grade 12Secondary
ungraded
5 16 17 18 19 20
5 4,199,967 3,862,995 3,557,585 3,374,786 91,812
6 65,495 55,650 49,987 46,474 09 10,719 10,639 10,599 10,092 01 84,030 80,655 75,416 76,275 156 37,819 36,781 33,613 30,708 1753 541,650 513,707 488,227 468,281 2,638
1 63,333 60,702 56,772 55,334 02 48,472 44,526 42,667 40,927 05 11,479 10,028 8,367 7,681 06 7,099 5,028 4,113 4,002 2,3442 233,376 213,074 194,670 169,832 0
2 147,106 123,454 105,009 95,443 01 16,161 13,613 13,238 11,234 958 21,800 21,013 19,537 18,598 06 178,385 167,459 149,710 144,342 06 84,937 81,968 78,556 71,755 0
1 38,992 39,306 38,199 39,114 04 37,569 36,316 33,859 33,149 6312 56,874 51,358 46,582 41,958 809 55,735 46,857 41,091 37,806 03 16,100 16,839 16,242 16,322 0
1 76,188 68,452 62,814 61,767 02 79,576 75,397 72,302 68,757 06 149,275 143,421 130,215 126,380 6,6258 67,434 68,614 68,601 74,749 00 41,807 36,461 31,077 27,688 3,577
2 79,020 73,264 67,715 65,443 09 12,134 11,970 11,287 11,057 219 23,829 22,898 22,022 22,400 09 40,265 33,676 25,983 21,828 373 17,532 16,922 16,000 15,959 0
0 108,724 104,930 100,600 97,078 16,5982 30,031 26,961 22,736 19,594 00 242,566 229,873 194,223 185,680 56,7788 128,987 105,322 96,966 85,893 07 8,071 8,014 7,820 7,662 0
2 164,768 145,347 141,330 134,417 06 49,091 47,340 42,648 39,321 1,0368 45,179 45,820 45,161 45,559 2690 158,874 153,174 143,749 139,930 8930 13,709 12,492 11,421 10,848 0
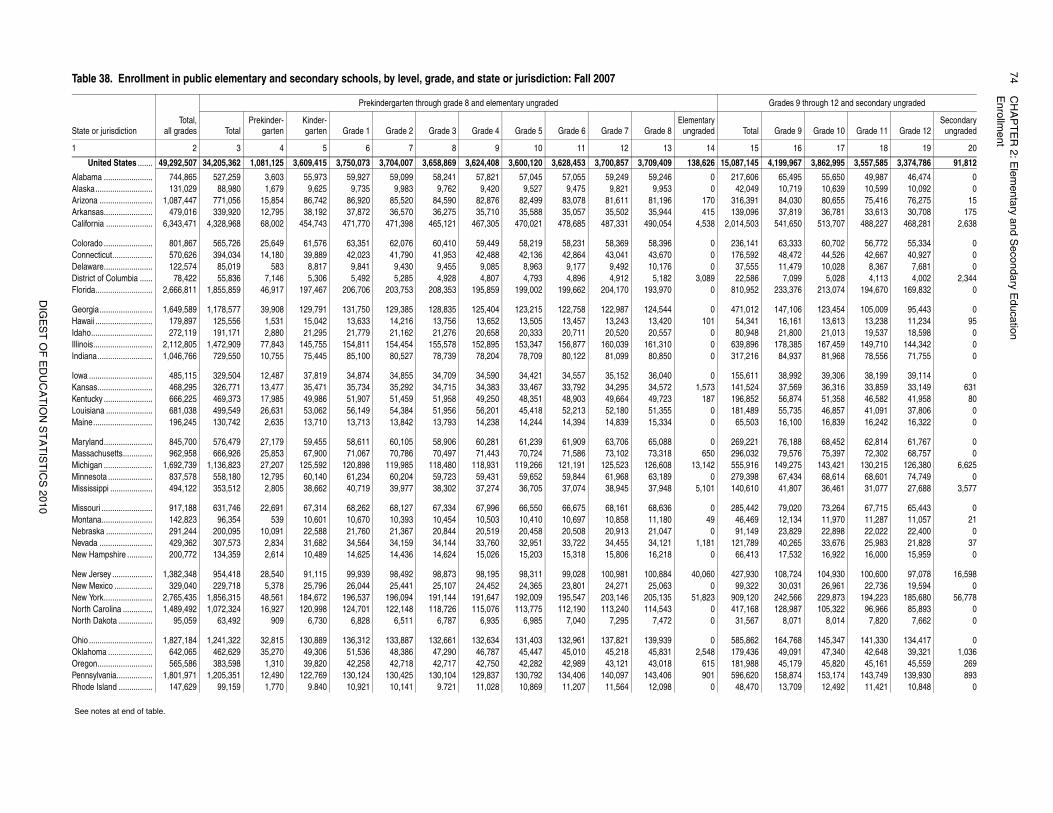
Table 38. Enrollment in public elementary and secondary schools, by level, grade, and state or jurisdiction: Fall 2007
State or jurisdictionTotal,
all grades
Prekindergarten through grade 8 and elementary ungraded
TotalPrekinder-
gartenKinder-garten Grade 1 Grade 2 Grade 3 Grade 4 Grade 5 Grade 6 Grade 7 Grade 8
Elementaryungraded Tota
1 2 3 4 5 6 7 8 9 10 11 12 13 14 1
United States ....... 49,292,507 34,205,362 1,081,125 3,609,415 3,750,073 3,704,007 3,658,869 3,624,408 3,600,120 3,628,453 3,700,857 3,709,409 138,626 15,087,14
Alabama ....................... 744,865 527,259 3,603 55,973 59,927 59,099 58,241 57,821 57,045 57,055 59,249 59,246 0 217,60Alaska........................... 131,029 88,980 1,679 9,625 9,735 9,983 9,762 9,420 9,527 9,475 9,821 9,953 0 42,04Arizona ......................... 1,087,447 771,056 15,854 86,742 86,920 85,520 84,590 82,876 82,499 83,078 81,611 81,196 170 316,39Arkansas....................... 479,016 339,920 12,795 38,192 37,872 36,570 36,275 35,710 35,588 35,057 35,502 35,944 415 139,09California ...................... 6,343,471 4,328,968 68,002 454,743 471,770 471,398 465,121 467,305 470,021 478,685 487,331 490,054 4,538 2,014,50
Colorado ....................... 801,867 565,726 25,649 61,576 63,351 62,076 60,410 59,449 58,219 58,231 58,369 58,396 0 236,14Connecticut................... 570,626 394,034 14,180 39,889 42,023 41,790 41,953 42,488 42,136 42,864 43,041 43,670 0 176,59Delaware....................... 122,574 85,019 583 8,817 9,841 9,430 9,455 9,085 8,963 9,177 9,492 10,176 0 37,55District of Columbia ...... 78,422 55,836 7,146 5,306 5,492 5,285 4,928 4,807 4,793 4,896 4,912 5,182 3,089 22,58Florida........................... 2,666,811 1,855,859 46,917 197,467 206,706 203,753 208,353 195,859 199,002 199,662 204,170 193,970 0 810,95
Georgia......................... 1,649,589 1,178,577 39,908 129,791 131,750 129,385 128,835 125,404 123,215 122,758 122,987 124,544 0 471,01Hawaii ........................... 179,897 125,556 1,531 15,042 13,633 14,216 13,756 13,652 13,505 13,457 13,243 13,420 101 54,34Idaho............................. 272,119 191,171 2,880 21,295 21,779 21,162 21,276 20,658 20,333 20,711 20,520 20,557 0 80,94Illinois............................ 2,112,805 1,472,909 77,843 145,755 154,811 154,454 155,578 152,895 153,347 156,877 160,039 161,310 0 639,89Indiana.......................... 1,046,766 729,550 10,755 75,445 85,100 80,527 78,739 78,204 78,709 80,122 81,099 80,850 0 317,21
Iowa .............................. 485,115 329,504 12,487 37,819 34,874 34,855 34,709 34,590 34,421 34,557 35,152 36,040 0 155,61Kansas.......................... 468,295 326,771 13,477 35,471 35,734 35,292 34,715 34,383 33,467 33,792 34,295 34,572 1,573 141,52Kentucky ....................... 666,225 469,373 17,985 49,986 51,907 51,459 51,958 49,250 48,351 48,903 49,664 49,723 187 196,85Louisiana ...................... 681,038 499,549 26,631 53,062 56,149 54,384 51,956 56,201 45,418 52,213 52,180 51,355 0 181,48Maine............................ 196,245 130,742 2,635 13,710 13,713 13,842 13,793 14,238 14,244 14,394 14,839 15,334 0 65,50
Maryland....................... 845,700 576,479 27,179 59,455 58,611 60,105 58,906 60,281 61,239 61,909 63,706 65,088 0 269,22Massachusetts.............. 962,958 666,926 25,853 67,900 71,067 70,786 70,497 71,443 70,724 71,586 73,102 73,318 650 296,03Michigan ....................... 1,692,739 1,136,823 27,207 125,592 120,898 119,985 118,480 118,931 119,266 121,191 125,523 126,608 13,142 555,91Minnesota ..................... 837,578 558,180 12,795 60,140 61,234 60,204 59,723 59,431 59,652 59,844 61,968 63,189 0 279,39Mississippi .................... 494,122 353,512 2,805 38,662 40,719 39,977 38,302 37,274 36,705 37,074 38,945 37,948 5,101 140,61
Missouri ........................ 917,188 631,746 22,691 67,314 68,262 68,127 67,334 67,996 66,550 66,675 68,161 68,636 0 285,44Montana........................ 142,823 96,354 539 10,601 10,670 10,393 10,454 10,503 10,410 10,697 10,858 11,180 49 46,46Nebraska ...................... 291,244 200,095 10,091 22,588 21,760 21,367 20,844 20,519 20,458 20,508 20,913 21,047 0 91,14Nevada ......................... 429,362 307,573 2,834 31,682 34,564 34,159 34,144 33,760 32,951 33,722 34,455 34,121 1,181 121,78New Hampshire ............ 200,772 134,359 2,614 10,489 14,625 14,436 14,624 15,026 15,203 15,318 15,806 16,218 0 66,41
New Jersey ................... 1,382,348 954,418 28,540 91,115 99,939 98,492 98,873 98,195 98,311 99,028 100,981 100,884 40,060 427,93New Mexico .................. 329,040 229,718 5,378 25,796 26,044 25,441 25,107 24,452 24,365 23,801 24,271 25,063 0 99,32New York....................... 2,765,435 1,856,315 48,561 184,672 196,537 196,094 191,144 191,647 192,009 195,547 203,146 205,135 51,823 909,12North Carolina .............. 1,489,492 1,072,324 16,927 120,998 124,701 122,148 118,726 115,076 113,775 112,190 113,240 114,543 0 417,16North Dakota ................ 95,059 63,492 909 6,730 6,828 6,511 6,787 6,935 6,985 7,040 7,295 7,472 0 31,56
Ohio .............................. 1,827,184 1,241,322 32,815 130,889 136,312 133,887 132,661 132,634 131,403 132,961 137,821 139,939 0 585,86Oklahoma ..................... 642,065 462,629 35,270 49,306 51,536 48,386 47,290 46,787 45,447 45,010 45,218 45,831 2,548 179,43Oregon.......................... 565,586 383,598 1,310 39,820 42,258 42,718 42,717 42,750 42,282 42,989 43,121 43,018 615 181,98Pennsylvania................. 1,801,971 1,205,351 12,490 122,769 130,124 130,425 130,104 129,837 130,792 134,406 140,097 143,406 901 596,62Rhode Island ................ 147,629 99,159 1,770 9.840 10,921 10,141 9.721 11,028 10,869 11,207 11,564 12,098 0 48,47
See notes at end of table.
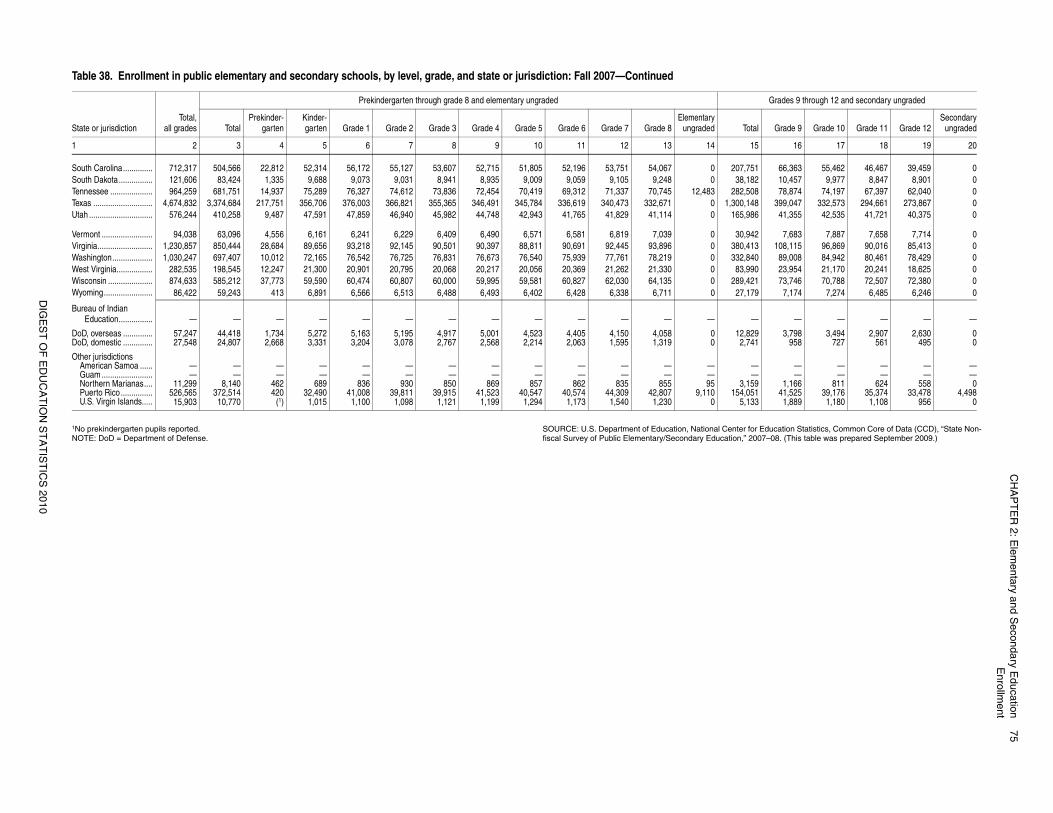
CH
AP
TE
R 2
: Ele
me
nta
ry an
d S
eco
nd
ary E
du
catio
n7
5E
nro
llme
nt
DIG
ES
T O
F E
DU
CA
TIO
N S
TA
TIS
TIC
S 2
01
0
r Education Statistics, Common Core of Data (CCD), “State Non-07–08. (This table was prepared September 2009.)
1 66,363 55,462 46,467 39,459 02 10,457 9,977 8,847 8,901 08 78,874 74,197 67,397 62,040 08 399,047 332,573 294,661 273,867 06 41,355 42,535 41,721 40,375 0
2 7,683 7,887 7,658 7,714 03 108,115 96,869 90,016 85,413 00 89,008 84,942 80,461 78,429 00 23,954 21,170 20,241 18,625 01 73,746 70,788 72,507 72,380 09 7,174 7,274 6,485 6,246 0
— — — — —
9 3,798 3,494 2,907 2,630 01 958 727 561 495 0
— — — — —— — — — —
9 1,166 811 624 558 01 41,525 39,176 35,374 33,478 4,4983 1,889 1,180 1,108 956 0
Grades 9 through 12 and secondary ungraded
l Grade 9 Grade 10 Grade 11 Grade 12Secondary
ungraded
5 16 17 18 19 20
1No prekindergarten pupils reported. NOTE: DoD = Department of Defense.
SOURCE: U.S. Department of Education, National Center fofiscal Survey of Public Elementary/Secondary Education,” 20
South Carolina.............. 712,317 504,566 22,812 52,314 56,172 55,127 53,607 52,715 51,805 52,196 53,751 54,067 0 207,75South Dakota ................ 121,606 83,424 1,335 9,688 9,073 9,031 8,941 8,935 9,009 9,059 9,105 9,248 0 38,18Tennessee .................... 964,259 681,751 14,937 75,289 76,327 74,612 73,836 72,454 70,419 69,312 71,337 70,745 12,483 282,50Texas ............................ 4,674,832 3,374,684 217,751 356,706 376,003 366,821 355,365 346,491 345,784 336,619 340,473 332,671 0 1,300,14Utah .............................. 576,244 410,258 9,487 47,591 47,859 46,940 45,982 44,748 42,943 41,765 41,829 41,114 0 165,98
Vermont ........................ 94,038 63,096 4,556 6,161 6,241 6,229 6,409 6,490 6,571 6,581 6,819 7,039 0 30,94Virginia.......................... 1,230,857 850,444 28,684 89,656 93,218 92,145 90,501 90,397 88,811 90,691 92,445 93,896 0 380,41Washington................... 1,030,247 697,407 10,012 72,165 76,542 76,725 76,831 76,673 76,540 75,939 77,761 78,219 0 332,84West Virginia................. 282,535 198,545 12,247 21,300 20,901 20,795 20,068 20,217 20,056 20,369 21,262 21,330 0 83,99Wisconsin ..................... 874,633 585,212 37,773 59,590 60,474 60,807 60,000 59,995 59,581 60,827 62,030 64,135 0 289,42Wyoming....................... 86,422 59,243 413 6,891 6,566 6,513 6,488 6,493 6,402 6,428 6,338 6,711 0 27,17
Bureau of Indian Education................ — — — — — — — — — — — — — —
DoD, overseas .............. 57,247 44,418 1,734 5,272 5,163 5,195 4,917 5,001 4,523 4,405 4,150 4,058 0 12,82DoD, domestic .............. 27,548 24,807 2,668 3,331 3,204 3,078 2,767 2,568 2,214 2,063 1,595 1,319 0 2,74
Other jurisdictionsAmerican Samoa ...... — — — — — — — — — — — — — —Guam ........................ — — — — — — — — — — — — — —Northern Marianas.... 11,299 8,140 462 689 836 930 850 869 857 862 835 855 95 3,15Puerto Rico ............... 526,565 372,514 420 32,490 41,008 39,811 39,915 41,523 40,547 40,574 44,309 42,807 9,110 154,05U.S. Virgin Islands..... 15,903 10,770 (1) 1,015 1,100 1,098 1,121 1,199 1,294 1,173 1,540 1,230 0 5,13
Table 38. Enrollment in public elementary and secondary schools, by level, grade, and state or jurisdiction: Fall 2007—Continued
State or jurisdictionTotal,
all grades
Prekindergarten through grade 8 and elementary ungraded
TotalPrekinder-
gartenKinder-garten Grade 1 Grade 2 Grade 3 Grade 4 Grade 5 Grade 6 Grade 7 Grade 8
Elementaryungraded Tota
1 2 3 4 5 6 7 8 9 10 11 12 13 14 1
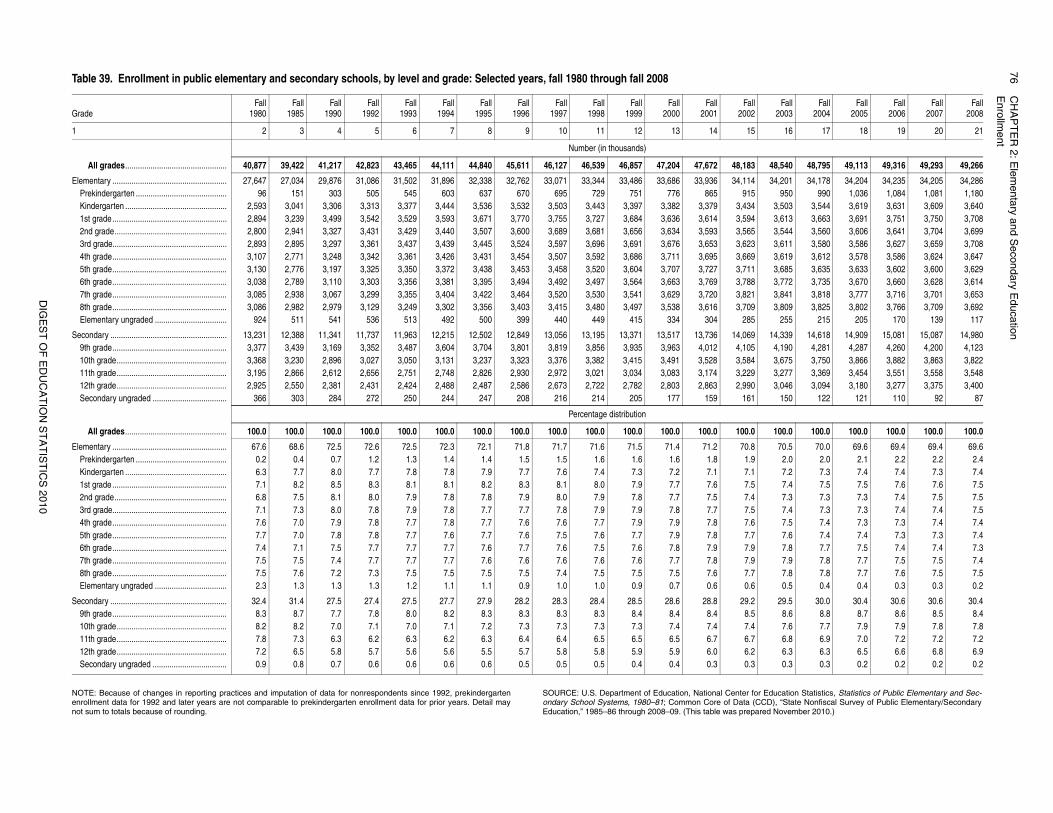
76
CH
AP
TE
R 2
: Ele
me
nta
ry an
d S
eco
nd
ary E
du
catio
nE
nro
llme
nt
DIG
ES
T O
F E
DU
CA
TIO
N S
TA
TIS
TIC
S 2
01
0
r Education Statistics, Statistics of Public Elementary and Sec-CCD), “State Nonfiscal Survey of Public Elementary/Secondaryared November 2010.)
Fall2003
Fall2004
Fall2005
Fall2006
Fall2007
Fall2008
16 17 18 19 20 21
48,540 48,795 49,113 49,316 49,293 49,266
34,201 34,178 34,204 34,235 34,205 34,286950 990 1,036 1,084 1,081 1,180
3,503 3,544 3,619 3,631 3,609 3,6403,613 3,663 3,691 3,751 3,750 3,7083,544 3,560 3,606 3,641 3,704 3,6993,611 3,580 3,586 3,627 3,659 3,7083,619 3,612 3,578 3,586 3,624 3,6473,685 3,635 3,633 3,602 3,600 3,6293,772 3,735 3,670 3,660 3,628 3,6143,841 3,818 3,777 3,716 3,701 3,6533,809 3,825 3,802 3,766 3,709 3,692
255 215 205 170 139 117
14,339 14,618 14,909 15,081 15,087 14,9804,190 4,281 4,287 4,260 4,200 4,1233,675 3,750 3,866 3,882 3,863 3,8223,277 3,369 3,454 3,551 3,558 3,5483,046 3,094 3,180 3,277 3,375 3,400
150 122 121 110 92 87
100.0 100.0 100.0 100.0 100.0 100.0
70.5 70.0 69.6 69.4 69.4 69.62.0 2.0 2.1 2.2 2.2 2.47.2 7.3 7.4 7.4 7.3 7.47.4 7.5 7.5 7.6 7.6 7.57.3 7.3 7.3 7.4 7.5 7.57.4 7.3 7.3 7.4 7.4 7.57.5 7.4 7.3 7.3 7.4 7.47.6 7.4 7.4 7.3 7.3 7.47.8 7.7 7.5 7.4 7.4 7.37.9 7.8 7.7 7.5 7.5 7.47.8 7.8 7.7 7.6 7.5 7.50.5 0.4 0.4 0.3 0.3 0.2
29.5 30.0 30.4 30.6 30.6 30.48.6 8.8 8.7 8.6 8.5 8.47.6 7.7 7.9 7.9 7.8 7.86.8 6.9 7.0 7.2 7.2 7.26.3 6.3 6.5 6.6 6.8 6.90.3 0.3 0.2 0.2 0.2 0.2
NOTE: Because of changes in reporting practices and imputation of data for nonrespondents since 1992, prekindergartenenrollment data for 1992 and later years are not comparable to prekindergarten enrollment data for prior years. Detail maynot sum to totals because of rounding.
SOURCE: U.S. Department of Education, National Center foondary School Systems, 1980–81; Common Core of Data (Education,” 1985–86 through 2008–09. (This table was prep
Table 39. Enrollment in public elementary and secondary schools, by level and grade: Selected years, fall 1980 through fall 2008
GradeFall
1980Fall
1985Fall
1990Fall
1992Fall
1993Fall
1994Fall
1995Fall
1996Fall
1997Fall
1998Fall
1999Fall
2000Fall
2001Fall
2002
1 2 3 4 5 6 7 8 9 10 11 12 13 14 15
Number (in thousands)
All grades................................................ 40,877 39,422 41,217 42,823 43,465 44,111 44,840 45,611 46,127 46,539 46,857 47,204 47,672 48,183
Elementary ...................................................... 27,647 27,034 29,876 31,086 31,502 31,896 32,338 32,762 33,071 33,344 33,486 33,686 33,936 34,114Prekindergarten ........................................... 96 151 303 505 545 603 637 670 695 729 751 776 865 915Kindergarten ................................................ 2,593 3,041 3,306 3,313 3,377 3,444 3,536 3,532 3,503 3,443 3,397 3,382 3,379 3,4341st grade...................................................... 2,894 3,239 3,499 3,542 3,529 3,593 3,671 3,770 3,755 3,727 3,684 3,636 3,614 3,5942nd grade..................................................... 2,800 2,941 3,327 3,431 3,429 3,440 3,507 3,600 3,689 3,681 3,656 3,634 3,593 3,5653rd grade...................................................... 2,893 2,895 3,297 3,361 3,437 3,439 3,445 3,524 3,597 3,696 3,691 3,676 3,653 3,6234th grade...................................................... 3,107 2,771 3,248 3,342 3,361 3,426 3,431 3,454 3,507 3,592 3,686 3,711 3,695 3,6695th grade...................................................... 3,130 2,776 3,197 3,325 3,350 3,372 3,438 3,453 3,458 3,520 3,604 3,707 3,727 3,7116th grade...................................................... 3,038 2,789 3,110 3,303 3,356 3,381 3,395 3,494 3,492 3,497 3,564 3,663 3,769 3,7887th grade...................................................... 3,085 2,938 3,067 3,299 3,355 3,404 3,422 3,464 3,520 3,530 3,541 3,629 3,720 3,8218th grade...................................................... 3,086 2,982 2,979 3,129 3,249 3,302 3,356 3,403 3,415 3,480 3,497 3,538 3,616 3,709Elementary ungraded .................................. 924 511 541 536 513 492 500 399 440 449 415 334 304 285
Secondary ....................................................... 13,231 12,388 11,341 11,737 11,963 12,215 12,502 12,849 13,056 13,195 13,371 13,517 13,736 14,0699th grade...................................................... 3,377 3,439 3,169 3,352 3,487 3,604 3,704 3,801 3,819 3,856 3,935 3,963 4,012 4,10510th grade.................................................... 3,368 3,230 2,896 3,027 3,050 3,131 3,237 3,323 3,376 3,382 3,415 3,491 3,528 3,58411th grade.................................................... 3,195 2,866 2,612 2,656 2,751 2,748 2,826 2,930 2,972 3,021 3,034 3,083 3,174 3,22912th grade.................................................... 2,925 2,550 2,381 2,431 2,424 2,488 2,487 2,586 2,673 2,722 2,782 2,803 2,863 2,990Secondary ungraded ................................... 366 303 284 272 250 244 247 208 216 214 205 177 159 161
Percentage distribution
All grades................................................ 100.0 100.0 100.0 100.0 100.0 100.0 100.0 100.0 100.0 100.0 100.0 100.0 100.0 100.0
Elementary ...................................................... 67.6 68.6 72.5 72.6 72.5 72.3 72.1 71.8 71.7 71.6 71.5 71.4 71.2 70.8Prekindergarten ........................................... 0.2 0.4 0.7 1.2 1.3 1.4 1.4 1.5 1.5 1.6 1.6 1.6 1.8 1.9Kindergarten ................................................ 6.3 7.7 8.0 7.7 7.8 7.8 7.9 7.7 7.6 7.4 7.3 7.2 7.1 7.11st grade...................................................... 7.1 8.2 8.5 8.3 8.1 8.1 8.2 8.3 8.1 8.0 7.9 7.7 7.6 7.52nd grade..................................................... 6.8 7.5 8.1 8.0 7.9 7.8 7.8 7.9 8.0 7.9 7.8 7.7 7.5 7.43rd grade...................................................... 7.1 7.3 8.0 7.8 7.9 7.8 7.7 7.7 7.8 7.9 7.9 7.8 7.7 7.54th grade...................................................... 7.6 7.0 7.9 7.8 7.7 7.8 7.7 7.6 7.6 7.7 7.9 7.9 7.8 7.65th grade...................................................... 7.7 7.0 7.8 7.8 7.7 7.6 7.7 7.6 7.5 7.6 7.7 7.9 7.8 7.76th grade...................................................... 7.4 7.1 7.5 7.7 7.7 7.7 7.6 7.7 7.6 7.5 7.6 7.8 7.9 7.97th grade...................................................... 7.5 7.5 7.4 7.7 7.7 7.7 7.6 7.6 7.6 7.6 7.6 7.7 7.8 7.98th grade...................................................... 7.5 7.6 7.2 7.3 7.5 7.5 7.5 7.5 7.4 7.5 7.5 7.5 7.6 7.7Elementary ungraded .................................. 2.3 1.3 1.3 1.3 1.2 1.1 1.1 0.9 1.0 1.0 0.9 0.7 0.6 0.6
Secondary ....................................................... 32.4 31.4 27.5 27.4 27.5 27.7 27.9 28.2 28.3 28.4 28.5 28.6 28.8 29.29th grade...................................................... 8.3 8.7 7.7 7.8 8.0 8.2 8.3 8.3 8.3 8.3 8.4 8.4 8.4 8.510th grade.................................................... 8.2 8.2 7.0 7.1 7.0 7.1 7.2 7.3 7.3 7.3 7.3 7.4 7.4 7.411th grade.................................................... 7.8 7.3 6.3 6.2 6.3 6.2 6.3 6.4 6.4 6.5 6.5 6.5 6.7 6.712th grade.................................................... 7.2 6.5 5.8 5.7 5.6 5.6 5.5 5.7 5.8 5.8 5.9 5.9 6.0 6.2Secondary ungraded ................................... 0.9 0.8 0.7 0.6 0.6 0.6 0.6 0.5 0.5 0.5 0.4 0.4 0.3 0.3
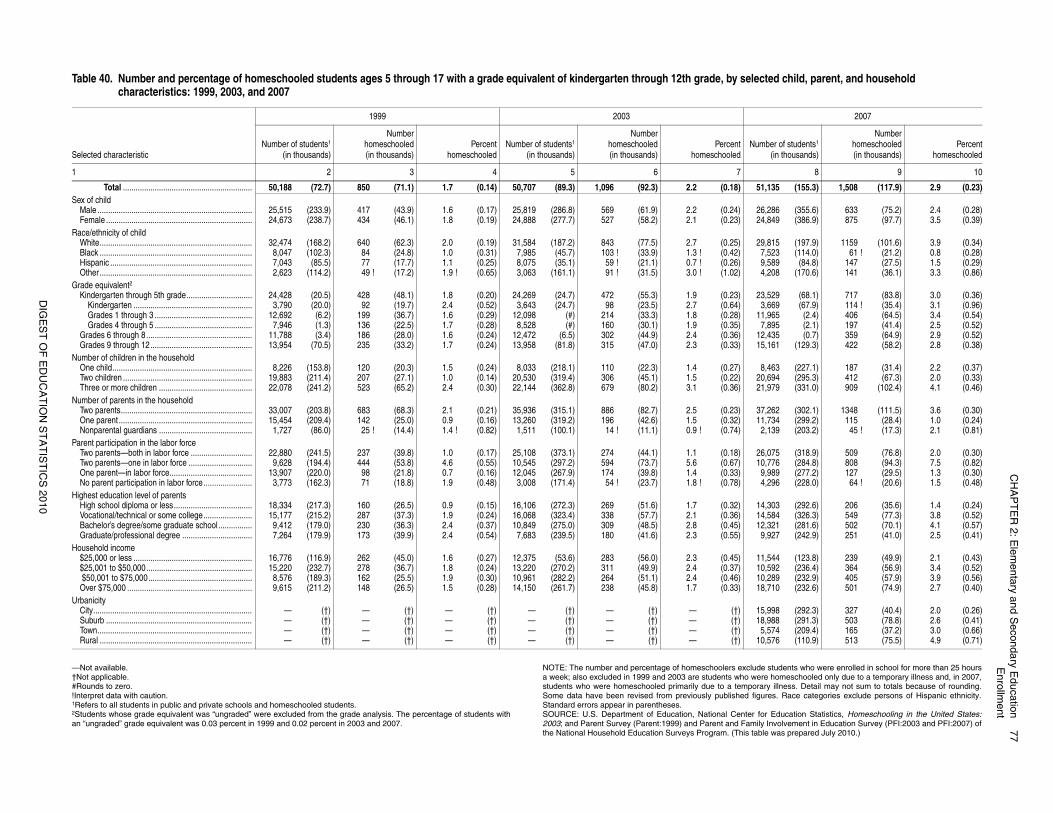
CH
AP
TE
R 2
: Ele
me
nta
ry an
d S
eco
nd
ary E
du
catio
n7
7E
nro
llme
nt
DIG
ES
T O
F E
DU
CA
TIO
N S
TA
TIS
TIC
S 2
01
0
de students who were enrolled in school for more than 25 hoursere homeschooled only due to a temporary illness and, in 2007,rary illness. Detail may not sum to totals because of rounding.
igures. Race categories exclude persons of Hispanic ethnicity.
for Education Statistics, Homeschooling in the United States:ily Involvement in Education Survey (PFI:2003 and PFI:2007) ofble was prepared July 2010.)
cted child, parent, and household
2007
umber of students1
(in thousands)
Numberhomeschooled(in thousands)
Percenthomeschooled
8 9 10
51,135 (155.3) 1,508 (117.9) 2.9 (0.23)
26,286 (355.6) 633 (75.2) 2.4 (0.28)24,849 (386.9) 875 (97.7) 3.5 (0.39)
29,815 (197.9) 1159 (101.6) 3.9 (0.34)7,523 (114.0) 61 ! (21.2) 0.8 (0.28)9,589 (84.8) 147 (27.5) 1.5 (0.29)4,208 (170.6) 141 (36.1) 3.3 (0.86)
23,529 (68.1) 717 (83.8) 3.0 (0.36)3,669 (67.9) 114 ! (35.4) 3.1 (0.96)
11,965 (2.4) 406 (64.5) 3.4 (0.54)7,895 (2.1) 197 (41.4) 2.5 (0.52)
12,435 (0.7) 359 (64.9) 2.9 (0.52)15,161 (129.3) 422 (58.2) 2.8 (0.38)
8,463 (227.1) 187 (31.4) 2.2 (0.37)20,694 (295.3) 412 (67.3) 2.0 (0.33)21,979 (331.0) 909 (102.4) 4.1 (0.46)
37,262 (302.1) 1348 (111.5) 3.6 (0.30)11,734 (299.2) 115 (28.4) 1.0 (0.24)
2,139 (203.2) 45 ! (17.3) 2.1 (0.81)
26,075 (318.9) 509 (76.8) 2.0 (0.30)10,776 (284.8) 808 (94.3) 7.5 (0.82)
9,989 (277.2) 127 (29.5) 1.3 (0.30)4,296 (228.0) 64 ! (20.6) 1.5 (0.48)
14,303 (292.6) 206 (35.6) 1.4 (0.24)14,584 (326.3) 549 (77.3) 3.8 (0.52)12,321 (281.6) 502 (70.1) 4.1 (0.57)
9,927 (242.9) 251 (41.0) 2.5 (0.41)
11,544 (123.8) 239 (49.9) 2.1 (0.43)10,592 (236.4) 364 (56.9) 3.4 (0.52)10,289 (232.9) 405 (57.9) 3.9 (0.56)18,710 (232.6) 501 (74.9) 2.7 (0.40)
15,998 (292.3) 327 (40.4) 2.0 (0.26)18,988 (291.3) 503 (78.8) 2.6 (0.41)
5,574 (209.4) 165 (37.2) 3.0 (0.66)10,576 (110.9) 513 (75.5) 4.9 (0.71)
—Not available.†Not applicable.#Rounds to zero.!Interpret data with caution.1Refers to all students in public and private schools and homeschooled students.2Students whose grade equivalent was “ungraded” were excluded from the grade analysis. The percentage of students withan “ungraded” grade equivalent was 0.03 percent in 1999 and 0.02 percent in 2003 and 2007.
NOTE: The number and percentage of homeschoolers exclua week; also excluded in 1999 and 2003 are students who wstudents who were homeschooled primarily due to a tempoSome data have been revised from previously published fStandard errors appear in parentheses.SOURCE: U.S. Department of Education, National Center2003; and Parent Survey (Parent:1999) and Parent and Famthe National Household Education Surveys Program. (This ta
Table 40. Number and percentage of homeschooled students ages 5 through 17 with a grade equivalent of kindergarten through 12th grade, by selecharacteristics: 1999, 2003, and 2007
Selected characteristic
1999 2003
Number of students1
(in thousands)
Numberhomeschooled(in thousands)
Percenthomeschooled
Number of students1
(in thousands)
Numberhomeschooled(in thousands)
Percenthomeschooled
N
1 2 3 4 5 6 7
Total ............................................................. 50,188 (72.7) 850 (71.1) 1.7 (0.14) 50,707 (89.3) 1,096 (92.3) 2.2 (0.18)Sex of child
Male ......................................................................... 25,515 (233.9) 417 (43.9) 1.6 (0.17) 25,819 (286.8) 569 (61.9) 2.2 (0.24)Female ..................................................................... 24,673 (238.7) 434 (46.1) 1.8 (0.19) 24,888 (277.7) 527 (58.2) 2.1 (0.23)
Race/ethnicity of childWhite........................................................................ 32,474 (168.2) 640 (62.3) 2.0 (0.19) 31,584 (187.2) 843 (77.5) 2.7 (0.25)Black ........................................................................ 8,047 (102.3) 84 (24.8) 1.0 (0.31) 7,985 (45.7) 103 ! (33.9) 1.3 ! (0.42)Hispanic ................................................................... 7,043 (85.5) 77 (17.7) 1.1 (0.25) 8,075 (35.1) 59 ! (21.1) 0.7 ! (0.26)Other........................................................................ 2,623 (114.2) 49 ! (17.2) 1.9 ! (0.65) 3,063 (161.1) 91 ! (31.5) 3.0 ! (1.02)
Grade equivalent2Kindergarten through 5th grade............................... 24,428 (20.5) 428 (48.1) 1.8 (0.20) 24,269 (24.7) 472 (55.3) 1.9 (0.23)
Kindergarten ........................................................ 3,790 (20.0) 92 (19.7) 2.4 (0.52) 3,643 (24.7) 98 (23.5) 2.7 (0.64)Grades 1 through 3 .............................................. 12,692 (6.2) 199 (36.7) 1.6 (0.29) 12,098 (#) 214 (33.3) 1.8 (0.28)Grades 4 through 5 .............................................. 7,946 (1.3) 136 (22.5) 1.7 (0.28) 8,528 (#) 160 (30.1) 1.9 (0.35)
Grades 6 through 8.................................................. 11,788 (3.4) 186 (28.0) 1.6 (0.24) 12,472 (6.5) 302 (44.9) 2.4 (0.36)Grades 9 through 12................................................ 13,954 (70.5) 235 (33.2) 1.7 (0.24) 13,958 (81.8) 315 (47.0) 2.3 (0.33)
Number of children in the householdOne child.................................................................. 8,226 (153.8) 120 (20.3) 1.5 (0.24) 8,033 (218.1) 110 (22.3) 1.4 (0.27)Two children ............................................................. 19,883 (211.4) 207 (27.1) 1.0 (0.14) 20,530 (319.4) 306 (45.1) 1.5 (0.22)Three or more children ............................................ 22,078 (241.2) 523 (65.2) 2.4 (0.30) 22,144 (362.8) 679 (80.2) 3.1 (0.36)
Number of parents in the householdTwo parents.............................................................. 33,007 (203.8) 683 (68.3) 2.1 (0.21) 35,936 (315.1) 886 (82.7) 2.5 (0.23)One parent............................................................... 15,454 (209.4) 142 (25.0) 0.9 (0.16) 13,260 (319.2) 196 (42.6) 1.5 (0.32)Nonparental guardians ............................................ 1,727 (86.0) 25 ! (14.4) 1.4 ! (0.82) 1,511 (100.1) 14 ! (11.1) 0.9 ! (0.74)
Parent participation in the labor forceTwo parents—both in labor force ............................. 22,880 (241.5) 237 (39.8) 1.0 (0.17) 25,108 (373.1) 274 (44.1) 1.1 (0.18)Two parents—one in labor force .............................. 9,628 (194.4) 444 (53.8) 4.6 (0.55) 10,545 (297.2) 594 (73.7) 5.6 (0.67)One parent—in labor force....................................... 13,907 (220.0) 98 (21.8) 0.7 (0.16) 12,045 (267.9) 174 (39.8) 1.4 (0.33)No parent participation in labor force....................... 3,773 (162.3) 71 (18.8) 1.9 (0.48) 3,008 (171.4) 54 ! (23.7) 1.8 ! (0.78)
Highest education level of parentsHigh school diploma or less..................................... 18,334 (217.3) 160 (26.5) 0.9 (0.15) 16,106 (272.3) 269 (51.6) 1.7 (0.32)Vocational/technical or some college....................... 15,177 (215.2) 287 (37.3) 1.9 (0.24) 16,068 (323.4) 338 (57.7) 2.1 (0.36)Bachelor’s degree/some graduate school................ 9,412 (179.0) 230 (36.3) 2.4 (0.37) 10,849 (275.0) 309 (48.5) 2.8 (0.45)Graduate/professional degree ................................. 7,264 (179.9) 173 (39.9) 2.4 (0.54) 7,683 (239.5) 180 (41.6) 2.3 (0.55)
Household income$25,000 or less ........................................................ 16,776 (116.9) 262 (45.0) 1.6 (0.27) 12,375 (53.6) 283 (56.0) 2.3 (0.45)$25,001 to $50,000.................................................. 15,220 (232.7) 278 (36.7) 1.8 (0.24) 13,220 (270.2) 311 (49.9) 2.4 (0.37) $50,001 to $75,000................................................. 8,576 (189.3) 162 (25.5) 1.9 (0.30) 10,961 (282.2) 264 (51.1) 2.4 (0.46)Over $75,000 ........................................................... 9,615 (211.2) 148 (26.5) 1.5 (0.28) 14,150 (261.7) 238 (45.8) 1.7 (0.33)
UrbanicityCity........................................................................... — (†) — (†) — (†) — (†) — (†) — (†)Suburb ..................................................................... — (†) — (†) — (†) — (†) — (†) — (†)Town......................................................................... — (†) — (†) — (†) — (†) — (†) — (†)Rural ........................................................................ — (†) — (†) — (†) — (†) — (†) — (†)
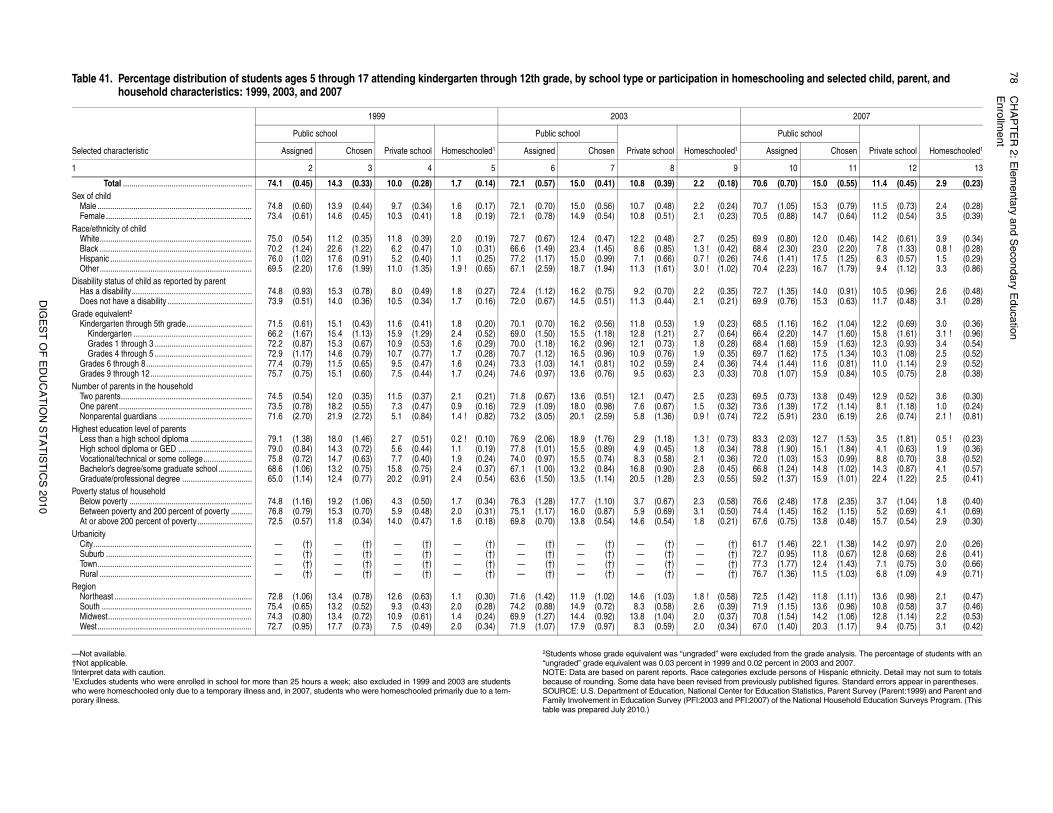
78
CH
AP
TE
R 2
: Ele
me
nta
ry an
d S
eco
nd
ary E
du
catio
nE
nro
llme
nt
DIG
ES
T O
F E
DU
CA
TIO
N S
TA
TIS
TIC
S 2
01
0
ded from the grade analysis. The percentage of students with an2 percent in 2003 and 2007.clude persons of Hispanic ethnicity. Detail may not sum to totalsiously published figures. Standard errors appear in parentheses.Education Statistics, Parent Survey (Parent:1999) and Parent and07) of the National Household Education Surveys Program. (This
schooling and selected child, parent, and
2007
Public school
Private school Homeschooled1Assigned Chosen
10 11 12 13
0.6 (0.70) 15.0 (0.55) 11.4 (0.45) 2.9 (0.23)
0.7 (1.05) 15.3 (0.79) 11.5 (0.73) 2.4 (0.28)0.5 (0.88) 14.7 (0.64) 11.2 (0.54) 3.5 (0.39)
9.9 (0.80) 12.0 (0.46) 14.2 (0.61) 3.9 (0.34)8.4 (2.30) 23.0 (2.20) 7.8 (1.33) 0.8 ! (0.28)4.6 (1.41) 17.5 (1.25) 6.3 (0.57) 1.5 (0.29)0.4 (2.23) 16.7 (1.79) 9.4 (1.12) 3.3 (0.86)
2.7 (1.35) 14.0 (0.91) 10.5 (0.96) 2.6 (0.48)9.9 (0.76) 15.3 (0.63) 11.7 (0.48) 3.1 (0.28)
8.5 (1.16) 16.2 (1.04) 12.2 (0.69) 3.0 (0.36)6.4 (2.20) 14.7 (1.60) 15.8 (1.61) 3.1 ! (0.96)8.4 (1.68) 15.9 (1.63) 12.3 (0.93) 3.4 (0.54)9.7 (1.62) 17.5 (1.34) 10.3 (1.08) 2.5 (0.52)4.4 (1.44) 11.6 (0.81) 11.0 (1.14) 2.9 (0.52)0.8 (1.07) 15.9 (0.84) 10.5 (0.75) 2.8 (0.38)
9.5 (0.73) 13.8 (0.49) 12.9 (0.52) 3.6 (0.30)3.6 (1.39) 17.2 (1.14) 8.1 (1.18) 1.0 (0.24)2.2 (5.91) 23.0 (6.19) 2.6 (0.74) 2.1 ! (0.81)
3.3 (2.03) 12.7 (1.53) 3.5 (1.81) 0.5 ! (0.23)8.8 (1.90) 15.1 (1.84) 4.1 (0.63) 1.9 (0.36)2.0 (1.03) 15.3 (0.99) 8.8 (0.70) 3.8 (0.52)6.8 (1.24) 14.8 (1.02) 14.3 (0.87) 4.1 (0.57)9.2 (1.37) 15.9 (1.01) 22.4 (1.22) 2.5 (0.41)
6.6 (2.48) 17.8 (2.35) 3.7 (1.04) 1.8 (0.40)4.4 (1.45) 16.2 (1.15) 5.2 (0.69) 4.1 (0.69)7.6 (0.75) 13.8 (0.48) 15.7 (0.54) 2.9 (0.30)
1.7 (1.46) 22.1 (1.38) 14.2 (0.97) 2.0 (0.26)2.7 (0.95) 11.8 (0.67) 12.8 (0.68) 2.6 (0.41)7.3 (1.77) 12.4 (1.43) 7.1 (0.75) 3.0 (0.66)6.7 (1.36) 11.5 (1.03) 6.8 (1.09) 4.9 (0.71)
2.5 (1.42) 11.8 (1.11) 13.6 (0.98) 2.1 (0.47)1.9 (1.15) 13.6 (0.96) 10.8 (0.58) 3.7 (0.46)0.8 (1.54) 14.2 (1.06) 12.8 (1.14) 2.2 (0.53)7.0 (1.40) 20.3 (1.17) 9.4 (0.75) 3.1 (0.42)
—Not available.†Not applicable.!Interpret data with caution.1Excludes students who were enrolled in school for more than 25 hours a week; also excluded in 1999 and 2003 are studentswho were homeschooled only due to a temporary illness and, in 2007, students who were homeschooled primarily due to a tem-porary illness.
2Students whose grade equivalent was “ungraded” were exclu“ungraded” grade equivalent was 0.03 percent in 1999 and 0.0NOTE: Data are based on parent reports. Race categories exbecause of rounding. Some data have been revised from prevSOURCE: U.S. Department of Education, National Center for Family Involvement in Education Survey (PFI:2003 and PFI:20table was prepared July 2010.)
Table 41. Percentage distribution of students ages 5 through 17 attending kindergarten through 12th grade, by school type or participation in homehousehold characteristics: 1999, 2003, and 2007
Selected characteristic
1999 2003
Public school
Private school Homeschooled1
Public school
Private school Homeschooled1Assigned Chosen Assigned Chosen
1 2 3 4 5 6 7 8 9
Total ............................................................. 74.1 (0.45) 14.3 (0.33) 10.0 (0.28) 1.7 (0.14) 72.1 (0.57) 15.0 (0.41) 10.8 (0.39) 2.2 (0.18) 7Sex of child
Male ......................................................................... 74.8 (0.60) 13.9 (0.44) 9.7 (0.34) 1.6 (0.17) 72.1 (0.70) 15.0 (0.56) 10.7 (0.48) 2.2 (0.24) 7Female ..................................................................... 73.4 (0.61) 14.6 (0.45) 10.3 (0.41) 1.8 (0.19) 72.1 (0.78) 14.9 (0.54) 10.8 (0.51) 2.1 (0.23) 7
Race/ethnicity of child White........................................................................ 75.0 (0.54) 11.2 (0.35) 11.8 (0.39) 2.0 (0.19) 72.7 (0.67) 12.4 (0.47) 12.2 (0.48) 2.7 (0.25) 6Black ........................................................................ 70.2 (1.24) 22.6 (1.22) 6.2 (0.47) 1.0 (0.31) 66.6 (1.49) 23.4 (1.45) 8.6 (0.85) 1.3 ! (0.42) 6Hispanic ................................................................... 76.0 (1.02) 17.6 (0.91) 5.2 (0.40) 1.1 (0.25) 77.2 (1.17) 15.0 (0.99) 7.1 (0.66) 0.7 ! (0.26) 7Other........................................................................ 69.5 (2.20) 17.6 (1.99) 11.0 (1.35) 1.9 ! (0.65) 67.1 (2.59) 18.7 (1.94) 11.3 (1.61) 3.0 ! (1.02) 7
Disability status of child as reported by parent Has a disability......................................................... 74.8 (0.93) 15.3 (0.78) 8.0 (0.49) 1.8 (0.27) 72.4 (1.12) 16.2 (0.75) 9.2 (0.70) 2.2 (0.35) 7Does not have a disability ........................................ 73.9 (0.51) 14.0 (0.36) 10.5 (0.34) 1.7 (0.16) 72.0 (0.67) 14.5 (0.51) 11.3 (0.44) 2.1 (0.21) 6
Grade equivalent2 Kindergarten through 5th grade............................... 71.5 (0.61) 15.1 (0.43) 11.6 (0.41) 1.8 (0.20) 70.1 (0.70) 16.2 (0.56) 11.8 (0.53) 1.9 (0.23) 6
Kindergarten ........................................................ 66.2 (1.67) 15.4 (1.13) 15.9 (1.29) 2.4 (0.52) 69.0 (1.50) 15.5 (1.18) 12.8 (1.21) 2.7 (0.64) 6Grades 1 through 3 .............................................. 72.2 (0.87) 15.3 (0.67) 10.9 (0.53) 1.6 (0.29) 70.0 (1.18) 16.2 (0.96) 12.1 (0.73) 1.8 (0.28) 6Grades 4 through 5 .............................................. 72.9 (1.17) 14.6 (0.79) 10.7 (0.77) 1.7 (0.28) 70.7 (1.12) 16.5 (0.96) 10.9 (0.76) 1.9 (0.35) 6
Grades 6 through 8.................................................. 77.4 (0.79) 11.5 (0.65) 9.5 (0.47) 1.6 (0.24) 73.3 (1.03) 14.1 (0.81) 10.2 (0.59) 2.4 (0.36) 7Grades 9 through 12................................................ 75.7 (0.75) 15.1 (0.60) 7.5 (0.44) 1.7 (0.24) 74.6 (0.97) 13.6 (0.76) 9.5 (0.63) 2.3 (0.33) 7
Number of parents in the household Two parents.............................................................. 74.5 (0.54) 12.0 (0.35) 11.5 (0.37) 2.1 (0.21) 71.8 (0.67) 13.6 (0.51) 12.1 (0.47) 2.5 (0.23) 6One parent............................................................... 73.5 (0.78) 18.2 (0.55) 7.3 (0.47) 0.9 (0.16) 72.9 (1.09) 18.0 (0.98) 7.6 (0.67) 1.5 (0.32) 7Nonparental guardians ............................................ 71.6 (2.70) 21.9 (2.72) 5.1 (0.84) 1.4 ! (0.82) 73.2 (3.05) 20.1 (2.59) 5.8 (1.36) 0.9 ! (0.74) 7
Highest education level of parents Less than a high school diploma ............................. 79.1 (1.38) 18.0 (1.46) 2.7 (0.51) 0.2 ! (0.10) 76.9 (2.06) 18.9 (1.76) 2.9 (1.18) 1.3 ! (0.73) 8High school diploma or GED ................................... 79.0 (0.84) 14.3 (0.72) 5.6 (0.44) 1.1 (0.19) 77.8 (1.01) 15.5 (0.89) 4.9 (0.45) 1.8 (0.34) 7Vocational/technical or some college....................... 75.8 (0.72) 14.7 (0.63) 7.7 (0.40) 1.9 (0.24) 74.0 (0.97) 15.5 (0.74) 8.3 (0.58) 2.1 (0.36) 7Bachelor’s degree/some graduate school................ 68.6 (1.06) 13.2 (0.75) 15.8 (0.75) 2.4 (0.37) 67.1 (1.00) 13.2 (0.84) 16.8 (0.90) 2.8 (0.45) 6Graduate/professional degree ................................. 65.0 (1.14) 12.4 (0.77) 20.2 (0.91) 2.4 (0.54) 63.6 (1.50) 13.5 (1.14) 20.5 (1.28) 2.3 (0.55) 5
Poverty status of household Below poverty .......................................................... 74.8 (1.16) 19.2 (1.06) 4.3 (0.50) 1.7 (0.34) 76.3 (1.28) 17.7 (1.10) 3.7 (0.67) 2.3 (0.58) 7Between poverty and 200 percent of poverty .......... 76.8 (0.79) 15.3 (0.70) 5.9 (0.48) 2.0 (0.31) 75.1 (1.17) 16.0 (0.87) 5.9 (0.69) 3.1 (0.50) 7At or above 200 percent of poverty.......................... 72.5 (0.57) 11.8 (0.34) 14.0 (0.47) 1.6 (0.18) 69.8 (0.70) 13.8 (0.54) 14.6 (0.54) 1.8 (0.21) 6
Urbanicity City........................................................................... — (†) — (†) — (†) — (†) — (†) — (†) — (†) — (†) 6Suburb ..................................................................... — (†) — (†) — (†) — (†) — (†) — (†) — (†) — (†) 7Town......................................................................... — (†) — (†) — (†) — (†) — (†) — (†) — (†) — (†) 7Rural ........................................................................ — (†) — (†) — (†) — (†) — (†) — (†) — (†) — (†) 7
Region Northeast ................................................................. 72.8 (1.06) 13.4 (0.78) 12.6 (0.63) 1.1 (0.30) 71.6 (1.42) 11.9 (1.02) 14.6 (1.03) 1.8 ! (0.58) 7South ....................................................................... 75.4 (0.65) 13.2 (0.52) 9.3 (0.43) 2.0 (0.28) 74.2 (0.88) 14.9 (0.72) 8.3 (0.58) 2.6 (0.39) 7Midwest.................................................................... 74.3 (0.80) 13.4 (0.72) 10.9 (0.61) 1.4 (0.24) 69.9 (1.27) 14.4 (0.92) 13.8 (1.04) 2.0 (0.37) 7West......................................................................... 72.7 (0.95) 17.7 (0.73) 7.5 (0.49) 2.0 (0.34) 71.9 (1.07) 17.9 (0.97) 8.3 (0.59) 2.0 (0.34) 6
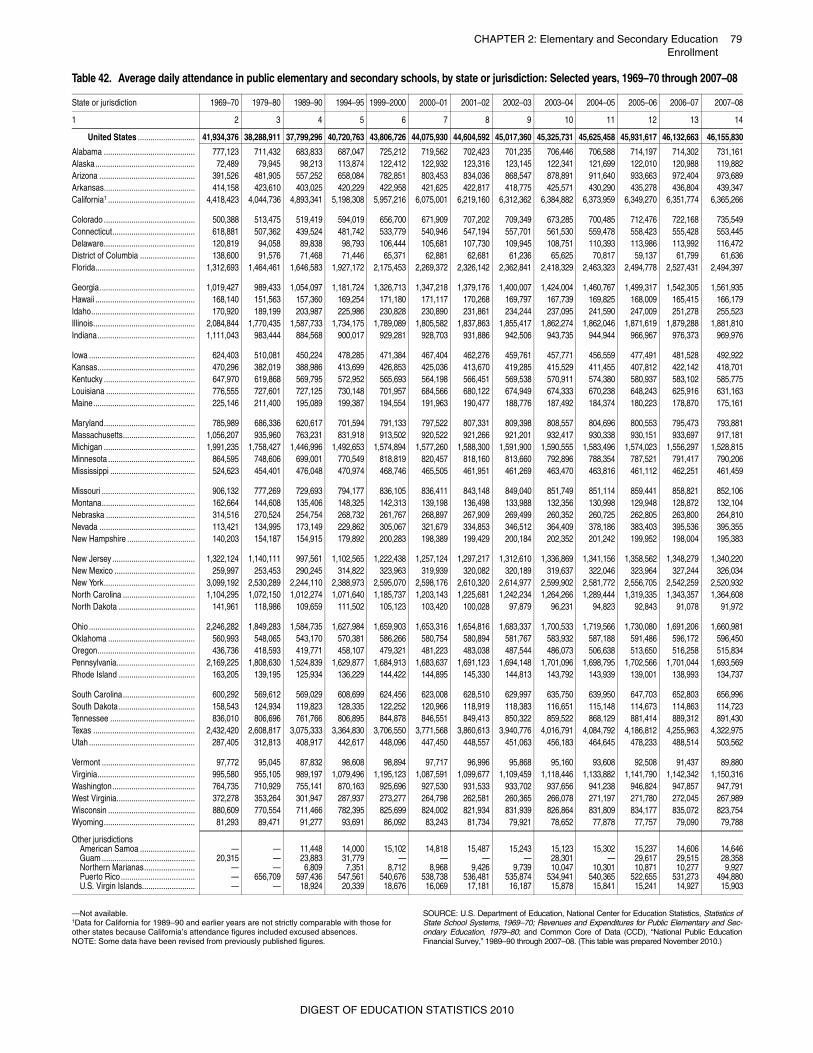
CHAPTER 2: Elementary and Secondary Education 79Enrollment
—Not available.1Data for California for 1989–90 and earlier years are not strictly comparable with those forother states because California’s attendance figures included excused absences. NOTE: Some data have been revised from previously published figures.
SOURCE: U.S. Department of Education, National Center for Education Statistics, Statistics ofState School Systems, 1969–70; Revenues and Expenditures for Public Elementary and Sec-ondary Education, 1979–80; and Common Core of Data (CCD), “National Public EducationFinancial Survey,” 1989–90 through 2007–08. (This table was prepared November 2010.)
Table 42. Average daily attendance in public elementary and secondary schools, by state or jurisdiction: Selected years, 1969–70 through 2007–08
State or jurisdiction 1969–70 1979–80 1989–90 1994–95 1999–2000 2000–01 2001–02 2002–03 2003–04 2004–05 2005–06 2006–07 2007–08
1 2 3 4 5 6 7 8 9 10 11 12 13 14
United States ........................... 41,934,376 38,288,911 37,799,296 40,720,763 43,806,726 44,075,930 44,604,592 45,017,360 45,325,731 45,625,458 45,931,617 46,132,663 46,155,830
Alabama ........................................... 777,123 711,432 683,833 687,047 725,212 719,562 702,423 701,235 706,446 706,588 714,197 714,302 731,161Alaska............................................... 72,489 79,945 98,213 113,874 122,412 122,932 123,316 123,145 122,341 121,699 122,010 120,988 119,882Arizona ............................................. 391,526 481,905 557,252 658,084 782,851 803,453 834,036 868,547 878,891 911,640 933,663 972,404 973,689Arkansas........................................... 414,158 423,610 403,025 420,229 422,958 421,625 422,817 418,775 425,571 430,290 435,278 436,804 439,347California1 ......................................... 4,418,423 4,044,736 4,893,341 5,198,308 5,957,216 6,075,001 6,219,160 6,312,362 6,384,882 6,373,959 6,349,270 6,351,774 6,365,266
Colorado ........................................... 500,388 513,475 519,419 594,019 656,700 671,909 707,202 709,349 673,285 700,485 712,476 722,168 735,549Connecticut....................................... 618,881 507,362 439,524 481,742 533,779 540,946 547,194 557,701 561,530 559,478 558,423 555,428 553,445Delaware........................................... 120,819 94,058 89,838 98,793 106,444 105,681 107,730 109,945 108,751 110,393 113,986 113,992 116,472District of Columbia .......................... 138,600 91,576 71,468 71,446 65,371 62,881 62,681 61,236 65,625 70,817 59,137 61,799 61,636Florida............................................... 1,312,693 1,464,461 1,646,583 1,927,172 2,175,453 2,269,372 2,326,142 2,362,841 2,418,329 2,463,323 2,494,778 2,527,431 2,494,397
Georgia............................................. 1,019,427 989,433 1,054,097 1,181,724 1,326,713 1,347,218 1,379,176 1,400,007 1,424,004 1,460,767 1,499,317 1,542,305 1,561,935Hawaii ............................................... 168,140 151,563 157,360 169,254 171,180 171,117 170,268 169,797 167,739 169,825 168,009 165,415 166,179Idaho................................................. 170,920 189,199 203,987 225,986 230,828 230,890 231,861 234,244 237,095 241,590 247,009 251,278 255,523Illinois................................................ 2,084,844 1,770,435 1,587,733 1,734,175 1,789,089 1,805,582 1,837,863 1,855,417 1,862,274 1,862,046 1,871,619 1,879,288 1,881,810Indiana.............................................. 1,111,043 983,444 884,568 900,017 929,281 928,703 931,886 942,506 943,735 944,944 966,967 976,373 969,976
Iowa .................................................. 624,403 510,081 450,224 478,285 471,384 467,404 462,276 459,761 457,771 456,559 477,491 481,528 492,922Kansas.............................................. 470,296 382,019 388,986 413,699 426,853 425,036 413,670 419,285 415,529 411,455 407,812 422,142 418,701Kentucky ........................................... 647,970 619,868 569,795 572,952 565,693 564,198 566,451 569,538 570,911 574,380 580,937 583,102 585,775Louisiana .......................................... 776,555 727,601 727,125 730,148 701,957 684,566 680,122 674,949 674,333 670,238 648,243 625,916 631,163Maine................................................ 225,146 211,400 195,089 199,387 194,554 191,963 190,477 188,776 187,492 184,374 180,223 178,870 175,161
Maryland........................................... 785,989 686,336 620,617 701,594 791,133 797,522 807,331 809,398 808,557 804,696 800,553 795,473 793,881Massachusetts.................................. 1,056,207 935,960 763,231 831,918 913,502 920,522 921,266 921,201 932,417 930,338 930,151 933,697 917,181Michigan ........................................... 1,991,235 1,758,427 1,446,996 1,492,653 1,574,894 1,577,260 1,588,300 1,591,900 1,590,555 1,583,496 1,574,023 1,556,297 1,528,815Minnesota ......................................... 864,595 748,606 699,001 770,549 818,819 820,457 818,160 813,660 792,896 788,354 787,521 791,417 790,206Mississippi ........................................ 524,623 454,401 476,048 470,974 468,746 465,505 461,951 461,269 463,470 463,816 461,112 462,251 461,459
Missouri ............................................ 906,132 777,269 729,693 794,177 836,105 836,411 843,148 849,040 851,749 851,114 859,441 858,821 852,106Montana............................................ 162,664 144,608 135,406 148,325 142,313 139,198 136,498 133,988 132,356 130,998 129,948 128,872 132,104Nebraska .......................................... 314,516 270,524 254,754 268,732 261,767 268,897 267,909 269,499 260,352 260,725 262,805 263,800 264,810Nevada ............................................. 113,421 134,995 173,149 229,862 305,067 321,679 334,853 346,512 364,409 378,186 383,403 395,536 395,355New Hampshire ................................ 140,203 154,187 154,915 179,892 200,283 198,389 199,429 200,184 202,352 201,242 199,952 198,004 195,383
New Jersey ....................................... 1,322,124 1,140,111 997,561 1,102,565 1,222,438 1,257,124 1,297,217 1,312,610 1,336,869 1,341,156 1,358,562 1,348,279 1,340,220New Mexico ...................................... 259,997 253,453 290,245 314,822 323,963 319,939 320,082 320,189 319,637 322,046 323,964 327,244 326,034New York........................................... 3,099,192 2,530,289 2,244,110 2,388,973 2,595,070 2,598,176 2,610,320 2,614,977 2,599,902 2,581,772 2,556,705 2,542,259 2,520,932North Carolina .................................. 1,104,295 1,072,150 1,012,274 1,071,640 1,185,737 1,203,143 1,225,681 1,242,234 1,264,266 1,289,444 1,319,335 1,343,357 1,364,608North Dakota .................................... 141,961 118,986 109,659 111,502 105,123 103,420 100,028 97,879 96,231 94,823 92,843 91,078 91,972
Ohio .................................................. 2,246,282 1,849,283 1,584,735 1,627,984 1,659,903 1,653,316 1,654,816 1,683,337 1,700,533 1,719,566 1,730,080 1,691,206 1,660,981Oklahoma ......................................... 560,993 548,065 543,170 570,381 586,266 580,754 580,894 581,767 583,932 587,188 591,486 596,172 596,450Oregon.............................................. 436,736 418,593 419,771 458,107 479,321 481,223 483,038 487,544 486,073 506,638 513,650 516,258 515,834Pennsylvania..................................... 2,169,225 1,808,630 1,524,839 1,629,877 1,684,913 1,683,637 1,691,123 1,694,148 1,701,096 1,698,795 1,702,566 1,701,044 1,693,569Rhode Island .................................... 163,205 139,195 125,934 136,229 144,422 144,895 145,330 144,813 143,792 143,939 139,001 138,993 134,737
South Carolina.................................. 600,292 569,612 569,029 608,699 624,456 623,008 628,510 629,997 635,750 639,950 647,703 652,803 656,996South Dakota .................................... 158,543 124,934 119,823 128,335 122,252 120,966 118,919 118,383 116,651 115,148 114,673 114,863 114,723Tennessee ........................................ 836,010 806,696 761,766 806,895 844,878 846,551 849,413 850,322 859,522 868,129 881,414 889,312 891,430Texas ................................................ 2,432,420 2,608,817 3,075,333 3,364,830 3,706,550 3,771,568 3,860,613 3,940,776 4,016,791 4,084,792 4,186,812 4,255,963 4,322,975Utah .................................................. 287,405 312,813 408,917 442,617 448,096 447,450 448,557 451,063 456,183 464,645 478,233 488,514 503,562
Vermont ............................................ 97,772 95,045 87,832 98,608 98,894 97,717 96,996 95,868 95,160 93,608 92,508 91,437 89,880Virginia.............................................. 995,580 955,105 989,197 1,079,496 1,195,123 1,087,591 1,099,677 1,109,459 1,118,446 1,133,882 1,141,790 1,142,342 1,150,316Washington....................................... 764,735 710,929 755,141 870,163 925,696 927,530 931,533 933,702 937,656 941,238 946,824 947,857 947,791West Virginia..................................... 372,278 353,264 301,947 287,937 273,277 264,798 262,581 260,365 266,078 271,197 271,780 272,045 267,989Wisconsin ......................................... 880,609 770,554 711,466 782,395 825,699 824,002 821,934 831,939 826,864 831,809 834,177 835,072 823,754Wyoming........................................... 81,293 89,471 91,277 93,691 86,092 83,243 81,734 79,921 78,652 77,878 77,757 79,090 79,788
Other jurisdictionsAmerican Samoa .......................... — — 11,448 14,000 15,102 14,818 15,487 15,243 15,123 15,302 15,237 14,606 14,646Guam ............................................ 20,315 — 23,883 31,779 — — — — 28,301 — 29,617 29,515 28,358Northern Marianas........................ — — 6,809 7,351 8,712 8,968 9,426 9,739 10,047 10,301 10,871 10,277 9,927Puerto Rico ................................... — 656,709 597,436 547,561 540,676 538,738 536,481 535,874 534,941 540,365 522,655 531,273 494,880U.S. Virgin Islands......................... — — 18,924 20,339 18,676 16,069 17,181 16,187 15,878 15,841 15,241 14,927 15,903
DIGEST OF EDUCATION STATISTICS 2010
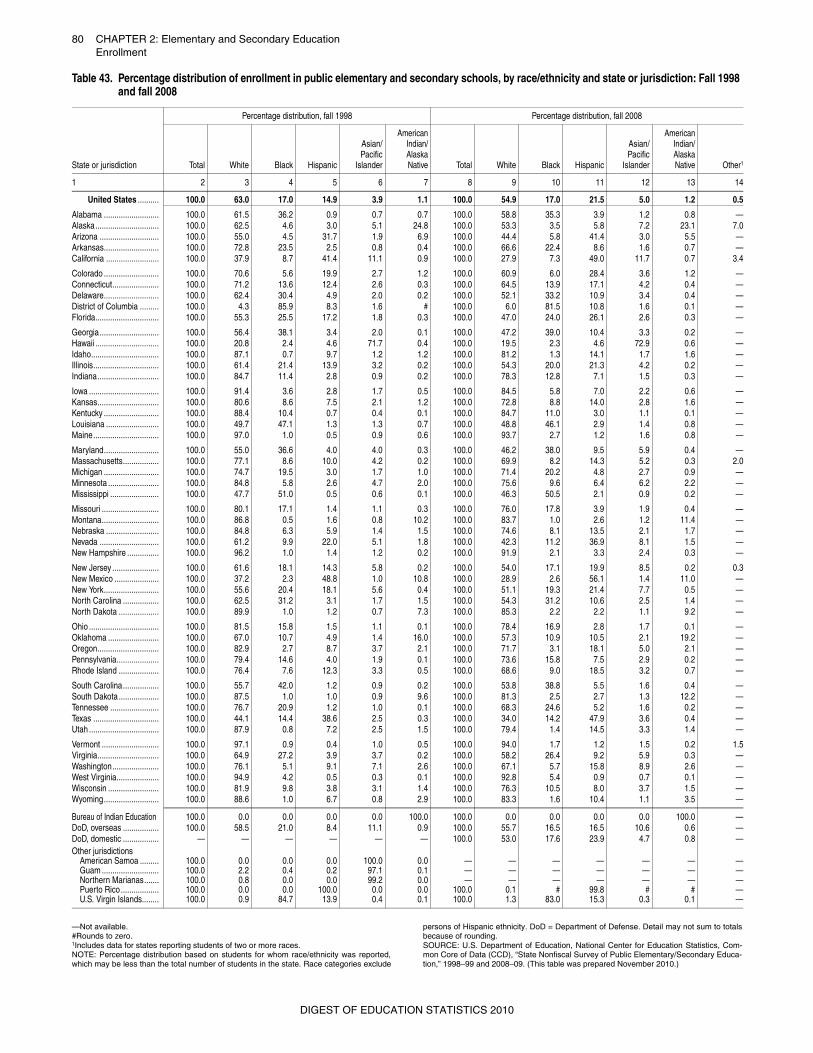
80 CHAPTER 2: Elementary and Secondary EducationEnrollment
—Not available. #Rounds to zero. 1Includes data for states reporting students of two or more races.NOTE: Percentage distribution based on students for whom race/ethnicity was reported,which may be less than the total number of students in the state. Race categories exclude
persons of Hispanic ethnicity. DoD = Department of Defense. Detail may not sum to totalsbecause of rounding.SOURCE: U.S. Department of Education, National Center for Education Statistics, Com-mon Core of Data (CCD), “State Nonfiscal Survey of Public Elementary/Secondary Educa-tion,” 1998–99 and 2008–09. (This table was prepared November 2010.)
Table 43. Percentage distribution of enrollment in public elementary and secondary schools, by race/ethnicity and state or jurisdiction: Fall 1998 and fall 2008
State or jurisdiction
Percentage distribution, fall 1998 Percentage distribution, fall 2008
Total White Black Hispanic
Asian/Pacific
Islander
AmericanIndian/AlaskaNative Total White Black Hispanic
Asian/Pacific
Islander
AmericanIndian/AlaskaNative Other1
1 2 3 4 5 6 7 8 9 10 11 12 13 14
United States .......... 100.0 63.0 17.0 14.9 3.9 1.1 100.0 54.9 17.0 21.5 5.0 1.2 0.5
Alabama .......................... 100.0 61.5 36.2 0.9 0.7 0.7 100.0 58.8 35.3 3.9 1.2 0.8 —Alaska.............................. 100.0 62.5 4.6 3.0 5.1 24.8 100.0 53.3 3.5 5.8 7.2 23.1 7.0Arizona ............................ 100.0 55.0 4.5 31.7 1.9 6.9 100.0 44.4 5.8 41.4 3.0 5.5 —Arkansas.......................... 100.0 72.8 23.5 2.5 0.8 0.4 100.0 66.6 22.4 8.6 1.6 0.7 —California ......................... 100.0 37.9 8.7 41.4 11.1 0.9 100.0 27.9 7.3 49.0 11.7 0.7 3.4
Colorado .......................... 100.0 70.6 5.6 19.9 2.7 1.2 100.0 60.9 6.0 28.4 3.6 1.2 —Connecticut...................... 100.0 71.2 13.6 12.4 2.6 0.3 100.0 64.5 13.9 17.1 4.2 0.4 —Delaware.......................... 100.0 62.4 30.4 4.9 2.0 0.2 100.0 52.1 33.2 10.9 3.4 0.4 —District of Columbia ......... 100.0 4.3 85.9 8.3 1.6 # 100.0 6.0 81.5 10.8 1.6 0.1 —Florida.............................. 100.0 55.3 25.5 17.2 1.8 0.3 100.0 47.0 24.0 26.1 2.6 0.3 —
Georgia............................ 100.0 56.4 38.1 3.4 2.0 0.1 100.0 47.2 39.0 10.4 3.3 0.2 —Hawaii .............................. 100.0 20.8 2.4 4.6 71.7 0.4 100.0 19.5 2.3 4.6 72.9 0.6 —Idaho................................ 100.0 87.1 0.7 9.7 1.2 1.2 100.0 81.2 1.3 14.1 1.7 1.6 —Illinois............................... 100.0 61.4 21.4 13.9 3.2 0.2 100.0 54.3 20.0 21.3 4.2 0.2 —Indiana............................. 100.0 84.7 11.4 2.8 0.9 0.2 100.0 78.3 12.8 7.1 1.5 0.3 —
Iowa ................................. 100.0 91.4 3.6 2.8 1.7 0.5 100.0 84.5 5.8 7.0 2.2 0.6 —Kansas............................. 100.0 80.6 8.6 7.5 2.1 1.2 100.0 72.8 8.8 14.0 2.8 1.6 —Kentucky .......................... 100.0 88.4 10.4 0.7 0.4 0.1 100.0 84.7 11.0 3.0 1.1 0.1 —Louisiana ......................... 100.0 49.7 47.1 1.3 1.3 0.7 100.0 48.8 46.1 2.9 1.4 0.8 —Maine............................... 100.0 97.0 1.0 0.5 0.9 0.6 100.0 93.7 2.7 1.2 1.6 0.8 —
Maryland.......................... 100.0 55.0 36.6 4.0 4.0 0.3 100.0 46.2 38.0 9.5 5.9 0.4 —Massachusetts................. 100.0 77.1 8.6 10.0 4.2 0.2 100.0 69.9 8.2 14.3 5.2 0.3 2.0Michigan .......................... 100.0 74.7 19.5 3.0 1.7 1.0 100.0 71.4 20.2 4.8 2.7 0.9 —Minnesota ........................ 100.0 84.8 5.8 2.6 4.7 2.0 100.0 75.6 9.6 6.4 6.2 2.2 —Mississippi ....................... 100.0 47.7 51.0 0.5 0.6 0.1 100.0 46.3 50.5 2.1 0.9 0.2 —
Missouri ........................... 100.0 80.1 17.1 1.4 1.1 0.3 100.0 76.0 17.8 3.9 1.9 0.4 —Montana........................... 100.0 86.8 0.5 1.6 0.8 10.2 100.0 83.7 1.0 2.6 1.2 11.4 —Nebraska ......................... 100.0 84.8 6.3 5.9 1.4 1.5 100.0 74.6 8.1 13.5 2.1 1.7 —Nevada ............................ 100.0 61.2 9.9 22.0 5.1 1.8 100.0 42.3 11.2 36.9 8.1 1.5 —New Hampshire ............... 100.0 96.2 1.0 1.4 1.2 0.2 100.0 91.9 2.1 3.3 2.4 0.3 —
New Jersey ...................... 100.0 61.6 18.1 14.3 5.8 0.2 100.0 54.0 17.1 19.9 8.5 0.2 0.3New Mexico ..................... 100.0 37.2 2.3 48.8 1.0 10.8 100.0 28.9 2.6 56.1 1.4 11.0 —New York.......................... 100.0 55.6 20.4 18.1 5.6 0.4 100.0 51.1 19.3 21.4 7.7 0.5 —North Carolina ................. 100.0 62.5 31.2 3.1 1.7 1.5 100.0 54.3 31.2 10.6 2.5 1.4 —North Dakota ................... 100.0 89.9 1.0 1.2 0.7 7.3 100.0 85.3 2.2 2.2 1.1 9.2 —
Ohio ................................. 100.0 81.5 15.8 1.5 1.1 0.1 100.0 78.4 16.9 2.8 1.7 0.1 —Oklahoma ........................ 100.0 67.0 10.7 4.9 1.4 16.0 100.0 57.3 10.9 10.5 2.1 19.2 —Oregon............................. 100.0 82.9 2.7 8.7 3.7 2.1 100.0 71.7 3.1 18.1 5.0 2.1 —Pennsylvania.................... 100.0 79.4 14.6 4.0 1.9 0.1 100.0 73.6 15.8 7.5 2.9 0.2 —Rhode Island ................... 100.0 76.4 7.6 12.3 3.3 0.5 100.0 68.6 9.0 18.5 3.2 0.7 —
South Carolina................. 100.0 55.7 42.0 1.2 0.9 0.2 100.0 53.8 38.8 5.5 1.6 0.4 —South Dakota ................... 100.0 87.5 1.0 1.0 0.9 9.6 100.0 81.3 2.5 2.7 1.3 12.2 —Tennessee ....................... 100.0 76.7 20.9 1.2 1.0 0.1 100.0 68.3 24.6 5.2 1.6 0.2 —Texas ............................... 100.0 44.1 14.4 38.6 2.5 0.3 100.0 34.0 14.2 47.9 3.6 0.4 —Utah ................................. 100.0 87.9 0.8 7.2 2.5 1.5 100.0 79.4 1.4 14.5 3.3 1.4 —
Vermont ........................... 100.0 97.1 0.9 0.4 1.0 0.5 100.0 94.0 1.7 1.2 1.5 0.2 1.5Virginia............................. 100.0 64.9 27.2 3.9 3.7 0.2 100.0 58.2 26.4 9.2 5.9 0.3 —Washington...................... 100.0 76.1 5.1 9.1 7.1 2.6 100.0 67.1 5.7 15.8 8.9 2.6 —West Virginia.................... 100.0 94.9 4.2 0.5 0.3 0.1 100.0 92.8 5.4 0.9 0.7 0.1 —Wisconsin ........................ 100.0 81.9 9.8 3.8 3.1 1.4 100.0 76.3 10.5 8.0 3.7 1.5 —Wyoming.......................... 100.0 88.6 1.0 6.7 0.8 2.9 100.0 83.3 1.6 10.4 1.1 3.5 —
Bureau of Indian Education 100.0 0.0 0.0 0.0 0.0 100.0 100.0 0.0 0.0 0.0 0.0 100.0 —DoD, overseas ................. 100.0 58.5 21.0 8.4 11.1 0.9 100.0 55.7 16.5 16.5 10.6 0.6 —DoD, domestic ................. — — — — — — 100.0 53.0 17.6 23.9 4.7 0.8 —Other jurisdictions
American Samoa ......... 100.0 0.0 0.0 0.0 100.0 0.0 — — — — — — —Guam ........................... 100.0 2.2 0.4 0.2 97.1 0.1 — — — — — — —Northern Marianas....... 100.0 0.8 0.0 0.0 99.2 0.0 — — — — — — —Puerto Rico.................. 100.0 0.0 0.0 100.0 0.0 0.0 100.0 0.1 # 99.8 # # —U.S. Virgin Islands........ 100.0 0.9 84.7 13.9 0.4 0.1 100.0 1.3 83.0 15.3 0.3 0.1 —
DIGEST OF EDUCATION STATISTICS 2010
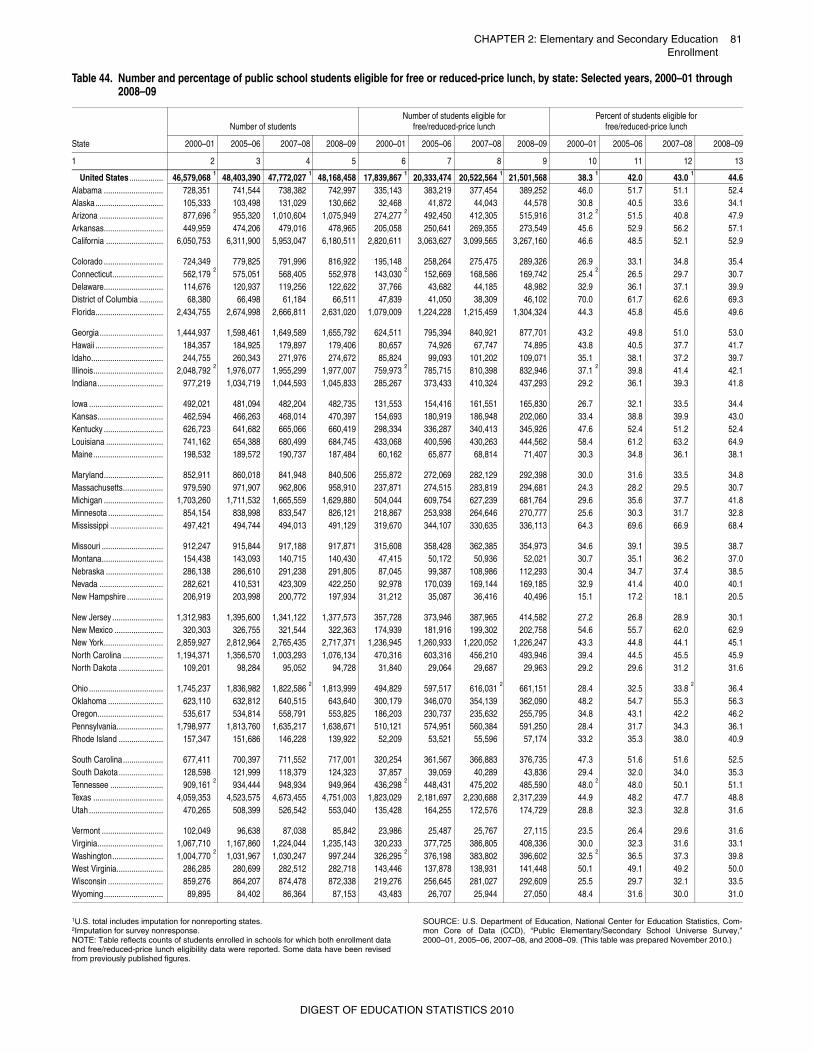
CHAPTER 2: Elementary and Secondary Education 81Enrollment
1U.S. total includes imputation for nonreporting states.2Imputation for survey nonresponse.NOTE: Table reflects counts of students enrolled in schools for which both enrollment dataand free/reduced-price lunch eligibility data were reported. Some data have been revisedfrom previously published figures.
SOURCE: U.S. Department of Education, National Center for Education Statistics, Com-mon Core of Data (CCD), “Public Elementary/Secondary School Universe Survey,”2000–01, 2005–06, 2007–08, and 2008–09. (This table was prepared November 2010.)
Table 44. Number and percentage of public school students eligible for free or reduced-price lunch, by state: Selected years, 2000–01 through 2008–09
State
Number of studentsNumber of students eligible for
free/reduced-price lunchPercent of students eligible for
free/reduced-price lunch
2000–01 2005–06 2007–08 2008–09 2000–01 2005–06 2007–08 2008–09 2000–01 2005–06 2007–08 2008–09
1 2 3 4 5 6 7 8 9 10 11 12 13
United States ................ 46,579,068 1 48,403,390 47,772,027 1 48,168,458 17,839,867 1 20,333,474 20,522,564 1 21,501,568 38.3 1 42.0 43.0 1 44.6Alabama ............................ 728,351 741,544 738,382 742,997 335,143 383,219 377,454 389,252 46.0 51.7 51.1 52.4Alaska................................ 105,333 103,498 131,029 130,662 32,468 41,872 44,043 44,578 30.8 40.5 33.6 34.1Arizona .............................. 877,696
2955,320 1,010,604 1,075,949 274,277
2492,450 412,305 515,916 31.2
251.5 40.8 47.9
Arkansas............................ 449,959 474,206 479,016 478,965 205,058 250,641 269,355 273,549 45.6 52.9 56.2 57.1California ........................... 6,050,753 6,311,900 5,953,047 6,180,511 2,820,611 3,063,627 3,099,565 3,267,160 46.6 48.5 52.1 52.9
Colorado ............................ 724,349 779,825 791,996 816,922 195,148 258,264 275,475 289,326 26.9 33.1 34.8 35.4Connecticut........................ 562,179
2575,051 568,405 552,978 143,030
2152,669 168,586 169,742 25.4
226.5 29.7 30.7
Delaware............................ 114,676 120,937 119,256 122,622 37,766 43,682 44,185 48,982 32.9 36.1 37.1 39.9District of Columbia ........... 68,380 66,498 61,184 66,511 47,839 41,050 38,309 46,102 70.0 61.7 62.6 69.3Florida................................ 2,434,755 2,674,998 2,666,811 2,631,020 1,079,009 1,224,228 1,215,459 1,304,324 44.3 45.8 45.6 49.6
Georgia.............................. 1,444,937 1,598,461 1,649,589 1,655,792 624,511 795,394 840,921 877,701 43.2 49.8 51.0 53.0Hawaii ................................ 184,357 184,925 179,897 179,406 80,657 74,926 67,747 74,895 43.8 40.5 37.7 41.7Idaho.................................. 244,755 260,343 271,976 274,672 85,824 99,093 101,202 109,071 35.1 38.1 37.2 39.7Illinois................................. 2,048,792
21,976,077 1,955,299 1,977,007 759,973
2785,715 810,398 832,946 37.1
239.8 41.4 42.1
Indiana............................... 977,219 1,034,719 1,044,593 1,045,833 285,267 373,433 410,324 437,293 29.2 36.1 39.3 41.8
Iowa ................................... 492,021 481,094 482,204 482,735 131,553 154,416 161,551 165,830 26.7 32.1 33.5 34.4Kansas............................... 462,594 466,263 468,014 470,397 154,693 180,919 186,948 202,060 33.4 38.8 39.9 43.0Kentucky ............................ 626,723 641,682 665,066 660,419 298,334 336,287 340,413 345,926 47.6 52.4 51.2 52.4Louisiana ........................... 741,162 654,388 680,499 684,745 433,068 400,596 430,263 444,562 58.4 61.2 63.2 64.9Maine................................. 198,532 189,572 190,737 187,484 60,162 65,877 68,814 71,407 30.3 34.8 36.1 38.1
Maryland............................ 852,911 860,018 841,948 840,506 255,872 272,069 282,129 292,398 30.0 31.6 33.5 34.8Massachusetts................... 979,590 971,907 962,806 958,910 237,871 274,515 283,819 294,681 24.3 28.2 29.5 30.7Michigan ............................ 1,703,260 1,711,532 1,665,559 1,629,880 504,044 609,754 627,239 681,764 29.6 35.6 37.7 41.8Minnesota .......................... 854,154 838,998 833,547 826,121 218,867 253,938 264,646 270,777 25.6 30.3 31.7 32.8Mississippi ......................... 497,421 494,744 494,013 491,129 319,670 344,107 330,635 336,113 64.3 69.6 66.9 68.4
Missouri ............................. 912,247 915,844 917,188 917,871 315,608 358,428 362,385 354,973 34.6 39.1 39.5 38.7Montana............................. 154,438 143,093 140,715 140,430 47,415 50,172 50,936 52,021 30.7 35.1 36.2 37.0Nebraska ........................... 286,138 286,610 291,238 291,805 87,045 99,387 108,986 112,293 30.4 34.7 37.4 38.5Nevada .............................. 282,621 410,531 423,309 422,250 92,978 170,039 169,144 169,185 32.9 41.4 40.0 40.1New Hampshire ................. 206,919 203,998 200,772 197,934 31,212 35,087 36,416 40,496 15.1 17.2 18.1 20.5
New Jersey ........................ 1,312,983 1,395,600 1,341,122 1,377,573 357,728 373,946 387,965 414,582 27.2 26.8 28.9 30.1New Mexico ....................... 320,303 326,755 321,544 322,363 174,939 181,916 199,302 202,758 54.6 55.7 62.0 62.9New York............................ 2,859,927 2,812,964 2,765,435 2,717,371 1,236,945 1,260,933 1,220,052 1,226,247 43.3 44.8 44.1 45.1North Carolina ................... 1,194,371 1,356,570 1,003,293 1,076,134 470,316 603,316 456,210 493,946 39.4 44.5 45.5 45.9North Dakota ..................... 109,201 98,284 95,052 94,728 31,840 29,064 29,687 29,963 29.2 29.6 31.2 31.6
Ohio ................................... 1,745,237 1,836,982 1,822,5862
1,813,999 494,829 597,517 616,0312
661,151 28.4 32.5 33.82
36.4Oklahoma .......................... 623,110 632,812 640,515 643,640 300,179 346,070 354,139 362,090 48.2 54.7 55.3 56.3Oregon............................... 535,617 534,814 558,791 553,825 186,203 230,737 235,632 255,795 34.8 43.1 42.2 46.2Pennsylvania...................... 1,798,977 1,813,760 1,635,217 1,638,671 510,121 574,951 560,384 591,250 28.4 31.7 34.3 36.1Rhode Island ..................... 157,347 151,686 146,228 139,922 52,209 53,521 55,596 57,174 33.2 35.3 38.0 40.9
South Carolina................... 677,411 700,397 711,552 717,001 320,254 361,567 366,883 376,735 47.3 51.6 51.6 52.5South Dakota ..................... 128,598 121,999 118,379 124,323 37,857 39,059 40,289 43,836 29.4 32.0 34.0 35.3Tennessee ......................... 909,161
2934,444 948,934 949,964 436,298
2448,431 475,202 485,590 48.0
248.0 50.1 51.1
Texas ................................. 4,059,353 4,523,575 4,673,455 4,751,003 1,823,029 2,181,697 2,230,688 2,317,239 44.9 48.2 47.7 48.8Utah ................................... 470,265 508,399 526,542 553,040 135,428 164,255 172,576 174,729 28.8 32.3 32.8 31.6
Vermont ............................. 102,049 96,638 87,038 85,842 23,986 25,487 25,767 27,115 23.5 26.4 29.6 31.6Virginia............................... 1,067,710 1,167,860 1,224,044 1,235,143 320,233 377,725 386,805 408,336 30.0 32.3 31.6 33.1Washington........................ 1,004,770
21,031,967 1,030,247 997,244 326,295
2376,198 383,802 396,602 32.5
236.5 37.3 39.8
West Virginia...................... 286,285 280,699 282,512 282,718 143,446 137,878 138,931 141,448 50.1 49.1 49.2 50.0Wisconsin .......................... 859,276 864,207 874,478 872,338 219,276 256,645 281,027 292,609 25.5 29.7 32.1 33.5Wyoming............................ 89,895 84,402 86,364 87,153 43,483 26,707 25,944 27,050 48.4 31.6 30.0 31.0
DIGEST OF EDUCATION STATISTICS 2010
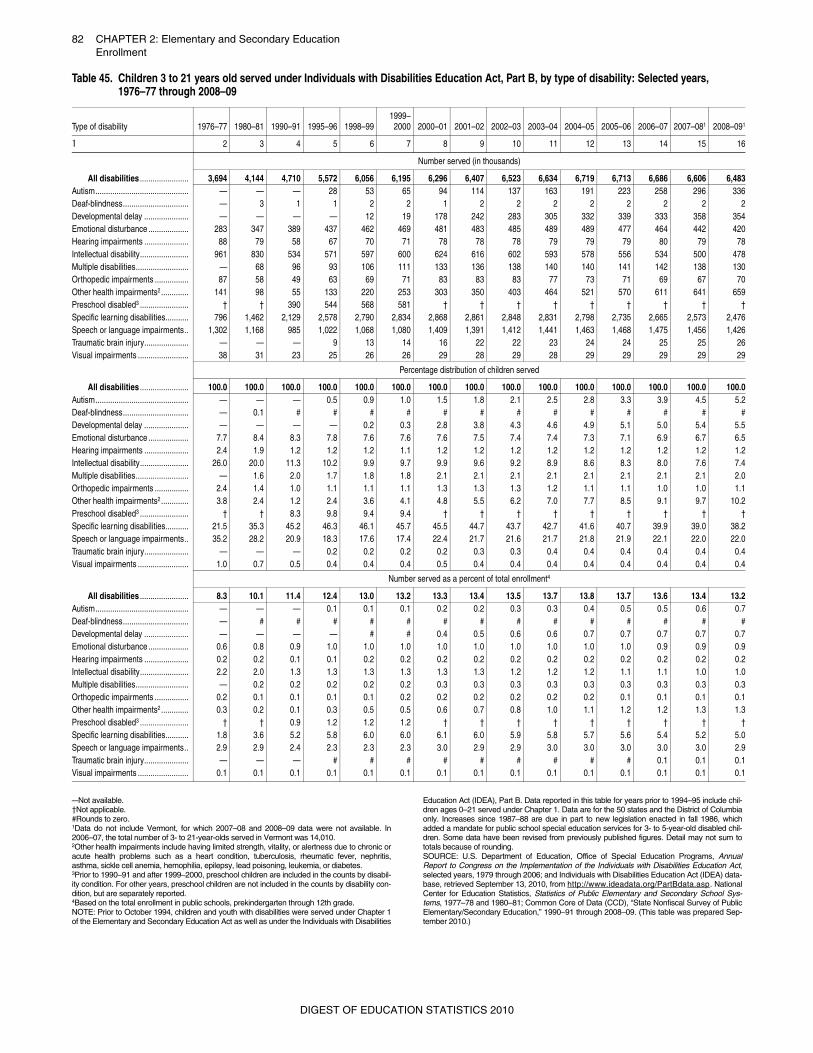
82 CHAPTER 2: Elementary and Secondary EducationEnrollment
—Not available. †Not applicable.#Rounds to zero. 1Data do not include Vermont, for which 2007–08 and 2008–09 data were not available. In2006–07, the total number of 3- to 21-year-olds served in Vermont was 14,010.2Other health impairments include having limited strength, vitality, or alertness due to chronic oracute health problems such as a heart condition, tuberculosis, rheumatic fever, nephritis,asthma, sickle cell anemia, hemophilia, epilepsy, lead poisoning, leukemia, or diabetes.3Prior to 1990–91 and after 1999–2000, preschool children are included in the counts by disabil-ity condition. For other years, preschool children are not included in the counts by disability con-dition, but are separately reported.4Based on the total enrollment in public schools, prekindergarten through 12th grade.NOTE: Prior to October 1994, children and youth with disabilities were served under Chapter 1of the Elementary and Secondary Education Act as well as under the Individuals with Disabilities
Education Act (IDEA), Part B. Data reported in this table for years prior to 1994–95 include chil-dren ages 0–21 served under Chapter 1. Data are for the 50 states and the District of Columbiaonly. Increases since 1987–88 are due in part to new legislation enacted in fall 1986, whichadded a mandate for public school special education services for 3- to 5-year-old disabled chil-dren. Some data have been revised from previously published figures. Detail may not sum tototals because of rounding.SOURCE: U.S. Department of Education, Office of Special Education Programs, AnnualReport to Congress on the Implementation of the Individuals with Disabilities Education Act,selected years, 1979 through 2006; and Individuals with Disabilities Education Act (IDEA) data-base, retrieved September 13, 2010, from http://www.ideadata.org/PartBdata.asp. NationalCenter for Education Statistics, Statistics of Public Elementary and Secondary School Sys-tems, 1977–78 and 1980–81; Common Core of Data (CCD), “State Nonfiscal Survey of PublicElementary/Secondary Education,” 1990–91 through 2008–09. (This table was prepared Sep-tember 2010.)
Table 45. Children 3 to 21 years old served under Individuals with Disabilities Education Act, Part B, by type of disability: Selected years, 1976–77 through 2008–09
Type of disability 1976–77 1980–81 1990–91 1995–96 1998–991999–
2000 2000–01 2001–02 2002–03 2003–04 2004–05 2005–06 2006–07 2007–081 2008–091
1 2 3 4 5 6 7 8 9 10 11 12 13 14 15 16
Number served (in thousands)
All disabilities ....................... 3,694 4,144 4,710 5,572 6,056 6,195 6,296 6,407 6,523 6,634 6,719 6,713 6,686 6,606 6,483Autism............................................ — — — 28 53 65 94 114 137 163 191 223 258 296 336Deaf-blindness............................... — 3 1 1 2 2 1 2 2 2 2 2 2 2 2Developmental delay ..................... — — — — 12 19 178 242 283 305 332 339 333 358 354Emotional disturbance ................... 283 347 389 437 462 469 481 483 485 489 489 477 464 442 420Hearing impairments ..................... 88 79 58 67 70 71 78 78 78 79 79 79 80 79 78Intellectual disability....................... 961 830 534 571 597 600 624 616 602 593 578 556 534 500 478Multiple disabilities......................... — 68 96 93 106 111 133 136 138 140 140 141 142 138 130Orthopedic impairments ................ 87 58 49 63 69 71 83 83 83 77 73 71 69 67 70Other health impairments2............. 141 98 55 133 220 253 303 350 403 464 521 570 611 641 659Preschool disabled3 ....................... † † 390 544 568 581 † † † † † † † † †Specific learning disabilities........... 796 1,462 2,129 2,578 2,790 2,834 2,868 2,861 2,848 2,831 2,798 2,735 2,665 2,573 2,476Speech or language impairments.. 1,302 1,168 985 1,022 1,068 1,080 1,409 1,391 1,412 1,441 1,463 1,468 1,475 1,456 1,426Traumatic brain injury..................... — — — 9 13 14 16 22 22 23 24 24 25 25 26Visual impairments ........................ 38 31 23 25 26 26 29 28 29 28 29 29 29 29 29
Percentage distribution of children served
All disabilities ....................... 100.0 100.0 100.0 100.0 100.0 100.0 100.0 100.0 100.0 100.0 100.0 100.0 100.0 100.0 100.0Autism............................................ — — — 0.5 0.9 1.0 1.5 1.8 2.1 2.5 2.8 3.3 3.9 4.5 5.2Deaf-blindness............................... — 0.1 # # # # # # # # # # # # #Developmental delay ..................... — — — — 0.2 0.3 2.8 3.8 4.3 4.6 4.9 5.1 5.0 5.4 5.5Emotional disturbance ................... 7.7 8.4 8.3 7.8 7.6 7.6 7.6 7.5 7.4 7.4 7.3 7.1 6.9 6.7 6.5Hearing impairments ..................... 2.4 1.9 1.2 1.2 1.2 1.1 1.2 1.2 1.2 1.2 1.2 1.2 1.2 1.2 1.2Intellectual disability....................... 26.0 20.0 11.3 10.2 9.9 9.7 9.9 9.6 9.2 8.9 8.6 8.3 8.0 7.6 7.4Multiple disabilities......................... — 1.6 2.0 1.7 1.8 1.8 2.1 2.1 2.1 2.1 2.1 2.1 2.1 2.1 2.0Orthopedic impairments ................ 2.4 1.4 1.0 1.1 1.1 1.1 1.3 1.3 1.3 1.2 1.1 1.1 1.0 1.0 1.1Other health impairments2............. 3.8 2.4 1.2 2.4 3.6 4.1 4.8 5.5 6.2 7.0 7.7 8.5 9.1 9.7 10.2Preschool disabled3 ....................... † † 8.3 9.8 9.4 9.4 † † † † † † † † †Specific learning disabilities........... 21.5 35.3 45.2 46.3 46.1 45.7 45.5 44.7 43.7 42.7 41.6 40.7 39.9 39.0 38.2Speech or language impairments.. 35.2 28.2 20.9 18.3 17.6 17.4 22.4 21.7 21.6 21.7 21.8 21.9 22.1 22.0 22.0Traumatic brain injury..................... — — — 0.2 0.2 0.2 0.2 0.3 0.3 0.4 0.4 0.4 0.4 0.4 0.4Visual impairments ........................ 1.0 0.7 0.5 0.4 0.4 0.4 0.5 0.4 0.4 0.4 0.4 0.4 0.4 0.4 0.4
Number served as a percent of total enrollment4
All disabilities ....................... 8.3 10.1 11.4 12.4 13.0 13.2 13.3 13.4 13.5 13.7 13.8 13.7 13.6 13.4 13.2Autism............................................ — — — 0.1 0.1 0.1 0.2 0.2 0.3 0.3 0.4 0.5 0.5 0.6 0.7Deaf-blindness............................... — # # # # # # # # # # # # # #Developmental delay ..................... — — — — # # 0.4 0.5 0.6 0.6 0.7 0.7 0.7 0.7 0.7Emotional disturbance ................... 0.6 0.8 0.9 1.0 1.0 1.0 1.0 1.0 1.0 1.0 1.0 1.0 0.9 0.9 0.9Hearing impairments ..................... 0.2 0.2 0.1 0.1 0.2 0.2 0.2 0.2 0.2 0.2 0.2 0.2 0.2 0.2 0.2Intellectual disability....................... 2.2 2.0 1.3 1.3 1.3 1.3 1.3 1.3 1.2 1.2 1.2 1.1 1.1 1.0 1.0Multiple disabilities......................... — 0.2 0.2 0.2 0.2 0.2 0.3 0.3 0.3 0.3 0.3 0.3 0.3 0.3 0.3Orthopedic impairments ................ 0.2 0.1 0.1 0.1 0.1 0.2 0.2 0.2 0.2 0.2 0.2 0.1 0.1 0.1 0.1Other health impairments2............. 0.3 0.2 0.1 0.3 0.5 0.5 0.6 0.7 0.8 1.0 1.1 1.2 1.2 1.3 1.3Preschool disabled3 ....................... † † 0.9 1.2 1.2 1.2 † † † † † † † † †Specific learning disabilities........... 1.8 3.6 5.2 5.8 6.0 6.0 6.1 6.0 5.9 5.8 5.7 5.6 5.4 5.2 5.0Speech or language impairments.. 2.9 2.9 2.4 2.3 2.3 2.3 3.0 2.9 2.9 3.0 3.0 3.0 3.0 3.0 2.9Traumatic brain injury..................... — — — # # # # # # # # # 0.1 0.1 0.1Visual impairments ........................ 0.1 0.1 0.1 0.1 0.1 0.1 0.1 0.1 0.1 0.1 0.1 0.1 0.1 0.1 0.1
DIGEST OF EDUCATION STATISTICS 2010
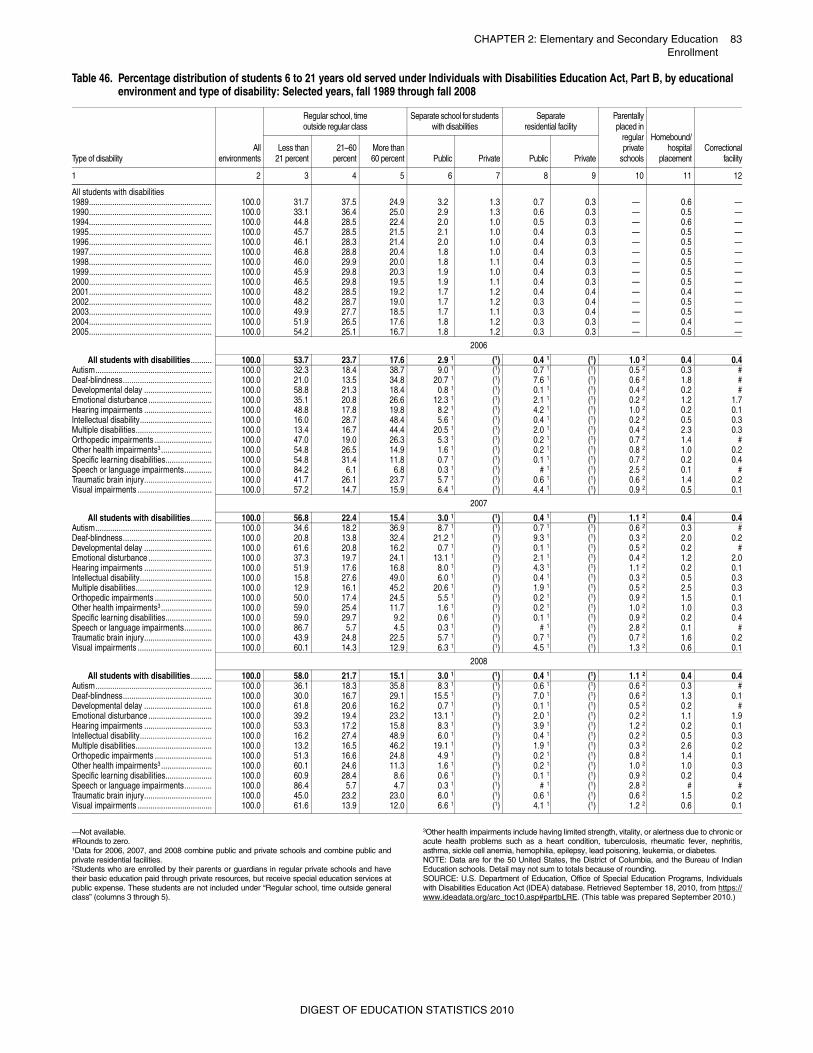
CHAPTER 2: Elementary and Secondary Education 83Enrollment
—Not available.#Rounds to zero. 1Data for 2006, 2007, and 2008 combine public and private schools and combine public andprivate residential facilities.2Students who are enrolled by their parents or guardians in regular private schools and havetheir basic education paid through private resources, but receive special education services atpublic expense. These students are not included under “Regular school, time outside generalclass” (columns 3 through 5).
3Other health impairments include having limited strength, vitality, or alertness due to chronic oracute health problems such as a heart condition, tuberculosis, rheumatic fever, nephritis,asthma, sickle cell anemia, hemophilia, epilepsy, lead poisoning, leukemia, or diabetes.NOTE: Data are for the 50 United States, the District of Columbia, and the Bureau of IndianEducation schools. Detail may not sum to totals because of rounding. SOURCE: U.S. Department of Education, Office of Special Education Programs, Individualswith Disabilities Education Act (IDEA) database. Retrieved September 18, 2010, from https://www.ideadata.org/arc_toc10.asp#partbLRE. (This table was prepared September 2010.)
Table 46. Percentage distribution of students 6 to 21 years old served under Individuals with Disabilities Education Act, Part B, by educational environment and type of disability: Selected years, fall 1989 through fall 2008
Type of disabilityAll
environments
Regular school, time outside regular class
Separate school for students with disabilities
Separate residential facility
Parentallyplaced in
regularprivate
schools
Homebound/hospital
placementCorrectional
facilityLess than
21 percent21–60
percentMore than60 percent Public Private Public Private
1 2 3 4 5 6 7 8 9 10 11 12
All students with disabilities1989.......................................................... 100.0 31.7 37.5 24.9 3.2 1.3 0.7 0.3 — 0.6 —1990.......................................................... 100.0 33.1 36.4 25.0 2.9 1.3 0.6 0.3 — 0.5 —1994.......................................................... 100.0 44.8 28.5 22.4 2.0 1.0 0.5 0.3 — 0.6 —1995.......................................................... 100.0 45.7 28.5 21.5 2.1 1.0 0.4 0.3 — 0.5 —1996.......................................................... 100.0 46.1 28.3 21.4 2.0 1.0 0.4 0.3 — 0.5 —1997.......................................................... 100.0 46.8 28.8 20.4 1.8 1.0 0.4 0.3 — 0.5 —1998.......................................................... 100.0 46.0 29.9 20.0 1.8 1.1 0.4 0.3 — 0.5 —1999.......................................................... 100.0 45.9 29.8 20.3 1.9 1.0 0.4 0.3 — 0.5 —2000.......................................................... 100.0 46.5 29.8 19.5 1.9 1.1 0.4 0.3 — 0.5 —2001.......................................................... 100.0 48.2 28.5 19.2 1.7 1.2 0.4 0.4 — 0.4 —2002.......................................................... 100.0 48.2 28.7 19.0 1.7 1.2 0.3 0.4 — 0.5 —2003.......................................................... 100.0 49.9 27.7 18.5 1.7 1.1 0.3 0.4 — 0.5 —2004.......................................................... 100.0 51.9 26.5 17.6 1.8 1.2 0.3 0.3 — 0.4 —2005.......................................................... 100.0 54.2 25.1 16.7 1.8 1.2 0.3 0.3 — 0.5 —
2006
All students with disabilities.......... 100.0 53.7 23.7 17.6 2.9 1 (1) 0.4 1 (1) 1.0 2 0.4 0.4Autism....................................................... 100.0 32.3 18.4 38.7 9.0 1 (1) 0.7 1 (1) 0.5 2 0.3 #Deaf-blindness.......................................... 100.0 21.0 13.5 34.8 20.7 1 (1) 7.6 1 (1) 0.6 2 1.8 #Developmental delay ................................ 100.0 58.8 21.3 18.4 0.8 1 (1) 0.1 1 (1) 0.4 2 0.2 #Emotional disturbance .............................. 100.0 35.1 20.8 26.6 12.3 1 (1) 2.1 1 (1) 0.2 2 1.2 1.7Hearing impairments ................................ 100.0 48.8 17.8 19.8 8.2 1 (1) 4.2 1 (1) 1.0 2 0.2 0.1Intellectual disability.................................. 100.0 16.0 28.7 48.4 5.6 1 (1) 0.4 1 (1) 0.2 2 0.5 0.3Multiple disabilities.................................... 100.0 13.4 16.7 44.4 20.5 1 (1) 2.0 1 (1) 0.4 2 2.3 0.3Orthopedic impairments ........................... 100.0 47.0 19.0 26.3 5.3 1 (1) 0.2 1 (1) 0.7 2 1.4 #Other health impairments3........................ 100.0 54.8 26.5 14.9 1.6 1 (1) 0.2 1 (1) 0.8 2 1.0 0.2Specific learning disabilities...................... 100.0 54.8 31.4 11.8 0.7 1 (1) 0.1 1 (1) 0.7 2 0.2 0.4Speech or language impairments............. 100.0 84.2 6.1 6.8 0.3 1 (1) # 1 (1) 2.5 2 0.1 #Traumatic brain injury................................ 100.0 41.7 26.1 23.7 5.7 1 (1) 0.6 1 (1) 0.6 2 1.4 0.2Visual impairments ................................... 100.0 57.2 14.7 15.9 6.4 1 (1) 4.4 1 (1) 0.9 2 0.5 0.1
2007
All students with disabilities.......... 100.0 56.8 22.4 15.4 3.0 1 (1) 0.4 1 (1) 1.1 2 0.4 0.4Autism....................................................... 100.0 34.6 18.2 36.9 8.7 1 (1) 0.7 1 (1) 0.6 2 0.3 #Deaf-blindness.......................................... 100.0 20.8 13.8 32.4 21.2 1 (1) 9.3 1 (1) 0.3 2 2.0 0.2Developmental delay ................................ 100.0 61.6 20.8 16.2 0.7 1 (1) 0.1 1 (1) 0.5 2 0.2 #Emotional disturbance .............................. 100.0 37.3 19.7 24.1 13.1 1 (1) 2.1 1 (1) 0.4 2 1.2 2.0Hearing impairments ................................ 100.0 51.9 17.6 16.8 8.0 1 (1) 4.3 1 (1) 1.1 2 0.2 0.1Intellectual disability.................................. 100.0 15.8 27.6 49.0 6.0 1 (1) 0.4 1 (1) 0.3 2 0.5 0.3Multiple disabilities.................................... 100.0 12.9 16.1 45.2 20.6 1 (1) 1.9 1 (1) 0.5 2 2.5 0.3Orthopedic impairments ........................... 100.0 50.0 17.4 24.5 5.5 1 (1) 0.2 1 (1) 0.9 2 1.5 0.1Other health impairments3........................ 100.0 59.0 25.4 11.7 1.6 1 (1) 0.2 1 (1) 1.0 2 1.0 0.3Specific learning disabilities...................... 100.0 59.0 29.7 9.2 0.6 1 (1) 0.1 1 (1) 0.9 2 0.2 0.4Speech or language impairments............. 100.0 86.7 5.7 4.5 0.3 1 (1) # 1 (1) 2.8 2 0.1 #Traumatic brain injury................................ 100.0 43.9 24.8 22.5 5.7 1 (1) 0.7 1 (1) 0.7 2 1.6 0.2Visual impairments ................................... 100.0 60.1 14.3 12.9 6.3 1 (1) 4.5 1 (1) 1.3 2 0.6 0.1
2008
All students with disabilities.......... 100.0 58.0 21.7 15.1 3.0 1 (1) 0.4 1 (1) 1.1 2 0.4 0.4Autism....................................................... 100.0 36.1 18.3 35.8 8.3 1 (1) 0.6 1 (1) 0.6 2 0.3 #Deaf-blindness.......................................... 100.0 30.0 16.7 29.1 15.5 1 (1) 7.0 1 (1) 0.6 2 1.3 0.1Developmental delay ................................ 100.0 61.8 20.6 16.2 0.7 1 (1) 0.1 1 (1) 0.5 2 0.2 #Emotional disturbance .............................. 100.0 39.2 19.4 23.2 13.1 1 (1) 2.0 1 (1) 0.2 2 1.1 1.9Hearing impairments ................................ 100.0 53.3 17.2 15.8 8.3 1 (1) 3.9 1 (1) 1.2 2 0.2 0.1Intellectual disability.................................. 100.0 16.2 27.4 48.9 6.0 1 (1) 0.4 1 (1) 0.2 2 0.5 0.3Multiple disabilities.................................... 100.0 13.2 16.5 46.2 19.1 1 (1) 1.9 1 (1) 0.3 2 2.6 0.2Orthopedic impairments ........................... 100.0 51.3 16.6 24.8 4.9 1 (1) 0.2 1 (1) 0.8 2 1.4 0.1Other health impairments3........................ 100.0 60.1 24.6 11.3 1.6 1 (1) 0.2 1 (1) 1.0 2 1.0 0.3Specific learning disabilities...................... 100.0 60.9 28.4 8.6 0.6 1 (1) 0.1 1 (1) 0.9 2 0.2 0.4Speech or language impairments............. 100.0 86.4 5.7 4.7 0.3 1 (1) # 1 (1) 2.8 2 # #Traumatic brain injury................................ 100.0 45.0 23.2 23.0 6.0 1 (1) 0.6 1 (1) 0.6 2 1.5 0.2Visual impairments ................................... 100.0 61.6 13.9 12.0 6.6 1 (1) 4.1 1 (1) 1.2 2 0.6 0.1
DIGEST OF EDUCATION STATISTICS 2010
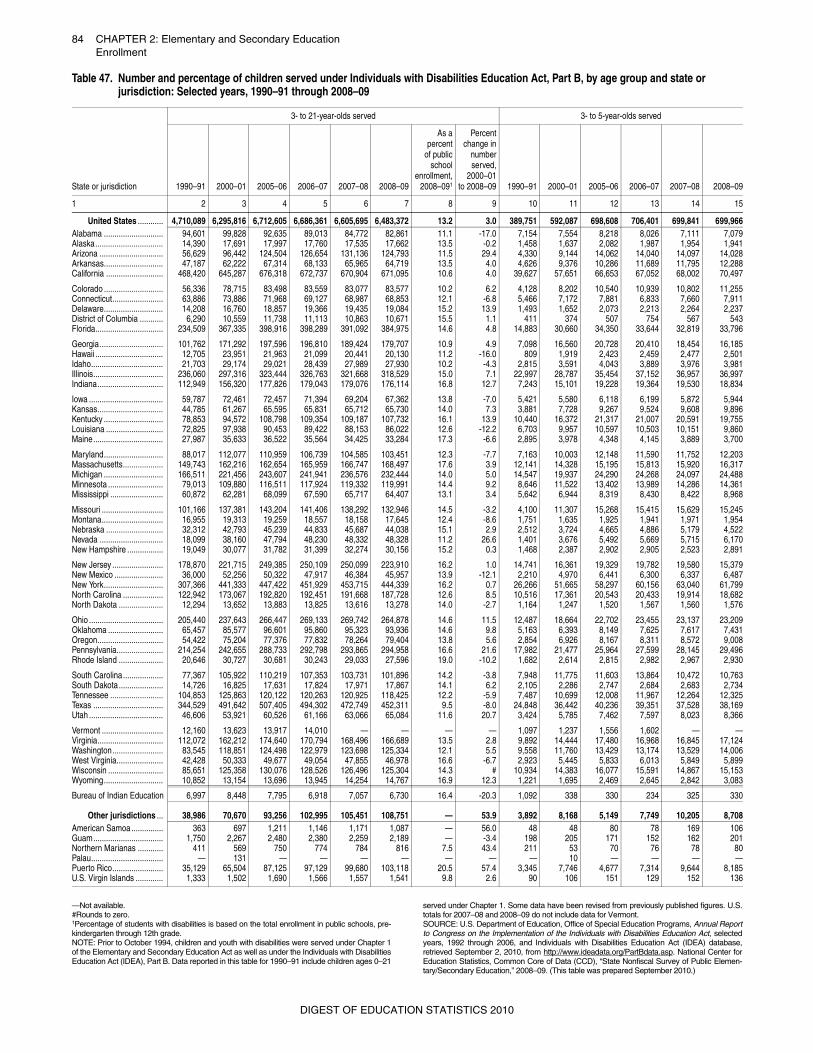
84 CHAPTER 2: Elementary and Secondary EducationEnrollment
—Not available.#Rounds to zero.1Percentage of students with disabilities is based on the total enrollment in public schools, pre-kindergarten through 12th grade. NOTE: Prior to October 1994, children and youth with disabilities were served under Chapter 1of the Elementary and Secondary Education Act as well as under the Individuals with DisabilitiesEducation Act (IDEA), Part B. Data reported in this table for 1990–91 include children ages 0–21
served under Chapter 1. Some data have been revised from previously published figures. U.S.totals for 2007–08 and 2008–09 do not include data for Vermont.SOURCE: U.S. Department of Education, Office of Special Education Programs, Annual Reportto Congress on the Implementation of the Individuals with Disabilities Education Act, selectedyears, 1992 through 2006, and Individuals with Disabilities Education Act (IDEA) database,retrieved September 2, 2010, from http://www.ideadata.org/PartBdata.asp. National Center forEducation Statistics, Common Core of Data (CCD), “State Nonfiscal Survey of Public Elemen-tary/Secondary Education,” 2008–09. (This table was prepared September 2010.)
Table 47. Number and percentage of children served under Individuals with Disabilities Education Act, Part B, by age group and state or jurisdiction: Selected years, 1990–91 through 2008–09
State or jurisdiction
3- to 21-year-olds served 3- to 5-year-olds served
1990–91 2000–01 2005–06 2006–07 2007–08 2008–09
As apercent
of publicschool
enrollment,2008–091
Percentchange in
numberserved,
2000–01to 2008–09 1990–91 2000–01 2005–06 2006–07 2007–08 2008–09
1 2 3 4 5 6 7 8 9 10 11 12 13 14 15
United States ............ 4,710,089 6,295,816 6,712,605 6,686,361 6,605,695 6,483,372 13.2 3.0 389,751 592,087 698,608 706,401 699,841 699,966Alabama ............................ 94,601 99,828 92,635 89,013 84,772 82,861 11.1 -17.0 7,154 7,554 8,218 8,026 7,111 7,079Alaska................................ 14,390 17,691 17,997 17,760 17,535 17,662 13.5 -0.2 1,458 1,637 2,082 1,987 1,954 1,941Arizona .............................. 56,629 96,442 124,504 126,654 131,136 124,793 11.5 29.4 4,330 9,144 14,062 14,040 14,097 14,028Arkansas............................ 47,187 62,222 67,314 68,133 65,965 64,719 13.5 4.0 4,626 9,376 10,286 11,689 11,795 12,288California ........................... 468,420 645,287 676,318 672,737 670,904 671,095 10.6 4.0 39,627 57,651 66,653 67,052 68,002 70,497
Colorado ............................ 56,336 78,715 83,498 83,559 83,077 83,577 10.2 6.2 4,128 8,202 10,540 10,939 10,802 11,255Connecticut........................ 63,886 73,886 71,968 69,127 68,987 68,853 12.1 -6.8 5,466 7,172 7,881 6,833 7,660 7,911Delaware............................ 14,208 16,760 18,857 19,366 19,435 19,084 15.2 13.9 1,493 1,652 2,073 2,213 2,264 2,237District of Columbia ........... 6,290 10,559 11,738 11,113 10,863 10,671 15.5 1.1 411 374 507 754 567 543Florida................................ 234,509 367,335 398,916 398,289 391,092 384,975 14.6 4.8 14,883 30,660 34,350 33,644 32,819 33,796
Georgia.............................. 101,762 171,292 197,596 196,810 189,424 179,707 10.9 4.9 7,098 16,560 20,728 20,410 18,454 16,185Hawaii ................................ 12,705 23,951 21,963 21,099 20,441 20,130 11.2 -16.0 809 1,919 2,423 2,459 2,477 2,501Idaho.................................. 21,703 29,174 29,021 28,439 27,989 27,930 10.2 -4.3 2,815 3,591 4,043 3,889 3,976 3,981Illinois................................. 236,060 297,316 323,444 326,763 321,668 318,529 15.0 7.1 22,997 28,787 35,454 37,152 36,957 36,997Indiana............................... 112,949 156,320 177,826 179,043 179,076 176,114 16.8 12.7 7,243 15,101 19,228 19,364 19,530 18,834
Iowa ................................... 59,787 72,461 72,457 71,394 69,204 67,362 13.8 -7.0 5,421 5,580 6,118 6,199 5,872 5,944Kansas............................... 44,785 61,267 65,595 65,831 65,712 65,730 14.0 7.3 3,881 7,728 9,267 9,524 9,608 9,896Kentucky ............................ 78,853 94,572 108,798 109,354 109,187 107,732 16.1 13.9 10,440 16,372 21,317 21,007 20,591 19,755Louisiana ........................... 72,825 97,938 90,453 89,422 88,153 86,022 12.6 -12.2 6,703 9,957 10,597 10,503 10,151 9,860Maine................................. 27,987 35,633 36,522 35,564 34,425 33,284 17.3 -6.6 2,895 3,978 4,348 4,145 3,889 3,700
Maryland............................ 88,017 112,077 110,959 106,739 104,585 103,451 12.3 -7.7 7,163 10,003 12,148 11,590 11,752 12,203Massachusetts................... 149,743 162,216 162,654 165,959 166,747 168,497 17.6 3.9 12,141 14,328 15,195 15,813 15,920 16,317Michigan ............................ 166,511 221,456 243,607 241,941 236,576 232,444 14.0 5.0 14,547 19,937 24,290 24,268 24,097 24,488Minnesota .......................... 79,013 109,880 116,511 117,924 119,332 119,991 14.4 9.2 8,646 11,522 13,402 13,989 14,286 14,361Mississippi ......................... 60,872 62,281 68,099 67,590 65,717 64,407 13.1 3.4 5,642 6,944 8,319 8,430 8,422 8,968
Missouri ............................. 101,166 137,381 143,204 141,406 138,292 132,946 14.5 -3.2 4,100 11,307 15,268 15,415 15,629 15,245Montana............................. 16,955 19,313 19,259 18,557 18,158 17,645 12.4 -8.6 1,751 1,635 1,925 1,941 1,971 1,954Nebraska ........................... 32,312 42,793 45,239 44,833 45,687 44,038 15.1 2.9 2,512 3,724 4,665 4,886 5,179 4,522Nevada .............................. 18,099 38,160 47,794 48,230 48,332 48,328 11.2 26.6 1,401 3,676 5,492 5,669 5,715 6,170New Hampshire ................. 19,049 30,077 31,782 31,399 32,274 30,156 15.2 0.3 1,468 2,387 2,902 2,905 2,523 2,891
New Jersey ........................ 178,870 221,715 249,385 250,109 250,099 223,910 16.2 1.0 14,741 16,361 19,329 19,782 19,580 15,379New Mexico ....................... 36,000 52,256 50,322 47,917 46,384 45,957 13.9 -12.1 2,210 4,970 6,441 6,300 6,337 6,487New York............................ 307,366 441,333 447,422 451,929 453,715 444,339 16.2 0.7 26,266 51,665 58,297 60,156 63,040 61,799North Carolina ................... 122,942 173,067 192,820 192,451 191,668 187,728 12.6 8.5 10,516 17,361 20,543 20,433 19,914 18,682North Dakota ..................... 12,294 13,652 13,883 13,825 13,616 13,278 14.0 -2.7 1,164 1,247 1,520 1,567 1,560 1,576
Ohio ................................... 205,440 237,643 266,447 269,133 269,742 264,878 14.6 11.5 12,487 18,664 22,702 23,455 23,137 23,209Oklahoma .......................... 65,457 85,577 96,601 95,860 95,323 93,936 14.6 9.8 5,163 6,393 8,149 7,625 7,617 7,431Oregon............................... 54,422 75,204 77,376 77,832 78,264 79,404 13.8 5.6 2,854 6,926 8,167 8,311 8,572 9,008Pennsylvania...................... 214,254 242,655 288,733 292,798 293,865 294,958 16.6 21.6 17,982 21,477 25,964 27,599 28,145 29,496Rhode Island ..................... 20,646 30,727 30,681 30,243 29,033 27,596 19.0 -10.2 1,682 2,614 2,815 2,982 2,967 2,930
South Carolina................... 77,367 105,922 110,219 107,353 103,731 101,896 14.2 -3.8 7,948 11,775 11,603 13,864 10,472 10,763South Dakota ..................... 14,726 16,825 17,631 17,824 17,971 17,867 14.1 6.2 2,105 2,286 2,747 2,684 2,683 2,734Tennessee ......................... 104,853 125,863 120,122 120,263 120,925 118,425 12.2 -5.9 7,487 10,699 12,008 11,967 12,264 12,325Texas ................................. 344,529 491,642 507,405 494,302 472,749 452,311 9.5 -8.0 24,848 36,442 40,236 39,351 37,528 38,169Utah ................................... 46,606 53,921 60,526 61,166 63,066 65,084 11.6 20.7 3,424 5,785 7,462 7,597 8,023 8,366
Vermont ............................. 12,160 13,623 13,917 14,010 — — — — 1,097 1,237 1,556 1,602 — —Virginia............................... 112,072 162,212 174,640 170,794 168,496 166,689 13.5 2.8 9,892 14,444 17,480 16,968 16,845 17,124Washington........................ 83,545 118,851 124,498 122,979 123,698 125,334 12.1 5.5 9,558 11,760 13,429 13,174 13,529 14,006West Virginia...................... 42,428 50,333 49,677 49,054 47,855 46,978 16.6 -6.7 2,923 5,445 5,833 6,013 5,849 5,899Wisconsin .......................... 85,651 125,358 130,076 128,526 126,496 125,304 14.3 # 10,934 14,383 16,077 15,591 14,867 15,153Wyoming............................ 10,852 13,154 13,696 13,945 14,254 14,767 16.9 12.3 1,221 1,695 2,469 2,645 2,842 3,083
Bureau of Indian Education 6,997 8,448 7,795 6,918 7,057 6,730 16.4 -20.3 1,092 338 330 234 325 330
Other jurisdictions ... 38,986 70,670 93,256 102,995 105,451 108,751 — 53.9 3,892 8,168 5,149 7,749 10,205 8,708American Samoa............... 363 697 1,211 1,146 1,171 1,087 — 56.0 48 48 80 78 169 106Guam................................. 1,750 2,267 2,480 2,380 2,259 2,189 — -3.4 198 205 171 152 162 201Northern Marianas ............ 411 569 750 774 784 816 7.5 43.4 211 53 70 76 78 80Palau.................................. — 131 — — — — — — — 10 — — — —Puerto Rico........................ 35,129 65,504 87,125 97,129 99,680 103,118 20.5 57.4 3,345 7,746 4,677 7,314 9,644 8,185U.S. Virgin Islands ............. 1,333 1,502 1,690 1,566 1,557 1,541 9.8 2.6 90 106 151 129 152 136
DIGEST OF EDUCATION STATISTICS 2010
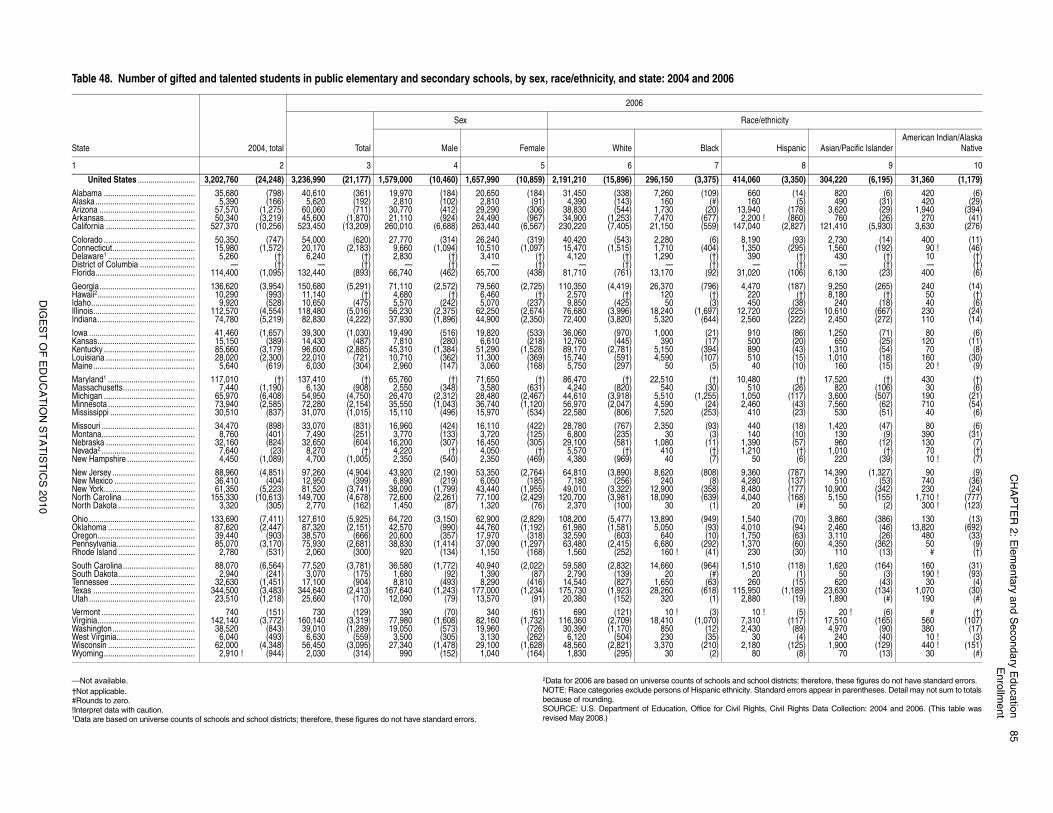
CH
AP
TE
R 2
: Ele
me
nta
ry an
d S
eco
nd
ary E
du
catio
n8
5E
nro
llme
nt
DIG
ES
T O
F E
DU
CA
TIO
N S
TA
TIS
TIC
S 2
01
0
hool districts; therefore, these figures do not have standard errors.tandard errors appear in parentheses. Detail may not sum to totals
hts, Civil Rights Data Collection: 2004 and 2006. (This table was
e/ethnicity
Hispanic Asian/Pacific IslanderAmerican Indian/Alaska
Native
8 9 10
0 (3,350) 304,220 (6,195) 31,360 (1,179)0 (14) 820 (6) 420 (6)0 (5) 490 (31) 420 (29)0 (178) 3,620 (29) 1,940 (394)0 ! (860) 760 (26) 270 (41)0 (2,827) 121,410 (5,930) 3,630 (276)
0 (93) 2,730 (14) 400 (11)0 (295) 1,560 (192) 90 ! (46)0 (†) 430 (†) 10 (†)
(†) — (†) — (†)0 (106) 6,130 (23) 400 (6)
0 (187) 9,250 (265) 240 (14)0 (†) 8,180 (†) 50 (†)0 (38) 240 (18) 40 (6)0 (225) 10,610 (667) 230 (24)0 (222) 2,450 (272) 110 (14)
0 (86) 1,250 (71) 80 (6)0 (20) 650 (25) 120 (11)0 (43) 1,310 (54) 70 (8)0 (15) 1,010 (18) 160 (30)0 (10) 160 (15) 20 ! (9)
0 (†) 17,520 (†) 430 (†)0 (26) 820 (106) 30 (6)0 (117) 3,600 (507) 190 (21)0 (43) 7,560 (62) 710 (54)0 (23) 530 (51) 40 (6)
0 (18) 1,420 (47) 80 (6)0 (10) 130 (9) 390 (31)0 (57) 960 (12) 130 (7)0 (†) 1,010 (†) 70 (†)0 (6) 220 (39) 10 ! (7)
0 (787) 14,390 (1,327) 90 (9)0 (137) 510 (53) 740 (36)0 (177) 10,900 (342) 230 (24)0 (168) 5,150 (155) 1,710 ! (777)0 (#) 50 (2) 300 ! (123)
0 (70) 3,860 (386) 130 (13)0 (94) 2,460 (46) 13,820 (692)0 (63) 3,110 (26) 480 (33)0 (60) 4,350 (362) 50 (9)0 (30) 110 (13) # (†)
0 (118) 1,620 (164) 160 (31)0 (1) 50 (3) 190 ! (93)0 (15) 620 (43) 30 (4)0 (1,189) 23,630 (134) 1,070 (30)0 (19) 1,890 (#) 190 (#)
0 ! (5) 20 ! (6) # (†)0 (117) 17,510 (165) 560 (107)0 (89) 4,970 (90) 380 (17)0 (4) 240 (40) 10 ! (3)0 (125) 1,900 (129) 440 ! (151)0 (8) 70 (13) 30 (#)
—Not available.†Not applicable.#Rounds to zero.!Interpret data with caution.1Data are based on universe counts of schools and school districts; therefore, these figures do not have standard errors.
2Data for 2006 are based on universe counts of schools and scNOTE: Race categories exclude persons of Hispanic ethnicity. Sbecause of rounding.SOURCE: U.S. Department of Education, Office for Civil Rigrevised May 2008.)
Table 48. Number of gifted and talented students in public elementary and secondary schools, by sex, race/ethnicity, and state: 2004 and 2006
State 2004, total
2006
Total
Sex Rac
Male Female White Black
1 2 3 4 5 6 7
United States ........................... 3,202,760 (24,248) 3,236,990 (21,177) 1,579,000 (10,460) 1,657,990 (10,859) 2,191,210 (15,896) 296,150 (3,375) 414,06Alabama ........................................... 35,680 (798) 40,610 (361) 19,970 (184) 20,650 (184) 31,450 (338) 7,260 (109) 66Alaska............................................... 5,390 (166) 5,620 (192) 2,810 (102) 2,810 (91) 4,390 (143) 160 (#) 16Arizona ............................................. 57,570 (1,275) 60,060 (711) 30,770 (412) 29,290 (306) 38,830 (544) 1,730 (20) 13,94Arkansas........................................... 50,340 (3,219) 45,600 (1,870) 21,110 (924) 24,490 (967) 34,900 (1,253) 7,470 (677) 2,20California .......................................... 527,370 (10,256) 523,450 (13,209) 260,010 (6,688) 263,440 (6,567) 230,220 (7,405) 21,150 (559) 147,04
Colorado ........................................... 50,350 (747) 54,000 (620) 27,770 (314) 26,240 (319) 40,420 (543) 2,280 (6) 8,19Connecticut....................................... 15,980 (1,572) 20,170 (2,183) 9,660 (1,094) 10,510 (1,097) 15,470 (1,515) 1,710 (404) 1,35Delaware1 ......................................... 5,260 (†) 6,240 (†) 2,830 (†) 3,410 (†) 4,120 (†) 1,290 (†) 39District of Columbia .......................... — (†) — (†) — (†) — (†) — (†) — (†) —Florida............................................... 114,400 (1,095) 132,440 (893) 66,740 (462) 65,700 (438) 81,710 (761) 13,170 (92) 31,02
Georgia............................................. 136,620 (3,954) 150,680 (5,291) 71,110 (2,572) 79,560 (2,725) 110,350 (4,419) 26,370 (796) 4,47Hawaii2.............................................. 10,290 (993) 11,140 (†) 4,680 (†) 6,460 (†) 2,570 (†) 120 (†) 22Idaho................................................. 9,920 (528) 10,650 (475) 5,570 (242) 5,070 (237) 9,850 (425) 50 (3) 45Illinois................................................ 112,570 (4,554) 118,480 (5,016) 56,230 (2,375) 62,250 (2,674) 76,680 (3,996) 18,240 (1,697) 12,72Indiana.............................................. 74,780 (5,219) 82,830 (4,222) 37,930 (1,896) 44,900 (2,350) 72,400 (3,820) 5,320 (644) 2,56
Iowa .................................................. 41,460 (1,657) 39,300 (1,030) 19,490 (516) 19,820 (533) 36,060 (970) 1,000 (21) 91Kansas.............................................. 15,150 (389) 14,430 (487) 7,810 (280) 6,610 (218) 12,760 (445) 390 (17) 50Kentucky ........................................... 85,660 (3,179) 96,600 (2,885) 45,310 (1,384) 51,290 (1,528) 89,170 (2,781) 5,150 (394) 89Louisiana .......................................... 28,020 (2,300) 22,010 (721) 10,710 (362) 11,300 (369) 15,740 (591) 4,590 (107) 51Maine................................................ 5,640 (619) 6,030 (304) 2,960 (147) 3,060 (168) 5,750 (297) 50 (5) 4
Maryland1 ......................................... 117,010 (†) 137,410 (†) 65,760 (†) 71,650 (†) 86,470 (†) 22,510 (†) 10,48Massachusetts.................................. 7,440 (1,190) 6,130 (908) 2,550 (348) 3,580 (631) 4,240 (820) 540 (30) 51Michigan ........................................... 65,970 (6,408) 54,950 (4,750) 26,470 (2,312) 28,480 (2,467) 44,610 (3,918) 5,510 (1,255) 1,05Minnesota ......................................... 73,940 (2,585) 72,280 (2,154) 35,550 (1,043) 36,740 (1,120) 56,970 (2,047) 4,590 (24) 2,46Mississippi ........................................ 30,510 (837) 31,070 (1,015) 15,110 (496) 15,970 (534) 22,580 (806) 7,520 (253) 41
Missouri ............................................ 34,470 (898) 33,070 (831) 16,960 (424) 16,110 (422) 28,780 (767) 2,350 (93) 44Montana............................................ 8,760 (401) 7,490 (251) 3,770 (133) 3,720 (125) 6,800 (235) 30 (3) 14Nebraska .......................................... 32,160 (824) 32,650 (604) 16,200 (307) 16,450 (305) 29,100 (581) 1,080 (11) 1,39Nevada2 ............................................ 7,640 (23) 8,270 (†) 4,220 (†) 4,050 (†) 5,570 (†) 410 (†) 1,21New Hampshire ................................ 4,450 (1,089) 4,700 (1,005) 2,350 (540) 2,350 (469) 4,380 (969) 40 (7) 5
New Jersey ....................................... 88,960 (4,851) 97,260 (4,904) 43,920 (2,190) 53,350 (2,764) 64,810 (3,890) 8,620 (808) 9,36New Mexico ...................................... 36,410 (404) 12,950 (399) 6,890 (219) 6,050 (185) 7,180 (256) 240 (8) 4,28New York........................................... 61,350 (5,223) 81,520 (3,741) 38,090 (1,799) 43,440 (1,955) 49,010 (3,322) 12,900 (358) 8,48North Carolina .................................. 155,330 (10,613) 149,700 (4,678) 72,600 (2,261) 77,100 (2,429) 120,700 (3,981) 18,090 (639) 4,04North Dakota .................................... 3,320 (305) 2,770 (162) 1,450 (87) 1,320 (76) 2,370 (100) 30 (1) 2
Ohio .................................................. 133,690 (7,411) 127,610 (5,925) 64,720 (3,150) 62,900 (2,829) 108,200 (5,477) 13,890 (949) 1,54Oklahoma ......................................... 87,620 (2,447) 87,320 (2,151) 42,570 (990) 44,760 (1,192) 61,980 (1,581) 5,050 (93) 4,01Oregon.............................................. 39,440 (903) 38,570 (666) 20,600 (357) 17,970 (318) 32,590 (603) 640 (10) 1,75Pennsylvania..................................... 85,070 (3,170) 75,930 (2,681) 38,830 (1,414) 37,090 (1,297) 63,480 (2,415) 6,680 (292) 1,37Rhode Island .................................... 2,780 (531) 2,060 (300) 920 (134) 1,150 (168) 1,560 (252) 160 ! (41) 23
South Carolina.................................. 88,070 (6,564) 77,520 (3,781) 36,580 (1,772) 40,940 (2,022) 59,580 (2,832) 14,660 (964) 1,51South Dakota .................................... 2,940 (241) 3,070 (175) 1,680 (92) 1,390 (87) 2,790 (139) 20 (#) 2Tennessee ........................................ 32,630 (1,451) 17,100 (904) 8,810 (493) 8,290 (416) 14,540 (827) 1,650 (63) 26Texas ................................................ 344,500 (3,483) 344,640 (2,413) 167,640 (1,243) 177,000 (1,234) 175,730 (1,923) 28,260 (618) 115,95Utah .................................................. 23,510 (1,218) 25,660 (170) 12,090 (79) 13,570 (91) 20,380 (152) 320 (1) 2,88
Vermont ............................................ 740 (151) 730 (129) 390 (70) 340 (61) 690 (121) 10 ! (3) 1Virginia.............................................. 142,140 (3,772) 160,140 (3,319) 77,980 (1,608) 82,160 (1,732) 116,360 (2,709) 18,410 (1,070) 7,31Washington....................................... 38,520 (843) 39,010 (1,289) 19,050 (573) 19,960 (726) 30,390 (1,170) 850 (12) 2,43West Virginia..................................... 6,040 (493) 6,630 (559) 3,500 (305) 3,130 (262) 6,120 (504) 230 (35) 3Wisconsin ......................................... 62,000 (4,348) 56,450 (3,095) 27,340 (1,478) 29,100 (1,628) 48,560 (2,821) 3,370 (210) 2,18Wyoming........................................... 2,910 ! (944) 2,030 (314) 990 (152) 1,040 (164) 1,830 (295) 30 (2) 8
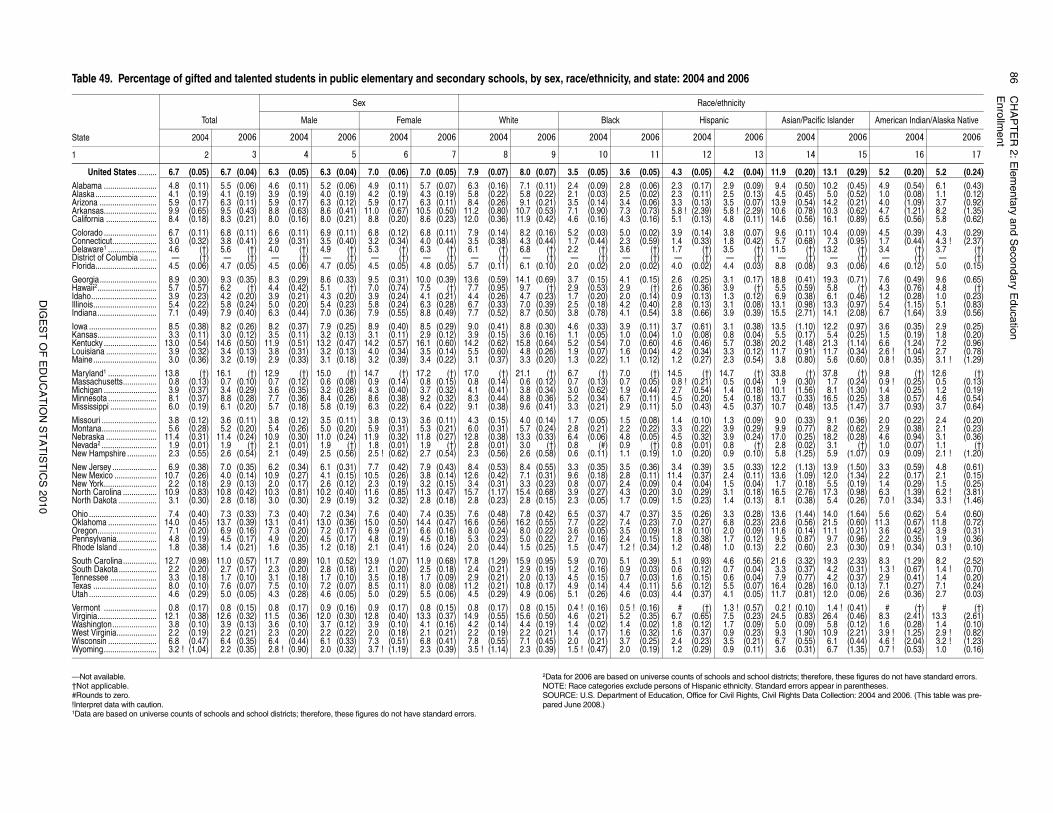
86
CH
AP
TE
R 2
: Ele
me
nta
ry an
d S
eco
nd
ary E
du
catio
nE
nro
llme
nt
DIG
ES
T O
F E
DU
CA
TIO
N S
TA
TIS
TIC
S 2
01
0
hool districts; therefore, these figures do not have standard errors.Standard errors appear in parentheses., Civil Rights Data Collection: 2004 and 2006. (This table was pre-
Asian/Pacific Islander American Indian/Alaska Native
6 2004 2006 2004 2006
13 14 15 16 17
4) 11.9 (0.20) 13.1 (0.29) 5.2 (0.20) 5.2 (0.24)9) 9.4 (0.50) 10.2 (0.45) 4.9 (0.54) 6.1 (0.43)3) 4.5 (0.45) 5.0 (0.52) 1.0 (0.08) 1.1 (0.12)7) 13.9 (0.54) 14.2 (0.21) 4.0 (1.09) 3.7 (0.92)9) 10.6 (0.78) 10.3 (0.62) 4.7 (1.21) 8.2 (1.35)1) 14.6 (0.56) 16.1 (0.89) 6.5 (0.56) 5.8 (0.62)
7) 9.6 (0.11) 10.4 (0.09) 4.5 (0.39) 4.3 (0.29)2) 5.7 (0.68) 7.3 (0.95) 1.7 (0.44) 4.3 ! (2.37)†) 11.5 (†) 13.2 (†) 3.4 (†) 3.7 (†)†) — (†) — (†) — (†) — (†)3) 8.8 (0.08) 9.3 (0.06) 4.6 (0.12) 5.0 (0.15)
7) 18.8 (0.41) 19.3 (0.71) 7.6 (0.49) 9.6 (0.65)†) 5.5 (0.59) 5.8 (†) 4.3 (0.76) 4.8 (†)2) 6.9 (0.38) 6.1 (0.46) 1.2 (0.28) 1.0 (0.23)8) 13.1 (0.98) 13.3 (0.97) 5.4 (1.15) 5.1 (0.83)9) 15.5 (2.71) 14.1 (2.08) 6.7 (1.64) 3.9 (0.56)
8) 13.5 (1.10) 12.2 (0.97) 3.6 (0.35) 2.9 (0.25)4) 5.5 (0.17) 5.4 (0.25) 1.5 (0.19) 1.8 (0.20)8) 20.2 (1.48) 21.3 (1.14) 6.6 (1.24) 7.2 (0.96)2) 11.7 (0.91) 11.7 (0.34) 2.6 ! (1.04) 2.7 (0.78)4) 3.8 (0.80) 5.6 (0.60) 0.8 ! (0.35) 3.1 ! (1.29)
†) 33.8 (†) 37.8 (†) 9.8 (†) 12.6 (†)4) 1.9 (0.30) 1.7 (0.24) 0.9 ! (0.25) 0.5 (0.13)8) 10.1 (1.56) 8.1 (1.30) 1.4 (0.25) 1.2 (0.19)8) 13.7 (0.33) 16.5 (0.25) 3.8 (0.57) 4.6 (0.54)7) 10.7 (0.48) 13.5 (1.47) 3.7 (0.93) 3.7 (0.64)
9) 9.0 (0.33) 9.1 (0.36) 2.0 (0.22) 2.4 (0.20)9) 9.9 (0.77) 8.2 (0.62) 2.9 (0.38) 2.1 (0.23)4) 17.0 (0.25) 18.2 (0.28) 4.6 (0.94) 3.1 (0.36)†) 2.8 (0.02) 3.1 (†) 1.0 (0.07) 1.1 (†)0) 5.8 (1.25) 5.9 (1.07) 0.9 (0.09) 2.1 ! (1.20)
3) 12.2 (1.13) 13.9 (1.50) 3.3 (0.59) 4.8 (0.61)1) 13.6 (1.09) 12.0 (1.34) 2.2 (0.17) 2.1 (0.15)4) 1.7 (0.18) 5.5 (0.19) 1.4 (0.29) 1.5 (0.25)8) 16.5 (2.76) 17.3 (0.98) 6.3 (1.39) 6.2 ! (3.81)3) 8.1 (0.38) 5.4 (0.26) 7.0 ! (3.34) 3.3 ! (1.46)
8) 13.6 (1.44) 14.0 (1.64) 5.6 (0.62) 5.4 (0.60)3) 23.6 (0.56) 21.5 (0.60) 11.3 (0.67) 11.8 (0.72)9) 11.6 (0.14) 11.1 (0.21) 3.6 (0.42) 3.9 (0.31)2) 9.5 (0.87) 9.7 (0.96) 2.2 (0.35) 1.9 (0.36)3) 2.2 (0.60) 2.3 (0.30) 0.9 ! (0.34) 0.3 ! (0.10)
6) 21.6 (3.32) 19.3 (2.33) 8.3 (1.29) 8.2 (2.52)4) 3.3 (0.37) 4.2 (0.31) 1.3 ! (0.67) 1.4 ! (0.70)4) 7.9 (0.77) 4.2 (0.37) 2.9 (0.41) 1.4 (0.20)7) 16.4 (0.28) 16.0 (0.13) 7.1 (0.27) 7.1 (0.24)5) 11.7 (0.81) 12.0 (0.06) 2.6 (0.36) 2.7 (0.03)
7) 0.2 ! (0.10) 1.4 ! (0.41) # (†) # (†)3) 24.5 (0.83) 26.4 (0.46) 8.3 (2.41) 13.3 (2.61)9) 5.0 (0.09) 5.8 (0.12) 1.6 (0.28) 1.4 (0.10)3) 9.3 (1.90) 10.9 (2.21) 3.9 ! (1.25) 2.9 ! (0.82)1) 6.7 (0.55) 6.1 (0.44) 4.6 ! (2.04) 3.2 ! (1.23)1) 3.6 (0.31) 6.7 (1.35) 0.7 ! (0.53) 1.0 (0.16)
—Not available.†Not applicable.#Rounds to zero.!Interpret data with caution.1Data are based on universe counts of schools and school districts; therefore, these figures do not have standard errors.
2Data for 2006 are based on universe counts of schools and scNOTE: Race categories exclude persons of Hispanic ethnicity. SOURCE: U.S. Department of Education, Office for Civil Rightspared June 2008.)
Table 49. Percentage of gifted and talented students in public elementary and secondary schools, by sex, race/ethnicity, and state: 2004 and 2006
State
Total
Sex Race/ethnicity
Male Female White Black Hispanic
2004 2006 2004 2006 2004 2006 2004 2006 2004 2006 2004 200
1 2 3 4 5 6 7 8 9 10 11 12
United States ......... 6.7 (0.05) 6.7 (0.04) 6.3 (0.05) 6.3 (0.04) 7.0 (0.06) 7.0 (0.05) 7.9 (0.07) 8.0 (0.07) 3.5 (0.05) 3.6 (0.05) 4.3 (0.05) 4.2 (0.0Alabama ......................... 4.8 (0.11) 5.5 (0.06) 4.6 (0.11) 5.2 (0.06) 4.9 (0.11) 5.7 (0.07) 6.3 (0.16) 7.1 (0.11) 2.4 (0.09) 2.8 (0.06) 2.3 (0.17) 2.9 (0.0Alaska............................. 4.1 (0.19) 4.1 (0.19) 3.9 (0.19) 4.0 (0.19) 4.2 (0.19) 4.3 (0.19) 5.8 (0.22) 5.8 (0.22) 2.1 (0.03) 2.5 (0.02) 2.3 (0.11) 2.5 (0.1Arizona ........................... 5.9 (0.17) 6.3 (0.11) 5.9 (0.17) 6.3 (0.12) 5.9 (0.17) 6.3 (0.11) 8.4 (0.26) 9.1 (0.21) 3.5 (0.14) 3.4 (0.06) 3.3 (0.13) 3.5 (0.0Arkansas......................... 9.9 (0.65) 9.5 (0.43) 8.8 (0.63) 8.6 (0.41) 11.0 (0.67) 10.5 (0.50) 11.2 (0.80) 10.7 (0.53) 7.1 (0.90) 7.3 (0.73) 5.8 ! (2.39) 5.8 ! (2.2California ........................ 8.4 (0.18) 8.3 (0.21) 8.0 (0.16) 8.0 (0.21) 8.8 (0.20) 8.6 (0.23) 12.0 (0.36) 11.9 (0.42) 4.6 (0.16) 4.3 (0.16) 5.1 (0.13) 4.8 (0.1
Colorado ......................... 6.7 (0.11) 6.8 (0.11) 6.6 (0.11) 6.9 (0.11) 6.8 (0.12) 6.8 (0.11) 7.9 (0.14) 8.2 (0.16) 5.2 (0.03) 5.0 (0.02) 3.9 (0.14) 3.8 (0.0Connecticut..................... 3.0 (0.32) 3.8 (0.41) 2.9 (0.31) 3.5 (0.40) 3.2 (0.34) 4.0 (0.44) 3.5 (0.38) 4.3 (0.44) 1.7 (0.44) 2.3 (0.59) 1.4 (0.33) 1.8 (0.4Delaware1 ....................... 4.6 (†) 5.6 (†) 4.0 (†) 4.9 (†) 5.3 (†) 6.3 (†) 6.1 (†) 6.8 (†) 2.2 (†) 3.6 (†) 1.7 (†) 3.5 (District of Columbia ........ — (†) — (†) — (†) — (†) — (†) — (†) — (†) — (†) — (†) — (†) — (†) — (Florida............................. 4.5 (0.06) 4.7 (0.05) 4.5 (0.06) 4.7 (0.05) 4.5 (0.05) 4.8 (0.05) 5.7 (0.11) 6.1 (0.10) 2.0 (0.02) 2.0 (0.02) 4.0 (0.02) 4.4 (0.0
Georgia........................... 8.9 (0.30) 9.3 (0.35) 8.3 (0.29) 8.6 (0.33) 9.5 (0.31) 10.0 (0.39) 13.6 (0.59) 14.1 (0.69) 3.7 (0.15) 4.1 (0.15) 2.6 (0.25) 3.1 (0.1Hawaii2............................ 5.7 (0.57) 6.2 (†) 4.4 (0.42) 5.1 (†) 7.0 (0.74) 7.5 (†) 7.7 (0.95) 9.7 (†) 2.9 (0.53) 2.9 (†) 2.6 (0.36) 3.9 (Idaho............................... 3.9 (0.23) 4.2 (0.20) 3.9 (0.21) 4.3 (0.20) 3.9 (0.24) 4.1 (0.21) 4.4 (0.26) 4.7 (0.23) 1.7 (0.20) 2.0 (0.14) 0.9 (0.13) 1.3 (0.1Illinois.............................. 5.4 (0.22) 5.8 (0.24) 5.0 (0.20) 5.4 (0.23) 5.8 (0.24) 6.3 (0.28) 6.7 (0.33) 7.0 (0.39) 2.5 (0.18) 4.2 (0.40) 2.8 (0.13) 3.1 (0.0Indiana............................ 7.1 (0.49) 7.9 (0.40) 6.3 (0.44) 7.0 (0.36) 7.9 (0.55) 8.8 (0.49) 7.7 (0.52) 8.7 (0.50) 3.8 (0.78) 4.1 (0.54) 3.8 (0.66) 3.9 (0.3
Iowa ................................ 8.5 (0.38) 8.2 (0.26) 8.2 (0.37) 7.9 (0.25) 8.9 (0.40) 8.5 (0.29) 9.0 (0.41) 8.8 (0.30) 4.6 (0.33) 3.9 (0.11) 3.7 (0.61) 3.1 (0.3Kansas............................ 3.3 (0.11) 3.0 (0.12) 3.5 (0.11) 3.2 (0.13) 3.1 (0.11) 2.9 (0.12) 3.9 (0.15) 3.6 (0.16) 1.1 (0.05) 1.0 (0.04) 1.0 (0.08) 0.8 (0.0Kentucky ......................... 13.0 (0.54) 14.6 (0.50) 11.9 (0.51) 13.2 (0.47) 14.2 (0.57) 16.1 (0.60) 14.2 (0.62) 15.8 (0.64) 5.2 (0.54) 7.0 (0.60) 4.6 (0.46) 5.7 (0.3Louisiana ........................ 3.9 (0.32) 3.4 (0.13) 3.8 (0.31) 3.2 (0.13) 4.0 (0.34) 3.5 (0.14) 5.5 (0.60) 4.8 (0.26) 1.9 (0.07) 1.6 (0.04) 4.2 (0.34) 3.3 (0.1Maine.............................. 3.0 (0.36) 3.2 (0.19) 2.9 (0.33) 3.1 (0.18) 3.2 (0.39) 3.4 (0.22) 3.1 (0.37) 3.3 (0.20) 1.3 (0.22) 1.1 (0.12) 1.2 (0.27) 2.3 (0.5
Maryland1 ....................... 13.8 (†) 16.1 (†) 12.9 (†) 15.0 (†) 14.7 (†) 17.2 (†) 17.0 (†) 21.1 (†) 6.7 (†) 7.0 (†) 14.5 (†) 14.7 (Massachusetts................ 0.8 (0.13) 0.7 (0.10) 0.7 (0.12) 0.6 (0.08) 0.9 (0.14) 0.8 (0.15) 0.8 (0.14) 0.6 (0.12) 0.7 (0.13) 0.7 (0.05) 0.8 ! (0.21) 0.5 (0.0Michigan ......................... 3.9 (0.37) 3.4 (0.29) 3.6 (0.35) 3.2 (0.28) 4.3 (0.40) 3.7 (0.32) 4.1 (0.41) 3.8 (0.34) 3.0 (0.62) 1.9 (0.44) 2.7 (0.54) 1.4 (0.1Minnesota ....................... 8.1 (0.37) 8.8 (0.28) 7.7 (0.36) 8.4 (0.26) 8.6 (0.38) 9.2 (0.32) 8.3 (0.44) 8.8 (0.36) 5.2 (0.34) 6.7 (0.11) 4.5 (0.20) 5.4 (0.1Mississippi ...................... 6.0 (0.19) 6.1 (0.20) 5.7 (0.18) 5.8 (0.19) 6.3 (0.22) 6.4 (0.22) 9.1 (0.38) 9.6 (0.41) 3.3 (0.21) 2.9 (0.11) 5.0 (0.43) 4.5 (0.3
Missouri .......................... 3.8 (0.12) 3.6 (0.11) 3.8 (0.12) 3.5 (0.11) 3.8 (0.13) 3.6 (0.11) 4.3 (0.15) 4.0 (0.14) 1.7 (0.05) 1.5 (0.08) 1.4 (0.10) 1.3 (0.0Montana.......................... 5.6 (0.28) 5.2 (0.20) 5.4 (0.26) 5.0 (0.20) 5.9 (0.31) 5.3 (0.21) 6.0 (0.31) 5.7 (0.24) 2.8 (0.21) 2.2 (0.22) 3.3 (0.22) 3.9 (0.2Nebraska ........................ 11.4 (0.31) 11.4 (0.24) 10.9 (0.30) 11.0 (0.24) 11.9 (0.32) 11.8 (0.27) 12.8 (0.38) 13.3 (0.33) 6.4 (0.06) 4.8 (0.05) 4.5 (0.32) 3.9 (0.2Nevada2 .......................... 1.9 (0.01) 1.9 (†) 2.1 (0.01) 1.9 (†) 1.8 (0.01) 1.9 (†) 2.8 (0.01) 3.0 (†) 0.8 (#) 0.9 (†) 0.8 (0.01) 0.8 (New Hampshire .............. 2.3 (0.55) 2.6 (0.54) 2.1 (0.49) 2.5 (0.56) 2.5 ! (0.62) 2.7 (0.54) 2.3 (0.56) 2.6 (0.58) 0.6 (0.11) 1.1 (0.19) 1.0 (0.20) 0.9 (0.1
New Jersey ..................... 6.9 (0.38) 7.0 (0.35) 6.2 (0.34) 6.1 (0.31) 7.7 (0.42) 7.9 (0.43) 8.4 (0.53) 8.4 (0.55) 3.3 (0.35) 3.5 (0.36) 3.4 (0.39) 3.5 (0.3New Mexico .................... 10.7 (0.26) 4.0 (0.14) 10.9 (0.27) 4.1 (0.15) 10.5 (0.26) 3.8 (0.14) 12.6 (0.42) 7.1 (0.31) 9.6 (0.18) 2.8 (0.11) 11.4 (0.37) 2.4 (0.1New York......................... 2.2 (0.18) 2.9 (0.13) 2.0 (0.17) 2.6 (0.12) 2.3 (0.19) 3.2 (0.15) 3.4 (0.31) 3.3 (0.23) 0.8 (0.07) 2.4 (0.09) 0.4 (0.04) 1.5 (0.0North Carolina ................ 10.9 (0.83) 10.8 (0.42) 10.3 (0.81) 10.2 (0.40) 11.6 (0.85) 11.3 (0.47) 15.7 (1.17) 15.4 (0.68) 3.9 (0.27) 4.3 (0.20) 3.0 (0.29) 3.1 (0.1North Dakota .................. 3.1 (0.30) 2.8 (0.18) 3.0 (0.30) 2.9 (0.19) 3.2 (0.32) 2.8 (0.18) 2.8 (0.23) 2.8 (0.15) 2.3 (0.05) 1.7 (0.09) 1.5 (0.23) 1.4 (0.1
Ohio ................................ 7.4 (0.40) 7.3 (0.33) 7.3 (0.40) 7.2 (0.34) 7.6 (0.40) 7.4 (0.35) 7.6 (0.48) 7.8 (0.42) 6.5 (0.37) 4.7 (0.37) 3.5 (0.26) 3.3 (0.2Oklahoma ....................... 14.0 (0.45) 13.7 (0.39) 13.1 (0.41) 13.0 (0.36) 15.0 (0.50) 14.4 (0.47) 16.6 (0.56) 16.2 (0.55) 7.7 (0.22) 7.4 (0.23) 7.0 (0.27) 6.8 (0.2Oregon............................ 7.1 (0.20) 6.9 (0.16) 7.3 (0.20) 7.2 (0.17) 6.9 (0.21) 6.6 (0.16) 8.0 (0.24) 8.0 (0.22) 3.6 (0.05) 3.5 (0.09) 1.8 (0.10) 2.0 (0.0Pennsylvania................... 4.8 (0.19) 4.5 (0.17) 4.9 (0.20) 4.5 (0.17) 4.8 (0.19) 4.5 (0.18) 5.3 (0.23) 5.0 (0.22) 2.7 (0.16) 2.4 (0.15) 1.8 (0.38) 1.7 (0.1Rhode Island .................. 1.8 (0.38) 1.4 (0.21) 1.6 (0.35) 1.2 (0.18) 2.1 (0.41) 1.6 (0.24) 2.0 (0.44) 1.5 (0.25) 1.5 (0.47) 1.2 ! (0.34) 1.2 (0.48) 1.0 (0.1
South Carolina................ 12.7 (0.98) 11.0 (0.57) 11.7 (0.89) 10.1 (0.52) 13.9 (1.07) 11.9 (0.68) 17.8 (1.29) 15.9 (0.95) 5.9 (0.70) 5.1 (0.39) 5.1 (0.93) 4.6 (0.5South Dakota .................. 2.2 (0.20) 2.7 (0.17) 2.3 (0.20) 2.8 (0.18) 2.1 (0.20) 2.5 (0.18) 2.4 (0.21) 2.9 (0.19) 1.2 (0.16) 0.9 (0.03) 0.6 (0.12) 0.7 (0.0Tennessee ...................... 3.3 (0.18) 1.7 (0.10) 3.1 (0.18) 1.7 (0.10) 3.5 (0.18) 1.7 (0.09) 2.9 (0.21) 2.0 (0.13) 4.5 (0.15) 0.7 (0.03) 1.6 (0.15) 0.6 (0.0Texas .............................. 8.0 (0.10) 7.6 (0.07) 7.5 (0.10) 7.2 (0.07) 8.5 (0.11) 8.0 (0.08) 11.2 (0.21) 10.8 (0.17) 4.9 (0.14) 4.4 (0.11) 5.6 (0.12) 5.5 (0.0Utah ................................ 4.6 (0.29) 5.0 (0.05) 4.3 (0.28) 4.6 (0.05) 5.0 (0.29) 5.5 (0.06) 4.5 (0.29) 4.9 (0.06) 5.1 (0.26) 4.6 (0.03) 4.4 (0.37) 4.1 (0.0
Vermont ......................... 0.8 (0.17) 0.8 (0.15) 0.8 (0.17) 0.9 (0.16) 0.9 (0.17) 0.8 (0.15) 0.8 (0.17) 0.8 (0.15) 0.4 ! (0.16) 0.5 ! (0.16) # (†) 1.3 ! (0.5Virginia............................ 12.1 (0.38) 12.6 (0.32) 11.5 (0.36) 12.0 (0.30) 12.8 (0.40) 13.3 (0.37) 14.9 (0.55) 15.6 (0.50) 4.6 (0.21) 5.2 (0.35) 6.7 (0.65) 7.5 (0.2Washington..................... 3.8 (0.10) 3.9 (0.13) 3.6 (0.10) 3.7 (0.12) 3.9 (0.10) 4.1 (0.16) 4.2 (0.14) 4.4 (0.19) 1.4 (0.02) 1.4 (0.02) 1.8 (0.12) 1.7 (0.0West Virginia................... 2.2 (0.19) 2.2 (0.21) 2.3 (0.20) 2.2 (0.22) 2.0 (0.18) 2.1 (0.21) 2.2 (0.19) 2.2 (0.21) 1.4 (0.17) 1.6 (0.32) 1.6 (0.37) 0.9 (0.2Wisconsin ....................... 6.8 (0.47) 6.4 (0.35) 6.4 (0.44) 6.1 (0.33) 7.3 (0.51) 6.8 (0.41) 7.8 (0.55) 7.1 (0.45) 2.0 (0.21) 3.7 (0.25) 2.4 (0.23) 3.5 (0.2Wyoming......................... 3.2 ! (1.04) 2.2 (0.35) 2.8 ! (0.90) 2.0 (0.32) 3.7 ! (1.19) 2.3 (0.39) 3.5 ! (1.14) 2.3 (0.39) 1.5 ! (0.47) 2.0 (0.19) 1.2 (0.29) 0.9 (0.1
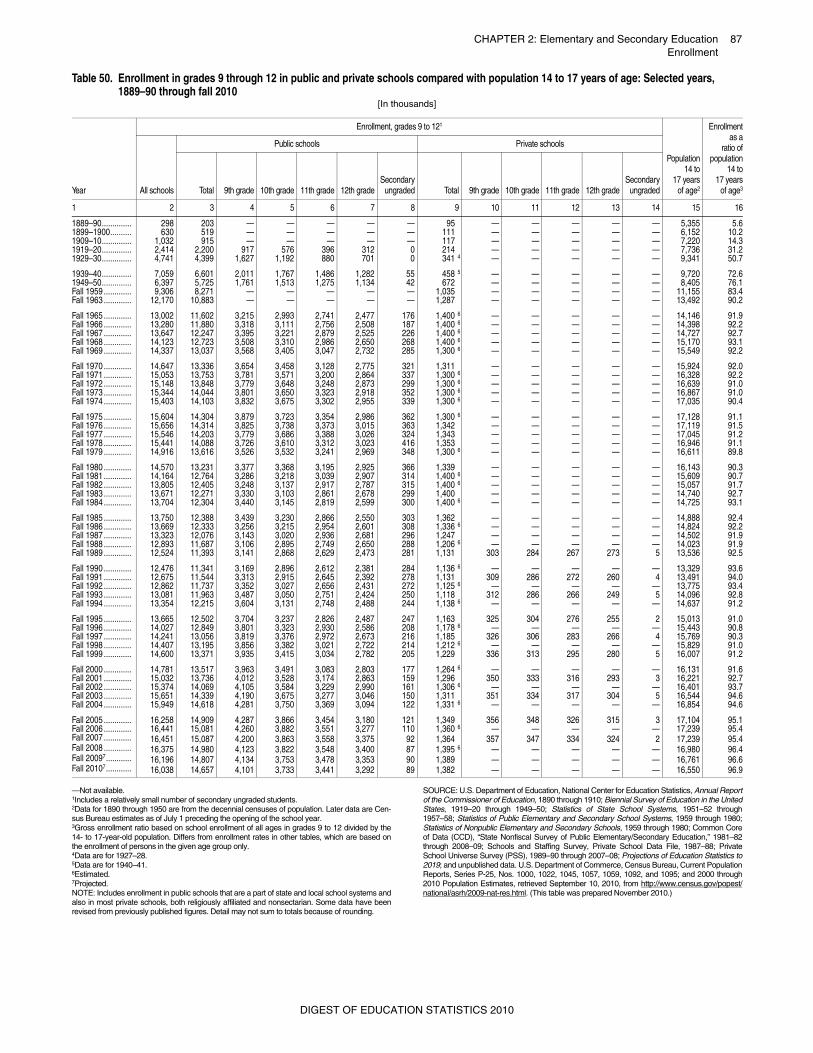
CHAPTER 2: Elementary and Secondary Education 87Enrollment
—Not available. 1Includes a relatively small number of secondary ungraded students. 2Data for 1890 through 1950 are from the decennial censuses of population. Later data are Cen-sus Bureau estimates as of July 1 preceding the opening of the school year. 3Gross enrollment ratio based on school enrollment of all ages in grades 9 to 12 divided by the14- to 17-year-old population. Differs from enrollment rates in other tables, which are based onthe enrollment of persons in the given age group only. 4Data are for 1927–28. 5Data are for 1940–41. 6Estimated. 7Projected. NOTE: Includes enrollment in public schools that are a part of state and local school systems andalso in most private schools, both religiously affiliated and nonsectarian. Some data have beenrevised from previously published figures. Detail may not sum to totals because of rounding.
SOURCE: U.S. Department of Education, National Center for Education Statistics, Annual Reportof the Commissioner of Education, 1890 through 1910; Biennial Survey of Education in the UnitedStates, 1919–20 through 1949–50; Statistics of State School Systems, 1951–52 through1957–58; Statistics of Public Elementary and Secondary School Systems, 1959 through 1980;Statistics of Nonpublic Elementary and Secondary Schools, 1959 through 1980; Common Coreof Data (CCD), “State Nonfiscal Survey of Public Elementary/Secondary Education,” 1981–82through 2008–09; Schools and Staffing Survey, Private School Data File, 1987–88; PrivateSchool Universe Survey (PSS), 1989–90 through 2007–08; Projections of Education Statistics to2019; and unpublished data. U.S. Department of Commerce, Census Bureau, Current PopulationReports, Series P-25, Nos. 1000, 1022, 1045, 1057, 1059, 1092, and 1095; and 2000 through2010 Population Estimates, retrieved September 10, 2010, from http://www.census.gov/popest/national/asrh/2009-nat-res.html. (This table was prepared November 2010.)
Table 50. Enrollment in grades 9 through 12 in public and private schools compared with population 14 to 17 years of age: Selected years, 1889–90 through fall 2010
[In thousands]
Year
Enrollment, grades 9 to 121
Population14 to
17 yearsof age2
Enrollmentas a
ratio ofpopulation
14 to17 years
of age3All schools
Public schools Private schools
Total 9th grade 10th grade 11th grade 12th gradeSecondary
ungraded Total 9th grade 10th grade 11th grade 12th gradeSecondary
ungraded
1 2 3 4 5 6 7 8 9 10 11 12 13 14 15 16
1889–90.............. 298 203 — — — — — 95 — — — — — 5,355 5.61899–1900.......... 630 519 — — — — — 111 — — — — — 6,152 10.21909–10.............. 1,032 915 — — — — — 117 — — — — — 7,220 14.31919–20.............. 2,414 2,200 917 576 396 312 0 214 — — — — — 7,736 31.21929–30.............. 4,741 4,399 1,627 1,192 880 701 0 341 4 — — — — — 9,341 50.7
1939–40.............. 7,059 6,601 2,011 1,767 1,486 1,282 55 458 5 — — — — — 9,720 72.61949–50.............. 6,397 5,725 1,761 1,513 1,275 1,134 42 672 — — — — — 8,405 76.1Fall 1959 ............. 9,306 8,271 — — — — — 1,035 — — — — — 11,155 83.4Fall 1963 ............. 12,170 10,883 — — — — — 1,287 — — — — — 13,492 90.2
Fall 1965 ............. 13,002 11,602 3,215 2,993 2,741 2,477 176 1,400 6 — — — — — 14,146 91.9Fall 1966 ............. 13,280 11,880 3,318 3,111 2,756 2,508 187 1,400 6 — — — — — 14,398 92.2Fall 1967 ............. 13,647 12,247 3,395 3,221 2,879 2,525 226 1,400 6 — — — — — 14,727 92.7Fall 1968 ............. 14,123 12,723 3,508 3,310 2,986 2,650 268 1,400 6 — — — — — 15,170 93.1Fall 1969 ............. 14,337 13,037 3,568 3,405 3,047 2,732 285 1,300 6 — — — — — 15,549 92.2
Fall 1970 ............. 14,647 13,336 3,654 3,458 3,128 2,775 321 1,311 — — — — — 15,924 92.0Fall 1971 ............. 15,053 13,753 3,781 3,571 3,200 2,864 337 1,300 6 — — — — — 16,328 92.2Fall 1972 ............. 15,148 13,848 3,779 3,648 3,248 2,873 299 1,300 6 — — — — — 16,639 91.0Fall 1973 ............. 15,344 14,044 3,801 3,650 3,323 2,918 352 1,300 6 — — — — — 16,867 91.0Fall 1974 ............. 15,403 14,103 3,832 3,675 3,302 2,955 339 1,300 6 — — — — — 17,035 90.4
Fall 1975 ............. 15,604 14,304 3,879 3,723 3,354 2,986 362 1,300 6 — — — — — 17,128 91.1Fall 1976 ............. 15,656 14,314 3,825 3,738 3,373 3,015 363 1,342 — — — — — 17,119 91.5Fall 1977 ............. 15,546 14,203 3,779 3,686 3,388 3,026 324 1,343 — — — — — 17,045 91.2Fall 1978 ............. 15,441 14,088 3,726 3,610 3,312 3,023 416 1,353 — — — — — 16,946 91.1Fall 1979 ............. 14,916 13,616 3,526 3,532 3,241 2,969 348 1,300 6 — — — — — 16,611 89.8
Fall 1980 ............. 14,570 13,231 3,377 3,368 3,195 2,925 366 1,339 — — — — — 16,143 90.3Fall 1981 ............. 14,164 12,764 3,286 3,218 3,039 2,907 314 1,400 6 — — — — — 15,609 90.7Fall 1982 ............. 13,805 12,405 3,248 3,137 2,917 2,787 315 1,400 6 — — — — — 15,057 91.7Fall 1983 ............. 13,671 12,271 3,330 3,103 2,861 2,678 299 1,400 — — — — — 14,740 92.7Fall 1984 ............. 13,704 12,304 3,440 3,145 2,819 2,599 300 1,400 6 — — — — — 14,725 93.1
Fall 1985 ............. 13,750 12,388 3,439 3,230 2,866 2,550 303 1,362 — — — — — 14,888 92.4Fall 1986 ............. 13,669 12,333 3,256 3,215 2,954 2,601 308 1,336 6 — — — — — 14,824 92.2Fall 1987 ............. 13,323 12,076 3,143 3,020 2,936 2,681 296 1,247 — — — — — 14,502 91.9Fall 1988 ............. 12,893 11,687 3,106 2,895 2,749 2,650 288 1,206 6 — — — — — 14,023 91.9Fall 1989 ............. 12,524 11,393 3,141 2,868 2,629 2,473 281 1,131 303 284 267 273 5 13,536 92.5
Fall 1990 ............. 12,476 11,341 3,169 2,896 2,612 2,381 284 1,136 6 — — — — — 13,329 93.6Fall 1991 ............. 12,675 11,544 3,313 2,915 2,645 2,392 278 1,131 309 286 272 260 4 13,491 94.0Fall 1992 ............. 12,862 11,737 3,352 3,027 2,656 2,431 272 1,125 6 — — — — — 13,775 93.4Fall 1993 ............. 13,081 11,963 3,487 3,050 2,751 2,424 250 1,118 312 286 266 249 5 14,096 92.8Fall 1994 ............. 13,354 12,215 3,604 3,131 2,748 2,488 244 1,138 6 — — — — — 14,637 91.2
Fall 1995 ............. 13,665 12,502 3,704 3,237 2,826 2,487 247 1,163 325 304 276 255 2 15,013 91.0Fall 1996 ............. 14,027 12,849 3,801 3,323 2,930 2,586 208 1,178 6 — — — — — 15,443 90.8Fall 1997 ............. 14,241 13,056 3,819 3,376 2,972 2,673 216 1,185 326 306 283 266 4 15,769 90.3Fall 1998 ............. 14,407 13,195 3,856 3,382 3,021 2,722 214 1,212 6 — — — — — 15,829 91.0Fall 1999 ............. 14,600 13,371 3,935 3,415 3,034 2,782 205 1,229 336 313 295 280 5 16,007 91.2
Fall 2000 ............. 14,781 13,517 3,963 3,491 3,083 2,803 177 1,264 6 — — — — — 16,131 91.6Fall 2001 ............. 15,032 13,736 4,012 3,528 3,174 2,863 159 1,296 350 333 316 293 3 16,221 92.7Fall 2002 ............. 15,374 14,069 4,105 3,584 3,229 2,990 161 1,306 6 — — — — — 16,401 93.7Fall 2003 ............. 15,651 14,339 4,190 3,675 3,277 3,046 150 1,311 351 334 317 304 5 16,544 94.6Fall 2004 ............. 15,949 14,618 4,281 3,750 3,369 3,094 122 1,331 6 — — — — — 16,854 94.6
Fall 2005 ............. 16,258 14,909 4,287 3,866 3,454 3,180 121 1,349 356 348 326 315 3 17,104 95.1Fall 2006 ............. 16,441 15,081 4,260 3,882 3,551 3,277 110 1,360 6 — — — — — 17,239 95.4Fall 2007 ............. 16,451 15,087 4,200 3,863 3,558 3,375 92 1,364 357 347 334 324 2 17,239 95.4Fall 2008 ............. 16,375 14,980 4,123 3,822 3,548 3,400 87 1,395 6 — — — — — 16,980 96.4Fall 20097............ 16,196 14,807 4,134 3,753 3,478 3,353 90 1,389 — — — — — 16,761 96.6Fall 20107............ 16,038 14,657 4,101 3,733 3,441 3,292 89 1,382 — — — — — 16,550 96.9
DIGEST OF EDUCATION STATISTICS 2010
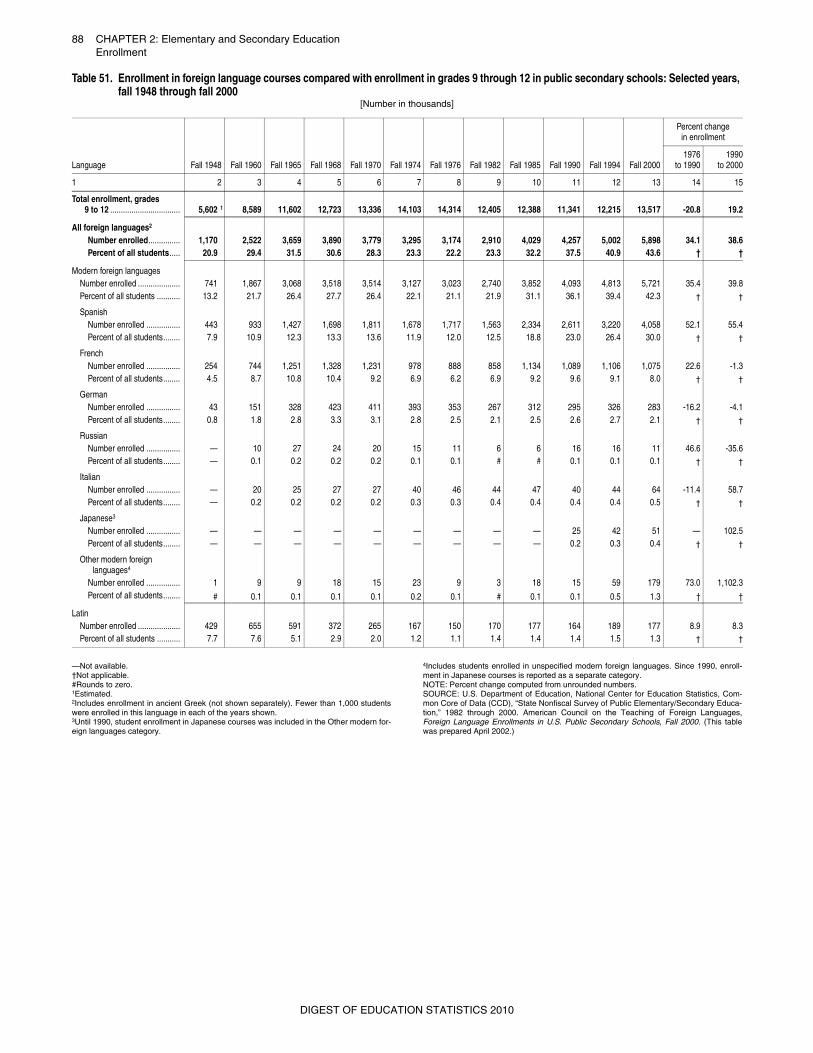
88 CHAPTER 2: Elementary and Secondary EducationEnrollment
—Not available.†Not applicable.#Rounds to zero.1Estimated.2Includes enrollment in ancient Greek (not shown separately). Fewer than 1,000 studentswere enrolled in this language in each of the years shown.3Until 1990, student enrollment in Japanese courses was included in the Other modern for-eign languages category.
4Includes students enrolled in unspecified modern foreign languages. Since 1990, enroll-ment in Japanese courses is reported as a separate category.NOTE: Percent change computed from unrounded numbers.SOURCE: U.S. Department of Education, National Center for Education Statistics, Com-mon Core of Data (CCD), “State Nonfiscal Survey of Public Elementary/Secondary Educa-tion,” 1982 through 2000. American Council on the Teaching of Foreign Languages,Foreign Language Enrollments in U.S. Public Secondary Schools, Fall 2000. (This tablewas prepared April 2002.)
Table 51. Enrollment in foreign language courses compared with enrollment in grades 9 through 12 in public secondary schools: Selected years, fall 1948 through fall 2000
[Number in thousands]
Language Fall 1948 Fall 1960 Fall 1965 Fall 1968 Fall 1970 Fall 1974 Fall 1976 Fall 1982 Fall 1985 Fall 1990 Fall 1994 Fall 2000
Percent change in enrollment
1976to 1990
1990to 2000
1 2 3 4 5 6 7 8 9 10 11 12 13 14 15
Total enrollment, grades9 to 12 ................................. 5,602 1 8,589 11,602 12,723 13,336 14,103 14,314 12,405 12,388 11,341 12,215 13,517 -20.8 19.2
All foreign languages2
Number enrolled............... 1,170 2,522 3,659 3,890 3,779 3,295 3,174 2,910 4,029 4,257 5,002 5,898 34.1 38.6Percent of all students..... 20.9 29.4 31.5 30.6 28.3 23.3 22.2 23.3 32.2 37.5 40.9 43.6 † †
Modern foreign languagesNumber enrolled .................... 741 1,867 3,068 3,518 3,514 3,127 3,023 2,740 3,852 4,093 4,813 5,721 35.4 39.8Percent of all students ........... 13.2 21.7 26.4 27.7 26.4 22.1 21.1 21.9 31.1 36.1 39.4 42.3 † †
SpanishNumber enrolled ................ 443 933 1,427 1,698 1,811 1,678 1,717 1,563 2,334 2,611 3,220 4,058 52.1 55.4Percent of all students........ 7.9 10.9 12.3 13.3 13.6 11.9 12.0 12.5 18.8 23.0 26.4 30.0 † †
FrenchNumber enrolled ................ 254 744 1,251 1,328 1,231 978 888 858 1,134 1,089 1,106 1,075 22.6 -1.3Percent of all students........ 4.5 8.7 10.8 10.4 9.2 6.9 6.2 6.9 9.2 9.6 9.1 8.0 † †
GermanNumber enrolled ................ 43 151 328 423 411 393 353 267 312 295 326 283 -16.2 -4.1Percent of all students........ 0.8 1.8 2.8 3.3 3.1 2.8 2.5 2.1 2.5 2.6 2.7 2.1 † †
RussianNumber enrolled ................ — 10 27 24 20 15 11 6 6 16 16 11 46.6 -35.6Percent of all students........ — 0.1 0.2 0.2 0.2 0.1 0.1 # # 0.1 0.1 0.1 † †
ItalianNumber enrolled ................ — 20 25 27 27 40 46 44 47 40 44 64 -11.4 58.7Percent of all students........ — 0.2 0.2 0.2 0.2 0.3 0.3 0.4 0.4 0.4 0.4 0.5 † †
Japanese3
Number enrolled ................ — — — — — — — — — 25 42 51 — 102.5Percent of all students........ — — — — — — — — — 0.2 0.3 0.4 † †
Other modern foreign languages4
Number enrolled ................ 1 9 9 18 15 23 9 3 18 15 59 179 73.0 1,102.3Percent of all students........ # 0.1 0.1 0.1 0.1 0.2 0.1 # 0.1 0.1 0.5 1.3 † †
LatinNumber enrolled .................... 429 655 591 372 265 167 150 170 177 164 189 177 8.9 8.3Percent of all students ........... 7.7 7.6 5.1 2.9 2.0 1.2 1.1 1.4 1.4 1.4 1.5 1.3 † †
DIGEST OF EDUCATION STATISTICS 2010
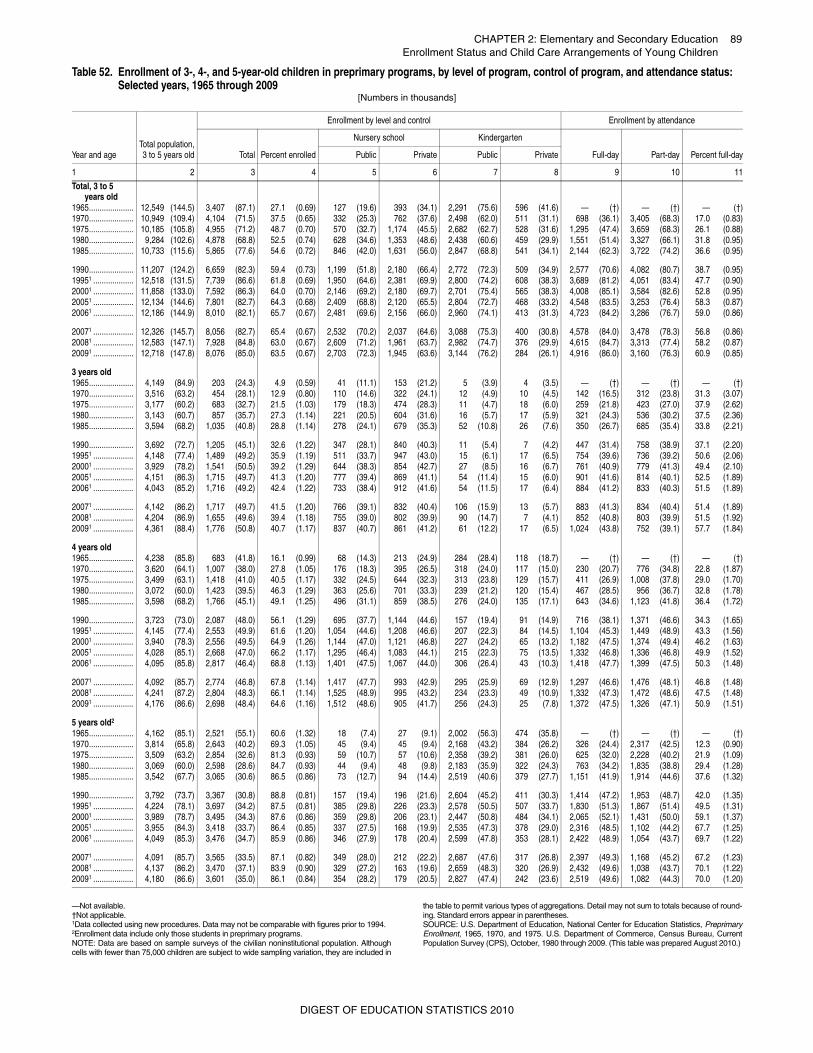
CHAPTER 2: Elementary and Secondary Education 89Enrollment Status and Child Care Arrangements of Young Children
ent Status and Child Care Arrangem
—Not available.†Not applicable. 1Data collected using new procedures. Data may not be comparable with figures prior to 1994.2Enrollment data include only those students in preprimary programs.NOTE: Data are based on sample surveys of the civilian noninstitutional population. Althoughcells with fewer than 75,000 children are subject to wide sampling variation, they are included in
the table to permit various types of aggregations. Detail may not sum to totals because of round-ing. Standard errors appear in parentheses.SOURCE: U.S. Department of Education, National Center for Education Statistics, PreprimaryEnrollment, 1965, 1970, and 1975. U.S. Department of Commerce, Census Bureau, CurrentPopulation Survey (CPS), October, 1980 through 2009. (This table was prepared August 2010.)
Enrollm Table 52. Enrollment of 3-, 4-, and 5-year-old children in preprimary programs, by level of program, control of program, and attendance status: Selected years, 1965 through 2009
[Numbers in thousands]
Year and ageTotal population,3 to 5 years old
Enrollment by level and control Enrollment by attendance
Total Percent enrolled
Nursery school Kindergarten
Full-day Part-day Percent full-dayPublic Private Public Private
1 2 3 4 5 6 7 8 9 10 11
Total, 3 to 5 years old
1965..................... 12,549 (144.5) 3,407 (87.1) 27.1 (0.69) 127 (19.6) 393 (34.1) 2,291 (75.6) 596 (41.6) — (†) — (†) — (†)1970..................... 10,949 (109.4) 4,104 (71.5) 37.5 (0.65) 332 (25.3) 762 (37.6) 2,498 (62.0) 511 (31.1) 698 (36.1) 3,405 (68.3) 17.0 (0.83)1975..................... 10,185 (105.8) 4,955 (71.2) 48.7 (0.70) 570 (32.7) 1,174 (45.5) 2,682 (62.7) 528 (31.6) 1,295 (47.4) 3,659 (68.3) 26.1 (0.88)1980..................... 9,284 (102.6) 4,878 (68.8) 52.5 (0.74) 628 (34.6) 1,353 (48.6) 2,438 (60.6) 459 (29.9) 1,551 (51.4) 3,327 (66.1) 31.8 (0.95)1985..................... 10,733 (115.6) 5,865 (77.6) 54.6 (0.72) 846 (42.0) 1,631 (56.0) 2,847 (68.8) 541 (34.1) 2,144 (62.3) 3,722 (74.2) 36.6 (0.95)
1990..................... 11,207 (124.2) 6,659 (82.3) 59.4 (0.73) 1,199 (51.8) 2,180 (66.4) 2,772 (72.3) 509 (34.9) 2,577 (70.6) 4,082 (80.7) 38.7 (0.95)19951 ................... 12,518 (131.5) 7,739 (86.6) 61.8 (0.69) 1,950 (64.6) 2,381 (69.9) 2,800 (74.2) 608 (38.3) 3,689 (81.2) 4,051 (83.4) 47.7 (0.90)20001 ................... 11,858 (133.0) 7,592 (86.3) 64.0 (0.70) 2,146 (69.2) 2,180 (69.7) 2,701 (75.4) 565 (38.3) 4,008 (85.1) 3,584 (82.6) 52.8 (0.95)20051 ................... 12,134 (144.6) 7,801 (82.7) 64.3 (0.68) 2,409 (68.8) 2,120 (65.5) 2,804 (72.7) 468 (33.2) 4,548 (83.5) 3,253 (76.4) 58.3 (0.87)20061 ................... 12,186 (144.9) 8,010 (82.1) 65.7 (0.67) 2,481 (69.6) 2,156 (66.0) 2,960 (74.1) 413 (31.3) 4,723 (84.2) 3,286 (76.7) 59.0 (0.86)
20071 ................... 12,326 (145.7) 8,056 (82.7) 65.4 (0.67) 2,532 (70.2) 2,037 (64.6) 3,088 (75.3) 400 (30.8) 4,578 (84.0) 3,478 (78.3) 56.8 (0.86)20081 ................... 12,583 (147.1) 7,928 (84.8) 63.0 (0.67) 2,609 (71.2) 1,961 (63.7) 2,982 (74.7) 376 (29.9) 4,615 (84.7) 3,313 (77.4) 58.2 (0.87)20091 ................... 12,718 (147.8) 8,076 (85.0) 63.5 (0.67) 2,703 (72.3) 1,945 (63.6) 3,144 (76.2) 284 (26.1) 4,916 (86.0) 3,160 (76.3) 60.9 (0.85)
3 years old1965..................... 4,149 (84.9) 203 (24.3) 4.9 (0.59) 41 (11.1) 153 (21.2) 5 (3.9) 4 (3.5) — (†) — (†) — (†)1970..................... 3,516 (63.2) 454 (28.1) 12.9 (0.80) 110 (14.6) 322 (24.1) 12 (4.9) 10 (4.5) 142 (16.5) 312 (23.8) 31.3 (3.07)1975..................... 3,177 (60.2) 683 (32.7) 21.5 (1.03) 179 (18.3) 474 (28.3) 11 (4.7) 18 (6.0) 259 (21.8) 423 (27.0) 37.9 (2.62)1980..................... 3,143 (60.7) 857 (35.7) 27.3 (1.14) 221 (20.5) 604 (31.6) 16 (5.7) 17 (5.9) 321 (24.3) 536 (30.2) 37.5 (2.36)1985..................... 3,594 (68.2) 1,035 (40.8) 28.8 (1.14) 278 (24.1) 679 (35.3) 52 (10.8) 26 (7.6) 350 (26.7) 685 (35.4) 33.8 (2.21)
1990..................... 3,692 (72.7) 1,205 (45.1) 32.6 (1.22) 347 (28.1) 840 (40.3) 11 (5.4) 7 (4.2) 447 (31.4) 758 (38.9) 37.1 (2.20)19951 ................... 4,148 (77.4) 1,489 (49.2) 35.9 (1.19) 511 (33.7) 947 (43.0) 15 (6.1) 17 (6.5) 754 (39.6) 736 (39.2) 50.6 (2.06)20001 ................... 3,929 (78.2) 1,541 (50.5) 39.2 (1.29) 644 (38.3) 854 (42.7) 27 (8.5) 16 (6.7) 761 (40.9) 779 (41.3) 49.4 (2.10)20051 ................... 4,151 (86.3) 1,715 (49.7) 41.3 (1.20) 777 (39.4) 869 (41.1) 54 (11.4) 15 (6.0) 901 (41.6) 814 (40.1) 52.5 (1.89)20061 ................... 4,043 (85.2) 1,716 (49.2) 42.4 (1.22) 733 (38.4) 912 (41.6) 54 (11.5) 17 (6.4) 884 (41.2) 833 (40.3) 51.5 (1.89)
20071 ................... 4,142 (86.2) 1,717 (49.7) 41.5 (1.20) 766 (39.1) 832 (40.4) 106 (15.9) 13 (5.7) 883 (41.3) 834 (40.4) 51.4 (1.89)20081 ................... 4,204 (86.9) 1,655 (49.6) 39.4 (1.18) 755 (39.0) 802 (39.9) 90 (14.7) 7 (4.1) 852 (40.8) 803 (39.9) 51.5 (1.92)20091 ................... 4,361 (88.4) 1,776 (50.8) 40.7 (1.17) 837 (40.7) 861 (41.2) 61 (12.2) 17 (6.5) 1,024 (43.8) 752 (39.1) 57.7 (1.84)
4 years old1965..................... 4,238 (85.8) 683 (41.8) 16.1 (0.99) 68 (14.3) 213 (24.9) 284 (28.4) 118 (18.7) — (†) — (†) — (†)1970..................... 3,620 (64.1) 1,007 (38.0) 27.8 (1.05) 176 (18.3) 395 (26.5) 318 (24.0) 117 (15.0) 230 (20.7) 776 (34.8) 22.8 (1.87)1975..................... 3,499 (63.1) 1,418 (41.0) 40.5 (1.17) 332 (24.5) 644 (32.3) 313 (23.8) 129 (15.7) 411 (26.9) 1,008 (37.8) 29.0 (1.70)1980..................... 3,072 (60.0) 1,423 (39.5) 46.3 (1.29) 363 (25.6) 701 (33.3) 239 (21.2) 120 (15.4) 467 (28.5) 956 (36.7) 32.8 (1.78)1985..................... 3,598 (68.2) 1,766 (45.1) 49.1 (1.25) 496 (31.1) 859 (38.5) 276 (24.0) 135 (17.1) 643 (34.6) 1,123 (41.8) 36.4 (1.72)
1990..................... 3,723 (73.0) 2,087 (48.0) 56.1 (1.29) 695 (37.7) 1,144 (44.6) 157 (19.4) 91 (14.9) 716 (38.1) 1,371 (46.6) 34.3 (1.65)19951 ................... 4,145 (77.4) 2,553 (49.9) 61.6 (1.20) 1,054 (44.6) 1,208 (46.6) 207 (22.3) 84 (14.5) 1,104 (45.3) 1,449 (48.9) 43.3 (1.56)20001 ................... 3,940 (78.3) 2,556 (49.5) 64.9 (1.26) 1,144 (47.0) 1,121 (46.8) 227 (24.2) 65 (13.2) 1,182 (47.5) 1,374 (49.4) 46.2 (1.63)20051 ................... 4,028 (85.1) 2,668 (47.0) 66.2 (1.17) 1,295 (46.4) 1,083 (44.1) 215 (22.3) 75 (13.5) 1,332 (46.8) 1,336 (46.8) 49.9 (1.52)20061 ................... 4,095 (85.8) 2,817 (46.4) 68.8 (1.13) 1,401 (47.5) 1,067 (44.0) 306 (26.4) 43 (10.3) 1,418 (47.7) 1,399 (47.5) 50.3 (1.48)
20071 ................... 4,092 (85.7) 2,774 (46.8) 67.8 (1.14) 1,417 (47.7) 993 (42.9) 295 (25.9) 69 (12.9) 1,297 (46.6) 1,476 (48.1) 46.8 (1.48)20081 ................... 4,241 (87.2) 2,804 (48.3) 66.1 (1.14) 1,525 (48.9) 995 (43.2) 234 (23.3) 49 (10.9) 1,332 (47.3) 1,472 (48.6) 47.5 (1.48)20091 ................... 4,176 (86.6) 2,698 (48.4) 64.6 (1.16) 1,512 (48.6) 905 (41.7) 256 (24.3) 25 (7.8) 1,372 (47.5) 1,326 (47.1) 50.9 (1.51)
5 years old2
1965..................... 4,162 (85.1) 2,521 (55.1) 60.6 (1.32) 18 (7.4) 27 (9.1) 2,002 (56.3) 474 (35.8) — (†) — (†) — (†)1970..................... 3,814 (65.8) 2,643 (40.2) 69.3 (1.05) 45 (9.4) 45 (9.4) 2,168 (43.2) 384 (26.2) 326 (24.4) 2,317 (42.5) 12.3 (0.90)1975..................... 3,509 (63.2) 2,854 (32.6) 81.3 (0.93) 59 (10.7) 57 (10.6) 2,358 (39.2) 381 (26.0) 625 (32.0) 2,228 (40.2) 21.9 (1.09)1980..................... 3,069 (60.0) 2,598 (28.6) 84.7 (0.93) 44 (9.4) 48 (9.8) 2,183 (35.9) 322 (24.3) 763 (34.2) 1,835 (38.8) 29.4 (1.28)1985..................... 3,542 (67.7) 3,065 (30.6) 86.5 (0.86) 73 (12.7) 94 (14.4) 2,519 (40.6) 379 (27.7) 1,151 (41.9) 1,914 (44.6) 37.6 (1.32)
1990..................... 3,792 (73.7) 3,367 (30.8) 88.8 (0.81) 157 (19.4) 196 (21.6) 2,604 (45.2) 411 (30.3) 1,414 (47.2) 1,953 (48.7) 42.0 (1.35)19951 ................... 4,224 (78.1) 3,697 (34.2) 87.5 (0.81) 385 (29.8) 226 (23.3) 2,578 (50.5) 507 (33.7) 1,830 (51.3) 1,867 (51.4) 49.5 (1.31)20001 ................... 3,989 (78.7) 3,495 (34.3) 87.6 (0.86) 359 (29.8) 206 (23.1) 2,447 (50.8) 484 (34.1) 2,065 (52.1) 1,431 (50.0) 59.1 (1.37)20051 ................... 3,955 (84.3) 3,418 (33.7) 86.4 (0.85) 337 (27.5) 168 (19.9) 2,535 (47.3) 378 (29.0) 2,316 (48.5) 1,102 (44.2) 67.7 (1.25)20061 ................... 4,049 (85.3) 3,476 (34.7) 85.9 (0.86) 346 (27.9) 178 (20.4) 2,599 (47.8) 353 (28.1) 2,422 (48.9) 1,054 (43.7) 69.7 (1.22)
20071 ................... 4,091 (85.7) 3,565 (33.5) 87.1 (0.82) 349 (28.0) 212 (22.2) 2,687 (47.6) 317 (26.8) 2,397 (49.3) 1,168 (45.2) 67.2 (1.23)20081 ................... 4,137 (86.2) 3,470 (37.1) 83.9 (0.90) 329 (27.2) 163 (19.6) 2,659 (48.3) 320 (26.9) 2,432 (49.6) 1,038 (43.7) 70.1 (1.22)20091 ................... 4,180 (86.6) 3,601 (35.0) 86.1 (0.84) 354 (28.2) 179 (20.5) 2,827 (47.4) 242 (23.6) 2,519 (49.6) 1,082 (44.3) 70.0 (1.20)
DIGEST OF EDUCATION STATISTICS 2010
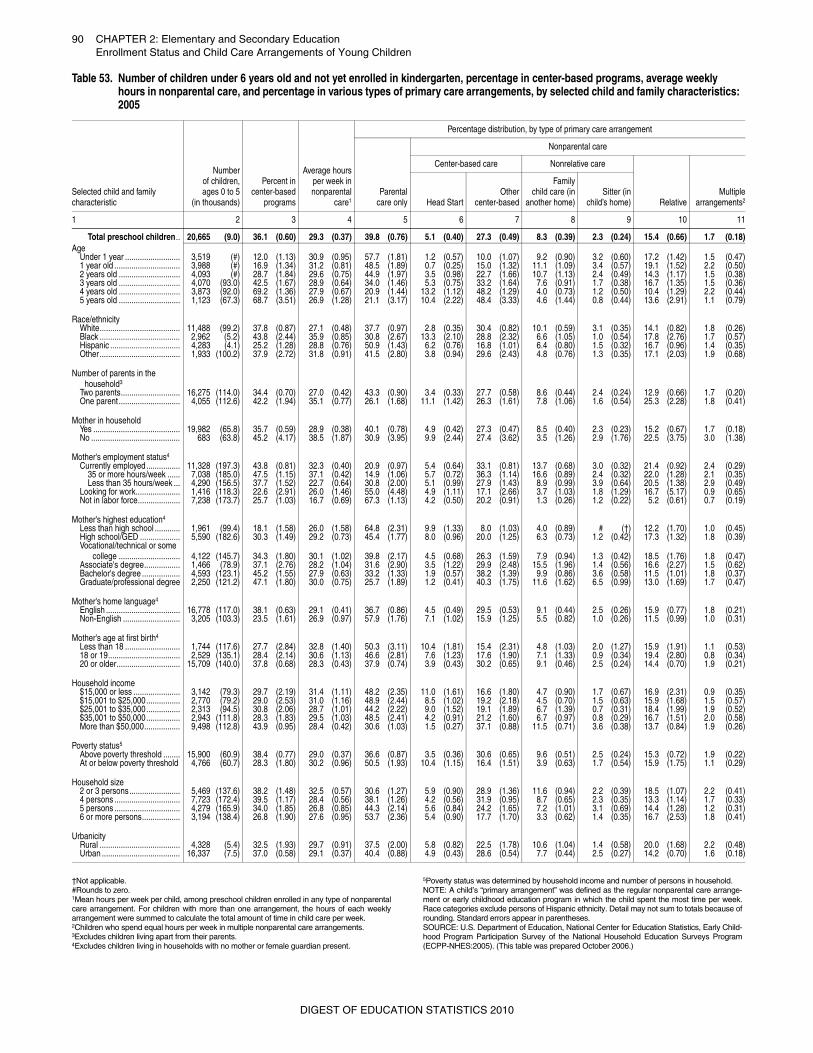
90 CHAPTER 2: Elementary and Secondary EducationEnrollment Status and Child Care Arrangements of Young Children
†Not applicable.#Rounds to zero.1Mean hours per week per child, among preschool children enrolled in any type of nonparentalcare arrangement. For children with more than one arrangement, the hours of each weeklyarrangement were summed to calculate the total amount of time in child care per week.2Children who spend equal hours per week in multiple nonparental care arrangements.3Excludes children living apart from their parents.4Excludes children living in households with no mother or female guardian present.
5Poverty status was determined by household income and number of persons in household.NOTE: A child’s “primary arrangement” was defined as the regular nonparental care arrange-ment or early childhood education program in which the child spent the most time per week.Race categories exclude persons of Hispanic ethnicity. Detail may not sum to totals because ofrounding. Standard errors appear in parentheses.SOURCE: U.S. Department of Education, National Center for Education Statistics, Early Child-hood Program Participation Survey of the National Household Education Surveys Program(ECPP-NHES:2005). (This table was prepared October 2006.)
Table 53. Number of children under 6 years old and not yet enrolled in kindergarten, percentage in center-based programs, average weekly hours in nonparental care, and percentage in various types of primary care arrangements, by selected child and family characteristics: 2005
Selected child and family characteristic
Numberof children,ages 0 to 5
(in thousands)
Percent incenter-based
programs
Average hoursper week innonparental
care1
Percentage distribution, by type of primary care arrangement
Parentalcare only
Nonparental care
Center-based care Nonrelative care
RelativeMultiple
arrangements2Head StartOther
center-based
Familychild care (in
another home)Sitter (in
child’s home)
1 2 3 4 5 6 7 8 9 10 11
Total preschool children.. 20,665 (9.0) 36.1 (0.60) 29.3 (0.37) 39.8 (0.76) 5.1 (0.40) 27.3 (0.49) 8.3 (0.39) 2.3 (0.24) 15.4 (0.66) 1.7 (0.18)Age
Under 1 year .......................... 3,519 (#) 12.0 (1.13) 30.9 (0.95) 57.7 (1.81) 1.2 (0.57) 10.0 (1.07) 9.2 (0.90) 3.2 (0.60) 17.2 (1.42) 1.5 (0.47)1 year old ............................... 3,988 (#) 16.9 (1.34) 31.2 (0.81) 48.5 (1.89) 0.7 (0.25) 15.0 (1.32) 11.1 (1.09) 3.4 (0.57) 19.1 (1.52) 2.2 (0.50)2 years old ............................. 4,093 (#) 28.7 (1.84) 29.6 (0.75) 44.9 (1.97) 3.5 (0.98) 22.7 (1.66) 10.7 (1.13) 2.4 (0.49) 14.3 (1.17) 1.5 (0.38)3 years old ............................. 4,070 (93.0) 42.5 (1.67) 28.9 (0.64) 34.0 (1.46) 5.3 (0.75) 33.2 (1.64) 7.6 (0.91) 1.7 (0.38) 16.7 (1.35) 1.5 (0.36)4 years old ............................. 3,873 (92.0) 69.2 (1.36) 27.9 (0.67) 20.9 (1.44) 13.2 (1.12) 48.2 (1.29) 4.0 (0.73) 1.2 (0.50) 10.4 (1.29) 2.2 (0.44)5 years old ............................. 1,123 (67.3) 68.7 (3.51) 26.9 (1.28) 21.1 (3.17) 10.4 (2.22) 48.4 (3.33) 4.6 (1.44) 0.8 (0.44) 13.6 (2.91) 1.1 (0.79)
Race/ethnicityWhite...................................... 11,488 (99.2) 37.8 (0.87) 27.1 (0.48) 37.7 (0.97) 2.8 (0.35) 30.4 (0.82) 10.1 (0.59) 3.1 (0.35) 14.1 (0.82) 1.8 (0.26)Black ...................................... 2,962 (5.2) 43.8 (2.44) 35.9 (0.85) 30.8 (2.67) 13.3 (2.10) 28.8 (2.32) 6.6 (1.05) 1.0 (0.54) 17.8 (2.76) 1.7 (0.57)Hispanic ................................. 4,283 (4.1) 25.2 (1.28) 28.8 (0.76) 50.9 (1.43) 6.2 (0.76) 16.8 (1.01) 6.4 (0.80) 1.5 (0.32) 16.7 (0.96) 1.4 (0.35)Other...................................... 1,933 (100.2) 37.9 (2.72) 31.8 (0.91) 41.5 (2.80) 3.8 (0.94) 29.6 (2.43) 4.8 (0.76) 1.3 (0.35) 17.1 (2.03) 1.9 (0.68)
Number of parents in the household3
Two parents............................ 16,275 (114.0) 34.4 (0.70) 27.0 (0.42) 43.3 (0.90) 3.4 (0.33) 27.7 (0.58) 8.6 (0.44) 2.4 (0.24) 12.9 (0.66) 1.7 (0.20)One parent............................. 4,055 (112.6) 42.2 (1.94) 35.1 (0.77) 26.1 (1.68) 11.1 (1.42) 26.3 (1.61) 7.8 (1.06) 1.6 (0.54) 25.3 (2.28) 1.8 (0.41)
Mother in householdYes ......................................... 19,982 (65.8) 35.7 (0.59) 28.9 (0.38) 40.1 (0.78) 4.9 (0.42) 27.3 (0.47) 8.5 (0.40) 2.3 (0.23) 15.2 (0.67) 1.7 (0.18)No .......................................... 683 (63.8) 45.2 (4.17) 38.5 (1.87) 30.9 (3.95) 9.9 (2.44) 27.4 (3.62) 3.5 (1.26) 2.9 (1.76) 22.5 (3.75) 3.0 (1.38)
Mother's employment status4
Currently employed................ 11,328 (197.3) 43.8 (0.81) 32.3 (0.40) 20.9 (0.97) 5.4 (0.64) 33.1 (0.81) 13.7 (0.68) 3.0 (0.32) 21.4 (0.92) 2.4 (0.29)35 or more hours/week ...... 7,038 (185.0) 47.5 (1.15) 37.1 (0.42) 14.9 (1.06) 5.7 (0.72) 36.3 (1.14) 16.6 (0.89) 2.4 (0.32) 22.0 (1.28) 2.1 (0.35)Less than 35 hours/week ... 4,290 (156.5) 37.7 (1.52) 22.7 (0.64) 30.8 (2.00) 5.1 (0.99) 27.9 (1.43) 8.9 (0.99) 3.9 (0.64) 20.5 (1.38) 2.9 (0.49)
Looking for work..................... 1,416 (118.3) 22.6 (2.91) 26.0 (1.46) 55.0 (4.48) 4.9 (1.11) 17.1 (2.66) 3.7 (1.03) 1.8 (1.29) 16.7 (5.17) 0.9 (0.65)Not in labor force.................... 7,238 (173.7) 25.7 (1.03) 16.7 (0.69) 67.3 (1.13) 4.2 (0.50) 20.2 (0.91) 1.3 (0.26) 1.2 (0.22) 5.2 (0.61) 0.7 (0.19)
Mother's highest education4
Less than high school ............ 1,961 (99.4) 18.1 (1.58) 26.0 (1.58) 64.8 (2.31) 9.9 (1.33) 8.0 (1.03) 4.0 (0.89) # (†) 12.2 (1.70) 1.0 (0.45)High school/GED ................... 5,590 (182.6) 30.3 (1.49) 29.2 (0.73) 45.4 (1.77) 8.0 (0.96) 20.0 (1.25) 6.3 (0.73) 1.2 (0.42) 17.3 (1.32) 1.8 (0.39)Vocational/technical or some
college ............................. 4,122 (145.7) 34.3 (1.80) 30.1 (1.02) 39.8 (2.17) 4.5 (0.68) 26.3 (1.59) 7.9 (0.94) 1.3 (0.42) 18.5 (1.76) 1.8 (0.47)Associate's degree................. 1,466 (78.9) 37.1 (2.76) 28.2 (1.04) 31.6 (2.90) 3.5 (1.22) 29.9 (2.48) 15.5 (1.96) 1.4 (0.56) 16.6 (2.27) 1.5 (0.62)Bachelor's degree .................. 4,593 (123.1) 45.2 (1.55) 27.9 (0.63) 33.2 (1.33) 1.9 (0.57) 38.2 (1.39) 9.9 (0.86) 3.6 (0.58) 11.5 (1.01) 1.8 (0.37)Graduate/professional degree 2,250 (121.2) 47.1 (1.80) 30.0 (0.75) 25.7 (1.89) 1.2 (0.41) 40.3 (1.75) 11.6 (1.62) 6.5 (0.99) 13.0 (1.69) 1.7 (0.47)
Mother's home language4
English ................................... 16,778 (117.0) 38.1 (0.63) 29.1 (0.41) 36.7 (0.86) 4.5 (0.49) 29.5 (0.53) 9.1 (0.44) 2.5 (0.26) 15.9 (0.77) 1.8 (0.21)Non-English ........................... 3,205 (103.3) 23.5 (1.61) 26.9 (0.97) 57.9 (1.76) 7.1 (1.02) 15.9 (1.25) 5.5 (0.82) 1.0 (0.26) 11.5 (0.99) 1.0 (0.31)
Mother's age at first birth4
Less than 18 .......................... 1,744 (117.6) 27.7 (2.84) 32.8 (1.40) 50.3 (3.11) 10.4 (1.81) 15.4 (2.31) 4.8 (1.03) 2.0 (1.27) 15.9 (1.91) 1.1 (0.53)18 or 19.................................. 2,529 (135.1) 28.4 (2.14) 30.6 (1.13) 46.6 (2.81) 7.6 (1.23) 17.6 (1.90) 7.1 (1.33) 0.9 (0.34) 19.4 (2.80) 0.8 (0.34)20 or older.............................. 15,709 (140.0) 37.8 (0.68) 28.3 (0.43) 37.9 (0.74) 3.9 (0.43) 30.2 (0.65) 9.1 (0.46) 2.5 (0.24) 14.4 (0.70) 1.9 (0.21)
Household income$15,000 or less ...................... 3,142 (79.3) 29.7 (2.19) 31.4 (1.11) 48.2 (2.35) 11.0 (1.61) 16.6 (1.80) 4.7 (0.90) 1.7 (0.67) 16.9 (2.31) 0.9 (0.35)$15,001 to $25,000................ 2,770 (79.2) 29.0 (2.53) 31.0 (1.16) 48.9 (2.44) 8.5 (1.02) 19.2 (2.18) 4.5 (0.70) 1.5 (0.63) 15.9 (1.68) 1.5 (0.57)$25,001 to $35,000................ 2,313 (94.5) 30.8 (2.06) 28.7 (1.01) 44.2 (2.22) 9.0 (1.52) 19.1 (1.89) 6.7 (1.39) 0.7 (0.31) 18.4 (1.99) 1.9 (0.52)$35,001 to $50,000................ 2,943 (111.8) 28.3 (1.83) 29.5 (1.03) 48.5 (2.41) 4.2 (0.91) 21.2 (1.60) 6.7 (0.97) 0.8 (0.29) 16.7 (1.51) 2.0 (0.58)More than $50,000................. 9,498 (112.8) 43.9 (0.95) 28.4 (0.42) 30.6 (1.03) 1.5 (0.27) 37.1 (0.88) 11.5 (0.71) 3.6 (0.38) 13.7 (0.84) 1.9 (0.26)
Poverty status5
Above poverty threshold ........ 15,900 (60.9) 38.4 (0.77) 29.0 (0.37) 36.6 (0.87) 3.5 (0.36) 30.6 (0.65) 9.6 (0.51) 2.5 (0.24) 15.3 (0.72) 1.9 (0.22)At or below poverty threshold 4,766 (60.7) 28.3 (1.80) 30.2 (0.96) 50.5 (1.93) 10.4 (1.15) 16.4 (1.51) 3.9 (0.63) 1.7 (0.54) 15.9 (1.75) 1.1 (0.29)
Household size2 or 3 persons........................ 5,469 (137.6) 38.2 (1.48) 32.5 (0.57) 30.6 (1.27) 5.9 (0.90) 28.9 (1.36) 11.6 (0.94) 2.2 (0.39) 18.5 (1.07) 2.2 (0.41)4 persons ............................... 7,723 (172.4) 39.5 (1.17) 28.4 (0.56) 38.1 (1.26) 4.2 (0.56) 31.9 (0.95) 8.7 (0.65) 2.3 (0.35) 13.3 (1.14) 1.7 (0.33)5 persons ............................... 4,279 (165.9) 34.0 (1.85) 26.8 (0.85) 44.3 (2.14) 5.6 (0.84) 24.2 (1.65) 7.2 (1.01) 3.1 (0.69) 14.4 (1.28) 1.2 (0.31)6 or more persons.................. 3,194 (138.4) 26.8 (1.90) 27.6 (0.95) 53.7 (2.36) 5.4 (0.90) 17.7 (1.70) 3.3 (0.62) 1.4 (0.35) 16.7 (2.53) 1.8 (0.41)
UrbanicityRural ...................................... 4,328 (5.4) 32.5 (1.93) 29.7 (0.91) 37.5 (2.00) 5.8 (0.82) 22.5 (1.78) 10.6 (1.04) 1.4 (0.58) 20.0 (1.68) 2.2 (0.48)Urban ..................................... 16,337 (7.5) 37.0 (0.58) 29.1 (0.37) 40.4 (0.88) 4.9 (0.43) 28.6 (0.54) 7.7 (0.44) 2.5 (0.27) 14.2 (0.70) 1.6 (0.18)
DIGEST OF EDUCATION STATISTICS 2010
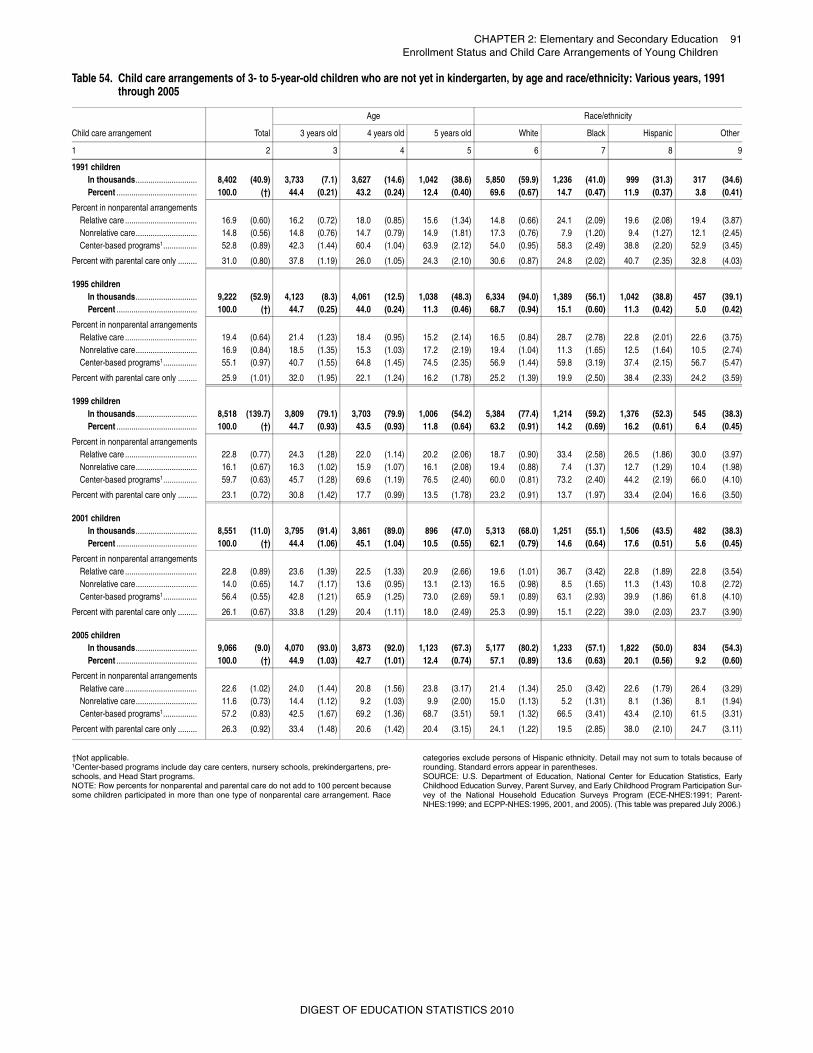
CHAPTER 2: Elementary and Secondary Education 91Enrollment Status and Child Care Arrangements of Young Children
†Not applicable.1Center-based programs include day care centers, nursery schools, prekindergartens, pre-schools, and Head Start programs.NOTE: Row percents for nonparental and parental care do not add to 100 percent becausesome children participated in more than one type of nonparental care arrangement. Race
categories exclude persons of Hispanic ethnicity. Detail may not sum to totals because ofrounding. Standard errors appear in parentheses.SOURCE: U.S. Department of Education, National Center for Education Statistics, EarlyChildhood Education Survey, Parent Survey, and Early Childhood Program Participation Sur-vey of the National Household Education Surveys Program (ECE-NHES:1991; Parent-NHES:1999; and ECPP-NHES:1995, 2001, and 2005). (This table was prepared July 2006.)
Table 54. Child care arrangements of 3- to 5-year-old children who are not yet in kindergarten, by age and race/ethnicity: Various years, 1991 through 2005
Child care arrangement Total
Age Race/ethnicity
3 years old 4 years old 5 years old White Black Hispanic Other
1 2 3 4 5 6 7 8 9
1991 childrenIn thousands............................. 8,402 (40.9) 3,733 (7.1) 3,627 (14.6) 1,042 (38.6) 5,850 (59.9) 1,236 (41.0) 999 (31.3) 317 (34.6)Percent ...................................... 100.0 (†) 44.4 (0.21) 43.2 (0.24) 12.4 (0.40) 69.6 (0.67) 14.7 (0.47) 11.9 (0.37) 3.8 (0.41)
Percent in nonparental arrangementsRelative care .................................. 16.9 (0.60) 16.2 (0.72) 18.0 (0.85) 15.6 (1.34) 14.8 (0.66) 24.1 (2.09) 19.6 (2.08) 19.4 (3.87)Nonrelative care............................. 14.8 (0.56) 14.8 (0.76) 14.7 (0.79) 14.9 (1.81) 17.3 (0.76) 7.9 (1.20) 9.4 (1.27) 12.1 (2.45)Center-based programs1................ 52.8 (0.89) 42.3 (1.44) 60.4 (1.04) 63.9 (2.12) 54.0 (0.95) 58.3 (2.49) 38.8 (2.20) 52.9 (3.45)
Percent with parental care only ......... 31.0 (0.80) 37.8 (1.19) 26.0 (1.05) 24.3 (2.10) 30.6 (0.87) 24.8 (2.02) 40.7 (2.35) 32.8 (4.03)
1995 childrenIn thousands............................. 9,222 (52.9) 4,123 (8.3) 4,061 (12.5) 1,038 (48.3) 6,334 (94.0) 1,389 (56.1) 1,042 (38.8) 457 (39.1)Percent ...................................... 100.0 (†) 44.7 (0.25) 44.0 (0.24) 11.3 (0.46) 68.7 (0.94) 15.1 (0.60) 11.3 (0.42) 5.0 (0.42)
Percent in nonparental arrangementsRelative care .................................. 19.4 (0.64) 21.4 (1.23) 18.4 (0.95) 15.2 (2.14) 16.5 (0.84) 28.7 (2.78) 22.8 (2.01) 22.6 (3.75)Nonrelative care............................. 16.9 (0.84) 18.5 (1.35) 15.3 (1.03) 17.2 (2.19) 19.4 (1.04) 11.3 (1.65) 12.5 (1.64) 10.5 (2.74)Center-based programs1................ 55.1 (0.97) 40.7 (1.55) 64.8 (1.45) 74.5 (2.35) 56.9 (1.44) 59.8 (3.19) 37.4 (2.15) 56.7 (5.47)
Percent with parental care only ......... 25.9 (1.01) 32.0 (1.95) 22.1 (1.24) 16.2 (1.78) 25.2 (1.39) 19.9 (2.50) 38.4 (2.33) 24.2 (3.59)
1999 childrenIn thousands............................. 8,518 (139.7) 3,809 (79.1) 3,703 (79.9) 1,006 (54.2) 5,384 (77.4) 1,214 (59.2) 1,376 (52.3) 545 (38.3)Percent ...................................... 100.0 (†) 44.7 (0.93) 43.5 (0.93) 11.8 (0.64) 63.2 (0.91) 14.2 (0.69) 16.2 (0.61) 6.4 (0.45)
Percent in nonparental arrangementsRelative care .................................. 22.8 (0.77) 24.3 (1.28) 22.0 (1.14) 20.2 (2.06) 18.7 (0.90) 33.4 (2.58) 26.5 (1.86) 30.0 (3.97)Nonrelative care............................. 16.1 (0.67) 16.3 (1.02) 15.9 (1.07) 16.1 (2.08) 19.4 (0.88) 7.4 (1.37) 12.7 (1.29) 10.4 (1.98)Center-based programs1................ 59.7 (0.63) 45.7 (1.28) 69.6 (1.19) 76.5 (2.40) 60.0 (0.81) 73.2 (2.40) 44.2 (2.19) 66.0 (4.10)
Percent with parental care only ......... 23.1 (0.72) 30.8 (1.42) 17.7 (0.99) 13.5 (1.78) 23.2 (0.91) 13.7 (1.97) 33.4 (2.04) 16.6 (3.50)
2001 childrenIn thousands............................. 8,551 (11.0) 3,795 (91.4) 3,861 (89.0) 896 (47.0) 5,313 (68.0) 1,251 (55.1) 1,506 (43.5) 482 (38.3)Percent ...................................... 100.0 (†) 44.4 (1.06) 45.1 (1.04) 10.5 (0.55) 62.1 (0.79) 14.6 (0.64) 17.6 (0.51) 5.6 (0.45)
Percent in nonparental arrangementsRelative care .................................. 22.8 (0.89) 23.6 (1.39) 22.5 (1.33) 20.9 (2.66) 19.6 (1.01) 36.7 (3.42) 22.8 (1.89) 22.8 (3.54)Nonrelative care............................. 14.0 (0.65) 14.7 (1.17) 13.6 (0.95) 13.1 (2.13) 16.5 (0.98) 8.5 (1.65) 11.3 (1.43) 10.8 (2.72)Center-based programs1................ 56.4 (0.55) 42.8 (1.21) 65.9 (1.25) 73.0 (2.69) 59.1 (0.89) 63.1 (2.93) 39.9 (1.86) 61.8 (4.10)
Percent with parental care only ......... 26.1 (0.67) 33.8 (1.29) 20.4 (1.11) 18.0 (2.49) 25.3 (0.99) 15.1 (2.22) 39.0 (2.03) 23.7 (3.90)
2005 childrenIn thousands............................. 9,066 (9.0) 4,070 (93.0) 3,873 (92.0) 1,123 (67.3) 5,177 (80.2) 1,233 (57.1) 1,822 (50.0) 834 (54.3)Percent ...................................... 100.0 (†) 44.9 (1.03) 42.7 (1.01) 12.4 (0.74) 57.1 (0.89) 13.6 (0.63) 20.1 (0.56) 9.2 (0.60)
Percent in nonparental arrangementsRelative care .................................. 22.6 (1.02) 24.0 (1.44) 20.8 (1.56) 23.8 (3.17) 21.4 (1.34) 25.0 (3.42) 22.6 (1.79) 26.4 (3.29)Nonrelative care............................. 11.6 (0.73) 14.4 (1.12) 9.2 (1.03) 9.9 (2.00) 15.0 (1.13) 5.2 (1.31) 8.1 (1.36) 8.1 (1.94)Center-based programs1................ 57.2 (0.83) 42.5 (1.67) 69.2 (1.36) 68.7 (3.51) 59.1 (1.32) 66.5 (3.41) 43.4 (2.10) 61.5 (3.31)
Percent with parental care only ......... 26.3 (0.92) 33.4 (1.48) 20.6 (1.42) 20.4 (3.15) 24.1 (1.22) 19.5 (2.85) 38.0 (2.10) 24.7 (3.11)
DIGEST OF EDUCATION STATISTICS 2010
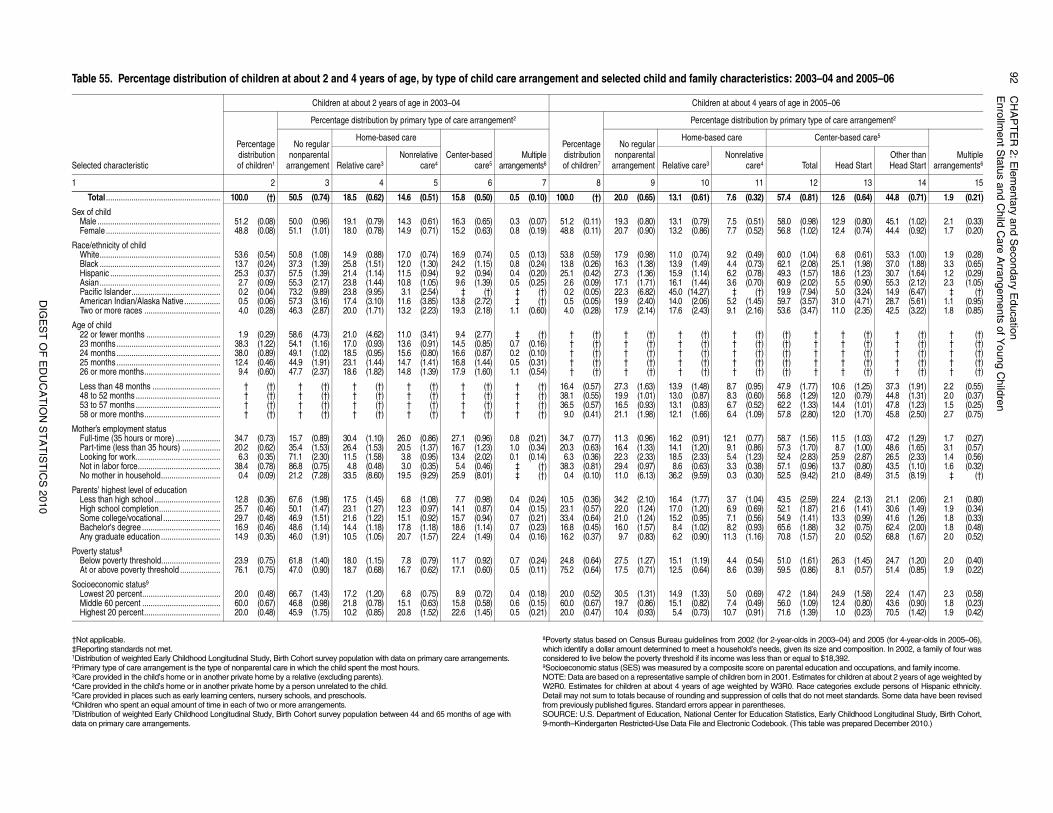
92
CH
AP
TE
R 2
: Ele
me
nta
ry an
d S
eco
nd
ary E
du
catio
nE
nro
llme
nt S
tatu
s an
d C
hild
Ca
re A
rran
ge
me
nts o
f Yo
un
g C
hild
ren
DIG
ES
T O
F E
DU
CA
TIO
N S
TA
TIS
TIC
S 2
01
0
(for 2-year-olds in 2003–04) and 2005 (for 4-year-olds in 2005–06), needs, given its size and composition. In 2002, a family of four wasss than or equal to $18,392.re on parental education and occupations, and family income.rn in 2001. Estimates for children at about 2 years of age weighted by by W3R0. Race categories exclude persons of Hispanic ethnicity.n of cells that do not meet standards. Some data have been revisedntheses.
ducation Statistics, Early Childhood Longitudinal Study, Birth Cohort,odebook. (This table was prepared December 2010.)
eristics: 2003–04 and 2005–06
years of age in 2005–06
tion by primary type of care arrangement2
Center-based care5
Multiplearrangements6
vee4 Total Head Start
Other thanHead Start
11 12 13 14 15
2) 57.4 (0.81) 12.6 (0.64) 44.8 (0.71) 1.9 (0.21)
1) 58.0 (0.98) 12.9 (0.80) 45.1 (1.02) 2.1 (0.33)2) 56.8 (1.02) 12.4 (0.74) 44.4 (0.92) 1.7 (0.20)
9) 60.0 (1.04) 6.8 (0.61) 53.3 (1.00) 1.9 (0.28)3) 62.1 (2.08) 25.1 (1.98) 37.0 (1.88) 3.3 (0.65)8) 49.3 (1.57) 18.6 (1.23) 30.7 (1.64) 1.2 (0.29)0) 60.9 (2.02) 5.5 (0.90) 55.3 (2.12) 2.3 (1.05)(†) 19.9 (7.94) 5.0 (3.24) 14.9 (6.47) ‡ (†)5) 59.7 (3.57) 31.0 (4.71) 28.7 (5.61) 1.1 (0.95)6) 53.6 (3.47) 11.0 (2.35) 42.5 (3.22) 1.8 (0.85)
(†) (†) † † (†) † (†) † (†)(†) (†) † † (†) † (†) † (†)(†) (†) † † (†) † (†) † (†)(†) (†) † † (†) † (†) † (†)(†) (†) † † (†) † (†) † (†)
5) 47.9 (1.77) 10.6 (1.25) 37.3 (1.91) 2.2 (0.55)0) 56.8 (1.29) 12.0 (0.79) 44.8 (1.31) 2.0 (0.37)2) 62.2 (1.33) 14.4 (1.01) 47.8 (1.23) 1.5 (0.25)9) 57.8 (2.80) 12.0 (1.70) 45.8 (2.50) 2.7 (0.75)
7) 58.7 (1.56) 11.5 (1.03) 47.2 (1.29) 1.7 (0.27)6) 57.3 (1.70) 8.7 (1.00) 48.6 (1.65) 3.1 (0.57)3) 52.4 (2.83) 25.9 (2.87) 26.5 (2.33) 1.4 (0.56)8) 57.1 (0.96) 13.7 (0.80) 43.5 (1.10) 1.6 (0.32)0) 52.5 (9.42) 21.0 (8.49) 31.5 (8.19) ‡ (†)
4) 43.5 (2.59) 22.4 (2.13) 21.1 (2.06) 2.1 (0.80)9) 52.1 (1.87) 21.6 (1.41) 30.6 (1.49) 1.9 (0.34)6) 54.9 (1.41) 13.3 (0.99) 41.6 (1.26) 1.8 (0.33)3) 65.6 (1.88) 3.2 (0.75) 62.4 (2.00) 1.8 (0.48)6) 70.8 (1.57) 2.0 (0.52) 68.8 (1.67) 2.0 (0.52)
4) 51.0 (1.61) 26.3 (1.45) 24.7 (1.20) 2.0 (0.40)9) 59.5 (0.86) 8.1 (0.57) 51.4 (0.85) 1.9 (0.22)
9) 47.2 (1.84) 24.9 (1.58) 22.4 (1.47) 2.3 (0.58)9) 56.0 (1.09) 12.4 (0.80) 43.6 (0.90) 1.8 (0.23)1) 71.6 (1.39) 1.0 (0.23) 70.5 (1.42) 1.9 (0.42)
†Not applicable.‡Reporting standards not met.1Distribution of weighted Early Childhood Longitudinal Study, Birth Cohort survey population with data on primary care arrangements.2Primary type of care arrangement is the type of nonparental care in which the child spent the most hours.3Care provided in the child’s home or in another private home by a relative (excluding parents).4Care provided in the child’s home or in another private home by a person unrelated to the child.5Care provided in places such as early learning centers, nursery schools, and preschools.6Children who spent an equal amount of time in each of two or more arrangements.7Distribution of weighted Early Childhood Longitudinal Study, Birth Cohort survey population between 44 and 65 months of age withdata on primary care arrangements.
8Poverty status based on Census Bureau guidelines from 2002which identify a dollar amount determined to meet a household’sconsidered to live below the poverty threshold if its income was le9Socioeconomic status (SES) was measured by a composite scoNOTE: Data are based on a representative sample of children boW2R0. Estimates for children at about 4 years of age weightedDetail may not sum to totals because of rounding and suppressiofrom previously published figures. Standard errors appear in pareSOURCE: U.S. Department of Education, National Center for E9-month–Kindergarten Restricted-Use Data File and Electronic C
Table 55. Percentage distribution of children at about 2 and 4 years of age, by type of child care arrangement and selected child and family charact
Selected characteristic
Children at about 2 years of age in 2003–04 Children at about 4
Percentagedistributionof children1
Percentage distribution by primary type of care arrangement2
Percentagedistributionof children7
Percentage distribu
No regularnonparental
arrangement
Home-based care
Center-basedcare5
Multiplearrangements6
No regularnonparental
arrangement
Home-based care
Relative care3Nonrelative
care4 Relative care3Nonrelati
car
1 2 3 4 5 6 7 8 9 10
Total ...................................................... 100.0 (†) 50.5 (0.74) 18.5 (0.62) 14.6 (0.51) 15.8 (0.50) 0.5 (0.10) 100.0 (†) 20.0 (0.65) 13.1 (0.61) 7.6 (0.3
Sex of childMale .......................................................... 51.2 (0.08) 50.0 (0.96) 19.1 (0.79) 14.3 (0.61) 16.3 (0.65) 0.3 (0.07) 51.2 (0.11) 19.3 (0.80) 13.1 (0.79) 7.5 (0.5Female ...................................................... 48.8 (0.08) 51.1 (1.01) 18.0 (0.78) 14.9 (0.71) 15.2 (0.63) 0.8 (0.19) 48.8 (0.11) 20.7 (0.90) 13.2 (0.86) 7.7 (0.5
Race/ethnicity of childWhite......................................................... 53.6 (0.54) 50.8 (1.08) 14.9 (0.88) 17.0 (0.74) 16.9 (0.74) 0.5 (0.13) 53.8 (0.59) 17.9 (0.98) 11.0 (0.74) 9.2 (0.4Black ......................................................... 13.7 (0.24) 37.3 (1.39) 25.8 (1.51) 12.0 (1.30) 24.2 (1.15) 0.8 (0.24) 13.8 (0.26) 16.3 (1.38) 13.9 (1.49) 4.4 (0.7Hispanic .................................................... 25.3 (0.37) 57.5 (1.39) 21.4 (1.14) 11.5 (0.94) 9.2 (0.94) 0.4 (0.20) 25.1 (0.42) 27.3 (1.36) 15.9 (1.14) 6.2 (0.7Asian......................................................... 2.7 (0.09) 55.3 (2.17) 23.8 (1.44) 10.8 (1.05) 9.6 (1.39) 0.5 (0.25) 2.6 (0.09) 17.1 (1.71) 16.1 (1.44) 3.6 (0.7Pacific Islander.......................................... 0.2 (0.04) 73.2 (9.89) 23.8 (9.95) 3.1 (2.54) ‡ (†) ‡ (†) 0.2 (0.05) 22.3 (6.82) 45.0 (14.27) ‡American Indian/Alaska Native ................. 0.5 (0.06) 57.3 (3.16) 17.4 (3.10) 11.6 (3.85) 13.8 (2.72) ‡ (†) 0.5 (0.05) 19.9 (2.40) 14.0 (2.06) 5.2 (1.4Two or more races .................................... 4.0 (0.28) 46.3 (2.87) 20.0 (1.71) 13.2 (2.23) 19.3 (2.18) 1.1 (0.60) 4.0 (0.28) 17.9 (2.14) 17.6 (2.43) 9.1 (2.1
Age of child22 or fewer months ................................... 1.9 (0.29) 58.6 (4.73) 21.0 (4.62) 11.0 (3.41) 9.4 (2.77) ‡ (†) † (†) † (†) † (†) †23 months ................................................. 38.3 (1.22) 54.1 (1.16) 17.0 (0.93) 13.6 (0.91) 14.5 (0.85) 0.7 (0.16) † (†) † (†) † (†) †24 months ................................................. 38.0 (0.89) 49.1 (1.02) 18.5 (0.95) 15.6 (0.80) 16.6 (0.87) 0.2 (0.10) † (†) † (†) † (†) †25 months ................................................. 12.4 (0.46) 44.9 (1.91) 23.1 (1.44) 14.7 (1.41) 16.8 (1.44) 0.5 (0.31) † (†) † (†) † (†) †26 or more months.................................... 9.4 (0.60) 47.7 (2.37) 18.6 (1.82) 14.8 (1.39) 17.9 (1.60) 1.1 (0.54) † (†) † (†) † (†) †
Less than 48 months ................................ † (†) † (†) † (†) † (†) † (†) † (†) 16.4 (0.57) 27.3 (1.63) 13.9 (1.48) 8.7 (0.948 to 52 months ........................................ † (†) † (†) † (†) † (†) † (†) † (†) 38.1 (0.55) 19.9 (1.01) 13.0 (0.87) 8.3 (0.653 to 57 months ........................................ † (†) † (†) † (†) † (†) † (†) † (†) 36.5 (0.57) 16.5 (0.93) 13.1 (0.83) 6.7 (0.558 or more months.................................... † (†) † (†) † (†) † (†) † (†) † (†) 9.0 (0.41) 21.1 (1.98) 12.1 (1.66) 6.4 (1.0
Mother’s employment statusFull-time (35 hours or more) ..................... 34.7 (0.73) 15.7 (0.89) 30.4 (1.10) 26.0 (0.86) 27.1 (0.96) 0.8 (0.21) 34.7 (0.77) 11.3 (0.96) 16.2 (0.91) 12.1 (0.7Part-time (less than 35 hours) .................. 20.2 (0.62) 35.4 (1.53) 26.4 (1.53) 20.5 (1.37) 16.7 (1.23) 1.0 (0.34) 20.3 (0.63) 16.4 (1.33) 14.1 (1.20) 9.1 (0.8Looking for work........................................ 6.3 (0.35) 71.1 (2.30) 11.5 (1.58) 3.8 (0.95) 13.4 (2.02) 0.1 (0.14) 6.3 (0.36) 22.3 (2.33) 18.5 (2.33) 5.4 (1.2Not in labor force....................................... 38.4 (0.78) 86.8 (0.75) 4.8 (0.48) 3.0 (0.35) 5.4 (0.46) ‡ (†) 38.3 (0.81) 29.4 (0.97) 8.6 (0.63) 3.3 (0.3No mother in household............................ 0.4 (0.09) 21.2 (7.28) 33.5 (8.60) 19.5 (9.29) 25.9 (8.01) ‡ (†) 0.4 (0.10) 11.0 (6.13) 36.2 (9.59) 0.3 (0.3
Parents’ highest level of educationLess than high school ............................... 12.8 (0.36) 67.6 (1.98) 17.5 (1.45) 6.8 (1.08) 7.7 (0.98) 0.4 (0.24) 10.5 (0.36) 34.2 (2.10) 16.4 (1.77) 3.7 (1.0High school completion............................. 25.7 (0.46) 50.1 (1.47) 23.1 (1.27) 12.3 (0.97) 14.1 (0.87) 0.4 (0.15) 23.1 (0.57) 22.0 (1.24) 17.0 (1.20) 6.9 (0.6Some college/vocational ........................... 29.7 (0.48) 46.9 (1.51) 21.6 (1.22) 15.1 (0.92) 15.7 (0.94) 0.7 (0.21) 33.4 (0.64) 21.0 (1.24) 15.2 (0.95) 7.1 (0.5Bachelor's degree ..................................... 16.9 (0.46) 48.6 (1.14) 14.4 (1.18) 17.8 (1.18) 18.6 (1.14) 0.7 (0.23) 16.8 (0.45) 16.0 (1.57) 8.4 (1.02) 8.2 (0.9Any graduate education ............................ 14.9 (0.35) 46.0 (1.91) 10.5 (1.05) 20.7 (1.57) 22.4 (1.49) 0.4 (0.16) 16.2 (0.37) 9.7 (0.83) 6.2 (0.90) 11.3 (1.1
Poverty status8
Below poverty threshold............................ 23.9 (0.75) 61.8 (1.40) 18.0 (1.15) 7.8 (0.79) 11.7 (0.92) 0.7 (0.24) 24.8 (0.64) 27.5 (1.27) 15.1 (1.19) 4.4 (0.5At or above poverty threshold ................... 76.1 (0.75) 47.0 (0.90) 18.7 (0.68) 16.7 (0.62) 17.1 (0.60) 0.5 (0.11) 75.2 (0.64) 17.5 (0.71) 12.5 (0.64) 8.6 (0.3
Socioeconomic status9
Lowest 20 percent..................................... 20.0 (0.48) 66.7 (1.43) 17.2 (1.20) 6.8 (0.75) 8.9 (0.72) 0.4 (0.18) 20.0 (0.52) 30.5 (1.31) 14.9 (1.33) 5.0 (0.6Middle 60 percent ..................................... 60.0 (0.67) 46.8 (0.98) 21.8 (0.78) 15.1 (0.63) 15.8 (0.58) 0.6 (0.15) 60.0 (0.67) 19.7 (0.86) 15.1 (0.82) 7.4 (0.4Highest 20 percent.................................... 20.0 (0.48) 45.9 (1.75) 10.2 (0.85) 20.8 (1.52) 22.6 (1.45) 0.5 (0.21) 20.0 (0.47) 10.4 (0.93) 5.4 (0.73) 10.7 (0.9
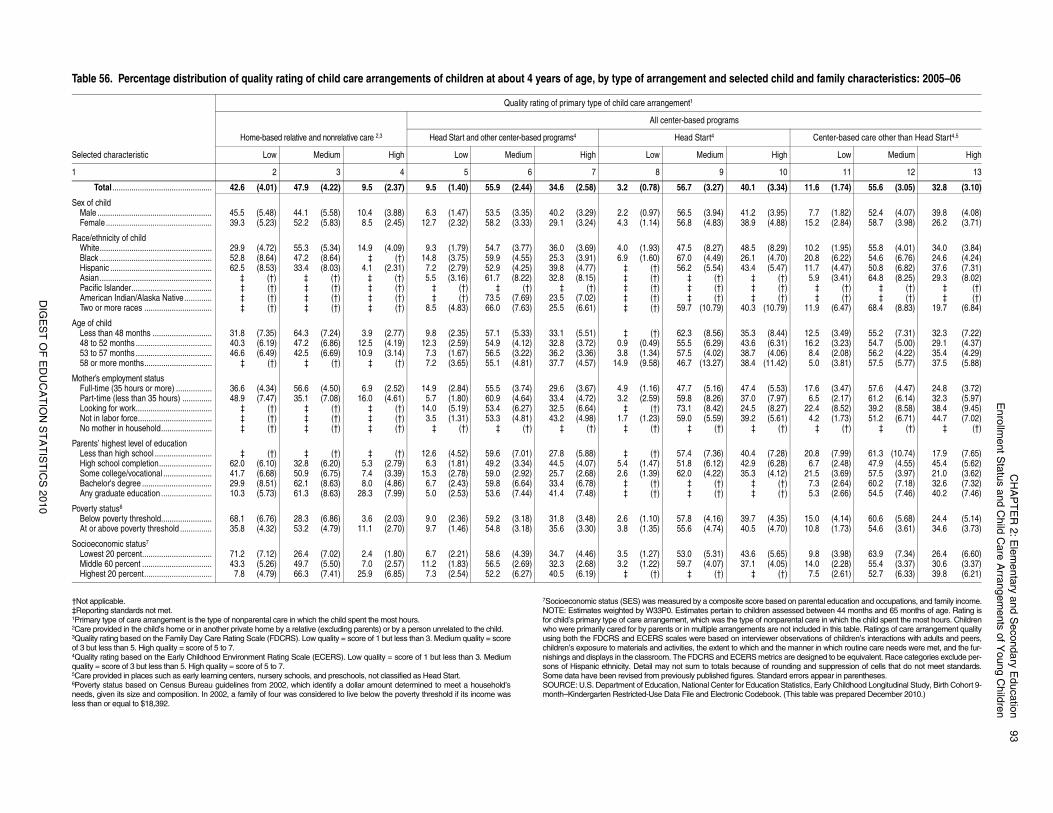
CH
AP
TE
R 2
: Ele
me
nta
ry an
d S
eco
nd
ary E
du
catio
n9
3E
nro
llme
nt S
tatu
s an
d C
hild
Ca
re A
rran
ge
me
nts o
f Yo
un
g C
hild
ren
DIG
ES
T O
F E
DU
CA
TIO
N S
TA
TIS
TIC
S 2
01
0
re based on parental education and occupations, and family income.dren assessed between 44 months and 65 months of age. Rating isof nonparental care in which the child spent the most hours. Childrennts are not included in this table. Ratings of care arrangement qualityviewer observations of children’s interactions with adults and peers,h and the manner in which routine care needs were met, and the fur- metrics are designed to be equivalent. Race categories exclude per-e of rounding and suppression of cells that do not meet standards. Standard errors appear in parentheses.ucation Statistics, Early Childhood Longitudinal Study, Birth Cohort 9-debook. (This table was prepared December 2010.)
ed child and family characteristics: 2005–06
Center-based care other than Head Start4,5
High Low Medium High
10 11 12 13
(3.34) 11.6 (1.74) 55.6 (3.05) 32.8 (3.10)
(3.95) 7.7 (1.82) 52.4 (4.07) 39.8 (4.08)(4.88) 15.2 (2.84) 58.7 (3.98) 26.2 (3.71)
(8.29) 10.2 (1.95) 55.8 (4.01) 34.0 (3.84)(4.70) 20.8 (6.22) 54.6 (6.76) 24.6 (4.24)(5.47) 11.7 (4.47) 50.8 (6.82) 37.6 (7.31)
(†) 5.9 (3.41) 64.8 (8.25) 29.3 (8.02)(†) ‡ (†) ‡ (†) ‡ (†)(†) ‡ (†) ‡ (†) ‡ (†)
(10.79) 11.9 (6.47) 68.4 (8.83) 19.7 (6.84)
(8.44) 12.5 (3.49) 55.2 (7.31) 32.3 (7.22)(6.31) 16.2 (3.23) 54.7 (5.00) 29.1 (4.37)(4.06) 8.4 (2.08) 56.2 (4.22) 35.4 (4.29)
(11.42) 5.0 (3.81) 57.5 (5.77) 37.5 (5.88)
(5.53) 17.6 (3.47) 57.6 (4.47) 24.8 (3.72)(7.97) 6.5 (2.17) 61.2 (6.14) 32.3 (5.97)(8.27) 22.4 (8.52) 39.2 (8.58) 38.4 (9.45)(5.61) 4.2 (1.73) 51.2 (6.71) 44.7 (7.02)
(†) ‡ (†) ‡ (†) ‡ (†)
(7.28) 20.8 (7.99) 61.3 (10.74) 17.9 (7.65)(6.28) 6.7 (2.48) 47.9 (4.55) 45.4 (5.62)(4.12) 21.5 (3.69) 57.5 (3.97) 21.0 (3.62)
(†) 7.3 (2.64) 60.2 (7.18) 32.6 (7.32)(†) 5.3 (2.66) 54.5 (7.46) 40.2 (7.46)
(4.35) 15.0 (4.14) 60.6 (5.68) 24.4 (5.14)(4.70) 10.8 (1.73) 54.6 (3.61) 34.6 (3.73)
(5.65) 9.8 (3.98) 63.9 (7.34) 26.4 (6.60)(4.05) 14.0 (2.28) 55.4 (3.37) 30.6 (3.37)
(†) 7.5 (2.61) 52.7 (6.33) 39.8 (6.21)
†Not applicable.‡Reporting standards not met.1Primary type of care arrangement is the type of nonparental care in which the child spent the most hours.2Care provided in the child’s home or in another private home by a relative (excluding parents) or by a person unrelated to the child.3Quality rating based on the Family Day Care Rating Scale (FDCRS). Low quality = score of 1 but less than 3. Medium quality = scoreof 3 but less than 5. High quality = score of 5 to 7.4Quality rating based on the Early Childhood Environment Rating Scale (ECERS). Low quality = score of 1 but less than 3. Mediumquality = score of 3 but less than 5. High quality = score of 5 to 7.5Care provided in places such as early learning centers, nursery schools, and preschools, not classified as Head Start.6Poverty status based on Census Bureau guidelines from 2002, which identify a dollar amount determined to meet a household’sneeds, given its size and composition. In 2002, a family of four was considered to live below the poverty threshold if its income wasless than or equal to $18,392.
7Socioeconomic status (SES) was measured by a composite scoNOTE: Estimates weighted by W33P0. Estimates pertain to chilfor child’s primary type of care arrangement, which was the type who were primarily cared for by parents or in multiple arrangemeusing both the FDCRS and ECERS scales were based on interchildren’s exposure to materials and activities, the extent to whicnishings and displays in the classroom. The FDCRS and ECERSsons of Hispanic ethnicity. Detail may not sum to totals becausSome data have been revised from previously published figures.SOURCE: U.S. Department of Education, National Center for Edmonth–Kindergarten Restricted-Use Data File and Electronic Co
Table 56. Percentage distribution of quality rating of child care arrangements of children at about 4 years of age, by type of arrangement and select
Selected characteristic
Quality rating of primary type of child care arrangement1
Home-based relative and nonrelative care 2,3
All center-based programs
Head Start and other center-based programs4 Head Start4
Low Medium High Low Medium High Low Medium
1 2 3 4 5 6 7 8 9
Total ............................................... 42.6 (4.01) 47.9 (4.22) 9.5 (2.37) 9.5 (1.40) 55.9 (2.44) 34.6 (2.58) 3.2 (0.78) 56.7 (3.27) 40.1
Sex of childMale ...................................................... 45.5 (5.48) 44.1 (5.58) 10.4 (3.88) 6.3 (1.47) 53.5 (3.35) 40.2 (3.29) 2.2 (0.97) 56.5 (3.94) 41.2Female .................................................. 39.3 (5.23) 52.2 (5.83) 8.5 (2.45) 12.7 (2.32) 58.2 (3.33) 29.1 (3.24) 4.3 (1.14) 56.8 (4.83) 38.9
Race/ethnicity of childWhite..................................................... 29.9 (4.72) 55.3 (5.34) 14.9 (4.09) 9.3 (1.79) 54.7 (3.77) 36.0 (3.69) 4.0 (1.93) 47.5 (8.27) 48.5Black ..................................................... 52.8 (8.64) 47.2 (8.64) ‡ (†) 14.8 (3.75) 59.9 (4.55) 25.3 (3.91) 6.9 (1.60) 67.0 (4.49) 26.1Hispanic ................................................ 62.5 (8.53) 33.4 (8.03) 4.1 (2.31) 7.2 (2.79) 52.9 (4.25) 39.8 (4.77) ‡ (†) 56.2 (5.54) 43.4Asian..................................................... ‡ (†) ‡ (†) ‡ (†) 5.5 (3.16) 61.7 (8.22) 32.8 (8.15) ‡ (†) ‡ (†) ‡Pacific Islander...................................... ‡ (†) ‡ (†) ‡ (†) ‡ (†) ‡ (†) ‡ (†) ‡ (†) ‡ (†) ‡American Indian/Alaska Native ............. ‡ (†) ‡ (†) ‡ (†) ‡ (†) 73.5 (7.69) 23.5 (7.02) ‡ (†) ‡ (†) ‡Two or more races ................................ ‡ (†) ‡ (†) ‡ (†) 8.5 (4.83) 66.0 (7.63) 25.5 (6.61) ‡ (†) 59.7 (10.79) 40.3
Age of childLess than 48 months ............................ 31.8 (7.35) 64.3 (7.24) 3.9 (2.77) 9.8 (2.35) 57.1 (5.33) 33.1 (5.51) ‡ (†) 62.3 (8.56) 35.348 to 52 months .................................... 40.3 (6.19) 47.2 (6.86) 12.5 (4.19) 12.3 (2.59) 54.9 (4.12) 32.8 (3.72) 0.9 (0.49) 55.5 (6.29) 43.653 to 57 months .................................... 46.6 (6.49) 42.5 (6.69) 10.9 (3.14) 7.3 (1.67) 56.5 (3.22) 36.2 (3.36) 3.8 (1.34) 57.5 (4.02) 38.758 or more months................................ ‡ (†) ‡ (†) ‡ (†) 7.2 (3.65) 55.1 (4.81) 37.7 (4.57) 14.9 (9.58) 46.7 (13.27) 38.4
Mother’s employment statusFull-time (35 hours or more) ................. 36.6 (4.34) 56.6 (4.50) 6.9 (2.52) 14.9 (2.84) 55.5 (3.74) 29.6 (3.67) 4.9 (1.16) 47.7 (5.16) 47.4Part-time (less than 35 hours) .............. 48.9 (7.47) 35.1 (7.08) 16.0 (4.61) 5.7 (1.80) 60.9 (4.64) 33.4 (4.72) 3.2 (2.59) 59.8 (8.26) 37.0Looking for work.................................... ‡ (†) ‡ (†) ‡ (†) 14.0 (5.19) 53.4 (6.27) 32.5 (6.64) ‡ (†) 73.1 (8.42) 24.5Not in labor force................................... ‡ (†) ‡ (†) ‡ (†) 3.5 (1.31) 53.3 (4.81) 43.2 (4.98) 1.7 (1.23) 59.0 (5.59) 39.2No mother in household........................ ‡ (†) ‡ (†) ‡ (†) ‡ (†) ‡ (†) ‡ (†) ‡ (†) ‡ (†) ‡
Parents’ highest level of educationLess than high school ........................... ‡ (†) ‡ (†) ‡ (†) 12.6 (4.52) 59.6 (7.01) 27.8 (5.88) ‡ (†) 57.4 (7.36) 40.4High school completion......................... 62.0 (6.10) 32.8 (6.20) 5.3 (2.79) 6.3 (1.81) 49.2 (3.34) 44.5 (4.07) 5.4 (1.47) 51.8 (6.12) 42.9Some college/vocational ....................... 41.7 (6.68) 50.9 (6.75) 7.4 (3.39) 15.3 (2.78) 59.0 (2.92) 25.7 (2.68) 2.6 (1.39) 62.0 (4.22) 35.3Bachelor's degree ................................. 29.9 (8.51) 62.1 (8.63) 8.0 (4.86) 6.7 (2.43) 59.8 (6.64) 33.4 (6.78) ‡ (†) ‡ (†) ‡Any graduate education ........................ 10.3 (5.73) 61.3 (8.63) 28.3 (7.99) 5.0 (2.53) 53.6 (7.44) 41.4 (7.48) ‡ (†) ‡ (†) ‡
Poverty status6
Below poverty threshold........................ 68.1 (6.76) 28.3 (6.86) 3.6 (2.03) 9.0 (2.36) 59.2 (3.18) 31.8 (3.48) 2.6 (1.10) 57.8 (4.16) 39.7At or above poverty threshold ............... 35.8 (4.32) 53.2 (4.79) 11.1 (2.70) 9.7 (1.46) 54.8 (3.18) 35.6 (3.30) 3.8 (1.35) 55.6 (4.74) 40.5
Socioeconomic status7
Lowest 20 percent................................. 71.2 (7.12) 26.4 (7.02) 2.4 (1.80) 6.7 (2.21) 58.6 (4.39) 34.7 (4.46) 3.5 (1.27) 53.0 (5.31) 43.6Middle 60 percent ................................. 43.3 (5.26) 49.7 (5.50) 7.0 (2.57) 11.2 (1.83) 56.5 (2.69) 32.3 (2.68) 3.2 (1.22) 59.7 (4.07) 37.1Highest 20 percent................................ 7.8 (4.79) 66.3 (7.41) 25.9 (6.85) 7.3 (2.54) 52.2 (6.27) 40.5 (6.19) ‡ (†) ‡ (†) ‡
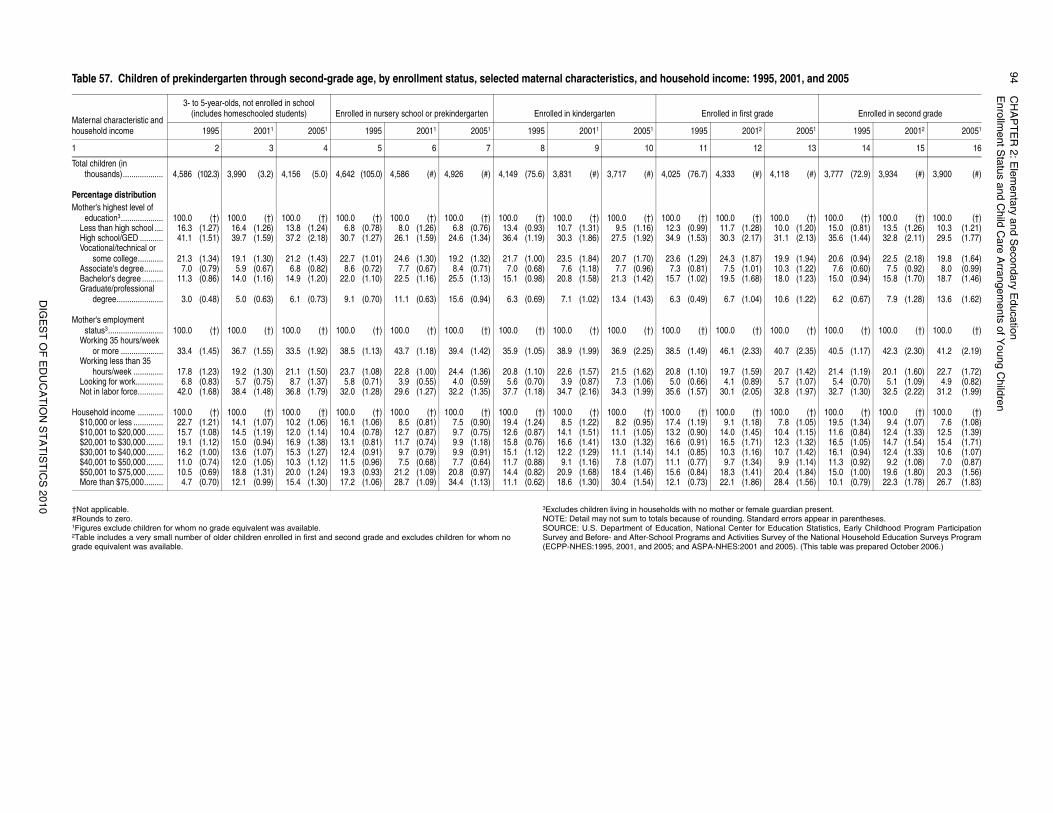
94
CH
AP
TE
R 2
: Ele
me
nta
ry an
d S
eco
nd
ary E
du
catio
nE
nro
llme
nt S
tatu
s an
d C
hild
Ca
re A
rran
ge
me
nts o
f Yo
un
g C
hild
ren
DIG
ES
T O
F E
DU
CA
TIO
N S
TA
TIS
TIC
S 2
01
0 ale guardian present.andard errors appear in parentheses.for Education Statistics, Early Childhood Program Participations Survey of the National Household Education Surveys Program and 2005). (This table was prepared October 2006.)
995, 2001, and 2005
rade Enrolled in second grade
12 20051 1995 20012 20051
2 13 14 15 16
#) 4,118 (#) 3,777 (72.9) 3,934 (#) 3,900 (#)
†) 100.0 (†) 100.0 (†) 100.0 (†) 100.0 (†)8) 10.0 (1.20) 15.0 (0.81) 13.5 (1.26) 10.3 (1.21)7) 31.1 (2.13) 35.6 (1.44) 32.8 (2.11) 29.5 (1.77)
7) 19.9 (1.94) 20.6 (0.94) 22.5 (2.18) 19.8 (1.64)1) 10.3 (1.22) 7.6 (0.60) 7.5 (0.92) 8.0 (0.99)8) 18.0 (1.23) 15.0 (0.94) 15.8 (1.70) 18.7 (1.46)
4) 10.6 (1.22) 6.2 (0.67) 7.9 (1.28) 13.6 (1.62)
†) 100.0 (†) 100.0 (†) 100.0 (†) 100.0 (†)
3) 40.7 (2.35) 40.5 (1.17) 42.3 (2.30) 41.2 (2.19)
9) 20.7 (1.42) 21.4 (1.19) 20.1 (1.60) 22.7 (1.72)9) 5.7 (1.07) 5.4 (0.70) 5.1 (1.09) 4.9 (0.82)5) 32.8 (1.97) 32.7 (1.30) 32.5 (2.22) 31.2 (1.99)
†) 100.0 (†) 100.0 (†) 100.0 (†) 100.0 (†)8) 7.8 (1.05) 19.5 (1.34) 9.4 (1.07) 7.6 (1.08)5) 10.4 (1.15) 11.6 (0.84) 12.4 (1.33) 12.5 (1.39)1) 12.3 (1.32) 16.5 (1.05) 14.7 (1.54) 15.4 (1.71)6) 10.7 (1.42) 16.1 (0.94) 12.4 (1.33) 10.6 (1.07)4) 9.9 (1.14) 11.3 (0.92) 9.2 (1.08) 7.0 (0.87)1) 20.4 (1.84) 15.0 (1.00) 19.6 (1.80) 20.3 (1.56)6) 28.4 (1.56) 10.1 (0.79) 22.3 (1.78) 26.7 (1.83)
†Not applicable.#Rounds to zero.1Figures exclude children for whom no grade equivalent was available.2Table includes a very small number of older children enrolled in first and second grade and excludes children for whom nograde equivalent was available.
3Excludes children living in households with no mother or femNOTE: Detail may not sum to totals because of rounding. StSOURCE: U.S. Department of Education, National Center Survey and Before- and After-School Programs and Activitie(ECPP-NHES:1995, 2001, and 2005; and ASPA-NHES:2001
Table 57. Children of prekindergarten through second-grade age, by enrollment status, selected maternal characteristics, and household income: 1
Maternal characteristic and household income
3- to 5-year-olds, not enrolled in school(includes homeschooled students) Enrolled in nursery school or prekindergarten Enrolled in kindergarten Enrolled in first g
1995 20011 20051 1995 20011 20051 1995 20011 20051 1995 200
1 2 3 4 5 6 7 8 9 10 11 1
Total children (in thousands)................... 4,586 (102.3) 3,990 (3.2) 4,156 (5.0) 4,642 (105.0) 4,586 (#) 4,926 (#) 4,149 (75.6) 3,831 (#) 3,717 (#) 4,025 (76.7) 4,333 (
Percentage distributionMother's highest level of
education3.................... 100.0 (†) 100.0 (†) 100.0 (†) 100.0 (†) 100.0 (†) 100.0 (†) 100.0 (†) 100.0 (†) 100.0 (†) 100.0 (†) 100.0 (Less than high school .... 16.3 (1.27) 16.4 (1.26) 13.8 (1.24) 6.8 (0.78) 8.0 (1.26) 6.8 (0.76) 13.4 (0.93) 10.7 (1.31) 9.5 (1.16) 12.3 (0.99) 11.7 (1.2High school/GED ........... 41.1 (1.51) 39.7 (1.59) 37.2 (2.18) 30.7 (1.27) 26.1 (1.59) 24.6 (1.34) 36.4 (1.19) 30.3 (1.86) 27.5 (1.92) 34.9 (1.53) 30.3 (2.1Vocational/technical or
some college............ 21.3 (1.34) 19.1 (1.30) 21.2 (1.43) 22.7 (1.01) 24.6 (1.30) 19.2 (1.32) 21.7 (1.00) 23.5 (1.84) 20.7 (1.70) 23.6 (1.29) 24.3 (1.8Associate's degree......... 7.0 (0.79) 5.9 (0.67) 6.8 (0.82) 8.6 (0.72) 7.7 (0.67) 8.4 (0.71) 7.0 (0.68) 7.6 (1.18) 7.7 (0.96) 7.3 (0.81) 7.5 (1.0Bachelor's degree .......... 11.3 (0.86) 14.0 (1.16) 14.9 (1.20) 22.0 (1.10) 22.5 (1.16) 25.5 (1.13) 15.1 (0.98) 20.8 (1.58) 21.3 (1.42) 15.7 (1.02) 19.5 (1.6Graduate/professional
degree...................... 3.0 (0.48) 5.0 (0.63) 6.1 (0.73) 9.1 (0.70) 11.1 (0.63) 15.6 (0.94) 6.3 (0.69) 7.1 (1.02) 13.4 (1.43) 6.3 (0.49) 6.7 (1.0
Mother's employment status3.......................... 100.0 (†) 100.0 (†) 100.0 (†) 100.0 (†) 100.0 (†) 100.0 (†) 100.0 (†) 100.0 (†) 100.0 (†) 100.0 (†) 100.0 (
Working 35 hours/week or more .................... 33.4 (1.45) 36.7 (1.55) 33.5 (1.92) 38.5 (1.13) 43.7 (1.18) 39.4 (1.42) 35.9 (1.05) 38.9 (1.99) 36.9 (2.25) 38.5 (1.49) 46.1 (2.3
Working less than 35 hours/week .............. 17.8 (1.23) 19.2 (1.30) 21.1 (1.50) 23.7 (1.08) 22.8 (1.00) 24.4 (1.36) 20.8 (1.10) 22.6 (1.57) 21.5 (1.62) 20.8 (1.10) 19.7 (1.5
Looking for work............. 6.8 (0.83) 5.7 (0.75) 8.7 (1.37) 5.8 (0.71) 3.9 (0.55) 4.0 (0.59) 5.6 (0.70) 3.9 (0.87) 7.3 (1.06) 5.0 (0.66) 4.1 (0.8Not in labor force............ 42.0 (1.68) 38.4 (1.48) 36.8 (1.79) 32.0 (1.28) 29.6 (1.27) 32.2 (1.35) 37.7 (1.18) 34.7 (2.16) 34.3 (1.99) 35.6 (1.57) 30.1 (2.0
Household income ............ 100.0 (†) 100.0 (†) 100.0 (†) 100.0 (†) 100.0 (†) 100.0 (†) 100.0 (†) 100.0 (†) 100.0 (†) 100.0 (†) 100.0 ($10,000 or less .............. 22.7 (1.21) 14.1 (1.07) 10.2 (1.06) 16.1 (1.06) 8.5 (0.81) 7.5 (0.90) 19.4 (1.24) 8.5 (1.22) 8.2 (0.95) 17.4 (1.19) 9.1 (1.1$10,001 to $20,000........ 15.7 (1.08) 14.5 (1.19) 12.0 (1.14) 10.4 (0.78) 12.7 (0.87) 9.7 (0.75) 12.6 (0.87) 14.1 (1.51) 11.1 (1.05) 13.2 (0.90) 14.0 (1.4$20,001 to $30,000........ 19.1 (1.12) 15.0 (0.94) 16.9 (1.38) 13.1 (0.81) 11.7 (0.74) 9.9 (1.18) 15.8 (0.76) 16.6 (1.41) 13.0 (1.32) 16.6 (0.91) 16.5 (1.7$30,001 to $40,000........ 16.2 (1.00) 13.6 (1.07) 15.3 (1.27) 12.4 (0.91) 9.7 (0.79) 9.9 (0.91) 15.1 (1.12) 12.2 (1.29) 11.1 (1.14) 14.1 (0.85) 10.3 (1.1$40,001 to $50,000........ 11.0 (0.74) 12.0 (1.05) 10.3 (1.12) 11.5 (0.96) 7.5 (0.68) 7.7 (0.64) 11.7 (0.88) 9.1 (1.16) 7.8 (1.07) 11.1 (0.77) 9.7 (1.3$50,001 to $75,000........ 10.5 (0.69) 18.8 (1.31) 20.0 (1.24) 19.3 (0.93) 21.2 (1.09) 20.8 (0.97) 14.4 (0.82) 20.9 (1.68) 18.4 (1.46) 15.6 (0.84) 18.3 (1.4More than $75,000......... 4.7 (0.70) 12.1 (0.99) 15.4 (1.30) 17.2 (1.06) 28.7 (1.09) 34.4 (1.13) 11.1 (0.62) 18.6 (1.30) 30.4 (1.54) 12.1 (0.73) 22.1 (1.8
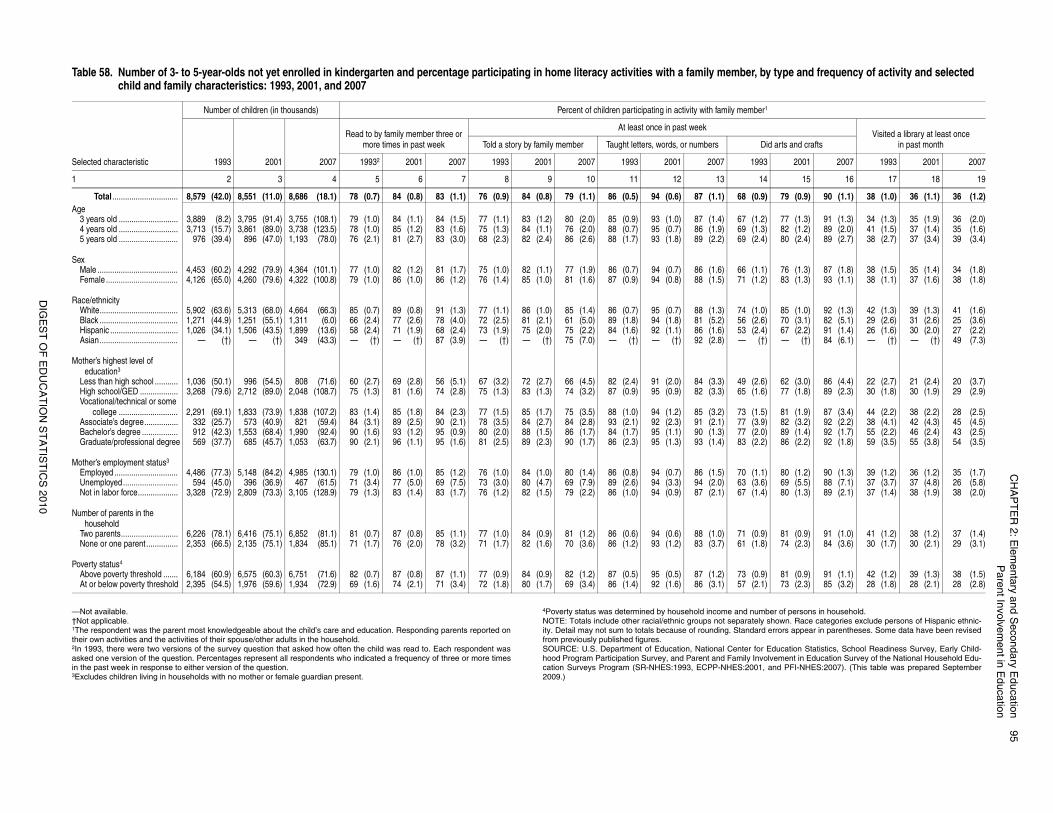
CH
AP
TE
R 2
: Ele
me
nta
ry an
d S
eco
nd
ary E
du
catio
n9
5P
are
nt In
volve
ment in
Ed
uca
tion
DIG
ES
T O
F E
DU
CA
TIO
N S
TA
TIS
TIC
S 2
01
0
umber of persons in household.ly shown. Race categories exclude persons of Hispanic ethnic-
ard errors appear in parentheses. Some data have been revised
or Education Statistics, School Readiness Survey, Early Child-nvolvement in Education Survey of the National Household Edu-1, and PFI-NHES:2007). (This table was prepared September
Involvement in Education , by type and frequency of activity and selected
er1
Visited a library at least once in past monthDid arts and crafts
993 2001 2007 1993 2001 2007
14 15 16 17 18 19
0.9) 79 (0.9) 90 (1.1) 38 (1.0) 36 (1.1) 36 (1.2)
1.2) 77 (1.3) 91 (1.3) 34 (1.3) 35 (1.9) 36 (2.0)1.3) 82 (1.2) 89 (2.0) 41 (1.5) 37 (1.4) 35 (1.6)2.4) 80 (2.4) 89 (2.7) 38 (2.7) 37 (3.4) 39 (3.4)
1.1) 76 (1.3) 87 (1.8) 38 (1.5) 35 (1.4) 34 (1.8)1.2) 83 (1.3) 93 (1.1) 38 (1.1) 37 (1.6) 38 (1.8)
1.0) 85 (1.0) 92 (1.3) 42 (1.3) 39 (1.3) 41 (1.6)2.6) 70 (3.1) 82 (5.1) 29 (2.6) 31 (2.6) 25 (3.6)2.4) 67 (2.2) 91 (1.4) 26 (1.6) 30 (2.0) 27 (2.2)(†) — (†) 84 (6.1) — (†) — (†) 49 (7.3)
2.6) 62 (3.0) 86 (4.4) 22 (2.7) 21 (2.4) 20 (3.7)1.6) 77 (1.8) 89 (2.3) 30 (1.8) 30 (1.9) 29 (2.9)
1.5) 81 (1.9) 87 (3.4) 44 (2.2) 38 (2.2) 28 (2.5)3.9) 82 (3.2) 92 (2.2) 38 (4.1) 42 (4.3) 45 (4.5)2.0) 89 (1.4) 92 (1.7) 55 (2.2) 46 (2.4) 43 (2.5)2.2) 86 (2.2) 92 (1.8) 59 (3.5) 55 (3.8) 54 (3.5)
1.1) 80 (1.2) 90 (1.3) 39 (1.2) 36 (1.2) 35 (1.7)3.6) 69 (5.5) 88 (7.1) 37 (3.7) 37 (4.8) 26 (5.8)1.4) 80 (1.3) 89 (2.1) 37 (1.4) 38 (1.9) 38 (2.0)
0.9) 81 (0.9) 91 (1.0) 41 (1.2) 38 (1.2) 37 (1.4)1.8) 74 (2.3) 84 (3.6) 30 (1.7) 30 (2.1) 29 (3.1)
0.9) 81 (0.9) 91 (1.1) 42 (1.2) 39 (1.3) 38 (1.5)2.1) 73 (2.3) 85 (3.2) 28 (1.8) 28 (2.1) 28 (2.8)
—Not available.†Not applicable.1The respondent was the parent most knowledgeable about the child’s care and education. Responding parents reported ontheir own activities and the activities of their spouse/other adults in the household.2In 1993, there were two versions of the survey question that asked how often the child was read to. Each respondent wasasked one version of the question. Percentages represent all respondents who indicated a frequency of three or more timesin the past week in response to either version of the question.3Excludes children living in households with no mother or female guardian present.
4Poverty status was determined by household income and nNOTE: Totals include other racial/ethnic groups not separateity. Detail may not sum to totals because of rounding. Standfrom previously published figures.SOURCE: U.S. Department of Education, National Center fhood Program Participation Survey, and Parent and Family Ication Surveys Program (SR-NHES:1993, ECPP-NHES:2002009.)
Parent Table 58. Number of 3- to 5-year-olds not yet enrolled in kindergarten and percentage participating in home literacy activities with a family memberchild and family characteristics: 1993, 2001, and 2007
Selected characteristic
Number of children (in thousands) Percent of children participating in activity with family memb
1993 2001 2007
Read to by family member three or more times in past week
At least once in past week
Told a story by family member Taught letters, words, or numbers
19932 2001 2007 1993 2001 2007 1993 2001 2007 1
1 2 3 4 5 6 7 8 9 10 11 12 13
Total ............................... 8,579 (42.0) 8,551 (11.0) 8,686 (18.1) 78 (0.7) 84 (0.8) 83 (1.1) 76 (0.9) 84 (0.8) 79 (1.1) 86 (0.5) 94 (0.6) 87 (1.1) 68 (Age
3 years old ............................ 3,889 (8.2) 3,795 (91.4) 3,755 (108.1) 79 (1.0) 84 (1.1) 84 (1.5) 77 (1.1) 83 (1.2) 80 (2.0) 85 (0.9) 93 (1.0) 87 (1.4) 67 (4 years old ............................ 3,713 (15.7) 3,861 (89.0) 3,738 (123.5) 78 (1.0) 85 (1.2) 83 (1.6) 75 (1.3) 84 (1.1) 76 (2.0) 88 (0.7) 95 (0.7) 86 (1.9) 69 (5 years old ............................ 976 (39.4) 896 (47.0) 1,193 (78.0) 76 (2.1) 81 (2.7) 83 (3.0) 68 (2.3) 82 (2.4) 86 (2.6) 88 (1.7) 93 (1.8) 89 (2.2) 69 (
SexMale ...................................... 4,453 (60.2) 4,292 (79.9) 4,364 (101.1) 77 (1.0) 82 (1.2) 81 (1.7) 75 (1.0) 82 (1.1) 77 (1.9) 86 (0.7) 94 (0.7) 86 (1.6) 66 (Female .................................. 4,126 (65.0) 4,260 (79.6) 4,322 (100.8) 79 (1.0) 86 (1.0) 86 (1.2) 76 (1.4) 85 (1.0) 81 (1.6) 87 (0.9) 94 (0.8) 88 (1.5) 71 (
Race/ethnicity White..................................... 5,902 (63.6) 5,313 (68.0) 4,664 (66.3) 85 (0.7) 89 (0.8) 91 (1.3) 77 (1.1) 86 (1.0) 85 (1.4) 86 (0.7) 95 (0.7) 88 (1.3) 74 (Black ..................................... 1,271 (44.9) 1,251 (55.1) 1,311 (6.0) 66 (2.4) 77 (2.6) 78 (4.0) 72 (2.5) 81 (2.1) 61 (5.0) 89 (1.8) 94 (1.8) 81 (5.2) 56 (Hispanic ................................ 1,026 (34.1) 1,506 (43.5) 1,899 (13.6) 58 (2.4) 71 (1.9) 68 (2.4) 73 (1.9) 75 (2.0) 75 (2.2) 84 (1.6) 92 (1.1) 86 (1.6) 53 (Asian..................................... — (†) — (†) 349 (43.3) — (†) — (†) 87 (3.9) — (†) — (†) 75 (7.0) — (†) — (†) 92 (2.8) —
Mother’s highest level of education3
Less than high school ........... 1,036 (50.1) 996 (54.5) 808 (71.6) 60 (2.7) 69 (2.8) 56 (5.1) 67 (3.2) 72 (2.7) 66 (4.5) 82 (2.4) 91 (2.0) 84 (3.3) 49 (High school/GED .................. 3,268 (79.6) 2,712 (89.0) 2,048 (108.7) 75 (1.3) 81 (1.6) 74 (2.8) 75 (1.3) 83 (1.3) 74 (3.2) 87 (0.9) 95 (0.9) 82 (3.3) 65 (Vocational/technical or some
college ............................ 2,291 (69.1) 1,833 (73.9) 1,838 (107.2) 83 (1.4) 85 (1.8) 84 (2.3) 77 (1.5) 85 (1.7) 75 (3.5) 88 (1.0) 94 (1.2) 85 (3.2) 73 (Associate’s degree................ 332 (25.7) 573 (40.9) 821 (59.4) 84 (3.1) 89 (2.5) 90 (2.1) 78 (3.5) 84 (2.7) 84 (2.8) 93 (2.1) 92 (2.3) 91 (2.1) 77 (Bachelor’s degree ................. 912 (42.3) 1,553 (68.4) 1,990 (92.4) 90 (1.6) 93 (1.2) 95 (0.9) 80 (2.0) 88 (1.5) 86 (1.7) 84 (1.7) 95 (1.1) 90 (1.3) 77 (Graduate/professional degree 569 (37.7) 685 (45.7) 1,053 (63.7) 90 (2.1) 96 (1.1) 95 (1.6) 81 (2.5) 89 (2.3) 90 (1.7) 86 (2.3) 95 (1.3) 93 (1.4) 83 (
Mother’s employment status3
Employed .............................. 4,486 (77.3) 5,148 (84.2) 4,985 (130.1) 79 (1.0) 86 (1.0) 85 (1.2) 76 (1.0) 84 (1.0) 80 (1.4) 86 (0.8) 94 (0.7) 86 (1.5) 70 (Unemployed.......................... 594 (45.0) 396 (36.9) 467 (61.5) 71 (3.4) 77 (5.0) 69 (7.5) 73 (3.0) 80 (4.7) 69 (7.9) 89 (2.6) 94 (3.3) 94 (2.0) 63 (Not in labor force................... 3,328 (72.9) 2,809 (73.3) 3,105 (128.9) 79 (1.3) 83 (1.4) 83 (1.7) 76 (1.2) 82 (1.5) 79 (2.2) 86 (1.0) 94 (0.9) 87 (2.1) 67 (
Number of parents in the household
Two parents........................... 6,226 (78.1) 6,416 (75.1) 6,852 (81.1) 81 (0.7) 87 (0.8) 85 (1.1) 77 (1.0) 84 (0.9) 81 (1.2) 86 (0.6) 94 (0.6) 88 (1.0) 71 (None or one parent............... 2,353 (66.5) 2,135 (75.1) 1,834 (85.1) 71 (1.7) 76 (2.0) 78 (3.2) 71 (1.7) 82 (1.6) 70 (3.6) 86 (1.2) 93 (1.2) 83 (3.7) 61 (
Poverty status4
Above poverty threshold ....... 6,184 (60.9) 6,575 (60.3) 6,751 (71.6) 82 (0.7) 87 (0.8) 87 (1.1) 77 (0.9) 84 (0.9) 82 (1.2) 87 (0.5) 95 (0.5) 87 (1.2) 73 (At or below poverty threshold 2,395 (54.5) 1,976 (59.6) 1,934 (72.9) 69 (1.6) 74 (2.1) 71 (3.4) 72 (1.8) 80 (1.7) 69 (3.4) 86 (1.4) 92 (1.6) 86 (3.1) 57 (
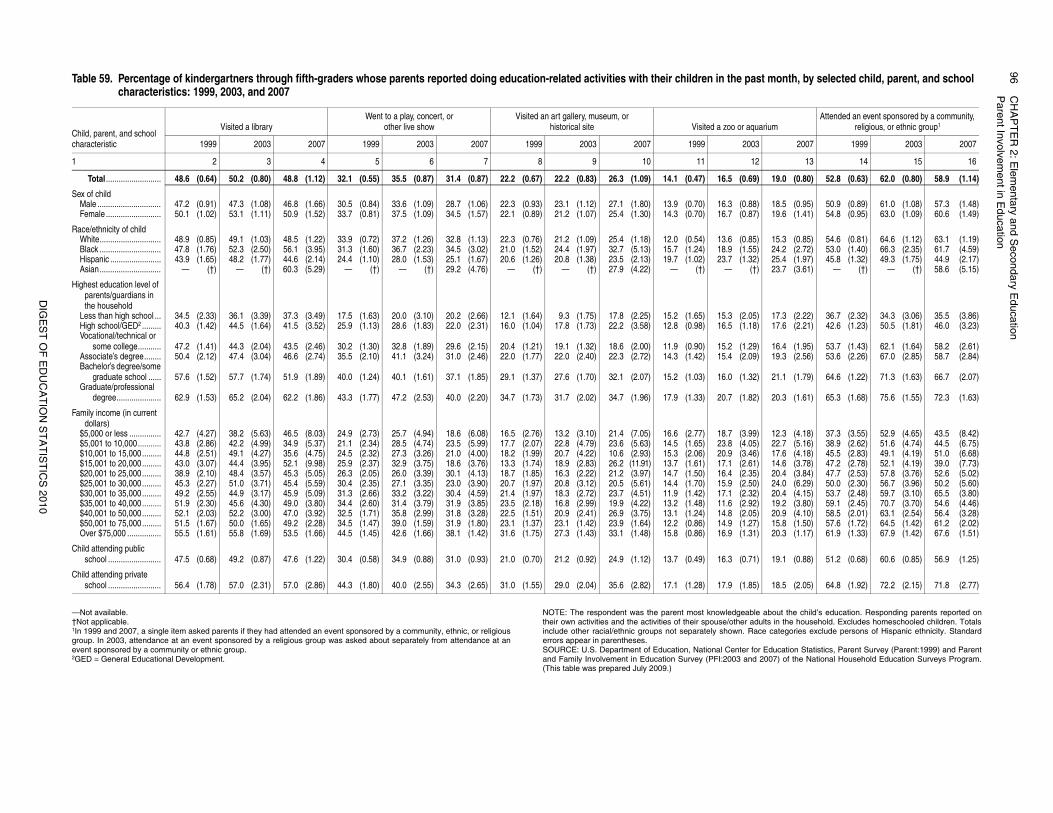
96
CH
AP
TE
R 2
: Ele
me
nta
ry an
d S
eco
nd
ary E
du
catio
nP
are
nt In
volve
me
nt in
Ed
uca
tion
DIG
ES
T O
F E
DU
CA
TIO
N S
TA
TIS
TIC
S 2
01
0
e about the child’s education. Responding parents reported ondults in the household. Excludes homeschooled children. Totalsce categories exclude persons of Hispanic ethnicity. Standard
r Education Statistics, Parent Survey (Parent:1999) and Parent 2007) of the National Household Education Surveys Program.
st month, by selected child, parent, and school
uariumAttended an event sponsored by a community,
religious, or ethnic group1
3 2007 1999 2003 2007
2 13 14 15 16
) 19.0 (0.80) 52.8 (0.63) 62.0 (0.80) 58.9 (1.14)
) 18.5 (0.95) 50.9 (0.89) 61.0 (1.08) 57.3 (1.48)) 19.6 (1.41) 54.8 (0.95) 63.0 (1.09) 60.6 (1.49)
) 15.3 (0.85) 54.6 (0.81) 64.6 (1.12) 63.1 (1.19)) 24.2 (2.72) 53.0 (1.40) 66.3 (2.35) 61.7 (4.59)) 25.4 (1.97) 45.8 (1.32) 49.3 (1.75) 44.9 (2.17)) 23.7 (3.61) — (†) — (†) 58.6 (5.15)
) 17.3 (2.22) 36.7 (2.32) 34.3 (3.06) 35.5 (3.86)) 17.6 (2.21) 42.6 (1.23) 50.5 (1.81) 46.0 (3.23)
) 16.4 (1.95) 53.7 (1.43) 62.1 (1.64) 58.2 (2.61)) 19.3 (2.56) 53.6 (2.26) 67.0 (2.85) 58.7 (2.84)
) 21.1 (1.79) 64.6 (1.22) 71.3 (1.63) 66.7 (2.07)
) 20.3 (1.61) 65.3 (1.68) 75.6 (1.55) 72.3 (1.63)
) 12.3 (4.18) 37.3 (3.55) 52.9 (4.65) 43.5 (8.42)) 22.7 (5.16) 38.9 (2.62) 51.6 (4.74) 44.5 (6.75)) 17.6 (4.18) 45.5 (2.83) 49.1 (4.19) 51.0 (6.68)) 14.6 (3.78) 47.2 (2.78) 52.1 (4.19) 39.0 (7.73)) 20.4 (3.84) 47.7 (2.53) 57.8 (3.76) 52.6 (5.02)) 24.0 (6.29) 50.0 (2.30) 56.7 (3.96) 50.2 (5.60)) 20.4 (4.15) 53.7 (2.48) 59.7 (3.10) 65.5 (3.80)) 19.2 (3.80) 59.1 (2.45) 70.7 (3.70) 54.6 (4.46)) 20.9 (4.10) 58.5 (2.01) 63.1 (2.54) 56.4 (3.28)) 15.8 (1.50) 57.6 (1.72) 64.5 (1.42) 61.2 (2.02)) 20.3 (1.17) 61.9 (1.33) 67.9 (1.42) 67.6 (1.51)
) 19.1 (0.88) 51.2 (0.68) 60.6 (0.85) 56.9 (1.25)
) 18.5 (2.05) 64.8 (1.92) 72.2 (2.15) 71.8 (2.77)
—Not available.†Not applicable.1In 1999 and 2007, a single item asked parents if they had attended an event sponsored by a community, ethnic, or religiousgroup. In 2003, attendance at an event sponsored by a religious group was asked about separately from attendance at anevent sponsored by a community or ethnic group.2GED = General Educational Development.
NOTE: The respondent was the parent most knowledgeabltheir own activities and the activities of their spouse/other ainclude other racial/ethnic groups not separately shown. Raerrors appear in parentheses.SOURCE: U.S. Department of Education, National Center foand Family Involvement in Education Survey (PFI:2003 and(This table was prepared July 2009.)
Table 59. Percentage of kindergartners through fifth-graders whose parents reported doing education-related activities with their children in the pacharacteristics: 1999, 2003, and 2007
Child, parent, and school characteristic
Visited a libraryWent to a play, concert, or
other live showVisited an art gallery, museum, or
historical site Visited a zoo or aq
1999 2003 2007 1999 2003 2007 1999 2003 2007 1999 200
1 2 3 4 5 6 7 8 9 10 11 1
Total .......................... 48.6 (0.64) 50.2 (0.80) 48.8 (1.12) 32.1 (0.55) 35.5 (0.87) 31.4 (0.87) 22.2 (0.67) 22.2 (0.83) 26.3 (1.09) 14.1 (0.47) 16.5 (0.69
Sex of childMale .............................. 47.2 (0.91) 47.3 (1.08) 46.8 (1.66) 30.5 (0.84) 33.6 (1.09) 28.7 (1.06) 22.3 (0.93) 23.1 (1.12) 27.1 (1.80) 13.9 (0.70) 16.3 (0.88Female .......................... 50.1 (1.02) 53.1 (1.11) 50.9 (1.52) 33.7 (0.81) 37.5 (1.09) 34.5 (1.57) 22.1 (0.89) 21.2 (1.07) 25.4 (1.30) 14.3 (0.70) 16.7 (0.87
Race/ethnicity of childWhite............................. 48.9 (0.85) 49.1 (1.03) 48.5 (1.22) 33.9 (0.72) 37.2 (1.26) 32.8 (1.13) 22.3 (0.76) 21.2 (1.09) 25.4 (1.18) 12.0 (0.54) 13.6 (0.85Black ............................. 47.8 (1.76) 52.3 (2.50) 56.1 (3.95) 31.3 (1.60) 36.7 (2.23) 34.5 (3.02) 21.0 (1.52) 24.4 (1.97) 32.7 (5.13) 15.7 (1.24) 18.9 (1.55Hispanic ........................ 43.9 (1.65) 48.2 (1.77) 44.6 (2.14) 24.4 (1.10) 28.0 (1.53) 25.1 (1.67) 20.6 (1.26) 20.8 (1.38) 23.5 (2.13) 19.7 (1.02) 23.7 (1.32Asian............................. — (†) — (†) 60.3 (5.29) — (†) — (†) 29.2 (4.76) — (†) — (†) 27.9 (4.22) — (†) — (†
Highest education level of parents/guardians in the household
Less than high school ... 34.5 (2.33) 36.1 (3.39) 37.3 (3.49) 17.5 (1.63) 20.0 (3.10) 20.2 (2.66) 12.1 (1.64) 9.3 (1.75) 17.8 (2.25) 15.2 (1.65) 15.3 (2.05High school/GED2 ......... 40.3 (1.42) 44.5 (1.64) 41.5 (3.52) 25.9 (1.13) 28.6 (1.83) 22.0 (2.31) 16.0 (1.04) 17.8 (1.73) 22.2 (3.58) 12.8 (0.98) 16.5 (1.18Vocational/technical or
some college........... 47.2 (1.41) 44.3 (2.04) 43.5 (2.46) 30.2 (1.30) 32.8 (1.89) 29.6 (2.15) 20.4 (1.21) 19.1 (1.32) 18.6 (2.00) 11.9 (0.90) 15.2 (1.29Associate’s degree........ 50.4 (2.12) 47.4 (3.04) 46.6 (2.74) 35.5 (2.10) 41.1 (3.24) 31.0 (2.46) 22.0 (1.77) 22.0 (2.40) 22.3 (2.72) 14.3 (1.42) 15.4 (2.09Bachelor’s degree/some
graduate school ...... 57.6 (1.52) 57.7 (1.74) 51.9 (1.89) 40.0 (1.24) 40.1 (1.61) 37.1 (1.85) 29.1 (1.37) 27.6 (1.70) 32.1 (2.07) 15.2 (1.03) 16.0 (1.32Graduate/professional
degree..................... 62.9 (1.53) 65.2 (2.04) 62.2 (1.86) 43.3 (1.77) 47.2 (2.53) 40.0 (2.20) 34.7 (1.73) 31.7 (2.02) 34.7 (1.96) 17.9 (1.33) 20.7 (1.82
Family income (in current dollars)
$5,000 or less ............... 42.7 (4.27) 38.2 (5.63) 46.5 (8.03) 24.9 (2.73) 25.7 (4.94) 18.6 (6.08) 16.5 (2.76) 13.2 (3.10) 21.4 (7.05) 16.6 (2.77) 18.7 (3.99$5,001 to 10,000........... 43.8 (2.86) 42.2 (4.99) 34.9 (5.37) 21.1 (2.34) 28.5 (4.74) 23.5 (5.99) 17.7 (2.07) 22.8 (4.79) 23.6 (5.63) 14.5 (1.65) 23.8 (4.05$10,001 to 15,000......... 44.8 (2.51) 49.1 (4.27) 35.6 (4.75) 24.5 (2.32) 27.3 (3.26) 21.0 (4.00) 18.2 (1.99) 20.7 (4.22) 10.6 (2.93) 15.3 (2.06) 20.9 (3.46$15,001 to 20,000......... 43.0 (3.07) 44.4 (3.95) 52.1 (9.98) 25.9 (2.37) 32.9 (3.75) 18.6 (3.76) 13.3 (1.74) 18.9 (2.83) 26.2 (11.91) 13.7 (1.61) 17.1 (2.61$20,001 to 25,000......... 38.9 (2.10) 48.4 (3.57) 45.3 (5.05) 26.3 (2.05) 26.0 (3.39) 30.1 (4.13) 18.7 (1.85) 16.3 (2.22) 21.2 (3.97) 14.7 (1.50) 16.4 (2.35$25,001 to 30,000......... 45.3 (2.27) 51.0 (3.71) 45.4 (5.59) 30.4 (2.35) 27.1 (3.35) 23.0 (3.90) 20.7 (1.97) 20.8 (3.12) 20.5 (5.61) 14.4 (1.70) 15.9 (2.50$30,001 to 35,000......... 49.2 (2.55) 44.9 (3.17) 45.9 (5.09) 31.3 (2.66) 33.2 (3.22) 30.4 (4.59) 21.4 (1.97) 18.3 (2.72) 23.7 (4.51) 11.9 (1.42) 17.1 (2.32$35,001 to 40,000......... 51.9 (2.30) 45.6 (4.30) 49.0 (3.80) 34.4 (2.60) 31.4 (3.79) 31.9 (3.85) 23.5 (2.18) 16.8 (2.99) 19.9 (4.22) 13.2 (1.48) 11.6 (2.92$40,001 to 50,000......... 52.1 (2.03) 52.2 (3.00) 47.0 (3.92) 32.5 (1.71) 35.8 (2.99) 31.8 (3.28) 22.5 (1.51) 20.9 (2.41) 26.9 (3.75) 13.1 (1.24) 14.8 (2.05$50,001 to 75,000......... 51.5 (1.67) 50.0 (1.65) 49.2 (2.28) 34.5 (1.47) 39.0 (1.59) 31.9 (1.80) 23.1 (1.37) 23.1 (1.42) 23.9 (1.64) 12.2 (0.86) 14.9 (1.27Over $75,000 ................ 55.5 (1.61) 55.8 (1.69) 53.5 (1.66) 44.5 (1.45) 42.6 (1.66) 38.1 (1.42) 31.6 (1.75) 27.3 (1.43) 33.1 (1.48) 15.8 (0.86) 16.9 (1.31
Child attending public school ......................... 47.5 (0.68) 49.2 (0.87) 47.6 (1.22) 30.4 (0.58) 34.9 (0.88) 31.0 (0.93) 21.0 (0.70) 21.2 (0.92) 24.9 (1.12) 13.7 (0.49) 16.3 (0.71
Child attending private school ......................... 56.4 (1.78) 57.0 (2.31) 57.0 (2.86) 44.3 (1.80) 40.0 (2.55) 34.3 (2.65) 31.0 (1.55) 29.0 (2.04) 35.6 (2.82) 17.1 (1.28) 17.9 (1.85
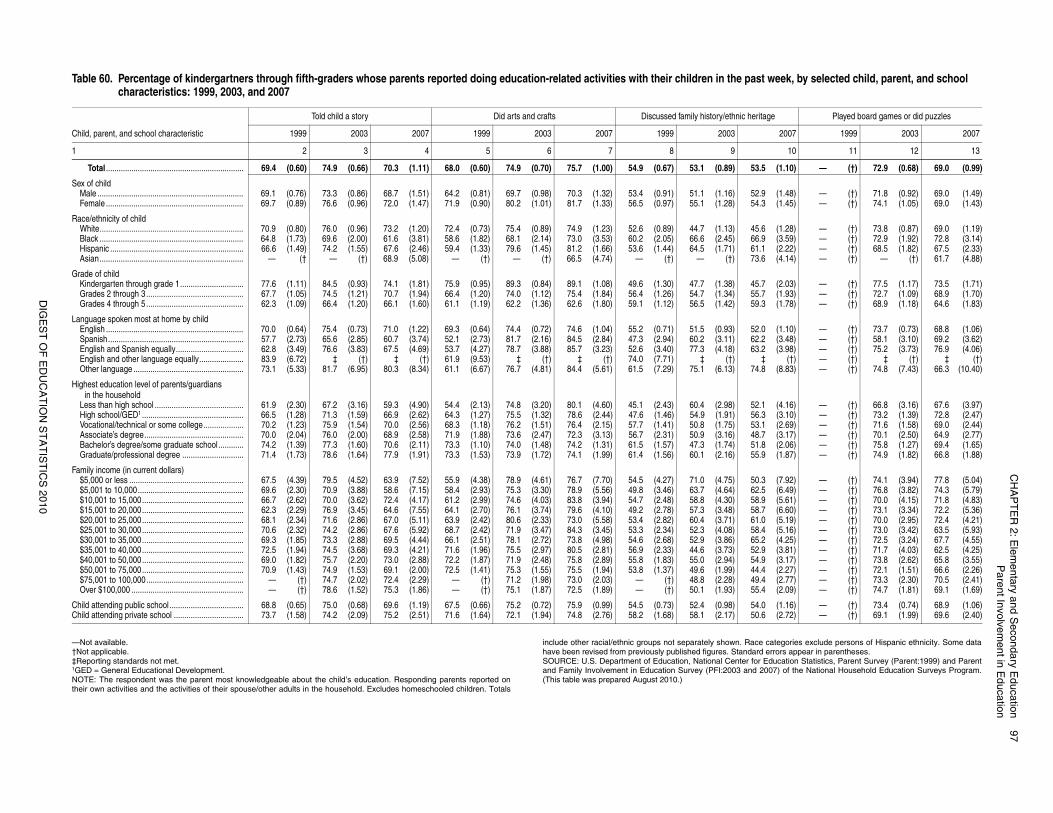
CH
AP
TE
R 2
: Ele
me
nta
ry an
d S
eco
nd
ary E
du
catio
n9
7P
are
nt In
volve
ment in
Ed
uca
tion
DIG
ES
T O
F E
DU
CA
TIO
N S
TA
TIS
TIC
S 2
01
0
ce categories exclude persons of Hispanic ethnicity. Some datard errors appear in parentheses.r Education Statistics, Parent Survey (Parent:1999) and Parent 2007) of the National Household Education Surveys Program.
st week, by selected child, parent, and school
ritage Played board games or did puzzles
2007 1999 2003 2007
10 11 12 13
3.5 (1.10) — (†) 72.9 (0.68) 69.0 (0.99)
2.9 (1.48) — (†) 71.8 (0.92) 69.0 (1.49)4.3 (1.45) — (†) 74.1 (1.05) 69.0 (1.43)
5.6 (1.28) — (†) 73.8 (0.87) 69.0 (1.19)6.9 (3.59) — (†) 72.9 (1.92) 72.8 (3.14)1.1 (2.22) — (†) 68.5 (1.82) 67.5 (2.33)3.6 (4.14) — (†) — (†) 61.7 (4.88)
5.7 (2.03) — (†) 77.5 (1.17) 73.5 (1.71)5.7 (1.93) — (†) 72.7 (1.09) 68.9 (1.70)9.3 (1.78) — (†) 68.9 (1.18) 64.6 (1.83)
2.0 (1.10) — (†) 73.7 (0.73) 68.8 (1.06)2.2 (3.48) — (†) 58.1 (3.10) 69.2 (3.62)3.2 (3.98) — (†) 75.2 (3.73) 76.9 (4.06)
‡ (†) — (†) ‡ (†) ‡ (†)4.8 (8.83) — (†) 74.8 (7.43) 66.3 (10.40)
2.1 (4.16) — (†) 66.8 (3.16) 67.6 (3.97)6.3 (3.10) — (†) 73.2 (1.39) 72.8 (2.47)3.1 (2.69) — (†) 71.6 (1.58) 69.0 (2.44)8.7 (3.17) — (†) 70.1 (2.50) 64.9 (2.77)1.8 (2.06) — (†) 75.8 (1.27) 69.4 (1.65)5.9 (1.87) — (†) 74.9 (1.82) 66.8 (1.88)
0.3 (7.92) — (†) 74.1 (3.94) 77.8 (5.04)2.5 (6.49) — (†) 76.8 (3.82) 74.3 (5.79)8.9 (5.61) — (†) 70.0 (4.15) 71.8 (4.83)8.7 (6.60) — (†) 73.1 (3.34) 72.2 (5.36)1.0 (5.19) — (†) 70.0 (2.95) 72.4 (4.21)8.4 (5.16) — (†) 73.0 (3.42) 63.5 (5.93)5.2 (4.25) — (†) 72.5 (3.24) 67.7 (4.55)2.9 (3.81) — (†) 71.7 (4.03) 62.5 (4.25)4.9 (3.17) — (†) 73.8 (2.62) 65.8 (3.55)4.4 (2.27) — (†) 72.1 (1.51) 66.6 (2.26)9.4 (2.77) — (†) 73.3 (2.30) 70.5 (2.41)5.4 (2.09) — (†) 74.7 (1.81) 69.1 (1.69)
4.0 (1.16) — (†) 73.4 (0.74) 68.9 (1.06)0.6 (2.72) — (†) 69.1 (1.99) 69.6 (2.40)
—Not available.†Not applicable.‡Reporting standards not met.1GED = General Educational Development.NOTE: The respondent was the parent most knowledgeable about the child’s education. Responding parents reported ontheir own activities and the activities of their spouse/other adults in the household. Excludes homeschooled children. Totals
include other racial/ethnic groups not separately shown. Rahave been revised from previously published figures. StandaSOURCE: U.S. Department of Education, National Center foand Family Involvement in Education Survey (PFI:2003 and(This table was prepared August 2010.)
Table 60. Percentage of kindergartners through fifth-graders whose parents reported doing education-related activities with their children in the pacharacteristics: 1999, 2003, and 2007
Child, parent, and school characteristic
Told child a story Did arts and crafts Discussed family history/ethnic he
1999 2003 2007 1999 2003 2007 1999 2003
1 2 3 4 5 6 7 8 9
Total ................................................................. 69.4 (0.60) 74.9 (0.66) 70.3 (1.11) 68.0 (0.60) 74.9 (0.70) 75.7 (1.00) 54.9 (0.67) 53.1 (0.89) 5
Sex of childMale ..................................................................... 69.1 (0.76) 73.3 (0.86) 68.7 (1.51) 64.2 (0.81) 69.7 (0.98) 70.3 (1.32) 53.4 (0.91) 51.1 (1.16) 5Female ................................................................. 69.7 (0.89) 76.6 (0.96) 72.0 (1.47) 71.9 (0.90) 80.2 (1.01) 81.7 (1.33) 56.5 (0.97) 55.1 (1.28) 5
Race/ethnicity of childWhite.................................................................... 70.9 (0.80) 76.0 (0.96) 73.2 (1.20) 72.4 (0.73) 75.4 (0.89) 74.9 (1.23) 52.6 (0.89) 44.7 (1.13) 4Black .................................................................... 64.8 (1.73) 69.6 (2.00) 61.6 (3.81) 58.6 (1.82) 68.1 (2.14) 73.0 (3.53) 60.2 (2.05) 66.6 (2.45) 6Hispanic ............................................................... 66.6 (1.49) 74.2 (1.55) 67.6 (2.46) 59.4 (1.33) 79.6 (1.45) 81.2 (1.66) 53.6 (1.44) 64.5 (1.71) 6Asian.................................................................... — († — (†) 68.9 (5.08) — (†) — (†) 66.5 (4.74) — (†) — (†) 7
Grade of childKindergarten through grade 1.............................. 77.6 (1.11) 84.5 (0.93) 74.1 (1.81) 75.9 (0.95) 89.3 (0.84) 89.1 (1.08) 49.6 (1.30) 47.7 (1.38) 4Grades 2 through 3.............................................. 67.7 (1.05) 74.5 (1.21) 70.7 (1.94) 66.4 (1.20) 74.0 (1.12) 75.4 (1.84) 56.4 (1.26) 54.7 (1.34) 5Grades 4 through 5.............................................. 62.3 (1.09) 66.4 (1.20) 66.1 (1.60) 61.1 (1.19) 62.2 (1.36) 62.6 (1.80) 59.1 (1.12) 56.5 (1.42) 5
Language spoken most at home by childEnglish ................................................................. 70.0 (0.64) 75.4 (0.73) 71.0 (1.22) 69.3 (0.64) 74.4 (0.72) 74.6 (1.04) 55.2 (0.71) 51.5 (0.93) 5Spanish................................................................ 57.7 (2.73) 65.6 (2.85) 60.7 (3.74) 52.1 (2.73) 81.7 (2.16) 84.5 (2.84) 47.3 (2.94) 60.2 (3.11) 6English and Spanish equally................................ 62.8 (3.49) 76.6 (3.83) 67.5 (4.69) 53.7 (4.27) 78.7 (3.88) 85.7 (3.23) 52.6 (3.40) 77.3 (4.18) 6English and other language equally..................... 83.9 (6.72) ‡ (†) ‡ (†) 61.9 (9.53) ‡ (†) ‡ (†) 74.0 (7.71) ‡ (†)Other language .................................................... 73.1 (5.33) 81.7 (6.95) 80.3 (8.34) 61.1 (6.67) 76.7 (4.81) 84.4 (5.61) 61.5 (7.29) 75.1 (6.13) 7
Highest education level of parents/guardians in the household
Less than high school .......................................... 61.9 (2.30) 67.2 (3.16) 59.3 (4.90) 54.4 (2.13) 74.8 (3.20) 80.1 (4.60) 45.1 (2.43) 60.4 (2.98) 5High school/GED1 ................................................ 66.5 (1.28) 71.3 (1.59) 66.9 (2.62) 64.3 (1.27) 75.5 (1.32) 78.6 (2.44) 47.6 (1.46) 54.9 (1.91) 5Vocational/technical or some college................... 70.2 (1.23) 75.9 (1.54) 70.0 (2.56) 68.3 (1.18) 76.2 (1.51) 76.4 (2.15) 57.7 (1.41) 50.8 (1.75) 5Associate’s degree............................................... 70.0 (2.04) 76.0 (2.00) 68.9 (2.58) 71.9 (1.88) 73.6 (2.47) 72.3 (3.13) 56.7 (2.31) 50.9 (3.16) 4Bachelor’s degree/some graduate school............ 74.2 (1.39) 77.3 (1.60) 70.6 (2.11) 73.3 (1.10) 74.0 (1.48) 74.2 (1.31) 61.5 (1.57) 47.3 (1.74) 5Graduate/professional degree ............................. 71.4 (1.73) 78.6 (1.64) 77.9 (1.91) 73.3 (1.53) 73.9 (1.72) 74.1 (1.99) 61.4 (1.56) 60.1 (2.16) 5
Family income (in current dollars)$5,000 or less ...................................................... 67.5 (4.39) 79.5 (4.52) 63.9 (7.52) 55.9 (4.38) 78.9 (4.61) 76.7 (7.70) 54.5 (4.27) 71.0 (4.75) 5$5,001 to 10,000.................................................. 69.6 (2.30) 70.9 (3.88) 58.6 (7.15) 58.4 (2.93) 75.3 (3.30) 78.9 (5.56) 49.8 (3.46) 63.7 (4.64) 6$10,001 to 15,000................................................ 66.7 (2.62) 70.0 (3.62) 72.4 (4.17) 61.2 (2.99) 74.6 (4.03) 83.8 (3.94) 54.7 (2.48) 58.8 (4.30) 5$15,001 to 20,000................................................ 62.3 (2.29) 76.9 (3.45) 64.6 (7.55) 64.1 (2.70) 76.1 (3.74) 79.6 (4.10) 49.2 (2.78) 57.3 (3.48) 5$20,001 to 25,000................................................ 68.1 (2.34) 71.6 (2.86) 67.0 (5.11) 63.9 (2.42) 80.6 (2.33) 73.0 (5.58) 53.4 (2.82) 60.4 (3.71) 6$25,001 to 30,000................................................ 70.6 (2.32) 74.2 (2.86) 67.6 (5.92) 68.7 (2.42) 71.9 (3.47) 84.3 (3.45) 53.3 (2.34) 52.3 (4.08) 5$30,001 to 35,000................................................ 69.3 (1.85) 73.3 (2.88) 69.5 (4.44) 66.1 (2.51) 78.1 (2.72) 73.8 (4.98) 54.6 (2.68) 52.9 (3.86) 6$35,001 to 40,000................................................ 72.5 (1.94) 74.5 (3.68) 69.3 (4.21) 71.6 (1.96) 75.5 (2.97) 80.5 (2.81) 56.9 (2.33) 44.6 (3.73) 5$40,001 to 50,000................................................ 69.0 (1.82) 75.7 (2.20) 73.0 (2.88) 72.2 (1.87) 71.9 (2.48) 75.8 (2.89) 55.8 (1.83) 55.0 (2.94) 5$50,001 to 75,000................................................ 70.9 (1.43) 74.9 (1.53) 69.1 (2.00) 72.5 (1.41) 75.3 (1.55) 75.5 (1.94) 53.8 (1.37) 49.6 (1.99) 4$75,001 to 100,000.............................................. — (†) 74.7 (2.02) 72.4 (2.29) — (†) 71.2 (1.98) 73.0 (2.03) — (†) 48.8 (2.28) 4Over $100,000 ..................................................... — (†) 78.6 (1.52) 75.3 (1.86) — (†) 75.1 (1.87) 72.5 (1.89) — (†) 50.1 (1.93) 5
Child attending public school ................................... 68.8 (0.65) 75.0 (0.68) 69.6 (1.19) 67.5 (0.66) 75.2 (0.72) 75.9 (0.99) 54.5 (0.73) 52.4 (0.98) 5Child attending private school ................................. 73.7 (1.58) 74.2 (2.09) 75.2 (2.51) 71.6 (1.64) 72.1 (1.94) 74.8 (2.76) 58.2 (1.68) 58.1 (2.17) 5
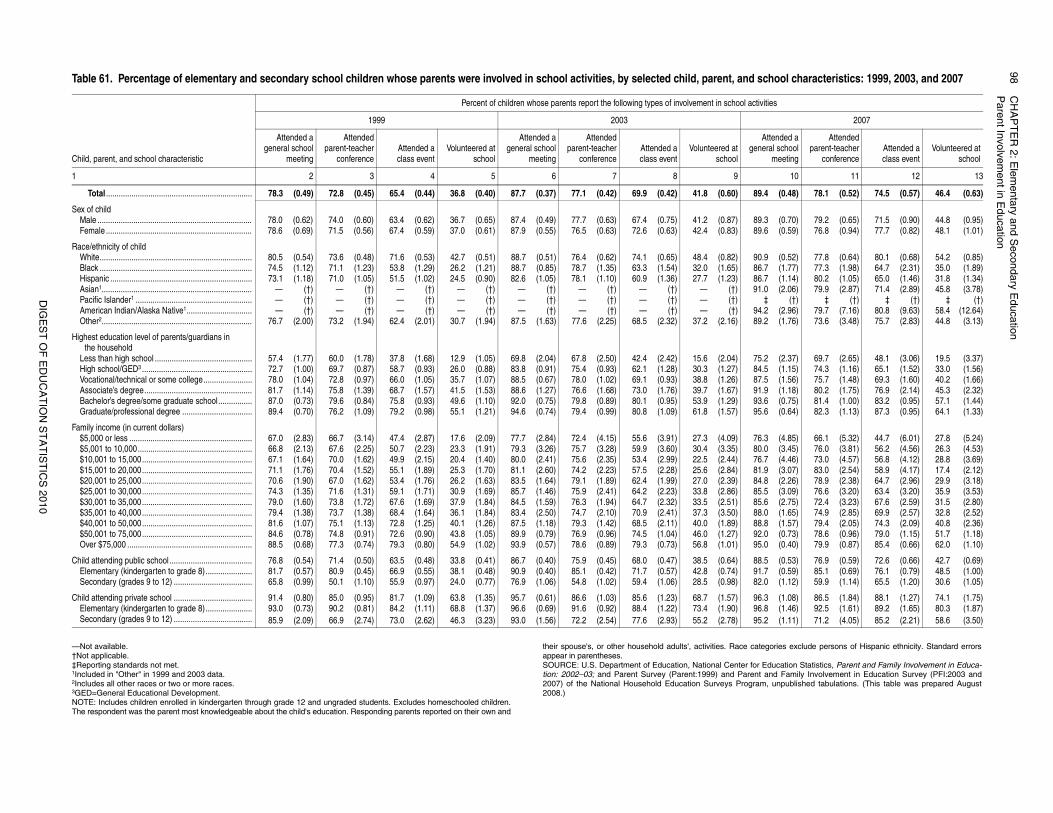
98
CH
AP
TE
R 2
: Ele
me
nta
ry an
d S
eco
nd
ary E
du
catio
nP
are
nt In
volve
me
nt in
Ed
uca
tion
DIG
ES
T O
F E
DU
CA
TIO
N S
TA
TIS
TIC
S 2
01
0
ategories exclude persons of Hispanic ethnicity. Standard errors
r Education Statistics, Parent and Family Involvement in Educa-nt and Family Involvement in Education Survey (PFI:2003 andam, unpublished tabulations. (This table was prepared August
school characteristics: 1999, 2003, and 2007
tivities
2007
Attended aneral school
meeting
Attendedparent-teacher
conferenceAttended aclass event
Volunteered atschool
10 11 12 13
9.4 (0.48) 78.1 (0.52) 74.5 (0.57) 46.4 (0.63)
9.3 (0.70) 79.2 (0.65) 71.5 (0.90) 44.8 (0.95)9.6 (0.59) 76.8 (0.94) 77.7 (0.82) 48.1 (1.01)
0.9 (0.52) 77.8 (0.64) 80.1 (0.68) 54.2 (0.85)6.7 (1.77) 77.3 (1.98) 64.7 (2.31) 35.0 (1.89)6.7 (1.14) 80.2 (1.05) 65.0 (1.46) 31.8 (1.34)1.0 (2.06) 79.9 (2.87) 71.4 (2.89) 45.8 (3.78)
‡ (†) ‡ (†) ‡ (†) ‡ (†)4.2 (2.96) 79.7 (7.16) 80.8 (9.63) 58.4 (12.64)9.2 (1.76) 73.6 (3.48) 75.7 (2.83) 44.8 (3.13)
5.2 (2.37) 69.7 (2.65) 48.1 (3.06) 19.5 (3.37)4.5 (1.15) 74.3 (1.16) 65.1 (1.52) 33.0 (1.56)7.5 (1.56) 75.7 (1.48) 69.3 (1.60) 40.2 (1.66)1.9 (1.18) 80.2 (1.75) 76.9 (2.14) 45.3 (2.32)3.6 (0.75) 81.4 (1.00) 83.2 (0.95) 57.1 (1.44)5.6 (0.64) 82.3 (1.13) 87.3 (0.95) 64.1 (1.33)
6.3 (4.85) 66.1 (5.32) 44.7 (6.01) 27.8 (5.24)0.0 (3.45) 76.0 (3.81) 56.2 (4.56) 26.3 (4.53)6.7 (4.46) 73.0 (4.57) 56.8 (4.12) 28.8 (3.69)1.9 (3.07) 83.0 (2.54) 58.9 (4.17) 17.4 (2.12)4.8 (2.26) 78.9 (2.38) 64.7 (2.96) 29.9 (3.18)5.5 (3.09) 76.6 (3.20) 63.4 (3.20) 35.9 (3.53)5.6 (2.75) 72.4 (3.23) 67.6 (2.59) 31.5 (2.80)8.0 (1.65) 74.9 (2.85) 69.9 (2.57) 32.8 (2.52)8.8 (1.57) 79.4 (2.05) 74.3 (2.09) 40.8 (2.36)2.0 (0.73) 78.6 (0.96) 79.0 (1.15) 51.7 (1.18)5.0 (0.40) 79.9 (0.87) 85.4 (0.66) 62.0 (1.10)
8.5 (0.53) 76.9 (0.59) 72.6 (0.66) 42.7 (0.69)1.7 (0.59) 85.1 (0.69) 76.1 (0.79) 48.5 (1.00)2.0 (1.12) 59.9 (1.14) 65.5 (1.20) 30.6 (1.05)
6.3 (1.08) 86.5 (1.84) 88.1 (1.27) 74.1 (1.75)6.8 (1.46) 92.5 (1.61) 89.2 (1.65) 80.3 (1.87)5.2 (1.11) 71.2 (4.05) 85.2 (2.21) 58.6 (3.50)
—Not available. †Not applicable.‡Reporting standards not met.1Included in "Other" in 1999 and 2003 data. 2Includes all other races or two or more races. 3GED=General Educational Development. NOTE: Includes children enrolled in kindergarten through grade 12 and ungraded students. Excludes homeschooled children.The respondent was the parent most knowledgeable about the child's education. Responding parents reported on their own and
their spouse's, or other household adults', activities. Race cappear in parentheses. SOURCE: U.S. Department of Education, National Center fotion: 2002–03; and Parent Survey (Parent:1999) and Pare2007) of the National Household Education Surveys Progr2008.)
Table 61. Percentage of elementary and secondary school children whose parents were involved in school activities, by selected child, parent, and
Child, parent, and school characteristic
Percent of children whose parents report the following types of involvement in school ac
1999 2003
Attended ageneral school
meeting
Attendedparent-teacher
conferenceAttended aclass event
Volunteered atschool
Attended ageneral school
meeting
Attendedparent-teacher
conferenceAttended aclass event
Volunteered atschool
ge
1 2 3 4 5 6 7 8 9
Total ..................................................................... 78.3 (0.49) 72.8 (0.45) 65.4 (0.44) 36.8 (0.40) 87.7 (0.37) 77.1 (0.42) 69.9 (0.42) 41.8 (0.60) 8
Sex of childMale ......................................................................... 78.0 (0.62) 74.0 (0.60) 63.4 (0.62) 36.7 (0.65) 87.4 (0.49) 77.7 (0.63) 67.4 (0.75) 41.2 (0.87) 8Female ..................................................................... 78.6 (0.69) 71.5 (0.56) 67.4 (0.59) 37.0 (0.61) 87.9 (0.55) 76.5 (0.63) 72.6 (0.63) 42.4 (0.83) 8
Race/ethnicity of childWhite........................................................................ 80.5 (0.54) 73.6 (0.48) 71.6 (0.53) 42.7 (0.51) 88.7 (0.51) 76.4 (0.62) 74.1 (0.65) 48.4 (0.82) 9Black ........................................................................ 74.5 (1.12) 71.1 (1.23) 53.8 (1.29) 26.2 (1.21) 88.7 (0.85) 78.7 (1.35) 63.3 (1.54) 32.0 (1.65) 8Hispanic ................................................................... 73.1 (1.18) 71.0 (1.05) 51.5 (1.02) 24.5 (0.90) 82.6 (1.05) 78.1 (1.10) 60.9 (1.36) 27.7 (1.23) 8Asian1....................................................................... — (†) — (†) — (†) — (†) — (†) — (†) — (†) — (†) 9Pacific Islander1 ....................................................... — (†) — (†) — (†) — (†) — (†) — (†) — (†) — (†)American Indian/Alaska Native1............................... — (†) — (†) — (†) — (†) — (†) — (†) — (†) — (†) 9Other2....................................................................... 76.7 (2.00) 73.2 (1.94) 62.4 (2.01) 30.7 (1.94) 87.5 (1.63) 77.6 (2.25) 68.5 (2.32) 37.2 (2.16) 8
Highest education level of parents/guardians in the household
Less than high school .............................................. 57.4 (1.77) 60.0 (1.78) 37.8 (1.68) 12.9 (1.05) 69.8 (2.04) 67.8 (2.50) 42.4 (2.42) 15.6 (2.04) 7High school/GED3 .................................................... 72.7 (1.00) 69.7 (0.87) 58.7 (0.93) 26.0 (0.88) 83.8 (0.91) 75.4 (0.93) 62.1 (1.28) 30.3 (1.27) 8Vocational/technical or some college....................... 78.0 (1.04) 72.8 (0.97) 66.0 (1.05) 35.7 (1.07) 88.5 (0.67) 78.0 (1.02) 69.1 (0.93) 38.8 (1.26) 8Associate’s degree................................................... 81.7 (1.14) 75.8 (1.39) 68.7 (1.57) 41.5 (1.53) 88.6 (1.27) 76.6 (1.68) 73.0 (1.76) 39.7 (1.67) 9Bachelor’s degree/some graduate school................ 87.0 (0.73) 79.6 (0.84) 75.8 (0.93) 49.6 (1.10) 92.0 (0.75) 79.8 (0.89) 80.1 (0.95) 53.9 (1.29) 9Graduate/professional degree ................................. 89.4 (0.70) 76.2 (1.09) 79.2 (0.98) 55.1 (1.21) 94.6 (0.74) 79.4 (0.99) 80.8 (1.09) 61.8 (1.57) 9
Family income (in current dollars)$5,000 or less .......................................................... 67.0 (2.83) 66.7 (3.14) 47.4 (2.87) 17.6 (2.09) 77.7 (2.84) 72.4 (4.15) 55.6 (3.91) 27.3 (4.09) 7$5,001 to 10,000...................................................... 66.8 (2.13) 67.6 (2.25) 50.7 (2.23) 23.3 (1.91) 79.3 (3.26) 75.7 (3.28) 59.9 (3.60) 30.4 (3.35) 8$10,001 to 15,000.................................................... 67.1 (1.64) 70.0 (1.62) 49.9 (2.15) 20.4 (1.40) 80.0 (2.41) 75.6 (2.35) 53.4 (2.99) 22.5 (2.44) 7$15,001 to 20,000.................................................... 71.1 (1.76) 70.4 (1.52) 55.1 (1.89) 25.3 (1.70) 81.1 (2.60) 74.2 (2.23) 57.5 (2.28) 25.6 (2.84) 8$20,001 to 25,000.................................................... 70.6 (1.90) 67.0 (1.62) 53.4 (1.76) 26.2 (1.63) 83.5 (1.64) 79.1 (1.89) 62.4 (1.99) 27.0 (2.39) 8$25,001 to 30,000.................................................... 74.3 (1.35) 71.6 (1.31) 59.1 (1.71) 30.9 (1.69) 85.7 (1.46) 75.9 (2.41) 64.2 (2.23) 33.8 (2.86) 8$30,001 to 35,000.................................................... 79.0 (1.60) 73.8 (1.72) 67.6 (1.69) 37.9 (1.84) 84.5 (1.59) 76.3 (1.94) 64.7 (2.32) 33.5 (2.51) 8$35,001 to 40,000.................................................... 79.4 (1.38) 73.7 (1.38) 68.4 (1.64) 36.1 (1.84) 83.4 (2.50) 74.7 (2.10) 70.9 (2.41) 37.3 (3.50) 8$40,001 to 50,000.................................................... 81.6 (1.07) 75.1 (1.13) 72.8 (1.25) 40.1 (1.26) 87.5 (1.18) 79.3 (1.42) 68.5 (2.11) 40.0 (1.89) 8$50,001 to 75,000.................................................... 84.6 (0.78) 74.8 (0.91) 72.6 (0.90) 43.8 (1.05) 89.9 (0.79) 76.9 (0.96) 74.5 (1.04) 46.0 (1.27) 9Over $75,000 ........................................................... 88.5 (0.68) 77.3 (0.74) 79.3 (0.80) 54.9 (1.02) 93.9 (0.57) 78.6 (0.89) 79.3 (0.73) 56.8 (1.01) 9
Child attending public school ....................................... 76.8 (0.54) 71.4 (0.50) 63.5 (0.48) 33.8 (0.41) 86.7 (0.40) 75.9 (0.45) 68.0 (0.47) 38.5 (0.64) 8Elementary (kindergarten to grade 8)...................... 81.7 (0.57) 80.9 (0.45) 66.9 (0.55) 38.1 (0.48) 90.9 (0.40) 85.1 (0.42) 71.7 (0.57) 42.8 (0.74) 9Secondary (grades 9 to 12) ..................................... 65.8 (0.99) 50.1 (1.10) 55.9 (0.97) 24.0 (0.77) 76.9 (1.06) 54.8 (1.02) 59.4 (1.06) 28.5 (0.98) 8
Child attending private school ..................................... 91.4 (0.80) 85.0 (0.95) 81.7 (1.09) 63.8 (1.35) 95.7 (0.61) 86.6 (1.03) 85.6 (1.23) 68.7 (1.57) 9Elementary (kindergarten to grade 8)...................... 93.0 (0.73) 90.2 (0.81) 84.2 (1.11) 68.8 (1.37) 96.6 (0.69) 91.6 (0.92) 88.4 (1.22) 73.4 (1.90) 9Secondary (grades 9 to 12) ..................................... 85.9 (2.09) 66.9 (2.74) 73.0 (2.62) 46.3 (3.23) 93.0 (1.56) 72.2 (2.54) 77.6 (2.93) 55.2 (2.78) 9
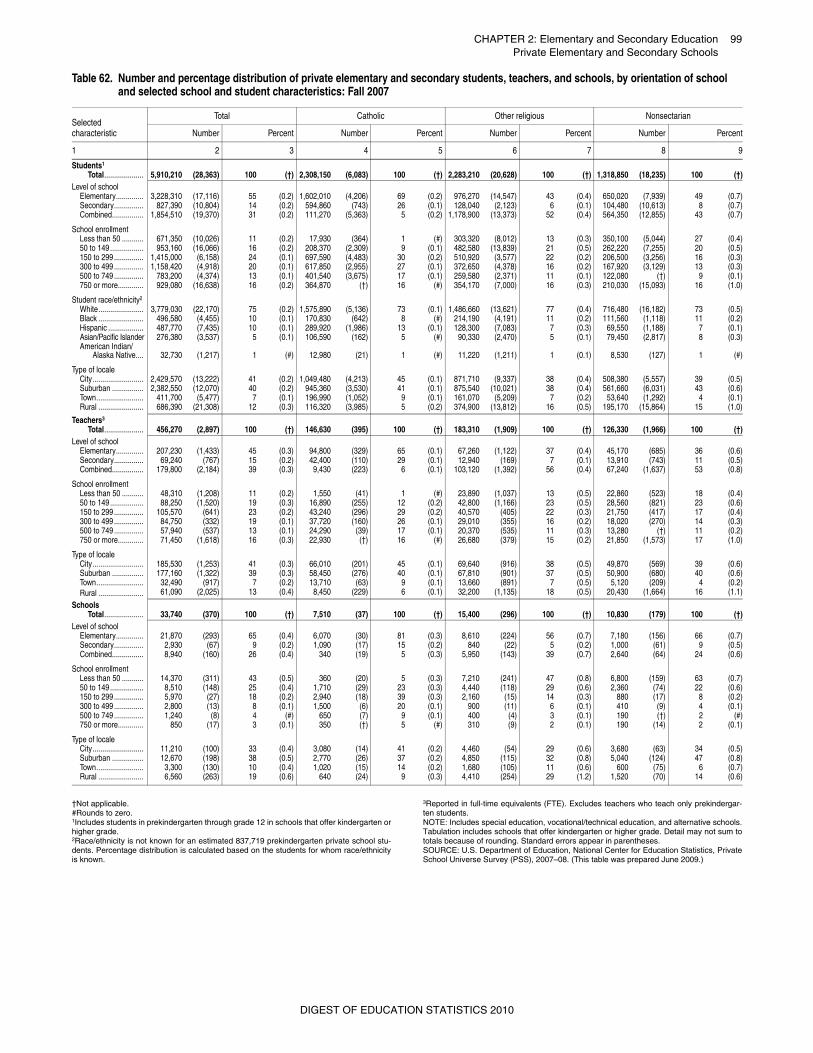
CHAPTER 2: Elementary and Secondary Education 99Private Elementary and Secondary Schools
Elementary and Secondary Schools
Private†Not applicable.#Rounds to zero.1Includes students in prekindergarten through grade 12 in schools that offer kindergarten orhigher grade.2Race/ethnicity is not known for an estimated 837,719 prekindergarten private school stu-dents. Percentage distribution is calculated based on the students for whom race/ethnicityis known.
3Reported in full-time equivalents (FTE). Excludes teachers who teach only prekindergar-ten students.NOTE: Includes special education, vocational/technical education, and alternative schools.Tabulation includes schools that offer kindergarten or higher grade. Detail may not sum tototals because of rounding. Standard errors appear in parentheses.SOURCE: U.S. Department of Education, National Center for Education Statistics, PrivateSchool Universe Survey (PSS), 2007–08. (This table was prepared June 2009.)
Table 62. Number and percentage distribution of private elementary and secondary students, teachers, and schools, by orientation of school and selected school and student characteristics: Fall 2007
Selected characteristic
Total Catholic Other religious Nonsectarian
Number Percent Number Percent Number Percent Number Percent
1 2 3 4 5 6 7 8 9
Students1
Total.................... 5,910,210 (28,363) 100 (†) 2,308,150 (6,083) 100 (†) 2,283,210 (20,628) 100 (†) 1,318,850 (18,235) 100 (†)Level of school
Elementary.............. 3,228,310 (17,116) 55 (0.2) 1,602,010 (4,206) 69 (0.2) 976,270 (14,547) 43 (0.4) 650,020 (7,939) 49 (0.7)Secondary............... 827,390 (10,804) 14 (0.2) 594,860 (743) 26 (0.1) 128,040 (2,123) 6 (0.1) 104,480 (10,613) 8 (0.7)Combined................ 1,854,510 (19,370) 31 (0.2) 111,270 (5,363) 5 (0.2) 1,178,900 (13,373) 52 (0.4) 564,350 (12,855) 43 (0.7)
School enrollmentLess than 50 ........... 671,350 (10,026) 11 (0.2) 17,930 (364) 1 (#) 303,320 (8,012) 13 (0.3) 350,100 (5,044) 27 (0.4)50 to 149................. 953,160 (16,066) 16 (0.2) 208,370 (2,309) 9 (0.1) 482,580 (13,839) 21 (0.5) 262,220 (7,255) 20 (0.5)150 to 299 ............... 1,415,000 (6,158) 24 (0.1) 697,590 (4,483) 30 (0.2) 510,920 (3,577) 22 (0.2) 206,500 (3,256) 16 (0.3)300 to 499 ............... 1,158,420 (4,918) 20 (0.1) 617,850 (2,955) 27 (0.1) 372,650 (4,378) 16 (0.2) 167,920 (3,129) 13 (0.3)500 to 749............... 783,200 (4,374) 13 (0.1) 401,540 (3,675) 17 (0.1) 259,580 (2,371) 11 (0.1) 122,080 (†) 9 (0.1)750 or more............. 929,080 (16,638) 16 (0.2) 364,870 (†) 16 (#) 354,170 (7,000) 16 (0.3) 210,030 (15,093) 16 (1.0)
Student race/ethnicity2
White....................... 3,779,030 (22,170) 75 (0.2) 1,575,890 (5,136) 73 (0.1) 1,486,660 (13,621) 77 (0.4) 716,480 (16,182) 73 (0.5)Black ....................... 496,580 (4,455) 10 (0.1) 170,830 (642) 8 (#) 214,190 (4,191) 11 (0.2) 111,560 (1,118) 11 (0.2)Hispanic .................. 487,770 (7,435) 10 (0.1) 289,920 (1,986) 13 (0.1) 128,300 (7,083) 7 (0.3) 69,550 (1,188) 7 (0.1)Asian/Pacific Islander 276,380 (3,537) 5 (0.1) 106,590 (162) 5 (#) 90,330 (2,470) 5 (0.1) 79,450 (2,817) 8 (0.3)American Indian/
Alaska Native.... 32,730 (1,217) 1 (#) 12,980 (21) 1 (#) 11,220 (1,211) 1 (0.1) 8,530 (127) 1 (#)
Type of localeCity.......................... 2,429,570 (13,222) 41 (0.2) 1,049,480 (4,213) 45 (0.1) 871,710 (9,337) 38 (0.4) 508,380 (5,557) 39 (0.5)Suburban ................ 2,382,550 (12,070) 40 (0.2) 945,360 (3,530) 41 (0.1) 875,540 (10,021) 38 (0.4) 561,660 (6,031) 43 (0.6)Town........................ 411,700 (5,477) 7 (0.1) 196,990 (1,052) 9 (0.1) 161,070 (5,209) 7 (0.2) 53,640 (1,292) 4 (0.1)Rural ....................... 686,390 (21,308) 12 (0.3) 116,320 (3,985) 5 (0.2) 374,900 (13,812) 16 (0.5) 195,170 (15,864) 15 (1.0)
Teachers3
Total.................... 456,270 (2,897) 100 (†) 146,630 (395) 100 (†) 183,310 (1,909) 100 (†) 126,330 (1,966) 100 (†)Level of school
Elementary.............. 207,230 (1,433) 45 (0.3) 94,800 (329) 65 (0.1) 67,260 (1,122) 37 (0.4) 45,170 (685) 36 (0.6)Secondary............... 69,240 (767) 15 (0.2) 42,400 (110) 29 (0.1) 12,940 (169) 7 (0.1) 13,910 (743) 11 (0.5)Combined................ 179,800 (2,184) 39 (0.3) 9,430 (223) 6 (0.1) 103,120 (1,392) 56 (0.4) 67,240 (1,637) 53 (0.8)
School enrollmentLess than 50 ........... 48,310 (1,208) 11 (0.2) 1,550 (41) 1 (#) 23,890 (1,037) 13 (0.5) 22,860 (523) 18 (0.4)50 to 149................. 88,250 (1,520) 19 (0.3) 16,890 (255) 12 (0.2) 42,800 (1,166) 23 (0.5) 28,560 (821) 23 (0.6)150 to 299............... 105,570 (641) 23 (0.2) 43,240 (296) 29 (0.2) 40,570 (405) 22 (0.3) 21,750 (417) 17 (0.4)300 to 499............... 84,750 (332) 19 (0.1) 37,720 (160) 26 (0.1) 29,010 (355) 16 (0.2) 18,020 (270) 14 (0.3)500 to 749............... 57,940 (537) 13 (0.1) 24,290 (39) 17 (0.1) 20,370 (535) 11 (0.3) 13,280 (†) 11 (0.2)750 or more............. 71,450 (1,618) 16 (0.3) 22,930 (†) 16 (#) 26,680 (379) 15 (0.2) 21,850 (1,573) 17 (1.0)
Type of localeCity.......................... 185,530 (1,253) 41 (0.3) 66,010 (201) 45 (0.1) 69,640 (916) 38 (0.5) 49,870 (569) 39 (0.6)Suburban ................ 177,160 (1,322) 39 (0.3) 58,450 (276) 40 (0.1) 67,810 (901) 37 (0.5) 50,900 (680) 40 (0.6)Town........................ 32,490 (917) 7 (0.2) 13,710 (63) 9 (0.1) 13,660 (891) 7 (0.5) 5,120 (209) 4 (0.2)Rural ....................... 61,090 (2,025) 13 (0.4) 8,450 (229) 6 (0.1) 32,200 (1,135) 18 (0.5) 20,430 (1,664) 16 (1.1)
SchoolsTotal.................... 33,740 (370) 100 (†) 7,510 (37) 100 (†) 15,400 (296) 100 (†) 10,830 (179) 100 (†)
Level of schoolElementary.............. 21,870 (293) 65 (0.4) 6,070 (30) 81 (0.3) 8,610 (224) 56 (0.7) 7,180 (156) 66 (0.7)Secondary............... 2,930 (67) 9 (0.2) 1,090 (17) 15 (0.2) 840 (22) 5 (0.2) 1,000 (61) 9 (0.5)Combined................ 8,940 (160) 26 (0.4) 340 (19) 5 (0.3) 5,950 (143) 39 (0.7) 2,640 (64) 24 (0.6)
School enrollmentLess than 50 ........... 14,370 (311) 43 (0.5) 360 (20) 5 (0.3) 7,210 (241) 47 (0.8) 6,800 (159) 63 (0.7)50 to 149................. 8,510 (148) 25 (0.4) 1,710 (29) 23 (0.3) 4,440 (118) 29 (0.6) 2,360 (74) 22 (0.6)150 to 299............... 5,970 (27) 18 (0.2) 2,940 (18) 39 (0.3) 2,160 (15) 14 (0.3) 880 (17) 8 (0.2)300 to 499............... 2,800 (13) 8 (0.1) 1,500 (6) 20 (0.1) 900 (11) 6 (0.1) 410 (9) 4 (0.1)500 to 749 ............... 1,240 (8) 4 (#) 650 (7) 9 (0.1) 400 (4) 3 (0.1) 190 (†) 2 (#)750 or more............. 850 (17) 3 (0.1) 350 (†) 5 (#) 310 (9) 2 (0.1) 190 (14) 2 (0.1)
Type of localeCity.......................... 11,210 (100) 33 (0.4) 3,080 (14) 41 (0.2) 4,460 (54) 29 (0.6) 3,680 (63) 34 (0.5)Suburban ................ 12,670 (198) 38 (0.5) 2,770 (26) 37 (0.2) 4,850 (115) 32 (0.8) 5,040 (124) 47 (0.8)Town........................ 3,300 (130) 10 (0.4) 1,020 (15) 14 (0.2) 1,680 (105) 11 (0.6) 600 (75) 6 (0.7)Rural ....................... 6,560 (263) 19 (0.6) 640 (24) 9 (0.3) 4,410 (254) 29 (1.2) 1,520 (70) 14 (0.6)
DIGEST OF EDUCATION STATISTICS 2010
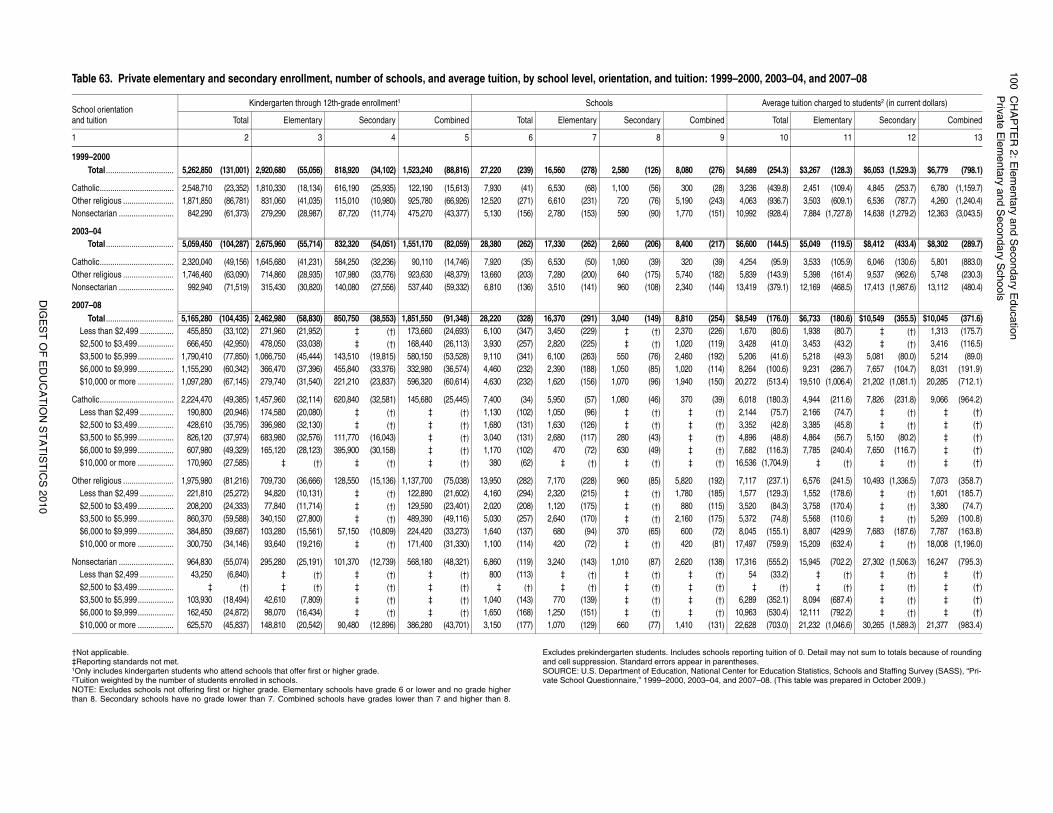
10
0C
HA
PT
ER
2: E
lem
en
tary a
nd
Se
con
da
ry Ed
uca
tion
Priva
te E
lem
en
tary a
nd
Se
con
da
ry Sch
oo
lsDIG
ES
T O
F E
DU
CA
TIO
N S
TA
TIS
TIC
S 2
01
0
ng tuition of 0. Detail may not sum to totals because of rounding.r Education Statistics, Schools and Staffing Survey (SASS), “Pri-–08. (This table was prepared in October 2009.)
0, 2003–04, and 2007–08
Average tuition charged to students2 (in current dollars)
Total Elementary Secondary Combined
10 11 12 13
(254.3) $3,267 (128.3) $6,053 (1,529.3) $6,779 (798.1)
(439.8) 2,451 (109.4) 4,845 (253.7) 6,780 (1,159.7)(936.7) 3,503 (609.1) 6,536 (787.7) 4,260 (1,240.4)(928.4) 7,884 (1,727.8) 14,638 (1,279.2) 12,363 (3,043.5)
(144.5) $5,049 (119.5) $8,412 (433.4) $8,302 (289.7)
(95.9) 3,533 (105.9) 6,046 (130.6) 5,801 (883.0)(143.9) 5,398 (161.4) 9,537 (962.6) 5,748 (230.3)(379.1) 12,169 (468.5) 17,413 (1,987.6) 13,112 (480.4)
(176.0) $6,733 (180.6) $10,549 (355.5) $10,045 (371.6)(80.6) 1,938 (80.7) ‡ (†) 1,313 (175.7)(41.0) 3,453 (43.2) ‡ (†) 3,416 (116.5)(41.6) 5,218 (49.3) 5,081 (80.0) 5,214 (89.0)
(100.6) 9,231 (286.7) 7,657 (104.7) 8,031 (191.9)(513.4) 19,510 (1,006.4) 21,202 (1,081.1) 20,285 (712.1)
(180.3) 4,944 (211.6) 7,826 (231.8) 9,066 (964.2)(75.7) 2,166 (74.7) ‡ (†) ‡ (†)(42.8) 3,385 (45.8) ‡ (†) ‡ (†)(48.8) 4,864 (56.7) 5,150 (80.2) ‡ (†)
(116.3) 7,785 (240.4) 7,650 (116.7) ‡ (†)(1,704.9) ‡ (†) ‡ (†) ‡ (†)
(237.1) 6,576 (241.5) 10,493 (1,336.5) 7,073 (358.7)(129.3) 1,552 (178.6) ‡ (†) 1,601 (185.7)(84.3) 3,758 (170.4) ‡ (†) 3,380 (74.7)(74.8) 5,568 (110.6) ‡ (†) 5,269 (100.8)
(155.1) 8,807 (429.9) 7,683 (187.6) 7,787 (163.8)(759.9) 15,209 (632.4) ‡ (†) 18,008 (1,196.0)
(555.2) 15,945 (702.2) 27,302 (1,506.3) 16,247 (795.3)(33.2) ‡ (†) ‡ (†) ‡ (†)
(†) ‡ (†) ‡ (†) ‡ (†)(352.1) 8,094 (687.4) ‡ (†) ‡ (†)(530.4) 12,111 (792.2) ‡ (†) ‡ (†)(703.0) 21,232 (1,046.6) 30,265 (1,589.3) 21,377 (983.4)
†Not applicable. ‡Reporting standards not met. 1Only includes kindergarten students who attend schools that offer first or higher grade. 2Tuition weighted by the number of students enrolled in schools. NOTE: Excludes schools not offering first or higher grade. Elementary schools have grade 6 or lower and no grade higherthan 8. Secondary schools have no grade lower than 7. Combined schools have grades lower than 7 and higher than 8.
Excludes prekindergarten students. Includes schools reportiand cell suppression. Standard errors appear in parenthesesSOURCE: U.S. Department of Education, National Center fovate School Questionnaire,” 1999–2000, 2003–04, and 2007
Table 63. Private elementary and secondary enrollment, number of schools, and average tuition, by school level, orientation, and tuition: 1999–200
School orientationand tuition
Kindergarten through 12th-grade enrollment1 Schools
Total Elementary Secondary Combined Total Elementary Secondary Combined
1 2 3 4 5 6 7 8 9
1999–2000Total ................................ 5,262,850 (131,001) 2,920,680 (55,056) 818,920 (34,102) 1,523,240 (88,816) 27,220 (239) 16,560 (278) 2,580 (126) 8,080 (276) $4,689
Catholic................................... 2,548,710 (23,352) 1,810,330 (18,134) 616,190 (25,935) 122,190 (15,613) 7,930 (41) 6,530 (68) 1,100 (56) 300 (28) 3,236Other religious ........................ 1,871,850 (86,781) 831,060 (41,035) 115,010 (10,980) 925,780 (66,926) 12,520 (271) 6,610 (231) 720 (76) 5,190 (243) 4,063Nonsectarian .......................... 842,290 (61,373) 279,290 (28,987) 87,720 (11,774) 475,270 (43,377) 5,130 (156) 2,780 (153) 590 (90) 1,770 (151) 10,992
2003–04Total ................................ 5,059,450 (104,287) 2,675,960 (55,714) 832,320 (54,051) 1,551,170 (82,059) 28,380 (262) 17,330 (262) 2,660 (206) 8,400 (217) $6,600
Catholic................................... 2,320,040 (49,156) 1,645,680 (41,231) 584,250 (32,236) 90,110 (14,746) 7,920 (35) 6,530 (50) 1,060 (39) 320 (39) 4,254Other religious ........................ 1,746,460 (63,090) 714,860 (28,935) 107,980 (33,776) 923,630 (48,379) 13,660 (203) 7,280 (200) 640 (175) 5,740 (182) 5,839Nonsectarian .......................... 992,940 (71,519) 315,430 (30,820) 140,080 (27,556) 537,440 (59,332) 6,810 (136) 3,510 (141) 960 (108) 2,340 (144) 13,419
2007–08Total ................................ 5,165,280 (104,435) 2,462,980 (58,830) 850,750 (38,553) 1,851,550 (91,348) 28,220 (328) 16,370 (291) 3,040 (149) 8,810 (254) $8,549
Less than $2,499 ................ 455,850 (33,102) 271,960 (21,952) ‡ (†) 173,660 (24,693) 6,100 (347) 3,450 (229) ‡ (†) 2,370 (226) 1,670$2,500 to $3,499................. 666,450 (42,950) 478,050 (33,038) ‡ (†) 168,440 (26,113) 3,930 (257) 2,820 (225) ‡ (†) 1,020 (119) 3,428$3,500 to $5,999................. 1,790,410 (77,850) 1,066,750 (45,444) 143,510 (19,815) 580,150 (53,528) 9,110 (341) 6,100 (263) 550 (76) 2,460 (192) 5,206$6,000 to $9,999................. 1,155,290 (60,342) 366,470 (37,396) 455,840 (33,376) 332,980 (36,574) 4,460 (232) 2,390 (188) 1,050 (85) 1,020 (114) 8,264$10,000 or more ................. 1,097,280 (67,145) 279,740 (31,540) 221,210 (23,837) 596,320 (60,614) 4,630 (232) 1,620 (156) 1,070 (96) 1,940 (150) 20,272
Catholic................................... 2,224,470 (49,385) 1,457,960 (32,114) 620,840 (32,581) 145,680 (25,445) 7,400 (34) 5,950 (57) 1,080 (46) 370 (39) 6,018Less than $2,499 ................ 190,800 (20,946) 174,580 (20,080) ‡ (†) ‡ (†) 1,130 (102) 1,050 (96) ‡ (†) ‡ (†) 2,144$2,500 to $3,499................. 428,610 (35,795) 396,980 (32,130) ‡ (†) ‡ (†) 1,680 (131) 1,630 (126) ‡ (†) ‡ (†) 3,352$3,500 to $5,999................. 826,120 (37,974) 683,980 (32,576) 111,770 (16,043) ‡ (†) 3,040 (131) 2,680 (117) 280 (43) ‡ (†) 4,896$6,000 to $9,999................. 607,980 (49,329) 165,120 (28,123) 395,900 (30,158) ‡ (†) 1,170 (102) 470 (72) 630 (49) ‡ (†) 7,682$10,000 or more ................. 170,960 (27,585) ‡ (†) ‡ (†) ‡ (†) 380 (62) ‡ (†) ‡ (†) ‡ (†) 16,536
Other religious ........................ 1,975,980 (81,216) 709,730 (36,666) 128,550 (15,136) 1,137,700 (75,038) 13,950 (282) 7,170 (228) 960 (85) 5,820 (192) 7,117Less than $2,499 ................ 221,810 (25,272) 94,820 (10,131) ‡ (†) 122,890 (21,602) 4,160 (294) 2,320 (215) ‡ (†) 1,780 (185) 1,577$2,500 to $3,499................. 208,200 (24,333) 77,840 (11,714) ‡ (†) 129,590 (23,401) 2,020 (208) 1,120 (175) ‡ (†) 880 (115) 3,520$3,500 to $5,999................. 860,370 (59,588) 340,150 (27,800) ‡ (†) 489,390 (49,116) 5,030 (257) 2,640 (170) ‡ (†) 2,160 (175) 5,372$6,000 to $9,999................. 384,850 (39,687) 103,280 (15,561) 57,150 (10,809) 224,420 (33,273) 1,640 (137) 680 (94) 370 (65) 600 (72) 8,045$10,000 or more ................. 300,750 (34,146) 93,640 (19,216) ‡ (†) 171,400 (31,330) 1,100 (114) 420 (72) ‡ (†) 420 (81) 17,497
Nonsectarian .......................... 964,830 (55,074) 295,280 (25,191) 101,370 (12,739) 568,180 (48,321) 6,860 (119) 3,240 (143) 1,010 (87) 2,620 (138) 17,316Less than $2,499 ................ 43,250 (6,840) ‡ (†) ‡ (†) ‡ (†) 800 (113) ‡ (†) ‡ (†) ‡ (†) 54$2,500 to $3,499................. ‡ (†) ‡ (†) ‡ (†) ‡ (†) ‡ (†) ‡ (†) ‡ (†) ‡ (†) ‡$3,500 to $5,999................. 103,930 (18,494) 42,610 (7,809) ‡ (†) ‡ (†) 1,040 (143) 770 (139) ‡ (†) ‡ (†) 6,289$6,000 to $9,999................. 162,450 (24,872) 98,070 (16,434) ‡ (†) ‡ (†) 1,650 (168) 1,250 (151) ‡ (†) ‡ (†) 10,963$10,000 or more ................. 625,570 (45,837) 148,810 (20,542) 90,480 (12,896) 386,280 (43,701) 3,150 (177) 1,070 (129) 660 (77) 1,410 (131) 22,628
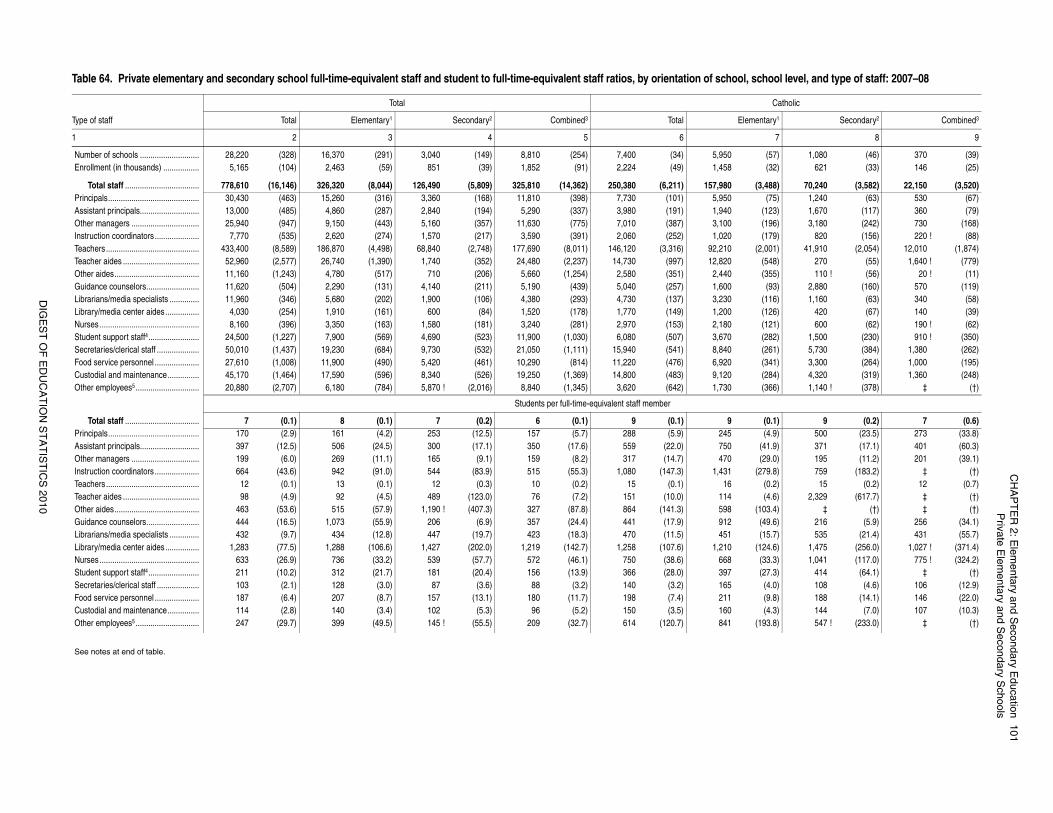
CH
AP
TE
R 2
: Ele
me
nta
ry an
d S
eco
nd
ary E
du
catio
n1
01
Priva
te E
lem
en
tary a
nd
Se
con
da
ry Sch
oo
ls
DIG
ES
T O
F E
DU
CA
TIO
N S
TA
TIS
TIC
S 2
01
0
chool level, and type of staff: 2007–08
Catholic
entary1 Secondary2 Combined3
7 8 9
(57) 1,080 (46) 370 (39)(32) 621 (33) 146 (25)
(3,488) 70,240 (3,582) 22,150 (3,520)(75) 1,240 (63) 530 (67)
(123) 1,670 (117) 360 (79)(196) 3,180 (242) 730 (168)(179) 820 (156) 220 ! (88)
(2,001) 41,910 (2,054) 12,010 (1,874)(548) 270 (55) 1,640 ! (779)(355) 110 ! (56) 20 ! (11)(93) 2,880 (160) 570 (119)
(116) 1,160 (63) 340 (58)(126) 420 (67) 140 (39)(121) 600 (62) 190 ! (62)(282) 1,500 (230) 910 ! (350)(261) 5,730 (384) 1,380 (262)(341) 3,300 (264) 1,000 (195)(284) 4,320 (319) 1,360 (248)(366) 1,140 ! (378) ‡ (†)
(0.1) 9 (0.2) 7 (0.6)(4.9) 500 (23.5) 273 (33.8)
(41.9) 371 (17.1) 401 (60.3)(29.0) 195 (11.2) 201 (39.1)
(279.8) 759 (183.2) ‡ (†)(0.2) 15 (0.2) 12 (0.7)(4.6) 2,329 (617.7) ‡ (†)
(103.4) ‡ (†) ‡ (†)(49.6) 216 (5.9) 256 (34.1)(15.7) 535 (21.4) 431 (55.7)
(124.6) 1,475 (256.0) 1,027 ! (371.4)(33.3) 1,041 (117.0) 775 ! (324.2)(27.3) 414 (64.1) ‡ (†)
(4.0) 108 (4.6) 106 (12.9)(9.8) 188 (14.1) 146 (22.0)(4.3) 144 (7.0) 107 (10.3)
(193.8) 547 ! (233.0) ‡ (†)
Table 64. Private elementary and secondary school full-time-equivalent staff and student to full-time-equivalent staff ratios, by orientation of school, s
Type of staff
Total
Total Elementary1 Secondary2 Combined3 Total Elem
1 2 3 4 5 6
Number of schools ............................ 28,220 (328) 16,370 (291) 3,040 (149) 8,810 (254) 7,400 (34) 5,950Enrollment (in thousands) ................. 5,165 (104) 2,463 (59) 851 (39) 1,852 (91) 2,224 (49) 1,458
Total staff ................................... 778,610 (16,146) 326,320 (8,044) 126,490 (5,809) 325,810 (14,362) 250,380 (6,211) 157,980Principals........................................... 30,430 (463) 15,260 (316) 3,360 (168) 11,810 (398) 7,730 (101) 5,950Assistant principals............................ 13,000 (485) 4,860 (287) 2,840 (194) 5,290 (337) 3,980 (191) 1,940Other managers ................................ 25,940 (947) 9,150 (443) 5,160 (357) 11,630 (775) 7,010 (387) 3,100Instruction coordinators ..................... 7,770 (535) 2,620 (274) 1,570 (217) 3,590 (391) 2,060 (252) 1,020Teachers............................................ 433,400 (8,589) 186,870 (4,498) 68,840 (2,748) 177,690 (8,011) 146,120 (3,316) 92,210Teacher aides .................................... 52,960 (2,577) 26,740 (1,390) 1,740 (352) 24,480 (2,237) 14,730 (997) 12,820Other aides........................................ 11,160 (1,243) 4,780 (517) 710 (206) 5,660 (1,254) 2,580 (351) 2,440Guidance counselors......................... 11,620 (504) 2,290 (131) 4,140 (211) 5,190 (439) 5,040 (257) 1,600Librarians/media specialists .............. 11,960 (346) 5,680 (202) 1,900 (106) 4,380 (293) 4,730 (137) 3,230Library/media center aides................ 4,030 (254) 1,910 (161) 600 (84) 1,520 (178) 1,770 (149) 1,200Nurses ............................................... 8,160 (396) 3,350 (163) 1,580 (181) 3,240 (281) 2,970 (153) 2,180Student support staff4........................ 24,500 (1,227) 7,900 (569) 4,690 (523) 11,900 (1,030) 6,080 (507) 3,670Secretaries/clerical staff .................... 50,010 (1,437) 19,230 (684) 9,730 (532) 21,050 (1,111) 15,940 (541) 8,840Food service personnel ..................... 27,610 (1,008) 11,900 (490) 5,420 (461) 10,290 (814) 11,220 (476) 6,920Custodial and maintenance............... 45,170 (1,464) 17,590 (596) 8,340 (526) 19,250 (1,369) 14,800 (483) 9,120Other employees5.............................. 20,880 (2,707) 6,180 (784) 5,870 ! (2,016) 8,840 (1,345) 3,620 (642) 1,730
Students per full-time-equivalent staff member
Total staff ................................... 7 (0.1) 8 (0.1) 7 (0.2) 6 (0.1) 9 (0.1) 9Principals........................................... 170 (2.9) 161 (4.2) 253 (12.5) 157 (5.7) 288 (5.9) 245Assistant principals............................ 397 (12.5) 506 (24.5) 300 (17.1) 350 (17.6) 559 (22.0) 750Other managers ................................ 199 (6.0) 269 (11.1) 165 (9.1) 159 (8.2) 317 (14.7) 470Instruction coordinators ..................... 664 (43.6) 942 (91.0) 544 (83.9) 515 (55.3) 1,080 (147.3) 1,431Teachers............................................ 12 (0.1) 13 (0.1) 12 (0.3) 10 (0.2) 15 (0.1) 16Teacher aides .................................... 98 (4.9) 92 (4.5) 489 (123.0) 76 (7.2) 151 (10.0) 114Other aides........................................ 463 (53.6) 515 (57.9) 1,190 ! (407.3) 327 (87.8) 864 (141.3) 598Guidance counselors......................... 444 (16.5) 1,073 (55.9) 206 (6.9) 357 (24.4) 441 (17.9) 912Librarians/media specialists .............. 432 (9.7) 434 (12.8) 447 (19.7) 423 (18.3) 470 (11.5) 451Library/media center aides................ 1,283 (77.5) 1,288 (106.6) 1,427 (202.0) 1,219 (142.7) 1,258 (107.6) 1,210Nurses ............................................... 633 (26.9) 736 (33.2) 539 (57.7) 572 (46.1) 750 (38.6) 668Student support staff4........................ 211 (10.2) 312 (21.7) 181 (20.4) 156 (13.9) 366 (28.0) 397Secretaries/clerical staff .................... 103 (2.1) 128 (3.0) 87 (3.6) 88 (3.2) 140 (3.2) 165Food service personnel ..................... 187 (6.4) 207 (8.7) 157 (13.1) 180 (11.7) 198 (7.4) 211Custodial and maintenance............... 114 (2.8) 140 (3.4) 102 (5.3) 96 (5.2) 150 (3.5) 160Other employees5.............................. 247 (29.7) 399 (49.5) 145 ! (55.5) 209 (32.7) 614 (120.7) 841
See notes at end of table.
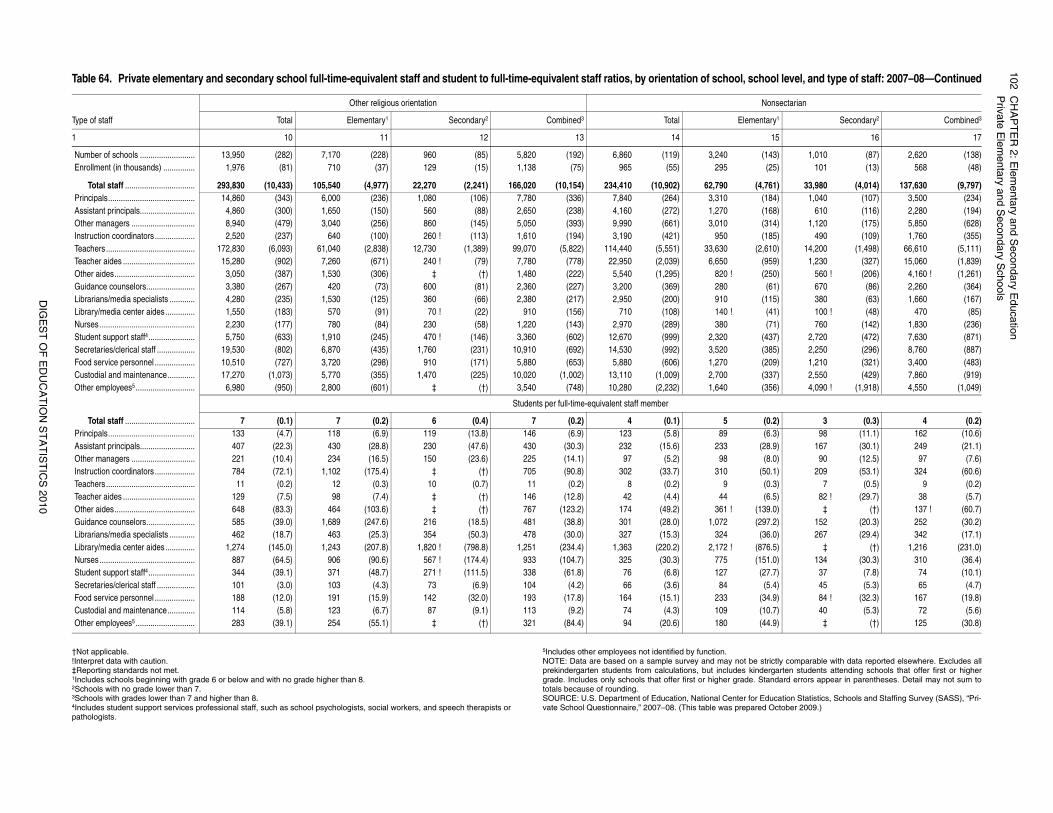
10
2C
HA
PT
ER
2: E
lem
en
tary a
nd
Se
con
da
ry Ed
uca
tion
Priva
te E
lem
en
tary a
nd
Se
con
da
ry Sch
oo
lsDIG
ES
T O
F E
DU
CA
TIO
N S
TA
TIS
TIC
S 2
01
0
strictly comparable with data reported elsewhere. Excludes allndergarten students attending schools that offer first or higher Standard errors appear in parentheses. Detail may not sum to
r Education Statistics, Schools and Staffing Survey (SASS), “Pri-red October 2009.)
hool level, and type of staff: 2007–08—Continued
Nonsectarian
entary1 Secondary2 Combined3
15 16 17
(143) 1,010 (87) 2,620 (138)(25) 101 (13) 568 (48)
(4,761) 33,980 (4,014) 137,630 (9,797)(184) 1,040 (107) 3,500 (234)(168) 610 (116) 2,280 (194)(314) 1,120 (175) 5,850 (628)(185) 490 (109) 1,760 (355)
(2,610) 14,200 (1,498) 66,610 (5,111)(959) 1,230 (327) 15,060 (1,839)(250) 560 ! (206) 4,160 ! (1,261)
(61) 670 (86) 2,260 (364)(115) 380 (63) 1,660 (167)
(41) 100 ! (48) 470 (85)(71) 760 (142) 1,830 (236)
(437) 2,720 (472) 7,630 (871)(385) 2,250 (296) 8,760 (887)(209) 1,210 (321) 3,400 (483)(337) 2,550 (429) 7,860 (919)(356) 4,090 ! (1,918) 4,550 (1,049)
(0.2) 3 (0.3) 4 (0.2)(6.3) 98 (11.1) 162 (10.6)
(28.9) 167 (30.1) 249 (21.1)(8.0) 90 (12.5) 97 (7.6)
(50.1) 209 (53.1) 324 (60.6)(0.3) 7 (0.5) 9 (0.2)(6.5) 82 ! (29.7) 38 (5.7)
(139.0) ‡ (†) 137 ! (60.7)(297.2) 152 (20.3) 252 (30.2)(36.0) 267 (29.4) 342 (17.1)
(876.5) ‡ (†) 1,216 (231.0)(151.0) 134 (30.3) 310 (36.4)(27.7) 37 (7.8) 74 (10.1)
(5.4) 45 (5.3) 65 (4.7)(34.9) 84 ! (32.3) 167 (19.8)(10.7) 40 (5.3) 72 (5.6)(44.9) ‡ (†) 125 (30.8)
†Not applicable. !Interpret data with caution.‡Reporting standards not met.1Includes schools beginning with grade 6 or below and with no grade higher than 8.2Schools with no grade lower than 7.3Schools with grades lower than 7 and higher than 8.4Includes student support services professional staff, such as school psychologists, social workers, and speech therapists orpathologists.
5Includes other employees not identified by function.NOTE: Data are based on a sample survey and may not beprekindergarten students from calculations, but includes kigrade. Includes only schools that offer first or higher grade.totals because of rounding.SOURCE: U.S. Department of Education, National Center fovate School Questionnaire,” 2007–08. (This table was prepa
Table 64. Private elementary and secondary school full-time-equivalent staff and student to full-time-equivalent staff ratios, by orientation of school, sc
Type of staff
Other religious orientation
Total Elementary1 Secondary2 Combined3 Total Elem
1 10 11 12 13 14
Number of schools .......................... 13,950 (282) 7,170 (228) 960 (85) 5,820 (192) 6,860 (119) 3,240Enrollment (in thousands) ............... 1,976 (81) 710 (37) 129 (15) 1,138 (75) 965 (55) 295
Total staff ................................. 293,830 (10,433) 105,540 (4,977) 22,270 (2,241) 166,020 (10,154) 234,410 (10,902) 62,790Principals......................................... 14,860 (343) 6,000 (236) 1,080 (106) 7,780 (336) 7,840 (264) 3,310Assistant principals.......................... 4,860 (300) 1,650 (150) 560 (88) 2,650 (238) 4,160 (272) 1,270Other managers .............................. 8,940 (479) 3,040 (256) 860 (145) 5,050 (393) 9,990 (661) 3,010Instruction coordinators ................... 2,520 (237) 640 (100) 260 ! (113) 1,610 (194) 3,190 (421) 950Teachers.......................................... 172,830 (6,093) 61,040 (2,838) 12,730 (1,389) 99,070 (5,822) 114,440 (5,551) 33,630Teacher aides .................................. 15,280 (902) 7,260 (671) 240 ! (79) 7,780 (778) 22,950 (2,039) 6,650Other aides...................................... 3,050 (387) 1,530 (306) ‡ (†) 1,480 (222) 5,540 (1,295) 820 !Guidance counselors....................... 3,380 (267) 420 (73) 600 (81) 2,360 (227) 3,200 (369) 280Librarians/media specialists ............ 4,280 (235) 1,530 (125) 360 (66) 2,380 (217) 2,950 (200) 910Library/media center aides.............. 1,550 (183) 570 (91) 70 ! (22) 910 (156) 710 (108) 140 !Nurses ............................................. 2,230 (177) 780 (84) 230 (58) 1,220 (143) 2,970 (289) 380Student support staff4...................... 5,750 (633) 1,910 (245) 470 ! (146) 3,360 (602) 12,670 (999) 2,320Secretaries/clerical staff .................. 19,530 (802) 6,870 (435) 1,760 (231) 10,910 (692) 14,530 (992) 3,520Food service personnel ................... 10,510 (727) 3,720 (298) 910 (171) 5,880 (653) 5,880 (606) 1,270Custodial and maintenance............. 17,270 (1,073) 5,770 (355) 1,470 (225) 10,020 (1,002) 13,110 (1,009) 2,700Other employees5............................ 6,980 (950) 2,800 (601) ‡ (†) 3,540 (748) 10,280 (2,232) 1,640
Students per full-time-equivalent staff member
Total staff ................................. 7 (0.1) 7 (0.2) 6 (0.4) 7 (0.2) 4 (0.1) 5Principals......................................... 133 (4.7) 118 (6.9) 119 (13.8) 146 (6.9) 123 (5.8) 89Assistant principals.......................... 407 (22.3) 430 (28.8) 230 (47.6) 430 (30.3) 232 (15.6) 233Other managers .............................. 221 (10.4) 234 (16.5) 150 (23.6) 225 (14.1) 97 (5.2) 98Instruction coordinators ................... 784 (72.1) 1,102 (175.4) ‡ (†) 705 (90.8) 302 (33.7) 310Teachers.......................................... 11 (0.2) 12 (0.3) 10 (0.7) 11 (0.2) 8 (0.2) 9Teacher aides .................................. 129 (7.5) 98 (7.4) ‡ (†) 146 (12.8) 42 (4.4) 44Other aides...................................... 648 (83.3) 464 (103.6) ‡ (†) 767 (123.2) 174 (49.2) 361 !Guidance counselors....................... 585 (39.0) 1,689 (247.6) 216 (18.5) 481 (38.8) 301 (28.0) 1,072Librarians/media specialists ............ 462 (18.7) 463 (25.3) 354 (50.3) 478 (30.0) 327 (15.3) 324Library/media center aides.............. 1,274 (145.0) 1,243 (207.8) 1,820 ! (798.8) 1,251 (234.4) 1,363 (220.2) 2,172 !Nurses ............................................. 887 (64.5) 906 (90.6) 567 ! (174.4) 933 (104.7) 325 (30.3) 775Student support staff4...................... 344 (39.1) 371 (48.7) 271 ! (111.5) 338 (61.8) 76 (6.8) 127Secretaries/clerical staff .................. 101 (3.0) 103 (4.3) 73 (6.9) 104 (4.2) 66 (3.6) 84Food service personnel ................... 188 (12.0) 191 (15.9) 142 (32.0) 193 (17.8) 164 (15.1) 233Custodial and maintenance............. 114 (5.8) 123 (6.7) 87 (9.1) 113 (9.2) 74 (4.3) 109Other employees5............................ 283 (39.1) 254 (55.1) ‡ (†) 321 (84.4) 94 (20.6) 180
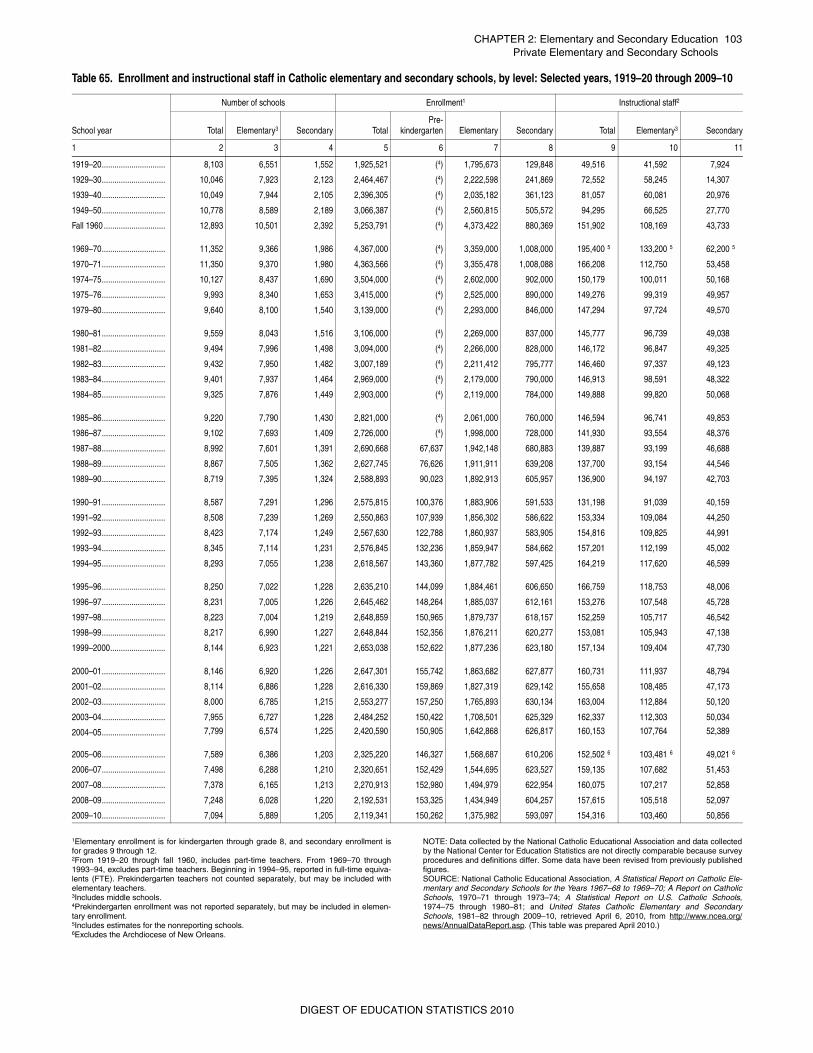
CHAPTER 2: Elementary and Secondary Education 103Private Elementary and Secondary Schools
1Elementary enrollment is for kindergarten through grade 8, and secondary enrollment isfor grades 9 through 12.2From 1919–20 through fall 1960, includes part-time teachers. From 1969–70 through1993–94, excludes part-time teachers. Beginning in 1994–95, reported in full-time equiva-lents (FTE). Prekindergarten teachers not counted separately, but may be included withelementary teachers.3Includes middle schools.4Prekindergarten enrollment was not reported separately, but may be included in elemen-tary enrollment.5Includes estimates for the nonreporting schools. 6Excludes the Archdiocese of New Orleans.
NOTE: Data collected by the National Catholic Educational Association and data collectedby the National Center for Education Statistics are not directly comparable because surveyprocedures and definitions differ. Some data have been revised from previously publishedfigures. SOURCE: National Catholic Educational Association, A Statistical Report on Catholic Ele-mentary and Secondary Schools for the Years 1967–68 to 1969–70; A Report on CatholicSchools, 1970–71 through 1973–74; A Statistical Report on U.S. Catholic Schools,1974–75 through 1980–81; and United States Catholic Elementary and SecondarySchools, 1981–82 through 2009–10, retrieved April 6, 2010, from http://www.ncea.org/news/AnnualDataReport.asp. (This table was prepared April 2010.)
Table 65. Enrollment and instructional staff in Catholic elementary and secondary schools, by level: Selected years, 1919–20 through 2009–10
School year
Number of schools Enrollment1 Instructional staff2
Total Elementary3 Secondary TotalPre-
kindergarten Elementary Secondary Total Elementary3 Secondary
1 2 3 4 5 6 7 8 9 10 11
1919–20.............................. 8,103 6,551 1,552 1,925,521 (4) 1,795,673 129,848 49,516 41,592 7,924
1929–30.............................. 10,046 7,923 2,123 2,464,467 (4) 2,222,598 241,869 72,552 58,245 14,307
1939–40.............................. 10,049 7,944 2,105 2,396,305 (4) 2,035,182 361,123 81,057 60,081 20,976
1949–50.............................. 10,778 8,589 2,189 3,066,387 (4) 2,560,815 505,572 94,295 66,525 27,770
Fall 1960 ............................. 12,893 10,501 2,392 5,253,791 (4) 4,373,422 880,369 151,902 108,169 43,733
1969–70.............................. 11,352 9,366 1,986 4,367,000 (4) 3,359,000 1,008,000 195,400 5 133,200 5 62,200 5
1970–71.............................. 11,350 9,370 1,980 4,363,566 (4) 3,355,478 1,008,088 166,208 112,750 53,458
1974–75.............................. 10,127 8,437 1,690 3,504,000 (4) 2,602,000 902,000 150,179 100,011 50,168
1975–76.............................. 9,993 8,340 1,653 3,415,000 (4) 2,525,000 890,000 149,276 99,319 49,957
1979–80.............................. 9,640 8,100 1,540 3,139,000 (4) 2,293,000 846,000 147,294 97,724 49,570
1980–81.............................. 9,559 8,043 1,516 3,106,000 (4) 2,269,000 837,000 145,777 96,739 49,038
1981–82.............................. 9,494 7,996 1,498 3,094,000 (4) 2,266,000 828,000 146,172 96,847 49,325
1982–83.............................. 9,432 7,950 1,482 3,007,189 (4) 2,211,412 795,777 146,460 97,337 49,123
1983–84.............................. 9,401 7,937 1,464 2,969,000 (4) 2,179,000 790,000 146,913 98,591 48,322
1984–85.............................. 9,325 7,876 1,449 2,903,000 (4) 2,119,000 784,000 149,888 99,820 50,068
1985–86.............................. 9,220 7,790 1,430 2,821,000 (4) 2,061,000 760,000 146,594 96,741 49,853
1986–87.............................. 9,102 7,693 1,409 2,726,000 (4) 1,998,000 728,000 141,930 93,554 48,376
1987–88.............................. 8,992 7,601 1,391 2,690,668 67,637 1,942,148 680,883 139,887 93,199 46,688
1988–89.............................. 8,867 7,505 1,362 2,627,745 76,626 1,911,911 639,208 137,700 93,154 44,546
1989–90.............................. 8,719 7,395 1,324 2,588,893 90,023 1,892,913 605,957 136,900 94,197 42,703
1990–91.............................. 8,587 7,291 1,296 2,575,815 100,376 1,883,906 591,533 131,198 91,039 40,159
1991–92.............................. 8,508 7,239 1,269 2,550,863 107,939 1,856,302 586,622 153,334 109,084 44,250
1992–93.............................. 8,423 7,174 1,249 2,567,630 122,788 1,860,937 583,905 154,816 109,825 44,991
1993–94.............................. 8,345 7,114 1,231 2,576,845 132,236 1,859,947 584,662 157,201 112,199 45,002
1994–95.............................. 8,293 7,055 1,238 2,618,567 143,360 1,877,782 597,425 164,219 117,620 46,599
1995–96.............................. 8,250 7,022 1,228 2,635,210 144,099 1,884,461 606,650 166,759 118,753 48,006
1996–97.............................. 8,231 7,005 1,226 2,645,462 148,264 1,885,037 612,161 153,276 107,548 45,728
1997–98.............................. 8,223 7,004 1,219 2,648,859 150,965 1,879,737 618,157 152,259 105,717 46,542
1998–99.............................. 8,217 6,990 1,227 2,648,844 152,356 1,876,211 620,277 153,081 105,943 47,138
1999–2000.......................... 8,144 6,923 1,221 2,653,038 152,622 1,877,236 623,180 157,134 109,404 47,730
2000–01.............................. 8,146 6,920 1,226 2,647,301 155,742 1,863,682 627,877 160,731 111,937 48,794
2001–02.............................. 8,114 6,886 1,228 2,616,330 159,869 1,827,319 629,142 155,658 108,485 47,173
2002–03.............................. 8,000 6,785 1,215 2,553,277 157,250 1,765,893 630,134 163,004 112,884 50,120
2003–04.............................. 7,955 6,727 1,228 2,484,252 150,422 1,708,501 625,329 162,337 112,303 50,034
2004–05.............................. 7,799 6,574 1,225 2,420,590 150,905 1,642,868 626,817 160,153 107,764 52,389
2005–06.............................. 7,589 6,386 1,203 2,325,220 146,327 1,568,687 610,206 152,502 6 103,481 6 49,021 6
2006–07.............................. 7,498 6,288 1,210 2,320,651 152,429 1,544,695 623,527 159,135 107,682 51,453
2007–08.............................. 7,378 6,165 1,213 2,270,913 152,980 1,494,979 622,954 160,075 107,217 52,858
2008–09.............................. 7,248 6,028 1,220 2,192,531 153,325 1,434,949 604,257 157,615 105,518 52,097
2009–10.............................. 7,094 5,889 1,205 2,119,341 150,262 1,375,982 593,097 154,316 103,460 50,856
DIGEST OF EDUCATION STATISTICS 2010
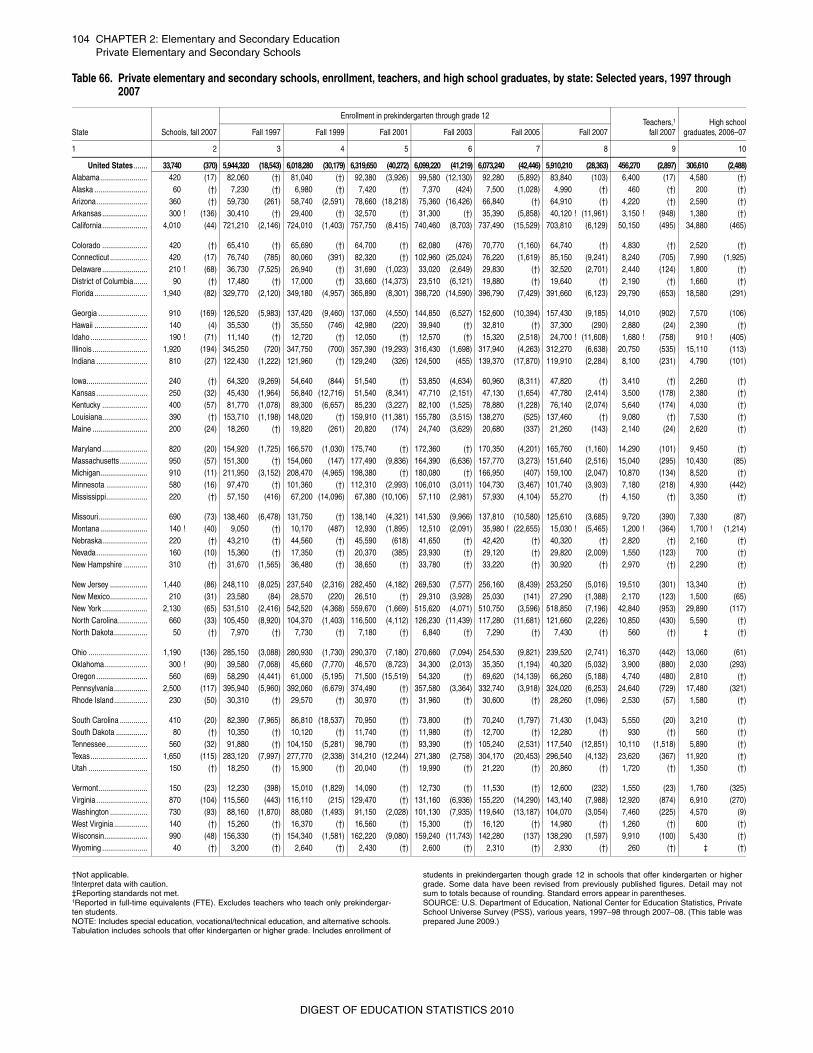
104 CHAPTER 2: Elementary and Secondary EducationPrivate Elementary and Secondary Schools
†Not applicable.!Interpret data with caution.‡Reporting standards not met. 1Reported in full-time equivalents (FTE). Excludes teachers who teach only prekindergar-ten students.NOTE: Includes special education, vocational/technical education, and alternative schools.Tabulation includes schools that offer kindergarten or higher grade. Includes enrollment of
students in prekindergarten though grade 12 in schools that offer kindergarten or highergrade. Some data have been revised from previously published figures. Detail may notsum to totals because of rounding. Standard errors appear in parentheses.SOURCE: U.S. Department of Education, National Center for Education Statistics, PrivateSchool Universe Survey (PSS), various years, 1997–98 through 2007–08. (This table wasprepared June 2009.)
Table 66. Private elementary and secondary schools, enrollment, teachers, and high school graduates, by state: Selected years, 1997 through 2007
State Schools, fall 2007
Enrollment in prekindergarten through grade 12Teachers,1
fall 2007High school
graduates, 2006–07Fall 1997 Fall 1999 Fall 2001 Fall 2003 Fall 2005 Fall 2007
1 2 3 4 5 6 7 8 9 10
United States ....... 33,740 (370) 5,944,320 (18,543) 6,018,280 (30,179) 6,319,650 (40,272) 6,099,220 (41,219) 6,073,240 (42,446) 5,910,210 (28,363) 456,270 (2,897) 306,610 (2,488)Alabama........................ 420 (17) 82,060 (†) 81,040 (†) 92,380 (3,926) 99,580 (12,130) 92,280 (5,892) 83,840 (103) 6,400 (17) 4,580 (†)Alaska ........................... 60 (†) 7,230 (†) 6,980 (†) 7,420 (†) 7,370 (424) 7,500 (1,028) 4,990 (†) 460 (†) 200 (†)Arizona.......................... 360 (†) 59,730 (261) 58,740 (2,591) 78,660 (18,218) 75,360 (16,426) 66,840 (†) 64,910 (†) 4,220 (†) 2,590 (†)Arkansas....................... 300 ! (136) 30,410 (†) 29,400 (†) 32,570 (†) 31,300 (†) 35,390 (5,858) 40,120 ! (11,961) 3,150 ! (948) 1,380 (†)California....................... 4,010 (44) 721,210 (2,146) 724,010 (1,403) 757,750 (8,415) 740,460 (8,703) 737,490 (15,529) 703,810 (6,129) 50,150 (495) 34,880 (465)
Colorado ....................... 420 (†) 65,410 (†) 65,690 (†) 64,700 (†) 62,080 (476) 70,770 (1,160) 64,740 (†) 4,830 (†) 2,520 (†)Connecticut ................... 420 (17) 76,740 (785) 80,060 (391) 82,320 (†) 102,960 (25,024) 76,220 (1,619) 85,150 (9,241) 8,240 (705) 7,990 (1,925)Delaware ....................... 210 ! (68) 36,730 (7,525) 26,940 (†) 31,690 (1,023) 33,020 (2,649) 29,830 (†) 32,520 (2,701) 2,440 (124) 1,800 (†)District of Columbia....... 90 (†) 17,480 (†) 17,000 (†) 33,660 (14,373) 23,510 (6,121) 19,880 (†) 19,640 (†) 2,190 (†) 1,660 (†)Florida ........................... 1,940 (82) 329,770 (2,120) 349,180 (4,957) 365,890 (8,301) 398,720 (14,590) 396,790 (7,429) 391,660 (6,123) 29,790 (653) 18,580 (291)
Georgia ......................... 910 (169) 126,520 (5,983) 137,420 (9,460) 137,060 (4,550) 144,850 (6,527) 152,600 (10,394) 157,430 (9,185) 14,010 (902) 7,570 (106)Hawaii ........................... 140 (4) 35,530 (†) 35,550 (746) 42,980 (220) 39,940 (†) 32,810 (†) 37,300 (290) 2,880 (24) 2,390 (†)Idaho ............................. 190 ! (71) 11,140 (†) 12,720 (†) 12,050 (†) 12,570 (†) 15,320 (2,518) 24,700 ! (11,608) 1,680 ! (758) 910 ! (405)Illinois ............................ 1,920 (194) 345,250 (720) 347,750 (700) 357,390 (19,293) 316,430 (1,698) 317,940 (4,263) 312,270 (6,638) 20,750 (535) 15,110 (113)Indiana .......................... 810 (27) 122,430 (1,222) 121,960 (†) 129,240 (326) 124,500 (455) 139,370 (17,870) 119,910 (2,284) 8,100 (231) 4,790 (101)
Iowa............................... 240 (†) 64,320 (9,269) 54,640 (844) 51,540 (†) 53,850 (4,634) 60,960 (8,311) 47,820 (†) 3,410 (†) 2,260 (†)Kansas .......................... 250 (32) 45,430 (1,964) 56,840 (12,716) 51,540 (8,341) 47,710 (2,151) 47,130 (1,654) 47,780 (2,414) 3,500 (178) 2,380 (†)Kentucky ....................... 400 (57) 81,770 (1,078) 89,300 (6,657) 85,230 (3,227) 82,100 (1,525) 78,880 (1,228) 76,140 (2,074) 5,640 (174) 4,030 (†)Louisiana....................... 390 (†) 153,710 (1,198) 148,020 (†) 159,910 (11,381) 155,780 (3,515) 138,270 (525) 137,460 (†) 9,080 (†) 7,530 (†)Maine ............................ 200 (24) 18,260 (†) 19,820 (261) 20,820 (174) 24,740 (3,629) 20,680 (337) 21,260 (143) 2,140 (24) 2,620 (†)
Maryland ....................... 820 (20) 154,920 (1,725) 166,570 (1,030) 175,740 (†) 172,360 (†) 170,350 (4,201) 165,760 (1,160) 14,290 (101) 9,450 (†)Massachusetts .............. 950 (57) 151,300 (†) 154,060 (147) 177,490 (9,836) 164,390 (6,636) 157,770 (3,273) 151,640 (2,516) 15,040 (295) 10,430 (85)Michigan........................ 910 (11) 211,950 (3,152) 208,470 (4,965) 198,380 (†) 180,080 (†) 166,950 (407) 159,100 (2,047) 10,870 (134) 8,520 (†)Minnesota ..................... 580 (16) 97,470 (†) 101,360 (†) 112,310 (2,993) 106,010 (3,011) 104,730 (3,467) 101,740 (3,903) 7,180 (218) 4,930 (442)Mississippi..................... 220 (†) 57,150 (416) 67,200 (14,096) 67,380 (10,106) 57,110 (2,981) 57,930 (4,104) 55,270 (†) 4,150 (†) 3,350 (†)
Missouri......................... 690 (73) 138,460 (6,478) 131,750 (†) 138,140 (4,321) 141,530 (9,966) 137,810 (10,580) 125,610 (3,685) 9,720 (390) 7,330 (87)Montana ........................ 140 ! (40) 9,050 (†) 10,170 (487) 12,930 (1,895) 12,510 (2,091) 35,980 ! (22,655) 15,030 ! (5,465) 1,200 ! (364) 1,700 ! (1,214)Nebraska....................... 220 (†) 43,210 (†) 44,560 (†) 45,590 (618) 41,650 (†) 42,420 (†) 40,320 (†) 2,820 (†) 2,160 (†)Nevada.......................... 160 (10) 15,360 (†) 17,350 (†) 20,370 (385) 23,930 (†) 29,120 (†) 29,820 (2,009) 1,550 (123) 700 (†)New Hampshire ............ 310 (†) 31,670 (1,565) 36,480 (†) 38,650 (†) 33,780 (†) 33,220 (†) 30,920 (†) 2,970 (†) 2,290 (†)
New Jersey ................... 1,440 (86) 248,110 (8,025) 237,540 (2,316) 282,450 (4,182) 269,530 (7,577) 256,160 (8,439) 253,250 (5,016) 19,510 (301) 13,340 (†)New Mexico................... 210 (31) 23,580 (84) 28,570 (220) 26,510 (†) 29,310 (3,928) 25,030 (141) 27,290 (1,388) 2,170 (123) 1,500 (65)New York ....................... 2,130 (65) 531,510 (2,416) 542,520 (4,368) 559,670 (1,669) 515,620 (4,071) 510,750 (3,596) 518,850 (7,196) 42,840 (953) 29,890 (117)North Carolina............... 660 (33) 105,450 (8,920) 104,370 (1,403) 116,500 (4,112) 126,230 (11,439) 117,280 (11,681) 121,660 (2,226) 10,850 (430) 5,590 (†)North Dakota................. 50 (†) 7,970 (†) 7,730 (†) 7,180 (†) 6,840 (†) 7,290 (†) 7,430 (†) 560 (†) ‡ (†)
Ohio .............................. 1,190 (136) 285,150 (3,088) 280,930 (1,730) 290,370 (7,180) 270,660 (7,094) 254,530 (9,821) 239,520 (2,741) 16,370 (442) 13,060 (61)Oklahoma...................... 300 ! (90) 39,580 (7,068) 45,660 (7,770) 46,570 (8,723) 34,300 (2,013) 35,350 (1,194) 40,320 (5,032) 3,900 (880) 2,030 (293)Oregon .......................... 560 (69) 58,290 (4,441) 61,000 (5,195) 71,500 (15,519) 54,320 (†) 69,620 (14,139) 66,260 (5,188) 4,740 (480) 2,810 (†)Pennsylvania................. 2,500 (117) 395,940 (5,960) 392,060 (6,679) 374,490 (†) 357,580 (3,364) 332,740 (3,918) 324,020 (6,253) 24,640 (729) 17,480 (321)Rhode Island................. 230 (50) 30,310 (†) 29,570 (†) 30,970 (†) 31,960 (†) 30,600 (†) 28,260 (1,096) 2,530 (57) 1,580 (†)
South Carolina .............. 410 (20) 82,390 (7,965) 86,810 (18,537) 70,950 (†) 73,800 (†) 70,240 (1,797) 71,430 (1,043) 5,550 (20) 3,210 (†)South Dakota ................ 80 (†) 10,350 (†) 10,120 (†) 11,740 (†) 11,980 (†) 12,700 (†) 12,280 (†) 930 (†) 560 (†)Tennessee..................... 560 (32) 91,880 (†) 104,150 (5,281) 98,790 (†) 93,390 (†) 105,240 (2,531) 117,540 (12,851) 10,110 (1,518) 5,890 (†)Texas............................. 1,650 (115) 283,120 (7,997) 277,770 (2,338) 314,210 (12,244) 271,380 (2,758) 304,170 (20,453) 296,540 (4,132) 23,620 (367) 11,920 (†)Utah .............................. 150 (†) 18,250 (†) 15,900 (†) 20,040 (†) 19,990 (†) 21,220 (†) 20,860 (†) 1,720 (†) 1,350 (†)
Vermont......................... 150 (23) 12,230 (398) 15,010 (1,829) 14,090 (†) 12,730 (†) 11,530 (†) 12,600 (232) 1,550 (23) 1,760 (325)Virginia .......................... 870 (104) 115,560 (443) 116,110 (215) 129,470 (†) 131,160 (6,936) 155,220 (14,290) 143,140 (7,988) 12,920 (874) 6,910 (270)Washington ................... 730 (93) 88,160 (1,870) 88,080 (1,493) 91,150 (2,028) 101,130 (7,935) 119,640 (13,187) 104,070 (3,054) 7,460 (225) 4,570 (9)West Virginia ................. 140 (†) 15,260 (†) 16,370 (†) 16,560 (†) 15,300 (†) 16,120 (†) 14,980 (†) 1,260 (†) 600 (†)Wisconsin...................... 990 (48) 156,330 (†) 154,340 (1,581) 162,220 (9,080) 159,240 (11,743) 142,280 (137) 138,290 (1,597) 9,910 (100) 5,430 (†)Wyoming ....................... 40 (†) 3,200 (†) 2,640 (†) 2,430 (†) 2,600 (†) 2,310 (†) 2,930 (†) 260 (†) ‡ (†)
DIGEST OF EDUCATION STATISTICS 2010
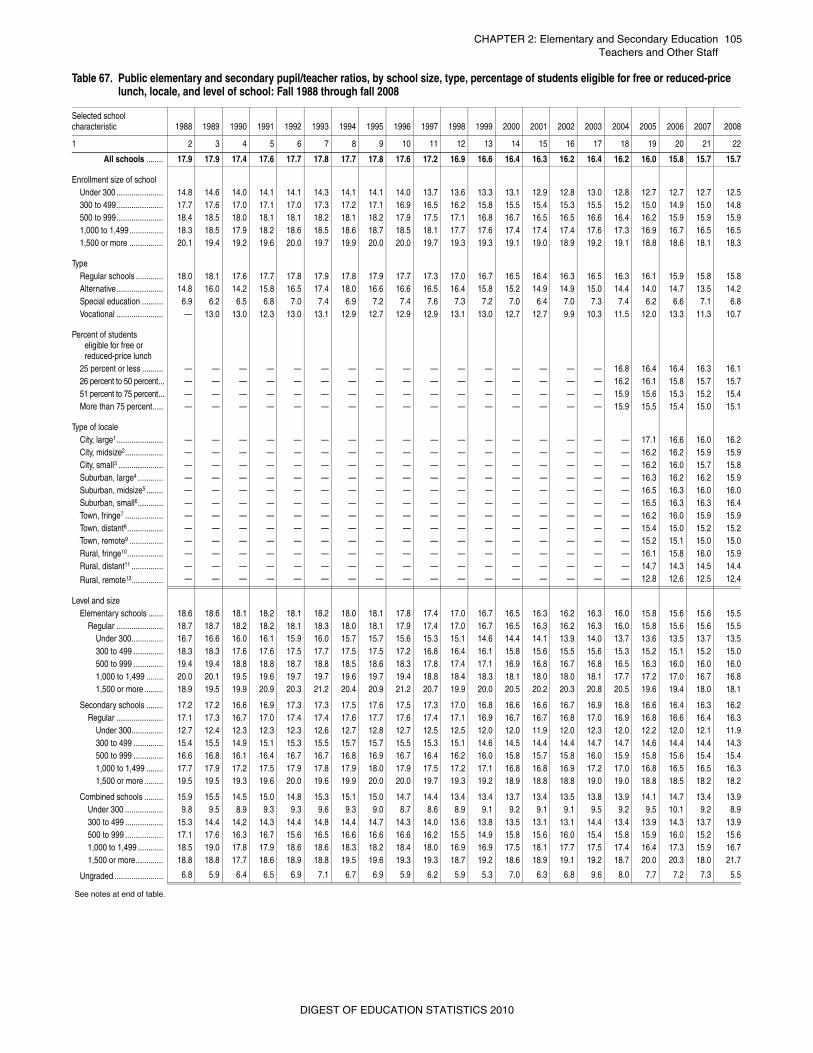
CHAPTER 2: Elementary and Secondary Education 105Teachers and Other Staff
s and Other Staff
TeacherTable 67. Public elementary and secondary pupil/teacher ratios, by school size, type, percentage of students eligible for free or reduced-price lunch, locale, and level of school: Fall 1988 through fall 2008
Selected school characteristic 1988 1989 1990 1991 1992 1993 1994 1995 1996 1997 1998 1999 2000 2001 2002 2003 2004 2005 2006 2007 2008
1 2 3 4 5 6 7 8 9 10 11 12 13 14 15 16 17 18 19 20 21 22
All schools ........ 17.9 17.9 17.4 17.6 17.7 17.8 17.7 17.8 17.6 17.2 16.9 16.6 16.4 16.3 16.2 16.4 16.2 16.0 15.8 15.7 15.7
Enrollment size of school Under 300 ...................... 14.8 14.6 14.0 14.1 14.1 14.3 14.1 14.1 14.0 13.7 13.6 13.3 13.1 12.9 12.8 13.0 12.8 12.7 12.7 12.7 12.5300 to 499...................... 17.7 17.6 17.0 17.1 17.0 17.3 17.2 17.1 16.9 16.5 16.2 15.8 15.5 15.4 15.3 15.5 15.2 15.0 14.9 15.0 14.8500 to 999...................... 18.4 18.5 18.0 18.1 18.1 18.2 18.1 18.2 17.9 17.5 17.1 16.8 16.7 16.5 16.5 16.6 16.4 16.2 15.9 15.9 15.91,000 to 1,499................ 18.3 18.5 17.9 18.2 18.6 18.5 18.6 18.7 18.5 18.1 17.7 17.6 17.4 17.4 17.4 17.6 17.3 16.9 16.7 16.5 16.51,500 or more ................ 20.1 19.4 19.2 19.6 20.0 19.7 19.9 20.0 20.0 19.7 19.3 19.3 19.1 19.0 18.9 19.2 19.1 18.8 18.6 18.1 18.3
TypeRegular schools ............. 18.0 18.1 17.6 17.7 17.8 17.9 17.8 17.9 17.7 17.3 17.0 16.7 16.5 16.4 16.3 16.5 16.3 16.1 15.9 15.8 15.8Alternative...................... 14.8 16.0 14.2 15.8 16.5 17.4 18.0 16.6 16.6 16.5 16.4 15.8 15.2 14.9 14.9 15.0 14.4 14.0 14.7 13.5 14.2Special education .......... 6.9 6.2 6.5 6.8 7.0 7.4 6.9 7.2 7.4 7.6 7.3 7.2 7.0 6.4 7.0 7.3 7.4 6.2 6.6 7.1 6.8Vocational ...................... — 13.0 13.0 12.3 13.0 13.1 12.9 12.7 12.9 12.9 13.1 13.0 12.7 12.7 9.9 10.3 11.5 12.0 13.3 11.3 10.7
Percent of students eligible for free or reduced-price lunch
25 percent or less .......... — — — — — — — — — — — — — — — — 16.8 16.4 16.4 16.3 16.126 percent to 50 percent... — — — — — — — — — — — — — — — — 16.2 16.1 15.8 15.7 15.751 percent to 75 percent... — — — — — — — — — — — — — — — — 15.9 15.6 15.3 15.2 15.4More than 75 percent..... — — — — — — — — — — — — — — — — 15.9 15.5 15.4 15.0 15.1
Type of localeCity, large1...................... — — — — — — — — — — — — — — — — — 17.1 16.6 16.0 16.2City, midsize2.................. — — — — — — — — — — — — — — — — — 16.2 16.2 15.9 15.9City, small3 ..................... — — — — — — — — — — — — — — — — — 16.2 16.0 15.7 15.8Suburban, large4 ............ — — — — — — — — — — — — — — — — — 16.3 16.2 16.2 15.9Suburban, midsize5 ........ — — — — — — — — — — — — — — — — — 16.5 16.3 16.0 16.0Suburban, small6............ — — — — — — — — — — — — — — — — — 16.5 16.3 16.3 16.4Town, fringe7 .................. — — — — — — — — — — — — — — — — — 16.2 16.0 15.9 15.9Town, distant8................. — — — — — — — — — — — — — — — — — 15.4 15.0 15.2 15.2Town, remote9 ................ — — — — — — — — — — — — — — — — — 15.2 15.1 15.0 15.0Rural, fringe10................. — — — — — — — — — — — — — — — — — 16.1 15.8 16.0 15.9Rural, distant11 ............... — — — — — — — — — — — — — — — — — 14.7 14.3 14.5 14.4
Rural, remote12............... — — — — — — — — — — — — — — — — — 12.8 12.6 12.5 12.4
Level and sizeElementary schools ....... 18.6 18.6 18.1 18.2 18.1 18.2 18.0 18.1 17.8 17.4 17.0 16.7 16.5 16.3 16.2 16.3 16.0 15.8 15.6 15.6 15.5
Regular ...................... 18.7 18.7 18.2 18.2 18.1 18.3 18.0 18.1 17.9 17.4 17.0 16.7 16.5 16.3 16.2 16.3 16.0 15.8 15.6 15.6 15.5Under 300............... 16.7 16.6 16.0 16.1 15.9 16.0 15.7 15.7 15.6 15.3 15.1 14.6 14.4 14.1 13.9 14.0 13.7 13.6 13.5 13.7 13.5300 to 499 .............. 18.3 18.3 17.6 17.6 17.5 17.7 17.5 17.5 17.2 16.8 16.4 16.1 15.8 15.6 15.5 15.6 15.3 15.2 15.1 15.2 15.0500 to 999 .............. 19.4 19.4 18.8 18.8 18.7 18.8 18.5 18.6 18.3 17.8 17.4 17.1 16.9 16.8 16.7 16.8 16.5 16.3 16.0 16.0 16.01,000 to 1,499 ........ 20.0 20.1 19.5 19.6 19.7 19.7 19.6 19.7 19.4 18.8 18.4 18.3 18.1 18.0 18.0 18.1 17.7 17.2 17.0 16.7 16.81,500 or more ......... 18.9 19.5 19.9 20.9 20.3 21.2 20.4 20.9 21.2 20.7 19.9 20.0 20.5 20.2 20.3 20.8 20.5 19.6 19.4 18.0 18.1
Secondary schools ........ 17.2 17.2 16.6 16.9 17.3 17.3 17.5 17.6 17.5 17.3 17.0 16.8 16.6 16.6 16.7 16.9 16.8 16.6 16.4 16.3 16.2Regular ...................... 17.1 17.3 16.7 17.0 17.4 17.4 17.6 17.7 17.6 17.4 17.1 16.9 16.7 16.7 16.8 17.0 16.9 16.8 16.6 16.4 16.3
Under 300............... 12.7 12.4 12.3 12.3 12.3 12.6 12.7 12.8 12.7 12.5 12.5 12.0 12.0 11.9 12.0 12.3 12.0 12.2 12.0 12.1 11.9300 to 499 .............. 15.4 15.5 14.9 15.1 15.3 15.5 15.7 15.7 15.5 15.3 15.1 14.6 14.5 14.4 14.4 14.7 14.7 14.6 14.4 14.4 14.3500 to 999 .............. 16.6 16.8 16.1 16.4 16.7 16.7 16.8 16.9 16.7 16.4 16.2 16.0 15.8 15.7 15.8 16.0 15.9 15.8 15.6 15.4 15.41,000 to 1,499 ........ 17.7 17.9 17.2 17.5 17.9 17.8 17.9 18.0 17.9 17.5 17.2 17.1 16.8 16.8 16.9 17.2 17.0 16.8 16.5 16.5 16.31,500 or more ......... 19.5 19.5 19.3 19.6 20.0 19.6 19.9 20.0 20.0 19.7 19.3 19.2 18.9 18.8 18.8 19.0 19.0 18.8 18.5 18.2 18.2
Combined schools ......... 15.9 15.5 14.5 15.0 14.8 15.3 15.1 15.0 14.7 14.4 13.4 13.4 13.7 13.4 13.5 13.8 13.9 14.1 14.7 13.4 13.9Under 300 .................. 9.8 9.5 8.9 9.3 9.3 9.6 9.3 9.0 8.7 8.6 8.9 9.1 9.2 9.1 9.1 9.5 9.2 9.5 10.1 9.2 8.9300 to 499 .................. 15.3 14.4 14.2 14.3 14.4 14.8 14.4 14.7 14.3 14.0 13.6 13.8 13.5 13.1 13.1 14.4 13.4 13.9 14.3 13.7 13.9500 to 999 .................. 17.1 17.6 16.3 16.7 15.6 16.5 16.6 16.6 16.6 16.2 15.5 14.9 15.8 15.6 16.0 15.4 15.8 15.9 16.0 15.2 15.61,000 to 1,499 ............ 18.5 19.0 17.8 17.9 18.6 18.6 18.3 18.2 18.4 18.0 16.9 16.9 17.5 18.1 17.7 17.5 17.4 16.4 17.3 15.9 16.71,500 or more............. 18.8 18.8 17.7 18.6 18.9 18.8 19.5 19.6 19.3 19.3 18.7 19.2 18.6 18.9 19.1 19.2 18.7 20.0 20.3 18.0 21.7
Ungraded ....................... 6.8 5.9 6.4 6.5 6.9 7.1 6.7 6.9 5.9 6.2 5.9 5.3 7.0 6.3 6.8 9.6 8.0 7.7 7.2 7.3 5.5
See notes at end of table.
DIGEST OF EDUCATION STATISTICS 2010
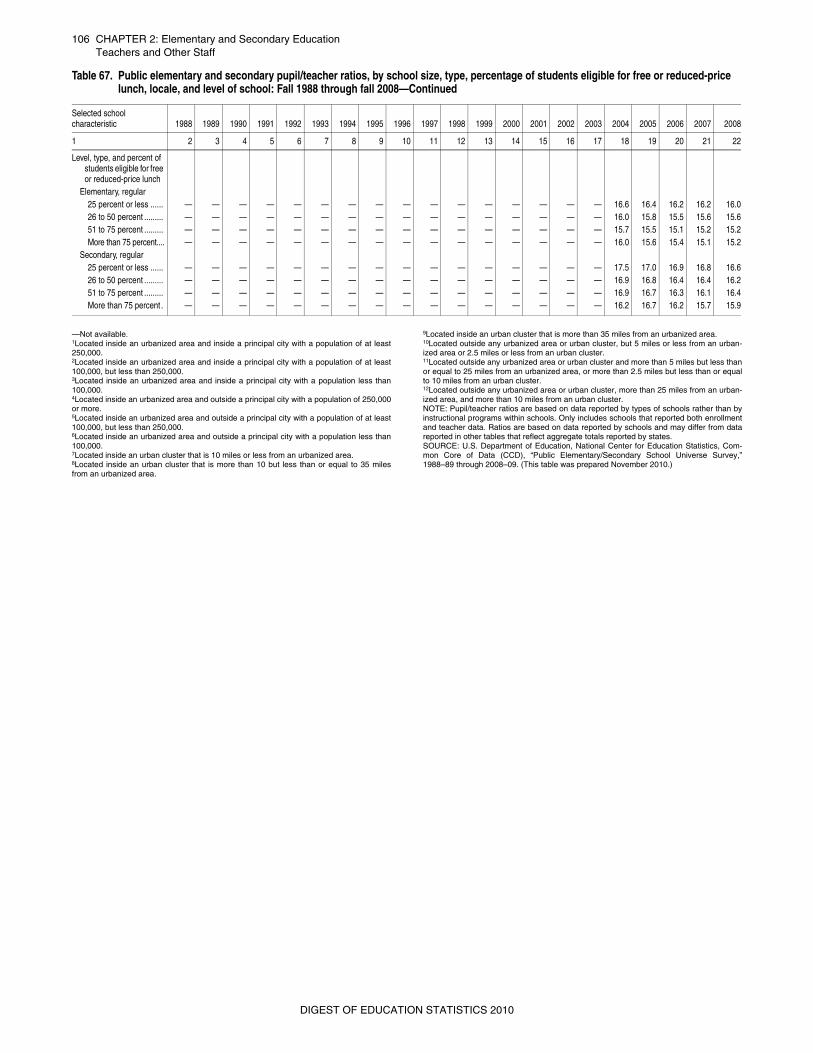
106 CHAPTER 2: Elementary and Secondary EducationTeachers and Other Staff
—Not available.1Located inside an urbanized area and inside a principal city with a population of at least250,000.2Located inside an urbanized area and inside a principal city with a population of at least100,000, but less than 250,000.3Located inside an urbanized area and inside a principal city with a population less than100,000.4Located inside an urbanized area and outside a principal city with a population of 250,000or more.5Located inside an urbanized area and outside a principal city with a population of at least100,000, but less than 250,000.6Located inside an urbanized area and outside a principal city with a population less than100,000.7Located inside an urban cluster that is 10 miles or less from an urbanized area.8Located inside an urban cluster that is more than 10 but less than or equal to 35 milesfrom an urbanized area.
9Located inside an urban cluster that is more than 35 miles from an urbanized area.10Located outside any urbanized area or urban cluster, but 5 miles or less from an urban-ized area or 2.5 miles or less from an urban cluster.11Located outside any urbanized area or urban cluster and more than 5 miles but less thanor equal to 25 miles from an urbanized area, or more than 2.5 miles but less than or equalto 10 miles from an urban cluster.12Located outside any urbanized area or urban cluster, more than 25 miles from an urban-ized area, and more than 10 miles from an urban cluster.NOTE: Pupil/teacher ratios are based on data reported by types of schools rather than byinstructional programs within schools. Only includes schools that reported both enrollmentand teacher data. Ratios are based on data reported by schools and may differ from datareported in other tables that reflect aggregate totals reported by states.SOURCE: U.S. Department of Education, National Center for Education Statistics, Com-mon Core of Data (CCD), “Public Elementary/Secondary School Universe Survey,”1988–89 through 2008–09. (This table was prepared November 2010.)
Level, type, and percent of students eligible for free or reduced-price lunch
Elementary, regular25 percent or less ...... — — — — — — — — — — — — — — — — 16.6 16.4 16.2 16.2 16.026 to 50 percent ......... — — — — — — — — — — — — — — — — 16.0 15.8 15.5 15.6 15.651 to 75 percent ......... — — — — — — — — — — — — — — — — 15.7 15.5 15.1 15.2 15.2More than 75 percent.... — — — — — — — — — — — — — — — — 16.0 15.6 15.4 15.1 15.2
Secondary, regular25 percent or less ...... — — — — — — — — — — — — — — — — 17.5 17.0 16.9 16.8 16.626 to 50 percent ......... — — — — — — — — — — — — — — — — 16.9 16.8 16.4 16.4 16.251 to 75 percent ......... — — — — — — — — — — — — — — — — 16.9 16.7 16.3 16.1 16.4More than 75 percent . — — — — — — — — — — — — — — — — 16.2 16.7 16.2 15.7 15.9
Table 67. Public elementary and secondary pupil/teacher ratios, by school size, type, percentage of students eligible for free or reduced-price lunch, locale, and level of school: Fall 1988 through fall 2008—Continued
Selected school characteristic 1988 1989 1990 1991 1992 1993 1994 1995 1996 1997 1998 1999 2000 2001 2002 2003 2004 2005 2006 2007 2008
1 2 3 4 5 6 7 8 9 10 11 12 13 14 15 16 17 18 19 20 21 22
DIGEST OF EDUCATION STATISTICS 2010
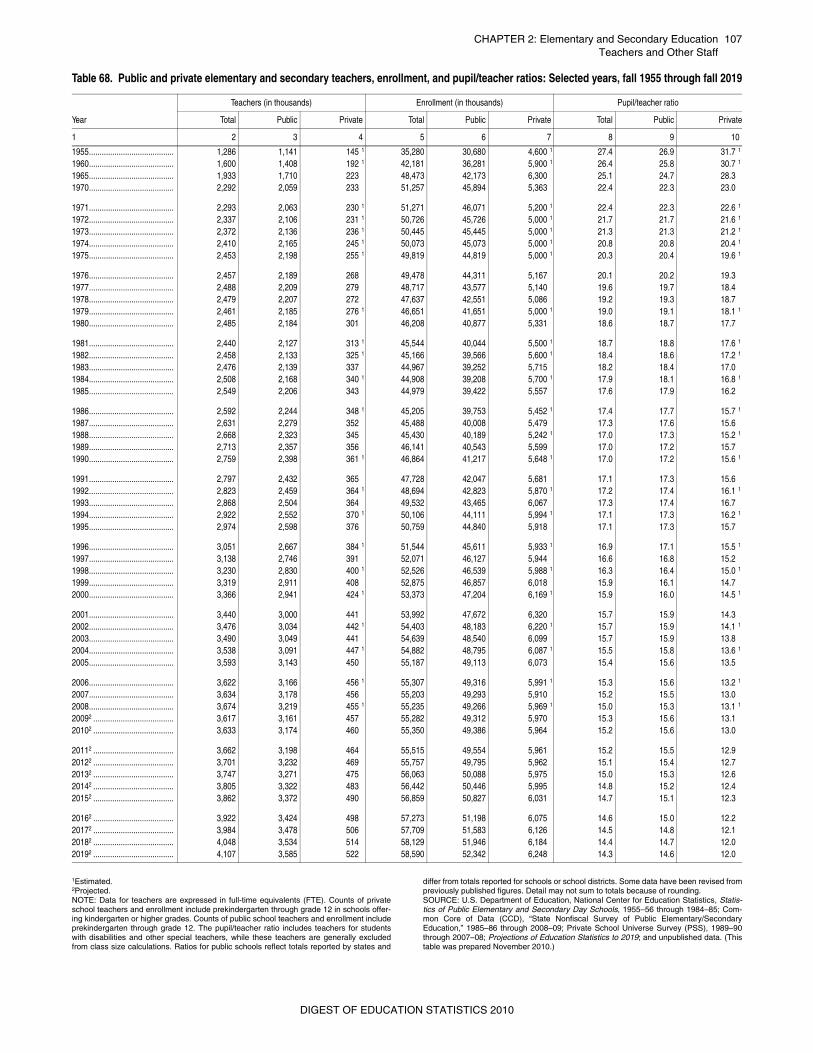
CHAPTER 2: Elementary and Secondary Education 107Teachers and Other Staff
1Estimated. 2Projected. NOTE: Data for teachers are expressed in full-time equivalents (FTE). Counts of privateschool teachers and enrollment include prekindergarten through grade 12 in schools offer-ing kindergarten or higher grades. Counts of public school teachers and enrollment includeprekindergarten through grade 12. The pupil/teacher ratio includes teachers for studentswith disabilities and other special teachers, while these teachers are generally excludedfrom class size calculations. Ratios for public schools reflect totals reported by states and
differ from totals reported for schools or school districts. Some data have been revised frompreviously published figures. Detail may not sum to totals because of rounding. SOURCE: U.S. Department of Education, National Center for Education Statistics, Statis-tics of Public Elementary and Secondary Day Schools, 1955–56 through 1984–85; Com-mon Core of Data (CCD), “State Nonfiscal Survey of Public Elementary/SecondaryEducation,” 1985–86 through 2008–09; Private School Universe Survey (PSS), 1989–90through 2007–08; Projections of Education Statistics to 2019; and unpublished data. (Thistable was prepared November 2010.)
Table 68. Public and private elementary and secondary teachers, enrollment, and pupil/teacher ratios: Selected years, fall 1955 through fall 2019
Year
Teachers (in thousands) Enrollment (in thousands) Pupil/teacher ratio
Total Public Private Total Public Private Total Public Private
1 2 3 4 5 6 7 8 9 10
1955........................................ 1,286 1,141 145 1 35,280 30,680 4,600 1 27.4 26.9 31.7 1
1960........................................ 1,600 1,408 192 1 42,181 36,281 5,900 1 26.4 25.8 30.7 1
1965........................................ 1,933 1,710 223 48,473 42,173 6,300 25.1 24.7 28.31970........................................ 2,292 2,059 233 51,257 45,894 5,363 22.4 22.3 23.0
1971........................................ 2,293 2,063 230 1 51,271 46,071 5,200 1 22.4 22.3 22.6 1
1972........................................ 2,337 2,106 231 1 50,726 45,726 5,000 1 21.7 21.7 21.6 1
1973........................................ 2,372 2,136 236 1 50,445 45,445 5,000 1 21.3 21.3 21.2 1
1974........................................ 2,410 2,165 245 1 50,073 45,073 5,000 1 20.8 20.8 20.4 1
1975........................................ 2,453 2,198 255 1 49,819 44,819 5,000 1 20.3 20.4 19.6 1
1976........................................ 2,457 2,189 268 49,478 44,311 5,167 20.1 20.2 19.31977........................................ 2,488 2,209 279 48,717 43,577 5,140 19.6 19.7 18.41978........................................ 2,479 2,207 272 47,637 42,551 5,086 19.2 19.3 18.71979........................................ 2,461 2,185 276 1 46,651 41,651 5,000 1 19.0 19.1 18.1 1
1980........................................ 2,485 2,184 301 46,208 40,877 5,331 18.6 18.7 17.7
1981........................................ 2,440 2,127 313 1 45,544 40,044 5,500 1 18.7 18.8 17.6 1
1982........................................ 2,458 2,133 325 1 45,166 39,566 5,600 1 18.4 18.6 17.2 1
1983........................................ 2,476 2,139 337 44,967 39,252 5,715 18.2 18.4 17.01984........................................ 2,508 2,168 340 1 44,908 39,208 5,700 1 17.9 18.1 16.8 1
1985........................................ 2,549 2,206 343 44,979 39,422 5,557 17.6 17.9 16.2
1986........................................ 2,592 2,244 348 1 45,205 39,753 5,452 1 17.4 17.7 15.7 1
1987........................................ 2,631 2,279 352 45,488 40,008 5,479 17.3 17.6 15.61988........................................ 2,668 2,323 345 45,430 40,189 5,242 1 17.0 17.3 15.2 1
1989........................................ 2,713 2,357 356 46,141 40,543 5,599 17.0 17.2 15.71990........................................ 2,759 2,398 361 1 46,864 41,217 5,648 1 17.0 17.2 15.6 1
1991........................................ 2,797 2,432 365 47,728 42,047 5,681 17.1 17.3 15.61992........................................ 2,823 2,459 364 1 48,694 42,823 5,870 1 17.2 17.4 16.1 1
1993........................................ 2,868 2,504 364 49,532 43,465 6,067 17.3 17.4 16.71994........................................ 2,922 2,552 370 1 50,106 44,111 5,994 1 17.1 17.3 16.2 1
1995........................................ 2,974 2,598 376 50,759 44,840 5,918 17.1 17.3 15.7
1996........................................ 3,051 2,667 384 1 51,544 45,611 5,933 1 16.9 17.1 15.5 1
1997........................................ 3,138 2,746 391 52,071 46,127 5,944 16.6 16.8 15.21998........................................ 3,230 2,830 400 1 52,526 46,539 5,988 1 16.3 16.4 15.0 1
1999........................................ 3,319 2,911 408 52,875 46,857 6,018 15.9 16.1 14.72000........................................ 3,366 2,941 424 1 53,373 47,204 6,169 1 15.9 16.0 14.5 1
2001........................................ 3,440 3,000 441 53,992 47,672 6,320 15.7 15.9 14.32002........................................ 3,476 3,034 442 1 54,403 48,183 6,220 1 15.7 15.9 14.1 1
2003........................................ 3,490 3,049 441 54,639 48,540 6,099 15.7 15.9 13.82004........................................ 3,538 3,091 447 1 54,882 48,795 6,087 1 15.5 15.8 13.6 1
2005........................................ 3,593 3,143 450 55,187 49,113 6,073 15.4 15.6 13.5
2006........................................ 3,622 3,166 456 1 55,307 49,316 5,991 1 15.3 15.6 13.2 1
2007........................................ 3,634 3,178 456 55,203 49,293 5,910 15.2 15.5 13.02008........................................ 3,674 3,219 455 1 55,235 49,266 5,969 1 15.0 15.3 13.1 1
20092 ...................................... 3,617 3,161 457 55,282 49,312 5,970 15.3 15.6 13.120102 ...................................... 3,633 3,174 460 55,350 49,386 5,964 15.2 15.6 13.0
20112 ...................................... 3,662 3,198 464 55,515 49,554 5,961 15.2 15.5 12.920122 ...................................... 3,701 3,232 469 55,757 49,795 5,962 15.1 15.4 12.720132 ...................................... 3,747 3,271 475 56,063 50,088 5,975 15.0 15.3 12.620142 ...................................... 3,805 3,322 483 56,442 50,446 5,995 14.8 15.2 12.420152 ...................................... 3,862 3,372 490 56,859 50,827 6,031 14.7 15.1 12.3
20162 ...................................... 3,922 3,424 498 57,273 51,198 6,075 14.6 15.0 12.220172 ...................................... 3,984 3,478 506 57,709 51,583 6,126 14.5 14.8 12.120182 ...................................... 4,048 3,534 514 58,129 51,946 6,184 14.4 14.7 12.020192 ...................................... 4,107 3,585 522 58,590 52,342 6,248 14.3 14.6 12.0
DIGEST OF EDUCATION STATISTICS 2010
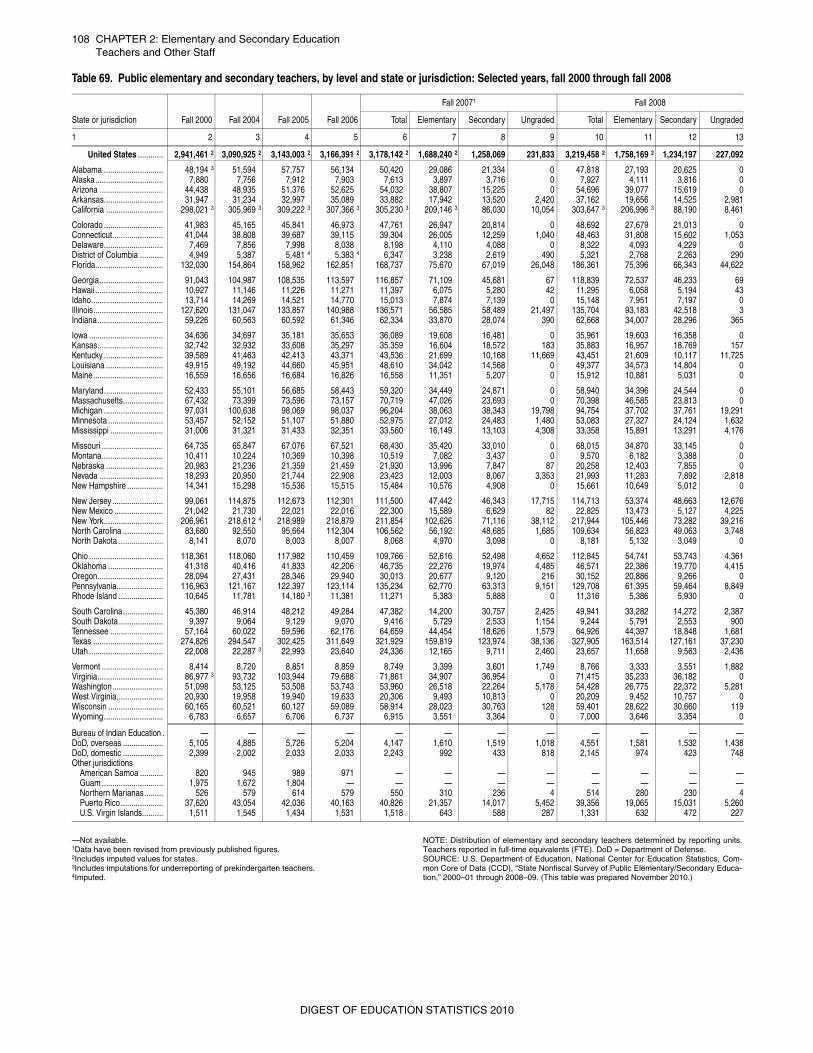
108 CHAPTER 2: Elementary and Secondary EducationTeachers and Other Staff
—Not available. 1Data have been revised from previously published figures. 2Includes imputed values for states.3Includes imputations for underreporting of prekindergarten teachers. 4Imputed.
NOTE: Distribution of elementary and secondary teachers determined by reporting units.Teachers reported in full-time equivalents (FTE). DoD = Department of Defense. SOURCE: U.S. Department of Education, National Center for Education Statistics, Com-mon Core of Data (CCD), “State Nonfiscal Survey of Public Elementary/Secondary Educa-tion,” 2000–01 through 2008–09. (This table was prepared November 2010.)
Table 69. Public elementary and secondary teachers, by level and state or jurisdiction: Selected years, fall 2000 through fall 2008
State or jurisdiction Fall 2000 Fall 2004 Fall 2005 Fall 2006
Fall 20071 Fall 2008
Total Elementary Secondary Ungraded Total Elementary Secondary Ungraded
1 2 3 4 5 6 7 8 9 10 11 12 13
United States ............ 2,941,461 2 3,090,925 2 3,143,003 2 3,166,391 2 3,178,142 2 1,688,240 2 1,258,069 231,833 3,219,458 2 1,758,169 2 1,234,197 227,092
Alabama ............................ 48,194 3 51,594 57,757 56,134 50,420 29,086 21,334 0 47,818 27,193 20,625 0Alaska................................ 7,880 7,756 7,912 7,903 7,613 3,897 3,716 0 7,927 4,111 3,816 0Arizona .............................. 44,438 48,935 51,376 52,625 54,032 38,807 15,225 0 54,696 39,077 15,619 0Arkansas............................ 31,947 31,234 32,997 35,089 33,882 17,942 13,520 2,420 37,162 19,656 14,525 2,981California ........................... 298,021 3 305,969 3 309,222 3 307,366 3 305,230 3 209,146 3 86,030 10,054 303,647 3 206,996 3 88,190 8,461
Colorado ............................ 41,983 45,165 45,841 46,973 47,761 26,947 20,814 0 48,692 27,679 21,013 0Connecticut........................ 41,044 38,808 39,687 39,115 39,304 26,005 12,259 1,040 48,463 31,808 15,602 1,053Delaware............................ 7,469 7,856 7,998 8,038 8,198 4,110 4,088 0 8,322 4,093 4,229 0District of Columbia ........... 4,949 5,387 5,481 4 5,383 4 6,347 3,238 2,619 490 5,321 2,768 2,263 290Florida................................ 132,030 154,864 158,962 162,851 168,737 75,670 67,019 26,048 186,361 75,396 66,343 44,622
Georgia.............................. 91,043 104,987 108,535 113,597 116,857 71,109 45,681 67 118,839 72,537 46,233 69Hawaii ................................ 10,927 11,146 11,226 11,271 11,397 6,075 5,280 42 11,295 6,058 5,194 43Idaho.................................. 13,714 14,269 14,521 14,770 15,013 7,874 7,139 0 15,148 7,951 7,197 0Illinois................................. 127,620 131,047 133,857 140,988 136,571 56,585 58,489 21,497 135,704 93,183 42,518 3Indiana............................... 59,226 60,563 60,592 61,346 62,334 33,870 28,074 390 62,668 34,007 28,296 365
Iowa ................................... 34,636 34,697 35,181 35,653 36,089 19,608 16,481 0 35,961 19,603 16,358 0Kansas............................... 32,742 32,932 33,608 35,297 35,359 16,604 18,572 183 35,883 16,957 18,769 157Kentucky ............................ 39,589 41,463 42,413 43,371 43,536 21,699 10,168 11,669 43,451 21,609 10,117 11,725Louisiana ........................... 49,915 49,192 44,660 45,951 48,610 34,042 14,568 0 49,377 34,573 14,804 0Maine................................. 16,559 16,656 16,684 16,826 16,558 11,351 5,207 0 15,912 10,881 5,031 0
Maryland............................ 52,433 55,101 56,685 58,443 59,320 34,449 24,871 0 58,940 34,396 24,544 0Massachusetts................... 67,432 73,399 73,596 73,157 70,719 47,026 23,693 0 70,398 46,585 23,813 0Michigan ............................ 97,031 100,638 98,069 98,037 96,204 38,063 38,343 19,798 94,754 37,702 37,761 19,291Minnesota .......................... 53,457 52,152 51,107 51,880 52,975 27,012 24,483 1,480 53,083 27,327 24,124 1,632Mississippi ......................... 31,006 31,321 31,433 32,351 33,560 16,149 13,103 4,308 33,358 15,891 13,291 4,176
Missouri ............................. 64,735 65,847 67,076 67,521 68,430 35,420 33,010 0 68,015 34,870 33,145 0Montana............................. 10,411 10,224 10,369 10,398 10,519 7,082 3,437 0 9,570 6,182 3,388 0Nebraska ........................... 20,983 21,236 21,359 21,459 21,930 13,996 7,847 87 20,258 12,403 7,855 0Nevada .............................. 18,293 20,950 21,744 22,908 23,423 12,003 8,067 3,353 21,993 11,283 7,892 2,818New Hampshire ................. 14,341 15,298 15,536 15,515 15,484 10,576 4,908 0 15,661 10,649 5,012 0
New Jersey ........................ 99,061 114,875 112,673 112,301 111,500 47,442 46,343 17,715 114,713 53,374 48,663 12,676New Mexico ....................... 21,042 21,730 22,021 22,016 22,300 15,589 6,629 82 22,825 13,473 5,127 4,225New York............................ 206,961 218,612 4 218,989 218,879 211,854 102,626 71,116 38,112 217,944 105,446 73,282 39,216North Carolina ................... 83,680 92,550 95,664 112,304 106,562 56,192 48,685 1,685 109,634 56,823 49,063 3,748North Dakota ..................... 8,141 8,070 8,003 8,007 8,068 4,970 3,098 0 8,181 5,132 3,049 0
Ohio ................................... 118,361 118,060 117,982 110,459 109,766 52,616 52,498 4,652 112,845 54,741 53,743 4,361Oklahoma .......................... 41,318 40,416 41,833 42,206 46,735 22,276 19,974 4,485 46,571 22,386 19,770 4,415Oregon............................... 28,094 27,431 28,346 29,940 30,013 20,677 9,120 216 30,152 20,886 9,266 0Pennsylvania...................... 116,963 121,167 122,397 123,114 135,234 62,770 63,313 9,151 129,708 61,395 59,464 8,849Rhode Island ..................... 10,645 11,781 14,180 3 11,381 11,271 5,383 5,888 0 11,316 5,386 5,930 0
South Carolina................... 45,380 46,914 48,212 49,284 47,382 14,200 30,757 2,425 49,941 33,282 14,272 2,387South Dakota ..................... 9,397 9,064 9,129 9,070 9,416 5,729 2,533 1,154 9,244 5,791 2,553 900Tennessee ......................... 57,164 60,022 59,596 62,176 64,659 44,454 18,626 1,579 64,926 44,397 18,848 1,681Texas ................................. 274,826 294,547 302,425 311,649 321,929 159,819 123,974 38,136 327,905 163,514 127,161 37,230Utah ................................... 22,008 22,287 3 22,993 23,640 24,336 12,165 9,711 2,460 23,657 11,658 9,563 2,436
Vermont ............................. 8,414 8,720 8,851 8,859 8,749 3,399 3,601 1,749 8,766 3,333 3,551 1,882Virginia............................... 86,977 3 93,732 103,944 79,688 71,861 34,907 36,954 0 71,415 35,233 36,182 0Washington........................ 51,098 53,125 53,508 53,743 53,960 26,518 22,264 5,178 54,428 26,775 22,372 5,281West Virginia...................... 20,930 19,958 19,940 19,633 20,306 9,493 10,813 0 20,209 9,452 10,757 0Wisconsin .......................... 60,165 60,521 60,127 59,089 58,914 28,023 30,763 128 59,401 28,622 30,660 119Wyoming............................ 6,783 6,657 6,706 6,737 6,915 3,551 3,364 0 7,000 3,646 3,354 0
Bureau of Indian Education . — — — — — — — — — — — —DoD, overseas ................... 5,105 4,885 5,726 5,204 4,147 1,610 1,519 1,018 4,551 1,581 1,532 1,438DoD, domestic ................... 2,399 2,002 2,033 2,033 2,243 992 433 818 2,145 974 423 748Other jurisdictions
American Samoa ........... 820 945 989 971 — — — — — — — —Guam ............................. 1,975 1,672 1,804 — — — — — — — — —Northern Marianas......... 526 579 614 579 550 310 236 4 514 280 230 4Puerto Rico .................... 37,620 43,054 42,036 40,163 40,826 21,357 14,017 5,452 39,356 19,065 15,031 5,260U.S. Virgin Islands.......... 1,511 1,545 1,434 1,531 1,518 643 588 287 1,331 632 472 227
DIGEST OF EDUCATION STATISTICS 2010
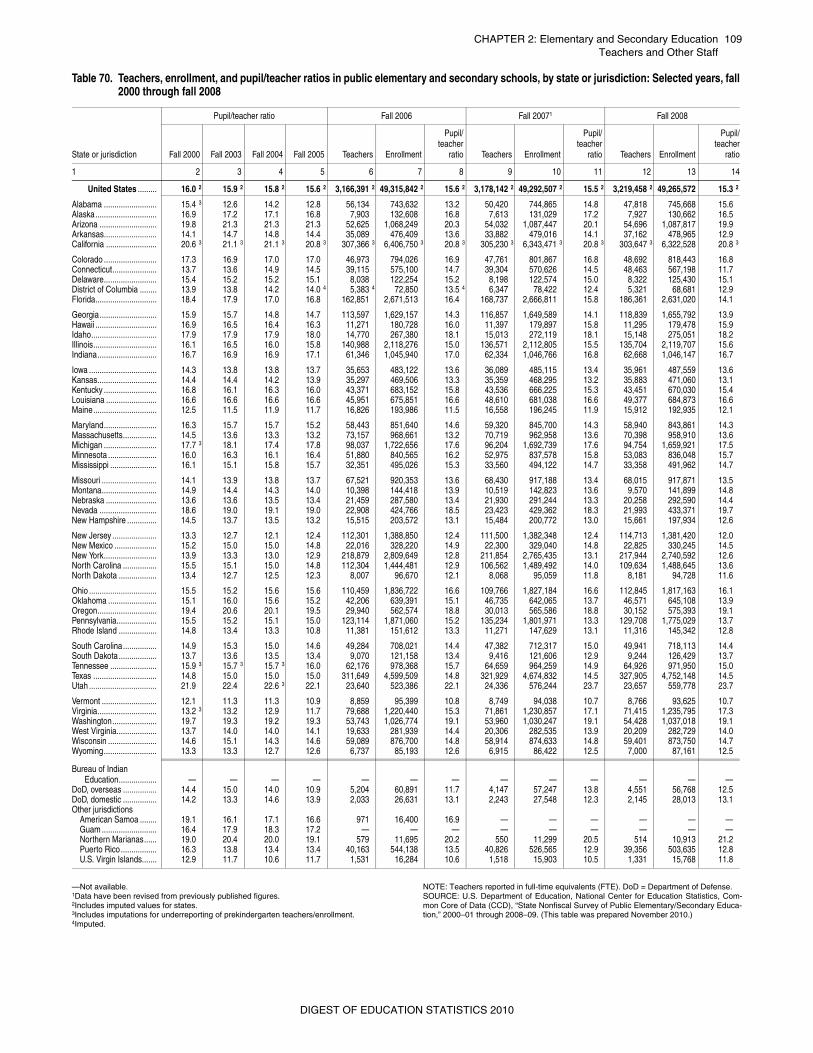
CHAPTER 2: Elementary and Secondary Education 109Teachers and Other Staff
—Not available. 1Data have been revised from previously published figures.2Includes imputed values for states.3Includes imputations for underreporting of prekindergarten teachers/enrollment. 4Imputed.
NOTE: Teachers reported in full-time equivalents (FTE). DoD = Department of Defense. SOURCE: U.S. Department of Education, National Center for Education Statistics, Com-mon Core of Data (CCD), “State Nonfiscal Survey of Public Elementary/Secondary Educa-tion,” 2000–01 through 2008–09. (This table was prepared November 2010.)
Table 70. Teachers, enrollment, and pupil/teacher ratios in public elementary and secondary schools, by state or jurisdiction: Selected years, fall 2000 through fall 2008
State or jurisdiction
Pupil/teacher ratio Fall 2006 Fall 20071 Fall 2008
Fall 2000 Fall 2003 Fall 2004 Fall 2005 Teachers Enrollment
Pupil/teacher
ratio Teachers Enrollment
Pupil/teacher
ratio Teachers Enrollment
Pupil/teacher
ratio
1 2 3 4 5 6 7 8 9 10 11 12 13 14
United States ......... 16.0 2 15.9 2 15.8 2 15.6 2 3,166,391 2 49,315,842 2 15.6 2 3,178,142 2 49,292,507 2 15.5 2 3,219,458 2 49,265,572 15.3 2
Alabama ......................... 15.4 3 12.6 14.2 12.8 56,134 743,632 13.2 50,420 744,865 14.8 47,818 745,668 15.6Alaska............................. 16.9 17.2 17.1 16.8 7,903 132,608 16.8 7,613 131,029 17.2 7,927 130,662 16.5Arizona ........................... 19.8 21.3 21.3 21.3 52,625 1,068,249 20.3 54,032 1,087,447 20.1 54,696 1,087,817 19.9Arkansas......................... 14.1 14.7 14.8 14.4 35,089 476,409 13.6 33,882 479,016 14.1 37,162 478,965 12.9
California ........................ 20.6 3 21.1 3 21.1 3 20.8 3 307,366 3 6,406,750 3 20.8 3 305,230 3 6,343,471 3 20.8 3 303,647 3 6,322,528 20.8 3
Colorado ......................... 17.3 16.9 17.0 17.0 46,973 794,026 16.9 47,761 801,867 16.8 48,692 818,443 16.8Connecticut..................... 13.7 13.6 14.9 14.5 39,115 575,100 14.7 39,304 570,626 14.5 48,463 567,198 11.7Delaware......................... 15.4 15.2 15.2 15.1 8,038 122,254 15.2 8,198 122,574 15.0 8,322 125,430 15.1District of Columbia ........ 13.9 13.8 14.2 14.0 4 5,383 4 72,850 13.5 4 6,347 78,422 12.4 5,321 68,681 12.9Florida............................. 18.4 17.9 17.0 16.8 162,851 2,671,513 16.4 168,737 2,666,811 15.8 186,361 2,631,020 14.1
Georgia........................... 15.9 15.7 14.8 14.7 113,597 1,629,157 14.3 116,857 1,649,589 14.1 118,839 1,655,792 13.9Hawaii ............................. 16.9 16.5 16.4 16.3 11,271 180,728 16.0 11,397 179,897 15.8 11,295 179,478 15.9Idaho............................... 17.9 17.9 17.9 18.0 14,770 267,380 18.1 15,013 272,119 18.1 15,148 275,051 18.2Illinois.............................. 16.1 16.5 16.0 15.8 140,988 2,118,276 15.0 136,571 2,112,805 15.5 135,704 2,119,707 15.6Indiana............................ 16.7 16.9 16.9 17.1 61,346 1,045,940 17.0 62,334 1,046,766 16.8 62,668 1,046,147 16.7
Iowa ................................ 14.3 13.8 13.8 13.7 35,653 483,122 13.6 36,089 485,115 13.4 35,961 487,559 13.6Kansas............................ 14.4 14.4 14.2 13.9 35,297 469,506 13.3 35,359 468,295 13.2 35,883 471,060 13.1Kentucky ......................... 16.8 16.1 16.3 16.0 43,371 683,152 15.8 43,536 666,225 15.3 43,451 670,030 15.4Louisiana ........................ 16.6 16.6 16.6 16.6 45,951 675,851 16.6 48,610 681,038 16.6 49,377 684,873 16.6Maine.............................. 12.5 11.5 11.9 11.7 16,826 193,986 11.5 16,558 196,245 11.9 15,912 192,935 12.1
Maryland......................... 16.3 15.7 15.7 15.2 58,443 851,640 14.6 59,320 845,700 14.3 58,940 843,861 14.3Massachusetts................ 14.5 13.6 13.3 13.2 73,157 968,661 13.2 70,719 962,958 13.6 70,398 958,910 13.6Michigan ......................... 17.7 3 18.1 17.4 17.8 98,037 1,722,656 17.6 96,204 1,692,739 17.6 94,754 1,659,921 17.5
Minnesota ....................... 16.0 16.3 16.1 16.4 51,880 840,565 16.2 52,975 837,578 15.8 53,083 836,048 15.7Mississippi ...................... 16.1 15.1 15.8 15.7 32,351 495,026 15.3 33,560 494,122 14.7 33,358 491,962 14.7
Missouri .......................... 14.1 13.9 13.8 13.7 67,521 920,353 13.6 68,430 917,188 13.4 68,015 917,871 13.5Montana.......................... 14.9 14.4 14.3 14.0 10,398 144,418 13.9 10,519 142,823 13.6 9,570 141,899 14.8Nebraska ........................ 13.6 13.6 13.5 13.4 21,459 287,580 13.4 21,930 291,244 13.3 20,258 292,590 14.4Nevada ........................... 18.6 19.0 19.1 19.0 22,908 424,766 18.5 23,423 429,362 18.3 21,993 433,371 19.7New Hampshire .............. 14.5 13.7 13.5 13.2 15,515 203,572 13.1 15,484 200,772 13.0 15,661 197,934 12.6
New Jersey ..................... 13.3 12.7 12.1 12.4 112,301 1,388,850 12.4 111,500 1,382,348 12.4 114,713 1,381,420 12.0
New Mexico .................... 15.2 15.0 15.0 14.8 22,016 328,220 14.9 22,300 329,040 14.8 22,825 330,245 14.5New York......................... 13.9 13.3 13.0 12.9 218,879 2,809,649 12.8 211,854 2,765,435 13.1 217,944 2,740,592 12.6North Carolina ................ 15.5 15.1 15.0 14.8 112,304 1,444,481 12.9 106,562 1,489,492 14.0 109,634 1,488,645 13.6North Dakota .................. 13.4 12.7 12.5 12.3 8,007 96,670 12.1 8,068 95,059 11.8 8,181 94,728 11.6
Ohio ................................ 15.5 15.2 15.6 15.6 110,459 1,836,722 16.6 109,766 1,827,184 16.6 112,845 1,817,163 16.1Oklahoma ....................... 15.1 16.0 15.6 15.2 42,206 639,391 15.1 46,735 642,065 13.7 46,571 645,108 13.9Oregon............................ 19.4 20.6 20.1 19.5 29,940 562,574 18.8 30,013 565,586 18.8 30,152 575,393 19.1Pennsylvania................... 15.5 15.2 15.1 15.0 123,114 1,871,060 15.2 135,234 1,801,971 13.3 129,708 1,775,029 13.7Rhode Island .................. 14.8 13.4 13.3 10.8 11,381 151,612 13.3 11,271 147,629 13.1 11,316 145,342 12.8
South Carolina................ 14.9 15.3 15.0 14.6 49,284 708,021 14.4 47,382 712,317 15.0 49,941 718,113 14.4
South Dakota .................. 13.7 13.6 13.5 13.4 9,070 121,158 13.4 9,416 121,606 12.9 9,244 126,429 13.7Tennessee ...................... 15.9 3 15.7 3 15.7 3 16.0 62,176 978,368 15.7 64,659 964,259 14.9 64,926 971,950 15.0Texas .............................. 14.8 15.0 15.0 15.0 311,649 4,599,509 14.8 321,929 4,674,832 14.5 327,905 4,752,148 14.5Utah ................................ 21.9 22.4 22.6 3 22.1 23,640 523,386 22.1 24,336 576,244 23.7 23,657 559,778 23.7
Vermont .......................... 12.1 11.3 11.3 10.9 8,859 95,399 10.8 8,749 94,038 10.7 8,766 93,625 10.7Virginia............................ 13.2 3 13.2 12.9 11.7 79,688 1,220,440 15.3 71,861 1,230,857 17.1 71,415 1,235,795 17.3
Washington..................... 19.7 19.3 19.2 19.3 53,743 1,026,774 19.1 53,960 1,030,247 19.1 54,428 1,037,018 19.1West Virginia................... 13.7 14.0 14.0 14.1 19,633 281,939 14.4 20,306 282,535 13.9 20,209 282,729 14.0Wisconsin ....................... 14.6 15.1 14.3 14.6 59,089 876,700 14.8 58,914 874,633 14.8 59,401 873,750 14.7Wyoming......................... 13.3 13.3 12.7 12.6 6,737 85,193 12.6 6,915 86,422 12.5 7,000 87,161 12.5
Bureau of Indian Education.................. — — — — — — — — — — — — —
DoD, overseas ................ 14.4 15.0 14.0 10.9 5,204 60,891 11.7 4,147 57,247 13.8 4,551 56,768 12.5DoD, domestic ................ 14.2 13.3 14.6 13.9 2,033 26,631 13.1 2,243 27,548 12.3 2,145 28,013 13.1Other jurisdictions
American Samoa ........ 19.1 16.1 17.1 16.6 971 16,400 16.9 — — — — — —Guam .......................... 16.4 17.9 18.3 17.2 — — — — — — — — —
Northern Marianas...... 19.0 20.4 20.0 19.1 579 11,695 20.2 550 11,299 20.5 514 10,913 21.2Puerto Rico................. 16.3 13.8 13.4 13.4 40,163 544,138 13.5 40,826 526,565 12.9 39,356 503,635 12.8U.S. Virgin Islands....... 12.9 11.7 10.6 11.7 1,531 16,284 10.6 1,518 15,903 10.5 1,331 15,768 11.8
DIGEST OF EDUCATION STATISTICS 2010
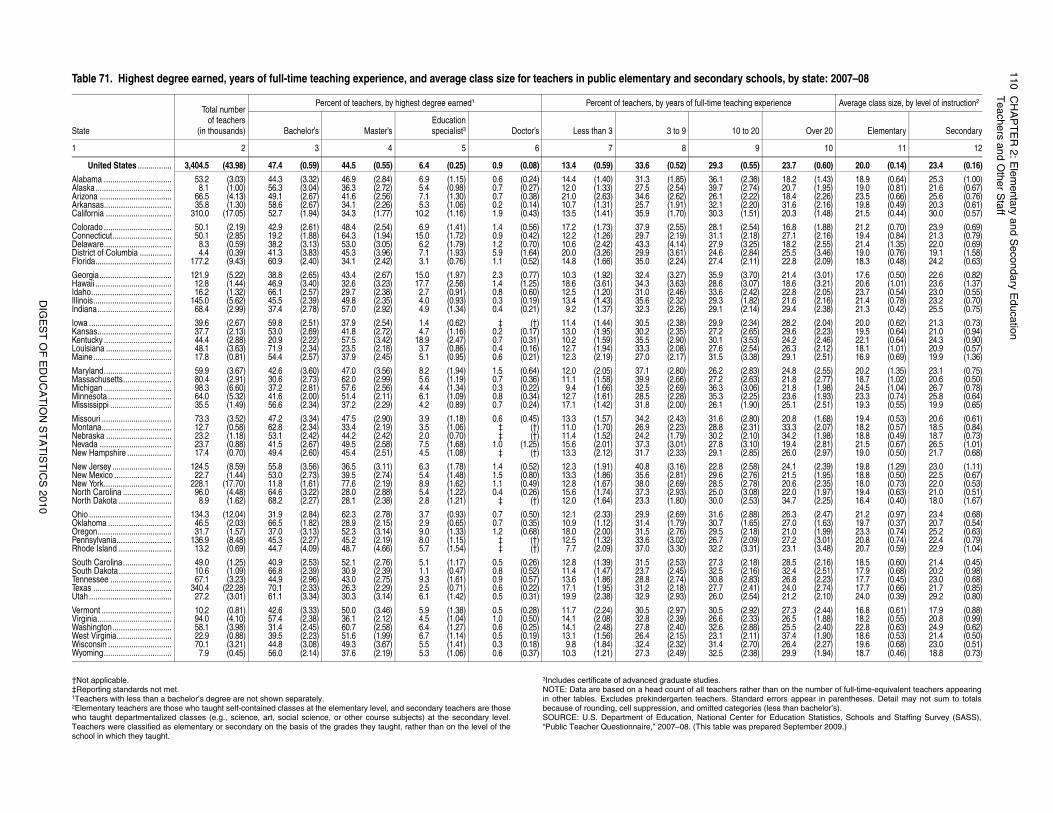
11
0C
HA
PT
ER
2: E
lem
en
tary a
nd
Se
con
da
ry Ed
uca
tion
Teach
ers a
nd O
the
r Sta
ff
DIG
ES
T O
F E
DU
CA
TIO
N S
TA
TIS
TIC
S 2
01
0
r than on the number of full-time-equivalent teachers appearingrd errors appear in parentheses. Detail may not sum to totalss (less than bachelor’s).for Education Statistics, Schools and Staffing Survey (SASS),epared September 2009.)
hools, by state: 2007–08
experience Average class size, by level of instruction2
0 Over 20 Elementary Secondary
9 10 11 12
) 23.7 (0.60) 20.0 (0.14) 23.4 (0.16)
) 18.2 (1.43) 18.9 (0.64) 25.3 (1.00)) 20.7 (1.95) 19.0 (0.81) 21.6 (0.67)) 18.4 (2.26) 23.5 (0.66) 25.6 (0.76)) 31.6 (2.16) 19.8 (0.49) 20.3 (0.61)) 20.3 (1.48) 21.5 (0.44) 30.0 (0.57)
) 16.8 (1.88) 21.2 (0.70) 23.9 (0.69)) 27.1 (2.16) 19.4 (0.84) 21.3 (0.79)) 18.2 (2.55) 21.4 (1.35) 22.0 (0.69)) 25.5 (3.46) 19.0 (0.76) 19.1 (1.58)) 22.8 (2.09) 18.3 (0.48) 24.2 (0.63)
) 21.4 (3.01) 17.6 (0.50) 22.6 (0.82)) 18.6 (3.21) 20.6 (1.01) 23.6 (1.37)) 22.8 (2.05) 23.7 (0.54) 23.0 (0.55)) 21.6 (2.16) 21.4 (0.78) 23.2 (0.70)) 29.4 (2.38) 21.3 (0.42) 25.5 (0.75)
) 28.2 (2.04) 20.0 (0.62) 21.3 (0.73)) 29.6 (2.23) 19.5 (0.64) 21.0 (0.94)) 24.2 (2.46) 22.1 (0.64) 24.3 (0.90)) 26.3 (2.12) 18.1 (1.01) 20.9 (0.57)) 29.1 (2.51) 16.9 (0.69) 19.9 (1.36)
) 24.8 (2.55) 20.2 (1.35) 23.1 (0.75)) 21.8 (2.77) 18.7 (1.02) 20.6 (0.50)) 21.8 (1.98) 24.5 (1.04) 26.7 (0.78)) 23.6 (1.93) 23.3 (0.74) 25.8 (0.64)) 25.1 (2.51) 19.3 (0.55) 19.9 (0.65)
) 20.8 (1.68) 19.4 (0.53) 20.6 (0.61)) 33.3 (2.07) 18.2 (0.57) 18.5 (0.84)) 34.2 (1.98) 18.8 (0.49) 18.7 (0.73)) 19.4 (2.81) 21.5 (0.67) 26.5 (1.01)) 26.0 (2.97) 19.0 (0.50) 21.7 (0.68)
) 24.1 (2.39) 19.8 (1.29) 23.0 (1.11)) 21.5 (1.95) 18.8 (0.50) 22.5 (0.67)) 20.6 (2.35) 18.0 (0.73) 22.0 (0.53)) 22.0 (1.97) 19.4 (0.63) 21.0 (0.51)) 34.7 (2.25) 16.4 (0.40) 18.0 (1.67)
) 26.3 (2.47) 21.2 (0.97) 23.4 (0.68)) 27.0 (1.63) 19.7 (0.37) 20.7 (0.54)) 21.0 (1.99) 23.3 (0.74) 25.2 (0.63)) 27.2 (3.01) 20.8 (0.74) 22.4 (0.79)) 23.1 (3.48) 20.7 (0.59) 22.9 (1.04)
) 28.5 (2.16) 18.5 (0.60) 21.4 (0.45)) 32.4 (2.51) 17.9 (0.68) 20.2 (0.98)) 26.8 (2.23) 17.7 (0.45) 23.0 (0.68)) 24.0 (2.74) 17.7 (0.66) 21.7 (0.85)) 21.2 (2.10) 24.0 (0.39) 29.2 (0.80)
) 27.3 (2.44) 16.8 (0.61) 17.9 (0.88)) 26.5 (1.88) 18.2 (0.55) 20.8 (0.99)) 25.5 (2.40) 22.8 (0.63) 24.9 (0.62)) 37.4 (1.90) 18.6 (0.53) 21.4 (0.50)) 26.4 (2.27) 19.6 (0.68) 23.0 (0.51)) 29.9 (1.94) 18.7 (0.46) 18.8 (0.73)
†Not applicable.‡Reporting standards not met. 1Teachers with less than a bachelor’s degree are not shown separately. 2Elementary teachers are those who taught self-contained classes at the elementary level, and secondary teachers are thosewho taught departmentalized classes (e.g., science, art, social science, or other course subjects) at the secondary level.Teachers were classified as elementary or secondary on the basis of the grades they taught, rather than on the level of theschool in which they taught.
3Includes certificate of advanced graduate studies. NOTE: Data are based on a head count of all teachers rathein other tables. Excludes prekindergarten teachers. Standabecause of rounding, cell suppression, and omitted categorieSOURCE: U.S. Department of Education, National Center “Public Teacher Questionnaire,” 2007–08. (This table was pr
Table 71. Highest degree earned, years of full-time teaching experience, and average class size for teachers in public elementary and secondary sc
State
Total numberof teachers
(in thousands)
Percent of teachers, by highest degree earned1 Percent of teachers, by years of full-time teaching
Bachelor’s Master’sEducationspecialist3 Doctor’s Less than 3 3 to 9 10 to 2
1 2 3 4 5 6 7 8
United States ................ 3,404.5 (43.98) 47.4 (0.59) 44.5 (0.55) 6.4 (0.25) 0.9 (0.08) 13.4 (0.59) 33.6 (0.52) 29.3 (0.55
Alabama ................................ 53.2 (3.03) 44.3 (3.32) 46.9 (2.84) 6.9 (1.15) 0.6 (0.24) 14.4 (1.40) 31.3 (1.85) 36.1 (2.36Alaska.................................... 8.1 (1.00) 56.3 (3.04) 36.3 (2.72) 5.4 (0.98) 0.7 (0.27) 12.0 (1.33) 27.5 (2.54) 39.7 (2.74Arizona .................................. 66.5 (4.13) 49.1 (2.67) 41.6 (2.56) 7.1 (1.30) 0.7 (0.38) 21.0 (2.63) 34.6 (2.62) 26.1 (2.22Arkansas................................ 35.8 (1.30) 58.6 (2.67) 34.1 (2.26) 5.3 (1.06) 0.2 (0.14) 10.7 (1.31) 25.7 (1.91) 32.1 (2.20California ............................... 310.0 (17.05) 52.7 (1.94) 34.3 (1.77) 10.2 (1.16) 1.9 (0.43) 13.5 (1.41) 35.9 (1.70) 30.3 (1.51
Colorado ................................ 50.1 (2.19) 42.9 (2.61) 48.4 (2.54) 6.9 (1.41) 1.4 (0.56) 17.2 (1.73) 37.9 (2.55) 28.1 (2.54Connecticut............................ 50.1 (2.85) 19.2 (1.88) 64.3 (1.94) 15.0 (1.72) 0.9 (0.42) 12.2 (1.26) 29.7 (2.19) 31.1 (2.18Delaware................................ 8.3 (0.59) 38.2 (3.13) 53.0 (3.05) 6.2 (1.79) 1.2 (0.70) 10.6 (2.42) 43.3 (4.14) 27.9 (3.25District of Columbia ............... 4.4 (0.39) 41.3 (3.83) 45.3 (3.96) 7.1 (1.93) 5.9 (1.64) 20.0 (3.26) 29.9 (3.61) 24.6 (2.84Florida.................................... 177.2 (9.43) 60.9 (2.40) 34.1 (2.42) 3.1 (0.76) 1.1 (0.52) 14.8 (1.66) 35.0 (2.24) 27.4 (2.11
Georgia.................................. 121.9 (5.22) 38.8 (2.65) 43.4 (2.67) 15.0 (1.97) 2.3 (0.77) 10.3 (1.92) 32.4 (3.27) 35.9 (3.70Hawaii .................................... 12.8 (1.44) 46.9 (3.40) 32.6 (3.23) 17.7 (2.56) 1.4 (1.25) 18.6 (3.61) 34.3 (3.63) 28.6 (3.07Idaho...................................... 16.2 (1.32) 66.1 (2.57) 29.7 (2.38) 2.7 (0.91) 0.8 (0.60) 12.5 (1.20) 31.0 (2.46) 33.6 (2.42Illinois..................................... 145.0 (5.62) 45.5 (2.39) 49.8 (2.35) 4.0 (0.93) 0.3 (0.19) 13.4 (1.43) 35.6 (2.32) 29.3 (1.82Indiana................................... 68.4 (2.99) 37.4 (2.78) 57.0 (2.92) 4.9 (1.34) 0.4 (0.21) 9.2 (1.37) 32.3 (2.26) 29.1 (2.14
Iowa ....................................... 39.6 (2.67) 59.8 (2.51) 37.9 (2.54) 1.4 (0.62) ‡ (†) 11.4 (1.44) 30.5 (2.38) 29.9 (2.34Kansas................................... 37.7 (2.13) 53.0 (2.69) 41.8 (2.72) 4.7 (1.16) 0.2 (0.17) 13.0 (1.95) 30.2 (2.35) 27.2 (2.65Kentucky ................................ 44.4 (2.88) 20.9 (2.22) 57.5 (3.42) 18.9 (2.47) 0.7 (0.31) 10.2 (1.59) 35.5 (2.90) 30.1 (3.53Louisiana ............................... 48.1 (3.63) 71.9 (2.34) 23.5 (2.18) 3.7 (0.86) 0.4 (0.16) 12.7 (1.94) 33.3 (2.08) 27.6 (2.54Maine..................................... 17.8 (0.81) 54.4 (2.57) 37.9 (2.45) 5.1 (0.95) 0.6 (0.21) 12.3 (2.19) 27.0 (2.17) 31.5 (3.38
Maryland................................ 59.9 (3.67) 42.6 (3.60) 47.0 (3.56) 8.2 (1.94) 1.5 (0.64) 12.0 (2.05) 37.1 (2.80) 26.2 (2.83Massachusetts....................... 80.4 (2.91) 30.6 (2.73) 62.0 (2.99) 5.6 (1.19) 0.7 (0.36) 11.1 (1.58) 39.9 (2.66) 27.2 (2.63Michigan ................................ 98.3 (6.60) 37.2 (2.81) 57.6 (2.56) 4.4 (1.34) 0.3 (0.22) 9.4 (1.66) 32.5 (2.69) 36.3 (3.06Minnesota .............................. 64.0 (5.32) 41.6 (2.00) 51.4 (2.11) 6.1 (1.09) 0.8 (0.34) 12.7 (1.61) 28.5 (2.28) 35.3 (2.25Mississippi ............................. 35.5 (1.49) 56.6 (2.34) 37.2 (2.29) 4.2 (0.89) 0.7 (0.24) 17.1 (1.42) 31.8 (2.00) 26.1 (1.90
Missouri ................................. 73.3 (3.52) 47.2 (3.34) 47.5 (2.90) 3.9 (1.18) 0.6 (0.45) 13.3 (1.57) 34.2 (2.43) 31.6 (2.80Montana................................. 12.7 (0.58) 62.8 (2.34) 33.4 (2.19) 3.5 (1.06) ‡ (†) 11.0 (1.70) 26.9 (2.23) 28.8 (2.31Nebraska ............................... 23.2 (1.18) 53.1 (2.42) 44.2 (2.42) 2.0 (0.70) ‡ (†) 11.4 (1.52) 24.2 (1.79) 30.2 (2.10Nevada .................................. 23.7 (0.88) 41.5 (2.67) 49.5 (2.58) 7.5 (1.68) 1.0 (1.25) 15.6 (2.01) 37.3 (3.01) 27.8 (3.10New Hampshire ..................... 17.4 (0.70) 49.4 (2.60) 45.4 (2.51) 4.5 (1.08) ‡ (†) 13.3 (2.12) 31.7 (2.33) 29.1 (2.85
New Jersey ............................ 124.5 (8.59) 55.8 (3.56) 36.5 (3.11) 6.3 (1.78) 1.4 (0.52) 12.3 (1.91) 40.8 (3.16) 22.8 (2.58New Mexico ........................... 22.7 (1.44) 53.0 (2.73) 39.5 (2.74) 5.4 (1.48) 1.5 (0.80) 13.3 (1.86) 35.6 (2.81) 29.6 (2.76New York................................ 228.1 (17.70) 11.8 (1.61) 77.6 (2.19) 8.9 (1.62) 1.1 (0.49) 12.8 (1.67) 38.0 (2.69) 28.5 (2.78North Carolina ....................... 96.0 (4.48) 64.6 (3.22) 28.0 (2.88) 5.4 (1.22) 0.4 (0.26) 15.6 (1.74) 37.3 (2.93) 25.0 (3.08North Dakota ......................... 8.9 (1.62) 68.2 (2.27) 28.1 (2.38) 2.8 (1.21) ‡ (†) 12.0 (1.64) 23.3 (1.80) 30.0 (2.53
Ohio ....................................... 134.3 (12.04) 31.9 (2.84) 62.3 (2.78) 3.7 (0.93) 0.7 (0.50) 12.1 (2.33) 29.9 (2.69) 31.6 (2.88Oklahoma .............................. 46.5 (2.03) 66.5 (1.82) 28.9 (2.15) 2.9 (0.65) 0.7 (0.35) 10.9 (1.12) 31.4 (1.79) 30.7 (1.65Oregon................................... 31.7 (1.57) 37.0 (3.13) 52.3 (3.14) 9.0 (1.33) 1.2 (0.68) 18.0 (2.00) 31.5 (2.76) 29.5 (2.18Pennsylvania.......................... 136.9 (8.48) 45.3 (2.27) 45.2 (2.19) 8.0 (1.15) ‡ (†) 12.5 (1.32) 33.6 (3.02) 26.7 (2.09Rhode Island ......................... 13.2 (0.69) 44.7 (4.09) 48.7 (4.66) 5.7 (1.54) ‡ (†) 7.7 (2.09) 37.0 (3.30) 32.2 (3.31
South Carolina....................... 49.0 (1.25) 40.9 (2.53) 52.1 (2.76) 5.1 (1.17) 0.5 (0.26) 12.8 (1.39) 31.5 (2.53) 27.3 (2.18South Dakota ......................... 10.6 (1.09) 66.8 (2.39) 30.9 (2.39) 1.1 (0.47) 0.8 (0.52) 11.4 (1.47) 23.7 (2.45) 32.5 (2.16Tennessee ............................. 67.1 (3.23) 44.9 (2.96) 43.0 (2.75) 9.3 (1.61) 0.9 (0.57) 13.6 (1.86) 28.8 (2.74) 30.8 (2.83Texas ..................................... 340.4 (22.28) 70.1 (2.33) 26.3 (2.29) 2.5 (0.71) 0.6 (0.22) 17.1 (1.95) 31.2 (2.18) 27.7 (2.41Utah ....................................... 27.2 (3.01) 61.1 (3.34) 30.3 (3.14) 6.1 (1.42) 0.5 (0.31) 19.9 (2.38) 32.9 (2.93) 26.0 (2.54
Vermont ................................. 10.2 (0.81) 42.6 (3.33) 50.0 (3.46) 5.9 (1.38) 0.5 (0.28) 11.7 (2.24) 30.5 (2.97) 30.5 (2.92Virginia................................... 94.0 (4.10) 57.4 (2.38) 36.1 (2.12) 4.5 (1.04) 1.0 (0.50) 14.1 (2.08) 32.8 (2.39) 26.6 (2.33Washington............................ 58.1 (3.98) 31.4 (2.45) 60.7 (2.58) 6.4 (1.27) 0.6 (0.25) 14.1 (2.48) 27.8 (2.40) 32.6 (2.88West Virginia.......................... 22.9 (0.88) 39.5 (2.23) 51.6 (1.99) 6.7 (1.14) 0.5 (0.19) 13.1 (1.56) 26.4 (2.15) 23.1 (2.11Wisconsin .............................. 70.1 (3.21) 44.8 (3.08) 49.3 (3.67) 5.5 (1.41) 0.3 (0.18) 9.8 (1.84) 32.4 (2.32) 31.4 (2.70Wyoming................................ 7.9 (0.45) 56.0 (2.14) 37.6 (2.19) 5.3 (1.06) 0.6 (0.37) 10.3 (1.21) 27.3 (2.49) 32.5 (2.38
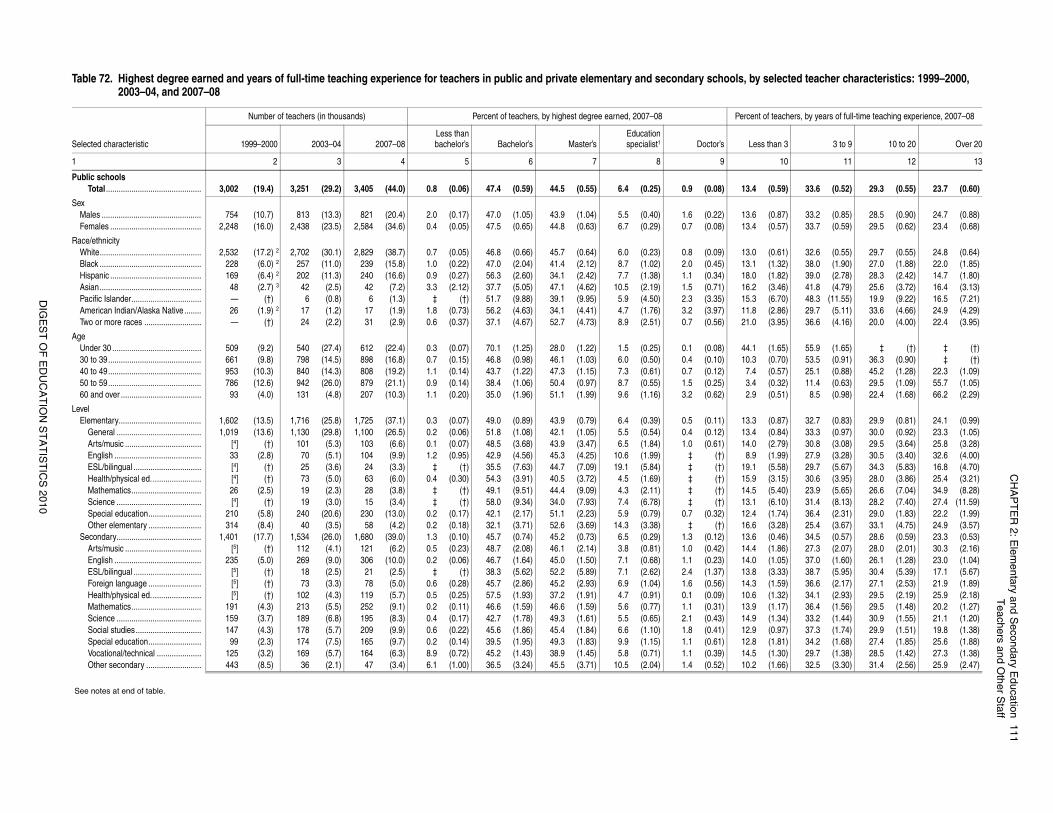
CH
AP
TE
R 2
: Ele
me
nta
ry an
d S
eco
nd
ary E
du
catio
n1
11
Tea
chers a
nd O
the
r Sta
ff
DIG
ES
T O
F E
DU
CA
TIO
N S
TA
TIS
TIC
S 2
01
0
y selected teacher characteristics: 1999–2000,
nt of teachers, by years of full-time teaching experience, 2007–08
ss than 3 3 to 9 10 to 20 Over 20
10 11 12 13
(0.59) 33.6 (0.52) 29.3 (0.55) 23.7 (0.60)
(0.87) 33.2 (0.85) 28.5 (0.90) 24.7 (0.88)(0.57) 33.7 (0.59) 29.5 (0.62) 23.4 (0.68)
(0.61) 32.6 (0.55) 29.7 (0.55) 24.8 (0.64)(1.32) 38.0 (1.90) 27.0 (1.88) 22.0 (1.85)(1.82) 39.0 (2.78) 28.3 (2.42) 14.7 (1.80)(3.46) 41.8 (4.79) 25.6 (3.72) 16.4 (3.13)(6.70) 48.3 (11.55) 19.9 (9.22) 16.5 (7.21)(2.86) 29.7 (5.11) 33.6 (4.66) 24.9 (4.29)(3.95) 36.6 (4.16) 20.0 (4.00) 22.4 (3.95)
(1.65) 55.9 (1.65) ‡ (†) ‡ (†)(0.70) 53.5 (0.91) 36.3 (0.90) ‡ (†)(0.57) 25.1 (0.88) 45.2 (1.28) 22.3 (1.09)(0.32) 11.4 (0.63) 29.5 (1.09) 55.7 (1.05)(0.51) 8.5 (0.98) 22.4 (1.68) 66.2 (2.29)
(0.87) 32.7 (0.83) 29.9 (0.81) 24.1 (0.99)(0.84) 33.3 (0.97) 30.0 (0.92) 23.3 (1.05)(2.79) 30.8 (3.08) 29.5 (3.64) 25.8 (3.28)(1.99) 27.9 (3.28) 30.5 (3.40) 32.6 (4.00)(5.58) 29.7 (5.67) 34.3 (5.83) 16.8 (4.70)(3.15) 30.6 (3.95) 28.0 (3.86) 25.4 (3.21)(5.40) 23.9 (5.65) 26.6 (7.04) 34.9 (8.28)(6.10) 31.4 (8.13) 28.2 (7.40) 27.4 (11.59)(1.74) 36.4 (2.31) 29.0 (1.83) 22.2 (1.99)(3.28) 25.4 (3.67) 33.1 (4.75) 24.9 (3.57)(0.46) 34.5 (0.57) 28.6 (0.59) 23.3 (0.53)(1.86) 27.3 (2.07) 28.0 (2.01) 30.3 (2.16)(1.05) 37.0 (1.60) 26.1 (1.28) 23.0 (1.04)(3.33) 38.7 (5.95) 30.4 (5.39) 17.1 (5.67)(1.59) 36.6 (2.17) 27.1 (2.53) 21.9 (1.89)(1.32) 34.1 (2.93) 29.5 (2.19) 25.9 (2.18)(1.17) 36.4 (1.56) 29.5 (1.48) 20.2 (1.27)(1.34) 33.2 (1.44) 30.9 (1.55) 21.1 (1.20)(0.97) 37.3 (1.74) 29.9 (1.51) 19.8 (1.38)(1.81) 34.2 (1.68) 27.4 (1.85) 25.6 (1.88)(1.30) 29.7 (1.38) 28.5 (1.42) 27.3 (1.38)(1.66) 32.5 (3.30) 31.4 (2.56) 25.9 (2.47)
Table 72. Highest degree earned and years of full-time teaching experience for teachers in public and private elementary and secondary schools, b2003–04, and 2007–08
Selected characteristic
Number of teachers (in thousands) Percent of teachers, by highest degree earned, 2007–08 Perce
1999–2000 2003–04 2007–08Less thanbachelor’s Bachelor’s Master’s
Educationspecialist1 Doctor’s Le
1 2 3 4 5 6 7 8 9
Public schoolsTotal ............................................. 3,002 (19.4) 3,251 (29.2) 3,405 (44.0) 0.8 (0.06) 47.4 (0.59) 44.5 (0.55) 6.4 (0.25) 0.9 (0.08) 13.4
SexMales ............................................... 754 (10.7) 813 (13.3) 821 (20.4) 2.0 (0.17) 47.0 (1.05) 43.9 (1.04) 5.5 (0.40) 1.6 (0.22) 13.6Females ........................................... 2,248 (16.0) 2,438 (23.5) 2,584 (34.6) 0.4 (0.05) 47.5 (0.65) 44.8 (0.63) 6.7 (0.29) 0.7 (0.08) 13.4
Race/ethnicityWhite................................................ 2,532 (17.2) 2 2,702 (30.1) 2,829 (38.7) 0.7 (0.05) 46.8 (0.66) 45.7 (0.64) 6.0 (0.23) 0.8 (0.09) 13.0Black ................................................ 228 (6.0) 2 257 (11.0) 239 (15.8) 1.0 (0.22) 47.0 (2.04) 41.4 (2.12) 8.7 (1.02) 2.0 (0.45) 13.1Hispanic ........................................... 169 (6.4) 2 202 (11.3) 240 (16.6) 0.9 (0.27) 56.3 (2.60) 34.1 (2.42) 7.7 (1.38) 1.1 (0.34) 18.0Asian................................................ 48 (2.7) 3 42 (2.5) 42 (7.2) 3.3 (2.12) 37.7 (5.05) 47.1 (4.62) 10.5 (2.19) 1.5 (0.71) 16.2Pacific Islander................................. — (†) 6 (0.8) 6 (1.3) ‡ (†) 51.7 (9.88) 39.1 (9.95) 5.9 (4.50) 2.3 (3.35) 15.3American Indian/Alaska Native ........ 26 (1.9) 2 17 (1.2) 17 (1.9) 1.8 (0.73) 56.2 (4.63) 34.1 (4.41) 4.7 (1.76) 3.2 (3.97) 11.8Two or more races ........................... — (†) 24 (2.2) 31 (2.9) 0.6 (0.37) 37.1 (4.67) 52.7 (4.73) 8.9 (2.51) 0.7 (0.56) 21.0
AgeUnder 30 .......................................... 509 (9.2) 540 (27.4) 612 (22.4) 0.3 (0.07) 70.1 (1.25) 28.0 (1.22) 1.5 (0.25) 0.1 (0.08) 44.130 to 39............................................ 661 (9.8) 798 (14.5) 898 (16.8) 0.7 (0.15) 46.8 (0.98) 46.1 (1.03) 6.0 (0.50) 0.4 (0.10) 10.340 to 49............................................ 953 (10.3) 840 (14.3) 808 (19.2) 1.1 (0.14) 43.7 (1.22) 47.3 (1.15) 7.3 (0.61) 0.7 (0.12) 7.450 to 59............................................ 786 (12.6) 942 (26.0) 879 (21.1) 0.9 (0.14) 38.4 (1.06) 50.4 (0.97) 8.7 (0.55) 1.5 (0.25) 3.460 and over ...................................... 93 (4.0) 131 (4.8) 207 (10.3) 1.1 (0.20) 35.0 (1.96) 51.1 (1.99) 9.6 (1.16) 3.2 (0.62) 2.9
LevelElementary....................................... 1,602 (13.5) 1,716 (25.8) 1,725 (37.1) 0.3 (0.07) 49.0 (0.89) 43.9 (0.79) 6.4 (0.39) 0.5 (0.11) 13.3
General ........................................ 1,019 (13.6) 1,130 (29.8) 1,100 (26.5) 0.2 (0.06) 51.8 (1.08) 42.1 (1.05) 5.5 (0.54) 0.4 (0.12) 13.4Arts/music .................................... [4] (†) 101 (5.3) 103 (6.6) 0.1 (0.07) 48.5 (3.68) 43.9 (3.47) 6.5 (1.84) 1.0 (0.61) 14.0English ......................................... 33 (2.8) 70 (5.1) 104 (9.9) 1.2 (0.95) 42.9 (4.56) 45.3 (4.25) 10.6 (1.99) ‡ (†) 8.9ESL/bilingual ................................ [4] (†) 25 (3.6) 24 (3.3) ‡ (†) 35.5 (7.63) 44.7 (7.09) 19.1 (5.84) ‡ (†) 19.1Health/physical ed........................ [4] (†) 73 (5.0) 63 (6.0) 0.4 (0.30) 54.3 (3.91) 40.5 (3.72) 4.5 (1.69) ‡ (†) 15.9Mathematics................................. 26 (2.5) 19 (2.3) 28 (3.8) ‡ (†) 49.1 (9.51) 44.4 (9.09) 4.3 (2.11) ‡ (†) 14.5Science ........................................ [4] (†) 19 (3.0) 15 (3.4) ‡ (†) 58.0 (9.34) 34.0 (7.93) 7.4 (6.78) ‡ (†) 13.1Special education......................... 210 (5.8) 240 (20.6) 230 (13.0) 0.2 (0.17) 42.1 (2.17) 51.1 (2.23) 5.9 (0.79) 0.7 (0.32) 12.4Other elementary ......................... 314 (8.4) 40 (3.5) 58 (4.2) 0.2 (0.18) 32.1 (3.71) 52.6 (3.69) 14.3 (3.38) ‡ (†) 16.6
Secondary........................................ 1,401 (17.7) 1,534 (26.0) 1,680 (39.0) 1.3 (0.10) 45.7 (0.74) 45.2 (0.73) 6.5 (0.29) 1.3 (0.12) 13.6Arts/music .................................... [5] (†) 112 (4.1) 121 (6.2) 0.5 (0.23) 48.7 (2.08) 46.1 (2.14) 3.8 (0.81) 1.0 (0.42) 14.4English ......................................... 235 (5.0) 269 (9.0) 306 (10.0) 0.2 (0.06) 46.7 (1.64) 45.0 (1.50) 7.1 (0.68) 1.1 (0.23) 14.0ESL/bilingual ................................ [5] (†) 18 (2.5) 21 (2.5) ‡ (†) 38.3 (5.62) 52.2 (5.89) 7.1 (2.62) 2.4 (1.37) 13.8Foreign language ......................... [5] (†) 73 (3.3) 78 (5.0) 0.6 (0.28) 45.7 (2.86) 45.2 (2.93) 6.9 (1.04) 1.6 (0.56) 14.3Health/physical ed........................ [5] (†) 102 (4.3) 119 (5.7) 0.5 (0.25) 57.5 (1.93) 37.2 (1.91) 4.7 (0.91) 0.1 (0.09) 10.6Mathematics................................. 191 (4.3) 213 (5.5) 252 (9.1) 0.2 (0.11) 46.6 (1.59) 46.6 (1.59) 5.6 (0.77) 1.1 (0.31) 13.9Science ........................................ 159 (3.7) 189 (6.8) 195 (8.3) 0.4 (0.17) 42.7 (1.78) 49.3 (1.61) 5.5 (0.65) 2.1 (0.43) 14.9Social studies............................... 147 (4.3) 178 (5.7) 209 (9.9) 0.6 (0.22) 45.6 (1.86) 45.4 (1.84) 6.6 (1.10) 1.8 (0.41) 12.9Special education......................... 99 (2.3) 174 (7.5) 165 (9.7) 0.2 (0.14) 39.5 (1.95) 49.3 (1.83) 9.9 (1.15) 1.1 (0.61) 12.8Vocational/technical ..................... 125 (3.2) 169 (5.7) 164 (6.3) 8.9 (0.72) 45.2 (1.43) 38.9 (1.45) 5.8 (0.71) 1.1 (0.39) 14.5Other secondary .......................... 443 (8.5) 36 (2.1) 47 (3.4) 6.1 (1.00) 36.5 (3.24) 45.5 (3.71) 10.5 (2.04) 1.4 (0.52) 10.2
See notes at end of table.
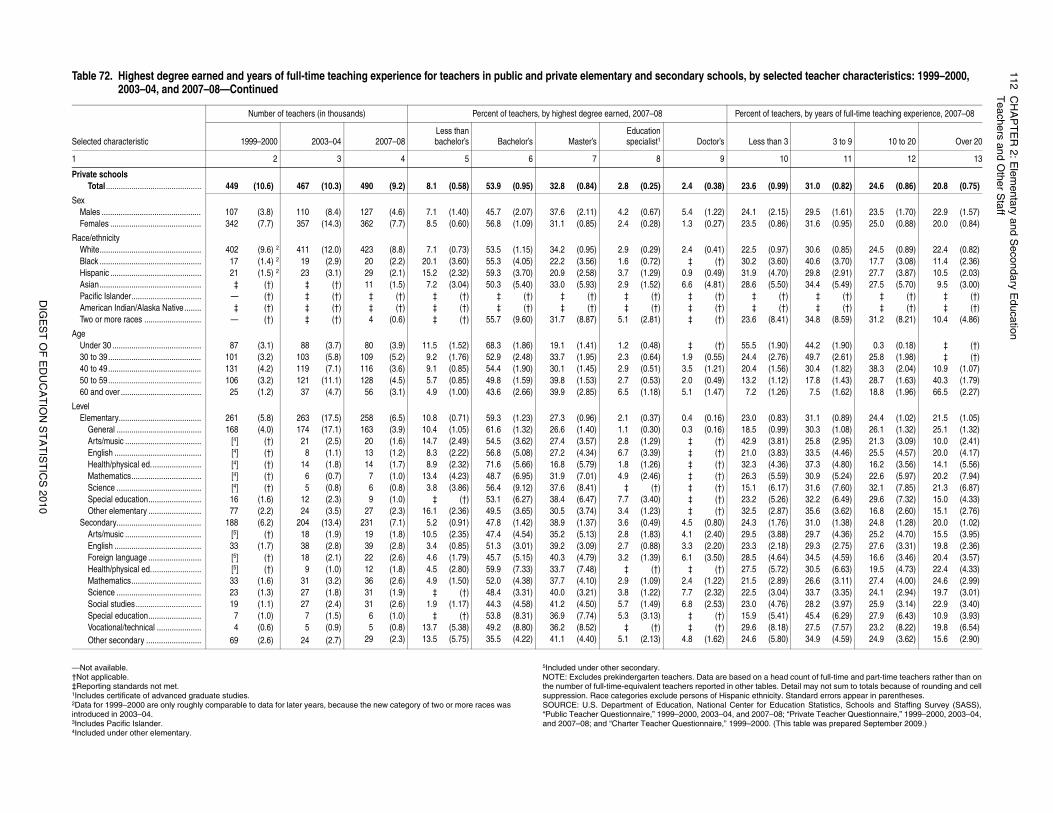
11
2C
HA
PT
ER
2: E
lem
en
tary a
nd
Se
con
da
ry Ed
uca
tion
Teach
ers a
nd O
the
r Sta
ff
DIG
ES
T O
F E
DU
CA
TIO
N S
TA
TIS
TIC
S 2
01
0
n a head count of full-time and part-time teachers rather than ontables. Detail may not sum to totals because of rounding and cellthnicity. Standard errors appear in parentheses. for Education Statistics, Schools and Staffing Survey (SASS),007–08; “Private Teacher Questionnaire,” 1999–2000, 2003–04,000. (This table was prepared September 2009.)
(0.99) 31.0 (0.82) 24.6 (0.86) 20.8 (0.75)
(2.15) 29.5 (1.61) 23.5 (1.70) 22.9 (1.57)(0.86) 31.6 (0.95) 25.0 (0.88) 20.0 (0.84)
(0.97) 30.6 (0.85) 24.5 (0.89) 22.4 (0.82)(3.60) 40.6 (3.70) 17.7 (3.08) 11.4 (2.36)(4.70) 29.8 (2.91) 27.7 (3.87) 10.5 (2.03)(5.50) 34.4 (5.49) 27.5 (5.70) 9.5 (3.00)
(†) ‡ (†) ‡ (†) ‡ (†)(†) ‡ (†) ‡ (†) ‡ (†)
(8.41) 34.8 (8.59) 31.2 (8.21) 10.4 (4.86)
(1.90) 44.2 (1.90) 0.3 (0.18) ‡ (†)(2.76) 49.7 (2.61) 25.8 (1.98) ‡ (†)(1.56) 30.4 (1.82) 38.3 (2.04) 10.9 (1.07)(1.12) 17.8 (1.43) 28.7 (1.63) 40.3 (1.79)(1.26) 7.5 (1.62) 18.8 (1.96) 66.5 (2.27)
(0.83) 31.1 (0.89) 24.4 (1.02) 21.5 (1.05)(0.99) 30.3 (1.08) 26.1 (1.32) 25.1 (1.32)(3.81) 25.8 (2.95) 21.3 (3.09) 10.0 (2.41)(3.83) 33.5 (4.46) 25.5 (4.57) 20.0 (4.17)(4.36) 37.3 (4.80) 16.2 (3.56) 14.1 (5.56)(5.59) 30.9 (5.24) 22.6 (5.97) 20.2 (7.94)(6.17) 31.6 (7.60) 32.1 (7.85) 21.3 (6.87)(5.26) 32.2 (6.49) 29.6 (7.32) 15.0 (4.33)(2.87) 35.6 (3.62) 16.8 (2.60) 15.1 (2.76)(1.76) 31.0 (1.38) 24.8 (1.28) 20.0 (1.02)(3.88) 29.7 (4.36) 25.2 (4.70) 15.5 (3.95)(2.18) 29.3 (2.75) 27.6 (3.31) 19.8 (2.36)(4.64) 34.5 (4.59) 16.6 (3.46) 20.4 (3.57)(5.72) 30.5 (6.63) 19.5 (4.73) 22.4 (4.33)(2.89) 26.6 (3.11) 27.4 (4.00) 24.6 (2.99)(3.04) 33.7 (3.35) 24.1 (2.94) 19.7 (3.01)(4.76) 28.2 (3.97) 25.9 (3.14) 22.9 (3.40)(5.41) 45.4 (6.29) 27.9 (6.43) 10.9 (3.93)(8.18) 27.5 (7.57) 23.2 (8.22) 19.8 (6.54)(5.80) 34.9 (4.59) 24.9 (3.62) 15.6 (2.90)
y selected teacher characteristics: 1999–2000,
nt of teachers, by years of full-time teaching experience, 2007–08
ss than 3 3 to 9 10 to 20 Over 20
10 11 12 13
—Not available.†Not applicable.‡Reporting standards not met. 1Includes certificate of advanced graduate studies. 2Data for 1999–2000 are only roughly comparable to data for later years, because the new category of two or more races wasintroduced in 2003–04.3Includes Pacific Islander.4Included under other elementary.
5Included under other secondary.NOTE: Excludes prekindergarten teachers. Data are based othe number of full-time-equivalent teachers reported in other suppression. Race categories exclude persons of Hispanic eSOURCE: U.S. Department of Education, National Center “Public Teacher Questionnaire,” 1999–2000, 2003–04, and 2and 2007–08; and “Charter Teacher Questionnaire,” 1999–2
Private schoolsTotal ............................................. 449 (10.6) 467 (10.3) 490 (9.2) 8.1 (0.58) 53.9 (0.95) 32.8 (0.84) 2.8 (0.25) 2.4 (0.38) 23.6
SexMales ............................................... 107 (3.8) 110 (8.4) 127 (4.6) 7.1 (1.40) 45.7 (2.07) 37.6 (2.11) 4.2 (0.67) 5.4 (1.22) 24.1Females ........................................... 342 (7.7) 357 (14.3) 362 (7.7) 8.5 (0.60) 56.8 (1.09) 31.1 (0.85) 2.4 (0.28) 1.3 (0.27) 23.5
Race/ethnicityWhite................................................ 402 (9.6) 2 411 (12.0) 423 (8.8) 7.1 (0.73) 53.5 (1.15) 34.2 (0.95) 2.9 (0.29) 2.4 (0.41) 22.5Black ................................................ 17 (1.4) 2 19 (2.9) 20 (2.2) 20.1 (3.60) 55.3 (4.05) 22.2 (3.56) 1.6 (0.72) ‡ (†) 30.2Hispanic ........................................... 21 (1.5) 2 23 (3.1) 29 (2.1) 15.2 (2.32) 59.3 (3.70) 20.9 (2.58) 3.7 (1.29) 0.9 (0.49) 31.9Asian................................................ ‡ (†) ‡ (†) 11 (1.5) 7.2 (3.04) 50.3 (5.40) 33.0 (5.93) 2.9 (1.52) 6.6 (4.81) 28.6Pacific Islander................................. — (†) ‡ (†) ‡ (†) ‡ (†) ‡ (†) ‡ (†) ‡ (†) ‡ (†) ‡American Indian/Alaska Native ........ ‡ (†) ‡ (†) ‡ (†) ‡ (†) ‡ (†) ‡ (†) ‡ (†) ‡ (†) ‡Two or more races ........................... — (†) ‡ (†) 4 (0.6) ‡ (†) 55.7 (9.60) 31.7 (8.87) 5.1 (2.81) ‡ (†) 23.6
AgeUnder 30 .......................................... 87 (3.1) 88 (3.7) 80 (3.9) 11.5 (1.52) 68.3 (1.86) 19.1 (1.41) 1.2 (0.48) ‡ (†) 55.530 to 39............................................ 101 (3.2) 103 (5.8) 109 (5.2) 9.2 (1.76) 52.9 (2.48) 33.7 (1.95) 2.3 (0.64) 1.9 (0.55) 24.440 to 49............................................ 131 (4.2) 119 (7.1) 116 (3.6) 9.1 (0.85) 54.4 (1.90) 30.1 (1.45) 2.9 (0.51) 3.5 (1.21) 20.450 to 59............................................ 106 (3.2) 121 (11.1) 128 (4.5) 5.7 (0.85) 49.8 (1.59) 39.8 (1.53) 2.7 (0.53) 2.0 (0.49) 13.260 and over ...................................... 25 (1.2) 37 (4.7) 56 (3.1) 4.9 (1.00) 43.6 (2.66) 39.9 (2.85) 6.5 (1.18) 5.1 (1.47) 7.2
LevelElementary....................................... 261 (5.8) 263 (17.5) 258 (6.5) 10.8 (0.71) 59.3 (1.23) 27.3 (0.96) 2.1 (0.37) 0.4 (0.16) 23.0
General ........................................ 168 (4.0) 174 (17.1) 163 (3.9) 10.4 (1.05) 61.6 (1.32) 26.6 (1.40) 1.1 (0.30) 0.3 (0.16) 18.5Arts/music .................................... [4] (†) 21 (2.5) 20 (1.6) 14.7 (2.49) 54.5 (3.62) 27.4 (3.57) 2.8 (1.29) ‡ (†) 42.9English ......................................... [4] (†) 8 (1.1) 13 (1.2) 8.3 (2.22) 56.8 (5.08) 27.2 (4.34) 6.7 (3.39) ‡ (†) 21.0Health/physical ed........................ [4] (†) 14 (1.8) 14 (1.7) 8.9 (2.32) 71.6 (5.66) 16.8 (5.79) 1.8 (1.26) ‡ (†) 32.3Mathematics................................. [4] (†) 6 (0.7) 7 (1.0) 13.4 (4.23) 48.7 (6.95) 31.9 (7.01) 4.9 (2.46) ‡ (†) 26.3Science ........................................ [4] (†) 5 (0.8) 6 (0.8) 3.8 (3.86) 56.4 (9.12) 37.6 (8.41) ‡ (†) ‡ (†) 15.1Special education......................... 16 (1.6) 12 (2.3) 9 (1.0) ‡ (†) 53.1 (6.27) 38.4 (6.47) 7.7 (3.40) ‡ (†) 23.2Other elementary ......................... 77 (2.2) 24 (3.5) 27 (2.3) 16.1 (2.36) 49.5 (3.65) 30.5 (3.74) 3.4 (1.23) ‡ (†) 32.5
Secondary........................................ 188 (6.2) 204 (13.4) 231 (7.1) 5.2 (0.91) 47.8 (1.42) 38.9 (1.37) 3.6 (0.49) 4.5 (0.80) 24.3Arts/music .................................... [5] (†) 18 (1.9) 19 (1.8) 10.5 (2.35) 47.4 (4.54) 35.2 (5.13) 2.8 (1.83) 4.1 (2.40) 29.5English ......................................... 33 (1.7) 38 (2.8) 39 (2.8) 3.4 (0.85) 51.3 (3.01) 39.2 (3.09) 2.7 (0.88) 3.3 (2.20) 23.3Foreign language ......................... [5] (†) 18 (2.1) 22 (2.6) 4.6 (1.79) 45.7 (5.15) 40.3 (4.79) 3.2 (1.39) 6.1 (3.50) 28.5Health/physical ed........................ [5] (†) 9 (1.0) 12 (1.8) 4.5 (2.80) 59.9 (7.33) 33.7 (7.48) ‡ (†) ‡ (†) 27.5Mathematics................................. 33 (1.6) 31 (3.2) 36 (2.6) 4.9 (1.50) 52.0 (4.38) 37.7 (4.10) 2.9 (1.09) 2.4 (1.22) 21.5Science ........................................ 23 (1.3) 27 (1.8) 31 (1.9) ‡ (†) 48.4 (3.31) 40.0 (3.21) 3.8 (1.22) 7.7 (2.32) 22.5Social studies............................... 19 (1.1) 27 (2.4) 31 (2.6) 1.9 (1.17) 44.3 (4.58) 41.2 (4.50) 5.7 (1.49) 6.8 (2.53) 23.0Special education......................... 7 (1.0) 7 (1.5) 6 (1.0) ‡ (†) 53.8 (8.31) 36.9 (7.74) 5.3 (3.13) ‡ (†) 15.9Vocational/technical ..................... 4 (0.6) 5 (0.9) 5 (0.8) 13.7 (5.38) 49.2 (8.80) 36.2 (8.52) ‡ (†) ‡ (†) 29.6Other secondary .......................... 69 (2.6) 24 (2.7) 29 (2.3) 13.5 (5.75) 35.5 (4.22) 41.1 (4.40) 5.1 (2.13) 4.8 (1.62) 24.6
Table 72. Highest degree earned and years of full-time teaching experience for teachers in public and private elementary and secondary schools, b2003–04, and 2007–08—Continued
Selected characteristic
Number of teachers (in thousands) Percent of teachers, by highest degree earned, 2007–08 Perce
1999–2000 2003–04 2007–08Less thanbachelor’s Bachelor’s Master’s
Educationspecialist1 Doctor’s Le
1 2 3 4 5 6 7 8 9
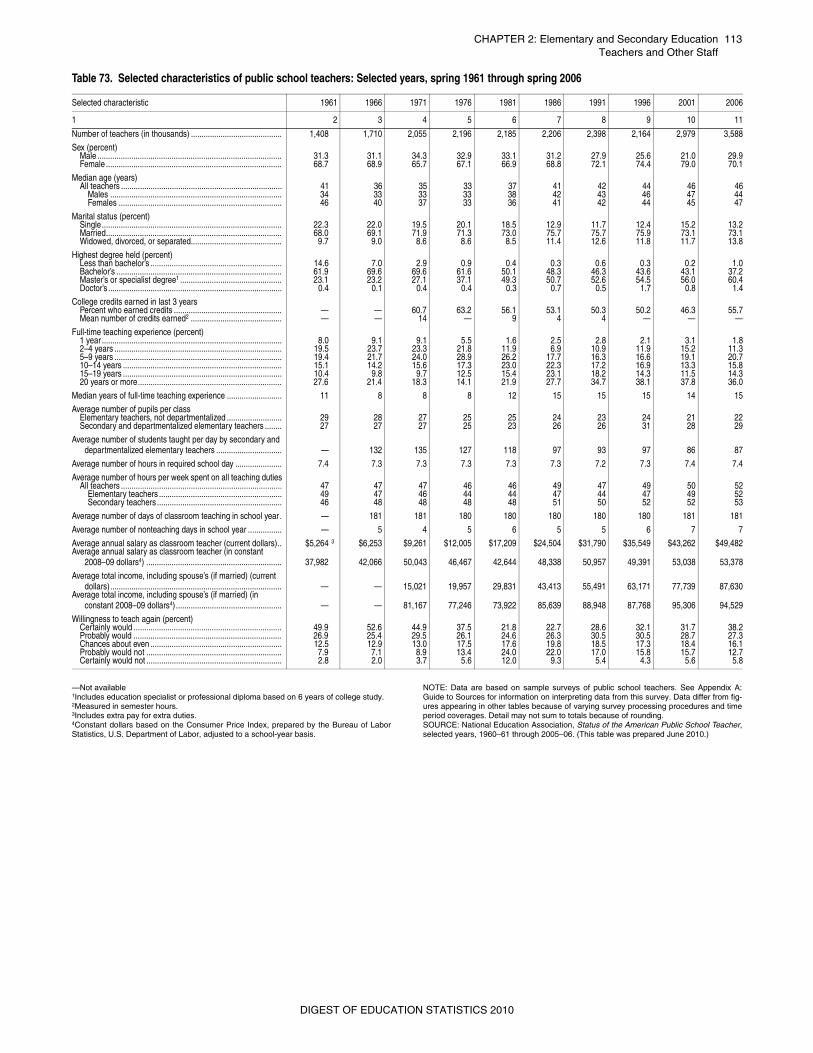
CHAPTER 2: Elementary and Secondary Education 113Teachers and Other Staff
—Not available1Includes education specialist or professional diploma based on 6 years of college study.2Measured in semester hours.3Includes extra pay for extra duties.4Constant dollars based on the Consumer Price Index, prepared by the Bureau of LaborStatistics, U.S. Department of Labor, adjusted to a school-year basis.
NOTE: Data are based on sample surveys of public school teachers. See Appendix A:Guide to Sources for information on interpreting data from this survey. Data differ from fig-ures appearing in other tables because of varying survey processing procedures and timeperiod coverages. Detail may not sum to totals because of rounding.SOURCE: National Education Association, Status of the American Public School Teacher,selected years, 1960–61 through 2005–06. (This table was prepared June 2010.)
Table 73. Selected characteristics of public school teachers: Selected years, spring 1961 through spring 2006
Selected characteristic 1961 1966 1971 1976 1981 1986 1991 1996 2001 2006
1 2 3 4 5 6 7 8 9 10 11
Number of teachers (in thousands) ........................................... 1,408 1,710 2,055 2,196 2,185 2,206 2,398 2,164 2,979 3,588
Sex (percent)Male ....................................................................................... 31.3 31.1 34.3 32.9 33.1 31.2 27.9 25.6 21.0 29.9Female ................................................................................... 68.7 68.9 65.7 67.1 66.9 68.8 72.1 74.4 79.0 70.1
Median age (years)All teachers ............................................................................ 41 36 35 33 37 41 42 44 46 46
Males ................................................................................. 34 33 33 33 38 42 43 46 47 44Females ............................................................................. 46 40 37 33 36 41 42 44 45 47
Marital status (percent)Single..................................................................................... 22.3 22.0 19.5 20.1 18.5 12.9 11.7 12.4 15.2 13.2Married................................................................................... 68.0 69.1 71.9 71.3 73.0 75.7 75.7 75.9 73.1 73.1Widowed, divorced, or separated........................................... 9.7 9.0 8.6 8.6 8.5 11.4 12.6 11.8 11.7 13.8
Highest degree held (percent)Less than bachelor’s .............................................................. 14.6 7.0 2.9 0.9 0.4 0.3 0.6 0.3 0.2 1.0Bachelor’s .............................................................................. 61.9 69.6 69.6 61.6 50.1 48.3 46.3 43.6 43.1 37.2Master’s or specialist degree1 ................................................ 23.1 23.2 27.1 37.1 49.3 50.7 52.6 54.5 56.0 60.4Doctor’s .................................................................................. 0.4 0.1 0.4 0.4 0.3 0.7 0.5 1.7 0.8 1.4
College credits earned in last 3 yearsPercent who earned credits ................................................... — — 60.7 63.2 56.1 53.1 50.3 50.2 46.3 55.7Mean number of credits earned2 ........................................... — — 14 — 9 4 4 — — —
Full-time teaching experience (percent)1 year ..................................................................................... 8.0 9.1 9.1 5.5 1.6 2.5 2.8 2.1 3.1 1.82–4 years ............................................................................... 19.5 23.7 23.3 21.8 11.9 6.9 10.9 11.9 15.2 11.35–9 years ............................................................................... 19.4 21.7 24.0 28.9 26.2 17.7 16.3 16.6 19.1 20.710–14 years ........................................................................... 15.1 14.2 15.6 17.3 23.0 22.3 17.2 16.9 13.3 15.815–19 years ........................................................................... 10.4 9.8 9.7 12.5 15.4 23.1 18.2 14.3 11.5 14.320 years or more.................................................................... 27.6 21.4 18.3 14.1 21.9 27.7 34.7 38.1 37.8 36.0
Median years of full-time teaching experience .......................... 11 8 8 8 12 15 15 15 14 15
Average number of pupils per classElementary teachers, not departmentalized .......................... 29 28 27 25 25 24 23 24 21 22Secondary and departmentalized elementary teachers ........ 27 27 27 25 23 26 26 31 28 29
Average number of students taught per day by secondary and departmentalized elementary teachers ............................... — 132 135 127 118 97 93 97 86 87
Average number of hours in required school day ...................... 7.4 7.3 7.3 7.3 7.3 7.3 7.2 7.3 7.4 7.4
Average number of hours per week spent on all teaching duties All teachers ............................................................................ 47 47 47 46 46 49 47 49 50 52
Elementary teachers .......................................................... 49 47 46 44 44 47 44 47 49 52Secondary teachers ........................................................... 46 48 48 48 48 51 50 52 52 53
Average number of days of classroom teaching in school year. — 181 181 180 180 180 180 180 181 181
Average number of nonteaching days in school year ................ — 5 4 5 6 5 5 6 7 7
Average annual salary as classroom teacher (current dollars).. $5,264 3 $6,253 $9,261 $12,005 $17,209 $24,504 $31,790 $35,549 $43,262 $49,482Average annual salary as classroom teacher (in constant
2008–09 dollars4) ................................................................ 37,982 42,066 50,043 46,467 42,644 48,338 50,957 49,391 53,038 53,378
Average total income, including spouse’s (if married) (current dollars)................................................................................. — — 15,021 19,957 29,831 43,413 55,491 63,171 77,739 87,630
Average total income, including spouse’s (if married) (in constant 2008–09 dollars4) .................................................. — — 81,167 77,246 73,922 85,639 88,948 87,768 95,306 94,529
Willingness to teach again (percent)Certainly would ...................................................................... 49.9 52.6 44.9 37.5 21.8 22.7 28.6 32.1 31.7 38.2Probably would ...................................................................... 26.9 25.4 29.5 26.1 24.6 26.3 30.5 30.5 28.7 27.3Chances about even .............................................................. 12.5 12.9 13.0 17.5 17.6 19.8 18.5 17.3 18.4 16.1Probably would not ................................................................ 7.9 7.1 8.9 13.4 24.0 22.0 17.0 15.8 15.7 12.7Certainly would not ................................................................ 2.8 2.0 3.7 5.6 12.0 9.3 5.4 4.3 5.6 5.8
DIGEST OF EDUCATION STATISTICS 2010
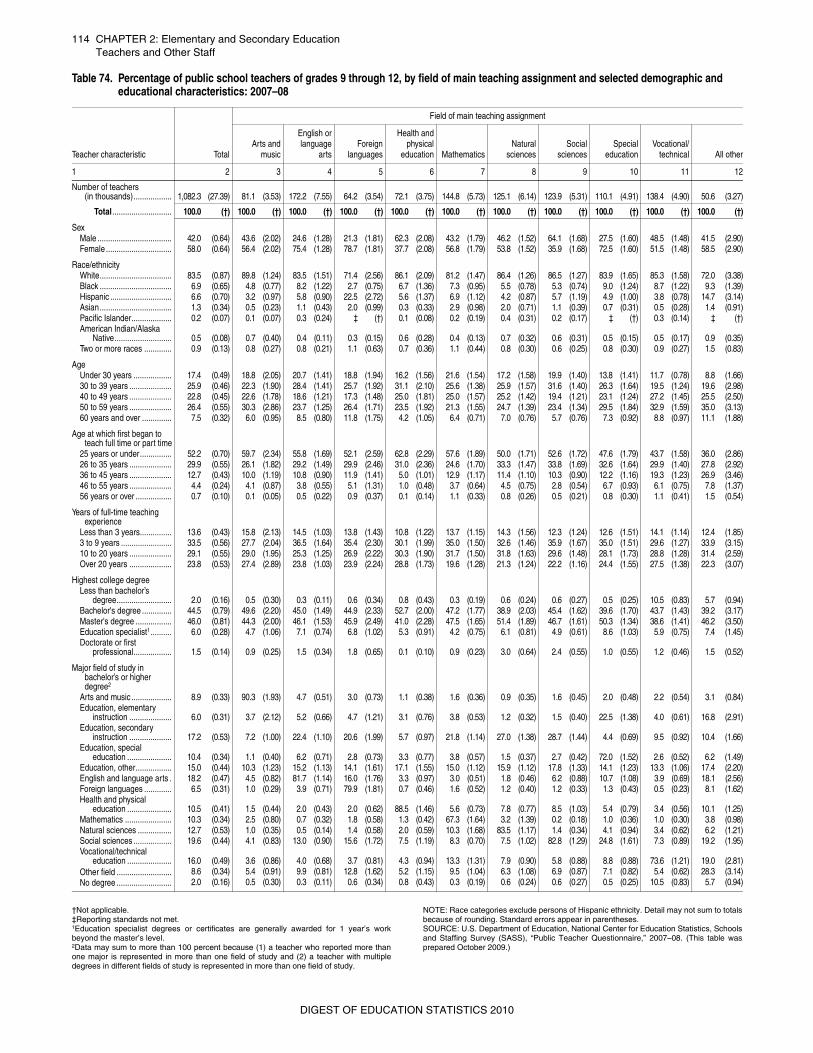
114 CHAPTER 2: Elementary and Secondary EducationTeachers and Other Staff
†Not applicable.‡Reporting standards not met.1Education specialist degrees or certificates are generally awarded for 1 year’s workbeyond the master’s level. 2Data may sum to more than 100 percent because (1) a teacher who reported more thanone major is represented in more than one field of study and (2) a teacher with multipledegrees in different fields of study is represented in more than one field of study.
NOTE: Race categories exclude persons of Hispanic ethnicity. Detail may not sum to totalsbecause of rounding. Standard errors appear in parentheses. SOURCE: U.S. Department of Education, National Center for Education Statistics, Schoolsand Staffing Survey (SASS), “Public Teacher Questionnaire,” 2007–08. (This table wasprepared October 2009.)
Table 74. Percentage of public school teachers of grades 9 through 12, by field of main teaching assignment and selected demographic and educational characteristics: 2007–08
Teacher characteristic Total
Field of main teaching assignment
Arts andmusic
English orlanguage
artsForeign
languages
Health andphysical
education MathematicsNatural
sciencesSocial
sciencesSpecial
educationVocational/
technical All other
1 2 3 4 5 6 7 8 9 10 11 12
Number of teachers (in thousands).................. 1,082.3 (27.39) 81.1 (3.53) 172.2 (7.55) 64.2 (3.54) 72.1 (3.75) 144.8 (5.73) 125.1 (6.14) 123.9 (5.31) 110.1 (4.91) 138.4 (4.90) 50.6 (3.27)
Total............................ 100.0 (†) 100.0 (†) 100.0 (†) 100.0 (†) 100.0 (†) 100.0 (†) 100.0 (†) 100.0 (†) 100.0 (†) 100.0 (†) 100.0 (†)
SexMale ................................... 42.0 (0.64) 43.6 (2.02) 24.6 (1.28) 21.3 (1.81) 62.3 (2.08) 43.2 (1.79) 46.2 (1.52) 64.1 (1.68) 27.5 (1.60) 48.5 (1.48) 41.5 (2.90)Female ............................... 58.0 (0.64) 56.4 (2.02) 75.4 (1.28) 78.7 (1.81) 37.7 (2.08) 56.8 (1.79) 53.8 (1.52) 35.9 (1.68) 72.5 (1.60) 51.5 (1.48) 58.5 (2.90)
Race/ethnicityWhite.................................. 83.5 (0.87) 89.8 (1.24) 83.5 (1.51) 71.4 (2.56) 86.1 (2.09) 81.2 (1.47) 86.4 (1.26) 86.5 (1.27) 83.9 (1.65) 85.3 (1.58) 72.0 (3.38)Black .................................. 6.9 (0.65) 4.8 (0.77) 8.2 (1.22) 2.7 (0.75) 6.7 (1.36) 7.3 (0.95) 5.5 (0.78) 5.3 (0.74) 9.0 (1.24) 8.7 (1.22) 9.3 (1.39)Hispanic ............................. 6.6 (0.70) 3.2 (0.97) 5.8 (0.90) 22.5 (2.72) 5.6 (1.37) 6.9 (1.12) 4.2 (0.87) 5.7 (1.19) 4.9 (1.00) 3.8 (0.78) 14.7 (3.14)Asian.................................. 1.3 (0.34) 0.5 (0.23) 1.1 (0.43) 2.0 (0.99) 0.3 (0.33) 2.9 (0.98) 2.0 (0.71) 1.1 (0.39) 0.7 (0.31) 0.5 (0.28) 1.4 (0.91)Pacific Islander................... 0.2 (0.07) 0.1 (0.07) 0.3 (0.24) ‡ (†) 0.1 (0.08) 0.2 (0.19) 0.4 (0.31) 0.2 (0.17) ‡ (†) 0.3 (0.14) ‡ (†)American Indian/Alaska
Native........................... 0.5 (0.08) 0.7 (0.40) 0.4 (0.11) 0.3 (0.15) 0.6 (0.28) 0.4 (0.13) 0.7 (0.32) 0.6 (0.31) 0.5 (0.15) 0.5 (0.17) 0.9 (0.35)Two or more races ............. 0.9 (0.13) 0.8 (0.27) 0.8 (0.21) 1.1 (0.63) 0.7 (0.36) 1.1 (0.44) 0.8 (0.30) 0.6 (0.25) 0.8 (0.30) 0.9 (0.27) 1.5 (0.83)
AgeUnder 30 years .................. 17.4 (0.49) 18.8 (2.05) 20.7 (1.41) 18.8 (1.94) 16.2 (1.56) 21.6 (1.54) 17.2 (1.58) 19.9 (1.40) 13.8 (1.41) 11.7 (0.78) 8.8 (1.66)30 to 39 years .................... 25.9 (0.46) 22.3 (1.90) 28.4 (1.41) 25.7 (1.92) 31.1 (2.10) 25.6 (1.38) 25.9 (1.57) 31.6 (1.40) 26.3 (1.64) 19.5 (1.24) 19.6 (2.98)40 to 49 years .................... 22.8 (0.45) 22.6 (1.78) 18.6 (1.21) 17.3 (1.48) 25.0 (1.81) 25.0 (1.57) 25.2 (1.42) 19.4 (1.21) 23.1 (1.24) 27.2 (1.45) 25.5 (2.50)50 to 59 years .................... 26.4 (0.55) 30.3 (2.86) 23.7 (1.25) 26.4 (1.71) 23.5 (1.92) 21.3 (1.55) 24.7 (1.39) 23.4 (1.34) 29.5 (1.84) 32.9 (1.59) 35.0 (3.13)60 years and over .............. 7.5 (0.32) 6.0 (0.95) 8.5 (0.80) 11.8 (1.75) 4.2 (1.05) 6.4 (0.71) 7.0 (0.76) 5.7 (0.76) 7.3 (0.92) 8.8 (0.97) 11.1 (1.88)
Age at which first began to teach full time or part time
25 years or under............... 52.2 (0.70) 59.7 (2.34) 55.8 (1.69) 52.1 (2.59) 62.8 (2.29) 57.6 (1.89) 50.0 (1.71) 52.6 (1.72) 47.6 (1.79) 43.7 (1.58) 36.0 (2.86)26 to 35 years .................... 29.9 (0.55) 26.1 (1.82) 29.2 (1.49) 29.9 (2.46) 31.0 (2.36) 24.6 (1.70) 33.3 (1.47) 33.8 (1.69) 32.6 (1.64) 29.9 (1.40) 27.8 (2.92)36 to 45 years .................... 12.7 (0.43) 10.0 (1.19) 10.8 (0.90) 11.9 (1.41) 5.0 (1.01) 12.9 (1.17) 11.4 (1.10) 10.3 (0.90) 12.2 (1.16) 19.3 (1.23) 26.9 (3.46)46 to 55 years .................... 4.4 (0.24) 4.1 (0.87) 3.8 (0.55) 5.1 (1.31) 1.0 (0.48) 3.7 (0.64) 4.5 (0.75) 2.8 (0.54) 6.7 (0.93) 6.1 (0.75) 7.8 (1.37)56 years or over ................. 0.7 (0.10) 0.1 (0.05) 0.5 (0.22) 0.9 (0.37) 0.1 (0.14) 1.1 (0.33) 0.8 (0.26) 0.5 (0.21) 0.8 (0.30) 1.1 (0.41) 1.5 (0.54)
Years of full-time teaching experience
Less than 3 years............... 13.6 (0.43) 15.8 (2.13) 14.5 (1.03) 13.8 (1.43) 10.8 (1.22) 13.7 (1.15) 14.3 (1.56) 12.3 (1.24) 12.6 (1.51) 14.1 (1.14) 12.4 (1.85)3 to 9 years ........................ 33.5 (0.56) 27.7 (2.04) 36.5 (1.64) 35.4 (2.30) 30.1 (1.99) 35.0 (1.50) 32.6 (1.46) 35.9 (1.67) 35.0 (1.51) 29.6 (1.27) 33.9 (3.15)10 to 20 years .................... 29.1 (0.55) 29.0 (1.95) 25.3 (1.25) 26.9 (2.22) 30.3 (1.90) 31.7 (1.50) 31.8 (1.63) 29.6 (1.48) 28.1 (1.73) 28.8 (1.28) 31.4 (2.59)Over 20 years .................... 23.8 (0.53) 27.4 (2.89) 23.8 (1.03) 23.9 (2.24) 28.8 (1.73) 19.6 (1.28) 21.3 (1.24) 22.2 (1.16) 24.4 (1.55) 27.5 (1.38) 22.3 (3.07)
Highest college degreeLess than bachelor’s
degree.......................... 2.0 (0.16) 0.5 (0.30) 0.3 (0.11) 0.6 (0.34) 0.8 (0.43) 0.3 (0.19) 0.6 (0.24) 0.6 (0.27) 0.5 (0.25) 10.5 (0.83) 5.7 (0.94)Bachelor's degree .............. 44.5 (0.79) 49.6 (2.20) 45.0 (1.49) 44.9 (2.33) 52.7 (2.00) 47.2 (1.77) 38.9 (2.03) 45.4 (1.62) 39.6 (1.70) 43.7 (1.43) 39.2 (3.17)Master's degree ................. 46.0 (0.81) 44.3 (2.00) 46.1 (1.53) 45.9 (2.49) 41.0 (2.28) 47.5 (1.65) 51.4 (1.89) 46.7 (1.61) 50.3 (1.34) 38.6 (1.41) 46.2 (3.50)Education specialist1.......... 6.0 (0.28) 4.7 (1.06) 7.1 (0.74) 6.8 (1.02) 5.3 (0.91) 4.2 (0.75) 6.1 (0.81) 4.9 (0.61) 8.6 (1.03) 5.9 (0.75) 7.4 (1.45)Doctorate or first
professional.................. 1.5 (0.14) 0.9 (0.25) 1.5 (0.34) 1.8 (0.65) 0.1 (0.10) 0.9 (0.23) 3.0 (0.64) 2.4 (0.55) 1.0 (0.55) 1.2 (0.46) 1.5 (0.52)
Major field of study in bachelor’s or higher degree2
Arts and music ................... 8.9 (0.33) 90.3 (1.93) 4.7 (0.51) 3.0 (0.73) 1.1 (0.38) 1.6 (0.36) 0.9 (0.35) 1.6 (0.45) 2.0 (0.48) 2.2 (0.54) 3.1 (0.84)Education, elementary
instruction .................... 6.0 (0.31) 3.7 (2.12) 5.2 (0.66) 4.7 (1.21) 3.1 (0.76) 3.8 (0.53) 1.2 (0.32) 1.5 (0.40) 22.5 (1.38) 4.0 (0.61) 16.8 (2.91)Education, secondary
instruction .................... 17.2 (0.53) 7.2 (1.00) 22.4 (1.10) 20.6 (1.99) 5.7 (0.97) 21.8 (1.14) 27.0 (1.38) 28.7 (1.44) 4.4 (0.69) 9.5 (0.92) 10.4 (1.66)Education, special
education ..................... 10.4 (0.34) 1.1 (0.40) 6.2 (0.71) 2.8 (0.73) 3.3 (0.77) 3.8 (0.57) 1.5 (0.37) 2.7 (0.42) 72.0 (1.52) 2.6 (0.52) 6.2 (1.49)Education, other................. 15.0 (0.44) 10.3 (1.23) 15.2 (1.13) 14.1 (1.61) 17.1 (1.55) 15.0 (1.12) 15.9 (1.12) 17.8 (1.33) 14.1 (1.23) 13.3 (1.06) 17.4 (2.20)English and language arts . 18.2 (0.47) 4.5 (0.82) 81.7 (1.14) 16.0 (1.76) 3.3 (0.97) 3.0 (0.51) 1.8 (0.46) 6.2 (0.88) 10.7 (1.08) 3.9 (0.69) 18.1 (2.56)Foreign languages ............. 6.5 (0.31) 1.0 (0.29) 3.9 (0.71) 79.9 (1.81) 0.7 (0.46) 1.6 (0.52) 1.2 (0.40) 1.2 (0.33) 1.3 (0.43) 0.5 (0.23) 8.1 (1.62)Health and physical
education ..................... 10.5 (0.41) 1.5 (0.44) 2.0 (0.43) 2.0 (0.62) 88.5 (1.46) 5.6 (0.73) 7.8 (0.77) 8.5 (1.03) 5.4 (0.79) 3.4 (0.56) 10.1 (1.25)Mathematics ...................... 10.3 (0.34) 2.5 (0.80) 0.7 (0.32) 1.8 (0.58) 1.3 (0.42) 67.3 (1.64) 3.2 (1.39) 0.2 (0.18) 1.0 (0.36) 1.0 (0.30) 3.8 (0.98)Natural sciences ................ 12.7 (0.53) 1.0 (0.35) 0.5 (0.14) 1.4 (0.58) 2.0 (0.59) 10.3 (1.68) 83.5 (1.17) 1.4 (0.34) 4.1 (0.94) 3.4 (0.62) 6.2 (1.21)Social sciences .................. 19.6 (0.44) 4.1 (0.83) 13.0 (0.90) 15.6 (1.72) 7.5 (1.19) 8.3 (0.70) 7.5 (1.02) 82.8 (1.29) 24.8 (1.61) 7.3 (0.89) 19.2 (1.95)Vocational/technical
education ..................... 16.0 (0.49) 3.6 (0.86) 4.0 (0.68) 3.7 (0.81) 4.3 (0.94) 13.3 (1.31) 7.9 (0.90) 5.8 (0.88) 8.8 (0.88) 73.6 (1.21) 19.0 (2.81)Other field .......................... 8.6 (0.34) 5.4 (0.91) 9.9 (0.81) 12.8 (1.62) 5.2 (1.15) 9.5 (1.04) 6.3 (1.08) 6.9 (0.87) 7.1 (0.82) 5.4 (0.62) 28.3 (3.14)No degree .......................... 2.0 (0.16) 0.5 (0.30) 0.3 (0.11) 0.6 (0.34) 0.8 (0.43) 0.3 (0.19) 0.6 (0.24) 0.6 (0.27) 0.5 (0.25) 10.5 (0.83) 5.7 (0.94)
DIGEST OF EDUCATION STATISTICS 2010
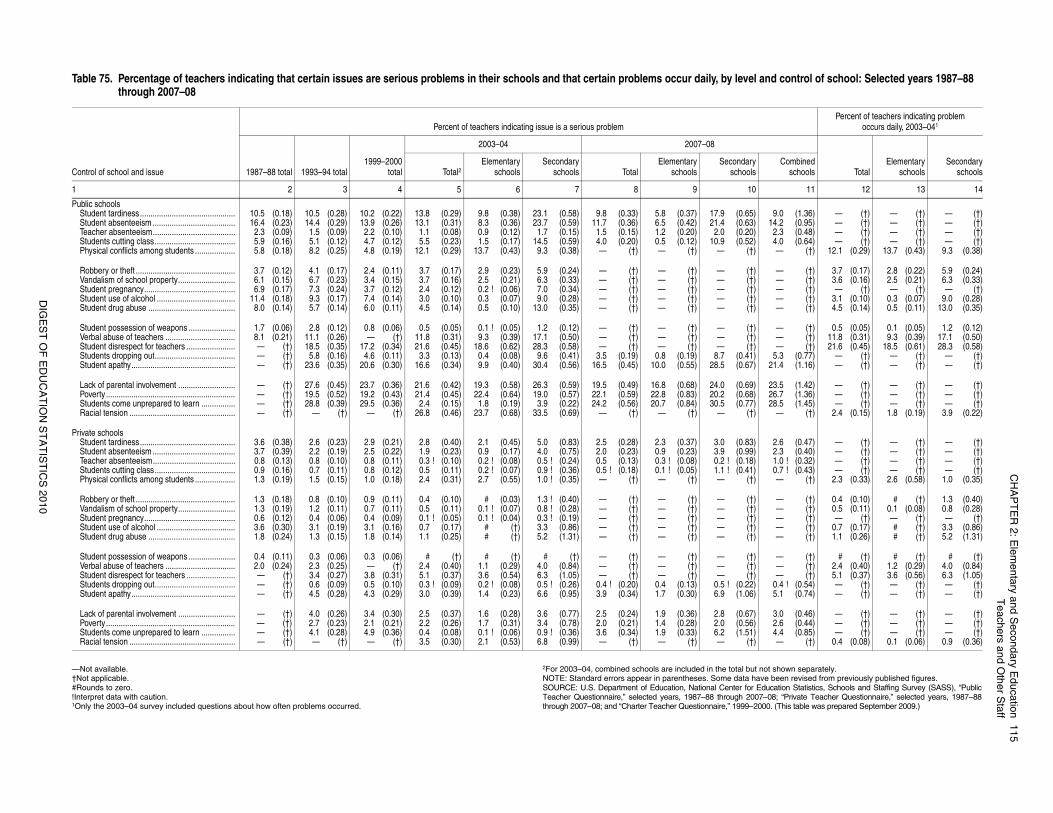
CH
AP
TE
R 2
: Ele
me
nta
ry an
d S
eco
nd
ary E
du
catio
n1
15
Tea
chers a
nd O
the
r Sta
ff
DIG
ES
T O
F E
DU
CA
TIO
N S
TA
TIS
TIC
S 2
01
0
t not shown separately.ave been revised from previously published figures.Education Statistics, Schools and Staffing Survey (SASS), “Public07–08; “Private Teacher Questionnaire,” selected years, 1987–88000. (This table was prepared September 2009.)
and control of school: Selected years 1987–88
Percent of teachers indicating problem occurs daily, 2003–041
TotalElementary
schoolsSecondary
schoolsCombined
schools
11 12 13 14
9.0 (1.36) — (†) — (†) — (†)14.2 (0.95) — (†) — (†) — (†)
2.3 (0.48) — (†) — (†) — (†)4.0 (0.64) — (†) — (†) — (†)— (†) 12.1 (0.29) 13.7 (0.43) 9.3 (0.38)
— (†) 3.7 (0.17) 2.8 (0.22) 5.9 (0.24)— (†) 3.6 (0.16) 2.5 (0.21) 6.3 (0.33)— (†) — (†) — (†) — (†)— (†) 3.1 (0.10) 0.3 (0.07) 9.0 (0.28)— (†) 4.5 (0.14) 0.5 (0.11) 13.0 (0.35)
— (†) 0.5 (0.05) 0.1 (0.05) 1.2 (0.12)— (†) 11.8 (0.31) 9.3 (0.39) 17.1 (0.50)— (†) 21.6 (0.45) 18.5 (0.61) 28.3 (0.58)
5.3 (0.77) — (†) — (†) — (†)21.4 (1.16) — (†) — (†) — (†)
23.5 (1.42) — (†) — (†) — (†)26.7 (1.36) — (†) — (†) — (†)28.5 (1.45) — (†) — (†) — (†)
— (†) 2.4 (0.15) 1.8 (0.19) 3.9 (0.22)
2.6 (0.47) — (†) — (†) — (†)2.3 (0.40) — (†) — (†) — (†)1.0 ! (0.32) — (†) — (†) — (†)0.7 ! (0.43) — (†) — (†) — (†)— (†) 2.3 (0.33) 2.6 (0.58) 1.0 (0.35)
— (†) 0.4 (0.10) # (†) 1.3 (0.40)— (†) 0.5 (0.11) 0.1 (0.08) 0.8 (0.28)— (†) — (†) — (†) — (†)— (†) 0.7 (0.17) # (†) 3.3 (0.86)— (†) 1.1 (0.26) # (†) 5.2 (1.31)
— (†) # (†) # (†) # (†)— (†) 2.4 (0.40) 1.2 (0.29) 4.0 (0.84)— (†) 5.1 (0.37) 3.6 (0.56) 6.3 (1.05)
0.4 ! (0.54) — (†) — (†) — (†)5.1 (0.74) — (†) — (†) — (†)
3.0 (0.46) — (†) — (†) — (†)2.6 (0.44) — (†) — (†) — (†)4.4 (0.85) — (†) — (†) — (†)— (†) 0.4 (0.08) 0.1 (0.06) 0.9 (0.36)
—Not available. †Not applicable.#Rounds to zero.!Interpret data with caution.1Only the 2003–04 survey included questions about how often problems occurred.
2For 2003–04, combined schools are included in the total buNOTE: Standard errors appear in parentheses. Some data hSOURCE: U.S. Department of Education, National Center for Teacher Questionnaire,” selected years, 1987–88 through 20through 2007–08; and “Charter Teacher Questionnaire,” 1999–2
Table 75. Percentage of teachers indicating that certain issues are serious problems in their schools and that certain problems occur daily, by levelthrough 2007–08
Control of school and issue
Percent of teachers indicating issue is a serious problem
1987–88 total 1993–94 total1999–2000
total
2003–04 2007–08
Total2Elementary
schoolsSecondary
schools TotalElementary
schoolsSecondary
schools
1 2 3 4 5 6 7 8 9 10
Public schoolsStudent tardiness............................................. 10.5 (0.18) 10.5 (0.28) 10.2 (0.22) 13.8 (0.29) 9.8 (0.38) 23.1 (0.58) 9.8 (0.33) 5.8 (0.37) 17.9 (0.65)Student absenteeism ....................................... 16.4 (0.23) 14.4 (0.29) 13.9 (0.26) 13.1 (0.31) 8.3 (0.36) 23.7 (0.59) 11.7 (0.36) 6.5 (0.42) 21.4 (0.63)Teacher absenteeism....................................... 2.3 (0.09) 1.5 (0.09) 2.2 (0.10) 1.1 (0.08) 0.9 (0.12) 1.7 (0.15) 1.5 (0.15) 1.2 (0.20) 2.0 (0.20)Students cutting class...................................... 5.9 (0.16) 5.1 (0.12) 4.7 (0.12) 5.5 (0.23) 1.5 (0.17) 14.5 (0.59) 4.0 (0.20) 0.5 (0.12) 10.9 (0.52)Physical conflicts among students ................... 5.8 (0.18) 8.2 (0.25) 4.8 (0.19) 12.1 (0.29) 13.7 (0.43) 9.3 (0.38) — (†) — (†) — (†)
Robbery or theft ............................................... 3.7 (0.12) 4.1 (0.17) 2.4 (0.11) 3.7 (0.17) 2.9 (0.23) 5.9 (0.24) — (†) — (†) — (†)Vandalism of school property........................... 6.1 (0.15) 6.7 (0.23) 3.4 (0.15) 3.7 (0.16) 2.5 (0.21) 6.3 (0.33) — (†) — (†) — (†)Student pregnancy........................................... 6.9 (0.17) 7.3 (0.24) 3.7 (0.12) 2.4 (0.12) 0.2 ! (0.06) 7.0 (0.34) — (†) — (†) — (†)Student use of alcohol ..................................... 11.4 (0.18) 9.3 (0.17) 7.4 (0.14) 3.0 (0.10) 0.3 (0.07) 9.0 (0.28) — (†) — (†) — (†)Student drug abuse ......................................... 8.0 (0.14) 5.7 (0.14) 6.0 (0.11) 4.5 (0.14) 0.5 (0.10) 13.0 (0.35) — (†) — (†) — (†)
Student possession of weapons ...................... 1.7 (0.06) 2.8 (0.12) 0.8 (0.06) 0.5 (0.05) 0.1 ! (0.05) 1.2 (0.12) — (†) — (†) — (†)Verbal abuse of teachers ................................. 8.1 (0.21) 11.1 (0.26) — (†) 11.8 (0.31) 9.3 (0.39) 17.1 (0.50) — (†) — (†) — (†)Student disrespect for teachers ....................... — (†) 18.5 (0.35) 17.2 (0.34) 21.6 (0.45) 18.6 (0.62) 28.3 (0.58) — (†) — (†) — (†)Students dropping out...................................... — (†) 5.8 (0.16) 4.6 (0.11) 3.3 (0.13) 0.4 (0.08) 9.6 (0.41) 3.5 (0.19) 0.8 (0.19) 8.7 (0.41)Student apathy................................................. — (†) 23.6 (0.35) 20.6 (0.30) 16.6 (0.34) 9.9 (0.40) 30.4 (0.56) 16.5 (0.45) 10.0 (0.55) 28.5 (0.67)
Lack of parental involvement ........................... — (†) 27.6 (0.45) 23.7 (0.36) 21.6 (0.42) 19.3 (0.58) 26.3 (0.59) 19.5 (0.49) 16.8 (0.68) 24.0 (0.69)Poverty ............................................................. — (†) 19.5 (0.52) 19.2 (0.43) 21.4 (0.45) 22.4 (0.64) 19.0 (0.57) 22.1 (0.59) 22.8 (0.83) 20.2 (0.68)Students come unprepared to learn ................ — (†) 28.8 (0.39) 29.5 (0.36) 2.4 (0.15) 1.8 (0.19) 3.9 (0.22) 24.2 (0.56) 20.7 (0.84) 30.5 (0.77)Racial tension .................................................. — (†) — (†) — (†) 26.8 (0.46) 23.7 (0.68) 33.5 (0.69) — (†) — (†) — (†)
Private schoolsStudent tardiness............................................. 3.6 (0.38) 2.6 (0.23) 2.9 (0.21) 2.8 (0.40) 2.1 (0.45) 5.0 (0.83) 2.5 (0.28) 2.3 (0.37) 3.0 (0.83)Student absenteeism ....................................... 3.7 (0.39) 2.2 (0.19) 2.5 (0.22) 1.9 (0.23) 0.9 (0.17) 4.0 (0.75) 2.0 (0.23) 0.9 (0.23) 3.9 (0.99)Teacher absenteeism....................................... 0.8 (0.13) 0.8 (0.10) 0.8 (0.11) 0.3 ! (0.10) 0.2 ! (0.08) 0.5 ! (0.24) 0.5 (0.13) 0.3 ! (0.08) 0.2 ! (0.18)Students cutting class...................................... 0.9 (0.16) 0.7 (0.11) 0.8 (0.12) 0.5 (0.11) 0.2 ! (0.07) 0.9 ! (0.36) 0.5 ! (0.18) 0.1 ! (0.05) 1.1 ! (0.41)Physical conflicts among students ................... 1.3 (0.19) 1.5 (0.15) 1.0 (0.18) 2.4 (0.31) 2.7 (0.55) 1.0 ! (0.35) — (†) — (†) — (†)
Robbery or theft ............................................... 1.3 (0.18) 0.8 (0.10) 0.9 (0.11) 0.4 (0.10) # (0.03) 1.3 ! (0.40) — (†) — (†) — (†)Vandalism of school property........................... 1.3 (0.19) 1.2 (0.11) 0.7 (0.11) 0.5 (0.11) 0.1 ! (0.07) 0.8 ! (0.28) — (†) — (†) — (†)Student pregnancy........................................... 0.6 (0.12) 0.4 (0.06) 0.4 (0.09) 0.1 ! (0.05) 0.1 ! (0.04) 0.3 ! (0.19) — (†) — (†) — (†)Student use of alcohol ..................................... 3.6 (0.30) 3.1 (0.19) 3.1 (0.16) 0.7 (0.17) # (†) 3.3 (0.86) — (†) — (†) — (†)Student drug abuse ......................................... 1.8 (0.24) 1.3 (0.15) 1.8 (0.14) 1.1 (0.25) # (†) 5.2 (1.31) — (†) — (†) — (†)
Student possession of weapons ...................... 0.4 (0.11) 0.3 (0.06) 0.3 (0.06) # (†) # (†) # (†) — (†) — (†) — (†)Verbal abuse of teachers ................................. 2.0 (0.24) 2.3 (0.25) — (†) 2.4 (0.40) 1.1 (0.29) 4.0 (0.84) — (†) — (†) — (†)Student disrespect for teachers ....................... — (†) 3.4 (0.27) 3.8 (0.31) 5.1 (0.37) 3.6 (0.54) 6.3 (1.05) — (†) — (†) — (†)Students dropping out...................................... — (†) 0.6 (0.09) 0.5 (0.10) 0.3 ! (0.09) 0.2 ! (0.08) 0.5 ! (0.26) 0.4 ! (0.20) 0.4 (0.13) 0.5 ! (0.22)Student apathy................................................. — (†) 4.5 (0.28) 4.3 (0.29) 3.0 (0.39) 1.4 (0.23) 6.6 (0.95) 3.9 (0.34) 1.7 (0.30) 6.9 (1.06)
Lack of parental involvement ........................... — (†) 4.0 (0.26) 3.4 (0.30) 2.5 (0.37) 1.6 (0.28) 3.6 (0.77) 2.5 (0.24) 1.9 (0.36) 2.8 (0.67)Poverty ............................................................. — (†) 2.7 (0.23) 2.1 (0.21) 2.2 (0.26) 1.7 (0.31) 3.4 (0.78) 2.0 (0.21) 1.4 (0.28) 2.0 (0.56)Students come unprepared to learn ................ — (†) 4.1 (0.28) 4.9 (0.36) 0.4 (0.08) 0.1 ! (0.06) 0.9 ! (0.36) 3.6 (0.34) 1.9 (0.33) 6.2 (1.51)Racial tension .................................................. — (†) — (†) — (†) 3.5 (0.30) 2.1 (0.53) 6.8 (0.99) — (†) — (†) — (†)
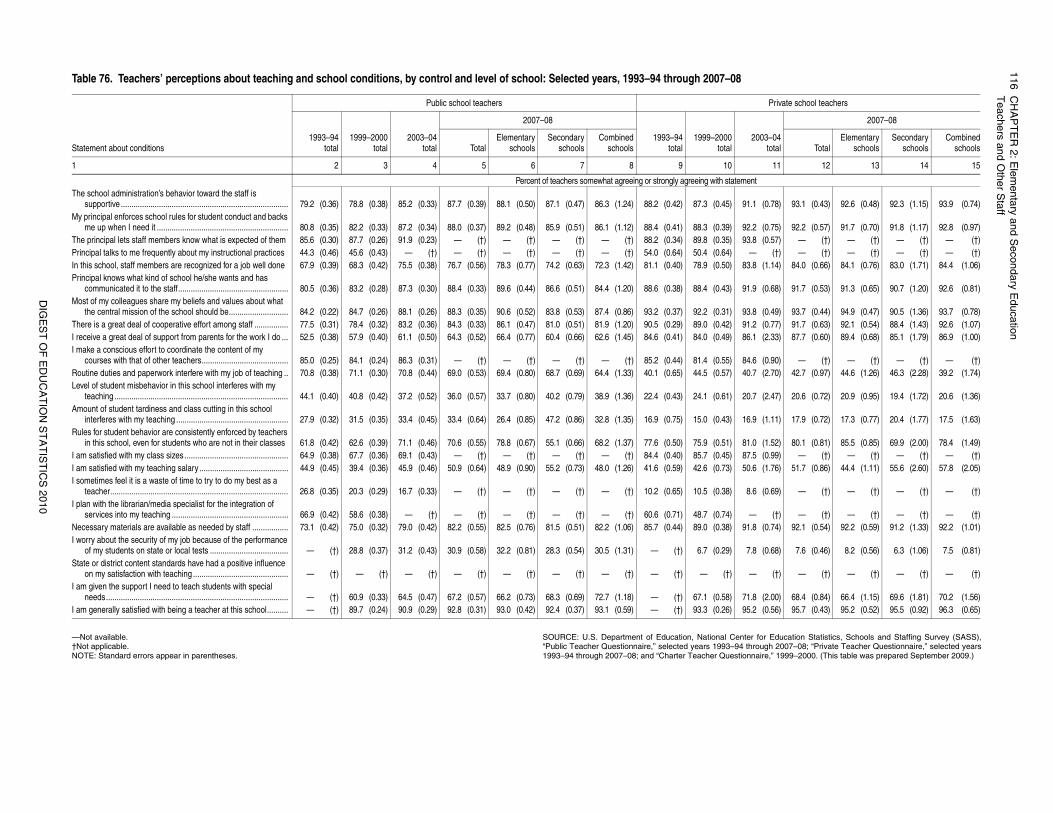
11
6C
HA
PT
ER
2: E
lem
en
tary a
nd
Se
con
da
ry Ed
uca
tion
Teach
ers a
nd O
the
r Sta
ff
DIG
ES
T O
F E
DU
CA
TIO
N S
TA
TIS
TIC
S 2
01
0
for Education Statistics, Schools and Staffing Survey (SASS),ough 2007–08; “Private Teacher Questionnaire,” selected yearsaire,” 1999–2000. (This table was prepared September 2009.)
Private school teachers
003–04total
2007–08
TotalElementary
schoolsSecondary
schoolsCombined
schools
11 12 13 14 15
t
(0.78) 93.1 (0.43) 92.6 (0.48) 92.3 (1.15) 93.9 (0.74)
(0.75) 92.2 (0.57) 91.7 (0.70) 91.8 (1.17) 92.8 (0.97)(0.57) — (†) — (†) — (†) — (†)
(†) — (†) — (†) — (†) — (†)(1.14) 84.0 (0.66) 84.1 (0.76) 83.0 (1.71) 84.4 (1.06)
(0.68) 91.7 (0.53) 91.3 (0.65) 90.7 (1.20) 92.6 (0.81)
(0.49) 93.7 (0.44) 94.9 (0.47) 90.5 (1.36) 93.7 (0.78)(0.77) 91.7 (0.63) 92.1 (0.54) 88.4 (1.43) 92.6 (1.07)(2.33) 87.7 (0.60) 89.4 (0.68) 85.1 (1.79) 86.9 (1.00)
(0.90) — (†) — (†) — (†) — (†)(2.70) 42.7 (0.97) 44.6 (1.26) 46.3 (2.28) 39.2 (1.74)
(2.47) 20.6 (0.72) 20.9 (0.95) 19.4 (1.72) 20.6 (1.36)
(1.11) 17.9 (0.72) 17.3 (0.77) 20.4 (1.77) 17.5 (1.63)
(1.52) 80.1 (0.81) 85.5 (0.85) 69.9 (2.00) 78.4 (1.49)(0.99) — (†) — (†) — (†) — (†)(1.76) 51.7 (0.86) 44.4 (1.11) 55.6 (2.60) 57.8 (2.05)
(0.69) — (†) — (†) — (†) — (†)
(†) — (†) — (†) — (†) — (†)(0.74) 92.1 (0.54) 92.2 (0.59) 91.2 (1.33) 92.2 (1.01)
(0.68) 7.6 (0.46) 8.2 (0.56) 6.3 (1.06) 7.5 (0.81)
(†) — (†) — (†) — (†) — (†)
(2.00) 68.4 (0.84) 66.4 (1.15) 69.6 (1.81) 70.2 (1.56)(0.56) 95.7 (0.43) 95.2 (0.52) 95.5 (0.92) 96.3 (0.65)
—Not available. †Not applicable.NOTE: Standard errors appear in parentheses.
SOURCE: U.S. Department of Education, National Center “Public Teacher Questionnaire,” selected years 1993–94 thr1993–94 through 2007–08; and “Charter Teacher Questionn
Table 76. Teachers’ perceptions about teaching and school conditions, by control and level of school: Selected years, 1993–94 through 2007–08
Statement about conditions
Public school teachers
1993–94total
1999–2000total
2003–04total
2007–08
1993–94total
1999–2000total
2Total
Elementaryschools
Secondaryschools
Combinedschools
1 2 3 4 5 6 7 8 9 10
Percent of teachers somewhat agreeing or strongly agreeing with statemenThe school administration’s behavior toward the staff is
supportive ............................................................................... 79.2 (0.36) 78.8 (0.38) 85.2 (0.33) 87.7 (0.39) 88.1 (0.50) 87.1 (0.47) 86.3 (1.24) 88.2 (0.42) 87.3 (0.45) 91.1My principal enforces school rules for student conduct and backs
me up when I need it .............................................................. 80.8 (0.35) 82.2 (0.33) 87.2 (0.34) 88.0 (0.37) 89.2 (0.48) 85.9 (0.51) 86.1 (1.12) 88.4 (0.41) 88.3 (0.39) 92.2The principal lets staff members know what is expected of them 85.6 (0.30) 87.7 (0.26) 91.9 (0.23) — (†) — (†) — (†) — (†) 88.2 (0.34) 89.8 (0.35) 93.8Principal talks to me frequently about my instructional practices 44.3 (0.46) 45.6 (0.43) — (†) — (†) — (†) — (†) — (†) 54.0 (0.64) 50.4 (0.64) —In this school, staff members are recognized for a job well done 67.9 (0.39) 68.3 (0.42) 75.5 (0.38) 76.7 (0.56) 78.3 (0.77) 74.2 (0.63) 72.3 (1.42) 81.1 (0.40) 78.9 (0.50) 83.8Principal knows what kind of school he/she wants and has
communicated it to the staff.................................................... 80.5 (0.36) 83.2 (0.28) 87.3 (0.30) 88.4 (0.33) 89.6 (0.44) 86.6 (0.51) 84.4 (1.20) 88.6 (0.38) 88.4 (0.43) 91.9Most of my colleagues share my beliefs and values about what
the central mission of the school should be............................ 84.2 (0.22) 84.7 (0.26) 88.1 (0.26) 88.3 (0.35) 90.6 (0.52) 83.8 (0.53) 87.4 (0.86) 93.2 (0.37) 92.2 (0.31) 93.8There is a great deal of cooperative effort among staff ................ 77.5 (0.31) 78.4 (0.32) 83.2 (0.36) 84.3 (0.33) 86.1 (0.47) 81.0 (0.51) 81.9 (1.20) 90.5 (0.29) 89.0 (0.42) 91.2I receive a great deal of support from parents for the work I do ... 52.5 (0.38) 57.9 (0.40) 61.1 (0.50) 64.3 (0.52) 66.4 (0.77) 60.4 (0.66) 62.6 (1.45) 84.6 (0.41) 84.0 (0.49) 86.1I make a conscious effort to coordinate the content of my
courses with that of other teachers......................................... 85.0 (0.25) 84.1 (0.24) 86.3 (0.31) — (†) — (†) — (†) — (†) 85.2 (0.44) 81.4 (0.55) 84.6Routine duties and paperwork interfere with my job of teaching .. 70.8 (0.38) 71.1 (0.30) 70.8 (0.44) 69.0 (0.53) 69.4 (0.80) 68.7 (0.69) 64.4 (1.33) 40.1 (0.65) 44.5 (0.57) 40.7Level of student misbehavior in this school interferes with my
teaching .................................................................................. 44.1 (0.40) 40.8 (0.42) 37.2 (0.52) 36.0 (0.57) 33.7 (0.80) 40.2 (0.79) 38.9 (1.36) 22.4 (0.43) 24.1 (0.61) 20.7Amount of student tardiness and class cutting in this school
interferes with my teaching ..................................................... 27.9 (0.32) 31.5 (0.35) 33.4 (0.45) 33.4 (0.64) 26.4 (0.85) 47.2 (0.86) 32.8 (1.35) 16.9 (0.75) 15.0 (0.43) 16.9Rules for student behavior are consistently enforced by teachers
in this school, even for students who are not in their classes 61.8 (0.42) 62.6 (0.39) 71.1 (0.46) 70.6 (0.55) 78.8 (0.67) 55.1 (0.66) 68.2 (1.37) 77.6 (0.50) 75.9 (0.51) 81.0I am satisfied with my class sizes ................................................. 64.9 (0.38) 67.7 (0.36) 69.1 (0.43) — (†) — (†) — (†) — (†) 84.4 (0.40) 85.7 (0.45) 87.5I am satisfied with my teaching salary .......................................... 44.9 (0.45) 39.4 (0.36) 45.9 (0.46) 50.9 (0.64) 48.9 (0.90) 55.2 (0.73) 48.0 (1.26) 41.6 (0.59) 42.6 (0.73) 50.6I sometimes feel it is a waste of time to try to do my best as a
teacher.................................................................................... 26.8 (0.35) 20.3 (0.29) 16.7 (0.33) — (†) — (†) — (†) — (†) 10.2 (0.65) 10.5 (0.38) 8.6I plan with the librarian/media specialist for the integration of
services into my teaching ....................................................... 66.9 (0.42) 58.6 (0.38) — (†) — (†) — (†) — (†) — (†) 60.6 (0.71) 48.7 (0.74) —Necessary materials are available as needed by staff ................. 73.1 (0.42) 75.0 (0.32) 79.0 (0.42) 82.2 (0.55) 82.5 (0.76) 81.5 (0.51) 82.2 (1.06) 85.7 (0.44) 89.0 (0.38) 91.8I worry about the security of my job because of the performance
of my students on state or local tests ..................................... — (†) 28.8 (0.37) 31.2 (0.43) 30.9 (0.58) 32.2 (0.81) 28.3 (0.54) 30.5 (1.31) — (†) 6.7 (0.29) 7.8State or district content standards have had a positive influence
on my satisfaction with teaching ............................................. — (†) — (†) — (†) — (†) — (†) — (†) — (†) — (†) — (†) —I am given the support I need to teach students with special
needs...................................................................................... — (†) 60.9 (0.33) 64.5 (0.47) 67.2 (0.57) 66.2 (0.73) 68.3 (0.69) 72.7 (1.18) — (†) 67.1 (0.58) 71.8I am generally satisfied with being a teacher at this school.......... — (†) 89.7 (0.24) 90.9 (0.29) 92.8 (0.31) 93.0 (0.42) 92.4 (0.37) 93.1 (0.59) — (†) 93.3 (0.26) 95.2
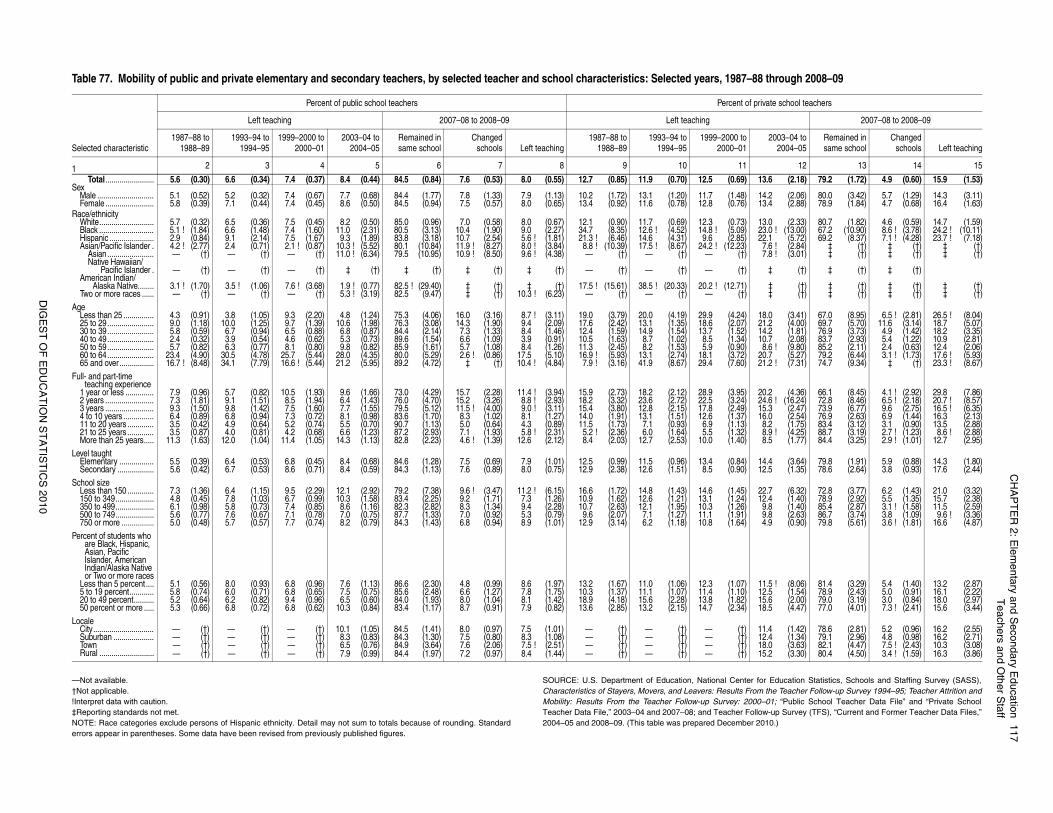
CH
AP
TE
R 2
: Ele
me
nta
ry an
d S
eco
nd
ary E
du
catio
n1
17
Tea
chers a
nd O
the
r Sta
ff
DIG
ES
T O
F E
DU
CA
TIO
N S
TA
TIS
TIC
S 2
01
0
for Education Statistics, Schools and Staffing Survey (SASS),m the Teacher Follow-up Survey 1994–95; Teacher Attrition and0–01; “Public School Teacher Data File” and “Private Schoolllow-up Survey (TFS), “Current and Former Teacher Data Files,”2010.)
8 through 2008–09
rivate school teachers
2007–08 to 2008–09
2003–04 to2004–05
Remained insame school
Changedschools Left teaching
12 13 14 15
13.6 (2.18) 79.2 (1.72) 4.9 (0.60) 15.9 (1.53)
14.2 (2.06) 80.0 (3.42) 5.7 (1.29) 14.3 (3.11)13.4 (2.88) 78.9 (1.84) 4.7 (0.68) 16.4 (1.63)
13.0 (2.33) 80.7 (1.82) 4.6 (0.59) 14.7 (1.59)23.0 ! (13.00) 67.2 (10.90) 8.6 ! (3.78) 24.2 ! (10.11)22.1 (5.72) 69.2 (8.37) 7.1 ! (4.28) 23.7 ! (7.18)7.6 ! (2.84) ‡ (†) ‡ (†) ‡ (†)7.8 ! (3.01) ‡ (†) ‡ (†) ‡ (†)
‡ (†) ‡ (†) ‡ (†)
‡ (†) ‡ (†) ‡ (†) ‡ (†)‡ (†) ‡ (†) ‡ (†) ‡ (†)
18.0 (3.41) 67.0 (8.95) 6.5 ! (2.81) 26.5 ! (8.04)21.2 (4.00) 69.7 (5.70) 11.6 (3.14) 18.7 (5.07)14.2 (1.81) 76.9 (3.73) 4.9 (1.42) 18.2 (3.35)10.7 (2.08) 83.7 (2.93) 5.4 (1.22) 10.9 (2.81)8.6 ! (9.80) 85.2 (2.11) 2.4 (0.63) 12.4 (2.06)
20.7 (5.27) 79.2 (6.44) 3.1 ! (1.73) 17.6 ! (5.93)21.2 ! (7.31) 74.7 (9.34) ‡ (†) 23.3 ! (8.67)
20.2 (4.36) 66.1 (8.45) 4.1 ! (2.92) 29.8 (7.86)24.6 ! (16.24) 72.8 (8.46) 6.5 ! (2.18) 20.7 ! (8.57)15.3 (2.47) 73.9 (6.77) 9.6 (2.75) 16.5 ! (6.35)16.0 (2.54) 76.9 (2.63) 6.9 (1.44) 16.3 (2.13)8.2 (1.75) 83.4 (3.12) 3.1 (0.90) 13.5 (2.88)8.9 ! (4.25) 88.7 (3.19) 2.7 ! (1.23) 8.6 ! (2.88)8.5 (1.77) 84.4 (3.25) 2.9 ! (1.01) 12.7 (2.95)
14.4 (3.64) 79.8 (1.91) 5.9 (0.88) 14.3 (1.80)12.5 (1.35) 78.6 (2.64) 3.8 (0.93) 17.6 (2.44)
22.7 (6.32) 72.8 (3.77) 6.2 (1.43) 21.0 (3.32)12.4 (1.40) 78.9 (2.92) 5.5 (1.35) 15.7 (2.38)9.8 (1.40) 85.4 (2.87) 3.1 ! (1.58) 11.5 (2.59)9.8 (2.63) 86.7 (3.74) 3.8 (1.09) 9.6 ! (3.36)4.9 (0.90) 79.8 (5.61) 3.6 ! (1.81) 16.6 (4.87)
11.5 ! (8.06) 81.4 (3.29) 5.4 (1.40) 13.2 (2.87)12.5 (1.54) 78.9 (2.43) 5.0 (0.91) 16.1 (2.22)15.6 (2.00) 79.0 (3.19) 3.0 (0.84) 18.0 (2.97)18.5 (4.47) 77.0 (4.01) 7.3 ! (2.41) 15.6 (3.44)
11.4 (1.42) 78.6 (2.81) 5.2 (0.96) 16.2 (2.55)12.4 (1.34) 79.1 (2.96) 4.8 (0.98) 16.2 (2.71)18.0 (3.63) 82.1 (4.47) 7.5 ! (2.43) 10.3 (3.08)15.2 (3.30) 80.4 (4.50) 3.4 ! (1.59) 16.3 (3.86)
—Not available.†Not applicable.!Interpret data with caution.‡Reporting standards not met.NOTE: Race categories exclude persons of Hispanic ethnicity. Detail may not sum to totals because of rounding. Standarderrors appear in parentheses. Some data have been revised from previously published figures.
SOURCE: U.S. Department of Education, National Center Characteristics of Stayers, Movers, and Leavers: Results FroMobility: Results From the Teacher Follow-up Survey: 200Teacher Data File,” 2003–04 and 2007–08; and Teacher Fo2004–05 and 2008–09. (This table was prepared December
Table 77. Mobility of public and private elementary and secondary teachers, by selected teacher and school characteristics: Selected years, 1987–8
Selected characteristic
Percent of public school teachers Percent of p
Left teaching 2007–08 to 2008–09 Left teaching
1987–88 to1988–89
1993–94 to1994–95
1999–2000 to2000–01
2003–04 to2004–05
Remained insame school
Changedschools Left teaching
1987–88 to1988–89
1993–94 to1994–95
1999–2000 to2000–01
1 2 3 4 5 6 7 8 9 10 11
Total........................ 5.6 (0.30) 6.6 (0.34) 7.4 (0.37) 8.4 (0.44) 84.5 (0.84) 7.6 (0.53) 8.0 (0.55) 12.7 (0.85) 11.9 (0.70) 12.5 (0.69)Sex
Male ............................ 5.1 (0.52) 5.2 (0.32) 7.4 (0.67) 7.7 (0.68) 84.4 (1.77) 7.8 (1.33) 7.9 (1.13) 10.2 (1.72) 13.1 (1.20) 11.7 (1.48)Female ........................ 5.8 (0.39) 7.1 (0.44) 7.4 (0.45) 8.6 (0.50) 84.5 (0.94) 7.5 (0.57) 8.0 (0.65) 13.4 (0.92) 11.6 (0.78) 12.8 (0.76)
Race/ethnicityWhite........................... 5.7 (0.32) 6.5 (0.36) 7.5 (0.45) 8.2 (0.50) 85.0 (0.96) 7.0 (0.58) 8.0 (0.67) 12.1 (0.90) 11.7 (0.69) 12.3 (0.73)Black ........................... 5.1 ! (1.84) 6.6 (1.48) 7.4 (1.60) 11.0 (2.31) 80.5 (3.13) 10.4 (1.90) 9.0 (2.27) 34.7 (8.35) 12.6 ! (4.52) 14.8 ! (5.09)Hispanic ...................... 2.9 (0.84) 9.1 (2.14) 7.5 (1.67) 9.3 (1.89) 83.8 (3.18) 10.7 (2.54) 5.6 ! (1.81) 21.3 ! (6.46) 14.6 (4.31) 9.6 (2.85)Asian/Pacific Islander . 4.2 ! (2.77) 2.4 (0.71) 2.1 ! (0.87) 10.3 ! (5.52) 80.1 (10.84) 11.9 ! (8.27) 8.0 ! (3.84) 8.8 ! (10.39) 17.5 ! (8.67) 24.2 ! (12.23)
Asian....................... — (†) — (†) — (†) 11.0 ! (6.34) 79.5 (10.95) 10.9 ! (8.50) 9.6 ! (4.38) — (†) — (†) — (†)Native Hawaiian/
Pacific Islander . — (†) — (†) — (†) ‡ (†) ‡ (†) ‡ (†) ‡ (†) — (†) — (†) — (†)American Indian/
Alaska Native........ 3.1 ! (1.70) 3.5 ! (1.06) 7.6 ! (3.68) 1.9 ! (0.77) 82.5 ! (29.40) ‡ (†) ‡ (†) 17.5 ! (15.61) 38.5 ! (20.33) 20.2 ! (12.71)Two or more races ...... — (†) — (†) — (†) 5.3 ! (3.19) 82.5 (9.47) ‡ (†) 10.3 ! (6.23) — (†) — (†) — (†)
AgeLess than 25 ............... 4.3 (0.91) 3.8 (1.05) 9.3 (2.20) 4.8 (1.24) 75.3 (4.06) 16.0 (3.16) 8.7 ! (3.11) 19.0 (3.79) 20.0 (4.19) 29.9 (4.24)25 to 29....................... 9.0 (1.18) 10.0 (1.25) 9.7 (1.39) 10.6 (1.98) 76.3 (3.08) 14.3 (1.90) 9.4 (2.09) 17.6 (2.42) 13.1 (1.35) 18.6 (2.07)30 to 39....................... 5.8 (0.59) 6.7 (0.94) 6.5 (0.88) 6.8 (0.87) 84.4 (2.14) 7.3 (1.33) 8.4 (1.46) 12.4 (1.59) 14.9 (1.54) 13.7 (1.52)40 to 49....................... 2.4 (0.32) 3.9 (0.54) 4.6 (0.62) 5.3 (0.73) 89.6 (1.54) 6.6 (1.09) 3.9 (0.91) 10.5 (1.63) 8.7 (1.02) 8.5 (1.34)50 to 59....................... 5.7 (0.82) 6.3 (0.77) 8.1 (0.80) 9.8 (0.82) 85.9 (1.61) 5.7 (1.08) 8.4 (1.26) 11.3 (2.45) 8.2 (1.53) 5.9 (0.90)60 to 64....................... 23.4 (4.90) 30.5 (4.78) 25.7 (5.44) 28.0 (4.35) 80.0 (5.29) 2.6 ! (0.86) 17.5 (5.10) 16.9 ! (5.93) 13.1 (2.74) 18.1 (3.72)65 and over ................. 16.7 ! (8.48) 34.1 (7.79) 16.6 ! (5.44) 21.2 (5.95) 89.2 (4.72) ‡ (†) 10.4 ! (4.84) 7.9 ! (3.16) 41.9 (8.67) 29.4 (7.60)
Full- and part-time teaching experience
1 year or less .............. 7.9 (0.96) 5.7 (0.82) 10.5 (1.93) 9.6 (1.66) 73.0 (4.29) 15.7 (2.28) 11.4 ! (3.94) 15.9 (2.73) 18.2 (2.12) 28.9 (3.95)2 years ........................ 7.3 (1.81) 9.1 (1.51) 8.5 (1.94) 6.4 (1.43) 76.0 (4.70) 15.2 (3.26) 8.8 ! (2.93) 18.2 (3.32) 23.6 (2.72) 22.5 (3.24)3 years ........................ 9.3 (1.50) 9.8 (1.42) 7.5 (1.60) 7.7 (1.55) 79.5 (5.12) 11.5 ! (4.00) 9.0 ! (3.11) 15.4 (3.80) 12.8 (2.15) 17.8 (2.49)4 to 10 years ............... 6.4 (0.89) 6.8 (0.94) 7.3 (0.72) 8.1 (0.98) 83.6 (1.70) 8.3 (1.02) 8.1 (1.27) 14.0 (1.91) 13.1 (1.51) 12.6 (1.37)11 to 20 years ............. 3.5 (0.42) 4.9 (0.64) 5.2 (0.74) 5.5 (0.70) 90.7 (1.13) 5.0 (0.64) 4.3 (0.89) 11.5 (1.73) 7.1 (0.93) 6.9 (1.13)21 to 25 years ............. 3.5 (0.87) 4.0 (0.81) 4.2 (0.68) 6.6 (1.23) 87.2 (2.93) 7.1 (1.93) 5.8 ! (2.31) 5.2 ! (2.36) 6.0 (1.64) 5.5 (1.32)More than 25 years..... 11.3 (1.63) 12.0 (1.04) 11.4 (1.05) 14.3 (1.13) 82.8 (2.23) 4.6 ! (1.39) 12.6 (2.12) 8.4 (2.03) 12.7 (2.53) 10.0 (1.40)
Level taughtElementary ................. 5.5 (0.39) 6.4 (0.53) 6.8 (0.45) 8.4 (0.68) 84.6 (1.28) 7.5 (0.69) 7.9 (1.01) 12.5 (0.99) 11.5 (0.96) 13.4 (0.84)Secondary .................. 5.6 (0.42) 6.7 (0.53) 8.6 (0.71) 8.4 (0.59) 84.3 (1.13) 7.6 (0.89) 8.0 (0.75) 12.9 (2.38) 12.6 (1.51) 8.5 (0.90)
School sizeLess than 150 ............. 7.3 (1.36) 6.4 (1.15) 9.5 (2.29) 12.1 (2.92) 79.2 (7.38) 9.6 ! (3.47) 11.2 ! (6.15) 16.6 (1.72) 14.8 (1.43) 14.6 (1.45)150 to 349................... 4.8 (0.45) 7.8 (1.03) 6.7 (0.99) 10.3 (1.58) 83.4 (2.25) 9.2 (1.71) 7.3 (1.26) 10.9 (1.62) 12.6 (1.21) 13.1 (1.24)350 to 499................... 6.1 (0.98) 5.8 (0.73) 7.4 (0.85) 8.6 (1.16) 82.3 (2.82) 8.3 (1.34) 9.4 (2.28) 10.7 (2.63) 12.1 (1.95) 10.3 (1.26)500 to 749................... 5.6 (0.77) 7.6 (0.67) 7.1 (0.78) 7.0 (0.75) 87.7 (1.33) 7.0 (0.92) 5.3 (0.79) 9.6 (2.07) 7.1 (1.27) 11.1 (1.91)750 or more ................ 5.0 (0.48) 5.7 (0.57) 7.7 (0.74) 8.2 (0.79) 84.3 (1.43) 6.8 (0.94) 8.9 (1.01) 12.9 (3.14) 6.2 (1.18) 10.8 (1.64)
Percent of students who are Black, Hispanic, Asian, Pacific Islander, American Indian/Alaska Native or Two or more races
Less than 5 percent .... 5.1 (0.56) 8.0 (0.93) 6.8 (0.96) 7.6 (1.13) 86.6 (2.30) 4.8 (0.99) 8.6 (1.97) 13.2 (1.67) 11.0 (1.06) 12.3 (1.07)5 to 19 percent............ 5.8 (0.74) 6.0 (0.71) 6.8 (0.65) 7.5 (0.75) 85.6 (2.48) 6.6 (1.27) 7.8 (1.75) 10.3 (1.37) 11.1 (1.07) 11.4 (1.10)20 to 49 percent.......... 5.2 (0.64) 6.2 (0.82) 9.4 (0.96) 6.5 (0.60) 84.0 (1.93) 8.0 (1.04) 8.1 (1.42) 18.9 (4.18) 15.6 (2.28) 13.8 (1.82)50 percent or more ..... 5.3 (0.66) 6.8 (0.72) 6.8 (0.62) 10.3 (0.84) 83.4 (1.17) 8.7 (0.91) 7.9 (0.82) 13.6 (2.85) 13.2 (2.15) 14.7 (2.34)
LocaleCity.............................. — (†) — (†) — (†) 10.1 (1.05) 84.5 (1.41) 8.0 (0.97) 7.5 (1.01) — (†) — (†) — (†)Suburban .................... — (†) — (†) — (†) 8.3 (0.83) 84.3 (1.30) 7.5 (0.80) 8.3 (1.08) — (†) — (†) — (†)Town — (†) — (†) — (†) 6.5 (0.76) 84.9 (3.64) 7.6 (2.06) 7.5 ! (2.51) — (†) — (†) — (†)Rural ........................... — (†) — (†) — (†) 7.9 (0.99) 84.4 (1.97) 7.2 (0.97) 8.4 (1.44) — (†) — (†) — (†)
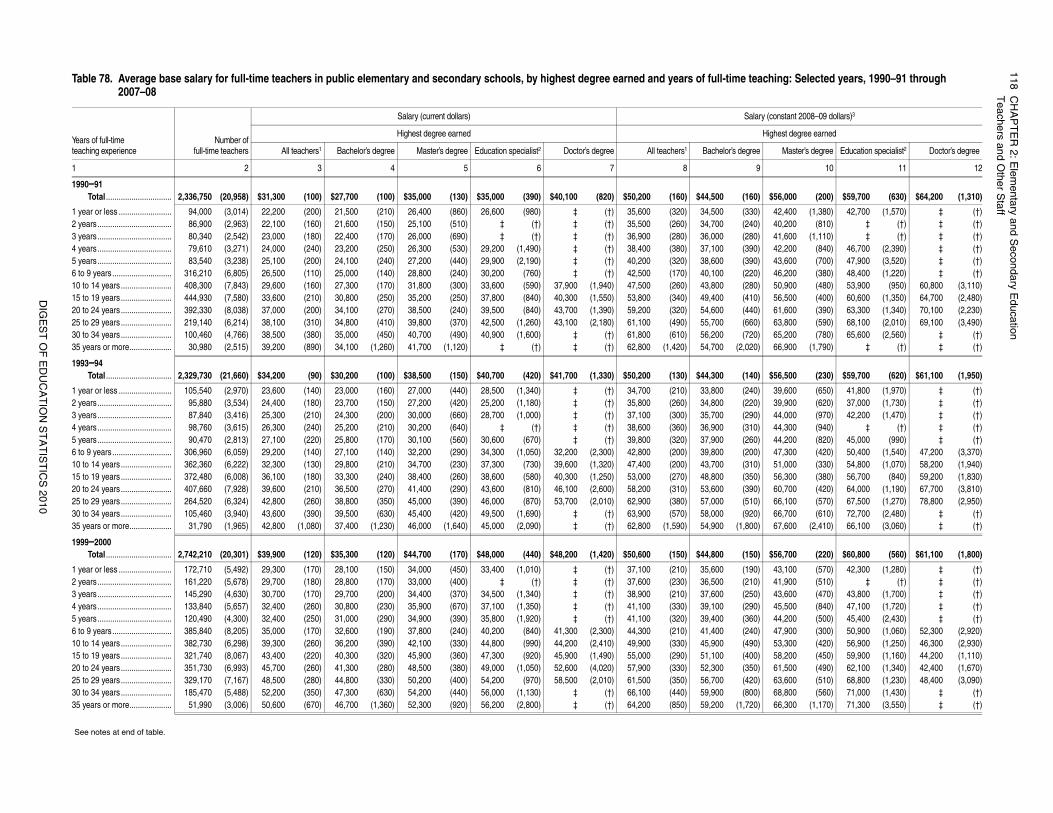
11
8C
HA
PT
ER
2: E
lem
en
tary a
nd
Se
con
da
ry Ed
uca
tion
Teach
ers a
nd O
the
r Sta
ff
DIG
ES
T O
F E
DU
CA
TIO
N S
TA
TIS
TIC
S 2
01
0
aching: Selected years, 1990–91 through
ary (constant 2008–09 dollars)3
Highest degree earned
e Master’s degree Education specialist2 Doctor’s degree
9 10 11 12
) $56,000 (200) $59,700 (630) $64,200 (1,310)
) 42,400 (1,380) 42,700 (1,570) ‡ (†)) 40,200 (810) ‡ (†) ‡ (†)) 41,600 (1,110) ‡ (†) ‡ (†)) 42,200 (840) 46,700 (2,390) ‡ (†)) 43,600 (700) 47,900 (3,520) ‡ (†)) 46,200 (380) 48,400 (1,220) ‡ (†)) 50,900 (480) 53,900 (950) 60,800 (3,110)) 56,500 (400) 60,600 (1,350) 64,700 (2,480)) 61,600 (390) 63,300 (1,340) 70,100 (2,230)) 63,800 (590) 68,100 (2,010) 69,100 (3,490)) 65,200 (780) 65,600 (2,560) ‡ (†)) 66,900 (1,790) ‡ (†) ‡ (†)
) $56,500 (230) $59,700 (620) $61,100 (1,950)
) 39,600 (650) 41,800 (1,970) ‡ (†)) 39,900 (620) 37,000 (1,730) ‡ (†)) 44,000 (970) 42,200 (1,470) ‡ (†)) 44,300 (940) ‡ (†) ‡ (†)) 44,200 (820) 45,000 (990) ‡ (†)) 47,300 (420) 50,400 (1,540) 47,200 (3,370)) 51,000 (330) 54,800 (1,070) 58,200 (1,940)) 56,300 (380) 56,700 (840) 59,200 (1,830)) 60,700 (420) 64,000 (1,190) 67,700 (3,810)) 66,100 (570) 67,500 (1,270) 78,800 (2,950)) 66,700 (610) 72,700 (2,480) ‡ (†)) 67,600 (2,410) 66,100 (3,060) ‡ (†)
) $56,700 (220) $60,800 (560) $61,100 (1,800)
) 43,100 (570) 42,300 (1,280) ‡ (†)) 41,900 (510) ‡ (†) ‡ (†)) 43,600 (470) 43,800 (1,700) ‡ (†)) 45,500 (840) 47,100 (1,720) ‡ (†)) 44,200 (500) 45,400 (2,430) ‡ (†)) 47,900 (300) 50,900 (1,060) 52,300 (2,920)) 53,300 (420) 56,900 (1,250) 46,300 (2,930)) 58,200 (450) 59,900 (1,160) 44,200 (1,110)) 61,500 (490) 62,100 (1,340) 42,400 (1,670)) 63,600 (510) 68,800 (1,230) 48,400 (3,090)) 68,800 (560) 71,000 (1,430) ‡ (†)) 66,300 (1,170) 71,300 (3,550) ‡ (†)
Table 78. Average base salary for full-time teachers in public elementary and secondary schools, by highest degree earned and years of full-time te2007–08
Years of full-time teaching experience
Number offull-time teachers
Salary (current dollars) Sal
Highest degree earned
All teachers1 Bachelor’s degree Master’s degree Education specialist2 Doctor’s degree All teachers1 Bachelor’s degre
1 2 3 4 5 6 7 8
1990–91Total ............................... 2,336,750 (20,958) $31,300 (100) $27,700 (100) $35,000 (130) $35,000 (390) $40,100 (820) $50,200 (160) $44,500 (160
1 year or less ......................... 94,000 (3,014) 22,200 (200) 21,500 (210) 26,400 (860) 26,600 (980) ‡ (†) 35,600 (320) 34,500 (3302 years................................... 86,900 (2,963) 22,100 (160) 21,600 (150) 25,100 (510) ‡ (†) ‡ (†) 35,500 (260) 34,700 (2403 years................................... 80,340 (2,542) 23,000 (180) 22,400 (170) 26,000 (690) ‡ (†) ‡ (†) 36,900 (280) 36,000 (2804 years................................... 79,610 (3,271) 24,000 (240) 23,200 (250) 26,300 (530) 29,200 (1,490) ‡ (†) 38,400 (380) 37,100 (3905 years................................... 83,540 (3,238) 25,100 (200) 24,100 (240) 27,200 (440) 29,900 (2,190) ‡ (†) 40,200 (320) 38,600 (3906 to 9 years............................ 316,210 (6,805) 26,500 (110) 25,000 (140) 28,800 (240) 30,200 (760) ‡ (†) 42,500 (170) 40,100 (22010 to 14 years ........................ 408,300 (7,843) 29,600 (160) 27,300 (170) 31,800 (300) 33,600 (590) 37,900 (1,940) 47,500 (260) 43,800 (28015 to 19 years ........................ 444,930 (7,580) 33,600 (210) 30,800 (250) 35,200 (250) 37,800 (840) 40,300 (1,550) 53,800 (340) 49,400 (41020 to 24 years ........................ 392,330 (8,038) 37,000 (200) 34,100 (270) 38,500 (240) 39,500 (840) 43,700 (1,390) 59,200 (320) 54,600 (44025 to 29 years ........................ 219,140 (6,214) 38,100 (310) 34,800 (410) 39,800 (370) 42,500 (1,260) 43,100 (2,180) 61,100 (490) 55,700 (66030 to 34 years ........................ 100,460 (4,766) 38,500 (380) 35,000 (450) 40,700 (490) 40,900 (1,600) ‡ (†) 61,800 (610) 56,200 (72035 years or more.................... 30,980 (2,515) 39,200 (890) 34,100 (1,260) 41,700 (1,120) ‡ (†) ‡ (†) 62,800 (1,420) 54,700 (2,020
1993–94Total ............................... 2,329,730 (21,660) $34,200 (90) $30,200 (100) $38,500 (150) $40,700 (420) $41,700 (1,330) $50,200 (130) $44,300 (140
1 year or less ......................... 105,540 (2,970) 23,600 (140) 23,000 (160) 27,000 (440) 28,500 (1,340) ‡ (†) 34,700 (210) 33,800 (2402 years................................... 95,880 (3,534) 24,400 (180) 23,700 (150) 27,200 (420) 25,200 (1,180) ‡ (†) 35,800 (260) 34,800 (2203 years................................... 87,840 (3,416) 25,300 (210) 24,300 (200) 30,000 (660) 28,700 (1,000) ‡ (†) 37,100 (300) 35,700 (2904 years................................... 98,760 (3,615) 26,300 (240) 25,200 (210) 30,200 (640) ‡ (†) ‡ (†) 38,600 (360) 36,900 (3105 years................................... 90,470 (2,813) 27,100 (220) 25,800 (170) 30,100 (560) 30,600 (670) ‡ (†) 39,800 (320) 37,900 (2606 to 9 years............................ 306,960 (6,059) 29,200 (140) 27,100 (140) 32,200 (290) 34,300 (1,050) 32,200 (2,300) 42,800 (200) 39,800 (20010 to 14 years ........................ 362,360 (6,222) 32,300 (130) 29,800 (210) 34,700 (230) 37,300 (730) 39,600 (1,320) 47,400 (200) 43,700 (31015 to 19 years ........................ 372,480 (6,008) 36,100 (180) 33,300 (240) 38,400 (260) 38,600 (580) 40,300 (1,250) 53,000 (270) 48,800 (35020 to 24 years ........................ 407,660 (7,928) 39,600 (210) 36,500 (270) 41,400 (290) 43,600 (810) 46,100 (2,600) 58,200 (310) 53,600 (39025 to 29 years ........................ 264,520 (6,324) 42,800 (260) 38,800 (350) 45,000 (390) 46,000 (870) 53,700 (2,010) 62,900 (380) 57,000 (51030 to 34 years ........................ 105,460 (3,940) 43,600 (390) 39,500 (630) 45,400 (420) 49,500 (1,690) ‡ (†) 63,900 (570) 58,000 (92035 years or more.................... 31,790 (1,965) 42,800 (1,080) 37,400 (1,230) 46,000 (1,640) 45,000 (2,090) ‡ (†) 62,800 (1,590) 54,900 (1,800
1999–2000Total ............................... 2,742,210 (20,301) $39,900 (120) $35,300 (120) $44,700 (170) $48,000 (440) $48,200 (1,420) $50,600 (150) $44,800 (150
1 year or less ......................... 172,710 (5,492) 29,300 (170) 28,100 (150) 34,000 (450) 33,400 (1,010) ‡ (†) 37,100 (210) 35,600 (1902 years................................... 161,220 (5,678) 29,700 (180) 28,800 (170) 33,000 (400) ‡ (†) ‡ (†) 37,600 (230) 36,500 (2103 years................................... 145,290 (4,630) 30,700 (170) 29,700 (200) 34,400 (370) 34,500 (1,340) ‡ (†) 38,900 (210) 37,600 (2504 years................................... 133,840 (5,657) 32,400 (260) 30,800 (230) 35,900 (670) 37,100 (1,350) ‡ (†) 41,100 (330) 39,100 (2905 years................................... 120,490 (4,300) 32,400 (250) 31,000 (290) 34,900 (390) 35,800 (1,920) ‡ (†) 41,100 (320) 39,400 (3606 to 9 years............................ 385,840 (8,205) 35,000 (170) 32,600 (190) 37,800 (240) 40,200 (840) 41,300 (2,300) 44,300 (210) 41,400 (24010 to 14 years ........................ 382,730 (6,298) 39,300 (260) 36,200 (390) 42,100 (330) 44,800 (990) 44,200 (2,410) 49,900 (330) 45,900 (49015 to 19 years ........................ 321,740 (8,067) 43,400 (220) 40,300 (320) 45,900 (360) 47,300 (920) 45,900 (1,490) 55,000 (290) 51,100 (40020 to 24 years ........................ 351,730 (6,993) 45,700 (260) 41,300 (280) 48,500 (380) 49,000 (1,050) 52,600 (4,020) 57,900 (330) 52,300 (35025 to 29 years ........................ 329,170 (7,167) 48,500 (280) 44,800 (330) 50,200 (400) 54,200 (970) 58,500 (2,010) 61,500 (350) 56,700 (42030 to 34 years ........................ 185,470 (5,488) 52,200 (350) 47,300 (630) 54,200 (440) 56,000 (1,130) ‡ (†) 66,100 (440) 59,900 (80035 years or more.................... 51,990 (3,006) 50,600 (670) 46,700 (1,360) 52,300 (920) 56,200 (2,800) ‡ (†) 64,200 (850) 59,200 (1,720
See notes at end of table.
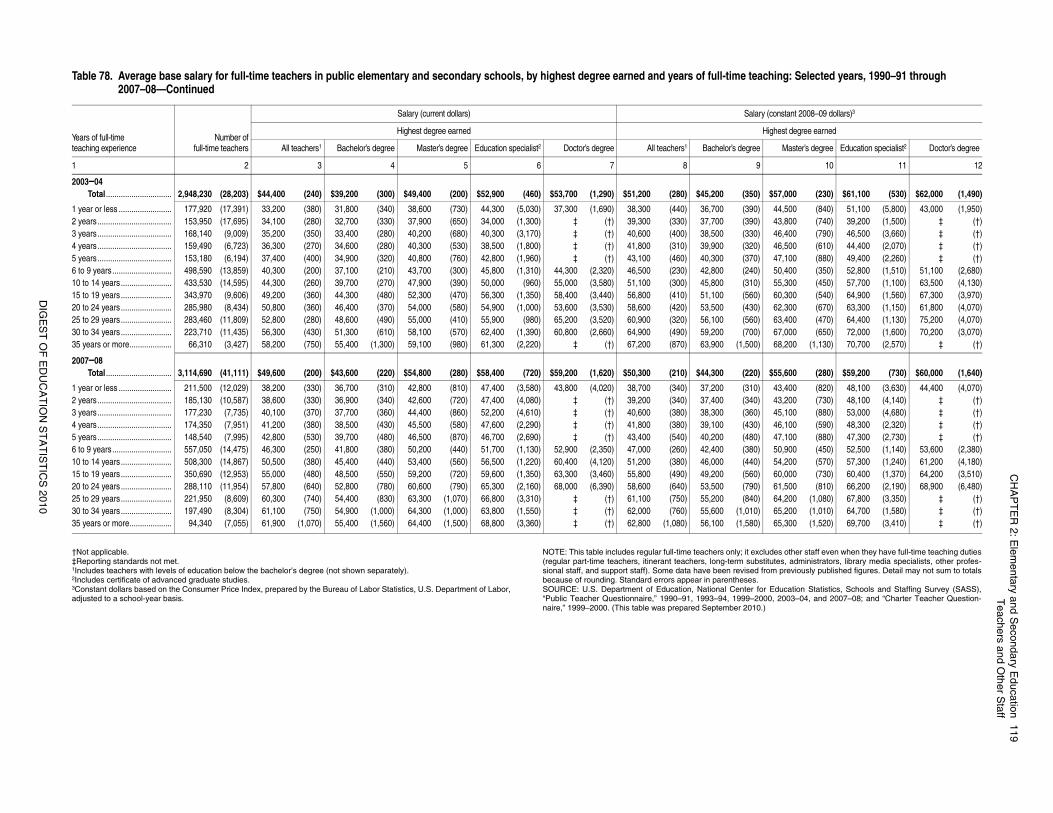
CH
AP
TE
R 2
: Ele
me
nta
ry an
d S
eco
nd
ary E
du
catio
n1
19
Tea
chers a
nd O
the
r Sta
ff
DIG
ES
T O
F E
DU
CA
TIO
N S
TA
TIS
TIC
S 2
01
0
xcludes other staff even when they have full-time teaching dutiesbstitutes, administrators, library media specialists, other profes-d from previously published figures. Detail may not sum to totals.for Education Statistics, Schools and Staffing Survey (SASS),
2000, 2003–04, and 2007–08; and “Charter Teacher Question-0.)
) $57,000 (230) $61,100 (530) $62,000 (1,490)
) 44,500 (840) 51,100 (5,800) 43,000 (1,950)) 43,800 (740) 39,200 (1,500) ‡ (†)) 46,400 (790) 46,500 (3,660) ‡ (†)) 46,500 (610) 44,400 (2,070) ‡ (†)) 47,100 (880) 49,400 (2,260) ‡ (†)) 50,400 (350) 52,800 (1,510) 51,100 (2,680)) 55,300 (450) 57,700 (1,100) 63,500 (4,130)) 60,300 (540) 64,900 (1,560) 67,300 (3,970)) 62,300 (670) 63,300 (1,150) 61,800 (4,070)) 63,400 (470) 64,400 (1,130) 75,200 (4,070)) 67,000 (650) 72,000 (1,600) 70,200 (3,070)) 68,200 (1,130) 70,700 (2,570) ‡ (†)
) $55,600 (280) $59,200 (730) $60,000 (1,640)
) 43,400 (820) 48,100 (3,630) 44,400 (4,070)) 43,200 (730) 48,100 (4,140) ‡ (†)) 45,100 (880) 53,000 (4,680) ‡ (†)) 46,100 (590) 48,300 (2,320) ‡ (†)) 47,100 (880) 47,300 (2,730) ‡ (†)) 50,900 (450) 52,500 (1,140) 53,600 (2,380)) 54,200 (570) 57,300 (1,240) 61,200 (4,180)) 60,000 (730) 60,400 (1,370) 64,200 (3,510)) 61,500 (810) 66,200 (2,190) 68,900 (6,480)) 64,200 (1,080) 67,800 (3,350) ‡ (†)) 65,200 (1,010) 64,700 (1,580) ‡ (†)) 65,300 (1,520) 69,700 (3,410) ‡ (†)
aching: Selected years, 1990–91 through
ary (constant 2008–09 dollars)3
Highest degree earned
e Master’s degree Education specialist2 Doctor’s degree
9 10 11 12
†Not applicable.‡Reporting standards not met. 1Includes teachers with levels of education below the bachelor’s degree (not shown separately).2Includes certificate of advanced graduate studies.3Constant dollars based on the Consumer Price Index, prepared by the Bureau of Labor Statistics, U.S. Department of Labor,adjusted to a school-year basis.
NOTE: This table includes regular full-time teachers only; it e(regular part-time teachers, itinerant teachers, long-term susional staff, and support staff). Some data have been revisebecause of rounding. Standard errors appear in parenthesesSOURCE: U.S. Department of Education, National Center “Public Teacher Questionnaire,” 1990–91, 1993–94, 1999–naire,” 1999–2000. (This table was prepared September 201
2003–04Total ............................... 2,948,230 (28,203) $44,400 (240) $39,200 (300) $49,400 (200) $52,900 (460) $53,700 (1,290) $51,200 (280) $45,200 (350
1 year or less ......................... 177,920 (17,391) 33,200 (380) 31,800 (340) 38,600 (730) 44,300 (5,030) 37,300 (1,690) 38,300 (440) 36,700 (3902 years................................... 153,950 (17,695) 34,100 (280) 32,700 (330) 37,900 (650) 34,000 (1,300) ‡ (†) 39,300 (330) 37,700 (3903 years................................... 168,140 (9,009) 35,200 (350) 33,400 (280) 40,200 (680) 40,300 (3,170) ‡ (†) 40,600 (400) 38,500 (3304 years................................... 159,490 (6,723) 36,300 (270) 34,600 (280) 40,300 (530) 38,500 (1,800) ‡ (†) 41,800 (310) 39,900 (3205 years................................... 153,180 (6,194) 37,400 (400) 34,900 (320) 40,800 (760) 42,800 (1,960) ‡ (†) 43,100 (460) 40,300 (3706 to 9 years............................ 498,590 (13,859) 40,300 (200) 37,100 (210) 43,700 (300) 45,800 (1,310) 44,300 (2,320) 46,500 (230) 42,800 (24010 to 14 years ........................ 433,530 (14,595) 44,300 (260) 39,700 (270) 47,900 (390) 50,000 (960) 55,000 (3,580) 51,100 (300) 45,800 (31015 to 19 years ........................ 343,970 (9,606) 49,200 (360) 44,300 (480) 52,300 (470) 56,300 (1,350) 58,400 (3,440) 56,800 (410) 51,100 (56020 to 24 years ........................ 285,980 (8,434) 50,800 (360) 46,400 (370) 54,000 (580) 54,900 (1,000) 53,600 (3,530) 58,600 (420) 53,500 (43025 to 29 years ........................ 283,460 (11,809) 52,800 (280) 48,600 (490) 55,000 (410) 55,900 (980) 65,200 (3,520) 60,900 (320) 56,100 (56030 to 34 years ........................ 223,710 (11,435) 56,300 (430) 51,300 (610) 58,100 (570) 62,400 (1,390) 60,800 (2,660) 64,900 (490) 59,200 (70035 years or more.................... 66,310 (3,427) 58,200 (750) 55,400 (1,300) 59,100 (980) 61,300 (2,220) ‡ (†) 67,200 (870) 63,900 (1,500
2007–08Total ............................... 3,114,690 (41,111) $49,600 (200) $43,600 (220) $54,800 (280) $58,400 (720) $59,200 (1,620) $50,300 (210) $44,300 (220
1 year or less ......................... 211,500 (12,029) 38,200 (330) 36,700 (310) 42,800 (810) 47,400 (3,580) 43,800 (4,020) 38,700 (340) 37,200 (3102 years................................... 185,130 (10,587) 38,600 (330) 36,900 (340) 42,600 (720) 47,400 (4,080) ‡ (†) 39,200 (340) 37,400 (3403 years................................... 177,230 (7,735) 40,100 (370) 37,700 (360) 44,400 (860) 52,200 (4,610) ‡ (†) 40,600 (380) 38,300 (3604 years................................... 174,350 (7,951) 41,200 (380) 38,500 (430) 45,500 (580) 47,600 (2,290) ‡ (†) 41,800 (380) 39,100 (4305 years................................... 148,540 (7,995) 42,800 (530) 39,700 (480) 46,500 (870) 46,700 (2,690) ‡ (†) 43,400 (540) 40,200 (4806 to 9 years............................ 557,050 (14,475) 46,300 (250) 41,800 (380) 50,200 (440) 51,700 (1,130) 52,900 (2,350) 47,000 (260) 42,400 (38010 to 14 years ........................ 508,300 (14,867) 50,500 (380) 45,400 (440) 53,400 (560) 56,500 (1,220) 60,400 (4,120) 51,200 (380) 46,000 (44015 to 19 years ........................ 350,690 (12,953) 55,000 (480) 48,500 (550) 59,200 (720) 59,600 (1,350) 63,300 (3,460) 55,800 (490) 49,200 (56020 to 24 years ........................ 288,110 (11,954) 57,800 (640) 52,800 (780) 60,600 (790) 65,300 (2,160) 68,000 (6,390) 58,600 (640) 53,500 (79025 to 29 years ........................ 221,950 (8,609) 60,300 (740) 54,400 (830) 63,300 (1,070) 66,800 (3,310) ‡ (†) 61,100 (750) 55,200 (84030 to 34 years ........................ 197,490 (8,304) 61,100 (750) 54,900 (1,000) 64,300 (1,000) 63,800 (1,550) ‡ (†) 62,000 (760) 55,600 (1,01035 years or more.................... 94,340 (7,055) 61,900 (1,070) 55,400 (1,560) 64,400 (1,500) 68,800 (3,360) ‡ (†) 62,800 (1,080) 56,100 (1,580
Table 78. Average base salary for full-time teachers in public elementary and secondary schools, by highest degree earned and years of full-time te2007–08—Continued
Years of full-time teaching experience
Number offull-time teachers
Salary (current dollars) Sal
Highest degree earned
All teachers1 Bachelor’s degree Master’s degree Education specialist2 Doctor’s degree All teachers1 Bachelor’s degre
1 2 3 4 5 6 7 8
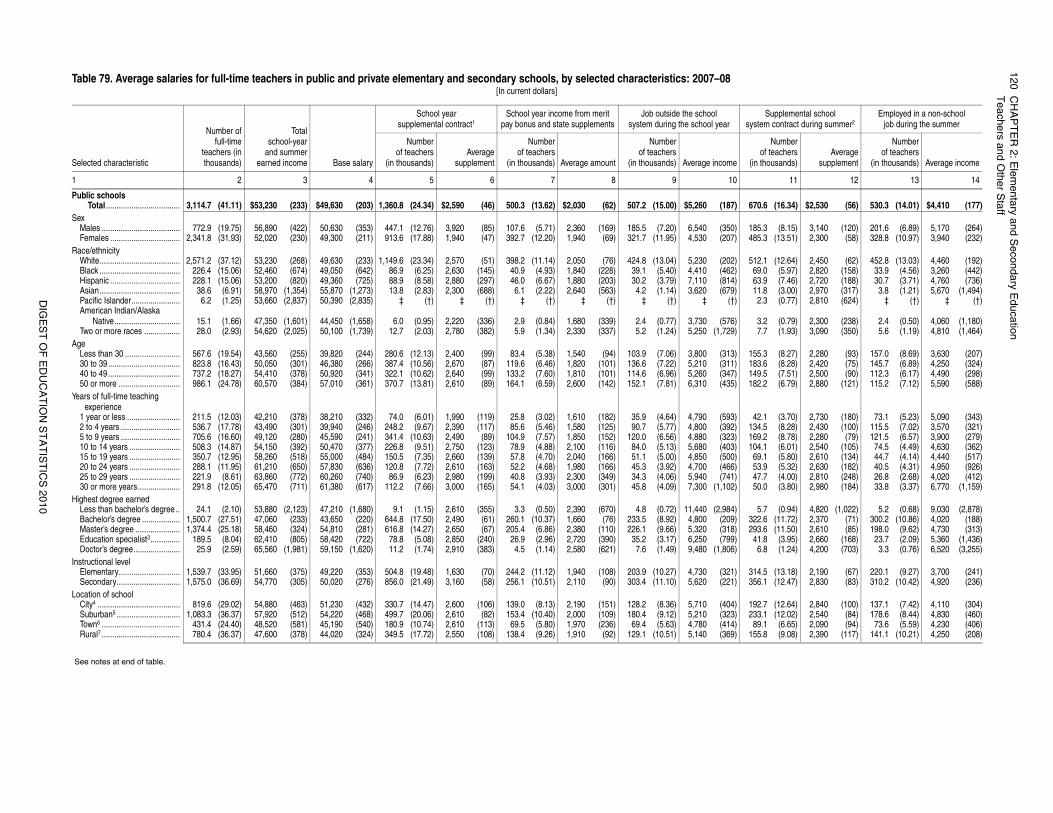
12
0C
HA
PT
ER
2: E
lem
en
tary a
nd
Se
con
da
ry Ed
uca
tion
Teach
ers a
nd O
the
r Sta
ff
DIG
ES
T O
F E
DU
CA
TIO
N S
TA
TIS
TIC
S 2
01
0
Supplemental school tem contract during summer2
Employed in a non-school job during the summer
Numberof teachers thousands)
Averagesupplement
Numberof teachers
(in thousands) Average income
11 12 13 14
0.6 (16.34) $2,530 (56) 530.3 (14.01) $4,410 (177)
5.3 (8.15) 3,140 (120) 201.6 (6.89) 5,170 (264)5.3 (13.51) 2,300 (58) 328.8 (10.97) 3,940 (232)
2.1 (12.64) 2,450 (62) 452.8 (13.03) 4,460 (192)9.0 (5.97) 2,820 (158) 33.9 (4.56) 3,260 (442)3.9 (7.46) 2,720 (188) 30.7 (3.71) 4,760 (736)1.8 (3.00) 2,970 (317) 3.8 (1.21) 5,670 (1,494)2.3 (0.77) 2,810 (624) ‡ (†) ‡ (†)
3.2 (0.79) 2,300 (238) 2.4 (0.50) 4,060 (1,180)7.7 (1.93) 3,090 (350) 5.6 (1.19) 4,810 (1,464)
5.3 (8.27) 2,280 (93) 157.0 (8.69) 3,630 (207)3.6 (8.28) 2,420 (75) 145.7 (6.89) 4,250 (324)9.5 (7.51) 2,500 (90) 112.3 (6.17) 4,490 (298)2.2 (6.79) 2,880 (121) 115.2 (7.12) 5,590 (588)
2.1 (3.70) 2,730 (180) 73.1 (5.23) 5,090 (343)4.5 (8.28) 2,430 (100) 115.5 (7.02) 3,570 (321)9.2 (8.78) 2,280 (79) 121.5 (6.57) 3,900 (279)4.1 (6.01) 2,540 (105) 74.5 (4.49) 4,630 (362)9.1 (5.80) 2,610 (134) 44.7 (4.14) 4,440 (517)3.9 (5.32) 2,630 (182) 40.5 (4.31) 4,950 (926)7.7 (4.00) 2,810 (248) 26.8 (2.68) 4,020 (412)0.0 (3.80) 2,980 (184) 33.8 (3.37) 6,770 (1,159)
5.7 (0.94) 4,820 (1,022) 5.2 (0.68) 9,030 (2,878)2.6 (11.72) 2,370 (71) 300.2 (10.86) 4,020 (188)3.6 (11.50) 2,610 (85) 198.0 (9.62) 4,730 (313)1.8 (3.95) 2,660 (168) 23.7 (2.09) 5,360 (1,436)6.8 (1.24) 4,200 (703) 3.3 (0.76) 6,520 (3,255)
4.5 (13.18) 2,190 (67) 220.1 (9.27) 3,700 (241)6.1 (12.47) 2,830 (83) 310.2 (10.42) 4,920 (236)
2.7 (12.64) 2,840 (100) 137.1 (7.42) 4,110 (304)3.1 (12.02) 2,540 (84) 178.6 (8.44) 4,830 (460)9.1 (6.65) 2,090 (94) 73.6 (5.59) 4,230 (406)5.8 (9.08) 2,390 (117) 141.1 (10.21) 4,250 (208)
Table 79. Average salaries for full-time teachers in public and private elementary and secondary schools, by selected characteristics: 2007–08[In current dollars]
Selected characteristic
Number offull-time
teachers (inthousands)
Totalschool-year
and summerearned income Base salary
School year supplemental contract1
School year income from merit pay bonus and state supplements
Job outside the school system during the school year sys
Numberof teachers
(in thousands)Average
supplement
Numberof teachers
(in thousands) Average amount
Numberof teachers
(in thousands) Average income (in
1 2 3 4 5 6 7 8 9 10
Public schools Total ................................... 3,114.7 (41.11) $53,230 (233) $49,630 (203) 1,360.8 (24.34) $2,590 (46) 500.3 (13.62) $2,030 (62) 507.2 (15.00) $5,260 (187) 67
SexMales ..................................... 772.9 (19.75) 56,890 (422) 50,630 (353) 447.1 (12.76) 3,920 (85) 107.6 (5.71) 2,360 (169) 185.5 (7.20) 6,540 (350) 18Females ................................. 2,341.8 (31.93) 52,020 (230) 49,300 (211) 913.6 (17.88) 1,940 (47) 392.7 (12.20) 1,940 (69) 321.7 (11.95) 4,530 (207) 48
Race/ethnicityWhite...................................... 2,571.2 (37.12) 53,230 (268) 49,630 (233) 1,149.6 (23.34) 2,570 (51) 398.2 (11.14) 2,050 (76) 424.8 (13.04) 5,230 (202) 51Black ...................................... 226.4 (15.06) 52,460 (674) 49,050 (642) 86.9 (6.25) 2,630 (145) 40.9 (4.93) 1,840 (228) 39.1 (5.40) 4,410 (462) 6Hispanic ................................. 228.1 (15.06) 53,200 (820) 49,360 (725) 88.9 (8.58) 2,880 (297) 46.0 (6.67) 1,880 (203) 30.2 (3.79) 7,110 (814) 6Asian...................................... 38.6 (6.91) 58,970 (1,354) 55,870 (1,273) 13.8 (2.83) 2,300 (688) 6.1 (2.22) 2,640 (563) 4.2 (1.14) 3,620 (679) 1Pacific Islander....................... 6.2 (1.25) 53,660 (2,837) 50,390 (2,835) ‡ (†) ‡ (†) ‡ (†) ‡ (†) ‡ (†) ‡ (†)American Indian/Alaska
Native............................... 15.1 (1.66) 47,350 (1,601) 44,450 (1,658) 6.0 (0.95) 2,220 (336) 2.9 (0.84) 1,680 (339) 2.4 (0.77) 3,730 (576)Two or more races ................. 28.0 (2.93) 54,620 (2,025) 50,100 (1,739) 12.7 (2.03) 2,780 (382) 5.9 (1.34) 2,330 (337) 5.2 (1.24) 5,250 (1,729)
AgeLess than 30 .......................... 567.6 (19.54) 43,560 (255) 39,820 (244) 280.6 (12.13) 2,400 (99) 83.4 (5.38) 1,540 (94) 103.9 (7.06) 3,800 (313) 1530 to 39.................................. 823.8 (16.43) 50,050 (301) 46,380 (266) 387.4 (10.56) 2,670 (87) 119.6 (6.46) 1,820 (101) 136.6 (7.22) 5,210 (311) 1840 to 49.................................. 737.2 (18.27) 54,410 (378) 50,920 (341) 322.1 (10.62) 2,640 (99) 133.2 (7.60) 1,810 (101) 114.6 (6.96) 5,260 (347) 1450 or more ............................. 986.1 (24.78) 60,570 (384) 57,010 (361) 370.7 (13.81) 2,610 (89) 164.1 (6.59) 2,600 (142) 152.1 (7.81) 6,310 (435) 18
Years of full-time teaching experience
1 year or less ......................... 211.5 (12.03) 42,210 (378) 38,210 (332) 74.0 (6.01) 1,990 (119) 25.8 (3.02) 1,610 (182) 35.9 (4.64) 4,790 (593) 42 to 4 years ............................ 536.7 (17.78) 43,490 (301) 39,940 (246) 248.2 (9.67) 2,390 (117) 85.6 (5.46) 1,580 (125) 90.7 (5.77) 4,800 (392) 135 to 9 years ............................ 705.6 (16.60) 49,120 (280) 45,590 (241) 341.4 (10.63) 2,490 (89) 104.9 (7.57) 1,850 (152) 120.0 (6.56) 4,880 (323) 1610 to 14 years ........................ 508.3 (14.87) 54,150 (392) 50,470 (377) 226.8 (9.51) 2,750 (123) 78.9 (4.88) 2,100 (116) 84.0 (5.13) 5,680 (403) 1015 to 19 years ........................ 350.7 (12.95) 58,260 (518) 55,000 (484) 150.5 (7.35) 2,660 (139) 57.8 (4.70) 2,040 (166) 51.1 (5.00) 4,850 (500) 620 to 24 years ........................ 288.1 (11.95) 61,210 (650) 57,830 (636) 120.8 (7.72) 2,610 (163) 52.2 (4.68) 1,980 (166) 45.3 (3.92) 4,700 (466) 525 to 29 years ........................ 221.9 (8.61) 63,860 (772) 60,260 (740) 86.9 (6.23) 2,980 (199) 40.8 (3.93) 2,300 (349) 34.3 (4.06) 5,940 (741) 430 or more years.................... 291.8 (12.05) 65,470 (711) 61,380 (617) 112.2 (7.66) 3,000 (165) 54.1 (4.03) 3,000 (301) 45.8 (4.09) 7,300 (1,102) 5
Highest degree earnedLess than bachelor’s degree.. 24.1 (2.10) 53,880 (2,123) 47,210 (1,680) 9.1 (1.15) 2,610 (355) 3.3 (0.50) 2,390 (670) 4.8 (0.72) 11,440 (2,984)Bachelor’s degree .................. 1,500.7 (27.51) 47,060 (233) 43,650 (220) 644.8 (17.50) 2,490 (61) 260.1 (10.37) 1,660 (76) 233.5 (8.92) 4,800 (209) 32Master’s degree ..................... 1,374.4 (25.18) 58,460 (324) 54,810 (281) 616.8 (14.27) 2,650 (67) 205.4 (6.86) 2,380 (110) 226.1 (9.66) 5,320 (318) 29Education specialist3.............. 189.5 (8.04) 62,410 (805) 58,420 (722) 78.8 (5.08) 2,850 (240) 26.9 (2.96) 2,720 (390) 35.2 (3.17) 6,250 (799) 4Doctor’s degree...................... 25.9 (2.59) 65,560 (1,981) 59,150 (1,620) 11.2 (1.74) 2,910 (383) 4.5 (1.14) 2,580 (621) 7.6 (1.49) 9,480 (1,806)
Instructional levelElementary............................. 1,539.7 (33.95) 51,660 (375) 49,220 (353) 504.8 (19.48) 1,630 (70) 244.2 (11.12) 1,940 (108) 203.9 (10.27) 4,730 (321) 31Secondary.............................. 1,575.0 (36.69) 54,770 (305) 50,020 (276) 856.0 (21.49) 3,160 (58) 256.1 (10.51) 2,110 (90) 303.4 (11.10) 5,620 (221) 35
Location of schoolCity4 ....................................... 819.6 (29.02) 54,880 (463) 51,230 (432) 330.7 (14.47) 2,600 (106) 139.0 (8.13) 2,190 (151) 128.2 (8.36) 5,710 (404) 19Suburban5 .............................. 1,083.3 (36.37) 57,920 (512) 54,220 (468) 499.7 (20.06) 2,610 (82) 153.4 (10.40) 2,000 (109) 180.4 (9.12) 5,210 (323) 23Town6 ..................................... 431.4 (24.40) 48,520 (581) 45,190 (540) 180.9 (10.74) 2,610 (113) 69.5 (5.80) 1,970 (236) 69.4 (5.63) 4,780 (414) 8Rural7 ..................................... 780.4 (36.37) 47,600 (378) 44,020 (324) 349.5 (17.72) 2,550 (108) 138.4 (9.26) 1,910 (92) 129.1 (10.51) 5,140 (369) 15
See notes at end of table.
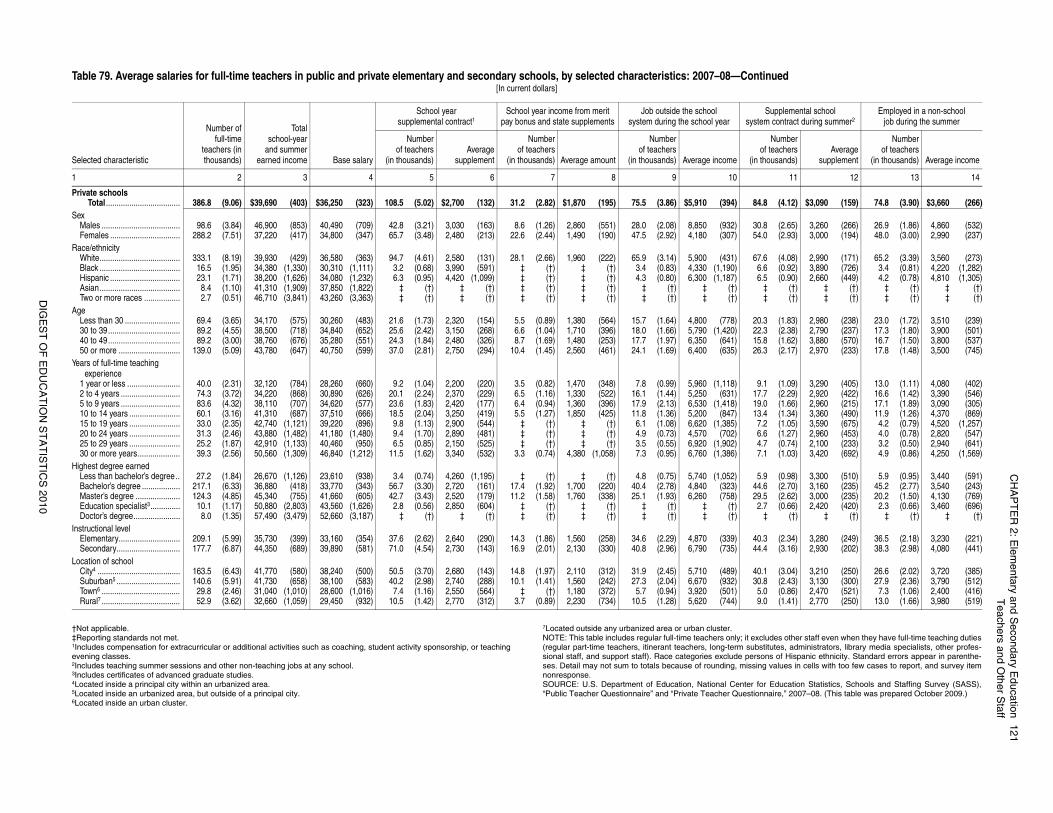
CH
AP
TE
R 2
: Ele
me
nta
ry an
d S
eco
nd
ary E
du
catio
n1
21
Tea
chers a
nd O
the
r Sta
ff
DIG
ES
T O
F E
DU
CA
TIO
N S
TA
TIS
TIC
S 2
01
0
xcludes other staff even when they have full-time teaching dutiesbstitutes, administrators, library media specialists, other profes-sons of Hispanic ethnicity. Standard errors appear in parenthe-ing values in cells with too few cases to report, and survey item
for Education Statistics, Schools and Staffing Survey (SASS),onnaire,” 2007–08. (This table was prepared October 2009.)
4.8 (4.12) $3,090 (159) 74.8 (3.90) $3,660 (266)
0.8 (2.65) 3,260 (266) 26.9 (1.86) 4,860 (532)4.0 (2.93) 3,000 (194) 48.0 (3.00) 2,990 (237)
7.6 (4.08) 2,990 (171) 65.2 (3.39) 3,560 (273)6.6 (0.92) 3,890 (726) 3.4 (0.81) 4,220 (1,282)6.5 (0.90) 2,660 (449) 4.2 (0.78) 4,810 (1,305)
‡ (†) ‡ (†) ‡ (†) ‡ (†)‡ (†) ‡ (†) ‡ (†) ‡ (†)
0.3 (1.83) 2,980 (238) 23.0 (1.72) 3,510 (239)2.3 (2.38) 2,790 (237) 17.3 (1.80) 3,900 (501)5.8 (1.62) 3,880 (570) 16.7 (1.50) 3,800 (537)6.3 (2.17) 2,970 (233) 17.8 (1.48) 3,500 (745)
9.1 (1.09) 3,290 (405) 13.0 (1.11) 4,080 (402)7.7 (2.29) 2,920 (422) 16.6 (1.42) 3,390 (546)9.0 (1.66) 2,960 (215) 17.1 (1.89) 3,090 (305)3.4 (1.34) 3,360 (490) 11.9 (1.26) 4,370 (869)7.2 (1.05) 3,590 (675) 4.2 (0.79) 4,520 (1,257)6.6 (1.27) 2,960 (453) 4.0 (0.78) 2,820 (547)4.7 (0.74) 2,100 (233) 3.2 (0.50) 2,940 (641)7.1 (1.03) 3,420 (692) 4.9 (0.86) 4,250 (1,569)
5.9 (0.98) 3,300 (510) 5.9 (0.95) 3,440 (591)4.6 (2.70) 3,160 (235) 45.2 (2.77) 3,540 (243)9.5 (2.62) 3,000 (235) 20.2 (1.50) 4,130 (769)2.7 (0.66) 2,420 (420) 2.3 (0.66) 3,460 (696)
‡ (†) ‡ (†) ‡ (†) ‡ (†)
0.3 (2.34) 3,280 (249) 36.5 (2.18) 3,230 (221)4.4 (3.16) 2,930 (202) 38.3 (2.98) 4,080 (441)
0.1 (3.04) 3,210 (250) 26.6 (2.02) 3,720 (385)0.8 (2.43) 3,130 (300) 27.9 (2.36) 3,790 (512)5.0 (0.86) 2,470 (521) 7.3 (1.06) 2,400 (416)9.0 (1.41) 2,770 (250) 13.0 (1.66) 3,980 (519)
tinued
Supplemental school tem contract during summer2
Employed in a non-school job during the summer
Numberof teachers thousands)
Averagesupplement
Numberof teachers
(in thousands) Average income
11 12 13 14
†Not applicable.‡Reporting standards not met. 1Includes compensation for extracurricular or additional activities such as coaching, student activity sponsorship, or teachingevening classes.2Includes teaching summer sessions and other non-teaching jobs at any school.3Includes certificates of advanced graduate studies.4Located inside a principal city within an urbanized area.5Located inside an urbanized area, but outside of a principal city.6Located inside an urban cluster.
7Located outside any urbanized area or urban cluster.NOTE: This table includes regular full-time teachers only; it e(regular part-time teachers, itinerant teachers, long-term susional staff, and support staff). Race categories exclude perses. Detail may not sum to totals because of rounding, missnonresponse.SOURCE: U.S. Department of Education, National Center “Public Teacher Questionnaire” and “Private Teacher Questi
Private schoolsTotal ................................... 386.8 (9.06) $39,690 (403) $36,250 (323) 108.5 (5.02) $2,700 (132) 31.2 (2.82) $1,870 (195) 75.5 (3.86) $5,910 (394) 8
SexMales ..................................... 98.6 (3.84) 46,900 (853) 40,490 (709) 42.8 (3.21) 3,030 (163) 8.6 (1.26) 2,860 (551) 28.0 (2.08) 8,850 (932) 3Females ................................. 288.2 (7.51) 37,220 (417) 34,800 (347) 65.7 (3.48) 2,480 (213) 22.6 (2.44) 1,490 (190) 47.5 (2.92) 4,180 (307) 5
Race/ethnicityWhite...................................... 333.1 (8.19) 39,930 (429) 36,580 (363) 94.7 (4.61) 2,580 (131) 28.1 (2.66) 1,960 (222) 65.9 (3.14) 5,900 (431) 6Black ...................................... 16.5 (1.95) 34,380 (1,330) 30,310 (1,111) 3.2 (0.68) 3,990 (591) ‡ (†) ‡ (†) 3.4 (0.83) 4,330 (1,190)Hispanic ................................. 23.1 (1.71) 38,200 (1,626) 34,080 (1,232) 6.3 (0.95) 4,420 (1,099) ‡ (†) ‡ (†) 4.3 (0.80) 6,300 (1,187)Asian...................................... 8.4 (1.10) 41,310 (1,909) 37,850 (1,822) ‡ (†) ‡ (†) ‡ (†) ‡ (†) ‡ (†) ‡ (†)Two or more races ................. 2.7 (0.51) 46,710 (3,841) 43,260 (3,363) ‡ (†) ‡ (†) ‡ (†) ‡ (†) ‡ (†) ‡ (†)
AgeLess than 30 .......................... 69.4 (3.65) 34,170 (575) 30,260 (483) 21.6 (1.73) 2,320 (154) 5.5 (0.89) 1,380 (564) 15.7 (1.64) 4,800 (778) 230 to 39.................................. 89.2 (4.55) 38,500 (718) 34,840 (652) 25.6 (2.42) 3,150 (268) 6.6 (1.04) 1,710 (396) 18.0 (1.66) 5,790 (1,420) 240 to 49.................................. 89.2 (3.00) 38,760 (676) 35,280 (551) 24.3 (1.84) 2,480 (326) 8.7 (1.69) 1,480 (253) 17.7 (1.97) 6,350 (641) 150 or more ............................. 139.0 (5.09) 43,780 (647) 40,750 (599) 37.0 (2.81) 2,750 (294) 10.4 (1.45) 2,560 (461) 24.1 (1.69) 6,400 (635) 2
Years of full-time teaching experience
1 year or less ......................... 40.0 (2.31) 32,120 (784) 28,260 (660) 9.2 (1.04) 2,200 (220) 3.5 (0.82) 1,470 (348) 7.8 (0.99) 5,960 (1,118)2 to 4 years ............................ 74.3 (3.72) 34,220 (868) 30,890 (626) 20.1 (2.24) 2,370 (229) 6.5 (1.16) 1,330 (522) 16.1 (1.44) 5,250 (631) 15 to 9 years ............................ 83.6 (4.32) 38,110 (707) 34,620 (577) 23.6 (1.83) 2,420 (177) 6.4 (0.94) 1,360 (396) 17.9 (2.13) 6,530 (1,418) 110 to 14 years ........................ 60.1 (3.16) 41,310 (687) 37,510 (666) 18.5 (2.04) 3,250 (419) 5.5 (1.27) 1,850 (425) 11.8 (1.36) 5,200 (847) 115 to 19 years ........................ 33.0 (2.35) 42,740 (1,121) 39,220 (896) 9.8 (1.13) 2,900 (544) ‡ (†) ‡ (†) 6.1 (1.08) 6,620 (1,385)20 to 24 years ........................ 31.3 (2.46) 43,880 (1,482) 41,180 (1,480) 9.4 (1.70) 2,890 (481) ‡ (†) ‡ (†) 4.9 (0.73) 4,570 (702)25 to 29 years ........................ 25.2 (1.87) 42,910 (1,133) 40,460 (950) 6.5 (0.85) 2,150 (525) ‡ (†) ‡ (†) 3.5 (0.55) 6,920 (1,902)30 or more years.................... 39.3 (2.56) 50,560 (1,309) 46,840 (1,212) 11.5 (1.62) 3,340 (532) 3.3 (0.74) 4,380 (1,058) 7.3 (0.95) 6,760 (1,386)
Highest degree earnedLess than bachelor’s degree.. 27.2 (1.84) 26,670 (1,126) 23,610 (938) 3.4 (0.74) 4,260 (1,195) ‡ (†) ‡ (†) 4.8 (0.75) 5,740 (1,052)Bachelor’s degree .................. 217.1 (6.33) 36,880 (418) 33,770 (343) 56.7 (3.30) 2,720 (161) 17.4 (1.92) 1,700 (220) 40.4 (2.78) 4,840 (323) 4Master’s degree ..................... 124.3 (4.85) 45,340 (755) 41,660 (605) 42.7 (3.43) 2,520 (179) 11.2 (1.58) 1,760 (338) 25.1 (1.93) 6,260 (758) 2Education specialist3.............. 10.1 (1.17) 50,880 (2,803) 43,560 (1,626) 2.8 (0.56) 2,850 (604) ‡ (†) ‡ (†) ‡ (†) ‡ (†)Doctor’s degree...................... 8.0 (1.35) 57,490 (3,479) 52,660 (3,187) ‡ (†) ‡ (†) ‡ (†) ‡ (†) ‡ (†) ‡ (†)
Instructional levelElementary............................. 209.1 (5.99) 35,730 (399) 33,160 (354) 37.6 (2.62) 2,640 (290) 14.3 (1.86) 1,560 (258) 34.6 (2.29) 4,870 (339) 4Secondary.............................. 177.7 (6.87) 44,350 (689) 39,890 (581) 71.0 (4.54) 2,730 (143) 16.9 (2.01) 2,130 (330) 40.8 (2.96) 6,790 (735) 4
Location of schoolCity4 ....................................... 163.5 (6.43) 41,770 (580) 38,240 (500) 50.5 (3.70) 2,680 (143) 14.8 (1.97) 2,110 (312) 31.9 (2.45) 5,710 (489) 4Suburban5 .............................. 140.6 (5.91) 41,730 (658) 38,100 (583) 40.2 (2.98) 2,740 (288) 10.1 (1.41) 1,560 (242) 27.3 (2.04) 6,670 (932) 3Town6 ..................................... 29.8 (2.46) 31,040 (1,010) 28,600 (1,016) 7.4 (1.16) 2,550 (564) ‡ (†) 1,180 (372) 5.7 (0.94) 3,920 (501)Rural7 ..................................... 52.9 (3.62) 32,660 (1,059) 29,450 (932) 10.5 (1.42) 2,770 (312) 3.7 (0.89) 2,230 (734) 10.5 (1.28) 5,620 (744)
Table 79. Average salaries for full-time teachers in public and private elementary and secondary schools, by selected characteristics: 2007–08—Con[In current dollars]
Selected characteristic
Number offull-time
teachers (inthousands)
Totalschool-year
and summerearned income Base salary
School year supplemental contract1
School year income from merit pay bonus and state supplements
Job outside the school system during the school year sys
Numberof teachers
(in thousands)Average
supplement
Numberof teachers
(in thousands) Average amount
Numberof teachers
(in thousands) Average income (in
1 2 3 4 5 6 7 8 9 10
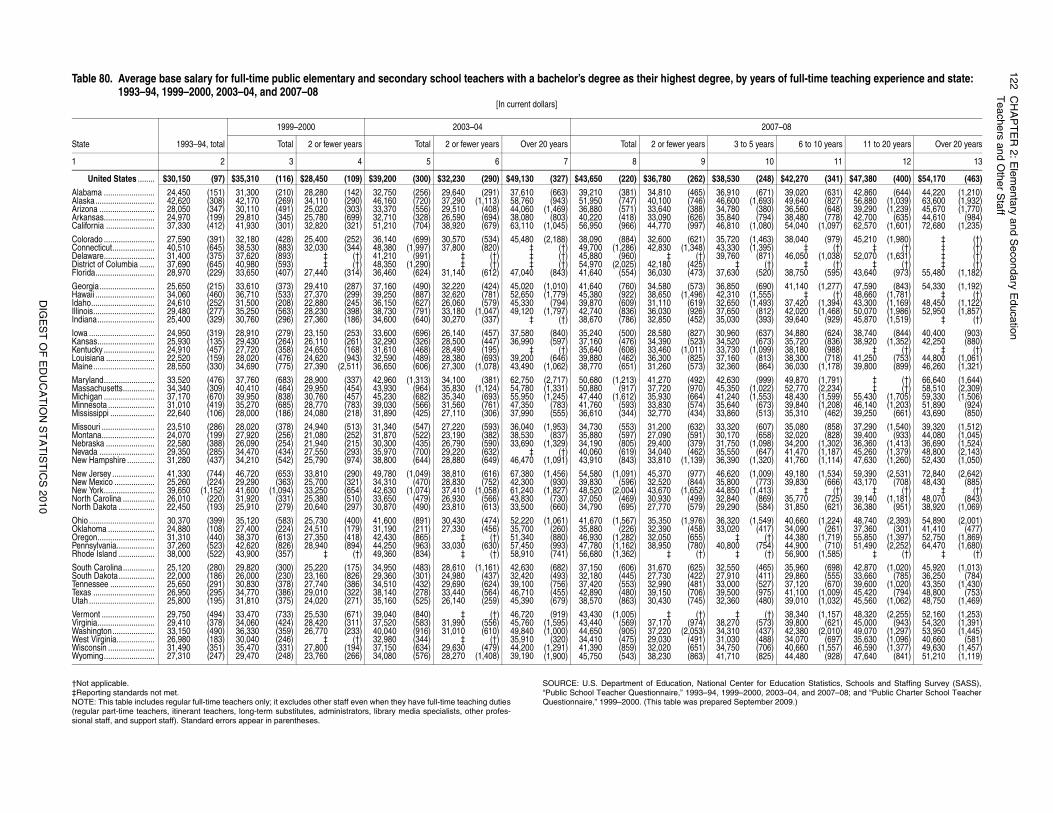
12
2C
HA
PT
ER
2: E
lem
en
tary a
nd
Se
con
da
ry Ed
uca
tion
Teach
ers a
nd O
the
r Sta
ff
DIG
ES
T O
F E
DU
CA
TIO
N S
TA
TIS
TIC
S 2
01
0
for Education Statistics, Schools and Staffing Survey (SASS),0, 2003–04, and 2007–08; and “Public Charter School Teachermber 2009.)
ears of full-time teaching experience and state:
2007–08
years 6 to 10 years 11 to 20 years Over 20 years
10 11 12 13
(248) $42,270 (341) $47,380 (400) $54,170 (463)(671) 39,020 (631) 42,860 (644) 44,220 (1,210),693) 49,640 (827) 56,880 (1,039) 63,600 (1,932)(380) 36,560 (648) 39,290 (1,239) 45,670 (1,770)(794) 38,480 (778) 42,700 (635) 44,610 (984),080) 54,040 (1,097) 62,570 (1,601) 72,680 (1,235)
,463) 38,040 (979) 45,210 (1,980) ‡ (†),395) ‡ (†) ‡ (†) ‡ (†)(871) 46,050 (1,038) 52,070 (1,631) ‡ (†)
(†) ‡ (†) ‡ (†) ‡ (†)(520) 38,750 (595) 43,640 (973) 55,480 (1,182)
(690) 41,140 (1,277) 47,590 (843) 54,330 (1,192),555) ‡ (†) 48,660 (1,781) ‡ (†),493) 37,420 (1,394) 43,300 (1,169) 48,450 (1,122)(812) 42,020 (1,468) 50,070 (1,986) 52,950 (1,857)(393) 39,640 (929) 45,870 (1,519) ‡ (†)
(637) 34,880 (624) 38,740 (844) 40,400 (903)(673) 35,720 (836) 38,920 (1,352) 42,250 (880),099) 38,180 (988) ‡ (†) ‡ (†)(813) 38,300 (718) 41,250 (753) 44,800 (1,061)(864) 36,030 (1,178) 39,800 (899) 46,260 (1,321)
(999) 49,870 (1,791) ‡ (†) 66,640 (1,644),022) 52,770 (2,234) ‡ (†) 58,510 (2,309),553) 48,430 (1,599) 55,430 (1,705) 59,330 (1,506)(673) 39,840 (1,208) 46,140 (1,203) 51,890 (924)(513) 35,310 (462) 39,250 (661) 43,690 (850)
(607) 35,080 (858) 37,290 (1,540) 39,320 (1,512)(658) 32,020 (828) 39,400 (933) 44,080 (1,045),098) 34,200 (1,302) 36,360 (1,413) 36,690 (1,524)(647) 41,470 (1,187) 45,260 (1,379) 48,800 (2,143),320) 41,760 (1,114) 47,630 (1,260) 52,430 (1,050)
,009) 49,180 (1,534) 59,390 (2,531) 72,840 (2,642)(773) 39,830 (666) 43,170 (708) 48,430 (885),413) ‡ (†) ‡ (†) ‡ (†)(869) 35,770 (725) 39,140 (1,181) 48,070 (843)(584) 31,850 (621) 36,380 (951) 38,920 (1,069)
,549) 40,660 (1,224) 48,740 (2,393) 54,890 (2,001)(417) 34,090 (261) 37,360 (301) 41,410 (477)
(†) 44,380 (1,719) 55,850 (1,397) 52,750 (1,869)(754) 44,900 (710) 51,490 (2,252) 64,470 (1,680)
(†) 56,900 (1,585) ‡ (†) ‡ (†)
(465) 35,960 (698) 42,870 (1,020) 45,920 (1,013)(411) 29,860 (555) 33,660 (785) 36,250 (784)(527) 37,120 (670) 39,600 (1,020) 43,350 (1,430)(975) 41,100 (1,009) 45,420 (794) 48,800 (753)(480) 39,010 (1,032) 45,560 (1,062) 48,750 (1,469)
(†) 38,340 (1,157) 48,320 (2,255) 52,160 (1,253)(573) 39,800 (621) 45,000 (943) 54,320 (1,391)(437) 42,380 (2,010) 49,070 (1,297) 53,950 (1,445)(488) 34,070 (697) 35,630 (1,096) 40,660 (581)(706) 40,660 (1,557) 46,590 (1,377) 49,630 (1,457)(825) 44,480 (928) 47,640 (841) 51,210 (1,119)
†Not applicable.‡Reporting standards not met. NOTE: This table includes regular full-time teachers only; it excludes other staff even when they have full-time teaching duties(regular part-time teachers, itinerant teachers, long-term substitutes, administrators, library media specialists, other profes-sional staff, and support staff). Standard errors appear in parentheses.
SOURCE: U.S. Department of Education, National Center “Public School Teacher Questionnaire,” 1993–94, 1999–200Questionnaire,” 1999–2000. (This table was prepared Septe
Table 80. Average base salary for full-time public elementary and secondary school teachers with a bachelor’s degree as their highest degree, by y1993–94, 1999–2000, 2003–04, and 2007–08
[In current dollars]
State 1993–94, total
1999–2000 2003–04
Total 2 or fewer years Total 2 or fewer years Over 20 years Total 2 or fewer years 3 to 5
1 2 3 4 5 6 7 8 9
United States ........ $30,150 (97) $35,310 (116) $28,450 (109) $39,200 (300) $32,230 (290) $49,130 (327) $43,650 (220) $36,780 (262) $38,530Alabama ........................ 24,450 (151) 31,300 (210) 28,280 (142) 32,750 (256) 29,640 (291) 37,610 (663) 39,210 (381) 34,810 (465) 36,910Alaska............................ 42,620 (308) 42,170 (269) 34,110 (290) 46,160 (720) 37,290 (1,113) 58,760 (943) 51,950 (747) 40,100 (746) 46,600 (1Arizona .......................... 28,050 (347) 30,110 (491) 25,020 (303) 33,370 (556) 29,510 (408) 44,060 (1,469) 36,880 (571) 33,640 (388) 34,780Arkansas........................ 24,970 (199) 29,810 (345) 25,780 (699) 32,710 (328) 26,590 (694) 38,080 (803) 40,220 (418) 33,090 (626) 35,840California ....................... 37,330 (412) 41,930 (301) 32,820 (321) 51,210 (704) 38,920 (679) 63,110 (1,045) 56,950 (966) 44,770 (997) 46,810 (1
Colorado ........................ 27,590 (391) 32,180 (428) 25,400 (252) 36,140 (699) 30,570 (534) 45,480 (2,188) 38,090 (884) 32,600 (621) 35,720 (1Connecticut.................... 40,510 (645) 38,530 (883) 32,030 (344) 48,380 (1,997) 37,800 (820) ‡ (†) 49,700 (1,286) 42,830 (1,348) 43,330 (1Delaware........................ 31,400 (375) 37,620 (893) ‡ (†) 41,210 (991) ‡ (†) ‡ (†) 45,880 (960) ‡ (†) 39,760District of Columbia ....... 37,690 (645) 40,980 (593) ‡ (†) 48,350 (1,290) ‡ (†) ‡ (†) 54,970 (2,025) 42,180 (425) ‡Florida............................ 28,970 (229) 33,650 (407) 27,440 (314) 36,460 (624) 31,140 (612) 47,040 (843) 41,640 (554) 36,030 (473) 37,630
Georgia.......................... 25,650 (215) 33,610 (373) 29,410 (287) 37,160 (490) 32,220 (424) 45,020 (1,010) 41,640 (760) 34,580 (573) 36,850Hawaii ............................ 34,060 (460) 36,710 (533) 27,370 (299) 39,250 (887) 32,620 (781) 52,650 (1,779) 45,380 (922) 38,650 (1,496) 42,310 (1Idaho.............................. 24,610 (252) 31,500 (208) 22,880 (245) 36,150 (627) 26,060 (579) 45,330 (794) 39,870 (609) 31,110 (619) 32,650 (1Illinois............................. 29,480 (277) 35,250 (563) 28,230 (398) 38,730 (791) 33,180 (1,047) 49,120 (1,797) 42,740 (836) 36,030 (926) 37,650Indiana........................... 25,400 (329) 30,760 (296) 27,360 (186) 34,600 (640) 30,270 (337) ‡ (†) 38,670 (786) 32,850 (452) 35,030
Iowa ............................... 24,950 (319) 28,910 (279) 23,150 (253) 33,600 (696) 26,140 (457) 37,580 (840) 35,240 (500) 28,580 (827) 30,960Kansas........................... 25,930 (135) 29,430 (264) 26,110 (261) 32,290 (326) 28,500 (447) 36,990 (597) 37,160 (476) 34,390 (523) 34,520Kentucky ........................ 24,910 (457) 27,720 (358) 24,650 (168) 31,610 (468) 28,490 (195) ‡ (†) 35,640 (608) 33,460 (1,011) 33,730 (1Louisiana ....................... 22,520 (159) 28,020 (476) 24,620 (943) 32,590 (489) 28,380 (693) 39,200 (646) 39,880 (462) 36,300 (825) 37,160Maine............................. 28,550 (330) 34,690 (775) 27,390 (2,511) 36,650 (606) 27,300 (1,078) 43,490 (1,062) 38,770 (651) 31,260 (573) 32,360
Maryland........................ 33,520 (476) 37,760 (683) 28,900 (337) 42,960 (1,313) 34,100 (381) 62,750 (2,717) 50,680 (1,213) 41,270 (492) 42,630Massachusetts............... 34,340 (309) 40,410 (464) 29,950 (454) 43,930 (964) 35,830 (1,124) 54,780 (1,331) 50,880 (917) 37,720 (970) 45,350 (1Michigan ........................ 37,170 (670) 39,950 (838) 30,760 (457) 45,230 (682) 35,340 (693) 55,950 (1,245) 47,440 (1,612) 35,930 (664) 41,240 (1Minnesota ...................... 31,010 (419) 35,270 (685) 28,770 (783) 39,030 (566) 31,560 (761) 47,350 (783) 41,760 (593) 33,830 (574) 35,640Mississippi ..................... 22,640 (106) 28,000 (186) 24,080 (218) 31,890 (425) 27,110 (306) 37,990 (555) 36,610 (344) 32,770 (434) 33,860
Missouri ......................... 23,510 (286) 28,020 (378) 24,940 (513) 31,340 (547) 27,220 (593) 36,040 (1,953) 34,730 (553) 31,200 (632) 33,320Montana......................... 24,070 (199) 27,920 (256) 21,080 (252) 31,870 (522) 23,190 (382) 38,530 (837) 35,880 (597) 27,090 (591) 30,170Nebraska ....................... 22,580 (388) 26,090 (254) 21,940 (215) 30,300 (435) 26,790 (590) 33,690 (1,329) 34,190 (805) 29,400 (379) 31,750 (1Nevada .......................... 29,350 (285) 34,470 (434) 27,550 (293) 35,970 (700) 29,220 (632) ‡ (†) 40,060 (619) 34,040 (462) 35,550New Hampshire ............. 31,280 (437) 34,210 (542) 25,790 (974) 38,800 (644) 28,880 (649) 46,470 (1,091) 43,910 (843) 33,810 (1,139) 36,390 (1
New Jersey .................... 41,330 (744) 46,720 (653) 33,810 (290) 49,780 (1,049) 38,810 (616) 67,380 (1,456) 54,580 (1,091) 45,370 (977) 46,620 (1New Mexico ................... 25,260 (224) 29,290 (363) 25,700 (321) 34,310 (470) 28,830 (752) 42,300 (930) 39,830 (596) 32,520 (844) 35,800New York........................ 39,650 (1,152) 41,600 (1,094) 33,250 (654) 42,630 (1,074) 37,410 (1,058) 61,240 (1,827) 48,520 (2,004) 43,670 (1,652) 44,850 (1North Carolina ............... 26,010 (220) 31,920 (331) 25,380 (510) 33,650 (479) 26,930 (566) 43,830 (730) 37,050 (469) 30,930 (499) 32,840North Dakota ................. 22,450 (193) 25,910 (279) 20,640 (297) 30,870 (490) 23,810 (613) 33,500 (660) 34,790 (695) 27,770 (579) 29,290
Ohio ............................... 30,370 (399) 35,120 (583) 25,730 (400) 41,600 (891) 30,430 (474) 52,220 (1,061) 41,670 (1,567) 35,350 (1,976) 36,320 (1Oklahoma ...................... 24,880 (108) 27,400 (224) 24,510 (179) 31,190 (211) 27,330 (456) 35,700 (260) 35,880 (226) 32,390 (458) 33,020Oregon........................... 31,310 (440) 38,370 (613) 27,350 (418) 42,430 (865) ‡ (†) 51,340 (880) 46,930 (1,282) 32,050 (655) ‡Pennsylvania.................. 37,260 (523) 42,620 (826) 28,940 (894) 44,250 (963) 33,030 (630) 57,450 (993) 47,780 (1,162) 38,950 (780) 40,800Rhode Island ................. 38,000 (522) 43,900 (357) ‡ (†) 49,360 (834) ‡ (†) 58,910 (741) 56,680 (1,362) ‡ (†) ‡
South Carolina............... 25,120 (280) 29,820 (300) 25,220 (175) 34,950 (483) 28,610 (1,161) 42,630 (682) 37,150 (606) 31,670 (625) 32,550South Dakota ................. 22,000 (186) 26,000 (230) 23,160 (826) 29,360 (301) 24,980 (437) 32,420 (493) 32,180 (445) 27,730 (422) 27,910Tennessee ..................... 25,650 (291) 30,830 (378) 27,740 (386) 34,510 (432) 29,690 (624) 39,100 (756) 37,420 (553) 32,990 (481) 33,000Texas ............................. 26,950 (295) 34,770 (386) 29,010 (322) 38,140 (278) 33,440 (564) 46,710 (455) 42,890 (480) 39,150 (706) 39,500Utah ............................... 25,800 (195) 31,810 (375) 24,020 (271) 35,160 (525) 26,140 (259) 45,390 (679) 38,570 (863) 30,430 (745) 32,360
Vermont ......................... 29,750 (494) 33,470 (733) 25,530 (671) 39,040 (840) ‡ (†) 46,720 (919) 43,430 (1,005) ‡ (†) ‡Virginia........................... 29,410 (378) 34,060 (424) 28,420 (311) 37,520 (583) 31,990 (556) 45,760 (1,595) 43,440 (569) 37,170 (974) 38,270Washington.................... 33,150 (490) 36,330 (359) 26,770 (233) 40,040 (916) 31,010 (610) 49,840 (1,000) 44,650 (905) 37,220 (2,053) 34,310West Virginia.................. 26,980 (183) 30,040 (246) ‡ (†) 32,980 (344) ‡ (†) 35,910 (320) 34,410 (475) 29,030 (491) 31,030Wisconsin ...................... 31,490 (351) 35,470 (331) 27,800 (194) 37,150 (634) 29,630 (479) 44,200 (1,291) 41,390 (859) 32,020 (651) 34,750Wyoming........................ 27,310 (247) 29,470 (248) 23,760 (266) 34,080 (576) 28,270 (1,408) 39,190 (1,900) 45,750 (543) 38,230 (863) 41,710
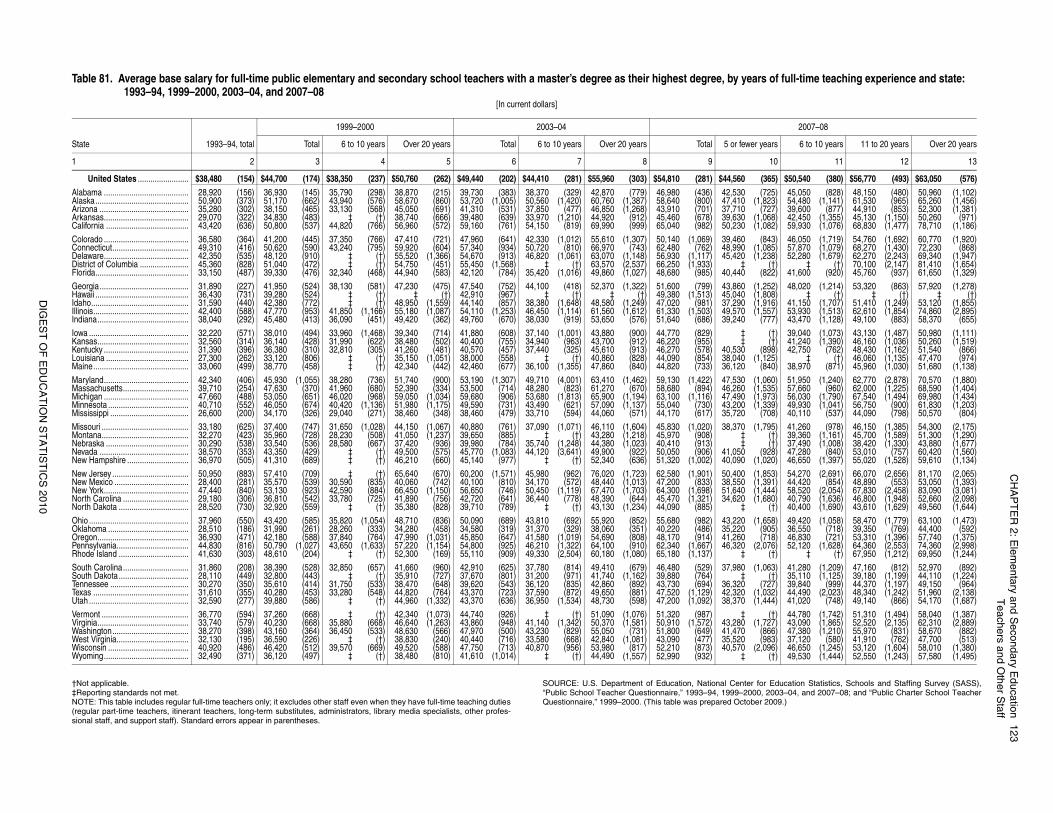
CH
AP
TE
R 2
: Ele
me
nta
ry an
d S
eco
nd
ary E
du
catio
n1
23
Tea
chers a
nd O
the
r Sta
ff
DIG
ES
T O
F E
DU
CA
TIO
N S
TA
TIS
TIC
S 2
01
0
for Education Statistics, Schools and Staffing Survey (SASS),0, 2003–04, and 2007–08; and “Public Charter School Teacherer 2009.)
rs of full-time teaching experience and state:
2007–08
r years 6 to 10 years 11 to 20 years Over 20 years
10 11 12 13
(365) $50,540 (380) $56,770 (493) $63,050 (576)(725) 45,050 (828) 48,150 (480) 50,960 (1,102)
1,823) 54,480 (1,141) 61,530 (965) 65,260 (1,456)(727) 39,600 (877) 44,910 (853) 52,300 (1,381)
1,068) 42,450 (1,355) 45,130 (1,150) 50,260 (971)1,082) 59,930 (1,076) 68,830 (1,477) 78,710 (1,186)
(843) 46,050 (1,719) 54,760 (1,692) 60,770 (1,920)1,085) 57,870 (1,079) 68,270 (1,430) 72,230 (868)1,238) 52,280 (1,679) 62,270 (2,243) 69,340 (1,947)
(†) ‡ (†) 70,100 (2,147) 81,410 (1,654)(822) 41,600 (920) 45,760 (937) 61,650 (1,329)
1,252) 48,020 (1,214) 53,320 (863) 57,920 (1,278)1,808) ‡ (†) ‡ (†) ‡ (†)1,916) 41,150 (1,707) 51,410 (1,249) 53,120 (1,855)1,557) 53,930 (1,513) 62,610 (1,854) 74,860 (2,895)(777) 43,470 (1,128) 49,100 (883) 58,370 (655)
(†) 39,040 (1,073) 43,130 (1,487) 50,980 (1,111)(†) 41,240 (1,390) 46,160 (1,036) 50,260 (1,519)
(898) 42,750 (762) 48,430 (1,162) 51,540 (866)1,125) ‡ (†) 46,060 (1,135) 47,470 (974)(840) 38,970 (871) 45,960 (1,030) 51,680 (1,138)
1,060) 51,950 (1,240) 62,770 (2,878) 70,570 (1,880)1,535) 57,660 (960) 62,000 (1,225) 68,590 (1,404)1,973) 56,030 (1,790) 67,540 (1,494) 69,980 (1,434)1,339) 49,930 (1,041) 56,750 (900) 61,830 (1,203)(708) 40,110 (537) 44,090 (798) 50,570 (804)
1,795) 41,260 (978) 46,150 (1,385) 54,300 (2,175)(†) 39,360 (1,161) 45,700 (1,589) 51,300 (1,290)(†) 37,490 (1,008) 38,420 (1,330) 43,880 (1,677)
(928) 47,280 (840) 53,010 (757) 60,420 (1,560)1,020) 46,650 (1,397) 55,020 (1,528) 59,610 (1,134)
1,853) 54,270 (2,691) 66,070 (2,656) 81,170 (2,065)1,391) 44,420 (854) 48,890 (553) 53,050 (1,393)1,444) 58,520 (2,054) 67,830 (2,458) 83,090 (3,081)1,680) 40,790 (1,636) 46,800 (1,948) 52,660 (2,098)
(†) 40,400 (1,690) 43,610 (1,629) 49,560 (1,644)
1,658) 49,420 (1,058) 58,470 (1,779) 63,100 (1,473)(905) 36,550 (718) 39,350 (769) 44,400 (592)(718) 46,830 (721) 53,310 (1,396) 57,740 (1,375)
2,076) 52,120 (1,628) 64,360 (2,553) 74,360 (2,998)(†) ‡ (†) 67,950 (1,212) 69,950 (1,244)
1,063) 41,280 (1,209) 47,160 (812) 52,970 (892)(†) 35,110 (1,125) 39,180 (1,199) 44,110 (1,224)
(727) 39,840 (999) 44,370 (1,197) 49,150 (964)1,032) 44,490 (2,023) 48,340 (1,242) 51,960 (2,138)1,444) 41,020 (748) 49,140 (866) 54,170 (1,687)
(†) 44,780 (1,742) 51,310 (1,494) 58,040 (1,387)1,727) 43,090 (1,865) 52,520 (2,135) 62,310 (2,889)(866) 47,380 (1,210) 55,970 (831) 58,670 (882)(983) 37,120 (580) 41,910 (762) 47,700 (513)
2,096) 46,650 (1,245) 53,120 (1,604) 58,010 (1,380)(†) 49,530 (1,444) 52,550 (1,243) 57,580 (1,495)
†Not applicable.‡Reporting standards not met. NOTE: This table includes regular full-time teachers only; it excludes other staff even when they have full-time teaching duties(regular part-time teachers, itinerant teachers, long-term substitutes, administrators, library media specialists, other profes-sional staff, and support staff). Standard errors appear in parentheses.
SOURCE: U.S. Department of Education, National Center “Public School Teacher Questionnaire,” 1993–94, 1999–200Questionnaire,” 1999–2000. (This table was prepared Octob
Table 81. Average base salary for full-time public elementary and secondary school teachers with a master’s degree as their highest degree, by yea1993–94, 1999–2000, 2003–04, and 2007–08
[In current dollars]
State 1993–94, total
1999–2000 2003–04
Total 6 to 10 years Over 20 years Total 6 to 10 years Over 20 years Total 5 or fewe
1 2 3 4 5 6 7 8 9
United States ........................ $38,480 (154) $44,700 (174) $38,350 (237) $50,760 (262) $49,440 (202) $44,410 (281) $55,960 (303) $54,810 (281) $44,560Alabama ........................................ 28,920 (156) 36,930 (145) 35,790 (298) 38,870 (215) 39,730 (383) 38,370 (329) 42,870 (779) 46,980 (436) 42,530Alaska............................................ 50,900 (373) 51,170 (662) 43,940 (576) 58,670 (860) 53,720 (1,005) 50,560 (1,420) 60,760 (1,387) 58,640 (800) 47,410 (Arizona .......................................... 35,280 (302) 38,150 (465) 33,130 (568) 45,050 (691) 41,310 (531) 37,850 (477) 46,850 (1,268) 43,910 (701) 37,710Arkansas........................................ 29,070 (322) 34,830 (483) ‡ (†) 38,740 (666) 39,480 (639) 33,970 (1,210) 44,920 (912) 45,460 (678) 39,630 (California ....................................... 43,420 (636) 50,800 (537) 44,820 (766) 56,960 (572) 59,160 (761) 54,150 (819) 69,990 (999) 65,040 (982) 50,230 (
Colorado ........................................ 36,580 (364) 41,200 (445) 37,350 (766) 47,410 (721) 47,960 (641) 42,330 (1,012) 55,610 (1,307) 50,140 (1,069) 39,460Connecticut.................................... 49,310 (416) 50,620 (590) 43,240 (795) 59,920 (604) 57,340 (934) 50,720 (810) 66,970 (743) 62,480 (762) 48,990 (Delaware........................................ 42,350 (535) 48,120 (910) ‡ (†) 55,520 (1,366) 54,670 (913) 46,820 (1,061) 63,070 (1,148) 56,930 (1,117) 45,420 (District of Columbia ....................... 45,360 (828) 51,040 (472) ‡ (†) 54,750 (451) 55,450 (1,568) ‡ (†) 63,570 (2,537) 66,250 (1,933) ‡Florida............................................ 33,150 (487) 39,330 (476) 32,340 (468) 44,940 (583) 42,120 (784) 35,420 (1,016) 49,860 (1,027) 48,680 (985) 40,440
Georgia.......................................... 31,890 (227) 41,950 (524) 38,130 (581) 47,230 (475) 47,540 (752) 44,100 (418) 52,370 (1,322) 51,600 (799) 43,860 (Hawaii ............................................ 36,430 (731) 39,280 (524) ‡ (†) ‡ (†) 42,910 (967) ‡ (†) ‡ (†) 49,380 (1,513) 45,040 (Idaho.............................................. 31,590 (440) 42,380 (772) ‡ (†) 48,950 (1,559) 44,140 (857) 38,380 (1,648) 48,580 (1,249) 47,020 (981) 37,290 (Illinois............................................. 42,400 (588) 47,770 (953) 41,850 (1,166) 55,180 (1,087) 54,110 (1,253) 46,450 (1,114) 61,560 (1,612) 61,330 (1,503) 49,570 (Indiana........................................... 38,040 (292) 45,480 (413) 36,090 (451) 49,420 (362) 49,760 (670) 38,030 (919) 53,650 (576) 51,640 (686) 39,240
Iowa ............................................... 32,220 (571) 38,010 (494) 33,960 (1,468) 39,340 (714) 41,880 (608) 37,140 (1,001) 43,880 (900) 44,770 (829) ‡Kansas........................................... 32,560 (314) 36,140 (428) 31,990 (622) 38,480 (502) 40,400 (755) 34,940 (963) 43,700 (912) 46,220 (955) ‡Kentucky ........................................ 31,390 (396) 36,380 (310) 32,810 (305) 41,260 (481) 40,570 (457) 37,440 (325) 45,610 (913) 46,270 (578) 40,530Louisiana ....................................... 27,300 (262) 33,120 (806) ‡ (†) 35,150 (1,051) 38,000 (558) ‡ (†) 40,860 (828) 44,090 (854) 38,040 (Maine............................................. 33,060 (499) 38,770 (458) ‡ (†) 42,340 (442) 42,460 (677) 36,100 (1,355) 47,860 (840) 44,820 (733) 36,120
Maryland........................................ 42,340 (406) 45,930 (1,055) 38,280 (736) 51,740 (900) 53,190 (1,307) 49,710 (4,001) 63,410 (1,462) 59,130 (1,422) 47,530 (Massachusetts............................... 39,710 (254) 47,630 (370) 41,960 (680) 52,390 (334) 53,500 (714) 48,280 (823) 61,270 (670) 58,680 (894) 46,260 (Michigan ........................................ 47,660 (488) 53,050 (651) 46,020 (968) 59,050 (1,034) 59,680 (906) 53,680 (1,813) 65,900 (1,194) 63,100 (1,116) 47,490 (Minnesota ...................................... 40,710 (552) 46,050 (674) 40,420 (1,136) 51,980 (1,175) 49,590 (731) 43,490 (621) 57,090 (1,137) 55,040 (730) 43,200 (Mississippi ..................................... 26,600 (200) 34,170 (326) 29,040 (271) 38,460 (348) 38,460 (479) 33,710 (594) 44,060 (571) 44,170 (617) 35,720
Missouri ......................................... 33,180 (625) 37,400 (747) 31,650 (1,028) 44,150 (1,067) 40,880 (761) 37,090 (1,071) 46,110 (1,604) 45,830 (1,020) 38,370 (Montana......................................... 32,270 (423) 35,960 (728) 28,230 (508) 41,050 (1,237) 39,650 (885) ‡ (†) 43,280 (1,218) 45,970 (908) ‡Nebraska ....................................... 30,290 (538) 33,540 (536) 28,580 (667) 37,420 (936) 39,980 (784) 35,740 (1,248) 44,380 (1,023) 40,410 (913) ‡Nevada .......................................... 38,570 (353) 43,350 (429) ‡ (†) 49,500 (575) 45,770 (1,083) 44,120 (3,641) 49,900 (922) 50,050 (906) 41,050New Hampshire ............................. 36,970 (505) 41,310 (689) ‡ (†) 46,210 (660) 45,140 (977) ‡ (†) 52,340 (636) 51,320 (1,002) 40,090 (
New Jersey .................................... 50,950 (883) 57,410 (709) ‡ (†) 65,640 (670) 60,200 (1,571) 45,980 (962) 76,020 (1,723) 62,580 (1,901) 50,400 (New Mexico ................................... 28,400 (281) 35,570 (539) 30,590 (835) 40,060 (742) 40,100 (810) 34,170 (572) 48,440 (1,013) 47,200 (833) 38,550 (New York........................................ 47,440 (840) 53,130 (923) 42,590 (884) 66,450 (1,150) 56,650 (746) 50,450 (1,119) 67,470 (1,703) 64,300 (1,698) 51,640 (North Carolina ............................... 29,180 (306) 36,810 (542) 33,780 (725) 41,890 (756) 42,720 (641) 36,440 (778) 48,390 (644) 45,470 (1,321) 34,620 (North Dakota ................................. 28,520 (730) 32,920 (559) ‡ (†) 35,380 (828) 39,710 (789) ‡ (†) 43,130 (1,234) 44,090 (885) ‡
Ohio ............................................... 37,960 (550) 43,420 (585) 35,820 (1,054) 48,710 (836) 50,090 (689) 43,810 (692) 55,920 (852) 55,680 (982) 43,220 (Oklahoma ...................................... 28,510 (186) 31,990 (261) 28,260 (333) 34,280 (458) 34,580 (319) 31,370 (329) 38,060 (351) 40,220 (486) 35,220Oregon........................................... 36,930 (471) 42,180 (588) 37,840 (764) 47,990 (1,031) 45,850 (647) 41,580 (1,019) 54,690 (808) 48,170 (914) 41,260Pennsylvania.................................. 44,830 (816) 50,790 (1,027) 43,650 (1,633) 57,220 (1,154) 54,800 (925) 46,210 (1,322) 64,100 (910) 62,340 (1,667) 46,320 (Rhode Island ................................. 41,630 (303) 48,610 (204) ‡ (†) 52,300 (169) 55,110 (909) 49,330 (2,504) 60,180 (1,080) 65,180 (1,137) ‡
South Carolina............................... 31,860 (208) 38,390 (528) 32,850 (657) 41,660 (960) 42,910 (625) 37,780 (814) 49,410 (679) 46,480 (529) 37,980 (South Dakota ................................. 28,110 (449) 32,800 (443) ‡ (†) 35,910 (727) 37,670 (801) 31,200 (971) 41,740 (1,162) 39,880 (764) ‡Tennessee ..................................... 30,270 (350) 35,610 (414) 31,750 (533) 38,470 (648) 39,620 (543) 36,120 (835) 42,860 (892) 43,730 (694) 36,320Texas ............................................. 31,610 (355) 40,280 (453) 33,280 (548) 44,820 (764) 43,370 (723) 37,590 (872) 49,650 (881) 47,520 (1,129) 42,320 (Utah ............................................... 32,590 (277) 39,880 (586) ‡ (†) 44,960 (1,332) 43,370 (636) 36,950 (1,534) 48,730 (598) 47,200 (1,092) 38,370 (
Vermont ......................................... 36,770 (594) 37,260 (668) ‡ (†) 42,340 (1,073) 44,740 (926) ‡ (†) 51,090 (1,076) 51,320 (987) ‡Virginia........................................... 33,740 (579) 40,230 (668) 35,880 (668) 46,640 (1,263) 43,860 (948) 41,140 (1,342) 50,370 (1,581) 50,910 (1,572) 43,280 (Washington.................................... 38,270 (398) 43,160 (364) 36,450 (533) 48,630 (566) 47,970 (500) 43,230 (829) 55,050 (731) 51,800 (649) 41,470West Virginia.................................. 32,130 (195) 36,590 (226) ‡ (†) 38,830 (240) 40,440 (716) 33,580 (668) 42,840 (1,081) 43,090 (477) 35,520Wisconsin ...................................... 40,920 (486) 46,420 (512) 39,570 (669) 49,520 (588) 47,750 (713) 40,870 (956) 53,980 (817) 52,210 (873) 40,570 (Wyoming........................................ 32,490 (371) 36,120 (497) ‡ (†) 38,480 (810) 41,610 (1,014) ‡ (†) 44,490 (1,557) 52,990 (932) ‡
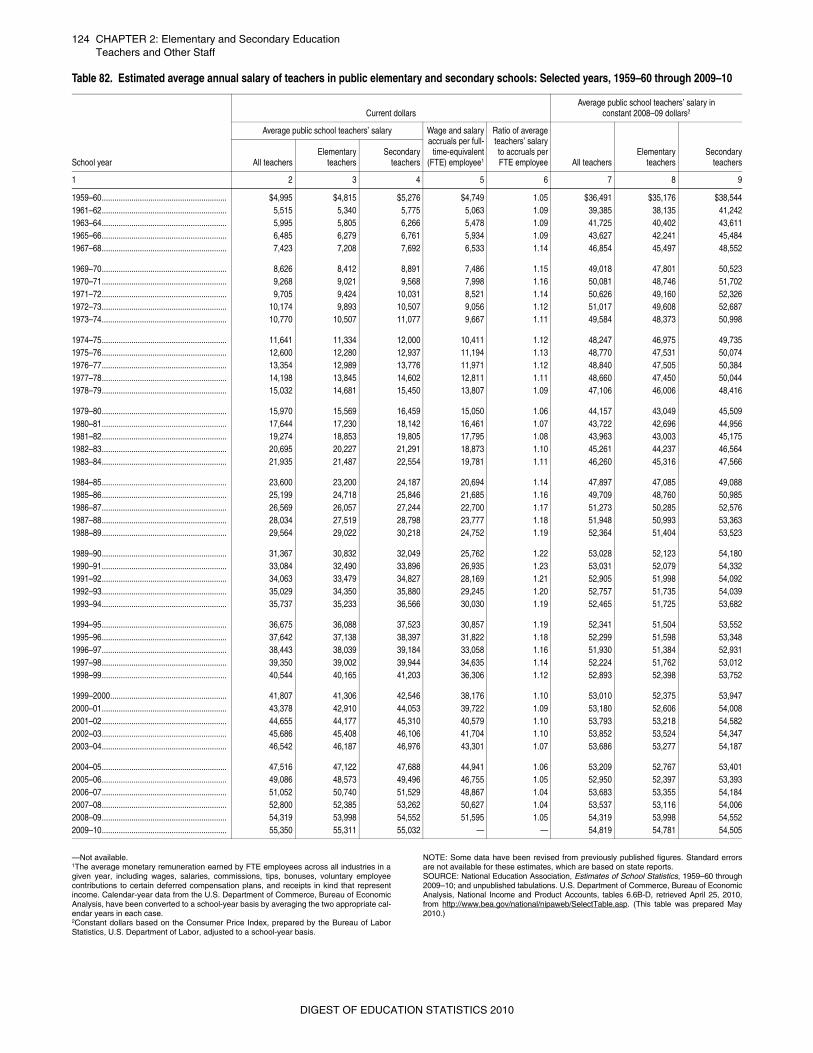
124 CHAPTER 2: Elementary and Secondary EducationTeachers and Other Staff
—Not available.1The average monetary remuneration earned by FTE employees across all industries in agiven year, including wages, salaries, commissions, tips, bonuses, voluntary employeecontributions to certain deferred compensation plans, and receipts in kind that representincome. Calendar-year data from the U.S. Department of Commerce, Bureau of EconomicAnalysis, have been converted to a school-year basis by averaging the two appropriate cal-endar years in each case.2Constant dollars based on the Consumer Price Index, prepared by the Bureau of LaborStatistics, U.S. Department of Labor, adjusted to a school-year basis.
NOTE: Some data have been revised from previously published figures. Standard errorsare not available for these estimates, which are based on state reports.SOURCE: National Education Association, Estimates of School Statistics, 1959–60 through2009–10; and unpublished tabulations. U.S. Department of Commerce, Bureau of EconomicAnalysis, National Income and Product Accounts, tables 6.6B-D, retrieved April 25, 2010,from http://www.bea.gov/national/nipaweb/SelectTable.asp. (This table was prepared May2010.)
Table 82. Estimated average annual salary of teachers in public elementary and secondary schools: Selected years, 1959–60 through 2009–10
School year
Current dollarsAverage public school teachers’ salary in
constant 2008–09 dollars2
Average public school teachers’ salary Wage and salaryaccruals per full-
time-equivalent(FTE) employee1
Ratio of averageteachers’ salaryto accruals perFTE employee All teachers
Elementaryteachers
SecondaryteachersAll teachers
Elementaryteachers
Secondaryteachers
1 2 3 4 5 6 7 8 9
1959–60........................................................... $4,995 $4,815 $5,276 $4,749 1.05 $36,491 $35,176 $38,5441961–62........................................................... 5,515 5,340 5,775 5,063 1.09 39,385 38,135 41,2421963–64........................................................... 5,995 5,805 6,266 5,478 1.09 41,725 40,402 43,6111965–66........................................................... 6,485 6,279 6,761 5,934 1.09 43,627 42,241 45,4841967–68........................................................... 7,423 7,208 7,692 6,533 1.14 46,854 45,497 48,552
1969–70........................................................... 8,626 8,412 8,891 7,486 1.15 49,018 47,801 50,5231970–71........................................................... 9,268 9,021 9,568 7,998 1.16 50,081 48,746 51,7021971–72........................................................... 9,705 9,424 10,031 8,521 1.14 50,626 49,160 52,3261972–73........................................................... 10,174 9,893 10,507 9,056 1.12 51,017 49,608 52,6871973–74........................................................... 10,770 10,507 11,077 9,667 1.11 49,584 48,373 50,998
1974–75........................................................... 11,641 11,334 12,000 10,411 1.12 48,247 46,975 49,7351975–76........................................................... 12,600 12,280 12,937 11,194 1.13 48,770 47,531 50,0741976–77........................................................... 13,354 12,989 13,776 11,971 1.12 48,840 47,505 50,3841977–78........................................................... 14,198 13,845 14,602 12,811 1.11 48,660 47,450 50,0441978–79........................................................... 15,032 14,681 15,450 13,807 1.09 47,106 46,006 48,416
1979–80........................................................... 15,970 15,569 16,459 15,050 1.06 44,157 43,049 45,5091980–81........................................................... 17,644 17,230 18,142 16,461 1.07 43,722 42,696 44,9561981–82........................................................... 19,274 18,853 19,805 17,795 1.08 43,963 43,003 45,1751982–83........................................................... 20,695 20,227 21,291 18,873 1.10 45,261 44,237 46,5641983–84........................................................... 21,935 21,487 22,554 19,781 1.11 46,260 45,316 47,566
1984–85........................................................... 23,600 23,200 24,187 20,694 1.14 47,897 47,085 49,0881985–86........................................................... 25,199 24,718 25,846 21,685 1.16 49,709 48,760 50,9851986–87........................................................... 26,569 26,057 27,244 22,700 1.17 51,273 50,285 52,5761987–88........................................................... 28,034 27,519 28,798 23,777 1.18 51,948 50,993 53,3631988–89........................................................... 29,564 29,022 30,218 24,752 1.19 52,364 51,404 53,523
1989–90........................................................... 31,367 30,832 32,049 25,762 1.22 53,028 52,123 54,1801990–91........................................................... 33,084 32,490 33,896 26,935 1.23 53,031 52,079 54,3321991–92........................................................... 34,063 33,479 34,827 28,169 1.21 52,905 51,998 54,0921992–93........................................................... 35,029 34,350 35,880 29,245 1.20 52,757 51,735 54,0391993–94........................................................... 35,737 35,233 36,566 30,030 1.19 52,465 51,725 53,682
1994–95........................................................... 36,675 36,088 37,523 30,857 1.19 52,341 51,504 53,5521995–96........................................................... 37,642 37,138 38,397 31,822 1.18 52,299 51,598 53,3481996–97........................................................... 38,443 38,039 39,184 33,058 1.16 51,930 51,384 52,9311997–98........................................................... 39,350 39,002 39,944 34,635 1.14 52,224 51,762 53,0121998–99........................................................... 40,544 40,165 41,203 36,306 1.12 52,893 52,398 53,752
1999–2000....................................................... 41,807 41,306 42,546 38,176 1.10 53,010 52,375 53,9472000–01........................................................... 43,378 42,910 44,053 39,722 1.09 53,180 52,606 54,0082001–02........................................................... 44,655 44,177 45,310 40,579 1.10 53,793 53,218 54,5822002–03........................................................... 45,686 45,408 46,106 41,704 1.10 53,852 53,524 54,3472003–04........................................................... 46,542 46,187 46,976 43,301 1.07 53,686 53,277 54,187
2004–05........................................................... 47,516 47,122 47,688 44,941 1.06 53,209 52,767 53,4012005–06........................................................... 49,086 48,573 49,496 46,755 1.05 52,950 52,397 53,3932006–07........................................................... 51,052 50,740 51,529 48,867 1.04 53,683 53,355 54,1842007–08........................................................... 52,800 52,385 53,262 50,627 1.04 53,537 53,116 54,0062008–09........................................................... 54,319 53,998 54,552 51,595 1.05 54,319 53,998 54,5522009–10........................................................... 55,350 55,311 55,032 — — 54,819 54,781 54,505
DIGEST OF EDUCATION STATISTICS 2010
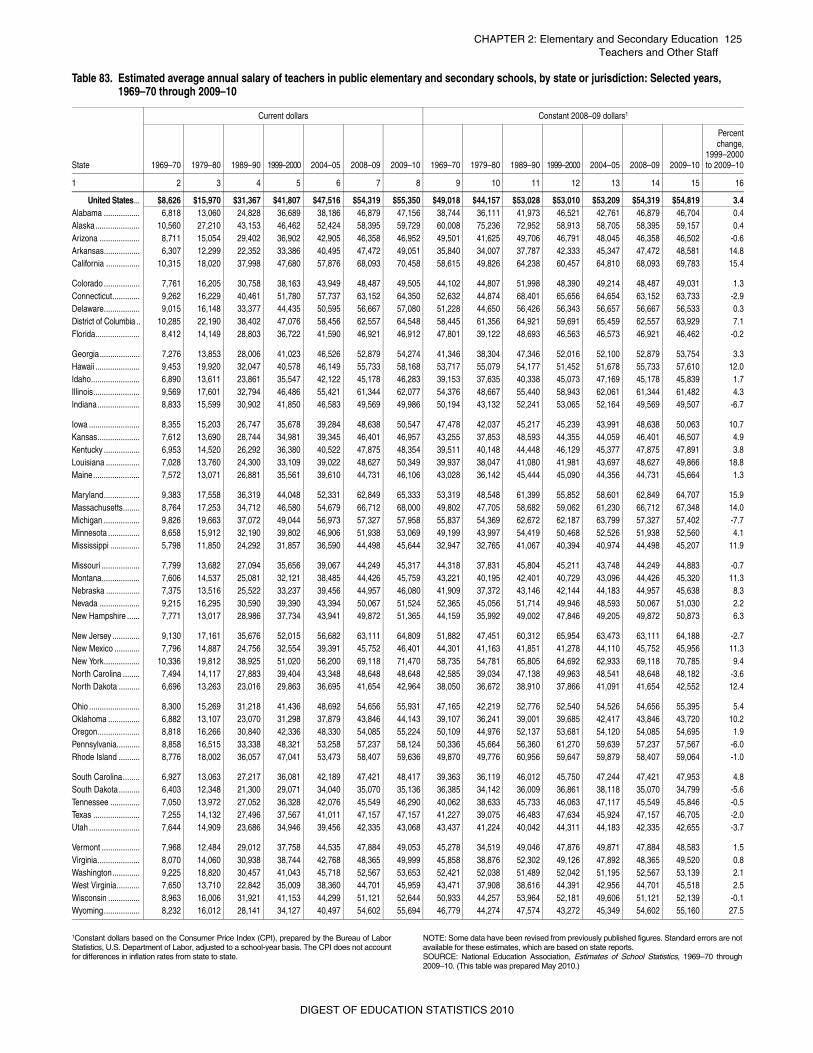
CHAPTER 2: Elementary and Secondary Education 125Teachers and Other Staff
1Constant dollars based on the Consumer Price Index (CPI), prepared by the Bureau of LaborStatistics, U.S. Department of Labor, adjusted to a school-year basis. The CPI does not accountfor differences in inflation rates from state to state.
NOTE: Some data have been revised from previously published figures. Standard errors are notavailable for these estimates, which are based on state reports.SOURCE: National Education Association, Estimates of School Statistics, 1969–70 through2009–10. (This table was prepared May 2010.)
Table 83. Estimated average annual salary of teachers in public elementary and secondary schools, by state or jurisdiction: Selected years, 1969–70 through 2009–10
State
Current dollars Constant 2008–09 dollars1
1969–70 1979–80 1989–90 1999–2000 2004–05 2008–09 2009–10 1969–70 1979–80 1989–90 1999–2000 2004–05 2008–09 2009–10
Percentchange,
1999–2000to 2009–10
1 2 3 4 5 6 7 8 9 10 11 12 13 14 15 16
United States... $8,626 $15,970 $31,367 $41,807 $47,516 $54,319 $55,350 $49,018 $44,157 $53,028 $53,010 $53,209 $54,319 $54,819 3.4Alabama ................. 6,818 13,060 24,828 36,689 38,186 46,879 47,156 38,744 36,111 41,973 46,521 42,761 46,879 46,704 0.4Alaska..................... 10,560 27,210 43,153 46,462 52,424 58,395 59,729 60,008 75,236 72,952 58,913 58,705 58,395 59,157 0.4Arizona ................... 8,711 15,054 29,402 36,902 42,905 46,358 46,952 49,501 41,625 49,706 46,791 48,045 46,358 46,502 -0.6Arkansas................. 6,307 12,299 22,352 33,386 40,495 47,472 49,051 35,840 34,007 37,787 42,333 45,347 47,472 48,581 14.8California ................ 10,315 18,020 37,998 47,680 57,876 68,093 70,458 58,615 49,826 64,238 60,457 64,810 68,093 69,783 15.4
Colorado ................. 7,761 16,205 30,758 38,163 43,949 48,487 49,505 44,102 44,807 51,998 48,390 49,214 48,487 49,031 1.3Connecticut............. 9,262 16,229 40,461 51,780 57,737 63,152 64,350 52,632 44,874 68,401 65,656 64,654 63,152 63,733 -2.9Delaware................. 9,015 16,148 33,377 44,435 50,595 56,667 57,080 51,228 44,650 56,426 56,343 56,657 56,667 56,533 0.3District of Columbia .. 10,285 22,190 38,402 47,076 58,456 62,557 64,548 58,445 61,356 64,921 59,691 65,459 62,557 63,929 7.1Florida..................... 8,412 14,149 28,803 36,722 41,590 46,921 46,912 47,801 39,122 48,693 46,563 46,573 46,921 46,462 -0.2
Georgia................... 7,276 13,853 28,006 41,023 46,526 52,879 54,274 41,346 38,304 47,346 52,016 52,100 52,879 53,754 3.3Hawaii ..................... 9,453 19,920 32,047 40,578 46,149 55,733 58,168 53,717 55,079 54,177 51,452 51,678 55,733 57,610 12.0Idaho....................... 6,890 13,611 23,861 35,547 42,122 45,178 46,283 39,153 37,635 40,338 45,073 47,169 45,178 45,839 1.7Illinois...................... 9,569 17,601 32,794 46,486 55,421 61,344 62,077 54,376 48,667 55,440 58,943 62,061 61,344 61,482 4.3Indiana.................... 8,833 15,599 30,902 41,850 46,583 49,569 49,986 50,194 43,132 52,241 53,065 52,164 49,569 49,507 -6.7
Iowa ........................ 8,355 15,203 26,747 35,678 39,284 48,638 50,547 47,478 42,037 45,217 45,239 43,991 48,638 50,063 10.7Kansas.................... 7,612 13,690 28,744 34,981 39,345 46,401 46,957 43,255 37,853 48,593 44,355 44,059 46,401 46,507 4.9Kentucky ................. 6,953 14,520 26,292 36,380 40,522 47,875 48,354 39,511 40,148 44,448 46,129 45,377 47,875 47,891 3.8Louisiana ................ 7,028 13,760 24,300 33,109 39,022 48,627 50,349 39,937 38,047 41,080 41,981 43,697 48,627 49,866 18.8Maine...................... 7,572 13,071 26,881 35,561 39,610 44,731 46,106 43,028 36,142 45,444 45,090 44,356 44,731 45,664 1.3
Maryland................. 9,383 17,558 36,319 44,048 52,331 62,849 65,333 53,319 48,548 61,399 55,852 58,601 62,849 64,707 15.9Massachusetts........ 8,764 17,253 34,712 46,580 54,679 66,712 68,000 49,802 47,705 58,682 59,062 61,230 66,712 67,348 14.0Michigan ................. 9,826 19,663 37,072 49,044 56,973 57,327 57,958 55,837 54,369 62,672 62,187 63,799 57,327 57,402 -7.7Minnesota ............... 8,658 15,912 32,190 39,802 46,906 51,938 53,069 49,199 43,997 54,419 50,468 52,526 51,938 52,560 4.1Mississippi .............. 5,798 11,850 24,292 31,857 36,590 44,498 45,644 32,947 32,765 41,067 40,394 40,974 44,498 45,207 11.9
Missouri .................. 7,799 13,682 27,094 35,656 39,067 44,249 45,317 44,318 37,831 45,804 45,211 43,748 44,249 44,883 -0.7Montana.................. 7,606 14,537 25,081 32,121 38,485 44,426 45,759 43,221 40,195 42,401 40,729 43,096 44,426 45,320 11.3Nebraska ................ 7,375 13,516 25,522 33,237 39,456 44,957 46,080 41,909 37,372 43,146 42,144 44,183 44,957 45,638 8.3Nevada ................... 9,215 16,295 30,590 39,390 43,394 50,067 51,524 52,365 45,056 51,714 49,946 48,593 50,067 51,030 2.2New Hampshire ...... 7,771 13,017 28,986 37,734 43,941 49,872 51,365 44,159 35,992 49,002 47,846 49,205 49,872 50,873 6.3
New Jersey ............. 9,130 17,161 35,676 52,015 56,682 63,111 64,809 51,882 47,451 60,312 65,954 63,473 63,111 64,188 -2.7New Mexico ............ 7,796 14,887 24,756 32,554 39,391 45,752 46,401 44,301 41,163 41,851 41,278 44,110 45,752 45,956 11.3New York................. 10,336 19,812 38,925 51,020 56,200 69,118 71,470 58,735 54,781 65,805 64,692 62,933 69,118 70,785 9.4North Carolina ........ 7,494 14,117 27,883 39,404 43,348 48,648 48,648 42,585 39,034 47,138 49,963 48,541 48,648 48,182 -3.6North Dakota .......... 6,696 13,263 23,016 29,863 36,695 41,654 42,964 38,050 36,672 38,910 37,866 41,091 41,654 42,552 12.4
Ohio ........................ 8,300 15,269 31,218 41,436 48,692 54,656 55,931 47,165 42,219 52,776 52,540 54,526 54,656 55,395 5.4Oklahoma ............... 6,882 13,107 23,070 31,298 37,879 43,846 44,143 39,107 36,241 39,001 39,685 42,417 43,846 43,720 10.2Oregon.................... 8,818 16,266 30,840 42,336 48,330 54,085 55,224 50,109 44,976 52,137 53,681 54,120 54,085 54,695 1.9Pennsylvania........... 8,858 16,515 33,338 48,321 53,258 57,237 58,124 50,336 45,664 56,360 61,270 59,639 57,237 57,567 -6.0Rhode Island .......... 8,776 18,002 36,057 47,041 53,473 58,407 59,636 49,870 49,776 60,956 59,647 59,879 58,407 59,064 -1.0
South Carolina........ 6,927 13,063 27,217 36,081 42,189 47,421 48,417 39,363 36,119 46,012 45,750 47,244 47,421 47,953 4.8South Dakota .......... 6,403 12,348 21,300 29,071 34,040 35,070 35,136 36,385 34,142 36,009 36,861 38,118 35,070 34,799 -5.6Tennessee .............. 7,050 13,972 27,052 36,328 42,076 45,549 46,290 40,062 38,633 45,733 46,063 47,117 45,549 45,846 -0.5Texas ...................... 7,255 14,132 27,496 37,567 41,011 47,157 47,157 41,227 39,075 46,483 47,634 45,924 47,157 46,705 -2.0Utah ........................ 7,644 14,909 23,686 34,946 39,456 42,335 43,068 43,437 41,224 40,042 44,311 44,183 42,335 42,655 -3.7
Vermont .................. 7,968 12,484 29,012 37,758 44,535 47,884 49,053 45,278 34,519 49,046 47,876 49,871 47,884 48,583 1.5Virginia.................... 8,070 14,060 30,938 38,744 42,768 48,365 49,999 45,858 38,876 52,302 49,126 47,892 48,365 49,520 0.8Washington............. 9,225 18,820 30,457 41,043 45,718 52,567 53,653 52,421 52,038 51,489 52,042 51,195 52,567 53,139 2.1West Virginia........... 7,650 13,710 22,842 35,009 38,360 44,701 45,959 43,471 37,908 38,616 44,391 42,956 44,701 45,518 2.5Wisconsin ............... 8,963 16,006 31,921 41,153 44,299 51,121 52,644 50,933 44,257 53,964 52,181 49,606 51,121 52,139 -0.1Wyoming................. 8,232 16,012 28,141 34,127 40,497 54,602 55,694 46,779 44,274 47,574 43,272 45,349 54,602 55,160 27.5
DIGEST OF EDUCATION STATISTICS 2010
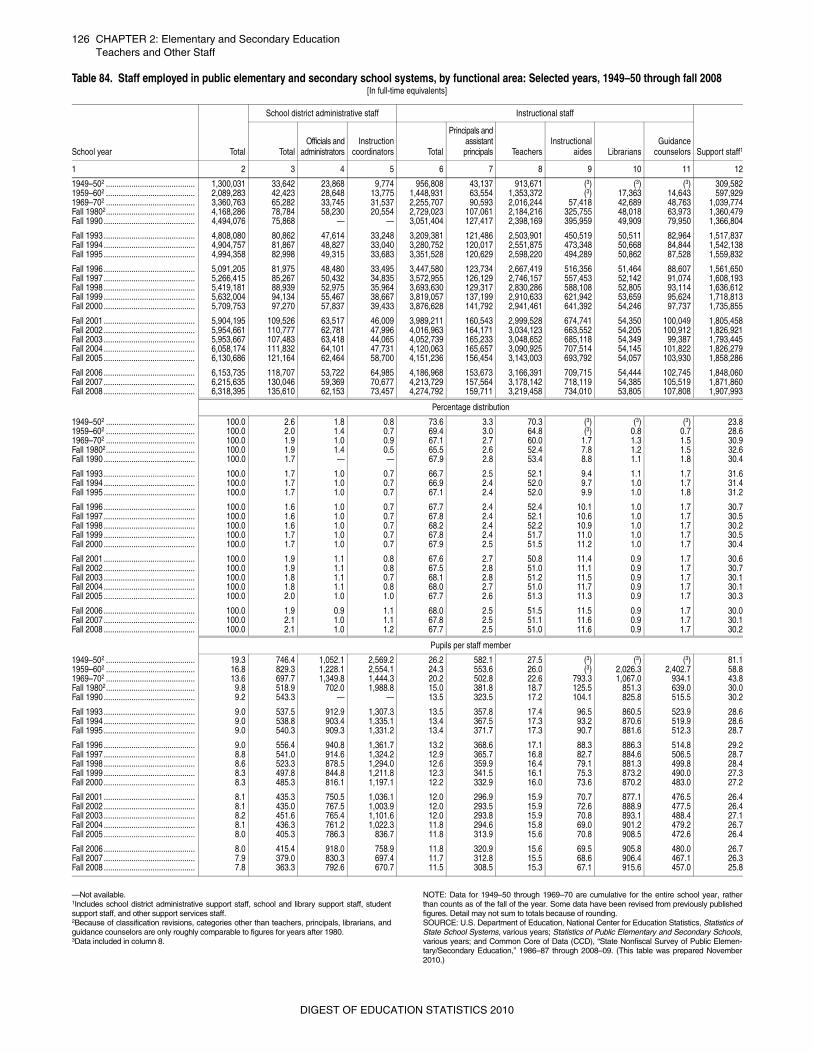
126 CHAPTER 2: Elementary and Secondary EducationTeachers and Other Staff
—Not available. 1Includes school district administrative support staff, school and library support staff, studentsupport staff, and other support services staff.2Because of classification revisions, categories other than teachers, principals, librarians, andguidance counselors are only roughly comparable to figures for years after 1980.3Data included in column 8.
NOTE: Data for 1949–50 through 1969–70 are cumulative for the entire school year, ratherthan counts as of the fall of the year. Some data have been revised from previously publishedfigures. Detail may not sum to totals because of rounding. SOURCE: U.S. Department of Education, National Center for Education Statistics, Statistics ofState School Systems, various years; Statistics of Public Elementary and Secondary Schools,various years; and Common Core of Data (CCD), “State Nonfiscal Survey of Public Elemen-tary/Secondary Education,” 1986–87 through 2008–09. (This table was prepared November2010.)
Table 84. Staff employed in public elementary and secondary school systems, by functional area: Selected years, 1949–50 through fall 2008[In full-time equivalents]
School year Total
School district administrative staff Instructional staff
Support staff1TotalOfficials and
administratorsInstruction
coordinators Total
Principals andassistantprincipals Teachers
Instructionalaides Librarians
Guidancecounselors
1 2 3 4 5 6 7 8 9 10 11 12
1949–502 .......................................... 1,300,031 33,642 23,868 9,774 956,808 43,137 913,671 (3) (3) (3) 309,5821959–602 .......................................... 2,089,283 42,423 28,648 13,775 1,448,931 63,554 1,353,372 (3) 17,363 14,643 597,9291969–702 .......................................... 3,360,763 65,282 33,745 31,537 2,255,707 90,593 2,016,244 57,418 42,689 48,763 1,039,774Fall 19802.......................................... 4,168,286 78,784 58,230 20,554 2,729,023 107,061 2,184,216 325,755 48,018 63,973 1,360,479Fall 1990 ........................................... 4,494,076 75,868 — — 3,051,404 127,417 2,398,169 395,959 49,909 79,950 1,366,804
Fall 1993 ........................................... 4,808,080 80,862 47,614 33,248 3,209,381 121,486 2,503,901 450,519 50,511 82,964 1,517,837Fall 1994 ........................................... 4,904,757 81,867 48,827 33,040 3,280,752 120,017 2,551,875 473,348 50,668 84,844 1,542,138Fall 1995 ........................................... 4,994,358 82,998 49,315 33,683 3,351,528 120,629 2,598,220 494,289 50,862 87,528 1,559,832
Fall 1996 ........................................... 5,091,205 81,975 48,480 33,495 3,447,580 123,734 2,667,419 516,356 51,464 88,607 1,561,650Fall 1997 ........................................... 5,266,415 85,267 50,432 34,835 3,572,955 126,129 2,746,157 557,453 52,142 91,074 1,608,193Fall 1998 ........................................... 5,419,181 88,939 52,975 35,964 3,693,630 129,317 2,830,286 588,108 52,805 93,114 1,636,612Fall 1999 ........................................... 5,632,004 94,134 55,467 38,667 3,819,057 137,199 2,910,633 621,942 53,659 95,624 1,718,813Fall 2000 ........................................... 5,709,753 97,270 57,837 39,433 3,876,628 141,792 2,941,461 641,392 54,246 97,737 1,735,855
Fall 2001 ........................................... 5,904,195 109,526 63,517 46,009 3,989,211 160,543 2,999,528 674,741 54,350 100,049 1,805,458Fall 2002 ........................................... 5,954,661 110,777 62,781 47,996 4,016,963 164,171 3,034,123 663,552 54,205 100,912 1,826,921Fall 2003 ........................................... 5,953,667 107,483 63,418 44,065 4,052,739 165,233 3,048,652 685,118 54,349 99,387 1,793,445Fall 2004 ........................................... 6,058,174 111,832 64,101 47,731 4,120,063 165,657 3,090,925 707,514 54,145 101,822 1,826,279Fall 2005 ........................................... 6,130,686 121,164 62,464 58,700 4,151,236 156,454 3,143,003 693,792 54,057 103,930 1,858,286
Fall 2006 ........................................... 6,153,735 118,707 53,722 64,985 4,186,968 153,673 3,166,391 709,715 54,444 102,745 1,848,060Fall 2007 ........................................... 6,215,635 130,046 59,369 70,677 4,213,729 157,564 3,178,142 718,119 54,385 105,519 1,871,860Fall 2008 ........................................... 6,318,395 135,610 62,153 73,457 4,274,792 159,711 3,219,458 734,010 53,805 107,808 1,907,993
Percentage distribution
1949–502 .......................................... 100.0 2.6 1.8 0.8 73.6 3.3 70.3 (3) (3) (3) 23.81959–602 .......................................... 100.0 2.0 1.4 0.7 69.4 3.0 64.8 (3) 0.8 0.7 28.61969–702 .......................................... 100.0 1.9 1.0 0.9 67.1 2.7 60.0 1.7 1.3 1.5 30.9Fall 19802.......................................... 100.0 1.9 1.4 0.5 65.5 2.6 52.4 7.8 1.2 1.5 32.6Fall 1990 ........................................... 100.0 1.7 — — 67.9 2.8 53.4 8.8 1.1 1.8 30.4
Fall 1993 ........................................... 100.0 1.7 1.0 0.7 66.7 2.5 52.1 9.4 1.1 1.7 31.6Fall 1994 ........................................... 100.0 1.7 1.0 0.7 66.9 2.4 52.0 9.7 1.0 1.7 31.4Fall 1995 ........................................... 100.0 1.7 1.0 0.7 67.1 2.4 52.0 9.9 1.0 1.8 31.2
Fall 1996 ........................................... 100.0 1.6 1.0 0.7 67.7 2.4 52.4 10.1 1.0 1.7 30.7Fall 1997 ........................................... 100.0 1.6 1.0 0.7 67.8 2.4 52.1 10.6 1.0 1.7 30.5Fall 1998 ........................................... 100.0 1.6 1.0 0.7 68.2 2.4 52.2 10.9 1.0 1.7 30.2Fall 1999 ........................................... 100.0 1.7 1.0 0.7 67.8 2.4 51.7 11.0 1.0 1.7 30.5Fall 2000 ........................................... 100.0 1.7 1.0 0.7 67.9 2.5 51.5 11.2 1.0 1.7 30.4
Fall 2001 ........................................... 100.0 1.9 1.1 0.8 67.6 2.7 50.8 11.4 0.9 1.7 30.6Fall 2002 ........................................... 100.0 1.9 1.1 0.8 67.5 2.8 51.0 11.1 0.9 1.7 30.7Fall 2003 ........................................... 100.0 1.8 1.1 0.7 68.1 2.8 51.2 11.5 0.9 1.7 30.1Fall 2004 ........................................... 100.0 1.8 1.1 0.8 68.0 2.7 51.0 11.7 0.9 1.7 30.1Fall 2005 ........................................... 100.0 2.0 1.0 1.0 67.7 2.6 51.3 11.3 0.9 1.7 30.3
Fall 2006 ........................................... 100.0 1.9 0.9 1.1 68.0 2.5 51.5 11.5 0.9 1.7 30.0Fall 2007 ........................................... 100.0 2.1 1.0 1.1 67.8 2.5 51.1 11.6 0.9 1.7 30.1Fall 2008 ........................................... 100.0 2.1 1.0 1.2 67.7 2.5 51.0 11.6 0.9 1.7 30.2
Pupils per staff member
1949–502 .......................................... 19.3 746.4 1,052.1 2,569.2 26.2 582.1 27.5 (3) (3) (3) 81.11959–602 .......................................... 16.8 829.3 1,228.1 2,554.1 24.3 553.6 26.0 (3) 2,026.3 2,402.7 58.81969–702 .......................................... 13.6 697.7 1,349.8 1,444.3 20.2 502.8 22.6 793.3 1,067.0 934.1 43.8Fall 19802.......................................... 9.8 518.9 702.0 1,988.8 15.0 381.8 18.7 125.5 851.3 639.0 30.0Fall 1990 ........................................... 9.2 543.3 — — 13.5 323.5 17.2 104.1 825.8 515.5 30.2
Fall 1993 ........................................... 9.0 537.5 912.9 1,307.3 13.5 357.8 17.4 96.5 860.5 523.9 28.6Fall 1994 ........................................... 9.0 538.8 903.4 1,335.1 13.4 367.5 17.3 93.2 870.6 519.9 28.6Fall 1995 ........................................... 9.0 540.3 909.3 1,331.2 13.4 371.7 17.3 90.7 881.6 512.3 28.7
Fall 1996 ........................................... 9.0 556.4 940.8 1,361.7 13.2 368.6 17.1 88.3 886.3 514.8 29.2Fall 1997 ........................................... 8.8 541.0 914.6 1,324.2 12.9 365.7 16.8 82.7 884.6 506.5 28.7Fall 1998 ........................................... 8.6 523.3 878.5 1,294.0 12.6 359.9 16.4 79.1 881.3 499.8 28.4Fall 1999 ........................................... 8.3 497.8 844.8 1,211.8 12.3 341.5 16.1 75.3 873.2 490.0 27.3Fall 2000 ........................................... 8.3 485.3 816.1 1,197.1 12.2 332.9 16.0 73.6 870.2 483.0 27.2
Fall 2001 ........................................... 8.1 435.3 750.5 1,036.1 12.0 296.9 15.9 70.7 877.1 476.5 26.4Fall 2002 ........................................... 8.1 435.0 767.5 1,003.9 12.0 293.5 15.9 72.6 888.9 477.5 26.4Fall 2003 ........................................... 8.2 451.6 765.4 1,101.6 12.0 293.8 15.9 70.8 893.1 488.4 27.1Fall 2004 ........................................... 8.1 436.3 761.2 1,022.3 11.8 294.6 15.8 69.0 901.2 479.2 26.7Fall 2005 ........................................... 8.0 405.3 786.3 836.7 11.8 313.9 15.6 70.8 908.5 472.6 26.4
Fall 2006 ........................................... 8.0 415.4 918.0 758.9 11.8 320.9 15.6 69.5 905.8 480.0 26.7Fall 2007 ........................................... 7.9 379.0 830.3 697.4 11.7 312.8 15.5 68.6 906.4 467.1 26.3Fall 2008 ........................................... 7.8 363.3 792.6 670.7 11.5 308.5 15.3 67.1 915.6 457.0 25.8
DIGEST OF EDUCATION STATISTICS 2010
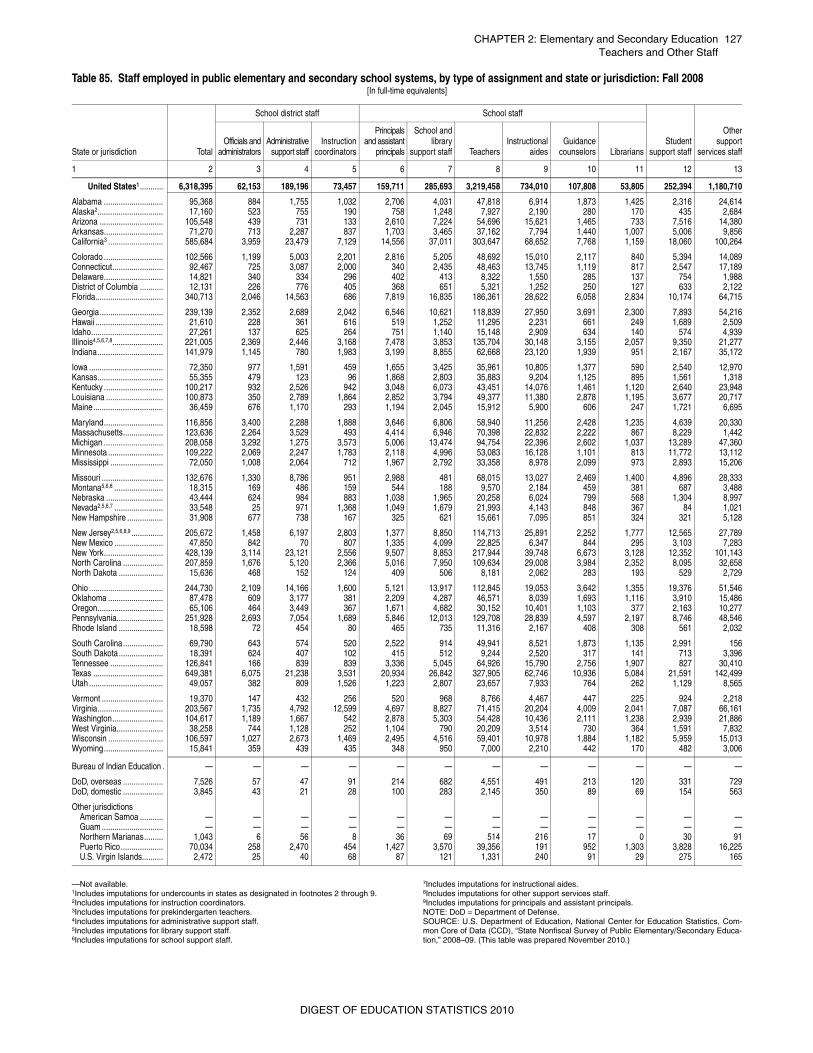
CHAPTER 2: Elementary and Secondary Education 127Teachers and Other Staff
—Not available.1Includes imputations for undercounts in states as designated in footnotes 2 through 9.2Includes imputations for instruction coordinators.3Includes imputations for prekindergarten teachers.4Includes imputations for administrative support staff.5Includes imputations for library support staff.6Includes imputations for school support staff.
7Includes imputations for instructional aides.8Includes imputations for other support services staff.9Includes imputations for principals and assistant principals.NOTE: DoD = Department of Defense. SOURCE: U.S. Department of Education, National Center for Education Statistics, Com-mon Core of Data (CCD), “State Nonfiscal Survey of Public Elementary/Secondary Educa-tion,” 2008–09. (This table was prepared November 2010.)
Table 85. Staff employed in public elementary and secondary school systems, by type of assignment and state or jurisdiction: Fall 2008[In full-time equivalents]
State or jurisdiction Total
School district staff School staff
Studentsupport staff
Othersupport
services staffOfficials and
administratorsAdministrative
support staffInstruction
coordinators
Principalsand assistant
principals
School andlibrary
support staff TeachersInstructional
aidesGuidance
counselors Librarians
1 2 3 4 5 6 7 8 9 10 11 12 13
United States1 ........... 6,318,395 62,153 189,196 73,457 159,711 285,693 3,219,458 734,010 107,808 53,805 252,394 1,180,710
Alabama ............................ 95,368 884 1,755 1,032 2,706 4,031 47,818 6,914 1,873 1,425 2,316 24,614Alaska2............................... 17,160 523 755 190 758 1,248 7,927 2,190 280 170 435 2,684Arizona .............................. 105,548 439 731 133 2,610 7,224 54,696 15,621 1,465 733 7,516 14,380Arkansas............................ 71,270 713 2,287 837 1,703 3,465 37,162 7,794 1,440 1,007 5,006 9,856California3 .......................... 585,684 3,959 23,479 7,129 14,556 37,011 303,647 68,652 7,768 1,159 18,060 100,264
Colorado ............................ 102,566 1,199 5,003 2,201 2,816 5,205 48,692 15,010 2,117 840 5,394 14,089Connecticut........................ 92,467 725 3,087 2,000 340 2,435 48,463 13,745 1,119 817 2,547 17,189Delaware............................ 14,821 340 334 296 402 413 8,322 1,550 285 137 754 1,988District of Columbia ........... 12,131 226 776 405 368 651 5,321 1,252 250 127 633 2,122Florida................................ 340,713 2,046 14,563 686 7,819 16,835 186,361 28,622 6,058 2,834 10,174 64,715
Georgia.............................. 239,139 2,352 2,689 2,042 6,546 10,621 118,839 27,950 3,691 2,300 7,893 54,216Hawaii ................................ 21,610 228 361 616 519 1,252 11,295 2,231 661 249 1,689 2,509Idaho.................................. 27,261 137 625 264 751 1,140 15,148 2,909 634 140 574 4,939Illinois4,5,6,7,8........................ 221,005 2,369 2,446 3,168 7,478 3,853 135,704 30,148 3,155 2,057 9,350 21,277Indiana............................... 141,979 1,145 780 1,983 3,199 8,855 62,668 23,120 1,939 951 2,167 35,172
Iowa ................................... 72,350 977 1,591 459 1,655 3,425 35,961 10,805 1,377 590 2,540 12,970Kansas............................... 55,355 479 123 96 1,868 2,803 35,883 9,204 1,125 895 1,561 1,318Kentucky ............................ 100,217 932 2,526 942 3,048 6,073 43,451 14,076 1,461 1,120 2,640 23,948Louisiana ........................... 100,873 350 2,789 1,864 2,852 3,794 49,377 11,380 2,878 1,195 3,677 20,717Maine................................. 36,459 676 1,170 293 1,194 2,045 15,912 5,900 606 247 1,721 6,695
Maryland............................ 116,856 3,400 2,288 1,888 3,646 6,806 58,940 11,256 2,428 1,235 4,639 20,330Massachusetts................... 123,636 2,264 3,529 493 4,414 6,946 70,398 22,832 2,222 867 8,229 1,442Michigan ............................ 208,058 3,292 1,275 3,573 5,006 13,474 94,754 22,396 2,602 1,037 13,289 47,360Minnesota .......................... 109,222 2,069 2,247 1,783 2,118 4,996 53,083 16,128 1,101 813 11,772 13,112Mississippi ......................... 72,050 1,008 2,064 712 1,967 2,792 33,358 8,978 2,099 973 2,893 15,206
Missouri ............................. 132,676 1,330 8,786 951 2,988 481 68,015 13,027 2,469 1,400 4,896 28,333Montana5,6,8 ....................... 18,315 169 486 159 544 188 9,570 2,184 459 381 687 3,488Nebraska ........................... 43,444 624 984 883 1,038 1,965 20,258 6,024 799 568 1,304 8,997Nevada2,5,6,7 ....................... 33,548 25 971 1,368 1,049 1,679 21,993 4,143 848 367 84 1,021New Hampshire ................. 31,908 677 738 167 325 621 15,661 7,095 851 324 321 5,128
New Jersey2,5,6,8,9 ............... 205,672 1,458 6,197 2,803 1,377 8,850 114,713 25,891 2,252 1,777 12,565 27,789New Mexico ....................... 47,850 842 70 807 1,335 4,099 22,825 6,347 844 295 3,103 7,283New York............................ 428,139 3,114 23,121 2,556 9,507 8,853 217,944 39,748 6,673 3,128 12,352 101,143North Carolina ................... 207,859 1,676 5,120 2,366 5,016 7,950 109,634 29,008 3,984 2,352 8,095 32,658North Dakota ..................... 15,636 468 152 124 409 506 8,181 2,062 283 193 529 2,729
Ohio ................................... 244,730 2,109 14,166 1,600 5,121 13,917 112,845 19,053 3,642 1,355 19,376 51,546Oklahoma .......................... 87,478 609 3,177 381 2,209 4,287 46,571 8,039 1,693 1,116 3,910 15,486Oregon............................... 65,106 464 3,449 367 1,671 4,682 30,152 10,401 1,103 377 2,163 10,277Pennsylvania...................... 251,928 2,693 7,054 1,689 5,846 12,013 129,708 28,839 4,597 2,197 8,746 48,546Rhode Island ..................... 18,598 72 454 80 465 735 11,316 2,167 408 308 561 2,032
South Carolina................... 69,790 643 574 520 2,522 914 49,941 8,521 1,873 1,135 2,991 156South Dakota ..................... 18,391 624 407 102 415 512 9,244 2,520 317 141 713 3,396Tennessee ......................... 126,841 166 839 839 3,336 5,045 64,926 15,790 2,756 1,907 827 30,410Texas ................................. 649,381 6,075 21,238 3,531 20,934 26,842 327,905 62,746 10,936 5,084 21,591 142,499Utah ................................... 49,057 382 809 1,526 1,223 2,807 23,657 7,933 764 262 1,129 8,565
Vermont ............................. 19,370 147 432 256 520 968 8,766 4,467 447 225 924 2,218Virginia............................... 203,567 1,735 4,792 12,599 4,697 8,827 71,415 20,204 4,009 2,041 7,087 66,161Washington........................ 104,617 1,189 1,667 542 2,878 5,303 54,428 10,436 2,111 1,238 2,939 21,886West Virginia...................... 38,258 744 1,128 252 1,104 790 20,209 3,514 730 364 1,591 7,832Wisconsin .......................... 106,597 1,027 2,673 1,469 2,495 4,516 59,401 10,978 1,884 1,182 5,959 15,013Wyoming............................ 15,841 359 439 435 348 950 7,000 2,210 442 170 482 3,006
Bureau of Indian Education . — — — — — — — — — — — —
DoD, overseas ................... 7,526 57 47 91 214 682 4,551 491 213 120 331 729DoD, domestic ................... 3,845 43 21 28 100 283 2,145 350 89 69 154 563
Other jurisdictionsAmerican Samoa ........... — — — — — — — — — — — —Guam ............................. — — — — — — — — — — — —Northern Marianas......... 1,043 6 56 8 36 69 514 216 17 0 30 91Puerto Rico .................... 70,034 258 2,470 454 1,427 3,570 39,356 191 952 1,303 3,828 16,225U.S. Virgin Islands.......... 2,472 25 40 68 87 121 1,331 240 91 29 275 165
DIGEST OF EDUCATION STATISTICS 2010
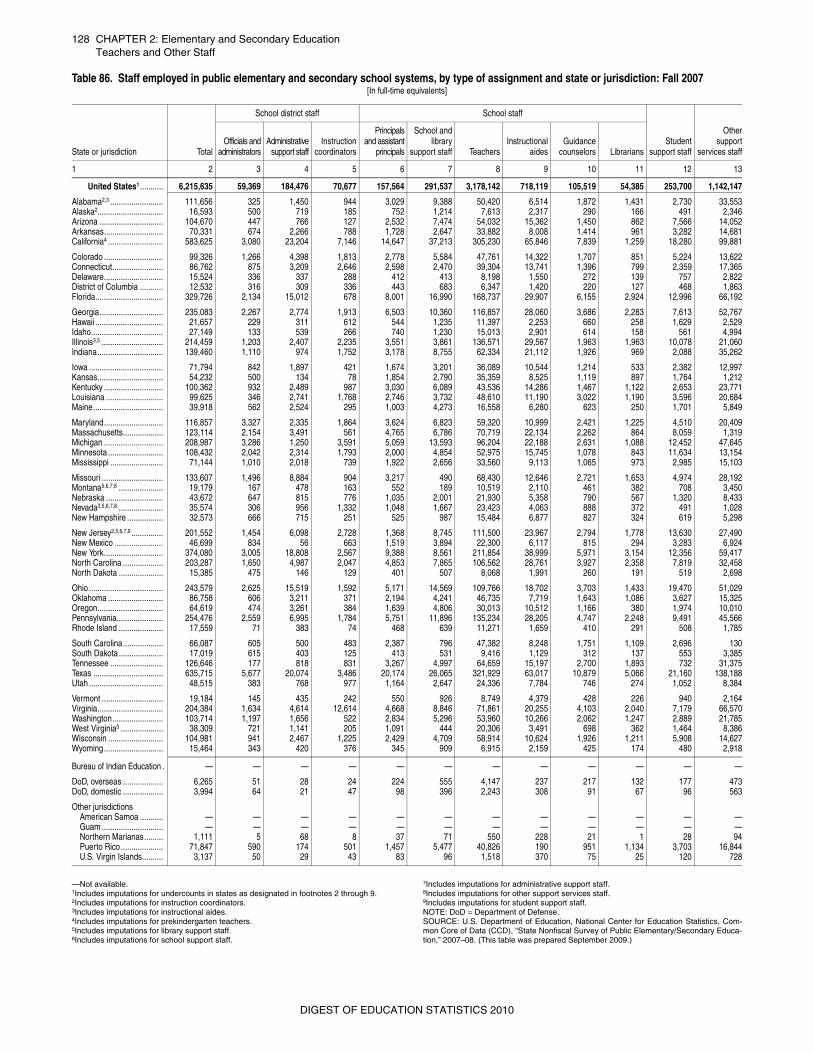
128 CHAPTER 2: Elementary and Secondary EducationTeachers and Other Staff
—Not available.1Includes imputations for undercounts in states as designated in footnotes 2 through 9.2Includes imputations for instruction coordinators.3Includes imputations for instructional aides.4Includes imputations for prekindergarten teachers.5Includes imputations for library support staff.6Includes imputations for school support staff.
7Includes imputations for administrative support staff.8Includes imputations for other support services staff.9Includes imputations for student support staff.NOTE: DoD = Department of Defense. SOURCE: U.S. Department of Education, National Center for Education Statistics, Com-mon Core of Data (CCD), “State Nonfiscal Survey of Public Elementary/Secondary Educa-tion,” 2007–08. (This table was prepared September 2009.)
Table 86. Staff employed in public elementary and secondary school systems, by type of assignment and state or jurisdiction: Fall 2007[In full-time equivalents]
State or jurisdiction Total
School district staff School staff
Studentsupport staff
Othersupport
services staffOfficials and
administratorsAdministrative
support staffInstruction
coordinators
Principalsand assistant
principals
School andlibrary
support staff TeachersInstructional
aidesGuidance
counselors Librarians
1 2 3 4 5 6 7 8 9 10 11 12 13
United States1 ........... 6,215,635 59,369 184,476 70,677 157,564 291,537 3,178,142 718,119 105,519 54,385 253,700 1,142,147
Alabama2,3 ......................... 111,656 325 1,450 944 3,029 9,388 50,420 6,514 1,872 1,431 2,730 33,553Alaska2............................... 16,593 500 719 185 752 1,214 7,613 2,317 290 166 491 2,346Arizona .............................. 104,670 447 766 127 2,532 7,474 54,032 15,362 1,450 862 7,566 14,052Arkansas............................ 70,331 674 2,266 788 1,728 2,647 33,882 8,008 1,414 961 3,282 14,681California4 .......................... 583,625 3,080 23,204 7,146 14,647 37,213 305,230 65,846 7,839 1,259 18,280 99,881
Colorado ............................ 99,326 1,266 4,398 1,813 2,778 5,584 47,761 14,322 1,707 851 5,224 13,622Connecticut........................ 86,762 875 3,209 2,646 2,598 2,470 39,304 13,741 1,396 799 2,359 17,365Delaware............................ 15,524 336 337 288 412 413 8,198 1,550 272 139 757 2,822District of Columbia ........... 12,532 316 309 336 443 683 6,347 1,420 220 127 468 1,863Florida................................ 329,726 2,134 15,012 678 8,001 16,990 168,737 29,907 6,155 2,924 12,996 66,192
Georgia.............................. 235,083 2,267 2,774 1,913 6,503 10,360 116,857 28,060 3,686 2,283 7,613 52,767Hawaii ................................ 21,657 229 311 612 544 1,235 11,397 2,253 660 258 1,629 2,529Idaho.................................. 27,149 133 539 266 740 1,230 15,013 2,901 614 158 561 4,994Illinois3,5 ............................. 214,459 1,203 2,407 2,235 3,551 3,861 136,571 29,567 1,963 1,963 10,078 21,060Indiana............................... 139,460 1,110 974 1,752 3,178 8,755 62,334 21,112 1,926 969 2,088 35,262
Iowa ................................... 71,794 842 1,897 421 1,674 3,201 36,089 10,544 1,214 533 2,382 12,997Kansas............................... 54,232 500 134 78 1,854 2,790 35,359 8,525 1,119 897 1,764 1,212Kentucky ............................ 100,362 932 2,489 987 3,030 6,089 43,536 14,286 1,467 1,122 2,653 23,771Louisiana ........................... 99,625 346 2,741 1,768 2,746 3,732 48,610 11,190 3,022 1,190 3,596 20,684Maine................................. 39,918 562 2,524 295 1,003 4,273 16,558 6,280 623 250 1,701 5,849
Maryland............................ 116,857 3,327 2,335 1,864 3,624 6,823 59,320 10,999 2,421 1,225 4,510 20,409Massachusetts................... 123,114 2,154 3,491 561 4,765 6,786 70,719 22,134 2,262 864 8,059 1,319Michigan ............................ 208,987 3,286 1,250 3,591 5,059 13,593 96,204 22,188 2,631 1,088 12,452 47,645Minnesota .......................... 108,432 2,042 2,314 1,793 2,000 4,854 52,975 15,745 1,078 843 11,634 13,154Mississippi ......................... 71,144 1,010 2,018 739 1,922 2,656 33,560 9,113 1,065 973 2,985 15,103
Missouri ............................. 133,607 1,496 8,884 904 3,217 490 68,430 12,646 2,721 1,653 4,974 28,192Montana5,6,7,8 ..................... 19,179 167 478 163 552 189 10,519 2,110 461 382 708 3,450Nebraska ........................... 43,672 647 815 776 1,035 2,001 21,930 5,358 790 567 1,320 8,433Nevada3,5,6,7,8 ..................... 35,574 306 956 1,332 1,048 1,667 23,423 4,063 888 372 491 1,028New Hampshire ................. 32,573 666 715 251 525 987 15,484 6,877 827 324 619 5,298
New Jersey2,5,6,7,9 ............... 201,552 1,454 6,098 2,728 1,368 8,745 111,500 23,967 2,794 1,778 13,630 27,490New Mexico ....................... 46,699 834 56 663 1,519 3,894 22,300 6,117 815 294 3,283 6,924New York............................ 374,080 3,005 18,808 2,567 9,388 8,561 211,854 38,999 5,971 3,154 12,356 59,417North Carolina ................... 203,287 1,650 4,987 2,047 4,853 7,865 106,562 28,761 3,927 2,358 7,819 32,458North Dakota ..................... 15,385 475 146 129 401 507 8,068 1,991 260 191 519 2,698
Ohio ................................... 243,579 2,625 15,519 1,592 5,171 14,569 109,766 18,702 3,703 1,433 19,470 51,029Oklahoma .......................... 86,758 606 3,211 371 2,194 4,241 46,735 7,719 1,643 1,086 3,627 15,325Oregon............................... 64,619 474 3,261 384 1,639 4,806 30,013 10,512 1,166 380 1,974 10,010Pennsylvania...................... 254,476 2,559 6,995 1,784 5,751 11,896 135,234 28,205 4,747 2,248 9,491 45,566Rhode Island ..................... 17,559 71 383 74 468 639 11,271 1,659 410 291 508 1,785
South Carolina................... 66,087 605 500 483 2,387 796 47,382 8,248 1,751 1,109 2,696 130South Dakota ..................... 17,019 615 403 125 413 531 9,416 1,129 312 137 553 3,385Tennessee ......................... 126,646 177 818 831 3,267 4,997 64,659 15,197 2,700 1,893 732 31,375Texas ................................. 635,715 5,677 20,074 3,486 20,174 26,065 321,929 63,017 10,879 5,066 21,160 138,188Utah ................................... 48,515 383 768 977 1,164 2,647 24,336 7,784 746 274 1,052 8,384
Vermont ............................. 19,184 145 435 242 550 926 8,749 4,379 428 226 940 2,164Virginia............................... 204,384 1,634 4,614 12,614 4,668 8,846 71,861 20,255 4,103 2,040 7,179 66,570Washington........................ 103,714 1,197 1,656 522 2,834 5,296 53,960 10,266 2,062 1,247 2,889 21,785West Virginia5 .................... 38,309 721 1,141 205 1,091 444 20,306 3,491 698 362 1,464 8,386Wisconsin .......................... 104,981 941 2,467 1,225 2,429 4,709 58,914 10,624 1,926 1,211 5,908 14,627Wyoming............................ 15,464 343 420 376 345 909 6,915 2,159 425 174 480 2,918
Bureau of Indian Education . — — — — — — — — — — — —
DoD, overseas ................... 6,265 51 28 24 224 555 4,147 237 217 132 177 473DoD, domestic ................... 3,994 64 21 47 98 396 2,243 308 91 67 96 563
Other jurisdictionsAmerican Samoa ........... — — — — — — — — — — — —Guam ............................. — — — — — — — — — — — —Northern Marianas......... 1,111 5 68 8 37 71 550 228 21 1 28 94Puerto Rico .................... 71,847 590 174 501 1,457 5,477 40,826 190 951 1,134 3,703 16,844U.S. Virgin Islands.......... 3,137 50 29 43 83 96 1,518 370 75 25 120 728
DIGEST OF EDUCATION STATISTICS 2010
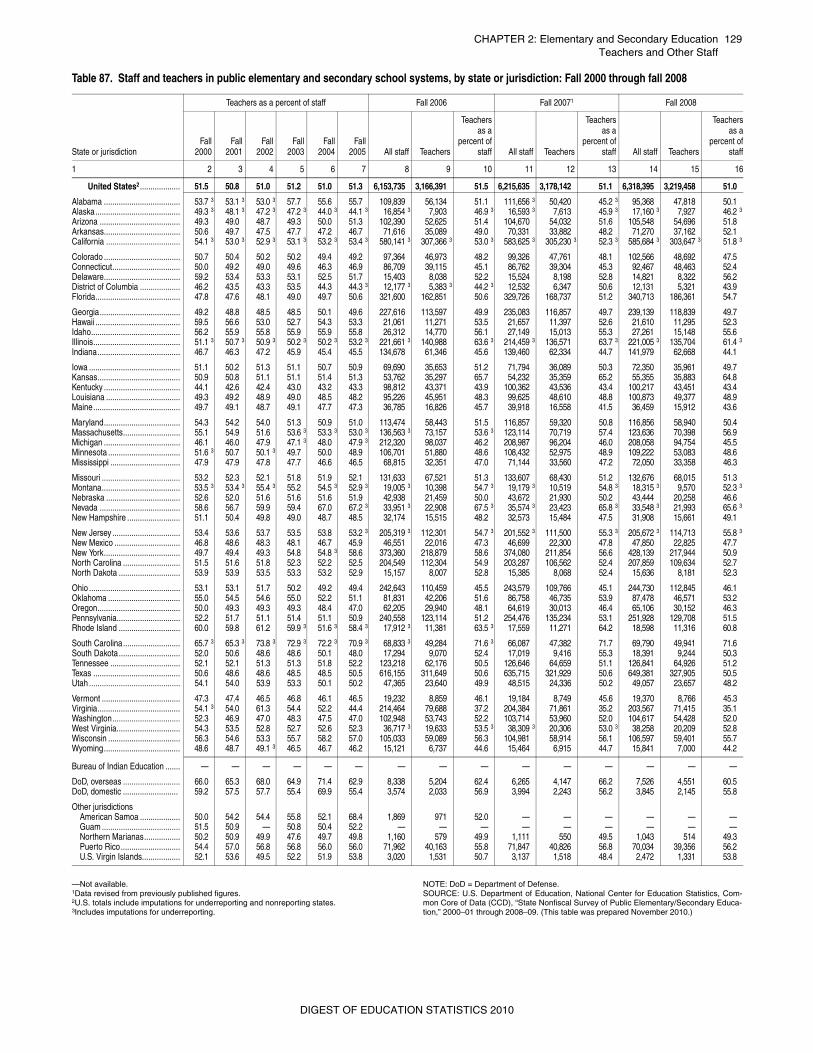
CHAPTER 2: Elementary and Secondary Education 129Teachers and Other Staff
—Not available.1Data revised from previously published figures. 2U.S. totals include imputations for underreporting and nonreporting states. 3Includes imputations for underreporting.
NOTE: DoD = Department of Defense.SOURCE: U.S. Department of Education, National Center for Education Statistics, Com-mon Core of Data (CCD), “State Nonfiscal Survey of Public Elementary/Secondary Educa-tion,” 2000–01 through 2008–09. (This table was prepared November 2010.)
Table 87. Staff and teachers in public elementary and secondary school systems, by state or jurisdiction: Fall 2000 through fall 2008
State or jurisdiction
Teachers as a percent of staff Fall 2006 Fall 20071 Fall 2008
Fall2000
Fall2001
Fall2002
Fall2003
Fall2004
Fall2005 All staff Teachers
Teachersas a
percent ofstaff All staff Teachers
Teachersas a
percent ofstaff All staff Teachers
Teachersas a
percent ofstaff
1 2 3 4 5 6 7 8 9 10 11 12 13 14 15 16
United States2 ................... 51.5 50.8 51.0 51.2 51.0 51.3 6,153,735 3,166,391 51.5 6,215,635 3,178,142 51.1 6,318,395 3,219,458 51.0
Alabama .................................... 53.7 3 53.1 3 53.0 3 57.7 55.6 55.7 109,839 56,134 51.1 111,656 3 50,420 45.2 3 95,368 47,818 50.1Alaska........................................ 49.3 3 48.1 3 47.2 3 47.2 3 44.0 3 44.1 3 16,854 3 7,903 46.9 3 16,593 3 7,613 45.9 3 17,160 3 7,927 46.2 3
Arizona ...................................... 49.3 49.0 48.7 49.3 50.0 51.3 102,390 52,625 51.4 104,670 54,032 51.6 105,548 54,696 51.8
Arkansas.................................... 50.6 49.7 47.5 47.7 47.2 46.7 71,616 35,089 49.0 70,331 33,882 48.2 71,270 37,162 52.1
California ................................... 54.1 3 53.0 3 52.9 3 53.1 3 53.2 3 53.4 3 580,141 3 307,366 3 53.0 3 583,625 3 305,230 3 52.3 3 585,684 3 303,647 3 51.8 3
Colorado .................................... 50.7 50.4 50.2 50.2 49.4 49.2 97,364 46,973 48.2 99,326 47,761 48.1 102,566 48,692 47.5
Connecticut................................ 50.0 49.2 49.0 49.6 46.3 46.9 86,709 39,115 45.1 86,762 39,304 45.3 92,467 48,463 52.4Delaware.................................... 59.2 53.4 53.3 53.1 52.5 51.7 15,403 8,038 52.2 15,524 8,198 52.8 14,821 8,322 56.2District of Columbia ................... 46.2 43.5 43.3 53.5 44.3 44.3 3 12,177 3 5,383 3 44.2 3 12,532 6,347 50.6 12,131 5,321 43.9Florida........................................ 47.8 47.6 48.1 49.0 49.7 50.6 321,600 162,851 50.6 329,726 168,737 51.2 340,713 186,361 54.7
Georgia...................................... 49.2 48.8 48.5 48.5 50.1 49.6 227,616 113,597 49.9 235,083 116,857 49.7 239,139 118,839 49.7
Hawaii ........................................ 59.5 56.6 53.0 52.7 54.3 53.3 21,061 11,271 53.5 21,657 11,397 52.6 21,610 11,295 52.3Idaho.......................................... 56.2 55.9 55.8 55.9 55.9 55.8 26,312 14,770 56.1 27,149 15,013 55.3 27,261 15,148 55.6Illinois......................................... 51.1 3 50.7 3 50.9 3 50.2 3 50.2 3 53.2 3 221,661 3 140,988 63.6 3 214,459 3 136,571 63.7 3 221,005 3 135,704 61.4 3
Indiana....................................... 46.7 46.3 47.2 45.9 45.4 45.5 134,678 61,346 45.6 139,460 62,334 44.7 141,979 62,668 44.1
Iowa ........................................... 51.1 50.2 51.3 51.1 50.7 50.9 69,690 35,653 51.2 71,794 36,089 50.3 72,350 35,961 49.7Kansas....................................... 50.9 50.8 51.1 51.1 51.4 51.3 53,762 35,297 65.7 54,232 35,359 65.2 55,355 35,883 64.8Kentucky .................................... 44.1 42.6 42.4 43.0 43.2 43.3 98,812 43,371 43.9 100,362 43,536 43.4 100,217 43,451 43.4Louisiana ................................... 49.3 49.2 48.9 49.0 48.5 48.2 95,226 45,951 48.3 99,625 48,610 48.8 100,873 49,377 48.9Maine......................................... 49.7 49.1 48.7 49.1 47.7 47.3 36,785 16,826 45.7 39,918 16,558 41.5 36,459 15,912 43.6
Maryland.................................... 54.3 54.2 54.0 51.3 50.9 51.0 113,474 58,443 51.5 116,857 59,320 50.8 116,856 58,940 50.4Massachusetts........................... 55.1 54.9 51.6 53.6 3 53.3 3 53.0 3 136,563 3 73,157 53.6 3 123,114 70,719 57.4 123,636 70,398 56.9Michigan .................................... 46.1 46.0 47.9 47.1 3 48.0 47.9 3 212,320 98,037 46.2 208,987 96,204 46.0 208,058 94,754 45.5Minnesota .................................. 51.6 3 50.7 50.1 3 49.7 50.0 48.9 106,701 51,880 48.6 108,432 52,975 48.9 109,222 53,083 48.6
Mississippi ................................. 47.9 47.9 47.8 47.7 46.6 46.5 68,815 32,351 47.0 71,144 33,560 47.2 72,050 33,358 46.3
Missouri ..................................... 53.2 52.3 52.1 51.8 51.9 52.1 131,633 67,521 51.3 133,607 68,430 51.2 132,676 68,015 51.3Montana..................................... 53.5 3 53.4 3 55.4 3 55.2 54.5 3 52.9 3 19,005 3 10,398 54.7 3 19,179 3 10,519 54.8 3 18,315 3 9,570 52.3 3
Nebraska ................................... 52.6 52.0 51.6 51.6 51.6 51.9 42,938 21,459 50.0 43,672 21,930 50.2 43,444 20,258 46.6Nevada ...................................... 58.6 56.7 59.9 59.4 67.0 67.2 3 33,951 3 22,908 67.5 3 35,574 3 23,423 65.8 3 33,548 3 21,993 65.6 3
New Hampshire ......................... 51.1 50.4 49.8 49.0 48.7 48.5 32,174 15,515 48.2 32,573 15,484 47.5 31,908 15,661 49.1
New Jersey ................................ 53.4 53.6 53.7 53.5 53.8 53.2 3 205,319 3 112,301 54.7 3 201,552 3 111,500 55.3 3 205,672 3 114,713 55.8 3
New Mexico ............................... 46.8 48.6 48.3 48.1 46.7 45.9 46,551 22,016 47.3 46,699 22,300 47.8 47,850 22,825 47.7New York.................................... 49.7 49.4 49.3 54.8 54.8 3 58.6 373,360 218,879 58.6 374,080 211,854 56.6 428,139 217,944 50.9North Carolina ........................... 51.5 51.6 51.8 52.3 52.2 52.5 204,549 112,304 54.9 203,287 106,562 52.4 207,859 109,634 52.7
North Dakota ............................. 53.9 53.9 53.5 53.3 53.2 52.9 15,157 8,007 52.8 15,385 8,068 52.4 15,636 8,181 52.3
Ohio ........................................... 53.1 53.1 51.7 50.2 49.2 49.4 242,643 110,459 45.5 243,579 109,766 45.1 244,730 112,845 46.1Oklahoma .................................. 55.0 54.5 54.6 55.0 52.2 51.1 81,831 42,206 51.6 86,758 46,735 53.9 87,478 46,571 53.2
Oregon....................................... 50.0 49.3 49.3 49.3 48.4 47.0 62,205 29,940 48.1 64,619 30,013 46.4 65,106 30,152 46.3Pennsylvania.............................. 52.2 51.7 51.1 51.4 51.1 50.9 240,558 123,114 51.2 254,476 135,234 53.1 251,928 129,708 51.5Rhode Island ............................. 60.0 59.8 61.2 59.9 3 51.6 3 58.4 3 17,912 3 11,381 63.5 3 17,559 11,271 64.2 18,598 11,316 60.8
South Carolina........................... 65.7 3 65.3 3 73.8 3 72.9 3 72.2 3 70.9 3 68,833 3 49,284 71.6 3 66,087 47,382 71.7 69,790 49,941 71.6South Dakota ............................. 52.0 50.6 48.6 48.6 50.1 48.0 17,294 9,070 52.4 17,019 9,416 55.3 18,391 9,244 50.3Tennessee ................................. 52.1 52.1 51.3 51.3 51.8 52.2 123,218 62,176 50.5 126,646 64,659 51.1 126,841 64,926 51.2Texas ......................................... 50.6 48.6 48.6 48.5 48.5 50.5 616,155 311,649 50.6 635,715 321,929 50.6 649,381 327,905 50.5Utah ........................................... 54.1 54.0 53.9 53.3 50.1 50.2 47,365 23,640 49.9 48,515 24,336 50.2 49,057 23,657 48.2
Vermont ..................................... 47.3 47.4 46.5 46.8 46.1 46.5 19,232 8,859 46.1 19,184 8,749 45.6 19,370 8,766 45.3Virginia....................................... 54.1 3 54.0 61.3 54.4 52.2 44.4 214,464 79,688 37.2 204,384 71,861 35.2 203,567 71,415 35.1
Washington................................ 52.3 46.9 47.0 48.3 47.5 47.0 102,948 53,743 52.2 103,714 53,960 52.0 104,617 54,428 52.0
West Virginia.............................. 54.3 53.5 52.8 52.7 52.6 52.3 36,717 3 19,633 53.5 3 38,309 3 20,306 53.0 3 38,258 20,209 52.8Wisconsin .................................. 56.3 54.6 53.3 55.7 58.2 57.0 105,033 59,089 56.3 104,981 58,914 56.1 106,597 59,401 55.7
Wyoming.................................... 48.6 48.7 49.1 3 46.5 46.7 46.2 15,121 6,737 44.6 15,464 6,915 44.7 15,841 7,000 44.2
Bureau of Indian Education ....... — — — — — — — — — — — — — — —
DoD, overseas ........................... 66.0 65.3 68.0 64.9 71.4 62.9 8,338 5,204 62.4 6,265 4,147 66.2 7,526 4,551 60.5
DoD, domestic .......................... 59.2 57.5 57.7 55.4 69.9 55.4 3,574 2,033 56.9 3,994 2,243 56.2 3,845 2,145 55.8
Other jurisdictionsAmerican Samoa ................... 50.0 54.2 54.4 55.8 52.1 68.4 1,869 971 52.0 — — — — — —Guam ..................................... 51.5 50.9 — 50.8 50.4 52.2 — — — — — — — — —Northern Marianas................. 50.2 50.9 49.9 47.6 49.7 49.8 1,160 579 49.9 1,111 550 49.5 1,043 514 49.3Puerto Rico ............................ 54.4 57.0 56.8 56.8 56.0 56.0 71,962 40,163 55.8 71,847 40,826 56.8 70,034 39,356 56.2U.S. Virgin Islands.................. 52.1 53.6 49.5 52.2 51.9 53.8 3,020 1,531 50.7 3,137 1,518 48.4 2,472 1,331 53.8
DIGEST OF EDUCATION STATISTICS 2010
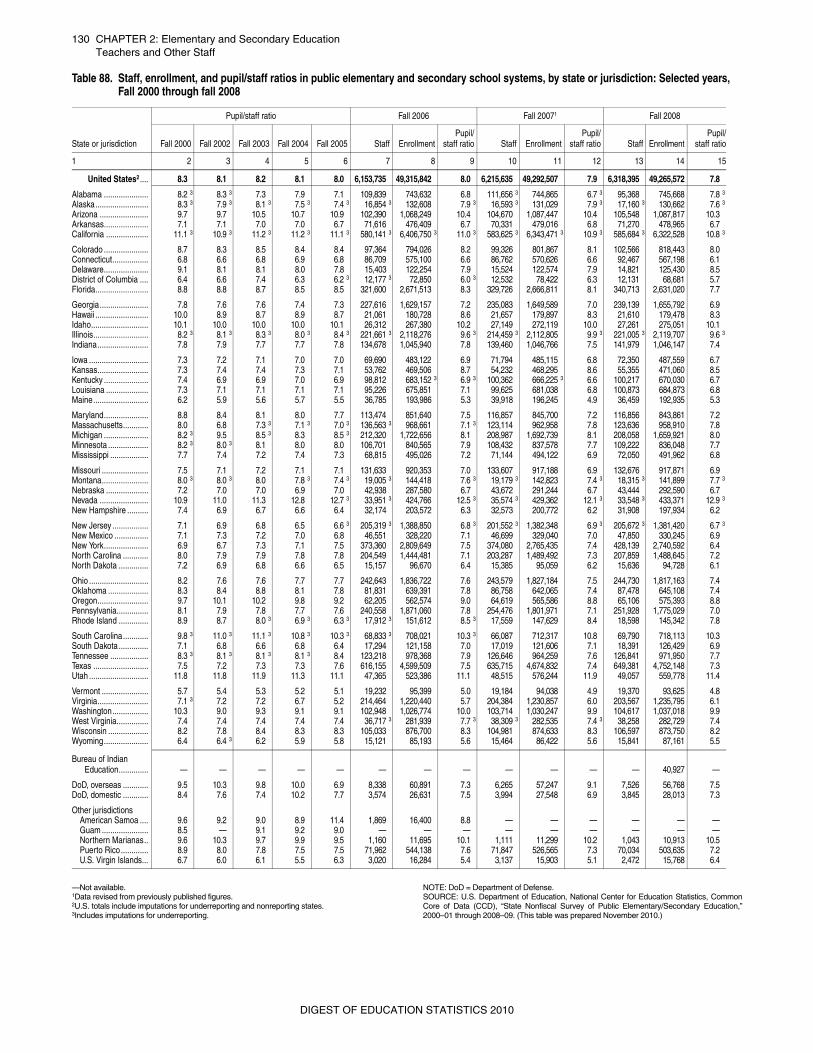
130 CHAPTER 2: Elementary and Secondary EducationTeachers and Other Staff
—Not available. 1Data revised from previously published figures. 2U.S. totals include imputations for underreporting and nonreporting states. 3Includes imputations for underreporting.
NOTE: DoD = Department of Defense. SOURCE: U.S. Department of Education, National Center for Education Statistics, CommonCore of Data (CCD), “State Nonfiscal Survey of Public Elementary/Secondary Education,”2000–01 through 2008–09. (This table was prepared November 2010.)
Table 88. Staff, enrollment, and pupil/staff ratios in public elementary and secondary school systems, by state or jurisdiction: Selected years, Fall 2000 through fall 2008
State or jurisdiction
Pupil/staff ratio Fall 2006 Fall 20071 Fall 2008
Fall 2000 Fall 2002 Fall 2003 Fall 2004 Fall 2005 Staff EnrollmentPupil/
staff ratio Staff EnrollmentPupil/
staff ratio Staff EnrollmentPupil/
staff ratio
1 2 3 4 5 6 7 8 9 10 11 12 13 14 15
United States2 .... 8.3 8.1 8.2 8.1 8.0 6,153,735 49,315,842 8.0 6,215,635 49,292,507 7.9 6,318,395 49,265,572 7.8
Alabama ..................... 8.2 3 8.3 3 7.3 7.9 7.1 109,839 743,632 6.8 111,656 3 744,865 6.7 3 95,368 745,668 7.8 3
Alaska......................... 8.3 3 7.9 3 8.1 3 7.5 3 7.4 3 16,854 3 132,608 7.9 3 16,593 3 131,029 7.9 3 17,160 3 130,662 7.6 3
Arizona ....................... 9.7 9.7 10.5 10.7 10.9 102,390 1,068,249 10.4 104,670 1,087,447 10.4 105,548 1,087,817 10.3
Arkansas..................... 7.1 7.1 7.0 7.0 6.7 71,616 476,409 6.7 70,331 479,016 6.8 71,270 478,965 6.7
California .................... 11.1 3 10.9 3 11.2 3 11.2 3 11.1 3 580,141 3 6,406,750 3 11.0 3 583,625 3 6,343,471 3 10.9 3 585,684 3 6,322,528 10.8 3
Colorado ..................... 8.7 8.3 8.5 8.4 8.4 97,364 794,026 8.2 99,326 801,867 8.1 102,566 818,443 8.0Connecticut................. 6.8 6.6 6.8 6.9 6.8 86,709 575,100 6.6 86,762 570,626 6.6 92,467 567,198 6.1Delaware..................... 9.1 8.1 8.1 8.0 7.8 15,403 122,254 7.9 15,524 122,574 7.9 14,821 125,430 8.5District of Columbia .... 6.4 6.6 7.4 6.3 6.2 3 12,177 3 72,850 6.0 3 12,532 78,422 6.3 12,131 68,681 5.7Florida......................... 8.8 8.8 8.7 8.5 8.5 321,600 2,671,513 8.3 329,726 2,666,811 8.1 340,713 2,631,020 7.7
Georgia....................... 7.8 7.6 7.6 7.4 7.3 227,616 1,629,157 7.2 235,083 1,649,589 7.0 239,139 1,655,792 6.9
Hawaii ......................... 10.0 8.9 8.7 8.9 8.7 21,061 180,728 8.6 21,657 179,897 8.3 21,610 179,478 8.3Idaho........................... 10.1 10.0 10.0 10.0 10.1 26,312 267,380 10.2 27,149 272,119 10.0 27,261 275,051 10.1Illinois.......................... 8.2 3 8.1 3 8.3 3 8.0 3 8.4 3 221,661 3 2,118,276 9.6 3 214,459 3 2,112,805 9.9 3 221,005 3 2,119,707 9.6 3
Indiana........................ 7.8 7.9 7.7 7.7 7.8 134,678 1,045,940 7.8 139,460 1,046,766 7.5 141,979 1,046,147 7.4
Iowa ............................ 7.3 7.2 7.1 7.0 7.0 69,690 483,122 6.9 71,794 485,115 6.8 72,350 487,559 6.7Kansas........................ 7.3 7.4 7.4 7.3 7.1 53,762 469,506 8.7 54,232 468,295 8.6 55,355 471,060 8.5Kentucky ..................... 7.4 6.9 6.9 7.0 6.9 98,812 683,152 3 6.9 3 100,362 666,225 3 6.6 100,217 670,030 6.7Louisiana .................... 7.3 7.1 7.1 7.1 7.1 95,226 675,851 7.1 99,625 681,038 6.8 100,873 684,873 6.8Maine.......................... 6.2 5.9 5.6 5.7 5.5 36,785 193,986 5.3 39,918 196,245 4.9 36,459 192,935 5.3
Maryland..................... 8.8 8.4 8.1 8.0 7.7 113,474 851,640 7.5 116,857 845,700 7.2 116,856 843,861 7.2Massachusetts............ 8.0 6.8 7.3 3 7.1 3 7.0 3 136,563 3 968,661 7.1 3 123,114 962,958 7.8 123,636 958,910 7.8Michigan ..................... 8.2 3 9.5 8.5 3 8.3 8.5 3 212,320 1,722,656 8.1 208,987 1,692,739 8.1 208,058 1,659,921 8.0Minnesota ................... 8.2 3 8.0 3 8.1 8.0 8.0 106,701 840,565 7.9 108,432 837,578 7.7 109,222 836,048 7.7
Mississippi .................. 7.7 7.4 7.2 7.4 7.3 68,815 495,026 7.2 71,144 494,122 6.9 72,050 491,962 6.8
Missouri ...................... 7.5 7.1 7.2 7.1 7.1 131,633 920,353 7.0 133,607 917,188 6.9 132,676 917,871 6.9Montana...................... 8.0 3 8.0 3 8.0 7.8 3 7.4 3 19,005 3 144,418 7.6 3 19,179 3 142,823 7.4 3 18,315 3 141,899 7.7 3
Nebraska .................... 7.2 7.0 7.0 6.9 7.0 42,938 287,580 6.7 43,672 291,244 6.7 43,444 292,590 6.7Nevada ....................... 10.9 11.0 11.3 12.8 12.7 3 33,951 3 424,766 12.5 3 35,574 3 429,362 12.1 3 33,548 3 433,371 12.9 3
New Hampshire .......... 7.4 6.9 6.7 6.6 6.4 32,174 203,572 6.3 32,573 200,772 6.2 31,908 197,934 6.2
New Jersey ................. 7.1 6.9 6.8 6.5 6.6 3 205,319 3 1,388,850 6.8 3 201,552 3 1,382,348 6.9 3 205,672 3 1,381,420 6.7 3
New Mexico ................ 7.1 7.3 7.2 7.0 6.8 46,551 328,220 7.1 46,699 329,040 7.0 47,850 330,245 6.9New York..................... 6.9 6.7 7.3 7.1 7.5 373,360 2,809,649 7.5 374,080 2,765,435 7.4 428,139 2,740,592 6.4North Carolina ............ 8.0 7.9 7.9 7.8 7.8 204,549 1,444,481 7.1 203,287 1,489,492 7.3 207,859 1,488,645 7.2
North Dakota .............. 7.2 6.9 6.8 6.6 6.5 15,157 96,670 6.4 15,385 95,059 6.2 15,636 94,728 6.1
Ohio ............................ 8.2 7.6 7.6 7.7 7.7 242,643 1,836,722 7.6 243,579 1,827,184 7.5 244,730 1,817,163 7.4Oklahoma ................... 8.3 8.4 8.8 8.1 7.8 81,831 639,391 7.8 86,758 642,065 7.4 87,478 645,108 7.4
Oregon........................ 9.7 10.1 10.2 9.8 9.2 62,205 562,574 9.0 64,619 565,586 8.8 65,106 575,393 8.8Pennsylvania............... 8.1 7.9 7.8 7.7 7.6 240,558 1,871,060 7.8 254,476 1,801,971 7.1 251,928 1,775,029 7.0Rhode Island .............. 8.9 8.7 8.0 3 6.9 3 6.3 3 17,912 3 151,612 8.5 3 17,559 147,629 8.4 18,598 145,342 7.8
South Carolina............ 9.8 3 11.0 3 11.1 3 10.8 3 10.3 3 68,833 3 708,021 10.3 3 66,087 712,317 10.8 69,790 718,113 10.3South Dakota .............. 7.1 6.8 6.6 6.8 6.4 17,294 121,158 7.0 17,019 121,606 7.1 18,391 126,429 6.9Tennessee .................. 8.3 3 8.1 3 8.1 3 8.1 3 8.4 123,218 978,368 7.9 126,646 964,259 7.6 126,841 971,950 7.7Texas .......................... 7.5 7.2 7.3 7.3 7.6 616,155 4,599,509 7.5 635,715 4,674,832 7.4 649,381 4,752,148 7.3Utah ............................ 11.8 11.8 11.9 11.3 11.1 47,365 523,386 11.1 48,515 576,244 11.9 49,057 559,778 11.4
Vermont ...................... 5.7 5.4 5.3 5.2 5.1 19,232 95,399 5.0 19,184 94,038 4.9 19,370 93,625 4.8Virginia........................ 7.1 3 7.2 7.2 6.7 5.2 214,464 1,220,440 5.7 204,384 1,230,857 6.0 203,567 1,235,795 6.1
Washington................. 10.3 9.0 9.3 9.1 9.1 102,948 1,026,774 10.0 103,714 1,030,247 9.9 104,617 1,037,018 9.9
West Virginia............... 7.4 7.4 7.4 7.4 7.4 36,717 3 281,939 7.7 3 38,309 3 282,535 7.4 3 38,258 282,729 7.4Wisconsin ................... 8.2 7.8 8.4 8.3 8.3 105,033 876,700 8.3 104,981 874,633 8.3 106,597 873,750 8.2Wyoming..................... 6.4 6.4 3 6.2 5.9 5.8 15,121 85,193 5.6 15,464 86,422 5.6 15,841 87,161 5.5
Bureau of Indian Education.............. — — — — — — — — — — — — 40,927 —
DoD, overseas ............ 9.5 10.3 9.8 10.0 6.9 8,338 60,891 7.3 6,265 57,247 9.1 7,526 56,768 7.5DoD, domestic ............ 8.4 7.6 7.4 10.2 7.7 3,574 26,631 7.5 3,994 27,548 6.9 3,845 28,013 7.3
Other jurisdictionsAmerican Samoa .... 9.6 9.2 9.0 8.9 11.4 1,869 16,400 8.8 — — — — — —Guam ...................... 8.5 — 9.1 9.2 9.0 — — — — — — — — —Northern Marianas.. 9.6 10.3 9.7 9.9 9.5 1,160 11,695 10.1 1,111 11,299 10.2 1,043 10,913 10.5Puerto Rico ............. 8.9 8.0 7.8 7.5 7.5 71,962 544,138 7.6 71,847 526,565 7.3 70,034 503,635 7.2U.S. Virgin Islands... 6.7 6.0 6.1 5.5 6.3 3,020 16,284 5.4 3,137 15,903 5.1 2,472 15,768 6.4
DIGEST OF EDUCATION STATISTICS 2010
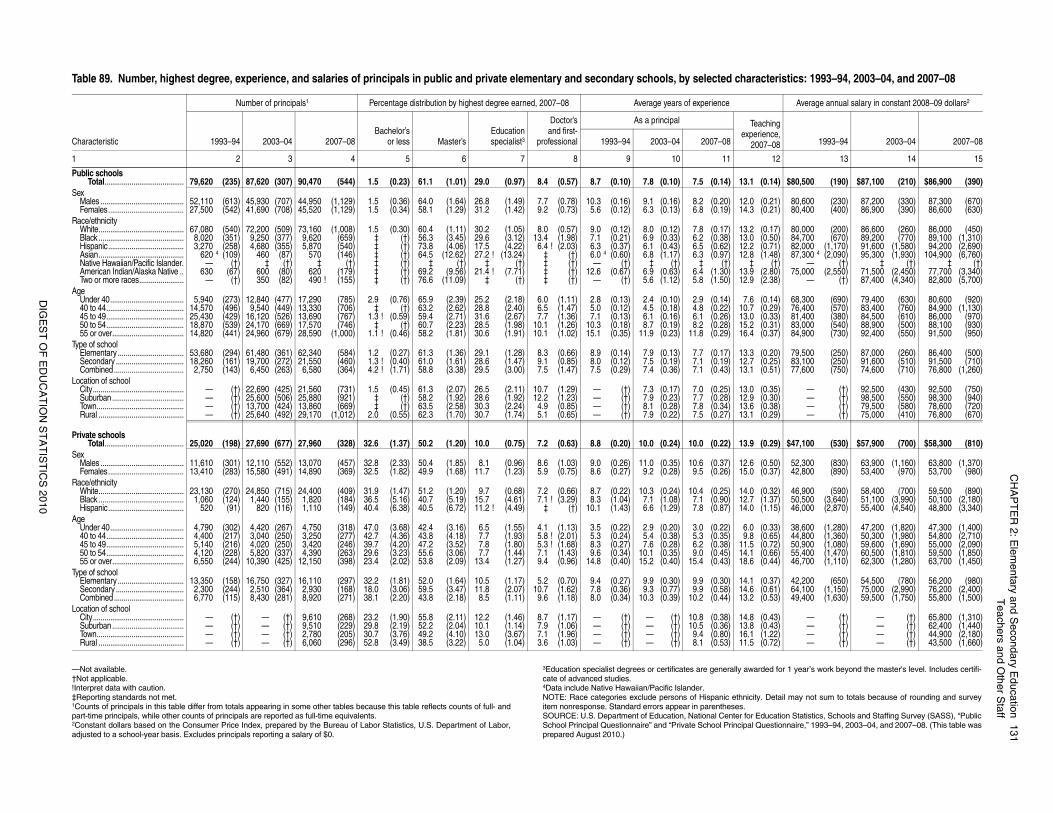
CH
AP
TE
R 2
: Ele
me
nta
ry an
d S
eco
nd
ary E
du
catio
n1
31
Tea
chers a
nd O
the
r Sta
ff
DIG
ES
T O
F E
DU
CA
TIO
N S
TA
TIS
TIC
S 2
01
0
rded for 1 year’s work beyond the master's level. Includes certifi-
ty. Detail may not sum to totals because of rounding and survey
Education Statistics, Schools and Staffing Survey (SASS), “PublicQuestionnaire,” 1993–94, 2003–04, and 2007–08. (This table was
acteristics: 1993–94, 2003–04, and 2007–08
Average annual salary in constant 2008–09 dollars2
achingrience,
007–08 1993–94 2003–04 2007–08
12 13 14 15
(0.14) $80,500 (190) $87,100 (210) $86,900 (390)
(0.21) 80,600 (230) 87,200 (330) 87,300 (670)(0.21) 80,400 (400) 86,900 (390) 86,600 (630)
(0.17) 80,000 (200) 86,600 (260) 86,000 (450)(0.50) 84,700 (670) 89,200 (770) 89,100 (1,310)(0.71) 82,000 (1,170) 91,600 (1,580) 94,200 (2,690)(1.48) 87,300 4 (2,090) 95,300 (1,930) 104,900 (6,760)
(†) — (†) ‡ (†) ‡ (†)(2.80) 75,000 (2,550) 71,500 (2,450) 77,700 (3,340)(2.38) — (†) 87,400 (4,340) 82,800 (5,700)
(0.14) 68,300 (690) 79,400 (630) 80,600 (920)(0.29) 76,400 (570) 83,400 (760) 84,900 (1,130)(0.33) 81,400 (380) 84,500 (610) 86,000 (970)(0.31) 83,000 (540) 88,900 (500) 88,100 (930)(0.37) 84,900 (730) 92,400 (550) 91,500 (950)
(0.20) 79,500 (250) 87,000 (260) 86,400 (500)(0.25) 83,100 (250) 91,600 (510) 91,500 (710)(0.51) 77,600 (750) 74,600 (710) 76,800 (1,260)
(0.35) — (†) 92,500 (430) 92,500 (750)(0.30) — (†) 98,500 (550) 98,300 (940)(0.38) — (†) 79,500 (580) 78,600 (720)(0.29) — (†) 75,000 (410) 76,800 (670)
(0.29) $47,100 (530) $57,900 (700) $58,300 (810)
(0.50) 52,300 (830) 63,900 (1,160) 63,800 (1,370)(0.37) 42,800 (890) 53,400 (970) 53,700 (980)
(0.32) 46,900 (590) 58,400 (700) 59,500 (890)(1.37) 50,500 (3,640) 51,100 (3,990) 50,100 (2,180)(1.15) 46,000 (2,870) 55,400 (4,540) 48,800 (3,340)
(0.33) 38,600 (1,280) 47,200 (1,820) 47,300 (1,400)(0.65) 44,800 (1,360) 50,300 (1,980) 54,800 (2,710)(0.72) 50,900 (1,080) 59,600 (1,690) 55,000 (2,090)(0.66) 55,400 (1,470) 60,500 (1,810) 59,500 (1,850)(0.44) 46,700 (1,110) 62,300 (1,280) 63,700 (1,450)
(0.37) 42,200 (650) 54,500 (780) 56,200 (980)(0.61) 64,100 (1,150) 75,000 (2,990) 76,200 (2,400)(0.53) 49,400 (1,630) 59,500 (1,750) 55,800 (1,500)
(0.43) — (†) — (†) 65,800 (1,310)(0.43) — (†) — (†) 62,400 (1,440)(1.22) — (†) — (†) 44,900 (2,180)(0.72) — (†) — (†) 43,500 (1,660)
—Not available.†Not applicable.!Interpret data with caution.‡Reporting standards not met.1Counts of principals in this table differ from totals appearing in some other tables because this table reflects counts of full- andpart-time principals, while other counts of principals are reported as full-time equivalents. 2Constant dollars based on the Consumer Price Index, prepared by the Bureau of Labor Statistics, U.S. Department of Labor,adjusted to a school-year basis. Excludes principals reporting a salary of $0.
3Education specialist degrees or certificates are generally awacate of advanced studies.4Data include Native Hawaiian/Pacific Islander.NOTE: Race categories exclude persons of Hispanic ethniciitem nonresponse. Standard errors appear in parentheses. SOURCE: U.S. Department of Education, National Center for School Principal Questionnaire” and “Private School Principal prepared August 2010.)
Table 89. Number, highest degree, experience, and salaries of principals in public and private elementary and secondary schools, by selected char
Characteristic
Number of principals1 Percentage distribution by highest degree earned, 2007–08 Average years of experience
1993–94 2003–04 2007–08Bachelor’s
or less Master’sEducationspecialist3
Doctor’sand first-
professional
As a principal Teexpe
21993–94 2003–04 2007–08
1 2 3 4 5 6 7 8 9 10 11
Public schoolsTotal......................................... 79,620 (235) 87,620 (307) 90,470 (544) 1.5 (0.23) 61.1 (1.01) 29.0 (0.97) 8.4 (0.57) 8.7 (0.10) 7.8 (0.10) 7.5 (0.14) 13.1
SexMales ........................................... 52,110 (613) 45,930 (707) 44,950 (1,129) 1.5 (0.36) 64.0 (1.64) 26.8 (1.49) 7.7 (0.78) 10.3 (0.16) 9.1 (0.16) 8.2 (0.20) 12.0Females....................................... 27,500 (542) 41,690 (708) 45,520 (1,129) 1.5 (0.34) 58.1 (1.29) 31.2 (1.42) 9.2 (0.73) 5.6 (0.12) 6.3 (0.13) 6.8 (0.19) 14.3
Race/ethnicityWhite............................................ 67,080 (540) 72,200 (509) 73,160 (1,008) 1.5 (0.30) 60.4 (1.11) 30.2 (1.05) 8.0 (0.57) 9.0 (0.12) 8.0 (0.12) 7.8 (0.17) 13.2Black ............................................ 8,020 (351) 9,250 (377) 9,620 (659) ‡ (†) 56.3 (3.45) 29.6 (3.12) 13.4 (1.98) 7.1 (0.21) 6.9 (0.33) 6.2 (0.38) 13.0Hispanic....................................... 3,270 (258) 4,680 (355) 5,870 (540) ‡ (†) 73.8 (4.06) 17.5 (4.22) 6.4 ! (2.03) 6.3 (0.37) 6.1 (0.43) 6.5 (0.62) 12.2Asian............................................ 620 4 (109) 460 (87) 570 (146) ‡ (†) 64.5 (12.62) 27.2 ! (13.24) ‡ (†) 6.0 4 (0.60) 6.8 (1.17) 6.3 (0.97) 12.8Native Hawaiian/Pacific Islander. — (†) ‡ (†) ‡ (†) ‡ (†) ‡ (†) ‡ (†) ‡ (†) — (†) ‡ (†) ‡ (†) ‡American Indian/Alaska Native .. 630 (67) 600 (80) 620 (179) ‡ (†) 69.2 (9.56) 21.4 ! (7.71) ‡ (†) 12.6 (0.67) 6.9 (0.63) 6.4 (1.30) 13.9Two or more races....................... — (†) 350 (82) 490 ! (155) ‡ (†) 76.6 (11.09) ‡ (†) ‡ (†) — (†) 5.6 (1.12) 5.8 (1.50) 12.9
AgeUnder 40...................................... 5,940 (273) 12,840 (477) 17,290 (785) 2.9 (0.76) 65.9 (2.39) 25.2 (2.18) 6.0 (1.11) 2.8 (0.13) 2.4 (0.10) 2.9 (0.14) 7.640 to 44........................................ 14,570 (496) 9,540 (449) 13,330 (706) ‡ (†) 63.2 (2.62) 28.8 (2.40) 6.5 (1.47) 5.0 (0.12) 4.5 (0.18) 4.8 (0.22) 10.745 to 49........................................ 25,430 (429) 16,120 (526) 13,690 (767) 1.3 ! (0.59) 59.4 (2.71) 31.6 (2.67) 7.7 (1.36) 7.1 (0.13) 6.1 (0.16) 6.1 (0.26) 13.050 to 54........................................ 18,870 (539) 24,170 (669) 17,570 (746) ‡ (†) 60.7 (2.23) 28.5 (1.98) 10.1 (1.26) 10.3 (0.18) 8.7 (0.19) 8.2 (0.28) 15.255 or over..................................... 14,820 (441) 24,960 (679) 28,590 (1,000) 1.1 ! (0.46) 58.2 (1.81) 30.6 (1.91) 10.1 (1.02) 15.1 (0.35) 11.9 (0.23) 11.8 (0.29) 16.4
Type of schoolElementary .................................. 53,680 (294) 61,480 (361) 62,340 (584) 1.2 (0.27) 61.3 (1.36) 29.1 (1.28) 8.3 (0.66) 8.9 (0.14) 7.9 (0.13) 7.7 (0.17) 13.3Secondary ................................... 18,260 (161) 19,700 (272) 21,550 (460) 1.3 ! (0.40) 61.0 (1.61) 28.6 (1.47) 9.1 (0.85) 8.0 (0.12) 7.5 (0.19) 7.1 (0.19) 12.7Combined.................................... 2,750 (143) 6,450 (263) 6,580 (364) 4.2 ! (1.71) 58.8 (3.38) 29.5 (3.00) 7.5 (1.47) 7.5 (0.29) 7.4 (0.36) 7.1 (0.43) 13.1
Location of schoolCity............................................... — (†) 22,690 (425) 21,560 (731) 1.5 (0.45) 61.3 (2.07) 26.5 (2.11) 10.7 (1.29) — (†) 7.3 (0.17) 7.0 (0.25) 13.0Suburban..................................... — (†) 25,600 (506) 25,880 (921) ‡ (†) 58.2 (1.92) 28.6 (1.92) 12.2 (1.23) — (†) 7.9 (0.23) 7.7 (0.28) 12.9Town............................................. — (†) 13,700 (424) 13,860 (669) ‡ (†) 63.5 (2.58) 30.3 (2.24) 4.9 (0.85) — (†) 8.1 (0.28) 7.8 (0.34) 13.6Rural ............................................ — (†) 25,640 (492) 29,170 (1,012) 2.0 (0.55) 62.3 (1.70) 30.7 (1.74) 5.1 (0.65) — (†) 7.9 (0.22) 7.5 (0.27) 13.1
Private schoolsTotal......................................... 25,020 (198) 27,690 (677) 27,960 (328) 32.6 (1.37) 50.2 (1.20) 10.0 (0.75) 7.2 (0.63) 8.8 (0.20) 10.0 (0.24) 10.0 (0.22) 13.9
SexMales ........................................... 11,610 (301) 12,110 (552) 13,070 (457) 32.8 (2.33) 50.4 (1.85) 8.1 (0.96) 8.6 (1.03) 9.0 (0.26) 11.0 (0.35) 10.6 (0.37) 12.6Females....................................... 13,410 (283) 15,580 (491) 14,890 (369) 32.5 (1.82) 49.9 (1.68) 11.7 (1.23) 5.9 (0.75) 8.6 (0.27) 9.2 (0.28) 9.5 (0.26) 15.0
Race/ethnicityWhite............................................ 23,130 (270) 24,850 (715) 24,400 (409) 31.9 (1.47) 51.2 (1.20) 9.7 (0.68) 7.2 (0.66) 8.7 (0.22) 10.3 (0.24) 10.4 (0.25) 14.0Black ............................................ 1,060 (124) 1,440 (155) 1,820 (184) 36.5 (5.16) 40.7 (5.19) 15.7 (4.61) 7.1 ! (3.29) 8.3 (1.04) 7.1 (1.08) 7.1 (0.90) 12.7Hispanic....................................... 520 (91) 820 (116) 1,110 (149) 40.4 (6.38) 40.5 (6.72) 11.2 ! (4.49) ‡ (†) 10.1 (1.43) 6.6 (1.29) 7.8 (0.87) 14.0
AgeUnder 40...................................... 4,790 (302) 4,420 (267) 4,750 (318) 47.0 (3.68) 42.4 (3.16) 6.5 (1.55) 4.1 (1.13) 3.5 (0.22) 2.9 (0.20) 3.0 (0.22) 6.040 to 44........................................ 4,400 (217) 3,040 (250) 3,250 (277) 42.7 (4.36) 43.8 (4.18) 7.7 (1.93) 5.8 ! (2.01) 5.3 (0.24) 5.4 (0.38) 5.3 (0.35) 9.845 to 49........................................ 5,140 (216) 4,020 (250) 3,420 (246) 39.7 (4.20) 47.2 (3.52) 7.8 (1.80) 5.3 ! (1.68) 8.3 (0.27) 7.6 (0.28) 6.2 (0.38) 11.550 to 54........................................ 4,120 (228) 5,820 (337) 4,390 (263) 29.6 (3.23) 55.6 (3.06) 7.7 (1.44) 7.1 (1.43) 9.6 (0.34) 10.1 (0.35) 9.0 (0.45) 14.155 or over..................................... 6,550 (244) 10,390 (425) 12,150 (398) 23.4 (2.02) 53.8 (2.09) 13.4 (1.27) 9.4 (0.96) 14.8 (0.40) 15.2 (0.40) 15.4 (0.43) 18.6
Type of schoolElementary .................................. 13,350 (158) 16,750 (327) 16,110 (297) 32.2 (1.81) 52.0 (1.64) 10.5 (1.17) 5.2 (0.70) 9.4 (0.27) 9.9 (0.30) 9.9 (0.30) 14.1Secondary ................................... 2,300 (244) 2,510 (364) 2,930 (168) 18.0 (3.06) 59.5 (3.47) 11.8 (2.07) 10.7 (1.62) 7.8 (0.36) 9.3 (0.77) 9.9 (0.58) 14.6Combined.................................... 6,770 (115) 8,430 (281) 8,920 (271) 38.1 (2.20) 43.8 (2.18) 8.5 (1.11) 9.6 (1.18) 8.0 (0.34) 10.3 (0.39) 10.2 (0.44) 13.2
Location of schoolCity............................................... — (†) — (†) 9,610 (268) 23.2 (1.90) 55.8 (2.11) 12.2 (1.46) 8.7 (1.17) — (†) — (†) 10.8 (0.38) 14.8Suburban..................................... — (†) — (†) 9,510 (229) 29.8 (2.19) 52.2 (2.04) 10.1 (1.14) 7.9 (1.06) — (†) — (†) 10.5 (0.36) 13.8Town............................................. — (†) — (†) 2,780 (205) 30.7 (3.76) 49.2 (4.10) 13.0 (3.67) 7.1 (1.96) — (†) — (†) 9.4 (0.80) 16.1Rural ............................................ — (†) — (†) 6,060 (296) 52.8 (3.49) 38.5 (3.22) 5.0 (1.04) 3.6 (1.03) — (†) — (†) 8.1 (0.53) 11.5
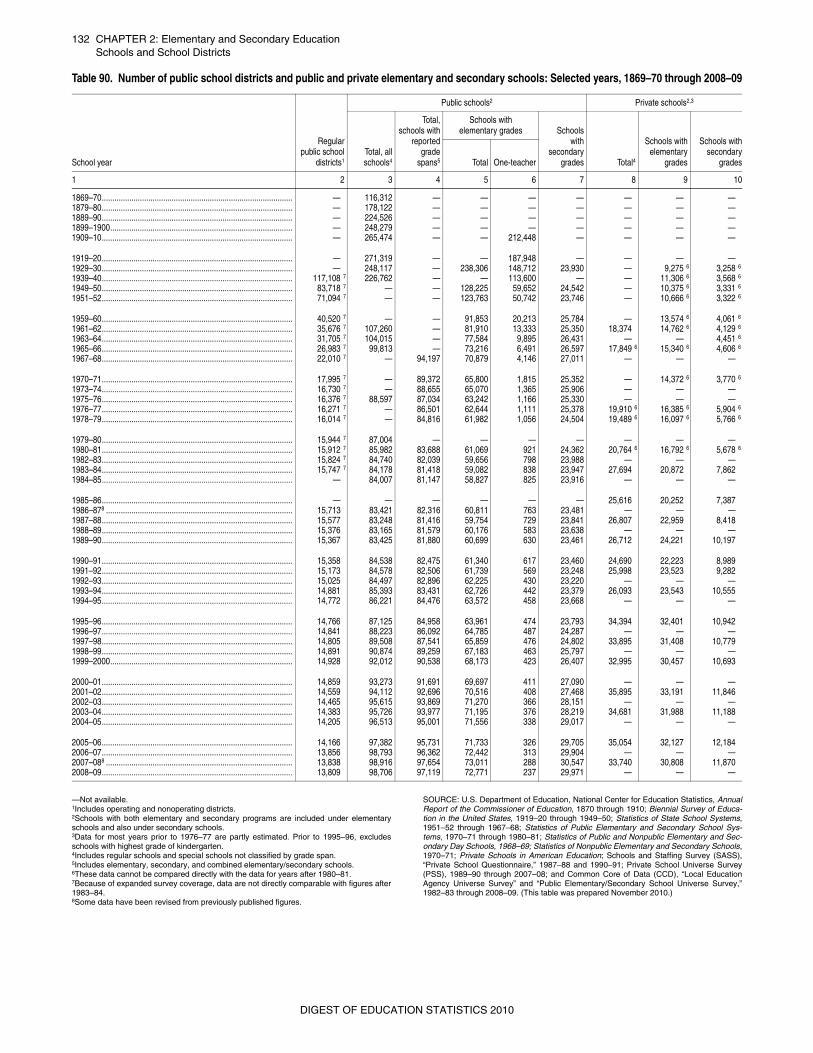
132 CHAPTER 2: Elementary and Secondary EducationSchools and School Districts
and School Districts
Schools—Not available. 1Includes operating and nonoperating districts. 2Schools with both elementary and secondary programs are included under elementaryschools and also under secondary schools.3Data for most years prior to 1976–77 are partly estimated. Prior to 1995–96, excludesschools with highest grade of kindergarten.4Includes regular schools and special schools not classified by grade span. 5Includes elementary, secondary, and combined elementary/secondary schools.6These data cannot be compared directly with the data for years after 1980–81. 7Because of expanded survey coverage, data are not directly comparable with figures after1983–84.8Some data have been revised from previously published figures.
SOURCE: U.S. Department of Education, National Center for Education Statistics, AnnualReport of the Commissioner of Education, 1870 through 1910; Biennial Survey of Educa-tion in the United States, 1919–20 through 1949–50; Statistics of State School Systems,1951–52 through 1967–68; Statistics of Public Elementary and Secondary School Sys-tems, 1970–71 through 1980–81; Statistics of Public and Nonpublic Elementary and Sec-ondary Day Schools, 1968–69; Statistics of Nonpublic Elementary and Secondary Schools,1970–71; Private Schools in American Education; Schools and Staffing Survey (SASS),“Private School Questionnaire,” 1987–88 and 1990–91; Private School Universe Survey(PSS), 1989–90 through 2007–08; and Common Core of Data (CCD), “Local EducationAgency Universe Survey” and “Public Elementary/Secondary School Universe Survey,”1982–83 through 2008–09. (This table was prepared November 2010.)
Table 90. Number of public school districts and public and private elementary and secondary schools: Selected years, 1869–70 through 2008–09
School year
Regularpublic school
districts1
Public schools2 Private schools2,3
Total, allschools4
Total,schools with
reportedgrade
spans5
Schools with elementary grades Schools
withsecondary
grades Total4
Schools withelementary
grades
Schools withsecondary
gradesTotal One-teacher
1 2 3 4 5 6 7 8 9 10
1869–70.......................................................................................... — 116,312 — — — — — — —1879–80.......................................................................................... — 178,122 — — — — — — —1889–90.......................................................................................... — 224,526 — — — — — — —1899–1900...................................................................................... — 248,279 — — — — — — —1909–10.......................................................................................... — 265,474 — — 212,448 — — — —
1919–20.......................................................................................... — 271,319 — — 187,948 — — — —1929–30.......................................................................................... — 248,117 — 238,306 148,712 23,930 — 9,275 6 3,258 6
1939–40.......................................................................................... 117,108 7 226,762 — — 113,600 — — 11,306 6 3,568 6
1949–50.......................................................................................... 83,718 7 — — 128,225 59,652 24,542 — 10,375 6 3,331 6
1951–52.......................................................................................... 71,094 7 — — 123,763 50,742 23,746 — 10,666 6 3,322 6
1959–60.......................................................................................... 40,520 7 — — 91,853 20,213 25,784 — 13,574 6 4,061 6
1961–62.......................................................................................... 35,676 7 107,260 — 81,910 13,333 25,350 18,374 14,762 6 4,129 6
1963–64.......................................................................................... 31,705 7 104,015 — 77,584 9,895 26,431 — — 4,451 6
1965–66.......................................................................................... 26,983 7 99,813 — 73,216 6,491 26,597 17,849 6 15,340 6 4,606 6
1967–68.......................................................................................... 22,010 7 — 94,197 70,879 4,146 27,011 — — —
1970–71.......................................................................................... 17,995 7 — 89,372 65,800 1,815 25,352 — 14,372 6 3,770 6
1973–74.......................................................................................... 16,730 7 — 88,655 65,070 1,365 25,906 — — —1975–76.......................................................................................... 16,376 7 88,597 87,034 63,242 1,166 25,330 — — —1976–77.......................................................................................... 16,271 7 — 86,501 62,644 1,111 25,378 19,910 6 16,385 6 5,904 6
1978–79.......................................................................................... 16,014 7 — 84,816 61,982 1,056 24,504 19,489 6 16,097 6 5,766 6
1979–80.......................................................................................... 15,944 7 87,004 — — — — — — —1980–81.......................................................................................... 15,912 7 85,982 83,688 61,069 921 24,362 20,764 6 16,792 6 5,678 6
1982–83.......................................................................................... 15,824 7 84,740 82,039 59,656 798 23,988 — — —1983–84.......................................................................................... 15,747 7 84,178 81,418 59,082 838 23,947 27,694 20,872 7,8621984–85.......................................................................................... — 84,007 81,147 58,827 825 23,916 — — —
1985–86.......................................................................................... — — — — — — 25,616 20,252 7,3871986–878 ........................................................................................ 15,713 83,421 82,316 60,811 763 23,481 — — —1987–88.......................................................................................... 15,577 83,248 81,416 59,754 729 23,841 26,807 22,959 8,4181988–89.......................................................................................... 15,376 83,165 81,579 60,176 583 23,638 — — —1989–90.......................................................................................... 15,367 83,425 81,880 60,699 630 23,461 26,712 24,221 10,197
1990–91.......................................................................................... 15,358 84,538 82,475 61,340 617 23,460 24,690 22,223 8,9891991–92.......................................................................................... 15,173 84,578 82,506 61,739 569 23,248 25,998 23,523 9,2821992–93.......................................................................................... 15,025 84,497 82,896 62,225 430 23,220 — — —1993–94.......................................................................................... 14,881 85,393 83,431 62,726 442 23,379 26,093 23,543 10,5551994–95.......................................................................................... 14,772 86,221 84,476 63,572 458 23,668 — — —
1995–96.......................................................................................... 14,766 87,125 84,958 63,961 474 23,793 34,394 32,401 10,9421996–97.......................................................................................... 14,841 88,223 86,092 64,785 487 24,287 — — —1997–98.......................................................................................... 14,805 89,508 87,541 65,859 476 24,802 33,895 31,408 10,7791998–99.......................................................................................... 14,891 90,874 89,259 67,183 463 25,797 — — —1999–2000...................................................................................... 14,928 92,012 90,538 68,173 423 26,407 32,995 30,457 10,693
2000–01.......................................................................................... 14,859 93,273 91,691 69,697 411 27,090 — — —2001–02.......................................................................................... 14,559 94,112 92,696 70,516 408 27,468 35,895 33,191 11,8462002–03.......................................................................................... 14,465 95,615 93,869 71,270 366 28,151 — — —2003–04.......................................................................................... 14,383 95,726 93,977 71,195 376 28,219 34,681 31,988 11,1882004–05.......................................................................................... 14,205 96,513 95,001 71,556 338 29,017 — — —
2005–06.......................................................................................... 14,166 97,382 95,731 71,733 326 29,705 35,054 32,127 12,1842006–07.......................................................................................... 13,856 98,793 96,362 72,442 313 29,904 — — —2007–088 ........................................................................................ 13,838 98,916 97,654 73,011 288 30,547 33,740 30,808 11,8702008–09.......................................................................................... 13,809 98,706 97,119 72,771 237 29,971 — — —
DIGEST OF EDUCATION STATISTICS 2010
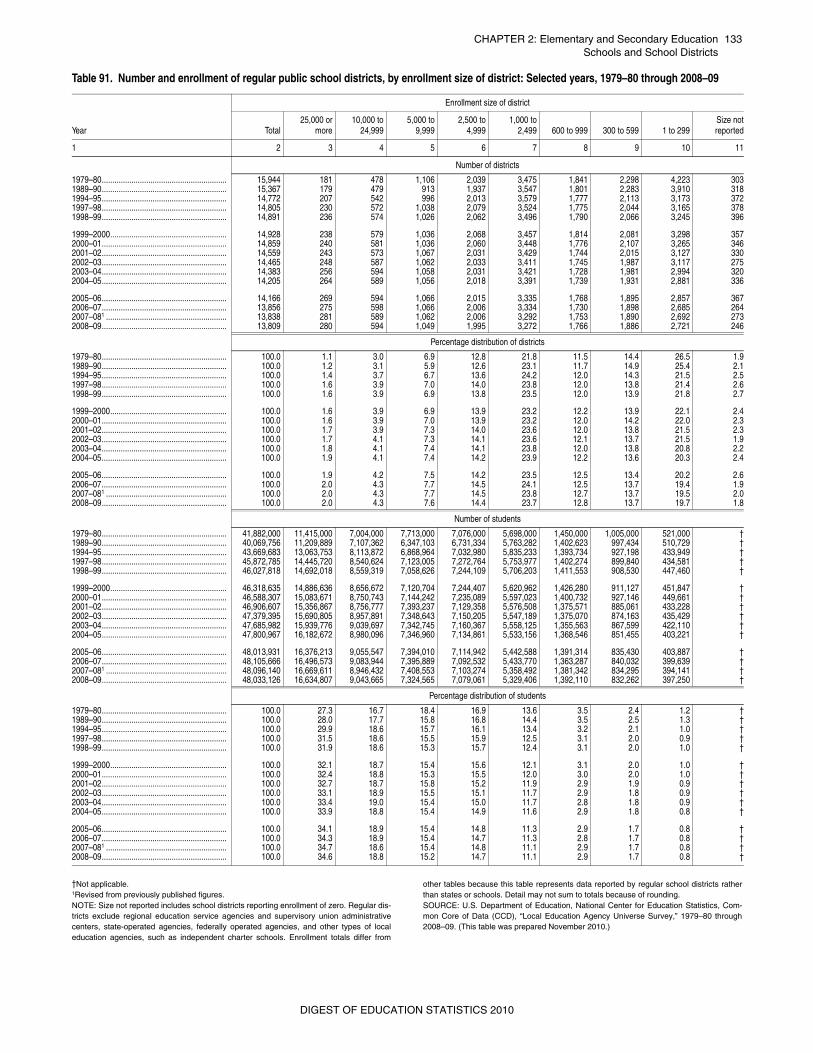
CHAPTER 2: Elementary and Secondary Education 133Schools and School Districts
†Not applicable.1Revised from previously published figures.NOTE: Size not reported includes school districts reporting enrollment of zero. Regular dis-tricts exclude regional education service agencies and supervisory union administrativecenters, state-operated agencies, federally operated agencies, and other types of localeducation agencies, such as independent charter schools. Enrollment totals differ from
other tables because this table represents data reported by regular school districts ratherthan states or schools. Detail may not sum to totals because of rounding.SOURCE: U.S. Department of Education, National Center for Education Statistics, Com-mon Core of Data (CCD), “Local Education Agency Universe Survey,” 1979–80 through2008–09. (This table was prepared November 2010.)
Table 91. Number and enrollment of regular public school districts, by enrollment size of district: Selected years, 1979–80 through 2008–09
Year
Enrollment size of district
Total25,000 or
more10,000 to
24,9995,000 to
9,9992,500 to
4,9991,000 to
2,499 600 to 999 300 to 599 1 to 299Size notreported
1 2 3 4 5 6 7 8 9 10 11
Number of districts
1979–80........................................................... 15,944 181 478 1,106 2,039 3,475 1,841 2,298 4,223 3031989–90........................................................... 15,367 179 479 913 1,937 3,547 1,801 2,283 3,910 3181994–95........................................................... 14,772 207 542 996 2,013 3,579 1,777 2,113 3,173 3721997–98........................................................... 14,805 230 572 1,038 2,079 3,524 1,775 2,044 3,165 3781998–99........................................................... 14,891 236 574 1,026 2,062 3,496 1,790 2,066 3,245 396
1999–2000....................................................... 14,928 238 579 1,036 2,068 3,457 1,814 2,081 3,298 3572000–01........................................................... 14,859 240 581 1,036 2,060 3,448 1,776 2,107 3,265 3462001–02........................................................... 14,559 243 573 1,067 2,031 3,429 1,744 2,015 3,127 3302002–03........................................................... 14,465 248 587 1,062 2,033 3,411 1,745 1,987 3,117 2752003–04........................................................... 14,383 256 594 1,058 2,031 3,421 1,728 1,981 2,994 3202004–05........................................................... 14,205 264 589 1,056 2,018 3,391 1,739 1,931 2,881 336
2005–06........................................................... 14,166 269 594 1,066 2,015 3,335 1,768 1,895 2,857 3672006–07........................................................... 13,856 275 598 1,066 2,006 3,334 1,730 1,898 2,685 2642007–081 ......................................................... 13,838 281 589 1,062 2,006 3,292 1,753 1,890 2,692 2732008–09........................................................... 13,809 280 594 1,049 1,995 3,272 1,766 1,886 2,721 246
Percentage distribution of districts
1979–80........................................................... 100.0 1.1 3.0 6.9 12.8 21.8 11.5 14.4 26.5 1.91989–90........................................................... 100.0 1.2 3.1 5.9 12.6 23.1 11.7 14.9 25.4 2.11994–95........................................................... 100.0 1.4 3.7 6.7 13.6 24.2 12.0 14.3 21.5 2.51997–98........................................................... 100.0 1.6 3.9 7.0 14.0 23.8 12.0 13.8 21.4 2.61998–99........................................................... 100.0 1.6 3.9 6.9 13.8 23.5 12.0 13.9 21.8 2.7
1999–2000....................................................... 100.0 1.6 3.9 6.9 13.9 23.2 12.2 13.9 22.1 2.42000–01........................................................... 100.0 1.6 3.9 7.0 13.9 23.2 12.0 14.2 22.0 2.32001–02........................................................... 100.0 1.7 3.9 7.3 14.0 23.6 12.0 13.8 21.5 2.32002–03........................................................... 100.0 1.7 4.1 7.3 14.1 23.6 12.1 13.7 21.5 1.92003–04........................................................... 100.0 1.8 4.1 7.4 14.1 23.8 12.0 13.8 20.8 2.22004–05........................................................... 100.0 1.9 4.1 7.4 14.2 23.9 12.2 13.6 20.3 2.4
2005–06........................................................... 100.0 1.9 4.2 7.5 14.2 23.5 12.5 13.4 20.2 2.62006–07........................................................... 100.0 2.0 4.3 7.7 14.5 24.1 12.5 13.7 19.4 1.92007–081 ......................................................... 100.0 2.0 4.3 7.7 14.5 23.8 12.7 13.7 19.5 2.02008–09........................................................... 100.0 2.0 4.3 7.6 14.4 23.7 12.8 13.7 19.7 1.8
Number of students
1979–80........................................................... 41,882,000 11,415,000 7,004,000 7,713,000 7,076,000 5,698,000 1,450,000 1,005,000 521,000 †1989–90........................................................... 40,069,756 11,209,889 7,107,362 6,347,103 6,731,334 5,763,282 1,402,623 997,434 510,729 †1994–95........................................................... 43,669,683 13,063,753 8,113,872 6,868,964 7,032,980 5,835,233 1,393,734 927,198 433,949 †1997–98........................................................... 45,872,785 14,445,720 8,540,624 7,123,005 7,272,764 5,753,977 1,402,274 899,840 434,581 †1998–99........................................................... 46,027,818 14,692,018 8,559,319 7,058,626 7,244,109 5,706,203 1,411,553 908,530 447,460 †
1999–2000....................................................... 46,318,635 14,886,636 8,656,672 7,120,704 7,244,407 5,620,962 1,426,280 911,127 451,847 †2000–01........................................................... 46,588,307 15,083,671 8,750,743 7,144,242 7,235,089 5,597,023 1,400,732 927,146 449,661 †2001–02........................................................... 46,906,607 15,356,867 8,756,777 7,393,237 7,129,358 5,576,508 1,375,571 885,061 433,228 †2002–03........................................................... 47,379,395 15,690,805 8,957,891 7,348,643 7,150,205 5,547,189 1,375,070 874,163 435,429 †2003–04........................................................... 47,685,982 15,939,776 9,039,697 7,342,745 7,160,367 5,558,125 1,355,563 867,599 422,110 †2004–05........................................................... 47,800,967 16,182,672 8,980,096 7,346,960 7,134,861 5,533,156 1,368,546 851,455 403,221 †
2005–06........................................................... 48,013,931 16,376,213 9,055,547 7,394,010 7,114,942 5,442,588 1,391,314 835,430 403,887 †2006–07........................................................... 48,105,666 16,496,573 9,083,944 7,395,889 7,092,532 5,433,770 1,363,287 840,032 399,639 †2007–081 ......................................................... 48,096,140 16,669,611 8,946,432 7,408,553 7,103,274 5,358,492 1,381,342 834,295 394,141 †2008–09........................................................... 48,033,126 16,634,807 9,043,665 7,324,565 7,079,061 5,329,406 1,392,110 832,262 397,250 †
Percentage distribution of students
1979–80........................................................... 100.0 27.3 16.7 18.4 16.9 13.6 3.5 2.4 1.2 †1989–90........................................................... 100.0 28.0 17.7 15.8 16.8 14.4 3.5 2.5 1.3 †1994–95........................................................... 100.0 29.9 18.6 15.7 16.1 13.4 3.2 2.1 1.0 †1997–98........................................................... 100.0 31.5 18.6 15.5 15.9 12.5 3.1 2.0 0.9 †1998–99........................................................... 100.0 31.9 18.6 15.3 15.7 12.4 3.1 2.0 1.0 †
1999–2000....................................................... 100.0 32.1 18.7 15.4 15.6 12.1 3.1 2.0 1.0 †2000–01........................................................... 100.0 32.4 18.8 15.3 15.5 12.0 3.0 2.0 1.0 †2001–02........................................................... 100.0 32.7 18.7 15.8 15.2 11.9 2.9 1.9 0.9 †2002–03........................................................... 100.0 33.1 18.9 15.5 15.1 11.7 2.9 1.8 0.9 †2003–04........................................................... 100.0 33.4 19.0 15.4 15.0 11.7 2.8 1.8 0.9 †2004–05........................................................... 100.0 33.9 18.8 15.4 14.9 11.6 2.9 1.8 0.8 †
2005–06........................................................... 100.0 34.1 18.9 15.4 14.8 11.3 2.9 1.7 0.8 †2006–07........................................................... 100.0 34.3 18.9 15.4 14.7 11.3 2.8 1.7 0.8 †2007–081 ......................................................... 100.0 34.7 18.6 15.4 14.8 11.1 2.9 1.7 0.8 †2008–09........................................................... 100.0 34.6 18.8 15.2 14.7 11.1 2.9 1.7 0.8 †
DIGEST OF EDUCATION STATISTICS 2010
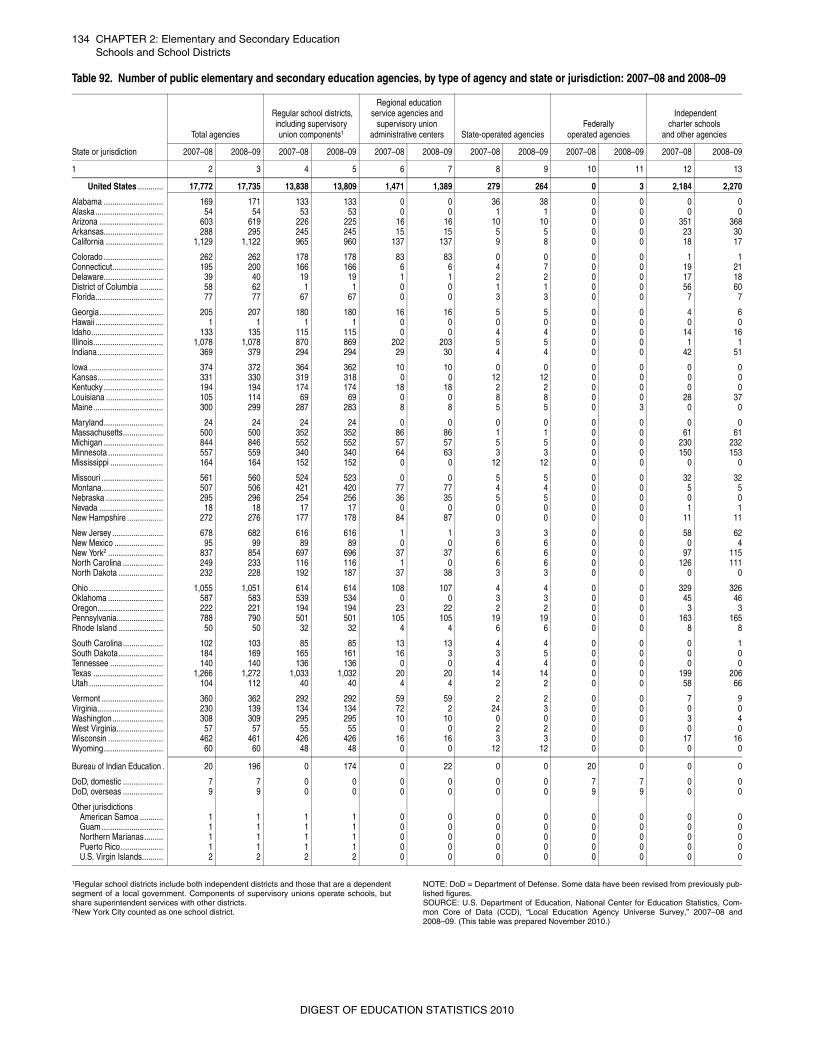
134 CHAPTER 2: Elementary and Secondary EducationSchools and School Districts
1Regular school districts include both independent districts and those that are a dependentsegment of a local government. Components of supervisory unions operate schools, butshare superintendent services with other districts.2New York City counted as one school district.
NOTE: DoD = Department of Defense. Some data have been revised from previously pub-lished figures.SOURCE: U.S. Department of Education, National Center for Education Statistics, Com-mon Core of Data (CCD), “Local Education Agency Universe Survey,” 2007–08 and2008–09. (This table was prepared November 2010.)
Table 92. Number of public elementary and secondary education agencies, by type of agency and state or jurisdiction: 2007–08 and 2008–09
State or jurisdiction
Total agencies
Regular school districts, including supervisory union components1
Regional education service agencies and
supervisory union administrative centers State-operated agencies
Federally operated agencies
Independent charter schools
and other agencies
2007–08 2008–09 2007–08 2008–09 2007–08 2008–09 2007–08 2008–09 2007–08 2008–09 2007–08 2008–09
1 2 3 4 5 6 7 8 9 10 11 12 13
United States ............ 17,772 17,735 13,838 13,809 1,471 1,389 279 264 0 3 2,184 2,270
Alabama ............................ 169 171 133 133 0 0 36 38 0 0 0 0Alaska................................ 54 54 53 53 0 0 1 1 0 0 0 0Arizona .............................. 603 619 226 225 16 16 10 10 0 0 351 368Arkansas............................ 288 295 245 245 15 15 5 5 0 0 23 30California ........................... 1,129 1,122 965 960 137 137 9 8 0 0 18 17
Colorado ............................ 262 262 178 178 83 83 0 0 0 0 1 1Connecticut........................ 195 200 166 166 6 6 4 7 0 0 19 21Delaware............................ 39 40 19 19 1 1 2 2 0 0 17 18District of Columbia ........... 58 62 1 1 0 0 1 1 0 0 56 60Florida................................ 77 77 67 67 0 0 3 3 0 0 7 7
Georgia.............................. 205 207 180 180 16 16 5 5 0 0 4 6Hawaii ................................ 1 1 1 1 0 0 0 0 0 0 0 0Idaho.................................. 133 135 115 115 0 0 4 4 0 0 14 16Illinois................................. 1,078 1,078 870 869 202 203 5 5 0 0 1 1Indiana............................... 369 379 294 294 29 30 4 4 0 0 42 51
Iowa ................................... 374 372 364 362 10 10 0 0 0 0 0 0Kansas............................... 331 330 319 318 0 0 12 12 0 0 0 0Kentucky ............................ 194 194 174 174 18 18 2 2 0 0 0 0Louisiana ........................... 105 114 69 69 0 0 8 8 0 0 28 37Maine................................. 300 299 287 283 8 8 5 5 0 3 0 0
Maryland............................ 24 24 24 24 0 0 0 0 0 0 0 0Massachusetts................... 500 500 352 352 86 86 1 1 0 0 61 61Michigan ............................ 844 846 552 552 57 57 5 5 0 0 230 232Minnesota .......................... 557 559 340 340 64 63 3 3 0 0 150 153Mississippi ......................... 164 164 152 152 0 0 12 12 0 0 0 0
Missouri ............................. 561 560 524 523 0 0 5 5 0 0 32 32Montana............................. 507 506 421 420 77 77 4 4 0 0 5 5Nebraska ........................... 295 296 254 256 36 35 5 5 0 0 0 0Nevada .............................. 18 18 17 17 0 0 0 0 0 0 1 1New Hampshire ................. 272 276 177 178 84 87 0 0 0 0 11 11
New Jersey ........................ 678 682 616 616 1 1 3 3 0 0 58 62New Mexico ....................... 95 99 89 89 0 0 6 6 0 0 0 4New York2 .......................... 837 854 697 696 37 37 6 6 0 0 97 115North Carolina ................... 249 233 116 116 1 0 6 6 0 0 126 111North Dakota ..................... 232 228 192 187 37 38 3 3 0 0 0 0
Ohio ................................... 1,055 1,051 614 614 108 107 4 4 0 0 329 326Oklahoma .......................... 587 583 539 534 0 0 3 3 0 0 45 46Oregon............................... 222 221 194 194 23 22 2 2 0 0 3 3Pennsylvania...................... 788 790 501 501 105 105 19 19 0 0 163 165Rhode Island ..................... 50 50 32 32 4 4 6 6 0 0 8 8
South Carolina................... 102 103 85 85 13 13 4 4 0 0 0 1South Dakota ..................... 184 169 165 161 16 3 3 5 0 0 0 0Tennessee ......................... 140 140 136 136 0 0 4 4 0 0 0 0Texas ................................. 1,266 1,272 1,033 1,032 20 20 14 14 0 0 199 206Utah ................................... 104 112 40 40 4 4 2 2 0 0 58 66
Vermont ............................. 360 362 292 292 59 59 2 2 0 0 7 9Virginia............................... 230 139 134 134 72 2 24 3 0 0 0 0Washington........................ 308 309 295 295 10 10 0 0 0 0 3 4West Virginia...................... 57 57 55 55 0 0 2 2 0 0 0 0Wisconsin .......................... 462 461 426 426 16 16 3 3 0 0 17 16Wyoming............................ 60 60 48 48 0 0 12 12 0 0 0 0
Bureau of Indian Education . 20 196 0 174 0 22 0 0 20 0 0 0
DoD, domestic ................... 7 7 0 0 0 0 0 0 7 7 0 0DoD, overseas ................... 9 9 0 0 0 0 0 0 9 9 0 0
Other jurisdictionsAmerican Samoa ........... 1 1 1 1 0 0 0 0 0 0 0 0Guam ............................. 1 1 1 1 0 0 0 0 0 0 0 0Northern Marianas......... 1 1 1 1 0 0 0 0 0 0 0 0Puerto Rico.................... 1 1 1 1 0 0 0 0 0 0 0 0U.S. Virgin Islands.......... 2 2 2 2 0 0 0 0 0 0 0 0
DIGEST OF EDUCATION STATISTICS 2010
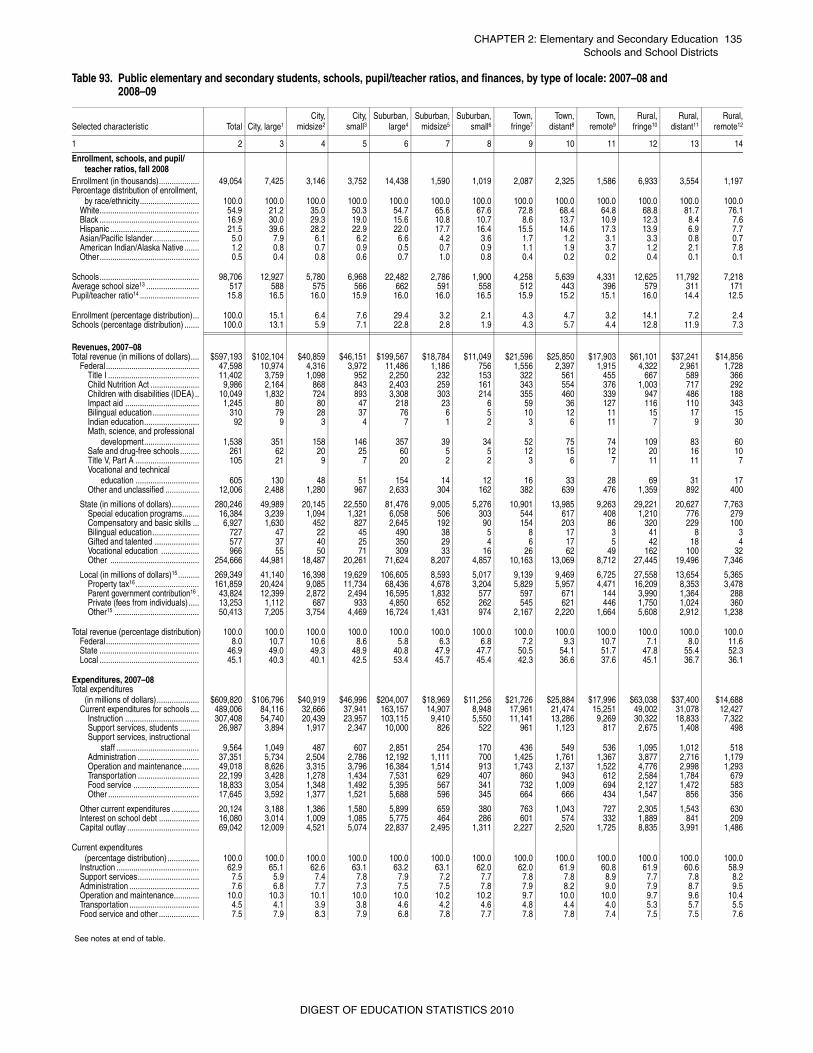
CHAPTER 2: Elementary and Secondary Education 135Schools and School Districts
Table 93. Public elementary and secondary students, schools, pupil/teacher ratios, and finances, by type of locale: 2007–08 and 2008–09
Selected characteristic Total City, large1City,
midsize2City,
small3Suburban,
large4Suburban,
midsize5Suburban,
small6Town,
fringe7Town,
distant8Town,
remote9Rural,
fringe10Rural,
distant11Rural,
remote12
1 2 3 4 5 6 7 8 9 10 11 12 13 14
Enrollment, schools, and pupil/ teacher ratios, fall 2008
Enrollment (in thousands)................... 49,054 7,425 3,146 3,752 14,438 1,590 1,019 2,087 2,325 1,586 6,933 3,554 1,197Percentage distribution of enrollment,
by race/ethnicity............................ 100.0 100.0 100.0 100.0 100.0 100.0 100.0 100.0 100.0 100.0 100.0 100.0 100.0White............................................... 54.9 21.2 35.0 50.3 54.7 65.6 67.6 72.8 68.4 64.8 68.8 81.7 76.1Black ............................................... 16.9 30.0 29.3 19.0 15.6 10.8 10.7 8.6 13.7 10.9 12.3 8.4 7.6Hispanic .......................................... 21.5 39.6 28.2 22.9 22.0 17.7 16.4 15.5 14.6 17.3 13.9 6.9 7.7Asian/Pacific Islander...................... 5.0 7.9 6.1 6.2 6.6 4.2 3.6 1.7 1.2 3.1 3.3 0.8 0.7American Indian/Alaska Native ....... 1.2 0.8 0.7 0.9 0.5 0.7 0.9 1.1 1.9 3.7 1.2 2.1 7.8Other............................................... 0.5 0.4 0.8 0.6 0.7 1.0 0.8 0.4 0.2 0.2 0.4 0.1 0.1
Schools............................................... 98,706 12,927 5,780 6,968 22,482 2,786 1,900 4,258 5,639 4,331 12,625 11,792 7,218Average school size13 ......................... 517 588 575 566 662 591 558 512 443 396 579 311 171Pupil/teacher ratio14 ............................ 15.8 16.5 16.0 15.9 16.0 16.0 16.5 15.9 15.2 15.1 16.0 14.4 12.5
Enrollment (percentage distribution)... 100.0 15.1 6.4 7.6 29.4 3.2 2.1 4.3 4.7 3.2 14.1 7.2 2.4Schools (percentage distribution) ....... 100.0 13.1 5.9 7.1 22.8 2.8 1.9 4.3 5.7 4.4 12.8 11.9 7.3
Revenues, 2007–08Total revenue (in millions of dollars).... $597,193 $102,104 $40,859 $46,151 $199,567 $18,784 $11,049 $21,596 $25,850 $17,903 $61,101 $37,241 $14,856
Federal............................................ 47,598 10,974 4,316 3,972 11,486 1,186 756 1,556 2,397 1,915 4,322 2,961 1,728Title I ........................................... 11,402 3,759 1,098 952 2,250 232 153 322 561 455 667 589 366Child Nutrition Act ....................... 9,986 2,164 868 843 2,403 259 161 343 554 376 1,003 717 292Children with disabilities (IDEA) .. 10,049 1,832 724 893 3,308 303 214 355 460 339 947 486 188Impact aid ................................... 1,245 80 80 47 218 23 6 59 36 127 116 110 343Bilingual education ...................... 310 79 28 37 76 6 5 10 12 11 15 17 15Indian education.......................... 92 9 3 4 7 1 2 3 6 11 7 9 30Math, science, and professional
development.......................... 1,538 351 158 146 357 39 34 52 75 74 109 83 60Safe and drug-free schools ......... 261 62 20 25 60 5 5 12 15 12 20 16 10Title V, Part A .............................. 105 21 9 7 20 2 2 3 6 7 11 11 7Vocational and technical
education .............................. 605 130 48 51 154 14 12 16 33 28 69 31 17Other and unclassified ................ 12,006 2,488 1,280 967 2,633 304 162 382 639 476 1,359 892 400
State (in millions of dollars)............. 280,246 49,989 20,145 22,550 81,476 9,005 5,276 10,901 13,985 9,263 29,221 20,627 7,763Special education programs........ 16,384 3,239 1,094 1,321 6,058 506 303 544 617 408 1,210 776 279Compensatory and basic skills ... 6,927 1,630 452 827 2,645 192 90 154 203 86 320 229 100Bilingual education ...................... 727 47 22 45 490 38 5 8 17 3 41 8 3Gifted and talented ..................... 577 37 40 25 350 29 4 6 17 5 42 18 4Vocational education .................. 966 55 50 71 309 33 16 26 62 49 162 100 32Other .......................................... 254,666 44,981 18,487 20,261 71,624 8,207 4,857 10,163 13,069 8,712 27,445 19,496 7,346
Local (in millions of dollars)15 .......... 269,349 41,140 16,398 19,629 106,605 8,593 5,017 9,139 9,469 6,725 27,558 13,654 5,365Property tax16 .............................. 161,859 20,424 9,085 11,734 68,436 4,678 3,204 5,829 5,957 4,471 16,209 8,353 3,478Parent government contribution16 . 43,824 12,399 2,872 2,494 16,595 1,832 577 597 671 144 3,990 1,364 288Private (fees from individuals) ..... 13,253 1,112 687 933 4,850 652 262 545 621 446 1,750 1,024 360Other15 ........................................ 50,413 7,205 3,754 4,469 16,724 1,431 974 2,167 2,220 1,664 5,608 2,912 1,238
Total revenue (percentage distribution) 100.0 100.0 100.0 100.0 100.0 100.0 100.0 100.0 100.0 100.0 100.0 100.0 100.0Federal............................................ 8.0 10.7 10.6 8.6 5.8 6.3 6.8 7.2 9.3 10.7 7.1 8.0 11.6State ............................................... 46.9 49.0 49.3 48.9 40.8 47.9 47.7 50.5 54.1 51.7 47.8 55.4 52.3Local ............................................... 45.1 40.3 40.1 42.5 53.4 45.7 45.4 42.3 36.6 37.6 45.1 36.7 36.1
Expenditures, 2007–08Total expenditures
(in millions of dollars).................... $609,820 $106,796 $40,919 $46,996 $204,007 $18,969 $11,256 $21,726 $25,884 $17,996 $63,038 $37,400 $14,688Current expenditures for schools .... 489,006 84,116 32,666 37,941 163,157 14,907 8,948 17,961 21,474 15,251 49,002 31,078 12,427
Instruction ................................... 307,408 54,740 20,439 23,957 103,115 9,410 5,550 11,141 13,286 9,269 30,322 18,833 7,322Support services, students ......... 26,987 3,894 1,917 2,347 10,000 826 522 961 1,123 817 2,675 1,408 498Support services, instructional
staff ....................................... 9,564 1,049 487 607 2,851 254 170 436 549 536 1,095 1,012 518Administration ............................. 37,351 5,734 2,504 2,786 12,192 1,111 700 1,425 1,761 1,367 3,877 2,716 1,179Operation and maintenance........ 49,018 8,626 3,315 3,796 16,384 1,514 913 1,743 2,137 1,522 4,776 2,998 1,293Transportation ............................. 22,199 3,428 1,278 1,434 7,531 629 407 860 943 612 2,584 1,784 679Food service ............................... 18,833 3,054 1,348 1,492 5,395 567 341 732 1,009 694 2,127 1,472 583Other ........................................... 17,645 3,592 1,377 1,521 5,688 596 345 664 666 434 1,547 856 356
Other current expenditures ............. 20,124 3,188 1,386 1,580 5,899 659 380 763 1,043 727 2,305 1,543 630Interest on school debt ................... 16,080 3,014 1,009 1,085 5,775 464 286 601 574 332 1,889 841 209Capital outlay .................................. 69,042 12,009 4,521 5,074 22,837 2,495 1,311 2,227 2,520 1,725 8,835 3,991 1,486
Current expenditures (percentage distribution)............... 100.0 100.0 100.0 100.0 100.0 100.0 100.0 100.0 100.0 100.0 100.0 100.0 100.0
Instruction ....................................... 62.9 65.1 62.6 63.1 63.2 63.1 62.0 62.0 61.9 60.8 61.9 60.6 58.9Support services............................. 7.5 5.9 7.4 7.8 7.9 7.2 7.7 7.8 7.8 8.9 7.7 7.8 8.2Administration ................................. 7.6 6.8 7.7 7.3 7.5 7.5 7.8 7.9 8.2 9.0 7.9 8.7 9.5Operation and maintenance............ 10.0 10.3 10.1 10.0 10.0 10.2 10.2 9.7 10.0 10.0 9.7 9.6 10.4Transportation ................................. 4.5 4.1 3.9 3.8 4.6 4.2 4.6 4.8 4.4 4.0 5.3 5.7 5.5Food service and other ................... 7.5 7.9 8.3 7.9 6.8 7.8 7.7 7.8 7.8 7.4 7.5 7.5 7.6
See notes at end of table.
DIGEST OF EDUCATION STATISTICS 2010
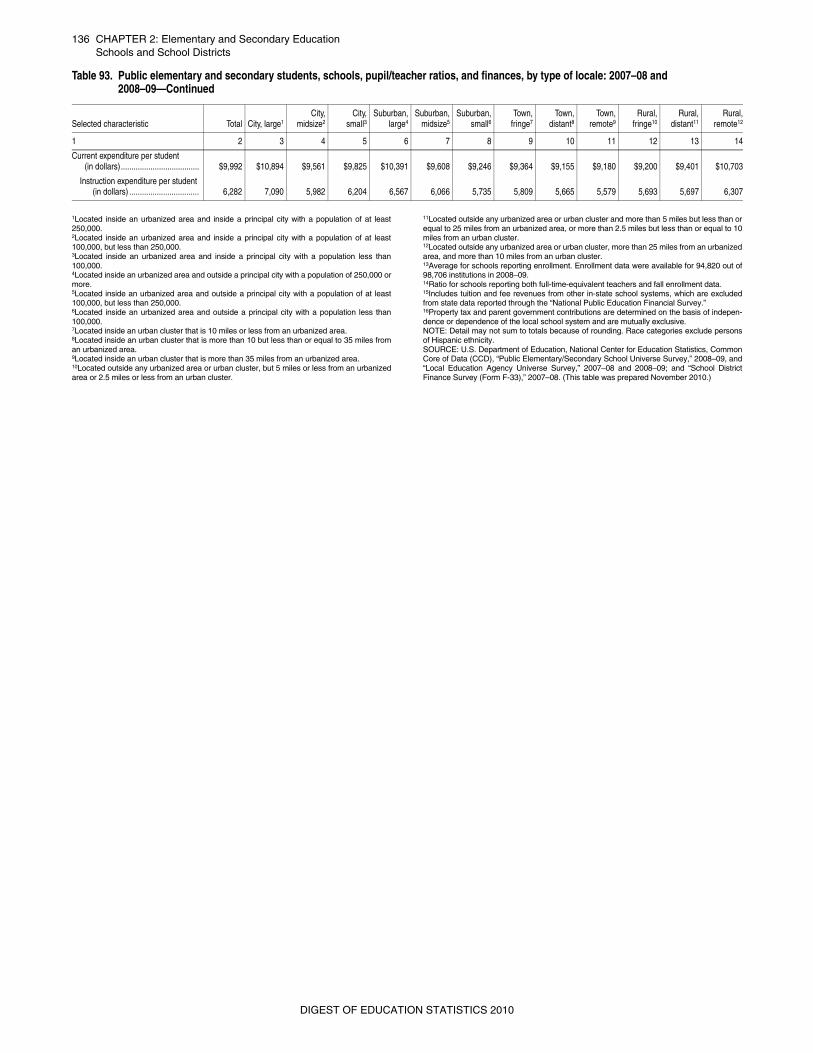
136 CHAPTER 2: Elementary and Secondary EducationSchools and School Districts
1Located inside an urbanized area and inside a principal city with a population of at least250,000.2Located inside an urbanized area and inside a principal city with a population of at least100,000, but less than 250,000.3Located inside an urbanized area and inside a principal city with a population less than100,000.4Located inside an urbanized area and outside a principal city with a population of 250,000 ormore.5Located inside an urbanized area and outside a principal city with a population of at least100,000, but less than 250,000.6Located inside an urbanized area and outside a principal city with a population less than100,000.7Located inside an urban cluster that is 10 miles or less from an urbanized area.8Located inside an urban cluster that is more than 10 but less than or equal to 35 miles froman urbanized area.9Located inside an urban cluster that is more than 35 miles from an urbanized area.10Located outside any urbanized area or urban cluster, but 5 miles or less from an urbanizedarea or 2.5 miles or less from an urban cluster.
11Located outside any urbanized area or urban cluster and more than 5 miles but less than orequal to 25 miles from an urbanized area, or more than 2.5 miles but less than or equal to 10miles from an urban cluster.12Located outside any urbanized area or urban cluster, more than 25 miles from an urbanizedarea, and more than 10 miles from an urban cluster.13Average for schools reporting enrollment. Enrollment data were available for 94,820 out of98,706 institutions in 2008–09.14Ratio for schools reporting both full-time-equivalent teachers and fall enrollment data. 15Includes tuition and fee revenues from other in-state school systems, which are excludedfrom state data reported through the “National Public Education Financial Survey.”16Property tax and parent government contributions are determined on the basis of indepen-dence or dependence of the local school system and are mutually exclusive. NOTE: Detail may not sum to totals because of rounding. Race categories exclude personsof Hispanic ethnicity.SOURCE: U.S. Department of Education, National Center for Education Statistics, CommonCore of Data (CCD), “Public Elementary/Secondary School Universe Survey,” 2008–09, and“Local Education Agency Universe Survey,” 2007–08 and 2008–09; and “School DistrictFinance Survey (Form F-33),” 2007–08. (This table was prepared November 2010.)
Current expenditure per student(in dollars)..................................... $9,992 $10,894 $9,561 $9,825 $10,391 $9,608 $9,246 $9,364 $9,155 $9,180 $9,200 $9,401 $10,703
Instruction expenditure per student (in dollars) ................................. 6,282 7,090 5,982 6,204 6,567 6,066 5,735 5,809 5,665 5,579 5,693 5,697 6,307
Table 93. Public elementary and secondary students, schools, pupil/teacher ratios, and finances, by type of locale: 2007–08 and 2008–09—Continued
Selected characteristic Total City, large1City,
midsize2City,
small3Suburban,
large4Suburban,
midsize5Suburban,
small6Town,
fringe7Town,
distant8Town,
remote9Rural,
fringe10Rural,
distant11Rural,
remote12
1 2 3 4 5 6 7 8 9 10 11 12 13 14
DIGEST OF EDUCATION STATISTICS 2010
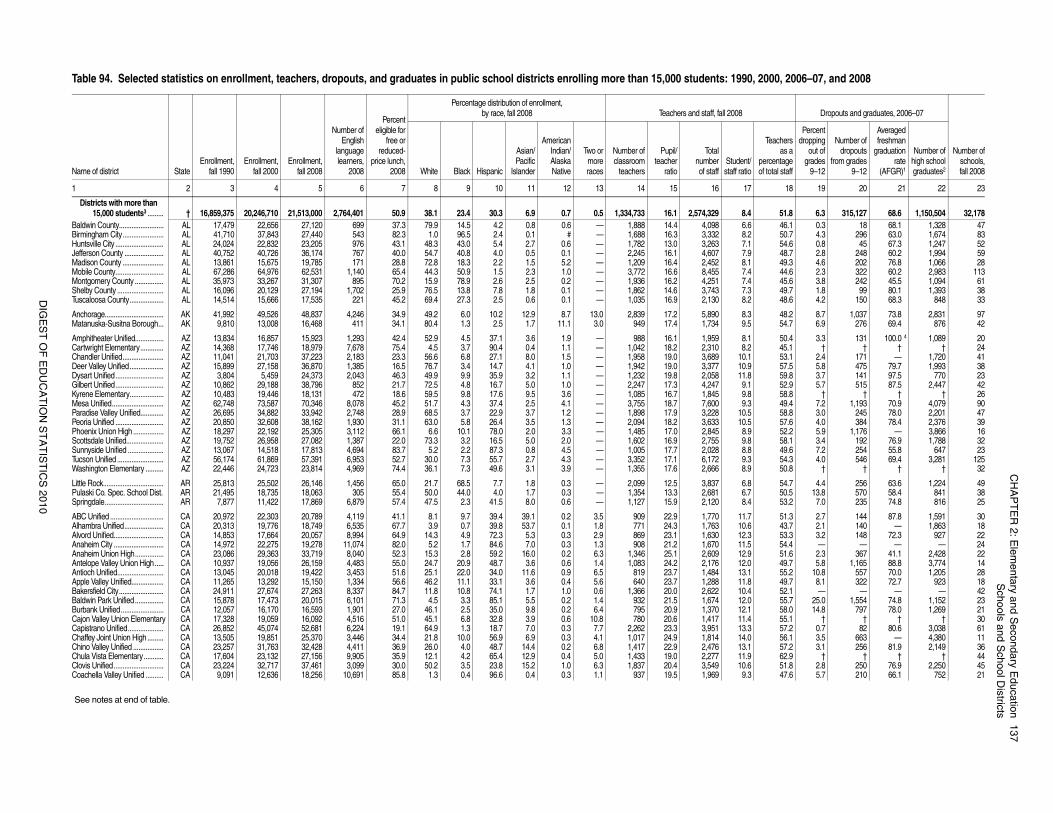
CH
AP
TE
R 2
: Ele
me
nta
ry an
d S
eco
nd
ary E
du
catio
n1
37
Sch
oo
ls an
d S
cho
ol D
istricts
DIG
ES
T O
F E
DU
CA
TIO
N S
TA
TIS
TIC
S 2
01
0
2000, 2006–07, and 2008
Dropouts and graduates, 2006–07
Number ofschools,fall 2008
Teachersas a
percentageof total staff
Percentdropping
out ofgrades
9–12
Number ofdropouts
from grades9–12
Averagedfreshman
graduationrate
(AFGR)1
Number ofhigh schoolgraduates2
18 19 20 21 22 23
51.8 6.3 315,127 68.6 1,150,504 32,17846.1 0.3 18 68.1 1,328 4750.7 4.3 296 63.0 1,674 8354.6 0.8 45 67.3 1,247 5248.7 2.8 248 60.2 1,994 5949.3 4.6 202 76.8 1,066 2844.6 2.3 322 60.2 2,983 11345.6 3.8 242 45.5 1,094 6149.7 1.8 99 80.1 1,393 3848.6 4.2 150 68.3 848 33
48.2 8.7 1,037 73.8 2,831 9754.7 6.9 276 69.4 876 42
50.4 3.3 131 100.0 4 1,089 2045.1 † † † † 2453.1 2.4 171 — 1,720 4157.5 5.8 475 79.7 1,993 3859.8 3.7 141 97.5 770 2352.9 5.7 515 87.5 2,447 4258.8 † † † † 2649.4 7.2 1,193 70.9 4,079 9058.8 3.0 245 78.0 2,201 4757.6 4.0 384 78.4 2,376 3952.2 5.9 1,176 — 3,866 1658.1 3.4 192 76.9 1,788 3249.6 7.2 254 55.8 647 2354.3 4.0 546 69.4 3,281 12550.8 † † † † 32
54.7 4.4 256 63.6 1,224 4950.5 13.8 570 58.4 841 3853.2 7.0 235 74.8 816 25
51.3 2.7 144 87.8 1,591 3043.7 2.1 140 — 1,863 1853.3 3.2 148 72.3 927 2254.4 — — — — 2451.6 2.3 367 41.1 2,428 2249.7 5.8 1,165 88.8 3,774 1455.2 10.8 557 70.0 1,205 2849.7 8.1 322 72.7 923 1852.1 — — — — 4255.7 25.0 1,554 74.8 1,152 2358.0 14.8 797 78.0 1,269 2155.1 † † † † 3057.2 0.7 82 80.6 3,038 6156.1 3.5 663 — 4,380 1157.2 3.1 256 81.9 2,149 3662.9 † † † † 4451.8 2.8 250 76.9 2,250 4547.6 5.7 210 66.1 752 21
Table 94. Selected statistics on enrollment, teachers, dropouts, and graduates in public school districts enrolling more than 15,000 students: 1990,
Name of district StateEnrollment,
fall 1990Enrollment,
fall 2000Enrollment,
fall 2008
Number ofEnglish
languagelearners,
2008
Percenteligible for
free orreduced-
price lunch,2008
Percentage distribution of enrollment, by race, fall 2008 Teachers and staff, fall 2008
White Black Hispanic
Asian/Pacific
Islander
AmericanIndian/AlaskaNative
Two ormoreraces
Number ofclassroom
teachers
Pupil/teacher
ratio
Totalnumberof staff
Student/staff ratio
1 2 3 4 5 6 7 8 9 10 11 12 13 14 15 16 17
Districts with more than 15,000 students3 ......... † 16,859,375 20,246,710 21,513,000 2,764,401 50.9 38.1 23.4 30.3 6.9 0.7 0.5 1,334,733 16.1 2,574,329 8.4
Baldwin County......................... AL 17,479 22,656 27,120 699 37.3 79.9 14.5 4.2 0.8 0.6 — 1,888 14.4 4,098 6.6Birmingham City....................... AL 41,710 37,843 27,440 543 82.3 1.0 96.5 2.4 0.1 # — 1,688 16.3 3,332 8.2Huntsville City ........................... AL 24,024 22,832 23,205 976 43.1 48.3 43.0 5.4 2.7 0.6 — 1,782 13.0 3,263 7.1Jefferson County ...................... AL 40,752 40,726 36,174 767 40.0 54.7 40.8 4.0 0.5 0.1 — 2,245 16.1 4,607 7.9Madison County ....................... AL 13,861 15,675 19,785 171 28.8 72.8 18.3 2.2 1.5 5.2 — 1,209 16.4 2,452 8.1Mobile County........................... AL 67,286 64,976 62,531 1,140 65.4 44.3 50.9 1.5 2.3 1.0 — 3,772 16.6 8,455 7.4Montgomery County ................ AL 35,973 33,267 31,307 895 70.2 15.9 78.9 2.6 2.5 0.2 — 1,936 16.2 4,251 7.4Shelby County .......................... AL 16,096 20,129 27,194 1,702 25.9 76.5 13.8 7.8 1.8 0.1 — 1,862 14.6 3,743 7.3Tuscaloosa County................... AL 14,514 15,666 17,535 221 45.2 69.4 27.3 2.5 0.6 0.1 — 1,035 16.9 2,130 8.2
Anchorage................................. AK 41,992 49,526 48,837 4,246 34.9 49.2 6.0 10.2 12.9 8.7 13.0 2,839 17.2 5,890 8.3Matanuska-Susitna Borough... AK 9,810 13,008 16,468 411 34.1 80.4 1.3 2.5 1.7 11.1 3.0 949 17.4 1,734 9.5
Amphitheater Unified................ AZ 13,834 16,857 15,923 1,293 42.4 52.9 4.5 37.1 3.6 1.9 — 988 16.1 1,959 8.1Cartwright Elementary............. AZ 14,368 17,746 18,979 7,678 75.4 4.5 3.7 90.4 0.4 1.1 — 1,042 18.2 2,310 8.2Chandler Unified....................... AZ 11,041 21,703 37,223 2,183 23.3 56.6 6.8 27.1 8.0 1.5 — 1,958 19.0 3,689 10.1Deer Valley Unified................... AZ 15,899 27,158 36,870 1,385 16.5 76.7 3.4 14.7 4.1 1.0 — 1,942 19.0 3,377 10.9Dysart Unified........................... AZ 3,804 5,459 24,373 2,043 46.3 49.9 9.9 35.9 3.2 1.1 — 1,232 19.8 2,058 11.8Gilbert Unified........................... AZ 10,862 29,188 38,796 852 21.7 72.5 4.8 16.7 5.0 1.0 — 2,247 17.3 4,247 9.1Kyrene Elementary................... AZ 10,483 19,446 18,131 472 18.6 59.5 9.8 17.6 9.5 3.6 — 1,085 16.7 1,845 9.8Mesa Unified............................. AZ 62,748 73,587 70,346 8,078 45.2 51.7 4.3 37.4 2.5 4.1 — 3,755 18.7 7,600 9.3Paradise Valley Unified............. AZ 26,695 34,882 33,942 2,748 28.9 68.5 3.7 22.9 3.7 1.2 — 1,898 17.9 3,228 10.5Peoria Unified ........................... AZ 20,850 32,608 38,162 1,930 31.1 63.0 5.8 26.4 3.5 1.3 — 2,094 18.2 3,633 10.5Phoenix Union High ................. AZ 18,297 22,192 25,305 3,112 66.1 6.6 10.1 78.0 2.0 3.3 — 1,485 17.0 2,845 8.9Scottsdale Unified..................... AZ 19,752 26,958 27,082 1,387 22.0 73.3 3.2 16.5 5.0 2.0 — 1,602 16.9 2,755 9.8Sunnyside Unified .................... AZ 13,067 14,518 17,813 4,694 83.7 5.2 2.2 87.3 0.8 4.5 — 1,005 17.7 2,028 8.8Tucson Unified .......................... AZ 56,174 61,869 57,391 6,953 52.7 30.0 7.3 55.7 2.7 4.3 — 3,352 17.1 6,172 9.3Washington Elementary .......... AZ 22,446 24,723 23,814 4,969 74.4 36.1 7.3 49.6 3.1 3.9 — 1,355 17.6 2,666 8.9
Little Rock.................................. AR 25,813 25,502 26,146 1,456 65.0 21.7 68.5 7.7 1.8 0.3 — 2,099 12.5 3,837 6.8Pulaski Co. Spec. School Dist. AR 21,495 18,735 18,063 305 55.4 50.0 44.0 4.0 1.7 0.3 — 1,354 13.3 2,681 6.7Springdale................................. AR 7,877 11,422 17,869 6,879 57.4 47.5 2.3 41.5 8.0 0.6 — 1,127 15.9 2,120 8.4
ABC Unified .............................. CA 20,972 22,303 20,789 4,119 41.1 8.1 9.7 39.4 39.1 0.2 3.5 909 22.9 1,770 11.7Alhambra Unified...................... CA 20,313 19,776 18,749 6,535 67.7 3.9 0.7 39.8 53.7 0.1 1.8 771 24.3 1,763 10.6Alvord Unified............................ CA 14,853 17,664 20,057 8,994 64.9 14.3 4.9 72.3 5.3 0.3 2.9 869 23.1 1,630 12.3Anaheim City ............................ CA 14,972 22,275 19,278 11,074 82.0 5.2 1.7 84.6 7.0 0.3 1.3 908 21.2 1,670 11.5Anaheim Union High................ CA 23,086 29,363 33,719 8,040 52.3 15.3 2.8 59.2 16.0 0.2 6.3 1,346 25.1 2,609 12.9Antelope Valley Union High..... CA 10,937 19,056 26,159 4,483 55.0 24.7 20.9 48.7 3.6 0.6 1.4 1,083 24.2 2,176 12.0Antioch Unified.......................... CA 13,045 20,018 19,422 3,453 51.6 25.1 22.0 34.0 11.6 0.9 6.5 819 23.7 1,484 13.1Apple Valley Unified.................. CA 11,265 13,292 15,150 1,334 56.6 46.2 11.1 33.1 3.6 0.4 5.6 640 23.7 1,288 11.8Bakersfield City......................... CA 24,911 27,674 27,263 8,337 84.7 11.8 10.8 74.1 1.7 1.0 0.6 1,366 20.0 2,622 10.4Baldwin Park Unified................ CA 15,878 17,473 20,015 6,101 71.3 4.5 3.3 85.1 5.5 0.2 1.4 932 21.5 1,674 12.0Burbank Unified........................ CA 12,057 16,170 16,593 1,901 27.0 46.1 2.5 35.0 9.8 0.2 6.4 795 20.9 1,370 12.1Cajon Valley Union Elementary CA 17,328 19,059 16,092 4,516 51.0 45.1 6.8 32.8 3.9 0.6 10.8 780 20.6 1,417 11.4Capistrano Unified.................... CA 26,852 45,074 52,681 6,224 19.1 64.9 1.3 18.7 7.0 0.3 7.7 2,262 23.3 3,951 13.3Chaffey Joint Union High......... CA 13,505 19,851 25,370 3,446 34.4 21.8 10.0 56.9 6.9 0.3 4.1 1,017 24.9 1,814 14.0Chino Valley Unified ................. CA 23,257 31,763 32,428 4,411 36.9 26.0 4.0 48.7 14.4 0.2 6.8 1,417 22.9 2,476 13.1Chula Vista Elementary........... CA 17,604 23,132 27,156 9,905 35.9 12.1 4.2 65.4 12.9 0.4 5.0 1,433 19.0 2,277 11.9Clovis Unified............................ CA 23,224 32,717 37,461 3,099 30.0 50.2 3.5 23.8 15.2 1.0 6.3 1,837 20.4 3,549 10.6Coachella Valley Unified .......... CA 9,091 12,636 18,256 10,691 85.8 1.3 0.4 96.6 0.4 0.3 1.1 937 19.5 1,969 9.3
See notes at end of table.
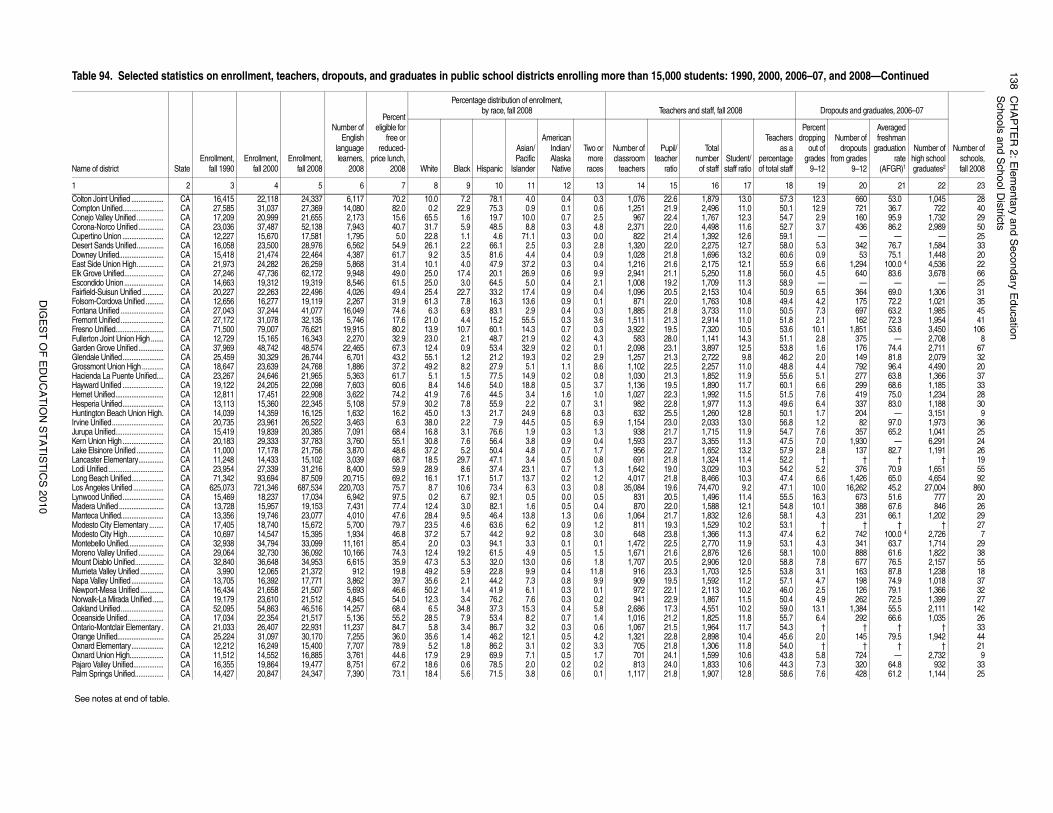
13
8C
HA
PT
ER
2: E
lem
en
tary a
nd
Se
con
da
ry Ed
uca
tion
Sch
oo
ls an
d S
cho
ol D
istricts
DIG
ES
T O
F E
DU
CA
TIO
N S
TA
TIS
TIC
S 2
01
0
57.3 12.3 660 53.0 1,045 2850.1 12.9 721 36.7 722 4054.7 2.9 160 95.9 1,732 2952.7 3.7 436 86.2 2,989 5059.1 — — — — 2558.0 5.3 342 76.7 1,584 3360.6 0.9 53 75.1 1,448 2055.9 6.6 1,294 100.0 4 4,536 2256.0 4.5 640 83.6 3,678 6658.9 — — — — 2550.9 6.5 364 69.0 1,306 3149.4 4.2 175 72.2 1,021 3550.5 7.3 697 63.2 1,985 4551.8 2.1 162 72.3 1,954 4153.6 10.1 1,851 53.6 3,450 10651.1 2.8 375 — 2,708 853.8 1.6 176 74.4 2,711 6746.2 2.0 149 81.8 2,079 3248.8 4.4 792 96.4 4,490 2055.6 5.1 277 63.8 1,366 3760.1 6.6 299 68.6 1,185 3351.5 7.6 419 75.0 1,234 2849.6 6.4 337 83.0 1,188 3050.1 1.7 204 — 3,151 956.8 1.2 82 97.0 1,973 3654.7 7.6 357 65.2 1,041 2547.5 7.0 1,930 — 6,291 2457.9 2.8 137 82.7 1,191 2652.2 † † † † 1954.2 5.2 376 70.9 1,651 5547.4 6.6 1,426 65.0 4,654 9247.1 10.0 16,262 45.2 27,004 86055.5 16.3 673 51.6 777 2054.8 10.1 388 67.6 846 2658.1 4.3 231 66.1 1,202 2953.1 † † † † 2747.4 6.2 742 100.0 4 2,726 753.1 4.3 341 63.7 1,714 2958.1 10.0 888 61.6 1,822 3858.8 7.8 677 76.5 2,157 5553.8 3.1 163 87.8 1,238 1857.1 4.7 198 74.9 1,018 3746.0 2.5 126 79.1 1,366 3250.4 4.9 262 72.5 1,399 2759.0 13.1 1,384 55.5 2,111 14255.7 6.4 292 66.6 1,035 2654.3 † † † † 3345.6 2.0 145 79.5 1,942 4454.0 † † † † 2143.8 5.8 724 — 2,732 944.3 7.3 320 64.8 932 3358.6 7.6 428 61.2 1,144 25
2000, 2006–07, and 2008—Continued
Dropouts and graduates, 2006–07
Number ofschools,fall 2008
Teachersas a
percentageof total staff
Percentdropping
out ofgrades
9–12
Number ofdropouts
from grades9–12
Averagedfreshman
graduationrate
(AFGR)1
Number ofhigh schoolgraduates2
18 19 20 21 22 23
Colton Joint Unified .................. CA 16,415 22,118 24,337 6,117 70.2 10.0 7.2 78.1 4.0 0.4 0.3 1,076 22.6 1,879 13.0Compton Unified....................... CA 27,585 31,037 27,369 14,080 82.0 0.2 22.9 75.3 0.9 0.1 0.6 1,251 21.9 2,496 11.0Conejo Valley Unified............... CA 17,209 20,999 21,655 2,173 15.6 65.5 1.6 19.7 10.0 0.7 2.5 967 22.4 1,767 12.3Corona-Norco Unified.............. CA 23,036 37,487 52,138 7,943 40.7 31.7 5.9 48.5 8.8 0.3 4.8 2,371 22.0 4,498 11.6Cupertino Union ....................... CA 12,227 15,670 17,581 1,795 5.0 22.8 1.1 4.6 71.1 0.3 0.0 822 21.4 1,392 12.6Desert Sands Unified............... CA 16,058 23,500 28,976 6,562 54.9 26.1 2.2 66.1 2.5 0.3 2.8 1,320 22.0 2,275 12.7Downey Unified......................... CA 15,418 21,474 22,464 4,387 61.7 9.2 3.5 81.6 4.4 0.4 0.9 1,028 21.8 1,696 13.2East Side Union High............... CA 21,973 24,282 26,259 5,868 31.4 10.1 4.0 47.9 37.2 0.3 0.4 1,216 21.6 2,175 12.1Elk Grove Unified...................... CA 27,246 47,736 62,172 9,948 49.0 25.0 17.4 20.1 26.9 0.6 9.9 2,941 21.1 5,250 11.8Escondido Union...................... CA 14,663 19,312 19,319 8,546 61.5 25.0 3.0 64.5 5.0 0.4 2.1 1,008 19.2 1,709 11.3Fairfield-Suisun Unified ............ CA 20,227 22,263 22,496 4,026 49.4 25.4 22.7 33.2 17.4 0.9 0.4 1,096 20.5 2,153 10.4Folsom-Cordova Unified .......... CA 12,656 16,277 19,119 2,267 31.9 61.3 7.8 16.3 13.6 0.9 0.1 871 22.0 1,763 10.8Fontana Unified ........................ CA 27,043 37,244 41,077 16,049 74.6 6.3 6.9 83.1 2.9 0.4 0.3 1,885 21.8 3,733 11.0Fremont Unified........................ CA 27,172 31,078 32,135 5,746 17.6 21.0 4.4 15.2 55.5 0.3 3.6 1,511 21.3 2,914 11.0Fresno Unified........................... CA 71,500 79,007 76,621 19,915 80.2 13.9 10.7 60.1 14.3 0.7 0.3 3,922 19.5 7,320 10.5Fullerton Joint Union High ....... CA 12,729 15,165 16,343 2,270 32.9 23.0 2.1 48.7 21.9 0.2 4.3 583 28.0 1,141 14.3Garden Grove Unified.............. CA 37,969 48,742 48,574 22,465 67.3 12.4 0.9 53.4 32.9 0.2 0.1 2,098 23.1 3,897 12.5Glendale Unified....................... CA 25,459 30,329 26,744 6,701 43.2 55.1 1.2 21.2 19.3 0.2 2.9 1,257 21.3 2,722 9.8Grossmont Union High ............ CA 18,647 23,639 24,768 1,886 37.2 49.2 8.2 27.9 5.1 1.1 8.6 1,102 22.5 2,257 11.0Hacienda La Puente Unified.... CA 23,267 24,646 21,965 5,363 61.7 5.1 1.5 77.5 14.9 0.2 0.8 1,030 21.3 1,852 11.9Hayward Unified ....................... CA 19,122 24,205 22,098 7,603 60.6 8.4 14.6 54.0 18.8 0.5 3.7 1,136 19.5 1,890 11.7Hemet Unified........................... CA 12,811 17,451 22,908 3,622 74.2 41.9 7.6 44.5 3.4 1.6 1.0 1,027 22.3 1,992 11.5Hesperia Unified....................... CA 13,113 15,360 22,345 5,108 57.9 30.2 7.8 55.9 2.2 0.7 3.1 982 22.8 1,977 11.3Huntington Beach Union High. CA 14,039 14,359 16,125 1,632 16.2 45.0 1.3 21.7 24.9 6.8 0.3 632 25.5 1,260 12.8Irvine Unified............................. CA 20,735 23,961 26,522 3,463 6.3 38.0 2.2 7.9 44.5 0.5 6.9 1,154 23.0 2,033 13.0Jurupa Unified........................... CA 15,419 19,839 20,385 7,091 68.4 16.8 3.1 76.6 1.9 0.3 1.3 938 21.7 1,715 11.9Kern Union High....................... CA 20,183 29,333 37,783 3,760 55.1 30.8 7.6 56.4 3.8 0.9 0.4 1,593 23.7 3,355 11.3Lake Elsinore Unified ............... CA 11,000 17,178 21,756 3,870 48.6 37.2 5.2 50.4 4.8 0.7 1.7 956 22.7 1,652 13.2Lancaster Elementary.............. CA 11,248 14,433 15,102 3,039 68.7 18.5 29.7 47.1 3.4 0.5 0.8 691 21.8 1,324 11.4Lodi Unified............................... CA 23,954 27,339 31,216 8,400 59.9 28.9 8.6 37.4 23.1 0.7 1.3 1,642 19.0 3,029 10.3Long Beach Unified.................. CA 71,342 93,694 87,509 20,715 69.2 16.1 17.1 51.7 13.7 0.2 1.2 4,017 21.8 8,466 10.3Los Angeles Unified................. CA 625,073 721,346 687,534 220,703 75.7 8.7 10.6 73.4 6.3 0.3 0.8 35,084 19.6 74,470 9.2Lynwood Unified....................... CA 15,469 18,237 17,034 6,942 97.5 0.2 6.7 92.1 0.5 0.0 0.5 831 20.5 1,496 11.4Madera Unified ......................... CA 13,728 15,957 19,153 7,431 77.4 12.4 3.0 82.1 1.6 0.5 0.4 870 22.0 1,588 12.1Manteca Unified........................ CA 13,356 19,746 23,077 4,010 47.6 28.4 9.5 46.4 13.8 1.3 0.6 1,064 21.7 1,832 12.6Modesto City Elementary........ CA 17,405 18,740 15,672 5,700 79.7 23.5 4.6 63.6 6.2 0.9 1.2 811 19.3 1,529 10.2Modesto City High.................... CA 10,697 14,547 15,395 1,934 46.8 37.2 5.7 44.2 9.2 0.8 3.0 648 23.8 1,366 11.3Montebello Unified.................... CA 32,938 34,794 33,099 11,161 85.4 2.0 0.3 94.1 3.3 0.1 0.1 1,472 22.5 2,770 11.9Moreno Valley Unified .............. CA 29,064 32,730 36,092 10,166 74.3 12.4 19.2 61.5 4.9 0.5 1.5 1,671 21.6 2,876 12.6Mount Diablo Unified................ CA 32,840 36,648 34,953 6,615 35.9 47.3 5.3 32.0 13.0 0.6 1.8 1,707 20.5 2,906 12.0Murrieta Valley Unified ............. CA 3,990 12,065 21,372 912 19.8 49.2 5.9 22.8 9.9 0.4 11.8 916 23.3 1,703 12.5Napa Valley Unified.................. CA 13,705 16,392 17,771 3,862 39.7 35.6 2.1 44.2 7.3 0.8 9.9 909 19.5 1,592 11.2Newport-Mesa Unified............. CA 16,434 21,658 21,507 5,693 46.6 50.2 1.4 41.9 6.1 0.3 0.1 972 22.1 2,113 10.2Norwalk-La Mirada Unified ...... CA 19,179 23,610 21,512 4,845 54.0 12.3 3.4 76.2 7.6 0.3 0.2 941 22.9 1,867 11.5Oakland Unified........................ CA 52,095 54,863 46,516 14,257 68.4 6.5 34.8 37.3 15.3 0.4 5.8 2,686 17.3 4,551 10.2Oceanside Unified.................... CA 17,034 22,354 21,517 5,136 55.2 28.5 7.9 53.4 8.2 0.7 1.4 1,016 21.2 1,825 11.8Ontario-Montclair Elementary . CA 21,033 26,407 22,931 11,237 84.7 5.8 3.4 86.7 3.2 0.3 0.6 1,067 21.5 1,964 11.7Orange Unified.......................... CA 25,224 31,097 30,170 7,255 36.0 35.6 1.4 46.2 12.1 0.5 4.2 1,321 22.8 2,898 10.4Oxnard Elementary.................. CA 12,212 16,249 15,400 7,707 78.9 5.2 1.8 86.2 3.1 0.2 3.3 705 21.8 1,306 11.8Oxnard Union High................... CA 11,512 14,552 16,885 3,761 44.6 17.9 2.9 69.9 7.1 0.5 1.7 701 24.1 1,599 10.6Pajaro Valley Unified................. CA 16,355 19,864 19,477 8,751 67.2 18.6 0.6 78.5 2.0 0.2 0.2 813 24.0 1,833 10.6Palm Springs Unified................ CA 14,427 20,847 24,347 7,390 73.1 18.4 5.6 71.5 3.8 0.6 0.1 1,117 21.8 1,907 12.8
See notes at end of table.
Table 94. Selected statistics on enrollment, teachers, dropouts, and graduates in public school districts enrolling more than 15,000 students: 1990,
Name of district StateEnrollment,
fall 1990Enrollment,
fall 2000Enrollment,
fall 2008
Number ofEnglish
languagelearners,
2008
Percenteligible for
free orreduced-
price lunch,2008
Percentage distribution of enrollment, by race, fall 2008 Teachers and staff, fall 2008
White Black Hispanic
Asian/Pacific
Islander
AmericanIndian/AlaskaNative
Two ormoreraces
Number ofclassroom
teachers
Pupil/teacher
ratio
Totalnumberof staff
Student/staff ratio
1 2 3 4 5 6 7 8 9 10 11 12 13 14 15 16 17
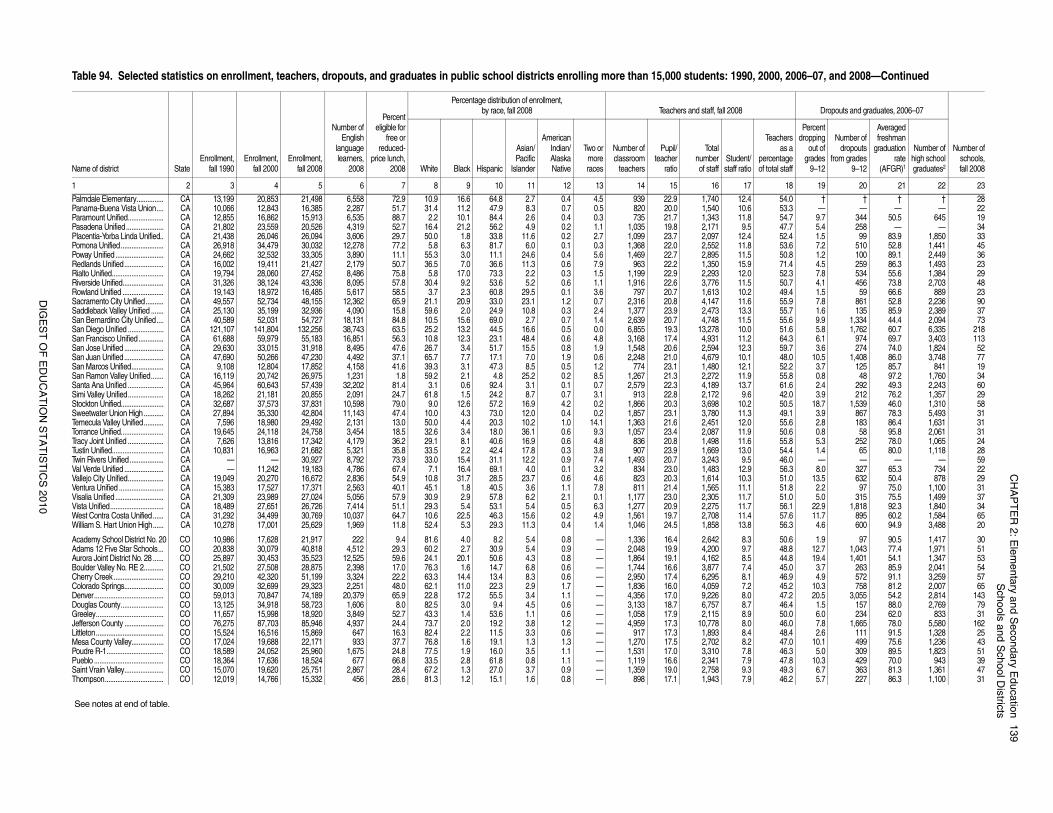
CH
AP
TE
R 2
: Ele
me
nta
ry an
d S
eco
nd
ary E
du
catio
n1
39
Sch
oo
ls an
d S
cho
ol D
istricts
DIG
ES
T O
F E
DU
CA
TIO
N S
TA
TIS
TIC
S 2
01
0
54.0 † † † † 2853.3 — — — — 2254.7 9.7 344 50.5 645 1947.7 5.4 258 — — 3452.4 1.5 99 83.9 1,850 3353.6 7.2 510 52.8 1,441 4550.8 1.2 100 89.1 2,449 3671.4 4.5 259 86.3 1,493 2352.3 7.8 534 55.6 1,384 2950.7 4.1 456 73.8 2,703 4849.4 1.5 59 66.6 889 2355.9 7.8 861 52.8 2,236 9055.7 1.6 135 85.9 2,389 3755.6 9.9 1,334 44.4 2,094 7351.6 5.8 1,762 60.7 6,335 21864.3 6.1 974 69.7 3,403 11359.7 3.6 274 74.0 1,824 5248.0 10.5 1,408 86.0 3,748 7752.2 3.7 125 85.7 841 1955.8 0.8 48 97.2 1,760 3461.6 2.4 292 49.3 2,243 6042.0 3.9 212 76.2 1,357 2950.5 18.7 1,539 46.0 1,310 5849.1 3.9 867 78.3 5,493 3155.6 2.8 183 86.4 1,631 3150.6 0.8 58 95.8 2,061 3155.8 5.3 252 78.0 1,065 2454.4 1.4 65 80.0 1,118 2846.0 — — — — 5956.3 8.0 327 65.3 734 2251.0 13.5 632 50.4 878 2951.8 2.2 97 75.0 1,100 3151.0 5.0 315 75.5 1,499 3756.1 22.9 1,818 92.3 1,840 3457.6 11.7 895 60.2 1,584 6556.3 4.6 600 94.9 3,488 20
50.6 1.9 97 90.5 1,417 3048.8 12.7 1,043 77.4 1,971 5144.8 19.4 1,401 54.1 1,347 5345.0 3.7 263 85.9 2,041 5446.9 4.9 572 91.1 3,259 5745.2 10.3 758 81.2 2,007 6547.2 20.5 3,055 54.2 2,814 14346.4 1.5 157 88.0 2,769 7950.0 6.0 234 62.0 833 3146.0 7.8 1,665 78.0 5,580 16248.4 2.6 111 91.5 1,328 2547.0 10.1 499 75.6 1,236 4346.3 5.0 309 89.5 1,823 5147.8 10.3 429 70.0 943 3949.3 6.7 363 81.3 1,361 4746.2 5.7 227 86.3 1,100 31
2000, 2006–07, and 2008—Continued
Dropouts and graduates, 2006–07
Number ofschools,fall 2008
Teachersas a
percentageof total staff
Percentdropping
out ofgrades
9–12
Number ofdropouts
from grades9–12
Averagedfreshman
graduationrate
(AFGR)1
Number ofhigh schoolgraduates2
18 19 20 21 22 23
Palmdale Elementary............... CA 13,199 20,853 21,498 6,558 72.9 10.9 16.6 64.8 2.7 0.4 4.5 939 22.9 1,740 12.4Panama-Buena Vista Union.... CA 10,066 12,843 16,385 2,287 51.7 31.4 11.2 47.9 8.3 0.7 0.5 820 20.0 1,540 10.6Paramount Unified.................... CA 12,855 16,862 15,913 6,535 88.7 2.2 10.1 84.4 2.6 0.4 0.3 735 21.7 1,343 11.8Pasadena Unified..................... CA 21,802 23,559 20,526 4,319 52.7 16.4 21.2 56.2 4.9 0.2 1.1 1,035 19.8 2,171 9.5Placentia-Yorba Linda Unified.. CA 21,438 26,046 26,094 3,606 29.7 50.0 1.8 33.8 11.6 0.2 2.7 1,099 23.7 2,097 12.4Pomona Unified........................ CA 26,918 34,479 30,032 12,278 77.2 5.8 6.3 81.7 6.0 0.1 0.3 1,368 22.0 2,552 11.8Poway Unified........................... CA 24,662 32,532 33,305 3,890 11.1 55.3 3.0 11.1 24.6 0.4 5.6 1,469 22.7 2,895 11.5Redlands Unified...................... CA 16,002 19,411 21,427 2,179 50.7 36.5 7.0 36.6 11.3 0.6 7.9 963 22.2 1,350 15.9Rialto Unified............................. CA 19,794 28,060 27,452 8,486 75.8 5.8 17.0 73.3 2.2 0.3 1.5 1,199 22.9 2,293 12.0Riverside Unified....................... CA 31,326 38,124 43,336 8,095 57.8 30.4 9.2 53.6 5.2 0.6 1.1 1,916 22.6 3,776 11.5Rowland Unified ....................... CA 19,143 18,972 16,485 5,617 58.5 3.7 2.3 60.8 29.5 0.1 3.6 797 20.7 1,613 10.2Sacramento City Unified.......... CA 49,557 52,734 48,155 12,362 65.9 21.1 20.9 33.0 23.1 1.2 0.7 2,316 20.8 4,147 11.6Saddleback Valley Unified ....... CA 25,130 35,199 32,936 4,090 15.8 59.6 2.0 24.9 10.8 0.3 2.4 1,377 23.9 2,473 13.3San Bernardino City Unified.... CA 40,589 52,031 54,727 18,131 84.8 10.5 15.6 69.0 2.7 0.7 1.4 2,639 20.7 4,748 11.5San Diego Unified .................... CA 121,107 141,804 132,256 38,743 63.5 25.2 13.2 44.5 16.6 0.5 0.0 6,855 19.3 13,278 10.0San Francisco Unified.............. CA 61,688 59,979 55,183 16,851 56.3 10.8 12.3 23.1 48.4 0.6 4.8 3,168 17.4 4,931 11.2San Jose Unified ...................... CA 29,630 33,015 31,918 8,495 47.6 26.7 3.4 51.7 15.5 0.8 1.9 1,548 20.6 2,594 12.3San Juan Unified...................... CA 47,690 50,266 47,230 4,492 37.1 65.7 7.7 17.1 7.0 1.9 0.6 2,248 21.0 4,679 10.1San Marcos Unified.................. CA 9,108 12,804 17,852 4,158 41.6 39.3 3.1 47.3 8.5 0.5 1.2 774 23.1 1,480 12.1San Ramon Valley Unified....... CA 16,119 20,742 26,975 1,231 1.8 59.2 2.1 4.8 25.2 0.2 8.5 1,267 21.3 2,272 11.9Santa Ana Unified .................... CA 45,964 60,643 57,439 32,202 81.4 3.1 0.6 92.4 3.1 0.1 0.7 2,579 22.3 4,189 13.7Simi Valley Unified.................... CA 18,262 21,181 20,855 2,091 24.7 61.8 1.5 24.2 8.7 0.7 3.1 913 22.8 2,172 9.6Stockton Unified........................ CA 32,687 37,573 37,831 10,598 79.0 9.0 12.6 57.2 16.9 4.2 0.2 1,866 20.3 3,698 10.2Sweetwater Union High........... CA 27,894 35,330 42,804 11,143 47.4 10.0 4.3 73.0 12.0 0.4 0.2 1,857 23.1 3,780 11.3Temecula Valley Unified........... CA 7,596 18,980 29,492 2,131 13.0 50.0 4.4 20.3 10.2 1.0 14.1 1,363 21.6 2,451 12.0Torrance Unified........................ CA 19,645 24,118 24,758 3,454 18.5 32.6 3.4 18.0 36.1 0.6 9.3 1,057 23.4 2,087 11.9Tracy Joint Unified .................... CA 7,626 13,816 17,342 4,179 36.2 29.1 8.1 40.6 16.9 0.6 4.8 836 20.8 1,498 11.6Tustin Unified............................. CA 10,831 16,963 21,682 5,321 35.8 33.5 2.2 42.4 17.8 0.3 3.8 907 23.9 1,669 13.0Twin Rivers Unified................... CA — — 30,927 8,792 73.9 33.0 15.4 31.1 12.2 0.9 7.4 1,493 20.7 3,243 9.5Val Verde Unified ...................... CA — 11,242 19,183 4,786 67.4 7.1 16.4 69.1 4.0 0.1 3.2 834 23.0 1,483 12.9Vallejo City Unified.................... CA 19,049 20,270 16,672 2,836 54.9 10.8 31.7 28.5 23.7 0.6 4.6 823 20.3 1,614 10.3Ventura Unified ......................... CA 15,383 17,527 17,371 2,563 40.1 45.1 1.8 40.5 3.6 1.1 7.8 811 21.4 1,565 11.1Visalia Unified........................... CA 21,309 23,989 27,024 5,056 57.9 30.9 2.9 57.8 6.2 2.1 0.1 1,177 23.0 2,305 11.7Vista Unified.............................. CA 18,489 27,651 26,726 7,414 51.1 29.3 5.4 53.1 5.4 0.5 6.3 1,277 20.9 2,275 11.7West Contra Costa Unified...... CA 31,292 34,499 30,769 10,037 64.7 10.6 22.5 46.3 15.6 0.2 4.9 1,561 19.7 2,708 11.4William S. Hart Union High...... CA 10,278 17,001 25,629 1,969 11.8 52.4 5.3 29.3 11.3 0.4 1.4 1,046 24.5 1,858 13.8
Academy School District No. 20 CO 10,986 17,628 21,917 222 9.4 81.6 4.0 8.2 5.4 0.8 — 1,336 16.4 2,642 8.3Adams 12 Five Star Schools... CO 20,838 30,079 40,818 4,512 29.3 60.2 2.7 30.9 5.4 0.9 — 2,048 19.9 4,200 9.7Aurora Joint District No. 28 ...... CO 25,897 30,453 35,523 12,525 59.6 24.1 20.1 50.6 4.3 0.8 — 1,864 19.1 4,162 8.5Boulder Valley No. RE 2........... CO 21,502 27,508 28,875 2,398 17.0 76.3 1.6 14.7 6.8 0.6 — 1,744 16.6 3,877 7.4Cherry Creek............................ CO 29,210 42,320 51,199 3,324 22.2 63.3 14.4 13.4 8.3 0.6 — 2,950 17.4 6,295 8.1Colorado Springs...................... CO 30,009 32,699 29,323 2,251 48.0 62.1 11.0 22.3 2.9 1.7 — 1,836 16.0 4,059 7.2Denver....................................... CO 59,013 70,847 74,189 20,379 65.9 22.8 17.2 55.5 3.4 1.1 — 4,356 17.0 9,226 8.0Douglas County........................ CO 13,125 34,918 58,723 1,606 8.0 82.5 3.0 9.4 4.5 0.6 — 3,133 18.7 6,757 8.7Greeley...................................... CO 11,657 15,998 18,920 3,849 52.7 43.3 1.4 53.6 1.1 0.6 — 1,058 17.9 2,115 8.9Jefferson County ...................... CO 76,275 87,703 85,946 4,937 24.4 73.7 2.0 19.2 3.8 1.2 — 4,959 17.3 10,778 8.0Littleton...................................... CO 15,524 16,516 15,869 647 16.3 82.4 2.2 11.5 3.3 0.6 — 917 17.3 1,893 8.4Mesa County Valley.................. CO 17,024 19,688 22,171 933 37.7 76.8 1.6 19.1 1.3 1.3 — 1,270 17.5 2,702 8.2Poudre R-1................................ CO 18,589 24,052 25,960 1,675 24.8 77.5 1.9 16.0 3.5 1.1 — 1,531 17.0 3,310 7.8Pueblo ....................................... CO 18,364 17,636 18,524 677 66.8 33.5 2.8 61.8 0.8 1.1 — 1,119 16.6 2,341 7.9Saint Vrain Valley...................... CO 15,070 19,620 25,751 2,867 28.4 67.2 1.3 27.0 3.7 0.9 — 1,359 19.0 2,758 9.3Thompson................................. CO 12,019 14,766 15,332 456 28.6 81.3 1.2 15.1 1.6 0.8 — 898 17.1 1,943 7.9
See notes at end of table.
Table 94. Selected statistics on enrollment, teachers, dropouts, and graduates in public school districts enrolling more than 15,000 students: 1990,
Name of district StateEnrollment,
fall 1990Enrollment,
fall 2000Enrollment,
fall 2008
Number ofEnglish
languagelearners,
2008
Percenteligible for
free orreduced-
price lunch,2008
Percentage distribution of enrollment, by race, fall 2008 Teachers and staff, fall 2008
White Black Hispanic
Asian/Pacific
Islander
AmericanIndian/AlaskaNative
Two ormoreraces
Number ofclassroom
teachers
Pupil/teacher
ratio
Totalnumberof staff
Student/staff ratio
1 2 3 4 5 6 7 8 9 10 11 12 13 14 15 16 17
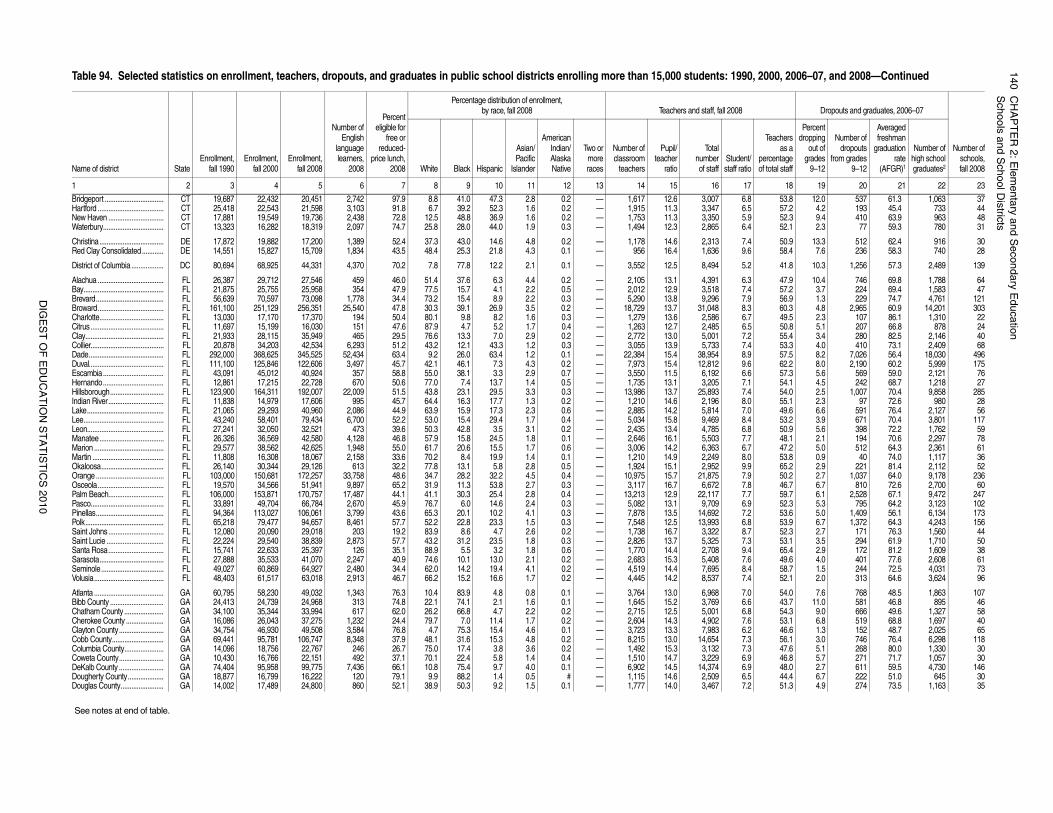
14
0C
HA
PT
ER
2: E
lem
en
tary a
nd
Se
con
da
ry Ed
uca
tion
Sch
oo
ls an
d S
cho
ol D
istricts
DIG
ES
T O
F E
DU
CA
TIO
N S
TA
TIS
TIC
S 2
01
0
53.8 12.0 537 61.3 1,063 3757.2 4.2 193 45.4 733 4452.3 9.4 410 63.9 963 4852.1 2.3 77 59.3 780 31
50.9 13.3 512 62.4 916 3058.4 7.6 236 58.3 740 28
41.8 10.3 1,256 57.3 2,489 139
47.9 10.4 746 69.8 1,788 6457.2 3.7 224 69.4 1,583 4756.9 1.3 229 74.7 4,761 12160.3 4.8 2,965 60.9 14,201 30349.5 2.3 107 86.1 1,310 2250.8 5.1 207 66.8 878 2455.4 3.4 280 82.5 2,146 4053.3 4.0 410 73.1 2,409 6857.5 8.2 7,026 56.4 18,030 49662.2 8.0 2,190 60.2 5,999 17557.3 5.6 569 59.0 2,121 7654.1 4.5 242 68.7 1,218 2754.0 2.5 1,007 70.4 9,858 28555.1 2.3 97 72.6 980 2849.6 6.6 591 76.4 2,127 5653.2 3.9 671 70.4 3,801 11750.9 5.6 398 72.2 1,762 5948.1 2.1 194 70.6 2,297 7847.2 5.0 512 64.3 2,361 6153.8 0.9 40 74.0 1,117 3665.2 2.9 221 81.4 2,112 5250.2 2.7 1,037 64.0 9,178 23646.7 6.7 810 72.6 2,700 6059.7 6.1 2,528 67.1 9,472 24752.3 5.3 795 64.2 3,123 10253.6 5.0 1,409 56.1 6,134 17353.9 6.7 1,372 64.3 4,243 15652.3 2.7 171 76.3 1,560 4453.1 3.5 294 61.9 1,710 5065.4 2.9 172 81.2 1,609 3849.6 4.0 401 77.6 2,608 6158.7 1.5 244 72.5 4,031 7352.1 2.0 313 64.6 3,624 96
54.0 7.6 768 48.5 1,863 10743.7 11.0 581 46.8 895 4654.3 9.0 666 49.6 1,327 5853.1 6.8 519 68.8 1,697 4046.6 1.3 152 48.7 2,025 6556.1 3.0 746 76.4 6,298 11847.6 5.1 268 80.0 1,330 3046.8 5.7 271 71.7 1,057 3048.0 2.7 611 59.5 4,730 14644.4 6.7 222 51.0 645 3051.3 4.9 274 73.5 1,163 35
2000, 2006–07, and 2008—Continued
Dropouts and graduates, 2006–07
Number ofschools,fall 2008
Teachersas a
percentageof total staff
Percentdropping
out ofgrades
9–12
Number ofdropouts
from grades9–12
Averagedfreshman
graduationrate
(AFGR)1
Number ofhigh schoolgraduates2
18 19 20 21 22 23
Bridgeport ................................. CT 19,687 22,432 20,451 2,742 97.9 8.8 41.0 47.3 2.8 0.2 — 1,617 12.6 3,007 6.8Hartford ..................................... CT 25,418 22,543 21,598 3,103 91.8 6.7 39.2 52.3 1.6 0.2 — 1,915 11.3 3,347 6.5New Haven ............................... CT 17,881 19,549 19,736 2,438 72.8 12.5 48.8 36.9 1.6 0.2 — 1,753 11.3 3,350 5.9Waterbury.................................. CT 13,323 16,282 18,319 2,097 74.7 25.8 28.0 44.0 1.9 0.3 — 1,494 12.3 2,865 6.4
Christina.................................... DE 17,872 19,882 17,200 1,389 52.4 37.3 43.0 14.6 4.8 0.2 — 1,178 14.6 2,313 7.4Red Clay Consolidated............ DE 14,551 15,827 15,709 1,834 43.5 48.4 25.3 21.8 4.3 0.1 — 956 16.4 1,636 9.6
District of Columbia .................. DC 80,694 68,925 44,331 4,370 70.2 7.8 77.8 12.2 2.1 0.1 — 3,552 12.5 8,494 5.2
Alachua ..................................... FL 26,387 29,712 27,546 459 46.0 51.4 37.6 6.3 4.4 0.2 — 2,105 13.1 4,391 6.3Bay............................................. FL 21,875 25,755 25,958 354 47.9 77.5 15.7 4.1 2.2 0.5 — 2,012 12.9 3,518 7.4Brevard...................................... FL 56,639 70,597 73,098 1,778 34.4 73.2 15.4 8.9 2.2 0.3 — 5,290 13.8 9,296 7.9Broward..................................... FL 161,100 251,129 256,351 25,540 47.8 30.3 39.1 26.9 3.5 0.2 — 18,729 13.7 31,048 8.3Charlotte.................................... FL 13,030 17,170 17,370 194 50.4 80.1 9.8 8.2 1.6 0.3 — 1,279 13.6 2,586 6.7Citrus......................................... FL 11,697 15,199 16,030 151 47.6 87.9 4.7 5.2 1.7 0.4 — 1,263 12.7 2,485 6.5Clay............................................ FL 21,933 28,115 35,949 465 29.5 76.6 13.3 7.0 2.9 0.2 — 2,772 13.0 5,001 7.2Collier......................................... FL 20,878 34,203 42,534 6,293 51.2 43.2 12.1 43.3 1.2 0.3 — 3,055 13.9 5,733 7.4Dade.......................................... FL 292,000 368,625 345,525 52,434 63.4 9.2 26.0 63.4 1.2 0.1 — 22,384 15.4 38,954 8.9Duval.......................................... FL 111,100 125,846 122,606 3,497 45.7 42.1 46.1 7.3 4.3 0.2 — 7,973 15.4 12,812 9.6Escambia.................................. FL 43,091 45,012 40,924 357 58.8 55.0 38.1 3.3 2.9 0.7 — 3,550 11.5 6,192 6.6Hernando.................................. FL 12,861 17,215 22,728 670 50.6 77.0 7.4 13.7 1.4 0.5 — 1,735 13.1 3,205 7.1Hillsborough.............................. FL 123,900 164,311 192,007 22,009 51.5 43.8 23.1 29.5 3.3 0.3 — 13,986 13.7 25,893 7.4Indian River............................... FL 11,838 14,979 17,606 995 45.7 64.4 16.3 17.7 1.3 0.2 — 1,210 14.6 2,196 8.0Lake........................................... FL 21,065 29,293 40,960 2,086 44.9 63.9 15.9 17.3 2.3 0.6 — 2,885 14.2 5,814 7.0Lee............................................. FL 43,240 58,401 79,434 6,700 52.2 53.0 15.4 29.4 1.7 0.4 — 5,034 15.8 9,469 8.4Leon........................................... FL 27,241 32,050 32,521 473 39.6 50.3 42.8 3.5 3.1 0.2 — 2,435 13.4 4,785 6.8Manatee.................................... FL 26,326 36,569 42,580 4,128 46.8 57.9 15.8 24.5 1.8 0.1 — 2,646 16.1 5,503 7.7Marion ....................................... FL 29,577 38,562 42,625 1,948 55.0 61.7 20.6 15.5 1.7 0.6 — 3,006 14.2 6,363 6.7Martin ........................................ FL 11,808 16,308 18,067 2,158 33.6 70.2 8.4 19.9 1.4 0.1 — 1,210 14.9 2,249 8.0Okaloosa................................... FL 26,140 30,344 29,126 613 32.2 77.8 13.1 5.8 2.8 0.5 — 1,924 15.1 2,952 9.9Orange ...................................... FL 103,000 150,681 172,257 33,758 48.6 34.7 28.2 32.2 4.5 0.4 — 10,975 15.7 21,875 7.9Osceola..................................... FL 19,570 34,566 51,941 9,897 65.2 31.9 11.3 53.8 2.7 0.3 — 3,117 16.7 6,672 7.8Palm Beach............................... FL 106,000 153,871 170,757 17,487 44.1 41.1 30.3 25.4 2.8 0.4 — 13,213 12.9 22,117 7.7Pasco......................................... FL 33,891 49,704 66,784 2,670 45.9 76.7 6.0 14.6 2.4 0.3 — 5,082 13.1 9,709 6.9Pinellas...................................... FL 94,364 113,027 106,061 3,799 43.6 65.3 20.1 10.2 4.1 0.3 — 7,878 13.5 14,692 7.2Polk............................................ FL 65,218 79,477 94,657 8,461 57.7 52.2 22.8 23.3 1.5 0.3 — 7,548 12.5 13,993 6.8Saint Johns............................... FL 12,080 20,090 29,018 203 19.2 83.9 8.6 4.7 2.6 0.2 — 1,738 16.7 3,322 8.7Saint Lucie ................................ FL 22,224 29,540 38,839 2,873 57.7 43.2 31.2 23.5 1.8 0.3 — 2,826 13.7 5,325 7.3Santa Rosa............................... FL 15,741 22,633 25,397 126 35.1 88.9 5.5 3.2 1.8 0.6 — 1,770 14.4 2,708 9.4Sarasota.................................... FL 27,888 35,533 41,070 2,247 40.9 74.6 10.1 13.0 2.1 0.2 — 2,683 15.3 5,408 7.6Seminole................................... FL 49,027 60,869 64,927 2,480 34.4 62.0 14.2 19.4 4.1 0.2 — 4,519 14.4 7,695 8.4Volusia....................................... FL 48,403 61,517 63,018 2,913 46.7 66.2 15.2 16.6 1.7 0.2 — 4,445 14.2 8,537 7.4
Atlanta ....................................... GA 60,795 58,230 49,032 1,343 76.3 10.4 83.9 4.8 0.8 0.1 — 3,764 13.0 6,968 7.0Bibb County .............................. GA 24,413 24,739 24,968 313 74.8 22.1 74.1 2.1 1.6 0.1 — 1,645 15.2 3,769 6.6Chatham County ...................... GA 34,100 35,344 33,994 617 62.0 26.2 66.8 4.7 2.2 0.2 — 2,715 12.5 5,001 6.8Cherokee County ..................... GA 16,086 26,043 37,275 1,232 24.4 79.7 7.0 11.4 1.7 0.2 — 2,604 14.3 4,902 7.6Clayton County......................... GA 34,754 46,930 49,508 3,584 76.8 4.7 75.3 15.4 4.6 0.1 — 3,723 13.3 7,983 6.2Cobb County............................. GA 69,441 95,781 106,747 8,348 37.9 48.1 31.6 15.3 4.8 0.2 — 8,215 13.0 14,654 7.3Columbia County...................... GA 14,096 18,756 22,767 246 26.7 75.0 17.4 3.8 3.6 0.2 — 1,492 15.3 3,132 7.3Coweta County......................... GA 10,430 16,766 22,151 492 37.1 70.1 22.4 5.8 1.4 0.4 — 1,510 14.7 3,229 6.9DeKalb County ......................... GA 74,404 95,958 99,775 7,436 66.1 10.8 75.4 9.7 4.0 0.1 — 6,902 14.5 14,374 6.9Dougherty County.................... GA 18,877 16,799 16,222 120 79.1 9.9 88.2 1.4 0.5 # — 1,115 14.6 2,509 6.5Douglas County........................ GA 14,002 17,489 24,800 860 52.1 38.9 50.3 9.2 1.5 0.1 — 1,777 14.0 3,467 7.2
See notes at end of table.
Table 94. Selected statistics on enrollment, teachers, dropouts, and graduates in public school districts enrolling more than 15,000 students: 1990,
Name of district StateEnrollment,
fall 1990Enrollment,
fall 2000Enrollment,
fall 2008
Number ofEnglish
languagelearners,
2008
Percenteligible for
free orreduced-
price lunch,2008
Percentage distribution of enrollment, by race, fall 2008 Teachers and staff, fall 2008
White Black Hispanic
Asian/Pacific
Islander
AmericanIndian/AlaskaNative
Two ormoreraces
Number ofclassroom
teachers
Pupil/teacher
ratio
Totalnumberof staff
Student/staff ratio
1 2 3 4 5 6 7 8 9 10 11 12 13 14 15 16 17
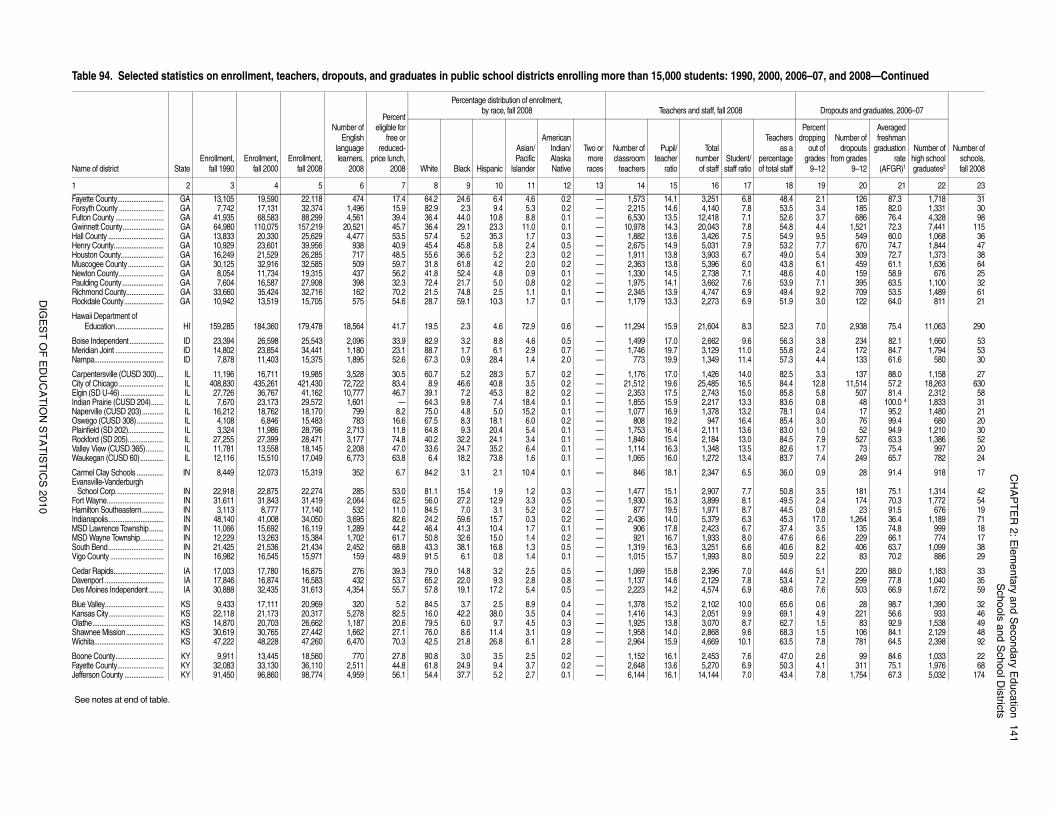
CH
AP
TE
R 2
: Ele
me
nta
ry an
d S
eco
nd
ary E
du
catio
n1
41
Sch
oo
ls an
d S
cho
ol D
istricts
DIG
ES
T O
F E
DU
CA
TIO
N S
TA
TIS
TIC
S 2
01
0
48.4 2.1 126 87.3 1,718 3153.5 3.4 185 82.0 1,331 3052.6 3.7 686 76.4 4,328 9854.8 4.4 1,521 72.3 7,441 11554.9 9.5 549 60.0 1,068 3653.2 7.7 670 74.7 1,844 4749.0 5.4 309 72.7 1,373 3843.8 6.1 459 61.1 1,636 6448.6 4.0 159 58.9 676 2553.9 7.1 395 63.5 1,100 3249.4 9.2 709 53.5 1,489 6151.9 3.0 122 64.0 811 21
52.3 7.0 2,938 75.4 11,063 290
56.3 3.8 234 82.1 1,660 5355.8 2.4 172 84.7 1,794 5357.3 4.4 133 61.6 580 30
82.5 3.3 137 88.0 1,158 2784.4 12.8 11,514 57.2 18,263 63085.8 5.8 507 81.4 2,312 5883.6 0.8 48 100.0 4 1,833 3178.1 0.4 17 95.2 1,480 2185.4 3.0 76 99.4 680 2083.0 1.0 52 94.9 1,210 3084.5 7.9 527 63.3 1,386 5282.6 1.7 73 75.4 997 2083.7 7.4 249 65.7 782 24
36.0 0.9 28 91.4 918 17
50.8 3.5 181 75.1 1,314 4249.5 2.4 174 70.3 1,772 5444.5 0.8 23 91.5 676 1945.3 17.0 1,264 36.4 1,189 7137.4 3.5 135 74.8 999 1847.6 6.6 229 66.1 774 1740.6 8.2 406 63.7 1,099 3850.9 2.2 83 70.2 886 29
44.6 5.1 220 88.0 1,183 3353.4 7.2 299 77.8 1,040 3548.6 7.6 503 66.9 1,672 59
65.6 0.6 28 98.7 1,390 3269.1 4.9 221 56.6 933 4662.7 1.5 83 92.9 1,538 4968.3 1.5 106 84.1 2,129 4863.5 7.8 781 64.5 2,398 92
47.0 2.6 99 84.6 1,033 2250.3 4.1 311 75.1 1,976 6843.4 7.8 1,754 67.3 5,032 174
2000, 2006–07, and 2008—Continued
Dropouts and graduates, 2006–07
Number ofschools,fall 2008
Teachersas a
percentageof total staff
Percentdropping
out ofgrades
9–12
Number ofdropouts
from grades9–12
Averagedfreshman
graduationrate
(AFGR)1
Number ofhigh schoolgraduates2
18 19 20 21 22 23
Fayette County.......................... GA 13,105 19,590 22,118 474 17.4 64.2 24.6 6.4 4.6 0.2 — 1,573 14.1 3,251 6.8Forsyth County ......................... GA 7,742 17,131 32,374 1,496 15.9 82.9 2.3 9.4 5.3 0.2 — 2,215 14.6 4,140 7.8Fulton County ........................... GA 41,935 68,583 88,299 4,561 39.4 36.4 44.0 10.8 8.8 0.1 — 6,530 13.5 12,418 7.1Gwinnett County....................... GA 64,980 110,075 157,219 20,521 45.7 36.4 29.1 23.3 11.0 0.1 — 10,978 14.3 20,043 7.8Hall County ............................... GA 13,833 20,330 25,629 4,477 53.5 57.4 5.2 35.3 1.7 0.3 — 1,882 13.6 3,426 7.5Henry County............................ GA 10,929 23,601 39,956 938 40.9 45.4 45.8 5.8 2.4 0.5 — 2,675 14.9 5,031 7.9Houston County........................ GA 16,249 21,529 26,285 717 48.5 55.6 36.6 5.2 2.3 0.2 — 1,911 13.8 3,903 6.7Muscogee County.................... GA 30,125 32,916 32,585 509 59.7 31.8 61.8 4.2 2.0 0.2 — 2,363 13.8 5,396 6.0Newton County......................... GA 8,054 11,734 19,315 437 56.2 41.8 52.4 4.8 0.9 0.1 — 1,330 14.5 2,738 7.1Paulding County ....................... GA 7,604 16,587 27,908 398 32.3 72.4 21.7 5.0 0.8 0.2 — 1,975 14.1 3,662 7.6Richmond County..................... GA 33,660 35,424 32,716 162 70.2 21.5 74.8 2.5 1.1 0.1 — 2,345 13.9 4,747 6.9Rockdale County...................... GA 10,942 13,519 15,705 575 54.6 28.7 59.1 10.3 1.7 0.1 — 1,179 13.3 2,273 6.9
Hawaii Department of Education........................... HI 159,285 184,360 179,478 18,564 41.7 19.5 2.3 4.6 72.9 0.6 — 11,294 15.9 21,604 8.3
Boise Independent................... ID 23,394 26,598 25,543 2,096 33.9 82.9 3.2 8.8 4.6 0.5 — 1,499 17.0 2,662 9.6Meridian Joint ........................... ID 14,802 23,854 34,441 1,180 23.1 88.7 1.7 6.1 2.9 0.7 — 1,746 19.7 3,129 11.0Nampa....................................... ID 7,878 11,403 15,375 1,895 52.6 67.3 0.9 28.4 1.4 2.0 — 773 19.9 1,349 11.4
Carpentersville (CUSD 300).... IL 11,196 16,711 19,985 3,528 30.5 60.7 5.2 28.3 5.7 0.2 — 1,176 17.0 1,426 14.0City of Chicago ......................... IL 408,830 435,261 421,430 72,722 83.4 8.9 46.6 40.8 3.5 0.2 — 21,512 19.6 25,485 16.5Elgin (SD U-46) ........................ IL 27,726 36,767 41,162 10,777 46.7 39.1 7.2 45.3 8.2 0.2 — 2,353 17.5 2,743 15.0Indian Prairie (CUSD 204)....... IL 7,670 23,173 29,572 1,601 — 64.3 9.8 7.4 18.4 0.1 — 1,855 15.9 2,217 13.3Naperville (CUSD 203)............ IL 16,212 18,762 18,170 799 8.2 75.0 4.8 5.0 15.2 0.1 — 1,077 16.9 1,378 13.2Oswego (CUSD 308)............... IL 4,108 6,846 15,483 783 16.6 67.5 8.3 18.1 6.0 0.2 — 808 19.2 947 16.4Plainfield (SD 202).................... IL 3,324 11,986 28,796 2,713 11.8 64.8 9.3 20.4 5.4 0.1 — 1,753 16.4 2,111 13.6Rockford (SD 205).................... IL 27,255 27,399 28,471 3,177 74.8 40.2 32.2 24.1 3.4 0.1 — 1,846 15.4 2,184 13.0Valley View (CUSD 365).......... IL 11,781 13,558 18,145 2,208 47.0 33.6 24.7 35.2 6.4 0.1 — 1,114 16.3 1,348 13.5Waukegan (CUSD 60)............. IL 12,116 15,510 17,049 6,773 63.8 6.4 18.2 73.8 1.6 0.1 — 1,065 16.0 1,272 13.4
Carmel Clay Schools ............... IN 8,449 12,073 15,319 352 6.7 84.2 3.1 2.1 10.4 0.1 — 846 18.1 2,347 6.5Evansville-Vanderburgh School Corp........................... IN 22,918 22,875 22,274 285 53.0 81.1 15.4 1.9 1.2 0.3 — 1,477 15.1 2,907 7.7Fort Wayne................................ IN 31,611 31,843 31,419 2,064 62.5 56.0 27.2 12.9 3.3 0.5 — 1,930 16.3 3,899 8.1Hamilton Southeastern............ IN 3,113 8,777 17,140 532 11.0 84.5 7.0 3.1 5.2 0.2 — 877 19.5 1,971 8.7Indianapolis............................... IN 48,140 41,008 34,050 3,695 82.6 24.2 59.6 15.7 0.3 0.2 — 2,436 14.0 5,379 6.3MSD Lawrence Township........ IN 11,066 15,692 16,119 1,289 44.2 46.4 41.3 10.4 1.7 0.1 — 906 17.8 2,423 6.7MSD Wayne Township............. IN 12,229 13,263 15,384 1,702 61.7 50.8 32.6 15.0 1.4 0.2 — 921 16.7 1,933 8.0South Bend............................... IN 21,425 21,536 21,434 2,452 68.8 43.3 38.1 16.8 1.3 0.5 — 1,319 16.3 3,251 6.6Vigo County .............................. IN 16,982 16,545 15,971 159 48.9 91.5 6.1 0.8 1.4 0.1 — 1,015 15.7 1,993 8.0
Cedar Rapids............................ IA 17,003 17,780 16,875 276 39.3 79.0 14.8 3.2 2.5 0.5 — 1,069 15.8 2,396 7.0Davenport ................................. IA 17,846 16,874 16,583 432 53.7 65.2 22.0 9.3 2.8 0.8 — 1,137 14.6 2,129 7.8Des Moines Independent ........ IA 30,888 32,435 31,613 4,354 55.7 57.8 19.1 17.2 5.4 0.5 — 2,223 14.2 4,574 6.9
Blue Valley................................. KS 9,433 17,111 20,969 320 5.2 84.5 3.7 2.5 8.9 0.4 — 1,378 15.2 2,102 10.0Kansas City............................... KS 22,118 21,173 20,317 5,278 82.5 16.0 42.2 38.0 3.5 0.4 — 1,416 14.3 2,051 9.9Olathe........................................ KS 14,870 20,703 26,662 1,187 20.6 79.5 6.0 9.7 4.5 0.3 — 1,925 13.8 3,070 8.7Shawnee Mission..................... KS 30,619 30,765 27,442 1,662 27.1 76.0 8.6 11.4 3.1 0.9 — 1,958 14.0 2,868 9.6Wichita....................................... KS 47,222 48,228 47,260 6,470 70.3 42.5 21.8 26.8 6.1 2.8 — 2,964 15.9 4,669 10.1
Boone County........................... KY 9,911 13,445 18,560 770 27.8 90.8 3.0 3.5 2.5 0.2 — 1,152 16.1 2,453 7.6Fayette County.......................... KY 32,083 33,130 36,110 2,511 44.8 61.8 24.9 9.4 3.7 0.2 — 2,648 13.6 5,270 6.9Jefferson County ...................... KY 91,450 96,860 98,774 4,959 56.1 54.4 37.7 5.2 2.7 0.1 — 6,144 16.1 14,144 7.0
See notes at end of table.
Table 94. Selected statistics on enrollment, teachers, dropouts, and graduates in public school districts enrolling more than 15,000 students: 1990,
Name of district StateEnrollment,
fall 1990Enrollment,
fall 2000Enrollment,
fall 2008
Number ofEnglish
languagelearners,
2008
Percenteligible for
free orreduced-
price lunch,2008
Percentage distribution of enrollment, by race, fall 2008 Teachers and staff, fall 2008
White Black Hispanic
Asian/Pacific
Islander
AmericanIndian/AlaskaNative
Two ormoreraces
Number ofclassroom
teachers
Pupil/teacher
ratio
Totalnumberof staff
Student/staff ratio
1 2 3 4 5 6 7 8 9 10 11 12 13 14 15 16 17
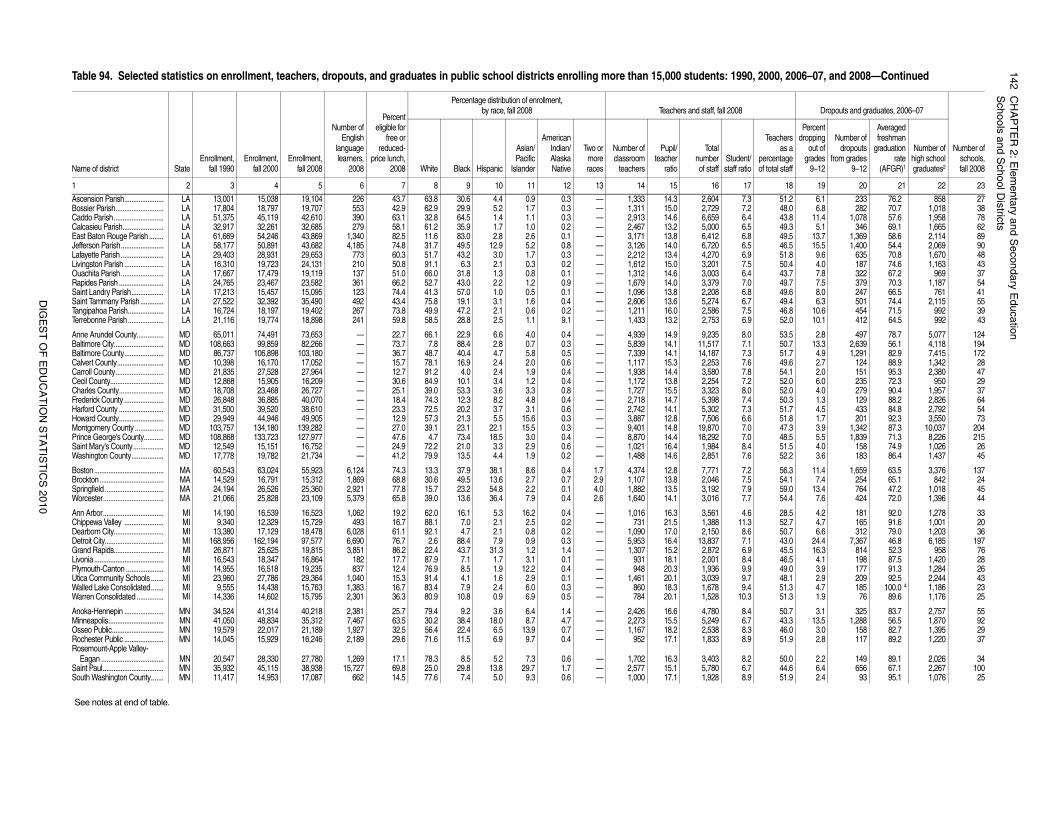
14
2C
HA
PT
ER
2: E
lem
en
tary a
nd
Se
con
da
ry Ed
uca
tion
Sch
oo
ls an
d S
cho
ol D
istricts
DIG
ES
T O
F E
DU
CA
TIO
N S
TA
TIS
TIC
S 2
01
0
51.2 6.1 233 76.2 858 2748.0 6.8 282 70.7 1,018 3843.8 11.4 1,078 57.6 1,958 7849.3 5.1 346 69.1 1,665 6249.5 13.7 1,369 58.6 2,114 8946.5 15.5 1,400 54.4 2,069 9051.8 9.6 635 70.8 1,670 4850.4 4.0 187 74.6 1,163 4343.7 7.8 322 67.2 969 3749.7 7.5 379 70.3 1,187 5449.6 8.0 247 66.5 761 4149.4 6.3 501 74.4 2,115 5546.8 10.6 454 71.5 992 3952.0 10.1 412 64.5 992 43
53.5 2.8 497 78.7 5,077 12450.7 13.3 2,639 56.1 4,118 19451.7 4.9 1,291 82.9 7,415 17249.6 2.7 124 88.9 1,342 2854.1 2.0 151 95.3 2,380 4752.0 6.0 235 72.3 950 2952.0 4.0 279 90.4 1,957 3750.3 1.3 129 88.2 2,826 6451.7 4.5 433 84.8 2,792 5451.8 1.7 201 92.3 3,550 7347.3 3.9 1,342 87.3 10,037 20448.5 5.5 1,839 71.3 8,226 21551.5 4.0 158 74.9 1,026 2652.2 3.6 183 86.4 1,437 45
56.3 11.4 1,659 63.5 3,376 13754.1 7.4 254 65.1 842 2459.0 13.4 764 47.2 1,018 4554.4 7.6 424 72.0 1,396 44
28.5 4.2 181 92.0 1,278 3352.7 4.7 165 91.6 1,001 2050.7 6.6 312 79.0 1,203 3643.0 24.4 7,367 46.8 6,185 19745.5 16.3 814 52.3 958 7646.5 4.1 198 87.5 1,420 2849.0 3.9 177 91.3 1,284 2648.1 2.9 209 92.5 2,244 4351.3 4.7 185 100.0 4 1,186 2351.3 1.9 76 89.6 1,176 25
50.7 3.1 325 83.7 2,757 5543.3 13.5 1,288 56.5 1,870 9246.0 3.0 158 82.7 1,395 2951.9 2.8 117 89.2 1,220 37
50.0 2.2 149 89.1 2,026 3444.6 6.4 656 67.1 2,267 10051.9 2.4 93 95.1 1,076 25
2000, 2006–07, and 2008—Continued
Dropouts and graduates, 2006–07
Number ofschools,fall 2008
Teachersas a
percentageof total staff
Percentdropping
out ofgrades
9–12
Number ofdropouts
from grades9–12
Averagedfreshman
graduationrate
(AFGR)1
Number ofhigh schoolgraduates2
18 19 20 21 22 23
Ascension Parish...................... LA 13,001 15,038 19,104 226 43.7 63.8 30.6 4.4 0.9 0.3 — 1,333 14.3 2,604 7.3Bossier Parish........................... LA 17,804 18,797 19,707 553 42.9 62.9 29.9 5.2 1.7 0.3 — 1,311 15.0 2,729 7.2Caddo Parish............................ LA 51,375 45,119 42,610 390 63.1 32.8 64.5 1.4 1.1 0.3 — 2,913 14.6 6,659 6.4Calcasieu Parish....................... LA 32,917 32,261 32,685 279 58.1 61.2 35.9 1.7 1.0 0.2 — 2,467 13.2 5,000 6.5East Baton Rouge Parish ........ LA 61,669 54,246 43,869 1,340 82.5 11.6 83.0 2.8 2.6 0.1 — 3,171 13.8 6,412 6.8Jefferson Parish........................ LA 58,177 50,891 43,682 4,185 74.8 31.7 49.5 12.9 5.2 0.8 — 3,126 14.0 6,720 6.5Lafayette Parish........................ LA 29,403 28,931 29,653 773 60.3 51.7 43.2 3.0 1.7 0.3 — 2,212 13.4 4,270 6.9Livingston Parish ...................... LA 16,310 19,723 24,131 210 50.8 91.1 6.3 2.1 0.3 0.2 — 1,612 15.0 3,201 7.5Ouachita Parish........................ LA 17,667 17,479 19,119 137 51.0 66.0 31.8 1.3 0.8 0.1 — 1,312 14.6 3,003 6.4Rapides Parish ......................... LA 24,765 23,467 23,582 361 66.2 52.7 43.0 2.2 1.2 0.9 — 1,679 14.0 3,379 7.0Saint Landry Parish.................. LA 17,213 15,457 15,095 123 74.4 41.3 57.0 1.0 0.5 0.1 — 1,096 13.8 2,208 6.8Saint Tammany Parish............. LA 27,522 32,392 35,490 492 43.4 75.8 19.1 3.1 1.6 0.4 — 2,606 13.6 5,274 6.7Tangipahoa Parish.................... LA 16,724 18,197 19,402 267 73.8 49.9 47.2 2.1 0.6 0.2 — 1,211 16.0 2,586 7.5Terrebonne Parish.................... LA 21,116 19,774 18,898 241 59.8 58.5 28.8 2.5 1.1 9.1 — 1,433 13.2 2,753 6.9
Anne Arundel County............... MD 65,011 74,491 73,653 — 22.7 66.1 22.9 6.6 4.0 0.4 — 4,939 14.9 9,235 8.0Baltimore City............................ MD 108,663 99,859 82,266 — 73.7 7.8 88.4 2.8 0.7 0.3 — 5,839 14.1 11,517 7.1Baltimore County...................... MD 86,737 106,898 103,180 — 36.7 48.7 40.4 4.7 5.8 0.5 — 7,339 14.1 14,187 7.3Calvert County.......................... MD 10,398 16,170 17,052 — 15.7 78.1 16.9 2.4 2.0 0.6 — 1,117 15.3 2,253 7.6Carroll County........................... MD 21,835 27,528 27,964 — 12.7 91.2 4.0 2.4 1.9 0.4 — 1,938 14.4 3,580 7.8Cecil County.............................. MD 12,868 15,905 16,209 — 30.6 84.9 10.1 3.4 1.2 0.4 — 1,172 13.8 2,254 7.2Charles County......................... MD 18,708 23,468 26,727 — 25.1 39.0 53.3 3.6 3.3 0.8 — 1,727 15.5 3,323 8.0Frederick County ...................... MD 26,848 36,885 40,070 — 18.4 74.3 12.3 8.2 4.8 0.4 — 2,718 14.7 5,398 7.4Harford County ......................... MD 31,500 39,520 38,610 — 23.3 72.5 20.2 3.7 3.1 0.6 — 2,742 14.1 5,302 7.3Howard County......................... MD 29,949 44,946 49,905 — 12.9 57.3 21.3 5.5 15.6 0.3 — 3,887 12.8 7,506 6.6Montgomery County ................ MD 103,757 134,180 139,282 — 27.0 39.1 23.1 22.1 15.5 0.3 — 9,401 14.8 19,870 7.0Prince George's County........... MD 108,868 133,723 127,977 — 47.6 4.7 73.4 18.5 3.0 0.4 — 8,870 14.4 18,292 7.0Saint Mary's County................. MD 12,549 15,151 16,752 — 24.9 72.2 21.0 3.3 2.9 0.6 — 1,021 16.4 1,984 8.4Washington County.................. MD 17,778 19,782 21,734 — 41.2 79.9 13.5 4.4 1.9 0.2 — 1,488 14.6 2,851 7.6
Boston....................................... MA 60,543 63,024 55,923 6,124 74.3 13.3 37.9 38.1 8.6 0.4 1.7 4,374 12.8 7,771 7.2Brockton.................................... MA 14,529 16,791 15,312 1,869 68.8 30.6 49.5 13.6 2.7 0.7 2.9 1,107 13.8 2,046 7.5Springfield ................................. MA 24,194 26,526 25,360 2,921 77.8 15.7 23.2 54.8 2.2 0.1 4.0 1,882 13.5 3,192 7.9Worcester.................................. MA 21,066 25,828 23,109 5,379 65.8 39.0 13.6 36.4 7.9 0.4 2.6 1,640 14.1 3,016 7.7
Ann Arbor.................................. MI 14,190 16,539 16,523 1,062 19.2 62.0 16.1 5.3 16.2 0.4 — 1,016 16.3 3,561 4.6Chippewa Valley ...................... MI 9,340 12,329 15,729 493 16.7 88.1 7.0 2.1 2.5 0.2 — 731 21.5 1,388 11.3Dearborn City............................ MI 13,380 17,129 18,478 6,028 61.1 92.1 4.7 2.1 0.8 0.2 — 1,090 17.0 2,150 8.6Detroit City................................. MI 168,956 162,194 97,577 6,690 76.7 2.6 88.4 7.9 0.9 0.3 — 5,953 16.4 13,837 7.1Grand Rapids............................ MI 26,871 25,625 19,815 3,851 86.2 22.4 43.7 31.3 1.2 1.4 — 1,307 15.2 2,872 6.9Livonia....................................... MI 16,543 18,347 16,864 182 17.7 87.9 7.1 1.7 3.1 0.1 — 931 18.1 2,001 8.4Plymouth-Canton ..................... MI 14,955 16,518 19,235 837 12.4 76.9 8.5 1.9 12.2 0.4 — 948 20.3 1,936 9.9Utica Community Schools ....... MI 23,960 27,786 29,364 1,040 15.3 91.4 4.1 1.6 2.9 0.1 — 1,461 20.1 3,039 9.7Walled Lake Consolidated....... MI 9,555 14,438 15,763 1,383 16.7 83.4 7.9 2.4 6.0 0.3 — 860 18.3 1,678 9.4Warren Consolidated ............... MI 14,336 14,602 15,795 2,301 36.3 80.9 10.8 0.9 6.9 0.5 — 784 20.1 1,528 10.3
Anoka-Hennepin ...................... MN 34,524 41,314 40,218 2,381 25.7 79.4 9.2 3.6 6.4 1.4 — 2,426 16.6 4,780 8.4Minneapolis............................... MN 41,050 48,834 35,312 7,467 63.5 30.2 38.4 18.0 8.7 4.7 — 2,273 15.5 5,249 6.7Osseo Public............................. MN 19,579 22,017 21,189 1,927 32.5 56.4 22.4 6.5 13.9 0.7 — 1,167 18.2 2,538 8.3Rochester Public ...................... MN 14,045 15,929 16,246 2,189 29.6 71.6 11.5 6.9 9.7 0.4 — 952 17.1 1,833 8.9Rosemount-Apple Valley-
Eagan ................................... MN 20,547 28,330 27,780 1,269 17.1 78.3 8.5 5.2 7.3 0.6 — 1,702 16.3 3,403 8.2Saint Paul.................................. MN 35,932 45,115 38,938 15,727 69.8 25.0 29.8 13.8 29.7 1.7 — 2,577 15.1 5,780 6.7South Washington County....... MN 11,417 14,953 17,087 662 14.5 77.6 7.4 5.0 9.3 0.6 — 1,000 17.1 1,928 8.9
See notes at end of table.
Table 94. Selected statistics on enrollment, teachers, dropouts, and graduates in public school districts enrolling more than 15,000 students: 1990,
Name of district StateEnrollment,
fall 1990Enrollment,
fall 2000Enrollment,
fall 2008
Number ofEnglish
languagelearners,
2008
Percenteligible for
free orreduced-
price lunch,2008
Percentage distribution of enrollment, by race, fall 2008 Teachers and staff, fall 2008
White Black Hispanic
Asian/Pacific
Islander
AmericanIndian/AlaskaNative
Two ormoreraces
Number ofclassroom
teachers
Pupil/teacher
ratio
Totalnumberof staff
Student/staff ratio
1 2 3 4 5 6 7 8 9 10 11 12 13 14 15 16 17
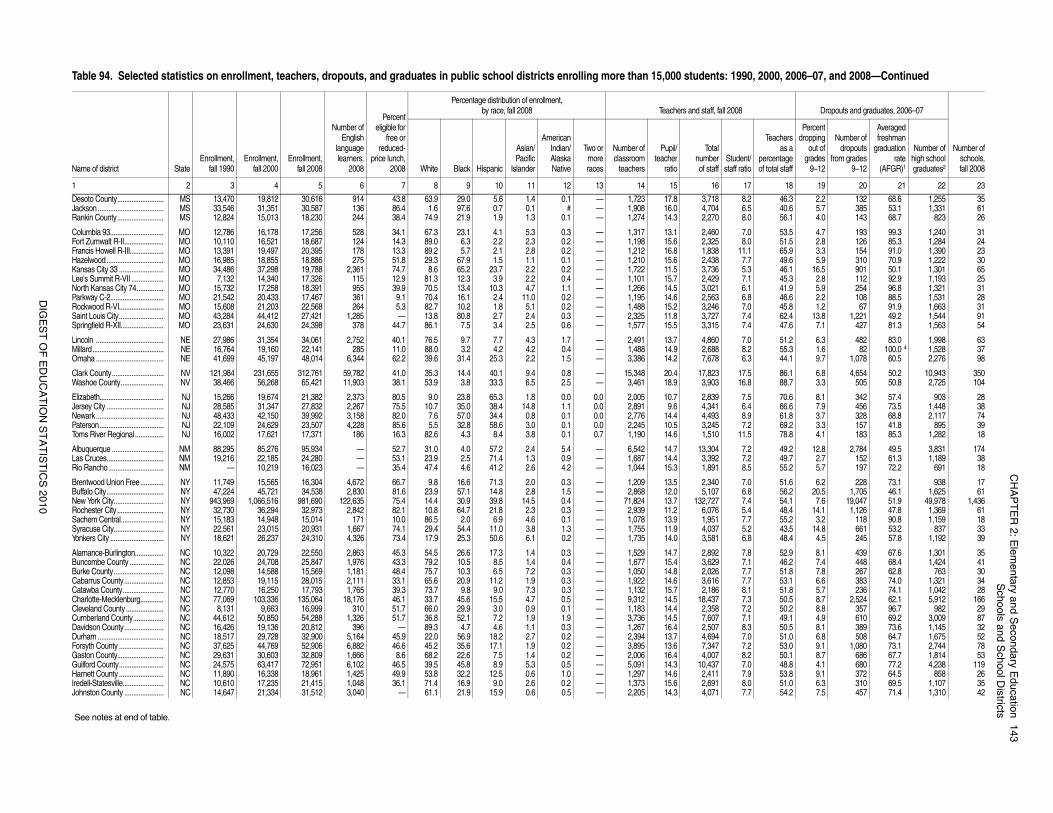
CH
AP
TE
R 2
: Ele
me
nta
ry an
d S
eco
nd
ary E
du
catio
n1
43
Sch
oo
ls an
d S
cho
ol D
istricts
DIG
ES
T O
F E
DU
CA
TIO
N S
TA
TIS
TIC
S 2
01
0
46.3 2.2 132 68.6 1,255 3540.6 5.7 385 53.1 1,331 6156.1 4.0 143 68.7 823 26
53.5 4.7 193 99.3 1,240 3151.5 2.8 126 85.3 1,284 2465.9 3.3 154 91.0 1,390 2349.6 5.9 310 70.9 1,222 3046.1 16.5 901 50.1 1,301 6545.3 2.8 112 92.9 1,193 2541.9 5.9 254 96.8 1,321 3146.6 2.2 108 88.5 1,531 2845.8 1.2 67 91.9 1,663 3162.4 13.8 1,221 49.2 1,544 9147.6 7.1 427 81.3 1,563 54
51.2 6.3 482 83.0 1,998 6355.3 1.6 82 100.0 4 1,528 3744.1 9.7 1,078 60.5 2,276 98
86.1 6.8 4,654 50.2 10,943 35088.7 3.3 505 50.8 2,725 104
70.6 8.1 342 57.4 903 2866.6 7.9 456 73.5 1,448 3861.8 3.7 328 68.8 2,117 7469.2 3.3 157 41.8 895 3978.8 4.1 183 85.3 1,282 18
49.2 12.8 2,784 49.5 3,831 17449.7 2.7 152 61.3 1,189 3855.2 5.7 197 72.2 691 18
51.6 6.2 228 73.1 938 1756.2 20.5 1,705 46.1 1,625 6154.1 7.6 19,047 51.9 49,978 1,43648.4 14.1 1,126 47.8 1,369 6155.2 3.2 118 90.8 1,159 1843.5 14.8 661 53.2 837 3348.4 4.5 245 57.8 1,192 39
52.9 8.1 439 67.6 1,301 3546.2 7.4 448 68.4 1,424 4151.8 7.8 267 62.8 763 3053.1 6.6 383 74.0 1,321 3451.8 5.7 236 74.1 1,042 2850.5 8.7 2,524 62.1 5,912 16650.2 8.8 357 96.7 982 2949.1 4.9 610 69.2 3,009 8750.5 8.1 389 73.6 1,145 3251.0 6.8 508 64.7 1,675 5253.0 9.1 1,080 73.1 2,744 7850.1 8.7 686 67.7 1,814 5348.8 4.1 680 77.2 4,238 11953.8 9.1 372 64.5 858 2651.0 6.3 310 69.5 1,107 3554.2 7.5 457 71.4 1,310 42
2000, 2006–07, and 2008—Continued
Dropouts and graduates, 2006–07
Number ofschools,fall 2008
Teachersas a
percentageof total staff
Percentdropping
out ofgrades
9–12
Number ofdropouts
from grades9–12
Averagedfreshman
graduationrate
(AFGR)1
Number ofhigh schoolgraduates2
18 19 20 21 22 23
Desoto County.......................... MS 13,470 19,812 30,616 914 43.8 63.9 29.0 5.6 1.4 0.1 — 1,723 17.8 3,718 8.2Jackson..................................... MS 33,546 31,351 30,587 136 86.4 1.6 97.6 0.7 0.1 # — 1,908 16.0 4,704 6.5Rankin County.......................... MS 12,824 15,013 18,230 244 38.4 74.9 21.9 1.9 1.3 0.1 — 1,274 14.3 2,270 8.0
Columbia 93.............................. MO 12,786 16,178 17,256 528 34.1 67.3 23.1 4.1 5.3 0.3 — 1,317 13.1 2,460 7.0Fort Zumwalt R-II...................... MO 10,110 16,521 18,687 124 14.3 89.0 6.3 2.2 2.3 0.2 — 1,198 15.6 2,325 8.0Francis Howell R-III................... MO 13,391 19,497 20,395 178 13.3 89.2 5.7 2.1 2.8 0.2 — 1,212 16.8 1,838 11.1Hazelwood................................ MO 16,985 18,855 18,886 275 51.8 29.3 67.9 1.5 1.1 0.1 — 1,210 15.6 2,438 7.7Kansas City 33 ......................... MO 34,486 37,298 19,788 2,361 74.7 8.6 65.2 23.7 2.2 0.2 — 1,722 11.5 3,736 5.3Lee's Summit R-VII .................. MO 7,132 14,340 17,326 115 12.9 81.3 12.3 3.9 2.2 0.4 — 1,101 15.7 2,429 7.1North Kansas City 74............... MO 15,732 17,258 18,391 955 39.9 70.5 13.4 10.3 4.7 1.1 — 1,266 14.5 3,021 6.1Parkway C-2.............................. MO 21,542 20,433 17,467 361 9.1 70.4 16.1 2.4 11.0 0.2 — 1,195 14.6 2,563 6.8Rockwood R-VI......................... MO 15,608 21,203 22,568 264 5.3 82.7 10.2 1.8 5.1 0.2 — 1,488 15.2 3,246 7.0Saint Louis City......................... MO 43,284 44,412 27,421 1,285 — 13.8 80.8 2.7 2.4 0.3 — 2,325 11.8 3,727 7.4Springfield R-XII........................ MO 23,631 24,630 24,398 378 44.7 86.1 7.5 3.4 2.5 0.6 — 1,577 15.5 3,315 7.4
Lincoln ...................................... NE 27,986 31,354 34,061 2,752 40.1 76.5 9.7 7.7 4.3 1.7 — 2,491 13.7 4,860 7.0Millard........................................ NE 16,764 19,160 22,141 285 11.0 88.0 3.2 4.2 4.2 0.4 — 1,488 14.9 2,688 8.2Omaha ...................................... NE 41,699 45,197 48,014 6,344 62.2 39.6 31.4 25.3 2.2 1.5 — 3,386 14.2 7,678 6.3
Clark County............................. NV 121,984 231,655 312,761 59,782 41.0 35.3 14.4 40.1 9.4 0.8 — 15,348 20.4 17,823 17.5Washoe County........................ NV 38,466 56,268 65,421 11,903 38.1 53.9 3.8 33.3 6.5 2.5 — 3,461 18.9 3,903 16.8
Elizabeth.................................... NJ 15,266 19,674 21,382 2,373 80.5 9.0 23.8 65.3 1.8 0.0 0.0 2,005 10.7 2,839 7.5Jersey City ................................ NJ 28,585 31,347 27,832 2,267 75.5 10.7 35.0 38.4 14.8 1.1 0.0 2,891 9.6 4,341 6.4Newark...................................... NJ 48,433 42,150 39,992 3,158 82.0 7.6 57.0 34.4 0.8 0.1 0.0 2,776 14.4 4,493 8.9Paterson.................................... NJ 22,109 24,629 23,507 4,228 85.6 5.5 32.8 58.6 3.0 0.1 0.0 2,245 10.5 3,245 7.2Toms River Regional................ NJ 16,002 17,621 17,371 186 16.3 82.6 4.3 8.4 3.8 0.1 0.7 1,190 14.6 1,510 11.5
Albuquerque ............................. NM 88,295 85,276 95,934 — 52.7 31.0 4.0 57.2 2.4 5.4 — 6,542 14.7 13,304 7.2Las Cruces................................ NM 19,216 22,185 24,280 — 53.1 23.9 2.5 71.4 1.3 0.9 — 1,687 14.4 3,392 7.2Rio Rancho............................... NM — 10,219 16,023 — 35.4 47.4 4.6 41.2 2.6 4.2 — 1,044 15.3 1,891 8.5
Brentwood Union Free............. NY 11,749 15,565 16,304 4,672 66.7 9.8 16.6 71.3 2.0 0.3 — 1,209 13.5 2,340 7.0Buffalo City................................ NY 47,224 45,721 34,538 2,830 81.6 23.9 57.1 14.8 2.8 1.5 — 2,868 12.0 5,107 6.8New York City............................ NY 943,969 1,066,516 981,690 122,635 75.4 14.4 30.9 39.8 14.5 0.4 — 71,824 13.7 132,727 7.4Rochester City.......................... NY 32,730 36,294 32,973 2,842 82.1 10.8 64.7 21.8 2.3 0.3 — 2,939 11.2 6,076 5.4Sachem Central........................ NY 15,183 14,948 15,014 171 10.0 86.5 2.0 6.9 4.6 0.1 — 1,078 13.9 1,951 7.7Syracuse City............................ NY 22,561 23,015 20,931 1,667 74.1 29.4 54.4 11.0 3.8 1.3 — 1,755 11.9 4,037 5.2Yonkers City .............................. NY 18,621 26,237 24,310 4,326 73.4 17.9 25.3 50.6 6.1 0.2 — 1,735 14.0 3,581 6.8
Alamance-Burlington................ NC 10,322 20,729 22,550 2,863 45.3 54.5 26.6 17.3 1.4 0.3 — 1,529 14.7 2,892 7.8Buncombe County ................... NC 22,026 24,708 25,847 1,976 43.3 79.2 10.5 8.5 1.4 0.4 — 1,677 15.4 3,629 7.1Burke County............................ NC 12,098 14,588 15,569 1,181 48.4 75.7 10.3 6.5 7.2 0.3 — 1,050 14.8 2,026 7.7Cabarrus County...................... NC 12,853 19,115 28,015 2,111 33.1 65.6 20.9 11.2 1.9 0.3 — 1,922 14.6 3,616 7.7Catawba County....................... NC 12,770 16,250 17,793 1,765 39.3 73.7 9.8 9.0 7.3 0.3 — 1,132 15.7 2,186 8.1Charlotte-Mecklenburg............. NC 77,069 103,336 135,064 18,176 46.1 33.7 45.6 15.5 4.7 0.5 — 9,312 14.5 18,437 7.3Cleveland County..................... NC 8,131 9,663 16,999 310 51.7 66.0 29.9 3.0 0.9 0.1 — 1,183 14.4 2,358 7.2Cumberland County................. NC 44,612 50,850 54,288 1,326 51.7 36.8 52.1 7.2 1.9 1.9 — 3,736 14.5 7,607 7.1Davidson County...................... NC 16,426 19,136 20,812 396 — 89.3 4.7 4.6 1.1 0.3 — 1,267 16.4 2,507 8.3Durham ..................................... NC 18,517 29,728 32,900 5,164 45.9 22.0 56.9 18.2 2.7 0.2 — 2,394 13.7 4,694 7.0Forsyth County ......................... NC 37,625 44,769 52,906 6,882 46.6 45.2 35.6 17.1 1.9 0.2 — 3,895 13.6 7,347 7.2Gaston County.......................... NC 29,631 30,603 32,809 1,666 8.6 68.2 22.6 7.5 1.4 0.2 — 2,006 16.4 4,007 8.2Guilford County......................... NC 24,575 63,417 72,951 6,102 46.5 39.5 45.8 8.9 5.3 0.5 — 5,091 14.3 10,437 7.0Harnett County ......................... NC 11,890 16,338 18,961 1,425 49.9 53.8 32.2 12.5 0.6 1.0 — 1,297 14.6 2,411 7.9Iredell-Statesville....................... NC 10,610 17,235 21,415 1,048 36.1 71.4 16.9 9.0 2.6 0.2 — 1,373 15.6 2,691 8.0Johnston County ...................... NC 14,647 21,334 31,512 3,040 — 61.1 21.9 15.9 0.6 0.5 — 2,205 14.3 4,071 7.7
See notes at end of table.
Table 94. Selected statistics on enrollment, teachers, dropouts, and graduates in public school districts enrolling more than 15,000 students: 1990,
Name of district StateEnrollment,
fall 1990Enrollment,
fall 2000Enrollment,
fall 2008
Number ofEnglish
languagelearners,
2008
Percenteligible for
free orreduced-
price lunch,2008
Percentage distribution of enrollment, by race, fall 2008 Teachers and staff, fall 2008
White Black Hispanic
Asian/Pacific
Islander
AmericanIndian/AlaskaNative
Two ormoreraces
Number ofclassroom
teachers
Pupil/teacher
ratio
Totalnumberof staff
Student/staff ratio
1 2 3 4 5 6 7 8 9 10 11 12 13 14 15 16 17
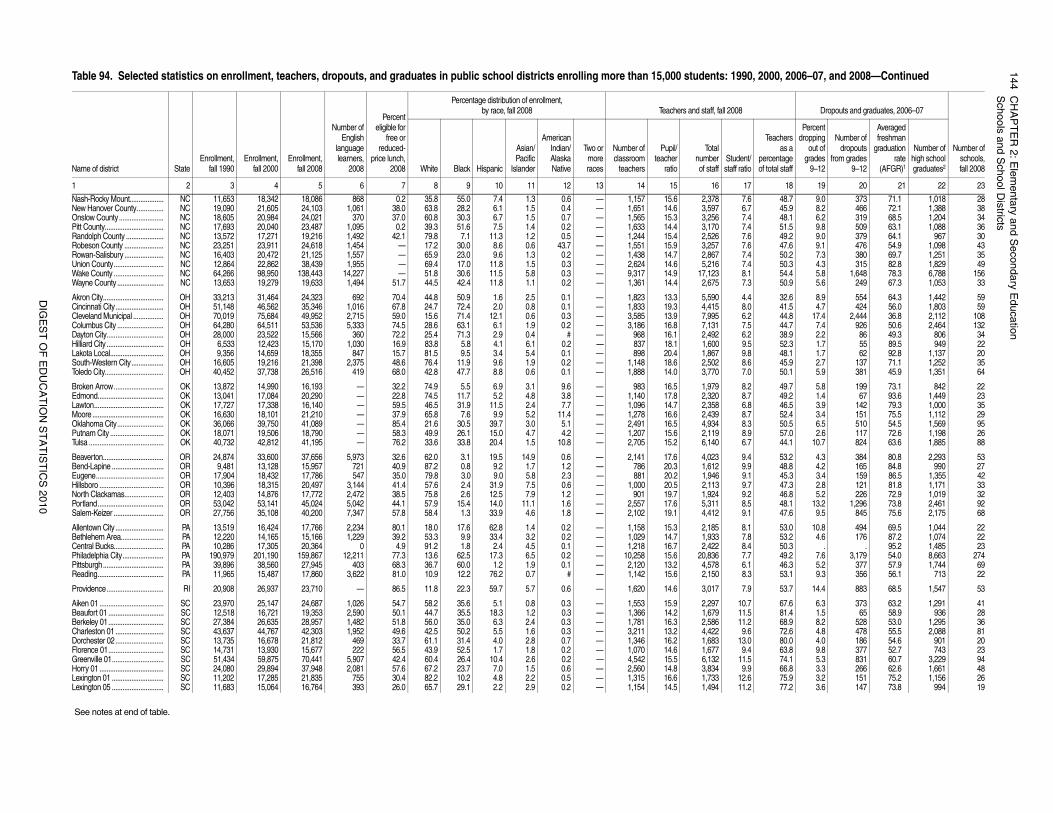
14
4C
HA
PT
ER
2: E
lem
en
tary a
nd
Se
con
da
ry Ed
uca
tion
Sch
oo
ls an
d S
cho
ol D
istricts
DIG
ES
T O
F E
DU
CA
TIO
N S
TA
TIS
TIC
S 2
01
0
48.7 9.0 373 71.1 1,018 2845.9 8.2 466 72.1 1,388 3848.1 6.2 319 68.5 1,204 3451.5 9.8 509 63.1 1,088 3649.2 9.0 379 64.1 967 3047.6 9.1 476 54.9 1,098 4350.2 7.3 380 69.7 1,251 3550.3 4.3 315 82.8 1,829 4954.4 5.8 1,648 78.3 6,788 15650.9 5.6 249 67.3 1,053 33
32.6 8.9 554 64.3 1,442 5941.5 4.7 424 56.0 1,803 5944.8 17.4 2,444 36.8 2,112 10844.7 7.4 926 50.6 2,464 13238.9 2.2 86 49.3 806 3452.3 1.7 55 89.5 949 2248.1 1.7 62 92.8 1,137 2045.9 2.7 137 71.1 1,252 3550.1 5.9 381 45.9 1,351 64
49.7 5.8 199 73.1 842 2249.2 1.4 67 93.6 1,449 2346.5 3.9 142 79.3 1,000 3552.4 3.4 151 75.5 1,112 2950.5 6.5 510 54.5 1,569 9557.0 2.6 117 72.6 1,198 2644.1 10.7 824 63.6 1,885 88
53.2 4.3 384 80.8 2,293 5348.8 4.2 165 84.8 990 2745.3 3.4 159 86.5 1,355 4247.3 2.8 121 81.8 1,171 3346.8 5.2 226 72.9 1,019 3248.1 13.2 1,296 73.8 2,461 9247.6 9.5 845 75.6 2,175 68
53.0 10.8 494 69.5 1,044 2253.2 4.6 176 87.2 1,074 2250.3 . . 95.2 1,485 2349.2 7.6 3,179 54.0 8,663 27446.3 5.2 377 57.9 1,744 6953.1 9.3 356 56.1 713 22
53.7 14.4 883 68.5 1,547 53
67.6 6.3 373 63.2 1,291 4181.4 1.5 65 58.9 936 2868.9 8.2 528 53.0 1,295 3672.6 4.8 478 55.5 2,088 8180.0 4.0 186 54.6 901 2063.8 9.8 377 52.7 743 2374.1 5.3 831 60.7 3,229 9466.8 3.3 266 62.6 1,661 4875.9 3.2 151 75.2 1,156 2677.2 3.6 147 73.8 994 19
2000, 2006–07, and 2008—Continued
Dropouts and graduates, 2006–07
Number ofschools,fall 2008
Teachersas a
percentageof total staff
Percentdropping
out ofgrades
9–12
Number ofdropouts
from grades9–12
Averagedfreshman
graduationrate
(AFGR)1
Number ofhigh schoolgraduates2
18 19 20 21 22 23
Nash-Rocky Mount................... NC 11,653 18,342 18,086 868 0.2 35.8 55.0 7.4 1.3 0.6 — 1,157 15.6 2,378 7.6New Hanover County............... NC 19,090 21,605 24,103 1,061 38.0 63.8 28.2 6.1 1.5 0.4 — 1,651 14.6 3,597 6.7Onslow County......................... NC 18,605 20,984 24,021 370 37.0 60.8 30.3 6.7 1.5 0.7 — 1,565 15.3 3,256 7.4Pitt County................................. NC 17,693 20,040 23,487 1,095 0.2 39.3 51.6 7.5 1.4 0.2 — 1,633 14.4 3,170 7.4Randolph County ..................... NC 13,572 17,271 19,216 1,492 42.1 79.8 7.1 11.3 1.2 0.5 — 1,244 15.4 2,526 7.6Robeson County ...................... NC 23,251 23,911 24,618 1,454 — 17.2 30.0 8.6 0.6 43.7 — 1,551 15.9 3,257 7.6Rowan-Salisbury ...................... NC 16,403 20,472 21,125 1,557 — 65.9 23.0 9.6 1.3 0.2 — 1,438 14.7 2,867 7.4Union County............................ NC 12,864 22,862 38,439 1,955 — 69.4 17.0 11.8 1.5 0.3 — 2,624 14.6 5,216 7.4Wake County ............................ NC 64,266 98,950 138,443 14,227 — 51.8 30.6 11.5 5.8 0.3 — 9,317 14.9 17,123 8.1Wayne County.......................... NC 13,653 19,279 19,633 1,494 51.7 44.5 42.4 11.8 1.1 0.2 — 1,361 14.4 2,675 7.3
Akron City.................................. OH 33,213 31,464 24,323 692 70.4 44.8 50.9 1.6 2.5 0.1 — 1,823 13.3 5,590 4.4Cincinnati City........................... OH 51,148 46,562 35,346 1,016 67.8 24.7 72.4 2.0 0.8 0.1 — 1,833 19.3 4,415 8.0Cleveland Municipal ................. OH 70,019 75,684 49,952 2,715 59.0 15.6 71.4 12.1 0.6 0.3 — 3,585 13.9 7,995 6.2Columbus City .......................... OH 64,280 64,511 53,536 5,333 74.5 28.6 63.1 6.1 1.9 0.2 — 3,186 16.8 7,131 7.5Dayton City................................ OH 28,000 23,522 15,566 360 72.2 25.4 71.3 2.9 0.4 # — 968 16.1 2,492 6.2Hilliard City ................................ OH 6,533 12,423 15,170 1,030 16.9 83.8 5.8 4.1 6.1 0.2 — 837 18.1 1,600 9.5Lakota Local.............................. OH 9,356 14,659 18,355 847 15.7 81.5 9.5 3.4 5.4 0.1 — 898 20.4 1,867 9.8South-Western City.................. OH 16,605 19,216 21,398 2,375 48.6 76.4 11.9 9.6 1.9 0.2 — 1,148 18.6 2,502 8.6Toledo City................................. OH 40,452 37,738 26,516 419 68.0 42.8 47.7 8.8 0.6 0.1 — 1,888 14.0 3,770 7.0
Broken Arrow............................ OK 13,872 14,990 16,193 — 32.2 74.9 5.5 6.9 3.1 9.6 — 983 16.5 1,979 8.2Edmond..................................... OK 13,041 17,084 20,290 — 22.8 74.5 11.7 5.2 4.8 3.8 — 1,140 17.8 2,320 8.7Lawton....................................... OK 17,727 17,338 16,140 — 59.5 46.5 31.9 11.5 2.4 7.7 — 1,096 14.7 2,358 6.8Moore........................................ OK 16,630 18,101 21,210 — 37.9 65.8 7.6 9.9 5.2 11.4 — 1,278 16.6 2,439 8.7Oklahoma City.......................... OK 36,066 39,750 41,089 — 85.4 21.6 30.5 39.7 3.0 5.1 — 2,491 16.5 4,934 8.3Putnam City .............................. OK 18,071 19,506 18,790 — 58.3 49.9 26.1 15.0 4.7 4.2 — 1,207 15.6 2,119 8.9Tulsa .......................................... OK 40,732 42,812 41,195 — 76.2 33.6 33.8 20.4 1.5 10.8 — 2,705 15.2 6,140 6.7
Beaverton.................................. OR 24,874 33,600 37,656 5,973 32.6 62.0 3.1 19.5 14.9 0.6 — 2,141 17.6 4,023 9.4Bend-Lapine ............................. OR 9,481 13,128 15,957 721 40.9 87.2 0.8 9.2 1.7 1.2 — 786 20.3 1,612 9.9Eugene...................................... OR 17,904 18,432 17,786 547 35.0 79.8 3.0 9.0 5.8 2.3 — 881 20.2 1,946 9.1Hillsboro .................................... OR 10,396 18,315 20,497 3,144 41.4 57.6 2.4 31.9 7.5 0.6 — 1,000 20.5 2,113 9.7North Clackamas...................... OR 12,403 14,876 17,772 2,472 38.5 75.8 2.6 12.5 7.9 1.2 — 901 19.7 1,924 9.2Portland..................................... OR 53,042 53,141 45,024 5,042 44.1 57.9 15.4 14.0 11.1 1.6 — 2,557 17.6 5,311 8.5Salem-Keizer ............................ OR 27,756 35,108 40,200 7,347 57.8 58.4 1.3 33.9 4.6 1.8 — 2,102 19.1 4,412 9.1
Allentown City........................... PA 13,519 16,424 17,766 2,234 80.1 18.0 17.6 62.8 1.4 0.2 — 1,158 15.3 2,185 8.1Bethlehem Area........................ PA 12,220 14,165 15,166 1,229 39.2 53.3 9.9 33.4 3.2 0.2 — 1,029 14.7 1,933 7.8Central Bucks............................ PA 10,286 17,305 20,364 0 4.9 91.2 1.8 2.4 4.5 0.1 — 1,218 16.7 2,422 8.4Philadelphia City....................... PA 190,979 201,190 159,867 12,211 77.3 13.6 62.5 17.3 6.5 0.2 — 10,258 15.6 20,836 7.7Pittsburgh.................................. PA 39,896 38,560 27,945 403 68.3 36.7 60.0 1.2 1.9 0.1 — 2,120 13.2 4,578 6.1Reading..................................... PA 11,965 15,487 17,860 3,622 81.0 10.9 12.2 76.2 0.7 # — 1,142 15.6 2,150 8.3
Providence................................ RI 20,908 26,937 23,710 — 86.5 11.8 22.3 59.7 5.7 0.6 — 1,620 14.6 3,017 7.9
Aiken 01 .................................... SC 23,970 25,147 24,687 1,026 54.7 58.2 35.6 5.1 0.8 0.3 — 1,553 15.9 2,297 10.7Beaufort 01 ............................... SC 12,518 16,721 19,353 2,590 50.1 44.7 35.5 18.3 1.2 0.3 — 1,366 14.2 1,679 11.5Berkeley 01............................... SC 27,384 26,635 28,957 1,482 51.8 56.0 35.0 6.3 2.4 0.3 — 1,781 16.3 2,586 11.2Charleston 01........................... SC 43,637 44,767 42,303 1,952 49.6 42.5 50.2 5.5 1.6 0.3 — 3,211 13.2 4,422 9.6Dorchester 02........................... SC 13,735 16,678 21,812 469 33.7 61.1 31.4 4.0 2.8 0.7 — 1,346 16.2 1,683 13.0Florence 01............................... SC 14,731 13,930 15,677 222 56.5 43.9 52.5 1.7 1.8 0.2 — 1,070 14.6 1,677 9.4Greenville 01............................. SC 51,434 59,875 70,441 5,907 42.4 60.4 26.4 10.4 2.6 0.2 — 4,542 15.5 6,132 11.5Horry 01 .................................... SC 24,080 29,894 37,948 2,081 57.6 67.2 23.7 7.0 1.5 0.6 — 2,560 14.8 3,834 9.9Lexington 01 ............................. SC 11,202 17,285 21,835 755 30.4 82.2 10.2 4.8 2.2 0.5 — 1,315 16.6 1,733 12.6Lexington 05 ............................. SC 11,683 15,064 16,764 393 26.0 65.7 29.1 2.2 2.9 0.2 — 1,154 14.5 1,494 11.2
See notes at end of table.
Table 94. Selected statistics on enrollment, teachers, dropouts, and graduates in public school districts enrolling more than 15,000 students: 1990,
Name of district StateEnrollment,
fall 1990Enrollment,
fall 2000Enrollment,
fall 2008
Number ofEnglish
languagelearners,
2008
Percenteligible for
free orreduced-
price lunch,2008
Percentage distribution of enrollment, by race, fall 2008 Teachers and staff, fall 2008
White Black Hispanic
Asian/Pacific
Islander
AmericanIndian/AlaskaNative
Two ormoreraces
Number ofclassroom
teachers
Pupil/teacher
ratio
Totalnumberof staff
Student/staff ratio
1 2 3 4 5 6 7 8 9 10 11 12 13 14 15 16 17
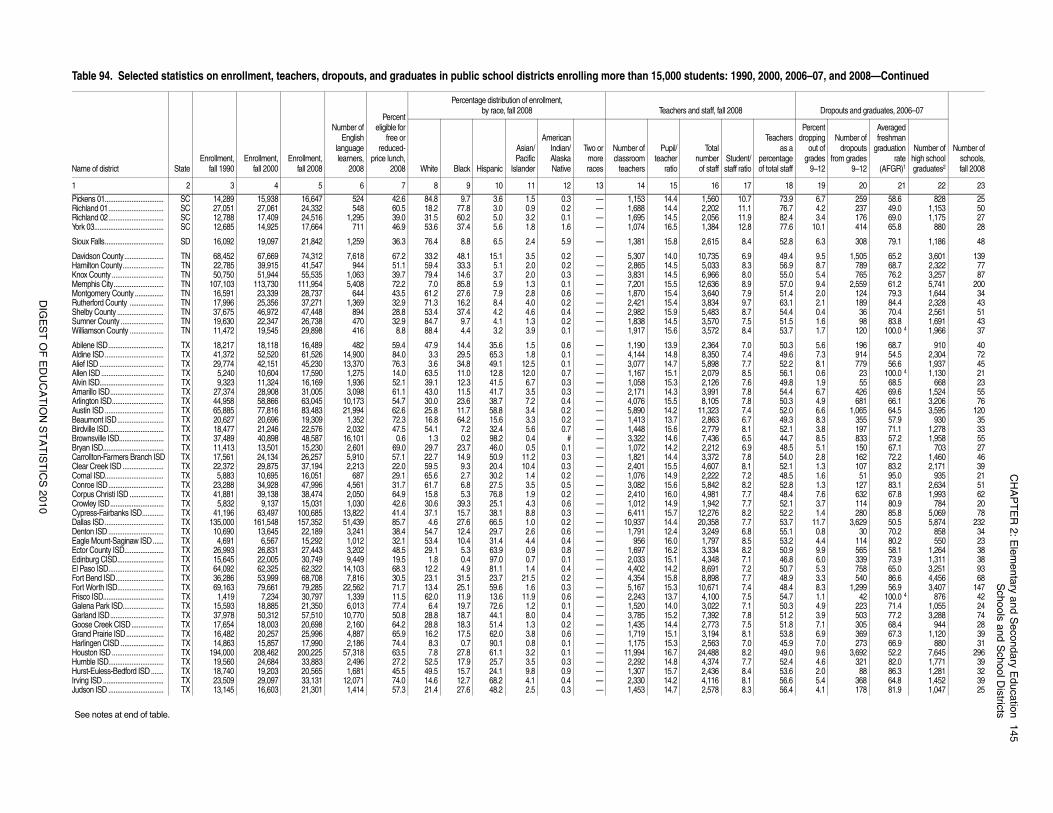
CH
AP
TE
R 2
: Ele
me
nta
ry an
d S
eco
nd
ary E
du
catio
n1
45
Sch
oo
ls an
d S
cho
ol D
istricts
DIG
ES
T O
F E
DU
CA
TIO
N S
TA
TIS
TIC
S 2
01
0
73.9 6.7 259 58.6 828 2576.7 4.2 237 49.0 1,153 5082.4 3.4 176 69.0 1,175 2777.6 10.1 414 65.8 880 28
52.8 6.3 308 79.1 1,186 48
49.4 9.5 1,505 65.2 3,601 13956.9 8.7 789 68.7 2,322 7755.0 5.4 765 76.2 3,257 8757.0 9.4 2,559 61.2 5,741 20051.4 2.0 124 79.3 1,644 3463.1 2.1 189 84.4 2,328 4354.4 0.4 36 70.4 2,561 5151.5 1.6 98 83.8 1,691 4353.7 1.7 120 100.0 4 1,966 37
50.3 5.6 196 68.7 910 4049.6 7.3 914 54.5 2,304 7252.2 8.1 779 56.6 1,937 4556.1 0.6 23 100.0 4 1,130 2149.8 1.9 55 68.5 668 2354.4 6.7 426 69.6 1,524 5550.3 4.9 681 66.1 3,206 7652.0 6.6 1,065 64.5 3,595 12049.3 8.3 355 57.9 930 3552.1 3.8 197 71.1 1,278 3344.7 8.5 833 57.2 1,958 5548.5 5.1 150 67.1 703 2754.0 2.8 162 72.2 1,460 4652.1 1.3 107 83.2 2,171 3948.5 1.6 51 95.0 935 2152.8 1.3 127 83.1 2,634 5148.4 7.6 632 67.8 1,993 6252.1 3.7 114 80.9 784 2052.2 1.4 280 85.8 5,069 7853.7 11.7 3,629 50.5 5,874 23255.1 0.8 30 70.2 858 3453.2 4.4 114 80.2 550 2350.9 9.9 565 58.1 1,264 3846.8 6.0 339 73.9 1,311 3850.7 5.3 758 65.0 3,251 9348.9 3.3 540 86.6 4,456 6848.4 8.3 1,299 56.9 3,407 14754.7 1.1 42 100.0 4 876 4250.3 4.9 223 71.4 1,055 2451.2 3.9 503 77.2 3,288 7451.8 7.1 305 68.4 944 2853.8 6.9 369 67.3 1,120 3945.9 7.0 273 66.9 880 3149.0 9.6 3,692 52.2 7,645 29652.4 4.6 321 82.0 1,771 3953.6 2.0 88 86.3 1,281 3256.6 5.4 368 64.8 1,452 3956.4 4.1 178 81.9 1,047 25
2000, 2006–07, and 2008—Continued
Dropouts and graduates, 2006–07
Number ofschools,fall 2008
Teachersas a
percentageof total staff
Percentdropping
out ofgrades
9–12
Number ofdropouts
from grades9–12
Averagedfreshman
graduationrate
(AFGR)1
Number ofhigh schoolgraduates2
18 19 20 21 22 23
Pickens 01................................. SC 14,289 15,938 16,647 524 42.6 84.8 9.7 3.6 1.5 0.3 — 1,153 14.4 1,560 10.7Richland 01............................... SC 27,051 27,061 24,332 548 60.5 18.2 77.8 3.0 0.9 0.2 — 1,688 14.4 2,202 11.1Richland 02............................... SC 12,788 17,409 24,516 1,295 39.0 31.5 60.2 5.0 3.2 0.1 — 1,695 14.5 2,056 11.9York 03....................................... SC 12,685 14,925 17,664 711 46.9 53.6 37.4 5.6 1.8 1.6 — 1,074 16.5 1,384 12.8
Sioux Falls................................. SD 16,092 19,097 21,842 1,259 36.3 76.4 8.8 6.5 2.4 5.9 — 1,381 15.8 2,615 8.4
Davidson County...................... TN 68,452 67,669 74,312 7,618 67.2 33.2 48.1 15.1 3.5 0.2 — 5,307 14.0 10,735 6.9Hamilton County....................... TN 22,785 39,915 41,547 944 51.1 59.4 33.3 5.1 2.0 0.2 — 2,865 14.5 5,033 8.3Knox County ............................. TN 50,750 51,944 55,535 1,063 39.7 79.4 14.6 3.7 2.0 0.3 — 3,831 14.5 6,966 8.0Memphis City............................ TN 107,103 113,730 111,954 5,408 72.2 7.0 85.8 5.9 1.3 0.1 — 7,201 15.5 12,636 8.9Montgomery County ................ TN 16,591 23,339 28,737 644 43.5 61.2 27.6 7.9 2.8 0.6 — 1,870 15.4 3,640 7.9Rutherford County ................... TN 17,996 25,356 37,271 1,369 32.9 71.3 16.2 8.4 4.0 0.2 — 2,421 15.4 3,834 9.7Shelby County .......................... TN 37,675 46,972 47,448 894 28.8 53.4 37.4 4.2 4.6 0.4 — 2,982 15.9 5,483 8.7Sumner County ........................ TN 19,630 22,347 26,738 470 32.9 84.7 9.7 4.1 1.3 0.2 — 1,838 14.5 3,570 7.5Williamson County ................... TN 11,472 19,545 29,898 416 8.8 88.4 4.4 3.2 3.9 0.1 — 1,917 15.6 3,572 8.4
Abilene ISD............................... TX 18,217 18,118 16,489 482 59.4 47.9 14.4 35.6 1.5 0.6 — 1,190 13.9 2,364 7.0Aldine ISD................................. TX 41,372 52,520 61,526 14,900 84.0 3.3 29.5 65.3 1.8 0.1 — 4,144 14.8 8,350 7.4Alief ISD .................................... TX 29,774 42,151 45,230 13,370 76.3 3.6 34.8 49.1 12.5 0.1 — 3,077 14.7 5,898 7.7Allen ISD................................... TX 5,240 10,604 17,590 1,275 14.0 63.5 11.0 12.8 12.0 0.7 — 1,167 15.1 2,079 8.5Alvin ISD.................................... TX 9,323 11,324 16,169 1,936 52.1 39.1 12.3 41.5 6.7 0.3 — 1,058 15.3 2,126 7.6Amarillo ISD.............................. TX 27,374 28,908 31,005 3,098 61.1 43.0 11.5 41.7 3.5 0.3 — 2,171 14.3 3,991 7.8Arlington ISD............................. TX 44,958 58,866 63,045 10,173 54.7 30.0 23.6 38.7 7.2 0.4 — 4,076 15.5 8,105 7.8Austin ISD................................. TX 65,885 77,816 83,483 21,994 62.6 25.8 11.7 58.8 3.4 0.2 — 5,890 14.2 11,323 7.4Beaumont ISD.......................... TX 20,627 20,696 19,309 1,352 72.3 16.8 64.2 15.6 3.3 0.2 — 1,413 13.7 2,863 6.7Birdville ISD............................... TX 18,477 21,246 22,576 2,032 47.5 54.1 7.2 32.4 5.6 0.7 — 1,448 15.6 2,779 8.1Brownsville ISD......................... TX 37,489 40,898 48,587 16,101 0.6 1.3 0.2 98.2 0.4 # — 3,322 14.6 7,436 6.5Bryan ISD.................................. TX 11,413 13,501 15,230 2,601 69.0 29.7 23.7 46.0 0.5 0.1 — 1,072 14.2 2,212 6.9Carrollton-Farmers Branch ISD TX 17,561 24,134 26,257 5,910 57.1 22.7 14.9 50.9 11.2 0.3 — 1,821 14.4 3,372 7.8Clear Creek ISD....................... TX 22,372 29,875 37,194 2,213 22.0 59.5 9.3 20.4 10.4 0.3 — 2,401 15.5 4,607 8.1Comal ISD................................. TX 5,883 10,695 16,051 687 29.1 65.6 2.7 30.2 1.4 0.2 — 1,076 14.9 2,222 7.2Conroe ISD............................... TX 23,288 34,928 47,996 4,561 31.7 61.7 6.8 27.5 3.5 0.5 — 3,082 15.6 5,842 8.2Corpus Christi ISD ................... TX 41,881 39,138 38,474 2,050 64.9 15.8 5.3 76.8 1.9 0.2 — 2,410 16.0 4,981 7.7Crowley ISD.............................. TX 5,832 9,137 15,031 1,030 42.6 30.6 39.3 25.1 4.3 0.6 — 1,012 14.9 1,942 7.7Cypress-Fairbanks ISD............ TX 41,196 63,497 100,685 13,822 41.4 37.1 15.7 38.1 8.8 0.3 — 6,411 15.7 12,276 8.2Dallas ISD................................. TX 135,000 161,548 157,352 51,439 85.7 4.6 27.6 66.5 1.0 0.2 — 10,937 14.4 20,358 7.7Denton ISD............................... TX 10,690 13,645 22,189 3,241 38.4 54.7 12.4 29.7 2.6 0.6 — 1,791 12.4 3,249 6.8Eagle Mount-Saginaw ISD...... TX 4,691 6,567 15,292 1,012 32.1 53.4 10.4 31.4 4.4 0.4 — 956 16.0 1,797 8.5Ector County ISD...................... TX 26,993 26,831 27,443 3,202 48.5 29.1 5.3 63.9 0.9 0.8 — 1,697 16.2 3,334 8.2Edinburg CISD.......................... TX 15,645 22,005 30,749 9,449 19.5 1.8 0.4 97.0 0.7 0.1 — 2,033 15.1 4,348 7.1El Paso ISD............................... TX 64,092 62,325 62,322 14,103 68.3 12.2 4.9 81.1 1.4 0.4 — 4,402 14.2 8,691 7.2Fort Bend ISD........................... TX 36,286 53,999 68,708 7,816 30.5 23.1 31.5 23.7 21.5 0.2 — 4,354 15.8 8,898 7.7Fort Worth ISD.......................... TX 69,163 79,661 79,285 22,562 71.7 13.4 25.1 59.6 1.6 0.3 — 5,167 15.3 10,671 7.4Frisco ISD.................................. TX 1,419 7,234 30,797 1,339 11.5 62.0 11.9 13.6 11.9 0.6 — 2,243 13.7 4,100 7.5Galena Park ISD....................... TX 15,593 18,885 21,350 6,013 77.4 6.4 19.7 72.6 1.2 0.1 — 1,520 14.0 3,022 7.1Garland ISD.............................. TX 37,978 50,312 57,510 10,770 50.8 28.8 18.7 44.1 8.0 0.4 — 3,785 15.2 7,392 7.8Goose Creek CISD.................. TX 17,654 18,003 20,698 2,160 64.2 28.8 18.3 51.4 1.3 0.2 — 1,435 14.4 2,773 7.5Grand Prairie ISD..................... TX 16,482 20,257 25,996 4,887 65.9 16.2 17.5 62.0 3.8 0.6 — 1,719 15.1 3,194 8.1Harlingen CISD ........................ TX 14,863 15,857 17,990 2,186 74.4 8.3 0.7 90.1 0.8 0.1 — 1,175 15.3 2,563 7.0Houston ISD ............................. TX 194,000 208,462 200,225 57,318 63.5 7.8 27.8 61.1 3.2 0.1 — 11,994 16.7 24,488 8.2Humble ISD............................... TX 19,560 24,684 33,883 2,496 27.2 52.5 17.9 25.7 3.5 0.3 — 2,292 14.8 4,374 7.7Hurst-Euless-Bedford ISD....... TX 18,740 19,203 20,565 1,681 45.5 49.5 15.7 24.1 9.8 0.9 — 1,307 15.7 2,436 8.4Irving ISD .................................. TX 23,509 29,097 33,131 12,071 74.0 14.6 12.7 68.2 4.1 0.4 — 2,330 14.2 4,116 8.1Judson ISD ............................... TX 13,145 16,603 21,301 1,414 57.3 21.4 27.6 48.2 2.5 0.3 — 1,453 14.7 2,578 8.3
See notes at end of table.
Table 94. Selected statistics on enrollment, teachers, dropouts, and graduates in public school districts enrolling more than 15,000 students: 1990,
Name of district StateEnrollment,
fall 1990Enrollment,
fall 2000Enrollment,
fall 2008
Number ofEnglish
languagelearners,
2008
Percenteligible for
free orreduced-
price lunch,2008
Percentage distribution of enrollment, by race, fall 2008 Teachers and staff, fall 2008
White Black Hispanic
Asian/Pacific
Islander
AmericanIndian/AlaskaNative
Two ormoreraces
Number ofclassroom
teachers
Pupil/teacher
ratio
Totalnumberof staff
Student/staff ratio
1 2 3 4 5 6 7 8 9 10 11 12 13 14 15 16 17
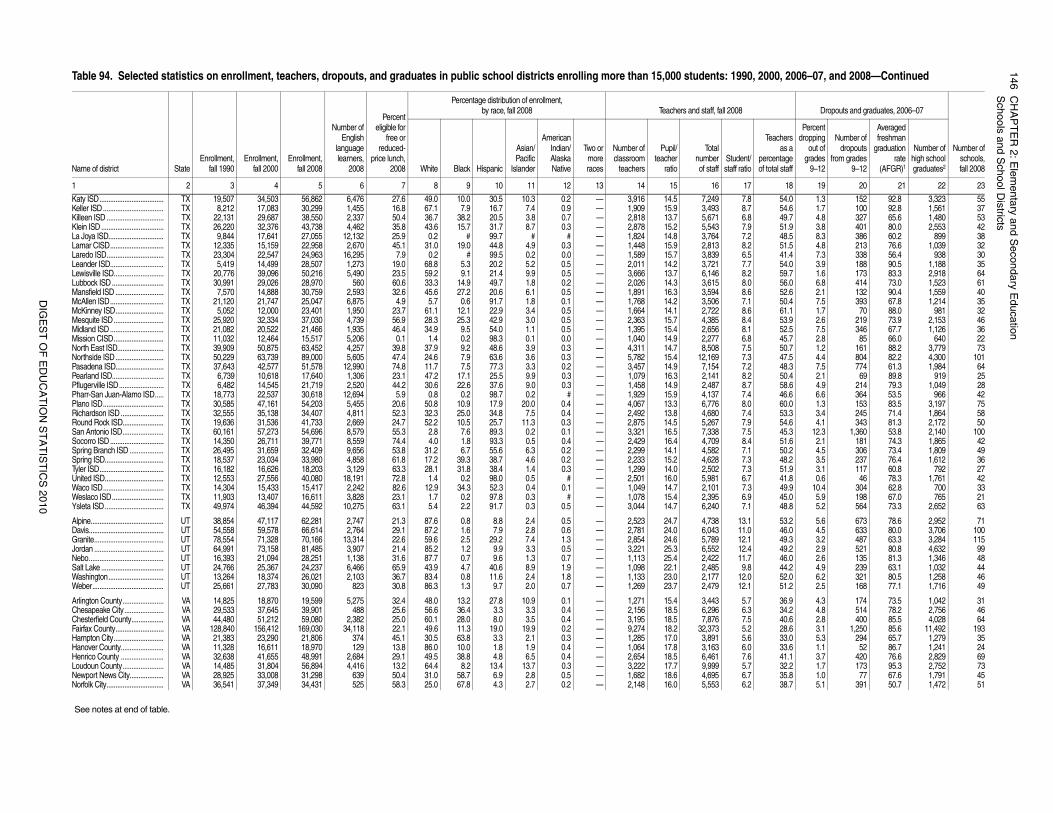
14
6C
HA
PT
ER
2: E
lem
en
tary a
nd
Se
con
da
ry Ed
uca
tion
Sch
oo
ls an
d S
cho
ol D
istricts
DIG
ES
T O
F E
DU
CA
TIO
N S
TA
TIS
TIC
S 2
01
0
54.0 1.3 152 92.8 3,323 5554.6 1.7 100 92.8 1,561 3749.7 4.8 327 65.6 1,480 5351.9 3.8 401 80.0 2,553 4248.5 8.3 386 60.2 899 3851.5 4.8 213 76.6 1,039 3241.4 7.3 338 56.4 938 3054.0 3.9 188 90.5 1,188 3559.7 1.6 173 83.3 2,918 6456.0 6.8 414 73.0 1,523 6152.6 2.1 132 90.4 1,559 4050.4 7.5 393 67.8 1,214 3561.1 1.7 70 88.0 981 3253.9 2.6 219 73.9 2,153 4652.5 7.5 346 67.7 1,126 3645.7 2.8 85 66.0 640 2250.7 1.2 161 88.2 3,779 7347.5 4.4 804 82.2 4,300 10148.3 7.5 774 61.3 1,984 6450.4 2.1 69 89.8 919 2558.6 4.9 214 79.3 1,049 2846.6 6.6 364 53.5 966 4260.0 1.3 153 83.5 3,197 7553.3 3.4 245 71.4 1,864 5854.6 4.1 343 81.3 2,172 5045.3 12.3 1,360 53.8 2,140 10051.6 2.1 181 74.3 1,865 4250.2 4.5 306 73.4 1,809 4948.2 3.5 237 76.4 1,612 3651.9 3.1 117 60.8 792 2741.8 0.6 46 78.3 1,761 4249.9 10.4 304 62.8 700 3345.0 5.9 198 67.0 765 2148.8 5.2 564 73.3 2,652 63
53.2 5.6 673 78.6 2,952 7146.0 4.5 633 80.0 3,706 10049.3 3.2 487 63.3 3,284 11549.2 2.9 521 80.8 4,632 9946.0 2.6 135 81.3 1,346 4844.2 4.9 239 63.1 1,032 4452.0 6.2 321 80.5 1,258 4651.2 2.5 168 77.1 1,716 49
36.9 4.3 174 73.5 1,042 3134.2 4.8 514 78.2 2,756 4640.6 2.8 400 85.5 4,028 6428.6 3.1 1,250 85.6 11,492 19333.0 5.3 294 65.7 1,279 3533.6 1.1 52 86.7 1,241 2441.1 3.7 420 76.6 2,829 6932.2 1.7 173 95.3 2,752 7335.8 1.0 77 67.6 1,791 4538.7 5.1 391 50.7 1,472 51
2000, 2006–07, and 2008—Continued
Dropouts and graduates, 2006–07
Number ofschools,fall 2008
Teachersas a
percentageof total staff
Percentdropping
out ofgrades
9–12
Number ofdropouts
from grades9–12
Averagedfreshman
graduationrate
(AFGR)1
Number ofhigh schoolgraduates2
18 19 20 21 22 23
Katy ISD.................................... TX 19,507 34,503 56,862 6,476 27.6 49.0 10.0 30.5 10.3 0.2 — 3,916 14.5 7,249 7.8Keller ISD.................................. TX 8,212 17,083 30,299 1,455 16.8 67.1 7.9 16.7 7.4 0.9 — 1,909 15.9 3,493 8.7Killeen ISD ................................ TX 22,131 29,687 38,550 2,337 50.4 36.7 38.2 20.5 3.8 0.7 — 2,818 13.7 5,671 6.8Klein ISD................................... TX 26,220 32,376 43,738 4,462 35.8 43.6 15.7 31.7 8.7 0.3 — 2,878 15.2 5,543 7.9La Joya ISD............................... TX 9,844 17,641 27,055 12,132 25.9 0.2 # 99.7 # # — 1,824 14.8 3,764 7.2Lamar CISD.............................. TX 12,335 15,159 22,958 2,670 45.1 31.0 19.0 44.8 4.9 0.3 — 1,448 15.9 2,813 8.2Laredo ISD................................ TX 23,304 22,547 24,963 16,295 7.9 0.2 # 99.5 0.2 0.0 — 1,589 15.7 3,839 6.5Leander ISD.............................. TX 5,419 14,499 28,507 1,273 19.0 68.8 5.3 20.2 5.2 0.5 — 2,011 14.2 3,721 7.7Lewisville ISD............................ TX 20,776 39,096 50,216 5,490 23.5 59.2 9.1 21.4 9.9 0.5 — 3,666 13.7 6,146 8.2Lubbock ISD............................. TX 30,991 29,026 28,970 560 60.6 33.3 14.9 49.7 1.8 0.2 — 2,026 14.3 3,615 8.0Mansfield ISD ........................... TX 7,570 14,888 30,759 2,593 32.6 45.6 27.2 20.6 6.1 0.5 — 1,891 16.3 3,594 8.6McAllen ISD.............................. TX 21,120 21,747 25,047 6,875 4.9 5.7 0.6 91.7 1.8 0.1 — 1,768 14.2 3,506 7.1McKinney ISD........................... TX 5,052 12,000 23,401 1,950 23.7 61.1 12.1 22.9 3.4 0.5 — 1,664 14.1 2,722 8.6Mesquite ISD............................ TX 25,920 32,334 37,030 4,739 56.9 28.3 25.3 42.9 3.0 0.5 — 2,363 15.7 4,385 8.4Midland ISD.............................. TX 21,082 20,522 21,466 1,935 46.4 34.9 9.5 54.0 1.1 0.5 — 1,395 15.4 2,656 8.1Mission CISD............................ TX 11,032 12,464 15,517 5,206 0.1 1.4 0.2 98.3 0.1 0.0 — 1,040 14.9 2,277 6.8North East ISD.......................... TX 39,909 50,875 63,452 4,257 39.8 37.9 9.2 48.6 3.9 0.3 — 4,311 14.7 8,508 7.5Northside ISD........................... TX 50,229 63,739 89,000 5,605 47.4 24.6 7.9 63.6 3.6 0.3 — 5,782 15.4 12,169 7.3Pasadena ISD........................... TX 37,643 42,577 51,578 12,990 74.8 11.7 7.5 77.3 3.3 0.2 — 3,457 14.9 7,154 7.2Pearland ISD............................. TX 6,739 10,618 17,640 1,306 23.1 47.2 17.1 25.5 9.9 0.3 — 1,079 16.3 2,141 8.2Pflugerville ISD......................... TX 6,482 14,545 21,719 2,520 44.2 30.6 22.6 37.6 9.0 0.3 — 1,458 14.9 2,487 8.7Pharr-San Juan-Alamo ISD..... TX 18,773 22,537 30,618 12,694 5.9 0.8 0.2 98.7 0.2 # — 1,929 15.9 4,137 7.4Plano ISD.................................. TX 30,585 47,161 54,203 5,455 20.6 50.8 10.9 17.9 20.0 0.4 — 4,067 13.3 6,776 8.0Richardson ISD........................ TX 32,555 35,138 34,407 4,811 52.3 32.3 25.0 34.8 7.5 0.4 — 2,492 13.8 4,680 7.4Round Rock ISD....................... TX 19,636 31,536 41,733 2,669 24.7 52.2 10.5 25.7 11.3 0.3 — 2,875 14.5 5,267 7.9San Antonio ISD....................... TX 60,161 57,273 54,696 8,579 55.3 2.8 7.6 89.3 0.2 0.1 — 3,321 16.5 7,338 7.5Socorro ISD.............................. TX 14,350 26,711 39,771 8,559 74.4 4.0 1.8 93.3 0.5 0.4 — 2,429 16.4 4,709 8.4Spring Branch ISD ................... TX 26,495 31,659 32,409 9,656 53.8 31.2 6.7 55.6 6.3 0.2 — 2,299 14.1 4,582 7.1Spring ISD................................. TX 18,537 23,034 33,980 4,858 61.8 17.2 39.3 38.7 4.6 0.2 — 2,233 15.2 4,628 7.3Tyler ISD.................................... TX 16,182 16,626 18,203 3,129 63.3 28.1 31.8 38.4 1.4 0.3 — 1,299 14.0 2,502 7.3United ISD................................. TX 12,553 27,556 40,080 18,191 72.8 1.4 0.2 98.0 0.5 # — 2,501 16.0 5,981 6.7Waco ISD.................................. TX 14,304 15,433 15,417 2,242 82.6 12.9 34.3 52.3 0.4 0.1 — 1,049 14.7 2,101 7.3Weslaco ISD............................. TX 11,903 13,407 16,611 3,828 23.1 1.7 0.2 97.8 0.3 # — 1,078 15.4 2,395 6.9Ysleta ISD................................. TX 49,974 46,394 44,592 10,275 63.1 5.4 2.2 91.7 0.3 0.5 — 3,044 14.7 6,240 7.1
Alpine......................................... UT 38,854 47,117 62,281 2,747 21.3 87.6 0.8 8.8 2.4 0.5 — 2,523 24.7 4,738 13.1Davis.......................................... UT 54,558 59,578 66,614 2,764 29.1 87.2 1.6 7.9 2.8 0.6 — 2,781 24.0 6,043 11.0Granite....................................... UT 78,554 71,328 70,166 13,314 22.6 59.6 2.5 29.2 7.4 1.3 — 2,854 24.6 5,789 12.1Jordan ....................................... UT 64,991 73,158 81,485 3,907 21.4 85.2 1.2 9.9 3.3 0.5 — 3,221 25.3 6,552 12.4Nebo.......................................... UT 16,393 21,094 28,251 1,138 31.6 87.7 0.7 9.6 1.3 0.7 — 1,113 25.4 2,422 11.7Salt Lake ................................... UT 24,766 25,367 24,237 6,466 65.9 43.9 4.7 40.6 8.9 1.9 — 1,098 22.1 2,485 9.8Washington............................... UT 13,264 18,374 26,021 2,103 36.7 83.4 0.8 11.6 2.4 1.8 — 1,133 23.0 2,177 12.0Weber........................................ UT 25,661 27,783 30,090 823 30.8 86.3 1.3 9.7 2.0 0.7 — 1,269 23.7 2,479 12.1
Arlington County....................... VA 14,825 18,870 19,599 5,275 32.4 48.0 13.2 27.8 10.9 0.1 — 1,271 15.4 3,443 5.7Chesapeake City...................... VA 29,533 37,645 39,901 488 25.6 56.6 36.4 3.3 3.3 0.4 — 2,156 18.5 6,296 6.3Chesterfield County.................. VA 44,480 51,212 59,080 2,382 25.0 60.1 28.0 8.0 3.5 0.4 — 3,195 18.5 7,876 7.5Fairfax County........................... VA 128,840 156,412 169,030 34,118 22.1 49.6 11.3 19.0 19.9 0.2 — 9,274 18.2 32,373 5.2Hampton City............................ VA 21,383 23,290 21,806 374 45.1 30.5 63.8 3.3 2.1 0.3 — 1,285 17.0 3,891 5.6Hanover County........................ VA 11,328 16,611 18,970 129 13.8 86.0 10.0 1.8 1.9 0.4 — 1,064 17.8 3,163 6.0Henrico County ........................ VA 32,638 41,655 48,991 2,684 29.1 49.5 38.8 4.8 6.5 0.4 — 2,654 18.5 6,461 7.6Loudoun County....................... VA 14,485 31,804 56,894 4,416 13.2 64.4 8.2 13.4 13.7 0.3 — 3,222 17.7 9,999 5.7Newport News City................... VA 28,925 33,008 31,298 639 50.4 31.0 58.7 6.9 2.8 0.5 — 1,682 18.6 4,695 6.7Norfolk City................................ VA 36,541 37,349 34,431 525 58.3 25.0 67.8 4.3 2.7 0.2 — 2,148 16.0 5,553 6.2
See notes at end of table.
Table 94. Selected statistics on enrollment, teachers, dropouts, and graduates in public school districts enrolling more than 15,000 students: 1990,
Name of district StateEnrollment,
fall 1990Enrollment,
fall 2000Enrollment,
fall 2008
Number ofEnglish
languagelearners,
2008
Percenteligible for
free orreduced-
price lunch,2008
Percentage distribution of enrollment, by race, fall 2008 Teachers and staff, fall 2008
White Black Hispanic
Asian/Pacific
Islander
AmericanIndian/AlaskaNative
Two ormoreraces
Number ofclassroom
teachers
Pupil/teacher
ratio
Totalnumberof staff
Student/staff ratio
1 2 3 4 5 6 7 8 9 10 11 12 13 14 15 16 17
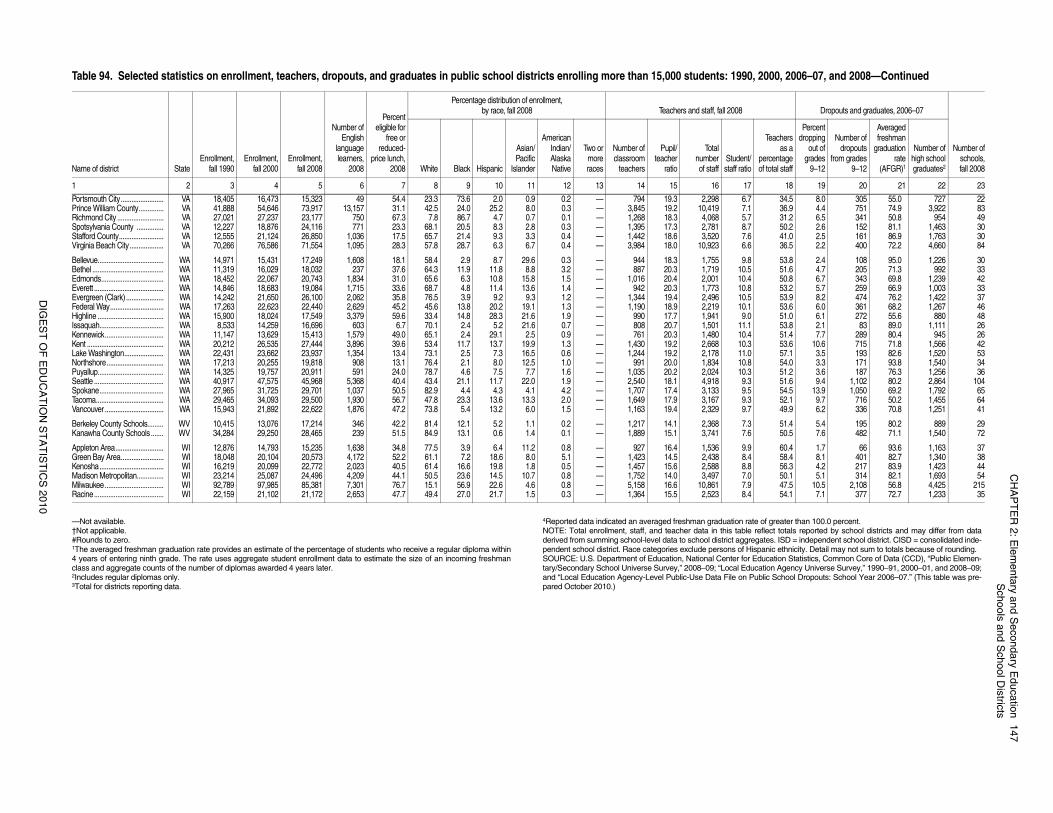
CH
AP
TE
R 2
: Ele
me
nta
ry an
d S
eco
nd
ary E
du
catio
n1
47
Sch
oo
ls an
d S
cho
ol D
istricts
DIG
ES
T O
F E
DU
CA
TIO
N S
TA
TIS
TIC
S 2
01
0
of greater than 100.0 percent. reflect totals reported by school districts and may differ from datagates. ISD = independent school district. CISD = consolidated inde-panic ethnicity. Detail may not sum to totals because of rounding.ducation Statistics, Common Core of Data (CCD), “Public Elemen-
cation Agency Universe Survey,” 1990–91, 2000–01, and 2008–09;ublic School Dropouts: School Year 2006–07.” (This table was pre-
34.5 8.0 305 55.0 727 2236.9 4.4 751 74.9 3,922 8331.2 6.5 341 50.8 954 4950.2 2.6 152 81.1 1,463 3041.0 2.5 161 86.9 1,763 3036.5 2.2 400 72.2 4,660 84
53.8 2.4 108 95.0 1,226 3051.6 4.7 205 71.3 992 3350.8 6.7 343 69.8 1,239 4253.2 5.7 259 66.9 1,003 3353.9 8.2 474 76.2 1,422 3753.6 6.0 361 68.2 1,267 4651.0 6.1 272 55.6 880 4853.8 2.1 83 89.0 1,111 2651.4 7.7 289 80.4 945 2653.6 10.6 715 71.8 1,566 4257.1 3.5 193 82.6 1,520 5354.0 3.3 171 93.8 1,540 3451.2 3.6 187 76.3 1,256 3651.6 9.4 1,102 80.2 2,864 10454.5 13.9 1,050 69.2 1,792 6552.1 9.7 716 50.2 1,455 6449.9 6.2 336 70.8 1,251 41
51.4 5.4 195 80.2 889 2950.5 7.6 482 71.1 1,540 72
60.4 1.7 66 93.6 1,163 3758.4 8.1 401 82.7 1,340 3856.3 4.2 217 83.9 1,423 4450.1 5.1 314 82.1 1,693 5447.5 10.5 2,108 56.8 4,425 21554.1 7.1 377 72.7 1,233 35
2000, 2006–07, and 2008—Continued
Dropouts and graduates, 2006–07
Number ofschools,fall 2008
Teachersas a
percentageof total staff
Percentdropping
out ofgrades
9–12
Number ofdropouts
from grades9–12
Averagedfreshman
graduationrate
(AFGR)1
Number ofhigh schoolgraduates2
18 19 20 21 22 23
—Not available. †Not applicable. #Rounds to zero.1The averaged freshman graduation rate provides an estimate of the percentage of students who receive a regular diploma within4 years of entering ninth grade. The rate uses aggregate student enrollment data to estimate the size of an incoming freshmanclass and aggregate counts of the number of diplomas awarded 4 years later.2Includes regular diplomas only. 3Total for districts reporting data.
4Reported data indicated an averaged freshman graduation rateNOTE: Total enrollment, staff, and teacher data in this table derived from summing school-level data to school district aggrependent school district. Race categories exclude persons of HisSOURCE: U.S. Department of Education, National Center for Etary/Secondary School Universe Survey,” 2008–09; “Local Eduand “Local Education Agency-Level Public-Use Data File on Ppared October 2010.)
Portsmouth City........................ VA 18,405 16,473 15,323 49 54.4 23.3 73.6 2.0 0.9 0.2 — 794 19.3 2,298 6.7Prince William County.............. VA 41,888 54,646 73,917 13,157 31.1 42.5 24.0 25.2 8.0 0.3 — 3,845 19.2 10,419 7.1Richmond City .......................... VA 27,021 27,237 23,177 750 67.3 7.8 86.7 4.7 0.7 0.1 — 1,268 18.3 4,068 5.7Spotsylvania County ............... VA 12,227 18,876 24,116 771 23.3 68.1 20.5 8.3 2.8 0.3 — 1,395 17.3 2,781 8.7Stafford County......................... VA 12,555 21,124 26,850 1,036 17.5 65.7 21.4 9.3 3.3 0.4 — 1,442 18.6 3,520 7.6Virginia Beach City................... VA 70,266 76,586 71,554 1,095 28.3 57.8 28.7 6.3 6.7 0.4 — 3,984 18.0 10,923 6.6
Bellevue..................................... WA 14,971 15,431 17,249 1,608 18.1 58.4 2.9 8.7 29.6 0.3 — 944 18.3 1,755 9.8Bethel ........................................ WA 11,319 16,029 18,032 237 37.6 64.3 11.9 11.8 8.8 3.2 — 887 20.3 1,719 10.5Edmonds................................... WA 18,452 22,067 20,743 1,834 31.0 65.6 6.3 10.8 15.8 1.5 — 1,016 20.4 2,001 10.4Everett ....................................... WA 14,846 18,683 19,084 1,715 33.6 68.7 4.8 11.4 13.6 1.4 — 942 20.3 1,773 10.8Evergreen (Clark) ..................... WA 14,242 21,650 26,100 2,062 35.8 76.5 3.9 9.2 9.3 1.2 — 1,344 19.4 2,496 10.5Federal Way.............................. WA 17,263 22,623 22,440 2,629 45.2 45.6 13.8 20.2 19.1 1.3 — 1,190 18.9 2,219 10.1Highline ..................................... WA 15,900 18,024 17,549 3,379 59.6 33.4 14.8 28.3 21.6 1.9 — 990 17.7 1,941 9.0Issaquah.................................... WA 8,533 14,259 16,696 603 6.7 70.1 2.4 5.2 21.6 0.7 — 808 20.7 1,501 11.1Kennewick................................. WA 11,147 13,629 15,413 1,579 49.0 65.1 2.4 29.1 2.5 0.9 — 761 20.3 1,480 10.4Kent ........................................... WA 20,212 26,535 27,444 3,896 39.6 53.4 11.7 13.7 19.9 1.3 — 1,430 19.2 2,668 10.3Lake Washington...................... WA 22,431 23,662 23,937 1,354 13.4 73.1 2.5 7.3 16.5 0.6 — 1,244 19.2 2,178 11.0Northshore................................ WA 17,213 20,255 19,818 908 13.1 76.4 2.1 8.0 12.5 1.0 — 991 20.0 1,834 10.8Puyallup..................................... WA 14,325 19,757 20,911 591 24.0 78.7 4.6 7.5 7.7 1.6 — 1,035 20.2 2,024 10.3Seattle ....................................... WA 40,917 47,575 45,968 5,368 40.4 43.4 21.1 11.7 22.0 1.9 — 2,540 18.1 4,918 9.3Spokane.................................... WA 27,965 31,725 29,701 1,037 50.5 82.9 4.4 4.3 4.1 4.2 — 1,707 17.4 3,133 9.5Tacoma...................................... WA 29,465 34,093 29,500 1,930 56.7 47.8 23.3 13.6 13.3 2.0 — 1,649 17.9 3,167 9.3Vancouver ................................. WA 15,943 21,892 22,622 1,876 47.2 73.8 5.4 13.2 6.0 1.5 — 1,163 19.4 2,329 9.7
Berkeley County Schools......... WV 10,415 13,076 17,214 346 42.2 81.4 12.1 5.2 1.1 0.2 — 1,217 14.1 2,368 7.3Kanawha County Schools....... WV 34,284 29,250 28,465 239 51.5 84.9 13.1 0.6 1.4 0.1 — 1,889 15.1 3,741 7.6
Appleton Area........................... WI 12,876 14,793 15,235 1,638 34.8 77.5 3.9 6.4 11.2 0.8 — 927 16.4 1,536 9.9Green Bay Area........................ WI 18,048 20,104 20,573 4,172 52.2 61.1 7.2 18.6 8.0 5.1 — 1,423 14.5 2,438 8.4Kenosha.................................... WI 16,219 20,099 22,772 2,023 40.5 61.4 16.6 19.8 1.8 0.5 — 1,457 15.6 2,588 8.8Madison Metropolitan............... WI 23,214 25,087 24,496 4,209 44.1 50.5 23.6 14.5 10.7 0.8 — 1,752 14.0 3,497 7.0Milwaukee................................. WI 92,789 97,985 85,381 7,301 76.7 15.1 56.9 22.6 4.6 0.8 — 5,158 16.6 10,861 7.9Racine....................................... WI 22,159 21,102 21,172 2,653 47.7 49.4 27.0 21.7 1.5 0.3 — 1,364 15.5 2,523 8.4
Table 94. Selected statistics on enrollment, teachers, dropouts, and graduates in public school districts enrolling more than 15,000 students: 1990,
Name of district StateEnrollment,
fall 1990Enrollment,
fall 2000Enrollment,
fall 2008
Number ofEnglish
languagelearners,
2008
Percenteligible for
free orreduced-
price lunch,2008
Percentage distribution of enrollment, by race, fall 2008 Teachers and staff, fall 2008
White Black Hispanic
Asian/Pacific
Islander
AmericanIndian/AlaskaNative
Two ormoreraces
Number ofclassroom
teachers
Pupil/teacher
ratio
Totalnumberof staff
Student/staff ratio
1 2 3 4 5 6 7 8 9 10 11 12 13 14 15 16 17
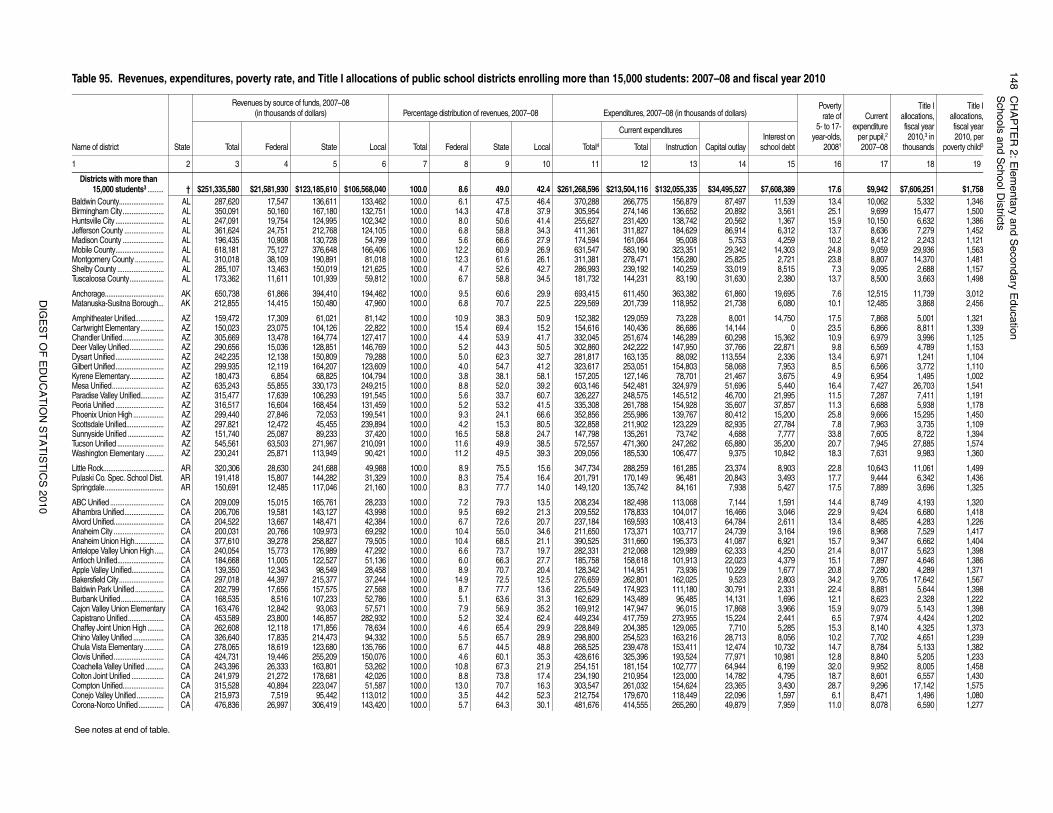
14
8C
HA
PT
ER
2: E
lem
en
tary a
nd
Se
con
da
ry Ed
uca
tion
Sch
oo
ls an
d S
cho
ol D
istricts
DIG
ES
T O
F E
DU
CA
TIO
N S
TA
TIS
TIC
S 2
01
0
iscal year 2010
Povertyrate of
5- to 17-year-olds,
20081
Currentexpenditure
per pupil,2
2007–08
Title Iallocations,fiscal year2010,3 in
thousands
Title Iallocations,fiscal year2010, per
poverty child3Interest on
school debt
15 16 17 18 19
$7,608,389 17.6 $9,942 $7,606,251 $1,75811,539 13.4 10,062 5,332 1,3463,561 25.1 9,699 15,477 1,5001,367 15.9 10,150 6,632 1,3866,312 13.7 8,636 7,279 1,4524,259 10.2 8,412 2,243 1,121
14,303 24.8 9,059 29,936 1,5632,721 23.8 8,807 14,370 1,4818,515 7.3 9,095 2,688 1,1572,380 13.7 8,500 3,663 1,498
19,695 7.6 12,515 11,739 3,0126,080 10.1 12,485 3,868 2,456
14,750 17.5 7,868 5,001 1,3210 23.5 6,866 8,811 1,339
15,362 10.9 6,979 3,996 1,12522,871 9.8 6,569 4,789 1,1532,336 13.4 6,971 1,241 1,1047,953 8.5 6,566 3,772 1,1103,675 4.9 6,954 1,495 1,0025,440 16.4 7,427 26,703 1,541
21,995 11.5 7,287 7,411 1,19137,857 11.3 6,688 5,938 1,17815,200 25.8 9,666 15,295 1,45027,784 7.8 7,963 3,735 1,1097,777 33.8 7,605 8,722 1,394
35,200 20.7 7,945 27,885 1,57410,842 18.3 7,631 9,983 1,360
8,903 22.8 10,643 11,061 1,4993,493 17.7 9,444 6,342 1,4365,427 17.5 7,889 3,696 1,325
1,591 14.4 8,749 4,193 1,3203,046 22.9 9,424 6,680 1,4182,611 13.4 8,485 4,283 1,2263,164 19.6 8,968 7,529 1,4176,921 15.7 9,347 6,662 1,4044,250 21.4 8,017 5,623 1,3984,379 15.1 7,897 4,646 1,3861,677 20.8 7,280 4,289 1,3712,803 34.2 9,705 17,642 1,5672,331 22.4 8,881 5,644 1,3981,696 12.1 8,623 2,328 1,2223,966 15.9 9,079 5,143 1,3982,441 6.5 7,974 4,424 1,2025,285 15.3 8,140 4,325 1,3738,056 10.2 7,702 4,651 1,239
10,732 14.7 8,784 5,133 1,38210,981 12.8 8,840 5,205 1,2336,199 32.0 9,952 8,005 1,4584,795 18.7 8,601 6,557 1,4303,430 28.7 9,296 17,142 1,5751,597 6.1 8,471 1,496 1,0807,959 11.0 8,078 6,590 1,277
Table 95. Revenues, expenditures, poverty rate, and Title I allocations of public school districts enrolling more than 15,000 students: 2007–08 and f
Name of district State
Revenues by source of funds, 2007–08 (in thousands of dollars) Percentage distribution of revenues, 2007–08 Expenditures, 2007–08 (in thousands of dollars)
Total Federal State Local Total Federal State Local Total4
Current expenditures
Capital outlayTotal Instruction
1 2 3 4 5 6 7 8 9 10 11 12 13 14
Districts with more than 15,000 students3 ......... † $251,335,580 $21,581,930 $123,185,610 $106,568,040 100.0 8.6 49.0 42.4 $261,268,596 $213,504,116 $132,055,335 $34,495,527
Baldwin County......................... AL 287,620 17,547 136,611 133,462 100.0 6.1 47.5 46.4 370,288 266,775 156,879 87,497Birmingham City....................... AL 350,091 50,160 167,180 132,751 100.0 14.3 47.8 37.9 305,954 274,146 136,652 20,892Huntsville City ........................... AL 247,091 19,754 124,995 102,342 100.0 8.0 50.6 41.4 255,627 231,420 138,742 20,562Jefferson County ...................... AL 361,624 24,751 212,768 124,105 100.0 6.8 58.8 34.3 411,361 311,827 184,629 86,914Madison County ....................... AL 196,435 10,908 130,728 54,799 100.0 5.6 66.6 27.9 174,594 161,064 95,008 5,753Mobile County........................... AL 618,181 75,127 376,648 166,406 100.0 12.2 60.9 26.9 631,547 583,190 323,351 29,342Montgomery County ................ AL 310,018 38,109 190,891 81,018 100.0 12.3 61.6 26.1 311,381 278,471 156,280 25,825Shelby County .......................... AL 285,107 13,463 150,019 121,625 100.0 4.7 52.6 42.7 286,993 239,192 140,259 33,019Tuscaloosa County................... AL 173,362 11,611 101,939 59,812 100.0 6.7 58.8 34.5 181,732 144,231 83,190 31,630
Anchorage................................. AK 650,738 61,866 394,410 194,462 100.0 9.5 60.6 29.9 693,415 611,450 363,382 61,860Matanuska-Susitna Borough... AK 212,855 14,415 150,480 47,960 100.0 6.8 70.7 22.5 229,569 201,739 118,952 21,738
Amphitheater Unified................ AZ 159,472 17,309 61,021 81,142 100.0 10.9 38.3 50.9 152,382 129,059 73,228 8,001Cartwright Elementary............. AZ 150,023 23,075 104,126 22,822 100.0 15.4 69.4 15.2 154,616 140,436 86,686 14,144Chandler Unified....................... AZ 305,669 13,478 164,774 127,417 100.0 4.4 53.9 41.7 332,045 251,674 146,289 60,298Deer Valley Unified................... AZ 290,656 15,036 128,851 146,769 100.0 5.2 44.3 50.5 302,860 242,222 147,950 37,766Dysart Unified........................... AZ 242,235 12,138 150,809 79,288 100.0 5.0 62.3 32.7 281,817 163,135 88,092 113,554Gilbert Unified........................... AZ 299,935 12,119 164,207 123,609 100.0 4.0 54.7 41.2 323,617 253,051 154,803 58,068Kyrene Elementary................... AZ 180,473 6,854 68,825 104,794 100.0 3.8 38.1 58.1 157,205 127,146 78,701 21,467Mesa Unified............................. AZ 635,243 55,855 330,173 249,215 100.0 8.8 52.0 39.2 603,146 542,481 324,979 51,696Paradise Valley Unified............. AZ 315,477 17,639 106,293 191,545 100.0 5.6 33.7 60.7 326,227 248,575 145,512 46,700Peoria Unified ........................... AZ 316,517 16,604 168,454 131,459 100.0 5.2 53.2 41.5 335,308 261,788 154,928 35,607Phoenix Union High ................. AZ 299,440 27,846 72,053 199,541 100.0 9.3 24.1 66.6 352,856 255,986 139,767 80,412Scottsdale Unified..................... AZ 297,821 12,472 45,455 239,894 100.0 4.2 15.3 80.5 322,858 211,902 123,229 82,935Sunnyside Unified .................... AZ 151,740 25,087 89,233 37,420 100.0 16.5 58.8 24.7 147,798 135,261 73,742 4,688Tucson Unified .......................... AZ 545,561 63,503 271,967 210,091 100.0 11.6 49.9 38.5 572,557 471,360 247,262 65,880Washington Elementary .......... AZ 230,241 25,871 113,949 90,421 100.0 11.2 49.5 39.3 209,056 185,530 106,477 9,375
Little Rock.................................. AR 320,306 28,630 241,688 49,988 100.0 8.9 75.5 15.6 347,734 288,259 161,285 23,374Pulaski Co. Spec. School Dist. AR 191,418 15,807 144,282 31,329 100.0 8.3 75.4 16.4 201,791 170,149 96,481 20,843Springdale................................. AR 150,691 12,485 117,046 21,160 100.0 8.3 77.7 14.0 149,120 135,742 84,161 7,938
ABC Unified .............................. CA 209,009 15,015 165,761 28,233 100.0 7.2 79.3 13.5 208,234 182,498 113,068 7,144Alhambra Unified...................... CA 206,706 19,581 143,127 43,998 100.0 9.5 69.2 21.3 209,552 178,833 104,017 16,466Alvord Unified............................ CA 204,522 13,667 148,471 42,384 100.0 6.7 72.6 20.7 237,184 169,593 108,413 64,784Anaheim City ............................ CA 200,031 20,766 109,973 69,292 100.0 10.4 55.0 34.6 211,650 173,371 103,717 24,739Anaheim Union High................ CA 377,610 39,278 258,827 79,505 100.0 10.4 68.5 21.1 390,525 311,660 195,373 41,087Antelope Valley Union High..... CA 240,054 15,773 176,989 47,292 100.0 6.6 73.7 19.7 282,331 212,068 129,989 62,333Antioch Unified.......................... CA 184,668 11,005 122,527 51,136 100.0 6.0 66.3 27.7 185,758 158,618 101,913 22,023Apple Valley Unified.................. CA 139,350 12,343 98,549 28,458 100.0 8.9 70.7 20.4 128,342 114,951 73,936 10,229Bakersfield City......................... CA 297,018 44,397 215,377 37,244 100.0 14.9 72.5 12.5 276,659 262,801 162,025 9,523Baldwin Park Unified................ CA 202,799 17,656 157,575 27,568 100.0 8.7 77.7 13.6 225,549 174,923 111,180 30,791Burbank Unified........................ CA 168,535 8,516 107,233 52,786 100.0 5.1 63.6 31.3 162,629 143,489 96,485 14,131Cajon Valley Union Elementary CA 163,476 12,842 93,063 57,571 100.0 7.9 56.9 35.2 169,912 147,947 96,015 17,868Capistrano Unified.................... CA 453,589 23,800 146,857 282,932 100.0 5.2 32.4 62.4 449,234 417,759 273,955 15,224Chaffey Joint Union High ......... CA 262,608 12,118 171,856 78,634 100.0 4.6 65.4 29.9 228,849 204,385 129,065 7,710Chino Valley Unified ................. CA 326,640 17,835 214,473 94,332 100.0 5.5 65.7 28.9 298,800 254,523 163,216 28,713Chula Vista Elementary........... CA 278,065 18,619 123,680 135,766 100.0 6.7 44.5 48.8 268,525 239,478 153,411 12,474Clovis Unified............................ CA 424,731 19,446 255,209 150,076 100.0 4.6 60.1 35.3 428,616 325,396 193,524 77,971Coachella Valley Unified .......... CA 243,396 26,333 163,801 53,262 100.0 10.8 67.3 21.9 254,151 181,154 102,777 64,944Colton Joint Unified .................. CA 241,979 21,272 178,681 42,026 100.0 8.8 73.8 17.4 234,190 210,954 123,000 14,782Compton Unified....................... CA 315,528 40,894 223,047 51,587 100.0 13.0 70.7 16.3 303,547 261,032 154,624 23,365Conejo Valley Unified............... CA 215,973 7,519 95,442 113,012 100.0 3.5 44.2 52.3 212,754 179,670 118,449 22,096Corona-Norco Unified.............. CA 476,836 26,997 306,419 143,420 100.0 5.7 64.3 30.1 481,676 414,555 265,260 49,879
See notes at end of table.
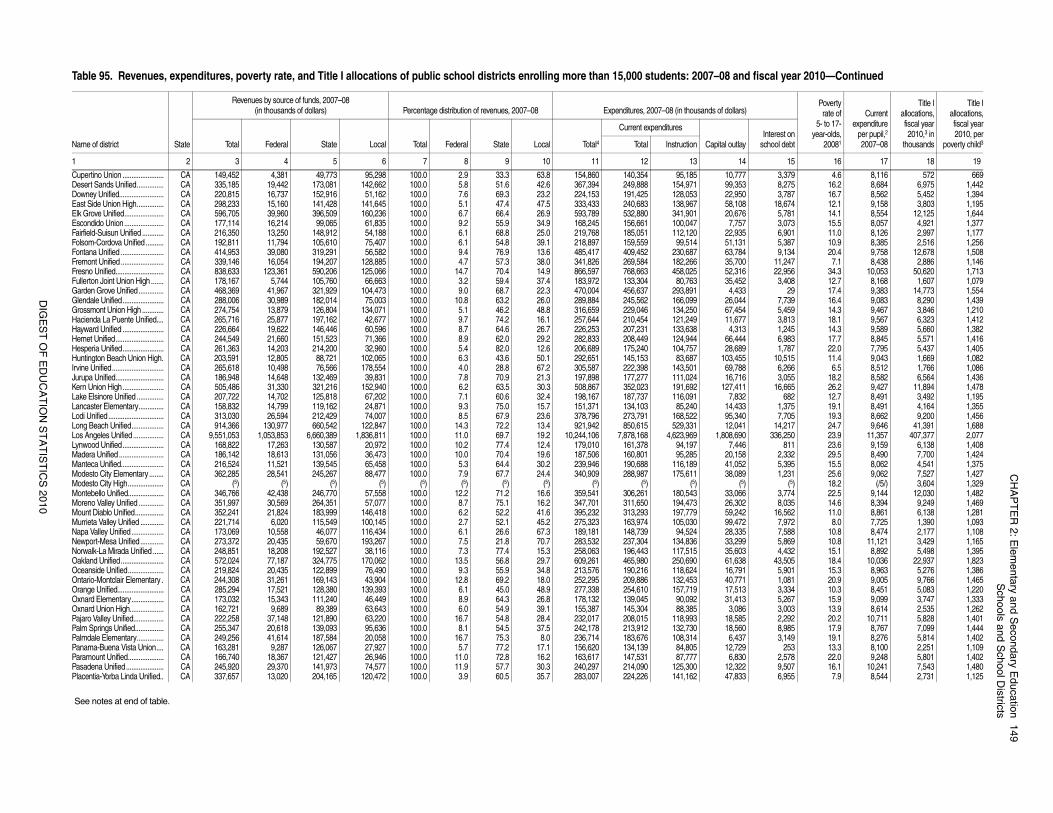
CH
AP
TE
R 2
: Ele
me
nta
ry an
d S
eco
nd
ary E
du
catio
n1
49
Sch
oo
ls an
d S
cho
ol D
istricts
DIG
ES
T O
F E
DU
CA
TIO
N S
TA
TIS
TIC
S 2
01
0
3,379 4.6 8,116 572 6698,275 16.2 8,684 6,975 1,4423,787 16.7 8,562 5,452 1,394
18,674 12.1 9,158 3,803 1,1955,781 14.1 8,554 12,125 1,6443,073 15.5 8,057 4,921 1,3776,901 11.0 8,126 2,997 1,1775,387 10.9 8,385 2,516 1,2569,134 20.4 9,758 12,678 1,508
11,247 7.1 8,438 2,886 1,14622,956 34.3 10,053 50,620 1,7133,408 12.7 8,168 1,607 1,079
29 17.4 9,383 14,773 1,5547,739 16.4 9,083 8,290 1,4395,459 14.3 9,467 3,846 1,2103,813 18.1 9,567 6,323 1,4121,245 14.3 9,589 5,660 1,3826,983 17.7 8,845 5,571 1,4161,787 22.0 7,795 5,437 1,405
10,515 11.4 9,043 1,669 1,0826,266 6.5 8,512 1,766 1,0863,055 18.2 8,582 6,564 1,436
16,665 26.2 9,427 11,894 1,478682 12.7 8,491 3,492 1,195
1,375 19.1 8,491 4,164 1,3557,705 19.3 8,662 9,200 1,456
14,217 24.7 9,646 41,391 1,688336,250 23.9 11,357 407,377 2,077
811 23.6 9,159 6,138 1,4082,332 29.5 8,490 7,700 1,4245,395 15.5 8,062 4,541 1,3751,231 25.6 9,062 7,527 1,427
(5) 18.2 (/5/) 3,604 1,3293,774 22.5 9,144 12,030 1,4828,035 14.6 8,394 9,249 1,469
16,562 11.0 8,861 6,138 1,2817,972 8.0 7,725 1,390 1,0937,588 10.8 8,474 2,177 1,1085,869 10.8 11,121 3,429 1,1654,432 15.1 8,892 5,498 1,395
43,505 18.4 10,036 22,937 1,8235,901 15.3 8,963 5,276 1,3861,081 20.9 9,005 9,766 1,4653,334 10.3 8,451 5,083 1,2205,267 15.9 9,099 3,747 1,3333,003 13.9 8,614 2,535 1,2622,292 20.2 10,711 5,828 1,4018,985 17.9 8,767 7,099 1,4443,149 19.1 8,276 5,814 1,402
253 13.3 8,100 2,251 1,1092,578 22.0 9,248 5,801 1,4029,507 16.1 10,241 7,543 1,4806,955 7.9 8,544 2,731 1,125
iscal year 2010—Continued
Povertyrate of
5- to 17-year-olds,
20081
Currentexpenditure
per pupil,2
2007–08
Title Iallocations,fiscal year2010,3 in
thousands
Title Iallocations,fiscal year2010, per
poverty child3Interest on
school debt
15 16 17 18 19
Cupertino Union ....................... CA 149,452 4,381 49,773 95,298 100.0 2.9 33.3 63.8 154,860 140,354 95,185 10,777Desert Sands Unified............... CA 335,185 19,442 173,081 142,662 100.0 5.8 51.6 42.6 367,394 249,888 154,971 99,353Downey Unified......................... CA 220,815 16,737 152,916 51,162 100.0 7.6 69.3 23.2 224,153 191,425 128,053 22,950East Side Union High............... CA 298,233 15,160 141,428 141,645 100.0 5.1 47.4 47.5 333,433 240,683 138,967 58,108Elk Grove Unified...................... CA 596,705 39,960 396,509 160,236 100.0 6.7 66.4 26.9 593,789 532,880 341,901 20,676Escondido Union...................... CA 177,114 16,214 99,065 61,835 100.0 9.2 55.9 34.9 168,245 156,661 100,047 7,757Fairfield-Suisun Unified ............ CA 216,350 13,250 148,912 54,188 100.0 6.1 68.8 25.0 219,768 185,051 112,120 22,935Folsom-Cordova Unified .......... CA 192,811 11,794 105,610 75,407 100.0 6.1 54.8 39.1 218,897 159,559 99,514 51,131Fontana Unified ........................ CA 414,953 39,080 319,291 56,582 100.0 9.4 76.9 13.6 485,417 409,452 230,687 63,784Fremont Unified........................ CA 339,146 16,054 194,207 128,885 100.0 4.7 57.3 38.0 341,826 269,584 182,266 35,700Fresno Unified........................... CA 838,633 123,361 590,206 125,066 100.0 14.7 70.4 14.9 866,597 768,663 458,025 52,316Fullerton Joint Union High....... CA 178,167 5,744 105,760 66,663 100.0 3.2 59.4 37.4 183,972 133,304 80,763 35,452Garden Grove Unified.............. CA 468,369 41,967 321,929 104,473 100.0 9.0 68.7 22.3 470,004 456,637 293,891 4,433Glendale Unified....................... CA 288,006 30,989 182,014 75,003 100.0 10.8 63.2 26.0 289,884 245,562 166,099 26,044Grossmont Union High ............ CA 274,754 13,879 126,804 134,071 100.0 5.1 46.2 48.8 316,659 229,046 134,250 67,454Hacienda La Puente Unified.... CA 265,716 25,877 197,162 42,677 100.0 9.7 74.2 16.1 257,644 210,454 121,249 11,677Hayward Unified ....................... CA 226,664 19,622 146,446 60,596 100.0 8.7 64.6 26.7 226,253 207,231 133,638 4,313Hemet Unified........................... CA 244,549 21,660 151,523 71,366 100.0 8.9 62.0 29.2 282,833 208,449 124,944 66,444Hesperia Unified....................... CA 261,363 14,203 214,200 32,960 100.0 5.4 82.0 12.6 206,689 175,240 104,757 28,689Huntington Beach Union High. CA 203,591 12,805 88,721 102,065 100.0 6.3 43.6 50.1 292,651 145,153 83,687 103,455Irvine Unified............................. CA 265,618 10,498 76,566 178,554 100.0 4.0 28.8 67.2 305,587 222,398 143,501 69,788Jurupa Unified........................... CA 186,948 14,648 132,469 39,831 100.0 7.8 70.9 21.3 197,898 177,277 111,024 16,716Kern Union High....................... CA 505,486 31,330 321,216 152,940 100.0 6.2 63.5 30.3 508,867 352,023 191,692 127,411Lake Elsinore Unified ............... CA 207,722 14,702 125,818 67,202 100.0 7.1 60.6 32.4 198,167 187,737 116,091 7,832Lancaster Elementary.............. CA 158,832 14,799 119,162 24,871 100.0 9.3 75.0 15.7 151,371 134,103 85,240 14,433Lodi Unified............................... CA 313,030 26,594 212,429 74,007 100.0 8.5 67.9 23.6 378,796 273,791 168,522 95,340Long Beach Unified.................. CA 914,366 130,977 660,542 122,847 100.0 14.3 72.2 13.4 921,942 850,615 529,331 12,041Los Angeles Unified................. CA 9,551,053 1,053,853 6,660,389 1,836,811 100.0 11.0 69.7 19.2 10,244,106 7,878,168 4,623,969 1,808,690Lynwood Unified....................... CA 168,822 17,263 130,587 20,972 100.0 10.2 77.4 12.4 179,010 161,378 94,197 7,446Madera Unified ......................... CA 186,142 18,613 131,056 36,473 100.0 10.0 70.4 19.6 187,506 160,801 95,285 20,158Manteca Unified........................ CA 216,524 11,521 139,545 65,458 100.0 5.3 64.4 30.2 239,946 190,688 116,189 41,052Modesto City Elementary........ CA 362,285 28,541 245,267 88,477 100.0 7.9 67.7 24.4 340,909 288,987 175,611 38,089Modesto City High.................... CA (5) (5) (5) (5) (5) (5) (5) (5) (5) (5) (5) (5)Montebello Unified.................... CA 346,766 42,438 246,770 57,558 100.0 12.2 71.2 16.6 359,541 306,261 180,543 33,066Moreno Valley Unified .............. CA 351,997 30,569 264,351 57,077 100.0 8.7 75.1 16.2 347,701 311,650 194,473 26,302Mount Diablo Unified................ CA 352,241 21,824 183,999 146,418 100.0 6.2 52.2 41.6 395,232 313,293 197,779 59,242Murrieta Valley Unified ............. CA 221,714 6,020 115,549 100,145 100.0 2.7 52.1 45.2 275,323 163,974 105,030 99,472Napa Valley Unified.................. CA 173,069 10,558 46,077 116,434 100.0 6.1 26.6 67.3 189,181 148,739 94,524 28,335Newport-Mesa Unified............. CA 273,372 20,435 59,670 193,267 100.0 7.5 21.8 70.7 283,532 237,304 134,836 33,299Norwalk-La Mirada Unified ...... CA 248,851 18,208 192,527 38,116 100.0 7.3 77.4 15.3 258,063 196,443 117,515 35,603Oakland Unified........................ CA 572,024 77,187 324,775 170,062 100.0 13.5 56.8 29.7 609,261 465,980 250,690 61,638Oceanside Unified.................... CA 219,824 20,435 122,899 76,490 100.0 9.3 55.9 34.8 213,576 190,216 118,624 16,791Ontario-Montclair Elementary . CA 244,308 31,261 169,143 43,904 100.0 12.8 69.2 18.0 252,295 209,886 132,453 40,771Orange Unified.......................... CA 285,294 17,521 128,380 139,393 100.0 6.1 45.0 48.9 277,338 254,610 157,719 17,513Oxnard Elementary.................. CA 173,032 15,343 111,240 46,449 100.0 8.9 64.3 26.8 178,132 139,045 90,092 31,413Oxnard Union High................... CA 162,721 9,689 89,389 63,643 100.0 6.0 54.9 39.1 155,387 145,304 88,385 3,086Pajaro Valley Unified................. CA 222,258 37,148 121,890 63,220 100.0 16.7 54.8 28.4 232,017 208,015 118,993 18,585Palm Springs Unified................ CA 255,347 20,618 139,093 95,636 100.0 8.1 54.5 37.5 242,178 213,912 132,730 18,560Palmdale Elementary............... CA 249,256 41,614 187,584 20,058 100.0 16.7 75.3 8.0 236,714 183,676 108,314 6,437Panama-Buena Vista Union.... CA 163,281 9,287 126,067 27,927 100.0 5.7 77.2 17.1 156,620 134,139 84,805 12,729Paramount Unified.................... CA 166,740 18,367 121,427 26,946 100.0 11.0 72.8 16.2 163,617 147,531 87,777 6,830Pasadena Unified..................... CA 245,920 29,370 141,973 74,577 100.0 11.9 57.7 30.3 240,297 214,090 125,300 12,322Placentia-Yorba Linda Unified.. CA 337,657 13,020 204,165 120,472 100.0 3.9 60.5 35.7 283,007 224,226 141,162 47,833
See notes at end of table.
Table 95. Revenues, expenditures, poverty rate, and Title I allocations of public school districts enrolling more than 15,000 students: 2007–08 and f
Name of district State
Revenues by source of funds, 2007–08 (in thousands of dollars) Percentage distribution of revenues, 2007–08 Expenditures, 2007–08 (in thousands of dollars)
Total Federal State Local Total Federal State Local Total4
Current expenditures
Capital outlayTotal Instruction
1 2 3 4 5 6 7 8 9 10 11 12 13 14
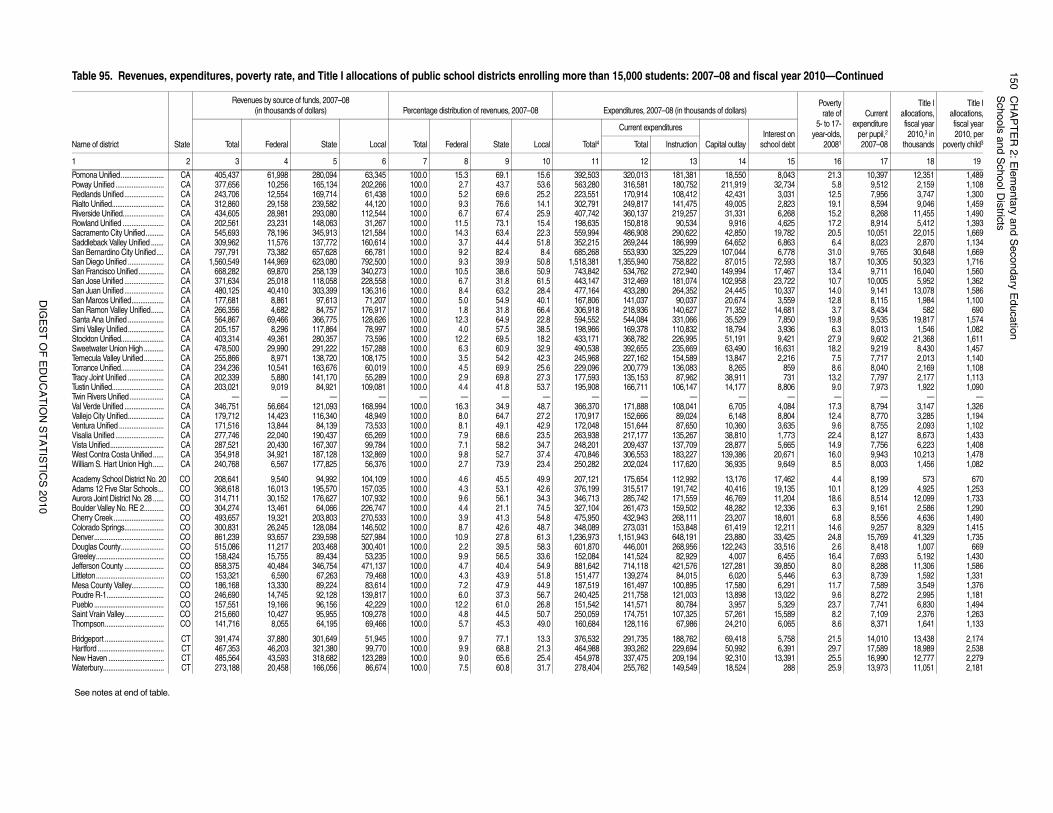
15
0C
HA
PT
ER
2: E
lem
en
tary a
nd
Se
con
da
ry Ed
uca
tion
Sch
oo
ls an
d S
cho
ol D
istricts
DIG
ES
T O
F E
DU
CA
TIO
N S
TA
TIS
TIC
S 2
01
0
8,043 21.3 10,397 12,351 1,48932,734 5.8 9,512 2,159 1,1083,031 12.5 7,956 3,747 1,3002,823 19.1 8,594 9,046 1,4596,268 15.2 8,268 11,455 1,4904,625 17.2 8,914 5,412 1,393
19,782 20.5 10,051 22,015 1,6696,863 6.4 8,023 2,870 1,1346,778 31.0 9,765 30,648 1,669
72,593 18.7 10,305 50,323 1,71617,467 13.4 9,711 16,040 1,56023,722 10.7 10,005 5,952 1,36210,337 14.0 9,141 13,078 1,5863,559 12.8 8,115 1,984 1,100
14,681 3.7 8,434 582 6907,850 19.8 9,535 19,817 1,5743,936 6.3 8,013 1,546 1,0829,421 27.9 9,602 21,368 1,611
16,631 18.2 9,219 8,430 1,4572,216 7.5 7,717 2,013 1,140
859 8.6 8,040 2,169 1,108731 13.2 7,797 2,177 1,113
8,806 9.0 7,973 1,922 1,090— — — — —
4,084 17.3 8,794 3,147 1,3268,804 12.4 8,770 3,285 1,1943,635 9.6 8,755 2,093 1,1021,773 22.4 8,127 8,673 1,4335,665 14.9 7,756 6,223 1,408
20,671 16.0 9,943 10,213 1,4789,649 8.5 8,003 1,456 1,082
17,462 4.4 8,199 573 67019,135 10.1 8,129 4,925 1,25311,204 18.6 8,514 12,099 1,73312,336 6.3 9,161 2,586 1,29018,601 6.8 8,556 4,636 1,49012,211 14.6 9,257 8,329 1,41533,425 24.8 15,769 41,329 1,73533,516 2.6 8,418 1,007 6696,455 16.4 7,693 5,192 1,430
39,850 8.0 8,288 11,306 1,5865,446 6.3 8,739 1,592 1,3316,291 11.7 7,589 3,549 1,376
13,022 9.6 8,272 2,995 1,1815,329 23.7 7,741 6,830 1,494
15,589 8.2 7,109 2,376 1,2636,065 8.6 8,371 1,641 1,133
5,758 21.5 14,010 13,438 2,1746,391 29.7 17,589 18,989 2,538
13,391 25.5 16,990 12,777 2,279288 25.9 13,973 11,051 2,181
iscal year 2010—Continued
Povertyrate of
5- to 17-year-olds,
20081
Currentexpenditure
per pupil,2
2007–08
Title Iallocations,fiscal year2010,3 in
thousands
Title Iallocations,fiscal year2010, per
poverty child3Interest on
school debt
15 16 17 18 19
Pomona Unified........................ CA 405,437 61,998 280,094 63,345 100.0 15.3 69.1 15.6 392,503 320,013 181,381 18,550Poway Unified........................... CA 377,656 10,256 165,134 202,266 100.0 2.7 43.7 53.6 563,280 316,581 180,752 211,919Redlands Unified...................... CA 243,706 12,554 169,714 61,438 100.0 5.2 69.6 25.2 223,551 170,914 108,412 42,431Rialto Unified............................. CA 312,860 29,158 239,582 44,120 100.0 9.3 76.6 14.1 302,791 249,817 141,475 49,005Riverside Unified....................... CA 434,605 28,981 293,080 112,544 100.0 6.7 67.4 25.9 407,742 360,137 219,257 31,331Rowland Unified ....................... CA 202,561 23,231 148,063 31,267 100.0 11.5 73.1 15.4 198,635 150,818 90,534 9,916Sacramento City Unified.......... CA 545,693 78,196 345,913 121,584 100.0 14.3 63.4 22.3 559,994 486,908 290,622 42,850Saddleback Valley Unified ....... CA 309,962 11,576 137,772 160,614 100.0 3.7 44.4 51.8 352,215 269,244 186,999 64,652San Bernardino City Unified.... CA 797,791 73,382 657,628 66,781 100.0 9.2 82.4 8.4 685,268 553,930 325,229 107,044San Diego Unified .................... CA 1,560,549 144,969 623,080 792,500 100.0 9.3 39.9 50.8 1,518,381 1,355,940 758,822 87,015San Francisco Unified.............. CA 668,282 69,870 258,139 340,273 100.0 10.5 38.6 50.9 743,842 534,762 272,940 149,994San Jose Unified ...................... CA 371,634 25,018 118,058 228,558 100.0 6.7 31.8 61.5 443,147 312,469 181,074 102,958San Juan Unified...................... CA 480,125 40,410 303,399 136,316 100.0 8.4 63.2 28.4 477,164 433,280 264,352 24,445San Marcos Unified.................. CA 177,681 8,861 97,613 71,207 100.0 5.0 54.9 40.1 167,806 141,037 90,037 20,674San Ramon Valley Unified....... CA 266,356 4,682 84,757 176,917 100.0 1.8 31.8 66.4 306,918 218,936 140,627 71,352Santa Ana Unified .................... CA 564,867 69,466 366,775 128,626 100.0 12.3 64.9 22.8 594,552 544,084 331,066 35,529Simi Valley Unified.................... CA 205,157 8,296 117,864 78,997 100.0 4.0 57.5 38.5 198,966 169,378 110,832 18,794Stockton Unified........................ CA 403,314 49,361 280,357 73,596 100.0 12.2 69.5 18.2 433,171 368,782 226,995 51,191Sweetwater Union High........... CA 478,500 29,990 291,222 157,288 100.0 6.3 60.9 32.9 490,538 392,655 235,669 63,490Temecula Valley Unified........... CA 255,866 8,971 138,720 108,175 100.0 3.5 54.2 42.3 245,968 227,162 154,589 13,847Torrance Unified........................ CA 234,236 10,541 163,676 60,019 100.0 4.5 69.9 25.6 229,096 200,779 136,083 8,265Tracy Joint Unified .................... CA 202,339 5,880 141,170 55,289 100.0 2.9 69.8 27.3 177,593 135,153 87,962 38,911Tustin Unified............................. CA 203,021 9,019 84,921 109,081 100.0 4.4 41.8 53.7 195,908 166,711 106,147 14,177Twin Rivers Unified................... CA — — — — — — — — — — — —Val Verde Unified ...................... CA 346,751 56,664 121,093 168,994 100.0 16.3 34.9 48.7 366,370 171,888 108,041 6,705Vallejo City Unified.................... CA 179,712 14,423 116,340 48,949 100.0 8.0 64.7 27.2 170,917 152,666 89,024 6,148Ventura Unified ......................... CA 171,516 13,844 84,139 73,533 100.0 8.1 49.1 42.9 172,048 151,644 87,650 10,360Visalia Unified........................... CA 277,746 22,040 190,437 65,269 100.0 7.9 68.6 23.5 263,938 217,177 135,267 38,810Vista Unified.............................. CA 287,521 20,430 167,307 99,784 100.0 7.1 58.2 34.7 248,201 209,437 137,709 28,877West Contra Costa Unified...... CA 354,918 34,921 187,128 132,869 100.0 9.8 52.7 37.4 470,846 306,553 183,227 139,386William S. Hart Union High...... CA 240,768 6,567 177,825 56,376 100.0 2.7 73.9 23.4 250,282 202,024 117,620 36,935
Academy School District No. 20 CO 208,641 9,540 94,992 104,109 100.0 4.6 45.5 49.9 207,121 175,654 112,992 13,176Adams 12 Five Star Schools... CO 368,618 16,013 195,570 157,035 100.0 4.3 53.1 42.6 376,199 315,517 191,742 40,416Aurora Joint District No. 28 ...... CO 314,711 30,152 176,627 107,932 100.0 9.6 56.1 34.3 346,713 285,742 171,559 46,769Boulder Valley No. RE 2........... CO 304,274 13,461 64,066 226,747 100.0 4.4 21.1 74.5 327,104 261,473 159,502 48,282Cherry Creek............................ CO 493,657 19,321 203,803 270,533 100.0 3.9 41.3 54.8 475,950 432,943 268,111 23,207Colorado Springs...................... CO 300,831 26,245 128,084 146,502 100.0 8.7 42.6 48.7 348,089 273,031 153,848 61,419Denver....................................... CO 861,239 93,657 239,598 527,984 100.0 10.9 27.8 61.3 1,236,973 1,151,943 648,191 23,880Douglas County........................ CO 515,086 11,217 203,468 300,401 100.0 2.2 39.5 58.3 601,870 446,001 268,956 122,243Greeley...................................... CO 158,424 15,755 89,434 53,235 100.0 9.9 56.5 33.6 152,084 141,524 82,929 4,007Jefferson County ...................... CO 858,375 40,484 346,754 471,137 100.0 4.7 40.4 54.9 881,642 714,118 421,576 127,281Littleton...................................... CO 153,321 6,590 67,263 79,468 100.0 4.3 43.9 51.8 151,477 139,274 84,015 6,020Mesa County Valley.................. CO 186,168 13,330 89,224 83,614 100.0 7.2 47.9 44.9 187,519 161,497 100,895 17,580Poudre R-1................................ CO 246,690 14,745 92,128 139,817 100.0 6.0 37.3 56.7 240,425 211,758 121,003 13,898Pueblo ....................................... CO 157,551 19,166 96,156 42,229 100.0 12.2 61.0 26.8 151,542 141,571 80,784 3,957Saint Vrain Valley...................... CO 215,660 10,427 95,955 109,278 100.0 4.8 44.5 50.7 250,059 174,751 107,325 57,261Thompson................................. CO 141,716 8,055 64,195 69,466 100.0 5.7 45.3 49.0 160,684 128,116 67,986 24,210
Bridgeport ................................. CT 391,474 37,880 301,649 51,945 100.0 9.7 77.1 13.3 376,532 291,735 188,762 69,418Hartford ..................................... CT 467,353 46,203 321,380 99,770 100.0 9.9 68.8 21.3 464,988 393,262 229,694 50,992New Haven ............................... CT 485,564 43,593 318,682 123,289 100.0 9.0 65.6 25.4 454,978 337,475 209,194 92,310Waterbury.................................. CT 273,188 20,458 166,056 86,674 100.0 7.5 60.8 31.7 278,404 255,762 149,549 18,524
See notes at end of table.
Table 95. Revenues, expenditures, poverty rate, and Title I allocations of public school districts enrolling more than 15,000 students: 2007–08 and f
Name of district State
Revenues by source of funds, 2007–08 (in thousands of dollars) Percentage distribution of revenues, 2007–08 Expenditures, 2007–08 (in thousands of dollars)
Total Federal State Local Total Federal State Local Total4
Current expenditures
Capital outlayTotal Instruction
1 2 3 4 5 6 7 8 9 10 11 12 13 14
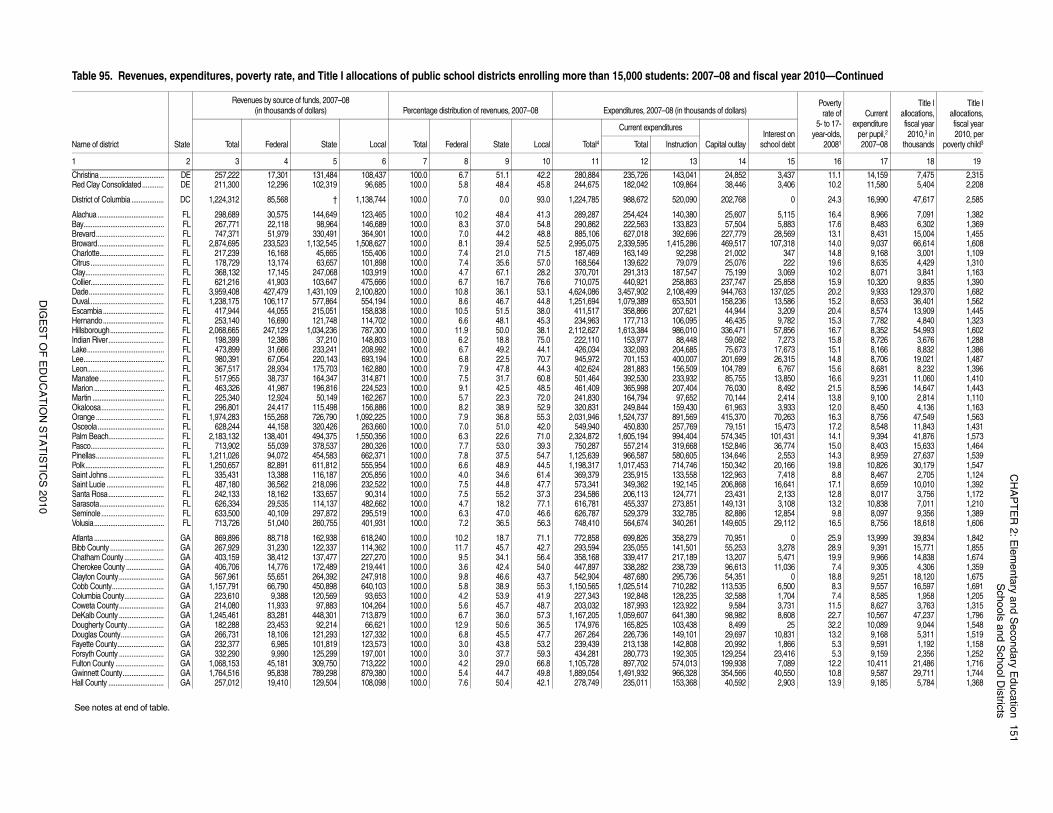
CH
AP
TE
R 2
: Ele
me
nta
ry an
d S
eco
nd
ary E
du
catio
n1
51
Sch
oo
ls an
d S
cho
ol D
istricts
DIG
ES
T O
F E
DU
CA
TIO
N S
TA
TIS
TIC
S 2
01
0
3,437 11.1 14,159 7,475 2,3153,406 10.2 11,580 5,404 2,208
0 24.3 16,990 47,617 2,585
5,115 16.4 8,966 7,091 1,3825,883 17.6 8,483 6,302 1,369
28,569 13.1 8,431 15,004 1,455107,318 14.0 9,037 66,614 1,608
347 14.8 9,168 3,001 1,109222 19.6 8,635 4,429 1,310
3,069 10.2 8,071 3,841 1,16325,858 15.9 10,320 9,835 1,390
137,025 20.2 9,933 129,370 1,68213,586 15.2 8,653 36,401 1,5623,209 20.4 8,574 13,909 1,4459,782 15.3 7,782 4,840 1,323
57,856 16.7 8,352 54,993 1,6027,273 15.8 8,726 3,676 1,288
17,673 15.1 8,166 8,832 1,38626,315 14.8 8,706 19,021 1,4876,767 15.6 8,681 8,232 1,396
13,850 16.6 9,231 11,060 1,4108,492 21.5 8,596 14,647 1,4432,414 13.8 9,100 2,814 1,1103,933 12.0 8,450 4,136 1,163
70,263 16.3 8,756 47,549 1,56315,473 17.2 8,548 11,843 1,431
101,431 14.1 9,394 41,876 1,57336,774 15.0 8,403 15,633 1,4642,553 14.3 8,959 27,637 1,539
20,166 19.8 10,826 30,179 1,5477,418 8.8 8,467 2,705 1,124
16,641 17.1 8,659 10,010 1,3922,133 12.8 8,017 3,756 1,1723,108 13.2 10,838 7,011 1,210
12,854 9.8 8,097 9,356 1,38929,112 16.5 8,756 18,618 1,606
0 25.9 13,999 39,834 1,8423,278 28.9 9,391 15,771 1,8555,471 19.9 9,966 14,838 1,674
11,036 7.4 9,305 4,306 1,3590 18.8 9,251 18,120 1,675
6,500 8.3 9,557 16,597 1,6911,704 7.4 8,585 1,958 1,2053,731 11.5 8,627 3,763 1,3158,608 22.7 10,567 47,237 1,796
25 32.2 10,089 9,044 1,54810,831 13.2 9,168 5,311 1,5191,866 5.3 9,591 1,192 1,158
23,416 5.3 9,159 2,356 1,2527,089 12.2 10,411 21,486 1,716
40,550 10.8 9,587 29,711 1,7442,903 13.9 9,185 5,784 1,368
iscal year 2010—Continued
Povertyrate of
5- to 17-year-olds,
20081
Currentexpenditure
per pupil,2
2007–08
Title Iallocations,fiscal year2010,3 in
thousands
Title Iallocations,fiscal year2010, per
poverty child3Interest on
school debt
15 16 17 18 19
Christina.................................... DE 257,222 17,301 131,484 108,437 100.0 6.7 51.1 42.2 280,884 235,726 143,041 24,852Red Clay Consolidated............ DE 211,300 12,296 102,319 96,685 100.0 5.8 48.4 45.8 244,675 182,042 109,864 38,446
District of Columbia .................. DC 1,224,312 85,568 † 1,138,744 100.0 7.0 0.0 93.0 1,224,785 988,672 520,090 202,768
Alachua ..................................... FL 298,689 30,575 144,649 123,465 100.0 10.2 48.4 41.3 289,287 254,424 140,380 25,607Bay............................................. FL 267,771 22,118 98,964 146,689 100.0 8.3 37.0 54.8 290,862 222,563 133,823 57,504Brevard...................................... FL 747,371 51,979 330,491 364,901 100.0 7.0 44.2 48.8 885,106 627,018 392,696 227,779Broward..................................... FL 2,874,695 233,523 1,132,545 1,508,627 100.0 8.1 39.4 52.5 2,995,075 2,339,595 1,415,286 469,517Charlotte.................................... FL 217,239 16,168 45,665 155,406 100.0 7.4 21.0 71.5 187,469 163,149 92,298 21,002Citrus......................................... FL 178,729 13,174 63,657 101,898 100.0 7.4 35.6 57.0 168,564 139,622 79,079 25,076Clay............................................ FL 368,132 17,145 247,068 103,919 100.0 4.7 67.1 28.2 370,701 291,313 187,547 75,199Collier......................................... FL 621,216 41,903 103,647 475,666 100.0 6.7 16.7 76.6 710,075 440,921 258,863 237,747Dade.......................................... FL 3,959,408 427,479 1,431,109 2,100,820 100.0 10.8 36.1 53.1 4,624,086 3,457,902 2,108,499 944,763Duval.......................................... FL 1,238,175 106,117 577,864 554,194 100.0 8.6 46.7 44.8 1,251,694 1,079,389 653,501 158,236Escambia.................................. FL 417,944 44,055 215,051 158,838 100.0 10.5 51.5 38.0 411,517 358,866 207,621 44,944Hernando.................................. FL 253,140 16,690 121,748 114,702 100.0 6.6 48.1 45.3 234,963 177,713 106,095 46,435Hillsborough.............................. FL 2,068,665 247,129 1,034,236 787,300 100.0 11.9 50.0 38.1 2,112,627 1,613,384 986,010 336,471Indian River............................... FL 198,399 12,386 37,210 148,803 100.0 6.2 18.8 75.0 222,110 153,977 88,448 59,062Lake........................................... FL 473,899 31,666 233,241 208,992 100.0 6.7 49.2 44.1 426,034 332,093 204,685 75,673Lee............................................. FL 980,391 67,054 220,143 693,194 100.0 6.8 22.5 70.7 945,972 701,153 400,007 201,699Leon........................................... FL 367,517 28,934 175,703 162,880 100.0 7.9 47.8 44.3 402,624 281,883 156,509 104,789Manatee.................................... FL 517,955 38,737 164,347 314,871 100.0 7.5 31.7 60.8 501,464 392,530 233,932 85,755Marion ....................................... FL 463,326 41,987 196,816 224,523 100.0 9.1 42.5 48.5 461,409 365,998 207,404 76,030Martin ........................................ FL 225,340 12,924 50,149 162,267 100.0 5.7 22.3 72.0 241,830 164,794 97,652 70,144Okaloosa................................... FL 296,801 24,417 115,498 156,886 100.0 8.2 38.9 52.9 320,831 249,844 159,430 61,963Orange ...................................... FL 1,974,283 155,268 726,790 1,092,225 100.0 7.9 36.8 55.3 2,031,946 1,524,737 891,569 415,370Osceola..................................... FL 628,244 44,158 320,426 263,660 100.0 7.0 51.0 42.0 549,940 450,830 257,769 79,151Palm Beach............................... FL 2,183,132 138,401 494,375 1,550,356 100.0 6.3 22.6 71.0 2,324,872 1,605,194 994,404 574,345Pasco......................................... FL 713,902 55,039 378,537 280,326 100.0 7.7 53.0 39.3 750,287 557,214 319,668 152,846Pinellas...................................... FL 1,211,026 94,072 454,583 662,371 100.0 7.8 37.5 54.7 1,125,639 966,587 580,605 134,646Polk............................................ FL 1,250,657 82,891 611,812 555,954 100.0 6.6 48.9 44.5 1,198,317 1,017,453 714,746 150,342Saint Johns............................... FL 335,431 13,388 116,187 205,856 100.0 4.0 34.6 61.4 369,379 235,915 133,558 122,963Saint Lucie ................................ FL 487,180 36,562 218,096 232,522 100.0 7.5 44.8 47.7 573,341 349,362 192,145 206,868Santa Rosa............................... FL 242,133 18,162 133,657 90,314 100.0 7.5 55.2 37.3 234,586 206,113 124,771 23,431Sarasota.................................... FL 626,334 29,535 114,137 482,662 100.0 4.7 18.2 77.1 616,781 455,337 273,851 149,131Seminole................................... FL 633,500 40,109 297,872 295,519 100.0 6.3 47.0 46.6 626,787 529,379 332,785 82,886Volusia....................................... FL 713,726 51,040 260,755 401,931 100.0 7.2 36.5 56.3 748,410 564,674 340,261 149,605
Atlanta ....................................... GA 869,896 88,718 162,938 618,240 100.0 10.2 18.7 71.1 772,858 699,826 358,279 70,951Bibb County .............................. GA 267,929 31,230 122,337 114,362 100.0 11.7 45.7 42.7 293,594 235,055 141,501 55,253Chatham County ...................... GA 403,159 38,412 137,477 227,270 100.0 9.5 34.1 56.4 358,168 339,417 217,189 13,207Cherokee County ..................... GA 406,706 14,776 172,489 219,441 100.0 3.6 42.4 54.0 447,897 338,282 238,739 96,613Clayton County......................... GA 567,961 55,651 264,392 247,918 100.0 9.8 46.6 43.7 542,904 487,680 295,736 54,351Cobb County............................. GA 1,157,791 66,790 450,898 640,103 100.0 5.8 38.9 55.3 1,150,565 1,025,514 710,282 113,535Columbia County...................... GA 223,610 9,388 120,569 93,653 100.0 4.2 53.9 41.9 227,343 192,848 128,235 32,588Coweta County......................... GA 214,080 11,933 97,883 104,264 100.0 5.6 45.7 48.7 203,032 187,993 123,922 9,584DeKalb County ......................... GA 1,245,461 83,281 448,301 713,879 100.0 6.7 36.0 57.3 1,167,205 1,059,607 641,380 98,982Dougherty County.................... GA 182,288 23,453 92,214 66,621 100.0 12.9 50.6 36.5 174,976 165,825 103,438 8,499Douglas County........................ GA 266,731 18,106 121,293 127,332 100.0 6.8 45.5 47.7 267,264 226,736 149,101 29,697Fayette County.......................... GA 232,377 6,985 101,819 123,573 100.0 3.0 43.8 53.2 239,439 213,138 142,808 20,992Forsyth County ......................... GA 332,290 9,990 125,299 197,001 100.0 3.0 37.7 59.3 434,281 280,773 192,305 129,254Fulton County ........................... GA 1,068,153 45,181 309,750 713,222 100.0 4.2 29.0 66.8 1,105,728 897,702 574,013 199,938Gwinnett County....................... GA 1,764,516 95,838 789,298 879,380 100.0 5.4 44.7 49.8 1,889,054 1,491,932 966,328 354,566Hall County ............................... GA 257,012 19,410 129,504 108,098 100.0 7.6 50.4 42.1 278,749 235,011 153,368 40,592
See notes at end of table.
Table 95. Revenues, expenditures, poverty rate, and Title I allocations of public school districts enrolling more than 15,000 students: 2007–08 and f
Name of district State
Revenues by source of funds, 2007–08 (in thousands of dollars) Percentage distribution of revenues, 2007–08 Expenditures, 2007–08 (in thousands of dollars)
Total Federal State Local Total Federal State Local Total4
Current expenditures
Capital outlayTotal Instruction
1 2 3 4 5 6 7 8 9 10 11 12 13 14

15
2C
HA
PT
ER
2: E
lem
en
tary a
nd
Se
con
da
ry Ed
uca
tion
Sch
oo
ls an
d S
cho
ol D
istricts
DIG
ES
T O
F E
DU
CA
TIO
N S
TA
TIS
TIC
S 2
01
0
7,778 10.0 8,729 5,675 1,3663,603 15.3 9,493 5,874 1,538
164 24.0 9,994 13,384 1,6231,803 16.3 9,028 5,017 1,4865,272 7.8 8,709 2,929 1,2597,307 32.3 9,522 20,342 1,716
0 15.9 9,753 3,734 1,443
0 9.1 11,800 42,599 2,366
5,487 9.9 8,338 5,071 1,39613,342 7.1 5,910 2,901 1,2886,985 13.4 5,937 3,345 1,415
11,491 7.8 8,867 2,156 1,264207,167 25.5 10,392 307,538 2,41711,429 11.6 9,408 7,449 1,48117,360 3.3 9,075 674 787
806 3.4 10,999 560 78311,457 4.1 7,994 388 80218,740 4.5 8,339 570 7995,278 22.3 9,776 13,793 1,7502,215 9.2 10,223 2,328 1,3002,358 20.1 9,280 5,973 1,606
6,217 3.1 8,878 428 634
4,400 20.7 9,504 8,921 1,5243,769 17.4 9,989 11,672 1,622
437 3.2 7,653 317 6844,252 29.7 11,822 37,585 2,0242,700 12.8 9,668 2,822 1,1851,624 21.0 10,022 3,961 1,3932,169 21.2 11,169 10,206 1,679
232 23.4 8,290 5,603 1,442
3,140 10.1 9,475 2,920 1,3021,008 18.1 8,932 5,260 1,510
823 15.3 10,152 9,777 1,594
12,557 2.1 8,900 364 7715,212 27.6 10,832 12,525 1,961
10,907 4.9 9,509 1,873 1,45512,055 5.4 9,453 3,309 1,4779,873 16.8 10,609 21,841 2,196
9,435 6.8 7,577 1,712 1,1699,561 17.0 9,205 11,585 1,588
21,815 18.4 9,966 39,599 1,769
4,155 12.4 8,941 3,620 1,3912,012 16.6 8,843 5,492 1,5535,128 24.8 9,482 21,978 1,9377,801 18.4 9,500 10,128 1,615
0 24.1 10,662 28,257 1,8118,546 18.5 11,434 24,829 1,7813,844 17.6 9,107 10,919 1,6292,056 13.6 8,215 4,758 1,478
iscal year 2010—Continued
Povertyrate of
5- to 17-year-olds,
20081
Currentexpenditure
per pupil,2
2007–08
Title Iallocations,fiscal year2010,3 in
thousands
Title Iallocations,fiscal year2010, per
poverty child3Interest on
school debt
15 16 17 18 19
Henry County............................ GA 409,143 17,997 182,677 208,469 100.0 4.4 44.6 51.0 467,379 340,447 232,153 114,958Houston County........................ GA 274,811 19,817 148,855 106,139 100.0 7.2 54.2 38.6 268,040 246,068 159,940 17,369Muscogee County.................... GA 383,045 36,117 205,422 141,506 100.0 9.4 53.6 36.9 359,337 327,428 203,527 29,817Newton County......................... GA 204,512 12,599 114,914 76,999 100.0 6.2 56.2 37.7 202,766 172,543 112,428 28,309Paulding County ....................... GA 285,118 11,930 158,018 115,170 100.0 4.2 55.4 40.4 302,571 233,890 160,373 61,247Richmond County..................... GA 355,388 42,257 180,911 132,220 100.0 11.9 50.9 37.2 355,950 313,338 199,736 35,160Rockdale County...................... GA 163,316 10,605 70,840 81,871 100.0 6.5 43.4 50.1 164,500 152,278 93,526 12,222
Hawaii Department of Education........................... HI 2,541,703 310,732 2,154,313 76,658 100.0 12.2 84.8 3.0 2,242,408 2,122,779 1,281,836 94,455
Boise Independent................... ID 246,531 17,279 130,619 98,633 100.0 7.0 53.0 40.0 237,138 213,571 133,104 16,209Meridian Joint ........................... ID 249,927 12,219 164,406 73,302 100.0 4.9 65.8 29.3 215,764 197,567 120,523 4,785Nampa....................................... ID 105,735 10,524 75,872 19,339 100.0 10.0 71.8 18.3 111,553 90,258 56,729 14,310
Carpentersville (CUSD 300).... IL 206,757 9,595 48,150 149,012 100.0 4.6 23.3 72.1 259,816 173,739 103,449 68,591City of Chicago ......................... IL 4,844,616 808,902 2,061,414 1,974,300 100.0 16.7 42.6 40.8 4,941,544 4,235,025 2,529,405 429,476Elgin (SD U-46) ........................ IL 415,492 26,716 125,148 263,628 100.0 6.4 30.1 63.4 422,445 382,981 213,579 17,086Indian Prairie (CUSD 204)....... IL 307,410 6,588 59,468 241,354 100.0 2.1 19.3 78.5 314,863 264,327 175,362 32,617Naperville (CUSD 203)............ IL 236,757 6,235 36,562 193,960 100.0 2.6 15.4 81.9 217,923 200,306 124,846 12,873Oswego (CUSD 308)............... IL 158,651 1,969 51,552 105,130 100.0 1.2 32.5 66.3 220,071 117,143 67,728 81,295Plainfield (SD 202).................... IL 275,809 5,216 105,231 165,362 100.0 1.9 38.2 60.0 338,776 237,296 151,683 76,587Rockford (SD 205).................... IL 334,925 38,850 142,789 153,286 100.0 11.6 42.6 45.8 302,210 286,945 167,416 3,959Valley View (CUSD 365).......... IL 213,274 9,608 68,612 135,054 100.0 4.5 32.2 63.3 229,755 184,094 112,835 42,631Waukegan (CUSD 60)............. IL 167,197 17,855 84,071 65,271 100.0 10.7 50.3 39.0 164,774 158,181 89,214 2,249
Carmel Clay Schools ............... IN 169,519 10,359 45,249 113,911 100.0 6.1 26.7 67.2 157,859 133,395 83,767 14,222Evansville-Vanderburgh School Corp........................... IN 249,125 27,568 112,067 109,490 100.0 11.1 45.0 43.9 232,482 211,607 124,745 14,311Fort Wayne................................ IN 358,885 35,435 176,554 146,896 100.0 9.9 49.2 40.9 352,536 315,277 199,429 26,298Hamilton Southeastern............ IN 162,191 2,019 61,407 98,765 100.0 1.2 37.9 60.9 136,230 123,950 71,327 9,410Indianapolis............................... IN 529,391 73,689 279,396 176,306 100.0 13.9 52.8 33.3 510,246 416,805 211,709 61,621MSD Lawrence Township........ IN 173,785 7,867 76,863 89,055 100.0 4.5 44.2 51.2 206,322 156,169 102,323 46,616MSD Wayne Township............. IN 176,782 20,648 94,659 61,475 100.0 11.7 53.5 34.8 180,604 149,499 97,438 26,040South Bend............................... IN 288,432 36,188 132,801 119,443 100.0 12.5 46.0 41.4 258,055 241,023 149,855 11,349Vigo County .............................. IN 159,462 11,092 84,969 63,401 100.0 7.0 53.3 39.8 150,021 134,319 84,664 12,345
Cedar Rapids............................ IA 200,351 10,102 90,937 99,312 100.0 5.0 45.4 49.6 181,129 159,547 102,918 9,584Davenport ................................. IA 181,449 13,326 85,122 83,001 100.0 7.3 46.9 45.7 165,867 145,362 98,514 13,679Des Moines Independent ........ IA 382,539 39,218 187,461 155,860 100.0 10.3 49.0 40.7 388,799 325,311 208,971 49,341
Blue Valley................................. KS 252,185 5,726 82,684 163,775 100.0 2.3 32.8 64.9 226,021 186,041 113,458 26,899Kansas City............................... KS 245,546 21,480 156,904 67,162 100.0 8.7 63.9 27.4 228,242 216,263 123,476 6,767Olathe........................................ KS 303,341 11,715 150,185 141,441 100.0 3.9 49.5 46.6 285,221 248,750 159,493 24,738Shawnee Mission..................... KS 321,118 12,961 117,975 190,182 100.0 4.0 36.7 59.2 331,940 262,785 170,559 57,077Wichita....................................... KS 562,916 58,078 343,744 161,094 100.0 10.3 61.1 28.6 546,969 496,388 274,059 40,708
Boone County........................... KY 169,818 8,427 71,443 89,948 100.0 5.0 42.1 53.0 184,138 136,663 81,706 36,990Fayette County.......................... KY 392,707 30,696 146,059 215,952 100.0 7.8 37.2 55.0 386,392 326,008 195,540 48,394Jefferson County ...................... KY 1,087,693 114,025 455,522 518,146 100.0 10.5 41.9 47.6 1,042,775 955,482 512,944 56,781
Ascension Parish...................... LA 196,643 14,431 88,961 93,251 100.0 7.3 45.2 47.4 200,971 166,255 101,571 30,097Bossier Parish........................... LA 191,025 17,255 92,392 81,378 100.0 9.0 48.4 42.6 207,705 172,676 100,848 31,837Caddo Parish............................ LA 447,996 54,595 216,580 176,821 100.0 12.2 48.3 39.5 445,261 406,440 239,982 32,447Calcasieu Parish....................... LA 343,787 41,273 154,459 148,055 100.0 12.0 44.9 43.1 334,883 308,966 176,087 17,573East Baton Rouge Parish ........ LA 558,999 76,800 191,558 290,641 100.0 13.7 34.3 52.0 524,151 487,400 282,353 35,113Jefferson Parish........................ LA 544,822 109,854 156,008 278,960 100.0 20.2 28.6 51.2 548,542 497,032 286,193 40,278Lafayette Parish........................ LA 312,317 37,057 125,114 150,146 100.0 11.9 40.1 48.1 287,241 271,055 169,311 11,650Livingston Parish ...................... LA 205,192 15,152 135,728 54,312 100.0 7.4 66.1 26.5 200,638 191,112 122,423 7,198
See notes at end of table.
Table 95. Revenues, expenditures, poverty rate, and Title I allocations of public school districts enrolling more than 15,000 students: 2007–08 and f
Name of district State
Revenues by source of funds, 2007–08 (in thousands of dollars) Percentage distribution of revenues, 2007–08 Expenditures, 2007–08 (in thousands of dollars)
Total Federal State Local Total Federal State Local Total4
Current expenditures
Capital outlayTotal Instruction
1 2 3 4 5 6 7 8 9 10 11 12 13 14
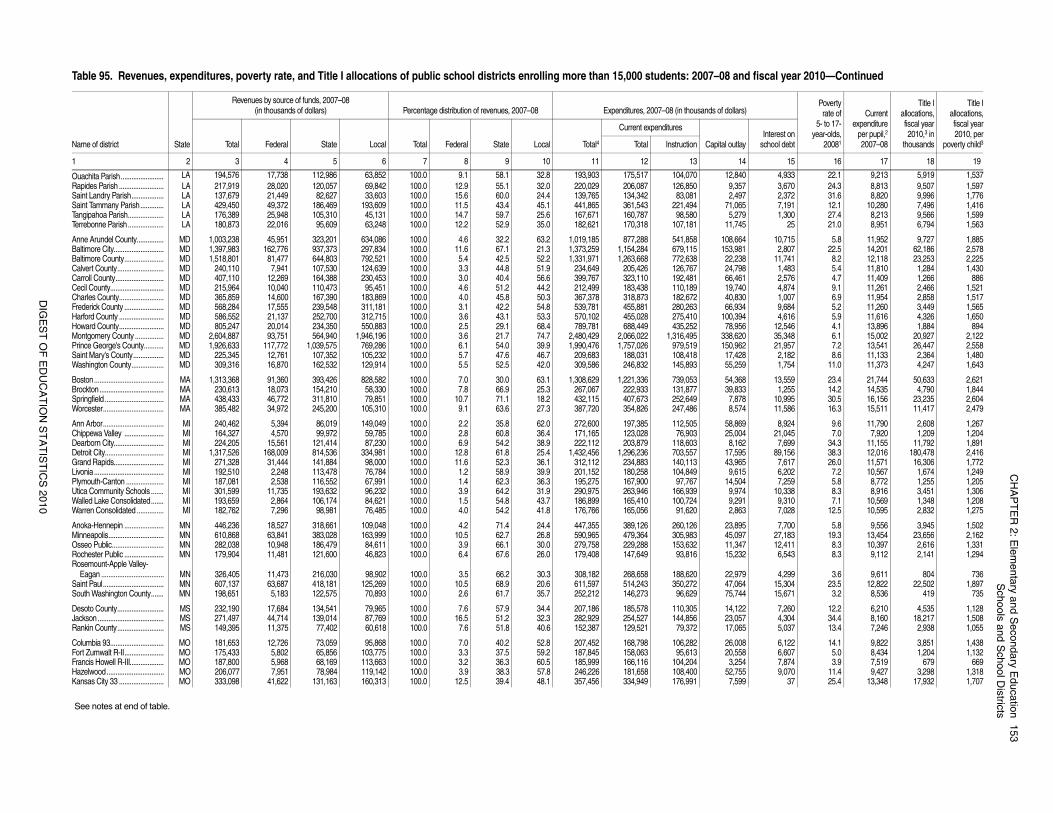
CH
AP
TE
R 2
: Ele
me
nta
ry an
d S
eco
nd
ary E
du
catio
n1
53
Sch
oo
ls an
d S
cho
ol D
istricts
DIG
ES
T O
F E
DU
CA
TIO
N S
TA
TIS
TIC
S 2
01
0
4,933 22.1 9,213 5,919 1,5373,670 24.3 8,813 9,507 1,5972,372 31.6 8,820 9,996 1,7767,191 12.1 10,280 7,496 1,4161,300 27.4 8,213 9,566 1,599
25 21.0 8,951 6,794 1,563
10,715 5.8 11,952 9,727 1,8852,807 22.5 14,201 62,186 2,578
11,741 8.2 12,118 23,253 2,2251,483 5.4 11,810 1,284 1,4302,576 4.7 11,409 1,266 8864,874 9.1 11,261 2,466 1,5211,007 6.9 11,954 2,858 1,5179,684 5.2 11,260 3,449 1,5654,616 5.9 11,616 4,326 1,650
12,546 4.1 13,896 1,884 89435,348 6.1 15,002 20,927 2,12221,957 7.2 13,541 26,447 2,5582,182 8.6 11,133 2,364 1,4801,754 11.0 11,373 4,247 1,643
13,559 23.4 21,744 50,633 2,6211,255 14.2 14,535 4,790 1,844
10,995 30.5 16,156 23,235 2,60411,586 16.3 15,511 11,417 2,479
8,924 9.6 11,790 2,608 1,26721,045 7.0 7,920 1,209 1,2047,699 34.3 11,155 11,792 1,891
89,156 38.3 12,016 180,478 2,4167,617 26.0 11,571 16,306 1,7726,202 7.2 10,567 1,674 1,2497,259 5.8 8,772 1,255 1,205
10,338 8.3 8,916 3,451 1,3069,310 7.1 10,569 1,348 1,2087,028 12.5 10,595 2,832 1,275
7,700 5.8 9,556 3,945 1,50227,183 19.3 13,454 23,656 2,16212,411 8.3 10,397 2,616 1,3316,543 8.3 9,112 2,141 1,294
4,299 3.6 9,611 804 73615,304 23.5 12,822 22,502 1,89715,671 3.2 8,536 419 735
7,260 12.2 6,210 4,535 1,1284,304 34.4 8,160 18,217 1,5085,037 13.4 7,246 2,938 1,055
6,122 14.1 9,822 3,851 1,4386,607 5.0 8,434 1,204 1,1327,874 3.9 7,519 679 6699,070 11.4 9,427 3,298 1,318
37 25.4 13,348 17,932 1,707
iscal year 2010—Continued
Povertyrate of
5- to 17-year-olds,
20081
Currentexpenditure
per pupil,2
2007–08
Title Iallocations,fiscal year2010,3 in
thousands
Title Iallocations,fiscal year2010, per
poverty child3Interest on
school debt
15 16 17 18 19
Ouachita Parish........................ LA 194,576 17,738 112,986 63,852 100.0 9.1 58.1 32.8 193,903 175,517 104,070 12,840Rapides Parish ......................... LA 217,919 28,020 120,057 69,842 100.0 12.9 55.1 32.0 220,029 206,087 126,850 9,357Saint Landry Parish.................. LA 137,679 21,449 82,627 33,603 100.0 15.6 60.0 24.4 139,765 134,342 83,081 2,497Saint Tammany Parish............. LA 429,450 49,372 186,469 193,609 100.0 11.5 43.4 45.1 441,865 361,543 221,494 71,065Tangipahoa Parish.................... LA 176,389 25,948 105,310 45,131 100.0 14.7 59.7 25.6 167,671 160,787 98,580 5,279Terrebonne Parish.................... LA 180,873 22,016 95,609 63,248 100.0 12.2 52.9 35.0 182,621 170,318 107,181 11,745
Anne Arundel County............... MD 1,003,238 45,951 323,201 634,086 100.0 4.6 32.2 63.2 1,019,185 877,288 541,858 108,664Baltimore City............................ MD 1,397,983 162,776 937,373 297,834 100.0 11.6 67.1 21.3 1,373,259 1,154,284 679,115 153,981Baltimore County...................... MD 1,518,801 81,477 644,803 792,521 100.0 5.4 42.5 52.2 1,331,971 1,263,668 772,638 22,238Calvert County.......................... MD 240,110 7,941 107,530 124,639 100.0 3.3 44.8 51.9 234,649 205,426 126,767 24,798Carroll County........................... MD 407,110 12,269 164,388 230,453 100.0 3.0 40.4 56.6 399,767 323,110 192,481 66,461Cecil County.............................. MD 215,964 10,040 110,473 95,451 100.0 4.6 51.2 44.2 212,499 183,438 110,189 19,740Charles County......................... MD 365,859 14,600 167,390 183,869 100.0 4.0 45.8 50.3 367,378 318,873 182,672 40,830Frederick County ...................... MD 568,284 17,555 239,548 311,181 100.0 3.1 42.2 54.8 539,781 455,881 280,263 66,934Harford County ......................... MD 586,552 21,137 252,700 312,715 100.0 3.6 43.1 53.3 570,102 455,028 275,410 100,394Howard County......................... MD 805,247 20,014 234,350 550,883 100.0 2.5 29.1 68.4 789,781 688,449 435,252 78,956Montgomery County ................ MD 2,604,887 93,751 564,940 1,946,196 100.0 3.6 21.7 74.7 2,480,429 2,066,022 1,316,495 338,620Prince George's County........... MD 1,926,633 117,772 1,039,575 769,286 100.0 6.1 54.0 39.9 1,990,476 1,757,026 979,519 150,962Saint Mary's County................. MD 225,345 12,761 107,352 105,232 100.0 5.7 47.6 46.7 209,683 188,031 108,418 17,428Washington County.................. MD 309,316 16,870 162,532 129,914 100.0 5.5 52.5 42.0 309,586 246,832 145,893 55,259
Boston....................................... MA 1,313,368 91,360 393,426 828,582 100.0 7.0 30.0 63.1 1,308,629 1,221,336 739,053 54,368Brockton.................................... MA 230,613 18,073 154,210 58,330 100.0 7.8 66.9 25.3 267,067 222,933 131,877 39,833Springfield ................................. MA 438,433 46,772 311,810 79,851 100.0 10.7 71.1 18.2 432,115 407,673 252,649 7,878Worcester.................................. MA 385,482 34,972 245,200 105,310 100.0 9.1 63.6 27.3 387,720 354,826 247,486 8,574
Ann Arbor.................................. MI 240,462 5,394 86,019 149,049 100.0 2.2 35.8 62.0 272,600 197,385 112,505 58,869Chippewa Valley ...................... MI 164,327 4,570 99,972 59,785 100.0 2.8 60.8 36.4 171,165 123,028 76,903 25,004Dearborn City............................ MI 224,205 15,561 121,414 87,230 100.0 6.9 54.2 38.9 222,112 203,879 118,603 8,162Detroit City................................. MI 1,317,526 168,009 814,536 334,981 100.0 12.8 61.8 25.4 1,432,456 1,296,236 703,557 17,595Grand Rapids............................ MI 271,328 31,444 141,884 98,000 100.0 11.6 52.3 36.1 312,112 234,883 140,113 43,965Livonia....................................... MI 192,510 2,248 113,478 76,784 100.0 1.2 58.9 39.9 201,152 180,258 104,849 9,615Plymouth-Canton ..................... MI 187,081 2,538 116,552 67,991 100.0 1.4 62.3 36.3 195,275 167,900 97,767 14,504Utica Community Schools ....... MI 301,599 11,735 193,632 96,232 100.0 3.9 64.2 31.9 290,975 263,946 166,939 9,974Walled Lake Consolidated....... MI 193,659 2,864 106,174 84,621 100.0 1.5 54.8 43.7 186,899 165,410 100,724 9,291Warren Consolidated ............... MI 182,762 7,296 98,981 76,485 100.0 4.0 54.2 41.8 176,766 165,056 91,620 2,863
Anoka-Hennepin ...................... MN 446,236 18,527 318,661 109,048 100.0 4.2 71.4 24.4 447,355 389,126 260,126 23,895Minneapolis............................... MN 610,868 63,841 383,028 163,999 100.0 10.5 62.7 26.8 590,965 479,364 305,983 45,097Osseo Public............................. MN 282,038 10,948 186,479 84,611 100.0 3.9 66.1 30.0 279,758 229,288 153,632 11,347Rochester Public ...................... MN 179,904 11,481 121,600 46,823 100.0 6.4 67.6 26.0 179,408 147,649 93,816 15,232Rosemount-Apple Valley-
Eagan ................................... MN 326,405 11,473 216,030 98,902 100.0 3.5 66.2 30.3 308,182 268,658 188,620 22,979Saint Paul.................................. MN 607,137 63,687 418,181 125,269 100.0 10.5 68.9 20.6 611,597 514,243 350,272 47,064South Washington County....... MN 198,651 5,183 122,575 70,893 100.0 2.6 61.7 35.7 252,212 146,273 96,629 75,744
Desoto County.......................... MS 232,190 17,684 134,541 79,965 100.0 7.6 57.9 34.4 207,186 185,578 110,305 14,122Jackson..................................... MS 271,497 44,714 139,014 87,769 100.0 16.5 51.2 32.3 282,929 254,527 144,856 23,057Rankin County.......................... MS 149,395 11,375 77,402 60,618 100.0 7.6 51.8 40.6 152,387 129,521 79,372 17,065
Columbia 93.............................. MO 181,653 12,726 73,059 95,868 100.0 7.0 40.2 52.8 207,452 168,798 106,282 26,008Fort Zumwalt R-II...................... MO 175,433 5,802 65,856 103,775 100.0 3.3 37.5 59.2 187,845 158,063 95,613 20,558Francis Howell R-III................... MO 187,800 5,968 68,169 113,663 100.0 3.2 36.3 60.5 185,999 166,116 104,204 3,254Hazelwood................................ MO 206,077 7,951 78,984 119,142 100.0 3.9 38.3 57.8 246,226 181,658 108,400 52,755Kansas City 33 ......................... MO 333,098 41,622 131,163 160,313 100.0 12.5 39.4 48.1 357,456 334,949 176,991 7,599
See notes at end of table.
Table 95. Revenues, expenditures, poverty rate, and Title I allocations of public school districts enrolling more than 15,000 students: 2007–08 and f
Name of district State
Revenues by source of funds, 2007–08 (in thousands of dollars) Percentage distribution of revenues, 2007–08 Expenditures, 2007–08 (in thousands of dollars)
Total Federal State Local Total Federal State Local Total4
Current expenditures
Capital outlayTotal Instruction
1 2 3 4 5 6 7 8 9 10 11 12 13 14
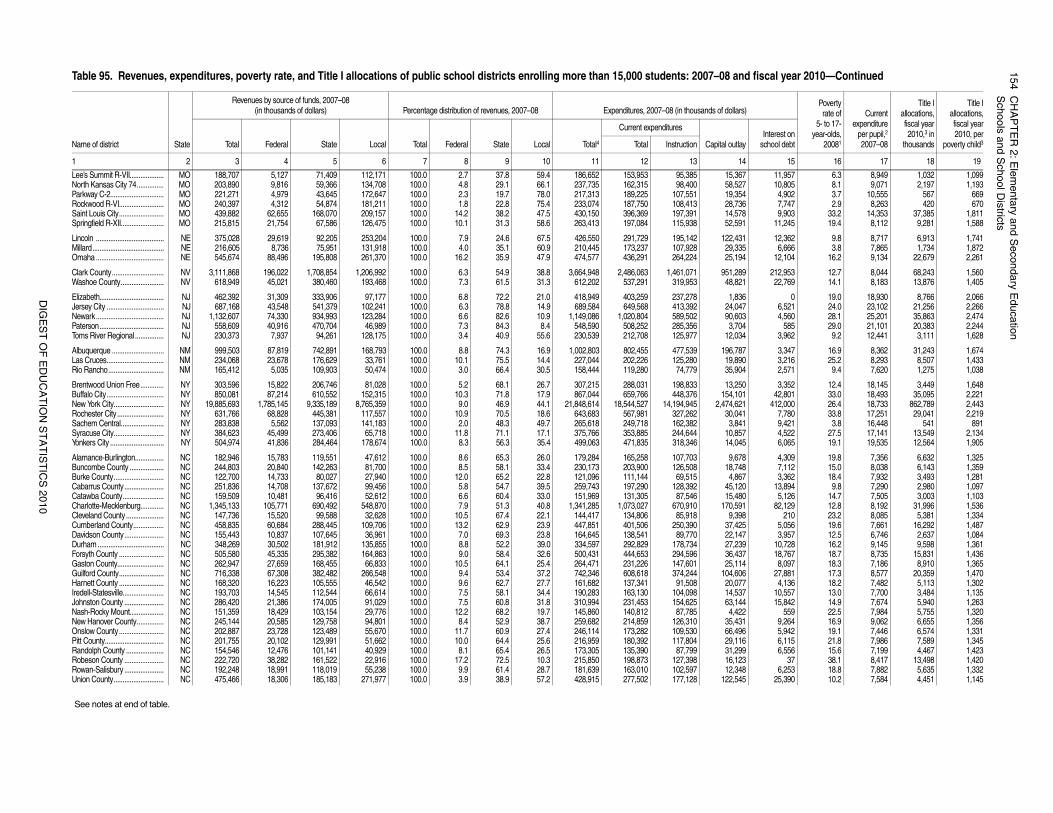
15
4C
HA
PT
ER
2: E
lem
en
tary a
nd
Se
con
da
ry Ed
uca
tion
Sch
oo
ls an
d S
cho
ol D
istricts
DIG
ES
T O
F E
DU
CA
TIO
N S
TA
TIS
TIC
S 2
01
0
11,957 6.3 8,949 1,032 1,09910,805 8.1 9,071 2,197 1,1934,902 3.7 10,555 567 6697,747 2.9 8,263 420 6709,903 33.2 14,353 37,385 1,811
11,245 19.4 8,112 9,281 1,588
12,362 9.8 8,717 6,913 1,7416,666 3.8 7,865 1,734 1,872
12,104 16.2 9,134 22,679 2,261
212,953 12.7 8,044 68,243 1,56022,769 14.1 8,183 13,876 1,405
0 19.0 18,930 8,766 2,0666,521 24.0 23,102 21,256 2,2664,560 28.1 25,201 35,863 2,474
585 29.0 21,101 20,383 2,2443,962 9.2 12,441 3,111 1,628
3,347 16.9 8,362 31,243 1,6743,216 25.2 8,293 8,507 1,4332,571 9.4 7,620 1,275 1,038
3,352 12.4 18,145 3,449 1,64842,801 33.0 18,493 35,095 2,221
412,000 26.4 18,733 862,789 2,4437,780 33.8 17,251 29,041 2,2199,421 3.8 16,448 541 8914,522 27.5 17,141 13,549 2,1346,065 19.1 19,535 12,564 1,905
4,309 19.8 7,356 6,632 1,3257,112 15.0 8,038 6,143 1,3593,362 18.4 7,932 3,493 1,281
13,894 9.8 7,290 2,980 1,0975,126 14.7 7,505 3,003 1,103
82,129 12.8 8,192 31,996 1,536210 23.2 8,085 5,381 1,334
5,056 19.6 7,661 16,292 1,4873,957 12.5 6,746 2,637 1,084
10,728 16.2 9,145 9,598 1,36118,767 18.7 8,735 15,831 1,4368,097 18.3 7,186 8,910 1,365
27,881 17.3 8,577 20,359 1,4704,136 18.2 7,482 5,113 1,302
10,557 13.0 7,700 3,484 1,13515,842 14.9 7,674 5,940 1,263
559 22.5 7,984 5,755 1,3209,264 16.9 9,062 6,655 1,3565,942 19.1 7,446 6,574 1,3316,115 21.8 7,986 7,589 1,3456,556 15.6 7,199 4,467 1,423
37 38.1 8,417 13,498 1,4206,253 18.8 7,882 5,635 1,332
25,390 10.2 7,584 4,451 1,145
iscal year 2010—Continued
Povertyrate of
5- to 17-year-olds,
20081
Currentexpenditure
per pupil,2
2007–08
Title Iallocations,fiscal year2010,3 in
thousands
Title Iallocations,fiscal year2010, per
poverty child3Interest on
school debt
15 16 17 18 19
Lee’s Summit R-VII................... MO 188,707 5,127 71,409 112,171 100.0 2.7 37.8 59.4 186,652 153,953 95,385 15,367North Kansas City 74............... MO 203,890 9,816 59,366 134,708 100.0 4.8 29.1 66.1 237,735 162,315 98,400 58,527Parkway C-2.............................. MO 221,271 4,979 43,645 172,647 100.0 2.3 19.7 78.0 217,313 189,225 107,551 19,354Rockwood R-VI......................... MO 240,397 4,312 54,874 181,211 100.0 1.8 22.8 75.4 233,074 187,750 108,413 28,736Saint Louis City......................... MO 439,882 62,655 168,070 209,157 100.0 14.2 38.2 47.5 430,150 396,369 197,391 14,578Springfield R-XII........................ MO 215,815 21,754 67,586 126,475 100.0 10.1 31.3 58.6 263,413 197,084 115,938 52,591
Lincoln ...................................... NE 375,028 29,619 92,205 253,204 100.0 7.9 24.6 67.5 426,550 291,729 195,142 122,431Millard........................................ NE 216,605 8,736 75,951 131,918 100.0 4.0 35.1 60.9 210,445 173,237 107,928 29,335Omaha ...................................... NE 545,674 88,496 195,808 261,370 100.0 16.2 35.9 47.9 474,577 436,291 264,224 25,194
Clark County............................. NV 3,111,868 196,022 1,708,854 1,206,992 100.0 6.3 54.9 38.8 3,664,948 2,486,063 1,461,071 951,289Washoe County........................ NV 618,949 45,021 380,460 193,468 100.0 7.3 61.5 31.3 612,202 537,291 319,953 48,821
Elizabeth.................................... NJ 462,392 31,309 333,906 97,177 100.0 6.8 72.2 21.0 418,949 403,259 237,278 1,836Jersey City ................................ NJ 687,168 43,548 541,379 102,241 100.0 6.3 78.8 14.9 689,584 649,568 413,392 24,047Newark...................................... NJ 1,132,607 74,330 934,993 123,284 100.0 6.6 82.6 10.9 1,149,086 1,020,804 589,502 90,603Paterson.................................... NJ 558,609 40,916 470,704 46,989 100.0 7.3 84.3 8.4 548,590 508,252 285,356 3,704Toms River Regional................ NJ 230,373 7,937 94,261 128,175 100.0 3.4 40.9 55.6 230,539 212,708 125,977 12,034
Albuquerque ............................. NM 999,503 87,819 742,891 168,793 100.0 8.8 74.3 16.9 1,002,803 802,455 477,539 196,787Las Cruces................................ NM 234,068 23,678 176,629 33,761 100.0 10.1 75.5 14.4 227,044 202,226 125,280 19,890Rio Rancho............................... NM 165,412 5,035 109,903 50,474 100.0 3.0 66.4 30.5 158,444 119,280 74,779 35,904
Brentwood Union Free............. NY 303,596 15,822 206,746 81,028 100.0 5.2 68.1 26.7 307,215 288,031 198,833 13,250Buffalo City................................ NY 850,081 87,214 610,552 152,315 100.0 10.3 71.8 17.9 867,044 659,766 448,376 154,101New York City............................ NY 19,885,693 1,785,145 9,335,189 8,765,359 100.0 9.0 46.9 44.1 21,848,614 18,544,527 14,194,945 2,474,621Rochester City.......................... NY 631,766 68,828 445,381 117,557 100.0 10.9 70.5 18.6 643,683 567,981 327,262 30,041Sachem Central........................ NY 283,838 5,562 137,093 141,183 100.0 2.0 48.3 49.7 265,618 249,718 162,382 3,841Syracuse City............................ NY 384,623 45,499 273,406 65,718 100.0 11.8 71.1 17.1 375,766 353,885 244,644 10,857Yonkers City .............................. NY 504,974 41,836 284,464 178,674 100.0 8.3 56.3 35.4 499,063 471,835 318,346 14,045
Alamance-Burlington................ NC 182,946 15,783 119,551 47,612 100.0 8.6 65.3 26.0 179,284 165,258 107,703 9,678Buncombe County ................... NC 244,803 20,840 142,263 81,700 100.0 8.5 58.1 33.4 230,173 203,900 126,508 18,748Burke County............................ NC 122,700 14,733 80,027 27,940 100.0 12.0 65.2 22.8 121,096 111,144 69,515 4,867Cabarrus County...................... NC 251,836 14,708 137,672 99,456 100.0 5.8 54.7 39.5 259,743 197,290 128,392 45,120Catawba County....................... NC 159,509 10,481 96,416 52,612 100.0 6.6 60.4 33.0 151,969 131,305 87,546 15,480Charlotte-Mecklenburg............. NC 1,345,133 105,771 690,492 548,870 100.0 7.9 51.3 40.8 1,341,285 1,073,027 670,910 170,591Cleveland County..................... NC 147,736 15,520 99,588 32,628 100.0 10.5 67.4 22.1 144,417 134,806 85,918 9,398Cumberland County................. NC 458,835 60,684 288,445 109,706 100.0 13.2 62.9 23.9 447,851 401,506 250,390 37,425Davidson County...................... NC 155,443 10,837 107,645 36,961 100.0 7.0 69.3 23.8 164,645 138,541 89,770 22,147Durham ..................................... NC 348,269 30,502 181,912 135,855 100.0 8.8 52.2 39.0 334,597 292,829 178,734 27,239Forsyth County ......................... NC 505,580 45,335 295,382 164,863 100.0 9.0 58.4 32.6 500,431 444,653 294,596 36,437Gaston County.......................... NC 262,947 27,659 168,455 66,833 100.0 10.5 64.1 25.4 264,471 231,226 147,601 25,114Guilford County......................... NC 716,338 67,308 382,482 266,548 100.0 9.4 53.4 37.2 742,346 608,618 374,244 104,606Harnett County ......................... NC 168,320 16,223 105,555 46,542 100.0 9.6 62.7 27.7 161,682 137,341 91,508 20,077Iredell-Statesville....................... NC 193,703 14,545 112,544 66,614 100.0 7.5 58.1 34.4 190,283 163,130 104,098 14,537Johnston County ...................... NC 286,420 21,386 174,005 91,029 100.0 7.5 60.8 31.8 310,994 231,453 154,625 63,144Nash-Rocky Mount................... NC 151,359 18,429 103,154 29,776 100.0 12.2 68.2 19.7 145,860 140,812 87,785 4,422New Hanover County............... NC 245,144 20,585 129,758 94,801 100.0 8.4 52.9 38.7 259,682 214,859 126,310 35,431Onslow County......................... NC 202,887 23,728 123,489 55,670 100.0 11.7 60.9 27.4 246,114 173,282 109,530 66,496Pitt County................................. NC 201,755 20,102 129,991 51,662 100.0 10.0 64.4 25.6 216,959 180,392 117,804 29,116Randolph County ..................... NC 154,546 12,476 101,141 40,929 100.0 8.1 65.4 26.5 173,305 135,390 87,799 31,299Robeson County ...................... NC 222,720 38,282 161,522 22,916 100.0 17.2 72.5 10.3 215,850 198,873 127,398 16,123Rowan-Salisbury ...................... NC 192,248 18,991 118,019 55,238 100.0 9.9 61.4 28.7 181,639 163,010 102,597 12,348Union County............................ NC 475,466 18,306 185,183 271,977 100.0 3.9 38.9 57.2 428,915 277,502 177,128 122,545
See notes at end of table.
Table 95. Revenues, expenditures, poverty rate, and Title I allocations of public school districts enrolling more than 15,000 students: 2007–08 and f
Name of district State
Revenues by source of funds, 2007–08 (in thousands of dollars) Percentage distribution of revenues, 2007–08 Expenditures, 2007–08 (in thousands of dollars)
Total Federal State Local Total Federal State Local Total4
Current expenditures
Capital outlayTotal Instruction
1 2 3 4 5 6 7 8 9 10 11 12 13 14
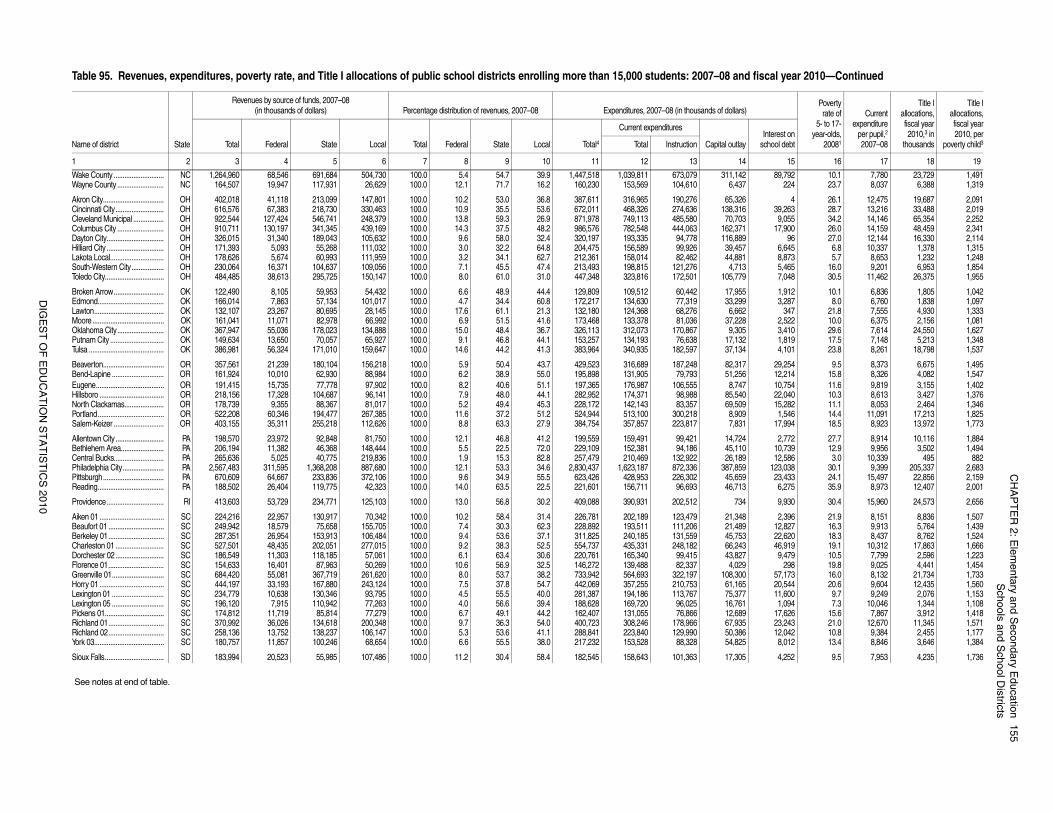
CH
AP
TE
R 2
: Ele
me
nta
ry an
d S
eco
nd
ary E
du
catio
n1
55
Sch
oo
ls an
d S
cho
ol D
istricts
DIG
ES
T O
F E
DU
CA
TIO
N S
TA
TIS
TIC
S 2
01
0
89,792 10.1 7,780 23,729 1,491224 23.7 8,037 6,388 1,319
4 26.1 12,475 19,687 2,09139,263 28.7 13,216 33,488 2,0199,055 34.2 14,146 65,354 2,252
17,900 26.0 14,159 48,459 2,34196 27.0 12,144 16,330 2,114
6,645 6.8 10,337 1,378 1,3158,873 5.7 8,653 1,232 1,2485,465 16.0 9,201 6,953 1,8547,048 30.5 11,462 26,375 1,955
1,912 10.1 6,836 1,805 1,0423,287 8.0 6,760 1,838 1,097
347 21.8 7,555 4,930 1,3332,522 10.0 6,375 2,156 1,0813,410 29.6 7,614 24,550 1,6271,819 17.5 7,148 5,213 1,3484,101 23.8 8,261 18,798 1,537
29,254 9.5 8,373 6,675 1,49512,214 15.8 8,326 4,082 1,54710,754 11.6 9,819 3,155 1,40222,040 10.3 8,613 3,427 1,37615,282 11.1 8,053 2,464 1,3461,546 14.4 11,091 17,213 1,825
17,994 18.5 8,923 13,972 1,773
2,772 27.7 8,914 10,116 1,88410,739 12.9 9,956 3,502 1,49412,586 3.0 10,339 495 882
123,038 30.1 9,399 205,337 2,68323,433 24.1 15,497 22,856 2,1596,275 35.9 8,973 12,407 2,001
9,930 30.4 15,960 24,573 2,656
2,396 21.9 8,151 8,836 1,50712,827 16.3 9,913 5,764 1,43922,620 18.3 8,437 8,762 1,52446,919 19.1 10,312 17,863 1,6669,479 10.5 7,799 2,596 1,223
298 19.8 9,025 4,441 1,45457,173 16.0 8,132 21,734 1,73320,544 20.6 9,604 12,435 1,56011,600 9.7 9,249 2,076 1,1531,094 7.3 10,046 1,344 1,108
17,626 15.6 7,867 3,912 1,41823,243 21.0 12,670 11,345 1,57112,042 10.8 9,384 2,455 1,1778,012 13.4 8,846 3,646 1,384
4,252 9.5 7,953 4,235 1,736
iscal year 2010—Continued
Povertyrate of
5- to 17-year-olds,
20081
Currentexpenditure
per pupil,2
2007–08
Title Iallocations,fiscal year2010,3 in
thousands
Title Iallocations,fiscal year2010, per
poverty child3Interest on
school debt
15 16 17 18 19
Wake County ............................ NC 1,264,960 68,546 691,684 504,730 100.0 5.4 54.7 39.9 1,447,518 1,039,811 673,079 311,142Wayne County.......................... NC 164,507 19,947 117,931 26,629 100.0 12.1 71.7 16.2 160,230 153,569 104,610 6,437
Akron City.................................. OH 402,018 41,118 213,099 147,801 100.0 10.2 53.0 36.8 387,611 316,965 190,276 65,326Cincinnati City........................... OH 616,576 67,383 218,730 330,463 100.0 10.9 35.5 53.6 672,011 468,326 274,636 138,316Cleveland Municipal ................. OH 922,544 127,424 546,741 248,379 100.0 13.8 59.3 26.9 871,978 749,113 485,580 70,703Columbus City .......................... OH 910,711 130,197 341,345 439,169 100.0 14.3 37.5 48.2 986,576 782,548 444,063 162,371Dayton City................................ OH 326,015 31,340 189,043 105,632 100.0 9.6 58.0 32.4 320,197 193,335 94,778 116,889Hilliard City ................................ OH 171,393 5,093 55,268 111,032 100.0 3.0 32.2 64.8 204,475 156,589 99,926 39,457Lakota Local.............................. OH 178,626 5,674 60,993 111,959 100.0 3.2 34.1 62.7 212,361 158,014 82,462 44,881South-Western City.................. OH 230,064 16,371 104,637 109,056 100.0 7.1 45.5 47.4 213,493 198,815 121,276 4,713Toledo City................................. OH 484,485 38,613 295,725 150,147 100.0 8.0 61.0 31.0 447,348 323,816 172,501 105,779
Broken Arrow............................ OK 122,490 8,105 59,953 54,432 100.0 6.6 48.9 44.4 129,809 109,512 60,442 17,955Edmond..................................... OK 166,014 7,863 57,134 101,017 100.0 4.7 34.4 60.8 172,217 134,630 77,319 33,299Lawton....................................... OK 132,107 23,267 80,695 28,145 100.0 17.6 61.1 21.3 132,180 124,368 68,276 6,662Moore........................................ OK 161,041 11,071 82,978 66,992 100.0 6.9 51.5 41.6 173,468 133,378 81,036 37,228Oklahoma City.......................... OK 367,947 55,036 178,023 134,888 100.0 15.0 48.4 36.7 326,113 312,073 170,867 9,305Putnam City .............................. OK 149,634 13,650 70,057 65,927 100.0 9.1 46.8 44.1 153,257 134,193 76,638 17,132Tulsa .......................................... OK 386,981 56,324 171,010 159,647 100.0 14.6 44.2 41.3 383,964 340,935 182,597 37,134
Beaverton.................................. OR 357,561 21,239 180,104 156,218 100.0 5.9 50.4 43.7 429,523 316,689 187,248 82,317Bend-Lapine ............................. OR 161,924 10,010 62,930 88,984 100.0 6.2 38.9 55.0 195,898 131,905 79,793 51,256Eugene...................................... OR 191,415 15,735 77,778 97,902 100.0 8.2 40.6 51.1 197,365 176,987 106,555 8,747Hillsboro .................................... OR 218,156 17,328 104,687 96,141 100.0 7.9 48.0 44.1 282,952 174,371 98,988 85,540North Clackamas...................... OR 178,739 9,355 88,367 81,017 100.0 5.2 49.4 45.3 228,172 142,143 83,357 69,509Portland..................................... OR 522,208 60,346 194,477 267,385 100.0 11.6 37.2 51.2 524,944 513,100 300,218 8,909Salem-Keizer ............................ OR 403,155 35,311 255,218 112,626 100.0 8.8 63.3 27.9 384,754 357,857 223,817 7,831
Allentown City........................... PA 198,570 23,972 92,848 81,750 100.0 12.1 46.8 41.2 199,559 159,491 99,421 14,724Bethlehem Area........................ PA 206,194 11,382 46,368 148,444 100.0 5.5 22.5 72.0 229,109 152,381 94,186 45,110Central Bucks............................ PA 265,636 5,025 40,775 219,836 100.0 1.9 15.3 82.8 257,479 210,469 132,922 26,189Philadelphia City....................... PA 2,567,483 311,595 1,368,208 887,680 100.0 12.1 53.3 34.6 2,830,437 1,623,187 872,336 387,859Pittsburgh.................................. PA 670,609 64,667 233,836 372,106 100.0 9.6 34.9 55.5 623,426 428,953 226,302 45,659Reading..................................... PA 188,502 26,404 119,775 42,323 100.0 14.0 63.5 22.5 221,601 156,711 96,693 46,713
Providence................................ RI 413,603 53,729 234,771 125,103 100.0 13.0 56.8 30.2 409,088 390,931 202,512 734
Aiken 01 .................................... SC 224,216 22,957 130,917 70,342 100.0 10.2 58.4 31.4 226,781 202,189 123,479 21,348Beaufort 01 ............................... SC 249,942 18,579 75,658 155,705 100.0 7.4 30.3 62.3 228,892 193,511 111,206 21,489Berkeley 01............................... SC 287,351 26,954 153,913 106,484 100.0 9.4 53.6 37.1 311,825 240,185 131,559 45,753Charleston 01........................... SC 527,501 48,435 202,051 277,015 100.0 9.2 38.3 52.5 554,737 435,331 248,182 66,243Dorchester 02........................... SC 186,549 11,303 118,185 57,061 100.0 6.1 63.4 30.6 220,761 165,340 99,415 43,827Florence 01............................... SC 154,633 16,401 87,963 50,269 100.0 10.6 56.9 32.5 146,272 139,488 82,337 4,029Greenville 01............................. SC 684,420 55,081 367,719 261,620 100.0 8.0 53.7 38.2 733,942 564,693 322,197 108,300Horry 01 .................................... SC 444,197 33,193 167,880 243,124 100.0 7.5 37.8 54.7 442,069 357,255 210,753 61,165Lexington 01 ............................. SC 234,779 10,638 130,346 93,795 100.0 4.5 55.5 40.0 281,387 194,186 113,767 75,377Lexington 05 ............................. SC 196,120 7,915 110,942 77,263 100.0 4.0 56.6 39.4 188,628 169,720 96,025 16,761Pickens 01................................. SC 174,812 11,719 85,814 77,279 100.0 6.7 49.1 44.2 162,407 131,055 76,866 12,689Richland 01............................... SC 370,992 36,026 134,618 200,348 100.0 9.7 36.3 54.0 400,723 308,246 178,966 67,935Richland 02............................... SC 258,136 13,752 138,237 106,147 100.0 5.3 53.6 41.1 288,841 223,840 129,990 50,386York 03....................................... SC 180,757 11,857 100,246 68,654 100.0 6.6 55.5 38.0 217,232 153,528 88,328 54,825
Sioux Falls................................. SD 183,994 20,523 55,985 107,486 100.0 11.2 30.4 58.4 182,545 158,643 101,363 17,305
See notes at end of table.
Table 95. Revenues, expenditures, poverty rate, and Title I allocations of public school districts enrolling more than 15,000 students: 2007–08 and f
Name of district State
Revenues by source of funds, 2007–08 (in thousands of dollars) Percentage distribution of revenues, 2007–08 Expenditures, 2007–08 (in thousands of dollars)
Total Federal State Local Total Federal State Local Total4
Current expenditures
Capital outlayTotal Instruction
1 2 3 4 5 6 7 8 9 10 11 12 13 14
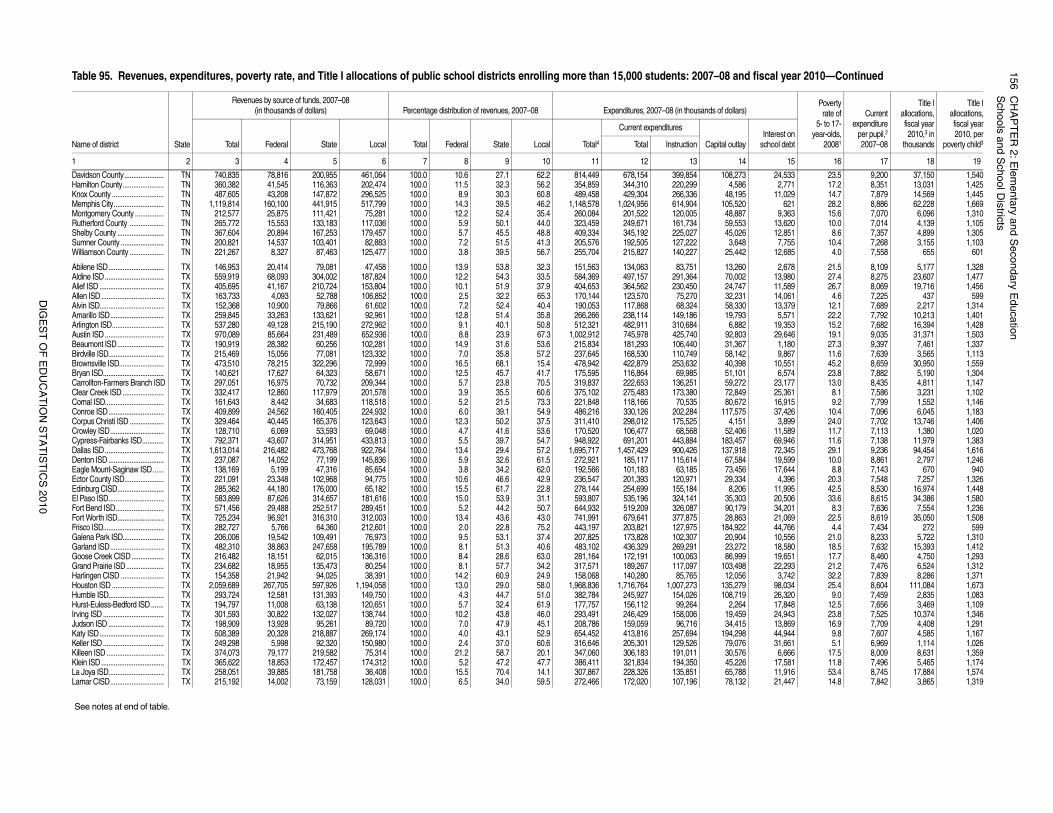
15
6C
HA
PT
ER
2: E
lem
en
tary a
nd
Se
con
da
ry Ed
uca
tion
Sch
oo
ls an
d S
cho
ol D
istricts
DIG
ES
T O
F E
DU
CA
TIO
N S
TA
TIS
TIC
S 2
01
0
24,533 23.5 9,200 37,150 1,5402,771 17.2 8,351 13,031 1,425
11,029 14.7 7,879 14,569 1,445621 28.2 8,886 62,228 1,669
9,363 15.6 7,070 6,096 1,31013,620 10.0 7,014 4,139 1,10512,851 8.6 7,357 4,899 1,3057,755 10.4 7,268 3,155 1,103
12,685 4.0 7,558 655 601
2,678 21.5 8,109 5,177 1,32813,980 27.4 8,275 23,607 1,47711,589 26.7 8,069 19,716 1,45614,061 4.6 7,225 437 59913,379 12.1 7,689 2,217 1,3145,571 22.2 7,792 10,213 1,401
19,353 15.2 7,682 16,394 1,42829,646 19.1 9,035 31,371 1,5031,180 27.3 9,397 7,461 1,3379,867 11.6 7,639 3,565 1,113
10,551 45.2 8,659 30,950 1,5596,574 23.8 7,882 5,190 1,304
23,177 13.0 8,435 4,811 1,14725,361 8.1 7,586 3,231 1,10216,915 9.2 7,799 1,552 1,14637,426 10.4 7,096 6,045 1,1833,899 24.0 7,702 13,746 1,406
11,589 11.7 7,113 1,380 1,02069,946 11.6 7,138 11,979 1,38372,345 29.1 9,236 94,454 1,61619,599 10.0 8,861 2,797 1,24617,644 8.8 7,143 670 9404,396 20.3 7,548 7,257 1,326
11,995 42.5 8,530 16,974 1,44820,506 33.6 8,615 34,386 1,58034,201 8.3 7,636 7,554 1,23621,069 22.5 8,619 35,050 1,50844,766 4.4 7,434 272 59910,556 21.0 8,233 5,722 1,31018,580 18.5 7,632 15,393 1,41219,651 17.7 8,460 4,750 1,29322,293 21.2 7,476 6,524 1,3123,742 32.2 7,839 8,286 1,371
98,034 25.4 8,604 111,084 1,67326,320 9.0 7,459 2,835 1,08317,848 12.5 7,656 3,469 1,10924,943 23.8 7,525 10,374 1,34613,869 16.9 7,709 4,408 1,29144,944 9.8 7,607 4,585 1,16731,661 5.1 6,969 1,114 1,0266,666 17.5 8,009 8,631 1,359
17,581 11.8 7,496 5,465 1,17411,916 53.4 8,745 17,884 1,57421,447 14.8 7,842 3,865 1,319
iscal year 2010—Continued
Povertyrate of
5- to 17-year-olds,
20081
Currentexpenditure
per pupil,2
2007–08
Title Iallocations,fiscal year2010,3 in
thousands
Title Iallocations,fiscal year2010, per
poverty child3Interest on
school debt
15 16 17 18 19
Davidson County...................... TN 740,835 78,816 200,955 461,064 100.0 10.6 27.1 62.2 814,449 678,154 399,854 108,273Hamilton County....................... TN 360,382 41,545 116,363 202,474 100.0 11.5 32.3 56.2 354,859 344,310 220,299 4,586Knox County ............................. TN 487,605 43,208 147,872 296,525 100.0 8.9 30.3 60.8 489,458 429,304 266,336 48,195Memphis City............................ TN 1,119,814 160,100 441,915 517,799 100.0 14.3 39.5 46.2 1,148,578 1,024,956 614,904 105,520Montgomery County ................ TN 212,577 25,875 111,421 75,281 100.0 12.2 52.4 35.4 260,084 201,522 120,005 48,887Rutherford County ................... TN 265,772 15,553 133,183 117,036 100.0 5.9 50.1 44.0 323,459 249,671 161,734 59,553Shelby County .......................... TN 367,604 20,894 167,253 179,457 100.0 5.7 45.5 48.8 409,334 345,192 225,027 45,026Sumner County ........................ TN 200,821 14,537 103,401 82,883 100.0 7.2 51.5 41.3 205,576 192,505 127,222 3,648Williamson County ................... TN 221,267 8,327 87,463 125,477 100.0 3.8 39.5 56.7 255,704 215,827 140,227 25,442
Abilene ISD............................... TX 146,953 20,414 79,081 47,458 100.0 13.9 53.8 32.3 151,563 134,063 83,751 13,260Aldine ISD................................. TX 559,919 68,093 304,002 187,824 100.0 12.2 54.3 33.5 584,369 497,157 291,364 70,002Alief ISD .................................... TX 405,695 41,167 210,724 153,804 100.0 10.1 51.9 37.9 404,653 364,562 230,450 24,747Allen ISD................................... TX 163,733 4,093 52,788 106,852 100.0 2.5 32.2 65.3 170,144 123,570 75,270 32,231Alvin ISD.................................... TX 152,368 10,900 79,866 61,602 100.0 7.2 52.4 40.4 190,053 117,868 68,324 58,330Amarillo ISD.............................. TX 259,845 33,263 133,621 92,961 100.0 12.8 51.4 35.8 266,266 238,114 149,186 19,793Arlington ISD............................. TX 537,280 49,128 215,190 272,962 100.0 9.1 40.1 50.8 512,321 482,911 310,684 6,882Austin ISD................................. TX 970,089 85,664 231,489 652,936 100.0 8.8 23.9 67.3 1,002,912 745,978 425,740 92,803Beaumont ISD.......................... TX 190,919 28,382 60,256 102,281 100.0 14.9 31.6 53.6 215,834 181,293 106,440 31,367Birdville ISD............................... TX 215,469 15,056 77,081 123,332 100.0 7.0 35.8 57.2 237,645 168,530 110,749 58,142Brownsville ISD......................... TX 473,510 78,215 322,296 72,999 100.0 16.5 68.1 15.4 478,942 422,879 253,632 40,398Bryan ISD.................................. TX 140,621 17,627 64,323 58,671 100.0 12.5 45.7 41.7 175,595 116,864 69,985 51,101Carrollton-Farmers Branch ISD TX 297,051 16,975 70,732 209,344 100.0 5.7 23.8 70.5 319,837 222,653 136,251 59,272Clear Creek ISD....................... TX 332,417 12,860 117,979 201,578 100.0 3.9 35.5 60.6 375,102 275,483 173,380 72,849Comal ISD................................. TX 161,643 8,442 34,683 118,518 100.0 5.2 21.5 73.3 221,848 118,166 70,535 80,672Conroe ISD............................... TX 409,899 24,562 160,405 224,932 100.0 6.0 39.1 54.9 486,216 330,126 202,284 117,575Corpus Christi ISD ................... TX 329,464 40,445 165,376 123,643 100.0 12.3 50.2 37.5 311,410 298,012 175,525 4,151Crowley ISD.............................. TX 128,710 6,069 53,593 69,048 100.0 4.7 41.6 53.6 170,520 106,477 68,568 52,406Cypress-Fairbanks ISD............ TX 792,371 43,607 314,951 433,813 100.0 5.5 39.7 54.7 948,922 691,201 443,884 183,457Dallas ISD................................. TX 1,613,014 216,482 473,768 922,764 100.0 13.4 29.4 57.2 1,695,717 1,457,429 900,426 137,918Denton ISD............................... TX 237,087 14,052 77,199 145,836 100.0 5.9 32.6 61.5 272,921 185,117 115,614 67,584Eagle Mount-Saginaw ISD...... TX 138,169 5,199 47,316 85,654 100.0 3.8 34.2 62.0 192,566 101,183 63,185 73,456Ector County ISD...................... TX 221,091 23,348 102,968 94,775 100.0 10.6 46.6 42.9 236,547 201,393 120,971 29,334Edinburg CISD.......................... TX 285,362 44,180 176,000 65,182 100.0 15.5 61.7 22.8 278,144 254,699 155,184 8,206El Paso ISD............................... TX 583,899 87,626 314,657 181,616 100.0 15.0 53.9 31.1 593,807 535,196 324,141 35,303Fort Bend ISD........................... TX 571,456 29,488 252,517 289,451 100.0 5.2 44.2 50.7 644,932 519,209 326,087 90,179Fort Worth ISD.......................... TX 725,234 96,921 316,310 312,003 100.0 13.4 43.6 43.0 741,991 679,641 377,875 28,863Frisco ISD.................................. TX 282,727 5,766 64,360 212,601 100.0 2.0 22.8 75.2 443,197 203,821 127,975 184,922Galena Park ISD....................... TX 206,006 19,542 109,491 76,973 100.0 9.5 53.1 37.4 207,825 173,828 102,307 20,904Garland ISD.............................. TX 482,310 38,863 247,658 195,789 100.0 8.1 51.3 40.6 483,102 436,329 269,291 23,272Goose Creek CISD.................. TX 216,482 18,151 62,015 136,316 100.0 8.4 28.6 63.0 281,164 172,191 100,063 86,999Grand Prairie ISD..................... TX 234,682 18,955 135,473 80,254 100.0 8.1 57.7 34.2 317,571 189,267 117,097 103,498Harlingen CISD ........................ TX 154,358 21,942 94,025 38,391 100.0 14.2 60.9 24.9 158,068 140,280 85,765 12,056Houston ISD ............................. TX 2,059,689 267,705 597,926 1,194,058 100.0 13.0 29.0 58.0 1,968,836 1,716,764 1,007,273 135,279Humble ISD............................... TX 293,724 12,581 131,393 149,750 100.0 4.3 44.7 51.0 382,784 245,927 154,026 108,719Hurst-Euless-Bedford ISD....... TX 194,797 11,008 63,138 120,651 100.0 5.7 32.4 61.9 177,757 156,112 99,264 2,264Irving ISD .................................. TX 301,593 30,822 132,027 138,744 100.0 10.2 43.8 46.0 293,491 246,429 158,006 19,459Judson ISD ............................... TX 198,909 13,928 95,261 89,720 100.0 7.0 47.9 45.1 208,786 159,059 96,716 34,415Katy ISD.................................... TX 508,389 20,328 218,887 269,174 100.0 4.0 43.1 52.9 654,452 413,816 257,694 194,298Keller ISD.................................. TX 249,298 5,998 92,320 150,980 100.0 2.4 37.0 60.6 316,646 205,301 129,526 79,076Killeen ISD ................................ TX 374,073 79,177 219,582 75,314 100.0 21.2 58.7 20.1 347,060 306,183 191,011 30,576Klein ISD................................... TX 365,622 18,853 172,457 174,312 100.0 5.2 47.2 47.7 386,411 321,834 194,350 45,226La Joya ISD............................... TX 258,051 39,885 181,758 36,408 100.0 15.5 70.4 14.1 307,867 228,326 135,851 65,788Lamar CISD.............................. TX 215,192 14,002 73,159 128,031 100.0 6.5 34.0 59.5 272,466 172,020 107,196 78,132
See notes at end of table.
Table 95. Revenues, expenditures, poverty rate, and Title I allocations of public school districts enrolling more than 15,000 students: 2007–08 and f
Name of district State
Revenues by source of funds, 2007–08 (in thousands of dollars) Percentage distribution of revenues, 2007–08 Expenditures, 2007–08 (in thousands of dollars)
Total Federal State Local Total Federal State Local Total4
Current expenditures
Capital outlayTotal Instruction
1 2 3 4 5 6 7 8 9 10 11 12 13 14
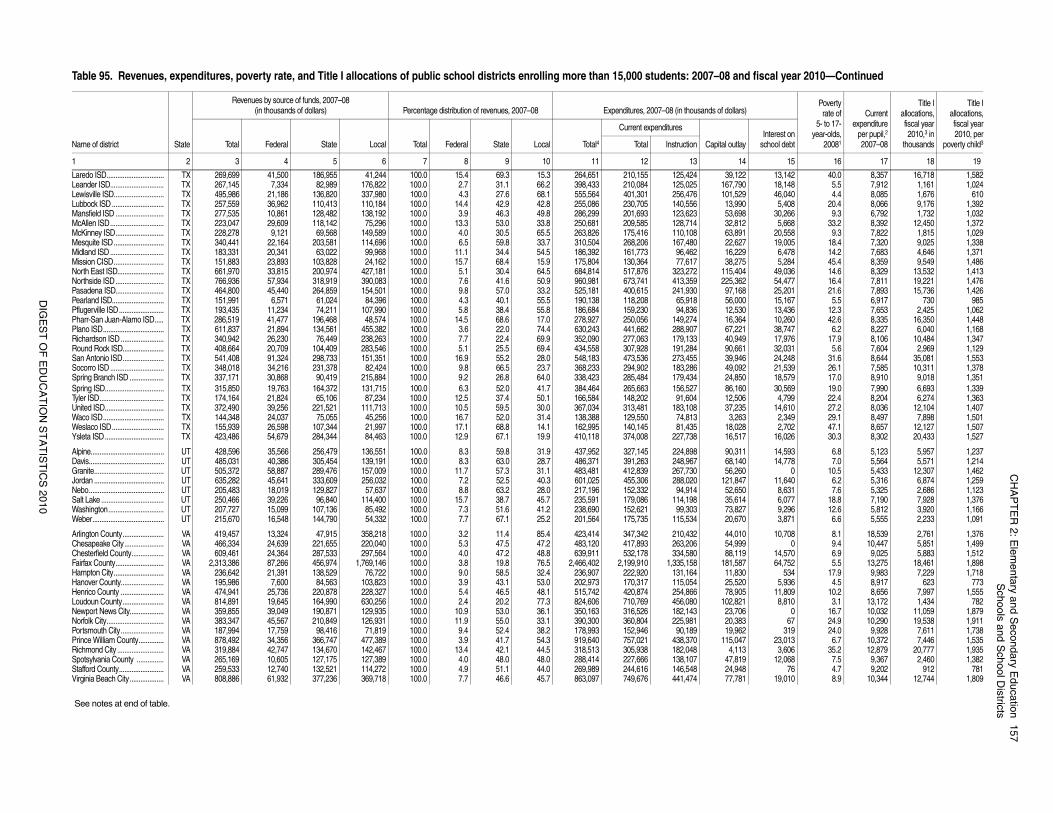
CH
AP
TE
R 2
: Ele
me
nta
ry an
d S
eco
nd
ary E
du
catio
n1
57
Sch
oo
ls an
d S
cho
ol D
istricts
DIG
ES
T O
F E
DU
CA
TIO
N S
TA
TIS
TIC
S 2
01
0
13,142 40.0 8,357 16,718 1,58218,148 5.5 7,912 1,161 1,02446,040 4.4 8,085 1,676 6105,408 20.4 8,066 9,176 1,392
30,266 9.3 6,792 1,732 1,0325,668 33.2 8,392 12,450 1,372
20,558 9.3 7,822 1,815 1,02919,005 18.4 7,320 9,025 1,3386,478 14.2 7,683 4,646 1,3715,284 45.4 8,359 9,549 1,486
49,036 14.6 8,329 13,532 1,41354,477 16.4 7,811 19,221 1,47625,201 21.6 7,893 15,736 1,42615,167 5.5 6,917 730 98513,436 12.3 7,653 2,425 1,06210,260 42.6 8,335 16,350 1,44838,747 6.2 8,227 6,040 1,16817,976 17.9 8,106 10,484 1,34732,031 5.6 7,604 2,969 1,12924,248 31.6 8,644 35,081 1,55321,539 26.1 7,585 10,311 1,37818,579 17.0 8,910 9,018 1,35130,569 19.0 7,990 6,693 1,3394,799 22.4 8,204 6,274 1,363
14,610 27.2 8,036 12,104 1,4072,349 29.1 8,497 7,898 1,5012,702 47.1 8,657 12,127 1,507
16,026 30.3 8,302 20,433 1,527
14,593 6.8 5,123 5,957 1,23714,778 7.0 5,564 5,571 1,214
0 10.5 5,433 12,307 1,46211,640 6.2 5,316 6,874 1,2598,631 7.6 5,325 2,686 1,1236,077 18.8 7,190 7,928 1,3769,296 12.6 5,812 3,920 1,1663,871 6.6 5,555 2,233 1,091
10,708 8.1 18,539 2,761 1,3760 9.4 10,447 5,851 1,499
14,570 6.9 9,025 5,883 1,51264,752 5.5 13,275 18,461 1,898
534 17.9 9,983 7,229 1,7185,936 4.5 8,917 623 773
11,809 10.2 8,656 7,997 1,5558,810 3.1 13,172 1,434 782
0 16.7 10,032 11,059 1,87967 24.9 10,290 19,538 1,911
319 24.0 9,928 7,611 1,73823,013 6.7 10,372 7,446 1,5353,606 35.2 12,879 20,777 1,935
12,068 7.5 9,367 2,460 1,38276 4.7 9,202 912 781
19,010 8.9 10,344 12,744 1,809
iscal year 2010—Continued
Povertyrate of
5- to 17-year-olds,
20081
Currentexpenditure
per pupil,2
2007–08
Title Iallocations,fiscal year2010,3 in
thousands
Title Iallocations,fiscal year2010, per
poverty child3Interest on
school debt
15 16 17 18 19
Laredo ISD................................ TX 269,699 41,500 186,955 41,244 100.0 15.4 69.3 15.3 264,651 210,155 125,424 39,122Leander ISD.............................. TX 267,145 7,334 82,989 176,822 100.0 2.7 31.1 66.2 398,433 210,084 125,025 167,790Lewisville ISD............................ TX 495,986 21,186 136,820 337,980 100.0 4.3 27.6 68.1 555,564 401,301 256,476 101,529Lubbock ISD............................. TX 257,559 36,962 110,413 110,184 100.0 14.4 42.9 42.8 255,086 230,705 140,556 13,990Mansfield ISD ........................... TX 277,535 10,861 128,482 138,192 100.0 3.9 46.3 49.8 286,299 201,693 123,623 53,698McAllen ISD.............................. TX 223,047 29,609 118,142 75,296 100.0 13.3 53.0 33.8 250,681 209,585 128,714 32,812McKinney ISD........................... TX 228,278 9,121 69,568 149,589 100.0 4.0 30.5 65.5 263,826 175,416 110,108 63,891Mesquite ISD............................ TX 340,441 22,164 203,581 114,696 100.0 6.5 59.8 33.7 310,504 268,206 167,480 22,627Midland ISD.............................. TX 183,331 20,341 63,022 99,968 100.0 11.1 34.4 54.5 186,392 161,773 96,462 16,229Mission CISD............................ TX 151,883 23,893 103,828 24,162 100.0 15.7 68.4 15.9 175,804 130,364 77,617 38,275North East ISD.......................... TX 661,970 33,815 200,974 427,181 100.0 5.1 30.4 64.5 684,814 517,876 323,272 115,404Northside ISD........................... TX 766,936 57,934 318,919 390,083 100.0 7.6 41.6 50.9 960,981 673,741 413,359 225,362Pasadena ISD........................... TX 464,800 45,440 264,859 154,501 100.0 9.8 57.0 33.2 525,181 400,615 241,930 97,168Pearland ISD............................. TX 151,991 6,571 61,024 84,396 100.0 4.3 40.1 55.5 190,138 118,208 65,918 56,000Pflugerville ISD......................... TX 193,435 11,234 74,211 107,990 100.0 5.8 38.4 55.8 186,684 159,230 94,836 12,530Pharr-San Juan-Alamo ISD..... TX 286,519 41,477 196,468 48,574 100.0 14.5 68.6 17.0 278,927 250,056 149,274 16,364Plano ISD.................................. TX 611,837 21,894 134,561 455,382 100.0 3.6 22.0 74.4 630,243 441,662 288,907 67,221Richardson ISD........................ TX 340,942 26,230 76,449 238,263 100.0 7.7 22.4 69.9 352,090 277,063 179,133 40,949Round Rock ISD....................... TX 408,664 20,709 104,409 283,546 100.0 5.1 25.5 69.4 434,558 307,928 191,284 90,661San Antonio ISD....................... TX 541,408 91,324 298,733 151,351 100.0 16.9 55.2 28.0 548,183 473,536 273,455 39,946Socorro ISD.............................. TX 348,018 34,216 231,378 82,424 100.0 9.8 66.5 23.7 368,233 294,902 183,286 49,092Spring Branch ISD ................... TX 337,171 30,868 90,419 215,884 100.0 9.2 26.8 64.0 338,423 285,484 179,434 24,850Spring ISD................................. TX 315,850 19,763 164,372 131,715 100.0 6.3 52.0 41.7 384,464 265,663 156,527 86,160Tyler ISD.................................... TX 174,164 21,824 65,106 87,234 100.0 12.5 37.4 50.1 166,584 148,202 91,604 12,506United ISD................................. TX 372,490 39,256 221,521 111,713 100.0 10.5 59.5 30.0 367,034 313,481 183,108 37,235Waco ISD.................................. TX 144,348 24,037 75,055 45,256 100.0 16.7 52.0 31.4 138,388 129,550 74,813 3,263Weslaco ISD............................. TX 155,939 26,598 107,344 21,997 100.0 17.1 68.8 14.1 162,995 140,145 81,435 18,028Ysleta ISD................................. TX 423,486 54,679 284,344 84,463 100.0 12.9 67.1 19.9 410,118 374,008 227,738 16,517
Alpine......................................... UT 428,596 35,566 256,479 136,551 100.0 8.3 59.8 31.9 437,952 327,145 224,898 90,311Davis.......................................... UT 485,031 40,386 305,454 139,191 100.0 8.3 63.0 28.7 486,371 391,263 248,967 68,140Granite....................................... UT 505,372 58,887 289,476 157,009 100.0 11.7 57.3 31.1 483,481 412,839 267,730 56,260Jordan ....................................... UT 635,282 45,641 333,609 256,032 100.0 7.2 52.5 40.3 601,025 455,306 288,020 121,847Nebo.......................................... UT 205,483 18,019 129,827 57,637 100.0 8.8 63.2 28.0 217,196 152,332 94,914 52,650Salt Lake ................................... UT 250,466 39,226 96,840 114,400 100.0 15.7 38.7 45.7 235,591 179,086 114,198 35,614Washington............................... UT 207,727 15,099 107,136 85,492 100.0 7.3 51.6 41.2 238,690 152,621 99,303 73,827Weber........................................ UT 215,670 16,548 144,790 54,332 100.0 7.7 67.1 25.2 201,564 175,735 115,534 20,670
Arlington County....................... VA 419,457 13,324 47,915 358,218 100.0 3.2 11.4 85.4 423,414 347,342 210,432 44,010Chesapeake City...................... VA 466,334 24,639 221,655 220,040 100.0 5.3 47.5 47.2 483,120 417,893 263,206 54,999Chesterfield County.................. VA 609,461 24,364 287,533 297,564 100.0 4.0 47.2 48.8 639,911 532,178 334,580 88,119Fairfax County........................... VA 2,313,386 87,266 456,974 1,769,146 100.0 3.8 19.8 76.5 2,466,402 2,199,910 1,335,158 181,587Hampton City............................ VA 236,642 21,391 138,529 76,722 100.0 9.0 58.5 32.4 236,907 222,920 131,164 11,830Hanover County........................ VA 195,986 7,600 84,563 103,823 100.0 3.9 43.1 53.0 202,973 170,317 115,054 25,520Henrico County ........................ VA 474,941 25,736 220,878 228,327 100.0 5.4 46.5 48.1 515,742 420,874 254,866 78,905Loudoun County....................... VA 814,891 19,645 164,990 630,256 100.0 2.4 20.2 77.3 824,606 710,769 456,080 102,821Newport News City................... VA 359,855 39,049 190,871 129,935 100.0 10.9 53.0 36.1 350,163 316,526 182,143 23,706Norfolk City................................ VA 383,347 45,567 210,849 126,931 100.0 11.9 55.0 33.1 390,300 360,804 225,981 20,383Portsmouth City........................ VA 187,994 17,759 98,416 71,819 100.0 9.4 52.4 38.2 178,993 152,946 90,189 19,962Prince William County.............. VA 878,492 34,356 366,747 477,389 100.0 3.9 41.7 54.3 919,640 757,021 438,370 115,047Richmond City .......................... VA 319,884 42,747 134,670 142,467 100.0 13.4 42.1 44.5 318,513 305,938 182,048 4,113Spotsylvania County ............... VA 265,169 10,605 127,175 127,389 100.0 4.0 48.0 48.0 288,414 227,666 138,107 47,819Stafford County......................... VA 259,533 12,740 132,521 114,272 100.0 4.9 51.1 44.0 269,989 244,616 146,548 24,948Virginia Beach City................... VA 808,886 61,932 377,236 369,718 100.0 7.7 46.6 45.7 863,097 749,676 441,474 77,781
See notes at end of table.
Table 95. Revenues, expenditures, poverty rate, and Title I allocations of public school districts enrolling more than 15,000 students: 2007–08 and f
Name of district State
Revenues by source of funds, 2007–08 (in thousands of dollars) Percentage distribution of revenues, 2007–08 Expenditures, 2007–08 (in thousands of dollars)
Total Federal State Local Total Federal State Local Total4
Current expenditures
Capital outlayTotal Instruction
1 2 3 4 5 6 7 8 9 10 11 12 13 14
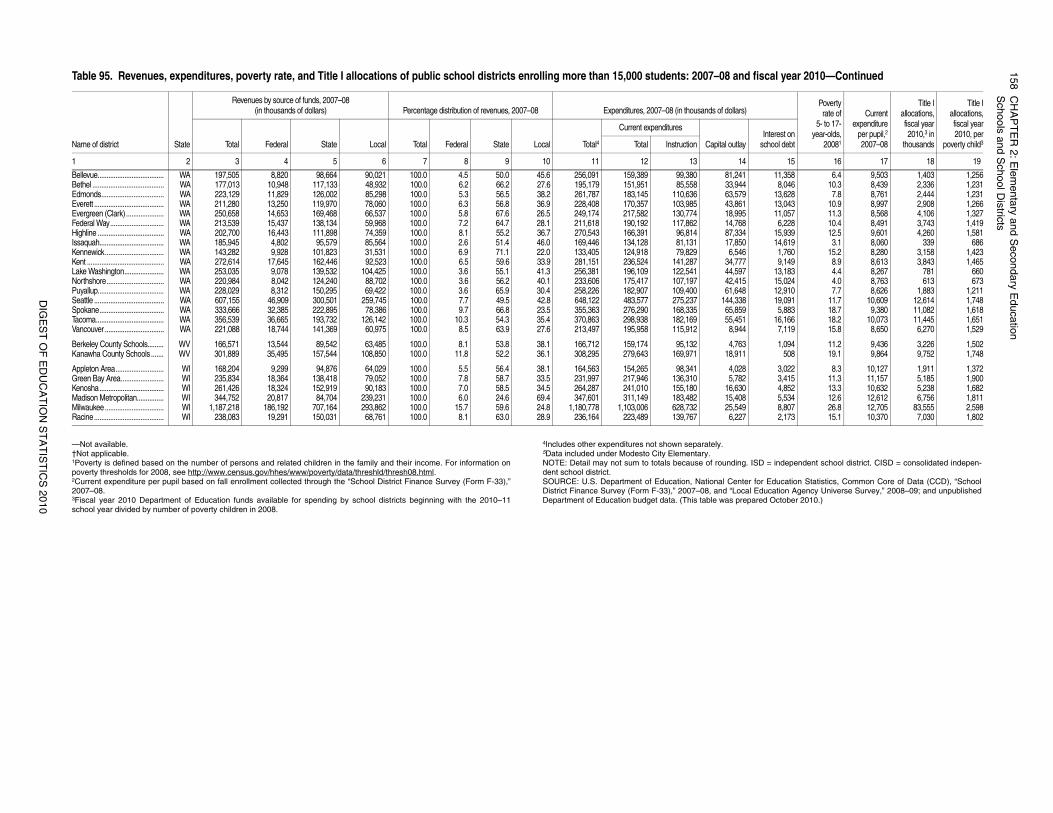
15
8C
HA
PT
ER
2: E
lem
en
tary a
nd
Se
con
da
ry Ed
uca
tion
Sch
oo
ls an
d S
cho
ol D
istricts
DIG
ES
T O
F E
DU
CA
TIO
N S
TA
TIS
TIC
S 2
01
0
D = independent school district. CISD = consolidated indepen-
for Education Statistics, Common Core of Data (CCD), “Schoolducation Agency Universe Survey,” 2008–09; and unpublished
red October 2010.)
11,358 6.4 9,503 1,403 1,2568,046 10.3 8,439 2,336 1,231
13,628 7.8 8,761 2,444 1,23113,043 10.9 8,997 2,908 1,26611,057 11.3 8,568 4,106 1,3276,228 10.4 8,491 3,743 1,419
15,939 12.5 9,601 4,260 1,58114,619 3.1 8,060 339 6861,760 15.2 8,280 3,158 1,4239,149 8.9 8,613 3,843 1,465
13,183 4.4 8,267 781 66015,024 4.0 8,763 613 67312,910 7.7 8,626 1,883 1,21119,091 11.7 10,609 12,614 1,7485,883 18.7 9,380 11,082 1,618
16,166 18.2 10,073 11,445 1,6517,119 15.8 8,650 6,270 1,529
1,094 11.2 9,436 3,226 1,502508 19.1 9,864 9,752 1,748
3,022 8.3 10,127 1,911 1,3723,415 11.3 11,157 5,185 1,9004,852 13.3 10,632 5,238 1,6825,534 12.6 12,612 6,756 1,8118,807 26.8 12,705 83,555 2,5982,173 15.1 10,370 7,030 1,802
iscal year 2010—Continued
Povertyrate of
5- to 17-year-olds,
20081
Currentexpenditure
per pupil,2
2007–08
Title Iallocations,fiscal year2010,3 in
thousands
Title Iallocations,fiscal year2010, per
poverty child3Interest on
school debt
15 16 17 18 19
—Not available.†Not applicable. 1Poverty is defined based on the number of persons and related children in the family and their income. For information onpoverty thresholds for 2008, see http://www.census.gov/hhes/www/poverty/data/threshld/thresh08.html.2Current expenditure per pupil based on fall enrollment collected through the “School District Finance Survey (Form F-33),”2007–08.3Fiscal year 2010 Department of Education funds available for spending by school districts beginning with the 2010–11school year divided by number of poverty children in 2008.
4Includes other expenditures not shown separately.5Data included under Modesto City Elementary.NOTE: Detail may not sum to totals because of rounding. ISdent school district.SOURCE: U.S. Department of Education, National Center District Finance Survey (Form F-33),” 2007–08, and “Local EDepartment of Education budget data. (This table was prepa
Bellevue..................................... WA 197,505 8,820 98,664 90,021 100.0 4.5 50.0 45.6 256,091 159,389 99,380 81,241Bethel ........................................ WA 177,013 10,948 117,133 48,932 100.0 6.2 66.2 27.6 195,179 151,951 85,558 33,944Edmonds................................... WA 223,129 11,829 126,002 85,298 100.0 5.3 56.5 38.2 261,787 183,145 110,636 63,579Everett ....................................... WA 211,280 13,250 119,970 78,060 100.0 6.3 56.8 36.9 228,408 170,357 103,985 43,861Evergreen (Clark) ..................... WA 250,658 14,653 169,468 66,537 100.0 5.8 67.6 26.5 249,174 217,582 130,774 18,995Federal Way.............................. WA 213,539 15,437 138,134 59,968 100.0 7.2 64.7 28.1 211,618 190,192 117,862 14,768Highline ..................................... WA 202,700 16,443 111,898 74,359 100.0 8.1 55.2 36.7 270,543 166,391 96,814 87,334Issaquah.................................... WA 185,945 4,802 95,579 85,564 100.0 2.6 51.4 46.0 169,446 134,128 81,131 17,850Kennewick................................. WA 143,282 9,928 101,823 31,531 100.0 6.9 71.1 22.0 133,405 124,918 79,829 6,546Kent ........................................... WA 272,614 17,645 162,446 92,523 100.0 6.5 59.6 33.9 281,151 236,524 141,287 34,777Lake Washington...................... WA 253,035 9,078 139,532 104,425 100.0 3.6 55.1 41.3 256,381 196,109 122,541 44,597Northshore................................ WA 220,984 8,042 124,240 88,702 100.0 3.6 56.2 40.1 233,606 175,417 107,197 42,415Puyallup..................................... WA 228,029 8,312 150,295 69,422 100.0 3.6 65.9 30.4 258,226 182,907 109,400 61,648Seattle ....................................... WA 607,155 46,909 300,501 259,745 100.0 7.7 49.5 42.8 648,122 483,577 275,237 144,338Spokane.................................... WA 333,666 32,385 222,895 78,386 100.0 9.7 66.8 23.5 355,363 276,290 168,335 65,859Tacoma...................................... WA 356,539 36,665 193,732 126,142 100.0 10.3 54.3 35.4 370,863 298,938 182,169 55,451Vancouver ................................. WA 221,088 18,744 141,369 60,975 100.0 8.5 63.9 27.6 213,497 195,958 115,912 8,944
Berkeley County Schools......... WV 166,571 13,544 89,542 63,485 100.0 8.1 53.8 38.1 166,712 159,174 95,132 4,763Kanawha County Schools....... WV 301,889 35,495 157,544 108,850 100.0 11.8 52.2 36.1 308,295 279,643 169,971 18,911
Appleton Area........................... WI 168,204 9,299 94,876 64,029 100.0 5.5 56.4 38.1 164,563 154,265 98,341 4,028Green Bay Area........................ WI 235,834 18,364 138,418 79,052 100.0 7.8 58.7 33.5 231,997 217,946 136,310 5,782Kenosha.................................... WI 261,426 18,324 152,919 90,183 100.0 7.0 58.5 34.5 264,287 241,010 155,180 16,630Madison Metropolitan............... WI 344,752 20,817 84,704 239,231 100.0 6.0 24.6 69.4 347,601 311,149 183,482 15,408Milwaukee................................. WI 1,187,218 186,192 707,164 293,862 100.0 15.7 59.6 24.8 1,180,778 1,103,006 628,732 25,549Racine....................................... WI 238,083 19,291 150,031 68,761 100.0 8.1 63.0 28.9 236,164 223,489 139,767 6,227
Table 95. Revenues, expenditures, poverty rate, and Title I allocations of public school districts enrolling more than 15,000 students: 2007–08 and f
Name of district State
Revenues by source of funds, 2007–08 (in thousands of dollars) Percentage distribution of revenues, 2007–08 Expenditures, 2007–08 (in thousands of dollars)
Total Federal State Local Total Federal State Local Total4
Current expenditures
Capital outlayTotal Instruction
1 2 3 4 5 6 7 8 9 10 11 12 13 14
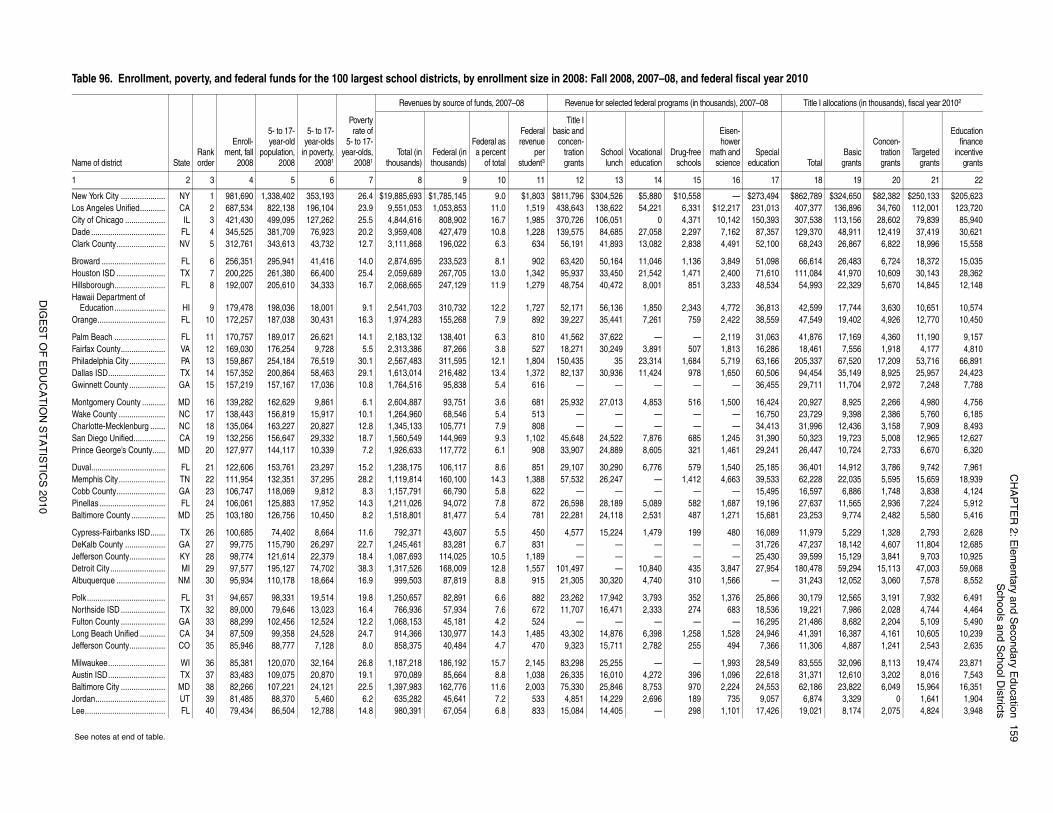
CH
AP
TE
R 2
: Ele
me
nta
ry an
d S
eco
nd
ary E
du
catio
n1
59
Sch
oo
ls an
d S
cho
ol D
istricts
DIG
ES
T O
F E
DU
CA
TIO
N S
TA
TIS
TIC
S 2
01
0
l year 2010
–08 Title I allocations (in thousands), fiscal year 20102
Specialucation Total
Basicgrants
Concen-trationgrants
Targetedgrants
Educationfinance
incentivegrants
17 18 19 20 21 22
73,494 $862,789 $324,650 $82,382 $250,133 $205,62331,013 407,377 136,896 34,760 112,001 123,72050,393 307,538 113,156 28,602 79,839 85,94087,357 129,370 48,911 12,419 37,419 30,62152,100 68,243 26,867 6,822 18,996 15,558
51,098 66,614 26,483 6,724 18,372 15,03571,610 111,084 41,970 10,609 30,143 28,36248,534 54,993 22,329 5,670 14,845 12,148
36,813 42,599 17,744 3,630 10,651 10,57438,559 47,549 19,402 4,926 12,770 10,450
31,063 41,876 17,169 4,360 11,190 9,15716,286 18,461 7,556 1,918 4,177 4,81063,166 205,337 67,520 17,209 53,716 66,89160,506 94,454 35,149 8,925 25,957 24,42336,455 29,711 11,704 2,972 7,248 7,788
16,424 20,927 8,925 2,266 4,980 4,75616,750 23,729 9,398 2,386 5,760 6,18534,413 31,996 12,436 3,158 7,909 8,49331,390 50,323 19,723 5,008 12,965 12,62729,241 26,447 10,724 2,733 6,670 6,320
25,185 36,401 14,912 3,786 9,742 7,96139,533 62,228 22,035 5,595 15,659 18,93915,495 16,597 6,886 1,748 3,838 4,12419,196 27,637 11,565 2,936 7,224 5,91215,681 23,253 9,774 2,482 5,580 5,416
16,089 11,979 5,229 1,328 2,793 2,62831,726 47,237 18,142 4,607 11,804 12,68525,430 39,599 15,129 3,841 9,703 10,92527,954 180,478 59,294 15,113 47,003 59,068
— 31,243 12,052 3,060 7,578 8,552
25,866 30,179 12,565 3,191 7,932 6,49118,536 19,221 7,986 2,028 4,744 4,46416,295 21,486 8,682 2,204 5,109 5,49024,946 41,391 16,387 4,161 10,605 10,2397,366 11,306 4,887 1,241 2,543 2,635
28,549 83,555 32,096 8,113 19,474 23,87122,618 31,371 12,610 3,202 8,016 7,54324,553 62,186 23,822 6,049 15,964 16,351
9,057 6,874 3,329 0 1,641 1,90417,426 19,021 8,174 2,075 4,824 3,948
Table 96. Enrollment, poverty, and federal funds for the 100 largest school districts, by enrollment size in 2008: Fall 2008, 2007–08, and federal fisca
Name of district StateRankorder
Enroll-ment, fall
2008
5- to 17-year-old
population,2008
5- to 17-year-olds
in poverty,20081
Povertyrate of
5- to 17-year-olds,
20081
Revenues by source of funds, 2007–08 Revenue for selected federal programs (in thousands), 2007
Total (inthousands)
Federal (inthousands)
Federal asa percent
of total
Federalrevenue
perstudent3
Title Ibasic and
concen-trationgrants
Schoollunch
Vocationaleducation
Drug-freeschools
Eisen-hower
math andscience ed
1 2 3 4 5 6 7 8 9 10 11 12 13 14 15 16
New York City ..................... NY 1 981,690 1,338,402 353,193 26.4 $19,885,693 $1,785,145 9.0 $1,803 $811,796 $304,526 $5,880 $10,558 — $2Los Angeles Unified............ CA 2 687,534 822,138 196,104 23.9 9,551,053 1,053,853 11.0 1,519 438,643 138,622 54,221 6,331 $12,217 2City of Chicago ................... IL 3 421,430 499,095 127,262 25.5 4,844,616 808,902 16.7 1,985 370,726 106,051 0 4,371 10,142 1Dade ................................... FL 4 345,525 381,709 76,923 20.2 3,959,408 427,479 10.8 1,228 139,575 84,685 27,058 2,297 7,162Clark County....................... NV 5 312,761 343,613 43,732 12.7 3,111,868 196,022 6.3 634 56,191 41,893 13,082 2,838 4,491
Broward .............................. FL 6 256,351 295,941 41,416 14.0 2,874,695 233,523 8.1 902 63,420 50,164 11,046 1,136 3,849Houston ISD ....................... TX 7 200,225 261,380 66,400 25.4 2,059,689 267,705 13.0 1,342 95,937 33,450 21,542 1,471 2,400Hillsborough........................ FL 8 192,007 205,610 34,333 16.7 2,068,665 247,129 11.9 1,279 48,754 40,472 8,001 851 3,233Hawaii Department of
Education........................ HI 9 179,478 198,036 18,001 9.1 2,541,703 310,732 12.2 1,727 52,171 56,136 1,850 2,343 4,772Orange................................ FL 10 172,257 187,038 30,431 16.3 1,974,283 155,268 7.9 892 39,227 35,441 7,261 759 2,422
Palm Beach ........................ FL 11 170,757 189,017 26,621 14.1 2,183,132 138,401 6.3 810 41,562 37,622 — — 2,119Fairfax County..................... VA 12 169,030 176,254 9,728 5.5 2,313,386 87,266 3.8 527 18,271 30,249 3,891 507 1,813Philadelphia City................. PA 13 159,867 254,184 76,519 30.1 2,567,483 311,595 12.1 1,804 150,435 35 23,314 1,684 5,719Dallas ISD........................... TX 14 157,352 200,864 58,463 29.1 1,613,014 216,482 13.4 1,372 82,137 30,936 11,424 978 1,650Gwinnett County ................. GA 15 157,219 157,167 17,036 10.8 1,764,516 95,838 5.4 616 — — — — —
Montgomery County ........... MD 16 139,282 162,629 9,861 6.1 2,604,887 93,751 3.6 681 25,932 27,013 4,853 516 1,500Wake County ...................... NC 17 138,443 156,819 15,917 10.1 1,264,960 68,546 5.4 513 — — — — —Charlotte-Mecklenburg ....... NC 18 135,064 163,227 20,827 12.8 1,345,133 105,771 7.9 808 — — — — —San Diego Unified............... CA 19 132,256 156,647 29,332 18.7 1,560,549 144,969 9.3 1,102 45,648 24,522 7,876 685 1,245Prince George’s County...... MD 20 127,977 144,117 10,339 7.2 1,926,633 117,772 6.1 908 33,907 24,889 8,605 321 1,461
Duval................................... FL 21 122,606 153,761 23,297 15.2 1,238,175 106,117 8.6 851 29,107 30,290 6,776 579 1,540Memphis City...................... TN 22 111,954 132,351 37,295 28.2 1,119,814 160,100 14.3 1,388 57,532 26,247 — 1,412 4,663Cobb County....................... GA 23 106,747 118,069 9,812 8.3 1,157,791 66,790 5.8 622 — — — — —Pinellas ............................... FL 24 106,061 125,883 17,952 14.3 1,211,026 94,072 7.8 872 26,598 28,189 5,089 582 1,687Baltimore County ................ MD 25 103,180 126,756 10,450 8.2 1,518,801 81,477 5.4 781 22,281 24,118 2,531 487 1,271
Cypress-Fairbanks ISD....... TX 26 100,685 74,402 8,664 11.6 792,371 43,607 5.5 450 4,577 15,224 1,479 199 480DeKalb County ................... GA 27 99,775 115,790 26,297 22.7 1,245,461 83,281 6.7 831 — — — — —Jefferson County................. KY 28 98,774 121,614 22,379 18.4 1,087,693 114,025 10.5 1,189 — — — — —Detroit City.......................... MI 29 97,577 195,127 74,702 38.3 1,317,526 168,009 12.8 1,557 101,497 — 10,840 435 3,847Albuquerque ....................... NM 30 95,934 110,178 18,664 16.9 999,503 87,819 8.8 915 21,305 30,320 4,740 310 1,566
Polk..................................... FL 31 94,657 98,331 19,514 19.8 1,250,657 82,891 6.6 882 23,262 17,942 3,793 352 1,376Northside ISD ..................... TX 32 89,000 79,646 13,023 16.4 766,936 57,934 7.6 672 11,707 16,471 2,333 274 683Fulton County ..................... GA 33 88,299 102,456 12,524 12.2 1,068,153 45,181 4.2 524 — — — — —Long Beach Unified ............ CA 34 87,509 99,358 24,528 24.7 914,366 130,977 14.3 1,485 43,302 14,876 6,398 1,258 1,528Jefferson County................. CO 35 85,946 88,777 7,128 8.0 858,375 40,484 4.7 470 9,323 15,711 2,782 255 494
Milwaukee........................... WI 36 85,381 120,070 32,164 26.8 1,187,218 186,192 15.7 2,145 83,298 25,255 — — 1,993Austin ISD........................... TX 37 83,483 109,075 20,870 19.1 970,089 85,664 8.8 1,038 26,335 16,010 4,272 396 1,096Baltimore City ..................... MD 38 82,266 107,221 24,121 22.5 1,397,983 162,776 11.6 2,003 75,330 25,846 8,753 970 2,224Jordan................................. UT 39 81,485 88,370 5,460 6.2 635,282 45,641 7.2 533 4,851 14,229 2,696 189 735Lee...................................... FL 40 79,434 86,504 12,788 14.8 980,391 67,054 6.8 833 15,084 14,405 — 298 1,101
See notes at end of table.
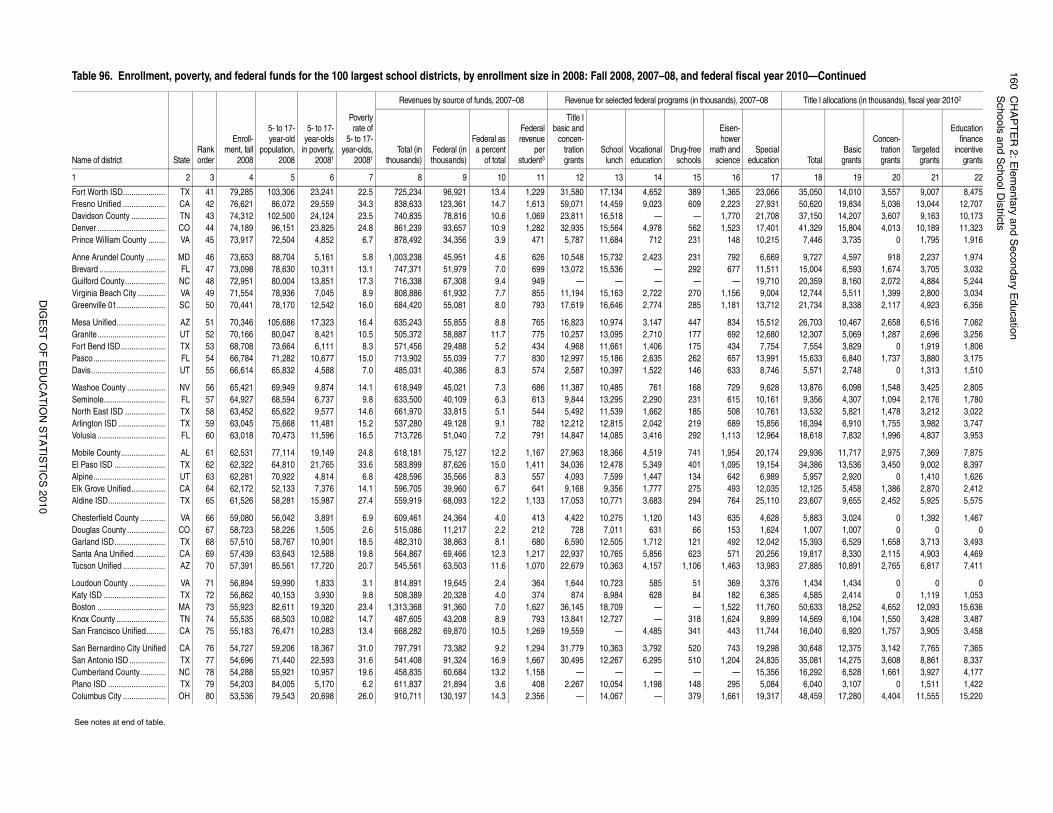
16
0C
HA
PT
ER
2: E
lem
en
tary a
nd
Se
con
da
ry Ed
uca
tion
Sch
oo
ls an
d S
cho
ol D
istricts
DIG
ES
T O
F E
DU
CA
TIO
N S
TA
TIS
TIC
S 2
01
0
23,066 35,050 14,010 3,557 9,007 8,47527,931 50,620 19,834 5,036 13,044 12,70721,708 37,150 14,207 3,607 9,163 10,17317,401 41,329 15,804 4,013 10,189 11,32310,215 7,446 3,735 0 1,795 1,916
6,669 9,727 4,597 918 2,237 1,97411,511 15,004 6,593 1,674 3,705 3,03219,710 20,359 8,160 2,072 4,884 5,244
9,004 12,744 5,511 1,399 2,800 3,03413,712 21,734 8,338 2,117 4,923 6,356
15,512 26,703 10,467 2,658 6,516 7,06212,680 12,307 5,069 1,287 2,696 3,256
7,754 7,554 3,829 0 1,919 1,80613,991 15,633 6,840 1,737 3,880 3,175
8,746 5,571 2,748 0 1,313 1,510
9,628 13,876 6,098 1,548 3,425 2,80510,161 9,356 4,307 1,094 2,176 1,78010,761 13,532 5,821 1,478 3,212 3,02215,856 16,394 6,910 1,755 3,982 3,74712,964 18,618 7,832 1,996 4,837 3,953
20,174 29,936 11,717 2,975 7,369 7,87519,154 34,386 13,536 3,450 9,002 8,3976,989 5,957 2,920 0 1,410 1,626
12,035 12,125 5,458 1,386 2,870 2,41225,110 23,607 9,655 2,452 5,925 5,575
4,628 5,883 3,024 0 1,392 1,4671,624 1,007 1,007 0 0 0
12,042 15,393 6,529 1,658 3,713 3,49320,256 19,817 8,330 2,115 4,903 4,46913,983 27,885 10,891 2,765 6,817 7,411
3,376 1,434 1,434 0 0 06,385 4,585 2,414 0 1,119 1,053
11,760 50,633 18,252 4,652 12,093 15,6369,899 14,569 6,104 1,550 3,428 3,487
11,744 16,040 6,920 1,757 3,905 3,458
19,298 30,648 12,375 3,142 7,765 7,36524,835 35,081 14,275 3,608 8,861 8,33715,356 16,292 6,528 1,661 3,927 4,177
5,084 6,040 3,107 0 1,511 1,42219,317 48,459 17,280 4,404 11,555 15,220
l year 2010—Continued
–08 Title I allocations (in thousands), fiscal year 20102
Specialucation Total
Basicgrants
Concen-trationgrants
Targetedgrants
Educationfinance
incentivegrants
17 18 19 20 21 22
Fort Worth ISD.................... TX 41 79,285 103,306 23,241 22.5 725,234 96,921 13.4 1,229 31,580 17,134 4,652 389 1,365Fresno Unified .................... CA 42 76,621 86,072 29,559 34.3 838,633 123,361 14.7 1,613 59,071 14,459 9,023 609 2,223Davidson County ................ TN 43 74,312 102,500 24,124 23.5 740,835 78,816 10.6 1,069 23,811 16,518 — — 1,770Denver ................................ CO 44 74,189 96,151 23,825 24.8 861,239 93,657 10.9 1,282 32,935 15,564 4,978 562 1,523Prince William County ........ VA 45 73,917 72,504 4,852 6.7 878,492 34,356 3.9 471 5,787 11,684 712 231 148
Anne Arundel County ......... MD 46 73,653 88,704 5,161 5.8 1,003,238 45,951 4.6 626 10,548 15,732 2,423 231 792Brevard ............................... FL 47 73,098 78,630 10,311 13.1 747,371 51,979 7.0 699 13,072 15,536 — 292 677Guilford County................... NC 48 72,951 80,004 13,851 17.3 716,338 67,308 9.4 949 — — — — —Virginia Beach City ............. VA 49 71,554 78,936 7,045 8.9 808,886 61,932 7.7 855 11,194 15,163 2,722 270 1,156Greenville 01....................... SC 50 70,441 78,170 12,542 16.0 684,420 55,081 8.0 793 17,619 16,646 2,774 285 1,181
Mesa Unified....................... AZ 51 70,346 105,686 17,323 16.4 635,243 55,855 8.8 765 16,823 10,974 3,147 447 834Granite................................ UT 52 70,166 80,047 8,421 10.5 505,372 58,887 11.7 775 10,257 13,095 2,710 177 692Fort Bend ISD..................... TX 53 68,708 73,664 6,111 8.3 571,456 29,488 5.2 434 4,968 11,661 1,406 175 434Pasco.................................. FL 54 66,784 71,282 10,677 15.0 713,902 55,039 7.7 830 12,997 15,186 2,635 262 657Davis................................... UT 55 66,614 65,832 4,588 7.0 485,031 40,386 8.3 574 2,587 10,397 1,522 146 633
Washoe County .................. NV 56 65,421 69,949 9,874 14.1 618,949 45,021 7.3 686 11,387 10,485 761 168 729Seminole............................. FL 57 64,927 68,594 6,737 9.8 633,500 40,109 6.3 613 9,844 13,295 2,290 231 615North East ISD ................... TX 58 63,452 65,622 9,577 14.6 661,970 33,815 5.1 544 5,492 11,539 1,662 185 508Arlington ISD ...................... TX 59 63,045 75,668 11,481 15.2 537,280 49,128 9.1 782 12,212 12,815 2,042 219 689Volusia ................................ FL 60 63,018 70,473 11,596 16.5 713,726 51,040 7.2 791 14,847 14,085 3,416 292 1,113
Mobile County..................... AL 61 62,531 77,114 19,149 24.8 618,181 75,127 12.2 1,167 27,963 18,366 4,519 741 1,954El Paso ISD ........................ TX 62 62,322 64,810 21,765 33.6 583,899 87,626 15.0 1,411 34,036 12,478 5,349 401 1,095Alpine.................................. UT 63 62,281 70,922 4,814 6.8 428,596 35,566 8.3 557 4,093 7,599 1,447 134 642Elk Grove Unified................ CA 64 62,172 52,133 7,376 14.1 596,705 39,960 6.7 641 9,168 9,356 1,777 275 493Aldine ISD........................... TX 65 61,526 58,281 15,987 27.4 559,919 68,093 12.2 1,133 17,053 10,771 3,683 294 764
Chesterfield County ............ VA 66 59,080 56,042 3,891 6.9 609,461 24,364 4.0 413 4,422 10,275 1,120 143 635Douglas County .................. CO 67 58,723 58,226 1,505 2.6 515,086 11,217 2.2 212 728 7,011 631 66 153Garland ISD........................ TX 68 57,510 58,767 10,901 18.5 482,310 38,863 8.1 680 6,590 12,505 1,712 121 492Santa Ana Unified............... CA 69 57,439 63,643 12,588 19.8 564,867 69,466 12.3 1,217 22,937 10,765 5,856 623 571Tucson Unified .................... AZ 70 57,391 85,561 17,720 20.7 545,561 63,503 11.6 1,070 22,679 10,363 4,157 1,106 1,463
Loudoun County ................. VA 71 56,894 59,990 1,833 3.1 814,891 19,645 2.4 364 1,644 10,723 585 51 369Katy ISD ............................. TX 72 56,862 40,153 3,930 9.8 508,389 20,328 4.0 374 874 8,984 628 84 182Boston ................................ MA 73 55,923 82,611 19,320 23.4 1,313,368 91,360 7.0 1,627 36,145 18,709 — — 1,522Knox County ....................... TN 74 55,535 68,503 10,082 14.7 487,605 43,208 8.9 793 13,841 12,727 — 318 1,624San Francisco Unified......... CA 75 55,183 76,471 10,283 13.4 668,282 69,870 10.5 1,269 19,559 — 4,485 341 443
San Bernardino City Unified CA 76 54,727 59,206 18,367 31.0 797,791 73,382 9.2 1,294 31,779 10,363 3,792 520 743San Antonio ISD ................. TX 77 54,696 71,440 22,593 31.6 541,408 91,324 16.9 1,667 30,495 12,267 6,295 510 1,204Cumberland County............ NC 78 54,288 55,921 10,957 19.6 458,835 60,684 13.2 1,158 — — — — —Plano ISD ........................... TX 79 54,203 84,005 5,170 6.2 611,837 21,894 3.6 408 2,267 10,054 1,198 148 295Columbus City .................... OH 80 53,536 79,543 20,698 26.0 910,711 130,197 14.3 2,356 — 14,067 — 379 1,661
See notes at end of table.
Table 96. Enrollment, poverty, and federal funds for the 100 largest school districts, by enrollment size in 2008: Fall 2008, 2007–08, and federal fisca
Name of district StateRankorder
Enroll-ment, fall
2008
5- to 17-year-old
population,2008
5- to 17-year-olds
in poverty,20081
Povertyrate of
5- to 17-year-olds,
20081
Revenues by source of funds, 2007–08 Revenue for selected federal programs (in thousands), 2007
Total (inthousands)
Federal (inthousands)
Federal asa percent
of total
Federalrevenue
perstudent3
Title Ibasic and
concen-trationgrants
Schoollunch
Vocationaleducation
Drug-freeschools
Eisen-hower
math andscience ed
1 2 3 4 5 6 7 8 9 10 11 12 13 14 15 16
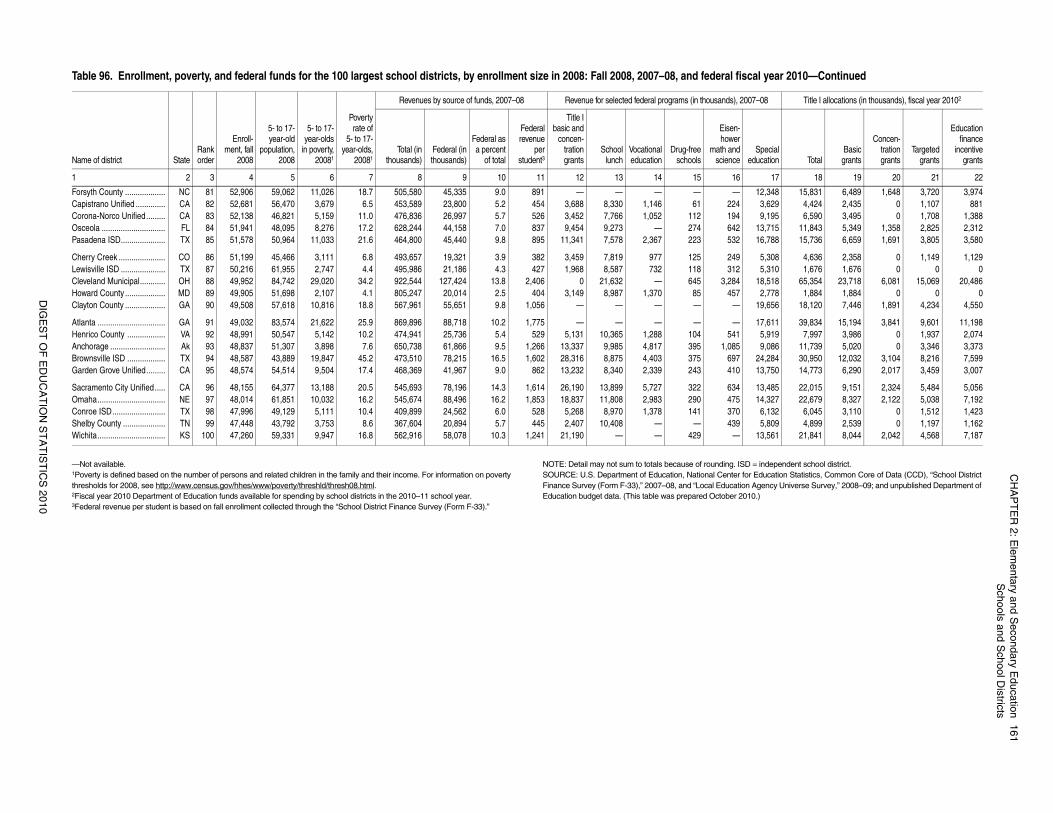
CH
AP
TE
R 2
: Ele
me
nta
ry an
d S
eco
nd
ary E
du
catio
n1
61
Sch
oo
ls an
d S
cho
ol D
istricts
DIG
ES
T O
F E
DU
CA
TIO
N S
TA
TIS
TIC
S 2
01
0
independent school district.ducation Statistics, Common Core of Data (CCD), “School Districtgency Universe Survey,” 2008–09; and unpublished Department of.)
12,348 15,831 6,489 1,648 3,720 3,9743,629 4,424 2,435 0 1,107 8819,195 6,590 3,495 0 1,708 1,388
13,715 11,843 5,349 1,358 2,825 2,31216,788 15,736 6,659 1,691 3,805 3,580
5,308 4,636 2,358 0 1,149 1,1295,310 1,676 1,676 0 0 0
18,518 65,354 23,718 6,081 15,069 20,4862,778 1,884 1,884 0 0 0
19,656 18,120 7,446 1,891 4,234 4,550
17,611 39,834 15,194 3,841 9,601 11,1985,919 7,997 3,986 0 1,937 2,0749,086 11,739 5,020 0 3,346 3,373
24,284 30,950 12,032 3,104 8,216 7,59913,750 14,773 6,290 2,017 3,459 3,007
13,485 22,015 9,151 2,324 5,484 5,05614,327 22,679 8,327 2,122 5,038 7,192
6,132 6,045 3,110 0 1,512 1,4235,809 4,899 2,539 0 1,197 1,162
13,561 21,841 8,044 2,042 4,568 7,187
l year 2010—Continued
–08 Title I allocations (in thousands), fiscal year 20102
Specialucation Total
Basicgrants
Concen-trationgrants
Targetedgrants
Educationfinance
incentivegrants
17 18 19 20 21 22
—Not available.1Poverty is defined based on the number of persons and related children in the family and their income. For information on povertythresholds for 2008, see http://www.census.gov/hhes/www/poverty/threshld/thresh08.html.2Fiscal year 2010 Department of Education funds available for spending by school districts in the 2010–11 school year.3Federal revenue per student is based on fall enrollment collected through the “School District Finance Survey (Form F-33).”
NOTE: Detail may not sum to totals because of rounding. ISD =SOURCE: U.S. Department of Education, National Center for EFinance Survey (Form F-33),” 2007–08, and “Local Education AEducation budget data. (This table was prepared October 2010
Forsyth County ................... NC 81 52,906 59,062 11,026 18.7 505,580 45,335 9.0 891 — — — — —Capistrano Unified .............. CA 82 52,681 56,470 3,679 6.5 453,589 23,800 5.2 454 3,688 8,330 1,146 61 224Corona-Norco Unified......... CA 83 52,138 46,821 5,159 11.0 476,836 26,997 5.7 526 3,452 7,766 1,052 112 194Osceola .............................. FL 84 51,941 48,095 8,276 17.2 628,244 44,158 7.0 837 9,454 9,273 — 274 642Pasadena ISD..................... TX 85 51,578 50,964 11,033 21.6 464,800 45,440 9.8 895 11,341 7,578 2,367 223 532
Cherry Creek ...................... CO 86 51,199 45,466 3,111 6.8 493,657 19,321 3.9 382 3,459 7,819 977 125 249Lewisville ISD ..................... TX 87 50,216 61,955 2,747 4.4 495,986 21,186 4.3 427 1,968 8,587 732 118 312Cleveland Municipal............ OH 88 49,952 84,742 29,020 34.2 922,544 127,424 13.8 2,406 0 21,632 — 645 3,284Howard County ................... MD 89 49,905 51,698 2,107 4.1 805,247 20,014 2.5 404 3,149 8,987 1,370 85 457Clayton County ................... GA 90 49,508 57,618 10,816 18.8 567,961 55,651 9.8 1,056 — — — — —
Atlanta ................................ GA 91 49,032 83,574 21,622 25.9 869,896 88,718 10.2 1,775 — — — — —Henrico County .................. VA 92 48,991 50,547 5,142 10.2 474,941 25,736 5.4 529 5,131 10,365 1,288 104 541Anchorage .......................... Ak 93 48,837 51,307 3,898 7.6 650,738 61,866 9.5 1,266 13,337 9,985 4,817 395 1,085Brownsville ISD .................. TX 94 48,587 43,889 19,847 45.2 473,510 78,215 16.5 1,602 28,316 8,875 4,403 375 697Garden Grove Unified......... CA 95 48,574 54,514 9,504 17.4 468,369 41,967 9.0 862 13,232 8,340 2,339 243 410
Sacramento City Unified..... CA 96 48,155 64,377 13,188 20.5 545,693 78,196 14.3 1,614 26,190 13,899 5,727 322 634Omaha................................ NE 97 48,014 61,851 10,032 16.2 545,674 88,496 16.2 1,853 18,837 11,808 2,983 290 475Conroe ISD......................... TX 98 47,996 49,129 5,111 10.4 409,899 24,562 6.0 528 5,268 8,970 1,378 141 370Shelby County .................... TN 99 47,448 43,792 3,753 8.6 367,604 20,894 5.7 445 2,407 10,408 — — 439Wichita................................ KS 100 47,260 59,331 9,947 16.8 562,916 58,078 10.3 1,241 21,190 — — 429 —
Table 96. Enrollment, poverty, and federal funds for the 100 largest school districts, by enrollment size in 2008: Fall 2008, 2007–08, and federal fisca
Name of district StateRankorder
Enroll-ment, fall
2008
5- to 17-year-old
population,2008
5- to 17-year-olds
in poverty,20081
Povertyrate of
5- to 17-year-olds,
20081
Revenues by source of funds, 2007–08 Revenue for selected federal programs (in thousands), 2007
Total (inthousands)
Federal (inthousands)
Federal asa percent
of total
Federalrevenue
perstudent3
Title Ibasic and
concen-trationgrants
Schoollunch
Vocationaleducation
Drug-freeschools
Eisen-hower
math andscience ed
1 2 3 4 5 6 7 8 9 10 11 12 13 14 15 16
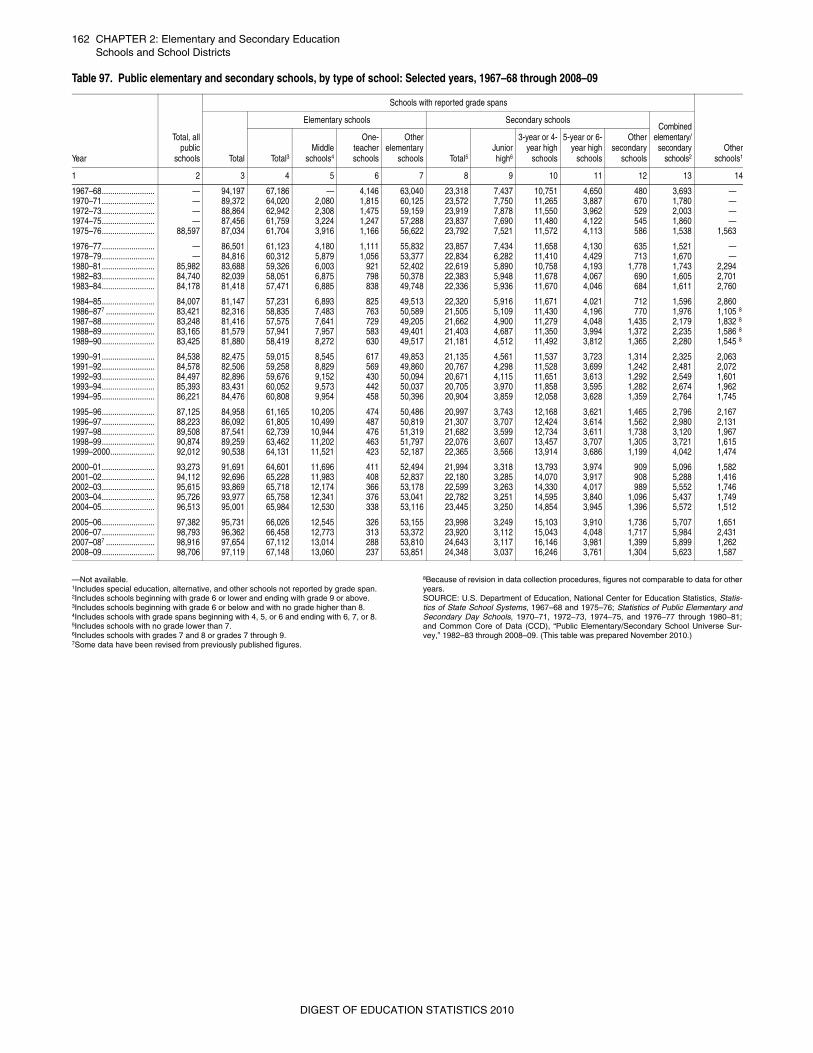
162 CHAPTER 2: Elementary and Secondary EducationSchools and School Districts
—Not available. 1Includes special education, alternative, and other schools not reported by grade span.2Includes schools beginning with grade 6 or lower and ending with grade 9 or above.3Includes schools beginning with grade 6 or below and with no grade higher than 8. 4Includes schools with grade spans beginning with 4, 5, or 6 and ending with 6, 7, or 8.5Includes schools with no grade lower than 7. 6Includes schools with grades 7 and 8 or grades 7 through 9. 7Some data have been revised from previously published figures.
8Because of revision in data collection procedures, figures not comparable to data for otheryears.SOURCE: U.S. Department of Education, National Center for Education Statistics, Statis-tics of State School Systems, 1967–68 and 1975–76; Statistics of Public Elementary andSecondary Day Schools, 1970–71, 1972–73, 1974–75, and 1976–77 through 1980–81;and Common Core of Data (CCD), “Public Elementary/Secondary School Universe Sur-vey,” 1982–83 through 2008–09. (This table was prepared November 2010.)
Table 97. Public elementary and secondary schools, by type of school: Selected years, 1967–68 through 2008–09
Year
Total, allpublic
schools
Schools with reported grade spans
Otherschools1Total
Elementary schools Secondary schoolsCombined
elementary/secondary
schools2Total3Middle
schools4
One-teacherschools
Otherelementary
schools Total5Juniorhigh6
3-year or 4-year high
schools
5-year or 6-year high
schools
Othersecondary
schools
1 2 3 4 5 6 7 8 9 10 11 12 13 14
1967–68......................... — 94,197 67,186 — 4,146 63,040 23,318 7,437 10,751 4,650 480 3,693 —1970–71......................... — 89,372 64,020 2,080 1,815 60,125 23,572 7,750 11,265 3,887 670 1,780 —1972–73......................... — 88,864 62,942 2,308 1,475 59,159 23,919 7,878 11,550 3,962 529 2,003 —1974–75......................... — 87,456 61,759 3,224 1,247 57,288 23,837 7,690 11,480 4,122 545 1,860 —1975–76......................... 88,597 87,034 61,704 3,916 1,166 56,622 23,792 7,521 11,572 4,113 586 1,538 1,563
1976–77......................... — 86,501 61,123 4,180 1,111 55,832 23,857 7,434 11,658 4,130 635 1,521 —1978–79......................... — 84,816 60,312 5,879 1,056 53,377 22,834 6,282 11,410 4,429 713 1,670 —1980–81......................... 85,982 83,688 59,326 6,003 921 52,402 22,619 5,890 10,758 4,193 1,778 1,743 2,2941982–83......................... 84,740 82,039 58,051 6,875 798 50,378 22,383 5,948 11,678 4,067 690 1,605 2,7011983–84......................... 84,178 81,418 57,471 6,885 838 49,748 22,336 5,936 11,670 4,046 684 1,611 2,760
1984–85......................... 84,007 81,147 57,231 6,893 825 49,513 22,320 5,916 11,671 4,021 712 1,596 2,8601986–877 ....................... 83,421 82,316 58,835 7,483 763 50,589 21,505 5,109 11,430 4,196 770 1,976 1,105 8
1987–88......................... 83,248 81,416 57,575 7,641 729 49,205 21,662 4,900 11,279 4,048 1,435 2,179 1,832 8
1988–89......................... 83,165 81,579 57,941 7,957 583 49,401 21,403 4,687 11,350 3,994 1,372 2,235 1,586 8
1989–90......................... 83,425 81,880 58,419 8,272 630 49,517 21,181 4,512 11,492 3,812 1,365 2,280 1,545 8
1990–91......................... 84,538 82,475 59,015 8,545 617 49,853 21,135 4,561 11,537 3,723 1,314 2,325 2,0631991–92......................... 84,578 82,506 59,258 8,829 569 49,860 20,767 4,298 11,528 3,699 1,242 2,481 2,0721992–93......................... 84,497 82,896 59,676 9,152 430 50,094 20,671 4,115 11,651 3,613 1,292 2,549 1,6011993–94......................... 85,393 83,431 60,052 9,573 442 50,037 20,705 3,970 11,858 3,595 1,282 2,674 1,9621994–95......................... 86,221 84,476 60,808 9,954 458 50,396 20,904 3,859 12,058 3,628 1,359 2,764 1,745
1995–96......................... 87,125 84,958 61,165 10,205 474 50,486 20,997 3,743 12,168 3,621 1,465 2,796 2,1671996–97......................... 88,223 86,092 61,805 10,499 487 50,819 21,307 3,707 12,424 3,614 1,562 2,980 2,1311997–98......................... 89,508 87,541 62,739 10,944 476 51,319 21,682 3,599 12,734 3,611 1,738 3,120 1,9671998–99......................... 90,874 89,259 63,462 11,202 463 51,797 22,076 3,607 13,457 3,707 1,305 3,721 1,6151999–2000..................... 92,012 90,538 64,131 11,521 423 52,187 22,365 3,566 13,914 3,686 1,199 4,042 1,474
2000–01......................... 93,273 91,691 64,601 11,696 411 52,494 21,994 3,318 13,793 3,974 909 5,096 1,5822001–02......................... 94,112 92,696 65,228 11,983 408 52,837 22,180 3,285 14,070 3,917 908 5,288 1,4162002–03......................... 95,615 93,869 65,718 12,174 366 53,178 22,599 3,263 14,330 4,017 989 5,552 1,7462003–04......................... 95,726 93,977 65,758 12,341 376 53,041 22,782 3,251 14,595 3,840 1,096 5,437 1,7492004–05......................... 96,513 95,001 65,984 12,530 338 53,116 23,445 3,250 14,854 3,945 1,396 5,572 1,512
2005–06......................... 97,382 95,731 66,026 12,545 326 53,155 23,998 3,249 15,103 3,910 1,736 5,707 1,6512006–07......................... 98,793 96,362 66,458 12,773 313 53,372 23,920 3,112 15,043 4,048 1,717 5,984 2,4312007–087 ....................... 98,916 97,654 67,112 13,014 288 53,810 24,643 3,117 16,146 3,981 1,399 5,899 1,2622008–09......................... 98,706 97,119 67,148 13,060 237 53,851 24,348 3,037 16,246 3,761 1,304 5,623 1,587
DIGEST OF EDUCATION STATISTICS 2010
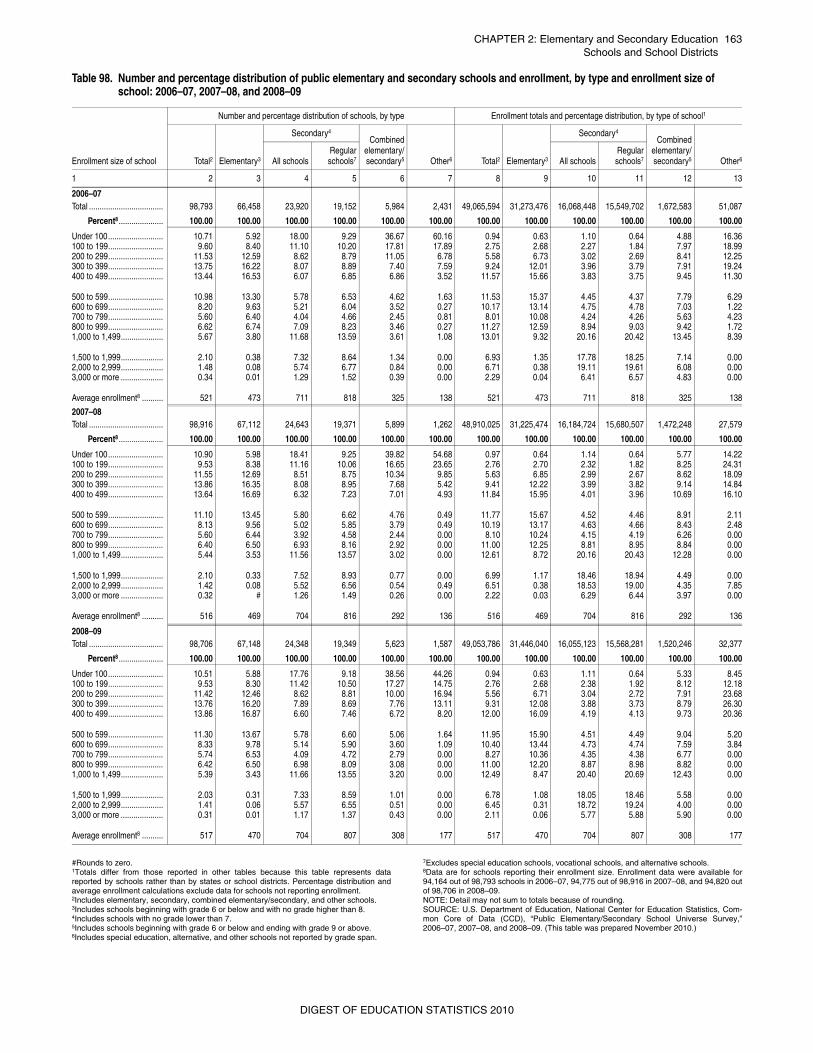
CHAPTER 2: Elementary and Secondary Education 163Schools and School Districts
#Rounds to zero.1Totals differ from those reported in other tables because this table represents datareported by schools rather than by states or school districts. Percentage distribution andaverage enrollment calculations exclude data for schools not reporting enrollment.2Includes elementary, secondary, combined elementary/secondary, and other schools.3Includes schools beginning with grade 6 or below and with no grade higher than 8. 4Includes schools with no grade lower than 7. 5Includes schools beginning with grade 6 or below and ending with grade 9 or above. 6Includes special education, alternative, and other schools not reported by grade span.
7Excludes special education schools, vocational schools, and alternative schools.8Data are for schools reporting their enrollment size. Enrollment data were available for94,164 out of 98,793 schools in 2006–07, 94,775 out of 98,916 in 2007–08, and 94,820 outof 98,706 in 2008–09. NOTE: Detail may not sum to totals because of rounding. SOURCE: U.S. Department of Education, National Center for Education Statistics, Com-mon Core of Data (CCD), “Public Elementary/Secondary School Universe Survey,”2006–07, 2007–08, and 2008–09. (This table was prepared November 2010.)
Table 98. Number and percentage distribution of public elementary and secondary schools and enrollment, by type and enrollment size of school: 2006–07, 2007–08, and 2008–09
Enrollment size of school
Number and percentage distribution of schools, by type Enrollment totals and percentage distribution, by type of school1
Total2 Elementary3
Secondary4
Combinedelementary/secondary5 Other6 Total2 Elementary3
Secondary4
Combinedelementary/secondary5 Other6All schools
Regularschools7 All schools
Regularschools7
1 2 3 4 5 6 7 8 9 10 11 12 13
2006–07Total ................................... 98,793 66,458 23,920 19,152 5,984 2,431 49,065,594 31,273,476 16,068,448 15,549,702 1,672,583 51,087
Percent8 ..................... 100.00 100.00 100.00 100.00 100.00 100.00 100.00 100.00 100.00 100.00 100.00 100.00
Under 100.......................... 10.71 5.92 18.00 9.29 36.67 60.16 0.94 0.63 1.10 0.64 4.88 16.36100 to 199.......................... 9.60 8.40 11.10 10.20 17.81 17.89 2.75 2.68 2.27 1.84 7.97 18.99200 to 299.......................... 11.53 12.59 8.62 8.79 11.05 6.78 5.58 6.73 3.02 2.69 8.41 12.25300 to 399.......................... 13.75 16.22 8.07 8.89 7.40 7.59 9.24 12.01 3.96 3.79 7.91 19.24400 to 499.......................... 13.44 16.53 6.07 6.85 6.86 3.52 11.57 15.66 3.83 3.75 9.45 11.30
500 to 599.......................... 10.98 13.30 5.78 6.53 4.62 1.63 11.53 15.37 4.45 4.37 7.79 6.29600 to 699.......................... 8.20 9.63 5.21 6.04 3.52 0.27 10.17 13.14 4.75 4.78 7.03 1.22700 to 799.......................... 5.60 6.40 4.04 4.66 2.45 0.81 8.01 10.08 4.24 4.26 5.63 4.23800 to 999.......................... 6.62 6.74 7.09 8.23 3.46 0.27 11.27 12.59 8.94 9.03 9.42 1.721,000 to 1,499.................... 5.67 3.80 11.68 13.59 3.61 1.08 13.01 9.32 20.16 20.42 13.45 8.39
1,500 to 1,999.................... 2.10 0.38 7.32 8.64 1.34 0.00 6.93 1.35 17.78 18.25 7.14 0.002,000 to 2,999.................... 1.48 0.08 5.74 6.77 0.84 0.00 6.71 0.38 19.11 19.61 6.08 0.003,000 or more .................... 0.34 0.01 1.29 1.52 0.39 0.00 2.29 0.04 6.41 6.57 4.83 0.00
Average enrollment8 .......... 521 473 711 818 325 138 521 473 711 818 325 138
2007–08Total ................................... 98,916 67,112 24,643 19,371 5,899 1,262 48,910,025 31,225,474 16,184,724 15,680,507 1,472,248 27,579
Percent8 ..................... 100.00 100.00 100.00 100.00 100.00 100.00 100.00 100.00 100.00 100.00 100.00 100.00
Under 100.......................... 10.90 5.98 18.41 9.25 39.82 54.68 0.97 0.64 1.14 0.64 5.77 14.22100 to 199.......................... 9.53 8.38 11.16 10.06 16.65 23.65 2.76 2.70 2.32 1.82 8.25 24.31200 to 299.......................... 11.55 12.69 8.51 8.75 10.34 9.85 5.63 6.85 2.99 2.67 8.62 18.09300 to 399.......................... 13.86 16.35 8.08 8.95 7.68 5.42 9.41 12.22 3.99 3.82 9.14 14.84400 to 499.......................... 13.64 16.69 6.32 7.23 7.01 4.93 11.84 15.95 4.01 3.96 10.69 16.10
500 to 599.......................... 11.10 13.45 5.80 6.62 4.76 0.49 11.77 15.67 4.52 4.46 8.91 2.11600 to 699.......................... 8.13 9.56 5.02 5.85 3.79 0.49 10.19 13.17 4.63 4.66 8.43 2.48700 to 799.......................... 5.60 6.44 3.92 4.58 2.44 0.00 8.10 10.24 4.15 4.19 6.26 0.00800 to 999.......................... 6.40 6.50 6.93 8.16 2.92 0.00 11.00 12.25 8.81 8.95 8.84 0.001,000 to 1,499.................... 5.44 3.53 11.56 13.57 3.02 0.00 12.61 8.72 20.16 20.43 12.28 0.00
1,500 to 1,999.................... 2.10 0.33 7.52 8.93 0.77 0.00 6.99 1.17 18.46 18.94 4.49 0.002,000 to 2,999.................... 1.42 0.08 5.52 6.56 0.54 0.49 6.51 0.38 18.53 19.00 4.35 7.853,000 or more .................... 0.32 # 1.26 1.49 0.26 0.00 2.22 0.03 6.29 6.44 3.97 0.00
Average enrollment8 .......... 516 469 704 816 292 136 516 469 704 816 292 136
2008–09Total ................................... 98,706 67,148 24,348 19,349 5,623 1,587 49,053,786 31,446,040 16,055,123 15,568,281 1,520,246 32,377
Percent8 ..................... 100.00 100.00 100.00 100.00 100.00 100.00 100.00 100.00 100.00 100.00 100.00 100.00
Under 100.......................... 10.51 5.88 17.76 9.18 38.56 44.26 0.94 0.63 1.11 0.64 5.33 8.45100 to 199.......................... 9.53 8.30 11.42 10.50 17.27 14.75 2.76 2.68 2.38 1.92 8.12 12.18200 to 299.......................... 11.42 12.46 8.62 8.81 10.00 16.94 5.56 6.71 3.04 2.72 7.91 23.68300 to 399.......................... 13.76 16.20 7.89 8.69 7.76 13.11 9.31 12.08 3.88 3.73 8.79 26.30400 to 499.......................... 13.86 16.87 6.60 7.46 6.72 8.20 12.00 16.09 4.19 4.13 9.73 20.36
500 to 599.......................... 11.30 13.67 5.78 6.60 5.06 1.64 11.95 15.90 4.51 4.49 9.04 5.20600 to 699.......................... 8.33 9.78 5.14 5.90 3.60 1.09 10.40 13.44 4.73 4.74 7.59 3.84700 to 799.......................... 5.74 6.53 4.09 4.72 2.79 0.00 8.27 10.36 4.35 4.38 6.77 0.00800 to 999.......................... 6.42 6.50 6.98 8.09 3.08 0.00 11.00 12.20 8.87 8.98 8.82 0.001,000 to 1,499.................... 5.39 3.43 11.66 13.55 3.20 0.00 12.49 8.47 20.40 20.69 12.43 0.00
1,500 to 1,999.................... 2.03 0.31 7.33 8.59 1.01 0.00 6.78 1.08 18.05 18.46 5.58 0.002,000 to 2,999.................... 1.41 0.06 5.57 6.55 0.51 0.00 6.45 0.31 18.72 19.24 4.00 0.003,000 or more .................... 0.31 0.01 1.17 1.37 0.43 0.00 2.11 0.06 5.77 5.88 5.90 0.00
Average enrollment8 .......... 517 470 704 807 308 177 517 470 704 807 308 177
DIGEST OF EDUCATION STATISTICS 2010
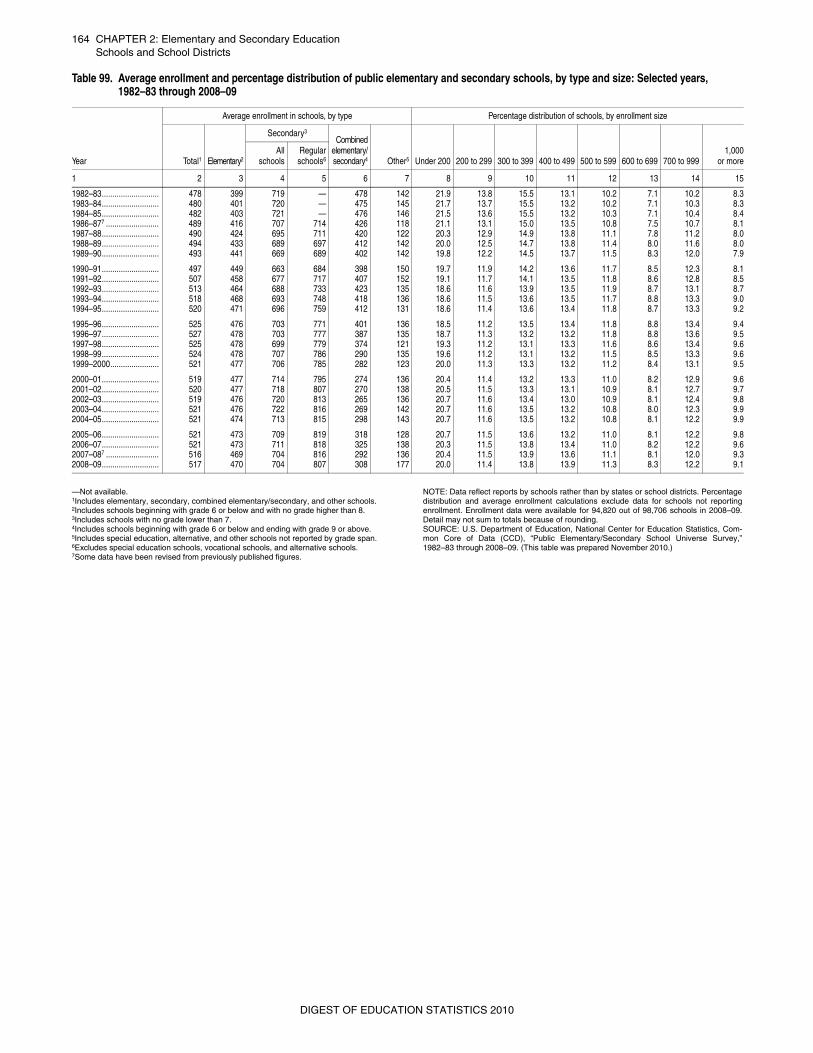
164 CHAPTER 2: Elementary and Secondary EducationSchools and School Districts
—Not available. 1Includes elementary, secondary, combined elementary/secondary, and other schools.2Includes schools beginning with grade 6 or below and with no grade higher than 8. 3Includes schools with no grade lower than 7. 4Includes schools beginning with grade 6 or below and ending with grade 9 or above.5Includes special education, alternative, and other schools not reported by grade span.6Excludes special education schools, vocational schools, and alternative schools.7Some data have been revised from previously published figures.
NOTE: Data reflect reports by schools rather than by states or school districts. Percentagedistribution and average enrollment calculations exclude data for schools not reportingenrollment. Enrollment data were available for 94,820 out of 98,706 schools in 2008–09.Detail may not sum to totals because of rounding. SOURCE: U.S. Department of Education, National Center for Education Statistics, Com-mon Core of Data (CCD), “Public Elementary/Secondary School Universe Survey,”1982–83 through 2008–09. (This table was prepared November 2010.)
Table 99. Average enrollment and percentage distribution of public elementary and secondary schools, by type and size: Selected years, 1982–83 through 2008–09
Year
Average enrollment in schools, by type Percentage distribution of schools, by enrollment size
Total1 Elementary2
Secondary3
Combinedelementary/secondary4 Other5 Under 200 200 to 299 300 to 399 400 to 499 500 to 599 600 to 699 700 to 999
1,000or more
Allschools
Regularschools6
1 2 3 4 5 6 7 8 9 10 11 12 13 14 15
1982–83........................... 478 399 719 — 478 142 21.9 13.8 15.5 13.1 10.2 7.1 10.2 8.31983–84........................... 480 401 720 — 475 145 21.7 13.7 15.5 13.2 10.2 7.1 10.3 8.31984–85........................... 482 403 721 — 476 146 21.5 13.6 15.5 13.2 10.3 7.1 10.4 8.41986–877 ......................... 489 416 707 714 426 118 21.1 13.1 15.0 13.5 10.8 7.5 10.7 8.11987–88........................... 490 424 695 711 420 122 20.3 12.9 14.9 13.8 11.1 7.8 11.2 8.01988–89........................... 494 433 689 697 412 142 20.0 12.5 14.7 13.8 11.4 8.0 11.6 8.01989–90........................... 493 441 669 689 402 142 19.8 12.2 14.5 13.7 11.5 8.3 12.0 7.9
1990–91........................... 497 449 663 684 398 150 19.7 11.9 14.2 13.6 11.7 8.5 12.3 8.11991–92........................... 507 458 677 717 407 152 19.1 11.7 14.1 13.5 11.8 8.6 12.8 8.51992–93........................... 513 464 688 733 423 135 18.6 11.6 13.9 13.5 11.9 8.7 13.1 8.71993–94........................... 518 468 693 748 418 136 18.6 11.5 13.6 13.5 11.7 8.8 13.3 9.01994–95........................... 520 471 696 759 412 131 18.6 11.4 13.6 13.4 11.8 8.7 13.3 9.2
1995–96........................... 525 476 703 771 401 136 18.5 11.2 13.5 13.4 11.8 8.8 13.4 9.41996–97........................... 527 478 703 777 387 135 18.7 11.3 13.2 13.2 11.8 8.8 13.6 9.51997–98........................... 525 478 699 779 374 121 19.3 11.2 13.1 13.3 11.6 8.6 13.4 9.61998–99........................... 524 478 707 786 290 135 19.6 11.2 13.1 13.2 11.5 8.5 13.3 9.61999–2000....................... 521 477 706 785 282 123 20.0 11.3 13.3 13.2 11.2 8.4 13.1 9.5
2000–01........................... 519 477 714 795 274 136 20.4 11.4 13.2 13.3 11.0 8.2 12.9 9.62001–02........................... 520 477 718 807 270 138 20.5 11.5 13.3 13.1 10.9 8.1 12.7 9.72002–03........................... 519 476 720 813 265 136 20.7 11.6 13.4 13.0 10.9 8.1 12.4 9.82003–04........................... 521 476 722 816 269 142 20.7 11.6 13.5 13.2 10.8 8.0 12.3 9.92004–05........................... 521 474 713 815 298 143 20.7 11.6 13.5 13.2 10.8 8.1 12.2 9.9
2005–06........................... 521 473 709 819 318 128 20.7 11.5 13.6 13.2 11.0 8.1 12.2 9.82006–07........................... 521 473 711 818 325 138 20.3 11.5 13.8 13.4 11.0 8.2 12.2 9.62007–087 ......................... 516 469 704 816 292 136 20.4 11.5 13.9 13.6 11.1 8.1 12.0 9.32008–09........................... 517 470 704 807 308 177 20.0 11.4 13.8 13.9 11.3 8.3 12.2 9.1
DIGEST OF EDUCATION STATISTICS 2010