Embed Size (px)
Citation preview
ELEctromagnetic DIAgnostics Research Center ELEDIA@UniTN (University of Trento) Via Sommarive 9, 38123 Trento, Italy
E-mail: [email protected] Web: www.eledia.org
IC1301 WIPE Cost Action – 2016 International Spring School April 18-20, 2016 – Bologna, Italy
EM Positioning for IoT Fundamentals and Advances
Federico Viani, Alessandro Polo, Andrea Massa

Copyright Notice
Tutti i diritti relativi ai contenuti del presente documento sono riservati. È vietato qualsiasi utilizzo, totale o parziale, dei contenuti inseriti nel presente documento, ivi
inclusa la memorizzazione, riproduzione, rielaborazione, diffusione o distribuzione dei contenuti stessi mediante qualunque piattaforma tecnologica, supporto o rete
telematica, senza previa autorizzazione scritta da parte dell’autore.
All rights to the content of this document are reserved. Any use, in whole or in part, of the contents included in this document, including the storage, reproduction, editing,
dissemination or distribution of their content through any technology platform, support, or computer network is forbidden without the prior written permission from
the author.
Outline
• EM Positioning for IoT – Intro and Motivation
• Active Localization of Mobile Devices
• Localization through optimization
• Semantic-based probabilistic approach
• Passive Localization of Transceiver-free Targets
• Target tracking
• Crowd detection
• Indirect occupancy estimation
• Conclusions and Actual Trends
© 2016 - ELEDIA Research Center 3
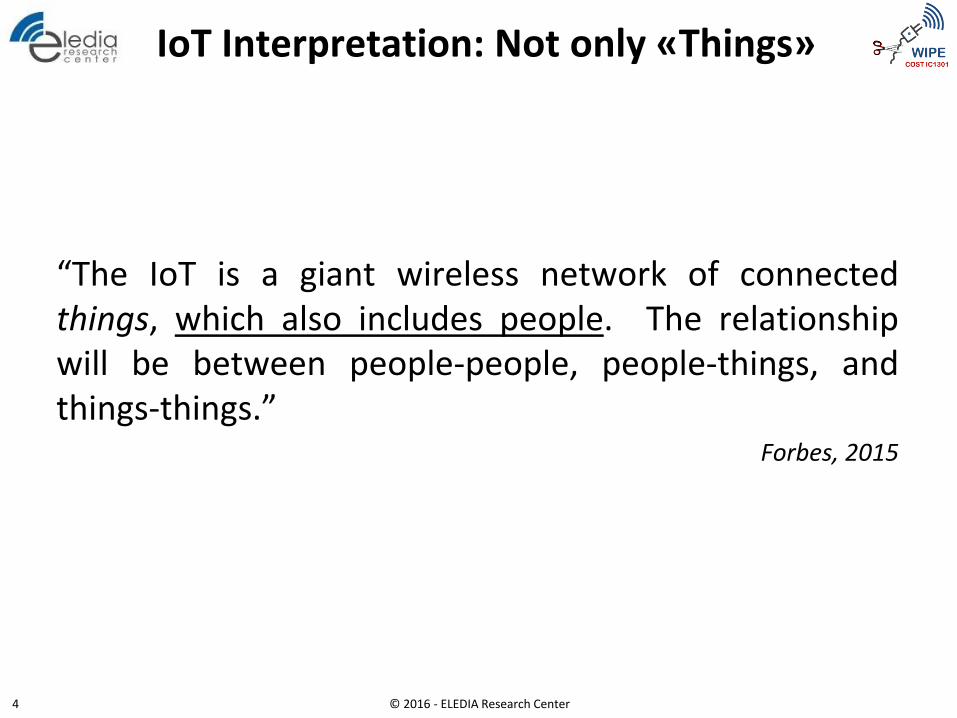
IoT Interpretation: Not only «Things»
“The IoT is a giant wireless network of connected things, which also includes people. The relationship will be between people-people, people-things, and things-things.”
Forbes, 2015
© 2016 - ELEDIA Research Center 4
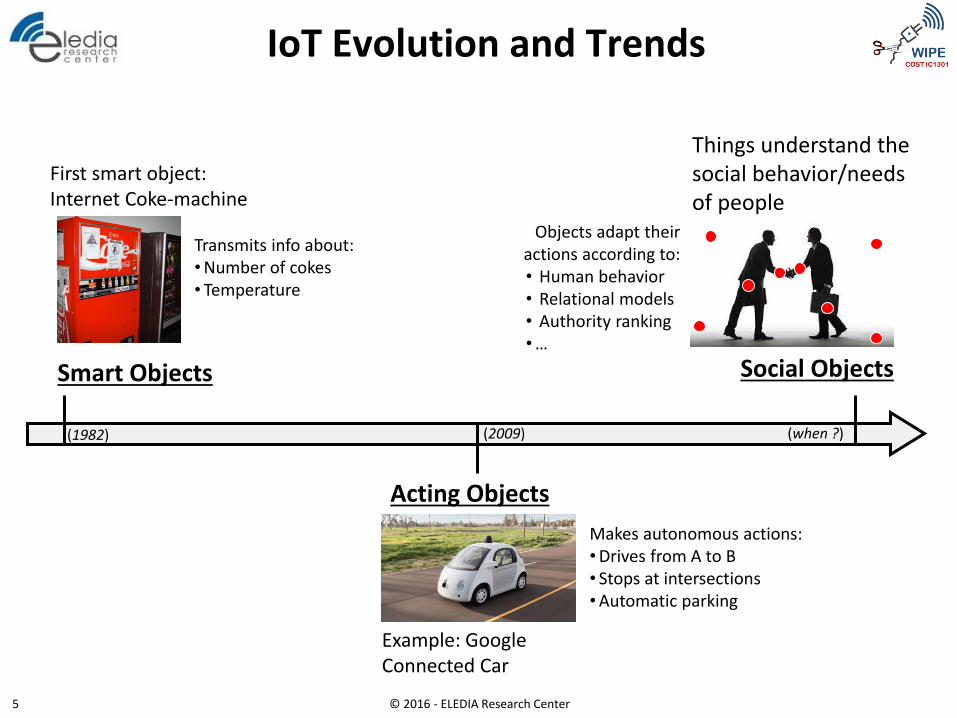
IoT Evolution and Trends
© 2016 - ELEDIA Research Center 5
Smart Objects
Acting Objects
Social Objects
First smart object: Internet Coke-machine
Example: Google Connected Car
Transmits info about: •Number of cokes • Temperature
Makes autonomous actions: •Drives from A to B • Stops at intersections •Automatic parking
Things understand the social behavior/needs of people
Objects adapt their actions according to: • Human behavior • Relational models • Authority ranking •…
(1982) (when ?) (2009)

IoT Evolution and Trends
© 2016 - ELEDIA Research Center 6
Smart Objects
Acting Objects
Social Objects
Transmits info about: •Number of cokes • Temperature
Makes autonomous actions: •Drives from A to B • Stops at intersections •Automatic parking
Things understand the social behavior/needs of people
Objects adapt their actions according to: • Human behavior • Relational models • Authority ranking •…
(1982) (when ?) (2009)
The Objects-People Relations are more and more
fundamental! WHAT CHALLENGES?
First smart object: Internet Coke-machine
Example: Google Connected Car
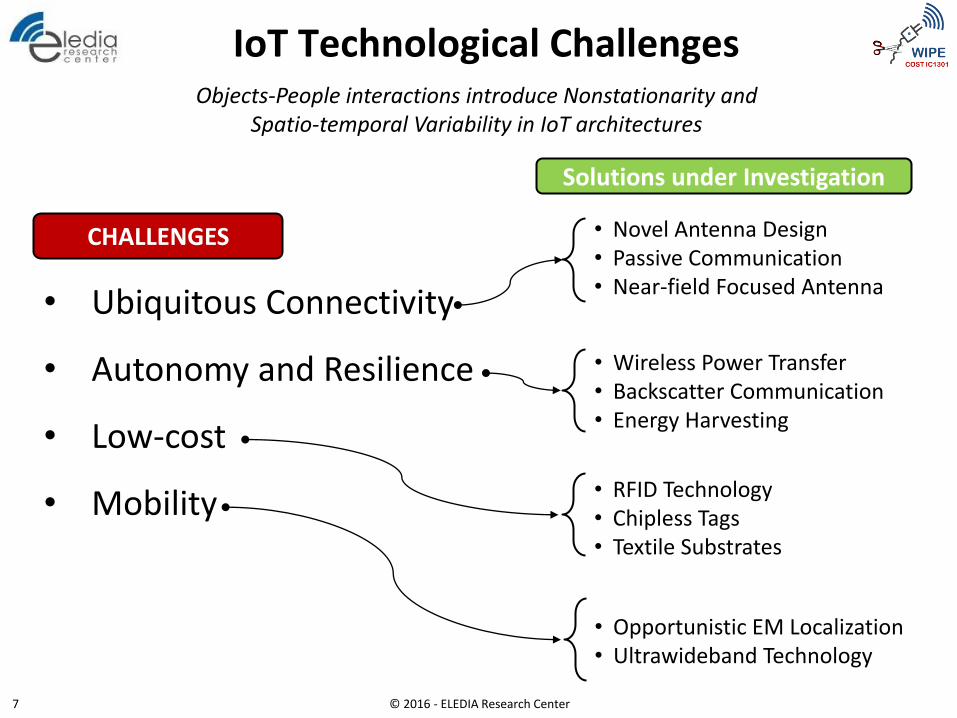
IoT Technological Challenges
© 2016 - ELEDIA Research Center 7
• Ubiquitous Connectivity
• Autonomy and Resilience
• Low-cost
• Mobility
• Novel Antenna Design • Passive Communication • Near-field Focused Antenna
• Wireless Power Transfer • Backscatter Communication • Energy Harvesting
• RFID Technology • Chipless Tags • Textile Substrates
• Opportunistic EM Localization • Ultrawideband Technology
Objects-People interactions introduce Nonstationarity and Spatio-temporal Variability in IoT architectures
CHALLENGES
Solutions under Investigation
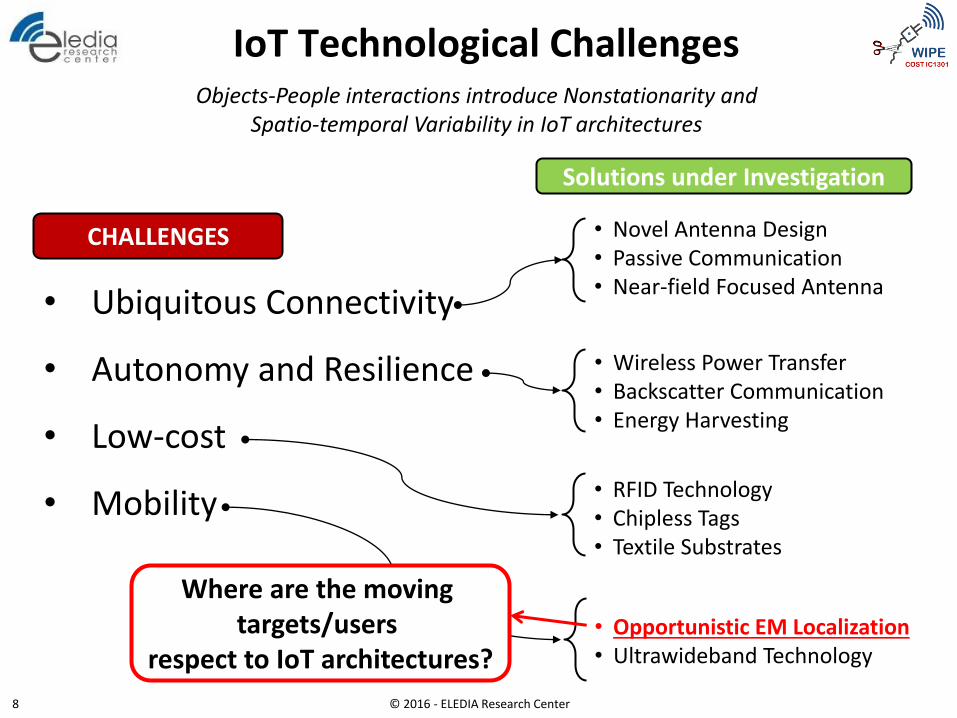
IoT Technological Challenges
© 2016 - ELEDIA Research Center 8
• Ubiquitous Connectivity
• Autonomy and Resilience
• Low-cost
• Mobility
• Novel Antenna Design • Passive Communication • Near-field Focused Antenna
• Wireless Power Transfer • Backscatter Communication • Energy Harvesting
• RFID Technology • Chipless Tags • Textile Substrates
• Opportunistic EM Localization • Ultrawideband Technology
CHALLENGES
Solutions under Investigation
Where are the moving targets/users
respect to IoT architectures?
Objects-People interactions introduce Nonstationarity and Spatio-temporal Variability in IoT architectures
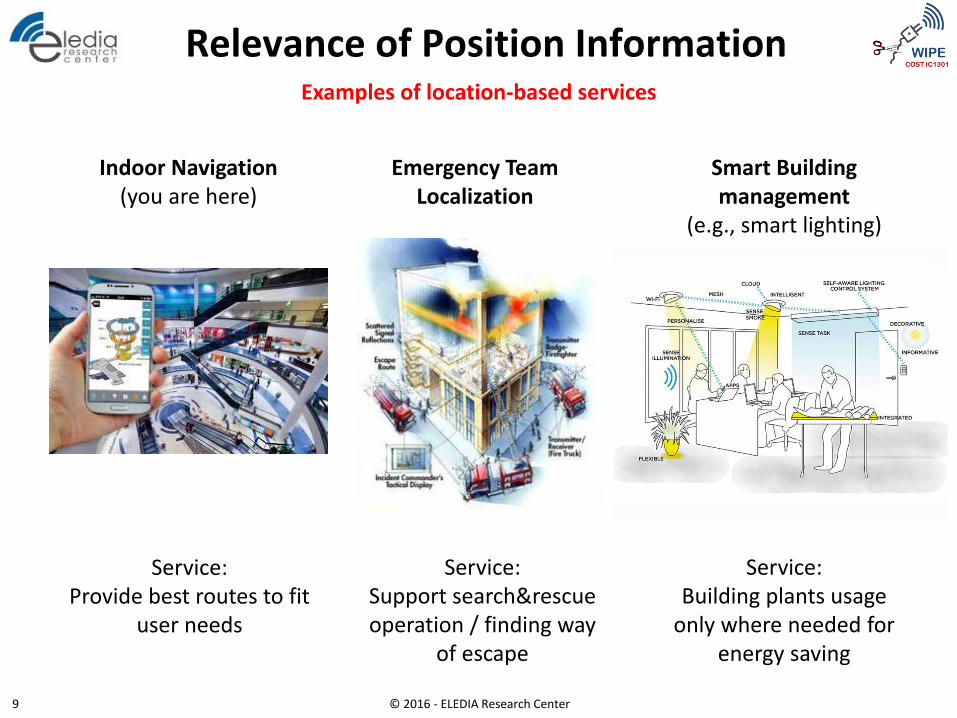
Relevance of Position Information
© 2016 - ELEDIA Research Center 9
Examples of location-based services
Indoor Navigation (you are here)
Emergency Team Localization
Smart Building management
(e.g., smart lighting)
Service: Provide best routes to fit
user needs
Service: Support search&rescue operation / finding way
of escape
Service: Building plants usage
only where needed for energy saving
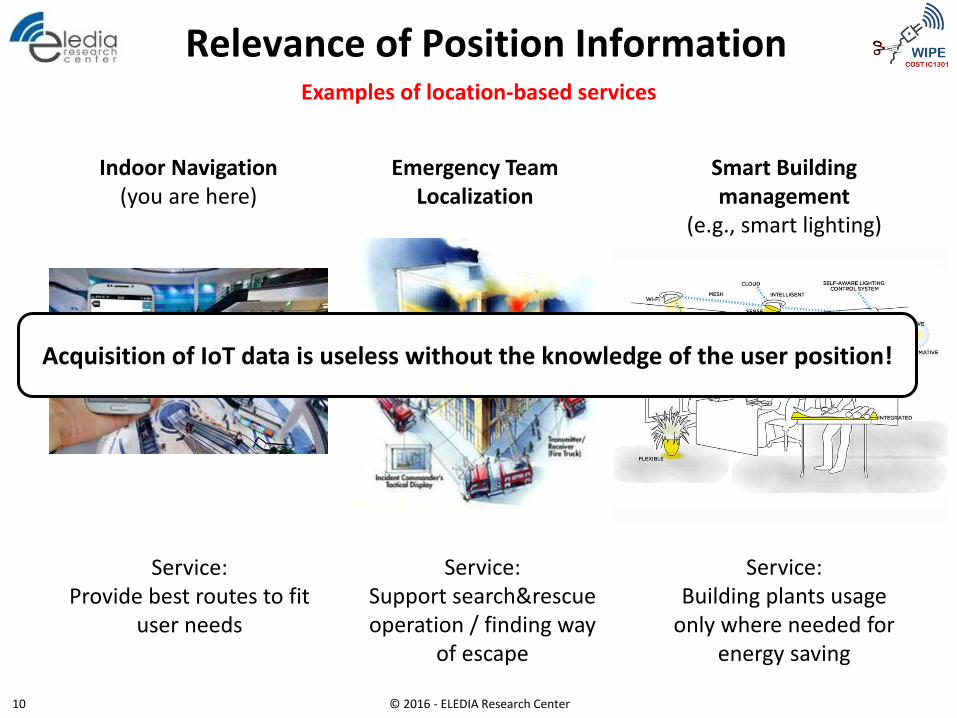
Relevance of Position Information
© 2016 - ELEDIA Research Center 10
Examples of location-based services
Indoor Navigation (you are here)
Emergency Team Localization
Smart Building management
(e.g., smart lighting)
Service: Provide best routes to fit
user needs
Service: Support search&rescue operation / finding way
of escape
Service: Building plants usage
only where needed for energy saving
Acquisition of IoT data is useless without the knowledge of the user position!
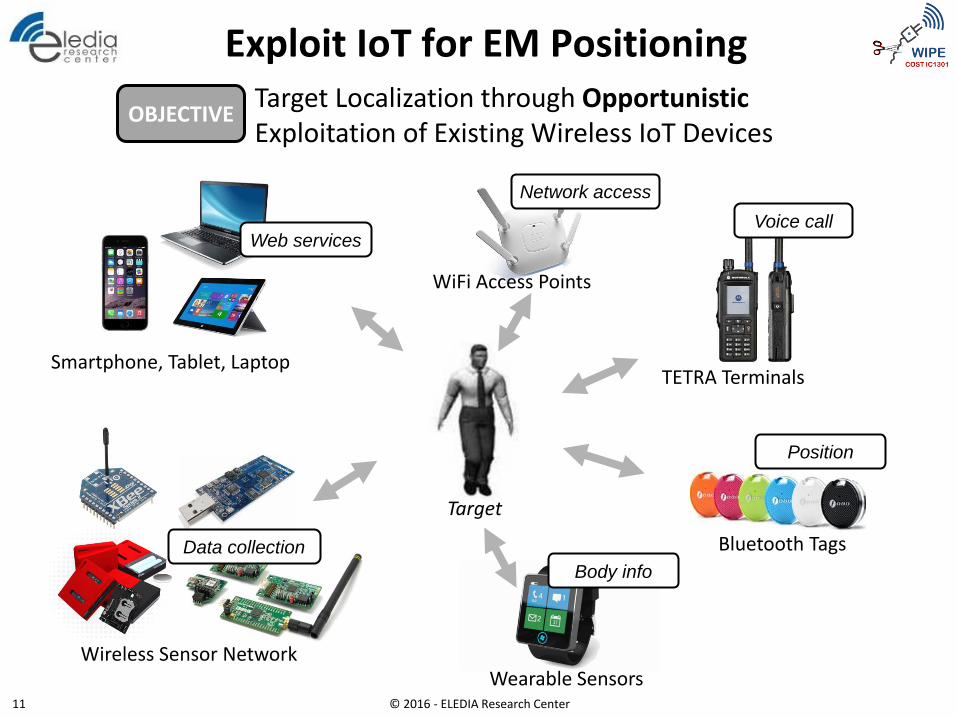
Exploit IoT for EM Positioning
© 2016 - ELEDIA Research Center 11
Smartphone, Tablet, Laptop
Wearable Sensors Wireless Sensor Network
WiFi Access Points
TETRA Terminals
Bluetooth Tags
Voice call
Network access
Web services
Body info
Data collection
Position
OBJECTIVE Target Localization through Opportunistic Exploitation of Existing Wireless IoT Devices
Target
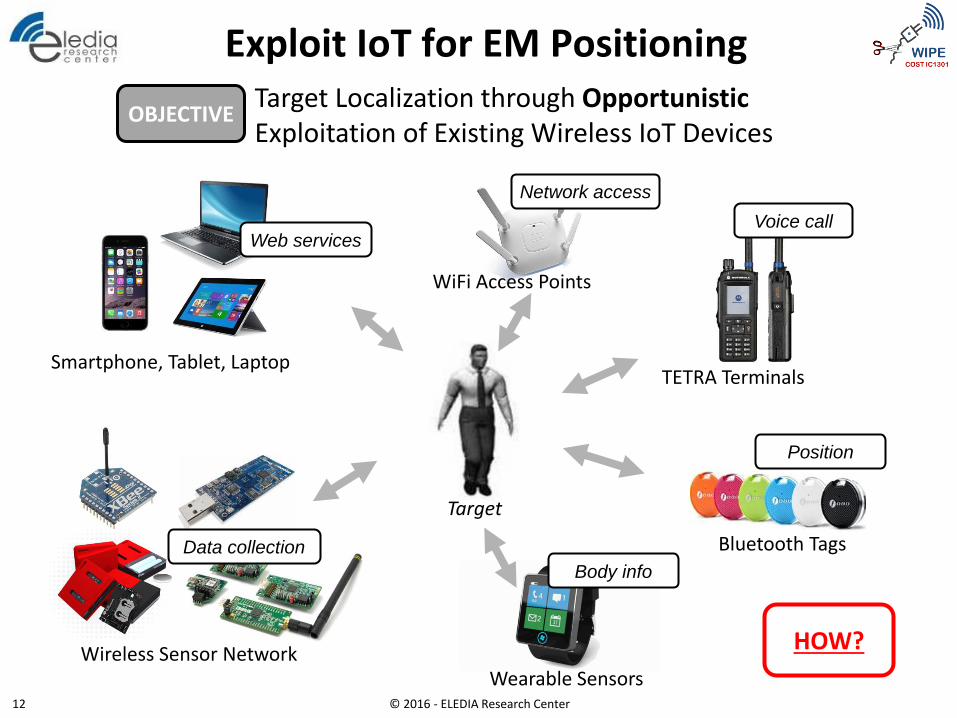
Exploit IoT for EM Positioning
© 2016 - ELEDIA Research Center 12
Smartphone, Tablet, Laptop
Wearable Sensors Wireless Sensor Network
WiFi Access Points
TETRA Terminals
Bluetooth Tags
Voice call
Network access
Web services
Body info
Data collection
Position
OBJECTIVE Target Localization through Opportunistic Exploitation of Existing Wireless IoT Devices
Target
HOW?
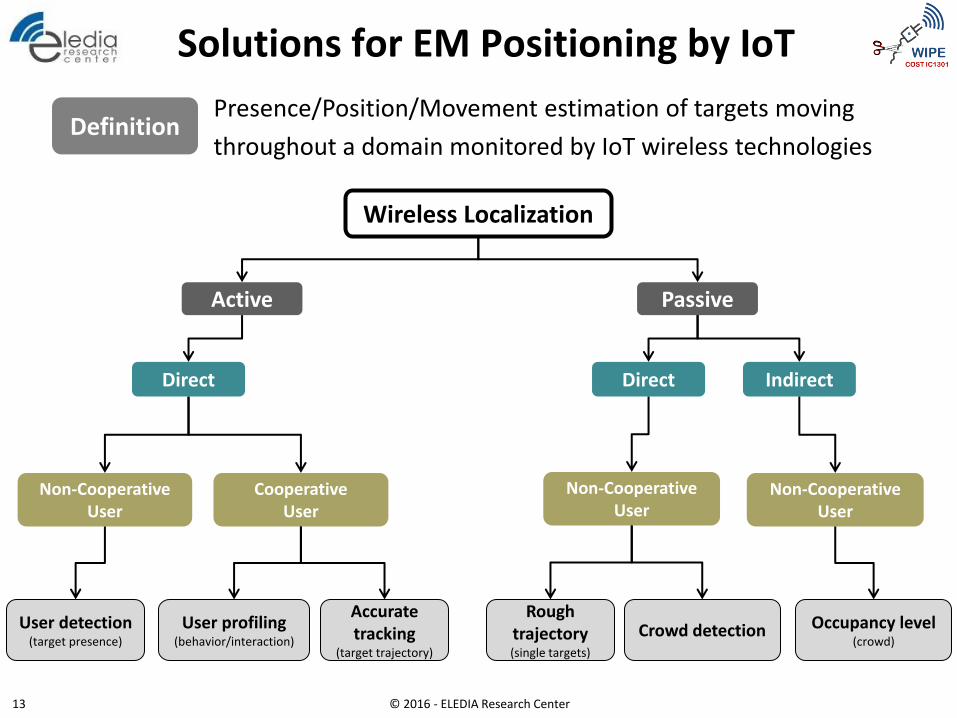
Solutions for EM Positioning by IoT
Wireless Localization
Non-Cooperative User
Occupancy level (crowd)
Cooperative User
Non-Cooperative User
Passive Active
Direct Direct Indirect
Non-Cooperative User
Rough trajectory (single targets)
Crowd detection User profiling (behavior/interaction)
Accurate tracking
(target trajectory)
User detection (target presence)
Definition Presence/Position/Movement estimation of targets moving
throughout a domain monitored by IoT wireless technologies
© 2016 - ELEDIA Research Center 13
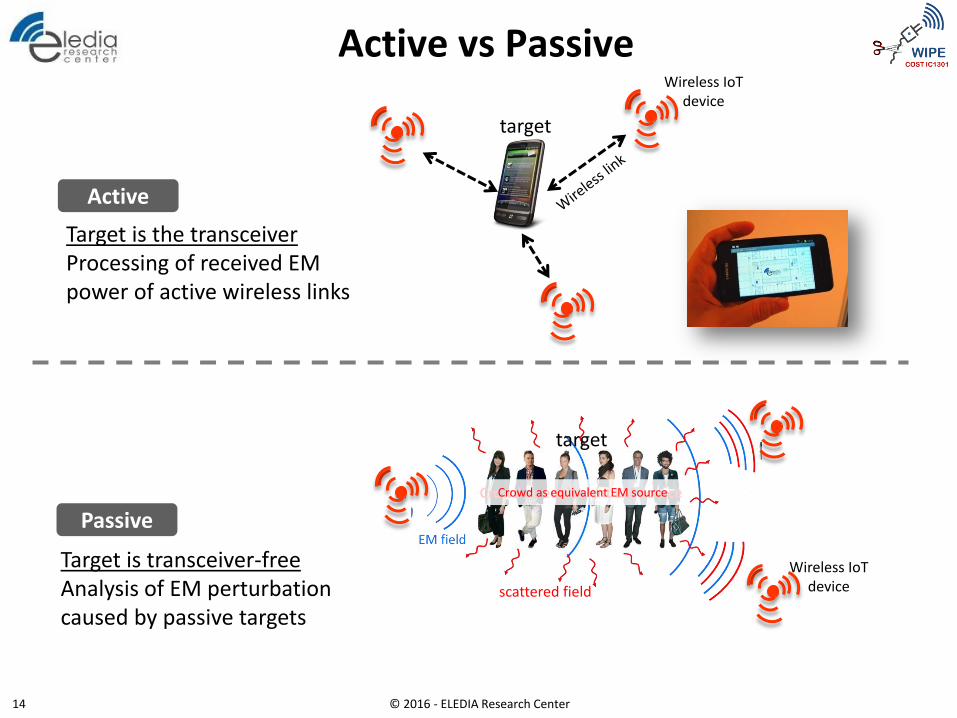
Active vs Passive
Passive
Active
Target is transceiver-free Analysis of EM perturbation caused by passive targets
Target is the transceiver Processing of received EM power of active wireless links
Wireless IoT device
Crowd as equivalent EM source
scattered field
Wireless IoT device
© 2016 - ELEDIA Research Center 14
target
target
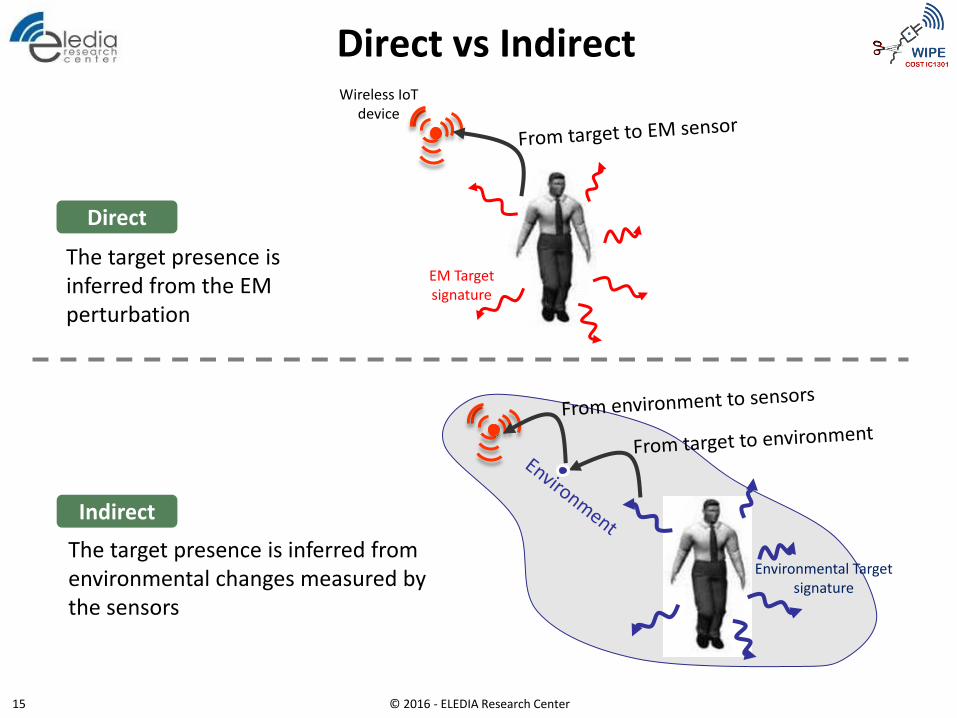
Direct vs Indirect
Direct
Indirect
The target presence is inferred from the EM perturbation
The target presence is inferred from environmental changes measured by the sensors
EM Target signature
Environmental Target signature
© 2016 - ELEDIA Research Center 15
Wireless IoT device
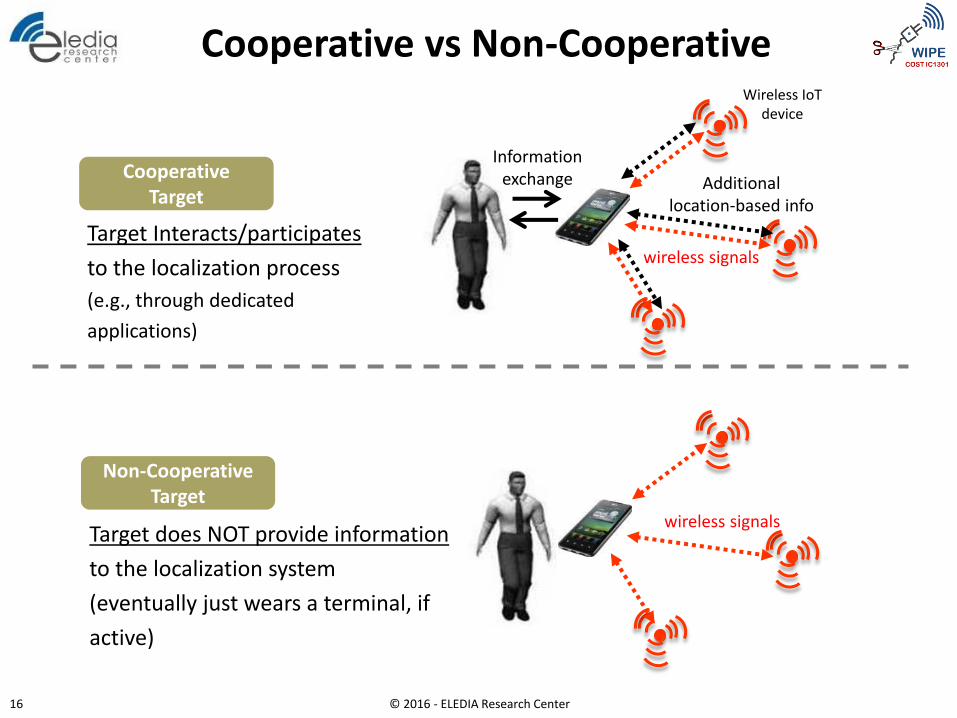
Target Interacts/participates
to the localization process
(e.g., through dedicated
applications)
Target does NOT provide information
to the localization system
(eventually just wears a terminal, if
active)
Cooperative Target
Non-Cooperative Target
Information exchange Additional
location-based info
wireless signals
wireless signals
Cooperative vs Non-Cooperative
© 2016 - ELEDIA Research Center 16
Wireless IoT device
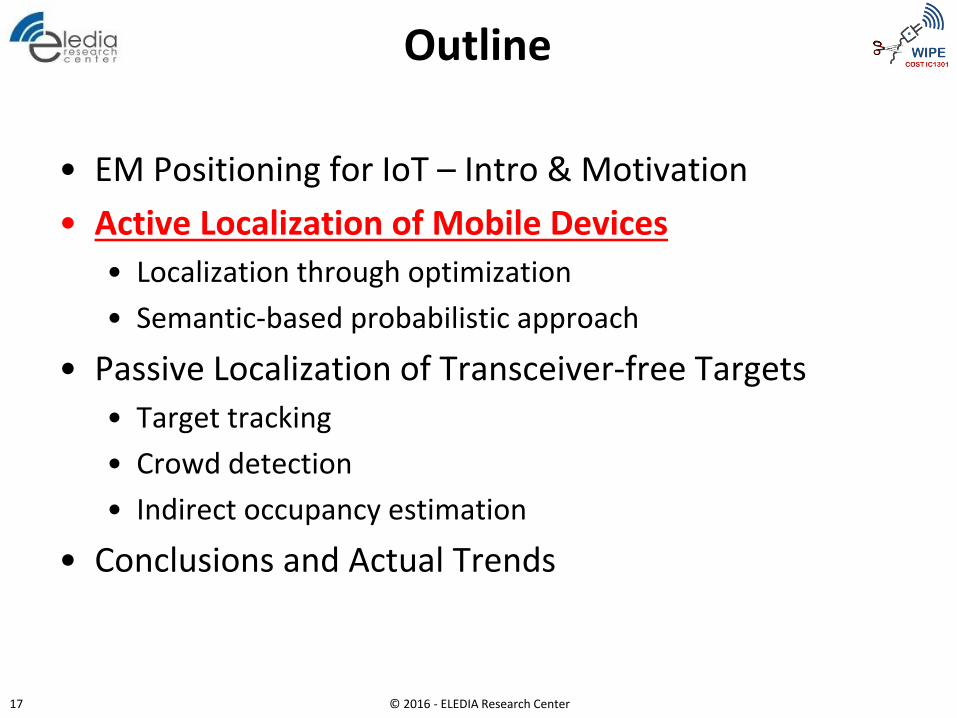
Outline
• EM Positioning for IoT – Intro & Motivation
• Active Localization of Mobile Devices
• Localization through optimization
• Semantic-based probabilistic approach
• Passive Localization of Transceiver-free Targets
• Target tracking
• Crowd detection
• Indirect occupancy estimation
• Conclusions and Actual Trends
© 2016 - ELEDIA Research Center 17
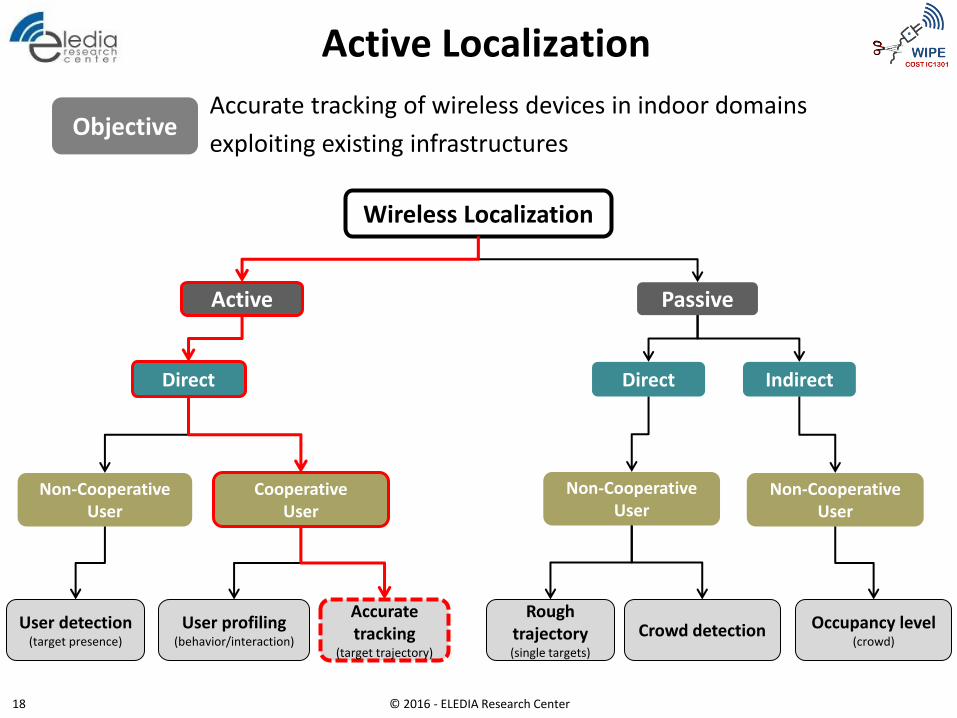
Active Localization
Wireless Localization
Non-Cooperative User
Occupancy level (crowd)
Non-Cooperative User
Passive
Direct Indirect
Non-Cooperative User
Rough trajectory (single targets)
Crowd detection User profiling (behavior/interaction)
User detection (target presence)
Objective Accurate tracking of wireless devices in indoor domains
exploiting existing infrastructures
Cooperative User
Active
Direct
Accurate tracking
(target trajectory)
© 2016 - ELEDIA Research Center 18
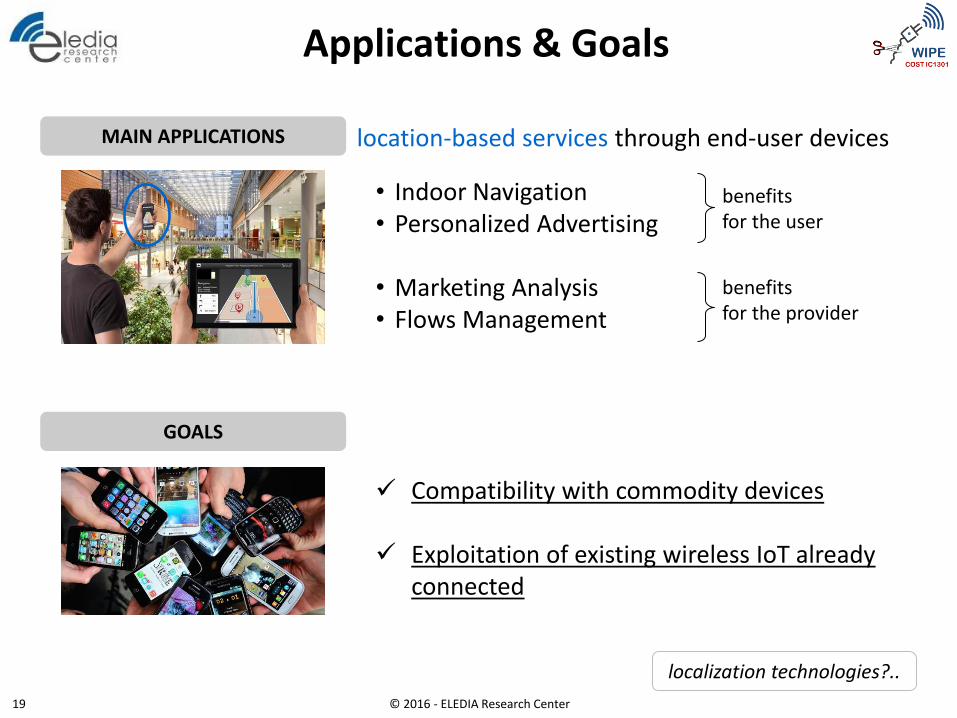
Applications & Goals
MAIN APPLICATIONS location-based services through end-user devices
localization technologies?..
• Indoor Navigation • Personalized Advertising
• Marketing Analysis • Flows Management
benefits for the user
benefits for the provider
GOALS
Compatibility with commodity devices
Exploitation of existing wireless IoT already connected
© 2016 - ELEDIA Research Center 19
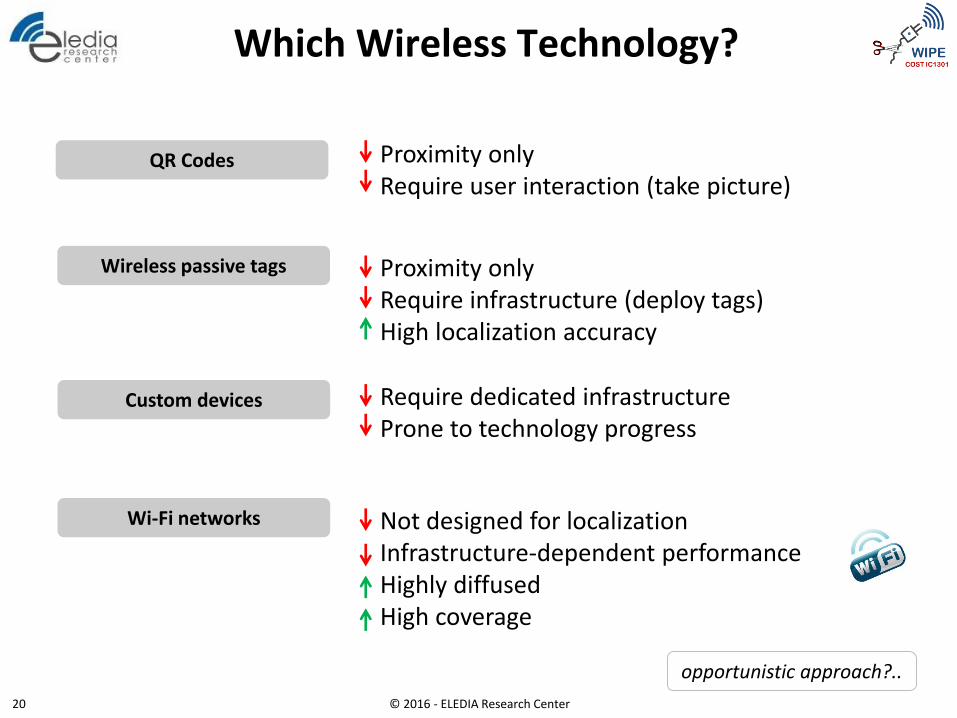
Which Wireless Technology?
Custom devices
Wi-Fi networks
Require dedicated infrastructure Prone to technology progress
Not designed for localization Infrastructure-dependent performance Highly diffused High coverage
opportunistic approach?..
QR Codes
Wireless passive tags
Proximity only Require user interaction (take picture)
Proximity only Require infrastructure (deploy tags) High localization accuracy
© 2016 - ELEDIA Research Center 20
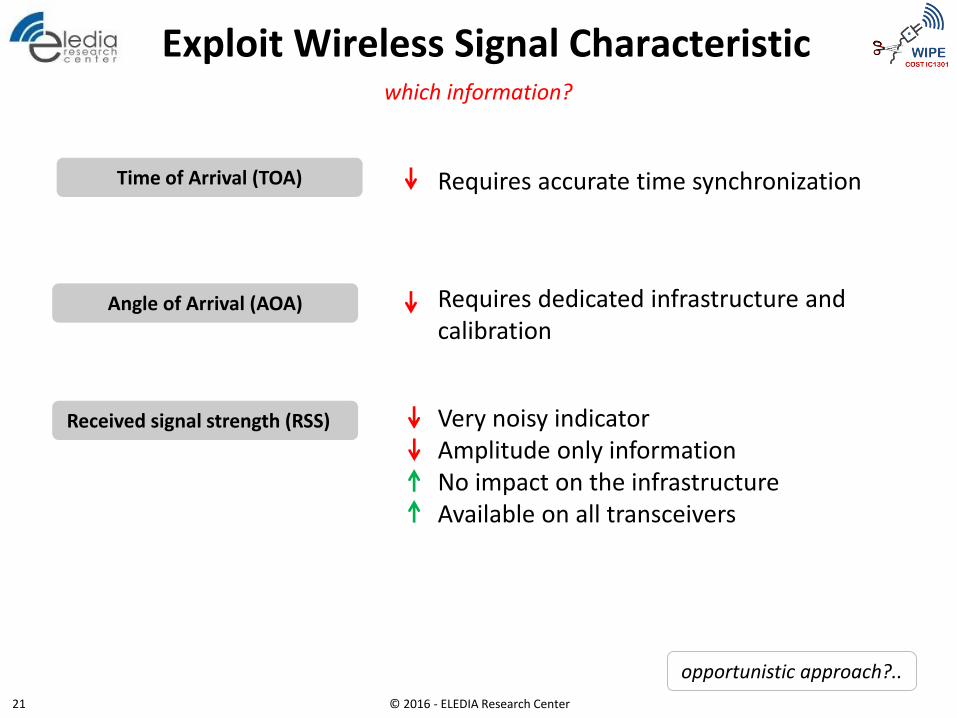
Exploit Wireless Signal Characteristic
opportunistic approach?..
Requires dedicated infrastructure and calibration
Very noisy indicator Amplitude only information No impact on the infrastructure Available on all transceivers
Time of Arrival (TOA)
Angle of Arrival (AOA)
Received signal strength (RSS)
Requires accurate time synchronization
which information?
© 2016 - ELEDIA Research Center 21
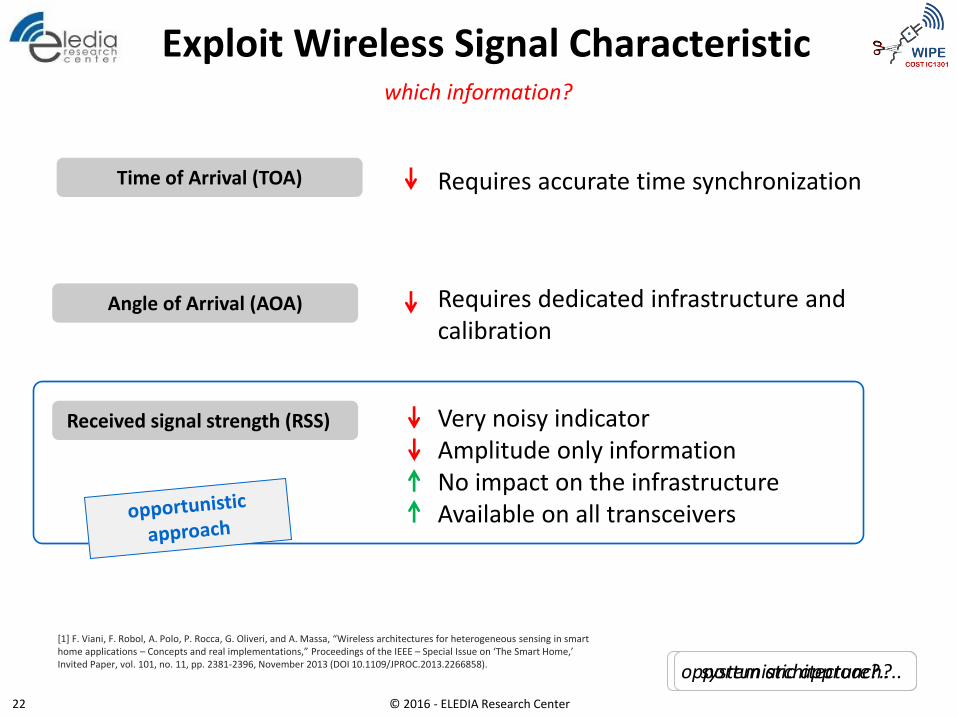
Exploit Wireless Signal Characteristic
opportunistic approach?..
Requires dedicated infrastructure and calibration
Very noisy indicator Amplitude only information No impact on the infrastructure Available on all transceivers
Time of Arrival (TOA)
Angle of Arrival (AOA)
Received signal strength (RSS)
Requires accurate time synchronization
which information?
© 2016 - ELEDIA Research Center 22
[1] F. Viani, F. Robol, A. Polo, P. Rocca, G. Oliveri, and A. Massa, “Wireless architectures for heterogeneous sensing in smart home applications – Concepts and real implementations,” Proceedings of the IEEE – Special Issue on ‘The Smart Home,’ Invited Paper, vol. 101, no. 11, pp. 2381-2396, November 2013 (DOI 10.1109/JPROC.2013.2266858). system architecture?..
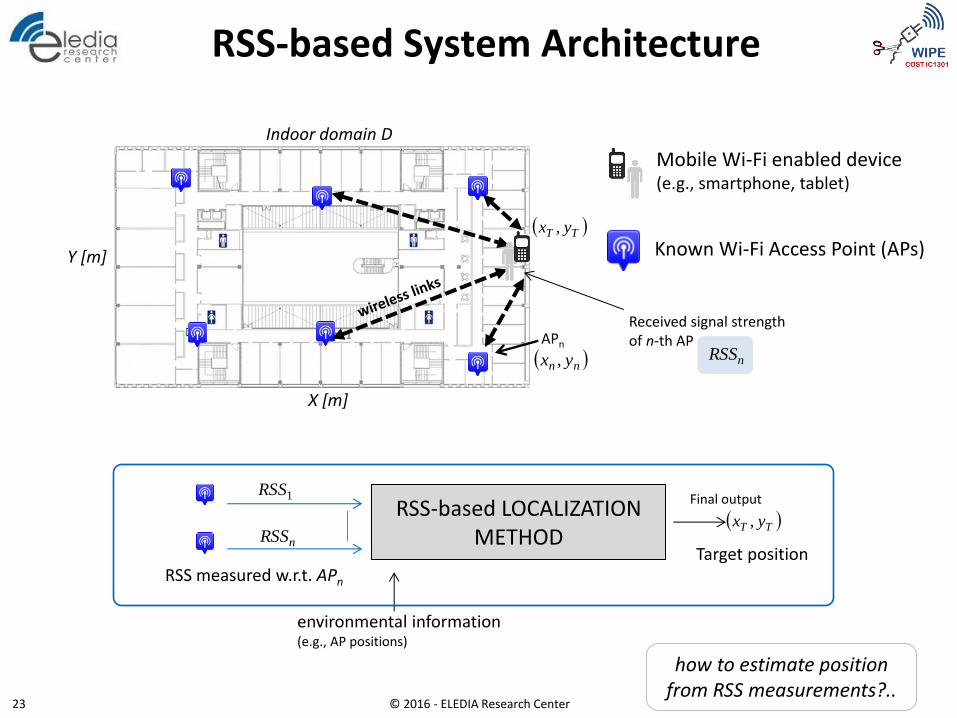
RSS-based System Architecture
how to estimate position from RSS measurements?..
RSS-based LOCALIZATION METHOD nRSS
1RSS
environmental information (e.g., AP positions)
Final output
Indoor domain D
X [m]
Y [m] Known Wi-Fi Access Point (APs)
Mobile Wi-Fi enabled device (e.g., smartphone, tablet)
nn yx ,
RSS measured w.r.t. APn
Target position
TT yx ,
TT yx ,
nRSSAPn
Received signal strength of n-th AP
© 2016 - ELEDIA Research Center 23
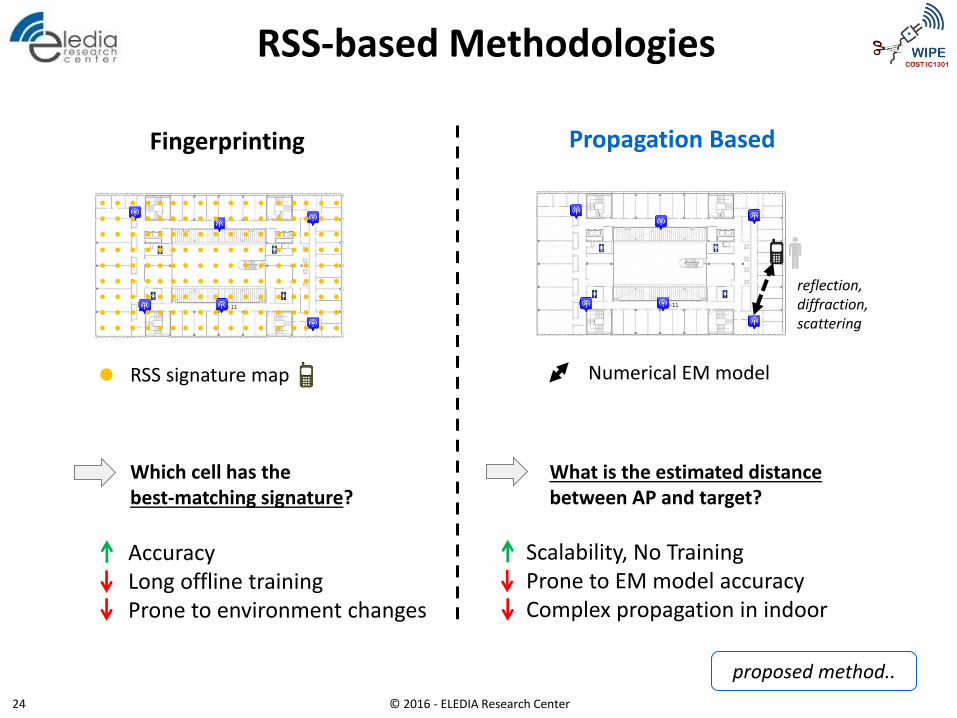
RSS-based Methodologies
proposed method..
Propagation Based Fingerprinting
RSS signature map
Which cell has the best-matching signature?
What is the estimated distance between AP and target?
Accuracy Long offline training Prone to environment changes
Scalability, No Training Prone to EM model accuracy Complex propagation in indoor
reflection, diffraction, scattering
Numerical EM model
© 2016 - ELEDIA Research Center 24
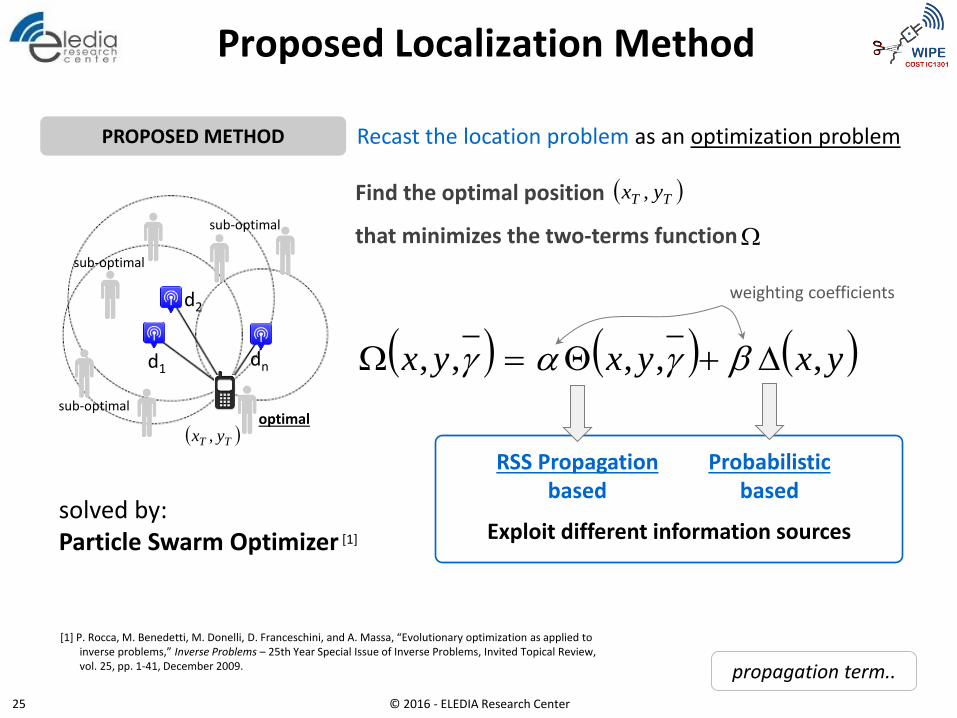
Proposed Localization Method
PROPOSED METHOD Recast the location problem as an optimization problem
d1 dn
d2
sub-optimal
sub-optimal
sub-optimal optimal
TT yx ,
Find the optimal position
that minimizes the two-terms function
TT yx ,
propagation term..
solved by: Particle Swarm Optimizer [1]
[1] P. Rocca, M. Benedetti, M. Donelli, D. Franceschini, and A. Massa, “Evolutionary optimization as applied to inverse problems,” Inverse Problems – 25th Year Special Issue of Inverse Problems, Invited Topical Review, vol. 25, pp. 1-41, December 2009.
weighting coefficients
RSS Propagation based
Probabilistic based
yxyxyx ,,,,,
Exploit different information sources
© 2016 - ELEDIA Research Center 25
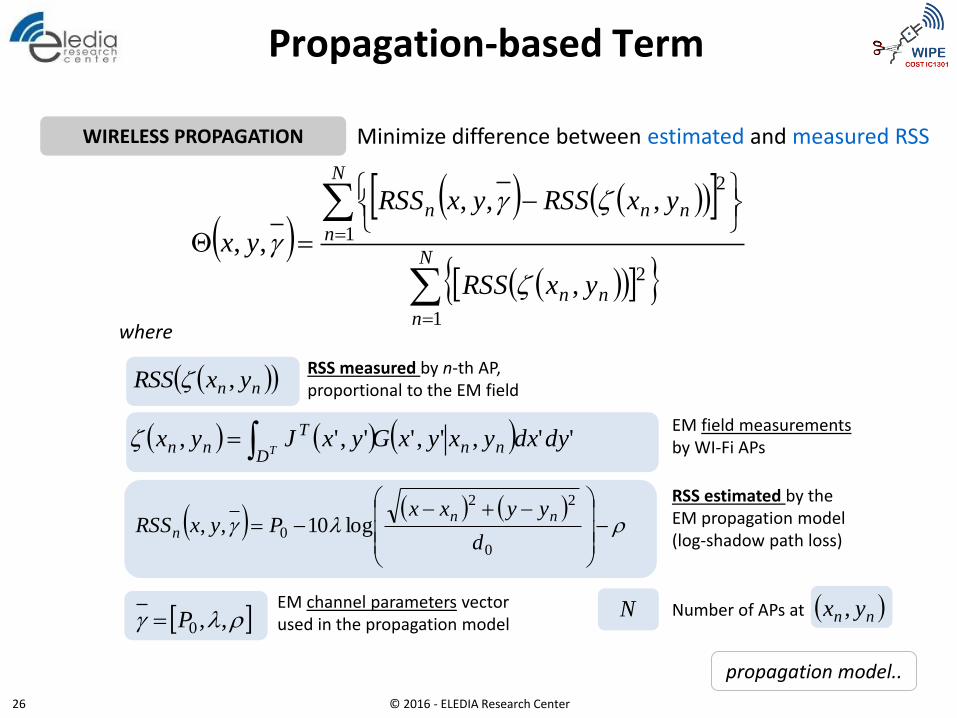
Propagation-based Term
WIRELESS PROPAGATION Minimize difference between estimated and measured RSS
propagation model..
EM field measurements by WI-Fi APs
N
n
nn
N
n
nnn
yxRSS
yxRSSyxRSS
yx
1
2
1
2
,
,,,
,,
where
nn yxRSS ,RSS measured by n-th AP, proportional to the EM field
RSS estimated by the EM propagation model (log-shadow path loss)
EM channel parameters vector used in the propagation model
0
22
0 log10,,d
yyxxPyxRSS
nnn
,,0PN Number of APs at nn yx ,
'',','',', dydxyxyxGyxJyx nnD
Tnn T
© 2016 - ELEDIA Research Center 26
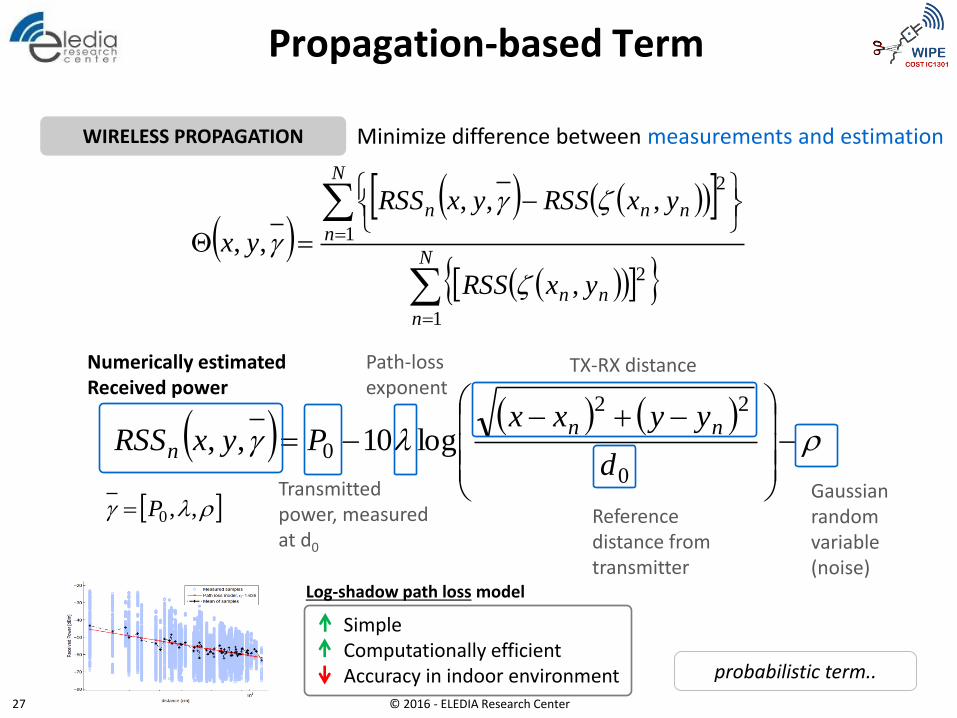
Propagation-based Term
WIRELESS PROPAGATION Minimize difference between measurements and estimation
probabilistic term..
0
22
0 log10,,d
yyxxPyxRSS
nnn
Numerically estimated Received power
Transmitted power, measured at d0
Reference distance from transmitter
Gaussian random variable (noise)
TX-RX distance Path-loss exponent
Simple Computationally efficient Accuracy in indoor environment
Log-shadow path loss model
N
n
nn
N
n
nnn
yxRSS
yxRSSyxRSS
yx
1
2
1
2
,
,,,
,,
,,0P
© 2016 - ELEDIA Research Center 27
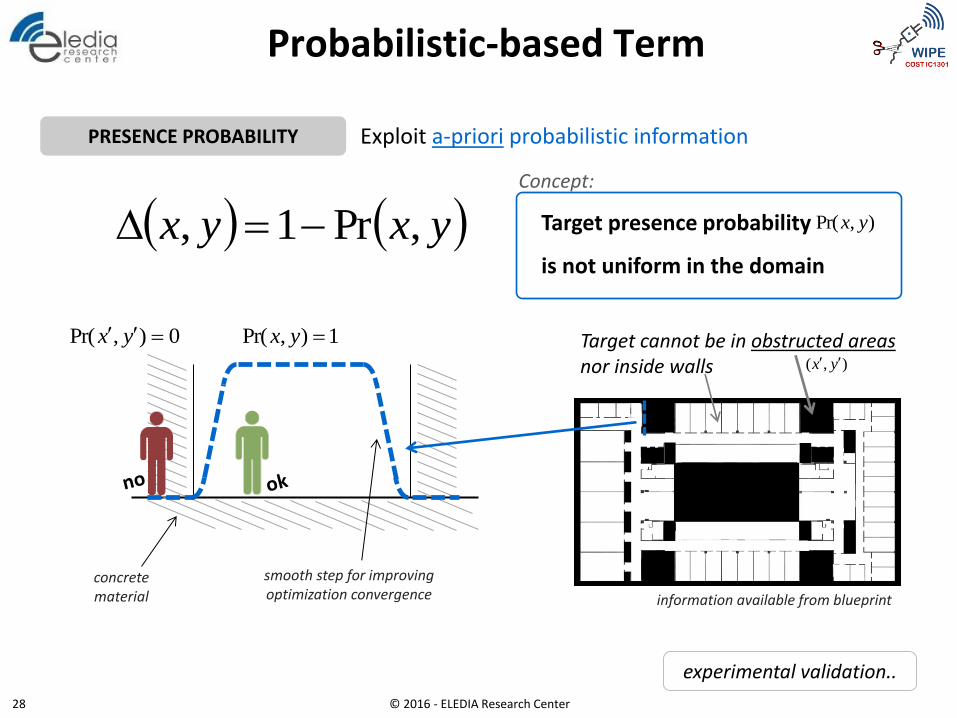
Probabilistic-based Term
PRESENCE PROBABILITY Exploit a-priori probabilistic information
experimental validation..
yxyx ,Pr1,
0),Pr( yx
smooth step for improving optimization convergence
1),Pr( yx
Target presence probability
is not uniform in the domain
Concept:
),Pr( yx
information available from blueprint
Target cannot be in obstructed areas nor inside walls ),( yx
concrete material
© 2016 - ELEDIA Research Center 28
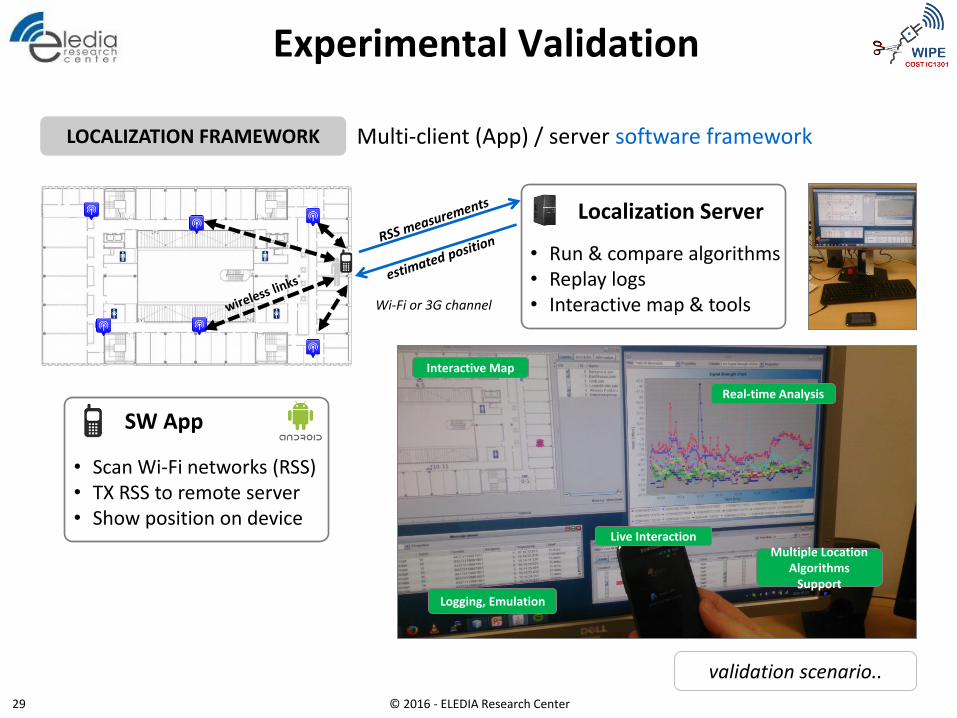
Experimental Validation
LOCALIZATION FRAMEWORK Multi-client (App) / server software framework
validation scenario..
Localization Server
SW App
• Scan Wi-Fi networks (RSS) • TX RSS to remote server • Show position on device
Wi-Fi or 3G channel
• Run & compare algorithms • Replay logs • Interactive map & tools
Interactive Map
Real-time Analysis
Multiple Location Algorithms
Support
Logging, Emulation
Live Interaction
© 2016 - ELEDIA Research Center 29
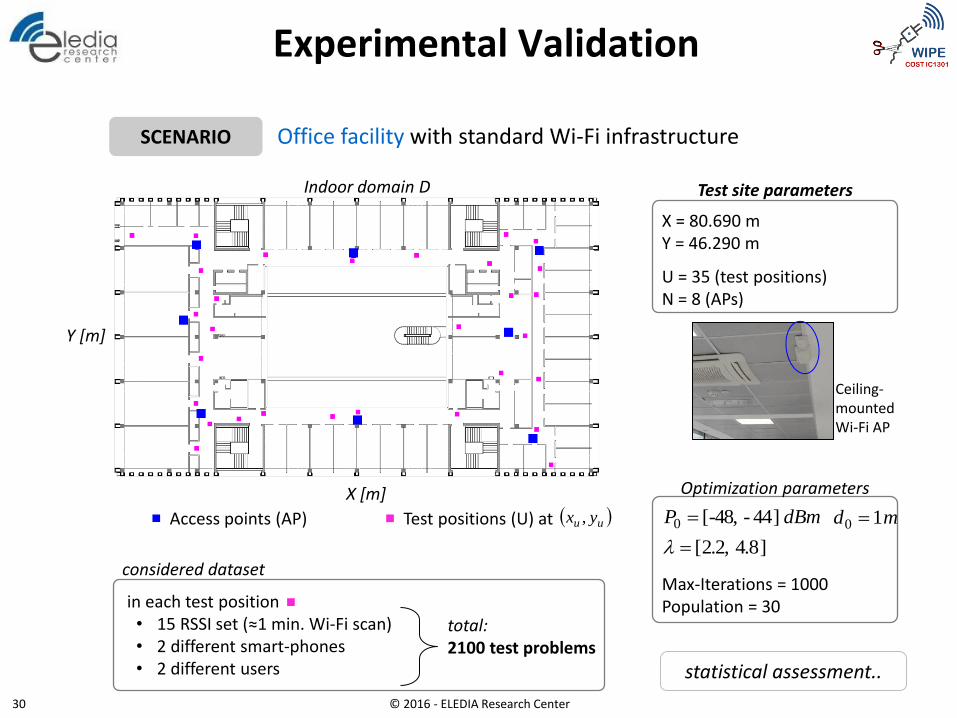
Experimental Validation
SCENARIO Office facility with standard Wi-Fi infrastructure
Access points (AP)
statistical assessment..
X = 80.690 m Y = 46.290 m
U = 35 (test positions) N = 8 (APs)
in each test position • 15 RSSI set (≈1 min. Wi-Fi scan) • 2 different smart-phones • 2 different users
total: 2100 test problems
Indoor domain D
X [m]
Y [m]
]4.8 2.2,[
]44- -48,[0
dBmP
Max-Iterations = 1000 Population = 30
md 10 uu yx ,Test positions (U) at
Test site parameters
Optimization parameters
considered dataset
Ceiling- mounted Wi-Fi AP
© 2016 - ELEDIA Research Center 30
Experimental Validation
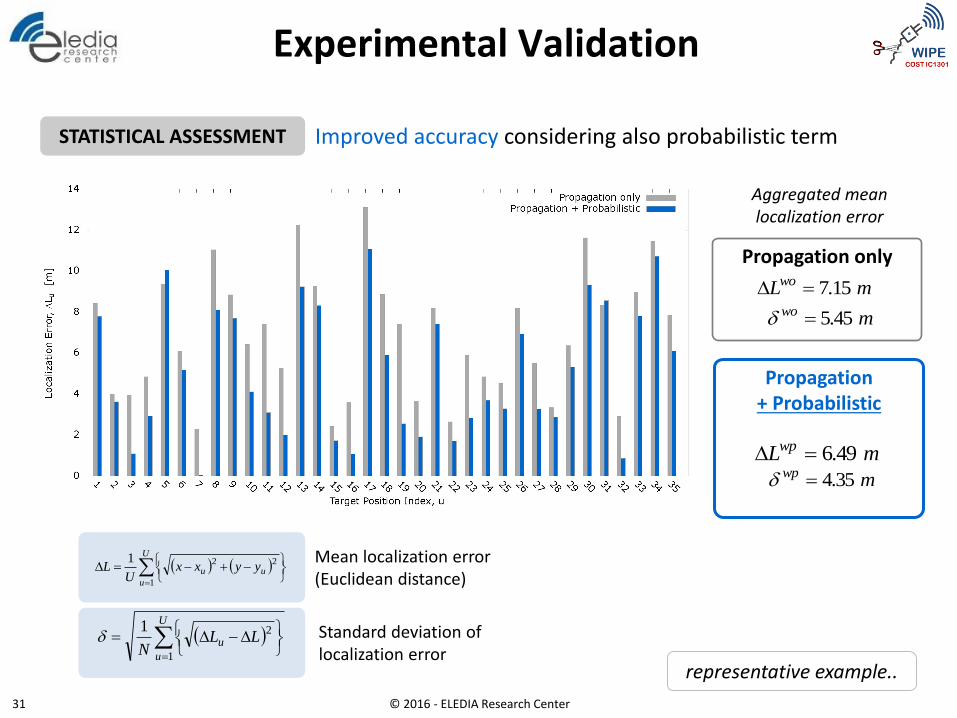
STATISTICAL ASSESSMENT Improved accuracy considering also probabilistic term
representative example..
Aggregated mean localization error
mLwo 7.15
Propagation + Probabilistic
mLwp 6.49
mwo 5.45
mwp 4.35
U
u
uu yyxxU
L1
221
Propagation only
U
u
u LLN
1
21
Mean localization error (Euclidean distance)
Standard deviation of localization error
© 2016 - ELEDIA Research Center 31
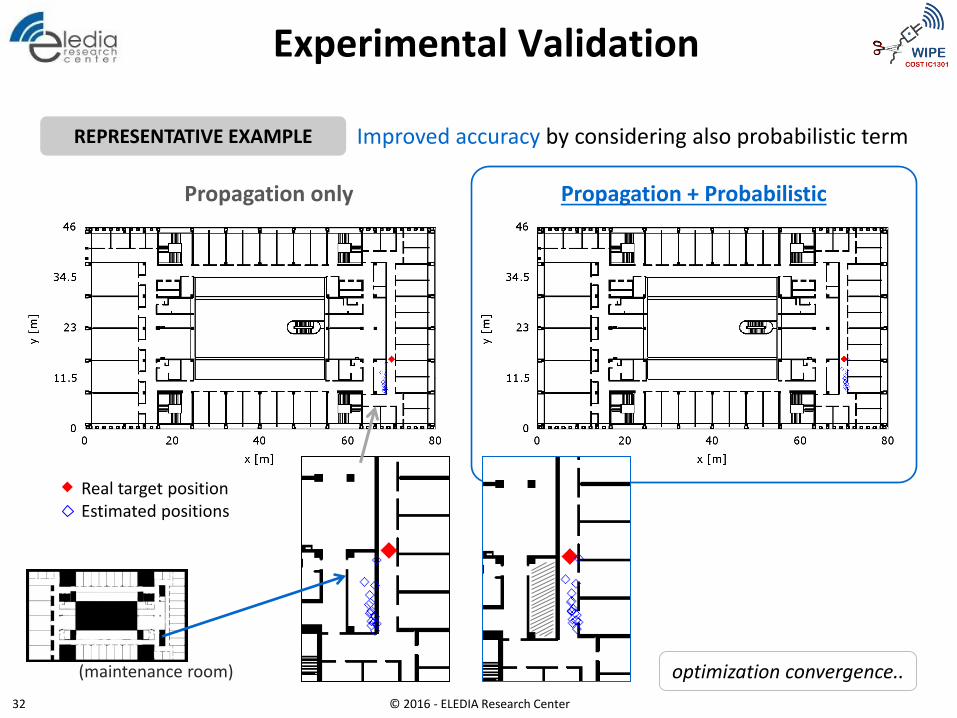
Experimental Validation
REPRESENTATIVE EXAMPLE Improved accuracy by considering also probabilistic term
Real target position
Propagation + Probabilistic Propagation only
(maintenance room) optimization convergence..
Estimated positions
© 2016 - ELEDIA Research Center 32
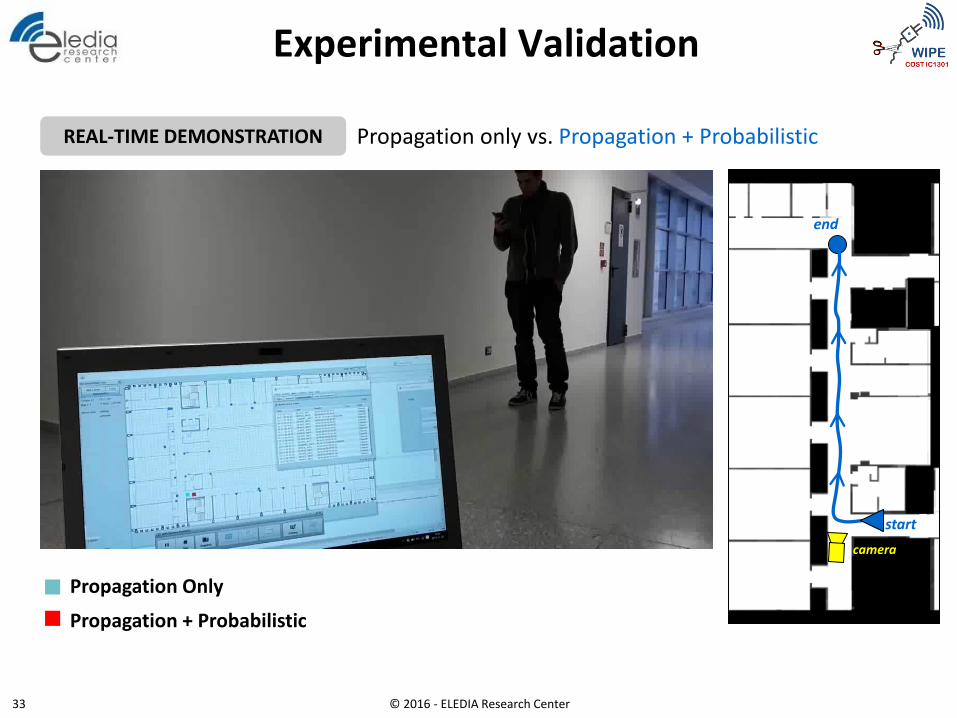
Experimental Validation
REAL-TIME DEMONSTRATION Propagation only vs. Propagation + Probabilistic
Propagation Only
Propagation + Probabilistic
start
end
camera
© 2016 - ELEDIA Research Center 33
Outline
• EM Positioning for IoT – Intro & Motivation
• Active Localization of Mobile Devices
• Localization through optimization
• Semantic-based probabilistic approach
• Passive Localization of Transceiver-free Targets
• Target tracking
• Crowd detection
• Indirect occupancy estimation
• Conclusions and Actual Trends
© 2016 - ELEDIA Research Center 34
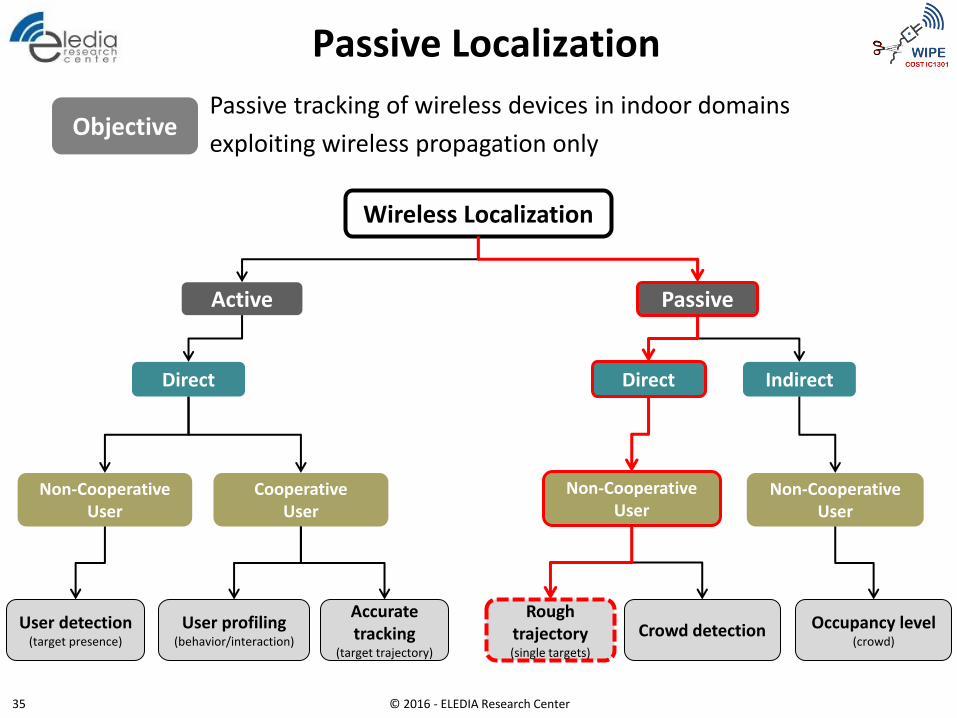
Passive Localization
Wireless Localization
Non-Cooperative User
Occupancy level (crowd)
Cooperative User
Non-Cooperative User
Passive Active
Direct Direct Indirect
Non-Cooperative User
Rough trajectory (single targets)
Crowd detection User profiling (behavior/interaction)
Accurate tracking
(target trajectory)
User detection (target presence)
Objective Passive tracking of wireless devices in indoor domains
exploiting wireless propagation only
© 2016 - ELEDIA Research Center 35
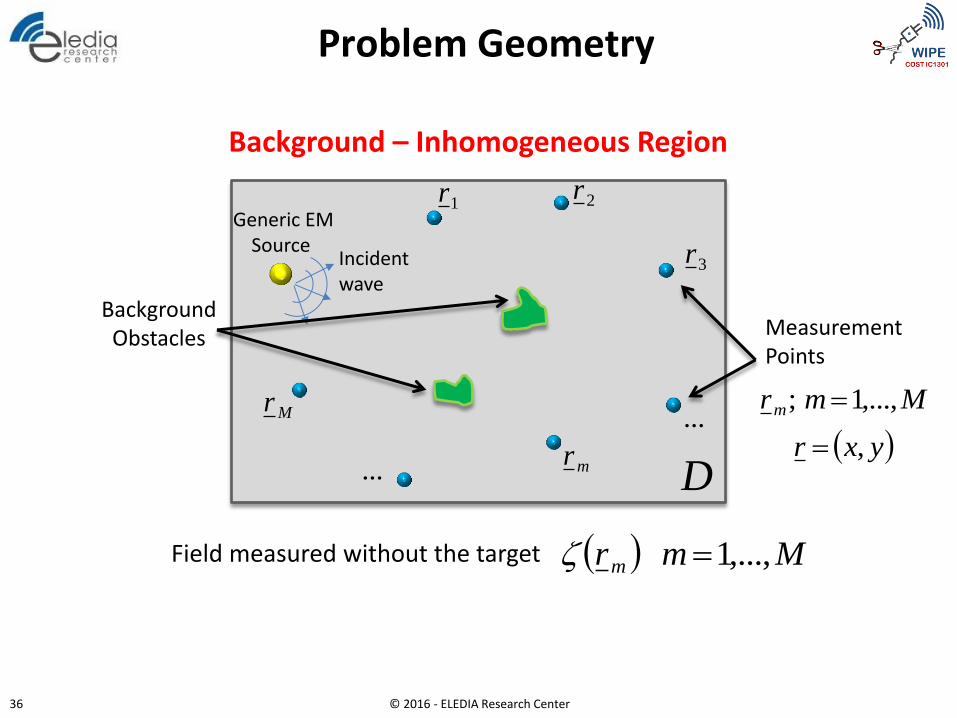
Problem Geometry
Generic EM Source
Incident wave
Measurement Points
Background – Inhomogeneous Region
Background Obstacles
Mmrm ,...,1Field measured without the target
Mmrm ,...,1;
1r 2r
3r
mr
...
...
Mr
D yxr ,
© 2016 - ELEDIA Research Center 36
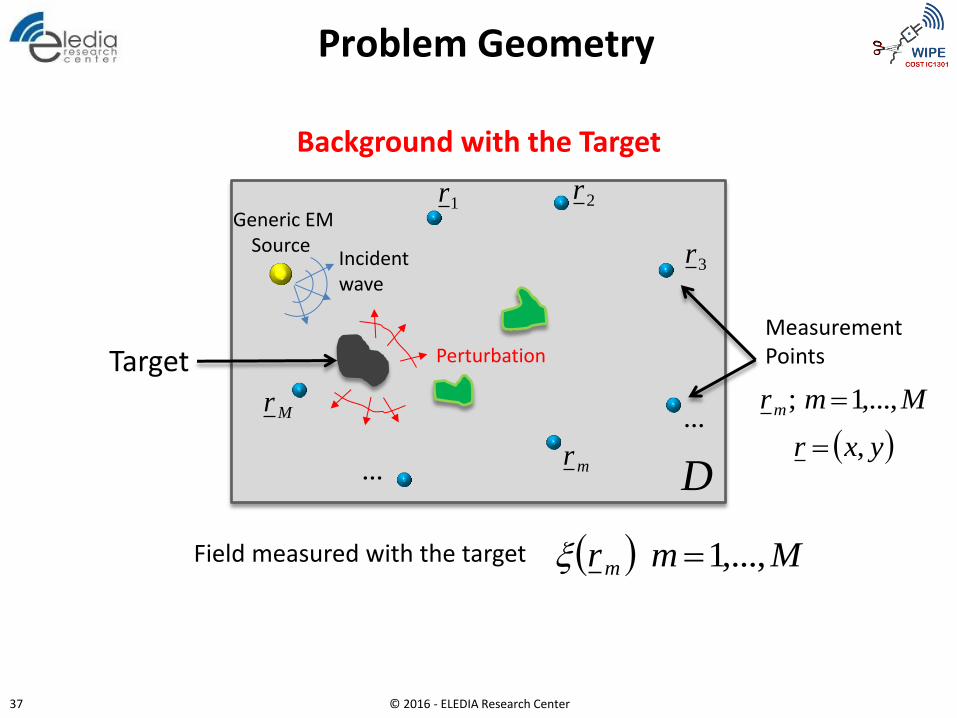
Problem Geometry
Background with the Target
Field measured with the target
Target
Mmrm ,...,1
Incident wave
Measurement Points
...
...
Perturbation
D
Mmrm ,...,1;
1r 2r
3r
mr
Mr
yxr ,
Generic EM Source
© 2016 - ELEDIA Research Center 37
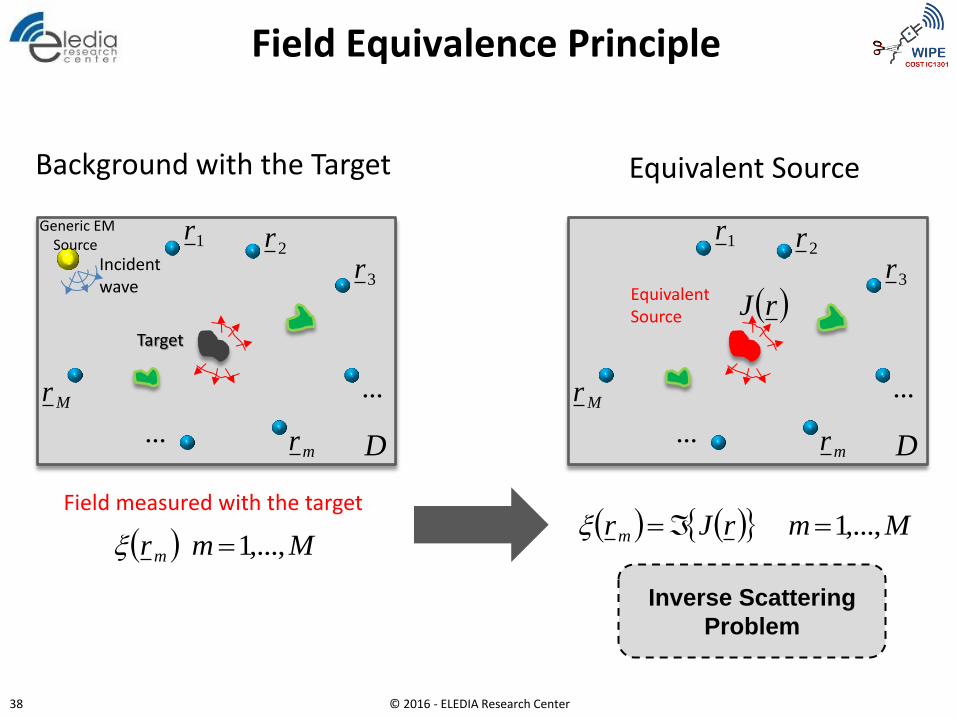
Field Equivalence Principle
Background with the Target
Incident wave
Target
1r2r
3r
mr
...
...
Mr
Generic EM Source 1r
2r
3r
mr
...
...
Mr
Equivalent Source
Field measured with the target
Mmrm ,...,1 MmrJrm ,...,1
rJ
D D
Equivalent Source
Inverse Scattering
Problem
© 2016 - ELEDIA Research Center 38
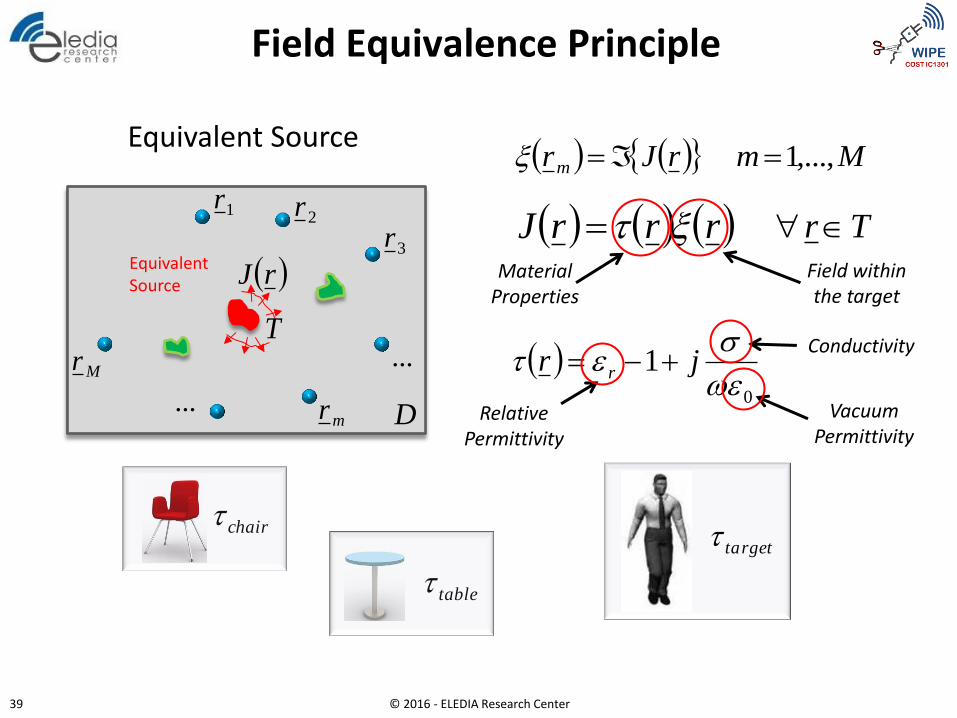
Field Equivalence Principle
1r2r
3r
mr
...
...
Mr
Equivalent Source
MmrJrm ,...,1
rJ
D
Equivalent Source
rrrJ Tr
T
Material Properties
Field within the target
0
1
jr r
Relative Permittivity
Conductivity
Vacuum Permittivity
table
chairrgetta
© 2016 - ELEDIA Research Center 39
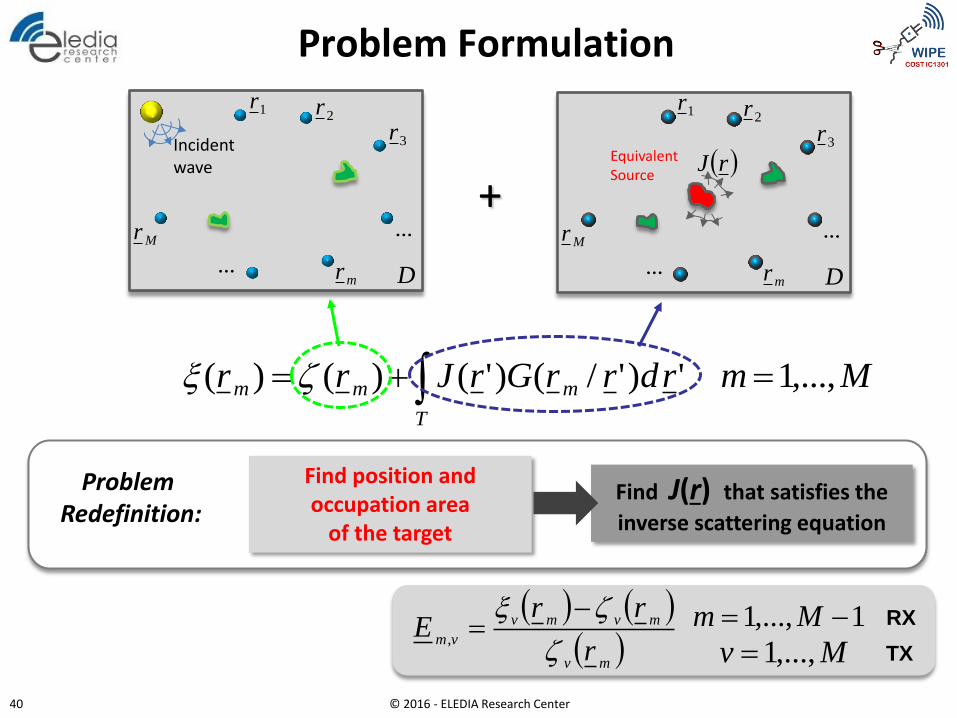
Problem Formulation
MmrdrrGrJrrT
mmm ,...,1')'/()'()()(
Find J(r) that satisfies the
inverse scattering equation
Find position and occupation area
of the target
Problem Redefinition:
1r2r
3r
mr
...
...
Mr
D
Incident wave
1r2r
3r
mr
...
...
Mr
Equivalent Source
rJ
D
+
mv
mvmv
vmr
rrE
,
1,...,1 Mm
Mv ,...,1 TX
RX
© 2016 - ELEDIA Research Center 40
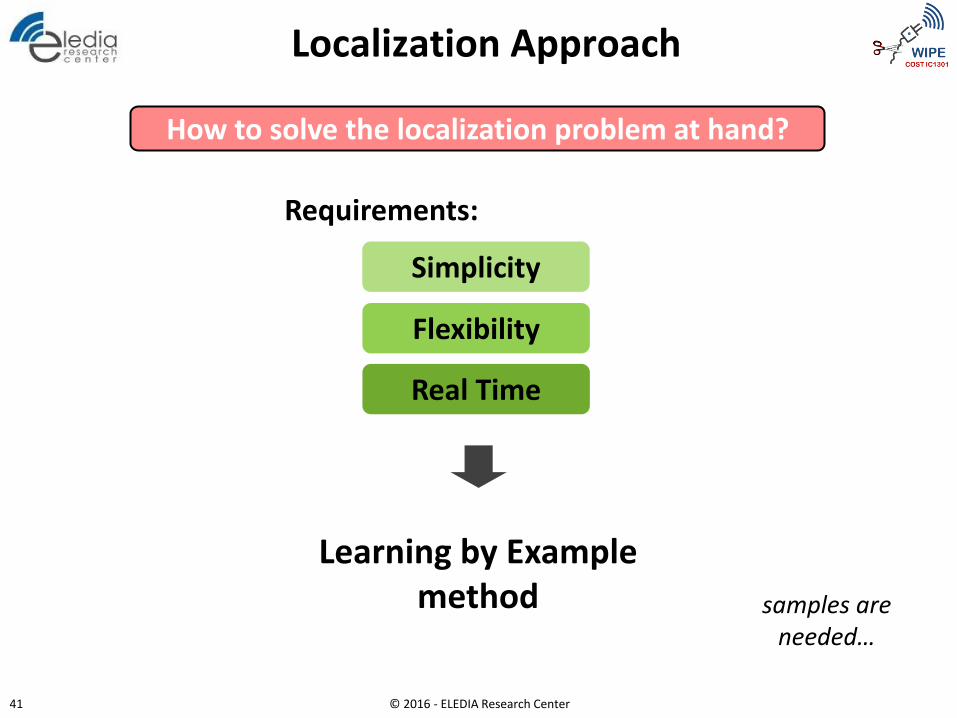
Localization Approach
How to solve the localization problem at hand?
Requirements:
Real Time
Simplicity
Flexibility
Learning by Example method samples are
needed…
© 2016 - ELEDIA Research Center 41
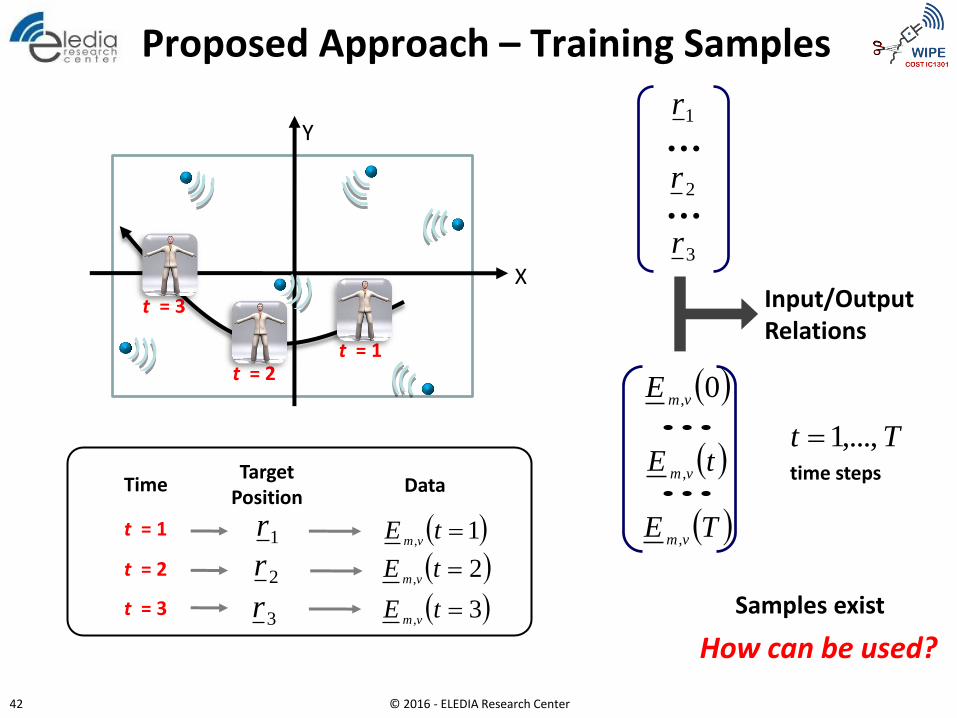
X
Y
t = 1 t = 2
t = 3
t = 1
Time Target
Position Data
Proposed Approach – Training Samples
1,
tEvm
2,
tEvm
3,
tEvm
0,vm
E
tEvm ,
TEvm ,
...
Tt ,...,1...
time steps
1r
t = 2
t = 3
2r
3r
1r
2r
3r...
...
Samples exist
How can be used?
Input/Output Relations
© 2016 - ELEDIA Research Center 42
1c
X
Y
X
Y
X
Y
t = 1
t = 2
t = 3
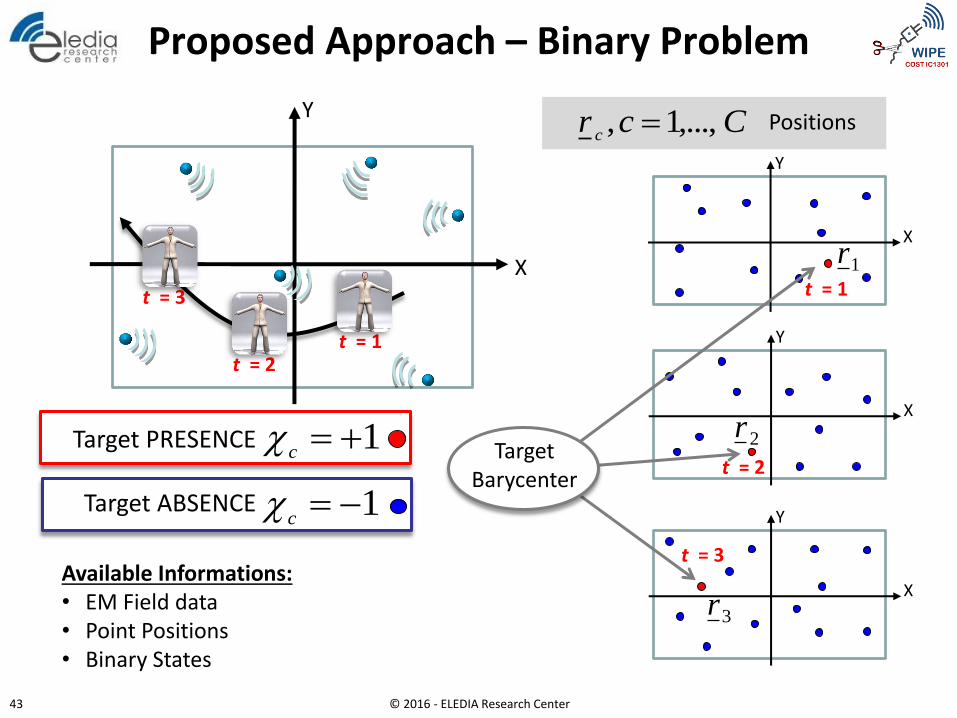
Proposed Approach – Binary Problem
X
Y
t = 1 t = 2
t = 3
Target PRESENCE
Target ABSENCE 1c
Ccrc
,...,1, Positions
1r
2r
3rAvailable Informations: • EM Field data • Point Positions • Binary States
Target Barycenter
© 2016 - ELEDIA Research Center 43
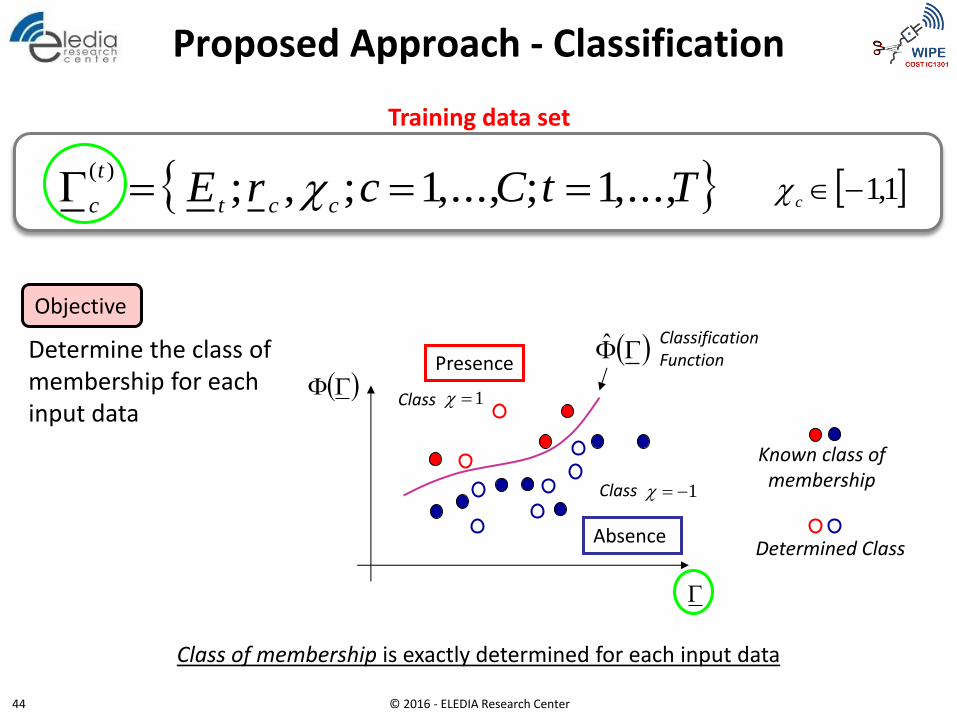
TtCcrEcct
t
c,...,1;,...,1;,;
)(
Classification Function
Objective
Determine the class of membership for each input data
Class
Class
Class of membership is exactly determined for each input data
Known class of membership
Determined Class
1
1
Presence
Absence
1,1c
Proposed Approach - Classification
Training data set
© 2016 - ELEDIA Research Center 44
Class
Class
Known class of membership
Determined Class
1
1
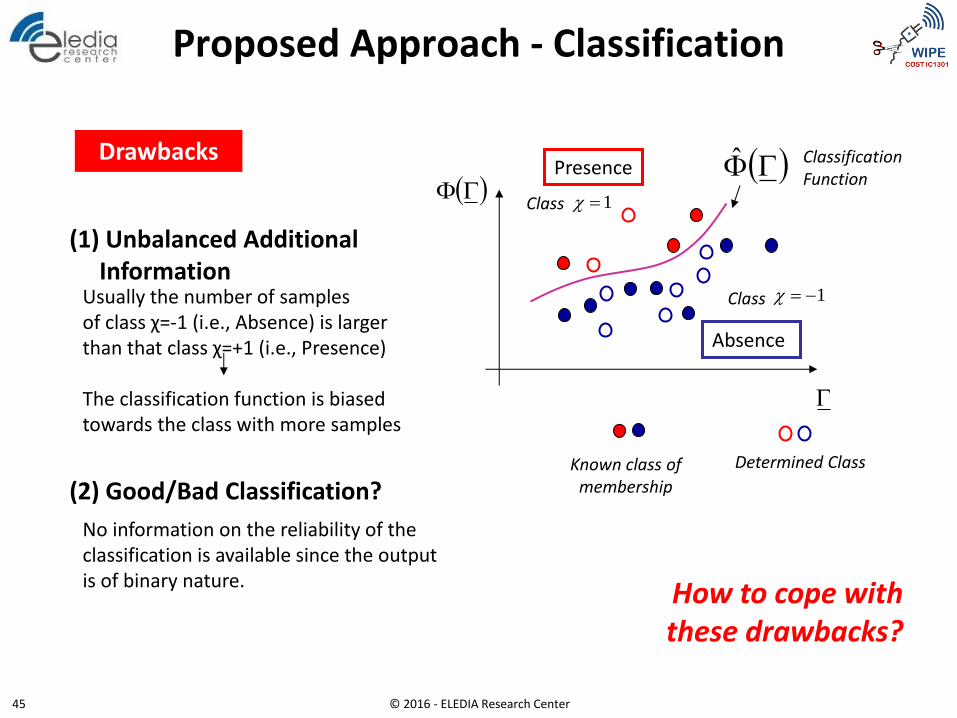
Drawbacks
(1) Unbalanced Additional Information
No information on the reliability of the classification is available since the output is of binary nature.
(2) Good/Bad Classification?
Classification Function
Usually the number of samples of class χ=-1 (i.e., Absence) is larger than that class χ=+1 (i.e., Presence) The classification function is biased towards the class with more samples
How to cope with these drawbacks?
Presence
Absence
© 2016 - ELEDIA Research Center 45
Proposed Approach - Classification
Classification Function
Class
Class
Known class of membership
Determined Class
1
1
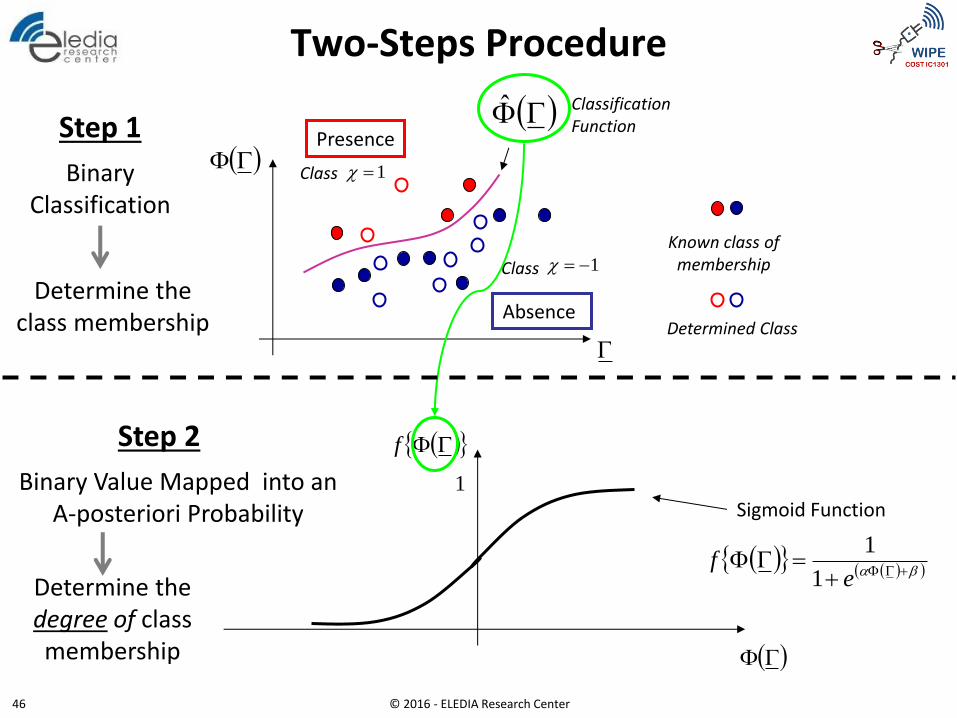
Step 1
Binary Classification
Step 2
Binary Value Mapped into an A-posteriori Probability
f
1
ef
1
1
Sigmoid Function
Two-Steps Procedure
Presence
Absence Determine the
class membership
Determine the degree of class membership
© 2016 - ELEDIA Research Center 46
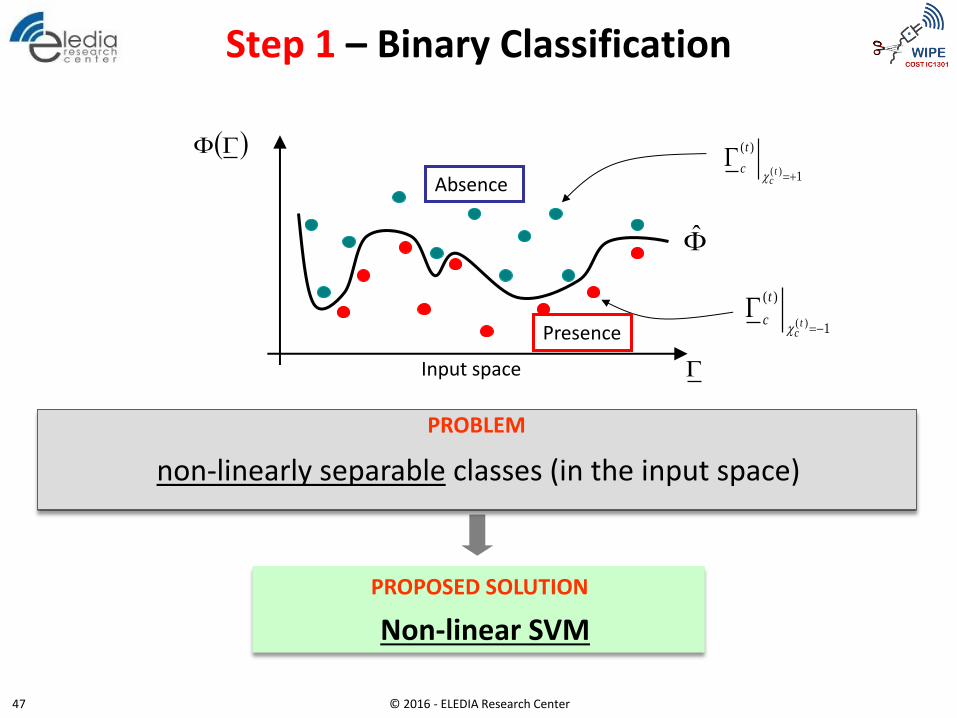
Non-linear SVM
Input space
PROPOSED SOLUTION
1
)(
)(
tc
t
c
1
)(
)(
tc
t
c
non-linearly separable classes (in the input space)
PROBLEM
Step 1 – Binary Classification
Presence
Absence
© 2016 - ELEDIA Research Center 47
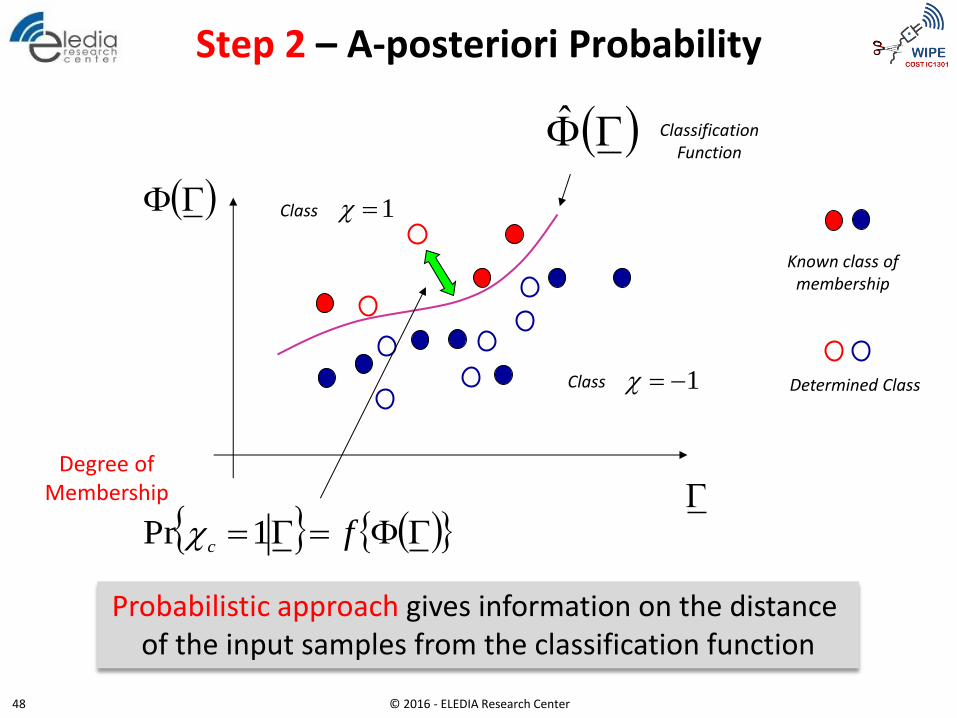
Classification Function
Class
Class
Known class of membership
Determined Class 1
1
f
c1Pr
Probabilistic approach gives information on the distance of the input samples from the classification function
Step 2 – A-posteriori Probability
Degree of Membership
© 2016 - ELEDIA Research Center 48
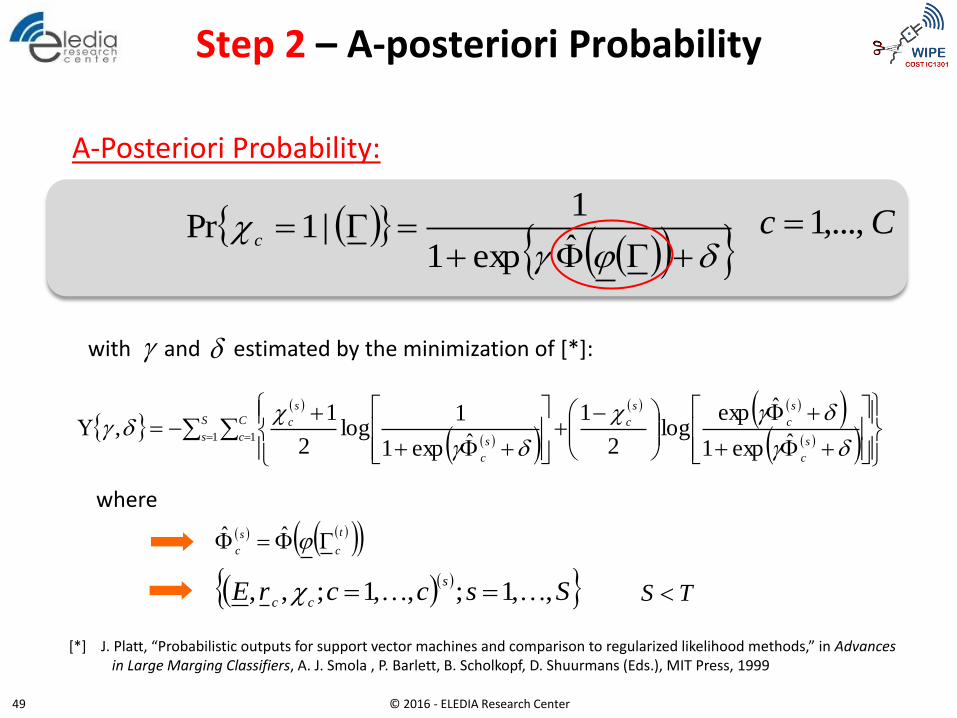
with and estimated by the minimization of [*]:
ˆexp1
1|1Pr
c
s
c
s
c
s
cS
s
C
c s
c
s
c
ˆexp1
ˆexplog
2
1
ˆexp1
1log
2
1,
1 1
SsccrEs
cc,,1;,,1;,,
where
t
c
s
c ˆˆ
A-Posteriori Probability:
Cc ,...,1
TS
Step 2 – A-posteriori Probability
[*] J. Platt, “Probabilistic outputs for support vector machines and comparison to regularized likelihood methods,” in Advances in Large Marging Classifiers, A. J. Smola , P. Barlett, B. Scholkopf, D. Shuurmans (Eds.), MIT Press, 1999
© 2016 - ELEDIA Research Center 49
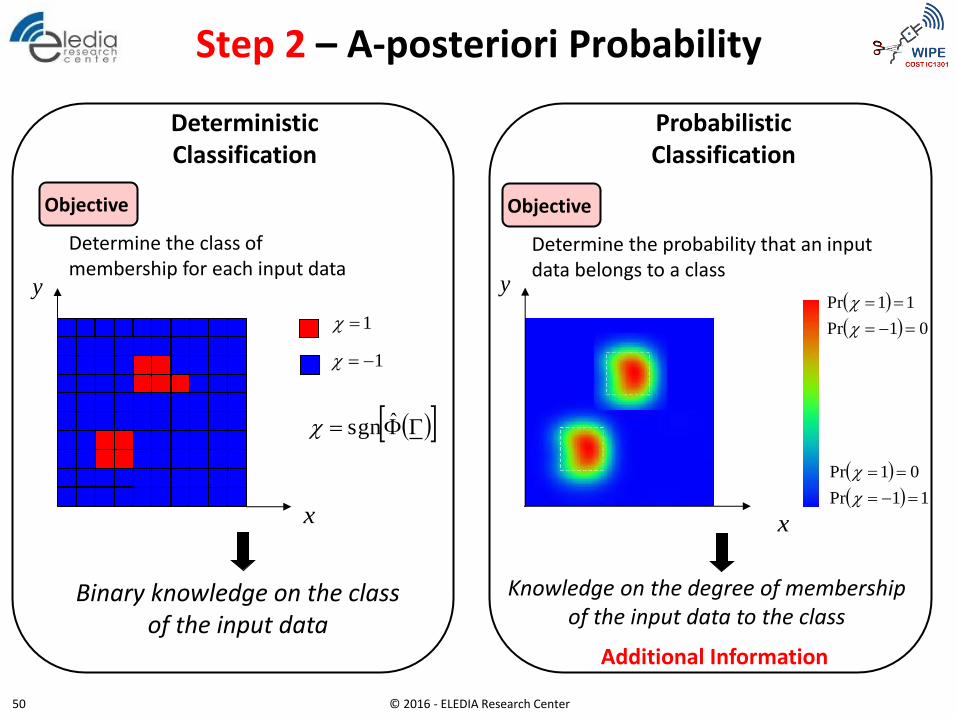
Deterministic Classification
Objective
Determine the class of membership for each input data
Probabilistic Classification
Objective
Determine the probability that an input data belongs to a class
1
1
ˆsgn
x
y
x
y
11Pr
01Pr
01Pr
11Pr
Binary knowledge on the class of the input data
Knowledge on the degree of membership of the input data to the class
Step 2 – A-posteriori Probability
Additional Information
© 2016 - ELEDIA Research Center 50
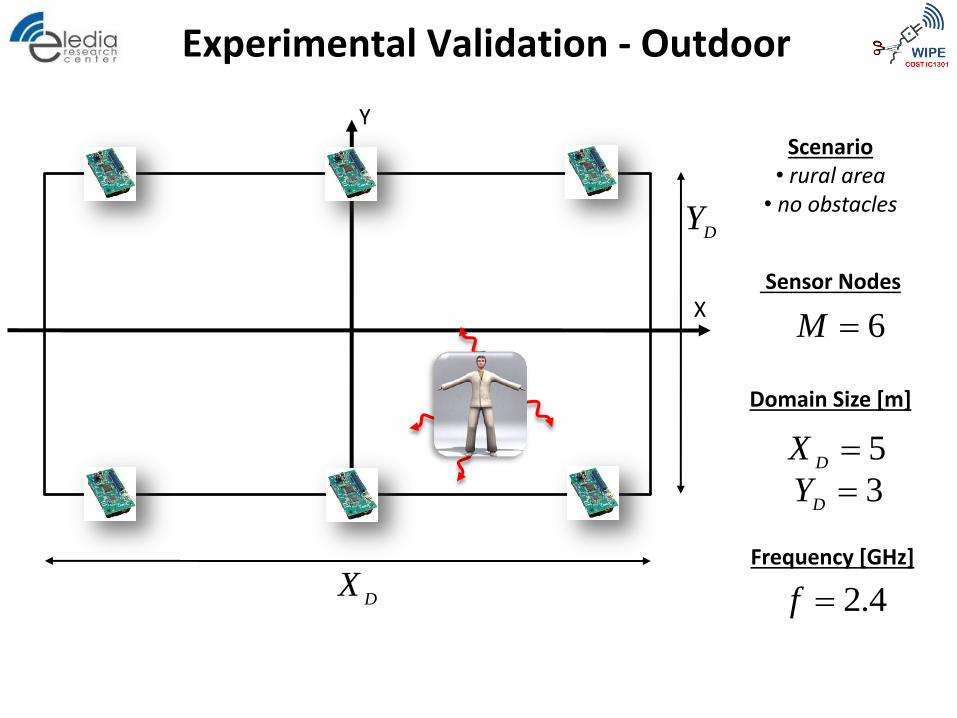
Experimental Validation - Outdoor
X
Y
6M
Sensor Nodes
Domain Size [m]
5D
X
3D
Y
DX
DY
Frequency [GHz]
4.2f
Scenario • rural area
• no obstacles
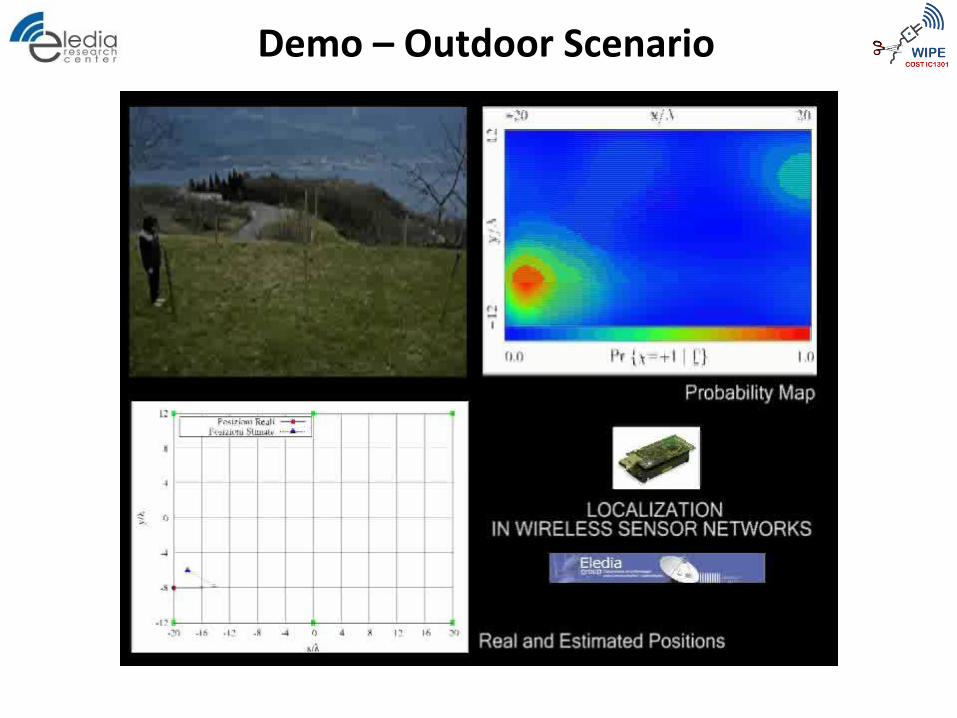
Demo – Outdoor Scenario
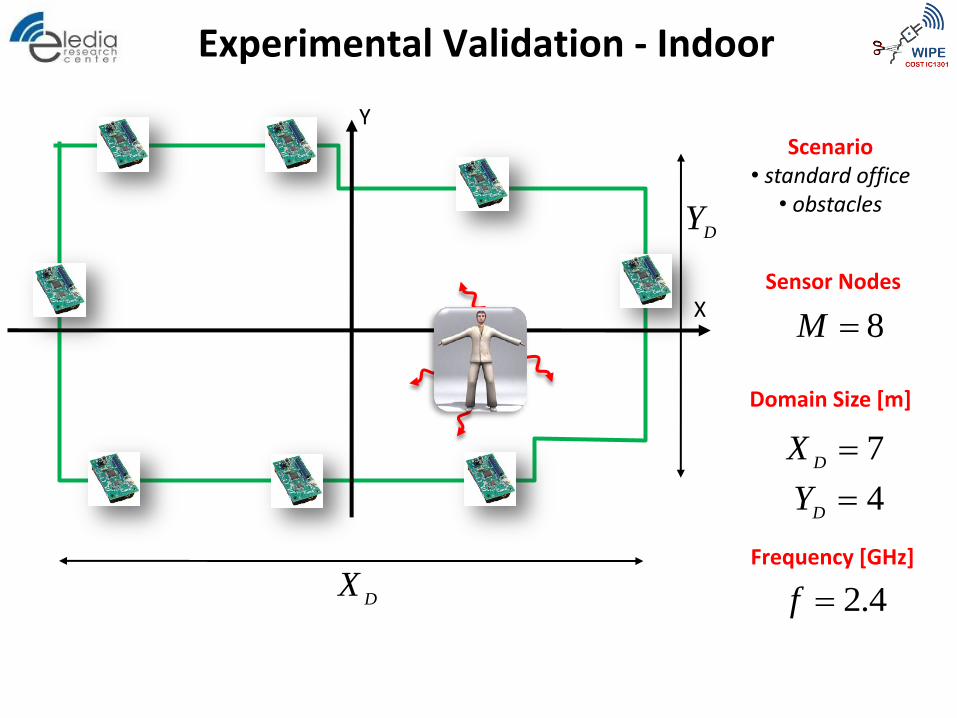
Experimental Validation - Indoor
X
Y
8M
Sensor Nodes
Domain Size [m]
7D
X
4D
Y
DX
DY
Frequency [GHz]
4.2f
Scenario • standard office
• obstacles
Maximum of Probability
Estimated Position (Kalman filtered)
Demo – Indoor Scenario (1/3)
Absence/Presence/Movement of Targets
Maximum of Probability
Estimated Position (Kalman filtered)
Demo – Indoor Scenario (2/3)
Heterogeneous Movements
Maximum of Probability
Estimated Position (Kalman filtered)
Demo – Indoor Scenario (3/3)
Unknown Obstacle
Outline
• EM Positioning for IoT – Intro & Motivation
• Active Localization of Mobile Devices
• Localization through optimization
• Semantic-based probabilistic approach
• Passive Localization of Transceiver-free Targets
• Target tracking
• Crowd detection
• Indirect occupancy estimation
• Conclusions and Actual Trends
© 2016 - ELEDIA Research Center 57
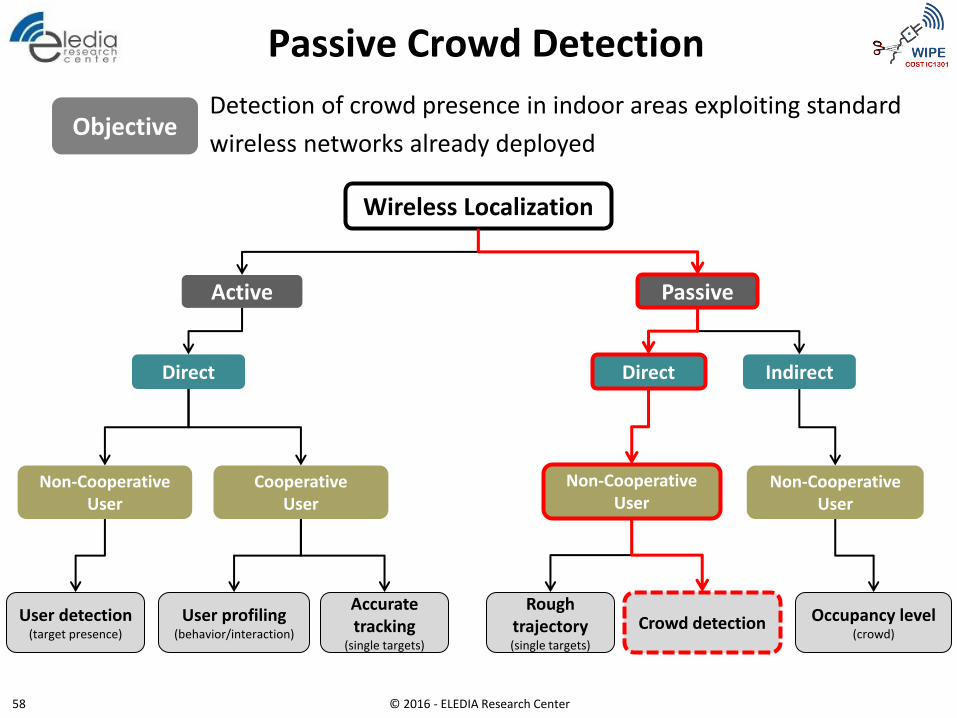
Passive Crowd Detection
Wireless Localization
Non-Cooperative User
Occupancy level (crowd)
Cooperative User
Non-Cooperative User
Passive Active
Direct Direct Indirect
Non-Cooperative User
Rough trajectory (single targets)
Crowd detection User profiling (behavior/interaction)
Accurate tracking
(single targets)
User detection (target presence)
© 2016 - ELEDIA Research Center 58
Objective Detection of crowd presence in indoor areas exploiting standard
wireless networks already deployed
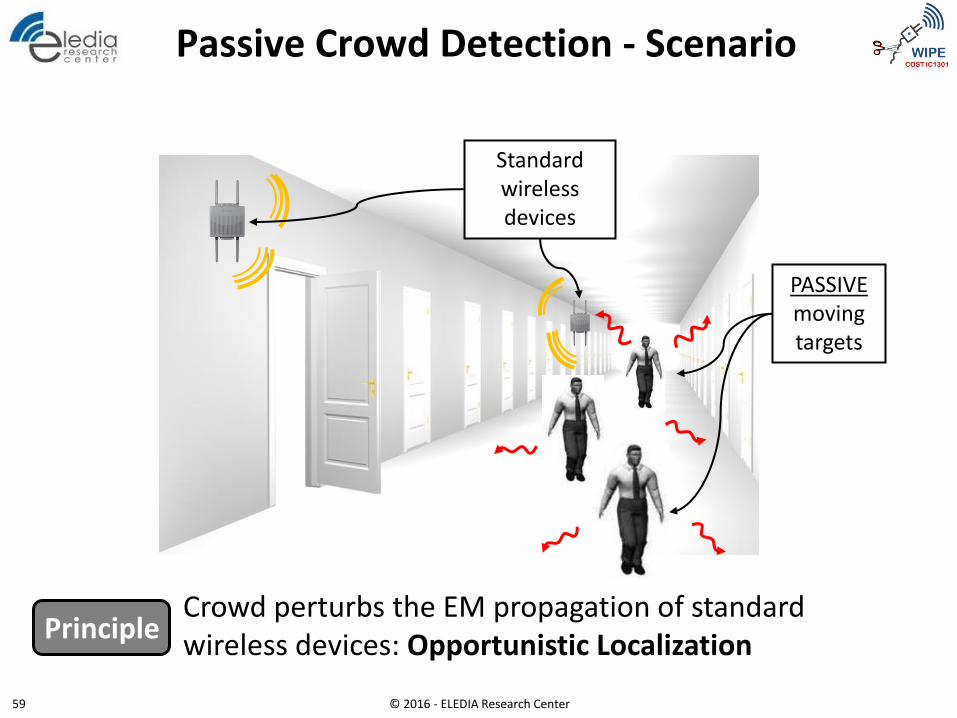
Passive Crowd Detection - Scenario
Principle Crowd perturbs the EM propagation of standard wireless devices: Opportunistic Localization
Standard wireless devices
PASSIVEmoving targets
© 2016 - ELEDIA Research Center 59
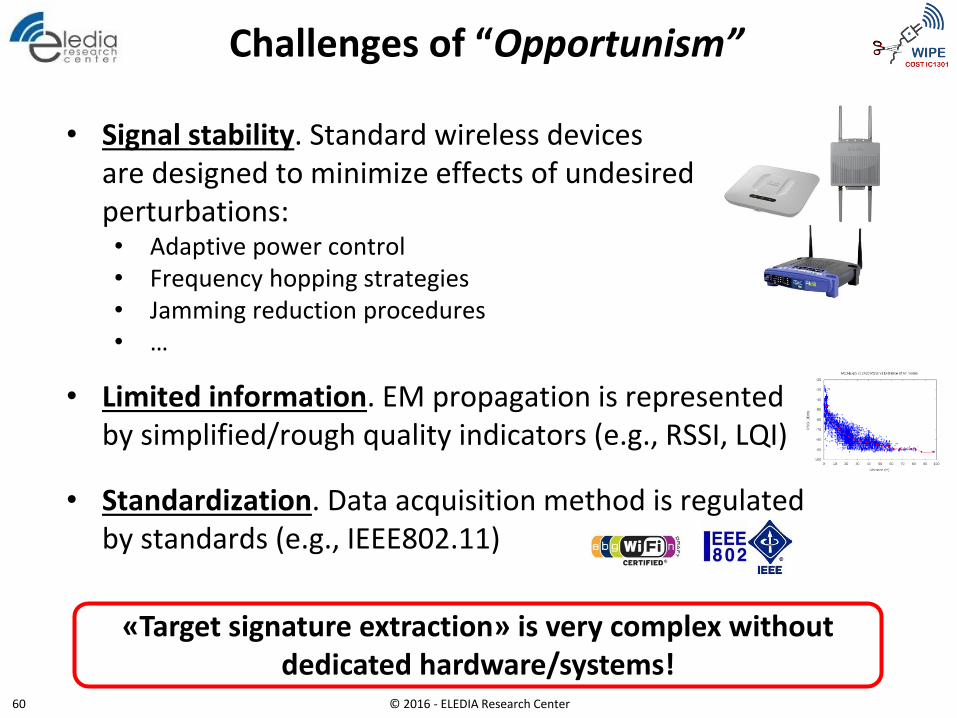
• Signal stability. Standard wireless devices are designed to minimize effects of undesired perturbations: • Adaptive power control • Frequency hopping strategies • Jamming reduction procedures • …
• Limited information. EM propagation is represented by simplified/rough quality indicators (e.g., RSSI, LQI)
• Standardization. Data acquisition method is regulated by standards (e.g., IEEE802.11)
Challenges of “Opportunism”
«Target signature extraction» is very complex without dedicated hardware/systems!
© 2016 - ELEDIA Research Center 60
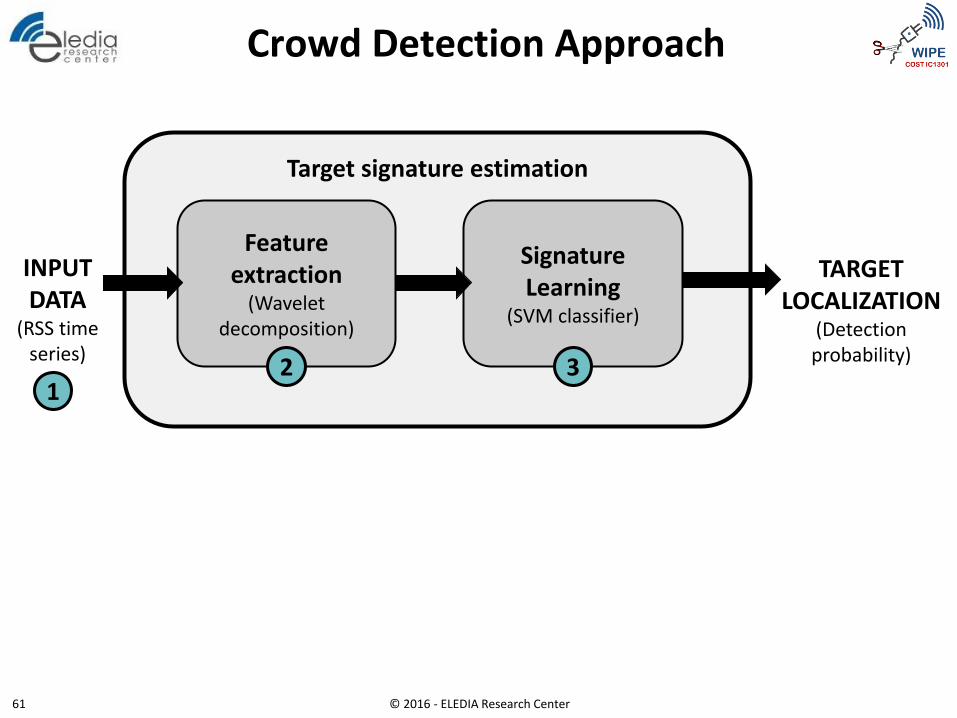
Target signature estimation
Crowd Detection Approach
Feature extraction
(Wavelet decomposition)
Signature Learning
(SVM classifier)
INPUT DATA
(RSS time series)
1 2 3
TARGET LOCALIZATION
(Detection probability)
© 2016 - ELEDIA Research Center 61
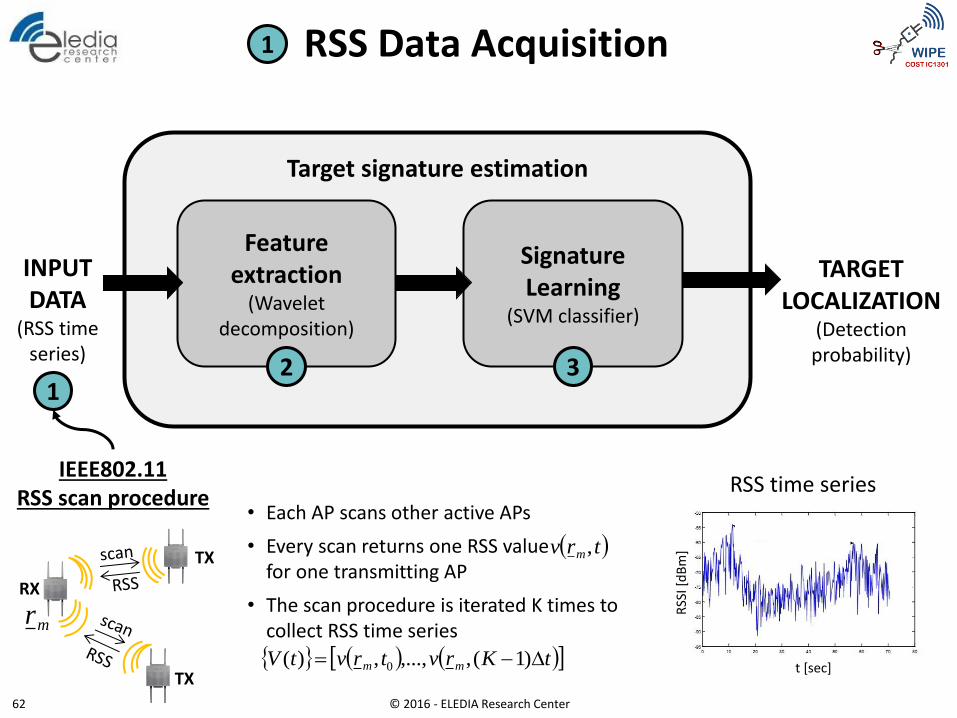
Target signature estimation
RSS Data Acquisition
Feature extraction
(Wavelet decomposition)
Signature Learning
(SVM classifier)
INPUT DATA
(RSS time series)
1 2 3
IEEE802.11 RSS scan procedure
RX
TX
TX
• Each AP scans other active APs
• Every scan returns one RSS value for one transmitting AP
• The scan procedure is iterated K times to collect RSS time series mr
tKrvtrvtV mm )1(,,...,,)( 0
trv m,
t [sec] R
SSI [
dB
m]
1
TARGET LOCALIZATION
(Detection probability)
RSS time series
© 2016 - ELEDIA Research Center 62
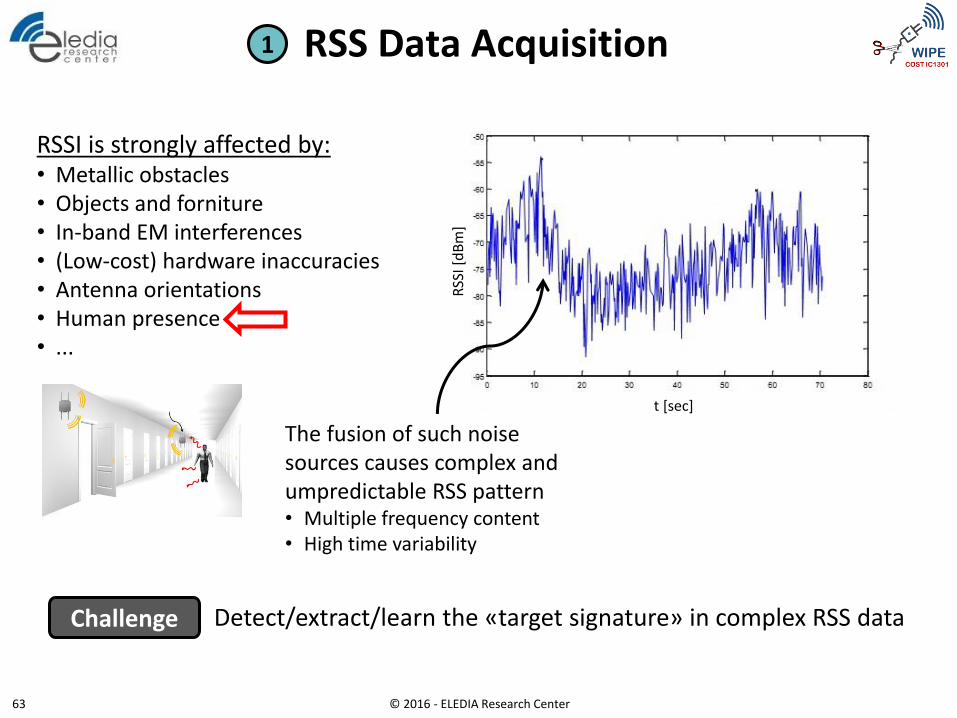
RSS Data Acquisition
t [sec]
RSS
I [d
Bm
]
RSSI is strongly affected by: • Metallic obstacles • Objects and forniture • In-band EM interferences • (Low-cost) hardware inaccuracies • Antenna orientations • Human presence • ...
The fusion of such noise sources causes complex and umpredictable RSS pattern • Multiple frequency content • High time variability
Challenge Detect/extract/learn the «target signature» in complex RSS data
1
© 2016 - ELEDIA Research Center 63
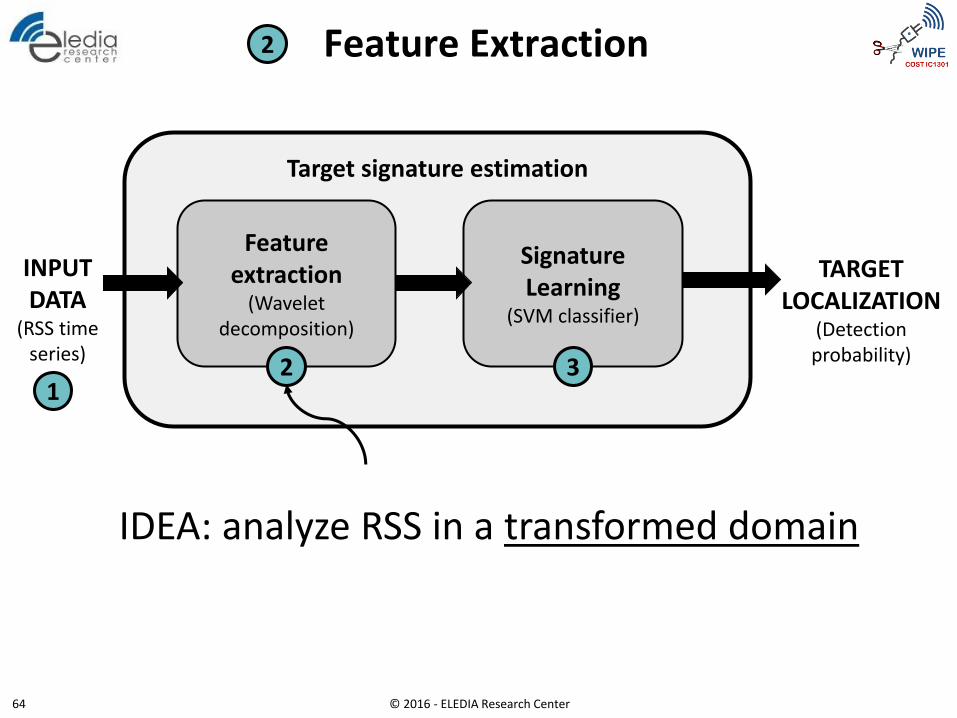
Target signature estimation
Feature Extraction
Feature extraction
(Wavelet decomposition)
Signature Learning
(SVM classifier)
INPUT DATA
(RSS time series)
TARGET LOCALIZATION
(Detection probability)
1 2 3
IDEA: analyze RSS in a transformed domain
2
© 2016 - ELEDIA Research Center 64
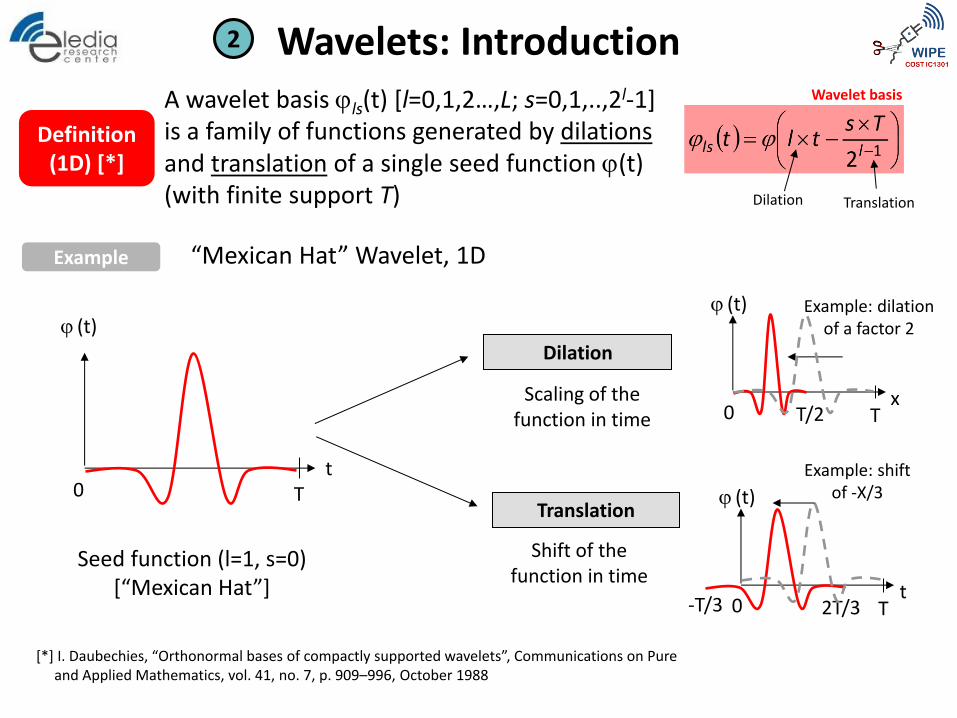
Wavelets: Introduction
Definition (1D) [*]
[*] I. Daubechies, “Orthonormal bases of compactly supported wavelets”, Communications on Pure and Applied Mathematics, vol. 41, no. 7, p. 909–996, October 1988
Example “Mexican Hat” Wavelet, 1D
Seed function (l=1, s=0) [“Mexican Hat”]
t 0 T
(t) Dilation
Translation
Scaling of the function in time
x 0 T
(t) Example: dilation of a factor 2
T/2
t 0 T
(t)
Example: shift of -X/3
-T/3
Shift of the function in time
2T/3
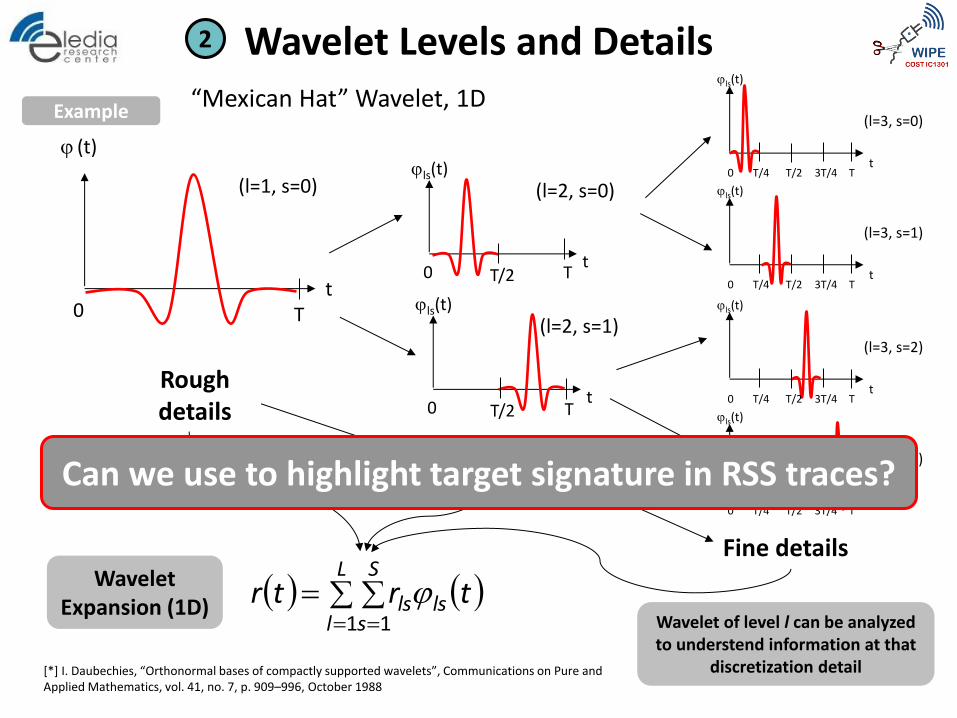
A wavelet basis ls(t) [l=0,1,2…,L; s=0,1,..,2l-1] is a family of functions generated by dilations and translation of a single seed function (t) (with finite support T)
Wavelet basis
Dilation Translation
2
[*] I. Daubechies, “Orthonormal bases of compactly supported wavelets”, Communications on Pure and Applied Mathematics, vol. 41, no. 7, p. 909–996, October 1988
Example “Mexican Hat” Wavelet, 1D
t
ls(t)
0 T
(l=2, s=0)
t
ls(t)
0 T
(l=2, s=1)
T/2
T/2
t 0 T
(t) t
ls(t)
0 T
(l=3, s=0)
T/2 3T/4 T/4
t
ls(t)
0 T
(l=3, s=1)
T/2 3T/4 T/4
t
ls(t)
0 T
(l=3, s=2)
T/2 3T/4 T/4
t
ls(t)
0 T
(l=3, s=3)
T/2 3T/4 T/4
L
l
S
slsls trtr
1 1
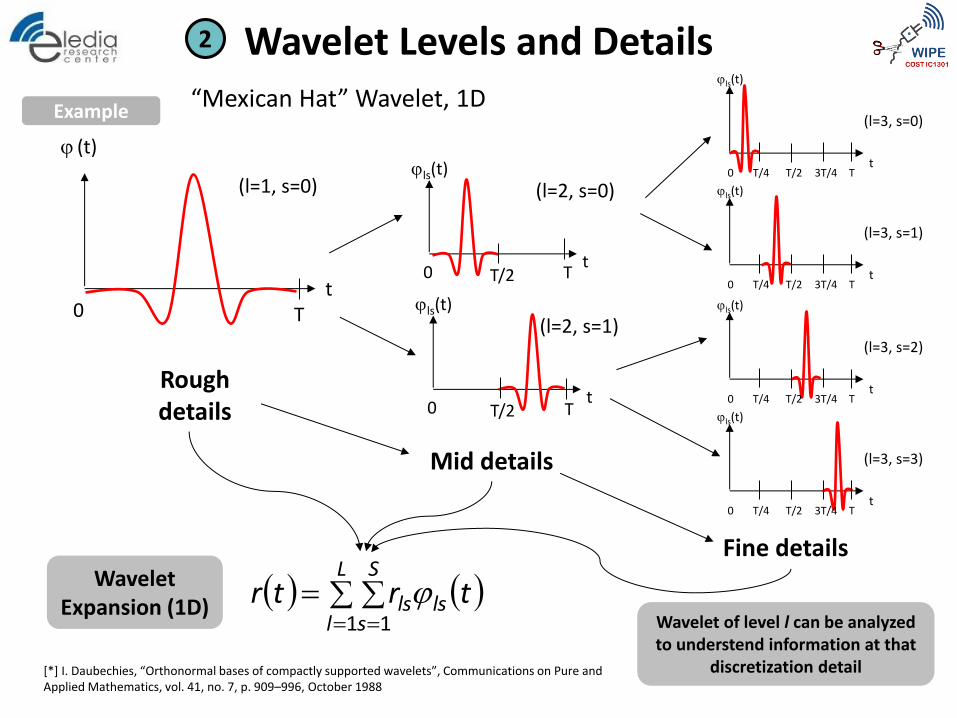
Wavelet Expansion (1D)
(l=1, s=0)
Rough details
Mid details
Fine details
Wavelet of level l can be analyzed to understend information at that
discretization detail
Wavelet Levels and Details 2
[*] I. Daubechies, “Orthonormal bases of compactly supported wavelets”, Communications on Pure and Applied Mathematics, vol. 41, no. 7, p. 909–996, October 1988
Example “Mexican Hat” Wavelet, 1D
t
ls(t)
0 T
(l=2, s=0)
t
ls(t)
0 T
(l=2, s=1)
T/2
T/2
t 0 T
(t) t
ls(t)
0 T
(l=3, s=0)
T/2 3T/4 T/4
t
ls(t)
0 T
(l=3, s=1)
T/2 3T/4 T/4
t
ls(t)
0 T
(l=3, s=2)
T/2 3T/4 T/4
t
ls(t)
0 T
(l=3, s=3)
T/2 3T/4 T/4
L
l
S
slsls trtr
1 1
Wavelet Expansion (1D)
(l=1, s=0)
Rough details
Mid details
Fine details
Wavelet of level l can be analyzed to understend information at that
discretization detail
Wavelet Levels and Details 2
Can we use to highlight target signature in RSS traces?
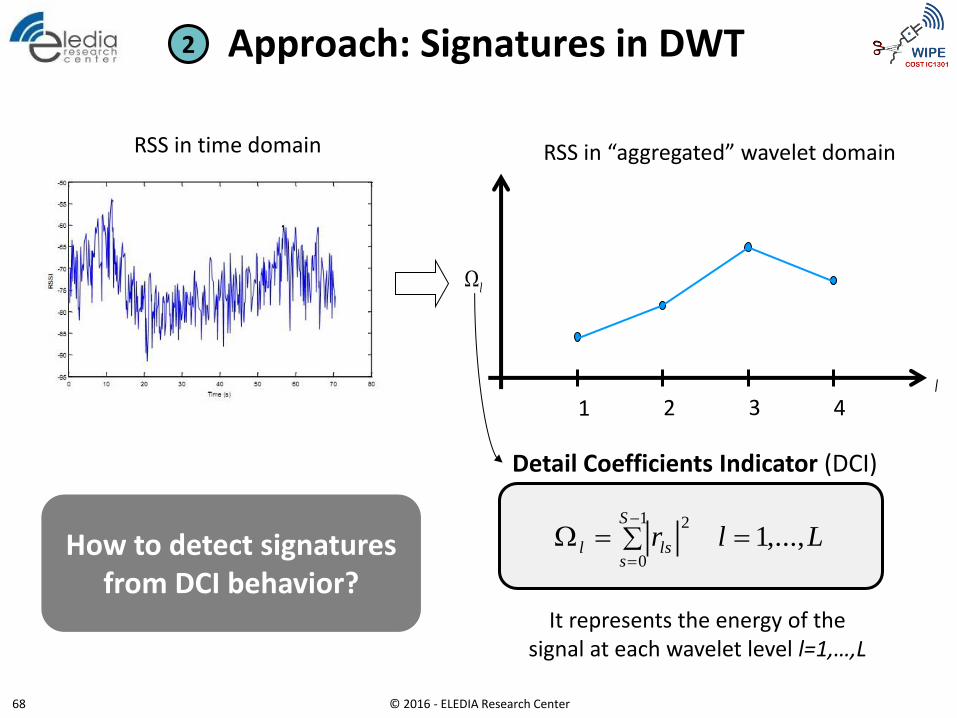
Approach: Signatures in DWT 2
RSS in time domain
l
l
1 2 3 4
RSS in “aggregated” wavelet domain
LlrS
slsl ,...,1
1
0
2
Detail Coefficients Indicator (DCI)
It represents the energy of the signal at each wavelet level l=1,…,L
How to detect signatures from DCI behavior?
© 2016 - ELEDIA Research Center 68
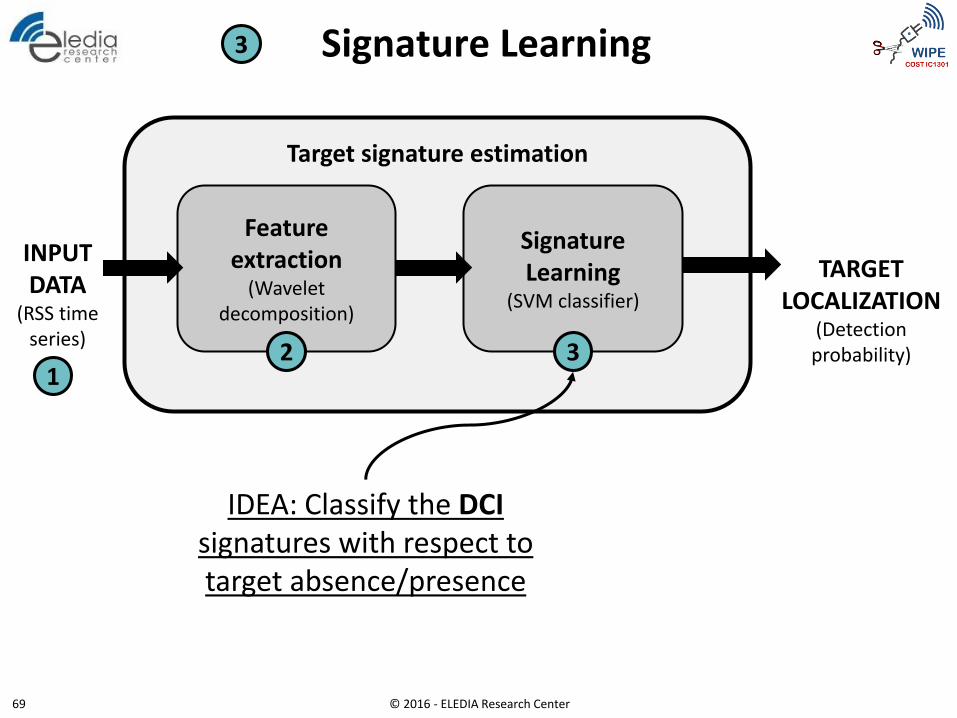
Target signature estimation
Signature Learning
Feature extraction
(Wavelet decomposition)
Signature Learning
(SVM classifier)
INPUT DATA
(RSS time series)
1 2 3
IDEA: Classify the DCI signatures with respect to target absence/presence
3
TARGET LOCALIZATION
(Detection probability)
© 2016 - ELEDIA Research Center 69
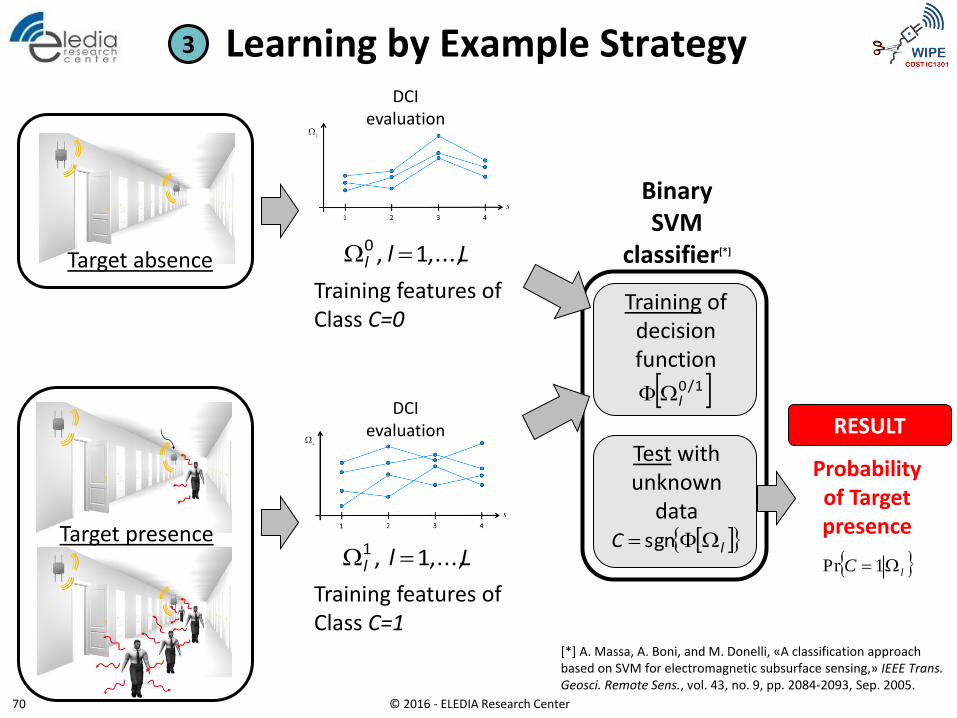
Learning by Example Strategy
Target absence
Target presence
DCI evaluation
DCI evaluation
Training features of Class C=0
Training features of Class C=1
Lll ,...,1,1
Lll ,...,1,0
Probability of Target presence
lC 1Pr
[*] A. Massa, A. Boni, and M. Donelli, «A classification approach based on SVM for electromagnetic subsurface sensing,» IEEE Trans. Geosci. Remote Sens., vol. 43, no. 9, pp. 2084-2093, Sep. 2005.
Binary SVM
classifier[*]
Training of decision function
1/0l
Test with unknown
data lC sgn
3
RESULT
© 2016 - ELEDIA Research Center 70
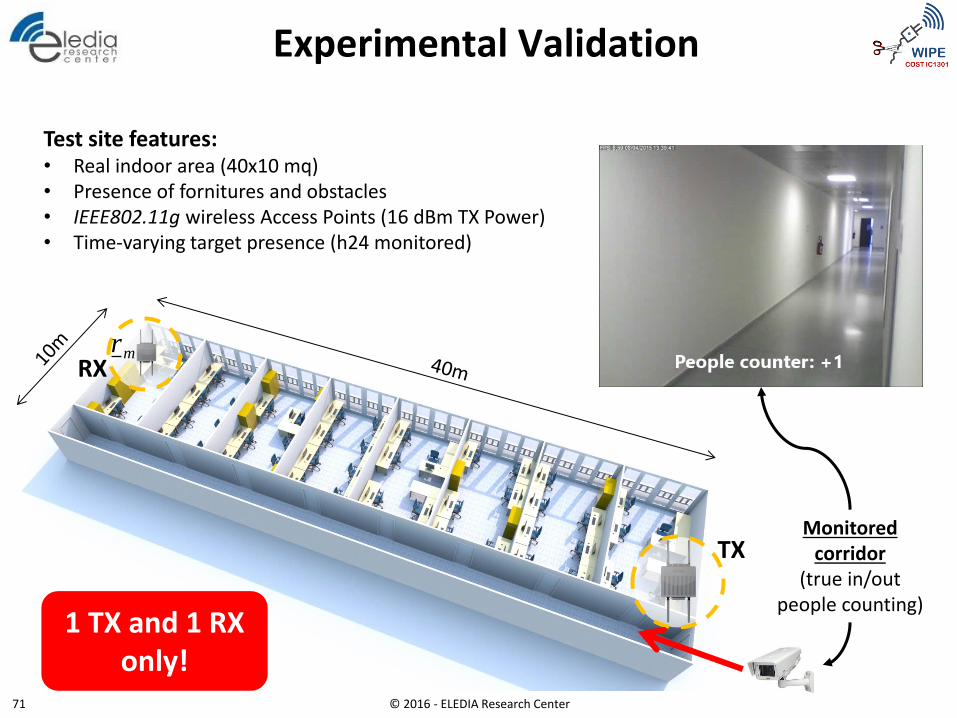
Experimental Validation
TX
mrRX
Test site features: • Real indoor area (40x10 mq) • Presence of fornitures and obstacles • IEEE802.11g wireless Access Points (16 dBm TX Power) • Time-varying target presence (h24 monitored)
Monitored corridor
(true in/out people counting)
1 TX and 1 RX only!
© 2016 - ELEDIA Research Center 71
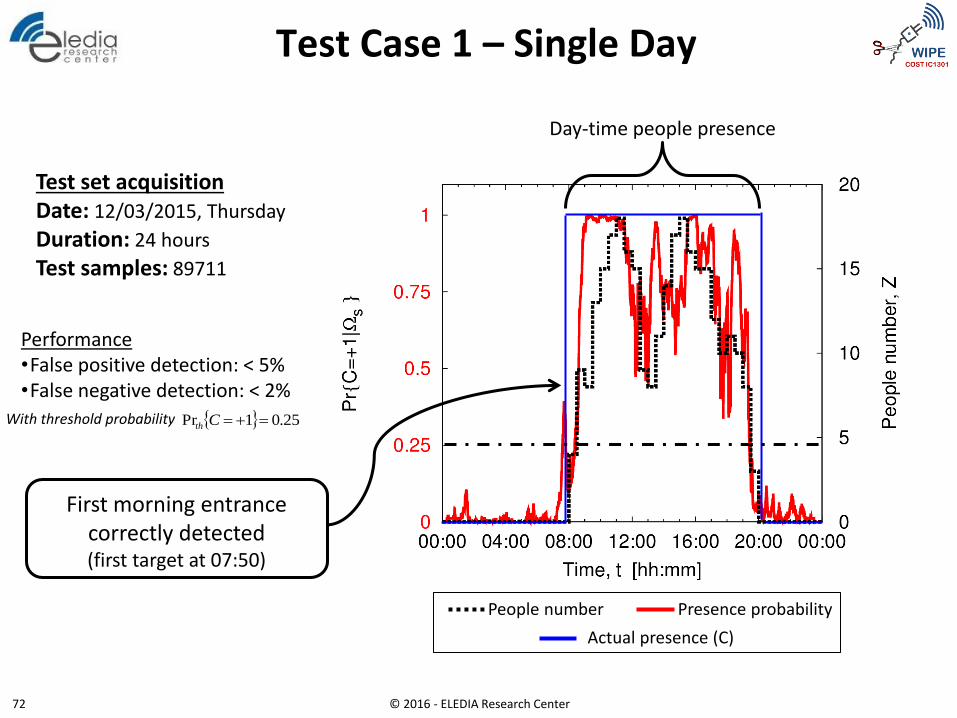
Test Case 1 – Single Day
Test set acquisition Date: 12/03/2015, Thursday
Duration: 24 hours
Test samples: 89711
First morning entrance correctly detected (first target at 07:50)
Day-time people presence
People number Presence probability
25.01Pr CthWith threshold probability
Performance •False positive detection: < 5% •False negative detection: < 2%
Actual presence (C)
© 2016 - ELEDIA Research Center 72
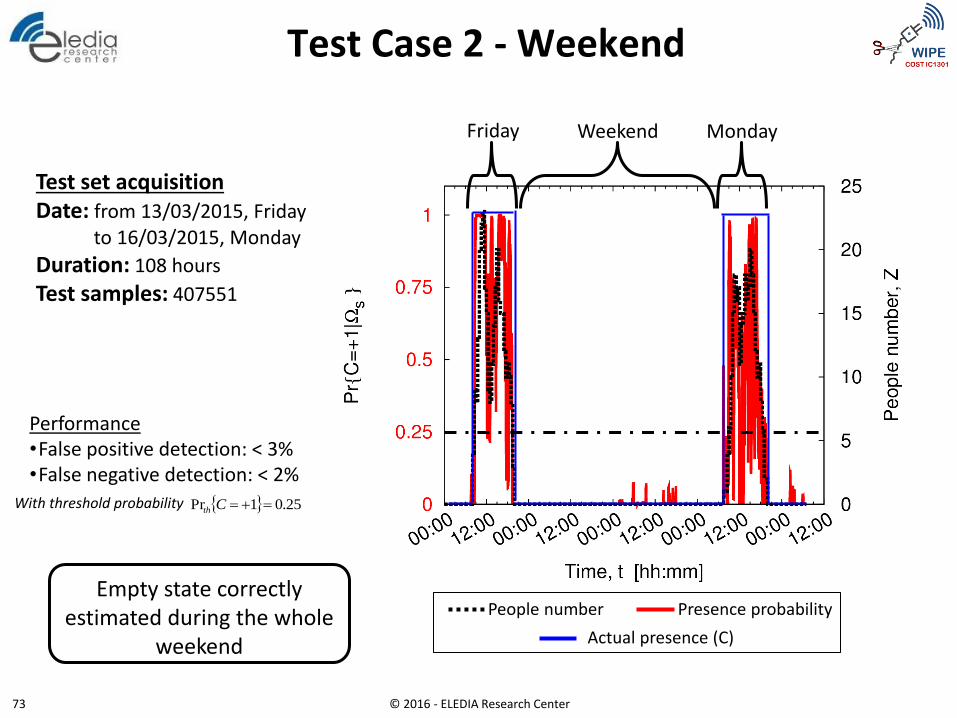
Test Case 2 - Weekend
Test set acquisition Date: from 13/03/2015, Friday to 16/03/2015, Monday
Duration: 108 hours
Test samples: 407551
Friday Weekend Monday
25.01Pr CthWith threshold probability
Performance •False positive detection: < 3% •False negative detection: < 2%
Empty state correctly estimated during the whole
weekend
People number Presence probability
Actual presence (C)
© 2016 - ELEDIA Research Center 73
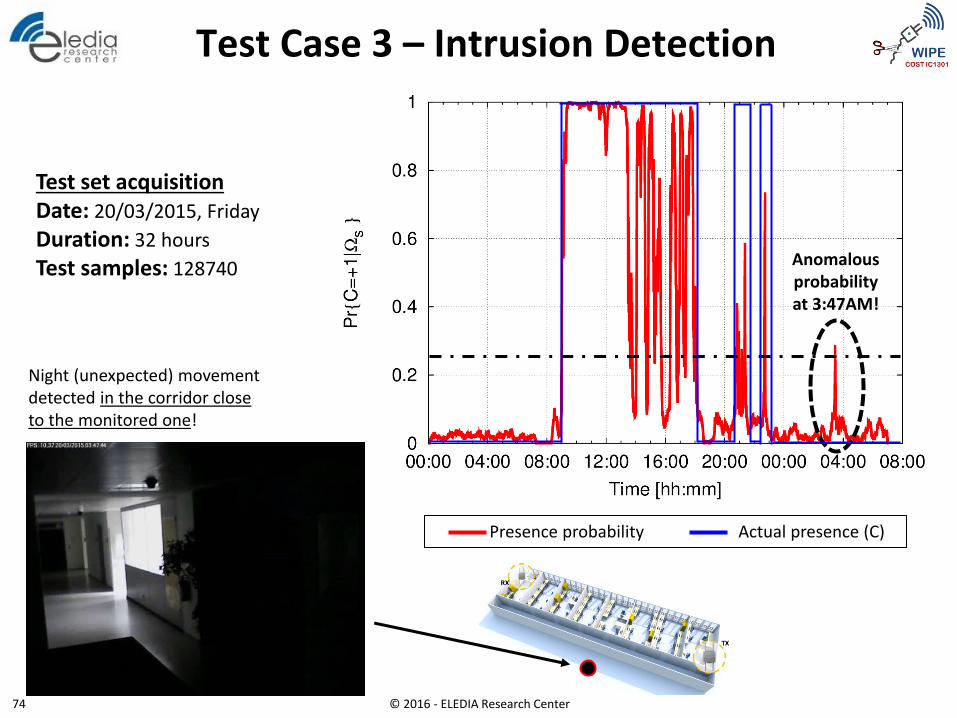
Test Case 3 – Intrusion Detection
Presence probability
Test set acquisition Date: 20/03/2015, Friday
Duration: 32 hours
Test samples: 128740 Anomalous probability at 3:47AM!
Night (unexpected) movement detected in the corridor close to the monitored one!
Actual presence (C)
© 2016 - ELEDIA Research Center 74
Outline
• EM Positioning for IoT – Intro & Motivation
• Active Localization of Mobile Devices
• Localization through optimization
• Semantic-based probabilistic approach
• Passive Localization of Transceiver-free Targets
• Target tracking
• Crowd detection
• Indirect occupancy estimation
• Conclusions and Actual Trends
© 2016 - ELEDIA Research Center 75
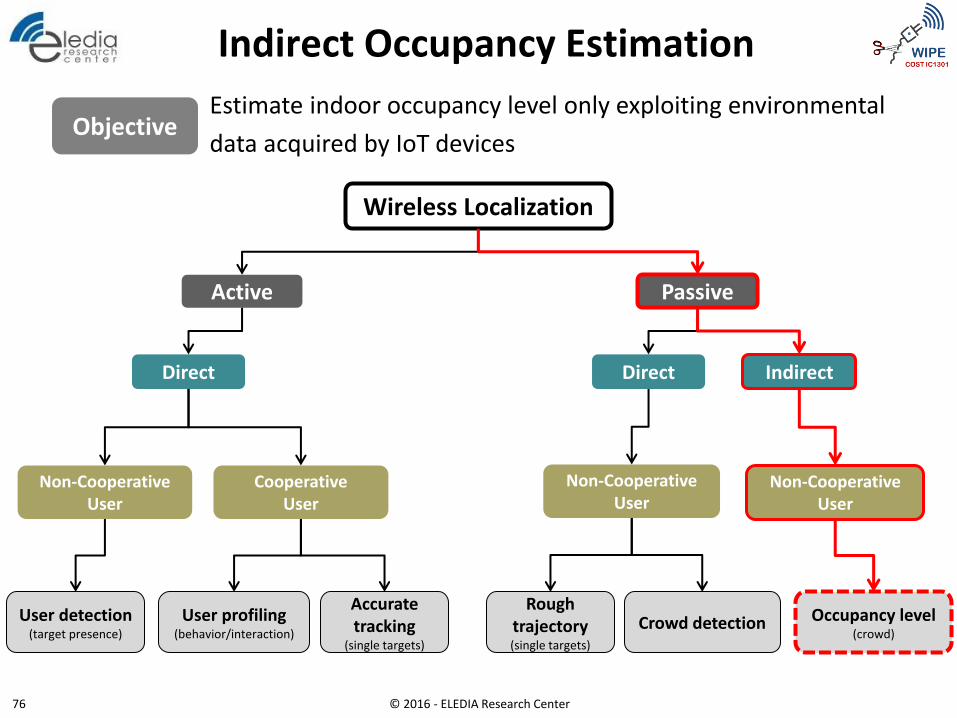
Indirect Occupancy Estimation
Wireless Localization
Non-Cooperative User
Occupancy level (crowd)
Cooperative User
Non-Cooperative User
Passive Active
Direct Direct Indirect
Non-Cooperative User
Rough trajectory (single targets)
Crowd detection User profiling (behavior/interaction)
Accurate tracking
(single targets)
User detection (target presence)
© 2016 - ELEDIA Research Center 76
Objective Estimate indoor occupancy level only exploiting environmental
data acquired by IoT devices
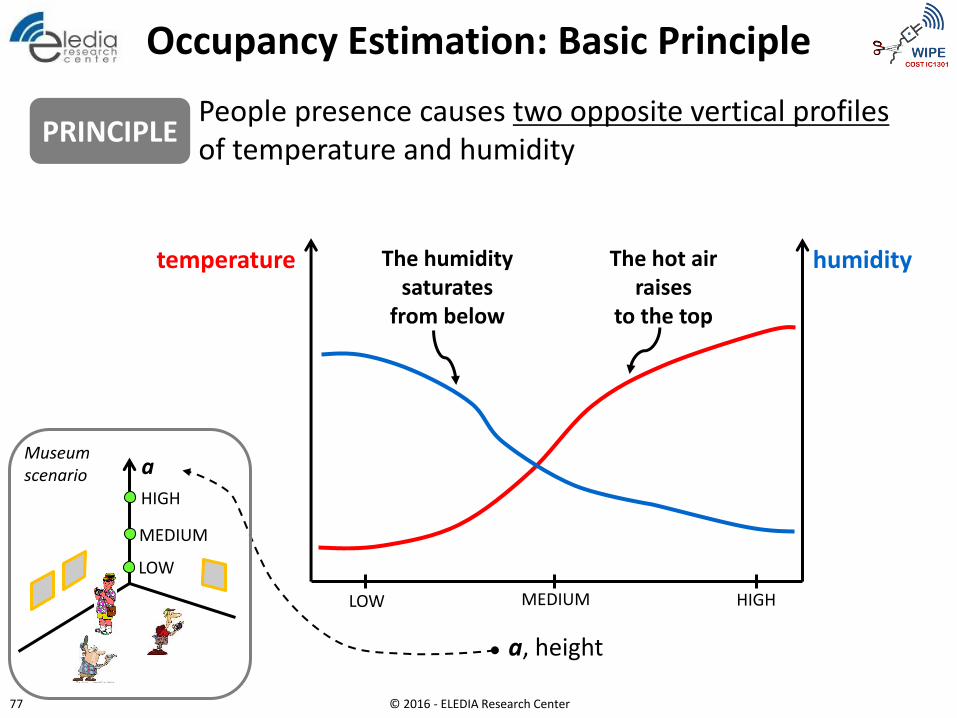
The hot air raises
to the top
The humidity saturates
from below
People presence causes two opposite vertical profiles of temperature and humidity
Occupancy Estimation: Basic Principle
temperature humidity
a, height
LOW MEDIUM HIGH
a
LOW
MEDIUM
HIGH
PRINCIPLE
Museum scenario
© 2016 - ELEDIA Research Center 77
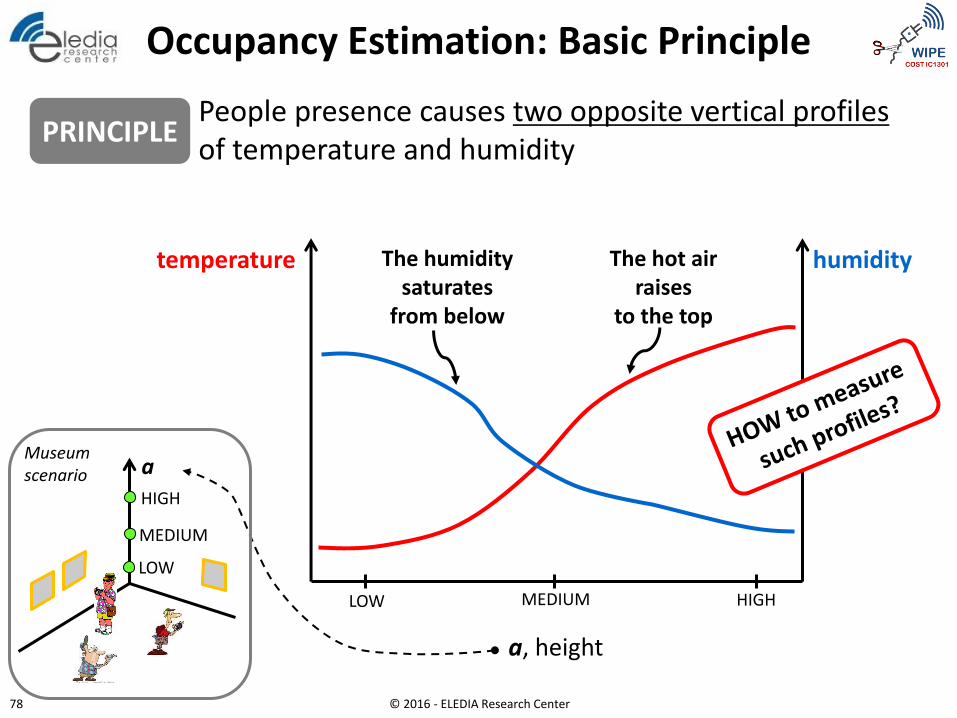
The hot air raises
to the top
The humidity saturates
from below
People presence causes two opposite vertical profiles of temperature and humidity
Occupancy Estimation: Basic Principle
LOW MEDIUM HIGH
PRINCIPLE
a, height
a
LOW
MEDIUM
HIGH
Museum scenario
temperature humidity
© 2016 - ELEDIA Research Center 78
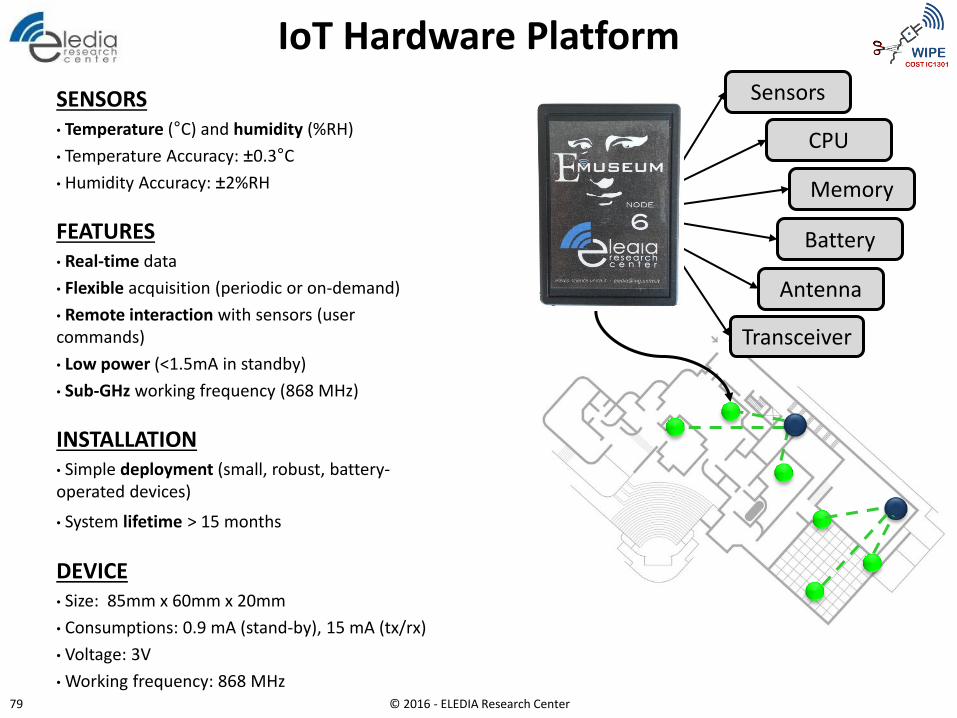
IoT Hardware Platform
SENSORS • Temperature (°C) and humidity (%RH)
• Temperature Accuracy: ±0.3°C
• Humidity Accuracy: ±2%RH
FEATURES • Real-time data
• Flexible acquisition (periodic or on-demand)
• Remote interaction with sensors (user commands)
• Low power (<1.5mA in standby)
• Sub-GHz working frequency (868 MHz)
INSTALLATION • Simple deployment (small, robust, battery-operated devices)
• System lifetime > 15 months
DEVICE • Size: 85mm x 60mm x 20mm
• Consumptions: 0.9 mA (stand-by), 15 mA (tx/rx)
• Voltage: 3V
• Working frequency: 868 MHz
Sensors
CPU
Memory
Battery
Transceiver
Antenna
© 2016 - ELEDIA Research Center 79
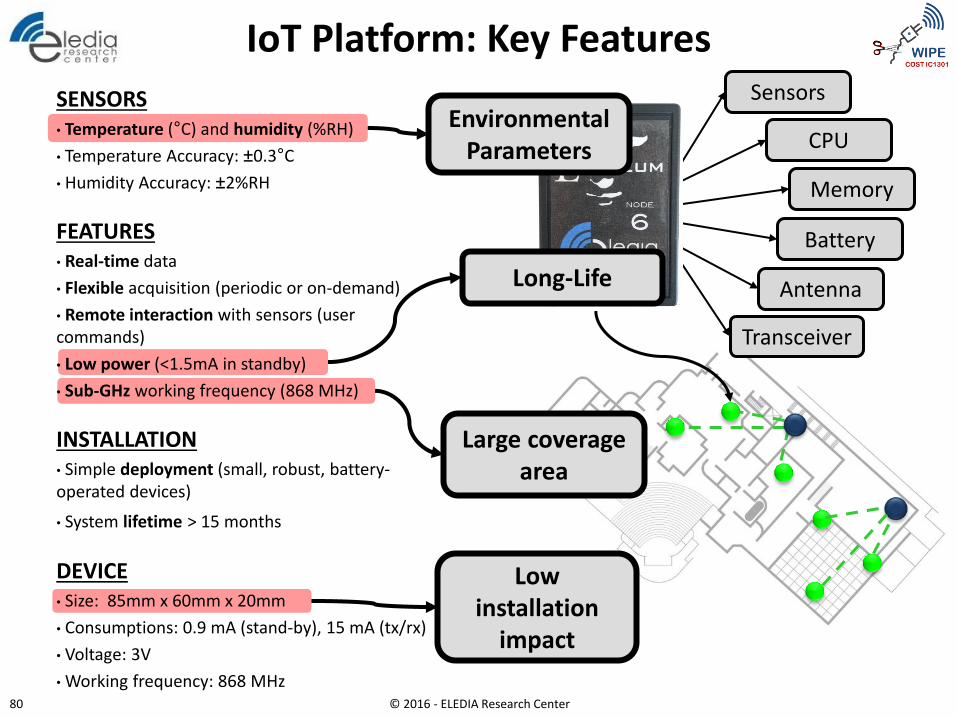
IoT Platform: Key Features
Large coverage area
Low installation
impact
SENSORS • Temperature (°C) and humidity (%RH)
• Temperature Accuracy: ±0.3°C
• Humidity Accuracy: ±2%RH
FEATURES • Real-time data
• Flexible acquisition (periodic or on-demand)
• Remote interaction with sensors (user commands)
• Low power (<1.5mA in standby)
• Sub-GHz working frequency (868 MHz)
INSTALLATION • Simple deployment (small, robust, battery-operated devices)
• System lifetime > 15 months
DEVICE • Size: 85mm x 60mm x 20mm
• Consumptions: 0.9 mA (stand-by), 15 mA (tx/rx)
• Voltage: 3V
• Working frequency: 868 MHz
Sensors
CPU
Memory
Battery
Transceiver
Antenna
Environmental Parameters
Long-Life
© 2016 - ELEDIA Research Center 80
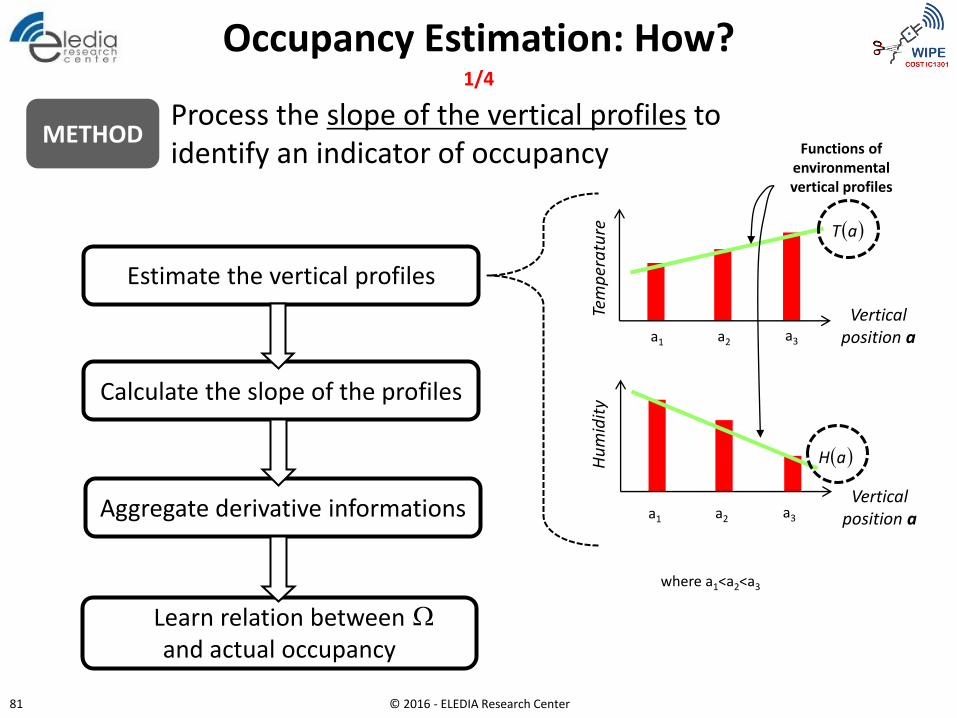
METHOD Process the slope of the vertical profiles to identify an indicator of occupancy
Estimate the vertical profiles
Calculate the slope of the profiles
Aggregate derivative informations
Vertical position a a1 a2 a3
Tem
per
atu
re
Vertical position a
Hu
mid
ity
aT
aH
Functions of environmental vertical profiles
a1 a2 a3
where a1<a2<a3
Occupancy Estimation: How? 1/4
Learn relation between and actual occupancy
© 2016 - ELEDIA Research Center 81
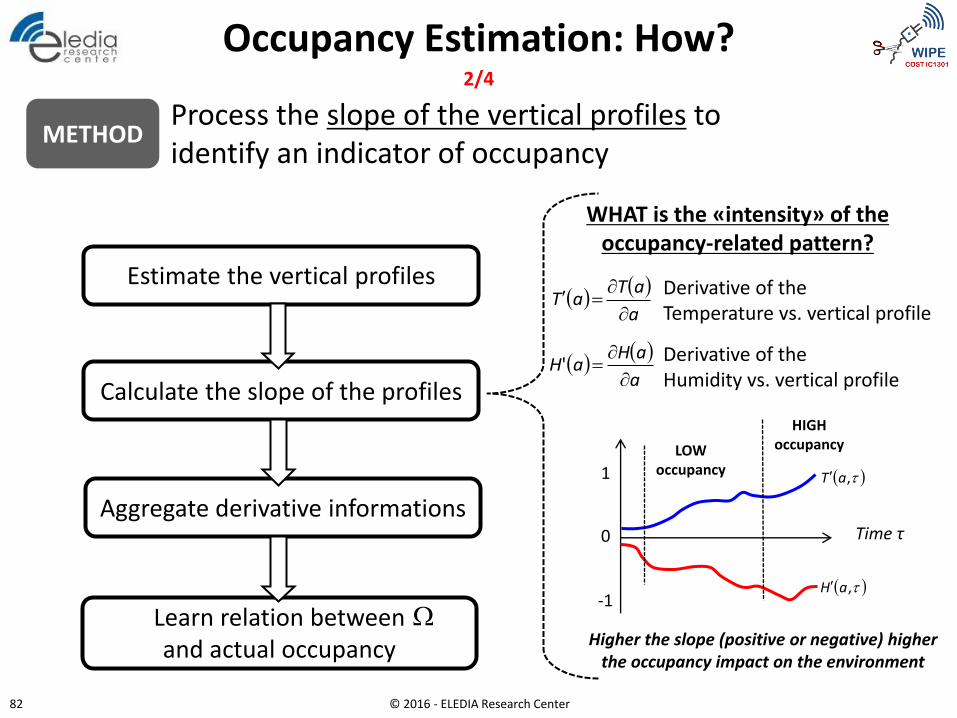
Estimate the vertical profiles
Calculate the slope of the profiles
Aggregate derivative informations
a
aTaT
Derivative of the Temperature vs. vertical profile
Derivative of the Humidity vs. vertical profile
WHAT is the «intensity» of the occupancy-related pattern?
Time τ 0
1
-1
,aT
,aH
Higher the slope (positive or negative) higher the occupancy impact on the environment
LOW occupancy
HIGH occupancy
a
aHaH
'
Occupancy Estimation: How?
METHOD Process the slope of the vertical profiles to identify an indicator of occupancy
2/4
Learn relation between and actual occupancy
© 2016 - ELEDIA Research Center 82
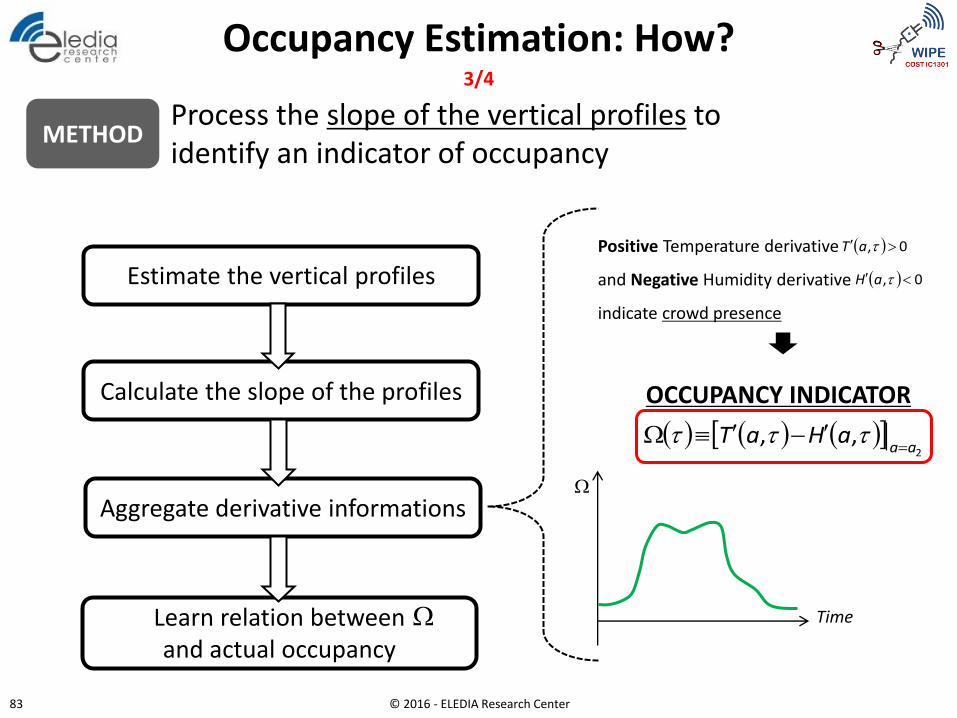
Learn relation between and actual occupancy
Positive Temperature derivative
and Negative Humidity derivative
indicate crowd presence
Estimate the vertical profiles
Calculate the slope of the profiles
Aggregate derivative informations
2
,,aa
aHaT
Time
0, aH
0, aT
OCCUPANCY INDICATOR
Occupancy Estimation: How?
METHOD Process the slope of the vertical profiles to identify an indicator of occupancy
3/4
© 2016 - ELEDIA Research Center 83
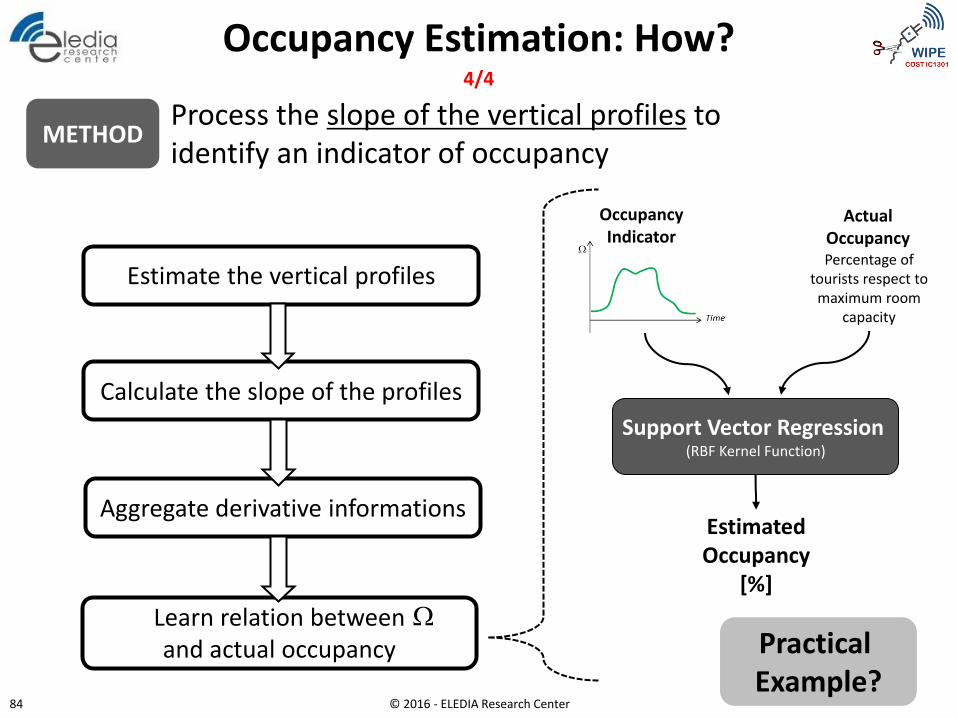
Learn relation between and actual occupancy Practical
Example?
Estimate the vertical profiles
Calculate the slope of the profiles
Aggregate derivative informations
Occupancy Estimation: How?
METHOD Process the slope of the vertical profiles to identify an indicator of occupancy
4/4
Occupancy Indicator
Actual Occupancy Percentage of
tourists respect to maximum room
capacity
Support Vector Regression (RBF Kernel Function)
Estimated Occupancy
[%]
© 2016 - ELEDIA Research Center 84

Deployment @ “Sala dei 500”
• Commissioned in 1494 by Girolamo
Savonarola, expanded in 1555 by
Cosimo I De’ Medici
• Largest and most important (historically
and artistically) hall in “Palazzo Vecchio”
in Florence
• Largest “civil power” hall in Italy
• Hosts sculptures and paintings made
between 1490 and 1600 (including
Michelangelo, Vasari, Giambologna,
Ghirlandaio, Passignano, Francavilla,…)
“Genio della Vittoria” Michelangelo Buonarroti
Sala dei 500, Firenze
“Pisa attaccata dalle truppe di Firenze”, Giorgio Vasari
© 2016 - ELEDIA Research Center 85
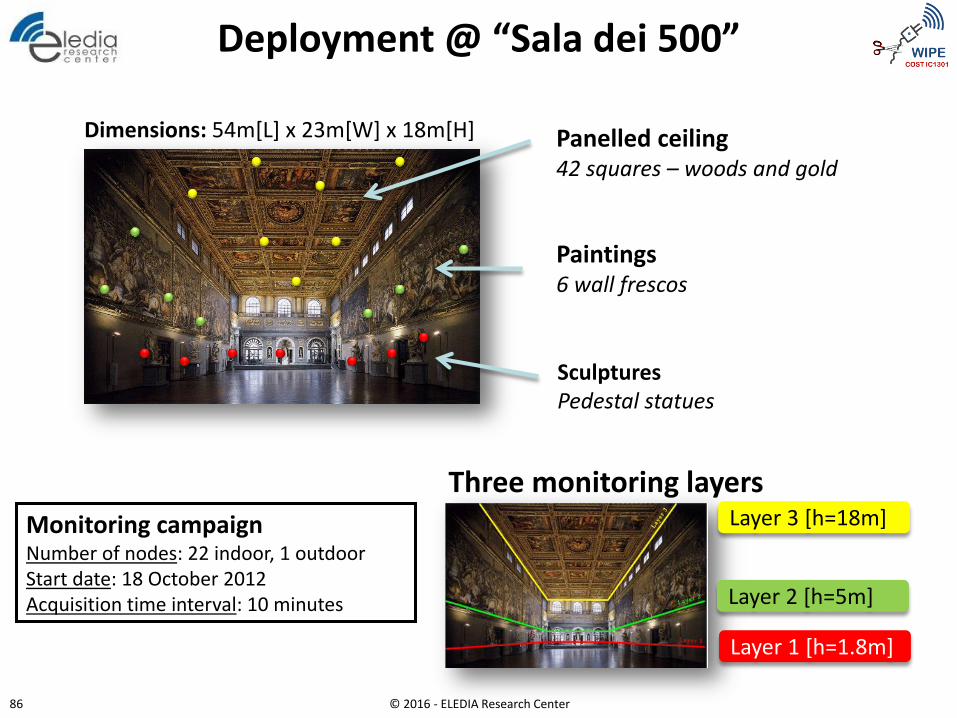
Deployment @ “Sala dei 500”
Dimensions: 54m[L] x 23m[W] x 18m[H] Panelled ceiling 42 squares – woods and gold
Paintings 6 wall frescos
Sculptures Pedestal statues
Three monitoring layers
Layer 1 [h=1.8m]
Layer 2 [h=5m]
Layer 3 [h=18m] Monitoring campaign Number of nodes: 22 indoor, 1 outdoor Start date: 18 October 2012 Acquisition time interval: 10 minutes
© 2016 - ELEDIA Research Center 86
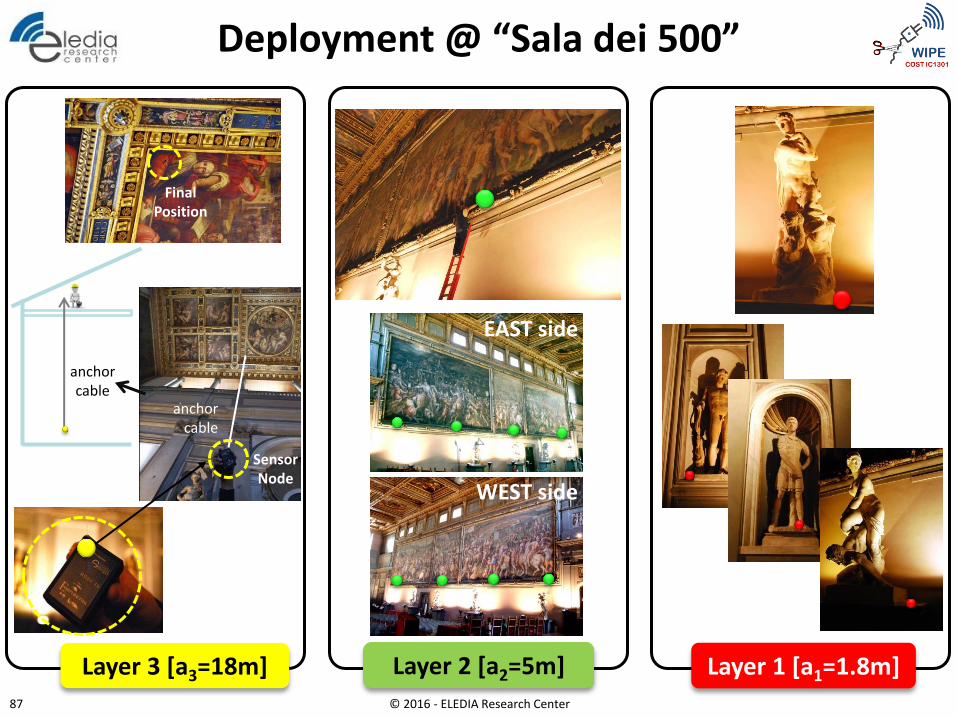
Layer 3 [a3=18m]
Sensor Node
Final Position
anchor cable
anchor cable
Layer 2 [a2=5m]
EAST side
WEST side
Layer 1 [a1=1.8m]
Deployment @ “Sala dei 500”
© 2016 - ELEDIA Research Center 87
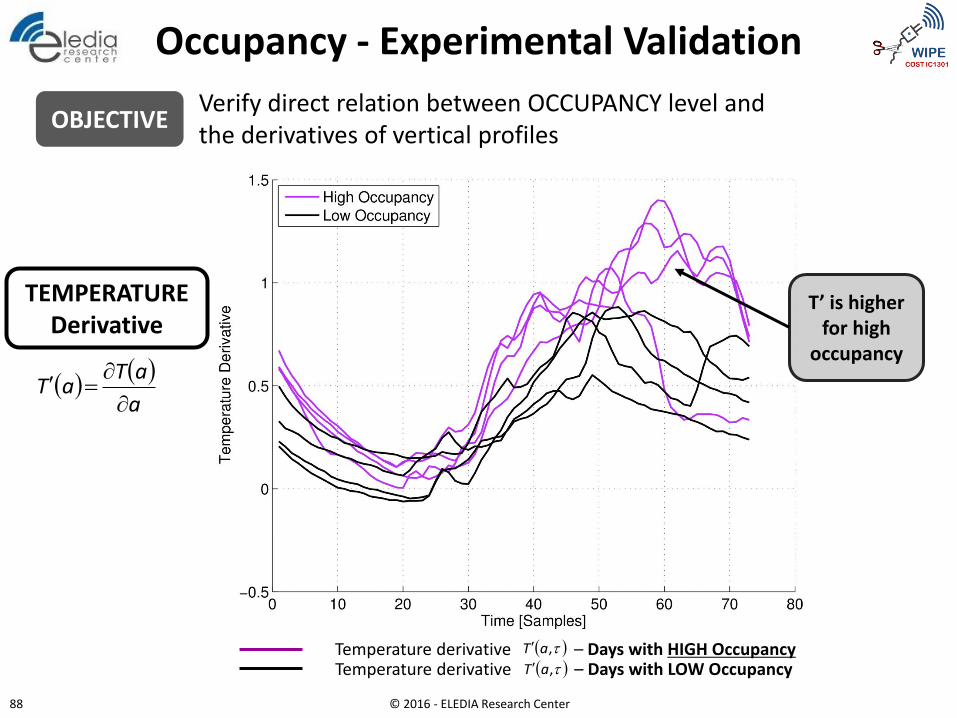
Temperature derivative – Days with HIGH Occupancy Temperature derivative – Days with LOW Occupancy
,aT
,aT
OBJECTIVE Verify direct relation between OCCUPANCY level and the derivatives of vertical profiles
Occupancy - Experimental Validation
TEMPERATURE Derivative
T’ is higher for high
occupancy
a
aTaT
© 2016 - ELEDIA Research Center 88
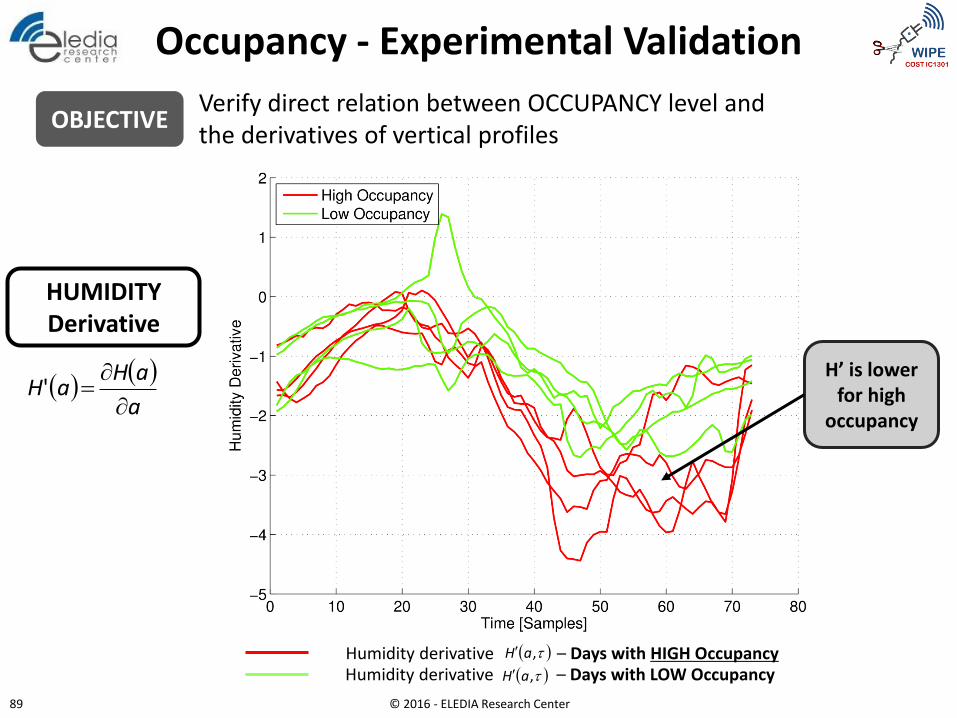
HUMIDITY Derivative
Humidity derivative – Days with LOW Occupancy Humidity derivative – Days with HIGH Occupancy
,aH
,aH
H’ is lower for high
occupancy
Occupancy - Experimental Validation
OBJECTIVE
a
aHaH
'
Verify direct relation between OCCUPANCY level and the derivatives of vertical profiles
© 2016 - ELEDIA Research Center 89
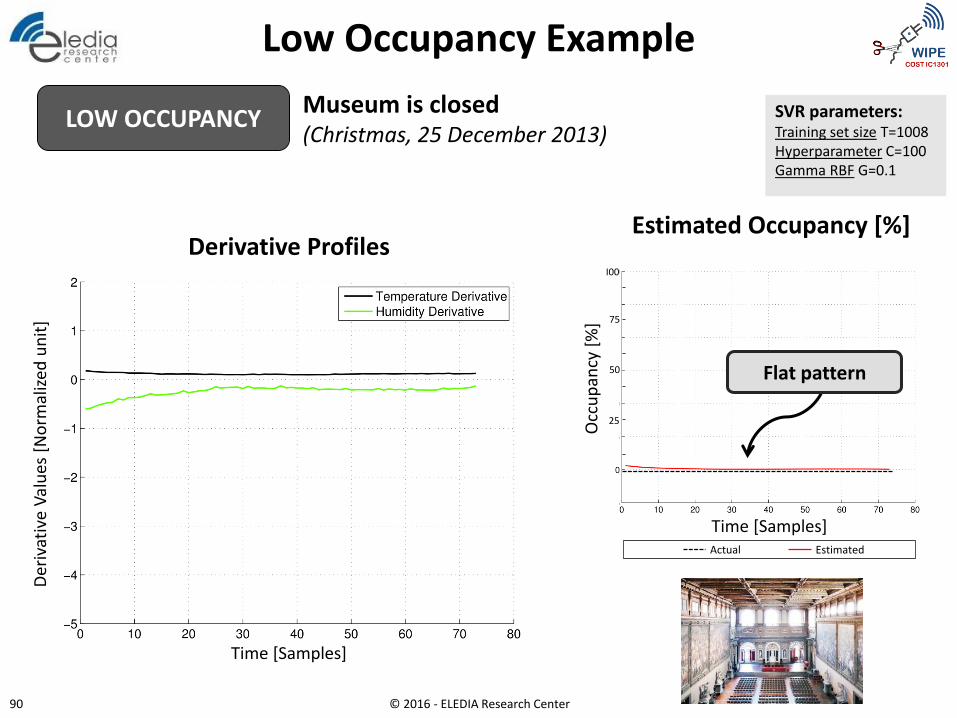
LOW OCCUPANCY Museum is closed (Christmas, 25 December 2013)
Derivative Profiles Estimated Occupancy [%]
Der
ivat
ive
Val
ues
[N
orm
aliz
ed u
nit
]
Time [Samples]
Time [Samples]
Low Occupancy Example
Flat pattern
I00
Actual Estimated
50
25
75
Occ
up
ancy
[%
]
SVR parameters: Training set size T=1008 Hyperparameter C=100 Gamma RBF G=0.1
© 2016 - ELEDIA Research Center 90
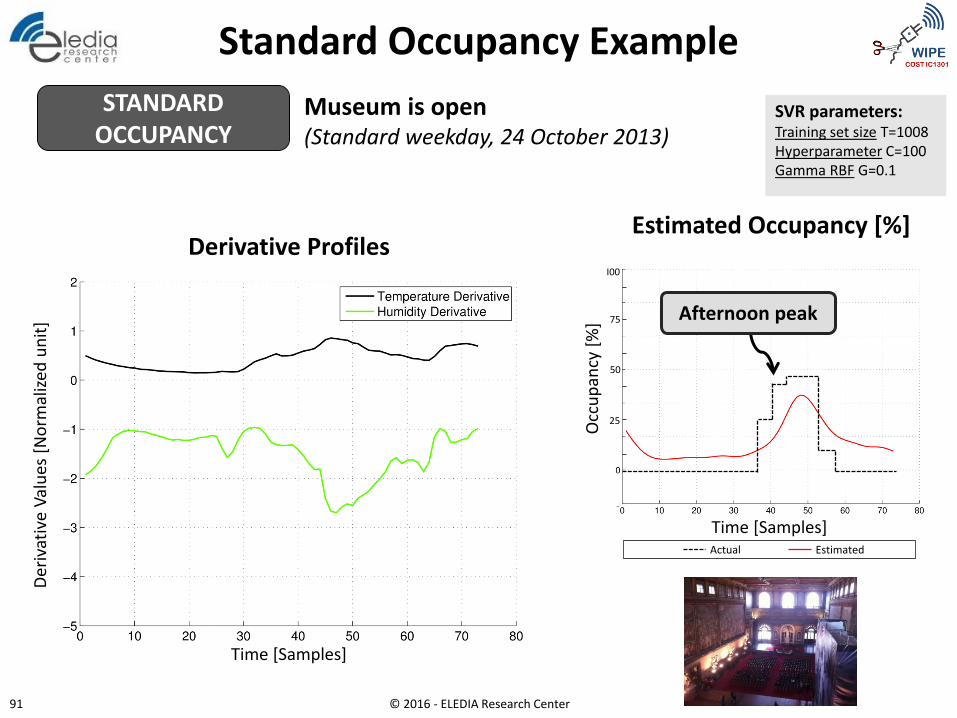
Museum is open (Standard weekday, 24 October 2013)
Der
ivat
ive
Val
ues
[N
orm
aliz
ed u
nit
]
Time [Samples]
Time [Samples]
Standard Occupancy Example
STANDARD OCCUPANCY
Afternoon peak
Actual Estimated
Derivative Profiles Estimated Occupancy [%]
I00
50
25
75
Occ
up
ancy
[%
]
SVR parameters: Training set size T=1008 Hyperparameter C=100 Gamma RBF G=0.1
© 2016 - ELEDIA Research Center 91
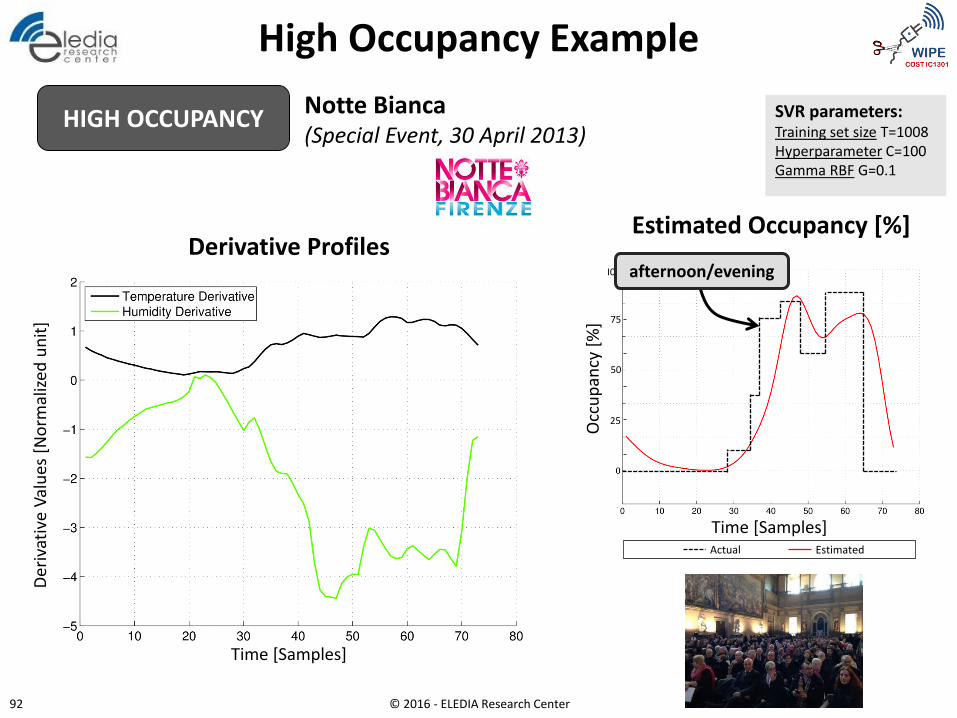
Notte Bianca (Special Event, 30 April 2013)
Der
ivat
ive
Val
ues
[N
orm
aliz
ed u
nit
]
Time [Samples]
Time [Samples]
High Occupancy Example
HIGH OCCUPANCY
Actual Estimated
Derivative Profiles Estimated Occupancy [%]
I00
50
25
75
Occ
up
ancy
[%
]
afternoon/evening
SVR parameters: Training set size T=1008 Hyperparameter C=100 Gamma RBF G=0.1
© 2016 - ELEDIA Research Center 92
Conclusions
• Opportunistic Approaches for Wireless Localization
• EM information from IoT Devices can be Exploited for Localization
• Different Approaches for Different Scenarios and Requirements
• Sensor Fusion Strategies Exploiting Heterogeneous IoT Devices/Technologies (RFID, wearables, etc.)
• Investigation of Hybrid Solutions “p-active” (passive and active)
Current Trends
© 2016 - ELEDIA Research Center 93

ELEctromagnetic DIAgnostics Research Center ELEDIA@UniTN (University of Trento) Via Sommarive 9, 38123 Trento, Italy
E-mail: [email protected] Web: www.eledia.org
IC1301 WIPE Cost Action – 2016 International Spring School April 18-20, 2016 – Bologna, Italy
EM Positioning for IoT Fundamentals and Advances
Federico Viani, Alessandro Polo, Andrea Massa