Embed Size (px)
Citation preview
8/4/2019 EMBARGOED Kicking the Tyres
http://slidepdf.com/reader/full/embargoed-kicking-the-tyres 1/42
kicking the tyresChoosing a voting system for New Zealand
embargoed until 20 september 2011
8/4/2019 EMBARGOED Kicking the Tyres
http://slidepdf.com/reader/full/embargoed-kicking-the-tyres 2/42
contents
Kicking the Tyres. Choosing a voting system for New Zealand 1
Evaluating Voting Systems 2
Mixed Member Proportional (MMP) 7
First-Past-the-Post (FPP) 11
Preferential Voting (PV) 15
Single Transferable Vote (STV) 19
Supplementary Member (SM) 23
Conclusion 27
Endnotes 29
Embargoed until 20 September 2011
8/4/2019 EMBARGOED Kicking the Tyres
http://slidepdf.com/reader/full/embargoed-kicking-the-tyres 3/42
acknowledgements
We wish to acknowledge Ian McAllister, Graeme Edgeler and Malcolm Mackerras for offering advice
and thorough and insightful comments on draft versions of this paper. Responsibility for the nal
paper and the views expressed within rests with us.
about the author
Steve Thomas is a Researcher at Maxim Institute. He was educated at the
University of Canterbury, graduating with a Master of Arts with Distinction.
Steve’s background is in politics and history, and he has researched and
written in a number of areas including New Zealand politics, education
and taxation. He is the author of two of Maxim Institute’s Tax Discussion
Series papers, its Roll Play education report, which examined how access
to Christchurch schools could be improved for more families, as well as
two reports in the Institute’s award-winning series of Parent Factor reports:
Inormation or parents and Access to education. He also published his rst book in 2008, Cotonou
and Pacifc Regionalism.
Embargoed until 20 September 2011
8/4/2019 EMBARGOED Kicking the Tyres
http://slidepdf.com/reader/full/embargoed-kicking-the-tyres 4/42kicking the tyres - 1
“New Zealanders have had to wait long enough for a chance to kick the tyres on MMP. So,
National will give them that chance by holding a binding referendum on MMP by no later
than 2011.
And, if a majority of voters decide MMP is not their preferred electoral system, we will offer
them a choice between a range of electoral systems to replace it.”
John Key, “Speech to the Annual National Party Conference,” Wellington, 3 August 20081
At the 2011 election in November, voters will get the chance to vote in a referendum on whether
New Zealand will keep its Mixed Member Proportional (MMP) voting system. Voters will also get the
chance to decide which voting system they would prefer if we do not keep MMP, out of four possible
alternatives. If a majority of voters decide that MMP ought to be kept, then parliament has said that
there will be a review of MMP to nd ways of improving it. The referendum is an opportunity to “kick
the tyres on MMP,” and see whether it should be kept or whether the voting system should change.
This should not be done without reasoned and considered national debate of all the options.
Every voting system operates within a specic political culture and party system and these factors
can inuence the way voters behave in using a particular voting system.2 This paper contributes to the
debate about which voting system New Zealand should have by evaluating the ve different voting
systems that voters will be asked to choose from at the 2011 referendum—MMP; First-Past-the-Post
(FPP); Preferential Voting (PV); Single Transferable Vote (STV); and Supplementary Member (SM).
We shall evaluate each system according to what we believe are criteria of effective representation.
We have limited ourselves to the questions which the referendum is asking about the voting system.
We therefore do not consider elements of the voting systems debate that are outside of this scope.
We hope that our evaluation will help voters to decide which system they will choose at
November’s referendum.
kicking the tyres
Choosing a voting system for New Zealand
Embargoed until 20 September 2011
8/4/2019 EMBARGOED Kicking the Tyres
http://slidepdf.com/reader/full/embargoed-kicking-the-tyres 5/42evaluating voting systems - 2
There is no perfect way of turning everyone’s votes into 120 politicians in parliament. Different voting
systems use different methods. This year, New Zealand is asking which system is best for our country.
What we decide will tangibly affect which MPs are elected, what parties get representation and how
governments are formed.1 For example, some systems (majoritarian ones) make it easier for major
parties to win most of the seats, while other systems (proportional ones) make it easier for minor
parties to win seats and normally mean parties have to share power.2
There are strengths and limitations to any system. Choosing a voting system involves making
trade-offs between each system’s strengths and limitations. So, how do we decide what’s important?3
Simply put, New Zealand should have a voting system that enables representative democracy
to ourish. That is, the voting system should enable our MPs and the government to have the
freedom to lead and to make decisions in the best interests of all New Zealanders, but it should
also encourage them to listen and be responsive to the interests of New Zealanders and their local
communities.4
Evaluation criteria
We have developed seven evaluation criteria and have organised them under two major headings:how voting systems enable quality representation; and how they affect the workings of parliament
and government.5 No system will get a tick against every criterion, and in fact, some of the criteria
might exclude each other. For example, there is often a trade-off between the government being able
to pass the laws that it wants, and making parliament more representative of society at large. Our
criteria cannot be used to produce a tally to decide which voting system is best. Instead they help us
to understand the systems, so that we can vote according to what we believe is most important for
quality representation.
evaluating voting
systems
Embargoed until 20 September 2011
8/4/2019 EMBARGOED Kicking the Tyres
http://slidepdf.com/reader/full/embargoed-kicking-the-tyres 6/42evaluating voting systems - 3
Representation
Representation is the life-blood of democratic government. Instead of four million people trying todecide every law together, we have people acting on our behalf to do so—those people are our MPs.
When it comes to voting systems, the question becomes—which system can produce a parliament
that represents the different communities and interests in our country well?
There are two common ways to think about how representation can be provided for in
parliament—through MPs who are from our local, geographic communities (called electorate
representation); or through MPs who represent interest groups to which people belong or with whom
people agree (called representation of interests).
1. Electorate representation—how important are electorate MPs in the system?
Electorate MPs are connected to, and held accountable by, a community of people who live ina particular place. A community knows that an electorate MP will have their concerns in mind
in parliament.6 This concern provides for a relational connection and loyalty between MPs and
voters. When an MP represents an electorate, their responsibility is quite clear—they represent
the people who are from their area while they make decisions about what is good for the country
as a whole.7
Electorate representation means that all local areas, whether rural or urban, North Island
or South, are heard in parliament.
2. Representation of interests—how does the system provide for the representation of interest
and identity groups in parliament?
Identity is not just shaped by location. For example, people are also shaped by the social, ethnic
and religious communities to which they belong or with whom they identify, which may not be
located all within one electorate.8 In a diverse and complex society, there is a range of other
interests that need to be considered when deciding what is good for everyone. It is important
that parliament can reect the breadth of society so that minority voices have the chance to be
heard in parliament.
All voting systems provide the opportunity for the representation of interests in some
way, but some systems make it easier for people from minority interest groups to be elected
and for those views to be easily represented. Given that society is comprised of a diversity of
communities it is difcult for two or three major political parties to represent all of the different
identities and groups. Majority rule cannot always take into account the wide range of theseperspectives in the decisions which affect the community.9 This is why some countries use
proportional systems. They are intended to elect a parliament that reects a wide cross-section
of the different interest and identity groups.
It is impossible to measure exactly how a system does or does not cater for interest group
representation. This is because an interest group can be represented by someone who is not
part of that group themselves. For example, a non-Pasika MP can act on behalf of the Pasika
community in parliament. But systems that are proportional are typically seen to be best at
Embargoed until 20 September 2011
8/4/2019 EMBARGOED Kicking the Tyres
http://slidepdf.com/reader/full/embargoed-kicking-the-tyres 7/42evaluating voting systems - 4
providing for interest groups to be represented. We will use the proportionality of parliament
as our measure for how well interest groups are represented. That is, whether the number
of seats each party has in parliament is roughly in proportion to the number of votes that it
receives. Proportionality is an imperfect measure because effective representation of interests
relies on more than the sheer number of people from different interest groups being elected to
parliament. However, it is the most helpful and concrete indicator available.
When it comes to voting systems, there is usually a theoretical tension between giving priority to
the representation of interests and giving priority to electorate representation. In practice, the two
do not need to be seen in opposition. In fact, they tend to operate together to produce effective
representation. Every MP comes from a particular ethnicity and might stand for that group’s interests
in parliament, but they can also represent the interests of their local electorate and the people who
they know of other ethnic groups, whose wishes and needs they consider as they think about whatis good for the country as a whole. The two styles of representation do not exclude each other—they
go hand-in-hand.
Effects on parliament and government
We also need to think about what the voting system means for how parliament functions in practice.
Voting systems inuence what sort of government is formed and how parliament does its job.
Particular criteria to consider are:
1. Accountability—does the voting system help voters hold the government and MPs to account
for their performance?
To quote the philosopher Karl Popper, “throwing out the rascals” ought to be easy if they are
not performing.10 In voting systems where people are chosen through party lists instead of an
electorate, this accountability can be reduced as MPs are reliant on their party’s success more
than the support of local voters.
2. Legitimacy—does the voting system deliver the electoral outcomes that voters, as a whole,
want and expect?
Voters should be condent that their vote counts towards the fair election of candidates and
parties. The voting system should not be biased but should assign all votes the same value
as much as possible.11 Voters should also be condent that their vote contributes towards the
outcome of an election and that they can accept the result as fair and reasonable—even if the
government which they did not prefer is elected.12
3. Stable government—does the voting system enable governments to form easily and do they
last for their term of ofce?
Stability helps the government to run smoothly, thereby helping people to have condence
Embargoed until 20 September 2011
8/4/2019 EMBARGOED Kicking the Tyres
http://slidepdf.com/reader/full/embargoed-kicking-the-tyres 8/42evaluating voting systems - 5
in the government and its work. The voting system can affect how stable the government is.
For example, if a voting system makes coalition government more likely, so that a number of
different parties will have to work together, then the government may not be very stable.13
4. Effective government—how easy or difcult is it for the government to carry out what it has
promised?
Governments need to be able to function effectively. If the voting system produces fractious
parliaments then it can be difcult for governments to do what they pledged to do when they
were elected.14
5. Opposition and oversight—does the system promote the formation of an opposition that can
criticise and challenge the government?
An effective opposition is required so that the government’s work gets debated, considered and
evaluated.15 For this to happen, a viable opposition party, or parties, need to be elected. Having
an opposition will not guarantee that these things happen well, but they do make it more likely.
If parliament is fractious then this may affect how unied—and therefore how effective—the
opposition is.
It is important to remember that these criteria cannot all exist perfectly in any system. For example,
the criteria of “effective government” and “opposition and oversight” tend to compete. The best
systems will give some room to all the criteria and will balance these competing elements. We now
turn to our evaluation of the ve different systems that will be considered at the referendum in the
order in which they will appear on the ballot paper, beginning with MMP.16
Embargoed until 20 September 2011
8/4/2019 EMBARGOED Kicking the Tyres
http://slidepdf.com/reader/full/embargoed-kicking-the-tyres 9/42mixed member proportional - 6
Embargoed until 20 September 2011
8/4/2019 EMBARGOED Kicking the Tyres
http://slidepdf.com/reader/full/embargoed-kicking-the-tyres 10/42mixed member proportional - 7
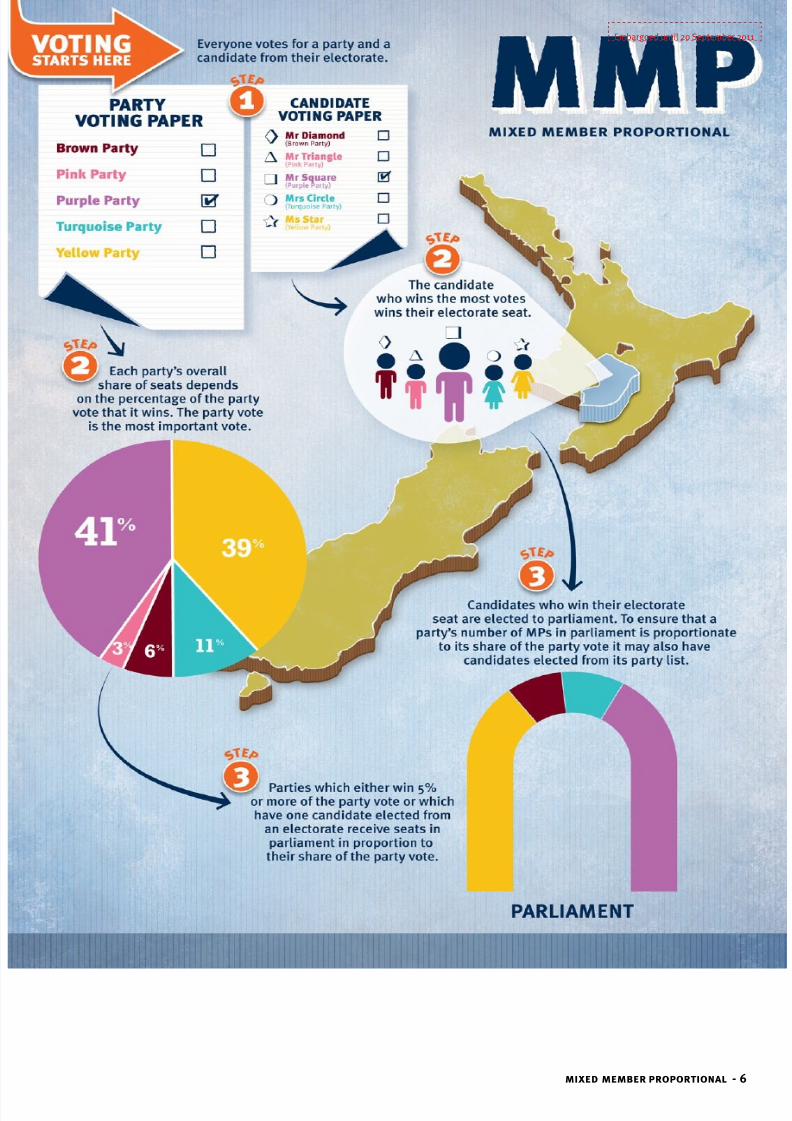
How does MMP work?
New Zealand has been using MMP as its voting system for fteen years since 1996. MMP blurs
the usual categories that voting systems fall into, by combining electorate representation with a
proportionally elected parliament.1
This combination happens by giving people two votes instead of one. One vote is for a local
candidate, and one vote is for a party. The second vote—the party vote—is the one that decides
each party’s total degree of representation in parliament. The idea is to make the allocation of seats
through all of parliament proportionate to the share of the party vote that each party receives. The
rst candidates to be given seats in parliament are the ones who win the most votes in their local
electorate. So each patch of New Zealand has their own MP who looks after their interests. Then
parties are allocated however many “top up” seats they need to get the overall proportion right.
These “top-up” seats are lled by MPs from a list of the party’s candidates that is drawn up before
the election.2
So, if a party wins ten percent of the votes, it gets roughly ten percent of the seats. If it wins
forty percent of the vote then it gets roughly forty percent of the seats, and so on. 3 But to get any
sort of representation, a party has to achieve one of two things. They either need to have a candidate
mixed memberproportional
The illustration opposite shows the key features of how MMP works.
M M P
Embargoed until 20 September 2011
8/4/2019 EMBARGOED Kicking the Tyres
http://slidepdf.com/reader/full/embargoed-kicking-the-tyres 11/42mixed member proportional - 8
voted into an electorate seat, or they have to win ve percent or more of the party vote. This is called
“crossing the threshold.”
One interesting curiosity in the system is that sometimes a party can also win more electorate
seats than it is entitled to according to its share of the party vote. So, theoretically, a party might
only win two percent of the nationwide party vote, but they might get ve people elected in local
electorates. When this happens “overhang” seats are created in parliament.4 The overhang seats
increase the total number of MPs in parliament by however many extra electorate MPs there are. This
is to ensure that the regular list seats are allocated proportionally. These “overhang seats” are the
reason we currently have 122 MPs in parliament instead of 120.
Like with every voting system, there are all sorts of details that can change under MMP. For
example, there could be more or fewer electorate seats or there could be different requirements for
how parties win seats. At this referendum we are being asked about MMP as it stands. If a majority
decide to keep MMP then parliament has said that the Electoral Commission will review MMP.5
Depending on whether the government acts on the review’s recommendations, the system could
change in the future.
The Electoral Commission says that there would be seven Maori seats under MMP.6
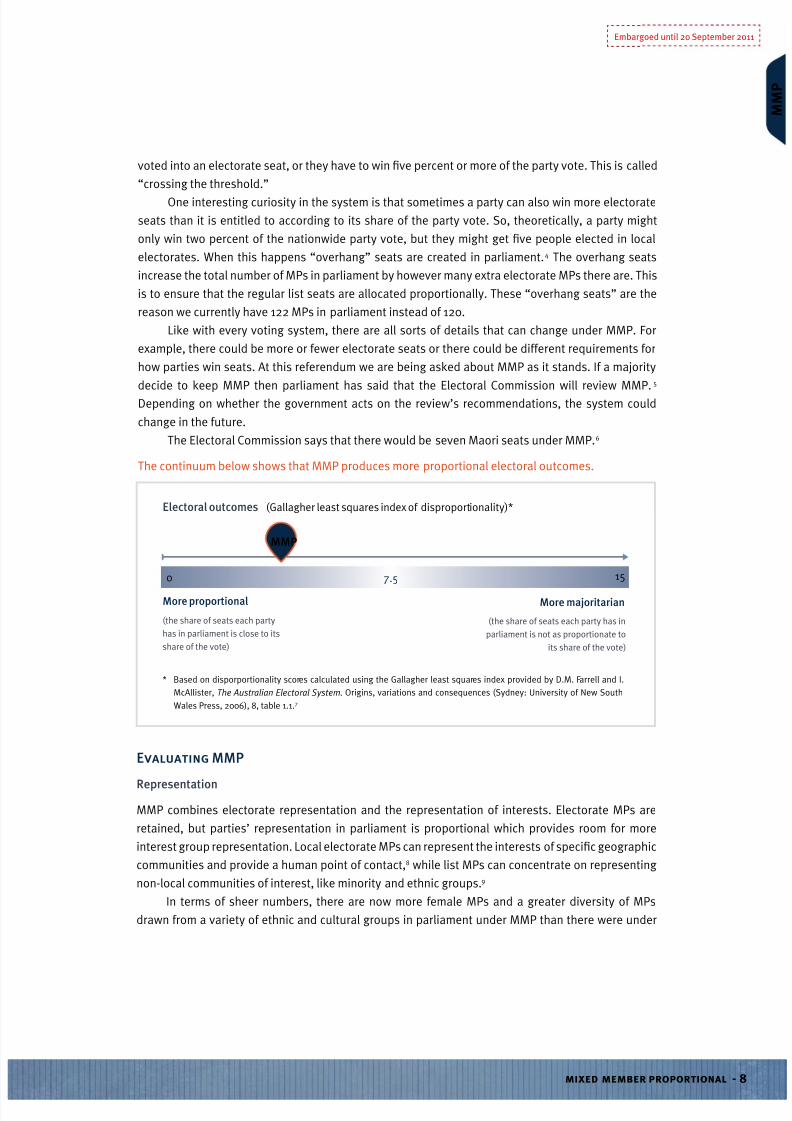
The continuum below shows that MMP produces more proportional electoral outcomes.
Electoral outcomes (Gallagher least squares index of disproportionality)*
More proportional
(the share of seats each party
has in parliament is close to its
share of the vote)
(the share of seats each party has in
parliament is not as proportionate to
its share of the vote)
More majoritarian
015
7.5
* Based on disporportionality scores calculated using the Gallagher least squares index provided by D.M. Farrell and I.
McAllister, The Australian Electoral System. Origins, variations and consequences (Sydney: University of New South
Wales Press, 2006), 8, table 1.1.7
MMP
Evaluating MMP
Representation
MMP combines electorate representation and the representation of interests. Electorate MPs are
retained, but parties’ representation in parliament is proportional which provides room for more
interest group representation. Local electorate MPs can represent the interests of specic geographic
communities and provide a human point of contact,8 while list MPs can concentrate on representing
non-local communities of interest, like minority and ethnic groups.9
In terms of sheer numbers, there are now more female MPs and a greater diversity of MPs
drawn from a variety of ethnic and cultural groups in parliament under MMP than there were under
Embargoed until 20 September 2011
M M P
8/4/2019 EMBARGOED Kicking the Tyres
http://slidepdf.com/reader/full/embargoed-kicking-the-tyres 12/42mixed member proportional - 9
FPP.10 This increase in diversity is partly because MMP has made it easier for major political parties
to stand a more diverse range of minority candidates within their lists, when these candidates might
have struggled to win an electorate seat.11 It is also because the proportional nature of MMP has
made it easier for the minor parties which represent different interest groups to be elected. New
Zealand’s experience concurs with other evidence that shows party list systems enhance interest
group representation.12
Overall, MMP provides well for both forms of representation, as both electorate and list MPs
have represented local communities and communities of interests. However, because government is
decided by the party vote rather than the electorate vote, MMP emphasises parties as the vehicle for
representation, rather than electorates.
Effects on parliament and government
MMP has had both positive and negative effects on the quality of New Zealand’s democracy. Against
predictions, it has led to increasingly stable governments. After a period of initial instability in the
mid-1990s, “multi-party governance” agreements have been created that have enabled minor parties
to maintain their points of difference in their core policy areas while having a say in government. 13
They have also helped various governments to pass legislation with relative ease.14
However, a serious problem with multi-party parliaments under MMP is that minor parties have
an incentive to prioritise the good of particular interests and minority groups in order to be elected.15
In this situation, it is more difcult for parties to work together to produce law that is in everyone’s
best interests because the focus can easily be on what is best for the particular group of people that
each party represents.16 This can easily take us into the murky ground of “identity politics” where
groups compete to promote their particular interests and ideas.
Another question-mark over MMP is to do with accountability. Those who originally supported
MMP argued that it would produce governments that were more accountable to voters. 17 But voters
do not vote directly for one political party to form a government under MMP; they vote for a range of
parties which bargain after election day.18 The indirect election of governments means that sometimes
parties that were part of a government which was voted out can stay in power as part of a newly
formed government. This is a threat to direct accountability. Another issue is that list MPs can owe
more loyalty to their parties than to voters so that they can receive a high list ranking.19
Under MMP we cannot conceive of the opposition as a collective entity that is entirely separate
from the government. Non-governing parties can do deals with the government to get their legislative
proposals on the agenda, and only oppose the government on certain issues.20
Summary: MMP
MMP provides well for electorate representation and the representation of interests, and can provide
for reasonably stable government.21 The strength of MMP is the ip-side of its drawbacks. It enables
more parties to be elected to parliament, which is great for the breadth of representation, but it also
gives parties a lot of power. It can also create bargaining instead of debate among parties, and a
weakened accountability of the government to voters. It can also encourage interest groups to act in
unhelpful ways.
M M P
Embargoed until 20 September 2011
8/4/2019 EMBARGOED Kicking the Tyres
http://slidepdf.com/reader/full/embargoed-kicking-the-tyres 13/42frst-past-the-post - 10
Embargoed until 20 September 2011
8/4/2019 EMBARGOED Kicking the Tyres
http://slidepdf.com/reader/full/embargoed-kicking-the-tyres 14/42frst-past-the-post - 11
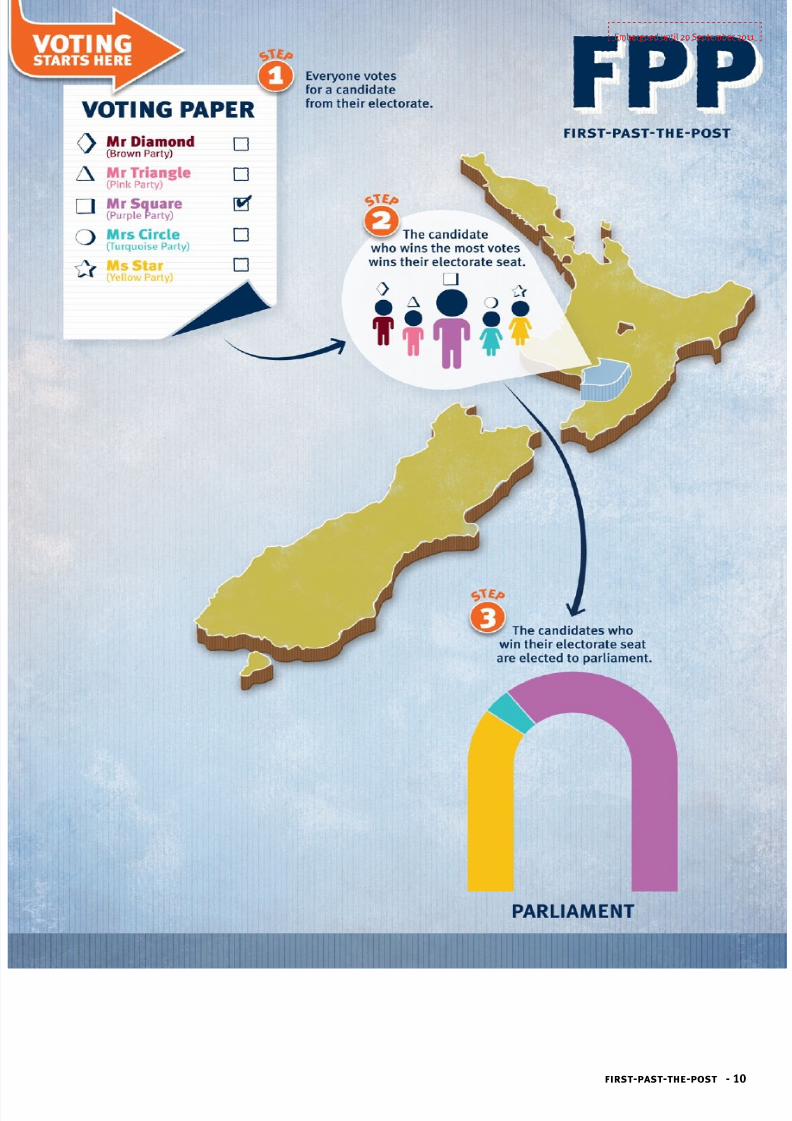
How does FPP work?
FPP is the voting system that New Zealand used up until 1996. Under FPP, voting is very simple.
Everyone casts one vote for one candidate from their local electorate and parliament is made up
entirely of those electorate MPs. All a candidate has to do to be elected under FPP is to win more
votes than any other candidate in their electorate.1
Voters put a mark beside the name of their preferred candidate on the ballot paper. The votes
can be counted quickly and by the end of election night it is usually certain which candidate has won
the most votes in each electorate and which party can form a government.2 Political parties win seats
in parliament by their candiates winning electorate seats. The party that wins the most electorate
seats has the mandate to form a government.Based on current census data, the Electoral Commission estimates that there would be twelve
Maori seats under FPP.3
F P P
The illustration opposite shows the key features of how FPP works.
frst-past-the-post
Embargoed until 20 September 2011
8/4/2019 EMBARGOED Kicking the Tyres
http://slidepdf.com/reader/full/embargoed-kicking-the-tyres 15/42frst-past-the-post - 12
Evaluating FPP
Representation
FPP originates from a time before political parties became a common way of organising political
representation. Local MPs were responsible for representing the interests of everyone in a geographic
community.5 Historically, under FPP in New Zealand, there was a close relationship between MPs and
their electorates. MPs returned to their electorates from parliament to meet with and live among
their constituents.6 The idea of electorate representation was that local MPs ought to exercise their
judgement according to their conscience, with one eye to local interests and another to national
interests.7 If the situation warranted, national interests were put rst. Electorate representation
under FPP and other similar systems encourages MPs and candidates to form a deep connection with
their local electorate.
However, a drawback of electorate representation under FPP (and other systems which elect
just one MP from each electorate), is that the system makes it harder for minority voices to be heard.8
This is usually because even if minor parties—which often represent minorities and specic interest
groups—win a high percentage of the vote from across the country they nd it hard to win electorate
seats because their share of the vote is not concentrated in one place.9 Interest group representation
under FPP mainly relies on the major parties representing a broad cross-section of interests in society,
but there is not much incentive for them to do so.10 The major parties tend to represent the interests of
the average, median voter at the centre of the political spectrum.11 It is difcult for minority interests
to enjoy formal avenues of parliamentary representation under FPP.
The quality of the representation under FPP is therefore lop-sided. Whether we get a good
balance depends on whether major parties choose to stand a diverse range of candidates in local
electorates, whether local MPs and major parties choose to act on behalf of different communities of
interest,12 and whether major parties pay heed to the good of everyone whom they represent—not
just those who voted for them.
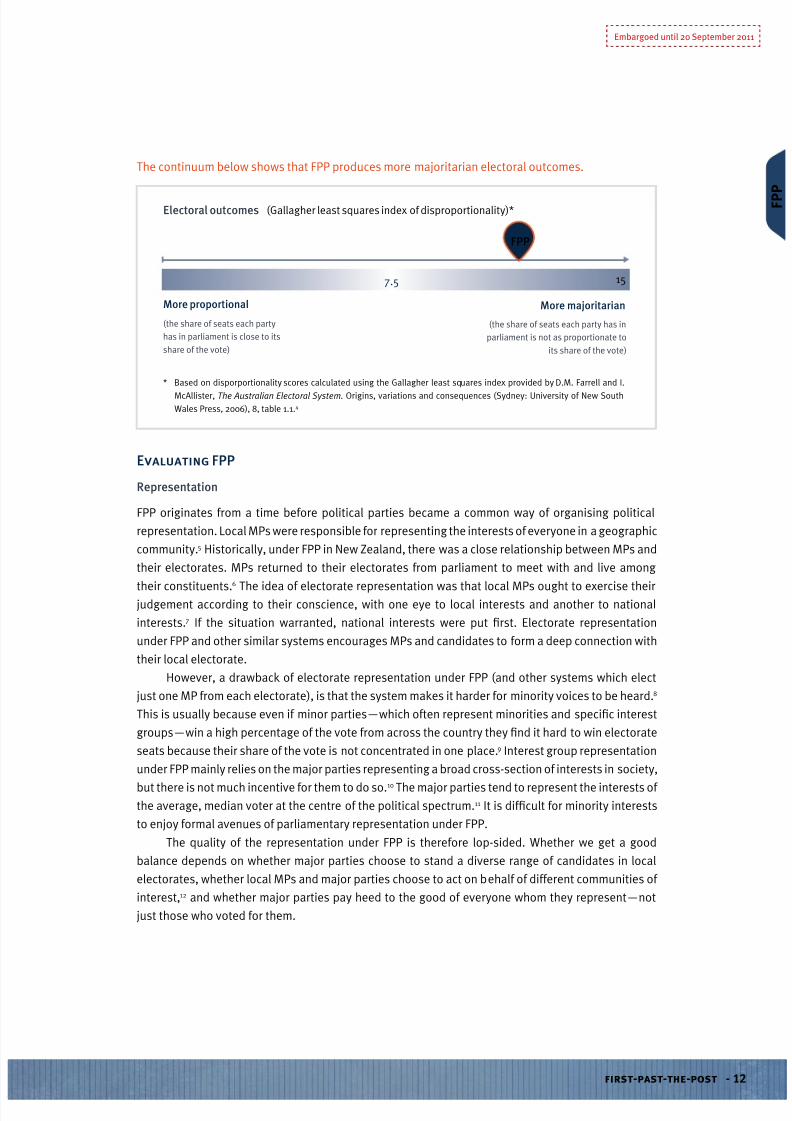
Electoral outcomes (Gallagher least squares index of disproportionality)*
More proportional
(the share of seats each party
has in parliament is close to its
share of the vote)
(the share of seats each party has in
parliament is not as proportionate to
its share of the vote)
More majoritarian
157.5
* Based on disporportionality scores calculated using the Gallagher least squares index provided by D.M. Farrell and I.
McAllister, The Australian Electoral System. Origins, variations and consequences (Sydney: University of New South
Wales Press, 2006), 8, table 1.1.4
FPP
The continuum below shows that FPP produces more majoritarian electoral outcomes.
F P P
Embargoed until 20 September 2011
8/4/2019 EMBARGOED Kicking the Tyres
http://slidepdf.com/reader/full/embargoed-kicking-the-tyres 16/42frst-past-the-post - 13
Effects on parliament and government
FPP is biased towards candidates standing for major parties, because minor parties’ supporters arelikely to be spread nation-wide and not concentrated in one electorate. This means the most common
outcome under FPP is a two-party system in parliament, where one party wins the largest number of
the seats in parliament and forms a government, and an opposition holds the second largest number
of seats.
“Marginal seats” are crucial under FPP, as those seats, which swing back and forth between
parties at different elections, are the ones that can decide the overall outcome. Parties and candidates
have an incentive to focus their campaigns on these seats, and they end up being driven by what is
important to voters in those electorates.13
One big criticism of FPP is that election results are often disproportionate at the national level—
that is, there is a legitimacy problem because the share of seats that parties win in parliament does
not always closely match their share of the vote.14 This happened in New Zealand under FPP. Between
1935 and 1993, the winning party won an average of 58 percent of the seats in parliament with only
an average of 46 percent of the vote, whereas minor parties averaged 12 percent of the vote but
only 0.1 percent of the seats.15 The last FPP election in 1993 is another example of the distortion
that can occur with FPP. The National Party was elected with 35 percent of the vote, while the
Labour Party, the Alliance, and the New Zealand First Party together won 61 percent. 16 These sorts
of disproportionate electoral outcomes and acute instances of “wrong winner” elections were
two important reasons why many New Zealanders grew disillusioned with FPP and voted against it
in the 1992 referendum.17 It can be hard for the government to claim that it has a strong mandate if
it does not have the support of a large proportion of voters.
The stability of a strong two-party system can be a double-edged sword. On the one hand,electoral outcomes are predictable—one political party is likely to form a government and to
implement its policies, and it is clear who the opposition is.18 On the other hand, strong single-
party majority governments can pass legislation with little interference, which can leave voters with
uncertainty about how responsive and accountable the government is. In New Zealand, FPP was
blamed for “manufacturing” dictatorial single-party governments.19
Summary: FPP
FPP is simple to understand and it usually produces clear results. FPP delivers strong, stable, single-
party majority government most of the time, and there is usually no confusion about which party
can form a government. It is easy for voters to dump a government and elect a new one since partiesgenerally do not negotiate together to form a government.20 But, as New Zealand’s experience
indicates, instances of highly disproportionate election results weakened the legitimacy of electoral
outcomes and the Cabinet’s tight control over legislation and parliament weakened the public’s trust
in government.21 It can also be difcult for minorities to be represented, either because safe seats
make it difcult to dislodge a popular candidate or because it is difcult for minority candidates to
win enough concentrated support in one electorate.
F P P
Embargoed until 20 September 2011
8/4/2019 EMBARGOED Kicking the Tyres
http://slidepdf.com/reader/full/embargoed-kicking-the-tyres 17/42preerential voting - 14
Embargoed until 20 September 2011
8/4/2019 EMBARGOED Kicking the Tyres
http://slidepdf.com/reader/full/embargoed-kicking-the-tyres 18/42preerential voting - 15
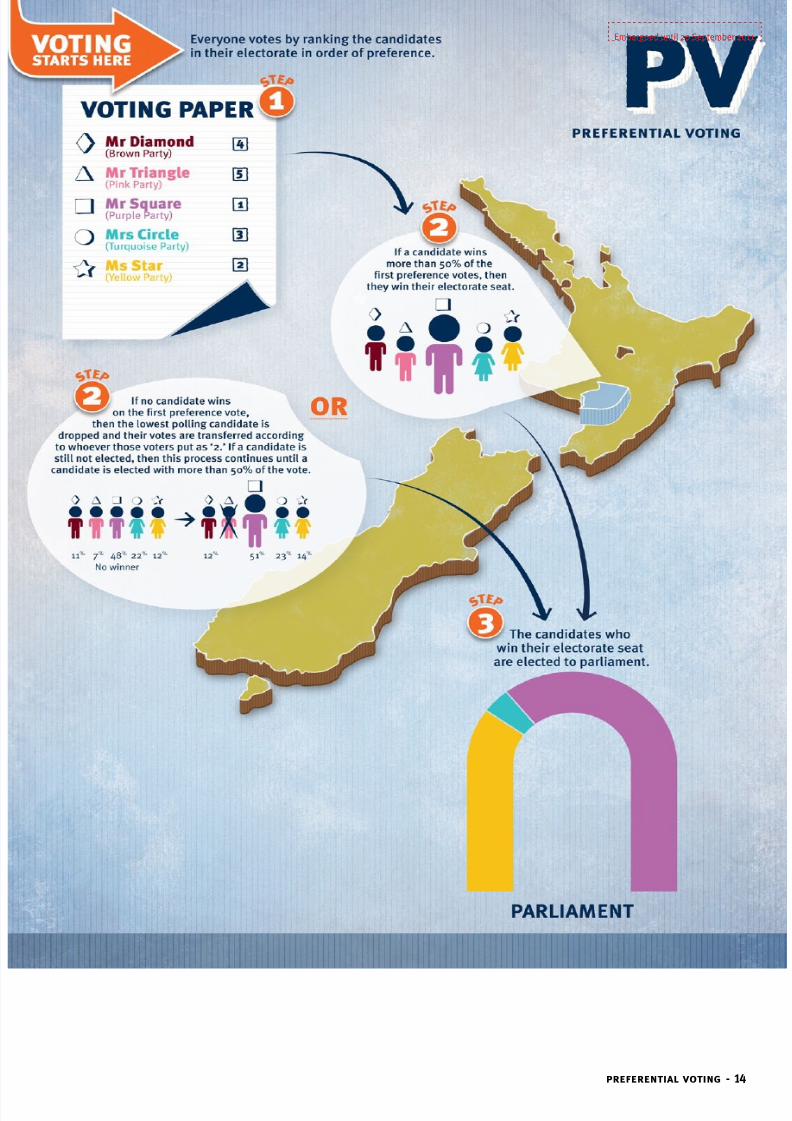
How does PV work?
Under PV, parliament is only made up of electorate MPs. Everyone gets one vote to elect one candidate
from their electorate. To be elected, a candidate has to win an absolute majority of the vote—that
is, more than 50 percent.1 Instead of just ticking a box, voters rank the candidates which they prefer.
Voters put a ‘1’ next to the name of their preferred candidate, followed by a ‘2’ next to their second
choice, a ‘3’ next to their third choice, and so on.2 The purpose of rank-ordering candidates is to
enable votes to be “transferred from one candidate to another.”3 If one candidate fails to win an
absolute majority during the rst round of counting votes then the preferences of the least popular
candidate are transferred to the other candidates. This process continues until a candidate wins an
absolute majority.
4
PV is a bit like a knock-out system in this respect.Depending on the PV system’s design, in some cases voters are required to indicate a
preference for every candidate on the ballot paper; while in others voters only have to indicate as
many preferences as they want. It is not clear yet which design New Zealand would choose if PV were
used in New Zealand.5
Political parties win their seats by their candidates winning in electorates. Typically, PV makes
it easy for one major party to form a government.
preerential
voting
P V
The illustration opposite shows the key features of how PV works.
Embargoed until 20 September 2011
8/4/2019 EMBARGOED Kicking the Tyres
http://slidepdf.com/reader/full/embargoed-kicking-the-tyres 19/42preerential voting - 16
Evaluating PV
Representation
Because PV’s basis is electorate representation, it provides a strong connection point between local
communities and parliament. Yet, because voters can indicate a list of preferences, those voters who
could otherwise be discouraged from voting for a minor party candidate can do so in the knowledge
that their latter preferences will count, even if their rst choice is eliminated. This gives minor parties a
ghting chance, unlike FPP. Some argue, however, that this is one of PV’s most serious shortcomings
since only the subsequent preferences of those who have supported the least popular candidate(s)
are taken into account when rst preferences are redistributed. 8 It is still difcult for minor party
candidates to challenge strong candidates in safe seats, yet PV is certainly an improvement on simple
majoritarian voting systems because voters can select their preferred candidate without worrying
about wasting their vote as happens with FPP.
Some also claim that PV can provide well for the representation of interests in divided societies
because it produces more moderate outcomes compared to FPP.9
Generally, however, PV tends to belimited at providing for the representation of interests in parliament.
Effects on parliament and government
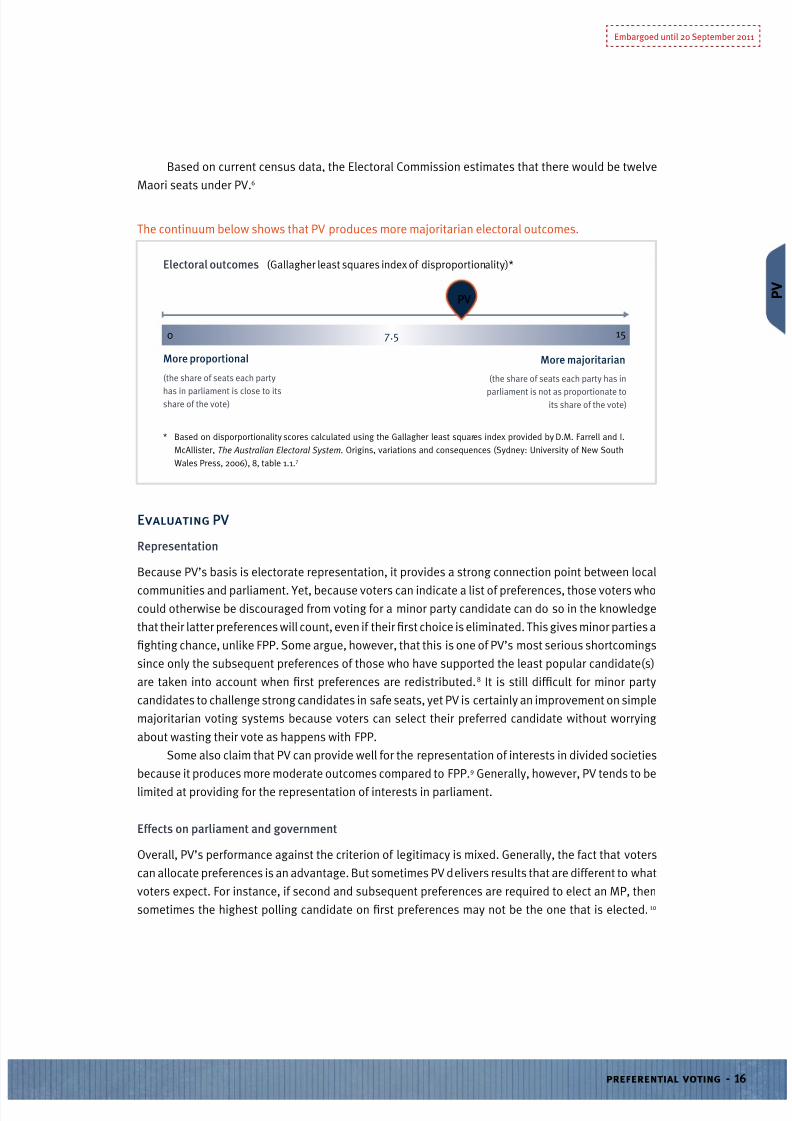
Overall, PV’s performance against the criterion of legitimacy is mixed. Generally, the fact that voters
can allocate preferences is an advantage. But sometimes PV delivers results that are different to what
voters expect. For instance, if second and subsequent preferences are required to elect an MP, then
sometimes the highest polling candidate on rst preferences may not be the one that is elected. 10
Electoral outcomes (Gallagher least squares index of disproportionality)*
More proportional
(the share of seats each party
has in parliament is close to its
share of the vote)
(the share of seats each party has in
parliament is not as proportionate to
its share of the vote)
More majoritarian
0 157.5
* Based on disporportionality scores calculated using the Gallagher least squares index provided by D.M. Farrell and I.
McAllister, The Australian Electoral System. Origins, variations and consequences (Sydney: University of New South
Wales Press, 2006), 8, table 1.1.7
PV
Based on current census data, the Electoral Commission estimates that there would be twelve
Maori seats under PV.6
The continuum below shows that PV produces more majoritarian electoral outcomes.
P V
Embargoed until 20 September 2011
8/4/2019 EMBARGOED Kicking the Tyres
http://slidepdf.com/reader/full/embargoed-kicking-the-tyres 20/42preerential voting - 17
Whether or not this is a good thing is contestable.
Like with other single-member electorate systems, sometimes a party’s share of seats is also
disproportionate to its vote share.11 For example, Australian PV elections have produced high levels
of distortion between the share of the vote and the share of the seats that parties have won. 12 In
three recent federal elections the winning party has won more seats but fewer votes than its rivals
according to nal preferences (1969, 1990 and 1998). In two more instances this happened on the
basis of rst preferences (1987 and 2010).13 This distortion drops PV’s legitimacy score.
The election of fewer political parties under PV ought to produce fairly predictable electoral
outcomes. PV tends to provide for a clear government and opposition since PV makes it difcult for
minor parties to be elected.14 If electoral outcomes are predictable then generally parliament and
government ought to be stable; although some of the stability observed in Australian elections is due
to compulsory voting and because there are two strong, well-organised parties.
A nal issue with PV concerns the party deals that can take place regarding voters’ preferences.
In Australia, for example, both the Liberal-National Coalition and the Labor Party try to beat each
other by “swapping preferences” to arrange the order in which preferences ow. 15 Because voting
is compulsory, the parties put a lot of energy into producing “how to vote” cards in each electorate
to maximise their own advantage over the opposition. This can unhelpfully affect the way that
parties campaign as political tactics can end up dominating discussion of the issues. Voters may
stop thinking about which candidates they would like to be their MP—which is the point of PV—and
accept a party’s choices.
Summary: PV
PV provides for strong electorate representation, through the election of local MPs, which usuallyleads to the election of single-party majority governments. That said, PV gives minor party candidates
a ghting chance of winning a seat when second and subsequent preferences are used to help elect
a candidate. However, it is still harder for minority candidates and parties to be represented in
parliament under PV because it is not a proportional system. Further, PV can sometimes produce
electoral outcomes that might not be considered entirely legitimate if the most popular candidate
on rst preferences does not win—although this point is debatable. While PV would enable voters to
more clearly express their preferences for certain candidates it could also introduce some new ways
for parties and candidates to engineer electoral outcomes, as parties would advise supportive voters
how to vote to give them the best advantage.16
P V
Embargoed until 20 September 2011
8/4/2019 EMBARGOED Kicking the Tyres
http://slidepdf.com/reader/full/embargoed-kicking-the-tyres 21/42single transerable vote - 18
Embargoed until 20 September 2011
8/4/2019 EMBARGOED Kicking the Tyres
http://slidepdf.com/reader/full/embargoed-kicking-the-tyres 22/42single transerable vote - 19
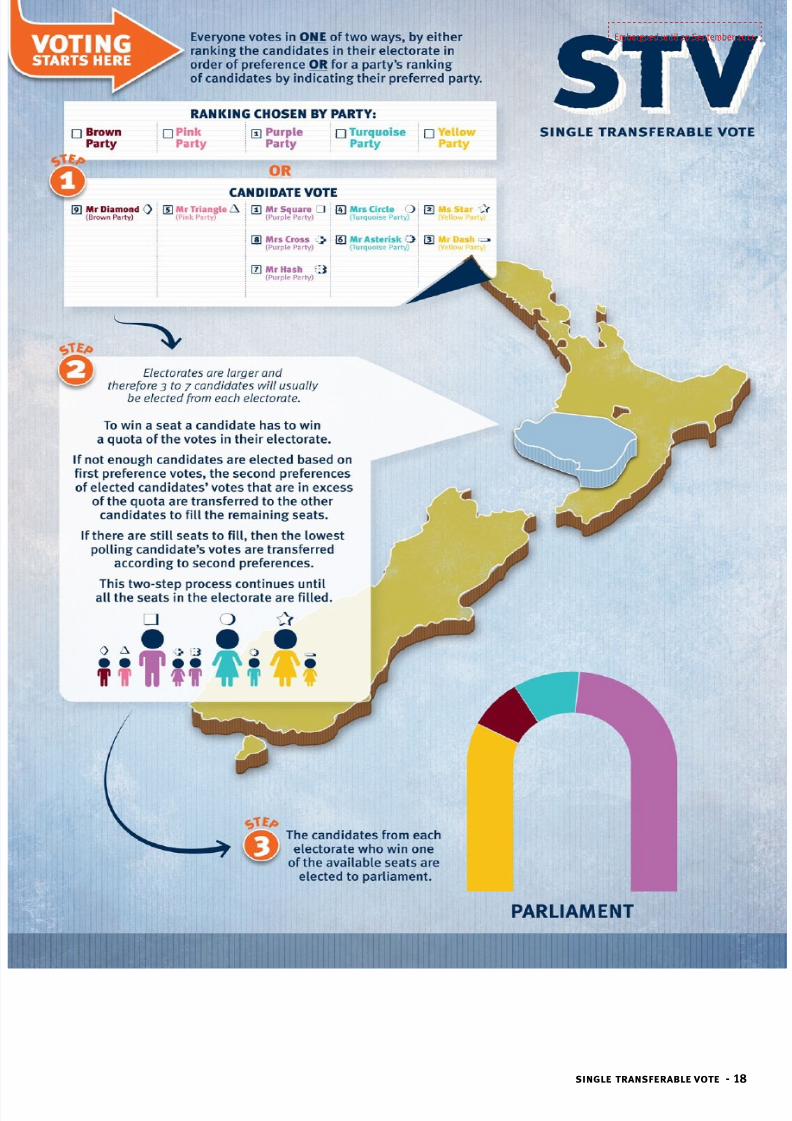
How does STV work?
STV may be familiar to voters who have participated in local body elections. All candidates are elected
from local electorates. But instead of electing just one candidate, each electorate typically elects
between three and seven candidates because the electorates are bigger but there are fewer of them.
If New Zealand used STV there could be between 24 and 30 electorates. Based on current census
data, the Electoral Commission estimates that there would probably be about four Maori electorates
and twelve Maori seats altogether.1 Everybody ranks their favourite candidates, like they do in PV.
A candidate secures a seat when they reach a particular quota of votes.2 If a candidate is elected at
the rst round of counting votes, any votes that they have in excess of the quota are transferred—
often proportionally—according to second preferences, to elect the next candidate.3 If seats are stillunlled after the surplus votes have been transferred, then the candidate with the lowest number of
votes is excluded and their votes are transferred according to voters’ second preferences.4 This two-
step process continues until all the seats in the electorate are lled.
If STV were introduced in New Zealand, voters would also be able to vote for a ranking chosen
by a party, instead of ranking all the candidates by themselves.5 This is called voting “above-the-
line.”6 Voting above-the-line is meant to make voting simpler for people. But voters who choose to
singletranserable vote S T
V
The illustration opposite shows the key features of how STV works.
Embargoed until 20 September 2011
8/4/2019 EMBARGOED Kicking the Tyres
http://slidepdf.com/reader/full/embargoed-kicking-the-tyres 23/42single transerable vote - 20
Evaluating STV
Representation
Because all MPs come from electorates, local representation is strong under STV.8 Every voter is
represented by more than one MP. Theoretically, constituents can have access to a variety of MPs
who can listen and act on their behalf, although given that electorates would have to increase insize it could be difcult for MPs to have much contact with all of the people in their electorate. For
example, Christchurch or central Auckland might become single electorates electing ve MPs each.
On the other hand, electorate representation could be strengthened if some MPs served certain
localised communities within their electorate to increase their chances of election. As the system
remains untried nationally in New Zealand, it is difcult to know how this issue would play out.
STV could help to increase the ethnic and social diversity of MPs in parliament as multi-member
electorates would make it easier for minor parties to win seats. 9 Major parties might also choose to
stand a wider cross-section of candidates who could represent different national interest or social
groups.10 Thus, STV could provide for a high level of representation of interests.
Effects on parliament and government
Sometimes STV can encourage candidates who represent the same party to compete against one
another when they stand in the same electorate.11 In Ireland, for instance, STV has contributed to
a strong focus on local issues in elections as candidates tap into local political concerns to garner
votes. However, national issues can be sidelined in local candidates’ election campaigns.12
STV can produce coalition government because of how minor parties’ candidates stand a better
chance of being elected. Strangely, one of the puzzles of how STV works in practice is that, in the
countries where it is used, large numbers of minor parties have not been elected to parliament.13 For
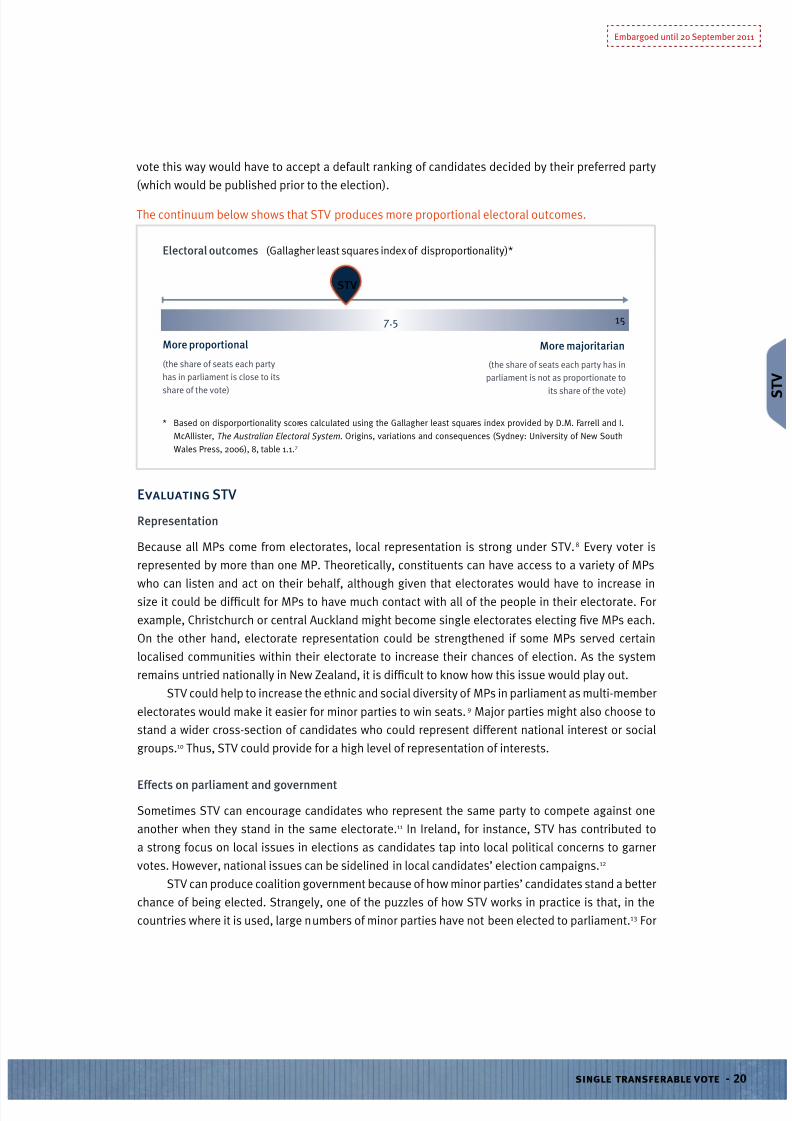
Electoral outcomes (Gallagher least squares index of disproportionality)*
More proportional
(the share of seats each party
has in parliament is close to its
share of the vote)
(the share of seats each party has in
parliament is not as proportionate to
its share of the vote)
More majoritarian
157.5
* Based on disporportionality scores calculated using the Gallagher least squares index provided by D.M. Farrell and I.
McAllister, The Australian Electoral System. Origins, variations and consequences (Sydney: University of New South
Wales Press, 2006), 8, table 1.1.7
STV
vote this way would have to accept a default ranking of candidates decided by their preferred party
(which would be published prior to the election).
The continuum below shows that STV produces more proportional electoral outcomes.
S T
V
Embargoed until 20 September 2011
8/4/2019 EMBARGOED Kicking the Tyres
http://slidepdf.com/reader/full/embargoed-kicking-the-tyres 24/42single transerable vote - 21
example, both Australia (at the federal senate level) and Malta use STV and have strong two-party
systems. This would not necessarily be a negative outcome if STV were used in New Zealand, since a
two-party system is likely to produce stable parliaments, governments which can more easily enact
legislation, and a clearly dened opposition.
Even though STV is not primarily designed to distribute seats in parliament proportionally,
examination of STV election results worldwide has shown that it still produces proportional
outcomes.14 The degree of proportionality depends on such design factors as how low the electoral
quota is and whether political parties stand a greater or lesser number of candidates “than they can
expect to get elected.”15 If STV were used in New Zealand the system would probably not produce
disproportionate election results, and “wrong winner” elections could be avoided.
Voting above-the-line however creates problematic issues for accountability and legitimacy.
This is because voting above-the-line essentially turns STV into a party vote system. 16 By voting
above-the-line, voters would not be choosing which candidates are elected—they would be choosingto accept the parties’ choice of candidates and the order in which they would be elected. The latter
point is important if parties make agreements to swap preferences to give an electoral advantage to
a potential coalition partner.17 In Australia, where voting above-the-line is used in federal senate and
state STV elections, between 85 and 95 percent of voters have been found to use it. 18 The option is
used by such a high proportion of voters because the alternative is the more time consuming and
potentially laborious task of rank-ordering literally dozens of candidates on the ballot paper.19
We do not know for certain whether New Zealand voters would prefer voting above-the-line to
indicating their own preferences for candidates.20 There is evidence that the majority of voters who
voted in New Zealand District Health Board STV elections listed their preferences for candidates in
alphabetical order. This behaviour might indicate that voters misunderstood that they had a single
transferable vote and not seven individual votes,21 or maybe that voters found voting under STV too
time consuming. While the evidence from New Zealand local body elections is helpful for illustrating
voter behaviour, it is still difcult to say denitely whether New Zealand would experience the same
accountability and legitimacy issues as Australia has if STV were used for parliamentary elections
because we cannot predict exactly how candidates, parties and voters would respond.
Summary: STV
STV is an attractive system in principle since it enables voters to indicate exactly which candidates
they would like in multi-member electorates. STV enables voters to choose both between and within
parties, meaning that parliament ought to reect a wider diversity of opinions within society.22 The
use of multi-member electorates also means that electoral outcomes will be more proportional.
The theoretical advantages of STV have to be weighed carefully against the practical issues
with using it and the way voters tend to interact with this relatively complex system. For example,
it could undermine the cohesiveness of political parties as candidates from the same party would
compete against each other for election. The option of voting above-the-line can also give parties
more control over which candidates are elected and in which order. In this case, many voters would
not actually end up individually choosing their local MPs. In short, the advantages offered by STV
could be eroded by measures to make it easier for voters to understand and use.
S T
V
Embargoed until 20 September 2011
8/4/2019 EMBARGOED Kicking the Tyres
http://slidepdf.com/reader/full/embargoed-kicking-the-tyres 25/42supplementary member - 22
Embargoed until 20 September 2011
8/4/2019 EMBARGOED Kicking the Tyres
http://slidepdf.com/reader/full/embargoed-kicking-the-tyres 26/42supplementary member - 23
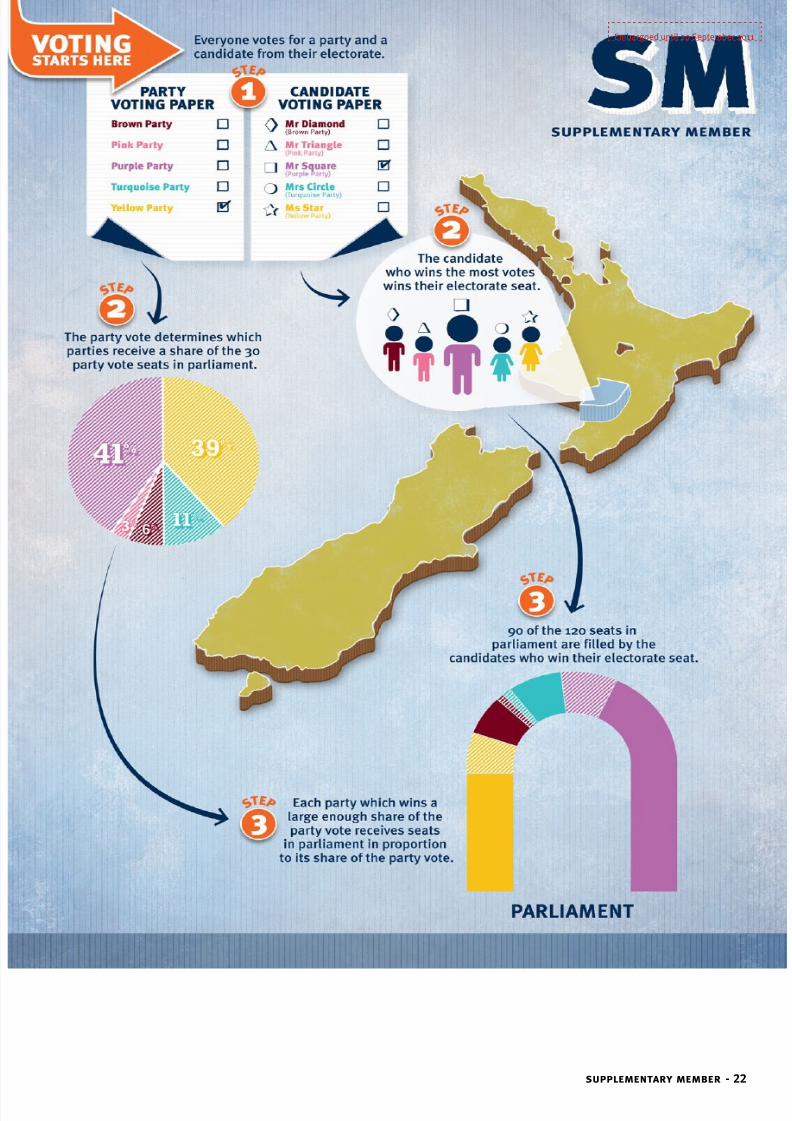
How does SM work?
SM is from the same family of voting systems as MMP. It is also a mixed system that tries to combine
electorate representation with some proportionality. Under SM, like MMP, everyone has two votes—
one for a candidate from their local electorate and one for a party. However, under SM the party vote
is not as important as under MMP because it is not used to allocate all of the seats in parliament
proportionally. In New Zealand, it would be used to determine the allocation of just 30 of the 120
seats to candidates drawn from party lists that parties would decide and publish before the election.1
The other 90 seats would go to the candidates who win the most votes in each electorate. 2 This is
the key difference between SM and MMP. The electorate vote and the party vote are independent of
each other. They work alongside each other, but are not fused as they are under MMP.3
The electionresults produced by SM are more majoritarian.4
If New Zealand chooses SM, then the way we vote would look similar to how we currently do,
even though the results and the outcome of elections would change. The electorate MPs would
be chosen in the same way as under MMP, while the party list MPs would be elected by everyone
ticking a box for a party as we do now. 5 Each party’s total number of seats in parliament would be
determinedby its combined number of electorate seats and list seats.
supplementary
member S M
The illustration opposite shows the key features of how SM works.
Embargoed until 20 September 2011
8/4/2019 EMBARGOED Kicking the Tyres
http://slidepdf.com/reader/full/embargoed-kicking-the-tyres 27/42supplementary member - 24
Evaluating SM
Representation
SM would increase the number of local electorate MPs from the current number of 70 to 90.8 MPs and
candidates would have an incentive to represent their electorate’s interests as well as their parties’.9
The problems which New Zealand’s list MPs have encountered under MMP would still remain. Thepopular perception that they are “faceless” MPs who are selected by party bosses, 10 or the issue of
split loyalty—do they primarily represent a party or voters—would not be xed. However, because
there would be more electorate MPs under SM, some of the punch would be taken out of those
issues.
Because three-quarters of the seats under SM would be electorate seats, the electorate seats
will become more important to how parties and candidates campaign. Some evidence suggests that
when political parties stand candidates in local electorates under mixed systems it helps them to
boost their share of the list vote.11 Hence, the prospect of receiving a boost in the list vote—however
great or small—might encourage more party competition in local electorates under SM than under
FPP, for example.12 On the other hand, parties might choose to coordinate their electorate nominations
as part of their electoral strategy, which could reduce the number of candidates contesting a seat. Itis hard to predict exactly what would happen, but it is thought that the latter effect could be stronger
in mixed systems in which electorate elections are more important—like SM. 13 There also might be
a stronger tendency for parties to coordinate their campaigns given New Zealand’s history of voter
choice being inuenced strongly by parties and that candidates only seem to have a limited effect on
the parties’ party vote because of the high instances of split voting.14
SM also differs from pure single-member electorate systems like FPP because it provides
specically for the representation of interests through the list system. Like the MMP party list system,
under SM party lists would encourage the major parties to put candidates on their list who do not
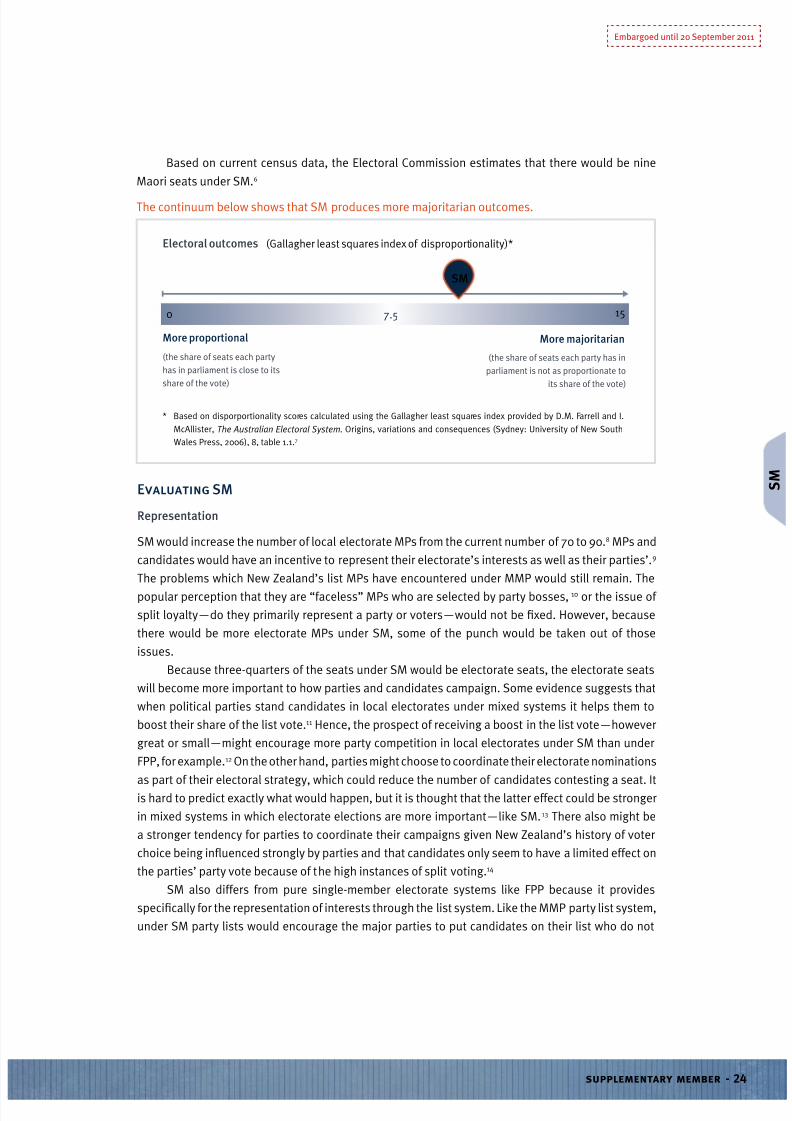
Electoral outcomes (Gallagher least squares index of disproportionality)*
More proportional
(the share of seats each party
has in parliament is close to its
share of the vote)
(the share of seats each party has in
parliament is not as proportionate to
its share of the vote)
More majoritarian
0 157.5
* Based on disporportionality scores calculated using the Gallagher least squares index provided by D.M. Farrell and I.
McAllister, The Australian Electoral System. Origins, variations and consequences (Sydney: University of New South
Wales Press, 2006), 8, table 1.1.7
SM
Based on current census data, the Electoral Commission estimates that there would be nine
Maori seats under SM.6
The continuum below shows that SM produces more majoritarian outcomes.
S M
Embargoed until 20 September 2011
8/4/2019 EMBARGOED Kicking the Tyres
http://slidepdf.com/reader/full/embargoed-kicking-the-tyres 28/42supplementary member - 25
necessarily have broad enough appeal to win an electorate seat, but who could represent minority
interest groups.15 The 30 list seats would make it possible for minor parties to win seats in parliament.
The effect would be more muted than under MMP, since there would be fewer list seats, and because
the party vote would only determine the share of the 30 list seats.16 Like MMP, SM allows for elements
of both electorate representation and representation of interests, but it is ultimately weighted
towards electorate representation because the party vote does not determine the allocation of all the
seats in parliament.
Effects on parliament and government
If New Zealand adopted SM, the outcome of elections would usually be more majoritarian because
of the smaller number of list MPs that would be elected compared to electorate MPs. 17 New Zealand
research has shown that SM would not have enough of an impact on the shape of parliament to make
it highly proportional.18 Single-party majority or majority coalition governments would be the most
likely ones to form.
The same legitimacy problems that exist with single member electorate systems would exist
with SM, although to a slightly lesser extent. For example, “marginal seats” would be important
for election results, meaning that some local areas might get prioritised over others. If a coalition
government formed, it would be more difcult for voters to hold it directly to account than a single-
party majority government.19
While there are potential legitimacy and accountability issues with SM, it can encourage
an effective opposition. Being a more majoritarian system, it can be expected over time not to
produce highly fragmented parliaments that have, say, more than ve parties. 20 If SM were used
in New Zealand, initially there would probably be about the same number of parties represented inparliament as there are now under MMP, due to the number of minor parties currently represented
which hold one electorate seat.21 But over time the smaller number of list seats would reduce minor
parties’ number of MPs and it could be harder for minor parties to win electorate seats. Generally
we could expect parliament would operate more like it did under FPP, with a clear government and
opposition, and with the government perhaps supported by a handful of minor parties.
Summary: SM
In trying to blend two styles of voting system, SM has some of the benets and some of the drawbacks
of both. It is neither a completely proportional system, nor does it guarantee that one party will win a
large enough majority to be able to govern alone.In terms of representation, SM has the potential to achieve a good balance between national
and local representation of interests.22 Electorate representation would be strong, creating good ties
between parliament and voters, but a quarter of parliament would also be made up of list MPs who
tend to be able to represent minority interest groups well.
Because there would be more electorate MPs under SM than under MMP the major parties
would benet, but there is also a chance coalitions would be needed to form a government and that
minor parties would have more representation than they typically do under single-member electorate
systems, like FPP.
S M S M
Embargoed until 20 September 2011

8/4/2019 EMBARGOED Kicking the Tyres
http://slidepdf.com/reader/full/embargoed-kicking-the-tyres 29/42
8/4/2019 EMBARGOED Kicking the Tyres
http://slidepdf.com/reader/full/embargoed-kicking-the-tyres 30/42conclusion - 27
conclusion
New Zealand should have a voting system that would enable our MPs and the government to have
the freedom to lead and to make decisions in the best interests of all New Zealanders, but it should
also require them to listen and be responsive to the interests of New Zealanders and their local
communities.
In November, we will have a chance to vote on which system we think could do this best. When
voting, there are a range of factors to consider, including:
Representation
– electorate representation;
– representation of interests;
Effects on parliament and government
– accountability;
– legitimacy;
– stable government;
– effective government; and
– opposition and oversight.
Embargoed until 20 September 2011
8/4/2019 EMBARGOED Kicking the Tyres
http://slidepdf.com/reader/full/embargoed-kicking-the-tyres 31/42conclusion - 28
By looking at these criteria, we have been able to think about the implications of the different voting
systems. We found that more proportional systems (such as MMP and STV) can contribute to healthy
representative democracy by improving the representation of interests without unduly inhibiting
either parliament’s role or the government’s freedom to govern. However, we also found that
negatively they can give political parties a lot of inuence, as candidates have to rely on their party’s
favour to be selected and then elected. Given the likelihood of multi-party parliaments under these
systems, there are greater incentives for political parties to do pre-election deals with each other
so that the successful ones can more easily form a coalition government. By giving political parties
greater inuence, these systems can weaken the degree of direct connection between parliament,
the government, and voters in local communities, as parties focus more on serving sectional interests
to win votes throughout the country. Inter-party bargaining can also mean it is difcult to know what
you’re voting for when you choose a party.
On the positive side, interest groups get a voice. On the downside, that voice can be too loud—if an interest group becomes politically important, it can dominate policy and law-making. Interest
group politics can make it difcult for MPs to govern with what is in everyone’s best interests in mind.
Voting systems which come from the majoritarian family can also provide for healthy
representative democracy. These systems provide well for electorate representation, which enables
the interests and views of local communities to be represented in parliament, and mean that voters
can hold MPs and the government more directly to account for their performance. Voters can also be
condent that electoral outcomes will be what they expect. But majoritarian systems are not so good
at providing for the representation of interests, because the composition of MPs in parliament tends
not to reect so closely different interest groups’ share of the population. Majoritarian voting systems
can also have other negative effects. For example, electoral outcomes are not as proportionate. Some
voters’ votes can count substantially more than the votes of others, depending on, for instance,
whether they live in a marginal or a safe seat. There is also the strong possibility of “wrong winner”
electoral outcomes where a party wins lots of seats but does not win a large majority of the vote
across the whole country.
Mixed voting systems, like SM or MMP use elements of both proportional and majoritarian
systems. They represent a trade-off between proportional representation and the direct accountability
of MPs to voters. Mixed systems do not eliminate the problems in either style of system but rather
smooth some of the rough edges of each and try to combine their benets.
Our evaluation has shown that there is no such thing as a perfect voting system—there are
aspects of each system which would be positive for representative democracy and aspects which
would be negative. When thinking about which system represents the best balance of positive andnegative features, voters will have to trade-off the features which they like by prioritising them
according to the kind of representative democracy that they believe is in New Zealand’s best interests.
We hope that each and every voter will decide their preferred system after thinking carefully about
what provides for effective representation, and with an awareness of each system’s implications.
Embargoed until 20 September 2011
8/4/2019 EMBARGOED Kicking the Tyres
http://slidepdf.com/reader/full/embargoed-kicking-the-tyres 32/42endnotes - 29
1 See, for example, works such as Pippa Norris’ Electoral
Engineering. Voting rules and political behaviour
(Cambridge: Cambridge University Press, 2004), 7-16. This
work highlights how different voting systems affect the
electoral incentives of candidates and parties and how
voters choose to exercise their vote depending on the
options available to them.
2 The following sources discuss the concepts of majoritarian
and proportional representation. S. Hix, R. Johnston and
A. Cummine, “Choosing an Electoral System” (London:
The British Academy Policy Centre, 2010), 21; M.B.
Vieira and D. Runciman, Representation (Cambridge,
United Kingdom: Polity Press, 2008), 74-79; G. Newman
and S. Bennett, “Electoral Systems,” Research Brie ,
10 (Canberra: Department of Parliamentary Services,
Parliament of Australia, 2006), 15; G.B. Powell, Elections
as Instruments o Democracy: Majoritarian and
proportional visions (New Haven, CT: Yale Univeristy
Press, 2000), 7, 9; M. Pinto-Duschinsky, “Send the Rascals
Packing: Defects of Proportional Representation and the
Virtues of the Westminster Model,” Representation 36
(1999): 117-126.
3 S. Hix, R. Johnston and A. Cummine, “Choosing an
Electoral System,” 20-24.
4 Previous Maxim Institute publications which discuss the
value of parliament’s deliberative role and representative
government’s role in protecting the common good include:
R. Ekins, “A Government for the People. The value of
representative democracy,” Guest Paper (Auckland:
Maxim Institute, 2009); and J. Waldron, “Parliamentary
Recklessness: Why we need to legislate more carefully,”
Annual John Graham Lecture (Auckland: Maxim Institute,
2008).
5 It is important to note that while the research which
we consider indicates general trends in terms of the
electoral outcomes associated with each system, they are
predictions, not an exact science. It is a best guess at what
might happen with each system, especially where some
systems are untried in New Zealand. S. Hix, R. Johnston
and A. Cummine, “Choosing an Electoral System,” 15.
Cf. E. McLeay and J. Vowles, “Redening Constituency
Representation: The roles of New Zealand MPs under
MMP,” Regional and Federal Studies 17, no. 1 (2007): 72;
L. Malpass and O.M. Hartwich, “Superseding MMP: Real
electoral reform for New Zealand,” Policy Monograph, 109
(St Leonard’s, NSW: Centre for Independent Studies (CIS),
2010), 6-7.
6 Cf. H.F. Pitkin, The Concept o Representation (Berkeley:
University of California Press, 1967), 155-156.
7 We value the community link because we believe that
the role of the state, which includes institutions like
our parliament, is to serve and protect the good of its
members. Elsewhere we have described what is good
for the members of society as the “common good.” We
think that what is good for people, this common good, is
revealed and realised as it is lived out in community. This
common good is indicated by the community’s history,
customs and traditions, ranging from its laws, music,
art or literature, to the patterns of everyday life, such as
work, study or play. The common good is also indicated
by reasoned deliberation about what the intrinsic basic
ends of a good life are, such as life, play, friendship, and
knowledge. These goods are not mutually exclusive;
each can be considered necessary for living a good life. A
representative’s job is to defend the common good. How
we conceive of the common good is discussed in more
detail in S. Thomas, “Governing for the Good: What does
it really mean?” Tax Discussion Series, 1 (Auckland: Maxim
Institute, 2008), 75-76. Also see R. Ekins, “A Government
for the People. The value of representative democracy,” 2.
8 M.B. Vieira and D. Runciman, Representation, 80-81.
9 See, for example, A. Lijphart, Patterns o Democracy:
1 J. Key, “National’s Blueprint for Change.” Speech to the
Annual National Party Conference, Wellington, 3 August”
(2008), pledge ten.
2 S. Hix, R. Johnston and A. Cummine, “Choosing an
Electoral System” (London: The British Academy Policy
Centre, 2010), 20; International Institute for Democracy
and Electoral Assistance (IDEA), “Electoral System Design:
The new international IDEA handbook” (Stockholm: 2005),
4-5; M.S. Shugart and M.P. Wattenberg, Mixed-member
Electoral Systems: The best o both worlds? (Oxford, UK;
New York: Oxford University Press, 2001), 592; R.S. Katz,
Democracy and Elections (New York: Oxford University
Press, 1997), 4-6.
kicking the tyres. choosing a voting system for new zealand
evaluating voting systems
endnotes
Embargoed until 20 September 2011
8/4/2019 EMBARGOED Kicking the Tyres
http://slidepdf.com/reader/full/embargoed-kicking-the-tyres 33/42endnotes - 30
1 A more formal, if broad, denition of such mixed voting
systems is that an “electoral system is ‘mixed’ if more than
one formula is employed to distribute legislative seats.”
F. Ferrara, E.S. Herron and M. Nishikawa, Mixed ElectoralSystems. Contamination and its consequences (New York:
Palgrave MacMillan, 2005), 17. Two political scientists who
have studied mixed voting systems, Matthew Shugart and
Martin Wattenberg, explain why they think mixed systems
represent the best of both worlds in the following way: “Our
general point is that MM systems permit myriad variations
that can suit a specic political context, while still holding
out the promise of providing the best of both worlds—i.e. the
best of both identiable governing blocs and proportionality,
and the best of both local accountability and cohesive and
programmatic national parties.” M.S. Shugart and M.P.
Wattenberg, Mixed-member Electoral Systems: The best o
both worlds? (Oxford, UK; New York: Oxford University Press,
2001), 1, 591-595.
2 This feature of MMP illustrates how the two votes are linkedtogether and why the system is proportional. S. Hix, R.
Johnston and A. Cummine, “Choosing an Electoral System,”
(London: The British Academy Policy Centre, 2010), 87;
F. Ferrara, E.S. Herron and M. Nishikawa, Mixed Electoral
Systems. Contamination and its consequences, 19; M.S.
Shugart and M.P. Wattenberg, Mixed-member Electoral
Systems: The best o both worlds? , 18-19.
3 Once the votes are counted and it is known which parties
have crossed either or both of the thresholds, the 120 seats
in parliament are allocated to parties roughly in proportion to
their vote share according to a mathematical formula called
Goverment orms and perormance in thirty-six countries
(New Haven: Yale University Press, 1999).
10 J. Vowles, S.A. Banducci and J.A. Karp, “Forecasting and
Evaluating the Consequences of Electoral Change in New
Zealand,” Acta Politica 41 (2006): 270, citing K. Popper,
“On the Theory of Democracy,” in All Lie is Problem-
solving (London: Routledge, 1987); and K. Popper, “The
Open Society and Its Enemies Revisited,” The Economist
28, no. 25 (1988): 28. Also see G.B. Powell, Elections as
Instruments o Democracy: Majoritarian and proportional
visions, 9; M. Pinto-Duschinsky, “Send the Rascals Packing:
Defects of proportional representation and the virtues of the
Westminster model,” 117-126.
11 P. McCarvill, “Devising an Electoral System for the 21st
Century: The case for AMS” (London: Institute for Public
Policy Research (IPPR), 2010), 5.
12 New Zealand Royal Commission on the Electoral System
and J.H. Wallace, Report o the Royal Commission on the
Electoral System: Towards a better democracy (Wellington:
Government Printer, 1986), 12. The legitimacy of election
results is therefore closely associated with the performance
of our democratic institutions, such as parliament or list
MPs. If our democratic institutions are believed to be failing
to provide the kind of representative democracy that voters
expect, then it can reect badly on the voting system.
International Institute for Democracy and Electoral Assistance
(IDEA), “Electoral System Design: The new international IDEA
handbook” (Stockholm: 2005), 10.
13 Cf. J. Boston, S. Church and T. Bale, “The Impact of
Proportional Representation on Government Effectiveness:
The New Zealand experience,” Australian Journal o Public Administration 62, no. 4 (2003): 10, citing M. Gallagher, M.
Laver and P. Mair, Representative Government in Modern
Europe (Boston: McGraw-Hill, 2001), 365, who “found that of
14 European countries during 1945-98, single-party majority
governments lasted an average of 953 days, coalitions
638 days and minority governments 505 days (or less than
one-and-a-half years).” Boston, Church and Bale also cite
W. Muller and K. Strøm, Coalition Governments in Western
Europe (Oxford: Oxford University Press, 2000); A. Lijphart,
Patterns of Democracy: Goverment forms and performance
in thirty-six countries; K. Strøm, Minority Government and
Majority Rule (New York: Cambridge University Press,
1990); and M. Taylor and V. Herman, “Party Systems and
Government Stability,” American Political Science Review
65, no. 1 (1971): 28-37 in support of the point that coalition
or minority governments are not as durable as single-party
majority governments. Also see J. Wallace, Report o the
Royal Commission on the Electoral System: Towards a better
democracy , (Wellington: Government Printer, 1986), 12.
14 J. Boston, S. Church and T. Bale, “The Impact of Proportional
Representation on Government Effectiveness: The New
Zealand experience,” 9, citing R. Weaver and B. Rockman,
“Assessing the Effects of Institutions,” in Do Institutions
Matter? Government capabilities in the United States and
abroad , eds. R. Weaver and B. Rockman (Washinton D.C.:
The Brookings Institute, 1993), 6; J. Wallace, Report o the
Royal Commission on the Electoral System: Towards a better
democracy , 12. Cf. S. Levine, N.S. Roberts and R. Salmond, “A
Wider View: MMP ten years on,” in The Baubles o Ofce. The
New Zealand General Election o 2005, eds. S. Levine and N.
S. Roberts (Wellington: Victoria University Press, 2007), 460.
15 Cf. A. Kaiser, “MMP, Minority Governments and Parliamentary
Opposition,” New Zealand Journal o Public and International
Law 7, no. 1 (2009): 86. On the deliberative role of parliament,
see: J. Waldron, “Parliamentary Recklessness: Why we need
to legislate more carefully,” 13, 29, 33; and E. Burke, “Speechto the Electors of Bristol on Being Elected. November 1774,”
in The Political Philosophy o Edmund Burke, ed. I. Hampsher
Monk (London: Longman, 1987), 110.
16 Cf. Electoral Referendum Act 2010, sch (1).
Mixed Member Proportional (MMP)
evaluating voting systems continued
Embargoed until 20 September 2011
8/4/2019 EMBARGOED Kicking the Tyres
http://slidepdf.com/reader/full/embargoed-kicking-the-tyres 34/42endnotes - 31
Mixed Member Proportional (MMP) cont.
the Sainte Laguë electoral formula. The system allows for a
whole number of seats to be allocated to parties. The system
also makes it harder for parties to win each additional seat.
G. Newman and S. Bennett, “Electoral Systems,” Research
Brie , 10 (Canberra: Department of Parliamentary Services,
Parliament of Australia, 2006), 18.
4 Scotland and Wales use a form of MMP but their systems do
not provide for “overhang” seats.
5 Electoral Referendum Act 2010, Part 4, 75(2).
6 Electoral Commission, “The MMP Voting System. Mixed
Member Proportional, Fact Sheet (Wellington: 2011), 1.
7 Also see disproportionality scores for 82 elections in 23
countries between 1979 and 1989. Source: M. Gallagher,
“Proportionality, Disproportionality and Electoral
Systems,” Electoral Studies 10, no. 1 (1991): 45-46. The
disproportionality index measures “the difference between
parties’ shares of the votes and their shares of the seats.” M.
Gallagher and P. Mitchell, The Politics o Electoral Systems,
(New York: Oxford University Press, 2005), 602. Levine and
Roberts also cite an average disproportionality gure of 2.9
for the ve New Zealand MMP elections between 1996 and
2008. S. Levine and N.S. Roberts, “MMP and the Future:
Political challenges and proposed reforms,” New Zealand
Journal o Public and International Law 7, no. 1 (2009): 146.
8 E. McLeay and J. Vowles, “Redening Constituency
Representation: The roles of New Zealand MPs under MMP,”
Regional and Federal Studies 17, no. 1 (2007): 72, citing
J.T. Anagnoson, “Home Style in New Zealand,” Legislative
Studies Quarterly 8, no. 2 (1983): 160. Anagnoson theorised
that the disciplined two-party system and the small size
of constituencies (between 20,000 to 35,000 residents)contributed to local MPs devoting a large share of their time
to electorate work.
9 List MPs who belong to minor parties, like ACT or the Green
Party, for example, have a greater incentive to represent
interest groups, national issues or their party’s policy
programme because contesting electorates is not a viable
electoral strategy for them. E. McLeay and J. Vowles,
“Redening Constituency Representation: The roles of
New Zealand MPs under MMP,” 87. New Zealand Royal
Commission on the Electoral System and J.H. Wallace, Report
o the Royal Commission on the Electoral System: Towards a
better democracy (Wellington: Government Printer, 1986), 53.
Also see R. Miller and J. Vowles, “Public Attitudes Towards
MMP and Coalition Government,” New Zealand Journal o
Public and International Law 7, no. 1 (2009): 97; J. Vowles,S.A. Banducci and J.A. Karp, “Forecasting and Evaluating the
Consequences of Electoral Change in New Zealand,” Acta
Politica 41 (2006): 275; and P. Brook Cowen, T. Cowen and
A. Tabarrok, “An Analysis of Proposals for Constitutional
Change in New Zealand” (Wellington: New Zealand Business
Roundtable, 1992), 3.17. MMP’s supporters even argue that
MMP is better than other electorate systems at providing
strong local representation because voters do not have to
be concerned about how their electorate vote will inuence
which government is formed. This means that they can
choose who they think will be the best person for their
electorate and the best party for the nation. Under FPP, PV,
SM and STV, voters who want to elect a particular party to
form a government have an incentive to support that party’s
local candidate(s). This motivation may outweigh their
desire for strong electorate representation. Graeme Edgeler,
Personal Communication, 6 May 2011.
10 In the case of women, the list seats have contributed to the
overall increase in women’s representation. For example, in
1987, 14 percent of MPs were women. In 1996, the total share
increased to 29 percent, with 45 percent of list MPs being
women. By 2005, the total share of women MPs increased
moderately to 33 percent and the list share had recovered to
1996 levels, at 46 percent. Forty-one women were elected to
parliament at the 2008 election. Four women have resigned
since then, so the total share of women in parliament is
currently about the same as in 2005, at 32 percent. However,
we should also bear in mind that women’s representation
was improving before MMP was introduced due to the Labour
Party standing more women in winnable electorates. We
should therefore not neglect to acknowledge how electorate
seats—and parties’ candidate selection strategies—have
contributed to the increase in women’s representation.
E. McLeay and J. Vowles, “Redening Constituency
Representation: The roles of New Zealand MPs under MMP,”
88. Cf. S. Levine, N.S. Roberts and R. Salmond, “A Wider
View: MMP ten years on,” in The Baubles o Ofce. The New
Zealand General Election o 2005 , eds. S. Levine and N. S.
Roberts (Wellington: Victoria University Press, 2007), 458-
459. Parliamentary Library, “Final Results for the 2008 New
Zealand General Election,” Parliamentary Library ResearchPaper (Wellington: 2008), 9. J. Vowles, S.A. Banducci and
J.A. Karp, “Forecasting and Evaluating the Consequences
of Electoral Change in New Zealand,” 274, citing New
Zealand Electoral Commission data. In terms of ethnic group
representation, Maori representation beneted from the
switch from FPP to MMP. In 1987, Maori made up about 5
percent of the MPs in parliament. At the rst MMP election
in 1996 their share increased to about 13 percent and the
proportion of MPs claiming Maori descent more than doubled
over the period from 1993 to 2005. Today, their share sits
at 17 percent of the seats (that is, there were 20 Maori MPs
elected at the 2008 election). After the 2005 election, Maori
representation had improved to the point that for the rst
time Maori were now slightly over-represented in parliament
in relation to their share of the population. Removing theseven Maori seats from the equation, Maori were represented
almost exactly in proportion to their population share.
The improvement is partly due to higher constituency
representation, with the increase in the number of Maori
seats from four to seven. However, as the gures illustrate,
the proportional list vote has also made a big difference.
An exception to the rule that the list system improved
representation for ethnic minority groups is that it did not
make a very big difference to the representation of Pacic
Islanders. Their overall share of parliamentary seats did not
Embargoed until 20 September 2011
8/4/2019 EMBARGOED Kicking the Tyres
http://slidepdf.com/reader/full/embargoed-kicking-the-tyres 35/42endnotes - 32
increase between 1993 and 2005. In 2008, ve Pacic Island
MPs were elected to parliament, whereas none were in 1990.
P.A. Joseph, “The Maori Seats in Parliament,” Te Oranga o
te Iwi Maori: A study o Maori economic and social progress
(Wellington: New Zealand Business Roundtable (NZBRT),
2008). Parliamentary Library, “The Origins of the Maori
Seats,” Parliamentary Library Research Paper (Wellington:
2009), 29. S. Levine, N.S. Roberts, and R. Salmond, “A Wider
View: MMP ten years on,” 457.
11 For instance, nearly all of the Asian MPs in parliament have
been elected from party lists. E. McLeay and J. Vowles,
“Redening Constituency Representation: The roles of New
Zealand MPs under MMP,” 88.
12 See J. Vowles, S.A. Banducci and J.A. Karp, “Forecasting and
Evaluating the Consequences of Electoral Change in New
Zealand,” 274.
13 J. Boston, “Innovative Political Management: Multi-party
governance in New Zealand,” Policy Quarterly 5, no. 2 (2009):
56. A longer treatment of New Zealand’s experience of multi-
party governance may be found in J. Boston and D. Bullock,
“Experiments in Executive Government Under MMP in New
Zealand: Contrasting approaches to multi-party governance,”
New Zealand Journal o Public and International Law 7, no. 1
(2009): 39-76.
14 S. Levine, N.S. Roberts, and R. Salmond, “A Wider View: MMP
ten years on,” 462.
15 Political and legal analysts Penelope Brooke Cowen, Tyler
Cowen and Alexander Tabarrok note that government can
be inuenced by special interest and minority groups under
mixed voting systems like MMP. This is easier when those
interest and minority groups can appeal to a minor party thatcan speak for them rather than having to work through the
channels of a major party which will tend to reect the views
of the majority. As Cowen, Cowen and Tabarrok say, “Partial
list systems channel interest group pressures through multi-
party coalitions instead.” P. Brook Cowen, T. Cowen and A.
Tabarrok, “An Analysis of Proposals for Constitutional Change
in New Zealand,” 3.4.
16 American economist and social scientist Mancur Olsen’s work
on collective action and group theory is also relevant to this
discussion. Olsen argued that small, concentrated special
interest groups can be more inuential in politics than groups
that are more numerous but less cohesive and organised
together. Further, the government—or in our case the major
governing party under MMP—has an incentive to listen to
what minority interest groups, lobby groups and minorityparties want and the policies which they demand in return for
their support in government. Olsen argued that minorities’
policies are not necessarily good for “the nation as a whole.”
See, for example, M. Olson, The Logic o Collective Action
and the Theory o Groups (New York: Shocken Books, 1971);
M. Olson, The Rise and Decline o Nations: Economic growth,
stagation and social rigidities (New Haven: Yale University
Press, 1982), cited in P. Brook Cowen, T. Cowen and A.
Tabarrok, “An Analysis of Proposals for Constitutional Change
in New Zealand,” 1.5. While this will not be the case for
every interest or issue supported by minorities, sometimes
their interests can be harmful because they prioritise some
goods over others. For example, a redistributive policy that
favours one group could, if it were expensive, be a big cost for
every taxpayer and therefore a cost for the entire productive
economy.
17 J. Vowles, S.A. Banducci and J.A. Karp, “Forecasting and
Evaluating the Consequences of Electoral Change in New
Zealand,” 270; J. Boston, S. Church and T. Bale, “The Impact
of Proportional Representation on Government Effectiveness:
The New Zealand experience,” Australian Journal o Public
Administration 62, no. 4 (2003): 18.
18 P.A. Joseph, “MMP and the Constitution,” New Zealand
Journal o Public and International Law 7, no. 1 (2009): 115.
19 Having said that, party selection rules might also be a factor
in whether candidates are nominated to stand for parties
in other voting systems. For example, MPs may not get
re-selected for an FPP electorate contest if they challenge
the party hierarchy. Further, in some cases under MMP,
electorate MPs might stand a better chance of winning
or holding an electorate seat because voters do not have
to vote for their favourite party when they vote for their
preferred candidate. Most of the other alternative systems
that are being considered at the referendum require voters
to vote for their party’s preferred candidate to vote for their
favourite party. We should also remember that even under
New Zealand’s old FPP voting system there was an equally, if
not more, tightly-disciplined party system than there is under
MMP. For example, voters’ choice of electoral candidate
tended to be inuenced by which parties voters supported
than by strong preferences for a particular candidates
(although the effect of candidate preferences have still
been detected). J.A. Karp, “Candidate Effects and Spill-overin Mixed Systems: Evidence from New Zealand,” Electoral
Studies 28 (2009): 42, citing J. Vowles et al., Toward’s
Consensus? The 1993 general election in New Zealand and the
transition to proportional representation (Auckland: Auckland
University Press, 1995), 161; D. Denemark, “Choosing MMP in
New Zealand: Explaining the 1993 electoral reform,” in Mixed-
Member Electoral Systems. The best o both worlds? eds. M.
S. Shugart and M. P. Wattenberg (Oxford: Oxford University
Press, 2001), 71.
20 A. Kaiser, “MMP, Minority Governments and Parliamentary
Opposition,” New Zealand Journal o Public and International
Law 7, no. 1 (2009): 79, 90. P.A. Joseph, “MMP and the
Constitution,” 121. Political analysts Claudia Geiringer, Polly
Higbee and Elizabeth McLeay note that the condence and
supply agreements entered into by the minor parties whichsupport the National Party have clauses that require the
minor parties to offer procedural support, such as for urgency
motions. C. Geiringer, P. Higbee and E. McLeay, “Standing
Orders Review 49th Parliament. Submission to Standing
Orders Committee” (Victoria University Wellington: The
Urgency Project, 2011), 8. These clauses could make it more
difcult for a minor party to oppose the major governing
party.
21 E. McLeay and J. Vowles, “Redening Constituency
Representation: The roles of New Zealand MPs under MMP,”
72.
Mixed Member Proportional (MMP) cont.
Embargoed until 20 September 2011
8/4/2019 EMBARGOED Kicking the Tyres
http://slidepdf.com/reader/full/embargoed-kicking-the-tyres 36/42endnotes - 33
1 S. Hix, R. Johnston and A. Cummine, “Choosing an Electoral
System” (London: The British Academy Policy Centre, 2010),
37; International Institute for Democracy and Electoral
Assistance (IDEA), “Electoral System Design: The new
international IDEA handbook” (Stockholm: 2005), 35.
2 P.A. Joseph, “MMP and the Constitution,” New Zealand Journal
o Public and International Law 7, no. 1 (2009): 117.
3 Electoral Commission, “The FPP Voting System. First Past the
Post, Fact Sheet (Wellington: 2011), 1.
4 Also see disproportionality scores for 82 elections in 23
countries between 1979 and 1989. Source: M. Gallagher,
“Proportionality, Disproportionality and Electoral Systems,”
Electoral Studies 10, no. 1 (1991): 45-46. The disproportionality
index measures “the difference between parties’ shares of
the votes and their shares of the seats.” M. Gallagher and P.
Mitchell, The Politics o Electoral Systems (New York: OxfordUniversity Press, 2005), 602. According to Gallagher, New
Zealand’s average score was 14.0 for three FPP elections
between 1979 and 1989.
5 B. Manin, The Principles o Representative Government
(Cambridge: Cambridge University Press, 1997), 95-98,
193ff; H.F. Pitkin, The Concept o Representation (Berkeley:
University of California Press, 1967), 168ff.
6 One 1983 study showed that MPs on average spent about
30 percent of their time on electorate work. Voters therefore
came to see MPs’ local work—ofciating at public functions,
dealing with housing and welfare issues, attending sporting
events, and more—as one of their main jobs. E. McLeay and
J. Vowles, “Redening Constituency Representation: The
roles of New Zealand MPs under MMP,” Regional and Federal
Studies 17, no. 1 (2007): 72, citing J.T. Anagnoson, “Home
Style in New Zealand,” Legislative Studies Quarterly 8, no. 2
(1983): 160.
7 M.B. Vieira and D. Runciman, Representation (Cambridge,
United Kingdom: Polity Press, 2008), x; B. Manin, The
Principles o Representative Government , 184-187; J. Coniff,
“Burke, Bristol and the Concept of Representation,” Western
Political Quarterly 30 (1977): 339; H.F. Pitkin, The Concept of
Representation, 168, 175, 184.
8 Cf. D. Denemark, “Choosing MMP in New Zealand: Explaining
the 1993 electoral reform,” in Mixed-Member Electoral
Systems. The best o both worlds? eds. M. S. Shugart and M.
P. Wattenberg (Oxford: Oxford University Press, 2001), 78-81.
9 International Institute for Democracy and Electoral Assistance
(IDEA), “Electoral System Design: The new international IDEA
handbook,” 6.
10 L. Malpass and O.M. Hartwich, “Superseding MMP: Real
electoral reform for New Zealand,” Policy Monograph, 109 (St
Leonard’s, NSW: Centre for Independent Studies (CIS), 2010), 5.
11 L. Malpass and O.M. Hartwich, “Superseding MMP: Real
electoral reform for New Zealand,” 5. P. Brook Cowen,
T. Cowen and A. Tabarrok, “An Analysis of Proposals for
Constitutional Change in New Zealand” (Wellington: New
Zealand Business Roundtable, 1992), 1.3-1.4, 3.4, citing D.
Mueller, Public Choice II (Cambridge University Press, 1989)
and A. Downs, An Economic Theory of Democracy (New York:
Harper and Row, 1957).
12 P. Brook Cowen, T. Cowen and A. Tabarrok, “An Analysis of
Proposals for Constitutional Change in New Zealand,” 1.3-
1.4, 3.4. This point is made in the 1986 Royal Commission’s
discussion of the Supplementary Member (SM) voting system
where they comment that SM would enable political parties
to represent minority interest groups by standing a more
diverse range of candidates. New Zealand Royal Commission
on the Electoral System and J.H. Wallace, Report o the
Royal Commission on the Electoral System: Towards a better
democracy (Wellington: Government Printer, 1986), 40-41.
Also see H. Catt, P. Harris and N.S. Roberts, Voter’s Choice.
Electoral change in New Zealand (Palmerston North: The
Dunmore Press, 1992), 39-40.
13 S. Hix, R. Johnston and A. Cummine, “Choosing an Electoral
System,” 45-46; P. Norris, Electoral Engineering. Voting rulesand political behaviour (Cambridge: Cambridge University
Press, 2004), 12. A similar point is made that FPP can
encourage ethnic cleavages, too. International Institute for
Democracy and Electoral Assistance (IDEA), “Electoral System
Design: The new international IDEA handbook,” 43.
14 S. Hix, R. Johnston and A. Cummine, “Choosing an Electoral
System,” 15-16; H. Catt, P. Harris and N.S. Roberts, Voter’s
Choice. Electoral change in New Zealand , 19-23; New Zealand
Royal Commission on the Electoral System and J.H. Wallace,
Report o the Royal Commission on the Electoral System:
Towards a better democracy , 13-16. The result in each
electorate seat is a snapshot of a particular community’s
preferences. Provided that a community elects the candidate
which they prefer it may not matter very much if election
results are disproportionate.
15 D. Denemark, “Choosing MMP in New Zealand: Explaining the
1993 electoral reform,” 75.
16 Electoral Commission, General Elections 1890-1993 - Seats
Won by Party (2011), http://www.elections.org.nz/elections/
resultsdata/fpp-seats-won.html (accessed 10 May 2011).
17 D. Denemark, “Choosing MMP in New Zealand: Explaining the
1993 electoral reform,” 76.
18 On the ease and clarity of policy implementation, see:
L. Malpass and O.M. Hartwich, “Superseding MMP: Real
electoral reform for New Zealand,” 5; New Zealand Business
Roundtable, “Submission to the MMP Review Committee”
(Wellington: 2000), ii, 3-5, 8; P. Brook Cowen, T. Cowen and A.
Tabarrok, “An Analysis of Proposals for Constitutional Change
in New Zealand,” 6.3-6.4.
19 The high level of retrospective accountability of governments
to voters, which FPP was supposed to provide at each
election, appeared to have disappeared by the 1980s with
the growing disproportionality of election results and acute
wrong-winner elections. D. Denemark, “Choosing MMP in New
Zealand: Explaining the 1993 electoral reform,” 72.
20 Strictly speaking, under FPP voters can only dump—that is
directly vote out—their local MP, not the government. This is
because under FPP voters elect candidates to parliament and
the government is formed by the party which has a majority
of MPs. But, because voters have direct control over which
First-Past-the-Post (FPP)
Embargoed until 20 September 2011
8/4/2019 EMBARGOED Kicking the Tyres
http://slidepdf.com/reader/full/embargoed-kicking-the-tyres 37/42endnotes - 34
candidates are elected from each electorate, it is still true to
say that it is easy for them to elect or dump a government
at the election. Graeme Edgeler, Personal Communication, 6
May 2011.
21 D. Denemark, “Choosing MMP in New Zealand: Explaining the
1993 electoral reform,” 70.
1 D.M. Farrell and I. McAllister, The Australian Electoral System.
Origins, variations and consequences (Sydney: University of
New South Wales Press, 2006), 3-4; International Institute for
Democracy and Electoral Assistance (IDEA), “Electoral System
Design: The new international IDEA handbook” (Stockholm:
2005), 48.
2 H. Catt, P. Harris and N.S. Roberts, Voter’s Choice. Electoral
change in New Zealand (Palmerston North: The DunmorePress, 1992), 83.
3 STV Taskforce, “Choosing Electoral Systems in Local
Government. A resource document” (Wellington: The
Department of Internal Affairs, 2002), 12.
4 PV therefore creates certain electoral incentives for voters,
candidates and political parties with implications for election
results and the legitimacy of electoral outcomes. Political
scientists David Farrell and Ian McAlister argue that PV ought
to be cursorily categorised as a non-proportional voting
system. However, their ndings suggest that preferential
voting produces different sorts of electoral behaviour among
candidates and voters, such as plumping for one candidate
and preference swapping among political parties. This means
that election results, and sometimes electoral outcomes,
can be different to what is expected of most single-member
electorate majoritarian voting systems. On this basis, they
argue that PV—and its cousin STV—ought to be thought of
differently as examples of a family of ordinal voting systems.
D.M. Farrell and I. McAllister, The Australian Electoral System.
Origins, variations and consequences, 171-173.
5 Electoral Referendum Act 2010, sch 2(5). It should be noted
that New Zealand already has a preferential system in STV,
which operates the same way as PV, for mayoral elections.
The form of STV used does not require voters to indicate
a preference for all candidates. Given that ranking every
candidate has not been a requirement at local body level, it is
probable that voters would not have to rank every candidate
if PV were used in general elections.
6 Electoral Commission, “The PV Voting System. Preferential
Voting, Fact Sheet (Wellington: 2011), 1.
7 Also see disproportionality scores calculated using the
Gallagher least squares index for 82 elections in 23
countries between 1979 and 1989. Source: 45-46. The
disproportionality index measures “the difference between
parties’ shares of the votes and their shares of the seats.” M.
Gallagher and P. Mitchell, The Politics o Electoral Systems
(New York: Oxford University Press, 2005), 602.
8 Lord Alexander, of Britain’s Jenkins Commission on the
Electoral System, found this scenario “wholly illogical,” as he
thought that it made more sense for the preferences of those
who supported the strongest candidates to be considered
when subsequent preferences were allocated to candidates.
McCarvill, citing Lord Alexander’s dissenting position in the
1998 Jenkins Commission Report. P. McCarvill, “Devising an
Electoral System for the 21st Century: The case for AMS”
(London: Institute for Public Policy Research (IPPR), 2010), 8.
9 Political scientist Ben Reilly writes that, “Political scientists
have long theorized that the use of preferential election
systems can help promote successful conict managementin divided societies. As it turns out, evidence … supports
this conclusion.” B. Reilly, “Electoral Systems for Divided
Societies,” Journal o Democracy 13, no. 2 (2002): 156-70.
Two divided societies which are nearby to New Zealand that
have used PV are Papua New Guinea, which uses a limited
preferential voting system based on the Alternative Vote,
and Fiji, where the 1998 constitution introduced instant
run-off voting. PV has worked with a mixture of success in
Papua New Guinea, such as in terms of participation, but
more attention is required to improve voters’ education
levels about PV’s implications. Fiji has experienced instances
of preference swapping, with parties attempting to exploit
the rules to gain an electoral advantage—and it has in fact
decided to change from its instant run-off PV system to
a proportional representation system. R. McIlveen, “The
Alternative Vote - The system that no-one wants,” Research
Note (London: Policy Exchange, 2010), 1, 5; A. Ladley and
J. Williams, “’Electoral Education’ in PNG: A survey of
existing literature and reports” (Wellington: Institute of
Policy Studies, School of Government, Victoria University of
Wellington, 2007), 57; J. Fraenkel, “A Note on the Fiji Electoral
System,” in From Election to Coup in Fiji. The 2006 campaign
and its atermath, ed. Jon and Stewart Firth (Canberra: ANU
E-Press; Asia Pacic Press, 2007), xxiv-xxviii.
10 New Zealand Royal Commission on the Electoral System
and J.H. Wallace, Report o the Royal Commission on the
Electoral System: Towards a better democracy (Wellington:
Government Printer, 1986), 31.
11 Cf. D.M. Farrell and I. McAllister, The Australian Electoral
System. Origins, variations and consequences, 81; S. Hix, R.
Johnston and A. Cummine, “Choosing an Electoral System”
(London: The British Academy Policy Centre, 2010), 56.
12 D.M. Farrell and I. McAllister, The Australian Electoral System.
Origins, variations and consequences, 81. In Australia,
compulsory voting and the prevailing use of full preferential
voting—where voters must mark a preference for every
candidate bar one on the ballot paper—undoubtedly
contribute to the strength of the major parties and the difculty
that minor parties face in winning electorate seats (and
therefore the high distortion between parties’ share of the vote
Preferential Voting (PV)
First-Past-the-Post (FPP) cont.
Embargoed until 20 September 2011
8/4/2019 EMBARGOED Kicking the Tyres
http://slidepdf.com/reader/full/embargoed-kicking-the-tyres 38/42endnotes - 35
and their share of parliamentary seats). Only New South Wales
and Queensland use optional preferential voting along the
lines of what New Zealand might use if PV were introduced.
13 R. McIlveen, “The Alternative Vote - The system that no-one
wants,” 9. This outcome also occurred in the 1940, 1954 and
1961 elections.
14 New Zealand Royal Commission on the Electoral System and
J.H. Wallace, Report o the Royal Commission on the Electoral
System: Towards a better democracy , 31.
15 D.M. Farrell and I. McAllister, The Australian Electoral System.
Origins, variations and consequences, 82-83, and more
generally chapter 6.
16 The 1986 Royal Commission on the Electoral System
was also hesitant to recommend PV as a voting system
for New Zealand. It thought that PV “might represent
some improvement over plurality [that is, FPP] in single-
member constituencies; however, we do not consider this
improvement would be signicant and do not regard it as the
best alternative to our present system [FPP].” New Zealand
Royal Commission on the Electoral System and J.H. Wallace,
Report o the Royal Commission on the Electoral System:
Towards a better democracy, 31. Further, Farrell and McAlister
remark that “Its [PV’s] preferential nature has [electoral]
consequences, and there is evidence that this is of increasing
signicance in recent elections.” D.M. Farrell and I. McAllister,
The Australian Electoral System. Origins, variations and
consequences, 171.
1 Electoral Commission, “The STV Voting System. Single
Transferable Vote,” Fact Sheet (Wellington: 2011), 1.
2 The electoral quota is determined by dividing the total
number of valid votes cast by the number of seats to be
lled in each electorate, plus one and then adding a whole
number, often “one,” or a fraction to the quotient. That is:
the electoral quota = (valid votes/(available seats + 1)) + 1.
International Institute for Democracy and Electoral Assistance
(IDEA), “Electoral System Design: The new international IDEA
handbook,” 71, 76; H. Catt, P. Harris and N.S. Roberts, Voter’s
Choice. Electoral change in New Zealand , 47-49.
3 The votes are often distributed on a pro rata basis. D.M.
Farrell and I. McAllister, The Australian Electoral System.Origins, variations and consequences, (Sydney: University of
New South Wales Press, 2006), 63ff, 94ff; H. Catt, P. Harris
and N.S. Roberts, Voter’s Choice. Electoral change in New
Zealand, (Palmerston North: The Dunmore Press, 1992), 49.
In New Zealand local body elections, the Meek method is
used to distribute the votes. This method ensures that the
“count, as far as possible, reects the voting preferences
of each voter and the number of wasted votes is kept to a
minimum.” STV Taskforce, “Choosing Electoral Systems in
Local Government. A resource document,” (Wellington: The
Department of Internal Affairs, 2002), 15, 35-39; B. Meek,
“A New Approach to the Single Transferable Vote,” Voting
Matters 1 (1994): 1-11.
4 H. Catt, P. Harris and N.S. Roberts, Voter’s Choice. Electoral
change in New Zealand , 49.
5 Electoral Referendum Act 2010, sch 2(6)(3).
6 H. Catt, P. Harris and N.S. Roberts, Voter’s Choice. Electoral
change in New Zealand, 49-50.
7 Also see disproportionality scores for 82 elections in 23
countries between 1979 and 1989. Source: M. Gallagher,
“Proportionality, Disproportionality and Electoral
Systems,” Electoral Studies 10, no. 1 (1991): 45-46. The
disproportionality index measures “the difference between
parties’ shares of the votes and their shares of the seats.” M.
Gallagher and P. Mitchell, The Politics o Electoral Systems
(New York: Oxford University Press, 2005), 602.
8 New Zealand Royal Commission on the Electoral System
and J.H. Wallace, Report o the Royal Commission on the
Electoral System: Towards a better democracy (Wellington:
Government Printer, 1986), 53.
9 New Zealand Royal Commission on the Electoral System and
J.H. Wallace, Report o the Royal Commission on the Electoral
System: Towards a better democracy , 48.
10 New Zealand Royal Commission on the Electoral System and
J.H. Wallace, Report o the Royal Commission on the Electoral
System: Towards a better democracy, 50-51.
11 S. Bowler and B. Grofman, Elections in Australia, Ireland
and Malta Under the Single Transerable Vote. Reectionson an embedded institution (Ann Arbor: The University of
Michigan Press, 2000), 9; New Zealand Royal Commission
on the Electoral System and J.H. Wallace, Report o the
Royal Commission on the Electoral System: Towards a better
democracy, 54.
12 M. Marsh, “Candidate-centred but Party Wrapped:
Campaigning in Ireland under STV,” in Elections in Australia,
Ireland, Malta under the Single Transerable Vote. Reections
on an embedded institution, eds. S. Bowler and B. Grofman
(Ann Arbor: University of Michigan Press, 2000), 129-130.
13 S. Bowler and B. Grofman, Elections in Australia, Ireland and
Malta Under the Single Transerable Vote. Reections on an
embedded institution, 9-10.
14 Political scientist David Farrell cites a Gallagher least squares
index of disproportionality score for of 5.4 for STV and 3.8
for MMP. D.M. Farrell, Electoral Systems: A comparative
introduction (New York: Palgrave, 2001), xiii, 241, cited in
D.M. Farrell and I. McAllister, The Australian Electoral System.
Origins, variations and consequences, 8. The proportionality
of STV in the case of Australian state elections is discussed in
D.M. Farrell and I. McAllister, The Australian Electoral System.
Origins, variations and consequences, 83-91.
15 New Zealand Royal Commission on the Electoral System and
J.H. Wallace, Report o the Royal Commission on the Electoral
System: Towards a better democracy, 48.
Single Transferable Vote (STV)
Preferential Voting (PV) continued
Embargoed until 20 September 2011
8/4/2019 EMBARGOED Kicking the Tyres
http://slidepdf.com/reader/full/embargoed-kicking-the-tyres 39/42endnotes - 36
16 Cf. D.M. Farrell and I. McAllister, The Australian Electoral
System. Origins, variations and consequences, 172.
17 P. Brent, “Time to Scrap the Ticket Vote for the Senate,” 11
(Canberra: Democratic Audit of Australia; Political Science
Programme, Research School of Social Sciences, Australia
National University, 2004), 1-4.
18 P. Brent, “Time to Scrap the Ticket Vote for the Senate,” 1.
Political scientists Ben Reilly and Michael Maley also provide
percentage gures for ticket voting use in the Australian
states for elections from 1984 to 1998. They show gures
of between 85 and 95 percent in total from elections in the
different Australian states. The share since 1990 has been
between 90 and 95 percent, indicating ticket voting’s high
popularity. B. Reilly and M. Maley, “The Single Transferable
Vote and the Alternative Vote Compared,” in Elections in
Australia, Ireland and Malta Under the Single Transerable
Vote. Reections on an embedded institution, eds. S. Bowler
and B. Grofman (Ann Arbor: The University of Michigan Press,
2000), 52.
19 B. Reilly and M. Maley, “The Single Transferable Vote and the
Alternative Vote Compared,” 52.
20 New Zealand Royal Commission on the Electoral System and
J.H. Wallace, Report o the Royal Commission on the Electoral
System: Towards a better democracy, 49.
21 Evidence cited in S. Levine and N.S. Roberts, “MMP and the
Future: Political challenges and proposed reforms,” New
Zealand Journal o Public and International Law 7, no. 1
(2009): 139.
22 S. Bowler and B. Grofman, Elections in Australia, Ireland and
Malta Under the Single Transerable Vote. Reections on an
embedded institution, 1ff.
1 The Electoral Referendum Act 2010 does not state either
which formula would be used to distribute the 30 list seats
among the political parties which cross the party vote
threshold or what the party vote threshold would be if SM
were used. The 1986 Royal Commission proposed that a
modied version of the Sainte Laguë electoral formula
ought to be used to distribute the list seats under SM so
that it would be more difcult for the major parties to win
their rst list seat in parliament. This formula or the regular
Sainte Laguë system that is used with MMP could be usedto allocate the list seats under SM. Further, the 1986 Royal
Commission did not specify a threshold for the list seats
but noted that an effective threshold of about ve percent
of the party vote would exist in an election of about two
million voters voting for a parliament of 120 MPs with 30
supplementary seats. Without a legal threshold the effective
threshold will of course vary according to how many votes
are cast at each election. A statutory ve percent threshold
party vote could be used with SM to solve this problem.
Electoral Referendum Act 2010, sch 2(7); New Zealand Royal
Commission on the Electoral System and J.H. Wallace, Report
o the Royal Commission on the Electoral System: Towards
a better democracy, (Wellington: Government Printer, 1986),
38-39, 71-73.
2 Electoral Referendum Act 2010, 10, sch 2(7)(2).
3 The terminology used to describe mixed voting systems like
this varies from Supplementary Member, to Mixed-Member
Majoritarian (MMM), to parallel systems (because the two
votes operate side-by-side, much how like parallel lines do
not touch). SM is often called Mixed-Member Majoritarian
outside of New Zealand because under such a system it is
likely that a single party would win an absolute majority of
seats in parliament. S. Hix, R. Johnston and A. Cummine,
“Choosing an Electoral System” (London: The British
Academy Policy Centre, 2010), 104-105; International Institute
for Democracy and Electoral Assistance (IDEA), “Electoral
System Design: The new international IDEA handbook”
(Stockholm: 2005), 104.
4 International Institute for Democracy and Electoral Assistance
(IDEA), “Electoral System Design: The new international IDEA
handbook,” 104, 112.
5 Note, the Electoral Referendum Act 2010 does not say how
the ballot paper would be designed—that is, whether there
would still be one ballot paper, just like with MMP, or whether
there would be two separate ballot papers. Ballot paperdesign can have an important effect on electoral outcomes.
As political scientist Jeffrey Karp indicates, “A number of
studies have found that the position of candidates on a ballot
can inuence electoral outcomes though the magnitude of
these effects varies. … Little is known, however, whether
these effects would extend from voting for candidates to
parties.” For instance, see J.G.S. Koppel and J. Steen, “The
Effects of Ballot Position on Election Outcomes,” Journal
o Politics 66, no. 267 (2004): 281 and J.M. Miller and J.A.
Krosnick, “The Impact of Candidate Name Order on Election
Outcomes,” Public Opinion Quarterly 62 (1998): 291-330,
cited in J.A. Karp, “Candidate Effects and Spill-over in Mixed
Systems: Evidence from New Zealand,” Electoral Studies 28
(2009): 42. In New Zealand, a minor party’s party vote in an
MMP election can benet from being associated with a local
candidate’s name if candidates’ names are printed side-by-
side with parties’ names on the ballot paper. This is important
because if no candidate stands in an electorate then the
party’s name is printed in alphabetical order below the names
of the parties which do stand candidates. Thus, minor parties
that contest fewer electorates have an electoral disadvantage
since their party name is printed further to the bottom of the
ballot paper, where some voters might not read. J.A. Karp,
“Candidate Effects and Spill-over in Mixed Systems: Evidence
from New Zealand,” 42-44.
Single Transferable Vote (STV) cont.
Supplementary Member (SM)
Embargoed until 20 September 2011
8/4/2019 EMBARGOED Kicking the Tyres
http://slidepdf.com/reader/full/embargoed-kicking-the-tyres 40/42endnotes - 37
6 Electoral Commission, “The SM Voting System.
Supplementary Member, Fact Sheet (Wellington: 2011), 1.
7 Also see disproportionality scores for 82 elections in 23
countries between 1979 and 1989. Source: M. Gallagher,
“Proportionality, Disproportionality and Electoral
Systems,” Electoral Studies 10, no. 1 (1991): 45-46. The
disproportionality index measures “the difference between
parties’ shares of the votes and their shares of the seats.” M.
Gallagher and P. Mitchell, The Politics o Electoral Systems
(New York: Oxford University Press, 2005), 602. Levine and
Roberts also cite an average disproportionality gure of 9.5
for ve New Zealand MMP elections between 1996 and 2008
re-run under SM rules. S. Levine and N.S. Roberts, “MMP
and the Future: Political challenges and proposed reforms,”
New Zealand Journal o Public and International Law 7, no. 1
(2009): 146.
8 H. Catt, P. Harris and N.S. Roberts, Voter’s Choice. Electoral
change in New Zealand (Palmerston North: The Dunmore
Press, 1992), 38.
9 New Zealand Royal Commission on the Electoral System and
J.H. Wallace, Report o the Royal Commission on the Electoral
System: Towards a better democracy, 41.
10 R. Miller and J. Vowles, “Public Attitudes Towards MMP and
Coalition Government,” New Zealand Journal o Public and
International Law 7, no. 1 (2009): 97. International Institute
for Democracy and Electoral Assistance (IDEA), “Electoral
System Design: The new international IDEA handbook,” 112;
M.S. Shugart and M.P. Wattenberg, Mixed-member Electoral
Systems: The best o both worlds? (Oxford, UK; New York:
Oxford University Press, 2001), 593-594; cf. New Zealand
Royal Commission on the Electoral System and J.H. Wallace,Report o the Royal Commission on the Electoral System:
Towards a better democracy, 42.
11 F. Ferrara, E.S. Herron and M. Nishikawa, Mixed Electoral
Systems. Contamination and its consequences (New York:
Palgrave MacMillan, 2005), 48, 63, 139-141; J.A. Karp,
“Candidate Effects and Spill-over in Mixed Systems: Evidence
from New Zealand,” 42.
12 In this respect, the style of politics and campaigning at the
electorate level might be more similar to the situation under
MMP. The assumption is that there is “contamination”
between the two electoral tiers; that is, parties which stand
electorate candidates will receive a boost to their party
vote even if they do not win an electorate seat. J.A. Karp,
“Candidate Effects and Spill-over in Mixed Systems: Evidence
from New Zealand,” 42, 45-46.13 F. Ferrara, E.S. Herron and M. Nishikawa, Mixed Electoral
Systems. Contamination and its consequences, 140.
Some analysis produced by political scientist Jeffrey Karp
nonetheless offers some clues. Using data from the 2005 and
2002 MMP elections, Karp nds that the impact of electorate
candidates on parties’ list votes is quite small. According to
Karp, parties “appear to matter more in New Zealand politics
even though districts are relatively small and MPs are likely
to invest a great deal of effort in constituency service.” Karp’s
ndings indicate that the inuence of electorate elections
over the party vote election might not be as important in New
Zealand under MMP, and in other mixed systems, as Ferrara
and others have stated. J.A. Karp, “Candidate Effects and
Spill-over in Mixed Systems: Evidence from New Zealand,”
49. However, we do not know for certain whether the result
would be the same with SM.
14 Jeffrey Karp nds only modest evidence that in New Zealand
electorate candidates have helped to increase their parties’
list vote. New Zealand’s high incidence of split voting—
between 29 and 39 percent of voters have split their vote
between the electorate and the list vote in MMP elections—
might explain some of the modest results. J.A. Karp,
“Candidate Effects and Spill-over in Mixed Systems: Evidence
from New Zealand,” 49.
15 New Zealand Royal Commission on the Electoral System and
J.H. Wallace, Report o the Royal Commission on the Electoral
System: Towards a better democracy, 40. Cf. International
Institute for Democracy and Electoral Assistance (IDEA),
“Electoral System Design: The new international IDEA
handbook,” 112; H. Catt, P. Harris and N.S. Roberts, Voter’s
Choice. Electoral change in New Zealand, 39-40.
16 New Zealand Royal Commission on the Electoral System and
J.H. Wallace, Report o the Royal Commission on the Electoral
System: Towards a better democracy, 39-42.
17 S. Hix, R. Johnston and A. Cummine, “Choosing an Electoral
System,” 97; M.S. Shugart and M.P. Wattenberg, Mixed-
member Electoral Systems: The best o both worlds? 13ff.
International Institute for Democracy and Electoral Assistance
(IDEA), “Electoral System Design: The new international IDEA
handbook,” 104.
18 New Zealand political scientists Stephen Levine and NigelRoberts re-ran New Zealand’s ve MMP election results,
between 1996 and 2008, using SM rules. Their ndings
showed that at three of the elections a single-party majority
government would have been elected and that overall
the election results would have been “three times more
disproportionate” than they were with MMP. S. Levine and
N.S. Roberts, “MMP and the Future: Political challenges and
proposed reforms,” 135, 142-146.
19 S. Levine and N.S. Roberts, “MMP and the Future: Political
challenges and proposed reforms,” 145; New Zealand Royal
Commission on the Electoral System and J.H. Wallace, Report
o the Royal Commission on the Electoral System: Towards a
better democracy, 39-42.
20 F. Ferrara, E.S. Herron and M. Nishikawa, Mixed Electoral
Systems. Contamination and its consequences, 139-141;International Institute for Democracy and Electoral Assistance
(IDEA), “Electoral System Design: The new international IDEA
handbook,” 112.
21 See tables 2 to 6 in S. Levine and N.S. Roberts, “MMP and
the Future: Political challenges and proposed reforms,” 143-
144. Cf. M.S. Shugart and M.P. Wattenberg, Mixed-member
Electoral Systems: The best o both worlds? 592.
22 M.S. Shugart and M.P. Wattenberg, Mixed-member Electoral
Systems: The best o both worlds? 591-592.
Supplementary Member (SM) cont.
Embargoed until 20 September 2011
8/4/2019 EMBARGOED Kicking the Tyres
http://slidepdf.com/reader/full/embargoed-kicking-the-tyres 41/42
First web edition published in September 2011 by Maxim Institute49 Cape Horn Road, Hillsborough, Auckland 1041, New Zealand
PO Box 49 074, Roskill South, Auckland 1445, New Zealand
Ph (+64) 9 627 3261 | Fax (+64) 9 627 3264 | www.maxim.org.nz
Copyright © 2011 Maxim Institute
ISBN 978-0-9864662-5-0
This publication is copyright. Except for the purpose of fair review, no part may be stored or transmitted in any form
or by any means, electronic or mechanical, including recording or storage in any information retrieval system, without
permission in writing from the publisher. No reproduction may be made, whether by photocopying or by any other
means, unless a license has been obtained from the publisher or its agent.
Embargoed until 20 September 2011
8/4/2019 EMBARGOED Kicking the Tyres
http://slidepdf.com/reader/full/embargoed-kicking-the-tyres 42/42
PO Box 49 074, Roskill South
Auckland 1445, New Zealand
49 Cape Horn Road
Hillsborough, Auckland
t. +64 9 627 3261
f. +64 9 627 3264
www.maxim.org.nz