Embed Size (px)
Citation preview
TRPLSC 1730 No. of Pages 10
Opinion
Embracing 3D Complexity in LeafCarbon–Water Exchange
J. Mason Earles,1,12 Thomas N. Buckley,2,12 Craig R. Brodersen,1 Florian A. Busch,3 F. Javier Cano,4
Brendan Choat,4 John R. Evans,3 Graham D. Farquhar,3 Richard Harwood,5 Minh Huynh,5
Grace P. John,6 Megan L. Miller,7 Fulton E. Rockwell,8 Lawren Sack,6
Christine Scoffoni,9 Paul C. Struik,10 Alex Wu,11 Xinyou Yin,10 andMargaret M. Barbour5,13,*,@
HighlightsPlant biologists have long resorted tohighly simplified 1D or 2D imagingmethods and modeling to study fun-damentally 3D leaf processes of CO2
and H2O transport.
Recent advances in imaging and com-putational technology are enabling adata-rich scientific pipeline that inte-grates leaf 3D measurement, anatomicalmodeling, and biophysical simulation.
Adopting a 3D approach is not onlycritical for testing when dimensionalityreduction is reliable and accurate, butalso promises to deliver insights about:(i) fundamental processes of leaf CO2
and H2O transport and exchange, (ii)the translation of leaf anatomical diver-sity to functional diversity, and (iii) fine-scale CO2 and H2O exchange pro-cesses in broader-scale models.
1School of Forestry & EnvironmentalStudies, Yale University, New Haven,CT 06511, USA2Department of Plant Sciences,University of California Davis, CA95916, USA3Research School of Biology,Australian National University, Action,ACT 0200, Australia4Hawkesbury Institute for theEnvironment, Western SydneyUniversity, Richmond, NSW 2753,Australia5University of Sydney, Sydney, NSW2006, Australia6Department of Ecology andEvolutionary Biology, University ofCalifornia Los Angeles, CA 90095,USA
Leaves are a nexus for the exchange of water, carbon, and energy betweenterrestrial plants and the atmosphere. Research in recent decades hashighlighted the critical importance of the underlying biophysical and anatomicaldeterminants of CO2 and H2O transport, but a quantitative understanding ofhow detailed 3D leaf anatomy mediates within-leaf transport has been hinderedby the lack of a consensus framework for analyzing or simulating transport andits spatial and temporal dynamics realistically, and by the difficulty of measur-ing within-leaf transport at the appropriate scales. We discuss how recenttechnological advancements now make a spatially explicit 3D leaf analysispossible, through new imaging and modeling tools that will allow us to addresslong-standing questions related to plant carbon–water exchange.
Why Does 3D Matter For Leaf Function?The leaves of green plants are a striking example of the nexus of structure and function, and ofphysiology and environment. Here carbon, water, and energy dance through multiple phases,tissues, and scales in a complex 3D landscape that has evolved and diversified under selectionfor effective exchange in contrasting environments. Yet plant biologists have often resorted tosimple leaf-scale models to study these processes – evading the difficult, confounding, andbeautiful 3D reality.
It is now well established that CO2 supply to the sites of photosynthesis (i.e., inside chloroplasts)is limited not only by stomata, but also by a 3D network of resistances within the leaf, collectivelytermed mesophyll resistance; the pathways for CO2 diffusion are further complicated by (photo)respiratory CO2 release in the mitochondria. Yet the precise locations and dynamics ofresistances within the mesophyll, their sensitivities to the internal and external environmentof the leaf, and their influence on the regulation of net photosynthetic rate remain poorlyunderstood. Similarly, recent research on the 3D architecture of leaf water transport hasestablished the existence of large water potential gradients outside the leaf xylem minor veins.These gradients develop as a result of transport resistances within the leaf, are influenced bytemperature and radiation absorption, and may contribute to stomatal dynamics and leafvulnerability to dehydration.
Imaging and simulation technology can now reproduce the inner reality of the leaf in a 3Dimage (see Glossary) with a clarity and resolution inconceivable a generation ago (Figure 1).Continued progress in understanding how leaf structure affects function hinges on embracingthe structural complexity of real leaves using technologies now widely available (Table 1). The
Trends in Plant Science, Month Year, Vol. xx, No. yy https://doi.org/10.1016/j.tplants.2018.09.005 1© 2018 Elsevier Ltd. All rights reserved.
TRPLSC 1730 No. of Pages 10
7College of Natural Resources,University of Idaho, Moscow, ID83844, USA8Department of Organism andEvolutionary Biology, HarvardUniversity, Cambridge, MA 02138,USA9Department of Biological Sciences,California State University LosAngeles, CA 90032, USA10Department of Plant Sciences,Wageningen University, Centre forCrop Systems Analysis, 6700 AKWageningen, The Netherlands11Centre for Plant Science, TheUniversity of Queensland, Brisbane,QLD 4072, Australia12Equal contribution13www.sydney.edu.au/science/people/margaret.barbour@Twitter: @Prof_Margaret
*Correspondence:[email protected](M.M. Barbour).
potential payoffs of a focused and coordinated effort on these problems are great, both forunderstanding how anatomical diversity translates into functional diversity and for harnessingthat knowledge to improve the photosynthetic performance of crops.
Limitations of a Bulk-Leaf Paradigm for Leaf CO2 and H2O TransportPhotosynthesis, respiration, and transpiration are governed by biochemical and transportprocesses at several spatial scales within and among multiple tissue types throughout theleaf. Most commonly, however, the leaf has been implicitly treated as a single point with nospatial structure, representing a CO2 sink during photosynthesis (or source during darkness)and an H2O source during transpiration (or sink during dewfall). These point sources and sinksare connected to the atmosphere through resistances arranged in series (e.g., through stomataand the leaf boundary layer), and Fick’s first law of diffusion is used to calculate rates of gasexchange with the atmosphere. A biochemical model is used to simulate the photosyntheticCO2 sink [1], and the H2O source is modeled as a wet surface in equilibrium with intercellular airat the measured leaf temperature.
This approach of aggregating transport and biochemistry at the leaf scale has driven tremen-dous advances by providing a simple bridge between processes at the cell and tissue scalesand observations at the leaf scale. However, a bulk-leaf approach precludes understandinghow the geometry and biochemistry of different tissue types within the leaf influence CO2 andH2O exchange. The photosynthetic rate of a single chloroplast depends on light intensity,[CO2], temperature, and photosynthetic capacity, all of which vary throughout the leaf becauseof the gradients generated by the interplay of transport with leaf structure. Thus, any singlechloroplast is influenced by 3D leaf structure in ways that simple models cannot easily resolve[2,3]. Similarly, complex spatial gradients in metabolites, the allocation of resources such asnitrogen, and temperature and water potential can influence water transport, stomatal function,and metabolism [4–8].
Spatial Aggregation Conflates Structural Features with Transport ProcessesBecause leaf CO2 transport and metabolism are not neatly organized into macroscopiccompartments, leaf-scale models and measurements inevitably mask a great deal of structuraland process complexity. For example, mesophyll conductance (gm), which describes 3Ddiffusional pathways between the intercellular airspaces and the chloroplast, is typicallycomputed from bulk-leaf estimates of intercellular CO2 concentration (ci), chloroplast CO2
concentration (cc), and leaf net CO2 assimilation rate (A) [9] and traditionally thought to bestrongly related to averaged mesophyll anatomy traits including cell wall thickness and chloro-plast surface area [10]. Apparent mesophyll conductance [11; gm,app] is a better termbecause in real leaves, both ci and cc vary considerably within a leaf and are dependent on the3D distribution and biochemical properties of CO2 sinks and sources [11–16] – features thatcan vary in ways not consistent with the conceptualization of gm as describing fixed pathways.As a result, some effects of environmental conditions on bulk-leaf gm,app may not reflect shifts inintrinsic transport properties, but may instead result from averaging fluxes and concentrationsacross the 3D leaf structure or from fine-scale positioning of CO2 sources relative to sinks.
For example, an effect of irradiance on gm,app can emerge from changes in the contributions ofdifferent mesophyll layers to CO2 uptake, despite constant transport properties in each layer[17], and chloroplast movement in response to light can alter gm,app by changing the spatialrelationship between supply pathways and reactive demand for CO2 [18]. Similarly, CO2
released from mitochondria can be refixed by chloroplasts, which can enhance gm,app andphotosynthesis by providing a CO2 source close to the photosynthetic sink [19]. Yet, the
2 Trends in Plant Science, Month Year, Vol. xx, No. yy
TRPLSC 1730 No. of Pages 10
Glossary3D image: typically represented as a‘stack’ of many 2D images, the basicspatial unit of a 3D image is avolumetric pixel, or ‘voxel’. Eachvoxel in a 3D image is populatedwith a value that corresponds withthe instrument and sensor type. Forexample, X-ray microCT imagescontain voxels that quantify the X-rayin a given region which oftencorresponds with differences inmaterial type, such as water, air, andcell wall.Apparent mesophyllconductance: apparent mesophyllconductance (gm) simplifies thecomplexity of fluxes and resistanceswithin the mesophyll to an apparentanalogy with Fick’s first law ofdiffusion where the conductance ischaracterized as the net flux of CO2
molecules divided by the driven forcefor diffusion of CO2 betweenintercellular airspace and RuBisCOsites inside chloroplasts. It is typicallycomputed from bulk-leaf estimates ofinternal CO2 concentration (ci),chloroplastic CO2 concentration (cc)and measured net CO2 exchange(A), both of which critically dependon the 3D distribution andbiochemical properties of CO2 sinksand sources along the CO2-diffusionpath.Image segmentation andclassification: image segmentationand classification is the process ofdigitally assigning values to eachvoxel based on their discrete class.For example, voxels belonging to theintercellular airspace, cells, and veinsclasses would each be assigned aunique value.Leaf hydraulic conductance:defined as the ratio of flow rate tothe gradient in water potential thatdrives the flow; leaf hydraulicconductance defines the efficiencywith which H2O molecules aretransported through the inside- andoutside-xylem pathways.Volumetric mesh: a volumetricmesh is derived from the raw 3Dimage and is a common data formatused for biophysical simulations. Itapproximates each segmented classusing 3D volumetric elements, suchas tetrahedra, blocks, or hexahedra.
likelihood of refixation depends on the relative positions of mitochondria and chloroplasts,which can shift over time [20,21]. Clearly these patterns and dynamics need to be accountedfor in future models seeking to predict gm,app at the leaf scale.
Similar issues arise in relation to functional traits other than gm. For example, a mismatchbetween light absorption and photosynthetic capacity among mesophyll layers can affect theresponse of CO2 uptake to irradiance and light quality [22–24] and hinder the interpretation ofchlorophyll fluorescence [25]. Although transdermally explicit models of photosynthesis havebeen used to address these questions [26,27], the role of leaf anatomical diversity remainslargely unexplored. In addition, the distribution of enzymes and metabolites influences meta-bolic fluxes measured at the leaf level [28]. A full understanding of photosynthetic function inintact leaves thus requires high resolution and/or spatially explicit treatments of CO2 transportto understand estimates of gm using both the stable isotope and the fluorescence methods [2].
Aggregating to the Tissue Scale Limits UnderstandingSome important parameters that affect water transport in leaves remain poorly known, becausethey depend on fine-scale features that cannot be accurately measured with traditional imagingor experimental methods, and this hinders attempts to model water transport [6,7,29–31]. Oneexample is tangential water flow through cell walls outside the xylem, which depends onanatomical features that are difficult to discern in 2D light micrographs, such as cell wallthickness and the location and extent of hydrophobic barriers to water flow such as lignin orsuberin, and forms a major component of leaf hydraulic conductance. The lateral connec-tivity or contact area between cells also affects transport but is difficult to estimate accuratelyfrom 2D light micrographs, particularly for cells with highly variable shapes within the vascularparenchyma, bundle sheath, and mesophyll. Our ability to model water movement within theleaf xylem may also be improved by 3D approaches that capture the arrangement andconnections between xylem conduits. The complexity of water movement through the xylemis increased as some conduits in the leaf vein network become gas filled (embolized) due towater stress [32].
Another process which depends on 3D tissue arrangement is water vapor transport, which istypically modeled by assuming the air is in chemical and thermal equilibrium with the nearestliquid water surface, generally a cell wall. This assumption implies that vapor concentrationadjacent to the cell surface equals equilibrium vapor pressure of that surface, which can becalculated from its water potential and temperature [6,30,31]. However, because this ‘localequilibrium’ approximation neglects the vapor gradients that must exist across air-filled porespaces between cells, it will tend to underestimate the total resistance to vapor transport withinthe leaf, especially as intercellular airspaces become large relative to cell size. Precise quantifi-cation of multidirectional vapor transport at these scales requires equally precise resolution ofthe actual tissue geometries. Indeed, interpretation of recent experiments using 0D models ofgas exchange and isotopic enrichment has recently challenged the assumption [33] that theairspaces on the interior side of a stomatal pore are saturated with water vapor at the leafsurface temperature, a dogma that is generally used to define stomatal conductance in gasexchange systems. Fully 3D models of both processes, together with spatially resolvedknowledge of cell wall material properties, could play a decisive role in resolving thiscontroversy.
Reducing Dimensionality Can Generate BiasIt is common to simplify descriptions of leaf anatomy to facilitate modeling and analysis. Thissimplification discards potentially important data, limiting insights and generating bias.
Trends in Plant Science, Month Year, Vol. xx, No. yy 3
TRPLSC 1730 No. of Pages 10
Intracellularorganiza on
20 μm 150 μm
30 μm5 μm
15 μm
100 μm
100 μm
Intercellularorganiza on
Tissue-levelorganiza on
(A) (C) (E)
(F)
Epi
(D)
Ana
tom
ical
mod
elin
gIm
agin
gFu
ncon
al tr
aits
Biop
hysi
cal m
odel
ing
(B)
(G)
Heat transferLight propaga on
H2O transportCO2 reac on–diffusion
Cell wall, plasmalemma, cytosol,chloroplast envelope and stromaultrastructure, organelle place-ment and biochemistry
Organelle and cell quan ty,posi on, biochemistry, anddynamics
Intercellular airspace (IAS)geometry; mesophyll surfacearea exposed to the IAS;stomatal–IAS linkage; epider-mal anatomy vein geometry
0 150Path length (μm)
CytChlVac
4 Trends in Plant Science, Month Year, Vol. xx, No. yy
TRPLSC 1730 No. of Pages 10
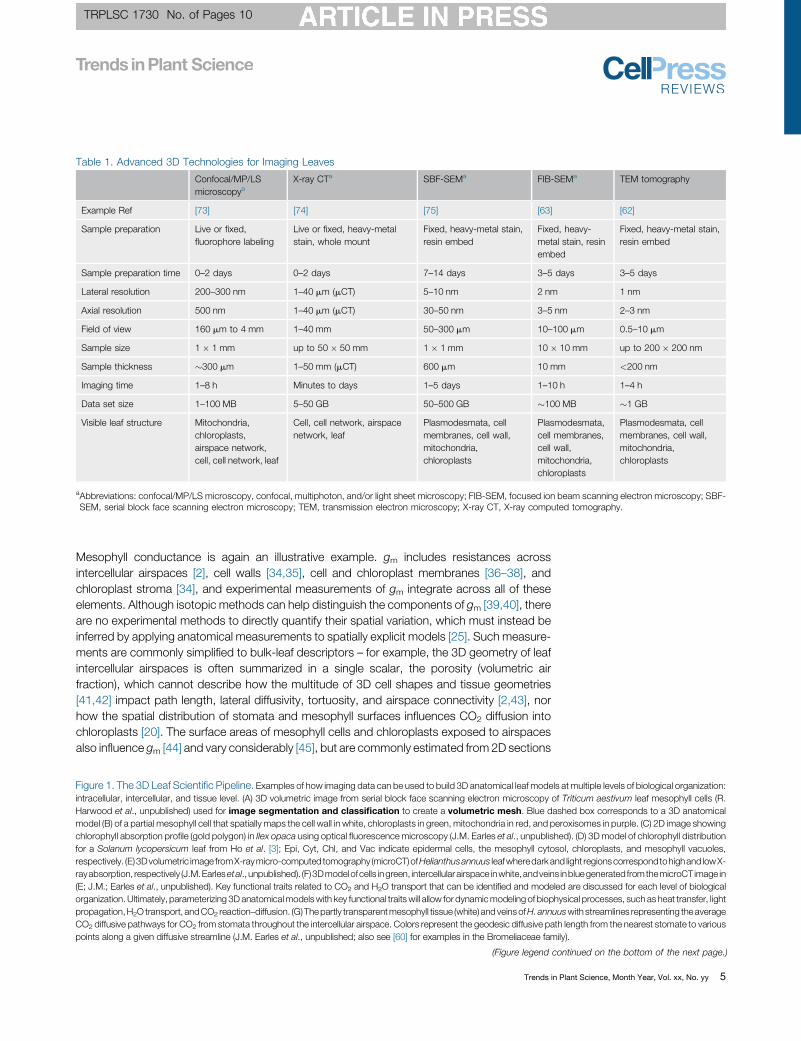
Table 1. Advanced 3D Technologies for Imaging Leaves
Confocal/MP/LSmicroscopya
X-ray CTa SBF-SEMa FIB-SEMa TEM tomography
Example Ref [73] [74] [75] [63] [62]
Sample preparation Live or fixed,fluorophore labeling
Live or fixed, heavy-metalstain, whole mount
Fixed, heavy-metal stain,resin embed
Fixed, heavy-metal stain, resinembed
Fixed, heavy-metal stain,resin embed
Sample preparation time 0–2 days 0–2 days 7–14 days 3–5 days 3–5 days
Lateral resolution 200–300 nm 1–40 mm (mCT) 5–10 nm 2 nm 1 nm
Axial resolution 500 nm 1–40 mm (mCT) 30–50 nm 3–5 nm 2–3 nm
Field of view 160 mm to 4 mm 1–40 mm 50–300 mm 10–100 mm 0.5–10 mm
Sample size 1 � 1 mm up to 50 � 50 mm 1 � 1 mm 10 � 10 mm up to 200 � 200 nm
Sample thickness �300 mm 1–50 mm (mCT) 600 mm 10 mm <200 nm
Imaging time 1–8 h Minutes to days 1–5 days 1–10 h 1–4 h
Data set size 1–100 MB 5–50 GB 50–500 GB �100 MB �1 GB
Visible leaf structure Mitochondria,chloroplasts,airspace network,cell, cell network, leaf
Cell, cell network, airspacenetwork, leaf
Plasmodesmata, cellmembranes, cell wall,mitochondria,chloroplasts
Plasmodesmata,cell membranes,cell wall,mitochondria,chloroplasts
Plasmodesmata, cellmembranes, cell wall,mitochondria,chloroplasts
aAbbreviations: confocal/MP/LS microscopy, confocal, multiphoton, and/or light sheet microscopy; FIB-SEM, focused ion beam scanning electron microscopy; SBF-SEM, serial block face scanning electron microscopy; TEM, transmission electron microscopy; X-ray CT, X-ray computed tomography.
Mesophyll conductance is again an illustrative example. gm includes resistances acrossintercellular airspaces [2], cell walls [34,35], cell and chloroplast membranes [36–38], andchloroplast stroma [34], and experimental measurements of gm integrate across all of theseelements. Although isotopic methods can help distinguish the components of gm [39,40], thereare no experimental methods to directly quantify their spatial variation, which must instead beinferred by applying anatomical measurements to spatially explicit models [25]. Such measure-ments are commonly simplified to bulk-leaf descriptors – for example, the 3D geometry of leafintercellular airspaces is often summarized in a single scalar, the porosity (volumetric airfraction), which cannot describe how the multitude of 3D cell shapes and tissue geometries[41,42] impact path length, lateral diffusivity, tortuosity, and airspace connectivity [2,43], norhow the spatial distribution of stomata and mesophyll surfaces influences CO2 diffusion intochloroplasts [20]. The surface areas of mesophyll cells and chloroplasts exposed to airspacesalso influence gm [44] and vary considerably [45], but are commonly estimated from 2D sections
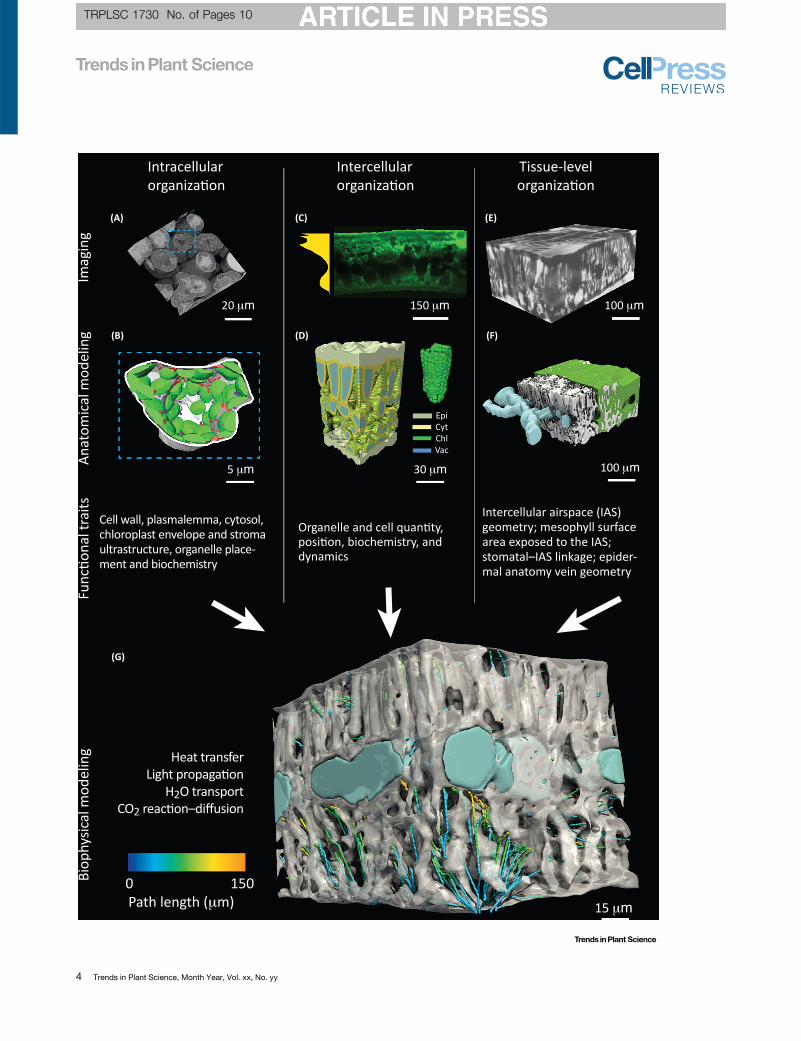
Figure 1.
(Figure legend continued on the bottom of the next page.)
The 3D Leaf Scientific Pipeline. Examples of how imaging data can be used to build 3D anatomical leaf models at multiple levels of biological organization:intracellular, intercellular, and tissue level. (A) 3D volumetric image from serial block face scanning electron microscopy of Triticum aestivum leaf mesophyll cells (R.Harwood et al., unpublished) used for image segmentation and classification to create a volumetric mesh. Blue dashed box corresponds to a 3D anatomicalmodel (B) of a partial mesophyll cell that spatially maps the cell wall in white, chloroplasts in green, mitochondria in red, and peroxisomes in purple. (C) 2D image showingchlorophyll absorption profile (gold polygon) in Ilex opaca using optical fluorescence microscopy (J.M. Earles et al., unpublished). (D) 3D model of chlorophyll distributionfor a Solanum lycopersicum leaf from Ho et al. [3]; Epi, Cyt, Chl, and Vac indicate epidermal cells, the mesophyll cytosol, chloroplasts, and mesophyll vacuoles,respectively. (E)3Dvolumetric image fromX-ray micro-computed tomography (microCT)ofHelianthusannuus leafwheredark and light regions correspondtohighandlow X-rayabsorption, respectively (J.M. Earles etal.,unpublished). (F)3Dmodelofcells ingreen, intercellular airspace inwhite, andveins inbluegenerated from themicroCT image in(E; J.M.; Earles et al., unpublished). Key functional traits related to CO2 and H2O transport that can be identified and modeled are discussed for each level of biologicalorganization. Ultimately, parameterizing 3D anatomical models with key functional traits will allow for dynamic modeling of biophysical processes, such as heat transfer, lightpropagation, H2O transport, and CO2 reaction–diffusion. (G) The partly transparent mesophyll tissue (white) and veins of H. annuus with streamlines representing the averageCO2 diffusive pathways for CO2 from stomata throughout the intercellular airspace. Colors represent the geodesic diffusive path length from the nearest stomate to variouspoints along a given diffusive streamline (J.M. Earles et al., unpublished; also see [60] for examples in the Bromeliaceae family).
Trends in Plant Science, Month Year, Vol. xx, No. yy 5
TRPLSC 1730 No. of Pages 10
based on simple models for cell shape. Complex cell geometries can confound such estimatesand complicate allometric scaling among cell dimensions [17,46].
Stable Isotope Discrimination May Depend on 3D Leaf AnatomyUnderstanding how bulk-leaf stable isotope discrimination arises from diffusion and exchangeat smaller scales would also benefit from a high-resolution, spatially explicit approach. Stableisotopes are important tools for plant physiologists as tracers of atoms through systems thatrecord processes such as carboxylation, mesophyll conductance, and transpiration [47].Theoretical models describing the underlying biophysics and biochemistry exist, but the mostwidely applied are spatially aggregated at the leaf level [48]. Examples of attempts to improve onthis include adding a conceptual dimension by analyzing CO2 fluxes in and out of the leaf inparallel [19], adding a spatial dimension by exploring radial isotope effects in leaf water [49–52],or adding a temporal dimension by probing nonsteady state leaf water isotope enrichment [53].However, there remains no spatially resolved and anatomically accurate 3D model of stableisotope fractionation [54], so we have no means to quantify the influence of 3D anatomy onisotope processes. 3D transport of 13CO2 within leaves is of particular interest because one ofthe primary techniques to estimate gm requires a thorough understanding of carbon isotopediscrimination within photosynthesizing leaves, and isotopic discrimination (during carboxyla-tion, respiration, photorespiration, retrodiffusion, and refixation) would be influenced by the 3Dstructure of leaf airspaces, which governs the relationship between diffusion paths andexchanging surfaces, and hence the relative rates of gross and net exchange to and fromthose surfaces. Similar issues are inherent in interpretation of photosynthetic C18O16O dis-crimination [40] and leaf water isotopes [54].
Toward a High-Resolution, Spatially Explicit ApproachApplied models of plant-atmosphere CO2 and H2O exchange do not typically represent the leafinterior in a spatially explicit way, because it is impractical with current technology to parame-terize and apply microscale spatially explicit models to address questions that integrate overlarge scales. This practical constraint should inform basic research that takes place within aspatially explicit paradigm (Box 1). In basic research, however, a mechanistically accurateunderstanding of leaf carbon and water exchange requires that we move beyond the spatiallyaggregated ‘bulk-leaf’ paradigm in imaging and modeling. Such a high-resolution 3D approachwill improve the reliability of leaf-scale models, thus informing their application at larger scales.
An obvious first step is to adopt spatially explicit models in research. Many insights have beengenerated using such models, with simplified cell, organelle, and tissue geometries, often
Box 1. Scaling to the Leaf and Canopy Level
Reliable prediction of global plant–atmosphere interactions [65] and crop yield [66] inevitably involves interaction ofmodeling efforts at different scales [67]. Complex, mechanistic models must ultimately be simplified for application atlarger scales, and likewise, understanding gained from a 3D anatomically explicit paradigm for modeling leaf processesmust eventually be shaped into a form that can be applied practically in the context of lower-dimensional or scaledmodels. Similar considerations have helped the application of leaf-level photosynthesis models to the crop canopy levelas a useful tool for estimating consequences of photosynthetic perturbations at the biochemical level [22,68].Analogously, upscaling of physiological processes that have been improved by 3D analyses and subsequently simplifiedfor the desired purpose will benefit our understanding of their effects on the canopy scale. This perspective shouldinform research design: for example, in studies using fine-scale 3D-driven imaging and modeling, hypotheses should beframed in terms of anatomical parameters that can be linked to commonly measured leaf traits (e.g., leaf mass per unitarea, leaf airspace fraction, or apparent mesophyll conductance). This ensures an immediate conduit for extension ofnew knowledge from the 3D paradigm to the vast body of existing leaf trait data [69]. Of particular benefit are analysesfocused explicitly on anatomical scaling [70,71] and on strategies for mapping 3D transport processes to widely useful1D models [72] or inferring 3D properties from 1D or 2D imaging data (e.g., tortuosity and porosity).
6 Trends in Plant Science, Month Year, Vol. xx, No. yy
TRPLSC 1730 No. of Pages 10
reconstructed from 2D cross-sectional images, to simulate light propagation [55], CO2 reaction–diffusion [3,13,56–58], and leaf waterand energy transport [6,30,31]. However, these approacheshave typically depended on simplifications of anatomy that may affect model predictions. Thus, acritical and more challenging step is to directly generate 3D tissue models from imaging data,thereby circumventing the abstractions and loss of spatial resolution inherent in simplified models.
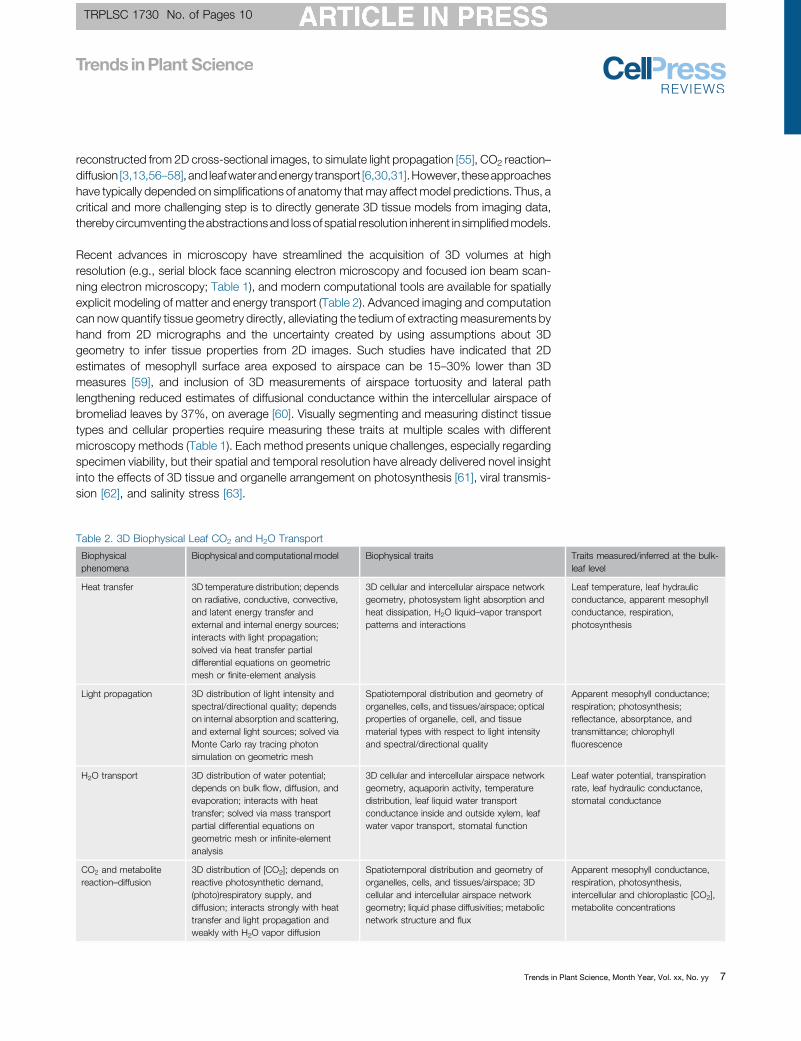
Recent advances in microscopy have streamlined the acquisition of 3D volumes at highresolution (e.g., serial block face scanning electron microscopy and focused ion beam scan-ning electron microscopy; Table 1), and modern computational tools are available for spatiallyexplicit modeling of matter and energy transport (Table 2). Advanced imaging and computationcan now quantify tissue geometry directly, alleviating the tedium of extracting measurements byhand from 2D micrographs and the uncertainty created by using assumptions about 3Dgeometry to infer tissue properties from 2D images. Such studies have indicated that 2Destimates of mesophyll surface area exposed to airspace can be 15–30% lower than 3Dmeasures [59], and inclusion of 3D measurements of airspace tortuosity and lateral pathlengthening reduced estimates of diffusional conductance within the intercellular airspace ofbromeliad leaves by 37%, on average [60]. Visually segmenting and measuring distinct tissuetypes and cellular properties require measuring these traits at multiple scales with differentmicroscopy methods (Table 1). Each method presents unique challenges, especially regardingspecimen viability, but their spatial and temporal resolution have already delivered novel insightinto the effects of 3D tissue and organelle arrangement on photosynthesis [61], viral transmis-sion [62], and salinity stress [63].
Table 2. 3D Biophysical Leaf CO2 and H2O Transport
Biophysicalphenomena
Biophysical and computational model Biophysical traits Traits measured/inferred at the bulk-leaf level
Heat transfer 3D temperature distribution; dependson radiative, conductive, convective,and latent energy transfer andexternal and internal energy sources;interacts with light propagation;solved via heat transfer partialdifferential equations on geometricmesh or finite-element analysis
3D cellular and intercellular airspace networkgeometry, photosystem light absorption andheat dissipation, H2O liquid–vapor transportpatterns and interactions
Leaf temperature, leaf hydraulicconductance, apparent mesophyllconductance, respiration,photosynthesis
Light propagation 3D distribution of light intensity andspectral/directional quality; dependson internal absorption and scattering,and external light sources; solved viaMonte Carlo ray tracing photonsimulation on geometric mesh
Spatiotemporal distribution and geometry oforganelles, cells, and tissues/airspace; opticalproperties of organelle, cell, and tissuematerial types with respect to light intensityand spectral/directional quality
Apparent mesophyll conductance;respiration; photosynthesis;reflectance, absorptance, andtransmittance; chlorophyllfluorescence
H2O transport 3D distribution of water potential;depends on bulk flow, diffusion, andevaporation; interacts with heattransfer; solved via mass transportpartial differential equations ongeometric mesh or infinite-elementanalysis
3D cellular and intercellular airspace networkgeometry, aquaporin activity, temperaturedistribution, leaf liquid water transportconductance inside and outside xylem, leafwater vapor transport, stomatal function
Leaf water potential, transpirationrate, leaf hydraulic conductance,stomatal conductance
CO2 and metabolitereaction–diffusion
3D distribution of [CO2]; depends onreactive photosynthetic demand,(photo)respiratory supply, anddiffusion; interacts strongly with heattransfer and light propagation andweakly with H2O vapor diffusion
Spatiotemporal distribution and geometry oforganelles, cells, and tissues/airspace; 3Dcellular and intercellular airspace networkgeometry; liquid phase diffusivities; metabolicnetwork structure and flux
Apparent mesophyll conductance,respiration, photosynthesis,intercellular and chloroplastic [CO2],metabolite concentrations
Trends in Plant Science, Month Year, Vol. xx, No. yy 7
TRPLSC 1730 No. of Pages 10
Outstanding QuestionsLight propagation and absorption:How does the 3D anatomical, bio-chemical, and biophysical arrange-ment of organelles, cells, airspace,and tissue types influence light propa-gation, absorption, and ultimately CO2
and H2O transport?
Interorganellar CO2 exchange:How does the spatial arrangement oforganelles, such as chloroplasts, mito-chondria, and vacuoles, influence CO2
transport through the liquid phase ofthe cell? What is the resulting effect onCO2 fixation, release, and refixationassociated with photosynthesis andrespiration? To which degree do plantsmodify these anatomical properties,and do these modifications convey acarbon benefit in given environments?
H2O transport pathways: What isthe influence of the 3D anatomicalarrangement of membrane transport-ers, organelles, cells, airspace, andtissue types on water potential gra-dients within the leaf? What is theresulting effect on stomatal dynamicsand transpiration?
Spatial coordination of intraleafCO2 and H2O sources and sinks:How does the geometric arrangementof stomata, organelles, and intercellu-lar airspaces influence light absorptionand affect leaf internal CO2 concentra-tion gradients within leaves? What arethe resulting effects on photosyntheticrate at the whole leaf level? To whatextent does internal leaf geometrymodulate water use efficiency ofleaves? What are the evolutionaryand adaptive solutions of plants to deal
A recent study provides a landmark example of integrated, anatomically explicit 3D modeling ofleaf transport [3]. That study applied 3D leaf microstructure data [based on micro-computedtomography (microCT) imaging; Table 1] to modules that calculated light and CO2 and HCO3
�
exchange in intercellular airspaces and within cells, with different scenarios for 3D distribution ofphotosynthetic capacity. This fusion of 3D imaging and modeling technologies enabled severalcritical insights about refixation of CO2, the role of carbonic anhydrase, and the economy ofphotosynthetic capacity distribution, especially when predictions from the 3D-explicit approachdiffered systematically from an earlier 2D model [64]. For example, the more realistic repre-sentation of the 3D interconnectivity within the intercellular airspaces resulted in 61.7% of(photo)respired CO2 estimated to be refixed by RuBisCO. An analogous 3D explicit modelcould provide a more exact description of vapor transport through the intercellular airspaces.Notably, 3D imaging at current resolution will not be sufficient, as some features of transport,such as liquid phase water transport through cell walls and membranes, depend on structuraldetails and material properties that must be determined empirically [6] or built up fromnanoscale models of wall, membrane, and cell structure [29].
It is likely that a 3D paradigm will substantially alter our understanding of many of the nuancedquestions associated with leaf anatomy and function. Currently, it is unclear a priori whether 3Danalysis for any given process would lead to qualitatively different understanding. However, thetechnological advances outlined here are rapidly obviating any justification for adhering to the statusquo (i.e., the spatially aggregated approach to studying leaf transport) without first, or concurrently,evaluating the results of analyses informed by high-resolution, spatially explicit approaches. Areasonable goal that could be achieved within the next decade with a coordinated, collaborativeapproach is to characterize internal leaf anatomy in detail for a few model species representing arange of plant functional types, and to apply the resulting data to a 3D model of leaf transport.Comparing predictions to leaf-scale gas exchange measurements would help determine howdiversity of leaf structure affects photosynthesis and transpiration, and how to account for theseeffects in traditional leaf-scale models. Thus, the leaf biology communities should embrace a 3Dapproach with all its complexity, and all its promise (see also Outstanding Questions).
AcknowledgmentsThis work was supported by the University of Sydney through the SREI 2020 scheme and by the ARC Centre for Translational
Photosynthesis. M.M.B. and R.H. acknowledge the facilities of the Australian Microscopy and Microanalysis Research Facility
at Sydney Microscopy and Microanalysis, and technical assistance from Timur Burykin and Elinor Goodman.
References
with environmental heterogeneity?
Isotope discrimination: How doesleaf internal 3D anatomical arrange-ment affect stable isotope fractionationand what are the implications of theseeffects for estimates of mesophyllconductance?
1. Farquhar, G.D. et al. (1980) A biochemical model of photosyn-thetic CO2 assimilation in leaves of C3 species. Planta 149, 78–90
2. Parkhurst, D.F. (1994) Tansley review no. 65. Diffusion of CO2 andother gases inside leaves. New Phytol. 126, 449–479
3. Ho, Q.T. et al. (2016) Three-dimensional microscale modelling ofCO2 transport and light propagation in tomato leaves enlightensphotosynthesis. Plant Cell Environ. 39, 50–61
4. Pieruschka, R. et al. (2010) The control of transpiration byabsorbed radiation. Proc. Natl. Acad. Sci. U. S. A. 107,13372–13377
5. Mott, K.A. and Peak, D. (2011) Alternative perspective on thecontrol of transpiration by radiation. Proc. Natl. Acad. Sci. U. S. A.108, 19820–19823
6. Rockwell, F.E. et al. (2014) The competition between liquid andvapor transport in transpiring leaves. Plant Physiol. 164, 1741–1758
7. Rockwell, F.E. et al. (2014) Leaf hydraulics I: scaling transportproperties from single cells to tissues. J. Theor. Biol. 340, 251–266
8 Trends in Plant Science, Month Year, Vol. xx, No. yy
8. Wang, S. et al. (2017) C4 photosynthesis in C3 rice: a theoreticalanalysis of biochemical and anatomical factors. Plant Cell Envi-ron. 40, 80–94
9. Flexas, J. et al. (2008) Mesophyll conductance to CO2: currentknowledge and future prospects. Plant Cell Environ. 31, 602–621
10. Evans, J.R. et al. (1994) The relationship between CO2 transferconductance and leaf anatomy in transgenic tobacco with areduced content of Rubisco. Aust. J. Plant Physiol. 21, 475–495
11. Tholen, D. et al. (2012) Variable mesophyll conductance revisited:theoretical background and experimental implications. Plant CellEnviron. 35, 2087–2103
12. Terashima, I. and Inoue, Y. (1984) Comparative photosyntheticproperties of palisade tissue chloroplasts and spongy tissuechloroplasts of Camellia japonica L.: functional adjustment ofthe photosynthetic apparatus to light environment within a leaf.Plant Cell Physiol. 25, 555–563
13. Tholen, D. and Zhu, X.-G. (2011) The mechanistic basis of internalconductance: a theoretical analysis of mesophyll cell photosyn-thesis and CO2 diffusion. Plant Physiol. 156, 90–105
TRPLSC 1730 No. of Pages 10
14. Hogewoning, S.W. et al. (2012) Photosynthetic quantum yielddynamics: from photosystems to leaves. Plant Cell 24, 1921–1935
15. Tcherkez, G. et al. (2012) Respiratory carbon fluxes in leaves.Curr. Opin. Plant Biol. 15, 308–314
16. Tcherkez, G. (2013) Is the recovery of (photo) respiratory CO2 andintermediates minimal? New Phytol. 198, 334–338
17. Théroux-Rancourt, G. and Gilbert, M.E. (2017) The light responseof mesophyll conductance is controlled by structure across leafprofiles. Plant Cell Environ. 40, 726–740
18. Tholen, D. et al. (2008) The chloroplast avoidance responsedecreases internal conductance to CO2 diffusion in Arabidopsisthaliana leaves. Plant Cell Environ. 31, 1688–1700
19. Busch, F.A. et al. (2013) C3 plants enhance rates of photosyn-thesis by reassimilating photorespired and respired CO2. PlantCell Environ. 36, 200–212
20. Berghuijs, H.N.C. et al. (2016) Mesophyll conductance and reac-tion-diffusion models for CO2 transport in C3 leaves; needs,opportunities and challenges. Plant Sci. 252, 62–75
21. Yin, X. and Struik, P.C. (2017) Can increased leaf photosynthesisbe converted into higher crop mass production? A simulationstudy for rice using the crop model GECROS. J. Exp. Bot. 68,2345–2360
22. Ögren, E. and Evans, J.R. (1993) Photosynthetic light responsecurves. 1. The influence of CO2 partial pressure and leaf inversion.Planta 189, 182–190
23. Vogelmann, T.C. and Evans, J.R. (2002) Profiles of light absorp-tion and chlorophyll within spinach leaves from chlorophyll fluo-rescence. Plant Cell Environ. 25, 1313–1323
24. Earles, J.M. et al. (2017) Excess diffuse light absorption in uppermesophyll limits CO2 drawdown and depresses photosynthesis.Plant Physiol. 174, 1082–1096
25. Evans, J.R. et al. (2017) Light quality affects chloroplast electrontransport rates estimated from Chl fluorescence measurements.Plant Cell Physiol. 58, 1652–1660
26. Hikosaka, K. and Terashima, I. (1995) A model of the acclimationof photosynthesis in the leaves of C3 plants to sun and shade withrespect to nitrogen use. Plant Cell Environ. 18, 605–618
27. Buckley, T.N. and Farquhar, G.D. (2004) A new analytical modelfor whole-leaf potential electron transport rate. Plant Cell Environ.27, 1487–1502
28. Mintz-Oron, S. et al. (2012) Reconstruction of Arabidopsis meta-bolic network models accounting for subcellular compartmental-ization and tissue-specificity. Proc. Natl. Acad. Sci. U. S. A. 109,339–344
29. Buckley, T.N. (2015) The contributions of apoplastic, symplasticand gas phase pathways for water transport outside the bundlesheath in leaves. Plant Cell Environ. 38, 7–22
30. Buckley, T.N. et al. (2015) How does leaf anatomy influence watertransport outside the xylem? Plant Physiol. 168, 1616–1635
31. Buckley, T.N. et al. (2017) The sites of evaporation within leaves.Plant Physiol. 173, 1763–1782
32. Choat, B. et al. (2018) Triggers of tree mortality under drought.Nature 558, 531–539
33. Cernusak, L.A. et al. (2018) Unsaturation of vapour pressureinside leaves of two conifer species. Sci. Rep. 8, 7667
34. Evans, J.R. et al. (2009) Resistances along the CO2 diffusionpathway inside leaves. J. Exp. Bot. 60, 2235–2248
35. Veromann-Jürgenson, L.L. et al. (2017) Extremely thick cell wallsand low mesophyll conductance: welcome to the world of ancientliving! J. Exp. Bot. 68, 1639–1653
36. Hanba, Y.T. et al. (2004) Overexpression of the barley aquaporinHvPIP2;1 increases internal CO2 conductance and CO2 assimi-lation in the leaves of transgenic rice plants. Plant Cell Physiol. 45,521–529
37. Flexas, J. et al. (2006) Tobacco aquaporin NtAQP1 is involved inmesophyll conductance to CO2 in vivo. Plant J. 48, 427–439
38. Groszmann, M. et al. (2017) Carbon dioxide and water transportthrough plant aquaporins. Plant Cell Environ. 40, 938–961
39. Gillon, J.S. and Yakir, D. (2000) Internal conductance to CO2
diffusion and C18OO discrimination in C3 leaves. Plant Physiol.123, 201–214
40. Barbour, M.M. et al. (2016) Online CO2 and H2O oxygen isotopefractionation allows estimation of mesophyll conductance in C4
plants, and reveals that mesophyll conductance decreases asleaves age in both C4 and C3 plants. New Phytol. 210, 875–889
41. Terashima, I. et al. (2011) Leaf functional anatomy in relation tophotosynthesis. Plant Physiol. 155, 108–116
42. Tosens, T. et al. (2012) Anatomical basis of variation in mesophyllresistance in eastern Australian sclerophylls: news of a long andwinding path. J. Exp. Bot. 63, 5105–5119
43. Pieruschka, R. et al. (2005) Lateral gas diffusion inside leaves. J.Exp. Bot. 56, 857–864
44. Tosens, T. et al. (2012) Developmental changes in mesophylldiffusion conductance and photosynthetic capacity under differ-ent light and water availabilities in Populus tremula: how structureconstrains function. Plant Cell Environ. 35, 839–856
45. Onoda, Y. et al. (2017) Physiological and structural tradeoffsunderlying the leaf economics spectrum. New Phytol. 214,1447–1463
46. Sage, T.L. and Sage, R.F. (2009) The functional anatomy of riceleaves: implications for refixation of photorespiratory CO2 andefforts to engineer C4 photosynthesis into rice. Plant Cell Physiol.50, 756–772
47. Yakir, D. and Sternberg, L.S.L. (2000) The use of stable isotopesto study ecosystem gas exchange. Oecologia 123, 297–311
48. Farquhar, G.D. and Richards, R.A. (1984) Isotopic composition ofplant carbon correlates with water-use efficiency of wheat gen-otypes. Aust. J. Plant Physiol. 11, 539–552
49. Gan, K.S. et al. (2002) 18O spatial patterns of vein xylem water,leaf water, and dry matter in cotton leaves. Plant Physiol. 130,1008–1021
50. Gan, K.S. et al. (2003) Evaluation of models of leaf water 18Oenrichment using measurements of spatial patterns of vein xylemwater, leaf water and dry matter in maize leaves. Plant CellEnviron. 26, 1479–1495
51. Ogée, J. et al. (2007) Non-steady-state, non-uniform transpirationrate and leaf anatomy effects on the progressive stable isotopeenrichment of leaf water along monocot leaves. Plant Cell Envi-ron. 30, 367–387
52. Gerlein-Safdi, C. et al. (2017) Leaf water 18O and 2H maps showdirectional enrichment discrepancy in Colocasia esculenta. PlantCell Environ. 40, 2095–2108
53. Farquhar, G.D. and Cernusak, L.A. (2005) On the isotopic com-position of leaf water in the non-steady state. Funct. Plant Biol.32, 293–303
54. Barbour, M.M. et al. (2017) Leaf water stable isotopes and watertransport outside the xylem. Plant Cell Environ. 40, 914–920
55. Xiao,Y. etal. (2016)The influence of leafanatomy onthe internal lightenvironment and photosyntheticelectrontransport rate:explorationwith a new leaf ray tracing model. J. Exp. Bot. 67, 6021–6035
56. Parkhurst, D.F. (1977) A three-dimensional model for CO2 uptakeby continuously distributed mesophyll in leaves. J. Theor. Biol. 67,471–488
57. Vesala, T. et al. (1996) Analysis of stomatal CO2 uptake by athree-dimensional cylindrically symmetric model. New Phytol.132, 235–245
58. Aalto, T. and Juurola, E. (2002) A three-dimensional model of CO2
transport in airspaces and mesophyll cells of a silver birch leaf.Plant Cell Environ. 25, 1399–1409
59. Théroux-Rancourt, G. et al. (2017) The bias of a two-dimensionalview: comparing two-dimensional and three-dimensional meso-phyll surface area estimates using noninvasive imaging. NewPhytol. 215, 1609–1622
60. Earles, J.M. et al. (2018) Beyond porosity: 3D leaf intercellularairspace traits than impact mesophyll conductance. Plant Phys-iol. Published online July 24, 2018. http://dx.doi.org/10.1104/pp.18.00550
Trends in Plant Science, Month Year, Vol. xx, No. yy 9
TRPLSC 1730 No. of Pages 10
61. Lehmeier, C. et al. (2017) Cell density and airspace patterning inthe leaf can be manipulated to increase leaf photosyntheticcapacity. Plant J. 92, 981–994
62. Jin, X. et al. (2017) Three-dimensional analysis of chloroplast struc-tures associated with virus infection. Plant Physiol. 176, 282–294
63. Yamane, K. et al. (2017) Three-dimensional ultrastructure ofchloroplast pockets formed under salinity stress. Plant Cell Envi-ron. 41, 563–575
64. Ho, Q.T. et al. (2012) A microscale model for combined CO2
diffusion and photosynthesis in leaves. PLoS One 7, e48376
65. Fatichi, S. et al. (2016) Modeling plant-water interactions: anecohydrological overview from the cell to the global scale. WIREsWater 3, 327–368
66. Australian Centre for International Agricultural Research (2014)Crop Yields and Global Food Security, Australian Centre forInternational Agricultural Research
67. Wu, A. et al. (2016) Connecting biochemical photosynthesismodels with crop models to support crop improvement. Front.Plant Sci. 7, 1–16
10 Trends in Plant Science, Month Year, Vol. xx, No. yy
68. Wu, A. et al. (2018) Simulating daily field crop canopy photosyn-thesis: an integrated software package. Funct. Plant Biol. 45,362–377
69. Wright, I.J. et al. (2004) The worldwide leaf economics spectrum.Nature 428, 821–827
70. John, G.P. et al. (2017) The anatomical and compositional basisof leaf mass per area. Ecol. Lett. 20, 412–425
71. John, G.P. et al. (2013) Allometry of cells and tissues withinleaves. Am. J. Bot. 100, 1936–1948
72. Pickard, W.F. (1982) Why is the substomatal chamber as large asit is? Plant Physiol. 69, 971–974
73. Lichtenberg, M. et al. (2017) Light sheet microscopy imaging oflight absorption and photosynthesis distribution in plant tissue.Plant Physiol. 175, 721–733
74. Verboven, P. et al. (2015) Synchrotron X-ray computed laminog-raphy of the 3D anatomy of tomato leaves. Plant J. 81, 169–182
75. Kittelmann, M. et al. (2016) Serial block face scanning electronmicroscopy and the reconstruction of plant cell membrane sys-tems. J. Microsc. 2, 200–211