Embed Size (px)
Citation preview
Chemosphere 119 (2015) 1000–1006
Contents lists available at ScienceDirect
Chemosphere
journal homepage: www.elsevier .com/locate /chemosphere
Emission of bisphenol analogues including bisphenol A and bisphenol Ffrom wastewater treatment plants in Korea
http://dx.doi.org/10.1016/j.chemosphere.2014.09.0110045-6535/� 2014 Elsevier Ltd. All rights reserved.
⇑ Corresponding authors at: Wadsworth Center, New York State Department of Health, and Department of Environmental Health Sciences, School of Public HeaUniversity of New York at Albany, USA. Tel.: +1 518 474 0015 (K. Kannan). Department of Marine Sciences and Convergent Technology, College of Science and TecHanyang University, Ansan, Republic of Korea. Tel.: +82 31 400 5534 (H.-B. Moon).
E-mail addresses: [email protected] (K. Kannan), [email protected] (H.-B. Moon).
Sunggyu Lee a, Chunyang Liao b, Geum-Ju Song c, Kongtae Ra d, Kurunthachalam Kannan b,f,⇑,Hyo-Bang Moon a,⇑a Department of Marine Sciences and Convergent Technology, College of Science and Technology, Hanyang University, Ansan 426-791, Republic of Koreab Wadsworth Center, New York State Department of Health, and Department of Environmental Health Sciences, School of Public Health, State University of New York at Albany,Empire State Plaza, P.O. Box 509, Albany, NY 12201-0509, USAc Institute of Environmental and Energy Technology, POSTECH, Pohang 790-784, Republic of Koread Marine Environment and Conservation Research Division, Korea Institute of Ocean Science and Technology (KIOST), Ansan 426-744, Republic of Koreaf Biochemistry Department, Faculty of Science and Experimental Biochemistry Unit, King Fahd Medical Research Center, King Abdulaziz University, PO Box 80216, Jeddah 21589,Saudi Arabia
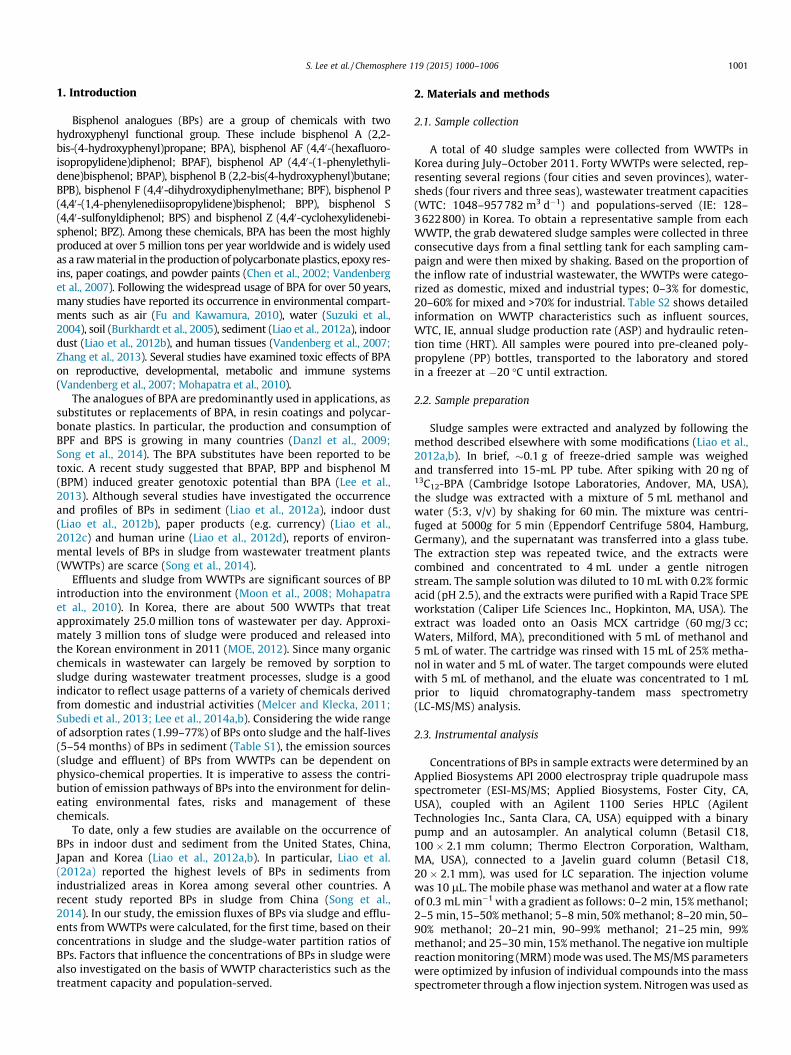
h i g h l i g h t s g r a p h i c a l a b s t r a c t
� Occurrence of several BP analogues insludge was confirmed.� High levels of bisphenol A were found
in industrial WWTP sludge.� Emission fluxes of bisphenols via
WWTPs in Korea were estimated.� This is the first nationwide survey to
determine BP analogues in sewagesludge of Korea.
a r t i c l e i n f o
Article history:Received 24 April 2014Received in revised form 29 August 2014Accepted 1 September 2014
Handling Editor: Caroline Gaus
Keywords:Bisphenol ABisphenol FEmissionEffluentSludgeWWTP
a b s t r a c t
Due to the regulation on bisphenol A (BPA) in several industrialized countries, the demand for otherbisphenol analogues (BPs) as substitutes for BPA is growing. Eight BPs were determined in sludge from40 representative wastewater treatment plants (WWTPs) in Korea. Total concentrations of BPs (RBP)in sludge ranged from <LOQ to 25700 ng g�1. The highest concentrations of RBP were found in sludgecollected from WWTPs that received discharges from the paper and textile industries. The profiles ofBPs were dependent on the proportions of industrial wastewater treated at each of the WWTPs. Thesludge from industrial WWTPs contained elevated proportions of BPA, whereas sludge from domesticWWTPs was dominated by bisphenol F (BPF), suggesting use of BPF in certain industrial products inKorea. No significant correlations were found between BPs and the WWTP characteristics. The averageper-capita emissions of BPs ranged from 0.04 (BPP) to 886 g capita�1 d (BPA) through WWTP discharges.The emission fluxes of RBP through industrial WWTPs were 2–3 orders of magnitudes higher than thosecalculated for domestic WWTPs, indicating that industrial discharges are the major source of BPs into theKorean environment. This is the first nationwide survey of BPs in sludge from Korean WWTPs.
� 2014 Elsevier Ltd. All rights reserved.
lth, Statehnology,
S. Lee et al. / Chemosphere 119 (2015) 1000–1006 1001
1. Introduction
Bisphenol analogues (BPs) are a group of chemicals with twohydroxyphenyl functional group. These include bisphenol A (2,2-bis-(4-hydroxyphenyl)propane; BPA), bisphenol AF (4,40-(hexafluoro-isopropylidene)diphenol; BPAF), bisphenol AP (4,40-(1-phenylethyli-dene)bisphenol; BPAP), bisphenol B (2,2-bis(4-hydroxyphenyl)butane;BPB), bisphenol F (4,40-dihydroxydiphenylmethane; BPF), bisphenol P(4,40-(1,4-phenylenediisopropylidene)bisphenol; BPP), bisphenol S(4,40-sulfonyldiphenol; BPS) and bisphenol Z (4,40-cyclohexylidenebi-sphenol; BPZ). Among these chemicals, BPA has been the most highlyproduced at over 5 million tons per year worldwide and is widely usedas a raw material in the production of polycarbonate plastics, epoxy res-ins, paper coatings, and powder paints (Chen et al., 2002; Vandenberget al., 2007). Following the widespread usage of BPA for over 50 years,many studies have reported its occurrence in environmental compart-ments such as air (Fu and Kawamura, 2010), water (Suzuki et al.,2004), soil (Burkhardt et al., 2005), sediment (Liao et al., 2012a), indoordust (Liao et al., 2012b), and human tissues (Vandenberg et al., 2007;Zhang et al., 2013). Several studies have examined toxic effects of BPAon reproductive, developmental, metabolic and immune systems(Vandenberg et al., 2007; Mohapatra et al., 2010).
The analogues of BPA are predominantly used in applications, assubstitutes or replacements of BPA, in resin coatings and polycar-bonate plastics. In particular, the production and consumption ofBPF and BPS is growing in many countries (Danzl et al., 2009;Song et al., 2014). The BPA substitutes have been reported to betoxic. A recent study suggested that BPAP, BPP and bisphenol M(BPM) induced greater genotoxic potential than BPA (Lee et al.,2013). Although several studies have investigated the occurrenceand profiles of BPs in sediment (Liao et al., 2012a), indoor dust(Liao et al., 2012b), paper products (e.g. currency) (Liao et al.,2012c) and human urine (Liao et al., 2012d), reports of environ-mental levels of BPs in sludge from wastewater treatment plants(WWTPs) are scarce (Song et al., 2014).
Effluents and sludge from WWTPs are significant sources of BPintroduction into the environment (Moon et al., 2008; Mohapatraet al., 2010). In Korea, there are about 500 WWTPs that treatapproximately 25.0 million tons of wastewater per day. Approxi-mately 3 million tons of sludge were produced and released intothe Korean environment in 2011 (MOE, 2012). Since many organicchemicals in wastewater can largely be removed by sorption tosludge during wastewater treatment processes, sludge is a goodindicator to reflect usage patterns of a variety of chemicals derivedfrom domestic and industrial activities (Melcer and Klecka, 2011;Subedi et al., 2013; Lee et al., 2014a,b). Considering the wide rangeof adsorption rates (1.99–77%) of BPs onto sludge and the half-lives(5–54 months) of BPs in sediment (Table S1), the emission sources(sludge and effluent) of BPs from WWTPs can be dependent onphysico-chemical properties. It is imperative to assess the contri-bution of emission pathways of BPs into the environment for delin-eating environmental fates, risks and management of thesechemicals.
To date, only a few studies are available on the occurrence ofBPs in indoor dust and sediment from the United States, China,Japan and Korea (Liao et al., 2012a,b). In particular, Liao et al.(2012a) reported the highest levels of BPs in sediments fromindustrialized areas in Korea among several other countries. Arecent study reported BPs in sludge from China (Song et al.,2014). In our study, the emission fluxes of BPs via sludge and efflu-ents from WWTPs were calculated, for the first time, based on theirconcentrations in sludge and the sludge-water partition ratios ofBPs. Factors that influence the concentrations of BPs in sludge werealso investigated on the basis of WWTP characteristics such as thetreatment capacity and population-served.
2. Materials and methods
2.1. Sample collection
A total of 40 sludge samples were collected from WWTPs inKorea during July–October 2011. Forty WWTPs were selected, rep-resenting several regions (four cities and seven provinces), water-sheds (four rivers and three seas), wastewater treatment capacities(WTC: 1048–957782 m3 d�1) and populations-served (IE: 128–3622800) in Korea. To obtain a representative sample from eachWWTP, the grab dewatered sludge samples were collected in threeconsecutive days from a final settling tank for each sampling cam-paign and were then mixed by shaking. Based on the proportion ofthe inflow rate of industrial wastewater, the WWTPs were catego-rized as domestic, mixed and industrial types; 0–3% for domestic,20–60% for mixed and >70% for industrial. Table S2 shows detailedinformation on WWTP characteristics such as influent sources,WTC, IE, annual sludge production rate (ASP) and hydraulic reten-tion time (HRT). All samples were poured into pre-cleaned poly-propylene (PP) bottles, transported to the laboratory and storedin a freezer at �20 �C until extraction.
2.2. Sample preparation
Sludge samples were extracted and analyzed by following themethod described elsewhere with some modifications (Liao et al.,2012a,b). In brief, �0.1 g of freeze-dried sample was weighedand transferred into 15-mL PP tube. After spiking with 20 ng of13C12-BPA (Cambridge Isotope Laboratories, Andover, MA, USA),the sludge was extracted with a mixture of 5 mL methanol andwater (5:3, v/v) by shaking for 60 min. The mixture was centri-fuged at 5000g for 5 min (Eppendorf Centrifuge 5804, Hamburg,Germany), and the supernatant was transferred into a glass tube.The extraction step was repeated twice, and the extracts werecombined and concentrated to 4 mL under a gentle nitrogenstream. The sample solution was diluted to 10 mL with 0.2% formicacid (pH 2.5), and the extracts were purified with a Rapid Trace SPEworkstation (Caliper Life Sciences Inc., Hopkinton, MA, USA). Theextract was loaded onto an Oasis MCX cartridge (60 mg/3 cc;Waters, Milford, MA), preconditioned with 5 mL of methanol and5 mL of water. The cartridge was rinsed with 15 mL of 25% metha-nol in water and 5 mL of water. The target compounds were elutedwith 5 mL of methanol, and the eluate was concentrated to 1 mLprior to liquid chromatography-tandem mass spectrometry(LC-MS/MS) analysis.
2.3. Instrumental analysis
Concentrations of BPs in sample extracts were determined by anApplied Biosystems API 2000 electrospray triple quadrupole massspectrometer (ESI-MS/MS; Applied Biosystems, Foster City, CA,USA), coupled with an Agilent 1100 Series HPLC (AgilentTechnologies Inc., Santa Clara, CA, USA) equipped with a binarypump and an autosampler. An analytical column (Betasil C18,100 � 2.1 mm column; Thermo Electron Corporation, Waltham,MA, USA), connected to a Javelin guard column (Betasil C18,20 � 2.1 mm), was used for LC separation. The injection volumewas 10 lL. The mobile phase was methanol and water at a flow rateof 0.3 mL min�1 with a gradient as follows: 0–2 min, 15% methanol;2–5 min, 15–50% methanol; 5–8 min, 50% methanol; 8–20 min, 50–90% methanol; 20–21 min, 90–99% methanol; 21–25 min, 99%methanol; and 25–30 min, 15% methanol. The negative ion multiplereaction monitoring (MRM) mode was used. The MS/MS parameterswere optimized by infusion of individual compounds into the massspectrometer through a flow injection system. Nitrogen was used as
1002 S. Lee et al. / Chemosphere 119 (2015) 1000–1006
both the curtain and collision gas. The quantification was based onan external calibration method and corrected for the recoveries ofthe internal standard, 13C12-BPA.
Total organic carbon (TOC) in sludge was measured using anElemental Analyzer (Flash 2000 series, Thermo Scientific Co., MA,USA) after removal of inorganic carbon with 1 N HCl. The moisturecontent in sludge was measured from their weights before andafter freeze-drying. The moisture content ranged from 54% to82% with a mean value of 69% (Table S2).
2.4. Quality assurance and quality control (QA/QC)
Procedural blanks were analyzed with every batch of samples tomonitor for background contamination. Trace levels of BPA and BPF(approximately 0.27 and 0.02 ng mL�1, respectively) were detectedin procedural blanks, and the background levels were subtractedfrom each sample concentrations. To validate the analytical methodused in our study, spiked blanks and matrix-spiked samples wereanalyzed routinely. Recoveries of BPs (40 ng for each compoundand 20 ng for 13C12-BPA) in spiked blanks (n = 4) ranged from65.6 ± 1.53% (mean ± SD) for BPAF to 146 ± 1.36% for BPF. Recover-ies of BPs (40 ng for each individual compound and 20 ng for13C12-BPA) in matrix-spiked samples (n = 4) ranged from55.9 ± 12.7% for BPP to 157 ± 9.64% for BPS. Further details regard-ing QA/QC are provided in the Supporting Information (Table S3).The limit of quantitation (LOQs) were calculated from the lowestacceptable calibration standard and a nominal sample weight of0.1 g. The calculated LOQs were 0.50 ng g�1 for BPA, BPAF, BPAPand BPS; 1.00 ng g�1 for BPB and BPP; and 2.00 ng g�1 for BPF andBPZ. A midpoint calibration standard was injected after every 20samples as a check for drift in instrumental sensitivity. Pure solvent(methanol) was injected periodically as a check for carryover of BPsbetween the samples analyzed. Instrumental calibration was veri-fied daily by the injection of 10 calibration standards at concentra-tions ranging from 0.02 to 100 ng mL�1 and the linearity of thecalibration curve (r) was >0.99 for each of the target compounds.The concentrations of BPs in sludge are reported on a dry weight(dw) basis.
Table 1Concentrations of bisphenol analogues (ng g�1 dry weight) in sludge from wastewater tre
BPA BPAF BPAP BPB B
Domestic WWTPs (n = 16)Mean 292 – 1.98 – 5Median 275 – NAa – 5Range 46.4–986 – nd-16.0 – 8DRb 100 0 12.5 0 1
Mixed WWTPs (n = 9)Mean 1050 0.70 – – 6Median 426 NA – – 6Range 20.6–5593 nd-3.59 – – 5DR 100 22.2 0 0 1
Industrial WWTPs (n = 15)Mean 3100 0.31 – – 2Median 145 NA – – NRange ndc–25600 nd-3.51 – – nDR 93.3 13.3 0 0 3
Total (n = 40)Mean 1520 0.28 0.79 – 3Median 275 NA NA – 2Range nd-25600 nd-3.59 nd-16.0 – nDR 97.5 10.0 5.00 0 7
a NA = Not available.b DR = Detection rate (%).c nd = Not detected.
2.5. Calculation of emission fluxes of BPs via sludge and effluentdischarges
The emission flux of BPs through sludge was calculated by mul-tiplying the concentrations (wet weight basis) of BPs in sludgewith the annual sludge production rate (tons year�1) for each ofthe studied WWTP (Table S1). The emission flux of BPs througheffluent discharges was calculated from the measured concentra-tions (wet weight basis) of BPs in sludge, the adsorption coefficient,and removal rates (Table S3) during the WWTP processes. Theemission fluxes of BPs through sludge (Es) and effluent (Ee) werecalculated as follows:
Es ¼CBPs � ASP
365
Ee ¼ð100�%S�%BÞ
%S� Es
where Es is the emission flux of BPs through sludge (g d�1), CBPs isthe concentrations of BPs in sludge (ng g�1 wet weight) and ASPis the annual sludge production rate (tons year�1) for each of thestudied WWTP. Ee is the emission flux of BPs through effluent(g d�1), %S is the adsorption rate of BPs onto the sludge, and %B isthe biodegradation rate of BPs during wastewater treatment. Per-capita environmental emissions (mg capita�1 d) of BPs througheach WWTP were calculated based on the population-served bythe plants and the total environmental emission fluxes (sum of Es
and Ee).
2.6. Statistical analysis
Concentrations below the LOQ were assigned a zero value for thecalculation of the mean and median, but were assigned as a value ofone-half of the respective LOQ for statistical analyses. One-wayANOVA with Turkey test was performed to assess differences inthe concentrations of BPs among three different WWTP types.Spearman rank correlation analysis was performed to investigatethe relationships between the concentrations of BPs in sludge andWWTP characteristics such as WTC, IE, ASP and HRT as well as
atment plants in Korea.
PF BPP BPS BPZ RBPs
44 1.06 7.06 – 85054 NA 3.60 – 6906.7–1780 nd-17.0 nd-34.9 – 140–210000 6.25 75.0 0 100
99 2.53 63.4 – 182092 NA 47.3 – 134061–947 nd-22.8 nd-268 – 630–634000 11.1 77.8 0 100
4.8 2.71 74.3 64.8 3270A NA 2.47 NA 740d-167 nd-26.2 nd-523 nd-969 nd-257003.3 13.3 60.0 13.3 93.3
84 2.01 44.9 24.3 197049 NA 3.80 NA 769d-1780 nd-26.2 nd-523 nd-969 nd-257005.0 10.0 70.0 5.00 97.5
S. Lee et al. / Chemosphere 119 (2015) 1000–1006 1003
TOC contents. Statistical analyses were performed using SPSS 18.0 Kfor Windows. Statistical significance was set at p < 0.05.
3. Results and discussion
3.1. Occurrence and concentrations of BPs in sludge
Concentrations of BPs in sludge collected from WWTPs in Koreaare summarized in Table 1. The concentrations of total BPs (RBP; thesum of 8 bisphenol analogues) ranged from <LOQ to 25700 (aver-age: 1970) ng g�1 dw. The most frequently detected analogue wasBPA, with a detection rate of 97.5%, followed by BPF (detection rate:75%) and BPS (70%). The detection rates of the other BPs were lessthan 10%, and BPB was not detected in any of the sludge samples.The average concentrations of the BPs detected in sludge sampleswere on the order of; BPA (1520 ng g�1 dw), BPF (384 ng g�1 dw),BPS (44.9 ng g�1 dw), BPZ (24.3 ng g�1 dw) and BPP (2.01 ng g�1
dw), indicating that BPA is still widely used bisphenol in Korea. In2012, the total worldwide production of BPA was 4.6 million tons,of which 53% was consumed in Asian countries such as Taiwan,Japan, China and Korea (Merchant Research & Consulting Ltd.,2014). The US, Taiwan, Korea, China and Japan ranked the top BPAproducers in the world (Merchant Research & Consulting Ltd.,2014).
Among the three types of WWTPs, the highest concentrations ofRBP were found in sludge obtained from industrial-WWTPs(I-WWTPs; average: 3270 ng g�1 dw), followed by those frommixed-WWTPs (M-WWTPs; 1820 ng g�1 dw) and domestic-WWTPs (D-WWTPs; 850 ng g�1 dw). Our results suggest that envi-ronmental contamination by BPs in Korea is associated more withindustrial activities than domestic activities. Among the individualsludge samples analyzed, the highest concentrations of RBP werefound in sludge from I-1 (25700 ng g�1 dw) and I-8 (9810 ng g�1
dw), which receive wastewater from the paper industries. Previousstudies have reported high concentrations of BP analogues in paperproducts such as currency bills and thermal papers (e.g. receipt) inmany countries (Liao and Kannan, 2011; Geens et al., 2012).
The concentrations of BPA, BPF and BPS in all sludge samples fromWWTPs ranged from <LOQ to 25600 (average: 1520) ng g�1 dw, from<LOQ to 1780 (average: 384) ng g�1 dw and from <LOQ to 523 (aver-age: 44.9) ng g�1 dw, respectively. Average concentrations of BPA andBPS in sludge from I-WWTPs were an order of magnitude higher thanthose found for D-WWTPs, indicating that BPA and BPS are mainlyreleased from industrial activities in Korea. The highest concentra-tions were found in I-1 (25600 ng g�1 dw) and I-8 (9280 ng g�1 dw)for BPA, and I-15 (523 ng g�1 dw) and I-8 (361 ng g�1 dw) for BPS.These facilities (I-1, I-8 and I-15) receive wastewater generated frompaper and textile industrial complexes. Our finding suggests that thepaper and textile industries are a source of BPA and BPS in the Koreanaquatic environment.
Table 2Global comparison of BPA concentrations (ng g�1 dry weight) in sludge measured in this
Country Sampling year na Me
Germany 1997 38 NACanada 1999 65 NACanada 2004 4 30Greece 2009 9 18Spain – 17 82China 2010–2011 52 4.6Korea 2012 40 15
a n = Sample number.b NA = Not available.c nd = Not detected.
In contrast to the patterns of concentrations of BPA and BPS, theaverage BPF concentrations in sludge from D-WWTPs (544 ng g�1
dw) and M-WWTPs (699 ng g�1 dw) were significantly (p < 0.05)higher than those measured for I-WWTPs (24.8 ng g�1 dw). In addi-tion, BPF was detected in all sludge samples from D- and M-WWTPs,but only 5 of the 15 sludge samples from I-WWTPs contained BPF,with concentrations <100 ng g�1 dw. This characteristic patternsuggests that BPF is associated with domestic activity rather thanindustrial activity in Korea. Further studies are needed to evaluatethe sources of BPF in domestic products in Korea.
BPA concentrations measured in sludge from WWTPs in Koreaare compared with reported data from the literature (Table 2).The concentrations of BPA (1520 ng g�1 dw) in our study werehigher than those reported for other countries, such as Germany(4-1363 ng g�1 dw; Fromme et al., 2002), Canada (3.78–74.4 ng g�1 dw; Chu et al., 2005), Greece (nd-3910 ng g�1 dw;Samaras et al., 2013), Spain (nd-680 ng g�1 dw; Dorival-Garcíaet al., 2012) and China (0.42–152 ng g�1 dw; Song et al., 2014).The highest concentration of BPA reported in sludge from Canada(36700 ng g�1 dw; Lee and Peart, 2000) was similar to thatmeasured in our study (25600 ng g�1 dw).
3.2. Compositional profiles of individual BPs
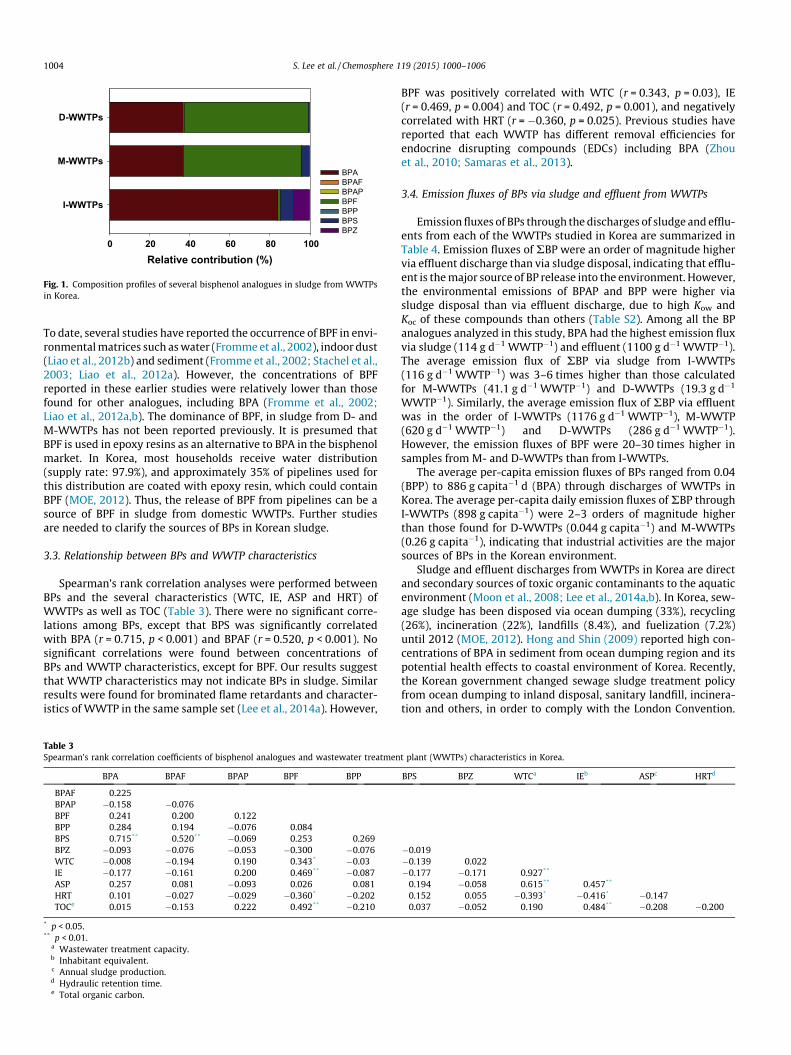
The relative contribution of individual BP analogues to the totalBP concentrations in sludge from WWTPs in Korea is presented inFig. 1. The major BPs found in all sludge samples were BPA, BPF andBPS, which collectively accounted for 97% of the RBP concentra-tions. Although limited information is available on the pattern ofBPs in environmental matrices, our results are similar to thosereported earlier. Song et al. (2014) investigated BP analogues insewage sludge samples from China. The concentrations of BPA,BPS and BPF collectively contributed 84% to the RBP concentra-tions. Liao et al. (2012a,b) reported similar profiles of BPs in sedi-ment and indoor dust samples from the US and several Asiancountries, including Korea, Japan and China. BPA and BPF collec-tively contributed 94% to the RBP concentrations in sediment fromthe US, Japan and China. In indoor dust samples, BPA, BPS and BPFwere the major compounds, accounting for >98% of the total BPs.Thus, our findings suggest that sewage sludge is a suitable environ-mental matrix for reflecting the usage pattern of BP analogues(Subedi et al., 2013; Lee et al., 2014a,b; Prichard et al., 2014).
The compositional profiles of BPs differed among the three typesof WWTP. The sludge from I-WWTPs was dominated by BPA,whereas sludge from D- and M-WWTPs was dominated by BPF. Thisimplies that the patterns of BPs are dependent on the proportion ofindustrial wastewater. The proportions of BPF to RBP concentra-tions in sludge from D- and M-WWTPs were 62 ± 22% (mean ± SD)and 59 ± 28% of the RBP concentrations, respectively. Our findingssuggest the existence of a specific source of BPF in domestic sources.
study with those reported for other countries.
an Range Reference
b 4–1363 Fromme et al. (2002)<20–36700 Lee and Peart (2000)
.7 3.78–74.4 Chu et al. (2005)60 ndc–3910 Samaras et al. (2013).8 nd-680 Dorival-García et al. (2012)9 0.42–152 Song et al. (2014)20 <0.5–25600 Present study
Relative contribution (%)0 20 40 60 80 100
I-WWTPs
M-WWTPs
D-WWTPs
BPABPAFBPAPBPFBPPBPSBPZ
Fig. 1. Composition profiles of several bisphenol analogues in sludge from WWTPsin Korea.
1004 S. Lee et al. / Chemosphere 119 (2015) 1000–1006
To date, several studies have reported the occurrence of BPF in envi-ronmental matrices such as water (Fromme et al., 2002), indoor dust(Liao et al., 2012b) and sediment (Fromme et al., 2002; Stachel et al.,2003; Liao et al., 2012a). However, the concentrations of BPFreported in these earlier studies were relatively lower than thosefound for other analogues, including BPA (Fromme et al., 2002;Liao et al., 2012a,b). The dominance of BPF, in sludge from D- andM-WWTPs has not been reported previously. It is presumed thatBPF is used in epoxy resins as an alternative to BPA in the bisphenolmarket. In Korea, most households receive water distribution(supply rate: 97.9%), and approximately 35% of pipelines used forthis distribution are coated with epoxy resin, which could containBPF (MOE, 2012). Thus, the release of BPF from pipelines can be asource of BPF in sludge from domestic WWTPs. Further studiesare needed to clarify the sources of BPs in Korean sludge.
3.3. Relationship between BPs and WWTP characteristics
Spearman’s rank correlation analyses were performed betweenBPs and the several characteristics (WTC, IE, ASP and HRT) ofWWTPs as well as TOC (Table 3). There were no significant corre-lations among BPs, except that BPS was significantly correlatedwith BPA (r = 0.715, p < 0.001) and BPAF (r = 0.520, p < 0.001). Nosignificant correlations were found between concentrations ofBPs and WWTP characteristics, except for BPF. Our results suggestthat WWTP characteristics may not indicate BPs in sludge. Similarresults were found for brominated flame retardants and character-istics of WWTP in the same sample set (Lee et al., 2014a). However,
Table 3Spearman’s rank correlation coefficients of bisphenol analogues and wastewater treatmen
BPA BPAF BPAP BPF BPP
BPAF 0.225BPAP �0.158 �0.076BPF 0.241 0.200 0.122BPP 0.284 0.194 �0.076 0.084BPS 0.715** 0.520** �0.069 0.253 0.269BPZ �0.093 �0.076 �0.053 �0.300 �0.076WTC �0.008 �0.194 0.190 0.343* �0.03IE �0.177 �0.161 0.200 0.469** �0.087ASP 0.257 0.081 �0.093 0.026 0.081HRT 0.101 �0.027 �0.029 �0.360* �0.202TOCe 0.015 �0.153 0.222 0.492** �0.210
* p < 0.05.** p < 0.01.
a Wastewater treatment capacity.b Inhabitant equivalent.c Annual sludge production.d Hydraulic retention time.e Total organic carbon.
BPF was positively correlated with WTC (r = 0.343, p = 0.03), IE(r = 0.469, p = 0.004) and TOC (r = 0.492, p = 0.001), and negativelycorrelated with HRT (r = �0.360, p = 0.025). Previous studies havereported that each WWTP has different removal efficiencies forendocrine disrupting compounds (EDCs) including BPA (Zhouet al., 2010; Samaras et al., 2013).
3.4. Emission fluxes of BPs via sludge and effluent from WWTPs
Emission fluxes of BPs through the discharges of sludge and efflu-ents from each of the WWTPs studied in Korea are summarized inTable 4. Emission fluxes of RBP were an order of magnitude highervia effluent discharge than via sludge disposal, indicating that efflu-ent is the major source of BP release into the environment. However,the environmental emissions of BPAP and BPP were higher viasludge disposal than via effluent discharge, due to high Kow andKoc of these compounds than others (Table S2). Among all the BPanalogues analyzed in this study, BPA had the highest emission fluxvia sludge (114 g d�1 WWTP�1) and effluent (1100 g d�1 WWTP�1).The average emission flux of RBP via sludge from I-WWTPs(116 g d�1 WWTP�1) was 3–6 times higher than those calculatedfor M-WWTPs (41.1 g d�1 WWTP�1) and D-WWTPs (19.3 g d�1
WWTP�1). Similarly, the average emission flux of RBP via effluentwas in the order of I-WWTPs (1176 g d�1 WWTP�1), M-WWTP(620 g d�1 WWTP�1) and D-WWTPs (286 g d�1 WWTP�1).However, the emission fluxes of BPF were 20–30 times higher insamples from M- and D-WWTPs than from I-WWTPs.
The average per-capita emission fluxes of BPs ranged from 0.04(BPP) to 886 g capita�1 d (BPA) through discharges of WWTPs inKorea. The average per-capita daily emission fluxes of RBP throughI-WWTPs (898 g capita�1) were 2–3 orders of magnitude higherthan those found for D-WWTPs (0.044 g capita�1) and M-WWTPs(0.26 g capita�1), indicating that industrial activities are the majorsources of BPs in the Korean environment.
Sludge and effluent discharges from WWTPs in Korea are directand secondary sources of toxic organic contaminants to the aquaticenvironment (Moon et al., 2008; Lee et al., 2014a,b). In Korea, sew-age sludge has been disposed via ocean dumping (33%), recycling(26%), incineration (22%), landfills (8.4%), and fuelization (7.2%)until 2012 (MOE, 2012). Hong and Shin (2009) reported high con-centrations of BPA in sediment from ocean dumping region and itspotential health effects to coastal environment of Korea. Recently,the Korean government changed sewage sludge treatment policyfrom ocean dumping to inland disposal, sanitary landfill, incinera-tion and others, in order to comply with the London Convention.
t plant (WWTPs) characteristics in Korea.
BPS BPZ WTCa IEb ASPc HRTd
�0.019�0.139 0.022�0.177 �0.171 0.927**
0.194 �0.058 0.615** 0.457**
0.152 0.055 �0.393* �0.416* �0.1470.037 �0.052 0.190 0.484** �0.208 �0.200
Table 4Average emission fluxes of BPs through discharges of sludge (g d�1 WWTP�1) and effluent (g d�1 WWTP�1), and per-capita discharge (mg capita�1 d WWTP�1) from each of thestudied WWTPs in Korea.
Analyte Domestic WWTP (n = 16) Mixed WWTP (n = 9) Industrial WWTP (n = 15)
Sludge Effluent Per-capita Sludge Effluent Per-capita Sludge Effluent Per-capita
BPA 9.65 93.0 16.1 24.2 233 158 114 1100 885800BPAF 0 0 0 0.03 0.02 0.10 0.004 0.003 17.4BPAP 0.02 0.01 0.05 0 0 0 0 0 0BPF 9.43 184 27.0 15.0 292 90.4 0.44 8.65 3253BPP 0.03 0.001 0.04 0.06 0.005 0.48 0.04 0.003 121BPS 0.18 8.93 0.34 1.88 95.3 8.22 1.33 67.6 8392BPZ 0 0 0 0 0 0 0.25 0.07 42.0RBPs 19.3 286 43.6 41.1 620 257 116 1176 897624
S. Lee et al. / Chemosphere 119 (2015) 1000–1006 1005
Considering the environmental release of large amounts of sludgeand effluents containing BPs, further studies are needed to evaluatethe potential health risks of BP exposure in wildlife and humans inKorea.
4. Conclusions
This is the first nationwide survey to determine BPs in sludgefrom Korean WWTPs. BP analogues were detected in all sludgesamples, except for BPB. The concentrations of BPA in sludge mea-sured in our study were higher than those reported for other coun-tries. The highest concentrations of RBP were found in sludge fromWWTPs associated with the paper and textile industries. Thesludge from I-WWTPs was dominated by BPA, whereas sludgefrom D- and M-WWTPs was dominated by BPF. Our findings sug-gest the use of BPF as an alternative for BPA in Korea in some appli-cations. No significant correlations were found between BPs andWWTP characteristics, except for BPF. The environmental emissionfluxes of RBP were an order of magnitude higher via effluent thanvia sludge. The average per-capita emission fluxes of RBP throughI-WWTPs were 2–3 orders of magnitude higher than those foundfor D- and M-WWTPs, indicating that industrial activities are themajor sources of BPs in Korean environment.
Acknowledgements
This study was supported by the Ministry of Environment ofKorea as the ‘‘Environmental Health Action Program(ARQ201303083)’’ and the ‘‘BK21 Plus Program’’ of Korea. SG Lee issupported by BK21 Plus program (F14SN08T1904) of NationalResearch Foundation of Korea.
Appendix A. Supplementary material
Supplementary data associated with this article can be found, inthe online version, at http://dx.doi.org/10.1016/j.chemosphere.2014.09.011.
References
Burkhardt, M.R., ReVello, R.C., Smith, S.G., Zaugg, S.D., 2005. Pressurized liquidextraction using water/isopropanol coupled with solid0phase extractioncleanup for industrial and anthropogenic waste-indicator compounds insediment. Anal. Chim. Acta 534, 89–100.
Chen, M.-Y., Ike, M., Fujita, M., 2002. Acute toxicity, mutagenicity, and estrogenicityof bisphenol-A and other bisphenols. Environ. Toxicol. 17, 80–86.
Chu, S., Haffner, G.D., Letcher, R.J., 2005. Simultaneous determination oftetrabromobisphenol A, tetrachlorobisphenol A, bisphenol A and otherhalogenated analogues in sediment and sludge by high performance liquidchromatography-electrospray tandem mass spectrometry. J. Chromatogr. A1097, 25–32.
Danzl, E., Sei, K., Soda, S., Ike, M., Fujita, M., 2009. Biodegradation of bisphenol A,bisphenol F and bisphenol S in seawater. Int. J. Environ. Res. Public Health 6,1472–1484.
Dorival-García, N., Zafra-Gómez, A., Navalón, A., Vílchez, J.L., 2012. Improved sampletreatment for the determination of bisphenol A and its chlorinated derivativesin sewage sludge samples by pressurized liquid extraction and liquidchromatography-tandem mass spectrometry. Talanta 101, 1–10.
Fromme, H., Küchler, T., Otto, T., Pilz, K., Müller, J., Wenzel, A., 2002. Occurrence ofphthalates and bisphenol A and F in the environment. Water Res. 36, 1429–1438.
Fu, P., Kawamura, K., 2010. Ubiquity of bisphenol A in the atmosphere. Environ.Pollut. 158, 3138–3143.
Geens, T., Goeyens, L., Kannan, K., Neels, H., Covaci, A., 2012. Levels of bisphenol-A inthermal paper receipts from Belgium and estimation of human exposure. Sci.Total Environ. 435–436, 30–33.
Hong, S., Shin, K.-H., 2009. Alkylphenols in the core sediment of a waste dumpsite inthe East Sea (Sea of Japan). Korea. Mar. Pollut. Bull. 58, 1566–1587.
Lee, H.-B., Peart, T.E., 2000. Bisphenol A contamination in Canadian municipal andindustrial wastewater and sludge samples. Water Qual. Res. J. Can. 35, 283–298.
Lee, S., Liu, X., Takeda, S., Choi, K., 2013. Genotoxic potentials and relatedmechanisms of bisphenol A and other bisphenol compounds: A comparisonstudy employing chicken DT40 cells. Chemosphere 93, 434–440.
Lee, S., Song, G.-J., Kannan, K., Moon, H.-B., 2014a. Occurrence of PBDEs and otheralternative brominated flame retardants in sludge from wastewater treatmentplants in Korea. Sci. Total Environ. 470–471, 1422–1429.
Lee, S., Moon, H.-B., Song, G.-J., Ra, K., Lee, W.-C., Kannan, K., 2014b. A nationwidesurvey and emission estimates of cyclic and linear siloxanes through sludge fromwastewater treatment plants in Korea. Sci. Total Environ. 497–498, 106–112.
Liao, C., Kannan, K., 2011. Widespread occurrence of bisphenol A in paper and paperproducts: Implications for human exposure. Environ. Sci. Technol. 45, 9372–9379.
Liao, C., Liu, F., Moon, H.-B., Yamashita, N., Yun, S., Kannan, K., 2012a. Bisphenolanalogues in sediments from industrialized areas in the United States, Japan,and Korea: spatial and temporal distributions. Environ. Sci. Technol. 46, 11558–11565.
Liao, C., Liu, F., Guo, Y., Moon, H.-B., Nakata, H., Wu, Q., Kannan, K., 2012b.Occurrence of eight bisphenol analogues in indoor dust from the United Statesand several Asian countries: implications for human exposure. Environ. Sci.Technol. 46, 9138–9145.
Liao, C., Liu, F., Kannan, K., 2012c. Bisphenol S, a new bisphenol analogues, in paperproducts and currency bills and its association with bisphenol A residues.Environ. Sci. Technol. 46, 6515–6522.
Liao, C., Liu, F., Alomirah, H., Loi, V.D., Mohd, M.A., Moon, H.-B., Nakata, H., Kannan,K., 2012d. Bisphenol S in urine from the United States and seven Asiancountries: occurrence and human exposures. Environ. Sci. Technol. 46, 6860–6866.
Melcer, H., Klecka, G., 2011. Treatment of wastewaters containing bisphenol A: stateof the science review. Water Environ. Res. 83, 650–666.
Merchant Research & Consulting Ltd (MRCL), 2014. Bisphenol A (BPA): 2014 worldmarket outlook and forecast up to 2018. Merchant Research & Consulting Ltd.<http://www.prweb.com/releases/2014/04/prweb11761146.htm> (accessed28.08.14).
Ministry of Environment (MoE), 2012. Statics of sewage in 2011, Ministry ofEnvironment, Seoul, Korea (in Korean).
Mohapatra, D.P., Brar, S.K., Tyagi, R.D., Surampalli, R.Y., 2010. Physico-chemical pre-treatment and biotransformation of wastewater and wastewater sludge-Fate ofbisphenol A. Chemosphere 78, 923–941.
Moon, H.-B., Yoon, S.-P., Jung, R.-H., Choi, M., 2008. Wastewater treatment plants(WWTPs) as a source of sediment contamination by toxic organic pollutantsand fecal sterols in a semi-enclosed bay in Korea. Chemosphere 73, 880–889.
Prichard, J., Hall, W., De Voogt, P., Zuccato, E., 2014. Sewage epidemiology and illicitdrug research: the development of ethical research guidelines. Sci. TotalEnviron. 472, 550–555.
Samaras, V., Stasinakis, A.S., Mamais, D., Thomaidis, N.S., Lekkas, T.D., 2013. Fate ofselected pharmaceuticals and synthetic endocrine disrupting compoundsduring wastewater treatment and sludge anaerobic digestion. J. Hazard.Mater. 244–245, 259–267.
Song, S., Song, M., Zeng, L., Wang, T., Liu, R., Ruan, T., Jiang, G., 2014. Occurrence andprofiles of bisphenol analogues in municipal sewage sludge in China. Environ.Pollut. 186, 14–19.

1006 S. Lee et al. / Chemosphere 119 (2015) 1000–1006
Stachel, B., Ehrhorn, U., Heemken, O.P., Lepom, P., 2003. Xenoestrogens in the RiverElbe and its tributaries. Environ. Pollut. 124, 497–507.
Subedi, B., Lee, S., Moon, H.-B., Kannan, K., 2013. Psychoactive pharmaceuticals insludge and their emission from wastewater treatment facilities in Korea.Environ. Sci. Technol. 47, 13321–13329.
Suzuki, T., Nakagawa, Y., Takano, I., Yaguchi, K., Yasuda, K., 2004. Environmental fateof bisphenol A and its biological metabolites in river water and their xeno-estrogenic activity. Environ. Sci. Technol. 38, 2389–2396.
Vandenberg, L.N., Hauser, R., Marcus, M., Olea, N., Welshons, W.V., 2007. Humanexposure to bisphenol A (BPA). Reprod. Toxicol. 24, 139–177.
Zhang, T., Sun, H., Kannan, K., 2013. Blood and urinary nisphenol A concentrations inchildren, adults, and pregnant women from china: partitioning between blood andurine and maternal and fetal cord blood. Environ. Sci. Technol. 47, 4686–4694.
Zhou, H., Huang, X., Wang, X., Zhi, X., Yang, C., Wen, X., Wang, Q., Tsuno, H., Tanaka,H., 2010. Behaviour of selected endocrine-disrupting chemicals in three sewagetreatment plants of Beijing. China. Environ. Monit. Assess. 161, 107–121.


![Bisphenol A Diglycidyl Ether of Bisphenol A Method · PDF file4 of 18 Diglycidyl Ether of Bisphenol A13 synonyms: 2,2-bis[4-(glycidyloxy)phenyl]propane, 4,4′-isopropylidenediphenol](https://img.pdfslide.net/doc/110x75/5a76e9947f8b9a93088d7abf/bisphenol-a-diglycidyl-ether-of-bisphenol-a-method-4-of-18-diglycidyl-ether.jpg)