Embed Size (px)
Citation preview
IOSR Journal of Business and Management (IOSR-JBM)
e-ISSN: 2278-487X, p-ISSN: 2319-7668. Volume 20, Issue 2. Ver. IV (February. 2018), PP 01-27
www.iosrjournals.org
DOI: 10.9790/487X-2002040127 www.iosrjournals.org 1 | Page
Employee Attrition and Employee Satisfaction: A Study of H.R.,
Performance Appraisal & Training Practices in Defence PSUs in
India.
1. Ruchira Dobhal, 2.
Dr Akankssha Nigam,
1. Research Scholar, Sri Ramswaroop Memorial University, Barabanki, Lucknow (Working as HR Manager, in a
DPSU, Lucknow) 2. Dy. Registrar (Academics), Sri Ramswaroop Memorial University, Barabanki, Lucknow.
Corresponding Author: Ruchira Dobhal
Abstract: The purpose of this study is to examine the impact of H.R. practices on the Employee Attrition in
Defence PSUs in India. Basically, Hiring Practices and Performance Appraisal & Training Practices are the
two major aspects of the H.R. Practices that have been researched upon in this paper. The Indian Government
has recently allowed Private Sector participation in the Defence Industry. This decision led to the entry of the
private companies to Defence Sector and it also proved to be an end of monopoly of Public Sector Undertakings
(PSUs). Now, the DPSUs are very much concerned about the employee switch over to the private companies -
their competitors. The major research question was who is more likely to switch over, Junior / Middle Level
Executives or Senior Level Executives? Hence, it became a compulsion for the researcher to conduct a
comparative research on attrition in DPSUs from the perception of Junior / Middle Level and Senior Level
Executives. The research concentrated on the relationship between Designation Level and the Hiring Practices
as well as Performance Appraisal & Training Practices. Researcher also investigated the correlations among
Hiring Practices, Performance Appraisal & Training Practices, Satisfaction Level of the executives and
Reasons of Attrition.
Keywords: Attrition, Employee Satisfaction, Hiring Practices, Performance Appraisal & Training Practices.
----------------------------------------------------------------------------------------------------------------------------- ----------
Date of Submission: 25-12-2017 Date of acceptance: 16-02-2018
----------------------------------------------------------------------------------------------------------------------------- ----------
I. Introduction
1.1. Overview
The Department of Defence Production in India was set up in 1962, to create an indigenous defence
production base which is self-reliant and self-sufficient. Department of Defence Supplies was created to forge
linkages between the civil industries and defence production units. The two departments were merged in
December, 1984 to form the Department of Defence Production and Supplies. Presently, 39 Ordnance Factories
and 8 Defence Public Sector Undertakings (DPSUs) are engaged in the task of manufacture of equipment and
stores for Defence Services.
India maintains an extensive defence industrial base principally owned by the government. India's defence
industrial capacity lies in three main classes of enterprises:
The Ordnance Factories (OF),
The Defence Public Sector Undertakings (DPSUs), and,
The Civilian Public and Private Sector manufacturing establishments.
The main organizations under the Department of Defence Production are as follows:
• Ordnance Factory Board (OFB)
• Hindustan Aeronautics Limited (HAL)
• Bharat Electronics Limited (BHEL)
• Bharat Dynamics Limited (BDL)
• BEML Limited (BEML)
• Mishra Dhatu Nigam Limited (MIDHANI)
• Mazagaon Dock Shipbuilders Limited (MDL)
• Garden Reach Shipbuilders & Engineers Limited (GRSE)
• Goa Shipyard Limited (GSL)
• Hindustan Shipyard Limited (HSL)
• Directorate General of Quality Assurance (DGQA)
• Directorate General of Aeronautical Quality Assurance (DGAQA)
Employee Attrition And Employee Satisfaction: A Study Of H.R., Performance Appraisal...
DOI: 10.9790/487X-2002040127 www.iosrjournals.org 2 | Page
• Directorate of Standardisation (DOS)
• Directorate of Planning & Coordination (Dte. of P&C)
• Defence Exhibition Organisation (DEO), and
• National Institute for Research & Development in Defence Shipbuilding (NIRDESH).
The government is also trying to promote greater Civil Sector participation in the armament process.
The Government has recently allowed Private Sector participation in the defence industry up to 100 per cent and
with Foreign Direct Investment permissible upto 49 per cent both subject to licensing, for manufacture of all
types of defence equipment within the country. The FDI beyond 49 per cent will be allowed in state of art
defence equipment manufacturing, with technology transfer under Indian control and management. Technically,
this means 100% FDI is allowed. This is expected to add to the investment already made in the Public Sector.
The human capital base for defence industrial segment to expand in the proportion desired and
anticipated requires severe augmentation. Traditionally, the sources of engineering talent for Defence and
Aerospace in India were few and the skills imparted to students were far from required. Over the past few years,
there has been a sudden increase in the number of institutions offering specialised engineering degree
programmes, however the demand continues to far outstrip the supply. Apart from volume, the quality of
Defence and Aerospace engineering talent from institutions has to be upgraded significantly, which is not
happening unfortunately.
The entry of private companies will end PSU monopoly and bring in both positive and not some
negative impacts. This besides increasing competition will force to go commercial and response to market
discipline. Integration of World Trade Organisations will bring in transparency, reduce procedural difficulties
and more disciplined work force. Galloping costs of Govt. intervention will be mitigated by disinvestment. The
HR concern is that the sudden turmoil has created a great disturbance in Human resource capital in defence
industrial segment and worst hit are defense PSUs.
1.2. Justifications and Significance of the Research
Despite the rising turnover rate in DPSUs in India in recent years, there are limited studies related to
this phenomenon of attrition. Employee attrition rate is a major topic of concern for the HR personnel and
higher authorities of DPSUs. If this problem is not properly addressed and researched upon right now,
government sector is surely going to suffer in the coming years. There is a need to study more about the reasons
of attrition, employee satisfaction, present hiring practices and performance appraisal & training practices. This
research is useful in understanding reasons of rate of attrition from the perspectives of Junior / Middle Level as
well as Senior Level Executives. Concerned stakeholders may use the findings and the results of this research to
further research upon on this topic or modify their present employee retention strategies in order to reduce the
rate of attrition.
1.3. Research Hypotheses & Objectives
Following research hypotheses & research objectives are developed to address the research problem.
Research Objective-1: To study the association between Designation Level (Junior / Middle Level Executives
or Senior Level Executives) and Hiring Practices in DPSUs in India.
Alternate Hypothesis-1 (H1): There is a significant association between the Designation Level (Junior /
Middle Level Executives or Senior Level Executives) and Hiring Practices in DPSUs in India.
Null Hypothesis-2 (H0): There is no significant association between the Designation Level (Junior / Middle
Level Executives or Senior Level Executives) and Hiring Practices in DPSUs in India.
Research Objective-2: To study the association between Designation Level (Junior / Middle Level Executives
or Senior Level Executives) and Performance Appraisal & Training Practices in DPSUs in India.
Alternate Hypothesis-1 (H1): There is a significant association between Designation Level (Junior / Middle
Level Executives or Senior Level Executives) and Performance Appraisal & Training Practices in DPSUs in
India.
Null Hypothesis-2 (H0): There is no significant association between Designation Level (Junior / Middle Level
Executives or Senior Level Executives) and Performance Appraisal & Training Practices in DPSUs in India.
Research Objective-3: To study the correlations among the Hiring Practices, Performance Appraisal &
Training Practices, Satisfaction Level of the Executives and Reasons of Attrition.
Employee Attrition And Employee Satisfaction: A Study Of H.R., Performance Appraisal...
DOI: 10.9790/487X-2002040127 www.iosrjournals.org 3 | Page
Alternate Hypothesis-1 (H1): There is correlation among the Hiring Practices, Performance Appraisal &
Training Practices, Satisfaction Level of the Executives and Reasons of Attrition in DPSUs in India.
Null Hypothesis-2 (H1): There is no correlation among the Hiring Practices, Performance Appraisal & Training
Practices, Satisfaction Level of the Executives and Reasons of Attrition in DPSUs in India.
II. Literature Review
2.1. Attrition Following are the ways to describe the definitions and the meaning of attrition and its rate.
„A reduction in the number of employees through retirement, resignation or death.‟
„Attrition is, the number of employees a company must replace in a given time period to the average
number of total employees.‟
Attrition rate can be defined as „the rate of shrinkage in size or number.‟
A reduction in the number of employees through retirement, resignation or death refers to
attrition. In the perfect environment of the corporate world, employees are highly motivated to do their jobs,
have good relations with others in the organisation, work hard to achieve the organisational goals, get paid well
for their work, have great chances for the career growth, and the flexible schedules so they could attend to
personal or family needs, as and when, necessary. But then there‟s the real world in which employees do leave
the jobs due to several reasons, that may be justified or may not be. Attrition results in the loss of revenue,
unhealthy organisational environment, and it may also encourage others to leave the job for the similar or the
other reasons.
Attrition is a phenomenon affecting any business organization in the industry. Over the past few years,
organizations have taken an increased interest in aligning their HR practices to their business goals. Managing a
highly discerning and independent workforce has thrown up exciting challenges. Attrition is a dynamic that
impacts business performance in more ways than the usually perceived Human Resource Development angle. It
is an issue which gives rise to questions like organizational health, morale and motivation and leads up to very
tangible aspects such as shareholder return and value. Low perceived value stands out as the most significant
factor for attrition. Increased dissatisfaction leads to reduced motivation, which in turn results in lowered
efficiency. When the efficiency is lowered, employees are not able to deliver their expected output which results
in their leaving the job. When employees quit, the perceived value is further lowered.
2.2. Review of the Previous Researches
Despite several studies carried out on employee attrition and employee retention, the researchers in the
field of strategic human resource management are still investigating the causal mechanisms between HR
practices and employee attrition rate and employee retention.
According to Boswell, Boudreau and Tichy (2005), ‘the decision of leaving the Organization is not
easy for an individual employee as well as significant energy is spent on finding new jobs, adjusting to new
situations, giving up known routines and interpersonal connection and is so stressful.‟ Therefore if timely and
proper measures are taken by the Organizations, some of the voluntary turnover in the Organization can be
prevented.
The reasons for employee turnover may vary from external environmental factors such as economy that
influence the business that in turn affects the employment levels (Pettman 1975; Mobley, 1982, Schervish,
1983; Terborg and Lee, 1984) to Organizational variables which are described by Mobley, 1982; Arthur,
(2001) are as following-
Type of industry,
Occupational category,
Organization size,
Payment,
Supervisory level,
Location,
Selection process,
Work environment,
Work assignments,
Benefits,
Promotions
The other factors as explained by Pettman, (1975); Mobley (1982); Arthur (2001), that influence employee
turnover in Organizations are the individual work variables such as demographic variables,
Employee Attrition And Employee Satisfaction: A Study Of H.R., Performance Appraisal...
DOI: 10.9790/487X-2002040127 www.iosrjournals.org 4 | Page
integrative variables like-
Job satisfaction,
Pay,
Promotion and
Working condition
And the individual non-working variables such as family related variables (Pettman, 1975; Mobley, 1982;).
Trevor, (2001), in his research found that employees who perform better and are intelligent enough
have more external employment opportunities available compared to average or poor performance employees
and thus they are more likely to leave.
High rates of voluntary turnover of such employees are often found to be harmful or disruptive to
firm‟s performance (Glebbeck & Bax, 2004).
When poor performers, choose to leave the Organization, it is good for the Organization (Abelson &
Baysinger, 1984).
Further voluntary turnover of critical work force is to be differentiated into avoidable and unavoidable
turnover (Barrick & Zimmerman, 2005).
Hinkin & Tracey, (2000), Estimates of the losses for each employee vary from a few thousand dollars
to more than two times the person‟s salary depending on the industry, the content of the job, the availability of
replacements and other factors. In some industries chronic shortage of qualified employees has driven up the
costs of turnover. Therefore the acquisition, development and retention of talent form the basis for developing
competitive advantage in many industries and countries (Pfeffer, 1994, 2005).
According to Rappaport, Bancroft, & Okum, (2003), organizations failing to retain high performers
will be left with an under staffed, less qualified workforce that ultimately hinders their ability to remain
competitive.
Three studies incorporated attitudinal and/or behavioural changes over time to better predict turnover.
Sturman and Trevor (2001) found that quitters‟ performance over time did not significantly change while stays‟
performance slope was positive. Demographic factors cannot be ignored as age, tenure, level of education, level
of income, job category, gender have influenced employee retention and have been found to have stable
relationship with turnover intention. Of the above demographic factors, age, tenure and income level was found
to be negatively related to turnover intention (Arnold & Feldman, 1982; Cotton & Tuttle, 1986; Gerhart, 1990:
Mobley et. al, 1979; Price & Mueller, 1986; Wai & Robinson, 1998; Weil & Kimball, 1995); level of education
is positively associated with turnover, the more educated the employees there is a tendency to quit (Berg, 1991;
Cotton & Tuttle, 1986); With respect to job category, Wai & Robinson, 1998 and Price and Mueller, 1986 found
that non-managerial employees are more likely to quit than managerial employees. Relationship between gender
and turnover showed mixed result. Cotton and Tuttle (1986) and Weisberg and Kirshenbaum (1993) found
females more likely to leave than males. Miller and Wheeler (1992) and Wai and Robinson (1998) reported no
relationship between gender and turnover. However the reasons for employee turnover vary from one
Organization to the other and from one person to another as they are not getting what they expect from the
Organization (Ongori, 2007). Mobley (1982) and Dickter, Roznowski and Harrison (1996) also called for more
research and theory pertaining to how the turnover process occurs over time.
III. Research Design This chapter defines the research design, population samples, data collection procedures and the
techniques of data analysis for examining the factors of Hiring Practices and performance appraisal and
training practices that affect the satisfaction level of the employee working in Defence PSUs in India. This
research is exploratory in nature. A survey was designed to measure the perceptions of employees for Hiring
Practices and performance appraisal and training practices of Defence PSUs in India. It also analyses the
correlations among the satisfaction level, reasons of employee attrition and Hiring Practices and performance
appraisal and training practices.
A survey was done with the help of the questionnaires and schedules using five point Likert scale
such as strongly agree-1, agree-2, neutral-3, disagree-4, and strongly disagree-5.
To collect information / data for the research purpose, quota sampling was used. The target population,
to which researcher would like to draw inferences, comprises the Junior & Middle Level Executives and
Senior Level Executives working in Defence PSUs in India; which can be said as the universe of the study.
We know that the population is heterogeneous in nature which is an advantage for the sampling, as it reduced
the biasness of the data. This research study is comparative in nature, so the data of Junior & Middle Level
Executives and Senior Level Executives, both were used. The survey was conducted of the employees to
collect the data. The total Sample size was of 600 employees out of which 472 employees were Junior &
Middle Level Executives and 128 employees were Senior Level Executives working in Defence PSUs in
Employee Attrition And Employee Satisfaction: A Study Of H.R., Performance Appraisal...
DOI: 10.9790/487X-2002040127 www.iosrjournals.org 5 | Page
India. For the analysis of the data, IBM SPSS STATISTICS 21 version software was used to perform
Frequency Analysis, Chi Square Analysis, and Correlations Analysis.
This study aimed to examine the association between designation level and the factors that affect
Hiring Practices & Performance Appraisal and Training Practices of Defence PSUs in India.
IV. Data Analysis, Interpretation & Findings 4.1. Demographic Analysis
Table-1: Age Age
Frequency Percent Valid Percent Cumulative Percent
Valid 20-30 60 10.0 10.0 10.0
31-40 304 50.7 50.7 60.7
41-50 152 25.3 25.3 86.0
51-60 84 14.0 14.0 100.0
Total 600 100.0 100.0
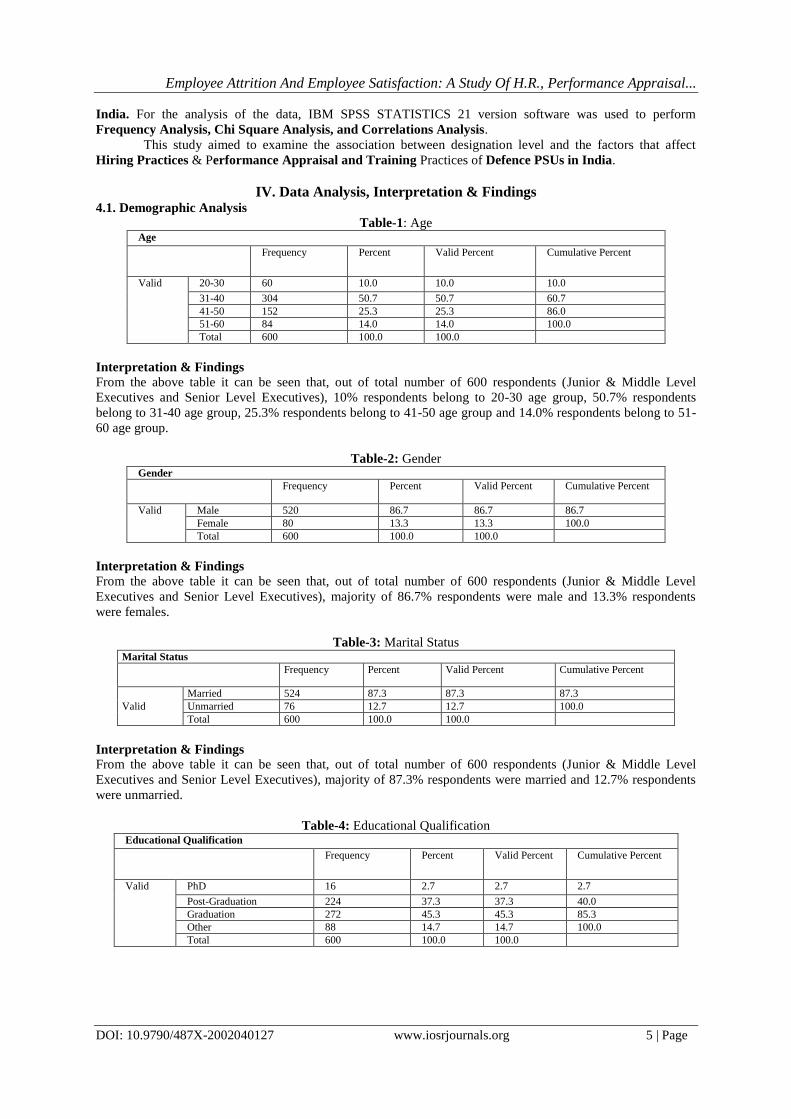
Interpretation & Findings
From the above table it can be seen that, out of total number of 600 respondents (Junior & Middle Level
Executives and Senior Level Executives), 10% respondents belong to 20-30 age group, 50.7% respondents
belong to 31-40 age group, 25.3% respondents belong to 41-50 age group and 14.0% respondents belong to 51-
60 age group.
Table-2: Gender Gender
Frequency Percent Valid Percent Cumulative Percent
Valid Male 520 86.7 86.7 86.7
Female 80 13.3 13.3 100.0
Total 600 100.0 100.0
Interpretation & Findings
From the above table it can be seen that, out of total number of 600 respondents (Junior & Middle Level
Executives and Senior Level Executives), majority of 86.7% respondents were male and 13.3% respondents
were females.
Table-3: Marital Status Marital Status
Frequency Percent Valid Percent Cumulative Percent
Valid
Married 524 87.3 87.3 87.3
Unmarried 76 12.7 12.7 100.0
Total 600 100.0 100.0
Interpretation & Findings
From the above table it can be seen that, out of total number of 600 respondents (Junior & Middle Level
Executives and Senior Level Executives), majority of 87.3% respondents were married and 12.7% respondents
were unmarried.
Table-4: Educational Qualification Educational Qualification
Frequency Percent Valid Percent Cumulative Percent
Valid PhD 16 2.7 2.7 2.7
Post-Graduation 224 37.3 37.3 40.0
Graduation 272 45.3 45.3 85.3
Other 88 14.7 14.7 100.0
Total 600 100.0 100.0
Employee Attrition And Employee Satisfaction: A Study Of H.R., Performance Appraisal...
DOI: 10.9790/487X-2002040127 www.iosrjournals.org 6 | Page
Interpretation & Findings
From the above table it can be seen that, out of total number of 600 (Junior & Middle Level Executives and
Senior Level Executives), 2.7% respondents had PhD, 37.3% respondents were post graduates, 45.3%
respondents were graduates and 14.7% respondents had other qualification.
Table-5: Professional / Technical Qualification
Professional / Technical Qualification
Frequency Percent Valid Percent Cumulative
Percent
Valid No 28 4.7 4.7 4.7
Yes 572 95.3 95.3 100.0
Total 600 100.0 100.0
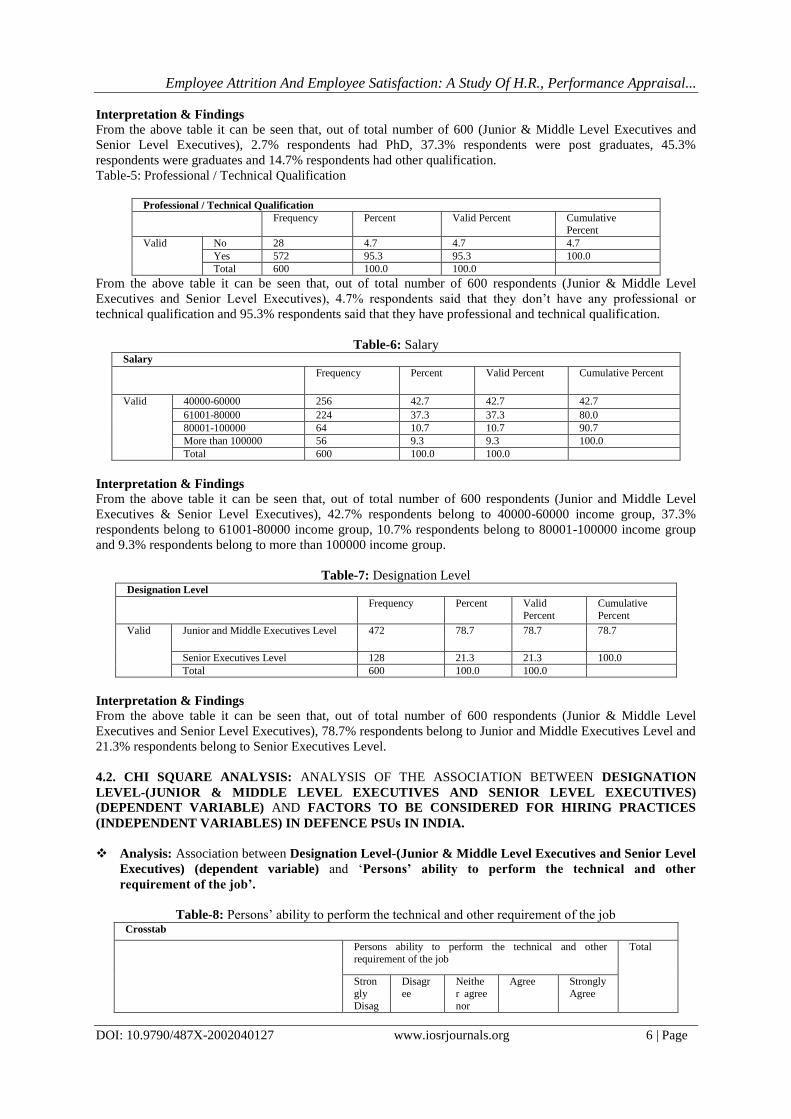
From the above table it can be seen that, out of total number of 600 respondents (Junior & Middle Level
Executives and Senior Level Executives), 4.7% respondents said that they don‟t have any professional or
technical qualification and 95.3% respondents said that they have professional and technical qualification.
Table-6: Salary Salary
Frequency Percent Valid Percent Cumulative Percent
Valid 40000-60000 256 42.7 42.7 42.7
61001-80000 224 37.3 37.3 80.0
80001-100000 64 10.7 10.7 90.7
More than 100000 56 9.3 9.3 100.0
Total 600 100.0 100.0
Interpretation & Findings
From the above table it can be seen that, out of total number of 600 respondents (Junior and Middle Level
Executives & Senior Level Executives), 42.7% respondents belong to 40000-60000 income group, 37.3%
respondents belong to 61001-80000 income group, 10.7% respondents belong to 80001-100000 income group
and 9.3% respondents belong to more than 100000 income group.
Table-7: Designation Level Designation Level
Frequency Percent Valid
Percent
Cumulative
Percent
Valid Junior and Middle Executives Level 472 78.7 78.7 78.7
Senior Executives Level 128 21.3 21.3 100.0
Total 600 100.0 100.0
Interpretation & Findings
From the above table it can be seen that, out of total number of 600 respondents (Junior & Middle Level
Executives and Senior Level Executives), 78.7% respondents belong to Junior and Middle Executives Level and
21.3% respondents belong to Senior Executives Level.
4.2. CHI SQUARE ANALYSIS: ANALYSIS OF THE ASSOCIATION BETWEEN DESIGNATION
LEVEL-(JUNIOR & MIDDLE LEVEL EXECUTIVES AND SENIOR LEVEL EXECUTIVES)
(DEPENDENT VARIABLE) AND FACTORS TO BE CONSIDERED FOR HIRING PRACTICES
(INDEPENDENT VARIABLES) IN DEFENCE PSUs IN INDIA.
Analysis: Association between Designation Level-(Junior & Middle Level Executives and Senior Level
Executives) (dependent variable) and „Persons’ ability to perform the technical and other
requirement of the job’.
Table-8: Persons‟ ability to perform the technical and other requirement of the job Crosstab
Persons ability to perform the technical and other
requirement of the job
Total
Stron
gly
Disag
Disagr
ee
Neithe
r agree
nor
Agree Strongly
Agree
Employee Attrition And Employee Satisfaction: A Study Of H.R., Performance Appraisal...
DOI: 10.9790/487X-2002040127 www.iosrjournals.org 7 | Page
ree disagree
Designation
Level
Junior and
Middle Executives
Level
Count 4 24 76 248 120 472
% within
Designation Level
0.8% 5.1% 16.1% 52.5% 25.4% 100.0%
Senior
Executives Level
Count 0 8 16 68 36 128
% within Designati
on Level
0.0% 6.2% 12.5% 53.1% 28.1% 100.0%
Total Count 4 32 92 316 156 600
% within Designati
on Level
0.7% 5.3% 15.3% 52.7% 26.0% 100.0%
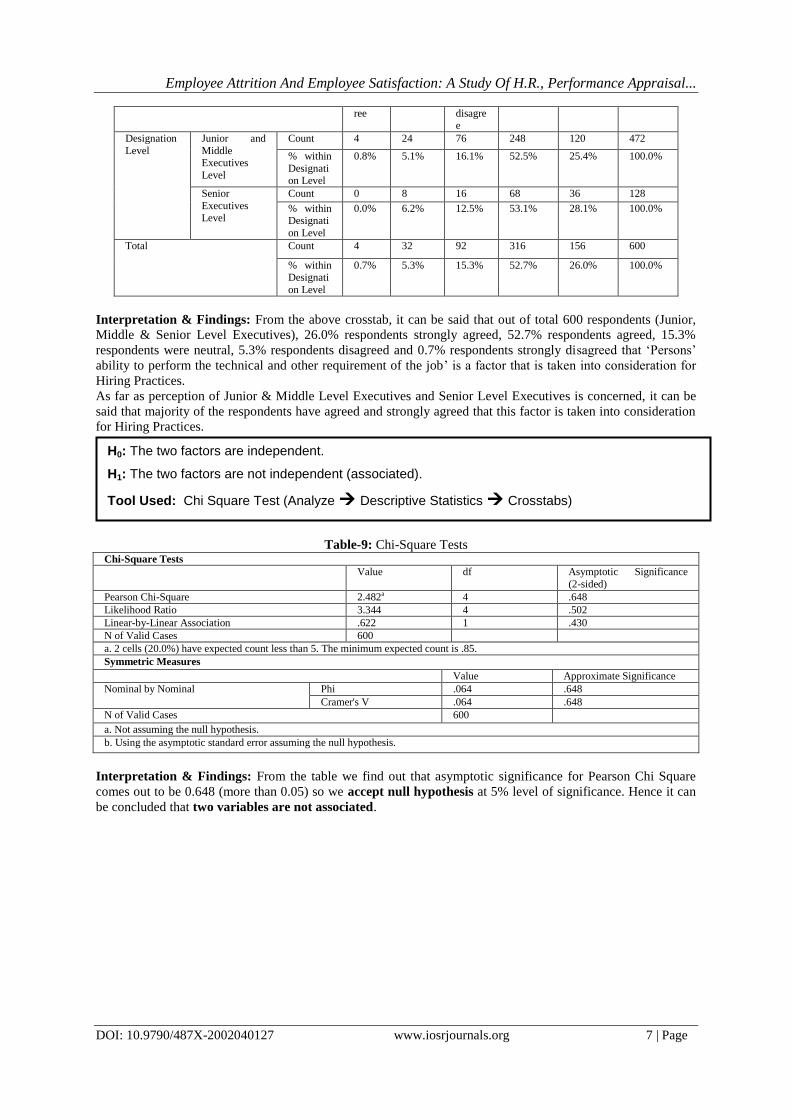
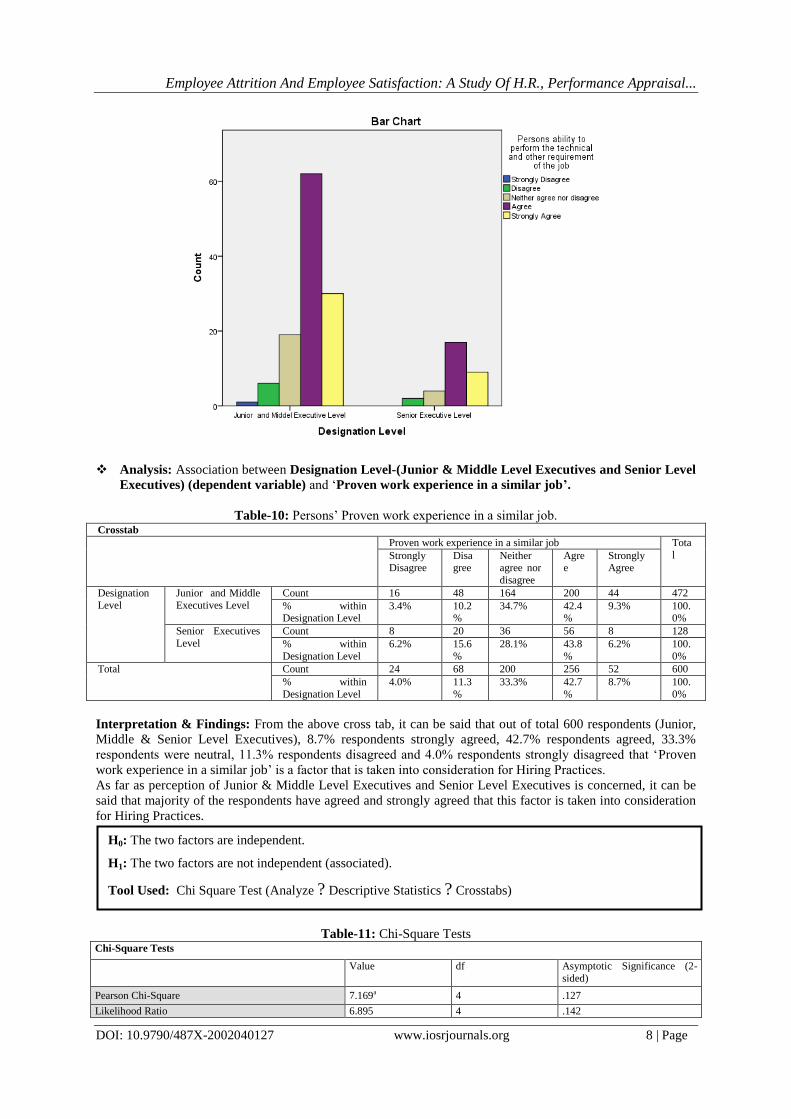
Interpretation & Findings: From the above crosstab, it can be said that out of total 600 respondents (Junior,
Middle & Senior Level Executives), 26.0% respondents strongly agreed, 52.7% respondents agreed, 15.3%
respondents were neutral, 5.3% respondents disagreed and 0.7% respondents strongly disagreed that „Persons‟
ability to perform the technical and other requirement of the job‟ is a factor that is taken into consideration for
Hiring Practices.
As far as perception of Junior & Middle Level Executives and Senior Level Executives is concerned, it can be
said that majority of the respondents have agreed and strongly agreed that this factor is taken into consideration
for Hiring Practices.
Table-9: Chi-Square Tests Chi-Square Tests
Value df Asymptotic Significance
(2-sided)
Pearson Chi-Square 2.482a 4 .648
Likelihood Ratio 3.344 4 .502
Linear-by-Linear Association .622 1 .430
N of Valid Cases 600
a. 2 cells (20.0%) have expected count less than 5. The minimum expected count is .85.
Symmetric Measures
Value Approximate Significance
Nominal by Nominal Phi .064 .648
Cramer's V .064 .648
N of Valid Cases 600
a. Not assuming the null hypothesis.
b. Using the asymptotic standard error assuming the null hypothesis.
Interpretation & Findings: From the table we find out that asymptotic significance for Pearson Chi Square
comes out to be 0.648 (more than 0.05) so we accept null hypothesis at 5% level of significance. Hence it can
be concluded that two variables are not associated.
H0: The two factors are independent.
H1: The two factors are not independent (associated).
Tool Used: Chi Square Test (Analyze Descriptive Statistics Crosstabs)
Employee Attrition And Employee Satisfaction: A Study Of H.R., Performance Appraisal...
DOI: 10.9790/487X-2002040127 www.iosrjournals.org 8 | Page
Analysis: Association between Designation Level-(Junior & Middle Level Executives and Senior Level
Executives) (dependent variable) and „Proven work experience in a similar job’.
Table-10: Persons‟ Proven work experience in a similar job. Crosstab
Proven work experience in a similar job Tota
l Strongly Disagree
Disagree
Neither agree nor
disagree
Agree
Strongly Agree
Designation
Level
Junior and Middle
Executives Level
Count 16 48 164 200 44 472
% within Designation Level
3.4% 10.2%
34.7% 42.4%
9.3% 100.0%
Senior Executives
Level
Count 8 20 36 56 8 128
% within
Designation Level
6.2% 15.6
%
28.1% 43.8
%
6.2% 100.
0%
Total Count 24 68 200 256 52 600
% within
Designation Level
4.0% 11.3
%
33.3% 42.7
%
8.7% 100.
0%
Interpretation & Findings: From the above cross tab, it can be said that out of total 600 respondents (Junior,
Middle & Senior Level Executives), 8.7% respondents strongly agreed, 42.7% respondents agreed, 33.3%
respondents were neutral, 11.3% respondents disagreed and 4.0% respondents strongly disagreed that „Proven
work experience in a similar job‟ is a factor that is taken into consideration for Hiring Practices.
As far as perception of Junior & Middle Level Executives and Senior Level Executives is concerned, it can be
said that majority of the respondents have agreed and strongly agreed that this factor is taken into consideration
for Hiring Practices.
Table-11: Chi-Square Tests Chi-Square Tests
Value df Asymptotic Significance (2-
sided)
Pearson Chi-Square 7.169a 4 .127
Likelihood Ratio 6.895 4 .142
H0: The two factors are independent.
H1: The two factors are not independent (associated).
Tool Used: Chi Square Test (Analyze ? Descriptive Statistics ? Crosstabs)
Employee Attrition And Employee Satisfaction: A Study Of H.R., Performance Appraisal...
DOI: 10.9790/487X-2002040127 www.iosrjournals.org 9 | Page
Linear-by-Linear Association 2.899 1 .089
N of Valid Cases 600
a. 0 cells (.0%) have expected count less than 5. The minimum expected count is 5.12.
Symmetric Measures
Value Approximate Significance
Nominal by Nominal Phi .109 .127
Cramer's V .109 .127
N of Valid Cases 600
a. Not assuming the null hypothesis.
b. Using the asymptotic standard error assuming the null hypothesis.
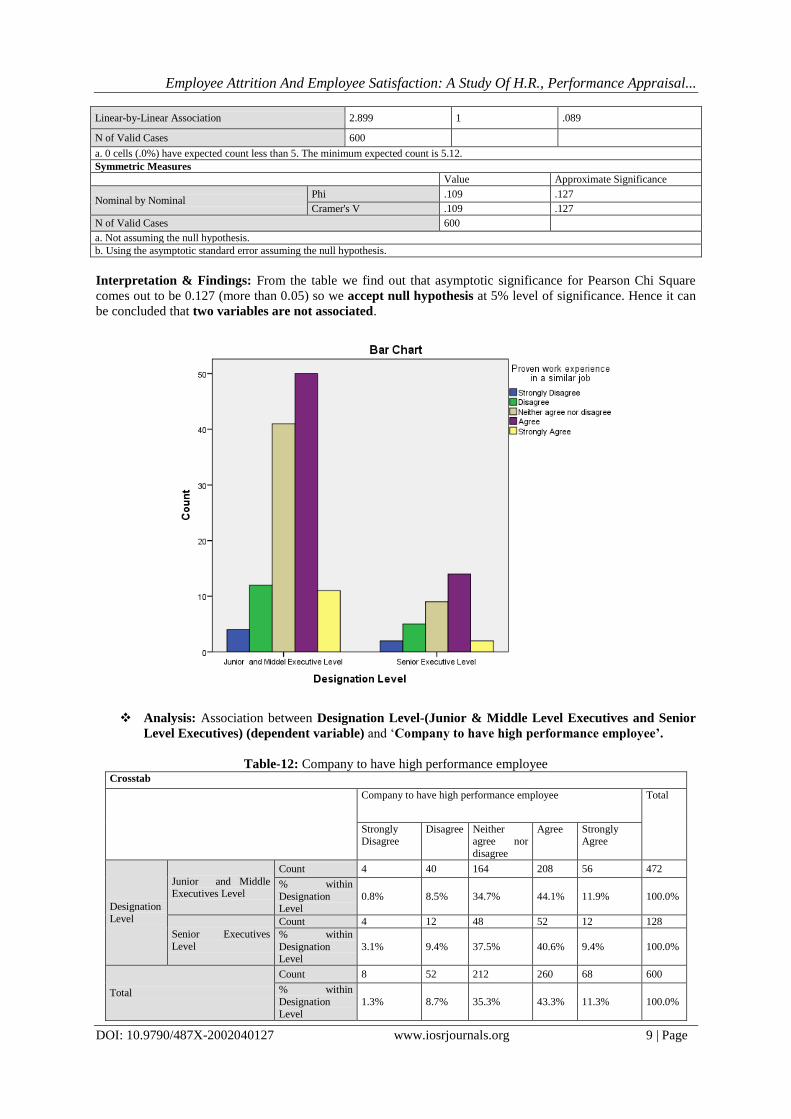
Interpretation & Findings: From the table we find out that asymptotic significance for Pearson Chi Square
comes out to be 0.127 (more than 0.05) so we accept null hypothesis at 5% level of significance. Hence it can
be concluded that two variables are not associated.
Analysis: Association between Designation Level-(Junior & Middle Level Executives and Senior
Level Executives) (dependent variable) and „Company to have high performance employee’.
Table-12: Company to have high performance employee Crosstab
Company to have high performance employee Total
Strongly Disagree
Disagree Neither agree nor
disagree
Agree Strongly Agree
Designation
Level
Junior and Middle Executives Level
Count 4 40 164 208 56 472
% within
Designation Level
0.8% 8.5% 34.7% 44.1% 11.9% 100.0%
Senior Executives
Level
Count 4 12 48 52 12 128
% within
Designation Level
3.1% 9.4% 37.5% 40.6% 9.4% 100.0%
Total
Count 8 52 212 260 68 600
% within
Designation
Level
1.3% 8.7% 35.3% 43.3% 11.3% 100.0%
Employee Attrition And Employee Satisfaction: A Study Of H.R., Performance Appraisal...
DOI: 10.9790/487X-2002040127 www.iosrjournals.org 10 | Page
Interpretation & Findings: From the above crosstab, it can be said that out of total 600 respondents (Junior,
Middle & Senior Level Executives), 11.3% respondents strongly agreed, 43.3% respondents agreed, 35.3%
respondents were neutral, 8.7% respondents disagreed and 1.3% respondents strongly disagreed that „Company
to have high performance employee‟ is a factor that is taken into consideration for Hiring Practices.
As far as perception of Junior & Middle Level Executives and Senior Level Executives is concerned, it can be
said that majority of the respondents have agreed and strongly agreed that this factor is taken into consideration
for Hiring Practices.
Table-13: Chi-Square Tests Chi-Square Tests
Value df Asymptotic Significance (2-sided)
Pearson Chi-Square 5.054a 4 .282
Likelihood Ratio 4.350 4 .361
Linear-by-Linear Association 2.660 1 .103
N of Valid Cases 600
a. 1 cells (10.0%) have expected count less than 5. The minimum expected count is 1.71.
Symmetric Measures
Value Approximate Significance
Nominal by Nominal Phi .092 .282
Cramer's V .092 .282
N of Valid Cases 600
a. Not assuming the null hypothesis.
b. Using the asymptotic standard error assuming the null hypothesis.
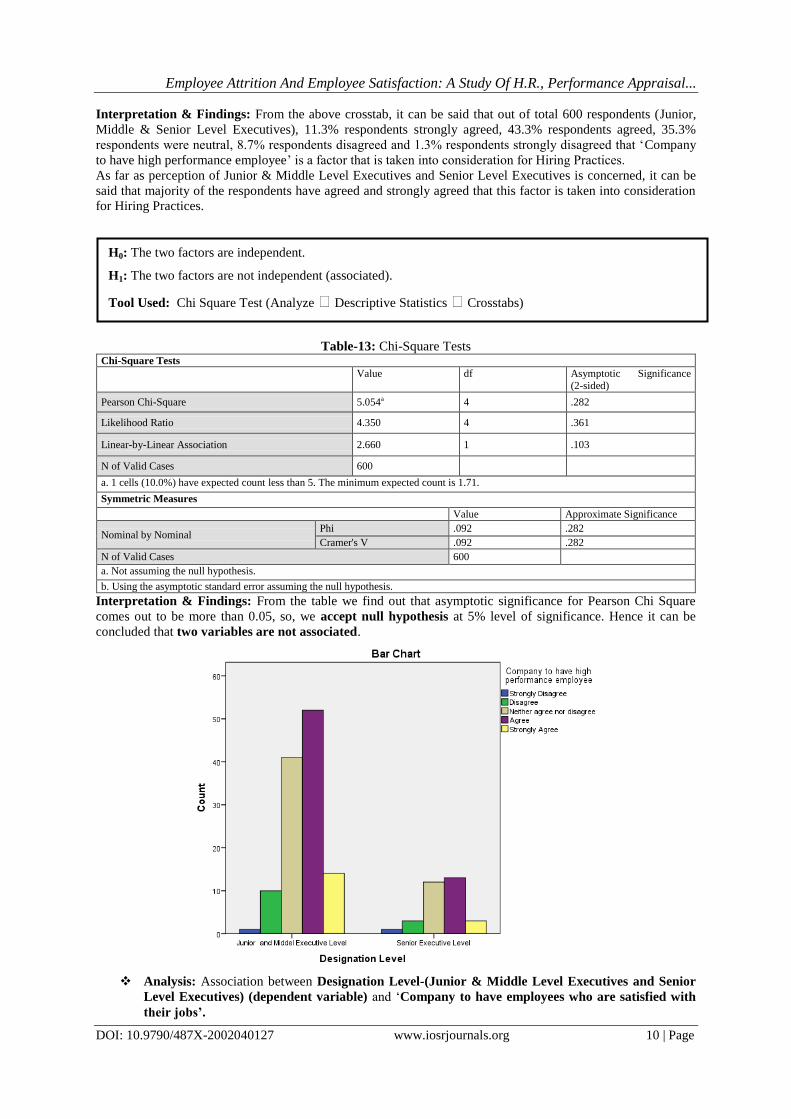
Interpretation & Findings: From the table we find out that asymptotic significance for Pearson Chi Square
comes out to be more than 0.05, so, we accept null hypothesis at 5% level of significance. Hence it can be
concluded that two variables are not associated.
Analysis: Association between Designation Level-(Junior & Middle Level Executives and Senior
Level Executives) (dependent variable) and „Company to have employees who are satisfied with
their jobs’.
H0: The two factors are independent.
H1: The two factors are not independent (associated).
Tool Used: Chi Square Test (Analyze Descriptive Statistics Crosstabs)
Employee Attrition And Employee Satisfaction: A Study Of H.R., Performance Appraisal...
DOI: 10.9790/487X-2002040127 www.iosrjournals.org 11 | Page
Table-14: Company to have employees who are satisfied with their jobs Crosstab
Company to have employees who are satisfied with their jobs Total
Strongly
Disagree
Disagree Neither
agree nor disagree
Agree Strongly
Agree
Design
ation
Level
Junior and Middle
Executives Level
Count 24 56 180 176 36 472
% within Designation Level
5.1% 11.9% 38.1% 37.3% 7.6% 100.0%
Senior Executives
Level
Count 4 16 44 52 12 128
% within Designation
Level 3.1% 12.5% 34.4% 40.6% 9.4% 100.0%
Total
Count 28 72 224 228 48 600
% within Designation
Level 4.7% 12.0% 37.3% 38.0% 8.0% 100.0%
Interpretation & Findings: From the above cross tab, it can be said that out of total 600 respondents (Junior,
Middle & Senior Level Executives), 8.0% respondents strongly agreed, 38.0% respondents agreed, 37.3%
respondents were neutral, 12.0% respondents disagreed and 4.7% respondents strongly disagreed that „Company
to have high performance employee‟ is a factor that is taken into consideration for Hiring Practices.
As far as perception of Junior & Middle Level Executives and Senior Level Executives is concerned, it can be
said that majority of the respondents have agreed and strongly agreed that this factor is taken into consideration
for Hiring Practices.
Table-15: Chi-Square Tests Chi-Square Tests
Value df Asymptotic Significance (2-
sided)
Pearson Chi-Square 1.924a 4 .750
Likelihood Ratio 1.993 4 .737
Linear-by-Linear Association 1.143 1 .285
N of Valid Cases 600
a. 0 cells (.0%) have expected count less than 5. The minimum expected count is 5.97.
Symmetric Measures
Value Approximate Significance
Nominal by Nominal Phi .057 .750
Cramer's V .057 .750
N of Valid Cases 600
a. Not assuming the null hypothesis.
b. Using the asymptotic standard error assuming the null hypothesis.
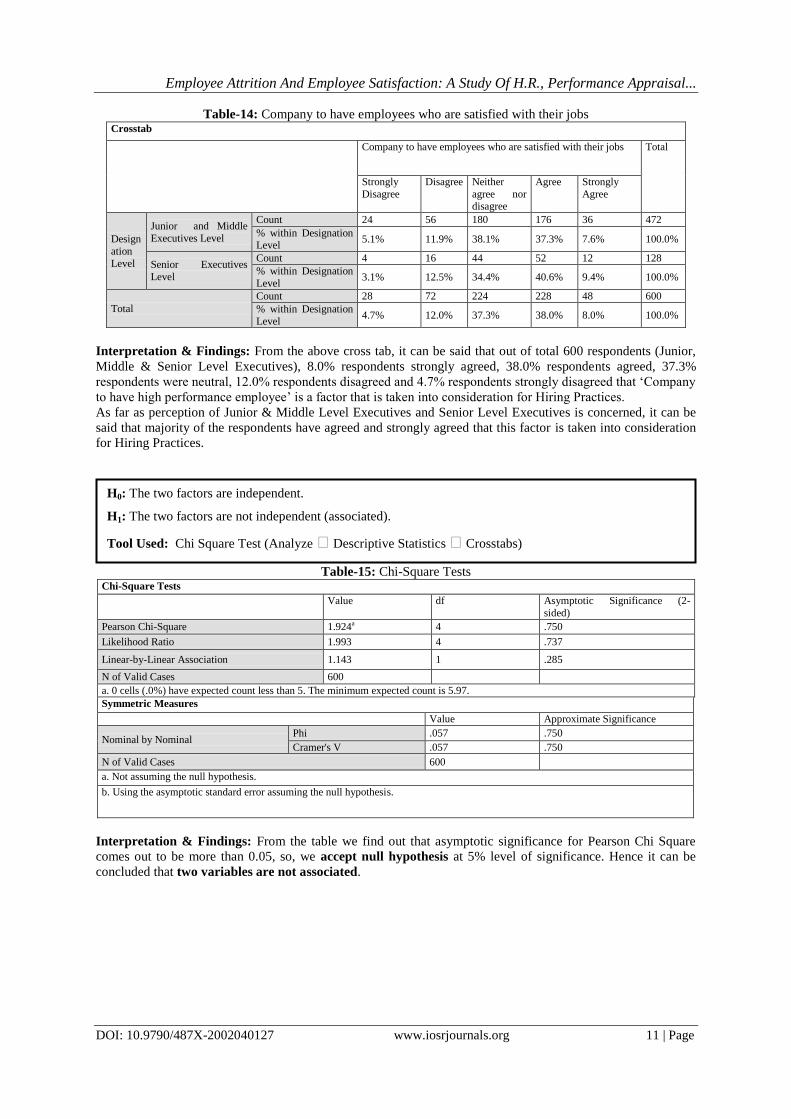
Interpretation & Findings: From the table we find out that asymptotic significance for Pearson Chi Square
comes out to be more than 0.05, so, we accept null hypothesis at 5% level of significance. Hence it can be
concluded that two variables are not associated.
H0: The two factors are independent.
H1: The two factors are not independent (associated).
Tool Used: Chi Square Test (Analyze Descriptive Statistics Crosstabs)
Employee Attrition And Employee Satisfaction: A Study Of H.R., Performance Appraisal...
DOI: 10.9790/487X-2002040127 www.iosrjournals.org 12 | Page
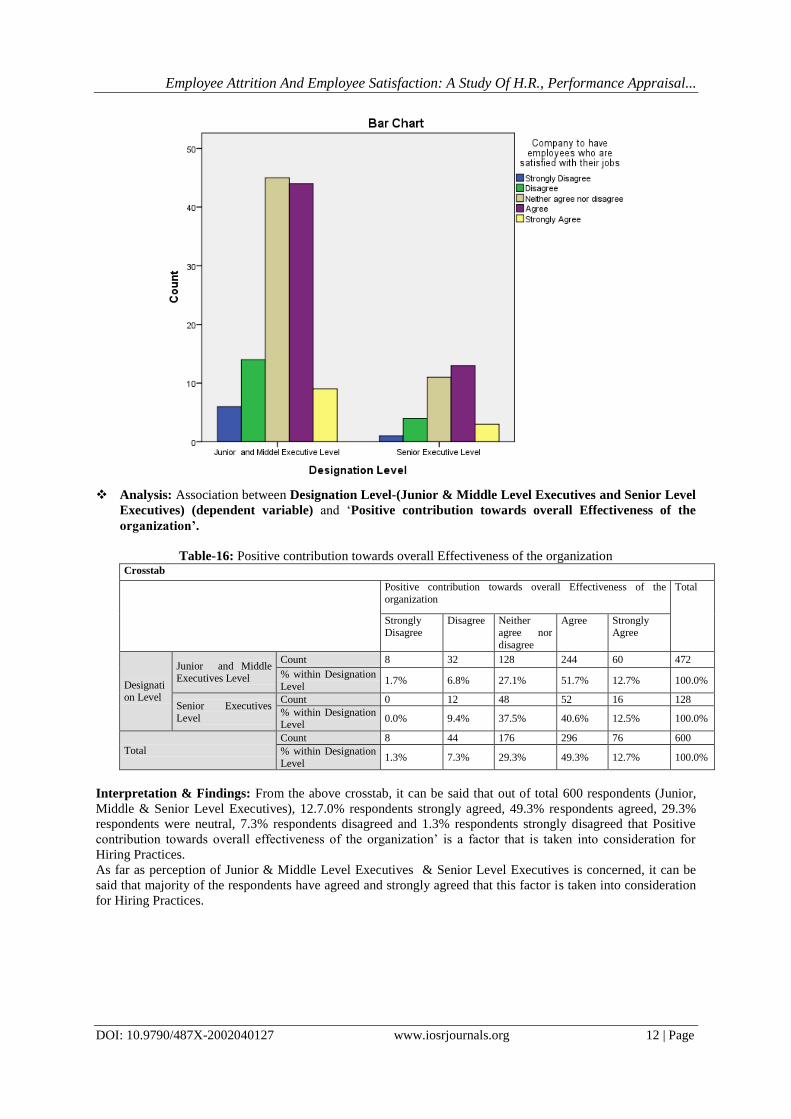
Analysis: Association between Designation Level-(Junior & Middle Level Executives and Senior Level
Executives) (dependent variable) and „Positive contribution towards overall Effectiveness of the
organization’.
Table-16: Positive contribution towards overall Effectiveness of the organization Crosstab
Positive contribution towards overall Effectiveness of the
organization
Total
Strongly Disagree
Disagree Neither agree nor
disagree
Agree Strongly Agree
Designation Level
Junior and Middle Executives Level
Count 8 32 128 244 60 472
% within Designation
Level 1.7% 6.8% 27.1% 51.7% 12.7% 100.0%
Senior Executives
Level
Count 0 12 48 52 16 128
% within Designation Level
0.0% 9.4% 37.5% 40.6% 12.5% 100.0%
Total
Count 8 44 176 296 76 600
% within Designation
Level 1.3% 7.3% 29.3% 49.3% 12.7% 100.0%
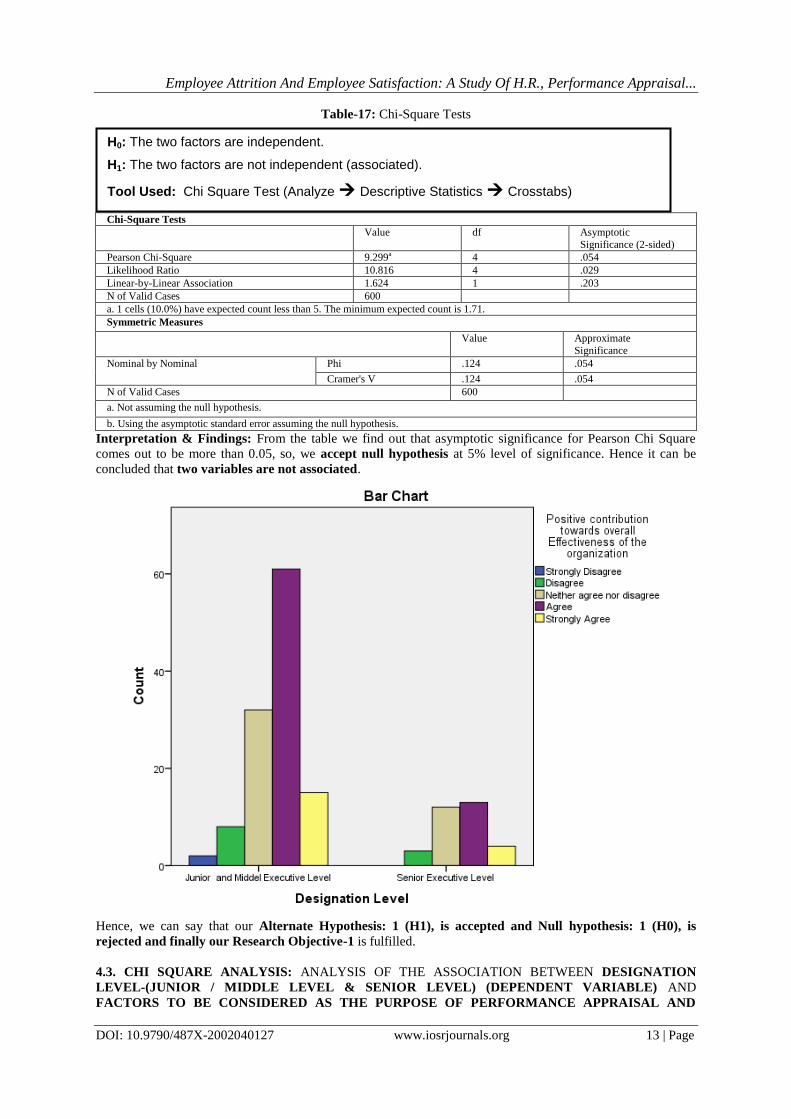
Interpretation & Findings: From the above crosstab, it can be said that out of total 600 respondents (Junior,
Middle & Senior Level Executives), 12.7.0% respondents strongly agreed, 49.3% respondents agreed, 29.3%
respondents were neutral, 7.3% respondents disagreed and 1.3% respondents strongly disagreed that Positive
contribution towards overall effectiveness of the organization‟ is a factor that is taken into consideration for
Hiring Practices.
As far as perception of Junior & Middle Level Executives & Senior Level Executives is concerned, it can be
said that majority of the respondents have agreed and strongly agreed that this factor is taken into consideration
for Hiring Practices.
Employee Attrition And Employee Satisfaction: A Study Of H.R., Performance Appraisal...
DOI: 10.9790/487X-2002040127 www.iosrjournals.org 13 | Page
Table-17: Chi-Square Tests
Chi-Square Tests
Value df Asymptotic
Significance (2-sided)
Pearson Chi-Square 9.299a 4 .054
Likelihood Ratio 10.816 4 .029
Linear-by-Linear Association 1.624 1 .203
N of Valid Cases 600
a. 1 cells (10.0%) have expected count less than 5. The minimum expected count is 1.71.
Symmetric Measures
Value Approximate
Significance
Nominal by Nominal Phi .124 .054
Cramer's V .124 .054
N of Valid Cases 600
a. Not assuming the null hypothesis.
b. Using the asymptotic standard error assuming the null hypothesis.
Interpretation & Findings: From the table we find out that asymptotic significance for Pearson Chi Square
comes out to be more than 0.05, so, we accept null hypothesis at 5% level of significance. Hence it can be
concluded that two variables are not associated.
Hence, we can say that our Alternate Hypothesis: 1 (H1), is accepted and Null hypothesis: 1 (H0), is
rejected and finally our Research Objective-1 is fulfilled.
4.3. CHI SQUARE ANALYSIS: ANALYSIS OF THE ASSOCIATION BETWEEN DESIGNATION
LEVEL-(JUNIOR / MIDDLE LEVEL & SENIOR LEVEL) (DEPENDENT VARIABLE) AND
FACTORS TO BE CONSIDERED AS THE PURPOSE OF PERFORMANCE APPRAISAL AND
H0: The two factors are independent.
H1: The two factors are not independent (associated).
Tool Used: Chi Square Test (Analyze Descriptive Statistics Crosstabs)
Employee Attrition And Employee Satisfaction: A Study Of H.R., Performance Appraisal...
DOI: 10.9790/487X-2002040127 www.iosrjournals.org 14 | Page
TRAINING (INDEPENDENT VARIABLES) OF THE DEFENCE PSUs IN INDIA.
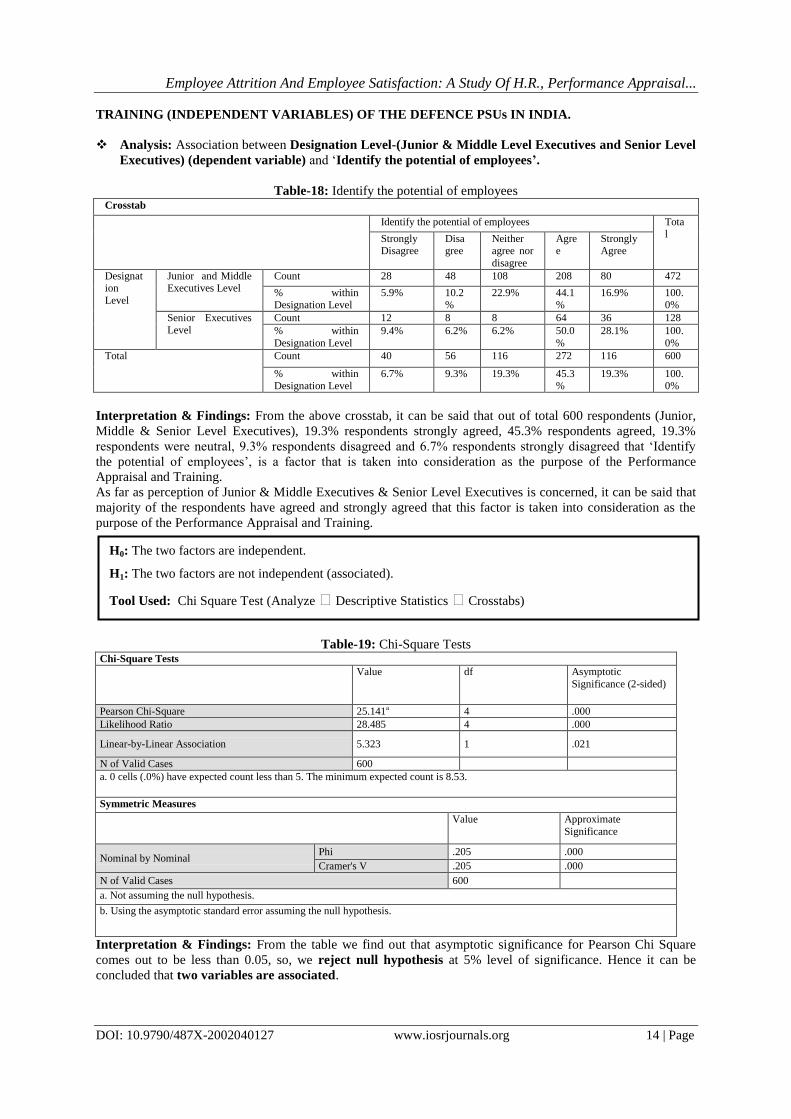
Analysis: Association between Designation Level-(Junior & Middle Level Executives and Senior Level
Executives) (dependent variable) and „Identify the potential of employees’.
Table-18: Identify the potential of employees Crosstab
Identify the potential of employees Total Strongly
Disagree Disagree
Neither agree nor
disagree
Agree
Strongly Agree
Designation
Level
Junior and Middle Executives Level
Count 28 48 108 208 80 472
% within Designation Level
5.9% 10.2%
22.9% 44.1%
16.9% 100.0%
Senior Executives
Level
Count 12 8 8 64 36 128
% within
Designation Level
9.4% 6.2% 6.2% 50.0
%
28.1% 100.
0%
Total Count 40 56 116 272 116 600
% within Designation Level
6.7% 9.3% 19.3% 45.3%
19.3% 100.0%
Interpretation & Findings: From the above crosstab, it can be said that out of total 600 respondents (Junior,
Middle & Senior Level Executives), 19.3% respondents strongly agreed, 45.3% respondents agreed, 19.3%
respondents were neutral, 9.3% respondents disagreed and 6.7% respondents strongly disagreed that „Identify
the potential of employees‟, is a factor that is taken into consideration as the purpose of the Performance
Appraisal and Training.
As far as perception of Junior & Middle Executives & Senior Level Executives is concerned, it can be said that
majority of the respondents have agreed and strongly agreed that this factor is taken into consideration as the
purpose of the Performance Appraisal and Training.
Table-19: Chi-Square Tests Chi-Square Tests
Value df Asymptotic
Significance (2-sided)
Pearson Chi-Square 25.141a 4 .000
Likelihood Ratio 28.485 4 .000
Linear-by-Linear Association 5.323 1 .021
N of Valid Cases 600
a. 0 cells (.0%) have expected count less than 5. The minimum expected count is 8.53.
Symmetric Measures
Value Approximate
Significance
Nominal by Nominal Phi .205 .000
Cramer's V .205 .000
N of Valid Cases 600
a. Not assuming the null hypothesis.
b. Using the asymptotic standard error assuming the null hypothesis.
Interpretation & Findings: From the table we find out that asymptotic significance for Pearson Chi Square
comes out to be less than 0.05, so, we reject null hypothesis at 5% level of significance. Hence it can be
concluded that two variables are associated.
H0: The two factors are independent.
H1: The two factors are not independent (associated).
Tool Used: Chi Square Test (Analyze Descriptive Statistics Crosstabs)
Employee Attrition And Employee Satisfaction: A Study Of H.R., Performance Appraisal...
DOI: 10.9790/487X-2002040127 www.iosrjournals.org 15 | Page
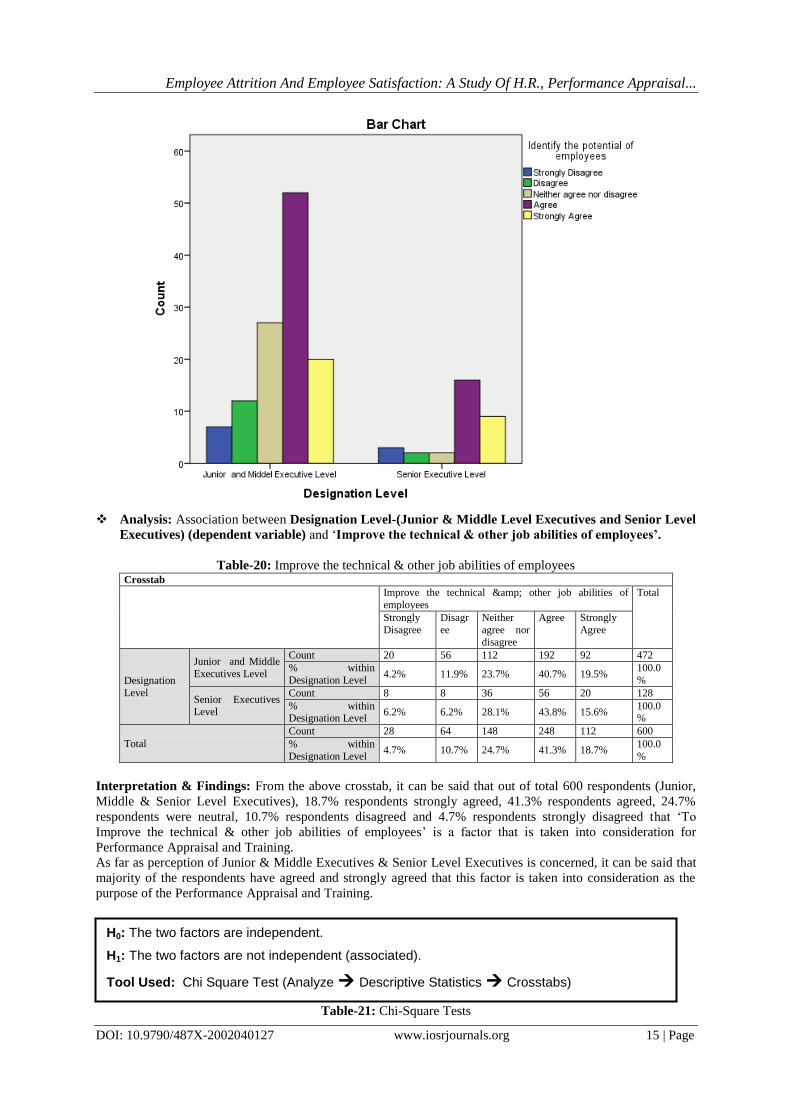
Analysis: Association between Designation Level-(Junior & Middle Level Executives and Senior Level
Executives) (dependent variable) and „Improve the technical & other job abilities of employees’.
Table-20: Improve the technical & other job abilities of employees Crosstab
Improve the technical & other job abilities of
employees
Total
Strongly
Disagree
Disagr
ee
Neither
agree nor
disagree
Agree Strongly
Agree
Designation
Level
Junior and Middle
Executives Level
Count 20 56 112 192 92 472
% within
Designation Level 4.2% 11.9% 23.7% 40.7% 19.5%
100.0
%
Senior Executives
Level
Count 8 8 36 56 20 128
% within Designation Level
6.2% 6.2% 28.1% 43.8% 15.6% 100.0%
Total
Count 28 64 148 248 112 600
% within
Designation Level 4.7% 10.7% 24.7% 41.3% 18.7%
100.0
%
Interpretation & Findings: From the above crosstab, it can be said that out of total 600 respondents (Junior,
Middle & Senior Level Executives), 18.7% respondents strongly agreed, 41.3% respondents agreed, 24.7%
respondents were neutral, 10.7% respondents disagreed and 4.7% respondents strongly disagreed that „To
Improve the technical & other job abilities of employees‟ is a factor that is taken into consideration for
Performance Appraisal and Training.
As far as perception of Junior & Middle Executives & Senior Level Executives is concerned, it can be said that
majority of the respondents have agreed and strongly agreed that this factor is taken into consideration as the
purpose of the Performance Appraisal and Training.
Table-21: Chi-Square Tests
H0: The two factors are independent.
H1: The two factors are not independent (associated).
Tool Used: Chi Square Test (Analyze Descriptive Statistics Crosstabs)
Employee Attrition And Employee Satisfaction: A Study Of H.R., Performance Appraisal...
DOI: 10.9790/487X-2002040127 www.iosrjournals.org 16 | Page
Chi-Square Tests
Value df Asymptotic Significance
(2-sided)
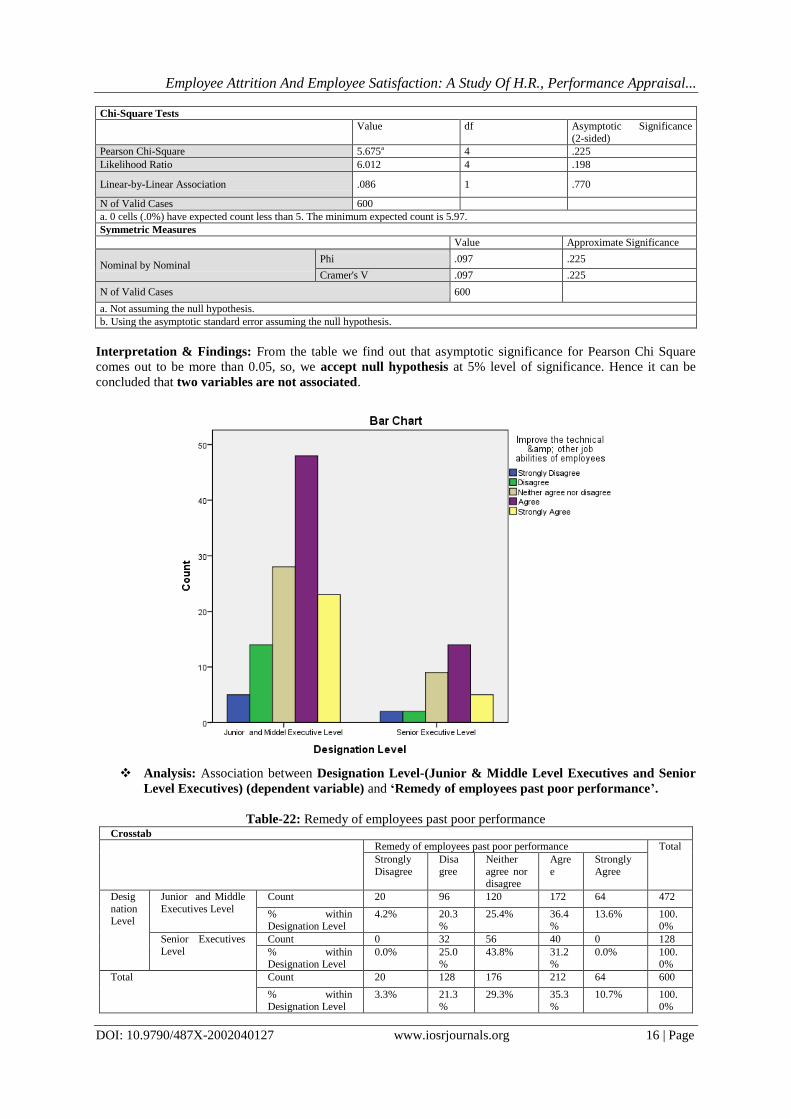
Pearson Chi-Square 5.675a 4 .225
Likelihood Ratio 6.012 4 .198
Linear-by-Linear Association .086 1 .770
N of Valid Cases 600
a. 0 cells (.0%) have expected count less than 5. The minimum expected count is 5.97.
Symmetric Measures
Value Approximate Significance
Nominal by Nominal Phi .097 .225
Cramer's V .097 .225
N of Valid Cases 600
a. Not assuming the null hypothesis.
b. Using the asymptotic standard error assuming the null hypothesis.
Interpretation & Findings: From the table we find out that asymptotic significance for Pearson Chi Square
comes out to be more than 0.05, so, we accept null hypothesis at 5% level of significance. Hence it can be
concluded that two variables are not associated.
Analysis: Association between Designation Level-(Junior & Middle Level Executives and Senior
Level Executives) (dependent variable) and ‘Remedy of employees past poor performance’.
Table-22: Remedy of employees past poor performance Crosstab
Remedy of employees past poor performance Total
Strongly
Disagree
Disa
gree
Neither
agree nor disagree
Agre
e
Strongly
Agree
Desig
nation Level
Junior and Middle
Executives Level
Count 20 96 120 172 64 472
% within Designation Level
4.2% 20.3%
25.4% 36.4%
13.6% 100.0%
Senior Executives
Level
Count 0 32 56 40 0 128
% within Designation Level
0.0% 25.0%
43.8% 31.2%
0.0% 100.0%
Total Count 20 128 176 212 64 600
% within Designation Level
3.3% 21.3%
29.3% 35.3%
10.7% 100.0%
Employee Attrition And Employee Satisfaction: A Study Of H.R., Performance Appraisal...
DOI: 10.9790/487X-2002040127 www.iosrjournals.org 17 | Page
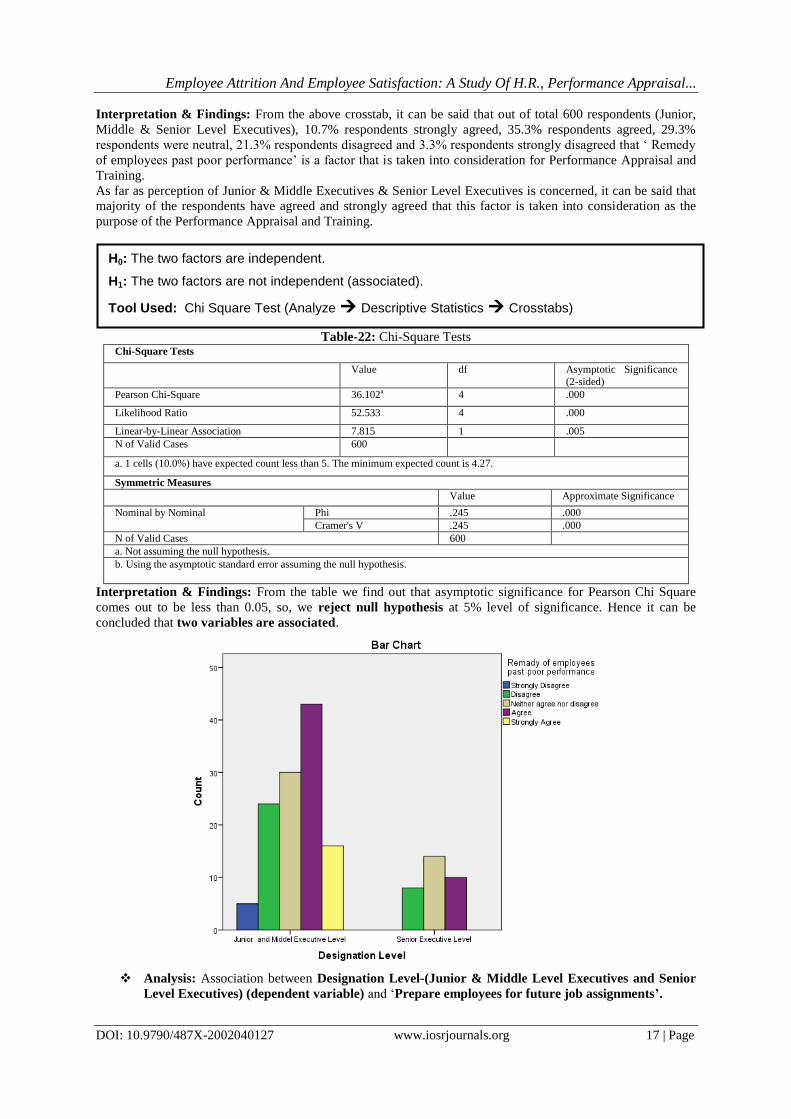
Interpretation & Findings: From the above crosstab, it can be said that out of total 600 respondents (Junior,
Middle & Senior Level Executives), 10.7% respondents strongly agreed, 35.3% respondents agreed, 29.3%
respondents were neutral, 21.3% respondents disagreed and 3.3% respondents strongly disagreed that „ Remedy
of employees past poor performance‟ is a factor that is taken into consideration for Performance Appraisal and
Training.
As far as perception of Junior & Middle Executives & Senior Level Executives is concerned, it can be said that
majority of the respondents have agreed and strongly agreed that this factor is taken into consideration as the
purpose of the Performance Appraisal and Training.
Table-22: Chi-Square Tests Chi-Square Tests
Value df Asymptotic Significance
(2-sided)
Pearson Chi-Square 36.102a 4 .000
Likelihood Ratio 52.533 4 .000
Linear-by-Linear Association 7.815 1 .005
N of Valid Cases 600
a. 1 cells (10.0%) have expected count less than 5. The minimum expected count is 4.27.
Symmetric Measures
Value Approximate Significance
Nominal by Nominal Phi .245 .000
Cramer's V .245 .000
N of Valid Cases 600
a. Not assuming the null hypothesis.
b. Using the asymptotic standard error assuming the null hypothesis.
Interpretation & Findings: From the table we find out that asymptotic significance for Pearson Chi Square
comes out to be less than 0.05, so, we reject null hypothesis at 5% level of significance. Hence it can be
concluded that two variables are associated.
Analysis: Association between Designation Level-(Junior & Middle Level Executives and Senior
Level Executives) (dependent variable) and „Prepare employees for future job assignments’.
H0: The two factors are independent.
H1: The two factors are not independent (associated).
Tool Used: Chi Square Test (Analyze Descriptive Statistics Crosstabs)
Employee Attrition And Employee Satisfaction: A Study Of H.R., Performance Appraisal...
DOI: 10.9790/487X-2002040127 www.iosrjournals.org 18 | Page
Table-23: Prepare employees for future job assignment Crosstab
Prepare employees for future job assignments Total
Strongly
Disagree
Disa
gree
Neither
agree nor disagree
Agre
e
Strongly
Agree
Design
ation
Level
Junior and Middle
Executives Level
Count 20 68 88 228 68 472
% within
Designation Level
4.2% 14.4
%
18.6% 48.3
%
14.4% 100.
0%
Senior Executives
Level
Count 4 24 12 68 20 128
% within Designation Level
3.1% 18.8%
9.4% 53.1%
15.6% 100.0%
Total Count 24 92 100 296 88 600
% within
Designation Level
4.0% 15.3
%
16.7% 49.3
%
14.7% 100.
0%
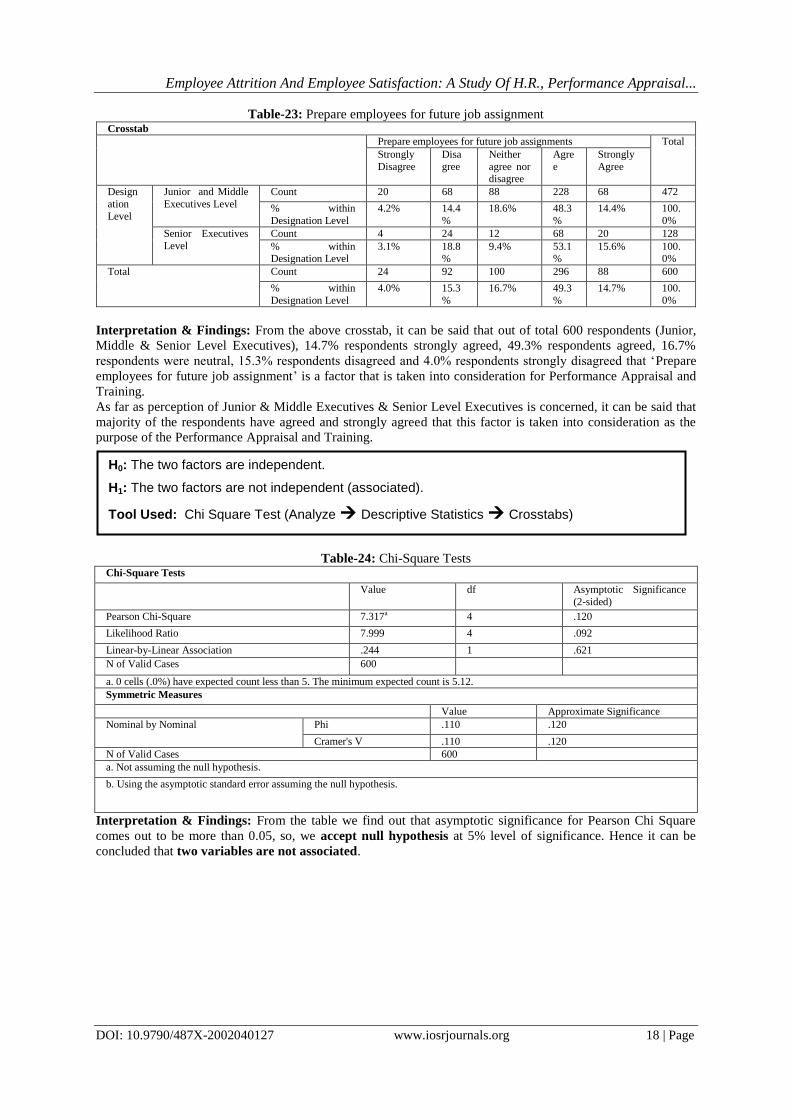
Interpretation & Findings: From the above crosstab, it can be said that out of total 600 respondents (Junior,
Middle & Senior Level Executives), 14.7% respondents strongly agreed, 49.3% respondents agreed, 16.7%
respondents were neutral, 15.3% respondents disagreed and 4.0% respondents strongly disagreed that „Prepare
employees for future job assignment‟ is a factor that is taken into consideration for Performance Appraisal and
Training.
As far as perception of Junior & Middle Executives & Senior Level Executives is concerned, it can be said that
majority of the respondents have agreed and strongly agreed that this factor is taken into consideration as the
purpose of the Performance Appraisal and Training.
Table-24: Chi-Square Tests Chi-Square Tests
Value df Asymptotic Significance
(2-sided)
Pearson Chi-Square 7.317a 4 .120
Likelihood Ratio 7.999 4 .092
Linear-by-Linear Association .244 1 .621
N of Valid Cases 600
a. 0 cells (.0%) have expected count less than 5. The minimum expected count is 5.12.
Symmetric Measures
Value Approximate Significance
Nominal by Nominal Phi .110 .120
Cramer's V .110 .120
N of Valid Cases 600
a. Not assuming the null hypothesis.
b. Using the asymptotic standard error assuming the null hypothesis.
Interpretation & Findings: From the table we find out that asymptotic significance for Pearson Chi Square
comes out to be more than 0.05, so, we accept null hypothesis at 5% level of significance. Hence it can be
concluded that two variables are not associated.
H0: The two factors are independent.
H1: The two factors are not independent (associated).
Tool Used: Chi Square Test (Analyze Descriptive Statistics Crosstabs)
Employee Attrition And Employee Satisfaction: A Study Of H.R., Performance Appraisal...
DOI: 10.9790/487X-2002040127 www.iosrjournals.org 19 | Page
Analysis: Association between Designation Level-(Junior & Middle Level Executives and Senior
Level Executives) (dependent variable) and „Build team work within the company’.
Table-25: Build team work within the company Crosstab
Build team work within the company Tota
l Strongly Disagree
Disagree
Neither agree nor
disagree
Agree
Strongly Agree
Design
ation Level
Junior and Middle
Executives Level
Count 24 64 124 192 68 472
% within
Designation Level
5.1% 13.6
%
26.3% 40.7
%
14.4% 100.
0%
Senior Executives
Level
Count 8 32 20 52 16 128
% within
Designation Level
6.2% 25.0
%
15.6% 40.6
%
12.5% 100.
0%
Total Count 32 96 144 244 84 600
% within Designation Level
5.3% 16.0%
24.0% 40.7%
14.0% 100.0%
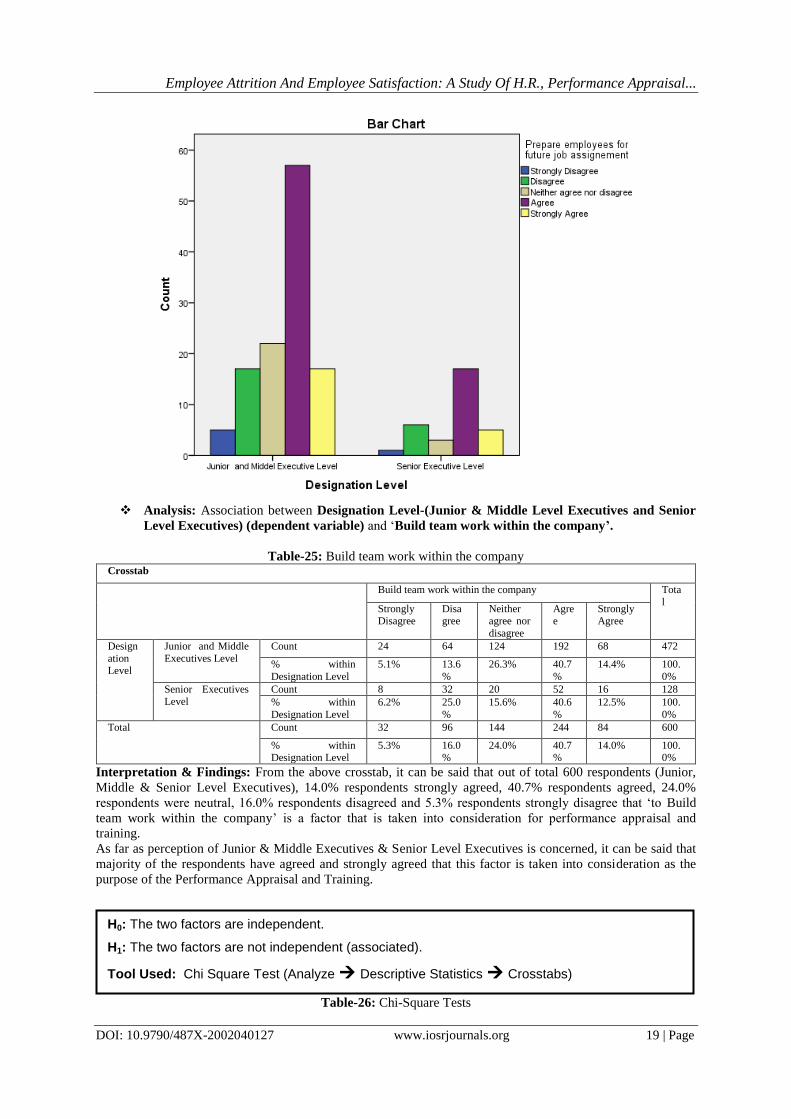
Interpretation & Findings: From the above crosstab, it can be said that out of total 600 respondents (Junior,
Middle & Senior Level Executives), 14.0% respondents strongly agreed, 40.7% respondents agreed, 24.0%
respondents were neutral, 16.0% respondents disagreed and 5.3% respondents strongly disagree that „to Build
team work within the company‟ is a factor that is taken into consideration for performance appraisal and
training.
As far as perception of Junior & Middle Executives & Senior Level Executives is concerned, it can be said that
majority of the respondents have agreed and strongly agreed that this factor is taken into consideration as the
purpose of the Performance Appraisal and Training.
Table-26: Chi-Square Tests
H0: The two factors are independent.
H1: The two factors are not independent (associated).
Tool Used: Chi Square Test (Analyze Descriptive Statistics Crosstabs)
Employee Attrition And Employee Satisfaction: A Study Of H.R., Performance Appraisal...
DOI: 10.9790/487X-2002040127 www.iosrjournals.org 20 | Page
Chi-Square Tests
Value df Asymptotic Significance (2-sided)
Pearson Chi-Square 13.511a 4 .009
Likelihood Ratio 13.149 4 .011
Linear-by-Linear Association 2.688 1 .101
N of Valid Cases 600
a. 0 cells (.0%) have expected count less than 5. The minimum expected count is 6.83.
Symmetric Measures
Value Approximate Significance
Nominal by Nominal Phi .150 .009
Cramer's V .150 .009
N of Valid Cases 600
a. Not assuming the null hypothesis.
b. Using the asymptotic standard error assuming the null hypothesis.
Interpretation & Findings: From the table we find out that asymptotic significance for Pearson Chi Square
comes out to be less than 0.05, so, we reject null hypothesis at 5% level of significance. Hence it can be
concluded that two variables are associated.
Analysis: Association between Designation Level-(Junior & Middle Level Executives and Senior
Level Executives) (dependent variable) and „Help employees understand the business, e.g.
knowledge of company, New technologies etc’.
Table-27: Help employees understand the business, e.g. knowledge of company, New technologies etc Crosstab
Help employees understand the business, e.g. knowledge of
company, New technologies etc
Total
Strongly Disagree
Disagree Neither agree nor
disagree
Agree Strongly Agree
Designati
on Level
Junior and
Middle Executives Level
Count 32 72 132 176 60 472
% within
Designation Level 6.8% 15.3% 28.0% 37.3% 12.7% 100.0%
Senior Executives Level
Count 16 20 40 32 20 128
% within
Designation Level 12.5% 15.6% 31.2% 25.0% 15.6% 100.0%
Total Count 48 92 172 208 80 600
Employee Attrition And Employee Satisfaction: A Study Of H.R., Performance Appraisal...
DOI: 10.9790/487X-2002040127 www.iosrjournals.org 21 | Page
% within Designation Level
8.0% 15.3% 28.7% 34.7% 13.3% 100.0%
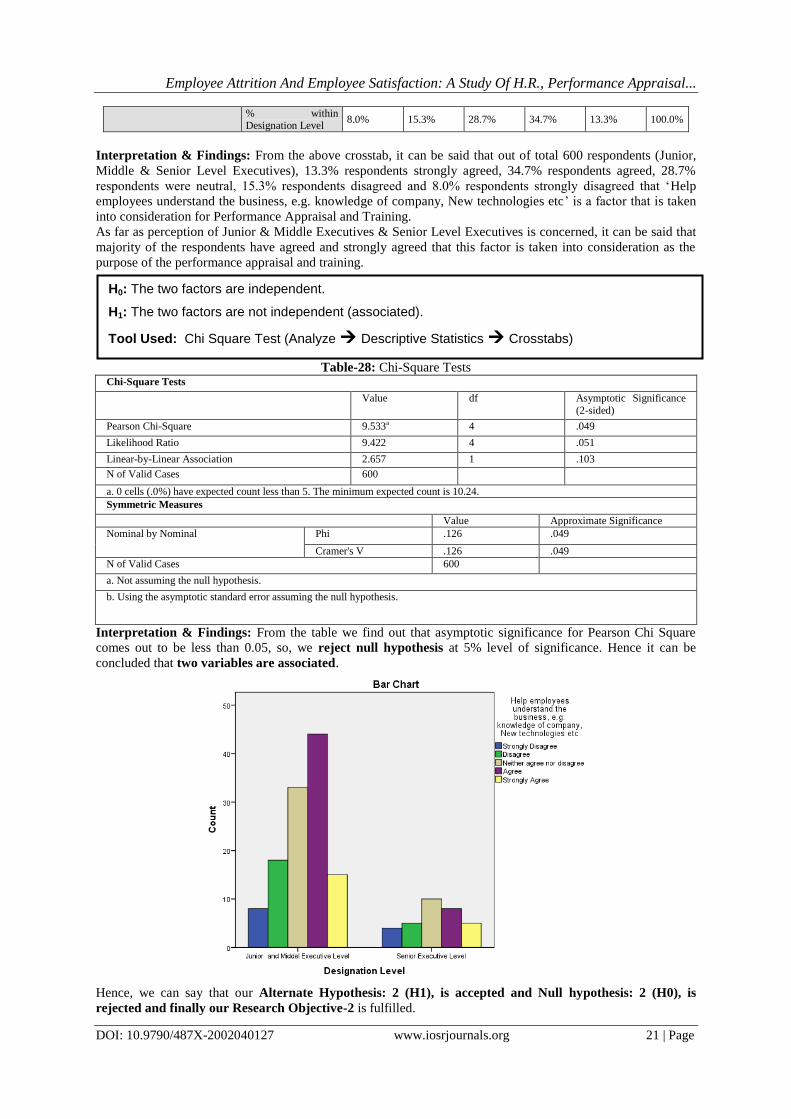
Interpretation & Findings: From the above crosstab, it can be said that out of total 600 respondents (Junior,
Middle & Senior Level Executives), 13.3% respondents strongly agreed, 34.7% respondents agreed, 28.7%
respondents were neutral, 15.3% respondents disagreed and 8.0% respondents strongly disagreed that „Help
employees understand the business, e.g. knowledge of company, New technologies etc‟ is a factor that is taken
into consideration for Performance Appraisal and Training.
As far as perception of Junior & Middle Executives & Senior Level Executives is concerned, it can be said that
majority of the respondents have agreed and strongly agreed that this factor is taken into consideration as the
purpose of the performance appraisal and training.
Table-28: Chi-Square Tests Chi-Square Tests
Value df Asymptotic Significance
(2-sided)
Pearson Chi-Square 9.533a 4 .049
Likelihood Ratio 9.422 4 .051
Linear-by-Linear Association 2.657 1 .103
N of Valid Cases 600
a. 0 cells (.0%) have expected count less than 5. The minimum expected count is 10.24.
Symmetric Measures
Value Approximate Significance
Nominal by Nominal Phi .126 .049
Cramer's V .126 .049
N of Valid Cases 600
a. Not assuming the null hypothesis.
b. Using the asymptotic standard error assuming the null hypothesis.
Interpretation & Findings: From the table we find out that asymptotic significance for Pearson Chi Square
comes out to be less than 0.05, so, we reject null hypothesis at 5% level of significance. Hence it can be
concluded that two variables are associated.
Hence, we can say that our Alternate Hypothesis: 2 (H1), is accepted and Null hypothesis: 2 (H0), is
rejected and finally our Research Objective-2 is fulfilled.
H0: The two factors are independent.
H1: The two factors are not independent (associated).
Tool Used: Chi Square Test (Analyze Descriptive Statistics Crosstabs)
Employee Attrition And Employee Satisfaction: A Study Of H.R., Performance Appraisal...
DOI: 10.9790/487X-2002040127 www.iosrjournals.org 22 | Page
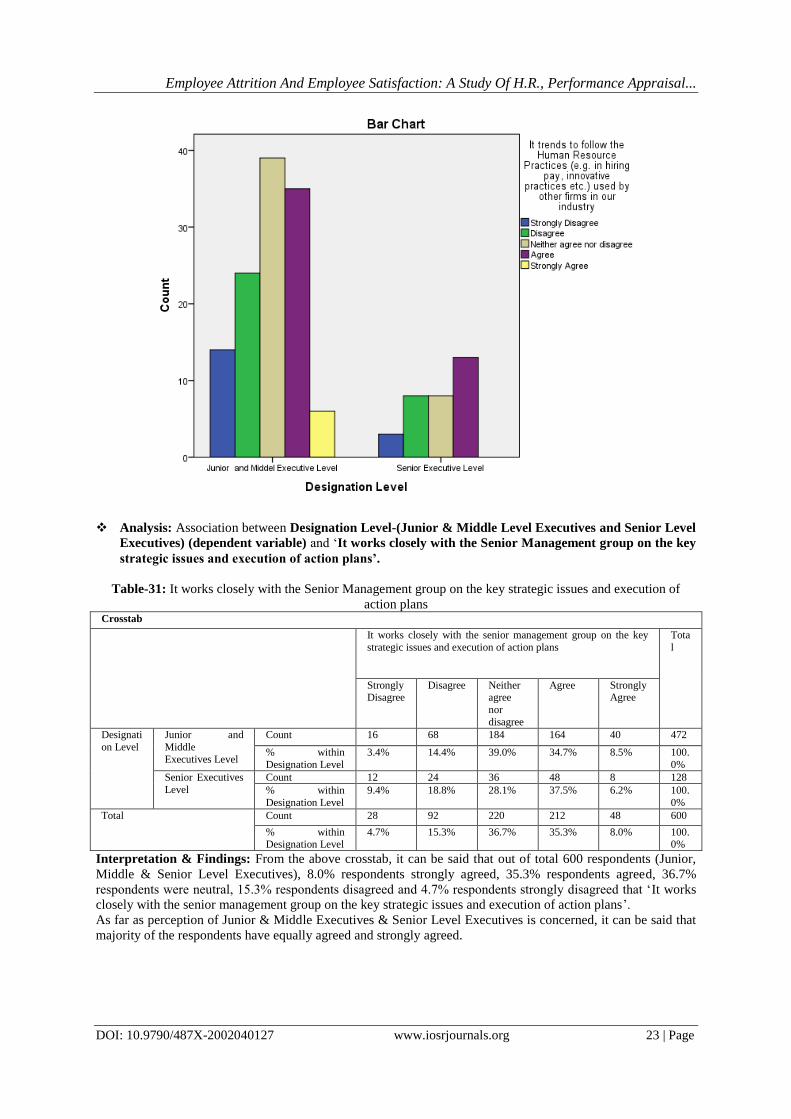
Analysis: Association between Designation Level-(Junior & Middle Level Executives and Senior Level
Executives) (dependent variable) and „It tends to follow the Human Resource Practices (e.g. in hiring
pay, innovative practices etc.) used by other firms in our industry.
Table-29: It tends to follow the Human Resource Practices (e.g. in hiring pay, innovative practices etc.) used by
other firms in our industry Crosstab
It tends to follow the Human Resource Practices (e.g. in hiring pay, innovative practices etc.) used by other firms in our industry
Total
Strongly
Disagree
Disagree Neither
agree nor
disagree
Agree Strongly
Agree
Designa
tion Level
Junior and
Middle Executives Level
Count 56 96 156 140 24 472
% within
Designation Level
11.9% 20.3% 33.1% 29.7% 5.1% 100.
0%
Senior Executives
Level
Count 12 32 32 52 0 128
% within
Designation Level
9.4% 25.0% 25.0% 40.6% 0.0% 100.
0%
Total Count 68 128 188 192 24 600
% within
Designation Level
11.3% 21.3% 31.3% 32.0% 4.0% 100.
0%
Interpretation & Findings: From the above crosstab, it can be said that out of total 600 respondents (Junior,
Middle & Senior Level Executives), 4.0% respondents strongly agreed, 32.0% respondents agreed, 31.3%
respondents were neutral, 21.3% respondents disagreed and 11.3% respondents strongly disagreed that „H.R.
Department or Personnel Department tends to follow the Human Resource Practices (e.g. in hiring pay,
innovative practices etc.).
As far as perception of Junior & Middle Executives & Senior Level Executives is concerned, it can be said that
majority of the Senior Level Executives have more agreed and more strongly agreed than the Junior & Middle
Level Executives that this factor is taken into consideration for H.R. practices.
Table-30: Chi-Square Tests Chi-Square Tests
Value df Asymptotic Significance (2-sided)
Pearson Chi-Square 13.950a 4 .007
Likelihood Ratio 18.845 4 .001
Linear-by-Linear Association .011 1 .917
N of Valid Cases 600
a. 0 cells (.0%) have expected count less than 5. The minimum expected count is 5.12.
Symmetric Measures
Value Approximate Significance
Nominal by Nominal Phi .152 .007
Cramer's V .152 .007
N of Valid Cases 600
a. Not assuming the null hypothesis.
b. Using the asymptotic standard error assuming the null hypothesis.
Interpretation & Findings: From the table we find out that asymptotic significance for Pearson Chi Square
comes out to be 0.007 (less than 0.05) so we reject null hypothesis at 5% level of significance. Hence it can be
concluded that two variables are associated.
H0: The two factors are independent.
H1: The two factors are not independent (associated).
Tool Used: Chi Square Test (Analyze Descriptive Statistics Crosstabs)
Employee Attrition And Employee Satisfaction: A Study Of H.R., Performance Appraisal...
DOI: 10.9790/487X-2002040127 www.iosrjournals.org 23 | Page
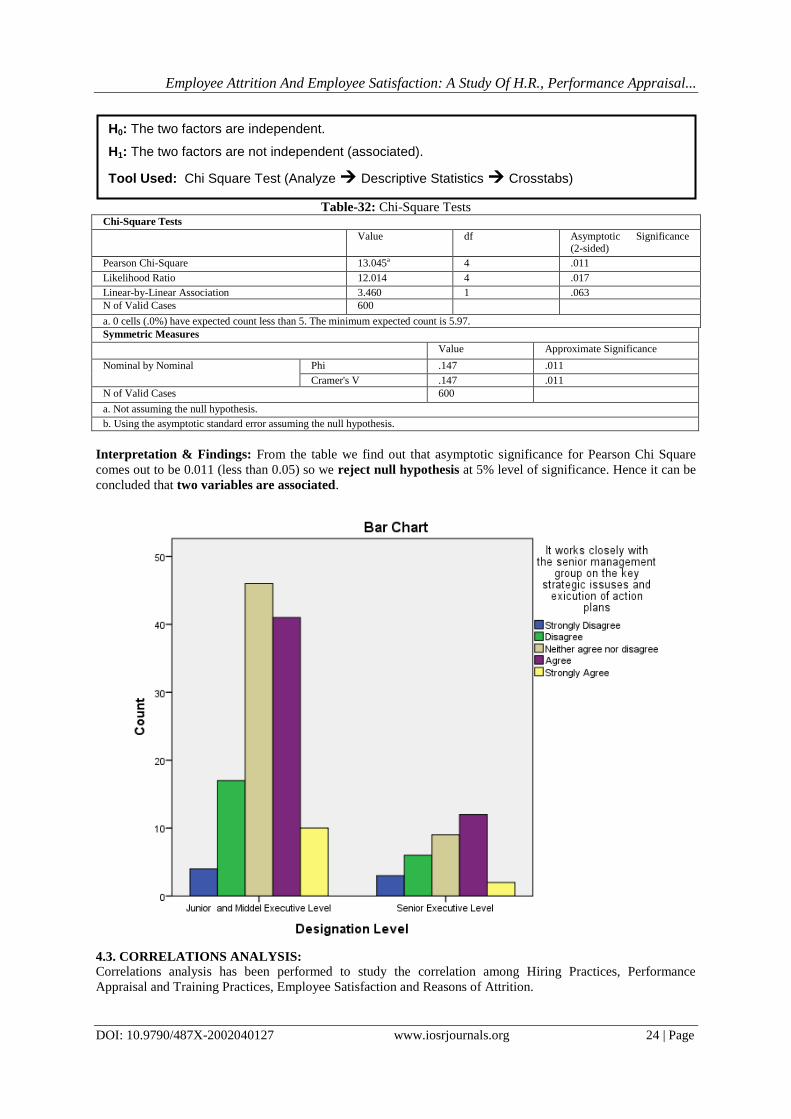
Analysis: Association between Designation Level-(Junior & Middle Level Executives and Senior Level
Executives) (dependent variable) and „It works closely with the Senior Management group on the key
strategic issues and execution of action plans’.
Table-31: It works closely with the Senior Management group on the key strategic issues and execution of
action plans Crosstab
It works closely with the senior management group on the key
strategic issues and execution of action plans
Tota
l
Strongly Disagree
Disagree Neither agree
nor
disagree
Agree Strongly Agree
Designati
on Level
Junior and
Middle
Executives Level
Count 16 68 184 164 40 472
% within
Designation Level
3.4% 14.4% 39.0% 34.7% 8.5% 100.
0%
Senior Executives
Level
Count 12 24 36 48 8 128
% within
Designation Level
9.4% 18.8% 28.1% 37.5% 6.2% 100.
0%
Total Count 28 92 220 212 48 600
% within Designation Level
4.7% 15.3% 36.7% 35.3% 8.0% 100.0%
Interpretation & Findings: From the above crosstab, it can be said that out of total 600 respondents (Junior,
Middle & Senior Level Executives), 8.0% respondents strongly agreed, 35.3% respondents agreed, 36.7%
respondents were neutral, 15.3% respondents disagreed and 4.7% respondents strongly disagreed that „It works
closely with the senior management group on the key strategic issues and execution of action plans‟.
As far as perception of Junior & Middle Executives & Senior Level Executives is concerned, it can be said that
majority of the respondents have equally agreed and strongly agreed.
Employee Attrition And Employee Satisfaction: A Study Of H.R., Performance Appraisal...
DOI: 10.9790/487X-2002040127 www.iosrjournals.org 24 | Page
Table-32: Chi-Square Tests Chi-Square Tests
Value df Asymptotic Significance (2-sided)
Pearson Chi-Square 13.045a 4 .011
Likelihood Ratio 12.014 4 .017
Linear-by-Linear Association 3.460 1 .063
N of Valid Cases 600
a. 0 cells (.0%) have expected count less than 5. The minimum expected count is 5.97.
Symmetric Measures
Value Approximate Significance
Nominal by Nominal Phi .147 .011
Cramer's V .147 .011
N of Valid Cases 600
a. Not assuming the null hypothesis.
b. Using the asymptotic standard error assuming the null hypothesis.
Interpretation & Findings: From the table we find out that asymptotic significance for Pearson Chi Square
comes out to be 0.011 (less than 0.05) so we reject null hypothesis at 5% level of significance. Hence it can be
concluded that two variables are associated.
4.3. CORRELATIONS ANALYSIS:
Correlations analysis has been performed to study the correlation among Hiring Practices, Performance
Appraisal and Training Practices, Employee Satisfaction and Reasons of Attrition.
H0: The two factors are independent.
H1: The two factors are not independent (associated).
Tool Used: Chi Square Test (Analyze Descriptive Statistics Crosstabs)
Employee Attrition And Employee Satisfaction: A Study Of H.R., Performance Appraisal...
DOI: 10.9790/487X-2002040127 www.iosrjournals.org 25 | Page
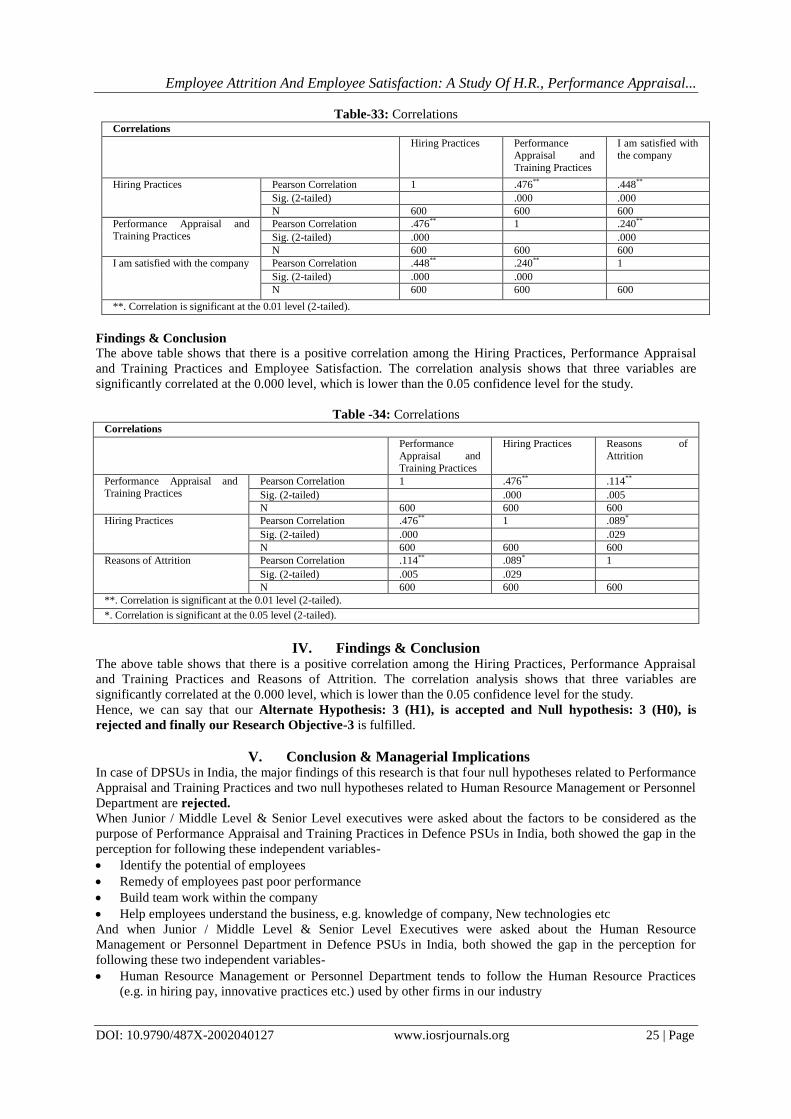
Table-33: Correlations Correlations
Hiring Practices Performance Appraisal and
Training Practices
I am satisfied with the company
Hiring Practices Pearson Correlation 1 .476** .448**
Sig. (2-tailed) .000 .000
N 600 600 600
Performance Appraisal and
Training Practices
Pearson Correlation .476** 1 .240**
Sig. (2-tailed) .000 .000
N 600 600 600
I am satisfied with the company Pearson Correlation .448** .240** 1
Sig. (2-tailed) .000 .000
N 600 600 600
**. Correlation is significant at the 0.01 level (2-tailed).
Findings & Conclusion
The above table shows that there is a positive correlation among the Hiring Practices, Performance Appraisal
and Training Practices and Employee Satisfaction. The correlation analysis shows that three variables are
significantly correlated at the 0.000 level, which is lower than the 0.05 confidence level for the study.
Table -34: Correlations Correlations
Performance
Appraisal and
Training Practices
Hiring Practices Reasons of
Attrition
Performance Appraisal and Training Practices
Pearson Correlation 1 .476** .114**
Sig. (2-tailed) .000 .005
N 600 600 600
Hiring Practices Pearson Correlation .476** 1 .089*
Sig. (2-tailed) .000 .029
N 600 600 600
Reasons of Attrition Pearson Correlation .114** .089* 1
Sig. (2-tailed) .005 .029
N 600 600 600
**. Correlation is significant at the 0.01 level (2-tailed).
*. Correlation is significant at the 0.05 level (2-tailed).
IV. Findings & Conclusion The above table shows that there is a positive correlation among the Hiring Practices, Performance Appraisal
and Training Practices and Reasons of Attrition. The correlation analysis shows that three variables are
significantly correlated at the 0.000 level, which is lower than the 0.05 confidence level for the study.
Hence, we can say that our Alternate Hypothesis: 3 (H1), is accepted and Null hypothesis: 3 (H0), is
rejected and finally our Research Objective-3 is fulfilled.
V. Conclusion & Managerial Implications In case of DPSUs in India, the major findings of this research is that four null hypotheses related to Performance
Appraisal and Training Practices and two null hypotheses related to Human Resource Management or Personnel
Department are rejected.
When Junior / Middle Level & Senior Level executives were asked about the factors to be considered as the
purpose of Performance Appraisal and Training Practices in Defence PSUs in India, both showed the gap in the
perception for following these independent variables-
Identify the potential of employees
Remedy of employees past poor performance
Build team work within the company
Help employees understand the business, e.g. knowledge of company, New technologies etc
And when Junior / Middle Level & Senior Level Executives were asked about the Human Resource
Management or Personnel Department in Defence PSUs in India, both showed the gap in the perception for
following these two independent variables-
Human Resource Management or Personnel Department tends to follow the Human Resource Practices
(e.g. in hiring pay, innovative practices etc.) used by other firms in our industry
Employee Attrition And Employee Satisfaction: A Study Of H.R., Performance Appraisal...
DOI: 10.9790/487X-2002040127 www.iosrjournals.org 26 | Page
Human Resource Management or Personnel Department works closely with the senior management group
on the key strategic issues and execution of action plans
And for rest of the independent variables related to hiring practices and performance appraisal and training
practices Defence PSUs in India, Junior / Middle Level & Senior Level executives, both showed similarity in
their responses hence, researcher didn‟t find the gap in their perceptions for the aforementioned independent
variables.
In Defence PSUs in India, because of comfort and job security of government job and post-retirement benefits
generally employees prefer to stick to the same work and work location. Until unless astronomically high
packages are not offered, government employees do not prefer to change their job. It can be easily verified and
corroborated as employees‟ attrition is less than one percent. Private and foreign investment is bringing money
in India to augment industrial growth but does not bring trained manpower. Companies are ready to pay higher
pay packages to trained and talented manpower. As they have not yet established their infrastructure; inducting
fresh graduate and further training them is the longest way to accomplish their journey. New players prefer
hiring talented and experienced man power that is only possible by alluring employees from DPSUs who are the
most preferred target employees. New players are exploiting these reasons and luring experienced manpower by
offering them higher pay packages. Defence PSUs are the only pool of most talented and most experienced
defence industrial manpower and unfortunately easy targets of new related firms. It has been observed that
defence PSU are most vulnerable to incoming investors as far as retention of Human Resource is concerned.
Therefore, this study was conducted to see the trends of Employee Attrition in Defence PSU and comparison of
existing HR practices in Defence PSUs; and further finding out correlation between Employee Attrition rate and
existing HR policies.
The companies should make retention strategies to control the attrition rate and while developing it, they should
keep in mind the following-
Management‟s support for the employees
Job satisfaction & motivation
Clarity of the job description at the recruitment and selection stage
Recognition should be given to achievers
Employees should have a say in the organisation
Regular training to upgrade the knowledge of employees
Comfortable work environment
Flexible work policies
Reward long term service
Hire effective leader
Span of workload
Hold exit interviews & regular review sessions
Taking care of employee‟s family‟s needs
After completing this paper, it can be concluded that there„s no universal attrition management solution
for every company. Each organization has to build its own motivation system based on compatibility between
organizational and individual goals. A solution varies from organisation to organisation and from industry to
industry. The organisations should have a clear understanding of their employee turnover rate and how it is
affecting their company. In order to make Defence PSUs in India, to be successful in their business ventures,
focus must be directed towards HR practices.
Companies should adopt remedial measures mentioned above and should retain their efficient
employees for as long as they can. Along with the subordinates, the supervisors also need to be trained to
control and retain their junior. Companies should calculate their attrition rate on regular basis and should also
calculate the cost attached to it. Thus, it can see whether this cost justifies the revenue generated by it or not.
References & Bibliography [1]. Abelson, M., B. Baysinger (1984), “Optimal and dysfunctional turnover: Toward an organizational level model,” Academy of
Management Review, Vol. 9 No.2, pp. 331–341. [2]. Arnold, H.J. and Feldman, D.C., (1982), “A multivariate analysis of the determinants of job turnover,” Journal of Applied
Psychology, Vol. 67, No.3, pp. 350-360.
[3]. Arthur, W., Bell, S., Donerspike, D., &Villado, A.,(2006), “ The use of Person-Organization fit in employment decision making; An assessment of its criterion related validity,” Journal of Applied Psychology, Vol.91, pp. 786-801.
[4]. Barrick, M.R., & Zimmerman, R.D.,(2005), “Reducing voluntary turnover, avoidable turnover through selection,” Journal of
Applied Psychology, Vol. 90, pp.159-166 [5]. Berg, T.R., (1991), The importance of equity perception and job satisfaction in predicting employee intent to stay at television
stations. Group and Organization Studies, Vol.16, No.3, pp. 268-284.
[6]. Bliss WG (2007), “Cost of employee turnover”, available atwww.isquare.com/turnover.
Employee Attrition And Employee Satisfaction: A Study Of H.R., Performance Appraisal...
DOI: 10.9790/487X-2002040127 www.iosrjournals.org 27 | Page
[7]. Boswell, W.R., Boudreau, J.W., &Tichy, J., (2005), “The relationship between employee job change and job satisfaction: The
honey moon-hangover effect,” Journal of Applied Psychology, Vol.47, pp.275-301.
[8]. Buckley (2004) “The attrition of both new and experienced teachers was a great challenge for schools and school administrators throughout the United States”, available at http://www.edfacilities.org/pubs/teacherretention.cfm
[9]. Cappelli, P. (2008), “Talent management for the twenty-first century”, Harvard Business Review, March, 74-81.
[10]. Chaminade B (2007), “A retention checklist: how do you rate?” available at www.humanresourcesmagazine.co.au. [11]. Cotton, J.L. and Tuttle, J.F., (1986), “Employee turnover: A meta-analysis and review with implications for research,” Academy of
Management Review, Vol.11, No.1, pp. 55-70.
[12]. Dickter, D.N., Roznowski, M. and Harrison, D.A., (1996), “Temporal tempering: An event history analysis of the process of voluntary turnover,” Journal of Applied Psychology, Vol.81, pp.707–716.
[13]. Gerhart, B., (1990)., “Voluntary turnover and alternative job opportunities,” Journal of Applied Psychology, Vol.75, No.5, pp. 467-
476. [14]. Glebbeek, A.C., & Bax, E.H.,(2004), “ Is high employee turnover really harmful? An empirical test using company records,”
Academy of Management Journal, Vol.47, pp. 277-286.
[15]. Hendricks S (2006), “Recruitment & retention of appropriately skilled people for the public service to meet the challenges of a developmental state”, Conference of senior managers of the Free State Provincial government, local authorities, state agencies
& thebusiness sector.
[16]. Hickman and Colonel (2003) “The trend of increased Army enlisted attritionby reviewing the existing facts regarding attrition”, available at http://services.oxfordjournals.org/cgi/searchresults?FIRSTINDEX=30&fulltext=pollack+attrition+2004
[17]. Hinkin, T.R., & Tracey, J.B.,(2000), “The cost of turnover: Putting a price on the learning curve,” Cornell Hotel & Restaurant
Administration Quarterly, Vol 41, pp.14-21. [18]. Holstein, W.J. (2005), “Best companies for leaders- P&G‟s A.G. Lafley is No. 1 for 2005”, The Chief Executive,
(November), 16-20.
[19]. http://www.effortlesshr.com/blog/understanding-employee-turnover [20]. http://www.wisegeek.org/what-is-employee-turnover.htm
[21]. Huselid, M. A., Beatty, R. W. & Becker, B. E. (2005), “ 'A Player' or 'A Positions'? The strategic logic of workforce
management”, Harvard Business Review, December, 110 117. [22]. Litheko E (2008), “Training them young is the way to up the skills base”, Sunday/Business Times, 29 June, p. 26. Mitchell, T.
R., Holtom, B. C., Lee, T. W., Sablynski, C. J., &Erez, M. (2001), “Why people stay: Using job embeddedness to predict
voluntary turnover”, Academy of Management Journal, 44, 1102–1121. [23]. Mobley, W. H. (1982). Employee Turnover: Causes, Consequences, and Control. Addison-Wesley Publishing, Philippines.
[24]. Mobley, W.H., Griffeth, R.W., Hand, H.H. and Meglino, B.M., (1979), “Review and conceptual analysis of the employee turnover
process,” Psychological Bulletin, Vol. 86, pp. 493-522. [25]. Ongori.H.(2007);” A Review of the Literature on Employee Attrition, African Journal of Business Management,” pp.049-054.
[26]. Pettman, B. O., (1975), “Labour Turnover and Retention,” John Wiley & Sons, New York.
[27]. Pfeffer, J. (2005), “Changing mental models: HR‟s most important task,” Human Resource Management Vol. 44, pp.123-128 [28]. Pfeffer, J., (1994), “Competitive advantage through people: Unleashing the power of the workforce,” Boston, MA: Harvard
Business School Press.
[29]. Price, J.L. and Mueller, C.W., (1986), “Absenteeism and turnover of hospital employees” .JAI Press Inc.
[30]. Rappaport, A., Bancroft, E., &Okum, L. (2003), “The aging workforce raises new talent management issues for employers” Journal
of Organizational Excellence, 23, 55-66. [31]. Schervish, P.G. (1983), “The structural determinants of unemployment, vulnerability and power in market relations,” New York:
Academic Press
[32]. Shaw, J.D., Gupta, N., &Delery, J.E., (2005), “Alternate conceptualizations of the relationship between voluntary turnover and Organizational performance,” Academy of management journal, Vol.48, pp. 50-68
[33]. Sturman, M.C., & Trevor, C.O., (2001), “The implications of linking the dynamic performance and turnover literatures, ”. Journal
of Applied Psychology, 86, 684–696. [34]. Terborg, J.R., & Lee, T.W., (1984). “A predictive study of Organizational tenure rates,” Academy of Management Journal, Vol.27,
pp.793-810.
[35]. Trevor, C.O. ((2001). “Interactions among actual ease-of-movement determinants and job satisfaction in the prediction of voluntary turnover,” .Academy of Management journal, Vol 44, pp.621-638
[36]. Wai, C.T. Teresa and Robinson, C.D.( 1998), “Reducing staff turnover: A case study of dialysis facilities.” Health Care
Management Review, Vol.23, No.4,: 21-42. [37]. Weil, P.A. and Kimball, P.A., (1995). “A model of voluntary turnover among hospital CEOs, “Hospital and Health Service
Administrative, 40(3): 362-385.
[38]. Weisberg, J. and Kirschenbaum, A., (1993), “Gender and turnover: A re-examination of the impact of sextons intent and actual job changes”. Human Relations, 46(8): 487-1006.
IOSR Journal of Business and Management (IOSR-JBM) is UGC approved Journal with Sl.
No. 4481, Journal no. 46879.
Ruchira Dobhal. "Employee Attrition and Employee Satisfaction: A Study of H.R., Performance
Appraisal & Training Practices in Defence PSUs in India.." IOSR Journal of Business and
Management (IOSR-JBM) 20.2 (2018): 01-027.


![Vol20-4 ความชุกของโรคโลหิตจาง [นิพนธ์ต้นฉบับ]](https://img.pdfslide.net/doc/110x75/55720cba497959fc0b8c4a30/vol20-4-.jpg)