Embed Size (px)
DESCRIPTION
Complete report on employee comitment
Citation preview

1
Chapter-I
PHILIPS ELECTRONICS INDIA LTD
-AN OVERVIEW
2
COMPANY PROFILE
MISSION amp VISION
Mission
Improve the quality of peoplersquos lives through timely introduction of meaningful innovations
Vision
ldquoIn a world where complexity increasingly touches every aspect of our daily lives we will lead
in bringing sense and simplicity to peoplerdquo
VALUES
Delight Customers
Deliver great results
Develop people
Depend on each other
GOALS amp OBJECTIVES
Delight Customers
We anticipate and exceed customer expectations
We demonstrate Passion for Philips and sense and simplicity
We create superior customer experiences based on deep insights
We act as One Philips ambassadors all the time
3
Deliver great results
We continually raise the bar
We play to win big and always set ambitious targets
We challenge the status quo and experiment with new ways
We take clear decisions and implement with speed and discipline
Develop people
We get the best from ourselves and each other
We attract the best players to create strong and diverse teams
We take risks by giving people stretch assignments to accelerate their development
We personally invest significant time to coach and recognize people
Depend on each other
We deliver more value by working as One Philips
We think as One Philips and act as owners
We trust and empower each other to contribute our best
We team up and allocate resources to the most promising opportunities
4
HISTORY
When Philips started manufacturing incandescent lamps in 1891 there was already a
separate industrial research laboratory outside the factory a concept virtually unknown
elsewhere In 1913 another major step was taken with the opening of a physics laboratory
(the Nat Lab) Under the leadership of Dr Gilles Holst the Philips Research organization
became a major center of technical competence and innovation
From 1914-1945
1914 to 1945 saw considerable growth and diversification Improvements were made to the
incandescent lamp and gas discharge lamps proved more efficient in generating light
Meanwhile our bulb expertise led to new products such as the X-ray tube and the radio valve
The invention of the pentode gave Philips an important patent in radio In 1923 Philips decided
to become a systems supplier instead of a components company and consequently the research
organization broadened its scope into radio as well as television
1945-1970
After World War II there was a period of expansion The sky was the limit Television built on
research carried out in the 30s became a mass-produced consumer phenomenon The invention
of the transistor by Bell Labs changed the world of electronics forever We built up a strong
patent position in magnetic materials and contributed many breakthroughs such as the LOCOS
process (LOCal Oxidation of Silicon) used in every modern Metal-Oxide-Semiconductor
(MOS) IC the rotary heads for the Philishave electric shaver (1950s) and the compact audio
cassette (1963) a breakthrough in audio recording Research laboratories in England France
Germany and the USA were founded
5
1970-today
From 1970 to the present day our research has been tied much more closely to our industrial and
business activities This resulted in revolutionary developments such as the introduction of the
CD the DVD and Blu-ray Disc In the medical sphere we made great strides forward in
magnetic-resonance imaging and ultrasound and with our increasing focus on health and well-
being these developments are still ongoing in 2006 we saw the first commercial launch of a 3D
scanner
In that same year we sold 80 of our Semiconductors business as a new independent company
NXP was created We also adopted Open Innovation as our way of working the High Tech
Campus Eindhoven was opened up to external companies
At Philips Research we continue to focus on meaningful innovations that improve peoplersquos
lives Ambilight for example has brought a whole new dimension to TV viewing and in 2007
we developed Lumiramic ndash a groundbreaking new phosphor technology for energy-efficient
white LEDs ndash together with our partners
The future of Philips Research
Philips Research will remain an important driving force in realizing Philipsrsquo vision to become an
even more market-driven and people-centric health and well-being company We do this by
continually evaluating key issues and trends in society to ensure that peoplersquos needs are at the
heart of our innovations now and in the future
Royal Philips Electronics of the Netherlands is a diversified Health and Well-being
company focused on improving peoplersquos lives through timely innovations As a world leader in
healthcare lifestyle and lighting Philips integrates technologies and design into people-centric
6
solutions based on fundamental customer insights and the brand promise of ldquosense and
simplicityrdquo
Headquartered in the Netherlands Philips employs approximately 121000 employees in more
than 60 countries worldwide With sales of EUR 26 billion in 2008 the company is a market
leader in cardiac care acute care and home healthcare energy efficient lighting solutions and new
lighting applications as well as lifestyle products for personal well-being and pleasure with
strong leadership positions in flat TV male shaving and grooming portable entertainment and
oral healthcare
Philips Electronics India Limited
Philips Electronics India Limited a subsidiary of the Netherlands-based Royal Philips
Electronics is the leading Health and Wellbeing company Today Philips is a simpler and more
focused company with global leadership positions in key markets of Healthcare Lighting and
Consumer Lifestyle addressing peoplersquos Health and wellbeing needs and aspirations as its
overarching theme
As one of the nations most well-known and well-loved brands Philips is a part of practically
every Indians life With recent launch of Philips Respironics product categories in obstructive
sleep apnea management and home respiratory care home decorative lighting range and ALU
range Philips products find use in virtually every aspect of an individualrsquos daily life 24X7 - at
home at work on the move and at rest Philips stands as a source of easy to use trendy and
innovative internationally acclaimed products with superior design and technology that enhance
the quality of consumers professional and personal lives
Philips has been operating in India for over 75 years and employs over 4500 employees around
7
the country The company has an excellent pan India distribution and after-sales service network
BUSINESSES
Lighting
Philips Electronics India Indiarsquos largest lighting company operates in business areas of Lamps
Luminaires Lighting Electronics Automotive and Special Lighting Today as global leader in
Lighting Philips is driving the switch to energy-efficient solutions With worldwide electrical
lighting using 19 per cent of all electricity the use of energy-efficient lighting will significantly
reduce energy consumption around the world and thereby cut harmful CO2 emissions Philips
India has been consistently working with industry bodies such as ELCOMA Bureau of energy
efficiency and NGOs towards addressing Indiarsquos power crisis through promotion of energy
efficient lighting in India
Philips provides advanced energy-efficient solutions for all segments road lighting office amp
industrial hospitality and home Philips is also a leader in shaping the future with exciting new
lighting applications and technologies such as LED technology which besides energy
efficiency provides attractive benefits and endless new lsquonever-before-possiblersquo lighting
solutions
In 2008 Philips inaugurated a global research and development (RampD) centre for lighting
electronics in India This was its third such unit in the world The facility which is situated in
Noida will not only cater to the needs of the Indian market but also the Asia-Pacific Europe and
North America The other RampD centres are located at Eindhoven in the Netherlands and in
Shanghai China One of the primary research areas for the centre is to develop products that can
8
tackle high voltage fluctuations in India The centre currently employs 35 engineers Around 40
per cent of Philipsrsquo revenue in India comes from the lighting business
Consumer lifestyle
Guided by the brand promise of ldquosense and simplicityrdquo and the consumer insights Philips
Consumer Lifestyle offers rich new consumer experiences that meet consumersrsquo desire for
relaxation and improving their state of mind Philips also responds to the consumers desire for
wellness and pleasure by introducing products that meet the individualrsquos interests in terms of
their mind space body and appearance
The Consumer Lifestyle arm in India operates in the business areas of Home Entertainment
solutions and Personal Infotainment with product categories such as TVs home theatre systems
music systems DVD players personal entertainment solutions sound accessories Domestic
Appliances and Personal care
Philips Innovation Campus (PIC)
Philips Innovation Campus (PIC) Bangalore is a division of Philips Electronics India Limited
which is owned 96 by Royal Philips Electronics NV The Netherlands It was established in
August 1996 with a vision to be an innovation hub creating next generation solutions and
products for Healthcare and Lifestyle With the objective of meeting the growing need for high-
quality cost-effective software development capacity within the organization PICrsquos share has
increased significantly from 8 in 1998 to around 20 in 2008
9
Working at PIC are about 1000 of the industrys finest professionals using state-of-the-art
software engineering paradigms and platforms including real-time systems component-based
software engineering and multi-threaded architecture to drive the creation of tomorrows
products and services PIC is an ISO 9001Tick IT SEI CMM SM level 5 company amp has
emerged as a critical partner in the development of strategic amp futuristic technologies for Philips
worldwide 60000 registered patents illustrate the innovative nature of the company Philips has
adopted an Open Innovation strategy which leverages the joint innovative power of partnering
companies and researchers to bring more innovations to the market effectively and faster PIC
has built-up extensive know-how and expertise in the software engineering and technology
domains relevant to its business In addition competencies in the areas of project management
requirement engineering and quality assurance have been established to offer customers products
and services of the highest quality at the fastest time-to-market and the lowest cost of
ownership
RESEARCH AND DEVELOPMENT
Since its foundation 100 years ago Philips Research has been at the forefront of fundamental
scientific research But with market focus being more and more important across almost all
corporate RampD organizations is this still the case If some of the pioneering work being done
by scientists across Research is anything to judge by the answer is a resounding ldquoyesrdquo
Itrsquos different at the cutting edge
In todayrsquos market-focused corporate RampD organizations the boundary between fundamental
scientific research and applied research is becoming increasing blurred ndash particularly when it
comes to some of the most exciting areas of research ldquoHere at Philips our way of working is
very dynamicrdquo says Philips Researchrsquos Chief Science Officer Emile Aarts ldquoThis means that you
10
can apply both the lsquofundamentalrsquo and the lsquoappliedrsquo labels to many of the projects that wersquore
working on because they are both very flexible termsrdquo Philips Researchrsquos work on sleep for
instance is an excellent example of this more dynamic approach ldquoThis is a very important area
for Philips ndash but therersquos currently very little fundamental knowledge available Thatrsquos why wersquore
involved in investigating the key issues at a more fundamental level together with our university
and research institute partners The only difference is that we want this research to lead to
marketable products and solutionsrdquo
Open Innovation in new areas
Despite the flexible nature of the ldquofundamentalrdquo and ldquoappliedrdquo labels it is still possible to detect
a decline in some areas of more fundamental research at Philips in recent years ldquoThis has mainly
occurred in fields that donrsquot support the execution of our companyrsquos Health and Well-being
strategyrdquo says Aarts As he explains this refocusing exercise has gone hand-in-hand with an
expansion of more fundamental research activities in a number of new fields such as deep-brain
stimulation and multi-modal imaging for healthcare applications ldquoIn these fields wersquore
considered to be an extremely important research partner ndash especially by colleagues working in
universitiesrdquo In the future Philips Research will continue to develop its reputation in a number
of exciting fundamental domains ndash ldquogreen lightingrdquo and skincare are just two examples ndash albeit
with a more applied focus ldquoHopefully this research will enable us to build on our strong
heritage of improving the quality of peoplersquos lives
11
BOARD OF DIRECTORS
Non-Executive Director amp Chairman S M Datta
Executive Vice Chairman amp Managing Director Murali Sivaraman
Executive Director Jan-Hein Louwman
Non-Executive Director S Venkatramani
India Management Team
MURALI SIVARAMANN - CEO
ANJAN BOSE - Healthcare
JAN-HEIN LOUWMAN ndash CEO
MAHESH KRISHNAN ndash Consumer lifestyle
RAJEEV CHOPRA ndash lighting
RAKESH SHARMA ndash Strategic Business Development
S NAGARAJAN ndash Human resources
VIVEK SHARMA ndash Chief Marketing Officer
WIDO MENHARDT ndash Philips Innovation Campus
12
Corporate Office-
Philips Electronics India Ltd
Technopolis Knowledge Park
Mahakali Caves Road
Chakala Andheri (East)Mumbai 400 093
Tel +91 22 66912000
VISION 2012
Through the Vision 2012 strategy we aim to fuel growth by making Philips the leading brand in
Health and Well-being Vision 2012 further positions Philips as a market-driven people-centric
company with a strategy and a structure that fully reflect the needs of its customer base while
also increasing shareholder value This is implemented through sharpened strategies in the three
core sectors Healthcare Lighting and Consumer Lifestyle
ldquoWith Vision 2010 we are putting people right at the center of things with Health and Well-
being as our overarching theme We are thereby putting into practice our mission improving the
quality of life through the introduction of meaningful innovationsrdquo ndash Gerard Kleisterlee
President and CEO of Royal Philips Electronic
Our Ways of Working
1 We are a people-centric company that organizes around customers and markets
2 We invest in a strong brand and consistently deliver on our brand promise of ldquosense and
simplicityrdquo in our actions products and services
13
3 We deliver innovation by investing in world class strengths in end-user insights
technology design and superior supplier networks
4 We develop our peoplersquos leadership talent and engagement and align ourselves with high
performance benchmarks
5 We invest in high growth and profitable businesses and emerging geographies to achieve
market leadership positions
6 We are committed to sustainability and focus on making the difference in efficient energy
use
7 We drive operational excellence and quality to best in class levels allowing us the above
mentioned strategic investments in our businesses
BRAND PROMISE
It is the combination of two unique capabilities that enables us to deliver on our ldquosense and
simplicityrdquo promise These capabilities are firstly by understanding people and secondly
technology integration and product design
We put our end users front and center of product innovations starting with understanding their
needs and aspirations We use best-in-class research facilities and agencies to validate and ensure
that our product innovations are designed around peoplersquos needs and aspirations easy to
experience and advanced
SUSTAINABILITY
14
In 2009 we evaluated our sustainability strategy and resolved to fully leverage sustainability as
an integral part of our overall strategy and an additional driver of growth as reflected in the
Philips Management Agenda 2012
To deliver on our brand promise of ldquosense and simplicityrdquo and at the same time provide the
company direction for the longer term in this area we have identified three sustainability
leadership key performance indicators where we can bring our competencies to bear lsquocarersquo
lsquoenergy efficiencyrsquo and lsquomaterialsrsquo including targets for 2015
Bringing care to more than 500 million people
Target 500 million lives touched by 2015
Improving energy efficiency of Philips products
Target 50 improvement by 2015 (for the average total product portfolio) compared to
2009
Closing the materials loop
Target Double global collection recycling amounts and recycled materials in products
by 2015 compared to 2009
Each sector will take the lead on one of the leadership key performance indicators with
Healthcare leading lsquocarersquo Lighting lsquoenergy efficiencyrsquo and Consumer Lifestyle lsquomaterialsrsquo
In addition we defined a set of complementary performance indicators to accelerate change and
drive performance including the EcoVision4 parameters
With EcoVision4 we have committed to the following by 2012
15
bull Generate 30 of total revenues from Green Products
bull Double investment in Green Innovations to a cumulative EUR 1 billion
bull Improve our operational energy efficiency by 25 and reduce our CO2 emissions by 25 all
compared with the base year 2007
SOCIAL COMMITMENT
Living up to this commitment means we use our capabilities to enhance the lives of our
employees and people in society at large Within the company we encourage teamwork and
collaboration in an environment that enables employees to reach their full potential
Building on our rich heritage of involvement in social issues we have established our own
approach of supporting the communities where we live and work focusing on energy efficiency
and healthcare
Sustainable lighting
There is a pressing need to find innovative lighting solutions for the 16 billion people who live
in areas with no access to the electricity grid or where the grid is unreliable Thatrsquos why we have
developed SMILE (Sustainable Model in Lighting Everywhere)
Launched as a pilot in 2006 in four Indian states SMILE includes two lighting solutions UDAY
a rechargeable portable lantern and KIRAN a hand-cranked LED flashlight Today are
distributed in eighth Indian states
16
SWOT ANALYSIS
Strengths
bull India was a market where the first mover enjoyed advantages over latecomers
bull The first image of the product lasted long in the eyes of the consumer and the first to enter the
market could gain the largest market share
bull PHILIPS is committed to enhance its image to the Chinese market as investors
bull PHILIPS was building a wholly owned manufacturing plant in India to show the
Chinese the commitment Korea had to the Chinese society
bull Labor costs in India were less and would defray the cost of producing high-end
bull Samsung has been making color TVs for many years in Korea before moving to the Chinese
market
Weaknesses
bull PHILIPS must continue to control all costs to maintain success
bull India has a reputation of being a protected market (protectionism)
bull India was a market where the first mover enjoyed advantages over late comers PHILIPS is
trying to overcome the first comer advantage Japan manufacturers have over them by being those
first comers
bull Companies such as Sony and Matsushita had built sales and service networks that were
favorable to their sales programs in India while Samsung would have to catch up in that area
17
bull Samsung is not as experienced in manufacturing high-end TVs for a higher-end market
segment
Opportunities
bull Based on the data that on 28 of the 220 million rural households own a color TV PHILIPS
focus on the domestic India market should be to penetrate the rural household market which
would mean that for those purposes the low-end production of sets in the 13rdquo to 20rdquo range should
be produced to appeal to that segmentrsquos purchasing ability
bull Larger more high-end models can be produced to appeal to an urban customer in India as well
as being an export to the US and European higher end customers
bull With success in the higher-end manufacturing and sales of premium TVs in India PHILIPS can
establish themselves as high-end producers around the world
Threats
bull PHILIPS faces intense competition in the color TV market
bull A premium-priced product wouldnrsquot sell in large volumes so pricing can be a problem
bull Since PHILIPS didnrsquot have an established marketing strategy issues of how to market the
product may arise
bull Loss of profitability because related to over-employment at most facilities
bull Is the per capita income level such that it can support sales of product at any level
bull If PHILIPS fails to be successful in the Chinese market with high-end product it will be known
around the world bull India was a market where the first mover enjoyed advantages over late
comers
bull The first image of the product lasted long in the eyes of the consumer and the first to enter the
18
market could gain the largest market share
bull PHILIPS is committed to enhance its image to the Chinese market as investors
PHILIPS ELECTRONICS MOHALI PLANT
The mohali plant was established in 1985 as PUNJAB ANAND LAMP Ltd as its second
division of lamp industry after the varodra plant at that time it was a joint stock company and
majority of shares was with Punjab Anand Lamp around 75 but in the year 2001 the company
ownership changed and the whole shares was bought by PHILIPS ELECTRONIC INDIA Ltd
and its name was changed to PHILIPS ELECTRONIC INDIA Ltd MOHALI LIGHT
FACTORY
The plant is situated in Industrial focal point PHASE-9 MOHALI near Mohali railway station
and is sreaded in 26 acres Total employees of tis plant is 532 including casual employees This
company is a landmark in the Punjab state as it is the only factory which is most profitable one
than any industry located in Punjab
19
OVERVIEW OF VARIOUS FRONTS OF
PHILIPS ELECTRONICS INDIA Ltd
Manufacturing-
Today the product range of Philips include the following products ndash
Televisions- LCD Plasma Flat Screen Smart Touch XL
Recorders DVD Players I pods and Home Theatre Systems
Audio Products - Audio Systems Remote Controls AudioVideo Accessories
Digital Photo Products and Frames
Portable Audio and Video Systems Accessories like Headphones and Speakers
PC Products - Mouse and Keyboard Multi Media Headsets External Hard Disk Drives
Mobile Phones
Male Shaving and Grooming - Dry Shavers Beard Trimmers
Personal Care - Beauty and Hair Care Products
20
Kitchen Appliances - Blenders and Hand Blenders Juicers and Citruspresses Food
Processors and Mixers Coffee Makers and Kettles Frying and Grilling Appliances
Toasters and Snacking Products
Household Products - Irons Vacuum Cleaners Water Purifiers
Professional Lighting - Industrial Shops and offices Road and Area Hospitality Sports
Lighting City Beautification and Petrol Stations
Automotive Lighting - In Cars Motorcycles and Trucks
Home Lighting
SERVICS
Philips E-waste Management Program in India
Philips has tied up with a recycler for collecting transporting and recycling unwanted broken
down consumer products
At Philips we offer consumers a convenient way of recycling their unwanted obsolete and
damaged Philips products by dropping them off at convenient locations The program
encompasses 8 major cities across India Consumers can approach one of 27 authorized Philips
service centres which will act as collection points for consumer products which need recycling
Our efforts are to expand the network in the near future
Philips ensures that the consumer products received will be recycled in an environment-friendly
manner Philips understand the corporate social responsibility and takes steps towards providing
a safer environment to the future generations We design our products to continuously realize
improvements and reduce their overall life cycle environmental impact Designing products for
21
recycling is an integral part of this approach Our aim is to use our planetrsquos limited resources
effectively and respect the principle of extended producer responsibility This also calls for
manufacturers to engage in developing solutions for effective and efficient recycling of their
products We will continue to promote and invest into improved recycling systems to reduce the
impact of electronic waste on the environment
MANUFACTURING AT MOHALI PLANT ndash
Mohali plant mainly manufactures lighting products basically of domestic usage this includes the
following products ndash
CFL bulbs ndash
1 Genie - 5 watt 8 watt 11 watt
2 Essential ndash 8 watt 11 watt 14 watt 18 watt 23 watt 29 watt
3 Tornado ndash 5 watt 8 watt 11 watt 14 watt 18 watt 23watt 29 watt
4 T5 slim tube 28 watt
Coil plant ndash Philips Electronics India is the only company that produces coils in the whole
lighting industries in the world and in India only at the MOHALI PLANT
22
Chapter-II
OBJECTIVES OF THE STUDY
23
OBJECTIVES OF THE STUDY
To study the various aspects of Satisfaction Level of the Employees working at Philips
Electronics India Ltd Mohali
To analyze the effect of Job satisfaction on the organisation
To determine the relation between job satisfaction of employees and their commitment
towards the organisation
To analyze the performance model adopted by the Philips Electronics India Ltd Mohali
to handle their manpower
To suggest remedial measures for the improvement of the companyrsquos performance
24
Chapter-III
Employees Commitment
25
Employees who are engaged in their work and committed to their organizations give companies
crucial competitive advantagesmdashincluding higher productivity and lower employee turnover
Thus it is not surprising that organizations of all sizes and types have invested substantially in
policies and practices that foster engagement and commitment in their workforces
But what are employee engagement and commitment exactly This report examines the ways in
which employers and corporate consultants define these terms today and offers ideas for
strengthening employee engagement Though different organizations define engagement
differently some common themes emerge These themes include employeesrsquo satisfaction with
their work and pride in their employer the extent to which people enjoy and believe in what they
do for work and the perception that their employer values what they bring to the table The
greater an employeersquos engagement the more likely he or she is to ldquogo the extra milerdquo and deliver
excellent on-the-job performance In addition engaged employees may be more likely to commit
to staying with their current organization Software giant Intuit2 for example found that highly
engaged employees are 13 times more likely to be high performers than less engaged
employees They are also five times less likely to voluntarily leave the company
Clearly engagement and commitment can potentially translate into valuable business results for
an organization To help you reap the benefits of an engaged committed workforce at your
organization this report provides guidelines for understanding and measuring employee
engagement and for designing and implementing effective engagement initiatives As you will
26
see everyday human resource practices such as recruitment training performance management
and workforce surveys can provide powerful levers for enhancing engagement
Employee Engagement Key Ingredients
ldquoEmployee Engagement Definedrdquo shows examples of engagement definitions used by various
corporations and consultancies Clearly definitions of employee engagement vary greatly across
organizations Many managers wonder how such an elusive concept can be quantified The term
does encompass several ingredients for which researchers have developed measurement
techniques These ingredients include the degree to which employees fully occupy themselves in
their work as well as the strength of their commitment to the employer and role Fortunately
there is much research on these elements of engagementmdashwork that has deep roots in individual
and group psychology
Definition
ldquoNo company small or large can win over the long run without energized employees who
believe in the [firms] mission and understand how to achieve it Thats why you need to take the
measure of employee engagement at least once a year through anonymous surveys in which
people feel completely safe to speak their mindsrdquo
-Jack and Suzy Welch-
Common Themes How Companies Measure Engagement
Employers typically assess their employeesrsquo engagement levels with company-wide attitude
or opinion surveys
27
1048657 Pride in employer
1048657 Satisfaction with employer
1048657 Job satisfaction
1048657 Opportunity to perform well at challenging work
1048657 Recognition and positive feedback for onersquos contributions
1048657 Personal support from onersquos supervisor
1048657 Effort above and beyond the minimum
1048657 Understanding the link between onersquos job and the organizationrsquos mission
1048657 Prospects for future growth with onersquos employer
1048657 Intention to stay with onersquos employer
The Link Between Employer Practices and Employee Engagement
How does an engaged workforce generate valuable business results for an organization The
process starts with employer practices such as job and task design recruitment selection
training compensation performance management and career development Such practices affect
employeesrsquo level of engagement as well as job performance Performance and engagement then
interact to produce business results Figure 1 depicts these relationships
28
EMPLOYEE COMMITMENT EMPLOYEE ENGAGEMENT
1048657 How do you and other managers in your
organization define commitment
1048657 Are some employees in your company
engaged in their work but not committed to
the organization Committed to staying with
your firm but not exactly engaged in their
work Both engaged and committed
1048657 To whom are your organizations employees
committed The company Their supervisor
Co-workers Team members Customers
1048657 What business results has commitment from
1048657 How do you and other managers in your
organization define employee engagement
1048657 How do you know that certain employees in
your company are engaged Do they relish
their jobs Enjoy specific responsibilities or
tasks Willingly ldquogo the extra milerdquo
1048657 In teams departments or business units in
your company that have a large number of
engaged employees what business results
are you seeing Higher productivity Lower
costs Greater revenues More efficiency
29
employees created for your organization For
example has commitment reduced turnover
and therefore decreased recruitment hiring
and training costs
1048657 What does your company do to reciprocate
employees commitment Is the organization
living up to its side of the bargain
Lower turnover Higher product or service
quality
1048657 Conversely how do disengaged employees
behave and what are the consequent costs
for their teams units-and your entire
company
As Figure 2 suggests a person possesses attributes such as knowledge skills abilities
temperament attitudes and personality He or she uses these attributes to accomplish work
behaviors according to organization-defined procedures by applying tools equipment andor
technology Work behaviors in turn create the products and services that make an organization
successful We classify work behaviors into three categories those required to accomplish duties
and tasks specified in a job description (prescribed behaviors) ldquoextrardquo behaviors that an
employee contributes for the good of the organization (voluntary behaviors) and behaviors
prohibited by an employer (proscribed behaviors including unexcused absenteeism stealing and
other counterproductive or illegal actions) Of course job performance occurs in an
organizational context which includes elements such as leadership physical setting and social
setting
30
Employers naturally want to encourage workers to perform prescribed and voluntary activities
while avoiding proscribed ones To achieve these goals organizations use a number of HR
practices that directly affect the person process and context components of job performance
Employeesrsquo reactions to these practices determine their levels of engagement and commitment
31
Chapter-IV
32
LITERATURE OF THE REVIEW
ldquo Job Satisfaction That Leads To The Commitment Of
The Employees in The Organisationrdquo
Literature of Review
Gerge Bill Authentic Leadership
In his book Authentic Leadership former Medtronic CEO Bill George makes an obvious
point that business leaders rarely say out loud ldquoMissions motivate dollars donrsquotrdquo
What he means is that purpose is what drives employee commitment not the financial
rewards that come to others Workers donrsquot get up in the morning and say ldquoGee I can
33
hardly wait to get to work today to maximize shareholder profitsrdquo Even when employees
are shareholders who can benefit from improved financials what draws people to their
chosen careers is the work itself and its purpose in the world more than the profit
possibilities
Mr George goes on to say ldquoI find there is universal agreement (among middle managers)
that you cannot inspire employees by urging them to help management get the companyrsquos
stock price uprdquo
There is in fact quite a bit of literature on this subject In Awakening Corporate Soul
authors Eric Klein and John Izzo say that employee commitment requires knowing ldquothe
purpose of our work it means recognizing the purpose our organization fulfills that goes
beyond the bottom line and it means articulating to others how their (workersrsquo) efforts
contribute to a larger purposerdquo
In Built to Last Jim Collins and James Porras spend an entire book explaining their five
year research study of major companies that led to this conclusion about employee
commitment Purpose within a company is what sustains it profit is important but when
itrsquos the prime directive companies falter
-Marshal Goldsmith-
How to Increase Employee Commitment
In practice this involves walking the talk being transparent communicating effectively treating
people equally teaching leading subordinates to increasingly excellent performance ndash and
responding to subordinates as mature individuals who are owed fairness the truth and
recognition of their achievements
34
Since managers interact directly and frequently with subordinates they are usually more tuned
in to how employees are feeling than are executives Managers are in a better position to know
for example when employees are feeling alienated and disengaged from their work which is
very common today -- and expensive
Gaining employee commitment results in greater profits because enthusiastic employees stay
contribute discretionary effort and engage customers Performance soars when customers are
enthused and stay and when executives managers and employees are a collaborative team
united in achieving common goals
But managers are often called middle managers for good reason their job is to motivate and
guide subordinates while they at the same time are being judged by their bosses Because of
their ldquotweenrdquo position in the hierarchy managers to effective support direct reports must also
create relationships with potential allies especially those with greater power who have access to
top decision makers
Harvard University Factors that Impact Employee Well Being Commitment and
Productivity
Business executives from the C-suite and HR to QC and RampD are by nature focused on the
corporate bottom line A new trend in our dawning age of social sustainability is that many
experts believe more attention should be paid to the dotted line - the one signed when a person
35
commits to employment at a company New Harvard research validates this approach affirming
that trust and purpose play a significant role in building successful productive workplaces
The behavioral research conducted by a team at Harvard University and Massachusetts General
Hospital identifies the factors most likely to impact 21st century employee well being
commitment and productivity The researchers found that commitment is largely influenced by
ones sense of purpose feeling of personal impact and overall trust in the organization
Productivity is largely affected by the quality of human relationships including cooperative
social group moods and interaction
The results lead us to conclude that workplaces that provide positive environments that foster
interpersonal trust and quality personal relationships create the most committed and productive
employees says Nancy Etcoff PhD the lead researcher on the study
Expert Shares Keys to Building Successful Workplace Relationships
According to business strategist Courtney Anderson JD MBA Outstanding leadership
today means much more than just doing your job Success is creating an environment that fosters
happy committed productive team members
Anderson explains that reinvigorating workplaces by enhancing trust and employee commitment
does not have to be difficult The biggest challenge she says is making the time to truly change
in our overscheduled instant access competitive work environments With a little know-how it
can be easy to evolve workplace well being and respond to these compelling research results
-Mark Howell-
CEO Bright Point
High-performing companies recognize that employee commitment is a major contributing factor
toward sustaining long-term success and creating value An engaged employee is involved and
excited about their work and acts in a manner that will forward the organizationrsquos interest An
36
engaged workforce helps optimize and retain talent for the long-term because the employees
choose to stay even when other employment alternatives exist
According to Walker Information the top three drivers of employee commitment are
Satisfaction Fairness and Care amp Concern for employees Put simply committed employees
want to enjoy their work feel they are appreciated and know they are making a contribution to
their companyrsquos strategic objectives Additionally employees who have trust in their leadership
and are trusted by their leadership have a greater dedication and are ultimately more productive
on the job However according to recent data provided by the National Business Research
Institute (NBRI) only 31 of all employees are truly engaged
At BrightPoint we take employee engagement seriously and we work to create a culture that
inspires employee loyalty and satisfaction The results of BrightPointrsquos commitment to its
employees are shown in the 2011 BPNA Employee Commitment Survey The survey
determined that close to 80 of respondents indicated they were satisfied with their jobs and
daily activities General employee satisfaction increases when managers take an active interest
in their employees beyond their day-to-day job responsibilities According to NBRI managers
that actively coach build relationships and keep an open dialogue with their employees improve
employee engagement
We have a diverse workforce where each employee brings unique value and has individual
needs Managers are learning to manage the individual and not the position In order to give
managers the tools they need to be successful BrightPoint places strong emphasis on targeted
leadership training workshops and continual learning resources In 2011 906 of managers at
BrightPoint NA participated in the development opportunities offered and also made an effort to
37
help reinforce the learning of their team members This signals that our leadership team is taking
an active interest in professional development and its connection to employee commitment
As BrightPoint continues to increase focus on employee engagement the organization will grow
stronger and maintain a substantial advantage over our competition Our employees possess the
knowledge experience and resiliency to respond quickly to the demands of the marketplace and
through their genuine commitment will deliver what our customers want with increasing
efficiency and effectiveness Our responsibility is value-creation by growing our business and
maintaining high levels of customer service and loyalty We believe the best way to accomplish
this is through a strong committed and engaged workforce
Performance Model Adopted At Mohali Plant
38
Process adopted by Philips Electronics Mohali Plant for Job Satisfaction of Employee that leads commitment of the employees
39
Recruiting
The messages in Philips Electronics Mohali organization conveys while seeking to attract job
applicants also can influence future employeesrsquo engagement and commitment If your firm has
designed jobs specifically to engage employees then organization want to ensure that recruiting
ads extol these positionsrsquo attractive featuresmdashsuch as challenging work assignments a highly
skilled team environment or minimal supervision Applicants who notice and respond to these
ads will more likely be motivated by these features Also consider how organization might best
seek candidates from inside your organization When Organisation recruit existing employees for
desirable jobs you enhance their engagement (by maximizing the person-job fit) and
commitment (by providing growth and advancement opportunities to employees in return for
their loyalty) If Organisation recruit from outside when qualified internal candidates are
available Organization may unwittingly suggest to current employees that your company is not
willing to reciprocate their commitment Existing staff may then begin questioning their own
commitment to the firm By contrast organisation recruit external candidates to both the job and
your organization For these candidates ensure that recruiting messages highlight attractive job
features organizational values and commitment reciprocity That is in return for performance
and dedication your company offers competitive pay and benefits flexible work hours and
learning and career advancement opportunities Also remember that prospective employees have
multiple commitments You will inevitably have to compete with those commitments as
organization try to attract candidates to your firm Most people find it easier to make a new
commitment when it is compatible with their other obligations For example you boost your
chances of recruiting a highly qualified candidate who is a single parent if you offer flexible
work hours family health benefits and on-site day care ldquoRecruiting for Engagement and
Commitmentrdquo
40
Employee Selection
Once recruiting efforts produce a pool of promising job candidates Philips select among them to
fill available positions When organisation select the right individuals for the right jobs new
hires carry out their work more smoothly and experience fewer performance problems The
result Greater enjoyment ofmdashand engagement inmdashthe job
To enhance engagement through your selection of employees identify those candidates who are
best-suited to the job and your organizationrsquos culture Also use candidate assessment methods
that have obvious relevance to the job in questionmdashfor example by asking interviewees what
they know about the role and having them provide work samples Most candidates will view
these techniques more positively than tests with less apparent relevance such as personality and
integrity assessments Successful candidates feel good about having ldquopassed the test and see
company as careful and capable for having selected them A positive initial impression of an
employer encourages growth of long-term commitment
Training and Development
Training and development can serve as additional levers for enhancing engagement and
commitment For new hires training usually begins with orientation Orientation presents several
important opportunitiesmdashincluding explaining pay work schedules and company policies Most
important it gives you a chance to encourage employee engagement by explaining how the new
hirersquos job contributes to the organizationrsquos mission Through orientation Mohali Plant of Philips
Electronics describe how r company is organized introduce the new employee to his or her co-
workers give the person a tour of the area where he or she will be working and explain safety
regulations and other procedural matters In short you foster person-organization fitmdashvital for
developing productive and dedicated employees Through training you help new and current
41
employees acquire the knowledge and skills they need to perform their jobs And employees who
enhance their skills through training are more likely to engage fully in their work because they
derive satisfaction from mastering new tasks Training also enhances employeesrsquo value to your
company as well as their own employability in the job market In addition most companies offer
higher wages for skilled workers to compensate them for their greater value and to discourage
turnover
Compensation
Like the HR practices discussed above compensation can powerfully influence employee
engagement and commitment Some compensation components encourage commitment to
employers while others motivate engagement in the job It is possible to stimulate one and not
the other though itrsquos generally better to foster both For example a company that offers a strong
performance incentive system but no retirement plan will probably realize exceptional
engagement from its workers however they may eventually commit themselves to another
company that does offer a good retirement plan Meanwhile an organization that offers generous
retirement benefits but a traditional seniority-based pay grade system may have committed
employees however these workers might deliver pedestrian performance as they bide their time
until retirement In designing compensation plans you therefore need to consider employee
engagement and commitment strategically
Encourage managers to include employees in the goal-setting process This technique helps to
ensure that workers understand the goals It also promotes acceptance of challenging objectives
because people generally feel more committed to goals they have helped define In addition
consider how you and other managers will recognize and encourage contributions that exceed
expectations For example when a piece of equipment malfunctions Joe finds other ways to
maintain production rather than merely shutting down the machine and waiting for the
42
maintenance staff to fix it Or when a less experienced co-worker encounters a new task Sally
offers friendly coaching instead of standing by and waiting for the inevitable mistakes to crop
up Performance management processes operate on a continuous basis Therefore they provide
perhaps the best ongoing opportunities for employers to foster employee engagement and
commitment For example managers can use routine discussions about performance and
feedback sessions to learn which aspects of the job hold the most interest for each employee and
which tasks are most challenging During such discussions managers also can define what going
above and beyond the call of dutyrdquo looks like and generate ideas for rewarding such
contributions An employeersquos aspirations and career goals can receive careful attention during
performance appraisal meetings Without inquiring into an employeersquos personal life a supervisor
can nevertheless explore ways to enhance the compatibility between the workerrsquos commitment to
your organization and the employeersquos other life commitments Through such means the
organization personalizes its relationship to each employee and provides support while also
expressing appreciation for their contributionsmdash key drivers of engagement and commitment
To further engage employees and win their commitment through your performance management
programs consider how to treat your organizationrsquos most experienced employees In many cases
these employees understand the intricacies of a job better than their supervisors or managers do
By virtue of long identification with your organization they may be deeply committed to high-
level goals They use their expertise to contribute in ways that newer employees simply cannot
match But many of them also may be planning to retire soon especially if they are from the
ldquoBaby Boomerrdquo generation How will you transfer their knowledge to younger workers Design
a performance management system that recognizes and rewards proactive sharing of knowledge
and expertise among co-workers For example create knowledge repositories or learning
histories that can be stored in databases that employees can access and then create incentives
43
for people who contribute to and use these repositories Of course effective performance
management systems also identify employees who are not meeting expectations Failing to
address problem performance can erode other employeesrsquo engagement and commitment as their
workloads increase and they conclude that the company is willing to tolerate poor performance
If feedback coaching and remedial training are of little avail the manager may need to move the
person to a different position within the company where he or she can make a more valuable
contribution or let the individual go if there is no good match elsewhere in the organization
44
Chapter-V
RESEARCH METHODOLOGY
The basic task of research is to generate accurate information for use in decision-making
Research can be defined as the systematic and objective process of gathering recording and
analyzing data for aid in making business decisions As the project involves analyzing of
45
financial structure the research is exploratory in nature covering financial parameters and come
of the important ratios to carry out research There are basically two techniques adopted for
obtaining information
Primary Data
Secondary Data
Primary Data is gathered specifically for the project at hand through personal interviews with
the accounts officers
Sample Size = 100 Employees
Secondary data is previously collected and assembled for some project other than the one at
hand It is gathered and recorded by someone else prior to current needs of the researcher It is
less expensive than the primary date
Secondary Data can be obtained from both external and internal sources
External data may be collected from books and periodicals government sources media and other
commercial sources
Internal data is that secondary data which is created recorded or generated by the organization
As the project is explanatory in nature secondary data is collected from the reports of the
company books journals and interest Secondary data is gathered from annual reports official
records and standing orders of the units
CHAPTER - VI
DATA ANALYSIS AND INTERPRETATION
46
The data after collection is to be processed and analyzed in accordance with the outline
and down for the purpose at the time of developing research plan
Technically speaking processing implies editing coding classification and tabulation of
collected data so that they are amenable to analysis The term analysis refers to the computation
of certain measures along with searching for pattern groups Thus in the process of analysis
relationship or difference should be subjected to statistical tests of significance to determine with
what validity data can be said to indicate any conclusions
The analysis of data in a general way involves a number of closely related operations
which are performed with the purpose of summarizing the collected data and organizing them in
such a manner that they answer the research questions In this study the researcher followed
above process carefully and it is presented in this chapter
47
Table 41 ndash To know the department in which employees are belongs to
S
ou rc
e
survey data
Inference
From the above table it shows that 35 of employees are belongs to
production department
FIGURE 41
S
SI No
D
Department
N
No of Respondents
P
Percentage
1
1
M
Mechanical
3
30
3
30
2
2
E
Electrical
2
25
2
25
3
3
P
Production
3
35
3
35
4
4
O
Others
1
10
1
10
T
Total
1
100
1
100
48
REPRESENTS THE DEPARTMENT
Table 42 ndash To know working experience of the employees
Source survey data
Inference
From the above table it shows that 34 of the employees have 4 ndash 6
years experience
S
SI No
W
Work Experience
N
No of Respondents
P
Percentage
1
1
B
Below 2 years
1
33
1
13
2
2
2
2ndash 4 years
3
30
3
30
3
3
4
4ndash 6 years
3
34
3
34
4
4
A
Above 6 years
2
23
2
23
T
otal
1
100
1
100
49
FIGURE 42
REPRESENTS THE EXPERIENCE OF THE EMPLOYEES
Table 43 ndash To know the physical working environment
S
SI No
W
Working Environment
N
No of Respondents
P
Percentage
1
1
E
Excellent
1
12
1
12
2
2
G
Good
5
57
5
57
3
3
F
Fair
2
28
2
28
4
4
P
Poor
0
03
0
33
5
5
V
Very Poor
0
00
0
00
T
Total
1
100
1
100
Source survey data
Inference
From the above table it shows that 57 of the employees were feeling good about the working environment
50
FIGURE 43
REPRESENTS THE PHYSICAL WOKING ENVIRONMENT
51
Table 44 ndash To know the satisfaction level of employees towards the non-monitory benefits
S
SI No
N
Non-Monitory Benefits offered
to Employees
N
No of Respondents
P
Percentage
1
1
H
Highly Satisfied
1
14
1
14
2
2
S
Satisfied
5
54
5
54
3
3
N
Neither Satisfied nor Dissatisfied
2
25
2
25
4
4
D
Dissatisfied
0
05
0
05
5
5
H
Highly Dissatisfied
0
02
0
02
Total 1
100
1
100
Source survey data
Inference
From the above table it shows that 54 of the employees were satisfied towards the non-monitory benefits
FIGURE 44
REPRESENTS THE SATISFACTION LEVEL OF EMPLOYEES TOWARDS THE NON-MONITORY BENEFITS
52
Table 45 ndash To know the satisfaction level of respondents towards the work
assigned
Source survey dataInference
From the above table it shows that 45 of the respondents were satisfied towards the work assigned
FIGURE 45
S
SI No
A
Amount of Work
N
No of Respondents
P
Percentage
1
1
H
Highly satisfied
2
20
2
20
2
2
S
Satisfied
4
45
4
45
3
3
N
Neither Satisfied nor Dissatisfied
1
12
1
12
4
4
D
Dissatisfied
1
18
1
18
5
5
H
Highly Dissatisfied
0
06
0
06
Total 1
100
1
100
53
REPRESENTS THE SATISFACTION LEVEL OF RESPONDENTS TOWARDS THE WORK ASSIGNED
54
Table 46 ndash Opinion about the career development programme in their organisation
S
SI No
C
Career Development
N
No of Respondents
P
Percentage
H
Highly satisfied
1
12
1
12
S
Satisfied
5
56
5
56
N
Neither Satisfied nor Dissatisfied
2
22
2
22
D
Dissatisfied
1
10
1
10
H
Highly Dissatisfied
0
00
0
00
Total 1
100
1
100
Source survey data
Inference
From the above table it shows that 56 of the employees were satisfied
with the opinion about the carrier development programme in their organisation
FIGURE 46
REPRESENTS OPINION ABOUT THE CAREER DEVELOPMENT
PROGRAMME IN THEIR ORGANISATION
55
Table 47 ndash To know the cooperation of co-workers
S
SI No
C
Co-operation of Workers
N
No of Respondents
P
Percentage
1
1
H
Highly satisfied
2
20
2
20
2
2
S
Satisfied
6
66
6
66
3
3
N
Neither Satisfied nor Dissatisfied
1
11
1
11
4
4
D
Dissatisfied
0
03
0
03
5
5
H
Highly Dissatisfied
0
00
0
00
Total 1
100
1
100
Source survey data
Inference
From the above table it shows that 66 of the employees were satisfied
with the cooperation of co-workers
FIGURE 47
56
REPRESENTS THE COOPERATION OF CO-WORKERS
57
Table 48 ndash To know the satisfaction of Respondents with top management
S
SI No
S
Satisfaction with Top
Management
N
No of Respondents
P
Percentage
1
1
H
Highly satisfied
2
26
2
26
2
2
S
Satisfied
5
51
5
51
3
3
N
Neither Satisfied nor Dissatisfied
1
17
1
17
4
4
D
Dissatisfied
0
06
0
06
5
5
H
Highly dissatisfied
0
00
0
00
Total 1
100
1
100
Source survey data
Inference
From the above table it shows that 51 of the employees were satisfied with the top management
FIGURE 48
58
REPRESENTS THE SATISFACTION OF RESPONDENTS WITH TOP MANAGEMENT
Table 49 ndash To know the satisfaction of Respondents with their subordinates
Source survey data
Inference
From the above table it shows that 67 of the employees were satisfied with their subordinates
S
SI
No
S
Satisfaction with Subordinates
N
No of Respondents
P
Percentage
1
1
H
Highly satisfied
1
12
1
12
2
2
S
Satisfied
6
67
6
67
2
3
N
Neither Satisfied nor Dissatisfied
1
14
1
14
4
D
Dissatisfied
0
07
0
07
5
5
H
Highly Dissatisfied
0
00
0
00
Total 1
100
1
100
59
FIGURE 49
REPRESENTS THE SATISFACTION OF RESPONDENTS WITH THEIR SUBORDINATES
60
Table 410 ndash To know the level of satisfaction regarding nature of job
S
SI No
J
Job Satisfaction
N
No of Respondents
P
Percentage
1
1
H
Highly satisfied
2
22
2
22
2
2
S
Satisfied
5
56
5
56
3
3
N
Neither Satisfied nor Dissatisfied
1
16
1
16
4
4
D
Dissatisfied
0
07
0
07
5
5
H
Highly Dissatisfied
0
00
0
00
Total 1
100
1
100
Source survey dataInference
From the above table it shows that 56 of the employees were satisfied with their job
FIGURE 410
61
REPRESENTS THE LEVEL OF SATISFACTION REGARDING THE NATURE OF JOB
Table 411 ndash To know whether there is any job pressure in their work
Source survey data
Inference
From the above table it shows that 72 of employees said there is job pressure in their work
FIGURE 411
REPRESENTS WHETHER THERE IS ANY JOB PRESSURE IN THEIR WORK
S
SI No
J
Job Pressure
N
No of Respondents
P
Percentage
1
1
Y
Yes
7
72
7
72
2
2
N
No
2
28
2
28
T
Total
1
100
1
100
62
Table 412 ndash To know the opinion regarding opportunity provided by the organisation in developing skills
amp talents
S
SI No
D
Development of Skills and
Talents
N
No of Respondents
P
Percentage
1
1
H
Highly Agree
1
12
1
12
2
2
A
Agree
5
52
5
52
3
3
N
Neither Agree nor Disagree
2
28
2
28
4
4
D
Disagree
0
06
0
06
5
5
H
Highly Disagree
0
02
0
02
Total 1
100
1
100
Source survey data
Inference
From the above table it shows that 52 of employees agreed regarding opportunity provided by the organisation in developing skills amp talents
63
FIRGURE 412
REPRESENTS THE OPPORTUNITY PROVIDED BY THE ORGANISATION IN DEVELOPING SKILLS amp TALENTS
64
Table 413 ndash To know the satisfaction level of welfare facilities provided by the management
S
SI No
W
Welfare Facilities
N
No of Respondents
P
Percentage
1
1
H
Highly satisfied
0
09
9
09
2
2
S
Satisfied
5
57
5
57
3
3
N
Neither Satisfied nor Dissatisfied
2
29
2
29
4
4
D
Dissatisfied
5
05
0
05
5
5
H
Highly Dissatisfied
0
00
0
00
Total 1
100
1
100
Source survey data
Inference
From the above table it shows that 57 of the employees were satisfied with the welfare facilities provided by the management
FIGURE 413
REPRESENTS THE SATISFACTION LEVEL OF WELFARE FACILITIES PROVIDED BY THE MANGEMENT
65
Table 414 ndash To know the employee satisfaction towards the salary
Source survey data
Inference
From the above table it shows that 67 of the employees were satisfied
with their salary
FIGURE 414
REPRESENTS THE SATISFACTION TOWARDS THE SALARY
S
SI No
P
Payment Satisfaction
N
No of Respondents
P
Percentage
1
1
Y
Yes
6
67
6
67
2
2
N
No
3
33
3
33
T
otal
1
100
1
100
66
Table 415 ndash To know the employees willingness amp Commitment Towards
Organisation
Source survey data
Inference
From the above table it shows that 59 of the employees were willing to
continue in this organisation
FIGURE 415
REPRESENTS THE EMPLOYEES WILLINGNESS TO CONTINUE
S
SI No
W
Willingness to Work
N
No of Respondents
P
Percentage
1
1
Y
Yes
5
59
5
59
2
2
N
No
4
41
4
41
T
Total
1
00
1
00
67
CHI-SQUARE METHOD
The chi square test is one of the simplest and most widely used non-
parametric tests in statistical work As a non-parametric test it can be used to determine
if categorical data shows dependency or the two classifications are independent It can
also be used to make comparisons between theoretical population and actual data
when categories are used
n
Chi square χsup2= sum (O-E) sup2 E
i =1
Where O= observed frequency
E= expected frequency
68
OBSERVED FREQUENCY
Table 419 shows the relationship between the department and the job satisfaction
Over All
Job
SatisfactionHighly
SatisfiedSatisfied
Neither
Satisfied nor
Dissatisfied
DissatisfiedHighly
Dissatisfied
Sub
Total
Mechanical 5 6 14 3 2 30
Electrical 6 8 6 3 2 25
Production 9 13 7 4 2 35
Others 2 3 2 2 1 10
Sub Total 22 30 29 12 7 100
69
EXPECTED FREQUENCY
Over All
Job
SatisfactionHighly
SatisfiedSatisfied
Neither
Satisfied nor
Dissatisfied
DissatisfiedHighly
Dissatisfied
Sub
Total
Mechanical 7 8 9 4 2 30
Electrical 5 8 7 3 2 25
Production 8 11 10 4 2 35
Others 2 3 3 1 1 10
Sub Total 22 30 29 12 7 100
Null Hypothesis (Ho)
There is no significant difference between the department and the job satisfaction
Alternative Hypothesis (Ho)
There is significant difference between the job satisfaction
Co Relation
70
Chapter-V
CONCLUSIONS AND
RECOMMENDATIONS
71
CONCLUSION
On the basis of Analysis of Job Satisfaction Level of the Employees of Philips Electronics India
Ltd Mohali made in the previous chapters following conclusions are drawn
General Profile The plant of PHILIPS is ideally located in the Mohali Industrial focal point
Phase 9 near Chandigarh the capital of Punjab on a campus of 17 hectares The working
environment of the company is very healthy The visitors feel happy after the campus
Indigenous Technology PHILIPS is the only lighting manufacturing company based on purely
indigenous technology Philips was appropriately chosen as the brand name as self reliance and
building up of Indian Engineering capabilities remain the guiding spirit of PHILIPS
Financial structure PHILIPS is a low debt company signifying its dependence mainly on
its internal accruals for its financial requirements PHILIPS continues to strengthen its financial
position by channelising these internal accruals to fund its expansion programmes
Working results PTL has registered a handsome and constant growth in its profits because
of a brisk demand for new and better technology electronic items None of the other electronic
company has shown such a steady growth Philips has recorded the lowest current ratio
However with this lowest current ratio PTL still enjoys moderate payment period and highest
velocity of creditors and debtors only due to commitment of itrsquos employees
72
SUMMARY
According to the 1999 Gallup Poll the four elements that have proven to be effective in creating
employee loyalty are praise and recognition a sense of contribution to the company learning and
development and having a best friend at work
Creating a fairy-tale work environment begins withrecognition Your employees need it more
than money perks or titles Here are eight tips regarding recognition Remember these and your
employees may just start whistling while they work It is up to me The corporate culture or
financial rewards will not make your team successful It is up to you Recognition is one thing
that is completely in your control
Strong relationships are vital in todays economy Strengthening employee relationships is even
more necessary as companies downsize and lay off As your workforce shrinks and you need to
do more with less keeping quality employees becomes even more critical As a manager it is
your job to bond your best people to your company through recognition And you also must help
direct and motivate your core performers
Simple rewards earn big returns There are some relatively simple things you can do that will
earn big returns For example remember your employees birthdays and work anniversaries find
out what inexpensive rewards they value (for example tickets to a ball game or a half day off to
spend time with their kids) make the most of your formal service awards with some preparation
and a group presentation walk around your department every day and talk to your
people and thank them sincerely and often
73
Make it specific Praise and recognition must be specific to have impact General praise such as
You do great work actually can have the opposite effect and leave your employees wondering
Does he have any idea what I really do around here Specific praise links individual
accomplishments to company goals For example Cheryl I noticed the way you handled that
customer complaint Great work As you know we value quick resolutions of problems as
one of our core strategies
Ask the best to stay Call your best people into your office one at a time Let that bright young
college graduate know you value his fresh ideas and energy Tell the 20-year veteran how much
your team relies on her expertise and organizational skillsRemarkably a significant percent of
high-impact performers report that they left their last job because No one ever asked me to
stay
Forget cash
Remember the saying Money cant buy everything Well its true Dont wait until you can
offer an employee a raise or promotion Real thanks is its own reward In numerous surveys of
work satisfaction top on employees lists is feeling appreciated In fact when employees feel
recognized and involved they are much less likely to keep asking about money
Recognize
Recognition means most to an employee when it is sincere and spontaneous According to the
largest study ever conducted on workplace satisfaction (Gallup 1999) recognition should occur
at least every seven days If you wait until a year-end party or an annual review you are waiting
much too long to recognize and you probably are losing people you do not need to
74
Recognition works
Neglect can be a poisoned apple Recognition is the elixir that will spark better attitudes and
performance Jeffrey Pfeffer of Stanford University says The returns from managing people in
ways that build high commitment typically are on the order of 30 to 50 percent
Take a hard look in the mirror and ask yourself how you can recognize the fairest of them all
Learn to recognize your employees for their efforts thank them often and reward their
achievements You can awaken them from their anger and apathy and they will fall in love with
their jobs again Chances are you will work together happily ever after
So there is direct relation with employee satisfaction and their commitment towards the
organization and it is also clear from the above discussion that only monetary elements are not
sufficient for employee satisfaction rather other element like employer behavior recognisation
and other moral value
75
RECOMMENDATIONS
PHILIPS should increase its capacity utilization It should work at full capacity to
minimize its cost of production With this increase in capacity utilization the total cost
will spread over more units thereby decreasing the per unit cost
PHILIPS should decrease the credit facilities provided to its consumers The payback
period is quite high in case of debtors as compared to creditors it should be more or less
equal as it will help in improving company liquidity
PHILIPS should focus more on the consumer lifestyle goods in India parallel to its other
business as it accounts very less as compare to other businesses of Philips
Another recommendation for Mohali plant is about the HR department that is they
should appoint permanent and skilled workers as against casual workers which generally add
up to the profit of the company
76
BIBLIOGRAPHY
1 Values-Based Leadership Rebuilding Employee Commitment Performance and Productivity ( Thomas D Kuczmarski)
2 Monthly Journals of Philips Electronics India Ltd
3 Authentic Leadership Medtronic CEO Bill George
4 wwwindiaphilipscom
5 wwwwikipediacom
6 httpwwwemployeecommitmentcom
7 One Foot Out The Door How to Combat The Psychological Recession Thatrsquos Alienating Employees And Hurting American Business Judith Bardwick
8 Employee Commitment A Leader Ship Guide Joe Folkman
9 Harvard University Factors that Impact Employee Well Being Commitment and Productivity -An Article
77
Questionnaire
Name __________________________________________________________
Age______________________________ Gender _______________________
Qualification _______________________ Contact No ___________________
Q1 In which department you are working
Electrical Production Mechanical Other
Q2 What is your working experience
gt2 Years 2-4 Years 4-6 Years lt 6 Years
Q3 How You like the physical Working Environment of the organization
Excellent Good Fair Poor Very Poor
Q4 Are you satisfied with Non-Monitory benefits provided by the organisation
Highly Satisfied Satisfied Neither Satisfied Nor dissatisfied
Highly Dissatisfied Dissatisfied
Q5 Are you satisfied with your work
Highly Satisfied Satisfied Neither Satisfied Nor dissatisfied
Highly Dissatisfied Dissatisfied
Q6 Are you satisfied with the career development programe of the company
Highly Satisfied Satisfied Neither Satisfied Nor dissatisfied
Highly Dissatisfied Dissatisfied
Q7 Is other staff of the organization is co-operative with you
Highly Satisfied Satisfied Neither Satisfied Nor dissatisfied
Highly Dissatisfied Dissatisfied
Q8 Are you satisfied with top level management
Highly Satisfied Satisfied Neither Satisfied Nor dissatisfied
Highly Dissatisfied Dissatisfied
78
Q9 Are you satisfied with your subordinates
Highly Satisfied Satisfied Neither Satisfied Nor dissatisfied
Highly Dissatisfied Dissatisfied
Q10 Are you satisfied with the nature of the Job
Highly Satisfied Satisfied Neither Satisfied Nor dissatisfied
Highly Dissatisfied Dissatisfied
Q11 Do you have any Job Pressure in work
Yes No
Q12 Do you satisfied with the opportunities provided by the organisation
Highly Satisfied Satisfied Neither Satisfied Nor dissatisfied
Highly Dissatisfied Dissatisfied
Q13 Are you satisfied with the welfare facilities provided by the organisation
Highly Satisfied Satisfied Neither Satisfied Nor dissatisfied
Highly Dissatisfied Dissatisfied
Q14 Are you satisfied towards your salary
Highly Satisfied Satisfied Neither Satisfied Nor dissatisfied
Highly Dissatisfied Dissatisfied
Q15 Are you committed towards the organisation
Yes No
Signature
2
COMPANY PROFILE
MISSION amp VISION
Mission
Improve the quality of peoplersquos lives through timely introduction of meaningful innovations
Vision
ldquoIn a world where complexity increasingly touches every aspect of our daily lives we will lead
in bringing sense and simplicity to peoplerdquo
VALUES
Delight Customers
Deliver great results
Develop people
Depend on each other
GOALS amp OBJECTIVES
Delight Customers
We anticipate and exceed customer expectations
We demonstrate Passion for Philips and sense and simplicity
We create superior customer experiences based on deep insights
We act as One Philips ambassadors all the time
3
Deliver great results
We continually raise the bar
We play to win big and always set ambitious targets
We challenge the status quo and experiment with new ways
We take clear decisions and implement with speed and discipline
Develop people
We get the best from ourselves and each other
We attract the best players to create strong and diverse teams
We take risks by giving people stretch assignments to accelerate their development
We personally invest significant time to coach and recognize people
Depend on each other
We deliver more value by working as One Philips
We think as One Philips and act as owners
We trust and empower each other to contribute our best
We team up and allocate resources to the most promising opportunities
4
HISTORY
When Philips started manufacturing incandescent lamps in 1891 there was already a
separate industrial research laboratory outside the factory a concept virtually unknown
elsewhere In 1913 another major step was taken with the opening of a physics laboratory
(the Nat Lab) Under the leadership of Dr Gilles Holst the Philips Research organization
became a major center of technical competence and innovation
From 1914-1945
1914 to 1945 saw considerable growth and diversification Improvements were made to the
incandescent lamp and gas discharge lamps proved more efficient in generating light
Meanwhile our bulb expertise led to new products such as the X-ray tube and the radio valve
The invention of the pentode gave Philips an important patent in radio In 1923 Philips decided
to become a systems supplier instead of a components company and consequently the research
organization broadened its scope into radio as well as television
1945-1970
After World War II there was a period of expansion The sky was the limit Television built on
research carried out in the 30s became a mass-produced consumer phenomenon The invention
of the transistor by Bell Labs changed the world of electronics forever We built up a strong
patent position in magnetic materials and contributed many breakthroughs such as the LOCOS
process (LOCal Oxidation of Silicon) used in every modern Metal-Oxide-Semiconductor
(MOS) IC the rotary heads for the Philishave electric shaver (1950s) and the compact audio
cassette (1963) a breakthrough in audio recording Research laboratories in England France
Germany and the USA were founded
5
1970-today
From 1970 to the present day our research has been tied much more closely to our industrial and
business activities This resulted in revolutionary developments such as the introduction of the
CD the DVD and Blu-ray Disc In the medical sphere we made great strides forward in
magnetic-resonance imaging and ultrasound and with our increasing focus on health and well-
being these developments are still ongoing in 2006 we saw the first commercial launch of a 3D
scanner
In that same year we sold 80 of our Semiconductors business as a new independent company
NXP was created We also adopted Open Innovation as our way of working the High Tech
Campus Eindhoven was opened up to external companies
At Philips Research we continue to focus on meaningful innovations that improve peoplersquos
lives Ambilight for example has brought a whole new dimension to TV viewing and in 2007
we developed Lumiramic ndash a groundbreaking new phosphor technology for energy-efficient
white LEDs ndash together with our partners
The future of Philips Research
Philips Research will remain an important driving force in realizing Philipsrsquo vision to become an
even more market-driven and people-centric health and well-being company We do this by
continually evaluating key issues and trends in society to ensure that peoplersquos needs are at the
heart of our innovations now and in the future
Royal Philips Electronics of the Netherlands is a diversified Health and Well-being
company focused on improving peoplersquos lives through timely innovations As a world leader in
healthcare lifestyle and lighting Philips integrates technologies and design into people-centric
6
solutions based on fundamental customer insights and the brand promise of ldquosense and
simplicityrdquo
Headquartered in the Netherlands Philips employs approximately 121000 employees in more
than 60 countries worldwide With sales of EUR 26 billion in 2008 the company is a market
leader in cardiac care acute care and home healthcare energy efficient lighting solutions and new
lighting applications as well as lifestyle products for personal well-being and pleasure with
strong leadership positions in flat TV male shaving and grooming portable entertainment and
oral healthcare
Philips Electronics India Limited
Philips Electronics India Limited a subsidiary of the Netherlands-based Royal Philips
Electronics is the leading Health and Wellbeing company Today Philips is a simpler and more
focused company with global leadership positions in key markets of Healthcare Lighting and
Consumer Lifestyle addressing peoplersquos Health and wellbeing needs and aspirations as its
overarching theme
As one of the nations most well-known and well-loved brands Philips is a part of practically
every Indians life With recent launch of Philips Respironics product categories in obstructive
sleep apnea management and home respiratory care home decorative lighting range and ALU
range Philips products find use in virtually every aspect of an individualrsquos daily life 24X7 - at
home at work on the move and at rest Philips stands as a source of easy to use trendy and
innovative internationally acclaimed products with superior design and technology that enhance
the quality of consumers professional and personal lives
Philips has been operating in India for over 75 years and employs over 4500 employees around
7
the country The company has an excellent pan India distribution and after-sales service network
BUSINESSES
Lighting
Philips Electronics India Indiarsquos largest lighting company operates in business areas of Lamps
Luminaires Lighting Electronics Automotive and Special Lighting Today as global leader in
Lighting Philips is driving the switch to energy-efficient solutions With worldwide electrical
lighting using 19 per cent of all electricity the use of energy-efficient lighting will significantly
reduce energy consumption around the world and thereby cut harmful CO2 emissions Philips
India has been consistently working with industry bodies such as ELCOMA Bureau of energy
efficiency and NGOs towards addressing Indiarsquos power crisis through promotion of energy
efficient lighting in India
Philips provides advanced energy-efficient solutions for all segments road lighting office amp
industrial hospitality and home Philips is also a leader in shaping the future with exciting new
lighting applications and technologies such as LED technology which besides energy
efficiency provides attractive benefits and endless new lsquonever-before-possiblersquo lighting
solutions
In 2008 Philips inaugurated a global research and development (RampD) centre for lighting
electronics in India This was its third such unit in the world The facility which is situated in
Noida will not only cater to the needs of the Indian market but also the Asia-Pacific Europe and
North America The other RampD centres are located at Eindhoven in the Netherlands and in
Shanghai China One of the primary research areas for the centre is to develop products that can
8
tackle high voltage fluctuations in India The centre currently employs 35 engineers Around 40
per cent of Philipsrsquo revenue in India comes from the lighting business
Consumer lifestyle
Guided by the brand promise of ldquosense and simplicityrdquo and the consumer insights Philips
Consumer Lifestyle offers rich new consumer experiences that meet consumersrsquo desire for
relaxation and improving their state of mind Philips also responds to the consumers desire for
wellness and pleasure by introducing products that meet the individualrsquos interests in terms of
their mind space body and appearance
The Consumer Lifestyle arm in India operates in the business areas of Home Entertainment
solutions and Personal Infotainment with product categories such as TVs home theatre systems
music systems DVD players personal entertainment solutions sound accessories Domestic
Appliances and Personal care
Philips Innovation Campus (PIC)
Philips Innovation Campus (PIC) Bangalore is a division of Philips Electronics India Limited
which is owned 96 by Royal Philips Electronics NV The Netherlands It was established in
August 1996 with a vision to be an innovation hub creating next generation solutions and
products for Healthcare and Lifestyle With the objective of meeting the growing need for high-
quality cost-effective software development capacity within the organization PICrsquos share has
increased significantly from 8 in 1998 to around 20 in 2008
9
Working at PIC are about 1000 of the industrys finest professionals using state-of-the-art
software engineering paradigms and platforms including real-time systems component-based
software engineering and multi-threaded architecture to drive the creation of tomorrows
products and services PIC is an ISO 9001Tick IT SEI CMM SM level 5 company amp has
emerged as a critical partner in the development of strategic amp futuristic technologies for Philips
worldwide 60000 registered patents illustrate the innovative nature of the company Philips has
adopted an Open Innovation strategy which leverages the joint innovative power of partnering
companies and researchers to bring more innovations to the market effectively and faster PIC
has built-up extensive know-how and expertise in the software engineering and technology
domains relevant to its business In addition competencies in the areas of project management
requirement engineering and quality assurance have been established to offer customers products
and services of the highest quality at the fastest time-to-market and the lowest cost of
ownership
RESEARCH AND DEVELOPMENT
Since its foundation 100 years ago Philips Research has been at the forefront of fundamental
scientific research But with market focus being more and more important across almost all
corporate RampD organizations is this still the case If some of the pioneering work being done
by scientists across Research is anything to judge by the answer is a resounding ldquoyesrdquo
Itrsquos different at the cutting edge
In todayrsquos market-focused corporate RampD organizations the boundary between fundamental
scientific research and applied research is becoming increasing blurred ndash particularly when it
comes to some of the most exciting areas of research ldquoHere at Philips our way of working is
very dynamicrdquo says Philips Researchrsquos Chief Science Officer Emile Aarts ldquoThis means that you
10
can apply both the lsquofundamentalrsquo and the lsquoappliedrsquo labels to many of the projects that wersquore
working on because they are both very flexible termsrdquo Philips Researchrsquos work on sleep for
instance is an excellent example of this more dynamic approach ldquoThis is a very important area
for Philips ndash but therersquos currently very little fundamental knowledge available Thatrsquos why wersquore
involved in investigating the key issues at a more fundamental level together with our university
and research institute partners The only difference is that we want this research to lead to
marketable products and solutionsrdquo
Open Innovation in new areas
Despite the flexible nature of the ldquofundamentalrdquo and ldquoappliedrdquo labels it is still possible to detect
a decline in some areas of more fundamental research at Philips in recent years ldquoThis has mainly
occurred in fields that donrsquot support the execution of our companyrsquos Health and Well-being
strategyrdquo says Aarts As he explains this refocusing exercise has gone hand-in-hand with an
expansion of more fundamental research activities in a number of new fields such as deep-brain
stimulation and multi-modal imaging for healthcare applications ldquoIn these fields wersquore
considered to be an extremely important research partner ndash especially by colleagues working in
universitiesrdquo In the future Philips Research will continue to develop its reputation in a number
of exciting fundamental domains ndash ldquogreen lightingrdquo and skincare are just two examples ndash albeit
with a more applied focus ldquoHopefully this research will enable us to build on our strong
heritage of improving the quality of peoplersquos lives
11
BOARD OF DIRECTORS
Non-Executive Director amp Chairman S M Datta
Executive Vice Chairman amp Managing Director Murali Sivaraman
Executive Director Jan-Hein Louwman
Non-Executive Director S Venkatramani
India Management Team
MURALI SIVARAMANN - CEO
ANJAN BOSE - Healthcare
JAN-HEIN LOUWMAN ndash CEO
MAHESH KRISHNAN ndash Consumer lifestyle
RAJEEV CHOPRA ndash lighting
RAKESH SHARMA ndash Strategic Business Development
S NAGARAJAN ndash Human resources
VIVEK SHARMA ndash Chief Marketing Officer
WIDO MENHARDT ndash Philips Innovation Campus
12
Corporate Office-
Philips Electronics India Ltd
Technopolis Knowledge Park
Mahakali Caves Road
Chakala Andheri (East)Mumbai 400 093
Tel +91 22 66912000
VISION 2012
Through the Vision 2012 strategy we aim to fuel growth by making Philips the leading brand in
Health and Well-being Vision 2012 further positions Philips as a market-driven people-centric
company with a strategy and a structure that fully reflect the needs of its customer base while
also increasing shareholder value This is implemented through sharpened strategies in the three
core sectors Healthcare Lighting and Consumer Lifestyle
ldquoWith Vision 2010 we are putting people right at the center of things with Health and Well-
being as our overarching theme We are thereby putting into practice our mission improving the
quality of life through the introduction of meaningful innovationsrdquo ndash Gerard Kleisterlee
President and CEO of Royal Philips Electronic
Our Ways of Working
1 We are a people-centric company that organizes around customers and markets
2 We invest in a strong brand and consistently deliver on our brand promise of ldquosense and
simplicityrdquo in our actions products and services
13
3 We deliver innovation by investing in world class strengths in end-user insights
technology design and superior supplier networks
4 We develop our peoplersquos leadership talent and engagement and align ourselves with high
performance benchmarks
5 We invest in high growth and profitable businesses and emerging geographies to achieve
market leadership positions
6 We are committed to sustainability and focus on making the difference in efficient energy
use
7 We drive operational excellence and quality to best in class levels allowing us the above
mentioned strategic investments in our businesses
BRAND PROMISE
It is the combination of two unique capabilities that enables us to deliver on our ldquosense and
simplicityrdquo promise These capabilities are firstly by understanding people and secondly
technology integration and product design
We put our end users front and center of product innovations starting with understanding their
needs and aspirations We use best-in-class research facilities and agencies to validate and ensure
that our product innovations are designed around peoplersquos needs and aspirations easy to
experience and advanced
SUSTAINABILITY
14
In 2009 we evaluated our sustainability strategy and resolved to fully leverage sustainability as
an integral part of our overall strategy and an additional driver of growth as reflected in the
Philips Management Agenda 2012
To deliver on our brand promise of ldquosense and simplicityrdquo and at the same time provide the
company direction for the longer term in this area we have identified three sustainability
leadership key performance indicators where we can bring our competencies to bear lsquocarersquo
lsquoenergy efficiencyrsquo and lsquomaterialsrsquo including targets for 2015
Bringing care to more than 500 million people
Target 500 million lives touched by 2015
Improving energy efficiency of Philips products
Target 50 improvement by 2015 (for the average total product portfolio) compared to
2009
Closing the materials loop
Target Double global collection recycling amounts and recycled materials in products
by 2015 compared to 2009
Each sector will take the lead on one of the leadership key performance indicators with
Healthcare leading lsquocarersquo Lighting lsquoenergy efficiencyrsquo and Consumer Lifestyle lsquomaterialsrsquo
In addition we defined a set of complementary performance indicators to accelerate change and
drive performance including the EcoVision4 parameters
With EcoVision4 we have committed to the following by 2012
15
bull Generate 30 of total revenues from Green Products
bull Double investment in Green Innovations to a cumulative EUR 1 billion
bull Improve our operational energy efficiency by 25 and reduce our CO2 emissions by 25 all
compared with the base year 2007
SOCIAL COMMITMENT
Living up to this commitment means we use our capabilities to enhance the lives of our
employees and people in society at large Within the company we encourage teamwork and
collaboration in an environment that enables employees to reach their full potential
Building on our rich heritage of involvement in social issues we have established our own
approach of supporting the communities where we live and work focusing on energy efficiency
and healthcare
Sustainable lighting
There is a pressing need to find innovative lighting solutions for the 16 billion people who live
in areas with no access to the electricity grid or where the grid is unreliable Thatrsquos why we have
developed SMILE (Sustainable Model in Lighting Everywhere)
Launched as a pilot in 2006 in four Indian states SMILE includes two lighting solutions UDAY
a rechargeable portable lantern and KIRAN a hand-cranked LED flashlight Today are
distributed in eighth Indian states
16
SWOT ANALYSIS
Strengths
bull India was a market where the first mover enjoyed advantages over latecomers
bull The first image of the product lasted long in the eyes of the consumer and the first to enter the
market could gain the largest market share
bull PHILIPS is committed to enhance its image to the Chinese market as investors
bull PHILIPS was building a wholly owned manufacturing plant in India to show the
Chinese the commitment Korea had to the Chinese society
bull Labor costs in India were less and would defray the cost of producing high-end
bull Samsung has been making color TVs for many years in Korea before moving to the Chinese
market
Weaknesses
bull PHILIPS must continue to control all costs to maintain success
bull India has a reputation of being a protected market (protectionism)
bull India was a market where the first mover enjoyed advantages over late comers PHILIPS is
trying to overcome the first comer advantage Japan manufacturers have over them by being those
first comers
bull Companies such as Sony and Matsushita had built sales and service networks that were
favorable to their sales programs in India while Samsung would have to catch up in that area
17
bull Samsung is not as experienced in manufacturing high-end TVs for a higher-end market
segment
Opportunities
bull Based on the data that on 28 of the 220 million rural households own a color TV PHILIPS
focus on the domestic India market should be to penetrate the rural household market which
would mean that for those purposes the low-end production of sets in the 13rdquo to 20rdquo range should
be produced to appeal to that segmentrsquos purchasing ability
bull Larger more high-end models can be produced to appeal to an urban customer in India as well
as being an export to the US and European higher end customers
bull With success in the higher-end manufacturing and sales of premium TVs in India PHILIPS can
establish themselves as high-end producers around the world
Threats
bull PHILIPS faces intense competition in the color TV market
bull A premium-priced product wouldnrsquot sell in large volumes so pricing can be a problem
bull Since PHILIPS didnrsquot have an established marketing strategy issues of how to market the
product may arise
bull Loss of profitability because related to over-employment at most facilities
bull Is the per capita income level such that it can support sales of product at any level
bull If PHILIPS fails to be successful in the Chinese market with high-end product it will be known
around the world bull India was a market where the first mover enjoyed advantages over late
comers
bull The first image of the product lasted long in the eyes of the consumer and the first to enter the
18
market could gain the largest market share
bull PHILIPS is committed to enhance its image to the Chinese market as investors
PHILIPS ELECTRONICS MOHALI PLANT
The mohali plant was established in 1985 as PUNJAB ANAND LAMP Ltd as its second
division of lamp industry after the varodra plant at that time it was a joint stock company and
majority of shares was with Punjab Anand Lamp around 75 but in the year 2001 the company
ownership changed and the whole shares was bought by PHILIPS ELECTRONIC INDIA Ltd
and its name was changed to PHILIPS ELECTRONIC INDIA Ltd MOHALI LIGHT
FACTORY
The plant is situated in Industrial focal point PHASE-9 MOHALI near Mohali railway station
and is sreaded in 26 acres Total employees of tis plant is 532 including casual employees This
company is a landmark in the Punjab state as it is the only factory which is most profitable one
than any industry located in Punjab
19
OVERVIEW OF VARIOUS FRONTS OF
PHILIPS ELECTRONICS INDIA Ltd
Manufacturing-
Today the product range of Philips include the following products ndash
Televisions- LCD Plasma Flat Screen Smart Touch XL
Recorders DVD Players I pods and Home Theatre Systems
Audio Products - Audio Systems Remote Controls AudioVideo Accessories
Digital Photo Products and Frames
Portable Audio and Video Systems Accessories like Headphones and Speakers
PC Products - Mouse and Keyboard Multi Media Headsets External Hard Disk Drives
Mobile Phones
Male Shaving and Grooming - Dry Shavers Beard Trimmers
Personal Care - Beauty and Hair Care Products
20
Kitchen Appliances - Blenders and Hand Blenders Juicers and Citruspresses Food
Processors and Mixers Coffee Makers and Kettles Frying and Grilling Appliances
Toasters and Snacking Products
Household Products - Irons Vacuum Cleaners Water Purifiers
Professional Lighting - Industrial Shops and offices Road and Area Hospitality Sports
Lighting City Beautification and Petrol Stations
Automotive Lighting - In Cars Motorcycles and Trucks
Home Lighting
SERVICS
Philips E-waste Management Program in India
Philips has tied up with a recycler for collecting transporting and recycling unwanted broken
down consumer products
At Philips we offer consumers a convenient way of recycling their unwanted obsolete and
damaged Philips products by dropping them off at convenient locations The program
encompasses 8 major cities across India Consumers can approach one of 27 authorized Philips
service centres which will act as collection points for consumer products which need recycling
Our efforts are to expand the network in the near future
Philips ensures that the consumer products received will be recycled in an environment-friendly
manner Philips understand the corporate social responsibility and takes steps towards providing
a safer environment to the future generations We design our products to continuously realize
improvements and reduce their overall life cycle environmental impact Designing products for
21
recycling is an integral part of this approach Our aim is to use our planetrsquos limited resources
effectively and respect the principle of extended producer responsibility This also calls for
manufacturers to engage in developing solutions for effective and efficient recycling of their
products We will continue to promote and invest into improved recycling systems to reduce the
impact of electronic waste on the environment
MANUFACTURING AT MOHALI PLANT ndash
Mohali plant mainly manufactures lighting products basically of domestic usage this includes the
following products ndash
CFL bulbs ndash
1 Genie - 5 watt 8 watt 11 watt
2 Essential ndash 8 watt 11 watt 14 watt 18 watt 23 watt 29 watt
3 Tornado ndash 5 watt 8 watt 11 watt 14 watt 18 watt 23watt 29 watt
4 T5 slim tube 28 watt
Coil plant ndash Philips Electronics India is the only company that produces coils in the whole
lighting industries in the world and in India only at the MOHALI PLANT
22
Chapter-II
OBJECTIVES OF THE STUDY
23
OBJECTIVES OF THE STUDY
To study the various aspects of Satisfaction Level of the Employees working at Philips
Electronics India Ltd Mohali
To analyze the effect of Job satisfaction on the organisation
To determine the relation between job satisfaction of employees and their commitment
towards the organisation
To analyze the performance model adopted by the Philips Electronics India Ltd Mohali
to handle their manpower
To suggest remedial measures for the improvement of the companyrsquos performance
24
Chapter-III
Employees Commitment
25
Employees who are engaged in their work and committed to their organizations give companies
crucial competitive advantagesmdashincluding higher productivity and lower employee turnover
Thus it is not surprising that organizations of all sizes and types have invested substantially in
policies and practices that foster engagement and commitment in their workforces
But what are employee engagement and commitment exactly This report examines the ways in
which employers and corporate consultants define these terms today and offers ideas for
strengthening employee engagement Though different organizations define engagement
differently some common themes emerge These themes include employeesrsquo satisfaction with
their work and pride in their employer the extent to which people enjoy and believe in what they
do for work and the perception that their employer values what they bring to the table The
greater an employeersquos engagement the more likely he or she is to ldquogo the extra milerdquo and deliver
excellent on-the-job performance In addition engaged employees may be more likely to commit
to staying with their current organization Software giant Intuit2 for example found that highly
engaged employees are 13 times more likely to be high performers than less engaged
employees They are also five times less likely to voluntarily leave the company
Clearly engagement and commitment can potentially translate into valuable business results for
an organization To help you reap the benefits of an engaged committed workforce at your
organization this report provides guidelines for understanding and measuring employee
engagement and for designing and implementing effective engagement initiatives As you will
26
see everyday human resource practices such as recruitment training performance management
and workforce surveys can provide powerful levers for enhancing engagement
Employee Engagement Key Ingredients
ldquoEmployee Engagement Definedrdquo shows examples of engagement definitions used by various
corporations and consultancies Clearly definitions of employee engagement vary greatly across
organizations Many managers wonder how such an elusive concept can be quantified The term
does encompass several ingredients for which researchers have developed measurement
techniques These ingredients include the degree to which employees fully occupy themselves in
their work as well as the strength of their commitment to the employer and role Fortunately
there is much research on these elements of engagementmdashwork that has deep roots in individual
and group psychology
Definition
ldquoNo company small or large can win over the long run without energized employees who
believe in the [firms] mission and understand how to achieve it Thats why you need to take the
measure of employee engagement at least once a year through anonymous surveys in which
people feel completely safe to speak their mindsrdquo
-Jack and Suzy Welch-
Common Themes How Companies Measure Engagement
Employers typically assess their employeesrsquo engagement levels with company-wide attitude
or opinion surveys
27
1048657 Pride in employer
1048657 Satisfaction with employer
1048657 Job satisfaction
1048657 Opportunity to perform well at challenging work
1048657 Recognition and positive feedback for onersquos contributions
1048657 Personal support from onersquos supervisor
1048657 Effort above and beyond the minimum
1048657 Understanding the link between onersquos job and the organizationrsquos mission
1048657 Prospects for future growth with onersquos employer
1048657 Intention to stay with onersquos employer
The Link Between Employer Practices and Employee Engagement
How does an engaged workforce generate valuable business results for an organization The
process starts with employer practices such as job and task design recruitment selection
training compensation performance management and career development Such practices affect
employeesrsquo level of engagement as well as job performance Performance and engagement then
interact to produce business results Figure 1 depicts these relationships
28
EMPLOYEE COMMITMENT EMPLOYEE ENGAGEMENT
1048657 How do you and other managers in your
organization define commitment
1048657 Are some employees in your company
engaged in their work but not committed to
the organization Committed to staying with
your firm but not exactly engaged in their
work Both engaged and committed
1048657 To whom are your organizations employees
committed The company Their supervisor
Co-workers Team members Customers
1048657 What business results has commitment from
1048657 How do you and other managers in your
organization define employee engagement
1048657 How do you know that certain employees in
your company are engaged Do they relish
their jobs Enjoy specific responsibilities or
tasks Willingly ldquogo the extra milerdquo
1048657 In teams departments or business units in
your company that have a large number of
engaged employees what business results
are you seeing Higher productivity Lower
costs Greater revenues More efficiency
29
employees created for your organization For
example has commitment reduced turnover
and therefore decreased recruitment hiring
and training costs
1048657 What does your company do to reciprocate
employees commitment Is the organization
living up to its side of the bargain
Lower turnover Higher product or service
quality
1048657 Conversely how do disengaged employees
behave and what are the consequent costs
for their teams units-and your entire
company
As Figure 2 suggests a person possesses attributes such as knowledge skills abilities
temperament attitudes and personality He or she uses these attributes to accomplish work
behaviors according to organization-defined procedures by applying tools equipment andor
technology Work behaviors in turn create the products and services that make an organization
successful We classify work behaviors into three categories those required to accomplish duties
and tasks specified in a job description (prescribed behaviors) ldquoextrardquo behaviors that an
employee contributes for the good of the organization (voluntary behaviors) and behaviors
prohibited by an employer (proscribed behaviors including unexcused absenteeism stealing and
other counterproductive or illegal actions) Of course job performance occurs in an
organizational context which includes elements such as leadership physical setting and social
setting
30
Employers naturally want to encourage workers to perform prescribed and voluntary activities
while avoiding proscribed ones To achieve these goals organizations use a number of HR
practices that directly affect the person process and context components of job performance
Employeesrsquo reactions to these practices determine their levels of engagement and commitment
31
Chapter-IV
32
LITERATURE OF THE REVIEW
ldquo Job Satisfaction That Leads To The Commitment Of
The Employees in The Organisationrdquo
Literature of Review
Gerge Bill Authentic Leadership
In his book Authentic Leadership former Medtronic CEO Bill George makes an obvious
point that business leaders rarely say out loud ldquoMissions motivate dollars donrsquotrdquo
What he means is that purpose is what drives employee commitment not the financial
rewards that come to others Workers donrsquot get up in the morning and say ldquoGee I can
33
hardly wait to get to work today to maximize shareholder profitsrdquo Even when employees
are shareholders who can benefit from improved financials what draws people to their
chosen careers is the work itself and its purpose in the world more than the profit
possibilities
Mr George goes on to say ldquoI find there is universal agreement (among middle managers)
that you cannot inspire employees by urging them to help management get the companyrsquos
stock price uprdquo
There is in fact quite a bit of literature on this subject In Awakening Corporate Soul
authors Eric Klein and John Izzo say that employee commitment requires knowing ldquothe
purpose of our work it means recognizing the purpose our organization fulfills that goes
beyond the bottom line and it means articulating to others how their (workersrsquo) efforts
contribute to a larger purposerdquo
In Built to Last Jim Collins and James Porras spend an entire book explaining their five
year research study of major companies that led to this conclusion about employee
commitment Purpose within a company is what sustains it profit is important but when
itrsquos the prime directive companies falter
-Marshal Goldsmith-
How to Increase Employee Commitment
In practice this involves walking the talk being transparent communicating effectively treating
people equally teaching leading subordinates to increasingly excellent performance ndash and
responding to subordinates as mature individuals who are owed fairness the truth and
recognition of their achievements
34
Since managers interact directly and frequently with subordinates they are usually more tuned
in to how employees are feeling than are executives Managers are in a better position to know
for example when employees are feeling alienated and disengaged from their work which is
very common today -- and expensive
Gaining employee commitment results in greater profits because enthusiastic employees stay
contribute discretionary effort and engage customers Performance soars when customers are
enthused and stay and when executives managers and employees are a collaborative team
united in achieving common goals
But managers are often called middle managers for good reason their job is to motivate and
guide subordinates while they at the same time are being judged by their bosses Because of
their ldquotweenrdquo position in the hierarchy managers to effective support direct reports must also
create relationships with potential allies especially those with greater power who have access to
top decision makers
Harvard University Factors that Impact Employee Well Being Commitment and
Productivity
Business executives from the C-suite and HR to QC and RampD are by nature focused on the
corporate bottom line A new trend in our dawning age of social sustainability is that many
experts believe more attention should be paid to the dotted line - the one signed when a person
35
commits to employment at a company New Harvard research validates this approach affirming
that trust and purpose play a significant role in building successful productive workplaces
The behavioral research conducted by a team at Harvard University and Massachusetts General
Hospital identifies the factors most likely to impact 21st century employee well being
commitment and productivity The researchers found that commitment is largely influenced by
ones sense of purpose feeling of personal impact and overall trust in the organization
Productivity is largely affected by the quality of human relationships including cooperative
social group moods and interaction
The results lead us to conclude that workplaces that provide positive environments that foster
interpersonal trust and quality personal relationships create the most committed and productive
employees says Nancy Etcoff PhD the lead researcher on the study
Expert Shares Keys to Building Successful Workplace Relationships
According to business strategist Courtney Anderson JD MBA Outstanding leadership
today means much more than just doing your job Success is creating an environment that fosters
happy committed productive team members
Anderson explains that reinvigorating workplaces by enhancing trust and employee commitment
does not have to be difficult The biggest challenge she says is making the time to truly change
in our overscheduled instant access competitive work environments With a little know-how it
can be easy to evolve workplace well being and respond to these compelling research results
-Mark Howell-
CEO Bright Point
High-performing companies recognize that employee commitment is a major contributing factor
toward sustaining long-term success and creating value An engaged employee is involved and
excited about their work and acts in a manner that will forward the organizationrsquos interest An
36
engaged workforce helps optimize and retain talent for the long-term because the employees
choose to stay even when other employment alternatives exist
According to Walker Information the top three drivers of employee commitment are
Satisfaction Fairness and Care amp Concern for employees Put simply committed employees
want to enjoy their work feel they are appreciated and know they are making a contribution to
their companyrsquos strategic objectives Additionally employees who have trust in their leadership
and are trusted by their leadership have a greater dedication and are ultimately more productive
on the job However according to recent data provided by the National Business Research
Institute (NBRI) only 31 of all employees are truly engaged
At BrightPoint we take employee engagement seriously and we work to create a culture that
inspires employee loyalty and satisfaction The results of BrightPointrsquos commitment to its
employees are shown in the 2011 BPNA Employee Commitment Survey The survey
determined that close to 80 of respondents indicated they were satisfied with their jobs and
daily activities General employee satisfaction increases when managers take an active interest
in their employees beyond their day-to-day job responsibilities According to NBRI managers
that actively coach build relationships and keep an open dialogue with their employees improve
employee engagement
We have a diverse workforce where each employee brings unique value and has individual
needs Managers are learning to manage the individual and not the position In order to give
managers the tools they need to be successful BrightPoint places strong emphasis on targeted
leadership training workshops and continual learning resources In 2011 906 of managers at
BrightPoint NA participated in the development opportunities offered and also made an effort to
37
help reinforce the learning of their team members This signals that our leadership team is taking
an active interest in professional development and its connection to employee commitment
As BrightPoint continues to increase focus on employee engagement the organization will grow
stronger and maintain a substantial advantage over our competition Our employees possess the
knowledge experience and resiliency to respond quickly to the demands of the marketplace and
through their genuine commitment will deliver what our customers want with increasing
efficiency and effectiveness Our responsibility is value-creation by growing our business and
maintaining high levels of customer service and loyalty We believe the best way to accomplish
this is through a strong committed and engaged workforce
Performance Model Adopted At Mohali Plant
38
Process adopted by Philips Electronics Mohali Plant for Job Satisfaction of Employee that leads commitment of the employees
39
Recruiting
The messages in Philips Electronics Mohali organization conveys while seeking to attract job
applicants also can influence future employeesrsquo engagement and commitment If your firm has
designed jobs specifically to engage employees then organization want to ensure that recruiting
ads extol these positionsrsquo attractive featuresmdashsuch as challenging work assignments a highly
skilled team environment or minimal supervision Applicants who notice and respond to these
ads will more likely be motivated by these features Also consider how organization might best
seek candidates from inside your organization When Organisation recruit existing employees for
desirable jobs you enhance their engagement (by maximizing the person-job fit) and
commitment (by providing growth and advancement opportunities to employees in return for
their loyalty) If Organisation recruit from outside when qualified internal candidates are
available Organization may unwittingly suggest to current employees that your company is not
willing to reciprocate their commitment Existing staff may then begin questioning their own
commitment to the firm By contrast organisation recruit external candidates to both the job and
your organization For these candidates ensure that recruiting messages highlight attractive job
features organizational values and commitment reciprocity That is in return for performance
and dedication your company offers competitive pay and benefits flexible work hours and
learning and career advancement opportunities Also remember that prospective employees have
multiple commitments You will inevitably have to compete with those commitments as
organization try to attract candidates to your firm Most people find it easier to make a new
commitment when it is compatible with their other obligations For example you boost your
chances of recruiting a highly qualified candidate who is a single parent if you offer flexible
work hours family health benefits and on-site day care ldquoRecruiting for Engagement and
Commitmentrdquo
40
Employee Selection
Once recruiting efforts produce a pool of promising job candidates Philips select among them to
fill available positions When organisation select the right individuals for the right jobs new
hires carry out their work more smoothly and experience fewer performance problems The
result Greater enjoyment ofmdashand engagement inmdashthe job
To enhance engagement through your selection of employees identify those candidates who are
best-suited to the job and your organizationrsquos culture Also use candidate assessment methods
that have obvious relevance to the job in questionmdashfor example by asking interviewees what
they know about the role and having them provide work samples Most candidates will view
these techniques more positively than tests with less apparent relevance such as personality and
integrity assessments Successful candidates feel good about having ldquopassed the test and see
company as careful and capable for having selected them A positive initial impression of an
employer encourages growth of long-term commitment
Training and Development
Training and development can serve as additional levers for enhancing engagement and
commitment For new hires training usually begins with orientation Orientation presents several
important opportunitiesmdashincluding explaining pay work schedules and company policies Most
important it gives you a chance to encourage employee engagement by explaining how the new
hirersquos job contributes to the organizationrsquos mission Through orientation Mohali Plant of Philips
Electronics describe how r company is organized introduce the new employee to his or her co-
workers give the person a tour of the area where he or she will be working and explain safety
regulations and other procedural matters In short you foster person-organization fitmdashvital for
developing productive and dedicated employees Through training you help new and current
41
employees acquire the knowledge and skills they need to perform their jobs And employees who
enhance their skills through training are more likely to engage fully in their work because they
derive satisfaction from mastering new tasks Training also enhances employeesrsquo value to your
company as well as their own employability in the job market In addition most companies offer
higher wages for skilled workers to compensate them for their greater value and to discourage
turnover
Compensation
Like the HR practices discussed above compensation can powerfully influence employee
engagement and commitment Some compensation components encourage commitment to
employers while others motivate engagement in the job It is possible to stimulate one and not
the other though itrsquos generally better to foster both For example a company that offers a strong
performance incentive system but no retirement plan will probably realize exceptional
engagement from its workers however they may eventually commit themselves to another
company that does offer a good retirement plan Meanwhile an organization that offers generous
retirement benefits but a traditional seniority-based pay grade system may have committed
employees however these workers might deliver pedestrian performance as they bide their time
until retirement In designing compensation plans you therefore need to consider employee
engagement and commitment strategically
Encourage managers to include employees in the goal-setting process This technique helps to
ensure that workers understand the goals It also promotes acceptance of challenging objectives
because people generally feel more committed to goals they have helped define In addition
consider how you and other managers will recognize and encourage contributions that exceed
expectations For example when a piece of equipment malfunctions Joe finds other ways to
maintain production rather than merely shutting down the machine and waiting for the
42
maintenance staff to fix it Or when a less experienced co-worker encounters a new task Sally
offers friendly coaching instead of standing by and waiting for the inevitable mistakes to crop
up Performance management processes operate on a continuous basis Therefore they provide
perhaps the best ongoing opportunities for employers to foster employee engagement and
commitment For example managers can use routine discussions about performance and
feedback sessions to learn which aspects of the job hold the most interest for each employee and
which tasks are most challenging During such discussions managers also can define what going
above and beyond the call of dutyrdquo looks like and generate ideas for rewarding such
contributions An employeersquos aspirations and career goals can receive careful attention during
performance appraisal meetings Without inquiring into an employeersquos personal life a supervisor
can nevertheless explore ways to enhance the compatibility between the workerrsquos commitment to
your organization and the employeersquos other life commitments Through such means the
organization personalizes its relationship to each employee and provides support while also
expressing appreciation for their contributionsmdash key drivers of engagement and commitment
To further engage employees and win their commitment through your performance management
programs consider how to treat your organizationrsquos most experienced employees In many cases
these employees understand the intricacies of a job better than their supervisors or managers do
By virtue of long identification with your organization they may be deeply committed to high-
level goals They use their expertise to contribute in ways that newer employees simply cannot
match But many of them also may be planning to retire soon especially if they are from the
ldquoBaby Boomerrdquo generation How will you transfer their knowledge to younger workers Design
a performance management system that recognizes and rewards proactive sharing of knowledge
and expertise among co-workers For example create knowledge repositories or learning
histories that can be stored in databases that employees can access and then create incentives
43
for people who contribute to and use these repositories Of course effective performance
management systems also identify employees who are not meeting expectations Failing to
address problem performance can erode other employeesrsquo engagement and commitment as their
workloads increase and they conclude that the company is willing to tolerate poor performance
If feedback coaching and remedial training are of little avail the manager may need to move the
person to a different position within the company where he or she can make a more valuable
contribution or let the individual go if there is no good match elsewhere in the organization
44
Chapter-V
RESEARCH METHODOLOGY
The basic task of research is to generate accurate information for use in decision-making
Research can be defined as the systematic and objective process of gathering recording and
analyzing data for aid in making business decisions As the project involves analyzing of
45
financial structure the research is exploratory in nature covering financial parameters and come
of the important ratios to carry out research There are basically two techniques adopted for
obtaining information
Primary Data
Secondary Data
Primary Data is gathered specifically for the project at hand through personal interviews with
the accounts officers
Sample Size = 100 Employees
Secondary data is previously collected and assembled for some project other than the one at
hand It is gathered and recorded by someone else prior to current needs of the researcher It is
less expensive than the primary date
Secondary Data can be obtained from both external and internal sources
External data may be collected from books and periodicals government sources media and other
commercial sources
Internal data is that secondary data which is created recorded or generated by the organization
As the project is explanatory in nature secondary data is collected from the reports of the
company books journals and interest Secondary data is gathered from annual reports official
records and standing orders of the units
CHAPTER - VI
DATA ANALYSIS AND INTERPRETATION
46
The data after collection is to be processed and analyzed in accordance with the outline
and down for the purpose at the time of developing research plan
Technically speaking processing implies editing coding classification and tabulation of
collected data so that they are amenable to analysis The term analysis refers to the computation
of certain measures along with searching for pattern groups Thus in the process of analysis
relationship or difference should be subjected to statistical tests of significance to determine with
what validity data can be said to indicate any conclusions
The analysis of data in a general way involves a number of closely related operations
which are performed with the purpose of summarizing the collected data and organizing them in
such a manner that they answer the research questions In this study the researcher followed
above process carefully and it is presented in this chapter
47
Table 41 ndash To know the department in which employees are belongs to
S
ou rc
e
survey data
Inference
From the above table it shows that 35 of employees are belongs to
production department
FIGURE 41
S
SI No
D
Department
N
No of Respondents
P
Percentage
1
1
M
Mechanical
3
30
3
30
2
2
E
Electrical
2
25
2
25
3
3
P
Production
3
35
3
35
4
4
O
Others
1
10
1
10
T
Total
1
100
1
100
48
REPRESENTS THE DEPARTMENT
Table 42 ndash To know working experience of the employees
Source survey data
Inference
From the above table it shows that 34 of the employees have 4 ndash 6
years experience
S
SI No
W
Work Experience
N
No of Respondents
P
Percentage
1
1
B
Below 2 years
1
33
1
13
2
2
2
2ndash 4 years
3
30
3
30
3
3
4
4ndash 6 years
3
34
3
34
4
4
A
Above 6 years
2
23
2
23
T
otal
1
100
1
100
49
FIGURE 42
REPRESENTS THE EXPERIENCE OF THE EMPLOYEES
Table 43 ndash To know the physical working environment
S
SI No
W
Working Environment
N
No of Respondents
P
Percentage
1
1
E
Excellent
1
12
1
12
2
2
G
Good
5
57
5
57
3
3
F
Fair
2
28
2
28
4
4
P
Poor
0
03
0
33
5
5
V
Very Poor
0
00
0
00
T
Total
1
100
1
100
Source survey data
Inference
From the above table it shows that 57 of the employees were feeling good about the working environment
50
FIGURE 43
REPRESENTS THE PHYSICAL WOKING ENVIRONMENT
51
Table 44 ndash To know the satisfaction level of employees towards the non-monitory benefits
S
SI No
N
Non-Monitory Benefits offered
to Employees
N
No of Respondents
P
Percentage
1
1
H
Highly Satisfied
1
14
1
14
2
2
S
Satisfied
5
54
5
54
3
3
N
Neither Satisfied nor Dissatisfied
2
25
2
25
4
4
D
Dissatisfied
0
05
0
05
5
5
H
Highly Dissatisfied
0
02
0
02
Total 1
100
1
100
Source survey data
Inference
From the above table it shows that 54 of the employees were satisfied towards the non-monitory benefits
FIGURE 44
REPRESENTS THE SATISFACTION LEVEL OF EMPLOYEES TOWARDS THE NON-MONITORY BENEFITS
52
Table 45 ndash To know the satisfaction level of respondents towards the work
assigned
Source survey dataInference
From the above table it shows that 45 of the respondents were satisfied towards the work assigned
FIGURE 45
S
SI No
A
Amount of Work
N
No of Respondents
P
Percentage
1
1
H
Highly satisfied
2
20
2
20
2
2
S
Satisfied
4
45
4
45
3
3
N
Neither Satisfied nor Dissatisfied
1
12
1
12
4
4
D
Dissatisfied
1
18
1
18
5
5
H
Highly Dissatisfied
0
06
0
06
Total 1
100
1
100
53
REPRESENTS THE SATISFACTION LEVEL OF RESPONDENTS TOWARDS THE WORK ASSIGNED
54
Table 46 ndash Opinion about the career development programme in their organisation
S
SI No
C
Career Development
N
No of Respondents
P
Percentage
H
Highly satisfied
1
12
1
12
S
Satisfied
5
56
5
56
N
Neither Satisfied nor Dissatisfied
2
22
2
22
D
Dissatisfied
1
10
1
10
H
Highly Dissatisfied
0
00
0
00
Total 1
100
1
100
Source survey data
Inference
From the above table it shows that 56 of the employees were satisfied
with the opinion about the carrier development programme in their organisation
FIGURE 46
REPRESENTS OPINION ABOUT THE CAREER DEVELOPMENT
PROGRAMME IN THEIR ORGANISATION
55
Table 47 ndash To know the cooperation of co-workers
S
SI No
C
Co-operation of Workers
N
No of Respondents
P
Percentage
1
1
H
Highly satisfied
2
20
2
20
2
2
S
Satisfied
6
66
6
66
3
3
N
Neither Satisfied nor Dissatisfied
1
11
1
11
4
4
D
Dissatisfied
0
03
0
03
5
5
H
Highly Dissatisfied
0
00
0
00
Total 1
100
1
100
Source survey data
Inference
From the above table it shows that 66 of the employees were satisfied
with the cooperation of co-workers
FIGURE 47
56
REPRESENTS THE COOPERATION OF CO-WORKERS
57
Table 48 ndash To know the satisfaction of Respondents with top management
S
SI No
S
Satisfaction with Top
Management
N
No of Respondents
P
Percentage
1
1
H
Highly satisfied
2
26
2
26
2
2
S
Satisfied
5
51
5
51
3
3
N
Neither Satisfied nor Dissatisfied
1
17
1
17
4
4
D
Dissatisfied
0
06
0
06
5
5
H
Highly dissatisfied
0
00
0
00
Total 1
100
1
100
Source survey data
Inference
From the above table it shows that 51 of the employees were satisfied with the top management
FIGURE 48
58
REPRESENTS THE SATISFACTION OF RESPONDENTS WITH TOP MANAGEMENT
Table 49 ndash To know the satisfaction of Respondents with their subordinates
Source survey data
Inference
From the above table it shows that 67 of the employees were satisfied with their subordinates
S
SI
No
S
Satisfaction with Subordinates
N
No of Respondents
P
Percentage
1
1
H
Highly satisfied
1
12
1
12
2
2
S
Satisfied
6
67
6
67
2
3
N
Neither Satisfied nor Dissatisfied
1
14
1
14
4
D
Dissatisfied
0
07
0
07
5
5
H
Highly Dissatisfied
0
00
0
00
Total 1
100
1
100
59
FIGURE 49
REPRESENTS THE SATISFACTION OF RESPONDENTS WITH THEIR SUBORDINATES
60
Table 410 ndash To know the level of satisfaction regarding nature of job
S
SI No
J
Job Satisfaction
N
No of Respondents
P
Percentage
1
1
H
Highly satisfied
2
22
2
22
2
2
S
Satisfied
5
56
5
56
3
3
N
Neither Satisfied nor Dissatisfied
1
16
1
16
4
4
D
Dissatisfied
0
07
0
07
5
5
H
Highly Dissatisfied
0
00
0
00
Total 1
100
1
100
Source survey dataInference
From the above table it shows that 56 of the employees were satisfied with their job
FIGURE 410
61
REPRESENTS THE LEVEL OF SATISFACTION REGARDING THE NATURE OF JOB
Table 411 ndash To know whether there is any job pressure in their work
Source survey data
Inference
From the above table it shows that 72 of employees said there is job pressure in their work
FIGURE 411
REPRESENTS WHETHER THERE IS ANY JOB PRESSURE IN THEIR WORK
S
SI No
J
Job Pressure
N
No of Respondents
P
Percentage
1
1
Y
Yes
7
72
7
72
2
2
N
No
2
28
2
28
T
Total
1
100
1
100
62
Table 412 ndash To know the opinion regarding opportunity provided by the organisation in developing skills
amp talents
S
SI No
D
Development of Skills and
Talents
N
No of Respondents
P
Percentage
1
1
H
Highly Agree
1
12
1
12
2
2
A
Agree
5
52
5
52
3
3
N
Neither Agree nor Disagree
2
28
2
28
4
4
D
Disagree
0
06
0
06
5
5
H
Highly Disagree
0
02
0
02
Total 1
100
1
100
Source survey data
Inference
From the above table it shows that 52 of employees agreed regarding opportunity provided by the organisation in developing skills amp talents
63
FIRGURE 412
REPRESENTS THE OPPORTUNITY PROVIDED BY THE ORGANISATION IN DEVELOPING SKILLS amp TALENTS
64
Table 413 ndash To know the satisfaction level of welfare facilities provided by the management
S
SI No
W
Welfare Facilities
N
No of Respondents
P
Percentage
1
1
H
Highly satisfied
0
09
9
09
2
2
S
Satisfied
5
57
5
57
3
3
N
Neither Satisfied nor Dissatisfied
2
29
2
29
4
4
D
Dissatisfied
5
05
0
05
5
5
H
Highly Dissatisfied
0
00
0
00
Total 1
100
1
100
Source survey data
Inference
From the above table it shows that 57 of the employees were satisfied with the welfare facilities provided by the management
FIGURE 413
REPRESENTS THE SATISFACTION LEVEL OF WELFARE FACILITIES PROVIDED BY THE MANGEMENT
65
Table 414 ndash To know the employee satisfaction towards the salary
Source survey data
Inference
From the above table it shows that 67 of the employees were satisfied
with their salary
FIGURE 414
REPRESENTS THE SATISFACTION TOWARDS THE SALARY
S
SI No
P
Payment Satisfaction
N
No of Respondents
P
Percentage
1
1
Y
Yes
6
67
6
67
2
2
N
No
3
33
3
33
T
otal
1
100
1
100
66
Table 415 ndash To know the employees willingness amp Commitment Towards
Organisation
Source survey data
Inference
From the above table it shows that 59 of the employees were willing to
continue in this organisation
FIGURE 415
REPRESENTS THE EMPLOYEES WILLINGNESS TO CONTINUE
S
SI No
W
Willingness to Work
N
No of Respondents
P
Percentage
1
1
Y
Yes
5
59
5
59
2
2
N
No
4
41
4
41
T
Total
1
00
1
00
67
CHI-SQUARE METHOD
The chi square test is one of the simplest and most widely used non-
parametric tests in statistical work As a non-parametric test it can be used to determine
if categorical data shows dependency or the two classifications are independent It can
also be used to make comparisons between theoretical population and actual data
when categories are used
n
Chi square χsup2= sum (O-E) sup2 E
i =1
Where O= observed frequency
E= expected frequency
68
OBSERVED FREQUENCY
Table 419 shows the relationship between the department and the job satisfaction
Over All
Job
SatisfactionHighly
SatisfiedSatisfied
Neither
Satisfied nor
Dissatisfied
DissatisfiedHighly
Dissatisfied
Sub
Total
Mechanical 5 6 14 3 2 30
Electrical 6 8 6 3 2 25
Production 9 13 7 4 2 35
Others 2 3 2 2 1 10
Sub Total 22 30 29 12 7 100
69
EXPECTED FREQUENCY
Over All
Job
SatisfactionHighly
SatisfiedSatisfied
Neither
Satisfied nor
Dissatisfied
DissatisfiedHighly
Dissatisfied
Sub
Total
Mechanical 7 8 9 4 2 30
Electrical 5 8 7 3 2 25
Production 8 11 10 4 2 35
Others 2 3 3 1 1 10
Sub Total 22 30 29 12 7 100
Null Hypothesis (Ho)
There is no significant difference between the department and the job satisfaction
Alternative Hypothesis (Ho)
There is significant difference between the job satisfaction
Co Relation
70
Chapter-V
CONCLUSIONS AND
RECOMMENDATIONS
71
CONCLUSION
On the basis of Analysis of Job Satisfaction Level of the Employees of Philips Electronics India
Ltd Mohali made in the previous chapters following conclusions are drawn
General Profile The plant of PHILIPS is ideally located in the Mohali Industrial focal point
Phase 9 near Chandigarh the capital of Punjab on a campus of 17 hectares The working
environment of the company is very healthy The visitors feel happy after the campus
Indigenous Technology PHILIPS is the only lighting manufacturing company based on purely
indigenous technology Philips was appropriately chosen as the brand name as self reliance and
building up of Indian Engineering capabilities remain the guiding spirit of PHILIPS
Financial structure PHILIPS is a low debt company signifying its dependence mainly on
its internal accruals for its financial requirements PHILIPS continues to strengthen its financial
position by channelising these internal accruals to fund its expansion programmes
Working results PTL has registered a handsome and constant growth in its profits because
of a brisk demand for new and better technology electronic items None of the other electronic
company has shown such a steady growth Philips has recorded the lowest current ratio
However with this lowest current ratio PTL still enjoys moderate payment period and highest
velocity of creditors and debtors only due to commitment of itrsquos employees
72
SUMMARY
According to the 1999 Gallup Poll the four elements that have proven to be effective in creating
employee loyalty are praise and recognition a sense of contribution to the company learning and
development and having a best friend at work
Creating a fairy-tale work environment begins withrecognition Your employees need it more
than money perks or titles Here are eight tips regarding recognition Remember these and your
employees may just start whistling while they work It is up to me The corporate culture or
financial rewards will not make your team successful It is up to you Recognition is one thing
that is completely in your control
Strong relationships are vital in todays economy Strengthening employee relationships is even
more necessary as companies downsize and lay off As your workforce shrinks and you need to
do more with less keeping quality employees becomes even more critical As a manager it is
your job to bond your best people to your company through recognition And you also must help
direct and motivate your core performers
Simple rewards earn big returns There are some relatively simple things you can do that will
earn big returns For example remember your employees birthdays and work anniversaries find
out what inexpensive rewards they value (for example tickets to a ball game or a half day off to
spend time with their kids) make the most of your formal service awards with some preparation
and a group presentation walk around your department every day and talk to your
people and thank them sincerely and often
73
Make it specific Praise and recognition must be specific to have impact General praise such as
You do great work actually can have the opposite effect and leave your employees wondering
Does he have any idea what I really do around here Specific praise links individual
accomplishments to company goals For example Cheryl I noticed the way you handled that
customer complaint Great work As you know we value quick resolutions of problems as
one of our core strategies
Ask the best to stay Call your best people into your office one at a time Let that bright young
college graduate know you value his fresh ideas and energy Tell the 20-year veteran how much
your team relies on her expertise and organizational skillsRemarkably a significant percent of
high-impact performers report that they left their last job because No one ever asked me to
stay
Forget cash
Remember the saying Money cant buy everything Well its true Dont wait until you can
offer an employee a raise or promotion Real thanks is its own reward In numerous surveys of
work satisfaction top on employees lists is feeling appreciated In fact when employees feel
recognized and involved they are much less likely to keep asking about money
Recognize
Recognition means most to an employee when it is sincere and spontaneous According to the
largest study ever conducted on workplace satisfaction (Gallup 1999) recognition should occur
at least every seven days If you wait until a year-end party or an annual review you are waiting
much too long to recognize and you probably are losing people you do not need to
74
Recognition works
Neglect can be a poisoned apple Recognition is the elixir that will spark better attitudes and
performance Jeffrey Pfeffer of Stanford University says The returns from managing people in
ways that build high commitment typically are on the order of 30 to 50 percent
Take a hard look in the mirror and ask yourself how you can recognize the fairest of them all
Learn to recognize your employees for their efforts thank them often and reward their
achievements You can awaken them from their anger and apathy and they will fall in love with
their jobs again Chances are you will work together happily ever after
So there is direct relation with employee satisfaction and their commitment towards the
organization and it is also clear from the above discussion that only monetary elements are not
sufficient for employee satisfaction rather other element like employer behavior recognisation
and other moral value
75
RECOMMENDATIONS
PHILIPS should increase its capacity utilization It should work at full capacity to
minimize its cost of production With this increase in capacity utilization the total cost
will spread over more units thereby decreasing the per unit cost
PHILIPS should decrease the credit facilities provided to its consumers The payback
period is quite high in case of debtors as compared to creditors it should be more or less
equal as it will help in improving company liquidity
PHILIPS should focus more on the consumer lifestyle goods in India parallel to its other
business as it accounts very less as compare to other businesses of Philips
Another recommendation for Mohali plant is about the HR department that is they
should appoint permanent and skilled workers as against casual workers which generally add
up to the profit of the company
76
BIBLIOGRAPHY
1 Values-Based Leadership Rebuilding Employee Commitment Performance and Productivity ( Thomas D Kuczmarski)
2 Monthly Journals of Philips Electronics India Ltd
3 Authentic Leadership Medtronic CEO Bill George
4 wwwindiaphilipscom
5 wwwwikipediacom
6 httpwwwemployeecommitmentcom
7 One Foot Out The Door How to Combat The Psychological Recession Thatrsquos Alienating Employees And Hurting American Business Judith Bardwick
8 Employee Commitment A Leader Ship Guide Joe Folkman
9 Harvard University Factors that Impact Employee Well Being Commitment and Productivity -An Article
77
Questionnaire
Name __________________________________________________________
Age______________________________ Gender _______________________
Qualification _______________________ Contact No ___________________
Q1 In which department you are working
Electrical Production Mechanical Other
Q2 What is your working experience
gt2 Years 2-4 Years 4-6 Years lt 6 Years
Q3 How You like the physical Working Environment of the organization
Excellent Good Fair Poor Very Poor
Q4 Are you satisfied with Non-Monitory benefits provided by the organisation
Highly Satisfied Satisfied Neither Satisfied Nor dissatisfied
Highly Dissatisfied Dissatisfied
Q5 Are you satisfied with your work
Highly Satisfied Satisfied Neither Satisfied Nor dissatisfied
Highly Dissatisfied Dissatisfied
Q6 Are you satisfied with the career development programe of the company
Highly Satisfied Satisfied Neither Satisfied Nor dissatisfied
Highly Dissatisfied Dissatisfied
Q7 Is other staff of the organization is co-operative with you
Highly Satisfied Satisfied Neither Satisfied Nor dissatisfied
Highly Dissatisfied Dissatisfied
Q8 Are you satisfied with top level management
Highly Satisfied Satisfied Neither Satisfied Nor dissatisfied
Highly Dissatisfied Dissatisfied
78
Q9 Are you satisfied with your subordinates
Highly Satisfied Satisfied Neither Satisfied Nor dissatisfied
Highly Dissatisfied Dissatisfied
Q10 Are you satisfied with the nature of the Job
Highly Satisfied Satisfied Neither Satisfied Nor dissatisfied
Highly Dissatisfied Dissatisfied
Q11 Do you have any Job Pressure in work
Yes No
Q12 Do you satisfied with the opportunities provided by the organisation
Highly Satisfied Satisfied Neither Satisfied Nor dissatisfied
Highly Dissatisfied Dissatisfied
Q13 Are you satisfied with the welfare facilities provided by the organisation
Highly Satisfied Satisfied Neither Satisfied Nor dissatisfied
Highly Dissatisfied Dissatisfied
Q14 Are you satisfied towards your salary
Highly Satisfied Satisfied Neither Satisfied Nor dissatisfied
Highly Dissatisfied Dissatisfied
Q15 Are you committed towards the organisation
Yes No
Signature

3
Deliver great results
We continually raise the bar
We play to win big and always set ambitious targets
We challenge the status quo and experiment with new ways
We take clear decisions and implement with speed and discipline
Develop people
We get the best from ourselves and each other
We attract the best players to create strong and diverse teams
We take risks by giving people stretch assignments to accelerate their development
We personally invest significant time to coach and recognize people
Depend on each other
We deliver more value by working as One Philips
We think as One Philips and act as owners
We trust and empower each other to contribute our best
We team up and allocate resources to the most promising opportunities
4
HISTORY
When Philips started manufacturing incandescent lamps in 1891 there was already a
separate industrial research laboratory outside the factory a concept virtually unknown
elsewhere In 1913 another major step was taken with the opening of a physics laboratory
(the Nat Lab) Under the leadership of Dr Gilles Holst the Philips Research organization
became a major center of technical competence and innovation
From 1914-1945
1914 to 1945 saw considerable growth and diversification Improvements were made to the
incandescent lamp and gas discharge lamps proved more efficient in generating light
Meanwhile our bulb expertise led to new products such as the X-ray tube and the radio valve
The invention of the pentode gave Philips an important patent in radio In 1923 Philips decided
to become a systems supplier instead of a components company and consequently the research
organization broadened its scope into radio as well as television
1945-1970
After World War II there was a period of expansion The sky was the limit Television built on
research carried out in the 30s became a mass-produced consumer phenomenon The invention
of the transistor by Bell Labs changed the world of electronics forever We built up a strong
patent position in magnetic materials and contributed many breakthroughs such as the LOCOS
process (LOCal Oxidation of Silicon) used in every modern Metal-Oxide-Semiconductor
(MOS) IC the rotary heads for the Philishave electric shaver (1950s) and the compact audio
cassette (1963) a breakthrough in audio recording Research laboratories in England France
Germany and the USA were founded
5
1970-today
From 1970 to the present day our research has been tied much more closely to our industrial and
business activities This resulted in revolutionary developments such as the introduction of the
CD the DVD and Blu-ray Disc In the medical sphere we made great strides forward in
magnetic-resonance imaging and ultrasound and with our increasing focus on health and well-
being these developments are still ongoing in 2006 we saw the first commercial launch of a 3D
scanner
In that same year we sold 80 of our Semiconductors business as a new independent company
NXP was created We also adopted Open Innovation as our way of working the High Tech
Campus Eindhoven was opened up to external companies
At Philips Research we continue to focus on meaningful innovations that improve peoplersquos
lives Ambilight for example has brought a whole new dimension to TV viewing and in 2007
we developed Lumiramic ndash a groundbreaking new phosphor technology for energy-efficient
white LEDs ndash together with our partners
The future of Philips Research
Philips Research will remain an important driving force in realizing Philipsrsquo vision to become an
even more market-driven and people-centric health and well-being company We do this by
continually evaluating key issues and trends in society to ensure that peoplersquos needs are at the
heart of our innovations now and in the future
Royal Philips Electronics of the Netherlands is a diversified Health and Well-being
company focused on improving peoplersquos lives through timely innovations As a world leader in
healthcare lifestyle and lighting Philips integrates technologies and design into people-centric
6
solutions based on fundamental customer insights and the brand promise of ldquosense and
simplicityrdquo
Headquartered in the Netherlands Philips employs approximately 121000 employees in more
than 60 countries worldwide With sales of EUR 26 billion in 2008 the company is a market
leader in cardiac care acute care and home healthcare energy efficient lighting solutions and new
lighting applications as well as lifestyle products for personal well-being and pleasure with
strong leadership positions in flat TV male shaving and grooming portable entertainment and
oral healthcare
Philips Electronics India Limited
Philips Electronics India Limited a subsidiary of the Netherlands-based Royal Philips
Electronics is the leading Health and Wellbeing company Today Philips is a simpler and more
focused company with global leadership positions in key markets of Healthcare Lighting and
Consumer Lifestyle addressing peoplersquos Health and wellbeing needs and aspirations as its
overarching theme
As one of the nations most well-known and well-loved brands Philips is a part of practically
every Indians life With recent launch of Philips Respironics product categories in obstructive
sleep apnea management and home respiratory care home decorative lighting range and ALU
range Philips products find use in virtually every aspect of an individualrsquos daily life 24X7 - at
home at work on the move and at rest Philips stands as a source of easy to use trendy and
innovative internationally acclaimed products with superior design and technology that enhance
the quality of consumers professional and personal lives
Philips has been operating in India for over 75 years and employs over 4500 employees around
7
the country The company has an excellent pan India distribution and after-sales service network
BUSINESSES
Lighting
Philips Electronics India Indiarsquos largest lighting company operates in business areas of Lamps
Luminaires Lighting Electronics Automotive and Special Lighting Today as global leader in
Lighting Philips is driving the switch to energy-efficient solutions With worldwide electrical
lighting using 19 per cent of all electricity the use of energy-efficient lighting will significantly
reduce energy consumption around the world and thereby cut harmful CO2 emissions Philips
India has been consistently working with industry bodies such as ELCOMA Bureau of energy
efficiency and NGOs towards addressing Indiarsquos power crisis through promotion of energy
efficient lighting in India
Philips provides advanced energy-efficient solutions for all segments road lighting office amp
industrial hospitality and home Philips is also a leader in shaping the future with exciting new
lighting applications and technologies such as LED technology which besides energy
efficiency provides attractive benefits and endless new lsquonever-before-possiblersquo lighting
solutions
In 2008 Philips inaugurated a global research and development (RampD) centre for lighting
electronics in India This was its third such unit in the world The facility which is situated in
Noida will not only cater to the needs of the Indian market but also the Asia-Pacific Europe and
North America The other RampD centres are located at Eindhoven in the Netherlands and in
Shanghai China One of the primary research areas for the centre is to develop products that can
8
tackle high voltage fluctuations in India The centre currently employs 35 engineers Around 40
per cent of Philipsrsquo revenue in India comes from the lighting business
Consumer lifestyle
Guided by the brand promise of ldquosense and simplicityrdquo and the consumer insights Philips
Consumer Lifestyle offers rich new consumer experiences that meet consumersrsquo desire for
relaxation and improving their state of mind Philips also responds to the consumers desire for
wellness and pleasure by introducing products that meet the individualrsquos interests in terms of
their mind space body and appearance
The Consumer Lifestyle arm in India operates in the business areas of Home Entertainment
solutions and Personal Infotainment with product categories such as TVs home theatre systems
music systems DVD players personal entertainment solutions sound accessories Domestic
Appliances and Personal care
Philips Innovation Campus (PIC)
Philips Innovation Campus (PIC) Bangalore is a division of Philips Electronics India Limited
which is owned 96 by Royal Philips Electronics NV The Netherlands It was established in
August 1996 with a vision to be an innovation hub creating next generation solutions and
products for Healthcare and Lifestyle With the objective of meeting the growing need for high-
quality cost-effective software development capacity within the organization PICrsquos share has
increased significantly from 8 in 1998 to around 20 in 2008
9
Working at PIC are about 1000 of the industrys finest professionals using state-of-the-art
software engineering paradigms and platforms including real-time systems component-based
software engineering and multi-threaded architecture to drive the creation of tomorrows
products and services PIC is an ISO 9001Tick IT SEI CMM SM level 5 company amp has
emerged as a critical partner in the development of strategic amp futuristic technologies for Philips
worldwide 60000 registered patents illustrate the innovative nature of the company Philips has
adopted an Open Innovation strategy which leverages the joint innovative power of partnering
companies and researchers to bring more innovations to the market effectively and faster PIC
has built-up extensive know-how and expertise in the software engineering and technology
domains relevant to its business In addition competencies in the areas of project management
requirement engineering and quality assurance have been established to offer customers products
and services of the highest quality at the fastest time-to-market and the lowest cost of
ownership
RESEARCH AND DEVELOPMENT
Since its foundation 100 years ago Philips Research has been at the forefront of fundamental
scientific research But with market focus being more and more important across almost all
corporate RampD organizations is this still the case If some of the pioneering work being done
by scientists across Research is anything to judge by the answer is a resounding ldquoyesrdquo
Itrsquos different at the cutting edge
In todayrsquos market-focused corporate RampD organizations the boundary between fundamental
scientific research and applied research is becoming increasing blurred ndash particularly when it
comes to some of the most exciting areas of research ldquoHere at Philips our way of working is
very dynamicrdquo says Philips Researchrsquos Chief Science Officer Emile Aarts ldquoThis means that you
10
can apply both the lsquofundamentalrsquo and the lsquoappliedrsquo labels to many of the projects that wersquore
working on because they are both very flexible termsrdquo Philips Researchrsquos work on sleep for
instance is an excellent example of this more dynamic approach ldquoThis is a very important area
for Philips ndash but therersquos currently very little fundamental knowledge available Thatrsquos why wersquore
involved in investigating the key issues at a more fundamental level together with our university
and research institute partners The only difference is that we want this research to lead to
marketable products and solutionsrdquo
Open Innovation in new areas
Despite the flexible nature of the ldquofundamentalrdquo and ldquoappliedrdquo labels it is still possible to detect
a decline in some areas of more fundamental research at Philips in recent years ldquoThis has mainly
occurred in fields that donrsquot support the execution of our companyrsquos Health and Well-being
strategyrdquo says Aarts As he explains this refocusing exercise has gone hand-in-hand with an
expansion of more fundamental research activities in a number of new fields such as deep-brain
stimulation and multi-modal imaging for healthcare applications ldquoIn these fields wersquore
considered to be an extremely important research partner ndash especially by colleagues working in
universitiesrdquo In the future Philips Research will continue to develop its reputation in a number
of exciting fundamental domains ndash ldquogreen lightingrdquo and skincare are just two examples ndash albeit
with a more applied focus ldquoHopefully this research will enable us to build on our strong
heritage of improving the quality of peoplersquos lives
11
BOARD OF DIRECTORS
Non-Executive Director amp Chairman S M Datta
Executive Vice Chairman amp Managing Director Murali Sivaraman
Executive Director Jan-Hein Louwman
Non-Executive Director S Venkatramani
India Management Team
MURALI SIVARAMANN - CEO
ANJAN BOSE - Healthcare
JAN-HEIN LOUWMAN ndash CEO
MAHESH KRISHNAN ndash Consumer lifestyle
RAJEEV CHOPRA ndash lighting
RAKESH SHARMA ndash Strategic Business Development
S NAGARAJAN ndash Human resources
VIVEK SHARMA ndash Chief Marketing Officer
WIDO MENHARDT ndash Philips Innovation Campus
12
Corporate Office-
Philips Electronics India Ltd
Technopolis Knowledge Park
Mahakali Caves Road
Chakala Andheri (East)Mumbai 400 093
Tel +91 22 66912000
VISION 2012
Through the Vision 2012 strategy we aim to fuel growth by making Philips the leading brand in
Health and Well-being Vision 2012 further positions Philips as a market-driven people-centric
company with a strategy and a structure that fully reflect the needs of its customer base while
also increasing shareholder value This is implemented through sharpened strategies in the three
core sectors Healthcare Lighting and Consumer Lifestyle
ldquoWith Vision 2010 we are putting people right at the center of things with Health and Well-
being as our overarching theme We are thereby putting into practice our mission improving the
quality of life through the introduction of meaningful innovationsrdquo ndash Gerard Kleisterlee
President and CEO of Royal Philips Electronic
Our Ways of Working
1 We are a people-centric company that organizes around customers and markets
2 We invest in a strong brand and consistently deliver on our brand promise of ldquosense and
simplicityrdquo in our actions products and services
13
3 We deliver innovation by investing in world class strengths in end-user insights
technology design and superior supplier networks
4 We develop our peoplersquos leadership talent and engagement and align ourselves with high
performance benchmarks
5 We invest in high growth and profitable businesses and emerging geographies to achieve
market leadership positions
6 We are committed to sustainability and focus on making the difference in efficient energy
use
7 We drive operational excellence and quality to best in class levels allowing us the above
mentioned strategic investments in our businesses
BRAND PROMISE
It is the combination of two unique capabilities that enables us to deliver on our ldquosense and
simplicityrdquo promise These capabilities are firstly by understanding people and secondly
technology integration and product design
We put our end users front and center of product innovations starting with understanding their
needs and aspirations We use best-in-class research facilities and agencies to validate and ensure
that our product innovations are designed around peoplersquos needs and aspirations easy to
experience and advanced
SUSTAINABILITY
14
In 2009 we evaluated our sustainability strategy and resolved to fully leverage sustainability as
an integral part of our overall strategy and an additional driver of growth as reflected in the
Philips Management Agenda 2012
To deliver on our brand promise of ldquosense and simplicityrdquo and at the same time provide the
company direction for the longer term in this area we have identified three sustainability
leadership key performance indicators where we can bring our competencies to bear lsquocarersquo
lsquoenergy efficiencyrsquo and lsquomaterialsrsquo including targets for 2015
Bringing care to more than 500 million people
Target 500 million lives touched by 2015
Improving energy efficiency of Philips products
Target 50 improvement by 2015 (for the average total product portfolio) compared to
2009
Closing the materials loop
Target Double global collection recycling amounts and recycled materials in products
by 2015 compared to 2009
Each sector will take the lead on one of the leadership key performance indicators with
Healthcare leading lsquocarersquo Lighting lsquoenergy efficiencyrsquo and Consumer Lifestyle lsquomaterialsrsquo
In addition we defined a set of complementary performance indicators to accelerate change and
drive performance including the EcoVision4 parameters
With EcoVision4 we have committed to the following by 2012
15
bull Generate 30 of total revenues from Green Products
bull Double investment in Green Innovations to a cumulative EUR 1 billion
bull Improve our operational energy efficiency by 25 and reduce our CO2 emissions by 25 all
compared with the base year 2007
SOCIAL COMMITMENT
Living up to this commitment means we use our capabilities to enhance the lives of our
employees and people in society at large Within the company we encourage teamwork and
collaboration in an environment that enables employees to reach their full potential
Building on our rich heritage of involvement in social issues we have established our own
approach of supporting the communities where we live and work focusing on energy efficiency
and healthcare
Sustainable lighting
There is a pressing need to find innovative lighting solutions for the 16 billion people who live
in areas with no access to the electricity grid or where the grid is unreliable Thatrsquos why we have
developed SMILE (Sustainable Model in Lighting Everywhere)
Launched as a pilot in 2006 in four Indian states SMILE includes two lighting solutions UDAY
a rechargeable portable lantern and KIRAN a hand-cranked LED flashlight Today are
distributed in eighth Indian states
16
SWOT ANALYSIS
Strengths
bull India was a market where the first mover enjoyed advantages over latecomers
bull The first image of the product lasted long in the eyes of the consumer and the first to enter the
market could gain the largest market share
bull PHILIPS is committed to enhance its image to the Chinese market as investors
bull PHILIPS was building a wholly owned manufacturing plant in India to show the
Chinese the commitment Korea had to the Chinese society
bull Labor costs in India were less and would defray the cost of producing high-end
bull Samsung has been making color TVs for many years in Korea before moving to the Chinese
market
Weaknesses
bull PHILIPS must continue to control all costs to maintain success
bull India has a reputation of being a protected market (protectionism)
bull India was a market where the first mover enjoyed advantages over late comers PHILIPS is
trying to overcome the first comer advantage Japan manufacturers have over them by being those
first comers
bull Companies such as Sony and Matsushita had built sales and service networks that were
favorable to their sales programs in India while Samsung would have to catch up in that area
17
bull Samsung is not as experienced in manufacturing high-end TVs for a higher-end market
segment
Opportunities
bull Based on the data that on 28 of the 220 million rural households own a color TV PHILIPS
focus on the domestic India market should be to penetrate the rural household market which
would mean that for those purposes the low-end production of sets in the 13rdquo to 20rdquo range should
be produced to appeal to that segmentrsquos purchasing ability
bull Larger more high-end models can be produced to appeal to an urban customer in India as well
as being an export to the US and European higher end customers
bull With success in the higher-end manufacturing and sales of premium TVs in India PHILIPS can
establish themselves as high-end producers around the world
Threats
bull PHILIPS faces intense competition in the color TV market
bull A premium-priced product wouldnrsquot sell in large volumes so pricing can be a problem
bull Since PHILIPS didnrsquot have an established marketing strategy issues of how to market the
product may arise
bull Loss of profitability because related to over-employment at most facilities
bull Is the per capita income level such that it can support sales of product at any level
bull If PHILIPS fails to be successful in the Chinese market with high-end product it will be known
around the world bull India was a market where the first mover enjoyed advantages over late
comers
bull The first image of the product lasted long in the eyes of the consumer and the first to enter the
18
market could gain the largest market share
bull PHILIPS is committed to enhance its image to the Chinese market as investors
PHILIPS ELECTRONICS MOHALI PLANT
The mohali plant was established in 1985 as PUNJAB ANAND LAMP Ltd as its second
division of lamp industry after the varodra plant at that time it was a joint stock company and
majority of shares was with Punjab Anand Lamp around 75 but in the year 2001 the company
ownership changed and the whole shares was bought by PHILIPS ELECTRONIC INDIA Ltd
and its name was changed to PHILIPS ELECTRONIC INDIA Ltd MOHALI LIGHT
FACTORY
The plant is situated in Industrial focal point PHASE-9 MOHALI near Mohali railway station
and is sreaded in 26 acres Total employees of tis plant is 532 including casual employees This
company is a landmark in the Punjab state as it is the only factory which is most profitable one
than any industry located in Punjab
19
OVERVIEW OF VARIOUS FRONTS OF
PHILIPS ELECTRONICS INDIA Ltd
Manufacturing-
Today the product range of Philips include the following products ndash
Televisions- LCD Plasma Flat Screen Smart Touch XL
Recorders DVD Players I pods and Home Theatre Systems
Audio Products - Audio Systems Remote Controls AudioVideo Accessories
Digital Photo Products and Frames
Portable Audio and Video Systems Accessories like Headphones and Speakers
PC Products - Mouse and Keyboard Multi Media Headsets External Hard Disk Drives
Mobile Phones
Male Shaving and Grooming - Dry Shavers Beard Trimmers
Personal Care - Beauty and Hair Care Products
20
Kitchen Appliances - Blenders and Hand Blenders Juicers and Citruspresses Food
Processors and Mixers Coffee Makers and Kettles Frying and Grilling Appliances
Toasters and Snacking Products
Household Products - Irons Vacuum Cleaners Water Purifiers
Professional Lighting - Industrial Shops and offices Road and Area Hospitality Sports
Lighting City Beautification and Petrol Stations
Automotive Lighting - In Cars Motorcycles and Trucks
Home Lighting
SERVICS
Philips E-waste Management Program in India
Philips has tied up with a recycler for collecting transporting and recycling unwanted broken
down consumer products
At Philips we offer consumers a convenient way of recycling their unwanted obsolete and
damaged Philips products by dropping them off at convenient locations The program
encompasses 8 major cities across India Consumers can approach one of 27 authorized Philips
service centres which will act as collection points for consumer products which need recycling
Our efforts are to expand the network in the near future
Philips ensures that the consumer products received will be recycled in an environment-friendly
manner Philips understand the corporate social responsibility and takes steps towards providing
a safer environment to the future generations We design our products to continuously realize
improvements and reduce their overall life cycle environmental impact Designing products for
21
recycling is an integral part of this approach Our aim is to use our planetrsquos limited resources
effectively and respect the principle of extended producer responsibility This also calls for
manufacturers to engage in developing solutions for effective and efficient recycling of their
products We will continue to promote and invest into improved recycling systems to reduce the
impact of electronic waste on the environment
MANUFACTURING AT MOHALI PLANT ndash
Mohali plant mainly manufactures lighting products basically of domestic usage this includes the
following products ndash
CFL bulbs ndash
1 Genie - 5 watt 8 watt 11 watt
2 Essential ndash 8 watt 11 watt 14 watt 18 watt 23 watt 29 watt
3 Tornado ndash 5 watt 8 watt 11 watt 14 watt 18 watt 23watt 29 watt
4 T5 slim tube 28 watt
Coil plant ndash Philips Electronics India is the only company that produces coils in the whole
lighting industries in the world and in India only at the MOHALI PLANT
22
Chapter-II
OBJECTIVES OF THE STUDY
23
OBJECTIVES OF THE STUDY
To study the various aspects of Satisfaction Level of the Employees working at Philips
Electronics India Ltd Mohali
To analyze the effect of Job satisfaction on the organisation
To determine the relation between job satisfaction of employees and their commitment
towards the organisation
To analyze the performance model adopted by the Philips Electronics India Ltd Mohali
to handle their manpower
To suggest remedial measures for the improvement of the companyrsquos performance
24
Chapter-III
Employees Commitment
25
Employees who are engaged in their work and committed to their organizations give companies
crucial competitive advantagesmdashincluding higher productivity and lower employee turnover
Thus it is not surprising that organizations of all sizes and types have invested substantially in
policies and practices that foster engagement and commitment in their workforces
But what are employee engagement and commitment exactly This report examines the ways in
which employers and corporate consultants define these terms today and offers ideas for
strengthening employee engagement Though different organizations define engagement
differently some common themes emerge These themes include employeesrsquo satisfaction with
their work and pride in their employer the extent to which people enjoy and believe in what they
do for work and the perception that their employer values what they bring to the table The
greater an employeersquos engagement the more likely he or she is to ldquogo the extra milerdquo and deliver
excellent on-the-job performance In addition engaged employees may be more likely to commit
to staying with their current organization Software giant Intuit2 for example found that highly
engaged employees are 13 times more likely to be high performers than less engaged
employees They are also five times less likely to voluntarily leave the company
Clearly engagement and commitment can potentially translate into valuable business results for
an organization To help you reap the benefits of an engaged committed workforce at your
organization this report provides guidelines for understanding and measuring employee
engagement and for designing and implementing effective engagement initiatives As you will
26
see everyday human resource practices such as recruitment training performance management
and workforce surveys can provide powerful levers for enhancing engagement
Employee Engagement Key Ingredients
ldquoEmployee Engagement Definedrdquo shows examples of engagement definitions used by various
corporations and consultancies Clearly definitions of employee engagement vary greatly across
organizations Many managers wonder how such an elusive concept can be quantified The term
does encompass several ingredients for which researchers have developed measurement
techniques These ingredients include the degree to which employees fully occupy themselves in
their work as well as the strength of their commitment to the employer and role Fortunately
there is much research on these elements of engagementmdashwork that has deep roots in individual
and group psychology
Definition
ldquoNo company small or large can win over the long run without energized employees who
believe in the [firms] mission and understand how to achieve it Thats why you need to take the
measure of employee engagement at least once a year through anonymous surveys in which
people feel completely safe to speak their mindsrdquo
-Jack and Suzy Welch-
Common Themes How Companies Measure Engagement
Employers typically assess their employeesrsquo engagement levels with company-wide attitude
or opinion surveys
27
1048657 Pride in employer
1048657 Satisfaction with employer
1048657 Job satisfaction
1048657 Opportunity to perform well at challenging work
1048657 Recognition and positive feedback for onersquos contributions
1048657 Personal support from onersquos supervisor
1048657 Effort above and beyond the minimum
1048657 Understanding the link between onersquos job and the organizationrsquos mission
1048657 Prospects for future growth with onersquos employer
1048657 Intention to stay with onersquos employer
The Link Between Employer Practices and Employee Engagement
How does an engaged workforce generate valuable business results for an organization The
process starts with employer practices such as job and task design recruitment selection
training compensation performance management and career development Such practices affect
employeesrsquo level of engagement as well as job performance Performance and engagement then
interact to produce business results Figure 1 depicts these relationships
28
EMPLOYEE COMMITMENT EMPLOYEE ENGAGEMENT
1048657 How do you and other managers in your
organization define commitment
1048657 Are some employees in your company
engaged in their work but not committed to
the organization Committed to staying with
your firm but not exactly engaged in their
work Both engaged and committed
1048657 To whom are your organizations employees
committed The company Their supervisor
Co-workers Team members Customers
1048657 What business results has commitment from
1048657 How do you and other managers in your
organization define employee engagement
1048657 How do you know that certain employees in
your company are engaged Do they relish
their jobs Enjoy specific responsibilities or
tasks Willingly ldquogo the extra milerdquo
1048657 In teams departments or business units in
your company that have a large number of
engaged employees what business results
are you seeing Higher productivity Lower
costs Greater revenues More efficiency
29
employees created for your organization For
example has commitment reduced turnover
and therefore decreased recruitment hiring
and training costs
1048657 What does your company do to reciprocate
employees commitment Is the organization
living up to its side of the bargain
Lower turnover Higher product or service
quality
1048657 Conversely how do disengaged employees
behave and what are the consequent costs
for their teams units-and your entire
company
As Figure 2 suggests a person possesses attributes such as knowledge skills abilities
temperament attitudes and personality He or she uses these attributes to accomplish work
behaviors according to organization-defined procedures by applying tools equipment andor
technology Work behaviors in turn create the products and services that make an organization
successful We classify work behaviors into three categories those required to accomplish duties
and tasks specified in a job description (prescribed behaviors) ldquoextrardquo behaviors that an
employee contributes for the good of the organization (voluntary behaviors) and behaviors
prohibited by an employer (proscribed behaviors including unexcused absenteeism stealing and
other counterproductive or illegal actions) Of course job performance occurs in an
organizational context which includes elements such as leadership physical setting and social
setting
30
Employers naturally want to encourage workers to perform prescribed and voluntary activities
while avoiding proscribed ones To achieve these goals organizations use a number of HR
practices that directly affect the person process and context components of job performance
Employeesrsquo reactions to these practices determine their levels of engagement and commitment
31
Chapter-IV
32
LITERATURE OF THE REVIEW
ldquo Job Satisfaction That Leads To The Commitment Of
The Employees in The Organisationrdquo
Literature of Review
Gerge Bill Authentic Leadership
In his book Authentic Leadership former Medtronic CEO Bill George makes an obvious
point that business leaders rarely say out loud ldquoMissions motivate dollars donrsquotrdquo
What he means is that purpose is what drives employee commitment not the financial
rewards that come to others Workers donrsquot get up in the morning and say ldquoGee I can
33
hardly wait to get to work today to maximize shareholder profitsrdquo Even when employees
are shareholders who can benefit from improved financials what draws people to their
chosen careers is the work itself and its purpose in the world more than the profit
possibilities
Mr George goes on to say ldquoI find there is universal agreement (among middle managers)
that you cannot inspire employees by urging them to help management get the companyrsquos
stock price uprdquo
There is in fact quite a bit of literature on this subject In Awakening Corporate Soul
authors Eric Klein and John Izzo say that employee commitment requires knowing ldquothe
purpose of our work it means recognizing the purpose our organization fulfills that goes
beyond the bottom line and it means articulating to others how their (workersrsquo) efforts
contribute to a larger purposerdquo
In Built to Last Jim Collins and James Porras spend an entire book explaining their five
year research study of major companies that led to this conclusion about employee
commitment Purpose within a company is what sustains it profit is important but when
itrsquos the prime directive companies falter
-Marshal Goldsmith-
How to Increase Employee Commitment
In practice this involves walking the talk being transparent communicating effectively treating
people equally teaching leading subordinates to increasingly excellent performance ndash and
responding to subordinates as mature individuals who are owed fairness the truth and
recognition of their achievements
34
Since managers interact directly and frequently with subordinates they are usually more tuned
in to how employees are feeling than are executives Managers are in a better position to know
for example when employees are feeling alienated and disengaged from their work which is
very common today -- and expensive
Gaining employee commitment results in greater profits because enthusiastic employees stay
contribute discretionary effort and engage customers Performance soars when customers are
enthused and stay and when executives managers and employees are a collaborative team
united in achieving common goals
But managers are often called middle managers for good reason their job is to motivate and
guide subordinates while they at the same time are being judged by their bosses Because of
their ldquotweenrdquo position in the hierarchy managers to effective support direct reports must also
create relationships with potential allies especially those with greater power who have access to
top decision makers
Harvard University Factors that Impact Employee Well Being Commitment and
Productivity
Business executives from the C-suite and HR to QC and RampD are by nature focused on the
corporate bottom line A new trend in our dawning age of social sustainability is that many
experts believe more attention should be paid to the dotted line - the one signed when a person
35
commits to employment at a company New Harvard research validates this approach affirming
that trust and purpose play a significant role in building successful productive workplaces
The behavioral research conducted by a team at Harvard University and Massachusetts General
Hospital identifies the factors most likely to impact 21st century employee well being
commitment and productivity The researchers found that commitment is largely influenced by
ones sense of purpose feeling of personal impact and overall trust in the organization
Productivity is largely affected by the quality of human relationships including cooperative
social group moods and interaction
The results lead us to conclude that workplaces that provide positive environments that foster
interpersonal trust and quality personal relationships create the most committed and productive
employees says Nancy Etcoff PhD the lead researcher on the study
Expert Shares Keys to Building Successful Workplace Relationships
According to business strategist Courtney Anderson JD MBA Outstanding leadership
today means much more than just doing your job Success is creating an environment that fosters
happy committed productive team members
Anderson explains that reinvigorating workplaces by enhancing trust and employee commitment
does not have to be difficult The biggest challenge she says is making the time to truly change
in our overscheduled instant access competitive work environments With a little know-how it
can be easy to evolve workplace well being and respond to these compelling research results
-Mark Howell-
CEO Bright Point
High-performing companies recognize that employee commitment is a major contributing factor
toward sustaining long-term success and creating value An engaged employee is involved and
excited about their work and acts in a manner that will forward the organizationrsquos interest An
36
engaged workforce helps optimize and retain talent for the long-term because the employees
choose to stay even when other employment alternatives exist
According to Walker Information the top three drivers of employee commitment are
Satisfaction Fairness and Care amp Concern for employees Put simply committed employees
want to enjoy their work feel they are appreciated and know they are making a contribution to
their companyrsquos strategic objectives Additionally employees who have trust in their leadership
and are trusted by their leadership have a greater dedication and are ultimately more productive
on the job However according to recent data provided by the National Business Research
Institute (NBRI) only 31 of all employees are truly engaged
At BrightPoint we take employee engagement seriously and we work to create a culture that
inspires employee loyalty and satisfaction The results of BrightPointrsquos commitment to its
employees are shown in the 2011 BPNA Employee Commitment Survey The survey
determined that close to 80 of respondents indicated they were satisfied with their jobs and
daily activities General employee satisfaction increases when managers take an active interest
in their employees beyond their day-to-day job responsibilities According to NBRI managers
that actively coach build relationships and keep an open dialogue with their employees improve
employee engagement
We have a diverse workforce where each employee brings unique value and has individual
needs Managers are learning to manage the individual and not the position In order to give
managers the tools they need to be successful BrightPoint places strong emphasis on targeted
leadership training workshops and continual learning resources In 2011 906 of managers at
BrightPoint NA participated in the development opportunities offered and also made an effort to
37
help reinforce the learning of their team members This signals that our leadership team is taking
an active interest in professional development and its connection to employee commitment
As BrightPoint continues to increase focus on employee engagement the organization will grow
stronger and maintain a substantial advantage over our competition Our employees possess the
knowledge experience and resiliency to respond quickly to the demands of the marketplace and
through their genuine commitment will deliver what our customers want with increasing
efficiency and effectiveness Our responsibility is value-creation by growing our business and
maintaining high levels of customer service and loyalty We believe the best way to accomplish
this is through a strong committed and engaged workforce
Performance Model Adopted At Mohali Plant
38
Process adopted by Philips Electronics Mohali Plant for Job Satisfaction of Employee that leads commitment of the employees
39
Recruiting
The messages in Philips Electronics Mohali organization conveys while seeking to attract job
applicants also can influence future employeesrsquo engagement and commitment If your firm has
designed jobs specifically to engage employees then organization want to ensure that recruiting
ads extol these positionsrsquo attractive featuresmdashsuch as challenging work assignments a highly
skilled team environment or minimal supervision Applicants who notice and respond to these
ads will more likely be motivated by these features Also consider how organization might best
seek candidates from inside your organization When Organisation recruit existing employees for
desirable jobs you enhance their engagement (by maximizing the person-job fit) and
commitment (by providing growth and advancement opportunities to employees in return for
their loyalty) If Organisation recruit from outside when qualified internal candidates are
available Organization may unwittingly suggest to current employees that your company is not
willing to reciprocate their commitment Existing staff may then begin questioning their own
commitment to the firm By contrast organisation recruit external candidates to both the job and
your organization For these candidates ensure that recruiting messages highlight attractive job
features organizational values and commitment reciprocity That is in return for performance
and dedication your company offers competitive pay and benefits flexible work hours and
learning and career advancement opportunities Also remember that prospective employees have
multiple commitments You will inevitably have to compete with those commitments as
organization try to attract candidates to your firm Most people find it easier to make a new
commitment when it is compatible with their other obligations For example you boost your
chances of recruiting a highly qualified candidate who is a single parent if you offer flexible
work hours family health benefits and on-site day care ldquoRecruiting for Engagement and
Commitmentrdquo
40
Employee Selection
Once recruiting efforts produce a pool of promising job candidates Philips select among them to
fill available positions When organisation select the right individuals for the right jobs new
hires carry out their work more smoothly and experience fewer performance problems The
result Greater enjoyment ofmdashand engagement inmdashthe job
To enhance engagement through your selection of employees identify those candidates who are
best-suited to the job and your organizationrsquos culture Also use candidate assessment methods
that have obvious relevance to the job in questionmdashfor example by asking interviewees what
they know about the role and having them provide work samples Most candidates will view
these techniques more positively than tests with less apparent relevance such as personality and
integrity assessments Successful candidates feel good about having ldquopassed the test and see
company as careful and capable for having selected them A positive initial impression of an
employer encourages growth of long-term commitment
Training and Development
Training and development can serve as additional levers for enhancing engagement and
commitment For new hires training usually begins with orientation Orientation presents several
important opportunitiesmdashincluding explaining pay work schedules and company policies Most
important it gives you a chance to encourage employee engagement by explaining how the new
hirersquos job contributes to the organizationrsquos mission Through orientation Mohali Plant of Philips
Electronics describe how r company is organized introduce the new employee to his or her co-
workers give the person a tour of the area where he or she will be working and explain safety
regulations and other procedural matters In short you foster person-organization fitmdashvital for
developing productive and dedicated employees Through training you help new and current
41
employees acquire the knowledge and skills they need to perform their jobs And employees who
enhance their skills through training are more likely to engage fully in their work because they
derive satisfaction from mastering new tasks Training also enhances employeesrsquo value to your
company as well as their own employability in the job market In addition most companies offer
higher wages for skilled workers to compensate them for their greater value and to discourage
turnover
Compensation
Like the HR practices discussed above compensation can powerfully influence employee
engagement and commitment Some compensation components encourage commitment to
employers while others motivate engagement in the job It is possible to stimulate one and not
the other though itrsquos generally better to foster both For example a company that offers a strong
performance incentive system but no retirement plan will probably realize exceptional
engagement from its workers however they may eventually commit themselves to another
company that does offer a good retirement plan Meanwhile an organization that offers generous
retirement benefits but a traditional seniority-based pay grade system may have committed
employees however these workers might deliver pedestrian performance as they bide their time
until retirement In designing compensation plans you therefore need to consider employee
engagement and commitment strategically
Encourage managers to include employees in the goal-setting process This technique helps to
ensure that workers understand the goals It also promotes acceptance of challenging objectives
because people generally feel more committed to goals they have helped define In addition
consider how you and other managers will recognize and encourage contributions that exceed
expectations For example when a piece of equipment malfunctions Joe finds other ways to
maintain production rather than merely shutting down the machine and waiting for the
42
maintenance staff to fix it Or when a less experienced co-worker encounters a new task Sally
offers friendly coaching instead of standing by and waiting for the inevitable mistakes to crop
up Performance management processes operate on a continuous basis Therefore they provide
perhaps the best ongoing opportunities for employers to foster employee engagement and
commitment For example managers can use routine discussions about performance and
feedback sessions to learn which aspects of the job hold the most interest for each employee and
which tasks are most challenging During such discussions managers also can define what going
above and beyond the call of dutyrdquo looks like and generate ideas for rewarding such
contributions An employeersquos aspirations and career goals can receive careful attention during
performance appraisal meetings Without inquiring into an employeersquos personal life a supervisor
can nevertheless explore ways to enhance the compatibility between the workerrsquos commitment to
your organization and the employeersquos other life commitments Through such means the
organization personalizes its relationship to each employee and provides support while also
expressing appreciation for their contributionsmdash key drivers of engagement and commitment
To further engage employees and win their commitment through your performance management
programs consider how to treat your organizationrsquos most experienced employees In many cases
these employees understand the intricacies of a job better than their supervisors or managers do
By virtue of long identification with your organization they may be deeply committed to high-
level goals They use their expertise to contribute in ways that newer employees simply cannot
match But many of them also may be planning to retire soon especially if they are from the
ldquoBaby Boomerrdquo generation How will you transfer their knowledge to younger workers Design
a performance management system that recognizes and rewards proactive sharing of knowledge
and expertise among co-workers For example create knowledge repositories or learning
histories that can be stored in databases that employees can access and then create incentives
43
for people who contribute to and use these repositories Of course effective performance
management systems also identify employees who are not meeting expectations Failing to
address problem performance can erode other employeesrsquo engagement and commitment as their
workloads increase and they conclude that the company is willing to tolerate poor performance
If feedback coaching and remedial training are of little avail the manager may need to move the
person to a different position within the company where he or she can make a more valuable
contribution or let the individual go if there is no good match elsewhere in the organization
44
Chapter-V
RESEARCH METHODOLOGY
The basic task of research is to generate accurate information for use in decision-making
Research can be defined as the systematic and objective process of gathering recording and
analyzing data for aid in making business decisions As the project involves analyzing of
45
financial structure the research is exploratory in nature covering financial parameters and come
of the important ratios to carry out research There are basically two techniques adopted for
obtaining information
Primary Data
Secondary Data
Primary Data is gathered specifically for the project at hand through personal interviews with
the accounts officers
Sample Size = 100 Employees
Secondary data is previously collected and assembled for some project other than the one at
hand It is gathered and recorded by someone else prior to current needs of the researcher It is
less expensive than the primary date
Secondary Data can be obtained from both external and internal sources
External data may be collected from books and periodicals government sources media and other
commercial sources
Internal data is that secondary data which is created recorded or generated by the organization
As the project is explanatory in nature secondary data is collected from the reports of the
company books journals and interest Secondary data is gathered from annual reports official
records and standing orders of the units
CHAPTER - VI
DATA ANALYSIS AND INTERPRETATION
46
The data after collection is to be processed and analyzed in accordance with the outline
and down for the purpose at the time of developing research plan
Technically speaking processing implies editing coding classification and tabulation of
collected data so that they are amenable to analysis The term analysis refers to the computation
of certain measures along with searching for pattern groups Thus in the process of analysis
relationship or difference should be subjected to statistical tests of significance to determine with
what validity data can be said to indicate any conclusions
The analysis of data in a general way involves a number of closely related operations
which are performed with the purpose of summarizing the collected data and organizing them in
such a manner that they answer the research questions In this study the researcher followed
above process carefully and it is presented in this chapter
47
Table 41 ndash To know the department in which employees are belongs to
S
ou rc
e
survey data
Inference
From the above table it shows that 35 of employees are belongs to
production department
FIGURE 41
S
SI No
D
Department
N
No of Respondents
P
Percentage
1
1
M
Mechanical
3
30
3
30
2
2
E
Electrical
2
25
2
25
3
3
P
Production
3
35
3
35
4
4
O
Others
1
10
1
10
T
Total
1
100
1
100
48
REPRESENTS THE DEPARTMENT
Table 42 ndash To know working experience of the employees
Source survey data
Inference
From the above table it shows that 34 of the employees have 4 ndash 6
years experience
S
SI No
W
Work Experience
N
No of Respondents
P
Percentage
1
1
B
Below 2 years
1
33
1
13
2
2
2
2ndash 4 years
3
30
3
30
3
3
4
4ndash 6 years
3
34
3
34
4
4
A
Above 6 years
2
23
2
23
T
otal
1
100
1
100
49
FIGURE 42
REPRESENTS THE EXPERIENCE OF THE EMPLOYEES
Table 43 ndash To know the physical working environment
S
SI No
W
Working Environment
N
No of Respondents
P
Percentage
1
1
E
Excellent
1
12
1
12
2
2
G
Good
5
57
5
57
3
3
F
Fair
2
28
2
28
4
4
P
Poor
0
03
0
33
5
5
V
Very Poor
0
00
0
00
T
Total
1
100
1
100
Source survey data
Inference
From the above table it shows that 57 of the employees were feeling good about the working environment
50
FIGURE 43
REPRESENTS THE PHYSICAL WOKING ENVIRONMENT
51
Table 44 ndash To know the satisfaction level of employees towards the non-monitory benefits
S
SI No
N
Non-Monitory Benefits offered
to Employees
N
No of Respondents
P
Percentage
1
1
H
Highly Satisfied
1
14
1
14
2
2
S
Satisfied
5
54
5
54
3
3
N
Neither Satisfied nor Dissatisfied
2
25
2
25
4
4
D
Dissatisfied
0
05
0
05
5
5
H
Highly Dissatisfied
0
02
0
02
Total 1
100
1
100
Source survey data
Inference
From the above table it shows that 54 of the employees were satisfied towards the non-monitory benefits
FIGURE 44
REPRESENTS THE SATISFACTION LEVEL OF EMPLOYEES TOWARDS THE NON-MONITORY BENEFITS
52
Table 45 ndash To know the satisfaction level of respondents towards the work
assigned
Source survey dataInference
From the above table it shows that 45 of the respondents were satisfied towards the work assigned
FIGURE 45
S
SI No
A
Amount of Work
N
No of Respondents
P
Percentage
1
1
H
Highly satisfied
2
20
2
20
2
2
S
Satisfied
4
45
4
45
3
3
N
Neither Satisfied nor Dissatisfied
1
12
1
12
4
4
D
Dissatisfied
1
18
1
18
5
5
H
Highly Dissatisfied
0
06
0
06
Total 1
100
1
100
53
REPRESENTS THE SATISFACTION LEVEL OF RESPONDENTS TOWARDS THE WORK ASSIGNED
54
Table 46 ndash Opinion about the career development programme in their organisation
S
SI No
C
Career Development
N
No of Respondents
P
Percentage
H
Highly satisfied
1
12
1
12
S
Satisfied
5
56
5
56
N
Neither Satisfied nor Dissatisfied
2
22
2
22
D
Dissatisfied
1
10
1
10
H
Highly Dissatisfied
0
00
0
00
Total 1
100
1
100
Source survey data
Inference
From the above table it shows that 56 of the employees were satisfied
with the opinion about the carrier development programme in their organisation
FIGURE 46
REPRESENTS OPINION ABOUT THE CAREER DEVELOPMENT
PROGRAMME IN THEIR ORGANISATION
55
Table 47 ndash To know the cooperation of co-workers
S
SI No
C
Co-operation of Workers
N
No of Respondents
P
Percentage
1
1
H
Highly satisfied
2
20
2
20
2
2
S
Satisfied
6
66
6
66
3
3
N
Neither Satisfied nor Dissatisfied
1
11
1
11
4
4
D
Dissatisfied
0
03
0
03
5
5
H
Highly Dissatisfied
0
00
0
00
Total 1
100
1
100
Source survey data
Inference
From the above table it shows that 66 of the employees were satisfied
with the cooperation of co-workers
FIGURE 47
56
REPRESENTS THE COOPERATION OF CO-WORKERS
57
Table 48 ndash To know the satisfaction of Respondents with top management
S
SI No
S
Satisfaction with Top
Management
N
No of Respondents
P
Percentage
1
1
H
Highly satisfied
2
26
2
26
2
2
S
Satisfied
5
51
5
51
3
3
N
Neither Satisfied nor Dissatisfied
1
17
1
17
4
4
D
Dissatisfied
0
06
0
06
5
5
H
Highly dissatisfied
0
00
0
00
Total 1
100
1
100
Source survey data
Inference
From the above table it shows that 51 of the employees were satisfied with the top management
FIGURE 48
58
REPRESENTS THE SATISFACTION OF RESPONDENTS WITH TOP MANAGEMENT
Table 49 ndash To know the satisfaction of Respondents with their subordinates
Source survey data
Inference
From the above table it shows that 67 of the employees were satisfied with their subordinates
S
SI
No
S
Satisfaction with Subordinates
N
No of Respondents
P
Percentage
1
1
H
Highly satisfied
1
12
1
12
2
2
S
Satisfied
6
67
6
67
2
3
N
Neither Satisfied nor Dissatisfied
1
14
1
14
4
D
Dissatisfied
0
07
0
07
5
5
H
Highly Dissatisfied
0
00
0
00
Total 1
100
1
100
59
FIGURE 49
REPRESENTS THE SATISFACTION OF RESPONDENTS WITH THEIR SUBORDINATES
60
Table 410 ndash To know the level of satisfaction regarding nature of job
S
SI No
J
Job Satisfaction
N
No of Respondents
P
Percentage
1
1
H
Highly satisfied
2
22
2
22
2
2
S
Satisfied
5
56
5
56
3
3
N
Neither Satisfied nor Dissatisfied
1
16
1
16
4
4
D
Dissatisfied
0
07
0
07
5
5
H
Highly Dissatisfied
0
00
0
00
Total 1
100
1
100
Source survey dataInference
From the above table it shows that 56 of the employees were satisfied with their job
FIGURE 410
61
REPRESENTS THE LEVEL OF SATISFACTION REGARDING THE NATURE OF JOB
Table 411 ndash To know whether there is any job pressure in their work
Source survey data
Inference
From the above table it shows that 72 of employees said there is job pressure in their work
FIGURE 411
REPRESENTS WHETHER THERE IS ANY JOB PRESSURE IN THEIR WORK
S
SI No
J
Job Pressure
N
No of Respondents
P
Percentage
1
1
Y
Yes
7
72
7
72
2
2
N
No
2
28
2
28
T
Total
1
100
1
100
62
Table 412 ndash To know the opinion regarding opportunity provided by the organisation in developing skills
amp talents
S
SI No
D
Development of Skills and
Talents
N
No of Respondents
P
Percentage
1
1
H
Highly Agree
1
12
1
12
2
2
A
Agree
5
52
5
52
3
3
N
Neither Agree nor Disagree
2
28
2
28
4
4
D
Disagree
0
06
0
06
5
5
H
Highly Disagree
0
02
0
02
Total 1
100
1
100
Source survey data
Inference
From the above table it shows that 52 of employees agreed regarding opportunity provided by the organisation in developing skills amp talents
63
FIRGURE 412
REPRESENTS THE OPPORTUNITY PROVIDED BY THE ORGANISATION IN DEVELOPING SKILLS amp TALENTS
64
Table 413 ndash To know the satisfaction level of welfare facilities provided by the management
S
SI No
W
Welfare Facilities
N
No of Respondents
P
Percentage
1
1
H
Highly satisfied
0
09
9
09
2
2
S
Satisfied
5
57
5
57
3
3
N
Neither Satisfied nor Dissatisfied
2
29
2
29
4
4
D
Dissatisfied
5
05
0
05
5
5
H
Highly Dissatisfied
0
00
0
00
Total 1
100
1
100
Source survey data
Inference
From the above table it shows that 57 of the employees were satisfied with the welfare facilities provided by the management
FIGURE 413
REPRESENTS THE SATISFACTION LEVEL OF WELFARE FACILITIES PROVIDED BY THE MANGEMENT
65
Table 414 ndash To know the employee satisfaction towards the salary
Source survey data
Inference
From the above table it shows that 67 of the employees were satisfied
with their salary
FIGURE 414
REPRESENTS THE SATISFACTION TOWARDS THE SALARY
S
SI No
P
Payment Satisfaction
N
No of Respondents
P
Percentage
1
1
Y
Yes
6
67
6
67
2
2
N
No
3
33
3
33
T
otal
1
100
1
100
66
Table 415 ndash To know the employees willingness amp Commitment Towards
Organisation
Source survey data
Inference
From the above table it shows that 59 of the employees were willing to
continue in this organisation
FIGURE 415
REPRESENTS THE EMPLOYEES WILLINGNESS TO CONTINUE
S
SI No
W
Willingness to Work
N
No of Respondents
P
Percentage
1
1
Y
Yes
5
59
5
59
2
2
N
No
4
41
4
41
T
Total
1
00
1
00
67
CHI-SQUARE METHOD
The chi square test is one of the simplest and most widely used non-
parametric tests in statistical work As a non-parametric test it can be used to determine
if categorical data shows dependency or the two classifications are independent It can
also be used to make comparisons between theoretical population and actual data
when categories are used
n
Chi square χsup2= sum (O-E) sup2 E
i =1
Where O= observed frequency
E= expected frequency
68
OBSERVED FREQUENCY
Table 419 shows the relationship between the department and the job satisfaction
Over All
Job
SatisfactionHighly
SatisfiedSatisfied
Neither
Satisfied nor
Dissatisfied
DissatisfiedHighly
Dissatisfied
Sub
Total
Mechanical 5 6 14 3 2 30
Electrical 6 8 6 3 2 25
Production 9 13 7 4 2 35
Others 2 3 2 2 1 10
Sub Total 22 30 29 12 7 100
69
EXPECTED FREQUENCY
Over All
Job
SatisfactionHighly
SatisfiedSatisfied
Neither
Satisfied nor
Dissatisfied
DissatisfiedHighly
Dissatisfied
Sub
Total
Mechanical 7 8 9 4 2 30
Electrical 5 8 7 3 2 25
Production 8 11 10 4 2 35
Others 2 3 3 1 1 10
Sub Total 22 30 29 12 7 100
Null Hypothesis (Ho)
There is no significant difference between the department and the job satisfaction
Alternative Hypothesis (Ho)
There is significant difference between the job satisfaction
Co Relation
70
Chapter-V
CONCLUSIONS AND
RECOMMENDATIONS
71
CONCLUSION
On the basis of Analysis of Job Satisfaction Level of the Employees of Philips Electronics India
Ltd Mohali made in the previous chapters following conclusions are drawn
General Profile The plant of PHILIPS is ideally located in the Mohali Industrial focal point
Phase 9 near Chandigarh the capital of Punjab on a campus of 17 hectares The working
environment of the company is very healthy The visitors feel happy after the campus
Indigenous Technology PHILIPS is the only lighting manufacturing company based on purely
indigenous technology Philips was appropriately chosen as the brand name as self reliance and
building up of Indian Engineering capabilities remain the guiding spirit of PHILIPS
Financial structure PHILIPS is a low debt company signifying its dependence mainly on
its internal accruals for its financial requirements PHILIPS continues to strengthen its financial
position by channelising these internal accruals to fund its expansion programmes
Working results PTL has registered a handsome and constant growth in its profits because
of a brisk demand for new and better technology electronic items None of the other electronic
company has shown such a steady growth Philips has recorded the lowest current ratio
However with this lowest current ratio PTL still enjoys moderate payment period and highest
velocity of creditors and debtors only due to commitment of itrsquos employees
72
SUMMARY
According to the 1999 Gallup Poll the four elements that have proven to be effective in creating
employee loyalty are praise and recognition a sense of contribution to the company learning and
development and having a best friend at work
Creating a fairy-tale work environment begins withrecognition Your employees need it more
than money perks or titles Here are eight tips regarding recognition Remember these and your
employees may just start whistling while they work It is up to me The corporate culture or
financial rewards will not make your team successful It is up to you Recognition is one thing
that is completely in your control
Strong relationships are vital in todays economy Strengthening employee relationships is even
more necessary as companies downsize and lay off As your workforce shrinks and you need to
do more with less keeping quality employees becomes even more critical As a manager it is
your job to bond your best people to your company through recognition And you also must help
direct and motivate your core performers
Simple rewards earn big returns There are some relatively simple things you can do that will
earn big returns For example remember your employees birthdays and work anniversaries find
out what inexpensive rewards they value (for example tickets to a ball game or a half day off to
spend time with their kids) make the most of your formal service awards with some preparation
and a group presentation walk around your department every day and talk to your
people and thank them sincerely and often
73
Make it specific Praise and recognition must be specific to have impact General praise such as
You do great work actually can have the opposite effect and leave your employees wondering
Does he have any idea what I really do around here Specific praise links individual
accomplishments to company goals For example Cheryl I noticed the way you handled that
customer complaint Great work As you know we value quick resolutions of problems as
one of our core strategies
Ask the best to stay Call your best people into your office one at a time Let that bright young
college graduate know you value his fresh ideas and energy Tell the 20-year veteran how much
your team relies on her expertise and organizational skillsRemarkably a significant percent of
high-impact performers report that they left their last job because No one ever asked me to
stay
Forget cash
Remember the saying Money cant buy everything Well its true Dont wait until you can
offer an employee a raise or promotion Real thanks is its own reward In numerous surveys of
work satisfaction top on employees lists is feeling appreciated In fact when employees feel
recognized and involved they are much less likely to keep asking about money
Recognize
Recognition means most to an employee when it is sincere and spontaneous According to the
largest study ever conducted on workplace satisfaction (Gallup 1999) recognition should occur
at least every seven days If you wait until a year-end party or an annual review you are waiting
much too long to recognize and you probably are losing people you do not need to
74
Recognition works
Neglect can be a poisoned apple Recognition is the elixir that will spark better attitudes and
performance Jeffrey Pfeffer of Stanford University says The returns from managing people in
ways that build high commitment typically are on the order of 30 to 50 percent
Take a hard look in the mirror and ask yourself how you can recognize the fairest of them all
Learn to recognize your employees for their efforts thank them often and reward their
achievements You can awaken them from their anger and apathy and they will fall in love with
their jobs again Chances are you will work together happily ever after
So there is direct relation with employee satisfaction and their commitment towards the
organization and it is also clear from the above discussion that only monetary elements are not
sufficient for employee satisfaction rather other element like employer behavior recognisation
and other moral value
75
RECOMMENDATIONS
PHILIPS should increase its capacity utilization It should work at full capacity to
minimize its cost of production With this increase in capacity utilization the total cost
will spread over more units thereby decreasing the per unit cost
PHILIPS should decrease the credit facilities provided to its consumers The payback
period is quite high in case of debtors as compared to creditors it should be more or less
equal as it will help in improving company liquidity
PHILIPS should focus more on the consumer lifestyle goods in India parallel to its other
business as it accounts very less as compare to other businesses of Philips
Another recommendation for Mohali plant is about the HR department that is they
should appoint permanent and skilled workers as against casual workers which generally add
up to the profit of the company
76
BIBLIOGRAPHY
1 Values-Based Leadership Rebuilding Employee Commitment Performance and Productivity ( Thomas D Kuczmarski)
2 Monthly Journals of Philips Electronics India Ltd
3 Authentic Leadership Medtronic CEO Bill George
4 wwwindiaphilipscom
5 wwwwikipediacom
6 httpwwwemployeecommitmentcom
7 One Foot Out The Door How to Combat The Psychological Recession Thatrsquos Alienating Employees And Hurting American Business Judith Bardwick
8 Employee Commitment A Leader Ship Guide Joe Folkman
9 Harvard University Factors that Impact Employee Well Being Commitment and Productivity -An Article
77
Questionnaire
Name __________________________________________________________
Age______________________________ Gender _______________________
Qualification _______________________ Contact No ___________________
Q1 In which department you are working
Electrical Production Mechanical Other
Q2 What is your working experience
gt2 Years 2-4 Years 4-6 Years lt 6 Years
Q3 How You like the physical Working Environment of the organization
Excellent Good Fair Poor Very Poor
Q4 Are you satisfied with Non-Monitory benefits provided by the organisation
Highly Satisfied Satisfied Neither Satisfied Nor dissatisfied
Highly Dissatisfied Dissatisfied
Q5 Are you satisfied with your work
Highly Satisfied Satisfied Neither Satisfied Nor dissatisfied
Highly Dissatisfied Dissatisfied
Q6 Are you satisfied with the career development programe of the company
Highly Satisfied Satisfied Neither Satisfied Nor dissatisfied
Highly Dissatisfied Dissatisfied
Q7 Is other staff of the organization is co-operative with you
Highly Satisfied Satisfied Neither Satisfied Nor dissatisfied
Highly Dissatisfied Dissatisfied
Q8 Are you satisfied with top level management
Highly Satisfied Satisfied Neither Satisfied Nor dissatisfied
Highly Dissatisfied Dissatisfied
78
Q9 Are you satisfied with your subordinates
Highly Satisfied Satisfied Neither Satisfied Nor dissatisfied
Highly Dissatisfied Dissatisfied
Q10 Are you satisfied with the nature of the Job
Highly Satisfied Satisfied Neither Satisfied Nor dissatisfied
Highly Dissatisfied Dissatisfied
Q11 Do you have any Job Pressure in work
Yes No
Q12 Do you satisfied with the opportunities provided by the organisation
Highly Satisfied Satisfied Neither Satisfied Nor dissatisfied
Highly Dissatisfied Dissatisfied
Q13 Are you satisfied with the welfare facilities provided by the organisation
Highly Satisfied Satisfied Neither Satisfied Nor dissatisfied
Highly Dissatisfied Dissatisfied
Q14 Are you satisfied towards your salary
Highly Satisfied Satisfied Neither Satisfied Nor dissatisfied
Highly Dissatisfied Dissatisfied
Q15 Are you committed towards the organisation
Yes No
Signature

4
HISTORY
When Philips started manufacturing incandescent lamps in 1891 there was already a
separate industrial research laboratory outside the factory a concept virtually unknown
elsewhere In 1913 another major step was taken with the opening of a physics laboratory
(the Nat Lab) Under the leadership of Dr Gilles Holst the Philips Research organization
became a major center of technical competence and innovation
From 1914-1945
1914 to 1945 saw considerable growth and diversification Improvements were made to the
incandescent lamp and gas discharge lamps proved more efficient in generating light
Meanwhile our bulb expertise led to new products such as the X-ray tube and the radio valve
The invention of the pentode gave Philips an important patent in radio In 1923 Philips decided
to become a systems supplier instead of a components company and consequently the research
organization broadened its scope into radio as well as television
1945-1970
After World War II there was a period of expansion The sky was the limit Television built on
research carried out in the 30s became a mass-produced consumer phenomenon The invention
of the transistor by Bell Labs changed the world of electronics forever We built up a strong
patent position in magnetic materials and contributed many breakthroughs such as the LOCOS
process (LOCal Oxidation of Silicon) used in every modern Metal-Oxide-Semiconductor
(MOS) IC the rotary heads for the Philishave electric shaver (1950s) and the compact audio
cassette (1963) a breakthrough in audio recording Research laboratories in England France
Germany and the USA were founded
5
1970-today
From 1970 to the present day our research has been tied much more closely to our industrial and
business activities This resulted in revolutionary developments such as the introduction of the
CD the DVD and Blu-ray Disc In the medical sphere we made great strides forward in
magnetic-resonance imaging and ultrasound and with our increasing focus on health and well-
being these developments are still ongoing in 2006 we saw the first commercial launch of a 3D
scanner
In that same year we sold 80 of our Semiconductors business as a new independent company
NXP was created We also adopted Open Innovation as our way of working the High Tech
Campus Eindhoven was opened up to external companies
At Philips Research we continue to focus on meaningful innovations that improve peoplersquos
lives Ambilight for example has brought a whole new dimension to TV viewing and in 2007
we developed Lumiramic ndash a groundbreaking new phosphor technology for energy-efficient
white LEDs ndash together with our partners
The future of Philips Research
Philips Research will remain an important driving force in realizing Philipsrsquo vision to become an
even more market-driven and people-centric health and well-being company We do this by
continually evaluating key issues and trends in society to ensure that peoplersquos needs are at the
heart of our innovations now and in the future
Royal Philips Electronics of the Netherlands is a diversified Health and Well-being
company focused on improving peoplersquos lives through timely innovations As a world leader in
healthcare lifestyle and lighting Philips integrates technologies and design into people-centric
6
solutions based on fundamental customer insights and the brand promise of ldquosense and
simplicityrdquo
Headquartered in the Netherlands Philips employs approximately 121000 employees in more
than 60 countries worldwide With sales of EUR 26 billion in 2008 the company is a market
leader in cardiac care acute care and home healthcare energy efficient lighting solutions and new
lighting applications as well as lifestyle products for personal well-being and pleasure with
strong leadership positions in flat TV male shaving and grooming portable entertainment and
oral healthcare
Philips Electronics India Limited
Philips Electronics India Limited a subsidiary of the Netherlands-based Royal Philips
Electronics is the leading Health and Wellbeing company Today Philips is a simpler and more
focused company with global leadership positions in key markets of Healthcare Lighting and
Consumer Lifestyle addressing peoplersquos Health and wellbeing needs and aspirations as its
overarching theme
As one of the nations most well-known and well-loved brands Philips is a part of practically
every Indians life With recent launch of Philips Respironics product categories in obstructive
sleep apnea management and home respiratory care home decorative lighting range and ALU
range Philips products find use in virtually every aspect of an individualrsquos daily life 24X7 - at
home at work on the move and at rest Philips stands as a source of easy to use trendy and
innovative internationally acclaimed products with superior design and technology that enhance
the quality of consumers professional and personal lives
Philips has been operating in India for over 75 years and employs over 4500 employees around
7
the country The company has an excellent pan India distribution and after-sales service network
BUSINESSES
Lighting
Philips Electronics India Indiarsquos largest lighting company operates in business areas of Lamps
Luminaires Lighting Electronics Automotive and Special Lighting Today as global leader in
Lighting Philips is driving the switch to energy-efficient solutions With worldwide electrical
lighting using 19 per cent of all electricity the use of energy-efficient lighting will significantly
reduce energy consumption around the world and thereby cut harmful CO2 emissions Philips
India has been consistently working with industry bodies such as ELCOMA Bureau of energy
efficiency and NGOs towards addressing Indiarsquos power crisis through promotion of energy
efficient lighting in India
Philips provides advanced energy-efficient solutions for all segments road lighting office amp
industrial hospitality and home Philips is also a leader in shaping the future with exciting new
lighting applications and technologies such as LED technology which besides energy
efficiency provides attractive benefits and endless new lsquonever-before-possiblersquo lighting
solutions
In 2008 Philips inaugurated a global research and development (RampD) centre for lighting
electronics in India This was its third such unit in the world The facility which is situated in
Noida will not only cater to the needs of the Indian market but also the Asia-Pacific Europe and
North America The other RampD centres are located at Eindhoven in the Netherlands and in
Shanghai China One of the primary research areas for the centre is to develop products that can
8
tackle high voltage fluctuations in India The centre currently employs 35 engineers Around 40
per cent of Philipsrsquo revenue in India comes from the lighting business
Consumer lifestyle
Guided by the brand promise of ldquosense and simplicityrdquo and the consumer insights Philips
Consumer Lifestyle offers rich new consumer experiences that meet consumersrsquo desire for
relaxation and improving their state of mind Philips also responds to the consumers desire for
wellness and pleasure by introducing products that meet the individualrsquos interests in terms of
their mind space body and appearance
The Consumer Lifestyle arm in India operates in the business areas of Home Entertainment
solutions and Personal Infotainment with product categories such as TVs home theatre systems
music systems DVD players personal entertainment solutions sound accessories Domestic
Appliances and Personal care
Philips Innovation Campus (PIC)
Philips Innovation Campus (PIC) Bangalore is a division of Philips Electronics India Limited
which is owned 96 by Royal Philips Electronics NV The Netherlands It was established in
August 1996 with a vision to be an innovation hub creating next generation solutions and
products for Healthcare and Lifestyle With the objective of meeting the growing need for high-
quality cost-effective software development capacity within the organization PICrsquos share has
increased significantly from 8 in 1998 to around 20 in 2008
9
Working at PIC are about 1000 of the industrys finest professionals using state-of-the-art
software engineering paradigms and platforms including real-time systems component-based
software engineering and multi-threaded architecture to drive the creation of tomorrows
products and services PIC is an ISO 9001Tick IT SEI CMM SM level 5 company amp has
emerged as a critical partner in the development of strategic amp futuristic technologies for Philips
worldwide 60000 registered patents illustrate the innovative nature of the company Philips has
adopted an Open Innovation strategy which leverages the joint innovative power of partnering
companies and researchers to bring more innovations to the market effectively and faster PIC
has built-up extensive know-how and expertise in the software engineering and technology
domains relevant to its business In addition competencies in the areas of project management
requirement engineering and quality assurance have been established to offer customers products
and services of the highest quality at the fastest time-to-market and the lowest cost of
ownership
RESEARCH AND DEVELOPMENT
Since its foundation 100 years ago Philips Research has been at the forefront of fundamental
scientific research But with market focus being more and more important across almost all
corporate RampD organizations is this still the case If some of the pioneering work being done
by scientists across Research is anything to judge by the answer is a resounding ldquoyesrdquo
Itrsquos different at the cutting edge
In todayrsquos market-focused corporate RampD organizations the boundary between fundamental
scientific research and applied research is becoming increasing blurred ndash particularly when it
comes to some of the most exciting areas of research ldquoHere at Philips our way of working is
very dynamicrdquo says Philips Researchrsquos Chief Science Officer Emile Aarts ldquoThis means that you
10
can apply both the lsquofundamentalrsquo and the lsquoappliedrsquo labels to many of the projects that wersquore
working on because they are both very flexible termsrdquo Philips Researchrsquos work on sleep for
instance is an excellent example of this more dynamic approach ldquoThis is a very important area
for Philips ndash but therersquos currently very little fundamental knowledge available Thatrsquos why wersquore
involved in investigating the key issues at a more fundamental level together with our university
and research institute partners The only difference is that we want this research to lead to
marketable products and solutionsrdquo
Open Innovation in new areas
Despite the flexible nature of the ldquofundamentalrdquo and ldquoappliedrdquo labels it is still possible to detect
a decline in some areas of more fundamental research at Philips in recent years ldquoThis has mainly
occurred in fields that donrsquot support the execution of our companyrsquos Health and Well-being
strategyrdquo says Aarts As he explains this refocusing exercise has gone hand-in-hand with an
expansion of more fundamental research activities in a number of new fields such as deep-brain
stimulation and multi-modal imaging for healthcare applications ldquoIn these fields wersquore
considered to be an extremely important research partner ndash especially by colleagues working in
universitiesrdquo In the future Philips Research will continue to develop its reputation in a number
of exciting fundamental domains ndash ldquogreen lightingrdquo and skincare are just two examples ndash albeit
with a more applied focus ldquoHopefully this research will enable us to build on our strong
heritage of improving the quality of peoplersquos lives
11
BOARD OF DIRECTORS
Non-Executive Director amp Chairman S M Datta
Executive Vice Chairman amp Managing Director Murali Sivaraman
Executive Director Jan-Hein Louwman
Non-Executive Director S Venkatramani
India Management Team
MURALI SIVARAMANN - CEO
ANJAN BOSE - Healthcare
JAN-HEIN LOUWMAN ndash CEO
MAHESH KRISHNAN ndash Consumer lifestyle
RAJEEV CHOPRA ndash lighting
RAKESH SHARMA ndash Strategic Business Development
S NAGARAJAN ndash Human resources
VIVEK SHARMA ndash Chief Marketing Officer
WIDO MENHARDT ndash Philips Innovation Campus
12
Corporate Office-
Philips Electronics India Ltd
Technopolis Knowledge Park
Mahakali Caves Road
Chakala Andheri (East)Mumbai 400 093
Tel +91 22 66912000
VISION 2012
Through the Vision 2012 strategy we aim to fuel growth by making Philips the leading brand in
Health and Well-being Vision 2012 further positions Philips as a market-driven people-centric
company with a strategy and a structure that fully reflect the needs of its customer base while
also increasing shareholder value This is implemented through sharpened strategies in the three
core sectors Healthcare Lighting and Consumer Lifestyle
ldquoWith Vision 2010 we are putting people right at the center of things with Health and Well-
being as our overarching theme We are thereby putting into practice our mission improving the
quality of life through the introduction of meaningful innovationsrdquo ndash Gerard Kleisterlee
President and CEO of Royal Philips Electronic
Our Ways of Working
1 We are a people-centric company that organizes around customers and markets
2 We invest in a strong brand and consistently deliver on our brand promise of ldquosense and
simplicityrdquo in our actions products and services
13
3 We deliver innovation by investing in world class strengths in end-user insights
technology design and superior supplier networks
4 We develop our peoplersquos leadership talent and engagement and align ourselves with high
performance benchmarks
5 We invest in high growth and profitable businesses and emerging geographies to achieve
market leadership positions
6 We are committed to sustainability and focus on making the difference in efficient energy
use
7 We drive operational excellence and quality to best in class levels allowing us the above
mentioned strategic investments in our businesses
BRAND PROMISE
It is the combination of two unique capabilities that enables us to deliver on our ldquosense and
simplicityrdquo promise These capabilities are firstly by understanding people and secondly
technology integration and product design
We put our end users front and center of product innovations starting with understanding their
needs and aspirations We use best-in-class research facilities and agencies to validate and ensure
that our product innovations are designed around peoplersquos needs and aspirations easy to
experience and advanced
SUSTAINABILITY
14
In 2009 we evaluated our sustainability strategy and resolved to fully leverage sustainability as
an integral part of our overall strategy and an additional driver of growth as reflected in the
Philips Management Agenda 2012
To deliver on our brand promise of ldquosense and simplicityrdquo and at the same time provide the
company direction for the longer term in this area we have identified three sustainability
leadership key performance indicators where we can bring our competencies to bear lsquocarersquo
lsquoenergy efficiencyrsquo and lsquomaterialsrsquo including targets for 2015
Bringing care to more than 500 million people
Target 500 million lives touched by 2015
Improving energy efficiency of Philips products
Target 50 improvement by 2015 (for the average total product portfolio) compared to
2009
Closing the materials loop
Target Double global collection recycling amounts and recycled materials in products
by 2015 compared to 2009
Each sector will take the lead on one of the leadership key performance indicators with
Healthcare leading lsquocarersquo Lighting lsquoenergy efficiencyrsquo and Consumer Lifestyle lsquomaterialsrsquo
In addition we defined a set of complementary performance indicators to accelerate change and
drive performance including the EcoVision4 parameters
With EcoVision4 we have committed to the following by 2012
15
bull Generate 30 of total revenues from Green Products
bull Double investment in Green Innovations to a cumulative EUR 1 billion
bull Improve our operational energy efficiency by 25 and reduce our CO2 emissions by 25 all
compared with the base year 2007
SOCIAL COMMITMENT
Living up to this commitment means we use our capabilities to enhance the lives of our
employees and people in society at large Within the company we encourage teamwork and
collaboration in an environment that enables employees to reach their full potential
Building on our rich heritage of involvement in social issues we have established our own
approach of supporting the communities where we live and work focusing on energy efficiency
and healthcare
Sustainable lighting
There is a pressing need to find innovative lighting solutions for the 16 billion people who live
in areas with no access to the electricity grid or where the grid is unreliable Thatrsquos why we have
developed SMILE (Sustainable Model in Lighting Everywhere)
Launched as a pilot in 2006 in four Indian states SMILE includes two lighting solutions UDAY
a rechargeable portable lantern and KIRAN a hand-cranked LED flashlight Today are
distributed in eighth Indian states
16
SWOT ANALYSIS
Strengths
bull India was a market where the first mover enjoyed advantages over latecomers
bull The first image of the product lasted long in the eyes of the consumer and the first to enter the
market could gain the largest market share
bull PHILIPS is committed to enhance its image to the Chinese market as investors
bull PHILIPS was building a wholly owned manufacturing plant in India to show the
Chinese the commitment Korea had to the Chinese society
bull Labor costs in India were less and would defray the cost of producing high-end
bull Samsung has been making color TVs for many years in Korea before moving to the Chinese
market
Weaknesses
bull PHILIPS must continue to control all costs to maintain success
bull India has a reputation of being a protected market (protectionism)
bull India was a market where the first mover enjoyed advantages over late comers PHILIPS is
trying to overcome the first comer advantage Japan manufacturers have over them by being those
first comers
bull Companies such as Sony and Matsushita had built sales and service networks that were
favorable to their sales programs in India while Samsung would have to catch up in that area
17
bull Samsung is not as experienced in manufacturing high-end TVs for a higher-end market
segment
Opportunities
bull Based on the data that on 28 of the 220 million rural households own a color TV PHILIPS
focus on the domestic India market should be to penetrate the rural household market which
would mean that for those purposes the low-end production of sets in the 13rdquo to 20rdquo range should
be produced to appeal to that segmentrsquos purchasing ability
bull Larger more high-end models can be produced to appeal to an urban customer in India as well
as being an export to the US and European higher end customers
bull With success in the higher-end manufacturing and sales of premium TVs in India PHILIPS can
establish themselves as high-end producers around the world
Threats
bull PHILIPS faces intense competition in the color TV market
bull A premium-priced product wouldnrsquot sell in large volumes so pricing can be a problem
bull Since PHILIPS didnrsquot have an established marketing strategy issues of how to market the
product may arise
bull Loss of profitability because related to over-employment at most facilities
bull Is the per capita income level such that it can support sales of product at any level
bull If PHILIPS fails to be successful in the Chinese market with high-end product it will be known
around the world bull India was a market where the first mover enjoyed advantages over late
comers
bull The first image of the product lasted long in the eyes of the consumer and the first to enter the
18
market could gain the largest market share
bull PHILIPS is committed to enhance its image to the Chinese market as investors
PHILIPS ELECTRONICS MOHALI PLANT
The mohali plant was established in 1985 as PUNJAB ANAND LAMP Ltd as its second
division of lamp industry after the varodra plant at that time it was a joint stock company and
majority of shares was with Punjab Anand Lamp around 75 but in the year 2001 the company
ownership changed and the whole shares was bought by PHILIPS ELECTRONIC INDIA Ltd
and its name was changed to PHILIPS ELECTRONIC INDIA Ltd MOHALI LIGHT
FACTORY
The plant is situated in Industrial focal point PHASE-9 MOHALI near Mohali railway station
and is sreaded in 26 acres Total employees of tis plant is 532 including casual employees This
company is a landmark in the Punjab state as it is the only factory which is most profitable one
than any industry located in Punjab
19
OVERVIEW OF VARIOUS FRONTS OF
PHILIPS ELECTRONICS INDIA Ltd
Manufacturing-
Today the product range of Philips include the following products ndash
Televisions- LCD Plasma Flat Screen Smart Touch XL
Recorders DVD Players I pods and Home Theatre Systems
Audio Products - Audio Systems Remote Controls AudioVideo Accessories
Digital Photo Products and Frames
Portable Audio and Video Systems Accessories like Headphones and Speakers
PC Products - Mouse and Keyboard Multi Media Headsets External Hard Disk Drives
Mobile Phones
Male Shaving and Grooming - Dry Shavers Beard Trimmers
Personal Care - Beauty and Hair Care Products
20
Kitchen Appliances - Blenders and Hand Blenders Juicers and Citruspresses Food
Processors and Mixers Coffee Makers and Kettles Frying and Grilling Appliances
Toasters and Snacking Products
Household Products - Irons Vacuum Cleaners Water Purifiers
Professional Lighting - Industrial Shops and offices Road and Area Hospitality Sports
Lighting City Beautification and Petrol Stations
Automotive Lighting - In Cars Motorcycles and Trucks
Home Lighting
SERVICS
Philips E-waste Management Program in India
Philips has tied up with a recycler for collecting transporting and recycling unwanted broken
down consumer products
At Philips we offer consumers a convenient way of recycling their unwanted obsolete and
damaged Philips products by dropping them off at convenient locations The program
encompasses 8 major cities across India Consumers can approach one of 27 authorized Philips
service centres which will act as collection points for consumer products which need recycling
Our efforts are to expand the network in the near future
Philips ensures that the consumer products received will be recycled in an environment-friendly
manner Philips understand the corporate social responsibility and takes steps towards providing
a safer environment to the future generations We design our products to continuously realize
improvements and reduce their overall life cycle environmental impact Designing products for
21
recycling is an integral part of this approach Our aim is to use our planetrsquos limited resources
effectively and respect the principle of extended producer responsibility This also calls for
manufacturers to engage in developing solutions for effective and efficient recycling of their
products We will continue to promote and invest into improved recycling systems to reduce the
impact of electronic waste on the environment
MANUFACTURING AT MOHALI PLANT ndash
Mohali plant mainly manufactures lighting products basically of domestic usage this includes the
following products ndash
CFL bulbs ndash
1 Genie - 5 watt 8 watt 11 watt
2 Essential ndash 8 watt 11 watt 14 watt 18 watt 23 watt 29 watt
3 Tornado ndash 5 watt 8 watt 11 watt 14 watt 18 watt 23watt 29 watt
4 T5 slim tube 28 watt
Coil plant ndash Philips Electronics India is the only company that produces coils in the whole
lighting industries in the world and in India only at the MOHALI PLANT
22
Chapter-II
OBJECTIVES OF THE STUDY
23
OBJECTIVES OF THE STUDY
To study the various aspects of Satisfaction Level of the Employees working at Philips
Electronics India Ltd Mohali
To analyze the effect of Job satisfaction on the organisation
To determine the relation between job satisfaction of employees and their commitment
towards the organisation
To analyze the performance model adopted by the Philips Electronics India Ltd Mohali
to handle their manpower
To suggest remedial measures for the improvement of the companyrsquos performance
24
Chapter-III
Employees Commitment
25
Employees who are engaged in their work and committed to their organizations give companies
crucial competitive advantagesmdashincluding higher productivity and lower employee turnover
Thus it is not surprising that organizations of all sizes and types have invested substantially in
policies and practices that foster engagement and commitment in their workforces
But what are employee engagement and commitment exactly This report examines the ways in
which employers and corporate consultants define these terms today and offers ideas for
strengthening employee engagement Though different organizations define engagement
differently some common themes emerge These themes include employeesrsquo satisfaction with
their work and pride in their employer the extent to which people enjoy and believe in what they
do for work and the perception that their employer values what they bring to the table The
greater an employeersquos engagement the more likely he or she is to ldquogo the extra milerdquo and deliver
excellent on-the-job performance In addition engaged employees may be more likely to commit
to staying with their current organization Software giant Intuit2 for example found that highly
engaged employees are 13 times more likely to be high performers than less engaged
employees They are also five times less likely to voluntarily leave the company
Clearly engagement and commitment can potentially translate into valuable business results for
an organization To help you reap the benefits of an engaged committed workforce at your
organization this report provides guidelines for understanding and measuring employee
engagement and for designing and implementing effective engagement initiatives As you will
26
see everyday human resource practices such as recruitment training performance management
and workforce surveys can provide powerful levers for enhancing engagement
Employee Engagement Key Ingredients
ldquoEmployee Engagement Definedrdquo shows examples of engagement definitions used by various
corporations and consultancies Clearly definitions of employee engagement vary greatly across
organizations Many managers wonder how such an elusive concept can be quantified The term
does encompass several ingredients for which researchers have developed measurement
techniques These ingredients include the degree to which employees fully occupy themselves in
their work as well as the strength of their commitment to the employer and role Fortunately
there is much research on these elements of engagementmdashwork that has deep roots in individual
and group psychology
Definition
ldquoNo company small or large can win over the long run without energized employees who
believe in the [firms] mission and understand how to achieve it Thats why you need to take the
measure of employee engagement at least once a year through anonymous surveys in which
people feel completely safe to speak their mindsrdquo
-Jack and Suzy Welch-
Common Themes How Companies Measure Engagement
Employers typically assess their employeesrsquo engagement levels with company-wide attitude
or opinion surveys
27
1048657 Pride in employer
1048657 Satisfaction with employer
1048657 Job satisfaction
1048657 Opportunity to perform well at challenging work
1048657 Recognition and positive feedback for onersquos contributions
1048657 Personal support from onersquos supervisor
1048657 Effort above and beyond the minimum
1048657 Understanding the link between onersquos job and the organizationrsquos mission
1048657 Prospects for future growth with onersquos employer
1048657 Intention to stay with onersquos employer
The Link Between Employer Practices and Employee Engagement
How does an engaged workforce generate valuable business results for an organization The
process starts with employer practices such as job and task design recruitment selection
training compensation performance management and career development Such practices affect
employeesrsquo level of engagement as well as job performance Performance and engagement then
interact to produce business results Figure 1 depicts these relationships
28
EMPLOYEE COMMITMENT EMPLOYEE ENGAGEMENT
1048657 How do you and other managers in your
organization define commitment
1048657 Are some employees in your company
engaged in their work but not committed to
the organization Committed to staying with
your firm but not exactly engaged in their
work Both engaged and committed
1048657 To whom are your organizations employees
committed The company Their supervisor
Co-workers Team members Customers
1048657 What business results has commitment from
1048657 How do you and other managers in your
organization define employee engagement
1048657 How do you know that certain employees in
your company are engaged Do they relish
their jobs Enjoy specific responsibilities or
tasks Willingly ldquogo the extra milerdquo
1048657 In teams departments or business units in
your company that have a large number of
engaged employees what business results
are you seeing Higher productivity Lower
costs Greater revenues More efficiency
29
employees created for your organization For
example has commitment reduced turnover
and therefore decreased recruitment hiring
and training costs
1048657 What does your company do to reciprocate
employees commitment Is the organization
living up to its side of the bargain
Lower turnover Higher product or service
quality
1048657 Conversely how do disengaged employees
behave and what are the consequent costs
for their teams units-and your entire
company
As Figure 2 suggests a person possesses attributes such as knowledge skills abilities
temperament attitudes and personality He or she uses these attributes to accomplish work
behaviors according to organization-defined procedures by applying tools equipment andor
technology Work behaviors in turn create the products and services that make an organization
successful We classify work behaviors into three categories those required to accomplish duties
and tasks specified in a job description (prescribed behaviors) ldquoextrardquo behaviors that an
employee contributes for the good of the organization (voluntary behaviors) and behaviors
prohibited by an employer (proscribed behaviors including unexcused absenteeism stealing and
other counterproductive or illegal actions) Of course job performance occurs in an
organizational context which includes elements such as leadership physical setting and social
setting
30
Employers naturally want to encourage workers to perform prescribed and voluntary activities
while avoiding proscribed ones To achieve these goals organizations use a number of HR
practices that directly affect the person process and context components of job performance
Employeesrsquo reactions to these practices determine their levels of engagement and commitment
31
Chapter-IV
32
LITERATURE OF THE REVIEW
ldquo Job Satisfaction That Leads To The Commitment Of
The Employees in The Organisationrdquo
Literature of Review
Gerge Bill Authentic Leadership
In his book Authentic Leadership former Medtronic CEO Bill George makes an obvious
point that business leaders rarely say out loud ldquoMissions motivate dollars donrsquotrdquo
What he means is that purpose is what drives employee commitment not the financial
rewards that come to others Workers donrsquot get up in the morning and say ldquoGee I can
33
hardly wait to get to work today to maximize shareholder profitsrdquo Even when employees
are shareholders who can benefit from improved financials what draws people to their
chosen careers is the work itself and its purpose in the world more than the profit
possibilities
Mr George goes on to say ldquoI find there is universal agreement (among middle managers)
that you cannot inspire employees by urging them to help management get the companyrsquos
stock price uprdquo
There is in fact quite a bit of literature on this subject In Awakening Corporate Soul
authors Eric Klein and John Izzo say that employee commitment requires knowing ldquothe
purpose of our work it means recognizing the purpose our organization fulfills that goes
beyond the bottom line and it means articulating to others how their (workersrsquo) efforts
contribute to a larger purposerdquo
In Built to Last Jim Collins and James Porras spend an entire book explaining their five
year research study of major companies that led to this conclusion about employee
commitment Purpose within a company is what sustains it profit is important but when
itrsquos the prime directive companies falter
-Marshal Goldsmith-
How to Increase Employee Commitment
In practice this involves walking the talk being transparent communicating effectively treating
people equally teaching leading subordinates to increasingly excellent performance ndash and
responding to subordinates as mature individuals who are owed fairness the truth and
recognition of their achievements
34
Since managers interact directly and frequently with subordinates they are usually more tuned
in to how employees are feeling than are executives Managers are in a better position to know
for example when employees are feeling alienated and disengaged from their work which is
very common today -- and expensive
Gaining employee commitment results in greater profits because enthusiastic employees stay
contribute discretionary effort and engage customers Performance soars when customers are
enthused and stay and when executives managers and employees are a collaborative team
united in achieving common goals
But managers are often called middle managers for good reason their job is to motivate and
guide subordinates while they at the same time are being judged by their bosses Because of
their ldquotweenrdquo position in the hierarchy managers to effective support direct reports must also
create relationships with potential allies especially those with greater power who have access to
top decision makers
Harvard University Factors that Impact Employee Well Being Commitment and
Productivity
Business executives from the C-suite and HR to QC and RampD are by nature focused on the
corporate bottom line A new trend in our dawning age of social sustainability is that many
experts believe more attention should be paid to the dotted line - the one signed when a person
35
commits to employment at a company New Harvard research validates this approach affirming
that trust and purpose play a significant role in building successful productive workplaces
The behavioral research conducted by a team at Harvard University and Massachusetts General
Hospital identifies the factors most likely to impact 21st century employee well being
commitment and productivity The researchers found that commitment is largely influenced by
ones sense of purpose feeling of personal impact and overall trust in the organization
Productivity is largely affected by the quality of human relationships including cooperative
social group moods and interaction
The results lead us to conclude that workplaces that provide positive environments that foster
interpersonal trust and quality personal relationships create the most committed and productive
employees says Nancy Etcoff PhD the lead researcher on the study
Expert Shares Keys to Building Successful Workplace Relationships
According to business strategist Courtney Anderson JD MBA Outstanding leadership
today means much more than just doing your job Success is creating an environment that fosters
happy committed productive team members
Anderson explains that reinvigorating workplaces by enhancing trust and employee commitment
does not have to be difficult The biggest challenge she says is making the time to truly change
in our overscheduled instant access competitive work environments With a little know-how it
can be easy to evolve workplace well being and respond to these compelling research results
-Mark Howell-
CEO Bright Point
High-performing companies recognize that employee commitment is a major contributing factor
toward sustaining long-term success and creating value An engaged employee is involved and
excited about their work and acts in a manner that will forward the organizationrsquos interest An
36
engaged workforce helps optimize and retain talent for the long-term because the employees
choose to stay even when other employment alternatives exist
According to Walker Information the top three drivers of employee commitment are
Satisfaction Fairness and Care amp Concern for employees Put simply committed employees
want to enjoy their work feel they are appreciated and know they are making a contribution to
their companyrsquos strategic objectives Additionally employees who have trust in their leadership
and are trusted by their leadership have a greater dedication and are ultimately more productive
on the job However according to recent data provided by the National Business Research
Institute (NBRI) only 31 of all employees are truly engaged
At BrightPoint we take employee engagement seriously and we work to create a culture that
inspires employee loyalty and satisfaction The results of BrightPointrsquos commitment to its
employees are shown in the 2011 BPNA Employee Commitment Survey The survey
determined that close to 80 of respondents indicated they were satisfied with their jobs and
daily activities General employee satisfaction increases when managers take an active interest
in their employees beyond their day-to-day job responsibilities According to NBRI managers
that actively coach build relationships and keep an open dialogue with their employees improve
employee engagement
We have a diverse workforce where each employee brings unique value and has individual
needs Managers are learning to manage the individual and not the position In order to give
managers the tools they need to be successful BrightPoint places strong emphasis on targeted
leadership training workshops and continual learning resources In 2011 906 of managers at
BrightPoint NA participated in the development opportunities offered and also made an effort to
37
help reinforce the learning of their team members This signals that our leadership team is taking
an active interest in professional development and its connection to employee commitment
As BrightPoint continues to increase focus on employee engagement the organization will grow
stronger and maintain a substantial advantage over our competition Our employees possess the
knowledge experience and resiliency to respond quickly to the demands of the marketplace and
through their genuine commitment will deliver what our customers want with increasing
efficiency and effectiveness Our responsibility is value-creation by growing our business and
maintaining high levels of customer service and loyalty We believe the best way to accomplish
this is through a strong committed and engaged workforce
Performance Model Adopted At Mohali Plant
38
Process adopted by Philips Electronics Mohali Plant for Job Satisfaction of Employee that leads commitment of the employees
39
Recruiting
The messages in Philips Electronics Mohali organization conveys while seeking to attract job
applicants also can influence future employeesrsquo engagement and commitment If your firm has
designed jobs specifically to engage employees then organization want to ensure that recruiting
ads extol these positionsrsquo attractive featuresmdashsuch as challenging work assignments a highly
skilled team environment or minimal supervision Applicants who notice and respond to these
ads will more likely be motivated by these features Also consider how organization might best
seek candidates from inside your organization When Organisation recruit existing employees for
desirable jobs you enhance their engagement (by maximizing the person-job fit) and
commitment (by providing growth and advancement opportunities to employees in return for
their loyalty) If Organisation recruit from outside when qualified internal candidates are
available Organization may unwittingly suggest to current employees that your company is not
willing to reciprocate their commitment Existing staff may then begin questioning their own
commitment to the firm By contrast organisation recruit external candidates to both the job and
your organization For these candidates ensure that recruiting messages highlight attractive job
features organizational values and commitment reciprocity That is in return for performance
and dedication your company offers competitive pay and benefits flexible work hours and
learning and career advancement opportunities Also remember that prospective employees have
multiple commitments You will inevitably have to compete with those commitments as
organization try to attract candidates to your firm Most people find it easier to make a new
commitment when it is compatible with their other obligations For example you boost your
chances of recruiting a highly qualified candidate who is a single parent if you offer flexible
work hours family health benefits and on-site day care ldquoRecruiting for Engagement and
Commitmentrdquo
40
Employee Selection
Once recruiting efforts produce a pool of promising job candidates Philips select among them to
fill available positions When organisation select the right individuals for the right jobs new
hires carry out their work more smoothly and experience fewer performance problems The
result Greater enjoyment ofmdashand engagement inmdashthe job
To enhance engagement through your selection of employees identify those candidates who are
best-suited to the job and your organizationrsquos culture Also use candidate assessment methods
that have obvious relevance to the job in questionmdashfor example by asking interviewees what
they know about the role and having them provide work samples Most candidates will view
these techniques more positively than tests with less apparent relevance such as personality and
integrity assessments Successful candidates feel good about having ldquopassed the test and see
company as careful and capable for having selected them A positive initial impression of an
employer encourages growth of long-term commitment
Training and Development
Training and development can serve as additional levers for enhancing engagement and
commitment For new hires training usually begins with orientation Orientation presents several
important opportunitiesmdashincluding explaining pay work schedules and company policies Most
important it gives you a chance to encourage employee engagement by explaining how the new
hirersquos job contributes to the organizationrsquos mission Through orientation Mohali Plant of Philips
Electronics describe how r company is organized introduce the new employee to his or her co-
workers give the person a tour of the area where he or she will be working and explain safety
regulations and other procedural matters In short you foster person-organization fitmdashvital for
developing productive and dedicated employees Through training you help new and current
41
employees acquire the knowledge and skills they need to perform their jobs And employees who
enhance their skills through training are more likely to engage fully in their work because they
derive satisfaction from mastering new tasks Training also enhances employeesrsquo value to your
company as well as their own employability in the job market In addition most companies offer
higher wages for skilled workers to compensate them for their greater value and to discourage
turnover
Compensation
Like the HR practices discussed above compensation can powerfully influence employee
engagement and commitment Some compensation components encourage commitment to
employers while others motivate engagement in the job It is possible to stimulate one and not
the other though itrsquos generally better to foster both For example a company that offers a strong
performance incentive system but no retirement plan will probably realize exceptional
engagement from its workers however they may eventually commit themselves to another
company that does offer a good retirement plan Meanwhile an organization that offers generous
retirement benefits but a traditional seniority-based pay grade system may have committed
employees however these workers might deliver pedestrian performance as they bide their time
until retirement In designing compensation plans you therefore need to consider employee
engagement and commitment strategically
Encourage managers to include employees in the goal-setting process This technique helps to
ensure that workers understand the goals It also promotes acceptance of challenging objectives
because people generally feel more committed to goals they have helped define In addition
consider how you and other managers will recognize and encourage contributions that exceed
expectations For example when a piece of equipment malfunctions Joe finds other ways to
maintain production rather than merely shutting down the machine and waiting for the
42
maintenance staff to fix it Or when a less experienced co-worker encounters a new task Sally
offers friendly coaching instead of standing by and waiting for the inevitable mistakes to crop
up Performance management processes operate on a continuous basis Therefore they provide
perhaps the best ongoing opportunities for employers to foster employee engagement and
commitment For example managers can use routine discussions about performance and
feedback sessions to learn which aspects of the job hold the most interest for each employee and
which tasks are most challenging During such discussions managers also can define what going
above and beyond the call of dutyrdquo looks like and generate ideas for rewarding such
contributions An employeersquos aspirations and career goals can receive careful attention during
performance appraisal meetings Without inquiring into an employeersquos personal life a supervisor
can nevertheless explore ways to enhance the compatibility between the workerrsquos commitment to
your organization and the employeersquos other life commitments Through such means the
organization personalizes its relationship to each employee and provides support while also
expressing appreciation for their contributionsmdash key drivers of engagement and commitment
To further engage employees and win their commitment through your performance management
programs consider how to treat your organizationrsquos most experienced employees In many cases
these employees understand the intricacies of a job better than their supervisors or managers do
By virtue of long identification with your organization they may be deeply committed to high-
level goals They use their expertise to contribute in ways that newer employees simply cannot
match But many of them also may be planning to retire soon especially if they are from the
ldquoBaby Boomerrdquo generation How will you transfer their knowledge to younger workers Design
a performance management system that recognizes and rewards proactive sharing of knowledge
and expertise among co-workers For example create knowledge repositories or learning
histories that can be stored in databases that employees can access and then create incentives
43
for people who contribute to and use these repositories Of course effective performance
management systems also identify employees who are not meeting expectations Failing to
address problem performance can erode other employeesrsquo engagement and commitment as their
workloads increase and they conclude that the company is willing to tolerate poor performance
If feedback coaching and remedial training are of little avail the manager may need to move the
person to a different position within the company where he or she can make a more valuable
contribution or let the individual go if there is no good match elsewhere in the organization
44
Chapter-V
RESEARCH METHODOLOGY
The basic task of research is to generate accurate information for use in decision-making
Research can be defined as the systematic and objective process of gathering recording and
analyzing data for aid in making business decisions As the project involves analyzing of
45
financial structure the research is exploratory in nature covering financial parameters and come
of the important ratios to carry out research There are basically two techniques adopted for
obtaining information
Primary Data
Secondary Data
Primary Data is gathered specifically for the project at hand through personal interviews with
the accounts officers
Sample Size = 100 Employees
Secondary data is previously collected and assembled for some project other than the one at
hand It is gathered and recorded by someone else prior to current needs of the researcher It is
less expensive than the primary date
Secondary Data can be obtained from both external and internal sources
External data may be collected from books and periodicals government sources media and other
commercial sources
Internal data is that secondary data which is created recorded or generated by the organization
As the project is explanatory in nature secondary data is collected from the reports of the
company books journals and interest Secondary data is gathered from annual reports official
records and standing orders of the units
CHAPTER - VI
DATA ANALYSIS AND INTERPRETATION
46
The data after collection is to be processed and analyzed in accordance with the outline
and down for the purpose at the time of developing research plan
Technically speaking processing implies editing coding classification and tabulation of
collected data so that they are amenable to analysis The term analysis refers to the computation
of certain measures along with searching for pattern groups Thus in the process of analysis
relationship or difference should be subjected to statistical tests of significance to determine with
what validity data can be said to indicate any conclusions
The analysis of data in a general way involves a number of closely related operations
which are performed with the purpose of summarizing the collected data and organizing them in
such a manner that they answer the research questions In this study the researcher followed
above process carefully and it is presented in this chapter
47
Table 41 ndash To know the department in which employees are belongs to
S
ou rc
e
survey data
Inference
From the above table it shows that 35 of employees are belongs to
production department
FIGURE 41
S
SI No
D
Department
N
No of Respondents
P
Percentage
1
1
M
Mechanical
3
30
3
30
2
2
E
Electrical
2
25
2
25
3
3
P
Production
3
35
3
35
4
4
O
Others
1
10
1
10
T
Total
1
100
1
100
48
REPRESENTS THE DEPARTMENT
Table 42 ndash To know working experience of the employees
Source survey data
Inference
From the above table it shows that 34 of the employees have 4 ndash 6
years experience
S
SI No
W
Work Experience
N
No of Respondents
P
Percentage
1
1
B
Below 2 years
1
33
1
13
2
2
2
2ndash 4 years
3
30
3
30
3
3
4
4ndash 6 years
3
34
3
34
4
4
A
Above 6 years
2
23
2
23
T
otal
1
100
1
100
49
FIGURE 42
REPRESENTS THE EXPERIENCE OF THE EMPLOYEES
Table 43 ndash To know the physical working environment
S
SI No
W
Working Environment
N
No of Respondents
P
Percentage
1
1
E
Excellent
1
12
1
12
2
2
G
Good
5
57
5
57
3
3
F
Fair
2
28
2
28
4
4
P
Poor
0
03
0
33
5
5
V
Very Poor
0
00
0
00
T
Total
1
100
1
100
Source survey data
Inference
From the above table it shows that 57 of the employees were feeling good about the working environment
50
FIGURE 43
REPRESENTS THE PHYSICAL WOKING ENVIRONMENT
51
Table 44 ndash To know the satisfaction level of employees towards the non-monitory benefits
S
SI No
N
Non-Monitory Benefits offered
to Employees
N
No of Respondents
P
Percentage
1
1
H
Highly Satisfied
1
14
1
14
2
2
S
Satisfied
5
54
5
54
3
3
N
Neither Satisfied nor Dissatisfied
2
25
2
25
4
4
D
Dissatisfied
0
05
0
05
5
5
H
Highly Dissatisfied
0
02
0
02
Total 1
100
1
100
Source survey data
Inference
From the above table it shows that 54 of the employees were satisfied towards the non-monitory benefits
FIGURE 44
REPRESENTS THE SATISFACTION LEVEL OF EMPLOYEES TOWARDS THE NON-MONITORY BENEFITS
52
Table 45 ndash To know the satisfaction level of respondents towards the work
assigned
Source survey dataInference
From the above table it shows that 45 of the respondents were satisfied towards the work assigned
FIGURE 45
S
SI No
A
Amount of Work
N
No of Respondents
P
Percentage
1
1
H
Highly satisfied
2
20
2
20
2
2
S
Satisfied
4
45
4
45
3
3
N
Neither Satisfied nor Dissatisfied
1
12
1
12
4
4
D
Dissatisfied
1
18
1
18
5
5
H
Highly Dissatisfied
0
06
0
06
Total 1
100
1
100
53
REPRESENTS THE SATISFACTION LEVEL OF RESPONDENTS TOWARDS THE WORK ASSIGNED
54
Table 46 ndash Opinion about the career development programme in their organisation
S
SI No
C
Career Development
N
No of Respondents
P
Percentage
H
Highly satisfied
1
12
1
12
S
Satisfied
5
56
5
56
N
Neither Satisfied nor Dissatisfied
2
22
2
22
D
Dissatisfied
1
10
1
10
H
Highly Dissatisfied
0
00
0
00
Total 1
100
1
100
Source survey data
Inference
From the above table it shows that 56 of the employees were satisfied
with the opinion about the carrier development programme in their organisation
FIGURE 46
REPRESENTS OPINION ABOUT THE CAREER DEVELOPMENT
PROGRAMME IN THEIR ORGANISATION
55
Table 47 ndash To know the cooperation of co-workers
S
SI No
C
Co-operation of Workers
N
No of Respondents
P
Percentage
1
1
H
Highly satisfied
2
20
2
20
2
2
S
Satisfied
6
66
6
66
3
3
N
Neither Satisfied nor Dissatisfied
1
11
1
11
4
4
D
Dissatisfied
0
03
0
03
5
5
H
Highly Dissatisfied
0
00
0
00
Total 1
100
1
100
Source survey data
Inference
From the above table it shows that 66 of the employees were satisfied
with the cooperation of co-workers
FIGURE 47
56
REPRESENTS THE COOPERATION OF CO-WORKERS
57
Table 48 ndash To know the satisfaction of Respondents with top management
S
SI No
S
Satisfaction with Top
Management
N
No of Respondents
P
Percentage
1
1
H
Highly satisfied
2
26
2
26
2
2
S
Satisfied
5
51
5
51
3
3
N
Neither Satisfied nor Dissatisfied
1
17
1
17
4
4
D
Dissatisfied
0
06
0
06
5
5
H
Highly dissatisfied
0
00
0
00
Total 1
100
1
100
Source survey data
Inference
From the above table it shows that 51 of the employees were satisfied with the top management
FIGURE 48
58
REPRESENTS THE SATISFACTION OF RESPONDENTS WITH TOP MANAGEMENT
Table 49 ndash To know the satisfaction of Respondents with their subordinates
Source survey data
Inference
From the above table it shows that 67 of the employees were satisfied with their subordinates
S
SI
No
S
Satisfaction with Subordinates
N
No of Respondents
P
Percentage
1
1
H
Highly satisfied
1
12
1
12
2
2
S
Satisfied
6
67
6
67
2
3
N
Neither Satisfied nor Dissatisfied
1
14
1
14
4
D
Dissatisfied
0
07
0
07
5
5
H
Highly Dissatisfied
0
00
0
00
Total 1
100
1
100
59
FIGURE 49
REPRESENTS THE SATISFACTION OF RESPONDENTS WITH THEIR SUBORDINATES
60
Table 410 ndash To know the level of satisfaction regarding nature of job
S
SI No
J
Job Satisfaction
N
No of Respondents
P
Percentage
1
1
H
Highly satisfied
2
22
2
22
2
2
S
Satisfied
5
56
5
56
3
3
N
Neither Satisfied nor Dissatisfied
1
16
1
16
4
4
D
Dissatisfied
0
07
0
07
5
5
H
Highly Dissatisfied
0
00
0
00
Total 1
100
1
100
Source survey dataInference
From the above table it shows that 56 of the employees were satisfied with their job
FIGURE 410
61
REPRESENTS THE LEVEL OF SATISFACTION REGARDING THE NATURE OF JOB
Table 411 ndash To know whether there is any job pressure in their work
Source survey data
Inference
From the above table it shows that 72 of employees said there is job pressure in their work
FIGURE 411
REPRESENTS WHETHER THERE IS ANY JOB PRESSURE IN THEIR WORK
S
SI No
J
Job Pressure
N
No of Respondents
P
Percentage
1
1
Y
Yes
7
72
7
72
2
2
N
No
2
28
2
28
T
Total
1
100
1
100
62
Table 412 ndash To know the opinion regarding opportunity provided by the organisation in developing skills
amp talents
S
SI No
D
Development of Skills and
Talents
N
No of Respondents
P
Percentage
1
1
H
Highly Agree
1
12
1
12
2
2
A
Agree
5
52
5
52
3
3
N
Neither Agree nor Disagree
2
28
2
28
4
4
D
Disagree
0
06
0
06
5
5
H
Highly Disagree
0
02
0
02
Total 1
100
1
100
Source survey data
Inference
From the above table it shows that 52 of employees agreed regarding opportunity provided by the organisation in developing skills amp talents
63
FIRGURE 412
REPRESENTS THE OPPORTUNITY PROVIDED BY THE ORGANISATION IN DEVELOPING SKILLS amp TALENTS
64
Table 413 ndash To know the satisfaction level of welfare facilities provided by the management
S
SI No
W
Welfare Facilities
N
No of Respondents
P
Percentage
1
1
H
Highly satisfied
0
09
9
09
2
2
S
Satisfied
5
57
5
57
3
3
N
Neither Satisfied nor Dissatisfied
2
29
2
29
4
4
D
Dissatisfied
5
05
0
05
5
5
H
Highly Dissatisfied
0
00
0
00
Total 1
100
1
100
Source survey data
Inference
From the above table it shows that 57 of the employees were satisfied with the welfare facilities provided by the management
FIGURE 413
REPRESENTS THE SATISFACTION LEVEL OF WELFARE FACILITIES PROVIDED BY THE MANGEMENT
65
Table 414 ndash To know the employee satisfaction towards the salary
Source survey data
Inference
From the above table it shows that 67 of the employees were satisfied
with their salary
FIGURE 414
REPRESENTS THE SATISFACTION TOWARDS THE SALARY
S
SI No
P
Payment Satisfaction
N
No of Respondents
P
Percentage
1
1
Y
Yes
6
67
6
67
2
2
N
No
3
33
3
33
T
otal
1
100
1
100
66
Table 415 ndash To know the employees willingness amp Commitment Towards
Organisation
Source survey data
Inference
From the above table it shows that 59 of the employees were willing to
continue in this organisation
FIGURE 415
REPRESENTS THE EMPLOYEES WILLINGNESS TO CONTINUE
S
SI No
W
Willingness to Work
N
No of Respondents
P
Percentage
1
1
Y
Yes
5
59
5
59
2
2
N
No
4
41
4
41
T
Total
1
00
1
00
67
CHI-SQUARE METHOD
The chi square test is one of the simplest and most widely used non-
parametric tests in statistical work As a non-parametric test it can be used to determine
if categorical data shows dependency or the two classifications are independent It can
also be used to make comparisons between theoretical population and actual data
when categories are used
n
Chi square χsup2= sum (O-E) sup2 E
i =1
Where O= observed frequency
E= expected frequency
68
OBSERVED FREQUENCY
Table 419 shows the relationship between the department and the job satisfaction
Over All
Job
SatisfactionHighly
SatisfiedSatisfied
Neither
Satisfied nor
Dissatisfied
DissatisfiedHighly
Dissatisfied
Sub
Total
Mechanical 5 6 14 3 2 30
Electrical 6 8 6 3 2 25
Production 9 13 7 4 2 35
Others 2 3 2 2 1 10
Sub Total 22 30 29 12 7 100
69
EXPECTED FREQUENCY
Over All
Job
SatisfactionHighly
SatisfiedSatisfied
Neither
Satisfied nor
Dissatisfied
DissatisfiedHighly
Dissatisfied
Sub
Total
Mechanical 7 8 9 4 2 30
Electrical 5 8 7 3 2 25
Production 8 11 10 4 2 35
Others 2 3 3 1 1 10
Sub Total 22 30 29 12 7 100
Null Hypothesis (Ho)
There is no significant difference between the department and the job satisfaction
Alternative Hypothesis (Ho)
There is significant difference between the job satisfaction
Co Relation
70
Chapter-V
CONCLUSIONS AND
RECOMMENDATIONS
71
CONCLUSION
On the basis of Analysis of Job Satisfaction Level of the Employees of Philips Electronics India
Ltd Mohali made in the previous chapters following conclusions are drawn
General Profile The plant of PHILIPS is ideally located in the Mohali Industrial focal point
Phase 9 near Chandigarh the capital of Punjab on a campus of 17 hectares The working
environment of the company is very healthy The visitors feel happy after the campus
Indigenous Technology PHILIPS is the only lighting manufacturing company based on purely
indigenous technology Philips was appropriately chosen as the brand name as self reliance and
building up of Indian Engineering capabilities remain the guiding spirit of PHILIPS
Financial structure PHILIPS is a low debt company signifying its dependence mainly on
its internal accruals for its financial requirements PHILIPS continues to strengthen its financial
position by channelising these internal accruals to fund its expansion programmes
Working results PTL has registered a handsome and constant growth in its profits because
of a brisk demand for new and better technology electronic items None of the other electronic
company has shown such a steady growth Philips has recorded the lowest current ratio
However with this lowest current ratio PTL still enjoys moderate payment period and highest
velocity of creditors and debtors only due to commitment of itrsquos employees
72
SUMMARY
According to the 1999 Gallup Poll the four elements that have proven to be effective in creating
employee loyalty are praise and recognition a sense of contribution to the company learning and
development and having a best friend at work
Creating a fairy-tale work environment begins withrecognition Your employees need it more
than money perks or titles Here are eight tips regarding recognition Remember these and your
employees may just start whistling while they work It is up to me The corporate culture or
financial rewards will not make your team successful It is up to you Recognition is one thing
that is completely in your control
Strong relationships are vital in todays economy Strengthening employee relationships is even
more necessary as companies downsize and lay off As your workforce shrinks and you need to
do more with less keeping quality employees becomes even more critical As a manager it is
your job to bond your best people to your company through recognition And you also must help
direct and motivate your core performers
Simple rewards earn big returns There are some relatively simple things you can do that will
earn big returns For example remember your employees birthdays and work anniversaries find
out what inexpensive rewards they value (for example tickets to a ball game or a half day off to
spend time with their kids) make the most of your formal service awards with some preparation
and a group presentation walk around your department every day and talk to your
people and thank them sincerely and often
73
Make it specific Praise and recognition must be specific to have impact General praise such as
You do great work actually can have the opposite effect and leave your employees wondering
Does he have any idea what I really do around here Specific praise links individual
accomplishments to company goals For example Cheryl I noticed the way you handled that
customer complaint Great work As you know we value quick resolutions of problems as
one of our core strategies
Ask the best to stay Call your best people into your office one at a time Let that bright young
college graduate know you value his fresh ideas and energy Tell the 20-year veteran how much
your team relies on her expertise and organizational skillsRemarkably a significant percent of
high-impact performers report that they left their last job because No one ever asked me to
stay
Forget cash
Remember the saying Money cant buy everything Well its true Dont wait until you can
offer an employee a raise or promotion Real thanks is its own reward In numerous surveys of
work satisfaction top on employees lists is feeling appreciated In fact when employees feel
recognized and involved they are much less likely to keep asking about money
Recognize
Recognition means most to an employee when it is sincere and spontaneous According to the
largest study ever conducted on workplace satisfaction (Gallup 1999) recognition should occur
at least every seven days If you wait until a year-end party or an annual review you are waiting
much too long to recognize and you probably are losing people you do not need to
74
Recognition works
Neglect can be a poisoned apple Recognition is the elixir that will spark better attitudes and
performance Jeffrey Pfeffer of Stanford University says The returns from managing people in
ways that build high commitment typically are on the order of 30 to 50 percent
Take a hard look in the mirror and ask yourself how you can recognize the fairest of them all
Learn to recognize your employees for their efforts thank them often and reward their
achievements You can awaken them from their anger and apathy and they will fall in love with
their jobs again Chances are you will work together happily ever after
So there is direct relation with employee satisfaction and their commitment towards the
organization and it is also clear from the above discussion that only monetary elements are not
sufficient for employee satisfaction rather other element like employer behavior recognisation
and other moral value
75
RECOMMENDATIONS
PHILIPS should increase its capacity utilization It should work at full capacity to
minimize its cost of production With this increase in capacity utilization the total cost
will spread over more units thereby decreasing the per unit cost
PHILIPS should decrease the credit facilities provided to its consumers The payback
period is quite high in case of debtors as compared to creditors it should be more or less
equal as it will help in improving company liquidity
PHILIPS should focus more on the consumer lifestyle goods in India parallel to its other
business as it accounts very less as compare to other businesses of Philips
Another recommendation for Mohali plant is about the HR department that is they
should appoint permanent and skilled workers as against casual workers which generally add
up to the profit of the company
76
BIBLIOGRAPHY
1 Values-Based Leadership Rebuilding Employee Commitment Performance and Productivity ( Thomas D Kuczmarski)
2 Monthly Journals of Philips Electronics India Ltd
3 Authentic Leadership Medtronic CEO Bill George
4 wwwindiaphilipscom
5 wwwwikipediacom
6 httpwwwemployeecommitmentcom
7 One Foot Out The Door How to Combat The Psychological Recession Thatrsquos Alienating Employees And Hurting American Business Judith Bardwick
8 Employee Commitment A Leader Ship Guide Joe Folkman
9 Harvard University Factors that Impact Employee Well Being Commitment and Productivity -An Article
77
Questionnaire
Name __________________________________________________________
Age______________________________ Gender _______________________
Qualification _______________________ Contact No ___________________
Q1 In which department you are working
Electrical Production Mechanical Other
Q2 What is your working experience
gt2 Years 2-4 Years 4-6 Years lt 6 Years
Q3 How You like the physical Working Environment of the organization
Excellent Good Fair Poor Very Poor
Q4 Are you satisfied with Non-Monitory benefits provided by the organisation
Highly Satisfied Satisfied Neither Satisfied Nor dissatisfied
Highly Dissatisfied Dissatisfied
Q5 Are you satisfied with your work
Highly Satisfied Satisfied Neither Satisfied Nor dissatisfied
Highly Dissatisfied Dissatisfied
Q6 Are you satisfied with the career development programe of the company
Highly Satisfied Satisfied Neither Satisfied Nor dissatisfied
Highly Dissatisfied Dissatisfied
Q7 Is other staff of the organization is co-operative with you
Highly Satisfied Satisfied Neither Satisfied Nor dissatisfied
Highly Dissatisfied Dissatisfied
Q8 Are you satisfied with top level management
Highly Satisfied Satisfied Neither Satisfied Nor dissatisfied
Highly Dissatisfied Dissatisfied
78
Q9 Are you satisfied with your subordinates
Highly Satisfied Satisfied Neither Satisfied Nor dissatisfied
Highly Dissatisfied Dissatisfied
Q10 Are you satisfied with the nature of the Job
Highly Satisfied Satisfied Neither Satisfied Nor dissatisfied
Highly Dissatisfied Dissatisfied
Q11 Do you have any Job Pressure in work
Yes No
Q12 Do you satisfied with the opportunities provided by the organisation
Highly Satisfied Satisfied Neither Satisfied Nor dissatisfied
Highly Dissatisfied Dissatisfied
Q13 Are you satisfied with the welfare facilities provided by the organisation
Highly Satisfied Satisfied Neither Satisfied Nor dissatisfied
Highly Dissatisfied Dissatisfied
Q14 Are you satisfied towards your salary
Highly Satisfied Satisfied Neither Satisfied Nor dissatisfied
Highly Dissatisfied Dissatisfied
Q15 Are you committed towards the organisation
Yes No
Signature

5
1970-today
From 1970 to the present day our research has been tied much more closely to our industrial and
business activities This resulted in revolutionary developments such as the introduction of the
CD the DVD and Blu-ray Disc In the medical sphere we made great strides forward in
magnetic-resonance imaging and ultrasound and with our increasing focus on health and well-
being these developments are still ongoing in 2006 we saw the first commercial launch of a 3D
scanner
In that same year we sold 80 of our Semiconductors business as a new independent company
NXP was created We also adopted Open Innovation as our way of working the High Tech
Campus Eindhoven was opened up to external companies
At Philips Research we continue to focus on meaningful innovations that improve peoplersquos
lives Ambilight for example has brought a whole new dimension to TV viewing and in 2007
we developed Lumiramic ndash a groundbreaking new phosphor technology for energy-efficient
white LEDs ndash together with our partners
The future of Philips Research
Philips Research will remain an important driving force in realizing Philipsrsquo vision to become an
even more market-driven and people-centric health and well-being company We do this by
continually evaluating key issues and trends in society to ensure that peoplersquos needs are at the
heart of our innovations now and in the future
Royal Philips Electronics of the Netherlands is a diversified Health and Well-being
company focused on improving peoplersquos lives through timely innovations As a world leader in
healthcare lifestyle and lighting Philips integrates technologies and design into people-centric
6
solutions based on fundamental customer insights and the brand promise of ldquosense and
simplicityrdquo
Headquartered in the Netherlands Philips employs approximately 121000 employees in more
than 60 countries worldwide With sales of EUR 26 billion in 2008 the company is a market
leader in cardiac care acute care and home healthcare energy efficient lighting solutions and new
lighting applications as well as lifestyle products for personal well-being and pleasure with
strong leadership positions in flat TV male shaving and grooming portable entertainment and
oral healthcare
Philips Electronics India Limited
Philips Electronics India Limited a subsidiary of the Netherlands-based Royal Philips
Electronics is the leading Health and Wellbeing company Today Philips is a simpler and more
focused company with global leadership positions in key markets of Healthcare Lighting and
Consumer Lifestyle addressing peoplersquos Health and wellbeing needs and aspirations as its
overarching theme
As one of the nations most well-known and well-loved brands Philips is a part of practically
every Indians life With recent launch of Philips Respironics product categories in obstructive
sleep apnea management and home respiratory care home decorative lighting range and ALU
range Philips products find use in virtually every aspect of an individualrsquos daily life 24X7 - at
home at work on the move and at rest Philips stands as a source of easy to use trendy and
innovative internationally acclaimed products with superior design and technology that enhance
the quality of consumers professional and personal lives
Philips has been operating in India for over 75 years and employs over 4500 employees around
7
the country The company has an excellent pan India distribution and after-sales service network
BUSINESSES
Lighting
Philips Electronics India Indiarsquos largest lighting company operates in business areas of Lamps
Luminaires Lighting Electronics Automotive and Special Lighting Today as global leader in
Lighting Philips is driving the switch to energy-efficient solutions With worldwide electrical
lighting using 19 per cent of all electricity the use of energy-efficient lighting will significantly
reduce energy consumption around the world and thereby cut harmful CO2 emissions Philips
India has been consistently working with industry bodies such as ELCOMA Bureau of energy
efficiency and NGOs towards addressing Indiarsquos power crisis through promotion of energy
efficient lighting in India
Philips provides advanced energy-efficient solutions for all segments road lighting office amp
industrial hospitality and home Philips is also a leader in shaping the future with exciting new
lighting applications and technologies such as LED technology which besides energy
efficiency provides attractive benefits and endless new lsquonever-before-possiblersquo lighting
solutions
In 2008 Philips inaugurated a global research and development (RampD) centre for lighting
electronics in India This was its third such unit in the world The facility which is situated in
Noida will not only cater to the needs of the Indian market but also the Asia-Pacific Europe and
North America The other RampD centres are located at Eindhoven in the Netherlands and in
Shanghai China One of the primary research areas for the centre is to develop products that can
8
tackle high voltage fluctuations in India The centre currently employs 35 engineers Around 40
per cent of Philipsrsquo revenue in India comes from the lighting business
Consumer lifestyle
Guided by the brand promise of ldquosense and simplicityrdquo and the consumer insights Philips
Consumer Lifestyle offers rich new consumer experiences that meet consumersrsquo desire for
relaxation and improving their state of mind Philips also responds to the consumers desire for
wellness and pleasure by introducing products that meet the individualrsquos interests in terms of
their mind space body and appearance
The Consumer Lifestyle arm in India operates in the business areas of Home Entertainment
solutions and Personal Infotainment with product categories such as TVs home theatre systems
music systems DVD players personal entertainment solutions sound accessories Domestic
Appliances and Personal care
Philips Innovation Campus (PIC)
Philips Innovation Campus (PIC) Bangalore is a division of Philips Electronics India Limited
which is owned 96 by Royal Philips Electronics NV The Netherlands It was established in
August 1996 with a vision to be an innovation hub creating next generation solutions and
products for Healthcare and Lifestyle With the objective of meeting the growing need for high-
quality cost-effective software development capacity within the organization PICrsquos share has
increased significantly from 8 in 1998 to around 20 in 2008
9
Working at PIC are about 1000 of the industrys finest professionals using state-of-the-art
software engineering paradigms and platforms including real-time systems component-based
software engineering and multi-threaded architecture to drive the creation of tomorrows
products and services PIC is an ISO 9001Tick IT SEI CMM SM level 5 company amp has
emerged as a critical partner in the development of strategic amp futuristic technologies for Philips
worldwide 60000 registered patents illustrate the innovative nature of the company Philips has
adopted an Open Innovation strategy which leverages the joint innovative power of partnering
companies and researchers to bring more innovations to the market effectively and faster PIC
has built-up extensive know-how and expertise in the software engineering and technology
domains relevant to its business In addition competencies in the areas of project management
requirement engineering and quality assurance have been established to offer customers products
and services of the highest quality at the fastest time-to-market and the lowest cost of
ownership
RESEARCH AND DEVELOPMENT
Since its foundation 100 years ago Philips Research has been at the forefront of fundamental
scientific research But with market focus being more and more important across almost all
corporate RampD organizations is this still the case If some of the pioneering work being done
by scientists across Research is anything to judge by the answer is a resounding ldquoyesrdquo
Itrsquos different at the cutting edge
In todayrsquos market-focused corporate RampD organizations the boundary between fundamental
scientific research and applied research is becoming increasing blurred ndash particularly when it
comes to some of the most exciting areas of research ldquoHere at Philips our way of working is
very dynamicrdquo says Philips Researchrsquos Chief Science Officer Emile Aarts ldquoThis means that you
10
can apply both the lsquofundamentalrsquo and the lsquoappliedrsquo labels to many of the projects that wersquore
working on because they are both very flexible termsrdquo Philips Researchrsquos work on sleep for
instance is an excellent example of this more dynamic approach ldquoThis is a very important area
for Philips ndash but therersquos currently very little fundamental knowledge available Thatrsquos why wersquore
involved in investigating the key issues at a more fundamental level together with our university
and research institute partners The only difference is that we want this research to lead to
marketable products and solutionsrdquo
Open Innovation in new areas
Despite the flexible nature of the ldquofundamentalrdquo and ldquoappliedrdquo labels it is still possible to detect
a decline in some areas of more fundamental research at Philips in recent years ldquoThis has mainly
occurred in fields that donrsquot support the execution of our companyrsquos Health and Well-being
strategyrdquo says Aarts As he explains this refocusing exercise has gone hand-in-hand with an
expansion of more fundamental research activities in a number of new fields such as deep-brain
stimulation and multi-modal imaging for healthcare applications ldquoIn these fields wersquore
considered to be an extremely important research partner ndash especially by colleagues working in
universitiesrdquo In the future Philips Research will continue to develop its reputation in a number
of exciting fundamental domains ndash ldquogreen lightingrdquo and skincare are just two examples ndash albeit
with a more applied focus ldquoHopefully this research will enable us to build on our strong
heritage of improving the quality of peoplersquos lives
11
BOARD OF DIRECTORS
Non-Executive Director amp Chairman S M Datta
Executive Vice Chairman amp Managing Director Murali Sivaraman
Executive Director Jan-Hein Louwman
Non-Executive Director S Venkatramani
India Management Team
MURALI SIVARAMANN - CEO
ANJAN BOSE - Healthcare
JAN-HEIN LOUWMAN ndash CEO
MAHESH KRISHNAN ndash Consumer lifestyle
RAJEEV CHOPRA ndash lighting
RAKESH SHARMA ndash Strategic Business Development
S NAGARAJAN ndash Human resources
VIVEK SHARMA ndash Chief Marketing Officer
WIDO MENHARDT ndash Philips Innovation Campus
12
Corporate Office-
Philips Electronics India Ltd
Technopolis Knowledge Park
Mahakali Caves Road
Chakala Andheri (East)Mumbai 400 093
Tel +91 22 66912000
VISION 2012
Through the Vision 2012 strategy we aim to fuel growth by making Philips the leading brand in
Health and Well-being Vision 2012 further positions Philips as a market-driven people-centric
company with a strategy and a structure that fully reflect the needs of its customer base while
also increasing shareholder value This is implemented through sharpened strategies in the three
core sectors Healthcare Lighting and Consumer Lifestyle
ldquoWith Vision 2010 we are putting people right at the center of things with Health and Well-
being as our overarching theme We are thereby putting into practice our mission improving the
quality of life through the introduction of meaningful innovationsrdquo ndash Gerard Kleisterlee
President and CEO of Royal Philips Electronic
Our Ways of Working
1 We are a people-centric company that organizes around customers and markets
2 We invest in a strong brand and consistently deliver on our brand promise of ldquosense and
simplicityrdquo in our actions products and services
13
3 We deliver innovation by investing in world class strengths in end-user insights
technology design and superior supplier networks
4 We develop our peoplersquos leadership talent and engagement and align ourselves with high
performance benchmarks
5 We invest in high growth and profitable businesses and emerging geographies to achieve
market leadership positions
6 We are committed to sustainability and focus on making the difference in efficient energy
use
7 We drive operational excellence and quality to best in class levels allowing us the above
mentioned strategic investments in our businesses
BRAND PROMISE
It is the combination of two unique capabilities that enables us to deliver on our ldquosense and
simplicityrdquo promise These capabilities are firstly by understanding people and secondly
technology integration and product design
We put our end users front and center of product innovations starting with understanding their
needs and aspirations We use best-in-class research facilities and agencies to validate and ensure
that our product innovations are designed around peoplersquos needs and aspirations easy to
experience and advanced
SUSTAINABILITY
14
In 2009 we evaluated our sustainability strategy and resolved to fully leverage sustainability as
an integral part of our overall strategy and an additional driver of growth as reflected in the
Philips Management Agenda 2012
To deliver on our brand promise of ldquosense and simplicityrdquo and at the same time provide the
company direction for the longer term in this area we have identified three sustainability
leadership key performance indicators where we can bring our competencies to bear lsquocarersquo
lsquoenergy efficiencyrsquo and lsquomaterialsrsquo including targets for 2015
Bringing care to more than 500 million people
Target 500 million lives touched by 2015
Improving energy efficiency of Philips products
Target 50 improvement by 2015 (for the average total product portfolio) compared to
2009
Closing the materials loop
Target Double global collection recycling amounts and recycled materials in products
by 2015 compared to 2009
Each sector will take the lead on one of the leadership key performance indicators with
Healthcare leading lsquocarersquo Lighting lsquoenergy efficiencyrsquo and Consumer Lifestyle lsquomaterialsrsquo
In addition we defined a set of complementary performance indicators to accelerate change and
drive performance including the EcoVision4 parameters
With EcoVision4 we have committed to the following by 2012
15
bull Generate 30 of total revenues from Green Products
bull Double investment in Green Innovations to a cumulative EUR 1 billion
bull Improve our operational energy efficiency by 25 and reduce our CO2 emissions by 25 all
compared with the base year 2007
SOCIAL COMMITMENT
Living up to this commitment means we use our capabilities to enhance the lives of our
employees and people in society at large Within the company we encourage teamwork and
collaboration in an environment that enables employees to reach their full potential
Building on our rich heritage of involvement in social issues we have established our own
approach of supporting the communities where we live and work focusing on energy efficiency
and healthcare
Sustainable lighting
There is a pressing need to find innovative lighting solutions for the 16 billion people who live
in areas with no access to the electricity grid or where the grid is unreliable Thatrsquos why we have
developed SMILE (Sustainable Model in Lighting Everywhere)
Launched as a pilot in 2006 in four Indian states SMILE includes two lighting solutions UDAY
a rechargeable portable lantern and KIRAN a hand-cranked LED flashlight Today are
distributed in eighth Indian states
16
SWOT ANALYSIS
Strengths
bull India was a market where the first mover enjoyed advantages over latecomers
bull The first image of the product lasted long in the eyes of the consumer and the first to enter the
market could gain the largest market share
bull PHILIPS is committed to enhance its image to the Chinese market as investors
bull PHILIPS was building a wholly owned manufacturing plant in India to show the
Chinese the commitment Korea had to the Chinese society
bull Labor costs in India were less and would defray the cost of producing high-end
bull Samsung has been making color TVs for many years in Korea before moving to the Chinese
market
Weaknesses
bull PHILIPS must continue to control all costs to maintain success
bull India has a reputation of being a protected market (protectionism)
bull India was a market where the first mover enjoyed advantages over late comers PHILIPS is
trying to overcome the first comer advantage Japan manufacturers have over them by being those
first comers
bull Companies such as Sony and Matsushita had built sales and service networks that were
favorable to their sales programs in India while Samsung would have to catch up in that area
17
bull Samsung is not as experienced in manufacturing high-end TVs for a higher-end market
segment
Opportunities
bull Based on the data that on 28 of the 220 million rural households own a color TV PHILIPS
focus on the domestic India market should be to penetrate the rural household market which
would mean that for those purposes the low-end production of sets in the 13rdquo to 20rdquo range should
be produced to appeal to that segmentrsquos purchasing ability
bull Larger more high-end models can be produced to appeal to an urban customer in India as well
as being an export to the US and European higher end customers
bull With success in the higher-end manufacturing and sales of premium TVs in India PHILIPS can
establish themselves as high-end producers around the world
Threats
bull PHILIPS faces intense competition in the color TV market
bull A premium-priced product wouldnrsquot sell in large volumes so pricing can be a problem
bull Since PHILIPS didnrsquot have an established marketing strategy issues of how to market the
product may arise
bull Loss of profitability because related to over-employment at most facilities
bull Is the per capita income level such that it can support sales of product at any level
bull If PHILIPS fails to be successful in the Chinese market with high-end product it will be known
around the world bull India was a market where the first mover enjoyed advantages over late
comers
bull The first image of the product lasted long in the eyes of the consumer and the first to enter the
18
market could gain the largest market share
bull PHILIPS is committed to enhance its image to the Chinese market as investors
PHILIPS ELECTRONICS MOHALI PLANT
The mohali plant was established in 1985 as PUNJAB ANAND LAMP Ltd as its second
division of lamp industry after the varodra plant at that time it was a joint stock company and
majority of shares was with Punjab Anand Lamp around 75 but in the year 2001 the company
ownership changed and the whole shares was bought by PHILIPS ELECTRONIC INDIA Ltd
and its name was changed to PHILIPS ELECTRONIC INDIA Ltd MOHALI LIGHT
FACTORY
The plant is situated in Industrial focal point PHASE-9 MOHALI near Mohali railway station
and is sreaded in 26 acres Total employees of tis plant is 532 including casual employees This
company is a landmark in the Punjab state as it is the only factory which is most profitable one
than any industry located in Punjab
19
OVERVIEW OF VARIOUS FRONTS OF
PHILIPS ELECTRONICS INDIA Ltd
Manufacturing-
Today the product range of Philips include the following products ndash
Televisions- LCD Plasma Flat Screen Smart Touch XL
Recorders DVD Players I pods and Home Theatre Systems
Audio Products - Audio Systems Remote Controls AudioVideo Accessories
Digital Photo Products and Frames
Portable Audio and Video Systems Accessories like Headphones and Speakers
PC Products - Mouse and Keyboard Multi Media Headsets External Hard Disk Drives
Mobile Phones
Male Shaving and Grooming - Dry Shavers Beard Trimmers
Personal Care - Beauty and Hair Care Products
20
Kitchen Appliances - Blenders and Hand Blenders Juicers and Citruspresses Food
Processors and Mixers Coffee Makers and Kettles Frying and Grilling Appliances
Toasters and Snacking Products
Household Products - Irons Vacuum Cleaners Water Purifiers
Professional Lighting - Industrial Shops and offices Road and Area Hospitality Sports
Lighting City Beautification and Petrol Stations
Automotive Lighting - In Cars Motorcycles and Trucks
Home Lighting
SERVICS
Philips E-waste Management Program in India
Philips has tied up with a recycler for collecting transporting and recycling unwanted broken
down consumer products
At Philips we offer consumers a convenient way of recycling their unwanted obsolete and
damaged Philips products by dropping them off at convenient locations The program
encompasses 8 major cities across India Consumers can approach one of 27 authorized Philips
service centres which will act as collection points for consumer products which need recycling
Our efforts are to expand the network in the near future
Philips ensures that the consumer products received will be recycled in an environment-friendly
manner Philips understand the corporate social responsibility and takes steps towards providing
a safer environment to the future generations We design our products to continuously realize
improvements and reduce their overall life cycle environmental impact Designing products for
21
recycling is an integral part of this approach Our aim is to use our planetrsquos limited resources
effectively and respect the principle of extended producer responsibility This also calls for
manufacturers to engage in developing solutions for effective and efficient recycling of their
products We will continue to promote and invest into improved recycling systems to reduce the
impact of electronic waste on the environment
MANUFACTURING AT MOHALI PLANT ndash
Mohali plant mainly manufactures lighting products basically of domestic usage this includes the
following products ndash
CFL bulbs ndash
1 Genie - 5 watt 8 watt 11 watt
2 Essential ndash 8 watt 11 watt 14 watt 18 watt 23 watt 29 watt
3 Tornado ndash 5 watt 8 watt 11 watt 14 watt 18 watt 23watt 29 watt
4 T5 slim tube 28 watt
Coil plant ndash Philips Electronics India is the only company that produces coils in the whole
lighting industries in the world and in India only at the MOHALI PLANT
22
Chapter-II
OBJECTIVES OF THE STUDY
23
OBJECTIVES OF THE STUDY
To study the various aspects of Satisfaction Level of the Employees working at Philips
Electronics India Ltd Mohali
To analyze the effect of Job satisfaction on the organisation
To determine the relation between job satisfaction of employees and their commitment
towards the organisation
To analyze the performance model adopted by the Philips Electronics India Ltd Mohali
to handle their manpower
To suggest remedial measures for the improvement of the companyrsquos performance
24
Chapter-III
Employees Commitment
25
Employees who are engaged in their work and committed to their organizations give companies
crucial competitive advantagesmdashincluding higher productivity and lower employee turnover
Thus it is not surprising that organizations of all sizes and types have invested substantially in
policies and practices that foster engagement and commitment in their workforces
But what are employee engagement and commitment exactly This report examines the ways in
which employers and corporate consultants define these terms today and offers ideas for
strengthening employee engagement Though different organizations define engagement
differently some common themes emerge These themes include employeesrsquo satisfaction with
their work and pride in their employer the extent to which people enjoy and believe in what they
do for work and the perception that their employer values what they bring to the table The
greater an employeersquos engagement the more likely he or she is to ldquogo the extra milerdquo and deliver
excellent on-the-job performance In addition engaged employees may be more likely to commit
to staying with their current organization Software giant Intuit2 for example found that highly
engaged employees are 13 times more likely to be high performers than less engaged
employees They are also five times less likely to voluntarily leave the company
Clearly engagement and commitment can potentially translate into valuable business results for
an organization To help you reap the benefits of an engaged committed workforce at your
organization this report provides guidelines for understanding and measuring employee
engagement and for designing and implementing effective engagement initiatives As you will
26
see everyday human resource practices such as recruitment training performance management
and workforce surveys can provide powerful levers for enhancing engagement
Employee Engagement Key Ingredients
ldquoEmployee Engagement Definedrdquo shows examples of engagement definitions used by various
corporations and consultancies Clearly definitions of employee engagement vary greatly across
organizations Many managers wonder how such an elusive concept can be quantified The term
does encompass several ingredients for which researchers have developed measurement
techniques These ingredients include the degree to which employees fully occupy themselves in
their work as well as the strength of their commitment to the employer and role Fortunately
there is much research on these elements of engagementmdashwork that has deep roots in individual
and group psychology
Definition
ldquoNo company small or large can win over the long run without energized employees who
believe in the [firms] mission and understand how to achieve it Thats why you need to take the
measure of employee engagement at least once a year through anonymous surveys in which
people feel completely safe to speak their mindsrdquo
-Jack and Suzy Welch-
Common Themes How Companies Measure Engagement
Employers typically assess their employeesrsquo engagement levels with company-wide attitude
or opinion surveys
27
1048657 Pride in employer
1048657 Satisfaction with employer
1048657 Job satisfaction
1048657 Opportunity to perform well at challenging work
1048657 Recognition and positive feedback for onersquos contributions
1048657 Personal support from onersquos supervisor
1048657 Effort above and beyond the minimum
1048657 Understanding the link between onersquos job and the organizationrsquos mission
1048657 Prospects for future growth with onersquos employer
1048657 Intention to stay with onersquos employer
The Link Between Employer Practices and Employee Engagement
How does an engaged workforce generate valuable business results for an organization The
process starts with employer practices such as job and task design recruitment selection
training compensation performance management and career development Such practices affect
employeesrsquo level of engagement as well as job performance Performance and engagement then
interact to produce business results Figure 1 depicts these relationships
28
EMPLOYEE COMMITMENT EMPLOYEE ENGAGEMENT
1048657 How do you and other managers in your
organization define commitment
1048657 Are some employees in your company
engaged in their work but not committed to
the organization Committed to staying with
your firm but not exactly engaged in their
work Both engaged and committed
1048657 To whom are your organizations employees
committed The company Their supervisor
Co-workers Team members Customers
1048657 What business results has commitment from
1048657 How do you and other managers in your
organization define employee engagement
1048657 How do you know that certain employees in
your company are engaged Do they relish
their jobs Enjoy specific responsibilities or
tasks Willingly ldquogo the extra milerdquo
1048657 In teams departments or business units in
your company that have a large number of
engaged employees what business results
are you seeing Higher productivity Lower
costs Greater revenues More efficiency
29
employees created for your organization For
example has commitment reduced turnover
and therefore decreased recruitment hiring
and training costs
1048657 What does your company do to reciprocate
employees commitment Is the organization
living up to its side of the bargain
Lower turnover Higher product or service
quality
1048657 Conversely how do disengaged employees
behave and what are the consequent costs
for their teams units-and your entire
company
As Figure 2 suggests a person possesses attributes such as knowledge skills abilities
temperament attitudes and personality He or she uses these attributes to accomplish work
behaviors according to organization-defined procedures by applying tools equipment andor
technology Work behaviors in turn create the products and services that make an organization
successful We classify work behaviors into three categories those required to accomplish duties
and tasks specified in a job description (prescribed behaviors) ldquoextrardquo behaviors that an
employee contributes for the good of the organization (voluntary behaviors) and behaviors
prohibited by an employer (proscribed behaviors including unexcused absenteeism stealing and
other counterproductive or illegal actions) Of course job performance occurs in an
organizational context which includes elements such as leadership physical setting and social
setting
30
Employers naturally want to encourage workers to perform prescribed and voluntary activities
while avoiding proscribed ones To achieve these goals organizations use a number of HR
practices that directly affect the person process and context components of job performance
Employeesrsquo reactions to these practices determine their levels of engagement and commitment
31
Chapter-IV
32
LITERATURE OF THE REVIEW
ldquo Job Satisfaction That Leads To The Commitment Of
The Employees in The Organisationrdquo
Literature of Review
Gerge Bill Authentic Leadership
In his book Authentic Leadership former Medtronic CEO Bill George makes an obvious
point that business leaders rarely say out loud ldquoMissions motivate dollars donrsquotrdquo
What he means is that purpose is what drives employee commitment not the financial
rewards that come to others Workers donrsquot get up in the morning and say ldquoGee I can
33
hardly wait to get to work today to maximize shareholder profitsrdquo Even when employees
are shareholders who can benefit from improved financials what draws people to their
chosen careers is the work itself and its purpose in the world more than the profit
possibilities
Mr George goes on to say ldquoI find there is universal agreement (among middle managers)
that you cannot inspire employees by urging them to help management get the companyrsquos
stock price uprdquo
There is in fact quite a bit of literature on this subject In Awakening Corporate Soul
authors Eric Klein and John Izzo say that employee commitment requires knowing ldquothe
purpose of our work it means recognizing the purpose our organization fulfills that goes
beyond the bottom line and it means articulating to others how their (workersrsquo) efforts
contribute to a larger purposerdquo
In Built to Last Jim Collins and James Porras spend an entire book explaining their five
year research study of major companies that led to this conclusion about employee
commitment Purpose within a company is what sustains it profit is important but when
itrsquos the prime directive companies falter
-Marshal Goldsmith-
How to Increase Employee Commitment
In practice this involves walking the talk being transparent communicating effectively treating
people equally teaching leading subordinates to increasingly excellent performance ndash and
responding to subordinates as mature individuals who are owed fairness the truth and
recognition of their achievements
34
Since managers interact directly and frequently with subordinates they are usually more tuned
in to how employees are feeling than are executives Managers are in a better position to know
for example when employees are feeling alienated and disengaged from their work which is
very common today -- and expensive
Gaining employee commitment results in greater profits because enthusiastic employees stay
contribute discretionary effort and engage customers Performance soars when customers are
enthused and stay and when executives managers and employees are a collaborative team
united in achieving common goals
But managers are often called middle managers for good reason their job is to motivate and
guide subordinates while they at the same time are being judged by their bosses Because of
their ldquotweenrdquo position in the hierarchy managers to effective support direct reports must also
create relationships with potential allies especially those with greater power who have access to
top decision makers
Harvard University Factors that Impact Employee Well Being Commitment and
Productivity
Business executives from the C-suite and HR to QC and RampD are by nature focused on the
corporate bottom line A new trend in our dawning age of social sustainability is that many
experts believe more attention should be paid to the dotted line - the one signed when a person
35
commits to employment at a company New Harvard research validates this approach affirming
that trust and purpose play a significant role in building successful productive workplaces
The behavioral research conducted by a team at Harvard University and Massachusetts General
Hospital identifies the factors most likely to impact 21st century employee well being
commitment and productivity The researchers found that commitment is largely influenced by
ones sense of purpose feeling of personal impact and overall trust in the organization
Productivity is largely affected by the quality of human relationships including cooperative
social group moods and interaction
The results lead us to conclude that workplaces that provide positive environments that foster
interpersonal trust and quality personal relationships create the most committed and productive
employees says Nancy Etcoff PhD the lead researcher on the study
Expert Shares Keys to Building Successful Workplace Relationships
According to business strategist Courtney Anderson JD MBA Outstanding leadership
today means much more than just doing your job Success is creating an environment that fosters
happy committed productive team members
Anderson explains that reinvigorating workplaces by enhancing trust and employee commitment
does not have to be difficult The biggest challenge she says is making the time to truly change
in our overscheduled instant access competitive work environments With a little know-how it
can be easy to evolve workplace well being and respond to these compelling research results
-Mark Howell-
CEO Bright Point
High-performing companies recognize that employee commitment is a major contributing factor
toward sustaining long-term success and creating value An engaged employee is involved and
excited about their work and acts in a manner that will forward the organizationrsquos interest An
36
engaged workforce helps optimize and retain talent for the long-term because the employees
choose to stay even when other employment alternatives exist
According to Walker Information the top three drivers of employee commitment are
Satisfaction Fairness and Care amp Concern for employees Put simply committed employees
want to enjoy their work feel they are appreciated and know they are making a contribution to
their companyrsquos strategic objectives Additionally employees who have trust in their leadership
and are trusted by their leadership have a greater dedication and are ultimately more productive
on the job However according to recent data provided by the National Business Research
Institute (NBRI) only 31 of all employees are truly engaged
At BrightPoint we take employee engagement seriously and we work to create a culture that
inspires employee loyalty and satisfaction The results of BrightPointrsquos commitment to its
employees are shown in the 2011 BPNA Employee Commitment Survey The survey
determined that close to 80 of respondents indicated they were satisfied with their jobs and
daily activities General employee satisfaction increases when managers take an active interest
in their employees beyond their day-to-day job responsibilities According to NBRI managers
that actively coach build relationships and keep an open dialogue with their employees improve
employee engagement
We have a diverse workforce where each employee brings unique value and has individual
needs Managers are learning to manage the individual and not the position In order to give
managers the tools they need to be successful BrightPoint places strong emphasis on targeted
leadership training workshops and continual learning resources In 2011 906 of managers at
BrightPoint NA participated in the development opportunities offered and also made an effort to
37
help reinforce the learning of their team members This signals that our leadership team is taking
an active interest in professional development and its connection to employee commitment
As BrightPoint continues to increase focus on employee engagement the organization will grow
stronger and maintain a substantial advantage over our competition Our employees possess the
knowledge experience and resiliency to respond quickly to the demands of the marketplace and
through their genuine commitment will deliver what our customers want with increasing
efficiency and effectiveness Our responsibility is value-creation by growing our business and
maintaining high levels of customer service and loyalty We believe the best way to accomplish
this is through a strong committed and engaged workforce
Performance Model Adopted At Mohali Plant
38
Process adopted by Philips Electronics Mohali Plant for Job Satisfaction of Employee that leads commitment of the employees
39
Recruiting
The messages in Philips Electronics Mohali organization conveys while seeking to attract job
applicants also can influence future employeesrsquo engagement and commitment If your firm has
designed jobs specifically to engage employees then organization want to ensure that recruiting
ads extol these positionsrsquo attractive featuresmdashsuch as challenging work assignments a highly
skilled team environment or minimal supervision Applicants who notice and respond to these
ads will more likely be motivated by these features Also consider how organization might best
seek candidates from inside your organization When Organisation recruit existing employees for
desirable jobs you enhance their engagement (by maximizing the person-job fit) and
commitment (by providing growth and advancement opportunities to employees in return for
their loyalty) If Organisation recruit from outside when qualified internal candidates are
available Organization may unwittingly suggest to current employees that your company is not
willing to reciprocate their commitment Existing staff may then begin questioning their own
commitment to the firm By contrast organisation recruit external candidates to both the job and
your organization For these candidates ensure that recruiting messages highlight attractive job
features organizational values and commitment reciprocity That is in return for performance
and dedication your company offers competitive pay and benefits flexible work hours and
learning and career advancement opportunities Also remember that prospective employees have
multiple commitments You will inevitably have to compete with those commitments as
organization try to attract candidates to your firm Most people find it easier to make a new
commitment when it is compatible with their other obligations For example you boost your
chances of recruiting a highly qualified candidate who is a single parent if you offer flexible
work hours family health benefits and on-site day care ldquoRecruiting for Engagement and
Commitmentrdquo
40
Employee Selection
Once recruiting efforts produce a pool of promising job candidates Philips select among them to
fill available positions When organisation select the right individuals for the right jobs new
hires carry out their work more smoothly and experience fewer performance problems The
result Greater enjoyment ofmdashand engagement inmdashthe job
To enhance engagement through your selection of employees identify those candidates who are
best-suited to the job and your organizationrsquos culture Also use candidate assessment methods
that have obvious relevance to the job in questionmdashfor example by asking interviewees what
they know about the role and having them provide work samples Most candidates will view
these techniques more positively than tests with less apparent relevance such as personality and
integrity assessments Successful candidates feel good about having ldquopassed the test and see
company as careful and capable for having selected them A positive initial impression of an
employer encourages growth of long-term commitment
Training and Development
Training and development can serve as additional levers for enhancing engagement and
commitment For new hires training usually begins with orientation Orientation presents several
important opportunitiesmdashincluding explaining pay work schedules and company policies Most
important it gives you a chance to encourage employee engagement by explaining how the new
hirersquos job contributes to the organizationrsquos mission Through orientation Mohali Plant of Philips
Electronics describe how r company is organized introduce the new employee to his or her co-
workers give the person a tour of the area where he or she will be working and explain safety
regulations and other procedural matters In short you foster person-organization fitmdashvital for
developing productive and dedicated employees Through training you help new and current
41
employees acquire the knowledge and skills they need to perform their jobs And employees who
enhance their skills through training are more likely to engage fully in their work because they
derive satisfaction from mastering new tasks Training also enhances employeesrsquo value to your
company as well as their own employability in the job market In addition most companies offer
higher wages for skilled workers to compensate them for their greater value and to discourage
turnover
Compensation
Like the HR practices discussed above compensation can powerfully influence employee
engagement and commitment Some compensation components encourage commitment to
employers while others motivate engagement in the job It is possible to stimulate one and not
the other though itrsquos generally better to foster both For example a company that offers a strong
performance incentive system but no retirement plan will probably realize exceptional
engagement from its workers however they may eventually commit themselves to another
company that does offer a good retirement plan Meanwhile an organization that offers generous
retirement benefits but a traditional seniority-based pay grade system may have committed
employees however these workers might deliver pedestrian performance as they bide their time
until retirement In designing compensation plans you therefore need to consider employee
engagement and commitment strategically
Encourage managers to include employees in the goal-setting process This technique helps to
ensure that workers understand the goals It also promotes acceptance of challenging objectives
because people generally feel more committed to goals they have helped define In addition
consider how you and other managers will recognize and encourage contributions that exceed
expectations For example when a piece of equipment malfunctions Joe finds other ways to
maintain production rather than merely shutting down the machine and waiting for the
42
maintenance staff to fix it Or when a less experienced co-worker encounters a new task Sally
offers friendly coaching instead of standing by and waiting for the inevitable mistakes to crop
up Performance management processes operate on a continuous basis Therefore they provide
perhaps the best ongoing opportunities for employers to foster employee engagement and
commitment For example managers can use routine discussions about performance and
feedback sessions to learn which aspects of the job hold the most interest for each employee and
which tasks are most challenging During such discussions managers also can define what going
above and beyond the call of dutyrdquo looks like and generate ideas for rewarding such
contributions An employeersquos aspirations and career goals can receive careful attention during
performance appraisal meetings Without inquiring into an employeersquos personal life a supervisor
can nevertheless explore ways to enhance the compatibility between the workerrsquos commitment to
your organization and the employeersquos other life commitments Through such means the
organization personalizes its relationship to each employee and provides support while also
expressing appreciation for their contributionsmdash key drivers of engagement and commitment
To further engage employees and win their commitment through your performance management
programs consider how to treat your organizationrsquos most experienced employees In many cases
these employees understand the intricacies of a job better than their supervisors or managers do
By virtue of long identification with your organization they may be deeply committed to high-
level goals They use their expertise to contribute in ways that newer employees simply cannot
match But many of them also may be planning to retire soon especially if they are from the
ldquoBaby Boomerrdquo generation How will you transfer their knowledge to younger workers Design
a performance management system that recognizes and rewards proactive sharing of knowledge
and expertise among co-workers For example create knowledge repositories or learning
histories that can be stored in databases that employees can access and then create incentives
43
for people who contribute to and use these repositories Of course effective performance
management systems also identify employees who are not meeting expectations Failing to
address problem performance can erode other employeesrsquo engagement and commitment as their
workloads increase and they conclude that the company is willing to tolerate poor performance
If feedback coaching and remedial training are of little avail the manager may need to move the
person to a different position within the company where he or she can make a more valuable
contribution or let the individual go if there is no good match elsewhere in the organization
44
Chapter-V
RESEARCH METHODOLOGY
The basic task of research is to generate accurate information for use in decision-making
Research can be defined as the systematic and objective process of gathering recording and
analyzing data for aid in making business decisions As the project involves analyzing of
45
financial structure the research is exploratory in nature covering financial parameters and come
of the important ratios to carry out research There are basically two techniques adopted for
obtaining information
Primary Data
Secondary Data
Primary Data is gathered specifically for the project at hand through personal interviews with
the accounts officers
Sample Size = 100 Employees
Secondary data is previously collected and assembled for some project other than the one at
hand It is gathered and recorded by someone else prior to current needs of the researcher It is
less expensive than the primary date
Secondary Data can be obtained from both external and internal sources
External data may be collected from books and periodicals government sources media and other
commercial sources
Internal data is that secondary data which is created recorded or generated by the organization
As the project is explanatory in nature secondary data is collected from the reports of the
company books journals and interest Secondary data is gathered from annual reports official
records and standing orders of the units
CHAPTER - VI
DATA ANALYSIS AND INTERPRETATION
46
The data after collection is to be processed and analyzed in accordance with the outline
and down for the purpose at the time of developing research plan
Technically speaking processing implies editing coding classification and tabulation of
collected data so that they are amenable to analysis The term analysis refers to the computation
of certain measures along with searching for pattern groups Thus in the process of analysis
relationship or difference should be subjected to statistical tests of significance to determine with
what validity data can be said to indicate any conclusions
The analysis of data in a general way involves a number of closely related operations
which are performed with the purpose of summarizing the collected data and organizing them in
such a manner that they answer the research questions In this study the researcher followed
above process carefully and it is presented in this chapter
47
Table 41 ndash To know the department in which employees are belongs to
S
ou rc
e
survey data
Inference
From the above table it shows that 35 of employees are belongs to
production department
FIGURE 41
S
SI No
D
Department
N
No of Respondents
P
Percentage
1
1
M
Mechanical
3
30
3
30
2
2
E
Electrical
2
25
2
25
3
3
P
Production
3
35
3
35
4
4
O
Others
1
10
1
10
T
Total
1
100
1
100
48
REPRESENTS THE DEPARTMENT
Table 42 ndash To know working experience of the employees
Source survey data
Inference
From the above table it shows that 34 of the employees have 4 ndash 6
years experience
S
SI No
W
Work Experience
N
No of Respondents
P
Percentage
1
1
B
Below 2 years
1
33
1
13
2
2
2
2ndash 4 years
3
30
3
30
3
3
4
4ndash 6 years
3
34
3
34
4
4
A
Above 6 years
2
23
2
23
T
otal
1
100
1
100
49
FIGURE 42
REPRESENTS THE EXPERIENCE OF THE EMPLOYEES
Table 43 ndash To know the physical working environment
S
SI No
W
Working Environment
N
No of Respondents
P
Percentage
1
1
E
Excellent
1
12
1
12
2
2
G
Good
5
57
5
57
3
3
F
Fair
2
28
2
28
4
4
P
Poor
0
03
0
33
5
5
V
Very Poor
0
00
0
00
T
Total
1
100
1
100
Source survey data
Inference
From the above table it shows that 57 of the employees were feeling good about the working environment
50
FIGURE 43
REPRESENTS THE PHYSICAL WOKING ENVIRONMENT
51
Table 44 ndash To know the satisfaction level of employees towards the non-monitory benefits
S
SI No
N
Non-Monitory Benefits offered
to Employees
N
No of Respondents
P
Percentage
1
1
H
Highly Satisfied
1
14
1
14
2
2
S
Satisfied
5
54
5
54
3
3
N
Neither Satisfied nor Dissatisfied
2
25
2
25
4
4
D
Dissatisfied
0
05
0
05
5
5
H
Highly Dissatisfied
0
02
0
02
Total 1
100
1
100
Source survey data
Inference
From the above table it shows that 54 of the employees were satisfied towards the non-monitory benefits
FIGURE 44
REPRESENTS THE SATISFACTION LEVEL OF EMPLOYEES TOWARDS THE NON-MONITORY BENEFITS
52
Table 45 ndash To know the satisfaction level of respondents towards the work
assigned
Source survey dataInference
From the above table it shows that 45 of the respondents were satisfied towards the work assigned
FIGURE 45
S
SI No
A
Amount of Work
N
No of Respondents
P
Percentage
1
1
H
Highly satisfied
2
20
2
20
2
2
S
Satisfied
4
45
4
45
3
3
N
Neither Satisfied nor Dissatisfied
1
12
1
12
4
4
D
Dissatisfied
1
18
1
18
5
5
H
Highly Dissatisfied
0
06
0
06
Total 1
100
1
100
53
REPRESENTS THE SATISFACTION LEVEL OF RESPONDENTS TOWARDS THE WORK ASSIGNED
54
Table 46 ndash Opinion about the career development programme in their organisation
S
SI No
C
Career Development
N
No of Respondents
P
Percentage
H
Highly satisfied
1
12
1
12
S
Satisfied
5
56
5
56
N
Neither Satisfied nor Dissatisfied
2
22
2
22
D
Dissatisfied
1
10
1
10
H
Highly Dissatisfied
0
00
0
00
Total 1
100
1
100
Source survey data
Inference
From the above table it shows that 56 of the employees were satisfied
with the opinion about the carrier development programme in their organisation
FIGURE 46
REPRESENTS OPINION ABOUT THE CAREER DEVELOPMENT
PROGRAMME IN THEIR ORGANISATION
55
Table 47 ndash To know the cooperation of co-workers
S
SI No
C
Co-operation of Workers
N
No of Respondents
P
Percentage
1
1
H
Highly satisfied
2
20
2
20
2
2
S
Satisfied
6
66
6
66
3
3
N
Neither Satisfied nor Dissatisfied
1
11
1
11
4
4
D
Dissatisfied
0
03
0
03
5
5
H
Highly Dissatisfied
0
00
0
00
Total 1
100
1
100
Source survey data
Inference
From the above table it shows that 66 of the employees were satisfied
with the cooperation of co-workers
FIGURE 47
56
REPRESENTS THE COOPERATION OF CO-WORKERS
57
Table 48 ndash To know the satisfaction of Respondents with top management
S
SI No
S
Satisfaction with Top
Management
N
No of Respondents
P
Percentage
1
1
H
Highly satisfied
2
26
2
26
2
2
S
Satisfied
5
51
5
51
3
3
N
Neither Satisfied nor Dissatisfied
1
17
1
17
4
4
D
Dissatisfied
0
06
0
06
5
5
H
Highly dissatisfied
0
00
0
00
Total 1
100
1
100
Source survey data
Inference
From the above table it shows that 51 of the employees were satisfied with the top management
FIGURE 48
58
REPRESENTS THE SATISFACTION OF RESPONDENTS WITH TOP MANAGEMENT
Table 49 ndash To know the satisfaction of Respondents with their subordinates
Source survey data
Inference
From the above table it shows that 67 of the employees were satisfied with their subordinates
S
SI
No
S
Satisfaction with Subordinates
N
No of Respondents
P
Percentage
1
1
H
Highly satisfied
1
12
1
12
2
2
S
Satisfied
6
67
6
67
2
3
N
Neither Satisfied nor Dissatisfied
1
14
1
14
4
D
Dissatisfied
0
07
0
07
5
5
H
Highly Dissatisfied
0
00
0
00
Total 1
100
1
100
59
FIGURE 49
REPRESENTS THE SATISFACTION OF RESPONDENTS WITH THEIR SUBORDINATES
60
Table 410 ndash To know the level of satisfaction regarding nature of job
S
SI No
J
Job Satisfaction
N
No of Respondents
P
Percentage
1
1
H
Highly satisfied
2
22
2
22
2
2
S
Satisfied
5
56
5
56
3
3
N
Neither Satisfied nor Dissatisfied
1
16
1
16
4
4
D
Dissatisfied
0
07
0
07
5
5
H
Highly Dissatisfied
0
00
0
00
Total 1
100
1
100
Source survey dataInference
From the above table it shows that 56 of the employees were satisfied with their job
FIGURE 410
61
REPRESENTS THE LEVEL OF SATISFACTION REGARDING THE NATURE OF JOB
Table 411 ndash To know whether there is any job pressure in their work
Source survey data
Inference
From the above table it shows that 72 of employees said there is job pressure in their work
FIGURE 411
REPRESENTS WHETHER THERE IS ANY JOB PRESSURE IN THEIR WORK
S
SI No
J
Job Pressure
N
No of Respondents
P
Percentage
1
1
Y
Yes
7
72
7
72
2
2
N
No
2
28
2
28
T
Total
1
100
1
100
62
Table 412 ndash To know the opinion regarding opportunity provided by the organisation in developing skills
amp talents
S
SI No
D
Development of Skills and
Talents
N
No of Respondents
P
Percentage
1
1
H
Highly Agree
1
12
1
12
2
2
A
Agree
5
52
5
52
3
3
N
Neither Agree nor Disagree
2
28
2
28
4
4
D
Disagree
0
06
0
06
5
5
H
Highly Disagree
0
02
0
02
Total 1
100
1
100
Source survey data
Inference
From the above table it shows that 52 of employees agreed regarding opportunity provided by the organisation in developing skills amp talents
63
FIRGURE 412
REPRESENTS THE OPPORTUNITY PROVIDED BY THE ORGANISATION IN DEVELOPING SKILLS amp TALENTS
64
Table 413 ndash To know the satisfaction level of welfare facilities provided by the management
S
SI No
W
Welfare Facilities
N
No of Respondents
P
Percentage
1
1
H
Highly satisfied
0
09
9
09
2
2
S
Satisfied
5
57
5
57
3
3
N
Neither Satisfied nor Dissatisfied
2
29
2
29
4
4
D
Dissatisfied
5
05
0
05
5
5
H
Highly Dissatisfied
0
00
0
00
Total 1
100
1
100
Source survey data
Inference
From the above table it shows that 57 of the employees were satisfied with the welfare facilities provided by the management
FIGURE 413
REPRESENTS THE SATISFACTION LEVEL OF WELFARE FACILITIES PROVIDED BY THE MANGEMENT
65
Table 414 ndash To know the employee satisfaction towards the salary
Source survey data
Inference
From the above table it shows that 67 of the employees were satisfied
with their salary
FIGURE 414
REPRESENTS THE SATISFACTION TOWARDS THE SALARY
S
SI No
P
Payment Satisfaction
N
No of Respondents
P
Percentage
1
1
Y
Yes
6
67
6
67
2
2
N
No
3
33
3
33
T
otal
1
100
1
100
66
Table 415 ndash To know the employees willingness amp Commitment Towards
Organisation
Source survey data
Inference
From the above table it shows that 59 of the employees were willing to
continue in this organisation
FIGURE 415
REPRESENTS THE EMPLOYEES WILLINGNESS TO CONTINUE
S
SI No
W
Willingness to Work
N
No of Respondents
P
Percentage
1
1
Y
Yes
5
59
5
59
2
2
N
No
4
41
4
41
T
Total
1
00
1
00
67
CHI-SQUARE METHOD
The chi square test is one of the simplest and most widely used non-
parametric tests in statistical work As a non-parametric test it can be used to determine
if categorical data shows dependency or the two classifications are independent It can
also be used to make comparisons between theoretical population and actual data
when categories are used
n
Chi square χsup2= sum (O-E) sup2 E
i =1
Where O= observed frequency
E= expected frequency
68
OBSERVED FREQUENCY
Table 419 shows the relationship between the department and the job satisfaction
Over All
Job
SatisfactionHighly
SatisfiedSatisfied
Neither
Satisfied nor
Dissatisfied
DissatisfiedHighly
Dissatisfied
Sub
Total
Mechanical 5 6 14 3 2 30
Electrical 6 8 6 3 2 25
Production 9 13 7 4 2 35
Others 2 3 2 2 1 10
Sub Total 22 30 29 12 7 100
69
EXPECTED FREQUENCY
Over All
Job
SatisfactionHighly
SatisfiedSatisfied
Neither
Satisfied nor
Dissatisfied
DissatisfiedHighly
Dissatisfied
Sub
Total
Mechanical 7 8 9 4 2 30
Electrical 5 8 7 3 2 25
Production 8 11 10 4 2 35
Others 2 3 3 1 1 10
Sub Total 22 30 29 12 7 100
Null Hypothesis (Ho)
There is no significant difference between the department and the job satisfaction
Alternative Hypothesis (Ho)
There is significant difference between the job satisfaction
Co Relation
70
Chapter-V
CONCLUSIONS AND
RECOMMENDATIONS
71
CONCLUSION
On the basis of Analysis of Job Satisfaction Level of the Employees of Philips Electronics India
Ltd Mohali made in the previous chapters following conclusions are drawn
General Profile The plant of PHILIPS is ideally located in the Mohali Industrial focal point
Phase 9 near Chandigarh the capital of Punjab on a campus of 17 hectares The working
environment of the company is very healthy The visitors feel happy after the campus
Indigenous Technology PHILIPS is the only lighting manufacturing company based on purely
indigenous technology Philips was appropriately chosen as the brand name as self reliance and
building up of Indian Engineering capabilities remain the guiding spirit of PHILIPS
Financial structure PHILIPS is a low debt company signifying its dependence mainly on
its internal accruals for its financial requirements PHILIPS continues to strengthen its financial
position by channelising these internal accruals to fund its expansion programmes
Working results PTL has registered a handsome and constant growth in its profits because
of a brisk demand for new and better technology electronic items None of the other electronic
company has shown such a steady growth Philips has recorded the lowest current ratio
However with this lowest current ratio PTL still enjoys moderate payment period and highest
velocity of creditors and debtors only due to commitment of itrsquos employees
72
SUMMARY
According to the 1999 Gallup Poll the four elements that have proven to be effective in creating
employee loyalty are praise and recognition a sense of contribution to the company learning and
development and having a best friend at work
Creating a fairy-tale work environment begins withrecognition Your employees need it more
than money perks or titles Here are eight tips regarding recognition Remember these and your
employees may just start whistling while they work It is up to me The corporate culture or
financial rewards will not make your team successful It is up to you Recognition is one thing
that is completely in your control
Strong relationships are vital in todays economy Strengthening employee relationships is even
more necessary as companies downsize and lay off As your workforce shrinks and you need to
do more with less keeping quality employees becomes even more critical As a manager it is
your job to bond your best people to your company through recognition And you also must help
direct and motivate your core performers
Simple rewards earn big returns There are some relatively simple things you can do that will
earn big returns For example remember your employees birthdays and work anniversaries find
out what inexpensive rewards they value (for example tickets to a ball game or a half day off to
spend time with their kids) make the most of your formal service awards with some preparation
and a group presentation walk around your department every day and talk to your
people and thank them sincerely and often
73
Make it specific Praise and recognition must be specific to have impact General praise such as
You do great work actually can have the opposite effect and leave your employees wondering
Does he have any idea what I really do around here Specific praise links individual
accomplishments to company goals For example Cheryl I noticed the way you handled that
customer complaint Great work As you know we value quick resolutions of problems as
one of our core strategies
Ask the best to stay Call your best people into your office one at a time Let that bright young
college graduate know you value his fresh ideas and energy Tell the 20-year veteran how much
your team relies on her expertise and organizational skillsRemarkably a significant percent of
high-impact performers report that they left their last job because No one ever asked me to
stay
Forget cash
Remember the saying Money cant buy everything Well its true Dont wait until you can
offer an employee a raise or promotion Real thanks is its own reward In numerous surveys of
work satisfaction top on employees lists is feeling appreciated In fact when employees feel
recognized and involved they are much less likely to keep asking about money
Recognize
Recognition means most to an employee when it is sincere and spontaneous According to the
largest study ever conducted on workplace satisfaction (Gallup 1999) recognition should occur
at least every seven days If you wait until a year-end party or an annual review you are waiting
much too long to recognize and you probably are losing people you do not need to
74
Recognition works
Neglect can be a poisoned apple Recognition is the elixir that will spark better attitudes and
performance Jeffrey Pfeffer of Stanford University says The returns from managing people in
ways that build high commitment typically are on the order of 30 to 50 percent
Take a hard look in the mirror and ask yourself how you can recognize the fairest of them all
Learn to recognize your employees for their efforts thank them often and reward their
achievements You can awaken them from their anger and apathy and they will fall in love with
their jobs again Chances are you will work together happily ever after
So there is direct relation with employee satisfaction and their commitment towards the
organization and it is also clear from the above discussion that only monetary elements are not
sufficient for employee satisfaction rather other element like employer behavior recognisation
and other moral value
75
RECOMMENDATIONS
PHILIPS should increase its capacity utilization It should work at full capacity to
minimize its cost of production With this increase in capacity utilization the total cost
will spread over more units thereby decreasing the per unit cost
PHILIPS should decrease the credit facilities provided to its consumers The payback
period is quite high in case of debtors as compared to creditors it should be more or less
equal as it will help in improving company liquidity
PHILIPS should focus more on the consumer lifestyle goods in India parallel to its other
business as it accounts very less as compare to other businesses of Philips
Another recommendation for Mohali plant is about the HR department that is they
should appoint permanent and skilled workers as against casual workers which generally add
up to the profit of the company
76
BIBLIOGRAPHY
1 Values-Based Leadership Rebuilding Employee Commitment Performance and Productivity ( Thomas D Kuczmarski)
2 Monthly Journals of Philips Electronics India Ltd
3 Authentic Leadership Medtronic CEO Bill George
4 wwwindiaphilipscom
5 wwwwikipediacom
6 httpwwwemployeecommitmentcom
7 One Foot Out The Door How to Combat The Psychological Recession Thatrsquos Alienating Employees And Hurting American Business Judith Bardwick
8 Employee Commitment A Leader Ship Guide Joe Folkman
9 Harvard University Factors that Impact Employee Well Being Commitment and Productivity -An Article
77
Questionnaire
Name __________________________________________________________
Age______________________________ Gender _______________________
Qualification _______________________ Contact No ___________________
Q1 In which department you are working
Electrical Production Mechanical Other
Q2 What is your working experience
gt2 Years 2-4 Years 4-6 Years lt 6 Years
Q3 How You like the physical Working Environment of the organization
Excellent Good Fair Poor Very Poor
Q4 Are you satisfied with Non-Monitory benefits provided by the organisation
Highly Satisfied Satisfied Neither Satisfied Nor dissatisfied
Highly Dissatisfied Dissatisfied
Q5 Are you satisfied with your work
Highly Satisfied Satisfied Neither Satisfied Nor dissatisfied
Highly Dissatisfied Dissatisfied
Q6 Are you satisfied with the career development programe of the company
Highly Satisfied Satisfied Neither Satisfied Nor dissatisfied
Highly Dissatisfied Dissatisfied
Q7 Is other staff of the organization is co-operative with you
Highly Satisfied Satisfied Neither Satisfied Nor dissatisfied
Highly Dissatisfied Dissatisfied
Q8 Are you satisfied with top level management
Highly Satisfied Satisfied Neither Satisfied Nor dissatisfied
Highly Dissatisfied Dissatisfied
78
Q9 Are you satisfied with your subordinates
Highly Satisfied Satisfied Neither Satisfied Nor dissatisfied
Highly Dissatisfied Dissatisfied
Q10 Are you satisfied with the nature of the Job
Highly Satisfied Satisfied Neither Satisfied Nor dissatisfied
Highly Dissatisfied Dissatisfied
Q11 Do you have any Job Pressure in work
Yes No
Q12 Do you satisfied with the opportunities provided by the organisation
Highly Satisfied Satisfied Neither Satisfied Nor dissatisfied
Highly Dissatisfied Dissatisfied
Q13 Are you satisfied with the welfare facilities provided by the organisation
Highly Satisfied Satisfied Neither Satisfied Nor dissatisfied
Highly Dissatisfied Dissatisfied
Q14 Are you satisfied towards your salary
Highly Satisfied Satisfied Neither Satisfied Nor dissatisfied
Highly Dissatisfied Dissatisfied
Q15 Are you committed towards the organisation
Yes No
Signature

6
solutions based on fundamental customer insights and the brand promise of ldquosense and
simplicityrdquo
Headquartered in the Netherlands Philips employs approximately 121000 employees in more
than 60 countries worldwide With sales of EUR 26 billion in 2008 the company is a market
leader in cardiac care acute care and home healthcare energy efficient lighting solutions and new
lighting applications as well as lifestyle products for personal well-being and pleasure with
strong leadership positions in flat TV male shaving and grooming portable entertainment and
oral healthcare
Philips Electronics India Limited
Philips Electronics India Limited a subsidiary of the Netherlands-based Royal Philips
Electronics is the leading Health and Wellbeing company Today Philips is a simpler and more
focused company with global leadership positions in key markets of Healthcare Lighting and
Consumer Lifestyle addressing peoplersquos Health and wellbeing needs and aspirations as its
overarching theme
As one of the nations most well-known and well-loved brands Philips is a part of practically
every Indians life With recent launch of Philips Respironics product categories in obstructive
sleep apnea management and home respiratory care home decorative lighting range and ALU
range Philips products find use in virtually every aspect of an individualrsquos daily life 24X7 - at
home at work on the move and at rest Philips stands as a source of easy to use trendy and
innovative internationally acclaimed products with superior design and technology that enhance
the quality of consumers professional and personal lives
Philips has been operating in India for over 75 years and employs over 4500 employees around
7
the country The company has an excellent pan India distribution and after-sales service network
BUSINESSES
Lighting
Philips Electronics India Indiarsquos largest lighting company operates in business areas of Lamps
Luminaires Lighting Electronics Automotive and Special Lighting Today as global leader in
Lighting Philips is driving the switch to energy-efficient solutions With worldwide electrical
lighting using 19 per cent of all electricity the use of energy-efficient lighting will significantly
reduce energy consumption around the world and thereby cut harmful CO2 emissions Philips
India has been consistently working with industry bodies such as ELCOMA Bureau of energy
efficiency and NGOs towards addressing Indiarsquos power crisis through promotion of energy
efficient lighting in India
Philips provides advanced energy-efficient solutions for all segments road lighting office amp
industrial hospitality and home Philips is also a leader in shaping the future with exciting new
lighting applications and technologies such as LED technology which besides energy
efficiency provides attractive benefits and endless new lsquonever-before-possiblersquo lighting
solutions
In 2008 Philips inaugurated a global research and development (RampD) centre for lighting
electronics in India This was its third such unit in the world The facility which is situated in
Noida will not only cater to the needs of the Indian market but also the Asia-Pacific Europe and
North America The other RampD centres are located at Eindhoven in the Netherlands and in
Shanghai China One of the primary research areas for the centre is to develop products that can
8
tackle high voltage fluctuations in India The centre currently employs 35 engineers Around 40
per cent of Philipsrsquo revenue in India comes from the lighting business
Consumer lifestyle
Guided by the brand promise of ldquosense and simplicityrdquo and the consumer insights Philips
Consumer Lifestyle offers rich new consumer experiences that meet consumersrsquo desire for
relaxation and improving their state of mind Philips also responds to the consumers desire for
wellness and pleasure by introducing products that meet the individualrsquos interests in terms of
their mind space body and appearance
The Consumer Lifestyle arm in India operates in the business areas of Home Entertainment
solutions and Personal Infotainment with product categories such as TVs home theatre systems
music systems DVD players personal entertainment solutions sound accessories Domestic
Appliances and Personal care
Philips Innovation Campus (PIC)
Philips Innovation Campus (PIC) Bangalore is a division of Philips Electronics India Limited
which is owned 96 by Royal Philips Electronics NV The Netherlands It was established in
August 1996 with a vision to be an innovation hub creating next generation solutions and
products for Healthcare and Lifestyle With the objective of meeting the growing need for high-
quality cost-effective software development capacity within the organization PICrsquos share has
increased significantly from 8 in 1998 to around 20 in 2008
9
Working at PIC are about 1000 of the industrys finest professionals using state-of-the-art
software engineering paradigms and platforms including real-time systems component-based
software engineering and multi-threaded architecture to drive the creation of tomorrows
products and services PIC is an ISO 9001Tick IT SEI CMM SM level 5 company amp has
emerged as a critical partner in the development of strategic amp futuristic technologies for Philips
worldwide 60000 registered patents illustrate the innovative nature of the company Philips has
adopted an Open Innovation strategy which leverages the joint innovative power of partnering
companies and researchers to bring more innovations to the market effectively and faster PIC
has built-up extensive know-how and expertise in the software engineering and technology
domains relevant to its business In addition competencies in the areas of project management
requirement engineering and quality assurance have been established to offer customers products
and services of the highest quality at the fastest time-to-market and the lowest cost of
ownership
RESEARCH AND DEVELOPMENT
Since its foundation 100 years ago Philips Research has been at the forefront of fundamental
scientific research But with market focus being more and more important across almost all
corporate RampD organizations is this still the case If some of the pioneering work being done
by scientists across Research is anything to judge by the answer is a resounding ldquoyesrdquo
Itrsquos different at the cutting edge
In todayrsquos market-focused corporate RampD organizations the boundary between fundamental
scientific research and applied research is becoming increasing blurred ndash particularly when it
comes to some of the most exciting areas of research ldquoHere at Philips our way of working is
very dynamicrdquo says Philips Researchrsquos Chief Science Officer Emile Aarts ldquoThis means that you
10
can apply both the lsquofundamentalrsquo and the lsquoappliedrsquo labels to many of the projects that wersquore
working on because they are both very flexible termsrdquo Philips Researchrsquos work on sleep for
instance is an excellent example of this more dynamic approach ldquoThis is a very important area
for Philips ndash but therersquos currently very little fundamental knowledge available Thatrsquos why wersquore
involved in investigating the key issues at a more fundamental level together with our university
and research institute partners The only difference is that we want this research to lead to
marketable products and solutionsrdquo
Open Innovation in new areas
Despite the flexible nature of the ldquofundamentalrdquo and ldquoappliedrdquo labels it is still possible to detect
a decline in some areas of more fundamental research at Philips in recent years ldquoThis has mainly
occurred in fields that donrsquot support the execution of our companyrsquos Health and Well-being
strategyrdquo says Aarts As he explains this refocusing exercise has gone hand-in-hand with an
expansion of more fundamental research activities in a number of new fields such as deep-brain
stimulation and multi-modal imaging for healthcare applications ldquoIn these fields wersquore
considered to be an extremely important research partner ndash especially by colleagues working in
universitiesrdquo In the future Philips Research will continue to develop its reputation in a number
of exciting fundamental domains ndash ldquogreen lightingrdquo and skincare are just two examples ndash albeit
with a more applied focus ldquoHopefully this research will enable us to build on our strong
heritage of improving the quality of peoplersquos lives
11
BOARD OF DIRECTORS
Non-Executive Director amp Chairman S M Datta
Executive Vice Chairman amp Managing Director Murali Sivaraman
Executive Director Jan-Hein Louwman
Non-Executive Director S Venkatramani
India Management Team
MURALI SIVARAMANN - CEO
ANJAN BOSE - Healthcare
JAN-HEIN LOUWMAN ndash CEO
MAHESH KRISHNAN ndash Consumer lifestyle
RAJEEV CHOPRA ndash lighting
RAKESH SHARMA ndash Strategic Business Development
S NAGARAJAN ndash Human resources
VIVEK SHARMA ndash Chief Marketing Officer
WIDO MENHARDT ndash Philips Innovation Campus
12
Corporate Office-
Philips Electronics India Ltd
Technopolis Knowledge Park
Mahakali Caves Road
Chakala Andheri (East)Mumbai 400 093
Tel +91 22 66912000
VISION 2012
Through the Vision 2012 strategy we aim to fuel growth by making Philips the leading brand in
Health and Well-being Vision 2012 further positions Philips as a market-driven people-centric
company with a strategy and a structure that fully reflect the needs of its customer base while
also increasing shareholder value This is implemented through sharpened strategies in the three
core sectors Healthcare Lighting and Consumer Lifestyle
ldquoWith Vision 2010 we are putting people right at the center of things with Health and Well-
being as our overarching theme We are thereby putting into practice our mission improving the
quality of life through the introduction of meaningful innovationsrdquo ndash Gerard Kleisterlee
President and CEO of Royal Philips Electronic
Our Ways of Working
1 We are a people-centric company that organizes around customers and markets
2 We invest in a strong brand and consistently deliver on our brand promise of ldquosense and
simplicityrdquo in our actions products and services
13
3 We deliver innovation by investing in world class strengths in end-user insights
technology design and superior supplier networks
4 We develop our peoplersquos leadership talent and engagement and align ourselves with high
performance benchmarks
5 We invest in high growth and profitable businesses and emerging geographies to achieve
market leadership positions
6 We are committed to sustainability and focus on making the difference in efficient energy
use
7 We drive operational excellence and quality to best in class levels allowing us the above
mentioned strategic investments in our businesses
BRAND PROMISE
It is the combination of two unique capabilities that enables us to deliver on our ldquosense and
simplicityrdquo promise These capabilities are firstly by understanding people and secondly
technology integration and product design
We put our end users front and center of product innovations starting with understanding their
needs and aspirations We use best-in-class research facilities and agencies to validate and ensure
that our product innovations are designed around peoplersquos needs and aspirations easy to
experience and advanced
SUSTAINABILITY
14
In 2009 we evaluated our sustainability strategy and resolved to fully leverage sustainability as
an integral part of our overall strategy and an additional driver of growth as reflected in the
Philips Management Agenda 2012
To deliver on our brand promise of ldquosense and simplicityrdquo and at the same time provide the
company direction for the longer term in this area we have identified three sustainability
leadership key performance indicators where we can bring our competencies to bear lsquocarersquo
lsquoenergy efficiencyrsquo and lsquomaterialsrsquo including targets for 2015
Bringing care to more than 500 million people
Target 500 million lives touched by 2015
Improving energy efficiency of Philips products
Target 50 improvement by 2015 (for the average total product portfolio) compared to
2009
Closing the materials loop
Target Double global collection recycling amounts and recycled materials in products
by 2015 compared to 2009
Each sector will take the lead on one of the leadership key performance indicators with
Healthcare leading lsquocarersquo Lighting lsquoenergy efficiencyrsquo and Consumer Lifestyle lsquomaterialsrsquo
In addition we defined a set of complementary performance indicators to accelerate change and
drive performance including the EcoVision4 parameters
With EcoVision4 we have committed to the following by 2012
15
bull Generate 30 of total revenues from Green Products
bull Double investment in Green Innovations to a cumulative EUR 1 billion
bull Improve our operational energy efficiency by 25 and reduce our CO2 emissions by 25 all
compared with the base year 2007
SOCIAL COMMITMENT
Living up to this commitment means we use our capabilities to enhance the lives of our
employees and people in society at large Within the company we encourage teamwork and
collaboration in an environment that enables employees to reach their full potential
Building on our rich heritage of involvement in social issues we have established our own
approach of supporting the communities where we live and work focusing on energy efficiency
and healthcare
Sustainable lighting
There is a pressing need to find innovative lighting solutions for the 16 billion people who live
in areas with no access to the electricity grid or where the grid is unreliable Thatrsquos why we have
developed SMILE (Sustainable Model in Lighting Everywhere)
Launched as a pilot in 2006 in four Indian states SMILE includes two lighting solutions UDAY
a rechargeable portable lantern and KIRAN a hand-cranked LED flashlight Today are
distributed in eighth Indian states
16
SWOT ANALYSIS
Strengths
bull India was a market where the first mover enjoyed advantages over latecomers
bull The first image of the product lasted long in the eyes of the consumer and the first to enter the
market could gain the largest market share
bull PHILIPS is committed to enhance its image to the Chinese market as investors
bull PHILIPS was building a wholly owned manufacturing plant in India to show the
Chinese the commitment Korea had to the Chinese society
bull Labor costs in India were less and would defray the cost of producing high-end
bull Samsung has been making color TVs for many years in Korea before moving to the Chinese
market
Weaknesses
bull PHILIPS must continue to control all costs to maintain success
bull India has a reputation of being a protected market (protectionism)
bull India was a market where the first mover enjoyed advantages over late comers PHILIPS is
trying to overcome the first comer advantage Japan manufacturers have over them by being those
first comers
bull Companies such as Sony and Matsushita had built sales and service networks that were
favorable to their sales programs in India while Samsung would have to catch up in that area
17
bull Samsung is not as experienced in manufacturing high-end TVs for a higher-end market
segment
Opportunities
bull Based on the data that on 28 of the 220 million rural households own a color TV PHILIPS
focus on the domestic India market should be to penetrate the rural household market which
would mean that for those purposes the low-end production of sets in the 13rdquo to 20rdquo range should
be produced to appeal to that segmentrsquos purchasing ability
bull Larger more high-end models can be produced to appeal to an urban customer in India as well
as being an export to the US and European higher end customers
bull With success in the higher-end manufacturing and sales of premium TVs in India PHILIPS can
establish themselves as high-end producers around the world
Threats
bull PHILIPS faces intense competition in the color TV market
bull A premium-priced product wouldnrsquot sell in large volumes so pricing can be a problem
bull Since PHILIPS didnrsquot have an established marketing strategy issues of how to market the
product may arise
bull Loss of profitability because related to over-employment at most facilities
bull Is the per capita income level such that it can support sales of product at any level
bull If PHILIPS fails to be successful in the Chinese market with high-end product it will be known
around the world bull India was a market where the first mover enjoyed advantages over late
comers
bull The first image of the product lasted long in the eyes of the consumer and the first to enter the
18
market could gain the largest market share
bull PHILIPS is committed to enhance its image to the Chinese market as investors
PHILIPS ELECTRONICS MOHALI PLANT
The mohali plant was established in 1985 as PUNJAB ANAND LAMP Ltd as its second
division of lamp industry after the varodra plant at that time it was a joint stock company and
majority of shares was with Punjab Anand Lamp around 75 but in the year 2001 the company
ownership changed and the whole shares was bought by PHILIPS ELECTRONIC INDIA Ltd
and its name was changed to PHILIPS ELECTRONIC INDIA Ltd MOHALI LIGHT
FACTORY
The plant is situated in Industrial focal point PHASE-9 MOHALI near Mohali railway station
and is sreaded in 26 acres Total employees of tis plant is 532 including casual employees This
company is a landmark in the Punjab state as it is the only factory which is most profitable one
than any industry located in Punjab
19
OVERVIEW OF VARIOUS FRONTS OF
PHILIPS ELECTRONICS INDIA Ltd
Manufacturing-
Today the product range of Philips include the following products ndash
Televisions- LCD Plasma Flat Screen Smart Touch XL
Recorders DVD Players I pods and Home Theatre Systems
Audio Products - Audio Systems Remote Controls AudioVideo Accessories
Digital Photo Products and Frames
Portable Audio and Video Systems Accessories like Headphones and Speakers
PC Products - Mouse and Keyboard Multi Media Headsets External Hard Disk Drives
Mobile Phones
Male Shaving and Grooming - Dry Shavers Beard Trimmers
Personal Care - Beauty and Hair Care Products
20
Kitchen Appliances - Blenders and Hand Blenders Juicers and Citruspresses Food
Processors and Mixers Coffee Makers and Kettles Frying and Grilling Appliances
Toasters and Snacking Products
Household Products - Irons Vacuum Cleaners Water Purifiers
Professional Lighting - Industrial Shops and offices Road and Area Hospitality Sports
Lighting City Beautification and Petrol Stations
Automotive Lighting - In Cars Motorcycles and Trucks
Home Lighting
SERVICS
Philips E-waste Management Program in India
Philips has tied up with a recycler for collecting transporting and recycling unwanted broken
down consumer products
At Philips we offer consumers a convenient way of recycling their unwanted obsolete and
damaged Philips products by dropping them off at convenient locations The program
encompasses 8 major cities across India Consumers can approach one of 27 authorized Philips
service centres which will act as collection points for consumer products which need recycling
Our efforts are to expand the network in the near future
Philips ensures that the consumer products received will be recycled in an environment-friendly
manner Philips understand the corporate social responsibility and takes steps towards providing
a safer environment to the future generations We design our products to continuously realize
improvements and reduce their overall life cycle environmental impact Designing products for
21
recycling is an integral part of this approach Our aim is to use our planetrsquos limited resources
effectively and respect the principle of extended producer responsibility This also calls for
manufacturers to engage in developing solutions for effective and efficient recycling of their
products We will continue to promote and invest into improved recycling systems to reduce the
impact of electronic waste on the environment
MANUFACTURING AT MOHALI PLANT ndash
Mohali plant mainly manufactures lighting products basically of domestic usage this includes the
following products ndash
CFL bulbs ndash
1 Genie - 5 watt 8 watt 11 watt
2 Essential ndash 8 watt 11 watt 14 watt 18 watt 23 watt 29 watt
3 Tornado ndash 5 watt 8 watt 11 watt 14 watt 18 watt 23watt 29 watt
4 T5 slim tube 28 watt
Coil plant ndash Philips Electronics India is the only company that produces coils in the whole
lighting industries in the world and in India only at the MOHALI PLANT
22
Chapter-II
OBJECTIVES OF THE STUDY
23
OBJECTIVES OF THE STUDY
To study the various aspects of Satisfaction Level of the Employees working at Philips
Electronics India Ltd Mohali
To analyze the effect of Job satisfaction on the organisation
To determine the relation between job satisfaction of employees and their commitment
towards the organisation
To analyze the performance model adopted by the Philips Electronics India Ltd Mohali
to handle their manpower
To suggest remedial measures for the improvement of the companyrsquos performance
24
Chapter-III
Employees Commitment
25
Employees who are engaged in their work and committed to their organizations give companies
crucial competitive advantagesmdashincluding higher productivity and lower employee turnover
Thus it is not surprising that organizations of all sizes and types have invested substantially in
policies and practices that foster engagement and commitment in their workforces
But what are employee engagement and commitment exactly This report examines the ways in
which employers and corporate consultants define these terms today and offers ideas for
strengthening employee engagement Though different organizations define engagement
differently some common themes emerge These themes include employeesrsquo satisfaction with
their work and pride in their employer the extent to which people enjoy and believe in what they
do for work and the perception that their employer values what they bring to the table The
greater an employeersquos engagement the more likely he or she is to ldquogo the extra milerdquo and deliver
excellent on-the-job performance In addition engaged employees may be more likely to commit
to staying with their current organization Software giant Intuit2 for example found that highly
engaged employees are 13 times more likely to be high performers than less engaged
employees They are also five times less likely to voluntarily leave the company
Clearly engagement and commitment can potentially translate into valuable business results for
an organization To help you reap the benefits of an engaged committed workforce at your
organization this report provides guidelines for understanding and measuring employee
engagement and for designing and implementing effective engagement initiatives As you will
26
see everyday human resource practices such as recruitment training performance management
and workforce surveys can provide powerful levers for enhancing engagement
Employee Engagement Key Ingredients
ldquoEmployee Engagement Definedrdquo shows examples of engagement definitions used by various
corporations and consultancies Clearly definitions of employee engagement vary greatly across
organizations Many managers wonder how such an elusive concept can be quantified The term
does encompass several ingredients for which researchers have developed measurement
techniques These ingredients include the degree to which employees fully occupy themselves in
their work as well as the strength of their commitment to the employer and role Fortunately
there is much research on these elements of engagementmdashwork that has deep roots in individual
and group psychology
Definition
ldquoNo company small or large can win over the long run without energized employees who
believe in the [firms] mission and understand how to achieve it Thats why you need to take the
measure of employee engagement at least once a year through anonymous surveys in which
people feel completely safe to speak their mindsrdquo
-Jack and Suzy Welch-
Common Themes How Companies Measure Engagement
Employers typically assess their employeesrsquo engagement levels with company-wide attitude
or opinion surveys
27
1048657 Pride in employer
1048657 Satisfaction with employer
1048657 Job satisfaction
1048657 Opportunity to perform well at challenging work
1048657 Recognition and positive feedback for onersquos contributions
1048657 Personal support from onersquos supervisor
1048657 Effort above and beyond the minimum
1048657 Understanding the link between onersquos job and the organizationrsquos mission
1048657 Prospects for future growth with onersquos employer
1048657 Intention to stay with onersquos employer
The Link Between Employer Practices and Employee Engagement
How does an engaged workforce generate valuable business results for an organization The
process starts with employer practices such as job and task design recruitment selection
training compensation performance management and career development Such practices affect
employeesrsquo level of engagement as well as job performance Performance and engagement then
interact to produce business results Figure 1 depicts these relationships
28
EMPLOYEE COMMITMENT EMPLOYEE ENGAGEMENT
1048657 How do you and other managers in your
organization define commitment
1048657 Are some employees in your company
engaged in their work but not committed to
the organization Committed to staying with
your firm but not exactly engaged in their
work Both engaged and committed
1048657 To whom are your organizations employees
committed The company Their supervisor
Co-workers Team members Customers
1048657 What business results has commitment from
1048657 How do you and other managers in your
organization define employee engagement
1048657 How do you know that certain employees in
your company are engaged Do they relish
their jobs Enjoy specific responsibilities or
tasks Willingly ldquogo the extra milerdquo
1048657 In teams departments or business units in
your company that have a large number of
engaged employees what business results
are you seeing Higher productivity Lower
costs Greater revenues More efficiency
29
employees created for your organization For
example has commitment reduced turnover
and therefore decreased recruitment hiring
and training costs
1048657 What does your company do to reciprocate
employees commitment Is the organization
living up to its side of the bargain
Lower turnover Higher product or service
quality
1048657 Conversely how do disengaged employees
behave and what are the consequent costs
for their teams units-and your entire
company
As Figure 2 suggests a person possesses attributes such as knowledge skills abilities
temperament attitudes and personality He or she uses these attributes to accomplish work
behaviors according to organization-defined procedures by applying tools equipment andor
technology Work behaviors in turn create the products and services that make an organization
successful We classify work behaviors into three categories those required to accomplish duties
and tasks specified in a job description (prescribed behaviors) ldquoextrardquo behaviors that an
employee contributes for the good of the organization (voluntary behaviors) and behaviors
prohibited by an employer (proscribed behaviors including unexcused absenteeism stealing and
other counterproductive or illegal actions) Of course job performance occurs in an
organizational context which includes elements such as leadership physical setting and social
setting
30
Employers naturally want to encourage workers to perform prescribed and voluntary activities
while avoiding proscribed ones To achieve these goals organizations use a number of HR
practices that directly affect the person process and context components of job performance
Employeesrsquo reactions to these practices determine their levels of engagement and commitment
31
Chapter-IV
32
LITERATURE OF THE REVIEW
ldquo Job Satisfaction That Leads To The Commitment Of
The Employees in The Organisationrdquo
Literature of Review
Gerge Bill Authentic Leadership
In his book Authentic Leadership former Medtronic CEO Bill George makes an obvious
point that business leaders rarely say out loud ldquoMissions motivate dollars donrsquotrdquo
What he means is that purpose is what drives employee commitment not the financial
rewards that come to others Workers donrsquot get up in the morning and say ldquoGee I can
33
hardly wait to get to work today to maximize shareholder profitsrdquo Even when employees
are shareholders who can benefit from improved financials what draws people to their
chosen careers is the work itself and its purpose in the world more than the profit
possibilities
Mr George goes on to say ldquoI find there is universal agreement (among middle managers)
that you cannot inspire employees by urging them to help management get the companyrsquos
stock price uprdquo
There is in fact quite a bit of literature on this subject In Awakening Corporate Soul
authors Eric Klein and John Izzo say that employee commitment requires knowing ldquothe
purpose of our work it means recognizing the purpose our organization fulfills that goes
beyond the bottom line and it means articulating to others how their (workersrsquo) efforts
contribute to a larger purposerdquo
In Built to Last Jim Collins and James Porras spend an entire book explaining their five
year research study of major companies that led to this conclusion about employee
commitment Purpose within a company is what sustains it profit is important but when
itrsquos the prime directive companies falter
-Marshal Goldsmith-
How to Increase Employee Commitment
In practice this involves walking the talk being transparent communicating effectively treating
people equally teaching leading subordinates to increasingly excellent performance ndash and
responding to subordinates as mature individuals who are owed fairness the truth and
recognition of their achievements
34
Since managers interact directly and frequently with subordinates they are usually more tuned
in to how employees are feeling than are executives Managers are in a better position to know
for example when employees are feeling alienated and disengaged from their work which is
very common today -- and expensive
Gaining employee commitment results in greater profits because enthusiastic employees stay
contribute discretionary effort and engage customers Performance soars when customers are
enthused and stay and when executives managers and employees are a collaborative team
united in achieving common goals
But managers are often called middle managers for good reason their job is to motivate and
guide subordinates while they at the same time are being judged by their bosses Because of
their ldquotweenrdquo position in the hierarchy managers to effective support direct reports must also
create relationships with potential allies especially those with greater power who have access to
top decision makers
Harvard University Factors that Impact Employee Well Being Commitment and
Productivity
Business executives from the C-suite and HR to QC and RampD are by nature focused on the
corporate bottom line A new trend in our dawning age of social sustainability is that many
experts believe more attention should be paid to the dotted line - the one signed when a person
35
commits to employment at a company New Harvard research validates this approach affirming
that trust and purpose play a significant role in building successful productive workplaces
The behavioral research conducted by a team at Harvard University and Massachusetts General
Hospital identifies the factors most likely to impact 21st century employee well being
commitment and productivity The researchers found that commitment is largely influenced by
ones sense of purpose feeling of personal impact and overall trust in the organization
Productivity is largely affected by the quality of human relationships including cooperative
social group moods and interaction
The results lead us to conclude that workplaces that provide positive environments that foster
interpersonal trust and quality personal relationships create the most committed and productive
employees says Nancy Etcoff PhD the lead researcher on the study
Expert Shares Keys to Building Successful Workplace Relationships
According to business strategist Courtney Anderson JD MBA Outstanding leadership
today means much more than just doing your job Success is creating an environment that fosters
happy committed productive team members
Anderson explains that reinvigorating workplaces by enhancing trust and employee commitment
does not have to be difficult The biggest challenge she says is making the time to truly change
in our overscheduled instant access competitive work environments With a little know-how it
can be easy to evolve workplace well being and respond to these compelling research results
-Mark Howell-
CEO Bright Point
High-performing companies recognize that employee commitment is a major contributing factor
toward sustaining long-term success and creating value An engaged employee is involved and
excited about their work and acts in a manner that will forward the organizationrsquos interest An
36
engaged workforce helps optimize and retain talent for the long-term because the employees
choose to stay even when other employment alternatives exist
According to Walker Information the top three drivers of employee commitment are
Satisfaction Fairness and Care amp Concern for employees Put simply committed employees
want to enjoy their work feel they are appreciated and know they are making a contribution to
their companyrsquos strategic objectives Additionally employees who have trust in their leadership
and are trusted by their leadership have a greater dedication and are ultimately more productive
on the job However according to recent data provided by the National Business Research
Institute (NBRI) only 31 of all employees are truly engaged
At BrightPoint we take employee engagement seriously and we work to create a culture that
inspires employee loyalty and satisfaction The results of BrightPointrsquos commitment to its
employees are shown in the 2011 BPNA Employee Commitment Survey The survey
determined that close to 80 of respondents indicated they were satisfied with their jobs and
daily activities General employee satisfaction increases when managers take an active interest
in their employees beyond their day-to-day job responsibilities According to NBRI managers
that actively coach build relationships and keep an open dialogue with their employees improve
employee engagement
We have a diverse workforce where each employee brings unique value and has individual
needs Managers are learning to manage the individual and not the position In order to give
managers the tools they need to be successful BrightPoint places strong emphasis on targeted
leadership training workshops and continual learning resources In 2011 906 of managers at
BrightPoint NA participated in the development opportunities offered and also made an effort to
37
help reinforce the learning of their team members This signals that our leadership team is taking
an active interest in professional development and its connection to employee commitment
As BrightPoint continues to increase focus on employee engagement the organization will grow
stronger and maintain a substantial advantage over our competition Our employees possess the
knowledge experience and resiliency to respond quickly to the demands of the marketplace and
through their genuine commitment will deliver what our customers want with increasing
efficiency and effectiveness Our responsibility is value-creation by growing our business and
maintaining high levels of customer service and loyalty We believe the best way to accomplish
this is through a strong committed and engaged workforce
Performance Model Adopted At Mohali Plant
38
Process adopted by Philips Electronics Mohali Plant for Job Satisfaction of Employee that leads commitment of the employees
39
Recruiting
The messages in Philips Electronics Mohali organization conveys while seeking to attract job
applicants also can influence future employeesrsquo engagement and commitment If your firm has
designed jobs specifically to engage employees then organization want to ensure that recruiting
ads extol these positionsrsquo attractive featuresmdashsuch as challenging work assignments a highly
skilled team environment or minimal supervision Applicants who notice and respond to these
ads will more likely be motivated by these features Also consider how organization might best
seek candidates from inside your organization When Organisation recruit existing employees for
desirable jobs you enhance their engagement (by maximizing the person-job fit) and
commitment (by providing growth and advancement opportunities to employees in return for
their loyalty) If Organisation recruit from outside when qualified internal candidates are
available Organization may unwittingly suggest to current employees that your company is not
willing to reciprocate their commitment Existing staff may then begin questioning their own
commitment to the firm By contrast organisation recruit external candidates to both the job and
your organization For these candidates ensure that recruiting messages highlight attractive job
features organizational values and commitment reciprocity That is in return for performance
and dedication your company offers competitive pay and benefits flexible work hours and
learning and career advancement opportunities Also remember that prospective employees have
multiple commitments You will inevitably have to compete with those commitments as
organization try to attract candidates to your firm Most people find it easier to make a new
commitment when it is compatible with their other obligations For example you boost your
chances of recruiting a highly qualified candidate who is a single parent if you offer flexible
work hours family health benefits and on-site day care ldquoRecruiting for Engagement and
Commitmentrdquo
40
Employee Selection
Once recruiting efforts produce a pool of promising job candidates Philips select among them to
fill available positions When organisation select the right individuals for the right jobs new
hires carry out their work more smoothly and experience fewer performance problems The
result Greater enjoyment ofmdashand engagement inmdashthe job
To enhance engagement through your selection of employees identify those candidates who are
best-suited to the job and your organizationrsquos culture Also use candidate assessment methods
that have obvious relevance to the job in questionmdashfor example by asking interviewees what
they know about the role and having them provide work samples Most candidates will view
these techniques more positively than tests with less apparent relevance such as personality and
integrity assessments Successful candidates feel good about having ldquopassed the test and see
company as careful and capable for having selected them A positive initial impression of an
employer encourages growth of long-term commitment
Training and Development
Training and development can serve as additional levers for enhancing engagement and
commitment For new hires training usually begins with orientation Orientation presents several
important opportunitiesmdashincluding explaining pay work schedules and company policies Most
important it gives you a chance to encourage employee engagement by explaining how the new
hirersquos job contributes to the organizationrsquos mission Through orientation Mohali Plant of Philips
Electronics describe how r company is organized introduce the new employee to his or her co-
workers give the person a tour of the area where he or she will be working and explain safety
regulations and other procedural matters In short you foster person-organization fitmdashvital for
developing productive and dedicated employees Through training you help new and current
41
employees acquire the knowledge and skills they need to perform their jobs And employees who
enhance their skills through training are more likely to engage fully in their work because they
derive satisfaction from mastering new tasks Training also enhances employeesrsquo value to your
company as well as their own employability in the job market In addition most companies offer
higher wages for skilled workers to compensate them for their greater value and to discourage
turnover
Compensation
Like the HR practices discussed above compensation can powerfully influence employee
engagement and commitment Some compensation components encourage commitment to
employers while others motivate engagement in the job It is possible to stimulate one and not
the other though itrsquos generally better to foster both For example a company that offers a strong
performance incentive system but no retirement plan will probably realize exceptional
engagement from its workers however they may eventually commit themselves to another
company that does offer a good retirement plan Meanwhile an organization that offers generous
retirement benefits but a traditional seniority-based pay grade system may have committed
employees however these workers might deliver pedestrian performance as they bide their time
until retirement In designing compensation plans you therefore need to consider employee
engagement and commitment strategically
Encourage managers to include employees in the goal-setting process This technique helps to
ensure that workers understand the goals It also promotes acceptance of challenging objectives
because people generally feel more committed to goals they have helped define In addition
consider how you and other managers will recognize and encourage contributions that exceed
expectations For example when a piece of equipment malfunctions Joe finds other ways to
maintain production rather than merely shutting down the machine and waiting for the
42
maintenance staff to fix it Or when a less experienced co-worker encounters a new task Sally
offers friendly coaching instead of standing by and waiting for the inevitable mistakes to crop
up Performance management processes operate on a continuous basis Therefore they provide
perhaps the best ongoing opportunities for employers to foster employee engagement and
commitment For example managers can use routine discussions about performance and
feedback sessions to learn which aspects of the job hold the most interest for each employee and
which tasks are most challenging During such discussions managers also can define what going
above and beyond the call of dutyrdquo looks like and generate ideas for rewarding such
contributions An employeersquos aspirations and career goals can receive careful attention during
performance appraisal meetings Without inquiring into an employeersquos personal life a supervisor
can nevertheless explore ways to enhance the compatibility between the workerrsquos commitment to
your organization and the employeersquos other life commitments Through such means the
organization personalizes its relationship to each employee and provides support while also
expressing appreciation for their contributionsmdash key drivers of engagement and commitment
To further engage employees and win their commitment through your performance management
programs consider how to treat your organizationrsquos most experienced employees In many cases
these employees understand the intricacies of a job better than their supervisors or managers do
By virtue of long identification with your organization they may be deeply committed to high-
level goals They use their expertise to contribute in ways that newer employees simply cannot
match But many of them also may be planning to retire soon especially if they are from the
ldquoBaby Boomerrdquo generation How will you transfer their knowledge to younger workers Design
a performance management system that recognizes and rewards proactive sharing of knowledge
and expertise among co-workers For example create knowledge repositories or learning
histories that can be stored in databases that employees can access and then create incentives
43
for people who contribute to and use these repositories Of course effective performance
management systems also identify employees who are not meeting expectations Failing to
address problem performance can erode other employeesrsquo engagement and commitment as their
workloads increase and they conclude that the company is willing to tolerate poor performance
If feedback coaching and remedial training are of little avail the manager may need to move the
person to a different position within the company where he or she can make a more valuable
contribution or let the individual go if there is no good match elsewhere in the organization
44
Chapter-V
RESEARCH METHODOLOGY
The basic task of research is to generate accurate information for use in decision-making
Research can be defined as the systematic and objective process of gathering recording and
analyzing data for aid in making business decisions As the project involves analyzing of
45
financial structure the research is exploratory in nature covering financial parameters and come
of the important ratios to carry out research There are basically two techniques adopted for
obtaining information
Primary Data
Secondary Data
Primary Data is gathered specifically for the project at hand through personal interviews with
the accounts officers
Sample Size = 100 Employees
Secondary data is previously collected and assembled for some project other than the one at
hand It is gathered and recorded by someone else prior to current needs of the researcher It is
less expensive than the primary date
Secondary Data can be obtained from both external and internal sources
External data may be collected from books and periodicals government sources media and other
commercial sources
Internal data is that secondary data which is created recorded or generated by the organization
As the project is explanatory in nature secondary data is collected from the reports of the
company books journals and interest Secondary data is gathered from annual reports official
records and standing orders of the units
CHAPTER - VI
DATA ANALYSIS AND INTERPRETATION
46
The data after collection is to be processed and analyzed in accordance with the outline
and down for the purpose at the time of developing research plan
Technically speaking processing implies editing coding classification and tabulation of
collected data so that they are amenable to analysis The term analysis refers to the computation
of certain measures along with searching for pattern groups Thus in the process of analysis
relationship or difference should be subjected to statistical tests of significance to determine with
what validity data can be said to indicate any conclusions
The analysis of data in a general way involves a number of closely related operations
which are performed with the purpose of summarizing the collected data and organizing them in
such a manner that they answer the research questions In this study the researcher followed
above process carefully and it is presented in this chapter
47
Table 41 ndash To know the department in which employees are belongs to
S
ou rc
e
survey data
Inference
From the above table it shows that 35 of employees are belongs to
production department
FIGURE 41
S
SI No
D
Department
N
No of Respondents
P
Percentage
1
1
M
Mechanical
3
30
3
30
2
2
E
Electrical
2
25
2
25
3
3
P
Production
3
35
3
35
4
4
O
Others
1
10
1
10
T
Total
1
100
1
100
48
REPRESENTS THE DEPARTMENT
Table 42 ndash To know working experience of the employees
Source survey data
Inference
From the above table it shows that 34 of the employees have 4 ndash 6
years experience
S
SI No
W
Work Experience
N
No of Respondents
P
Percentage
1
1
B
Below 2 years
1
33
1
13
2
2
2
2ndash 4 years
3
30
3
30
3
3
4
4ndash 6 years
3
34
3
34
4
4
A
Above 6 years
2
23
2
23
T
otal
1
100
1
100
49
FIGURE 42
REPRESENTS THE EXPERIENCE OF THE EMPLOYEES
Table 43 ndash To know the physical working environment
S
SI No
W
Working Environment
N
No of Respondents
P
Percentage
1
1
E
Excellent
1
12
1
12
2
2
G
Good
5
57
5
57
3
3
F
Fair
2
28
2
28
4
4
P
Poor
0
03
0
33
5
5
V
Very Poor
0
00
0
00
T
Total
1
100
1
100
Source survey data
Inference
From the above table it shows that 57 of the employees were feeling good about the working environment
50
FIGURE 43
REPRESENTS THE PHYSICAL WOKING ENVIRONMENT
51
Table 44 ndash To know the satisfaction level of employees towards the non-monitory benefits
S
SI No
N
Non-Monitory Benefits offered
to Employees
N
No of Respondents
P
Percentage
1
1
H
Highly Satisfied
1
14
1
14
2
2
S
Satisfied
5
54
5
54
3
3
N
Neither Satisfied nor Dissatisfied
2
25
2
25
4
4
D
Dissatisfied
0
05
0
05
5
5
H
Highly Dissatisfied
0
02
0
02
Total 1
100
1
100
Source survey data
Inference
From the above table it shows that 54 of the employees were satisfied towards the non-monitory benefits
FIGURE 44
REPRESENTS THE SATISFACTION LEVEL OF EMPLOYEES TOWARDS THE NON-MONITORY BENEFITS
52
Table 45 ndash To know the satisfaction level of respondents towards the work
assigned
Source survey dataInference
From the above table it shows that 45 of the respondents were satisfied towards the work assigned
FIGURE 45
S
SI No
A
Amount of Work
N
No of Respondents
P
Percentage
1
1
H
Highly satisfied
2
20
2
20
2
2
S
Satisfied
4
45
4
45
3
3
N
Neither Satisfied nor Dissatisfied
1
12
1
12
4
4
D
Dissatisfied
1
18
1
18
5
5
H
Highly Dissatisfied
0
06
0
06
Total 1
100
1
100
53
REPRESENTS THE SATISFACTION LEVEL OF RESPONDENTS TOWARDS THE WORK ASSIGNED
54
Table 46 ndash Opinion about the career development programme in their organisation
S
SI No
C
Career Development
N
No of Respondents
P
Percentage
H
Highly satisfied
1
12
1
12
S
Satisfied
5
56
5
56
N
Neither Satisfied nor Dissatisfied
2
22
2
22
D
Dissatisfied
1
10
1
10
H
Highly Dissatisfied
0
00
0
00
Total 1
100
1
100
Source survey data
Inference
From the above table it shows that 56 of the employees were satisfied
with the opinion about the carrier development programme in their organisation
FIGURE 46
REPRESENTS OPINION ABOUT THE CAREER DEVELOPMENT
PROGRAMME IN THEIR ORGANISATION
55
Table 47 ndash To know the cooperation of co-workers
S
SI No
C
Co-operation of Workers
N
No of Respondents
P
Percentage
1
1
H
Highly satisfied
2
20
2
20
2
2
S
Satisfied
6
66
6
66
3
3
N
Neither Satisfied nor Dissatisfied
1
11
1
11
4
4
D
Dissatisfied
0
03
0
03
5
5
H
Highly Dissatisfied
0
00
0
00
Total 1
100
1
100
Source survey data
Inference
From the above table it shows that 66 of the employees were satisfied
with the cooperation of co-workers
FIGURE 47
56
REPRESENTS THE COOPERATION OF CO-WORKERS
57
Table 48 ndash To know the satisfaction of Respondents with top management
S
SI No
S
Satisfaction with Top
Management
N
No of Respondents
P
Percentage
1
1
H
Highly satisfied
2
26
2
26
2
2
S
Satisfied
5
51
5
51
3
3
N
Neither Satisfied nor Dissatisfied
1
17
1
17
4
4
D
Dissatisfied
0
06
0
06
5
5
H
Highly dissatisfied
0
00
0
00
Total 1
100
1
100
Source survey data
Inference
From the above table it shows that 51 of the employees were satisfied with the top management
FIGURE 48
58
REPRESENTS THE SATISFACTION OF RESPONDENTS WITH TOP MANAGEMENT
Table 49 ndash To know the satisfaction of Respondents with their subordinates
Source survey data
Inference
From the above table it shows that 67 of the employees were satisfied with their subordinates
S
SI
No
S
Satisfaction with Subordinates
N
No of Respondents
P
Percentage
1
1
H
Highly satisfied
1
12
1
12
2
2
S
Satisfied
6
67
6
67
2
3
N
Neither Satisfied nor Dissatisfied
1
14
1
14
4
D
Dissatisfied
0
07
0
07
5
5
H
Highly Dissatisfied
0
00
0
00
Total 1
100
1
100
59
FIGURE 49
REPRESENTS THE SATISFACTION OF RESPONDENTS WITH THEIR SUBORDINATES
60
Table 410 ndash To know the level of satisfaction regarding nature of job
S
SI No
J
Job Satisfaction
N
No of Respondents
P
Percentage
1
1
H
Highly satisfied
2
22
2
22
2
2
S
Satisfied
5
56
5
56
3
3
N
Neither Satisfied nor Dissatisfied
1
16
1
16
4
4
D
Dissatisfied
0
07
0
07
5
5
H
Highly Dissatisfied
0
00
0
00
Total 1
100
1
100
Source survey dataInference
From the above table it shows that 56 of the employees were satisfied with their job
FIGURE 410
61
REPRESENTS THE LEVEL OF SATISFACTION REGARDING THE NATURE OF JOB
Table 411 ndash To know whether there is any job pressure in their work
Source survey data
Inference
From the above table it shows that 72 of employees said there is job pressure in their work
FIGURE 411
REPRESENTS WHETHER THERE IS ANY JOB PRESSURE IN THEIR WORK
S
SI No
J
Job Pressure
N
No of Respondents
P
Percentage
1
1
Y
Yes
7
72
7
72
2
2
N
No
2
28
2
28
T
Total
1
100
1
100
62
Table 412 ndash To know the opinion regarding opportunity provided by the organisation in developing skills
amp talents
S
SI No
D
Development of Skills and
Talents
N
No of Respondents
P
Percentage
1
1
H
Highly Agree
1
12
1
12
2
2
A
Agree
5
52
5
52
3
3
N
Neither Agree nor Disagree
2
28
2
28
4
4
D
Disagree
0
06
0
06
5
5
H
Highly Disagree
0
02
0
02
Total 1
100
1
100
Source survey data
Inference
From the above table it shows that 52 of employees agreed regarding opportunity provided by the organisation in developing skills amp talents
63
FIRGURE 412
REPRESENTS THE OPPORTUNITY PROVIDED BY THE ORGANISATION IN DEVELOPING SKILLS amp TALENTS
64
Table 413 ndash To know the satisfaction level of welfare facilities provided by the management
S
SI No
W
Welfare Facilities
N
No of Respondents
P
Percentage
1
1
H
Highly satisfied
0
09
9
09
2
2
S
Satisfied
5
57
5
57
3
3
N
Neither Satisfied nor Dissatisfied
2
29
2
29
4
4
D
Dissatisfied
5
05
0
05
5
5
H
Highly Dissatisfied
0
00
0
00
Total 1
100
1
100
Source survey data
Inference
From the above table it shows that 57 of the employees were satisfied with the welfare facilities provided by the management
FIGURE 413
REPRESENTS THE SATISFACTION LEVEL OF WELFARE FACILITIES PROVIDED BY THE MANGEMENT
65
Table 414 ndash To know the employee satisfaction towards the salary
Source survey data
Inference
From the above table it shows that 67 of the employees were satisfied
with their salary
FIGURE 414
REPRESENTS THE SATISFACTION TOWARDS THE SALARY
S
SI No
P
Payment Satisfaction
N
No of Respondents
P
Percentage
1
1
Y
Yes
6
67
6
67
2
2
N
No
3
33
3
33
T
otal
1
100
1
100
66
Table 415 ndash To know the employees willingness amp Commitment Towards
Organisation
Source survey data
Inference
From the above table it shows that 59 of the employees were willing to
continue in this organisation
FIGURE 415
REPRESENTS THE EMPLOYEES WILLINGNESS TO CONTINUE
S
SI No
W
Willingness to Work
N
No of Respondents
P
Percentage
1
1
Y
Yes
5
59
5
59
2
2
N
No
4
41
4
41
T
Total
1
00
1
00
67
CHI-SQUARE METHOD
The chi square test is one of the simplest and most widely used non-
parametric tests in statistical work As a non-parametric test it can be used to determine
if categorical data shows dependency or the two classifications are independent It can
also be used to make comparisons between theoretical population and actual data
when categories are used
n
Chi square χsup2= sum (O-E) sup2 E
i =1
Where O= observed frequency
E= expected frequency
68
OBSERVED FREQUENCY
Table 419 shows the relationship between the department and the job satisfaction
Over All
Job
SatisfactionHighly
SatisfiedSatisfied
Neither
Satisfied nor
Dissatisfied
DissatisfiedHighly
Dissatisfied
Sub
Total
Mechanical 5 6 14 3 2 30
Electrical 6 8 6 3 2 25
Production 9 13 7 4 2 35
Others 2 3 2 2 1 10
Sub Total 22 30 29 12 7 100
69
EXPECTED FREQUENCY
Over All
Job
SatisfactionHighly
SatisfiedSatisfied
Neither
Satisfied nor
Dissatisfied
DissatisfiedHighly
Dissatisfied
Sub
Total
Mechanical 7 8 9 4 2 30
Electrical 5 8 7 3 2 25
Production 8 11 10 4 2 35
Others 2 3 3 1 1 10
Sub Total 22 30 29 12 7 100
Null Hypothesis (Ho)
There is no significant difference between the department and the job satisfaction
Alternative Hypothesis (Ho)
There is significant difference between the job satisfaction
Co Relation
70
Chapter-V
CONCLUSIONS AND
RECOMMENDATIONS
71
CONCLUSION
On the basis of Analysis of Job Satisfaction Level of the Employees of Philips Electronics India
Ltd Mohali made in the previous chapters following conclusions are drawn
General Profile The plant of PHILIPS is ideally located in the Mohali Industrial focal point
Phase 9 near Chandigarh the capital of Punjab on a campus of 17 hectares The working
environment of the company is very healthy The visitors feel happy after the campus
Indigenous Technology PHILIPS is the only lighting manufacturing company based on purely
indigenous technology Philips was appropriately chosen as the brand name as self reliance and
building up of Indian Engineering capabilities remain the guiding spirit of PHILIPS
Financial structure PHILIPS is a low debt company signifying its dependence mainly on
its internal accruals for its financial requirements PHILIPS continues to strengthen its financial
position by channelising these internal accruals to fund its expansion programmes
Working results PTL has registered a handsome and constant growth in its profits because
of a brisk demand for new and better technology electronic items None of the other electronic
company has shown such a steady growth Philips has recorded the lowest current ratio
However with this lowest current ratio PTL still enjoys moderate payment period and highest
velocity of creditors and debtors only due to commitment of itrsquos employees
72
SUMMARY
According to the 1999 Gallup Poll the four elements that have proven to be effective in creating
employee loyalty are praise and recognition a sense of contribution to the company learning and
development and having a best friend at work
Creating a fairy-tale work environment begins withrecognition Your employees need it more
than money perks or titles Here are eight tips regarding recognition Remember these and your
employees may just start whistling while they work It is up to me The corporate culture or
financial rewards will not make your team successful It is up to you Recognition is one thing
that is completely in your control
Strong relationships are vital in todays economy Strengthening employee relationships is even
more necessary as companies downsize and lay off As your workforce shrinks and you need to
do more with less keeping quality employees becomes even more critical As a manager it is
your job to bond your best people to your company through recognition And you also must help
direct and motivate your core performers
Simple rewards earn big returns There are some relatively simple things you can do that will
earn big returns For example remember your employees birthdays and work anniversaries find
out what inexpensive rewards they value (for example tickets to a ball game or a half day off to
spend time with their kids) make the most of your formal service awards with some preparation
and a group presentation walk around your department every day and talk to your
people and thank them sincerely and often
73
Make it specific Praise and recognition must be specific to have impact General praise such as
You do great work actually can have the opposite effect and leave your employees wondering
Does he have any idea what I really do around here Specific praise links individual
accomplishments to company goals For example Cheryl I noticed the way you handled that
customer complaint Great work As you know we value quick resolutions of problems as
one of our core strategies
Ask the best to stay Call your best people into your office one at a time Let that bright young
college graduate know you value his fresh ideas and energy Tell the 20-year veteran how much
your team relies on her expertise and organizational skillsRemarkably a significant percent of
high-impact performers report that they left their last job because No one ever asked me to
stay
Forget cash
Remember the saying Money cant buy everything Well its true Dont wait until you can
offer an employee a raise or promotion Real thanks is its own reward In numerous surveys of
work satisfaction top on employees lists is feeling appreciated In fact when employees feel
recognized and involved they are much less likely to keep asking about money
Recognize
Recognition means most to an employee when it is sincere and spontaneous According to the
largest study ever conducted on workplace satisfaction (Gallup 1999) recognition should occur
at least every seven days If you wait until a year-end party or an annual review you are waiting
much too long to recognize and you probably are losing people you do not need to
74
Recognition works
Neglect can be a poisoned apple Recognition is the elixir that will spark better attitudes and
performance Jeffrey Pfeffer of Stanford University says The returns from managing people in
ways that build high commitment typically are on the order of 30 to 50 percent
Take a hard look in the mirror and ask yourself how you can recognize the fairest of them all
Learn to recognize your employees for their efforts thank them often and reward their
achievements You can awaken them from their anger and apathy and they will fall in love with
their jobs again Chances are you will work together happily ever after
So there is direct relation with employee satisfaction and their commitment towards the
organization and it is also clear from the above discussion that only monetary elements are not
sufficient for employee satisfaction rather other element like employer behavior recognisation
and other moral value
75
RECOMMENDATIONS
PHILIPS should increase its capacity utilization It should work at full capacity to
minimize its cost of production With this increase in capacity utilization the total cost
will spread over more units thereby decreasing the per unit cost
PHILIPS should decrease the credit facilities provided to its consumers The payback
period is quite high in case of debtors as compared to creditors it should be more or less
equal as it will help in improving company liquidity
PHILIPS should focus more on the consumer lifestyle goods in India parallel to its other
business as it accounts very less as compare to other businesses of Philips
Another recommendation for Mohali plant is about the HR department that is they
should appoint permanent and skilled workers as against casual workers which generally add
up to the profit of the company
76
BIBLIOGRAPHY
1 Values-Based Leadership Rebuilding Employee Commitment Performance and Productivity ( Thomas D Kuczmarski)
2 Monthly Journals of Philips Electronics India Ltd
3 Authentic Leadership Medtronic CEO Bill George
4 wwwindiaphilipscom
5 wwwwikipediacom
6 httpwwwemployeecommitmentcom
7 One Foot Out The Door How to Combat The Psychological Recession Thatrsquos Alienating Employees And Hurting American Business Judith Bardwick
8 Employee Commitment A Leader Ship Guide Joe Folkman
9 Harvard University Factors that Impact Employee Well Being Commitment and Productivity -An Article
77
Questionnaire
Name __________________________________________________________
Age______________________________ Gender _______________________
Qualification _______________________ Contact No ___________________
Q1 In which department you are working
Electrical Production Mechanical Other
Q2 What is your working experience
gt2 Years 2-4 Years 4-6 Years lt 6 Years
Q3 How You like the physical Working Environment of the organization
Excellent Good Fair Poor Very Poor
Q4 Are you satisfied with Non-Monitory benefits provided by the organisation
Highly Satisfied Satisfied Neither Satisfied Nor dissatisfied
Highly Dissatisfied Dissatisfied
Q5 Are you satisfied with your work
Highly Satisfied Satisfied Neither Satisfied Nor dissatisfied
Highly Dissatisfied Dissatisfied
Q6 Are you satisfied with the career development programe of the company
Highly Satisfied Satisfied Neither Satisfied Nor dissatisfied
Highly Dissatisfied Dissatisfied
Q7 Is other staff of the organization is co-operative with you
Highly Satisfied Satisfied Neither Satisfied Nor dissatisfied
Highly Dissatisfied Dissatisfied
Q8 Are you satisfied with top level management
Highly Satisfied Satisfied Neither Satisfied Nor dissatisfied
Highly Dissatisfied Dissatisfied
78
Q9 Are you satisfied with your subordinates
Highly Satisfied Satisfied Neither Satisfied Nor dissatisfied
Highly Dissatisfied Dissatisfied
Q10 Are you satisfied with the nature of the Job
Highly Satisfied Satisfied Neither Satisfied Nor dissatisfied
Highly Dissatisfied Dissatisfied
Q11 Do you have any Job Pressure in work
Yes No
Q12 Do you satisfied with the opportunities provided by the organisation
Highly Satisfied Satisfied Neither Satisfied Nor dissatisfied
Highly Dissatisfied Dissatisfied
Q13 Are you satisfied with the welfare facilities provided by the organisation
Highly Satisfied Satisfied Neither Satisfied Nor dissatisfied
Highly Dissatisfied Dissatisfied
Q14 Are you satisfied towards your salary
Highly Satisfied Satisfied Neither Satisfied Nor dissatisfied
Highly Dissatisfied Dissatisfied
Q15 Are you committed towards the organisation
Yes No
Signature
7
the country The company has an excellent pan India distribution and after-sales service network
BUSINESSES
Lighting
Philips Electronics India Indiarsquos largest lighting company operates in business areas of Lamps
Luminaires Lighting Electronics Automotive and Special Lighting Today as global leader in
Lighting Philips is driving the switch to energy-efficient solutions With worldwide electrical
lighting using 19 per cent of all electricity the use of energy-efficient lighting will significantly
reduce energy consumption around the world and thereby cut harmful CO2 emissions Philips
India has been consistently working with industry bodies such as ELCOMA Bureau of energy
efficiency and NGOs towards addressing Indiarsquos power crisis through promotion of energy
efficient lighting in India
Philips provides advanced energy-efficient solutions for all segments road lighting office amp
industrial hospitality and home Philips is also a leader in shaping the future with exciting new
lighting applications and technologies such as LED technology which besides energy
efficiency provides attractive benefits and endless new lsquonever-before-possiblersquo lighting
solutions
In 2008 Philips inaugurated a global research and development (RampD) centre for lighting
electronics in India This was its third such unit in the world The facility which is situated in
Noida will not only cater to the needs of the Indian market but also the Asia-Pacific Europe and
North America The other RampD centres are located at Eindhoven in the Netherlands and in
Shanghai China One of the primary research areas for the centre is to develop products that can
8
tackle high voltage fluctuations in India The centre currently employs 35 engineers Around 40
per cent of Philipsrsquo revenue in India comes from the lighting business
Consumer lifestyle
Guided by the brand promise of ldquosense and simplicityrdquo and the consumer insights Philips
Consumer Lifestyle offers rich new consumer experiences that meet consumersrsquo desire for
relaxation and improving their state of mind Philips also responds to the consumers desire for
wellness and pleasure by introducing products that meet the individualrsquos interests in terms of
their mind space body and appearance
The Consumer Lifestyle arm in India operates in the business areas of Home Entertainment
solutions and Personal Infotainment with product categories such as TVs home theatre systems
music systems DVD players personal entertainment solutions sound accessories Domestic
Appliances and Personal care
Philips Innovation Campus (PIC)
Philips Innovation Campus (PIC) Bangalore is a division of Philips Electronics India Limited
which is owned 96 by Royal Philips Electronics NV The Netherlands It was established in
August 1996 with a vision to be an innovation hub creating next generation solutions and
products for Healthcare and Lifestyle With the objective of meeting the growing need for high-
quality cost-effective software development capacity within the organization PICrsquos share has
increased significantly from 8 in 1998 to around 20 in 2008
9
Working at PIC are about 1000 of the industrys finest professionals using state-of-the-art
software engineering paradigms and platforms including real-time systems component-based
software engineering and multi-threaded architecture to drive the creation of tomorrows
products and services PIC is an ISO 9001Tick IT SEI CMM SM level 5 company amp has
emerged as a critical partner in the development of strategic amp futuristic technologies for Philips
worldwide 60000 registered patents illustrate the innovative nature of the company Philips has
adopted an Open Innovation strategy which leverages the joint innovative power of partnering
companies and researchers to bring more innovations to the market effectively and faster PIC
has built-up extensive know-how and expertise in the software engineering and technology
domains relevant to its business In addition competencies in the areas of project management
requirement engineering and quality assurance have been established to offer customers products
and services of the highest quality at the fastest time-to-market and the lowest cost of
ownership
RESEARCH AND DEVELOPMENT
Since its foundation 100 years ago Philips Research has been at the forefront of fundamental
scientific research But with market focus being more and more important across almost all
corporate RampD organizations is this still the case If some of the pioneering work being done
by scientists across Research is anything to judge by the answer is a resounding ldquoyesrdquo
Itrsquos different at the cutting edge
In todayrsquos market-focused corporate RampD organizations the boundary between fundamental
scientific research and applied research is becoming increasing blurred ndash particularly when it
comes to some of the most exciting areas of research ldquoHere at Philips our way of working is
very dynamicrdquo says Philips Researchrsquos Chief Science Officer Emile Aarts ldquoThis means that you
10
can apply both the lsquofundamentalrsquo and the lsquoappliedrsquo labels to many of the projects that wersquore
working on because they are both very flexible termsrdquo Philips Researchrsquos work on sleep for
instance is an excellent example of this more dynamic approach ldquoThis is a very important area
for Philips ndash but therersquos currently very little fundamental knowledge available Thatrsquos why wersquore
involved in investigating the key issues at a more fundamental level together with our university
and research institute partners The only difference is that we want this research to lead to
marketable products and solutionsrdquo
Open Innovation in new areas
Despite the flexible nature of the ldquofundamentalrdquo and ldquoappliedrdquo labels it is still possible to detect
a decline in some areas of more fundamental research at Philips in recent years ldquoThis has mainly
occurred in fields that donrsquot support the execution of our companyrsquos Health and Well-being
strategyrdquo says Aarts As he explains this refocusing exercise has gone hand-in-hand with an
expansion of more fundamental research activities in a number of new fields such as deep-brain
stimulation and multi-modal imaging for healthcare applications ldquoIn these fields wersquore
considered to be an extremely important research partner ndash especially by colleagues working in
universitiesrdquo In the future Philips Research will continue to develop its reputation in a number
of exciting fundamental domains ndash ldquogreen lightingrdquo and skincare are just two examples ndash albeit
with a more applied focus ldquoHopefully this research will enable us to build on our strong
heritage of improving the quality of peoplersquos lives
11
BOARD OF DIRECTORS
Non-Executive Director amp Chairman S M Datta
Executive Vice Chairman amp Managing Director Murali Sivaraman
Executive Director Jan-Hein Louwman
Non-Executive Director S Venkatramani
India Management Team
MURALI SIVARAMANN - CEO
ANJAN BOSE - Healthcare
JAN-HEIN LOUWMAN ndash CEO
MAHESH KRISHNAN ndash Consumer lifestyle
RAJEEV CHOPRA ndash lighting
RAKESH SHARMA ndash Strategic Business Development
S NAGARAJAN ndash Human resources
VIVEK SHARMA ndash Chief Marketing Officer
WIDO MENHARDT ndash Philips Innovation Campus
12
Corporate Office-
Philips Electronics India Ltd
Technopolis Knowledge Park
Mahakali Caves Road
Chakala Andheri (East)Mumbai 400 093
Tel +91 22 66912000
VISION 2012
Through the Vision 2012 strategy we aim to fuel growth by making Philips the leading brand in
Health and Well-being Vision 2012 further positions Philips as a market-driven people-centric
company with a strategy and a structure that fully reflect the needs of its customer base while
also increasing shareholder value This is implemented through sharpened strategies in the three
core sectors Healthcare Lighting and Consumer Lifestyle
ldquoWith Vision 2010 we are putting people right at the center of things with Health and Well-
being as our overarching theme We are thereby putting into practice our mission improving the
quality of life through the introduction of meaningful innovationsrdquo ndash Gerard Kleisterlee
President and CEO of Royal Philips Electronic
Our Ways of Working
1 We are a people-centric company that organizes around customers and markets
2 We invest in a strong brand and consistently deliver on our brand promise of ldquosense and
simplicityrdquo in our actions products and services
13
3 We deliver innovation by investing in world class strengths in end-user insights
technology design and superior supplier networks
4 We develop our peoplersquos leadership talent and engagement and align ourselves with high
performance benchmarks
5 We invest in high growth and profitable businesses and emerging geographies to achieve
market leadership positions
6 We are committed to sustainability and focus on making the difference in efficient energy
use
7 We drive operational excellence and quality to best in class levels allowing us the above
mentioned strategic investments in our businesses
BRAND PROMISE
It is the combination of two unique capabilities that enables us to deliver on our ldquosense and
simplicityrdquo promise These capabilities are firstly by understanding people and secondly
technology integration and product design
We put our end users front and center of product innovations starting with understanding their
needs and aspirations We use best-in-class research facilities and agencies to validate and ensure
that our product innovations are designed around peoplersquos needs and aspirations easy to
experience and advanced
SUSTAINABILITY
14
In 2009 we evaluated our sustainability strategy and resolved to fully leverage sustainability as
an integral part of our overall strategy and an additional driver of growth as reflected in the
Philips Management Agenda 2012
To deliver on our brand promise of ldquosense and simplicityrdquo and at the same time provide the
company direction for the longer term in this area we have identified three sustainability
leadership key performance indicators where we can bring our competencies to bear lsquocarersquo
lsquoenergy efficiencyrsquo and lsquomaterialsrsquo including targets for 2015
Bringing care to more than 500 million people
Target 500 million lives touched by 2015
Improving energy efficiency of Philips products
Target 50 improvement by 2015 (for the average total product portfolio) compared to
2009
Closing the materials loop
Target Double global collection recycling amounts and recycled materials in products
by 2015 compared to 2009
Each sector will take the lead on one of the leadership key performance indicators with
Healthcare leading lsquocarersquo Lighting lsquoenergy efficiencyrsquo and Consumer Lifestyle lsquomaterialsrsquo
In addition we defined a set of complementary performance indicators to accelerate change and
drive performance including the EcoVision4 parameters
With EcoVision4 we have committed to the following by 2012
15
bull Generate 30 of total revenues from Green Products
bull Double investment in Green Innovations to a cumulative EUR 1 billion
bull Improve our operational energy efficiency by 25 and reduce our CO2 emissions by 25 all
compared with the base year 2007
SOCIAL COMMITMENT
Living up to this commitment means we use our capabilities to enhance the lives of our
employees and people in society at large Within the company we encourage teamwork and
collaboration in an environment that enables employees to reach their full potential
Building on our rich heritage of involvement in social issues we have established our own
approach of supporting the communities where we live and work focusing on energy efficiency
and healthcare
Sustainable lighting
There is a pressing need to find innovative lighting solutions for the 16 billion people who live
in areas with no access to the electricity grid or where the grid is unreliable Thatrsquos why we have
developed SMILE (Sustainable Model in Lighting Everywhere)
Launched as a pilot in 2006 in four Indian states SMILE includes two lighting solutions UDAY
a rechargeable portable lantern and KIRAN a hand-cranked LED flashlight Today are
distributed in eighth Indian states
16
SWOT ANALYSIS
Strengths
bull India was a market where the first mover enjoyed advantages over latecomers
bull The first image of the product lasted long in the eyes of the consumer and the first to enter the
market could gain the largest market share
bull PHILIPS is committed to enhance its image to the Chinese market as investors
bull PHILIPS was building a wholly owned manufacturing plant in India to show the
Chinese the commitment Korea had to the Chinese society
bull Labor costs in India were less and would defray the cost of producing high-end
bull Samsung has been making color TVs for many years in Korea before moving to the Chinese
market
Weaknesses
bull PHILIPS must continue to control all costs to maintain success
bull India has a reputation of being a protected market (protectionism)
bull India was a market where the first mover enjoyed advantages over late comers PHILIPS is
trying to overcome the first comer advantage Japan manufacturers have over them by being those
first comers
bull Companies such as Sony and Matsushita had built sales and service networks that were
favorable to their sales programs in India while Samsung would have to catch up in that area
17
bull Samsung is not as experienced in manufacturing high-end TVs for a higher-end market
segment
Opportunities
bull Based on the data that on 28 of the 220 million rural households own a color TV PHILIPS
focus on the domestic India market should be to penetrate the rural household market which
would mean that for those purposes the low-end production of sets in the 13rdquo to 20rdquo range should
be produced to appeal to that segmentrsquos purchasing ability
bull Larger more high-end models can be produced to appeal to an urban customer in India as well
as being an export to the US and European higher end customers
bull With success in the higher-end manufacturing and sales of premium TVs in India PHILIPS can
establish themselves as high-end producers around the world
Threats
bull PHILIPS faces intense competition in the color TV market
bull A premium-priced product wouldnrsquot sell in large volumes so pricing can be a problem
bull Since PHILIPS didnrsquot have an established marketing strategy issues of how to market the
product may arise
bull Loss of profitability because related to over-employment at most facilities
bull Is the per capita income level such that it can support sales of product at any level
bull If PHILIPS fails to be successful in the Chinese market with high-end product it will be known
around the world bull India was a market where the first mover enjoyed advantages over late
comers
bull The first image of the product lasted long in the eyes of the consumer and the first to enter the
18
market could gain the largest market share
bull PHILIPS is committed to enhance its image to the Chinese market as investors
PHILIPS ELECTRONICS MOHALI PLANT
The mohali plant was established in 1985 as PUNJAB ANAND LAMP Ltd as its second
division of lamp industry after the varodra plant at that time it was a joint stock company and
majority of shares was with Punjab Anand Lamp around 75 but in the year 2001 the company
ownership changed and the whole shares was bought by PHILIPS ELECTRONIC INDIA Ltd
and its name was changed to PHILIPS ELECTRONIC INDIA Ltd MOHALI LIGHT
FACTORY
The plant is situated in Industrial focal point PHASE-9 MOHALI near Mohali railway station
and is sreaded in 26 acres Total employees of tis plant is 532 including casual employees This
company is a landmark in the Punjab state as it is the only factory which is most profitable one
than any industry located in Punjab
19
OVERVIEW OF VARIOUS FRONTS OF
PHILIPS ELECTRONICS INDIA Ltd
Manufacturing-
Today the product range of Philips include the following products ndash
Televisions- LCD Plasma Flat Screen Smart Touch XL
Recorders DVD Players I pods and Home Theatre Systems
Audio Products - Audio Systems Remote Controls AudioVideo Accessories
Digital Photo Products and Frames
Portable Audio and Video Systems Accessories like Headphones and Speakers
PC Products - Mouse and Keyboard Multi Media Headsets External Hard Disk Drives
Mobile Phones
Male Shaving and Grooming - Dry Shavers Beard Trimmers
Personal Care - Beauty and Hair Care Products
20
Kitchen Appliances - Blenders and Hand Blenders Juicers and Citruspresses Food
Processors and Mixers Coffee Makers and Kettles Frying and Grilling Appliances
Toasters and Snacking Products
Household Products - Irons Vacuum Cleaners Water Purifiers
Professional Lighting - Industrial Shops and offices Road and Area Hospitality Sports
Lighting City Beautification and Petrol Stations
Automotive Lighting - In Cars Motorcycles and Trucks
Home Lighting
SERVICS
Philips E-waste Management Program in India
Philips has tied up with a recycler for collecting transporting and recycling unwanted broken
down consumer products
At Philips we offer consumers a convenient way of recycling their unwanted obsolete and
damaged Philips products by dropping them off at convenient locations The program
encompasses 8 major cities across India Consumers can approach one of 27 authorized Philips
service centres which will act as collection points for consumer products which need recycling
Our efforts are to expand the network in the near future
Philips ensures that the consumer products received will be recycled in an environment-friendly
manner Philips understand the corporate social responsibility and takes steps towards providing
a safer environment to the future generations We design our products to continuously realize
improvements and reduce their overall life cycle environmental impact Designing products for
21
recycling is an integral part of this approach Our aim is to use our planetrsquos limited resources
effectively and respect the principle of extended producer responsibility This also calls for
manufacturers to engage in developing solutions for effective and efficient recycling of their
products We will continue to promote and invest into improved recycling systems to reduce the
impact of electronic waste on the environment
MANUFACTURING AT MOHALI PLANT ndash
Mohali plant mainly manufactures lighting products basically of domestic usage this includes the
following products ndash
CFL bulbs ndash
1 Genie - 5 watt 8 watt 11 watt
2 Essential ndash 8 watt 11 watt 14 watt 18 watt 23 watt 29 watt
3 Tornado ndash 5 watt 8 watt 11 watt 14 watt 18 watt 23watt 29 watt
4 T5 slim tube 28 watt
Coil plant ndash Philips Electronics India is the only company that produces coils in the whole
lighting industries in the world and in India only at the MOHALI PLANT
22
Chapter-II
OBJECTIVES OF THE STUDY
23
OBJECTIVES OF THE STUDY
To study the various aspects of Satisfaction Level of the Employees working at Philips
Electronics India Ltd Mohali
To analyze the effect of Job satisfaction on the organisation
To determine the relation between job satisfaction of employees and their commitment
towards the organisation
To analyze the performance model adopted by the Philips Electronics India Ltd Mohali
to handle their manpower
To suggest remedial measures for the improvement of the companyrsquos performance
24
Chapter-III
Employees Commitment
25
Employees who are engaged in their work and committed to their organizations give companies
crucial competitive advantagesmdashincluding higher productivity and lower employee turnover
Thus it is not surprising that organizations of all sizes and types have invested substantially in
policies and practices that foster engagement and commitment in their workforces
But what are employee engagement and commitment exactly This report examines the ways in
which employers and corporate consultants define these terms today and offers ideas for
strengthening employee engagement Though different organizations define engagement
differently some common themes emerge These themes include employeesrsquo satisfaction with
their work and pride in their employer the extent to which people enjoy and believe in what they
do for work and the perception that their employer values what they bring to the table The
greater an employeersquos engagement the more likely he or she is to ldquogo the extra milerdquo and deliver
excellent on-the-job performance In addition engaged employees may be more likely to commit
to staying with their current organization Software giant Intuit2 for example found that highly
engaged employees are 13 times more likely to be high performers than less engaged
employees They are also five times less likely to voluntarily leave the company
Clearly engagement and commitment can potentially translate into valuable business results for
an organization To help you reap the benefits of an engaged committed workforce at your
organization this report provides guidelines for understanding and measuring employee
engagement and for designing and implementing effective engagement initiatives As you will
26
see everyday human resource practices such as recruitment training performance management
and workforce surveys can provide powerful levers for enhancing engagement
Employee Engagement Key Ingredients
ldquoEmployee Engagement Definedrdquo shows examples of engagement definitions used by various
corporations and consultancies Clearly definitions of employee engagement vary greatly across
organizations Many managers wonder how such an elusive concept can be quantified The term
does encompass several ingredients for which researchers have developed measurement
techniques These ingredients include the degree to which employees fully occupy themselves in
their work as well as the strength of their commitment to the employer and role Fortunately
there is much research on these elements of engagementmdashwork that has deep roots in individual
and group psychology
Definition
ldquoNo company small or large can win over the long run without energized employees who
believe in the [firms] mission and understand how to achieve it Thats why you need to take the
measure of employee engagement at least once a year through anonymous surveys in which
people feel completely safe to speak their mindsrdquo
-Jack and Suzy Welch-
Common Themes How Companies Measure Engagement
Employers typically assess their employeesrsquo engagement levels with company-wide attitude
or opinion surveys
27
1048657 Pride in employer
1048657 Satisfaction with employer
1048657 Job satisfaction
1048657 Opportunity to perform well at challenging work
1048657 Recognition and positive feedback for onersquos contributions
1048657 Personal support from onersquos supervisor
1048657 Effort above and beyond the minimum
1048657 Understanding the link between onersquos job and the organizationrsquos mission
1048657 Prospects for future growth with onersquos employer
1048657 Intention to stay with onersquos employer
The Link Between Employer Practices and Employee Engagement
How does an engaged workforce generate valuable business results for an organization The
process starts with employer practices such as job and task design recruitment selection
training compensation performance management and career development Such practices affect
employeesrsquo level of engagement as well as job performance Performance and engagement then
interact to produce business results Figure 1 depicts these relationships
28
EMPLOYEE COMMITMENT EMPLOYEE ENGAGEMENT
1048657 How do you and other managers in your
organization define commitment
1048657 Are some employees in your company
engaged in their work but not committed to
the organization Committed to staying with
your firm but not exactly engaged in their
work Both engaged and committed
1048657 To whom are your organizations employees
committed The company Their supervisor
Co-workers Team members Customers
1048657 What business results has commitment from
1048657 How do you and other managers in your
organization define employee engagement
1048657 How do you know that certain employees in
your company are engaged Do they relish
their jobs Enjoy specific responsibilities or
tasks Willingly ldquogo the extra milerdquo
1048657 In teams departments or business units in
your company that have a large number of
engaged employees what business results
are you seeing Higher productivity Lower
costs Greater revenues More efficiency
29
employees created for your organization For
example has commitment reduced turnover
and therefore decreased recruitment hiring
and training costs
1048657 What does your company do to reciprocate
employees commitment Is the organization
living up to its side of the bargain
Lower turnover Higher product or service
quality
1048657 Conversely how do disengaged employees
behave and what are the consequent costs
for their teams units-and your entire
company
As Figure 2 suggests a person possesses attributes such as knowledge skills abilities
temperament attitudes and personality He or she uses these attributes to accomplish work
behaviors according to organization-defined procedures by applying tools equipment andor
technology Work behaviors in turn create the products and services that make an organization
successful We classify work behaviors into three categories those required to accomplish duties
and tasks specified in a job description (prescribed behaviors) ldquoextrardquo behaviors that an
employee contributes for the good of the organization (voluntary behaviors) and behaviors
prohibited by an employer (proscribed behaviors including unexcused absenteeism stealing and
other counterproductive or illegal actions) Of course job performance occurs in an
organizational context which includes elements such as leadership physical setting and social
setting
30
Employers naturally want to encourage workers to perform prescribed and voluntary activities
while avoiding proscribed ones To achieve these goals organizations use a number of HR
practices that directly affect the person process and context components of job performance
Employeesrsquo reactions to these practices determine their levels of engagement and commitment
31
Chapter-IV
32
LITERATURE OF THE REVIEW
ldquo Job Satisfaction That Leads To The Commitment Of
The Employees in The Organisationrdquo
Literature of Review
Gerge Bill Authentic Leadership
In his book Authentic Leadership former Medtronic CEO Bill George makes an obvious
point that business leaders rarely say out loud ldquoMissions motivate dollars donrsquotrdquo
What he means is that purpose is what drives employee commitment not the financial
rewards that come to others Workers donrsquot get up in the morning and say ldquoGee I can
33
hardly wait to get to work today to maximize shareholder profitsrdquo Even when employees
are shareholders who can benefit from improved financials what draws people to their
chosen careers is the work itself and its purpose in the world more than the profit
possibilities
Mr George goes on to say ldquoI find there is universal agreement (among middle managers)
that you cannot inspire employees by urging them to help management get the companyrsquos
stock price uprdquo
There is in fact quite a bit of literature on this subject In Awakening Corporate Soul
authors Eric Klein and John Izzo say that employee commitment requires knowing ldquothe
purpose of our work it means recognizing the purpose our organization fulfills that goes
beyond the bottom line and it means articulating to others how their (workersrsquo) efforts
contribute to a larger purposerdquo
In Built to Last Jim Collins and James Porras spend an entire book explaining their five
year research study of major companies that led to this conclusion about employee
commitment Purpose within a company is what sustains it profit is important but when
itrsquos the prime directive companies falter
-Marshal Goldsmith-
How to Increase Employee Commitment
In practice this involves walking the talk being transparent communicating effectively treating
people equally teaching leading subordinates to increasingly excellent performance ndash and
responding to subordinates as mature individuals who are owed fairness the truth and
recognition of their achievements
34
Since managers interact directly and frequently with subordinates they are usually more tuned
in to how employees are feeling than are executives Managers are in a better position to know
for example when employees are feeling alienated and disengaged from their work which is
very common today -- and expensive
Gaining employee commitment results in greater profits because enthusiastic employees stay
contribute discretionary effort and engage customers Performance soars when customers are
enthused and stay and when executives managers and employees are a collaborative team
united in achieving common goals
But managers are often called middle managers for good reason their job is to motivate and
guide subordinates while they at the same time are being judged by their bosses Because of
their ldquotweenrdquo position in the hierarchy managers to effective support direct reports must also
create relationships with potential allies especially those with greater power who have access to
top decision makers
Harvard University Factors that Impact Employee Well Being Commitment and
Productivity
Business executives from the C-suite and HR to QC and RampD are by nature focused on the
corporate bottom line A new trend in our dawning age of social sustainability is that many
experts believe more attention should be paid to the dotted line - the one signed when a person
35
commits to employment at a company New Harvard research validates this approach affirming
that trust and purpose play a significant role in building successful productive workplaces
The behavioral research conducted by a team at Harvard University and Massachusetts General
Hospital identifies the factors most likely to impact 21st century employee well being
commitment and productivity The researchers found that commitment is largely influenced by
ones sense of purpose feeling of personal impact and overall trust in the organization
Productivity is largely affected by the quality of human relationships including cooperative
social group moods and interaction
The results lead us to conclude that workplaces that provide positive environments that foster
interpersonal trust and quality personal relationships create the most committed and productive
employees says Nancy Etcoff PhD the lead researcher on the study
Expert Shares Keys to Building Successful Workplace Relationships
According to business strategist Courtney Anderson JD MBA Outstanding leadership
today means much more than just doing your job Success is creating an environment that fosters
happy committed productive team members
Anderson explains that reinvigorating workplaces by enhancing trust and employee commitment
does not have to be difficult The biggest challenge she says is making the time to truly change
in our overscheduled instant access competitive work environments With a little know-how it
can be easy to evolve workplace well being and respond to these compelling research results
-Mark Howell-
CEO Bright Point
High-performing companies recognize that employee commitment is a major contributing factor
toward sustaining long-term success and creating value An engaged employee is involved and
excited about their work and acts in a manner that will forward the organizationrsquos interest An
36
engaged workforce helps optimize and retain talent for the long-term because the employees
choose to stay even when other employment alternatives exist
According to Walker Information the top three drivers of employee commitment are
Satisfaction Fairness and Care amp Concern for employees Put simply committed employees
want to enjoy their work feel they are appreciated and know they are making a contribution to
their companyrsquos strategic objectives Additionally employees who have trust in their leadership
and are trusted by their leadership have a greater dedication and are ultimately more productive
on the job However according to recent data provided by the National Business Research
Institute (NBRI) only 31 of all employees are truly engaged
At BrightPoint we take employee engagement seriously and we work to create a culture that
inspires employee loyalty and satisfaction The results of BrightPointrsquos commitment to its
employees are shown in the 2011 BPNA Employee Commitment Survey The survey
determined that close to 80 of respondents indicated they were satisfied with their jobs and
daily activities General employee satisfaction increases when managers take an active interest
in their employees beyond their day-to-day job responsibilities According to NBRI managers
that actively coach build relationships and keep an open dialogue with their employees improve
employee engagement
We have a diverse workforce where each employee brings unique value and has individual
needs Managers are learning to manage the individual and not the position In order to give
managers the tools they need to be successful BrightPoint places strong emphasis on targeted
leadership training workshops and continual learning resources In 2011 906 of managers at
BrightPoint NA participated in the development opportunities offered and also made an effort to
37
help reinforce the learning of their team members This signals that our leadership team is taking
an active interest in professional development and its connection to employee commitment
As BrightPoint continues to increase focus on employee engagement the organization will grow
stronger and maintain a substantial advantage over our competition Our employees possess the
knowledge experience and resiliency to respond quickly to the demands of the marketplace and
through their genuine commitment will deliver what our customers want with increasing
efficiency and effectiveness Our responsibility is value-creation by growing our business and
maintaining high levels of customer service and loyalty We believe the best way to accomplish
this is through a strong committed and engaged workforce
Performance Model Adopted At Mohali Plant
38
Process adopted by Philips Electronics Mohali Plant for Job Satisfaction of Employee that leads commitment of the employees
39
Recruiting
The messages in Philips Electronics Mohali organization conveys while seeking to attract job
applicants also can influence future employeesrsquo engagement and commitment If your firm has
designed jobs specifically to engage employees then organization want to ensure that recruiting
ads extol these positionsrsquo attractive featuresmdashsuch as challenging work assignments a highly
skilled team environment or minimal supervision Applicants who notice and respond to these
ads will more likely be motivated by these features Also consider how organization might best
seek candidates from inside your organization When Organisation recruit existing employees for
desirable jobs you enhance their engagement (by maximizing the person-job fit) and
commitment (by providing growth and advancement opportunities to employees in return for
their loyalty) If Organisation recruit from outside when qualified internal candidates are
available Organization may unwittingly suggest to current employees that your company is not
willing to reciprocate their commitment Existing staff may then begin questioning their own
commitment to the firm By contrast organisation recruit external candidates to both the job and
your organization For these candidates ensure that recruiting messages highlight attractive job
features organizational values and commitment reciprocity That is in return for performance
and dedication your company offers competitive pay and benefits flexible work hours and
learning and career advancement opportunities Also remember that prospective employees have
multiple commitments You will inevitably have to compete with those commitments as
organization try to attract candidates to your firm Most people find it easier to make a new
commitment when it is compatible with their other obligations For example you boost your
chances of recruiting a highly qualified candidate who is a single parent if you offer flexible
work hours family health benefits and on-site day care ldquoRecruiting for Engagement and
Commitmentrdquo
40
Employee Selection
Once recruiting efforts produce a pool of promising job candidates Philips select among them to
fill available positions When organisation select the right individuals for the right jobs new
hires carry out their work more smoothly and experience fewer performance problems The
result Greater enjoyment ofmdashand engagement inmdashthe job
To enhance engagement through your selection of employees identify those candidates who are
best-suited to the job and your organizationrsquos culture Also use candidate assessment methods
that have obvious relevance to the job in questionmdashfor example by asking interviewees what
they know about the role and having them provide work samples Most candidates will view
these techniques more positively than tests with less apparent relevance such as personality and
integrity assessments Successful candidates feel good about having ldquopassed the test and see
company as careful and capable for having selected them A positive initial impression of an
employer encourages growth of long-term commitment
Training and Development
Training and development can serve as additional levers for enhancing engagement and
commitment For new hires training usually begins with orientation Orientation presents several
important opportunitiesmdashincluding explaining pay work schedules and company policies Most
important it gives you a chance to encourage employee engagement by explaining how the new
hirersquos job contributes to the organizationrsquos mission Through orientation Mohali Plant of Philips
Electronics describe how r company is organized introduce the new employee to his or her co-
workers give the person a tour of the area where he or she will be working and explain safety
regulations and other procedural matters In short you foster person-organization fitmdashvital for
developing productive and dedicated employees Through training you help new and current
41
employees acquire the knowledge and skills they need to perform their jobs And employees who
enhance their skills through training are more likely to engage fully in their work because they
derive satisfaction from mastering new tasks Training also enhances employeesrsquo value to your
company as well as their own employability in the job market In addition most companies offer
higher wages for skilled workers to compensate them for their greater value and to discourage
turnover
Compensation
Like the HR practices discussed above compensation can powerfully influence employee
engagement and commitment Some compensation components encourage commitment to
employers while others motivate engagement in the job It is possible to stimulate one and not
the other though itrsquos generally better to foster both For example a company that offers a strong
performance incentive system but no retirement plan will probably realize exceptional
engagement from its workers however they may eventually commit themselves to another
company that does offer a good retirement plan Meanwhile an organization that offers generous
retirement benefits but a traditional seniority-based pay grade system may have committed
employees however these workers might deliver pedestrian performance as they bide their time
until retirement In designing compensation plans you therefore need to consider employee
engagement and commitment strategically
Encourage managers to include employees in the goal-setting process This technique helps to
ensure that workers understand the goals It also promotes acceptance of challenging objectives
because people generally feel more committed to goals they have helped define In addition
consider how you and other managers will recognize and encourage contributions that exceed
expectations For example when a piece of equipment malfunctions Joe finds other ways to
maintain production rather than merely shutting down the machine and waiting for the
42
maintenance staff to fix it Or when a less experienced co-worker encounters a new task Sally
offers friendly coaching instead of standing by and waiting for the inevitable mistakes to crop
up Performance management processes operate on a continuous basis Therefore they provide
perhaps the best ongoing opportunities for employers to foster employee engagement and
commitment For example managers can use routine discussions about performance and
feedback sessions to learn which aspects of the job hold the most interest for each employee and
which tasks are most challenging During such discussions managers also can define what going
above and beyond the call of dutyrdquo looks like and generate ideas for rewarding such
contributions An employeersquos aspirations and career goals can receive careful attention during
performance appraisal meetings Without inquiring into an employeersquos personal life a supervisor
can nevertheless explore ways to enhance the compatibility between the workerrsquos commitment to
your organization and the employeersquos other life commitments Through such means the
organization personalizes its relationship to each employee and provides support while also
expressing appreciation for their contributionsmdash key drivers of engagement and commitment
To further engage employees and win their commitment through your performance management
programs consider how to treat your organizationrsquos most experienced employees In many cases
these employees understand the intricacies of a job better than their supervisors or managers do
By virtue of long identification with your organization they may be deeply committed to high-
level goals They use their expertise to contribute in ways that newer employees simply cannot
match But many of them also may be planning to retire soon especially if they are from the
ldquoBaby Boomerrdquo generation How will you transfer their knowledge to younger workers Design
a performance management system that recognizes and rewards proactive sharing of knowledge
and expertise among co-workers For example create knowledge repositories or learning
histories that can be stored in databases that employees can access and then create incentives
43
for people who contribute to and use these repositories Of course effective performance
management systems also identify employees who are not meeting expectations Failing to
address problem performance can erode other employeesrsquo engagement and commitment as their
workloads increase and they conclude that the company is willing to tolerate poor performance
If feedback coaching and remedial training are of little avail the manager may need to move the
person to a different position within the company where he or she can make a more valuable
contribution or let the individual go if there is no good match elsewhere in the organization
44
Chapter-V
RESEARCH METHODOLOGY
The basic task of research is to generate accurate information for use in decision-making
Research can be defined as the systematic and objective process of gathering recording and
analyzing data for aid in making business decisions As the project involves analyzing of
45
financial structure the research is exploratory in nature covering financial parameters and come
of the important ratios to carry out research There are basically two techniques adopted for
obtaining information
Primary Data
Secondary Data
Primary Data is gathered specifically for the project at hand through personal interviews with
the accounts officers
Sample Size = 100 Employees
Secondary data is previously collected and assembled for some project other than the one at
hand It is gathered and recorded by someone else prior to current needs of the researcher It is
less expensive than the primary date
Secondary Data can be obtained from both external and internal sources
External data may be collected from books and periodicals government sources media and other
commercial sources
Internal data is that secondary data which is created recorded or generated by the organization
As the project is explanatory in nature secondary data is collected from the reports of the
company books journals and interest Secondary data is gathered from annual reports official
records and standing orders of the units
CHAPTER - VI
DATA ANALYSIS AND INTERPRETATION
46
The data after collection is to be processed and analyzed in accordance with the outline
and down for the purpose at the time of developing research plan
Technically speaking processing implies editing coding classification and tabulation of
collected data so that they are amenable to analysis The term analysis refers to the computation
of certain measures along with searching for pattern groups Thus in the process of analysis
relationship or difference should be subjected to statistical tests of significance to determine with
what validity data can be said to indicate any conclusions
The analysis of data in a general way involves a number of closely related operations
which are performed with the purpose of summarizing the collected data and organizing them in
such a manner that they answer the research questions In this study the researcher followed
above process carefully and it is presented in this chapter
47
Table 41 ndash To know the department in which employees are belongs to
S
ou rc
e
survey data
Inference
From the above table it shows that 35 of employees are belongs to
production department
FIGURE 41
S
SI No
D
Department
N
No of Respondents
P
Percentage
1
1
M
Mechanical
3
30
3
30
2
2
E
Electrical
2
25
2
25
3
3
P
Production
3
35
3
35
4
4
O
Others
1
10
1
10
T
Total
1
100
1
100
48
REPRESENTS THE DEPARTMENT
Table 42 ndash To know working experience of the employees
Source survey data
Inference
From the above table it shows that 34 of the employees have 4 ndash 6
years experience
S
SI No
W
Work Experience
N
No of Respondents
P
Percentage
1
1
B
Below 2 years
1
33
1
13
2
2
2
2ndash 4 years
3
30
3
30
3
3
4
4ndash 6 years
3
34
3
34
4
4
A
Above 6 years
2
23
2
23
T
otal
1
100
1
100
49
FIGURE 42
REPRESENTS THE EXPERIENCE OF THE EMPLOYEES
Table 43 ndash To know the physical working environment
S
SI No
W
Working Environment
N
No of Respondents
P
Percentage
1
1
E
Excellent
1
12
1
12
2
2
G
Good
5
57
5
57
3
3
F
Fair
2
28
2
28
4
4
P
Poor
0
03
0
33
5
5
V
Very Poor
0
00
0
00
T
Total
1
100
1
100
Source survey data
Inference
From the above table it shows that 57 of the employees were feeling good about the working environment
50
FIGURE 43
REPRESENTS THE PHYSICAL WOKING ENVIRONMENT
51
Table 44 ndash To know the satisfaction level of employees towards the non-monitory benefits
S
SI No
N
Non-Monitory Benefits offered
to Employees
N
No of Respondents
P
Percentage
1
1
H
Highly Satisfied
1
14
1
14
2
2
S
Satisfied
5
54
5
54
3
3
N
Neither Satisfied nor Dissatisfied
2
25
2
25
4
4
D
Dissatisfied
0
05
0
05
5
5
H
Highly Dissatisfied
0
02
0
02
Total 1
100
1
100
Source survey data
Inference
From the above table it shows that 54 of the employees were satisfied towards the non-monitory benefits
FIGURE 44
REPRESENTS THE SATISFACTION LEVEL OF EMPLOYEES TOWARDS THE NON-MONITORY BENEFITS
52
Table 45 ndash To know the satisfaction level of respondents towards the work
assigned
Source survey dataInference
From the above table it shows that 45 of the respondents were satisfied towards the work assigned
FIGURE 45
S
SI No
A
Amount of Work
N
No of Respondents
P
Percentage
1
1
H
Highly satisfied
2
20
2
20
2
2
S
Satisfied
4
45
4
45
3
3
N
Neither Satisfied nor Dissatisfied
1
12
1
12
4
4
D
Dissatisfied
1
18
1
18
5
5
H
Highly Dissatisfied
0
06
0
06
Total 1
100
1
100
53
REPRESENTS THE SATISFACTION LEVEL OF RESPONDENTS TOWARDS THE WORK ASSIGNED
54
Table 46 ndash Opinion about the career development programme in their organisation
S
SI No
C
Career Development
N
No of Respondents
P
Percentage
H
Highly satisfied
1
12
1
12
S
Satisfied
5
56
5
56
N
Neither Satisfied nor Dissatisfied
2
22
2
22
D
Dissatisfied
1
10
1
10
H
Highly Dissatisfied
0
00
0
00
Total 1
100
1
100
Source survey data
Inference
From the above table it shows that 56 of the employees were satisfied
with the opinion about the carrier development programme in their organisation
FIGURE 46
REPRESENTS OPINION ABOUT THE CAREER DEVELOPMENT
PROGRAMME IN THEIR ORGANISATION
55
Table 47 ndash To know the cooperation of co-workers
S
SI No
C
Co-operation of Workers
N
No of Respondents
P
Percentage
1
1
H
Highly satisfied
2
20
2
20
2
2
S
Satisfied
6
66
6
66
3
3
N
Neither Satisfied nor Dissatisfied
1
11
1
11
4
4
D
Dissatisfied
0
03
0
03
5
5
H
Highly Dissatisfied
0
00
0
00
Total 1
100
1
100
Source survey data
Inference
From the above table it shows that 66 of the employees were satisfied
with the cooperation of co-workers
FIGURE 47
56
REPRESENTS THE COOPERATION OF CO-WORKERS
57
Table 48 ndash To know the satisfaction of Respondents with top management
S
SI No
S
Satisfaction with Top
Management
N
No of Respondents
P
Percentage
1
1
H
Highly satisfied
2
26
2
26
2
2
S
Satisfied
5
51
5
51
3
3
N
Neither Satisfied nor Dissatisfied
1
17
1
17
4
4
D
Dissatisfied
0
06
0
06
5
5
H
Highly dissatisfied
0
00
0
00
Total 1
100
1
100
Source survey data
Inference
From the above table it shows that 51 of the employees were satisfied with the top management
FIGURE 48
58
REPRESENTS THE SATISFACTION OF RESPONDENTS WITH TOP MANAGEMENT
Table 49 ndash To know the satisfaction of Respondents with their subordinates
Source survey data
Inference
From the above table it shows that 67 of the employees were satisfied with their subordinates
S
SI
No
S
Satisfaction with Subordinates
N
No of Respondents
P
Percentage
1
1
H
Highly satisfied
1
12
1
12
2
2
S
Satisfied
6
67
6
67
2
3
N
Neither Satisfied nor Dissatisfied
1
14
1
14
4
D
Dissatisfied
0
07
0
07
5
5
H
Highly Dissatisfied
0
00
0
00
Total 1
100
1
100
59
FIGURE 49
REPRESENTS THE SATISFACTION OF RESPONDENTS WITH THEIR SUBORDINATES
60
Table 410 ndash To know the level of satisfaction regarding nature of job
S
SI No
J
Job Satisfaction
N
No of Respondents
P
Percentage
1
1
H
Highly satisfied
2
22
2
22
2
2
S
Satisfied
5
56
5
56
3
3
N
Neither Satisfied nor Dissatisfied
1
16
1
16
4
4
D
Dissatisfied
0
07
0
07
5
5
H
Highly Dissatisfied
0
00
0
00
Total 1
100
1
100
Source survey dataInference
From the above table it shows that 56 of the employees were satisfied with their job
FIGURE 410
61
REPRESENTS THE LEVEL OF SATISFACTION REGARDING THE NATURE OF JOB
Table 411 ndash To know whether there is any job pressure in their work
Source survey data
Inference
From the above table it shows that 72 of employees said there is job pressure in their work
FIGURE 411
REPRESENTS WHETHER THERE IS ANY JOB PRESSURE IN THEIR WORK
S
SI No
J
Job Pressure
N
No of Respondents
P
Percentage
1
1
Y
Yes
7
72
7
72
2
2
N
No
2
28
2
28
T
Total
1
100
1
100
62
Table 412 ndash To know the opinion regarding opportunity provided by the organisation in developing skills
amp talents
S
SI No
D
Development of Skills and
Talents
N
No of Respondents
P
Percentage
1
1
H
Highly Agree
1
12
1
12
2
2
A
Agree
5
52
5
52
3
3
N
Neither Agree nor Disagree
2
28
2
28
4
4
D
Disagree
0
06
0
06
5
5
H
Highly Disagree
0
02
0
02
Total 1
100
1
100
Source survey data
Inference
From the above table it shows that 52 of employees agreed regarding opportunity provided by the organisation in developing skills amp talents
63
FIRGURE 412
REPRESENTS THE OPPORTUNITY PROVIDED BY THE ORGANISATION IN DEVELOPING SKILLS amp TALENTS
64
Table 413 ndash To know the satisfaction level of welfare facilities provided by the management
S
SI No
W
Welfare Facilities
N
No of Respondents
P
Percentage
1
1
H
Highly satisfied
0
09
9
09
2
2
S
Satisfied
5
57
5
57
3
3
N
Neither Satisfied nor Dissatisfied
2
29
2
29
4
4
D
Dissatisfied
5
05
0
05
5
5
H
Highly Dissatisfied
0
00
0
00
Total 1
100
1
100
Source survey data
Inference
From the above table it shows that 57 of the employees were satisfied with the welfare facilities provided by the management
FIGURE 413
REPRESENTS THE SATISFACTION LEVEL OF WELFARE FACILITIES PROVIDED BY THE MANGEMENT
65
Table 414 ndash To know the employee satisfaction towards the salary
Source survey data
Inference
From the above table it shows that 67 of the employees were satisfied
with their salary
FIGURE 414
REPRESENTS THE SATISFACTION TOWARDS THE SALARY
S
SI No
P
Payment Satisfaction
N
No of Respondents
P
Percentage
1
1
Y
Yes
6
67
6
67
2
2
N
No
3
33
3
33
T
otal
1
100
1
100
66
Table 415 ndash To know the employees willingness amp Commitment Towards
Organisation
Source survey data
Inference
From the above table it shows that 59 of the employees were willing to
continue in this organisation
FIGURE 415
REPRESENTS THE EMPLOYEES WILLINGNESS TO CONTINUE
S
SI No
W
Willingness to Work
N
No of Respondents
P
Percentage
1
1
Y
Yes
5
59
5
59
2
2
N
No
4
41
4
41
T
Total
1
00
1
00
67
CHI-SQUARE METHOD
The chi square test is one of the simplest and most widely used non-
parametric tests in statistical work As a non-parametric test it can be used to determine
if categorical data shows dependency or the two classifications are independent It can
also be used to make comparisons between theoretical population and actual data
when categories are used
n
Chi square χsup2= sum (O-E) sup2 E
i =1
Where O= observed frequency
E= expected frequency
68
OBSERVED FREQUENCY
Table 419 shows the relationship between the department and the job satisfaction
Over All
Job
SatisfactionHighly
SatisfiedSatisfied
Neither
Satisfied nor
Dissatisfied
DissatisfiedHighly
Dissatisfied
Sub
Total
Mechanical 5 6 14 3 2 30
Electrical 6 8 6 3 2 25
Production 9 13 7 4 2 35
Others 2 3 2 2 1 10
Sub Total 22 30 29 12 7 100
69
EXPECTED FREQUENCY
Over All
Job
SatisfactionHighly
SatisfiedSatisfied
Neither
Satisfied nor
Dissatisfied
DissatisfiedHighly
Dissatisfied
Sub
Total
Mechanical 7 8 9 4 2 30
Electrical 5 8 7 3 2 25
Production 8 11 10 4 2 35
Others 2 3 3 1 1 10
Sub Total 22 30 29 12 7 100
Null Hypothesis (Ho)
There is no significant difference between the department and the job satisfaction
Alternative Hypothesis (Ho)
There is significant difference between the job satisfaction
Co Relation
70
Chapter-V
CONCLUSIONS AND
RECOMMENDATIONS
71
CONCLUSION
On the basis of Analysis of Job Satisfaction Level of the Employees of Philips Electronics India
Ltd Mohali made in the previous chapters following conclusions are drawn
General Profile The plant of PHILIPS is ideally located in the Mohali Industrial focal point
Phase 9 near Chandigarh the capital of Punjab on a campus of 17 hectares The working
environment of the company is very healthy The visitors feel happy after the campus
Indigenous Technology PHILIPS is the only lighting manufacturing company based on purely
indigenous technology Philips was appropriately chosen as the brand name as self reliance and
building up of Indian Engineering capabilities remain the guiding spirit of PHILIPS
Financial structure PHILIPS is a low debt company signifying its dependence mainly on
its internal accruals for its financial requirements PHILIPS continues to strengthen its financial
position by channelising these internal accruals to fund its expansion programmes
Working results PTL has registered a handsome and constant growth in its profits because
of a brisk demand for new and better technology electronic items None of the other electronic
company has shown such a steady growth Philips has recorded the lowest current ratio
However with this lowest current ratio PTL still enjoys moderate payment period and highest
velocity of creditors and debtors only due to commitment of itrsquos employees
72
SUMMARY
According to the 1999 Gallup Poll the four elements that have proven to be effective in creating
employee loyalty are praise and recognition a sense of contribution to the company learning and
development and having a best friend at work
Creating a fairy-tale work environment begins withrecognition Your employees need it more
than money perks or titles Here are eight tips regarding recognition Remember these and your
employees may just start whistling while they work It is up to me The corporate culture or
financial rewards will not make your team successful It is up to you Recognition is one thing
that is completely in your control
Strong relationships are vital in todays economy Strengthening employee relationships is even
more necessary as companies downsize and lay off As your workforce shrinks and you need to
do more with less keeping quality employees becomes even more critical As a manager it is
your job to bond your best people to your company through recognition And you also must help
direct and motivate your core performers
Simple rewards earn big returns There are some relatively simple things you can do that will
earn big returns For example remember your employees birthdays and work anniversaries find
out what inexpensive rewards they value (for example tickets to a ball game or a half day off to
spend time with their kids) make the most of your formal service awards with some preparation
and a group presentation walk around your department every day and talk to your
people and thank them sincerely and often
73
Make it specific Praise and recognition must be specific to have impact General praise such as
You do great work actually can have the opposite effect and leave your employees wondering
Does he have any idea what I really do around here Specific praise links individual
accomplishments to company goals For example Cheryl I noticed the way you handled that
customer complaint Great work As you know we value quick resolutions of problems as
one of our core strategies
Ask the best to stay Call your best people into your office one at a time Let that bright young
college graduate know you value his fresh ideas and energy Tell the 20-year veteran how much
your team relies on her expertise and organizational skillsRemarkably a significant percent of
high-impact performers report that they left their last job because No one ever asked me to
stay
Forget cash
Remember the saying Money cant buy everything Well its true Dont wait until you can
offer an employee a raise or promotion Real thanks is its own reward In numerous surveys of
work satisfaction top on employees lists is feeling appreciated In fact when employees feel
recognized and involved they are much less likely to keep asking about money
Recognize
Recognition means most to an employee when it is sincere and spontaneous According to the
largest study ever conducted on workplace satisfaction (Gallup 1999) recognition should occur
at least every seven days If you wait until a year-end party or an annual review you are waiting
much too long to recognize and you probably are losing people you do not need to
74
Recognition works
Neglect can be a poisoned apple Recognition is the elixir that will spark better attitudes and
performance Jeffrey Pfeffer of Stanford University says The returns from managing people in
ways that build high commitment typically are on the order of 30 to 50 percent
Take a hard look in the mirror and ask yourself how you can recognize the fairest of them all
Learn to recognize your employees for their efforts thank them often and reward their
achievements You can awaken them from their anger and apathy and they will fall in love with
their jobs again Chances are you will work together happily ever after
So there is direct relation with employee satisfaction and their commitment towards the
organization and it is also clear from the above discussion that only monetary elements are not
sufficient for employee satisfaction rather other element like employer behavior recognisation
and other moral value
75
RECOMMENDATIONS
PHILIPS should increase its capacity utilization It should work at full capacity to
minimize its cost of production With this increase in capacity utilization the total cost
will spread over more units thereby decreasing the per unit cost
PHILIPS should decrease the credit facilities provided to its consumers The payback
period is quite high in case of debtors as compared to creditors it should be more or less
equal as it will help in improving company liquidity
PHILIPS should focus more on the consumer lifestyle goods in India parallel to its other
business as it accounts very less as compare to other businesses of Philips
Another recommendation for Mohali plant is about the HR department that is they
should appoint permanent and skilled workers as against casual workers which generally add
up to the profit of the company
76
BIBLIOGRAPHY
1 Values-Based Leadership Rebuilding Employee Commitment Performance and Productivity ( Thomas D Kuczmarski)
2 Monthly Journals of Philips Electronics India Ltd
3 Authentic Leadership Medtronic CEO Bill George
4 wwwindiaphilipscom
5 wwwwikipediacom
6 httpwwwemployeecommitmentcom
7 One Foot Out The Door How to Combat The Psychological Recession Thatrsquos Alienating Employees And Hurting American Business Judith Bardwick
8 Employee Commitment A Leader Ship Guide Joe Folkman
9 Harvard University Factors that Impact Employee Well Being Commitment and Productivity -An Article
77
Questionnaire
Name __________________________________________________________
Age______________________________ Gender _______________________
Qualification _______________________ Contact No ___________________
Q1 In which department you are working
Electrical Production Mechanical Other
Q2 What is your working experience
gt2 Years 2-4 Years 4-6 Years lt 6 Years
Q3 How You like the physical Working Environment of the organization
Excellent Good Fair Poor Very Poor
Q4 Are you satisfied with Non-Monitory benefits provided by the organisation
Highly Satisfied Satisfied Neither Satisfied Nor dissatisfied
Highly Dissatisfied Dissatisfied
Q5 Are you satisfied with your work
Highly Satisfied Satisfied Neither Satisfied Nor dissatisfied
Highly Dissatisfied Dissatisfied
Q6 Are you satisfied with the career development programe of the company
Highly Satisfied Satisfied Neither Satisfied Nor dissatisfied
Highly Dissatisfied Dissatisfied
Q7 Is other staff of the organization is co-operative with you
Highly Satisfied Satisfied Neither Satisfied Nor dissatisfied
Highly Dissatisfied Dissatisfied
Q8 Are you satisfied with top level management
Highly Satisfied Satisfied Neither Satisfied Nor dissatisfied
Highly Dissatisfied Dissatisfied
78
Q9 Are you satisfied with your subordinates
Highly Satisfied Satisfied Neither Satisfied Nor dissatisfied
Highly Dissatisfied Dissatisfied
Q10 Are you satisfied with the nature of the Job
Highly Satisfied Satisfied Neither Satisfied Nor dissatisfied
Highly Dissatisfied Dissatisfied
Q11 Do you have any Job Pressure in work
Yes No
Q12 Do you satisfied with the opportunities provided by the organisation
Highly Satisfied Satisfied Neither Satisfied Nor dissatisfied
Highly Dissatisfied Dissatisfied
Q13 Are you satisfied with the welfare facilities provided by the organisation
Highly Satisfied Satisfied Neither Satisfied Nor dissatisfied
Highly Dissatisfied Dissatisfied
Q14 Are you satisfied towards your salary
Highly Satisfied Satisfied Neither Satisfied Nor dissatisfied
Highly Dissatisfied Dissatisfied
Q15 Are you committed towards the organisation
Yes No
Signature
9
Working at PIC are about 1000 of the industrys finest professionals using state-of-the-art
software engineering paradigms and platforms including real-time systems component-based
software engineering and multi-threaded architecture to drive the creation of tomorrows
products and services PIC is an ISO 9001Tick IT SEI CMM SM level 5 company amp has
emerged as a critical partner in the development of strategic amp futuristic technologies for Philips
worldwide 60000 registered patents illustrate the innovative nature of the company Philips has
adopted an Open Innovation strategy which leverages the joint innovative power of partnering
companies and researchers to bring more innovations to the market effectively and faster PIC
has built-up extensive know-how and expertise in the software engineering and technology
domains relevant to its business In addition competencies in the areas of project management
requirement engineering and quality assurance have been established to offer customers products
and services of the highest quality at the fastest time-to-market and the lowest cost of
ownership
RESEARCH AND DEVELOPMENT
Since its foundation 100 years ago Philips Research has been at the forefront of fundamental
scientific research But with market focus being more and more important across almost all
corporate RampD organizations is this still the case If some of the pioneering work being done
by scientists across Research is anything to judge by the answer is a resounding ldquoyesrdquo
Itrsquos different at the cutting edge
In todayrsquos market-focused corporate RampD organizations the boundary between fundamental
scientific research and applied research is becoming increasing blurred ndash particularly when it
comes to some of the most exciting areas of research ldquoHere at Philips our way of working is
very dynamicrdquo says Philips Researchrsquos Chief Science Officer Emile Aarts ldquoThis means that you
10
can apply both the lsquofundamentalrsquo and the lsquoappliedrsquo labels to many of the projects that wersquore
working on because they are both very flexible termsrdquo Philips Researchrsquos work on sleep for
instance is an excellent example of this more dynamic approach ldquoThis is a very important area
for Philips ndash but therersquos currently very little fundamental knowledge available Thatrsquos why wersquore
involved in investigating the key issues at a more fundamental level together with our university
and research institute partners The only difference is that we want this research to lead to
marketable products and solutionsrdquo
Open Innovation in new areas
Despite the flexible nature of the ldquofundamentalrdquo and ldquoappliedrdquo labels it is still possible to detect
a decline in some areas of more fundamental research at Philips in recent years ldquoThis has mainly
occurred in fields that donrsquot support the execution of our companyrsquos Health and Well-being
strategyrdquo says Aarts As he explains this refocusing exercise has gone hand-in-hand with an
expansion of more fundamental research activities in a number of new fields such as deep-brain
stimulation and multi-modal imaging for healthcare applications ldquoIn these fields wersquore
considered to be an extremely important research partner ndash especially by colleagues working in
universitiesrdquo In the future Philips Research will continue to develop its reputation in a number
of exciting fundamental domains ndash ldquogreen lightingrdquo and skincare are just two examples ndash albeit
with a more applied focus ldquoHopefully this research will enable us to build on our strong
heritage of improving the quality of peoplersquos lives
11
BOARD OF DIRECTORS
Non-Executive Director amp Chairman S M Datta
Executive Vice Chairman amp Managing Director Murali Sivaraman
Executive Director Jan-Hein Louwman
Non-Executive Director S Venkatramani
India Management Team
MURALI SIVARAMANN - CEO
ANJAN BOSE - Healthcare
JAN-HEIN LOUWMAN ndash CEO
MAHESH KRISHNAN ndash Consumer lifestyle
RAJEEV CHOPRA ndash lighting
RAKESH SHARMA ndash Strategic Business Development
S NAGARAJAN ndash Human resources
VIVEK SHARMA ndash Chief Marketing Officer
WIDO MENHARDT ndash Philips Innovation Campus
12
Corporate Office-
Philips Electronics India Ltd
Technopolis Knowledge Park
Mahakali Caves Road
Chakala Andheri (East)Mumbai 400 093
Tel +91 22 66912000
VISION 2012
Through the Vision 2012 strategy we aim to fuel growth by making Philips the leading brand in
Health and Well-being Vision 2012 further positions Philips as a market-driven people-centric
company with a strategy and a structure that fully reflect the needs of its customer base while
also increasing shareholder value This is implemented through sharpened strategies in the three
core sectors Healthcare Lighting and Consumer Lifestyle
ldquoWith Vision 2010 we are putting people right at the center of things with Health and Well-
being as our overarching theme We are thereby putting into practice our mission improving the
quality of life through the introduction of meaningful innovationsrdquo ndash Gerard Kleisterlee
President and CEO of Royal Philips Electronic
Our Ways of Working
1 We are a people-centric company that organizes around customers and markets
2 We invest in a strong brand and consistently deliver on our brand promise of ldquosense and
simplicityrdquo in our actions products and services
13
3 We deliver innovation by investing in world class strengths in end-user insights
technology design and superior supplier networks
4 We develop our peoplersquos leadership talent and engagement and align ourselves with high
performance benchmarks
5 We invest in high growth and profitable businesses and emerging geographies to achieve
market leadership positions
6 We are committed to sustainability and focus on making the difference in efficient energy
use
7 We drive operational excellence and quality to best in class levels allowing us the above
mentioned strategic investments in our businesses
BRAND PROMISE
It is the combination of two unique capabilities that enables us to deliver on our ldquosense and
simplicityrdquo promise These capabilities are firstly by understanding people and secondly
technology integration and product design
We put our end users front and center of product innovations starting with understanding their
needs and aspirations We use best-in-class research facilities and agencies to validate and ensure
that our product innovations are designed around peoplersquos needs and aspirations easy to
experience and advanced
SUSTAINABILITY
14
In 2009 we evaluated our sustainability strategy and resolved to fully leverage sustainability as
an integral part of our overall strategy and an additional driver of growth as reflected in the
Philips Management Agenda 2012
To deliver on our brand promise of ldquosense and simplicityrdquo and at the same time provide the
company direction for the longer term in this area we have identified three sustainability
leadership key performance indicators where we can bring our competencies to bear lsquocarersquo
lsquoenergy efficiencyrsquo and lsquomaterialsrsquo including targets for 2015
Bringing care to more than 500 million people
Target 500 million lives touched by 2015
Improving energy efficiency of Philips products
Target 50 improvement by 2015 (for the average total product portfolio) compared to
2009
Closing the materials loop
Target Double global collection recycling amounts and recycled materials in products
by 2015 compared to 2009
Each sector will take the lead on one of the leadership key performance indicators with
Healthcare leading lsquocarersquo Lighting lsquoenergy efficiencyrsquo and Consumer Lifestyle lsquomaterialsrsquo
In addition we defined a set of complementary performance indicators to accelerate change and
drive performance including the EcoVision4 parameters
With EcoVision4 we have committed to the following by 2012
15
bull Generate 30 of total revenues from Green Products
bull Double investment in Green Innovations to a cumulative EUR 1 billion
bull Improve our operational energy efficiency by 25 and reduce our CO2 emissions by 25 all
compared with the base year 2007
SOCIAL COMMITMENT
Living up to this commitment means we use our capabilities to enhance the lives of our
employees and people in society at large Within the company we encourage teamwork and
collaboration in an environment that enables employees to reach their full potential
Building on our rich heritage of involvement in social issues we have established our own
approach of supporting the communities where we live and work focusing on energy efficiency
and healthcare
Sustainable lighting
There is a pressing need to find innovative lighting solutions for the 16 billion people who live
in areas with no access to the electricity grid or where the grid is unreliable Thatrsquos why we have
developed SMILE (Sustainable Model in Lighting Everywhere)
Launched as a pilot in 2006 in four Indian states SMILE includes two lighting solutions UDAY
a rechargeable portable lantern and KIRAN a hand-cranked LED flashlight Today are
distributed in eighth Indian states
16
SWOT ANALYSIS
Strengths
bull India was a market where the first mover enjoyed advantages over latecomers
bull The first image of the product lasted long in the eyes of the consumer and the first to enter the
market could gain the largest market share
bull PHILIPS is committed to enhance its image to the Chinese market as investors
bull PHILIPS was building a wholly owned manufacturing plant in India to show the
Chinese the commitment Korea had to the Chinese society
bull Labor costs in India were less and would defray the cost of producing high-end
bull Samsung has been making color TVs for many years in Korea before moving to the Chinese
market
Weaknesses
bull PHILIPS must continue to control all costs to maintain success
bull India has a reputation of being a protected market (protectionism)
bull India was a market where the first mover enjoyed advantages over late comers PHILIPS is
trying to overcome the first comer advantage Japan manufacturers have over them by being those
first comers
bull Companies such as Sony and Matsushita had built sales and service networks that were
favorable to their sales programs in India while Samsung would have to catch up in that area
17
bull Samsung is not as experienced in manufacturing high-end TVs for a higher-end market
segment
Opportunities
bull Based on the data that on 28 of the 220 million rural households own a color TV PHILIPS
focus on the domestic India market should be to penetrate the rural household market which
would mean that for those purposes the low-end production of sets in the 13rdquo to 20rdquo range should
be produced to appeal to that segmentrsquos purchasing ability
bull Larger more high-end models can be produced to appeal to an urban customer in India as well
as being an export to the US and European higher end customers
bull With success in the higher-end manufacturing and sales of premium TVs in India PHILIPS can
establish themselves as high-end producers around the world
Threats
bull PHILIPS faces intense competition in the color TV market
bull A premium-priced product wouldnrsquot sell in large volumes so pricing can be a problem
bull Since PHILIPS didnrsquot have an established marketing strategy issues of how to market the
product may arise
bull Loss of profitability because related to over-employment at most facilities
bull Is the per capita income level such that it can support sales of product at any level
bull If PHILIPS fails to be successful in the Chinese market with high-end product it will be known
around the world bull India was a market where the first mover enjoyed advantages over late
comers
bull The first image of the product lasted long in the eyes of the consumer and the first to enter the
18
market could gain the largest market share
bull PHILIPS is committed to enhance its image to the Chinese market as investors
PHILIPS ELECTRONICS MOHALI PLANT
The mohali plant was established in 1985 as PUNJAB ANAND LAMP Ltd as its second
division of lamp industry after the varodra plant at that time it was a joint stock company and
majority of shares was with Punjab Anand Lamp around 75 but in the year 2001 the company
ownership changed and the whole shares was bought by PHILIPS ELECTRONIC INDIA Ltd
and its name was changed to PHILIPS ELECTRONIC INDIA Ltd MOHALI LIGHT
FACTORY
The plant is situated in Industrial focal point PHASE-9 MOHALI near Mohali railway station
and is sreaded in 26 acres Total employees of tis plant is 532 including casual employees This
company is a landmark in the Punjab state as it is the only factory which is most profitable one
than any industry located in Punjab
19
OVERVIEW OF VARIOUS FRONTS OF
PHILIPS ELECTRONICS INDIA Ltd
Manufacturing-
Today the product range of Philips include the following products ndash
Televisions- LCD Plasma Flat Screen Smart Touch XL
Recorders DVD Players I pods and Home Theatre Systems
Audio Products - Audio Systems Remote Controls AudioVideo Accessories
Digital Photo Products and Frames
Portable Audio and Video Systems Accessories like Headphones and Speakers
PC Products - Mouse and Keyboard Multi Media Headsets External Hard Disk Drives
Mobile Phones
Male Shaving and Grooming - Dry Shavers Beard Trimmers
Personal Care - Beauty and Hair Care Products
20
Kitchen Appliances - Blenders and Hand Blenders Juicers and Citruspresses Food
Processors and Mixers Coffee Makers and Kettles Frying and Grilling Appliances
Toasters and Snacking Products
Household Products - Irons Vacuum Cleaners Water Purifiers
Professional Lighting - Industrial Shops and offices Road and Area Hospitality Sports
Lighting City Beautification and Petrol Stations
Automotive Lighting - In Cars Motorcycles and Trucks
Home Lighting
SERVICS
Philips E-waste Management Program in India
Philips has tied up with a recycler for collecting transporting and recycling unwanted broken
down consumer products
At Philips we offer consumers a convenient way of recycling their unwanted obsolete and
damaged Philips products by dropping them off at convenient locations The program
encompasses 8 major cities across India Consumers can approach one of 27 authorized Philips
service centres which will act as collection points for consumer products which need recycling
Our efforts are to expand the network in the near future
Philips ensures that the consumer products received will be recycled in an environment-friendly
manner Philips understand the corporate social responsibility and takes steps towards providing
a safer environment to the future generations We design our products to continuously realize
improvements and reduce their overall life cycle environmental impact Designing products for
21
recycling is an integral part of this approach Our aim is to use our planetrsquos limited resources
effectively and respect the principle of extended producer responsibility This also calls for
manufacturers to engage in developing solutions for effective and efficient recycling of their
products We will continue to promote and invest into improved recycling systems to reduce the
impact of electronic waste on the environment
MANUFACTURING AT MOHALI PLANT ndash
Mohali plant mainly manufactures lighting products basically of domestic usage this includes the
following products ndash
CFL bulbs ndash
1 Genie - 5 watt 8 watt 11 watt
2 Essential ndash 8 watt 11 watt 14 watt 18 watt 23 watt 29 watt
3 Tornado ndash 5 watt 8 watt 11 watt 14 watt 18 watt 23watt 29 watt
4 T5 slim tube 28 watt
Coil plant ndash Philips Electronics India is the only company that produces coils in the whole
lighting industries in the world and in India only at the MOHALI PLANT
22
Chapter-II
OBJECTIVES OF THE STUDY
23
OBJECTIVES OF THE STUDY
To study the various aspects of Satisfaction Level of the Employees working at Philips
Electronics India Ltd Mohali
To analyze the effect of Job satisfaction on the organisation
To determine the relation between job satisfaction of employees and their commitment
towards the organisation
To analyze the performance model adopted by the Philips Electronics India Ltd Mohali
to handle their manpower
To suggest remedial measures for the improvement of the companyrsquos performance
24
Chapter-III
Employees Commitment
25
Employees who are engaged in their work and committed to their organizations give companies
crucial competitive advantagesmdashincluding higher productivity and lower employee turnover
Thus it is not surprising that organizations of all sizes and types have invested substantially in
policies and practices that foster engagement and commitment in their workforces
But what are employee engagement and commitment exactly This report examines the ways in
which employers and corporate consultants define these terms today and offers ideas for
strengthening employee engagement Though different organizations define engagement
differently some common themes emerge These themes include employeesrsquo satisfaction with
their work and pride in their employer the extent to which people enjoy and believe in what they
do for work and the perception that their employer values what they bring to the table The
greater an employeersquos engagement the more likely he or she is to ldquogo the extra milerdquo and deliver
excellent on-the-job performance In addition engaged employees may be more likely to commit
to staying with their current organization Software giant Intuit2 for example found that highly
engaged employees are 13 times more likely to be high performers than less engaged
employees They are also five times less likely to voluntarily leave the company
Clearly engagement and commitment can potentially translate into valuable business results for
an organization To help you reap the benefits of an engaged committed workforce at your
organization this report provides guidelines for understanding and measuring employee
engagement and for designing and implementing effective engagement initiatives As you will
26
see everyday human resource practices such as recruitment training performance management
and workforce surveys can provide powerful levers for enhancing engagement
Employee Engagement Key Ingredients
ldquoEmployee Engagement Definedrdquo shows examples of engagement definitions used by various
corporations and consultancies Clearly definitions of employee engagement vary greatly across
organizations Many managers wonder how such an elusive concept can be quantified The term
does encompass several ingredients for which researchers have developed measurement
techniques These ingredients include the degree to which employees fully occupy themselves in
their work as well as the strength of their commitment to the employer and role Fortunately
there is much research on these elements of engagementmdashwork that has deep roots in individual
and group psychology
Definition
ldquoNo company small or large can win over the long run without energized employees who
believe in the [firms] mission and understand how to achieve it Thats why you need to take the
measure of employee engagement at least once a year through anonymous surveys in which
people feel completely safe to speak their mindsrdquo
-Jack and Suzy Welch-
Common Themes How Companies Measure Engagement
Employers typically assess their employeesrsquo engagement levels with company-wide attitude
or opinion surveys
27
1048657 Pride in employer
1048657 Satisfaction with employer
1048657 Job satisfaction
1048657 Opportunity to perform well at challenging work
1048657 Recognition and positive feedback for onersquos contributions
1048657 Personal support from onersquos supervisor
1048657 Effort above and beyond the minimum
1048657 Understanding the link between onersquos job and the organizationrsquos mission
1048657 Prospects for future growth with onersquos employer
1048657 Intention to stay with onersquos employer
The Link Between Employer Practices and Employee Engagement
How does an engaged workforce generate valuable business results for an organization The
process starts with employer practices such as job and task design recruitment selection
training compensation performance management and career development Such practices affect
employeesrsquo level of engagement as well as job performance Performance and engagement then
interact to produce business results Figure 1 depicts these relationships
28
EMPLOYEE COMMITMENT EMPLOYEE ENGAGEMENT
1048657 How do you and other managers in your
organization define commitment
1048657 Are some employees in your company
engaged in their work but not committed to
the organization Committed to staying with
your firm but not exactly engaged in their
work Both engaged and committed
1048657 To whom are your organizations employees
committed The company Their supervisor
Co-workers Team members Customers
1048657 What business results has commitment from
1048657 How do you and other managers in your
organization define employee engagement
1048657 How do you know that certain employees in
your company are engaged Do they relish
their jobs Enjoy specific responsibilities or
tasks Willingly ldquogo the extra milerdquo
1048657 In teams departments or business units in
your company that have a large number of
engaged employees what business results
are you seeing Higher productivity Lower
costs Greater revenues More efficiency
29
employees created for your organization For
example has commitment reduced turnover
and therefore decreased recruitment hiring
and training costs
1048657 What does your company do to reciprocate
employees commitment Is the organization
living up to its side of the bargain
Lower turnover Higher product or service
quality
1048657 Conversely how do disengaged employees
behave and what are the consequent costs
for their teams units-and your entire
company
As Figure 2 suggests a person possesses attributes such as knowledge skills abilities
temperament attitudes and personality He or she uses these attributes to accomplish work
behaviors according to organization-defined procedures by applying tools equipment andor
technology Work behaviors in turn create the products and services that make an organization
successful We classify work behaviors into three categories those required to accomplish duties
and tasks specified in a job description (prescribed behaviors) ldquoextrardquo behaviors that an
employee contributes for the good of the organization (voluntary behaviors) and behaviors
prohibited by an employer (proscribed behaviors including unexcused absenteeism stealing and
other counterproductive or illegal actions) Of course job performance occurs in an
organizational context which includes elements such as leadership physical setting and social
setting
30
Employers naturally want to encourage workers to perform prescribed and voluntary activities
while avoiding proscribed ones To achieve these goals organizations use a number of HR
practices that directly affect the person process and context components of job performance
Employeesrsquo reactions to these practices determine their levels of engagement and commitment
31
Chapter-IV
32
LITERATURE OF THE REVIEW
ldquo Job Satisfaction That Leads To The Commitment Of
The Employees in The Organisationrdquo
Literature of Review
Gerge Bill Authentic Leadership
In his book Authentic Leadership former Medtronic CEO Bill George makes an obvious
point that business leaders rarely say out loud ldquoMissions motivate dollars donrsquotrdquo
What he means is that purpose is what drives employee commitment not the financial
rewards that come to others Workers donrsquot get up in the morning and say ldquoGee I can
33
hardly wait to get to work today to maximize shareholder profitsrdquo Even when employees
are shareholders who can benefit from improved financials what draws people to their
chosen careers is the work itself and its purpose in the world more than the profit
possibilities
Mr George goes on to say ldquoI find there is universal agreement (among middle managers)
that you cannot inspire employees by urging them to help management get the companyrsquos
stock price uprdquo
There is in fact quite a bit of literature on this subject In Awakening Corporate Soul
authors Eric Klein and John Izzo say that employee commitment requires knowing ldquothe
purpose of our work it means recognizing the purpose our organization fulfills that goes
beyond the bottom line and it means articulating to others how their (workersrsquo) efforts
contribute to a larger purposerdquo
In Built to Last Jim Collins and James Porras spend an entire book explaining their five
year research study of major companies that led to this conclusion about employee
commitment Purpose within a company is what sustains it profit is important but when
itrsquos the prime directive companies falter
-Marshal Goldsmith-
How to Increase Employee Commitment
In practice this involves walking the talk being transparent communicating effectively treating
people equally teaching leading subordinates to increasingly excellent performance ndash and
responding to subordinates as mature individuals who are owed fairness the truth and
recognition of their achievements
34
Since managers interact directly and frequently with subordinates they are usually more tuned
in to how employees are feeling than are executives Managers are in a better position to know
for example when employees are feeling alienated and disengaged from their work which is
very common today -- and expensive
Gaining employee commitment results in greater profits because enthusiastic employees stay
contribute discretionary effort and engage customers Performance soars when customers are
enthused and stay and when executives managers and employees are a collaborative team
united in achieving common goals
But managers are often called middle managers for good reason their job is to motivate and
guide subordinates while they at the same time are being judged by their bosses Because of
their ldquotweenrdquo position in the hierarchy managers to effective support direct reports must also
create relationships with potential allies especially those with greater power who have access to
top decision makers
Harvard University Factors that Impact Employee Well Being Commitment and
Productivity
Business executives from the C-suite and HR to QC and RampD are by nature focused on the
corporate bottom line A new trend in our dawning age of social sustainability is that many
experts believe more attention should be paid to the dotted line - the one signed when a person
35
commits to employment at a company New Harvard research validates this approach affirming
that trust and purpose play a significant role in building successful productive workplaces
The behavioral research conducted by a team at Harvard University and Massachusetts General
Hospital identifies the factors most likely to impact 21st century employee well being
commitment and productivity The researchers found that commitment is largely influenced by
ones sense of purpose feeling of personal impact and overall trust in the organization
Productivity is largely affected by the quality of human relationships including cooperative
social group moods and interaction
The results lead us to conclude that workplaces that provide positive environments that foster
interpersonal trust and quality personal relationships create the most committed and productive
employees says Nancy Etcoff PhD the lead researcher on the study
Expert Shares Keys to Building Successful Workplace Relationships
According to business strategist Courtney Anderson JD MBA Outstanding leadership
today means much more than just doing your job Success is creating an environment that fosters
happy committed productive team members
Anderson explains that reinvigorating workplaces by enhancing trust and employee commitment
does not have to be difficult The biggest challenge she says is making the time to truly change
in our overscheduled instant access competitive work environments With a little know-how it
can be easy to evolve workplace well being and respond to these compelling research results
-Mark Howell-
CEO Bright Point
High-performing companies recognize that employee commitment is a major contributing factor
toward sustaining long-term success and creating value An engaged employee is involved and
excited about their work and acts in a manner that will forward the organizationrsquos interest An
36
engaged workforce helps optimize and retain talent for the long-term because the employees
choose to stay even when other employment alternatives exist
According to Walker Information the top three drivers of employee commitment are
Satisfaction Fairness and Care amp Concern for employees Put simply committed employees
want to enjoy their work feel they are appreciated and know they are making a contribution to
their companyrsquos strategic objectives Additionally employees who have trust in their leadership
and are trusted by their leadership have a greater dedication and are ultimately more productive
on the job However according to recent data provided by the National Business Research
Institute (NBRI) only 31 of all employees are truly engaged
At BrightPoint we take employee engagement seriously and we work to create a culture that
inspires employee loyalty and satisfaction The results of BrightPointrsquos commitment to its
employees are shown in the 2011 BPNA Employee Commitment Survey The survey
determined that close to 80 of respondents indicated they were satisfied with their jobs and
daily activities General employee satisfaction increases when managers take an active interest
in their employees beyond their day-to-day job responsibilities According to NBRI managers
that actively coach build relationships and keep an open dialogue with their employees improve
employee engagement
We have a diverse workforce where each employee brings unique value and has individual
needs Managers are learning to manage the individual and not the position In order to give
managers the tools they need to be successful BrightPoint places strong emphasis on targeted
leadership training workshops and continual learning resources In 2011 906 of managers at
BrightPoint NA participated in the development opportunities offered and also made an effort to
37
help reinforce the learning of their team members This signals that our leadership team is taking
an active interest in professional development and its connection to employee commitment
As BrightPoint continues to increase focus on employee engagement the organization will grow
stronger and maintain a substantial advantage over our competition Our employees possess the
knowledge experience and resiliency to respond quickly to the demands of the marketplace and
through their genuine commitment will deliver what our customers want with increasing
efficiency and effectiveness Our responsibility is value-creation by growing our business and
maintaining high levels of customer service and loyalty We believe the best way to accomplish
this is through a strong committed and engaged workforce
Performance Model Adopted At Mohali Plant
38
Process adopted by Philips Electronics Mohali Plant for Job Satisfaction of Employee that leads commitment of the employees
39
Recruiting
The messages in Philips Electronics Mohali organization conveys while seeking to attract job
applicants also can influence future employeesrsquo engagement and commitment If your firm has
designed jobs specifically to engage employees then organization want to ensure that recruiting
ads extol these positionsrsquo attractive featuresmdashsuch as challenging work assignments a highly
skilled team environment or minimal supervision Applicants who notice and respond to these
ads will more likely be motivated by these features Also consider how organization might best
seek candidates from inside your organization When Organisation recruit existing employees for
desirable jobs you enhance their engagement (by maximizing the person-job fit) and
commitment (by providing growth and advancement opportunities to employees in return for
their loyalty) If Organisation recruit from outside when qualified internal candidates are
available Organization may unwittingly suggest to current employees that your company is not
willing to reciprocate their commitment Existing staff may then begin questioning their own
commitment to the firm By contrast organisation recruit external candidates to both the job and
your organization For these candidates ensure that recruiting messages highlight attractive job
features organizational values and commitment reciprocity That is in return for performance
and dedication your company offers competitive pay and benefits flexible work hours and
learning and career advancement opportunities Also remember that prospective employees have
multiple commitments You will inevitably have to compete with those commitments as
organization try to attract candidates to your firm Most people find it easier to make a new
commitment when it is compatible with their other obligations For example you boost your
chances of recruiting a highly qualified candidate who is a single parent if you offer flexible
work hours family health benefits and on-site day care ldquoRecruiting for Engagement and
Commitmentrdquo
40
Employee Selection
Once recruiting efforts produce a pool of promising job candidates Philips select among them to
fill available positions When organisation select the right individuals for the right jobs new
hires carry out their work more smoothly and experience fewer performance problems The
result Greater enjoyment ofmdashand engagement inmdashthe job
To enhance engagement through your selection of employees identify those candidates who are
best-suited to the job and your organizationrsquos culture Also use candidate assessment methods
that have obvious relevance to the job in questionmdashfor example by asking interviewees what
they know about the role and having them provide work samples Most candidates will view
these techniques more positively than tests with less apparent relevance such as personality and
integrity assessments Successful candidates feel good about having ldquopassed the test and see
company as careful and capable for having selected them A positive initial impression of an
employer encourages growth of long-term commitment
Training and Development
Training and development can serve as additional levers for enhancing engagement and
commitment For new hires training usually begins with orientation Orientation presents several
important opportunitiesmdashincluding explaining pay work schedules and company policies Most
important it gives you a chance to encourage employee engagement by explaining how the new
hirersquos job contributes to the organizationrsquos mission Through orientation Mohali Plant of Philips
Electronics describe how r company is organized introduce the new employee to his or her co-
workers give the person a tour of the area where he or she will be working and explain safety
regulations and other procedural matters In short you foster person-organization fitmdashvital for
developing productive and dedicated employees Through training you help new and current
41
employees acquire the knowledge and skills they need to perform their jobs And employees who
enhance their skills through training are more likely to engage fully in their work because they
derive satisfaction from mastering new tasks Training also enhances employeesrsquo value to your
company as well as their own employability in the job market In addition most companies offer
higher wages for skilled workers to compensate them for their greater value and to discourage
turnover
Compensation
Like the HR practices discussed above compensation can powerfully influence employee
engagement and commitment Some compensation components encourage commitment to
employers while others motivate engagement in the job It is possible to stimulate one and not
the other though itrsquos generally better to foster both For example a company that offers a strong
performance incentive system but no retirement plan will probably realize exceptional
engagement from its workers however they may eventually commit themselves to another
company that does offer a good retirement plan Meanwhile an organization that offers generous
retirement benefits but a traditional seniority-based pay grade system may have committed
employees however these workers might deliver pedestrian performance as they bide their time
until retirement In designing compensation plans you therefore need to consider employee
engagement and commitment strategically
Encourage managers to include employees in the goal-setting process This technique helps to
ensure that workers understand the goals It also promotes acceptance of challenging objectives
because people generally feel more committed to goals they have helped define In addition
consider how you and other managers will recognize and encourage contributions that exceed
expectations For example when a piece of equipment malfunctions Joe finds other ways to
maintain production rather than merely shutting down the machine and waiting for the
42
maintenance staff to fix it Or when a less experienced co-worker encounters a new task Sally
offers friendly coaching instead of standing by and waiting for the inevitable mistakes to crop
up Performance management processes operate on a continuous basis Therefore they provide
perhaps the best ongoing opportunities for employers to foster employee engagement and
commitment For example managers can use routine discussions about performance and
feedback sessions to learn which aspects of the job hold the most interest for each employee and
which tasks are most challenging During such discussions managers also can define what going
above and beyond the call of dutyrdquo looks like and generate ideas for rewarding such
contributions An employeersquos aspirations and career goals can receive careful attention during
performance appraisal meetings Without inquiring into an employeersquos personal life a supervisor
can nevertheless explore ways to enhance the compatibility between the workerrsquos commitment to
your organization and the employeersquos other life commitments Through such means the
organization personalizes its relationship to each employee and provides support while also
expressing appreciation for their contributionsmdash key drivers of engagement and commitment
To further engage employees and win their commitment through your performance management
programs consider how to treat your organizationrsquos most experienced employees In many cases
these employees understand the intricacies of a job better than their supervisors or managers do
By virtue of long identification with your organization they may be deeply committed to high-
level goals They use their expertise to contribute in ways that newer employees simply cannot
match But many of them also may be planning to retire soon especially if they are from the
ldquoBaby Boomerrdquo generation How will you transfer their knowledge to younger workers Design
a performance management system that recognizes and rewards proactive sharing of knowledge
and expertise among co-workers For example create knowledge repositories or learning
histories that can be stored in databases that employees can access and then create incentives
43
for people who contribute to and use these repositories Of course effective performance
management systems also identify employees who are not meeting expectations Failing to
address problem performance can erode other employeesrsquo engagement and commitment as their
workloads increase and they conclude that the company is willing to tolerate poor performance
If feedback coaching and remedial training are of little avail the manager may need to move the
person to a different position within the company where he or she can make a more valuable
contribution or let the individual go if there is no good match elsewhere in the organization
44
Chapter-V
RESEARCH METHODOLOGY
The basic task of research is to generate accurate information for use in decision-making
Research can be defined as the systematic and objective process of gathering recording and
analyzing data for aid in making business decisions As the project involves analyzing of
45
financial structure the research is exploratory in nature covering financial parameters and come
of the important ratios to carry out research There are basically two techniques adopted for
obtaining information
Primary Data
Secondary Data
Primary Data is gathered specifically for the project at hand through personal interviews with
the accounts officers
Sample Size = 100 Employees
Secondary data is previously collected and assembled for some project other than the one at
hand It is gathered and recorded by someone else prior to current needs of the researcher It is
less expensive than the primary date
Secondary Data can be obtained from both external and internal sources
External data may be collected from books and periodicals government sources media and other
commercial sources
Internal data is that secondary data which is created recorded or generated by the organization
As the project is explanatory in nature secondary data is collected from the reports of the
company books journals and interest Secondary data is gathered from annual reports official
records and standing orders of the units
CHAPTER - VI
DATA ANALYSIS AND INTERPRETATION
46
The data after collection is to be processed and analyzed in accordance with the outline
and down for the purpose at the time of developing research plan
Technically speaking processing implies editing coding classification and tabulation of
collected data so that they are amenable to analysis The term analysis refers to the computation
of certain measures along with searching for pattern groups Thus in the process of analysis
relationship or difference should be subjected to statistical tests of significance to determine with
what validity data can be said to indicate any conclusions
The analysis of data in a general way involves a number of closely related operations
which are performed with the purpose of summarizing the collected data and organizing them in
such a manner that they answer the research questions In this study the researcher followed
above process carefully and it is presented in this chapter
47
Table 41 ndash To know the department in which employees are belongs to
S
ou rc
e
survey data
Inference
From the above table it shows that 35 of employees are belongs to
production department
FIGURE 41
S
SI No
D
Department
N
No of Respondents
P
Percentage
1
1
M
Mechanical
3
30
3
30
2
2
E
Electrical
2
25
2
25
3
3
P
Production
3
35
3
35
4
4
O
Others
1
10
1
10
T
Total
1
100
1
100
48
REPRESENTS THE DEPARTMENT
Table 42 ndash To know working experience of the employees
Source survey data
Inference
From the above table it shows that 34 of the employees have 4 ndash 6
years experience
S
SI No
W
Work Experience
N
No of Respondents
P
Percentage
1
1
B
Below 2 years
1
33
1
13
2
2
2
2ndash 4 years
3
30
3
30
3
3
4
4ndash 6 years
3
34
3
34
4
4
A
Above 6 years
2
23
2
23
T
otal
1
100
1
100
49
FIGURE 42
REPRESENTS THE EXPERIENCE OF THE EMPLOYEES
Table 43 ndash To know the physical working environment
S
SI No
W
Working Environment
N
No of Respondents
P
Percentage
1
1
E
Excellent
1
12
1
12
2
2
G
Good
5
57
5
57
3
3
F
Fair
2
28
2
28
4
4
P
Poor
0
03
0
33
5
5
V
Very Poor
0
00
0
00
T
Total
1
100
1
100
Source survey data
Inference
From the above table it shows that 57 of the employees were feeling good about the working environment
50
FIGURE 43
REPRESENTS THE PHYSICAL WOKING ENVIRONMENT
51
Table 44 ndash To know the satisfaction level of employees towards the non-monitory benefits
S
SI No
N
Non-Monitory Benefits offered
to Employees
N
No of Respondents
P
Percentage
1
1
H
Highly Satisfied
1
14
1
14
2
2
S
Satisfied
5
54
5
54
3
3
N
Neither Satisfied nor Dissatisfied
2
25
2
25
4
4
D
Dissatisfied
0
05
0
05
5
5
H
Highly Dissatisfied
0
02
0
02
Total 1
100
1
100
Source survey data
Inference
From the above table it shows that 54 of the employees were satisfied towards the non-monitory benefits
FIGURE 44
REPRESENTS THE SATISFACTION LEVEL OF EMPLOYEES TOWARDS THE NON-MONITORY BENEFITS
52
Table 45 ndash To know the satisfaction level of respondents towards the work
assigned
Source survey dataInference
From the above table it shows that 45 of the respondents were satisfied towards the work assigned
FIGURE 45
S
SI No
A
Amount of Work
N
No of Respondents
P
Percentage
1
1
H
Highly satisfied
2
20
2
20
2
2
S
Satisfied
4
45
4
45
3
3
N
Neither Satisfied nor Dissatisfied
1
12
1
12
4
4
D
Dissatisfied
1
18
1
18
5
5
H
Highly Dissatisfied
0
06
0
06
Total 1
100
1
100
53
REPRESENTS THE SATISFACTION LEVEL OF RESPONDENTS TOWARDS THE WORK ASSIGNED
54
Table 46 ndash Opinion about the career development programme in their organisation
S
SI No
C
Career Development
N
No of Respondents
P
Percentage
H
Highly satisfied
1
12
1
12
S
Satisfied
5
56
5
56
N
Neither Satisfied nor Dissatisfied
2
22
2
22
D
Dissatisfied
1
10
1
10
H
Highly Dissatisfied
0
00
0
00
Total 1
100
1
100
Source survey data
Inference
From the above table it shows that 56 of the employees were satisfied
with the opinion about the carrier development programme in their organisation
FIGURE 46
REPRESENTS OPINION ABOUT THE CAREER DEVELOPMENT
PROGRAMME IN THEIR ORGANISATION
55
Table 47 ndash To know the cooperation of co-workers
S
SI No
C
Co-operation of Workers
N
No of Respondents
P
Percentage
1
1
H
Highly satisfied
2
20
2
20
2
2
S
Satisfied
6
66
6
66
3
3
N
Neither Satisfied nor Dissatisfied
1
11
1
11
4
4
D
Dissatisfied
0
03
0
03
5
5
H
Highly Dissatisfied
0
00
0
00
Total 1
100
1
100
Source survey data
Inference
From the above table it shows that 66 of the employees were satisfied
with the cooperation of co-workers
FIGURE 47
56
REPRESENTS THE COOPERATION OF CO-WORKERS
57
Table 48 ndash To know the satisfaction of Respondents with top management
S
SI No
S
Satisfaction with Top
Management
N
No of Respondents
P
Percentage
1
1
H
Highly satisfied
2
26
2
26
2
2
S
Satisfied
5
51
5
51
3
3
N
Neither Satisfied nor Dissatisfied
1
17
1
17
4
4
D
Dissatisfied
0
06
0
06
5
5
H
Highly dissatisfied
0
00
0
00
Total 1
100
1
100
Source survey data
Inference
From the above table it shows that 51 of the employees were satisfied with the top management
FIGURE 48
58
REPRESENTS THE SATISFACTION OF RESPONDENTS WITH TOP MANAGEMENT
Table 49 ndash To know the satisfaction of Respondents with their subordinates
Source survey data
Inference
From the above table it shows that 67 of the employees were satisfied with their subordinates
S
SI
No
S
Satisfaction with Subordinates
N
No of Respondents
P
Percentage
1
1
H
Highly satisfied
1
12
1
12
2
2
S
Satisfied
6
67
6
67
2
3
N
Neither Satisfied nor Dissatisfied
1
14
1
14
4
D
Dissatisfied
0
07
0
07
5
5
H
Highly Dissatisfied
0
00
0
00
Total 1
100
1
100
59
FIGURE 49
REPRESENTS THE SATISFACTION OF RESPONDENTS WITH THEIR SUBORDINATES
60
Table 410 ndash To know the level of satisfaction regarding nature of job
S
SI No
J
Job Satisfaction
N
No of Respondents
P
Percentage
1
1
H
Highly satisfied
2
22
2
22
2
2
S
Satisfied
5
56
5
56
3
3
N
Neither Satisfied nor Dissatisfied
1
16
1
16
4
4
D
Dissatisfied
0
07
0
07
5
5
H
Highly Dissatisfied
0
00
0
00
Total 1
100
1
100
Source survey dataInference
From the above table it shows that 56 of the employees were satisfied with their job
FIGURE 410
61
REPRESENTS THE LEVEL OF SATISFACTION REGARDING THE NATURE OF JOB
Table 411 ndash To know whether there is any job pressure in their work
Source survey data
Inference
From the above table it shows that 72 of employees said there is job pressure in their work
FIGURE 411
REPRESENTS WHETHER THERE IS ANY JOB PRESSURE IN THEIR WORK
S
SI No
J
Job Pressure
N
No of Respondents
P
Percentage
1
1
Y
Yes
7
72
7
72
2
2
N
No
2
28
2
28
T
Total
1
100
1
100
62
Table 412 ndash To know the opinion regarding opportunity provided by the organisation in developing skills
amp talents
S
SI No
D
Development of Skills and
Talents
N
No of Respondents
P
Percentage
1
1
H
Highly Agree
1
12
1
12
2
2
A
Agree
5
52
5
52
3
3
N
Neither Agree nor Disagree
2
28
2
28
4
4
D
Disagree
0
06
0
06
5
5
H
Highly Disagree
0
02
0
02
Total 1
100
1
100
Source survey data
Inference
From the above table it shows that 52 of employees agreed regarding opportunity provided by the organisation in developing skills amp talents
63
FIRGURE 412
REPRESENTS THE OPPORTUNITY PROVIDED BY THE ORGANISATION IN DEVELOPING SKILLS amp TALENTS
64
Table 413 ndash To know the satisfaction level of welfare facilities provided by the management
S
SI No
W
Welfare Facilities
N
No of Respondents
P
Percentage
1
1
H
Highly satisfied
0
09
9
09
2
2
S
Satisfied
5
57
5
57
3
3
N
Neither Satisfied nor Dissatisfied
2
29
2
29
4
4
D
Dissatisfied
5
05
0
05
5
5
H
Highly Dissatisfied
0
00
0
00
Total 1
100
1
100
Source survey data
Inference
From the above table it shows that 57 of the employees were satisfied with the welfare facilities provided by the management
FIGURE 413
REPRESENTS THE SATISFACTION LEVEL OF WELFARE FACILITIES PROVIDED BY THE MANGEMENT
65
Table 414 ndash To know the employee satisfaction towards the salary
Source survey data
Inference
From the above table it shows that 67 of the employees were satisfied
with their salary
FIGURE 414
REPRESENTS THE SATISFACTION TOWARDS THE SALARY
S
SI No
P
Payment Satisfaction
N
No of Respondents
P
Percentage
1
1
Y
Yes
6
67
6
67
2
2
N
No
3
33
3
33
T
otal
1
100
1
100
66
Table 415 ndash To know the employees willingness amp Commitment Towards
Organisation
Source survey data
Inference
From the above table it shows that 59 of the employees were willing to
continue in this organisation
FIGURE 415
REPRESENTS THE EMPLOYEES WILLINGNESS TO CONTINUE
S
SI No
W
Willingness to Work
N
No of Respondents
P
Percentage
1
1
Y
Yes
5
59
5
59
2
2
N
No
4
41
4
41
T
Total
1
00
1
00
67
CHI-SQUARE METHOD
The chi square test is one of the simplest and most widely used non-
parametric tests in statistical work As a non-parametric test it can be used to determine
if categorical data shows dependency or the two classifications are independent It can
also be used to make comparisons between theoretical population and actual data
when categories are used
n
Chi square χsup2= sum (O-E) sup2 E
i =1
Where O= observed frequency
E= expected frequency
68
OBSERVED FREQUENCY
Table 419 shows the relationship between the department and the job satisfaction
Over All
Job
SatisfactionHighly
SatisfiedSatisfied
Neither
Satisfied nor
Dissatisfied
DissatisfiedHighly
Dissatisfied
Sub
Total
Mechanical 5 6 14 3 2 30
Electrical 6 8 6 3 2 25
Production 9 13 7 4 2 35
Others 2 3 2 2 1 10
Sub Total 22 30 29 12 7 100
69
EXPECTED FREQUENCY
Over All
Job
SatisfactionHighly
SatisfiedSatisfied
Neither
Satisfied nor
Dissatisfied
DissatisfiedHighly
Dissatisfied
Sub
Total
Mechanical 7 8 9 4 2 30
Electrical 5 8 7 3 2 25
Production 8 11 10 4 2 35
Others 2 3 3 1 1 10
Sub Total 22 30 29 12 7 100
Null Hypothesis (Ho)
There is no significant difference between the department and the job satisfaction
Alternative Hypothesis (Ho)
There is significant difference between the job satisfaction
Co Relation
70
Chapter-V
CONCLUSIONS AND
RECOMMENDATIONS
71
CONCLUSION
On the basis of Analysis of Job Satisfaction Level of the Employees of Philips Electronics India
Ltd Mohali made in the previous chapters following conclusions are drawn
General Profile The plant of PHILIPS is ideally located in the Mohali Industrial focal point
Phase 9 near Chandigarh the capital of Punjab on a campus of 17 hectares The working
environment of the company is very healthy The visitors feel happy after the campus
Indigenous Technology PHILIPS is the only lighting manufacturing company based on purely
indigenous technology Philips was appropriately chosen as the brand name as self reliance and
building up of Indian Engineering capabilities remain the guiding spirit of PHILIPS
Financial structure PHILIPS is a low debt company signifying its dependence mainly on
its internal accruals for its financial requirements PHILIPS continues to strengthen its financial
position by channelising these internal accruals to fund its expansion programmes
Working results PTL has registered a handsome and constant growth in its profits because
of a brisk demand for new and better technology electronic items None of the other electronic
company has shown such a steady growth Philips has recorded the lowest current ratio
However with this lowest current ratio PTL still enjoys moderate payment period and highest
velocity of creditors and debtors only due to commitment of itrsquos employees
72
SUMMARY
According to the 1999 Gallup Poll the four elements that have proven to be effective in creating
employee loyalty are praise and recognition a sense of contribution to the company learning and
development and having a best friend at work
Creating a fairy-tale work environment begins withrecognition Your employees need it more
than money perks or titles Here are eight tips regarding recognition Remember these and your
employees may just start whistling while they work It is up to me The corporate culture or
financial rewards will not make your team successful It is up to you Recognition is one thing
that is completely in your control
Strong relationships are vital in todays economy Strengthening employee relationships is even
more necessary as companies downsize and lay off As your workforce shrinks and you need to
do more with less keeping quality employees becomes even more critical As a manager it is
your job to bond your best people to your company through recognition And you also must help
direct and motivate your core performers
Simple rewards earn big returns There are some relatively simple things you can do that will
earn big returns For example remember your employees birthdays and work anniversaries find
out what inexpensive rewards they value (for example tickets to a ball game or a half day off to
spend time with their kids) make the most of your formal service awards with some preparation
and a group presentation walk around your department every day and talk to your
people and thank them sincerely and often
73
Make it specific Praise and recognition must be specific to have impact General praise such as
You do great work actually can have the opposite effect and leave your employees wondering
Does he have any idea what I really do around here Specific praise links individual
accomplishments to company goals For example Cheryl I noticed the way you handled that
customer complaint Great work As you know we value quick resolutions of problems as
one of our core strategies
Ask the best to stay Call your best people into your office one at a time Let that bright young
college graduate know you value his fresh ideas and energy Tell the 20-year veteran how much
your team relies on her expertise and organizational skillsRemarkably a significant percent of
high-impact performers report that they left their last job because No one ever asked me to
stay
Forget cash
Remember the saying Money cant buy everything Well its true Dont wait until you can
offer an employee a raise or promotion Real thanks is its own reward In numerous surveys of
work satisfaction top on employees lists is feeling appreciated In fact when employees feel
recognized and involved they are much less likely to keep asking about money
Recognize
Recognition means most to an employee when it is sincere and spontaneous According to the
largest study ever conducted on workplace satisfaction (Gallup 1999) recognition should occur
at least every seven days If you wait until a year-end party or an annual review you are waiting
much too long to recognize and you probably are losing people you do not need to
74
Recognition works
Neglect can be a poisoned apple Recognition is the elixir that will spark better attitudes and
performance Jeffrey Pfeffer of Stanford University says The returns from managing people in
ways that build high commitment typically are on the order of 30 to 50 percent
Take a hard look in the mirror and ask yourself how you can recognize the fairest of them all
Learn to recognize your employees for their efforts thank them often and reward their
achievements You can awaken them from their anger and apathy and they will fall in love with
their jobs again Chances are you will work together happily ever after
So there is direct relation with employee satisfaction and their commitment towards the
organization and it is also clear from the above discussion that only monetary elements are not
sufficient for employee satisfaction rather other element like employer behavior recognisation
and other moral value
75
RECOMMENDATIONS
PHILIPS should increase its capacity utilization It should work at full capacity to
minimize its cost of production With this increase in capacity utilization the total cost
will spread over more units thereby decreasing the per unit cost
PHILIPS should decrease the credit facilities provided to its consumers The payback
period is quite high in case of debtors as compared to creditors it should be more or less
equal as it will help in improving company liquidity
PHILIPS should focus more on the consumer lifestyle goods in India parallel to its other
business as it accounts very less as compare to other businesses of Philips
Another recommendation for Mohali plant is about the HR department that is they
should appoint permanent and skilled workers as against casual workers which generally add
up to the profit of the company
76
BIBLIOGRAPHY
1 Values-Based Leadership Rebuilding Employee Commitment Performance and Productivity ( Thomas D Kuczmarski)
2 Monthly Journals of Philips Electronics India Ltd
3 Authentic Leadership Medtronic CEO Bill George
4 wwwindiaphilipscom
5 wwwwikipediacom
6 httpwwwemployeecommitmentcom
7 One Foot Out The Door How to Combat The Psychological Recession Thatrsquos Alienating Employees And Hurting American Business Judith Bardwick
8 Employee Commitment A Leader Ship Guide Joe Folkman
9 Harvard University Factors that Impact Employee Well Being Commitment and Productivity -An Article
77
Questionnaire
Name __________________________________________________________
Age______________________________ Gender _______________________
Qualification _______________________ Contact No ___________________
Q1 In which department you are working
Electrical Production Mechanical Other
Q2 What is your working experience
gt2 Years 2-4 Years 4-6 Years lt 6 Years
Q3 How You like the physical Working Environment of the organization
Excellent Good Fair Poor Very Poor
Q4 Are you satisfied with Non-Monitory benefits provided by the organisation
Highly Satisfied Satisfied Neither Satisfied Nor dissatisfied
Highly Dissatisfied Dissatisfied
Q5 Are you satisfied with your work
Highly Satisfied Satisfied Neither Satisfied Nor dissatisfied
Highly Dissatisfied Dissatisfied
Q6 Are you satisfied with the career development programe of the company
Highly Satisfied Satisfied Neither Satisfied Nor dissatisfied
Highly Dissatisfied Dissatisfied
Q7 Is other staff of the organization is co-operative with you
Highly Satisfied Satisfied Neither Satisfied Nor dissatisfied
Highly Dissatisfied Dissatisfied
Q8 Are you satisfied with top level management
Highly Satisfied Satisfied Neither Satisfied Nor dissatisfied
Highly Dissatisfied Dissatisfied
78
Q9 Are you satisfied with your subordinates
Highly Satisfied Satisfied Neither Satisfied Nor dissatisfied
Highly Dissatisfied Dissatisfied
Q10 Are you satisfied with the nature of the Job
Highly Satisfied Satisfied Neither Satisfied Nor dissatisfied
Highly Dissatisfied Dissatisfied
Q11 Do you have any Job Pressure in work
Yes No
Q12 Do you satisfied with the opportunities provided by the organisation
Highly Satisfied Satisfied Neither Satisfied Nor dissatisfied
Highly Dissatisfied Dissatisfied
Q13 Are you satisfied with the welfare facilities provided by the organisation
Highly Satisfied Satisfied Neither Satisfied Nor dissatisfied
Highly Dissatisfied Dissatisfied
Q14 Are you satisfied towards your salary
Highly Satisfied Satisfied Neither Satisfied Nor dissatisfied
Highly Dissatisfied Dissatisfied
Q15 Are you committed towards the organisation
Yes No
Signature

10
can apply both the lsquofundamentalrsquo and the lsquoappliedrsquo labels to many of the projects that wersquore
working on because they are both very flexible termsrdquo Philips Researchrsquos work on sleep for
instance is an excellent example of this more dynamic approach ldquoThis is a very important area
for Philips ndash but therersquos currently very little fundamental knowledge available Thatrsquos why wersquore
involved in investigating the key issues at a more fundamental level together with our university
and research institute partners The only difference is that we want this research to lead to
marketable products and solutionsrdquo
Open Innovation in new areas
Despite the flexible nature of the ldquofundamentalrdquo and ldquoappliedrdquo labels it is still possible to detect
a decline in some areas of more fundamental research at Philips in recent years ldquoThis has mainly
occurred in fields that donrsquot support the execution of our companyrsquos Health and Well-being
strategyrdquo says Aarts As he explains this refocusing exercise has gone hand-in-hand with an
expansion of more fundamental research activities in a number of new fields such as deep-brain
stimulation and multi-modal imaging for healthcare applications ldquoIn these fields wersquore
considered to be an extremely important research partner ndash especially by colleagues working in
universitiesrdquo In the future Philips Research will continue to develop its reputation in a number
of exciting fundamental domains ndash ldquogreen lightingrdquo and skincare are just two examples ndash albeit
with a more applied focus ldquoHopefully this research will enable us to build on our strong
heritage of improving the quality of peoplersquos lives
11
BOARD OF DIRECTORS
Non-Executive Director amp Chairman S M Datta
Executive Vice Chairman amp Managing Director Murali Sivaraman
Executive Director Jan-Hein Louwman
Non-Executive Director S Venkatramani
India Management Team
MURALI SIVARAMANN - CEO
ANJAN BOSE - Healthcare
JAN-HEIN LOUWMAN ndash CEO
MAHESH KRISHNAN ndash Consumer lifestyle
RAJEEV CHOPRA ndash lighting
RAKESH SHARMA ndash Strategic Business Development
S NAGARAJAN ndash Human resources
VIVEK SHARMA ndash Chief Marketing Officer
WIDO MENHARDT ndash Philips Innovation Campus
12
Corporate Office-
Philips Electronics India Ltd
Technopolis Knowledge Park
Mahakali Caves Road
Chakala Andheri (East)Mumbai 400 093
Tel +91 22 66912000
VISION 2012
Through the Vision 2012 strategy we aim to fuel growth by making Philips the leading brand in
Health and Well-being Vision 2012 further positions Philips as a market-driven people-centric
company with a strategy and a structure that fully reflect the needs of its customer base while
also increasing shareholder value This is implemented through sharpened strategies in the three
core sectors Healthcare Lighting and Consumer Lifestyle
ldquoWith Vision 2010 we are putting people right at the center of things with Health and Well-
being as our overarching theme We are thereby putting into practice our mission improving the
quality of life through the introduction of meaningful innovationsrdquo ndash Gerard Kleisterlee
President and CEO of Royal Philips Electronic
Our Ways of Working
1 We are a people-centric company that organizes around customers and markets
2 We invest in a strong brand and consistently deliver on our brand promise of ldquosense and
simplicityrdquo in our actions products and services
13
3 We deliver innovation by investing in world class strengths in end-user insights
technology design and superior supplier networks
4 We develop our peoplersquos leadership talent and engagement and align ourselves with high
performance benchmarks
5 We invest in high growth and profitable businesses and emerging geographies to achieve
market leadership positions
6 We are committed to sustainability and focus on making the difference in efficient energy
use
7 We drive operational excellence and quality to best in class levels allowing us the above
mentioned strategic investments in our businesses
BRAND PROMISE
It is the combination of two unique capabilities that enables us to deliver on our ldquosense and
simplicityrdquo promise These capabilities are firstly by understanding people and secondly
technology integration and product design
We put our end users front and center of product innovations starting with understanding their
needs and aspirations We use best-in-class research facilities and agencies to validate and ensure
that our product innovations are designed around peoplersquos needs and aspirations easy to
experience and advanced
SUSTAINABILITY
14
In 2009 we evaluated our sustainability strategy and resolved to fully leverage sustainability as
an integral part of our overall strategy and an additional driver of growth as reflected in the
Philips Management Agenda 2012
To deliver on our brand promise of ldquosense and simplicityrdquo and at the same time provide the
company direction for the longer term in this area we have identified three sustainability
leadership key performance indicators where we can bring our competencies to bear lsquocarersquo
lsquoenergy efficiencyrsquo and lsquomaterialsrsquo including targets for 2015
Bringing care to more than 500 million people
Target 500 million lives touched by 2015
Improving energy efficiency of Philips products
Target 50 improvement by 2015 (for the average total product portfolio) compared to
2009
Closing the materials loop
Target Double global collection recycling amounts and recycled materials in products
by 2015 compared to 2009
Each sector will take the lead on one of the leadership key performance indicators with
Healthcare leading lsquocarersquo Lighting lsquoenergy efficiencyrsquo and Consumer Lifestyle lsquomaterialsrsquo
In addition we defined a set of complementary performance indicators to accelerate change and
drive performance including the EcoVision4 parameters
With EcoVision4 we have committed to the following by 2012
15
bull Generate 30 of total revenues from Green Products
bull Double investment in Green Innovations to a cumulative EUR 1 billion
bull Improve our operational energy efficiency by 25 and reduce our CO2 emissions by 25 all
compared with the base year 2007
SOCIAL COMMITMENT
Living up to this commitment means we use our capabilities to enhance the lives of our
employees and people in society at large Within the company we encourage teamwork and
collaboration in an environment that enables employees to reach their full potential
Building on our rich heritage of involvement in social issues we have established our own
approach of supporting the communities where we live and work focusing on energy efficiency
and healthcare
Sustainable lighting
There is a pressing need to find innovative lighting solutions for the 16 billion people who live
in areas with no access to the electricity grid or where the grid is unreliable Thatrsquos why we have
developed SMILE (Sustainable Model in Lighting Everywhere)
Launched as a pilot in 2006 in four Indian states SMILE includes two lighting solutions UDAY
a rechargeable portable lantern and KIRAN a hand-cranked LED flashlight Today are
distributed in eighth Indian states
16
SWOT ANALYSIS
Strengths
bull India was a market where the first mover enjoyed advantages over latecomers
bull The first image of the product lasted long in the eyes of the consumer and the first to enter the
market could gain the largest market share
bull PHILIPS is committed to enhance its image to the Chinese market as investors
bull PHILIPS was building a wholly owned manufacturing plant in India to show the
Chinese the commitment Korea had to the Chinese society
bull Labor costs in India were less and would defray the cost of producing high-end
bull Samsung has been making color TVs for many years in Korea before moving to the Chinese
market
Weaknesses
bull PHILIPS must continue to control all costs to maintain success
bull India has a reputation of being a protected market (protectionism)
bull India was a market where the first mover enjoyed advantages over late comers PHILIPS is
trying to overcome the first comer advantage Japan manufacturers have over them by being those
first comers
bull Companies such as Sony and Matsushita had built sales and service networks that were
favorable to their sales programs in India while Samsung would have to catch up in that area
17
bull Samsung is not as experienced in manufacturing high-end TVs for a higher-end market
segment
Opportunities
bull Based on the data that on 28 of the 220 million rural households own a color TV PHILIPS
focus on the domestic India market should be to penetrate the rural household market which
would mean that for those purposes the low-end production of sets in the 13rdquo to 20rdquo range should
be produced to appeal to that segmentrsquos purchasing ability
bull Larger more high-end models can be produced to appeal to an urban customer in India as well
as being an export to the US and European higher end customers
bull With success in the higher-end manufacturing and sales of premium TVs in India PHILIPS can
establish themselves as high-end producers around the world
Threats
bull PHILIPS faces intense competition in the color TV market
bull A premium-priced product wouldnrsquot sell in large volumes so pricing can be a problem
bull Since PHILIPS didnrsquot have an established marketing strategy issues of how to market the
product may arise
bull Loss of profitability because related to over-employment at most facilities
bull Is the per capita income level such that it can support sales of product at any level
bull If PHILIPS fails to be successful in the Chinese market with high-end product it will be known
around the world bull India was a market where the first mover enjoyed advantages over late
comers
bull The first image of the product lasted long in the eyes of the consumer and the first to enter the
18
market could gain the largest market share
bull PHILIPS is committed to enhance its image to the Chinese market as investors
PHILIPS ELECTRONICS MOHALI PLANT
The mohali plant was established in 1985 as PUNJAB ANAND LAMP Ltd as its second
division of lamp industry after the varodra plant at that time it was a joint stock company and
majority of shares was with Punjab Anand Lamp around 75 but in the year 2001 the company
ownership changed and the whole shares was bought by PHILIPS ELECTRONIC INDIA Ltd
and its name was changed to PHILIPS ELECTRONIC INDIA Ltd MOHALI LIGHT
FACTORY
The plant is situated in Industrial focal point PHASE-9 MOHALI near Mohali railway station
and is sreaded in 26 acres Total employees of tis plant is 532 including casual employees This
company is a landmark in the Punjab state as it is the only factory which is most profitable one
than any industry located in Punjab
19
OVERVIEW OF VARIOUS FRONTS OF
PHILIPS ELECTRONICS INDIA Ltd
Manufacturing-
Today the product range of Philips include the following products ndash
Televisions- LCD Plasma Flat Screen Smart Touch XL
Recorders DVD Players I pods and Home Theatre Systems
Audio Products - Audio Systems Remote Controls AudioVideo Accessories
Digital Photo Products and Frames
Portable Audio and Video Systems Accessories like Headphones and Speakers
PC Products - Mouse and Keyboard Multi Media Headsets External Hard Disk Drives
Mobile Phones
Male Shaving and Grooming - Dry Shavers Beard Trimmers
Personal Care - Beauty and Hair Care Products
20
Kitchen Appliances - Blenders and Hand Blenders Juicers and Citruspresses Food
Processors and Mixers Coffee Makers and Kettles Frying and Grilling Appliances
Toasters and Snacking Products
Household Products - Irons Vacuum Cleaners Water Purifiers
Professional Lighting - Industrial Shops and offices Road and Area Hospitality Sports
Lighting City Beautification and Petrol Stations
Automotive Lighting - In Cars Motorcycles and Trucks
Home Lighting
SERVICS
Philips E-waste Management Program in India
Philips has tied up with a recycler for collecting transporting and recycling unwanted broken
down consumer products
At Philips we offer consumers a convenient way of recycling their unwanted obsolete and
damaged Philips products by dropping them off at convenient locations The program
encompasses 8 major cities across India Consumers can approach one of 27 authorized Philips
service centres which will act as collection points for consumer products which need recycling
Our efforts are to expand the network in the near future
Philips ensures that the consumer products received will be recycled in an environment-friendly
manner Philips understand the corporate social responsibility and takes steps towards providing
a safer environment to the future generations We design our products to continuously realize
improvements and reduce their overall life cycle environmental impact Designing products for
21
recycling is an integral part of this approach Our aim is to use our planetrsquos limited resources
effectively and respect the principle of extended producer responsibility This also calls for
manufacturers to engage in developing solutions for effective and efficient recycling of their
products We will continue to promote and invest into improved recycling systems to reduce the
impact of electronic waste on the environment
MANUFACTURING AT MOHALI PLANT ndash
Mohali plant mainly manufactures lighting products basically of domestic usage this includes the
following products ndash
CFL bulbs ndash
1 Genie - 5 watt 8 watt 11 watt
2 Essential ndash 8 watt 11 watt 14 watt 18 watt 23 watt 29 watt
3 Tornado ndash 5 watt 8 watt 11 watt 14 watt 18 watt 23watt 29 watt
4 T5 slim tube 28 watt
Coil plant ndash Philips Electronics India is the only company that produces coils in the whole
lighting industries in the world and in India only at the MOHALI PLANT
22
Chapter-II
OBJECTIVES OF THE STUDY
23
OBJECTIVES OF THE STUDY
To study the various aspects of Satisfaction Level of the Employees working at Philips
Electronics India Ltd Mohali
To analyze the effect of Job satisfaction on the organisation
To determine the relation between job satisfaction of employees and their commitment
towards the organisation
To analyze the performance model adopted by the Philips Electronics India Ltd Mohali
to handle their manpower
To suggest remedial measures for the improvement of the companyrsquos performance
24
Chapter-III
Employees Commitment
25
Employees who are engaged in their work and committed to their organizations give companies
crucial competitive advantagesmdashincluding higher productivity and lower employee turnover
Thus it is not surprising that organizations of all sizes and types have invested substantially in
policies and practices that foster engagement and commitment in their workforces
But what are employee engagement and commitment exactly This report examines the ways in
which employers and corporate consultants define these terms today and offers ideas for
strengthening employee engagement Though different organizations define engagement
differently some common themes emerge These themes include employeesrsquo satisfaction with
their work and pride in their employer the extent to which people enjoy and believe in what they
do for work and the perception that their employer values what they bring to the table The
greater an employeersquos engagement the more likely he or she is to ldquogo the extra milerdquo and deliver
excellent on-the-job performance In addition engaged employees may be more likely to commit
to staying with their current organization Software giant Intuit2 for example found that highly
engaged employees are 13 times more likely to be high performers than less engaged
employees They are also five times less likely to voluntarily leave the company
Clearly engagement and commitment can potentially translate into valuable business results for
an organization To help you reap the benefits of an engaged committed workforce at your
organization this report provides guidelines for understanding and measuring employee
engagement and for designing and implementing effective engagement initiatives As you will
26
see everyday human resource practices such as recruitment training performance management
and workforce surveys can provide powerful levers for enhancing engagement
Employee Engagement Key Ingredients
ldquoEmployee Engagement Definedrdquo shows examples of engagement definitions used by various
corporations and consultancies Clearly definitions of employee engagement vary greatly across
organizations Many managers wonder how such an elusive concept can be quantified The term
does encompass several ingredients for which researchers have developed measurement
techniques These ingredients include the degree to which employees fully occupy themselves in
their work as well as the strength of their commitment to the employer and role Fortunately
there is much research on these elements of engagementmdashwork that has deep roots in individual
and group psychology
Definition
ldquoNo company small or large can win over the long run without energized employees who
believe in the [firms] mission and understand how to achieve it Thats why you need to take the
measure of employee engagement at least once a year through anonymous surveys in which
people feel completely safe to speak their mindsrdquo
-Jack and Suzy Welch-
Common Themes How Companies Measure Engagement
Employers typically assess their employeesrsquo engagement levels with company-wide attitude
or opinion surveys
27
1048657 Pride in employer
1048657 Satisfaction with employer
1048657 Job satisfaction
1048657 Opportunity to perform well at challenging work
1048657 Recognition and positive feedback for onersquos contributions
1048657 Personal support from onersquos supervisor
1048657 Effort above and beyond the minimum
1048657 Understanding the link between onersquos job and the organizationrsquos mission
1048657 Prospects for future growth with onersquos employer
1048657 Intention to stay with onersquos employer
The Link Between Employer Practices and Employee Engagement
How does an engaged workforce generate valuable business results for an organization The
process starts with employer practices such as job and task design recruitment selection
training compensation performance management and career development Such practices affect
employeesrsquo level of engagement as well as job performance Performance and engagement then
interact to produce business results Figure 1 depicts these relationships
28
EMPLOYEE COMMITMENT EMPLOYEE ENGAGEMENT
1048657 How do you and other managers in your
organization define commitment
1048657 Are some employees in your company
engaged in their work but not committed to
the organization Committed to staying with
your firm but not exactly engaged in their
work Both engaged and committed
1048657 To whom are your organizations employees
committed The company Their supervisor
Co-workers Team members Customers
1048657 What business results has commitment from
1048657 How do you and other managers in your
organization define employee engagement
1048657 How do you know that certain employees in
your company are engaged Do they relish
their jobs Enjoy specific responsibilities or
tasks Willingly ldquogo the extra milerdquo
1048657 In teams departments or business units in
your company that have a large number of
engaged employees what business results
are you seeing Higher productivity Lower
costs Greater revenues More efficiency
29
employees created for your organization For
example has commitment reduced turnover
and therefore decreased recruitment hiring
and training costs
1048657 What does your company do to reciprocate
employees commitment Is the organization
living up to its side of the bargain
Lower turnover Higher product or service
quality
1048657 Conversely how do disengaged employees
behave and what are the consequent costs
for their teams units-and your entire
company
As Figure 2 suggests a person possesses attributes such as knowledge skills abilities
temperament attitudes and personality He or she uses these attributes to accomplish work
behaviors according to organization-defined procedures by applying tools equipment andor
technology Work behaviors in turn create the products and services that make an organization
successful We classify work behaviors into three categories those required to accomplish duties
and tasks specified in a job description (prescribed behaviors) ldquoextrardquo behaviors that an
employee contributes for the good of the organization (voluntary behaviors) and behaviors
prohibited by an employer (proscribed behaviors including unexcused absenteeism stealing and
other counterproductive or illegal actions) Of course job performance occurs in an
organizational context which includes elements such as leadership physical setting and social
setting
30
Employers naturally want to encourage workers to perform prescribed and voluntary activities
while avoiding proscribed ones To achieve these goals organizations use a number of HR
practices that directly affect the person process and context components of job performance
Employeesrsquo reactions to these practices determine their levels of engagement and commitment
31
Chapter-IV
32
LITERATURE OF THE REVIEW
ldquo Job Satisfaction That Leads To The Commitment Of
The Employees in The Organisationrdquo
Literature of Review
Gerge Bill Authentic Leadership
In his book Authentic Leadership former Medtronic CEO Bill George makes an obvious
point that business leaders rarely say out loud ldquoMissions motivate dollars donrsquotrdquo
What he means is that purpose is what drives employee commitment not the financial
rewards that come to others Workers donrsquot get up in the morning and say ldquoGee I can
33
hardly wait to get to work today to maximize shareholder profitsrdquo Even when employees
are shareholders who can benefit from improved financials what draws people to their
chosen careers is the work itself and its purpose in the world more than the profit
possibilities
Mr George goes on to say ldquoI find there is universal agreement (among middle managers)
that you cannot inspire employees by urging them to help management get the companyrsquos
stock price uprdquo
There is in fact quite a bit of literature on this subject In Awakening Corporate Soul
authors Eric Klein and John Izzo say that employee commitment requires knowing ldquothe
purpose of our work it means recognizing the purpose our organization fulfills that goes
beyond the bottom line and it means articulating to others how their (workersrsquo) efforts
contribute to a larger purposerdquo
In Built to Last Jim Collins and James Porras spend an entire book explaining their five
year research study of major companies that led to this conclusion about employee
commitment Purpose within a company is what sustains it profit is important but when
itrsquos the prime directive companies falter
-Marshal Goldsmith-
How to Increase Employee Commitment
In practice this involves walking the talk being transparent communicating effectively treating
people equally teaching leading subordinates to increasingly excellent performance ndash and
responding to subordinates as mature individuals who are owed fairness the truth and
recognition of their achievements
34
Since managers interact directly and frequently with subordinates they are usually more tuned
in to how employees are feeling than are executives Managers are in a better position to know
for example when employees are feeling alienated and disengaged from their work which is
very common today -- and expensive
Gaining employee commitment results in greater profits because enthusiastic employees stay
contribute discretionary effort and engage customers Performance soars when customers are
enthused and stay and when executives managers and employees are a collaborative team
united in achieving common goals
But managers are often called middle managers for good reason their job is to motivate and
guide subordinates while they at the same time are being judged by their bosses Because of
their ldquotweenrdquo position in the hierarchy managers to effective support direct reports must also
create relationships with potential allies especially those with greater power who have access to
top decision makers
Harvard University Factors that Impact Employee Well Being Commitment and
Productivity
Business executives from the C-suite and HR to QC and RampD are by nature focused on the
corporate bottom line A new trend in our dawning age of social sustainability is that many
experts believe more attention should be paid to the dotted line - the one signed when a person
35
commits to employment at a company New Harvard research validates this approach affirming
that trust and purpose play a significant role in building successful productive workplaces
The behavioral research conducted by a team at Harvard University and Massachusetts General
Hospital identifies the factors most likely to impact 21st century employee well being
commitment and productivity The researchers found that commitment is largely influenced by
ones sense of purpose feeling of personal impact and overall trust in the organization
Productivity is largely affected by the quality of human relationships including cooperative
social group moods and interaction
The results lead us to conclude that workplaces that provide positive environments that foster
interpersonal trust and quality personal relationships create the most committed and productive
employees says Nancy Etcoff PhD the lead researcher on the study
Expert Shares Keys to Building Successful Workplace Relationships
According to business strategist Courtney Anderson JD MBA Outstanding leadership
today means much more than just doing your job Success is creating an environment that fosters
happy committed productive team members
Anderson explains that reinvigorating workplaces by enhancing trust and employee commitment
does not have to be difficult The biggest challenge she says is making the time to truly change
in our overscheduled instant access competitive work environments With a little know-how it
can be easy to evolve workplace well being and respond to these compelling research results
-Mark Howell-
CEO Bright Point
High-performing companies recognize that employee commitment is a major contributing factor
toward sustaining long-term success and creating value An engaged employee is involved and
excited about their work and acts in a manner that will forward the organizationrsquos interest An
36
engaged workforce helps optimize and retain talent for the long-term because the employees
choose to stay even when other employment alternatives exist
According to Walker Information the top three drivers of employee commitment are
Satisfaction Fairness and Care amp Concern for employees Put simply committed employees
want to enjoy their work feel they are appreciated and know they are making a contribution to
their companyrsquos strategic objectives Additionally employees who have trust in their leadership
and are trusted by their leadership have a greater dedication and are ultimately more productive
on the job However according to recent data provided by the National Business Research
Institute (NBRI) only 31 of all employees are truly engaged
At BrightPoint we take employee engagement seriously and we work to create a culture that
inspires employee loyalty and satisfaction The results of BrightPointrsquos commitment to its
employees are shown in the 2011 BPNA Employee Commitment Survey The survey
determined that close to 80 of respondents indicated they were satisfied with their jobs and
daily activities General employee satisfaction increases when managers take an active interest
in their employees beyond their day-to-day job responsibilities According to NBRI managers
that actively coach build relationships and keep an open dialogue with their employees improve
employee engagement
We have a diverse workforce where each employee brings unique value and has individual
needs Managers are learning to manage the individual and not the position In order to give
managers the tools they need to be successful BrightPoint places strong emphasis on targeted
leadership training workshops and continual learning resources In 2011 906 of managers at
BrightPoint NA participated in the development opportunities offered and also made an effort to
37
help reinforce the learning of their team members This signals that our leadership team is taking
an active interest in professional development and its connection to employee commitment
As BrightPoint continues to increase focus on employee engagement the organization will grow
stronger and maintain a substantial advantage over our competition Our employees possess the
knowledge experience and resiliency to respond quickly to the demands of the marketplace and
through their genuine commitment will deliver what our customers want with increasing
efficiency and effectiveness Our responsibility is value-creation by growing our business and
maintaining high levels of customer service and loyalty We believe the best way to accomplish
this is through a strong committed and engaged workforce
Performance Model Adopted At Mohali Plant
38
Process adopted by Philips Electronics Mohali Plant for Job Satisfaction of Employee that leads commitment of the employees
39
Recruiting
The messages in Philips Electronics Mohali organization conveys while seeking to attract job
applicants also can influence future employeesrsquo engagement and commitment If your firm has
designed jobs specifically to engage employees then organization want to ensure that recruiting
ads extol these positionsrsquo attractive featuresmdashsuch as challenging work assignments a highly
skilled team environment or minimal supervision Applicants who notice and respond to these
ads will more likely be motivated by these features Also consider how organization might best
seek candidates from inside your organization When Organisation recruit existing employees for
desirable jobs you enhance their engagement (by maximizing the person-job fit) and
commitment (by providing growth and advancement opportunities to employees in return for
their loyalty) If Organisation recruit from outside when qualified internal candidates are
available Organization may unwittingly suggest to current employees that your company is not
willing to reciprocate their commitment Existing staff may then begin questioning their own
commitment to the firm By contrast organisation recruit external candidates to both the job and
your organization For these candidates ensure that recruiting messages highlight attractive job
features organizational values and commitment reciprocity That is in return for performance
and dedication your company offers competitive pay and benefits flexible work hours and
learning and career advancement opportunities Also remember that prospective employees have
multiple commitments You will inevitably have to compete with those commitments as
organization try to attract candidates to your firm Most people find it easier to make a new
commitment when it is compatible with their other obligations For example you boost your
chances of recruiting a highly qualified candidate who is a single parent if you offer flexible
work hours family health benefits and on-site day care ldquoRecruiting for Engagement and
Commitmentrdquo
40
Employee Selection
Once recruiting efforts produce a pool of promising job candidates Philips select among them to
fill available positions When organisation select the right individuals for the right jobs new
hires carry out their work more smoothly and experience fewer performance problems The
result Greater enjoyment ofmdashand engagement inmdashthe job
To enhance engagement through your selection of employees identify those candidates who are
best-suited to the job and your organizationrsquos culture Also use candidate assessment methods
that have obvious relevance to the job in questionmdashfor example by asking interviewees what
they know about the role and having them provide work samples Most candidates will view
these techniques more positively than tests with less apparent relevance such as personality and
integrity assessments Successful candidates feel good about having ldquopassed the test and see
company as careful and capable for having selected them A positive initial impression of an
employer encourages growth of long-term commitment
Training and Development
Training and development can serve as additional levers for enhancing engagement and
commitment For new hires training usually begins with orientation Orientation presents several
important opportunitiesmdashincluding explaining pay work schedules and company policies Most
important it gives you a chance to encourage employee engagement by explaining how the new
hirersquos job contributes to the organizationrsquos mission Through orientation Mohali Plant of Philips
Electronics describe how r company is organized introduce the new employee to his or her co-
workers give the person a tour of the area where he or she will be working and explain safety
regulations and other procedural matters In short you foster person-organization fitmdashvital for
developing productive and dedicated employees Through training you help new and current
41
employees acquire the knowledge and skills they need to perform their jobs And employees who
enhance their skills through training are more likely to engage fully in their work because they
derive satisfaction from mastering new tasks Training also enhances employeesrsquo value to your
company as well as their own employability in the job market In addition most companies offer
higher wages for skilled workers to compensate them for their greater value and to discourage
turnover
Compensation
Like the HR practices discussed above compensation can powerfully influence employee
engagement and commitment Some compensation components encourage commitment to
employers while others motivate engagement in the job It is possible to stimulate one and not
the other though itrsquos generally better to foster both For example a company that offers a strong
performance incentive system but no retirement plan will probably realize exceptional
engagement from its workers however they may eventually commit themselves to another
company that does offer a good retirement plan Meanwhile an organization that offers generous
retirement benefits but a traditional seniority-based pay grade system may have committed
employees however these workers might deliver pedestrian performance as they bide their time
until retirement In designing compensation plans you therefore need to consider employee
engagement and commitment strategically
Encourage managers to include employees in the goal-setting process This technique helps to
ensure that workers understand the goals It also promotes acceptance of challenging objectives
because people generally feel more committed to goals they have helped define In addition
consider how you and other managers will recognize and encourage contributions that exceed
expectations For example when a piece of equipment malfunctions Joe finds other ways to
maintain production rather than merely shutting down the machine and waiting for the
42
maintenance staff to fix it Or when a less experienced co-worker encounters a new task Sally
offers friendly coaching instead of standing by and waiting for the inevitable mistakes to crop
up Performance management processes operate on a continuous basis Therefore they provide
perhaps the best ongoing opportunities for employers to foster employee engagement and
commitment For example managers can use routine discussions about performance and
feedback sessions to learn which aspects of the job hold the most interest for each employee and
which tasks are most challenging During such discussions managers also can define what going
above and beyond the call of dutyrdquo looks like and generate ideas for rewarding such
contributions An employeersquos aspirations and career goals can receive careful attention during
performance appraisal meetings Without inquiring into an employeersquos personal life a supervisor
can nevertheless explore ways to enhance the compatibility between the workerrsquos commitment to
your organization and the employeersquos other life commitments Through such means the
organization personalizes its relationship to each employee and provides support while also
expressing appreciation for their contributionsmdash key drivers of engagement and commitment
To further engage employees and win their commitment through your performance management
programs consider how to treat your organizationrsquos most experienced employees In many cases
these employees understand the intricacies of a job better than their supervisors or managers do
By virtue of long identification with your organization they may be deeply committed to high-
level goals They use their expertise to contribute in ways that newer employees simply cannot
match But many of them also may be planning to retire soon especially if they are from the
ldquoBaby Boomerrdquo generation How will you transfer their knowledge to younger workers Design
a performance management system that recognizes and rewards proactive sharing of knowledge
and expertise among co-workers For example create knowledge repositories or learning
histories that can be stored in databases that employees can access and then create incentives
43
for people who contribute to and use these repositories Of course effective performance
management systems also identify employees who are not meeting expectations Failing to
address problem performance can erode other employeesrsquo engagement and commitment as their
workloads increase and they conclude that the company is willing to tolerate poor performance
If feedback coaching and remedial training are of little avail the manager may need to move the
person to a different position within the company where he or she can make a more valuable
contribution or let the individual go if there is no good match elsewhere in the organization
44
Chapter-V
RESEARCH METHODOLOGY
The basic task of research is to generate accurate information for use in decision-making
Research can be defined as the systematic and objective process of gathering recording and
analyzing data for aid in making business decisions As the project involves analyzing of
45
financial structure the research is exploratory in nature covering financial parameters and come
of the important ratios to carry out research There are basically two techniques adopted for
obtaining information
Primary Data
Secondary Data
Primary Data is gathered specifically for the project at hand through personal interviews with
the accounts officers
Sample Size = 100 Employees
Secondary data is previously collected and assembled for some project other than the one at
hand It is gathered and recorded by someone else prior to current needs of the researcher It is
less expensive than the primary date
Secondary Data can be obtained from both external and internal sources
External data may be collected from books and periodicals government sources media and other
commercial sources
Internal data is that secondary data which is created recorded or generated by the organization
As the project is explanatory in nature secondary data is collected from the reports of the
company books journals and interest Secondary data is gathered from annual reports official
records and standing orders of the units
CHAPTER - VI
DATA ANALYSIS AND INTERPRETATION
46
The data after collection is to be processed and analyzed in accordance with the outline
and down for the purpose at the time of developing research plan
Technically speaking processing implies editing coding classification and tabulation of
collected data so that they are amenable to analysis The term analysis refers to the computation
of certain measures along with searching for pattern groups Thus in the process of analysis
relationship or difference should be subjected to statistical tests of significance to determine with
what validity data can be said to indicate any conclusions
The analysis of data in a general way involves a number of closely related operations
which are performed with the purpose of summarizing the collected data and organizing them in
such a manner that they answer the research questions In this study the researcher followed
above process carefully and it is presented in this chapter
47
Table 41 ndash To know the department in which employees are belongs to
S
ou rc
e
survey data
Inference
From the above table it shows that 35 of employees are belongs to
production department
FIGURE 41
S
SI No
D
Department
N
No of Respondents
P
Percentage
1
1
M
Mechanical
3
30
3
30
2
2
E
Electrical
2
25
2
25
3
3
P
Production
3
35
3
35
4
4
O
Others
1
10
1
10
T
Total
1
100
1
100
48
REPRESENTS THE DEPARTMENT
Table 42 ndash To know working experience of the employees
Source survey data
Inference
From the above table it shows that 34 of the employees have 4 ndash 6
years experience
S
SI No
W
Work Experience
N
No of Respondents
P
Percentage
1
1
B
Below 2 years
1
33
1
13
2
2
2
2ndash 4 years
3
30
3
30
3
3
4
4ndash 6 years
3
34
3
34
4
4
A
Above 6 years
2
23
2
23
T
otal
1
100
1
100
49
FIGURE 42
REPRESENTS THE EXPERIENCE OF THE EMPLOYEES
Table 43 ndash To know the physical working environment
S
SI No
W
Working Environment
N
No of Respondents
P
Percentage
1
1
E
Excellent
1
12
1
12
2
2
G
Good
5
57
5
57
3
3
F
Fair
2
28
2
28
4
4
P
Poor
0
03
0
33
5
5
V
Very Poor
0
00
0
00
T
Total
1
100
1
100
Source survey data
Inference
From the above table it shows that 57 of the employees were feeling good about the working environment
50
FIGURE 43
REPRESENTS THE PHYSICAL WOKING ENVIRONMENT
51
Table 44 ndash To know the satisfaction level of employees towards the non-monitory benefits
S
SI No
N
Non-Monitory Benefits offered
to Employees
N
No of Respondents
P
Percentage
1
1
H
Highly Satisfied
1
14
1
14
2
2
S
Satisfied
5
54
5
54
3
3
N
Neither Satisfied nor Dissatisfied
2
25
2
25
4
4
D
Dissatisfied
0
05
0
05
5
5
H
Highly Dissatisfied
0
02
0
02
Total 1
100
1
100
Source survey data
Inference
From the above table it shows that 54 of the employees were satisfied towards the non-monitory benefits
FIGURE 44
REPRESENTS THE SATISFACTION LEVEL OF EMPLOYEES TOWARDS THE NON-MONITORY BENEFITS
52
Table 45 ndash To know the satisfaction level of respondents towards the work
assigned
Source survey dataInference
From the above table it shows that 45 of the respondents were satisfied towards the work assigned
FIGURE 45
S
SI No
A
Amount of Work
N
No of Respondents
P
Percentage
1
1
H
Highly satisfied
2
20
2
20
2
2
S
Satisfied
4
45
4
45
3
3
N
Neither Satisfied nor Dissatisfied
1
12
1
12
4
4
D
Dissatisfied
1
18
1
18
5
5
H
Highly Dissatisfied
0
06
0
06
Total 1
100
1
100
53
REPRESENTS THE SATISFACTION LEVEL OF RESPONDENTS TOWARDS THE WORK ASSIGNED
54
Table 46 ndash Opinion about the career development programme in their organisation
S
SI No
C
Career Development
N
No of Respondents
P
Percentage
H
Highly satisfied
1
12
1
12
S
Satisfied
5
56
5
56
N
Neither Satisfied nor Dissatisfied
2
22
2
22
D
Dissatisfied
1
10
1
10
H
Highly Dissatisfied
0
00
0
00
Total 1
100
1
100
Source survey data
Inference
From the above table it shows that 56 of the employees were satisfied
with the opinion about the carrier development programme in their organisation
FIGURE 46
REPRESENTS OPINION ABOUT THE CAREER DEVELOPMENT
PROGRAMME IN THEIR ORGANISATION
55
Table 47 ndash To know the cooperation of co-workers
S
SI No
C
Co-operation of Workers
N
No of Respondents
P
Percentage
1
1
H
Highly satisfied
2
20
2
20
2
2
S
Satisfied
6
66
6
66
3
3
N
Neither Satisfied nor Dissatisfied
1
11
1
11
4
4
D
Dissatisfied
0
03
0
03
5
5
H
Highly Dissatisfied
0
00
0
00
Total 1
100
1
100
Source survey data
Inference
From the above table it shows that 66 of the employees were satisfied
with the cooperation of co-workers
FIGURE 47
56
REPRESENTS THE COOPERATION OF CO-WORKERS
57
Table 48 ndash To know the satisfaction of Respondents with top management
S
SI No
S
Satisfaction with Top
Management
N
No of Respondents
P
Percentage
1
1
H
Highly satisfied
2
26
2
26
2
2
S
Satisfied
5
51
5
51
3
3
N
Neither Satisfied nor Dissatisfied
1
17
1
17
4
4
D
Dissatisfied
0
06
0
06
5
5
H
Highly dissatisfied
0
00
0
00
Total 1
100
1
100
Source survey data
Inference
From the above table it shows that 51 of the employees were satisfied with the top management
FIGURE 48
58
REPRESENTS THE SATISFACTION OF RESPONDENTS WITH TOP MANAGEMENT
Table 49 ndash To know the satisfaction of Respondents with their subordinates
Source survey data
Inference
From the above table it shows that 67 of the employees were satisfied with their subordinates
S
SI
No
S
Satisfaction with Subordinates
N
No of Respondents
P
Percentage
1
1
H
Highly satisfied
1
12
1
12
2
2
S
Satisfied
6
67
6
67
2
3
N
Neither Satisfied nor Dissatisfied
1
14
1
14
4
D
Dissatisfied
0
07
0
07
5
5
H
Highly Dissatisfied
0
00
0
00
Total 1
100
1
100
59
FIGURE 49
REPRESENTS THE SATISFACTION OF RESPONDENTS WITH THEIR SUBORDINATES
60
Table 410 ndash To know the level of satisfaction regarding nature of job
S
SI No
J
Job Satisfaction
N
No of Respondents
P
Percentage
1
1
H
Highly satisfied
2
22
2
22
2
2
S
Satisfied
5
56
5
56
3
3
N
Neither Satisfied nor Dissatisfied
1
16
1
16
4
4
D
Dissatisfied
0
07
0
07
5
5
H
Highly Dissatisfied
0
00
0
00
Total 1
100
1
100
Source survey dataInference
From the above table it shows that 56 of the employees were satisfied with their job
FIGURE 410
61
REPRESENTS THE LEVEL OF SATISFACTION REGARDING THE NATURE OF JOB
Table 411 ndash To know whether there is any job pressure in their work
Source survey data
Inference
From the above table it shows that 72 of employees said there is job pressure in their work
FIGURE 411
REPRESENTS WHETHER THERE IS ANY JOB PRESSURE IN THEIR WORK
S
SI No
J
Job Pressure
N
No of Respondents
P
Percentage
1
1
Y
Yes
7
72
7
72
2
2
N
No
2
28
2
28
T
Total
1
100
1
100
62
Table 412 ndash To know the opinion regarding opportunity provided by the organisation in developing skills
amp talents
S
SI No
D
Development of Skills and
Talents
N
No of Respondents
P
Percentage
1
1
H
Highly Agree
1
12
1
12
2
2
A
Agree
5
52
5
52
3
3
N
Neither Agree nor Disagree
2
28
2
28
4
4
D
Disagree
0
06
0
06
5
5
H
Highly Disagree
0
02
0
02
Total 1
100
1
100
Source survey data
Inference
From the above table it shows that 52 of employees agreed regarding opportunity provided by the organisation in developing skills amp talents
63
FIRGURE 412
REPRESENTS THE OPPORTUNITY PROVIDED BY THE ORGANISATION IN DEVELOPING SKILLS amp TALENTS
64
Table 413 ndash To know the satisfaction level of welfare facilities provided by the management
S
SI No
W
Welfare Facilities
N
No of Respondents
P
Percentage
1
1
H
Highly satisfied
0
09
9
09
2
2
S
Satisfied
5
57
5
57
3
3
N
Neither Satisfied nor Dissatisfied
2
29
2
29
4
4
D
Dissatisfied
5
05
0
05
5
5
H
Highly Dissatisfied
0
00
0
00
Total 1
100
1
100
Source survey data
Inference
From the above table it shows that 57 of the employees were satisfied with the welfare facilities provided by the management
FIGURE 413
REPRESENTS THE SATISFACTION LEVEL OF WELFARE FACILITIES PROVIDED BY THE MANGEMENT
65
Table 414 ndash To know the employee satisfaction towards the salary
Source survey data
Inference
From the above table it shows that 67 of the employees were satisfied
with their salary
FIGURE 414
REPRESENTS THE SATISFACTION TOWARDS THE SALARY
S
SI No
P
Payment Satisfaction
N
No of Respondents
P
Percentage
1
1
Y
Yes
6
67
6
67
2
2
N
No
3
33
3
33
T
otal
1
100
1
100
66
Table 415 ndash To know the employees willingness amp Commitment Towards
Organisation
Source survey data
Inference
From the above table it shows that 59 of the employees were willing to
continue in this organisation
FIGURE 415
REPRESENTS THE EMPLOYEES WILLINGNESS TO CONTINUE
S
SI No
W
Willingness to Work
N
No of Respondents
P
Percentage
1
1
Y
Yes
5
59
5
59
2
2
N
No
4
41
4
41
T
Total
1
00
1
00
67
CHI-SQUARE METHOD
The chi square test is one of the simplest and most widely used non-
parametric tests in statistical work As a non-parametric test it can be used to determine
if categorical data shows dependency or the two classifications are independent It can
also be used to make comparisons between theoretical population and actual data
when categories are used
n
Chi square χsup2= sum (O-E) sup2 E
i =1
Where O= observed frequency
E= expected frequency
68
OBSERVED FREQUENCY
Table 419 shows the relationship between the department and the job satisfaction
Over All
Job
SatisfactionHighly
SatisfiedSatisfied
Neither
Satisfied nor
Dissatisfied
DissatisfiedHighly
Dissatisfied
Sub
Total
Mechanical 5 6 14 3 2 30
Electrical 6 8 6 3 2 25
Production 9 13 7 4 2 35
Others 2 3 2 2 1 10
Sub Total 22 30 29 12 7 100
69
EXPECTED FREQUENCY
Over All
Job
SatisfactionHighly
SatisfiedSatisfied
Neither
Satisfied nor
Dissatisfied
DissatisfiedHighly
Dissatisfied
Sub
Total
Mechanical 7 8 9 4 2 30
Electrical 5 8 7 3 2 25
Production 8 11 10 4 2 35
Others 2 3 3 1 1 10
Sub Total 22 30 29 12 7 100
Null Hypothesis (Ho)
There is no significant difference between the department and the job satisfaction
Alternative Hypothesis (Ho)
There is significant difference between the job satisfaction
Co Relation
70
Chapter-V
CONCLUSIONS AND
RECOMMENDATIONS
71
CONCLUSION
On the basis of Analysis of Job Satisfaction Level of the Employees of Philips Electronics India
Ltd Mohali made in the previous chapters following conclusions are drawn
General Profile The plant of PHILIPS is ideally located in the Mohali Industrial focal point
Phase 9 near Chandigarh the capital of Punjab on a campus of 17 hectares The working
environment of the company is very healthy The visitors feel happy after the campus
Indigenous Technology PHILIPS is the only lighting manufacturing company based on purely
indigenous technology Philips was appropriately chosen as the brand name as self reliance and
building up of Indian Engineering capabilities remain the guiding spirit of PHILIPS
Financial structure PHILIPS is a low debt company signifying its dependence mainly on
its internal accruals for its financial requirements PHILIPS continues to strengthen its financial
position by channelising these internal accruals to fund its expansion programmes
Working results PTL has registered a handsome and constant growth in its profits because
of a brisk demand for new and better technology electronic items None of the other electronic
company has shown such a steady growth Philips has recorded the lowest current ratio
However with this lowest current ratio PTL still enjoys moderate payment period and highest
velocity of creditors and debtors only due to commitment of itrsquos employees
72
SUMMARY
According to the 1999 Gallup Poll the four elements that have proven to be effective in creating
employee loyalty are praise and recognition a sense of contribution to the company learning and
development and having a best friend at work
Creating a fairy-tale work environment begins withrecognition Your employees need it more
than money perks or titles Here are eight tips regarding recognition Remember these and your
employees may just start whistling while they work It is up to me The corporate culture or
financial rewards will not make your team successful It is up to you Recognition is one thing
that is completely in your control
Strong relationships are vital in todays economy Strengthening employee relationships is even
more necessary as companies downsize and lay off As your workforce shrinks and you need to
do more with less keeping quality employees becomes even more critical As a manager it is
your job to bond your best people to your company through recognition And you also must help
direct and motivate your core performers
Simple rewards earn big returns There are some relatively simple things you can do that will
earn big returns For example remember your employees birthdays and work anniversaries find
out what inexpensive rewards they value (for example tickets to a ball game or a half day off to
spend time with their kids) make the most of your formal service awards with some preparation
and a group presentation walk around your department every day and talk to your
people and thank them sincerely and often
73
Make it specific Praise and recognition must be specific to have impact General praise such as
You do great work actually can have the opposite effect and leave your employees wondering
Does he have any idea what I really do around here Specific praise links individual
accomplishments to company goals For example Cheryl I noticed the way you handled that
customer complaint Great work As you know we value quick resolutions of problems as
one of our core strategies
Ask the best to stay Call your best people into your office one at a time Let that bright young
college graduate know you value his fresh ideas and energy Tell the 20-year veteran how much
your team relies on her expertise and organizational skillsRemarkably a significant percent of
high-impact performers report that they left their last job because No one ever asked me to
stay
Forget cash
Remember the saying Money cant buy everything Well its true Dont wait until you can
offer an employee a raise or promotion Real thanks is its own reward In numerous surveys of
work satisfaction top on employees lists is feeling appreciated In fact when employees feel
recognized and involved they are much less likely to keep asking about money
Recognize
Recognition means most to an employee when it is sincere and spontaneous According to the
largest study ever conducted on workplace satisfaction (Gallup 1999) recognition should occur
at least every seven days If you wait until a year-end party or an annual review you are waiting
much too long to recognize and you probably are losing people you do not need to
74
Recognition works
Neglect can be a poisoned apple Recognition is the elixir that will spark better attitudes and
performance Jeffrey Pfeffer of Stanford University says The returns from managing people in
ways that build high commitment typically are on the order of 30 to 50 percent
Take a hard look in the mirror and ask yourself how you can recognize the fairest of them all
Learn to recognize your employees for their efforts thank them often and reward their
achievements You can awaken them from their anger and apathy and they will fall in love with
their jobs again Chances are you will work together happily ever after
So there is direct relation with employee satisfaction and their commitment towards the
organization and it is also clear from the above discussion that only monetary elements are not
sufficient for employee satisfaction rather other element like employer behavior recognisation
and other moral value
75
RECOMMENDATIONS
PHILIPS should increase its capacity utilization It should work at full capacity to
minimize its cost of production With this increase in capacity utilization the total cost
will spread over more units thereby decreasing the per unit cost
PHILIPS should decrease the credit facilities provided to its consumers The payback
period is quite high in case of debtors as compared to creditors it should be more or less
equal as it will help in improving company liquidity
PHILIPS should focus more on the consumer lifestyle goods in India parallel to its other
business as it accounts very less as compare to other businesses of Philips
Another recommendation for Mohali plant is about the HR department that is they
should appoint permanent and skilled workers as against casual workers which generally add
up to the profit of the company
76
BIBLIOGRAPHY
1 Values-Based Leadership Rebuilding Employee Commitment Performance and Productivity ( Thomas D Kuczmarski)
2 Monthly Journals of Philips Electronics India Ltd
3 Authentic Leadership Medtronic CEO Bill George
4 wwwindiaphilipscom
5 wwwwikipediacom
6 httpwwwemployeecommitmentcom
7 One Foot Out The Door How to Combat The Psychological Recession Thatrsquos Alienating Employees And Hurting American Business Judith Bardwick
8 Employee Commitment A Leader Ship Guide Joe Folkman
9 Harvard University Factors that Impact Employee Well Being Commitment and Productivity -An Article
77
Questionnaire
Name __________________________________________________________
Age______________________________ Gender _______________________
Qualification _______________________ Contact No ___________________
Q1 In which department you are working
Electrical Production Mechanical Other
Q2 What is your working experience
gt2 Years 2-4 Years 4-6 Years lt 6 Years
Q3 How You like the physical Working Environment of the organization
Excellent Good Fair Poor Very Poor
Q4 Are you satisfied with Non-Monitory benefits provided by the organisation
Highly Satisfied Satisfied Neither Satisfied Nor dissatisfied
Highly Dissatisfied Dissatisfied
Q5 Are you satisfied with your work
Highly Satisfied Satisfied Neither Satisfied Nor dissatisfied
Highly Dissatisfied Dissatisfied
Q6 Are you satisfied with the career development programe of the company
Highly Satisfied Satisfied Neither Satisfied Nor dissatisfied
Highly Dissatisfied Dissatisfied
Q7 Is other staff of the organization is co-operative with you
Highly Satisfied Satisfied Neither Satisfied Nor dissatisfied
Highly Dissatisfied Dissatisfied
Q8 Are you satisfied with top level management
Highly Satisfied Satisfied Neither Satisfied Nor dissatisfied
Highly Dissatisfied Dissatisfied
78
Q9 Are you satisfied with your subordinates
Highly Satisfied Satisfied Neither Satisfied Nor dissatisfied
Highly Dissatisfied Dissatisfied
Q10 Are you satisfied with the nature of the Job
Highly Satisfied Satisfied Neither Satisfied Nor dissatisfied
Highly Dissatisfied Dissatisfied
Q11 Do you have any Job Pressure in work
Yes No
Q12 Do you satisfied with the opportunities provided by the organisation
Highly Satisfied Satisfied Neither Satisfied Nor dissatisfied
Highly Dissatisfied Dissatisfied
Q13 Are you satisfied with the welfare facilities provided by the organisation
Highly Satisfied Satisfied Neither Satisfied Nor dissatisfied
Highly Dissatisfied Dissatisfied
Q14 Are you satisfied towards your salary
Highly Satisfied Satisfied Neither Satisfied Nor dissatisfied
Highly Dissatisfied Dissatisfied
Q15 Are you committed towards the organisation
Yes No
Signature

11
BOARD OF DIRECTORS
Non-Executive Director amp Chairman S M Datta
Executive Vice Chairman amp Managing Director Murali Sivaraman
Executive Director Jan-Hein Louwman
Non-Executive Director S Venkatramani
India Management Team
MURALI SIVARAMANN - CEO
ANJAN BOSE - Healthcare
JAN-HEIN LOUWMAN ndash CEO
MAHESH KRISHNAN ndash Consumer lifestyle
RAJEEV CHOPRA ndash lighting
RAKESH SHARMA ndash Strategic Business Development
S NAGARAJAN ndash Human resources
VIVEK SHARMA ndash Chief Marketing Officer
WIDO MENHARDT ndash Philips Innovation Campus
12
Corporate Office-
Philips Electronics India Ltd
Technopolis Knowledge Park
Mahakali Caves Road
Chakala Andheri (East)Mumbai 400 093
Tel +91 22 66912000
VISION 2012
Through the Vision 2012 strategy we aim to fuel growth by making Philips the leading brand in
Health and Well-being Vision 2012 further positions Philips as a market-driven people-centric
company with a strategy and a structure that fully reflect the needs of its customer base while
also increasing shareholder value This is implemented through sharpened strategies in the three
core sectors Healthcare Lighting and Consumer Lifestyle
ldquoWith Vision 2010 we are putting people right at the center of things with Health and Well-
being as our overarching theme We are thereby putting into practice our mission improving the
quality of life through the introduction of meaningful innovationsrdquo ndash Gerard Kleisterlee
President and CEO of Royal Philips Electronic
Our Ways of Working
1 We are a people-centric company that organizes around customers and markets
2 We invest in a strong brand and consistently deliver on our brand promise of ldquosense and
simplicityrdquo in our actions products and services
13
3 We deliver innovation by investing in world class strengths in end-user insights
technology design and superior supplier networks
4 We develop our peoplersquos leadership talent and engagement and align ourselves with high
performance benchmarks
5 We invest in high growth and profitable businesses and emerging geographies to achieve
market leadership positions
6 We are committed to sustainability and focus on making the difference in efficient energy
use
7 We drive operational excellence and quality to best in class levels allowing us the above
mentioned strategic investments in our businesses
BRAND PROMISE
It is the combination of two unique capabilities that enables us to deliver on our ldquosense and
simplicityrdquo promise These capabilities are firstly by understanding people and secondly
technology integration and product design
We put our end users front and center of product innovations starting with understanding their
needs and aspirations We use best-in-class research facilities and agencies to validate and ensure
that our product innovations are designed around peoplersquos needs and aspirations easy to
experience and advanced
SUSTAINABILITY
14
In 2009 we evaluated our sustainability strategy and resolved to fully leverage sustainability as
an integral part of our overall strategy and an additional driver of growth as reflected in the
Philips Management Agenda 2012
To deliver on our brand promise of ldquosense and simplicityrdquo and at the same time provide the
company direction for the longer term in this area we have identified three sustainability
leadership key performance indicators where we can bring our competencies to bear lsquocarersquo
lsquoenergy efficiencyrsquo and lsquomaterialsrsquo including targets for 2015
Bringing care to more than 500 million people
Target 500 million lives touched by 2015
Improving energy efficiency of Philips products
Target 50 improvement by 2015 (for the average total product portfolio) compared to
2009
Closing the materials loop
Target Double global collection recycling amounts and recycled materials in products
by 2015 compared to 2009
Each sector will take the lead on one of the leadership key performance indicators with
Healthcare leading lsquocarersquo Lighting lsquoenergy efficiencyrsquo and Consumer Lifestyle lsquomaterialsrsquo
In addition we defined a set of complementary performance indicators to accelerate change and
drive performance including the EcoVision4 parameters
With EcoVision4 we have committed to the following by 2012
15
bull Generate 30 of total revenues from Green Products
bull Double investment in Green Innovations to a cumulative EUR 1 billion
bull Improve our operational energy efficiency by 25 and reduce our CO2 emissions by 25 all
compared with the base year 2007
SOCIAL COMMITMENT
Living up to this commitment means we use our capabilities to enhance the lives of our
employees and people in society at large Within the company we encourage teamwork and
collaboration in an environment that enables employees to reach their full potential
Building on our rich heritage of involvement in social issues we have established our own
approach of supporting the communities where we live and work focusing on energy efficiency
and healthcare
Sustainable lighting
There is a pressing need to find innovative lighting solutions for the 16 billion people who live
in areas with no access to the electricity grid or where the grid is unreliable Thatrsquos why we have
developed SMILE (Sustainable Model in Lighting Everywhere)
Launched as a pilot in 2006 in four Indian states SMILE includes two lighting solutions UDAY
a rechargeable portable lantern and KIRAN a hand-cranked LED flashlight Today are
distributed in eighth Indian states
16
SWOT ANALYSIS
Strengths
bull India was a market where the first mover enjoyed advantages over latecomers
bull The first image of the product lasted long in the eyes of the consumer and the first to enter the
market could gain the largest market share
bull PHILIPS is committed to enhance its image to the Chinese market as investors
bull PHILIPS was building a wholly owned manufacturing plant in India to show the
Chinese the commitment Korea had to the Chinese society
bull Labor costs in India were less and would defray the cost of producing high-end
bull Samsung has been making color TVs for many years in Korea before moving to the Chinese
market
Weaknesses
bull PHILIPS must continue to control all costs to maintain success
bull India has a reputation of being a protected market (protectionism)
bull India was a market where the first mover enjoyed advantages over late comers PHILIPS is
trying to overcome the first comer advantage Japan manufacturers have over them by being those
first comers
bull Companies such as Sony and Matsushita had built sales and service networks that were
favorable to their sales programs in India while Samsung would have to catch up in that area
17
bull Samsung is not as experienced in manufacturing high-end TVs for a higher-end market
segment
Opportunities
bull Based on the data that on 28 of the 220 million rural households own a color TV PHILIPS
focus on the domestic India market should be to penetrate the rural household market which
would mean that for those purposes the low-end production of sets in the 13rdquo to 20rdquo range should
be produced to appeal to that segmentrsquos purchasing ability
bull Larger more high-end models can be produced to appeal to an urban customer in India as well
as being an export to the US and European higher end customers
bull With success in the higher-end manufacturing and sales of premium TVs in India PHILIPS can
establish themselves as high-end producers around the world
Threats
bull PHILIPS faces intense competition in the color TV market
bull A premium-priced product wouldnrsquot sell in large volumes so pricing can be a problem
bull Since PHILIPS didnrsquot have an established marketing strategy issues of how to market the
product may arise
bull Loss of profitability because related to over-employment at most facilities
bull Is the per capita income level such that it can support sales of product at any level
bull If PHILIPS fails to be successful in the Chinese market with high-end product it will be known
around the world bull India was a market where the first mover enjoyed advantages over late
comers
bull The first image of the product lasted long in the eyes of the consumer and the first to enter the
18
market could gain the largest market share
bull PHILIPS is committed to enhance its image to the Chinese market as investors
PHILIPS ELECTRONICS MOHALI PLANT
The mohali plant was established in 1985 as PUNJAB ANAND LAMP Ltd as its second
division of lamp industry after the varodra plant at that time it was a joint stock company and
majority of shares was with Punjab Anand Lamp around 75 but in the year 2001 the company
ownership changed and the whole shares was bought by PHILIPS ELECTRONIC INDIA Ltd
and its name was changed to PHILIPS ELECTRONIC INDIA Ltd MOHALI LIGHT
FACTORY
The plant is situated in Industrial focal point PHASE-9 MOHALI near Mohali railway station
and is sreaded in 26 acres Total employees of tis plant is 532 including casual employees This
company is a landmark in the Punjab state as it is the only factory which is most profitable one
than any industry located in Punjab
19
OVERVIEW OF VARIOUS FRONTS OF
PHILIPS ELECTRONICS INDIA Ltd
Manufacturing-
Today the product range of Philips include the following products ndash
Televisions- LCD Plasma Flat Screen Smart Touch XL
Recorders DVD Players I pods and Home Theatre Systems
Audio Products - Audio Systems Remote Controls AudioVideo Accessories
Digital Photo Products and Frames
Portable Audio and Video Systems Accessories like Headphones and Speakers
PC Products - Mouse and Keyboard Multi Media Headsets External Hard Disk Drives
Mobile Phones
Male Shaving and Grooming - Dry Shavers Beard Trimmers
Personal Care - Beauty and Hair Care Products
20
Kitchen Appliances - Blenders and Hand Blenders Juicers and Citruspresses Food
Processors and Mixers Coffee Makers and Kettles Frying and Grilling Appliances
Toasters and Snacking Products
Household Products - Irons Vacuum Cleaners Water Purifiers
Professional Lighting - Industrial Shops and offices Road and Area Hospitality Sports
Lighting City Beautification and Petrol Stations
Automotive Lighting - In Cars Motorcycles and Trucks
Home Lighting
SERVICS
Philips E-waste Management Program in India
Philips has tied up with a recycler for collecting transporting and recycling unwanted broken
down consumer products
At Philips we offer consumers a convenient way of recycling their unwanted obsolete and
damaged Philips products by dropping them off at convenient locations The program
encompasses 8 major cities across India Consumers can approach one of 27 authorized Philips
service centres which will act as collection points for consumer products which need recycling
Our efforts are to expand the network in the near future
Philips ensures that the consumer products received will be recycled in an environment-friendly
manner Philips understand the corporate social responsibility and takes steps towards providing
a safer environment to the future generations We design our products to continuously realize
improvements and reduce their overall life cycle environmental impact Designing products for
21
recycling is an integral part of this approach Our aim is to use our planetrsquos limited resources
effectively and respect the principle of extended producer responsibility This also calls for
manufacturers to engage in developing solutions for effective and efficient recycling of their
products We will continue to promote and invest into improved recycling systems to reduce the
impact of electronic waste on the environment
MANUFACTURING AT MOHALI PLANT ndash
Mohali plant mainly manufactures lighting products basically of domestic usage this includes the
following products ndash
CFL bulbs ndash
1 Genie - 5 watt 8 watt 11 watt
2 Essential ndash 8 watt 11 watt 14 watt 18 watt 23 watt 29 watt
3 Tornado ndash 5 watt 8 watt 11 watt 14 watt 18 watt 23watt 29 watt
4 T5 slim tube 28 watt
Coil plant ndash Philips Electronics India is the only company that produces coils in the whole
lighting industries in the world and in India only at the MOHALI PLANT
22
Chapter-II
OBJECTIVES OF THE STUDY
23
OBJECTIVES OF THE STUDY
To study the various aspects of Satisfaction Level of the Employees working at Philips
Electronics India Ltd Mohali
To analyze the effect of Job satisfaction on the organisation
To determine the relation between job satisfaction of employees and their commitment
towards the organisation
To analyze the performance model adopted by the Philips Electronics India Ltd Mohali
to handle their manpower
To suggest remedial measures for the improvement of the companyrsquos performance
24
Chapter-III
Employees Commitment
25
Employees who are engaged in their work and committed to their organizations give companies
crucial competitive advantagesmdashincluding higher productivity and lower employee turnover
Thus it is not surprising that organizations of all sizes and types have invested substantially in
policies and practices that foster engagement and commitment in their workforces
But what are employee engagement and commitment exactly This report examines the ways in
which employers and corporate consultants define these terms today and offers ideas for
strengthening employee engagement Though different organizations define engagement
differently some common themes emerge These themes include employeesrsquo satisfaction with
their work and pride in their employer the extent to which people enjoy and believe in what they
do for work and the perception that their employer values what they bring to the table The
greater an employeersquos engagement the more likely he or she is to ldquogo the extra milerdquo and deliver
excellent on-the-job performance In addition engaged employees may be more likely to commit
to staying with their current organization Software giant Intuit2 for example found that highly
engaged employees are 13 times more likely to be high performers than less engaged
employees They are also five times less likely to voluntarily leave the company
Clearly engagement and commitment can potentially translate into valuable business results for
an organization To help you reap the benefits of an engaged committed workforce at your
organization this report provides guidelines for understanding and measuring employee
engagement and for designing and implementing effective engagement initiatives As you will
26
see everyday human resource practices such as recruitment training performance management
and workforce surveys can provide powerful levers for enhancing engagement
Employee Engagement Key Ingredients
ldquoEmployee Engagement Definedrdquo shows examples of engagement definitions used by various
corporations and consultancies Clearly definitions of employee engagement vary greatly across
organizations Many managers wonder how such an elusive concept can be quantified The term
does encompass several ingredients for which researchers have developed measurement
techniques These ingredients include the degree to which employees fully occupy themselves in
their work as well as the strength of their commitment to the employer and role Fortunately
there is much research on these elements of engagementmdashwork that has deep roots in individual
and group psychology
Definition
ldquoNo company small or large can win over the long run without energized employees who
believe in the [firms] mission and understand how to achieve it Thats why you need to take the
measure of employee engagement at least once a year through anonymous surveys in which
people feel completely safe to speak their mindsrdquo
-Jack and Suzy Welch-
Common Themes How Companies Measure Engagement
Employers typically assess their employeesrsquo engagement levels with company-wide attitude
or opinion surveys
27
1048657 Pride in employer
1048657 Satisfaction with employer
1048657 Job satisfaction
1048657 Opportunity to perform well at challenging work
1048657 Recognition and positive feedback for onersquos contributions
1048657 Personal support from onersquos supervisor
1048657 Effort above and beyond the minimum
1048657 Understanding the link between onersquos job and the organizationrsquos mission
1048657 Prospects for future growth with onersquos employer
1048657 Intention to stay with onersquos employer
The Link Between Employer Practices and Employee Engagement
How does an engaged workforce generate valuable business results for an organization The
process starts with employer practices such as job and task design recruitment selection
training compensation performance management and career development Such practices affect
employeesrsquo level of engagement as well as job performance Performance and engagement then
interact to produce business results Figure 1 depicts these relationships
28
EMPLOYEE COMMITMENT EMPLOYEE ENGAGEMENT
1048657 How do you and other managers in your
organization define commitment
1048657 Are some employees in your company
engaged in their work but not committed to
the organization Committed to staying with
your firm but not exactly engaged in their
work Both engaged and committed
1048657 To whom are your organizations employees
committed The company Their supervisor
Co-workers Team members Customers
1048657 What business results has commitment from
1048657 How do you and other managers in your
organization define employee engagement
1048657 How do you know that certain employees in
your company are engaged Do they relish
their jobs Enjoy specific responsibilities or
tasks Willingly ldquogo the extra milerdquo
1048657 In teams departments or business units in
your company that have a large number of
engaged employees what business results
are you seeing Higher productivity Lower
costs Greater revenues More efficiency
29
employees created for your organization For
example has commitment reduced turnover
and therefore decreased recruitment hiring
and training costs
1048657 What does your company do to reciprocate
employees commitment Is the organization
living up to its side of the bargain
Lower turnover Higher product or service
quality
1048657 Conversely how do disengaged employees
behave and what are the consequent costs
for their teams units-and your entire
company
As Figure 2 suggests a person possesses attributes such as knowledge skills abilities
temperament attitudes and personality He or she uses these attributes to accomplish work
behaviors according to organization-defined procedures by applying tools equipment andor
technology Work behaviors in turn create the products and services that make an organization
successful We classify work behaviors into three categories those required to accomplish duties
and tasks specified in a job description (prescribed behaviors) ldquoextrardquo behaviors that an
employee contributes for the good of the organization (voluntary behaviors) and behaviors
prohibited by an employer (proscribed behaviors including unexcused absenteeism stealing and
other counterproductive or illegal actions) Of course job performance occurs in an
organizational context which includes elements such as leadership physical setting and social
setting
30
Employers naturally want to encourage workers to perform prescribed and voluntary activities
while avoiding proscribed ones To achieve these goals organizations use a number of HR
practices that directly affect the person process and context components of job performance
Employeesrsquo reactions to these practices determine their levels of engagement and commitment
31
Chapter-IV
32
LITERATURE OF THE REVIEW
ldquo Job Satisfaction That Leads To The Commitment Of
The Employees in The Organisationrdquo
Literature of Review
Gerge Bill Authentic Leadership
In his book Authentic Leadership former Medtronic CEO Bill George makes an obvious
point that business leaders rarely say out loud ldquoMissions motivate dollars donrsquotrdquo
What he means is that purpose is what drives employee commitment not the financial
rewards that come to others Workers donrsquot get up in the morning and say ldquoGee I can
33
hardly wait to get to work today to maximize shareholder profitsrdquo Even when employees
are shareholders who can benefit from improved financials what draws people to their
chosen careers is the work itself and its purpose in the world more than the profit
possibilities
Mr George goes on to say ldquoI find there is universal agreement (among middle managers)
that you cannot inspire employees by urging them to help management get the companyrsquos
stock price uprdquo
There is in fact quite a bit of literature on this subject In Awakening Corporate Soul
authors Eric Klein and John Izzo say that employee commitment requires knowing ldquothe
purpose of our work it means recognizing the purpose our organization fulfills that goes
beyond the bottom line and it means articulating to others how their (workersrsquo) efforts
contribute to a larger purposerdquo
In Built to Last Jim Collins and James Porras spend an entire book explaining their five
year research study of major companies that led to this conclusion about employee
commitment Purpose within a company is what sustains it profit is important but when
itrsquos the prime directive companies falter
-Marshal Goldsmith-
How to Increase Employee Commitment
In practice this involves walking the talk being transparent communicating effectively treating
people equally teaching leading subordinates to increasingly excellent performance ndash and
responding to subordinates as mature individuals who are owed fairness the truth and
recognition of their achievements
34
Since managers interact directly and frequently with subordinates they are usually more tuned
in to how employees are feeling than are executives Managers are in a better position to know
for example when employees are feeling alienated and disengaged from their work which is
very common today -- and expensive
Gaining employee commitment results in greater profits because enthusiastic employees stay
contribute discretionary effort and engage customers Performance soars when customers are
enthused and stay and when executives managers and employees are a collaborative team
united in achieving common goals
But managers are often called middle managers for good reason their job is to motivate and
guide subordinates while they at the same time are being judged by their bosses Because of
their ldquotweenrdquo position in the hierarchy managers to effective support direct reports must also
create relationships with potential allies especially those with greater power who have access to
top decision makers
Harvard University Factors that Impact Employee Well Being Commitment and
Productivity
Business executives from the C-suite and HR to QC and RampD are by nature focused on the
corporate bottom line A new trend in our dawning age of social sustainability is that many
experts believe more attention should be paid to the dotted line - the one signed when a person
35
commits to employment at a company New Harvard research validates this approach affirming
that trust and purpose play a significant role in building successful productive workplaces
The behavioral research conducted by a team at Harvard University and Massachusetts General
Hospital identifies the factors most likely to impact 21st century employee well being
commitment and productivity The researchers found that commitment is largely influenced by
ones sense of purpose feeling of personal impact and overall trust in the organization
Productivity is largely affected by the quality of human relationships including cooperative
social group moods and interaction
The results lead us to conclude that workplaces that provide positive environments that foster
interpersonal trust and quality personal relationships create the most committed and productive
employees says Nancy Etcoff PhD the lead researcher on the study
Expert Shares Keys to Building Successful Workplace Relationships
According to business strategist Courtney Anderson JD MBA Outstanding leadership
today means much more than just doing your job Success is creating an environment that fosters
happy committed productive team members
Anderson explains that reinvigorating workplaces by enhancing trust and employee commitment
does not have to be difficult The biggest challenge she says is making the time to truly change
in our overscheduled instant access competitive work environments With a little know-how it
can be easy to evolve workplace well being and respond to these compelling research results
-Mark Howell-
CEO Bright Point
High-performing companies recognize that employee commitment is a major contributing factor
toward sustaining long-term success and creating value An engaged employee is involved and
excited about their work and acts in a manner that will forward the organizationrsquos interest An
36
engaged workforce helps optimize and retain talent for the long-term because the employees
choose to stay even when other employment alternatives exist
According to Walker Information the top three drivers of employee commitment are
Satisfaction Fairness and Care amp Concern for employees Put simply committed employees
want to enjoy their work feel they are appreciated and know they are making a contribution to
their companyrsquos strategic objectives Additionally employees who have trust in their leadership
and are trusted by their leadership have a greater dedication and are ultimately more productive
on the job However according to recent data provided by the National Business Research
Institute (NBRI) only 31 of all employees are truly engaged
At BrightPoint we take employee engagement seriously and we work to create a culture that
inspires employee loyalty and satisfaction The results of BrightPointrsquos commitment to its
employees are shown in the 2011 BPNA Employee Commitment Survey The survey
determined that close to 80 of respondents indicated they were satisfied with their jobs and
daily activities General employee satisfaction increases when managers take an active interest
in their employees beyond their day-to-day job responsibilities According to NBRI managers
that actively coach build relationships and keep an open dialogue with their employees improve
employee engagement
We have a diverse workforce where each employee brings unique value and has individual
needs Managers are learning to manage the individual and not the position In order to give
managers the tools they need to be successful BrightPoint places strong emphasis on targeted
leadership training workshops and continual learning resources In 2011 906 of managers at
BrightPoint NA participated in the development opportunities offered and also made an effort to
37
help reinforce the learning of their team members This signals that our leadership team is taking
an active interest in professional development and its connection to employee commitment
As BrightPoint continues to increase focus on employee engagement the organization will grow
stronger and maintain a substantial advantage over our competition Our employees possess the
knowledge experience and resiliency to respond quickly to the demands of the marketplace and
through their genuine commitment will deliver what our customers want with increasing
efficiency and effectiveness Our responsibility is value-creation by growing our business and
maintaining high levels of customer service and loyalty We believe the best way to accomplish
this is through a strong committed and engaged workforce
Performance Model Adopted At Mohali Plant
38
Process adopted by Philips Electronics Mohali Plant for Job Satisfaction of Employee that leads commitment of the employees
39
Recruiting
The messages in Philips Electronics Mohali organization conveys while seeking to attract job
applicants also can influence future employeesrsquo engagement and commitment If your firm has
designed jobs specifically to engage employees then organization want to ensure that recruiting
ads extol these positionsrsquo attractive featuresmdashsuch as challenging work assignments a highly
skilled team environment or minimal supervision Applicants who notice and respond to these
ads will more likely be motivated by these features Also consider how organization might best
seek candidates from inside your organization When Organisation recruit existing employees for
desirable jobs you enhance their engagement (by maximizing the person-job fit) and
commitment (by providing growth and advancement opportunities to employees in return for
their loyalty) If Organisation recruit from outside when qualified internal candidates are
available Organization may unwittingly suggest to current employees that your company is not
willing to reciprocate their commitment Existing staff may then begin questioning their own
commitment to the firm By contrast organisation recruit external candidates to both the job and
your organization For these candidates ensure that recruiting messages highlight attractive job
features organizational values and commitment reciprocity That is in return for performance
and dedication your company offers competitive pay and benefits flexible work hours and
learning and career advancement opportunities Also remember that prospective employees have
multiple commitments You will inevitably have to compete with those commitments as
organization try to attract candidates to your firm Most people find it easier to make a new
commitment when it is compatible with their other obligations For example you boost your
chances of recruiting a highly qualified candidate who is a single parent if you offer flexible
work hours family health benefits and on-site day care ldquoRecruiting for Engagement and
Commitmentrdquo
40
Employee Selection
Once recruiting efforts produce a pool of promising job candidates Philips select among them to
fill available positions When organisation select the right individuals for the right jobs new
hires carry out their work more smoothly and experience fewer performance problems The
result Greater enjoyment ofmdashand engagement inmdashthe job
To enhance engagement through your selection of employees identify those candidates who are
best-suited to the job and your organizationrsquos culture Also use candidate assessment methods
that have obvious relevance to the job in questionmdashfor example by asking interviewees what
they know about the role and having them provide work samples Most candidates will view
these techniques more positively than tests with less apparent relevance such as personality and
integrity assessments Successful candidates feel good about having ldquopassed the test and see
company as careful and capable for having selected them A positive initial impression of an
employer encourages growth of long-term commitment
Training and Development
Training and development can serve as additional levers for enhancing engagement and
commitment For new hires training usually begins with orientation Orientation presents several
important opportunitiesmdashincluding explaining pay work schedules and company policies Most
important it gives you a chance to encourage employee engagement by explaining how the new
hirersquos job contributes to the organizationrsquos mission Through orientation Mohali Plant of Philips
Electronics describe how r company is organized introduce the new employee to his or her co-
workers give the person a tour of the area where he or she will be working and explain safety
regulations and other procedural matters In short you foster person-organization fitmdashvital for
developing productive and dedicated employees Through training you help new and current
41
employees acquire the knowledge and skills they need to perform their jobs And employees who
enhance their skills through training are more likely to engage fully in their work because they
derive satisfaction from mastering new tasks Training also enhances employeesrsquo value to your
company as well as their own employability in the job market In addition most companies offer
higher wages for skilled workers to compensate them for their greater value and to discourage
turnover
Compensation
Like the HR practices discussed above compensation can powerfully influence employee
engagement and commitment Some compensation components encourage commitment to
employers while others motivate engagement in the job It is possible to stimulate one and not
the other though itrsquos generally better to foster both For example a company that offers a strong
performance incentive system but no retirement plan will probably realize exceptional
engagement from its workers however they may eventually commit themselves to another
company that does offer a good retirement plan Meanwhile an organization that offers generous
retirement benefits but a traditional seniority-based pay grade system may have committed
employees however these workers might deliver pedestrian performance as they bide their time
until retirement In designing compensation plans you therefore need to consider employee
engagement and commitment strategically
Encourage managers to include employees in the goal-setting process This technique helps to
ensure that workers understand the goals It also promotes acceptance of challenging objectives
because people generally feel more committed to goals they have helped define In addition
consider how you and other managers will recognize and encourage contributions that exceed
expectations For example when a piece of equipment malfunctions Joe finds other ways to
maintain production rather than merely shutting down the machine and waiting for the
42
maintenance staff to fix it Or when a less experienced co-worker encounters a new task Sally
offers friendly coaching instead of standing by and waiting for the inevitable mistakes to crop
up Performance management processes operate on a continuous basis Therefore they provide
perhaps the best ongoing opportunities for employers to foster employee engagement and
commitment For example managers can use routine discussions about performance and
feedback sessions to learn which aspects of the job hold the most interest for each employee and
which tasks are most challenging During such discussions managers also can define what going
above and beyond the call of dutyrdquo looks like and generate ideas for rewarding such
contributions An employeersquos aspirations and career goals can receive careful attention during
performance appraisal meetings Without inquiring into an employeersquos personal life a supervisor
can nevertheless explore ways to enhance the compatibility between the workerrsquos commitment to
your organization and the employeersquos other life commitments Through such means the
organization personalizes its relationship to each employee and provides support while also
expressing appreciation for their contributionsmdash key drivers of engagement and commitment
To further engage employees and win their commitment through your performance management
programs consider how to treat your organizationrsquos most experienced employees In many cases
these employees understand the intricacies of a job better than their supervisors or managers do
By virtue of long identification with your organization they may be deeply committed to high-
level goals They use their expertise to contribute in ways that newer employees simply cannot
match But many of them also may be planning to retire soon especially if they are from the
ldquoBaby Boomerrdquo generation How will you transfer their knowledge to younger workers Design
a performance management system that recognizes and rewards proactive sharing of knowledge
and expertise among co-workers For example create knowledge repositories or learning
histories that can be stored in databases that employees can access and then create incentives
43
for people who contribute to and use these repositories Of course effective performance
management systems also identify employees who are not meeting expectations Failing to
address problem performance can erode other employeesrsquo engagement and commitment as their
workloads increase and they conclude that the company is willing to tolerate poor performance
If feedback coaching and remedial training are of little avail the manager may need to move the
person to a different position within the company where he or she can make a more valuable
contribution or let the individual go if there is no good match elsewhere in the organization
44
Chapter-V
RESEARCH METHODOLOGY
The basic task of research is to generate accurate information for use in decision-making
Research can be defined as the systematic and objective process of gathering recording and
analyzing data for aid in making business decisions As the project involves analyzing of
45
financial structure the research is exploratory in nature covering financial parameters and come
of the important ratios to carry out research There are basically two techniques adopted for
obtaining information
Primary Data
Secondary Data
Primary Data is gathered specifically for the project at hand through personal interviews with
the accounts officers
Sample Size = 100 Employees
Secondary data is previously collected and assembled for some project other than the one at
hand It is gathered and recorded by someone else prior to current needs of the researcher It is
less expensive than the primary date
Secondary Data can be obtained from both external and internal sources
External data may be collected from books and periodicals government sources media and other
commercial sources
Internal data is that secondary data which is created recorded or generated by the organization
As the project is explanatory in nature secondary data is collected from the reports of the
company books journals and interest Secondary data is gathered from annual reports official
records and standing orders of the units
CHAPTER - VI
DATA ANALYSIS AND INTERPRETATION
46
The data after collection is to be processed and analyzed in accordance with the outline
and down for the purpose at the time of developing research plan
Technically speaking processing implies editing coding classification and tabulation of
collected data so that they are amenable to analysis The term analysis refers to the computation
of certain measures along with searching for pattern groups Thus in the process of analysis
relationship or difference should be subjected to statistical tests of significance to determine with
what validity data can be said to indicate any conclusions
The analysis of data in a general way involves a number of closely related operations
which are performed with the purpose of summarizing the collected data and organizing them in
such a manner that they answer the research questions In this study the researcher followed
above process carefully and it is presented in this chapter
47
Table 41 ndash To know the department in which employees are belongs to
S
ou rc
e
survey data
Inference
From the above table it shows that 35 of employees are belongs to
production department
FIGURE 41
S
SI No
D
Department
N
No of Respondents
P
Percentage
1
1
M
Mechanical
3
30
3
30
2
2
E
Electrical
2
25
2
25
3
3
P
Production
3
35
3
35
4
4
O
Others
1
10
1
10
T
Total
1
100
1
100
48
REPRESENTS THE DEPARTMENT
Table 42 ndash To know working experience of the employees
Source survey data
Inference
From the above table it shows that 34 of the employees have 4 ndash 6
years experience
S
SI No
W
Work Experience
N
No of Respondents
P
Percentage
1
1
B
Below 2 years
1
33
1
13
2
2
2
2ndash 4 years
3
30
3
30
3
3
4
4ndash 6 years
3
34
3
34
4
4
A
Above 6 years
2
23
2
23
T
otal
1
100
1
100
49
FIGURE 42
REPRESENTS THE EXPERIENCE OF THE EMPLOYEES
Table 43 ndash To know the physical working environment
S
SI No
W
Working Environment
N
No of Respondents
P
Percentage
1
1
E
Excellent
1
12
1
12
2
2
G
Good
5
57
5
57
3
3
F
Fair
2
28
2
28
4
4
P
Poor
0
03
0
33
5
5
V
Very Poor
0
00
0
00
T
Total
1
100
1
100
Source survey data
Inference
From the above table it shows that 57 of the employees were feeling good about the working environment
50
FIGURE 43
REPRESENTS THE PHYSICAL WOKING ENVIRONMENT
51
Table 44 ndash To know the satisfaction level of employees towards the non-monitory benefits
S
SI No
N
Non-Monitory Benefits offered
to Employees
N
No of Respondents
P
Percentage
1
1
H
Highly Satisfied
1
14
1
14
2
2
S
Satisfied
5
54
5
54
3
3
N
Neither Satisfied nor Dissatisfied
2
25
2
25
4
4
D
Dissatisfied
0
05
0
05
5
5
H
Highly Dissatisfied
0
02
0
02
Total 1
100
1
100
Source survey data
Inference
From the above table it shows that 54 of the employees were satisfied towards the non-monitory benefits
FIGURE 44
REPRESENTS THE SATISFACTION LEVEL OF EMPLOYEES TOWARDS THE NON-MONITORY BENEFITS
52
Table 45 ndash To know the satisfaction level of respondents towards the work
assigned
Source survey dataInference
From the above table it shows that 45 of the respondents were satisfied towards the work assigned
FIGURE 45
S
SI No
A
Amount of Work
N
No of Respondents
P
Percentage
1
1
H
Highly satisfied
2
20
2
20
2
2
S
Satisfied
4
45
4
45
3
3
N
Neither Satisfied nor Dissatisfied
1
12
1
12
4
4
D
Dissatisfied
1
18
1
18
5
5
H
Highly Dissatisfied
0
06
0
06
Total 1
100
1
100
53
REPRESENTS THE SATISFACTION LEVEL OF RESPONDENTS TOWARDS THE WORK ASSIGNED
54
Table 46 ndash Opinion about the career development programme in their organisation
S
SI No
C
Career Development
N
No of Respondents
P
Percentage
H
Highly satisfied
1
12
1
12
S
Satisfied
5
56
5
56
N
Neither Satisfied nor Dissatisfied
2
22
2
22
D
Dissatisfied
1
10
1
10
H
Highly Dissatisfied
0
00
0
00
Total 1
100
1
100
Source survey data
Inference
From the above table it shows that 56 of the employees were satisfied
with the opinion about the carrier development programme in their organisation
FIGURE 46
REPRESENTS OPINION ABOUT THE CAREER DEVELOPMENT
PROGRAMME IN THEIR ORGANISATION
55
Table 47 ndash To know the cooperation of co-workers
S
SI No
C
Co-operation of Workers
N
No of Respondents
P
Percentage
1
1
H
Highly satisfied
2
20
2
20
2
2
S
Satisfied
6
66
6
66
3
3
N
Neither Satisfied nor Dissatisfied
1
11
1
11
4
4
D
Dissatisfied
0
03
0
03
5
5
H
Highly Dissatisfied
0
00
0
00
Total 1
100
1
100
Source survey data
Inference
From the above table it shows that 66 of the employees were satisfied
with the cooperation of co-workers
FIGURE 47
56
REPRESENTS THE COOPERATION OF CO-WORKERS
57
Table 48 ndash To know the satisfaction of Respondents with top management
S
SI No
S
Satisfaction with Top
Management
N
No of Respondents
P
Percentage
1
1
H
Highly satisfied
2
26
2
26
2
2
S
Satisfied
5
51
5
51
3
3
N
Neither Satisfied nor Dissatisfied
1
17
1
17
4
4
D
Dissatisfied
0
06
0
06
5
5
H
Highly dissatisfied
0
00
0
00
Total 1
100
1
100
Source survey data
Inference
From the above table it shows that 51 of the employees were satisfied with the top management
FIGURE 48
58
REPRESENTS THE SATISFACTION OF RESPONDENTS WITH TOP MANAGEMENT
Table 49 ndash To know the satisfaction of Respondents with their subordinates
Source survey data
Inference
From the above table it shows that 67 of the employees were satisfied with their subordinates
S
SI
No
S
Satisfaction with Subordinates
N
No of Respondents
P
Percentage
1
1
H
Highly satisfied
1
12
1
12
2
2
S
Satisfied
6
67
6
67
2
3
N
Neither Satisfied nor Dissatisfied
1
14
1
14
4
D
Dissatisfied
0
07
0
07
5
5
H
Highly Dissatisfied
0
00
0
00
Total 1
100
1
100
59
FIGURE 49
REPRESENTS THE SATISFACTION OF RESPONDENTS WITH THEIR SUBORDINATES
60
Table 410 ndash To know the level of satisfaction regarding nature of job
S
SI No
J
Job Satisfaction
N
No of Respondents
P
Percentage
1
1
H
Highly satisfied
2
22
2
22
2
2
S
Satisfied
5
56
5
56
3
3
N
Neither Satisfied nor Dissatisfied
1
16
1
16
4
4
D
Dissatisfied
0
07
0
07
5
5
H
Highly Dissatisfied
0
00
0
00
Total 1
100
1
100
Source survey dataInference
From the above table it shows that 56 of the employees were satisfied with their job
FIGURE 410
61
REPRESENTS THE LEVEL OF SATISFACTION REGARDING THE NATURE OF JOB
Table 411 ndash To know whether there is any job pressure in their work
Source survey data
Inference
From the above table it shows that 72 of employees said there is job pressure in their work
FIGURE 411
REPRESENTS WHETHER THERE IS ANY JOB PRESSURE IN THEIR WORK
S
SI No
J
Job Pressure
N
No of Respondents
P
Percentage
1
1
Y
Yes
7
72
7
72
2
2
N
No
2
28
2
28
T
Total
1
100
1
100
62
Table 412 ndash To know the opinion regarding opportunity provided by the organisation in developing skills
amp talents
S
SI No
D
Development of Skills and
Talents
N
No of Respondents
P
Percentage
1
1
H
Highly Agree
1
12
1
12
2
2
A
Agree
5
52
5
52
3
3
N
Neither Agree nor Disagree
2
28
2
28
4
4
D
Disagree
0
06
0
06
5
5
H
Highly Disagree
0
02
0
02
Total 1
100
1
100
Source survey data
Inference
From the above table it shows that 52 of employees agreed regarding opportunity provided by the organisation in developing skills amp talents
63
FIRGURE 412
REPRESENTS THE OPPORTUNITY PROVIDED BY THE ORGANISATION IN DEVELOPING SKILLS amp TALENTS
64
Table 413 ndash To know the satisfaction level of welfare facilities provided by the management
S
SI No
W
Welfare Facilities
N
No of Respondents
P
Percentage
1
1
H
Highly satisfied
0
09
9
09
2
2
S
Satisfied
5
57
5
57
3
3
N
Neither Satisfied nor Dissatisfied
2
29
2
29
4
4
D
Dissatisfied
5
05
0
05
5
5
H
Highly Dissatisfied
0
00
0
00
Total 1
100
1
100
Source survey data
Inference
From the above table it shows that 57 of the employees were satisfied with the welfare facilities provided by the management
FIGURE 413
REPRESENTS THE SATISFACTION LEVEL OF WELFARE FACILITIES PROVIDED BY THE MANGEMENT
65
Table 414 ndash To know the employee satisfaction towards the salary
Source survey data
Inference
From the above table it shows that 67 of the employees were satisfied
with their salary
FIGURE 414
REPRESENTS THE SATISFACTION TOWARDS THE SALARY
S
SI No
P
Payment Satisfaction
N
No of Respondents
P
Percentage
1
1
Y
Yes
6
67
6
67
2
2
N
No
3
33
3
33
T
otal
1
100
1
100
66
Table 415 ndash To know the employees willingness amp Commitment Towards
Organisation
Source survey data
Inference
From the above table it shows that 59 of the employees were willing to
continue in this organisation
FIGURE 415
REPRESENTS THE EMPLOYEES WILLINGNESS TO CONTINUE
S
SI No
W
Willingness to Work
N
No of Respondents
P
Percentage
1
1
Y
Yes
5
59
5
59
2
2
N
No
4
41
4
41
T
Total
1
00
1
00
67
CHI-SQUARE METHOD
The chi square test is one of the simplest and most widely used non-
parametric tests in statistical work As a non-parametric test it can be used to determine
if categorical data shows dependency or the two classifications are independent It can
also be used to make comparisons between theoretical population and actual data
when categories are used
n
Chi square χsup2= sum (O-E) sup2 E
i =1
Where O= observed frequency
E= expected frequency
68
OBSERVED FREQUENCY
Table 419 shows the relationship between the department and the job satisfaction
Over All
Job
SatisfactionHighly
SatisfiedSatisfied
Neither
Satisfied nor
Dissatisfied
DissatisfiedHighly
Dissatisfied
Sub
Total
Mechanical 5 6 14 3 2 30
Electrical 6 8 6 3 2 25
Production 9 13 7 4 2 35
Others 2 3 2 2 1 10
Sub Total 22 30 29 12 7 100
69
EXPECTED FREQUENCY
Over All
Job
SatisfactionHighly
SatisfiedSatisfied
Neither
Satisfied nor
Dissatisfied
DissatisfiedHighly
Dissatisfied
Sub
Total
Mechanical 7 8 9 4 2 30
Electrical 5 8 7 3 2 25
Production 8 11 10 4 2 35
Others 2 3 3 1 1 10
Sub Total 22 30 29 12 7 100
Null Hypothesis (Ho)
There is no significant difference between the department and the job satisfaction
Alternative Hypothesis (Ho)
There is significant difference between the job satisfaction
Co Relation
70
Chapter-V
CONCLUSIONS AND
RECOMMENDATIONS
71
CONCLUSION
On the basis of Analysis of Job Satisfaction Level of the Employees of Philips Electronics India
Ltd Mohali made in the previous chapters following conclusions are drawn
General Profile The plant of PHILIPS is ideally located in the Mohali Industrial focal point
Phase 9 near Chandigarh the capital of Punjab on a campus of 17 hectares The working
environment of the company is very healthy The visitors feel happy after the campus
Indigenous Technology PHILIPS is the only lighting manufacturing company based on purely
indigenous technology Philips was appropriately chosen as the brand name as self reliance and
building up of Indian Engineering capabilities remain the guiding spirit of PHILIPS
Financial structure PHILIPS is a low debt company signifying its dependence mainly on
its internal accruals for its financial requirements PHILIPS continues to strengthen its financial
position by channelising these internal accruals to fund its expansion programmes
Working results PTL has registered a handsome and constant growth in its profits because
of a brisk demand for new and better technology electronic items None of the other electronic
company has shown such a steady growth Philips has recorded the lowest current ratio
However with this lowest current ratio PTL still enjoys moderate payment period and highest
velocity of creditors and debtors only due to commitment of itrsquos employees
72
SUMMARY
According to the 1999 Gallup Poll the four elements that have proven to be effective in creating
employee loyalty are praise and recognition a sense of contribution to the company learning and
development and having a best friend at work
Creating a fairy-tale work environment begins withrecognition Your employees need it more
than money perks or titles Here are eight tips regarding recognition Remember these and your
employees may just start whistling while they work It is up to me The corporate culture or
financial rewards will not make your team successful It is up to you Recognition is one thing
that is completely in your control
Strong relationships are vital in todays economy Strengthening employee relationships is even
more necessary as companies downsize and lay off As your workforce shrinks and you need to
do more with less keeping quality employees becomes even more critical As a manager it is
your job to bond your best people to your company through recognition And you also must help
direct and motivate your core performers
Simple rewards earn big returns There are some relatively simple things you can do that will
earn big returns For example remember your employees birthdays and work anniversaries find
out what inexpensive rewards they value (for example tickets to a ball game or a half day off to
spend time with their kids) make the most of your formal service awards with some preparation
and a group presentation walk around your department every day and talk to your
people and thank them sincerely and often
73
Make it specific Praise and recognition must be specific to have impact General praise such as
You do great work actually can have the opposite effect and leave your employees wondering
Does he have any idea what I really do around here Specific praise links individual
accomplishments to company goals For example Cheryl I noticed the way you handled that
customer complaint Great work As you know we value quick resolutions of problems as
one of our core strategies
Ask the best to stay Call your best people into your office one at a time Let that bright young
college graduate know you value his fresh ideas and energy Tell the 20-year veteran how much
your team relies on her expertise and organizational skillsRemarkably a significant percent of
high-impact performers report that they left their last job because No one ever asked me to
stay
Forget cash
Remember the saying Money cant buy everything Well its true Dont wait until you can
offer an employee a raise or promotion Real thanks is its own reward In numerous surveys of
work satisfaction top on employees lists is feeling appreciated In fact when employees feel
recognized and involved they are much less likely to keep asking about money
Recognize
Recognition means most to an employee when it is sincere and spontaneous According to the
largest study ever conducted on workplace satisfaction (Gallup 1999) recognition should occur
at least every seven days If you wait until a year-end party or an annual review you are waiting
much too long to recognize and you probably are losing people you do not need to
74
Recognition works
Neglect can be a poisoned apple Recognition is the elixir that will spark better attitudes and
performance Jeffrey Pfeffer of Stanford University says The returns from managing people in
ways that build high commitment typically are on the order of 30 to 50 percent
Take a hard look in the mirror and ask yourself how you can recognize the fairest of them all
Learn to recognize your employees for their efforts thank them often and reward their
achievements You can awaken them from their anger and apathy and they will fall in love with
their jobs again Chances are you will work together happily ever after
So there is direct relation with employee satisfaction and their commitment towards the
organization and it is also clear from the above discussion that only monetary elements are not
sufficient for employee satisfaction rather other element like employer behavior recognisation
and other moral value
75
RECOMMENDATIONS
PHILIPS should increase its capacity utilization It should work at full capacity to
minimize its cost of production With this increase in capacity utilization the total cost
will spread over more units thereby decreasing the per unit cost
PHILIPS should decrease the credit facilities provided to its consumers The payback
period is quite high in case of debtors as compared to creditors it should be more or less
equal as it will help in improving company liquidity
PHILIPS should focus more on the consumer lifestyle goods in India parallel to its other
business as it accounts very less as compare to other businesses of Philips
Another recommendation for Mohali plant is about the HR department that is they
should appoint permanent and skilled workers as against casual workers which generally add
up to the profit of the company
76
BIBLIOGRAPHY
1 Values-Based Leadership Rebuilding Employee Commitment Performance and Productivity ( Thomas D Kuczmarski)
2 Monthly Journals of Philips Electronics India Ltd
3 Authentic Leadership Medtronic CEO Bill George
4 wwwindiaphilipscom
5 wwwwikipediacom
6 httpwwwemployeecommitmentcom
7 One Foot Out The Door How to Combat The Psychological Recession Thatrsquos Alienating Employees And Hurting American Business Judith Bardwick
8 Employee Commitment A Leader Ship Guide Joe Folkman
9 Harvard University Factors that Impact Employee Well Being Commitment and Productivity -An Article
77
Questionnaire
Name __________________________________________________________
Age______________________________ Gender _______________________
Qualification _______________________ Contact No ___________________
Q1 In which department you are working
Electrical Production Mechanical Other
Q2 What is your working experience
gt2 Years 2-4 Years 4-6 Years lt 6 Years
Q3 How You like the physical Working Environment of the organization
Excellent Good Fair Poor Very Poor
Q4 Are you satisfied with Non-Monitory benefits provided by the organisation
Highly Satisfied Satisfied Neither Satisfied Nor dissatisfied
Highly Dissatisfied Dissatisfied
Q5 Are you satisfied with your work
Highly Satisfied Satisfied Neither Satisfied Nor dissatisfied
Highly Dissatisfied Dissatisfied
Q6 Are you satisfied with the career development programe of the company
Highly Satisfied Satisfied Neither Satisfied Nor dissatisfied
Highly Dissatisfied Dissatisfied
Q7 Is other staff of the organization is co-operative with you
Highly Satisfied Satisfied Neither Satisfied Nor dissatisfied
Highly Dissatisfied Dissatisfied
Q8 Are you satisfied with top level management
Highly Satisfied Satisfied Neither Satisfied Nor dissatisfied
Highly Dissatisfied Dissatisfied
78
Q9 Are you satisfied with your subordinates
Highly Satisfied Satisfied Neither Satisfied Nor dissatisfied
Highly Dissatisfied Dissatisfied
Q10 Are you satisfied with the nature of the Job
Highly Satisfied Satisfied Neither Satisfied Nor dissatisfied
Highly Dissatisfied Dissatisfied
Q11 Do you have any Job Pressure in work
Yes No
Q12 Do you satisfied with the opportunities provided by the organisation
Highly Satisfied Satisfied Neither Satisfied Nor dissatisfied
Highly Dissatisfied Dissatisfied
Q13 Are you satisfied with the welfare facilities provided by the organisation
Highly Satisfied Satisfied Neither Satisfied Nor dissatisfied
Highly Dissatisfied Dissatisfied
Q14 Are you satisfied towards your salary
Highly Satisfied Satisfied Neither Satisfied Nor dissatisfied
Highly Dissatisfied Dissatisfied
Q15 Are you committed towards the organisation
Yes No
Signature

12
Corporate Office-
Philips Electronics India Ltd
Technopolis Knowledge Park
Mahakali Caves Road
Chakala Andheri (East)Mumbai 400 093
Tel +91 22 66912000
VISION 2012
Through the Vision 2012 strategy we aim to fuel growth by making Philips the leading brand in
Health and Well-being Vision 2012 further positions Philips as a market-driven people-centric
company with a strategy and a structure that fully reflect the needs of its customer base while
also increasing shareholder value This is implemented through sharpened strategies in the three
core sectors Healthcare Lighting and Consumer Lifestyle
ldquoWith Vision 2010 we are putting people right at the center of things with Health and Well-
being as our overarching theme We are thereby putting into practice our mission improving the
quality of life through the introduction of meaningful innovationsrdquo ndash Gerard Kleisterlee
President and CEO of Royal Philips Electronic
Our Ways of Working
1 We are a people-centric company that organizes around customers and markets
2 We invest in a strong brand and consistently deliver on our brand promise of ldquosense and
simplicityrdquo in our actions products and services
13
3 We deliver innovation by investing in world class strengths in end-user insights
technology design and superior supplier networks
4 We develop our peoplersquos leadership talent and engagement and align ourselves with high
performance benchmarks
5 We invest in high growth and profitable businesses and emerging geographies to achieve
market leadership positions
6 We are committed to sustainability and focus on making the difference in efficient energy
use
7 We drive operational excellence and quality to best in class levels allowing us the above
mentioned strategic investments in our businesses
BRAND PROMISE
It is the combination of two unique capabilities that enables us to deliver on our ldquosense and
simplicityrdquo promise These capabilities are firstly by understanding people and secondly
technology integration and product design
We put our end users front and center of product innovations starting with understanding their
needs and aspirations We use best-in-class research facilities and agencies to validate and ensure
that our product innovations are designed around peoplersquos needs and aspirations easy to
experience and advanced
SUSTAINABILITY
14
In 2009 we evaluated our sustainability strategy and resolved to fully leverage sustainability as
an integral part of our overall strategy and an additional driver of growth as reflected in the
Philips Management Agenda 2012
To deliver on our brand promise of ldquosense and simplicityrdquo and at the same time provide the
company direction for the longer term in this area we have identified three sustainability
leadership key performance indicators where we can bring our competencies to bear lsquocarersquo
lsquoenergy efficiencyrsquo and lsquomaterialsrsquo including targets for 2015
Bringing care to more than 500 million people
Target 500 million lives touched by 2015
Improving energy efficiency of Philips products
Target 50 improvement by 2015 (for the average total product portfolio) compared to
2009
Closing the materials loop
Target Double global collection recycling amounts and recycled materials in products
by 2015 compared to 2009
Each sector will take the lead on one of the leadership key performance indicators with
Healthcare leading lsquocarersquo Lighting lsquoenergy efficiencyrsquo and Consumer Lifestyle lsquomaterialsrsquo
In addition we defined a set of complementary performance indicators to accelerate change and
drive performance including the EcoVision4 parameters
With EcoVision4 we have committed to the following by 2012
15
bull Generate 30 of total revenues from Green Products
bull Double investment in Green Innovations to a cumulative EUR 1 billion
bull Improve our operational energy efficiency by 25 and reduce our CO2 emissions by 25 all
compared with the base year 2007
SOCIAL COMMITMENT
Living up to this commitment means we use our capabilities to enhance the lives of our
employees and people in society at large Within the company we encourage teamwork and
collaboration in an environment that enables employees to reach their full potential
Building on our rich heritage of involvement in social issues we have established our own
approach of supporting the communities where we live and work focusing on energy efficiency
and healthcare
Sustainable lighting
There is a pressing need to find innovative lighting solutions for the 16 billion people who live
in areas with no access to the electricity grid or where the grid is unreliable Thatrsquos why we have
developed SMILE (Sustainable Model in Lighting Everywhere)
Launched as a pilot in 2006 in four Indian states SMILE includes two lighting solutions UDAY
a rechargeable portable lantern and KIRAN a hand-cranked LED flashlight Today are
distributed in eighth Indian states
16
SWOT ANALYSIS
Strengths
bull India was a market where the first mover enjoyed advantages over latecomers
bull The first image of the product lasted long in the eyes of the consumer and the first to enter the
market could gain the largest market share
bull PHILIPS is committed to enhance its image to the Chinese market as investors
bull PHILIPS was building a wholly owned manufacturing plant in India to show the
Chinese the commitment Korea had to the Chinese society
bull Labor costs in India were less and would defray the cost of producing high-end
bull Samsung has been making color TVs for many years in Korea before moving to the Chinese
market
Weaknesses
bull PHILIPS must continue to control all costs to maintain success
bull India has a reputation of being a protected market (protectionism)
bull India was a market where the first mover enjoyed advantages over late comers PHILIPS is
trying to overcome the first comer advantage Japan manufacturers have over them by being those
first comers
bull Companies such as Sony and Matsushita had built sales and service networks that were
favorable to their sales programs in India while Samsung would have to catch up in that area
17
bull Samsung is not as experienced in manufacturing high-end TVs for a higher-end market
segment
Opportunities
bull Based on the data that on 28 of the 220 million rural households own a color TV PHILIPS
focus on the domestic India market should be to penetrate the rural household market which
would mean that for those purposes the low-end production of sets in the 13rdquo to 20rdquo range should
be produced to appeal to that segmentrsquos purchasing ability
bull Larger more high-end models can be produced to appeal to an urban customer in India as well
as being an export to the US and European higher end customers
bull With success in the higher-end manufacturing and sales of premium TVs in India PHILIPS can
establish themselves as high-end producers around the world
Threats
bull PHILIPS faces intense competition in the color TV market
bull A premium-priced product wouldnrsquot sell in large volumes so pricing can be a problem
bull Since PHILIPS didnrsquot have an established marketing strategy issues of how to market the
product may arise
bull Loss of profitability because related to over-employment at most facilities
bull Is the per capita income level such that it can support sales of product at any level
bull If PHILIPS fails to be successful in the Chinese market with high-end product it will be known
around the world bull India was a market where the first mover enjoyed advantages over late
comers
bull The first image of the product lasted long in the eyes of the consumer and the first to enter the
18
market could gain the largest market share
bull PHILIPS is committed to enhance its image to the Chinese market as investors
PHILIPS ELECTRONICS MOHALI PLANT
The mohali plant was established in 1985 as PUNJAB ANAND LAMP Ltd as its second
division of lamp industry after the varodra plant at that time it was a joint stock company and
majority of shares was with Punjab Anand Lamp around 75 but in the year 2001 the company
ownership changed and the whole shares was bought by PHILIPS ELECTRONIC INDIA Ltd
and its name was changed to PHILIPS ELECTRONIC INDIA Ltd MOHALI LIGHT
FACTORY
The plant is situated in Industrial focal point PHASE-9 MOHALI near Mohali railway station
and is sreaded in 26 acres Total employees of tis plant is 532 including casual employees This
company is a landmark in the Punjab state as it is the only factory which is most profitable one
than any industry located in Punjab
19
OVERVIEW OF VARIOUS FRONTS OF
PHILIPS ELECTRONICS INDIA Ltd
Manufacturing-
Today the product range of Philips include the following products ndash
Televisions- LCD Plasma Flat Screen Smart Touch XL
Recorders DVD Players I pods and Home Theatre Systems
Audio Products - Audio Systems Remote Controls AudioVideo Accessories
Digital Photo Products and Frames
Portable Audio and Video Systems Accessories like Headphones and Speakers
PC Products - Mouse and Keyboard Multi Media Headsets External Hard Disk Drives
Mobile Phones
Male Shaving and Grooming - Dry Shavers Beard Trimmers
Personal Care - Beauty and Hair Care Products
20
Kitchen Appliances - Blenders and Hand Blenders Juicers and Citruspresses Food
Processors and Mixers Coffee Makers and Kettles Frying and Grilling Appliances
Toasters and Snacking Products
Household Products - Irons Vacuum Cleaners Water Purifiers
Professional Lighting - Industrial Shops and offices Road and Area Hospitality Sports
Lighting City Beautification and Petrol Stations
Automotive Lighting - In Cars Motorcycles and Trucks
Home Lighting
SERVICS
Philips E-waste Management Program in India
Philips has tied up with a recycler for collecting transporting and recycling unwanted broken
down consumer products
At Philips we offer consumers a convenient way of recycling their unwanted obsolete and
damaged Philips products by dropping them off at convenient locations The program
encompasses 8 major cities across India Consumers can approach one of 27 authorized Philips
service centres which will act as collection points for consumer products which need recycling
Our efforts are to expand the network in the near future
Philips ensures that the consumer products received will be recycled in an environment-friendly
manner Philips understand the corporate social responsibility and takes steps towards providing
a safer environment to the future generations We design our products to continuously realize
improvements and reduce their overall life cycle environmental impact Designing products for
21
recycling is an integral part of this approach Our aim is to use our planetrsquos limited resources
effectively and respect the principle of extended producer responsibility This also calls for
manufacturers to engage in developing solutions for effective and efficient recycling of their
products We will continue to promote and invest into improved recycling systems to reduce the
impact of electronic waste on the environment
MANUFACTURING AT MOHALI PLANT ndash
Mohali plant mainly manufactures lighting products basically of domestic usage this includes the
following products ndash
CFL bulbs ndash
1 Genie - 5 watt 8 watt 11 watt
2 Essential ndash 8 watt 11 watt 14 watt 18 watt 23 watt 29 watt
3 Tornado ndash 5 watt 8 watt 11 watt 14 watt 18 watt 23watt 29 watt
4 T5 slim tube 28 watt
Coil plant ndash Philips Electronics India is the only company that produces coils in the whole
lighting industries in the world and in India only at the MOHALI PLANT
22
Chapter-II
OBJECTIVES OF THE STUDY
23
OBJECTIVES OF THE STUDY
To study the various aspects of Satisfaction Level of the Employees working at Philips
Electronics India Ltd Mohali
To analyze the effect of Job satisfaction on the organisation
To determine the relation between job satisfaction of employees and their commitment
towards the organisation
To analyze the performance model adopted by the Philips Electronics India Ltd Mohali
to handle their manpower
To suggest remedial measures for the improvement of the companyrsquos performance
24
Chapter-III
Employees Commitment
25
Employees who are engaged in their work and committed to their organizations give companies
crucial competitive advantagesmdashincluding higher productivity and lower employee turnover
Thus it is not surprising that organizations of all sizes and types have invested substantially in
policies and practices that foster engagement and commitment in their workforces
But what are employee engagement and commitment exactly This report examines the ways in
which employers and corporate consultants define these terms today and offers ideas for
strengthening employee engagement Though different organizations define engagement
differently some common themes emerge These themes include employeesrsquo satisfaction with
their work and pride in their employer the extent to which people enjoy and believe in what they
do for work and the perception that their employer values what they bring to the table The
greater an employeersquos engagement the more likely he or she is to ldquogo the extra milerdquo and deliver
excellent on-the-job performance In addition engaged employees may be more likely to commit
to staying with their current organization Software giant Intuit2 for example found that highly
engaged employees are 13 times more likely to be high performers than less engaged
employees They are also five times less likely to voluntarily leave the company
Clearly engagement and commitment can potentially translate into valuable business results for
an organization To help you reap the benefits of an engaged committed workforce at your
organization this report provides guidelines for understanding and measuring employee
engagement and for designing and implementing effective engagement initiatives As you will
26
see everyday human resource practices such as recruitment training performance management
and workforce surveys can provide powerful levers for enhancing engagement
Employee Engagement Key Ingredients
ldquoEmployee Engagement Definedrdquo shows examples of engagement definitions used by various
corporations and consultancies Clearly definitions of employee engagement vary greatly across
organizations Many managers wonder how such an elusive concept can be quantified The term
does encompass several ingredients for which researchers have developed measurement
techniques These ingredients include the degree to which employees fully occupy themselves in
their work as well as the strength of their commitment to the employer and role Fortunately
there is much research on these elements of engagementmdashwork that has deep roots in individual
and group psychology
Definition
ldquoNo company small or large can win over the long run without energized employees who
believe in the [firms] mission and understand how to achieve it Thats why you need to take the
measure of employee engagement at least once a year through anonymous surveys in which
people feel completely safe to speak their mindsrdquo
-Jack and Suzy Welch-
Common Themes How Companies Measure Engagement
Employers typically assess their employeesrsquo engagement levels with company-wide attitude
or opinion surveys
27
1048657 Pride in employer
1048657 Satisfaction with employer
1048657 Job satisfaction
1048657 Opportunity to perform well at challenging work
1048657 Recognition and positive feedback for onersquos contributions
1048657 Personal support from onersquos supervisor
1048657 Effort above and beyond the minimum
1048657 Understanding the link between onersquos job and the organizationrsquos mission
1048657 Prospects for future growth with onersquos employer
1048657 Intention to stay with onersquos employer
The Link Between Employer Practices and Employee Engagement
How does an engaged workforce generate valuable business results for an organization The
process starts with employer practices such as job and task design recruitment selection
training compensation performance management and career development Such practices affect
employeesrsquo level of engagement as well as job performance Performance and engagement then
interact to produce business results Figure 1 depicts these relationships
28
EMPLOYEE COMMITMENT EMPLOYEE ENGAGEMENT
1048657 How do you and other managers in your
organization define commitment
1048657 Are some employees in your company
engaged in their work but not committed to
the organization Committed to staying with
your firm but not exactly engaged in their
work Both engaged and committed
1048657 To whom are your organizations employees
committed The company Their supervisor
Co-workers Team members Customers
1048657 What business results has commitment from
1048657 How do you and other managers in your
organization define employee engagement
1048657 How do you know that certain employees in
your company are engaged Do they relish
their jobs Enjoy specific responsibilities or
tasks Willingly ldquogo the extra milerdquo
1048657 In teams departments or business units in
your company that have a large number of
engaged employees what business results
are you seeing Higher productivity Lower
costs Greater revenues More efficiency
29
employees created for your organization For
example has commitment reduced turnover
and therefore decreased recruitment hiring
and training costs
1048657 What does your company do to reciprocate
employees commitment Is the organization
living up to its side of the bargain
Lower turnover Higher product or service
quality
1048657 Conversely how do disengaged employees
behave and what are the consequent costs
for their teams units-and your entire
company
As Figure 2 suggests a person possesses attributes such as knowledge skills abilities
temperament attitudes and personality He or she uses these attributes to accomplish work
behaviors according to organization-defined procedures by applying tools equipment andor
technology Work behaviors in turn create the products and services that make an organization
successful We classify work behaviors into three categories those required to accomplish duties
and tasks specified in a job description (prescribed behaviors) ldquoextrardquo behaviors that an
employee contributes for the good of the organization (voluntary behaviors) and behaviors
prohibited by an employer (proscribed behaviors including unexcused absenteeism stealing and
other counterproductive or illegal actions) Of course job performance occurs in an
organizational context which includes elements such as leadership physical setting and social
setting
30
Employers naturally want to encourage workers to perform prescribed and voluntary activities
while avoiding proscribed ones To achieve these goals organizations use a number of HR
practices that directly affect the person process and context components of job performance
Employeesrsquo reactions to these practices determine their levels of engagement and commitment
31
Chapter-IV
32
LITERATURE OF THE REVIEW
ldquo Job Satisfaction That Leads To The Commitment Of
The Employees in The Organisationrdquo
Literature of Review
Gerge Bill Authentic Leadership
In his book Authentic Leadership former Medtronic CEO Bill George makes an obvious
point that business leaders rarely say out loud ldquoMissions motivate dollars donrsquotrdquo
What he means is that purpose is what drives employee commitment not the financial
rewards that come to others Workers donrsquot get up in the morning and say ldquoGee I can
33
hardly wait to get to work today to maximize shareholder profitsrdquo Even when employees
are shareholders who can benefit from improved financials what draws people to their
chosen careers is the work itself and its purpose in the world more than the profit
possibilities
Mr George goes on to say ldquoI find there is universal agreement (among middle managers)
that you cannot inspire employees by urging them to help management get the companyrsquos
stock price uprdquo
There is in fact quite a bit of literature on this subject In Awakening Corporate Soul
authors Eric Klein and John Izzo say that employee commitment requires knowing ldquothe
purpose of our work it means recognizing the purpose our organization fulfills that goes
beyond the bottom line and it means articulating to others how their (workersrsquo) efforts
contribute to a larger purposerdquo
In Built to Last Jim Collins and James Porras spend an entire book explaining their five
year research study of major companies that led to this conclusion about employee
commitment Purpose within a company is what sustains it profit is important but when
itrsquos the prime directive companies falter
-Marshal Goldsmith-
How to Increase Employee Commitment
In practice this involves walking the talk being transparent communicating effectively treating
people equally teaching leading subordinates to increasingly excellent performance ndash and
responding to subordinates as mature individuals who are owed fairness the truth and
recognition of their achievements
34
Since managers interact directly and frequently with subordinates they are usually more tuned
in to how employees are feeling than are executives Managers are in a better position to know
for example when employees are feeling alienated and disengaged from their work which is
very common today -- and expensive
Gaining employee commitment results in greater profits because enthusiastic employees stay
contribute discretionary effort and engage customers Performance soars when customers are
enthused and stay and when executives managers and employees are a collaborative team
united in achieving common goals
But managers are often called middle managers for good reason their job is to motivate and
guide subordinates while they at the same time are being judged by their bosses Because of
their ldquotweenrdquo position in the hierarchy managers to effective support direct reports must also
create relationships with potential allies especially those with greater power who have access to
top decision makers
Harvard University Factors that Impact Employee Well Being Commitment and
Productivity
Business executives from the C-suite and HR to QC and RampD are by nature focused on the
corporate bottom line A new trend in our dawning age of social sustainability is that many
experts believe more attention should be paid to the dotted line - the one signed when a person
35
commits to employment at a company New Harvard research validates this approach affirming
that trust and purpose play a significant role in building successful productive workplaces
The behavioral research conducted by a team at Harvard University and Massachusetts General
Hospital identifies the factors most likely to impact 21st century employee well being
commitment and productivity The researchers found that commitment is largely influenced by
ones sense of purpose feeling of personal impact and overall trust in the organization
Productivity is largely affected by the quality of human relationships including cooperative
social group moods and interaction
The results lead us to conclude that workplaces that provide positive environments that foster
interpersonal trust and quality personal relationships create the most committed and productive
employees says Nancy Etcoff PhD the lead researcher on the study
Expert Shares Keys to Building Successful Workplace Relationships
According to business strategist Courtney Anderson JD MBA Outstanding leadership
today means much more than just doing your job Success is creating an environment that fosters
happy committed productive team members
Anderson explains that reinvigorating workplaces by enhancing trust and employee commitment
does not have to be difficult The biggest challenge she says is making the time to truly change
in our overscheduled instant access competitive work environments With a little know-how it
can be easy to evolve workplace well being and respond to these compelling research results
-Mark Howell-
CEO Bright Point
High-performing companies recognize that employee commitment is a major contributing factor
toward sustaining long-term success and creating value An engaged employee is involved and
excited about their work and acts in a manner that will forward the organizationrsquos interest An
36
engaged workforce helps optimize and retain talent for the long-term because the employees
choose to stay even when other employment alternatives exist
According to Walker Information the top three drivers of employee commitment are
Satisfaction Fairness and Care amp Concern for employees Put simply committed employees
want to enjoy their work feel they are appreciated and know they are making a contribution to
their companyrsquos strategic objectives Additionally employees who have trust in their leadership
and are trusted by their leadership have a greater dedication and are ultimately more productive
on the job However according to recent data provided by the National Business Research
Institute (NBRI) only 31 of all employees are truly engaged
At BrightPoint we take employee engagement seriously and we work to create a culture that
inspires employee loyalty and satisfaction The results of BrightPointrsquos commitment to its
employees are shown in the 2011 BPNA Employee Commitment Survey The survey
determined that close to 80 of respondents indicated they were satisfied with their jobs and
daily activities General employee satisfaction increases when managers take an active interest
in their employees beyond their day-to-day job responsibilities According to NBRI managers
that actively coach build relationships and keep an open dialogue with their employees improve
employee engagement
We have a diverse workforce where each employee brings unique value and has individual
needs Managers are learning to manage the individual and not the position In order to give
managers the tools they need to be successful BrightPoint places strong emphasis on targeted
leadership training workshops and continual learning resources In 2011 906 of managers at
BrightPoint NA participated in the development opportunities offered and also made an effort to
37
help reinforce the learning of their team members This signals that our leadership team is taking
an active interest in professional development and its connection to employee commitment
As BrightPoint continues to increase focus on employee engagement the organization will grow
stronger and maintain a substantial advantage over our competition Our employees possess the
knowledge experience and resiliency to respond quickly to the demands of the marketplace and
through their genuine commitment will deliver what our customers want with increasing
efficiency and effectiveness Our responsibility is value-creation by growing our business and
maintaining high levels of customer service and loyalty We believe the best way to accomplish
this is through a strong committed and engaged workforce
Performance Model Adopted At Mohali Plant
38
Process adopted by Philips Electronics Mohali Plant for Job Satisfaction of Employee that leads commitment of the employees
39
Recruiting
The messages in Philips Electronics Mohali organization conveys while seeking to attract job
applicants also can influence future employeesrsquo engagement and commitment If your firm has
designed jobs specifically to engage employees then organization want to ensure that recruiting
ads extol these positionsrsquo attractive featuresmdashsuch as challenging work assignments a highly
skilled team environment or minimal supervision Applicants who notice and respond to these
ads will more likely be motivated by these features Also consider how organization might best
seek candidates from inside your organization When Organisation recruit existing employees for
desirable jobs you enhance their engagement (by maximizing the person-job fit) and
commitment (by providing growth and advancement opportunities to employees in return for
their loyalty) If Organisation recruit from outside when qualified internal candidates are
available Organization may unwittingly suggest to current employees that your company is not
willing to reciprocate their commitment Existing staff may then begin questioning their own
commitment to the firm By contrast organisation recruit external candidates to both the job and
your organization For these candidates ensure that recruiting messages highlight attractive job
features organizational values and commitment reciprocity That is in return for performance
and dedication your company offers competitive pay and benefits flexible work hours and
learning and career advancement opportunities Also remember that prospective employees have
multiple commitments You will inevitably have to compete with those commitments as
organization try to attract candidates to your firm Most people find it easier to make a new
commitment when it is compatible with their other obligations For example you boost your
chances of recruiting a highly qualified candidate who is a single parent if you offer flexible
work hours family health benefits and on-site day care ldquoRecruiting for Engagement and
Commitmentrdquo
40
Employee Selection
Once recruiting efforts produce a pool of promising job candidates Philips select among them to
fill available positions When organisation select the right individuals for the right jobs new
hires carry out their work more smoothly and experience fewer performance problems The
result Greater enjoyment ofmdashand engagement inmdashthe job
To enhance engagement through your selection of employees identify those candidates who are
best-suited to the job and your organizationrsquos culture Also use candidate assessment methods
that have obvious relevance to the job in questionmdashfor example by asking interviewees what
they know about the role and having them provide work samples Most candidates will view
these techniques more positively than tests with less apparent relevance such as personality and
integrity assessments Successful candidates feel good about having ldquopassed the test and see
company as careful and capable for having selected them A positive initial impression of an
employer encourages growth of long-term commitment
Training and Development
Training and development can serve as additional levers for enhancing engagement and
commitment For new hires training usually begins with orientation Orientation presents several
important opportunitiesmdashincluding explaining pay work schedules and company policies Most
important it gives you a chance to encourage employee engagement by explaining how the new
hirersquos job contributes to the organizationrsquos mission Through orientation Mohali Plant of Philips
Electronics describe how r company is organized introduce the new employee to his or her co-
workers give the person a tour of the area where he or she will be working and explain safety
regulations and other procedural matters In short you foster person-organization fitmdashvital for
developing productive and dedicated employees Through training you help new and current
41
employees acquire the knowledge and skills they need to perform their jobs And employees who
enhance their skills through training are more likely to engage fully in their work because they
derive satisfaction from mastering new tasks Training also enhances employeesrsquo value to your
company as well as their own employability in the job market In addition most companies offer
higher wages for skilled workers to compensate them for their greater value and to discourage
turnover
Compensation
Like the HR practices discussed above compensation can powerfully influence employee
engagement and commitment Some compensation components encourage commitment to
employers while others motivate engagement in the job It is possible to stimulate one and not
the other though itrsquos generally better to foster both For example a company that offers a strong
performance incentive system but no retirement plan will probably realize exceptional
engagement from its workers however they may eventually commit themselves to another
company that does offer a good retirement plan Meanwhile an organization that offers generous
retirement benefits but a traditional seniority-based pay grade system may have committed
employees however these workers might deliver pedestrian performance as they bide their time
until retirement In designing compensation plans you therefore need to consider employee
engagement and commitment strategically
Encourage managers to include employees in the goal-setting process This technique helps to
ensure that workers understand the goals It also promotes acceptance of challenging objectives
because people generally feel more committed to goals they have helped define In addition
consider how you and other managers will recognize and encourage contributions that exceed
expectations For example when a piece of equipment malfunctions Joe finds other ways to
maintain production rather than merely shutting down the machine and waiting for the
42
maintenance staff to fix it Or when a less experienced co-worker encounters a new task Sally
offers friendly coaching instead of standing by and waiting for the inevitable mistakes to crop
up Performance management processes operate on a continuous basis Therefore they provide
perhaps the best ongoing opportunities for employers to foster employee engagement and
commitment For example managers can use routine discussions about performance and
feedback sessions to learn which aspects of the job hold the most interest for each employee and
which tasks are most challenging During such discussions managers also can define what going
above and beyond the call of dutyrdquo looks like and generate ideas for rewarding such
contributions An employeersquos aspirations and career goals can receive careful attention during
performance appraisal meetings Without inquiring into an employeersquos personal life a supervisor
can nevertheless explore ways to enhance the compatibility between the workerrsquos commitment to
your organization and the employeersquos other life commitments Through such means the
organization personalizes its relationship to each employee and provides support while also
expressing appreciation for their contributionsmdash key drivers of engagement and commitment
To further engage employees and win their commitment through your performance management
programs consider how to treat your organizationrsquos most experienced employees In many cases
these employees understand the intricacies of a job better than their supervisors or managers do
By virtue of long identification with your organization they may be deeply committed to high-
level goals They use their expertise to contribute in ways that newer employees simply cannot
match But many of them also may be planning to retire soon especially if they are from the
ldquoBaby Boomerrdquo generation How will you transfer their knowledge to younger workers Design
a performance management system that recognizes and rewards proactive sharing of knowledge
and expertise among co-workers For example create knowledge repositories or learning
histories that can be stored in databases that employees can access and then create incentives
43
for people who contribute to and use these repositories Of course effective performance
management systems also identify employees who are not meeting expectations Failing to
address problem performance can erode other employeesrsquo engagement and commitment as their
workloads increase and they conclude that the company is willing to tolerate poor performance
If feedback coaching and remedial training are of little avail the manager may need to move the
person to a different position within the company where he or she can make a more valuable
contribution or let the individual go if there is no good match elsewhere in the organization
44
Chapter-V
RESEARCH METHODOLOGY
The basic task of research is to generate accurate information for use in decision-making
Research can be defined as the systematic and objective process of gathering recording and
analyzing data for aid in making business decisions As the project involves analyzing of
45
financial structure the research is exploratory in nature covering financial parameters and come
of the important ratios to carry out research There are basically two techniques adopted for
obtaining information
Primary Data
Secondary Data
Primary Data is gathered specifically for the project at hand through personal interviews with
the accounts officers
Sample Size = 100 Employees
Secondary data is previously collected and assembled for some project other than the one at
hand It is gathered and recorded by someone else prior to current needs of the researcher It is
less expensive than the primary date
Secondary Data can be obtained from both external and internal sources
External data may be collected from books and periodicals government sources media and other
commercial sources
Internal data is that secondary data which is created recorded or generated by the organization
As the project is explanatory in nature secondary data is collected from the reports of the
company books journals and interest Secondary data is gathered from annual reports official
records and standing orders of the units
CHAPTER - VI
DATA ANALYSIS AND INTERPRETATION
46
The data after collection is to be processed and analyzed in accordance with the outline
and down for the purpose at the time of developing research plan
Technically speaking processing implies editing coding classification and tabulation of
collected data so that they are amenable to analysis The term analysis refers to the computation
of certain measures along with searching for pattern groups Thus in the process of analysis
relationship or difference should be subjected to statistical tests of significance to determine with
what validity data can be said to indicate any conclusions
The analysis of data in a general way involves a number of closely related operations
which are performed with the purpose of summarizing the collected data and organizing them in
such a manner that they answer the research questions In this study the researcher followed
above process carefully and it is presented in this chapter
47
Table 41 ndash To know the department in which employees are belongs to
S
ou rc
e
survey data
Inference
From the above table it shows that 35 of employees are belongs to
production department
FIGURE 41
S
SI No
D
Department
N
No of Respondents
P
Percentage
1
1
M
Mechanical
3
30
3
30
2
2
E
Electrical
2
25
2
25
3
3
P
Production
3
35
3
35
4
4
O
Others
1
10
1
10
T
Total
1
100
1
100
48
REPRESENTS THE DEPARTMENT
Table 42 ndash To know working experience of the employees
Source survey data
Inference
From the above table it shows that 34 of the employees have 4 ndash 6
years experience
S
SI No
W
Work Experience
N
No of Respondents
P
Percentage
1
1
B
Below 2 years
1
33
1
13
2
2
2
2ndash 4 years
3
30
3
30
3
3
4
4ndash 6 years
3
34
3
34
4
4
A
Above 6 years
2
23
2
23
T
otal
1
100
1
100
49
FIGURE 42
REPRESENTS THE EXPERIENCE OF THE EMPLOYEES
Table 43 ndash To know the physical working environment
S
SI No
W
Working Environment
N
No of Respondents
P
Percentage
1
1
E
Excellent
1
12
1
12
2
2
G
Good
5
57
5
57
3
3
F
Fair
2
28
2
28
4
4
P
Poor
0
03
0
33
5
5
V
Very Poor
0
00
0
00
T
Total
1
100
1
100
Source survey data
Inference
From the above table it shows that 57 of the employees were feeling good about the working environment
50
FIGURE 43
REPRESENTS THE PHYSICAL WOKING ENVIRONMENT
51
Table 44 ndash To know the satisfaction level of employees towards the non-monitory benefits
S
SI No
N
Non-Monitory Benefits offered
to Employees
N
No of Respondents
P
Percentage
1
1
H
Highly Satisfied
1
14
1
14
2
2
S
Satisfied
5
54
5
54
3
3
N
Neither Satisfied nor Dissatisfied
2
25
2
25
4
4
D
Dissatisfied
0
05
0
05
5
5
H
Highly Dissatisfied
0
02
0
02
Total 1
100
1
100
Source survey data
Inference
From the above table it shows that 54 of the employees were satisfied towards the non-monitory benefits
FIGURE 44
REPRESENTS THE SATISFACTION LEVEL OF EMPLOYEES TOWARDS THE NON-MONITORY BENEFITS
52
Table 45 ndash To know the satisfaction level of respondents towards the work
assigned
Source survey dataInference
From the above table it shows that 45 of the respondents were satisfied towards the work assigned
FIGURE 45
S
SI No
A
Amount of Work
N
No of Respondents
P
Percentage
1
1
H
Highly satisfied
2
20
2
20
2
2
S
Satisfied
4
45
4
45
3
3
N
Neither Satisfied nor Dissatisfied
1
12
1
12
4
4
D
Dissatisfied
1
18
1
18
5
5
H
Highly Dissatisfied
0
06
0
06
Total 1
100
1
100
53
REPRESENTS THE SATISFACTION LEVEL OF RESPONDENTS TOWARDS THE WORK ASSIGNED
54
Table 46 ndash Opinion about the career development programme in their organisation
S
SI No
C
Career Development
N
No of Respondents
P
Percentage
H
Highly satisfied
1
12
1
12
S
Satisfied
5
56
5
56
N
Neither Satisfied nor Dissatisfied
2
22
2
22
D
Dissatisfied
1
10
1
10
H
Highly Dissatisfied
0
00
0
00
Total 1
100
1
100
Source survey data
Inference
From the above table it shows that 56 of the employees were satisfied
with the opinion about the carrier development programme in their organisation
FIGURE 46
REPRESENTS OPINION ABOUT THE CAREER DEVELOPMENT
PROGRAMME IN THEIR ORGANISATION
55
Table 47 ndash To know the cooperation of co-workers
S
SI No
C
Co-operation of Workers
N
No of Respondents
P
Percentage
1
1
H
Highly satisfied
2
20
2
20
2
2
S
Satisfied
6
66
6
66
3
3
N
Neither Satisfied nor Dissatisfied
1
11
1
11
4
4
D
Dissatisfied
0
03
0
03
5
5
H
Highly Dissatisfied
0
00
0
00
Total 1
100
1
100
Source survey data
Inference
From the above table it shows that 66 of the employees were satisfied
with the cooperation of co-workers
FIGURE 47
56
REPRESENTS THE COOPERATION OF CO-WORKERS
57
Table 48 ndash To know the satisfaction of Respondents with top management
S
SI No
S
Satisfaction with Top
Management
N
No of Respondents
P
Percentage
1
1
H
Highly satisfied
2
26
2
26
2
2
S
Satisfied
5
51
5
51
3
3
N
Neither Satisfied nor Dissatisfied
1
17
1
17
4
4
D
Dissatisfied
0
06
0
06
5
5
H
Highly dissatisfied
0
00
0
00
Total 1
100
1
100
Source survey data
Inference
From the above table it shows that 51 of the employees were satisfied with the top management
FIGURE 48
58
REPRESENTS THE SATISFACTION OF RESPONDENTS WITH TOP MANAGEMENT
Table 49 ndash To know the satisfaction of Respondents with their subordinates
Source survey data
Inference
From the above table it shows that 67 of the employees were satisfied with their subordinates
S
SI
No
S
Satisfaction with Subordinates
N
No of Respondents
P
Percentage
1
1
H
Highly satisfied
1
12
1
12
2
2
S
Satisfied
6
67
6
67
2
3
N
Neither Satisfied nor Dissatisfied
1
14
1
14
4
D
Dissatisfied
0
07
0
07
5
5
H
Highly Dissatisfied
0
00
0
00
Total 1
100
1
100
59
FIGURE 49
REPRESENTS THE SATISFACTION OF RESPONDENTS WITH THEIR SUBORDINATES
60
Table 410 ndash To know the level of satisfaction regarding nature of job
S
SI No
J
Job Satisfaction
N
No of Respondents
P
Percentage
1
1
H
Highly satisfied
2
22
2
22
2
2
S
Satisfied
5
56
5
56
3
3
N
Neither Satisfied nor Dissatisfied
1
16
1
16
4
4
D
Dissatisfied
0
07
0
07
5
5
H
Highly Dissatisfied
0
00
0
00
Total 1
100
1
100
Source survey dataInference
From the above table it shows that 56 of the employees were satisfied with their job
FIGURE 410
61
REPRESENTS THE LEVEL OF SATISFACTION REGARDING THE NATURE OF JOB
Table 411 ndash To know whether there is any job pressure in their work
Source survey data
Inference
From the above table it shows that 72 of employees said there is job pressure in their work
FIGURE 411
REPRESENTS WHETHER THERE IS ANY JOB PRESSURE IN THEIR WORK
S
SI No
J
Job Pressure
N
No of Respondents
P
Percentage
1
1
Y
Yes
7
72
7
72
2
2
N
No
2
28
2
28
T
Total
1
100
1
100
62
Table 412 ndash To know the opinion regarding opportunity provided by the organisation in developing skills
amp talents
S
SI No
D
Development of Skills and
Talents
N
No of Respondents
P
Percentage
1
1
H
Highly Agree
1
12
1
12
2
2
A
Agree
5
52
5
52
3
3
N
Neither Agree nor Disagree
2
28
2
28
4
4
D
Disagree
0
06
0
06
5
5
H
Highly Disagree
0
02
0
02
Total 1
100
1
100
Source survey data
Inference
From the above table it shows that 52 of employees agreed regarding opportunity provided by the organisation in developing skills amp talents
63
FIRGURE 412
REPRESENTS THE OPPORTUNITY PROVIDED BY THE ORGANISATION IN DEVELOPING SKILLS amp TALENTS
64
Table 413 ndash To know the satisfaction level of welfare facilities provided by the management
S
SI No
W
Welfare Facilities
N
No of Respondents
P
Percentage
1
1
H
Highly satisfied
0
09
9
09
2
2
S
Satisfied
5
57
5
57
3
3
N
Neither Satisfied nor Dissatisfied
2
29
2
29
4
4
D
Dissatisfied
5
05
0
05
5
5
H
Highly Dissatisfied
0
00
0
00
Total 1
100
1
100
Source survey data
Inference
From the above table it shows that 57 of the employees were satisfied with the welfare facilities provided by the management
FIGURE 413
REPRESENTS THE SATISFACTION LEVEL OF WELFARE FACILITIES PROVIDED BY THE MANGEMENT
65
Table 414 ndash To know the employee satisfaction towards the salary
Source survey data
Inference
From the above table it shows that 67 of the employees were satisfied
with their salary
FIGURE 414
REPRESENTS THE SATISFACTION TOWARDS THE SALARY
S
SI No
P
Payment Satisfaction
N
No of Respondents
P
Percentage
1
1
Y
Yes
6
67
6
67
2
2
N
No
3
33
3
33
T
otal
1
100
1
100
66
Table 415 ndash To know the employees willingness amp Commitment Towards
Organisation
Source survey data
Inference
From the above table it shows that 59 of the employees were willing to
continue in this organisation
FIGURE 415
REPRESENTS THE EMPLOYEES WILLINGNESS TO CONTINUE
S
SI No
W
Willingness to Work
N
No of Respondents
P
Percentage
1
1
Y
Yes
5
59
5
59
2
2
N
No
4
41
4
41
T
Total
1
00
1
00
67
CHI-SQUARE METHOD
The chi square test is one of the simplest and most widely used non-
parametric tests in statistical work As a non-parametric test it can be used to determine
if categorical data shows dependency or the two classifications are independent It can
also be used to make comparisons between theoretical population and actual data
when categories are used
n
Chi square χsup2= sum (O-E) sup2 E
i =1
Where O= observed frequency
E= expected frequency
68
OBSERVED FREQUENCY
Table 419 shows the relationship between the department and the job satisfaction
Over All
Job
SatisfactionHighly
SatisfiedSatisfied
Neither
Satisfied nor
Dissatisfied
DissatisfiedHighly
Dissatisfied
Sub
Total
Mechanical 5 6 14 3 2 30
Electrical 6 8 6 3 2 25
Production 9 13 7 4 2 35
Others 2 3 2 2 1 10
Sub Total 22 30 29 12 7 100
69
EXPECTED FREQUENCY
Over All
Job
SatisfactionHighly
SatisfiedSatisfied
Neither
Satisfied nor
Dissatisfied
DissatisfiedHighly
Dissatisfied
Sub
Total
Mechanical 7 8 9 4 2 30
Electrical 5 8 7 3 2 25
Production 8 11 10 4 2 35
Others 2 3 3 1 1 10
Sub Total 22 30 29 12 7 100
Null Hypothesis (Ho)
There is no significant difference between the department and the job satisfaction
Alternative Hypothesis (Ho)
There is significant difference between the job satisfaction
Co Relation
70
Chapter-V
CONCLUSIONS AND
RECOMMENDATIONS
71
CONCLUSION
On the basis of Analysis of Job Satisfaction Level of the Employees of Philips Electronics India
Ltd Mohali made in the previous chapters following conclusions are drawn
General Profile The plant of PHILIPS is ideally located in the Mohali Industrial focal point
Phase 9 near Chandigarh the capital of Punjab on a campus of 17 hectares The working
environment of the company is very healthy The visitors feel happy after the campus
Indigenous Technology PHILIPS is the only lighting manufacturing company based on purely
indigenous technology Philips was appropriately chosen as the brand name as self reliance and
building up of Indian Engineering capabilities remain the guiding spirit of PHILIPS
Financial structure PHILIPS is a low debt company signifying its dependence mainly on
its internal accruals for its financial requirements PHILIPS continues to strengthen its financial
position by channelising these internal accruals to fund its expansion programmes
Working results PTL has registered a handsome and constant growth in its profits because
of a brisk demand for new and better technology electronic items None of the other electronic
company has shown such a steady growth Philips has recorded the lowest current ratio
However with this lowest current ratio PTL still enjoys moderate payment period and highest
velocity of creditors and debtors only due to commitment of itrsquos employees
72
SUMMARY
According to the 1999 Gallup Poll the four elements that have proven to be effective in creating
employee loyalty are praise and recognition a sense of contribution to the company learning and
development and having a best friend at work
Creating a fairy-tale work environment begins withrecognition Your employees need it more
than money perks or titles Here are eight tips regarding recognition Remember these and your
employees may just start whistling while they work It is up to me The corporate culture or
financial rewards will not make your team successful It is up to you Recognition is one thing
that is completely in your control
Strong relationships are vital in todays economy Strengthening employee relationships is even
more necessary as companies downsize and lay off As your workforce shrinks and you need to
do more with less keeping quality employees becomes even more critical As a manager it is
your job to bond your best people to your company through recognition And you also must help
direct and motivate your core performers
Simple rewards earn big returns There are some relatively simple things you can do that will
earn big returns For example remember your employees birthdays and work anniversaries find
out what inexpensive rewards they value (for example tickets to a ball game or a half day off to
spend time with their kids) make the most of your formal service awards with some preparation
and a group presentation walk around your department every day and talk to your
people and thank them sincerely and often
73
Make it specific Praise and recognition must be specific to have impact General praise such as
You do great work actually can have the opposite effect and leave your employees wondering
Does he have any idea what I really do around here Specific praise links individual
accomplishments to company goals For example Cheryl I noticed the way you handled that
customer complaint Great work As you know we value quick resolutions of problems as
one of our core strategies
Ask the best to stay Call your best people into your office one at a time Let that bright young
college graduate know you value his fresh ideas and energy Tell the 20-year veteran how much
your team relies on her expertise and organizational skillsRemarkably a significant percent of
high-impact performers report that they left their last job because No one ever asked me to
stay
Forget cash
Remember the saying Money cant buy everything Well its true Dont wait until you can
offer an employee a raise or promotion Real thanks is its own reward In numerous surveys of
work satisfaction top on employees lists is feeling appreciated In fact when employees feel
recognized and involved they are much less likely to keep asking about money
Recognize
Recognition means most to an employee when it is sincere and spontaneous According to the
largest study ever conducted on workplace satisfaction (Gallup 1999) recognition should occur
at least every seven days If you wait until a year-end party or an annual review you are waiting
much too long to recognize and you probably are losing people you do not need to
74
Recognition works
Neglect can be a poisoned apple Recognition is the elixir that will spark better attitudes and
performance Jeffrey Pfeffer of Stanford University says The returns from managing people in
ways that build high commitment typically are on the order of 30 to 50 percent
Take a hard look in the mirror and ask yourself how you can recognize the fairest of them all
Learn to recognize your employees for their efforts thank them often and reward their
achievements You can awaken them from their anger and apathy and they will fall in love with
their jobs again Chances are you will work together happily ever after
So there is direct relation with employee satisfaction and their commitment towards the
organization and it is also clear from the above discussion that only monetary elements are not
sufficient for employee satisfaction rather other element like employer behavior recognisation
and other moral value
75
RECOMMENDATIONS
PHILIPS should increase its capacity utilization It should work at full capacity to
minimize its cost of production With this increase in capacity utilization the total cost
will spread over more units thereby decreasing the per unit cost
PHILIPS should decrease the credit facilities provided to its consumers The payback
period is quite high in case of debtors as compared to creditors it should be more or less
equal as it will help in improving company liquidity
PHILIPS should focus more on the consumer lifestyle goods in India parallel to its other
business as it accounts very less as compare to other businesses of Philips
Another recommendation for Mohali plant is about the HR department that is they
should appoint permanent and skilled workers as against casual workers which generally add
up to the profit of the company
76
BIBLIOGRAPHY
1 Values-Based Leadership Rebuilding Employee Commitment Performance and Productivity ( Thomas D Kuczmarski)
2 Monthly Journals of Philips Electronics India Ltd
3 Authentic Leadership Medtronic CEO Bill George
4 wwwindiaphilipscom
5 wwwwikipediacom
6 httpwwwemployeecommitmentcom
7 One Foot Out The Door How to Combat The Psychological Recession Thatrsquos Alienating Employees And Hurting American Business Judith Bardwick
8 Employee Commitment A Leader Ship Guide Joe Folkman
9 Harvard University Factors that Impact Employee Well Being Commitment and Productivity -An Article
77
Questionnaire
Name __________________________________________________________
Age______________________________ Gender _______________________
Qualification _______________________ Contact No ___________________
Q1 In which department you are working
Electrical Production Mechanical Other
Q2 What is your working experience
gt2 Years 2-4 Years 4-6 Years lt 6 Years
Q3 How You like the physical Working Environment of the organization
Excellent Good Fair Poor Very Poor
Q4 Are you satisfied with Non-Monitory benefits provided by the organisation
Highly Satisfied Satisfied Neither Satisfied Nor dissatisfied
Highly Dissatisfied Dissatisfied
Q5 Are you satisfied with your work
Highly Satisfied Satisfied Neither Satisfied Nor dissatisfied
Highly Dissatisfied Dissatisfied
Q6 Are you satisfied with the career development programe of the company
Highly Satisfied Satisfied Neither Satisfied Nor dissatisfied
Highly Dissatisfied Dissatisfied
Q7 Is other staff of the organization is co-operative with you
Highly Satisfied Satisfied Neither Satisfied Nor dissatisfied
Highly Dissatisfied Dissatisfied
Q8 Are you satisfied with top level management
Highly Satisfied Satisfied Neither Satisfied Nor dissatisfied
Highly Dissatisfied Dissatisfied
78
Q9 Are you satisfied with your subordinates
Highly Satisfied Satisfied Neither Satisfied Nor dissatisfied
Highly Dissatisfied Dissatisfied
Q10 Are you satisfied with the nature of the Job
Highly Satisfied Satisfied Neither Satisfied Nor dissatisfied
Highly Dissatisfied Dissatisfied
Q11 Do you have any Job Pressure in work
Yes No
Q12 Do you satisfied with the opportunities provided by the organisation
Highly Satisfied Satisfied Neither Satisfied Nor dissatisfied
Highly Dissatisfied Dissatisfied
Q13 Are you satisfied with the welfare facilities provided by the organisation
Highly Satisfied Satisfied Neither Satisfied Nor dissatisfied
Highly Dissatisfied Dissatisfied
Q14 Are you satisfied towards your salary
Highly Satisfied Satisfied Neither Satisfied Nor dissatisfied
Highly Dissatisfied Dissatisfied
Q15 Are you committed towards the organisation
Yes No
Signature
13
3 We deliver innovation by investing in world class strengths in end-user insights
technology design and superior supplier networks
4 We develop our peoplersquos leadership talent and engagement and align ourselves with high
performance benchmarks
5 We invest in high growth and profitable businesses and emerging geographies to achieve
market leadership positions
6 We are committed to sustainability and focus on making the difference in efficient energy
use
7 We drive operational excellence and quality to best in class levels allowing us the above
mentioned strategic investments in our businesses
BRAND PROMISE
It is the combination of two unique capabilities that enables us to deliver on our ldquosense and
simplicityrdquo promise These capabilities are firstly by understanding people and secondly
technology integration and product design
We put our end users front and center of product innovations starting with understanding their
needs and aspirations We use best-in-class research facilities and agencies to validate and ensure
that our product innovations are designed around peoplersquos needs and aspirations easy to
experience and advanced
SUSTAINABILITY
14
In 2009 we evaluated our sustainability strategy and resolved to fully leverage sustainability as
an integral part of our overall strategy and an additional driver of growth as reflected in the
Philips Management Agenda 2012
To deliver on our brand promise of ldquosense and simplicityrdquo and at the same time provide the
company direction for the longer term in this area we have identified three sustainability
leadership key performance indicators where we can bring our competencies to bear lsquocarersquo
lsquoenergy efficiencyrsquo and lsquomaterialsrsquo including targets for 2015
Bringing care to more than 500 million people
Target 500 million lives touched by 2015
Improving energy efficiency of Philips products
Target 50 improvement by 2015 (for the average total product portfolio) compared to
2009
Closing the materials loop
Target Double global collection recycling amounts and recycled materials in products
by 2015 compared to 2009
Each sector will take the lead on one of the leadership key performance indicators with
Healthcare leading lsquocarersquo Lighting lsquoenergy efficiencyrsquo and Consumer Lifestyle lsquomaterialsrsquo
In addition we defined a set of complementary performance indicators to accelerate change and
drive performance including the EcoVision4 parameters
With EcoVision4 we have committed to the following by 2012
15
bull Generate 30 of total revenues from Green Products
bull Double investment in Green Innovations to a cumulative EUR 1 billion
bull Improve our operational energy efficiency by 25 and reduce our CO2 emissions by 25 all
compared with the base year 2007
SOCIAL COMMITMENT
Living up to this commitment means we use our capabilities to enhance the lives of our
employees and people in society at large Within the company we encourage teamwork and
collaboration in an environment that enables employees to reach their full potential
Building on our rich heritage of involvement in social issues we have established our own
approach of supporting the communities where we live and work focusing on energy efficiency
and healthcare
Sustainable lighting
There is a pressing need to find innovative lighting solutions for the 16 billion people who live
in areas with no access to the electricity grid or where the grid is unreliable Thatrsquos why we have
developed SMILE (Sustainable Model in Lighting Everywhere)
Launched as a pilot in 2006 in four Indian states SMILE includes two lighting solutions UDAY
a rechargeable portable lantern and KIRAN a hand-cranked LED flashlight Today are
distributed in eighth Indian states
16
SWOT ANALYSIS
Strengths
bull India was a market where the first mover enjoyed advantages over latecomers
bull The first image of the product lasted long in the eyes of the consumer and the first to enter the
market could gain the largest market share
bull PHILIPS is committed to enhance its image to the Chinese market as investors
bull PHILIPS was building a wholly owned manufacturing plant in India to show the
Chinese the commitment Korea had to the Chinese society
bull Labor costs in India were less and would defray the cost of producing high-end
bull Samsung has been making color TVs for many years in Korea before moving to the Chinese
market
Weaknesses
bull PHILIPS must continue to control all costs to maintain success
bull India has a reputation of being a protected market (protectionism)
bull India was a market where the first mover enjoyed advantages over late comers PHILIPS is
trying to overcome the first comer advantage Japan manufacturers have over them by being those
first comers
bull Companies such as Sony and Matsushita had built sales and service networks that were
favorable to their sales programs in India while Samsung would have to catch up in that area
17
bull Samsung is not as experienced in manufacturing high-end TVs for a higher-end market
segment
Opportunities
bull Based on the data that on 28 of the 220 million rural households own a color TV PHILIPS
focus on the domestic India market should be to penetrate the rural household market which
would mean that for those purposes the low-end production of sets in the 13rdquo to 20rdquo range should
be produced to appeal to that segmentrsquos purchasing ability
bull Larger more high-end models can be produced to appeal to an urban customer in India as well
as being an export to the US and European higher end customers
bull With success in the higher-end manufacturing and sales of premium TVs in India PHILIPS can
establish themselves as high-end producers around the world
Threats
bull PHILIPS faces intense competition in the color TV market
bull A premium-priced product wouldnrsquot sell in large volumes so pricing can be a problem
bull Since PHILIPS didnrsquot have an established marketing strategy issues of how to market the
product may arise
bull Loss of profitability because related to over-employment at most facilities
bull Is the per capita income level such that it can support sales of product at any level
bull If PHILIPS fails to be successful in the Chinese market with high-end product it will be known
around the world bull India was a market where the first mover enjoyed advantages over late
comers
bull The first image of the product lasted long in the eyes of the consumer and the first to enter the
18
market could gain the largest market share
bull PHILIPS is committed to enhance its image to the Chinese market as investors
PHILIPS ELECTRONICS MOHALI PLANT
The mohali plant was established in 1985 as PUNJAB ANAND LAMP Ltd as its second
division of lamp industry after the varodra plant at that time it was a joint stock company and
majority of shares was with Punjab Anand Lamp around 75 but in the year 2001 the company
ownership changed and the whole shares was bought by PHILIPS ELECTRONIC INDIA Ltd
and its name was changed to PHILIPS ELECTRONIC INDIA Ltd MOHALI LIGHT
FACTORY
The plant is situated in Industrial focal point PHASE-9 MOHALI near Mohali railway station
and is sreaded in 26 acres Total employees of tis plant is 532 including casual employees This
company is a landmark in the Punjab state as it is the only factory which is most profitable one
than any industry located in Punjab
19
OVERVIEW OF VARIOUS FRONTS OF
PHILIPS ELECTRONICS INDIA Ltd
Manufacturing-
Today the product range of Philips include the following products ndash
Televisions- LCD Plasma Flat Screen Smart Touch XL
Recorders DVD Players I pods and Home Theatre Systems
Audio Products - Audio Systems Remote Controls AudioVideo Accessories
Digital Photo Products and Frames
Portable Audio and Video Systems Accessories like Headphones and Speakers
PC Products - Mouse and Keyboard Multi Media Headsets External Hard Disk Drives
Mobile Phones
Male Shaving and Grooming - Dry Shavers Beard Trimmers
Personal Care - Beauty and Hair Care Products
20
Kitchen Appliances - Blenders and Hand Blenders Juicers and Citruspresses Food
Processors and Mixers Coffee Makers and Kettles Frying and Grilling Appliances
Toasters and Snacking Products
Household Products - Irons Vacuum Cleaners Water Purifiers
Professional Lighting - Industrial Shops and offices Road and Area Hospitality Sports
Lighting City Beautification and Petrol Stations
Automotive Lighting - In Cars Motorcycles and Trucks
Home Lighting
SERVICS
Philips E-waste Management Program in India
Philips has tied up with a recycler for collecting transporting and recycling unwanted broken
down consumer products
At Philips we offer consumers a convenient way of recycling their unwanted obsolete and
damaged Philips products by dropping them off at convenient locations The program
encompasses 8 major cities across India Consumers can approach one of 27 authorized Philips
service centres which will act as collection points for consumer products which need recycling
Our efforts are to expand the network in the near future
Philips ensures that the consumer products received will be recycled in an environment-friendly
manner Philips understand the corporate social responsibility and takes steps towards providing
a safer environment to the future generations We design our products to continuously realize
improvements and reduce their overall life cycle environmental impact Designing products for
21
recycling is an integral part of this approach Our aim is to use our planetrsquos limited resources
effectively and respect the principle of extended producer responsibility This also calls for
manufacturers to engage in developing solutions for effective and efficient recycling of their
products We will continue to promote and invest into improved recycling systems to reduce the
impact of electronic waste on the environment
MANUFACTURING AT MOHALI PLANT ndash
Mohali plant mainly manufactures lighting products basically of domestic usage this includes the
following products ndash
CFL bulbs ndash
1 Genie - 5 watt 8 watt 11 watt
2 Essential ndash 8 watt 11 watt 14 watt 18 watt 23 watt 29 watt
3 Tornado ndash 5 watt 8 watt 11 watt 14 watt 18 watt 23watt 29 watt
4 T5 slim tube 28 watt
Coil plant ndash Philips Electronics India is the only company that produces coils in the whole
lighting industries in the world and in India only at the MOHALI PLANT
22
Chapter-II
OBJECTIVES OF THE STUDY
23
OBJECTIVES OF THE STUDY
To study the various aspects of Satisfaction Level of the Employees working at Philips
Electronics India Ltd Mohali
To analyze the effect of Job satisfaction on the organisation
To determine the relation between job satisfaction of employees and their commitment
towards the organisation
To analyze the performance model adopted by the Philips Electronics India Ltd Mohali
to handle their manpower
To suggest remedial measures for the improvement of the companyrsquos performance
24
Chapter-III
Employees Commitment
25
Employees who are engaged in their work and committed to their organizations give companies
crucial competitive advantagesmdashincluding higher productivity and lower employee turnover
Thus it is not surprising that organizations of all sizes and types have invested substantially in
policies and practices that foster engagement and commitment in their workforces
But what are employee engagement and commitment exactly This report examines the ways in
which employers and corporate consultants define these terms today and offers ideas for
strengthening employee engagement Though different organizations define engagement
differently some common themes emerge These themes include employeesrsquo satisfaction with
their work and pride in their employer the extent to which people enjoy and believe in what they
do for work and the perception that their employer values what they bring to the table The
greater an employeersquos engagement the more likely he or she is to ldquogo the extra milerdquo and deliver
excellent on-the-job performance In addition engaged employees may be more likely to commit
to staying with their current organization Software giant Intuit2 for example found that highly
engaged employees are 13 times more likely to be high performers than less engaged
employees They are also five times less likely to voluntarily leave the company
Clearly engagement and commitment can potentially translate into valuable business results for
an organization To help you reap the benefits of an engaged committed workforce at your
organization this report provides guidelines for understanding and measuring employee
engagement and for designing and implementing effective engagement initiatives As you will
26
see everyday human resource practices such as recruitment training performance management
and workforce surveys can provide powerful levers for enhancing engagement
Employee Engagement Key Ingredients
ldquoEmployee Engagement Definedrdquo shows examples of engagement definitions used by various
corporations and consultancies Clearly definitions of employee engagement vary greatly across
organizations Many managers wonder how such an elusive concept can be quantified The term
does encompass several ingredients for which researchers have developed measurement
techniques These ingredients include the degree to which employees fully occupy themselves in
their work as well as the strength of their commitment to the employer and role Fortunately
there is much research on these elements of engagementmdashwork that has deep roots in individual
and group psychology
Definition
ldquoNo company small or large can win over the long run without energized employees who
believe in the [firms] mission and understand how to achieve it Thats why you need to take the
measure of employee engagement at least once a year through anonymous surveys in which
people feel completely safe to speak their mindsrdquo
-Jack and Suzy Welch-
Common Themes How Companies Measure Engagement
Employers typically assess their employeesrsquo engagement levels with company-wide attitude
or opinion surveys
27
1048657 Pride in employer
1048657 Satisfaction with employer
1048657 Job satisfaction
1048657 Opportunity to perform well at challenging work
1048657 Recognition and positive feedback for onersquos contributions
1048657 Personal support from onersquos supervisor
1048657 Effort above and beyond the minimum
1048657 Understanding the link between onersquos job and the organizationrsquos mission
1048657 Prospects for future growth with onersquos employer
1048657 Intention to stay with onersquos employer
The Link Between Employer Practices and Employee Engagement
How does an engaged workforce generate valuable business results for an organization The
process starts with employer practices such as job and task design recruitment selection
training compensation performance management and career development Such practices affect
employeesrsquo level of engagement as well as job performance Performance and engagement then
interact to produce business results Figure 1 depicts these relationships
28
EMPLOYEE COMMITMENT EMPLOYEE ENGAGEMENT
1048657 How do you and other managers in your
organization define commitment
1048657 Are some employees in your company
engaged in their work but not committed to
the organization Committed to staying with
your firm but not exactly engaged in their
work Both engaged and committed
1048657 To whom are your organizations employees
committed The company Their supervisor
Co-workers Team members Customers
1048657 What business results has commitment from
1048657 How do you and other managers in your
organization define employee engagement
1048657 How do you know that certain employees in
your company are engaged Do they relish
their jobs Enjoy specific responsibilities or
tasks Willingly ldquogo the extra milerdquo
1048657 In teams departments or business units in
your company that have a large number of
engaged employees what business results
are you seeing Higher productivity Lower
costs Greater revenues More efficiency
29
employees created for your organization For
example has commitment reduced turnover
and therefore decreased recruitment hiring
and training costs
1048657 What does your company do to reciprocate
employees commitment Is the organization
living up to its side of the bargain
Lower turnover Higher product or service
quality
1048657 Conversely how do disengaged employees
behave and what are the consequent costs
for their teams units-and your entire
company
As Figure 2 suggests a person possesses attributes such as knowledge skills abilities
temperament attitudes and personality He or she uses these attributes to accomplish work
behaviors according to organization-defined procedures by applying tools equipment andor
technology Work behaviors in turn create the products and services that make an organization
successful We classify work behaviors into three categories those required to accomplish duties
and tasks specified in a job description (prescribed behaviors) ldquoextrardquo behaviors that an
employee contributes for the good of the organization (voluntary behaviors) and behaviors
prohibited by an employer (proscribed behaviors including unexcused absenteeism stealing and
other counterproductive or illegal actions) Of course job performance occurs in an
organizational context which includes elements such as leadership physical setting and social
setting
30
Employers naturally want to encourage workers to perform prescribed and voluntary activities
while avoiding proscribed ones To achieve these goals organizations use a number of HR
practices that directly affect the person process and context components of job performance
Employeesrsquo reactions to these practices determine their levels of engagement and commitment
31
Chapter-IV
32
LITERATURE OF THE REVIEW
ldquo Job Satisfaction That Leads To The Commitment Of
The Employees in The Organisationrdquo
Literature of Review
Gerge Bill Authentic Leadership
In his book Authentic Leadership former Medtronic CEO Bill George makes an obvious
point that business leaders rarely say out loud ldquoMissions motivate dollars donrsquotrdquo
What he means is that purpose is what drives employee commitment not the financial
rewards that come to others Workers donrsquot get up in the morning and say ldquoGee I can
33
hardly wait to get to work today to maximize shareholder profitsrdquo Even when employees
are shareholders who can benefit from improved financials what draws people to their
chosen careers is the work itself and its purpose in the world more than the profit
possibilities
Mr George goes on to say ldquoI find there is universal agreement (among middle managers)
that you cannot inspire employees by urging them to help management get the companyrsquos
stock price uprdquo
There is in fact quite a bit of literature on this subject In Awakening Corporate Soul
authors Eric Klein and John Izzo say that employee commitment requires knowing ldquothe
purpose of our work it means recognizing the purpose our organization fulfills that goes
beyond the bottom line and it means articulating to others how their (workersrsquo) efforts
contribute to a larger purposerdquo
In Built to Last Jim Collins and James Porras spend an entire book explaining their five
year research study of major companies that led to this conclusion about employee
commitment Purpose within a company is what sustains it profit is important but when
itrsquos the prime directive companies falter
-Marshal Goldsmith-
How to Increase Employee Commitment
In practice this involves walking the talk being transparent communicating effectively treating
people equally teaching leading subordinates to increasingly excellent performance ndash and
responding to subordinates as mature individuals who are owed fairness the truth and
recognition of their achievements
34
Since managers interact directly and frequently with subordinates they are usually more tuned
in to how employees are feeling than are executives Managers are in a better position to know
for example when employees are feeling alienated and disengaged from their work which is
very common today -- and expensive
Gaining employee commitment results in greater profits because enthusiastic employees stay
contribute discretionary effort and engage customers Performance soars when customers are
enthused and stay and when executives managers and employees are a collaborative team
united in achieving common goals
But managers are often called middle managers for good reason their job is to motivate and
guide subordinates while they at the same time are being judged by their bosses Because of
their ldquotweenrdquo position in the hierarchy managers to effective support direct reports must also
create relationships with potential allies especially those with greater power who have access to
top decision makers
Harvard University Factors that Impact Employee Well Being Commitment and
Productivity
Business executives from the C-suite and HR to QC and RampD are by nature focused on the
corporate bottom line A new trend in our dawning age of social sustainability is that many
experts believe more attention should be paid to the dotted line - the one signed when a person
35
commits to employment at a company New Harvard research validates this approach affirming
that trust and purpose play a significant role in building successful productive workplaces
The behavioral research conducted by a team at Harvard University and Massachusetts General
Hospital identifies the factors most likely to impact 21st century employee well being
commitment and productivity The researchers found that commitment is largely influenced by
ones sense of purpose feeling of personal impact and overall trust in the organization
Productivity is largely affected by the quality of human relationships including cooperative
social group moods and interaction
The results lead us to conclude that workplaces that provide positive environments that foster
interpersonal trust and quality personal relationships create the most committed and productive
employees says Nancy Etcoff PhD the lead researcher on the study
Expert Shares Keys to Building Successful Workplace Relationships
According to business strategist Courtney Anderson JD MBA Outstanding leadership
today means much more than just doing your job Success is creating an environment that fosters
happy committed productive team members
Anderson explains that reinvigorating workplaces by enhancing trust and employee commitment
does not have to be difficult The biggest challenge she says is making the time to truly change
in our overscheduled instant access competitive work environments With a little know-how it
can be easy to evolve workplace well being and respond to these compelling research results
-Mark Howell-
CEO Bright Point
High-performing companies recognize that employee commitment is a major contributing factor
toward sustaining long-term success and creating value An engaged employee is involved and
excited about their work and acts in a manner that will forward the organizationrsquos interest An
36
engaged workforce helps optimize and retain talent for the long-term because the employees
choose to stay even when other employment alternatives exist
According to Walker Information the top three drivers of employee commitment are
Satisfaction Fairness and Care amp Concern for employees Put simply committed employees
want to enjoy their work feel they are appreciated and know they are making a contribution to
their companyrsquos strategic objectives Additionally employees who have trust in their leadership
and are trusted by their leadership have a greater dedication and are ultimately more productive
on the job However according to recent data provided by the National Business Research
Institute (NBRI) only 31 of all employees are truly engaged
At BrightPoint we take employee engagement seriously and we work to create a culture that
inspires employee loyalty and satisfaction The results of BrightPointrsquos commitment to its
employees are shown in the 2011 BPNA Employee Commitment Survey The survey
determined that close to 80 of respondents indicated they were satisfied with their jobs and
daily activities General employee satisfaction increases when managers take an active interest
in their employees beyond their day-to-day job responsibilities According to NBRI managers
that actively coach build relationships and keep an open dialogue with their employees improve
employee engagement
We have a diverse workforce where each employee brings unique value and has individual
needs Managers are learning to manage the individual and not the position In order to give
managers the tools they need to be successful BrightPoint places strong emphasis on targeted
leadership training workshops and continual learning resources In 2011 906 of managers at
BrightPoint NA participated in the development opportunities offered and also made an effort to
37
help reinforce the learning of their team members This signals that our leadership team is taking
an active interest in professional development and its connection to employee commitment
As BrightPoint continues to increase focus on employee engagement the organization will grow
stronger and maintain a substantial advantage over our competition Our employees possess the
knowledge experience and resiliency to respond quickly to the demands of the marketplace and
through their genuine commitment will deliver what our customers want with increasing
efficiency and effectiveness Our responsibility is value-creation by growing our business and
maintaining high levels of customer service and loyalty We believe the best way to accomplish
this is through a strong committed and engaged workforce
Performance Model Adopted At Mohali Plant
38
Process adopted by Philips Electronics Mohali Plant for Job Satisfaction of Employee that leads commitment of the employees
39
Recruiting
The messages in Philips Electronics Mohali organization conveys while seeking to attract job
applicants also can influence future employeesrsquo engagement and commitment If your firm has
designed jobs specifically to engage employees then organization want to ensure that recruiting
ads extol these positionsrsquo attractive featuresmdashsuch as challenging work assignments a highly
skilled team environment or minimal supervision Applicants who notice and respond to these
ads will more likely be motivated by these features Also consider how organization might best
seek candidates from inside your organization When Organisation recruit existing employees for
desirable jobs you enhance their engagement (by maximizing the person-job fit) and
commitment (by providing growth and advancement opportunities to employees in return for
their loyalty) If Organisation recruit from outside when qualified internal candidates are
available Organization may unwittingly suggest to current employees that your company is not
willing to reciprocate their commitment Existing staff may then begin questioning their own
commitment to the firm By contrast organisation recruit external candidates to both the job and
your organization For these candidates ensure that recruiting messages highlight attractive job
features organizational values and commitment reciprocity That is in return for performance
and dedication your company offers competitive pay and benefits flexible work hours and
learning and career advancement opportunities Also remember that prospective employees have
multiple commitments You will inevitably have to compete with those commitments as
organization try to attract candidates to your firm Most people find it easier to make a new
commitment when it is compatible with their other obligations For example you boost your
chances of recruiting a highly qualified candidate who is a single parent if you offer flexible
work hours family health benefits and on-site day care ldquoRecruiting for Engagement and
Commitmentrdquo
40
Employee Selection
Once recruiting efforts produce a pool of promising job candidates Philips select among them to
fill available positions When organisation select the right individuals for the right jobs new
hires carry out their work more smoothly and experience fewer performance problems The
result Greater enjoyment ofmdashand engagement inmdashthe job
To enhance engagement through your selection of employees identify those candidates who are
best-suited to the job and your organizationrsquos culture Also use candidate assessment methods
that have obvious relevance to the job in questionmdashfor example by asking interviewees what
they know about the role and having them provide work samples Most candidates will view
these techniques more positively than tests with less apparent relevance such as personality and
integrity assessments Successful candidates feel good about having ldquopassed the test and see
company as careful and capable for having selected them A positive initial impression of an
employer encourages growth of long-term commitment
Training and Development
Training and development can serve as additional levers for enhancing engagement and
commitment For new hires training usually begins with orientation Orientation presents several
important opportunitiesmdashincluding explaining pay work schedules and company policies Most
important it gives you a chance to encourage employee engagement by explaining how the new
hirersquos job contributes to the organizationrsquos mission Through orientation Mohali Plant of Philips
Electronics describe how r company is organized introduce the new employee to his or her co-
workers give the person a tour of the area where he or she will be working and explain safety
regulations and other procedural matters In short you foster person-organization fitmdashvital for
developing productive and dedicated employees Through training you help new and current
41
employees acquire the knowledge and skills they need to perform their jobs And employees who
enhance their skills through training are more likely to engage fully in their work because they
derive satisfaction from mastering new tasks Training also enhances employeesrsquo value to your
company as well as their own employability in the job market In addition most companies offer
higher wages for skilled workers to compensate them for their greater value and to discourage
turnover
Compensation
Like the HR practices discussed above compensation can powerfully influence employee
engagement and commitment Some compensation components encourage commitment to
employers while others motivate engagement in the job It is possible to stimulate one and not
the other though itrsquos generally better to foster both For example a company that offers a strong
performance incentive system but no retirement plan will probably realize exceptional
engagement from its workers however they may eventually commit themselves to another
company that does offer a good retirement plan Meanwhile an organization that offers generous
retirement benefits but a traditional seniority-based pay grade system may have committed
employees however these workers might deliver pedestrian performance as they bide their time
until retirement In designing compensation plans you therefore need to consider employee
engagement and commitment strategically
Encourage managers to include employees in the goal-setting process This technique helps to
ensure that workers understand the goals It also promotes acceptance of challenging objectives
because people generally feel more committed to goals they have helped define In addition
consider how you and other managers will recognize and encourage contributions that exceed
expectations For example when a piece of equipment malfunctions Joe finds other ways to
maintain production rather than merely shutting down the machine and waiting for the
42
maintenance staff to fix it Or when a less experienced co-worker encounters a new task Sally
offers friendly coaching instead of standing by and waiting for the inevitable mistakes to crop
up Performance management processes operate on a continuous basis Therefore they provide
perhaps the best ongoing opportunities for employers to foster employee engagement and
commitment For example managers can use routine discussions about performance and
feedback sessions to learn which aspects of the job hold the most interest for each employee and
which tasks are most challenging During such discussions managers also can define what going
above and beyond the call of dutyrdquo looks like and generate ideas for rewarding such
contributions An employeersquos aspirations and career goals can receive careful attention during
performance appraisal meetings Without inquiring into an employeersquos personal life a supervisor
can nevertheless explore ways to enhance the compatibility between the workerrsquos commitment to
your organization and the employeersquos other life commitments Through such means the
organization personalizes its relationship to each employee and provides support while also
expressing appreciation for their contributionsmdash key drivers of engagement and commitment
To further engage employees and win their commitment through your performance management
programs consider how to treat your organizationrsquos most experienced employees In many cases
these employees understand the intricacies of a job better than their supervisors or managers do
By virtue of long identification with your organization they may be deeply committed to high-
level goals They use their expertise to contribute in ways that newer employees simply cannot
match But many of them also may be planning to retire soon especially if they are from the
ldquoBaby Boomerrdquo generation How will you transfer their knowledge to younger workers Design
a performance management system that recognizes and rewards proactive sharing of knowledge
and expertise among co-workers For example create knowledge repositories or learning
histories that can be stored in databases that employees can access and then create incentives
43
for people who contribute to and use these repositories Of course effective performance
management systems also identify employees who are not meeting expectations Failing to
address problem performance can erode other employeesrsquo engagement and commitment as their
workloads increase and they conclude that the company is willing to tolerate poor performance
If feedback coaching and remedial training are of little avail the manager may need to move the
person to a different position within the company where he or she can make a more valuable
contribution or let the individual go if there is no good match elsewhere in the organization
44
Chapter-V
RESEARCH METHODOLOGY
The basic task of research is to generate accurate information for use in decision-making
Research can be defined as the systematic and objective process of gathering recording and
analyzing data for aid in making business decisions As the project involves analyzing of
45
financial structure the research is exploratory in nature covering financial parameters and come
of the important ratios to carry out research There are basically two techniques adopted for
obtaining information
Primary Data
Secondary Data
Primary Data is gathered specifically for the project at hand through personal interviews with
the accounts officers
Sample Size = 100 Employees
Secondary data is previously collected and assembled for some project other than the one at
hand It is gathered and recorded by someone else prior to current needs of the researcher It is
less expensive than the primary date
Secondary Data can be obtained from both external and internal sources
External data may be collected from books and periodicals government sources media and other
commercial sources
Internal data is that secondary data which is created recorded or generated by the organization
As the project is explanatory in nature secondary data is collected from the reports of the
company books journals and interest Secondary data is gathered from annual reports official
records and standing orders of the units
CHAPTER - VI
DATA ANALYSIS AND INTERPRETATION
46
The data after collection is to be processed and analyzed in accordance with the outline
and down for the purpose at the time of developing research plan
Technically speaking processing implies editing coding classification and tabulation of
collected data so that they are amenable to analysis The term analysis refers to the computation
of certain measures along with searching for pattern groups Thus in the process of analysis
relationship or difference should be subjected to statistical tests of significance to determine with
what validity data can be said to indicate any conclusions
The analysis of data in a general way involves a number of closely related operations
which are performed with the purpose of summarizing the collected data and organizing them in
such a manner that they answer the research questions In this study the researcher followed
above process carefully and it is presented in this chapter
47
Table 41 ndash To know the department in which employees are belongs to
S
ou rc
e
survey data
Inference
From the above table it shows that 35 of employees are belongs to
production department
FIGURE 41
S
SI No
D
Department
N
No of Respondents
P
Percentage
1
1
M
Mechanical
3
30
3
30
2
2
E
Electrical
2
25
2
25
3
3
P
Production
3
35
3
35
4
4
O
Others
1
10
1
10
T
Total
1
100
1
100
48
REPRESENTS THE DEPARTMENT
Table 42 ndash To know working experience of the employees
Source survey data
Inference
From the above table it shows that 34 of the employees have 4 ndash 6
years experience
S
SI No
W
Work Experience
N
No of Respondents
P
Percentage
1
1
B
Below 2 years
1
33
1
13
2
2
2
2ndash 4 years
3
30
3
30
3
3
4
4ndash 6 years
3
34
3
34
4
4
A
Above 6 years
2
23
2
23
T
otal
1
100
1
100
49
FIGURE 42
REPRESENTS THE EXPERIENCE OF THE EMPLOYEES
Table 43 ndash To know the physical working environment
S
SI No
W
Working Environment
N
No of Respondents
P
Percentage
1
1
E
Excellent
1
12
1
12
2
2
G
Good
5
57
5
57
3
3
F
Fair
2
28
2
28
4
4
P
Poor
0
03
0
33
5
5
V
Very Poor
0
00
0
00
T
Total
1
100
1
100
Source survey data
Inference
From the above table it shows that 57 of the employees were feeling good about the working environment
50
FIGURE 43
REPRESENTS THE PHYSICAL WOKING ENVIRONMENT
51
Table 44 ndash To know the satisfaction level of employees towards the non-monitory benefits
S
SI No
N
Non-Monitory Benefits offered
to Employees
N
No of Respondents
P
Percentage
1
1
H
Highly Satisfied
1
14
1
14
2
2
S
Satisfied
5
54
5
54
3
3
N
Neither Satisfied nor Dissatisfied
2
25
2
25
4
4
D
Dissatisfied
0
05
0
05
5
5
H
Highly Dissatisfied
0
02
0
02
Total 1
100
1
100
Source survey data
Inference
From the above table it shows that 54 of the employees were satisfied towards the non-monitory benefits
FIGURE 44
REPRESENTS THE SATISFACTION LEVEL OF EMPLOYEES TOWARDS THE NON-MONITORY BENEFITS
52
Table 45 ndash To know the satisfaction level of respondents towards the work
assigned
Source survey dataInference
From the above table it shows that 45 of the respondents were satisfied towards the work assigned
FIGURE 45
S
SI No
A
Amount of Work
N
No of Respondents
P
Percentage
1
1
H
Highly satisfied
2
20
2
20
2
2
S
Satisfied
4
45
4
45
3
3
N
Neither Satisfied nor Dissatisfied
1
12
1
12
4
4
D
Dissatisfied
1
18
1
18
5
5
H
Highly Dissatisfied
0
06
0
06
Total 1
100
1
100
53
REPRESENTS THE SATISFACTION LEVEL OF RESPONDENTS TOWARDS THE WORK ASSIGNED
54
Table 46 ndash Opinion about the career development programme in their organisation
S
SI No
C
Career Development
N
No of Respondents
P
Percentage
H
Highly satisfied
1
12
1
12
S
Satisfied
5
56
5
56
N
Neither Satisfied nor Dissatisfied
2
22
2
22
D
Dissatisfied
1
10
1
10
H
Highly Dissatisfied
0
00
0
00
Total 1
100
1
100
Source survey data
Inference
From the above table it shows that 56 of the employees were satisfied
with the opinion about the carrier development programme in their organisation
FIGURE 46
REPRESENTS OPINION ABOUT THE CAREER DEVELOPMENT
PROGRAMME IN THEIR ORGANISATION
55
Table 47 ndash To know the cooperation of co-workers
S
SI No
C
Co-operation of Workers
N
No of Respondents
P
Percentage
1
1
H
Highly satisfied
2
20
2
20
2
2
S
Satisfied
6
66
6
66
3
3
N
Neither Satisfied nor Dissatisfied
1
11
1
11
4
4
D
Dissatisfied
0
03
0
03
5
5
H
Highly Dissatisfied
0
00
0
00
Total 1
100
1
100
Source survey data
Inference
From the above table it shows that 66 of the employees were satisfied
with the cooperation of co-workers
FIGURE 47
56
REPRESENTS THE COOPERATION OF CO-WORKERS
57
Table 48 ndash To know the satisfaction of Respondents with top management
S
SI No
S
Satisfaction with Top
Management
N
No of Respondents
P
Percentage
1
1
H
Highly satisfied
2
26
2
26
2
2
S
Satisfied
5
51
5
51
3
3
N
Neither Satisfied nor Dissatisfied
1
17
1
17
4
4
D
Dissatisfied
0
06
0
06
5
5
H
Highly dissatisfied
0
00
0
00
Total 1
100
1
100
Source survey data
Inference
From the above table it shows that 51 of the employees were satisfied with the top management
FIGURE 48
58
REPRESENTS THE SATISFACTION OF RESPONDENTS WITH TOP MANAGEMENT
Table 49 ndash To know the satisfaction of Respondents with their subordinates
Source survey data
Inference
From the above table it shows that 67 of the employees were satisfied with their subordinates
S
SI
No
S
Satisfaction with Subordinates
N
No of Respondents
P
Percentage
1
1
H
Highly satisfied
1
12
1
12
2
2
S
Satisfied
6
67
6
67
2
3
N
Neither Satisfied nor Dissatisfied
1
14
1
14
4
D
Dissatisfied
0
07
0
07
5
5
H
Highly Dissatisfied
0
00
0
00
Total 1
100
1
100
59
FIGURE 49
REPRESENTS THE SATISFACTION OF RESPONDENTS WITH THEIR SUBORDINATES
60
Table 410 ndash To know the level of satisfaction regarding nature of job
S
SI No
J
Job Satisfaction
N
No of Respondents
P
Percentage
1
1
H
Highly satisfied
2
22
2
22
2
2
S
Satisfied
5
56
5
56
3
3
N
Neither Satisfied nor Dissatisfied
1
16
1
16
4
4
D
Dissatisfied
0
07
0
07
5
5
H
Highly Dissatisfied
0
00
0
00
Total 1
100
1
100
Source survey dataInference
From the above table it shows that 56 of the employees were satisfied with their job
FIGURE 410
61
REPRESENTS THE LEVEL OF SATISFACTION REGARDING THE NATURE OF JOB
Table 411 ndash To know whether there is any job pressure in their work
Source survey data
Inference
From the above table it shows that 72 of employees said there is job pressure in their work
FIGURE 411
REPRESENTS WHETHER THERE IS ANY JOB PRESSURE IN THEIR WORK
S
SI No
J
Job Pressure
N
No of Respondents
P
Percentage
1
1
Y
Yes
7
72
7
72
2
2
N
No
2
28
2
28
T
Total
1
100
1
100
62
Table 412 ndash To know the opinion regarding opportunity provided by the organisation in developing skills
amp talents
S
SI No
D
Development of Skills and
Talents
N
No of Respondents
P
Percentage
1
1
H
Highly Agree
1
12
1
12
2
2
A
Agree
5
52
5
52
3
3
N
Neither Agree nor Disagree
2
28
2
28
4
4
D
Disagree
0
06
0
06
5
5
H
Highly Disagree
0
02
0
02
Total 1
100
1
100
Source survey data
Inference
From the above table it shows that 52 of employees agreed regarding opportunity provided by the organisation in developing skills amp talents
63
FIRGURE 412
REPRESENTS THE OPPORTUNITY PROVIDED BY THE ORGANISATION IN DEVELOPING SKILLS amp TALENTS
64
Table 413 ndash To know the satisfaction level of welfare facilities provided by the management
S
SI No
W
Welfare Facilities
N
No of Respondents
P
Percentage
1
1
H
Highly satisfied
0
09
9
09
2
2
S
Satisfied
5
57
5
57
3
3
N
Neither Satisfied nor Dissatisfied
2
29
2
29
4
4
D
Dissatisfied
5
05
0
05
5
5
H
Highly Dissatisfied
0
00
0
00
Total 1
100
1
100
Source survey data
Inference
From the above table it shows that 57 of the employees were satisfied with the welfare facilities provided by the management
FIGURE 413
REPRESENTS THE SATISFACTION LEVEL OF WELFARE FACILITIES PROVIDED BY THE MANGEMENT
65
Table 414 ndash To know the employee satisfaction towards the salary
Source survey data
Inference
From the above table it shows that 67 of the employees were satisfied
with their salary
FIGURE 414
REPRESENTS THE SATISFACTION TOWARDS THE SALARY
S
SI No
P
Payment Satisfaction
N
No of Respondents
P
Percentage
1
1
Y
Yes
6
67
6
67
2
2
N
No
3
33
3
33
T
otal
1
100
1
100
66
Table 415 ndash To know the employees willingness amp Commitment Towards
Organisation
Source survey data
Inference
From the above table it shows that 59 of the employees were willing to
continue in this organisation
FIGURE 415
REPRESENTS THE EMPLOYEES WILLINGNESS TO CONTINUE
S
SI No
W
Willingness to Work
N
No of Respondents
P
Percentage
1
1
Y
Yes
5
59
5
59
2
2
N
No
4
41
4
41
T
Total
1
00
1
00
67
CHI-SQUARE METHOD
The chi square test is one of the simplest and most widely used non-
parametric tests in statistical work As a non-parametric test it can be used to determine
if categorical data shows dependency or the two classifications are independent It can
also be used to make comparisons between theoretical population and actual data
when categories are used
n
Chi square χsup2= sum (O-E) sup2 E
i =1
Where O= observed frequency
E= expected frequency
68
OBSERVED FREQUENCY
Table 419 shows the relationship between the department and the job satisfaction
Over All
Job
SatisfactionHighly
SatisfiedSatisfied
Neither
Satisfied nor
Dissatisfied
DissatisfiedHighly
Dissatisfied
Sub
Total
Mechanical 5 6 14 3 2 30
Electrical 6 8 6 3 2 25
Production 9 13 7 4 2 35
Others 2 3 2 2 1 10
Sub Total 22 30 29 12 7 100
69
EXPECTED FREQUENCY
Over All
Job
SatisfactionHighly
SatisfiedSatisfied
Neither
Satisfied nor
Dissatisfied
DissatisfiedHighly
Dissatisfied
Sub
Total
Mechanical 7 8 9 4 2 30
Electrical 5 8 7 3 2 25
Production 8 11 10 4 2 35
Others 2 3 3 1 1 10
Sub Total 22 30 29 12 7 100
Null Hypothesis (Ho)
There is no significant difference between the department and the job satisfaction
Alternative Hypothesis (Ho)
There is significant difference between the job satisfaction
Co Relation
70
Chapter-V
CONCLUSIONS AND
RECOMMENDATIONS
71
CONCLUSION
On the basis of Analysis of Job Satisfaction Level of the Employees of Philips Electronics India
Ltd Mohali made in the previous chapters following conclusions are drawn
General Profile The plant of PHILIPS is ideally located in the Mohali Industrial focal point
Phase 9 near Chandigarh the capital of Punjab on a campus of 17 hectares The working
environment of the company is very healthy The visitors feel happy after the campus
Indigenous Technology PHILIPS is the only lighting manufacturing company based on purely
indigenous technology Philips was appropriately chosen as the brand name as self reliance and
building up of Indian Engineering capabilities remain the guiding spirit of PHILIPS
Financial structure PHILIPS is a low debt company signifying its dependence mainly on
its internal accruals for its financial requirements PHILIPS continues to strengthen its financial
position by channelising these internal accruals to fund its expansion programmes
Working results PTL has registered a handsome and constant growth in its profits because
of a brisk demand for new and better technology electronic items None of the other electronic
company has shown such a steady growth Philips has recorded the lowest current ratio
However with this lowest current ratio PTL still enjoys moderate payment period and highest
velocity of creditors and debtors only due to commitment of itrsquos employees
72
SUMMARY
According to the 1999 Gallup Poll the four elements that have proven to be effective in creating
employee loyalty are praise and recognition a sense of contribution to the company learning and
development and having a best friend at work
Creating a fairy-tale work environment begins withrecognition Your employees need it more
than money perks or titles Here are eight tips regarding recognition Remember these and your
employees may just start whistling while they work It is up to me The corporate culture or
financial rewards will not make your team successful It is up to you Recognition is one thing
that is completely in your control
Strong relationships are vital in todays economy Strengthening employee relationships is even
more necessary as companies downsize and lay off As your workforce shrinks and you need to
do more with less keeping quality employees becomes even more critical As a manager it is
your job to bond your best people to your company through recognition And you also must help
direct and motivate your core performers
Simple rewards earn big returns There are some relatively simple things you can do that will
earn big returns For example remember your employees birthdays and work anniversaries find
out what inexpensive rewards they value (for example tickets to a ball game or a half day off to
spend time with their kids) make the most of your formal service awards with some preparation
and a group presentation walk around your department every day and talk to your
people and thank them sincerely and often
73
Make it specific Praise and recognition must be specific to have impact General praise such as
You do great work actually can have the opposite effect and leave your employees wondering
Does he have any idea what I really do around here Specific praise links individual
accomplishments to company goals For example Cheryl I noticed the way you handled that
customer complaint Great work As you know we value quick resolutions of problems as
one of our core strategies
Ask the best to stay Call your best people into your office one at a time Let that bright young
college graduate know you value his fresh ideas and energy Tell the 20-year veteran how much
your team relies on her expertise and organizational skillsRemarkably a significant percent of
high-impact performers report that they left their last job because No one ever asked me to
stay
Forget cash
Remember the saying Money cant buy everything Well its true Dont wait until you can
offer an employee a raise or promotion Real thanks is its own reward In numerous surveys of
work satisfaction top on employees lists is feeling appreciated In fact when employees feel
recognized and involved they are much less likely to keep asking about money
Recognize
Recognition means most to an employee when it is sincere and spontaneous According to the
largest study ever conducted on workplace satisfaction (Gallup 1999) recognition should occur
at least every seven days If you wait until a year-end party or an annual review you are waiting
much too long to recognize and you probably are losing people you do not need to
74
Recognition works
Neglect can be a poisoned apple Recognition is the elixir that will spark better attitudes and
performance Jeffrey Pfeffer of Stanford University says The returns from managing people in
ways that build high commitment typically are on the order of 30 to 50 percent
Take a hard look in the mirror and ask yourself how you can recognize the fairest of them all
Learn to recognize your employees for their efforts thank them often and reward their
achievements You can awaken them from their anger and apathy and they will fall in love with
their jobs again Chances are you will work together happily ever after
So there is direct relation with employee satisfaction and their commitment towards the
organization and it is also clear from the above discussion that only monetary elements are not
sufficient for employee satisfaction rather other element like employer behavior recognisation
and other moral value
75
RECOMMENDATIONS
PHILIPS should increase its capacity utilization It should work at full capacity to
minimize its cost of production With this increase in capacity utilization the total cost
will spread over more units thereby decreasing the per unit cost
PHILIPS should decrease the credit facilities provided to its consumers The payback
period is quite high in case of debtors as compared to creditors it should be more or less
equal as it will help in improving company liquidity
PHILIPS should focus more on the consumer lifestyle goods in India parallel to its other
business as it accounts very less as compare to other businesses of Philips
Another recommendation for Mohali plant is about the HR department that is they
should appoint permanent and skilled workers as against casual workers which generally add
up to the profit of the company
76
BIBLIOGRAPHY
1 Values-Based Leadership Rebuilding Employee Commitment Performance and Productivity ( Thomas D Kuczmarski)
2 Monthly Journals of Philips Electronics India Ltd
3 Authentic Leadership Medtronic CEO Bill George
4 wwwindiaphilipscom
5 wwwwikipediacom
6 httpwwwemployeecommitmentcom
7 One Foot Out The Door How to Combat The Psychological Recession Thatrsquos Alienating Employees And Hurting American Business Judith Bardwick
8 Employee Commitment A Leader Ship Guide Joe Folkman
9 Harvard University Factors that Impact Employee Well Being Commitment and Productivity -An Article
77
Questionnaire
Name __________________________________________________________
Age______________________________ Gender _______________________
Qualification _______________________ Contact No ___________________
Q1 In which department you are working
Electrical Production Mechanical Other
Q2 What is your working experience
gt2 Years 2-4 Years 4-6 Years lt 6 Years
Q3 How You like the physical Working Environment of the organization
Excellent Good Fair Poor Very Poor
Q4 Are you satisfied with Non-Monitory benefits provided by the organisation
Highly Satisfied Satisfied Neither Satisfied Nor dissatisfied
Highly Dissatisfied Dissatisfied
Q5 Are you satisfied with your work
Highly Satisfied Satisfied Neither Satisfied Nor dissatisfied
Highly Dissatisfied Dissatisfied
Q6 Are you satisfied with the career development programe of the company
Highly Satisfied Satisfied Neither Satisfied Nor dissatisfied
Highly Dissatisfied Dissatisfied
Q7 Is other staff of the organization is co-operative with you
Highly Satisfied Satisfied Neither Satisfied Nor dissatisfied
Highly Dissatisfied Dissatisfied
Q8 Are you satisfied with top level management
Highly Satisfied Satisfied Neither Satisfied Nor dissatisfied
Highly Dissatisfied Dissatisfied
78
Q9 Are you satisfied with your subordinates
Highly Satisfied Satisfied Neither Satisfied Nor dissatisfied
Highly Dissatisfied Dissatisfied
Q10 Are you satisfied with the nature of the Job
Highly Satisfied Satisfied Neither Satisfied Nor dissatisfied
Highly Dissatisfied Dissatisfied
Q11 Do you have any Job Pressure in work
Yes No
Q12 Do you satisfied with the opportunities provided by the organisation
Highly Satisfied Satisfied Neither Satisfied Nor dissatisfied
Highly Dissatisfied Dissatisfied
Q13 Are you satisfied with the welfare facilities provided by the organisation
Highly Satisfied Satisfied Neither Satisfied Nor dissatisfied
Highly Dissatisfied Dissatisfied
Q14 Are you satisfied towards your salary
Highly Satisfied Satisfied Neither Satisfied Nor dissatisfied
Highly Dissatisfied Dissatisfied
Q15 Are you committed towards the organisation
Yes No
Signature

14
In 2009 we evaluated our sustainability strategy and resolved to fully leverage sustainability as
an integral part of our overall strategy and an additional driver of growth as reflected in the
Philips Management Agenda 2012
To deliver on our brand promise of ldquosense and simplicityrdquo and at the same time provide the
company direction for the longer term in this area we have identified three sustainability
leadership key performance indicators where we can bring our competencies to bear lsquocarersquo
lsquoenergy efficiencyrsquo and lsquomaterialsrsquo including targets for 2015
Bringing care to more than 500 million people
Target 500 million lives touched by 2015
Improving energy efficiency of Philips products
Target 50 improvement by 2015 (for the average total product portfolio) compared to
2009
Closing the materials loop
Target Double global collection recycling amounts and recycled materials in products
by 2015 compared to 2009
Each sector will take the lead on one of the leadership key performance indicators with
Healthcare leading lsquocarersquo Lighting lsquoenergy efficiencyrsquo and Consumer Lifestyle lsquomaterialsrsquo
In addition we defined a set of complementary performance indicators to accelerate change and
drive performance including the EcoVision4 parameters
With EcoVision4 we have committed to the following by 2012
15
bull Generate 30 of total revenues from Green Products
bull Double investment in Green Innovations to a cumulative EUR 1 billion
bull Improve our operational energy efficiency by 25 and reduce our CO2 emissions by 25 all
compared with the base year 2007
SOCIAL COMMITMENT
Living up to this commitment means we use our capabilities to enhance the lives of our
employees and people in society at large Within the company we encourage teamwork and
collaboration in an environment that enables employees to reach their full potential
Building on our rich heritage of involvement in social issues we have established our own
approach of supporting the communities where we live and work focusing on energy efficiency
and healthcare
Sustainable lighting
There is a pressing need to find innovative lighting solutions for the 16 billion people who live
in areas with no access to the electricity grid or where the grid is unreliable Thatrsquos why we have
developed SMILE (Sustainable Model in Lighting Everywhere)
Launched as a pilot in 2006 in four Indian states SMILE includes two lighting solutions UDAY
a rechargeable portable lantern and KIRAN a hand-cranked LED flashlight Today are
distributed in eighth Indian states
16
SWOT ANALYSIS
Strengths
bull India was a market where the first mover enjoyed advantages over latecomers
bull The first image of the product lasted long in the eyes of the consumer and the first to enter the
market could gain the largest market share
bull PHILIPS is committed to enhance its image to the Chinese market as investors
bull PHILIPS was building a wholly owned manufacturing plant in India to show the
Chinese the commitment Korea had to the Chinese society
bull Labor costs in India were less and would defray the cost of producing high-end
bull Samsung has been making color TVs for many years in Korea before moving to the Chinese
market
Weaknesses
bull PHILIPS must continue to control all costs to maintain success
bull India has a reputation of being a protected market (protectionism)
bull India was a market where the first mover enjoyed advantages over late comers PHILIPS is
trying to overcome the first comer advantage Japan manufacturers have over them by being those
first comers
bull Companies such as Sony and Matsushita had built sales and service networks that were
favorable to their sales programs in India while Samsung would have to catch up in that area
17
bull Samsung is not as experienced in manufacturing high-end TVs for a higher-end market
segment
Opportunities
bull Based on the data that on 28 of the 220 million rural households own a color TV PHILIPS
focus on the domestic India market should be to penetrate the rural household market which
would mean that for those purposes the low-end production of sets in the 13rdquo to 20rdquo range should
be produced to appeal to that segmentrsquos purchasing ability
bull Larger more high-end models can be produced to appeal to an urban customer in India as well
as being an export to the US and European higher end customers
bull With success in the higher-end manufacturing and sales of premium TVs in India PHILIPS can
establish themselves as high-end producers around the world
Threats
bull PHILIPS faces intense competition in the color TV market
bull A premium-priced product wouldnrsquot sell in large volumes so pricing can be a problem
bull Since PHILIPS didnrsquot have an established marketing strategy issues of how to market the
product may arise
bull Loss of profitability because related to over-employment at most facilities
bull Is the per capita income level such that it can support sales of product at any level
bull If PHILIPS fails to be successful in the Chinese market with high-end product it will be known
around the world bull India was a market where the first mover enjoyed advantages over late
comers
bull The first image of the product lasted long in the eyes of the consumer and the first to enter the
18
market could gain the largest market share
bull PHILIPS is committed to enhance its image to the Chinese market as investors
PHILIPS ELECTRONICS MOHALI PLANT
The mohali plant was established in 1985 as PUNJAB ANAND LAMP Ltd as its second
division of lamp industry after the varodra plant at that time it was a joint stock company and
majority of shares was with Punjab Anand Lamp around 75 but in the year 2001 the company
ownership changed and the whole shares was bought by PHILIPS ELECTRONIC INDIA Ltd
and its name was changed to PHILIPS ELECTRONIC INDIA Ltd MOHALI LIGHT
FACTORY
The plant is situated in Industrial focal point PHASE-9 MOHALI near Mohali railway station
and is sreaded in 26 acres Total employees of tis plant is 532 including casual employees This
company is a landmark in the Punjab state as it is the only factory which is most profitable one
than any industry located in Punjab
19
OVERVIEW OF VARIOUS FRONTS OF
PHILIPS ELECTRONICS INDIA Ltd
Manufacturing-
Today the product range of Philips include the following products ndash
Televisions- LCD Plasma Flat Screen Smart Touch XL
Recorders DVD Players I pods and Home Theatre Systems
Audio Products - Audio Systems Remote Controls AudioVideo Accessories
Digital Photo Products and Frames
Portable Audio and Video Systems Accessories like Headphones and Speakers
PC Products - Mouse and Keyboard Multi Media Headsets External Hard Disk Drives
Mobile Phones
Male Shaving and Grooming - Dry Shavers Beard Trimmers
Personal Care - Beauty and Hair Care Products
20
Kitchen Appliances - Blenders and Hand Blenders Juicers and Citruspresses Food
Processors and Mixers Coffee Makers and Kettles Frying and Grilling Appliances
Toasters and Snacking Products
Household Products - Irons Vacuum Cleaners Water Purifiers
Professional Lighting - Industrial Shops and offices Road and Area Hospitality Sports
Lighting City Beautification and Petrol Stations
Automotive Lighting - In Cars Motorcycles and Trucks
Home Lighting
SERVICS
Philips E-waste Management Program in India
Philips has tied up with a recycler for collecting transporting and recycling unwanted broken
down consumer products
At Philips we offer consumers a convenient way of recycling their unwanted obsolete and
damaged Philips products by dropping them off at convenient locations The program
encompasses 8 major cities across India Consumers can approach one of 27 authorized Philips
service centres which will act as collection points for consumer products which need recycling
Our efforts are to expand the network in the near future
Philips ensures that the consumer products received will be recycled in an environment-friendly
manner Philips understand the corporate social responsibility and takes steps towards providing
a safer environment to the future generations We design our products to continuously realize
improvements and reduce their overall life cycle environmental impact Designing products for
21
recycling is an integral part of this approach Our aim is to use our planetrsquos limited resources
effectively and respect the principle of extended producer responsibility This also calls for
manufacturers to engage in developing solutions for effective and efficient recycling of their
products We will continue to promote and invest into improved recycling systems to reduce the
impact of electronic waste on the environment
MANUFACTURING AT MOHALI PLANT ndash
Mohali plant mainly manufactures lighting products basically of domestic usage this includes the
following products ndash
CFL bulbs ndash
1 Genie - 5 watt 8 watt 11 watt
2 Essential ndash 8 watt 11 watt 14 watt 18 watt 23 watt 29 watt
3 Tornado ndash 5 watt 8 watt 11 watt 14 watt 18 watt 23watt 29 watt
4 T5 slim tube 28 watt
Coil plant ndash Philips Electronics India is the only company that produces coils in the whole
lighting industries in the world and in India only at the MOHALI PLANT
22
Chapter-II
OBJECTIVES OF THE STUDY
23
OBJECTIVES OF THE STUDY
To study the various aspects of Satisfaction Level of the Employees working at Philips
Electronics India Ltd Mohali
To analyze the effect of Job satisfaction on the organisation
To determine the relation between job satisfaction of employees and their commitment
towards the organisation
To analyze the performance model adopted by the Philips Electronics India Ltd Mohali
to handle their manpower
To suggest remedial measures for the improvement of the companyrsquos performance
24
Chapter-III
Employees Commitment
25
Employees who are engaged in their work and committed to their organizations give companies
crucial competitive advantagesmdashincluding higher productivity and lower employee turnover
Thus it is not surprising that organizations of all sizes and types have invested substantially in
policies and practices that foster engagement and commitment in their workforces
But what are employee engagement and commitment exactly This report examines the ways in
which employers and corporate consultants define these terms today and offers ideas for
strengthening employee engagement Though different organizations define engagement
differently some common themes emerge These themes include employeesrsquo satisfaction with
their work and pride in their employer the extent to which people enjoy and believe in what they
do for work and the perception that their employer values what they bring to the table The
greater an employeersquos engagement the more likely he or she is to ldquogo the extra milerdquo and deliver
excellent on-the-job performance In addition engaged employees may be more likely to commit
to staying with their current organization Software giant Intuit2 for example found that highly
engaged employees are 13 times more likely to be high performers than less engaged
employees They are also five times less likely to voluntarily leave the company
Clearly engagement and commitment can potentially translate into valuable business results for
an organization To help you reap the benefits of an engaged committed workforce at your
organization this report provides guidelines for understanding and measuring employee
engagement and for designing and implementing effective engagement initiatives As you will
26
see everyday human resource practices such as recruitment training performance management
and workforce surveys can provide powerful levers for enhancing engagement
Employee Engagement Key Ingredients
ldquoEmployee Engagement Definedrdquo shows examples of engagement definitions used by various
corporations and consultancies Clearly definitions of employee engagement vary greatly across
organizations Many managers wonder how such an elusive concept can be quantified The term
does encompass several ingredients for which researchers have developed measurement
techniques These ingredients include the degree to which employees fully occupy themselves in
their work as well as the strength of their commitment to the employer and role Fortunately
there is much research on these elements of engagementmdashwork that has deep roots in individual
and group psychology
Definition
ldquoNo company small or large can win over the long run without energized employees who
believe in the [firms] mission and understand how to achieve it Thats why you need to take the
measure of employee engagement at least once a year through anonymous surveys in which
people feel completely safe to speak their mindsrdquo
-Jack and Suzy Welch-
Common Themes How Companies Measure Engagement
Employers typically assess their employeesrsquo engagement levels with company-wide attitude
or opinion surveys
27
1048657 Pride in employer
1048657 Satisfaction with employer
1048657 Job satisfaction
1048657 Opportunity to perform well at challenging work
1048657 Recognition and positive feedback for onersquos contributions
1048657 Personal support from onersquos supervisor
1048657 Effort above and beyond the minimum
1048657 Understanding the link between onersquos job and the organizationrsquos mission
1048657 Prospects for future growth with onersquos employer
1048657 Intention to stay with onersquos employer
The Link Between Employer Practices and Employee Engagement
How does an engaged workforce generate valuable business results for an organization The
process starts with employer practices such as job and task design recruitment selection
training compensation performance management and career development Such practices affect
employeesrsquo level of engagement as well as job performance Performance and engagement then
interact to produce business results Figure 1 depicts these relationships
28
EMPLOYEE COMMITMENT EMPLOYEE ENGAGEMENT
1048657 How do you and other managers in your
organization define commitment
1048657 Are some employees in your company
engaged in their work but not committed to
the organization Committed to staying with
your firm but not exactly engaged in their
work Both engaged and committed
1048657 To whom are your organizations employees
committed The company Their supervisor
Co-workers Team members Customers
1048657 What business results has commitment from
1048657 How do you and other managers in your
organization define employee engagement
1048657 How do you know that certain employees in
your company are engaged Do they relish
their jobs Enjoy specific responsibilities or
tasks Willingly ldquogo the extra milerdquo
1048657 In teams departments or business units in
your company that have a large number of
engaged employees what business results
are you seeing Higher productivity Lower
costs Greater revenues More efficiency
29
employees created for your organization For
example has commitment reduced turnover
and therefore decreased recruitment hiring
and training costs
1048657 What does your company do to reciprocate
employees commitment Is the organization
living up to its side of the bargain
Lower turnover Higher product or service
quality
1048657 Conversely how do disengaged employees
behave and what are the consequent costs
for their teams units-and your entire
company
As Figure 2 suggests a person possesses attributes such as knowledge skills abilities
temperament attitudes and personality He or she uses these attributes to accomplish work
behaviors according to organization-defined procedures by applying tools equipment andor
technology Work behaviors in turn create the products and services that make an organization
successful We classify work behaviors into three categories those required to accomplish duties
and tasks specified in a job description (prescribed behaviors) ldquoextrardquo behaviors that an
employee contributes for the good of the organization (voluntary behaviors) and behaviors
prohibited by an employer (proscribed behaviors including unexcused absenteeism stealing and
other counterproductive or illegal actions) Of course job performance occurs in an
organizational context which includes elements such as leadership physical setting and social
setting
30
Employers naturally want to encourage workers to perform prescribed and voluntary activities
while avoiding proscribed ones To achieve these goals organizations use a number of HR
practices that directly affect the person process and context components of job performance
Employeesrsquo reactions to these practices determine their levels of engagement and commitment
31
Chapter-IV
32
LITERATURE OF THE REVIEW
ldquo Job Satisfaction That Leads To The Commitment Of
The Employees in The Organisationrdquo
Literature of Review
Gerge Bill Authentic Leadership
In his book Authentic Leadership former Medtronic CEO Bill George makes an obvious
point that business leaders rarely say out loud ldquoMissions motivate dollars donrsquotrdquo
What he means is that purpose is what drives employee commitment not the financial
rewards that come to others Workers donrsquot get up in the morning and say ldquoGee I can
33
hardly wait to get to work today to maximize shareholder profitsrdquo Even when employees
are shareholders who can benefit from improved financials what draws people to their
chosen careers is the work itself and its purpose in the world more than the profit
possibilities
Mr George goes on to say ldquoI find there is universal agreement (among middle managers)
that you cannot inspire employees by urging them to help management get the companyrsquos
stock price uprdquo
There is in fact quite a bit of literature on this subject In Awakening Corporate Soul
authors Eric Klein and John Izzo say that employee commitment requires knowing ldquothe
purpose of our work it means recognizing the purpose our organization fulfills that goes
beyond the bottom line and it means articulating to others how their (workersrsquo) efforts
contribute to a larger purposerdquo
In Built to Last Jim Collins and James Porras spend an entire book explaining their five
year research study of major companies that led to this conclusion about employee
commitment Purpose within a company is what sustains it profit is important but when
itrsquos the prime directive companies falter
-Marshal Goldsmith-
How to Increase Employee Commitment
In practice this involves walking the talk being transparent communicating effectively treating
people equally teaching leading subordinates to increasingly excellent performance ndash and
responding to subordinates as mature individuals who are owed fairness the truth and
recognition of their achievements
34
Since managers interact directly and frequently with subordinates they are usually more tuned
in to how employees are feeling than are executives Managers are in a better position to know
for example when employees are feeling alienated and disengaged from their work which is
very common today -- and expensive
Gaining employee commitment results in greater profits because enthusiastic employees stay
contribute discretionary effort and engage customers Performance soars when customers are
enthused and stay and when executives managers and employees are a collaborative team
united in achieving common goals
But managers are often called middle managers for good reason their job is to motivate and
guide subordinates while they at the same time are being judged by their bosses Because of
their ldquotweenrdquo position in the hierarchy managers to effective support direct reports must also
create relationships with potential allies especially those with greater power who have access to
top decision makers
Harvard University Factors that Impact Employee Well Being Commitment and
Productivity
Business executives from the C-suite and HR to QC and RampD are by nature focused on the
corporate bottom line A new trend in our dawning age of social sustainability is that many
experts believe more attention should be paid to the dotted line - the one signed when a person
35
commits to employment at a company New Harvard research validates this approach affirming
that trust and purpose play a significant role in building successful productive workplaces
The behavioral research conducted by a team at Harvard University and Massachusetts General
Hospital identifies the factors most likely to impact 21st century employee well being
commitment and productivity The researchers found that commitment is largely influenced by
ones sense of purpose feeling of personal impact and overall trust in the organization
Productivity is largely affected by the quality of human relationships including cooperative
social group moods and interaction
The results lead us to conclude that workplaces that provide positive environments that foster
interpersonal trust and quality personal relationships create the most committed and productive
employees says Nancy Etcoff PhD the lead researcher on the study
Expert Shares Keys to Building Successful Workplace Relationships
According to business strategist Courtney Anderson JD MBA Outstanding leadership
today means much more than just doing your job Success is creating an environment that fosters
happy committed productive team members
Anderson explains that reinvigorating workplaces by enhancing trust and employee commitment
does not have to be difficult The biggest challenge she says is making the time to truly change
in our overscheduled instant access competitive work environments With a little know-how it
can be easy to evolve workplace well being and respond to these compelling research results
-Mark Howell-
CEO Bright Point
High-performing companies recognize that employee commitment is a major contributing factor
toward sustaining long-term success and creating value An engaged employee is involved and
excited about their work and acts in a manner that will forward the organizationrsquos interest An
36
engaged workforce helps optimize and retain talent for the long-term because the employees
choose to stay even when other employment alternatives exist
According to Walker Information the top three drivers of employee commitment are
Satisfaction Fairness and Care amp Concern for employees Put simply committed employees
want to enjoy their work feel they are appreciated and know they are making a contribution to
their companyrsquos strategic objectives Additionally employees who have trust in their leadership
and are trusted by their leadership have a greater dedication and are ultimately more productive
on the job However according to recent data provided by the National Business Research
Institute (NBRI) only 31 of all employees are truly engaged
At BrightPoint we take employee engagement seriously and we work to create a culture that
inspires employee loyalty and satisfaction The results of BrightPointrsquos commitment to its
employees are shown in the 2011 BPNA Employee Commitment Survey The survey
determined that close to 80 of respondents indicated they were satisfied with their jobs and
daily activities General employee satisfaction increases when managers take an active interest
in their employees beyond their day-to-day job responsibilities According to NBRI managers
that actively coach build relationships and keep an open dialogue with their employees improve
employee engagement
We have a diverse workforce where each employee brings unique value and has individual
needs Managers are learning to manage the individual and not the position In order to give
managers the tools they need to be successful BrightPoint places strong emphasis on targeted
leadership training workshops and continual learning resources In 2011 906 of managers at
BrightPoint NA participated in the development opportunities offered and also made an effort to
37
help reinforce the learning of their team members This signals that our leadership team is taking
an active interest in professional development and its connection to employee commitment
As BrightPoint continues to increase focus on employee engagement the organization will grow
stronger and maintain a substantial advantage over our competition Our employees possess the
knowledge experience and resiliency to respond quickly to the demands of the marketplace and
through their genuine commitment will deliver what our customers want with increasing
efficiency and effectiveness Our responsibility is value-creation by growing our business and
maintaining high levels of customer service and loyalty We believe the best way to accomplish
this is through a strong committed and engaged workforce
Performance Model Adopted At Mohali Plant
38
Process adopted by Philips Electronics Mohali Plant for Job Satisfaction of Employee that leads commitment of the employees
39
Recruiting
The messages in Philips Electronics Mohali organization conveys while seeking to attract job
applicants also can influence future employeesrsquo engagement and commitment If your firm has
designed jobs specifically to engage employees then organization want to ensure that recruiting
ads extol these positionsrsquo attractive featuresmdashsuch as challenging work assignments a highly
skilled team environment or minimal supervision Applicants who notice and respond to these
ads will more likely be motivated by these features Also consider how organization might best
seek candidates from inside your organization When Organisation recruit existing employees for
desirable jobs you enhance their engagement (by maximizing the person-job fit) and
commitment (by providing growth and advancement opportunities to employees in return for
their loyalty) If Organisation recruit from outside when qualified internal candidates are
available Organization may unwittingly suggest to current employees that your company is not
willing to reciprocate their commitment Existing staff may then begin questioning their own
commitment to the firm By contrast organisation recruit external candidates to both the job and
your organization For these candidates ensure that recruiting messages highlight attractive job
features organizational values and commitment reciprocity That is in return for performance
and dedication your company offers competitive pay and benefits flexible work hours and
learning and career advancement opportunities Also remember that prospective employees have
multiple commitments You will inevitably have to compete with those commitments as
organization try to attract candidates to your firm Most people find it easier to make a new
commitment when it is compatible with their other obligations For example you boost your
chances of recruiting a highly qualified candidate who is a single parent if you offer flexible
work hours family health benefits and on-site day care ldquoRecruiting for Engagement and
Commitmentrdquo
40
Employee Selection
Once recruiting efforts produce a pool of promising job candidates Philips select among them to
fill available positions When organisation select the right individuals for the right jobs new
hires carry out their work more smoothly and experience fewer performance problems The
result Greater enjoyment ofmdashand engagement inmdashthe job
To enhance engagement through your selection of employees identify those candidates who are
best-suited to the job and your organizationrsquos culture Also use candidate assessment methods
that have obvious relevance to the job in questionmdashfor example by asking interviewees what
they know about the role and having them provide work samples Most candidates will view
these techniques more positively than tests with less apparent relevance such as personality and
integrity assessments Successful candidates feel good about having ldquopassed the test and see
company as careful and capable for having selected them A positive initial impression of an
employer encourages growth of long-term commitment
Training and Development
Training and development can serve as additional levers for enhancing engagement and
commitment For new hires training usually begins with orientation Orientation presents several
important opportunitiesmdashincluding explaining pay work schedules and company policies Most
important it gives you a chance to encourage employee engagement by explaining how the new
hirersquos job contributes to the organizationrsquos mission Through orientation Mohali Plant of Philips
Electronics describe how r company is organized introduce the new employee to his or her co-
workers give the person a tour of the area where he or she will be working and explain safety
regulations and other procedural matters In short you foster person-organization fitmdashvital for
developing productive and dedicated employees Through training you help new and current
41
employees acquire the knowledge and skills they need to perform their jobs And employees who
enhance their skills through training are more likely to engage fully in their work because they
derive satisfaction from mastering new tasks Training also enhances employeesrsquo value to your
company as well as their own employability in the job market In addition most companies offer
higher wages for skilled workers to compensate them for their greater value and to discourage
turnover
Compensation
Like the HR practices discussed above compensation can powerfully influence employee
engagement and commitment Some compensation components encourage commitment to
employers while others motivate engagement in the job It is possible to stimulate one and not
the other though itrsquos generally better to foster both For example a company that offers a strong
performance incentive system but no retirement plan will probably realize exceptional
engagement from its workers however they may eventually commit themselves to another
company that does offer a good retirement plan Meanwhile an organization that offers generous
retirement benefits but a traditional seniority-based pay grade system may have committed
employees however these workers might deliver pedestrian performance as they bide their time
until retirement In designing compensation plans you therefore need to consider employee
engagement and commitment strategically
Encourage managers to include employees in the goal-setting process This technique helps to
ensure that workers understand the goals It also promotes acceptance of challenging objectives
because people generally feel more committed to goals they have helped define In addition
consider how you and other managers will recognize and encourage contributions that exceed
expectations For example when a piece of equipment malfunctions Joe finds other ways to
maintain production rather than merely shutting down the machine and waiting for the
42
maintenance staff to fix it Or when a less experienced co-worker encounters a new task Sally
offers friendly coaching instead of standing by and waiting for the inevitable mistakes to crop
up Performance management processes operate on a continuous basis Therefore they provide
perhaps the best ongoing opportunities for employers to foster employee engagement and
commitment For example managers can use routine discussions about performance and
feedback sessions to learn which aspects of the job hold the most interest for each employee and
which tasks are most challenging During such discussions managers also can define what going
above and beyond the call of dutyrdquo looks like and generate ideas for rewarding such
contributions An employeersquos aspirations and career goals can receive careful attention during
performance appraisal meetings Without inquiring into an employeersquos personal life a supervisor
can nevertheless explore ways to enhance the compatibility between the workerrsquos commitment to
your organization and the employeersquos other life commitments Through such means the
organization personalizes its relationship to each employee and provides support while also
expressing appreciation for their contributionsmdash key drivers of engagement and commitment
To further engage employees and win their commitment through your performance management
programs consider how to treat your organizationrsquos most experienced employees In many cases
these employees understand the intricacies of a job better than their supervisors or managers do
By virtue of long identification with your organization they may be deeply committed to high-
level goals They use their expertise to contribute in ways that newer employees simply cannot
match But many of them also may be planning to retire soon especially if they are from the
ldquoBaby Boomerrdquo generation How will you transfer their knowledge to younger workers Design
a performance management system that recognizes and rewards proactive sharing of knowledge
and expertise among co-workers For example create knowledge repositories or learning
histories that can be stored in databases that employees can access and then create incentives
43
for people who contribute to and use these repositories Of course effective performance
management systems also identify employees who are not meeting expectations Failing to
address problem performance can erode other employeesrsquo engagement and commitment as their
workloads increase and they conclude that the company is willing to tolerate poor performance
If feedback coaching and remedial training are of little avail the manager may need to move the
person to a different position within the company where he or she can make a more valuable
contribution or let the individual go if there is no good match elsewhere in the organization
44
Chapter-V
RESEARCH METHODOLOGY
The basic task of research is to generate accurate information for use in decision-making
Research can be defined as the systematic and objective process of gathering recording and
analyzing data for aid in making business decisions As the project involves analyzing of
45
financial structure the research is exploratory in nature covering financial parameters and come
of the important ratios to carry out research There are basically two techniques adopted for
obtaining information
Primary Data
Secondary Data
Primary Data is gathered specifically for the project at hand through personal interviews with
the accounts officers
Sample Size = 100 Employees
Secondary data is previously collected and assembled for some project other than the one at
hand It is gathered and recorded by someone else prior to current needs of the researcher It is
less expensive than the primary date
Secondary Data can be obtained from both external and internal sources
External data may be collected from books and periodicals government sources media and other
commercial sources
Internal data is that secondary data which is created recorded or generated by the organization
As the project is explanatory in nature secondary data is collected from the reports of the
company books journals and interest Secondary data is gathered from annual reports official
records and standing orders of the units
CHAPTER - VI
DATA ANALYSIS AND INTERPRETATION
46
The data after collection is to be processed and analyzed in accordance with the outline
and down for the purpose at the time of developing research plan
Technically speaking processing implies editing coding classification and tabulation of
collected data so that they are amenable to analysis The term analysis refers to the computation
of certain measures along with searching for pattern groups Thus in the process of analysis
relationship or difference should be subjected to statistical tests of significance to determine with
what validity data can be said to indicate any conclusions
The analysis of data in a general way involves a number of closely related operations
which are performed with the purpose of summarizing the collected data and organizing them in
such a manner that they answer the research questions In this study the researcher followed
above process carefully and it is presented in this chapter
47
Table 41 ndash To know the department in which employees are belongs to
S
ou rc
e
survey data
Inference
From the above table it shows that 35 of employees are belongs to
production department
FIGURE 41
S
SI No
D
Department
N
No of Respondents
P
Percentage
1
1
M
Mechanical
3
30
3
30
2
2
E
Electrical
2
25
2
25
3
3
P
Production
3
35
3
35
4
4
O
Others
1
10
1
10
T
Total
1
100
1
100
48
REPRESENTS THE DEPARTMENT
Table 42 ndash To know working experience of the employees
Source survey data
Inference
From the above table it shows that 34 of the employees have 4 ndash 6
years experience
S
SI No
W
Work Experience
N
No of Respondents
P
Percentage
1
1
B
Below 2 years
1
33
1
13
2
2
2
2ndash 4 years
3
30
3
30
3
3
4
4ndash 6 years
3
34
3
34
4
4
A
Above 6 years
2
23
2
23
T
otal
1
100
1
100
49
FIGURE 42
REPRESENTS THE EXPERIENCE OF THE EMPLOYEES
Table 43 ndash To know the physical working environment
S
SI No
W
Working Environment
N
No of Respondents
P
Percentage
1
1
E
Excellent
1
12
1
12
2
2
G
Good
5
57
5
57
3
3
F
Fair
2
28
2
28
4
4
P
Poor
0
03
0
33
5
5
V
Very Poor
0
00
0
00
T
Total
1
100
1
100
Source survey data
Inference
From the above table it shows that 57 of the employees were feeling good about the working environment
50
FIGURE 43
REPRESENTS THE PHYSICAL WOKING ENVIRONMENT
51
Table 44 ndash To know the satisfaction level of employees towards the non-monitory benefits
S
SI No
N
Non-Monitory Benefits offered
to Employees
N
No of Respondents
P
Percentage
1
1
H
Highly Satisfied
1
14
1
14
2
2
S
Satisfied
5
54
5
54
3
3
N
Neither Satisfied nor Dissatisfied
2
25
2
25
4
4
D
Dissatisfied
0
05
0
05
5
5
H
Highly Dissatisfied
0
02
0
02
Total 1
100
1
100
Source survey data
Inference
From the above table it shows that 54 of the employees were satisfied towards the non-monitory benefits
FIGURE 44
REPRESENTS THE SATISFACTION LEVEL OF EMPLOYEES TOWARDS THE NON-MONITORY BENEFITS
52
Table 45 ndash To know the satisfaction level of respondents towards the work
assigned
Source survey dataInference
From the above table it shows that 45 of the respondents were satisfied towards the work assigned
FIGURE 45
S
SI No
A
Amount of Work
N
No of Respondents
P
Percentage
1
1
H
Highly satisfied
2
20
2
20
2
2
S
Satisfied
4
45
4
45
3
3
N
Neither Satisfied nor Dissatisfied
1
12
1
12
4
4
D
Dissatisfied
1
18
1
18
5
5
H
Highly Dissatisfied
0
06
0
06
Total 1
100
1
100
53
REPRESENTS THE SATISFACTION LEVEL OF RESPONDENTS TOWARDS THE WORK ASSIGNED
54
Table 46 ndash Opinion about the career development programme in their organisation
S
SI No
C
Career Development
N
No of Respondents
P
Percentage
H
Highly satisfied
1
12
1
12
S
Satisfied
5
56
5
56
N
Neither Satisfied nor Dissatisfied
2
22
2
22
D
Dissatisfied
1
10
1
10
H
Highly Dissatisfied
0
00
0
00
Total 1
100
1
100
Source survey data
Inference
From the above table it shows that 56 of the employees were satisfied
with the opinion about the carrier development programme in their organisation
FIGURE 46
REPRESENTS OPINION ABOUT THE CAREER DEVELOPMENT
PROGRAMME IN THEIR ORGANISATION
55
Table 47 ndash To know the cooperation of co-workers
S
SI No
C
Co-operation of Workers
N
No of Respondents
P
Percentage
1
1
H
Highly satisfied
2
20
2
20
2
2
S
Satisfied
6
66
6
66
3
3
N
Neither Satisfied nor Dissatisfied
1
11
1
11
4
4
D
Dissatisfied
0
03
0
03
5
5
H
Highly Dissatisfied
0
00
0
00
Total 1
100
1
100
Source survey data
Inference
From the above table it shows that 66 of the employees were satisfied
with the cooperation of co-workers
FIGURE 47
56
REPRESENTS THE COOPERATION OF CO-WORKERS
57
Table 48 ndash To know the satisfaction of Respondents with top management
S
SI No
S
Satisfaction with Top
Management
N
No of Respondents
P
Percentage
1
1
H
Highly satisfied
2
26
2
26
2
2
S
Satisfied
5
51
5
51
3
3
N
Neither Satisfied nor Dissatisfied
1
17
1
17
4
4
D
Dissatisfied
0
06
0
06
5
5
H
Highly dissatisfied
0
00
0
00
Total 1
100
1
100
Source survey data
Inference
From the above table it shows that 51 of the employees were satisfied with the top management
FIGURE 48
58
REPRESENTS THE SATISFACTION OF RESPONDENTS WITH TOP MANAGEMENT
Table 49 ndash To know the satisfaction of Respondents with their subordinates
Source survey data
Inference
From the above table it shows that 67 of the employees were satisfied with their subordinates
S
SI
No
S
Satisfaction with Subordinates
N
No of Respondents
P
Percentage
1
1
H
Highly satisfied
1
12
1
12
2
2
S
Satisfied
6
67
6
67
2
3
N
Neither Satisfied nor Dissatisfied
1
14
1
14
4
D
Dissatisfied
0
07
0
07
5
5
H
Highly Dissatisfied
0
00
0
00
Total 1
100
1
100
59
FIGURE 49
REPRESENTS THE SATISFACTION OF RESPONDENTS WITH THEIR SUBORDINATES
60
Table 410 ndash To know the level of satisfaction regarding nature of job
S
SI No
J
Job Satisfaction
N
No of Respondents
P
Percentage
1
1
H
Highly satisfied
2
22
2
22
2
2
S
Satisfied
5
56
5
56
3
3
N
Neither Satisfied nor Dissatisfied
1
16
1
16
4
4
D
Dissatisfied
0
07
0
07
5
5
H
Highly Dissatisfied
0
00
0
00
Total 1
100
1
100
Source survey dataInference
From the above table it shows that 56 of the employees were satisfied with their job
FIGURE 410
61
REPRESENTS THE LEVEL OF SATISFACTION REGARDING THE NATURE OF JOB
Table 411 ndash To know whether there is any job pressure in their work
Source survey data
Inference
From the above table it shows that 72 of employees said there is job pressure in their work
FIGURE 411
REPRESENTS WHETHER THERE IS ANY JOB PRESSURE IN THEIR WORK
S
SI No
J
Job Pressure
N
No of Respondents
P
Percentage
1
1
Y
Yes
7
72
7
72
2
2
N
No
2
28
2
28
T
Total
1
100
1
100
62
Table 412 ndash To know the opinion regarding opportunity provided by the organisation in developing skills
amp talents
S
SI No
D
Development of Skills and
Talents
N
No of Respondents
P
Percentage
1
1
H
Highly Agree
1
12
1
12
2
2
A
Agree
5
52
5
52
3
3
N
Neither Agree nor Disagree
2
28
2
28
4
4
D
Disagree
0
06
0
06
5
5
H
Highly Disagree
0
02
0
02
Total 1
100
1
100
Source survey data
Inference
From the above table it shows that 52 of employees agreed regarding opportunity provided by the organisation in developing skills amp talents
63
FIRGURE 412
REPRESENTS THE OPPORTUNITY PROVIDED BY THE ORGANISATION IN DEVELOPING SKILLS amp TALENTS
64
Table 413 ndash To know the satisfaction level of welfare facilities provided by the management
S
SI No
W
Welfare Facilities
N
No of Respondents
P
Percentage
1
1
H
Highly satisfied
0
09
9
09
2
2
S
Satisfied
5
57
5
57
3
3
N
Neither Satisfied nor Dissatisfied
2
29
2
29
4
4
D
Dissatisfied
5
05
0
05
5
5
H
Highly Dissatisfied
0
00
0
00
Total 1
100
1
100
Source survey data
Inference
From the above table it shows that 57 of the employees were satisfied with the welfare facilities provided by the management
FIGURE 413
REPRESENTS THE SATISFACTION LEVEL OF WELFARE FACILITIES PROVIDED BY THE MANGEMENT
65
Table 414 ndash To know the employee satisfaction towards the salary
Source survey data
Inference
From the above table it shows that 67 of the employees were satisfied
with their salary
FIGURE 414
REPRESENTS THE SATISFACTION TOWARDS THE SALARY
S
SI No
P
Payment Satisfaction
N
No of Respondents
P
Percentage
1
1
Y
Yes
6
67
6
67
2
2
N
No
3
33
3
33
T
otal
1
100
1
100
66
Table 415 ndash To know the employees willingness amp Commitment Towards
Organisation
Source survey data
Inference
From the above table it shows that 59 of the employees were willing to
continue in this organisation
FIGURE 415
REPRESENTS THE EMPLOYEES WILLINGNESS TO CONTINUE
S
SI No
W
Willingness to Work
N
No of Respondents
P
Percentage
1
1
Y
Yes
5
59
5
59
2
2
N
No
4
41
4
41
T
Total
1
00
1
00
67
CHI-SQUARE METHOD
The chi square test is one of the simplest and most widely used non-
parametric tests in statistical work As a non-parametric test it can be used to determine
if categorical data shows dependency or the two classifications are independent It can
also be used to make comparisons between theoretical population and actual data
when categories are used
n
Chi square χsup2= sum (O-E) sup2 E
i =1
Where O= observed frequency
E= expected frequency
68
OBSERVED FREQUENCY
Table 419 shows the relationship between the department and the job satisfaction
Over All
Job
SatisfactionHighly
SatisfiedSatisfied
Neither
Satisfied nor
Dissatisfied
DissatisfiedHighly
Dissatisfied
Sub
Total
Mechanical 5 6 14 3 2 30
Electrical 6 8 6 3 2 25
Production 9 13 7 4 2 35
Others 2 3 2 2 1 10
Sub Total 22 30 29 12 7 100
69
EXPECTED FREQUENCY
Over All
Job
SatisfactionHighly
SatisfiedSatisfied
Neither
Satisfied nor
Dissatisfied
DissatisfiedHighly
Dissatisfied
Sub
Total
Mechanical 7 8 9 4 2 30
Electrical 5 8 7 3 2 25
Production 8 11 10 4 2 35
Others 2 3 3 1 1 10
Sub Total 22 30 29 12 7 100
Null Hypothesis (Ho)
There is no significant difference between the department and the job satisfaction
Alternative Hypothesis (Ho)
There is significant difference between the job satisfaction
Co Relation
70
Chapter-V
CONCLUSIONS AND
RECOMMENDATIONS
71
CONCLUSION
On the basis of Analysis of Job Satisfaction Level of the Employees of Philips Electronics India
Ltd Mohali made in the previous chapters following conclusions are drawn
General Profile The plant of PHILIPS is ideally located in the Mohali Industrial focal point
Phase 9 near Chandigarh the capital of Punjab on a campus of 17 hectares The working
environment of the company is very healthy The visitors feel happy after the campus
Indigenous Technology PHILIPS is the only lighting manufacturing company based on purely
indigenous technology Philips was appropriately chosen as the brand name as self reliance and
building up of Indian Engineering capabilities remain the guiding spirit of PHILIPS
Financial structure PHILIPS is a low debt company signifying its dependence mainly on
its internal accruals for its financial requirements PHILIPS continues to strengthen its financial
position by channelising these internal accruals to fund its expansion programmes
Working results PTL has registered a handsome and constant growth in its profits because
of a brisk demand for new and better technology electronic items None of the other electronic
company has shown such a steady growth Philips has recorded the lowest current ratio
However with this lowest current ratio PTL still enjoys moderate payment period and highest
velocity of creditors and debtors only due to commitment of itrsquos employees
72
SUMMARY
According to the 1999 Gallup Poll the four elements that have proven to be effective in creating
employee loyalty are praise and recognition a sense of contribution to the company learning and
development and having a best friend at work
Creating a fairy-tale work environment begins withrecognition Your employees need it more
than money perks or titles Here are eight tips regarding recognition Remember these and your
employees may just start whistling while they work It is up to me The corporate culture or
financial rewards will not make your team successful It is up to you Recognition is one thing
that is completely in your control
Strong relationships are vital in todays economy Strengthening employee relationships is even
more necessary as companies downsize and lay off As your workforce shrinks and you need to
do more with less keeping quality employees becomes even more critical As a manager it is
your job to bond your best people to your company through recognition And you also must help
direct and motivate your core performers
Simple rewards earn big returns There are some relatively simple things you can do that will
earn big returns For example remember your employees birthdays and work anniversaries find
out what inexpensive rewards they value (for example tickets to a ball game or a half day off to
spend time with their kids) make the most of your formal service awards with some preparation
and a group presentation walk around your department every day and talk to your
people and thank them sincerely and often
73
Make it specific Praise and recognition must be specific to have impact General praise such as
You do great work actually can have the opposite effect and leave your employees wondering
Does he have any idea what I really do around here Specific praise links individual
accomplishments to company goals For example Cheryl I noticed the way you handled that
customer complaint Great work As you know we value quick resolutions of problems as
one of our core strategies
Ask the best to stay Call your best people into your office one at a time Let that bright young
college graduate know you value his fresh ideas and energy Tell the 20-year veteran how much
your team relies on her expertise and organizational skillsRemarkably a significant percent of
high-impact performers report that they left their last job because No one ever asked me to
stay
Forget cash
Remember the saying Money cant buy everything Well its true Dont wait until you can
offer an employee a raise or promotion Real thanks is its own reward In numerous surveys of
work satisfaction top on employees lists is feeling appreciated In fact when employees feel
recognized and involved they are much less likely to keep asking about money
Recognize
Recognition means most to an employee when it is sincere and spontaneous According to the
largest study ever conducted on workplace satisfaction (Gallup 1999) recognition should occur
at least every seven days If you wait until a year-end party or an annual review you are waiting
much too long to recognize and you probably are losing people you do not need to
74
Recognition works
Neglect can be a poisoned apple Recognition is the elixir that will spark better attitudes and
performance Jeffrey Pfeffer of Stanford University says The returns from managing people in
ways that build high commitment typically are on the order of 30 to 50 percent
Take a hard look in the mirror and ask yourself how you can recognize the fairest of them all
Learn to recognize your employees for their efforts thank them often and reward their
achievements You can awaken them from their anger and apathy and they will fall in love with
their jobs again Chances are you will work together happily ever after
So there is direct relation with employee satisfaction and their commitment towards the
organization and it is also clear from the above discussion that only monetary elements are not
sufficient for employee satisfaction rather other element like employer behavior recognisation
and other moral value
75
RECOMMENDATIONS
PHILIPS should increase its capacity utilization It should work at full capacity to
minimize its cost of production With this increase in capacity utilization the total cost
will spread over more units thereby decreasing the per unit cost
PHILIPS should decrease the credit facilities provided to its consumers The payback
period is quite high in case of debtors as compared to creditors it should be more or less
equal as it will help in improving company liquidity
PHILIPS should focus more on the consumer lifestyle goods in India parallel to its other
business as it accounts very less as compare to other businesses of Philips
Another recommendation for Mohali plant is about the HR department that is they
should appoint permanent and skilled workers as against casual workers which generally add
up to the profit of the company
76
BIBLIOGRAPHY
1 Values-Based Leadership Rebuilding Employee Commitment Performance and Productivity ( Thomas D Kuczmarski)
2 Monthly Journals of Philips Electronics India Ltd
3 Authentic Leadership Medtronic CEO Bill George
4 wwwindiaphilipscom
5 wwwwikipediacom
6 httpwwwemployeecommitmentcom
7 One Foot Out The Door How to Combat The Psychological Recession Thatrsquos Alienating Employees And Hurting American Business Judith Bardwick
8 Employee Commitment A Leader Ship Guide Joe Folkman
9 Harvard University Factors that Impact Employee Well Being Commitment and Productivity -An Article
77
Questionnaire
Name __________________________________________________________
Age______________________________ Gender _______________________
Qualification _______________________ Contact No ___________________
Q1 In which department you are working
Electrical Production Mechanical Other
Q2 What is your working experience
gt2 Years 2-4 Years 4-6 Years lt 6 Years
Q3 How You like the physical Working Environment of the organization
Excellent Good Fair Poor Very Poor
Q4 Are you satisfied with Non-Monitory benefits provided by the organisation
Highly Satisfied Satisfied Neither Satisfied Nor dissatisfied
Highly Dissatisfied Dissatisfied
Q5 Are you satisfied with your work
Highly Satisfied Satisfied Neither Satisfied Nor dissatisfied
Highly Dissatisfied Dissatisfied
Q6 Are you satisfied with the career development programe of the company
Highly Satisfied Satisfied Neither Satisfied Nor dissatisfied
Highly Dissatisfied Dissatisfied
Q7 Is other staff of the organization is co-operative with you
Highly Satisfied Satisfied Neither Satisfied Nor dissatisfied
Highly Dissatisfied Dissatisfied
Q8 Are you satisfied with top level management
Highly Satisfied Satisfied Neither Satisfied Nor dissatisfied
Highly Dissatisfied Dissatisfied
78
Q9 Are you satisfied with your subordinates
Highly Satisfied Satisfied Neither Satisfied Nor dissatisfied
Highly Dissatisfied Dissatisfied
Q10 Are you satisfied with the nature of the Job
Highly Satisfied Satisfied Neither Satisfied Nor dissatisfied
Highly Dissatisfied Dissatisfied
Q11 Do you have any Job Pressure in work
Yes No
Q12 Do you satisfied with the opportunities provided by the organisation
Highly Satisfied Satisfied Neither Satisfied Nor dissatisfied
Highly Dissatisfied Dissatisfied
Q13 Are you satisfied with the welfare facilities provided by the organisation
Highly Satisfied Satisfied Neither Satisfied Nor dissatisfied
Highly Dissatisfied Dissatisfied
Q14 Are you satisfied towards your salary
Highly Satisfied Satisfied Neither Satisfied Nor dissatisfied
Highly Dissatisfied Dissatisfied
Q15 Are you committed towards the organisation
Yes No
Signature

16
SWOT ANALYSIS
Strengths
bull India was a market where the first mover enjoyed advantages over latecomers
bull The first image of the product lasted long in the eyes of the consumer and the first to enter the
market could gain the largest market share
bull PHILIPS is committed to enhance its image to the Chinese market as investors
bull PHILIPS was building a wholly owned manufacturing plant in India to show the
Chinese the commitment Korea had to the Chinese society
bull Labor costs in India were less and would defray the cost of producing high-end
bull Samsung has been making color TVs for many years in Korea before moving to the Chinese
market
Weaknesses
bull PHILIPS must continue to control all costs to maintain success
bull India has a reputation of being a protected market (protectionism)
bull India was a market where the first mover enjoyed advantages over late comers PHILIPS is
trying to overcome the first comer advantage Japan manufacturers have over them by being those
first comers
bull Companies such as Sony and Matsushita had built sales and service networks that were
favorable to their sales programs in India while Samsung would have to catch up in that area
17
bull Samsung is not as experienced in manufacturing high-end TVs for a higher-end market
segment
Opportunities
bull Based on the data that on 28 of the 220 million rural households own a color TV PHILIPS
focus on the domestic India market should be to penetrate the rural household market which
would mean that for those purposes the low-end production of sets in the 13rdquo to 20rdquo range should
be produced to appeal to that segmentrsquos purchasing ability
bull Larger more high-end models can be produced to appeal to an urban customer in India as well
as being an export to the US and European higher end customers
bull With success in the higher-end manufacturing and sales of premium TVs in India PHILIPS can
establish themselves as high-end producers around the world
Threats
bull PHILIPS faces intense competition in the color TV market
bull A premium-priced product wouldnrsquot sell in large volumes so pricing can be a problem
bull Since PHILIPS didnrsquot have an established marketing strategy issues of how to market the
product may arise
bull Loss of profitability because related to over-employment at most facilities
bull Is the per capita income level such that it can support sales of product at any level
bull If PHILIPS fails to be successful in the Chinese market with high-end product it will be known
around the world bull India was a market where the first mover enjoyed advantages over late
comers
bull The first image of the product lasted long in the eyes of the consumer and the first to enter the
18
market could gain the largest market share
bull PHILIPS is committed to enhance its image to the Chinese market as investors
PHILIPS ELECTRONICS MOHALI PLANT
The mohali plant was established in 1985 as PUNJAB ANAND LAMP Ltd as its second
division of lamp industry after the varodra plant at that time it was a joint stock company and
majority of shares was with Punjab Anand Lamp around 75 but in the year 2001 the company
ownership changed and the whole shares was bought by PHILIPS ELECTRONIC INDIA Ltd
and its name was changed to PHILIPS ELECTRONIC INDIA Ltd MOHALI LIGHT
FACTORY
The plant is situated in Industrial focal point PHASE-9 MOHALI near Mohali railway station
and is sreaded in 26 acres Total employees of tis plant is 532 including casual employees This
company is a landmark in the Punjab state as it is the only factory which is most profitable one
than any industry located in Punjab
19
OVERVIEW OF VARIOUS FRONTS OF
PHILIPS ELECTRONICS INDIA Ltd
Manufacturing-
Today the product range of Philips include the following products ndash
Televisions- LCD Plasma Flat Screen Smart Touch XL
Recorders DVD Players I pods and Home Theatre Systems
Audio Products - Audio Systems Remote Controls AudioVideo Accessories
Digital Photo Products and Frames
Portable Audio and Video Systems Accessories like Headphones and Speakers
PC Products - Mouse and Keyboard Multi Media Headsets External Hard Disk Drives
Mobile Phones
Male Shaving and Grooming - Dry Shavers Beard Trimmers
Personal Care - Beauty and Hair Care Products
20
Kitchen Appliances - Blenders and Hand Blenders Juicers and Citruspresses Food
Processors and Mixers Coffee Makers and Kettles Frying and Grilling Appliances
Toasters and Snacking Products
Household Products - Irons Vacuum Cleaners Water Purifiers
Professional Lighting - Industrial Shops and offices Road and Area Hospitality Sports
Lighting City Beautification and Petrol Stations
Automotive Lighting - In Cars Motorcycles and Trucks
Home Lighting
SERVICS
Philips E-waste Management Program in India
Philips has tied up with a recycler for collecting transporting and recycling unwanted broken
down consumer products
At Philips we offer consumers a convenient way of recycling their unwanted obsolete and
damaged Philips products by dropping them off at convenient locations The program
encompasses 8 major cities across India Consumers can approach one of 27 authorized Philips
service centres which will act as collection points for consumer products which need recycling
Our efforts are to expand the network in the near future
Philips ensures that the consumer products received will be recycled in an environment-friendly
manner Philips understand the corporate social responsibility and takes steps towards providing
a safer environment to the future generations We design our products to continuously realize
improvements and reduce their overall life cycle environmental impact Designing products for
21
recycling is an integral part of this approach Our aim is to use our planetrsquos limited resources
effectively and respect the principle of extended producer responsibility This also calls for
manufacturers to engage in developing solutions for effective and efficient recycling of their
products We will continue to promote and invest into improved recycling systems to reduce the
impact of electronic waste on the environment
MANUFACTURING AT MOHALI PLANT ndash
Mohali plant mainly manufactures lighting products basically of domestic usage this includes the
following products ndash
CFL bulbs ndash
1 Genie - 5 watt 8 watt 11 watt
2 Essential ndash 8 watt 11 watt 14 watt 18 watt 23 watt 29 watt
3 Tornado ndash 5 watt 8 watt 11 watt 14 watt 18 watt 23watt 29 watt
4 T5 slim tube 28 watt
Coil plant ndash Philips Electronics India is the only company that produces coils in the whole
lighting industries in the world and in India only at the MOHALI PLANT
22
Chapter-II
OBJECTIVES OF THE STUDY
23
OBJECTIVES OF THE STUDY
To study the various aspects of Satisfaction Level of the Employees working at Philips
Electronics India Ltd Mohali
To analyze the effect of Job satisfaction on the organisation
To determine the relation between job satisfaction of employees and their commitment
towards the organisation
To analyze the performance model adopted by the Philips Electronics India Ltd Mohali
to handle their manpower
To suggest remedial measures for the improvement of the companyrsquos performance
24
Chapter-III
Employees Commitment
25
Employees who are engaged in their work and committed to their organizations give companies
crucial competitive advantagesmdashincluding higher productivity and lower employee turnover
Thus it is not surprising that organizations of all sizes and types have invested substantially in
policies and practices that foster engagement and commitment in their workforces
But what are employee engagement and commitment exactly This report examines the ways in
which employers and corporate consultants define these terms today and offers ideas for
strengthening employee engagement Though different organizations define engagement
differently some common themes emerge These themes include employeesrsquo satisfaction with
their work and pride in their employer the extent to which people enjoy and believe in what they
do for work and the perception that their employer values what they bring to the table The
greater an employeersquos engagement the more likely he or she is to ldquogo the extra milerdquo and deliver
excellent on-the-job performance In addition engaged employees may be more likely to commit
to staying with their current organization Software giant Intuit2 for example found that highly
engaged employees are 13 times more likely to be high performers than less engaged
employees They are also five times less likely to voluntarily leave the company
Clearly engagement and commitment can potentially translate into valuable business results for
an organization To help you reap the benefits of an engaged committed workforce at your
organization this report provides guidelines for understanding and measuring employee
engagement and for designing and implementing effective engagement initiatives As you will
26
see everyday human resource practices such as recruitment training performance management
and workforce surveys can provide powerful levers for enhancing engagement
Employee Engagement Key Ingredients
ldquoEmployee Engagement Definedrdquo shows examples of engagement definitions used by various
corporations and consultancies Clearly definitions of employee engagement vary greatly across
organizations Many managers wonder how such an elusive concept can be quantified The term
does encompass several ingredients for which researchers have developed measurement
techniques These ingredients include the degree to which employees fully occupy themselves in
their work as well as the strength of their commitment to the employer and role Fortunately
there is much research on these elements of engagementmdashwork that has deep roots in individual
and group psychology
Definition
ldquoNo company small or large can win over the long run without energized employees who
believe in the [firms] mission and understand how to achieve it Thats why you need to take the
measure of employee engagement at least once a year through anonymous surveys in which
people feel completely safe to speak their mindsrdquo
-Jack and Suzy Welch-
Common Themes How Companies Measure Engagement
Employers typically assess their employeesrsquo engagement levels with company-wide attitude
or opinion surveys
27
1048657 Pride in employer
1048657 Satisfaction with employer
1048657 Job satisfaction
1048657 Opportunity to perform well at challenging work
1048657 Recognition and positive feedback for onersquos contributions
1048657 Personal support from onersquos supervisor
1048657 Effort above and beyond the minimum
1048657 Understanding the link between onersquos job and the organizationrsquos mission
1048657 Prospects for future growth with onersquos employer
1048657 Intention to stay with onersquos employer
The Link Between Employer Practices and Employee Engagement
How does an engaged workforce generate valuable business results for an organization The
process starts with employer practices such as job and task design recruitment selection
training compensation performance management and career development Such practices affect
employeesrsquo level of engagement as well as job performance Performance and engagement then
interact to produce business results Figure 1 depicts these relationships
28
EMPLOYEE COMMITMENT EMPLOYEE ENGAGEMENT
1048657 How do you and other managers in your
organization define commitment
1048657 Are some employees in your company
engaged in their work but not committed to
the organization Committed to staying with
your firm but not exactly engaged in their
work Both engaged and committed
1048657 To whom are your organizations employees
committed The company Their supervisor
Co-workers Team members Customers
1048657 What business results has commitment from
1048657 How do you and other managers in your
organization define employee engagement
1048657 How do you know that certain employees in
your company are engaged Do they relish
their jobs Enjoy specific responsibilities or
tasks Willingly ldquogo the extra milerdquo
1048657 In teams departments or business units in
your company that have a large number of
engaged employees what business results
are you seeing Higher productivity Lower
costs Greater revenues More efficiency
29
employees created for your organization For
example has commitment reduced turnover
and therefore decreased recruitment hiring
and training costs
1048657 What does your company do to reciprocate
employees commitment Is the organization
living up to its side of the bargain
Lower turnover Higher product or service
quality
1048657 Conversely how do disengaged employees
behave and what are the consequent costs
for their teams units-and your entire
company
As Figure 2 suggests a person possesses attributes such as knowledge skills abilities
temperament attitudes and personality He or she uses these attributes to accomplish work
behaviors according to organization-defined procedures by applying tools equipment andor
technology Work behaviors in turn create the products and services that make an organization
successful We classify work behaviors into three categories those required to accomplish duties
and tasks specified in a job description (prescribed behaviors) ldquoextrardquo behaviors that an
employee contributes for the good of the organization (voluntary behaviors) and behaviors
prohibited by an employer (proscribed behaviors including unexcused absenteeism stealing and
other counterproductive or illegal actions) Of course job performance occurs in an
organizational context which includes elements such as leadership physical setting and social
setting
30
Employers naturally want to encourage workers to perform prescribed and voluntary activities
while avoiding proscribed ones To achieve these goals organizations use a number of HR
practices that directly affect the person process and context components of job performance
Employeesrsquo reactions to these practices determine their levels of engagement and commitment
31
Chapter-IV
32
LITERATURE OF THE REVIEW
ldquo Job Satisfaction That Leads To The Commitment Of
The Employees in The Organisationrdquo
Literature of Review
Gerge Bill Authentic Leadership
In his book Authentic Leadership former Medtronic CEO Bill George makes an obvious
point that business leaders rarely say out loud ldquoMissions motivate dollars donrsquotrdquo
What he means is that purpose is what drives employee commitment not the financial
rewards that come to others Workers donrsquot get up in the morning and say ldquoGee I can
33
hardly wait to get to work today to maximize shareholder profitsrdquo Even when employees
are shareholders who can benefit from improved financials what draws people to their
chosen careers is the work itself and its purpose in the world more than the profit
possibilities
Mr George goes on to say ldquoI find there is universal agreement (among middle managers)
that you cannot inspire employees by urging them to help management get the companyrsquos
stock price uprdquo
There is in fact quite a bit of literature on this subject In Awakening Corporate Soul
authors Eric Klein and John Izzo say that employee commitment requires knowing ldquothe
purpose of our work it means recognizing the purpose our organization fulfills that goes
beyond the bottom line and it means articulating to others how their (workersrsquo) efforts
contribute to a larger purposerdquo
In Built to Last Jim Collins and James Porras spend an entire book explaining their five
year research study of major companies that led to this conclusion about employee
commitment Purpose within a company is what sustains it profit is important but when
itrsquos the prime directive companies falter
-Marshal Goldsmith-
How to Increase Employee Commitment
In practice this involves walking the talk being transparent communicating effectively treating
people equally teaching leading subordinates to increasingly excellent performance ndash and
responding to subordinates as mature individuals who are owed fairness the truth and
recognition of their achievements
34
Since managers interact directly and frequently with subordinates they are usually more tuned
in to how employees are feeling than are executives Managers are in a better position to know
for example when employees are feeling alienated and disengaged from their work which is
very common today -- and expensive
Gaining employee commitment results in greater profits because enthusiastic employees stay
contribute discretionary effort and engage customers Performance soars when customers are
enthused and stay and when executives managers and employees are a collaborative team
united in achieving common goals
But managers are often called middle managers for good reason their job is to motivate and
guide subordinates while they at the same time are being judged by their bosses Because of
their ldquotweenrdquo position in the hierarchy managers to effective support direct reports must also
create relationships with potential allies especially those with greater power who have access to
top decision makers
Harvard University Factors that Impact Employee Well Being Commitment and
Productivity
Business executives from the C-suite and HR to QC and RampD are by nature focused on the
corporate bottom line A new trend in our dawning age of social sustainability is that many
experts believe more attention should be paid to the dotted line - the one signed when a person
35
commits to employment at a company New Harvard research validates this approach affirming
that trust and purpose play a significant role in building successful productive workplaces
The behavioral research conducted by a team at Harvard University and Massachusetts General
Hospital identifies the factors most likely to impact 21st century employee well being
commitment and productivity The researchers found that commitment is largely influenced by
ones sense of purpose feeling of personal impact and overall trust in the organization
Productivity is largely affected by the quality of human relationships including cooperative
social group moods and interaction
The results lead us to conclude that workplaces that provide positive environments that foster
interpersonal trust and quality personal relationships create the most committed and productive
employees says Nancy Etcoff PhD the lead researcher on the study
Expert Shares Keys to Building Successful Workplace Relationships
According to business strategist Courtney Anderson JD MBA Outstanding leadership
today means much more than just doing your job Success is creating an environment that fosters
happy committed productive team members
Anderson explains that reinvigorating workplaces by enhancing trust and employee commitment
does not have to be difficult The biggest challenge she says is making the time to truly change
in our overscheduled instant access competitive work environments With a little know-how it
can be easy to evolve workplace well being and respond to these compelling research results
-Mark Howell-
CEO Bright Point
High-performing companies recognize that employee commitment is a major contributing factor
toward sustaining long-term success and creating value An engaged employee is involved and
excited about their work and acts in a manner that will forward the organizationrsquos interest An
36
engaged workforce helps optimize and retain talent for the long-term because the employees
choose to stay even when other employment alternatives exist
According to Walker Information the top three drivers of employee commitment are
Satisfaction Fairness and Care amp Concern for employees Put simply committed employees
want to enjoy their work feel they are appreciated and know they are making a contribution to
their companyrsquos strategic objectives Additionally employees who have trust in their leadership
and are trusted by their leadership have a greater dedication and are ultimately more productive
on the job However according to recent data provided by the National Business Research
Institute (NBRI) only 31 of all employees are truly engaged
At BrightPoint we take employee engagement seriously and we work to create a culture that
inspires employee loyalty and satisfaction The results of BrightPointrsquos commitment to its
employees are shown in the 2011 BPNA Employee Commitment Survey The survey
determined that close to 80 of respondents indicated they were satisfied with their jobs and
daily activities General employee satisfaction increases when managers take an active interest
in their employees beyond their day-to-day job responsibilities According to NBRI managers
that actively coach build relationships and keep an open dialogue with their employees improve
employee engagement
We have a diverse workforce where each employee brings unique value and has individual
needs Managers are learning to manage the individual and not the position In order to give
managers the tools they need to be successful BrightPoint places strong emphasis on targeted
leadership training workshops and continual learning resources In 2011 906 of managers at
BrightPoint NA participated in the development opportunities offered and also made an effort to
37
help reinforce the learning of their team members This signals that our leadership team is taking
an active interest in professional development and its connection to employee commitment
As BrightPoint continues to increase focus on employee engagement the organization will grow
stronger and maintain a substantial advantage over our competition Our employees possess the
knowledge experience and resiliency to respond quickly to the demands of the marketplace and
through their genuine commitment will deliver what our customers want with increasing
efficiency and effectiveness Our responsibility is value-creation by growing our business and
maintaining high levels of customer service and loyalty We believe the best way to accomplish
this is through a strong committed and engaged workforce
Performance Model Adopted At Mohali Plant
38
Process adopted by Philips Electronics Mohali Plant for Job Satisfaction of Employee that leads commitment of the employees
39
Recruiting
The messages in Philips Electronics Mohali organization conveys while seeking to attract job
applicants also can influence future employeesrsquo engagement and commitment If your firm has
designed jobs specifically to engage employees then organization want to ensure that recruiting
ads extol these positionsrsquo attractive featuresmdashsuch as challenging work assignments a highly
skilled team environment or minimal supervision Applicants who notice and respond to these
ads will more likely be motivated by these features Also consider how organization might best
seek candidates from inside your organization When Organisation recruit existing employees for
desirable jobs you enhance their engagement (by maximizing the person-job fit) and
commitment (by providing growth and advancement opportunities to employees in return for
their loyalty) If Organisation recruit from outside when qualified internal candidates are
available Organization may unwittingly suggest to current employees that your company is not
willing to reciprocate their commitment Existing staff may then begin questioning their own
commitment to the firm By contrast organisation recruit external candidates to both the job and
your organization For these candidates ensure that recruiting messages highlight attractive job
features organizational values and commitment reciprocity That is in return for performance
and dedication your company offers competitive pay and benefits flexible work hours and
learning and career advancement opportunities Also remember that prospective employees have
multiple commitments You will inevitably have to compete with those commitments as
organization try to attract candidates to your firm Most people find it easier to make a new
commitment when it is compatible with their other obligations For example you boost your
chances of recruiting a highly qualified candidate who is a single parent if you offer flexible
work hours family health benefits and on-site day care ldquoRecruiting for Engagement and
Commitmentrdquo
40
Employee Selection
Once recruiting efforts produce a pool of promising job candidates Philips select among them to
fill available positions When organisation select the right individuals for the right jobs new
hires carry out their work more smoothly and experience fewer performance problems The
result Greater enjoyment ofmdashand engagement inmdashthe job
To enhance engagement through your selection of employees identify those candidates who are
best-suited to the job and your organizationrsquos culture Also use candidate assessment methods
that have obvious relevance to the job in questionmdashfor example by asking interviewees what
they know about the role and having them provide work samples Most candidates will view
these techniques more positively than tests with less apparent relevance such as personality and
integrity assessments Successful candidates feel good about having ldquopassed the test and see
company as careful and capable for having selected them A positive initial impression of an
employer encourages growth of long-term commitment
Training and Development
Training and development can serve as additional levers for enhancing engagement and
commitment For new hires training usually begins with orientation Orientation presents several
important opportunitiesmdashincluding explaining pay work schedules and company policies Most
important it gives you a chance to encourage employee engagement by explaining how the new
hirersquos job contributes to the organizationrsquos mission Through orientation Mohali Plant of Philips
Electronics describe how r company is organized introduce the new employee to his or her co-
workers give the person a tour of the area where he or she will be working and explain safety
regulations and other procedural matters In short you foster person-organization fitmdashvital for
developing productive and dedicated employees Through training you help new and current
41
employees acquire the knowledge and skills they need to perform their jobs And employees who
enhance their skills through training are more likely to engage fully in their work because they
derive satisfaction from mastering new tasks Training also enhances employeesrsquo value to your
company as well as their own employability in the job market In addition most companies offer
higher wages for skilled workers to compensate them for their greater value and to discourage
turnover
Compensation
Like the HR practices discussed above compensation can powerfully influence employee
engagement and commitment Some compensation components encourage commitment to
employers while others motivate engagement in the job It is possible to stimulate one and not
the other though itrsquos generally better to foster both For example a company that offers a strong
performance incentive system but no retirement plan will probably realize exceptional
engagement from its workers however they may eventually commit themselves to another
company that does offer a good retirement plan Meanwhile an organization that offers generous
retirement benefits but a traditional seniority-based pay grade system may have committed
employees however these workers might deliver pedestrian performance as they bide their time
until retirement In designing compensation plans you therefore need to consider employee
engagement and commitment strategically
Encourage managers to include employees in the goal-setting process This technique helps to
ensure that workers understand the goals It also promotes acceptance of challenging objectives
because people generally feel more committed to goals they have helped define In addition
consider how you and other managers will recognize and encourage contributions that exceed
expectations For example when a piece of equipment malfunctions Joe finds other ways to
maintain production rather than merely shutting down the machine and waiting for the
42
maintenance staff to fix it Or when a less experienced co-worker encounters a new task Sally
offers friendly coaching instead of standing by and waiting for the inevitable mistakes to crop
up Performance management processes operate on a continuous basis Therefore they provide
perhaps the best ongoing opportunities for employers to foster employee engagement and
commitment For example managers can use routine discussions about performance and
feedback sessions to learn which aspects of the job hold the most interest for each employee and
which tasks are most challenging During such discussions managers also can define what going
above and beyond the call of dutyrdquo looks like and generate ideas for rewarding such
contributions An employeersquos aspirations and career goals can receive careful attention during
performance appraisal meetings Without inquiring into an employeersquos personal life a supervisor
can nevertheless explore ways to enhance the compatibility between the workerrsquos commitment to
your organization and the employeersquos other life commitments Through such means the
organization personalizes its relationship to each employee and provides support while also
expressing appreciation for their contributionsmdash key drivers of engagement and commitment
To further engage employees and win their commitment through your performance management
programs consider how to treat your organizationrsquos most experienced employees In many cases
these employees understand the intricacies of a job better than their supervisors or managers do
By virtue of long identification with your organization they may be deeply committed to high-
level goals They use their expertise to contribute in ways that newer employees simply cannot
match But many of them also may be planning to retire soon especially if they are from the
ldquoBaby Boomerrdquo generation How will you transfer their knowledge to younger workers Design
a performance management system that recognizes and rewards proactive sharing of knowledge
and expertise among co-workers For example create knowledge repositories or learning
histories that can be stored in databases that employees can access and then create incentives
43
for people who contribute to and use these repositories Of course effective performance
management systems also identify employees who are not meeting expectations Failing to
address problem performance can erode other employeesrsquo engagement and commitment as their
workloads increase and they conclude that the company is willing to tolerate poor performance
If feedback coaching and remedial training are of little avail the manager may need to move the
person to a different position within the company where he or she can make a more valuable
contribution or let the individual go if there is no good match elsewhere in the organization
44
Chapter-V
RESEARCH METHODOLOGY
The basic task of research is to generate accurate information for use in decision-making
Research can be defined as the systematic and objective process of gathering recording and
analyzing data for aid in making business decisions As the project involves analyzing of
45
financial structure the research is exploratory in nature covering financial parameters and come
of the important ratios to carry out research There are basically two techniques adopted for
obtaining information
Primary Data
Secondary Data
Primary Data is gathered specifically for the project at hand through personal interviews with
the accounts officers
Sample Size = 100 Employees
Secondary data is previously collected and assembled for some project other than the one at
hand It is gathered and recorded by someone else prior to current needs of the researcher It is
less expensive than the primary date
Secondary Data can be obtained from both external and internal sources
External data may be collected from books and periodicals government sources media and other
commercial sources
Internal data is that secondary data which is created recorded or generated by the organization
As the project is explanatory in nature secondary data is collected from the reports of the
company books journals and interest Secondary data is gathered from annual reports official
records and standing orders of the units
CHAPTER - VI
DATA ANALYSIS AND INTERPRETATION
46
The data after collection is to be processed and analyzed in accordance with the outline
and down for the purpose at the time of developing research plan
Technically speaking processing implies editing coding classification and tabulation of
collected data so that they are amenable to analysis The term analysis refers to the computation
of certain measures along with searching for pattern groups Thus in the process of analysis
relationship or difference should be subjected to statistical tests of significance to determine with
what validity data can be said to indicate any conclusions
The analysis of data in a general way involves a number of closely related operations
which are performed with the purpose of summarizing the collected data and organizing them in
such a manner that they answer the research questions In this study the researcher followed
above process carefully and it is presented in this chapter
47
Table 41 ndash To know the department in which employees are belongs to
S
ou rc
e
survey data
Inference
From the above table it shows that 35 of employees are belongs to
production department
FIGURE 41
S
SI No
D
Department
N
No of Respondents
P
Percentage
1
1
M
Mechanical
3
30
3
30
2
2
E
Electrical
2
25
2
25
3
3
P
Production
3
35
3
35
4
4
O
Others
1
10
1
10
T
Total
1
100
1
100
48
REPRESENTS THE DEPARTMENT
Table 42 ndash To know working experience of the employees
Source survey data
Inference
From the above table it shows that 34 of the employees have 4 ndash 6
years experience
S
SI No
W
Work Experience
N
No of Respondents
P
Percentage
1
1
B
Below 2 years
1
33
1
13
2
2
2
2ndash 4 years
3
30
3
30
3
3
4
4ndash 6 years
3
34
3
34
4
4
A
Above 6 years
2
23
2
23
T
otal
1
100
1
100
49
FIGURE 42
REPRESENTS THE EXPERIENCE OF THE EMPLOYEES
Table 43 ndash To know the physical working environment
S
SI No
W
Working Environment
N
No of Respondents
P
Percentage
1
1
E
Excellent
1
12
1
12
2
2
G
Good
5
57
5
57
3
3
F
Fair
2
28
2
28
4
4
P
Poor
0
03
0
33
5
5
V
Very Poor
0
00
0
00
T
Total
1
100
1
100
Source survey data
Inference
From the above table it shows that 57 of the employees were feeling good about the working environment
50
FIGURE 43
REPRESENTS THE PHYSICAL WOKING ENVIRONMENT
51
Table 44 ndash To know the satisfaction level of employees towards the non-monitory benefits
S
SI No
N
Non-Monitory Benefits offered
to Employees
N
No of Respondents
P
Percentage
1
1
H
Highly Satisfied
1
14
1
14
2
2
S
Satisfied
5
54
5
54
3
3
N
Neither Satisfied nor Dissatisfied
2
25
2
25
4
4
D
Dissatisfied
0
05
0
05
5
5
H
Highly Dissatisfied
0
02
0
02
Total 1
100
1
100
Source survey data
Inference
From the above table it shows that 54 of the employees were satisfied towards the non-monitory benefits
FIGURE 44
REPRESENTS THE SATISFACTION LEVEL OF EMPLOYEES TOWARDS THE NON-MONITORY BENEFITS
52
Table 45 ndash To know the satisfaction level of respondents towards the work
assigned
Source survey dataInference
From the above table it shows that 45 of the respondents were satisfied towards the work assigned
FIGURE 45
S
SI No
A
Amount of Work
N
No of Respondents
P
Percentage
1
1
H
Highly satisfied
2
20
2
20
2
2
S
Satisfied
4
45
4
45
3
3
N
Neither Satisfied nor Dissatisfied
1
12
1
12
4
4
D
Dissatisfied
1
18
1
18
5
5
H
Highly Dissatisfied
0
06
0
06
Total 1
100
1
100
53
REPRESENTS THE SATISFACTION LEVEL OF RESPONDENTS TOWARDS THE WORK ASSIGNED
54
Table 46 ndash Opinion about the career development programme in their organisation
S
SI No
C
Career Development
N
No of Respondents
P
Percentage
H
Highly satisfied
1
12
1
12
S
Satisfied
5
56
5
56
N
Neither Satisfied nor Dissatisfied
2
22
2
22
D
Dissatisfied
1
10
1
10
H
Highly Dissatisfied
0
00
0
00
Total 1
100
1
100
Source survey data
Inference
From the above table it shows that 56 of the employees were satisfied
with the opinion about the carrier development programme in their organisation
FIGURE 46
REPRESENTS OPINION ABOUT THE CAREER DEVELOPMENT
PROGRAMME IN THEIR ORGANISATION
55
Table 47 ndash To know the cooperation of co-workers
S
SI No
C
Co-operation of Workers
N
No of Respondents
P
Percentage
1
1
H
Highly satisfied
2
20
2
20
2
2
S
Satisfied
6
66
6
66
3
3
N
Neither Satisfied nor Dissatisfied
1
11
1
11
4
4
D
Dissatisfied
0
03
0
03
5
5
H
Highly Dissatisfied
0
00
0
00
Total 1
100
1
100
Source survey data
Inference
From the above table it shows that 66 of the employees were satisfied
with the cooperation of co-workers
FIGURE 47
56
REPRESENTS THE COOPERATION OF CO-WORKERS
57
Table 48 ndash To know the satisfaction of Respondents with top management
S
SI No
S
Satisfaction with Top
Management
N
No of Respondents
P
Percentage
1
1
H
Highly satisfied
2
26
2
26
2
2
S
Satisfied
5
51
5
51
3
3
N
Neither Satisfied nor Dissatisfied
1
17
1
17
4
4
D
Dissatisfied
0
06
0
06
5
5
H
Highly dissatisfied
0
00
0
00
Total 1
100
1
100
Source survey data
Inference
From the above table it shows that 51 of the employees were satisfied with the top management
FIGURE 48
58
REPRESENTS THE SATISFACTION OF RESPONDENTS WITH TOP MANAGEMENT
Table 49 ndash To know the satisfaction of Respondents with their subordinates
Source survey data
Inference
From the above table it shows that 67 of the employees were satisfied with their subordinates
S
SI
No
S
Satisfaction with Subordinates
N
No of Respondents
P
Percentage
1
1
H
Highly satisfied
1
12
1
12
2
2
S
Satisfied
6
67
6
67
2
3
N
Neither Satisfied nor Dissatisfied
1
14
1
14
4
D
Dissatisfied
0
07
0
07
5
5
H
Highly Dissatisfied
0
00
0
00
Total 1
100
1
100
59
FIGURE 49
REPRESENTS THE SATISFACTION OF RESPONDENTS WITH THEIR SUBORDINATES
60
Table 410 ndash To know the level of satisfaction regarding nature of job
S
SI No
J
Job Satisfaction
N
No of Respondents
P
Percentage
1
1
H
Highly satisfied
2
22
2
22
2
2
S
Satisfied
5
56
5
56
3
3
N
Neither Satisfied nor Dissatisfied
1
16
1
16
4
4
D
Dissatisfied
0
07
0
07
5
5
H
Highly Dissatisfied
0
00
0
00
Total 1
100
1
100
Source survey dataInference
From the above table it shows that 56 of the employees were satisfied with their job
FIGURE 410
61
REPRESENTS THE LEVEL OF SATISFACTION REGARDING THE NATURE OF JOB
Table 411 ndash To know whether there is any job pressure in their work
Source survey data
Inference
From the above table it shows that 72 of employees said there is job pressure in their work
FIGURE 411
REPRESENTS WHETHER THERE IS ANY JOB PRESSURE IN THEIR WORK
S
SI No
J
Job Pressure
N
No of Respondents
P
Percentage
1
1
Y
Yes
7
72
7
72
2
2
N
No
2
28
2
28
T
Total
1
100
1
100
62
Table 412 ndash To know the opinion regarding opportunity provided by the organisation in developing skills
amp talents
S
SI No
D
Development of Skills and
Talents
N
No of Respondents
P
Percentage
1
1
H
Highly Agree
1
12
1
12
2
2
A
Agree
5
52
5
52
3
3
N
Neither Agree nor Disagree
2
28
2
28
4
4
D
Disagree
0
06
0
06
5
5
H
Highly Disagree
0
02
0
02
Total 1
100
1
100
Source survey data
Inference
From the above table it shows that 52 of employees agreed regarding opportunity provided by the organisation in developing skills amp talents
63
FIRGURE 412
REPRESENTS THE OPPORTUNITY PROVIDED BY THE ORGANISATION IN DEVELOPING SKILLS amp TALENTS
64
Table 413 ndash To know the satisfaction level of welfare facilities provided by the management
S
SI No
W
Welfare Facilities
N
No of Respondents
P
Percentage
1
1
H
Highly satisfied
0
09
9
09
2
2
S
Satisfied
5
57
5
57
3
3
N
Neither Satisfied nor Dissatisfied
2
29
2
29
4
4
D
Dissatisfied
5
05
0
05
5
5
H
Highly Dissatisfied
0
00
0
00
Total 1
100
1
100
Source survey data
Inference
From the above table it shows that 57 of the employees were satisfied with the welfare facilities provided by the management
FIGURE 413
REPRESENTS THE SATISFACTION LEVEL OF WELFARE FACILITIES PROVIDED BY THE MANGEMENT
65
Table 414 ndash To know the employee satisfaction towards the salary
Source survey data
Inference
From the above table it shows that 67 of the employees were satisfied
with their salary
FIGURE 414
REPRESENTS THE SATISFACTION TOWARDS THE SALARY
S
SI No
P
Payment Satisfaction
N
No of Respondents
P
Percentage
1
1
Y
Yes
6
67
6
67
2
2
N
No
3
33
3
33
T
otal
1
100
1
100
66
Table 415 ndash To know the employees willingness amp Commitment Towards
Organisation
Source survey data
Inference
From the above table it shows that 59 of the employees were willing to
continue in this organisation
FIGURE 415
REPRESENTS THE EMPLOYEES WILLINGNESS TO CONTINUE
S
SI No
W
Willingness to Work
N
No of Respondents
P
Percentage
1
1
Y
Yes
5
59
5
59
2
2
N
No
4
41
4
41
T
Total
1
00
1
00
67
CHI-SQUARE METHOD
The chi square test is one of the simplest and most widely used non-
parametric tests in statistical work As a non-parametric test it can be used to determine
if categorical data shows dependency or the two classifications are independent It can
also be used to make comparisons between theoretical population and actual data
when categories are used
n
Chi square χsup2= sum (O-E) sup2 E
i =1
Where O= observed frequency
E= expected frequency
68
OBSERVED FREQUENCY
Table 419 shows the relationship between the department and the job satisfaction
Over All
Job
SatisfactionHighly
SatisfiedSatisfied
Neither
Satisfied nor
Dissatisfied
DissatisfiedHighly
Dissatisfied
Sub
Total
Mechanical 5 6 14 3 2 30
Electrical 6 8 6 3 2 25
Production 9 13 7 4 2 35
Others 2 3 2 2 1 10
Sub Total 22 30 29 12 7 100
69
EXPECTED FREQUENCY
Over All
Job
SatisfactionHighly
SatisfiedSatisfied
Neither
Satisfied nor
Dissatisfied
DissatisfiedHighly
Dissatisfied
Sub
Total
Mechanical 7 8 9 4 2 30
Electrical 5 8 7 3 2 25
Production 8 11 10 4 2 35
Others 2 3 3 1 1 10
Sub Total 22 30 29 12 7 100
Null Hypothesis (Ho)
There is no significant difference between the department and the job satisfaction
Alternative Hypothesis (Ho)
There is significant difference between the job satisfaction
Co Relation
70
Chapter-V
CONCLUSIONS AND
RECOMMENDATIONS
71
CONCLUSION
On the basis of Analysis of Job Satisfaction Level of the Employees of Philips Electronics India
Ltd Mohali made in the previous chapters following conclusions are drawn
General Profile The plant of PHILIPS is ideally located in the Mohali Industrial focal point
Phase 9 near Chandigarh the capital of Punjab on a campus of 17 hectares The working
environment of the company is very healthy The visitors feel happy after the campus
Indigenous Technology PHILIPS is the only lighting manufacturing company based on purely
indigenous technology Philips was appropriately chosen as the brand name as self reliance and
building up of Indian Engineering capabilities remain the guiding spirit of PHILIPS
Financial structure PHILIPS is a low debt company signifying its dependence mainly on
its internal accruals for its financial requirements PHILIPS continues to strengthen its financial
position by channelising these internal accruals to fund its expansion programmes
Working results PTL has registered a handsome and constant growth in its profits because
of a brisk demand for new and better technology electronic items None of the other electronic
company has shown such a steady growth Philips has recorded the lowest current ratio
However with this lowest current ratio PTL still enjoys moderate payment period and highest
velocity of creditors and debtors only due to commitment of itrsquos employees
72
SUMMARY
According to the 1999 Gallup Poll the four elements that have proven to be effective in creating
employee loyalty are praise and recognition a sense of contribution to the company learning and
development and having a best friend at work
Creating a fairy-tale work environment begins withrecognition Your employees need it more
than money perks or titles Here are eight tips regarding recognition Remember these and your
employees may just start whistling while they work It is up to me The corporate culture or
financial rewards will not make your team successful It is up to you Recognition is one thing
that is completely in your control
Strong relationships are vital in todays economy Strengthening employee relationships is even
more necessary as companies downsize and lay off As your workforce shrinks and you need to
do more with less keeping quality employees becomes even more critical As a manager it is
your job to bond your best people to your company through recognition And you also must help
direct and motivate your core performers
Simple rewards earn big returns There are some relatively simple things you can do that will
earn big returns For example remember your employees birthdays and work anniversaries find
out what inexpensive rewards they value (for example tickets to a ball game or a half day off to
spend time with their kids) make the most of your formal service awards with some preparation
and a group presentation walk around your department every day and talk to your
people and thank them sincerely and often
73
Make it specific Praise and recognition must be specific to have impact General praise such as
You do great work actually can have the opposite effect and leave your employees wondering
Does he have any idea what I really do around here Specific praise links individual
accomplishments to company goals For example Cheryl I noticed the way you handled that
customer complaint Great work As you know we value quick resolutions of problems as
one of our core strategies
Ask the best to stay Call your best people into your office one at a time Let that bright young
college graduate know you value his fresh ideas and energy Tell the 20-year veteran how much
your team relies on her expertise and organizational skillsRemarkably a significant percent of
high-impact performers report that they left their last job because No one ever asked me to
stay
Forget cash
Remember the saying Money cant buy everything Well its true Dont wait until you can
offer an employee a raise or promotion Real thanks is its own reward In numerous surveys of
work satisfaction top on employees lists is feeling appreciated In fact when employees feel
recognized and involved they are much less likely to keep asking about money
Recognize
Recognition means most to an employee when it is sincere and spontaneous According to the
largest study ever conducted on workplace satisfaction (Gallup 1999) recognition should occur
at least every seven days If you wait until a year-end party or an annual review you are waiting
much too long to recognize and you probably are losing people you do not need to
74
Recognition works
Neglect can be a poisoned apple Recognition is the elixir that will spark better attitudes and
performance Jeffrey Pfeffer of Stanford University says The returns from managing people in
ways that build high commitment typically are on the order of 30 to 50 percent
Take a hard look in the mirror and ask yourself how you can recognize the fairest of them all
Learn to recognize your employees for their efforts thank them often and reward their
achievements You can awaken them from their anger and apathy and they will fall in love with
their jobs again Chances are you will work together happily ever after
So there is direct relation with employee satisfaction and their commitment towards the
organization and it is also clear from the above discussion that only monetary elements are not
sufficient for employee satisfaction rather other element like employer behavior recognisation
and other moral value
75
RECOMMENDATIONS
PHILIPS should increase its capacity utilization It should work at full capacity to
minimize its cost of production With this increase in capacity utilization the total cost
will spread over more units thereby decreasing the per unit cost
PHILIPS should decrease the credit facilities provided to its consumers The payback
period is quite high in case of debtors as compared to creditors it should be more or less
equal as it will help in improving company liquidity
PHILIPS should focus more on the consumer lifestyle goods in India parallel to its other
business as it accounts very less as compare to other businesses of Philips
Another recommendation for Mohali plant is about the HR department that is they
should appoint permanent and skilled workers as against casual workers which generally add
up to the profit of the company
76
BIBLIOGRAPHY
1 Values-Based Leadership Rebuilding Employee Commitment Performance and Productivity ( Thomas D Kuczmarski)
2 Monthly Journals of Philips Electronics India Ltd
3 Authentic Leadership Medtronic CEO Bill George
4 wwwindiaphilipscom
5 wwwwikipediacom
6 httpwwwemployeecommitmentcom
7 One Foot Out The Door How to Combat The Psychological Recession Thatrsquos Alienating Employees And Hurting American Business Judith Bardwick
8 Employee Commitment A Leader Ship Guide Joe Folkman
9 Harvard University Factors that Impact Employee Well Being Commitment and Productivity -An Article
77
Questionnaire
Name __________________________________________________________
Age______________________________ Gender _______________________
Qualification _______________________ Contact No ___________________
Q1 In which department you are working
Electrical Production Mechanical Other
Q2 What is your working experience
gt2 Years 2-4 Years 4-6 Years lt 6 Years
Q3 How You like the physical Working Environment of the organization
Excellent Good Fair Poor Very Poor
Q4 Are you satisfied with Non-Monitory benefits provided by the organisation
Highly Satisfied Satisfied Neither Satisfied Nor dissatisfied
Highly Dissatisfied Dissatisfied
Q5 Are you satisfied with your work
Highly Satisfied Satisfied Neither Satisfied Nor dissatisfied
Highly Dissatisfied Dissatisfied
Q6 Are you satisfied with the career development programe of the company
Highly Satisfied Satisfied Neither Satisfied Nor dissatisfied
Highly Dissatisfied Dissatisfied
Q7 Is other staff of the organization is co-operative with you
Highly Satisfied Satisfied Neither Satisfied Nor dissatisfied
Highly Dissatisfied Dissatisfied
Q8 Are you satisfied with top level management
Highly Satisfied Satisfied Neither Satisfied Nor dissatisfied
Highly Dissatisfied Dissatisfied
78
Q9 Are you satisfied with your subordinates
Highly Satisfied Satisfied Neither Satisfied Nor dissatisfied
Highly Dissatisfied Dissatisfied
Q10 Are you satisfied with the nature of the Job
Highly Satisfied Satisfied Neither Satisfied Nor dissatisfied
Highly Dissatisfied Dissatisfied
Q11 Do you have any Job Pressure in work
Yes No
Q12 Do you satisfied with the opportunities provided by the organisation
Highly Satisfied Satisfied Neither Satisfied Nor dissatisfied
Highly Dissatisfied Dissatisfied
Q13 Are you satisfied with the welfare facilities provided by the organisation
Highly Satisfied Satisfied Neither Satisfied Nor dissatisfied
Highly Dissatisfied Dissatisfied
Q14 Are you satisfied towards your salary
Highly Satisfied Satisfied Neither Satisfied Nor dissatisfied
Highly Dissatisfied Dissatisfied
Q15 Are you committed towards the organisation
Yes No
Signature

17
bull Samsung is not as experienced in manufacturing high-end TVs for a higher-end market
segment
Opportunities
bull Based on the data that on 28 of the 220 million rural households own a color TV PHILIPS
focus on the domestic India market should be to penetrate the rural household market which
would mean that for those purposes the low-end production of sets in the 13rdquo to 20rdquo range should
be produced to appeal to that segmentrsquos purchasing ability
bull Larger more high-end models can be produced to appeal to an urban customer in India as well
as being an export to the US and European higher end customers
bull With success in the higher-end manufacturing and sales of premium TVs in India PHILIPS can
establish themselves as high-end producers around the world
Threats
bull PHILIPS faces intense competition in the color TV market
bull A premium-priced product wouldnrsquot sell in large volumes so pricing can be a problem
bull Since PHILIPS didnrsquot have an established marketing strategy issues of how to market the
product may arise
bull Loss of profitability because related to over-employment at most facilities
bull Is the per capita income level such that it can support sales of product at any level
bull If PHILIPS fails to be successful in the Chinese market with high-end product it will be known
around the world bull India was a market where the first mover enjoyed advantages over late
comers
bull The first image of the product lasted long in the eyes of the consumer and the first to enter the
18
market could gain the largest market share
bull PHILIPS is committed to enhance its image to the Chinese market as investors
PHILIPS ELECTRONICS MOHALI PLANT
The mohali plant was established in 1985 as PUNJAB ANAND LAMP Ltd as its second
division of lamp industry after the varodra plant at that time it was a joint stock company and
majority of shares was with Punjab Anand Lamp around 75 but in the year 2001 the company
ownership changed and the whole shares was bought by PHILIPS ELECTRONIC INDIA Ltd
and its name was changed to PHILIPS ELECTRONIC INDIA Ltd MOHALI LIGHT
FACTORY
The plant is situated in Industrial focal point PHASE-9 MOHALI near Mohali railway station
and is sreaded in 26 acres Total employees of tis plant is 532 including casual employees This
company is a landmark in the Punjab state as it is the only factory which is most profitable one
than any industry located in Punjab
19
OVERVIEW OF VARIOUS FRONTS OF
PHILIPS ELECTRONICS INDIA Ltd
Manufacturing-
Today the product range of Philips include the following products ndash
Televisions- LCD Plasma Flat Screen Smart Touch XL
Recorders DVD Players I pods and Home Theatre Systems
Audio Products - Audio Systems Remote Controls AudioVideo Accessories
Digital Photo Products and Frames
Portable Audio and Video Systems Accessories like Headphones and Speakers
PC Products - Mouse and Keyboard Multi Media Headsets External Hard Disk Drives
Mobile Phones
Male Shaving and Grooming - Dry Shavers Beard Trimmers
Personal Care - Beauty and Hair Care Products
20
Kitchen Appliances - Blenders and Hand Blenders Juicers and Citruspresses Food
Processors and Mixers Coffee Makers and Kettles Frying and Grilling Appliances
Toasters and Snacking Products
Household Products - Irons Vacuum Cleaners Water Purifiers
Professional Lighting - Industrial Shops and offices Road and Area Hospitality Sports
Lighting City Beautification and Petrol Stations
Automotive Lighting - In Cars Motorcycles and Trucks
Home Lighting
SERVICS
Philips E-waste Management Program in India
Philips has tied up with a recycler for collecting transporting and recycling unwanted broken
down consumer products
At Philips we offer consumers a convenient way of recycling their unwanted obsolete and
damaged Philips products by dropping them off at convenient locations The program
encompasses 8 major cities across India Consumers can approach one of 27 authorized Philips
service centres which will act as collection points for consumer products which need recycling
Our efforts are to expand the network in the near future
Philips ensures that the consumer products received will be recycled in an environment-friendly
manner Philips understand the corporate social responsibility and takes steps towards providing
a safer environment to the future generations We design our products to continuously realize
improvements and reduce their overall life cycle environmental impact Designing products for
21
recycling is an integral part of this approach Our aim is to use our planetrsquos limited resources
effectively and respect the principle of extended producer responsibility This also calls for
manufacturers to engage in developing solutions for effective and efficient recycling of their
products We will continue to promote and invest into improved recycling systems to reduce the
impact of electronic waste on the environment
MANUFACTURING AT MOHALI PLANT ndash
Mohali plant mainly manufactures lighting products basically of domestic usage this includes the
following products ndash
CFL bulbs ndash
1 Genie - 5 watt 8 watt 11 watt
2 Essential ndash 8 watt 11 watt 14 watt 18 watt 23 watt 29 watt
3 Tornado ndash 5 watt 8 watt 11 watt 14 watt 18 watt 23watt 29 watt
4 T5 slim tube 28 watt
Coil plant ndash Philips Electronics India is the only company that produces coils in the whole
lighting industries in the world and in India only at the MOHALI PLANT
22
Chapter-II
OBJECTIVES OF THE STUDY
23
OBJECTIVES OF THE STUDY
To study the various aspects of Satisfaction Level of the Employees working at Philips
Electronics India Ltd Mohali
To analyze the effect of Job satisfaction on the organisation
To determine the relation between job satisfaction of employees and their commitment
towards the organisation
To analyze the performance model adopted by the Philips Electronics India Ltd Mohali
to handle their manpower
To suggest remedial measures for the improvement of the companyrsquos performance
24
Chapter-III
Employees Commitment
25
Employees who are engaged in their work and committed to their organizations give companies
crucial competitive advantagesmdashincluding higher productivity and lower employee turnover
Thus it is not surprising that organizations of all sizes and types have invested substantially in
policies and practices that foster engagement and commitment in their workforces
But what are employee engagement and commitment exactly This report examines the ways in
which employers and corporate consultants define these terms today and offers ideas for
strengthening employee engagement Though different organizations define engagement
differently some common themes emerge These themes include employeesrsquo satisfaction with
their work and pride in their employer the extent to which people enjoy and believe in what they
do for work and the perception that their employer values what they bring to the table The
greater an employeersquos engagement the more likely he or she is to ldquogo the extra milerdquo and deliver
excellent on-the-job performance In addition engaged employees may be more likely to commit
to staying with their current organization Software giant Intuit2 for example found that highly
engaged employees are 13 times more likely to be high performers than less engaged
employees They are also five times less likely to voluntarily leave the company
Clearly engagement and commitment can potentially translate into valuable business results for
an organization To help you reap the benefits of an engaged committed workforce at your
organization this report provides guidelines for understanding and measuring employee
engagement and for designing and implementing effective engagement initiatives As you will
26
see everyday human resource practices such as recruitment training performance management
and workforce surveys can provide powerful levers for enhancing engagement
Employee Engagement Key Ingredients
ldquoEmployee Engagement Definedrdquo shows examples of engagement definitions used by various
corporations and consultancies Clearly definitions of employee engagement vary greatly across
organizations Many managers wonder how such an elusive concept can be quantified The term
does encompass several ingredients for which researchers have developed measurement
techniques These ingredients include the degree to which employees fully occupy themselves in
their work as well as the strength of their commitment to the employer and role Fortunately
there is much research on these elements of engagementmdashwork that has deep roots in individual
and group psychology
Definition
ldquoNo company small or large can win over the long run without energized employees who
believe in the [firms] mission and understand how to achieve it Thats why you need to take the
measure of employee engagement at least once a year through anonymous surveys in which
people feel completely safe to speak their mindsrdquo
-Jack and Suzy Welch-
Common Themes How Companies Measure Engagement
Employers typically assess their employeesrsquo engagement levels with company-wide attitude
or opinion surveys
27
1048657 Pride in employer
1048657 Satisfaction with employer
1048657 Job satisfaction
1048657 Opportunity to perform well at challenging work
1048657 Recognition and positive feedback for onersquos contributions
1048657 Personal support from onersquos supervisor
1048657 Effort above and beyond the minimum
1048657 Understanding the link between onersquos job and the organizationrsquos mission
1048657 Prospects for future growth with onersquos employer
1048657 Intention to stay with onersquos employer
The Link Between Employer Practices and Employee Engagement
How does an engaged workforce generate valuable business results for an organization The
process starts with employer practices such as job and task design recruitment selection
training compensation performance management and career development Such practices affect
employeesrsquo level of engagement as well as job performance Performance and engagement then
interact to produce business results Figure 1 depicts these relationships
28
EMPLOYEE COMMITMENT EMPLOYEE ENGAGEMENT
1048657 How do you and other managers in your
organization define commitment
1048657 Are some employees in your company
engaged in their work but not committed to
the organization Committed to staying with
your firm but not exactly engaged in their
work Both engaged and committed
1048657 To whom are your organizations employees
committed The company Their supervisor
Co-workers Team members Customers
1048657 What business results has commitment from
1048657 How do you and other managers in your
organization define employee engagement
1048657 How do you know that certain employees in
your company are engaged Do they relish
their jobs Enjoy specific responsibilities or
tasks Willingly ldquogo the extra milerdquo
1048657 In teams departments or business units in
your company that have a large number of
engaged employees what business results
are you seeing Higher productivity Lower
costs Greater revenues More efficiency
29
employees created for your organization For
example has commitment reduced turnover
and therefore decreased recruitment hiring
and training costs
1048657 What does your company do to reciprocate
employees commitment Is the organization
living up to its side of the bargain
Lower turnover Higher product or service
quality
1048657 Conversely how do disengaged employees
behave and what are the consequent costs
for their teams units-and your entire
company
As Figure 2 suggests a person possesses attributes such as knowledge skills abilities
temperament attitudes and personality He or she uses these attributes to accomplish work
behaviors according to organization-defined procedures by applying tools equipment andor
technology Work behaviors in turn create the products and services that make an organization
successful We classify work behaviors into three categories those required to accomplish duties
and tasks specified in a job description (prescribed behaviors) ldquoextrardquo behaviors that an
employee contributes for the good of the organization (voluntary behaviors) and behaviors
prohibited by an employer (proscribed behaviors including unexcused absenteeism stealing and
other counterproductive or illegal actions) Of course job performance occurs in an
organizational context which includes elements such as leadership physical setting and social
setting
30
Employers naturally want to encourage workers to perform prescribed and voluntary activities
while avoiding proscribed ones To achieve these goals organizations use a number of HR
practices that directly affect the person process and context components of job performance
Employeesrsquo reactions to these practices determine their levels of engagement and commitment
31
Chapter-IV
32
LITERATURE OF THE REVIEW
ldquo Job Satisfaction That Leads To The Commitment Of
The Employees in The Organisationrdquo
Literature of Review
Gerge Bill Authentic Leadership
In his book Authentic Leadership former Medtronic CEO Bill George makes an obvious
point that business leaders rarely say out loud ldquoMissions motivate dollars donrsquotrdquo
What he means is that purpose is what drives employee commitment not the financial
rewards that come to others Workers donrsquot get up in the morning and say ldquoGee I can
33
hardly wait to get to work today to maximize shareholder profitsrdquo Even when employees
are shareholders who can benefit from improved financials what draws people to their
chosen careers is the work itself and its purpose in the world more than the profit
possibilities
Mr George goes on to say ldquoI find there is universal agreement (among middle managers)
that you cannot inspire employees by urging them to help management get the companyrsquos
stock price uprdquo
There is in fact quite a bit of literature on this subject In Awakening Corporate Soul
authors Eric Klein and John Izzo say that employee commitment requires knowing ldquothe
purpose of our work it means recognizing the purpose our organization fulfills that goes
beyond the bottom line and it means articulating to others how their (workersrsquo) efforts
contribute to a larger purposerdquo
In Built to Last Jim Collins and James Porras spend an entire book explaining their five
year research study of major companies that led to this conclusion about employee
commitment Purpose within a company is what sustains it profit is important but when
itrsquos the prime directive companies falter
-Marshal Goldsmith-
How to Increase Employee Commitment
In practice this involves walking the talk being transparent communicating effectively treating
people equally teaching leading subordinates to increasingly excellent performance ndash and
responding to subordinates as mature individuals who are owed fairness the truth and
recognition of their achievements
34
Since managers interact directly and frequently with subordinates they are usually more tuned
in to how employees are feeling than are executives Managers are in a better position to know
for example when employees are feeling alienated and disengaged from their work which is
very common today -- and expensive
Gaining employee commitment results in greater profits because enthusiastic employees stay
contribute discretionary effort and engage customers Performance soars when customers are
enthused and stay and when executives managers and employees are a collaborative team
united in achieving common goals
But managers are often called middle managers for good reason their job is to motivate and
guide subordinates while they at the same time are being judged by their bosses Because of
their ldquotweenrdquo position in the hierarchy managers to effective support direct reports must also
create relationships with potential allies especially those with greater power who have access to
top decision makers
Harvard University Factors that Impact Employee Well Being Commitment and
Productivity
Business executives from the C-suite and HR to QC and RampD are by nature focused on the
corporate bottom line A new trend in our dawning age of social sustainability is that many
experts believe more attention should be paid to the dotted line - the one signed when a person
35
commits to employment at a company New Harvard research validates this approach affirming
that trust and purpose play a significant role in building successful productive workplaces
The behavioral research conducted by a team at Harvard University and Massachusetts General
Hospital identifies the factors most likely to impact 21st century employee well being
commitment and productivity The researchers found that commitment is largely influenced by
ones sense of purpose feeling of personal impact and overall trust in the organization
Productivity is largely affected by the quality of human relationships including cooperative
social group moods and interaction
The results lead us to conclude that workplaces that provide positive environments that foster
interpersonal trust and quality personal relationships create the most committed and productive
employees says Nancy Etcoff PhD the lead researcher on the study
Expert Shares Keys to Building Successful Workplace Relationships
According to business strategist Courtney Anderson JD MBA Outstanding leadership
today means much more than just doing your job Success is creating an environment that fosters
happy committed productive team members
Anderson explains that reinvigorating workplaces by enhancing trust and employee commitment
does not have to be difficult The biggest challenge she says is making the time to truly change
in our overscheduled instant access competitive work environments With a little know-how it
can be easy to evolve workplace well being and respond to these compelling research results
-Mark Howell-
CEO Bright Point
High-performing companies recognize that employee commitment is a major contributing factor
toward sustaining long-term success and creating value An engaged employee is involved and
excited about their work and acts in a manner that will forward the organizationrsquos interest An
36
engaged workforce helps optimize and retain talent for the long-term because the employees
choose to stay even when other employment alternatives exist
According to Walker Information the top three drivers of employee commitment are
Satisfaction Fairness and Care amp Concern for employees Put simply committed employees
want to enjoy their work feel they are appreciated and know they are making a contribution to
their companyrsquos strategic objectives Additionally employees who have trust in their leadership
and are trusted by their leadership have a greater dedication and are ultimately more productive
on the job However according to recent data provided by the National Business Research
Institute (NBRI) only 31 of all employees are truly engaged
At BrightPoint we take employee engagement seriously and we work to create a culture that
inspires employee loyalty and satisfaction The results of BrightPointrsquos commitment to its
employees are shown in the 2011 BPNA Employee Commitment Survey The survey
determined that close to 80 of respondents indicated they were satisfied with their jobs and
daily activities General employee satisfaction increases when managers take an active interest
in their employees beyond their day-to-day job responsibilities According to NBRI managers
that actively coach build relationships and keep an open dialogue with their employees improve
employee engagement
We have a diverse workforce where each employee brings unique value and has individual
needs Managers are learning to manage the individual and not the position In order to give
managers the tools they need to be successful BrightPoint places strong emphasis on targeted
leadership training workshops and continual learning resources In 2011 906 of managers at
BrightPoint NA participated in the development opportunities offered and also made an effort to
37
help reinforce the learning of their team members This signals that our leadership team is taking
an active interest in professional development and its connection to employee commitment
As BrightPoint continues to increase focus on employee engagement the organization will grow
stronger and maintain a substantial advantage over our competition Our employees possess the
knowledge experience and resiliency to respond quickly to the demands of the marketplace and
through their genuine commitment will deliver what our customers want with increasing
efficiency and effectiveness Our responsibility is value-creation by growing our business and
maintaining high levels of customer service and loyalty We believe the best way to accomplish
this is through a strong committed and engaged workforce
Performance Model Adopted At Mohali Plant
38
Process adopted by Philips Electronics Mohali Plant for Job Satisfaction of Employee that leads commitment of the employees
39
Recruiting
The messages in Philips Electronics Mohali organization conveys while seeking to attract job
applicants also can influence future employeesrsquo engagement and commitment If your firm has
designed jobs specifically to engage employees then organization want to ensure that recruiting
ads extol these positionsrsquo attractive featuresmdashsuch as challenging work assignments a highly
skilled team environment or minimal supervision Applicants who notice and respond to these
ads will more likely be motivated by these features Also consider how organization might best
seek candidates from inside your organization When Organisation recruit existing employees for
desirable jobs you enhance their engagement (by maximizing the person-job fit) and
commitment (by providing growth and advancement opportunities to employees in return for
their loyalty) If Organisation recruit from outside when qualified internal candidates are
available Organization may unwittingly suggest to current employees that your company is not
willing to reciprocate their commitment Existing staff may then begin questioning their own
commitment to the firm By contrast organisation recruit external candidates to both the job and
your organization For these candidates ensure that recruiting messages highlight attractive job
features organizational values and commitment reciprocity That is in return for performance
and dedication your company offers competitive pay and benefits flexible work hours and
learning and career advancement opportunities Also remember that prospective employees have
multiple commitments You will inevitably have to compete with those commitments as
organization try to attract candidates to your firm Most people find it easier to make a new
commitment when it is compatible with their other obligations For example you boost your
chances of recruiting a highly qualified candidate who is a single parent if you offer flexible
work hours family health benefits and on-site day care ldquoRecruiting for Engagement and
Commitmentrdquo
40
Employee Selection
Once recruiting efforts produce a pool of promising job candidates Philips select among them to
fill available positions When organisation select the right individuals for the right jobs new
hires carry out their work more smoothly and experience fewer performance problems The
result Greater enjoyment ofmdashand engagement inmdashthe job
To enhance engagement through your selection of employees identify those candidates who are
best-suited to the job and your organizationrsquos culture Also use candidate assessment methods
that have obvious relevance to the job in questionmdashfor example by asking interviewees what
they know about the role and having them provide work samples Most candidates will view
these techniques more positively than tests with less apparent relevance such as personality and
integrity assessments Successful candidates feel good about having ldquopassed the test and see
company as careful and capable for having selected them A positive initial impression of an
employer encourages growth of long-term commitment
Training and Development
Training and development can serve as additional levers for enhancing engagement and
commitment For new hires training usually begins with orientation Orientation presents several
important opportunitiesmdashincluding explaining pay work schedules and company policies Most
important it gives you a chance to encourage employee engagement by explaining how the new
hirersquos job contributes to the organizationrsquos mission Through orientation Mohali Plant of Philips
Electronics describe how r company is organized introduce the new employee to his or her co-
workers give the person a tour of the area where he or she will be working and explain safety
regulations and other procedural matters In short you foster person-organization fitmdashvital for
developing productive and dedicated employees Through training you help new and current
41
employees acquire the knowledge and skills they need to perform their jobs And employees who
enhance their skills through training are more likely to engage fully in their work because they
derive satisfaction from mastering new tasks Training also enhances employeesrsquo value to your
company as well as their own employability in the job market In addition most companies offer
higher wages for skilled workers to compensate them for their greater value and to discourage
turnover
Compensation
Like the HR practices discussed above compensation can powerfully influence employee
engagement and commitment Some compensation components encourage commitment to
employers while others motivate engagement in the job It is possible to stimulate one and not
the other though itrsquos generally better to foster both For example a company that offers a strong
performance incentive system but no retirement plan will probably realize exceptional
engagement from its workers however they may eventually commit themselves to another
company that does offer a good retirement plan Meanwhile an organization that offers generous
retirement benefits but a traditional seniority-based pay grade system may have committed
employees however these workers might deliver pedestrian performance as they bide their time
until retirement In designing compensation plans you therefore need to consider employee
engagement and commitment strategically
Encourage managers to include employees in the goal-setting process This technique helps to
ensure that workers understand the goals It also promotes acceptance of challenging objectives
because people generally feel more committed to goals they have helped define In addition
consider how you and other managers will recognize and encourage contributions that exceed
expectations For example when a piece of equipment malfunctions Joe finds other ways to
maintain production rather than merely shutting down the machine and waiting for the
42
maintenance staff to fix it Or when a less experienced co-worker encounters a new task Sally
offers friendly coaching instead of standing by and waiting for the inevitable mistakes to crop
up Performance management processes operate on a continuous basis Therefore they provide
perhaps the best ongoing opportunities for employers to foster employee engagement and
commitment For example managers can use routine discussions about performance and
feedback sessions to learn which aspects of the job hold the most interest for each employee and
which tasks are most challenging During such discussions managers also can define what going
above and beyond the call of dutyrdquo looks like and generate ideas for rewarding such
contributions An employeersquos aspirations and career goals can receive careful attention during
performance appraisal meetings Without inquiring into an employeersquos personal life a supervisor
can nevertheless explore ways to enhance the compatibility between the workerrsquos commitment to
your organization and the employeersquos other life commitments Through such means the
organization personalizes its relationship to each employee and provides support while also
expressing appreciation for their contributionsmdash key drivers of engagement and commitment
To further engage employees and win their commitment through your performance management
programs consider how to treat your organizationrsquos most experienced employees In many cases
these employees understand the intricacies of a job better than their supervisors or managers do
By virtue of long identification with your organization they may be deeply committed to high-
level goals They use their expertise to contribute in ways that newer employees simply cannot
match But many of them also may be planning to retire soon especially if they are from the
ldquoBaby Boomerrdquo generation How will you transfer their knowledge to younger workers Design
a performance management system that recognizes and rewards proactive sharing of knowledge
and expertise among co-workers For example create knowledge repositories or learning
histories that can be stored in databases that employees can access and then create incentives
43
for people who contribute to and use these repositories Of course effective performance
management systems also identify employees who are not meeting expectations Failing to
address problem performance can erode other employeesrsquo engagement and commitment as their
workloads increase and they conclude that the company is willing to tolerate poor performance
If feedback coaching and remedial training are of little avail the manager may need to move the
person to a different position within the company where he or she can make a more valuable
contribution or let the individual go if there is no good match elsewhere in the organization
44
Chapter-V
RESEARCH METHODOLOGY
The basic task of research is to generate accurate information for use in decision-making
Research can be defined as the systematic and objective process of gathering recording and
analyzing data for aid in making business decisions As the project involves analyzing of
45
financial structure the research is exploratory in nature covering financial parameters and come
of the important ratios to carry out research There are basically two techniques adopted for
obtaining information
Primary Data
Secondary Data
Primary Data is gathered specifically for the project at hand through personal interviews with
the accounts officers
Sample Size = 100 Employees
Secondary data is previously collected and assembled for some project other than the one at
hand It is gathered and recorded by someone else prior to current needs of the researcher It is
less expensive than the primary date
Secondary Data can be obtained from both external and internal sources
External data may be collected from books and periodicals government sources media and other
commercial sources
Internal data is that secondary data which is created recorded or generated by the organization
As the project is explanatory in nature secondary data is collected from the reports of the
company books journals and interest Secondary data is gathered from annual reports official
records and standing orders of the units
CHAPTER - VI
DATA ANALYSIS AND INTERPRETATION
46
The data after collection is to be processed and analyzed in accordance with the outline
and down for the purpose at the time of developing research plan
Technically speaking processing implies editing coding classification and tabulation of
collected data so that they are amenable to analysis The term analysis refers to the computation
of certain measures along with searching for pattern groups Thus in the process of analysis
relationship or difference should be subjected to statistical tests of significance to determine with
what validity data can be said to indicate any conclusions
The analysis of data in a general way involves a number of closely related operations
which are performed with the purpose of summarizing the collected data and organizing them in
such a manner that they answer the research questions In this study the researcher followed
above process carefully and it is presented in this chapter
47
Table 41 ndash To know the department in which employees are belongs to
S
ou rc
e
survey data
Inference
From the above table it shows that 35 of employees are belongs to
production department
FIGURE 41
S
SI No
D
Department
N
No of Respondents
P
Percentage
1
1
M
Mechanical
3
30
3
30
2
2
E
Electrical
2
25
2
25
3
3
P
Production
3
35
3
35
4
4
O
Others
1
10
1
10
T
Total
1
100
1
100
48
REPRESENTS THE DEPARTMENT
Table 42 ndash To know working experience of the employees
Source survey data
Inference
From the above table it shows that 34 of the employees have 4 ndash 6
years experience
S
SI No
W
Work Experience
N
No of Respondents
P
Percentage
1
1
B
Below 2 years
1
33
1
13
2
2
2
2ndash 4 years
3
30
3
30
3
3
4
4ndash 6 years
3
34
3
34
4
4
A
Above 6 years
2
23
2
23
T
otal
1
100
1
100
49
FIGURE 42
REPRESENTS THE EXPERIENCE OF THE EMPLOYEES
Table 43 ndash To know the physical working environment
S
SI No
W
Working Environment
N
No of Respondents
P
Percentage
1
1
E
Excellent
1
12
1
12
2
2
G
Good
5
57
5
57
3
3
F
Fair
2
28
2
28
4
4
P
Poor
0
03
0
33
5
5
V
Very Poor
0
00
0
00
T
Total
1
100
1
100
Source survey data
Inference
From the above table it shows that 57 of the employees were feeling good about the working environment
50
FIGURE 43
REPRESENTS THE PHYSICAL WOKING ENVIRONMENT
51
Table 44 ndash To know the satisfaction level of employees towards the non-monitory benefits
S
SI No
N
Non-Monitory Benefits offered
to Employees
N
No of Respondents
P
Percentage
1
1
H
Highly Satisfied
1
14
1
14
2
2
S
Satisfied
5
54
5
54
3
3
N
Neither Satisfied nor Dissatisfied
2
25
2
25
4
4
D
Dissatisfied
0
05
0
05
5
5
H
Highly Dissatisfied
0
02
0
02
Total 1
100
1
100
Source survey data
Inference
From the above table it shows that 54 of the employees were satisfied towards the non-monitory benefits
FIGURE 44
REPRESENTS THE SATISFACTION LEVEL OF EMPLOYEES TOWARDS THE NON-MONITORY BENEFITS
52
Table 45 ndash To know the satisfaction level of respondents towards the work
assigned
Source survey dataInference
From the above table it shows that 45 of the respondents were satisfied towards the work assigned
FIGURE 45
S
SI No
A
Amount of Work
N
No of Respondents
P
Percentage
1
1
H
Highly satisfied
2
20
2
20
2
2
S
Satisfied
4
45
4
45
3
3
N
Neither Satisfied nor Dissatisfied
1
12
1
12
4
4
D
Dissatisfied
1
18
1
18
5
5
H
Highly Dissatisfied
0
06
0
06
Total 1
100
1
100
53
REPRESENTS THE SATISFACTION LEVEL OF RESPONDENTS TOWARDS THE WORK ASSIGNED
54
Table 46 ndash Opinion about the career development programme in their organisation
S
SI No
C
Career Development
N
No of Respondents
P
Percentage
H
Highly satisfied
1
12
1
12
S
Satisfied
5
56
5
56
N
Neither Satisfied nor Dissatisfied
2
22
2
22
D
Dissatisfied
1
10
1
10
H
Highly Dissatisfied
0
00
0
00
Total 1
100
1
100
Source survey data
Inference
From the above table it shows that 56 of the employees were satisfied
with the opinion about the carrier development programme in their organisation
FIGURE 46
REPRESENTS OPINION ABOUT THE CAREER DEVELOPMENT
PROGRAMME IN THEIR ORGANISATION
55
Table 47 ndash To know the cooperation of co-workers
S
SI No
C
Co-operation of Workers
N
No of Respondents
P
Percentage
1
1
H
Highly satisfied
2
20
2
20
2
2
S
Satisfied
6
66
6
66
3
3
N
Neither Satisfied nor Dissatisfied
1
11
1
11
4
4
D
Dissatisfied
0
03
0
03
5
5
H
Highly Dissatisfied
0
00
0
00
Total 1
100
1
100
Source survey data
Inference
From the above table it shows that 66 of the employees were satisfied
with the cooperation of co-workers
FIGURE 47
56
REPRESENTS THE COOPERATION OF CO-WORKERS
57
Table 48 ndash To know the satisfaction of Respondents with top management
S
SI No
S
Satisfaction with Top
Management
N
No of Respondents
P
Percentage
1
1
H
Highly satisfied
2
26
2
26
2
2
S
Satisfied
5
51
5
51
3
3
N
Neither Satisfied nor Dissatisfied
1
17
1
17
4
4
D
Dissatisfied
0
06
0
06
5
5
H
Highly dissatisfied
0
00
0
00
Total 1
100
1
100
Source survey data
Inference
From the above table it shows that 51 of the employees were satisfied with the top management
FIGURE 48
58
REPRESENTS THE SATISFACTION OF RESPONDENTS WITH TOP MANAGEMENT
Table 49 ndash To know the satisfaction of Respondents with their subordinates
Source survey data
Inference
From the above table it shows that 67 of the employees were satisfied with their subordinates
S
SI
No
S
Satisfaction with Subordinates
N
No of Respondents
P
Percentage
1
1
H
Highly satisfied
1
12
1
12
2
2
S
Satisfied
6
67
6
67
2
3
N
Neither Satisfied nor Dissatisfied
1
14
1
14
4
D
Dissatisfied
0
07
0
07
5
5
H
Highly Dissatisfied
0
00
0
00
Total 1
100
1
100
59
FIGURE 49
REPRESENTS THE SATISFACTION OF RESPONDENTS WITH THEIR SUBORDINATES
60
Table 410 ndash To know the level of satisfaction regarding nature of job
S
SI No
J
Job Satisfaction
N
No of Respondents
P
Percentage
1
1
H
Highly satisfied
2
22
2
22
2
2
S
Satisfied
5
56
5
56
3
3
N
Neither Satisfied nor Dissatisfied
1
16
1
16
4
4
D
Dissatisfied
0
07
0
07
5
5
H
Highly Dissatisfied
0
00
0
00
Total 1
100
1
100
Source survey dataInference
From the above table it shows that 56 of the employees were satisfied with their job
FIGURE 410
61
REPRESENTS THE LEVEL OF SATISFACTION REGARDING THE NATURE OF JOB
Table 411 ndash To know whether there is any job pressure in their work
Source survey data
Inference
From the above table it shows that 72 of employees said there is job pressure in their work
FIGURE 411
REPRESENTS WHETHER THERE IS ANY JOB PRESSURE IN THEIR WORK
S
SI No
J
Job Pressure
N
No of Respondents
P
Percentage
1
1
Y
Yes
7
72
7
72
2
2
N
No
2
28
2
28
T
Total
1
100
1
100
62
Table 412 ndash To know the opinion regarding opportunity provided by the organisation in developing skills
amp talents
S
SI No
D
Development of Skills and
Talents
N
No of Respondents
P
Percentage
1
1
H
Highly Agree
1
12
1
12
2
2
A
Agree
5
52
5
52
3
3
N
Neither Agree nor Disagree
2
28
2
28
4
4
D
Disagree
0
06
0
06
5
5
H
Highly Disagree
0
02
0
02
Total 1
100
1
100
Source survey data
Inference
From the above table it shows that 52 of employees agreed regarding opportunity provided by the organisation in developing skills amp talents
63
FIRGURE 412
REPRESENTS THE OPPORTUNITY PROVIDED BY THE ORGANISATION IN DEVELOPING SKILLS amp TALENTS
64
Table 413 ndash To know the satisfaction level of welfare facilities provided by the management
S
SI No
W
Welfare Facilities
N
No of Respondents
P
Percentage
1
1
H
Highly satisfied
0
09
9
09
2
2
S
Satisfied
5
57
5
57
3
3
N
Neither Satisfied nor Dissatisfied
2
29
2
29
4
4
D
Dissatisfied
5
05
0
05
5
5
H
Highly Dissatisfied
0
00
0
00
Total 1
100
1
100
Source survey data
Inference
From the above table it shows that 57 of the employees were satisfied with the welfare facilities provided by the management
FIGURE 413
REPRESENTS THE SATISFACTION LEVEL OF WELFARE FACILITIES PROVIDED BY THE MANGEMENT
65
Table 414 ndash To know the employee satisfaction towards the salary
Source survey data
Inference
From the above table it shows that 67 of the employees were satisfied
with their salary
FIGURE 414
REPRESENTS THE SATISFACTION TOWARDS THE SALARY
S
SI No
P
Payment Satisfaction
N
No of Respondents
P
Percentage
1
1
Y
Yes
6
67
6
67
2
2
N
No
3
33
3
33
T
otal
1
100
1
100
66
Table 415 ndash To know the employees willingness amp Commitment Towards
Organisation
Source survey data
Inference
From the above table it shows that 59 of the employees were willing to
continue in this organisation
FIGURE 415
REPRESENTS THE EMPLOYEES WILLINGNESS TO CONTINUE
S
SI No
W
Willingness to Work
N
No of Respondents
P
Percentage
1
1
Y
Yes
5
59
5
59
2
2
N
No
4
41
4
41
T
Total
1
00
1
00
67
CHI-SQUARE METHOD
The chi square test is one of the simplest and most widely used non-
parametric tests in statistical work As a non-parametric test it can be used to determine
if categorical data shows dependency or the two classifications are independent It can
also be used to make comparisons between theoretical population and actual data
when categories are used
n
Chi square χsup2= sum (O-E) sup2 E
i =1
Where O= observed frequency
E= expected frequency
68
OBSERVED FREQUENCY
Table 419 shows the relationship between the department and the job satisfaction
Over All
Job
SatisfactionHighly
SatisfiedSatisfied
Neither
Satisfied nor
Dissatisfied
DissatisfiedHighly
Dissatisfied
Sub
Total
Mechanical 5 6 14 3 2 30
Electrical 6 8 6 3 2 25
Production 9 13 7 4 2 35
Others 2 3 2 2 1 10
Sub Total 22 30 29 12 7 100
69
EXPECTED FREQUENCY
Over All
Job
SatisfactionHighly
SatisfiedSatisfied
Neither
Satisfied nor
Dissatisfied
DissatisfiedHighly
Dissatisfied
Sub
Total
Mechanical 7 8 9 4 2 30
Electrical 5 8 7 3 2 25
Production 8 11 10 4 2 35
Others 2 3 3 1 1 10
Sub Total 22 30 29 12 7 100
Null Hypothesis (Ho)
There is no significant difference between the department and the job satisfaction
Alternative Hypothesis (Ho)
There is significant difference between the job satisfaction
Co Relation
70
Chapter-V
CONCLUSIONS AND
RECOMMENDATIONS
71
CONCLUSION
On the basis of Analysis of Job Satisfaction Level of the Employees of Philips Electronics India
Ltd Mohali made in the previous chapters following conclusions are drawn
General Profile The plant of PHILIPS is ideally located in the Mohali Industrial focal point
Phase 9 near Chandigarh the capital of Punjab on a campus of 17 hectares The working
environment of the company is very healthy The visitors feel happy after the campus
Indigenous Technology PHILIPS is the only lighting manufacturing company based on purely
indigenous technology Philips was appropriately chosen as the brand name as self reliance and
building up of Indian Engineering capabilities remain the guiding spirit of PHILIPS
Financial structure PHILIPS is a low debt company signifying its dependence mainly on
its internal accruals for its financial requirements PHILIPS continues to strengthen its financial
position by channelising these internal accruals to fund its expansion programmes
Working results PTL has registered a handsome and constant growth in its profits because
of a brisk demand for new and better technology electronic items None of the other electronic
company has shown such a steady growth Philips has recorded the lowest current ratio
However with this lowest current ratio PTL still enjoys moderate payment period and highest
velocity of creditors and debtors only due to commitment of itrsquos employees
72
SUMMARY
According to the 1999 Gallup Poll the four elements that have proven to be effective in creating
employee loyalty are praise and recognition a sense of contribution to the company learning and
development and having a best friend at work
Creating a fairy-tale work environment begins withrecognition Your employees need it more
than money perks or titles Here are eight tips regarding recognition Remember these and your
employees may just start whistling while they work It is up to me The corporate culture or
financial rewards will not make your team successful It is up to you Recognition is one thing
that is completely in your control
Strong relationships are vital in todays economy Strengthening employee relationships is even
more necessary as companies downsize and lay off As your workforce shrinks and you need to
do more with less keeping quality employees becomes even more critical As a manager it is
your job to bond your best people to your company through recognition And you also must help
direct and motivate your core performers
Simple rewards earn big returns There are some relatively simple things you can do that will
earn big returns For example remember your employees birthdays and work anniversaries find
out what inexpensive rewards they value (for example tickets to a ball game or a half day off to
spend time with their kids) make the most of your formal service awards with some preparation
and a group presentation walk around your department every day and talk to your
people and thank them sincerely and often
73
Make it specific Praise and recognition must be specific to have impact General praise such as
You do great work actually can have the opposite effect and leave your employees wondering
Does he have any idea what I really do around here Specific praise links individual
accomplishments to company goals For example Cheryl I noticed the way you handled that
customer complaint Great work As you know we value quick resolutions of problems as
one of our core strategies
Ask the best to stay Call your best people into your office one at a time Let that bright young
college graduate know you value his fresh ideas and energy Tell the 20-year veteran how much
your team relies on her expertise and organizational skillsRemarkably a significant percent of
high-impact performers report that they left their last job because No one ever asked me to
stay
Forget cash
Remember the saying Money cant buy everything Well its true Dont wait until you can
offer an employee a raise or promotion Real thanks is its own reward In numerous surveys of
work satisfaction top on employees lists is feeling appreciated In fact when employees feel
recognized and involved they are much less likely to keep asking about money
Recognize
Recognition means most to an employee when it is sincere and spontaneous According to the
largest study ever conducted on workplace satisfaction (Gallup 1999) recognition should occur
at least every seven days If you wait until a year-end party or an annual review you are waiting
much too long to recognize and you probably are losing people you do not need to
74
Recognition works
Neglect can be a poisoned apple Recognition is the elixir that will spark better attitudes and
performance Jeffrey Pfeffer of Stanford University says The returns from managing people in
ways that build high commitment typically are on the order of 30 to 50 percent
Take a hard look in the mirror and ask yourself how you can recognize the fairest of them all
Learn to recognize your employees for their efforts thank them often and reward their
achievements You can awaken them from their anger and apathy and they will fall in love with
their jobs again Chances are you will work together happily ever after
So there is direct relation with employee satisfaction and their commitment towards the
organization and it is also clear from the above discussion that only monetary elements are not
sufficient for employee satisfaction rather other element like employer behavior recognisation
and other moral value
75
RECOMMENDATIONS
PHILIPS should increase its capacity utilization It should work at full capacity to
minimize its cost of production With this increase in capacity utilization the total cost
will spread over more units thereby decreasing the per unit cost
PHILIPS should decrease the credit facilities provided to its consumers The payback
period is quite high in case of debtors as compared to creditors it should be more or less
equal as it will help in improving company liquidity
PHILIPS should focus more on the consumer lifestyle goods in India parallel to its other
business as it accounts very less as compare to other businesses of Philips
Another recommendation for Mohali plant is about the HR department that is they
should appoint permanent and skilled workers as against casual workers which generally add
up to the profit of the company
76
BIBLIOGRAPHY
1 Values-Based Leadership Rebuilding Employee Commitment Performance and Productivity ( Thomas D Kuczmarski)
2 Monthly Journals of Philips Electronics India Ltd
3 Authentic Leadership Medtronic CEO Bill George
4 wwwindiaphilipscom
5 wwwwikipediacom
6 httpwwwemployeecommitmentcom
7 One Foot Out The Door How to Combat The Psychological Recession Thatrsquos Alienating Employees And Hurting American Business Judith Bardwick
8 Employee Commitment A Leader Ship Guide Joe Folkman
9 Harvard University Factors that Impact Employee Well Being Commitment and Productivity -An Article
77
Questionnaire
Name __________________________________________________________
Age______________________________ Gender _______________________
Qualification _______________________ Contact No ___________________
Q1 In which department you are working
Electrical Production Mechanical Other
Q2 What is your working experience
gt2 Years 2-4 Years 4-6 Years lt 6 Years
Q3 How You like the physical Working Environment of the organization
Excellent Good Fair Poor Very Poor
Q4 Are you satisfied with Non-Monitory benefits provided by the organisation
Highly Satisfied Satisfied Neither Satisfied Nor dissatisfied
Highly Dissatisfied Dissatisfied
Q5 Are you satisfied with your work
Highly Satisfied Satisfied Neither Satisfied Nor dissatisfied
Highly Dissatisfied Dissatisfied
Q6 Are you satisfied with the career development programe of the company
Highly Satisfied Satisfied Neither Satisfied Nor dissatisfied
Highly Dissatisfied Dissatisfied
Q7 Is other staff of the organization is co-operative with you
Highly Satisfied Satisfied Neither Satisfied Nor dissatisfied
Highly Dissatisfied Dissatisfied
Q8 Are you satisfied with top level management
Highly Satisfied Satisfied Neither Satisfied Nor dissatisfied
Highly Dissatisfied Dissatisfied
78
Q9 Are you satisfied with your subordinates
Highly Satisfied Satisfied Neither Satisfied Nor dissatisfied
Highly Dissatisfied Dissatisfied
Q10 Are you satisfied with the nature of the Job
Highly Satisfied Satisfied Neither Satisfied Nor dissatisfied
Highly Dissatisfied Dissatisfied
Q11 Do you have any Job Pressure in work
Yes No
Q12 Do you satisfied with the opportunities provided by the organisation
Highly Satisfied Satisfied Neither Satisfied Nor dissatisfied
Highly Dissatisfied Dissatisfied
Q13 Are you satisfied with the welfare facilities provided by the organisation
Highly Satisfied Satisfied Neither Satisfied Nor dissatisfied
Highly Dissatisfied Dissatisfied
Q14 Are you satisfied towards your salary
Highly Satisfied Satisfied Neither Satisfied Nor dissatisfied
Highly Dissatisfied Dissatisfied
Q15 Are you committed towards the organisation
Yes No
Signature
18
market could gain the largest market share
bull PHILIPS is committed to enhance its image to the Chinese market as investors
PHILIPS ELECTRONICS MOHALI PLANT
The mohali plant was established in 1985 as PUNJAB ANAND LAMP Ltd as its second
division of lamp industry after the varodra plant at that time it was a joint stock company and
majority of shares was with Punjab Anand Lamp around 75 but in the year 2001 the company
ownership changed and the whole shares was bought by PHILIPS ELECTRONIC INDIA Ltd
and its name was changed to PHILIPS ELECTRONIC INDIA Ltd MOHALI LIGHT
FACTORY
The plant is situated in Industrial focal point PHASE-9 MOHALI near Mohali railway station
and is sreaded in 26 acres Total employees of tis plant is 532 including casual employees This
company is a landmark in the Punjab state as it is the only factory which is most profitable one
than any industry located in Punjab
19
OVERVIEW OF VARIOUS FRONTS OF
PHILIPS ELECTRONICS INDIA Ltd
Manufacturing-
Today the product range of Philips include the following products ndash
Televisions- LCD Plasma Flat Screen Smart Touch XL
Recorders DVD Players I pods and Home Theatre Systems
Audio Products - Audio Systems Remote Controls AudioVideo Accessories
Digital Photo Products and Frames
Portable Audio and Video Systems Accessories like Headphones and Speakers
PC Products - Mouse and Keyboard Multi Media Headsets External Hard Disk Drives
Mobile Phones
Male Shaving and Grooming - Dry Shavers Beard Trimmers
Personal Care - Beauty and Hair Care Products
20
Kitchen Appliances - Blenders and Hand Blenders Juicers and Citruspresses Food
Processors and Mixers Coffee Makers and Kettles Frying and Grilling Appliances
Toasters and Snacking Products
Household Products - Irons Vacuum Cleaners Water Purifiers
Professional Lighting - Industrial Shops and offices Road and Area Hospitality Sports
Lighting City Beautification and Petrol Stations
Automotive Lighting - In Cars Motorcycles and Trucks
Home Lighting
SERVICS
Philips E-waste Management Program in India
Philips has tied up with a recycler for collecting transporting and recycling unwanted broken
down consumer products
At Philips we offer consumers a convenient way of recycling their unwanted obsolete and
damaged Philips products by dropping them off at convenient locations The program
encompasses 8 major cities across India Consumers can approach one of 27 authorized Philips
service centres which will act as collection points for consumer products which need recycling
Our efforts are to expand the network in the near future
Philips ensures that the consumer products received will be recycled in an environment-friendly
manner Philips understand the corporate social responsibility and takes steps towards providing
a safer environment to the future generations We design our products to continuously realize
improvements and reduce their overall life cycle environmental impact Designing products for
21
recycling is an integral part of this approach Our aim is to use our planetrsquos limited resources
effectively and respect the principle of extended producer responsibility This also calls for
manufacturers to engage in developing solutions for effective and efficient recycling of their
products We will continue to promote and invest into improved recycling systems to reduce the
impact of electronic waste on the environment
MANUFACTURING AT MOHALI PLANT ndash
Mohali plant mainly manufactures lighting products basically of domestic usage this includes the
following products ndash
CFL bulbs ndash
1 Genie - 5 watt 8 watt 11 watt
2 Essential ndash 8 watt 11 watt 14 watt 18 watt 23 watt 29 watt
3 Tornado ndash 5 watt 8 watt 11 watt 14 watt 18 watt 23watt 29 watt
4 T5 slim tube 28 watt
Coil plant ndash Philips Electronics India is the only company that produces coils in the whole
lighting industries in the world and in India only at the MOHALI PLANT
22
Chapter-II
OBJECTIVES OF THE STUDY
23
OBJECTIVES OF THE STUDY
To study the various aspects of Satisfaction Level of the Employees working at Philips
Electronics India Ltd Mohali
To analyze the effect of Job satisfaction on the organisation
To determine the relation between job satisfaction of employees and their commitment
towards the organisation
To analyze the performance model adopted by the Philips Electronics India Ltd Mohali
to handle their manpower
To suggest remedial measures for the improvement of the companyrsquos performance
24
Chapter-III
Employees Commitment
25
Employees who are engaged in their work and committed to their organizations give companies
crucial competitive advantagesmdashincluding higher productivity and lower employee turnover
Thus it is not surprising that organizations of all sizes and types have invested substantially in
policies and practices that foster engagement and commitment in their workforces
But what are employee engagement and commitment exactly This report examines the ways in
which employers and corporate consultants define these terms today and offers ideas for
strengthening employee engagement Though different organizations define engagement
differently some common themes emerge These themes include employeesrsquo satisfaction with
their work and pride in their employer the extent to which people enjoy and believe in what they
do for work and the perception that their employer values what they bring to the table The
greater an employeersquos engagement the more likely he or she is to ldquogo the extra milerdquo and deliver
excellent on-the-job performance In addition engaged employees may be more likely to commit
to staying with their current organization Software giant Intuit2 for example found that highly
engaged employees are 13 times more likely to be high performers than less engaged
employees They are also five times less likely to voluntarily leave the company
Clearly engagement and commitment can potentially translate into valuable business results for
an organization To help you reap the benefits of an engaged committed workforce at your
organization this report provides guidelines for understanding and measuring employee
engagement and for designing and implementing effective engagement initiatives As you will
26
see everyday human resource practices such as recruitment training performance management
and workforce surveys can provide powerful levers for enhancing engagement
Employee Engagement Key Ingredients
ldquoEmployee Engagement Definedrdquo shows examples of engagement definitions used by various
corporations and consultancies Clearly definitions of employee engagement vary greatly across
organizations Many managers wonder how such an elusive concept can be quantified The term
does encompass several ingredients for which researchers have developed measurement
techniques These ingredients include the degree to which employees fully occupy themselves in
their work as well as the strength of their commitment to the employer and role Fortunately
there is much research on these elements of engagementmdashwork that has deep roots in individual
and group psychology
Definition
ldquoNo company small or large can win over the long run without energized employees who
believe in the [firms] mission and understand how to achieve it Thats why you need to take the
measure of employee engagement at least once a year through anonymous surveys in which
people feel completely safe to speak their mindsrdquo
-Jack and Suzy Welch-
Common Themes How Companies Measure Engagement
Employers typically assess their employeesrsquo engagement levels with company-wide attitude
or opinion surveys
27
1048657 Pride in employer
1048657 Satisfaction with employer
1048657 Job satisfaction
1048657 Opportunity to perform well at challenging work
1048657 Recognition and positive feedback for onersquos contributions
1048657 Personal support from onersquos supervisor
1048657 Effort above and beyond the minimum
1048657 Understanding the link between onersquos job and the organizationrsquos mission
1048657 Prospects for future growth with onersquos employer
1048657 Intention to stay with onersquos employer
The Link Between Employer Practices and Employee Engagement
How does an engaged workforce generate valuable business results for an organization The
process starts with employer practices such as job and task design recruitment selection
training compensation performance management and career development Such practices affect
employeesrsquo level of engagement as well as job performance Performance and engagement then
interact to produce business results Figure 1 depicts these relationships
28
EMPLOYEE COMMITMENT EMPLOYEE ENGAGEMENT
1048657 How do you and other managers in your
organization define commitment
1048657 Are some employees in your company
engaged in their work but not committed to
the organization Committed to staying with
your firm but not exactly engaged in their
work Both engaged and committed
1048657 To whom are your organizations employees
committed The company Their supervisor
Co-workers Team members Customers
1048657 What business results has commitment from
1048657 How do you and other managers in your
organization define employee engagement
1048657 How do you know that certain employees in
your company are engaged Do they relish
their jobs Enjoy specific responsibilities or
tasks Willingly ldquogo the extra milerdquo
1048657 In teams departments or business units in
your company that have a large number of
engaged employees what business results
are you seeing Higher productivity Lower
costs Greater revenues More efficiency
29
employees created for your organization For
example has commitment reduced turnover
and therefore decreased recruitment hiring
and training costs
1048657 What does your company do to reciprocate
employees commitment Is the organization
living up to its side of the bargain
Lower turnover Higher product or service
quality
1048657 Conversely how do disengaged employees
behave and what are the consequent costs
for their teams units-and your entire
company
As Figure 2 suggests a person possesses attributes such as knowledge skills abilities
temperament attitudes and personality He or she uses these attributes to accomplish work
behaviors according to organization-defined procedures by applying tools equipment andor
technology Work behaviors in turn create the products and services that make an organization
successful We classify work behaviors into three categories those required to accomplish duties
and tasks specified in a job description (prescribed behaviors) ldquoextrardquo behaviors that an
employee contributes for the good of the organization (voluntary behaviors) and behaviors
prohibited by an employer (proscribed behaviors including unexcused absenteeism stealing and
other counterproductive or illegal actions) Of course job performance occurs in an
organizational context which includes elements such as leadership physical setting and social
setting
30
Employers naturally want to encourage workers to perform prescribed and voluntary activities
while avoiding proscribed ones To achieve these goals organizations use a number of HR
practices that directly affect the person process and context components of job performance
Employeesrsquo reactions to these practices determine their levels of engagement and commitment
31
Chapter-IV
32
LITERATURE OF THE REVIEW
ldquo Job Satisfaction That Leads To The Commitment Of
The Employees in The Organisationrdquo
Literature of Review
Gerge Bill Authentic Leadership
In his book Authentic Leadership former Medtronic CEO Bill George makes an obvious
point that business leaders rarely say out loud ldquoMissions motivate dollars donrsquotrdquo
What he means is that purpose is what drives employee commitment not the financial
rewards that come to others Workers donrsquot get up in the morning and say ldquoGee I can
33
hardly wait to get to work today to maximize shareholder profitsrdquo Even when employees
are shareholders who can benefit from improved financials what draws people to their
chosen careers is the work itself and its purpose in the world more than the profit
possibilities
Mr George goes on to say ldquoI find there is universal agreement (among middle managers)
that you cannot inspire employees by urging them to help management get the companyrsquos
stock price uprdquo
There is in fact quite a bit of literature on this subject In Awakening Corporate Soul
authors Eric Klein and John Izzo say that employee commitment requires knowing ldquothe
purpose of our work it means recognizing the purpose our organization fulfills that goes
beyond the bottom line and it means articulating to others how their (workersrsquo) efforts
contribute to a larger purposerdquo
In Built to Last Jim Collins and James Porras spend an entire book explaining their five
year research study of major companies that led to this conclusion about employee
commitment Purpose within a company is what sustains it profit is important but when
itrsquos the prime directive companies falter
-Marshal Goldsmith-
How to Increase Employee Commitment
In practice this involves walking the talk being transparent communicating effectively treating
people equally teaching leading subordinates to increasingly excellent performance ndash and
responding to subordinates as mature individuals who are owed fairness the truth and
recognition of their achievements
34
Since managers interact directly and frequently with subordinates they are usually more tuned
in to how employees are feeling than are executives Managers are in a better position to know
for example when employees are feeling alienated and disengaged from their work which is
very common today -- and expensive
Gaining employee commitment results in greater profits because enthusiastic employees stay
contribute discretionary effort and engage customers Performance soars when customers are
enthused and stay and when executives managers and employees are a collaborative team
united in achieving common goals
But managers are often called middle managers for good reason their job is to motivate and
guide subordinates while they at the same time are being judged by their bosses Because of
their ldquotweenrdquo position in the hierarchy managers to effective support direct reports must also
create relationships with potential allies especially those with greater power who have access to
top decision makers
Harvard University Factors that Impact Employee Well Being Commitment and
Productivity
Business executives from the C-suite and HR to QC and RampD are by nature focused on the
corporate bottom line A new trend in our dawning age of social sustainability is that many
experts believe more attention should be paid to the dotted line - the one signed when a person
35
commits to employment at a company New Harvard research validates this approach affirming
that trust and purpose play a significant role in building successful productive workplaces
The behavioral research conducted by a team at Harvard University and Massachusetts General
Hospital identifies the factors most likely to impact 21st century employee well being
commitment and productivity The researchers found that commitment is largely influenced by
ones sense of purpose feeling of personal impact and overall trust in the organization
Productivity is largely affected by the quality of human relationships including cooperative
social group moods and interaction
The results lead us to conclude that workplaces that provide positive environments that foster
interpersonal trust and quality personal relationships create the most committed and productive
employees says Nancy Etcoff PhD the lead researcher on the study
Expert Shares Keys to Building Successful Workplace Relationships
According to business strategist Courtney Anderson JD MBA Outstanding leadership
today means much more than just doing your job Success is creating an environment that fosters
happy committed productive team members
Anderson explains that reinvigorating workplaces by enhancing trust and employee commitment
does not have to be difficult The biggest challenge she says is making the time to truly change
in our overscheduled instant access competitive work environments With a little know-how it
can be easy to evolve workplace well being and respond to these compelling research results
-Mark Howell-
CEO Bright Point
High-performing companies recognize that employee commitment is a major contributing factor
toward sustaining long-term success and creating value An engaged employee is involved and
excited about their work and acts in a manner that will forward the organizationrsquos interest An
36
engaged workforce helps optimize and retain talent for the long-term because the employees
choose to stay even when other employment alternatives exist
According to Walker Information the top three drivers of employee commitment are
Satisfaction Fairness and Care amp Concern for employees Put simply committed employees
want to enjoy their work feel they are appreciated and know they are making a contribution to
their companyrsquos strategic objectives Additionally employees who have trust in their leadership
and are trusted by their leadership have a greater dedication and are ultimately more productive
on the job However according to recent data provided by the National Business Research
Institute (NBRI) only 31 of all employees are truly engaged
At BrightPoint we take employee engagement seriously and we work to create a culture that
inspires employee loyalty and satisfaction The results of BrightPointrsquos commitment to its
employees are shown in the 2011 BPNA Employee Commitment Survey The survey
determined that close to 80 of respondents indicated they were satisfied with their jobs and
daily activities General employee satisfaction increases when managers take an active interest
in their employees beyond their day-to-day job responsibilities According to NBRI managers
that actively coach build relationships and keep an open dialogue with their employees improve
employee engagement
We have a diverse workforce where each employee brings unique value and has individual
needs Managers are learning to manage the individual and not the position In order to give
managers the tools they need to be successful BrightPoint places strong emphasis on targeted
leadership training workshops and continual learning resources In 2011 906 of managers at
BrightPoint NA participated in the development opportunities offered and also made an effort to
37
help reinforce the learning of their team members This signals that our leadership team is taking
an active interest in professional development and its connection to employee commitment
As BrightPoint continues to increase focus on employee engagement the organization will grow
stronger and maintain a substantial advantage over our competition Our employees possess the
knowledge experience and resiliency to respond quickly to the demands of the marketplace and
through their genuine commitment will deliver what our customers want with increasing
efficiency and effectiveness Our responsibility is value-creation by growing our business and
maintaining high levels of customer service and loyalty We believe the best way to accomplish
this is through a strong committed and engaged workforce
Performance Model Adopted At Mohali Plant
38
Process adopted by Philips Electronics Mohali Plant for Job Satisfaction of Employee that leads commitment of the employees
39
Recruiting
The messages in Philips Electronics Mohali organization conveys while seeking to attract job
applicants also can influence future employeesrsquo engagement and commitment If your firm has
designed jobs specifically to engage employees then organization want to ensure that recruiting
ads extol these positionsrsquo attractive featuresmdashsuch as challenging work assignments a highly
skilled team environment or minimal supervision Applicants who notice and respond to these
ads will more likely be motivated by these features Also consider how organization might best
seek candidates from inside your organization When Organisation recruit existing employees for
desirable jobs you enhance their engagement (by maximizing the person-job fit) and
commitment (by providing growth and advancement opportunities to employees in return for
their loyalty) If Organisation recruit from outside when qualified internal candidates are
available Organization may unwittingly suggest to current employees that your company is not
willing to reciprocate their commitment Existing staff may then begin questioning their own
commitment to the firm By contrast organisation recruit external candidates to both the job and
your organization For these candidates ensure that recruiting messages highlight attractive job
features organizational values and commitment reciprocity That is in return for performance
and dedication your company offers competitive pay and benefits flexible work hours and
learning and career advancement opportunities Also remember that prospective employees have
multiple commitments You will inevitably have to compete with those commitments as
organization try to attract candidates to your firm Most people find it easier to make a new
commitment when it is compatible with their other obligations For example you boost your
chances of recruiting a highly qualified candidate who is a single parent if you offer flexible
work hours family health benefits and on-site day care ldquoRecruiting for Engagement and
Commitmentrdquo
40
Employee Selection
Once recruiting efforts produce a pool of promising job candidates Philips select among them to
fill available positions When organisation select the right individuals for the right jobs new
hires carry out their work more smoothly and experience fewer performance problems The
result Greater enjoyment ofmdashand engagement inmdashthe job
To enhance engagement through your selection of employees identify those candidates who are
best-suited to the job and your organizationrsquos culture Also use candidate assessment methods
that have obvious relevance to the job in questionmdashfor example by asking interviewees what
they know about the role and having them provide work samples Most candidates will view
these techniques more positively than tests with less apparent relevance such as personality and
integrity assessments Successful candidates feel good about having ldquopassed the test and see
company as careful and capable for having selected them A positive initial impression of an
employer encourages growth of long-term commitment
Training and Development
Training and development can serve as additional levers for enhancing engagement and
commitment For new hires training usually begins with orientation Orientation presents several
important opportunitiesmdashincluding explaining pay work schedules and company policies Most
important it gives you a chance to encourage employee engagement by explaining how the new
hirersquos job contributes to the organizationrsquos mission Through orientation Mohali Plant of Philips
Electronics describe how r company is organized introduce the new employee to his or her co-
workers give the person a tour of the area where he or she will be working and explain safety
regulations and other procedural matters In short you foster person-organization fitmdashvital for
developing productive and dedicated employees Through training you help new and current
41
employees acquire the knowledge and skills they need to perform their jobs And employees who
enhance their skills through training are more likely to engage fully in their work because they
derive satisfaction from mastering new tasks Training also enhances employeesrsquo value to your
company as well as their own employability in the job market In addition most companies offer
higher wages for skilled workers to compensate them for their greater value and to discourage
turnover
Compensation
Like the HR practices discussed above compensation can powerfully influence employee
engagement and commitment Some compensation components encourage commitment to
employers while others motivate engagement in the job It is possible to stimulate one and not
the other though itrsquos generally better to foster both For example a company that offers a strong
performance incentive system but no retirement plan will probably realize exceptional
engagement from its workers however they may eventually commit themselves to another
company that does offer a good retirement plan Meanwhile an organization that offers generous
retirement benefits but a traditional seniority-based pay grade system may have committed
employees however these workers might deliver pedestrian performance as they bide their time
until retirement In designing compensation plans you therefore need to consider employee
engagement and commitment strategically
Encourage managers to include employees in the goal-setting process This technique helps to
ensure that workers understand the goals It also promotes acceptance of challenging objectives
because people generally feel more committed to goals they have helped define In addition
consider how you and other managers will recognize and encourage contributions that exceed
expectations For example when a piece of equipment malfunctions Joe finds other ways to
maintain production rather than merely shutting down the machine and waiting for the
42
maintenance staff to fix it Or when a less experienced co-worker encounters a new task Sally
offers friendly coaching instead of standing by and waiting for the inevitable mistakes to crop
up Performance management processes operate on a continuous basis Therefore they provide
perhaps the best ongoing opportunities for employers to foster employee engagement and
commitment For example managers can use routine discussions about performance and
feedback sessions to learn which aspects of the job hold the most interest for each employee and
which tasks are most challenging During such discussions managers also can define what going
above and beyond the call of dutyrdquo looks like and generate ideas for rewarding such
contributions An employeersquos aspirations and career goals can receive careful attention during
performance appraisal meetings Without inquiring into an employeersquos personal life a supervisor
can nevertheless explore ways to enhance the compatibility between the workerrsquos commitment to
your organization and the employeersquos other life commitments Through such means the
organization personalizes its relationship to each employee and provides support while also
expressing appreciation for their contributionsmdash key drivers of engagement and commitment
To further engage employees and win their commitment through your performance management
programs consider how to treat your organizationrsquos most experienced employees In many cases
these employees understand the intricacies of a job better than their supervisors or managers do
By virtue of long identification with your organization they may be deeply committed to high-
level goals They use their expertise to contribute in ways that newer employees simply cannot
match But many of them also may be planning to retire soon especially if they are from the
ldquoBaby Boomerrdquo generation How will you transfer their knowledge to younger workers Design
a performance management system that recognizes and rewards proactive sharing of knowledge
and expertise among co-workers For example create knowledge repositories or learning
histories that can be stored in databases that employees can access and then create incentives
43
for people who contribute to and use these repositories Of course effective performance
management systems also identify employees who are not meeting expectations Failing to
address problem performance can erode other employeesrsquo engagement and commitment as their
workloads increase and they conclude that the company is willing to tolerate poor performance
If feedback coaching and remedial training are of little avail the manager may need to move the
person to a different position within the company where he or she can make a more valuable
contribution or let the individual go if there is no good match elsewhere in the organization
44
Chapter-V
RESEARCH METHODOLOGY
The basic task of research is to generate accurate information for use in decision-making
Research can be defined as the systematic and objective process of gathering recording and
analyzing data for aid in making business decisions As the project involves analyzing of
45
financial structure the research is exploratory in nature covering financial parameters and come
of the important ratios to carry out research There are basically two techniques adopted for
obtaining information
Primary Data
Secondary Data
Primary Data is gathered specifically for the project at hand through personal interviews with
the accounts officers
Sample Size = 100 Employees
Secondary data is previously collected and assembled for some project other than the one at
hand It is gathered and recorded by someone else prior to current needs of the researcher It is
less expensive than the primary date
Secondary Data can be obtained from both external and internal sources
External data may be collected from books and periodicals government sources media and other
commercial sources
Internal data is that secondary data which is created recorded or generated by the organization
As the project is explanatory in nature secondary data is collected from the reports of the
company books journals and interest Secondary data is gathered from annual reports official
records and standing orders of the units
CHAPTER - VI
DATA ANALYSIS AND INTERPRETATION
46
The data after collection is to be processed and analyzed in accordance with the outline
and down for the purpose at the time of developing research plan
Technically speaking processing implies editing coding classification and tabulation of
collected data so that they are amenable to analysis The term analysis refers to the computation
of certain measures along with searching for pattern groups Thus in the process of analysis
relationship or difference should be subjected to statistical tests of significance to determine with
what validity data can be said to indicate any conclusions
The analysis of data in a general way involves a number of closely related operations
which are performed with the purpose of summarizing the collected data and organizing them in
such a manner that they answer the research questions In this study the researcher followed
above process carefully and it is presented in this chapter
47
Table 41 ndash To know the department in which employees are belongs to
S
ou rc
e
survey data
Inference
From the above table it shows that 35 of employees are belongs to
production department
FIGURE 41
S
SI No
D
Department
N
No of Respondents
P
Percentage
1
1
M
Mechanical
3
30
3
30
2
2
E
Electrical
2
25
2
25
3
3
P
Production
3
35
3
35
4
4
O
Others
1
10
1
10
T
Total
1
100
1
100
48
REPRESENTS THE DEPARTMENT
Table 42 ndash To know working experience of the employees
Source survey data
Inference
From the above table it shows that 34 of the employees have 4 ndash 6
years experience
S
SI No
W
Work Experience
N
No of Respondents
P
Percentage
1
1
B
Below 2 years
1
33
1
13
2
2
2
2ndash 4 years
3
30
3
30
3
3
4
4ndash 6 years
3
34
3
34
4
4
A
Above 6 years
2
23
2
23
T
otal
1
100
1
100
49
FIGURE 42
REPRESENTS THE EXPERIENCE OF THE EMPLOYEES
Table 43 ndash To know the physical working environment
S
SI No
W
Working Environment
N
No of Respondents
P
Percentage
1
1
E
Excellent
1
12
1
12
2
2
G
Good
5
57
5
57
3
3
F
Fair
2
28
2
28
4
4
P
Poor
0
03
0
33
5
5
V
Very Poor
0
00
0
00
T
Total
1
100
1
100
Source survey data
Inference
From the above table it shows that 57 of the employees were feeling good about the working environment
50
FIGURE 43
REPRESENTS THE PHYSICAL WOKING ENVIRONMENT
51
Table 44 ndash To know the satisfaction level of employees towards the non-monitory benefits
S
SI No
N
Non-Monitory Benefits offered
to Employees
N
No of Respondents
P
Percentage
1
1
H
Highly Satisfied
1
14
1
14
2
2
S
Satisfied
5
54
5
54
3
3
N
Neither Satisfied nor Dissatisfied
2
25
2
25
4
4
D
Dissatisfied
0
05
0
05
5
5
H
Highly Dissatisfied
0
02
0
02
Total 1
100
1
100
Source survey data
Inference
From the above table it shows that 54 of the employees were satisfied towards the non-monitory benefits
FIGURE 44
REPRESENTS THE SATISFACTION LEVEL OF EMPLOYEES TOWARDS THE NON-MONITORY BENEFITS
52
Table 45 ndash To know the satisfaction level of respondents towards the work
assigned
Source survey dataInference
From the above table it shows that 45 of the respondents were satisfied towards the work assigned
FIGURE 45
S
SI No
A
Amount of Work
N
No of Respondents
P
Percentage
1
1
H
Highly satisfied
2
20
2
20
2
2
S
Satisfied
4
45
4
45
3
3
N
Neither Satisfied nor Dissatisfied
1
12
1
12
4
4
D
Dissatisfied
1
18
1
18
5
5
H
Highly Dissatisfied
0
06
0
06
Total 1
100
1
100
53
REPRESENTS THE SATISFACTION LEVEL OF RESPONDENTS TOWARDS THE WORK ASSIGNED
54
Table 46 ndash Opinion about the career development programme in their organisation
S
SI No
C
Career Development
N
No of Respondents
P
Percentage
H
Highly satisfied
1
12
1
12
S
Satisfied
5
56
5
56
N
Neither Satisfied nor Dissatisfied
2
22
2
22
D
Dissatisfied
1
10
1
10
H
Highly Dissatisfied
0
00
0
00
Total 1
100
1
100
Source survey data
Inference
From the above table it shows that 56 of the employees were satisfied
with the opinion about the carrier development programme in their organisation
FIGURE 46
REPRESENTS OPINION ABOUT THE CAREER DEVELOPMENT
PROGRAMME IN THEIR ORGANISATION
55
Table 47 ndash To know the cooperation of co-workers
S
SI No
C
Co-operation of Workers
N
No of Respondents
P
Percentage
1
1
H
Highly satisfied
2
20
2
20
2
2
S
Satisfied
6
66
6
66
3
3
N
Neither Satisfied nor Dissatisfied
1
11
1
11
4
4
D
Dissatisfied
0
03
0
03
5
5
H
Highly Dissatisfied
0
00
0
00
Total 1
100
1
100
Source survey data
Inference
From the above table it shows that 66 of the employees were satisfied
with the cooperation of co-workers
FIGURE 47
56
REPRESENTS THE COOPERATION OF CO-WORKERS
57
Table 48 ndash To know the satisfaction of Respondents with top management
S
SI No
S
Satisfaction with Top
Management
N
No of Respondents
P
Percentage
1
1
H
Highly satisfied
2
26
2
26
2
2
S
Satisfied
5
51
5
51
3
3
N
Neither Satisfied nor Dissatisfied
1
17
1
17
4
4
D
Dissatisfied
0
06
0
06
5
5
H
Highly dissatisfied
0
00
0
00
Total 1
100
1
100
Source survey data
Inference
From the above table it shows that 51 of the employees were satisfied with the top management
FIGURE 48
58
REPRESENTS THE SATISFACTION OF RESPONDENTS WITH TOP MANAGEMENT
Table 49 ndash To know the satisfaction of Respondents with their subordinates
Source survey data
Inference
From the above table it shows that 67 of the employees were satisfied with their subordinates
S
SI
No
S
Satisfaction with Subordinates
N
No of Respondents
P
Percentage
1
1
H
Highly satisfied
1
12
1
12
2
2
S
Satisfied
6
67
6
67
2
3
N
Neither Satisfied nor Dissatisfied
1
14
1
14
4
D
Dissatisfied
0
07
0
07
5
5
H
Highly Dissatisfied
0
00
0
00
Total 1
100
1
100
59
FIGURE 49
REPRESENTS THE SATISFACTION OF RESPONDENTS WITH THEIR SUBORDINATES
60
Table 410 ndash To know the level of satisfaction regarding nature of job
S
SI No
J
Job Satisfaction
N
No of Respondents
P
Percentage
1
1
H
Highly satisfied
2
22
2
22
2
2
S
Satisfied
5
56
5
56
3
3
N
Neither Satisfied nor Dissatisfied
1
16
1
16
4
4
D
Dissatisfied
0
07
0
07
5
5
H
Highly Dissatisfied
0
00
0
00
Total 1
100
1
100
Source survey dataInference
From the above table it shows that 56 of the employees were satisfied with their job
FIGURE 410
61
REPRESENTS THE LEVEL OF SATISFACTION REGARDING THE NATURE OF JOB
Table 411 ndash To know whether there is any job pressure in their work
Source survey data
Inference
From the above table it shows that 72 of employees said there is job pressure in their work
FIGURE 411
REPRESENTS WHETHER THERE IS ANY JOB PRESSURE IN THEIR WORK
S
SI No
J
Job Pressure
N
No of Respondents
P
Percentage
1
1
Y
Yes
7
72
7
72
2
2
N
No
2
28
2
28
T
Total
1
100
1
100
62
Table 412 ndash To know the opinion regarding opportunity provided by the organisation in developing skills
amp talents
S
SI No
D
Development of Skills and
Talents
N
No of Respondents
P
Percentage
1
1
H
Highly Agree
1
12
1
12
2
2
A
Agree
5
52
5
52
3
3
N
Neither Agree nor Disagree
2
28
2
28
4
4
D
Disagree
0
06
0
06
5
5
H
Highly Disagree
0
02
0
02
Total 1
100
1
100
Source survey data
Inference
From the above table it shows that 52 of employees agreed regarding opportunity provided by the organisation in developing skills amp talents
63
FIRGURE 412
REPRESENTS THE OPPORTUNITY PROVIDED BY THE ORGANISATION IN DEVELOPING SKILLS amp TALENTS
64
Table 413 ndash To know the satisfaction level of welfare facilities provided by the management
S
SI No
W
Welfare Facilities
N
No of Respondents
P
Percentage
1
1
H
Highly satisfied
0
09
9
09
2
2
S
Satisfied
5
57
5
57
3
3
N
Neither Satisfied nor Dissatisfied
2
29
2
29
4
4
D
Dissatisfied
5
05
0
05
5
5
H
Highly Dissatisfied
0
00
0
00
Total 1
100
1
100
Source survey data
Inference
From the above table it shows that 57 of the employees were satisfied with the welfare facilities provided by the management
FIGURE 413
REPRESENTS THE SATISFACTION LEVEL OF WELFARE FACILITIES PROVIDED BY THE MANGEMENT
65
Table 414 ndash To know the employee satisfaction towards the salary
Source survey data
Inference
From the above table it shows that 67 of the employees were satisfied
with their salary
FIGURE 414
REPRESENTS THE SATISFACTION TOWARDS THE SALARY
S
SI No
P
Payment Satisfaction
N
No of Respondents
P
Percentage
1
1
Y
Yes
6
67
6
67
2
2
N
No
3
33
3
33
T
otal
1
100
1
100
66
Table 415 ndash To know the employees willingness amp Commitment Towards
Organisation
Source survey data
Inference
From the above table it shows that 59 of the employees were willing to
continue in this organisation
FIGURE 415
REPRESENTS THE EMPLOYEES WILLINGNESS TO CONTINUE
S
SI No
W
Willingness to Work
N
No of Respondents
P
Percentage
1
1
Y
Yes
5
59
5
59
2
2
N
No
4
41
4
41
T
Total
1
00
1
00
67
CHI-SQUARE METHOD
The chi square test is one of the simplest and most widely used non-
parametric tests in statistical work As a non-parametric test it can be used to determine
if categorical data shows dependency or the two classifications are independent It can
also be used to make comparisons between theoretical population and actual data
when categories are used
n
Chi square χsup2= sum (O-E) sup2 E
i =1
Where O= observed frequency
E= expected frequency
68
OBSERVED FREQUENCY
Table 419 shows the relationship between the department and the job satisfaction
Over All
Job
SatisfactionHighly
SatisfiedSatisfied
Neither
Satisfied nor
Dissatisfied
DissatisfiedHighly
Dissatisfied
Sub
Total
Mechanical 5 6 14 3 2 30
Electrical 6 8 6 3 2 25
Production 9 13 7 4 2 35
Others 2 3 2 2 1 10
Sub Total 22 30 29 12 7 100
69
EXPECTED FREQUENCY
Over All
Job
SatisfactionHighly
SatisfiedSatisfied
Neither
Satisfied nor
Dissatisfied
DissatisfiedHighly
Dissatisfied
Sub
Total
Mechanical 7 8 9 4 2 30
Electrical 5 8 7 3 2 25
Production 8 11 10 4 2 35
Others 2 3 3 1 1 10
Sub Total 22 30 29 12 7 100
Null Hypothesis (Ho)
There is no significant difference between the department and the job satisfaction
Alternative Hypothesis (Ho)
There is significant difference between the job satisfaction
Co Relation
70
Chapter-V
CONCLUSIONS AND
RECOMMENDATIONS
71
CONCLUSION
On the basis of Analysis of Job Satisfaction Level of the Employees of Philips Electronics India
Ltd Mohali made in the previous chapters following conclusions are drawn
General Profile The plant of PHILIPS is ideally located in the Mohali Industrial focal point
Phase 9 near Chandigarh the capital of Punjab on a campus of 17 hectares The working
environment of the company is very healthy The visitors feel happy after the campus
Indigenous Technology PHILIPS is the only lighting manufacturing company based on purely
indigenous technology Philips was appropriately chosen as the brand name as self reliance and
building up of Indian Engineering capabilities remain the guiding spirit of PHILIPS
Financial structure PHILIPS is a low debt company signifying its dependence mainly on
its internal accruals for its financial requirements PHILIPS continues to strengthen its financial
position by channelising these internal accruals to fund its expansion programmes
Working results PTL has registered a handsome and constant growth in its profits because
of a brisk demand for new and better technology electronic items None of the other electronic
company has shown such a steady growth Philips has recorded the lowest current ratio
However with this lowest current ratio PTL still enjoys moderate payment period and highest
velocity of creditors and debtors only due to commitment of itrsquos employees
72
SUMMARY
According to the 1999 Gallup Poll the four elements that have proven to be effective in creating
employee loyalty are praise and recognition a sense of contribution to the company learning and
development and having a best friend at work
Creating a fairy-tale work environment begins withrecognition Your employees need it more
than money perks or titles Here are eight tips regarding recognition Remember these and your
employees may just start whistling while they work It is up to me The corporate culture or
financial rewards will not make your team successful It is up to you Recognition is one thing
that is completely in your control
Strong relationships are vital in todays economy Strengthening employee relationships is even
more necessary as companies downsize and lay off As your workforce shrinks and you need to
do more with less keeping quality employees becomes even more critical As a manager it is
your job to bond your best people to your company through recognition And you also must help
direct and motivate your core performers
Simple rewards earn big returns There are some relatively simple things you can do that will
earn big returns For example remember your employees birthdays and work anniversaries find
out what inexpensive rewards they value (for example tickets to a ball game or a half day off to
spend time with their kids) make the most of your formal service awards with some preparation
and a group presentation walk around your department every day and talk to your
people and thank them sincerely and often
73
Make it specific Praise and recognition must be specific to have impact General praise such as
You do great work actually can have the opposite effect and leave your employees wondering
Does he have any idea what I really do around here Specific praise links individual
accomplishments to company goals For example Cheryl I noticed the way you handled that
customer complaint Great work As you know we value quick resolutions of problems as
one of our core strategies
Ask the best to stay Call your best people into your office one at a time Let that bright young
college graduate know you value his fresh ideas and energy Tell the 20-year veteran how much
your team relies on her expertise and organizational skillsRemarkably a significant percent of
high-impact performers report that they left their last job because No one ever asked me to
stay
Forget cash
Remember the saying Money cant buy everything Well its true Dont wait until you can
offer an employee a raise or promotion Real thanks is its own reward In numerous surveys of
work satisfaction top on employees lists is feeling appreciated In fact when employees feel
recognized and involved they are much less likely to keep asking about money
Recognize
Recognition means most to an employee when it is sincere and spontaneous According to the
largest study ever conducted on workplace satisfaction (Gallup 1999) recognition should occur
at least every seven days If you wait until a year-end party or an annual review you are waiting
much too long to recognize and you probably are losing people you do not need to
74
Recognition works
Neglect can be a poisoned apple Recognition is the elixir that will spark better attitudes and
performance Jeffrey Pfeffer of Stanford University says The returns from managing people in
ways that build high commitment typically are on the order of 30 to 50 percent
Take a hard look in the mirror and ask yourself how you can recognize the fairest of them all
Learn to recognize your employees for their efforts thank them often and reward their
achievements You can awaken them from their anger and apathy and they will fall in love with
their jobs again Chances are you will work together happily ever after
So there is direct relation with employee satisfaction and their commitment towards the
organization and it is also clear from the above discussion that only monetary elements are not
sufficient for employee satisfaction rather other element like employer behavior recognisation
and other moral value
75
RECOMMENDATIONS
PHILIPS should increase its capacity utilization It should work at full capacity to
minimize its cost of production With this increase in capacity utilization the total cost
will spread over more units thereby decreasing the per unit cost
PHILIPS should decrease the credit facilities provided to its consumers The payback
period is quite high in case of debtors as compared to creditors it should be more or less
equal as it will help in improving company liquidity
PHILIPS should focus more on the consumer lifestyle goods in India parallel to its other
business as it accounts very less as compare to other businesses of Philips
Another recommendation for Mohali plant is about the HR department that is they
should appoint permanent and skilled workers as against casual workers which generally add
up to the profit of the company
76
BIBLIOGRAPHY
1 Values-Based Leadership Rebuilding Employee Commitment Performance and Productivity ( Thomas D Kuczmarski)
2 Monthly Journals of Philips Electronics India Ltd
3 Authentic Leadership Medtronic CEO Bill George
4 wwwindiaphilipscom
5 wwwwikipediacom
6 httpwwwemployeecommitmentcom
7 One Foot Out The Door How to Combat The Psychological Recession Thatrsquos Alienating Employees And Hurting American Business Judith Bardwick
8 Employee Commitment A Leader Ship Guide Joe Folkman
9 Harvard University Factors that Impact Employee Well Being Commitment and Productivity -An Article
77
Questionnaire
Name __________________________________________________________
Age______________________________ Gender _______________________
Qualification _______________________ Contact No ___________________
Q1 In which department you are working
Electrical Production Mechanical Other
Q2 What is your working experience
gt2 Years 2-4 Years 4-6 Years lt 6 Years
Q3 How You like the physical Working Environment of the organization
Excellent Good Fair Poor Very Poor
Q4 Are you satisfied with Non-Monitory benefits provided by the organisation
Highly Satisfied Satisfied Neither Satisfied Nor dissatisfied
Highly Dissatisfied Dissatisfied
Q5 Are you satisfied with your work
Highly Satisfied Satisfied Neither Satisfied Nor dissatisfied
Highly Dissatisfied Dissatisfied
Q6 Are you satisfied with the career development programe of the company
Highly Satisfied Satisfied Neither Satisfied Nor dissatisfied
Highly Dissatisfied Dissatisfied
Q7 Is other staff of the organization is co-operative with you
Highly Satisfied Satisfied Neither Satisfied Nor dissatisfied
Highly Dissatisfied Dissatisfied
Q8 Are you satisfied with top level management
Highly Satisfied Satisfied Neither Satisfied Nor dissatisfied
Highly Dissatisfied Dissatisfied
78
Q9 Are you satisfied with your subordinates
Highly Satisfied Satisfied Neither Satisfied Nor dissatisfied
Highly Dissatisfied Dissatisfied
Q10 Are you satisfied with the nature of the Job
Highly Satisfied Satisfied Neither Satisfied Nor dissatisfied
Highly Dissatisfied Dissatisfied
Q11 Do you have any Job Pressure in work
Yes No
Q12 Do you satisfied with the opportunities provided by the organisation
Highly Satisfied Satisfied Neither Satisfied Nor dissatisfied
Highly Dissatisfied Dissatisfied
Q13 Are you satisfied with the welfare facilities provided by the organisation
Highly Satisfied Satisfied Neither Satisfied Nor dissatisfied
Highly Dissatisfied Dissatisfied
Q14 Are you satisfied towards your salary
Highly Satisfied Satisfied Neither Satisfied Nor dissatisfied
Highly Dissatisfied Dissatisfied
Q15 Are you committed towards the organisation
Yes No
Signature

20
Kitchen Appliances - Blenders and Hand Blenders Juicers and Citruspresses Food
Processors and Mixers Coffee Makers and Kettles Frying and Grilling Appliances
Toasters and Snacking Products
Household Products - Irons Vacuum Cleaners Water Purifiers
Professional Lighting - Industrial Shops and offices Road and Area Hospitality Sports
Lighting City Beautification and Petrol Stations
Automotive Lighting - In Cars Motorcycles and Trucks
Home Lighting
SERVICS
Philips E-waste Management Program in India
Philips has tied up with a recycler for collecting transporting and recycling unwanted broken
down consumer products
At Philips we offer consumers a convenient way of recycling their unwanted obsolete and
damaged Philips products by dropping them off at convenient locations The program
encompasses 8 major cities across India Consumers can approach one of 27 authorized Philips
service centres which will act as collection points for consumer products which need recycling
Our efforts are to expand the network in the near future
Philips ensures that the consumer products received will be recycled in an environment-friendly
manner Philips understand the corporate social responsibility and takes steps towards providing
a safer environment to the future generations We design our products to continuously realize
improvements and reduce their overall life cycle environmental impact Designing products for
21
recycling is an integral part of this approach Our aim is to use our planetrsquos limited resources
effectively and respect the principle of extended producer responsibility This also calls for
manufacturers to engage in developing solutions for effective and efficient recycling of their
products We will continue to promote and invest into improved recycling systems to reduce the
impact of electronic waste on the environment
MANUFACTURING AT MOHALI PLANT ndash
Mohali plant mainly manufactures lighting products basically of domestic usage this includes the
following products ndash
CFL bulbs ndash
1 Genie - 5 watt 8 watt 11 watt
2 Essential ndash 8 watt 11 watt 14 watt 18 watt 23 watt 29 watt
3 Tornado ndash 5 watt 8 watt 11 watt 14 watt 18 watt 23watt 29 watt
4 T5 slim tube 28 watt
Coil plant ndash Philips Electronics India is the only company that produces coils in the whole
lighting industries in the world and in India only at the MOHALI PLANT
22
Chapter-II
OBJECTIVES OF THE STUDY
23
OBJECTIVES OF THE STUDY
To study the various aspects of Satisfaction Level of the Employees working at Philips
Electronics India Ltd Mohali
To analyze the effect of Job satisfaction on the organisation
To determine the relation between job satisfaction of employees and their commitment
towards the organisation
To analyze the performance model adopted by the Philips Electronics India Ltd Mohali
to handle their manpower
To suggest remedial measures for the improvement of the companyrsquos performance
24
Chapter-III
Employees Commitment
25
Employees who are engaged in their work and committed to their organizations give companies
crucial competitive advantagesmdashincluding higher productivity and lower employee turnover
Thus it is not surprising that organizations of all sizes and types have invested substantially in
policies and practices that foster engagement and commitment in their workforces
But what are employee engagement and commitment exactly This report examines the ways in
which employers and corporate consultants define these terms today and offers ideas for
strengthening employee engagement Though different organizations define engagement
differently some common themes emerge These themes include employeesrsquo satisfaction with
their work and pride in their employer the extent to which people enjoy and believe in what they
do for work and the perception that their employer values what they bring to the table The
greater an employeersquos engagement the more likely he or she is to ldquogo the extra milerdquo and deliver
excellent on-the-job performance In addition engaged employees may be more likely to commit
to staying with their current organization Software giant Intuit2 for example found that highly
engaged employees are 13 times more likely to be high performers than less engaged
employees They are also five times less likely to voluntarily leave the company
Clearly engagement and commitment can potentially translate into valuable business results for
an organization To help you reap the benefits of an engaged committed workforce at your
organization this report provides guidelines for understanding and measuring employee
engagement and for designing and implementing effective engagement initiatives As you will
26
see everyday human resource practices such as recruitment training performance management
and workforce surveys can provide powerful levers for enhancing engagement
Employee Engagement Key Ingredients
ldquoEmployee Engagement Definedrdquo shows examples of engagement definitions used by various
corporations and consultancies Clearly definitions of employee engagement vary greatly across
organizations Many managers wonder how such an elusive concept can be quantified The term
does encompass several ingredients for which researchers have developed measurement
techniques These ingredients include the degree to which employees fully occupy themselves in
their work as well as the strength of their commitment to the employer and role Fortunately
there is much research on these elements of engagementmdashwork that has deep roots in individual
and group psychology
Definition
ldquoNo company small or large can win over the long run without energized employees who
believe in the [firms] mission and understand how to achieve it Thats why you need to take the
measure of employee engagement at least once a year through anonymous surveys in which
people feel completely safe to speak their mindsrdquo
-Jack and Suzy Welch-
Common Themes How Companies Measure Engagement
Employers typically assess their employeesrsquo engagement levels with company-wide attitude
or opinion surveys
27
1048657 Pride in employer
1048657 Satisfaction with employer
1048657 Job satisfaction
1048657 Opportunity to perform well at challenging work
1048657 Recognition and positive feedback for onersquos contributions
1048657 Personal support from onersquos supervisor
1048657 Effort above and beyond the minimum
1048657 Understanding the link between onersquos job and the organizationrsquos mission
1048657 Prospects for future growth with onersquos employer
1048657 Intention to stay with onersquos employer
The Link Between Employer Practices and Employee Engagement
How does an engaged workforce generate valuable business results for an organization The
process starts with employer practices such as job and task design recruitment selection
training compensation performance management and career development Such practices affect
employeesrsquo level of engagement as well as job performance Performance and engagement then
interact to produce business results Figure 1 depicts these relationships
28
EMPLOYEE COMMITMENT EMPLOYEE ENGAGEMENT
1048657 How do you and other managers in your
organization define commitment
1048657 Are some employees in your company
engaged in their work but not committed to
the organization Committed to staying with
your firm but not exactly engaged in their
work Both engaged and committed
1048657 To whom are your organizations employees
committed The company Their supervisor
Co-workers Team members Customers
1048657 What business results has commitment from
1048657 How do you and other managers in your
organization define employee engagement
1048657 How do you know that certain employees in
your company are engaged Do they relish
their jobs Enjoy specific responsibilities or
tasks Willingly ldquogo the extra milerdquo
1048657 In teams departments or business units in
your company that have a large number of
engaged employees what business results
are you seeing Higher productivity Lower
costs Greater revenues More efficiency
29
employees created for your organization For
example has commitment reduced turnover
and therefore decreased recruitment hiring
and training costs
1048657 What does your company do to reciprocate
employees commitment Is the organization
living up to its side of the bargain
Lower turnover Higher product or service
quality
1048657 Conversely how do disengaged employees
behave and what are the consequent costs
for their teams units-and your entire
company
As Figure 2 suggests a person possesses attributes such as knowledge skills abilities
temperament attitudes and personality He or she uses these attributes to accomplish work
behaviors according to organization-defined procedures by applying tools equipment andor
technology Work behaviors in turn create the products and services that make an organization
successful We classify work behaviors into three categories those required to accomplish duties
and tasks specified in a job description (prescribed behaviors) ldquoextrardquo behaviors that an
employee contributes for the good of the organization (voluntary behaviors) and behaviors
prohibited by an employer (proscribed behaviors including unexcused absenteeism stealing and
other counterproductive or illegal actions) Of course job performance occurs in an
organizational context which includes elements such as leadership physical setting and social
setting
30
Employers naturally want to encourage workers to perform prescribed and voluntary activities
while avoiding proscribed ones To achieve these goals organizations use a number of HR
practices that directly affect the person process and context components of job performance
Employeesrsquo reactions to these practices determine their levels of engagement and commitment
31
Chapter-IV
32
LITERATURE OF THE REVIEW
ldquo Job Satisfaction That Leads To The Commitment Of
The Employees in The Organisationrdquo
Literature of Review
Gerge Bill Authentic Leadership
In his book Authentic Leadership former Medtronic CEO Bill George makes an obvious
point that business leaders rarely say out loud ldquoMissions motivate dollars donrsquotrdquo
What he means is that purpose is what drives employee commitment not the financial
rewards that come to others Workers donrsquot get up in the morning and say ldquoGee I can
33
hardly wait to get to work today to maximize shareholder profitsrdquo Even when employees
are shareholders who can benefit from improved financials what draws people to their
chosen careers is the work itself and its purpose in the world more than the profit
possibilities
Mr George goes on to say ldquoI find there is universal agreement (among middle managers)
that you cannot inspire employees by urging them to help management get the companyrsquos
stock price uprdquo
There is in fact quite a bit of literature on this subject In Awakening Corporate Soul
authors Eric Klein and John Izzo say that employee commitment requires knowing ldquothe
purpose of our work it means recognizing the purpose our organization fulfills that goes
beyond the bottom line and it means articulating to others how their (workersrsquo) efforts
contribute to a larger purposerdquo
In Built to Last Jim Collins and James Porras spend an entire book explaining their five
year research study of major companies that led to this conclusion about employee
commitment Purpose within a company is what sustains it profit is important but when
itrsquos the prime directive companies falter
-Marshal Goldsmith-
How to Increase Employee Commitment
In practice this involves walking the talk being transparent communicating effectively treating
people equally teaching leading subordinates to increasingly excellent performance ndash and
responding to subordinates as mature individuals who are owed fairness the truth and
recognition of their achievements
34
Since managers interact directly and frequently with subordinates they are usually more tuned
in to how employees are feeling than are executives Managers are in a better position to know
for example when employees are feeling alienated and disengaged from their work which is
very common today -- and expensive
Gaining employee commitment results in greater profits because enthusiastic employees stay
contribute discretionary effort and engage customers Performance soars when customers are
enthused and stay and when executives managers and employees are a collaborative team
united in achieving common goals
But managers are often called middle managers for good reason their job is to motivate and
guide subordinates while they at the same time are being judged by their bosses Because of
their ldquotweenrdquo position in the hierarchy managers to effective support direct reports must also
create relationships with potential allies especially those with greater power who have access to
top decision makers
Harvard University Factors that Impact Employee Well Being Commitment and
Productivity
Business executives from the C-suite and HR to QC and RampD are by nature focused on the
corporate bottom line A new trend in our dawning age of social sustainability is that many
experts believe more attention should be paid to the dotted line - the one signed when a person
35
commits to employment at a company New Harvard research validates this approach affirming
that trust and purpose play a significant role in building successful productive workplaces
The behavioral research conducted by a team at Harvard University and Massachusetts General
Hospital identifies the factors most likely to impact 21st century employee well being
commitment and productivity The researchers found that commitment is largely influenced by
ones sense of purpose feeling of personal impact and overall trust in the organization
Productivity is largely affected by the quality of human relationships including cooperative
social group moods and interaction
The results lead us to conclude that workplaces that provide positive environments that foster
interpersonal trust and quality personal relationships create the most committed and productive
employees says Nancy Etcoff PhD the lead researcher on the study
Expert Shares Keys to Building Successful Workplace Relationships
According to business strategist Courtney Anderson JD MBA Outstanding leadership
today means much more than just doing your job Success is creating an environment that fosters
happy committed productive team members
Anderson explains that reinvigorating workplaces by enhancing trust and employee commitment
does not have to be difficult The biggest challenge she says is making the time to truly change
in our overscheduled instant access competitive work environments With a little know-how it
can be easy to evolve workplace well being and respond to these compelling research results
-Mark Howell-
CEO Bright Point
High-performing companies recognize that employee commitment is a major contributing factor
toward sustaining long-term success and creating value An engaged employee is involved and
excited about their work and acts in a manner that will forward the organizationrsquos interest An
36
engaged workforce helps optimize and retain talent for the long-term because the employees
choose to stay even when other employment alternatives exist
According to Walker Information the top three drivers of employee commitment are
Satisfaction Fairness and Care amp Concern for employees Put simply committed employees
want to enjoy their work feel they are appreciated and know they are making a contribution to
their companyrsquos strategic objectives Additionally employees who have trust in their leadership
and are trusted by their leadership have a greater dedication and are ultimately more productive
on the job However according to recent data provided by the National Business Research
Institute (NBRI) only 31 of all employees are truly engaged
At BrightPoint we take employee engagement seriously and we work to create a culture that
inspires employee loyalty and satisfaction The results of BrightPointrsquos commitment to its
employees are shown in the 2011 BPNA Employee Commitment Survey The survey
determined that close to 80 of respondents indicated they were satisfied with their jobs and
daily activities General employee satisfaction increases when managers take an active interest
in their employees beyond their day-to-day job responsibilities According to NBRI managers
that actively coach build relationships and keep an open dialogue with their employees improve
employee engagement
We have a diverse workforce where each employee brings unique value and has individual
needs Managers are learning to manage the individual and not the position In order to give
managers the tools they need to be successful BrightPoint places strong emphasis on targeted
leadership training workshops and continual learning resources In 2011 906 of managers at
BrightPoint NA participated in the development opportunities offered and also made an effort to
37
help reinforce the learning of their team members This signals that our leadership team is taking
an active interest in professional development and its connection to employee commitment
As BrightPoint continues to increase focus on employee engagement the organization will grow
stronger and maintain a substantial advantage over our competition Our employees possess the
knowledge experience and resiliency to respond quickly to the demands of the marketplace and
through their genuine commitment will deliver what our customers want with increasing
efficiency and effectiveness Our responsibility is value-creation by growing our business and
maintaining high levels of customer service and loyalty We believe the best way to accomplish
this is through a strong committed and engaged workforce
Performance Model Adopted At Mohali Plant
38
Process adopted by Philips Electronics Mohali Plant for Job Satisfaction of Employee that leads commitment of the employees
39
Recruiting
The messages in Philips Electronics Mohali organization conveys while seeking to attract job
applicants also can influence future employeesrsquo engagement and commitment If your firm has
designed jobs specifically to engage employees then organization want to ensure that recruiting
ads extol these positionsrsquo attractive featuresmdashsuch as challenging work assignments a highly
skilled team environment or minimal supervision Applicants who notice and respond to these
ads will more likely be motivated by these features Also consider how organization might best
seek candidates from inside your organization When Organisation recruit existing employees for
desirable jobs you enhance their engagement (by maximizing the person-job fit) and
commitment (by providing growth and advancement opportunities to employees in return for
their loyalty) If Organisation recruit from outside when qualified internal candidates are
available Organization may unwittingly suggest to current employees that your company is not
willing to reciprocate their commitment Existing staff may then begin questioning their own
commitment to the firm By contrast organisation recruit external candidates to both the job and
your organization For these candidates ensure that recruiting messages highlight attractive job
features organizational values and commitment reciprocity That is in return for performance
and dedication your company offers competitive pay and benefits flexible work hours and
learning and career advancement opportunities Also remember that prospective employees have
multiple commitments You will inevitably have to compete with those commitments as
organization try to attract candidates to your firm Most people find it easier to make a new
commitment when it is compatible with their other obligations For example you boost your
chances of recruiting a highly qualified candidate who is a single parent if you offer flexible
work hours family health benefits and on-site day care ldquoRecruiting for Engagement and
Commitmentrdquo
40
Employee Selection
Once recruiting efforts produce a pool of promising job candidates Philips select among them to
fill available positions When organisation select the right individuals for the right jobs new
hires carry out their work more smoothly and experience fewer performance problems The
result Greater enjoyment ofmdashand engagement inmdashthe job
To enhance engagement through your selection of employees identify those candidates who are
best-suited to the job and your organizationrsquos culture Also use candidate assessment methods
that have obvious relevance to the job in questionmdashfor example by asking interviewees what
they know about the role and having them provide work samples Most candidates will view
these techniques more positively than tests with less apparent relevance such as personality and
integrity assessments Successful candidates feel good about having ldquopassed the test and see
company as careful and capable for having selected them A positive initial impression of an
employer encourages growth of long-term commitment
Training and Development
Training and development can serve as additional levers for enhancing engagement and
commitment For new hires training usually begins with orientation Orientation presents several
important opportunitiesmdashincluding explaining pay work schedules and company policies Most
important it gives you a chance to encourage employee engagement by explaining how the new
hirersquos job contributes to the organizationrsquos mission Through orientation Mohali Plant of Philips
Electronics describe how r company is organized introduce the new employee to his or her co-
workers give the person a tour of the area where he or she will be working and explain safety
regulations and other procedural matters In short you foster person-organization fitmdashvital for
developing productive and dedicated employees Through training you help new and current
41
employees acquire the knowledge and skills they need to perform their jobs And employees who
enhance their skills through training are more likely to engage fully in their work because they
derive satisfaction from mastering new tasks Training also enhances employeesrsquo value to your
company as well as their own employability in the job market In addition most companies offer
higher wages for skilled workers to compensate them for their greater value and to discourage
turnover
Compensation
Like the HR practices discussed above compensation can powerfully influence employee
engagement and commitment Some compensation components encourage commitment to
employers while others motivate engagement in the job It is possible to stimulate one and not
the other though itrsquos generally better to foster both For example a company that offers a strong
performance incentive system but no retirement plan will probably realize exceptional
engagement from its workers however they may eventually commit themselves to another
company that does offer a good retirement plan Meanwhile an organization that offers generous
retirement benefits but a traditional seniority-based pay grade system may have committed
employees however these workers might deliver pedestrian performance as they bide their time
until retirement In designing compensation plans you therefore need to consider employee
engagement and commitment strategically
Encourage managers to include employees in the goal-setting process This technique helps to
ensure that workers understand the goals It also promotes acceptance of challenging objectives
because people generally feel more committed to goals they have helped define In addition
consider how you and other managers will recognize and encourage contributions that exceed
expectations For example when a piece of equipment malfunctions Joe finds other ways to
maintain production rather than merely shutting down the machine and waiting for the
42
maintenance staff to fix it Or when a less experienced co-worker encounters a new task Sally
offers friendly coaching instead of standing by and waiting for the inevitable mistakes to crop
up Performance management processes operate on a continuous basis Therefore they provide
perhaps the best ongoing opportunities for employers to foster employee engagement and
commitment For example managers can use routine discussions about performance and
feedback sessions to learn which aspects of the job hold the most interest for each employee and
which tasks are most challenging During such discussions managers also can define what going
above and beyond the call of dutyrdquo looks like and generate ideas for rewarding such
contributions An employeersquos aspirations and career goals can receive careful attention during
performance appraisal meetings Without inquiring into an employeersquos personal life a supervisor
can nevertheless explore ways to enhance the compatibility between the workerrsquos commitment to
your organization and the employeersquos other life commitments Through such means the
organization personalizes its relationship to each employee and provides support while also
expressing appreciation for their contributionsmdash key drivers of engagement and commitment
To further engage employees and win their commitment through your performance management
programs consider how to treat your organizationrsquos most experienced employees In many cases
these employees understand the intricacies of a job better than their supervisors or managers do
By virtue of long identification with your organization they may be deeply committed to high-
level goals They use their expertise to contribute in ways that newer employees simply cannot
match But many of them also may be planning to retire soon especially if they are from the
ldquoBaby Boomerrdquo generation How will you transfer their knowledge to younger workers Design
a performance management system that recognizes and rewards proactive sharing of knowledge
and expertise among co-workers For example create knowledge repositories or learning
histories that can be stored in databases that employees can access and then create incentives
43
for people who contribute to and use these repositories Of course effective performance
management systems also identify employees who are not meeting expectations Failing to
address problem performance can erode other employeesrsquo engagement and commitment as their
workloads increase and they conclude that the company is willing to tolerate poor performance
If feedback coaching and remedial training are of little avail the manager may need to move the
person to a different position within the company where he or she can make a more valuable
contribution or let the individual go if there is no good match elsewhere in the organization
44
Chapter-V
RESEARCH METHODOLOGY
The basic task of research is to generate accurate information for use in decision-making
Research can be defined as the systematic and objective process of gathering recording and
analyzing data for aid in making business decisions As the project involves analyzing of
45
financial structure the research is exploratory in nature covering financial parameters and come
of the important ratios to carry out research There are basically two techniques adopted for
obtaining information
Primary Data
Secondary Data
Primary Data is gathered specifically for the project at hand through personal interviews with
the accounts officers
Sample Size = 100 Employees
Secondary data is previously collected and assembled for some project other than the one at
hand It is gathered and recorded by someone else prior to current needs of the researcher It is
less expensive than the primary date
Secondary Data can be obtained from both external and internal sources
External data may be collected from books and periodicals government sources media and other
commercial sources
Internal data is that secondary data which is created recorded or generated by the organization
As the project is explanatory in nature secondary data is collected from the reports of the
company books journals and interest Secondary data is gathered from annual reports official
records and standing orders of the units
CHAPTER - VI
DATA ANALYSIS AND INTERPRETATION
46
The data after collection is to be processed and analyzed in accordance with the outline
and down for the purpose at the time of developing research plan
Technically speaking processing implies editing coding classification and tabulation of
collected data so that they are amenable to analysis The term analysis refers to the computation
of certain measures along with searching for pattern groups Thus in the process of analysis
relationship or difference should be subjected to statistical tests of significance to determine with
what validity data can be said to indicate any conclusions
The analysis of data in a general way involves a number of closely related operations
which are performed with the purpose of summarizing the collected data and organizing them in
such a manner that they answer the research questions In this study the researcher followed
above process carefully and it is presented in this chapter
47
Table 41 ndash To know the department in which employees are belongs to
S
ou rc
e
survey data
Inference
From the above table it shows that 35 of employees are belongs to
production department
FIGURE 41
S
SI No
D
Department
N
No of Respondents
P
Percentage
1
1
M
Mechanical
3
30
3
30
2
2
E
Electrical
2
25
2
25
3
3
P
Production
3
35
3
35
4
4
O
Others
1
10
1
10
T
Total
1
100
1
100
48
REPRESENTS THE DEPARTMENT
Table 42 ndash To know working experience of the employees
Source survey data
Inference
From the above table it shows that 34 of the employees have 4 ndash 6
years experience
S
SI No
W
Work Experience
N
No of Respondents
P
Percentage
1
1
B
Below 2 years
1
33
1
13
2
2
2
2ndash 4 years
3
30
3
30
3
3
4
4ndash 6 years
3
34
3
34
4
4
A
Above 6 years
2
23
2
23
T
otal
1
100
1
100
49
FIGURE 42
REPRESENTS THE EXPERIENCE OF THE EMPLOYEES
Table 43 ndash To know the physical working environment
S
SI No
W
Working Environment
N
No of Respondents
P
Percentage
1
1
E
Excellent
1
12
1
12
2
2
G
Good
5
57
5
57
3
3
F
Fair
2
28
2
28
4
4
P
Poor
0
03
0
33
5
5
V
Very Poor
0
00
0
00
T
Total
1
100
1
100
Source survey data
Inference
From the above table it shows that 57 of the employees were feeling good about the working environment
50
FIGURE 43
REPRESENTS THE PHYSICAL WOKING ENVIRONMENT
51
Table 44 ndash To know the satisfaction level of employees towards the non-monitory benefits
S
SI No
N
Non-Monitory Benefits offered
to Employees
N
No of Respondents
P
Percentage
1
1
H
Highly Satisfied
1
14
1
14
2
2
S
Satisfied
5
54
5
54
3
3
N
Neither Satisfied nor Dissatisfied
2
25
2
25
4
4
D
Dissatisfied
0
05
0
05
5
5
H
Highly Dissatisfied
0
02
0
02
Total 1
100
1
100
Source survey data
Inference
From the above table it shows that 54 of the employees were satisfied towards the non-monitory benefits
FIGURE 44
REPRESENTS THE SATISFACTION LEVEL OF EMPLOYEES TOWARDS THE NON-MONITORY BENEFITS
52
Table 45 ndash To know the satisfaction level of respondents towards the work
assigned
Source survey dataInference
From the above table it shows that 45 of the respondents were satisfied towards the work assigned
FIGURE 45
S
SI No
A
Amount of Work
N
No of Respondents
P
Percentage
1
1
H
Highly satisfied
2
20
2
20
2
2
S
Satisfied
4
45
4
45
3
3
N
Neither Satisfied nor Dissatisfied
1
12
1
12
4
4
D
Dissatisfied
1
18
1
18
5
5
H
Highly Dissatisfied
0
06
0
06
Total 1
100
1
100
53
REPRESENTS THE SATISFACTION LEVEL OF RESPONDENTS TOWARDS THE WORK ASSIGNED
54
Table 46 ndash Opinion about the career development programme in their organisation
S
SI No
C
Career Development
N
No of Respondents
P
Percentage
H
Highly satisfied
1
12
1
12
S
Satisfied
5
56
5
56
N
Neither Satisfied nor Dissatisfied
2
22
2
22
D
Dissatisfied
1
10
1
10
H
Highly Dissatisfied
0
00
0
00
Total 1
100
1
100
Source survey data
Inference
From the above table it shows that 56 of the employees were satisfied
with the opinion about the carrier development programme in their organisation
FIGURE 46
REPRESENTS OPINION ABOUT THE CAREER DEVELOPMENT
PROGRAMME IN THEIR ORGANISATION
55
Table 47 ndash To know the cooperation of co-workers
S
SI No
C
Co-operation of Workers
N
No of Respondents
P
Percentage
1
1
H
Highly satisfied
2
20
2
20
2
2
S
Satisfied
6
66
6
66
3
3
N
Neither Satisfied nor Dissatisfied
1
11
1
11
4
4
D
Dissatisfied
0
03
0
03
5
5
H
Highly Dissatisfied
0
00
0
00
Total 1
100
1
100
Source survey data
Inference
From the above table it shows that 66 of the employees were satisfied
with the cooperation of co-workers
FIGURE 47
56
REPRESENTS THE COOPERATION OF CO-WORKERS
57
Table 48 ndash To know the satisfaction of Respondents with top management
S
SI No
S
Satisfaction with Top
Management
N
No of Respondents
P
Percentage
1
1
H
Highly satisfied
2
26
2
26
2
2
S
Satisfied
5
51
5
51
3
3
N
Neither Satisfied nor Dissatisfied
1
17
1
17
4
4
D
Dissatisfied
0
06
0
06
5
5
H
Highly dissatisfied
0
00
0
00
Total 1
100
1
100
Source survey data
Inference
From the above table it shows that 51 of the employees were satisfied with the top management
FIGURE 48
58
REPRESENTS THE SATISFACTION OF RESPONDENTS WITH TOP MANAGEMENT
Table 49 ndash To know the satisfaction of Respondents with their subordinates
Source survey data
Inference
From the above table it shows that 67 of the employees were satisfied with their subordinates
S
SI
No
S
Satisfaction with Subordinates
N
No of Respondents
P
Percentage
1
1
H
Highly satisfied
1
12
1
12
2
2
S
Satisfied
6
67
6
67
2
3
N
Neither Satisfied nor Dissatisfied
1
14
1
14
4
D
Dissatisfied
0
07
0
07
5
5
H
Highly Dissatisfied
0
00
0
00
Total 1
100
1
100
59
FIGURE 49
REPRESENTS THE SATISFACTION OF RESPONDENTS WITH THEIR SUBORDINATES
60
Table 410 ndash To know the level of satisfaction regarding nature of job
S
SI No
J
Job Satisfaction
N
No of Respondents
P
Percentage
1
1
H
Highly satisfied
2
22
2
22
2
2
S
Satisfied
5
56
5
56
3
3
N
Neither Satisfied nor Dissatisfied
1
16
1
16
4
4
D
Dissatisfied
0
07
0
07
5
5
H
Highly Dissatisfied
0
00
0
00
Total 1
100
1
100
Source survey dataInference
From the above table it shows that 56 of the employees were satisfied with their job
FIGURE 410
61
REPRESENTS THE LEVEL OF SATISFACTION REGARDING THE NATURE OF JOB
Table 411 ndash To know whether there is any job pressure in their work
Source survey data
Inference
From the above table it shows that 72 of employees said there is job pressure in their work
FIGURE 411
REPRESENTS WHETHER THERE IS ANY JOB PRESSURE IN THEIR WORK
S
SI No
J
Job Pressure
N
No of Respondents
P
Percentage
1
1
Y
Yes
7
72
7
72
2
2
N
No
2
28
2
28
T
Total
1
100
1
100
62
Table 412 ndash To know the opinion regarding opportunity provided by the organisation in developing skills
amp talents
S
SI No
D
Development of Skills and
Talents
N
No of Respondents
P
Percentage
1
1
H
Highly Agree
1
12
1
12
2
2
A
Agree
5
52
5
52
3
3
N
Neither Agree nor Disagree
2
28
2
28
4
4
D
Disagree
0
06
0
06
5
5
H
Highly Disagree
0
02
0
02
Total 1
100
1
100
Source survey data
Inference
From the above table it shows that 52 of employees agreed regarding opportunity provided by the organisation in developing skills amp talents
63
FIRGURE 412
REPRESENTS THE OPPORTUNITY PROVIDED BY THE ORGANISATION IN DEVELOPING SKILLS amp TALENTS
64
Table 413 ndash To know the satisfaction level of welfare facilities provided by the management
S
SI No
W
Welfare Facilities
N
No of Respondents
P
Percentage
1
1
H
Highly satisfied
0
09
9
09
2
2
S
Satisfied
5
57
5
57
3
3
N
Neither Satisfied nor Dissatisfied
2
29
2
29
4
4
D
Dissatisfied
5
05
0
05
5
5
H
Highly Dissatisfied
0
00
0
00
Total 1
100
1
100
Source survey data
Inference
From the above table it shows that 57 of the employees were satisfied with the welfare facilities provided by the management
FIGURE 413
REPRESENTS THE SATISFACTION LEVEL OF WELFARE FACILITIES PROVIDED BY THE MANGEMENT
65
Table 414 ndash To know the employee satisfaction towards the salary
Source survey data
Inference
From the above table it shows that 67 of the employees were satisfied
with their salary
FIGURE 414
REPRESENTS THE SATISFACTION TOWARDS THE SALARY
S
SI No
P
Payment Satisfaction
N
No of Respondents
P
Percentage
1
1
Y
Yes
6
67
6
67
2
2
N
No
3
33
3
33
T
otal
1
100
1
100
66
Table 415 ndash To know the employees willingness amp Commitment Towards
Organisation
Source survey data
Inference
From the above table it shows that 59 of the employees were willing to
continue in this organisation
FIGURE 415
REPRESENTS THE EMPLOYEES WILLINGNESS TO CONTINUE
S
SI No
W
Willingness to Work
N
No of Respondents
P
Percentage
1
1
Y
Yes
5
59
5
59
2
2
N
No
4
41
4
41
T
Total
1
00
1
00
67
CHI-SQUARE METHOD
The chi square test is one of the simplest and most widely used non-
parametric tests in statistical work As a non-parametric test it can be used to determine
if categorical data shows dependency or the two classifications are independent It can
also be used to make comparisons between theoretical population and actual data
when categories are used
n
Chi square χsup2= sum (O-E) sup2 E
i =1
Where O= observed frequency
E= expected frequency
68
OBSERVED FREQUENCY
Table 419 shows the relationship between the department and the job satisfaction
Over All
Job
SatisfactionHighly
SatisfiedSatisfied
Neither
Satisfied nor
Dissatisfied
DissatisfiedHighly
Dissatisfied
Sub
Total
Mechanical 5 6 14 3 2 30
Electrical 6 8 6 3 2 25
Production 9 13 7 4 2 35
Others 2 3 2 2 1 10
Sub Total 22 30 29 12 7 100
69
EXPECTED FREQUENCY
Over All
Job
SatisfactionHighly
SatisfiedSatisfied
Neither
Satisfied nor
Dissatisfied
DissatisfiedHighly
Dissatisfied
Sub
Total
Mechanical 7 8 9 4 2 30
Electrical 5 8 7 3 2 25
Production 8 11 10 4 2 35
Others 2 3 3 1 1 10
Sub Total 22 30 29 12 7 100
Null Hypothesis (Ho)
There is no significant difference between the department and the job satisfaction
Alternative Hypothesis (Ho)
There is significant difference between the job satisfaction
Co Relation
70
Chapter-V
CONCLUSIONS AND
RECOMMENDATIONS
71
CONCLUSION
On the basis of Analysis of Job Satisfaction Level of the Employees of Philips Electronics India
Ltd Mohali made in the previous chapters following conclusions are drawn
General Profile The plant of PHILIPS is ideally located in the Mohali Industrial focal point
Phase 9 near Chandigarh the capital of Punjab on a campus of 17 hectares The working
environment of the company is very healthy The visitors feel happy after the campus
Indigenous Technology PHILIPS is the only lighting manufacturing company based on purely
indigenous technology Philips was appropriately chosen as the brand name as self reliance and
building up of Indian Engineering capabilities remain the guiding spirit of PHILIPS
Financial structure PHILIPS is a low debt company signifying its dependence mainly on
its internal accruals for its financial requirements PHILIPS continues to strengthen its financial
position by channelising these internal accruals to fund its expansion programmes
Working results PTL has registered a handsome and constant growth in its profits because
of a brisk demand for new and better technology electronic items None of the other electronic
company has shown such a steady growth Philips has recorded the lowest current ratio
However with this lowest current ratio PTL still enjoys moderate payment period and highest
velocity of creditors and debtors only due to commitment of itrsquos employees
72
SUMMARY
According to the 1999 Gallup Poll the four elements that have proven to be effective in creating
employee loyalty are praise and recognition a sense of contribution to the company learning and
development and having a best friend at work
Creating a fairy-tale work environment begins withrecognition Your employees need it more
than money perks or titles Here are eight tips regarding recognition Remember these and your
employees may just start whistling while they work It is up to me The corporate culture or
financial rewards will not make your team successful It is up to you Recognition is one thing
that is completely in your control
Strong relationships are vital in todays economy Strengthening employee relationships is even
more necessary as companies downsize and lay off As your workforce shrinks and you need to
do more with less keeping quality employees becomes even more critical As a manager it is
your job to bond your best people to your company through recognition And you also must help
direct and motivate your core performers
Simple rewards earn big returns There are some relatively simple things you can do that will
earn big returns For example remember your employees birthdays and work anniversaries find
out what inexpensive rewards they value (for example tickets to a ball game or a half day off to
spend time with their kids) make the most of your formal service awards with some preparation
and a group presentation walk around your department every day and talk to your
people and thank them sincerely and often
73
Make it specific Praise and recognition must be specific to have impact General praise such as
You do great work actually can have the opposite effect and leave your employees wondering
Does he have any idea what I really do around here Specific praise links individual
accomplishments to company goals For example Cheryl I noticed the way you handled that
customer complaint Great work As you know we value quick resolutions of problems as
one of our core strategies
Ask the best to stay Call your best people into your office one at a time Let that bright young
college graduate know you value his fresh ideas and energy Tell the 20-year veteran how much
your team relies on her expertise and organizational skillsRemarkably a significant percent of
high-impact performers report that they left their last job because No one ever asked me to
stay
Forget cash
Remember the saying Money cant buy everything Well its true Dont wait until you can
offer an employee a raise or promotion Real thanks is its own reward In numerous surveys of
work satisfaction top on employees lists is feeling appreciated In fact when employees feel
recognized and involved they are much less likely to keep asking about money
Recognize
Recognition means most to an employee when it is sincere and spontaneous According to the
largest study ever conducted on workplace satisfaction (Gallup 1999) recognition should occur
at least every seven days If you wait until a year-end party or an annual review you are waiting
much too long to recognize and you probably are losing people you do not need to
74
Recognition works
Neglect can be a poisoned apple Recognition is the elixir that will spark better attitudes and
performance Jeffrey Pfeffer of Stanford University says The returns from managing people in
ways that build high commitment typically are on the order of 30 to 50 percent
Take a hard look in the mirror and ask yourself how you can recognize the fairest of them all
Learn to recognize your employees for their efforts thank them often and reward their
achievements You can awaken them from their anger and apathy and they will fall in love with
their jobs again Chances are you will work together happily ever after
So there is direct relation with employee satisfaction and their commitment towards the
organization and it is also clear from the above discussion that only monetary elements are not
sufficient for employee satisfaction rather other element like employer behavior recognisation
and other moral value
75
RECOMMENDATIONS
PHILIPS should increase its capacity utilization It should work at full capacity to
minimize its cost of production With this increase in capacity utilization the total cost
will spread over more units thereby decreasing the per unit cost
PHILIPS should decrease the credit facilities provided to its consumers The payback
period is quite high in case of debtors as compared to creditors it should be more or less
equal as it will help in improving company liquidity
PHILIPS should focus more on the consumer lifestyle goods in India parallel to its other
business as it accounts very less as compare to other businesses of Philips
Another recommendation for Mohali plant is about the HR department that is they
should appoint permanent and skilled workers as against casual workers which generally add
up to the profit of the company
76
BIBLIOGRAPHY
1 Values-Based Leadership Rebuilding Employee Commitment Performance and Productivity ( Thomas D Kuczmarski)
2 Monthly Journals of Philips Electronics India Ltd
3 Authentic Leadership Medtronic CEO Bill George
4 wwwindiaphilipscom
5 wwwwikipediacom
6 httpwwwemployeecommitmentcom
7 One Foot Out The Door How to Combat The Psychological Recession Thatrsquos Alienating Employees And Hurting American Business Judith Bardwick
8 Employee Commitment A Leader Ship Guide Joe Folkman
9 Harvard University Factors that Impact Employee Well Being Commitment and Productivity -An Article
77
Questionnaire
Name __________________________________________________________
Age______________________________ Gender _______________________
Qualification _______________________ Contact No ___________________
Q1 In which department you are working
Electrical Production Mechanical Other
Q2 What is your working experience
gt2 Years 2-4 Years 4-6 Years lt 6 Years
Q3 How You like the physical Working Environment of the organization
Excellent Good Fair Poor Very Poor
Q4 Are you satisfied with Non-Monitory benefits provided by the organisation
Highly Satisfied Satisfied Neither Satisfied Nor dissatisfied
Highly Dissatisfied Dissatisfied
Q5 Are you satisfied with your work
Highly Satisfied Satisfied Neither Satisfied Nor dissatisfied
Highly Dissatisfied Dissatisfied
Q6 Are you satisfied with the career development programe of the company
Highly Satisfied Satisfied Neither Satisfied Nor dissatisfied
Highly Dissatisfied Dissatisfied
Q7 Is other staff of the organization is co-operative with you
Highly Satisfied Satisfied Neither Satisfied Nor dissatisfied
Highly Dissatisfied Dissatisfied
Q8 Are you satisfied with top level management
Highly Satisfied Satisfied Neither Satisfied Nor dissatisfied
Highly Dissatisfied Dissatisfied
78
Q9 Are you satisfied with your subordinates
Highly Satisfied Satisfied Neither Satisfied Nor dissatisfied
Highly Dissatisfied Dissatisfied
Q10 Are you satisfied with the nature of the Job
Highly Satisfied Satisfied Neither Satisfied Nor dissatisfied
Highly Dissatisfied Dissatisfied
Q11 Do you have any Job Pressure in work
Yes No
Q12 Do you satisfied with the opportunities provided by the organisation
Highly Satisfied Satisfied Neither Satisfied Nor dissatisfied
Highly Dissatisfied Dissatisfied
Q13 Are you satisfied with the welfare facilities provided by the organisation
Highly Satisfied Satisfied Neither Satisfied Nor dissatisfied
Highly Dissatisfied Dissatisfied
Q14 Are you satisfied towards your salary
Highly Satisfied Satisfied Neither Satisfied Nor dissatisfied
Highly Dissatisfied Dissatisfied
Q15 Are you committed towards the organisation
Yes No
Signature

22
Chapter-II
OBJECTIVES OF THE STUDY
23
OBJECTIVES OF THE STUDY
To study the various aspects of Satisfaction Level of the Employees working at Philips
Electronics India Ltd Mohali
To analyze the effect of Job satisfaction on the organisation
To determine the relation between job satisfaction of employees and their commitment
towards the organisation
To analyze the performance model adopted by the Philips Electronics India Ltd Mohali
to handle their manpower
To suggest remedial measures for the improvement of the companyrsquos performance
24
Chapter-III
Employees Commitment
25
Employees who are engaged in their work and committed to their organizations give companies
crucial competitive advantagesmdashincluding higher productivity and lower employee turnover
Thus it is not surprising that organizations of all sizes and types have invested substantially in
policies and practices that foster engagement and commitment in their workforces
But what are employee engagement and commitment exactly This report examines the ways in
which employers and corporate consultants define these terms today and offers ideas for
strengthening employee engagement Though different organizations define engagement
differently some common themes emerge These themes include employeesrsquo satisfaction with
their work and pride in their employer the extent to which people enjoy and believe in what they
do for work and the perception that their employer values what they bring to the table The
greater an employeersquos engagement the more likely he or she is to ldquogo the extra milerdquo and deliver
excellent on-the-job performance In addition engaged employees may be more likely to commit
to staying with their current organization Software giant Intuit2 for example found that highly
engaged employees are 13 times more likely to be high performers than less engaged
employees They are also five times less likely to voluntarily leave the company
Clearly engagement and commitment can potentially translate into valuable business results for
an organization To help you reap the benefits of an engaged committed workforce at your
organization this report provides guidelines for understanding and measuring employee
engagement and for designing and implementing effective engagement initiatives As you will
26
see everyday human resource practices such as recruitment training performance management
and workforce surveys can provide powerful levers for enhancing engagement
Employee Engagement Key Ingredients
ldquoEmployee Engagement Definedrdquo shows examples of engagement definitions used by various
corporations and consultancies Clearly definitions of employee engagement vary greatly across
organizations Many managers wonder how such an elusive concept can be quantified The term
does encompass several ingredients for which researchers have developed measurement
techniques These ingredients include the degree to which employees fully occupy themselves in
their work as well as the strength of their commitment to the employer and role Fortunately
there is much research on these elements of engagementmdashwork that has deep roots in individual
and group psychology
Definition
ldquoNo company small or large can win over the long run without energized employees who
believe in the [firms] mission and understand how to achieve it Thats why you need to take the
measure of employee engagement at least once a year through anonymous surveys in which
people feel completely safe to speak their mindsrdquo
-Jack and Suzy Welch-
Common Themes How Companies Measure Engagement
Employers typically assess their employeesrsquo engagement levels with company-wide attitude
or opinion surveys
27
1048657 Pride in employer
1048657 Satisfaction with employer
1048657 Job satisfaction
1048657 Opportunity to perform well at challenging work
1048657 Recognition and positive feedback for onersquos contributions
1048657 Personal support from onersquos supervisor
1048657 Effort above and beyond the minimum
1048657 Understanding the link between onersquos job and the organizationrsquos mission
1048657 Prospects for future growth with onersquos employer
1048657 Intention to stay with onersquos employer
The Link Between Employer Practices and Employee Engagement
How does an engaged workforce generate valuable business results for an organization The
process starts with employer practices such as job and task design recruitment selection
training compensation performance management and career development Such practices affect
employeesrsquo level of engagement as well as job performance Performance and engagement then
interact to produce business results Figure 1 depicts these relationships
28
EMPLOYEE COMMITMENT EMPLOYEE ENGAGEMENT
1048657 How do you and other managers in your
organization define commitment
1048657 Are some employees in your company
engaged in their work but not committed to
the organization Committed to staying with
your firm but not exactly engaged in their
work Both engaged and committed
1048657 To whom are your organizations employees
committed The company Their supervisor
Co-workers Team members Customers
1048657 What business results has commitment from
1048657 How do you and other managers in your
organization define employee engagement
1048657 How do you know that certain employees in
your company are engaged Do they relish
their jobs Enjoy specific responsibilities or
tasks Willingly ldquogo the extra milerdquo
1048657 In teams departments or business units in
your company that have a large number of
engaged employees what business results
are you seeing Higher productivity Lower
costs Greater revenues More efficiency
29
employees created for your organization For
example has commitment reduced turnover
and therefore decreased recruitment hiring
and training costs
1048657 What does your company do to reciprocate
employees commitment Is the organization
living up to its side of the bargain
Lower turnover Higher product or service
quality
1048657 Conversely how do disengaged employees
behave and what are the consequent costs
for their teams units-and your entire
company
As Figure 2 suggests a person possesses attributes such as knowledge skills abilities
temperament attitudes and personality He or she uses these attributes to accomplish work
behaviors according to organization-defined procedures by applying tools equipment andor
technology Work behaviors in turn create the products and services that make an organization
successful We classify work behaviors into three categories those required to accomplish duties
and tasks specified in a job description (prescribed behaviors) ldquoextrardquo behaviors that an
employee contributes for the good of the organization (voluntary behaviors) and behaviors
prohibited by an employer (proscribed behaviors including unexcused absenteeism stealing and
other counterproductive or illegal actions) Of course job performance occurs in an
organizational context which includes elements such as leadership physical setting and social
setting
30
Employers naturally want to encourage workers to perform prescribed and voluntary activities
while avoiding proscribed ones To achieve these goals organizations use a number of HR
practices that directly affect the person process and context components of job performance
Employeesrsquo reactions to these practices determine their levels of engagement and commitment
31
Chapter-IV
32
LITERATURE OF THE REVIEW
ldquo Job Satisfaction That Leads To The Commitment Of
The Employees in The Organisationrdquo
Literature of Review
Gerge Bill Authentic Leadership
In his book Authentic Leadership former Medtronic CEO Bill George makes an obvious
point that business leaders rarely say out loud ldquoMissions motivate dollars donrsquotrdquo
What he means is that purpose is what drives employee commitment not the financial
rewards that come to others Workers donrsquot get up in the morning and say ldquoGee I can
33
hardly wait to get to work today to maximize shareholder profitsrdquo Even when employees
are shareholders who can benefit from improved financials what draws people to their
chosen careers is the work itself and its purpose in the world more than the profit
possibilities
Mr George goes on to say ldquoI find there is universal agreement (among middle managers)
that you cannot inspire employees by urging them to help management get the companyrsquos
stock price uprdquo
There is in fact quite a bit of literature on this subject In Awakening Corporate Soul
authors Eric Klein and John Izzo say that employee commitment requires knowing ldquothe
purpose of our work it means recognizing the purpose our organization fulfills that goes
beyond the bottom line and it means articulating to others how their (workersrsquo) efforts
contribute to a larger purposerdquo
In Built to Last Jim Collins and James Porras spend an entire book explaining their five
year research study of major companies that led to this conclusion about employee
commitment Purpose within a company is what sustains it profit is important but when
itrsquos the prime directive companies falter
-Marshal Goldsmith-
How to Increase Employee Commitment
In practice this involves walking the talk being transparent communicating effectively treating
people equally teaching leading subordinates to increasingly excellent performance ndash and
responding to subordinates as mature individuals who are owed fairness the truth and
recognition of their achievements
34
Since managers interact directly and frequently with subordinates they are usually more tuned
in to how employees are feeling than are executives Managers are in a better position to know
for example when employees are feeling alienated and disengaged from their work which is
very common today -- and expensive
Gaining employee commitment results in greater profits because enthusiastic employees stay
contribute discretionary effort and engage customers Performance soars when customers are
enthused and stay and when executives managers and employees are a collaborative team
united in achieving common goals
But managers are often called middle managers for good reason their job is to motivate and
guide subordinates while they at the same time are being judged by their bosses Because of
their ldquotweenrdquo position in the hierarchy managers to effective support direct reports must also
create relationships with potential allies especially those with greater power who have access to
top decision makers
Harvard University Factors that Impact Employee Well Being Commitment and
Productivity
Business executives from the C-suite and HR to QC and RampD are by nature focused on the
corporate bottom line A new trend in our dawning age of social sustainability is that many
experts believe more attention should be paid to the dotted line - the one signed when a person
35
commits to employment at a company New Harvard research validates this approach affirming
that trust and purpose play a significant role in building successful productive workplaces
The behavioral research conducted by a team at Harvard University and Massachusetts General
Hospital identifies the factors most likely to impact 21st century employee well being
commitment and productivity The researchers found that commitment is largely influenced by
ones sense of purpose feeling of personal impact and overall trust in the organization
Productivity is largely affected by the quality of human relationships including cooperative
social group moods and interaction
The results lead us to conclude that workplaces that provide positive environments that foster
interpersonal trust and quality personal relationships create the most committed and productive
employees says Nancy Etcoff PhD the lead researcher on the study
Expert Shares Keys to Building Successful Workplace Relationships
According to business strategist Courtney Anderson JD MBA Outstanding leadership
today means much more than just doing your job Success is creating an environment that fosters
happy committed productive team members
Anderson explains that reinvigorating workplaces by enhancing trust and employee commitment
does not have to be difficult The biggest challenge she says is making the time to truly change
in our overscheduled instant access competitive work environments With a little know-how it
can be easy to evolve workplace well being and respond to these compelling research results
-Mark Howell-
CEO Bright Point
High-performing companies recognize that employee commitment is a major contributing factor
toward sustaining long-term success and creating value An engaged employee is involved and
excited about their work and acts in a manner that will forward the organizationrsquos interest An
36
engaged workforce helps optimize and retain talent for the long-term because the employees
choose to stay even when other employment alternatives exist
According to Walker Information the top three drivers of employee commitment are
Satisfaction Fairness and Care amp Concern for employees Put simply committed employees
want to enjoy their work feel they are appreciated and know they are making a contribution to
their companyrsquos strategic objectives Additionally employees who have trust in their leadership
and are trusted by their leadership have a greater dedication and are ultimately more productive
on the job However according to recent data provided by the National Business Research
Institute (NBRI) only 31 of all employees are truly engaged
At BrightPoint we take employee engagement seriously and we work to create a culture that
inspires employee loyalty and satisfaction The results of BrightPointrsquos commitment to its
employees are shown in the 2011 BPNA Employee Commitment Survey The survey
determined that close to 80 of respondents indicated they were satisfied with their jobs and
daily activities General employee satisfaction increases when managers take an active interest
in their employees beyond their day-to-day job responsibilities According to NBRI managers
that actively coach build relationships and keep an open dialogue with their employees improve
employee engagement
We have a diverse workforce where each employee brings unique value and has individual
needs Managers are learning to manage the individual and not the position In order to give
managers the tools they need to be successful BrightPoint places strong emphasis on targeted
leadership training workshops and continual learning resources In 2011 906 of managers at
BrightPoint NA participated in the development opportunities offered and also made an effort to
37
help reinforce the learning of their team members This signals that our leadership team is taking
an active interest in professional development and its connection to employee commitment
As BrightPoint continues to increase focus on employee engagement the organization will grow
stronger and maintain a substantial advantage over our competition Our employees possess the
knowledge experience and resiliency to respond quickly to the demands of the marketplace and
through their genuine commitment will deliver what our customers want with increasing
efficiency and effectiveness Our responsibility is value-creation by growing our business and
maintaining high levels of customer service and loyalty We believe the best way to accomplish
this is through a strong committed and engaged workforce
Performance Model Adopted At Mohali Plant
38
Process adopted by Philips Electronics Mohali Plant for Job Satisfaction of Employee that leads commitment of the employees
39
Recruiting
The messages in Philips Electronics Mohali organization conveys while seeking to attract job
applicants also can influence future employeesrsquo engagement and commitment If your firm has
designed jobs specifically to engage employees then organization want to ensure that recruiting
ads extol these positionsrsquo attractive featuresmdashsuch as challenging work assignments a highly
skilled team environment or minimal supervision Applicants who notice and respond to these
ads will more likely be motivated by these features Also consider how organization might best
seek candidates from inside your organization When Organisation recruit existing employees for
desirable jobs you enhance their engagement (by maximizing the person-job fit) and
commitment (by providing growth and advancement opportunities to employees in return for
their loyalty) If Organisation recruit from outside when qualified internal candidates are
available Organization may unwittingly suggest to current employees that your company is not
willing to reciprocate their commitment Existing staff may then begin questioning their own
commitment to the firm By contrast organisation recruit external candidates to both the job and
your organization For these candidates ensure that recruiting messages highlight attractive job
features organizational values and commitment reciprocity That is in return for performance
and dedication your company offers competitive pay and benefits flexible work hours and
learning and career advancement opportunities Also remember that prospective employees have
multiple commitments You will inevitably have to compete with those commitments as
organization try to attract candidates to your firm Most people find it easier to make a new
commitment when it is compatible with their other obligations For example you boost your
chances of recruiting a highly qualified candidate who is a single parent if you offer flexible
work hours family health benefits and on-site day care ldquoRecruiting for Engagement and
Commitmentrdquo
40
Employee Selection
Once recruiting efforts produce a pool of promising job candidates Philips select among them to
fill available positions When organisation select the right individuals for the right jobs new
hires carry out their work more smoothly and experience fewer performance problems The
result Greater enjoyment ofmdashand engagement inmdashthe job
To enhance engagement through your selection of employees identify those candidates who are
best-suited to the job and your organizationrsquos culture Also use candidate assessment methods
that have obvious relevance to the job in questionmdashfor example by asking interviewees what
they know about the role and having them provide work samples Most candidates will view
these techniques more positively than tests with less apparent relevance such as personality and
integrity assessments Successful candidates feel good about having ldquopassed the test and see
company as careful and capable for having selected them A positive initial impression of an
employer encourages growth of long-term commitment
Training and Development
Training and development can serve as additional levers for enhancing engagement and
commitment For new hires training usually begins with orientation Orientation presents several
important opportunitiesmdashincluding explaining pay work schedules and company policies Most
important it gives you a chance to encourage employee engagement by explaining how the new
hirersquos job contributes to the organizationrsquos mission Through orientation Mohali Plant of Philips
Electronics describe how r company is organized introduce the new employee to his or her co-
workers give the person a tour of the area where he or she will be working and explain safety
regulations and other procedural matters In short you foster person-organization fitmdashvital for
developing productive and dedicated employees Through training you help new and current
41
employees acquire the knowledge and skills they need to perform their jobs And employees who
enhance their skills through training are more likely to engage fully in their work because they
derive satisfaction from mastering new tasks Training also enhances employeesrsquo value to your
company as well as their own employability in the job market In addition most companies offer
higher wages for skilled workers to compensate them for their greater value and to discourage
turnover
Compensation
Like the HR practices discussed above compensation can powerfully influence employee
engagement and commitment Some compensation components encourage commitment to
employers while others motivate engagement in the job It is possible to stimulate one and not
the other though itrsquos generally better to foster both For example a company that offers a strong
performance incentive system but no retirement plan will probably realize exceptional
engagement from its workers however they may eventually commit themselves to another
company that does offer a good retirement plan Meanwhile an organization that offers generous
retirement benefits but a traditional seniority-based pay grade system may have committed
employees however these workers might deliver pedestrian performance as they bide their time
until retirement In designing compensation plans you therefore need to consider employee
engagement and commitment strategically
Encourage managers to include employees in the goal-setting process This technique helps to
ensure that workers understand the goals It also promotes acceptance of challenging objectives
because people generally feel more committed to goals they have helped define In addition
consider how you and other managers will recognize and encourage contributions that exceed
expectations For example when a piece of equipment malfunctions Joe finds other ways to
maintain production rather than merely shutting down the machine and waiting for the
42
maintenance staff to fix it Or when a less experienced co-worker encounters a new task Sally
offers friendly coaching instead of standing by and waiting for the inevitable mistakes to crop
up Performance management processes operate on a continuous basis Therefore they provide
perhaps the best ongoing opportunities for employers to foster employee engagement and
commitment For example managers can use routine discussions about performance and
feedback sessions to learn which aspects of the job hold the most interest for each employee and
which tasks are most challenging During such discussions managers also can define what going
above and beyond the call of dutyrdquo looks like and generate ideas for rewarding such
contributions An employeersquos aspirations and career goals can receive careful attention during
performance appraisal meetings Without inquiring into an employeersquos personal life a supervisor
can nevertheless explore ways to enhance the compatibility between the workerrsquos commitment to
your organization and the employeersquos other life commitments Through such means the
organization personalizes its relationship to each employee and provides support while also
expressing appreciation for their contributionsmdash key drivers of engagement and commitment
To further engage employees and win their commitment through your performance management
programs consider how to treat your organizationrsquos most experienced employees In many cases
these employees understand the intricacies of a job better than their supervisors or managers do
By virtue of long identification with your organization they may be deeply committed to high-
level goals They use their expertise to contribute in ways that newer employees simply cannot
match But many of them also may be planning to retire soon especially if they are from the
ldquoBaby Boomerrdquo generation How will you transfer their knowledge to younger workers Design
a performance management system that recognizes and rewards proactive sharing of knowledge
and expertise among co-workers For example create knowledge repositories or learning
histories that can be stored in databases that employees can access and then create incentives
43
for people who contribute to and use these repositories Of course effective performance
management systems also identify employees who are not meeting expectations Failing to
address problem performance can erode other employeesrsquo engagement and commitment as their
workloads increase and they conclude that the company is willing to tolerate poor performance
If feedback coaching and remedial training are of little avail the manager may need to move the
person to a different position within the company where he or she can make a more valuable
contribution or let the individual go if there is no good match elsewhere in the organization
44
Chapter-V
RESEARCH METHODOLOGY
The basic task of research is to generate accurate information for use in decision-making
Research can be defined as the systematic and objective process of gathering recording and
analyzing data for aid in making business decisions As the project involves analyzing of
45
financial structure the research is exploratory in nature covering financial parameters and come
of the important ratios to carry out research There are basically two techniques adopted for
obtaining information
Primary Data
Secondary Data
Primary Data is gathered specifically for the project at hand through personal interviews with
the accounts officers
Sample Size = 100 Employees
Secondary data is previously collected and assembled for some project other than the one at
hand It is gathered and recorded by someone else prior to current needs of the researcher It is
less expensive than the primary date
Secondary Data can be obtained from both external and internal sources
External data may be collected from books and periodicals government sources media and other
commercial sources
Internal data is that secondary data which is created recorded or generated by the organization
As the project is explanatory in nature secondary data is collected from the reports of the
company books journals and interest Secondary data is gathered from annual reports official
records and standing orders of the units
CHAPTER - VI
DATA ANALYSIS AND INTERPRETATION
46
The data after collection is to be processed and analyzed in accordance with the outline
and down for the purpose at the time of developing research plan
Technically speaking processing implies editing coding classification and tabulation of
collected data so that they are amenable to analysis The term analysis refers to the computation
of certain measures along with searching for pattern groups Thus in the process of analysis
relationship or difference should be subjected to statistical tests of significance to determine with
what validity data can be said to indicate any conclusions
The analysis of data in a general way involves a number of closely related operations
which are performed with the purpose of summarizing the collected data and organizing them in
such a manner that they answer the research questions In this study the researcher followed
above process carefully and it is presented in this chapter
47
Table 41 ndash To know the department in which employees are belongs to
S
ou rc
e
survey data
Inference
From the above table it shows that 35 of employees are belongs to
production department
FIGURE 41
S
SI No
D
Department
N
No of Respondents
P
Percentage
1
1
M
Mechanical
3
30
3
30
2
2
E
Electrical
2
25
2
25
3
3
P
Production
3
35
3
35
4
4
O
Others
1
10
1
10
T
Total
1
100
1
100
48
REPRESENTS THE DEPARTMENT
Table 42 ndash To know working experience of the employees
Source survey data
Inference
From the above table it shows that 34 of the employees have 4 ndash 6
years experience
S
SI No
W
Work Experience
N
No of Respondents
P
Percentage
1
1
B
Below 2 years
1
33
1
13
2
2
2
2ndash 4 years
3
30
3
30
3
3
4
4ndash 6 years
3
34
3
34
4
4
A
Above 6 years
2
23
2
23
T
otal
1
100
1
100
49
FIGURE 42
REPRESENTS THE EXPERIENCE OF THE EMPLOYEES
Table 43 ndash To know the physical working environment
S
SI No
W
Working Environment
N
No of Respondents
P
Percentage
1
1
E
Excellent
1
12
1
12
2
2
G
Good
5
57
5
57
3
3
F
Fair
2
28
2
28
4
4
P
Poor
0
03
0
33
5
5
V
Very Poor
0
00
0
00
T
Total
1
100
1
100
Source survey data
Inference
From the above table it shows that 57 of the employees were feeling good about the working environment
50
FIGURE 43
REPRESENTS THE PHYSICAL WOKING ENVIRONMENT
51
Table 44 ndash To know the satisfaction level of employees towards the non-monitory benefits
S
SI No
N
Non-Monitory Benefits offered
to Employees
N
No of Respondents
P
Percentage
1
1
H
Highly Satisfied
1
14
1
14
2
2
S
Satisfied
5
54
5
54
3
3
N
Neither Satisfied nor Dissatisfied
2
25
2
25
4
4
D
Dissatisfied
0
05
0
05
5
5
H
Highly Dissatisfied
0
02
0
02
Total 1
100
1
100
Source survey data
Inference
From the above table it shows that 54 of the employees were satisfied towards the non-monitory benefits
FIGURE 44
REPRESENTS THE SATISFACTION LEVEL OF EMPLOYEES TOWARDS THE NON-MONITORY BENEFITS
52
Table 45 ndash To know the satisfaction level of respondents towards the work
assigned
Source survey dataInference
From the above table it shows that 45 of the respondents were satisfied towards the work assigned
FIGURE 45
S
SI No
A
Amount of Work
N
No of Respondents
P
Percentage
1
1
H
Highly satisfied
2
20
2
20
2
2
S
Satisfied
4
45
4
45
3
3
N
Neither Satisfied nor Dissatisfied
1
12
1
12
4
4
D
Dissatisfied
1
18
1
18
5
5
H
Highly Dissatisfied
0
06
0
06
Total 1
100
1
100
53
REPRESENTS THE SATISFACTION LEVEL OF RESPONDENTS TOWARDS THE WORK ASSIGNED
54
Table 46 ndash Opinion about the career development programme in their organisation
S
SI No
C
Career Development
N
No of Respondents
P
Percentage
H
Highly satisfied
1
12
1
12
S
Satisfied
5
56
5
56
N
Neither Satisfied nor Dissatisfied
2
22
2
22
D
Dissatisfied
1
10
1
10
H
Highly Dissatisfied
0
00
0
00
Total 1
100
1
100
Source survey data
Inference
From the above table it shows that 56 of the employees were satisfied
with the opinion about the carrier development programme in their organisation
FIGURE 46
REPRESENTS OPINION ABOUT THE CAREER DEVELOPMENT
PROGRAMME IN THEIR ORGANISATION
55
Table 47 ndash To know the cooperation of co-workers
S
SI No
C
Co-operation of Workers
N
No of Respondents
P
Percentage
1
1
H
Highly satisfied
2
20
2
20
2
2
S
Satisfied
6
66
6
66
3
3
N
Neither Satisfied nor Dissatisfied
1
11
1
11
4
4
D
Dissatisfied
0
03
0
03
5
5
H
Highly Dissatisfied
0
00
0
00
Total 1
100
1
100
Source survey data
Inference
From the above table it shows that 66 of the employees were satisfied
with the cooperation of co-workers
FIGURE 47
56
REPRESENTS THE COOPERATION OF CO-WORKERS
57
Table 48 ndash To know the satisfaction of Respondents with top management
S
SI No
S
Satisfaction with Top
Management
N
No of Respondents
P
Percentage
1
1
H
Highly satisfied
2
26
2
26
2
2
S
Satisfied
5
51
5
51
3
3
N
Neither Satisfied nor Dissatisfied
1
17
1
17
4
4
D
Dissatisfied
0
06
0
06
5
5
H
Highly dissatisfied
0
00
0
00
Total 1
100
1
100
Source survey data
Inference
From the above table it shows that 51 of the employees were satisfied with the top management
FIGURE 48
58
REPRESENTS THE SATISFACTION OF RESPONDENTS WITH TOP MANAGEMENT
Table 49 ndash To know the satisfaction of Respondents with their subordinates
Source survey data
Inference
From the above table it shows that 67 of the employees were satisfied with their subordinates
S
SI
No
S
Satisfaction with Subordinates
N
No of Respondents
P
Percentage
1
1
H
Highly satisfied
1
12
1
12
2
2
S
Satisfied
6
67
6
67
2
3
N
Neither Satisfied nor Dissatisfied
1
14
1
14
4
D
Dissatisfied
0
07
0
07
5
5
H
Highly Dissatisfied
0
00
0
00
Total 1
100
1
100
59
FIGURE 49
REPRESENTS THE SATISFACTION OF RESPONDENTS WITH THEIR SUBORDINATES
60
Table 410 ndash To know the level of satisfaction regarding nature of job
S
SI No
J
Job Satisfaction
N
No of Respondents
P
Percentage
1
1
H
Highly satisfied
2
22
2
22
2
2
S
Satisfied
5
56
5
56
3
3
N
Neither Satisfied nor Dissatisfied
1
16
1
16
4
4
D
Dissatisfied
0
07
0
07
5
5
H
Highly Dissatisfied
0
00
0
00
Total 1
100
1
100
Source survey dataInference
From the above table it shows that 56 of the employees were satisfied with their job
FIGURE 410
61
REPRESENTS THE LEVEL OF SATISFACTION REGARDING THE NATURE OF JOB
Table 411 ndash To know whether there is any job pressure in their work
Source survey data
Inference
From the above table it shows that 72 of employees said there is job pressure in their work
FIGURE 411
REPRESENTS WHETHER THERE IS ANY JOB PRESSURE IN THEIR WORK
S
SI No
J
Job Pressure
N
No of Respondents
P
Percentage
1
1
Y
Yes
7
72
7
72
2
2
N
No
2
28
2
28
T
Total
1
100
1
100
62
Table 412 ndash To know the opinion regarding opportunity provided by the organisation in developing skills
amp talents
S
SI No
D
Development of Skills and
Talents
N
No of Respondents
P
Percentage
1
1
H
Highly Agree
1
12
1
12
2
2
A
Agree
5
52
5
52
3
3
N
Neither Agree nor Disagree
2
28
2
28
4
4
D
Disagree
0
06
0
06
5
5
H
Highly Disagree
0
02
0
02
Total 1
100
1
100
Source survey data
Inference
From the above table it shows that 52 of employees agreed regarding opportunity provided by the organisation in developing skills amp talents
63
FIRGURE 412
REPRESENTS THE OPPORTUNITY PROVIDED BY THE ORGANISATION IN DEVELOPING SKILLS amp TALENTS
64
Table 413 ndash To know the satisfaction level of welfare facilities provided by the management
S
SI No
W
Welfare Facilities
N
No of Respondents
P
Percentage
1
1
H
Highly satisfied
0
09
9
09
2
2
S
Satisfied
5
57
5
57
3
3
N
Neither Satisfied nor Dissatisfied
2
29
2
29
4
4
D
Dissatisfied
5
05
0
05
5
5
H
Highly Dissatisfied
0
00
0
00
Total 1
100
1
100
Source survey data
Inference
From the above table it shows that 57 of the employees were satisfied with the welfare facilities provided by the management
FIGURE 413
REPRESENTS THE SATISFACTION LEVEL OF WELFARE FACILITIES PROVIDED BY THE MANGEMENT
65
Table 414 ndash To know the employee satisfaction towards the salary
Source survey data
Inference
From the above table it shows that 67 of the employees were satisfied
with their salary
FIGURE 414
REPRESENTS THE SATISFACTION TOWARDS THE SALARY
S
SI No
P
Payment Satisfaction
N
No of Respondents
P
Percentage
1
1
Y
Yes
6
67
6
67
2
2
N
No
3
33
3
33
T
otal
1
100
1
100
66
Table 415 ndash To know the employees willingness amp Commitment Towards
Organisation
Source survey data
Inference
From the above table it shows that 59 of the employees were willing to
continue in this organisation
FIGURE 415
REPRESENTS THE EMPLOYEES WILLINGNESS TO CONTINUE
S
SI No
W
Willingness to Work
N
No of Respondents
P
Percentage
1
1
Y
Yes
5
59
5
59
2
2
N
No
4
41
4
41
T
Total
1
00
1
00
67
CHI-SQUARE METHOD
The chi square test is one of the simplest and most widely used non-
parametric tests in statistical work As a non-parametric test it can be used to determine
if categorical data shows dependency or the two classifications are independent It can
also be used to make comparisons between theoretical population and actual data
when categories are used
n
Chi square χsup2= sum (O-E) sup2 E
i =1
Where O= observed frequency
E= expected frequency
68
OBSERVED FREQUENCY
Table 419 shows the relationship between the department and the job satisfaction
Over All
Job
SatisfactionHighly
SatisfiedSatisfied
Neither
Satisfied nor
Dissatisfied
DissatisfiedHighly
Dissatisfied
Sub
Total
Mechanical 5 6 14 3 2 30
Electrical 6 8 6 3 2 25
Production 9 13 7 4 2 35
Others 2 3 2 2 1 10
Sub Total 22 30 29 12 7 100
69
EXPECTED FREQUENCY
Over All
Job
SatisfactionHighly
SatisfiedSatisfied
Neither
Satisfied nor
Dissatisfied
DissatisfiedHighly
Dissatisfied
Sub
Total
Mechanical 7 8 9 4 2 30
Electrical 5 8 7 3 2 25
Production 8 11 10 4 2 35
Others 2 3 3 1 1 10
Sub Total 22 30 29 12 7 100
Null Hypothesis (Ho)
There is no significant difference between the department and the job satisfaction
Alternative Hypothesis (Ho)
There is significant difference between the job satisfaction
Co Relation
70
Chapter-V
CONCLUSIONS AND
RECOMMENDATIONS
71
CONCLUSION
On the basis of Analysis of Job Satisfaction Level of the Employees of Philips Electronics India
Ltd Mohali made in the previous chapters following conclusions are drawn
General Profile The plant of PHILIPS is ideally located in the Mohali Industrial focal point
Phase 9 near Chandigarh the capital of Punjab on a campus of 17 hectares The working
environment of the company is very healthy The visitors feel happy after the campus
Indigenous Technology PHILIPS is the only lighting manufacturing company based on purely
indigenous technology Philips was appropriately chosen as the brand name as self reliance and
building up of Indian Engineering capabilities remain the guiding spirit of PHILIPS
Financial structure PHILIPS is a low debt company signifying its dependence mainly on
its internal accruals for its financial requirements PHILIPS continues to strengthen its financial
position by channelising these internal accruals to fund its expansion programmes
Working results PTL has registered a handsome and constant growth in its profits because
of a brisk demand for new and better technology electronic items None of the other electronic
company has shown such a steady growth Philips has recorded the lowest current ratio
However with this lowest current ratio PTL still enjoys moderate payment period and highest
velocity of creditors and debtors only due to commitment of itrsquos employees
72
SUMMARY
According to the 1999 Gallup Poll the four elements that have proven to be effective in creating
employee loyalty are praise and recognition a sense of contribution to the company learning and
development and having a best friend at work
Creating a fairy-tale work environment begins withrecognition Your employees need it more
than money perks or titles Here are eight tips regarding recognition Remember these and your
employees may just start whistling while they work It is up to me The corporate culture or
financial rewards will not make your team successful It is up to you Recognition is one thing
that is completely in your control
Strong relationships are vital in todays economy Strengthening employee relationships is even
more necessary as companies downsize and lay off As your workforce shrinks and you need to
do more with less keeping quality employees becomes even more critical As a manager it is
your job to bond your best people to your company through recognition And you also must help
direct and motivate your core performers
Simple rewards earn big returns There are some relatively simple things you can do that will
earn big returns For example remember your employees birthdays and work anniversaries find
out what inexpensive rewards they value (for example tickets to a ball game or a half day off to
spend time with their kids) make the most of your formal service awards with some preparation
and a group presentation walk around your department every day and talk to your
people and thank them sincerely and often
73
Make it specific Praise and recognition must be specific to have impact General praise such as
You do great work actually can have the opposite effect and leave your employees wondering
Does he have any idea what I really do around here Specific praise links individual
accomplishments to company goals For example Cheryl I noticed the way you handled that
customer complaint Great work As you know we value quick resolutions of problems as
one of our core strategies
Ask the best to stay Call your best people into your office one at a time Let that bright young
college graduate know you value his fresh ideas and energy Tell the 20-year veteran how much
your team relies on her expertise and organizational skillsRemarkably a significant percent of
high-impact performers report that they left their last job because No one ever asked me to
stay
Forget cash
Remember the saying Money cant buy everything Well its true Dont wait until you can
offer an employee a raise or promotion Real thanks is its own reward In numerous surveys of
work satisfaction top on employees lists is feeling appreciated In fact when employees feel
recognized and involved they are much less likely to keep asking about money
Recognize
Recognition means most to an employee when it is sincere and spontaneous According to the
largest study ever conducted on workplace satisfaction (Gallup 1999) recognition should occur
at least every seven days If you wait until a year-end party or an annual review you are waiting
much too long to recognize and you probably are losing people you do not need to
74
Recognition works
Neglect can be a poisoned apple Recognition is the elixir that will spark better attitudes and
performance Jeffrey Pfeffer of Stanford University says The returns from managing people in
ways that build high commitment typically are on the order of 30 to 50 percent
Take a hard look in the mirror and ask yourself how you can recognize the fairest of them all
Learn to recognize your employees for their efforts thank them often and reward their
achievements You can awaken them from their anger and apathy and they will fall in love with
their jobs again Chances are you will work together happily ever after
So there is direct relation with employee satisfaction and their commitment towards the
organization and it is also clear from the above discussion that only monetary elements are not
sufficient for employee satisfaction rather other element like employer behavior recognisation
and other moral value
75
RECOMMENDATIONS
PHILIPS should increase its capacity utilization It should work at full capacity to
minimize its cost of production With this increase in capacity utilization the total cost
will spread over more units thereby decreasing the per unit cost
PHILIPS should decrease the credit facilities provided to its consumers The payback
period is quite high in case of debtors as compared to creditors it should be more or less
equal as it will help in improving company liquidity
PHILIPS should focus more on the consumer lifestyle goods in India parallel to its other
business as it accounts very less as compare to other businesses of Philips
Another recommendation for Mohali plant is about the HR department that is they
should appoint permanent and skilled workers as against casual workers which generally add
up to the profit of the company
76
BIBLIOGRAPHY
1 Values-Based Leadership Rebuilding Employee Commitment Performance and Productivity ( Thomas D Kuczmarski)
2 Monthly Journals of Philips Electronics India Ltd
3 Authentic Leadership Medtronic CEO Bill George
4 wwwindiaphilipscom
5 wwwwikipediacom
6 httpwwwemployeecommitmentcom
7 One Foot Out The Door How to Combat The Psychological Recession Thatrsquos Alienating Employees And Hurting American Business Judith Bardwick
8 Employee Commitment A Leader Ship Guide Joe Folkman
9 Harvard University Factors that Impact Employee Well Being Commitment and Productivity -An Article
77
Questionnaire
Name __________________________________________________________
Age______________________________ Gender _______________________
Qualification _______________________ Contact No ___________________
Q1 In which department you are working
Electrical Production Mechanical Other
Q2 What is your working experience
gt2 Years 2-4 Years 4-6 Years lt 6 Years
Q3 How You like the physical Working Environment of the organization
Excellent Good Fair Poor Very Poor
Q4 Are you satisfied with Non-Monitory benefits provided by the organisation
Highly Satisfied Satisfied Neither Satisfied Nor dissatisfied
Highly Dissatisfied Dissatisfied
Q5 Are you satisfied with your work
Highly Satisfied Satisfied Neither Satisfied Nor dissatisfied
Highly Dissatisfied Dissatisfied
Q6 Are you satisfied with the career development programe of the company
Highly Satisfied Satisfied Neither Satisfied Nor dissatisfied
Highly Dissatisfied Dissatisfied
Q7 Is other staff of the organization is co-operative with you
Highly Satisfied Satisfied Neither Satisfied Nor dissatisfied
Highly Dissatisfied Dissatisfied
Q8 Are you satisfied with top level management
Highly Satisfied Satisfied Neither Satisfied Nor dissatisfied
Highly Dissatisfied Dissatisfied
78
Q9 Are you satisfied with your subordinates
Highly Satisfied Satisfied Neither Satisfied Nor dissatisfied
Highly Dissatisfied Dissatisfied
Q10 Are you satisfied with the nature of the Job
Highly Satisfied Satisfied Neither Satisfied Nor dissatisfied
Highly Dissatisfied Dissatisfied
Q11 Do you have any Job Pressure in work
Yes No
Q12 Do you satisfied with the opportunities provided by the organisation
Highly Satisfied Satisfied Neither Satisfied Nor dissatisfied
Highly Dissatisfied Dissatisfied
Q13 Are you satisfied with the welfare facilities provided by the organisation
Highly Satisfied Satisfied Neither Satisfied Nor dissatisfied
Highly Dissatisfied Dissatisfied
Q14 Are you satisfied towards your salary
Highly Satisfied Satisfied Neither Satisfied Nor dissatisfied
Highly Dissatisfied Dissatisfied
Q15 Are you committed towards the organisation
Yes No
Signature

23
OBJECTIVES OF THE STUDY
To study the various aspects of Satisfaction Level of the Employees working at Philips
Electronics India Ltd Mohali
To analyze the effect of Job satisfaction on the organisation
To determine the relation between job satisfaction of employees and their commitment
towards the organisation
To analyze the performance model adopted by the Philips Electronics India Ltd Mohali
to handle their manpower
To suggest remedial measures for the improvement of the companyrsquos performance
24
Chapter-III
Employees Commitment
25
Employees who are engaged in their work and committed to their organizations give companies
crucial competitive advantagesmdashincluding higher productivity and lower employee turnover
Thus it is not surprising that organizations of all sizes and types have invested substantially in
policies and practices that foster engagement and commitment in their workforces
But what are employee engagement and commitment exactly This report examines the ways in
which employers and corporate consultants define these terms today and offers ideas for
strengthening employee engagement Though different organizations define engagement
differently some common themes emerge These themes include employeesrsquo satisfaction with
their work and pride in their employer the extent to which people enjoy and believe in what they
do for work and the perception that their employer values what they bring to the table The
greater an employeersquos engagement the more likely he or she is to ldquogo the extra milerdquo and deliver
excellent on-the-job performance In addition engaged employees may be more likely to commit
to staying with their current organization Software giant Intuit2 for example found that highly
engaged employees are 13 times more likely to be high performers than less engaged
employees They are also five times less likely to voluntarily leave the company
Clearly engagement and commitment can potentially translate into valuable business results for
an organization To help you reap the benefits of an engaged committed workforce at your
organization this report provides guidelines for understanding and measuring employee
engagement and for designing and implementing effective engagement initiatives As you will
26
see everyday human resource practices such as recruitment training performance management
and workforce surveys can provide powerful levers for enhancing engagement
Employee Engagement Key Ingredients
ldquoEmployee Engagement Definedrdquo shows examples of engagement definitions used by various
corporations and consultancies Clearly definitions of employee engagement vary greatly across
organizations Many managers wonder how such an elusive concept can be quantified The term
does encompass several ingredients for which researchers have developed measurement
techniques These ingredients include the degree to which employees fully occupy themselves in
their work as well as the strength of their commitment to the employer and role Fortunately
there is much research on these elements of engagementmdashwork that has deep roots in individual
and group psychology
Definition
ldquoNo company small or large can win over the long run without energized employees who
believe in the [firms] mission and understand how to achieve it Thats why you need to take the
measure of employee engagement at least once a year through anonymous surveys in which
people feel completely safe to speak their mindsrdquo
-Jack and Suzy Welch-
Common Themes How Companies Measure Engagement
Employers typically assess their employeesrsquo engagement levels with company-wide attitude
or opinion surveys
27
1048657 Pride in employer
1048657 Satisfaction with employer
1048657 Job satisfaction
1048657 Opportunity to perform well at challenging work
1048657 Recognition and positive feedback for onersquos contributions
1048657 Personal support from onersquos supervisor
1048657 Effort above and beyond the minimum
1048657 Understanding the link between onersquos job and the organizationrsquos mission
1048657 Prospects for future growth with onersquos employer
1048657 Intention to stay with onersquos employer
The Link Between Employer Practices and Employee Engagement
How does an engaged workforce generate valuable business results for an organization The
process starts with employer practices such as job and task design recruitment selection
training compensation performance management and career development Such practices affect
employeesrsquo level of engagement as well as job performance Performance and engagement then
interact to produce business results Figure 1 depicts these relationships
28
EMPLOYEE COMMITMENT EMPLOYEE ENGAGEMENT
1048657 How do you and other managers in your
organization define commitment
1048657 Are some employees in your company
engaged in their work but not committed to
the organization Committed to staying with
your firm but not exactly engaged in their
work Both engaged and committed
1048657 To whom are your organizations employees
committed The company Their supervisor
Co-workers Team members Customers
1048657 What business results has commitment from
1048657 How do you and other managers in your
organization define employee engagement
1048657 How do you know that certain employees in
your company are engaged Do they relish
their jobs Enjoy specific responsibilities or
tasks Willingly ldquogo the extra milerdquo
1048657 In teams departments or business units in
your company that have a large number of
engaged employees what business results
are you seeing Higher productivity Lower
costs Greater revenues More efficiency
29
employees created for your organization For
example has commitment reduced turnover
and therefore decreased recruitment hiring
and training costs
1048657 What does your company do to reciprocate
employees commitment Is the organization
living up to its side of the bargain
Lower turnover Higher product or service
quality
1048657 Conversely how do disengaged employees
behave and what are the consequent costs
for their teams units-and your entire
company
As Figure 2 suggests a person possesses attributes such as knowledge skills abilities
temperament attitudes and personality He or she uses these attributes to accomplish work
behaviors according to organization-defined procedures by applying tools equipment andor
technology Work behaviors in turn create the products and services that make an organization
successful We classify work behaviors into three categories those required to accomplish duties
and tasks specified in a job description (prescribed behaviors) ldquoextrardquo behaviors that an
employee contributes for the good of the organization (voluntary behaviors) and behaviors
prohibited by an employer (proscribed behaviors including unexcused absenteeism stealing and
other counterproductive or illegal actions) Of course job performance occurs in an
organizational context which includes elements such as leadership physical setting and social
setting
30
Employers naturally want to encourage workers to perform prescribed and voluntary activities
while avoiding proscribed ones To achieve these goals organizations use a number of HR
practices that directly affect the person process and context components of job performance
Employeesrsquo reactions to these practices determine their levels of engagement and commitment
31
Chapter-IV
32
LITERATURE OF THE REVIEW
ldquo Job Satisfaction That Leads To The Commitment Of
The Employees in The Organisationrdquo
Literature of Review
Gerge Bill Authentic Leadership
In his book Authentic Leadership former Medtronic CEO Bill George makes an obvious
point that business leaders rarely say out loud ldquoMissions motivate dollars donrsquotrdquo
What he means is that purpose is what drives employee commitment not the financial
rewards that come to others Workers donrsquot get up in the morning and say ldquoGee I can
33
hardly wait to get to work today to maximize shareholder profitsrdquo Even when employees
are shareholders who can benefit from improved financials what draws people to their
chosen careers is the work itself and its purpose in the world more than the profit
possibilities
Mr George goes on to say ldquoI find there is universal agreement (among middle managers)
that you cannot inspire employees by urging them to help management get the companyrsquos
stock price uprdquo
There is in fact quite a bit of literature on this subject In Awakening Corporate Soul
authors Eric Klein and John Izzo say that employee commitment requires knowing ldquothe
purpose of our work it means recognizing the purpose our organization fulfills that goes
beyond the bottom line and it means articulating to others how their (workersrsquo) efforts
contribute to a larger purposerdquo
In Built to Last Jim Collins and James Porras spend an entire book explaining their five
year research study of major companies that led to this conclusion about employee
commitment Purpose within a company is what sustains it profit is important but when
itrsquos the prime directive companies falter
-Marshal Goldsmith-
How to Increase Employee Commitment
In practice this involves walking the talk being transparent communicating effectively treating
people equally teaching leading subordinates to increasingly excellent performance ndash and
responding to subordinates as mature individuals who are owed fairness the truth and
recognition of their achievements
34
Since managers interact directly and frequently with subordinates they are usually more tuned
in to how employees are feeling than are executives Managers are in a better position to know
for example when employees are feeling alienated and disengaged from their work which is
very common today -- and expensive
Gaining employee commitment results in greater profits because enthusiastic employees stay
contribute discretionary effort and engage customers Performance soars when customers are
enthused and stay and when executives managers and employees are a collaborative team
united in achieving common goals
But managers are often called middle managers for good reason their job is to motivate and
guide subordinates while they at the same time are being judged by their bosses Because of
their ldquotweenrdquo position in the hierarchy managers to effective support direct reports must also
create relationships with potential allies especially those with greater power who have access to
top decision makers
Harvard University Factors that Impact Employee Well Being Commitment and
Productivity
Business executives from the C-suite and HR to QC and RampD are by nature focused on the
corporate bottom line A new trend in our dawning age of social sustainability is that many
experts believe more attention should be paid to the dotted line - the one signed when a person
35
commits to employment at a company New Harvard research validates this approach affirming
that trust and purpose play a significant role in building successful productive workplaces
The behavioral research conducted by a team at Harvard University and Massachusetts General
Hospital identifies the factors most likely to impact 21st century employee well being
commitment and productivity The researchers found that commitment is largely influenced by
ones sense of purpose feeling of personal impact and overall trust in the organization
Productivity is largely affected by the quality of human relationships including cooperative
social group moods and interaction
The results lead us to conclude that workplaces that provide positive environments that foster
interpersonal trust and quality personal relationships create the most committed and productive
employees says Nancy Etcoff PhD the lead researcher on the study
Expert Shares Keys to Building Successful Workplace Relationships
According to business strategist Courtney Anderson JD MBA Outstanding leadership
today means much more than just doing your job Success is creating an environment that fosters
happy committed productive team members
Anderson explains that reinvigorating workplaces by enhancing trust and employee commitment
does not have to be difficult The biggest challenge she says is making the time to truly change
in our overscheduled instant access competitive work environments With a little know-how it
can be easy to evolve workplace well being and respond to these compelling research results
-Mark Howell-
CEO Bright Point
High-performing companies recognize that employee commitment is a major contributing factor
toward sustaining long-term success and creating value An engaged employee is involved and
excited about their work and acts in a manner that will forward the organizationrsquos interest An
36
engaged workforce helps optimize and retain talent for the long-term because the employees
choose to stay even when other employment alternatives exist
According to Walker Information the top three drivers of employee commitment are
Satisfaction Fairness and Care amp Concern for employees Put simply committed employees
want to enjoy their work feel they are appreciated and know they are making a contribution to
their companyrsquos strategic objectives Additionally employees who have trust in their leadership
and are trusted by their leadership have a greater dedication and are ultimately more productive
on the job However according to recent data provided by the National Business Research
Institute (NBRI) only 31 of all employees are truly engaged
At BrightPoint we take employee engagement seriously and we work to create a culture that
inspires employee loyalty and satisfaction The results of BrightPointrsquos commitment to its
employees are shown in the 2011 BPNA Employee Commitment Survey The survey
determined that close to 80 of respondents indicated they were satisfied with their jobs and
daily activities General employee satisfaction increases when managers take an active interest
in their employees beyond their day-to-day job responsibilities According to NBRI managers
that actively coach build relationships and keep an open dialogue with their employees improve
employee engagement
We have a diverse workforce where each employee brings unique value and has individual
needs Managers are learning to manage the individual and not the position In order to give
managers the tools they need to be successful BrightPoint places strong emphasis on targeted
leadership training workshops and continual learning resources In 2011 906 of managers at
BrightPoint NA participated in the development opportunities offered and also made an effort to
37
help reinforce the learning of their team members This signals that our leadership team is taking
an active interest in professional development and its connection to employee commitment
As BrightPoint continues to increase focus on employee engagement the organization will grow
stronger and maintain a substantial advantage over our competition Our employees possess the
knowledge experience and resiliency to respond quickly to the demands of the marketplace and
through their genuine commitment will deliver what our customers want with increasing
efficiency and effectiveness Our responsibility is value-creation by growing our business and
maintaining high levels of customer service and loyalty We believe the best way to accomplish
this is through a strong committed and engaged workforce
Performance Model Adopted At Mohali Plant
38
Process adopted by Philips Electronics Mohali Plant for Job Satisfaction of Employee that leads commitment of the employees
39
Recruiting
The messages in Philips Electronics Mohali organization conveys while seeking to attract job
applicants also can influence future employeesrsquo engagement and commitment If your firm has
designed jobs specifically to engage employees then organization want to ensure that recruiting
ads extol these positionsrsquo attractive featuresmdashsuch as challenging work assignments a highly
skilled team environment or minimal supervision Applicants who notice and respond to these
ads will more likely be motivated by these features Also consider how organization might best
seek candidates from inside your organization When Organisation recruit existing employees for
desirable jobs you enhance their engagement (by maximizing the person-job fit) and
commitment (by providing growth and advancement opportunities to employees in return for
their loyalty) If Organisation recruit from outside when qualified internal candidates are
available Organization may unwittingly suggest to current employees that your company is not
willing to reciprocate their commitment Existing staff may then begin questioning their own
commitment to the firm By contrast organisation recruit external candidates to both the job and
your organization For these candidates ensure that recruiting messages highlight attractive job
features organizational values and commitment reciprocity That is in return for performance
and dedication your company offers competitive pay and benefits flexible work hours and
learning and career advancement opportunities Also remember that prospective employees have
multiple commitments You will inevitably have to compete with those commitments as
organization try to attract candidates to your firm Most people find it easier to make a new
commitment when it is compatible with their other obligations For example you boost your
chances of recruiting a highly qualified candidate who is a single parent if you offer flexible
work hours family health benefits and on-site day care ldquoRecruiting for Engagement and
Commitmentrdquo
40
Employee Selection
Once recruiting efforts produce a pool of promising job candidates Philips select among them to
fill available positions When organisation select the right individuals for the right jobs new
hires carry out their work more smoothly and experience fewer performance problems The
result Greater enjoyment ofmdashand engagement inmdashthe job
To enhance engagement through your selection of employees identify those candidates who are
best-suited to the job and your organizationrsquos culture Also use candidate assessment methods
that have obvious relevance to the job in questionmdashfor example by asking interviewees what
they know about the role and having them provide work samples Most candidates will view
these techniques more positively than tests with less apparent relevance such as personality and
integrity assessments Successful candidates feel good about having ldquopassed the test and see
company as careful and capable for having selected them A positive initial impression of an
employer encourages growth of long-term commitment
Training and Development
Training and development can serve as additional levers for enhancing engagement and
commitment For new hires training usually begins with orientation Orientation presents several
important opportunitiesmdashincluding explaining pay work schedules and company policies Most
important it gives you a chance to encourage employee engagement by explaining how the new
hirersquos job contributes to the organizationrsquos mission Through orientation Mohali Plant of Philips
Electronics describe how r company is organized introduce the new employee to his or her co-
workers give the person a tour of the area where he or she will be working and explain safety
regulations and other procedural matters In short you foster person-organization fitmdashvital for
developing productive and dedicated employees Through training you help new and current
41
employees acquire the knowledge and skills they need to perform their jobs And employees who
enhance their skills through training are more likely to engage fully in their work because they
derive satisfaction from mastering new tasks Training also enhances employeesrsquo value to your
company as well as their own employability in the job market In addition most companies offer
higher wages for skilled workers to compensate them for their greater value and to discourage
turnover
Compensation
Like the HR practices discussed above compensation can powerfully influence employee
engagement and commitment Some compensation components encourage commitment to
employers while others motivate engagement in the job It is possible to stimulate one and not
the other though itrsquos generally better to foster both For example a company that offers a strong
performance incentive system but no retirement plan will probably realize exceptional
engagement from its workers however they may eventually commit themselves to another
company that does offer a good retirement plan Meanwhile an organization that offers generous
retirement benefits but a traditional seniority-based pay grade system may have committed
employees however these workers might deliver pedestrian performance as they bide their time
until retirement In designing compensation plans you therefore need to consider employee
engagement and commitment strategically
Encourage managers to include employees in the goal-setting process This technique helps to
ensure that workers understand the goals It also promotes acceptance of challenging objectives
because people generally feel more committed to goals they have helped define In addition
consider how you and other managers will recognize and encourage contributions that exceed
expectations For example when a piece of equipment malfunctions Joe finds other ways to
maintain production rather than merely shutting down the machine and waiting for the
42
maintenance staff to fix it Or when a less experienced co-worker encounters a new task Sally
offers friendly coaching instead of standing by and waiting for the inevitable mistakes to crop
up Performance management processes operate on a continuous basis Therefore they provide
perhaps the best ongoing opportunities for employers to foster employee engagement and
commitment For example managers can use routine discussions about performance and
feedback sessions to learn which aspects of the job hold the most interest for each employee and
which tasks are most challenging During such discussions managers also can define what going
above and beyond the call of dutyrdquo looks like and generate ideas for rewarding such
contributions An employeersquos aspirations and career goals can receive careful attention during
performance appraisal meetings Without inquiring into an employeersquos personal life a supervisor
can nevertheless explore ways to enhance the compatibility between the workerrsquos commitment to
your organization and the employeersquos other life commitments Through such means the
organization personalizes its relationship to each employee and provides support while also
expressing appreciation for their contributionsmdash key drivers of engagement and commitment
To further engage employees and win their commitment through your performance management
programs consider how to treat your organizationrsquos most experienced employees In many cases
these employees understand the intricacies of a job better than their supervisors or managers do
By virtue of long identification with your organization they may be deeply committed to high-
level goals They use their expertise to contribute in ways that newer employees simply cannot
match But many of them also may be planning to retire soon especially if they are from the
ldquoBaby Boomerrdquo generation How will you transfer their knowledge to younger workers Design
a performance management system that recognizes and rewards proactive sharing of knowledge
and expertise among co-workers For example create knowledge repositories or learning
histories that can be stored in databases that employees can access and then create incentives
43
for people who contribute to and use these repositories Of course effective performance
management systems also identify employees who are not meeting expectations Failing to
address problem performance can erode other employeesrsquo engagement and commitment as their
workloads increase and they conclude that the company is willing to tolerate poor performance
If feedback coaching and remedial training are of little avail the manager may need to move the
person to a different position within the company where he or she can make a more valuable
contribution or let the individual go if there is no good match elsewhere in the organization
44
Chapter-V
RESEARCH METHODOLOGY
The basic task of research is to generate accurate information for use in decision-making
Research can be defined as the systematic and objective process of gathering recording and
analyzing data for aid in making business decisions As the project involves analyzing of
45
financial structure the research is exploratory in nature covering financial parameters and come
of the important ratios to carry out research There are basically two techniques adopted for
obtaining information
Primary Data
Secondary Data
Primary Data is gathered specifically for the project at hand through personal interviews with
the accounts officers
Sample Size = 100 Employees
Secondary data is previously collected and assembled for some project other than the one at
hand It is gathered and recorded by someone else prior to current needs of the researcher It is
less expensive than the primary date
Secondary Data can be obtained from both external and internal sources
External data may be collected from books and periodicals government sources media and other
commercial sources
Internal data is that secondary data which is created recorded or generated by the organization
As the project is explanatory in nature secondary data is collected from the reports of the
company books journals and interest Secondary data is gathered from annual reports official
records and standing orders of the units
CHAPTER - VI
DATA ANALYSIS AND INTERPRETATION
46
The data after collection is to be processed and analyzed in accordance with the outline
and down for the purpose at the time of developing research plan
Technically speaking processing implies editing coding classification and tabulation of
collected data so that they are amenable to analysis The term analysis refers to the computation
of certain measures along with searching for pattern groups Thus in the process of analysis
relationship or difference should be subjected to statistical tests of significance to determine with
what validity data can be said to indicate any conclusions
The analysis of data in a general way involves a number of closely related operations
which are performed with the purpose of summarizing the collected data and organizing them in
such a manner that they answer the research questions In this study the researcher followed
above process carefully and it is presented in this chapter
47
Table 41 ndash To know the department in which employees are belongs to
S
ou rc
e
survey data
Inference
From the above table it shows that 35 of employees are belongs to
production department
FIGURE 41
S
SI No
D
Department
N
No of Respondents
P
Percentage
1
1
M
Mechanical
3
30
3
30
2
2
E
Electrical
2
25
2
25
3
3
P
Production
3
35
3
35
4
4
O
Others
1
10
1
10
T
Total
1
100
1
100
48
REPRESENTS THE DEPARTMENT
Table 42 ndash To know working experience of the employees
Source survey data
Inference
From the above table it shows that 34 of the employees have 4 ndash 6
years experience
S
SI No
W
Work Experience
N
No of Respondents
P
Percentage
1
1
B
Below 2 years
1
33
1
13
2
2
2
2ndash 4 years
3
30
3
30
3
3
4
4ndash 6 years
3
34
3
34
4
4
A
Above 6 years
2
23
2
23
T
otal
1
100
1
100
49
FIGURE 42
REPRESENTS THE EXPERIENCE OF THE EMPLOYEES
Table 43 ndash To know the physical working environment
S
SI No
W
Working Environment
N
No of Respondents
P
Percentage
1
1
E
Excellent
1
12
1
12
2
2
G
Good
5
57
5
57
3
3
F
Fair
2
28
2
28
4
4
P
Poor
0
03
0
33
5
5
V
Very Poor
0
00
0
00
T
Total
1
100
1
100
Source survey data
Inference
From the above table it shows that 57 of the employees were feeling good about the working environment
50
FIGURE 43
REPRESENTS THE PHYSICAL WOKING ENVIRONMENT
51
Table 44 ndash To know the satisfaction level of employees towards the non-monitory benefits
S
SI No
N
Non-Monitory Benefits offered
to Employees
N
No of Respondents
P
Percentage
1
1
H
Highly Satisfied
1
14
1
14
2
2
S
Satisfied
5
54
5
54
3
3
N
Neither Satisfied nor Dissatisfied
2
25
2
25
4
4
D
Dissatisfied
0
05
0
05
5
5
H
Highly Dissatisfied
0
02
0
02
Total 1
100
1
100
Source survey data
Inference
From the above table it shows that 54 of the employees were satisfied towards the non-monitory benefits
FIGURE 44
REPRESENTS THE SATISFACTION LEVEL OF EMPLOYEES TOWARDS THE NON-MONITORY BENEFITS
52
Table 45 ndash To know the satisfaction level of respondents towards the work
assigned
Source survey dataInference
From the above table it shows that 45 of the respondents were satisfied towards the work assigned
FIGURE 45
S
SI No
A
Amount of Work
N
No of Respondents
P
Percentage
1
1
H
Highly satisfied
2
20
2
20
2
2
S
Satisfied
4
45
4
45
3
3
N
Neither Satisfied nor Dissatisfied
1
12
1
12
4
4
D
Dissatisfied
1
18
1
18
5
5
H
Highly Dissatisfied
0
06
0
06
Total 1
100
1
100
53
REPRESENTS THE SATISFACTION LEVEL OF RESPONDENTS TOWARDS THE WORK ASSIGNED
54
Table 46 ndash Opinion about the career development programme in their organisation
S
SI No
C
Career Development
N
No of Respondents
P
Percentage
H
Highly satisfied
1
12
1
12
S
Satisfied
5
56
5
56
N
Neither Satisfied nor Dissatisfied
2
22
2
22
D
Dissatisfied
1
10
1
10
H
Highly Dissatisfied
0
00
0
00
Total 1
100
1
100
Source survey data
Inference
From the above table it shows that 56 of the employees were satisfied
with the opinion about the carrier development programme in their organisation
FIGURE 46
REPRESENTS OPINION ABOUT THE CAREER DEVELOPMENT
PROGRAMME IN THEIR ORGANISATION
55
Table 47 ndash To know the cooperation of co-workers
S
SI No
C
Co-operation of Workers
N
No of Respondents
P
Percentage
1
1
H
Highly satisfied
2
20
2
20
2
2
S
Satisfied
6
66
6
66
3
3
N
Neither Satisfied nor Dissatisfied
1
11
1
11
4
4
D
Dissatisfied
0
03
0
03
5
5
H
Highly Dissatisfied
0
00
0
00
Total 1
100
1
100
Source survey data
Inference
From the above table it shows that 66 of the employees were satisfied
with the cooperation of co-workers
FIGURE 47
56
REPRESENTS THE COOPERATION OF CO-WORKERS
57
Table 48 ndash To know the satisfaction of Respondents with top management
S
SI No
S
Satisfaction with Top
Management
N
No of Respondents
P
Percentage
1
1
H
Highly satisfied
2
26
2
26
2
2
S
Satisfied
5
51
5
51
3
3
N
Neither Satisfied nor Dissatisfied
1
17
1
17
4
4
D
Dissatisfied
0
06
0
06
5
5
H
Highly dissatisfied
0
00
0
00
Total 1
100
1
100
Source survey data
Inference
From the above table it shows that 51 of the employees were satisfied with the top management
FIGURE 48
58
REPRESENTS THE SATISFACTION OF RESPONDENTS WITH TOP MANAGEMENT
Table 49 ndash To know the satisfaction of Respondents with their subordinates
Source survey data
Inference
From the above table it shows that 67 of the employees were satisfied with their subordinates
S
SI
No
S
Satisfaction with Subordinates
N
No of Respondents
P
Percentage
1
1
H
Highly satisfied
1
12
1
12
2
2
S
Satisfied
6
67
6
67
2
3
N
Neither Satisfied nor Dissatisfied
1
14
1
14
4
D
Dissatisfied
0
07
0
07
5
5
H
Highly Dissatisfied
0
00
0
00
Total 1
100
1
100
59
FIGURE 49
REPRESENTS THE SATISFACTION OF RESPONDENTS WITH THEIR SUBORDINATES
60
Table 410 ndash To know the level of satisfaction regarding nature of job
S
SI No
J
Job Satisfaction
N
No of Respondents
P
Percentage
1
1
H
Highly satisfied
2
22
2
22
2
2
S
Satisfied
5
56
5
56
3
3
N
Neither Satisfied nor Dissatisfied
1
16
1
16
4
4
D
Dissatisfied
0
07
0
07
5
5
H
Highly Dissatisfied
0
00
0
00
Total 1
100
1
100
Source survey dataInference
From the above table it shows that 56 of the employees were satisfied with their job
FIGURE 410
61
REPRESENTS THE LEVEL OF SATISFACTION REGARDING THE NATURE OF JOB
Table 411 ndash To know whether there is any job pressure in their work
Source survey data
Inference
From the above table it shows that 72 of employees said there is job pressure in their work
FIGURE 411
REPRESENTS WHETHER THERE IS ANY JOB PRESSURE IN THEIR WORK
S
SI No
J
Job Pressure
N
No of Respondents
P
Percentage
1
1
Y
Yes
7
72
7
72
2
2
N
No
2
28
2
28
T
Total
1
100
1
100
62
Table 412 ndash To know the opinion regarding opportunity provided by the organisation in developing skills
amp talents
S
SI No
D
Development of Skills and
Talents
N
No of Respondents
P
Percentage
1
1
H
Highly Agree
1
12
1
12
2
2
A
Agree
5
52
5
52
3
3
N
Neither Agree nor Disagree
2
28
2
28
4
4
D
Disagree
0
06
0
06
5
5
H
Highly Disagree
0
02
0
02
Total 1
100
1
100
Source survey data
Inference
From the above table it shows that 52 of employees agreed regarding opportunity provided by the organisation in developing skills amp talents
63
FIRGURE 412
REPRESENTS THE OPPORTUNITY PROVIDED BY THE ORGANISATION IN DEVELOPING SKILLS amp TALENTS
64
Table 413 ndash To know the satisfaction level of welfare facilities provided by the management
S
SI No
W
Welfare Facilities
N
No of Respondents
P
Percentage
1
1
H
Highly satisfied
0
09
9
09
2
2
S
Satisfied
5
57
5
57
3
3
N
Neither Satisfied nor Dissatisfied
2
29
2
29
4
4
D
Dissatisfied
5
05
0
05
5
5
H
Highly Dissatisfied
0
00
0
00
Total 1
100
1
100
Source survey data
Inference
From the above table it shows that 57 of the employees were satisfied with the welfare facilities provided by the management
FIGURE 413
REPRESENTS THE SATISFACTION LEVEL OF WELFARE FACILITIES PROVIDED BY THE MANGEMENT
65
Table 414 ndash To know the employee satisfaction towards the salary
Source survey data
Inference
From the above table it shows that 67 of the employees were satisfied
with their salary
FIGURE 414
REPRESENTS THE SATISFACTION TOWARDS THE SALARY
S
SI No
P
Payment Satisfaction
N
No of Respondents
P
Percentage
1
1
Y
Yes
6
67
6
67
2
2
N
No
3
33
3
33
T
otal
1
100
1
100
66
Table 415 ndash To know the employees willingness amp Commitment Towards
Organisation
Source survey data
Inference
From the above table it shows that 59 of the employees were willing to
continue in this organisation
FIGURE 415
REPRESENTS THE EMPLOYEES WILLINGNESS TO CONTINUE
S
SI No
W
Willingness to Work
N
No of Respondents
P
Percentage
1
1
Y
Yes
5
59
5
59
2
2
N
No
4
41
4
41
T
Total
1
00
1
00
67
CHI-SQUARE METHOD
The chi square test is one of the simplest and most widely used non-
parametric tests in statistical work As a non-parametric test it can be used to determine
if categorical data shows dependency or the two classifications are independent It can
also be used to make comparisons between theoretical population and actual data
when categories are used
n
Chi square χsup2= sum (O-E) sup2 E
i =1
Where O= observed frequency
E= expected frequency
68
OBSERVED FREQUENCY
Table 419 shows the relationship between the department and the job satisfaction
Over All
Job
SatisfactionHighly
SatisfiedSatisfied
Neither
Satisfied nor
Dissatisfied
DissatisfiedHighly
Dissatisfied
Sub
Total
Mechanical 5 6 14 3 2 30
Electrical 6 8 6 3 2 25
Production 9 13 7 4 2 35
Others 2 3 2 2 1 10
Sub Total 22 30 29 12 7 100
69
EXPECTED FREQUENCY
Over All
Job
SatisfactionHighly
SatisfiedSatisfied
Neither
Satisfied nor
Dissatisfied
DissatisfiedHighly
Dissatisfied
Sub
Total
Mechanical 7 8 9 4 2 30
Electrical 5 8 7 3 2 25
Production 8 11 10 4 2 35
Others 2 3 3 1 1 10
Sub Total 22 30 29 12 7 100
Null Hypothesis (Ho)
There is no significant difference between the department and the job satisfaction
Alternative Hypothesis (Ho)
There is significant difference between the job satisfaction
Co Relation
70
Chapter-V
CONCLUSIONS AND
RECOMMENDATIONS
71
CONCLUSION
On the basis of Analysis of Job Satisfaction Level of the Employees of Philips Electronics India
Ltd Mohali made in the previous chapters following conclusions are drawn
General Profile The plant of PHILIPS is ideally located in the Mohali Industrial focal point
Phase 9 near Chandigarh the capital of Punjab on a campus of 17 hectares The working
environment of the company is very healthy The visitors feel happy after the campus
Indigenous Technology PHILIPS is the only lighting manufacturing company based on purely
indigenous technology Philips was appropriately chosen as the brand name as self reliance and
building up of Indian Engineering capabilities remain the guiding spirit of PHILIPS
Financial structure PHILIPS is a low debt company signifying its dependence mainly on
its internal accruals for its financial requirements PHILIPS continues to strengthen its financial
position by channelising these internal accruals to fund its expansion programmes
Working results PTL has registered a handsome and constant growth in its profits because
of a brisk demand for new and better technology electronic items None of the other electronic
company has shown such a steady growth Philips has recorded the lowest current ratio
However with this lowest current ratio PTL still enjoys moderate payment period and highest
velocity of creditors and debtors only due to commitment of itrsquos employees
72
SUMMARY
According to the 1999 Gallup Poll the four elements that have proven to be effective in creating
employee loyalty are praise and recognition a sense of contribution to the company learning and
development and having a best friend at work
Creating a fairy-tale work environment begins withrecognition Your employees need it more
than money perks or titles Here are eight tips regarding recognition Remember these and your
employees may just start whistling while they work It is up to me The corporate culture or
financial rewards will not make your team successful It is up to you Recognition is one thing
that is completely in your control
Strong relationships are vital in todays economy Strengthening employee relationships is even
more necessary as companies downsize and lay off As your workforce shrinks and you need to
do more with less keeping quality employees becomes even more critical As a manager it is
your job to bond your best people to your company through recognition And you also must help
direct and motivate your core performers
Simple rewards earn big returns There are some relatively simple things you can do that will
earn big returns For example remember your employees birthdays and work anniversaries find
out what inexpensive rewards they value (for example tickets to a ball game or a half day off to
spend time with their kids) make the most of your formal service awards with some preparation
and a group presentation walk around your department every day and talk to your
people and thank them sincerely and often
73
Make it specific Praise and recognition must be specific to have impact General praise such as
You do great work actually can have the opposite effect and leave your employees wondering
Does he have any idea what I really do around here Specific praise links individual
accomplishments to company goals For example Cheryl I noticed the way you handled that
customer complaint Great work As you know we value quick resolutions of problems as
one of our core strategies
Ask the best to stay Call your best people into your office one at a time Let that bright young
college graduate know you value his fresh ideas and energy Tell the 20-year veteran how much
your team relies on her expertise and organizational skillsRemarkably a significant percent of
high-impact performers report that they left their last job because No one ever asked me to
stay
Forget cash
Remember the saying Money cant buy everything Well its true Dont wait until you can
offer an employee a raise or promotion Real thanks is its own reward In numerous surveys of
work satisfaction top on employees lists is feeling appreciated In fact when employees feel
recognized and involved they are much less likely to keep asking about money
Recognize
Recognition means most to an employee when it is sincere and spontaneous According to the
largest study ever conducted on workplace satisfaction (Gallup 1999) recognition should occur
at least every seven days If you wait until a year-end party or an annual review you are waiting
much too long to recognize and you probably are losing people you do not need to
74
Recognition works
Neglect can be a poisoned apple Recognition is the elixir that will spark better attitudes and
performance Jeffrey Pfeffer of Stanford University says The returns from managing people in
ways that build high commitment typically are on the order of 30 to 50 percent
Take a hard look in the mirror and ask yourself how you can recognize the fairest of them all
Learn to recognize your employees for their efforts thank them often and reward their
achievements You can awaken them from their anger and apathy and they will fall in love with
their jobs again Chances are you will work together happily ever after
So there is direct relation with employee satisfaction and their commitment towards the
organization and it is also clear from the above discussion that only monetary elements are not
sufficient for employee satisfaction rather other element like employer behavior recognisation
and other moral value
75
RECOMMENDATIONS
PHILIPS should increase its capacity utilization It should work at full capacity to
minimize its cost of production With this increase in capacity utilization the total cost
will spread over more units thereby decreasing the per unit cost
PHILIPS should decrease the credit facilities provided to its consumers The payback
period is quite high in case of debtors as compared to creditors it should be more or less
equal as it will help in improving company liquidity
PHILIPS should focus more on the consumer lifestyle goods in India parallel to its other
business as it accounts very less as compare to other businesses of Philips
Another recommendation for Mohali plant is about the HR department that is they
should appoint permanent and skilled workers as against casual workers which generally add
up to the profit of the company
76
BIBLIOGRAPHY
1 Values-Based Leadership Rebuilding Employee Commitment Performance and Productivity ( Thomas D Kuczmarski)
2 Monthly Journals of Philips Electronics India Ltd
3 Authentic Leadership Medtronic CEO Bill George
4 wwwindiaphilipscom
5 wwwwikipediacom
6 httpwwwemployeecommitmentcom
7 One Foot Out The Door How to Combat The Psychological Recession Thatrsquos Alienating Employees And Hurting American Business Judith Bardwick
8 Employee Commitment A Leader Ship Guide Joe Folkman
9 Harvard University Factors that Impact Employee Well Being Commitment and Productivity -An Article
77
Questionnaire
Name __________________________________________________________
Age______________________________ Gender _______________________
Qualification _______________________ Contact No ___________________
Q1 In which department you are working
Electrical Production Mechanical Other
Q2 What is your working experience
gt2 Years 2-4 Years 4-6 Years lt 6 Years
Q3 How You like the physical Working Environment of the organization
Excellent Good Fair Poor Very Poor
Q4 Are you satisfied with Non-Monitory benefits provided by the organisation
Highly Satisfied Satisfied Neither Satisfied Nor dissatisfied
Highly Dissatisfied Dissatisfied
Q5 Are you satisfied with your work
Highly Satisfied Satisfied Neither Satisfied Nor dissatisfied
Highly Dissatisfied Dissatisfied
Q6 Are you satisfied with the career development programe of the company
Highly Satisfied Satisfied Neither Satisfied Nor dissatisfied
Highly Dissatisfied Dissatisfied
Q7 Is other staff of the organization is co-operative with you
Highly Satisfied Satisfied Neither Satisfied Nor dissatisfied
Highly Dissatisfied Dissatisfied
Q8 Are you satisfied with top level management
Highly Satisfied Satisfied Neither Satisfied Nor dissatisfied
Highly Dissatisfied Dissatisfied
78
Q9 Are you satisfied with your subordinates
Highly Satisfied Satisfied Neither Satisfied Nor dissatisfied
Highly Dissatisfied Dissatisfied
Q10 Are you satisfied with the nature of the Job
Highly Satisfied Satisfied Neither Satisfied Nor dissatisfied
Highly Dissatisfied Dissatisfied
Q11 Do you have any Job Pressure in work
Yes No
Q12 Do you satisfied with the opportunities provided by the organisation
Highly Satisfied Satisfied Neither Satisfied Nor dissatisfied
Highly Dissatisfied Dissatisfied
Q13 Are you satisfied with the welfare facilities provided by the organisation
Highly Satisfied Satisfied Neither Satisfied Nor dissatisfied
Highly Dissatisfied Dissatisfied
Q14 Are you satisfied towards your salary
Highly Satisfied Satisfied Neither Satisfied Nor dissatisfied
Highly Dissatisfied Dissatisfied
Q15 Are you committed towards the organisation
Yes No
Signature

25
Employees who are engaged in their work and committed to their organizations give companies
crucial competitive advantagesmdashincluding higher productivity and lower employee turnover
Thus it is not surprising that organizations of all sizes and types have invested substantially in
policies and practices that foster engagement and commitment in their workforces
But what are employee engagement and commitment exactly This report examines the ways in
which employers and corporate consultants define these terms today and offers ideas for
strengthening employee engagement Though different organizations define engagement
differently some common themes emerge These themes include employeesrsquo satisfaction with
their work and pride in their employer the extent to which people enjoy and believe in what they
do for work and the perception that their employer values what they bring to the table The
greater an employeersquos engagement the more likely he or she is to ldquogo the extra milerdquo and deliver
excellent on-the-job performance In addition engaged employees may be more likely to commit
to staying with their current organization Software giant Intuit2 for example found that highly
engaged employees are 13 times more likely to be high performers than less engaged
employees They are also five times less likely to voluntarily leave the company
Clearly engagement and commitment can potentially translate into valuable business results for
an organization To help you reap the benefits of an engaged committed workforce at your
organization this report provides guidelines for understanding and measuring employee
engagement and for designing and implementing effective engagement initiatives As you will
26
see everyday human resource practices such as recruitment training performance management
and workforce surveys can provide powerful levers for enhancing engagement
Employee Engagement Key Ingredients
ldquoEmployee Engagement Definedrdquo shows examples of engagement definitions used by various
corporations and consultancies Clearly definitions of employee engagement vary greatly across
organizations Many managers wonder how such an elusive concept can be quantified The term
does encompass several ingredients for which researchers have developed measurement
techniques These ingredients include the degree to which employees fully occupy themselves in
their work as well as the strength of their commitment to the employer and role Fortunately
there is much research on these elements of engagementmdashwork that has deep roots in individual
and group psychology
Definition
ldquoNo company small or large can win over the long run without energized employees who
believe in the [firms] mission and understand how to achieve it Thats why you need to take the
measure of employee engagement at least once a year through anonymous surveys in which
people feel completely safe to speak their mindsrdquo
-Jack and Suzy Welch-
Common Themes How Companies Measure Engagement
Employers typically assess their employeesrsquo engagement levels with company-wide attitude
or opinion surveys
27
1048657 Pride in employer
1048657 Satisfaction with employer
1048657 Job satisfaction
1048657 Opportunity to perform well at challenging work
1048657 Recognition and positive feedback for onersquos contributions
1048657 Personal support from onersquos supervisor
1048657 Effort above and beyond the minimum
1048657 Understanding the link between onersquos job and the organizationrsquos mission
1048657 Prospects for future growth with onersquos employer
1048657 Intention to stay with onersquos employer
The Link Between Employer Practices and Employee Engagement
How does an engaged workforce generate valuable business results for an organization The
process starts with employer practices such as job and task design recruitment selection
training compensation performance management and career development Such practices affect
employeesrsquo level of engagement as well as job performance Performance and engagement then
interact to produce business results Figure 1 depicts these relationships
28
EMPLOYEE COMMITMENT EMPLOYEE ENGAGEMENT
1048657 How do you and other managers in your
organization define commitment
1048657 Are some employees in your company
engaged in their work but not committed to
the organization Committed to staying with
your firm but not exactly engaged in their
work Both engaged and committed
1048657 To whom are your organizations employees
committed The company Their supervisor
Co-workers Team members Customers
1048657 What business results has commitment from
1048657 How do you and other managers in your
organization define employee engagement
1048657 How do you know that certain employees in
your company are engaged Do they relish
their jobs Enjoy specific responsibilities or
tasks Willingly ldquogo the extra milerdquo
1048657 In teams departments or business units in
your company that have a large number of
engaged employees what business results
are you seeing Higher productivity Lower
costs Greater revenues More efficiency
29
employees created for your organization For
example has commitment reduced turnover
and therefore decreased recruitment hiring
and training costs
1048657 What does your company do to reciprocate
employees commitment Is the organization
living up to its side of the bargain
Lower turnover Higher product or service
quality
1048657 Conversely how do disengaged employees
behave and what are the consequent costs
for their teams units-and your entire
company
As Figure 2 suggests a person possesses attributes such as knowledge skills abilities
temperament attitudes and personality He or she uses these attributes to accomplish work
behaviors according to organization-defined procedures by applying tools equipment andor
technology Work behaviors in turn create the products and services that make an organization
successful We classify work behaviors into three categories those required to accomplish duties
and tasks specified in a job description (prescribed behaviors) ldquoextrardquo behaviors that an
employee contributes for the good of the organization (voluntary behaviors) and behaviors
prohibited by an employer (proscribed behaviors including unexcused absenteeism stealing and
other counterproductive or illegal actions) Of course job performance occurs in an
organizational context which includes elements such as leadership physical setting and social
setting
30
Employers naturally want to encourage workers to perform prescribed and voluntary activities
while avoiding proscribed ones To achieve these goals organizations use a number of HR
practices that directly affect the person process and context components of job performance
Employeesrsquo reactions to these practices determine their levels of engagement and commitment
31
Chapter-IV
32
LITERATURE OF THE REVIEW
ldquo Job Satisfaction That Leads To The Commitment Of
The Employees in The Organisationrdquo
Literature of Review
Gerge Bill Authentic Leadership
In his book Authentic Leadership former Medtronic CEO Bill George makes an obvious
point that business leaders rarely say out loud ldquoMissions motivate dollars donrsquotrdquo
What he means is that purpose is what drives employee commitment not the financial
rewards that come to others Workers donrsquot get up in the morning and say ldquoGee I can
33
hardly wait to get to work today to maximize shareholder profitsrdquo Even when employees
are shareholders who can benefit from improved financials what draws people to their
chosen careers is the work itself and its purpose in the world more than the profit
possibilities
Mr George goes on to say ldquoI find there is universal agreement (among middle managers)
that you cannot inspire employees by urging them to help management get the companyrsquos
stock price uprdquo
There is in fact quite a bit of literature on this subject In Awakening Corporate Soul
authors Eric Klein and John Izzo say that employee commitment requires knowing ldquothe
purpose of our work it means recognizing the purpose our organization fulfills that goes
beyond the bottom line and it means articulating to others how their (workersrsquo) efforts
contribute to a larger purposerdquo
In Built to Last Jim Collins and James Porras spend an entire book explaining their five
year research study of major companies that led to this conclusion about employee
commitment Purpose within a company is what sustains it profit is important but when
itrsquos the prime directive companies falter
-Marshal Goldsmith-
How to Increase Employee Commitment
In practice this involves walking the talk being transparent communicating effectively treating
people equally teaching leading subordinates to increasingly excellent performance ndash and
responding to subordinates as mature individuals who are owed fairness the truth and
recognition of their achievements
34
Since managers interact directly and frequently with subordinates they are usually more tuned
in to how employees are feeling than are executives Managers are in a better position to know
for example when employees are feeling alienated and disengaged from their work which is
very common today -- and expensive
Gaining employee commitment results in greater profits because enthusiastic employees stay
contribute discretionary effort and engage customers Performance soars when customers are
enthused and stay and when executives managers and employees are a collaborative team
united in achieving common goals
But managers are often called middle managers for good reason their job is to motivate and
guide subordinates while they at the same time are being judged by their bosses Because of
their ldquotweenrdquo position in the hierarchy managers to effective support direct reports must also
create relationships with potential allies especially those with greater power who have access to
top decision makers
Harvard University Factors that Impact Employee Well Being Commitment and
Productivity
Business executives from the C-suite and HR to QC and RampD are by nature focused on the
corporate bottom line A new trend in our dawning age of social sustainability is that many
experts believe more attention should be paid to the dotted line - the one signed when a person
35
commits to employment at a company New Harvard research validates this approach affirming
that trust and purpose play a significant role in building successful productive workplaces
The behavioral research conducted by a team at Harvard University and Massachusetts General
Hospital identifies the factors most likely to impact 21st century employee well being
commitment and productivity The researchers found that commitment is largely influenced by
ones sense of purpose feeling of personal impact and overall trust in the organization
Productivity is largely affected by the quality of human relationships including cooperative
social group moods and interaction
The results lead us to conclude that workplaces that provide positive environments that foster
interpersonal trust and quality personal relationships create the most committed and productive
employees says Nancy Etcoff PhD the lead researcher on the study
Expert Shares Keys to Building Successful Workplace Relationships
According to business strategist Courtney Anderson JD MBA Outstanding leadership
today means much more than just doing your job Success is creating an environment that fosters
happy committed productive team members
Anderson explains that reinvigorating workplaces by enhancing trust and employee commitment
does not have to be difficult The biggest challenge she says is making the time to truly change
in our overscheduled instant access competitive work environments With a little know-how it
can be easy to evolve workplace well being and respond to these compelling research results
-Mark Howell-
CEO Bright Point
High-performing companies recognize that employee commitment is a major contributing factor
toward sustaining long-term success and creating value An engaged employee is involved and
excited about their work and acts in a manner that will forward the organizationrsquos interest An
36
engaged workforce helps optimize and retain talent for the long-term because the employees
choose to stay even when other employment alternatives exist
According to Walker Information the top three drivers of employee commitment are
Satisfaction Fairness and Care amp Concern for employees Put simply committed employees
want to enjoy their work feel they are appreciated and know they are making a contribution to
their companyrsquos strategic objectives Additionally employees who have trust in their leadership
and are trusted by their leadership have a greater dedication and are ultimately more productive
on the job However according to recent data provided by the National Business Research
Institute (NBRI) only 31 of all employees are truly engaged
At BrightPoint we take employee engagement seriously and we work to create a culture that
inspires employee loyalty and satisfaction The results of BrightPointrsquos commitment to its
employees are shown in the 2011 BPNA Employee Commitment Survey The survey
determined that close to 80 of respondents indicated they were satisfied with their jobs and
daily activities General employee satisfaction increases when managers take an active interest
in their employees beyond their day-to-day job responsibilities According to NBRI managers
that actively coach build relationships and keep an open dialogue with their employees improve
employee engagement
We have a diverse workforce where each employee brings unique value and has individual
needs Managers are learning to manage the individual and not the position In order to give
managers the tools they need to be successful BrightPoint places strong emphasis on targeted
leadership training workshops and continual learning resources In 2011 906 of managers at
BrightPoint NA participated in the development opportunities offered and also made an effort to
37
help reinforce the learning of their team members This signals that our leadership team is taking
an active interest in professional development and its connection to employee commitment
As BrightPoint continues to increase focus on employee engagement the organization will grow
stronger and maintain a substantial advantage over our competition Our employees possess the
knowledge experience and resiliency to respond quickly to the demands of the marketplace and
through their genuine commitment will deliver what our customers want with increasing
efficiency and effectiveness Our responsibility is value-creation by growing our business and
maintaining high levels of customer service and loyalty We believe the best way to accomplish
this is through a strong committed and engaged workforce
Performance Model Adopted At Mohali Plant
38
Process adopted by Philips Electronics Mohali Plant for Job Satisfaction of Employee that leads commitment of the employees
39
Recruiting
The messages in Philips Electronics Mohali organization conveys while seeking to attract job
applicants also can influence future employeesrsquo engagement and commitment If your firm has
designed jobs specifically to engage employees then organization want to ensure that recruiting
ads extol these positionsrsquo attractive featuresmdashsuch as challenging work assignments a highly
skilled team environment or minimal supervision Applicants who notice and respond to these
ads will more likely be motivated by these features Also consider how organization might best
seek candidates from inside your organization When Organisation recruit existing employees for
desirable jobs you enhance their engagement (by maximizing the person-job fit) and
commitment (by providing growth and advancement opportunities to employees in return for
their loyalty) If Organisation recruit from outside when qualified internal candidates are
available Organization may unwittingly suggest to current employees that your company is not
willing to reciprocate their commitment Existing staff may then begin questioning their own
commitment to the firm By contrast organisation recruit external candidates to both the job and
your organization For these candidates ensure that recruiting messages highlight attractive job
features organizational values and commitment reciprocity That is in return for performance
and dedication your company offers competitive pay and benefits flexible work hours and
learning and career advancement opportunities Also remember that prospective employees have
multiple commitments You will inevitably have to compete with those commitments as
organization try to attract candidates to your firm Most people find it easier to make a new
commitment when it is compatible with their other obligations For example you boost your
chances of recruiting a highly qualified candidate who is a single parent if you offer flexible
work hours family health benefits and on-site day care ldquoRecruiting for Engagement and
Commitmentrdquo
40
Employee Selection
Once recruiting efforts produce a pool of promising job candidates Philips select among them to
fill available positions When organisation select the right individuals for the right jobs new
hires carry out their work more smoothly and experience fewer performance problems The
result Greater enjoyment ofmdashand engagement inmdashthe job
To enhance engagement through your selection of employees identify those candidates who are
best-suited to the job and your organizationrsquos culture Also use candidate assessment methods
that have obvious relevance to the job in questionmdashfor example by asking interviewees what
they know about the role and having them provide work samples Most candidates will view
these techniques more positively than tests with less apparent relevance such as personality and
integrity assessments Successful candidates feel good about having ldquopassed the test and see
company as careful and capable for having selected them A positive initial impression of an
employer encourages growth of long-term commitment
Training and Development
Training and development can serve as additional levers for enhancing engagement and
commitment For new hires training usually begins with orientation Orientation presents several
important opportunitiesmdashincluding explaining pay work schedules and company policies Most
important it gives you a chance to encourage employee engagement by explaining how the new
hirersquos job contributes to the organizationrsquos mission Through orientation Mohali Plant of Philips
Electronics describe how r company is organized introduce the new employee to his or her co-
workers give the person a tour of the area where he or she will be working and explain safety
regulations and other procedural matters In short you foster person-organization fitmdashvital for
developing productive and dedicated employees Through training you help new and current
41
employees acquire the knowledge and skills they need to perform their jobs And employees who
enhance their skills through training are more likely to engage fully in their work because they
derive satisfaction from mastering new tasks Training also enhances employeesrsquo value to your
company as well as their own employability in the job market In addition most companies offer
higher wages for skilled workers to compensate them for their greater value and to discourage
turnover
Compensation
Like the HR practices discussed above compensation can powerfully influence employee
engagement and commitment Some compensation components encourage commitment to
employers while others motivate engagement in the job It is possible to stimulate one and not
the other though itrsquos generally better to foster both For example a company that offers a strong
performance incentive system but no retirement plan will probably realize exceptional
engagement from its workers however they may eventually commit themselves to another
company that does offer a good retirement plan Meanwhile an organization that offers generous
retirement benefits but a traditional seniority-based pay grade system may have committed
employees however these workers might deliver pedestrian performance as they bide their time
until retirement In designing compensation plans you therefore need to consider employee
engagement and commitment strategically
Encourage managers to include employees in the goal-setting process This technique helps to
ensure that workers understand the goals It also promotes acceptance of challenging objectives
because people generally feel more committed to goals they have helped define In addition
consider how you and other managers will recognize and encourage contributions that exceed
expectations For example when a piece of equipment malfunctions Joe finds other ways to
maintain production rather than merely shutting down the machine and waiting for the
42
maintenance staff to fix it Or when a less experienced co-worker encounters a new task Sally
offers friendly coaching instead of standing by and waiting for the inevitable mistakes to crop
up Performance management processes operate on a continuous basis Therefore they provide
perhaps the best ongoing opportunities for employers to foster employee engagement and
commitment For example managers can use routine discussions about performance and
feedback sessions to learn which aspects of the job hold the most interest for each employee and
which tasks are most challenging During such discussions managers also can define what going
above and beyond the call of dutyrdquo looks like and generate ideas for rewarding such
contributions An employeersquos aspirations and career goals can receive careful attention during
performance appraisal meetings Without inquiring into an employeersquos personal life a supervisor
can nevertheless explore ways to enhance the compatibility between the workerrsquos commitment to
your organization and the employeersquos other life commitments Through such means the
organization personalizes its relationship to each employee and provides support while also
expressing appreciation for their contributionsmdash key drivers of engagement and commitment
To further engage employees and win their commitment through your performance management
programs consider how to treat your organizationrsquos most experienced employees In many cases
these employees understand the intricacies of a job better than their supervisors or managers do
By virtue of long identification with your organization they may be deeply committed to high-
level goals They use their expertise to contribute in ways that newer employees simply cannot
match But many of them also may be planning to retire soon especially if they are from the
ldquoBaby Boomerrdquo generation How will you transfer their knowledge to younger workers Design
a performance management system that recognizes and rewards proactive sharing of knowledge
and expertise among co-workers For example create knowledge repositories or learning
histories that can be stored in databases that employees can access and then create incentives
43
for people who contribute to and use these repositories Of course effective performance
management systems also identify employees who are not meeting expectations Failing to
address problem performance can erode other employeesrsquo engagement and commitment as their
workloads increase and they conclude that the company is willing to tolerate poor performance
If feedback coaching and remedial training are of little avail the manager may need to move the
person to a different position within the company where he or she can make a more valuable
contribution or let the individual go if there is no good match elsewhere in the organization
44
Chapter-V
RESEARCH METHODOLOGY
The basic task of research is to generate accurate information for use in decision-making
Research can be defined as the systematic and objective process of gathering recording and
analyzing data for aid in making business decisions As the project involves analyzing of
45
financial structure the research is exploratory in nature covering financial parameters and come
of the important ratios to carry out research There are basically two techniques adopted for
obtaining information
Primary Data
Secondary Data
Primary Data is gathered specifically for the project at hand through personal interviews with
the accounts officers
Sample Size = 100 Employees
Secondary data is previously collected and assembled for some project other than the one at
hand It is gathered and recorded by someone else prior to current needs of the researcher It is
less expensive than the primary date
Secondary Data can be obtained from both external and internal sources
External data may be collected from books and periodicals government sources media and other
commercial sources
Internal data is that secondary data which is created recorded or generated by the organization
As the project is explanatory in nature secondary data is collected from the reports of the
company books journals and interest Secondary data is gathered from annual reports official
records and standing orders of the units
CHAPTER - VI
DATA ANALYSIS AND INTERPRETATION
46
The data after collection is to be processed and analyzed in accordance with the outline
and down for the purpose at the time of developing research plan
Technically speaking processing implies editing coding classification and tabulation of
collected data so that they are amenable to analysis The term analysis refers to the computation
of certain measures along with searching for pattern groups Thus in the process of analysis
relationship or difference should be subjected to statistical tests of significance to determine with
what validity data can be said to indicate any conclusions
The analysis of data in a general way involves a number of closely related operations
which are performed with the purpose of summarizing the collected data and organizing them in
such a manner that they answer the research questions In this study the researcher followed
above process carefully and it is presented in this chapter
47
Table 41 ndash To know the department in which employees are belongs to
S
ou rc
e
survey data
Inference
From the above table it shows that 35 of employees are belongs to
production department
FIGURE 41
S
SI No
D
Department
N
No of Respondents
P
Percentage
1
1
M
Mechanical
3
30
3
30
2
2
E
Electrical
2
25
2
25
3
3
P
Production
3
35
3
35
4
4
O
Others
1
10
1
10
T
Total
1
100
1
100
48
REPRESENTS THE DEPARTMENT
Table 42 ndash To know working experience of the employees
Source survey data
Inference
From the above table it shows that 34 of the employees have 4 ndash 6
years experience
S
SI No
W
Work Experience
N
No of Respondents
P
Percentage
1
1
B
Below 2 years
1
33
1
13
2
2
2
2ndash 4 years
3
30
3
30
3
3
4
4ndash 6 years
3
34
3
34
4
4
A
Above 6 years
2
23
2
23
T
otal
1
100
1
100
49
FIGURE 42
REPRESENTS THE EXPERIENCE OF THE EMPLOYEES
Table 43 ndash To know the physical working environment
S
SI No
W
Working Environment
N
No of Respondents
P
Percentage
1
1
E
Excellent
1
12
1
12
2
2
G
Good
5
57
5
57
3
3
F
Fair
2
28
2
28
4
4
P
Poor
0
03
0
33
5
5
V
Very Poor
0
00
0
00
T
Total
1
100
1
100
Source survey data
Inference
From the above table it shows that 57 of the employees were feeling good about the working environment
50
FIGURE 43
REPRESENTS THE PHYSICAL WOKING ENVIRONMENT
51
Table 44 ndash To know the satisfaction level of employees towards the non-monitory benefits
S
SI No
N
Non-Monitory Benefits offered
to Employees
N
No of Respondents
P
Percentage
1
1
H
Highly Satisfied
1
14
1
14
2
2
S
Satisfied
5
54
5
54
3
3
N
Neither Satisfied nor Dissatisfied
2
25
2
25
4
4
D
Dissatisfied
0
05
0
05
5
5
H
Highly Dissatisfied
0
02
0
02
Total 1
100
1
100
Source survey data
Inference
From the above table it shows that 54 of the employees were satisfied towards the non-monitory benefits
FIGURE 44
REPRESENTS THE SATISFACTION LEVEL OF EMPLOYEES TOWARDS THE NON-MONITORY BENEFITS
52
Table 45 ndash To know the satisfaction level of respondents towards the work
assigned
Source survey dataInference
From the above table it shows that 45 of the respondents were satisfied towards the work assigned
FIGURE 45
S
SI No
A
Amount of Work
N
No of Respondents
P
Percentage
1
1
H
Highly satisfied
2
20
2
20
2
2
S
Satisfied
4
45
4
45
3
3
N
Neither Satisfied nor Dissatisfied
1
12
1
12
4
4
D
Dissatisfied
1
18
1
18
5
5
H
Highly Dissatisfied
0
06
0
06
Total 1
100
1
100
53
REPRESENTS THE SATISFACTION LEVEL OF RESPONDENTS TOWARDS THE WORK ASSIGNED
54
Table 46 ndash Opinion about the career development programme in their organisation
S
SI No
C
Career Development
N
No of Respondents
P
Percentage
H
Highly satisfied
1
12
1
12
S
Satisfied
5
56
5
56
N
Neither Satisfied nor Dissatisfied
2
22
2
22
D
Dissatisfied
1
10
1
10
H
Highly Dissatisfied
0
00
0
00
Total 1
100
1
100
Source survey data
Inference
From the above table it shows that 56 of the employees were satisfied
with the opinion about the carrier development programme in their organisation
FIGURE 46
REPRESENTS OPINION ABOUT THE CAREER DEVELOPMENT
PROGRAMME IN THEIR ORGANISATION
55
Table 47 ndash To know the cooperation of co-workers
S
SI No
C
Co-operation of Workers
N
No of Respondents
P
Percentage
1
1
H
Highly satisfied
2
20
2
20
2
2
S
Satisfied
6
66
6
66
3
3
N
Neither Satisfied nor Dissatisfied
1
11
1
11
4
4
D
Dissatisfied
0
03
0
03
5
5
H
Highly Dissatisfied
0
00
0
00
Total 1
100
1
100
Source survey data
Inference
From the above table it shows that 66 of the employees were satisfied
with the cooperation of co-workers
FIGURE 47
56
REPRESENTS THE COOPERATION OF CO-WORKERS
57
Table 48 ndash To know the satisfaction of Respondents with top management
S
SI No
S
Satisfaction with Top
Management
N
No of Respondents
P
Percentage
1
1
H
Highly satisfied
2
26
2
26
2
2
S
Satisfied
5
51
5
51
3
3
N
Neither Satisfied nor Dissatisfied
1
17
1
17
4
4
D
Dissatisfied
0
06
0
06
5
5
H
Highly dissatisfied
0
00
0
00
Total 1
100
1
100
Source survey data
Inference
From the above table it shows that 51 of the employees were satisfied with the top management
FIGURE 48
58
REPRESENTS THE SATISFACTION OF RESPONDENTS WITH TOP MANAGEMENT
Table 49 ndash To know the satisfaction of Respondents with their subordinates
Source survey data
Inference
From the above table it shows that 67 of the employees were satisfied with their subordinates
S
SI
No
S
Satisfaction with Subordinates
N
No of Respondents
P
Percentage
1
1
H
Highly satisfied
1
12
1
12
2
2
S
Satisfied
6
67
6
67
2
3
N
Neither Satisfied nor Dissatisfied
1
14
1
14
4
D
Dissatisfied
0
07
0
07
5
5
H
Highly Dissatisfied
0
00
0
00
Total 1
100
1
100
59
FIGURE 49
REPRESENTS THE SATISFACTION OF RESPONDENTS WITH THEIR SUBORDINATES
60
Table 410 ndash To know the level of satisfaction regarding nature of job
S
SI No
J
Job Satisfaction
N
No of Respondents
P
Percentage
1
1
H
Highly satisfied
2
22
2
22
2
2
S
Satisfied
5
56
5
56
3
3
N
Neither Satisfied nor Dissatisfied
1
16
1
16
4
4
D
Dissatisfied
0
07
0
07
5
5
H
Highly Dissatisfied
0
00
0
00
Total 1
100
1
100
Source survey dataInference
From the above table it shows that 56 of the employees were satisfied with their job
FIGURE 410
61
REPRESENTS THE LEVEL OF SATISFACTION REGARDING THE NATURE OF JOB
Table 411 ndash To know whether there is any job pressure in their work
Source survey data
Inference
From the above table it shows that 72 of employees said there is job pressure in their work
FIGURE 411
REPRESENTS WHETHER THERE IS ANY JOB PRESSURE IN THEIR WORK
S
SI No
J
Job Pressure
N
No of Respondents
P
Percentage
1
1
Y
Yes
7
72
7
72
2
2
N
No
2
28
2
28
T
Total
1
100
1
100
62
Table 412 ndash To know the opinion regarding opportunity provided by the organisation in developing skills
amp talents
S
SI No
D
Development of Skills and
Talents
N
No of Respondents
P
Percentage
1
1
H
Highly Agree
1
12
1
12
2
2
A
Agree
5
52
5
52
3
3
N
Neither Agree nor Disagree
2
28
2
28
4
4
D
Disagree
0
06
0
06
5
5
H
Highly Disagree
0
02
0
02
Total 1
100
1
100
Source survey data
Inference
From the above table it shows that 52 of employees agreed regarding opportunity provided by the organisation in developing skills amp talents
63
FIRGURE 412
REPRESENTS THE OPPORTUNITY PROVIDED BY THE ORGANISATION IN DEVELOPING SKILLS amp TALENTS
64
Table 413 ndash To know the satisfaction level of welfare facilities provided by the management
S
SI No
W
Welfare Facilities
N
No of Respondents
P
Percentage
1
1
H
Highly satisfied
0
09
9
09
2
2
S
Satisfied
5
57
5
57
3
3
N
Neither Satisfied nor Dissatisfied
2
29
2
29
4
4
D
Dissatisfied
5
05
0
05
5
5
H
Highly Dissatisfied
0
00
0
00
Total 1
100
1
100
Source survey data
Inference
From the above table it shows that 57 of the employees were satisfied with the welfare facilities provided by the management
FIGURE 413
REPRESENTS THE SATISFACTION LEVEL OF WELFARE FACILITIES PROVIDED BY THE MANGEMENT
65
Table 414 ndash To know the employee satisfaction towards the salary
Source survey data
Inference
From the above table it shows that 67 of the employees were satisfied
with their salary
FIGURE 414
REPRESENTS THE SATISFACTION TOWARDS THE SALARY
S
SI No
P
Payment Satisfaction
N
No of Respondents
P
Percentage
1
1
Y
Yes
6
67
6
67
2
2
N
No
3
33
3
33
T
otal
1
100
1
100
66
Table 415 ndash To know the employees willingness amp Commitment Towards
Organisation
Source survey data
Inference
From the above table it shows that 59 of the employees were willing to
continue in this organisation
FIGURE 415
REPRESENTS THE EMPLOYEES WILLINGNESS TO CONTINUE
S
SI No
W
Willingness to Work
N
No of Respondents
P
Percentage
1
1
Y
Yes
5
59
5
59
2
2
N
No
4
41
4
41
T
Total
1
00
1
00
67
CHI-SQUARE METHOD
The chi square test is one of the simplest and most widely used non-
parametric tests in statistical work As a non-parametric test it can be used to determine
if categorical data shows dependency or the two classifications are independent It can
also be used to make comparisons between theoretical population and actual data
when categories are used
n
Chi square χsup2= sum (O-E) sup2 E
i =1
Where O= observed frequency
E= expected frequency
68
OBSERVED FREQUENCY
Table 419 shows the relationship between the department and the job satisfaction
Over All
Job
SatisfactionHighly
SatisfiedSatisfied
Neither
Satisfied nor
Dissatisfied
DissatisfiedHighly
Dissatisfied
Sub
Total
Mechanical 5 6 14 3 2 30
Electrical 6 8 6 3 2 25
Production 9 13 7 4 2 35
Others 2 3 2 2 1 10
Sub Total 22 30 29 12 7 100
69
EXPECTED FREQUENCY
Over All
Job
SatisfactionHighly
SatisfiedSatisfied
Neither
Satisfied nor
Dissatisfied
DissatisfiedHighly
Dissatisfied
Sub
Total
Mechanical 7 8 9 4 2 30
Electrical 5 8 7 3 2 25
Production 8 11 10 4 2 35
Others 2 3 3 1 1 10
Sub Total 22 30 29 12 7 100
Null Hypothesis (Ho)
There is no significant difference between the department and the job satisfaction
Alternative Hypothesis (Ho)
There is significant difference between the job satisfaction
Co Relation
70
Chapter-V
CONCLUSIONS AND
RECOMMENDATIONS
71
CONCLUSION
On the basis of Analysis of Job Satisfaction Level of the Employees of Philips Electronics India
Ltd Mohali made in the previous chapters following conclusions are drawn
General Profile The plant of PHILIPS is ideally located in the Mohali Industrial focal point
Phase 9 near Chandigarh the capital of Punjab on a campus of 17 hectares The working
environment of the company is very healthy The visitors feel happy after the campus
Indigenous Technology PHILIPS is the only lighting manufacturing company based on purely
indigenous technology Philips was appropriately chosen as the brand name as self reliance and
building up of Indian Engineering capabilities remain the guiding spirit of PHILIPS
Financial structure PHILIPS is a low debt company signifying its dependence mainly on
its internal accruals for its financial requirements PHILIPS continues to strengthen its financial
position by channelising these internal accruals to fund its expansion programmes
Working results PTL has registered a handsome and constant growth in its profits because
of a brisk demand for new and better technology electronic items None of the other electronic
company has shown such a steady growth Philips has recorded the lowest current ratio
However with this lowest current ratio PTL still enjoys moderate payment period and highest
velocity of creditors and debtors only due to commitment of itrsquos employees
72
SUMMARY
According to the 1999 Gallup Poll the four elements that have proven to be effective in creating
employee loyalty are praise and recognition a sense of contribution to the company learning and
development and having a best friend at work
Creating a fairy-tale work environment begins withrecognition Your employees need it more
than money perks or titles Here are eight tips regarding recognition Remember these and your
employees may just start whistling while they work It is up to me The corporate culture or
financial rewards will not make your team successful It is up to you Recognition is one thing
that is completely in your control
Strong relationships are vital in todays economy Strengthening employee relationships is even
more necessary as companies downsize and lay off As your workforce shrinks and you need to
do more with less keeping quality employees becomes even more critical As a manager it is
your job to bond your best people to your company through recognition And you also must help
direct and motivate your core performers
Simple rewards earn big returns There are some relatively simple things you can do that will
earn big returns For example remember your employees birthdays and work anniversaries find
out what inexpensive rewards they value (for example tickets to a ball game or a half day off to
spend time with their kids) make the most of your formal service awards with some preparation
and a group presentation walk around your department every day and talk to your
people and thank them sincerely and often
73
Make it specific Praise and recognition must be specific to have impact General praise such as
You do great work actually can have the opposite effect and leave your employees wondering
Does he have any idea what I really do around here Specific praise links individual
accomplishments to company goals For example Cheryl I noticed the way you handled that
customer complaint Great work As you know we value quick resolutions of problems as
one of our core strategies
Ask the best to stay Call your best people into your office one at a time Let that bright young
college graduate know you value his fresh ideas and energy Tell the 20-year veteran how much
your team relies on her expertise and organizational skillsRemarkably a significant percent of
high-impact performers report that they left their last job because No one ever asked me to
stay
Forget cash
Remember the saying Money cant buy everything Well its true Dont wait until you can
offer an employee a raise or promotion Real thanks is its own reward In numerous surveys of
work satisfaction top on employees lists is feeling appreciated In fact when employees feel
recognized and involved they are much less likely to keep asking about money
Recognize
Recognition means most to an employee when it is sincere and spontaneous According to the
largest study ever conducted on workplace satisfaction (Gallup 1999) recognition should occur
at least every seven days If you wait until a year-end party or an annual review you are waiting
much too long to recognize and you probably are losing people you do not need to
74
Recognition works
Neglect can be a poisoned apple Recognition is the elixir that will spark better attitudes and
performance Jeffrey Pfeffer of Stanford University says The returns from managing people in
ways that build high commitment typically are on the order of 30 to 50 percent
Take a hard look in the mirror and ask yourself how you can recognize the fairest of them all
Learn to recognize your employees for their efforts thank them often and reward their
achievements You can awaken them from their anger and apathy and they will fall in love with
their jobs again Chances are you will work together happily ever after
So there is direct relation with employee satisfaction and their commitment towards the
organization and it is also clear from the above discussion that only monetary elements are not
sufficient for employee satisfaction rather other element like employer behavior recognisation
and other moral value
75
RECOMMENDATIONS
PHILIPS should increase its capacity utilization It should work at full capacity to
minimize its cost of production With this increase in capacity utilization the total cost
will spread over more units thereby decreasing the per unit cost
PHILIPS should decrease the credit facilities provided to its consumers The payback
period is quite high in case of debtors as compared to creditors it should be more or less
equal as it will help in improving company liquidity
PHILIPS should focus more on the consumer lifestyle goods in India parallel to its other
business as it accounts very less as compare to other businesses of Philips
Another recommendation for Mohali plant is about the HR department that is they
should appoint permanent and skilled workers as against casual workers which generally add
up to the profit of the company
76
BIBLIOGRAPHY
1 Values-Based Leadership Rebuilding Employee Commitment Performance and Productivity ( Thomas D Kuczmarski)
2 Monthly Journals of Philips Electronics India Ltd
3 Authentic Leadership Medtronic CEO Bill George
4 wwwindiaphilipscom
5 wwwwikipediacom
6 httpwwwemployeecommitmentcom
7 One Foot Out The Door How to Combat The Psychological Recession Thatrsquos Alienating Employees And Hurting American Business Judith Bardwick
8 Employee Commitment A Leader Ship Guide Joe Folkman
9 Harvard University Factors that Impact Employee Well Being Commitment and Productivity -An Article
77
Questionnaire
Name __________________________________________________________
Age______________________________ Gender _______________________
Qualification _______________________ Contact No ___________________
Q1 In which department you are working
Electrical Production Mechanical Other
Q2 What is your working experience
gt2 Years 2-4 Years 4-6 Years lt 6 Years
Q3 How You like the physical Working Environment of the organization
Excellent Good Fair Poor Very Poor
Q4 Are you satisfied with Non-Monitory benefits provided by the organisation
Highly Satisfied Satisfied Neither Satisfied Nor dissatisfied
Highly Dissatisfied Dissatisfied
Q5 Are you satisfied with your work
Highly Satisfied Satisfied Neither Satisfied Nor dissatisfied
Highly Dissatisfied Dissatisfied
Q6 Are you satisfied with the career development programe of the company
Highly Satisfied Satisfied Neither Satisfied Nor dissatisfied
Highly Dissatisfied Dissatisfied
Q7 Is other staff of the organization is co-operative with you
Highly Satisfied Satisfied Neither Satisfied Nor dissatisfied
Highly Dissatisfied Dissatisfied
Q8 Are you satisfied with top level management
Highly Satisfied Satisfied Neither Satisfied Nor dissatisfied
Highly Dissatisfied Dissatisfied
78
Q9 Are you satisfied with your subordinates
Highly Satisfied Satisfied Neither Satisfied Nor dissatisfied
Highly Dissatisfied Dissatisfied
Q10 Are you satisfied with the nature of the Job
Highly Satisfied Satisfied Neither Satisfied Nor dissatisfied
Highly Dissatisfied Dissatisfied
Q11 Do you have any Job Pressure in work
Yes No
Q12 Do you satisfied with the opportunities provided by the organisation
Highly Satisfied Satisfied Neither Satisfied Nor dissatisfied
Highly Dissatisfied Dissatisfied
Q13 Are you satisfied with the welfare facilities provided by the organisation
Highly Satisfied Satisfied Neither Satisfied Nor dissatisfied
Highly Dissatisfied Dissatisfied
Q14 Are you satisfied towards your salary
Highly Satisfied Satisfied Neither Satisfied Nor dissatisfied
Highly Dissatisfied Dissatisfied
Q15 Are you committed towards the organisation
Yes No
Signature

26
see everyday human resource practices such as recruitment training performance management
and workforce surveys can provide powerful levers for enhancing engagement
Employee Engagement Key Ingredients
ldquoEmployee Engagement Definedrdquo shows examples of engagement definitions used by various
corporations and consultancies Clearly definitions of employee engagement vary greatly across
organizations Many managers wonder how such an elusive concept can be quantified The term
does encompass several ingredients for which researchers have developed measurement
techniques These ingredients include the degree to which employees fully occupy themselves in
their work as well as the strength of their commitment to the employer and role Fortunately
there is much research on these elements of engagementmdashwork that has deep roots in individual
and group psychology
Definition
ldquoNo company small or large can win over the long run without energized employees who
believe in the [firms] mission and understand how to achieve it Thats why you need to take the
measure of employee engagement at least once a year through anonymous surveys in which
people feel completely safe to speak their mindsrdquo
-Jack and Suzy Welch-
Common Themes How Companies Measure Engagement
Employers typically assess their employeesrsquo engagement levels with company-wide attitude
or opinion surveys
27
1048657 Pride in employer
1048657 Satisfaction with employer
1048657 Job satisfaction
1048657 Opportunity to perform well at challenging work
1048657 Recognition and positive feedback for onersquos contributions
1048657 Personal support from onersquos supervisor
1048657 Effort above and beyond the minimum
1048657 Understanding the link between onersquos job and the organizationrsquos mission
1048657 Prospects for future growth with onersquos employer
1048657 Intention to stay with onersquos employer
The Link Between Employer Practices and Employee Engagement
How does an engaged workforce generate valuable business results for an organization The
process starts with employer practices such as job and task design recruitment selection
training compensation performance management and career development Such practices affect
employeesrsquo level of engagement as well as job performance Performance and engagement then
interact to produce business results Figure 1 depicts these relationships
28
EMPLOYEE COMMITMENT EMPLOYEE ENGAGEMENT
1048657 How do you and other managers in your
organization define commitment
1048657 Are some employees in your company
engaged in their work but not committed to
the organization Committed to staying with
your firm but not exactly engaged in their
work Both engaged and committed
1048657 To whom are your organizations employees
committed The company Their supervisor
Co-workers Team members Customers
1048657 What business results has commitment from
1048657 How do you and other managers in your
organization define employee engagement
1048657 How do you know that certain employees in
your company are engaged Do they relish
their jobs Enjoy specific responsibilities or
tasks Willingly ldquogo the extra milerdquo
1048657 In teams departments or business units in
your company that have a large number of
engaged employees what business results
are you seeing Higher productivity Lower
costs Greater revenues More efficiency
29
employees created for your organization For
example has commitment reduced turnover
and therefore decreased recruitment hiring
and training costs
1048657 What does your company do to reciprocate
employees commitment Is the organization
living up to its side of the bargain
Lower turnover Higher product or service
quality
1048657 Conversely how do disengaged employees
behave and what are the consequent costs
for their teams units-and your entire
company
As Figure 2 suggests a person possesses attributes such as knowledge skills abilities
temperament attitudes and personality He or she uses these attributes to accomplish work
behaviors according to organization-defined procedures by applying tools equipment andor
technology Work behaviors in turn create the products and services that make an organization
successful We classify work behaviors into three categories those required to accomplish duties
and tasks specified in a job description (prescribed behaviors) ldquoextrardquo behaviors that an
employee contributes for the good of the organization (voluntary behaviors) and behaviors
prohibited by an employer (proscribed behaviors including unexcused absenteeism stealing and
other counterproductive or illegal actions) Of course job performance occurs in an
organizational context which includes elements such as leadership physical setting and social
setting
30
Employers naturally want to encourage workers to perform prescribed and voluntary activities
while avoiding proscribed ones To achieve these goals organizations use a number of HR
practices that directly affect the person process and context components of job performance
Employeesrsquo reactions to these practices determine their levels of engagement and commitment
31
Chapter-IV
32
LITERATURE OF THE REVIEW
ldquo Job Satisfaction That Leads To The Commitment Of
The Employees in The Organisationrdquo
Literature of Review
Gerge Bill Authentic Leadership
In his book Authentic Leadership former Medtronic CEO Bill George makes an obvious
point that business leaders rarely say out loud ldquoMissions motivate dollars donrsquotrdquo
What he means is that purpose is what drives employee commitment not the financial
rewards that come to others Workers donrsquot get up in the morning and say ldquoGee I can
33
hardly wait to get to work today to maximize shareholder profitsrdquo Even when employees
are shareholders who can benefit from improved financials what draws people to their
chosen careers is the work itself and its purpose in the world more than the profit
possibilities
Mr George goes on to say ldquoI find there is universal agreement (among middle managers)
that you cannot inspire employees by urging them to help management get the companyrsquos
stock price uprdquo
There is in fact quite a bit of literature on this subject In Awakening Corporate Soul
authors Eric Klein and John Izzo say that employee commitment requires knowing ldquothe
purpose of our work it means recognizing the purpose our organization fulfills that goes
beyond the bottom line and it means articulating to others how their (workersrsquo) efforts
contribute to a larger purposerdquo
In Built to Last Jim Collins and James Porras spend an entire book explaining their five
year research study of major companies that led to this conclusion about employee
commitment Purpose within a company is what sustains it profit is important but when
itrsquos the prime directive companies falter
-Marshal Goldsmith-
How to Increase Employee Commitment
In practice this involves walking the talk being transparent communicating effectively treating
people equally teaching leading subordinates to increasingly excellent performance ndash and
responding to subordinates as mature individuals who are owed fairness the truth and
recognition of their achievements
34
Since managers interact directly and frequently with subordinates they are usually more tuned
in to how employees are feeling than are executives Managers are in a better position to know
for example when employees are feeling alienated and disengaged from their work which is
very common today -- and expensive
Gaining employee commitment results in greater profits because enthusiastic employees stay
contribute discretionary effort and engage customers Performance soars when customers are
enthused and stay and when executives managers and employees are a collaborative team
united in achieving common goals
But managers are often called middle managers for good reason their job is to motivate and
guide subordinates while they at the same time are being judged by their bosses Because of
their ldquotweenrdquo position in the hierarchy managers to effective support direct reports must also
create relationships with potential allies especially those with greater power who have access to
top decision makers
Harvard University Factors that Impact Employee Well Being Commitment and
Productivity
Business executives from the C-suite and HR to QC and RampD are by nature focused on the
corporate bottom line A new trend in our dawning age of social sustainability is that many
experts believe more attention should be paid to the dotted line - the one signed when a person
35
commits to employment at a company New Harvard research validates this approach affirming
that trust and purpose play a significant role in building successful productive workplaces
The behavioral research conducted by a team at Harvard University and Massachusetts General
Hospital identifies the factors most likely to impact 21st century employee well being
commitment and productivity The researchers found that commitment is largely influenced by
ones sense of purpose feeling of personal impact and overall trust in the organization
Productivity is largely affected by the quality of human relationships including cooperative
social group moods and interaction
The results lead us to conclude that workplaces that provide positive environments that foster
interpersonal trust and quality personal relationships create the most committed and productive
employees says Nancy Etcoff PhD the lead researcher on the study
Expert Shares Keys to Building Successful Workplace Relationships
According to business strategist Courtney Anderson JD MBA Outstanding leadership
today means much more than just doing your job Success is creating an environment that fosters
happy committed productive team members
Anderson explains that reinvigorating workplaces by enhancing trust and employee commitment
does not have to be difficult The biggest challenge she says is making the time to truly change
in our overscheduled instant access competitive work environments With a little know-how it
can be easy to evolve workplace well being and respond to these compelling research results
-Mark Howell-
CEO Bright Point
High-performing companies recognize that employee commitment is a major contributing factor
toward sustaining long-term success and creating value An engaged employee is involved and
excited about their work and acts in a manner that will forward the organizationrsquos interest An
36
engaged workforce helps optimize and retain talent for the long-term because the employees
choose to stay even when other employment alternatives exist
According to Walker Information the top three drivers of employee commitment are
Satisfaction Fairness and Care amp Concern for employees Put simply committed employees
want to enjoy their work feel they are appreciated and know they are making a contribution to
their companyrsquos strategic objectives Additionally employees who have trust in their leadership
and are trusted by their leadership have a greater dedication and are ultimately more productive
on the job However according to recent data provided by the National Business Research
Institute (NBRI) only 31 of all employees are truly engaged
At BrightPoint we take employee engagement seriously and we work to create a culture that
inspires employee loyalty and satisfaction The results of BrightPointrsquos commitment to its
employees are shown in the 2011 BPNA Employee Commitment Survey The survey
determined that close to 80 of respondents indicated they were satisfied with their jobs and
daily activities General employee satisfaction increases when managers take an active interest
in their employees beyond their day-to-day job responsibilities According to NBRI managers
that actively coach build relationships and keep an open dialogue with their employees improve
employee engagement
We have a diverse workforce where each employee brings unique value and has individual
needs Managers are learning to manage the individual and not the position In order to give
managers the tools they need to be successful BrightPoint places strong emphasis on targeted
leadership training workshops and continual learning resources In 2011 906 of managers at
BrightPoint NA participated in the development opportunities offered and also made an effort to
37
help reinforce the learning of their team members This signals that our leadership team is taking
an active interest in professional development and its connection to employee commitment
As BrightPoint continues to increase focus on employee engagement the organization will grow
stronger and maintain a substantial advantage over our competition Our employees possess the
knowledge experience and resiliency to respond quickly to the demands of the marketplace and
through their genuine commitment will deliver what our customers want with increasing
efficiency and effectiveness Our responsibility is value-creation by growing our business and
maintaining high levels of customer service and loyalty We believe the best way to accomplish
this is through a strong committed and engaged workforce
Performance Model Adopted At Mohali Plant
38
Process adopted by Philips Electronics Mohali Plant for Job Satisfaction of Employee that leads commitment of the employees
39
Recruiting
The messages in Philips Electronics Mohali organization conveys while seeking to attract job
applicants also can influence future employeesrsquo engagement and commitment If your firm has
designed jobs specifically to engage employees then organization want to ensure that recruiting
ads extol these positionsrsquo attractive featuresmdashsuch as challenging work assignments a highly
skilled team environment or minimal supervision Applicants who notice and respond to these
ads will more likely be motivated by these features Also consider how organization might best
seek candidates from inside your organization When Organisation recruit existing employees for
desirable jobs you enhance their engagement (by maximizing the person-job fit) and
commitment (by providing growth and advancement opportunities to employees in return for
their loyalty) If Organisation recruit from outside when qualified internal candidates are
available Organization may unwittingly suggest to current employees that your company is not
willing to reciprocate their commitment Existing staff may then begin questioning their own
commitment to the firm By contrast organisation recruit external candidates to both the job and
your organization For these candidates ensure that recruiting messages highlight attractive job
features organizational values and commitment reciprocity That is in return for performance
and dedication your company offers competitive pay and benefits flexible work hours and
learning and career advancement opportunities Also remember that prospective employees have
multiple commitments You will inevitably have to compete with those commitments as
organization try to attract candidates to your firm Most people find it easier to make a new
commitment when it is compatible with their other obligations For example you boost your
chances of recruiting a highly qualified candidate who is a single parent if you offer flexible
work hours family health benefits and on-site day care ldquoRecruiting for Engagement and
Commitmentrdquo
40
Employee Selection
Once recruiting efforts produce a pool of promising job candidates Philips select among them to
fill available positions When organisation select the right individuals for the right jobs new
hires carry out their work more smoothly and experience fewer performance problems The
result Greater enjoyment ofmdashand engagement inmdashthe job
To enhance engagement through your selection of employees identify those candidates who are
best-suited to the job and your organizationrsquos culture Also use candidate assessment methods
that have obvious relevance to the job in questionmdashfor example by asking interviewees what
they know about the role and having them provide work samples Most candidates will view
these techniques more positively than tests with less apparent relevance such as personality and
integrity assessments Successful candidates feel good about having ldquopassed the test and see
company as careful and capable for having selected them A positive initial impression of an
employer encourages growth of long-term commitment
Training and Development
Training and development can serve as additional levers for enhancing engagement and
commitment For new hires training usually begins with orientation Orientation presents several
important opportunitiesmdashincluding explaining pay work schedules and company policies Most
important it gives you a chance to encourage employee engagement by explaining how the new
hirersquos job contributes to the organizationrsquos mission Through orientation Mohali Plant of Philips
Electronics describe how r company is organized introduce the new employee to his or her co-
workers give the person a tour of the area where he or she will be working and explain safety
regulations and other procedural matters In short you foster person-organization fitmdashvital for
developing productive and dedicated employees Through training you help new and current
41
employees acquire the knowledge and skills they need to perform their jobs And employees who
enhance their skills through training are more likely to engage fully in their work because they
derive satisfaction from mastering new tasks Training also enhances employeesrsquo value to your
company as well as their own employability in the job market In addition most companies offer
higher wages for skilled workers to compensate them for their greater value and to discourage
turnover
Compensation
Like the HR practices discussed above compensation can powerfully influence employee
engagement and commitment Some compensation components encourage commitment to
employers while others motivate engagement in the job It is possible to stimulate one and not
the other though itrsquos generally better to foster both For example a company that offers a strong
performance incentive system but no retirement plan will probably realize exceptional
engagement from its workers however they may eventually commit themselves to another
company that does offer a good retirement plan Meanwhile an organization that offers generous
retirement benefits but a traditional seniority-based pay grade system may have committed
employees however these workers might deliver pedestrian performance as they bide their time
until retirement In designing compensation plans you therefore need to consider employee
engagement and commitment strategically
Encourage managers to include employees in the goal-setting process This technique helps to
ensure that workers understand the goals It also promotes acceptance of challenging objectives
because people generally feel more committed to goals they have helped define In addition
consider how you and other managers will recognize and encourage contributions that exceed
expectations For example when a piece of equipment malfunctions Joe finds other ways to
maintain production rather than merely shutting down the machine and waiting for the
42
maintenance staff to fix it Or when a less experienced co-worker encounters a new task Sally
offers friendly coaching instead of standing by and waiting for the inevitable mistakes to crop
up Performance management processes operate on a continuous basis Therefore they provide
perhaps the best ongoing opportunities for employers to foster employee engagement and
commitment For example managers can use routine discussions about performance and
feedback sessions to learn which aspects of the job hold the most interest for each employee and
which tasks are most challenging During such discussions managers also can define what going
above and beyond the call of dutyrdquo looks like and generate ideas for rewarding such
contributions An employeersquos aspirations and career goals can receive careful attention during
performance appraisal meetings Without inquiring into an employeersquos personal life a supervisor
can nevertheless explore ways to enhance the compatibility between the workerrsquos commitment to
your organization and the employeersquos other life commitments Through such means the
organization personalizes its relationship to each employee and provides support while also
expressing appreciation for their contributionsmdash key drivers of engagement and commitment
To further engage employees and win their commitment through your performance management
programs consider how to treat your organizationrsquos most experienced employees In many cases
these employees understand the intricacies of a job better than their supervisors or managers do
By virtue of long identification with your organization they may be deeply committed to high-
level goals They use their expertise to contribute in ways that newer employees simply cannot
match But many of them also may be planning to retire soon especially if they are from the
ldquoBaby Boomerrdquo generation How will you transfer their knowledge to younger workers Design
a performance management system that recognizes and rewards proactive sharing of knowledge
and expertise among co-workers For example create knowledge repositories or learning
histories that can be stored in databases that employees can access and then create incentives
43
for people who contribute to and use these repositories Of course effective performance
management systems also identify employees who are not meeting expectations Failing to
address problem performance can erode other employeesrsquo engagement and commitment as their
workloads increase and they conclude that the company is willing to tolerate poor performance
If feedback coaching and remedial training are of little avail the manager may need to move the
person to a different position within the company where he or she can make a more valuable
contribution or let the individual go if there is no good match elsewhere in the organization
44
Chapter-V
RESEARCH METHODOLOGY
The basic task of research is to generate accurate information for use in decision-making
Research can be defined as the systematic and objective process of gathering recording and
analyzing data for aid in making business decisions As the project involves analyzing of
45
financial structure the research is exploratory in nature covering financial parameters and come
of the important ratios to carry out research There are basically two techniques adopted for
obtaining information
Primary Data
Secondary Data
Primary Data is gathered specifically for the project at hand through personal interviews with
the accounts officers
Sample Size = 100 Employees
Secondary data is previously collected and assembled for some project other than the one at
hand It is gathered and recorded by someone else prior to current needs of the researcher It is
less expensive than the primary date
Secondary Data can be obtained from both external and internal sources
External data may be collected from books and periodicals government sources media and other
commercial sources
Internal data is that secondary data which is created recorded or generated by the organization
As the project is explanatory in nature secondary data is collected from the reports of the
company books journals and interest Secondary data is gathered from annual reports official
records and standing orders of the units
CHAPTER - VI
DATA ANALYSIS AND INTERPRETATION
46
The data after collection is to be processed and analyzed in accordance with the outline
and down for the purpose at the time of developing research plan
Technically speaking processing implies editing coding classification and tabulation of
collected data so that they are amenable to analysis The term analysis refers to the computation
of certain measures along with searching for pattern groups Thus in the process of analysis
relationship or difference should be subjected to statistical tests of significance to determine with
what validity data can be said to indicate any conclusions
The analysis of data in a general way involves a number of closely related operations
which are performed with the purpose of summarizing the collected data and organizing them in
such a manner that they answer the research questions In this study the researcher followed
above process carefully and it is presented in this chapter
47
Table 41 ndash To know the department in which employees are belongs to
S
ou rc
e
survey data
Inference
From the above table it shows that 35 of employees are belongs to
production department
FIGURE 41
S
SI No
D
Department
N
No of Respondents
P
Percentage
1
1
M
Mechanical
3
30
3
30
2
2
E
Electrical
2
25
2
25
3
3
P
Production
3
35
3
35
4
4
O
Others
1
10
1
10
T
Total
1
100
1
100
48
REPRESENTS THE DEPARTMENT
Table 42 ndash To know working experience of the employees
Source survey data
Inference
From the above table it shows that 34 of the employees have 4 ndash 6
years experience
S
SI No
W
Work Experience
N
No of Respondents
P
Percentage
1
1
B
Below 2 years
1
33
1
13
2
2
2
2ndash 4 years
3
30
3
30
3
3
4
4ndash 6 years
3
34
3
34
4
4
A
Above 6 years
2
23
2
23
T
otal
1
100
1
100
49
FIGURE 42
REPRESENTS THE EXPERIENCE OF THE EMPLOYEES
Table 43 ndash To know the physical working environment
S
SI No
W
Working Environment
N
No of Respondents
P
Percentage
1
1
E
Excellent
1
12
1
12
2
2
G
Good
5
57
5
57
3
3
F
Fair
2
28
2
28
4
4
P
Poor
0
03
0
33
5
5
V
Very Poor
0
00
0
00
T
Total
1
100
1
100
Source survey data
Inference
From the above table it shows that 57 of the employees were feeling good about the working environment
50
FIGURE 43
REPRESENTS THE PHYSICAL WOKING ENVIRONMENT
51
Table 44 ndash To know the satisfaction level of employees towards the non-monitory benefits
S
SI No
N
Non-Monitory Benefits offered
to Employees
N
No of Respondents
P
Percentage
1
1
H
Highly Satisfied
1
14
1
14
2
2
S
Satisfied
5
54
5
54
3
3
N
Neither Satisfied nor Dissatisfied
2
25
2
25
4
4
D
Dissatisfied
0
05
0
05
5
5
H
Highly Dissatisfied
0
02
0
02
Total 1
100
1
100
Source survey data
Inference
From the above table it shows that 54 of the employees were satisfied towards the non-monitory benefits
FIGURE 44
REPRESENTS THE SATISFACTION LEVEL OF EMPLOYEES TOWARDS THE NON-MONITORY BENEFITS
52
Table 45 ndash To know the satisfaction level of respondents towards the work
assigned
Source survey dataInference
From the above table it shows that 45 of the respondents were satisfied towards the work assigned
FIGURE 45
S
SI No
A
Amount of Work
N
No of Respondents
P
Percentage
1
1
H
Highly satisfied
2
20
2
20
2
2
S
Satisfied
4
45
4
45
3
3
N
Neither Satisfied nor Dissatisfied
1
12
1
12
4
4
D
Dissatisfied
1
18
1
18
5
5
H
Highly Dissatisfied
0
06
0
06
Total 1
100
1
100
53
REPRESENTS THE SATISFACTION LEVEL OF RESPONDENTS TOWARDS THE WORK ASSIGNED
54
Table 46 ndash Opinion about the career development programme in their organisation
S
SI No
C
Career Development
N
No of Respondents
P
Percentage
H
Highly satisfied
1
12
1
12
S
Satisfied
5
56
5
56
N
Neither Satisfied nor Dissatisfied
2
22
2
22
D
Dissatisfied
1
10
1
10
H
Highly Dissatisfied
0
00
0
00
Total 1
100
1
100
Source survey data
Inference
From the above table it shows that 56 of the employees were satisfied
with the opinion about the carrier development programme in their organisation
FIGURE 46
REPRESENTS OPINION ABOUT THE CAREER DEVELOPMENT
PROGRAMME IN THEIR ORGANISATION
55
Table 47 ndash To know the cooperation of co-workers
S
SI No
C
Co-operation of Workers
N
No of Respondents
P
Percentage
1
1
H
Highly satisfied
2
20
2
20
2
2
S
Satisfied
6
66
6
66
3
3
N
Neither Satisfied nor Dissatisfied
1
11
1
11
4
4
D
Dissatisfied
0
03
0
03
5
5
H
Highly Dissatisfied
0
00
0
00
Total 1
100
1
100
Source survey data
Inference
From the above table it shows that 66 of the employees were satisfied
with the cooperation of co-workers
FIGURE 47
56
REPRESENTS THE COOPERATION OF CO-WORKERS
57
Table 48 ndash To know the satisfaction of Respondents with top management
S
SI No
S
Satisfaction with Top
Management
N
No of Respondents
P
Percentage
1
1
H
Highly satisfied
2
26
2
26
2
2
S
Satisfied
5
51
5
51
3
3
N
Neither Satisfied nor Dissatisfied
1
17
1
17
4
4
D
Dissatisfied
0
06
0
06
5
5
H
Highly dissatisfied
0
00
0
00
Total 1
100
1
100
Source survey data
Inference
From the above table it shows that 51 of the employees were satisfied with the top management
FIGURE 48
58
REPRESENTS THE SATISFACTION OF RESPONDENTS WITH TOP MANAGEMENT
Table 49 ndash To know the satisfaction of Respondents with their subordinates
Source survey data
Inference
From the above table it shows that 67 of the employees were satisfied with their subordinates
S
SI
No
S
Satisfaction with Subordinates
N
No of Respondents
P
Percentage
1
1
H
Highly satisfied
1
12
1
12
2
2
S
Satisfied
6
67
6
67
2
3
N
Neither Satisfied nor Dissatisfied
1
14
1
14
4
D
Dissatisfied
0
07
0
07
5
5
H
Highly Dissatisfied
0
00
0
00
Total 1
100
1
100
59
FIGURE 49
REPRESENTS THE SATISFACTION OF RESPONDENTS WITH THEIR SUBORDINATES
60
Table 410 ndash To know the level of satisfaction regarding nature of job
S
SI No
J
Job Satisfaction
N
No of Respondents
P
Percentage
1
1
H
Highly satisfied
2
22
2
22
2
2
S
Satisfied
5
56
5
56
3
3
N
Neither Satisfied nor Dissatisfied
1
16
1
16
4
4
D
Dissatisfied
0
07
0
07
5
5
H
Highly Dissatisfied
0
00
0
00
Total 1
100
1
100
Source survey dataInference
From the above table it shows that 56 of the employees were satisfied with their job
FIGURE 410
61
REPRESENTS THE LEVEL OF SATISFACTION REGARDING THE NATURE OF JOB
Table 411 ndash To know whether there is any job pressure in their work
Source survey data
Inference
From the above table it shows that 72 of employees said there is job pressure in their work
FIGURE 411
REPRESENTS WHETHER THERE IS ANY JOB PRESSURE IN THEIR WORK
S
SI No
J
Job Pressure
N
No of Respondents
P
Percentage
1
1
Y
Yes
7
72
7
72
2
2
N
No
2
28
2
28
T
Total
1
100
1
100
62
Table 412 ndash To know the opinion regarding opportunity provided by the organisation in developing skills
amp talents
S
SI No
D
Development of Skills and
Talents
N
No of Respondents
P
Percentage
1
1
H
Highly Agree
1
12
1
12
2
2
A
Agree
5
52
5
52
3
3
N
Neither Agree nor Disagree
2
28
2
28
4
4
D
Disagree
0
06
0
06
5
5
H
Highly Disagree
0
02
0
02
Total 1
100
1
100
Source survey data
Inference
From the above table it shows that 52 of employees agreed regarding opportunity provided by the organisation in developing skills amp talents
63
FIRGURE 412
REPRESENTS THE OPPORTUNITY PROVIDED BY THE ORGANISATION IN DEVELOPING SKILLS amp TALENTS
64
Table 413 ndash To know the satisfaction level of welfare facilities provided by the management
S
SI No
W
Welfare Facilities
N
No of Respondents
P
Percentage
1
1
H
Highly satisfied
0
09
9
09
2
2
S
Satisfied
5
57
5
57
3
3
N
Neither Satisfied nor Dissatisfied
2
29
2
29
4
4
D
Dissatisfied
5
05
0
05
5
5
H
Highly Dissatisfied
0
00
0
00
Total 1
100
1
100
Source survey data
Inference
From the above table it shows that 57 of the employees were satisfied with the welfare facilities provided by the management
FIGURE 413
REPRESENTS THE SATISFACTION LEVEL OF WELFARE FACILITIES PROVIDED BY THE MANGEMENT
65
Table 414 ndash To know the employee satisfaction towards the salary
Source survey data
Inference
From the above table it shows that 67 of the employees were satisfied
with their salary
FIGURE 414
REPRESENTS THE SATISFACTION TOWARDS THE SALARY
S
SI No
P
Payment Satisfaction
N
No of Respondents
P
Percentage
1
1
Y
Yes
6
67
6
67
2
2
N
No
3
33
3
33
T
otal
1
100
1
100
66
Table 415 ndash To know the employees willingness amp Commitment Towards
Organisation
Source survey data
Inference
From the above table it shows that 59 of the employees were willing to
continue in this organisation
FIGURE 415
REPRESENTS THE EMPLOYEES WILLINGNESS TO CONTINUE
S
SI No
W
Willingness to Work
N
No of Respondents
P
Percentage
1
1
Y
Yes
5
59
5
59
2
2
N
No
4
41
4
41
T
Total
1
00
1
00
67
CHI-SQUARE METHOD
The chi square test is one of the simplest and most widely used non-
parametric tests in statistical work As a non-parametric test it can be used to determine
if categorical data shows dependency or the two classifications are independent It can
also be used to make comparisons between theoretical population and actual data
when categories are used
n
Chi square χsup2= sum (O-E) sup2 E
i =1
Where O= observed frequency
E= expected frequency
68
OBSERVED FREQUENCY
Table 419 shows the relationship between the department and the job satisfaction
Over All
Job
SatisfactionHighly
SatisfiedSatisfied
Neither
Satisfied nor
Dissatisfied
DissatisfiedHighly
Dissatisfied
Sub
Total
Mechanical 5 6 14 3 2 30
Electrical 6 8 6 3 2 25
Production 9 13 7 4 2 35
Others 2 3 2 2 1 10
Sub Total 22 30 29 12 7 100
69
EXPECTED FREQUENCY
Over All
Job
SatisfactionHighly
SatisfiedSatisfied
Neither
Satisfied nor
Dissatisfied
DissatisfiedHighly
Dissatisfied
Sub
Total
Mechanical 7 8 9 4 2 30
Electrical 5 8 7 3 2 25
Production 8 11 10 4 2 35
Others 2 3 3 1 1 10
Sub Total 22 30 29 12 7 100
Null Hypothesis (Ho)
There is no significant difference between the department and the job satisfaction
Alternative Hypothesis (Ho)
There is significant difference between the job satisfaction
Co Relation
70
Chapter-V
CONCLUSIONS AND
RECOMMENDATIONS
71
CONCLUSION
On the basis of Analysis of Job Satisfaction Level of the Employees of Philips Electronics India
Ltd Mohali made in the previous chapters following conclusions are drawn
General Profile The plant of PHILIPS is ideally located in the Mohali Industrial focal point
Phase 9 near Chandigarh the capital of Punjab on a campus of 17 hectares The working
environment of the company is very healthy The visitors feel happy after the campus
Indigenous Technology PHILIPS is the only lighting manufacturing company based on purely
indigenous technology Philips was appropriately chosen as the brand name as self reliance and
building up of Indian Engineering capabilities remain the guiding spirit of PHILIPS
Financial structure PHILIPS is a low debt company signifying its dependence mainly on
its internal accruals for its financial requirements PHILIPS continues to strengthen its financial
position by channelising these internal accruals to fund its expansion programmes
Working results PTL has registered a handsome and constant growth in its profits because
of a brisk demand for new and better technology electronic items None of the other electronic
company has shown such a steady growth Philips has recorded the lowest current ratio
However with this lowest current ratio PTL still enjoys moderate payment period and highest
velocity of creditors and debtors only due to commitment of itrsquos employees
72
SUMMARY
According to the 1999 Gallup Poll the four elements that have proven to be effective in creating
employee loyalty are praise and recognition a sense of contribution to the company learning and
development and having a best friend at work
Creating a fairy-tale work environment begins withrecognition Your employees need it more
than money perks or titles Here are eight tips regarding recognition Remember these and your
employees may just start whistling while they work It is up to me The corporate culture or
financial rewards will not make your team successful It is up to you Recognition is one thing
that is completely in your control
Strong relationships are vital in todays economy Strengthening employee relationships is even
more necessary as companies downsize and lay off As your workforce shrinks and you need to
do more with less keeping quality employees becomes even more critical As a manager it is
your job to bond your best people to your company through recognition And you also must help
direct and motivate your core performers
Simple rewards earn big returns There are some relatively simple things you can do that will
earn big returns For example remember your employees birthdays and work anniversaries find
out what inexpensive rewards they value (for example tickets to a ball game or a half day off to
spend time with their kids) make the most of your formal service awards with some preparation
and a group presentation walk around your department every day and talk to your
people and thank them sincerely and often
73
Make it specific Praise and recognition must be specific to have impact General praise such as
You do great work actually can have the opposite effect and leave your employees wondering
Does he have any idea what I really do around here Specific praise links individual
accomplishments to company goals For example Cheryl I noticed the way you handled that
customer complaint Great work As you know we value quick resolutions of problems as
one of our core strategies
Ask the best to stay Call your best people into your office one at a time Let that bright young
college graduate know you value his fresh ideas and energy Tell the 20-year veteran how much
your team relies on her expertise and organizational skillsRemarkably a significant percent of
high-impact performers report that they left their last job because No one ever asked me to
stay
Forget cash
Remember the saying Money cant buy everything Well its true Dont wait until you can
offer an employee a raise or promotion Real thanks is its own reward In numerous surveys of
work satisfaction top on employees lists is feeling appreciated In fact when employees feel
recognized and involved they are much less likely to keep asking about money
Recognize
Recognition means most to an employee when it is sincere and spontaneous According to the
largest study ever conducted on workplace satisfaction (Gallup 1999) recognition should occur
at least every seven days If you wait until a year-end party or an annual review you are waiting
much too long to recognize and you probably are losing people you do not need to
74
Recognition works
Neglect can be a poisoned apple Recognition is the elixir that will spark better attitudes and
performance Jeffrey Pfeffer of Stanford University says The returns from managing people in
ways that build high commitment typically are on the order of 30 to 50 percent
Take a hard look in the mirror and ask yourself how you can recognize the fairest of them all
Learn to recognize your employees for their efforts thank them often and reward their
achievements You can awaken them from their anger and apathy and they will fall in love with
their jobs again Chances are you will work together happily ever after
So there is direct relation with employee satisfaction and their commitment towards the
organization and it is also clear from the above discussion that only monetary elements are not
sufficient for employee satisfaction rather other element like employer behavior recognisation
and other moral value
75
RECOMMENDATIONS
PHILIPS should increase its capacity utilization It should work at full capacity to
minimize its cost of production With this increase in capacity utilization the total cost
will spread over more units thereby decreasing the per unit cost
PHILIPS should decrease the credit facilities provided to its consumers The payback
period is quite high in case of debtors as compared to creditors it should be more or less
equal as it will help in improving company liquidity
PHILIPS should focus more on the consumer lifestyle goods in India parallel to its other
business as it accounts very less as compare to other businesses of Philips
Another recommendation for Mohali plant is about the HR department that is they
should appoint permanent and skilled workers as against casual workers which generally add
up to the profit of the company
76
BIBLIOGRAPHY
1 Values-Based Leadership Rebuilding Employee Commitment Performance and Productivity ( Thomas D Kuczmarski)
2 Monthly Journals of Philips Electronics India Ltd
3 Authentic Leadership Medtronic CEO Bill George
4 wwwindiaphilipscom
5 wwwwikipediacom
6 httpwwwemployeecommitmentcom
7 One Foot Out The Door How to Combat The Psychological Recession Thatrsquos Alienating Employees And Hurting American Business Judith Bardwick
8 Employee Commitment A Leader Ship Guide Joe Folkman
9 Harvard University Factors that Impact Employee Well Being Commitment and Productivity -An Article
77
Questionnaire
Name __________________________________________________________
Age______________________________ Gender _______________________
Qualification _______________________ Contact No ___________________
Q1 In which department you are working
Electrical Production Mechanical Other
Q2 What is your working experience
gt2 Years 2-4 Years 4-6 Years lt 6 Years
Q3 How You like the physical Working Environment of the organization
Excellent Good Fair Poor Very Poor
Q4 Are you satisfied with Non-Monitory benefits provided by the organisation
Highly Satisfied Satisfied Neither Satisfied Nor dissatisfied
Highly Dissatisfied Dissatisfied
Q5 Are you satisfied with your work
Highly Satisfied Satisfied Neither Satisfied Nor dissatisfied
Highly Dissatisfied Dissatisfied
Q6 Are you satisfied with the career development programe of the company
Highly Satisfied Satisfied Neither Satisfied Nor dissatisfied
Highly Dissatisfied Dissatisfied
Q7 Is other staff of the organization is co-operative with you
Highly Satisfied Satisfied Neither Satisfied Nor dissatisfied
Highly Dissatisfied Dissatisfied
Q8 Are you satisfied with top level management
Highly Satisfied Satisfied Neither Satisfied Nor dissatisfied
Highly Dissatisfied Dissatisfied
78
Q9 Are you satisfied with your subordinates
Highly Satisfied Satisfied Neither Satisfied Nor dissatisfied
Highly Dissatisfied Dissatisfied
Q10 Are you satisfied with the nature of the Job
Highly Satisfied Satisfied Neither Satisfied Nor dissatisfied
Highly Dissatisfied Dissatisfied
Q11 Do you have any Job Pressure in work
Yes No
Q12 Do you satisfied with the opportunities provided by the organisation
Highly Satisfied Satisfied Neither Satisfied Nor dissatisfied
Highly Dissatisfied Dissatisfied
Q13 Are you satisfied with the welfare facilities provided by the organisation
Highly Satisfied Satisfied Neither Satisfied Nor dissatisfied
Highly Dissatisfied Dissatisfied
Q14 Are you satisfied towards your salary
Highly Satisfied Satisfied Neither Satisfied Nor dissatisfied
Highly Dissatisfied Dissatisfied
Q15 Are you committed towards the organisation
Yes No
Signature

28
EMPLOYEE COMMITMENT EMPLOYEE ENGAGEMENT
1048657 How do you and other managers in your
organization define commitment
1048657 Are some employees in your company
engaged in their work but not committed to
the organization Committed to staying with
your firm but not exactly engaged in their
work Both engaged and committed
1048657 To whom are your organizations employees
committed The company Their supervisor
Co-workers Team members Customers
1048657 What business results has commitment from
1048657 How do you and other managers in your
organization define employee engagement
1048657 How do you know that certain employees in
your company are engaged Do they relish
their jobs Enjoy specific responsibilities or
tasks Willingly ldquogo the extra milerdquo
1048657 In teams departments or business units in
your company that have a large number of
engaged employees what business results
are you seeing Higher productivity Lower
costs Greater revenues More efficiency
29
employees created for your organization For
example has commitment reduced turnover
and therefore decreased recruitment hiring
and training costs
1048657 What does your company do to reciprocate
employees commitment Is the organization
living up to its side of the bargain
Lower turnover Higher product or service
quality
1048657 Conversely how do disengaged employees
behave and what are the consequent costs
for their teams units-and your entire
company
As Figure 2 suggests a person possesses attributes such as knowledge skills abilities
temperament attitudes and personality He or she uses these attributes to accomplish work
behaviors according to organization-defined procedures by applying tools equipment andor
technology Work behaviors in turn create the products and services that make an organization
successful We classify work behaviors into three categories those required to accomplish duties
and tasks specified in a job description (prescribed behaviors) ldquoextrardquo behaviors that an
employee contributes for the good of the organization (voluntary behaviors) and behaviors
prohibited by an employer (proscribed behaviors including unexcused absenteeism stealing and
other counterproductive or illegal actions) Of course job performance occurs in an
organizational context which includes elements such as leadership physical setting and social
setting
30
Employers naturally want to encourage workers to perform prescribed and voluntary activities
while avoiding proscribed ones To achieve these goals organizations use a number of HR
practices that directly affect the person process and context components of job performance
Employeesrsquo reactions to these practices determine their levels of engagement and commitment
31
Chapter-IV
32
LITERATURE OF THE REVIEW
ldquo Job Satisfaction That Leads To The Commitment Of
The Employees in The Organisationrdquo
Literature of Review
Gerge Bill Authentic Leadership
In his book Authentic Leadership former Medtronic CEO Bill George makes an obvious
point that business leaders rarely say out loud ldquoMissions motivate dollars donrsquotrdquo
What he means is that purpose is what drives employee commitment not the financial
rewards that come to others Workers donrsquot get up in the morning and say ldquoGee I can
33
hardly wait to get to work today to maximize shareholder profitsrdquo Even when employees
are shareholders who can benefit from improved financials what draws people to their
chosen careers is the work itself and its purpose in the world more than the profit
possibilities
Mr George goes on to say ldquoI find there is universal agreement (among middle managers)
that you cannot inspire employees by urging them to help management get the companyrsquos
stock price uprdquo
There is in fact quite a bit of literature on this subject In Awakening Corporate Soul
authors Eric Klein and John Izzo say that employee commitment requires knowing ldquothe
purpose of our work it means recognizing the purpose our organization fulfills that goes
beyond the bottom line and it means articulating to others how their (workersrsquo) efforts
contribute to a larger purposerdquo
In Built to Last Jim Collins and James Porras spend an entire book explaining their five
year research study of major companies that led to this conclusion about employee
commitment Purpose within a company is what sustains it profit is important but when
itrsquos the prime directive companies falter
-Marshal Goldsmith-
How to Increase Employee Commitment
In practice this involves walking the talk being transparent communicating effectively treating
people equally teaching leading subordinates to increasingly excellent performance ndash and
responding to subordinates as mature individuals who are owed fairness the truth and
recognition of their achievements
34
Since managers interact directly and frequently with subordinates they are usually more tuned
in to how employees are feeling than are executives Managers are in a better position to know
for example when employees are feeling alienated and disengaged from their work which is
very common today -- and expensive
Gaining employee commitment results in greater profits because enthusiastic employees stay
contribute discretionary effort and engage customers Performance soars when customers are
enthused and stay and when executives managers and employees are a collaborative team
united in achieving common goals
But managers are often called middle managers for good reason their job is to motivate and
guide subordinates while they at the same time are being judged by their bosses Because of
their ldquotweenrdquo position in the hierarchy managers to effective support direct reports must also
create relationships with potential allies especially those with greater power who have access to
top decision makers
Harvard University Factors that Impact Employee Well Being Commitment and
Productivity
Business executives from the C-suite and HR to QC and RampD are by nature focused on the
corporate bottom line A new trend in our dawning age of social sustainability is that many
experts believe more attention should be paid to the dotted line - the one signed when a person
35
commits to employment at a company New Harvard research validates this approach affirming
that trust and purpose play a significant role in building successful productive workplaces
The behavioral research conducted by a team at Harvard University and Massachusetts General
Hospital identifies the factors most likely to impact 21st century employee well being
commitment and productivity The researchers found that commitment is largely influenced by
ones sense of purpose feeling of personal impact and overall trust in the organization
Productivity is largely affected by the quality of human relationships including cooperative
social group moods and interaction
The results lead us to conclude that workplaces that provide positive environments that foster
interpersonal trust and quality personal relationships create the most committed and productive
employees says Nancy Etcoff PhD the lead researcher on the study
Expert Shares Keys to Building Successful Workplace Relationships
According to business strategist Courtney Anderson JD MBA Outstanding leadership
today means much more than just doing your job Success is creating an environment that fosters
happy committed productive team members
Anderson explains that reinvigorating workplaces by enhancing trust and employee commitment
does not have to be difficult The biggest challenge she says is making the time to truly change
in our overscheduled instant access competitive work environments With a little know-how it
can be easy to evolve workplace well being and respond to these compelling research results
-Mark Howell-
CEO Bright Point
High-performing companies recognize that employee commitment is a major contributing factor
toward sustaining long-term success and creating value An engaged employee is involved and
excited about their work and acts in a manner that will forward the organizationrsquos interest An
36
engaged workforce helps optimize and retain talent for the long-term because the employees
choose to stay even when other employment alternatives exist
According to Walker Information the top three drivers of employee commitment are
Satisfaction Fairness and Care amp Concern for employees Put simply committed employees
want to enjoy their work feel they are appreciated and know they are making a contribution to
their companyrsquos strategic objectives Additionally employees who have trust in their leadership
and are trusted by their leadership have a greater dedication and are ultimately more productive
on the job However according to recent data provided by the National Business Research
Institute (NBRI) only 31 of all employees are truly engaged
At BrightPoint we take employee engagement seriously and we work to create a culture that
inspires employee loyalty and satisfaction The results of BrightPointrsquos commitment to its
employees are shown in the 2011 BPNA Employee Commitment Survey The survey
determined that close to 80 of respondents indicated they were satisfied with their jobs and
daily activities General employee satisfaction increases when managers take an active interest
in their employees beyond their day-to-day job responsibilities According to NBRI managers
that actively coach build relationships and keep an open dialogue with their employees improve
employee engagement
We have a diverse workforce where each employee brings unique value and has individual
needs Managers are learning to manage the individual and not the position In order to give
managers the tools they need to be successful BrightPoint places strong emphasis on targeted
leadership training workshops and continual learning resources In 2011 906 of managers at
BrightPoint NA participated in the development opportunities offered and also made an effort to
37
help reinforce the learning of their team members This signals that our leadership team is taking
an active interest in professional development and its connection to employee commitment
As BrightPoint continues to increase focus on employee engagement the organization will grow
stronger and maintain a substantial advantage over our competition Our employees possess the
knowledge experience and resiliency to respond quickly to the demands of the marketplace and
through their genuine commitment will deliver what our customers want with increasing
efficiency and effectiveness Our responsibility is value-creation by growing our business and
maintaining high levels of customer service and loyalty We believe the best way to accomplish
this is through a strong committed and engaged workforce
Performance Model Adopted At Mohali Plant
38
Process adopted by Philips Electronics Mohali Plant for Job Satisfaction of Employee that leads commitment of the employees
39
Recruiting
The messages in Philips Electronics Mohali organization conveys while seeking to attract job
applicants also can influence future employeesrsquo engagement and commitment If your firm has
designed jobs specifically to engage employees then organization want to ensure that recruiting
ads extol these positionsrsquo attractive featuresmdashsuch as challenging work assignments a highly
skilled team environment or minimal supervision Applicants who notice and respond to these
ads will more likely be motivated by these features Also consider how organization might best
seek candidates from inside your organization When Organisation recruit existing employees for
desirable jobs you enhance their engagement (by maximizing the person-job fit) and
commitment (by providing growth and advancement opportunities to employees in return for
their loyalty) If Organisation recruit from outside when qualified internal candidates are
available Organization may unwittingly suggest to current employees that your company is not
willing to reciprocate their commitment Existing staff may then begin questioning their own
commitment to the firm By contrast organisation recruit external candidates to both the job and
your organization For these candidates ensure that recruiting messages highlight attractive job
features organizational values and commitment reciprocity That is in return for performance
and dedication your company offers competitive pay and benefits flexible work hours and
learning and career advancement opportunities Also remember that prospective employees have
multiple commitments You will inevitably have to compete with those commitments as
organization try to attract candidates to your firm Most people find it easier to make a new
commitment when it is compatible with their other obligations For example you boost your
chances of recruiting a highly qualified candidate who is a single parent if you offer flexible
work hours family health benefits and on-site day care ldquoRecruiting for Engagement and
Commitmentrdquo
40
Employee Selection
Once recruiting efforts produce a pool of promising job candidates Philips select among them to
fill available positions When organisation select the right individuals for the right jobs new
hires carry out their work more smoothly and experience fewer performance problems The
result Greater enjoyment ofmdashand engagement inmdashthe job
To enhance engagement through your selection of employees identify those candidates who are
best-suited to the job and your organizationrsquos culture Also use candidate assessment methods
that have obvious relevance to the job in questionmdashfor example by asking interviewees what
they know about the role and having them provide work samples Most candidates will view
these techniques more positively than tests with less apparent relevance such as personality and
integrity assessments Successful candidates feel good about having ldquopassed the test and see
company as careful and capable for having selected them A positive initial impression of an
employer encourages growth of long-term commitment
Training and Development
Training and development can serve as additional levers for enhancing engagement and
commitment For new hires training usually begins with orientation Orientation presents several
important opportunitiesmdashincluding explaining pay work schedules and company policies Most
important it gives you a chance to encourage employee engagement by explaining how the new
hirersquos job contributes to the organizationrsquos mission Through orientation Mohali Plant of Philips
Electronics describe how r company is organized introduce the new employee to his or her co-
workers give the person a tour of the area where he or she will be working and explain safety
regulations and other procedural matters In short you foster person-organization fitmdashvital for
developing productive and dedicated employees Through training you help new and current
41
employees acquire the knowledge and skills they need to perform their jobs And employees who
enhance their skills through training are more likely to engage fully in their work because they
derive satisfaction from mastering new tasks Training also enhances employeesrsquo value to your
company as well as their own employability in the job market In addition most companies offer
higher wages for skilled workers to compensate them for their greater value and to discourage
turnover
Compensation
Like the HR practices discussed above compensation can powerfully influence employee
engagement and commitment Some compensation components encourage commitment to
employers while others motivate engagement in the job It is possible to stimulate one and not
the other though itrsquos generally better to foster both For example a company that offers a strong
performance incentive system but no retirement plan will probably realize exceptional
engagement from its workers however they may eventually commit themselves to another
company that does offer a good retirement plan Meanwhile an organization that offers generous
retirement benefits but a traditional seniority-based pay grade system may have committed
employees however these workers might deliver pedestrian performance as they bide their time
until retirement In designing compensation plans you therefore need to consider employee
engagement and commitment strategically
Encourage managers to include employees in the goal-setting process This technique helps to
ensure that workers understand the goals It also promotes acceptance of challenging objectives
because people generally feel more committed to goals they have helped define In addition
consider how you and other managers will recognize and encourage contributions that exceed
expectations For example when a piece of equipment malfunctions Joe finds other ways to
maintain production rather than merely shutting down the machine and waiting for the
42
maintenance staff to fix it Or when a less experienced co-worker encounters a new task Sally
offers friendly coaching instead of standing by and waiting for the inevitable mistakes to crop
up Performance management processes operate on a continuous basis Therefore they provide
perhaps the best ongoing opportunities for employers to foster employee engagement and
commitment For example managers can use routine discussions about performance and
feedback sessions to learn which aspects of the job hold the most interest for each employee and
which tasks are most challenging During such discussions managers also can define what going
above and beyond the call of dutyrdquo looks like and generate ideas for rewarding such
contributions An employeersquos aspirations and career goals can receive careful attention during
performance appraisal meetings Without inquiring into an employeersquos personal life a supervisor
can nevertheless explore ways to enhance the compatibility between the workerrsquos commitment to
your organization and the employeersquos other life commitments Through such means the
organization personalizes its relationship to each employee and provides support while also
expressing appreciation for their contributionsmdash key drivers of engagement and commitment
To further engage employees and win their commitment through your performance management
programs consider how to treat your organizationrsquos most experienced employees In many cases
these employees understand the intricacies of a job better than their supervisors or managers do
By virtue of long identification with your organization they may be deeply committed to high-
level goals They use their expertise to contribute in ways that newer employees simply cannot
match But many of them also may be planning to retire soon especially if they are from the
ldquoBaby Boomerrdquo generation How will you transfer their knowledge to younger workers Design
a performance management system that recognizes and rewards proactive sharing of knowledge
and expertise among co-workers For example create knowledge repositories or learning
histories that can be stored in databases that employees can access and then create incentives
43
for people who contribute to and use these repositories Of course effective performance
management systems also identify employees who are not meeting expectations Failing to
address problem performance can erode other employeesrsquo engagement and commitment as their
workloads increase and they conclude that the company is willing to tolerate poor performance
If feedback coaching and remedial training are of little avail the manager may need to move the
person to a different position within the company where he or she can make a more valuable
contribution or let the individual go if there is no good match elsewhere in the organization
44
Chapter-V
RESEARCH METHODOLOGY
The basic task of research is to generate accurate information for use in decision-making
Research can be defined as the systematic and objective process of gathering recording and
analyzing data for aid in making business decisions As the project involves analyzing of
45
financial structure the research is exploratory in nature covering financial parameters and come
of the important ratios to carry out research There are basically two techniques adopted for
obtaining information
Primary Data
Secondary Data
Primary Data is gathered specifically for the project at hand through personal interviews with
the accounts officers
Sample Size = 100 Employees
Secondary data is previously collected and assembled for some project other than the one at
hand It is gathered and recorded by someone else prior to current needs of the researcher It is
less expensive than the primary date
Secondary Data can be obtained from both external and internal sources
External data may be collected from books and periodicals government sources media and other
commercial sources
Internal data is that secondary data which is created recorded or generated by the organization
As the project is explanatory in nature secondary data is collected from the reports of the
company books journals and interest Secondary data is gathered from annual reports official
records and standing orders of the units
CHAPTER - VI
DATA ANALYSIS AND INTERPRETATION
46
The data after collection is to be processed and analyzed in accordance with the outline
and down for the purpose at the time of developing research plan
Technically speaking processing implies editing coding classification and tabulation of
collected data so that they are amenable to analysis The term analysis refers to the computation
of certain measures along with searching for pattern groups Thus in the process of analysis
relationship or difference should be subjected to statistical tests of significance to determine with
what validity data can be said to indicate any conclusions
The analysis of data in a general way involves a number of closely related operations
which are performed with the purpose of summarizing the collected data and organizing them in
such a manner that they answer the research questions In this study the researcher followed
above process carefully and it is presented in this chapter
47
Table 41 ndash To know the department in which employees are belongs to
S
ou rc
e
survey data
Inference
From the above table it shows that 35 of employees are belongs to
production department
FIGURE 41
S
SI No
D
Department
N
No of Respondents
P
Percentage
1
1
M
Mechanical
3
30
3
30
2
2
E
Electrical
2
25
2
25
3
3
P
Production
3
35
3
35
4
4
O
Others
1
10
1
10
T
Total
1
100
1
100
48
REPRESENTS THE DEPARTMENT
Table 42 ndash To know working experience of the employees
Source survey data
Inference
From the above table it shows that 34 of the employees have 4 ndash 6
years experience
S
SI No
W
Work Experience
N
No of Respondents
P
Percentage
1
1
B
Below 2 years
1
33
1
13
2
2
2
2ndash 4 years
3
30
3
30
3
3
4
4ndash 6 years
3
34
3
34
4
4
A
Above 6 years
2
23
2
23
T
otal
1
100
1
100
49
FIGURE 42
REPRESENTS THE EXPERIENCE OF THE EMPLOYEES
Table 43 ndash To know the physical working environment
S
SI No
W
Working Environment
N
No of Respondents
P
Percentage
1
1
E
Excellent
1
12
1
12
2
2
G
Good
5
57
5
57
3
3
F
Fair
2
28
2
28
4
4
P
Poor
0
03
0
33
5
5
V
Very Poor
0
00
0
00
T
Total
1
100
1
100
Source survey data
Inference
From the above table it shows that 57 of the employees were feeling good about the working environment
50
FIGURE 43
REPRESENTS THE PHYSICAL WOKING ENVIRONMENT
51
Table 44 ndash To know the satisfaction level of employees towards the non-monitory benefits
S
SI No
N
Non-Monitory Benefits offered
to Employees
N
No of Respondents
P
Percentage
1
1
H
Highly Satisfied
1
14
1
14
2
2
S
Satisfied
5
54
5
54
3
3
N
Neither Satisfied nor Dissatisfied
2
25
2
25
4
4
D
Dissatisfied
0
05
0
05
5
5
H
Highly Dissatisfied
0
02
0
02
Total 1
100
1
100
Source survey data
Inference
From the above table it shows that 54 of the employees were satisfied towards the non-monitory benefits
FIGURE 44
REPRESENTS THE SATISFACTION LEVEL OF EMPLOYEES TOWARDS THE NON-MONITORY BENEFITS
52
Table 45 ndash To know the satisfaction level of respondents towards the work
assigned
Source survey dataInference
From the above table it shows that 45 of the respondents were satisfied towards the work assigned
FIGURE 45
S
SI No
A
Amount of Work
N
No of Respondents
P
Percentage
1
1
H
Highly satisfied
2
20
2
20
2
2
S
Satisfied
4
45
4
45
3
3
N
Neither Satisfied nor Dissatisfied
1
12
1
12
4
4
D
Dissatisfied
1
18
1
18
5
5
H
Highly Dissatisfied
0
06
0
06
Total 1
100
1
100
53
REPRESENTS THE SATISFACTION LEVEL OF RESPONDENTS TOWARDS THE WORK ASSIGNED
54
Table 46 ndash Opinion about the career development programme in their organisation
S
SI No
C
Career Development
N
No of Respondents
P
Percentage
H
Highly satisfied
1
12
1
12
S
Satisfied
5
56
5
56
N
Neither Satisfied nor Dissatisfied
2
22
2
22
D
Dissatisfied
1
10
1
10
H
Highly Dissatisfied
0
00
0
00
Total 1
100
1
100
Source survey data
Inference
From the above table it shows that 56 of the employees were satisfied
with the opinion about the carrier development programme in their organisation
FIGURE 46
REPRESENTS OPINION ABOUT THE CAREER DEVELOPMENT
PROGRAMME IN THEIR ORGANISATION
55
Table 47 ndash To know the cooperation of co-workers
S
SI No
C
Co-operation of Workers
N
No of Respondents
P
Percentage
1
1
H
Highly satisfied
2
20
2
20
2
2
S
Satisfied
6
66
6
66
3
3
N
Neither Satisfied nor Dissatisfied
1
11
1
11
4
4
D
Dissatisfied
0
03
0
03
5
5
H
Highly Dissatisfied
0
00
0
00
Total 1
100
1
100
Source survey data
Inference
From the above table it shows that 66 of the employees were satisfied
with the cooperation of co-workers
FIGURE 47
56
REPRESENTS THE COOPERATION OF CO-WORKERS
57
Table 48 ndash To know the satisfaction of Respondents with top management
S
SI No
S
Satisfaction with Top
Management
N
No of Respondents
P
Percentage
1
1
H
Highly satisfied
2
26
2
26
2
2
S
Satisfied
5
51
5
51
3
3
N
Neither Satisfied nor Dissatisfied
1
17
1
17
4
4
D
Dissatisfied
0
06
0
06
5
5
H
Highly dissatisfied
0
00
0
00
Total 1
100
1
100
Source survey data
Inference
From the above table it shows that 51 of the employees were satisfied with the top management
FIGURE 48
58
REPRESENTS THE SATISFACTION OF RESPONDENTS WITH TOP MANAGEMENT
Table 49 ndash To know the satisfaction of Respondents with their subordinates
Source survey data
Inference
From the above table it shows that 67 of the employees were satisfied with their subordinates
S
SI
No
S
Satisfaction with Subordinates
N
No of Respondents
P
Percentage
1
1
H
Highly satisfied
1
12
1
12
2
2
S
Satisfied
6
67
6
67
2
3
N
Neither Satisfied nor Dissatisfied
1
14
1
14
4
D
Dissatisfied
0
07
0
07
5
5
H
Highly Dissatisfied
0
00
0
00
Total 1
100
1
100
59
FIGURE 49
REPRESENTS THE SATISFACTION OF RESPONDENTS WITH THEIR SUBORDINATES
60
Table 410 ndash To know the level of satisfaction regarding nature of job
S
SI No
J
Job Satisfaction
N
No of Respondents
P
Percentage
1
1
H
Highly satisfied
2
22
2
22
2
2
S
Satisfied
5
56
5
56
3
3
N
Neither Satisfied nor Dissatisfied
1
16
1
16
4
4
D
Dissatisfied
0
07
0
07
5
5
H
Highly Dissatisfied
0
00
0
00
Total 1
100
1
100
Source survey dataInference
From the above table it shows that 56 of the employees were satisfied with their job
FIGURE 410
61
REPRESENTS THE LEVEL OF SATISFACTION REGARDING THE NATURE OF JOB
Table 411 ndash To know whether there is any job pressure in their work
Source survey data
Inference
From the above table it shows that 72 of employees said there is job pressure in their work
FIGURE 411
REPRESENTS WHETHER THERE IS ANY JOB PRESSURE IN THEIR WORK
S
SI No
J
Job Pressure
N
No of Respondents
P
Percentage
1
1
Y
Yes
7
72
7
72
2
2
N
No
2
28
2
28
T
Total
1
100
1
100
62
Table 412 ndash To know the opinion regarding opportunity provided by the organisation in developing skills
amp talents
S
SI No
D
Development of Skills and
Talents
N
No of Respondents
P
Percentage
1
1
H
Highly Agree
1
12
1
12
2
2
A
Agree
5
52
5
52
3
3
N
Neither Agree nor Disagree
2
28
2
28
4
4
D
Disagree
0
06
0
06
5
5
H
Highly Disagree
0
02
0
02
Total 1
100
1
100
Source survey data
Inference
From the above table it shows that 52 of employees agreed regarding opportunity provided by the organisation in developing skills amp talents
63
FIRGURE 412
REPRESENTS THE OPPORTUNITY PROVIDED BY THE ORGANISATION IN DEVELOPING SKILLS amp TALENTS
64
Table 413 ndash To know the satisfaction level of welfare facilities provided by the management
S
SI No
W
Welfare Facilities
N
No of Respondents
P
Percentage
1
1
H
Highly satisfied
0
09
9
09
2
2
S
Satisfied
5
57
5
57
3
3
N
Neither Satisfied nor Dissatisfied
2
29
2
29
4
4
D
Dissatisfied
5
05
0
05
5
5
H
Highly Dissatisfied
0
00
0
00
Total 1
100
1
100
Source survey data
Inference
From the above table it shows that 57 of the employees were satisfied with the welfare facilities provided by the management
FIGURE 413
REPRESENTS THE SATISFACTION LEVEL OF WELFARE FACILITIES PROVIDED BY THE MANGEMENT
65
Table 414 ndash To know the employee satisfaction towards the salary
Source survey data
Inference
From the above table it shows that 67 of the employees were satisfied
with their salary
FIGURE 414
REPRESENTS THE SATISFACTION TOWARDS THE SALARY
S
SI No
P
Payment Satisfaction
N
No of Respondents
P
Percentage
1
1
Y
Yes
6
67
6
67
2
2
N
No
3
33
3
33
T
otal
1
100
1
100
66
Table 415 ndash To know the employees willingness amp Commitment Towards
Organisation
Source survey data
Inference
From the above table it shows that 59 of the employees were willing to
continue in this organisation
FIGURE 415
REPRESENTS THE EMPLOYEES WILLINGNESS TO CONTINUE
S
SI No
W
Willingness to Work
N
No of Respondents
P
Percentage
1
1
Y
Yes
5
59
5
59
2
2
N
No
4
41
4
41
T
Total
1
00
1
00
67
CHI-SQUARE METHOD
The chi square test is one of the simplest and most widely used non-
parametric tests in statistical work As a non-parametric test it can be used to determine
if categorical data shows dependency or the two classifications are independent It can
also be used to make comparisons between theoretical population and actual data
when categories are used
n
Chi square χsup2= sum (O-E) sup2 E
i =1
Where O= observed frequency
E= expected frequency
68
OBSERVED FREQUENCY
Table 419 shows the relationship between the department and the job satisfaction
Over All
Job
SatisfactionHighly
SatisfiedSatisfied
Neither
Satisfied nor
Dissatisfied
DissatisfiedHighly
Dissatisfied
Sub
Total
Mechanical 5 6 14 3 2 30
Electrical 6 8 6 3 2 25
Production 9 13 7 4 2 35
Others 2 3 2 2 1 10
Sub Total 22 30 29 12 7 100
69
EXPECTED FREQUENCY
Over All
Job
SatisfactionHighly
SatisfiedSatisfied
Neither
Satisfied nor
Dissatisfied
DissatisfiedHighly
Dissatisfied
Sub
Total
Mechanical 7 8 9 4 2 30
Electrical 5 8 7 3 2 25
Production 8 11 10 4 2 35
Others 2 3 3 1 1 10
Sub Total 22 30 29 12 7 100
Null Hypothesis (Ho)
There is no significant difference between the department and the job satisfaction
Alternative Hypothesis (Ho)
There is significant difference between the job satisfaction
Co Relation
70
Chapter-V
CONCLUSIONS AND
RECOMMENDATIONS
71
CONCLUSION
On the basis of Analysis of Job Satisfaction Level of the Employees of Philips Electronics India
Ltd Mohali made in the previous chapters following conclusions are drawn
General Profile The plant of PHILIPS is ideally located in the Mohali Industrial focal point
Phase 9 near Chandigarh the capital of Punjab on a campus of 17 hectares The working
environment of the company is very healthy The visitors feel happy after the campus
Indigenous Technology PHILIPS is the only lighting manufacturing company based on purely
indigenous technology Philips was appropriately chosen as the brand name as self reliance and
building up of Indian Engineering capabilities remain the guiding spirit of PHILIPS
Financial structure PHILIPS is a low debt company signifying its dependence mainly on
its internal accruals for its financial requirements PHILIPS continues to strengthen its financial
position by channelising these internal accruals to fund its expansion programmes
Working results PTL has registered a handsome and constant growth in its profits because
of a brisk demand for new and better technology electronic items None of the other electronic
company has shown such a steady growth Philips has recorded the lowest current ratio
However with this lowest current ratio PTL still enjoys moderate payment period and highest
velocity of creditors and debtors only due to commitment of itrsquos employees
72
SUMMARY
According to the 1999 Gallup Poll the four elements that have proven to be effective in creating
employee loyalty are praise and recognition a sense of contribution to the company learning and
development and having a best friend at work
Creating a fairy-tale work environment begins withrecognition Your employees need it more
than money perks or titles Here are eight tips regarding recognition Remember these and your
employees may just start whistling while they work It is up to me The corporate culture or
financial rewards will not make your team successful It is up to you Recognition is one thing
that is completely in your control
Strong relationships are vital in todays economy Strengthening employee relationships is even
more necessary as companies downsize and lay off As your workforce shrinks and you need to
do more with less keeping quality employees becomes even more critical As a manager it is
your job to bond your best people to your company through recognition And you also must help
direct and motivate your core performers
Simple rewards earn big returns There are some relatively simple things you can do that will
earn big returns For example remember your employees birthdays and work anniversaries find
out what inexpensive rewards they value (for example tickets to a ball game or a half day off to
spend time with their kids) make the most of your formal service awards with some preparation
and a group presentation walk around your department every day and talk to your
people and thank them sincerely and often
73
Make it specific Praise and recognition must be specific to have impact General praise such as
You do great work actually can have the opposite effect and leave your employees wondering
Does he have any idea what I really do around here Specific praise links individual
accomplishments to company goals For example Cheryl I noticed the way you handled that
customer complaint Great work As you know we value quick resolutions of problems as
one of our core strategies
Ask the best to stay Call your best people into your office one at a time Let that bright young
college graduate know you value his fresh ideas and energy Tell the 20-year veteran how much
your team relies on her expertise and organizational skillsRemarkably a significant percent of
high-impact performers report that they left their last job because No one ever asked me to
stay
Forget cash
Remember the saying Money cant buy everything Well its true Dont wait until you can
offer an employee a raise or promotion Real thanks is its own reward In numerous surveys of
work satisfaction top on employees lists is feeling appreciated In fact when employees feel
recognized and involved they are much less likely to keep asking about money
Recognize
Recognition means most to an employee when it is sincere and spontaneous According to the
largest study ever conducted on workplace satisfaction (Gallup 1999) recognition should occur
at least every seven days If you wait until a year-end party or an annual review you are waiting
much too long to recognize and you probably are losing people you do not need to
74
Recognition works
Neglect can be a poisoned apple Recognition is the elixir that will spark better attitudes and
performance Jeffrey Pfeffer of Stanford University says The returns from managing people in
ways that build high commitment typically are on the order of 30 to 50 percent
Take a hard look in the mirror and ask yourself how you can recognize the fairest of them all
Learn to recognize your employees for their efforts thank them often and reward their
achievements You can awaken them from their anger and apathy and they will fall in love with
their jobs again Chances are you will work together happily ever after
So there is direct relation with employee satisfaction and their commitment towards the
organization and it is also clear from the above discussion that only monetary elements are not
sufficient for employee satisfaction rather other element like employer behavior recognisation
and other moral value
75
RECOMMENDATIONS
PHILIPS should increase its capacity utilization It should work at full capacity to
minimize its cost of production With this increase in capacity utilization the total cost
will spread over more units thereby decreasing the per unit cost
PHILIPS should decrease the credit facilities provided to its consumers The payback
period is quite high in case of debtors as compared to creditors it should be more or less
equal as it will help in improving company liquidity
PHILIPS should focus more on the consumer lifestyle goods in India parallel to its other
business as it accounts very less as compare to other businesses of Philips
Another recommendation for Mohali plant is about the HR department that is they
should appoint permanent and skilled workers as against casual workers which generally add
up to the profit of the company
76
BIBLIOGRAPHY
1 Values-Based Leadership Rebuilding Employee Commitment Performance and Productivity ( Thomas D Kuczmarski)
2 Monthly Journals of Philips Electronics India Ltd
3 Authentic Leadership Medtronic CEO Bill George
4 wwwindiaphilipscom
5 wwwwikipediacom
6 httpwwwemployeecommitmentcom
7 One Foot Out The Door How to Combat The Psychological Recession Thatrsquos Alienating Employees And Hurting American Business Judith Bardwick
8 Employee Commitment A Leader Ship Guide Joe Folkman
9 Harvard University Factors that Impact Employee Well Being Commitment and Productivity -An Article
77
Questionnaire
Name __________________________________________________________
Age______________________________ Gender _______________________
Qualification _______________________ Contact No ___________________
Q1 In which department you are working
Electrical Production Mechanical Other
Q2 What is your working experience
gt2 Years 2-4 Years 4-6 Years lt 6 Years
Q3 How You like the physical Working Environment of the organization
Excellent Good Fair Poor Very Poor
Q4 Are you satisfied with Non-Monitory benefits provided by the organisation
Highly Satisfied Satisfied Neither Satisfied Nor dissatisfied
Highly Dissatisfied Dissatisfied
Q5 Are you satisfied with your work
Highly Satisfied Satisfied Neither Satisfied Nor dissatisfied
Highly Dissatisfied Dissatisfied
Q6 Are you satisfied with the career development programe of the company
Highly Satisfied Satisfied Neither Satisfied Nor dissatisfied
Highly Dissatisfied Dissatisfied
Q7 Is other staff of the organization is co-operative with you
Highly Satisfied Satisfied Neither Satisfied Nor dissatisfied
Highly Dissatisfied Dissatisfied
Q8 Are you satisfied with top level management
Highly Satisfied Satisfied Neither Satisfied Nor dissatisfied
Highly Dissatisfied Dissatisfied
78
Q9 Are you satisfied with your subordinates
Highly Satisfied Satisfied Neither Satisfied Nor dissatisfied
Highly Dissatisfied Dissatisfied
Q10 Are you satisfied with the nature of the Job
Highly Satisfied Satisfied Neither Satisfied Nor dissatisfied
Highly Dissatisfied Dissatisfied
Q11 Do you have any Job Pressure in work
Yes No
Q12 Do you satisfied with the opportunities provided by the organisation
Highly Satisfied Satisfied Neither Satisfied Nor dissatisfied
Highly Dissatisfied Dissatisfied
Q13 Are you satisfied with the welfare facilities provided by the organisation
Highly Satisfied Satisfied Neither Satisfied Nor dissatisfied
Highly Dissatisfied Dissatisfied
Q14 Are you satisfied towards your salary
Highly Satisfied Satisfied Neither Satisfied Nor dissatisfied
Highly Dissatisfied Dissatisfied
Q15 Are you committed towards the organisation
Yes No
Signature

29
employees created for your organization For
example has commitment reduced turnover
and therefore decreased recruitment hiring
and training costs
1048657 What does your company do to reciprocate
employees commitment Is the organization
living up to its side of the bargain
Lower turnover Higher product or service
quality
1048657 Conversely how do disengaged employees
behave and what are the consequent costs
for their teams units-and your entire
company
As Figure 2 suggests a person possesses attributes such as knowledge skills abilities
temperament attitudes and personality He or she uses these attributes to accomplish work
behaviors according to organization-defined procedures by applying tools equipment andor
technology Work behaviors in turn create the products and services that make an organization
successful We classify work behaviors into three categories those required to accomplish duties
and tasks specified in a job description (prescribed behaviors) ldquoextrardquo behaviors that an
employee contributes for the good of the organization (voluntary behaviors) and behaviors
prohibited by an employer (proscribed behaviors including unexcused absenteeism stealing and
other counterproductive or illegal actions) Of course job performance occurs in an
organizational context which includes elements such as leadership physical setting and social
setting
30
Employers naturally want to encourage workers to perform prescribed and voluntary activities
while avoiding proscribed ones To achieve these goals organizations use a number of HR
practices that directly affect the person process and context components of job performance
Employeesrsquo reactions to these practices determine their levels of engagement and commitment
31
Chapter-IV
32
LITERATURE OF THE REVIEW
ldquo Job Satisfaction That Leads To The Commitment Of
The Employees in The Organisationrdquo
Literature of Review
Gerge Bill Authentic Leadership
In his book Authentic Leadership former Medtronic CEO Bill George makes an obvious
point that business leaders rarely say out loud ldquoMissions motivate dollars donrsquotrdquo
What he means is that purpose is what drives employee commitment not the financial
rewards that come to others Workers donrsquot get up in the morning and say ldquoGee I can
33
hardly wait to get to work today to maximize shareholder profitsrdquo Even when employees
are shareholders who can benefit from improved financials what draws people to their
chosen careers is the work itself and its purpose in the world more than the profit
possibilities
Mr George goes on to say ldquoI find there is universal agreement (among middle managers)
that you cannot inspire employees by urging them to help management get the companyrsquos
stock price uprdquo
There is in fact quite a bit of literature on this subject In Awakening Corporate Soul
authors Eric Klein and John Izzo say that employee commitment requires knowing ldquothe
purpose of our work it means recognizing the purpose our organization fulfills that goes
beyond the bottom line and it means articulating to others how their (workersrsquo) efforts
contribute to a larger purposerdquo
In Built to Last Jim Collins and James Porras spend an entire book explaining their five
year research study of major companies that led to this conclusion about employee
commitment Purpose within a company is what sustains it profit is important but when
itrsquos the prime directive companies falter
-Marshal Goldsmith-
How to Increase Employee Commitment
In practice this involves walking the talk being transparent communicating effectively treating
people equally teaching leading subordinates to increasingly excellent performance ndash and
responding to subordinates as mature individuals who are owed fairness the truth and
recognition of their achievements
34
Since managers interact directly and frequently with subordinates they are usually more tuned
in to how employees are feeling than are executives Managers are in a better position to know
for example when employees are feeling alienated and disengaged from their work which is
very common today -- and expensive
Gaining employee commitment results in greater profits because enthusiastic employees stay
contribute discretionary effort and engage customers Performance soars when customers are
enthused and stay and when executives managers and employees are a collaborative team
united in achieving common goals
But managers are often called middle managers for good reason their job is to motivate and
guide subordinates while they at the same time are being judged by their bosses Because of
their ldquotweenrdquo position in the hierarchy managers to effective support direct reports must also
create relationships with potential allies especially those with greater power who have access to
top decision makers
Harvard University Factors that Impact Employee Well Being Commitment and
Productivity
Business executives from the C-suite and HR to QC and RampD are by nature focused on the
corporate bottom line A new trend in our dawning age of social sustainability is that many
experts believe more attention should be paid to the dotted line - the one signed when a person
35
commits to employment at a company New Harvard research validates this approach affirming
that trust and purpose play a significant role in building successful productive workplaces
The behavioral research conducted by a team at Harvard University and Massachusetts General
Hospital identifies the factors most likely to impact 21st century employee well being
commitment and productivity The researchers found that commitment is largely influenced by
ones sense of purpose feeling of personal impact and overall trust in the organization
Productivity is largely affected by the quality of human relationships including cooperative
social group moods and interaction
The results lead us to conclude that workplaces that provide positive environments that foster
interpersonal trust and quality personal relationships create the most committed and productive
employees says Nancy Etcoff PhD the lead researcher on the study
Expert Shares Keys to Building Successful Workplace Relationships
According to business strategist Courtney Anderson JD MBA Outstanding leadership
today means much more than just doing your job Success is creating an environment that fosters
happy committed productive team members
Anderson explains that reinvigorating workplaces by enhancing trust and employee commitment
does not have to be difficult The biggest challenge she says is making the time to truly change
in our overscheduled instant access competitive work environments With a little know-how it
can be easy to evolve workplace well being and respond to these compelling research results
-Mark Howell-
CEO Bright Point
High-performing companies recognize that employee commitment is a major contributing factor
toward sustaining long-term success and creating value An engaged employee is involved and
excited about their work and acts in a manner that will forward the organizationrsquos interest An
36
engaged workforce helps optimize and retain talent for the long-term because the employees
choose to stay even when other employment alternatives exist
According to Walker Information the top three drivers of employee commitment are
Satisfaction Fairness and Care amp Concern for employees Put simply committed employees
want to enjoy their work feel they are appreciated and know they are making a contribution to
their companyrsquos strategic objectives Additionally employees who have trust in their leadership
and are trusted by their leadership have a greater dedication and are ultimately more productive
on the job However according to recent data provided by the National Business Research
Institute (NBRI) only 31 of all employees are truly engaged
At BrightPoint we take employee engagement seriously and we work to create a culture that
inspires employee loyalty and satisfaction The results of BrightPointrsquos commitment to its
employees are shown in the 2011 BPNA Employee Commitment Survey The survey
determined that close to 80 of respondents indicated they were satisfied with their jobs and
daily activities General employee satisfaction increases when managers take an active interest
in their employees beyond their day-to-day job responsibilities According to NBRI managers
that actively coach build relationships and keep an open dialogue with their employees improve
employee engagement
We have a diverse workforce where each employee brings unique value and has individual
needs Managers are learning to manage the individual and not the position In order to give
managers the tools they need to be successful BrightPoint places strong emphasis on targeted
leadership training workshops and continual learning resources In 2011 906 of managers at
BrightPoint NA participated in the development opportunities offered and also made an effort to
37
help reinforce the learning of their team members This signals that our leadership team is taking
an active interest in professional development and its connection to employee commitment
As BrightPoint continues to increase focus on employee engagement the organization will grow
stronger and maintain a substantial advantage over our competition Our employees possess the
knowledge experience and resiliency to respond quickly to the demands of the marketplace and
through their genuine commitment will deliver what our customers want with increasing
efficiency and effectiveness Our responsibility is value-creation by growing our business and
maintaining high levels of customer service and loyalty We believe the best way to accomplish
this is through a strong committed and engaged workforce
Performance Model Adopted At Mohali Plant
38
Process adopted by Philips Electronics Mohali Plant for Job Satisfaction of Employee that leads commitment of the employees
39
Recruiting
The messages in Philips Electronics Mohali organization conveys while seeking to attract job
applicants also can influence future employeesrsquo engagement and commitment If your firm has
designed jobs specifically to engage employees then organization want to ensure that recruiting
ads extol these positionsrsquo attractive featuresmdashsuch as challenging work assignments a highly
skilled team environment or minimal supervision Applicants who notice and respond to these
ads will more likely be motivated by these features Also consider how organization might best
seek candidates from inside your organization When Organisation recruit existing employees for
desirable jobs you enhance their engagement (by maximizing the person-job fit) and
commitment (by providing growth and advancement opportunities to employees in return for
their loyalty) If Organisation recruit from outside when qualified internal candidates are
available Organization may unwittingly suggest to current employees that your company is not
willing to reciprocate their commitment Existing staff may then begin questioning their own
commitment to the firm By contrast organisation recruit external candidates to both the job and
your organization For these candidates ensure that recruiting messages highlight attractive job
features organizational values and commitment reciprocity That is in return for performance
and dedication your company offers competitive pay and benefits flexible work hours and
learning and career advancement opportunities Also remember that prospective employees have
multiple commitments You will inevitably have to compete with those commitments as
organization try to attract candidates to your firm Most people find it easier to make a new
commitment when it is compatible with their other obligations For example you boost your
chances of recruiting a highly qualified candidate who is a single parent if you offer flexible
work hours family health benefits and on-site day care ldquoRecruiting for Engagement and
Commitmentrdquo
40
Employee Selection
Once recruiting efforts produce a pool of promising job candidates Philips select among them to
fill available positions When organisation select the right individuals for the right jobs new
hires carry out their work more smoothly and experience fewer performance problems The
result Greater enjoyment ofmdashand engagement inmdashthe job
To enhance engagement through your selection of employees identify those candidates who are
best-suited to the job and your organizationrsquos culture Also use candidate assessment methods
that have obvious relevance to the job in questionmdashfor example by asking interviewees what
they know about the role and having them provide work samples Most candidates will view
these techniques more positively than tests with less apparent relevance such as personality and
integrity assessments Successful candidates feel good about having ldquopassed the test and see
company as careful and capable for having selected them A positive initial impression of an
employer encourages growth of long-term commitment
Training and Development
Training and development can serve as additional levers for enhancing engagement and
commitment For new hires training usually begins with orientation Orientation presents several
important opportunitiesmdashincluding explaining pay work schedules and company policies Most
important it gives you a chance to encourage employee engagement by explaining how the new
hirersquos job contributes to the organizationrsquos mission Through orientation Mohali Plant of Philips
Electronics describe how r company is organized introduce the new employee to his or her co-
workers give the person a tour of the area where he or she will be working and explain safety
regulations and other procedural matters In short you foster person-organization fitmdashvital for
developing productive and dedicated employees Through training you help new and current
41
employees acquire the knowledge and skills they need to perform their jobs And employees who
enhance their skills through training are more likely to engage fully in their work because they
derive satisfaction from mastering new tasks Training also enhances employeesrsquo value to your
company as well as their own employability in the job market In addition most companies offer
higher wages for skilled workers to compensate them for their greater value and to discourage
turnover
Compensation
Like the HR practices discussed above compensation can powerfully influence employee
engagement and commitment Some compensation components encourage commitment to
employers while others motivate engagement in the job It is possible to stimulate one and not
the other though itrsquos generally better to foster both For example a company that offers a strong
performance incentive system but no retirement plan will probably realize exceptional
engagement from its workers however they may eventually commit themselves to another
company that does offer a good retirement plan Meanwhile an organization that offers generous
retirement benefits but a traditional seniority-based pay grade system may have committed
employees however these workers might deliver pedestrian performance as they bide their time
until retirement In designing compensation plans you therefore need to consider employee
engagement and commitment strategically
Encourage managers to include employees in the goal-setting process This technique helps to
ensure that workers understand the goals It also promotes acceptance of challenging objectives
because people generally feel more committed to goals they have helped define In addition
consider how you and other managers will recognize and encourage contributions that exceed
expectations For example when a piece of equipment malfunctions Joe finds other ways to
maintain production rather than merely shutting down the machine and waiting for the
42
maintenance staff to fix it Or when a less experienced co-worker encounters a new task Sally
offers friendly coaching instead of standing by and waiting for the inevitable mistakes to crop
up Performance management processes operate on a continuous basis Therefore they provide
perhaps the best ongoing opportunities for employers to foster employee engagement and
commitment For example managers can use routine discussions about performance and
feedback sessions to learn which aspects of the job hold the most interest for each employee and
which tasks are most challenging During such discussions managers also can define what going
above and beyond the call of dutyrdquo looks like and generate ideas for rewarding such
contributions An employeersquos aspirations and career goals can receive careful attention during
performance appraisal meetings Without inquiring into an employeersquos personal life a supervisor
can nevertheless explore ways to enhance the compatibility between the workerrsquos commitment to
your organization and the employeersquos other life commitments Through such means the
organization personalizes its relationship to each employee and provides support while also
expressing appreciation for their contributionsmdash key drivers of engagement and commitment
To further engage employees and win their commitment through your performance management
programs consider how to treat your organizationrsquos most experienced employees In many cases
these employees understand the intricacies of a job better than their supervisors or managers do
By virtue of long identification with your organization they may be deeply committed to high-
level goals They use their expertise to contribute in ways that newer employees simply cannot
match But many of them also may be planning to retire soon especially if they are from the
ldquoBaby Boomerrdquo generation How will you transfer their knowledge to younger workers Design
a performance management system that recognizes and rewards proactive sharing of knowledge
and expertise among co-workers For example create knowledge repositories or learning
histories that can be stored in databases that employees can access and then create incentives
43
for people who contribute to and use these repositories Of course effective performance
management systems also identify employees who are not meeting expectations Failing to
address problem performance can erode other employeesrsquo engagement and commitment as their
workloads increase and they conclude that the company is willing to tolerate poor performance
If feedback coaching and remedial training are of little avail the manager may need to move the
person to a different position within the company where he or she can make a more valuable
contribution or let the individual go if there is no good match elsewhere in the organization
44
Chapter-V
RESEARCH METHODOLOGY
The basic task of research is to generate accurate information for use in decision-making
Research can be defined as the systematic and objective process of gathering recording and
analyzing data for aid in making business decisions As the project involves analyzing of
45
financial structure the research is exploratory in nature covering financial parameters and come
of the important ratios to carry out research There are basically two techniques adopted for
obtaining information
Primary Data
Secondary Data
Primary Data is gathered specifically for the project at hand through personal interviews with
the accounts officers
Sample Size = 100 Employees
Secondary data is previously collected and assembled for some project other than the one at
hand It is gathered and recorded by someone else prior to current needs of the researcher It is
less expensive than the primary date
Secondary Data can be obtained from both external and internal sources
External data may be collected from books and periodicals government sources media and other
commercial sources
Internal data is that secondary data which is created recorded or generated by the organization
As the project is explanatory in nature secondary data is collected from the reports of the
company books journals and interest Secondary data is gathered from annual reports official
records and standing orders of the units
CHAPTER - VI
DATA ANALYSIS AND INTERPRETATION
46
The data after collection is to be processed and analyzed in accordance with the outline
and down for the purpose at the time of developing research plan
Technically speaking processing implies editing coding classification and tabulation of
collected data so that they are amenable to analysis The term analysis refers to the computation
of certain measures along with searching for pattern groups Thus in the process of analysis
relationship or difference should be subjected to statistical tests of significance to determine with
what validity data can be said to indicate any conclusions
The analysis of data in a general way involves a number of closely related operations
which are performed with the purpose of summarizing the collected data and organizing them in
such a manner that they answer the research questions In this study the researcher followed
above process carefully and it is presented in this chapter
47
Table 41 ndash To know the department in which employees are belongs to
S
ou rc
e
survey data
Inference
From the above table it shows that 35 of employees are belongs to
production department
FIGURE 41
S
SI No
D
Department
N
No of Respondents
P
Percentage
1
1
M
Mechanical
3
30
3
30
2
2
E
Electrical
2
25
2
25
3
3
P
Production
3
35
3
35
4
4
O
Others
1
10
1
10
T
Total
1
100
1
100
48
REPRESENTS THE DEPARTMENT
Table 42 ndash To know working experience of the employees
Source survey data
Inference
From the above table it shows that 34 of the employees have 4 ndash 6
years experience
S
SI No
W
Work Experience
N
No of Respondents
P
Percentage
1
1
B
Below 2 years
1
33
1
13
2
2
2
2ndash 4 years
3
30
3
30
3
3
4
4ndash 6 years
3
34
3
34
4
4
A
Above 6 years
2
23
2
23
T
otal
1
100
1
100
49
FIGURE 42
REPRESENTS THE EXPERIENCE OF THE EMPLOYEES
Table 43 ndash To know the physical working environment
S
SI No
W
Working Environment
N
No of Respondents
P
Percentage
1
1
E
Excellent
1
12
1
12
2
2
G
Good
5
57
5
57
3
3
F
Fair
2
28
2
28
4
4
P
Poor
0
03
0
33
5
5
V
Very Poor
0
00
0
00
T
Total
1
100
1
100
Source survey data
Inference
From the above table it shows that 57 of the employees were feeling good about the working environment
50
FIGURE 43
REPRESENTS THE PHYSICAL WOKING ENVIRONMENT
51
Table 44 ndash To know the satisfaction level of employees towards the non-monitory benefits
S
SI No
N
Non-Monitory Benefits offered
to Employees
N
No of Respondents
P
Percentage
1
1
H
Highly Satisfied
1
14
1
14
2
2
S
Satisfied
5
54
5
54
3
3
N
Neither Satisfied nor Dissatisfied
2
25
2
25
4
4
D
Dissatisfied
0
05
0
05
5
5
H
Highly Dissatisfied
0
02
0
02
Total 1
100
1
100
Source survey data
Inference
From the above table it shows that 54 of the employees were satisfied towards the non-monitory benefits
FIGURE 44
REPRESENTS THE SATISFACTION LEVEL OF EMPLOYEES TOWARDS THE NON-MONITORY BENEFITS
52
Table 45 ndash To know the satisfaction level of respondents towards the work
assigned
Source survey dataInference
From the above table it shows that 45 of the respondents were satisfied towards the work assigned
FIGURE 45
S
SI No
A
Amount of Work
N
No of Respondents
P
Percentage
1
1
H
Highly satisfied
2
20
2
20
2
2
S
Satisfied
4
45
4
45
3
3
N
Neither Satisfied nor Dissatisfied
1
12
1
12
4
4
D
Dissatisfied
1
18
1
18
5
5
H
Highly Dissatisfied
0
06
0
06
Total 1
100
1
100
53
REPRESENTS THE SATISFACTION LEVEL OF RESPONDENTS TOWARDS THE WORK ASSIGNED
54
Table 46 ndash Opinion about the career development programme in their organisation
S
SI No
C
Career Development
N
No of Respondents
P
Percentage
H
Highly satisfied
1
12
1
12
S
Satisfied
5
56
5
56
N
Neither Satisfied nor Dissatisfied
2
22
2
22
D
Dissatisfied
1
10
1
10
H
Highly Dissatisfied
0
00
0
00
Total 1
100
1
100
Source survey data
Inference
From the above table it shows that 56 of the employees were satisfied
with the opinion about the carrier development programme in their organisation
FIGURE 46
REPRESENTS OPINION ABOUT THE CAREER DEVELOPMENT
PROGRAMME IN THEIR ORGANISATION
55
Table 47 ndash To know the cooperation of co-workers
S
SI No
C
Co-operation of Workers
N
No of Respondents
P
Percentage
1
1
H
Highly satisfied
2
20
2
20
2
2
S
Satisfied
6
66
6
66
3
3
N
Neither Satisfied nor Dissatisfied
1
11
1
11
4
4
D
Dissatisfied
0
03
0
03
5
5
H
Highly Dissatisfied
0
00
0
00
Total 1
100
1
100
Source survey data
Inference
From the above table it shows that 66 of the employees were satisfied
with the cooperation of co-workers
FIGURE 47
56
REPRESENTS THE COOPERATION OF CO-WORKERS
57
Table 48 ndash To know the satisfaction of Respondents with top management
S
SI No
S
Satisfaction with Top
Management
N
No of Respondents
P
Percentage
1
1
H
Highly satisfied
2
26
2
26
2
2
S
Satisfied
5
51
5
51
3
3
N
Neither Satisfied nor Dissatisfied
1
17
1
17
4
4
D
Dissatisfied
0
06
0
06
5
5
H
Highly dissatisfied
0
00
0
00
Total 1
100
1
100
Source survey data
Inference
From the above table it shows that 51 of the employees were satisfied with the top management
FIGURE 48
58
REPRESENTS THE SATISFACTION OF RESPONDENTS WITH TOP MANAGEMENT
Table 49 ndash To know the satisfaction of Respondents with their subordinates
Source survey data
Inference
From the above table it shows that 67 of the employees were satisfied with their subordinates
S
SI
No
S
Satisfaction with Subordinates
N
No of Respondents
P
Percentage
1
1
H
Highly satisfied
1
12
1
12
2
2
S
Satisfied
6
67
6
67
2
3
N
Neither Satisfied nor Dissatisfied
1
14
1
14
4
D
Dissatisfied
0
07
0
07
5
5
H
Highly Dissatisfied
0
00
0
00
Total 1
100
1
100
59
FIGURE 49
REPRESENTS THE SATISFACTION OF RESPONDENTS WITH THEIR SUBORDINATES
60
Table 410 ndash To know the level of satisfaction regarding nature of job
S
SI No
J
Job Satisfaction
N
No of Respondents
P
Percentage
1
1
H
Highly satisfied
2
22
2
22
2
2
S
Satisfied
5
56
5
56
3
3
N
Neither Satisfied nor Dissatisfied
1
16
1
16
4
4
D
Dissatisfied
0
07
0
07
5
5
H
Highly Dissatisfied
0
00
0
00
Total 1
100
1
100
Source survey dataInference
From the above table it shows that 56 of the employees were satisfied with their job
FIGURE 410
61
REPRESENTS THE LEVEL OF SATISFACTION REGARDING THE NATURE OF JOB
Table 411 ndash To know whether there is any job pressure in their work
Source survey data
Inference
From the above table it shows that 72 of employees said there is job pressure in their work
FIGURE 411
REPRESENTS WHETHER THERE IS ANY JOB PRESSURE IN THEIR WORK
S
SI No
J
Job Pressure
N
No of Respondents
P
Percentage
1
1
Y
Yes
7
72
7
72
2
2
N
No
2
28
2
28
T
Total
1
100
1
100
62
Table 412 ndash To know the opinion regarding opportunity provided by the organisation in developing skills
amp talents
S
SI No
D
Development of Skills and
Talents
N
No of Respondents
P
Percentage
1
1
H
Highly Agree
1
12
1
12
2
2
A
Agree
5
52
5
52
3
3
N
Neither Agree nor Disagree
2
28
2
28
4
4
D
Disagree
0
06
0
06
5
5
H
Highly Disagree
0
02
0
02
Total 1
100
1
100
Source survey data
Inference
From the above table it shows that 52 of employees agreed regarding opportunity provided by the organisation in developing skills amp talents
63
FIRGURE 412
REPRESENTS THE OPPORTUNITY PROVIDED BY THE ORGANISATION IN DEVELOPING SKILLS amp TALENTS
64
Table 413 ndash To know the satisfaction level of welfare facilities provided by the management
S
SI No
W
Welfare Facilities
N
No of Respondents
P
Percentage
1
1
H
Highly satisfied
0
09
9
09
2
2
S
Satisfied
5
57
5
57
3
3
N
Neither Satisfied nor Dissatisfied
2
29
2
29
4
4
D
Dissatisfied
5
05
0
05
5
5
H
Highly Dissatisfied
0
00
0
00
Total 1
100
1
100
Source survey data
Inference
From the above table it shows that 57 of the employees were satisfied with the welfare facilities provided by the management
FIGURE 413
REPRESENTS THE SATISFACTION LEVEL OF WELFARE FACILITIES PROVIDED BY THE MANGEMENT
65
Table 414 ndash To know the employee satisfaction towards the salary
Source survey data
Inference
From the above table it shows that 67 of the employees were satisfied
with their salary
FIGURE 414
REPRESENTS THE SATISFACTION TOWARDS THE SALARY
S
SI No
P
Payment Satisfaction
N
No of Respondents
P
Percentage
1
1
Y
Yes
6
67
6
67
2
2
N
No
3
33
3
33
T
otal
1
100
1
100
66
Table 415 ndash To know the employees willingness amp Commitment Towards
Organisation
Source survey data
Inference
From the above table it shows that 59 of the employees were willing to
continue in this organisation
FIGURE 415
REPRESENTS THE EMPLOYEES WILLINGNESS TO CONTINUE
S
SI No
W
Willingness to Work
N
No of Respondents
P
Percentage
1
1
Y
Yes
5
59
5
59
2
2
N
No
4
41
4
41
T
Total
1
00
1
00
67
CHI-SQUARE METHOD
The chi square test is one of the simplest and most widely used non-
parametric tests in statistical work As a non-parametric test it can be used to determine
if categorical data shows dependency or the two classifications are independent It can
also be used to make comparisons between theoretical population and actual data
when categories are used
n
Chi square χsup2= sum (O-E) sup2 E
i =1
Where O= observed frequency
E= expected frequency
68
OBSERVED FREQUENCY
Table 419 shows the relationship between the department and the job satisfaction
Over All
Job
SatisfactionHighly
SatisfiedSatisfied
Neither
Satisfied nor
Dissatisfied
DissatisfiedHighly
Dissatisfied
Sub
Total
Mechanical 5 6 14 3 2 30
Electrical 6 8 6 3 2 25
Production 9 13 7 4 2 35
Others 2 3 2 2 1 10
Sub Total 22 30 29 12 7 100
69
EXPECTED FREQUENCY
Over All
Job
SatisfactionHighly
SatisfiedSatisfied
Neither
Satisfied nor
Dissatisfied
DissatisfiedHighly
Dissatisfied
Sub
Total
Mechanical 7 8 9 4 2 30
Electrical 5 8 7 3 2 25
Production 8 11 10 4 2 35
Others 2 3 3 1 1 10
Sub Total 22 30 29 12 7 100
Null Hypothesis (Ho)
There is no significant difference between the department and the job satisfaction
Alternative Hypothesis (Ho)
There is significant difference between the job satisfaction
Co Relation
70
Chapter-V
CONCLUSIONS AND
RECOMMENDATIONS
71
CONCLUSION
On the basis of Analysis of Job Satisfaction Level of the Employees of Philips Electronics India
Ltd Mohali made in the previous chapters following conclusions are drawn
General Profile The plant of PHILIPS is ideally located in the Mohali Industrial focal point
Phase 9 near Chandigarh the capital of Punjab on a campus of 17 hectares The working
environment of the company is very healthy The visitors feel happy after the campus
Indigenous Technology PHILIPS is the only lighting manufacturing company based on purely
indigenous technology Philips was appropriately chosen as the brand name as self reliance and
building up of Indian Engineering capabilities remain the guiding spirit of PHILIPS
Financial structure PHILIPS is a low debt company signifying its dependence mainly on
its internal accruals for its financial requirements PHILIPS continues to strengthen its financial
position by channelising these internal accruals to fund its expansion programmes
Working results PTL has registered a handsome and constant growth in its profits because
of a brisk demand for new and better technology electronic items None of the other electronic
company has shown such a steady growth Philips has recorded the lowest current ratio
However with this lowest current ratio PTL still enjoys moderate payment period and highest
velocity of creditors and debtors only due to commitment of itrsquos employees
72
SUMMARY
According to the 1999 Gallup Poll the four elements that have proven to be effective in creating
employee loyalty are praise and recognition a sense of contribution to the company learning and
development and having a best friend at work
Creating a fairy-tale work environment begins withrecognition Your employees need it more
than money perks or titles Here are eight tips regarding recognition Remember these and your
employees may just start whistling while they work It is up to me The corporate culture or
financial rewards will not make your team successful It is up to you Recognition is one thing
that is completely in your control
Strong relationships are vital in todays economy Strengthening employee relationships is even
more necessary as companies downsize and lay off As your workforce shrinks and you need to
do more with less keeping quality employees becomes even more critical As a manager it is
your job to bond your best people to your company through recognition And you also must help
direct and motivate your core performers
Simple rewards earn big returns There are some relatively simple things you can do that will
earn big returns For example remember your employees birthdays and work anniversaries find
out what inexpensive rewards they value (for example tickets to a ball game or a half day off to
spend time with their kids) make the most of your formal service awards with some preparation
and a group presentation walk around your department every day and talk to your
people and thank them sincerely and often
73
Make it specific Praise and recognition must be specific to have impact General praise such as
You do great work actually can have the opposite effect and leave your employees wondering
Does he have any idea what I really do around here Specific praise links individual
accomplishments to company goals For example Cheryl I noticed the way you handled that
customer complaint Great work As you know we value quick resolutions of problems as
one of our core strategies
Ask the best to stay Call your best people into your office one at a time Let that bright young
college graduate know you value his fresh ideas and energy Tell the 20-year veteran how much
your team relies on her expertise and organizational skillsRemarkably a significant percent of
high-impact performers report that they left their last job because No one ever asked me to
stay
Forget cash
Remember the saying Money cant buy everything Well its true Dont wait until you can
offer an employee a raise or promotion Real thanks is its own reward In numerous surveys of
work satisfaction top on employees lists is feeling appreciated In fact when employees feel
recognized and involved they are much less likely to keep asking about money
Recognize
Recognition means most to an employee when it is sincere and spontaneous According to the
largest study ever conducted on workplace satisfaction (Gallup 1999) recognition should occur
at least every seven days If you wait until a year-end party or an annual review you are waiting
much too long to recognize and you probably are losing people you do not need to
74
Recognition works
Neglect can be a poisoned apple Recognition is the elixir that will spark better attitudes and
performance Jeffrey Pfeffer of Stanford University says The returns from managing people in
ways that build high commitment typically are on the order of 30 to 50 percent
Take a hard look in the mirror and ask yourself how you can recognize the fairest of them all
Learn to recognize your employees for their efforts thank them often and reward their
achievements You can awaken them from their anger and apathy and they will fall in love with
their jobs again Chances are you will work together happily ever after
So there is direct relation with employee satisfaction and their commitment towards the
organization and it is also clear from the above discussion that only monetary elements are not
sufficient for employee satisfaction rather other element like employer behavior recognisation
and other moral value
75
RECOMMENDATIONS
PHILIPS should increase its capacity utilization It should work at full capacity to
minimize its cost of production With this increase in capacity utilization the total cost
will spread over more units thereby decreasing the per unit cost
PHILIPS should decrease the credit facilities provided to its consumers The payback
period is quite high in case of debtors as compared to creditors it should be more or less
equal as it will help in improving company liquidity
PHILIPS should focus more on the consumer lifestyle goods in India parallel to its other
business as it accounts very less as compare to other businesses of Philips
Another recommendation for Mohali plant is about the HR department that is they
should appoint permanent and skilled workers as against casual workers which generally add
up to the profit of the company
76
BIBLIOGRAPHY
1 Values-Based Leadership Rebuilding Employee Commitment Performance and Productivity ( Thomas D Kuczmarski)
2 Monthly Journals of Philips Electronics India Ltd
3 Authentic Leadership Medtronic CEO Bill George
4 wwwindiaphilipscom
5 wwwwikipediacom
6 httpwwwemployeecommitmentcom
7 One Foot Out The Door How to Combat The Psychological Recession Thatrsquos Alienating Employees And Hurting American Business Judith Bardwick
8 Employee Commitment A Leader Ship Guide Joe Folkman
9 Harvard University Factors that Impact Employee Well Being Commitment and Productivity -An Article
77
Questionnaire
Name __________________________________________________________
Age______________________________ Gender _______________________
Qualification _______________________ Contact No ___________________
Q1 In which department you are working
Electrical Production Mechanical Other
Q2 What is your working experience
gt2 Years 2-4 Years 4-6 Years lt 6 Years
Q3 How You like the physical Working Environment of the organization
Excellent Good Fair Poor Very Poor
Q4 Are you satisfied with Non-Monitory benefits provided by the organisation
Highly Satisfied Satisfied Neither Satisfied Nor dissatisfied
Highly Dissatisfied Dissatisfied
Q5 Are you satisfied with your work
Highly Satisfied Satisfied Neither Satisfied Nor dissatisfied
Highly Dissatisfied Dissatisfied
Q6 Are you satisfied with the career development programe of the company
Highly Satisfied Satisfied Neither Satisfied Nor dissatisfied
Highly Dissatisfied Dissatisfied
Q7 Is other staff of the organization is co-operative with you
Highly Satisfied Satisfied Neither Satisfied Nor dissatisfied
Highly Dissatisfied Dissatisfied
Q8 Are you satisfied with top level management
Highly Satisfied Satisfied Neither Satisfied Nor dissatisfied
Highly Dissatisfied Dissatisfied
78
Q9 Are you satisfied with your subordinates
Highly Satisfied Satisfied Neither Satisfied Nor dissatisfied
Highly Dissatisfied Dissatisfied
Q10 Are you satisfied with the nature of the Job
Highly Satisfied Satisfied Neither Satisfied Nor dissatisfied
Highly Dissatisfied Dissatisfied
Q11 Do you have any Job Pressure in work
Yes No
Q12 Do you satisfied with the opportunities provided by the organisation
Highly Satisfied Satisfied Neither Satisfied Nor dissatisfied
Highly Dissatisfied Dissatisfied
Q13 Are you satisfied with the welfare facilities provided by the organisation
Highly Satisfied Satisfied Neither Satisfied Nor dissatisfied
Highly Dissatisfied Dissatisfied
Q14 Are you satisfied towards your salary
Highly Satisfied Satisfied Neither Satisfied Nor dissatisfied
Highly Dissatisfied Dissatisfied
Q15 Are you committed towards the organisation
Yes No
Signature

30
Employers naturally want to encourage workers to perform prescribed and voluntary activities
while avoiding proscribed ones To achieve these goals organizations use a number of HR
practices that directly affect the person process and context components of job performance
Employeesrsquo reactions to these practices determine their levels of engagement and commitment
31
Chapter-IV
32
LITERATURE OF THE REVIEW
ldquo Job Satisfaction That Leads To The Commitment Of
The Employees in The Organisationrdquo
Literature of Review
Gerge Bill Authentic Leadership
In his book Authentic Leadership former Medtronic CEO Bill George makes an obvious
point that business leaders rarely say out loud ldquoMissions motivate dollars donrsquotrdquo
What he means is that purpose is what drives employee commitment not the financial
rewards that come to others Workers donrsquot get up in the morning and say ldquoGee I can
33
hardly wait to get to work today to maximize shareholder profitsrdquo Even when employees
are shareholders who can benefit from improved financials what draws people to their
chosen careers is the work itself and its purpose in the world more than the profit
possibilities
Mr George goes on to say ldquoI find there is universal agreement (among middle managers)
that you cannot inspire employees by urging them to help management get the companyrsquos
stock price uprdquo
There is in fact quite a bit of literature on this subject In Awakening Corporate Soul
authors Eric Klein and John Izzo say that employee commitment requires knowing ldquothe
purpose of our work it means recognizing the purpose our organization fulfills that goes
beyond the bottom line and it means articulating to others how their (workersrsquo) efforts
contribute to a larger purposerdquo
In Built to Last Jim Collins and James Porras spend an entire book explaining their five
year research study of major companies that led to this conclusion about employee
commitment Purpose within a company is what sustains it profit is important but when
itrsquos the prime directive companies falter
-Marshal Goldsmith-
How to Increase Employee Commitment
In practice this involves walking the talk being transparent communicating effectively treating
people equally teaching leading subordinates to increasingly excellent performance ndash and
responding to subordinates as mature individuals who are owed fairness the truth and
recognition of their achievements
34
Since managers interact directly and frequently with subordinates they are usually more tuned
in to how employees are feeling than are executives Managers are in a better position to know
for example when employees are feeling alienated and disengaged from their work which is
very common today -- and expensive
Gaining employee commitment results in greater profits because enthusiastic employees stay
contribute discretionary effort and engage customers Performance soars when customers are
enthused and stay and when executives managers and employees are a collaborative team
united in achieving common goals
But managers are often called middle managers for good reason their job is to motivate and
guide subordinates while they at the same time are being judged by their bosses Because of
their ldquotweenrdquo position in the hierarchy managers to effective support direct reports must also
create relationships with potential allies especially those with greater power who have access to
top decision makers
Harvard University Factors that Impact Employee Well Being Commitment and
Productivity
Business executives from the C-suite and HR to QC and RampD are by nature focused on the
corporate bottom line A new trend in our dawning age of social sustainability is that many
experts believe more attention should be paid to the dotted line - the one signed when a person
35
commits to employment at a company New Harvard research validates this approach affirming
that trust and purpose play a significant role in building successful productive workplaces
The behavioral research conducted by a team at Harvard University and Massachusetts General
Hospital identifies the factors most likely to impact 21st century employee well being
commitment and productivity The researchers found that commitment is largely influenced by
ones sense of purpose feeling of personal impact and overall trust in the organization
Productivity is largely affected by the quality of human relationships including cooperative
social group moods and interaction
The results lead us to conclude that workplaces that provide positive environments that foster
interpersonal trust and quality personal relationships create the most committed and productive
employees says Nancy Etcoff PhD the lead researcher on the study
Expert Shares Keys to Building Successful Workplace Relationships
According to business strategist Courtney Anderson JD MBA Outstanding leadership
today means much more than just doing your job Success is creating an environment that fosters
happy committed productive team members
Anderson explains that reinvigorating workplaces by enhancing trust and employee commitment
does not have to be difficult The biggest challenge she says is making the time to truly change
in our overscheduled instant access competitive work environments With a little know-how it
can be easy to evolve workplace well being and respond to these compelling research results
-Mark Howell-
CEO Bright Point
High-performing companies recognize that employee commitment is a major contributing factor
toward sustaining long-term success and creating value An engaged employee is involved and
excited about their work and acts in a manner that will forward the organizationrsquos interest An
36
engaged workforce helps optimize and retain talent for the long-term because the employees
choose to stay even when other employment alternatives exist
According to Walker Information the top three drivers of employee commitment are
Satisfaction Fairness and Care amp Concern for employees Put simply committed employees
want to enjoy their work feel they are appreciated and know they are making a contribution to
their companyrsquos strategic objectives Additionally employees who have trust in their leadership
and are trusted by their leadership have a greater dedication and are ultimately more productive
on the job However according to recent data provided by the National Business Research
Institute (NBRI) only 31 of all employees are truly engaged
At BrightPoint we take employee engagement seriously and we work to create a culture that
inspires employee loyalty and satisfaction The results of BrightPointrsquos commitment to its
employees are shown in the 2011 BPNA Employee Commitment Survey The survey
determined that close to 80 of respondents indicated they were satisfied with their jobs and
daily activities General employee satisfaction increases when managers take an active interest
in their employees beyond their day-to-day job responsibilities According to NBRI managers
that actively coach build relationships and keep an open dialogue with their employees improve
employee engagement
We have a diverse workforce where each employee brings unique value and has individual
needs Managers are learning to manage the individual and not the position In order to give
managers the tools they need to be successful BrightPoint places strong emphasis on targeted
leadership training workshops and continual learning resources In 2011 906 of managers at
BrightPoint NA participated in the development opportunities offered and also made an effort to
37
help reinforce the learning of their team members This signals that our leadership team is taking
an active interest in professional development and its connection to employee commitment
As BrightPoint continues to increase focus on employee engagement the organization will grow
stronger and maintain a substantial advantage over our competition Our employees possess the
knowledge experience and resiliency to respond quickly to the demands of the marketplace and
through their genuine commitment will deliver what our customers want with increasing
efficiency and effectiveness Our responsibility is value-creation by growing our business and
maintaining high levels of customer service and loyalty We believe the best way to accomplish
this is through a strong committed and engaged workforce
Performance Model Adopted At Mohali Plant
38
Process adopted by Philips Electronics Mohali Plant for Job Satisfaction of Employee that leads commitment of the employees
39
Recruiting
The messages in Philips Electronics Mohali organization conveys while seeking to attract job
applicants also can influence future employeesrsquo engagement and commitment If your firm has
designed jobs specifically to engage employees then organization want to ensure that recruiting
ads extol these positionsrsquo attractive featuresmdashsuch as challenging work assignments a highly
skilled team environment or minimal supervision Applicants who notice and respond to these
ads will more likely be motivated by these features Also consider how organization might best
seek candidates from inside your organization When Organisation recruit existing employees for
desirable jobs you enhance their engagement (by maximizing the person-job fit) and
commitment (by providing growth and advancement opportunities to employees in return for
their loyalty) If Organisation recruit from outside when qualified internal candidates are
available Organization may unwittingly suggest to current employees that your company is not
willing to reciprocate their commitment Existing staff may then begin questioning their own
commitment to the firm By contrast organisation recruit external candidates to both the job and
your organization For these candidates ensure that recruiting messages highlight attractive job
features organizational values and commitment reciprocity That is in return for performance
and dedication your company offers competitive pay and benefits flexible work hours and
learning and career advancement opportunities Also remember that prospective employees have
multiple commitments You will inevitably have to compete with those commitments as
organization try to attract candidates to your firm Most people find it easier to make a new
commitment when it is compatible with their other obligations For example you boost your
chances of recruiting a highly qualified candidate who is a single parent if you offer flexible
work hours family health benefits and on-site day care ldquoRecruiting for Engagement and
Commitmentrdquo
40
Employee Selection
Once recruiting efforts produce a pool of promising job candidates Philips select among them to
fill available positions When organisation select the right individuals for the right jobs new
hires carry out their work more smoothly and experience fewer performance problems The
result Greater enjoyment ofmdashand engagement inmdashthe job
To enhance engagement through your selection of employees identify those candidates who are
best-suited to the job and your organizationrsquos culture Also use candidate assessment methods
that have obvious relevance to the job in questionmdashfor example by asking interviewees what
they know about the role and having them provide work samples Most candidates will view
these techniques more positively than tests with less apparent relevance such as personality and
integrity assessments Successful candidates feel good about having ldquopassed the test and see
company as careful and capable for having selected them A positive initial impression of an
employer encourages growth of long-term commitment
Training and Development
Training and development can serve as additional levers for enhancing engagement and
commitment For new hires training usually begins with orientation Orientation presents several
important opportunitiesmdashincluding explaining pay work schedules and company policies Most
important it gives you a chance to encourage employee engagement by explaining how the new
hirersquos job contributes to the organizationrsquos mission Through orientation Mohali Plant of Philips
Electronics describe how r company is organized introduce the new employee to his or her co-
workers give the person a tour of the area where he or she will be working and explain safety
regulations and other procedural matters In short you foster person-organization fitmdashvital for
developing productive and dedicated employees Through training you help new and current
41
employees acquire the knowledge and skills they need to perform their jobs And employees who
enhance their skills through training are more likely to engage fully in their work because they
derive satisfaction from mastering new tasks Training also enhances employeesrsquo value to your
company as well as their own employability in the job market In addition most companies offer
higher wages for skilled workers to compensate them for their greater value and to discourage
turnover
Compensation
Like the HR practices discussed above compensation can powerfully influence employee
engagement and commitment Some compensation components encourage commitment to
employers while others motivate engagement in the job It is possible to stimulate one and not
the other though itrsquos generally better to foster both For example a company that offers a strong
performance incentive system but no retirement plan will probably realize exceptional
engagement from its workers however they may eventually commit themselves to another
company that does offer a good retirement plan Meanwhile an organization that offers generous
retirement benefits but a traditional seniority-based pay grade system may have committed
employees however these workers might deliver pedestrian performance as they bide their time
until retirement In designing compensation plans you therefore need to consider employee
engagement and commitment strategically
Encourage managers to include employees in the goal-setting process This technique helps to
ensure that workers understand the goals It also promotes acceptance of challenging objectives
because people generally feel more committed to goals they have helped define In addition
consider how you and other managers will recognize and encourage contributions that exceed
expectations For example when a piece of equipment malfunctions Joe finds other ways to
maintain production rather than merely shutting down the machine and waiting for the
42
maintenance staff to fix it Or when a less experienced co-worker encounters a new task Sally
offers friendly coaching instead of standing by and waiting for the inevitable mistakes to crop
up Performance management processes operate on a continuous basis Therefore they provide
perhaps the best ongoing opportunities for employers to foster employee engagement and
commitment For example managers can use routine discussions about performance and
feedback sessions to learn which aspects of the job hold the most interest for each employee and
which tasks are most challenging During such discussions managers also can define what going
above and beyond the call of dutyrdquo looks like and generate ideas for rewarding such
contributions An employeersquos aspirations and career goals can receive careful attention during
performance appraisal meetings Without inquiring into an employeersquos personal life a supervisor
can nevertheless explore ways to enhance the compatibility between the workerrsquos commitment to
your organization and the employeersquos other life commitments Through such means the
organization personalizes its relationship to each employee and provides support while also
expressing appreciation for their contributionsmdash key drivers of engagement and commitment
To further engage employees and win their commitment through your performance management
programs consider how to treat your organizationrsquos most experienced employees In many cases
these employees understand the intricacies of a job better than their supervisors or managers do
By virtue of long identification with your organization they may be deeply committed to high-
level goals They use their expertise to contribute in ways that newer employees simply cannot
match But many of them also may be planning to retire soon especially if they are from the
ldquoBaby Boomerrdquo generation How will you transfer their knowledge to younger workers Design
a performance management system that recognizes and rewards proactive sharing of knowledge
and expertise among co-workers For example create knowledge repositories or learning
histories that can be stored in databases that employees can access and then create incentives
43
for people who contribute to and use these repositories Of course effective performance
management systems also identify employees who are not meeting expectations Failing to
address problem performance can erode other employeesrsquo engagement and commitment as their
workloads increase and they conclude that the company is willing to tolerate poor performance
If feedback coaching and remedial training are of little avail the manager may need to move the
person to a different position within the company where he or she can make a more valuable
contribution or let the individual go if there is no good match elsewhere in the organization
44
Chapter-V
RESEARCH METHODOLOGY
The basic task of research is to generate accurate information for use in decision-making
Research can be defined as the systematic and objective process of gathering recording and
analyzing data for aid in making business decisions As the project involves analyzing of
45
financial structure the research is exploratory in nature covering financial parameters and come
of the important ratios to carry out research There are basically two techniques adopted for
obtaining information
Primary Data
Secondary Data
Primary Data is gathered specifically for the project at hand through personal interviews with
the accounts officers
Sample Size = 100 Employees
Secondary data is previously collected and assembled for some project other than the one at
hand It is gathered and recorded by someone else prior to current needs of the researcher It is
less expensive than the primary date
Secondary Data can be obtained from both external and internal sources
External data may be collected from books and periodicals government sources media and other
commercial sources
Internal data is that secondary data which is created recorded or generated by the organization
As the project is explanatory in nature secondary data is collected from the reports of the
company books journals and interest Secondary data is gathered from annual reports official
records and standing orders of the units
CHAPTER - VI
DATA ANALYSIS AND INTERPRETATION
46
The data after collection is to be processed and analyzed in accordance with the outline
and down for the purpose at the time of developing research plan
Technically speaking processing implies editing coding classification and tabulation of
collected data so that they are amenable to analysis The term analysis refers to the computation
of certain measures along with searching for pattern groups Thus in the process of analysis
relationship or difference should be subjected to statistical tests of significance to determine with
what validity data can be said to indicate any conclusions
The analysis of data in a general way involves a number of closely related operations
which are performed with the purpose of summarizing the collected data and organizing them in
such a manner that they answer the research questions In this study the researcher followed
above process carefully and it is presented in this chapter
47
Table 41 ndash To know the department in which employees are belongs to
S
ou rc
e
survey data
Inference
From the above table it shows that 35 of employees are belongs to
production department
FIGURE 41
S
SI No
D
Department
N
No of Respondents
P
Percentage
1
1
M
Mechanical
3
30
3
30
2
2
E
Electrical
2
25
2
25
3
3
P
Production
3
35
3
35
4
4
O
Others
1
10
1
10
T
Total
1
100
1
100
48
REPRESENTS THE DEPARTMENT
Table 42 ndash To know working experience of the employees
Source survey data
Inference
From the above table it shows that 34 of the employees have 4 ndash 6
years experience
S
SI No
W
Work Experience
N
No of Respondents
P
Percentage
1
1
B
Below 2 years
1
33
1
13
2
2
2
2ndash 4 years
3
30
3
30
3
3
4
4ndash 6 years
3
34
3
34
4
4
A
Above 6 years
2
23
2
23
T
otal
1
100
1
100
49
FIGURE 42
REPRESENTS THE EXPERIENCE OF THE EMPLOYEES
Table 43 ndash To know the physical working environment
S
SI No
W
Working Environment
N
No of Respondents
P
Percentage
1
1
E
Excellent
1
12
1
12
2
2
G
Good
5
57
5
57
3
3
F
Fair
2
28
2
28
4
4
P
Poor
0
03
0
33
5
5
V
Very Poor
0
00
0
00
T
Total
1
100
1
100
Source survey data
Inference
From the above table it shows that 57 of the employees were feeling good about the working environment
50
FIGURE 43
REPRESENTS THE PHYSICAL WOKING ENVIRONMENT
51
Table 44 ndash To know the satisfaction level of employees towards the non-monitory benefits
S
SI No
N
Non-Monitory Benefits offered
to Employees
N
No of Respondents
P
Percentage
1
1
H
Highly Satisfied
1
14
1
14
2
2
S
Satisfied
5
54
5
54
3
3
N
Neither Satisfied nor Dissatisfied
2
25
2
25
4
4
D
Dissatisfied
0
05
0
05
5
5
H
Highly Dissatisfied
0
02
0
02
Total 1
100
1
100
Source survey data
Inference
From the above table it shows that 54 of the employees were satisfied towards the non-monitory benefits
FIGURE 44
REPRESENTS THE SATISFACTION LEVEL OF EMPLOYEES TOWARDS THE NON-MONITORY BENEFITS
52
Table 45 ndash To know the satisfaction level of respondents towards the work
assigned
Source survey dataInference
From the above table it shows that 45 of the respondents were satisfied towards the work assigned
FIGURE 45
S
SI No
A
Amount of Work
N
No of Respondents
P
Percentage
1
1
H
Highly satisfied
2
20
2
20
2
2
S
Satisfied
4
45
4
45
3
3
N
Neither Satisfied nor Dissatisfied
1
12
1
12
4
4
D
Dissatisfied
1
18
1
18
5
5
H
Highly Dissatisfied
0
06
0
06
Total 1
100
1
100
53
REPRESENTS THE SATISFACTION LEVEL OF RESPONDENTS TOWARDS THE WORK ASSIGNED
54
Table 46 ndash Opinion about the career development programme in their organisation
S
SI No
C
Career Development
N
No of Respondents
P
Percentage
H
Highly satisfied
1
12
1
12
S
Satisfied
5
56
5
56
N
Neither Satisfied nor Dissatisfied
2
22
2
22
D
Dissatisfied
1
10
1
10
H
Highly Dissatisfied
0
00
0
00
Total 1
100
1
100
Source survey data
Inference
From the above table it shows that 56 of the employees were satisfied
with the opinion about the carrier development programme in their organisation
FIGURE 46
REPRESENTS OPINION ABOUT THE CAREER DEVELOPMENT
PROGRAMME IN THEIR ORGANISATION
55
Table 47 ndash To know the cooperation of co-workers
S
SI No
C
Co-operation of Workers
N
No of Respondents
P
Percentage
1
1
H
Highly satisfied
2
20
2
20
2
2
S
Satisfied
6
66
6
66
3
3
N
Neither Satisfied nor Dissatisfied
1
11
1
11
4
4
D
Dissatisfied
0
03
0
03
5
5
H
Highly Dissatisfied
0
00
0
00
Total 1
100
1
100
Source survey data
Inference
From the above table it shows that 66 of the employees were satisfied
with the cooperation of co-workers
FIGURE 47
56
REPRESENTS THE COOPERATION OF CO-WORKERS
57
Table 48 ndash To know the satisfaction of Respondents with top management
S
SI No
S
Satisfaction with Top
Management
N
No of Respondents
P
Percentage
1
1
H
Highly satisfied
2
26
2
26
2
2
S
Satisfied
5
51
5
51
3
3
N
Neither Satisfied nor Dissatisfied
1
17
1
17
4
4
D
Dissatisfied
0
06
0
06
5
5
H
Highly dissatisfied
0
00
0
00
Total 1
100
1
100
Source survey data
Inference
From the above table it shows that 51 of the employees were satisfied with the top management
FIGURE 48
58
REPRESENTS THE SATISFACTION OF RESPONDENTS WITH TOP MANAGEMENT
Table 49 ndash To know the satisfaction of Respondents with their subordinates
Source survey data
Inference
From the above table it shows that 67 of the employees were satisfied with their subordinates
S
SI
No
S
Satisfaction with Subordinates
N
No of Respondents
P
Percentage
1
1
H
Highly satisfied
1
12
1
12
2
2
S
Satisfied
6
67
6
67
2
3
N
Neither Satisfied nor Dissatisfied
1
14
1
14
4
D
Dissatisfied
0
07
0
07
5
5
H
Highly Dissatisfied
0
00
0
00
Total 1
100
1
100
59
FIGURE 49
REPRESENTS THE SATISFACTION OF RESPONDENTS WITH THEIR SUBORDINATES
60
Table 410 ndash To know the level of satisfaction regarding nature of job
S
SI No
J
Job Satisfaction
N
No of Respondents
P
Percentage
1
1
H
Highly satisfied
2
22
2
22
2
2
S
Satisfied
5
56
5
56
3
3
N
Neither Satisfied nor Dissatisfied
1
16
1
16
4
4
D
Dissatisfied
0
07
0
07
5
5
H
Highly Dissatisfied
0
00
0
00
Total 1
100
1
100
Source survey dataInference
From the above table it shows that 56 of the employees were satisfied with their job
FIGURE 410
61
REPRESENTS THE LEVEL OF SATISFACTION REGARDING THE NATURE OF JOB
Table 411 ndash To know whether there is any job pressure in their work
Source survey data
Inference
From the above table it shows that 72 of employees said there is job pressure in their work
FIGURE 411
REPRESENTS WHETHER THERE IS ANY JOB PRESSURE IN THEIR WORK
S
SI No
J
Job Pressure
N
No of Respondents
P
Percentage
1
1
Y
Yes
7
72
7
72
2
2
N
No
2
28
2
28
T
Total
1
100
1
100
62
Table 412 ndash To know the opinion regarding opportunity provided by the organisation in developing skills
amp talents
S
SI No
D
Development of Skills and
Talents
N
No of Respondents
P
Percentage
1
1
H
Highly Agree
1
12
1
12
2
2
A
Agree
5
52
5
52
3
3
N
Neither Agree nor Disagree
2
28
2
28
4
4
D
Disagree
0
06
0
06
5
5
H
Highly Disagree
0
02
0
02
Total 1
100
1
100
Source survey data
Inference
From the above table it shows that 52 of employees agreed regarding opportunity provided by the organisation in developing skills amp talents
63
FIRGURE 412
REPRESENTS THE OPPORTUNITY PROVIDED BY THE ORGANISATION IN DEVELOPING SKILLS amp TALENTS
64
Table 413 ndash To know the satisfaction level of welfare facilities provided by the management
S
SI No
W
Welfare Facilities
N
No of Respondents
P
Percentage
1
1
H
Highly satisfied
0
09
9
09
2
2
S
Satisfied
5
57
5
57
3
3
N
Neither Satisfied nor Dissatisfied
2
29
2
29
4
4
D
Dissatisfied
5
05
0
05
5
5
H
Highly Dissatisfied
0
00
0
00
Total 1
100
1
100
Source survey data
Inference
From the above table it shows that 57 of the employees were satisfied with the welfare facilities provided by the management
FIGURE 413
REPRESENTS THE SATISFACTION LEVEL OF WELFARE FACILITIES PROVIDED BY THE MANGEMENT
65
Table 414 ndash To know the employee satisfaction towards the salary
Source survey data
Inference
From the above table it shows that 67 of the employees were satisfied
with their salary
FIGURE 414
REPRESENTS THE SATISFACTION TOWARDS THE SALARY
S
SI No
P
Payment Satisfaction
N
No of Respondents
P
Percentage
1
1
Y
Yes
6
67
6
67
2
2
N
No
3
33
3
33
T
otal
1
100
1
100
66
Table 415 ndash To know the employees willingness amp Commitment Towards
Organisation
Source survey data
Inference
From the above table it shows that 59 of the employees were willing to
continue in this organisation
FIGURE 415
REPRESENTS THE EMPLOYEES WILLINGNESS TO CONTINUE
S
SI No
W
Willingness to Work
N
No of Respondents
P
Percentage
1
1
Y
Yes
5
59
5
59
2
2
N
No
4
41
4
41
T
Total
1
00
1
00
67
CHI-SQUARE METHOD
The chi square test is one of the simplest and most widely used non-
parametric tests in statistical work As a non-parametric test it can be used to determine
if categorical data shows dependency or the two classifications are independent It can
also be used to make comparisons between theoretical population and actual data
when categories are used
n
Chi square χsup2= sum (O-E) sup2 E
i =1
Where O= observed frequency
E= expected frequency
68
OBSERVED FREQUENCY
Table 419 shows the relationship between the department and the job satisfaction
Over All
Job
SatisfactionHighly
SatisfiedSatisfied
Neither
Satisfied nor
Dissatisfied
DissatisfiedHighly
Dissatisfied
Sub
Total
Mechanical 5 6 14 3 2 30
Electrical 6 8 6 3 2 25
Production 9 13 7 4 2 35
Others 2 3 2 2 1 10
Sub Total 22 30 29 12 7 100
69
EXPECTED FREQUENCY
Over All
Job
SatisfactionHighly
SatisfiedSatisfied
Neither
Satisfied nor
Dissatisfied
DissatisfiedHighly
Dissatisfied
Sub
Total
Mechanical 7 8 9 4 2 30
Electrical 5 8 7 3 2 25
Production 8 11 10 4 2 35
Others 2 3 3 1 1 10
Sub Total 22 30 29 12 7 100
Null Hypothesis (Ho)
There is no significant difference between the department and the job satisfaction
Alternative Hypothesis (Ho)
There is significant difference between the job satisfaction
Co Relation
70
Chapter-V
CONCLUSIONS AND
RECOMMENDATIONS
71
CONCLUSION
On the basis of Analysis of Job Satisfaction Level of the Employees of Philips Electronics India
Ltd Mohali made in the previous chapters following conclusions are drawn
General Profile The plant of PHILIPS is ideally located in the Mohali Industrial focal point
Phase 9 near Chandigarh the capital of Punjab on a campus of 17 hectares The working
environment of the company is very healthy The visitors feel happy after the campus
Indigenous Technology PHILIPS is the only lighting manufacturing company based on purely
indigenous technology Philips was appropriately chosen as the brand name as self reliance and
building up of Indian Engineering capabilities remain the guiding spirit of PHILIPS
Financial structure PHILIPS is a low debt company signifying its dependence mainly on
its internal accruals for its financial requirements PHILIPS continues to strengthen its financial
position by channelising these internal accruals to fund its expansion programmes
Working results PTL has registered a handsome and constant growth in its profits because
of a brisk demand for new and better technology electronic items None of the other electronic
company has shown such a steady growth Philips has recorded the lowest current ratio
However with this lowest current ratio PTL still enjoys moderate payment period and highest
velocity of creditors and debtors only due to commitment of itrsquos employees
72
SUMMARY
According to the 1999 Gallup Poll the four elements that have proven to be effective in creating
employee loyalty are praise and recognition a sense of contribution to the company learning and
development and having a best friend at work
Creating a fairy-tale work environment begins withrecognition Your employees need it more
than money perks or titles Here are eight tips regarding recognition Remember these and your
employees may just start whistling while they work It is up to me The corporate culture or
financial rewards will not make your team successful It is up to you Recognition is one thing
that is completely in your control
Strong relationships are vital in todays economy Strengthening employee relationships is even
more necessary as companies downsize and lay off As your workforce shrinks and you need to
do more with less keeping quality employees becomes even more critical As a manager it is
your job to bond your best people to your company through recognition And you also must help
direct and motivate your core performers
Simple rewards earn big returns There are some relatively simple things you can do that will
earn big returns For example remember your employees birthdays and work anniversaries find
out what inexpensive rewards they value (for example tickets to a ball game or a half day off to
spend time with their kids) make the most of your formal service awards with some preparation
and a group presentation walk around your department every day and talk to your
people and thank them sincerely and often
73
Make it specific Praise and recognition must be specific to have impact General praise such as
You do great work actually can have the opposite effect and leave your employees wondering
Does he have any idea what I really do around here Specific praise links individual
accomplishments to company goals For example Cheryl I noticed the way you handled that
customer complaint Great work As you know we value quick resolutions of problems as
one of our core strategies
Ask the best to stay Call your best people into your office one at a time Let that bright young
college graduate know you value his fresh ideas and energy Tell the 20-year veteran how much
your team relies on her expertise and organizational skillsRemarkably a significant percent of
high-impact performers report that they left their last job because No one ever asked me to
stay
Forget cash
Remember the saying Money cant buy everything Well its true Dont wait until you can
offer an employee a raise or promotion Real thanks is its own reward In numerous surveys of
work satisfaction top on employees lists is feeling appreciated In fact when employees feel
recognized and involved they are much less likely to keep asking about money
Recognize
Recognition means most to an employee when it is sincere and spontaneous According to the
largest study ever conducted on workplace satisfaction (Gallup 1999) recognition should occur
at least every seven days If you wait until a year-end party or an annual review you are waiting
much too long to recognize and you probably are losing people you do not need to
74
Recognition works
Neglect can be a poisoned apple Recognition is the elixir that will spark better attitudes and
performance Jeffrey Pfeffer of Stanford University says The returns from managing people in
ways that build high commitment typically are on the order of 30 to 50 percent
Take a hard look in the mirror and ask yourself how you can recognize the fairest of them all
Learn to recognize your employees for their efforts thank them often and reward their
achievements You can awaken them from their anger and apathy and they will fall in love with
their jobs again Chances are you will work together happily ever after
So there is direct relation with employee satisfaction and their commitment towards the
organization and it is also clear from the above discussion that only monetary elements are not
sufficient for employee satisfaction rather other element like employer behavior recognisation
and other moral value
75
RECOMMENDATIONS
PHILIPS should increase its capacity utilization It should work at full capacity to
minimize its cost of production With this increase in capacity utilization the total cost
will spread over more units thereby decreasing the per unit cost
PHILIPS should decrease the credit facilities provided to its consumers The payback
period is quite high in case of debtors as compared to creditors it should be more or less
equal as it will help in improving company liquidity
PHILIPS should focus more on the consumer lifestyle goods in India parallel to its other
business as it accounts very less as compare to other businesses of Philips
Another recommendation for Mohali plant is about the HR department that is they
should appoint permanent and skilled workers as against casual workers which generally add
up to the profit of the company
76
BIBLIOGRAPHY
1 Values-Based Leadership Rebuilding Employee Commitment Performance and Productivity ( Thomas D Kuczmarski)
2 Monthly Journals of Philips Electronics India Ltd
3 Authentic Leadership Medtronic CEO Bill George
4 wwwindiaphilipscom
5 wwwwikipediacom
6 httpwwwemployeecommitmentcom
7 One Foot Out The Door How to Combat The Psychological Recession Thatrsquos Alienating Employees And Hurting American Business Judith Bardwick
8 Employee Commitment A Leader Ship Guide Joe Folkman
9 Harvard University Factors that Impact Employee Well Being Commitment and Productivity -An Article
77
Questionnaire
Name __________________________________________________________
Age______________________________ Gender _______________________
Qualification _______________________ Contact No ___________________
Q1 In which department you are working
Electrical Production Mechanical Other
Q2 What is your working experience
gt2 Years 2-4 Years 4-6 Years lt 6 Years
Q3 How You like the physical Working Environment of the organization
Excellent Good Fair Poor Very Poor
Q4 Are you satisfied with Non-Monitory benefits provided by the organisation
Highly Satisfied Satisfied Neither Satisfied Nor dissatisfied
Highly Dissatisfied Dissatisfied
Q5 Are you satisfied with your work
Highly Satisfied Satisfied Neither Satisfied Nor dissatisfied
Highly Dissatisfied Dissatisfied
Q6 Are you satisfied with the career development programe of the company
Highly Satisfied Satisfied Neither Satisfied Nor dissatisfied
Highly Dissatisfied Dissatisfied
Q7 Is other staff of the organization is co-operative with you
Highly Satisfied Satisfied Neither Satisfied Nor dissatisfied
Highly Dissatisfied Dissatisfied
Q8 Are you satisfied with top level management
Highly Satisfied Satisfied Neither Satisfied Nor dissatisfied
Highly Dissatisfied Dissatisfied
78
Q9 Are you satisfied with your subordinates
Highly Satisfied Satisfied Neither Satisfied Nor dissatisfied
Highly Dissatisfied Dissatisfied
Q10 Are you satisfied with the nature of the Job
Highly Satisfied Satisfied Neither Satisfied Nor dissatisfied
Highly Dissatisfied Dissatisfied
Q11 Do you have any Job Pressure in work
Yes No
Q12 Do you satisfied with the opportunities provided by the organisation
Highly Satisfied Satisfied Neither Satisfied Nor dissatisfied
Highly Dissatisfied Dissatisfied
Q13 Are you satisfied with the welfare facilities provided by the organisation
Highly Satisfied Satisfied Neither Satisfied Nor dissatisfied
Highly Dissatisfied Dissatisfied
Q14 Are you satisfied towards your salary
Highly Satisfied Satisfied Neither Satisfied Nor dissatisfied
Highly Dissatisfied Dissatisfied
Q15 Are you committed towards the organisation
Yes No
Signature
33
hardly wait to get to work today to maximize shareholder profitsrdquo Even when employees
are shareholders who can benefit from improved financials what draws people to their
chosen careers is the work itself and its purpose in the world more than the profit
possibilities
Mr George goes on to say ldquoI find there is universal agreement (among middle managers)
that you cannot inspire employees by urging them to help management get the companyrsquos
stock price uprdquo
There is in fact quite a bit of literature on this subject In Awakening Corporate Soul
authors Eric Klein and John Izzo say that employee commitment requires knowing ldquothe
purpose of our work it means recognizing the purpose our organization fulfills that goes
beyond the bottom line and it means articulating to others how their (workersrsquo) efforts
contribute to a larger purposerdquo
In Built to Last Jim Collins and James Porras spend an entire book explaining their five
year research study of major companies that led to this conclusion about employee
commitment Purpose within a company is what sustains it profit is important but when
itrsquos the prime directive companies falter
-Marshal Goldsmith-
How to Increase Employee Commitment
In practice this involves walking the talk being transparent communicating effectively treating
people equally teaching leading subordinates to increasingly excellent performance ndash and
responding to subordinates as mature individuals who are owed fairness the truth and
recognition of their achievements
34
Since managers interact directly and frequently with subordinates they are usually more tuned
in to how employees are feeling than are executives Managers are in a better position to know
for example when employees are feeling alienated and disengaged from their work which is
very common today -- and expensive
Gaining employee commitment results in greater profits because enthusiastic employees stay
contribute discretionary effort and engage customers Performance soars when customers are
enthused and stay and when executives managers and employees are a collaborative team
united in achieving common goals
But managers are often called middle managers for good reason their job is to motivate and
guide subordinates while they at the same time are being judged by their bosses Because of
their ldquotweenrdquo position in the hierarchy managers to effective support direct reports must also
create relationships with potential allies especially those with greater power who have access to
top decision makers
Harvard University Factors that Impact Employee Well Being Commitment and
Productivity
Business executives from the C-suite and HR to QC and RampD are by nature focused on the
corporate bottom line A new trend in our dawning age of social sustainability is that many
experts believe more attention should be paid to the dotted line - the one signed when a person
35
commits to employment at a company New Harvard research validates this approach affirming
that trust and purpose play a significant role in building successful productive workplaces
The behavioral research conducted by a team at Harvard University and Massachusetts General
Hospital identifies the factors most likely to impact 21st century employee well being
commitment and productivity The researchers found that commitment is largely influenced by
ones sense of purpose feeling of personal impact and overall trust in the organization
Productivity is largely affected by the quality of human relationships including cooperative
social group moods and interaction
The results lead us to conclude that workplaces that provide positive environments that foster
interpersonal trust and quality personal relationships create the most committed and productive
employees says Nancy Etcoff PhD the lead researcher on the study
Expert Shares Keys to Building Successful Workplace Relationships
According to business strategist Courtney Anderson JD MBA Outstanding leadership
today means much more than just doing your job Success is creating an environment that fosters
happy committed productive team members
Anderson explains that reinvigorating workplaces by enhancing trust and employee commitment
does not have to be difficult The biggest challenge she says is making the time to truly change
in our overscheduled instant access competitive work environments With a little know-how it
can be easy to evolve workplace well being and respond to these compelling research results
-Mark Howell-
CEO Bright Point
High-performing companies recognize that employee commitment is a major contributing factor
toward sustaining long-term success and creating value An engaged employee is involved and
excited about their work and acts in a manner that will forward the organizationrsquos interest An
36
engaged workforce helps optimize and retain talent for the long-term because the employees
choose to stay even when other employment alternatives exist
According to Walker Information the top three drivers of employee commitment are
Satisfaction Fairness and Care amp Concern for employees Put simply committed employees
want to enjoy their work feel they are appreciated and know they are making a contribution to
their companyrsquos strategic objectives Additionally employees who have trust in their leadership
and are trusted by their leadership have a greater dedication and are ultimately more productive
on the job However according to recent data provided by the National Business Research
Institute (NBRI) only 31 of all employees are truly engaged
At BrightPoint we take employee engagement seriously and we work to create a culture that
inspires employee loyalty and satisfaction The results of BrightPointrsquos commitment to its
employees are shown in the 2011 BPNA Employee Commitment Survey The survey
determined that close to 80 of respondents indicated they were satisfied with their jobs and
daily activities General employee satisfaction increases when managers take an active interest
in their employees beyond their day-to-day job responsibilities According to NBRI managers
that actively coach build relationships and keep an open dialogue with their employees improve
employee engagement
We have a diverse workforce where each employee brings unique value and has individual
needs Managers are learning to manage the individual and not the position In order to give
managers the tools they need to be successful BrightPoint places strong emphasis on targeted
leadership training workshops and continual learning resources In 2011 906 of managers at
BrightPoint NA participated in the development opportunities offered and also made an effort to
37
help reinforce the learning of their team members This signals that our leadership team is taking
an active interest in professional development and its connection to employee commitment
As BrightPoint continues to increase focus on employee engagement the organization will grow
stronger and maintain a substantial advantage over our competition Our employees possess the
knowledge experience and resiliency to respond quickly to the demands of the marketplace and
through their genuine commitment will deliver what our customers want with increasing
efficiency and effectiveness Our responsibility is value-creation by growing our business and
maintaining high levels of customer service and loyalty We believe the best way to accomplish
this is through a strong committed and engaged workforce
Performance Model Adopted At Mohali Plant
38
Process adopted by Philips Electronics Mohali Plant for Job Satisfaction of Employee that leads commitment of the employees
39
Recruiting
The messages in Philips Electronics Mohali organization conveys while seeking to attract job
applicants also can influence future employeesrsquo engagement and commitment If your firm has
designed jobs specifically to engage employees then organization want to ensure that recruiting
ads extol these positionsrsquo attractive featuresmdashsuch as challenging work assignments a highly
skilled team environment or minimal supervision Applicants who notice and respond to these
ads will more likely be motivated by these features Also consider how organization might best
seek candidates from inside your organization When Organisation recruit existing employees for
desirable jobs you enhance their engagement (by maximizing the person-job fit) and
commitment (by providing growth and advancement opportunities to employees in return for
their loyalty) If Organisation recruit from outside when qualified internal candidates are
available Organization may unwittingly suggest to current employees that your company is not
willing to reciprocate their commitment Existing staff may then begin questioning their own
commitment to the firm By contrast organisation recruit external candidates to both the job and
your organization For these candidates ensure that recruiting messages highlight attractive job
features organizational values and commitment reciprocity That is in return for performance
and dedication your company offers competitive pay and benefits flexible work hours and
learning and career advancement opportunities Also remember that prospective employees have
multiple commitments You will inevitably have to compete with those commitments as
organization try to attract candidates to your firm Most people find it easier to make a new
commitment when it is compatible with their other obligations For example you boost your
chances of recruiting a highly qualified candidate who is a single parent if you offer flexible
work hours family health benefits and on-site day care ldquoRecruiting for Engagement and
Commitmentrdquo
40
Employee Selection
Once recruiting efforts produce a pool of promising job candidates Philips select among them to
fill available positions When organisation select the right individuals for the right jobs new
hires carry out their work more smoothly and experience fewer performance problems The
result Greater enjoyment ofmdashand engagement inmdashthe job
To enhance engagement through your selection of employees identify those candidates who are
best-suited to the job and your organizationrsquos culture Also use candidate assessment methods
that have obvious relevance to the job in questionmdashfor example by asking interviewees what
they know about the role and having them provide work samples Most candidates will view
these techniques more positively than tests with less apparent relevance such as personality and
integrity assessments Successful candidates feel good about having ldquopassed the test and see
company as careful and capable for having selected them A positive initial impression of an
employer encourages growth of long-term commitment
Training and Development
Training and development can serve as additional levers for enhancing engagement and
commitment For new hires training usually begins with orientation Orientation presents several
important opportunitiesmdashincluding explaining pay work schedules and company policies Most
important it gives you a chance to encourage employee engagement by explaining how the new
hirersquos job contributes to the organizationrsquos mission Through orientation Mohali Plant of Philips
Electronics describe how r company is organized introduce the new employee to his or her co-
workers give the person a tour of the area where he or she will be working and explain safety
regulations and other procedural matters In short you foster person-organization fitmdashvital for
developing productive and dedicated employees Through training you help new and current
41
employees acquire the knowledge and skills they need to perform their jobs And employees who
enhance their skills through training are more likely to engage fully in their work because they
derive satisfaction from mastering new tasks Training also enhances employeesrsquo value to your
company as well as their own employability in the job market In addition most companies offer
higher wages for skilled workers to compensate them for their greater value and to discourage
turnover
Compensation
Like the HR practices discussed above compensation can powerfully influence employee
engagement and commitment Some compensation components encourage commitment to
employers while others motivate engagement in the job It is possible to stimulate one and not
the other though itrsquos generally better to foster both For example a company that offers a strong
performance incentive system but no retirement plan will probably realize exceptional
engagement from its workers however they may eventually commit themselves to another
company that does offer a good retirement plan Meanwhile an organization that offers generous
retirement benefits but a traditional seniority-based pay grade system may have committed
employees however these workers might deliver pedestrian performance as they bide their time
until retirement In designing compensation plans you therefore need to consider employee
engagement and commitment strategically
Encourage managers to include employees in the goal-setting process This technique helps to
ensure that workers understand the goals It also promotes acceptance of challenging objectives
because people generally feel more committed to goals they have helped define In addition
consider how you and other managers will recognize and encourage contributions that exceed
expectations For example when a piece of equipment malfunctions Joe finds other ways to
maintain production rather than merely shutting down the machine and waiting for the
42
maintenance staff to fix it Or when a less experienced co-worker encounters a new task Sally
offers friendly coaching instead of standing by and waiting for the inevitable mistakes to crop
up Performance management processes operate on a continuous basis Therefore they provide
perhaps the best ongoing opportunities for employers to foster employee engagement and
commitment For example managers can use routine discussions about performance and
feedback sessions to learn which aspects of the job hold the most interest for each employee and
which tasks are most challenging During such discussions managers also can define what going
above and beyond the call of dutyrdquo looks like and generate ideas for rewarding such
contributions An employeersquos aspirations and career goals can receive careful attention during
performance appraisal meetings Without inquiring into an employeersquos personal life a supervisor
can nevertheless explore ways to enhance the compatibility between the workerrsquos commitment to
your organization and the employeersquos other life commitments Through such means the
organization personalizes its relationship to each employee and provides support while also
expressing appreciation for their contributionsmdash key drivers of engagement and commitment
To further engage employees and win their commitment through your performance management
programs consider how to treat your organizationrsquos most experienced employees In many cases
these employees understand the intricacies of a job better than their supervisors or managers do
By virtue of long identification with your organization they may be deeply committed to high-
level goals They use their expertise to contribute in ways that newer employees simply cannot
match But many of them also may be planning to retire soon especially if they are from the
ldquoBaby Boomerrdquo generation How will you transfer their knowledge to younger workers Design
a performance management system that recognizes and rewards proactive sharing of knowledge
and expertise among co-workers For example create knowledge repositories or learning
histories that can be stored in databases that employees can access and then create incentives
43
for people who contribute to and use these repositories Of course effective performance
management systems also identify employees who are not meeting expectations Failing to
address problem performance can erode other employeesrsquo engagement and commitment as their
workloads increase and they conclude that the company is willing to tolerate poor performance
If feedback coaching and remedial training are of little avail the manager may need to move the
person to a different position within the company where he or she can make a more valuable
contribution or let the individual go if there is no good match elsewhere in the organization
44
Chapter-V
RESEARCH METHODOLOGY
The basic task of research is to generate accurate information for use in decision-making
Research can be defined as the systematic and objective process of gathering recording and
analyzing data for aid in making business decisions As the project involves analyzing of
45
financial structure the research is exploratory in nature covering financial parameters and come
of the important ratios to carry out research There are basically two techniques adopted for
obtaining information
Primary Data
Secondary Data
Primary Data is gathered specifically for the project at hand through personal interviews with
the accounts officers
Sample Size = 100 Employees
Secondary data is previously collected and assembled for some project other than the one at
hand It is gathered and recorded by someone else prior to current needs of the researcher It is
less expensive than the primary date
Secondary Data can be obtained from both external and internal sources
External data may be collected from books and periodicals government sources media and other
commercial sources
Internal data is that secondary data which is created recorded or generated by the organization
As the project is explanatory in nature secondary data is collected from the reports of the
company books journals and interest Secondary data is gathered from annual reports official
records and standing orders of the units
CHAPTER - VI
DATA ANALYSIS AND INTERPRETATION
46
The data after collection is to be processed and analyzed in accordance with the outline
and down for the purpose at the time of developing research plan
Technically speaking processing implies editing coding classification and tabulation of
collected data so that they are amenable to analysis The term analysis refers to the computation
of certain measures along with searching for pattern groups Thus in the process of analysis
relationship or difference should be subjected to statistical tests of significance to determine with
what validity data can be said to indicate any conclusions
The analysis of data in a general way involves a number of closely related operations
which are performed with the purpose of summarizing the collected data and organizing them in
such a manner that they answer the research questions In this study the researcher followed
above process carefully and it is presented in this chapter
47
Table 41 ndash To know the department in which employees are belongs to
S
ou rc
e
survey data
Inference
From the above table it shows that 35 of employees are belongs to
production department
FIGURE 41
S
SI No
D
Department
N
No of Respondents
P
Percentage
1
1
M
Mechanical
3
30
3
30
2
2
E
Electrical
2
25
2
25
3
3
P
Production
3
35
3
35
4
4
O
Others
1
10
1
10
T
Total
1
100
1
100
48
REPRESENTS THE DEPARTMENT
Table 42 ndash To know working experience of the employees
Source survey data
Inference
From the above table it shows that 34 of the employees have 4 ndash 6
years experience
S
SI No
W
Work Experience
N
No of Respondents
P
Percentage
1
1
B
Below 2 years
1
33
1
13
2
2
2
2ndash 4 years
3
30
3
30
3
3
4
4ndash 6 years
3
34
3
34
4
4
A
Above 6 years
2
23
2
23
T
otal
1
100
1
100
49
FIGURE 42
REPRESENTS THE EXPERIENCE OF THE EMPLOYEES
Table 43 ndash To know the physical working environment
S
SI No
W
Working Environment
N
No of Respondents
P
Percentage
1
1
E
Excellent
1
12
1
12
2
2
G
Good
5
57
5
57
3
3
F
Fair
2
28
2
28
4
4
P
Poor
0
03
0
33
5
5
V
Very Poor
0
00
0
00
T
Total
1
100
1
100
Source survey data
Inference
From the above table it shows that 57 of the employees were feeling good about the working environment
50
FIGURE 43
REPRESENTS THE PHYSICAL WOKING ENVIRONMENT
51
Table 44 ndash To know the satisfaction level of employees towards the non-monitory benefits
S
SI No
N
Non-Monitory Benefits offered
to Employees
N
No of Respondents
P
Percentage
1
1
H
Highly Satisfied
1
14
1
14
2
2
S
Satisfied
5
54
5
54
3
3
N
Neither Satisfied nor Dissatisfied
2
25
2
25
4
4
D
Dissatisfied
0
05
0
05
5
5
H
Highly Dissatisfied
0
02
0
02
Total 1
100
1
100
Source survey data
Inference
From the above table it shows that 54 of the employees were satisfied towards the non-monitory benefits
FIGURE 44
REPRESENTS THE SATISFACTION LEVEL OF EMPLOYEES TOWARDS THE NON-MONITORY BENEFITS
52
Table 45 ndash To know the satisfaction level of respondents towards the work
assigned
Source survey dataInference
From the above table it shows that 45 of the respondents were satisfied towards the work assigned
FIGURE 45
S
SI No
A
Amount of Work
N
No of Respondents
P
Percentage
1
1
H
Highly satisfied
2
20
2
20
2
2
S
Satisfied
4
45
4
45
3
3
N
Neither Satisfied nor Dissatisfied
1
12
1
12
4
4
D
Dissatisfied
1
18
1
18
5
5
H
Highly Dissatisfied
0
06
0
06
Total 1
100
1
100
53
REPRESENTS THE SATISFACTION LEVEL OF RESPONDENTS TOWARDS THE WORK ASSIGNED
54
Table 46 ndash Opinion about the career development programme in their organisation
S
SI No
C
Career Development
N
No of Respondents
P
Percentage
H
Highly satisfied
1
12
1
12
S
Satisfied
5
56
5
56
N
Neither Satisfied nor Dissatisfied
2
22
2
22
D
Dissatisfied
1
10
1
10
H
Highly Dissatisfied
0
00
0
00
Total 1
100
1
100
Source survey data
Inference
From the above table it shows that 56 of the employees were satisfied
with the opinion about the carrier development programme in their organisation
FIGURE 46
REPRESENTS OPINION ABOUT THE CAREER DEVELOPMENT
PROGRAMME IN THEIR ORGANISATION
55
Table 47 ndash To know the cooperation of co-workers
S
SI No
C
Co-operation of Workers
N
No of Respondents
P
Percentage
1
1
H
Highly satisfied
2
20
2
20
2
2
S
Satisfied
6
66
6
66
3
3
N
Neither Satisfied nor Dissatisfied
1
11
1
11
4
4
D
Dissatisfied
0
03
0
03
5
5
H
Highly Dissatisfied
0
00
0
00
Total 1
100
1
100
Source survey data
Inference
From the above table it shows that 66 of the employees were satisfied
with the cooperation of co-workers
FIGURE 47
56
REPRESENTS THE COOPERATION OF CO-WORKERS
57
Table 48 ndash To know the satisfaction of Respondents with top management
S
SI No
S
Satisfaction with Top
Management
N
No of Respondents
P
Percentage
1
1
H
Highly satisfied
2
26
2
26
2
2
S
Satisfied
5
51
5
51
3
3
N
Neither Satisfied nor Dissatisfied
1
17
1
17
4
4
D
Dissatisfied
0
06
0
06
5
5
H
Highly dissatisfied
0
00
0
00
Total 1
100
1
100
Source survey data
Inference
From the above table it shows that 51 of the employees were satisfied with the top management
FIGURE 48
58
REPRESENTS THE SATISFACTION OF RESPONDENTS WITH TOP MANAGEMENT
Table 49 ndash To know the satisfaction of Respondents with their subordinates
Source survey data
Inference
From the above table it shows that 67 of the employees were satisfied with their subordinates
S
SI
No
S
Satisfaction with Subordinates
N
No of Respondents
P
Percentage
1
1
H
Highly satisfied
1
12
1
12
2
2
S
Satisfied
6
67
6
67
2
3
N
Neither Satisfied nor Dissatisfied
1
14
1
14
4
D
Dissatisfied
0
07
0
07
5
5
H
Highly Dissatisfied
0
00
0
00
Total 1
100
1
100
59
FIGURE 49
REPRESENTS THE SATISFACTION OF RESPONDENTS WITH THEIR SUBORDINATES
60
Table 410 ndash To know the level of satisfaction regarding nature of job
S
SI No
J
Job Satisfaction
N
No of Respondents
P
Percentage
1
1
H
Highly satisfied
2
22
2
22
2
2
S
Satisfied
5
56
5
56
3
3
N
Neither Satisfied nor Dissatisfied
1
16
1
16
4
4
D
Dissatisfied
0
07
0
07
5
5
H
Highly Dissatisfied
0
00
0
00
Total 1
100
1
100
Source survey dataInference
From the above table it shows that 56 of the employees were satisfied with their job
FIGURE 410
61
REPRESENTS THE LEVEL OF SATISFACTION REGARDING THE NATURE OF JOB
Table 411 ndash To know whether there is any job pressure in their work
Source survey data
Inference
From the above table it shows that 72 of employees said there is job pressure in their work
FIGURE 411
REPRESENTS WHETHER THERE IS ANY JOB PRESSURE IN THEIR WORK
S
SI No
J
Job Pressure
N
No of Respondents
P
Percentage
1
1
Y
Yes
7
72
7
72
2
2
N
No
2
28
2
28
T
Total
1
100
1
100
62
Table 412 ndash To know the opinion regarding opportunity provided by the organisation in developing skills
amp talents
S
SI No
D
Development of Skills and
Talents
N
No of Respondents
P
Percentage
1
1
H
Highly Agree
1
12
1
12
2
2
A
Agree
5
52
5
52
3
3
N
Neither Agree nor Disagree
2
28
2
28
4
4
D
Disagree
0
06
0
06
5
5
H
Highly Disagree
0
02
0
02
Total 1
100
1
100
Source survey data
Inference
From the above table it shows that 52 of employees agreed regarding opportunity provided by the organisation in developing skills amp talents
63
FIRGURE 412
REPRESENTS THE OPPORTUNITY PROVIDED BY THE ORGANISATION IN DEVELOPING SKILLS amp TALENTS
64
Table 413 ndash To know the satisfaction level of welfare facilities provided by the management
S
SI No
W
Welfare Facilities
N
No of Respondents
P
Percentage
1
1
H
Highly satisfied
0
09
9
09
2
2
S
Satisfied
5
57
5
57
3
3
N
Neither Satisfied nor Dissatisfied
2
29
2
29
4
4
D
Dissatisfied
5
05
0
05
5
5
H
Highly Dissatisfied
0
00
0
00
Total 1
100
1
100
Source survey data
Inference
From the above table it shows that 57 of the employees were satisfied with the welfare facilities provided by the management
FIGURE 413
REPRESENTS THE SATISFACTION LEVEL OF WELFARE FACILITIES PROVIDED BY THE MANGEMENT
65
Table 414 ndash To know the employee satisfaction towards the salary
Source survey data
Inference
From the above table it shows that 67 of the employees were satisfied
with their salary
FIGURE 414
REPRESENTS THE SATISFACTION TOWARDS THE SALARY
S
SI No
P
Payment Satisfaction
N
No of Respondents
P
Percentage
1
1
Y
Yes
6
67
6
67
2
2
N
No
3
33
3
33
T
otal
1
100
1
100
66
Table 415 ndash To know the employees willingness amp Commitment Towards
Organisation
Source survey data
Inference
From the above table it shows that 59 of the employees were willing to
continue in this organisation
FIGURE 415
REPRESENTS THE EMPLOYEES WILLINGNESS TO CONTINUE
S
SI No
W
Willingness to Work
N
No of Respondents
P
Percentage
1
1
Y
Yes
5
59
5
59
2
2
N
No
4
41
4
41
T
Total
1
00
1
00
67
CHI-SQUARE METHOD
The chi square test is one of the simplest and most widely used non-
parametric tests in statistical work As a non-parametric test it can be used to determine
if categorical data shows dependency or the two classifications are independent It can
also be used to make comparisons between theoretical population and actual data
when categories are used
n
Chi square χsup2= sum (O-E) sup2 E
i =1
Where O= observed frequency
E= expected frequency
68
OBSERVED FREQUENCY
Table 419 shows the relationship between the department and the job satisfaction
Over All
Job
SatisfactionHighly
SatisfiedSatisfied
Neither
Satisfied nor
Dissatisfied
DissatisfiedHighly
Dissatisfied
Sub
Total
Mechanical 5 6 14 3 2 30
Electrical 6 8 6 3 2 25
Production 9 13 7 4 2 35
Others 2 3 2 2 1 10
Sub Total 22 30 29 12 7 100
69
EXPECTED FREQUENCY
Over All
Job
SatisfactionHighly
SatisfiedSatisfied
Neither
Satisfied nor
Dissatisfied
DissatisfiedHighly
Dissatisfied
Sub
Total
Mechanical 7 8 9 4 2 30
Electrical 5 8 7 3 2 25
Production 8 11 10 4 2 35
Others 2 3 3 1 1 10
Sub Total 22 30 29 12 7 100
Null Hypothesis (Ho)
There is no significant difference between the department and the job satisfaction
Alternative Hypothesis (Ho)
There is significant difference between the job satisfaction
Co Relation
70
Chapter-V
CONCLUSIONS AND
RECOMMENDATIONS
71
CONCLUSION
On the basis of Analysis of Job Satisfaction Level of the Employees of Philips Electronics India
Ltd Mohali made in the previous chapters following conclusions are drawn
General Profile The plant of PHILIPS is ideally located in the Mohali Industrial focal point
Phase 9 near Chandigarh the capital of Punjab on a campus of 17 hectares The working
environment of the company is very healthy The visitors feel happy after the campus
Indigenous Technology PHILIPS is the only lighting manufacturing company based on purely
indigenous technology Philips was appropriately chosen as the brand name as self reliance and
building up of Indian Engineering capabilities remain the guiding spirit of PHILIPS
Financial structure PHILIPS is a low debt company signifying its dependence mainly on
its internal accruals for its financial requirements PHILIPS continues to strengthen its financial
position by channelising these internal accruals to fund its expansion programmes
Working results PTL has registered a handsome and constant growth in its profits because
of a brisk demand for new and better technology electronic items None of the other electronic
company has shown such a steady growth Philips has recorded the lowest current ratio
However with this lowest current ratio PTL still enjoys moderate payment period and highest
velocity of creditors and debtors only due to commitment of itrsquos employees
72
SUMMARY
According to the 1999 Gallup Poll the four elements that have proven to be effective in creating
employee loyalty are praise and recognition a sense of contribution to the company learning and
development and having a best friend at work
Creating a fairy-tale work environment begins withrecognition Your employees need it more
than money perks or titles Here are eight tips regarding recognition Remember these and your
employees may just start whistling while they work It is up to me The corporate culture or
financial rewards will not make your team successful It is up to you Recognition is one thing
that is completely in your control
Strong relationships are vital in todays economy Strengthening employee relationships is even
more necessary as companies downsize and lay off As your workforce shrinks and you need to
do more with less keeping quality employees becomes even more critical As a manager it is
your job to bond your best people to your company through recognition And you also must help
direct and motivate your core performers
Simple rewards earn big returns There are some relatively simple things you can do that will
earn big returns For example remember your employees birthdays and work anniversaries find
out what inexpensive rewards they value (for example tickets to a ball game or a half day off to
spend time with their kids) make the most of your formal service awards with some preparation
and a group presentation walk around your department every day and talk to your
people and thank them sincerely and often
73
Make it specific Praise and recognition must be specific to have impact General praise such as
You do great work actually can have the opposite effect and leave your employees wondering
Does he have any idea what I really do around here Specific praise links individual
accomplishments to company goals For example Cheryl I noticed the way you handled that
customer complaint Great work As you know we value quick resolutions of problems as
one of our core strategies
Ask the best to stay Call your best people into your office one at a time Let that bright young
college graduate know you value his fresh ideas and energy Tell the 20-year veteran how much
your team relies on her expertise and organizational skillsRemarkably a significant percent of
high-impact performers report that they left their last job because No one ever asked me to
stay
Forget cash
Remember the saying Money cant buy everything Well its true Dont wait until you can
offer an employee a raise or promotion Real thanks is its own reward In numerous surveys of
work satisfaction top on employees lists is feeling appreciated In fact when employees feel
recognized and involved they are much less likely to keep asking about money
Recognize
Recognition means most to an employee when it is sincere and spontaneous According to the
largest study ever conducted on workplace satisfaction (Gallup 1999) recognition should occur
at least every seven days If you wait until a year-end party or an annual review you are waiting
much too long to recognize and you probably are losing people you do not need to
74
Recognition works
Neglect can be a poisoned apple Recognition is the elixir that will spark better attitudes and
performance Jeffrey Pfeffer of Stanford University says The returns from managing people in
ways that build high commitment typically are on the order of 30 to 50 percent
Take a hard look in the mirror and ask yourself how you can recognize the fairest of them all
Learn to recognize your employees for their efforts thank them often and reward their
achievements You can awaken them from their anger and apathy and they will fall in love with
their jobs again Chances are you will work together happily ever after
So there is direct relation with employee satisfaction and their commitment towards the
organization and it is also clear from the above discussion that only monetary elements are not
sufficient for employee satisfaction rather other element like employer behavior recognisation
and other moral value
75
RECOMMENDATIONS
PHILIPS should increase its capacity utilization It should work at full capacity to
minimize its cost of production With this increase in capacity utilization the total cost
will spread over more units thereby decreasing the per unit cost
PHILIPS should decrease the credit facilities provided to its consumers The payback
period is quite high in case of debtors as compared to creditors it should be more or less
equal as it will help in improving company liquidity
PHILIPS should focus more on the consumer lifestyle goods in India parallel to its other
business as it accounts very less as compare to other businesses of Philips
Another recommendation for Mohali plant is about the HR department that is they
should appoint permanent and skilled workers as against casual workers which generally add
up to the profit of the company
76
BIBLIOGRAPHY
1 Values-Based Leadership Rebuilding Employee Commitment Performance and Productivity ( Thomas D Kuczmarski)
2 Monthly Journals of Philips Electronics India Ltd
3 Authentic Leadership Medtronic CEO Bill George
4 wwwindiaphilipscom
5 wwwwikipediacom
6 httpwwwemployeecommitmentcom
7 One Foot Out The Door How to Combat The Psychological Recession Thatrsquos Alienating Employees And Hurting American Business Judith Bardwick
8 Employee Commitment A Leader Ship Guide Joe Folkman
9 Harvard University Factors that Impact Employee Well Being Commitment and Productivity -An Article
77
Questionnaire
Name __________________________________________________________
Age______________________________ Gender _______________________
Qualification _______________________ Contact No ___________________
Q1 In which department you are working
Electrical Production Mechanical Other
Q2 What is your working experience
gt2 Years 2-4 Years 4-6 Years lt 6 Years
Q3 How You like the physical Working Environment of the organization
Excellent Good Fair Poor Very Poor
Q4 Are you satisfied with Non-Monitory benefits provided by the organisation
Highly Satisfied Satisfied Neither Satisfied Nor dissatisfied
Highly Dissatisfied Dissatisfied
Q5 Are you satisfied with your work
Highly Satisfied Satisfied Neither Satisfied Nor dissatisfied
Highly Dissatisfied Dissatisfied
Q6 Are you satisfied with the career development programe of the company
Highly Satisfied Satisfied Neither Satisfied Nor dissatisfied
Highly Dissatisfied Dissatisfied
Q7 Is other staff of the organization is co-operative with you
Highly Satisfied Satisfied Neither Satisfied Nor dissatisfied
Highly Dissatisfied Dissatisfied
Q8 Are you satisfied with top level management
Highly Satisfied Satisfied Neither Satisfied Nor dissatisfied
Highly Dissatisfied Dissatisfied
78
Q9 Are you satisfied with your subordinates
Highly Satisfied Satisfied Neither Satisfied Nor dissatisfied
Highly Dissatisfied Dissatisfied
Q10 Are you satisfied with the nature of the Job
Highly Satisfied Satisfied Neither Satisfied Nor dissatisfied
Highly Dissatisfied Dissatisfied
Q11 Do you have any Job Pressure in work
Yes No
Q12 Do you satisfied with the opportunities provided by the organisation
Highly Satisfied Satisfied Neither Satisfied Nor dissatisfied
Highly Dissatisfied Dissatisfied
Q13 Are you satisfied with the welfare facilities provided by the organisation
Highly Satisfied Satisfied Neither Satisfied Nor dissatisfied
Highly Dissatisfied Dissatisfied
Q14 Are you satisfied towards your salary
Highly Satisfied Satisfied Neither Satisfied Nor dissatisfied
Highly Dissatisfied Dissatisfied
Q15 Are you committed towards the organisation
Yes No
Signature
34
Since managers interact directly and frequently with subordinates they are usually more tuned
in to how employees are feeling than are executives Managers are in a better position to know
for example when employees are feeling alienated and disengaged from their work which is
very common today -- and expensive
Gaining employee commitment results in greater profits because enthusiastic employees stay
contribute discretionary effort and engage customers Performance soars when customers are
enthused and stay and when executives managers and employees are a collaborative team
united in achieving common goals
But managers are often called middle managers for good reason their job is to motivate and
guide subordinates while they at the same time are being judged by their bosses Because of
their ldquotweenrdquo position in the hierarchy managers to effective support direct reports must also
create relationships with potential allies especially those with greater power who have access to
top decision makers
Harvard University Factors that Impact Employee Well Being Commitment and
Productivity
Business executives from the C-suite and HR to QC and RampD are by nature focused on the
corporate bottom line A new trend in our dawning age of social sustainability is that many
experts believe more attention should be paid to the dotted line - the one signed when a person
35
commits to employment at a company New Harvard research validates this approach affirming
that trust and purpose play a significant role in building successful productive workplaces
The behavioral research conducted by a team at Harvard University and Massachusetts General
Hospital identifies the factors most likely to impact 21st century employee well being
commitment and productivity The researchers found that commitment is largely influenced by
ones sense of purpose feeling of personal impact and overall trust in the organization
Productivity is largely affected by the quality of human relationships including cooperative
social group moods and interaction
The results lead us to conclude that workplaces that provide positive environments that foster
interpersonal trust and quality personal relationships create the most committed and productive
employees says Nancy Etcoff PhD the lead researcher on the study
Expert Shares Keys to Building Successful Workplace Relationships
According to business strategist Courtney Anderson JD MBA Outstanding leadership
today means much more than just doing your job Success is creating an environment that fosters
happy committed productive team members
Anderson explains that reinvigorating workplaces by enhancing trust and employee commitment
does not have to be difficult The biggest challenge she says is making the time to truly change
in our overscheduled instant access competitive work environments With a little know-how it
can be easy to evolve workplace well being and respond to these compelling research results
-Mark Howell-
CEO Bright Point
High-performing companies recognize that employee commitment is a major contributing factor
toward sustaining long-term success and creating value An engaged employee is involved and
excited about their work and acts in a manner that will forward the organizationrsquos interest An
36
engaged workforce helps optimize and retain talent for the long-term because the employees
choose to stay even when other employment alternatives exist
According to Walker Information the top three drivers of employee commitment are
Satisfaction Fairness and Care amp Concern for employees Put simply committed employees
want to enjoy their work feel they are appreciated and know they are making a contribution to
their companyrsquos strategic objectives Additionally employees who have trust in their leadership
and are trusted by their leadership have a greater dedication and are ultimately more productive
on the job However according to recent data provided by the National Business Research
Institute (NBRI) only 31 of all employees are truly engaged
At BrightPoint we take employee engagement seriously and we work to create a culture that
inspires employee loyalty and satisfaction The results of BrightPointrsquos commitment to its
employees are shown in the 2011 BPNA Employee Commitment Survey The survey
determined that close to 80 of respondents indicated they were satisfied with their jobs and
daily activities General employee satisfaction increases when managers take an active interest
in their employees beyond their day-to-day job responsibilities According to NBRI managers
that actively coach build relationships and keep an open dialogue with their employees improve
employee engagement
We have a diverse workforce where each employee brings unique value and has individual
needs Managers are learning to manage the individual and not the position In order to give
managers the tools they need to be successful BrightPoint places strong emphasis on targeted
leadership training workshops and continual learning resources In 2011 906 of managers at
BrightPoint NA participated in the development opportunities offered and also made an effort to
37
help reinforce the learning of their team members This signals that our leadership team is taking
an active interest in professional development and its connection to employee commitment
As BrightPoint continues to increase focus on employee engagement the organization will grow
stronger and maintain a substantial advantage over our competition Our employees possess the
knowledge experience and resiliency to respond quickly to the demands of the marketplace and
through their genuine commitment will deliver what our customers want with increasing
efficiency and effectiveness Our responsibility is value-creation by growing our business and
maintaining high levels of customer service and loyalty We believe the best way to accomplish
this is through a strong committed and engaged workforce
Performance Model Adopted At Mohali Plant
38
Process adopted by Philips Electronics Mohali Plant for Job Satisfaction of Employee that leads commitment of the employees
39
Recruiting
The messages in Philips Electronics Mohali organization conveys while seeking to attract job
applicants also can influence future employeesrsquo engagement and commitment If your firm has
designed jobs specifically to engage employees then organization want to ensure that recruiting
ads extol these positionsrsquo attractive featuresmdashsuch as challenging work assignments a highly
skilled team environment or minimal supervision Applicants who notice and respond to these
ads will more likely be motivated by these features Also consider how organization might best
seek candidates from inside your organization When Organisation recruit existing employees for
desirable jobs you enhance their engagement (by maximizing the person-job fit) and
commitment (by providing growth and advancement opportunities to employees in return for
their loyalty) If Organisation recruit from outside when qualified internal candidates are
available Organization may unwittingly suggest to current employees that your company is not
willing to reciprocate their commitment Existing staff may then begin questioning their own
commitment to the firm By contrast organisation recruit external candidates to both the job and
your organization For these candidates ensure that recruiting messages highlight attractive job
features organizational values and commitment reciprocity That is in return for performance
and dedication your company offers competitive pay and benefits flexible work hours and
learning and career advancement opportunities Also remember that prospective employees have
multiple commitments You will inevitably have to compete with those commitments as
organization try to attract candidates to your firm Most people find it easier to make a new
commitment when it is compatible with their other obligations For example you boost your
chances of recruiting a highly qualified candidate who is a single parent if you offer flexible
work hours family health benefits and on-site day care ldquoRecruiting for Engagement and
Commitmentrdquo
40
Employee Selection
Once recruiting efforts produce a pool of promising job candidates Philips select among them to
fill available positions When organisation select the right individuals for the right jobs new
hires carry out their work more smoothly and experience fewer performance problems The
result Greater enjoyment ofmdashand engagement inmdashthe job
To enhance engagement through your selection of employees identify those candidates who are
best-suited to the job and your organizationrsquos culture Also use candidate assessment methods
that have obvious relevance to the job in questionmdashfor example by asking interviewees what
they know about the role and having them provide work samples Most candidates will view
these techniques more positively than tests with less apparent relevance such as personality and
integrity assessments Successful candidates feel good about having ldquopassed the test and see
company as careful and capable for having selected them A positive initial impression of an
employer encourages growth of long-term commitment
Training and Development
Training and development can serve as additional levers for enhancing engagement and
commitment For new hires training usually begins with orientation Orientation presents several
important opportunitiesmdashincluding explaining pay work schedules and company policies Most
important it gives you a chance to encourage employee engagement by explaining how the new
hirersquos job contributes to the organizationrsquos mission Through orientation Mohali Plant of Philips
Electronics describe how r company is organized introduce the new employee to his or her co-
workers give the person a tour of the area where he or she will be working and explain safety
regulations and other procedural matters In short you foster person-organization fitmdashvital for
developing productive and dedicated employees Through training you help new and current
41
employees acquire the knowledge and skills they need to perform their jobs And employees who
enhance their skills through training are more likely to engage fully in their work because they
derive satisfaction from mastering new tasks Training also enhances employeesrsquo value to your
company as well as their own employability in the job market In addition most companies offer
higher wages for skilled workers to compensate them for their greater value and to discourage
turnover
Compensation
Like the HR practices discussed above compensation can powerfully influence employee
engagement and commitment Some compensation components encourage commitment to
employers while others motivate engagement in the job It is possible to stimulate one and not
the other though itrsquos generally better to foster both For example a company that offers a strong
performance incentive system but no retirement plan will probably realize exceptional
engagement from its workers however they may eventually commit themselves to another
company that does offer a good retirement plan Meanwhile an organization that offers generous
retirement benefits but a traditional seniority-based pay grade system may have committed
employees however these workers might deliver pedestrian performance as they bide their time
until retirement In designing compensation plans you therefore need to consider employee
engagement and commitment strategically
Encourage managers to include employees in the goal-setting process This technique helps to
ensure that workers understand the goals It also promotes acceptance of challenging objectives
because people generally feel more committed to goals they have helped define In addition
consider how you and other managers will recognize and encourage contributions that exceed
expectations For example when a piece of equipment malfunctions Joe finds other ways to
maintain production rather than merely shutting down the machine and waiting for the
42
maintenance staff to fix it Or when a less experienced co-worker encounters a new task Sally
offers friendly coaching instead of standing by and waiting for the inevitable mistakes to crop
up Performance management processes operate on a continuous basis Therefore they provide
perhaps the best ongoing opportunities for employers to foster employee engagement and
commitment For example managers can use routine discussions about performance and
feedback sessions to learn which aspects of the job hold the most interest for each employee and
which tasks are most challenging During such discussions managers also can define what going
above and beyond the call of dutyrdquo looks like and generate ideas for rewarding such
contributions An employeersquos aspirations and career goals can receive careful attention during
performance appraisal meetings Without inquiring into an employeersquos personal life a supervisor
can nevertheless explore ways to enhance the compatibility between the workerrsquos commitment to
your organization and the employeersquos other life commitments Through such means the
organization personalizes its relationship to each employee and provides support while also
expressing appreciation for their contributionsmdash key drivers of engagement and commitment
To further engage employees and win their commitment through your performance management
programs consider how to treat your organizationrsquos most experienced employees In many cases
these employees understand the intricacies of a job better than their supervisors or managers do
By virtue of long identification with your organization they may be deeply committed to high-
level goals They use their expertise to contribute in ways that newer employees simply cannot
match But many of them also may be planning to retire soon especially if they are from the
ldquoBaby Boomerrdquo generation How will you transfer their knowledge to younger workers Design
a performance management system that recognizes and rewards proactive sharing of knowledge
and expertise among co-workers For example create knowledge repositories or learning
histories that can be stored in databases that employees can access and then create incentives
43
for people who contribute to and use these repositories Of course effective performance
management systems also identify employees who are not meeting expectations Failing to
address problem performance can erode other employeesrsquo engagement and commitment as their
workloads increase and they conclude that the company is willing to tolerate poor performance
If feedback coaching and remedial training are of little avail the manager may need to move the
person to a different position within the company where he or she can make a more valuable
contribution or let the individual go if there is no good match elsewhere in the organization
44
Chapter-V
RESEARCH METHODOLOGY
The basic task of research is to generate accurate information for use in decision-making
Research can be defined as the systematic and objective process of gathering recording and
analyzing data for aid in making business decisions As the project involves analyzing of
45
financial structure the research is exploratory in nature covering financial parameters and come
of the important ratios to carry out research There are basically two techniques adopted for
obtaining information
Primary Data
Secondary Data
Primary Data is gathered specifically for the project at hand through personal interviews with
the accounts officers
Sample Size = 100 Employees
Secondary data is previously collected and assembled for some project other than the one at
hand It is gathered and recorded by someone else prior to current needs of the researcher It is
less expensive than the primary date
Secondary Data can be obtained from both external and internal sources
External data may be collected from books and periodicals government sources media and other
commercial sources
Internal data is that secondary data which is created recorded or generated by the organization
As the project is explanatory in nature secondary data is collected from the reports of the
company books journals and interest Secondary data is gathered from annual reports official
records and standing orders of the units
CHAPTER - VI
DATA ANALYSIS AND INTERPRETATION
46
The data after collection is to be processed and analyzed in accordance with the outline
and down for the purpose at the time of developing research plan
Technically speaking processing implies editing coding classification and tabulation of
collected data so that they are amenable to analysis The term analysis refers to the computation
of certain measures along with searching for pattern groups Thus in the process of analysis
relationship or difference should be subjected to statistical tests of significance to determine with
what validity data can be said to indicate any conclusions
The analysis of data in a general way involves a number of closely related operations
which are performed with the purpose of summarizing the collected data and organizing them in
such a manner that they answer the research questions In this study the researcher followed
above process carefully and it is presented in this chapter
47
Table 41 ndash To know the department in which employees are belongs to
S
ou rc
e
survey data
Inference
From the above table it shows that 35 of employees are belongs to
production department
FIGURE 41
S
SI No
D
Department
N
No of Respondents
P
Percentage
1
1
M
Mechanical
3
30
3
30
2
2
E
Electrical
2
25
2
25
3
3
P
Production
3
35
3
35
4
4
O
Others
1
10
1
10
T
Total
1
100
1
100
48
REPRESENTS THE DEPARTMENT
Table 42 ndash To know working experience of the employees
Source survey data
Inference
From the above table it shows that 34 of the employees have 4 ndash 6
years experience
S
SI No
W
Work Experience
N
No of Respondents
P
Percentage
1
1
B
Below 2 years
1
33
1
13
2
2
2
2ndash 4 years
3
30
3
30
3
3
4
4ndash 6 years
3
34
3
34
4
4
A
Above 6 years
2
23
2
23
T
otal
1
100
1
100
49
FIGURE 42
REPRESENTS THE EXPERIENCE OF THE EMPLOYEES
Table 43 ndash To know the physical working environment
S
SI No
W
Working Environment
N
No of Respondents
P
Percentage
1
1
E
Excellent
1
12
1
12
2
2
G
Good
5
57
5
57
3
3
F
Fair
2
28
2
28
4
4
P
Poor
0
03
0
33
5
5
V
Very Poor
0
00
0
00
T
Total
1
100
1
100
Source survey data
Inference
From the above table it shows that 57 of the employees were feeling good about the working environment
50
FIGURE 43
REPRESENTS THE PHYSICAL WOKING ENVIRONMENT
51
Table 44 ndash To know the satisfaction level of employees towards the non-monitory benefits
S
SI No
N
Non-Monitory Benefits offered
to Employees
N
No of Respondents
P
Percentage
1
1
H
Highly Satisfied
1
14
1
14
2
2
S
Satisfied
5
54
5
54
3
3
N
Neither Satisfied nor Dissatisfied
2
25
2
25
4
4
D
Dissatisfied
0
05
0
05
5
5
H
Highly Dissatisfied
0
02
0
02
Total 1
100
1
100
Source survey data
Inference
From the above table it shows that 54 of the employees were satisfied towards the non-monitory benefits
FIGURE 44
REPRESENTS THE SATISFACTION LEVEL OF EMPLOYEES TOWARDS THE NON-MONITORY BENEFITS
52
Table 45 ndash To know the satisfaction level of respondents towards the work
assigned
Source survey dataInference
From the above table it shows that 45 of the respondents were satisfied towards the work assigned
FIGURE 45
S
SI No
A
Amount of Work
N
No of Respondents
P
Percentage
1
1
H
Highly satisfied
2
20
2
20
2
2
S
Satisfied
4
45
4
45
3
3
N
Neither Satisfied nor Dissatisfied
1
12
1
12
4
4
D
Dissatisfied
1
18
1
18
5
5
H
Highly Dissatisfied
0
06
0
06
Total 1
100
1
100
53
REPRESENTS THE SATISFACTION LEVEL OF RESPONDENTS TOWARDS THE WORK ASSIGNED
54
Table 46 ndash Opinion about the career development programme in their organisation
S
SI No
C
Career Development
N
No of Respondents
P
Percentage
H
Highly satisfied
1
12
1
12
S
Satisfied
5
56
5
56
N
Neither Satisfied nor Dissatisfied
2
22
2
22
D
Dissatisfied
1
10
1
10
H
Highly Dissatisfied
0
00
0
00
Total 1
100
1
100
Source survey data
Inference
From the above table it shows that 56 of the employees were satisfied
with the opinion about the carrier development programme in their organisation
FIGURE 46
REPRESENTS OPINION ABOUT THE CAREER DEVELOPMENT
PROGRAMME IN THEIR ORGANISATION
55
Table 47 ndash To know the cooperation of co-workers
S
SI No
C
Co-operation of Workers
N
No of Respondents
P
Percentage
1
1
H
Highly satisfied
2
20
2
20
2
2
S
Satisfied
6
66
6
66
3
3
N
Neither Satisfied nor Dissatisfied
1
11
1
11
4
4
D
Dissatisfied
0
03
0
03
5
5
H
Highly Dissatisfied
0
00
0
00
Total 1
100
1
100
Source survey data
Inference
From the above table it shows that 66 of the employees were satisfied
with the cooperation of co-workers
FIGURE 47
56
REPRESENTS THE COOPERATION OF CO-WORKERS
57
Table 48 ndash To know the satisfaction of Respondents with top management
S
SI No
S
Satisfaction with Top
Management
N
No of Respondents
P
Percentage
1
1
H
Highly satisfied
2
26
2
26
2
2
S
Satisfied
5
51
5
51
3
3
N
Neither Satisfied nor Dissatisfied
1
17
1
17
4
4
D
Dissatisfied
0
06
0
06
5
5
H
Highly dissatisfied
0
00
0
00
Total 1
100
1
100
Source survey data
Inference
From the above table it shows that 51 of the employees were satisfied with the top management
FIGURE 48
58
REPRESENTS THE SATISFACTION OF RESPONDENTS WITH TOP MANAGEMENT
Table 49 ndash To know the satisfaction of Respondents with their subordinates
Source survey data
Inference
From the above table it shows that 67 of the employees were satisfied with their subordinates
S
SI
No
S
Satisfaction with Subordinates
N
No of Respondents
P
Percentage
1
1
H
Highly satisfied
1
12
1
12
2
2
S
Satisfied
6
67
6
67
2
3
N
Neither Satisfied nor Dissatisfied
1
14
1
14
4
D
Dissatisfied
0
07
0
07
5
5
H
Highly Dissatisfied
0
00
0
00
Total 1
100
1
100
59
FIGURE 49
REPRESENTS THE SATISFACTION OF RESPONDENTS WITH THEIR SUBORDINATES
60
Table 410 ndash To know the level of satisfaction regarding nature of job
S
SI No
J
Job Satisfaction
N
No of Respondents
P
Percentage
1
1
H
Highly satisfied
2
22
2
22
2
2
S
Satisfied
5
56
5
56
3
3
N
Neither Satisfied nor Dissatisfied
1
16
1
16
4
4
D
Dissatisfied
0
07
0
07
5
5
H
Highly Dissatisfied
0
00
0
00
Total 1
100
1
100
Source survey dataInference
From the above table it shows that 56 of the employees were satisfied with their job
FIGURE 410
61
REPRESENTS THE LEVEL OF SATISFACTION REGARDING THE NATURE OF JOB
Table 411 ndash To know whether there is any job pressure in their work
Source survey data
Inference
From the above table it shows that 72 of employees said there is job pressure in their work
FIGURE 411
REPRESENTS WHETHER THERE IS ANY JOB PRESSURE IN THEIR WORK
S
SI No
J
Job Pressure
N
No of Respondents
P
Percentage
1
1
Y
Yes
7
72
7
72
2
2
N
No
2
28
2
28
T
Total
1
100
1
100
62
Table 412 ndash To know the opinion regarding opportunity provided by the organisation in developing skills
amp talents
S
SI No
D
Development of Skills and
Talents
N
No of Respondents
P
Percentage
1
1
H
Highly Agree
1
12
1
12
2
2
A
Agree
5
52
5
52
3
3
N
Neither Agree nor Disagree
2
28
2
28
4
4
D
Disagree
0
06
0
06
5
5
H
Highly Disagree
0
02
0
02
Total 1
100
1
100
Source survey data
Inference
From the above table it shows that 52 of employees agreed regarding opportunity provided by the organisation in developing skills amp talents
63
FIRGURE 412
REPRESENTS THE OPPORTUNITY PROVIDED BY THE ORGANISATION IN DEVELOPING SKILLS amp TALENTS
64
Table 413 ndash To know the satisfaction level of welfare facilities provided by the management
S
SI No
W
Welfare Facilities
N
No of Respondents
P
Percentage
1
1
H
Highly satisfied
0
09
9
09
2
2
S
Satisfied
5
57
5
57
3
3
N
Neither Satisfied nor Dissatisfied
2
29
2
29
4
4
D
Dissatisfied
5
05
0
05
5
5
H
Highly Dissatisfied
0
00
0
00
Total 1
100
1
100
Source survey data
Inference
From the above table it shows that 57 of the employees were satisfied with the welfare facilities provided by the management
FIGURE 413
REPRESENTS THE SATISFACTION LEVEL OF WELFARE FACILITIES PROVIDED BY THE MANGEMENT
65
Table 414 ndash To know the employee satisfaction towards the salary
Source survey data
Inference
From the above table it shows that 67 of the employees were satisfied
with their salary
FIGURE 414
REPRESENTS THE SATISFACTION TOWARDS THE SALARY
S
SI No
P
Payment Satisfaction
N
No of Respondents
P
Percentage
1
1
Y
Yes
6
67
6
67
2
2
N
No
3
33
3
33
T
otal
1
100
1
100
66
Table 415 ndash To know the employees willingness amp Commitment Towards
Organisation
Source survey data
Inference
From the above table it shows that 59 of the employees were willing to
continue in this organisation
FIGURE 415
REPRESENTS THE EMPLOYEES WILLINGNESS TO CONTINUE
S
SI No
W
Willingness to Work
N
No of Respondents
P
Percentage
1
1
Y
Yes
5
59
5
59
2
2
N
No
4
41
4
41
T
Total
1
00
1
00
67
CHI-SQUARE METHOD
The chi square test is one of the simplest and most widely used non-
parametric tests in statistical work As a non-parametric test it can be used to determine
if categorical data shows dependency or the two classifications are independent It can
also be used to make comparisons between theoretical population and actual data
when categories are used
n
Chi square χsup2= sum (O-E) sup2 E
i =1
Where O= observed frequency
E= expected frequency
68
OBSERVED FREQUENCY
Table 419 shows the relationship between the department and the job satisfaction
Over All
Job
SatisfactionHighly
SatisfiedSatisfied
Neither
Satisfied nor
Dissatisfied
DissatisfiedHighly
Dissatisfied
Sub
Total
Mechanical 5 6 14 3 2 30
Electrical 6 8 6 3 2 25
Production 9 13 7 4 2 35
Others 2 3 2 2 1 10
Sub Total 22 30 29 12 7 100
69
EXPECTED FREQUENCY
Over All
Job
SatisfactionHighly
SatisfiedSatisfied
Neither
Satisfied nor
Dissatisfied
DissatisfiedHighly
Dissatisfied
Sub
Total
Mechanical 7 8 9 4 2 30
Electrical 5 8 7 3 2 25
Production 8 11 10 4 2 35
Others 2 3 3 1 1 10
Sub Total 22 30 29 12 7 100
Null Hypothesis (Ho)
There is no significant difference between the department and the job satisfaction
Alternative Hypothesis (Ho)
There is significant difference between the job satisfaction
Co Relation
70
Chapter-V
CONCLUSIONS AND
RECOMMENDATIONS
71
CONCLUSION
On the basis of Analysis of Job Satisfaction Level of the Employees of Philips Electronics India
Ltd Mohali made in the previous chapters following conclusions are drawn
General Profile The plant of PHILIPS is ideally located in the Mohali Industrial focal point
Phase 9 near Chandigarh the capital of Punjab on a campus of 17 hectares The working
environment of the company is very healthy The visitors feel happy after the campus
Indigenous Technology PHILIPS is the only lighting manufacturing company based on purely
indigenous technology Philips was appropriately chosen as the brand name as self reliance and
building up of Indian Engineering capabilities remain the guiding spirit of PHILIPS
Financial structure PHILIPS is a low debt company signifying its dependence mainly on
its internal accruals for its financial requirements PHILIPS continues to strengthen its financial
position by channelising these internal accruals to fund its expansion programmes
Working results PTL has registered a handsome and constant growth in its profits because
of a brisk demand for new and better technology electronic items None of the other electronic
company has shown such a steady growth Philips has recorded the lowest current ratio
However with this lowest current ratio PTL still enjoys moderate payment period and highest
velocity of creditors and debtors only due to commitment of itrsquos employees
72
SUMMARY
According to the 1999 Gallup Poll the four elements that have proven to be effective in creating
employee loyalty are praise and recognition a sense of contribution to the company learning and
development and having a best friend at work
Creating a fairy-tale work environment begins withrecognition Your employees need it more
than money perks or titles Here are eight tips regarding recognition Remember these and your
employees may just start whistling while they work It is up to me The corporate culture or
financial rewards will not make your team successful It is up to you Recognition is one thing
that is completely in your control
Strong relationships are vital in todays economy Strengthening employee relationships is even
more necessary as companies downsize and lay off As your workforce shrinks and you need to
do more with less keeping quality employees becomes even more critical As a manager it is
your job to bond your best people to your company through recognition And you also must help
direct and motivate your core performers
Simple rewards earn big returns There are some relatively simple things you can do that will
earn big returns For example remember your employees birthdays and work anniversaries find
out what inexpensive rewards they value (for example tickets to a ball game or a half day off to
spend time with their kids) make the most of your formal service awards with some preparation
and a group presentation walk around your department every day and talk to your
people and thank them sincerely and often
73
Make it specific Praise and recognition must be specific to have impact General praise such as
You do great work actually can have the opposite effect and leave your employees wondering
Does he have any idea what I really do around here Specific praise links individual
accomplishments to company goals For example Cheryl I noticed the way you handled that
customer complaint Great work As you know we value quick resolutions of problems as
one of our core strategies
Ask the best to stay Call your best people into your office one at a time Let that bright young
college graduate know you value his fresh ideas and energy Tell the 20-year veteran how much
your team relies on her expertise and organizational skillsRemarkably a significant percent of
high-impact performers report that they left their last job because No one ever asked me to
stay
Forget cash
Remember the saying Money cant buy everything Well its true Dont wait until you can
offer an employee a raise or promotion Real thanks is its own reward In numerous surveys of
work satisfaction top on employees lists is feeling appreciated In fact when employees feel
recognized and involved they are much less likely to keep asking about money
Recognize
Recognition means most to an employee when it is sincere and spontaneous According to the
largest study ever conducted on workplace satisfaction (Gallup 1999) recognition should occur
at least every seven days If you wait until a year-end party or an annual review you are waiting
much too long to recognize and you probably are losing people you do not need to
74
Recognition works
Neglect can be a poisoned apple Recognition is the elixir that will spark better attitudes and
performance Jeffrey Pfeffer of Stanford University says The returns from managing people in
ways that build high commitment typically are on the order of 30 to 50 percent
Take a hard look in the mirror and ask yourself how you can recognize the fairest of them all
Learn to recognize your employees for their efforts thank them often and reward their
achievements You can awaken them from their anger and apathy and they will fall in love with
their jobs again Chances are you will work together happily ever after
So there is direct relation with employee satisfaction and their commitment towards the
organization and it is also clear from the above discussion that only monetary elements are not
sufficient for employee satisfaction rather other element like employer behavior recognisation
and other moral value
75
RECOMMENDATIONS
PHILIPS should increase its capacity utilization It should work at full capacity to
minimize its cost of production With this increase in capacity utilization the total cost
will spread over more units thereby decreasing the per unit cost
PHILIPS should decrease the credit facilities provided to its consumers The payback
period is quite high in case of debtors as compared to creditors it should be more or less
equal as it will help in improving company liquidity
PHILIPS should focus more on the consumer lifestyle goods in India parallel to its other
business as it accounts very less as compare to other businesses of Philips
Another recommendation for Mohali plant is about the HR department that is they
should appoint permanent and skilled workers as against casual workers which generally add
up to the profit of the company
76
BIBLIOGRAPHY
1 Values-Based Leadership Rebuilding Employee Commitment Performance and Productivity ( Thomas D Kuczmarski)
2 Monthly Journals of Philips Electronics India Ltd
3 Authentic Leadership Medtronic CEO Bill George
4 wwwindiaphilipscom
5 wwwwikipediacom
6 httpwwwemployeecommitmentcom
7 One Foot Out The Door How to Combat The Psychological Recession Thatrsquos Alienating Employees And Hurting American Business Judith Bardwick
8 Employee Commitment A Leader Ship Guide Joe Folkman
9 Harvard University Factors that Impact Employee Well Being Commitment and Productivity -An Article
77
Questionnaire
Name __________________________________________________________
Age______________________________ Gender _______________________
Qualification _______________________ Contact No ___________________
Q1 In which department you are working
Electrical Production Mechanical Other
Q2 What is your working experience
gt2 Years 2-4 Years 4-6 Years lt 6 Years
Q3 How You like the physical Working Environment of the organization
Excellent Good Fair Poor Very Poor
Q4 Are you satisfied with Non-Monitory benefits provided by the organisation
Highly Satisfied Satisfied Neither Satisfied Nor dissatisfied
Highly Dissatisfied Dissatisfied
Q5 Are you satisfied with your work
Highly Satisfied Satisfied Neither Satisfied Nor dissatisfied
Highly Dissatisfied Dissatisfied
Q6 Are you satisfied with the career development programe of the company
Highly Satisfied Satisfied Neither Satisfied Nor dissatisfied
Highly Dissatisfied Dissatisfied
Q7 Is other staff of the organization is co-operative with you
Highly Satisfied Satisfied Neither Satisfied Nor dissatisfied
Highly Dissatisfied Dissatisfied
Q8 Are you satisfied with top level management
Highly Satisfied Satisfied Neither Satisfied Nor dissatisfied
Highly Dissatisfied Dissatisfied
78
Q9 Are you satisfied with your subordinates
Highly Satisfied Satisfied Neither Satisfied Nor dissatisfied
Highly Dissatisfied Dissatisfied
Q10 Are you satisfied with the nature of the Job
Highly Satisfied Satisfied Neither Satisfied Nor dissatisfied
Highly Dissatisfied Dissatisfied
Q11 Do you have any Job Pressure in work
Yes No
Q12 Do you satisfied with the opportunities provided by the organisation
Highly Satisfied Satisfied Neither Satisfied Nor dissatisfied
Highly Dissatisfied Dissatisfied
Q13 Are you satisfied with the welfare facilities provided by the organisation
Highly Satisfied Satisfied Neither Satisfied Nor dissatisfied
Highly Dissatisfied Dissatisfied
Q14 Are you satisfied towards your salary
Highly Satisfied Satisfied Neither Satisfied Nor dissatisfied
Highly Dissatisfied Dissatisfied
Q15 Are you committed towards the organisation
Yes No
Signature

35
commits to employment at a company New Harvard research validates this approach affirming
that trust and purpose play a significant role in building successful productive workplaces
The behavioral research conducted by a team at Harvard University and Massachusetts General
Hospital identifies the factors most likely to impact 21st century employee well being
commitment and productivity The researchers found that commitment is largely influenced by
ones sense of purpose feeling of personal impact and overall trust in the organization
Productivity is largely affected by the quality of human relationships including cooperative
social group moods and interaction
The results lead us to conclude that workplaces that provide positive environments that foster
interpersonal trust and quality personal relationships create the most committed and productive
employees says Nancy Etcoff PhD the lead researcher on the study
Expert Shares Keys to Building Successful Workplace Relationships
According to business strategist Courtney Anderson JD MBA Outstanding leadership
today means much more than just doing your job Success is creating an environment that fosters
happy committed productive team members
Anderson explains that reinvigorating workplaces by enhancing trust and employee commitment
does not have to be difficult The biggest challenge she says is making the time to truly change
in our overscheduled instant access competitive work environments With a little know-how it
can be easy to evolve workplace well being and respond to these compelling research results
-Mark Howell-
CEO Bright Point
High-performing companies recognize that employee commitment is a major contributing factor
toward sustaining long-term success and creating value An engaged employee is involved and
excited about their work and acts in a manner that will forward the organizationrsquos interest An
36
engaged workforce helps optimize and retain talent for the long-term because the employees
choose to stay even when other employment alternatives exist
According to Walker Information the top three drivers of employee commitment are
Satisfaction Fairness and Care amp Concern for employees Put simply committed employees
want to enjoy their work feel they are appreciated and know they are making a contribution to
their companyrsquos strategic objectives Additionally employees who have trust in their leadership
and are trusted by their leadership have a greater dedication and are ultimately more productive
on the job However according to recent data provided by the National Business Research
Institute (NBRI) only 31 of all employees are truly engaged
At BrightPoint we take employee engagement seriously and we work to create a culture that
inspires employee loyalty and satisfaction The results of BrightPointrsquos commitment to its
employees are shown in the 2011 BPNA Employee Commitment Survey The survey
determined that close to 80 of respondents indicated they were satisfied with their jobs and
daily activities General employee satisfaction increases when managers take an active interest
in their employees beyond their day-to-day job responsibilities According to NBRI managers
that actively coach build relationships and keep an open dialogue with their employees improve
employee engagement
We have a diverse workforce where each employee brings unique value and has individual
needs Managers are learning to manage the individual and not the position In order to give
managers the tools they need to be successful BrightPoint places strong emphasis on targeted
leadership training workshops and continual learning resources In 2011 906 of managers at
BrightPoint NA participated in the development opportunities offered and also made an effort to
37
help reinforce the learning of their team members This signals that our leadership team is taking
an active interest in professional development and its connection to employee commitment
As BrightPoint continues to increase focus on employee engagement the organization will grow
stronger and maintain a substantial advantage over our competition Our employees possess the
knowledge experience and resiliency to respond quickly to the demands of the marketplace and
through their genuine commitment will deliver what our customers want with increasing
efficiency and effectiveness Our responsibility is value-creation by growing our business and
maintaining high levels of customer service and loyalty We believe the best way to accomplish
this is through a strong committed and engaged workforce
Performance Model Adopted At Mohali Plant
38
Process adopted by Philips Electronics Mohali Plant for Job Satisfaction of Employee that leads commitment of the employees
39
Recruiting
The messages in Philips Electronics Mohali organization conveys while seeking to attract job
applicants also can influence future employeesrsquo engagement and commitment If your firm has
designed jobs specifically to engage employees then organization want to ensure that recruiting
ads extol these positionsrsquo attractive featuresmdashsuch as challenging work assignments a highly
skilled team environment or minimal supervision Applicants who notice and respond to these
ads will more likely be motivated by these features Also consider how organization might best
seek candidates from inside your organization When Organisation recruit existing employees for
desirable jobs you enhance their engagement (by maximizing the person-job fit) and
commitment (by providing growth and advancement opportunities to employees in return for
their loyalty) If Organisation recruit from outside when qualified internal candidates are
available Organization may unwittingly suggest to current employees that your company is not
willing to reciprocate their commitment Existing staff may then begin questioning their own
commitment to the firm By contrast organisation recruit external candidates to both the job and
your organization For these candidates ensure that recruiting messages highlight attractive job
features organizational values and commitment reciprocity That is in return for performance
and dedication your company offers competitive pay and benefits flexible work hours and
learning and career advancement opportunities Also remember that prospective employees have
multiple commitments You will inevitably have to compete with those commitments as
organization try to attract candidates to your firm Most people find it easier to make a new
commitment when it is compatible with their other obligations For example you boost your
chances of recruiting a highly qualified candidate who is a single parent if you offer flexible
work hours family health benefits and on-site day care ldquoRecruiting for Engagement and
Commitmentrdquo
40
Employee Selection
Once recruiting efforts produce a pool of promising job candidates Philips select among them to
fill available positions When organisation select the right individuals for the right jobs new
hires carry out their work more smoothly and experience fewer performance problems The
result Greater enjoyment ofmdashand engagement inmdashthe job
To enhance engagement through your selection of employees identify those candidates who are
best-suited to the job and your organizationrsquos culture Also use candidate assessment methods
that have obvious relevance to the job in questionmdashfor example by asking interviewees what
they know about the role and having them provide work samples Most candidates will view
these techniques more positively than tests with less apparent relevance such as personality and
integrity assessments Successful candidates feel good about having ldquopassed the test and see
company as careful and capable for having selected them A positive initial impression of an
employer encourages growth of long-term commitment
Training and Development
Training and development can serve as additional levers for enhancing engagement and
commitment For new hires training usually begins with orientation Orientation presents several
important opportunitiesmdashincluding explaining pay work schedules and company policies Most
important it gives you a chance to encourage employee engagement by explaining how the new
hirersquos job contributes to the organizationrsquos mission Through orientation Mohali Plant of Philips
Electronics describe how r company is organized introduce the new employee to his or her co-
workers give the person a tour of the area where he or she will be working and explain safety
regulations and other procedural matters In short you foster person-organization fitmdashvital for
developing productive and dedicated employees Through training you help new and current
41
employees acquire the knowledge and skills they need to perform their jobs And employees who
enhance their skills through training are more likely to engage fully in their work because they
derive satisfaction from mastering new tasks Training also enhances employeesrsquo value to your
company as well as their own employability in the job market In addition most companies offer
higher wages for skilled workers to compensate them for their greater value and to discourage
turnover
Compensation
Like the HR practices discussed above compensation can powerfully influence employee
engagement and commitment Some compensation components encourage commitment to
employers while others motivate engagement in the job It is possible to stimulate one and not
the other though itrsquos generally better to foster both For example a company that offers a strong
performance incentive system but no retirement plan will probably realize exceptional
engagement from its workers however they may eventually commit themselves to another
company that does offer a good retirement plan Meanwhile an organization that offers generous
retirement benefits but a traditional seniority-based pay grade system may have committed
employees however these workers might deliver pedestrian performance as they bide their time
until retirement In designing compensation plans you therefore need to consider employee
engagement and commitment strategically
Encourage managers to include employees in the goal-setting process This technique helps to
ensure that workers understand the goals It also promotes acceptance of challenging objectives
because people generally feel more committed to goals they have helped define In addition
consider how you and other managers will recognize and encourage contributions that exceed
expectations For example when a piece of equipment malfunctions Joe finds other ways to
maintain production rather than merely shutting down the machine and waiting for the
42
maintenance staff to fix it Or when a less experienced co-worker encounters a new task Sally
offers friendly coaching instead of standing by and waiting for the inevitable mistakes to crop
up Performance management processes operate on a continuous basis Therefore they provide
perhaps the best ongoing opportunities for employers to foster employee engagement and
commitment For example managers can use routine discussions about performance and
feedback sessions to learn which aspects of the job hold the most interest for each employee and
which tasks are most challenging During such discussions managers also can define what going
above and beyond the call of dutyrdquo looks like and generate ideas for rewarding such
contributions An employeersquos aspirations and career goals can receive careful attention during
performance appraisal meetings Without inquiring into an employeersquos personal life a supervisor
can nevertheless explore ways to enhance the compatibility between the workerrsquos commitment to
your organization and the employeersquos other life commitments Through such means the
organization personalizes its relationship to each employee and provides support while also
expressing appreciation for their contributionsmdash key drivers of engagement and commitment
To further engage employees and win their commitment through your performance management
programs consider how to treat your organizationrsquos most experienced employees In many cases
these employees understand the intricacies of a job better than their supervisors or managers do
By virtue of long identification with your organization they may be deeply committed to high-
level goals They use their expertise to contribute in ways that newer employees simply cannot
match But many of them also may be planning to retire soon especially if they are from the
ldquoBaby Boomerrdquo generation How will you transfer their knowledge to younger workers Design
a performance management system that recognizes and rewards proactive sharing of knowledge
and expertise among co-workers For example create knowledge repositories or learning
histories that can be stored in databases that employees can access and then create incentives
43
for people who contribute to and use these repositories Of course effective performance
management systems also identify employees who are not meeting expectations Failing to
address problem performance can erode other employeesrsquo engagement and commitment as their
workloads increase and they conclude that the company is willing to tolerate poor performance
If feedback coaching and remedial training are of little avail the manager may need to move the
person to a different position within the company where he or she can make a more valuable
contribution or let the individual go if there is no good match elsewhere in the organization
44
Chapter-V
RESEARCH METHODOLOGY
The basic task of research is to generate accurate information for use in decision-making
Research can be defined as the systematic and objective process of gathering recording and
analyzing data for aid in making business decisions As the project involves analyzing of
45
financial structure the research is exploratory in nature covering financial parameters and come
of the important ratios to carry out research There are basically two techniques adopted for
obtaining information
Primary Data
Secondary Data
Primary Data is gathered specifically for the project at hand through personal interviews with
the accounts officers
Sample Size = 100 Employees
Secondary data is previously collected and assembled for some project other than the one at
hand It is gathered and recorded by someone else prior to current needs of the researcher It is
less expensive than the primary date
Secondary Data can be obtained from both external and internal sources
External data may be collected from books and periodicals government sources media and other
commercial sources
Internal data is that secondary data which is created recorded or generated by the organization
As the project is explanatory in nature secondary data is collected from the reports of the
company books journals and interest Secondary data is gathered from annual reports official
records and standing orders of the units
CHAPTER - VI
DATA ANALYSIS AND INTERPRETATION
46
The data after collection is to be processed and analyzed in accordance with the outline
and down for the purpose at the time of developing research plan
Technically speaking processing implies editing coding classification and tabulation of
collected data so that they are amenable to analysis The term analysis refers to the computation
of certain measures along with searching for pattern groups Thus in the process of analysis
relationship or difference should be subjected to statistical tests of significance to determine with
what validity data can be said to indicate any conclusions
The analysis of data in a general way involves a number of closely related operations
which are performed with the purpose of summarizing the collected data and organizing them in
such a manner that they answer the research questions In this study the researcher followed
above process carefully and it is presented in this chapter
47
Table 41 ndash To know the department in which employees are belongs to
S
ou rc
e
survey data
Inference
From the above table it shows that 35 of employees are belongs to
production department
FIGURE 41
S
SI No
D
Department
N
No of Respondents
P
Percentage
1
1
M
Mechanical
3
30
3
30
2
2
E
Electrical
2
25
2
25
3
3
P
Production
3
35
3
35
4
4
O
Others
1
10
1
10
T
Total
1
100
1
100
48
REPRESENTS THE DEPARTMENT
Table 42 ndash To know working experience of the employees
Source survey data
Inference
From the above table it shows that 34 of the employees have 4 ndash 6
years experience
S
SI No
W
Work Experience
N
No of Respondents
P
Percentage
1
1
B
Below 2 years
1
33
1
13
2
2
2
2ndash 4 years
3
30
3
30
3
3
4
4ndash 6 years
3
34
3
34
4
4
A
Above 6 years
2
23
2
23
T
otal
1
100
1
100
49
FIGURE 42
REPRESENTS THE EXPERIENCE OF THE EMPLOYEES
Table 43 ndash To know the physical working environment
S
SI No
W
Working Environment
N
No of Respondents
P
Percentage
1
1
E
Excellent
1
12
1
12
2
2
G
Good
5
57
5
57
3
3
F
Fair
2
28
2
28
4
4
P
Poor
0
03
0
33
5
5
V
Very Poor
0
00
0
00
T
Total
1
100
1
100
Source survey data
Inference
From the above table it shows that 57 of the employees were feeling good about the working environment
50
FIGURE 43
REPRESENTS THE PHYSICAL WOKING ENVIRONMENT
51
Table 44 ndash To know the satisfaction level of employees towards the non-monitory benefits
S
SI No
N
Non-Monitory Benefits offered
to Employees
N
No of Respondents
P
Percentage
1
1
H
Highly Satisfied
1
14
1
14
2
2
S
Satisfied
5
54
5
54
3
3
N
Neither Satisfied nor Dissatisfied
2
25
2
25
4
4
D
Dissatisfied
0
05
0
05
5
5
H
Highly Dissatisfied
0
02
0
02
Total 1
100
1
100
Source survey data
Inference
From the above table it shows that 54 of the employees were satisfied towards the non-monitory benefits
FIGURE 44
REPRESENTS THE SATISFACTION LEVEL OF EMPLOYEES TOWARDS THE NON-MONITORY BENEFITS
52
Table 45 ndash To know the satisfaction level of respondents towards the work
assigned
Source survey dataInference
From the above table it shows that 45 of the respondents were satisfied towards the work assigned
FIGURE 45
S
SI No
A
Amount of Work
N
No of Respondents
P
Percentage
1
1
H
Highly satisfied
2
20
2
20
2
2
S
Satisfied
4
45
4
45
3
3
N
Neither Satisfied nor Dissatisfied
1
12
1
12
4
4
D
Dissatisfied
1
18
1
18
5
5
H
Highly Dissatisfied
0
06
0
06
Total 1
100
1
100
53
REPRESENTS THE SATISFACTION LEVEL OF RESPONDENTS TOWARDS THE WORK ASSIGNED
54
Table 46 ndash Opinion about the career development programme in their organisation
S
SI No
C
Career Development
N
No of Respondents
P
Percentage
H
Highly satisfied
1
12
1
12
S
Satisfied
5
56
5
56
N
Neither Satisfied nor Dissatisfied
2
22
2
22
D
Dissatisfied
1
10
1
10
H
Highly Dissatisfied
0
00
0
00
Total 1
100
1
100
Source survey data
Inference
From the above table it shows that 56 of the employees were satisfied
with the opinion about the carrier development programme in their organisation
FIGURE 46
REPRESENTS OPINION ABOUT THE CAREER DEVELOPMENT
PROGRAMME IN THEIR ORGANISATION
55
Table 47 ndash To know the cooperation of co-workers
S
SI No
C
Co-operation of Workers
N
No of Respondents
P
Percentage
1
1
H
Highly satisfied
2
20
2
20
2
2
S
Satisfied
6
66
6
66
3
3
N
Neither Satisfied nor Dissatisfied
1
11
1
11
4
4
D
Dissatisfied
0
03
0
03
5
5
H
Highly Dissatisfied
0
00
0
00
Total 1
100
1
100
Source survey data
Inference
From the above table it shows that 66 of the employees were satisfied
with the cooperation of co-workers
FIGURE 47
56
REPRESENTS THE COOPERATION OF CO-WORKERS
57
Table 48 ndash To know the satisfaction of Respondents with top management
S
SI No
S
Satisfaction with Top
Management
N
No of Respondents
P
Percentage
1
1
H
Highly satisfied
2
26
2
26
2
2
S
Satisfied
5
51
5
51
3
3
N
Neither Satisfied nor Dissatisfied
1
17
1
17
4
4
D
Dissatisfied
0
06
0
06
5
5
H
Highly dissatisfied
0
00
0
00
Total 1
100
1
100
Source survey data
Inference
From the above table it shows that 51 of the employees were satisfied with the top management
FIGURE 48
58
REPRESENTS THE SATISFACTION OF RESPONDENTS WITH TOP MANAGEMENT
Table 49 ndash To know the satisfaction of Respondents with their subordinates
Source survey data
Inference
From the above table it shows that 67 of the employees were satisfied with their subordinates
S
SI
No
S
Satisfaction with Subordinates
N
No of Respondents
P
Percentage
1
1
H
Highly satisfied
1
12
1
12
2
2
S
Satisfied
6
67
6
67
2
3
N
Neither Satisfied nor Dissatisfied
1
14
1
14
4
D
Dissatisfied
0
07
0
07
5
5
H
Highly Dissatisfied
0
00
0
00
Total 1
100
1
100
59
FIGURE 49
REPRESENTS THE SATISFACTION OF RESPONDENTS WITH THEIR SUBORDINATES
60
Table 410 ndash To know the level of satisfaction regarding nature of job
S
SI No
J
Job Satisfaction
N
No of Respondents
P
Percentage
1
1
H
Highly satisfied
2
22
2
22
2
2
S
Satisfied
5
56
5
56
3
3
N
Neither Satisfied nor Dissatisfied
1
16
1
16
4
4
D
Dissatisfied
0
07
0
07
5
5
H
Highly Dissatisfied
0
00
0
00
Total 1
100
1
100
Source survey dataInference
From the above table it shows that 56 of the employees were satisfied with their job
FIGURE 410
61
REPRESENTS THE LEVEL OF SATISFACTION REGARDING THE NATURE OF JOB
Table 411 ndash To know whether there is any job pressure in their work
Source survey data
Inference
From the above table it shows that 72 of employees said there is job pressure in their work
FIGURE 411
REPRESENTS WHETHER THERE IS ANY JOB PRESSURE IN THEIR WORK
S
SI No
J
Job Pressure
N
No of Respondents
P
Percentage
1
1
Y
Yes
7
72
7
72
2
2
N
No
2
28
2
28
T
Total
1
100
1
100
62
Table 412 ndash To know the opinion regarding opportunity provided by the organisation in developing skills
amp talents
S
SI No
D
Development of Skills and
Talents
N
No of Respondents
P
Percentage
1
1
H
Highly Agree
1
12
1
12
2
2
A
Agree
5
52
5
52
3
3
N
Neither Agree nor Disagree
2
28
2
28
4
4
D
Disagree
0
06
0
06
5
5
H
Highly Disagree
0
02
0
02
Total 1
100
1
100
Source survey data
Inference
From the above table it shows that 52 of employees agreed regarding opportunity provided by the organisation in developing skills amp talents
63
FIRGURE 412
REPRESENTS THE OPPORTUNITY PROVIDED BY THE ORGANISATION IN DEVELOPING SKILLS amp TALENTS
64
Table 413 ndash To know the satisfaction level of welfare facilities provided by the management
S
SI No
W
Welfare Facilities
N
No of Respondents
P
Percentage
1
1
H
Highly satisfied
0
09
9
09
2
2
S
Satisfied
5
57
5
57
3
3
N
Neither Satisfied nor Dissatisfied
2
29
2
29
4
4
D
Dissatisfied
5
05
0
05
5
5
H
Highly Dissatisfied
0
00
0
00
Total 1
100
1
100
Source survey data
Inference
From the above table it shows that 57 of the employees were satisfied with the welfare facilities provided by the management
FIGURE 413
REPRESENTS THE SATISFACTION LEVEL OF WELFARE FACILITIES PROVIDED BY THE MANGEMENT
65
Table 414 ndash To know the employee satisfaction towards the salary
Source survey data
Inference
From the above table it shows that 67 of the employees were satisfied
with their salary
FIGURE 414
REPRESENTS THE SATISFACTION TOWARDS THE SALARY
S
SI No
P
Payment Satisfaction
N
No of Respondents
P
Percentage
1
1
Y
Yes
6
67
6
67
2
2
N
No
3
33
3
33
T
otal
1
100
1
100
66
Table 415 ndash To know the employees willingness amp Commitment Towards
Organisation
Source survey data
Inference
From the above table it shows that 59 of the employees were willing to
continue in this organisation
FIGURE 415
REPRESENTS THE EMPLOYEES WILLINGNESS TO CONTINUE
S
SI No
W
Willingness to Work
N
No of Respondents
P
Percentage
1
1
Y
Yes
5
59
5
59
2
2
N
No
4
41
4
41
T
Total
1
00
1
00
67
CHI-SQUARE METHOD
The chi square test is one of the simplest and most widely used non-
parametric tests in statistical work As a non-parametric test it can be used to determine
if categorical data shows dependency or the two classifications are independent It can
also be used to make comparisons between theoretical population and actual data
when categories are used
n
Chi square χsup2= sum (O-E) sup2 E
i =1
Where O= observed frequency
E= expected frequency
68
OBSERVED FREQUENCY
Table 419 shows the relationship between the department and the job satisfaction
Over All
Job
SatisfactionHighly
SatisfiedSatisfied
Neither
Satisfied nor
Dissatisfied
DissatisfiedHighly
Dissatisfied
Sub
Total
Mechanical 5 6 14 3 2 30
Electrical 6 8 6 3 2 25
Production 9 13 7 4 2 35
Others 2 3 2 2 1 10
Sub Total 22 30 29 12 7 100
69
EXPECTED FREQUENCY
Over All
Job
SatisfactionHighly
SatisfiedSatisfied
Neither
Satisfied nor
Dissatisfied
DissatisfiedHighly
Dissatisfied
Sub
Total
Mechanical 7 8 9 4 2 30
Electrical 5 8 7 3 2 25
Production 8 11 10 4 2 35
Others 2 3 3 1 1 10
Sub Total 22 30 29 12 7 100
Null Hypothesis (Ho)
There is no significant difference between the department and the job satisfaction
Alternative Hypothesis (Ho)
There is significant difference between the job satisfaction
Co Relation
70
Chapter-V
CONCLUSIONS AND
RECOMMENDATIONS
71
CONCLUSION
On the basis of Analysis of Job Satisfaction Level of the Employees of Philips Electronics India
Ltd Mohali made in the previous chapters following conclusions are drawn
General Profile The plant of PHILIPS is ideally located in the Mohali Industrial focal point
Phase 9 near Chandigarh the capital of Punjab on a campus of 17 hectares The working
environment of the company is very healthy The visitors feel happy after the campus
Indigenous Technology PHILIPS is the only lighting manufacturing company based on purely
indigenous technology Philips was appropriately chosen as the brand name as self reliance and
building up of Indian Engineering capabilities remain the guiding spirit of PHILIPS
Financial structure PHILIPS is a low debt company signifying its dependence mainly on
its internal accruals for its financial requirements PHILIPS continues to strengthen its financial
position by channelising these internal accruals to fund its expansion programmes
Working results PTL has registered a handsome and constant growth in its profits because
of a brisk demand for new and better technology electronic items None of the other electronic
company has shown such a steady growth Philips has recorded the lowest current ratio
However with this lowest current ratio PTL still enjoys moderate payment period and highest
velocity of creditors and debtors only due to commitment of itrsquos employees
72
SUMMARY
According to the 1999 Gallup Poll the four elements that have proven to be effective in creating
employee loyalty are praise and recognition a sense of contribution to the company learning and
development and having a best friend at work
Creating a fairy-tale work environment begins withrecognition Your employees need it more
than money perks or titles Here are eight tips regarding recognition Remember these and your
employees may just start whistling while they work It is up to me The corporate culture or
financial rewards will not make your team successful It is up to you Recognition is one thing
that is completely in your control
Strong relationships are vital in todays economy Strengthening employee relationships is even
more necessary as companies downsize and lay off As your workforce shrinks and you need to
do more with less keeping quality employees becomes even more critical As a manager it is
your job to bond your best people to your company through recognition And you also must help
direct and motivate your core performers
Simple rewards earn big returns There are some relatively simple things you can do that will
earn big returns For example remember your employees birthdays and work anniversaries find
out what inexpensive rewards they value (for example tickets to a ball game or a half day off to
spend time with their kids) make the most of your formal service awards with some preparation
and a group presentation walk around your department every day and talk to your
people and thank them sincerely and often
73
Make it specific Praise and recognition must be specific to have impact General praise such as
You do great work actually can have the opposite effect and leave your employees wondering
Does he have any idea what I really do around here Specific praise links individual
accomplishments to company goals For example Cheryl I noticed the way you handled that
customer complaint Great work As you know we value quick resolutions of problems as
one of our core strategies
Ask the best to stay Call your best people into your office one at a time Let that bright young
college graduate know you value his fresh ideas and energy Tell the 20-year veteran how much
your team relies on her expertise and organizational skillsRemarkably a significant percent of
high-impact performers report that they left their last job because No one ever asked me to
stay
Forget cash
Remember the saying Money cant buy everything Well its true Dont wait until you can
offer an employee a raise or promotion Real thanks is its own reward In numerous surveys of
work satisfaction top on employees lists is feeling appreciated In fact when employees feel
recognized and involved they are much less likely to keep asking about money
Recognize
Recognition means most to an employee when it is sincere and spontaneous According to the
largest study ever conducted on workplace satisfaction (Gallup 1999) recognition should occur
at least every seven days If you wait until a year-end party or an annual review you are waiting
much too long to recognize and you probably are losing people you do not need to
74
Recognition works
Neglect can be a poisoned apple Recognition is the elixir that will spark better attitudes and
performance Jeffrey Pfeffer of Stanford University says The returns from managing people in
ways that build high commitment typically are on the order of 30 to 50 percent
Take a hard look in the mirror and ask yourself how you can recognize the fairest of them all
Learn to recognize your employees for their efforts thank them often and reward their
achievements You can awaken them from their anger and apathy and they will fall in love with
their jobs again Chances are you will work together happily ever after
So there is direct relation with employee satisfaction and their commitment towards the
organization and it is also clear from the above discussion that only monetary elements are not
sufficient for employee satisfaction rather other element like employer behavior recognisation
and other moral value
75
RECOMMENDATIONS
PHILIPS should increase its capacity utilization It should work at full capacity to
minimize its cost of production With this increase in capacity utilization the total cost
will spread over more units thereby decreasing the per unit cost
PHILIPS should decrease the credit facilities provided to its consumers The payback
period is quite high in case of debtors as compared to creditors it should be more or less
equal as it will help in improving company liquidity
PHILIPS should focus more on the consumer lifestyle goods in India parallel to its other
business as it accounts very less as compare to other businesses of Philips
Another recommendation for Mohali plant is about the HR department that is they
should appoint permanent and skilled workers as against casual workers which generally add
up to the profit of the company
76
BIBLIOGRAPHY
1 Values-Based Leadership Rebuilding Employee Commitment Performance and Productivity ( Thomas D Kuczmarski)
2 Monthly Journals of Philips Electronics India Ltd
3 Authentic Leadership Medtronic CEO Bill George
4 wwwindiaphilipscom
5 wwwwikipediacom
6 httpwwwemployeecommitmentcom
7 One Foot Out The Door How to Combat The Psychological Recession Thatrsquos Alienating Employees And Hurting American Business Judith Bardwick
8 Employee Commitment A Leader Ship Guide Joe Folkman
9 Harvard University Factors that Impact Employee Well Being Commitment and Productivity -An Article
77
Questionnaire
Name __________________________________________________________
Age______________________________ Gender _______________________
Qualification _______________________ Contact No ___________________
Q1 In which department you are working
Electrical Production Mechanical Other
Q2 What is your working experience
gt2 Years 2-4 Years 4-6 Years lt 6 Years
Q3 How You like the physical Working Environment of the organization
Excellent Good Fair Poor Very Poor
Q4 Are you satisfied with Non-Monitory benefits provided by the organisation
Highly Satisfied Satisfied Neither Satisfied Nor dissatisfied
Highly Dissatisfied Dissatisfied
Q5 Are you satisfied with your work
Highly Satisfied Satisfied Neither Satisfied Nor dissatisfied
Highly Dissatisfied Dissatisfied
Q6 Are you satisfied with the career development programe of the company
Highly Satisfied Satisfied Neither Satisfied Nor dissatisfied
Highly Dissatisfied Dissatisfied
Q7 Is other staff of the organization is co-operative with you
Highly Satisfied Satisfied Neither Satisfied Nor dissatisfied
Highly Dissatisfied Dissatisfied
Q8 Are you satisfied with top level management
Highly Satisfied Satisfied Neither Satisfied Nor dissatisfied
Highly Dissatisfied Dissatisfied
78
Q9 Are you satisfied with your subordinates
Highly Satisfied Satisfied Neither Satisfied Nor dissatisfied
Highly Dissatisfied Dissatisfied
Q10 Are you satisfied with the nature of the Job
Highly Satisfied Satisfied Neither Satisfied Nor dissatisfied
Highly Dissatisfied Dissatisfied
Q11 Do you have any Job Pressure in work
Yes No
Q12 Do you satisfied with the opportunities provided by the organisation
Highly Satisfied Satisfied Neither Satisfied Nor dissatisfied
Highly Dissatisfied Dissatisfied
Q13 Are you satisfied with the welfare facilities provided by the organisation
Highly Satisfied Satisfied Neither Satisfied Nor dissatisfied
Highly Dissatisfied Dissatisfied
Q14 Are you satisfied towards your salary
Highly Satisfied Satisfied Neither Satisfied Nor dissatisfied
Highly Dissatisfied Dissatisfied
Q15 Are you committed towards the organisation
Yes No
Signature
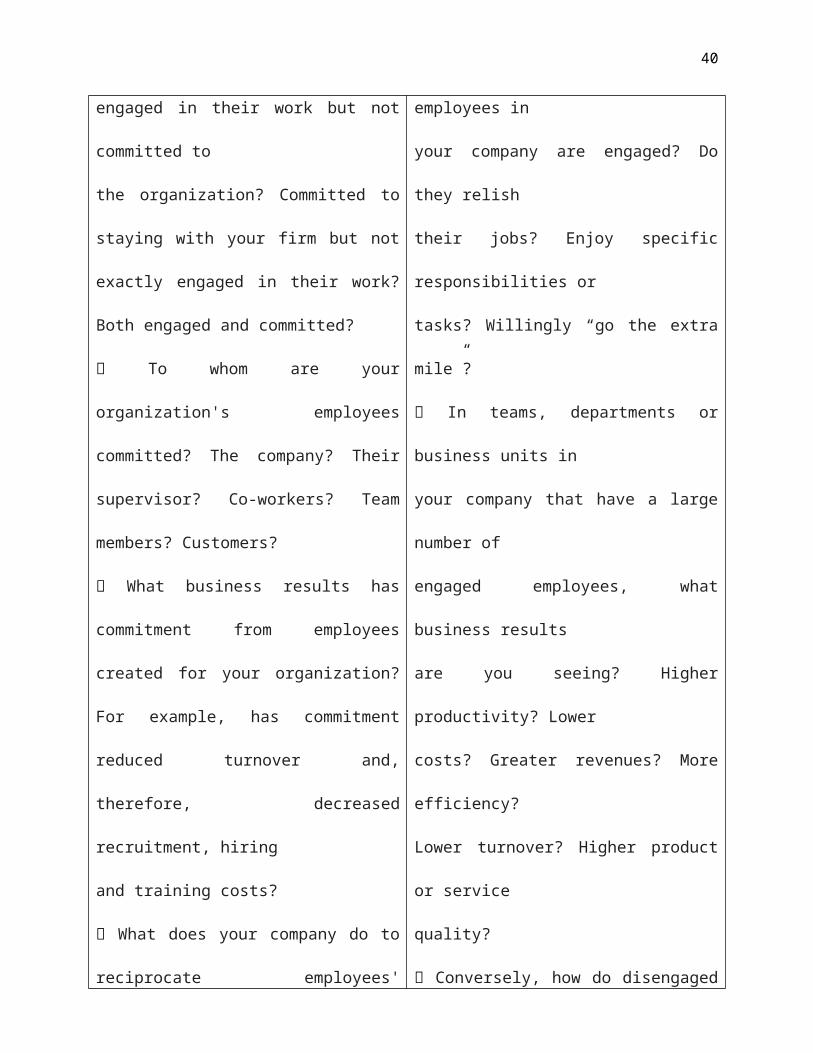

41
employees acquire the knowledge and skills they need to perform their jobs And employees who
enhance their skills through training are more likely to engage fully in their work because they
derive satisfaction from mastering new tasks Training also enhances employeesrsquo value to your
company as well as their own employability in the job market In addition most companies offer
higher wages for skilled workers to compensate them for their greater value and to discourage
turnover
Compensation
Like the HR practices discussed above compensation can powerfully influence employee
engagement and commitment Some compensation components encourage commitment to
employers while others motivate engagement in the job It is possible to stimulate one and not
the other though itrsquos generally better to foster both For example a company that offers a strong
performance incentive system but no retirement plan will probably realize exceptional
engagement from its workers however they may eventually commit themselves to another
company that does offer a good retirement plan Meanwhile an organization that offers generous
retirement benefits but a traditional seniority-based pay grade system may have committed
employees however these workers might deliver pedestrian performance as they bide their time
until retirement In designing compensation plans you therefore need to consider employee
engagement and commitment strategically
Encourage managers to include employees in the goal-setting process This technique helps to
ensure that workers understand the goals It also promotes acceptance of challenging objectives
because people generally feel more committed to goals they have helped define In addition
consider how you and other managers will recognize and encourage contributions that exceed
expectations For example when a piece of equipment malfunctions Joe finds other ways to
maintain production rather than merely shutting down the machine and waiting for the
42
maintenance staff to fix it Or when a less experienced co-worker encounters a new task Sally
offers friendly coaching instead of standing by and waiting for the inevitable mistakes to crop
up Performance management processes operate on a continuous basis Therefore they provide
perhaps the best ongoing opportunities for employers to foster employee engagement and
commitment For example managers can use routine discussions about performance and
feedback sessions to learn which aspects of the job hold the most interest for each employee and
which tasks are most challenging During such discussions managers also can define what going
above and beyond the call of dutyrdquo looks like and generate ideas for rewarding such
contributions An employeersquos aspirations and career goals can receive careful attention during
performance appraisal meetings Without inquiring into an employeersquos personal life a supervisor
can nevertheless explore ways to enhance the compatibility between the workerrsquos commitment to
your organization and the employeersquos other life commitments Through such means the
organization personalizes its relationship to each employee and provides support while also
expressing appreciation for their contributionsmdash key drivers of engagement and commitment
To further engage employees and win their commitment through your performance management
programs consider how to treat your organizationrsquos most experienced employees In many cases
these employees understand the intricacies of a job better than their supervisors or managers do
By virtue of long identification with your organization they may be deeply committed to high-
level goals They use their expertise to contribute in ways that newer employees simply cannot
match But many of them also may be planning to retire soon especially if they are from the
ldquoBaby Boomerrdquo generation How will you transfer their knowledge to younger workers Design
a performance management system that recognizes and rewards proactive sharing of knowledge
and expertise among co-workers For example create knowledge repositories or learning
histories that can be stored in databases that employees can access and then create incentives
43
for people who contribute to and use these repositories Of course effective performance
management systems also identify employees who are not meeting expectations Failing to
address problem performance can erode other employeesrsquo engagement and commitment as their
workloads increase and they conclude that the company is willing to tolerate poor performance
If feedback coaching and remedial training are of little avail the manager may need to move the
person to a different position within the company where he or she can make a more valuable
contribution or let the individual go if there is no good match elsewhere in the organization
44
Chapter-V
RESEARCH METHODOLOGY
The basic task of research is to generate accurate information for use in decision-making
Research can be defined as the systematic and objective process of gathering recording and
analyzing data for aid in making business decisions As the project involves analyzing of
45
financial structure the research is exploratory in nature covering financial parameters and come
of the important ratios to carry out research There are basically two techniques adopted for
obtaining information
Primary Data
Secondary Data
Primary Data is gathered specifically for the project at hand through personal interviews with
the accounts officers
Sample Size = 100 Employees
Secondary data is previously collected and assembled for some project other than the one at
hand It is gathered and recorded by someone else prior to current needs of the researcher It is
less expensive than the primary date
Secondary Data can be obtained from both external and internal sources
External data may be collected from books and periodicals government sources media and other
commercial sources
Internal data is that secondary data which is created recorded or generated by the organization
As the project is explanatory in nature secondary data is collected from the reports of the
company books journals and interest Secondary data is gathered from annual reports official
records and standing orders of the units
CHAPTER - VI
DATA ANALYSIS AND INTERPRETATION
46
The data after collection is to be processed and analyzed in accordance with the outline
and down for the purpose at the time of developing research plan
Technically speaking processing implies editing coding classification and tabulation of
collected data so that they are amenable to analysis The term analysis refers to the computation
of certain measures along with searching for pattern groups Thus in the process of analysis
relationship or difference should be subjected to statistical tests of significance to determine with
what validity data can be said to indicate any conclusions
The analysis of data in a general way involves a number of closely related operations
which are performed with the purpose of summarizing the collected data and organizing them in
such a manner that they answer the research questions In this study the researcher followed
above process carefully and it is presented in this chapter
47
Table 41 ndash To know the department in which employees are belongs to
S
ou rc
e
survey data
Inference
From the above table it shows that 35 of employees are belongs to
production department
FIGURE 41
S
SI No
D
Department
N
No of Respondents
P
Percentage
1
1
M
Mechanical
3
30
3
30
2
2
E
Electrical
2
25
2
25
3
3
P
Production
3
35
3
35
4
4
O
Others
1
10
1
10
T
Total
1
100
1
100
48
REPRESENTS THE DEPARTMENT
Table 42 ndash To know working experience of the employees
Source survey data
Inference
From the above table it shows that 34 of the employees have 4 ndash 6
years experience
S
SI No
W
Work Experience
N
No of Respondents
P
Percentage
1
1
B
Below 2 years
1
33
1
13
2
2
2
2ndash 4 years
3
30
3
30
3
3
4
4ndash 6 years
3
34
3
34
4
4
A
Above 6 years
2
23
2
23
T
otal
1
100
1
100
49
FIGURE 42
REPRESENTS THE EXPERIENCE OF THE EMPLOYEES
Table 43 ndash To know the physical working environment
S
SI No
W
Working Environment
N
No of Respondents
P
Percentage
1
1
E
Excellent
1
12
1
12
2
2
G
Good
5
57
5
57
3
3
F
Fair
2
28
2
28
4
4
P
Poor
0
03
0
33
5
5
V
Very Poor
0
00
0
00
T
Total
1
100
1
100
Source survey data
Inference
From the above table it shows that 57 of the employees were feeling good about the working environment
50
FIGURE 43
REPRESENTS THE PHYSICAL WOKING ENVIRONMENT
51
Table 44 ndash To know the satisfaction level of employees towards the non-monitory benefits
S
SI No
N
Non-Monitory Benefits offered
to Employees
N
No of Respondents
P
Percentage
1
1
H
Highly Satisfied
1
14
1
14
2
2
S
Satisfied
5
54
5
54
3
3
N
Neither Satisfied nor Dissatisfied
2
25
2
25
4
4
D
Dissatisfied
0
05
0
05
5
5
H
Highly Dissatisfied
0
02
0
02
Total 1
100
1
100
Source survey data
Inference
From the above table it shows that 54 of the employees were satisfied towards the non-monitory benefits
FIGURE 44
REPRESENTS THE SATISFACTION LEVEL OF EMPLOYEES TOWARDS THE NON-MONITORY BENEFITS
52
Table 45 ndash To know the satisfaction level of respondents towards the work
assigned
Source survey dataInference
From the above table it shows that 45 of the respondents were satisfied towards the work assigned
FIGURE 45
S
SI No
A
Amount of Work
N
No of Respondents
P
Percentage
1
1
H
Highly satisfied
2
20
2
20
2
2
S
Satisfied
4
45
4
45
3
3
N
Neither Satisfied nor Dissatisfied
1
12
1
12
4
4
D
Dissatisfied
1
18
1
18
5
5
H
Highly Dissatisfied
0
06
0
06
Total 1
100
1
100
53
REPRESENTS THE SATISFACTION LEVEL OF RESPONDENTS TOWARDS THE WORK ASSIGNED
54
Table 46 ndash Opinion about the career development programme in their organisation
S
SI No
C
Career Development
N
No of Respondents
P
Percentage
H
Highly satisfied
1
12
1
12
S
Satisfied
5
56
5
56
N
Neither Satisfied nor Dissatisfied
2
22
2
22
D
Dissatisfied
1
10
1
10
H
Highly Dissatisfied
0
00
0
00
Total 1
100
1
100
Source survey data
Inference
From the above table it shows that 56 of the employees were satisfied
with the opinion about the carrier development programme in their organisation
FIGURE 46
REPRESENTS OPINION ABOUT THE CAREER DEVELOPMENT
PROGRAMME IN THEIR ORGANISATION
55
Table 47 ndash To know the cooperation of co-workers
S
SI No
C
Co-operation of Workers
N
No of Respondents
P
Percentage
1
1
H
Highly satisfied
2
20
2
20
2
2
S
Satisfied
6
66
6
66
3
3
N
Neither Satisfied nor Dissatisfied
1
11
1
11
4
4
D
Dissatisfied
0
03
0
03
5
5
H
Highly Dissatisfied
0
00
0
00
Total 1
100
1
100
Source survey data
Inference
From the above table it shows that 66 of the employees were satisfied
with the cooperation of co-workers
FIGURE 47
56
REPRESENTS THE COOPERATION OF CO-WORKERS
57
Table 48 ndash To know the satisfaction of Respondents with top management
S
SI No
S
Satisfaction with Top
Management
N
No of Respondents
P
Percentage
1
1
H
Highly satisfied
2
26
2
26
2
2
S
Satisfied
5
51
5
51
3
3
N
Neither Satisfied nor Dissatisfied
1
17
1
17
4
4
D
Dissatisfied
0
06
0
06
5
5
H
Highly dissatisfied
0
00
0
00
Total 1
100
1
100
Source survey data
Inference
From the above table it shows that 51 of the employees were satisfied with the top management
FIGURE 48
58
REPRESENTS THE SATISFACTION OF RESPONDENTS WITH TOP MANAGEMENT
Table 49 ndash To know the satisfaction of Respondents with their subordinates
Source survey data
Inference
From the above table it shows that 67 of the employees were satisfied with their subordinates
S
SI
No
S
Satisfaction with Subordinates
N
No of Respondents
P
Percentage
1
1
H
Highly satisfied
1
12
1
12
2
2
S
Satisfied
6
67
6
67
2
3
N
Neither Satisfied nor Dissatisfied
1
14
1
14
4
D
Dissatisfied
0
07
0
07
5
5
H
Highly Dissatisfied
0
00
0
00
Total 1
100
1
100
59
FIGURE 49
REPRESENTS THE SATISFACTION OF RESPONDENTS WITH THEIR SUBORDINATES
60
Table 410 ndash To know the level of satisfaction regarding nature of job
S
SI No
J
Job Satisfaction
N
No of Respondents
P
Percentage
1
1
H
Highly satisfied
2
22
2
22
2
2
S
Satisfied
5
56
5
56
3
3
N
Neither Satisfied nor Dissatisfied
1
16
1
16
4
4
D
Dissatisfied
0
07
0
07
5
5
H
Highly Dissatisfied
0
00
0
00
Total 1
100
1
100
Source survey dataInference
From the above table it shows that 56 of the employees were satisfied with their job
FIGURE 410
61
REPRESENTS THE LEVEL OF SATISFACTION REGARDING THE NATURE OF JOB
Table 411 ndash To know whether there is any job pressure in their work
Source survey data
Inference
From the above table it shows that 72 of employees said there is job pressure in their work
FIGURE 411
REPRESENTS WHETHER THERE IS ANY JOB PRESSURE IN THEIR WORK
S
SI No
J
Job Pressure
N
No of Respondents
P
Percentage
1
1
Y
Yes
7
72
7
72
2
2
N
No
2
28
2
28
T
Total
1
100
1
100
62
Table 412 ndash To know the opinion regarding opportunity provided by the organisation in developing skills
amp talents
S
SI No
D
Development of Skills and
Talents
N
No of Respondents
P
Percentage
1
1
H
Highly Agree
1
12
1
12
2
2
A
Agree
5
52
5
52
3
3
N
Neither Agree nor Disagree
2
28
2
28
4
4
D
Disagree
0
06
0
06
5
5
H
Highly Disagree
0
02
0
02
Total 1
100
1
100
Source survey data
Inference
From the above table it shows that 52 of employees agreed regarding opportunity provided by the organisation in developing skills amp talents
63
FIRGURE 412
REPRESENTS THE OPPORTUNITY PROVIDED BY THE ORGANISATION IN DEVELOPING SKILLS amp TALENTS
64
Table 413 ndash To know the satisfaction level of welfare facilities provided by the management
S
SI No
W
Welfare Facilities
N
No of Respondents
P
Percentage
1
1
H
Highly satisfied
0
09
9
09
2
2
S
Satisfied
5
57
5
57
3
3
N
Neither Satisfied nor Dissatisfied
2
29
2
29
4
4
D
Dissatisfied
5
05
0
05
5
5
H
Highly Dissatisfied
0
00
0
00
Total 1
100
1
100
Source survey data
Inference
From the above table it shows that 57 of the employees were satisfied with the welfare facilities provided by the management
FIGURE 413
REPRESENTS THE SATISFACTION LEVEL OF WELFARE FACILITIES PROVIDED BY THE MANGEMENT
65
Table 414 ndash To know the employee satisfaction towards the salary
Source survey data
Inference
From the above table it shows that 67 of the employees were satisfied
with their salary
FIGURE 414
REPRESENTS THE SATISFACTION TOWARDS THE SALARY
S
SI No
P
Payment Satisfaction
N
No of Respondents
P
Percentage
1
1
Y
Yes
6
67
6
67
2
2
N
No
3
33
3
33
T
otal
1
100
1
100
66
Table 415 ndash To know the employees willingness amp Commitment Towards
Organisation
Source survey data
Inference
From the above table it shows that 59 of the employees were willing to
continue in this organisation
FIGURE 415
REPRESENTS THE EMPLOYEES WILLINGNESS TO CONTINUE
S
SI No
W
Willingness to Work
N
No of Respondents
P
Percentage
1
1
Y
Yes
5
59
5
59
2
2
N
No
4
41
4
41
T
Total
1
00
1
00
67
CHI-SQUARE METHOD
The chi square test is one of the simplest and most widely used non-
parametric tests in statistical work As a non-parametric test it can be used to determine
if categorical data shows dependency or the two classifications are independent It can
also be used to make comparisons between theoretical population and actual data
when categories are used
n
Chi square χsup2= sum (O-E) sup2 E
i =1
Where O= observed frequency
E= expected frequency
68
OBSERVED FREQUENCY
Table 419 shows the relationship between the department and the job satisfaction
Over All
Job
SatisfactionHighly
SatisfiedSatisfied
Neither
Satisfied nor
Dissatisfied
DissatisfiedHighly
Dissatisfied
Sub
Total
Mechanical 5 6 14 3 2 30
Electrical 6 8 6 3 2 25
Production 9 13 7 4 2 35
Others 2 3 2 2 1 10
Sub Total 22 30 29 12 7 100
69
EXPECTED FREQUENCY
Over All
Job
SatisfactionHighly
SatisfiedSatisfied
Neither
Satisfied nor
Dissatisfied
DissatisfiedHighly
Dissatisfied
Sub
Total
Mechanical 7 8 9 4 2 30
Electrical 5 8 7 3 2 25
Production 8 11 10 4 2 35
Others 2 3 3 1 1 10
Sub Total 22 30 29 12 7 100
Null Hypothesis (Ho)
There is no significant difference between the department and the job satisfaction
Alternative Hypothesis (Ho)
There is significant difference between the job satisfaction
Co Relation
70
Chapter-V
CONCLUSIONS AND
RECOMMENDATIONS
71
CONCLUSION
On the basis of Analysis of Job Satisfaction Level of the Employees of Philips Electronics India
Ltd Mohali made in the previous chapters following conclusions are drawn
General Profile The plant of PHILIPS is ideally located in the Mohali Industrial focal point
Phase 9 near Chandigarh the capital of Punjab on a campus of 17 hectares The working
environment of the company is very healthy The visitors feel happy after the campus
Indigenous Technology PHILIPS is the only lighting manufacturing company based on purely
indigenous technology Philips was appropriately chosen as the brand name as self reliance and
building up of Indian Engineering capabilities remain the guiding spirit of PHILIPS
Financial structure PHILIPS is a low debt company signifying its dependence mainly on
its internal accruals for its financial requirements PHILIPS continues to strengthen its financial
position by channelising these internal accruals to fund its expansion programmes
Working results PTL has registered a handsome and constant growth in its profits because
of a brisk demand for new and better technology electronic items None of the other electronic
company has shown such a steady growth Philips has recorded the lowest current ratio
However with this lowest current ratio PTL still enjoys moderate payment period and highest
velocity of creditors and debtors only due to commitment of itrsquos employees
72
SUMMARY
According to the 1999 Gallup Poll the four elements that have proven to be effective in creating
employee loyalty are praise and recognition a sense of contribution to the company learning and
development and having a best friend at work
Creating a fairy-tale work environment begins withrecognition Your employees need it more
than money perks or titles Here are eight tips regarding recognition Remember these and your
employees may just start whistling while they work It is up to me The corporate culture or
financial rewards will not make your team successful It is up to you Recognition is one thing
that is completely in your control
Strong relationships are vital in todays economy Strengthening employee relationships is even
more necessary as companies downsize and lay off As your workforce shrinks and you need to
do more with less keeping quality employees becomes even more critical As a manager it is
your job to bond your best people to your company through recognition And you also must help
direct and motivate your core performers
Simple rewards earn big returns There are some relatively simple things you can do that will
earn big returns For example remember your employees birthdays and work anniversaries find
out what inexpensive rewards they value (for example tickets to a ball game or a half day off to
spend time with their kids) make the most of your formal service awards with some preparation
and a group presentation walk around your department every day and talk to your
people and thank them sincerely and often
73
Make it specific Praise and recognition must be specific to have impact General praise such as
You do great work actually can have the opposite effect and leave your employees wondering
Does he have any idea what I really do around here Specific praise links individual
accomplishments to company goals For example Cheryl I noticed the way you handled that
customer complaint Great work As you know we value quick resolutions of problems as
one of our core strategies
Ask the best to stay Call your best people into your office one at a time Let that bright young
college graduate know you value his fresh ideas and energy Tell the 20-year veteran how much
your team relies on her expertise and organizational skillsRemarkably a significant percent of
high-impact performers report that they left their last job because No one ever asked me to
stay
Forget cash
Remember the saying Money cant buy everything Well its true Dont wait until you can
offer an employee a raise or promotion Real thanks is its own reward In numerous surveys of
work satisfaction top on employees lists is feeling appreciated In fact when employees feel
recognized and involved they are much less likely to keep asking about money
Recognize
Recognition means most to an employee when it is sincere and spontaneous According to the
largest study ever conducted on workplace satisfaction (Gallup 1999) recognition should occur
at least every seven days If you wait until a year-end party or an annual review you are waiting
much too long to recognize and you probably are losing people you do not need to
74
Recognition works
Neglect can be a poisoned apple Recognition is the elixir that will spark better attitudes and
performance Jeffrey Pfeffer of Stanford University says The returns from managing people in
ways that build high commitment typically are on the order of 30 to 50 percent
Take a hard look in the mirror and ask yourself how you can recognize the fairest of them all
Learn to recognize your employees for their efforts thank them often and reward their
achievements You can awaken them from their anger and apathy and they will fall in love with
their jobs again Chances are you will work together happily ever after
So there is direct relation with employee satisfaction and their commitment towards the
organization and it is also clear from the above discussion that only monetary elements are not
sufficient for employee satisfaction rather other element like employer behavior recognisation
and other moral value
75
RECOMMENDATIONS
PHILIPS should increase its capacity utilization It should work at full capacity to
minimize its cost of production With this increase in capacity utilization the total cost
will spread over more units thereby decreasing the per unit cost
PHILIPS should decrease the credit facilities provided to its consumers The payback
period is quite high in case of debtors as compared to creditors it should be more or less
equal as it will help in improving company liquidity
PHILIPS should focus more on the consumer lifestyle goods in India parallel to its other
business as it accounts very less as compare to other businesses of Philips
Another recommendation for Mohali plant is about the HR department that is they
should appoint permanent and skilled workers as against casual workers which generally add
up to the profit of the company
76
BIBLIOGRAPHY
1 Values-Based Leadership Rebuilding Employee Commitment Performance and Productivity ( Thomas D Kuczmarski)
2 Monthly Journals of Philips Electronics India Ltd
3 Authentic Leadership Medtronic CEO Bill George
4 wwwindiaphilipscom
5 wwwwikipediacom
6 httpwwwemployeecommitmentcom
7 One Foot Out The Door How to Combat The Psychological Recession Thatrsquos Alienating Employees And Hurting American Business Judith Bardwick
8 Employee Commitment A Leader Ship Guide Joe Folkman
9 Harvard University Factors that Impact Employee Well Being Commitment and Productivity -An Article
77
Questionnaire
Name __________________________________________________________
Age______________________________ Gender _______________________
Qualification _______________________ Contact No ___________________
Q1 In which department you are working
Electrical Production Mechanical Other
Q2 What is your working experience
gt2 Years 2-4 Years 4-6 Years lt 6 Years
Q3 How You like the physical Working Environment of the organization
Excellent Good Fair Poor Very Poor
Q4 Are you satisfied with Non-Monitory benefits provided by the organisation
Highly Satisfied Satisfied Neither Satisfied Nor dissatisfied
Highly Dissatisfied Dissatisfied
Q5 Are you satisfied with your work
Highly Satisfied Satisfied Neither Satisfied Nor dissatisfied
Highly Dissatisfied Dissatisfied
Q6 Are you satisfied with the career development programe of the company
Highly Satisfied Satisfied Neither Satisfied Nor dissatisfied
Highly Dissatisfied Dissatisfied
Q7 Is other staff of the organization is co-operative with you
Highly Satisfied Satisfied Neither Satisfied Nor dissatisfied
Highly Dissatisfied Dissatisfied
Q8 Are you satisfied with top level management
Highly Satisfied Satisfied Neither Satisfied Nor dissatisfied
Highly Dissatisfied Dissatisfied
78
Q9 Are you satisfied with your subordinates
Highly Satisfied Satisfied Neither Satisfied Nor dissatisfied
Highly Dissatisfied Dissatisfied
Q10 Are you satisfied with the nature of the Job
Highly Satisfied Satisfied Neither Satisfied Nor dissatisfied
Highly Dissatisfied Dissatisfied
Q11 Do you have any Job Pressure in work
Yes No
Q12 Do you satisfied with the opportunities provided by the organisation
Highly Satisfied Satisfied Neither Satisfied Nor dissatisfied
Highly Dissatisfied Dissatisfied
Q13 Are you satisfied with the welfare facilities provided by the organisation
Highly Satisfied Satisfied Neither Satisfied Nor dissatisfied
Highly Dissatisfied Dissatisfied
Q14 Are you satisfied towards your salary
Highly Satisfied Satisfied Neither Satisfied Nor dissatisfied
Highly Dissatisfied Dissatisfied
Q15 Are you committed towards the organisation
Yes No
Signature
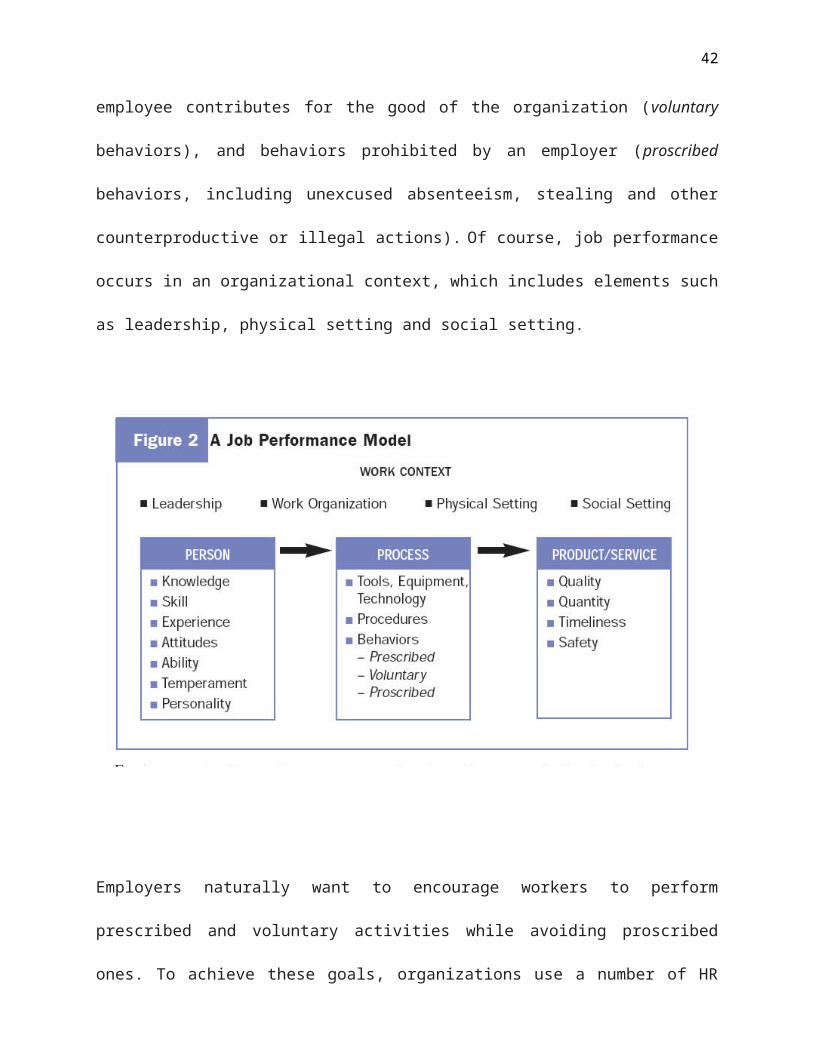

45
financial structure the research is exploratory in nature covering financial parameters and come
of the important ratios to carry out research There are basically two techniques adopted for
obtaining information
Primary Data
Secondary Data
Primary Data is gathered specifically for the project at hand through personal interviews with
the accounts officers
Sample Size = 100 Employees
Secondary data is previously collected and assembled for some project other than the one at
hand It is gathered and recorded by someone else prior to current needs of the researcher It is
less expensive than the primary date
Secondary Data can be obtained from both external and internal sources
External data may be collected from books and periodicals government sources media and other
commercial sources
Internal data is that secondary data which is created recorded or generated by the organization
As the project is explanatory in nature secondary data is collected from the reports of the
company books journals and interest Secondary data is gathered from annual reports official
records and standing orders of the units
CHAPTER - VI
DATA ANALYSIS AND INTERPRETATION
46
The data after collection is to be processed and analyzed in accordance with the outline
and down for the purpose at the time of developing research plan
Technically speaking processing implies editing coding classification and tabulation of
collected data so that they are amenable to analysis The term analysis refers to the computation
of certain measures along with searching for pattern groups Thus in the process of analysis
relationship or difference should be subjected to statistical tests of significance to determine with
what validity data can be said to indicate any conclusions
The analysis of data in a general way involves a number of closely related operations
which are performed with the purpose of summarizing the collected data and organizing them in
such a manner that they answer the research questions In this study the researcher followed
above process carefully and it is presented in this chapter
47
Table 41 ndash To know the department in which employees are belongs to
S
ou rc
e
survey data
Inference
From the above table it shows that 35 of employees are belongs to
production department
FIGURE 41
S
SI No
D
Department
N
No of Respondents
P
Percentage
1
1
M
Mechanical
3
30
3
30
2
2
E
Electrical
2
25
2
25
3
3
P
Production
3
35
3
35
4
4
O
Others
1
10
1
10
T
Total
1
100
1
100
48
REPRESENTS THE DEPARTMENT
Table 42 ndash To know working experience of the employees
Source survey data
Inference
From the above table it shows that 34 of the employees have 4 ndash 6
years experience
S
SI No
W
Work Experience
N
No of Respondents
P
Percentage
1
1
B
Below 2 years
1
33
1
13
2
2
2
2ndash 4 years
3
30
3
30
3
3
4
4ndash 6 years
3
34
3
34
4
4
A
Above 6 years
2
23
2
23
T
otal
1
100
1
100
49
FIGURE 42
REPRESENTS THE EXPERIENCE OF THE EMPLOYEES
Table 43 ndash To know the physical working environment
S
SI No
W
Working Environment
N
No of Respondents
P
Percentage
1
1
E
Excellent
1
12
1
12
2
2
G
Good
5
57
5
57
3
3
F
Fair
2
28
2
28
4
4
P
Poor
0
03
0
33
5
5
V
Very Poor
0
00
0
00
T
Total
1
100
1
100
Source survey data
Inference
From the above table it shows that 57 of the employees were feeling good about the working environment
50
FIGURE 43
REPRESENTS THE PHYSICAL WOKING ENVIRONMENT
51
Table 44 ndash To know the satisfaction level of employees towards the non-monitory benefits
S
SI No
N
Non-Monitory Benefits offered
to Employees
N
No of Respondents
P
Percentage
1
1
H
Highly Satisfied
1
14
1
14
2
2
S
Satisfied
5
54
5
54
3
3
N
Neither Satisfied nor Dissatisfied
2
25
2
25
4
4
D
Dissatisfied
0
05
0
05
5
5
H
Highly Dissatisfied
0
02
0
02
Total 1
100
1
100
Source survey data
Inference
From the above table it shows that 54 of the employees were satisfied towards the non-monitory benefits
FIGURE 44
REPRESENTS THE SATISFACTION LEVEL OF EMPLOYEES TOWARDS THE NON-MONITORY BENEFITS
52
Table 45 ndash To know the satisfaction level of respondents towards the work
assigned
Source survey dataInference
From the above table it shows that 45 of the respondents were satisfied towards the work assigned
FIGURE 45
S
SI No
A
Amount of Work
N
No of Respondents
P
Percentage
1
1
H
Highly satisfied
2
20
2
20
2
2
S
Satisfied
4
45
4
45
3
3
N
Neither Satisfied nor Dissatisfied
1
12
1
12
4
4
D
Dissatisfied
1
18
1
18
5
5
H
Highly Dissatisfied
0
06
0
06
Total 1
100
1
100
53
REPRESENTS THE SATISFACTION LEVEL OF RESPONDENTS TOWARDS THE WORK ASSIGNED
54
Table 46 ndash Opinion about the career development programme in their organisation
S
SI No
C
Career Development
N
No of Respondents
P
Percentage
H
Highly satisfied
1
12
1
12
S
Satisfied
5
56
5
56
N
Neither Satisfied nor Dissatisfied
2
22
2
22
D
Dissatisfied
1
10
1
10
H
Highly Dissatisfied
0
00
0
00
Total 1
100
1
100
Source survey data
Inference
From the above table it shows that 56 of the employees were satisfied
with the opinion about the carrier development programme in their organisation
FIGURE 46
REPRESENTS OPINION ABOUT THE CAREER DEVELOPMENT
PROGRAMME IN THEIR ORGANISATION
55
Table 47 ndash To know the cooperation of co-workers
S
SI No
C
Co-operation of Workers
N
No of Respondents
P
Percentage
1
1
H
Highly satisfied
2
20
2
20
2
2
S
Satisfied
6
66
6
66
3
3
N
Neither Satisfied nor Dissatisfied
1
11
1
11
4
4
D
Dissatisfied
0
03
0
03
5
5
H
Highly Dissatisfied
0
00
0
00
Total 1
100
1
100
Source survey data
Inference
From the above table it shows that 66 of the employees were satisfied
with the cooperation of co-workers
FIGURE 47
56
REPRESENTS THE COOPERATION OF CO-WORKERS
57
Table 48 ndash To know the satisfaction of Respondents with top management
S
SI No
S
Satisfaction with Top
Management
N
No of Respondents
P
Percentage
1
1
H
Highly satisfied
2
26
2
26
2
2
S
Satisfied
5
51
5
51
3
3
N
Neither Satisfied nor Dissatisfied
1
17
1
17
4
4
D
Dissatisfied
0
06
0
06
5
5
H
Highly dissatisfied
0
00
0
00
Total 1
100
1
100
Source survey data
Inference
From the above table it shows that 51 of the employees were satisfied with the top management
FIGURE 48
58
REPRESENTS THE SATISFACTION OF RESPONDENTS WITH TOP MANAGEMENT
Table 49 ndash To know the satisfaction of Respondents with their subordinates
Source survey data
Inference
From the above table it shows that 67 of the employees were satisfied with their subordinates
S
SI
No
S
Satisfaction with Subordinates
N
No of Respondents
P
Percentage
1
1
H
Highly satisfied
1
12
1
12
2
2
S
Satisfied
6
67
6
67
2
3
N
Neither Satisfied nor Dissatisfied
1
14
1
14
4
D
Dissatisfied
0
07
0
07
5
5
H
Highly Dissatisfied
0
00
0
00
Total 1
100
1
100
59
FIGURE 49
REPRESENTS THE SATISFACTION OF RESPONDENTS WITH THEIR SUBORDINATES
60
Table 410 ndash To know the level of satisfaction regarding nature of job
S
SI No
J
Job Satisfaction
N
No of Respondents
P
Percentage
1
1
H
Highly satisfied
2
22
2
22
2
2
S
Satisfied
5
56
5
56
3
3
N
Neither Satisfied nor Dissatisfied
1
16
1
16
4
4
D
Dissatisfied
0
07
0
07
5
5
H
Highly Dissatisfied
0
00
0
00
Total 1
100
1
100
Source survey dataInference
From the above table it shows that 56 of the employees were satisfied with their job
FIGURE 410
61
REPRESENTS THE LEVEL OF SATISFACTION REGARDING THE NATURE OF JOB
Table 411 ndash To know whether there is any job pressure in their work
Source survey data
Inference
From the above table it shows that 72 of employees said there is job pressure in their work
FIGURE 411
REPRESENTS WHETHER THERE IS ANY JOB PRESSURE IN THEIR WORK
S
SI No
J
Job Pressure
N
No of Respondents
P
Percentage
1
1
Y
Yes
7
72
7
72
2
2
N
No
2
28
2
28
T
Total
1
100
1
100
62
Table 412 ndash To know the opinion regarding opportunity provided by the organisation in developing skills
amp talents
S
SI No
D
Development of Skills and
Talents
N
No of Respondents
P
Percentage
1
1
H
Highly Agree
1
12
1
12
2
2
A
Agree
5
52
5
52
3
3
N
Neither Agree nor Disagree
2
28
2
28
4
4
D
Disagree
0
06
0
06
5
5
H
Highly Disagree
0
02
0
02
Total 1
100
1
100
Source survey data
Inference
From the above table it shows that 52 of employees agreed regarding opportunity provided by the organisation in developing skills amp talents
63
FIRGURE 412
REPRESENTS THE OPPORTUNITY PROVIDED BY THE ORGANISATION IN DEVELOPING SKILLS amp TALENTS
64
Table 413 ndash To know the satisfaction level of welfare facilities provided by the management
S
SI No
W
Welfare Facilities
N
No of Respondents
P
Percentage
1
1
H
Highly satisfied
0
09
9
09
2
2
S
Satisfied
5
57
5
57
3
3
N
Neither Satisfied nor Dissatisfied
2
29
2
29
4
4
D
Dissatisfied
5
05
0
05
5
5
H
Highly Dissatisfied
0
00
0
00
Total 1
100
1
100
Source survey data
Inference
From the above table it shows that 57 of the employees were satisfied with the welfare facilities provided by the management
FIGURE 413
REPRESENTS THE SATISFACTION LEVEL OF WELFARE FACILITIES PROVIDED BY THE MANGEMENT
65
Table 414 ndash To know the employee satisfaction towards the salary
Source survey data
Inference
From the above table it shows that 67 of the employees were satisfied
with their salary
FIGURE 414
REPRESENTS THE SATISFACTION TOWARDS THE SALARY
S
SI No
P
Payment Satisfaction
N
No of Respondents
P
Percentage
1
1
Y
Yes
6
67
6
67
2
2
N
No
3
33
3
33
T
otal
1
100
1
100
66
Table 415 ndash To know the employees willingness amp Commitment Towards
Organisation
Source survey data
Inference
From the above table it shows that 59 of the employees were willing to
continue in this organisation
FIGURE 415
REPRESENTS THE EMPLOYEES WILLINGNESS TO CONTINUE
S
SI No
W
Willingness to Work
N
No of Respondents
P
Percentage
1
1
Y
Yes
5
59
5
59
2
2
N
No
4
41
4
41
T
Total
1
00
1
00
67
CHI-SQUARE METHOD
The chi square test is one of the simplest and most widely used non-
parametric tests in statistical work As a non-parametric test it can be used to determine
if categorical data shows dependency or the two classifications are independent It can
also be used to make comparisons between theoretical population and actual data
when categories are used
n
Chi square χsup2= sum (O-E) sup2 E
i =1
Where O= observed frequency
E= expected frequency
68
OBSERVED FREQUENCY
Table 419 shows the relationship between the department and the job satisfaction
Over All
Job
SatisfactionHighly
SatisfiedSatisfied
Neither
Satisfied nor
Dissatisfied
DissatisfiedHighly
Dissatisfied
Sub
Total
Mechanical 5 6 14 3 2 30
Electrical 6 8 6 3 2 25
Production 9 13 7 4 2 35
Others 2 3 2 2 1 10
Sub Total 22 30 29 12 7 100
69
EXPECTED FREQUENCY
Over All
Job
SatisfactionHighly
SatisfiedSatisfied
Neither
Satisfied nor
Dissatisfied
DissatisfiedHighly
Dissatisfied
Sub
Total
Mechanical 7 8 9 4 2 30
Electrical 5 8 7 3 2 25
Production 8 11 10 4 2 35
Others 2 3 3 1 1 10
Sub Total 22 30 29 12 7 100
Null Hypothesis (Ho)
There is no significant difference between the department and the job satisfaction
Alternative Hypothesis (Ho)
There is significant difference between the job satisfaction
Co Relation
70
Chapter-V
CONCLUSIONS AND
RECOMMENDATIONS
71
CONCLUSION
On the basis of Analysis of Job Satisfaction Level of the Employees of Philips Electronics India
Ltd Mohali made in the previous chapters following conclusions are drawn
General Profile The plant of PHILIPS is ideally located in the Mohali Industrial focal point
Phase 9 near Chandigarh the capital of Punjab on a campus of 17 hectares The working
environment of the company is very healthy The visitors feel happy after the campus
Indigenous Technology PHILIPS is the only lighting manufacturing company based on purely
indigenous technology Philips was appropriately chosen as the brand name as self reliance and
building up of Indian Engineering capabilities remain the guiding spirit of PHILIPS
Financial structure PHILIPS is a low debt company signifying its dependence mainly on
its internal accruals for its financial requirements PHILIPS continues to strengthen its financial
position by channelising these internal accruals to fund its expansion programmes
Working results PTL has registered a handsome and constant growth in its profits because
of a brisk demand for new and better technology electronic items None of the other electronic
company has shown such a steady growth Philips has recorded the lowest current ratio
However with this lowest current ratio PTL still enjoys moderate payment period and highest
velocity of creditors and debtors only due to commitment of itrsquos employees
72
SUMMARY
According to the 1999 Gallup Poll the four elements that have proven to be effective in creating
employee loyalty are praise and recognition a sense of contribution to the company learning and
development and having a best friend at work
Creating a fairy-tale work environment begins withrecognition Your employees need it more
than money perks or titles Here are eight tips regarding recognition Remember these and your
employees may just start whistling while they work It is up to me The corporate culture or
financial rewards will not make your team successful It is up to you Recognition is one thing
that is completely in your control
Strong relationships are vital in todays economy Strengthening employee relationships is even
more necessary as companies downsize and lay off As your workforce shrinks and you need to
do more with less keeping quality employees becomes even more critical As a manager it is
your job to bond your best people to your company through recognition And you also must help
direct and motivate your core performers
Simple rewards earn big returns There are some relatively simple things you can do that will
earn big returns For example remember your employees birthdays and work anniversaries find
out what inexpensive rewards they value (for example tickets to a ball game or a half day off to
spend time with their kids) make the most of your formal service awards with some preparation
and a group presentation walk around your department every day and talk to your
people and thank them sincerely and often
73
Make it specific Praise and recognition must be specific to have impact General praise such as
You do great work actually can have the opposite effect and leave your employees wondering
Does he have any idea what I really do around here Specific praise links individual
accomplishments to company goals For example Cheryl I noticed the way you handled that
customer complaint Great work As you know we value quick resolutions of problems as
one of our core strategies
Ask the best to stay Call your best people into your office one at a time Let that bright young
college graduate know you value his fresh ideas and energy Tell the 20-year veteran how much
your team relies on her expertise and organizational skillsRemarkably a significant percent of
high-impact performers report that they left their last job because No one ever asked me to
stay
Forget cash
Remember the saying Money cant buy everything Well its true Dont wait until you can
offer an employee a raise or promotion Real thanks is its own reward In numerous surveys of
work satisfaction top on employees lists is feeling appreciated In fact when employees feel
recognized and involved they are much less likely to keep asking about money
Recognize
Recognition means most to an employee when it is sincere and spontaneous According to the
largest study ever conducted on workplace satisfaction (Gallup 1999) recognition should occur
at least every seven days If you wait until a year-end party or an annual review you are waiting
much too long to recognize and you probably are losing people you do not need to
74
Recognition works
Neglect can be a poisoned apple Recognition is the elixir that will spark better attitudes and
performance Jeffrey Pfeffer of Stanford University says The returns from managing people in
ways that build high commitment typically are on the order of 30 to 50 percent
Take a hard look in the mirror and ask yourself how you can recognize the fairest of them all
Learn to recognize your employees for their efforts thank them often and reward their
achievements You can awaken them from their anger and apathy and they will fall in love with
their jobs again Chances are you will work together happily ever after
So there is direct relation with employee satisfaction and their commitment towards the
organization and it is also clear from the above discussion that only monetary elements are not
sufficient for employee satisfaction rather other element like employer behavior recognisation
and other moral value
75
RECOMMENDATIONS
PHILIPS should increase its capacity utilization It should work at full capacity to
minimize its cost of production With this increase in capacity utilization the total cost
will spread over more units thereby decreasing the per unit cost
PHILIPS should decrease the credit facilities provided to its consumers The payback
period is quite high in case of debtors as compared to creditors it should be more or less
equal as it will help in improving company liquidity
PHILIPS should focus more on the consumer lifestyle goods in India parallel to its other
business as it accounts very less as compare to other businesses of Philips
Another recommendation for Mohali plant is about the HR department that is they
should appoint permanent and skilled workers as against casual workers which generally add
up to the profit of the company
76
BIBLIOGRAPHY
1 Values-Based Leadership Rebuilding Employee Commitment Performance and Productivity ( Thomas D Kuczmarski)
2 Monthly Journals of Philips Electronics India Ltd
3 Authentic Leadership Medtronic CEO Bill George
4 wwwindiaphilipscom
5 wwwwikipediacom
6 httpwwwemployeecommitmentcom
7 One Foot Out The Door How to Combat The Psychological Recession Thatrsquos Alienating Employees And Hurting American Business Judith Bardwick
8 Employee Commitment A Leader Ship Guide Joe Folkman
9 Harvard University Factors that Impact Employee Well Being Commitment and Productivity -An Article
77
Questionnaire
Name __________________________________________________________
Age______________________________ Gender _______________________
Qualification _______________________ Contact No ___________________
Q1 In which department you are working
Electrical Production Mechanical Other
Q2 What is your working experience
gt2 Years 2-4 Years 4-6 Years lt 6 Years
Q3 How You like the physical Working Environment of the organization
Excellent Good Fair Poor Very Poor
Q4 Are you satisfied with Non-Monitory benefits provided by the organisation
Highly Satisfied Satisfied Neither Satisfied Nor dissatisfied
Highly Dissatisfied Dissatisfied
Q5 Are you satisfied with your work
Highly Satisfied Satisfied Neither Satisfied Nor dissatisfied
Highly Dissatisfied Dissatisfied
Q6 Are you satisfied with the career development programe of the company
Highly Satisfied Satisfied Neither Satisfied Nor dissatisfied
Highly Dissatisfied Dissatisfied
Q7 Is other staff of the organization is co-operative with you
Highly Satisfied Satisfied Neither Satisfied Nor dissatisfied
Highly Dissatisfied Dissatisfied
Q8 Are you satisfied with top level management
Highly Satisfied Satisfied Neither Satisfied Nor dissatisfied
Highly Dissatisfied Dissatisfied
78
Q9 Are you satisfied with your subordinates
Highly Satisfied Satisfied Neither Satisfied Nor dissatisfied
Highly Dissatisfied Dissatisfied
Q10 Are you satisfied with the nature of the Job
Highly Satisfied Satisfied Neither Satisfied Nor dissatisfied
Highly Dissatisfied Dissatisfied
Q11 Do you have any Job Pressure in work
Yes No
Q12 Do you satisfied with the opportunities provided by the organisation
Highly Satisfied Satisfied Neither Satisfied Nor dissatisfied
Highly Dissatisfied Dissatisfied
Q13 Are you satisfied with the welfare facilities provided by the organisation
Highly Satisfied Satisfied Neither Satisfied Nor dissatisfied
Highly Dissatisfied Dissatisfied
Q14 Are you satisfied towards your salary
Highly Satisfied Satisfied Neither Satisfied Nor dissatisfied
Highly Dissatisfied Dissatisfied
Q15 Are you committed towards the organisation
Yes No
Signature
51
Table 44 ndash To know the satisfaction level of employees towards the non-monitory benefits
S
SI No
N
Non-Monitory Benefits offered
to Employees
N
No of Respondents
P
Percentage
1
1
H
Highly Satisfied
1
14
1
14
2
2
S
Satisfied
5
54
5
54
3
3
N
Neither Satisfied nor Dissatisfied
2
25
2
25
4
4
D
Dissatisfied
0
05
0
05
5
5
H
Highly Dissatisfied
0
02
0
02
Total 1
100
1
100
Source survey data
Inference
From the above table it shows that 54 of the employees were satisfied towards the non-monitory benefits
FIGURE 44
REPRESENTS THE SATISFACTION LEVEL OF EMPLOYEES TOWARDS THE NON-MONITORY BENEFITS
52
Table 45 ndash To know the satisfaction level of respondents towards the work
assigned
Source survey dataInference
From the above table it shows that 45 of the respondents were satisfied towards the work assigned
FIGURE 45
S
SI No
A
Amount of Work
N
No of Respondents
P
Percentage
1
1
H
Highly satisfied
2
20
2
20
2
2
S
Satisfied
4
45
4
45
3
3
N
Neither Satisfied nor Dissatisfied
1
12
1
12
4
4
D
Dissatisfied
1
18
1
18
5
5
H
Highly Dissatisfied
0
06
0
06
Total 1
100
1
100
53
REPRESENTS THE SATISFACTION LEVEL OF RESPONDENTS TOWARDS THE WORK ASSIGNED
54
Table 46 ndash Opinion about the career development programme in their organisation
S
SI No
C
Career Development
N
No of Respondents
P
Percentage
H
Highly satisfied
1
12
1
12
S
Satisfied
5
56
5
56
N
Neither Satisfied nor Dissatisfied
2
22
2
22
D
Dissatisfied
1
10
1
10
H
Highly Dissatisfied
0
00
0
00
Total 1
100
1
100
Source survey data
Inference
From the above table it shows that 56 of the employees were satisfied
with the opinion about the carrier development programme in their organisation
FIGURE 46
REPRESENTS OPINION ABOUT THE CAREER DEVELOPMENT
PROGRAMME IN THEIR ORGANISATION
55
Table 47 ndash To know the cooperation of co-workers
S
SI No
C
Co-operation of Workers
N
No of Respondents
P
Percentage
1
1
H
Highly satisfied
2
20
2
20
2
2
S
Satisfied
6
66
6
66
3
3
N
Neither Satisfied nor Dissatisfied
1
11
1
11
4
4
D
Dissatisfied
0
03
0
03
5
5
H
Highly Dissatisfied
0
00
0
00
Total 1
100
1
100
Source survey data
Inference
From the above table it shows that 66 of the employees were satisfied
with the cooperation of co-workers
FIGURE 47
56
REPRESENTS THE COOPERATION OF CO-WORKERS
57
Table 48 ndash To know the satisfaction of Respondents with top management
S
SI No
S
Satisfaction with Top
Management
N
No of Respondents
P
Percentage
1
1
H
Highly satisfied
2
26
2
26
2
2
S
Satisfied
5
51
5
51
3
3
N
Neither Satisfied nor Dissatisfied
1
17
1
17
4
4
D
Dissatisfied
0
06
0
06
5
5
H
Highly dissatisfied
0
00
0
00
Total 1
100
1
100
Source survey data
Inference
From the above table it shows that 51 of the employees were satisfied with the top management
FIGURE 48
58
REPRESENTS THE SATISFACTION OF RESPONDENTS WITH TOP MANAGEMENT
Table 49 ndash To know the satisfaction of Respondents with their subordinates
Source survey data
Inference
From the above table it shows that 67 of the employees were satisfied with their subordinates
S
SI
No
S
Satisfaction with Subordinates
N
No of Respondents
P
Percentage
1
1
H
Highly satisfied
1
12
1
12
2
2
S
Satisfied
6
67
6
67
2
3
N
Neither Satisfied nor Dissatisfied
1
14
1
14
4
D
Dissatisfied
0
07
0
07
5
5
H
Highly Dissatisfied
0
00
0
00
Total 1
100
1
100
59
FIGURE 49
REPRESENTS THE SATISFACTION OF RESPONDENTS WITH THEIR SUBORDINATES
60
Table 410 ndash To know the level of satisfaction regarding nature of job
S
SI No
J
Job Satisfaction
N
No of Respondents
P
Percentage
1
1
H
Highly satisfied
2
22
2
22
2
2
S
Satisfied
5
56
5
56
3
3
N
Neither Satisfied nor Dissatisfied
1
16
1
16
4
4
D
Dissatisfied
0
07
0
07
5
5
H
Highly Dissatisfied
0
00
0
00
Total 1
100
1
100
Source survey dataInference
From the above table it shows that 56 of the employees were satisfied with their job
FIGURE 410
61
REPRESENTS THE LEVEL OF SATISFACTION REGARDING THE NATURE OF JOB
Table 411 ndash To know whether there is any job pressure in their work
Source survey data
Inference
From the above table it shows that 72 of employees said there is job pressure in their work
FIGURE 411
REPRESENTS WHETHER THERE IS ANY JOB PRESSURE IN THEIR WORK
S
SI No
J
Job Pressure
N
No of Respondents
P
Percentage
1
1
Y
Yes
7
72
7
72
2
2
N
No
2
28
2
28
T
Total
1
100
1
100
62
Table 412 ndash To know the opinion regarding opportunity provided by the organisation in developing skills
amp talents
S
SI No
D
Development of Skills and
Talents
N
No of Respondents
P
Percentage
1
1
H
Highly Agree
1
12
1
12
2
2
A
Agree
5
52
5
52
3
3
N
Neither Agree nor Disagree
2
28
2
28
4
4
D
Disagree
0
06
0
06
5
5
H
Highly Disagree
0
02
0
02
Total 1
100
1
100
Source survey data
Inference
From the above table it shows that 52 of employees agreed regarding opportunity provided by the organisation in developing skills amp talents
63
FIRGURE 412
REPRESENTS THE OPPORTUNITY PROVIDED BY THE ORGANISATION IN DEVELOPING SKILLS amp TALENTS
64
Table 413 ndash To know the satisfaction level of welfare facilities provided by the management
S
SI No
W
Welfare Facilities
N
No of Respondents
P
Percentage
1
1
H
Highly satisfied
0
09
9
09
2
2
S
Satisfied
5
57
5
57
3
3
N
Neither Satisfied nor Dissatisfied
2
29
2
29
4
4
D
Dissatisfied
5
05
0
05
5
5
H
Highly Dissatisfied
0
00
0
00
Total 1
100
1
100
Source survey data
Inference
From the above table it shows that 57 of the employees were satisfied with the welfare facilities provided by the management
FIGURE 413
REPRESENTS THE SATISFACTION LEVEL OF WELFARE FACILITIES PROVIDED BY THE MANGEMENT
65
Table 414 ndash To know the employee satisfaction towards the salary
Source survey data
Inference
From the above table it shows that 67 of the employees were satisfied
with their salary
FIGURE 414
REPRESENTS THE SATISFACTION TOWARDS THE SALARY
S
SI No
P
Payment Satisfaction
N
No of Respondents
P
Percentage
1
1
Y
Yes
6
67
6
67
2
2
N
No
3
33
3
33
T
otal
1
100
1
100
66
Table 415 ndash To know the employees willingness amp Commitment Towards
Organisation
Source survey data
Inference
From the above table it shows that 59 of the employees were willing to
continue in this organisation
FIGURE 415
REPRESENTS THE EMPLOYEES WILLINGNESS TO CONTINUE
S
SI No
W
Willingness to Work
N
No of Respondents
P
Percentage
1
1
Y
Yes
5
59
5
59
2
2
N
No
4
41
4
41
T
Total
1
00
1
00
67
CHI-SQUARE METHOD
The chi square test is one of the simplest and most widely used non-
parametric tests in statistical work As a non-parametric test it can be used to determine
if categorical data shows dependency or the two classifications are independent It can
also be used to make comparisons between theoretical population and actual data
when categories are used
n
Chi square χsup2= sum (O-E) sup2 E
i =1
Where O= observed frequency
E= expected frequency
68
OBSERVED FREQUENCY
Table 419 shows the relationship between the department and the job satisfaction
Over All
Job
SatisfactionHighly
SatisfiedSatisfied
Neither
Satisfied nor
Dissatisfied
DissatisfiedHighly
Dissatisfied
Sub
Total
Mechanical 5 6 14 3 2 30
Electrical 6 8 6 3 2 25
Production 9 13 7 4 2 35
Others 2 3 2 2 1 10
Sub Total 22 30 29 12 7 100
69
EXPECTED FREQUENCY
Over All
Job
SatisfactionHighly
SatisfiedSatisfied
Neither
Satisfied nor
Dissatisfied
DissatisfiedHighly
Dissatisfied
Sub
Total
Mechanical 7 8 9 4 2 30
Electrical 5 8 7 3 2 25
Production 8 11 10 4 2 35
Others 2 3 3 1 1 10
Sub Total 22 30 29 12 7 100
Null Hypothesis (Ho)
There is no significant difference between the department and the job satisfaction
Alternative Hypothesis (Ho)
There is significant difference between the job satisfaction
Co Relation
70
Chapter-V
CONCLUSIONS AND
RECOMMENDATIONS
71
CONCLUSION
On the basis of Analysis of Job Satisfaction Level of the Employees of Philips Electronics India
Ltd Mohali made in the previous chapters following conclusions are drawn
General Profile The plant of PHILIPS is ideally located in the Mohali Industrial focal point
Phase 9 near Chandigarh the capital of Punjab on a campus of 17 hectares The working
environment of the company is very healthy The visitors feel happy after the campus
Indigenous Technology PHILIPS is the only lighting manufacturing company based on purely
indigenous technology Philips was appropriately chosen as the brand name as self reliance and
building up of Indian Engineering capabilities remain the guiding spirit of PHILIPS
Financial structure PHILIPS is a low debt company signifying its dependence mainly on
its internal accruals for its financial requirements PHILIPS continues to strengthen its financial
position by channelising these internal accruals to fund its expansion programmes
Working results PTL has registered a handsome and constant growth in its profits because
of a brisk demand for new and better technology electronic items None of the other electronic
company has shown such a steady growth Philips has recorded the lowest current ratio
However with this lowest current ratio PTL still enjoys moderate payment period and highest
velocity of creditors and debtors only due to commitment of itrsquos employees
72
SUMMARY
According to the 1999 Gallup Poll the four elements that have proven to be effective in creating
employee loyalty are praise and recognition a sense of contribution to the company learning and
development and having a best friend at work
Creating a fairy-tale work environment begins withrecognition Your employees need it more
than money perks or titles Here are eight tips regarding recognition Remember these and your
employees may just start whistling while they work It is up to me The corporate culture or
financial rewards will not make your team successful It is up to you Recognition is one thing
that is completely in your control
Strong relationships are vital in todays economy Strengthening employee relationships is even
more necessary as companies downsize and lay off As your workforce shrinks and you need to
do more with less keeping quality employees becomes even more critical As a manager it is
your job to bond your best people to your company through recognition And you also must help
direct and motivate your core performers
Simple rewards earn big returns There are some relatively simple things you can do that will
earn big returns For example remember your employees birthdays and work anniversaries find
out what inexpensive rewards they value (for example tickets to a ball game or a half day off to
spend time with their kids) make the most of your formal service awards with some preparation
and a group presentation walk around your department every day and talk to your
people and thank them sincerely and often
73
Make it specific Praise and recognition must be specific to have impact General praise such as
You do great work actually can have the opposite effect and leave your employees wondering
Does he have any idea what I really do around here Specific praise links individual
accomplishments to company goals For example Cheryl I noticed the way you handled that
customer complaint Great work As you know we value quick resolutions of problems as
one of our core strategies
Ask the best to stay Call your best people into your office one at a time Let that bright young
college graduate know you value his fresh ideas and energy Tell the 20-year veteran how much
your team relies on her expertise and organizational skillsRemarkably a significant percent of
high-impact performers report that they left their last job because No one ever asked me to
stay
Forget cash
Remember the saying Money cant buy everything Well its true Dont wait until you can
offer an employee a raise or promotion Real thanks is its own reward In numerous surveys of
work satisfaction top on employees lists is feeling appreciated In fact when employees feel
recognized and involved they are much less likely to keep asking about money
Recognize
Recognition means most to an employee when it is sincere and spontaneous According to the
largest study ever conducted on workplace satisfaction (Gallup 1999) recognition should occur
at least every seven days If you wait until a year-end party or an annual review you are waiting
much too long to recognize and you probably are losing people you do not need to
74
Recognition works
Neglect can be a poisoned apple Recognition is the elixir that will spark better attitudes and
performance Jeffrey Pfeffer of Stanford University says The returns from managing people in
ways that build high commitment typically are on the order of 30 to 50 percent
Take a hard look in the mirror and ask yourself how you can recognize the fairest of them all
Learn to recognize your employees for their efforts thank them often and reward their
achievements You can awaken them from their anger and apathy and they will fall in love with
their jobs again Chances are you will work together happily ever after
So there is direct relation with employee satisfaction and their commitment towards the
organization and it is also clear from the above discussion that only monetary elements are not
sufficient for employee satisfaction rather other element like employer behavior recognisation
and other moral value
75
RECOMMENDATIONS
PHILIPS should increase its capacity utilization It should work at full capacity to
minimize its cost of production With this increase in capacity utilization the total cost
will spread over more units thereby decreasing the per unit cost
PHILIPS should decrease the credit facilities provided to its consumers The payback
period is quite high in case of debtors as compared to creditors it should be more or less
equal as it will help in improving company liquidity
PHILIPS should focus more on the consumer lifestyle goods in India parallel to its other
business as it accounts very less as compare to other businesses of Philips
Another recommendation for Mohali plant is about the HR department that is they
should appoint permanent and skilled workers as against casual workers which generally add
up to the profit of the company
76
BIBLIOGRAPHY
1 Values-Based Leadership Rebuilding Employee Commitment Performance and Productivity ( Thomas D Kuczmarski)
2 Monthly Journals of Philips Electronics India Ltd
3 Authentic Leadership Medtronic CEO Bill George
4 wwwindiaphilipscom
5 wwwwikipediacom
6 httpwwwemployeecommitmentcom
7 One Foot Out The Door How to Combat The Psychological Recession Thatrsquos Alienating Employees And Hurting American Business Judith Bardwick
8 Employee Commitment A Leader Ship Guide Joe Folkman
9 Harvard University Factors that Impact Employee Well Being Commitment and Productivity -An Article
77
Questionnaire
Name __________________________________________________________
Age______________________________ Gender _______________________
Qualification _______________________ Contact No ___________________
Q1 In which department you are working
Electrical Production Mechanical Other
Q2 What is your working experience
gt2 Years 2-4 Years 4-6 Years lt 6 Years
Q3 How You like the physical Working Environment of the organization
Excellent Good Fair Poor Very Poor
Q4 Are you satisfied with Non-Monitory benefits provided by the organisation
Highly Satisfied Satisfied Neither Satisfied Nor dissatisfied
Highly Dissatisfied Dissatisfied
Q5 Are you satisfied with your work
Highly Satisfied Satisfied Neither Satisfied Nor dissatisfied
Highly Dissatisfied Dissatisfied
Q6 Are you satisfied with the career development programe of the company
Highly Satisfied Satisfied Neither Satisfied Nor dissatisfied
Highly Dissatisfied Dissatisfied
Q7 Is other staff of the organization is co-operative with you
Highly Satisfied Satisfied Neither Satisfied Nor dissatisfied
Highly Dissatisfied Dissatisfied
Q8 Are you satisfied with top level management
Highly Satisfied Satisfied Neither Satisfied Nor dissatisfied
Highly Dissatisfied Dissatisfied
78
Q9 Are you satisfied with your subordinates
Highly Satisfied Satisfied Neither Satisfied Nor dissatisfied
Highly Dissatisfied Dissatisfied
Q10 Are you satisfied with the nature of the Job
Highly Satisfied Satisfied Neither Satisfied Nor dissatisfied
Highly Dissatisfied Dissatisfied
Q11 Do you have any Job Pressure in work
Yes No
Q12 Do you satisfied with the opportunities provided by the organisation
Highly Satisfied Satisfied Neither Satisfied Nor dissatisfied
Highly Dissatisfied Dissatisfied
Q13 Are you satisfied with the welfare facilities provided by the organisation
Highly Satisfied Satisfied Neither Satisfied Nor dissatisfied
Highly Dissatisfied Dissatisfied
Q14 Are you satisfied towards your salary
Highly Satisfied Satisfied Neither Satisfied Nor dissatisfied
Highly Dissatisfied Dissatisfied
Q15 Are you committed towards the organisation
Yes No
Signature

52
Table 45 ndash To know the satisfaction level of respondents towards the work
assigned
Source survey dataInference
From the above table it shows that 45 of the respondents were satisfied towards the work assigned
FIGURE 45
S
SI No
A
Amount of Work
N
No of Respondents
P
Percentage
1
1
H
Highly satisfied
2
20
2
20
2
2
S
Satisfied
4
45
4
45
3
3
N
Neither Satisfied nor Dissatisfied
1
12
1
12
4
4
D
Dissatisfied
1
18
1
18
5
5
H
Highly Dissatisfied
0
06
0
06
Total 1
100
1
100
53
REPRESENTS THE SATISFACTION LEVEL OF RESPONDENTS TOWARDS THE WORK ASSIGNED
54
Table 46 ndash Opinion about the career development programme in their organisation
S
SI No
C
Career Development
N
No of Respondents
P
Percentage
H
Highly satisfied
1
12
1
12
S
Satisfied
5
56
5
56
N
Neither Satisfied nor Dissatisfied
2
22
2
22
D
Dissatisfied
1
10
1
10
H
Highly Dissatisfied
0
00
0
00
Total 1
100
1
100
Source survey data
Inference
From the above table it shows that 56 of the employees were satisfied
with the opinion about the carrier development programme in their organisation
FIGURE 46
REPRESENTS OPINION ABOUT THE CAREER DEVELOPMENT
PROGRAMME IN THEIR ORGANISATION
55
Table 47 ndash To know the cooperation of co-workers
S
SI No
C
Co-operation of Workers
N
No of Respondents
P
Percentage
1
1
H
Highly satisfied
2
20
2
20
2
2
S
Satisfied
6
66
6
66
3
3
N
Neither Satisfied nor Dissatisfied
1
11
1
11
4
4
D
Dissatisfied
0
03
0
03
5
5
H
Highly Dissatisfied
0
00
0
00
Total 1
100
1
100
Source survey data
Inference
From the above table it shows that 66 of the employees were satisfied
with the cooperation of co-workers
FIGURE 47
56
REPRESENTS THE COOPERATION OF CO-WORKERS
57
Table 48 ndash To know the satisfaction of Respondents with top management
S
SI No
S
Satisfaction with Top
Management
N
No of Respondents
P
Percentage
1
1
H
Highly satisfied
2
26
2
26
2
2
S
Satisfied
5
51
5
51
3
3
N
Neither Satisfied nor Dissatisfied
1
17
1
17
4
4
D
Dissatisfied
0
06
0
06
5
5
H
Highly dissatisfied
0
00
0
00
Total 1
100
1
100
Source survey data
Inference
From the above table it shows that 51 of the employees were satisfied with the top management
FIGURE 48
58
REPRESENTS THE SATISFACTION OF RESPONDENTS WITH TOP MANAGEMENT
Table 49 ndash To know the satisfaction of Respondents with their subordinates
Source survey data
Inference
From the above table it shows that 67 of the employees were satisfied with their subordinates
S
SI
No
S
Satisfaction with Subordinates
N
No of Respondents
P
Percentage
1
1
H
Highly satisfied
1
12
1
12
2
2
S
Satisfied
6
67
6
67
2
3
N
Neither Satisfied nor Dissatisfied
1
14
1
14
4
D
Dissatisfied
0
07
0
07
5
5
H
Highly Dissatisfied
0
00
0
00
Total 1
100
1
100
59
FIGURE 49
REPRESENTS THE SATISFACTION OF RESPONDENTS WITH THEIR SUBORDINATES
60
Table 410 ndash To know the level of satisfaction regarding nature of job
S
SI No
J
Job Satisfaction
N
No of Respondents
P
Percentage
1
1
H
Highly satisfied
2
22
2
22
2
2
S
Satisfied
5
56
5
56
3
3
N
Neither Satisfied nor Dissatisfied
1
16
1
16
4
4
D
Dissatisfied
0
07
0
07
5
5
H
Highly Dissatisfied
0
00
0
00
Total 1
100
1
100
Source survey dataInference
From the above table it shows that 56 of the employees were satisfied with their job
FIGURE 410
61
REPRESENTS THE LEVEL OF SATISFACTION REGARDING THE NATURE OF JOB
Table 411 ndash To know whether there is any job pressure in their work
Source survey data
Inference
From the above table it shows that 72 of employees said there is job pressure in their work
FIGURE 411
REPRESENTS WHETHER THERE IS ANY JOB PRESSURE IN THEIR WORK
S
SI No
J
Job Pressure
N
No of Respondents
P
Percentage
1
1
Y
Yes
7
72
7
72
2
2
N
No
2
28
2
28
T
Total
1
100
1
100
62
Table 412 ndash To know the opinion regarding opportunity provided by the organisation in developing skills
amp talents
S
SI No
D
Development of Skills and
Talents
N
No of Respondents
P
Percentage
1
1
H
Highly Agree
1
12
1
12
2
2
A
Agree
5
52
5
52
3
3
N
Neither Agree nor Disagree
2
28
2
28
4
4
D
Disagree
0
06
0
06
5
5
H
Highly Disagree
0
02
0
02
Total 1
100
1
100
Source survey data
Inference
From the above table it shows that 52 of employees agreed regarding opportunity provided by the organisation in developing skills amp talents
63
FIRGURE 412
REPRESENTS THE OPPORTUNITY PROVIDED BY THE ORGANISATION IN DEVELOPING SKILLS amp TALENTS
64
Table 413 ndash To know the satisfaction level of welfare facilities provided by the management
S
SI No
W
Welfare Facilities
N
No of Respondents
P
Percentage
1
1
H
Highly satisfied
0
09
9
09
2
2
S
Satisfied
5
57
5
57
3
3
N
Neither Satisfied nor Dissatisfied
2
29
2
29
4
4
D
Dissatisfied
5
05
0
05
5
5
H
Highly Dissatisfied
0
00
0
00
Total 1
100
1
100
Source survey data
Inference
From the above table it shows that 57 of the employees were satisfied with the welfare facilities provided by the management
FIGURE 413
REPRESENTS THE SATISFACTION LEVEL OF WELFARE FACILITIES PROVIDED BY THE MANGEMENT
65
Table 414 ndash To know the employee satisfaction towards the salary
Source survey data
Inference
From the above table it shows that 67 of the employees were satisfied
with their salary
FIGURE 414
REPRESENTS THE SATISFACTION TOWARDS THE SALARY
S
SI No
P
Payment Satisfaction
N
No of Respondents
P
Percentage
1
1
Y
Yes
6
67
6
67
2
2
N
No
3
33
3
33
T
otal
1
100
1
100
66
Table 415 ndash To know the employees willingness amp Commitment Towards
Organisation
Source survey data
Inference
From the above table it shows that 59 of the employees were willing to
continue in this organisation
FIGURE 415
REPRESENTS THE EMPLOYEES WILLINGNESS TO CONTINUE
S
SI No
W
Willingness to Work
N
No of Respondents
P
Percentage
1
1
Y
Yes
5
59
5
59
2
2
N
No
4
41
4
41
T
Total
1
00
1
00
67
CHI-SQUARE METHOD
The chi square test is one of the simplest and most widely used non-
parametric tests in statistical work As a non-parametric test it can be used to determine
if categorical data shows dependency or the two classifications are independent It can
also be used to make comparisons between theoretical population and actual data
when categories are used
n
Chi square χsup2= sum (O-E) sup2 E
i =1
Where O= observed frequency
E= expected frequency
68
OBSERVED FREQUENCY
Table 419 shows the relationship between the department and the job satisfaction
Over All
Job
SatisfactionHighly
SatisfiedSatisfied
Neither
Satisfied nor
Dissatisfied
DissatisfiedHighly
Dissatisfied
Sub
Total
Mechanical 5 6 14 3 2 30
Electrical 6 8 6 3 2 25
Production 9 13 7 4 2 35
Others 2 3 2 2 1 10
Sub Total 22 30 29 12 7 100
69
EXPECTED FREQUENCY
Over All
Job
SatisfactionHighly
SatisfiedSatisfied
Neither
Satisfied nor
Dissatisfied
DissatisfiedHighly
Dissatisfied
Sub
Total
Mechanical 7 8 9 4 2 30
Electrical 5 8 7 3 2 25
Production 8 11 10 4 2 35
Others 2 3 3 1 1 10
Sub Total 22 30 29 12 7 100
Null Hypothesis (Ho)
There is no significant difference between the department and the job satisfaction
Alternative Hypothesis (Ho)
There is significant difference between the job satisfaction
Co Relation
70
Chapter-V
CONCLUSIONS AND
RECOMMENDATIONS
71
CONCLUSION
On the basis of Analysis of Job Satisfaction Level of the Employees of Philips Electronics India
Ltd Mohali made in the previous chapters following conclusions are drawn
General Profile The plant of PHILIPS is ideally located in the Mohali Industrial focal point
Phase 9 near Chandigarh the capital of Punjab on a campus of 17 hectares The working
environment of the company is very healthy The visitors feel happy after the campus
Indigenous Technology PHILIPS is the only lighting manufacturing company based on purely
indigenous technology Philips was appropriately chosen as the brand name as self reliance and
building up of Indian Engineering capabilities remain the guiding spirit of PHILIPS
Financial structure PHILIPS is a low debt company signifying its dependence mainly on
its internal accruals for its financial requirements PHILIPS continues to strengthen its financial
position by channelising these internal accruals to fund its expansion programmes
Working results PTL has registered a handsome and constant growth in its profits because
of a brisk demand for new and better technology electronic items None of the other electronic
company has shown such a steady growth Philips has recorded the lowest current ratio
However with this lowest current ratio PTL still enjoys moderate payment period and highest
velocity of creditors and debtors only due to commitment of itrsquos employees
72
SUMMARY
According to the 1999 Gallup Poll the four elements that have proven to be effective in creating
employee loyalty are praise and recognition a sense of contribution to the company learning and
development and having a best friend at work
Creating a fairy-tale work environment begins withrecognition Your employees need it more
than money perks or titles Here are eight tips regarding recognition Remember these and your
employees may just start whistling while they work It is up to me The corporate culture or
financial rewards will not make your team successful It is up to you Recognition is one thing
that is completely in your control
Strong relationships are vital in todays economy Strengthening employee relationships is even
more necessary as companies downsize and lay off As your workforce shrinks and you need to
do more with less keeping quality employees becomes even more critical As a manager it is
your job to bond your best people to your company through recognition And you also must help
direct and motivate your core performers
Simple rewards earn big returns There are some relatively simple things you can do that will
earn big returns For example remember your employees birthdays and work anniversaries find
out what inexpensive rewards they value (for example tickets to a ball game or a half day off to
spend time with their kids) make the most of your formal service awards with some preparation
and a group presentation walk around your department every day and talk to your
people and thank them sincerely and often
73
Make it specific Praise and recognition must be specific to have impact General praise such as
You do great work actually can have the opposite effect and leave your employees wondering
Does he have any idea what I really do around here Specific praise links individual
accomplishments to company goals For example Cheryl I noticed the way you handled that
customer complaint Great work As you know we value quick resolutions of problems as
one of our core strategies
Ask the best to stay Call your best people into your office one at a time Let that bright young
college graduate know you value his fresh ideas and energy Tell the 20-year veteran how much
your team relies on her expertise and organizational skillsRemarkably a significant percent of
high-impact performers report that they left their last job because No one ever asked me to
stay
Forget cash
Remember the saying Money cant buy everything Well its true Dont wait until you can
offer an employee a raise or promotion Real thanks is its own reward In numerous surveys of
work satisfaction top on employees lists is feeling appreciated In fact when employees feel
recognized and involved they are much less likely to keep asking about money
Recognize
Recognition means most to an employee when it is sincere and spontaneous According to the
largest study ever conducted on workplace satisfaction (Gallup 1999) recognition should occur
at least every seven days If you wait until a year-end party or an annual review you are waiting
much too long to recognize and you probably are losing people you do not need to
74
Recognition works
Neglect can be a poisoned apple Recognition is the elixir that will spark better attitudes and
performance Jeffrey Pfeffer of Stanford University says The returns from managing people in
ways that build high commitment typically are on the order of 30 to 50 percent
Take a hard look in the mirror and ask yourself how you can recognize the fairest of them all
Learn to recognize your employees for their efforts thank them often and reward their
achievements You can awaken them from their anger and apathy and they will fall in love with
their jobs again Chances are you will work together happily ever after
So there is direct relation with employee satisfaction and their commitment towards the
organization and it is also clear from the above discussion that only monetary elements are not
sufficient for employee satisfaction rather other element like employer behavior recognisation
and other moral value
75
RECOMMENDATIONS
PHILIPS should increase its capacity utilization It should work at full capacity to
minimize its cost of production With this increase in capacity utilization the total cost
will spread over more units thereby decreasing the per unit cost
PHILIPS should decrease the credit facilities provided to its consumers The payback
period is quite high in case of debtors as compared to creditors it should be more or less
equal as it will help in improving company liquidity
PHILIPS should focus more on the consumer lifestyle goods in India parallel to its other
business as it accounts very less as compare to other businesses of Philips
Another recommendation for Mohali plant is about the HR department that is they
should appoint permanent and skilled workers as against casual workers which generally add
up to the profit of the company
76
BIBLIOGRAPHY
1 Values-Based Leadership Rebuilding Employee Commitment Performance and Productivity ( Thomas D Kuczmarski)
2 Monthly Journals of Philips Electronics India Ltd
3 Authentic Leadership Medtronic CEO Bill George
4 wwwindiaphilipscom
5 wwwwikipediacom
6 httpwwwemployeecommitmentcom
7 One Foot Out The Door How to Combat The Psychological Recession Thatrsquos Alienating Employees And Hurting American Business Judith Bardwick
8 Employee Commitment A Leader Ship Guide Joe Folkman
9 Harvard University Factors that Impact Employee Well Being Commitment and Productivity -An Article
77
Questionnaire
Name __________________________________________________________
Age______________________________ Gender _______________________
Qualification _______________________ Contact No ___________________
Q1 In which department you are working
Electrical Production Mechanical Other
Q2 What is your working experience
gt2 Years 2-4 Years 4-6 Years lt 6 Years
Q3 How You like the physical Working Environment of the organization
Excellent Good Fair Poor Very Poor
Q4 Are you satisfied with Non-Monitory benefits provided by the organisation
Highly Satisfied Satisfied Neither Satisfied Nor dissatisfied
Highly Dissatisfied Dissatisfied
Q5 Are you satisfied with your work
Highly Satisfied Satisfied Neither Satisfied Nor dissatisfied
Highly Dissatisfied Dissatisfied
Q6 Are you satisfied with the career development programe of the company
Highly Satisfied Satisfied Neither Satisfied Nor dissatisfied
Highly Dissatisfied Dissatisfied
Q7 Is other staff of the organization is co-operative with you
Highly Satisfied Satisfied Neither Satisfied Nor dissatisfied
Highly Dissatisfied Dissatisfied
Q8 Are you satisfied with top level management
Highly Satisfied Satisfied Neither Satisfied Nor dissatisfied
Highly Dissatisfied Dissatisfied
78
Q9 Are you satisfied with your subordinates
Highly Satisfied Satisfied Neither Satisfied Nor dissatisfied
Highly Dissatisfied Dissatisfied
Q10 Are you satisfied with the nature of the Job
Highly Satisfied Satisfied Neither Satisfied Nor dissatisfied
Highly Dissatisfied Dissatisfied
Q11 Do you have any Job Pressure in work
Yes No
Q12 Do you satisfied with the opportunities provided by the organisation
Highly Satisfied Satisfied Neither Satisfied Nor dissatisfied
Highly Dissatisfied Dissatisfied
Q13 Are you satisfied with the welfare facilities provided by the organisation
Highly Satisfied Satisfied Neither Satisfied Nor dissatisfied
Highly Dissatisfied Dissatisfied
Q14 Are you satisfied towards your salary
Highly Satisfied Satisfied Neither Satisfied Nor dissatisfied
Highly Dissatisfied Dissatisfied
Q15 Are you committed towards the organisation
Yes No
Signature
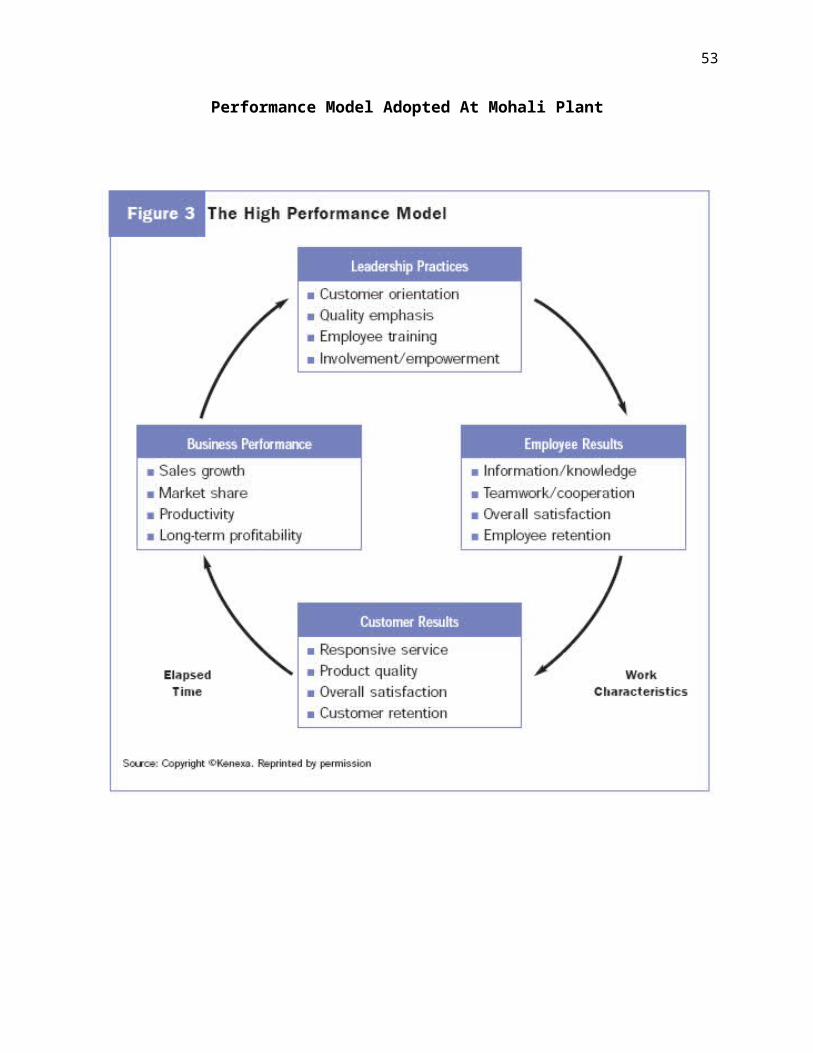

56
REPRESENTS THE COOPERATION OF CO-WORKERS
57
Table 48 ndash To know the satisfaction of Respondents with top management
S
SI No
S
Satisfaction with Top
Management
N
No of Respondents
P
Percentage
1
1
H
Highly satisfied
2
26
2
26
2
2
S
Satisfied
5
51
5
51
3
3
N
Neither Satisfied nor Dissatisfied
1
17
1
17
4
4
D
Dissatisfied
0
06
0
06
5
5
H
Highly dissatisfied
0
00
0
00
Total 1
100
1
100
Source survey data
Inference
From the above table it shows that 51 of the employees were satisfied with the top management
FIGURE 48
58
REPRESENTS THE SATISFACTION OF RESPONDENTS WITH TOP MANAGEMENT
Table 49 ndash To know the satisfaction of Respondents with their subordinates
Source survey data
Inference
From the above table it shows that 67 of the employees were satisfied with their subordinates
S
SI
No
S
Satisfaction with Subordinates
N
No of Respondents
P
Percentage
1
1
H
Highly satisfied
1
12
1
12
2
2
S
Satisfied
6
67
6
67
2
3
N
Neither Satisfied nor Dissatisfied
1
14
1
14
4
D
Dissatisfied
0
07
0
07
5
5
H
Highly Dissatisfied
0
00
0
00
Total 1
100
1
100
59
FIGURE 49
REPRESENTS THE SATISFACTION OF RESPONDENTS WITH THEIR SUBORDINATES
60
Table 410 ndash To know the level of satisfaction regarding nature of job
S
SI No
J
Job Satisfaction
N
No of Respondents
P
Percentage
1
1
H
Highly satisfied
2
22
2
22
2
2
S
Satisfied
5
56
5
56
3
3
N
Neither Satisfied nor Dissatisfied
1
16
1
16
4
4
D
Dissatisfied
0
07
0
07
5
5
H
Highly Dissatisfied
0
00
0
00
Total 1
100
1
100
Source survey dataInference
From the above table it shows that 56 of the employees were satisfied with their job
FIGURE 410
61
REPRESENTS THE LEVEL OF SATISFACTION REGARDING THE NATURE OF JOB
Table 411 ndash To know whether there is any job pressure in their work
Source survey data
Inference
From the above table it shows that 72 of employees said there is job pressure in their work
FIGURE 411
REPRESENTS WHETHER THERE IS ANY JOB PRESSURE IN THEIR WORK
S
SI No
J
Job Pressure
N
No of Respondents
P
Percentage
1
1
Y
Yes
7
72
7
72
2
2
N
No
2
28
2
28
T
Total
1
100
1
100
62
Table 412 ndash To know the opinion regarding opportunity provided by the organisation in developing skills
amp talents
S
SI No
D
Development of Skills and
Talents
N
No of Respondents
P
Percentage
1
1
H
Highly Agree
1
12
1
12
2
2
A
Agree
5
52
5
52
3
3
N
Neither Agree nor Disagree
2
28
2
28
4
4
D
Disagree
0
06
0
06
5
5
H
Highly Disagree
0
02
0
02
Total 1
100
1
100
Source survey data
Inference
From the above table it shows that 52 of employees agreed regarding opportunity provided by the organisation in developing skills amp talents
63
FIRGURE 412
REPRESENTS THE OPPORTUNITY PROVIDED BY THE ORGANISATION IN DEVELOPING SKILLS amp TALENTS
64
Table 413 ndash To know the satisfaction level of welfare facilities provided by the management
S
SI No
W
Welfare Facilities
N
No of Respondents
P
Percentage
1
1
H
Highly satisfied
0
09
9
09
2
2
S
Satisfied
5
57
5
57
3
3
N
Neither Satisfied nor Dissatisfied
2
29
2
29
4
4
D
Dissatisfied
5
05
0
05
5
5
H
Highly Dissatisfied
0
00
0
00
Total 1
100
1
100
Source survey data
Inference
From the above table it shows that 57 of the employees were satisfied with the welfare facilities provided by the management
FIGURE 413
REPRESENTS THE SATISFACTION LEVEL OF WELFARE FACILITIES PROVIDED BY THE MANGEMENT
65
Table 414 ndash To know the employee satisfaction towards the salary
Source survey data
Inference
From the above table it shows that 67 of the employees were satisfied
with their salary
FIGURE 414
REPRESENTS THE SATISFACTION TOWARDS THE SALARY
S
SI No
P
Payment Satisfaction
N
No of Respondents
P
Percentage
1
1
Y
Yes
6
67
6
67
2
2
N
No
3
33
3
33
T
otal
1
100
1
100
66
Table 415 ndash To know the employees willingness amp Commitment Towards
Organisation
Source survey data
Inference
From the above table it shows that 59 of the employees were willing to
continue in this organisation
FIGURE 415
REPRESENTS THE EMPLOYEES WILLINGNESS TO CONTINUE
S
SI No
W
Willingness to Work
N
No of Respondents
P
Percentage
1
1
Y
Yes
5
59
5
59
2
2
N
No
4
41
4
41
T
Total
1
00
1
00
67
CHI-SQUARE METHOD
The chi square test is one of the simplest and most widely used non-
parametric tests in statistical work As a non-parametric test it can be used to determine
if categorical data shows dependency or the two classifications are independent It can
also be used to make comparisons between theoretical population and actual data
when categories are used
n
Chi square χsup2= sum (O-E) sup2 E
i =1
Where O= observed frequency
E= expected frequency
68
OBSERVED FREQUENCY
Table 419 shows the relationship between the department and the job satisfaction
Over All
Job
SatisfactionHighly
SatisfiedSatisfied
Neither
Satisfied nor
Dissatisfied
DissatisfiedHighly
Dissatisfied
Sub
Total
Mechanical 5 6 14 3 2 30
Electrical 6 8 6 3 2 25
Production 9 13 7 4 2 35
Others 2 3 2 2 1 10
Sub Total 22 30 29 12 7 100
69
EXPECTED FREQUENCY
Over All
Job
SatisfactionHighly
SatisfiedSatisfied
Neither
Satisfied nor
Dissatisfied
DissatisfiedHighly
Dissatisfied
Sub
Total
Mechanical 7 8 9 4 2 30
Electrical 5 8 7 3 2 25
Production 8 11 10 4 2 35
Others 2 3 3 1 1 10
Sub Total 22 30 29 12 7 100
Null Hypothesis (Ho)
There is no significant difference between the department and the job satisfaction
Alternative Hypothesis (Ho)
There is significant difference between the job satisfaction
Co Relation
70
Chapter-V
CONCLUSIONS AND
RECOMMENDATIONS
71
CONCLUSION
On the basis of Analysis of Job Satisfaction Level of the Employees of Philips Electronics India
Ltd Mohali made in the previous chapters following conclusions are drawn
General Profile The plant of PHILIPS is ideally located in the Mohali Industrial focal point
Phase 9 near Chandigarh the capital of Punjab on a campus of 17 hectares The working
environment of the company is very healthy The visitors feel happy after the campus
Indigenous Technology PHILIPS is the only lighting manufacturing company based on purely
indigenous technology Philips was appropriately chosen as the brand name as self reliance and
building up of Indian Engineering capabilities remain the guiding spirit of PHILIPS
Financial structure PHILIPS is a low debt company signifying its dependence mainly on
its internal accruals for its financial requirements PHILIPS continues to strengthen its financial
position by channelising these internal accruals to fund its expansion programmes
Working results PTL has registered a handsome and constant growth in its profits because
of a brisk demand for new and better technology electronic items None of the other electronic
company has shown such a steady growth Philips has recorded the lowest current ratio
However with this lowest current ratio PTL still enjoys moderate payment period and highest
velocity of creditors and debtors only due to commitment of itrsquos employees
72
SUMMARY
According to the 1999 Gallup Poll the four elements that have proven to be effective in creating
employee loyalty are praise and recognition a sense of contribution to the company learning and
development and having a best friend at work
Creating a fairy-tale work environment begins withrecognition Your employees need it more
than money perks or titles Here are eight tips regarding recognition Remember these and your
employees may just start whistling while they work It is up to me The corporate culture or
financial rewards will not make your team successful It is up to you Recognition is one thing
that is completely in your control
Strong relationships are vital in todays economy Strengthening employee relationships is even
more necessary as companies downsize and lay off As your workforce shrinks and you need to
do more with less keeping quality employees becomes even more critical As a manager it is
your job to bond your best people to your company through recognition And you also must help
direct and motivate your core performers
Simple rewards earn big returns There are some relatively simple things you can do that will
earn big returns For example remember your employees birthdays and work anniversaries find
out what inexpensive rewards they value (for example tickets to a ball game or a half day off to
spend time with their kids) make the most of your formal service awards with some preparation
and a group presentation walk around your department every day and talk to your
people and thank them sincerely and often
73
Make it specific Praise and recognition must be specific to have impact General praise such as
You do great work actually can have the opposite effect and leave your employees wondering
Does he have any idea what I really do around here Specific praise links individual
accomplishments to company goals For example Cheryl I noticed the way you handled that
customer complaint Great work As you know we value quick resolutions of problems as
one of our core strategies
Ask the best to stay Call your best people into your office one at a time Let that bright young
college graduate know you value his fresh ideas and energy Tell the 20-year veteran how much
your team relies on her expertise and organizational skillsRemarkably a significant percent of
high-impact performers report that they left their last job because No one ever asked me to
stay
Forget cash
Remember the saying Money cant buy everything Well its true Dont wait until you can
offer an employee a raise or promotion Real thanks is its own reward In numerous surveys of
work satisfaction top on employees lists is feeling appreciated In fact when employees feel
recognized and involved they are much less likely to keep asking about money
Recognize
Recognition means most to an employee when it is sincere and spontaneous According to the
largest study ever conducted on workplace satisfaction (Gallup 1999) recognition should occur
at least every seven days If you wait until a year-end party or an annual review you are waiting
much too long to recognize and you probably are losing people you do not need to
74
Recognition works
Neglect can be a poisoned apple Recognition is the elixir that will spark better attitudes and
performance Jeffrey Pfeffer of Stanford University says The returns from managing people in
ways that build high commitment typically are on the order of 30 to 50 percent
Take a hard look in the mirror and ask yourself how you can recognize the fairest of them all
Learn to recognize your employees for their efforts thank them often and reward their
achievements You can awaken them from their anger and apathy and they will fall in love with
their jobs again Chances are you will work together happily ever after
So there is direct relation with employee satisfaction and their commitment towards the
organization and it is also clear from the above discussion that only monetary elements are not
sufficient for employee satisfaction rather other element like employer behavior recognisation
and other moral value
75
RECOMMENDATIONS
PHILIPS should increase its capacity utilization It should work at full capacity to
minimize its cost of production With this increase in capacity utilization the total cost
will spread over more units thereby decreasing the per unit cost
PHILIPS should decrease the credit facilities provided to its consumers The payback
period is quite high in case of debtors as compared to creditors it should be more or less
equal as it will help in improving company liquidity
PHILIPS should focus more on the consumer lifestyle goods in India parallel to its other
business as it accounts very less as compare to other businesses of Philips
Another recommendation for Mohali plant is about the HR department that is they
should appoint permanent and skilled workers as against casual workers which generally add
up to the profit of the company
76
BIBLIOGRAPHY
1 Values-Based Leadership Rebuilding Employee Commitment Performance and Productivity ( Thomas D Kuczmarski)
2 Monthly Journals of Philips Electronics India Ltd
3 Authentic Leadership Medtronic CEO Bill George
4 wwwindiaphilipscom
5 wwwwikipediacom
6 httpwwwemployeecommitmentcom
7 One Foot Out The Door How to Combat The Psychological Recession Thatrsquos Alienating Employees And Hurting American Business Judith Bardwick
8 Employee Commitment A Leader Ship Guide Joe Folkman
9 Harvard University Factors that Impact Employee Well Being Commitment and Productivity -An Article
77
Questionnaire
Name __________________________________________________________
Age______________________________ Gender _______________________
Qualification _______________________ Contact No ___________________
Q1 In which department you are working
Electrical Production Mechanical Other
Q2 What is your working experience
gt2 Years 2-4 Years 4-6 Years lt 6 Years
Q3 How You like the physical Working Environment of the organization
Excellent Good Fair Poor Very Poor
Q4 Are you satisfied with Non-Monitory benefits provided by the organisation
Highly Satisfied Satisfied Neither Satisfied Nor dissatisfied
Highly Dissatisfied Dissatisfied
Q5 Are you satisfied with your work
Highly Satisfied Satisfied Neither Satisfied Nor dissatisfied
Highly Dissatisfied Dissatisfied
Q6 Are you satisfied with the career development programe of the company
Highly Satisfied Satisfied Neither Satisfied Nor dissatisfied
Highly Dissatisfied Dissatisfied
Q7 Is other staff of the organization is co-operative with you
Highly Satisfied Satisfied Neither Satisfied Nor dissatisfied
Highly Dissatisfied Dissatisfied
Q8 Are you satisfied with top level management
Highly Satisfied Satisfied Neither Satisfied Nor dissatisfied
Highly Dissatisfied Dissatisfied
78
Q9 Are you satisfied with your subordinates
Highly Satisfied Satisfied Neither Satisfied Nor dissatisfied
Highly Dissatisfied Dissatisfied
Q10 Are you satisfied with the nature of the Job
Highly Satisfied Satisfied Neither Satisfied Nor dissatisfied
Highly Dissatisfied Dissatisfied
Q11 Do you have any Job Pressure in work
Yes No
Q12 Do you satisfied with the opportunities provided by the organisation
Highly Satisfied Satisfied Neither Satisfied Nor dissatisfied
Highly Dissatisfied Dissatisfied
Q13 Are you satisfied with the welfare facilities provided by the organisation
Highly Satisfied Satisfied Neither Satisfied Nor dissatisfied
Highly Dissatisfied Dissatisfied
Q14 Are you satisfied towards your salary
Highly Satisfied Satisfied Neither Satisfied Nor dissatisfied
Highly Dissatisfied Dissatisfied
Q15 Are you committed towards the organisation
Yes No
Signature
57
Table 48 ndash To know the satisfaction of Respondents with top management
S
SI No
S
Satisfaction with Top
Management
N
No of Respondents
P
Percentage
1
1
H
Highly satisfied
2
26
2
26
2
2
S
Satisfied
5
51
5
51
3
3
N
Neither Satisfied nor Dissatisfied
1
17
1
17
4
4
D
Dissatisfied
0
06
0
06
5
5
H
Highly dissatisfied
0
00
0
00
Total 1
100
1
100
Source survey data
Inference
From the above table it shows that 51 of the employees were satisfied with the top management
FIGURE 48
58
REPRESENTS THE SATISFACTION OF RESPONDENTS WITH TOP MANAGEMENT
Table 49 ndash To know the satisfaction of Respondents with their subordinates
Source survey data
Inference
From the above table it shows that 67 of the employees were satisfied with their subordinates
S
SI
No
S
Satisfaction with Subordinates
N
No of Respondents
P
Percentage
1
1
H
Highly satisfied
1
12
1
12
2
2
S
Satisfied
6
67
6
67
2
3
N
Neither Satisfied nor Dissatisfied
1
14
1
14
4
D
Dissatisfied
0
07
0
07
5
5
H
Highly Dissatisfied
0
00
0
00
Total 1
100
1
100
59
FIGURE 49
REPRESENTS THE SATISFACTION OF RESPONDENTS WITH THEIR SUBORDINATES
60
Table 410 ndash To know the level of satisfaction regarding nature of job
S
SI No
J
Job Satisfaction
N
No of Respondents
P
Percentage
1
1
H
Highly satisfied
2
22
2
22
2
2
S
Satisfied
5
56
5
56
3
3
N
Neither Satisfied nor Dissatisfied
1
16
1
16
4
4
D
Dissatisfied
0
07
0
07
5
5
H
Highly Dissatisfied
0
00
0
00
Total 1
100
1
100
Source survey dataInference
From the above table it shows that 56 of the employees were satisfied with their job
FIGURE 410
61
REPRESENTS THE LEVEL OF SATISFACTION REGARDING THE NATURE OF JOB
Table 411 ndash To know whether there is any job pressure in their work
Source survey data
Inference
From the above table it shows that 72 of employees said there is job pressure in their work
FIGURE 411
REPRESENTS WHETHER THERE IS ANY JOB PRESSURE IN THEIR WORK
S
SI No
J
Job Pressure
N
No of Respondents
P
Percentage
1
1
Y
Yes
7
72
7
72
2
2
N
No
2
28
2
28
T
Total
1
100
1
100
62
Table 412 ndash To know the opinion regarding opportunity provided by the organisation in developing skills
amp talents
S
SI No
D
Development of Skills and
Talents
N
No of Respondents
P
Percentage
1
1
H
Highly Agree
1
12
1
12
2
2
A
Agree
5
52
5
52
3
3
N
Neither Agree nor Disagree
2
28
2
28
4
4
D
Disagree
0
06
0
06
5
5
H
Highly Disagree
0
02
0
02
Total 1
100
1
100
Source survey data
Inference
From the above table it shows that 52 of employees agreed regarding opportunity provided by the organisation in developing skills amp talents
63
FIRGURE 412
REPRESENTS THE OPPORTUNITY PROVIDED BY THE ORGANISATION IN DEVELOPING SKILLS amp TALENTS
64
Table 413 ndash To know the satisfaction level of welfare facilities provided by the management
S
SI No
W
Welfare Facilities
N
No of Respondents
P
Percentage
1
1
H
Highly satisfied
0
09
9
09
2
2
S
Satisfied
5
57
5
57
3
3
N
Neither Satisfied nor Dissatisfied
2
29
2
29
4
4
D
Dissatisfied
5
05
0
05
5
5
H
Highly Dissatisfied
0
00
0
00
Total 1
100
1
100
Source survey data
Inference
From the above table it shows that 57 of the employees were satisfied with the welfare facilities provided by the management
FIGURE 413
REPRESENTS THE SATISFACTION LEVEL OF WELFARE FACILITIES PROVIDED BY THE MANGEMENT
65
Table 414 ndash To know the employee satisfaction towards the salary
Source survey data
Inference
From the above table it shows that 67 of the employees were satisfied
with their salary
FIGURE 414
REPRESENTS THE SATISFACTION TOWARDS THE SALARY
S
SI No
P
Payment Satisfaction
N
No of Respondents
P
Percentage
1
1
Y
Yes
6
67
6
67
2
2
N
No
3
33
3
33
T
otal
1
100
1
100
66
Table 415 ndash To know the employees willingness amp Commitment Towards
Organisation
Source survey data
Inference
From the above table it shows that 59 of the employees were willing to
continue in this organisation
FIGURE 415
REPRESENTS THE EMPLOYEES WILLINGNESS TO CONTINUE
S
SI No
W
Willingness to Work
N
No of Respondents
P
Percentage
1
1
Y
Yes
5
59
5
59
2
2
N
No
4
41
4
41
T
Total
1
00
1
00
67
CHI-SQUARE METHOD
The chi square test is one of the simplest and most widely used non-
parametric tests in statistical work As a non-parametric test it can be used to determine
if categorical data shows dependency or the two classifications are independent It can
also be used to make comparisons between theoretical population and actual data
when categories are used
n
Chi square χsup2= sum (O-E) sup2 E
i =1
Where O= observed frequency
E= expected frequency
68
OBSERVED FREQUENCY
Table 419 shows the relationship between the department and the job satisfaction
Over All
Job
SatisfactionHighly
SatisfiedSatisfied
Neither
Satisfied nor
Dissatisfied
DissatisfiedHighly
Dissatisfied
Sub
Total
Mechanical 5 6 14 3 2 30
Electrical 6 8 6 3 2 25
Production 9 13 7 4 2 35
Others 2 3 2 2 1 10
Sub Total 22 30 29 12 7 100
69
EXPECTED FREQUENCY
Over All
Job
SatisfactionHighly
SatisfiedSatisfied
Neither
Satisfied nor
Dissatisfied
DissatisfiedHighly
Dissatisfied
Sub
Total
Mechanical 7 8 9 4 2 30
Electrical 5 8 7 3 2 25
Production 8 11 10 4 2 35
Others 2 3 3 1 1 10
Sub Total 22 30 29 12 7 100
Null Hypothesis (Ho)
There is no significant difference between the department and the job satisfaction
Alternative Hypothesis (Ho)
There is significant difference between the job satisfaction
Co Relation
70
Chapter-V
CONCLUSIONS AND
RECOMMENDATIONS
71
CONCLUSION
On the basis of Analysis of Job Satisfaction Level of the Employees of Philips Electronics India
Ltd Mohali made in the previous chapters following conclusions are drawn
General Profile The plant of PHILIPS is ideally located in the Mohali Industrial focal point
Phase 9 near Chandigarh the capital of Punjab on a campus of 17 hectares The working
environment of the company is very healthy The visitors feel happy after the campus
Indigenous Technology PHILIPS is the only lighting manufacturing company based on purely
indigenous technology Philips was appropriately chosen as the brand name as self reliance and
building up of Indian Engineering capabilities remain the guiding spirit of PHILIPS
Financial structure PHILIPS is a low debt company signifying its dependence mainly on
its internal accruals for its financial requirements PHILIPS continues to strengthen its financial
position by channelising these internal accruals to fund its expansion programmes
Working results PTL has registered a handsome and constant growth in its profits because
of a brisk demand for new and better technology electronic items None of the other electronic
company has shown such a steady growth Philips has recorded the lowest current ratio
However with this lowest current ratio PTL still enjoys moderate payment period and highest
velocity of creditors and debtors only due to commitment of itrsquos employees
72
SUMMARY
According to the 1999 Gallup Poll the four elements that have proven to be effective in creating
employee loyalty are praise and recognition a sense of contribution to the company learning and
development and having a best friend at work
Creating a fairy-tale work environment begins withrecognition Your employees need it more
than money perks or titles Here are eight tips regarding recognition Remember these and your
employees may just start whistling while they work It is up to me The corporate culture or
financial rewards will not make your team successful It is up to you Recognition is one thing
that is completely in your control
Strong relationships are vital in todays economy Strengthening employee relationships is even
more necessary as companies downsize and lay off As your workforce shrinks and you need to
do more with less keeping quality employees becomes even more critical As a manager it is
your job to bond your best people to your company through recognition And you also must help
direct and motivate your core performers
Simple rewards earn big returns There are some relatively simple things you can do that will
earn big returns For example remember your employees birthdays and work anniversaries find
out what inexpensive rewards they value (for example tickets to a ball game or a half day off to
spend time with their kids) make the most of your formal service awards with some preparation
and a group presentation walk around your department every day and talk to your
people and thank them sincerely and often
73
Make it specific Praise and recognition must be specific to have impact General praise such as
You do great work actually can have the opposite effect and leave your employees wondering
Does he have any idea what I really do around here Specific praise links individual
accomplishments to company goals For example Cheryl I noticed the way you handled that
customer complaint Great work As you know we value quick resolutions of problems as
one of our core strategies
Ask the best to stay Call your best people into your office one at a time Let that bright young
college graduate know you value his fresh ideas and energy Tell the 20-year veteran how much
your team relies on her expertise and organizational skillsRemarkably a significant percent of
high-impact performers report that they left their last job because No one ever asked me to
stay
Forget cash
Remember the saying Money cant buy everything Well its true Dont wait until you can
offer an employee a raise or promotion Real thanks is its own reward In numerous surveys of
work satisfaction top on employees lists is feeling appreciated In fact when employees feel
recognized and involved they are much less likely to keep asking about money
Recognize
Recognition means most to an employee when it is sincere and spontaneous According to the
largest study ever conducted on workplace satisfaction (Gallup 1999) recognition should occur
at least every seven days If you wait until a year-end party or an annual review you are waiting
much too long to recognize and you probably are losing people you do not need to
74
Recognition works
Neglect can be a poisoned apple Recognition is the elixir that will spark better attitudes and
performance Jeffrey Pfeffer of Stanford University says The returns from managing people in
ways that build high commitment typically are on the order of 30 to 50 percent
Take a hard look in the mirror and ask yourself how you can recognize the fairest of them all
Learn to recognize your employees for their efforts thank them often and reward their
achievements You can awaken them from their anger and apathy and they will fall in love with
their jobs again Chances are you will work together happily ever after
So there is direct relation with employee satisfaction and their commitment towards the
organization and it is also clear from the above discussion that only monetary elements are not
sufficient for employee satisfaction rather other element like employer behavior recognisation
and other moral value
75
RECOMMENDATIONS
PHILIPS should increase its capacity utilization It should work at full capacity to
minimize its cost of production With this increase in capacity utilization the total cost
will spread over more units thereby decreasing the per unit cost
PHILIPS should decrease the credit facilities provided to its consumers The payback
period is quite high in case of debtors as compared to creditors it should be more or less
equal as it will help in improving company liquidity
PHILIPS should focus more on the consumer lifestyle goods in India parallel to its other
business as it accounts very less as compare to other businesses of Philips
Another recommendation for Mohali plant is about the HR department that is they
should appoint permanent and skilled workers as against casual workers which generally add
up to the profit of the company
76
BIBLIOGRAPHY
1 Values-Based Leadership Rebuilding Employee Commitment Performance and Productivity ( Thomas D Kuczmarski)
2 Monthly Journals of Philips Electronics India Ltd
3 Authentic Leadership Medtronic CEO Bill George
4 wwwindiaphilipscom
5 wwwwikipediacom
6 httpwwwemployeecommitmentcom
7 One Foot Out The Door How to Combat The Psychological Recession Thatrsquos Alienating Employees And Hurting American Business Judith Bardwick
8 Employee Commitment A Leader Ship Guide Joe Folkman
9 Harvard University Factors that Impact Employee Well Being Commitment and Productivity -An Article
77
Questionnaire
Name __________________________________________________________
Age______________________________ Gender _______________________
Qualification _______________________ Contact No ___________________
Q1 In which department you are working
Electrical Production Mechanical Other
Q2 What is your working experience
gt2 Years 2-4 Years 4-6 Years lt 6 Years
Q3 How You like the physical Working Environment of the organization
Excellent Good Fair Poor Very Poor
Q4 Are you satisfied with Non-Monitory benefits provided by the organisation
Highly Satisfied Satisfied Neither Satisfied Nor dissatisfied
Highly Dissatisfied Dissatisfied
Q5 Are you satisfied with your work
Highly Satisfied Satisfied Neither Satisfied Nor dissatisfied
Highly Dissatisfied Dissatisfied
Q6 Are you satisfied with the career development programe of the company
Highly Satisfied Satisfied Neither Satisfied Nor dissatisfied
Highly Dissatisfied Dissatisfied
Q7 Is other staff of the organization is co-operative with you
Highly Satisfied Satisfied Neither Satisfied Nor dissatisfied
Highly Dissatisfied Dissatisfied
Q8 Are you satisfied with top level management
Highly Satisfied Satisfied Neither Satisfied Nor dissatisfied
Highly Dissatisfied Dissatisfied
78
Q9 Are you satisfied with your subordinates
Highly Satisfied Satisfied Neither Satisfied Nor dissatisfied
Highly Dissatisfied Dissatisfied
Q10 Are you satisfied with the nature of the Job
Highly Satisfied Satisfied Neither Satisfied Nor dissatisfied
Highly Dissatisfied Dissatisfied
Q11 Do you have any Job Pressure in work
Yes No
Q12 Do you satisfied with the opportunities provided by the organisation
Highly Satisfied Satisfied Neither Satisfied Nor dissatisfied
Highly Dissatisfied Dissatisfied
Q13 Are you satisfied with the welfare facilities provided by the organisation
Highly Satisfied Satisfied Neither Satisfied Nor dissatisfied
Highly Dissatisfied Dissatisfied
Q14 Are you satisfied towards your salary
Highly Satisfied Satisfied Neither Satisfied Nor dissatisfied
Highly Dissatisfied Dissatisfied
Q15 Are you committed towards the organisation
Yes No
Signature

59
FIGURE 49
REPRESENTS THE SATISFACTION OF RESPONDENTS WITH THEIR SUBORDINATES
60
Table 410 ndash To know the level of satisfaction regarding nature of job
S
SI No
J
Job Satisfaction
N
No of Respondents
P
Percentage
1
1
H
Highly satisfied
2
22
2
22
2
2
S
Satisfied
5
56
5
56
3
3
N
Neither Satisfied nor Dissatisfied
1
16
1
16
4
4
D
Dissatisfied
0
07
0
07
5
5
H
Highly Dissatisfied
0
00
0
00
Total 1
100
1
100
Source survey dataInference
From the above table it shows that 56 of the employees were satisfied with their job
FIGURE 410
61
REPRESENTS THE LEVEL OF SATISFACTION REGARDING THE NATURE OF JOB
Table 411 ndash To know whether there is any job pressure in their work
Source survey data
Inference
From the above table it shows that 72 of employees said there is job pressure in their work
FIGURE 411
REPRESENTS WHETHER THERE IS ANY JOB PRESSURE IN THEIR WORK
S
SI No
J
Job Pressure
N
No of Respondents
P
Percentage
1
1
Y
Yes
7
72
7
72
2
2
N
No
2
28
2
28
T
Total
1
100
1
100
62
Table 412 ndash To know the opinion regarding opportunity provided by the organisation in developing skills
amp talents
S
SI No
D
Development of Skills and
Talents
N
No of Respondents
P
Percentage
1
1
H
Highly Agree
1
12
1
12
2
2
A
Agree
5
52
5
52
3
3
N
Neither Agree nor Disagree
2
28
2
28
4
4
D
Disagree
0
06
0
06
5
5
H
Highly Disagree
0
02
0
02
Total 1
100
1
100
Source survey data
Inference
From the above table it shows that 52 of employees agreed regarding opportunity provided by the organisation in developing skills amp talents
63
FIRGURE 412
REPRESENTS THE OPPORTUNITY PROVIDED BY THE ORGANISATION IN DEVELOPING SKILLS amp TALENTS
64
Table 413 ndash To know the satisfaction level of welfare facilities provided by the management
S
SI No
W
Welfare Facilities
N
No of Respondents
P
Percentage
1
1
H
Highly satisfied
0
09
9
09
2
2
S
Satisfied
5
57
5
57
3
3
N
Neither Satisfied nor Dissatisfied
2
29
2
29
4
4
D
Dissatisfied
5
05
0
05
5
5
H
Highly Dissatisfied
0
00
0
00
Total 1
100
1
100
Source survey data
Inference
From the above table it shows that 57 of the employees were satisfied with the welfare facilities provided by the management
FIGURE 413
REPRESENTS THE SATISFACTION LEVEL OF WELFARE FACILITIES PROVIDED BY THE MANGEMENT
65
Table 414 ndash To know the employee satisfaction towards the salary
Source survey data
Inference
From the above table it shows that 67 of the employees were satisfied
with their salary
FIGURE 414
REPRESENTS THE SATISFACTION TOWARDS THE SALARY
S
SI No
P
Payment Satisfaction
N
No of Respondents
P
Percentage
1
1
Y
Yes
6
67
6
67
2
2
N
No
3
33
3
33
T
otal
1
100
1
100
66
Table 415 ndash To know the employees willingness amp Commitment Towards
Organisation
Source survey data
Inference
From the above table it shows that 59 of the employees were willing to
continue in this organisation
FIGURE 415
REPRESENTS THE EMPLOYEES WILLINGNESS TO CONTINUE
S
SI No
W
Willingness to Work
N
No of Respondents
P
Percentage
1
1
Y
Yes
5
59
5
59
2
2
N
No
4
41
4
41
T
Total
1
00
1
00
67
CHI-SQUARE METHOD
The chi square test is one of the simplest and most widely used non-
parametric tests in statistical work As a non-parametric test it can be used to determine
if categorical data shows dependency or the two classifications are independent It can
also be used to make comparisons between theoretical population and actual data
when categories are used
n
Chi square χsup2= sum (O-E) sup2 E
i =1
Where O= observed frequency
E= expected frequency
68
OBSERVED FREQUENCY
Table 419 shows the relationship between the department and the job satisfaction
Over All
Job
SatisfactionHighly
SatisfiedSatisfied
Neither
Satisfied nor
Dissatisfied
DissatisfiedHighly
Dissatisfied
Sub
Total
Mechanical 5 6 14 3 2 30
Electrical 6 8 6 3 2 25
Production 9 13 7 4 2 35
Others 2 3 2 2 1 10
Sub Total 22 30 29 12 7 100
69
EXPECTED FREQUENCY
Over All
Job
SatisfactionHighly
SatisfiedSatisfied
Neither
Satisfied nor
Dissatisfied
DissatisfiedHighly
Dissatisfied
Sub
Total
Mechanical 7 8 9 4 2 30
Electrical 5 8 7 3 2 25
Production 8 11 10 4 2 35
Others 2 3 3 1 1 10
Sub Total 22 30 29 12 7 100
Null Hypothesis (Ho)
There is no significant difference between the department and the job satisfaction
Alternative Hypothesis (Ho)
There is significant difference between the job satisfaction
Co Relation
70
Chapter-V
CONCLUSIONS AND
RECOMMENDATIONS
71
CONCLUSION
On the basis of Analysis of Job Satisfaction Level of the Employees of Philips Electronics India
Ltd Mohali made in the previous chapters following conclusions are drawn
General Profile The plant of PHILIPS is ideally located in the Mohali Industrial focal point
Phase 9 near Chandigarh the capital of Punjab on a campus of 17 hectares The working
environment of the company is very healthy The visitors feel happy after the campus
Indigenous Technology PHILIPS is the only lighting manufacturing company based on purely
indigenous technology Philips was appropriately chosen as the brand name as self reliance and
building up of Indian Engineering capabilities remain the guiding spirit of PHILIPS
Financial structure PHILIPS is a low debt company signifying its dependence mainly on
its internal accruals for its financial requirements PHILIPS continues to strengthen its financial
position by channelising these internal accruals to fund its expansion programmes
Working results PTL has registered a handsome and constant growth in its profits because
of a brisk demand for new and better technology electronic items None of the other electronic
company has shown such a steady growth Philips has recorded the lowest current ratio
However with this lowest current ratio PTL still enjoys moderate payment period and highest
velocity of creditors and debtors only due to commitment of itrsquos employees
72
SUMMARY
According to the 1999 Gallup Poll the four elements that have proven to be effective in creating
employee loyalty are praise and recognition a sense of contribution to the company learning and
development and having a best friend at work
Creating a fairy-tale work environment begins withrecognition Your employees need it more
than money perks or titles Here are eight tips regarding recognition Remember these and your
employees may just start whistling while they work It is up to me The corporate culture or
financial rewards will not make your team successful It is up to you Recognition is one thing
that is completely in your control
Strong relationships are vital in todays economy Strengthening employee relationships is even
more necessary as companies downsize and lay off As your workforce shrinks and you need to
do more with less keeping quality employees becomes even more critical As a manager it is
your job to bond your best people to your company through recognition And you also must help
direct and motivate your core performers
Simple rewards earn big returns There are some relatively simple things you can do that will
earn big returns For example remember your employees birthdays and work anniversaries find
out what inexpensive rewards they value (for example tickets to a ball game or a half day off to
spend time with their kids) make the most of your formal service awards with some preparation
and a group presentation walk around your department every day and talk to your
people and thank them sincerely and often
73
Make it specific Praise and recognition must be specific to have impact General praise such as
You do great work actually can have the opposite effect and leave your employees wondering
Does he have any idea what I really do around here Specific praise links individual
accomplishments to company goals For example Cheryl I noticed the way you handled that
customer complaint Great work As you know we value quick resolutions of problems as
one of our core strategies
Ask the best to stay Call your best people into your office one at a time Let that bright young
college graduate know you value his fresh ideas and energy Tell the 20-year veteran how much
your team relies on her expertise and organizational skillsRemarkably a significant percent of
high-impact performers report that they left their last job because No one ever asked me to
stay
Forget cash
Remember the saying Money cant buy everything Well its true Dont wait until you can
offer an employee a raise or promotion Real thanks is its own reward In numerous surveys of
work satisfaction top on employees lists is feeling appreciated In fact when employees feel
recognized and involved they are much less likely to keep asking about money
Recognize
Recognition means most to an employee when it is sincere and spontaneous According to the
largest study ever conducted on workplace satisfaction (Gallup 1999) recognition should occur
at least every seven days If you wait until a year-end party or an annual review you are waiting
much too long to recognize and you probably are losing people you do not need to
74
Recognition works
Neglect can be a poisoned apple Recognition is the elixir that will spark better attitudes and
performance Jeffrey Pfeffer of Stanford University says The returns from managing people in
ways that build high commitment typically are on the order of 30 to 50 percent
Take a hard look in the mirror and ask yourself how you can recognize the fairest of them all
Learn to recognize your employees for their efforts thank them often and reward their
achievements You can awaken them from their anger and apathy and they will fall in love with
their jobs again Chances are you will work together happily ever after
So there is direct relation with employee satisfaction and their commitment towards the
organization and it is also clear from the above discussion that only monetary elements are not
sufficient for employee satisfaction rather other element like employer behavior recognisation
and other moral value
75
RECOMMENDATIONS
PHILIPS should increase its capacity utilization It should work at full capacity to
minimize its cost of production With this increase in capacity utilization the total cost
will spread over more units thereby decreasing the per unit cost
PHILIPS should decrease the credit facilities provided to its consumers The payback
period is quite high in case of debtors as compared to creditors it should be more or less
equal as it will help in improving company liquidity
PHILIPS should focus more on the consumer lifestyle goods in India parallel to its other
business as it accounts very less as compare to other businesses of Philips
Another recommendation for Mohali plant is about the HR department that is they
should appoint permanent and skilled workers as against casual workers which generally add
up to the profit of the company
76
BIBLIOGRAPHY
1 Values-Based Leadership Rebuilding Employee Commitment Performance and Productivity ( Thomas D Kuczmarski)
2 Monthly Journals of Philips Electronics India Ltd
3 Authentic Leadership Medtronic CEO Bill George
4 wwwindiaphilipscom
5 wwwwikipediacom
6 httpwwwemployeecommitmentcom
7 One Foot Out The Door How to Combat The Psychological Recession Thatrsquos Alienating Employees And Hurting American Business Judith Bardwick
8 Employee Commitment A Leader Ship Guide Joe Folkman
9 Harvard University Factors that Impact Employee Well Being Commitment and Productivity -An Article
77
Questionnaire
Name __________________________________________________________
Age______________________________ Gender _______________________
Qualification _______________________ Contact No ___________________
Q1 In which department you are working
Electrical Production Mechanical Other
Q2 What is your working experience
gt2 Years 2-4 Years 4-6 Years lt 6 Years
Q3 How You like the physical Working Environment of the organization
Excellent Good Fair Poor Very Poor
Q4 Are you satisfied with Non-Monitory benefits provided by the organisation
Highly Satisfied Satisfied Neither Satisfied Nor dissatisfied
Highly Dissatisfied Dissatisfied
Q5 Are you satisfied with your work
Highly Satisfied Satisfied Neither Satisfied Nor dissatisfied
Highly Dissatisfied Dissatisfied
Q6 Are you satisfied with the career development programe of the company
Highly Satisfied Satisfied Neither Satisfied Nor dissatisfied
Highly Dissatisfied Dissatisfied
Q7 Is other staff of the organization is co-operative with you
Highly Satisfied Satisfied Neither Satisfied Nor dissatisfied
Highly Dissatisfied Dissatisfied
Q8 Are you satisfied with top level management
Highly Satisfied Satisfied Neither Satisfied Nor dissatisfied
Highly Dissatisfied Dissatisfied
78
Q9 Are you satisfied with your subordinates
Highly Satisfied Satisfied Neither Satisfied Nor dissatisfied
Highly Dissatisfied Dissatisfied
Q10 Are you satisfied with the nature of the Job
Highly Satisfied Satisfied Neither Satisfied Nor dissatisfied
Highly Dissatisfied Dissatisfied
Q11 Do you have any Job Pressure in work
Yes No
Q12 Do you satisfied with the opportunities provided by the organisation
Highly Satisfied Satisfied Neither Satisfied Nor dissatisfied
Highly Dissatisfied Dissatisfied
Q13 Are you satisfied with the welfare facilities provided by the organisation
Highly Satisfied Satisfied Neither Satisfied Nor dissatisfied
Highly Dissatisfied Dissatisfied
Q14 Are you satisfied towards your salary
Highly Satisfied Satisfied Neither Satisfied Nor dissatisfied
Highly Dissatisfied Dissatisfied
Q15 Are you committed towards the organisation
Yes No
Signature
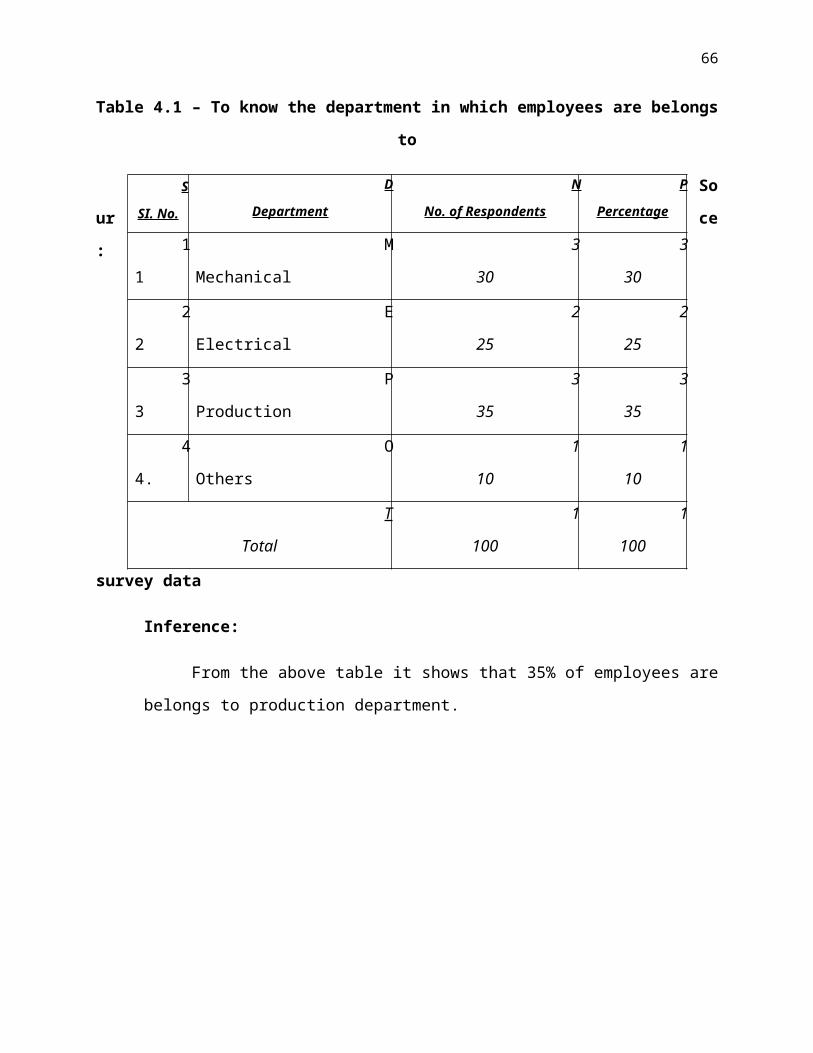
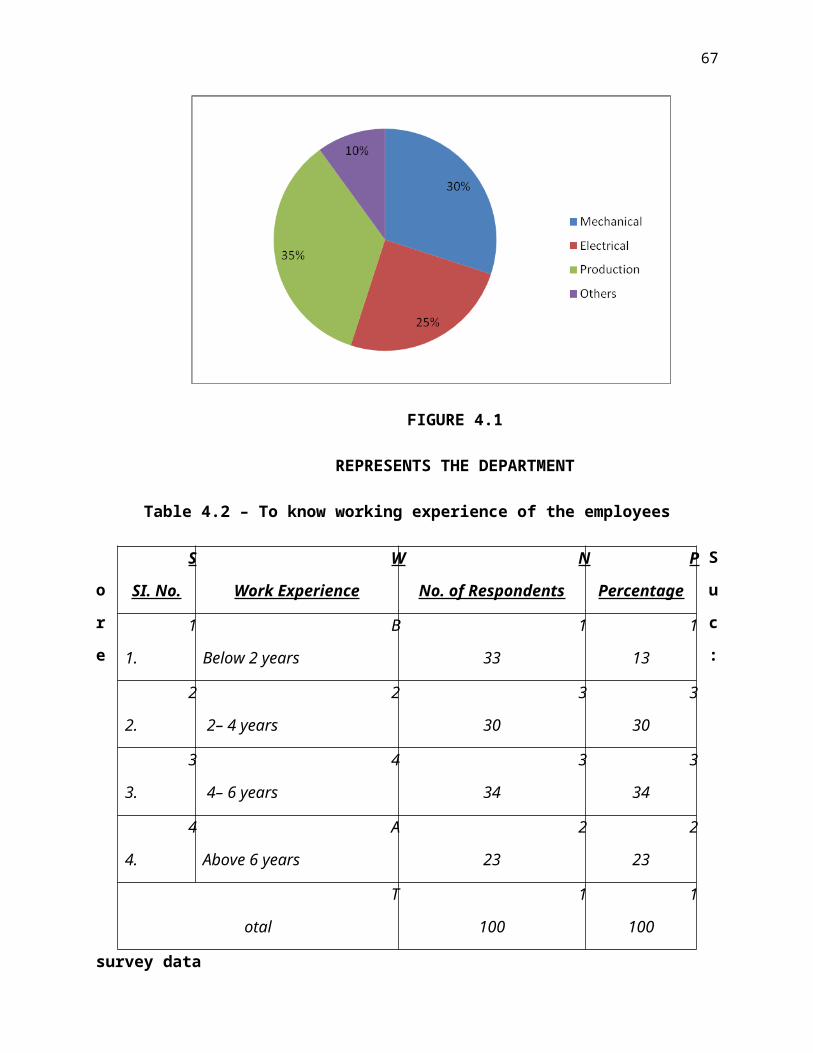
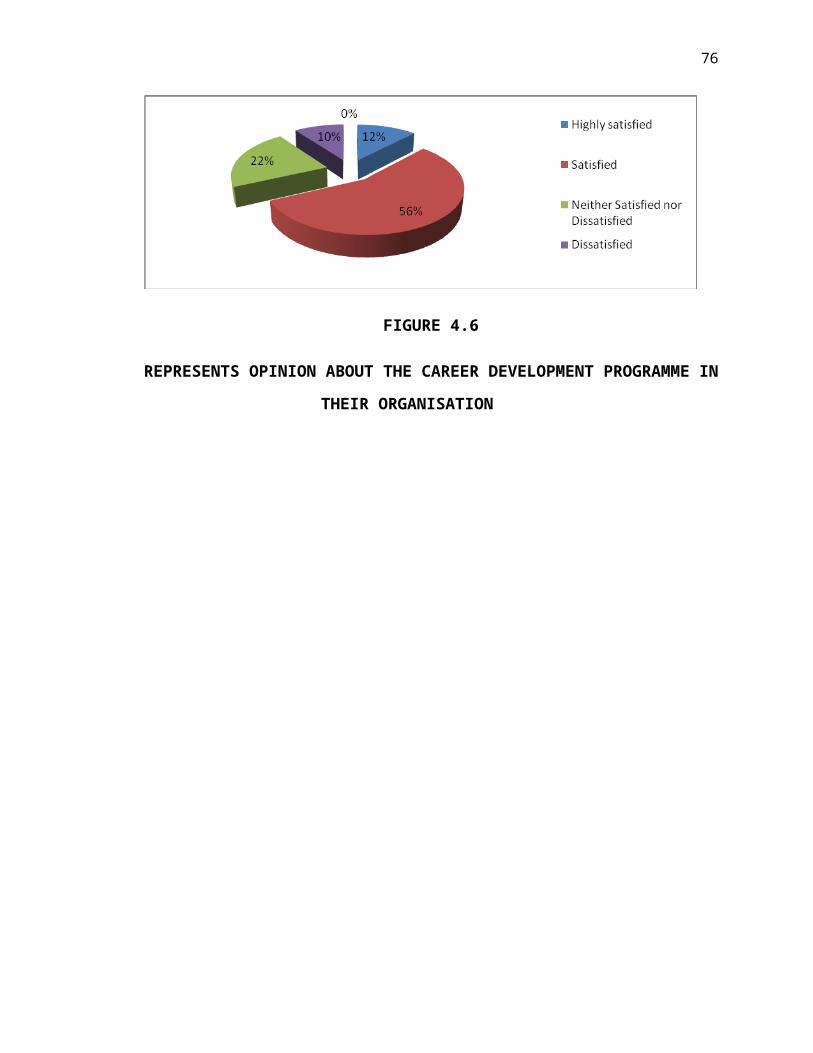
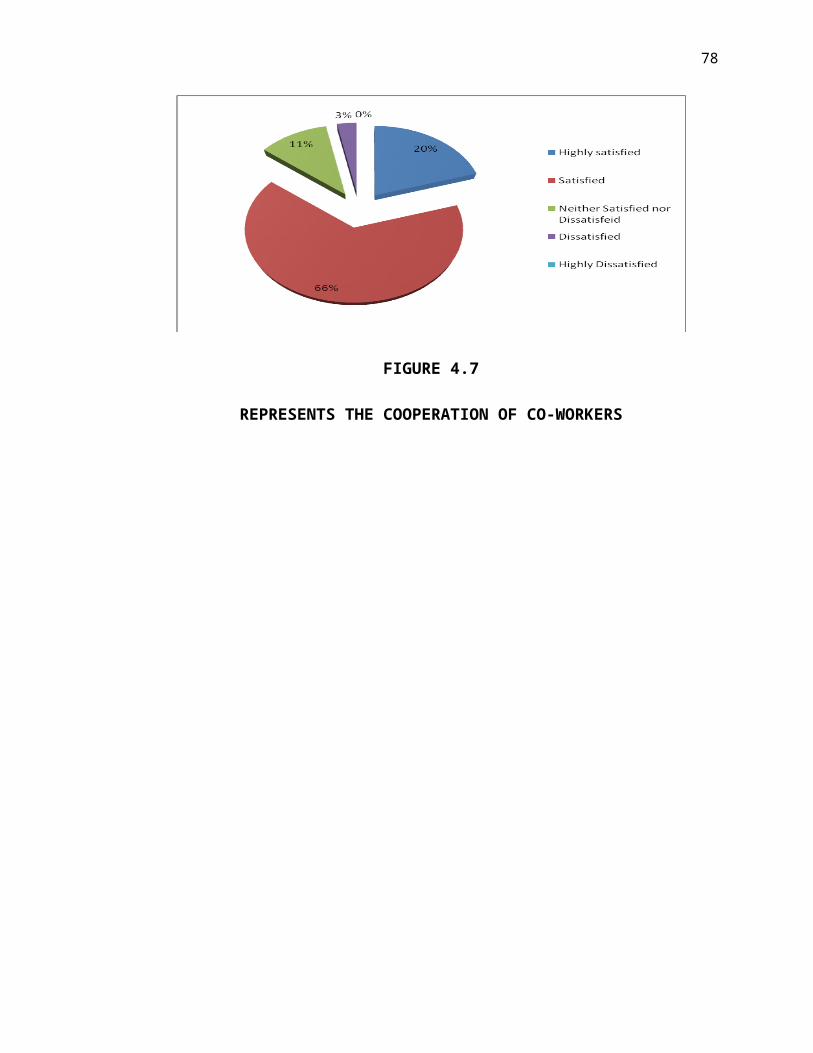