Embed Size (px)
Citation preview
San Jose State University San Jose State University
SJSU ScholarWorks SJSU ScholarWorks
Master's Projects Master's Theses and Graduate Research
2008
Employee Performance Assessment in Quality Assurance Employee Performance Assessment in Quality Assurance
Rahul Jain San Jose State University
Follow this and additional works at: https://scholarworks.sjsu.edu/etd_projects
Part of the Human Resources Management Commons
Recommended Citation Recommended Citation Jain, Rahul, "Employee Performance Assessment in Quality Assurance" (2008). Master's Projects. 84. DOI: https://doi.org/10.31979/etd.zf9z-sxu7 https://scholarworks.sjsu.edu/etd_projects/84
This Master's Project is brought to you for free and open access by the Master's Theses and Graduate Research at SJSU ScholarWorks. It has been accepted for inclusion in Master's Projects by an authorized administrator of SJSU ScholarWorks. For more information, please contact [email protected].
i
EMPLOYEE PERFORMANCE ASSESSMENT IN
QUALITY ASSURANCE using Analytical Hierarchy Process
A Project Report
Presented to
The Faculty of the Department of Computer Science
San Jose State University
In Partial Fulfillment
Of the Requirements for the Degree
Master of Computer Science
By
Rahul Jain
Dec 2008

ii
© 2008 Rahul Jain
ALL RIGHTS RESERVED
iii
Approved by: Department of Computer Science College of Science San José State University San José, CA
_____________________________________________________________
Dr. Robert Chun
_____________________________________________________________ Dr. Mark Stamp
_____________________________________________________________ Mr. Rohit Bhatia
iv
ACKNOWLEDGEMENTS
I would like to thank my project advisor, Dr. Robert Chun, for giving me an opportunity to work
under him, and his valuable support and advice throughout the project. I would also like to thank
Dr. Mark Stamp and Mr. Rohit Bhatia for being on my committee and showing faith in my work.
I also thank them for their valuable feedback and suggestions.
v
ABSTRACT
EMPLOYEE PERFORMANCE ASSESSMENT IN QUALITY ASSURANCE
By Rahul Jain
Employee performance often determines the progress of a company. Poor appraisals and
improper assessment directly effects employee satisfaction and impair company results. Many
managers rely primarily on behavioral impressions without appropriately including factual
information of the actual work done. There is clear benefit from procedures that elicit and use
both factual and subjective criteria for assessment. Analytical Hierarchy Process (AHP) is a
methodology that can be applied to complex decisions with multiple criteria [29]. AHP has the
capability to combine both subjective and objective evaluation factors, thereby minimizing bias
in decision making [29]. The methodology also allows subjective measures from both managers
and peers of a worker to be included.
This project proposes a unique application of AHP for the calculation of employee
performance by a quality assurance department. My implementation of the methodology shows
how subjective evaluation by both managers and peers and factual data can be combined to
better optimize performance appraisal results. The results of an AHP application can be
presented to the manager in graphical format to facilitate comprehension and interpretation. My
application of AHP improves upon all the current products in the market for performance
appraisal through the methodology to include both multi source subjective and factual data.
.
vi
TABLE OF CONTENTS
1. INTRODUCTION…………………………………………………………………………….1
2. EMPLOYEE PERFORMANCE……………………………………………………………..3
2.1 What is the need for optimal assessment? ………………………………………………3
2.2 Performance management methodology………………………………………………...3
3. AHP…………………………………………………………………………………………….5
3.1 History...……………………………………………………………………………………5
3.2 What is AHP?..………………………………………………………………...…………..5
4. HOW IT IS DONE TODAY………………………………………………………………….8
5. RELATED LITERATURE……………………………………………………………….....10
5.1 Literature studied………………………………………………………………..………10
5.2 Related literature evaluation conclusion…………………………………………….....15
6. RELATED COMMERCIAL SOFTWARE..………………………………………………16
6.1 List of software …………………………………………………………………………..16
6.2 Software evaluation conclusion…………………………………………………………20
7. PROJECT DETAILS……………………………………………………………………..…22
7.1 Overview …………………………………………………………………………………22
7.2 System Requirements……………………………………………………………………23
7.3 Software used…………………………………………………………………………….23
7.3.1 Defect Manager…………………………………………………………………...24
7.3.2 Visual Basic.NET………………………………………………………………....25
7.3.3 Microsoft SQL Server 2005………………………………………………………26
vii
8. IMPLEMENTATION DETAILS…………………………………………………………..27
8.1 Front-end design…………………………………………………………………………27
8.2 Back-end design………………………………………………………………………….33
8.3 Data Flow Diagram………………………………………………………………………36
9. AHP CALCULATIONS……………………………………………………………………..37
9.1 Subjective: Manager Ratings……………………………………………………………37
9.2 Factual Data Ratings…………………………………………………………………….40
9.3 Subjective: Peer Ratings…………………………………………………………………42
10. RESULTS..………………………………………………………………………………….46 10.1 Subjective Managerial Output.………………………………………………………..46
10.2 Factual Output…………………………..……………………………………….……..47
10.3 Subjective Peer to Peer Output………..……….……………………………………...48
10.4 Final Performance Report…………………..…………………………………………49
11. CONCLUSION……………………………………………………………………………..51
12. FUTURE WORK ……………………………………………………………………….….52
REFERENCES………………………………………………………………………………....53
APPENDIX A – Tables and Figures……………………………………………………….….56
PS: CD attached for Source Code
viii
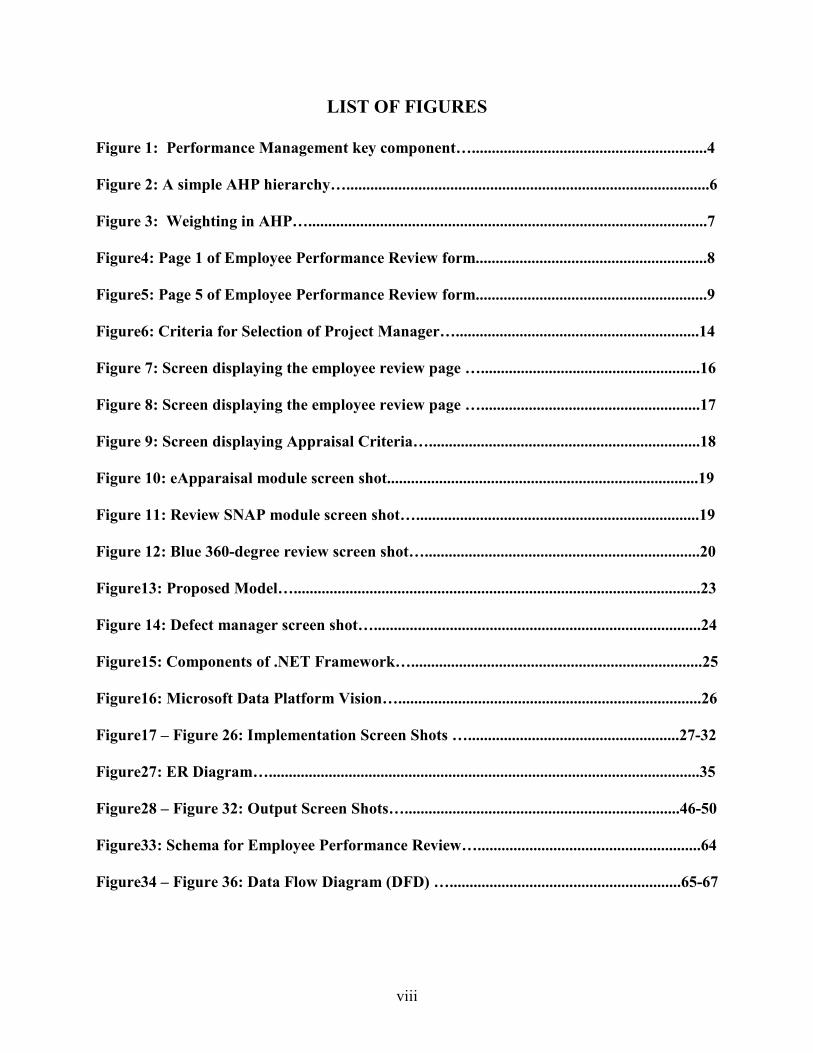
LIST OF FIGURES
Figure 1: Performance Management key component…...........................................................4
Figure 2: A simple AHP hierarchy…...........................................................................................6
Figure 3: Weighting in AHP…....................................................................................................7
Figure4: Page 1 of Employee Performance Review form..........................................................8
Figure5: Page 5 of Employee Performance Review form..........................................................9
Figure6: Criteria for Selection of Project Manager….............................................................14
Figure 7: Screen displaying the employee review page ….......................................................16
Figure 8: Screen displaying the employee review page ….......................................................17
Figure 9: Screen displaying Appraisal Criteria…....................................................................18
Figure 10: eApparaisal module screen shot..............................................................................19
Figure 11: Review SNAP module screen shot….......................................................................19
Figure 12: Blue 360-degree review screen shot….....................................................................20
Figure13: Proposed Model…......................................................................................................23
Figure 14: Defect manager screen shot…..................................................................................24
Figure15: Components of .NET Framework….........................................................................25
Figure16: Microsoft Data Platform Vision…............................................................................26
Figure17 – Figure 26: Implementation Screen Shots ….....................................................27-32
Figure27: ER Diagram…............................................................................................................35
Figure28 – Figure 32: Output Screen Shots….....................................................................46-50
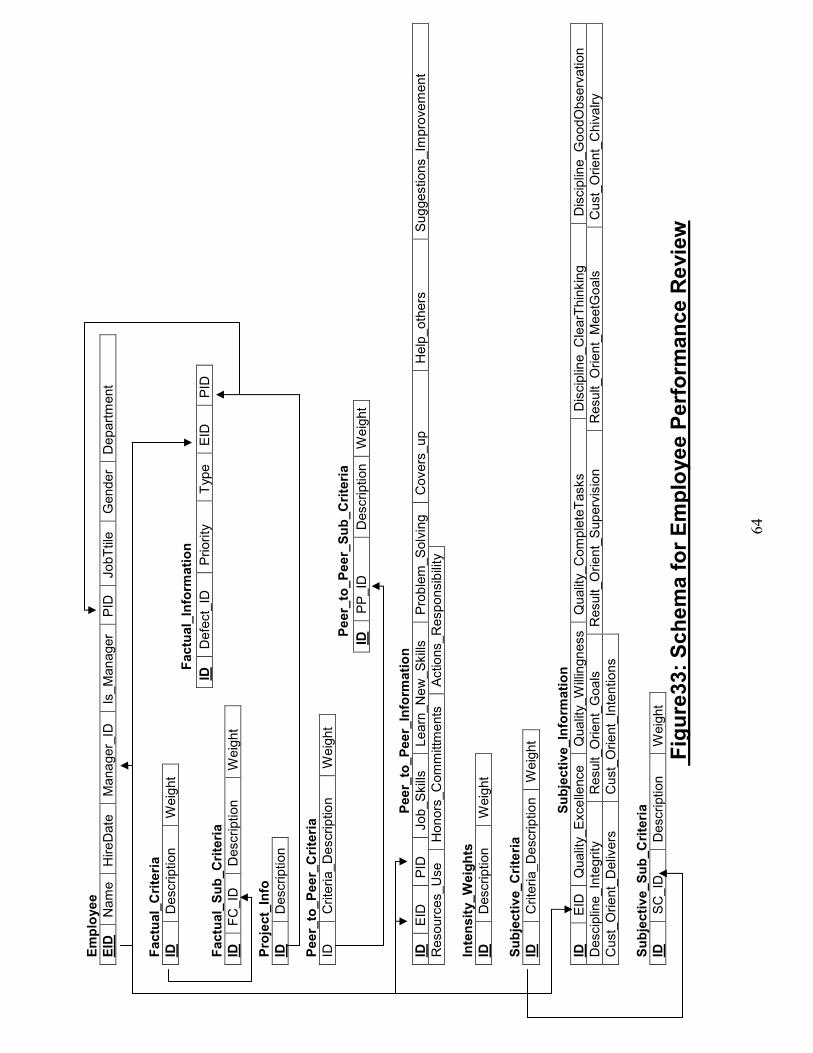
Figure33: Schema for Employee Performance Review…........................................................64
Figure34 – Figure 36: Data Flow Diagram (DFD) …..........................................................65-67
ix
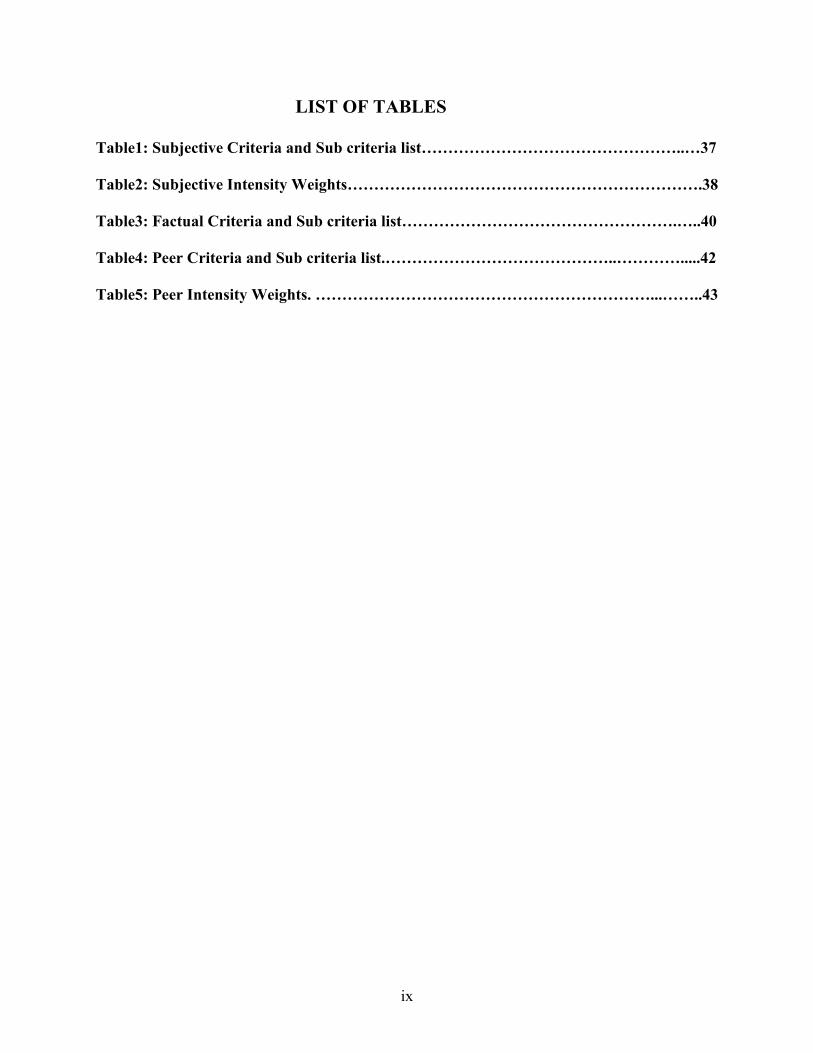
LIST OF TABLES
Table1: Subjective Criteria and Sub criteria list…………………………………………..…37
Table2: Subjective Intensity Weights………………………………………………………….38
Table3: Factual Criteria and Sub criteria list…………………………………………….…..40
Table4: Peer Criteria and Sub criteria list.……………………………………..………….....42
Table5: Peer Intensity Weights. ………………………………………………………...……..43
1
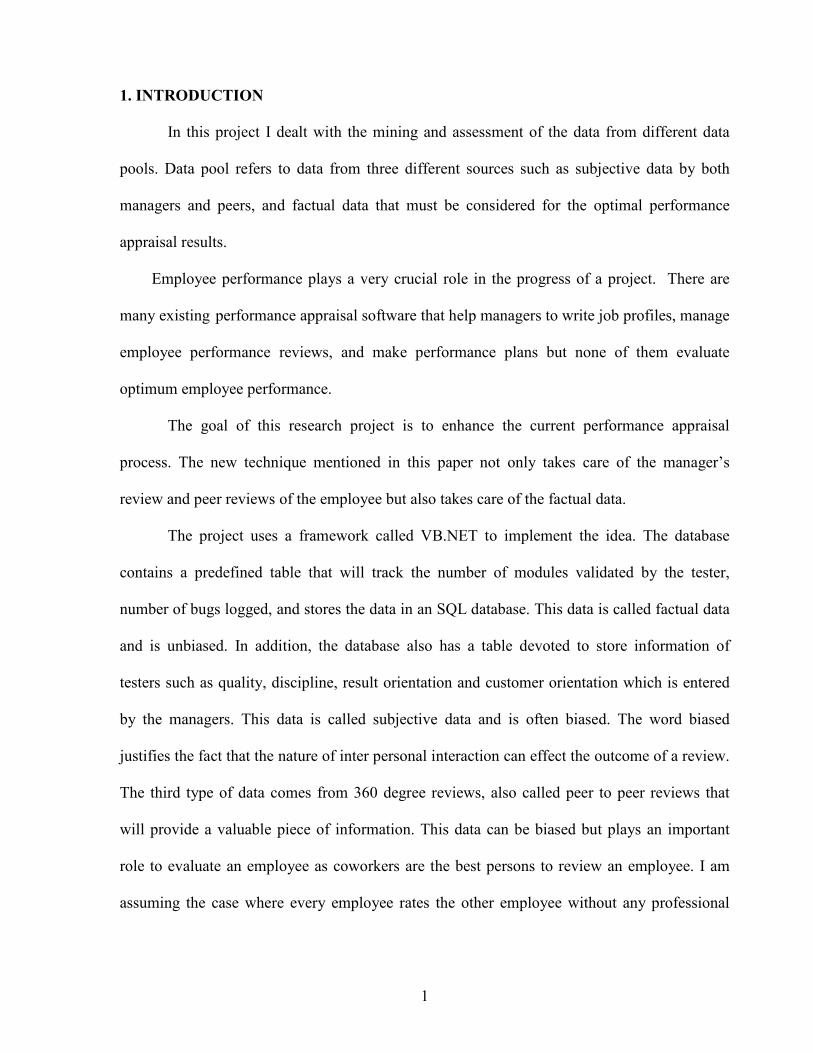
1. INTRODUCTION
In this project I dealt with the mining and assessment of the data from different data
pools. Data pool refers to data from three different sources such as subjective data by both
managers and peers, and factual data that must be considered for the optimal performance
appraisal results.
Employee performance plays a very crucial role in the progress of a project. There are
many existing performance appraisal software that help managers to write job profiles, manage
employee performance reviews, and make performance plans but none of them evaluate
optimum employee performance.
The goal of this research project is to enhance the current performance appraisal
process. The new technique mentioned in this paper not only takes care of the manager’s
review and peer reviews of the employee but also takes care of the factual data.
The project uses a framework called VB.NET to implement the idea. The database
contains a predefined table that will track the number of modules validated by the tester,
number of bugs logged, and stores the data in an SQL database. This data is called factual data
and is unbiased. In addition, the database also has a table devoted to store information of
testers such as quality, discipline, result orientation and customer orientation which is entered
by the managers. This data is called subjective data and is often biased. The word biased
justifies the fact that the nature of inter personal interaction can effect the outcome of a review.
The third type of data comes from 360 degree reviews, also called peer to peer reviews that
will provide a valuable piece of information. This data can be biased but plays an important
role to evaluate an employee as coworkers are the best persons to review an employee. I am
assuming the case where every employee rates the other employee without any professional
2
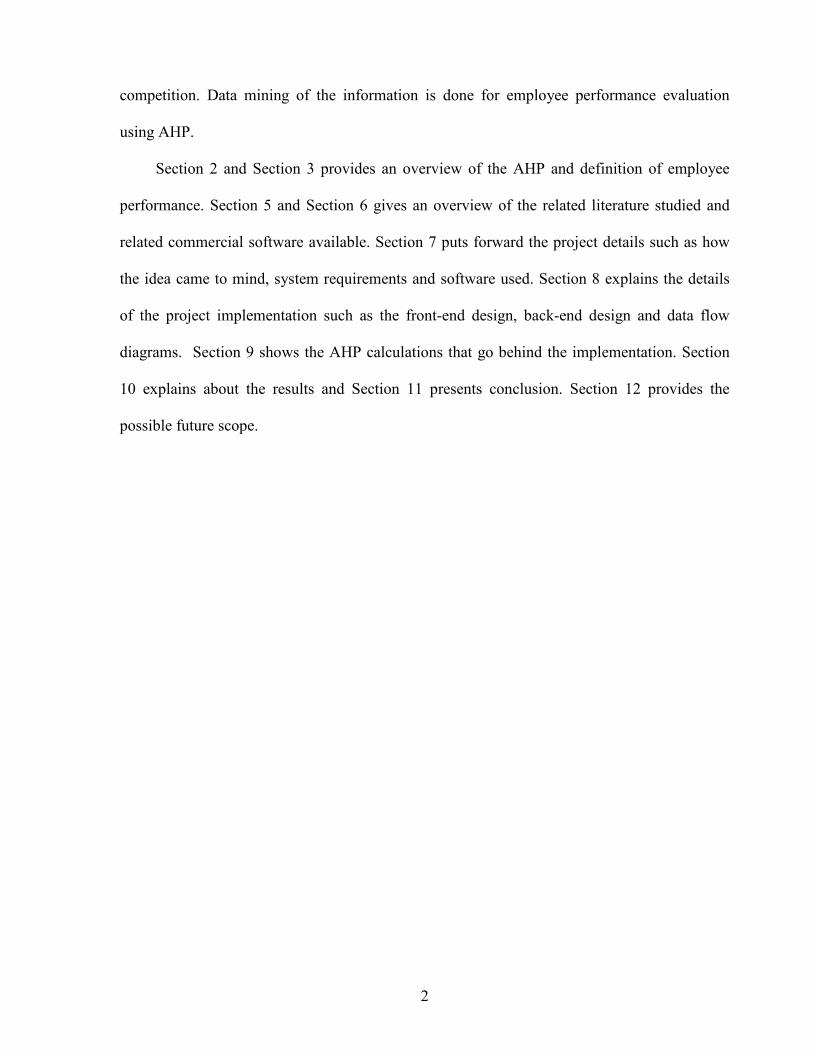
competition. Data mining of the information is done for employee performance evaluation
using AHP.
Section 2 and Section 3 provides an overview of the AHP and definition of employee
performance. Section 5 and Section 6 gives an overview of the related literature studied and
related commercial software available. Section 7 puts forward the project details such as how
the idea came to mind, system requirements and software used. Section 8 explains the details
of the project implementation such as the front-end design, back-end design and data flow
diagrams. Section 9 shows the AHP calculations that go behind the implementation. Section
10 explains about the results and Section 11 presents conclusion. Section 12 provides the
possible future scope.
3
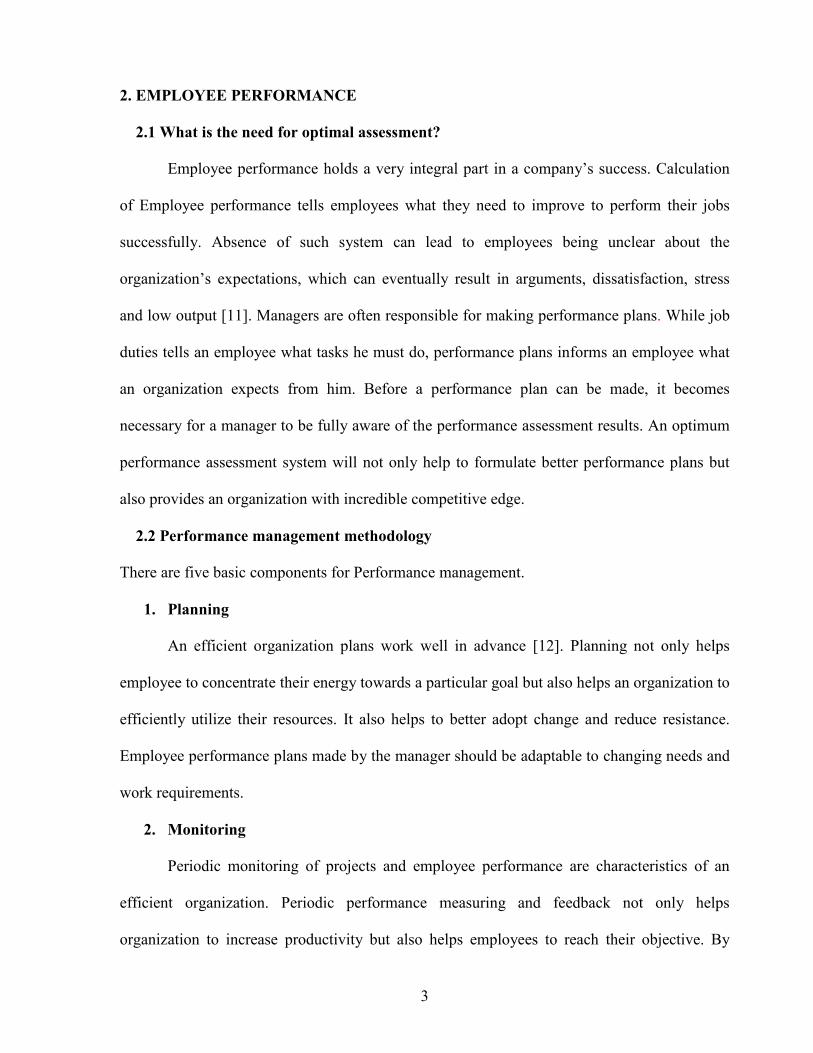
2. EMPLOYEE PERFORMANCE
2.1 What is the need for optimal assessment?
Employee performance holds a very integral part in a company’s success. Calculation
of Employee performance tells employees what they need to improve to perform their jobs
successfully. Absence of such system can lead to employees being unclear about the
organization’s expectations, which can eventually result in arguments, dissatisfaction, stress
and low output [11]. Managers are often responsible for making performance plans. While job
duties tells an employee what tasks he must do, performance plans informs an employee what
an organization expects from him. Before a performance plan can be made, it becomes
necessary for a manager to be fully aware of the performance assessment results. An optimum
performance assessment system will not only help to formulate better performance plans but
also provides an organization with incredible competitive edge.
2.2 Performance management methodology
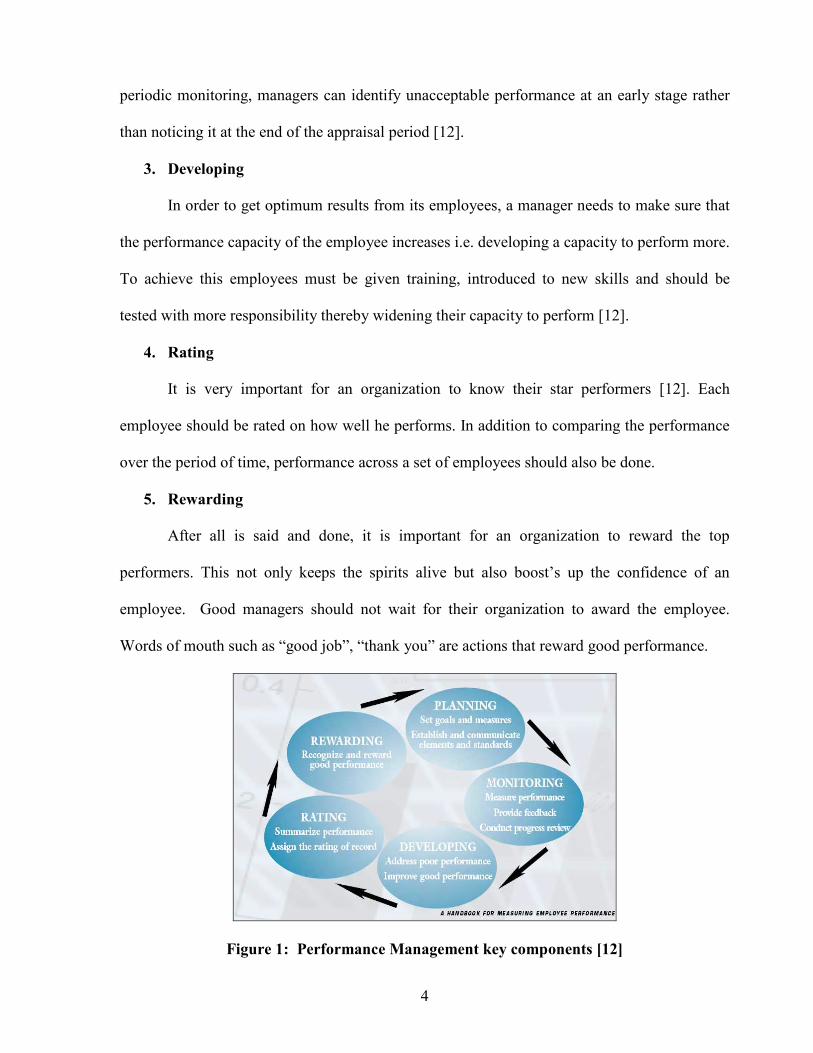
There are five basic components for Performance management.
1. Planning
An efficient organization plans work well in advance [12]. Planning not only helps
employee to concentrate their energy towards a particular goal but also helps an organization to
efficiently utilize their resources. It also helps to better adopt change and reduce resistance.
Employee performance plans made by the manager should be adaptable to changing needs and
work requirements.
2. Monitoring
Periodic monitoring of projects and employee performance are characteristics of an
efficient organization. Periodic performance measuring and feedback not only helps
organization to increase productivity but also helps employees to reach their objective. By
4
periodic monitoring, managers can identify unacceptable performance at an early stage rather
than noticing it at the end of the appraisal period [12].
3. Developing
In order to get optimum results from its employees, a manager needs to make sure that
the performance capacity of the employee increases i.e. developing a capacity to perform more.
To achieve this employees must be given training, introduced to new skills and should be
tested with more responsibility thereby widening their capacity to perform [12].
4. Rating
It is very important for an organization to know their star performers [12]. Each
employee should be rated on how well he performs. In addition to comparing the performance
over the period of time, performance across a set of employees should also be done.
5. Rewarding
After all is said and done, it is important for an organization to reward the top
performers. This not only keeps the spirits alive but also boost’s up the confidence of an
employee. Good managers should not wait for their organization to award the employee.
Words of mouth such as “good job”, “thank you” are actions that reward good performance.
Figure 1: Performance Management key components [12]
5
3. AHP
3.1 History
AHP was formulated by the American mathematician Dr Thomas L Saaty in the early
1980’s. Dr. Saaty’s motivation came while working for the Wharton School. He came across
the difficulty of differences between a scientist and lawyer for a systematic approach for
decision making. Dr. Saaty was motivated to develop a simple way that can help people with
complex decisions. This led to the development of AHP [2]. The power and simplicity of AHP
has led to its worldwide acceptance. AHP is used in fields such as research, education,
healthcare and government in a wide variety of a decision making situations. Implementation
of AHP can be seen in applications like during formulation of drug policy [2], selecting a
project manager [2], choosing marketing strategy [2], and personnel management.
Dr. Saaty founded a company called Expert Choice which makes Expert Choice
software based on AHP. The software provides a structured approach and process for
prioritization and decision making. The software has been in the market for 23 years and used
in universities worldwide. Dr. Saaty also formulated the next –generation version of the
software called Decision Lens. The Company quotes the software as:
“Decision Lens provides a family of desktop and web-based software solutions
designed to support group decision-making for planning, financial, IT and performance-related
decisions” [10]. Dr. Saaty currently works at the University of Pittsburgh, teaching in the
Joseph M. Katz Graduate School of Business.
3.2 What is AHP?
AHP stands for Analytical Hierarchical process. AHP involves breaking the problem
down into sub problems and later combining the solutions of the sub problems into a
conclusion [2]. By doing so, it takes into consideration all the factors such as judgment,
6
perception and impression that can affect decision making capability. AHP is used when a
complex decision needs to be made.
A common misconception that occurs is that people misunderstand AHP as an analysis
tool due to the use of the word “Analytical” in its name. AHP is more than a methodology that
helps in multiple choice decisions. It can be broken down into three steps:
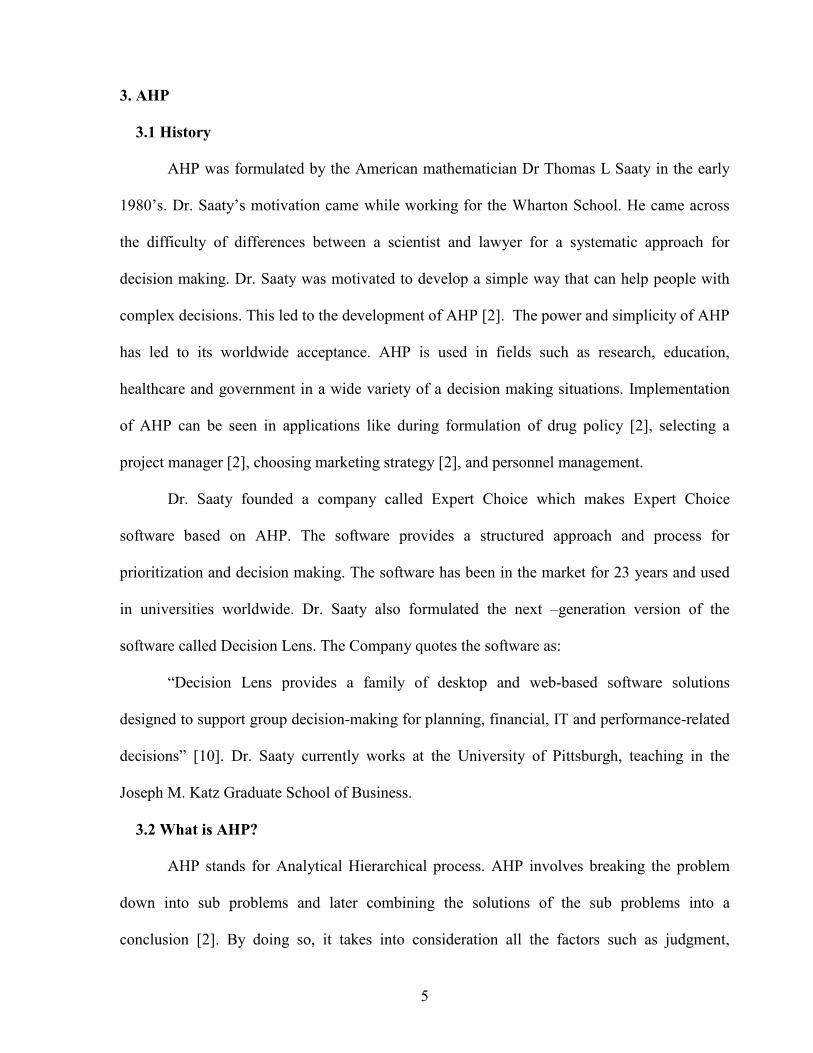
1. Decomposition
In decomposition, a problem is broken down into smaller manageable subproblems. To
do so, iteration is done starting from top (general level) to bottom (specific level) thereby
breaking the problem into submodules that becomes sub-hierarchies. Navigating through the
hierarchy from top to bottom, the AHP structure comprises of goal, criterion and sub criterion.
Figure 2: A simple AHP hierarchy [1]
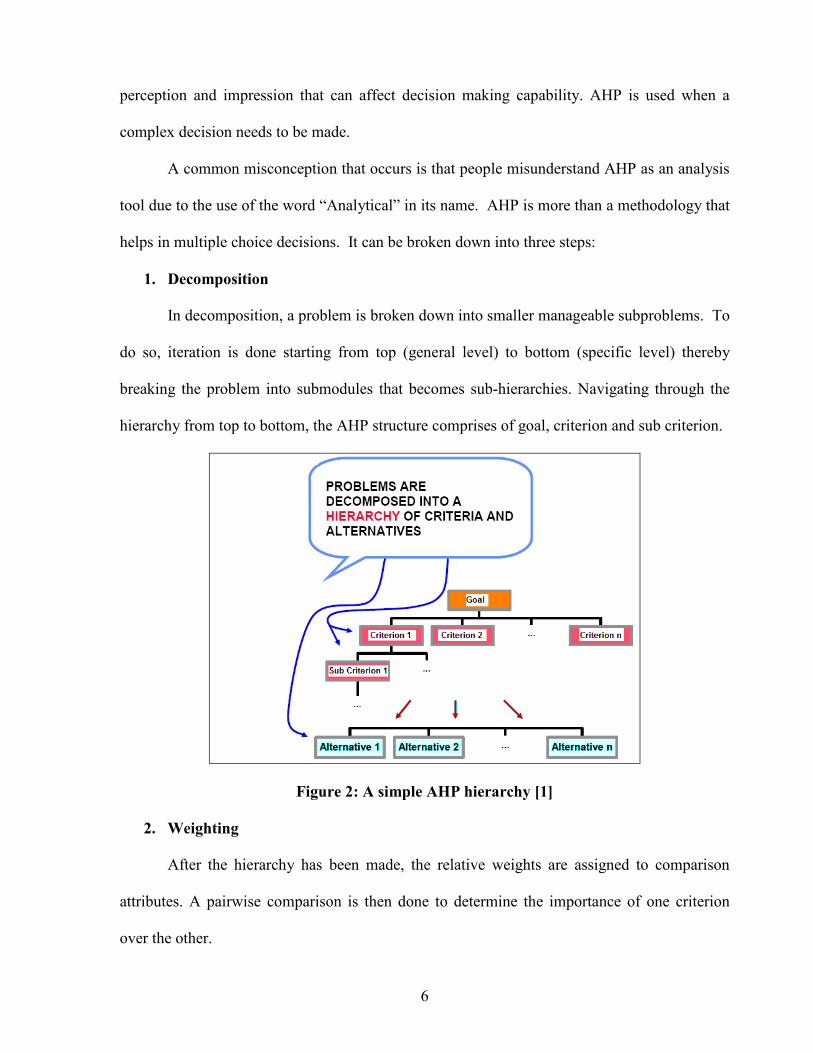
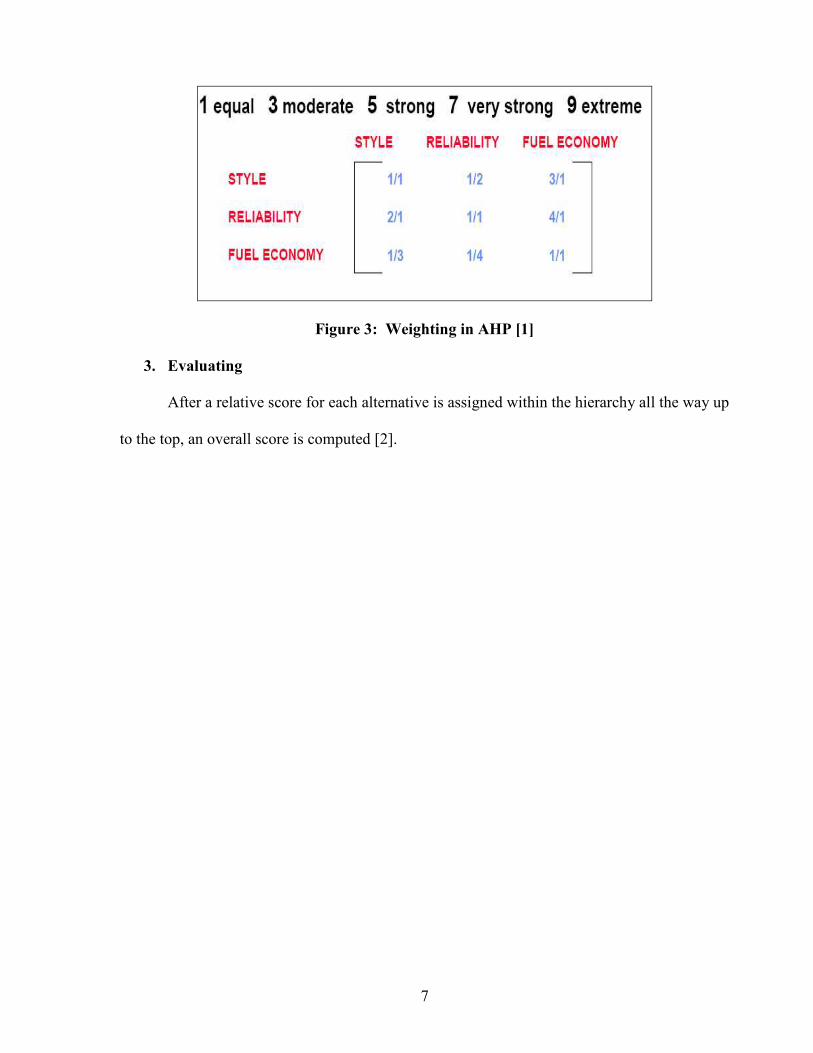
2. Weighting
After the hierarchy has been made, the relative weights are assigned to comparison
attributes. A pairwise comparison is then done to determine the importance of one criterion
over the other.
7
Figure 3: Weighting in AHP [1]
3. Evaluating
After a relative score for each alternative is assigned within the hierarchy all the way up
to the top, an overall score is computed [2].
8
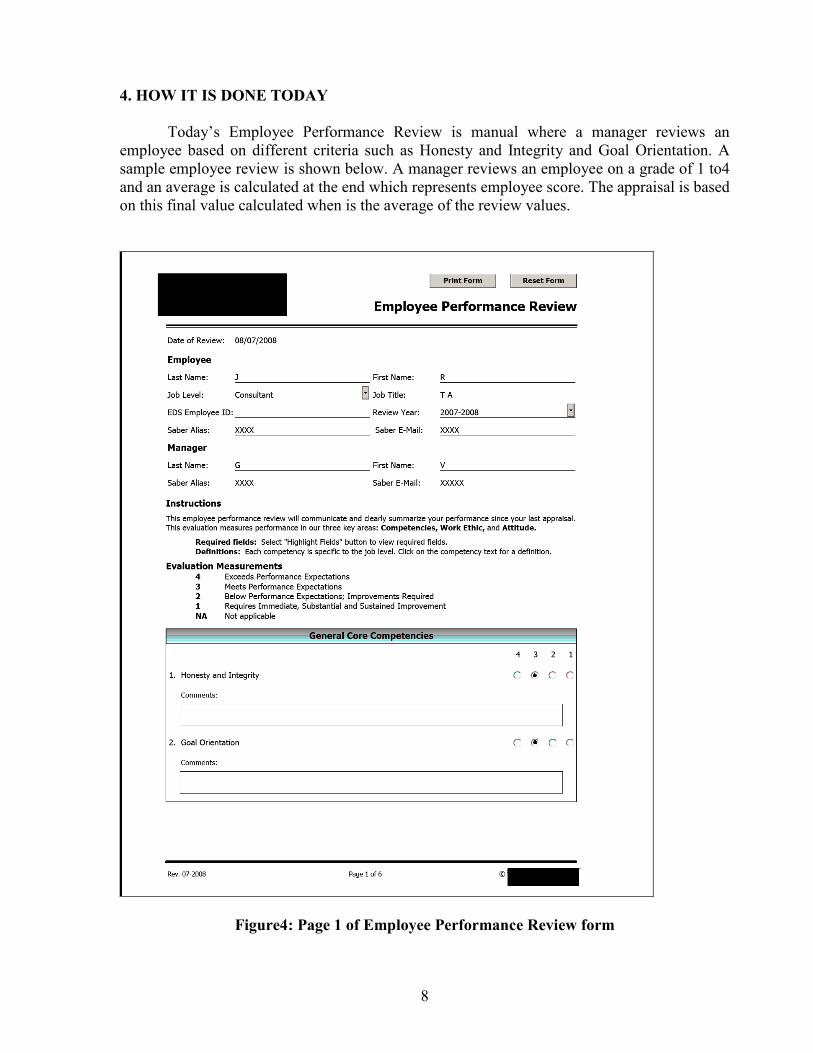
4. HOW IT IS DONE TODAY
Today’s Employee Performance Review is manual where a manager reviews an employee based on different criteria such as Honesty and Integrity and Goal Orientation. A sample employee review is shown below. A manager reviews an employee on a grade of 1 to4 and an average is calculated at the end which represents employee score. The appraisal is based on this final value calculated when is the average of the review values.
Figure4: Page 1 of Employee Performance Review form
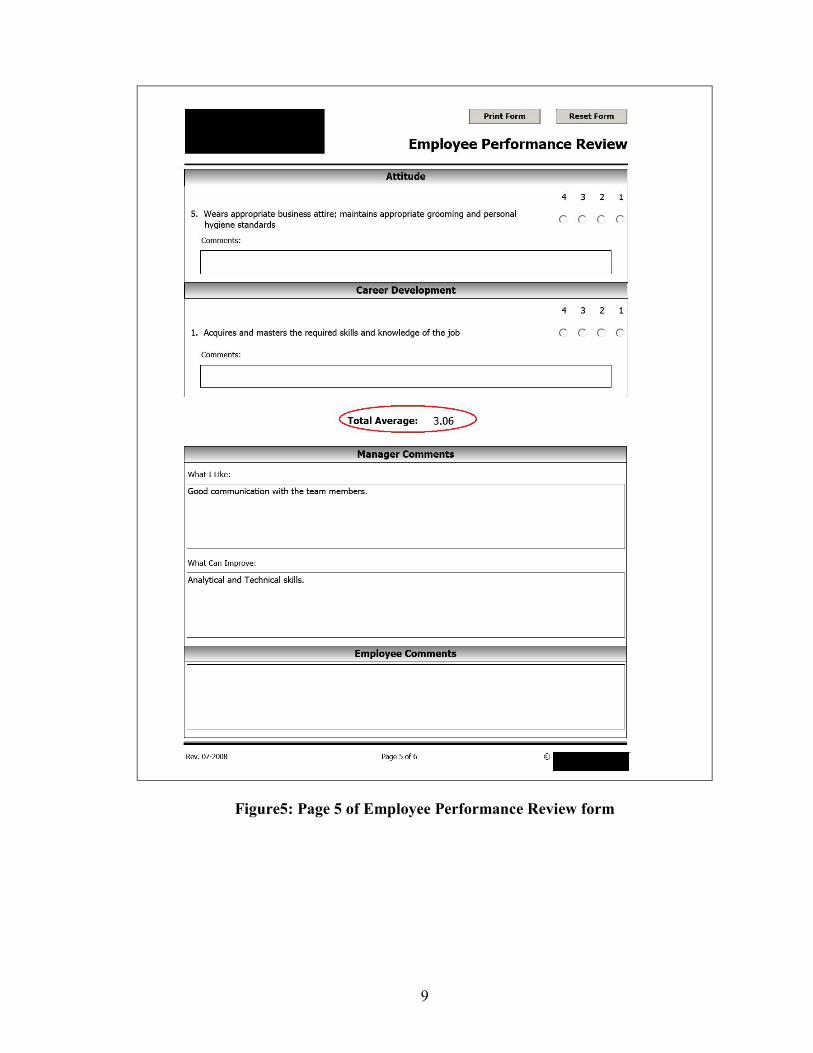
9
Figure5: Page 5 of Employee Performance Review form
10
5. RELATED LITERATURE
There is an extensive interest in AHP all over the world among computer scientists.
This section describes some of the excerpts from the numerous articles that were closely
studied. These articles discuss AHP or employee performance in general:
5.1 Literature studied
1. Title: A review of employee evaluation procedures and a description of “high Potential” executives and professionals [9]
The article examines employee evaluation procedures by focusing on assessment
center, psychological tests and personnel interview [9]. These procedures are used by
companies to select “high potential” executives [9]. Over the time, increased competition has
led the companies to identify and hire employees with appropriate skills to get maximum
output. Today, many resource executives realize the importance of human resource planning
and its incorporation as vital factor that helps the organization to get a competitive edge.
To achieve human resource goals three commonly used methods are the personal
interview, assessment centers, and standardized psychological tests [9]. The article reviews a
most recently available procedure called the System for Testing and the Evaluation of Potential
[9]. The first application of STEP program uses the estimates from the Potential for Successful
Performance (PSPs) for personnel decision making [9]. The second application of STEP
program is for the identification of the strength and weakness of personnel.
2. Title: How to Make a Decision: The Analytic Hierarchy Process [2] The paper explains the importance of AHP when it comes to making complex
decisions. People express their judgment in terms of importance, preference and likelihood [2].
We develop standards of excellence and poorness based on past knowledge and use them to
rate the alternatives. However, the above way is useful in repetitive situations such as salary
raises and admissions which should meet the established norms [2]. In the absence of norms
11
one often compares alternatives instead of rating norms [2]. The goal is to formulate efficient
hierarchical structure that includes criteria to determine the best choice [2].
3. Title: A Multicriteria Decision Model Application for Managing Group Decisions [20]
The paper explains the use of AHP by multicriteria decision model to resolve the
problem occurring due to of lack of consensus for choosing selection criteria [20]. MCDM was
applied to a publishing house responsible for the selection procedures, providing a list of
agency criteria that greatly influenced the agency selection [20]. It was discovered that
dominant criteria is not always crucial in affecting group rankings. Combined group judgments
were used by the selection making group to reduce the dominance but yet maintaining the
balance of power [22]. Computer simulations were used to study how power and assessment
of criteria were related.
4. Title: Personnel evaluation with AHP [21]
Personnel evaluation problem is a serious problem when it comes to hiring a right
person for any academic, business or government operation needs. Any mistake made, the
company has to bear with the consequences till the person retires. The main problem with
personnel evaluation is identification, weighting and evaluation [21]. Upon the identification of
attributes, weights are assigned and each candidate evaluated for a desirable criteria. Pairwise
comparisons are made between employment characteristics and overall desirability [21]. The
AHP provides an effective and simple method for personnel evaluation. Fear is that it might
prove to be complex or inconvenient for non-technical people [21].
5. Title: The Analytic Hierarchy Process: An Exposition [22]
The paper examines history and development of AHP [22]. Functions such as
structuring complexity, measurement and synthesis are responsible for AHP’s vast usage [22].
Paper addresses academic debates and defends why AHP is more superior in solving issues
12
involving transitivity [22]. Simplicity, flexibility and accuracy are the advantages of AHP to
MAUT [22]. This fact can be proven by the world wide usage of AHP, in applications such as
health care, strategic planning, benchmarking and quality management [22].
Although there are numerous organizations that have benefited from AHP but there are
organizations that are still unaware of it. The exposition hopes to educate these organizations
about the possible use of AHP to solve complex decisions [22].
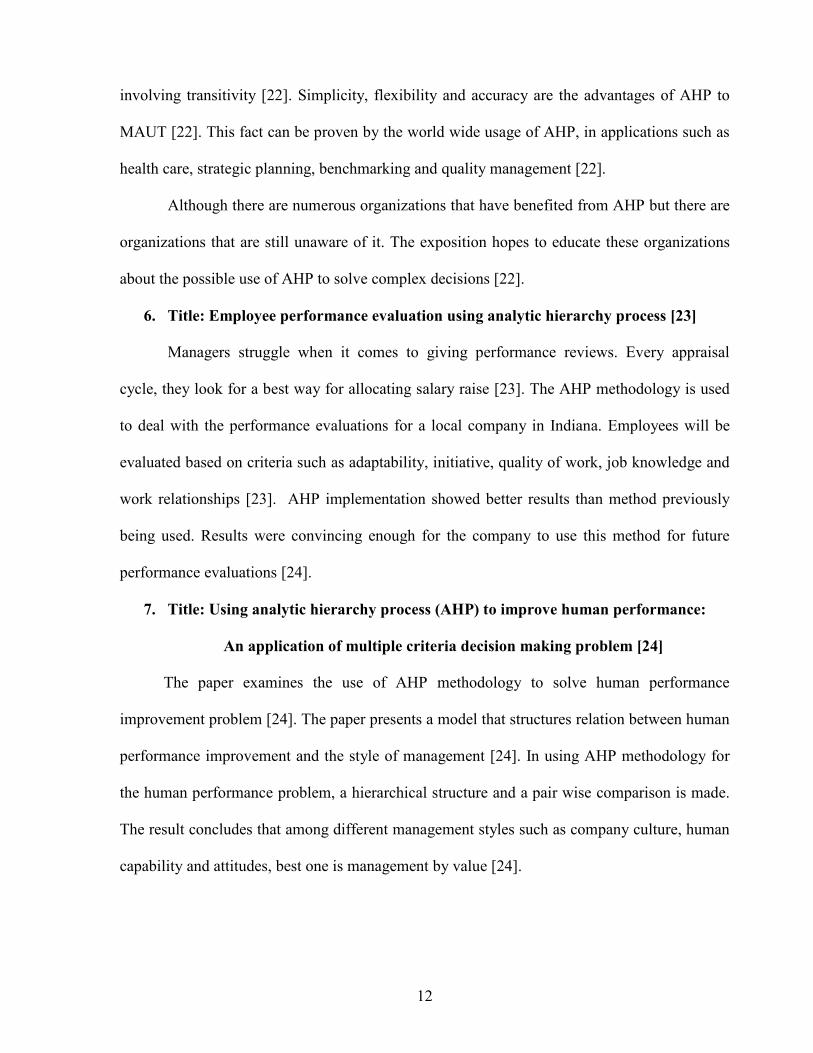
6. Title: Employee performance evaluation using analytic hierarchy process [23]
Managers struggle when it comes to giving performance reviews. Every appraisal
cycle, they look for a best way for allocating salary raise [23]. The AHP methodology is used
to deal with the performance evaluations for a local company in Indiana. Employees will be
evaluated based on criteria such as adaptability, initiative, quality of work, job knowledge and
work relationships [23]. AHP implementation showed better results than method previously
being used. Results were convincing enough for the company to use this method for future
performance evaluations [24].
7. Title: Using analytic hierarchy process (AHP) to improve human performance:
An application of multiple criteria decision making problem [24]
The paper examines the use of AHP methodology to solve human performance
improvement problem [24]. The paper presents a model that structures relation between human
performance improvement and the style of management [24]. In using AHP methodology for
the human performance problem, a hierarchical structure and a pair wise comparison is made.
The result concludes that among different management styles such as company culture, human
capability and attitudes, best one is management by value [24].
13
8. Title: Using the Analytical Hierarchy Process as Tool for Assessing Service
Quality [25]
Continuous quality improvement is a must for both manufacturing and service sectors
[25]. While manufacturing has made efforts to improve quality, the service sector has lagged
behind because of inherent difficulties such as poor customer satisfaction. The other measures
for service quality are reliability, responsiveness, assurance and empathy [25]. The paper
determines if a unified measure of service quality can be formulated [25]. AHP methodology is
used to present a model that helps to derive a single quality index.
9. Title: Employee performance evaluation by AHP: A case study [17]
Employee performance evaluation is done to get an insight about the employee’s
contribution to the organization [17]. The main objective of performance evaluation is to
identify and reward an employee who fulfills the organizational objective, concurrently to
analyze whether the objective is met. The paper uses AHP to calculate employee performance
based on subjective criteria such as planning, discipline, thinking,communication, commitment
and teamwork [17]. Each criterion is divided into sub criteria and pairwise comparisons are
done. The overall ranking of the employees are obtained based on the results calculated from
AHP.
10. Title: Application of Fuzzy Analytical Hierarchy Process in Selecting a
Project Manager [26]
A capable project manager has the decisive influence on the outcome of a project [26].
Qualitative measures are still used while selecting a project manager. The paper explains the
importance and selection of a good project manager. The paper establishes a mathematical
model of comprehensive evaluation by application of fuzzy AHP based on triangular fuzzy
14
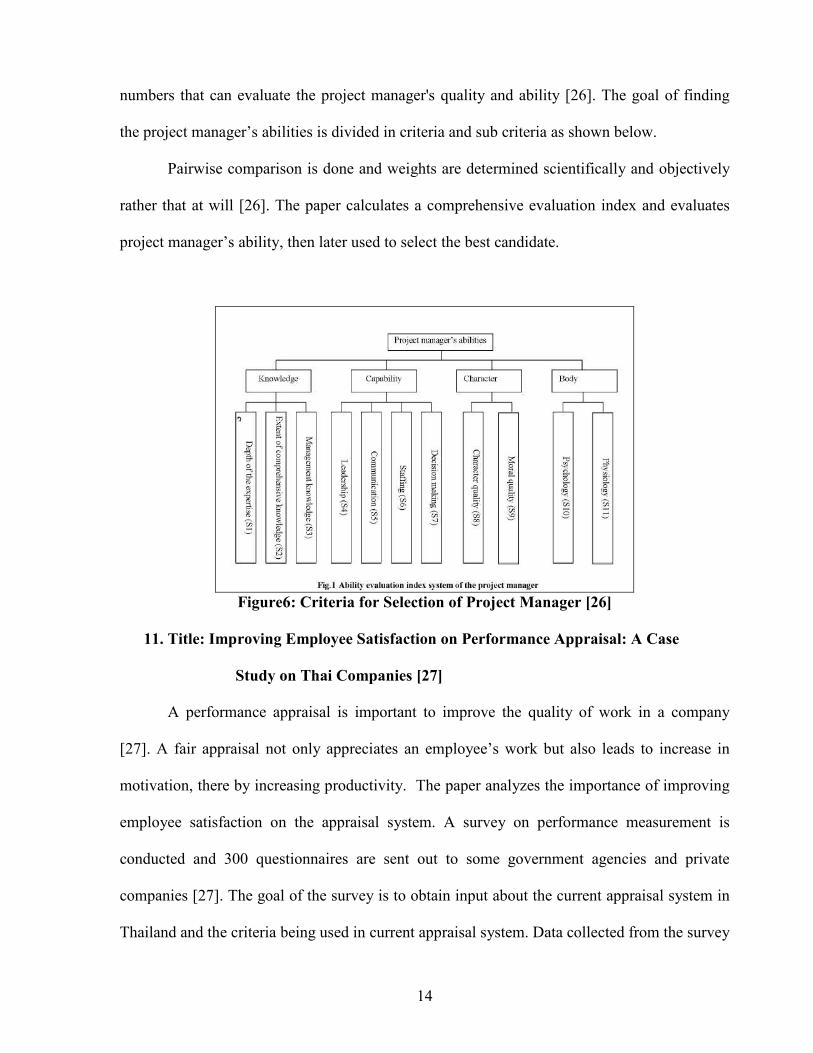
numbers that can evaluate the project manager's quality and ability [26]. The goal of finding
the project manager’s abilities is divided in criteria and sub criteria as shown below.
Pairwise comparison is done and weights are determined scientifically and objectively
rather that at will [26]. The paper calculates a comprehensive evaluation index and evaluates
project manager’s ability, then later used to select the best candidate.
Figure6: Criteria for Selection of Project Manager [26]
11. Title: Improving Employee Satisfaction on Performance Appraisal: A Case
Study on Thai Companies [27]
A performance appraisal is important to improve the quality of work in a company
[27]. A fair appraisal not only appreciates an employee’s work but also leads to increase in
motivation, there by increasing productivity. The paper analyzes the importance of improving
employee satisfaction on the appraisal system. A survey on performance measurement is
conducted and 300 questionnaires are sent out to some government agencies and private
companies [27]. The goal of the survey is to obtain input about the current appraisal system in
Thailand and the criteria being used in current appraisal system. Data collected from the survey
15
is analyzed and used to find the best suited appraisal system for Thai companies. The
comparison between government and private companies reveals that private employees are
better satisfied than the government.
5.2 Related literature evaluation conclusion
AHP and employee performance has been the center of discussion in numerous articles
published over the decade. Companies today understand the importance of assessing employee
performance and its function for a successful organization. The articles studied above reveals
that, inspite of AHP’s vital role in making complex decisions, not much has been researched or
explored in terms of AHP’s application to evaluate employee performance. The application of
AHP studied above varies only from a mere selection of a project manager to calculation of a
service quality index to improve human performance.
Also, the articles fail to address how the factual and subjective peer review could play a
role in an optimum employee performance review. The article “Employee performance
evaluation by AHP: A case study” [17], explains the subjective criteria for employee
performance. The paper does not discuss the importance of peer reviews and factual criteria for
performance appraisal. Another article “Employee performance evaluation using the analytic
hierarchy process” [23] discusses only the subjective managerial criteria selected by a
company’s directors to grade their employees.
The need still exists to better utilize AHP methodology in the area of employee
performance and to combine factors such as subjective managerial criteria, factual criteria and
subjective peer review criteria to optimize performance evaluation.
16
6. RELATED COMMERCIAL SOFTWARE
This section describes some of the existing performance appraisal software available
commercially.
6.1 List of software
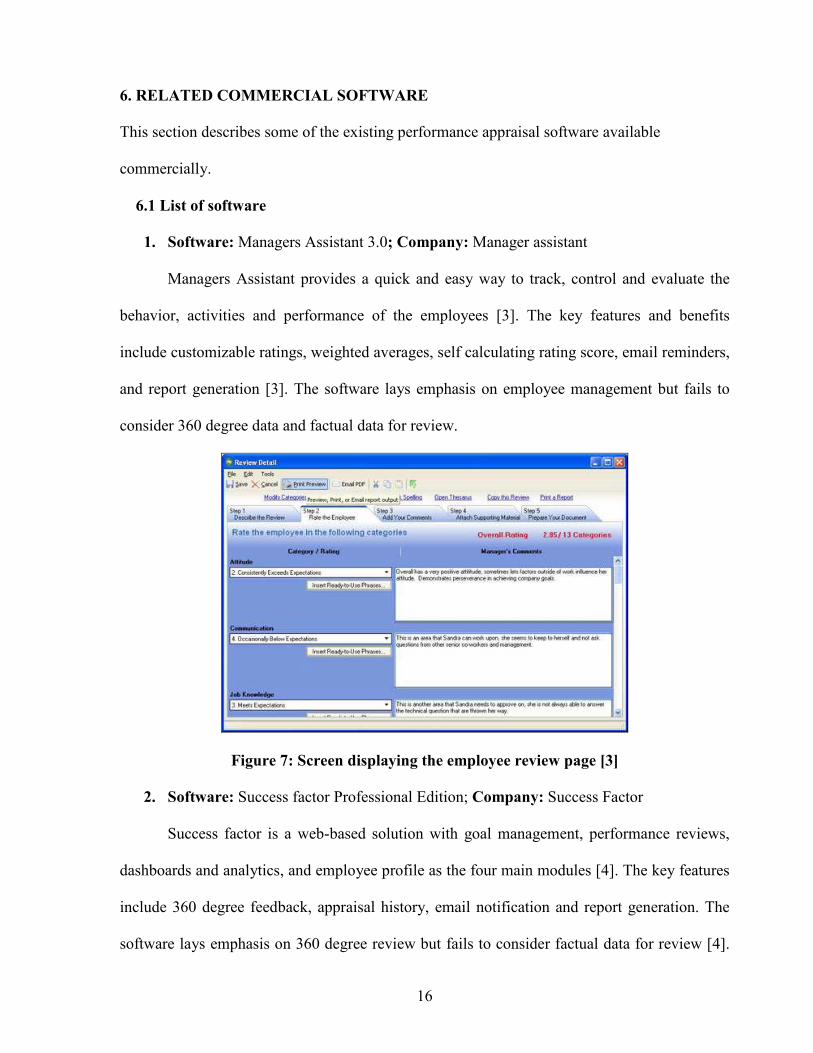
1. Software: Managers Assistant 3.0; Company: Manager assistant
Managers Assistant provides a quick and easy way to track, control and evaluate the
behavior, activities and performance of the employees [3]. The key features and benefits
include customizable ratings, weighted averages, self calculating rating score, email reminders,
and report generation [3]. The software lays emphasis on employee management but fails to
consider 360 degree data and factual data for review.
Figure 7: Screen displaying the employee review page [3]
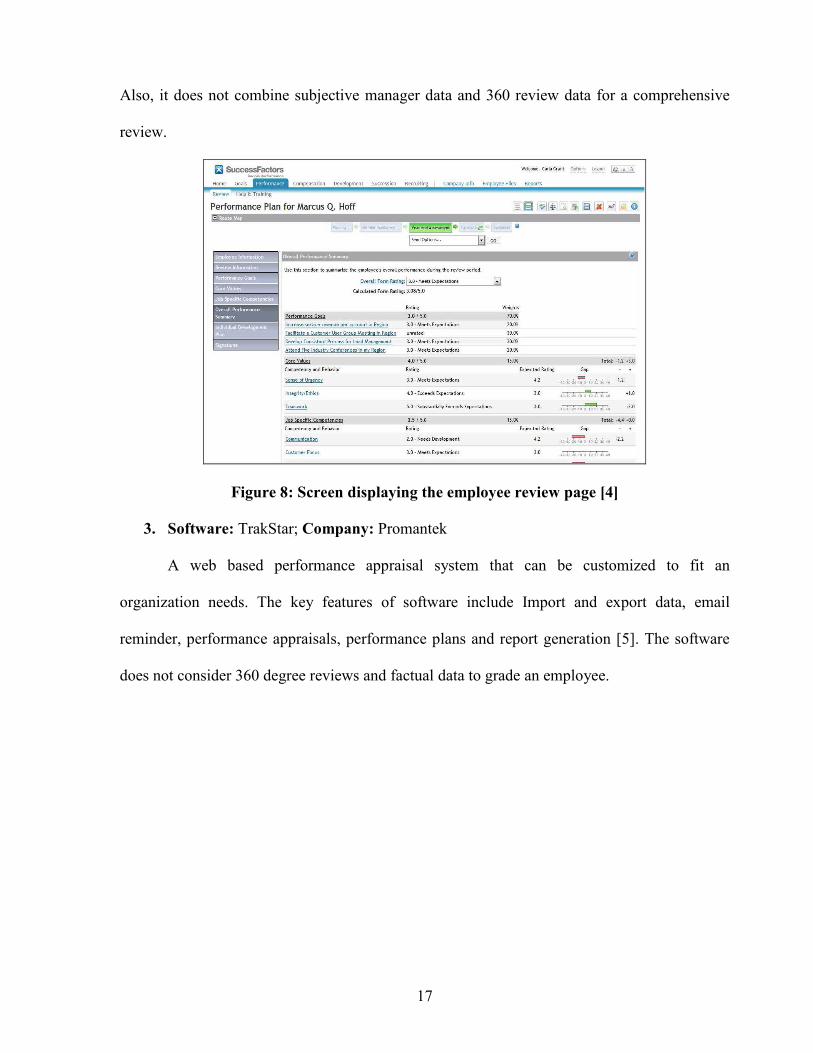
2. Software: Success factor Professional Edition; Company: Success Factor
Success factor is a web-based solution with goal management, performance reviews,
dashboards and analytics, and employee profile as the four main modules [4]. The key features
include 360 degree feedback, appraisal history, email notification and report generation. The
software lays emphasis on 360 degree review but fails to consider factual data for review [4].
17
Also, it does not combine subjective manager data and 360 review data for a comprehensive
review.
Figure 8: Screen displaying the employee review page [4]
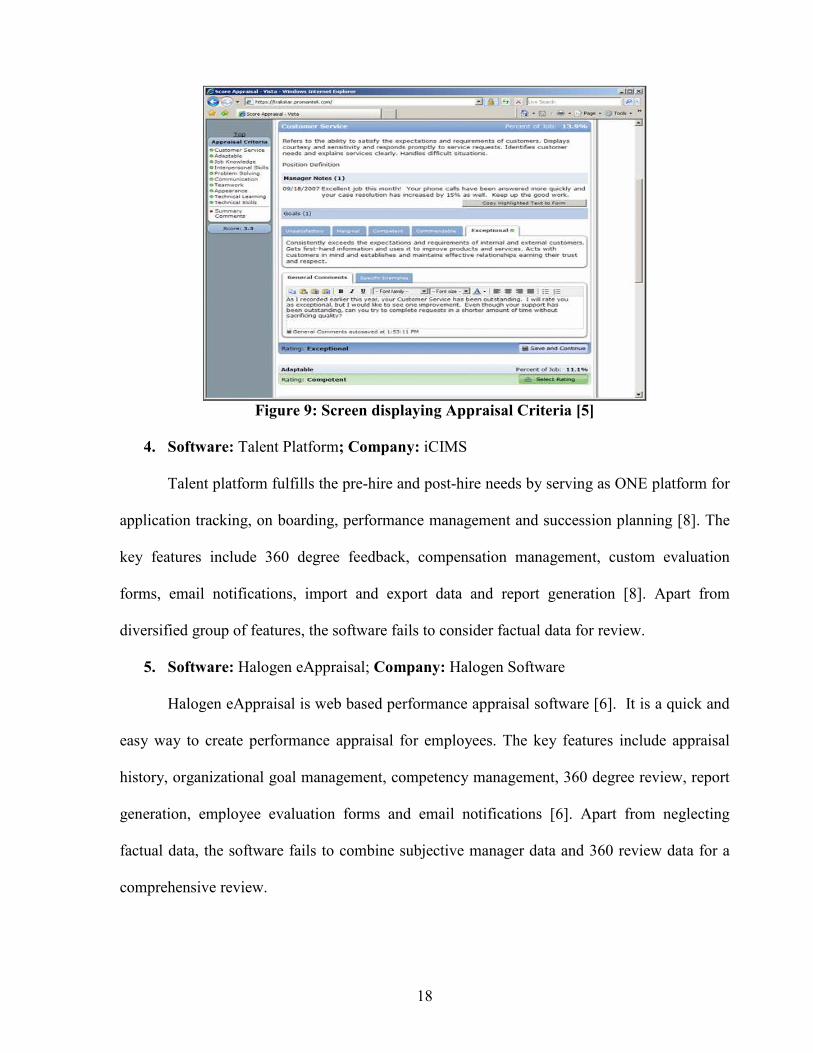
3. Software: TrakStar; Company: Promantek
A web based performance appraisal system that can be customized to fit an
organization needs. The key features of software include Import and export data, email
reminder, performance appraisals, performance plans and report generation [5]. The software
does not consider 360 degree reviews and factual data to grade an employee.
18
Figure 9: Screen displaying Appraisal Criteria [5]
4. Software: Talent Platform; Company: iCIMS
Talent platform fulfills the pre-hire and post-hire needs by serving as ONE platform for
application tracking, on boarding, performance management and succession planning [8]. The
key features include 360 degree feedback, compensation management, custom evaluation
forms, email notifications, import and export data and report generation [8]. Apart from
diversified group of features, the software fails to consider factual data for review.
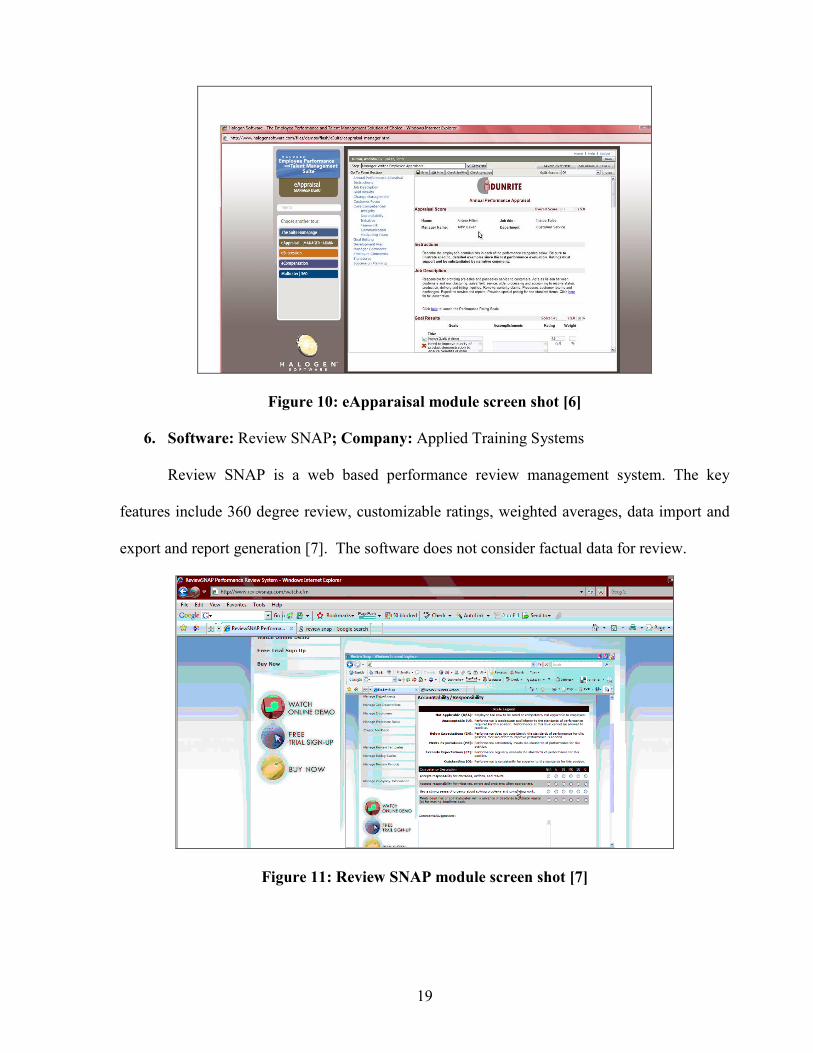
5. Software: Halogen eAppraisal; Company: Halogen Software
Halogen eAppraisal is web based performance appraisal software [6]. It is a quick and
easy way to create performance appraisal for employees. The key features include appraisal
history, organizational goal management, competency management, 360 degree review, report
generation, employee evaluation forms and email notifications [6]. Apart from neglecting
factual data, the software fails to combine subjective manager data and 360 review data for a
comprehensive review.
19
Figure 10: eApparaisal module screen shot [6]
6. Software: Review SNAP; Company: Applied Training Systems
Review SNAP is a web based performance review management system. The key
features include 360 degree review, customizable ratings, weighted averages, data import and
export and report generation [7]. The software does not consider factual data for review.
Figure 11: Review SNAP module screen shot [7]
20
7. Software: Blue; Company: eXplorance
Blue is web based, enterprise class software with applications such as surveys, 360
degree reviews, performance appraisals and training needs assessments [9]. The key features
include 360 degree feedback, import and export data, performance appraisals and custom
evaluation forms [9]. The software does not combine subjective manager data and 360 review
data for a comprehensive review.
Figure 12: Blue 360-degree review screen shot [9]
6.2 Software evaluation conclusion
Most of the software being used by organization or developed are performance
appraisal management software. They provide an interface to write job profiles, review
employees, store reviews and generate report. They review employee based on criteria such as
Integrity, Dependability, Teamwork, Customer satisfaction and Communication. Software like
Blue, eAppraisal takes care of the 360 reviews and the subjective managerial reviews done by
manager but fails to combine the results to formulate a ranking system.
21
Another problem that was not taken into consideration was none of the software was
ever designed to compute factual data. As an employee works for long time in a company the
review results tends to self influencing i.e. if a employee does well, he will continue to do well
and visa versa [30]. Factual data helps to overcome self influence by reflecting the work an
employee does. For example, for a quality assurance engineer factual data will reflect criteria
such as the number of bugs, priority of bugs and type.
In addition to the above problem none of the software was ever designed to handle complex
decision making. Almost all the software’s were designed for graphical representation of data
in form of charts, 3-D surfaces, scatter plots and flash animation.
The need still exists for software that combines the subjective data by both managers
and peers, and the factual data to rate employees and pick the star performer in an organization.
22
7. PROJECT DETAILS
7.1 Overview
As a result of the extensive research done which spans research papers, consulting top
line company managers and analyzing performance appraisal software, I understood how
employee performance is measured in most companies. From the research papers, it became
quite evident that work needs to be done to optimize current employee performance evaluation
system.
The current methodology can be enhanced if all the factors such as subjective
managerial data, factual data and subjective peer review data are taken into consideration.
Also, I realized that the most neglected part was the factual criteria which hold the capability to
further enhance the evaluation system. The idea to enhance the current methodology for
employee performance evaluation was further supported while I was interning for a company
called Risk Management Solutions.
During the performance reviews at RMS, I realized that my manager used subjective
criteria such as teamwork, communication, and discipline for grading employees. No matter
these criteria were exhaustive but they were often biased.
The research paper “Employee performance evaluation by AHP: A case study “[17]
introduced me to the idea of AHP and how it could be used for evaluating employee
performance. I decided to incorporate this methodology and came up with the plan which is
described below.
23
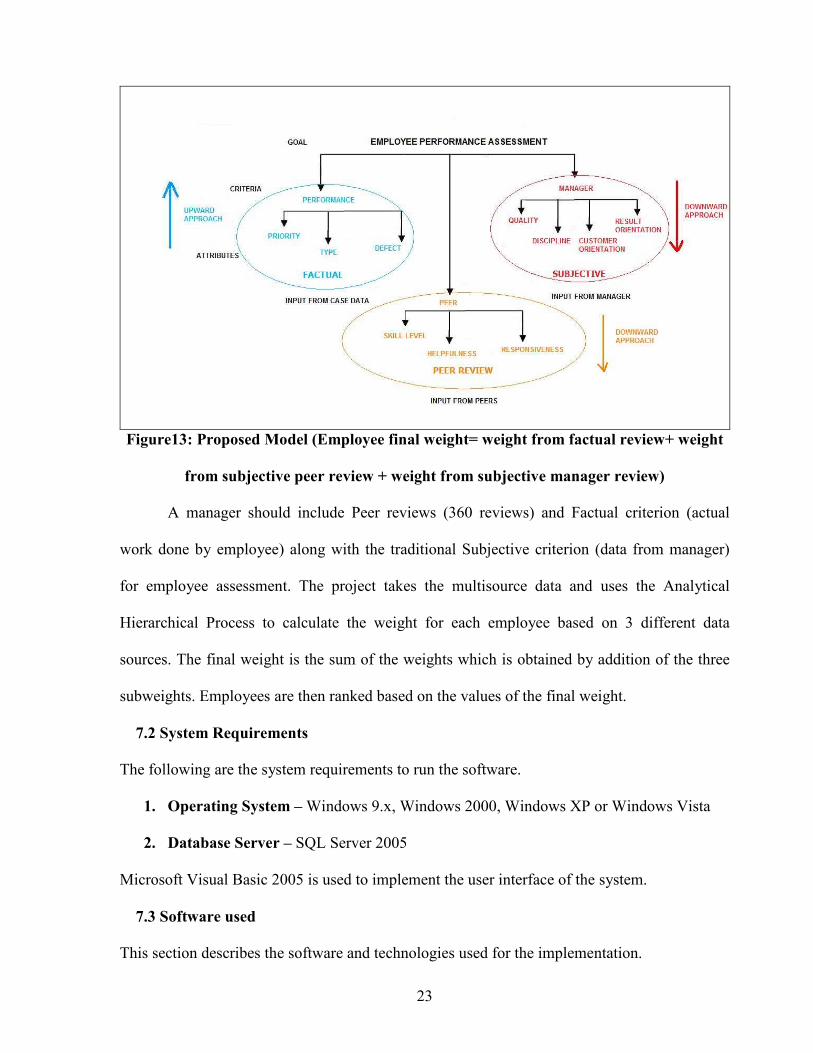
Figure13: Proposed Model (Employee final weight= weight from factual review+ weight
from subjective peer review + weight from subjective manager review)
A manager should include Peer reviews (360 reviews) and Factual criterion (actual
work done by employee) along with the traditional Subjective criterion (data from manager)
for employee assessment. The project takes the multisource data and uses the Analytical
Hierarchical Process to calculate the weight for each employee based on 3 different data
sources. The final weight is the sum of the weights which is obtained by addition of the three
subweights. Employees are then ranked based on the values of the final weight.
7.2 System Requirements
The following are the system requirements to run the software.
1. Operating System – Windows 9.x, Windows 2000, Windows XP or Windows Vista
2. Database Server – SQL Server 2005
Microsoft Visual Basic 2005 is used to implement the user interface of the system.
7.3 Software used
This section describes the software and technologies used for the implementation.
24
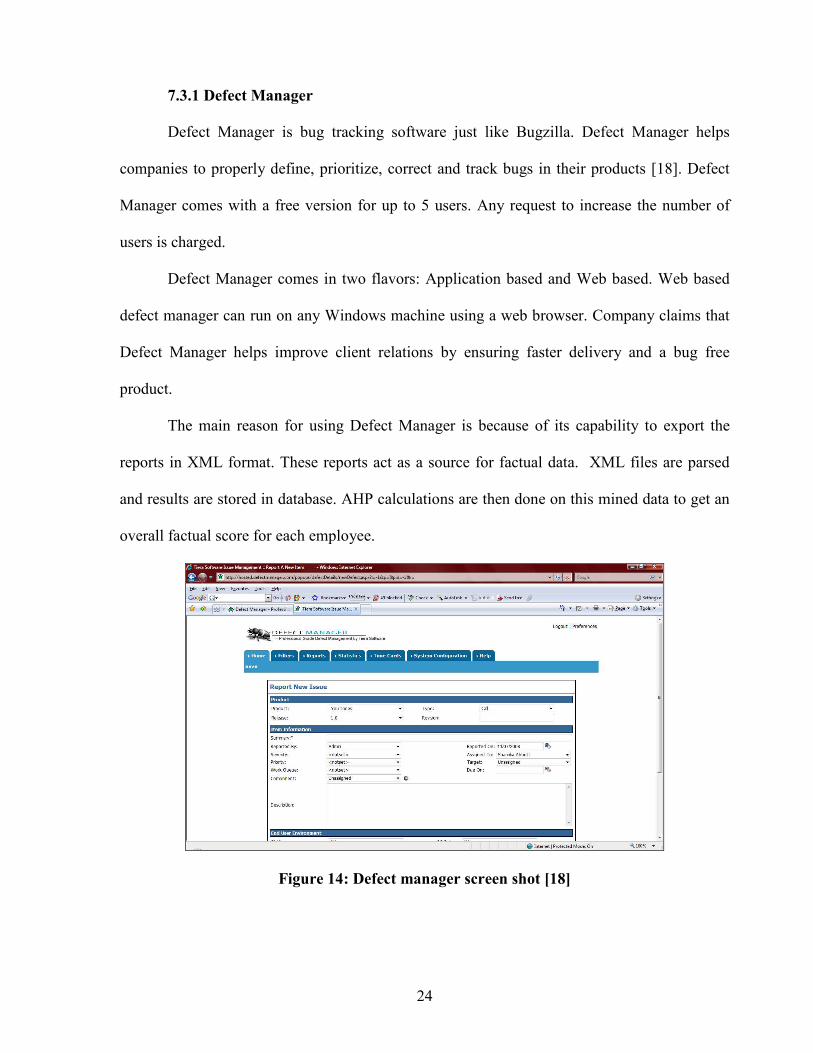
7.3.1 Defect Manager
Defect Manager is bug tracking software just like Bugzilla. Defect Manager helps
companies to properly define, prioritize, correct and track bugs in their products [18]. Defect
Manager comes with a free version for up to 5 users. Any request to increase the number of
users is charged.
Defect Manager comes in two flavors: Application based and Web based. Web based
defect manager can run on any Windows machine using a web browser. Company claims that
Defect Manager helps improve client relations by ensuring faster delivery and a bug free
product.
The main reason for using Defect Manager is because of its capability to export the
reports in XML format. These reports act as a source for factual data. XML files are parsed
and results are stored in database. AHP calculations are then done on this mined data to get an
overall factual score for each employee.
Figure 14: Defect manager screen shot [18]
25
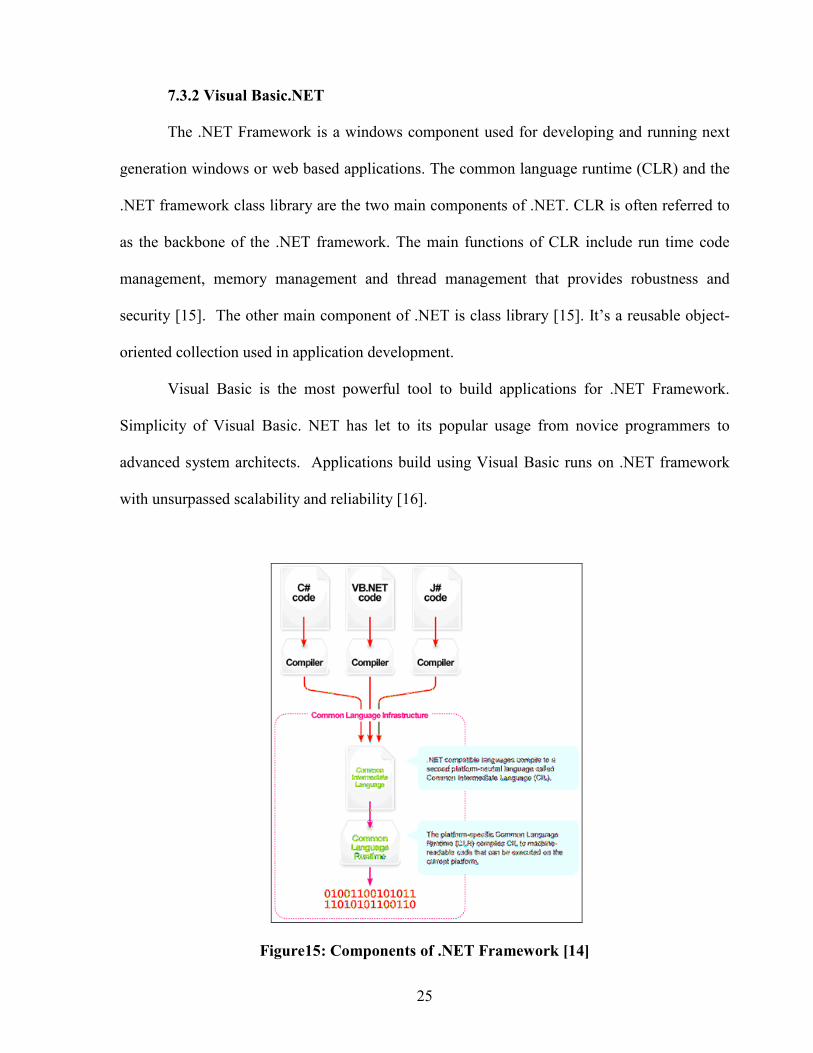
7.3.2 Visual Basic.NET
The .NET Framework is a windows component used for developing and running next
generation windows or web based applications. The common language runtime (CLR) and the
.NET framework class library are the two main components of .NET. CLR is often referred to
as the backbone of the .NET framework. The main functions of CLR include run time code
management, memory management and thread management that provides robustness and
security [15]. The other main component of .NET is class library [15]. It’s a reusable object-
oriented collection used in application development.
Visual Basic is the most powerful tool to build applications for .NET Framework.
Simplicity of Visual Basic. NET has let to its popular usage from novice programmers to
advanced system architects. Applications build using Visual Basic runs on .NET framework
with unsurpassed scalability and reliability [16].
Figure15: Components of .NET Framework [14]
26
7.3.3 Microsoft SQL Server 2005
SQL Server is a client-server relational Database Management System (RDBMS)
developed by Microsoft. SQL Server 2005 provides a platform for organizations to manage
data any place, anytime. [13]. SQL Server not only reduces the cost and management for
development of an application but also provides security for business critical applications.
Trial version of Microsoft SQL Server 2005 is available on Microsoft website.
Figure16: Microsoft Data Platform Vision [13]
27
8. IMPLEMENTATION DETAILS
This project uses Visual Basic.NET for front-end and SQL server 2005 for back-end.
Section 7.1 gives details about the screens used, Section 7.2 gives details about data repository
and section 7.3 explains the flow of data via DFD.
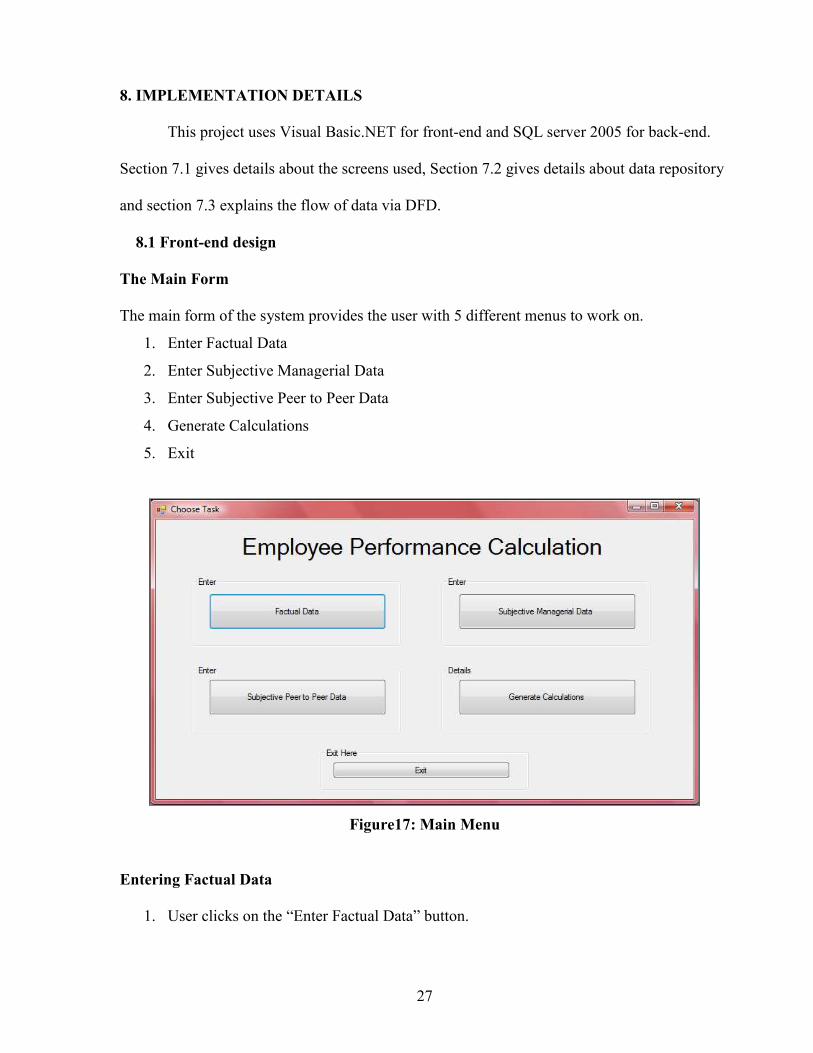
8.1 Front-end design
The Main Form
The main form of the system provides the user with 5 different menus to work on.
1. Enter Factual Data
2. Enter Subjective Managerial Data
3. Enter Subjective Peer to Peer Data
4. Generate Calculations
5. Exit
Figure17: Main Menu
Entering Factual Data
1. User clicks on the “Enter Factual Data” button.
28
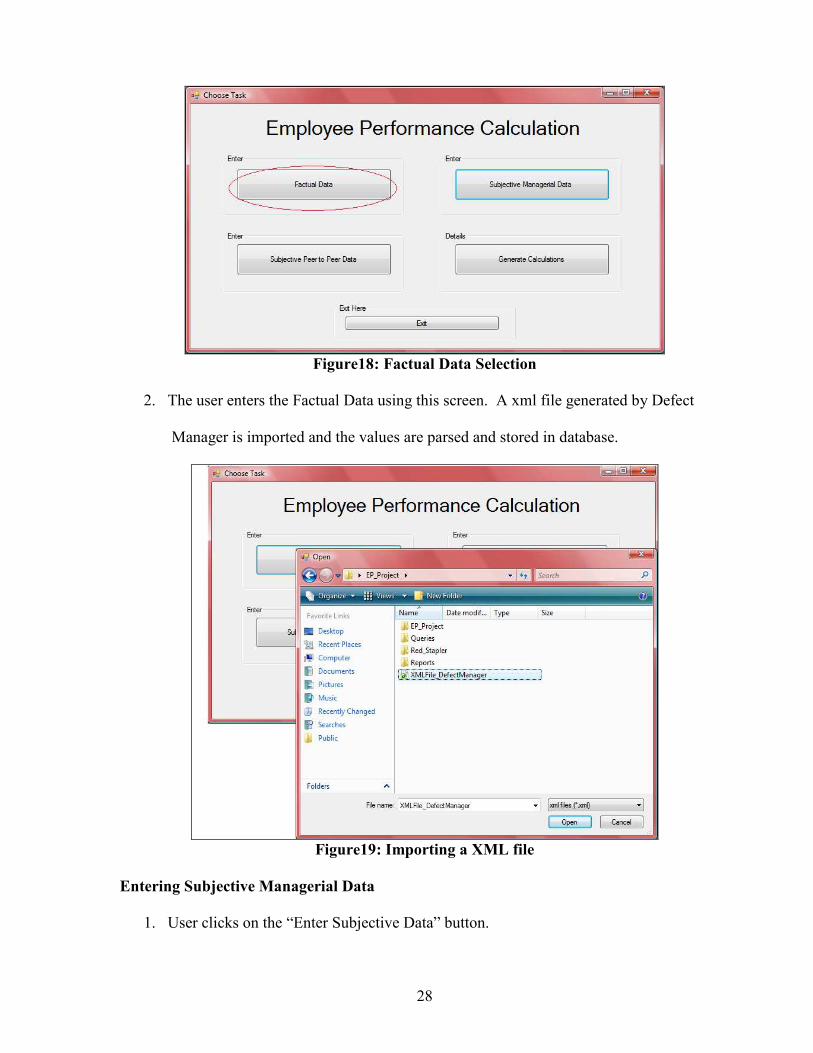
Figure18: Factual Data Selection
2. The user enters the Factual Data using this screen. A xml file generated by Defect
Manager is imported and the values are parsed and stored in database.
Figure19: Importing a XML file
Entering Subjective Managerial Data
1. User clicks on the “Enter Subjective Data” button.
29
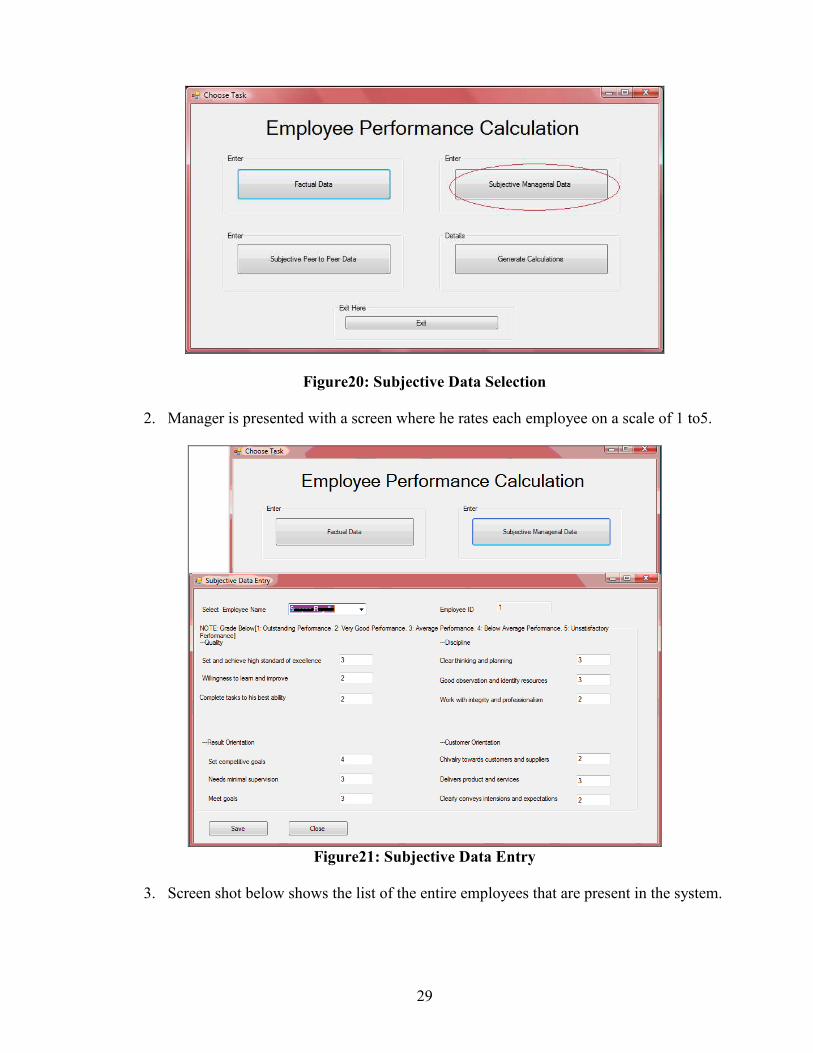
Figure20: Subjective Data Selection
2. Manager is presented with a screen where he rates each employee on a scale of 1 to5.
Figure21: Subjective Data Entry
3. Screen shot below shows the list of the entire employees that are present in the system.
30
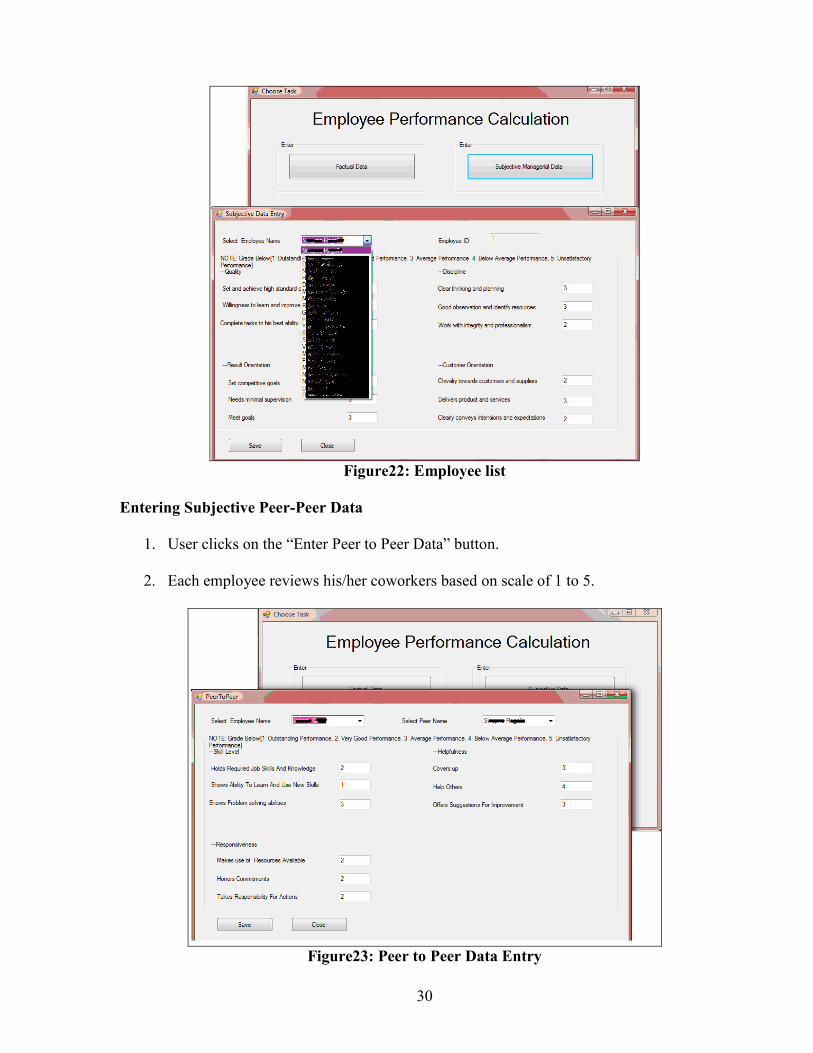
Figure22: Employee list
Entering Subjective Peer-Peer Data
1. User clicks on the “Enter Peer to Peer Data” button. 2. Each employee reviews his/her coworkers based on scale of 1 to 5.
Figure23: Peer to Peer Data Entry
31
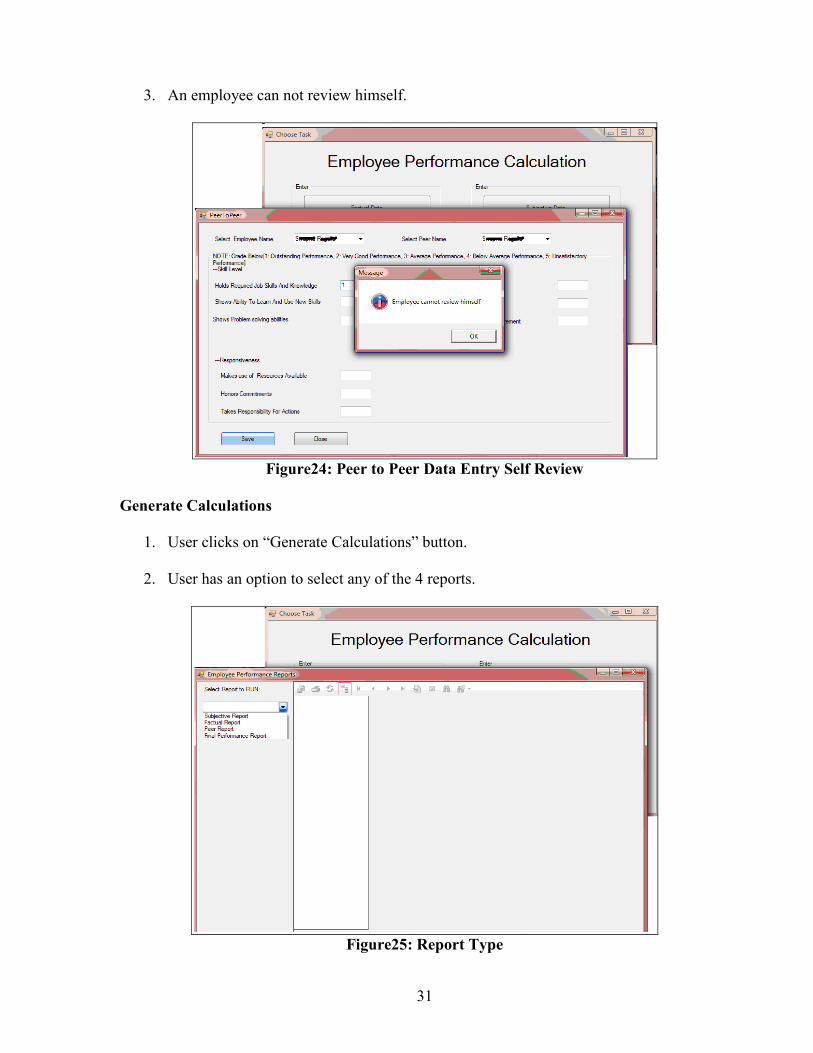
3. An employee can not review himself.
Figure24: Peer to Peer Data Entry Self Review
Generate Calculations
1. User clicks on “Generate Calculations” button.
2. User has an option to select any of the 4 reports.
Figure25: Report Type
32
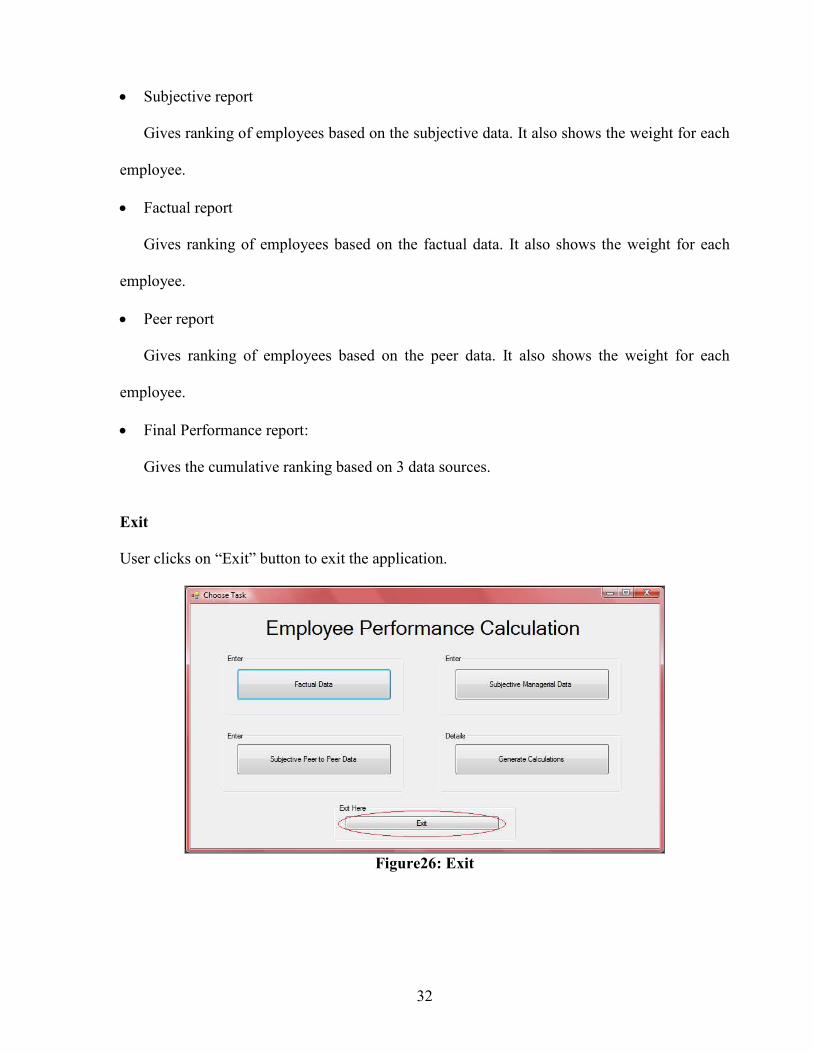
• Subjective report
Gives ranking of employees based on the subjective data. It also shows the weight for each
employee.
• Factual report
Gives ranking of employees based on the factual data. It also shows the weight for each
employee.
• Peer report
Gives ranking of employees based on the peer data. It also shows the weight for each
employee.
• Final Performance report:
Gives the cumulative ranking based on 3 data sources.
Exit User clicks on “Exit” button to exit the application.
Figure26: Exit
33
8.2 Back-end design
Normalization principals were used to enhance and develop the database design for the system.
Normalization
Normalization is used widely when designing relational databases. Normalization is a
process of organizing data in a database efficiently. It is a two step process that is used to
efficiently organize data in a database. First step is to make sure there are no data redundancy
and removing if any. Second step to make sure that data dependencies make sense. Normal
forms are the guidelines set by database community to ensure that databases are normalized.
Normal forms are numbered from one (1NF) through five (5NF) with one being the lowest
level. Relational databases are expected to be in the third normal form (3NF). Most common
normal forms are 1NF, 2NF and 3NF. 5NF is considered to be complex and not that widely
used.
Definition of Normal Form
First Normal Form
A relational table by definition is considered to be in first normal form represented as
1NF. It means that all values of the columns are atomic and has no repeating values [28].
Second Normal Form
A relational table in 1NF has every non key column is fully dependent upon the
primary key then it is considered to be in second normal form 2NF [28].
Third Normal Form
A relational table is in 2NF and every non-key column is non-transitively dependent
upon its primary key then it is considered to be in third normal form (3NF) [28]. Data
normalization is applied to remove redundancy.
34
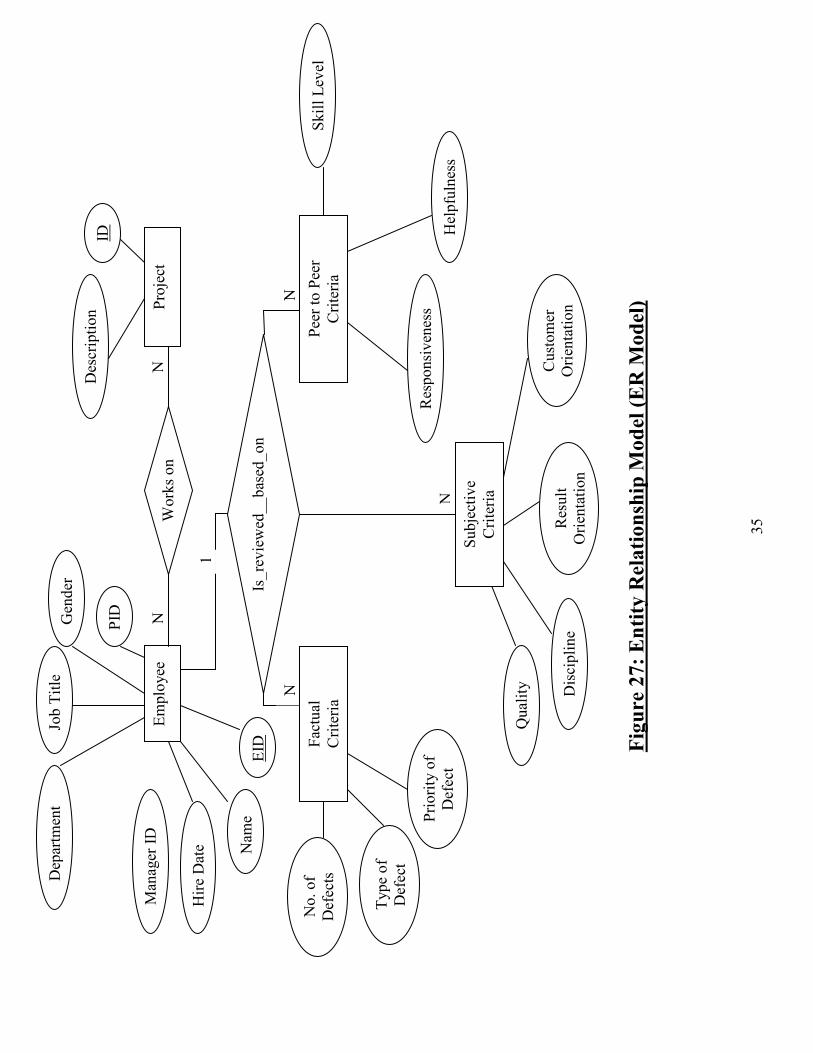
Normalization on the schema is applied and the following tables are obtained:
1. Table name: Employee
This table stores the names of the different employees of the organization and
associates each name with an Id, which uniquely identifies each employee.
Field Name Type Description
EID Integer Specifies employee id, primary key
Name nvarchar(50) Specifies employee name
Hire date Date time Specified the hire date of the employee
Manager_ID Integer Specifies the ID of the manager of the employee,
foreign key
Is_manager Integer Specified whether the employee is a manager or
not to other employees
PID Integer Specifies the project ID on which the employee
works, foreign key
JobTitle nvarchar(50) Specifies the job title of the employee
Gender nvarchar(50) Specifies the Gender of the employee
Department nvarchar(50) Specifies the Department in which the employee
works
2. Table name: Factual_Criteria
This table stores the different factual criteria on the basis of which the employees are
reviewed along with the weights assigned to these criterias.
Field Name Type Description
ID Integer Specifies criteria id, primary key
Description nvarchar(50) Specifies name of the criteria
Weight nvarchar(50) Specified the weight of the criteria
Explanation is provided in Appendix A for detailed Back-end design.
35
Fig
ure 27
: Ent
ity Relat
ions
hip
Mod
el (E
R M
odel)
N
N
1
Priority of
Defect
No. of
Defects
Type of
Defect
Quality N
N
N
Employee
Project
Factual
Criteria
Peer to
Peer
Criteria
Works on
EID
Nam
e
Hire Date
Manager ID
Gender
PID
Job Title
Departm
ent
Descriptio
n ID
Subjectiv
e
Criteria
Is_reviewed__
based_
on
Discipline
Result
Orientatio
n
Customer
Orientatio
n
Skill Level
Respo
nsiveness
Helpfulness
36
8.3 Data Flow Diagram
This section provides graphical representation of the flow of data. Level 0, Level1 and
Level 2 DFD’s are show below.
Level 0
Level 0 DFD represents the scope of the system. The DFD indentifies any external entity and
its input and output. All internal processes are ignored at this level.
Level 1
Level 1 DFD recognizes the major processes of the system. The DFD analyses the data
flow alias interaction that occurs between the processes and data stores.
Level 2
Level 2 DFD shows all level 1 processes into more details. The processes are broken
down into its constituent processes and children are shown.
Explanation is provided in Appendix A for detailed DFD.
37
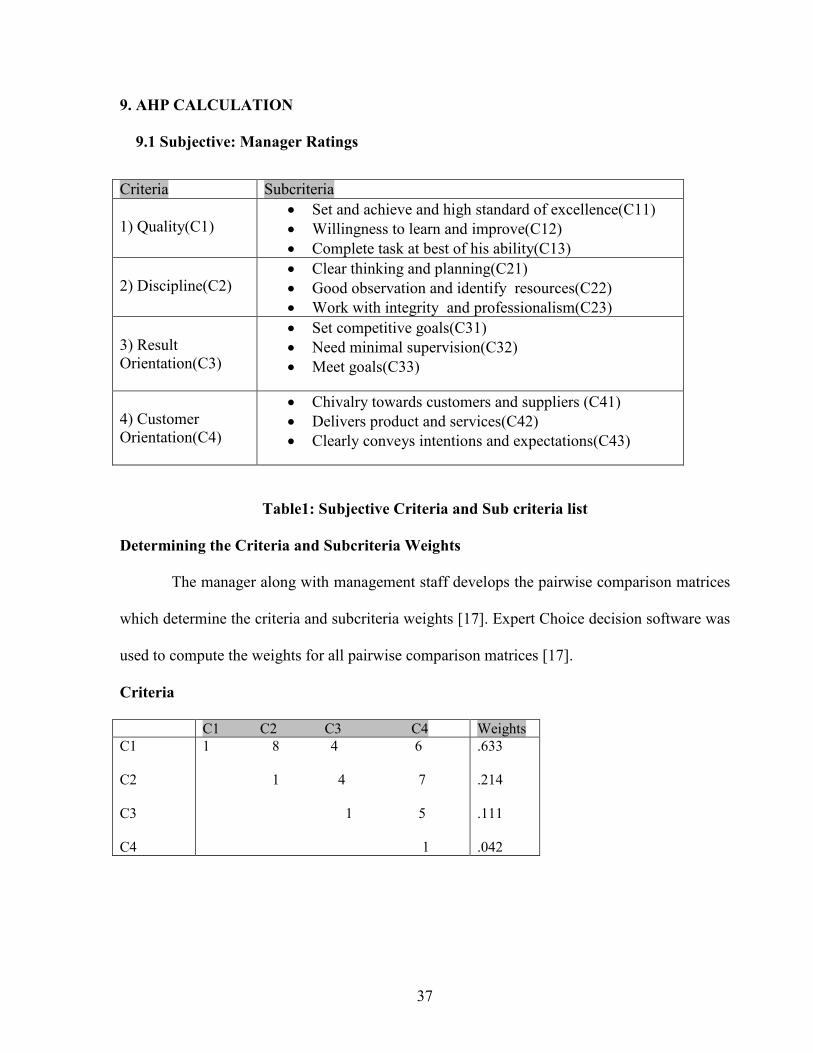
9. AHP CALCULATION
9.1 Subjective: Manager Ratings
Table1: Subjective Criteria and Sub criteria list
Determining the Criteria and Subcriteria Weights
The manager along with management staff develops the pairwise comparison matrices
which determine the criteria and subcriteria weights [17]. Expert Choice decision software was
used to compute the weights for all pairwise comparison matrices [17].
Criteria C1 C2 C3 C4 Weights C1 C2 C3 C4
1 8 4 6 1 4 7 1 5 1
.633 .214 .111 .042
Criteria Subcriteria 1) Quality(C1)
• Set and achieve and high standard of excellence(C11) • Willingness to learn and improve(C12) • Complete task at best of his ability(C13)
2) Discipline(C2)
• Clear thinking and planning(C21) • Good observation and identify resources(C22) • Work with integrity and professionalism(C23)
3) Result Orientation(C3)
• Set competitive goals(C31) • Need minimal supervision(C32) • Meet goals(C33)
4) Customer Orientation(C4)
• Chivalry towards customers and suppliers (C41) • Delivers product and services(C42) • Clearly conveys intentions and expectations(C43)
38
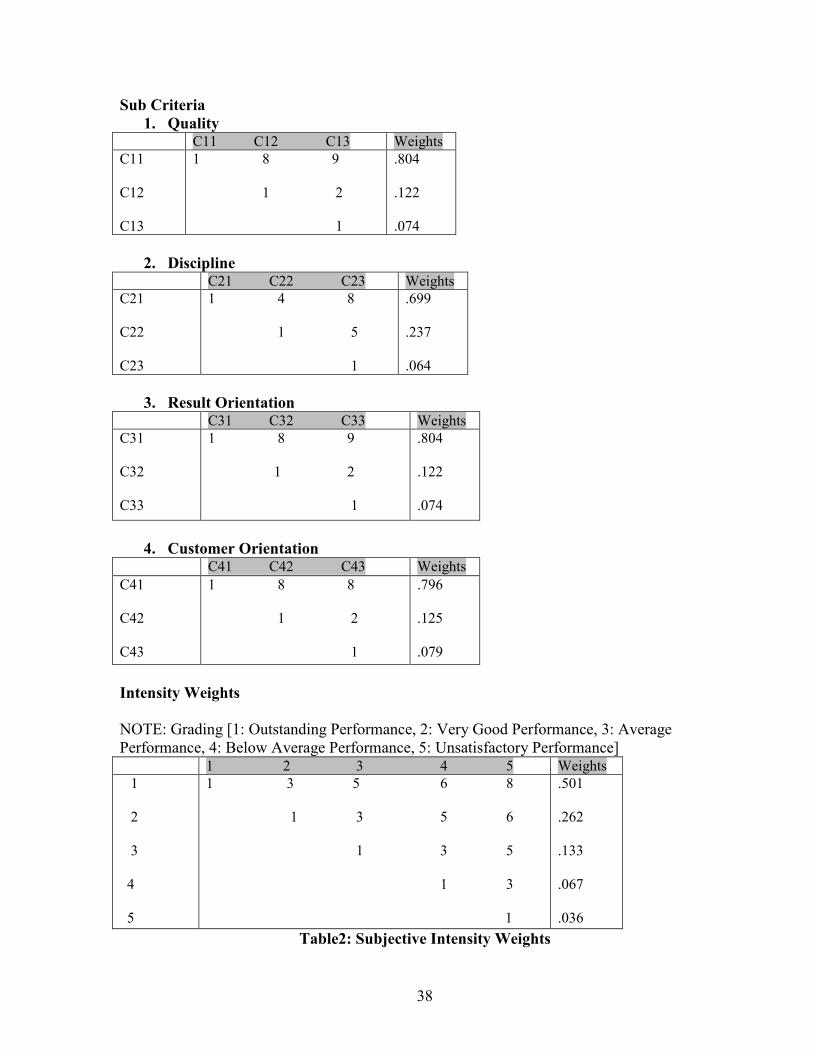
Sub Criteria 1. Quality
C11 C12 C13 Weights C11 C12 C13
1 8 9 1 2 1
.804 .122 .074
2. Discipline
C21 C22 C23 Weights C21 C22 C23
1 4 8 1 5 1
.699 .237 .064
3. Result Orientation
C31 C32 C33 Weights C31 C32 C33
1 8 9 1 2 1
.804 .122 .074
4. Customer Orientation
Intensity Weights NOTE: Grading [1: Outstanding Performance, 2: Very Good Performance, 3: Average Performance, 4: Below Average Performance, 5: Unsatisfactory Performance] 1 2 3 4 5 Weights 1 2 3 4 5
1 3 5 6 8 1 3 5 6 1 3 5 1 3
1
.501 .262 .133 .067 .036
Table2: Subjective Intensity Weights
C41 C42 C43 Weights C41 C42 C43
1 8 8 1 2 1
.796 .125 .079
39
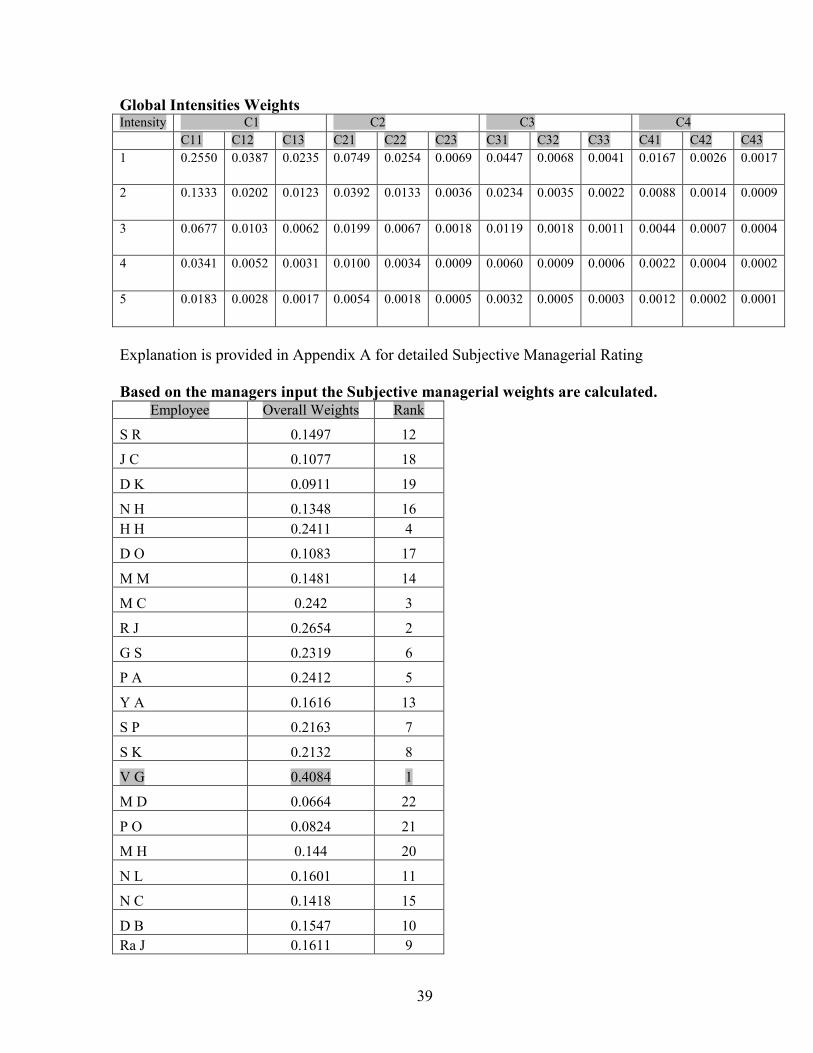
Global Intensities Weights Intensity C1 C2 C3 C4 C11 C12 C13 C21 C22 C23 C31 C32 C33 C41 C42 C43 1
0.2550 0.0387 0.0235 0.0749 0.0254 0.0069 0.0447 0.0068 0.0041 0.0167 0.0026 0.0017
2
0.1333 0.0202 0.0123 0.0392 0.0133 0.0036 0.0234 0.0035 0.0022 0.0088 0.0014 0.0009
3
0.0677 0.0103 0.0062 0.0199 0.0067 0.0018 0.0119 0.0018 0.0011 0.0044 0.0007 0.0004
4
0.0341 0.0052 0.0031 0.0100 0.0034 0.0009 0.0060 0.0009 0.0006 0.0022 0.0004 0.0002
5
0.0183 0.0028 0.0017 0.0054 0.0018 0.0005 0.0032 0.0005 0.0003 0.0012 0.0002 0.0001
Explanation is provided in Appendix A for detailed Subjective Managerial Rating Based on the managers input the Subjective managerial weights are calculated.
Employee Overall Weights Rank
S R 0.1497 12
J C 0.1077 18
D K 0.0911 19
N H 0.1348 16 H H 0.2411 4
D O 0.1083 17
M M 0.1481 14
M C 0.242 3
R J 0.2654 2
G S 0.2319 6
P A 0.2412 5
Y A 0.1616 13
S P 0.2163 7
S K 0.2132 8
V G 0.4084 1
M D 0.0664 22
P O 0.0824 21
M H 0.144 20
N L 0.1601 11
N C 0.1418 15
D B 0.1547 10 Ra J 0.1611 9
40
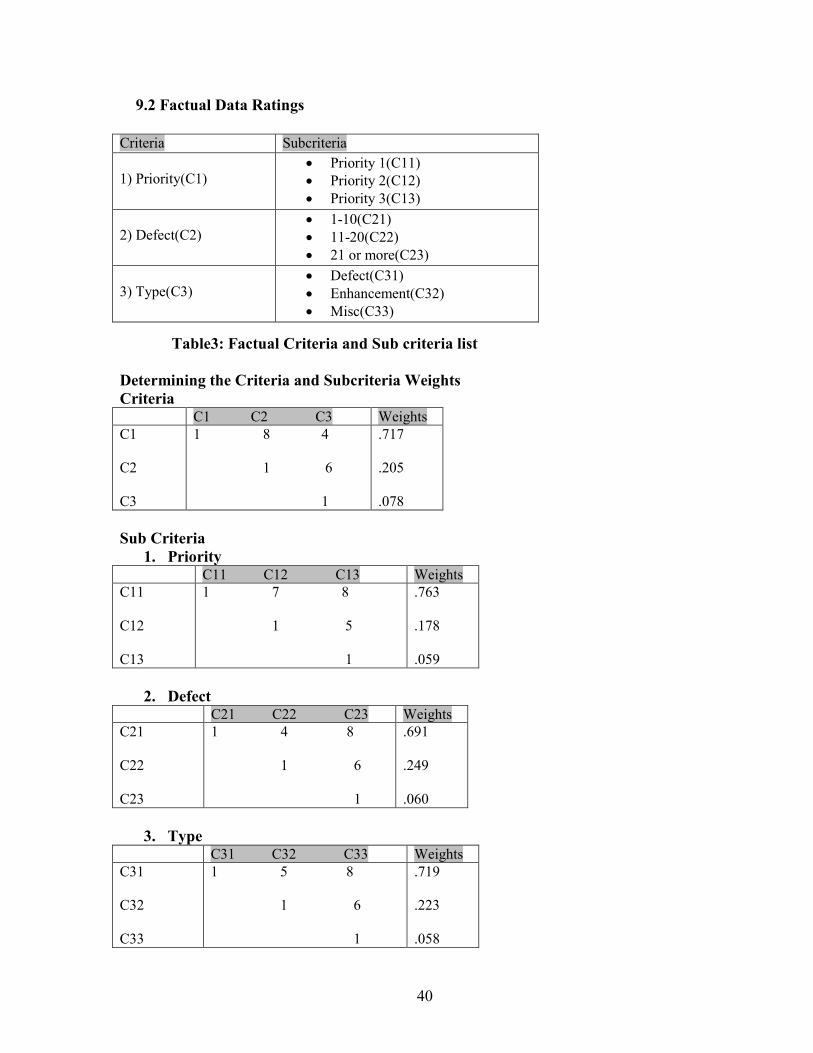
9.2 Factual Data Ratings
Table3: Factual Criteria and Sub criteria list Determining the Criteria and Subcriteria Weights Criteria C1 C2 C3 Weights C1 C2 C3
1 8 4 1 6 1
.717 .205 .078
Sub Criteria
1. Priority C11 C12 C13 Weights C11 C12 C13
1 7 8 1 5 1
.763 .178 .059
2. Defect
C21 C22 C23 Weights C21 C22 C23
1 4 8 1 6 1
.691 .249 .060
3. Type
C31 C32 C33 Weights C31 C32 C33
1 5 8 1 6 1
.719 .223 .058
Criteria Subcriteria 1) Priority(C1)
• Priority 1(C11) • Priority 2(C12) • Priority 3(C13)
2) Defect(C2)
• 1-10(C21) • 11-20(C22) • 21 or more(C23)
3) Type(C3)
• Defect(C31) • Enhancement(C32) • Misc(C33)
41
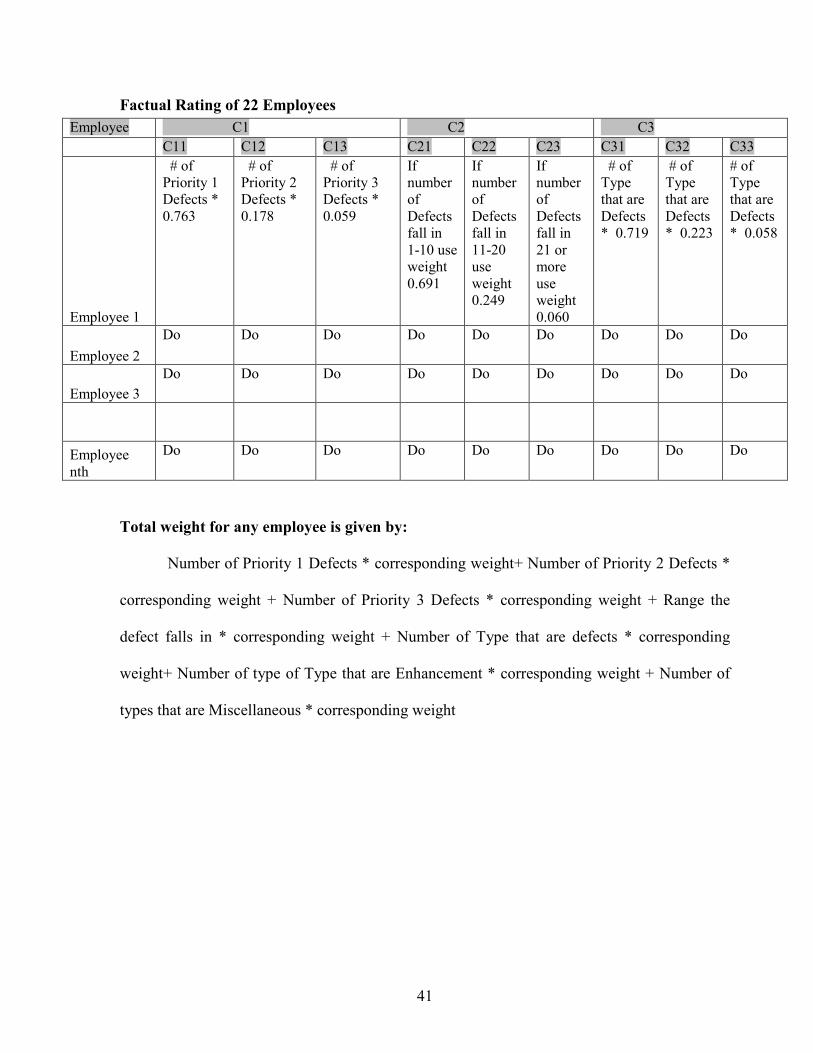
Factual Rating of 22 Employees
Total weight for any employee is given by:
Number of Priority 1 Defects * corresponding weight+ Number of Priority 2 Defects *
corresponding weight + Number of Priority 3 Defects * corresponding weight + Range the
defect falls in * corresponding weight + Number of Type that are defects * corresponding
weight+ Number of type of Type that are Enhancement * corresponding weight + Number of
types that are Miscellaneous * corresponding weight
Employee C1 C2 C3 C11 C12 C13 C21 C22 C23 C31 C32 C33
Employee 1
# of Priority 1 Defects * 0.763
# of Priority 2 Defects * 0.178
# of Priority 3 Defects * 0.059
If number of Defects fall in 1-10 use weight 0.691
If number of Defects fall in 11-20 use weight 0.249
If number of Defects fall in 21 or more use weight 0.060
# of Type that are Defects * 0.719
# of Type that are Defects * 0.223
# of Type that are Defects * 0.058
Employee 2 Do Do Do Do Do Do Do Do Do
Employee 3 Do Do Do Do Do Do Do Do Do
Employee nth
Do Do Do Do Do Do Do Do Do
42
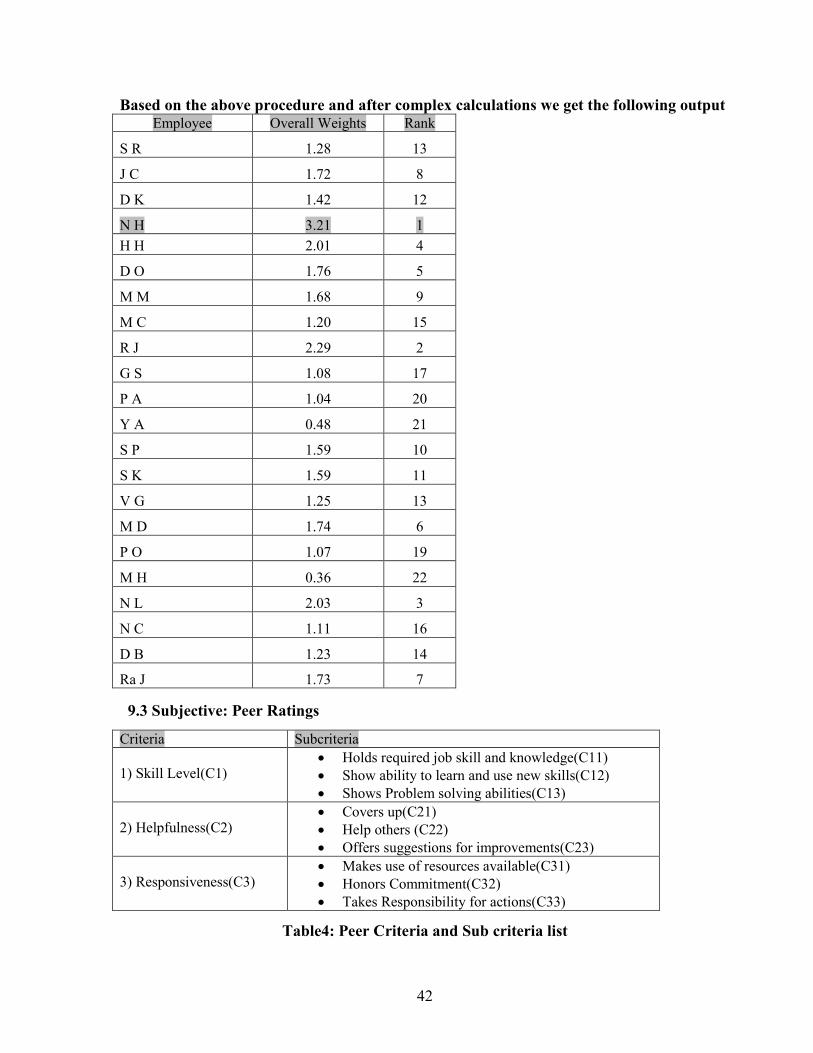
Based on the above procedure and after complex calculations we get the following output
9.3 Subjective: Peer Ratings
Table4: Peer Criteria and Sub criteria list
Employee Overall Weights Rank
S R 1.28 13
J C 1.72 8
D K 1.42 12
N H 3.21 1 H H 2.01 4
D O 1.76 5
M M 1.68 9
M C 1.20 15
R J 2.29 2
G S 1.08 17
P A 1.04 20
Y A 0.48 21
S P 1.59 10
S K 1.59 11
V G 1.25 13
M D 1.74 6
P O 1.07 19
M H 0.36 22
N L 2.03 3
N C 1.11 16
D B 1.23 14
Ra J 1.73 7
Criteria Subcriteria 1) Skill Level(C1)
• Holds required job skill and knowledge(C11) • Show ability to learn and use new skills(C12) • Shows Problem solving abilities(C13)
2) Helpfulness(C2)
• Covers up(C21) • Help others (C22) • Offers suggestions for improvements(C23)
3) Responsiveness(C3)
• Makes use of resources available(C31) • Honors Commitment(C32) • Takes Responsibility for actions(C33)
43
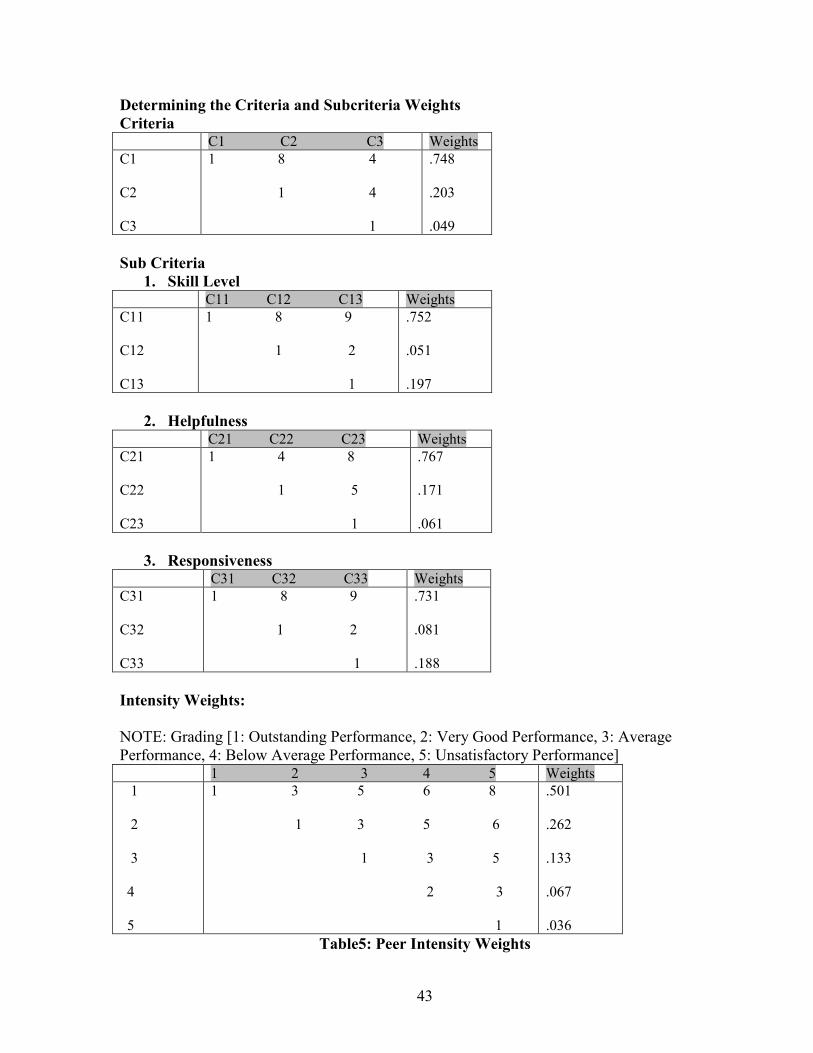
Determining the Criteria and Subcriteria Weights Criteria C1 C2 C3 Weights C1 C2 C3
1 8 4 1 4 1
.748 .203 .049
Sub Criteria
1. Skill Level C11 C12 C13 Weights C11 C12 C13
1 8 9 1 2 1
.752 .051 .197
2. Helpfulness
C21 C22 C23 Weights C21 C22 C23
1 4 8 1 5 1
.767 .171 .061
3. Responsiveness
C31 C32 C33 Weights C31 C32 C33
1 8 9 1 2 1
.731 .081 .188
Intensity Weights: NOTE: Grading [1: Outstanding Performance, 2: Very Good Performance, 3: Average Performance, 4: Below Average Performance, 5: Unsatisfactory Performance] 1 2 3 4 5 Weights 1 2 3 4 5
1 3 5 6 8 1 3 5 6 1 3 5 2 3
1
.501 .262 .133 .067 .036
Table5: Peer Intensity Weights
44
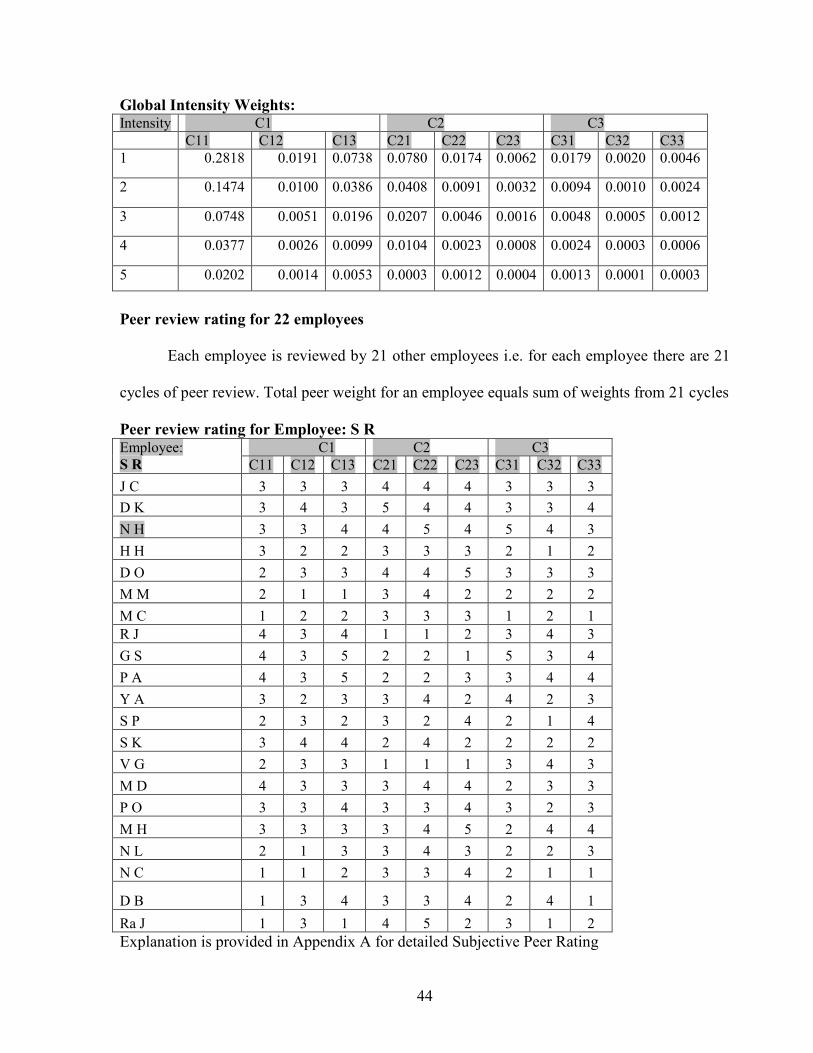
Global Intensity Weights: Intensity C1 C2 C3 C11 C12 C13 C21 C22 C23 C31 C32 C33 1 0.2818 0.0191 0.0738 0.0780 0.0174 0.0062 0.0179 0.0020 0.0046
2 0.1474 0.0100 0.0386 0.0408 0.0091 0.0032 0.0094 0.0010 0.0024
3 0.0748 0.0051 0.0196 0.0207 0.0046 0.0016 0.0048 0.0005 0.0012
4 0.0377 0.0026 0.0099 0.0104 0.0023 0.0008 0.0024 0.0003 0.0006
5 0.0202 0.0014 0.0053 0.0003 0.0012 0.0004 0.0013 0.0001 0.0003
Peer review rating for 22 employees
Each employee is reviewed by 21 other employees i.e. for each employee there are 21
cycles of peer review. Total peer weight for an employee equals sum of weights from 21 cycles
Peer review rating for Employee: S R Employee: S R
C1 C2 C3 C11 C12 C13 C21 C22 C23 C31 C32 C33
J C 3 3 3 4 4 4 3 3 3 D K 3 4 3 5 4 4 3 3 4 N H 3 3 4 4 5 4 5 4 3 H H 3 2 2 3 3 3 2 1 2 D O 2 3 3 4 4 5 3 3 3 M M 2 1 1 3 4 2 2 2 2 M C 1 2 2 3 3 3 1 2 1 R J 4 3 4 1 1 2 3 4 3 G S 4 3 5 2 2 1 5 3 4 P A 4 3 5 2 2 3 3 4 4 Y A 3 2 3 3 4 2 4 2 3 S P 2 3 2 3 2 4 2 1 4 S K 3 4 4 2 4 2 2 2 2 V G 2 3 3 1 1 1 3 4 3 M D 4 3 3 3 4 4 2 3 3 P O 3 3 4 3 3 4 3 2 3 M H 3 3 3 3 4 5 2 4 4 N L 2 1 3 3 4 3 2 2 3 N C 1 1 2 3 3 4 2 1 1
D B 1 3 4 3 3 4 2 4 1
Ra J 1 3 1 4 5 2 3 1 2 Explanation is provided in Appendix A for detailed Subjective Peer Rating
45
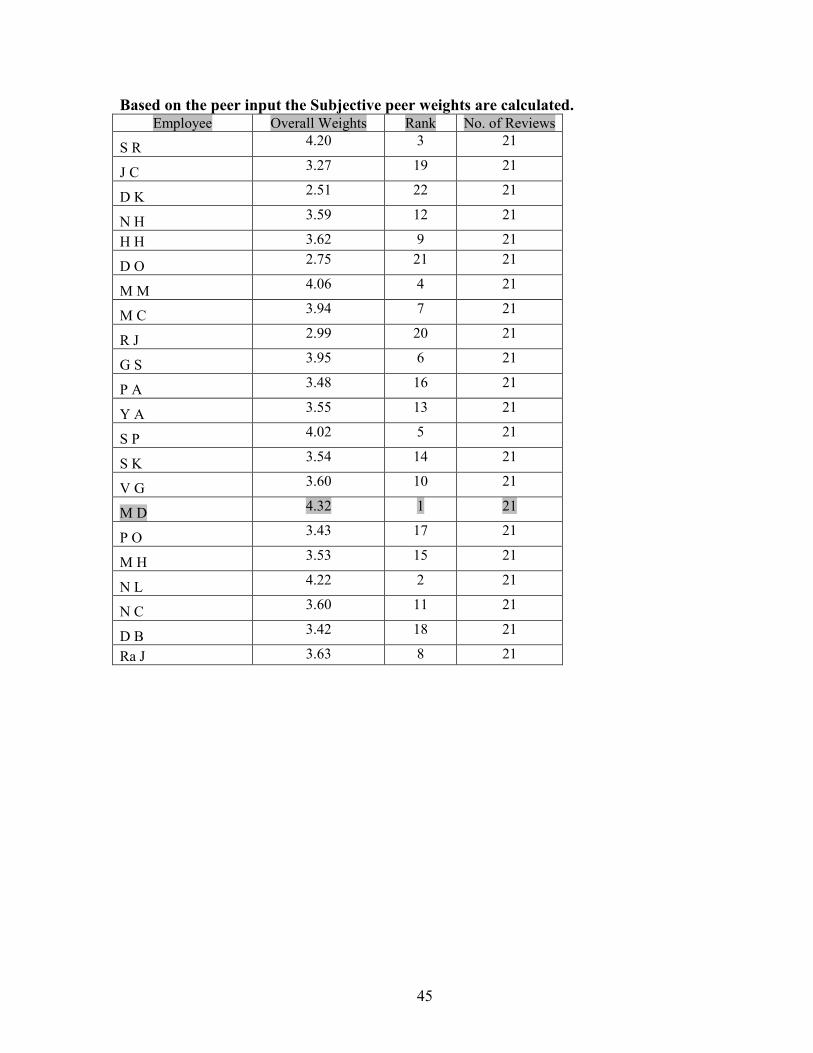
Based on the peer input the Subjective peer weights are calculated.
Employee Overall Weights Rank No. of Reviews
S R 4.20 3 21
J C 3.27 19 21
D K 2.51 22 21
N H 3.59 12 21
H H 3.62 9 21
D O 2.75 21 21
M M 4.06 4 21
M C 3.94 7 21
R J 2.99 20 21
G S 3.95 6 21
P A 3.48 16 21
Y A 3.55 13 21
S P 4.02 5 21
S K 3.54 14 21
V G 3.60 10 21
M D 4.32 1 21
P O 3.43 17 21
M H 3.53 15 21
N L 4.22 2 21
N C 3.60 11 21
D B 3.42 18 21
Ra J 3.63 8 21
46
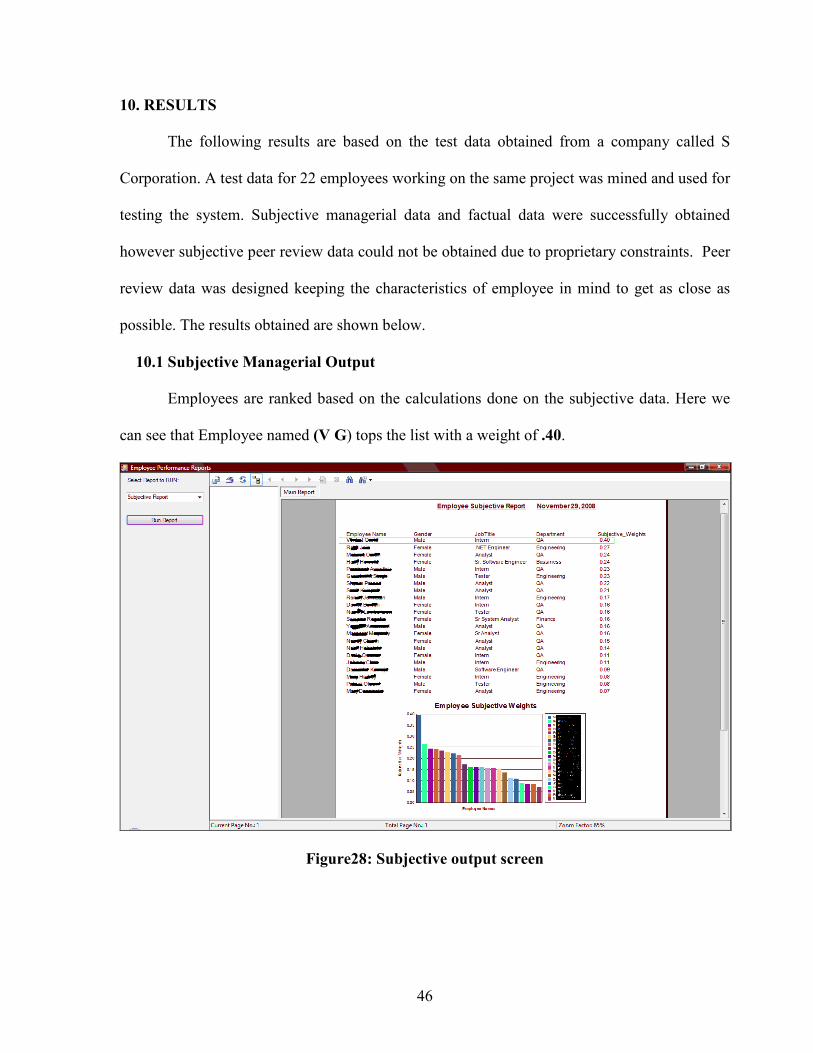
10. RESULTS
The following results are based on the test data obtained from a company called S
Corporation. A test data for 22 employees working on the same project was mined and used for
testing the system. Subjective managerial data and factual data were successfully obtained
however subjective peer review data could not be obtained due to proprietary constraints. Peer
review data was designed keeping the characteristics of employee in mind to get as close as
possible. The results obtained are shown below.
10.1 Subjective Managerial Output
Employees are ranked based on the calculations done on the subjective data. Here we
can see that Employee named (V G) tops the list with a weight of .40.
Figure28: Subjective output screen
47
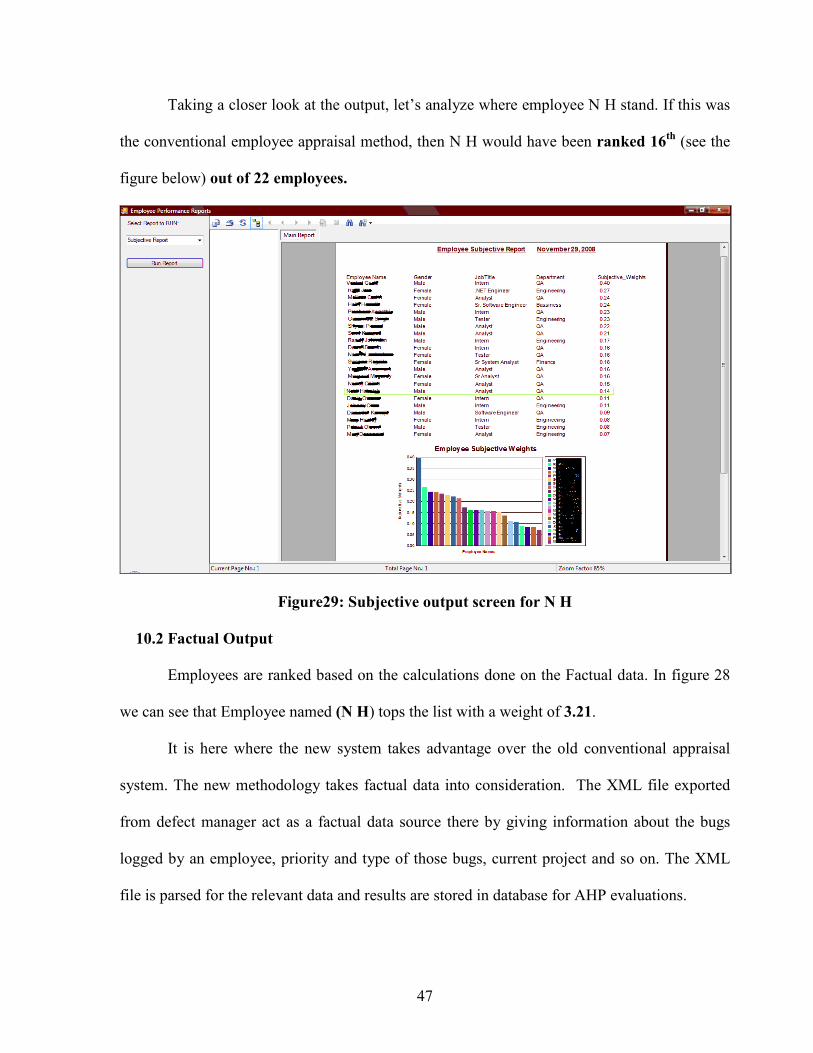
Taking a closer look at the output, let’s analyze where employee N H stand. If this was
the conventional employee appraisal method, then N H would have been ranked 16th (see the
figure below) out of 22 employees.
Figure29: Subjective output screen for N H
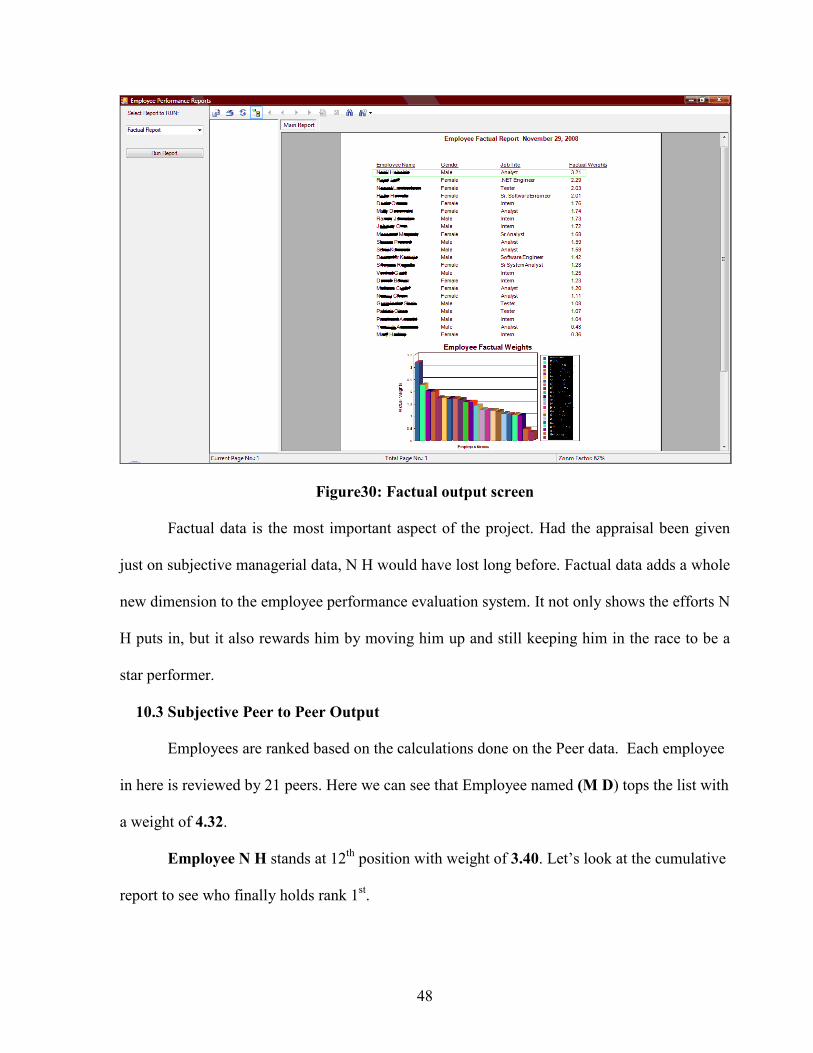
10.2 Factual Output
Employees are ranked based on the calculations done on the Factual data. In figure 28
we can see that Employee named (N H) tops the list with a weight of 3.21.
It is here where the new system takes advantage over the old conventional appraisal
system. The new methodology takes factual data into consideration. The XML file exported
from defect manager act as a factual data source there by giving information about the bugs
logged by an employee, priority and type of those bugs, current project and so on. The XML
file is parsed for the relevant data and results are stored in database for AHP evaluations.
48
Figure30: Factual output screen
Factual data is the most important aspect of the project. Had the appraisal been given
just on subjective managerial data, N H would have lost long before. Factual data adds a whole
new dimension to the employee performance evaluation system. It not only shows the efforts N
H puts in, but it also rewards him by moving him up and still keeping him in the race to be a
star performer.
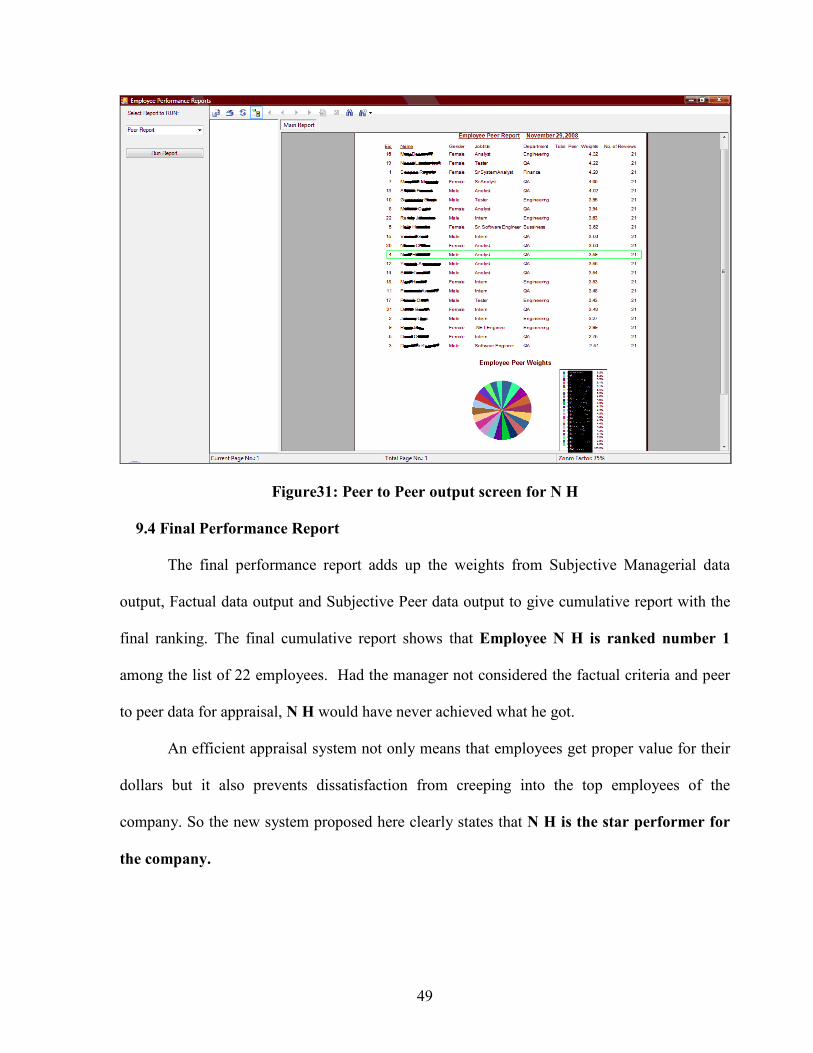
10.3 Subjective Peer to Peer Output
Employees are ranked based on the calculations done on the Peer data. Each employee
in here is reviewed by 21 peers. Here we can see that Employee named (M D) tops the list with
a weight of 4.32.
Employee N H stands at 12th position with weight of 3.40. Let’s look at the cumulative
report to see who finally holds rank 1st.
49
Figure31: Peer to Peer output screen for N H
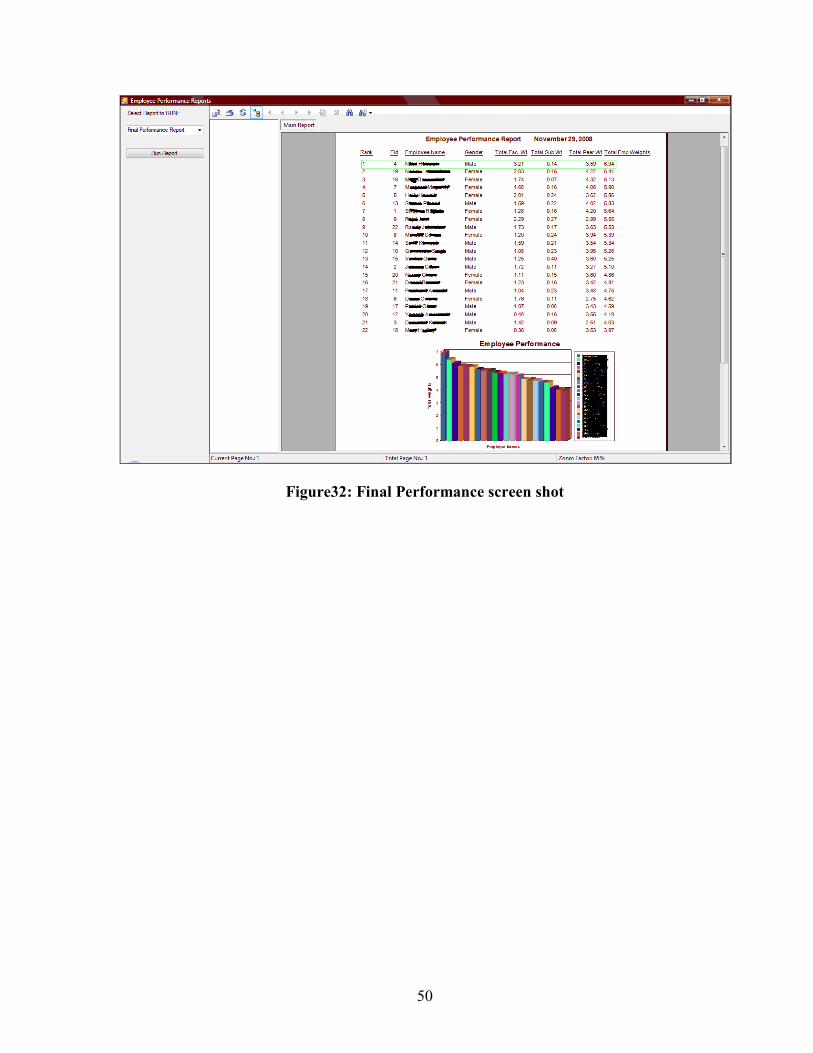
9.4 Final Performance Report
The final performance report adds up the weights from Subjective Managerial data
output, Factual data output and Subjective Peer data output to give cumulative report with the
final ranking. The final cumulative report shows that Employee N H is ranked number 1
among the list of 22 employees. Had the manager not considered the factual criteria and peer
to peer data for appraisal, N H would have never achieved what he got.
An efficient appraisal system not only means that employees get proper value for their
dollars but it also prevents dissatisfaction from creeping into the top employees of the
company. So the new system proposed here clearly states that N H is the star performer for
the company.
50
Figure32: Final Performance screen shot
51
11. CONCLUSION
After successful implementation of the idea, I conclude by saying multi-source data
should be taken into consideration to develop an efficient Employee performance appraisal
system. Taking into account just the subjective managerial data is not sufficient in returning
employees what they deserve. The new technique mentioned in this paper not only takes care
of the manager’s review and peer reviews of the employee but also takes care of the factual
data. It was also observed that the use of Factual data helps to overcome self influence by
reflecting the work an employee does. Factual data also helps to calculate optimum employee
performance.
AHP plays an important role in analysis of the multi-source data and giving up a
composite value. Pairwise comparisons are done for criteria of each data source and weights
for each employee is calculated based on three data sources. The composite value for each
employee is the sum of weights obtained by addition of three subweights. The computed values
are displayed to the manager graphically so that he can better conceptualize the complex multi-
source data. AHP acts as a good methodology when it comes to making complex decisions
such as in this particular case of Employee performance appraisal. I hope that companies use
the methodology being proposed in this project to provide a fair appraisal for the employee.
Employee performance appraisal using single source data and AHP are two techniques
that have been in use for decades. But the use of multi-source data along with AHP is being
proposed for the very first time. While both the techniques can stand by themselves, they are
more effective when used together and that is the essence of this project.
52
12. FUTURE WORK
Although comprehensive efforts were made to cover all aspects in this project, this system
has potential for further improvement. To better enhance the system, following developments
can be made, which can be easily incorporated in the system.
1. The current design of the system is focused on employees in a QA department. A more
generalized version can be made that fits to developer and other software personnel.
2. Efforts were made to get as accurate data as possible, but due to proprietary constraints
getting peer to peer data was difficult. The main reason responsible for this was the
lack of cooperation from companies as they would not give out the peer data.
3. A fuzzy aspect could also be taken into consideration. For example, let’s say we want
to make list of things that are important for washing clothes or I could say a good wash.
Some people say factors such as quality of detergent, efficiency of machine play an
important role, while some say load criteria ( such as heavy, medium and light) are the
deciding factors. To end this debate, fuzzy logic comes into play where lets say any 3
criterion are picked up which effect the wash to the maximum extent. A fuzzy logic can
also be applied to pick employee appraisal criteria.
4. To better enhance peer data and to neutralize the factor where one employee
deliberately gives poor review for his colleague, network messages can be studied.
Messages and emails sent over the company’s intranet are usually termed as social
messages. These messages can be studied and data can be mined for factors such as
who gets most emails seeking help, who replies promptly and so on. Numerical figures
can be deduced that can enhance peer review data.
53
REFERENCES
[1] R. Haas, O. Meixner,” An illustrated guide to Analytical Hierarchy Process” ,Pages 1-20,
2006.
[2] T L Saaty, “How to make a decision: The analytic hierarchy process”, European Journal of
Operational Research, North Holland, 1990
[3] Manager Assistant
http://www.managerassistant.com/products.html (retrived on November, 2008)
[4] Success Factor
http://www.successfactors.com/small-business/ (retrieved on November, 2008)
[5] TrakStar
http://www.promantek.com/performance_appraisal_software.html (retrieved on November,
2008)
[6] Halogen Software
http://www.halogensoftware.com/products/halogen-eappraisal/ (retrieved on November, 2008)
[7] Review SNAP
http://www.reviewsnap.com (retrieved on November, 2008)
[8] Talent Platform
http://www.icims.com/content/talentplatform.asp (retrieved on November, 2008)
[9] Blue
http://www.explorance.com/refonte/ (retrieved on November, 2008)
[10] Decision Lens
http://www.decisionlens.com/company/ (retrieved on November, 2008)
[11] S.Shrestha, J. Chalidabhongse, “Improving Employee Satisfaction on Performance
Appraisal: A Case Study on Thai Companies,” IEEE explore, vol. 1 issue 12, p1, June 2006
54
[12] Handbook for Measuring Employee Performance
www.opm.gov/perform/wppdf/handbook.pdf (retrieved on November, 2008)
[13] http://www.microsoft.com/sqlserver/2008/en/us/overview.aspx (retrieved on November,
2008)
[14] http://en.wikipedia.org/wiki/.NET_Framework (retrieved on November, 2008)
[15] http://msdn.microsoft.com/en-us/library/zw4w595w.aspx (retrieved on November, 2008)
[16] http://msdn.microsoft.com/en-us/vbasic/bb466159.aspx (retrieved on November, 2008)
[17] R. Islam, S.M. Rasad “ Employee performance evaluation by AHP: A case study”,
dISAHP 2005, pg1-16, July 8-10, 2005
[18] Defect Manager
http://www.tierasoft.com/over_defect.htm (retrieved on November, 2008)
[19] M. E. Baehr, “A review of employee evaluation procedures and a description of “high
potential” executives and professionals”, Journal of Business and Psychology, Volume 1, pg 3,
March, 1987
[20] M. A. P. Davies.” A Multicriteria Decision Model Application for Managing Group
Decisions “The Journal of the Operational Research Society, Vol. 45, pg. 47-58,1994
[21] F. A. Taylor III, A. F. Ketcham, D. Hoffman,” Personnel evaluation with AHP”,
Management Decision. London, Vol. 36, pg 679, 1998
[22] E.H. Forman, S. I. Gass, “The Analytic Hierarchy Process: An Exposition”, INFORMS,
Vol. 49, pg. 469-486, 2001
[23] R Hemaida, S. Everett,” Employee performance evaluation using the analytic hierarchy
process”, Academy of Information and Management Sciences Journal, 2003
55
[24] E. Albayrak, Y.C Erensal,” Using analytic hierarchy process (AHP) to improve human
performance: An application of multiple criteria decision making problem”, Journal of
Intelligent Manufacturing. London, Vol. 15, pg. 491, 2004
[25] D. Liu, R.R. Bishu, L Najjar,” Using the Analytical Hierarchy Process as Tool
for Assessing Service Quality”, IEMS, Vol. 4, pg. 129-135, December 2005.
[26] B. Xing, Z A-di,” Application of Fuzzy Analytical Hierarchy Process in Selecting a
Project Manager”, Management Science and Engineering, 2006
[27] S. Shrestha, J. Chalidabhongse,” Improving Employee Satisfaction on Performance
Appraisal: A Case Study on Thai Companies”, Volume 1, pg 106 – 110, 2006
[28] http://www.felixgers.de/teaching/sql/NormalForms_II.html (retrieved on November,
2008)
[29] Analytical Hierarchy Process: Overview http://thequalityportal.com/q_ahp.htm(retrived on November, 2008)
[30] http://www.performance-appraisal.com/bias.htm (retrieved on November, 2008)
56
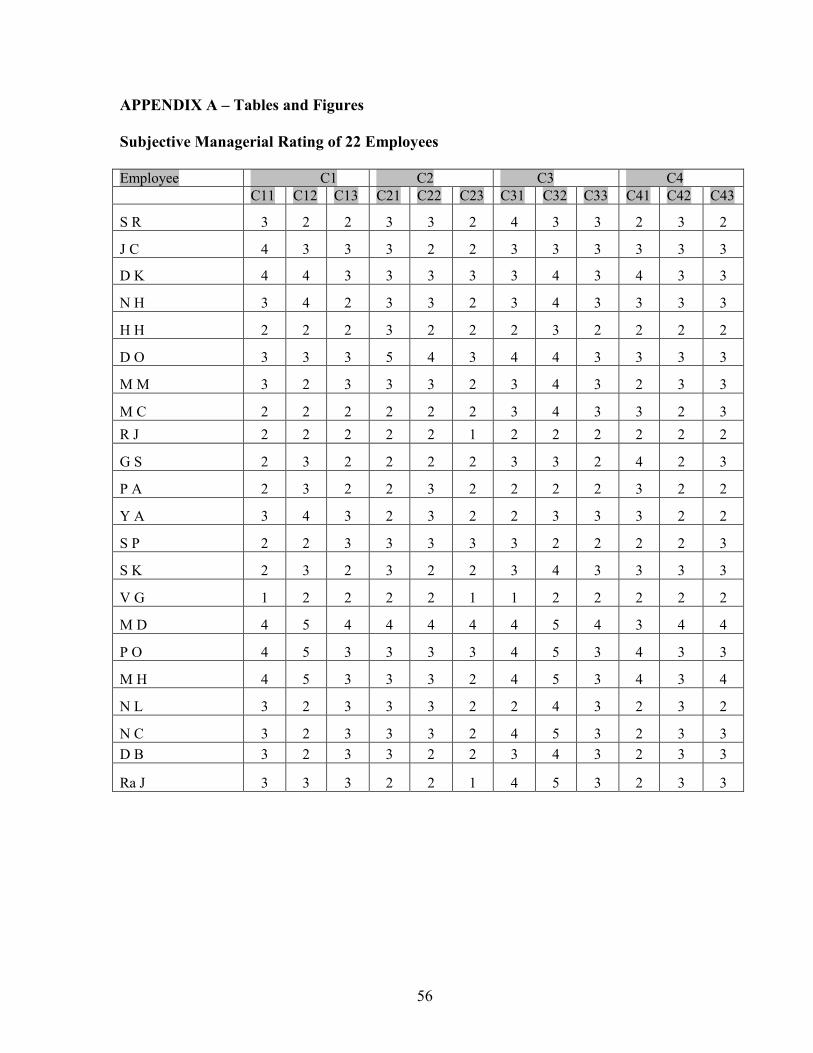
APPENDIX A – Tables and Figures
Subjective Managerial Rating of 22 Employees Employee C1 C2 C3 C4 C11 C12 C13 C21 C22 C23 C31 C32 C33 C41 C42 C43
S R 3 2 2 3 3 2 4 3 3 2 3 2
J C 4 3 3 3 2 2 3 3 3 3 3 3
D K 4 4 3 3 3 3 3 4 3 4 3 3
N H 3 4 2 3 3 2 3 4 3 3 3 3
H H 2 2 2 3 2 2 2 3 2 2 2 2
D O 3 3 3 5 4 3 4 4 3 3 3 3
M M 3 2 3 3 3 2 3 4 3 2 3 3
M C 2 2 2 2 2 2 3 4 3 3 2 3
R J 2 2 2 2 2 1 2 2 2 2 2 2
G S 2 3 2 2 2 2 3 3 2 4 2 3
P A 2 3 2 2 3 2 2 2 2 3 2 2
Y A 3 4 3 2 3 2 2 3 3 3 2 2
S P 2 2 3 3 3 3 3 2 2 2 2 3
S K 2 3 2 3 2 2 3 4 3 3 3 3
V G 1 2 2 2 2 1 1 2 2 2 2 2
M D 4 5 4 4 4 4 4 5 4 3 4 4
P O 4 5 3 3 3 3 4 5 3 4 3 3
M H 4 5 3 3 3 2 4 5 3 4 3 4
N L 3 2 3 3 3 2 2 4 3 2 3 2
N C 3 2 3 3 3 2 4 5 3 2 3 3 D B 3 2 3 3 2 2 3 4 3 2 3 3
Ra J 3 3 3 2 2 1 4 5 3 2 3 3
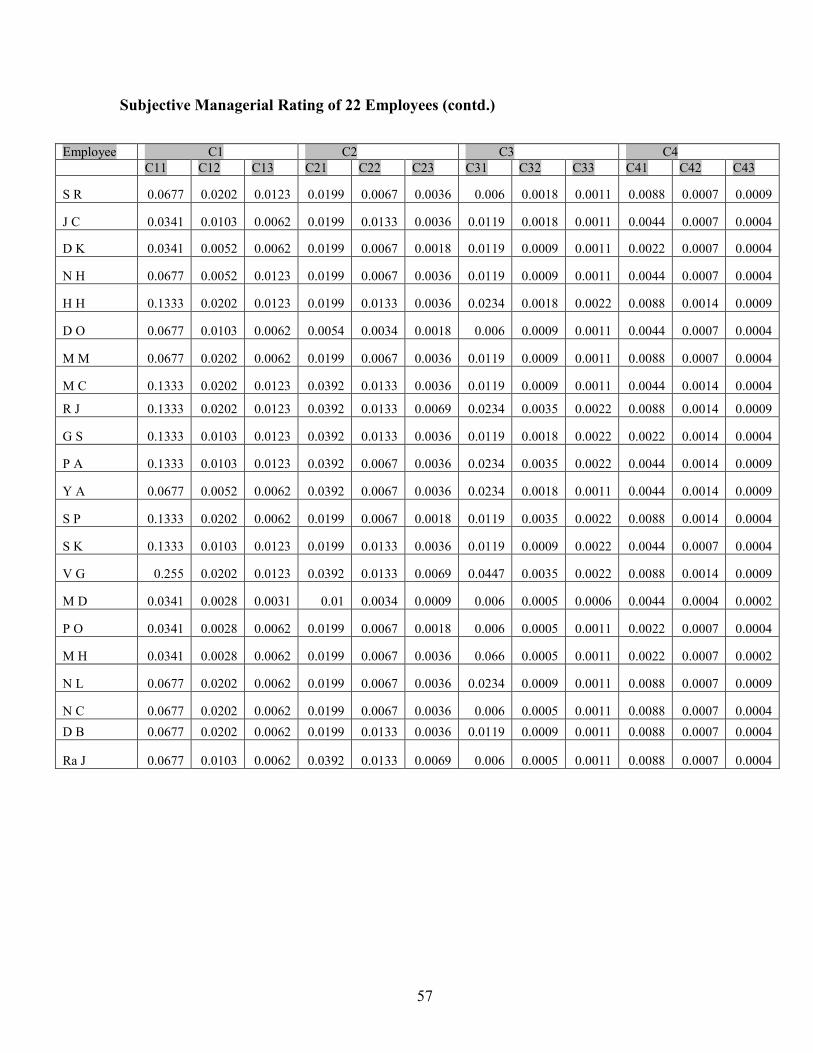
57
Subjective Managerial Rating of 22 Employees (contd.)
Employee C1 C2 C3 C4 C11 C12 C13 C21 C22 C23 C31 C32 C33 C41 C42 C43
S R 0.0677 0.0202 0.0123 0.0199 0.0067 0.0036 0.006 0.0018 0.0011 0.0088 0.0007 0.0009
J C 0.0341 0.0103 0.0062 0.0199 0.0133 0.0036 0.0119 0.0018 0.0011 0.0044 0.0007 0.0004
D K 0.0341 0.0052 0.0062 0.0199 0.0067 0.0018 0.0119 0.0009 0.0011 0.0022 0.0007 0.0004
N H 0.0677 0.0052 0.0123 0.0199 0.0067 0.0036 0.0119 0.0009 0.0011 0.0044 0.0007 0.0004
H H 0.1333 0.0202 0.0123 0.0199 0.0133 0.0036 0.0234 0.0018 0.0022 0.0088 0.0014 0.0009
D O 0.0677 0.0103 0.0062 0.0054 0.0034 0.0018 0.006 0.0009 0.0011 0.0044 0.0007 0.0004
M M 0.0677 0.0202 0.0062 0.0199 0.0067 0.0036 0.0119 0.0009 0.0011 0.0088 0.0007 0.0004
M C 0.1333 0.0202 0.0123 0.0392 0.0133 0.0036 0.0119 0.0009 0.0011 0.0044 0.0014 0.0004
R J 0.1333 0.0202 0.0123 0.0392 0.0133 0.0069 0.0234 0.0035 0.0022 0.0088 0.0014 0.0009
G S 0.1333 0.0103 0.0123 0.0392 0.0133 0.0036 0.0119 0.0018 0.0022 0.0022 0.0014 0.0004
P A 0.1333 0.0103 0.0123 0.0392 0.0067 0.0036 0.0234 0.0035 0.0022 0.0044 0.0014 0.0009
Y A 0.0677 0.0052 0.0062 0.0392 0.0067 0.0036 0.0234 0.0018 0.0011 0.0044 0.0014 0.0009
S P 0.1333 0.0202 0.0062 0.0199 0.0067 0.0018 0.0119 0.0035 0.0022 0.0088 0.0014 0.0004
S K 0.1333 0.0103 0.0123 0.0199 0.0133 0.0036 0.0119 0.0009 0.0022 0.0044 0.0007 0.0004
V G 0.255 0.0202 0.0123 0.0392 0.0133 0.0069 0.0447 0.0035 0.0022 0.0088 0.0014 0.0009
M D 0.0341 0.0028 0.0031 0.01 0.0034 0.0009 0.006 0.0005 0.0006 0.0044 0.0004 0.0002
P O 0.0341 0.0028 0.0062 0.0199 0.0067 0.0018 0.006 0.0005 0.0011 0.0022 0.0007 0.0004
M H 0.0341 0.0028 0.0062 0.0199 0.0067 0.0036 0.066 0.0005 0.0011 0.0022 0.0007 0.0002
N L 0.0677 0.0202 0.0062 0.0199 0.0067 0.0036 0.0234 0.0009 0.0011 0.0088 0.0007 0.0009
N C 0.0677 0.0202 0.0062 0.0199 0.0067 0.0036 0.006 0.0005 0.0011 0.0088 0.0007 0.0004
D B 0.0677 0.0202 0.0062 0.0199 0.0133 0.0036 0.0119 0.0009 0.0011 0.0088 0.0007 0.0004
Ra J 0.0677 0.0103 0.0062 0.0392 0.0133 0.0069 0.006 0.0005 0.0011 0.0088 0.0007 0.0004
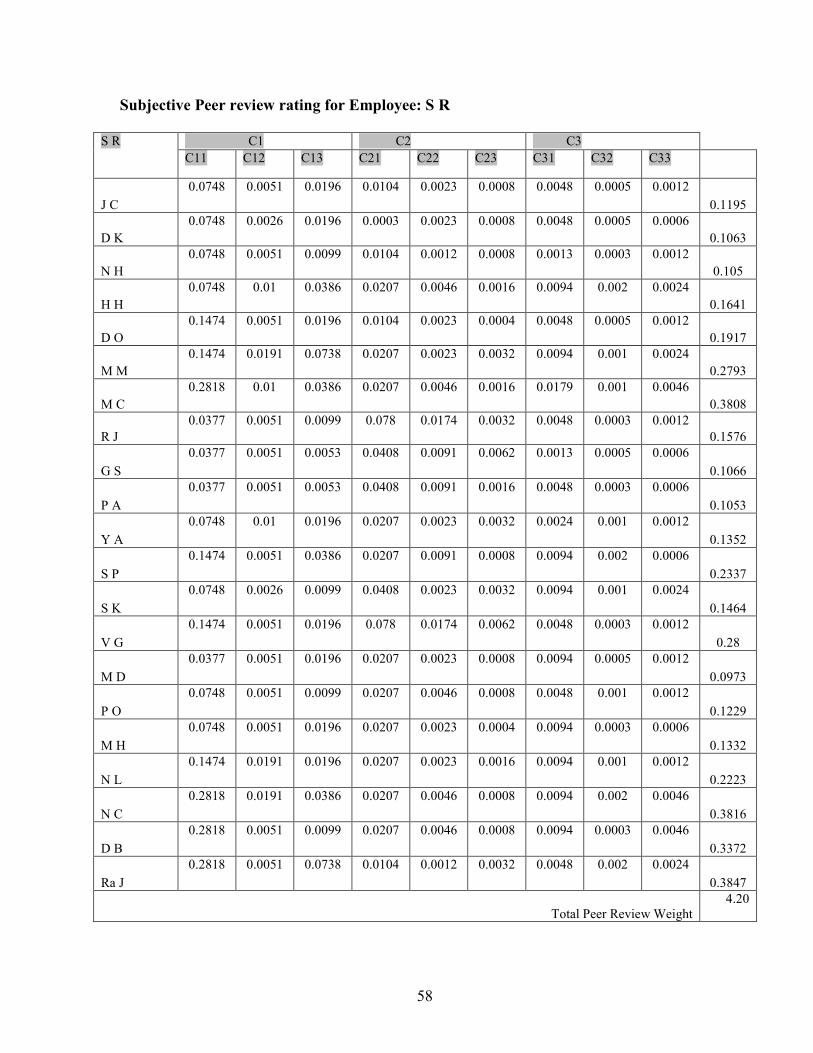
58
Subjective Peer review rating for Employee: S R
S R C1 C2 C3 C11 C12 C13 C21 C22 C23 C31 C32 C33
J C 0.0748 0.0051 0.0196 0.0104 0.0023 0.0008 0.0048 0.0005 0.0012
0.1195
D K 0.0748 0.0026 0.0196 0.0003 0.0023 0.0008 0.0048 0.0005 0.0006
0.1063
N H 0.0748 0.0051 0.0099 0.0104 0.0012 0.0008 0.0013 0.0003 0.0012
0.105
H H 0.0748 0.01 0.0386 0.0207 0.0046 0.0016 0.0094 0.002 0.0024
0.1641
D O 0.1474 0.0051 0.0196 0.0104 0.0023 0.0004 0.0048 0.0005 0.0012
0.1917
M M 0.1474 0.0191 0.0738 0.0207 0.0023 0.0032 0.0094 0.001 0.0024
0.2793
M C 0.2818 0.01 0.0386 0.0207 0.0046 0.0016 0.0179 0.001 0.0046
0.3808
R J 0.0377 0.0051 0.0099 0.078 0.0174 0.0032 0.0048 0.0003 0.0012
0.1576
G S 0.0377 0.0051 0.0053 0.0408 0.0091 0.0062 0.0013 0.0005 0.0006
0.1066
P A 0.0377 0.0051 0.0053 0.0408 0.0091 0.0016 0.0048 0.0003 0.0006
0.1053
Y A 0.0748 0.01 0.0196 0.0207 0.0023 0.0032 0.0024 0.001 0.0012
0.1352
S P 0.1474 0.0051 0.0386 0.0207 0.0091 0.0008 0.0094 0.002 0.0006
0.2337
S K 0.0748 0.0026 0.0099 0.0408 0.0023 0.0032 0.0094 0.001 0.0024
0.1464
V G 0.1474 0.0051 0.0196 0.078 0.0174 0.0062 0.0048 0.0003 0.0012
0.28
M D 0.0377 0.0051 0.0196 0.0207 0.0023 0.0008 0.0094 0.0005 0.0012
0.0973
P O 0.0748 0.0051 0.0099 0.0207 0.0046 0.0008 0.0048 0.001 0.0012
0.1229
M H 0.0748 0.0051 0.0196 0.0207 0.0023 0.0004 0.0094 0.0003 0.0006
0.1332
N L 0.1474 0.0191 0.0196 0.0207 0.0023 0.0016 0.0094 0.001 0.0012
0.2223
N C 0.2818 0.0191 0.0386 0.0207 0.0046 0.0008 0.0094 0.002 0.0046
0.3816
D B 0.2818 0.0051 0.0099 0.0207 0.0046 0.0008 0.0094 0.0003 0.0046
0.3372
Ra J 0.2818 0.0051 0.0738 0.0104 0.0012 0.0032 0.0048 0.002 0.0024
0.3847
Total Peer Review Weight 4.20
59
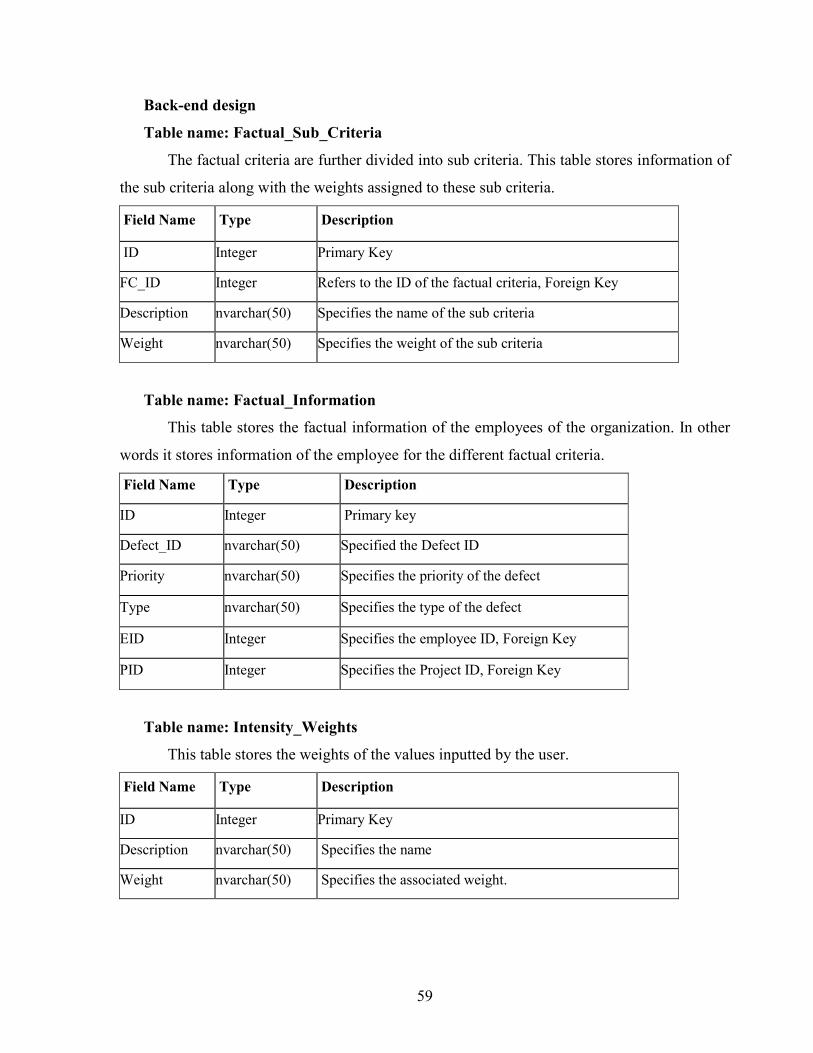
Back-end design
Table name: Factual_Sub_Criteria
The factual criteria are further divided into sub criteria. This table stores information of
the sub criteria along with the weights assigned to these sub criteria.
Field Name Type Description
ID Integer Primary Key
FC_ID Integer Refers to the ID of the factual criteria, Foreign Key
Description nvarchar(50) Specifies the name of the sub criteria
Weight nvarchar(50) Specifies the weight of the sub criteria
Table name: Factual_Information
This table stores the factual information of the employees of the organization. In other
words it stores information of the employee for the different factual criteria.
Field Name Type Description
ID Integer Primary key
Defect_ID nvarchar(50) Specified the Defect ID
Priority nvarchar(50) Specifies the priority of the defect
Type nvarchar(50) Specifies the type of the defect
EID Integer Specifies the employee ID, Foreign Key
PID Integer Specifies the Project ID, Foreign Key
Table name: Intensity_Weights
This table stores the weights of the values inputted by the user.
Field Name Type Description
ID Integer Primary Key
Description nvarchar(50) Specifies the name
Weight nvarchar(50) Specifies the associated weight.
60
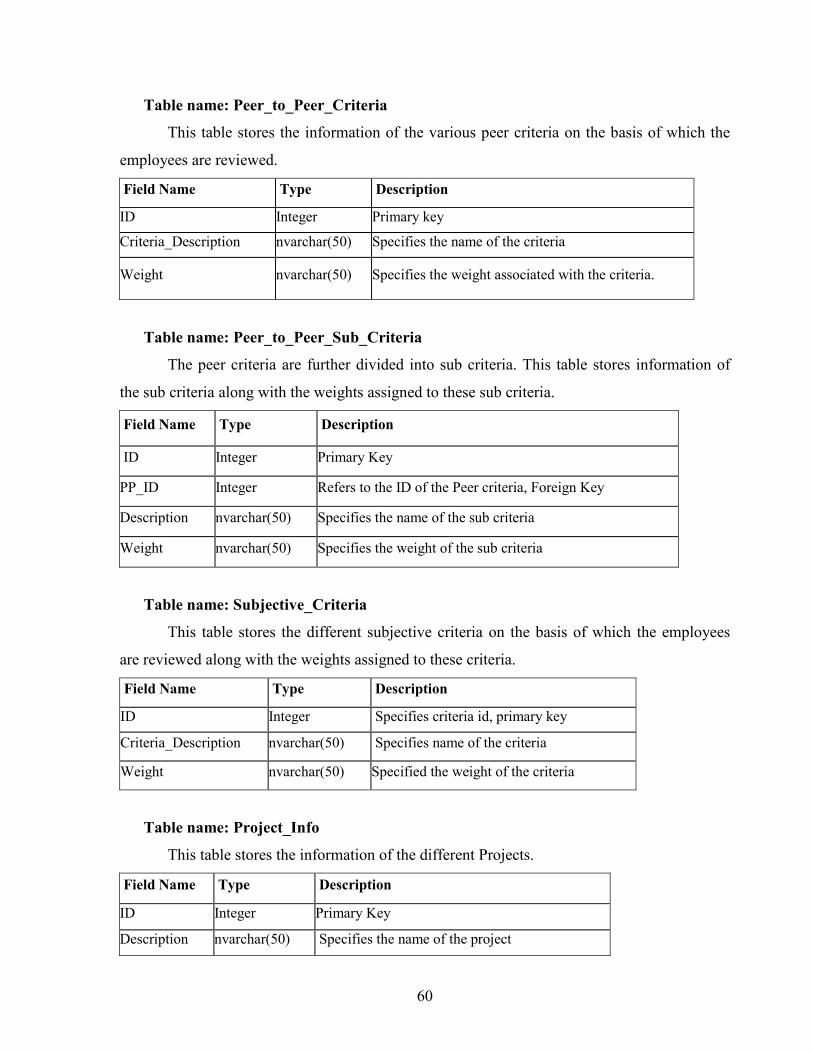
Table name: Peer_to_Peer_Criteria
This table stores the information of the various peer criteria on the basis of which the
employees are reviewed.
Field Name Type Description
ID Integer Primary key
Criteria_Description nvarchar(50) Specifies the name of the criteria
Weight nvarchar(50) Specifies the weight associated with the criteria.
Table name: Peer_to_Peer_Sub_Criteria
The peer criteria are further divided into sub criteria. This table stores information of
the sub criteria along with the weights assigned to these sub criteria.
Field Name Type Description
ID Integer Primary Key
PP_ID Integer Refers to the ID of the Peer criteria, Foreign Key
Description nvarchar(50) Specifies the name of the sub criteria
Weight nvarchar(50) Specifies the weight of the sub criteria
Table name: Subjective_Criteria
This table stores the different subjective criteria on the basis of which the employees
are reviewed along with the weights assigned to these criteria.
Field Name Type Description
ID Integer Specifies criteria id, primary key
Criteria_Description nvarchar(50) Specifies name of the criteria
Weight nvarchar(50) Specified the weight of the criteria
Table name: Project_Info
This table stores the information of the different Projects.
Field Name Type Description
ID Integer Primary Key
Description nvarchar(50) Specifies the name of the project
61
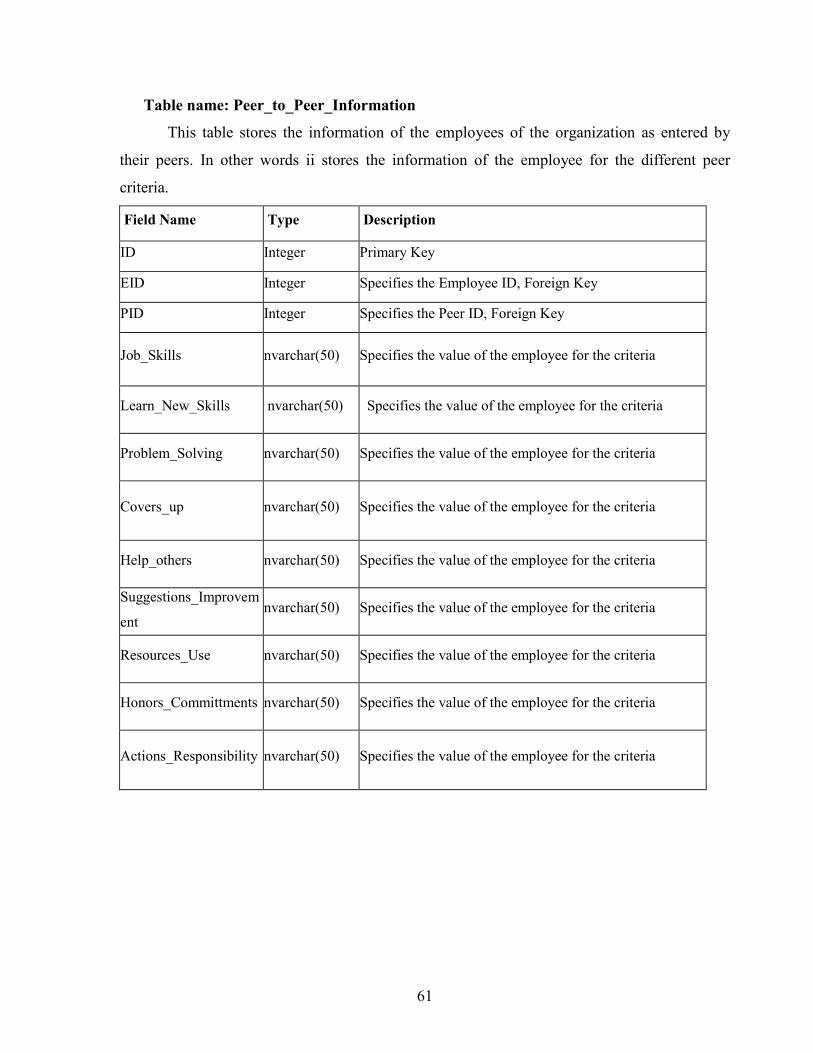
Table name: Peer_to_Peer_Information
This table stores the information of the employees of the organization as entered by
their peers. In other words ii stores the information of the employee for the different peer
criteria.
Field Name Type Description
ID Integer Primary Key
EID Integer Specifies the Employee ID, Foreign Key
PID Integer Specifies the Peer ID, Foreign Key
Job_Skills nvarchar(50) Specifies the value of the employee for the criteria
Learn_New_Skills nvarchar(50) Specifies the value of the employee for the criteria
Problem_Solving nvarchar(50) Specifies the value of the employee for the criteria
Covers_up nvarchar(50) Specifies the value of the employee for the criteria
Help_others nvarchar(50) Specifies the value of the employee for the criteria
Suggestions_Improvem
ent nvarchar(50) Specifies the value of the employee for the criteria
Resources_Use nvarchar(50) Specifies the value of the employee for the criteria
Honors_Committments nvarchar(50) Specifies the value of the employee for the criteria
Actions_Responsibility nvarchar(50) Specifies the value of the employee for the criteria
62
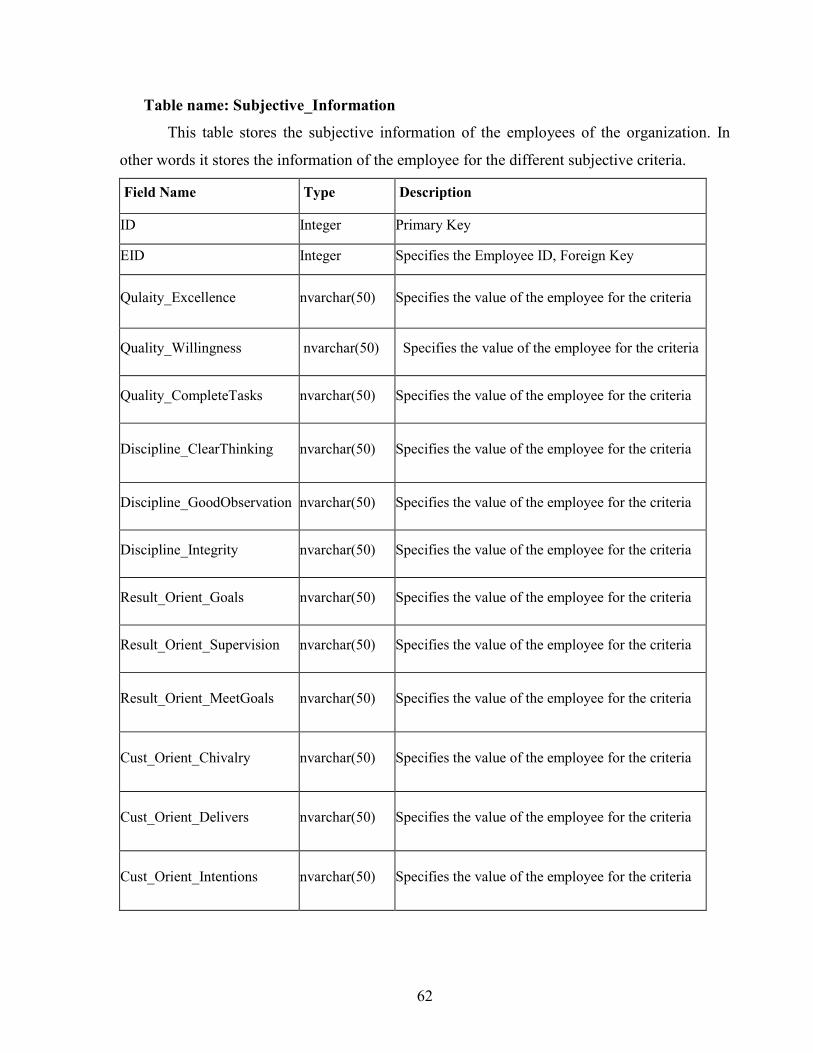
Table name: Subjective_Information
This table stores the subjective information of the employees of the organization. In
other words it stores the information of the employee for the different subjective criteria.
Field Name Type Description
ID Integer Primary Key
EID Integer Specifies the Employee ID, Foreign Key
Qulaity_Excellence nvarchar(50) Specifies the value of the employee for the criteria
Quality_Willingness nvarchar(50) Specifies the value of the employee for the criteria
Quality_CompleteTasks nvarchar(50) Specifies the value of the employee for the criteria
Discipline_ClearThinking nvarchar(50) Specifies the value of the employee for the criteria
Discipline_GoodObservation nvarchar(50) Specifies the value of the employee for the criteria
Discipline_Integrity nvarchar(50) Specifies the value of the employee for the criteria
Result_Orient_Goals nvarchar(50) Specifies the value of the employee for the criteria
Result_Orient_Supervision nvarchar(50) Specifies the value of the employee for the criteria
Result_Orient_MeetGoals nvarchar(50) Specifies the value of the employee for the criteria
Cust_Orient_Chivalry nvarchar(50) Specifies the value of the employee for the criteria
Cust_Orient_Delivers nvarchar(50) Specifies the value of the employee for the criteria
Cust_Orient_Intentions nvarchar(50) Specifies the value of the employee for the criteria
63
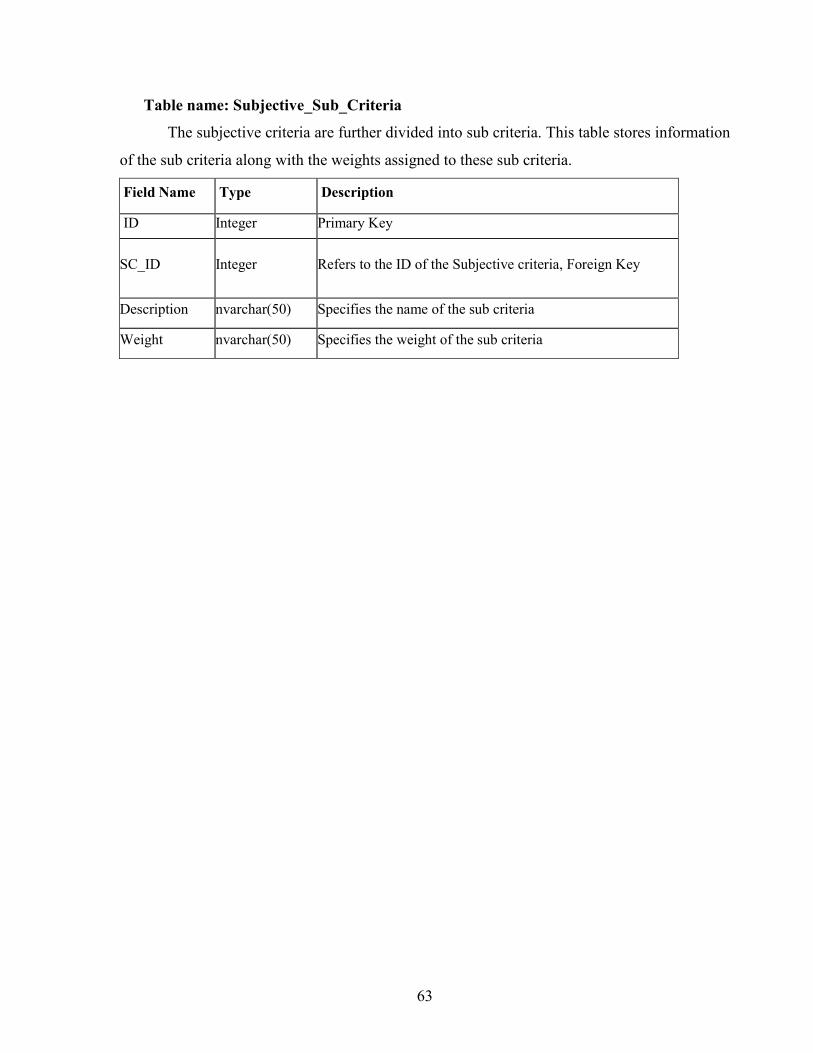
Table name: Subjective_Sub_Criteria
The subjective criteria are further divided into sub criteria. This table stores information
of the sub criteria along with the weights assigned to these sub criteria.
Field Name Type Description
ID Integer Primary Key
SC_ID Integer Refers to the ID of the Subjective criteria, Foreign Key
Description nvarchar(50) Specifies the name of the sub criteria
Weight nvarchar(50) Specifies the weight of the sub criteria
64
Em
plo
yee
EID
Nam
e HireDate
Manager_ID
Is_M
anager PID JobTtile
Gender
Department
Fac
tual
_Crite
ria
ID
Description
Weight
Fac
tual
_Info
rmat
ion
Fac
tual
_Sub_C
rite
ria
ID
FC_ID
Description
Weight
Pro
ject
_Info
ID
Description
Pee
r_to
_Pee
r_C
rite
ria
ID
Criteria_Description
Weight
Pee
r_to
_Pee
r_Sub_C
rite
ria
Pee
r_to
_Pee
r_In
form
atio
n
ID
EID
PID
Job_Skills
Learn_New_Skills
Problem
_Solving
Covers_up
Help_others
Suggestions_Improvem
ent
Resources_Use
Honors_Com
mittments
Actions_Responsibility
Inte
nsi
ty_W
eights
ID
Description
Weight
Subje
ctiv
e_C
rite
ria
ID
Criteria_Description
Weight
Subje
ctiv
e_In
form
atio
n
ID
EID Quality_Excellence
Quality_Willingness
Quality_Com
pleteTasks
Discipline_ClearThinking
Discipline_GoodO
bservation
Descipline_Integrity
Result_Orient_G
oals
Result_Orient_Supervision
Result_Orient_M
eetGoals
Cust_Orient_Chivalry
Cust_Orient_Delivers
Cust_Orient_Intentions
Subje
ctiv
e_Sub_C
rite
ria
ID
SC_ID
Description
Weight
Fig
ure
33: S
chem
a fo
r E
mplo
yee
Per
form
ance
Rev
iew
ID
Defect_ID
Priority
Type
EID
PID
ID
PP_ID
Description
Weight
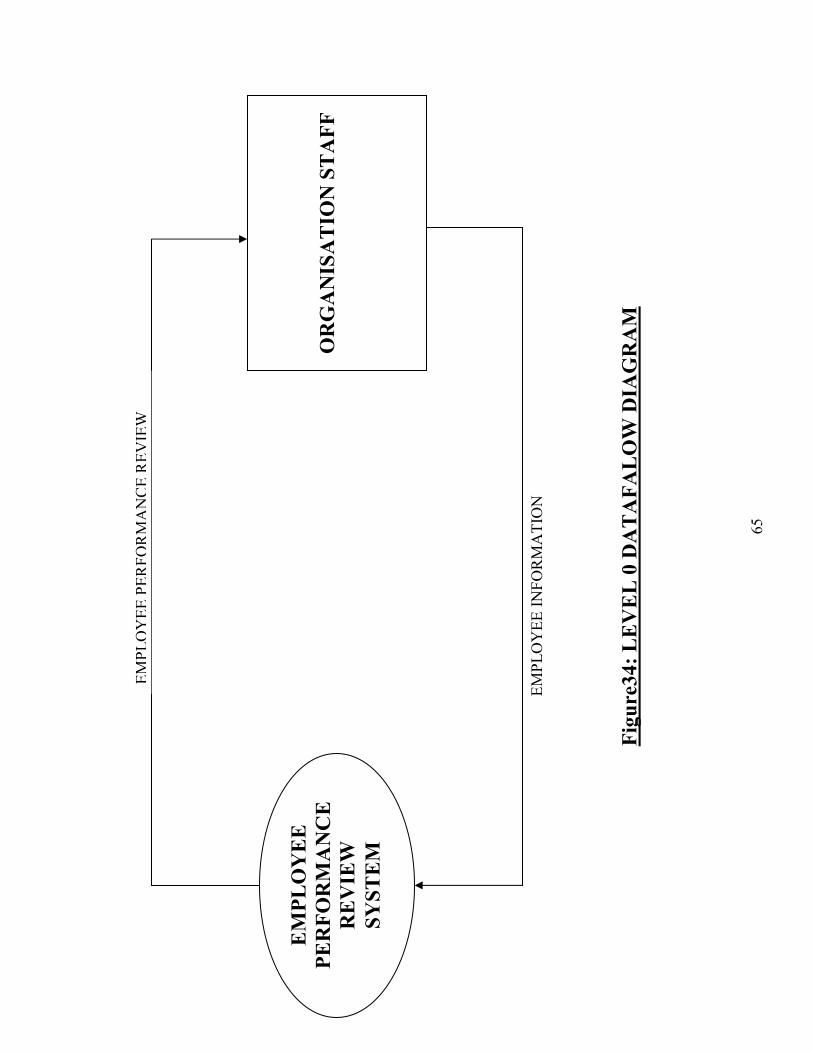
65
Fig
ure3
4: L
EVEL 0 D
ATAFALO
W D
IAGRAM
EM
PLOYEE
PERFORM
ANCE
REVIE
W
SYST
EM
ORGANIS
ATIO
N S
TAFF
EMPL
OYEE PERFO
RMANCE REVIEW
EMPL
OYEE IN
FORMATIO
N
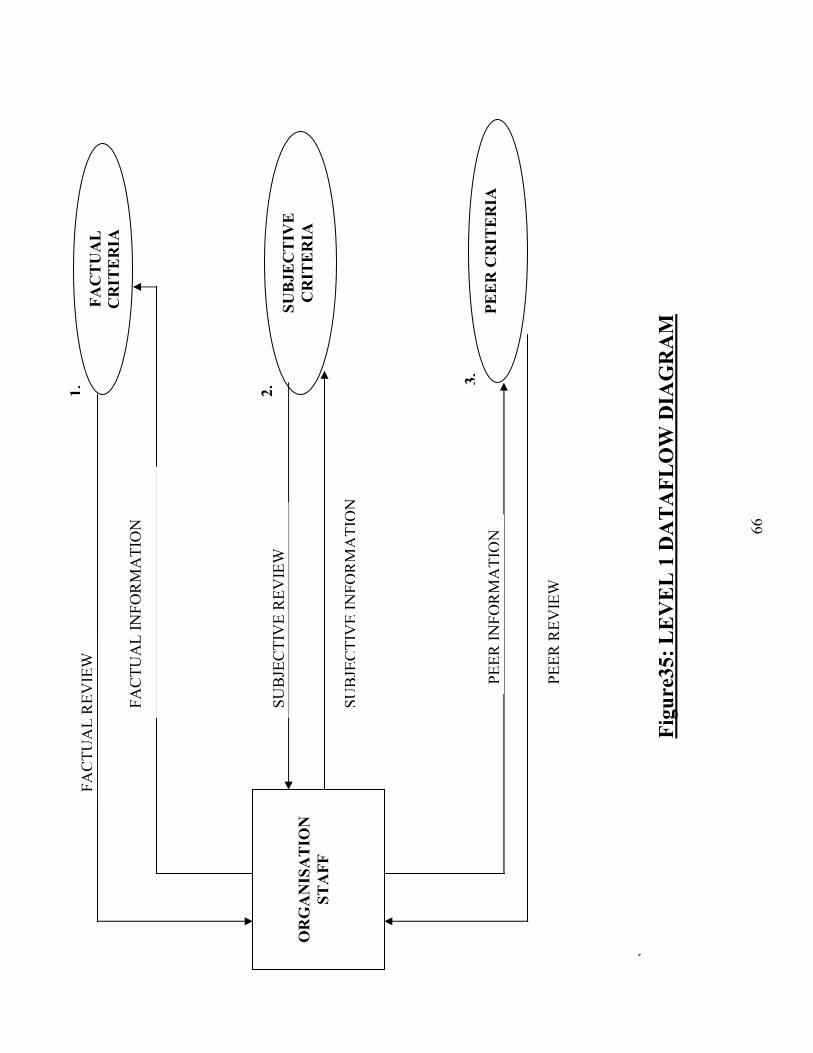
66
` Fig
ure3
5: L
EVEL 1 D
ATAFLO
W D
IAGRAM
O
RGANIS
ATIO
N
STAFF
FACTUAL
CRIT
ERIA
SUBJE
CTIV
E
CRIT
ERIA
PEER C
RIT
ERIA
1.
2. 3.
FACTUAL IN
FORMATIO
N
FACTUAL REVIEW
SUBJE
CTIV
E REVIEW
SUBJE
CTIV
E IN
FORMATIO
N
PEER IN
FORMATIO
N
PEER REVIEW
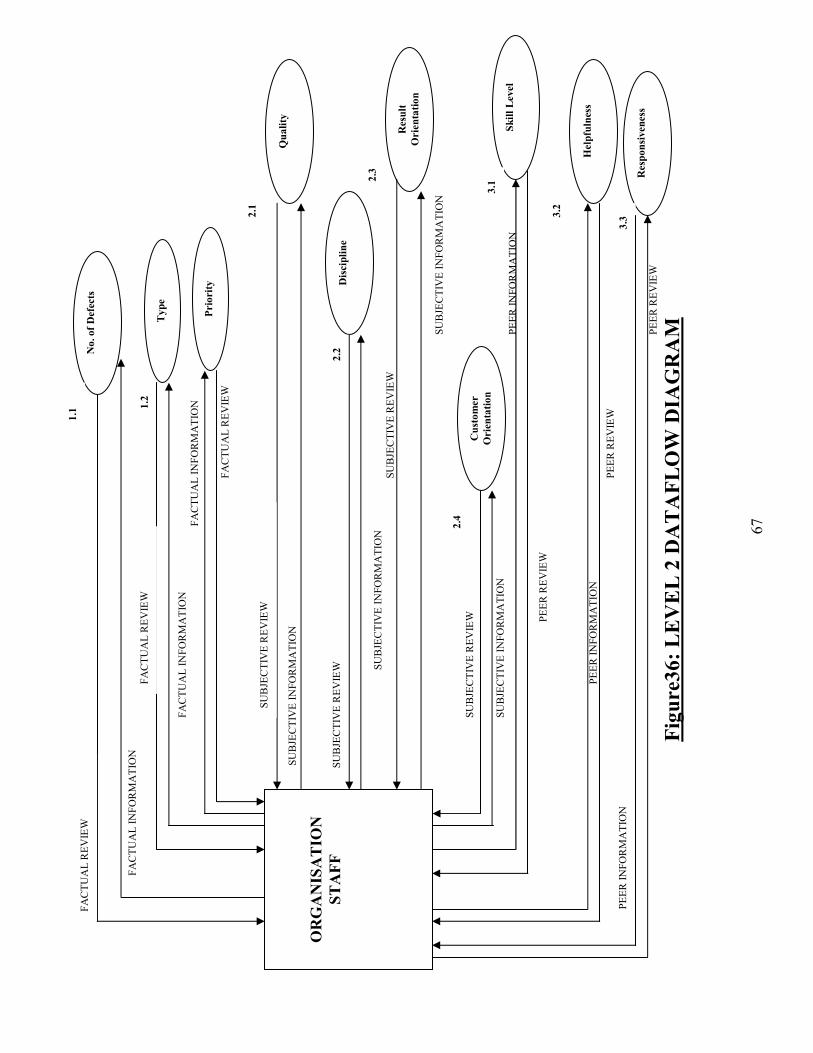
67
FA
CTUAL IN
FORMATIO
N
FA
CTUAL IN
FORMATIO
N
FACTUAL REVIEW
SUBJE
CTIV
E IN
FORMATIO
N
SUBJE
CTIV
E IN
FORMATIO
N
SUBJE
CTIV
E REVIEW
SU
BJE
CTIV
E IN
FORMATIO
N
SU
BJE
CTIV
E REVIEW
SU
BJE
CTIV
E IN
FORMATIO
N
PEER IN
FORMATIO
N
PE
ER REVIEW
PEER REVIEW
PE
ER IN
FORMATIO
N
PE
ER REVIEW
Fig
ure3
6: L
EVEL 2 D
ATAFLO
W D
IAGRAM
O
RGANIS
ATIO
N
STAFF
No. of D
efec
ts
1.1
FACTUAL IN
FORMATIO
N
FACTUAL REVIEW
SUBJE
CTIV
E REVIEW
SUBJE
CTIV
E REVIEW
PEER IN
FORMATIO
N
Typ
e
Prior
ity
1.2
FACTUAL REVIEW
Qua
lity
2.1
Discipl
ine
2.2
Res
ult
Orien
tatio
n
2.3
Cus
tom
er
Orien
tatio
n
2.4
Skill
Lev
el
3.1
Helpf
ulne
ss
3.2
Res
pons
iven
ess
3.3