Embed Size (px)
Citation preview
EMPLOYEE PERFORMANCE: THE CHALLENGE FOR MANAGERS
IN THE FREE STATE PUBLIC SERVICE
by
Rachel Thomas
(Student no. 2002133698)
Thesis submitted in requirement for the degree
Doctor Administrationis
FACULTY OF ECONOMIC AND MANAGEMENT SCIENCES
DEPARTMENT OF PUBLIC ADMINISTRATION AND MANAGEMENT
at the
UNIVERSITY OF THE FREE STATE
PROMOTER
Dr Francois Minnaar
BLOEMFONTEIN
July 2015
i
DECLARATION
I, RACHEL THOMAS, do hereby declare that the thesis titled ‘Employee
performance: the challenge for managers in the Free State Public Service’
submitted to the University of the Free State for the degree Doctor:
Administrationis is my own independent work and has not previously been
submitted by me to any other university/faculty. I further declare that all sources
used are acknowledged with complete references.
Furthermore, I cede copyright of the thesis in favour of the University of the Free
State.
_________________
Signature
ii
DEDICATION
This thesis is dedicated to my beloved Appappan and Amma.
My Appappan’s dream was that I become a medical doctor. I regret that I didn’t do
much towards that dream during my student days. So, I did this doctoral study at
this very late period of my life. This is my present to my parents though they are no
more; for loving me, tolerating me (especially my mother), and giving me the best
of everything beyond their means.
Following song express exactly how I feel about my parents.
You raise me up, so I can stand on mountains;
You raise me up to walk on stormy seas;
I am strong when I am on your shoulders;
You raise me up to more than I can be.
I am sure that my parents are watching from heaven above and rejoicing in my
achievement.
Rachel Thomas
July 2015
iii
ACKNOWLEDGEMENTS
My Lord and my creator who strengthened me to persevere and complete this
thesis, and for the promise “that I can do all things through Christ who strengthens
me” Philippians 4:13.
My loving husband Thomas for he encouraged me and stood by me every step of
the way. I wouldn’t have completed this thesis without his selfless support.
My loving children Priya, Deepa and Anand who cheered me at all times and even
dared to threaten me (the same way I used to do when they were students) if I
lagged behind.
Professor Koos Bekker for he believed in me. He lifted my spirit with encouraging
words whenever I discontinued the thesis due to work pressures. At one time he
even persuaded me to visualize myself in the red gown receiving the degree. May
his soul Rest in peace.
Dr.Francois Minnaar for he agreed to be my study promoter. This thesis would not
have been possible without his valuable guidance.
Professor Liezel Lues for she gave me valuable lessons in research and showed
me how to be organized in doing my thesis.
Duduzile Ndlovu for being so helpful and patient towards my understanding the
monster called ‘statistics’.
Robynne Sudbury for she edited the thesis and transformed my English into
proper English with right grammar at right places.
The Head of Departments of Free State Provincial Government departments for
they allowed me to conduct the research in their departments.
iv
The Director General Kopung Ralikontsane for he facilitated an enabling
environment to pursue my PhD.
The Chief Director: Moses Kau and IGR directorate staff for supporting me in
various ways.
Isaac Garaba, Irene Griffiths and Jeanne Jampies, for the valuable insights they
provided on the topic, as well as every other support they afforded to me.
Norma Lehasa for she supported me both spiritually and materially. She made it a
point to share information with me, and without her I would have missed very
critical deadlines relating to my thesis.
Every respondent who completed the questionnaire and everyone who took part in
the focus group interviews need special mention. I would not have completed the
thesis without their valuable assistance and support.
All my well- wishers who cared to enquire about the progress of my thesis.
v
ABSTRACT
The South African Public Service (SAPS) as the implementation machinery and
the right arm of the South African Government is expected to put forward effective
and efficient performance in order to uphold the wishes of the government of a
better life to all. It is known that effective and efficient public service performance
is reliant on the motivation, skills, competency, dedication and integrity of public
servants and the quality of management and leadership. The critical role of public
servants in the SAPS is acknowledged by leaders like Nelson Mandela, Thabo
Mbeki and the President Jacob Zuma in their several ‘State of the Nation’
addresses. The importance of people (human capital) in any organization is
emphasized by management theorists as well, and is a topic for continuous
interest and research. The role of human capital is afforded the crucial status
because people are the basic building blocks of organizations and are scarce,
inimitable and complex. People are the only resource that is dynamic and can
control, activate and convert other resources into goods and services. These
characteristics unique to people in fact make them the most valuable and
expensive of all other resources in any organization including the SAPS.
In light of the performance expectations from the public servants, there were
studies and reports that examined the performance reality of the SAPS. These
studies pointed to the fact that there are human resource challenges such as
shortage of capacity and skills in the Public Service that hinder its ability to provide
effective and efficient performance. The National Development Plan (NDP) and the
African Peer Review Mechanism (APRM) also reinforced the negative impact of
the skills shortage on the performance of the South African government. The
dearth in development of appropriate human resources and human resource
capacity to support effective and efficient governance, were identified as the most
challenging areas in the performance of the South African government.
vi
The Management Performance Assessment Tool (MPAT) that measured the
quality of management practices in the SAPS support the above argument. The
MPAT observed that human resource management was poor across the SAPS. As
a result, the MPAT report emphasized the strengthening of the management and
development of its human resources. The report further urged that the
management of human resources must be the major concern of leaders and
managers in the Public Service.
Likewise, documents such as the White Paper on Transformation of the Public
Service (WPTPS), 1997 and the White Paper on Human Resource Management
(WPHRM), 1995 also uphold the importance of managerial responsibility for
performance in the SAPS. The WPTPS, 1997 urges managers at all levels to be
leaders, visionaries, initiators, effective communicators and decision-makers
towards supporting employees so that the employees can provide effective and
efficient performance. The WPHRM, 1995 however regards management of
people as one of the very significant tasks of managers. Another solution towards
effective and efficient employee performance is public servants who are
empowered, motivated and committed and who are ready to perform. A further
answer in addressing the challenges of human resource capacity and performance
is the practice of performance management because performance management is
one vehicle through which managers can undertake their managerial
responsibilities of empowering and motivating employees. Performance
management is a tool that tells managers that they are responsible for the
performance of the staff who works with them.
Therefore, this study concentrated on the performance of public servants and the
crucial role played by managers in the Free State Public Service (FSPS) in
ensuring that the public servants give effective and efficient performance. It can be
deduced from the explanations given in the thesis that management support
together with objective performance management can lead to favourable work
environment, which in turn can result in effective and efficient employee
vii
performance, hence the reasoning behind the study and the research problem.
Therefore, the research questions that sought answers focused on whether
managers in the FSPS departments provide management support to employees,
manage employee performance objectively, and create a favourable work
environment that nurtures and motivates employees to contribute effective and
efficient performance.
The hypothesis therefore, indicated that the FSPS employees (public servants) will
be effective and efficient performers if their managers are able to create and
manage a positive work environment by providing management support, and by
implementing the current performance management system objectively. The aim
and objectives of the study, and the hypothesis, were validated through qualitative
and quantitative research and analysis. The thesis then concluded by presenting
the research findings and conclusions and by making recommendations on how
employee performance can be further improved in the FSPS.
viii
KEY TERMS THAT DESCRIBE THE SUBJECT OF THE THESIS
Employees in this study constitute the public servants employed by the Free State
Provincial Administration in terms of the Public Service Act of 1994. These
employees are responsible for the day to day administration and management of
the affairs of the Free State Provincial Government.
Performance can be explained as doing a task or function which requires that
employees have a willing attitude, the ability, and the required knowledge and
skills.
Effectiveness and efficiency: Performance for the purpose of this study is
measured by its effectiveness and efficiency. While effectiveness refers to the
ability to achieve goals or ‘doing the right things’; efficiency refers to doing things
right the first time to avoid wastage of resources. Efficiency further indicates a
satisfactory relationship between costs involved and benefits accrued.
Challenge refers to the responsibility of managers. In this instance, the
responsibility is to ensure that employee’s activities and outputs are directed
towards the attainment of organizational goals through the processes of
performance management, management support and by creating a favourable
work environment.
Management support can be made possible through basic managerial functions
such as planning, organizing, leading, and controlling.
Positive / Favourable Work Environment
Positive work environment is where employees are happy and motivated.
ix
Manager
A manager refers to “anyone whose duties in the main involve responsibility for the
work of others".
Free State Public Service/ Free State Provincial Administration
The eleven Free State provincial government departments with structures or
bodies of public officials/ servants constitute the Free State Public Service/
Provincial Administration (FSPS).

x
ABSTRAK
Daar word van die Suid Afrikaanse Openbare Sektor (SAOS) as die
implementerings masjien en die regterhand van die Suid Afrikaanse Regering
verwag om ‘n effektiewe en doeltreffende werksverrigting daar te stel ten einde die
wense van die regering van “’n beter lewe vir almal” te vervul. Effektiewe en
doeltreffende werkverrigting in die openbare diens is afhanklik van die motivering,
vaardighede, bevoegdheid, toegewydheid en integriteit van amptenare en die
kwaliteit van bestuur en leierskap. Die kritieke rol van amptenare in die SAOS
word erken deur leiers soos Nelson Mandela, Thabo Mbeki en die President,
Jacob Zuma in hulle onderskeie Staatsredes. Die belangrikheid van mense
(Menslike kapitaal) in enige organisasie word ook beklemtoon deur bestuurs
teoriste, en is ‘n onderwerp vir voortgesette belangstelling en navorsing. Die rol
van menslike kapitaal word gesien as die belangrikste status omdat mense die
basiese boublokke van organisasies is en skaars, uniek en kompleks is. Mense is
die enigste bron wat dinamies is en beheer kan word, wat ander bronne aktiveer
en verander na goedere en dienste. Hierdie karaktereienskappe is uniek aan
mense, dit maak hulle as ware die kosbaarste en duurste van alle ander bronne in
enige organisasie insluitende die SAOS.
In die lig van die prestasie verwagting van die amptenare, was daar studies en
verslae wat die prestasie realiteit van die SAOS getoets het. Hierdie studies wys
op die feit dat daar uitdagings is vir menslike hulpbronne soos die tekort aan
kapasiteit en vaardighede in die Openbare Sektor wat sy vermoë om effektiewe
werkverrigting te lewer belemmer. Die Nasionale Ontwikkelings Plan (NOP) en die
Afrika Gelyke Hersienings Meganisme (AGHM) het ook die negatiewe impak van
die vaardigheidstekort op die werkverrigting van die Suid Afrikaanse Regering
bevestig. Die tekort in ontwikkeling van vanpaste menslike ontwikkeling en
menslike hulpbron kapasiteit om effektiewe en doeltreffende regering daar te stel
is geïdentifeer as die uitdagendste areas in die werksverrigting van die Suid
Afrikaanse Regering.
xi
Die Bestuurs Werksverriging Assessering Instrument (BWAI) wat die kwaliteit van
bestuurspraktyke in die SAOS meet ondersteun die bogenoemde argument. Die
BWAI het waargeneem dat menslike hulpbron bestuur swak was regdeur die
SAOS. As resultaat het die BWAI verslag die versterking van die bestuur en
ontwikkeling van sy menslike hulpbronne beklemtoon. Die verslag het daarop
aangedring dat die bestuur van menslike hulpbronne die grootste bekommernis
van leiers en bestuurders in die Openbare Sektor moet wees.
Eweneens het dokumenste soos die Witskrif op Transformasie van die Openbare
Sektor (WTOP), 1997 en die Witskrif op Menslike Hulpbron Bestuur (WMHB) ,
1995 die belangrikheid van uitvoerende verantwoordelikheid vir werkverrigting in
die SAOS beklemtoon. Die WTOP, 1997 vereis van bestuurders op alle vlakke om
leiers, visionêre, inisieerders, effektiewe kommunikeerders en besluitnemers te
wees wat ten doel het om werknemers te ondersteun sodat die werknemers
effektiewe en doeltreffende werkverrigting kan verseker. Die WTOP, 1995 beskou
bestuur van mense as een van die belangrikste take van bestuurders. ‘n Ander
oplossing in die rigting van effektiewe en doeltreffende werknemer werkverrigting
is openbare amptenare wat bemagtig, gemotiveerd en toegewyd is en wat gereed
is om te presteer. ‘n Verdere antwoord in die aanspreek van die uitdagings van
menslike hulpbron kapsiteit en werkverrigting is oefening of werkverrigtingbestuur
omdat werkverrigtingbestuur een van die middele is waardeur bestuurders hulle
bestuursverantwoordelikhede kan onderneem en werknemers kan motiveer.
Werkverrigtingbestuur is ‘n instrument wat bestuurders wys dat hulle
verantwoordelik is vir die werkverrigting van die personeel wat saam met hulle
werk.
Daarom konsentreer hierdie studie op die werkverrigting van openbare amptenare
en die uiters belangrike rol wat bestuurders speel in die Vrystaatse Openbare
Sektor (VSOS) in die versekering dat die openbare amptenare effektiewe en
doeltreffende werksverrigting sal lewer. Dit kan afgelei word van die
verduidelikings wat in die tesis gegee word dat bestuursondersteuning saam met

xii
objektiewe werkverrigting-bestuur kan lei tot ‘n gunstige werksomgewing, wat weer
tot gevolg sal hê dat effektiewe en doeltreffende werknemer werkverrigting daar
gestel word, daarom die redenasie agter die studie en die navorsings probleem.
Daarom bevraagteken hierdie navorsing dit dat die gesoekte antwoorde daarop
fokus of bestuurders in die VSOS departement bestuursondersteuning aan
werknemers verskaf, daarin slaag om werknemers se werkverrigting objektief te
bestuur, en ‘n gunstige werksomgewing te skep wat werknemers motiveer en
aanmoedig om effektief by te dra en doeltreffend te presteer.
Daarom dui die hipotese daarop dat die VSOS se werknemers (openbare
amptenare) effektiewe en doeltreffende presteerder sal wees indien hulle
bestuurders daartoe in staat is om ‘n positiewe werksomgewing te skep deur die
verskaffing van bestuursondersteuning, en deur die objektiewe implementering
van die huidinge werkverrigtingsbestuurs sisteem. Die doel en doelwit van die
studie, en die hipotese, is betroubaar deur kwalitaitewe sowel as kwalitaitewe
navorsing en analisering. Die tesis het tot die gevolgtrekking gekom deur die
navorsingsbevindings en gevolgtrekkings voor te lê en deur aanbevelings te maak
oor hoe werknemers se werkverrigting verder verbeter kan word in die VSOS.
xiii
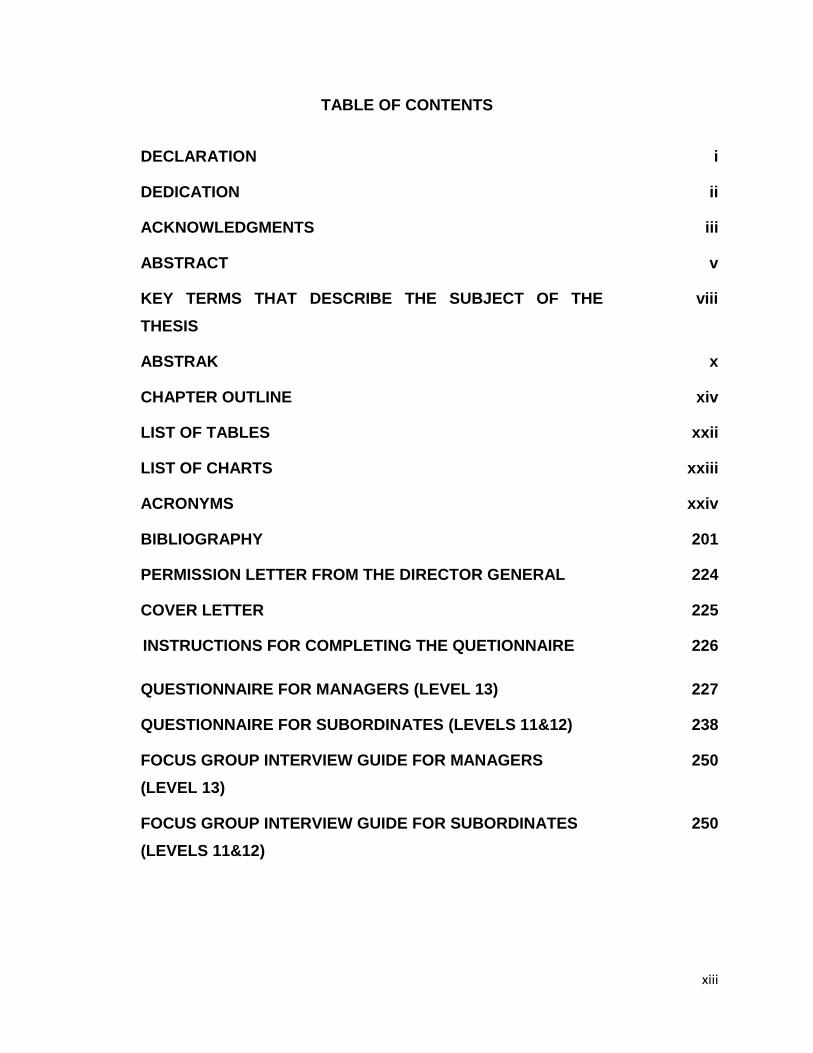
TABLE OF CONTENTS
DECLARATION i
DEDICATION ii
ACKNOWLEDGMENTS iii
ABSTRACT v
KEY TERMS THAT DESCRIBE THE SUBJECT OF THE
THESIS
viii
ABSTRAK x
CHAPTER OUTLINE xiv
LIST OF TABLES xxii
LIST OF CHARTS xxiii
ACRONYMS xxiv
BIBLIOGRAPHY 201
PERMISSION LETTER FROM THE DIRECTOR GENERAL 224
COVER LETTER 225
INSTRUCTIONS FOR COMPLETING THE QUETIONNAIRE 226
QUESTIONNAIRE FOR MANAGERS (LEVEL 13) 227
QUESTIONNAIRE FOR SUBORDINATES (LEVELS 11&12) 238
FOCUS GROUP INTERVIEW GUIDE FOR MANAGERS
(LEVEL 13)
250
FOCUS GROUP INTERVIEW GUIDE FOR SUBORDINATES
(LEVELS 11&12)
250
xiv
CHAPTER OUTLINE
CHAPTER 1: INTRODUCTION, OVERVIEW AND DEMARCATION OF THE
STUDY FIELD
1.1 INTRODUCTION 1
1.2 BACKGROUND 5
1.3 RATIONALE FOR THE STUDY 11
1.4 RESEARCH PROBLEM 12
1.5 RESEARCH QUESTION 13
1.6 RELEVANCE OF THE STUDY IN THE FSPS 13
1.6.1 Assumption 1 13
1.6.2 Assumption 2 14
1.6.3 Assumption 3 14
1.6.4 Assumption 4 14
1.6.5 Assumption 5 14
1.7 HYPOTHESIS 15
1.8 AIM AND OBJECTIVES OF THE STUDY 16
1.9 KEY WORDS AND CONCEPTS 17
1.9.1 Constitution 17
1.9.2 Government 17
1.9.3 Free State Provincial Government (FSPG) 18
1.9.4 Public Administration and public administration 18
1.9.5 South African Public Service (SAPS) 19
1.9.6 Free State Public Service (FSPS) 19
xv
1.9.7 Public Servants (Employees) 20
1.9.8 Manager 21
1.9.9 Management 21
1.9.10 Subordinates 22
1.9.11 Motivation 22
1.9.12 Performance Motivation 23
1.9.13 Performance Management 23
1.9.14 Effectiveness 24
1.9.15 Efficiency 24
1.9.16 Positive / Favourable Work Environment 25
1.10 IMPLICATION OF THE STUDY TO PUBLIC
ADMINISTRATION
25
1.10.1 Traditional public administration 26
1.10.2 The New public administration (NPA) 26
1.10.3 The New Public Management (NPM) 27
1.10.4 The New Public Service (NPS) 28
1.11 RESEARCH METHODOLOGY 29
1.12 SCOPE OF THE STUDY 30
1.12.1 Chapter Outline 30
1.13 CONCLUSION 31
xvi
CHAPTER 2: FAVOURABLE/ POSITIVE WORK ENVIRONMENT: THE
MOTIVATING PLATFORM FOR EFFECTIVE AND EFFICIENT EMPLOYEE
PERFORMANCE
2.1 INTRODUCTION 32
2.2 POSITIVE WORK ENVIRONMENT 33
2.2.1 Goal-setting 34
2.2.2 Performance feedback 34
2.2.3 Workplace incentives 34
2.2.4 Training, mentoring/coaching 34
2.2.5 Role congruity 34
2.2.6 Defined processes 34
2.2.7 Job aids 35
2.2.8 Opportunity to apply 35
2.3 CHARACTERISTICS OF POSITIVE WORK ENVIRONMENT 36
2.3.1 Employee Engagement and Positive Work Environment 36
2.3.2 Job Satisfaction and Positive Work Environment 40
2.3.3 Morale and Positive Work Environment 43
2.3.4 Motivation and Positive Work Environment 46
2.4 MOTIVATIONAL THEORIES THAT IMPACT ON POSITIVE
WORK ENVIRONMENT
48
2.4.1 Maslow’s Hierarchy of Needs Theory 48
2.4.2 Alderfer’s ERG Theory 49
2.4.3 Herzberg’s Two Factor Theory 50
2.4.4 McClelland’s Theory of Needs 51

xvii
2.4.5 McGregor’s Theory X and Y 51
2.4.6 Equity Theory 52
2.4.7 Goal Setting Theory 55
2.4.8 Vroom’s Expectancy Theory 56
2.4.9 Reinforcement Theory 58
2.5 ROLE OF MANAGERS IN CREATING A POSITIVE WORK
ENVIRONMENT
59
2.5.1 The rational economic man assumption 61
2.5.2 The social man assumption 61
2.5.3 The self - actualization assumption 62
2.5.4 The complex man assumption 63
2.6 GENERAL OBSERVATION 63
2.7 EMPLOYEES’ EXPECTATIONS ABOUT MANAGERS 67
2.8 CONCLUSION 68
xviii
CHAPTER 3: PERFORMANCE MANAGEMENT: A MANAGEMENT TOOL TO
ENHANCE EMPLOYEE PERFORMANCE IN THE FREE STATE PUBLIC
SERVICE
3.1 INTRODUCTION 69
3.2 PERFORMANCE MANAGEMENT 70
3.2.1 Aims and Objectives of Performance Management 72
3.3 PERFORMANCE MANAGEMENT AND ITS RELEVANCE IN
THE FSPS
74
3.4 MAJOR STEPS IN PERFORMANCE MANAGEMENT IN THE
FSPS
77
3.4.1 Performance Planning 77
3.4.2 Employee Performance Plan in the FSPS 81
3.4.3 Performance Monitoring, Evaluation and Measurement 84
3.5 OUTCOMES OF PERFORMANCE MANAGEMENT 89
3.5.1 Management Support 89
3.5.2 Two- way Feed-back 91
3.5.3 Performance Rewards 93
3.5.4 Management of Unsatisfactory Performance 95
3.6 PERFORMANCE MANAGEMENT SYSTEMS CHALLENGES
AND FAILURES
96
3.6.1 Rating Errors 100
3.6.2 Dysfunctional Performance 104
3.7 CONCLUSION 105
xix
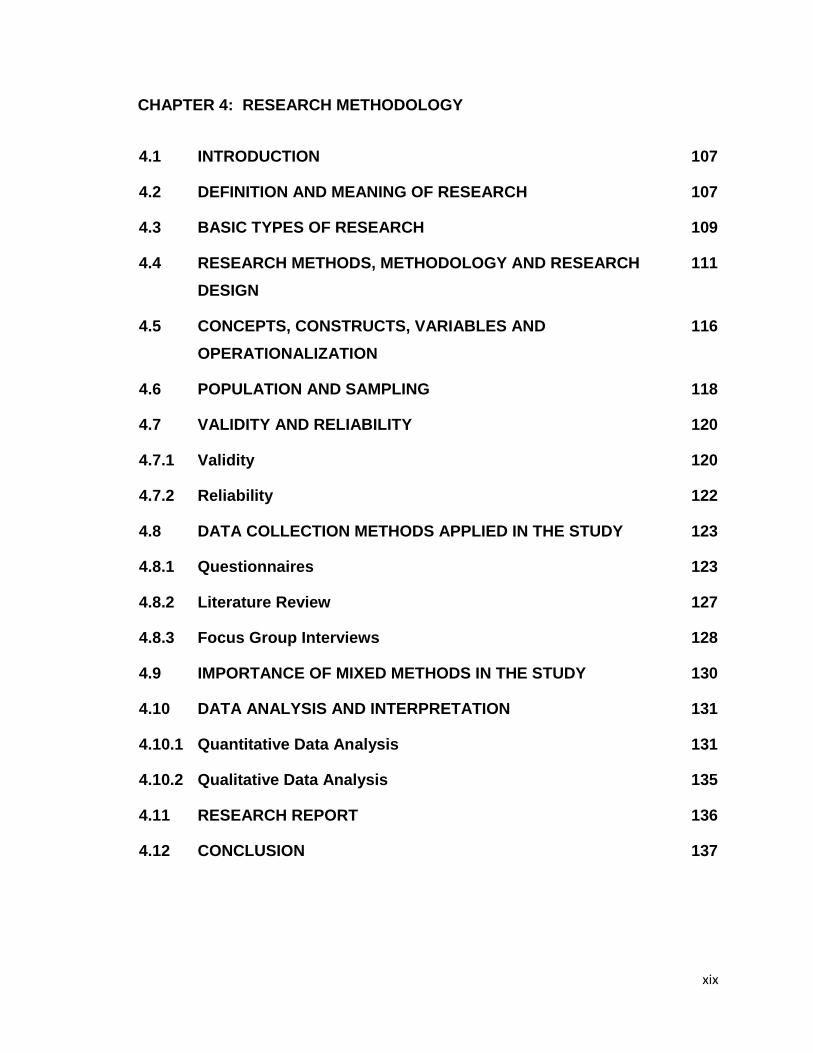
CHAPTER 4: RESEARCH METHODOLOGY
4.1 INTRODUCTION 107
4.2 DEFINITION AND MEANING OF RESEARCH 107
4.3 BASIC TYPES OF RESEARCH 109
4.4 RESEARCH METHODS, METHODOLOGY AND RESEARCH
DESIGN
111
4.5 CONCEPTS, CONSTRUCTS, VARIABLES AND
OPERATIONALIZATION
116
4.6 POPULATION AND SAMPLING 118
4.7 VALIDITY AND RELIABILITY 120
4.7.1 Validity 120
4.7.2 Reliability 122
4.8 DATA COLLECTION METHODS APPLIED IN THE STUDY 123
4.8.1 Questionnaires 123
4.8.2 Literature Review 127
4.8.3 Focus Group Interviews 128
4.9 IMPORTANCE OF MIXED METHODS IN THE STUDY 130
4.10 DATA ANALYSIS AND INTERPRETATION 131
4.10.1 Quantitative Data Analysis 131
4.10.2 Qualitative Data Analysis 135
4.11 RESEARCH REPORT 136
4.12 CONCLUSION
137
xx
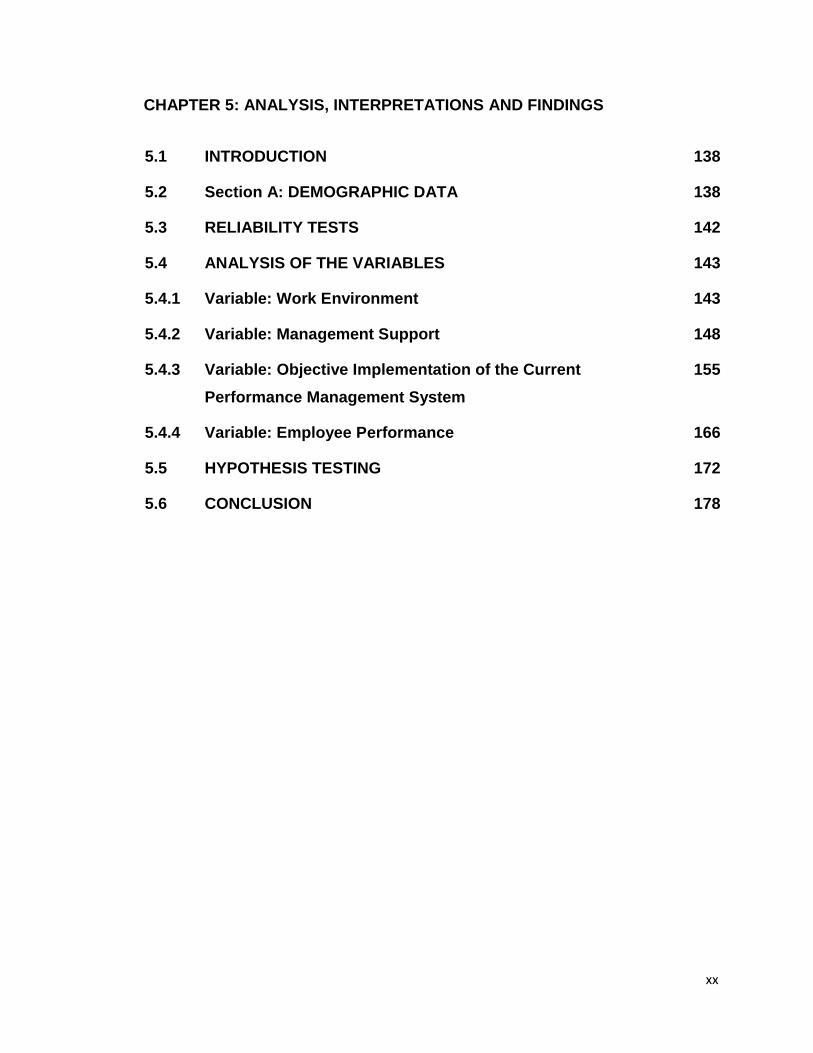
CHAPTER 5: ANALYSIS, INTERPRETATIONS AND FINDINGS
5.1 INTRODUCTION 138
5.2 Section A: DEMOGRAPHIC DATA 138
5.3 RELIABILITY TESTS 142
5.4 ANALYSIS OF THE VARIABLES 143
5.4.1 Variable: Work Environment 143
5.4.2 Variable: Management Support 148
5.4.3 Variable: Objective Implementation of the Current
Performance Management System
155
5.4.4 Variable: Employee Performance 166
5.5 HYPOTHESIS TESTING 172
5.6 CONCLUSION 178
xxi
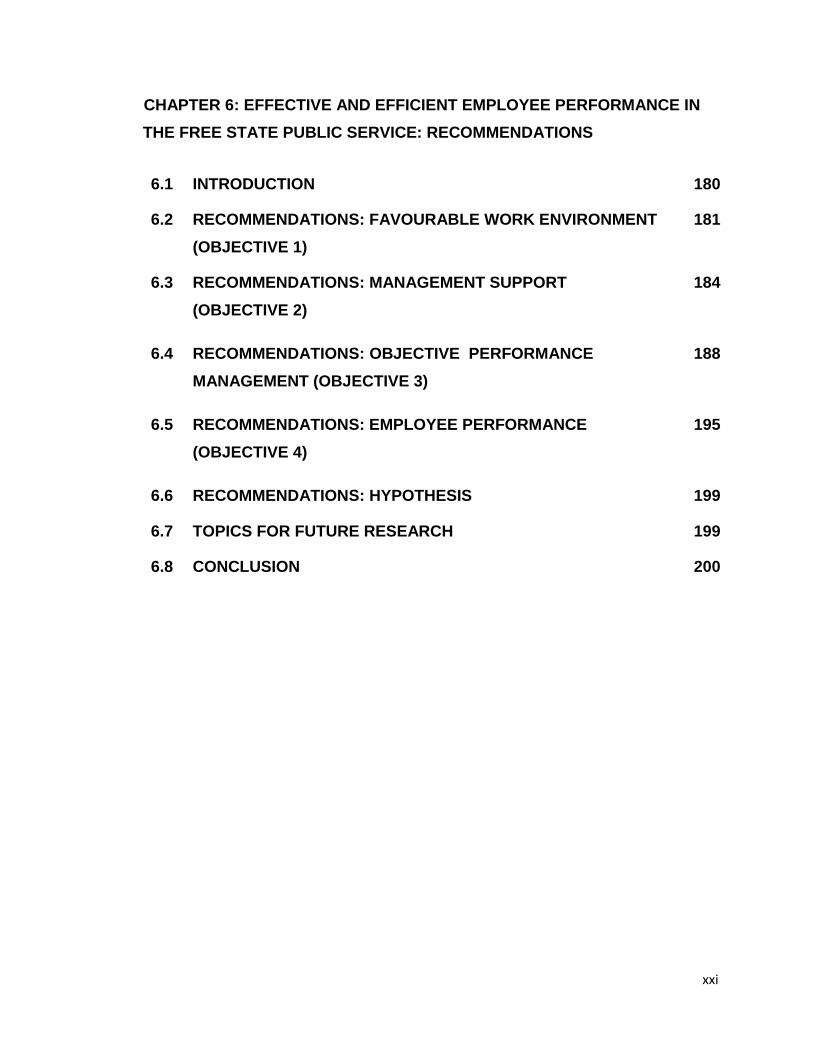
CHAPTER 6: EFFECTIVE AND EFFICIENT EMPLOYEE PERFORMANCE IN
THE FREE STATE PUBLIC SERVICE: RECOMMENDATIONS
6.1 INTRODUCTION 180
6.2 RECOMMENDATIONS: FAVOURABLE WORK ENVIRONMENT
(OBJECTIVE 1)
181
6.3 RECOMMENDATIONS: MANAGEMENT SUPPORT
(OBJECTIVE 2)
184
6.4 RECOMMENDATIONS: OBJECTIVE PERFORMANCE
MANAGEMENT (OBJECTIVE 3)
188
6.5 RECOMMENDATIONS: EMPLOYEE PERFORMANCE
(OBJECTIVE 4)
195
6.6 RECOMMENDATIONS: HYPOTHESIS 199
6.7 TOPICS FOR FUTURE RESEARCH 199
6.8 CONCLUSION 200
xxii
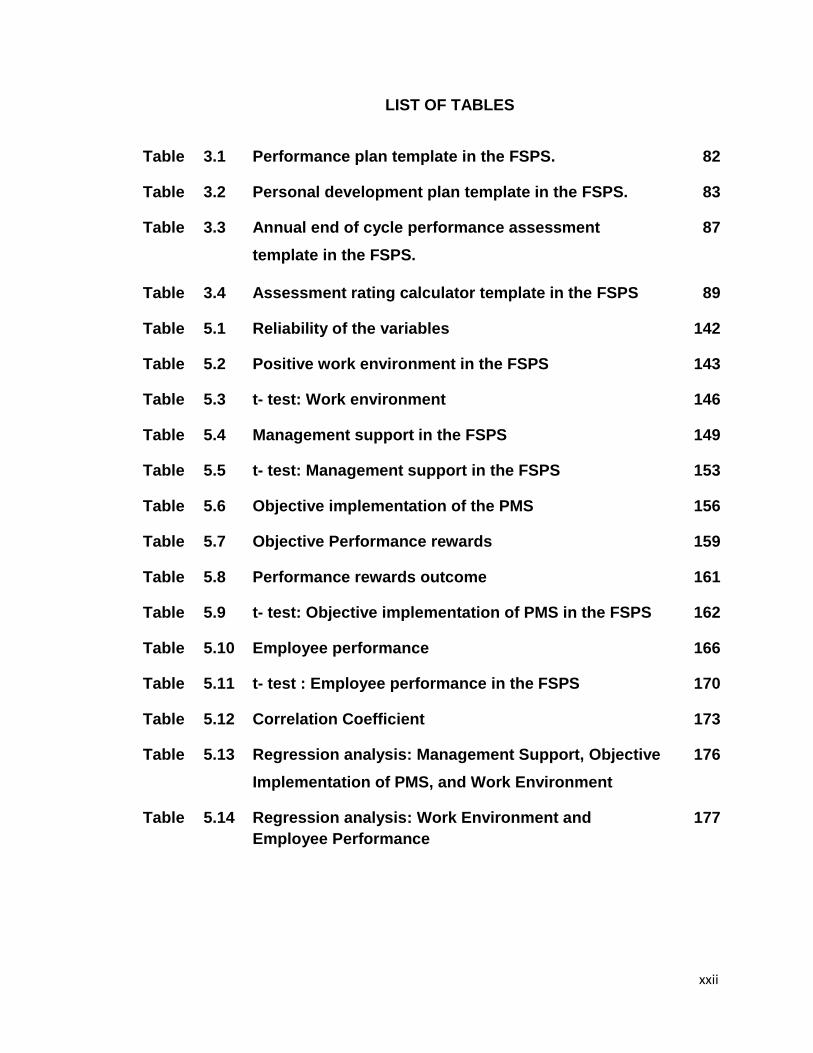
LIST OF TABLES
Table 3.1 Performance plan template in the FSPS. 82
Table 3.2 Personal development plan template in the FSPS. 83
Table 3.3 Annual end of cycle performance assessment
template in the FSPS.
87
Table 3.4 Assessment rating calculator template in the FSPS 89
Table 5.1 Reliability of the variables 142
Table 5.2 Positive work environment in the FSPS 143
Table 5.3 t- test: Work environment 146
Table 5.4 Management support in the FSPS 149
Table 5.5 t- test: Management support in the FSPS 153
Table 5.6 Objective implementation of the PMS 156
Table 5.7 Objective Performance rewards 159
Table 5.8 Performance rewards outcome 161
Table 5.9 t- test: Objective implementation of PMS in the FSPS 162
Table 5.10 Employee performance 166
Table 5.11 t- test : Employee performance in the FSPS 170
Table 5.12 Correlation Coefficient 173
Table 5.13 Regression analysis: Management Support, Objective
Implementation of PMS, and Work Environment
176
Table 5.14 Regression analysis: Work Environment and
Employee Performance
177
xxiii
LIST OF CHARTS
Chart 1.1 Diagrammatic representation of the Hypothesis 15
Chart 4. 1 Traditional research design 114
Chart 5.1 Total number of respondents 139
Chart 5.2 Respondents according to age 139
Chart 5.3 Respondents according to years of experience 140
Chart 5.4 Respondents according to gender 140
Chart 5.5 Respondents according to departments 141
Chart 5.6 Positive work environment: mean percentage 147
Chart 5.7 Management support: mean percentage 154
Chart 5.8 Objective implementation of the PMS : mean
percentage
163
Chart 5.9 Employee performance: mean Percentage 171
xxiv
ACRONYMS
APRM African Peer Review Mechanism
DPSA Department on Public Service and Administration
FSGDS Free State Growth and Development Strategy
FSPG Free State Provincial Government
FSPS Free State Public Service
WPHRM White Paper on Human Resource Management
HCI Human Capital Index
HDI Human Development Index
MPAT Management Performance Assessment Tool
NPA New Public Administration
NPM New Public Management
NPS New Public Service
OCB Organizational Citizenship Behaviour
PDP Personal Development Plan
PDM Performance and Management Development

xxv
PMS Performance Management System
PSC Public Service Commission
PSCBC Public Service Commission Bargaining Council
PSR Public Service Regulations
Q&Qn Question
RMIT Royal Melbourne Institute of Technology
SAPS South African Public Service/ South African
Provincial Administration
SDA Skills Development Act
SDLA Skills Development Levies Act
SETA Sector Education and Training Authority
TDTSA Transport distribution Training South Australia
VPSC Victorian Public Sector Commission
UNDP United Nations Development Programme
WPTPS White Paper on Transformation of the public service

xxvi
1
CHAPTER 1
INTRODUCTION, OVERVIEW AND DEMARCATION
OF THE STUDY FIELD
1.1 INTRODUCTION
When elected into power in 1994, the South African democratic government made
the promise that it would provide a better life to all in South Africa. This promise
created great expectations among the public for transparent, cost effective, quality
and customer centred government services. In order for the government to satisfy
public expectations, the Public Service (the implementation machinery of the
government) was entrusted with the critical and urgent responsibility of excellent
service delivery as the precursor to a better life for all. It was critical as the general
public established its opinion of the government on the nature and quality of
services it received from the Public Service. If the service was not satisfactory, the
government was perceived to be inefficient and ineffective, failing to honour its
promises and commitments. It was urgent furthermore, because the government
had to act quickly to manage the huge service delivery demands and backlogs.
Therefore, it became the South African Public Service’s (SAPS) responsibility to
put forward effective and efficient performance, in order to uphold the wishes of
the South African government for a better life. Bertucci (Department of Economic
and Social Affairs, 2005: v) concurs, stating that the development of countries is
dependent on the performance of public institutions, as these institutions assist the
governments to coordinate human actions for public interest. Consequently, the
quality of public institutions is reliant on the motivation, skills and integrity of
human capital and the quality of management and leadership.
2
Though the Constitution of the Republic of South Africa, 1996 and a number of
other legislations and policies supported the promise of a ‘better life’ for the South
Africans, the government soon realized that policies and legislations are not
enough to prepare the Public Service for, and to direct them in terms of, the
wishes of the government and the public. Government needed a transformation
from its cold, bureaucratic stand to a citizen centred, performance driven, and
responsive position. Ocampo (Department of Economic and Social Affairs, 2005:iii)
argues that Public Service will not be able to assist the government in its
development of goals, or act as the change agents for the transformation in the
wider society, without competent and dedicated public servants. According to
Bertucci, (Department of Economic and Social Affairs, 2005: v) this further called
for a transformation in mind-set of public servants.
Consequently, it was realized that a transformation in mind-set of all South African
public servants, employed by the national departments and the nine provincial
administrations in terms of the Public Service Act of 1994 (Act No.103 of 1994),
would require a change in their values and attitudes. Furthermore, the
transformation necessitated the public servants responsible for the day to day
management and administration of the affairs of the state to move to a
performance and result oriented paradigm that aligned their behaviour with that of
the citizens’ expectations. As the public servants are expected to do specific jobs,
and have skills and qualifications that are unique to their responsibilities, the call
for transformation of public servants’ mind sets required additional skill, motivation,
dedication, commitment, hard work and high performance. The following
paragraphs therefore endeavour to highlight the critical role of public servants in
the effective and efficient functioning of the Free State Public Service (FSPS) in
satisfying the expectations of the government as well as the public.

3
The role of public servants (human capital) in the performance of the SAPS was
acknowledged by Nelson Mandela (the first president of the democratic Republic
of South Africa) in his closing address in the Debate on the State of the Nation
Address (Mandela, 1999). The President (former) reminded the nation that the
progress that was started in all sectors of government should be sustained through
consistent, systematic and sustainable changes in the structure, as well as the
philosophy of the SAPS. He added that these changes are only possible through
many interventions including training, better management, a new cadre ship and
performance-based assessment of work done.
In 2004, the then President Thabo Mbeki (2004) echoed the same sentiment as
that of Nelson Mandela. In his opinion, the SAPS needed to inculcate the
necessary skills and motivation to meet the developmental challenges of the
democratic state. In his address to the first joint sitting of the third democratic
Parliament in Cape Town, Mbeki challenged the public sector to fulfil its
responsibilities to the people, and reminded its critical role in the process of the
growth, reconstruction and development of the country. He raised the importance
of focusing on improving skills levels within the public sector, and the need for
ensuring its managerial modernization. He reiterated the same opinion in all his
subsequent state of the nation addresses as well. In 2006, Mbeki reminded the
SAPS of the need to be effective and efficient as the state machinery, so that
government departments do not become an obstacle to the achievement of the
goal of a better life for all.
His Excellency, President Jacob Zuma (2009) affirmed the thinking of his
predecessors on the role of the SAPS in improving the life of people in South
Africa. The president strongly endorsed the same view in his 2010 State of the
Nation Address, which reiterated the government’s commitment to work harder to
build a strong developmental state that responds to the needs and aspirations of
the people. He urged the SAPS to comply with the vision of a performance-
oriented state, and advocated the SAPS’s working towards faster and improved
4
performance through excellence and hard work by a dedicated, capable and
responsive Public Service cadre (public servants) (Zuma, 2010).
The role of people (human capital) is emphasized by management theorists as
well, and is a topic for continuous interest and research. Amos, Ristow, A and
Ristow, L (2004:2-4) explain that people are the basic building blocks of any
organization irrespective of its size. Of all the resources in an organization
including finance, material, information, and machines, human resource is the
most important and dynamic as it is the only resource that can control, activate
and convert other resources into goods and services. Colquitt, Lepine and Wesson
(2010:12-14) agree that human resources are the most valuable and expensive of
all other resources, as the value of resources is determined by factors such as
scarcity, inimitability and social complexities. Resources which are scarce, rare
and necessary for the long term success of organizations become more valuable
and expensive. Thus, skilled, motivated, satisfied employees who are good team
players belong to this scarce resource category.
The other important factor which makes human resources scarce and valuable,
‘inimitability’, points to the fact that, while other resources such as project design,
infrastructure lay out, marketing strategies, machinery and equipment, to name a
few, can be imitated, human resources cannot be imitated for three reasons.
These include history, decisions, and individual complexities. Humans amass
wealth of knowledge and experience, are seats of great wisdom, and therefore
create history that cannot be bought or imitated by others. Furthermore, individuals
make numerous small decisions which are not noticeable by others, and this
makes them inimitable. People also create socially complex attributes such as
culture, teamwork, trust, and reputation, the origins of which are not always clear
to others. Thus, for all the above reasons, an organization that wishes to be
successful must give prime importance to its human resources, and appreciate
them as they can offer something other resources cannot.
5
1.2 BACKGROUND
In light of the abovementioned performance expectations from the public servants,
there were studies and reports that examined the performance of the SAPS.
These studies pointed to the fact that there are human resource challenges in the
SAPS that hinder its ability to provide effective and efficient performance. The
study conducted by the Centre for Policy Studies (Matshiqi, 2007:6), on the
performance of public service in relation to South African government’s better life
to all vision, revealed that the first decade of democracy was riddled with a
shortage in capacity, which affected public service productivity and delivery
adversely. Thus, it became apparent during the second term that appropriate
measures needed to be in place to improve the performance and productivity of
the SAPS, so that the gap between societies’ expectations and the pace and
quality of service delivery could be reduced and managed. It was also established
that, in addition to the shortage of capacity, the gap and the pressure between the
expectations and actual service delivery were aggravated by a shortage of
required skills (Matshiqi, 2007:6, 8) as well. A number of studies have confirmed
that the skills shortage is a real problem in South Africa, to the extent that it is
considered a national crisis (Solidarity Research Institute, 2010:2).
The National Development Plan (NDP) also reinforced the negative impact of the
skills shortage on the performance of the government, as the plan identified and
highlighted the key obstacle in creating a capable and developmental state as ‘the
lack of capacity and skills’ in the state (Chabane 2013:5). The SAPS performance
report by Matshiqi (2007:9,19) further makes reference to the Country Review
Report
of South Africa’s performance since 1994, where the African Peer Review
Mechanism (APRM) panel argued that South Africa suffers from a severe skills
shortage, especially at the provincial and local government levels, where delivery
of basic goods and services is very important. The APRM also emphasized that
“The capacity of state institutions to deliver services effectively and efficiently will
be compromised and remain weak as long as the skills constraints exist”. This lack
6
of capacity has resulted in under-spending, housing backlogs and other service
delivery demands in the length and breadth of South Africa.
Thus, the lack in development of appropriate human resources, and human
resource capacity to support effective and efficient government, were identified as
the most challenging areas in the performance of the South African government.
The Management Performance Assessment Tool (MPAT) (Department:
Performance Monitoring and Evaluation, 2012:49) also supports the
aforementioned statement. According to the MPAT report, effective human
resource management and development is central to the performance of the
SAPS. The weak results of this area in departments suggest that human resource
management and development in the SAPS still needs to be strengthened. The
state of management practices in the SAPS underlined that the quality of human
resource management was poor across the SAPS. As human resource
management and development strongly influences the performance of a
department, a vigorous effort is required to strengthen this particular area
(Department: Performance Monitoring and Evaluation, 2012: 2). Ocampo
(Department of Economic and Social Affairs, 2005: iii) adds that the management
of human resources must be the major concern of leaders and managers in the
SAPS.
Therefore, as a measure to curtail the capacity shortages, skills shortages and
other performance related challenges in the SAPS, the South African government
put in place certain structures and initiatives. These are briefly explained in the
following paragraphs.
With the intention of curbing the state’s capacity challenges, the government
enacted several pieces of legislation from as early as 1994, and tried various
forms of institutions to provide training and thereby develop skills and capacity of
the SAPS. The Skills Development Act (Act No. 97 of 1998) and the Skills
Development Levies Act (Act No. 9 of 1999) need special mention in this regard.
The Skills Development Act (SDA) was enacted to provide an institutional
7
framework for the formulation and implementation of national, sectorial and
workplace strategies, towards developing and improving the skills of the South
African workforce. The Skills Development Levies Act (SDLA) however provided
for the financing of skills development initiatives, through the imposition of a skills
development levy. Institutions such as the various Sector Education and Training
Authorities (SETA) were also established to facilitate education and training in
South Africa.
In addition, the Government established the Department of Performance
Monitoring and Evaluation during 2009 in the Presidency, in order to improve and
manage the performance of the SAPS through performance monitoring and
evaluation (Department: Performance Monitoring and Evaluation (DPME), 2012:2).
The DPME has since introduced various tools and systems to monitor and
evaluate performance, of which the Management Performance Assessment Tool
(MPAT) is one such tool. MPAT is a structured, evidence-based approach to
assess management practices in all national and provincial departments
(Department: Performance Monitoring and Evaluation, 2012:8). The MPAT report
provided a detailed picture of the state of management practices in all 156 national
and provincial departments every year. The assessment process involved the
senior management of departments, who undertook a self-assessment against 31
standards within four key performance areas and provided evidence to justify their
assessment (Department: Performance Monitoring and Evaluation, 2012:5). One
of the key performance areas on evaluation under MPAT, which is especially
applicable to this study, is human resource management (Department:
Performance Monitoring and Evaluation, 2012:9).
Another effort by the government to build the human resource capacity in the
SAPS is to equip the public servants with a theoretical and practical approach to
public administration management, through the establishment of the National
School of Government. The National School of Government was officially launched
on 21 October 2013 to provide high-quality education through training and
8
development that inculcate values, skills and knowledge, as well as to prepare the
public servants for career progression opportunities. According to the Public
Service and Administration Minister, the School of Government also aims to
urgently correct the wrongs that have haunted the SAPS in the past. Thus,
curricula and programs were designed on the basis of a sound understanding
regarding the challenges and realities of the public service environment (South
African Government News Agency, 2013:1).
Furthermore, documents such as the WPTPS, (1995) and the WPHRM, (1997) are
developed with the intention to support the public servants in becoming efficient
and effective performers. These frameworks spell out several requirements for
achieving effective and efficient performance from the employees. One of the
requirements according to WPTPS, 1995 is the empowerment and motivation of
managers at all levels to be leaders, visionaries, initiators, effective communicators
and decision-makers, towards supporting employees so that they respond
proactively (Department of Public Service and Administration 1995:37). The
WPHRM, 1997 (Department of Public Service and Administration, 1997:2) also
upholds the importance of managerial responsibility for results in the SAPS.
The mission of WPHRM, 1997 states that “…the management of people should be
regarded as a significant task for those who have been charged with the
responsibility…” (Department of Public Service and Administration,1997: 2). The
World Public Sector Report (Department of Economic and Social Affairs, United
Nations, 2005:v) endorses the requirement of leadership, clear vision and, strategy
for human resource development, as well as professional and systematic
management of public servants, towards transformation of individual public
servants. Hence, the importance of managers’ supporting and managing the
performance of employees is emphasized and ascertained. Empowered,
motivated and committed public servants, who are ready to work effectively and
efficiently towards the achievement of the goals of the SAPS, and towards the
satisfaction of their own personal and career-related goals, is another requirement
9
for effective and efficient employee performance (Department of Public Service
and Administration, 1995:37).
Another critical solution in addressing the challenges of human resource capacity
and performance is the age old practice of performance management, known by
different names including performance appraisal, performance evaluation,
performance review, merit appraisal, though the term performance management
denotes a more elaborate and inclusive process than the other terms (the other
terms form just one aspect of the performance management process). Van der
Waldt (Matshiqi, 2007:6) agrees that the effective management of performance in
the SAPS is crucial for sustaining a positive relationship between inputs and
outputs, as public institutions use scarce resources (input) to produce products
and services (outputs), or to derive maximum productivity with minimum
resources.
Moreover, performance management is one vehicle through which managers can
undertake their managerial responsibilities of empowering and motivating
employees. This statement is affirmed by the World Public Sector Report
(Department of Economic and Social Affairs, 2005:90) which states that
“performance management is a way of telling managers that they are responsible
for the performance of the staff who works with them and that they have to
manage them by setting objectives that relate to overall strategy; monitor their
performances and give them support, feedback and the opportunity to develop”.
Furthermore, performance management, which is an integral part of an effective
human resource management and development strategy, is an ongoing process
that forces the employee and employer (public servants and managers in this
instance) to strive together relentlessly towards improving employee's individual
performance, as well as contribution to the organization's wider objectives
(Department of Public Service and Administration, 1997:27). Performance
management also helps to derive efficient and effective performance by enabling
top managers to establish organizational goals, which are cascaded down to the
10
line managers, who in turn set goals and targets for their teams which are aligned
to the organizational goals. According to Van Der Waldt (Matshiqi, 2007:7) it also
facilitates a uniform understanding of the organizational goals from everyone in the
organization, leading to appropriate delegation, improved autonomy of employees,
enhanced employee development, clear roles, responsibilities and expectations of
the individuals, as well as involvement and participation of all.
Yet another solution to the skills and capacity shortage in the SAPS is for
managers to provide a work environment where existing human resources can
perform to an optimum. Management literature reveals that creating a favourable
work environment is a requirement to improve and sustain performance and
productivity. It is the responsibility of managers to create a favourable work
environment (growth medium) where employees are satisfied and motivated to
give effective and efficient performance. Day-to-day management practices that
enable people to realize their potential, experience satisfaction, and behave in
ways that contribute towards the organizational success, is one of the critical
factors that contribute to a favourable work environment (Amos et al.
2004:21,136,137). Meyer and Kirsten (2005:98, 99) add that a leader (manager)
creates a conducive environment for employees to perform in, and ensures that
employees are inspired and remain focused on the objectives of the organization.
Thus, the factors such as employee performance management, management
support and favourable work environment mentioned in the above paragraphs
form the foundation to the rationale of the study discussed hereafter.
11
1.3 RATIONALE FOR THE STUDY
As this study is very specific to the FSPS, it is imperative to make mention of
human resource challenges in the FSPS. The Free State Growth and
Development Strategy (Department of the Premier, Free State Province, 2012: 17)
has identified various concerns and challenges regarding the province’s capacity
and capability, the key pillars that support the growth and economic development
of the province. The challenges and concerns were attributed, to a disregard for
human resource management processes, among others.
The effective and efficient management and utilization of human resources cannot
be over looked in the Free State Province context, as South Africa as a country
has a shortage of skilled human resources. Thus, objective performance
management can serve as a practical means of improving performance as well as
identifying and developing talents in the SAPS. This raises a question regarding
performance management in the context of the SAPS, due to the perceptions the
public servants and others have about the performance management initiatives
and processes currently practiced.
Unfortunately, there is a perception among the public servants that there is no
performance management in the SAPS. This was reiterated by the delegates at
the government leadership summit 2013, who commented that performance
management is non-existent in government. The delegates added that, if senior
managers do their jobs diligently and are held accountable for their actions, South
Africa would have done better in terms of performance. The former minister in the
Presidency, Chabane (2013:5), agreed with the aforementioned, and added that if
all departments have good managers and the required skills, South Africa would
address many problems speedily. He confirmed that there is no performance
management in government, though there is a performance management system
supported by a legal framework. As Free State is one of the nine provinces of
South Africa, these observations and concerns are naturally applicable to the Free
State Province as well.
12
Management writers such as Amos et al. (2004:64) agree that managers have a
major effect on employee performance by planning, directing and improving the
performance of employees in line with the overall objectives of the organization. In
essence, the skills and capacity issue can be resolved to a great extent in the
FSPS, were managers to support, develop and retain their staff. Another challenge
facing all managers in the FSPS is to make the performance management system
work better to promote effective and efficient individual performance, which
translates to organizational performance. A further critical factor for effective and
efficient performance in the FSPS also (as mentioned in earlier paragraphs), is the
need for managers to create a favourable work environment where employees are
satisfied, motivated and remain focused on the objectives of the organization.
Therefore, this study will concentrate on the crucial role played by managers in the
FSPS in ensuring that public servants give effective and efficient performance, so
that the FSPS achieves its goal of better life to all. It can be deduced from the
explanations given in this chapter that management support, objective
performance management and favourable work environment can result in effective
and efficient employee performance, hence the reasoning behind the study and
the research problem.
1.4 RESEARCH PROBLEM
Based on the information presented thus far, managers in the FSPS ideally should
be able to influence and motivate their team by creating and managing a
favourable work environment through objective performance management, as well
as the provision of management support to employees so that they become
motivated and committed to give effective and efficient performance. However, the
general perception is that this ideal situation is not prevalent in the FSPS. Thus
the research question will be discussed hereafter.

13
1.5 RESEARCH QUESTION
Based on the aforementioned, the following research questions can be identified in
this study:
1.5.1 Are managers in the FSPS departments able to provide necessary
management support to employees?
1.5.2 Are managers in the FSPS departments able to manage employee
performance objectively?
1.5.3 Are managers in the FSPS departments able to create a favourable
environment that nurtures and motivates employees to contribute effective
and efficient performance?
1.6 RELEVENCE OF THE STUDY IN THE FSPS
As this study is very specific to the FSPS, its relevance was founded on the
conditions spelt out in the policies and frameworks developed in South Africa since
1994, as well as suggestions of various management theories aimed at improving
effective and efficient performance, thereby transforming the mind-sets of people.
Therefore, the expectations from the FSPS previously explained, and the
associated assumptions from the FSPS explained below, establish the relevance
of this study in the FSPS.
1.6.1 Assumption 1
It is assumed that the Free State Provincial government intends to fulfil its
commitment of better life to all through excellent service delivery to its people. This
intention is quite evident in the vision of the Free State Provincial Government
which is “a unified and prosperous Free State which fulfils the needs of all it’s
people’’ (Department of the Premier, 2007:107). In order to achieve this vision, the
Free State government needs to transform the FSPS into a dynamic, results
oriented organization, committed to performance excellence.
14
1.6.2 Assumption 2
It is also assumed that the FSPS will not be transformed into a dynamic, results
oriented organization without competent public servants (employees) who are
committed to provide effective and efficient performance.
1.6.3 Assumption 3
Another assumption is that it is the responsibility of managers to create a
favourable work environment in the FSPS so that the employees are satisfied and
motivated to give their best performance. As Meyer and Kirsten (2005:98, 99) have
suggested earlier, a leader not only creates an environment conducive to
performance for employees, but also makes sure that employees are inspired and
remain focused on the objectives of the organization.
1.6.4 Assumption 4
The fourth assumption is that the quality of employee performance depends on the
quality of management, and the support given to employees to perform.
1.6.5 Assumption 5
It is also assumed that the implementation of objective, systematic and fair
employee performance management processes in the FSPS is important in
creating a favourable work environment, where employees are developed to
optimize their performance.
These assumptions led the researcher to formulate a hypothesis that gave focus
and objectivity to the study by directing what specific aspects need to be
investigated, and what data needs to be collected.

15
1.7 HYPOTHESIS
The FSPS employees (public servants) will give effective and efficient
performance if their managers are able to create and manage a positive work
environment by providing management support and by implementing the current
performance management system objectively. The hypothesis can be presented
diagrammatically as follows.
1.1 Diagrammatic representation of the Hypothesis
Management
support
Positive work
environment
Objective implementation of
Performance Management
System
Effective and efficient
employee performance
16
1.8 AIM AND OBJECTIVES OF THE STUDY
The aim of the study is to shed light on whether the managers in the FSPS derive
effective and efficient performance from the public servants, and if not, what the
challenges and obstacles that hinder them in this regard are. The study will also
attempt to put forward suggestions for addressing the challenges (if any), towards
promoting and maintaining efficient and effective employee performance.
Consequently, the objectives of this study are as follows:
1.8.1 To study whether a favourable/positive work environment is prevalent in
the FSPS that motivates the public servants to be effective and efficient
performers.
1.8.2 To compare the perceptions of managers about management support
given to employees, and the expectations or perceptions by employees
about management support they receive from the managers, and
establish whether management support contributes to the effective and
efficient performance of employees.
1.8.3 To study the existing performance management system in the FSPS
departments to establish whether it is implemented objectively to
motivate employees to perform effectively and efficiently.
1.8.4 To study managers’ and subordinates’ perceptions about the
performance of subordinates, and establish whether the 2 groups agree
or differ in their perceptions.
1.8.5 To present a report on the research findings.
17
1.8.6 To make recommendations to address the key challenges (if any) that
would influence the effectiveness and efficiency of employee
performance in the FSPS.
1.9 KEY WORDS AND CONCEPTS
The following terms are applicable throughout the study and are thus defined
hereafter.
1.9.1 Constitution
The Constitution of the Republic of South Africa is the supreme law of the
Republic. The Constitution was used as a guiding document for this study, and
proposed the basic values and principles that should govern the public
administration. Specifically section 195 (1- h) stipulates that good human-resource
management (and career-development practices) must be adhered to in order to
maximize human potential, which supports the substance of this thesis to a great
extent.
1.9.2 Government
Government is defined by Venter (Besdziek, Buccus, Daniel, Gumede, Hicks,
Holtshausen, Jolobe, Landsberg, Malherbe, Schoeman, Sadie, Taljaard, Venter &
Zybrands, 2011:83) as “the body or bodies responsible for governing the state”.
The government of the Republic of South Africa is divided into national, provincial
and local spheres which are distinctive and interdependent. According to the
Constitution s. 40, each sphere has its own unique area of operation. The three
spheres are required to co-operate and acknowledge each other's area of
jurisdiction through co-operative government and intergovernmental relations
(Republic of South Africa, 1996:21).

18
1.9.3 Free State Provincial Government (FSPG)
South Africa has nine provincial governments, one for each province of which the
Free State Provincial Government is one. As per the Constitution of the Republic
of South Africa s. 103, s.104, s. 125 and s.195 (1996: 53, 54, 62, 99) each
province has a provincial legislature, provincial executives, and a provincial
administration. The legislative authority of a province is vested in its provincial
legislature, and the executive authority of a province is vested in the Premier of
that province. The Premier exercises the executive authority together with the
other members of the Executive Council. The Free State Executive Council
consists of the Premier, who is the head of the Province and the political head of
the Premier’s department, and ten (10) MECs (Members of Executive Council)
who are the political heads of departments namely, the Department of Agriculture
and Rural Development Cooperative Governance, Traditional Affairs and Human
Settlement; Economic Development, Tourism and Environmental Affairs;
Education; Finance; Health; Police, Roads and Transport; Public Works; Social
Development; and Sport, Arts, Culture and Recreation.
1.9.4 Public Administration and public administration
Public Administration (P and A written in capital letters) refers to the subject or
discipline of public administration which is studied, whereas public administration
(p and a written in small letters) is the process by which the entire state organ is
organized, managed, administered and controlled. Public administration (p.a.)
deals with the nature and practice of government and the public sector. The public
sector in South Africa is more inclusive than the Public Service. According to
Venter (Besdziek et al. 2011:83), it consists of the Public Service, the National
Botanical Institute, parastatal institutions, scientific councils, performing arts
councils and cultural institutions, public corporations, provincial administrations
and local governments.
19
Public administration deals with the management, administration and processes
of, as well as interactions and relations between, public institutions and other role
players and stakeholders. Other components of public administration include the
structuring, staffing, financing, and controlling of the public sector, and the
formulation, implementation and reviewing of policy. Furthermore, all state
interventions aimed at providing services to people to improve their quality of life is
the responsibility of the public administrative organ of the state. According to
Venter (Besdziek et al. 2011:84) this organ works under the political guidance and
leadership of the government of the day, and in the opinion of Cloete, (2012:86)
public administration is performed according to specific rules.
1.9.5 South African Public Service (SAPS)
According to Venter (Besdziek et al. 2011:82) the Public Service, through its public
servants, is responsible for the day to day administration and management of the
affairs of the government. The current SAPS is an amalgamation of the various
public services that existed in South Africa prior to 1994, including the TBVC
states (Transkei, Bophuthatswana, Venda and Ciskei) and the self- governing
territories.
1.9.6 Free State Public Service (FSPS)
There is an executive authority and administrative authority in every provincial
government. The administrative authority functions under the executive authority,
and is entrusted with the responsibility of managing and implementing the policies
of the government. The administrative authority is comprised of administrators,
otherwise called public servants, who are grouped as a body of individuals in
departments. The departments are segregated according to the objectives,
functions and services to be rendered by the administration. A director general or
head of department is the accounting authority of government departments. For
example, the accounting authority of the department of the Premier is called the
Director General, and the accounting authorities of other departments are
20
generally called Heads of Departments. They manage the departments together
with top, senior, middle and junior management as well as ordinary public officials
(Gildenhuys, 2004: 153,154). The eleven government departments (as stated
under Free State Provincial Government) with structures or bodies of public
officials constitute the FSPS.
1.9.7 Public Servants (Employees)
According to the Public Service Act (Republic of South Africa, 1994:20), chapter III
section 8 (1), public service is comprised of individuals who are employed (a) in
posts on the establishment of departments, and (b) additional to the establishment
of departments, and who may (2) be employed permanently or temporarily and in
a full‐time or part‐time capacity. According to Venter (Besdziek et al. 2011:82) the
Public Service is constituted of all those who are employed by the national
departments and the nine provincial administrations in terms of the Public Service
Act of 1994, and are responsible for the day to day administration and
management of the affairs of the government. They are trained to do specific jobs
and have skills and qualifications that are unique to their responsibilities (such as
doctors, teachers, engineers and police). The Public Service provides stability in a
state. Venter (Besdziek et al. 2011:93, 94) adds that public servants are
remunerated from tax, are therefore in the service of the public, and are referred to
as servants of the public (public servants). For the purpose of this study, the term
public servants will be used interchangeably with employees. Thus, these
administrators (public servants/ public officials) are expected to loyally serve the
government of the day by carrying out the Acts, ordinances, bylaws, and
regulations (Gildenhuys, 2004:153).
Theories of public administration clarify that the public officials are expected to
abide by specific values such as conforming to the political and judicial supremacy,
public accountability, honesty, justice and rationality. They are further expected to
submit to democratic principles, ethical standards, community values and common
law which are termed as administrative law (Gildenhuys, 2004: 154).
21
1.9.8 Manager
The WPHRM, 1995 defines a manager as “anyone whose duties in the main
involve responsibility for the work of others" (Department of Public Service and
Administration, 1997:10). Thus, the term includes not only those who are usually
referred to as managers, because they are members of the so-called management
echelon, but also all first-line supervisors performing the management functions.
For the purpose of this study a manager in the FSPS is defined as anyone who is
on salary level 13, and is accountable for the management and performance of
those who report to them.
1.9.9 Management
For the purpose of this study management involves the tasks and activities
undertaken by managers, regardless of their levels to achieve organizational
goals, which can be clustered under the basic managerial functions such as
planning, organizing, leading, and controlling (Hellriegel, Jackson, Slocum,
Staude, Amos, Klopper, Louw & Oosthuizen, 2008:9; Smit, Cronije, Brevis & Vrba,
2011:8). Planning involves defining organizational goals, and recommending ways
to achieve them. This involved firstly deciding on the direction the organizations
wants to take to achieve its goals, followed by the identification and commitment of
the scarce recourses. Finally, the tasks which must be completed to reach the
organizational goals must be decided upon (Hellriegel et al. 2008:10). Smit et al.
(2011:9) adds that planning encompasses the vision mission and goals.
Once the planning has been done, the organizing function helps to convert the
plans into actions, by assigning the tasks identified during the planning session to
individuals and groups within the organization. The organizing function also
provides an organizational structure that unifies the organization (Hellriegel et al.
2008:10), and it indicates how and where people and other resources should be
deployed (Smit et al. 2011:9) to achieve the organizational goals. Leading, which
is an integral part of the basic managerial functions, involves directing and

22
motivating human resources, so that they willingly work towards achieving the
organizational goals. In addition to planning, organizing and leading, the critical
responsibility of any manager is that of controlling where performance is monitored
continuously to ensure that the actual results are in line with planned results.
Controlling also involves taking corrective action when necessary (Smit et al.
2011:9).
1.9.10 Subordinates
A subordinate is defined by the Readers Digest Illustrated Oxford Dictionary (1998:
829) as “a person working under another”. Merriam Webster Learner’s Dictionary
(2015: np) defines a subordinate as a person “in a position of less power or
authority than someone else”. Subordinates for the purpose of this thesis refer to
occupational levels 11 and 12 reporting to occupational level 13.
1.9.11 Motivation
Motivation is the engine that drives human resources, and the factors that motivate
(motivators) are specific to individuals. Motivation energizes behaviour, gives
direction and provides the impetus to persist, even in the face of challenges and
problems (Grobler, Wärnich, Carrell, Elbert & Hatfield, 2011: 237). Mol (2012:20,
27, 40, 54) states that employees are only motivated to perform a task with
dedication and commitment, if that task arouses a sense of pride regarding
achievement. There are three motivators that give employees a sense of pride
including experiencing success, feeling the responsibility to achieve something
and receiving recognition for accomplishments. If anyone or more of these
motivators are built into the job, the jobholder will be motivated. There are several
motivational theories that explain the role and impact of motivation in individual
performance, which are discussed in chapter 2 of this study.
23
1.9.12 Performance
Performance is what people say and do, and all performance starts with a thought
according to Viedge (Werner, Bagraim, Cunningham, Landman, Potgieter, Viedge,
2011:117, 118). This statement can be further explained by means of an example.
When a manager asks an employee to draw up a report within a specified time,
the employee may first think about the request or instruction, and in the thought
process shall weigh the consequences, and may decide whether to complete the
task or not. Furthermore, employees must have a willing attitude, the ability, and
must be empowered to do the job in order to deliver effective and efficient
performance. More importantly, there are two major elements that influence
performance of individuals including factors that reside within the individual, and
factors that reside with the organization which is outside the control of individuals.
Factors related to the individuals are commitment to the organization, personality,
attitude, skills, ability, knowledge, being present at work, and motivation. Factors
related to the organization constitute leadership, organizational structure, systems
and processes, support, empowerment, opportunity to perform, job design and
rewards (Viedge in Werner et al. 2011:117, 118).
1.9.13 Performance Management
Performance management is a process through which managers can ensure that
employees’ activities and outputs are directed towards the attainment of
organizational goals (Noe, Hollenbeck, Gerhart & Wright, 2011: 8). According to
Joubert and Noah (Matshiqi, 2007:6), effective performance management involves
a formal management process of directing, measuring, evaluating and rewarding
human effort, competence and talent towards achieving the organization’s goals
within a framework of core values. Performance management can be explained
for the purpose of the study as setting goals and planning work together by
manager and subordinates, monitoring performance and giving feedback on an on-
going basis, developing the skills and capacity to perform, assessing and rating
employees at regular intervals, and, rewarding effective and efficient performance

24
(U.S Office of Personnel Management, n.d:1). It also includes corrective measures
for non- performance. In summary, performance management involves planning,
maintaining, monitoring, reviewing and rewarding of performance (Callaghan,
2005:3).
1.9.14 Effectiveness
Effectiveness refers to the ability to achieve goals and objectives with available
resources (Minnaar & Bekker, 2005:128). According to Grobler et al. (2011:154)
effectiveness constitutes doing the right things. For instance, if the goal of an
organization is to build 100 houses and it achieves the target, the organization is
said to be effective. The optimal use of resources is not a yardstick in this regard.
Similarly, if the goal of an employee is to write 20 reports in a year and he or she
achieves the target, he or she is said to be effective.
1.9.15 Efficiency
The definition of efficiency applicable to this study is that of Werner (2011:20, 21),
which suggests that efficiency is doing things right the first time to avoid wastage
of resources. If work has to be re-done, the resources and time used for the first
work was wasted. For example, if the goal was to build 100 houses and they are
built within a specified budget, to a specific quality, and within a time period, the
organization can be said to be efficient. On the contrary, if the houses were not
built to specified standards, the houses may be disqualified for human dwelling,
and all the houses would have to be demolished and rebuilt. Such actions would
have a bearing on the costs as well as the deadline. The cost and quality of the
management process are also important factors in measuring efficiency (Minnaar
& Bekker, 2005:128). In other words, if an organization maintains a satisfactory
relationship between costs involved and benefits accrued, such organizations are
said to be efficient (Grobler et al. 2011:154).
25
1.9.16 Positive / Favourable Work Environment
A positive/favourable work environment can simply be defined as the difference
between success and failure for an organization (Ruth, Crawford, Wysocki &
Kepner, 2012:1). According to White & HR Zone (Ruth et al. 2012:1) positive work
environment is where employees are happy and motivated. Hereafter, the terms
favourable or positive with regard to work environment will be used
interchangeably in this thesis.
1.10 IMPLICATIONS OF THE STUDY TO PUBLIC ADMINISTRATION
Public administration can be theorized as “an organisational structure, a system, a
function, an institutional construct, procedures and processes or just a set of
practices in the exercise of public authority”, suggests Kauzya (2002:2).
Administration, according to Wilson (1887:198), is the most visible part of
government and is as old as government itself. It represents the executive as well
as the operative and demonstrates that the government is in action.
Thus, in the quest for optimizing efficiency and effectiveness, there has been
considerable metamorphosis of the concept of public administration that has
moved from its traditional, centralised, neutral, controlled and expert application of
laws, rules and regulations, to the present public management. The main aim has
been to make public administration perform better in accomplishing the missions of
the State (Kauzya 2002:3). As such, public organizations have to be redesigned
focusing on innovative leadership and co-operation among employees in order to
ensure effectiveness and efficiency in public service delivery. This is demonstrated
in paradigms such as the ‘New Public Administration’, the ‘New Public
Management’, and the ‘New Public Service’ (Thornhill & van Dijk, 2010:103).
These paradigms are explained in the paragraphs below starting with the
Traditional Public Administration.
26
1.10.1 Traditional public administration
In the opinion of Denhardt & Denhardt (2007:12), the traditional public
administration has allowed public servants to deal effectively and efficiently with
complex and difficult problems. It has also helped public servants to maintain a
balance between political and administrative concerns. Given the circumstances of
its time, the traditional public administration served the organizations well, and it
continues to do so. Most government organizations still follow this basic model of
organization and management (Denhardt & Denhardt, 2007:12).
However, in spite of its many important contributions, the traditional public
administration has been seen as synonymous with bureaucracy, hierarchy, and
control (Denhardt & Denhardt, 2007: 24). Contemporary governments that are
faced with new and different challenges due to globalization and technological
advancement believe that the hierarchical structures and top-down approaches to
policy implementation are no longer effective. In addition, Dobuzinskis (Thornhill &
van Dijk, 2010:103) suggests that public administration needs to exhibit a more
client centred approach for it to be more effective and efficient. As a result, efforts
by a group of scholars at creating more humanistic organizations in the public
sector have resulted in the formation of another paradigm, the New Public
Administration.
1.10.2 The New public administration (NPA)
The NPA called for organizational humanism, openness, trust, honest
communications and personalization of its members and urged all administrators
to play a more active role in the development of public policy (Denhardt &
Denhardt, 2007: 38). The new paradigm realized that the complexity of
contemporary problems required the expertise of professionally trained
administrators and specialists and recognized the role of values in public
administration.
27
In order to improve efficiency and effectiveness, the concept of public
administration further moved to another paradigm, the New Public Management.
1.10.3 The New Public Management (NPM)
A new managerial approach in the public sector emerged in the 1980s and early
1990s and was called New Public Management. This new approach emphasizes
the economy, efficiency and effectiveness of government organizations,
instruments and programs, and higher quality service delivery. This new model of
public sector management is regarded by many authors "as a transformation of the
public sector and its relationship with government and society" (Katsamunska,
2012:78).
According to Bourgon (2005:16), the NPM is expected to provide answers to the
citizens as they demand and deserve high quality service that is free from
patronage or influence peddling. They expect access to information, services in
accordance with their needs and circumstances at the time they need them, and
not at the convenience of Departments or public servants. They expect to be
treated with respect by Public Service and public servants and earn and maintain
public trust.
The NPM recognized the importance of managers and advocated that managers
must be given greater freedom if they have to be instrumental in improving
efficiency and productivity (Denhardt & Denhardt, 2007: 26). The central ‘doctrines’
of the NPM amongst others are: hands- on professional management, explicit
standards and performance measures, emphasis on output controls, and
emphasis on greater discipline and frugality in the usage of resources (Hood,
1991:4,5). This paradigm further believed that the application of the above-
mentioned doctrines would transform the organizational structure, processes as
well as public service provisions.
28
The transition from the traditional public administration now stands at another
paradigm called the New Public Service.
1.10.4 The New Public Service (NPS)
According to Denhardt & Denhardt (2007:3), the NPS advocates that government
should be run like a democracy and public servants must act on this principle. This
paradigm envisages that the public servants must express renewed commitment
to the public interest, the governance process, and democratic citizenship. They
must learn new skills in policy development and implementation, recognize and
accept the complexity of the challenges they face, and treat their fellow public
servants and citizens with renewed dignity and respect. In the process the public
servants will feel more valued and energized, and consequently pay more
attention to citizens and serve them well. Citizens and public officials work together
to define and to address common problems in a cooperative and mutually
beneficial way. This new attitude and new involvement helps public servants to
serve citizens well, to advance the common good and contribute to a better life for
all. This movement manifests in the way public servants interact with political
leaders, engage with citizens, and bring about positive changes in the Public
Service and in the wider communities (Denhardt & Denhardt, 2007:4).
Thus, it can be stated that the transition from traditional public administration to
NPS clearly reflects the vision of South Africa, its leadership past and present, its
Constitution and other pieces of legislation of a ‘better life for all living in South
Africa’. The various paradigms also emphasize the role of the Public Service and
public servants in realizing the above-mentioned vision. Thus, this particular study
through its findings intends to contribute to the Free State public administration by
establishing how managers can create, manage and maintain effective and
efficient employee performance in the FSPS.

29
1.11 RESEARCH METHODOLOGY
Brynard and Hanekom (2006:6) describe research as a systematic,
multidimensional process by which data on phenomena is gathered and analyzed
to extend the boundaries of knowledge. Bhattacherjee (2012:1) adds that research
has to be scientific as it contributes to a body of science by following scientific
methods. The scientific method as applied to social sciences, which deals with
people or collections of people, and their individual or collective behaviours,
includes a variety of research approaches, tools, and techniques, such as
qualitative and quantitative data, statistical analysis, experiments, field surveys,
and case research among others (Bhattacherjee, 2012:1, 5).
Depending on the purpose of research, scientific research can be grouped into
three types namely exploratory, descriptive, and explanatory (Babbie, 2010:92-94;
Bhattacherjee, 2012:6). Depending on the purpose of the study, it can apply more
than one type of study (Babbie, 2010:92). As such, this study has applied
descriptive and explanatory research. Explanatory research was used in seeking
explanations of observed phenomena, and attempting to identify causal factors for
employee performance and or the lack of it. The study also employed descriptive
research as it systematically described a situation and provided information about
employee performance in the FSPS. Moreover, Bhattacherjee (2012:6) states that
most academic or doctoral research belongs to the explanation category, though
some amount of exploratory and/or descriptive research is needed during initial
phases.
Primary and secondary data were collected for the study. Primary data was
collected from public servants in Free State Provincial departments from salary
levels 11, 12 and 13 through random sampling. Salary levels 13 constitute
directors (managers in this study) and salary levels 11 and 12 are deputy directors
representing subordinates reporting to salary level 13. Data collection was mainly
on the management support, work environment, performance management and
the impact of these variables on the performance of public servants. Relevant

30
statistical tools were used to analyse the data collected through the various data
collection tools and techniques. Secondary data was collected from existing
literature that broadened the researcher’s knowledge, which brought clarity and
focus to the study. It also helped to build a theoretical base and to contextualize
the findings.
A separate chapter that elaborates on the research methodology is part of this
thesis.
1.12 SCOPE OF THE STUDY
This research study was undertaken in the eleven (11) government departments.
The data gathering through questionnaires and focus group interviews, was limited
to occupational levels 13 (Directors), 11 and 12 (deputy directors). The reason for
selecting these levels (13, 12 and 11) is that level 13 represents managers to
whom levels 11 and 12 directly report to. Thus, the opinions of managers and
subordinates shall have direct relevance to a great extent. This research study
shall take the form of a thesis consisting of six chapters which will contain
information as described below.
1.12.1 Chapter Outline
Chapter one provides the introduction and background to the study. It presents the
research problem, and outlines the purpose, objectives and the relevance of the
study, as well as the general research hypothesis. It also defines the important
terms and gives a description of the methodology.
Chapter two aims to contribute to a theoretical foundation and framework through
a literature study. Motivational theories that form a foundation for effective and
efficient employee performance, as well as management support, favourable work
environment and its impact on performance within the Public Service environment
are presented.
31
In chapter three, performance management is discussed with specific emphasis on
the Free State government departments. The chapter also highlights the key
factors in performance management, its benefits and its failures.
Chapter four provides an outline of the methodology used to conduct the research.
This chapter presents the research design and data collection techniques, study
population and sampling procedures. It also clarifies the rationale behind the
methodology applied, how the questionnaire was pre-tested, and what measures
were taken to ensure validity and reliability of the study.
Chapter five investigates the hypothesis and reports on the research findings
through statistical analysis and interpretation of the data collected. The
conclusions concerning the objectives and hypothesis are discussed and reported.
Chapter six reflects on the hypothesis and reiterates the objectives of the study,
and proposes recommendations based on the key findings.
1.13 CONCLUSION
In conclusion, this chapter introduced the topic and set the scene of the research.
Against the background of explanations given in this chapter, the reason for the
study was to examine whether managers in the FSPS are able to influence and
motivate their team by creating and managing a favourable work environment
through objective performance management, and through providing management
support to employees. The assumption was that, if the managers provide a
favourable work environment, their staff shall become motivated to give efficient
and effective performance. This led to the formulation of the hypothesis and the
aim of the study to be achieved by the research objectives. The research
methodology was only briefly mentioned in this chapter, as a separate chapter
(chapter 4) is dedicated to research methodology. The most important key
concepts applicable to this study were briefly explained, and the seven chapters
and its contents were outlined, and thus laid a strong foundation for the study.
32
CHAPTER 2
FAVOURABLE/ POSITIVE WORK ENVIRONMENT:
THE MOTIVATING PLATFORM FOR EFFECTIVE AND EFFICIENT
EMPLOYEE PERFORMANCE
2.1 INTRODUCTION
Organizations need individuals to carry out tasks and responsibilities towards
producing quality products or services in the pursuit of achieving organizational
goals and objectives. As the primary aim of management is to increase the
efficiency of the organization by achieving maximum outputs at minimal costs, an
important managerial function involves utilizing the full potential of employees. In
order to use the full potential of employees, managers need to know what
energizes them in performance, so that this energy can be appropriately
channelled towards specific outcomes that would add value to greater
organizational efficiency. This chapter therefore focuses on the factors that
energize employees to give effective and efficient performance, and the role of
managers in creating those energizing factors. A favourable/ positive work
environment is one of the key forces that energize individuals to provide effective
and efficient performance according to management literature. This is because a
favourable/positive work environment motivates employees, boosts morale,
creates job satisfaction, curtails unnecessary stress, decreases absenteeism and
labour turnover, and promotes effective and efficient performance. Furthermore,
Management support is one of the crucial factors in creating a positive work
environment. As such, creating a positive work environment in which employees
are productive is a fundamental responsibility of every manager.
As suggested in the first chapter, the terms favourable environment or positive
environment will be used interchangeably in this chapter when referring to work
environment, as both terms have the same meaning.
33
2.2 POSITIVE WORK ENVIRONMENT
Creating a positive workplace is critical to an organization’s success and managers
can create positive workplaces for their employees by establishing and maintaining
good relationships, nurturing teamwork, and encouraging innovations. (Ruth et al.,
2012:1). Leblebici (2012:39) supports that a positive work environment is critical
because it motivates employees for better performance and better productivity.
The workplace environment can impact on employee morale, productivity and
employee engagement both positively and negatively. As such, creating a positive
work environment must be the goal of all managers, as the work environment
factors influence employees engagement with their immediate environment, the
quality of work, level of innovation, teamwork, absenteeism and ultimately, the
length of their employment with the organization (Chandrasekhar, 2011:2, 4-5).
One of the important ways to create a favourable work environment is to adopt a
management style that would positively impact on the ethics, behaviour,
commitment, professionalism, drive and interpersonal relations of employees
(Chandrasekar, 2011:4). Chandrasekhar (2011:4) adds that a favourable work
environment can also be created if managers provide necessary management
support to their employees. Management support can be demonstrated by
delegating responsibilities with necessary authorities, making employees
accountable for their actions, encouraging teamwork, displaying confidence and
trust in the ability of their team members, and treating them as professionals. Such
an environment will promote trust, loyalty, and a sense of ownership towards the
organization, and influence the quality of work, level of innovation, and team spirit.
Furthermore, immediate managers must act as advocates for employees. They
must ensure provision of the necessary resources and support structures with
which to undertake the tasks. Most of all, they must give recognition and positive
encouragement when a job is well done (Chandrasekhar, 2011:4, 10).
34
Other factors that contribute to a positive environment are the following
(Chandrasekhar, 2011:5-7). Provision of these factors express management
support as well.
2.2.1 Goal setting
Employees must be involved in setting meaningful performance goals and
performance measures for their work.
2.2.2 Performance feedback
Employees need to know regularly how well they are performing, and how well
they are achieving their performance goals, as well as what needs to be changed
or improved.
2.2.3 Workplace incentives
Rewards must correspond with efforts/performance given expected standards.
2.2.4 Training, mentoring/coaching
Managers must help employees to perform better in their current role, and develop
their potential so that they are ready to fit well in a future role.
2.2.5 Role congruity
There must be consistency between the job that the employees perform and their
expectations when they joined the organization and any training given to them
later. There must also be conformity between the organization’s role expectations
and tasks allocated by the employee’s immediate supervisor.
2.2.6 Defined processes
Organizations must have standardized processes and procedures to maintain
quality. Managers must also manage and control any variations by documenting
and communicating it to employees.
35
2.2.7 Job aids
Employees need job aids such as templates, guides, models and checklists to
minimize error rates and to ensure quality.
2.2.8 Opportunity to apply
All employees must have the opportunity to apply their skills and knowledge, and
individual workloads and organizational systems and processes should not
obstruct them from doing so.
Characteristics of a favourable work environment according to Hurley,
Kliebenstein, Orazem and Miller (2005:22), are as follows:
employees receive salaries that commensurate with work;
there will be good communication within the organization;
employees receive recognition from their employer; and
employees have opportunities for training, development, advancement,
more challenges and responsibilities, and have better working conditions.
The Victorian Public Sector Commission (VPSC) (2014:1) in Australia
differentiates factors that contribute to a positive work environment into (i) strategic
and (ii) operational factors. Strategic factors include vision and values (shared
goals), leadership and accountability, and organizational communication.
Operational factors however include learning and development, workflow
management (the right skills, support and resources), and performance
management (agreeing what to achieve and how it will be achieved).
A favourable work environment can easily be distinguished from an unfavourable
work environment from their characteristics. According to Coan (n.d:1), an
unfavourable work environment is characterized by unfriendly and critical
managers, low employee morale and high employee turnover, absence of
feedback and an employee attitude where they count hours and minutes to leave

36
the work place. A favourable work environment is characterized by managers with
encouraging attitudes showing interest in their employees. Employees who know
how their managers regard them, employees with positive attitude (they do not
wait for the day to be over to leave the work place), and loyal employees who take
pride in working for the organization. Such a work environment is further
characterized by reduced employee turnover, higher employee morale, greater
loyalty and higher productivity.
Karim (2012:np) concurs, describing employee engagement, boosted morale,
enhanced outputs, job satisfaction, reduced employee stress, reduced employee
turnover and motivated employees as characteristics. Some of these
characteristics will be discussed in more detail hereafter.
2.3 CHARACTERISTICS OF POSITIVE WORK ENVIRONMENT
Favourable work environment characteristics such as employee engagement, job
satisfaction, employee morale, and employee motivation are detailed in this
section.
2.3.1 Employee Engagement and Positive Work Environment
Sridevi and Markos (2010:92) identify a positive relationship between employee
engagement and organizational performance outcomes, employee retention,
productivity, profitability, and customer loyalty suggest. They further state that the
more engaged the employees are; the more likely their organization is to exceed
its growth financially and otherwise. Employees not engaged often waste their
efforts and talents on less important tasks, will not show full commitment, might
leave the organization, and have far more issues about their organization.
37
There are several available definitions of employee engagement.
Kahn (Saks, 2006:601) defines employee engagement as the psychological
presence when occupying and performing an organizational role. Rothbard (Saks,
2006:601) also defines engagement as psychological presence, and adds that it
involves two critical components namely (i) attention and (ii) absorption. Attention
refers to reasoning ability and the amount of time one spends thinking about work,
while absorption refers to the intensity with which an individual focuses or gets
immersed in the work. Baumruk, Richman and Shaw (Sundaray, 2011:54) defines
employee engagement as the emotional and intellectual commitment to the
organisation, while Frank et al. (Sundaray, 2011:54) explain it as the amount of
discretionary efforts exhibited by employees in their job. These definitions point to
the fact that employee engagement is vital for the performance and growth of
organizations.
Karim (2012:np) states that employee engagement is a powerful factor for
organizational performance and success, as engaged employees are more
productive, customer-focused, and profit (service) generating. Employees are
more likely to become fully engaged and involved in their work if the workplace
provides a favourable work environment. Engaged employees are emotionally
attached to their organization, highly involved in their job, work with great passion
for the success of their organization, and perform beyond the employment
requirements. Employee engagement also reflects a two-way relationship between
employer and employee. Managers must realize that the management initiatives
will not materialize without determined, involved and engaged employees, and
must therefore keep employees engaged in their jobs to make them more efficient
and effective. Furthermore, employee engagement originates from (i) employee
commitment and (ii) organizational citizenship behaviour (OCB). These two
aspects are important parts as well as predictors of employee engagement
(Sridevi & Markos, 2010:89, 90). The feeling of commitment creates positive
attachment to and identification with the organization, the willingness to expend

38
extra efforts for the success of the organization, and the proud feeling to be a
member of that organization (Sridevi & Markos, 2010:90). OCB is explained by
Macey and Schneider as well as Robinson et al. (Sridevi & Markos, 2010:91) as a
factor that promotes initiatives, the urge to be proactive, and the desire to seek
opportunities to contribute one’s best, and work beyond one’s employment
contract. Hewitt (Sundaray, 2011:55) adds that engagement is an outcome of
employees’ experiences in an organization and manifests in three types of
behaviour namely say, stay and strive. According to Hewitt (2015:2,3), behaviour
‘say’ denotes that engaged employees will talk good and positive things about the
organization and act as its advocates. Engaged employees will continue to ‘stay’
with the organization as their talents are recognized and rewarded and are offered
attractive career opportunities to advance. Such employees will focus their energy
and effort to ‘strive’ for exceptional performance because management clarifies
objectives, creates a vision, put in place necessary systems and processes,
provides sufficient and necessary resources and gives appropriate feedback.
According to Baumruk and Gorman (Sridevi & Markos, 2010:92), engaged
employees demonstrate behaviours which improve organizational performance.
Such employees advocate for the organization, have an intense desire to stay with
the organization (even if they have opportunities to work elsewhere), and exert
extra time, effort and initiative towards the success of the organization. Engaged
employees give their organization the competitive advantages needed for its
success such as higher productivity, customer satisfaction, and lower employee
absenteeism and turnover (Sundaray, 2011:57).
Various factors influence employee engagement. According to Sundaray (2011:
55, 56) these factors include recruitment (candidates who are best-suited to the
job and to the organization’s culture), job design, career development
opportunities, leadership, empowerment and training and development, equal
opportunities and fair treatment, performance management, compensation, job
satisfaction and communication. Maslach et al. (Sundaray, 2011:54) states that
39
while a sustainable workload, feelings of choice and control, appropriate rewards
and recognition, a supportive work community, fairness and justice, and
meaningful and valued work leads to engagement, absence of it may lead to
employee disengagement. The Towers Perrin Talent Report (Sridevi & Markos,
2010:91) identifies ten workplace attributes which will result in employee
engagement. The top three among the ten drivers include management’s interest
in employees’ well-being, challenging work, and decision making authority. Sridevi
and Markos (2010: 91,92) make mention of various surveys that suggest critical
drivers to an engaged work force such as, the feeling of being valued and involved,
effective communication where employees can raise their views and ideas to the
management and, the manager himself or herself. According to Vance (Sridevi &
Markos, 2010:92) employee engagement is the outcome of both personal as well
as organizational attributes. Personal attributes relate to knowledge, skills,
abilities, temperament, attitudes and personality, whereas organizational
characteristics include amongst others leadership, physical and social setting,
human resource practices and components of job performance.
According to Saks (2006:603), a stronger theoretical rationale for explaining
employee engagement can be found in the Social Exchange Theory (SET). SET
argues that parties in an organization, in this instance the employer (represented
by management) and employee are in a state of reciprocal interdependence, and
therefore several obligations are created through their interactions. The theory
postulates that the relationships evolve over time into trust, loyalty, and mutual
commitments, as long as the parties abide by certain rules of exchange. According
to Cropanzano and Mitchell (Saks, 2006: 603), rules of exchange include
reciprocity or repayment rules, such that the actions of one party lead to a
response by the other party. For example, when employees receive a salary and
other fringe benefits from the organization, they are obliged to repay the
organization through their hard work, and vice versa. This is consistent with
Robinson et al.’s (Saks, 2006:603) description of engagement as a two-way
relationship between the employer and employee.
40
Thus, employee engagement refers to a positive attitude that the employees hold
about an organization, and this positive attitude is essential for individual and
organizational performance and success as engaged employees can help the
organization achieve its goals (Sundaray, 2011:56, 57). Similarly, job satisfaction
which is one of the many work related attitudes (Kumari, 2011:11), and as stated
earlier one of the characteristics of a positive work environment is explained in the
upcoming paragraphs.
2.3.2 Job Satisfaction and Positive Work Environment
Job satisfaction denotes favourable feelings and emotions with which employees
view their work. An individual with a high level of job satisfaction has positive
feelings about the job, while an individual who is dissatisfied with his/ her job has
negative feelings about the job (Kumari, 2011:11). According to Karim (2012: np),
the first step to job satisfaction is the existence of a positive work environment.
Organizations that fail to provide job satisfaction are at risk of losing their high
performing employees. Managers who provide the opportunity to maximize the
potential, creative abilities and talents of employees have a greater competitive
advantage in terms of providing job satisfaction, than those who do not.
Furthermore, employee engagement and a healthy work environment play a vital
role in creating job satisfaction among employees.
Locke and Lathan (Tella, Ayeni, & Popoola, 2007:4) define job satisfaction as an
emotional state that is pleasant and positive, arising from the assessment of one’s
job and job experiences. Job satisfaction is the result of employees’ perceptions of
how well their jobs provide those things that are important to them. Price (Mafini &
Pooe, 2013:2) defines job satisfaction as the “effective orientation that an
employee has towards his or her work”. To Sempane, Rieger and Roodt (Mafini &
Pooe, 2013:2), job satisfaction is the “individual’s perception and evaluation of the
overall work environment”. According to Bakotić and Babić, (2013:206), job
satisfaction is an indication of how much an employee likes the work and how
passionate and involved the individual is with his or her work. If the employee gets
41
a sense of comfort and gains positive experience from the work, then it can be said
that the employee has job satisfaction.
Luthan (Tella et al. 2007:4, 5) suggests that there are three important dimensions
to job satisfaction namely (i) emotional response to a job situation (which cannot
be seen but can only be inferred), (ii) how well the outcome meets or exceeds
expectations, and (iii) the attitude related to the characteristics of a job. For
example, if employees feel that their hard work is not recognized by their manager
they might develop a negative attitude towards the work, the manager and
colleagues. On the contrary, a positive attitude will be the result if they feel that
they are treated fairly and equitably and they receive rewards and recognition that
they have expected. The third dimension of job satisfaction refers to the attitude
related to the characteristics of a job such as the work itself, compensation,
promotion opportunities, supervision, and co- workers. There are various factors at
organizational and personal level that can influence job satisfaction.
According to Kabir and Mahamuda (2011:113) organizational factors that can
influence an individual’s level of job satisfaction include the level of pay and
benefits, the perceived fairness of organizational systems, the quality of the
working conditions, leadership and social relationships, the variety of tasks
involved, the interest and challenge the job generates, and the clarity of the job
requirements. Sageer, Rafat and Agarwal (2012:34-37) describes organisational
factors as organizational development, policies of compensation and development,
promotion and career development, job security, working conditions, relationship
with supervisor/manager, relationship with work group, and leadership styles.
Personal factors include personality, expectations, age, education and gender.
Other factors that contribute to job satisfaction involve the nature of work, salary,
stress, working conditions, colleagues, superiors, and working hours. Working
conditions, as one of the contributing factors to job satisfaction, include factors
related to the employee, environmental factors, and organizational factors (Bakotić
& Babić, 2013:206).
42
Sageer et al. (2012: 34) states that job satisfaction is influenced by job design, task
identity, recognition, responsibility, empowerment, quantity of tasks, and the level
of difficulty of tasks. Furthermore, the job characteristics model by Hackman and
Oldham (Nel, Werner, Poisat, Sono, Du Plessis, Ngalo, Van Hoek & Botha,
2011:294, 295) proposes that the task itself is key in job satisfaction, and jobs can
be redesigned to make employees feel that they are doing meaningful and
valuable work. This theory posits that job enrichment influences employees’ work
performance and satisfaction positively. According to the job characteristics theory,
the five critical job dimensions are skill variety, task identity, task significance,
autonomy and feedback. While the first three dimensions impact on the
meaningfulness of work, autonomy impacts on the responsibility experienced for
outcomes, and feedback on the employees knowledge of the actual results of work
activities. These five dimensions can be described in detail as follows.
Skills variety means that the job gives the opportunity to the incumbent to do
different tasks using different skills, abilities and talents, whereas task identity
refers to performing a complete job from beginning to end, rather than in bits and
pieces. Task significance relays the meaningfulness and the importance of the job,
and how it impacts on others, while autonomy refers to the freedom to do the work,
freedom to make decisions, and the freedom to choose how the job is done.
Finally, the fifth dimension, feedback, relates to clear and direct information the
employee receives about the job outcomes or the employee’s performance, and
how effectively the job was executed (Nel et al. 2011:295).
Thus, job satisfaction is critical for both the employee and the employer, as it
impacts on organizational behaviours (Kumari, 2011:11), and ultimately on the
performance and success of individuals and the organization. Levinson and Moser
(Tella et al. 2007:5) add that job satisfaction is so important that its absence often
leads to sluggishness and reduced organizational commitment. According to
Alexander, Litchtenstein and Hellmann as well as Jamal (Tella et al. 2007:5) a lack
43
of job satisfaction is even a forecaster of employees’ wanting to leave a job or the
organization.
Job satisfaction, employee morale and work environment are all linked as
contributors to effective and efficient performance. Shahu (2011:52) suggests that
if an employee is satisfied with his or her job, it is certain that his/her level of
morale will be high as well as the passion about the job. Thus, the chapter will now
focus on employee morale and how a positive work environment impacts on
employee morale, as well how employee morale is important for the success of an
organization.
2.3.3 Morale and Positive Work Environment
Morale can create a positive work environment and positive work environment can
generate employee morale. In the opinion of Ngambi (2011:764) employee morale
can energise and improve the productivity of employees. According to Shahu
(2011:51) employee morale depends on various factors, one being work life. The
work environment plays a vital role in determining employee morale, as an
employee will be happy in an organization that possesses a healthy (positive) work
environment, and a positive work culture, encouraging superior, friendly co-
workers and opportunities for growth. According to Karim (2012:n.p.) employee
morale, employee satisfaction and positive work environment are linked. Karim
(2012:n.p.) adds that employee morale can be achieved through employee
satisfaction, which can be derived from a positive work environment. The
importance of morale in organisations and its relevance to the organisational
environment, as well as to individuals’ and organizational success, can be
discovered in the following definitions.
According to Haddock (Ngambi, 2011:764), morale refers to the “positive feeling
groups have towards their organisations to which they belong and the special
affinity the members of the groups share with others, such as trust, self-worth,
purpose, pride in one’s achievement, and faith in the leadership and organisational
44
success”. Seroka (Ngambi, 2011:762) defines employee morale as the general
level of confidence or optimism experienced by an individual or a group, especially
if it affects discipline and willingness. Akintayo (2012:87) quotes Mendel in defining
morale as a “feeling, a state of mind, and a mental and emotional attitude”.
McKnight, Ahmad and Schroeder (Lee, Scheunemann, Hall & Payne, 2012:5)
explain morale as the good feelings that employees have about their work and
work environment. Washington and Watson (Akintayo, 2012:87,88) add that
morale is the feeling that an employee has about his or her job. This feeling is
founded on how the employees perceive themselves in the organization, and the
extent to which the organization not only satisfies and values the employee’s
expectations but also the employees’ inputs. Bentley and Rampel (Akintayo,
2012:88) attach two other dimensions to the meaning of morale namely (i) the
professional interest and (ii) enthusiasm that a person displays towards the
achievement of organizational goals. Linda, Babajide and Ajala (Akintayo,
2012:88) add that leadership styles, communication, employee participation in
decision making, and employee awareness on issues and problems affecting the
organization also affect employee morale, job satisfaction, and their intention to
stay or leave an organization.
Kareem (Akintayo, 2012:88) proposes that a managers’ ability to create a positive
work environment can impact on employee morale and performance.
Consequently, according to Adams (Akintayo, 2012:88), managers who manage
the work environment and provide reinforcement for desirable work behaviour
improve morale and satisfaction of the employees. Thus, Schuler (Ngambi,
2011:762) suggests that leaders (managers) need to create a culture of trust in an
organisation to improve morale in the work environment, as most employees who
experience low morale in the work environment blame management or their
immediate supervisors for their leadership-related competencies such as
communicating vision, energising staff, demonstrating trust and loyalty, and
developing teams. According to Schein (Ngambi, 2011:765), leaders will be able to
shape and influence organisational culture by being role models, by demonstrating
45
how objectively they allocate resources, how fairly they reward employees, and by
means of the criteria they use for recruitment, promotions, and terminations.
Levin (Ngambi, 2011:765) suggests that managers can create a climate of trust by
correlating their words and actions, as well as by being consistent in their actions.
The study by Psychometrics Canada (Ngambi, 2011:765) on employee morale
recommends that leaders should be more effective in addressing issues of morale,
by doing the following:
being active listeners;
providing clear expectations;
having open and informal interaction with staff;
communicating clearly and regularly;
assigning tasks to employees based on skills rather than office politics;
holding employees accountable and assigning them more responsibility;
managing resistance to change; and
yielding to individuals with greater expertise.
Furthermore, Bergh, Theron, Werner, Ngokha, May and Naidu (2009:9) states that
factors such as the feeling of being an important and integral part of the workplace,
recognition, and the sense of belongingness, all contribute to employee morale
and productivity. Millett (Lee et al. 2012:6) suggests that higher staff morale
results in improved productivity, improved creativity, reduced absenteeism, higher
attention to detail, a safer workplace, and an increased quality of work. In addition,
Mazin (Lee et al. 2012:6) add that employees of organizations that have higher
morale arrive on time for work, communicate better, waste less time on gossip,
have higher rates of retention, and are more creative.
Thus, it is evident that employee morale is very important in organisations, and if
not effectively managed, it can have adverse effects to the overall productivity and
performance of organisations. McKnight, Ahmad and Schroeder (Lee et al. 2012:6)
46
hold that motivation is a contributor to employee morale. Taking into consideration
the importance of motivation in an organizational setting, the concept is explained
in more detail hereafter.
2.3.4 Motivation and Positive Work Environment
A widely accepted assumption in an organizational context is that a positive
workplace environment motivates employees and produces better results.
Chandrasekhar (2011:2) agrees that the quality of an employee’s workplace
environment is a critical factor that impacts on their level of motivation and
subsequent performance. An article on motivation by the Society for Human
Resource Management (2010:1) narrates that the responsibility for motivation rests
on three pillars namely senior leadership, the direct manager, and the employee.
Motivation is essential for independent work as well as collaboration and
teamwork. Motivation is important for organizations to retain talents, meet goals
and to succeed beyond expectations.
Karim (2012:np) adds that the first step for managers to create a healthy and
productive work environment is to understand the factors that motivate employees
for reasons explained in the following definitions. Bartol and Martin (Senyucel,
2009:23) explain motivation as the “force that ignites, directs and maintains
people’s behaviour” in an organization. It is the engine that drives human beings,
energizes behaviour, gives direction and provides the impetus to persist, even in
the face of obstacles (Grobler et al. 2011: 237). In addition, motivation is intentional
and directional is the opinion of Nel et al. (2011:289). While the term intentional
refers to personal choice (not coerced) and the determination to persevere,
directional refers to the driving force aimed at attaining a specific goal. Nel et al.
(2011:289) add that motivated individuals are focused at achieving specific goals
even at the face of adversities.
47
Bartol and Martin (Senyucel, 2009:23) define motivation as the “force that ignites,
directs and maintains people’s behaviour”. While ignition denotes the initial interest
shown towards realizing a goal; direction signifies the actions that help individuals
to achieve their goals and maintenance relates to the upkeep of the behaviour
(actions) until the goal is achieved. Though motivation works as a
force/energizer/driver, it works differently in different individuals, as motivation is an
individual phenomenon. Thus, as individuals are unique, different factors can
motivate different individuals to reach the same goal. Though several factors can
serve as motivators, some factors can be more dominant than others, and the
dominant factor ignites certain behaviour in individuals. For example, while salary
(money) could be the dominant factor that energizes some individuals to go to
work every day, factors such as personal fulfilment, an interesting job, and the
work environment can be dominant motivating factors in others (Senyucel,
2009:23).
Rollinson (Senyucel, 2009:23) explains how motivation works in individuals to
change their behaviour. Individuals have two self’s namely (i) the actual self and
(ii) the ideal self. Actual self means that each individual has strengths,
weaknesses, feelings, beliefs and abilities, but may wish to be different and be
something else (the ideal self). The differences between the actual self and ideal
self are then termed as the needs. Individuals are energized by these needs that
direct them to certain goals. Thus, the motivation process can be said to be
activated by the needs of individuals. This particular concept of needs as the
motivator is the central theme of many motivational theories, as discussed
hereafter.
48
2.4 MOTIVATIONAL THEORIES THAT IMPACT ON POSITIVE WORK
ENVIRONMENT
Motivational theories are classified into content theories (explains what motivates
individuals), process theories (how individuals get motivated) and, reinforcement
theories (how individuals can be conditioned to be motivated to exhibit desirable
behaviour). Maslow’s Need Hierarchy Theory, Alderfer’s ERG Theory, Herzberg’s
Two Factors Theory, McClelland’s Achievement Motivation Theory, and
McGregor’s Theory X and Y are examples of content theories. Examples of
process theories include Adams’ Equity Theory, Locke’s Goal Setting Theory, and
Vroom’s Expectancy Theory, while Skinner’s Reinforcement Theory is an example
of a reinforcement theory (Swanepoel, Erasmus & Schenk, 2008:324).
2.4.1 Maslow’s Hierarchy of Needs Theory
Maslow based his theory on human needs, which he explained as a strong feeling
of dearth in some areas in an individual’s life. Maslow proposed five types of needs
being physiological, security, social/affiliation, esteem, and self-actualization,
arranged in a hierarchy from the lowest to highest. Physiological needs represent
the most fundamental biological needs of human beings such as food, air, water
and shelter, and therefore Maslow placed them at the bottom of the pyramid.
Safety needs represent the second level of needs, which would come to the fore
only once the physiological needs are satisfied. This theory emphasizes that the
employees would want to work in a safe environment where they can do their work
without any fear. The third level of needs, social needs, is activated once the safety
needs are satisfied. This represents the need of human beings to be loved and
accepted by others. After this esteem needs form the fourth level, which relates to
the need for recognition, self-respect and approval by others. Finally, the highest
need placed on the top of the pyramid is the self-actualization need. Individuals at
this level want to develop to their fullest potential. Such employees present
themselves as valuable assets to the organization as they can work most
effectively and efficiently (Kaur, 2013:1062,1063).
49
Maslow’s need hierarchy theory hypothesises that, a satisfied need ceases to be a
motivator and that, after an individual satisfies one level of needs, motivation shifts
to satisfying the next higher level of needs. Thus, individuals are constantly striving
towards achieving some level of needs. Maslow named this as the satisfaction-
progression hypothesis (Hellriegel et al. 2008:269, 271). The practicality of the
needs hierarchy theory lies in the fact that individuals have different needs and are
therefore motivated by different things. The need that acts as a motivator for one
individual may not be a motivator for another, and an effective motivator for one
individual at a given situation may not be effective in the same individual on a
different occasion (Swanepoel et al. 2008:326).
Managers can use this theory to motivate employees by providing financial and job
security, recognizing employee’s performance accomplishments, providing
opportunities to socialize, and providing opportunities for growth and development.
2.4.2 Alderfer’s ERG Theory
Alderfer’s theory states that there are three core needs that motivate employees
namely existence, relatedness, and growth. Existence needs are the basic material
needs necessary for one’s existence, similar to Maslow’s physiological and safety
needs. Relatedness needs refer to the desire for interpersonal relationships and
interaction, similar to Maslow’s affiliation/social needs (and esteem needs to a
certain extent). Growth needs relate to the inherent desire for personal
development, which can be compared to the esteem needs and self-actualization
needs defined by Maslow. Alderfer adds that more than one need can operate at
the same time, rather than in a hierarchy. Furthermore, if individuals are frustrated
with a particular need, they will focus on others or if they are discouraged with a
higher level need they can seek out greater satisfaction of a lower lever need to
compensate (Swanepoel et al. 2008:327).
50
Both Maslow’s theory and Alderfer’s theory are based on human needs however
the difference is that Maslow hypothesized fulfilment-progression, while Alderfer
theorized both fulfilment-progression and frustration-regression. Thus, Alderfer
adds that when a higher order need is difficult to satisfy, lower-level needs may
become more desirable, and the individual may retreat towards more easily
satisfied needs. A further difference between the two theories is that Maslow’s
theory maintains that each need is satisfied one after the other, and progresses
from simple to complex needs, whereas Alderfer’s theory holds that more than one
need operate simultaneously. Alderfer adds that once a lower-order need is
satisfied, there is an increased desire to satisfy a higher-order need, and the urge
to satisfy that particular need will increase the longer it remains unsatisfied (Anyim,
Chidi & Badejo, 2012:33).
2.4.3 Herzberg’s Two Factor Theory
Herzberg developed the two-factor theory of motivation by identifying two sets of
factors that influenced motivation and job satisfaction, called motivators and
hygiene factors. While motivators are job characteristics that create motivation
such as challenging work, responsibility, recognition, achievement, advancement
and growth; hygiene factors are non-task characteristics such as working
conditions, organizational policy, supervision and management, co-workers, salary,
status, and job security, that can create dissatisfaction if inadequate (Hellriegel et
al. 2008:274).
Though the hygiene factors prevent feelings of dissatisfaction, they will not
generate feelings of excitement about the job and the organization, however, the
absence of hygiene factors will lead to job dissatisfaction. In essence, hygiene
factors on their own are not sufficient to motivate employees, motivators need to
be present. Similarly, for motivators to operate as motivators, hygiene factors need
to be present as well (Swanepoel et al. 2008:328). Thus, managers must ensure
that both motivators and hygiene factors are present in the work environment.
51
2.4.4 McClelland’s Theory of Needs
According to Robbins et al. (Swanepoel et al., 2008:328, 329), McClelland’s theory
of needs propose three basic needs counting the need for achievement (nAch), the
need for power (nPow) and the need for affiliation (nAff). The need for
achievement articulates the aspiration to surpass some standard of behaviour,
such as the need to excel, and the need to be successful (Swanepoel et al.
2008:328). The need for power expresses the need to control others, resources
and the environment whereas, the need for affiliation conveys the need for
interpersonal relations, friendship, companionship, the need to associate with
others and the need to form part of groups.(Grobler et al. 2011:238). Hellriegel et
al. (2008:272) explains the three needs further. The achievement motive stipulates
that individuals assume personal responsibility for setting their goals, prefer to
pursue moderately difficult goals, and desire immediate and concrete feedback.
Individuals also desire standards of excellence in competitive situations. The
affiliation motive is expressed through the desire to develop and maintain close
relationship with others, to mutually satisfy interpersonal relationship needs.
Individuals tend to seek approval and reassurance from others and to conform to
group norms. This motive affects individuals’ willingness to work in teams. The
power motive expresses the desire to influence and control others and the social
environment and it impacts on how employees react to team operations.
2.4.5 McGregor’s Theory X and Y
McGregor developed two opposing approaches regarding how managers in an
organization or work situation observe human behaviour. The approaches were
called theory X and theory Y (Opu, 2008: 20,21). McGregor argues that managers
who believe in theory X have the perception that individuals have an innate dislike
for work and therefore would avoid it whenever possible. They are naturally selfish,
inherently lazy, lack initiative, have no ambition, are passive and do not care for
the needs of the organization. As a result, managers believe that employees need
to be persuaded, coerced, controlled, directed or threatened with punishment for
52
them to fit with the organizational needs. On the contrary, theory Y managers
perceive work to be a natural thing for individuals. Individuals are not lazy but self-
driven, self-directed, seek and accept responsibility all the time, and are not
passive or resistant to organizational needs. However, managers need to provide
such individuals with the right work environment, the right work systems and the
right resources. In such situations employees will be managed according to the
perceptions managers have about them, and not according to employees’ needs.
2.4.6 Equity Theory
Adams’ Equity Theory centres on how fairly individuals perceive themselves to be
treated in comparison to others. Employees in organizations make comparisons
between their perceived efforts and associated rewards, and the efforts of others
and their rewards. In other words, equity theory stresses that employees compare
their input outcome ratio with the input outcome ratio of others equivalent to them.
Inputs refer to anything that an individual spend at work such as effort, experience,
education, time, while outputs relate to anything an individual receives in return
such as praise, recognition, pay, benefits, promotions, increased status, and
supervisor approval. Equity and fairness are said to exist if these ratios are equal
and since the employees perceive the situation to be fair, they will not make any
changes to the status quo and continue with their behaviour. If the ratio
comparison produces unequal results, inequity and unfairness are said to exist,
and individuals will do something to equalize the unequal results (Swanepoel et al.
2008:331). Employees who feel inequitably treated will try to equalize the
treatment by means of altering their behaviour. They may decrease inputs, try to
get more output from the organization, just do enough work to survive, become
resistant, become excessively competitive (focus on reducing the outputs of
others) and/or resign (Tanner, 2014:2).
53
Equity theory cannot be fully explained without briefly mentioning the notions of
organizational justice and the resultant distributive justice, procedural justice and
interactional justice. Hence, the following paragraphs shall focus on these
concepts.
2.4.6.1 Organizational Justice
Cropanzano, Bowen and Gilliland (2007:34) propose that organizational justice is
a factor that contributes to the feeling of equity and fairness. Organizational justice
needs to be managed as it can benefit both the organization and employees by
reducing conflict situations, and by improving trust and commitment, job
performance, citizenship behaviours, and customer satisfaction. Organizational
justice is a personal evaluation about the ethical and moral standing of managerial
conduct. Managers quite often make the mistake of assuming that employees will
believe in organizational justice if they receive desirable outcomes. However, in
reality, managers are confusing outcome favourability with outcome justice, where
outcome favourability is a judgment of personal worth or value and outcome justice
is a judgment of moral correctness (Cropanzano et al. 2007:35).
Distributive justice and procedural justice are two significant dimensions of
organizational justice suggest Folger, Cropanzano and Greenberg (Lambert &
Hogan, 2011:32). Distributive justice is concerned with perceptions of the ends
(outcome), while procedural justice deals with perceptions of the means or
processes. Cropanzano et al. (2007:36) add a third dimension known as
interactional justice to the organizational justice concept. These are explained in
the following paragraphs.
2.4.6.2 Distributive Justice
According to Folger and Cropanzano as well as Greenberg (Lambert & Hogan,
2011:32), distributive justice deals with the perceptions that “organizational
outcomes the employees receive are equitable and fair”. Lambert (Lambert &
54
Hogan, 2011:32) adds that distributive justice is based on the exchange principle,
that employees compare the outputs they receive from the organization with their
inputs and conclude whether it is fair or otherwise. Greenberg (Lambert & Hogan,
2011:32) states that a number of outcomes such as pay, performance evaluations,
job assignments, reward and punishments shape employees’ perceptions.
According to Johnson (2007:6) also distributive justice refers to employees’
perceptions of the rewards they receive. Cropanzano et al. (2007: 37) however is
of the opinion that distributive justice is concerned with the allocations of outcomes
based on the premise that not all employees are treated alike, and that some
employees receive outcomes while others do not. Employees are concerned
whether they have received their fair share. The authors further suggest that three
allocation rules if appropriately applied can lead to distributive justice and they are;
(i) equality (same treatment to everyone), (ii) equity (based on contributions), and
(iii) need (according to need).
Adams (Hassan, 2002:55) adds that the degree of fair treatment received by
employees in comparison with other employees influences their motivation and
performance, as well as their decision to stay or leave the organization. According
to Greenberg (2005:44) distributive justice focuses on individuals’ beliefs that they
have received fair amounts of valued, work-related outcomes. For example,
workers consider the formal appraisals of their performance to be fair to the extent
that these ratings are based on their actual level of performance.
2.4.6.3 Procedural Justice
According to Folger and Cropanzano, as well as Greenberg (Lambert & Hogan,
2011:32), procedural justice refers to employees’ perceptions that the process, or
means by which organizational outcomes are determined, is fair. Employees
generally desire the process to be open and fair, regardless of the outcome.
Cropanzano et al. (2007:38) agrees that procedural justice focusses on the
fairness of decision-making in the resource allocation process. It concerns the
processes by which outcomes are allocated and not the outcome themselves.
55
Cropanzano et al. (2007:38) add that procedural justice establishes certain
principles specifying the roles of various stakeholders within the decision-making
processes, so that such a process is unbiased, representative and applied
consistently, accurately and ethically to all. This procedural justice is essential for
maintaining institutional legitimacy, as it influences employees’ convictions about
the organization as a whole. If the processes are perceived as just and fair,
employees show greater loyalty and willingness to behave in the organizations
best interests, supporting the organization and its leaders.
2.4.6.4 Interactional Justice
Interactional justice refers to the appropriateness of the treatment received from
authorities (Cropanzano et al. 2007:38), or the perceived fairness of the
interpersonal treatment that employees receive from the decision-makers in the
organization (Hassan, 2002:56). According to Johnson (2007:7), interactional
justice relates to employees’ perceptions of the fairness with regards to their
relationships with their supervisors. Bobocel and Holmvall (Johnson, 2007:7)
states that fair interpersonal treatment relates to clear and sufficient explanations
regarding allocation decisions, and treating recipients with dignity and respect
when implementing the decisions.
After pondering briefly on equity theory, the following paragraphs shall reflect on
the goal setting theory.
2.4.7 Goal Setting Theory
Goal setting theory suggests that goals which are specific and of a high standard
lead to a higher level of task performance than easy, vague and abstract goals,
such as ‘do one’s best’. Factors that contribute to the attainment of higher goals
include the individual’s commitment to the goals, task capability, knowledge
relevant and necessary to attain the goal, and the absence of conflicting goals. In
such instances, there will be a positive and direct relationship between goal
56
difficulty and task performance. As goals set the primary standard for self-
satisfaction, higher level goals are motivational because such goals require more
effort to attain. When such difficult, important and meaningful goals are achieved, it
gives employees the feeling of success, satisfaction and the confidence that they
are able to grow and meet challenges (Locke & Latham, 2006:265).
The goals’ relevance to performance according to Locke and Latham (2006:265)
are:
goals direct attention, effort and action towards goals;
goals require relevant task knowledge and skills, as performance is a
function of both ability and motivation;
goals motivate the use of existing ability, and motivate individuals to search
for new knowledge; and
goals, in conjunction with self-efficacy (task specific confidence), bring forth
other motivating variables such as personality traits, feedback, participation
in decision making, job autonomy and monetary incentives.
After explaining the role of goals in motivation leading to performance, the next
process theory focuses on the role of expectations in performance. The
expectancy theory by Vroom is briefly explained in the upcoming paragraphs.
2.4.8 Vroom’s Expectancy Theory
Expectancy theory, as a process theory of motivation, focuses on the individual’s
interactions with his/her environment. It describes motivation as a “function of
individuals’ perceptions they have about their surroundings and the expectations
they form based on these perceptions” (Ghazanfar, Chuanmin, Khan & Bashir,
2011:124). Expectancy theory, first developed by Vroom, is based on the three
components of expectancy, instrumentality and valence. Expectancy refers to
employees’ belief that effort leads to performance, and increased effort leads to
increased performance. Conditions that enhance expectancy include the
57
availability of correct resources, having the required job skills, and the availability
of the necessary support to get the job done correctly. Instrumentality can be
described as the assumption that performance results in valued outcome. Some
factors that support instrumentality include a clear understanding of the
relationship between performance and outcomes, trust and respect for individuals
who make decisions regarding rewards, as well as transparency in the process of
who gets what reward (Chaudhary, 2014:2). Redmond (Chaudhary, 2014:3) adds
that Vroom defines the third dimension of valence as value, which is associated
with any specific expected outcome, and thus the belief in outcome desirability.
There are individual differences in the level of value associated with outcomes. For
example, a cash bonus may not increase motivation of an employee striving for
formal recognition or promotion.
The tendency to act in a certain way depends on two factors namely (i) the
strength of the expectation regarding the outcome of a particular act, and (ii) the
desirability of the outcome as well as the attractiveness of rewards, performance-
reward link and effort-performance link. Attractiveness is linked to the importance
that an individual attaches to the rewards that can be achieved by performing a
task. The performance-outcome link refers to the degree to which the individual
believes that performance of a particular task will result in the desired outcome.
The effort-performance link refers to the degree to which an individual believes that
his or her efforts will lead to the performance necessary to achieve the desired
result (Swanepoel et al. 2008:333).
Having explained the role of content theories and process theories in motivation
and thereby performance; the discussion on this particular topic shall be concluded
by briefly touching on the reinforcement theory that focuses on how desirable
performance or behaviour can be safeguarded and maintained.
58
2.4.9 Reinforcement Theory
The Reinforcement Theory of motivation by Skinner states that an individual’s
behaviour is a function of its consequences based on the law of effect by
Thorndike. The law of effect postulates that behaviour with positive consequences
tends to be repeated, while behaviour with negative consequences tends not to be
repeated (Sourabh, Jake, Minjeong., Diemand, Berdine, Kumar 2013:1). Skinner
introduced the term reinforcement, and theorized that behaviour which is
reinforced tends to be repeated while behaviour which is not reinforced tends to
die out or become extinct (McLeod, 2007:1). Reinforcement Theory suggests that
behaviour is encouraged or discouraged depending on the consequences thereof.
According to Goldstein and Sorcher (Uduji, 2013:140), Reinforcement Theory
indicates that managers can encourage desirable behaviours. Bandura (Uduji,
2013:140) adds that they should also try to reduce undesirable outcomes by not
reinforcing wrong behaviour.
Positive reinforcement is a pleasurable incentive or reward following a desired
behaviour that encourages the continuance of the behaviour. According to Weiss
(Uduji, 2013:140), withdrawing or failing to provide a reinforcer for desirable
behaviour reduces motivation, and the behaviour can be extinguished or
discontinued. In other words, positive reinforcement is the positive response given
for a positive and required behaviour, which may stimulate its occurrence again
and again. If a manager praises an employee immediately upon finishing a difficult
report timeously, this may encourage the employee to repeat the outstanding
behaviour every time he or she is expected to complete a report. Rewards can be
a positive reinforcer, provided it stimulates the repetition of the accepted and
desired behaviour for which the individual was rewarded (Sourabh et al. 2013:1).
Negative reinforcement happens when negative or undesirable consequences are
removed from an employee. This can also be used for increasing desirable and
expected behaviour. Similarly, punishment entails the removal of positive
consequences for undesirable behaviour, so as to reduce the chances of repeating
59
undesirable behaviour in future. In other words, punishment means applying
undesirable consequence for undesirable behaviour (Sourabh et al. 2013:1).
Punishers are thus responses that decrease or weaken the chances of repeating a
wrong behaviour. It is the opposite of reinforcement since it is designed to weaken
or eliminate a negative response rather than increase it ((McLeod, 2007:1).
Extinction is similar to punishment as its purpose is also to limit undesirable
behaviour. The process of extinction begins when a valued reinforcement is
withdrawn in order to lessen the occurrence of an undesirable behaviour. Over
time, the process of extinction may result in eliminating the detrimental behaviour
altogether. However, extinction may also diminish a wanted behaviour because a
positive reinforcer is not available any longer (Encyclopaedia of management,
2009:1).
Managers can apply these motivation theories in their day to day management to
derive desirable performance from their employees. This is elaborated under the
following caption.
2.5 ROLE OF MANAGERS IN CREATING A POSITIVE WORK
ENVIRONMENT
Managers must create work environments in which individuals are motivated and
inspired to perform well to achieve organizational goals, as this is part of good
management (Swanepoel et al. 2008:316). Chandrasekhar (2011:4, 5) is also in
agreement, and proposes two ways in which to create such a work environment.
The first involves defining the physical environment, and the second involves
adopting appropriate management style(s) whereby managers will be able to
change the ethics, behaviour, commitment, professionalism, drive and
interpersonal relations of the employees for the better. There are many ways in
which managers and supervisors can create positive/favourable workplaces for
their employees where they will be happy and motivated (Ruth et al. 2012:1).
According to White (Ruth et al. 2012:1), some of the methods include using
appropriate positive reinforcement, listening and communicating openly and
60
thereby establishing a sound manager-employee relationship as well as
interpersonal relationships and teams.
White (Ruth et al. 2012:1) adds that balance, timing, and clarity are essential
ingredients for a manager to create positive relationships with his or her
employees. Balance is possible when there are set standards for reinforcing
actions. Furthermore, timing relates to giving recognition for actions or
achievements at the time they occur, so that employees can link the recognition to
the achievement. Clarity speaks to the specificity and simplicity with which the
employee understands the situation clearly.
Managerial actions that support a positive work environment are dependent on
their assumptions about the employees they manage, because such assumptions
influence managers’ motivational strategies, and their managerial styles.
Swanepoel et al. (2008: 316) elaborates on Schein’s theory on human
assumptions by suggesting how a work environment can be managed based on
the various assumptions managers have about their employees. Schein
(2004:172, 173) suggests that human nature in organizational context can be
categorised into (i) rational- economic, (ii) social, (iii) self actualizers and (iv)
complex people assumptions. While rational- economic assumption argues that
motivation of employees is built around economic interest, social assumption
emphasizes that employee’ motivation is influenced by their need to associate with
colleagues as well as to belong to groups. It is also assumed that self-actualizers
are motivated by challenging and interesting work, and that human nature is
complex because it is flexible and varied. This complexity further makes it difficult
to make common opinion about human nature.
Organizations must therefore, consider these basic assumptions about human
nature and develop and implement appropriate management strategies and
practices. Furthermore, managers must comprehend these basic assumptions to
avoid confusion caused by inconsistent practices as both incentive and control
systems in most organizations are built around assumptions about human nature
61
(Schein, 2004:173, 174). These four basic assumptions are explained in the
following paragraphs.
2.5.1 The rational economic man assumption
Swanepoel et al. (2008:316) cites Schein (1972) in proposing the doctrine of
rational economic man, which classifies human beings into two groups namely (i)
the untrustworthy, money motivated, calculative mass, and (ii) the trustworthy,
more broadly motivated, moral elite who must organize and manage the first group
(masses). Rational-economic employees (the first group) are believed to be
irrational and inherently lazy, their objectives are not linked to organizational
objectives, and they are incapable of self-discipline and self–control. This closely
resembles Mc Gregor’s theory X, as the role of management who believes in
theory X will try to coerce and control employees (Opu, 2008:21). Theory X relates
to an authoritarian style of management, where the emphasis is on “productivity,
on the concept of a fair day's work, on outputs, and on rewards for performance”.
The authoritarian attitude is based on the belief that employees have the innate
tendency to avoid work therefore they must be forced into work (Hindle, 2008:1).
These demeaning views about employees presuppose that managers possess
superior attributes, are motivated, self-controlled and rational, and as such will
manage the other group (Swanepoel et al. 2008: 317).
2.5.2 The social man assumption
Werner (Nel, van Dyk, Haasbroek, Schultz, Sono & Werner, 2004: 336) refers to
Schein (1980) in explaining the social man assumption. According to this
assumption, employees are primarily motivated by social needs, develop their self-
identity, and derive meaning from work through their social relationships at work.
Schein furthers that employees are more responsive to their peer group than to the
management, and are open to management only to the extent that management
can meet their social needs and needs for acceptance. The attitude, approach and
actions of a manager (towards their subordinates) with social assumptions will
62
differ significantly from those of a manager with economic assumptions. Therefore,
according to Werner (Nel, van Dyk, Haasbroek, Schultz, Sono & Werner, 2004:
336) a manager with social assumptions will pay much more attention to the needs
of subordinates, especially the need for social acceptance.
2.5.3 The self - actualization assumption
Schein (1980) emphasizes that all individuals, irrespective of talent and status,
seek self-actualization and desire a sense of meaning and accomplishment in work
when other needs are more or less satisfied. Maslow’s hierarchy of needs supports
this approach. Managers who hold with this assumption believe that employees
strive towards maturity and growth in their work, for which they must have
independence, autonomy and long term goals, and develop special skills and
greater adaptability. Such managers also believe that employees are basically self-
motivated and can exercise self-control, which corresponds with McGregor’s
Theory Y (Werner in Nel et al. 2004:336, 337).
Managers who believe in theory Y will develop employee potential towards the
achievement of common goals (Opu, 2008:21). Furthermore, managers who
believe in the self-actualization assumptions may refrain from external control
measures and strict supervision as such measures may cause employees to feel
threatened and may impact negatively on their maturity levels at work. Employees
who seek self-actualization could be better performers and will voluntarily integrate
their needs and goals with that of the organization. Swanepoel et al. (2008:320)
add that a manager who believes in this assumption will make the work intrinsically
more meaningful and challenging so that employees can reach the self-
actualization stage.
63
2.5.4 The complex man assumption
The complex man assumption according to Schein (1980), as referred by Werner
(Nel et al. 2004:337) suggests that humans are complex, dynamic and highly
changeable. Employees can develop new needs as a result of their experiences in
an organization, and employees’ needs may differ from individual to individual,
organization to organization and from department to department. Employees may
react differently to management strategies/leadership/management styles
depending on their own needs, goals, abilities, and the nature of their work.
Therefore, according to Schein (1980) there could never be one correct managerial
strategy /style that will work for all individuals at all times (Werner in Nel et al.
2004:337). In other words, employees are complex and varied, and several
motives at different levels of importance operate in individuals, which changes
according to time and situation. Thus, managers should be able to understand their
employees and use management and leadership styles accordingly.
2.6 GENERAL OBSERVATION
The theories stated in this chapter are critical as they express the relationship
between the variables such as management support, objective implementation of
the PMS, positive work environment leading to effective and efficient employee
performance as presented in the hypothesis. Questions that express the contents
of these theories will be part of the questionnaires so that the data collected could
contextualize the research questions and hypothesis. The following chapters gives
an overview as to how these theories link to the hypothesis and research
questions as stated in chapter 1 of this thesis.
The application of the Equity Theory by Adams helps managers in creating a
positive work environment, as equal and fair treatment of employees by managers
adds to the creation of a favourable work environment, which motivates employees
to do their work wholeheartedly (Chandrasekhar, 2011:11). Bell and Martin
(2012:110) add that this theory is important in the work situation and is
64
communication oriented. Effective managers can use managerial strategies to
facilitate equity in the work situation including positive expectations, goal setting,
positive feedback, availability to the employees, trust, employee development,
information distribution, participation in decision-making, rewarding employees,
and use of two-way communication.
Managers can also apply Vroom’s Expectancy Theory to motivate employees and
create a positive work environment. Managers can motivate their employees by
setting attainable performance standards and by providing the necessary support
and assistance in achieving these standards. The expectancy theory also
stipulates that managers must ensure a clear link between rewards and set
performance standards, as well as the link between employees’ personal goals
and the organizational goals. Managers must bear in mind that it is not the actual
attainability that determines employees’ motivation to exert efforts, but their
perceptions about the attractiveness of rewards and the link between performance
and rewards. It is also crucial for management to establish whether employees
believe that the performance standards set are attainable, and that there will be
appropriate rewards attached to successful performance (Swanepoel et al.
2008:334).
Reinforcement theory is another tool that managers can use to create a positive
work environment. Reinforcement theory explains how an individual learns
behaviour and how it can be moulded. Managers must take care to not to reward
all employees irrespective of their performance. They must explain to the
employees the reason for their actions of a positive or negative reinforcement,
punishment or extinction, and explain to employees how they can achieve positive
reinforcement (Sourabh et al. 2013:1).
65
Managers can use positive reinforcement more effectively to motivate their
employees by means of the following guidelines (Seidenfeld, 2013:1):
give the employee concrete, specific information about what he/she did right;
be specific;
reinforce immediately;
reward the employee as soon as possible after his/her good behaviour;
be sincere;
show genuine appreciation for the employee’s achievement;
give realistic reinforcement;
rewards should be proportionate to the importance of the behaviour; and
personalize the reinforcement.
Mangers must take extreme care that extinction does not diminish a desired
behaviour, because the absence of a positive reinforcer during a desirable
behaviour may cause the employee to stop exhibiting that particular preferred
behaviour. For example, if the normal practice was that the employees were
promptly praised by the manager every time they exhibited citizenship behaviour,
and the manager stops doing this, the employees may lose interest in doing
anything beyond their required duties (Encyclopaedia of Management, 2009:1). In
order for managers to motivate employees, they need to understand at what level
of motivation the employees are functioning in any given situation.
According to Mol (2012:19) employees function at one of the three basic levels of
motivation namely minimum level, expected level and maximum level. If
employees are at the minimum level, they perform at levels lower than those
required, while employees at the expected level will do just what is required, and
employees at the maximum level do more than what is expected and required.
Those on a minimum level come late to work and leave early, escape work
whenever they get the opportunity and make use of their full sick leave. Employees
66
at the expected level deliver the required amount of work loyally. However,
employees at the maximum level are said to be motivated as they are prepared to
walk the extra mile to achieve the goals. Swanepoel et al. (2008:315) states that
skills, potential, qualification and capabilities do not guarantee the desired
performance without motivation. In other words, work performance may be below
the desired level without the right motivation.
As motivation is key for performance, organizations (managers) must create a
workplace that is engaging and motivating, where employees want to stay, grow
and contribute their knowledge, experience and expertise to the success of the
organization (Society for Human Resource Management, 2010:1). Individuals who
are highly motivated will accomplish the most without any prompting or pushing.
They derive the feeling of satisfaction after every task completed, which urges
them to accomplish even more. According to Mol (2012:20) other factors that
motivate employees include pride in tasks and respect for achievements.
Individuals are motivated to perform only when their tasks stimulate their pride in
what they have accomplished, or have to accomplish, and they are respected for
their achievements. Thus, Mol (2012:21) suggests that managers can design work
in such a way that it becomes a source of pride for employees. Mol (2012:27, 40,
54) has also identified three key factors that give employees a sense of pride in
their work, which motivates employees when built into the job. The first motivating
factor is called experience of success, which refers to the fact that every individual
has the basic need to feel successful at what he or she does. The second factor
that motivates individuals is responsibility, which lies with the individual who makes
the decisions, while the third factor is recognition for achievement.
Therefore, to make employees perform productively, managers need to
understand their employees’ needs, and support them in achieving those needs as
needs satisfaction is the basis for motivation (Grobler et al. 2011:237). Identifying
individual needs could be a challenge for managers, as employees are complex,
unique and diverse. According to Chandrasekar (2011:14), factors that motivate
67
employee performance include interesting work, the opportunity to develop special
abilities, adequate information, enough authority, sufficient support, sufficient tools
and equipment, friendly and helpful colleagues, opportunity to see the results of
work, competent supervision, clearly defined responsibilities and good pay. These
are termed as job factors.
Finally, not only managers’ assumptions about their employees affect the quality of
the work environment, but also the expectations and assumptions of employees
about their managers, and the satisfaction of those expectations. Managers must
also try to satisfy the qualities that employees search for in them, and thereby
contribute to the right environment the employees are looking for. The following
paragraphs therefore, will explain briefly employees’ assumptions about managers.
2.7 EMPLOYEES’ EXPECTATIONS ABOUT MANAGERS
The calibre of managers is considered an important factor in creating a
favourable/positive work experience according to Parisi-Carew and Guthrie,
(2009:2). Employees desire managers who give them the opportunity and ability to
perform a wide range of challenging and stimulating work. Such managers
contribute to positive work environment which breeds innovation, enthusiasm, and
commitment amongst employees. Employees like to work with managers who:
are easy going and fun to work with;
are knowledgeable and competent;
exhibit sincere interest in their employees;
have trust in the capabilities and competencies of their employees;
believe in engaging with employees, and in relationship building;
are supportive and encouraging;
are interactive and engaging; and
respect, value, care, and treat employees as partners working together
towards common goals.
68
Employees prefer to work for managers who are exemplars, facilitate open
communication and interaction, and provide equal treatment in the work place. A
manager should be a role model in the workplace suggests Karim (2012:np). The
manager must set examples through his/her words and deeds which the
employees would honour, respect and follow. Managers must display a positive
attitude towards employees and show them how to interact and collaborate
effectively with others. This would contribute towards a positive work environment,
and towards enhanced productivity. Most employees desire an open, safe, and
welcoming environment in which they are encouraged to grow and learn (Parisi-
Carew & Guthrie, 2009:2).
2.8 CONCLUSION
Various factors that contribute to the creation of a positive work environment are
discussed in this chapter. It is explained that the work environment has a profound
influence on employee engagement, job satisfaction and morale, which leads to
employee motivation. Motivated individuals expend more effort than expected of
them in achieving goals. The various motivational theories were explored, with
emphasis on how managers can use these theories to support their employees
and create favourable work environment. Managers are urged to use motivation
techniques to explore human potential and talents to enhance performance.
Managers can make use of the content theory, process theory and the
reinforcement theory of motivation to create the desirable positive work
environment. If managers can succeed in supporting their employees and in
creating a favourable environment where employees are motivated, employees will
go the extra mile to give effective and efficient performance.
69
CHAPTER 3
PERFORMANCE MANAGEMENT: A MANAGEMENT TOOL TO
ENHANCE EMPLOYEE PERFORMANCE IN
THE FREE STATE PUBLIC SERVICE
3.1 INTRODUCTION
As the Free State Provincial Government realized the importance of employee
performance in attaining its goals and that performance cannot be left to chance
but needs to be facilitated and managed by individuals who are accountable for the
performance of others, the Provincial Government Departments put in place
performance management systems (PMSs) at individual employee levels. Though
performance management is done both at organizational level and individual
employee level, this chapter will focus only on performance management at
employee level as the emphasis of this thesis is on the performance of individual
employees. Furthermore, performance management at employee level is one of
the tools that managers can use to exhibit their management support through
performance planning, performance assessment and measurement, performance
feedback, professional as well as personal development of employees, and
performance rewards. Establishing measurable goals, developing operational
plans to achieve those goals, and measuring and evaluating progress and
achievement of the goals are all important factors in performance management at
the individual level.
This chapter will therefore give an account of employee performance management
processes and systems in general, and discuss how it is managed in the FSPS.
70
3.2 PERFORMANCE MANAGEMENT
Before elaborating on the processes and systems of employee performance
management, and its efficacy as a contributor to effective and efficient individual
performance, it is necessary to briefly discuss what employee performance
management is. Thus, definitions and explanations regarding employee
performance management will follow.
According to Bennet and Minty (Nel et al. 2011:408) performance management is
very important in organisations, as it facilitates strategy implementation, culture
change, performance development and improvement, as well as appropriate
remuneration. Armstrong according to Viedge (Werner, 2011: 117) adds that
performance management facilitates high performance through the processes of
performance planning, goal setting, monitoring, performance feedback, analysing
and assessing performance, reviewing, dealing with under-performance, and
coaching.
Van Aswegen, Gobind, Havenga, Kleynhans and Markham (2012:130) state that
performance management refers to the day to day management of individuals as
well as a process that guides employees in an organization towards achieving its
strategic goals. Furthermore, it refers to all organizational processes that identify,
manage and facilitate the performance of individual employees and teams. Apart
from human resource planning, training and development, and compensation, it
also encompasses the management of employee behaviour and attitudes, as well
as the creation of good relationships between individuals and teams (Van
Aswegen et al. 2012:130). Callaghan (2005:2) adds that additional components of
performance management include the regular review of actual achievement and
reward of employees for target achievement.
71
According to Dessler, Barkhuizen, Bezuidenhout, De Braine, Du Plessis, Nel,
Schultz, Stanz, and Van Der Walt, (2011:329), performance management is a
process where individual and team performance, aligned with the organizational
goals, is monitored, measured and developed continuously. Amos et al. (2004:64)
explains that performance management is an approach to managing individuals,
as well as a process that begins with translating the overall strategic objectives of
the organization into clear objectives for each employee.
Furthermore, Bacal according to Viedge (Werner, 2011:117) adds that
performance management is an ongoing communications process between an
employee and his or her immediate supervisor, the purpose of which is to establish
the various elements that lead to effective and efficient employee performance. It
embraces clear expectations and understanding about an employee’s essential job
functions and links employees’ job functions with the achievement of the
organization’s goals. Performance management also facilitates a clear
understanding on the meaning of a well performed job and on the manner in which
job performance is measured. It also reflects the barriers that hinder performance,
institutes measures to eliminate them, and deliberates on how the manager and
the employee must work together to improve employee performance. Furthermore,
performance feedback serves as a motivator that inspires employees to achieve
their full potential, experience satisfaction and commitment, and contribute to
organizational success (Amos et al. 2004: 64).
A further examination of the aims and objectives of performance management
provides added understanding on the importance of performance management.
This is elaborated on the next page.
72
3.2.1 Aims and Objectives of Performance Management
According to Meyer and Kirsten (2005:60), performance management has the
following objectives:
align and integrate individual, team and organizational objectives;
attract and retain skilled staff;
set standards and criteria for performance;
manage under-performance;
empower individuals to develop necessary skills and competence and
identify training and development opportunities;
open up channels of communication and feedback;
create a climate for motivation;
link pay and performance;
provide information for other human resource functions; and
create a performance culture.
Callaghan (2005:6) states that a well-implemented performance management
process and system is beneficial to the organization, its managers and employees.
The objectives of performance management include integration, open
communication, objective employee promotions, appropriate placement of
individuals, increased objectivity, equitable remuneration, structured career
planning, motivated employees, and improved capacity through training and
development. Callaghan (2005:1) adds that another important objective of
performance management is to make the attainment of individual and
organizational objectives an integral part and joint responsibility of the manager as
well as the employee. It is also intended to create the understanding in managers
that individual performance must not be left to chance, and that they are
responsible for facilitating and managing performance of their subordinates (Amos
et al. 2004:78).
73
Nel et al. (2011:407) states that the creation of a favourable work environment
where employees are adequately and appropriately supported to perform
effectively and efficiently towards common and shared goals is an important
objective of performance management. According to Viedge (Werner, 2011:121),
the performance management and development process in any organization
needs a performance management system (PMS), where each employee will have
formally documented goals and objectives. The system provides for a review
process as well. Otley (Abdullah, 2009:3) adds that information provided by the
performance management system (PMS) supports managers in performing their
jobs, as well as in developing and maintaining desirable behaviour in
organizations.
Cleveland and Murphy (Aguinis, 2009:6) state that a performance management
system (PMS) can serve six important purposes classified as strategic,
administrative, communication, developmental, organizational maintenance, and
documentation. The strategic purpose links the organization’s goals with
individual’s goals, so that individual’s work behaviours are consistent with the
attainment of organizational goals. The administrative purpose serves as a hub of
valid and useful information for making objective decisions about employees
regarding salary adjustments, promotions, employee retention or termination,
recognition of effective and efficient performance, and identification of poor
performers.
Furthermore, the PMS promotes communication as it allows employees to be
informed about how well they are doing, to identify specific areas that may need
improvement, and to be informed about the organization’s and the supervisor’s
priorities and expectations. It supports developmental purposes in that the system
allows managers to coach employees and help them improve performance on an
ongoing basis. PMS supports organizational maintenance as it yields information
about skills, abilities, promotional potential, and performance histories of
employees to be used in workforce planning, as well as in assessing future training
74
needs and evaluating performance achievements. Lastly, Cleveland and Murphy
(Aguinis, 2009:7) state that PMS documentation yields data that can be used not
only to make important administrative decisions but also in cases of litigation.
Having explained the importance of performance management, this chapter will
now focus on the performance management system and processes specific to the
FSPS.
3.3 PERFORMANCE MANAGEMENT AND ITS RELEVANCE IN THE FSPS
In the quest to improve the performance of its public service, the executing
authority of the FSPG determined and implemented a uniform performance
management system for employees in government departments. The performance
management system in the FSPS called the performance and development
management (PDM) follows the guidelines of the SAPS Regulations and guidance
from the Department of Public Service and Administration (DPSA). The PDM is
aimed at improving the performance of public servants (employees) by establishing
clear links between organizational development, culture change, personal and
professional development of employees and the delivery of quality services. The
PDM directs attention to employees’ key areas of activity, which are identified
through strategic planning processes. The PDM philosophy in the FSPS aims to
develop a sense of ownership for performance amongst all employees. It also
helps to build an environment where all individuals have the opportunity to be
motivated, inspired and developed to facilitate effective and efficient performance
(FSPG, 2001:4).
As this thesis focuses only on the performance of employees on levels 11 and 12,
the following paragraphs shall give detailed accounts on the performance and
development management system in the FSPS for employees up to levels 12.
75
The aim of the performance and development management system in the FSPS,
as stated in the FSPG Policy on Performance and Development Management
(PDM) (2001: 4), is to optimise individual achievements and individual performance
excellence towards the achievement of goals and objectives of the FSPG. The
objectives of the PDM in the FSPG are in line with explanations given in the
previous paragraphs. One of the objectives of the FSPG PDM is to lay a strong
foundation for performance management by establishing a performance and
learning culture in the Public Service, as well as by ensuring that all employees
know and understand what is expected of them. A further objective is to create a
culture of open interaction and communication about performance between
managers (supervisors) and employees, where employees’ development needs
are identified and managed. Objective and fair evaluation of individual performance
is yet another objective.
Apart from the objectives, there are also several principles on which the PDM
policy is founded in the FSPG, which are as follows (FSPG, 2001: 4):
PDM of employees must be the responsibility of designated managers
(supervisors), and it must be done in a consultative, supportive and non-
discriminatory manner, facilitating two way communications;
PDM must align with the departmental objectives and strategic plans, and
link with the overall skills development plan;
both supervisor and subordinate should understand the significance of
performance management, how it is conducted in the organization, and what
influence it could have on the employee’s future and the performance of
individuals and organization;
76
the PDM process must be planned in such a manner that the core
competencies and criteria are defined, as well as dates for performance
assessments, and reviews and performance feedback must be stipulated;
and
PDM and its processes must follow equity and fairness, and must not
become an administrative burden to the managers (supervisors).
Individual performance and development management, according to the FSPG
policy (2001), is managed in a yearly cycle. It is thus repeated every year, where
managers together with the employees are expected to identify common goals,
define each individual’s key responsibility area in terms of results expected, assess
individual performance to establish the degree of effectiveness, and assess
individuals’ contributions to the performance of the entire organization. The PDM
system in the FSPS consists of various phases including (i) performance planning,
(ii) performance monitoring, (iii) performance review and evaluation,(iv)
management support (v) two-way feedback, (vi) continuous learning and
development (vii) recognition & rewards of desired performance, and management
of unsatisfactory performance and (viii) appeal. Meyer and Kirsten (2005:62-67)
agree, adding that performance management starts with the performance planning
phase, where the purpose of the job is established, followed by management
support, where the manager provides the opportunity and the right environment for
the employees to perform to the agreed upon standards. The third phase,
according to Meyer and Kirsten (2005:62-67) is performance review/evaluation,
entailing the assessment of employee performance according to set standards.
The fourth step is performance discussion, followed by the formulation of
development plans.
77
3.4. MAJOR STEPS IN PERFORMANCE MANAGEMENT IN THE FSPS
Major steps in the performance management process according to Van Hoek (Nel,
Werner, Botha, Du Plessis, Mey, Ngalo, Poisat, Van Hoek, 2014:221) are:
performance planning;
performance coaching and mentoring;
performance measurement and evaluation; and
performance feedback and documentation.
These important steps form part of the performance management system in the
FSPS
According to McPheat (2010:13-23) performance management process involves:
goal setting;
defining priorities;
defining performance standards;
providing feedback;
maintaining records; and
managing poor performance.
The major steps are explained in the following paragraphs.
3.4.1 Performance Planning
Performance management starts with the clarification and communication of
organizational strategic objectives, and the alignment of individual and group goals
with that of the organizational objectives (Nel et al. 2011:407). Dessler et al.
(2011:329) concurs, stating that the starting point of the performance management
process is setting the direction, by sharing the organization’s higher level goals
such as vision, mission and strategies throughout the organization. These higher
78
level goals are converted into departmental, team and individual goals, ensuring
goal alignment between the individual, team, department and the organization.
Viedge (Werner, 2011:121) agrees that individual goals and measures are derived
from the strategy of the organization, such that the strategic objectives of the
organization are cascaded down through the different departments to the
managers and to their subordinates. Each official in the department thus has his or
her goals and measures, aligned with and linked to the organization’s broader
goals. This alignment ensures that every individual’s efforts are directed towards
the common goals, and that there will be no wasted or deviant efforts. Thus,
performance planning begins with goals setting. The importance of goal setting is
briefly presented hereunder.
3.4.1.1 Goal setting
‘Goal Setting: A Fresh Perspective’ by an Oracle White Paper (2012:2, 3, 5)
highlights the importance of setting goals in a PDM process. Goal setting must be
given a high priority, must be approached consistently, and must be cascaded
down through the organization, as it can ensure results against business strategy,
reach greater profitability, and inspire innovation. Furthermore, organizations that
consider the development of effective goals a priority will succeed in performance
management, in developing employees’ skills and confidence, and above all, in
achieving the mission and goals. Such organizations will lead the annual
performance journey in the right direction. Effective goals offer significant benefits
to the organization, as they add organizational discipline, encouraging everyone in
the organizations to be focused on the same destination. Such goals permit
accurate forecasting of resource needs, as well as efficient use of those resources,
avoiding unnecessary detours and stoppages. The above mentioned Oracle White
Paper (2012:5) presents the following guidelines by which managers can ensure
that employees achieve their goals:
79
the employee has the necessary tools, resources, access, support and
guidance required to complete the work;
expectations are well-defined, and employees have sufficient time in which to
meet the milestones;
goals must be reasonable and within the scope and capability of employees,
as impossible targets will be frustrating and can be demoralizing; and
managers must offer guidance and support.
With regard to the importance of goal setting in the PDM process, Locke’s Goal-
setting Theory is of great relevance. This theory is discussed in chapter 2 of this
thesis and therefore only brief mention will be made of it here. According to
Robbins et al. (Swanepoel et al. 2008:329), Locke’s goal setting theory advances
that individuals will perform better if they strive towards a definite goal as opposed
to an unspecified one. Good and Carin (2004:7) agree that employees who are
given goals that are specific and challenging outperform employees who are given
a goal to do their best or no goal at all. As implied, goals provide employees with
clear direction, challenge them to try hard, remind them that the end is in sight, and
encourage them to think about the process of reaching the end. Goals give focus
to employees’ actions, encourage efforts and tenacity, and foster goal attainment
strategies and action plans (Esu & Inyang, 2009:100).
The performance planning stage further aims to provide a thorough knowledge of
the performance management system and processes to the employees (Aguinis,
2009:15). At the beginning of each performance cycle, the supervisor and the
employee are expected to discuss and agree on a plan as to what needs to be
done, and how well it should be done. The performance planning discussion
further revolves around the deliberation of three aspects namely (i) results, (ii),
behaviours, and (iii) a development plan. These are briefly explained in the
following paragraphs.
80
3.4.1.2 Results
Results according to Aguinis (2009:15)refer to the outcomes an employee must
produce. The discussion of results includes key responsibility areas of a job, the
results of which the employee is responsible for producing. The discussion defines
specific objectives that the employee has to achieve in relation to each key
responsibility and performance standards that the employee has to adhere to while
achieving results. Objectives are statements of important and measurable
outcomes, and a performance standard refers to a yardstick that is used to
evaluate how well employees have achieved each objective. Performance
standards provide information about acceptable and unacceptable performance
(for example, quality, quantity, cost, and time).
3.4.1.3 Behaviour
Behaviour is an important aspect in measuring results. While it may be difficult to
establish specific objectives and standards for some jobs, it may also be difficult to
control the results of employee behaviours in others, even if they have control over
how the job is done (Aguinis, 2009:15). According to Shippmann et al. (Aguinis,
2009:15, 16), behaviours include competencies (knowledge, skills, and attitudes)
that are critical for the achievement of desired results.
3.4.1.4 Development plan
Another important step in the planning cycle is the creation of a development plan
that is mutually agreed upon by the supervisor and the employee. Ideally, such
plans highlight an employee’s strengths as well as the areas that need
development. According to Reyna and Sims (Aguinis, 2009:16), the development
plan provides an action plan to improve areas of weaknesses and further develop
areas of strength.
81
3.4.2 Employee Performance Plan in the FSPS
In the FSPS, documents such as strategic plans, competency profiles, job
descriptions, job specifications, and skills audits help to plan and manage the
performance of employees (FSPG, 2001:7). As the main aim of performance
management is effective and efficient employee performance, employees are
assessed on the achievement of their key responsibility areas as well as a code of
conduct, and assessments are done within an agreed framework of planned goals,
objectives and standards. Consequentially, each employee in the FSPS has a
performance plan.
The performance plan in the FSPS (as reflected on the FSPG: Performance and
Development Plan Template) starts with defining the key performance/results
areas (KPA/ KRA) of an employee, which include broad performance areas related
to the key responsibilities attached to a job. These KRAs correlate with the unit’s
goals and objectives, are derived from the departmental goals and objectives,
which are correlated with the organizational goals and objectives. After defining
KRAs, objectives are developed for each KRA which indicate what is to be
achieved by the particular KRA to realize the broader objectives of the
organisation. These are established through a process of consultation between the
individual and the supervisor during the performance planning and goal setting
process, before the commencement of the evaluation period. Weights are
allocated to each objective according to importance, and the weights for all
objectives must add up to 100%. A unit of measurement is attached to every
objective that will indicate whether the employee has achieved his or her objective.
Standards are developed for each unit of measurement, which specifies the
quantity, quality, time frames and other legal and procedural requirements that the
unit of measurement must comply with. A rating between1-5 is allocated for each
objective which will be converted into scores after discussion(s) between the
supervisor and the jobholder during the performance assessment phase. These
scores are the sum total of the ratings and the weight. Both manager (supervisor)
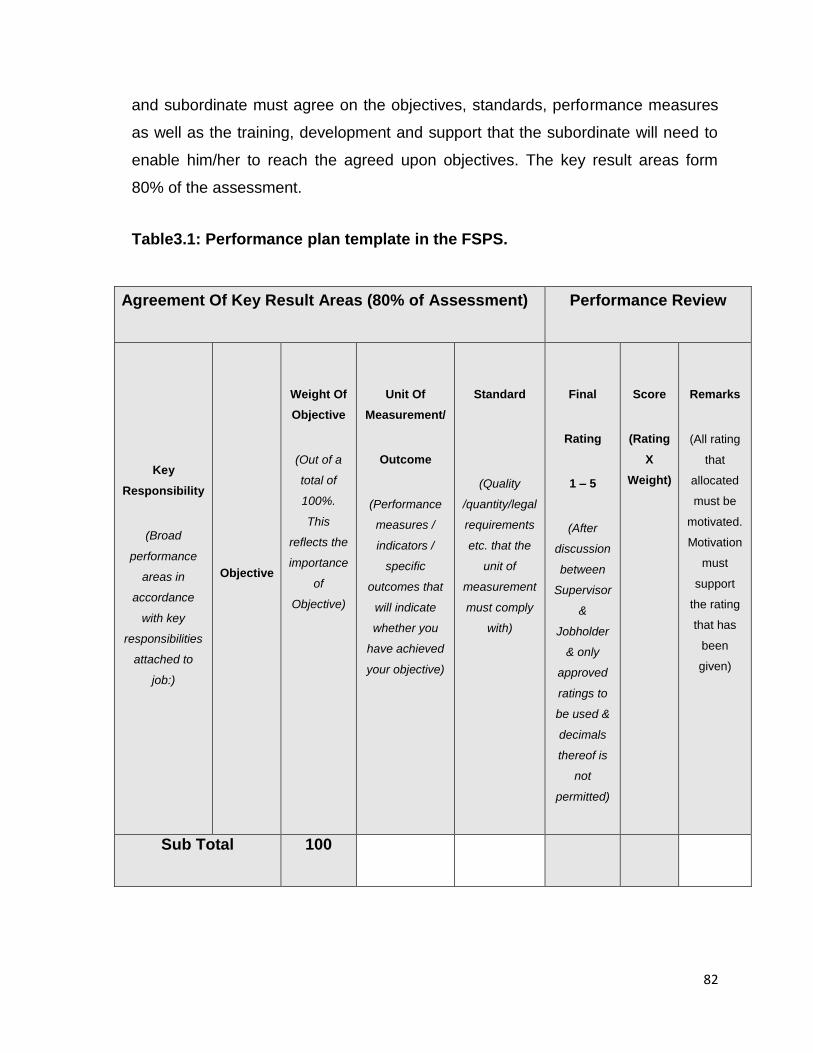
82
and subordinate must agree on the objectives, standards, performance measures
as well as the training, development and support that the subordinate will need to
enable him/her to reach the agreed upon objectives. The key result areas form
80% of the assessment.
Table3.1: Performance plan template in the FSPS.
Agreement Of Key Result Areas (80% of Assessment) Performance Review
Key
Responsibility
(Broad
performance
areas in
accordance
with key
responsibilities
attached to
job:)
Objective
Weight Of
Objective
(Out of a
total of
100%.
This
reflects the
importance
of
Objective)
Unit Of
Measurement/
Outcome
(Performance
measures /
indicators /
specific
outcomes that
will indicate
whether you
have achieved
your objective)
Standard
(Quality
/quantity/legal
requirements
etc. that the
unit of
measurement
must comply
with)
Final
Rating
1 – 5
(After
discussion
between
Supervisor
&
Jobholder
& only
approved
ratings to
be used &
decimals
thereof is
not
permitted)
Score
(Rating
X
Weight)
Remarks
(All rating
that
allocated
must be
motivated.
Motivation
must
support
the rating
that has
been
given)
Sub Total 100
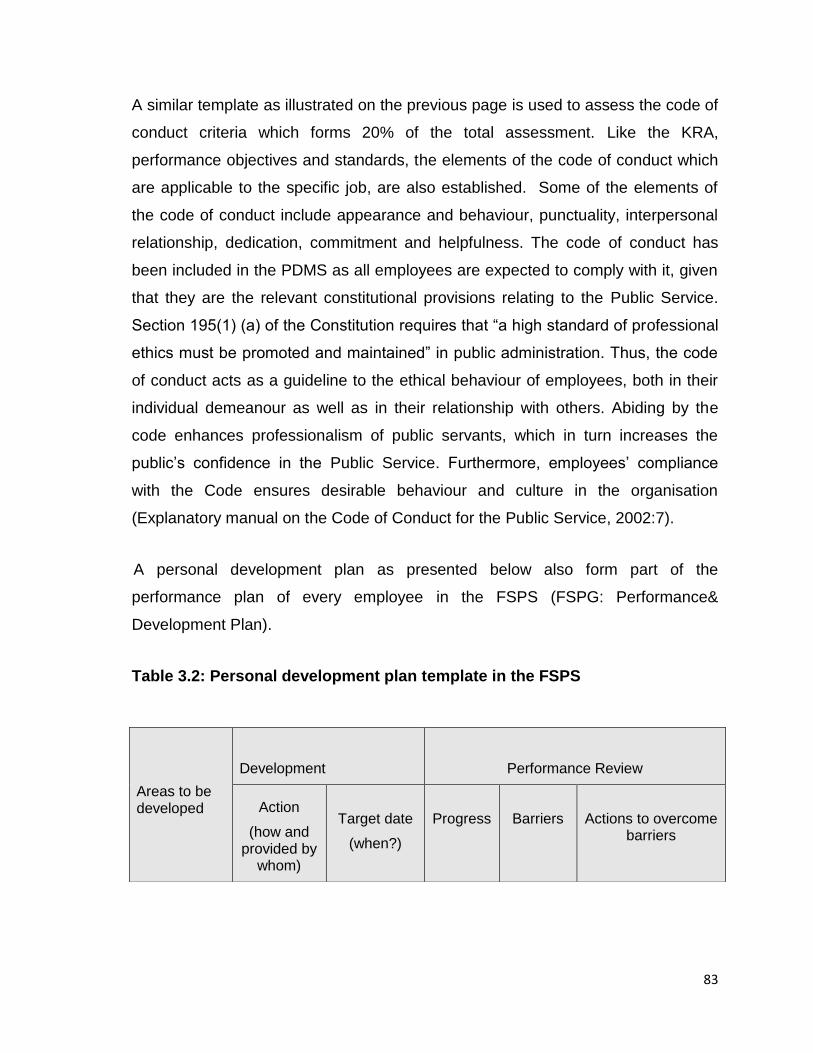
83
A similar template as illustrated on the previous page is used to assess the code of
conduct criteria which forms 20% of the total assessment. Like the KRA,
performance objectives and standards, the elements of the code of conduct which
are applicable to the specific job, are also established. Some of the elements of
the code of conduct include appearance and behaviour, punctuality, interpersonal
relationship, dedication, commitment and helpfulness. The code of conduct has
been included in the PDMS as all employees are expected to comply with it, given
that they are the relevant constitutional provisions relating to the Public Service.
Section 195(1) (a) of the Constitution requires that “a high standard of professional
ethics must be promoted and maintained” in public administration. Thus, the code
of conduct acts as a guideline to the ethical behaviour of employees, both in their
individual demeanour as well as in their relationship with others. Abiding by the
code enhances professionalism of public servants, which in turn increases the
public’s confidence in the Public Service. Furthermore, employees’ compliance
with the Code ensures desirable behaviour and culture in the organisation
(Explanatory manual on the Code of Conduct for the Public Service, 2002:7).
A personal development plan as presented below also form part of the
performance plan of every employee in the FSPS (FSPG: Performance&
Development Plan).
Table 3.2: Personal development plan template in the FSPS
Areas to be developed
Development Performance Review
Action
(how and provided by
whom)
Target date
(when?)
Progress
Barriers
Actions to overcome barriers
84
The planning phase lays the foundation for the monitoring and evaluation phase of
performance management. Goal setting and performance planning alone will not
yield performance excellence however. Similarly, monitoring and evaluation without
goals and performance planning are like a building without foundation.
3.4.3 Performance Monitoring, Evaluation and Measurement
The performance that is executed according to the plan needs to be continuously
monitored, evaluated and reviewed to establish that the planned performance has
produced the expected results. Therefore, the PDM system in the FSPS stipulates
continuous monitoring of performance by both the supervisor and the employee.
Continuous monitoring assists to determine progress made, detect and solve
performance problems as and when they arise, and identify development and
improvement needs. Furthermore, it helps to decide whether it is necessary to
modify objectives and targets, provides necessary management support, and
ensures ongoing learning and development (Dessler et al. 2011:329; FSPG,
2001:8). In addition, performance monitoring focuses on establishing whether
agreed upon actions are adhered to, and whether they are directed towards
expected results (United Nations Development Programme (UNDP), 2009:8).
While monitoring is an ongoing process by which parties involved obtain regular
feedback on their progress towards pre-set goals and objectives, evaluation is an
in-depth assessment of either completed or ongoing activities. It serves to
determine the extent to which stated objectives and goals are being achieved
(UNDP, 2009:8). Both monitoring and evaluation provide information that informs
decisions, improves performance and achieves planned results. While monitoring
provides factual information required by management, evaluation provides more
detailed assessment. Furthermore, evaluation and monitoring can be reciprocal
where the questions raised during monitoring can be answered by the evaluation
process, and evaluation can be more effective by using data generated through
monitoring, as it always relates to pre-identified results (UNDP, 2009:8, 9).
85
Erasmus et al. (Paile, 2012:20) state that in pursuit of evaluating/assessing
employee performance, managers must ensure that they assess actual
performance against the required level of performance. Performance
assessment/evaluation/appraisal is explained in detail in the following paragraphs,
as evaluation is a critical management tool in the performance management
process, which complements monitoring by providing an assessment of what
worked and what did not work, as well as the reasons for the particular situation.
3.4.3.1 Performance evaluation/appraisal/review
Organizations use various terms such as performance review, annual appraisal,
performance evaluation, employee evaluation, and merit assessment argue Grobler
et al. (2011:293). Performance appraisal refers to the ongoing process of assessing
and managing both the behaviour and performance outcomes of employees in the
workplace (Grobler et al. 2011:293). According to Cardy and Dobbins, (van der
Westhuizen & Wessels, 2011:266), performance appraisal is a formal and
systematic process to identify, measure, record and manage the job relevant
strengths and weaknesses of employees.
Grobler et al. (2011:297-298) add that there are several objectives of performance
appraisal. Performance appraisal aims at the optimum use and development of
human resources. It assists managers to make decisions about compensation,
promotion and retention. If performance appraisal is used correctly, it contributes to
the satisfaction and motivation of employees. Performance appraisal objectives
mainly fall into evaluative and developmental categories which help managers to
make decisions on appropriate rewards, as well as developmental needs of
employees. Evaluative objectives look at past performance, determine which
employees are performing to set standards, influence decisions on merit increases,
bonuses and compensation. Developmental objectives aim to develop better
performing employees for future performance. Performance feedback is a
developmental objective because managers are expected to give feedback to the
employees on their performance. Employees want to know how well they are doing,
86
and how the managers weigh them in terms of performance and such feedback
gives direction to employees for future performances. It recognizes strengths and
weaknesses in past performance and determines what direction employees must
take to rectify and improve for optimal performance. It also gives valuable
information about the training and development requirements of employees.
According to Grobler et al. (2011:299-300), performance appraisal should follow a
definite sequence. The system starts with determining the performance
requirements. An appraisal method is chosen, and managers/supervisors are
trained on the tool. The process is then discussed with employees and the actual
appraisal is conducted. The process concludes when the appraisal is discussed
with the employees, and future performance goals are agreed upon. The success of
performance appraisal is also dependent on the individual(s) who appraise and rate
the employees. In the FSPS, it is the responsibility of the immediate manager to
assess and rate his or her employees. However, the employees can rate
themselves and have the right to agree or disagree with the assessments and
ratings made by the immediate manager. Grobler et al. (2011:315-318) suggests
that performance ratings should be done by supervisors, peers, subordinates,
customers or clients as well as the employees themselves.
The SAPS Regulations (P.S.R, 2001: Section C.2) prescribes that assessment shall
be based only on the information contained in the designated performance
assessment instrument. Therefore, employees are assessed on the performance
plan that each and every employee in the FSPS has. The first page of the
performance assessment instrument in the FSPS has provisions for personal
details such as surname, job title, personnel number, salary notch, period under
review and whether the employee is on probation, permanent or on contract. The
assessment instrument incorporates comments by the rated employee and the rater
(manager in this instance), as well as actual performance appraisal that includes
rating, provision for training and development, and recommendations by the
manager (rater in this instance).
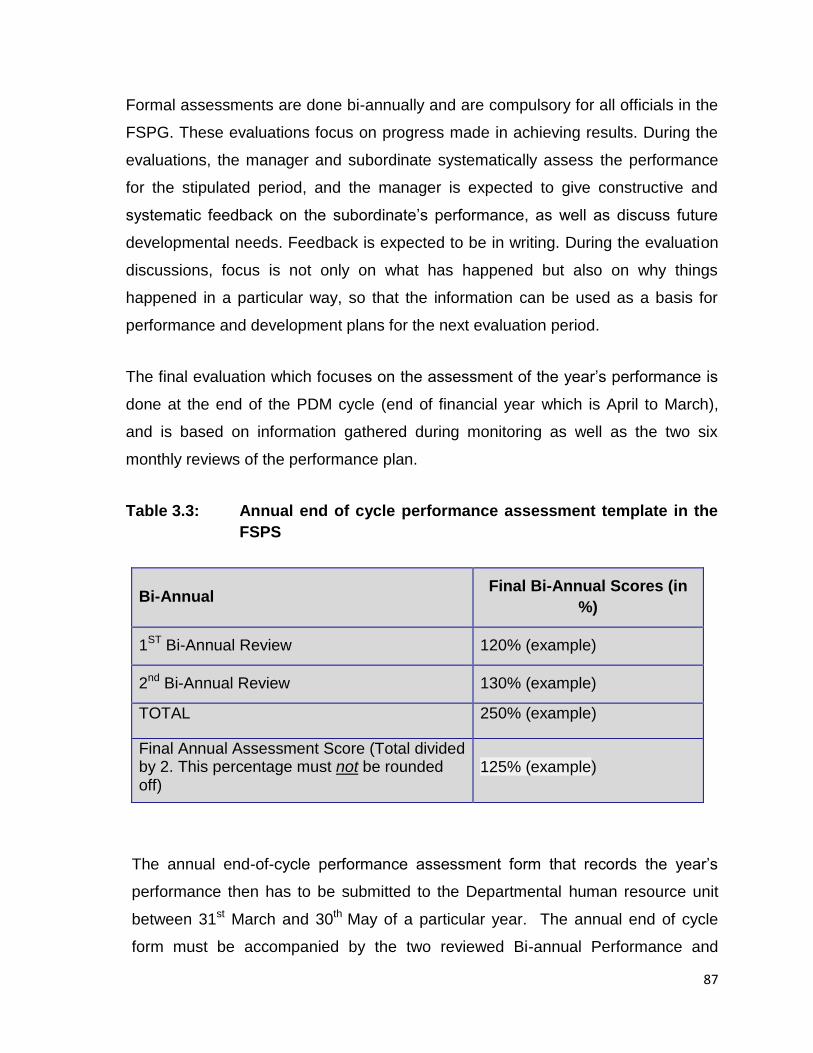
87
Formal assessments are done bi-annually and are compulsory for all officials in the
FSPG. These evaluations focus on progress made in achieving results. During the
evaluations, the manager and subordinate systematically assess the performance
for the stipulated period, and the manager is expected to give constructive and
systematic feedback on the subordinate’s performance, as well as discuss future
developmental needs. Feedback is expected to be in writing. During the evaluation
discussions, focus is not only on what has happened but also on why things
happened in a particular way, so that the information can be used as a basis for
performance and development plans for the next evaluation period.
The final evaluation which focuses on the assessment of the year’s performance is
done at the end of the PDM cycle (end of financial year which is April to March),
and is based on information gathered during monitoring as well as the two six
monthly reviews of the performance plan.
Table 3.3: Annual end of cycle performance assessment template in the
FSPS
Bi-Annual Final Bi-Annual Scores (in
%)
1ST Bi-Annual Review 120% (example)
2nd Bi-Annual Review 130% (example)
TOTAL 250% (example)
Final Annual Assessment Score (Total divided by 2. This percentage must not be rounded off)
125% (example)
The annual end-of-cycle performance assessment form that records the year’s
performance then has to be submitted to the Departmental human resource unit
between 31st March and 30th May of a particular year. The annual end of cycle
form must be accompanied by the two reviewed Bi-annual Performance and
88
Development Plans for the year under reporting. Both the manager and the
employee have to confirm in the annual end of cycle performance assessment
form that the scores have not in any way been altered or changed once they have
been agreed upon by both the manager and employee.
3.4.3.2 Performance measurement
Performance monitoring without measurement may not yield a complete
understanding of an individual’s performance, as performance measures provide
data and information supported by numeric description, enabling the manager to
make informed decisions. Thus a performance measure can be explained as a
numerical description of an activity and the results of that activity. Performance
measures are based on data where the data is expressed in numbers that indicate
how much, how well, and at what level, goals and objectives are achieved during a
specific period (Office of Financial Management 2014:1). According to Bititci
(Abdullah, 2009:3) measurement is an information system integral to the effective
and efficient functioning of the performance management system. Information from
performance measurement can be used to manage the performance of an
individual, a unit or an organization.
There are several reasons for measuring performance. Performance measuring
helps better Management as it assists managers to understand, manage, and
improve on activities and thereby results. Apart from establishing how well the
goals are being met, it helps to take corrective actions if necessary to improve
performance. Furthermore, performance measures provide the necessary data
and information to make informed decisions as it provide an overview of current
performance capabilities. It detects whether actual performance is getting better,
staying the same, or getting worse over time (Office of Financial Management
2014:2). Individual employee performance in the FSPS is measured against the
Unit of Measurements / Targets as identified in the performance plan and
concluded using the rating calculator presented on the next page.
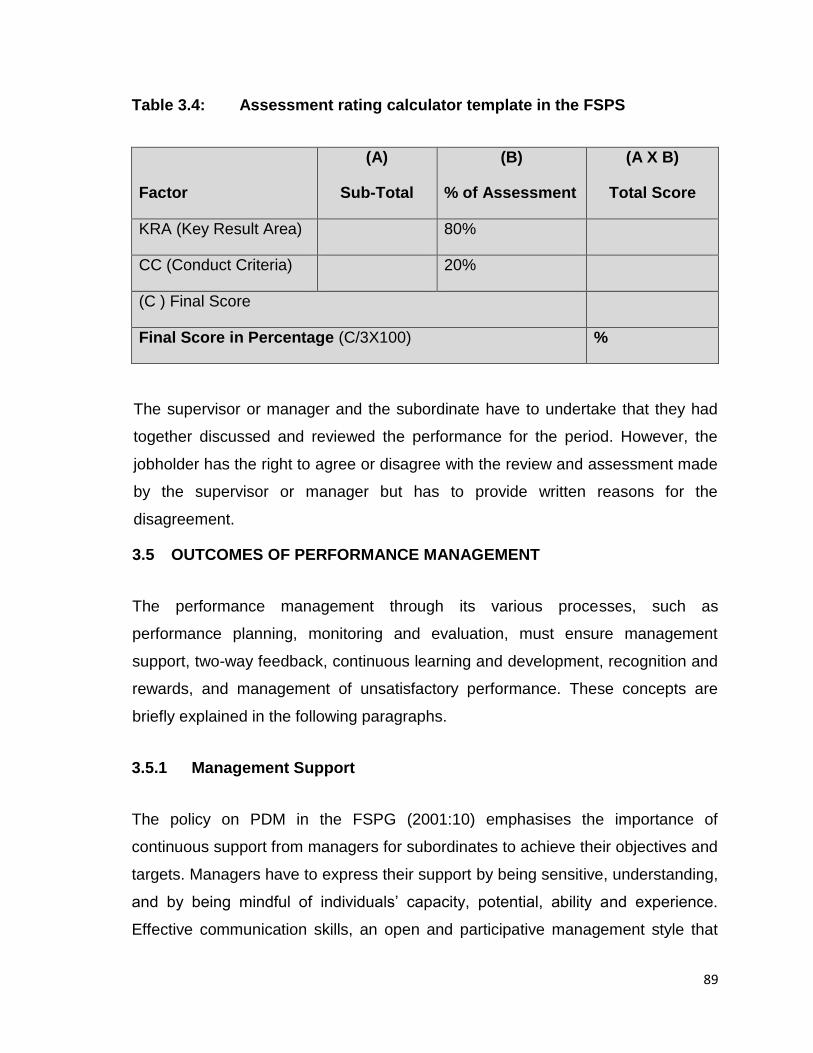
89
Table 3.4: Assessment rating calculator template in the FSPS
Factor
(A)
Sub-Total
(B)
% of Assessment
(A X B)
Total Score
KRA (Key Result Area) 80%
CC (Conduct Criteria) 20%
(C ) Final Score
Final Score in Percentage (C/3X100) %
The supervisor or manager and the subordinate have to undertake that they had
together discussed and reviewed the performance for the period. However, the
jobholder has the right to agree or disagree with the review and assessment made
by the supervisor or manager but has to provide written reasons for the
disagreement.
3.5 OUTCOMES OF PERFORMANCE MANAGEMENT
The performance management through its various processes, such as
performance planning, monitoring and evaluation, must ensure management
support, two-way feedback, continuous learning and development, recognition and
rewards, and management of unsatisfactory performance. These concepts are
briefly explained in the following paragraphs.
3.5.1 Management Support
The policy on PDM in the FSPG (2001:10) emphasises the importance of
continuous support from managers for subordinates to achieve their objectives and
targets. Managers have to express their support by being sensitive, understanding,
and by being mindful of individuals’ capacity, potential, ability and experience.
Effective communication skills, an open and participative management style that
90
encourages innovation and initiative, and the ability to correctly identify training,
development and support needs is required of any manager to provide the
necessary support to individual employees. Viedge (Werner, 2011:126) states that
managers can express their support by making employees aware that they have
confidence in them, and will stand by them in a time of need.
Managers must also show support through coaching and counselling. If the
monitoring and evaluation reveals a performance concern and the reasons for it,
the manager may have to coach the subordinate if it is due to lack of knowledge,
skills, ability or attitude. If however the performance discrepancy is due to some
personal or interpersonal problems, the manager needs to counsel the employees.
Callaghan (2005:8, 9) agrees that the supporting role of the manager in managing
and maintaining employee performance can be exercised through coaching the
employee in areas that require improvement. Coaching is an interactive process
that offers guidance to improve employees’ performance and capabilities,
encourages feedback, and is a vehicle for skills transfer. Callaghan (2005:8, 9)
adds that other management support interventions include mentoring, on-the-job
training, shadowing, and job observation.
Managers can also express their support by providing opportunities for their
employees to learn from the problems, challenges, opportunities and
achievements integral to the day-to-day activities. Learning and development is the
responsibility of the employee as much as it is the responsibility of the manager.
The manager must support the learning and development needs of his or her
employee by identifying the development needs in terms of competencies, skills,
knowledge, and behaviour required to perform at an acceptable standard, and
develop a mutually agreed upon personal development plan. The personal
development plan currently used in the FSPS includes details such as what the
employee needs to learn, how the employee will acquire this learning, what
support the supervisor needs to give to secure the learning, and by what date
(FSPG, 2001:11).
91
Amos et al. (2004:66, 67) suggest that managers can show management support
by involving their employees in setting the objectives, and allowing them to
manage their own performance. Setting objectives with employees helps to clarify
the standard of performance expected, the means of performance measurement,
the skills and resources necessary to achieve objectives, and the rewards
associated with achieving the agreed upon objectives.
3.5.2 Two - way Feedback
Yet another integral part of successful performance management is two-way
communication. For any PDM process to be effective there has to be open, honest
and constructive two-way communication and interaction that will build mutual trust
between the manager and the employee. It is the supervisor’s responsibility to
secure the employee’s commitment to achieve agreed upon targets, and then to
sustain and or improve on the commitment by giving regular feedback on work
performance. Regular feedback gives an employee the opportunity to improve, and
further enables both the supervisor and employee to set new mutually agreed upon
objectives, targets and standards for future work performance (FSPG, 2001:10).
According to the Indiana University Human Resources (2006:1), performance
feedback is the on-going process where information on expected and rendered
performance is exchanged between a manager and his or her employee. The
feedback must be constructive either to praise performance or to correct poor
performance.
Feedback can only be said to be constructive when it is tied to the pre-determined
performance standards, and when it is timely, specific, and more focused on
behaviour than on the employee. Feedback is constructive only when the intention
is to help and not to hurt, is directed at behaviour the employee can do something
about, and is limited to the amount that the receiver can use. During feedback the
manager must also obtain agreement on performance problems, explain negative
consequences, mutually seek solutions with the employee, agree on action plans,
encourage improvement, ensure understanding by the receiver, and must follow up
92
on the effects of feedback. Negative performance must be addressed immediately,
and care must be taken not to correct behaviour in public. Positive performance
also must be acknowledged immediately upon a good performance, and must
encourage the employee to maintain the good performance (Indiana University
Human Resources, 2006:1).
Feedback can be positive or negative, and it is part of a manager’s job, though
giving or receiving negative feedback generally is not a pleasant experience. This
statement is contained in the document on providing feedback and
addressing performance concerns by the Transport distribution Training South
Australia (TDTSA, 2008:3, 5). During feedback the TDTSA encourages the
manager to recognize and acknowledge employees’ accomplishments, offer
encouragement and support, and then correct mistakes. Effective performance
feedback provides additional opportunity for communication between managers
and employees, and for them to work together to ensure good results. Giving
feedback is crucial to effective performance management as it promotes learning
and provides motivation, either to improve any shortcomings or to give a sense of
achievement. Effective feedback can improve performance and commitment if it is
well-timed, constructive, specific, focused, and identifies and discusses the causes
of the problem, mutual solutions, action plans as well as an agreed upon date for a
specific follow-up (TDTSA, 2008:3, 5). This is applicable to the FSPS also.
It can undoubtedly be asserted that performance management will be incomplete
without the feedback component. Employees who are given feedback on their
performance generally outperform employees who are not given such feedback.
Combining goals and feedback has a more powerful effect on performance efforts
and perseverance than either goals or feedback alone (Good & Carin, 2004:7).
93
3.5.3 Performance Rewards
Recognition and rewards are other fundamental aspects of an effective
performance management process and system. These are formal
acknowledgements for better than average performance. Achievements on
mutually agreed upon objectives and targets to standard need to be positively
reinforced by means of recognition and rewards, in order to maintain the
commitment and positive performance attitude of employees. Positive performance
can be recognized in various ways. The PDM policy of the FSPG suggests that
performance above the required standards can be recognized by means of the
following (FSPS, 2001:7.7.1, 7.7.2):
a certificate of good performance;
acknowledgement of achievement in one-on-one interaction with the official
by the HOD;
provision of developmental opportunities;
providing an employee with the opportunity to be a mentor or coach for
others;
giving verbal compliments; and
declaring the official employee of the month or publicizing the names of
achievers in the company newsletter.
According to Callaghan (2005:10), consequence management is a term used for
recognition and rewards, because giving or withholding rewards or recognition has
a consequence on the employee’s motivation to perform. This is supported by the
reinforcement motivation theory which is explained in Chapter 2.
According to Bagraim (Werner, 2011: 99) the theory states that individuals engage
in activities that have positive consequences, and avoid activities that do not
produce positive consequences. Though linking reward to performance has
positive effects, they need to be designed with great care to avoid undesirable and
94
unintended consequences called dysfunctional performance (Good & Carin,
2004:13, 9).
While goals and feedback clearly boost performance, adding incentives can further
enhance interest in performing the task and persistence to achieve results (Good &
Carin, 2004:8). The link between reward, employee motivation and performance is
explained in Vroom’s Expectancy Theory. Vroom’s Expectancy Theory is detailed
in chapter 2 of this thesis. According to this theory, an effective performance
management system must therefore confirm to the employees that their efforts will
lead to performance, which in turn will lead to desirable and valuable rewards. If
any one of these factors is weak, the incentive system is not likely to have a
meaningful positive impact on performance (Good & Carin, 2004:8).
The current dispensation on merit bonuses and other forms of recognition for
outstanding performance, innovations or achievements in the FSPS is endorsed in
the Agreement on Remunerative Allowances and Benefits by the Public Service
Coordinating Bargaining Council (PSCBC) (Resolution No. 3 of 1999:56). There is
a link between measurement, performance, rewards and sustenance of
performance. Employees want recognition for achievement and recognition has a
positive impact on the retention of employees (Callaghan, 2005:10). However, the
rewards and recognition aspect of the performance management process is very
complex and highly emotional, and often yields negative dilemmas, lack of
objectivity, transparency and affordability.
In the same way that achievements on mutually agreed upon objectives and
targets are reinforced through recognition and rewards, unsatisfactory performance
needs to be corrected to maintain commitment and positive performance attitudes
of employees.
95
3.5.4. Management of Unsatisfactory Performance
According to the FSPG-PDM policy (2001:12-13), unsatisfactory or non-
performance is defined as the consistent failure of an employee to achieve an
acceptable level of performance, even after receiving management support and
developmental opportunities. As indicated in the earlier paragraphs, it is the
responsibility of managers/supervisors to monitor work progress, and continuously
provide remedial and systematic support to employees, so that they can improve
their performance. The Massachusetts Institute of Technology (MIT) personnel
policy manual (n.d.) refers to such remedial actions when employees fail to satisfy
the expectations attached to their jobs as progressive discipline. The manual
stipulates that poor work performance must be brought to the attention of the
employee promptly by his or her supervisor, and the employee should be afforded
the opportunity to improve his or her work performance. A discussion between the
supervisor and the employee, and a development plan (continually mentioned in
this chapter) outlining steps to improve performance, is supported by the above
mentioned manual. The performance review phase, as well as the continuous
monitoring, helps the manager to recognize performance problems and to provide
remedial strategies at early stages.
The Incapacity Code and Procedure for the Public Service (Public Service Co-
ordinating Bargaining Council Resolution 10, 1999: Section 1:1.1-1.7) recommends
the following for the management of poor performance:
assist employees to overcome poor performance;
promote efficient and effective performance;
prevent and correct inadequate performance;
develop common understanding of incapacity between employer and
employees;
prevent subjective or discriminatory actions by the employer toward
employees;
96
give necessary support to employees who are incapable of performing to the
requirements of their jobs; and
promote mutual respect between employees and between employers and
employees.
Though the performance management system and its outcomes look very
attractive in theory, in actual practice the implementation faces some challenges
and failures. The performance management system’s challenges and failures are
explained in the subsequent paragraphs.
3.6 PERFORMANCE MANAGEMENT SYSTEMS CHALLENGES AND
FAILURES
Sometimes even the well-constructed performance management system does not
yield the desired results, and there are various reasons for such failures. According
to Bailey (2012:1), one of the reasons is an unclear link between strategy and
execution. In many instances employees cannot relate how their everyday work
contributes to the mission of their organization, and how the achievement of their
goals link with their personal success.
Another challenge is attributed to the ratings, where every employee more or less
scores the same. In such instances, performance assessments put more emphasis
on scores than on employee strengths and weaknesses, and as a norm every one
scores a four out of five. This subjective scoring gives the impression that there are
no real meanings for outstanding performance or penalties for underperformance.
Managers’ reluctance for conversation and communication forces them to focus
more on the process. Moreover, managers give more importance to harmony and
acceptance, and do not have the courage to have open and objective
communication regarding efficient and effective performance. As a result,
managers treat the process as a mere paper-work exercise, which has no
significance to anyone. Furthermore, the absence of inspiration and excitement
about the future leads to a lack of trust in the system. Employees feel dejected and
97
discouraged, as they do not feel a sense of growth and progress to get involved in
high engagement and high performance. Many individuals who have been in the
same role for many years feel demotivated about their future and managers lack
the skills and capabilities to inspire such employees.
One of the main reasons for the failure of a PMS, according to Saravanja (2011:1-
3), is a lack of integration and collaboration between the performance management
system, strategic planning, human resource management processes,
organizational culture and structure and other major organizational systems and
processes. Another reason is the lack of buy-in from the users of the system, a
lack of trust in the system, and a lack of good relationships between stakeholders
and employees. Yet another valid reason for the failure of a system includes the
absence of support from top leadership and management to create a shared vision
that inspires employees to build a common purpose through the performance
management system. Furthermore, the absence of strong values and value-driven
leaders also contributes to such failure, as does a disregard for the systematic and
professional planning and implementation of the system which serves to allay the
fears, uncertainties and anxieties of employees.
Saravanja (2011:1-3) states that the absence of appropriate mechanisms to
ensure the objectivity of performance assessments (ratings and judgments), by
reducing favouritism and bias, is also a contributor to the failure of the system. In
addition, an absence of timeous and continuous performance feedback,
appropriate reward systems (that encourage high performance and discourage low
and mediocre performance), and appropriate mechanisms to deal with
underperformance, can also contribute to the failure of the system. Failure may
also be attributed to an absence of appropriate knowledge, attitudes and skills on
the part of everyone involved in the performance management system. Such
individuals may fail to objectively implement and utilize the system effectively and
efficiently.
98
Saravanja (2011:1-3) adds that failure can also be attributed to an absence of
good communication between the stakeholders, employee motivation programs,
an enabling organizational environment, a functional organizational structure, user
friendly organizational processes, proactive and developmental human resource
management and development policies, strategies and activities, and inspiring
leadership that generates passion and commitment for effective and efficient
performance in employees. As high motivation leads to high performance, the lack
of motivation leads to performance management system challenges. The lack of
continuous monitoring and evaluation can therefore also lead to performance
management system failure.
According to Good and Carin (2004:15, 16), one of the many reasons for the
failure of a performance management system is the lack of a link between the
performance measures and resource allocations. This impacts on the performance
of employees, as it makes them accountable for things they cannot control. Tunnel
vision, goal displacement, misrepresentation or corruption of data, manipulation of
reported data, and the uncritical acceptance of reports are all reasons for the
failure of performance management systems. According to Grobler et al.
(2011:294), the elements that defeat a performance management system include a
negative work culture, insufficient line management support, a lack of follow-up on
performance reviews, over emphasis on the appraisal aspect and ignoring the
development aspect, inadequate performance information, and a lack of objectivity.
Performance appraisal, which is an integral part of performance management, is a
critical contributing factor to the failure of a performance management system, as
various errors associated with performance appraisal taints the whole performance
management system. Performance appraisals can be a negative experience if not
done appropriately. They are very time consuming, and are subject to rater errors
and biases as they are conducted by human beings.
99
Some of the reasons for the failure for performance-based pay and rewards are as
follows (Callaghan, 2005:10, 11):
lack of objective and quantitative measures;
lack of immediate reinforcement (reward or recognition is given sometimes
even one year after the performance has happened);
sometimes behaviours and achievements that are not linked to the strategy
are promoted;
objectives, benefits and procedures are not clearly or uniformly understood
by all; and
sometimes performance-based-pay is not on par with efforts expended.
Furthermore, supervisors’ actions are controlled by perceptions and biases such
as erroneous first impressions and subjective assessments of job performances.
These errors can undermine the credibility of the performance evaluation process
(Good & Carin, 2004:17). Rating biases occur when ratings are inflated or deflated.
Ratings are inflated to get more bonuses/raises for the unit, to promote someone in
the unit and boost morale. Reasons for deflating ratings could include budget
constraints or an effort by managers to demonstrate dominance (who the boss is)
amongst others. As such, error in rating can be considered as one of the causes
for the failure of a performance management system. Lunenburg (2012: 1)
suggests that performance appraisal process sometimes is not accurate and
objective, and rating errors are common. Rating errors from the researcher’s
experience and observation can lead to inaccurate performance assessment and
measurement leading to wrong conclusions on performance rewards. Wrong
conclusions on performance rewards create dissatisfaction amongst employees.
100
3.6.1 Rating Errors
Some of the common rating errors prevalent in organizations are explained in the
following paragraphs as these errors contribute to the inaccurate rating of
employee performance, paving the way for distributive and procedural unfairness.
Managers must be aware of these rating errors and make conscious efforts to
eradicate them when they assess their employees. Then only the assessments
can be objective and yield the results it should.
3.6.1.1 Strictness
Some managers/supervisors tend to rate all subordinates with consistently low
scores. A strict rater gives ratings lower than the subordinate deserves, which in
effect is a punishment to excellent performers (Lunenburg, 2012:7).
3.6.1.2 Leniency
The lenient rater, however, is inclined to give higher ratings than the subordinate
deserves (Lunenburg, 2012:7). Khan (2012:1) refers to this as the compassion
effect error, where managers award excellent ratings intentionally to all the
employees in their unit. This may be to gain the support of all the staff, or to make
a positive impression on superiors by exaggeration of their capabilities. This again
is a punishment for superior performers, as there is no distinction between
performance and non-performance, and no recognition for performance excellence
(Lunenburg, 2012:7).
3.6.1.3 Central Tendency
Some raters are reluctant to rate subordinates with a very high or very low score.
They dislike being too strict with extremely low ratings, and they believe that no
one deserves the highest possible rating. The result of this attitude is that
everyone is rated as average (Lunenburg, 2012: 8). Khan (2012:1) states that
101
managers generally commit this type of error in order to avoid any criticism from
employees, or to avoid investigations by management due to any extreme
performance ratings.
3.6.1.4 Halo Effect
The Halo Effect takes place when a single positive attribute of an individual’s
performance influences the supervisor’s rating of that subordinate (Khan, 2012:1;
Lunenburg, 2012: 8 ; Meyer & Kirsten, 2005:65). For example, an employee may
be very good in oral and written communication and generally take care of the
manager’s written communications, but be inefficient in other aspects of his/her
responsibilities. This employee may consequently be given an excellent
performance rating because the manager is extremely happy with this one aspect
of his/her performance (Khan, 2012:1).
3.6.1.5 Recency of events
Ideally, performance appraisals should be based on data collected about a
subordinate’s performance over an entire evaluation period. However, as is often
the case, the supervisor is likely to rate the employee based on recent
performance that is most vivid in their memory (Lunenburg, 2012:8).
3.6.1.6 Preferential treatment error / Nepotism Error
This type of error is deliberately committed when a manager awards favourable
performance ratings to employees who are related, or are favourites, so that they
receive performance-linked employment benefits. This error can have adverse
effects on a work group’s morale (Khan, 2012:1).
102
3.6.1.7 Wrong meaning understood Error
This type of error is prevalent when there are large numbers of employees, and
more than one manager is responsible for the performance management. If the
managers do not have the same understanding and perception of the performance
criteria, they tend to interpret the same parameter differently. For example, if an
employee takes initiative and makes positive suggestions related to work, this may
be understood as a sign of good behaviour by one manager, but may be regarded
as disobedience and insubordination by others (Khan, 2012:1).
3.6.1.8 Resembling to me Error
Managers trying to be humane often fall into the trap of awarding higher
performance ratings to employees who resemble themselves in attitude, physical
appearance, temperament, performance, personality, race and gender (Khan,
2012:1). Meyer and Kirsten (2005:65) refer to this as the similarity error.
3.6.1.9 Overflow Error
Overflow error happens when a manager has a pre-conceived mind-set that an
employee, who was previously an excellent performer in the preceding
assessment evaluation period, must have performed excellently again (even if it is
not so) (Khan, 2012:1).
3.6.1.10 Typecast Error
Typecast error occurs when employees are categorized into groups based on
gender, race, ethnicity, culture or group as a result of a manager’s preconceived
beliefs, ignoring documentary evidence and rational judgment (Khan, 2012:1). It
can also be called bias, prejudice and stereotyping, as a decision about an
employee is made based on a belief or view, and not on objective performance
information (Meyer & Kirsten, 2005:65).

103
3.6.1.11 Horn Error
This type of error occurs when one negative factor overshadows other positive
factors, and the manager bases the rating on only the negative factor (Khan,
2012:1).
3.6.1.12 Initial Idea (first impression) Error
This error occurs when managers base their assessment on a first impression
about an employee, whether favourable or unfavourable, and ignore subsequent
information that is contrary to the initial impression (Khan, 2012:1).
3.6.1.13 Comparison Error
This type of error is visible when managers compare the performance of two
employees while awarding rating. In this situation an average employee can
receive an excellent rating because he/she is compared with a poor or non-
performer (Khan, 2012:1).
3.6.1.14 Contrast Error
In this situation low scores are given to employees if they differ from the appraiser
in attitudes, attributes and approaches (Meyer & Kirsten, 2005:65).
3.6.1.15 Errors of Logic
This occurs when a manager incorrectly groups tasks that appear to be related to
one another, and allocates the same mark for each task (Meyer & Kirsten,
2005:65).
104
3.6.1.16 Trait Assessment
Here the manager places emphasis on characteristics (such as sincerity and
friendliness) that have nothing to do with job performance (Meyer & Kirsten,
2005:65).
Dysfunctional performance is another reason for the failure of performance
management systems in organizations. This is explained in the following
paragraphs.
3.6.2 Dysfunctional Performance
Kelman and Friedman (2009:2) state that literature on performance measurement
in the government has linked performance measurement to unintended
dysfunctional consequences. These dysfunctional consequences are manifested in
effort substitution or gaming. Effort substitution occurs when employees reduce
their efforts on non-measured performance dimensions, while gaming occurs when
employees deliberately make performance on the measured performance
dimensions appear better than they are. According to Litzky et al. (van Fleet &
Griffin, 2006:701-702), organizational factors such as the organization’s reward
structure, unclear performance feedback, negative and untrusting attitudes,
perceived unfair treatment, and violations of trust amongst others, are quite often
the reasons for dysfunctional behaviour. Domske (Mathison & Vinja, 2010:112),
adds that mismanaged appraisals can lead to dysfunctional behaviour, as they
often are manipulative, abusive and autocratic.
In an ideal world, incentives can lead to enhanced motivation and performance
however, in the real world incentives can have dysfunctional effects which arise
from the perception of unfairness (Good & Carin, 2004:9). It is a fact that when
rewards are linked to performance, employees attach issues of fairness to it, and
as a result a perception of the distribution of rewards that is perceived as unfair
leads to significant problems. This statement is supported by Adams’ Equity
105
Theory which propagates the principle of balance. The theory holds that an
individual’s level of motivation is linked to his/her perception of balance, fairness
and justice practiced by the management. The higher is the individual’s perception
of fairness, the greater the motivation level and vice versa (Good & Carin, 2004:9).
The Equity Theory is explained in chapter 2 of this thesis.
For an organization to perform effectively, it has to manage the dysfunctional
effects of incentives. Good and Carin (2004:10) state that the most effective way to
cope with an employee’s sense of distributive injustice (unfair reward distribution)
is to establish procedural justice, a process by which the size of the reward is
determined. With regard to the impact of distributive and procedural justice, a high
reward is perceived by employees as fair regardless of the process by which it was
determined, whereas a lower reward will be perceived as fair only when the
process that determined the pay level was accepted as fair. In other words,
employees will tolerate rewards that they felt were unfair, if the process of
determining the distribution seemed fair. The process is more likely to be perceived
as fair when it is open and transparent, and when employees can contribute to the
process by providing relevant information.
3.7 CONCLUSION
The explanations in this chapter explicitly emphasize the importance of
performance management in the day to day management of employees. Effective
performance management encourages a high level of employee involvement, and
thus effective and efficient performance through participation in the planning and
delivery of work. This is achieved by participation in setting performance
objectives and standards, in monitoring and evaluation, in promoting employees’
personal and professional developmental goals, through constant feedback
(communication), and by providing appropriate recognition and rewards. As this is
done through mutual understanding and agreement between the manager and
employees, it leads to greater employee motivation and effective and efficient work
performance. Effective implementation of the performance management system
106
can generate many positive outcomes, and the opposite can happen if there is no
objectivity and procedural and distributive justice. The chapter also explored
possible system failures and errors that can lead to dysfunctional performance.
The chapter also established that the FSPS has a good PMS as it incorporates all
essential elements of PMS like performance planning and goal setting, defining
priorities, setting performance standards, performance coaching and mentoring,
performance measurement and evaluation, performance feedback and
documentation and management of good as well as poor performance.
107
CHAPTER 4
RESEARCH METHODOLOGY
4.1 INTRODUCTION
This chapter on research methodology focuses on the various steps that must be
followed to make research scientific. In the process, the chapter expands on the
definition and meaning of scientific research, explains different types of basic
research and differentiates between research methods, research methodology and
research design. It further explains the link between concepts, constructs,
variables and operationalization. The chapter also focuses on the significance of
establishing the population and the sample as well as the importance of validity
and reliability in scientific research. It advances on various data collection
techniques and tools that would aid in making valid observations. It further
elaborates on how these observations can be interpreted, concluded and
generalized in view of the hypothesis as well as the research questions, as stated
in chapter 1 of this thesis.
4.2 DEFINITION AND MEANING OF RESEARCH
Definitions on research can assist to understand the term objectively and clearly.
Research, according to Hutchinson (Brynard & Hanekom, 2006:3), is a scientific
and systematic investigation and study aimed at establishing facts to reach new
conclusions. Nyanjui (2013:1) defines research as the systematic activity directed
towards objectively investigating specific problems as it helps to discover
relationships between and among variables, and helps to answer specific
questions. Scientific research has well defined objectives and methods, generates
dependable data and produces reliable, clear and justifiable conclusions
(Krishnaswamy, Sivakumar & Mathirajan, 2006:4). Research is a systematic
collection, analysis and interpretation of data in order to solve a research question,
108
and it performs a methodical study in order to prove a hypothesis or answer a
specific question (Girish, 2012:8). Research aims to simplify complex problems,
discover relationships between events, and ultimately contribute to the betterment
of individuals’ lives (Marczyk, DeMatteo & Festinger, 2005:1). Research involves
planned and systematic collection, analysis and interpretation of data in order to
arrive at dependable conclusions (Singh, 2006:1).
Furthermore, research is a process that tries to obtain scientific knowledge by
employing objective methods and procedures, and has three characteristics
namely, (i) knowledge that is obtained by systematic observation, (ii) observation
that is controlled, and (iii) the results that can be replicated. The word objective
implies that the scientific methods are specific for each stage of the research
process, such as sampling methods, methods for measuring variables, methods to
collect information and finally for analysing the collected information. While
methods and techniques are determined based on the aim of the specific research
project, research methodology explains the logic behind the research methods
engaged in a scientific research study (Welman, Kruger & Mitchell, 2005:2, 9).
Bhattacherjee (2012:1) agrees that research can be scientific only if it follows the
scientific method, and contributes to a body of science as well.
Besides, scientific research operates at two levels namely the theoretical level and
empirical level. While the theoretical level builds theories by developing abstract
concepts and establishing relationships between those concepts, the empirical
level tests the theoretical concepts and relationships, and establishes how well it
links to observations of reality, building better theories. Scientific research in fact
involves the moving back and forth between theory and observations and
therefore, both theory and observations are essential components of scientific
research Bhattacherjee (2012:3).
To elaborate further, research has four purposes namely describing, explaining,
predicting phenomena, and ultimately controlling events. Research helps to
understand the world by acquiring knowledge, establishing facts and developing

109
new methods and theories. Research helps to make predictions and
generalizations through scientifically verifying clear statements called hypotheses.
By accepting or rejecting a hypothesis, research can establish relationships
between variables and predict what can happen given certain conditions. Finally,
the findings of research can be applied to real problems and situations. As
research can establish relationships between variables, it helps individuals to
control their environment and situations to suit their interests (Nyanjui, 2013:2).
According to Welman et al. (2005:22, 23), the purposes of research are to describe
how things are, explain why things are the way they are, and finally make
predictions about a phenomena.
4.3 BASIC TYPES OF RESEARCH
An understanding of the various types of research can also contribute to the
general comprehension of what scientific research is. The types of research
include applied or basic, deductive or inductive, quantitative and qualitative
(Neville, 2007:2), and or mixed (Creswell, Klassen, Plano Clark & Smith, 2011:4,
5). The primary aim of basic research is to improve knowledge without any
particular applied purpose, whereas applied research is designed to apply its
findings to a particular situation (Neville, 2007:3). In this particular research, the
findings will be applied to the FSPS and therefore, it can be said that the study
follows the route of applied research.
With regard to inductive and deductive types of research, inductive research is
sometimes called a bottom up approach as it moves from specific observations to
broader generalizations and theories. It begins with observations which establishes
patterns, formulates hypotheses which are tested, and leads to a theory (Burney,
2008:5). As it moves from particular situations to general ideas/theories, it is also
known as theory-building research (Bhattacherjee, 2012:3). Deductive research
however moves from general ideas/theories to specific and particular situations
(Neville, 2007:3). As the goal of deductive research is to test concepts and
patterns (testing hypotheses) from already existing theories, using new empirical
110
data to refine, improve, and extend existing theories, it is known as theory-testing
research (Bhattacherjee, 2012:3).
Deductive reasoning therefore works from the more general to the more specific,
and conclusion follows logically from evidences and available facts. A hypothesis
will be formulated from existing theory, which will then be observed, and
conclusions drawn from the observations (Burney, 2008:4). Therefore, a deductive
approach is used in this study. A clear hypothesis was presented in chapter 1 of
the thesis. The hypothesis was then tested by gathering data from a selected
sample of the population (Free State public servants). The data observed was then
collated, statistically analysed, and conclusions and generalizations were drawn on
the hypothesis. This is presented in Chapter 5 of this thesis.
Then there is qualitative, quantitative and mixed methods research. Quantitative
research is a mode of inquiry often used for deductive research, which tests
theories or hypotheses, gathers descriptive information, or examines relationships
among variables. The variables are measured and converted to numeric data,
which is then analysed statistically to establish cause effect relationships. Thus,
quantitative data can provide measurable evidence, establish probable cause and
effect relationships, provide for the replication and generalization to a population,
and facilitate the comparison of groups (Creswell et al. 2011:4, 5). Qualitative
research however is a superior method for conducting meaningful research
(Tewksbury 2009:37). The reasons are that, based on the methods used to collect
and analyse data, and based on the conclusions drawn from the study, the
knowledge gained through qualitative investigations is more informative, in-depth
and provides a better understanding compared to the knowledge acquired through
quantitative research. The third approach, mixed methods research, utilizes
multiple methods and intentionally integrates or combines quantitative research
(that measures the extent and regularity of concepts) with qualitative research (that
explores the meaning and deeper understanding of constructs/concepts), to draw
on the strengths of each method (Creswell et al. 2011:4,5). Qualitative, quantitative
111
and mixed methods research is further explained in this chapter under data
collection methods.
As research methods, methodology and research design are integral parts of
scientific research, these concepts are explained in the following paragraphs.
4.4 RESEARCH METHODS, METHODOLOGY AND RESEARCH DESIGN
Scientific research method refers to a standardized set of techniques for building
scientific knowledge, such as how to make valid observations, how to interpret
results and how to generalize those results. The scientific method allows
researchers to independently and impartially test pre-existing theories and prior
findings, and subject them to refinement or enhancements. There are several
characteristics of scientific research methods including replicability, precision,
falsifiability and parsimony (Bhattacherjee, 2012:5). Replicability ensures that
others will be able to obtain similar results when a scientific study is repeated.
Precision guarantees that theoretical concepts are defined accurately, so that
others are able to use the definitions to measure the concepts and test the theory.
Falsifiability suggests that a theory that is not specified in precise terms, or that
cannot be measured and tested, is not a scientific theory. Finally, parsimony
advocates that the scientific method must be the simplest, or logically the most
economical, of explanations (Bhattacherjee, 2012:5).
According to Cozby (Marczyk et al. 2005:4), the biggest benefit of the scientific
method is that it provides a set of clear and agreed upon guidelines for gathering,
evaluating, and reporting information of a research study. Research methods refer
to those techniques that are employed to study a particular research problem
(Kothari, 2004:7). According to Cohen, Manion and Morrison (2007:47), research
methods are a range of approaches that are used to gather data. This data is then
analysed and explained using statistical methods, based on which predictions are
made. Research methods are associated with prompting responses to
predetermined questions (questionnaire and interview schedule), recording
112
measurements, describing phenomena and performing experiments, participant
observation, role-playing, and non-directive interviewing.
A distinction between research methods and research methodology needs to be
acknowledged as they are not the same. Research methodology is a process that
helps to solve the research problem systematically, and the scope of research
methodology is wider than that of research methods. Research methodology not
only includes the research methods but also considers the logic behind the
methods used. It addresses why a research study has been undertaken, how the
research problem has been defined, why the hypothesis has been formulated,
what data has been collected, what particular method has been adopted, as well
as why and what particular technique of data analysis has been used (Kothari,
2004:7,8).
Research methodology involves the systematic procedures by which the
researcher starts from the initial identification of the problem to its final conclusions
including the review of literature, formulation of hypotheses, procedures for testing
hypotheses, measurement, data collection and analysis and interpretation of data
(Singh, 2006:79). Rajasekar, Philominathan and Chinnathambi (2013:5) agree that
research methodology is a systematic science of studying how research is to be
carried out and knowledge is gained. It suggests the suitable methods for the
chosen problem as well as the efficiency and accuracy of the methods. Thus, the
role of methodology is to carry on the research work in a scientific and valid
manner (Singh, 2006:79).
The research design is a framework, guide or master plan used for the planning,
analysis and implementation of a study (Dutta, 2013:10; Patidar, 2013:2, 4).
Research design is the planning of scientific enquiry or designing a strategy for
enquiring and finding out something. Research design encompasses two important
requirements namely (i) to specify clearly what needs to be found out and (ii) to
determine the best way to do it (Babbie & Mouton, 2001:72). Kothari (2004:31)
suggests that research design is the conceptual structure within which research is
113
conducted. It is the blueprint for the collection, measurement and analysis of data,
and as such gives an outline of what the researcher will do. The outline covers the
following:
what the study is about;
why the study being conducted;
where the study will be carried out;
what type of data is required;
where the required data can be found;
what periods of time the study will include;
what the sample design will be;
what techniques of data collection will be used;
how the data will be analysed; and
the style in which the report will be prepared.
Thus, research design lays a firm foundation for the research, and as such has an
influence on the reliability of the results. A research design which is not well
thought out may even give misleading conclusions and render the research
exercise futile. The design helps the researcher to organize ideas to identify flaws
and inadequacies (Kothari, 2004:32).
According to Babbie and Mouton, (2001:75), research design focuses on the end
product, the logic of the research, the plan of the study, and the type of evidence
needed to address the research problem or question sufficiently. Furthermore, a
research design commences with the clear formulation of a research problem or
question at the beginning of the study. As such, a research question is presented
in Chapter 1 of this thesis relating to management support, objective performance
management, and favourable work environment in the FSPS departments.
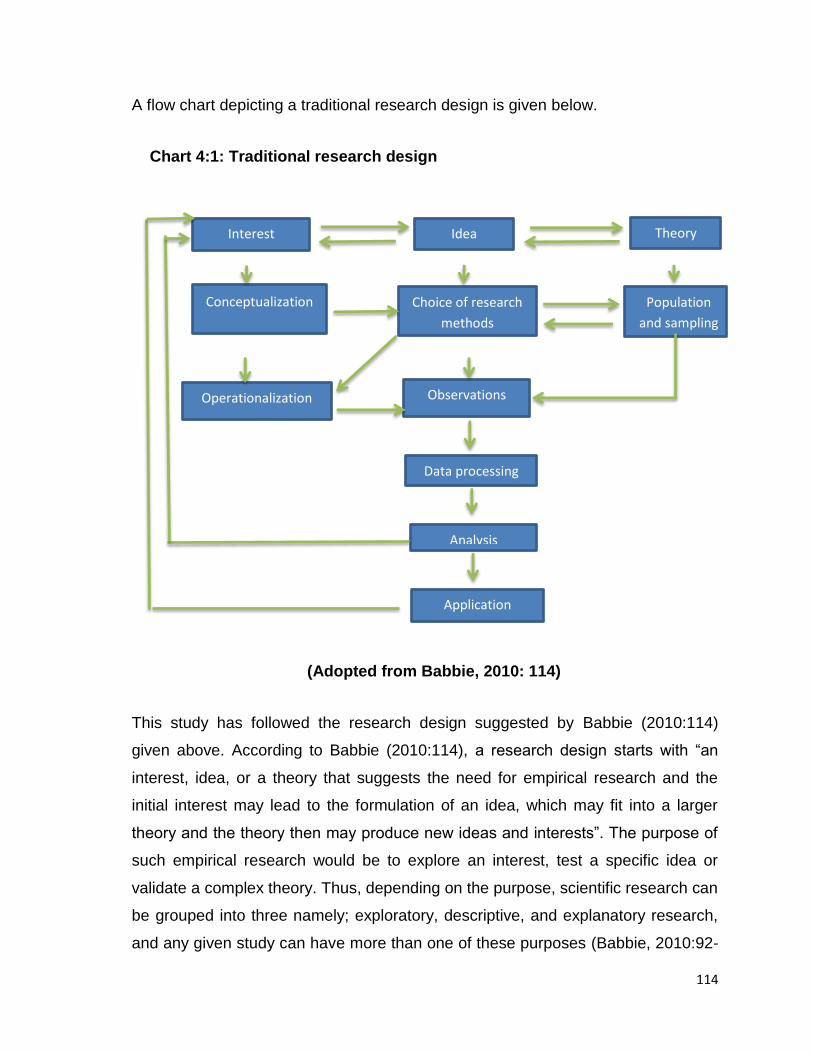
114
A flow chart depicting a traditional research design is given below.
Chart 4:1: Traditional research design
(Adopted from Babbie, 2010: 114)
This study has followed the research design suggested by Babbie (2010:114)
given above. According to Babbie (2010:114), a research design starts with “an
interest, idea, or a theory that suggests the need for empirical research and the
initial interest may lead to the formulation of an idea, which may fit into a larger
theory and the theory then may produce new ideas and interests”. The purpose of
such empirical research would be to explore an interest, test a specific idea or
validate a complex theory. Thus, depending on the purpose, scientific research can
be grouped into three namely; exploratory, descriptive, and explanatory research,
and any given study can have more than one of these purposes (Babbie, 2010:92-
Interest Idea Theory
Conceptualization
Operationalization
Choice of research
methods
Population
and sampling
Observations
Data processing
Analysis
Application
115
94; Bhattacherjee, 2012:6). These three types of research are briefly described
below, as is how they were integrated into the current study.
Exploratory research is often conducted in new areas of inquiry, where the goals of
the research are to (i) to establish the extent of a particular phenomenon, (ii) to
gather some initial ideas about that phenomenon, or (ii) to test the practicability of
undertaking a more extensive study regarding that phenomenon (Bhattacherjee,
2012:6). Babbie (2010:92) agrees that exploratory studies satisfy the researcher’s
curiosity and desire for better understanding of the phenomenon, and help to test
the feasibility of undertaking a more extensive study. Therefore, the researcher
used the initial literature review to obtain a clear understanding of the topic which
is employee performance: the challenge for managers in the FSPS. Aspects of
descriptive research also were used in the study, as it helped to make reliable and
careful observations as well as detailed documentation of the topic under study as
proposed by Bhattacherjee (2012:6). The descriptive study assisted the researcher
to observe and describe carefully and deliberately, what, where, when and how of
the research as suggested by Babbie (2010:93,94). Similarly, explanatory research
also was applied in the study as the study sought explanations of observed
phenomena and searched for answers. The study also attempted to identify causal
factors (Babbie, 2010:94; Bhattacherjee, 2012:6). As such, the main purpose of
this research was explanatory in nature and, the literature review as well as
descriptive and inferential analysis helped the researcher to direct the study
towards finding answers to the research question, to achieve the aims and
objectives of the study, as well as to test the hypothesis and draw conclusions and
make recommendations.
The flow chart further suggests that once the initial interest and purpose of the
study is established, the research design moves on to defining the concepts so
that they can be operationalized to be better understood. The need for clarifying
the concepts to gain a better understanding, and to draw meaningful conclusions
about them, is explained hereafter (Babbie, 2010:115).
116
4.5 CONCEPTS, CONSTRUCTS, VARIABLES AND OPERATIONALIZATION
The Oxford dictionary (1998:174) defines a concept as “a general notion or an
abstract idea”. Babbie (2010:126, 127) explains that individuals create a mental
image about an abstract idea from what they have observed, heard and
experienced. The technical term for the formation of that mental image, which
differs from individual to individual, is called conception. Conception helps
individuals to communicate, agree on the meaning, and thus have a common
understanding of such abstract terms. The process of agreeing on the meaning of
the terms is called conceptualization, and the result is called the concept.
Concepts cannot be observed directly or indirectly as they do not exist but are
made up. Though these observation and experiences are real, conceptions and
the concepts derived from them are only mental creations (Babbie, 2010:129).
To elaborate further, a concept is a construct that is created from individuals’
conceptions. Bhattacherjee (2012:10, 11) adds that a construct is an abstract
concept that is specifically generated to explain a particular phenomenon. A
construct can be a simple concept, such as an individual’s weight, or a
combination of a set of related concepts such as an individual’s communication
skill, which consists of several underlying concepts such as the individual’s
vocabulary, speaking and or writing skills, and fluency in speaking. Therefore, the
constructs used for scientific research must have specific and clear definitions that
others can make use of to understand exactly what it means and what it does not
mean (Bhattacherjee, 2012:11).
To make it easily understandable, constructs can be defined both conceptually and
operationally (Legget, 2011:3). While conceptual definition provides meaning to a
construct in abstract or theoretical terms, operational definition makes it concrete
and easily understandable by providing a clear definition as well as by specifying
the procedures used to measure it. Bhattacherjee (2012:11) adds that a construct
can be defined in two ways, by means of dictionary definitions and operational
definitions. The dictionary definition gives a synonym for a construct. For instance,
117
the dictionary definition of prejudice is bias, pre-conception, pre-judgment, pre-
disposition and partiality, and any of these terms in turn will be defined as an
attitude. Such definitions are not useful in scientific research for elaborating the
meaning and content of a construct. Therefore, scientific research requires
operational definitions that define constructs in terms of how they will be
understood by all.
For example, the operational definition of a concept such as manager, from the
topic under study, must therefore specify whether the researcher plans to define a
manager in terms of the position he/she holds, the post level, salary earned, the
budget managed, or the number of subordinates managed. Consequently, the
operational definition for the term manager is provided in chapter one of this thesis,
as are other key words and concepts.
Legget (2011:10) further states that a concept can also be operationalized by
creating variables. The Australian Bureau of Statistics (2013:1) defines a variable
as any characteristics, number, or quantity that can be measured or counted such
as age, gender, income, race, and class grades. It is also called a variable
because the value varies between samples in a population. Legget (2011:10), as
well as Brynard and Hanekom (2006:22) also agree that any characteristic that
varies, has at least two values, and can be measured is a variable.
In addition, there are independent variables and dependent variables (Legget,
2011:14). The independent variable is the cause of a behaviour or event, while the
dependent variable is the effect. For example, research questions and hypotheses
consist of independent and dependent variables. This can be illustrated using the
hypothesis of this research, which states that the FSPS employees (public
servants) will give effective and efficient performance if their managers are able to
create and manage a positive work environment by providing management
support and by implementing the current performance management system
objectively. This hypothesis has variables such as manager support, objective
implementation of performance management systems, positive work environment
118
(independent variables), and effective and efficient employee performance
(dependent variables). In this instance, effective and efficient performance is the
effect, while work environment, management support and objective
implementation of performance management systems are the causes of the effect
(independent variables). However, the variable positive work environment can be
considered both an independent and dependent variable, as this study works from
the premise that manager support and objective implementation of performance
management systems (independent variable) creates a positive work environment
(dependent variable), and a positive work environment (independent variable) in
turn produces effective and efficient employee performance (dependent variable).
Having explained conceptualization and operationalization, the chapter will now
focus on research population and sampling aspects of a research study.
4.6 POPULATION AND SAMPLING
One of the major aspects of any scientific research is to decide on the population
for the study (whom to study). Greener (2008:47) suggests that if a researcher
needs to get information about individuals, he or she needs to seek information
from each and every one of them. This is called the population, which is the total
number of individuals about whom the researcher wants to draw conclusions.
However, as there are many individuals in the population it is impossible to ask
everyone, hence the need to draw a sample from the population that represents
the whole population. Thus, sampling is a practical way of studying individuals with
certainty that the results represent the whole population.
There are two types of samples namely probability samples, and non-probability
samples. Probability samples include (i) simple random samples, (ii) stratified
random samples, (iii) systematic random samples, and (iv) cluster random
samples. Non-probability samples however include accidental or incidental
samples, quota samples, purposive samples, snowball samples, self-selection
samples, and convenient samples (Welman et al. 2005:56). The advantage of
119
probability sampling is that researchers can ascertain the prospects that any
member of the population could be present in the sample, whereas this aspect of
probability is not present in the non-probability sample. Another advantage of
probability sampling is that it enables researchers to estimate the sampling error,
which can be explained as the absence of an appropriate link between the sample
and the population. In other words, if there is a sampling error, the characteristics
of the sample will be different from the characteristics of the population from which
the sample was selected. The sampling error cannot be estimated in non-
probability sampling (Welman et al. 2005: 56, 57, 74).
Thus, the population for the topic under study was all Free State public servants at
salary levels 13, 12 and 11, from all 11 government departments. For the purpose
of the study, public servants at salary level 13 (director) were considered
managers while salary levels 11 and 12 (deputy director) were considered
subordinates reporting to levels 13. As it is not practically or economically possible
to involve all the members of the population in a research project, a sample of
managers at salary level 13, and subordinates at salary levels 11 and 12, was
selected.
The first step in selecting a sample is the preparation of a sampling frame which is
nothing but the complete list of the units of analysis, in which each unit of analysis
is mentioned only once (Welman et al. 2005:57). The IT sections in all 11
government departments provided e-mail addresses of all officials at levels 11, 12
and 13, and thus assisted the researcher to prepare the sampling frame. The
sampling frame therefore, consisted of 263 managers at level 13, 1818
subordinates at level 11 and 976 at level 12. Probability sampling methods were
used in this research. Systematic random sampling is used, as it is simpler, more
convenient, and as the name implies, more systematic to get a representative
sample from the population. Systematic sample selects every nth element from a
population of N elements (Welman et al. 2005:64). To elaborate further, from the
complete list of the population of occupational level 13, the researcher chose every
120
3rd element which constituted 78 managers. Similarly every 10th element was
chosen from levels 11 and 12 added together as both levels represented
subordinates, and established a sample of 181 subordinates. Then questionnaires
were distributed to the selected samples through e–mails.
As validity and reliability are important aspects of scientific research, these were
built into the research processes. The importance of these terms is briefly
explained in the following paragraphs.
4.7 VALIDITY AND RELIABILITY
Validity and reliability helps to establish and communicate the accuracy of research
processes and the trustworthiness of research findings (Roberts, Priest & Traynor,
2006:41). Validity and reliability are very crucial elements of research, as the
research should not misinform or mislead those who use it. The trustworthiness
depends on a number of research aspects such as the initial research question,
data collection (how, when and from whom), the data analysis, as well as the
conclusions drawn (Roberts et al. 2006:41).
4.7.1 Validity
Validity is a requirement for both quantitative and qualitative research, as invalid
research is worthless. Validity in fact demonstrates that a specific instrument used
in the research measures what it is expected to measure. According to Winter
(Cohen et al. 2007:133), in qualitative data validity can be addressed through
honesty, depth, richness and scope of the data collected, as well as the
participants approached, and the objectivity of the researcher. Gronlund (Cohen et
al. 2007:133) adds that because the subjectivity of respondents, their opinions,
attitudes and perspectives contribute to a degree of bias in qualitative data, validity
should be seen as a matter of degree rather than an absolute state. In quantitative
data, validity can be attained through careful sampling, appropriate data collection
techniques, and suitable statistical analysis of the data. It is impossible for
121
research to be 100 per cent valid in quantitative research, as it possesses an
inbuilt measure of standard of error. Hence, the best approach is to strive for the
minimum invalidity and maximum validity (Cohen et al. 2007:133).
Punch (Roberts et al. 2006:43) states that validity describes the extent to which a
“measure accurately represents the concept it claims to measure”. Validity,
according to Joppe (Golafshani, 2003: 599), refers to whether the research actually
measures what it was intended to measure, or how truthful the research results
are. Black (Roberts et al. 2006:43) suggests two broad measures of validity
namely external validity and internal validity. External validity refers to the ability to
apply the findings of the study to other individuals and other situations with
confidence, and ensures that the conditions under which the study is carried out
are representative of the situations and time to which the results are to apply.
The principle of external validity is applicable in this particular research, as the
population chosen and sample selected is representative of the FSPS at the time
of the study, and the environment at the time of the study is applicable to
everyone, as they are all governed by the same policies and procedures.
Therefore, the findings of the study can be applied to all employees in the FSPS.
Internal validity addresses the reasons for the outcomes of the study, and helps to
eliminate other unanticipated reasons for these outcomes. Care was taken to
ensure content validity, as it is related to the relevance and representativeness of
questions and other items in a questionnaire. The researcher formulated questions
focusing on the research question, hypotheses, aims and objectives, and a pilot
study was conducted on a sample similar to the population.
122
4.7.2 Reliability
Reliability, which is the other factor of measurement, relates to the accuracy and
consistency of the instruments used. If the instrument is reliable, it must be able to
produce the same information at a later stage, under similar conditions. Reliability,
according to Roberts et al. (2006:41), describes how far a particular test,
procedure or tool, such as a questionnaire, will produce similar results in different
circumstances, given that everything else remains the same. Any research tool
should provide the same information if used by different individuals, or if it is used
at different times. There must be internal consistency by which a relationship can
be established between all the results obtained from a single test or survey, which
can be tested with statistical procedures (Roberts et al. 2006:42).
According to Joppe (Golafshani, 2003:598), when the results are consistent over
time, accurately represent the total population under study, and can be reproduced
under a similar methodology, the research instrument can be said to be reliable. As
such, replicability or repeatability and generalizability of results or observations are
indicators of reliability. Kirk and Miller (Golafshani, 2003:598) identify three types of
reliability including (i) the degree to which a measurement done repeatedly
remains the same, (ii) the stability of a measurement over time, and (iii) the
similarity of measurements within a given time period.
The meaning of reliability differs in quantitative and qualitative research. Reliability
in quantitative research denotes precision, accuracy, dependability, consistency
and replicability over time, over instruments and over research population (Cohen
et al. 2007:146). Reliability in qualitative research, according to Lincoln and Guba
(Cohen et al. 2007:148), refers to credibility, neutrality, confirmability, consistency,
applicability, trustworthiness, transferability as well as dependability.
123
Data collection is a crucial and time consuming aspect of any research (Brynard &
Hanekom, 2005: 35) and this is explained in the paragraphs that follow.
4.8 DATA COLLECTION METHODS APPLIED IN THE STUDY
There are two basic methods for collecting the data namely qualitative methods,
and quantitative methods (Brynard & Hanekom, 2005: 36; Fox & Bayat, 2007:7).
Quantitative research follows systematic measurement and statistical analysis,
whereas qualitative research scientifically explains events, individuals, and matters
associated with them. Most research projects however, use both methods, and
both follow an ordered, planned and disciplined system of action (Fox & Bayat,
2007: 7). Quantitative and qualitative data collection techniques used in the study
are elaborated upon in the following paragraphs.
4.8.1 Questionnaires
Questionnaires are most often used as data collection tools in quantitative
methods. The questionnaire holds a collection of questions and many statements
as well. The objective of a questionnaire is to obtain facts and opinions about a
phenomenon from individuals who are knowledgeable on a particular issue. The
advantage of questionnaires is that they can be administered in various ways
including the mail, telephones, and hand delivery, and can be administered
individually or in groups, and via electronic devices such as e-mails and websites
(de Vos, Strydom, Fouche, & Delport, 2011:186-189). Electronic mails were used
to distribute the questionnaires in this study.
A well-defined research question, and clearly defined objectives, ensured the
relevance of questions in the questionnaire, and each question was thus directly
linked to the research question and the intended objectives, as recommended by
Eiselen and Uys (2005:3). Two sets of questionnaires were developed for this
study, one set for the managers (level 13), and another set for subordinates (levels
11 and 12). The questions for both sets of questionnaires were the same, except
124
for the wording and the phrasing of questions. For example, question no 7.1 for the
managers (section B) read ‘I disseminate information to my staff on time’, whereas
the question for subordinates reads ‘my manager disseminates information on
time’.
Questions were arranged in a logical order starting with biographical information
(non-threatening questions), and questions were grouped into sections based on
the research problem, hypothesis and aims and objectives of the study. As such,
questions were grouped according to demographic data, manager support,
favourable work environment, performance management in the FSPS,
recommendations to improve performance, and general comments. Care was
taken to keep the length of the questionnaire at the absolute minimum, with only
necessary questions, as the length of the questionnaire has a bearing on the
response rate (Eiselen & Uys, 2005:3,4).
The questionnaire consisted of a combination of factual and opinion-related
questions, as well as open-ended and closed questions (Eiselen & Uys, 2005:5).
Factual questions were mostly regarding a respondent’s demography (section A)
and about the respondent’s knowledge on performance management issues in
their respective departments. Most of the questions were opinion related questions
that revealed respondents’ attitudes or perceptions about management support,
work environment, the performance management system and employee
performance. Care was taken to avoid asking the respondents to provide
information about someone else’s opinions. As recommended by Neuman (Eiselen
& Uys, 2005:5), attention was also given to the respondent’s knowledge about an
issue before asking him/her to express an opinion, to avoid opinions on inaccurate
factual knowledge. For example, question 5 tests whether the respondents
understand the performance management system implemented in their department
before asking their opinions about the system in question 6.
125
The questionnaire also had multiple-choice questions. Response categories were
provided and respondents only needed to select a particular answer or answers.
Care was taken to ensure that all possible answers were included, that the
alternatives did not overlap, and that each question had clear instructions as to
how to complete the question (Eiselen & Uys, 2005:6, 7). There were no branching
or contingency questions. None of the questions were threatening or sensitive.
Mostly closed-ended questions were used, except for question 14, where
additional information was sought from the respondents. The reasons for not using
many open ended questions were the following:
open-ended questions could be coded only after the survey had been
concluded, which was time-consuming
if not carefully formulated and thoroughly prepared, an open-ended question
can yield unusable information for various reasons; and
the respondent may lack the necessary skills, knowledge, patience and
commitment to record his/her own response. As such, Eiselen and Uys
(2005:6) suggest that open-ended questions therefore be used cautiously,
and only when absolutely necessary.
Types of response categories were largely extent of agreement categories (Likert
scale), with few yes or no answers. The Likert scale had 3 and 5 categories. The 5
categories had strongly agree and strongly disagree at the extreme ends, with no
comments in the middle as neutral. Neuman (Eiselen & Uys, 2005: 8) caution that
there is a danger in providing the neutral category, as the respondents may opt to
choose the neutral option not because they do not have an opinion, but because
they want to avoid making a choice. However, the neutral option was provided so
as not to force the respondents to express an opinion when they did not have one.
Only three questions were of a ranking nature (questions 11, 12 and 13), and
question 14 was an open-ended question.
126
Every questionnaire was accompanied by a cover letter which explained the
purpose of the study, introduced the researcher, stated the approximate time
needed to complete the questionnaire, listed the contact details of the researcher,
and ensured confidentiality, as suggested by Eiselen and Uys (2005: 16). The
questionnaire was also accompanied by a letter from the Director General of the
province, informing the respective Head of Departments that permission had been
granted to the researcher to undertake the study.
4.8.1.1 Pre-test
After the first draft of the questionnaire was developed, the researcher consulted
the research guide (promoter) as well as the statistician, to ensure that all relevant
issues were covered, that appropriate questions were asked, that questions were
formulated in an understandable and clear manner, and that the response format
was appropriate. Once the questionnaire was finalized, the researcher also
performed a pre-test among a small group of respondents (15 respondents) similar
to those in the target population. The information collected from the pre- test was
not used in the final results, as the purpose of the pre-test was specifically to
identify and rectify problems in the questionnaire prior to the actual survey and to
gauge whether the questions would generate reliable and valid responses.
The pre-testing assisted the researcher in ensuring that the questionnaire was not
too long (which would cause the respondents to lose patience and interest), that
the questions were correctly worded, phrased and appropriate to the topic, and
that the questions were not sensitive. The researcher also tried to respect the
rights of the respondents, as none of the respondents were forced to participate, or
to provide any sensitive or incriminating responses. The respondents were assured
that their identity would remain confidential, as would their responses.
Respondents were given the complete freedom to withdraw their participation at
any point in time.
127
The literature review is discussed as a qualitative data collection technique in the
following paragraphs.
4.8.2 Literature Review
A literature review is a critical assessment and summary of past and present
literature in a given area of knowledge (Fox & Bayat, 2007:35). The Royal
Melbourne Institute of Technology (RMIT) (2014:1) concurs, and defines a
literature review as a “search and evaluation of the available literature in a given
subject area”. The process of compiling a literature review includes searches and
gathering of information, critical analysis of the gathered information to identify
gaps, contradictions and controversies, and formulation of questions for further
research. It conveys existing knowledge and ideas, as well as its strengths and
weaknesses. Literature that is presented in a logical and structured manner can be
synthesized and evaluated according to the guiding concept. As a literature review
is not a descriptive list or summary of the information gathered, it must be guided
by a research question and or research objectives.
According to Boote and Beile (2005:3), “a substantive, thorough, sophisticated
literature review is a precondition for doing substantive, thorough, sophisticated
research that advances people’s collective understanding”. Moreover, for collective
holistic understanding a researcher needs to grasp what has been done before,
and comprehend the meaning, strengths and weaknesses of existing studies. More
importantly, a researcher needs to appreciate already existing research in his/her
chosen field to be thorough, and for the research to be cumulative, meaningful and
useful. Creswell (Boote & Beile, 2005:5) suggests that the literature review should
meet three criteria “to present results of similar studies, to relate the present study
to the ongoing dialogue in the literature, and to provide a framework for comparing
the results of a study with other studies”.
128
4.8.2.1 Literature review presented in the current research
Chapters 2 and 3 this thesis provide a detailed literature review on management
support, favourable work environment, and performance management with
particular focus on performance management in the FSPS. The literature review
therefore assisted the researcher in several ways, as proposed by Fox and Bayat
(2007:36) and Bourner (RMIT, 2014:1). The literature review broadened the
perspectives of the researcher by providing a sound theoretical overview of the
existing research knowledge, theories and models, and prevented the researcher
from repeating already existing research as well as the errors and mistakes of
others. It also facilitated in contextualizing the existing work, and helped to
establish the need for research. A thorough literature review was the only method
by which the researcher could be familiarized with past and recent developments
related to the topic under study. It presented an understanding into the ways in
which to conduct the research, the best methods and techniques available,
problems that could be encountered, successes and strengths, as well as mistakes
and weaknesses. It also provided a better idea of what should and could be done,
and aided in deciding upon a specific focus. As suggested by Fox and Bayat
(2007:36, 37), information for the literature review was gathered from secondary
sources such as books, journals, newspapers, dictionaries, encyclopaedias,
government publications, documents on the internet and other printed and written
materials.
4.8.3 Focus Group Interviews
A second qualitative method that was used to collect data was focus group
interviews. According to Morgan (Doody, Slevin & Taggart, 2013:1) in focus group
interviews, data is gathered on a chosen topic through group interaction. Focus
groups help to reveal deeper levels of understanding that do not surface using
other data collection techniques. It is a creative process which can unravel a high
level of understanding and can produce rich data. However, unfortunately this
method is complex and time consuming and may collect a large volume of data,

129
some of which could be irrelevant. It also poses the potential for researcher bias
and the danger of misinterpreting consensus as well as modified responses
(Doody, Slevin & Taggart, 2013: 6).
A focus group interview, according to Lederman (Rabiee, 2004:655), refers to ‘a
technique involving the use of in-depth group interviews in which participants are
selected because they are a purposive, although not necessarily representative,
sample of a specific population but focused on a given topic. Participants in this
focus interview were therefore selected based on their knowledge of the study
area, but within the target group of occupational levels 13, 12 and 11. The data
generated from the focus group interviews was deeper and richer, as the groups
consisted of experts on the topic, and the discussions therefore generated more
ideas through interactions.
There were four focus groups consisting of two groups for senior managers at
occupational level 13 (groups of 7 and 9), and two groups for subordinates at
occupational levels 11 and 12 (8 and 10). Groups were represented by most of the
departments, and belonged to human resources, organizational development and
MPAT assessment committees. Some of the focus group members shall have
completed the questionnaire as well, but cannot be ascertained, as the
respondents were not required to indicate their names on the questionnaire to
maintain their anonymity.
The purpose of the discussions with the focus group was mainly to get deeper in to
the topic under study to get new insights and new information. Each focus group
interview lasted approximately two and half hours based on the participation, level
of discussions and the number of participants.
The questionnaires and the focus group interviews were implemented separately.
An interview guide was used to steer the focus group discussions. Sample
questionnaire and focus group interview guide is attached to the thesis.
130
4.9 IMPORTANCE OF MIXED METHODS IN THE STUDY
As a data collection method, the mixed methods approach focuses on collecting,
analysing, and mixing both quantitative and qualitative data in a single study or
series of studies. The basis of mixing the methods is that the combination provides
a better understanding of research problems than either approach alone could
(Creswell, 2006:5). Spratt, Walker and Robinson (2004:7) propose that the
meaning of the term mixed methods is influenced by the way the methods are
combined. For instance, both qualitative and quantitative methods can be used
simultaneously where the data is brought together for analysis, or successively if
the researcher wants one method to inform another (interviewing before surveying
to establish that survey questions shall elicit appropriate information).
Consequently, the mixing of both qualitative and quantitative data is part of the
mixed methods approach.
Mixed methods research does not simply refer to collecting qualitative and
quantitative data from various data collection methods, but involves the intentional
collection of both quantitative and qualitative data, combining the strengths of each
and minimizing their weaknesses. Three approaches of mixing data have been
discussed in the literature namely connecting data, embedding data and merging
data (Creswell et al. 2011: 5). The integration in the form of connecting data
involves analysing one dataset (e.g., a quantitative survey) to inform the
subsequent data collection (e.g., interview questions, identification of participants
to interview). The integration in this instance occurs by connecting the analysis of
results of the initial phase with the data collection of the second phase of research
(Creswell et al. 2011:5).
In the embedding data form of integration, a dataset of secondary priority is
embedded within a larger, primary design. An example is the collection of
supplemental qualitative data about how participants are experiencing an
intervention during an experimental trial. This type of integration can also take the
form of a qualitative data collection, which precedes an experimental trial to inform

131
development of procedures or follow an experimental trial to help explain the
results of the trial (Creswell et al. 2011:6). According to Sandelowski, Voils & Knafl
(Creswell et al. 2011:5), the merging data form of integration combines the
qualitative data with the quantitative data. The qualitative data can be in the form
of texts or images and the quantitative data in the form of numeric information.
These data can be integrated for example by reporting first the quantitative
statistical results followed by qualitative explanations or notes that support or
negate the quantitative results. Furthermore, merging type of integration can be
achieved by creating one dataset, for example by counting the occurrence of
themes from qualitative data, and comparing it with a quantitative dataset on same
theme.
The researcher used the merging data type of integration by combining the
qualitative data collected in the form of descriptive texts through focus group
interviews with quantitative data collected with the help of questionnaires. While
the quantitative data gave an overall picture; the qualitative data gave in-depth
focus on important areas. This integration was achieved by reporting results
together in Chapter 5 of the thesis where the analysis and interpretation of data
collected was presented.
4.10 DATA ANALYSIS AND INTERPRETATION
Scientific research cannot be complete without the analysis and interpretation of
the data collected through various data collection methods. The paragraphs below
will therefore give an account of data analysis in relation to this particular research.
4.10.1 Quantitative Data Analysis
According to Rubin and Babbie (de Vos et al. 2011:249), quantitative data analysis
is the technique by which researchers can convert data to an understandable and
interpretable numerical form so that it can be statistically analysed. This conversion
helps to study, test, explain, find meaning and draw conclusion about research
132
problems, and obtain answers to the research question. Through statistical
analysis the numerical data could be organized, classified, tabulated and
summarized to attach meaning to the data collected. In short, according to Royse
(de Vos et al. 2011:249), the quantitative analysis helps to draw meaningful
patterns of relationships from the raw data.
In this study, the data analysis was conducted with the help of computers, where
the data was fed into the computer and the statistical computations were done. As
suggested by Blaikie (de Vos et al. 2011:251), all four main categories of
quantitative methods of analysis were used in the analysis of this research, namely
descriptive, association, causation and inference. Descriptive statistics methods
were used to organize, summarize and interpret data, and to report on the
distributions of the sample of the population across a wide range of variables such
as department, age, years of experience, occupational level and gender. An
association of variables was established, and the hypothesis was tested to
establish whether the results are due to random factors or due to a real
relationship as described by Kreuger and Neuman (de Vos et al. 2011:252).
Statistical methods such as Cronbach’s alpha, the t-test, correlation coefficient and
regression are used to analyse the data collected through questionnaires, so as to
arrive at reliable and valid conclusions. Cronbach's alpha tested internal
consistency and scale reliability of questions used. The t-test, which is a
parametric test of statistical significance, was used to compare the differences
between two groups. The strength of the direct association between two variables
is quantified by the correlation coefficient method, while regression
analysis estimated the relationships among variables, and the R-square method
measured the variation of the dependent variable that is explained by the variation
in the independent variable(s). These statistical methods are explained briefly in
the following paragraphs.
133
4.10.1.1 Cronbach’s Alpha
Cronbach’s alpha measures the internal consistency and scale reliability of
questions to determine whether or not all the questions for each of the variables
actually measured that variable. Internal consistency describes the extent to which
all the items in a test measure the same concept or construct (Tavakol & Dennick,
2011:53). The alpha coefficient is used to describe the reliability of factors derived
from dichotomous questions with two possible answers (e.g.: yes/no) and/or
multipoint scales (e.g. Likert rating scale: 1 = strongly agree -5 = strongly
disagree). Alpha coefficients range in value from 0 to 1, the higher the score, the
more reliable the scale is. Nunnaly (Santos, 1999:n.p.) has indicated 0.7 to be an
acceptable reliability coefficient.
4.10.1.2 t-test
The t-test is a parametric test of statistical significance that can be used to
compare the differences between two groups. The most common use of the t-test
is to compare the mean outcome scores of groups to ascertain whether the
difference between two means is statistically significant (Rubin, 2012:161). The t-
test is used in this study to determine whether the mean scores of managers and
subordinates’ perceptions are significantly different, as the two groups are
composed of different individuals and are independent to one another (Lench,
2010:1). By looking at the p-value and comparing it to a value of 0.1 (10%), it is
possible to establish whether the groups hold the same opinion or not, and
whether they are significant. For instance, if the averages between the managers
and subordinates responses are different, the p-value will be less than 0.1, and if
the opinions of the 2 groups are the same, the p-value will be greater than 0.1.
Thus the basic intention of the t-test was to establish whether managers and
subordinates have different perceptions on management support, favourable work
environment, employee performance as well as objective implementation of the
current performance management system. These variables form the independent
134
variable(s) and dependent variable(s) of the hypotheses, and an analysis of these
variables enabled the researcher to analyse the hypotheses as well as each and
every objective of the study.
According to Rumsey (2011:1), a p-value helps the researcher to perform a
hypothesis test to determine the significance of the results. Forbes (2012:1) agrees
that statistical probability or the p-value helps to establish whether the findings in a
research study are statistically significant, and that the findings have not occurred
by chance.
4.10.1.3 Correlation coefficient
In addition to the t-test, a correlation coefficient also was calculated between
variables to ascertain the relationship between two variables. Correlation analysis
is a forecasting tool which helps to establish a relationship between two variables.
Two variables are said to correlate if a change in one is accompanied by a
predictable change in the other, and the degree to which they correlate can be
calculated if they are in numerical form. The result is expressed as a correlation
coefficient known as r (Scarlett, 2013:49). The value of r is always between +1 and
–1. A correlation coefficient (r) of +1 indicates that two variables are strongly
related in a positive linear sense, while a correlation coefficient of -1 indicates that
two variables are strongly related in a negative linear sense, and a correlation
coefficient of 0 indicates that there is no linear relationship between the two
variables (Rumsey, 2011:1). A high (positive or negative) r score assures a
meaningful correlation between variables, and rules out (to a great extent) the
possibility of coincidence. However, though correlation suggests a relationship or
causal link between two variables, it does not describe the amount of change in
one variable that corresponds to a given change in the other. This can be
determined by regression analysis (Scarlett, 2013:49, 50).

135
4.10.1.4 Regression analysis
Regression analysis is a statistical tool that helps to describe, estimate or predict
causal relationships between a dependent variable (outcome) and one or several
independent variables (predictor). It helps to predict how the dependent variable
changes if one or several independent variables change. It also determines cause-
effect analysis to establish how strong the influence of independent variables on
the dependent variable (outcome) is. Regression also tests a hypothesis to
establish a cause effect relationship (Boutellier, Gassmann, Raeder & Zeschky,
2013:2). For example, the hypothesis of this study can be tested to establish the
effect of independent variables such as management support and objective
implementation of PMS on work environment (dependent variable), or the effect of
favourable work environment (independent variable) on employee performance
(dependent variable). Regression also helps to assess the statistical significance of
the estimated relationships, that is, the degree of confidence that the true
relationship is close to the estimated relationship. Regression analysis therefore
helps to establish whether there is a significant correlation between two variables,
helps to determine that the correlation is not false and that there is no confusing
third variable (Scarlett, 2013:1).
4.10.2 Qualitative Data Analysis
Robson (Rabiee, 2004:657) states focus group interviews generate large amounts
of data which need to be organized. As suggested by Yin (Rabiee, 2004:657),
focus group interview data analysis involved examining, categorizing and
tabulating to eliminate unnecessary and irrelevant information, and to address the
goals of the study. As with quantitative analysis, the process of qualitative analysis
also aims to bring meaning to a situation by means of subjectivity exits. Therefore,
in order to minimize the potential bias in analysing and interpreting focus group
data, the analysis should be systematic, sequential, verifiable, and continuous
suggest Krueger and Casey (Rabiee, 2004:657).
136
There are a number of approaches to the focus group research data analysis,
though Krueger’s (Doody et al. 2013:4) framework analysis provides a number of
clear steps, which can help researchers to manage large amounts of qualitative
data more easily. As data collection and analysis occurs concurrently in focus
group research, Krueger (Doody et al. 2013:4) suggests a continuum of analysis,
ranging from the accumulation of raw data, to making descriptive statements about
that data, interpreting the data, and making conclusions and recommendations.
The researcher facilitated the discussion and made observational notes during the
focus interview process. Summary notes were prepared immediately after the
conclusion of the interviews. Thereafter descriptive statements were made and
rearranged under various thematic contexts, which were then interpreted to form
conclusions.
4.11 RESEARCH REPORT
Thus the thesis is written to present the researcher’s findings logically, objectively,
convincingly, clearly and concisely. Furthermore, the report provides an account of
the execution of the research project and of the results obtained. The results help
to evaluate the merits of the conclusions against data collected and analysed, and
can provide sufficient information for a possible replication of the study or repeat
analysis of the data, as suggested by Huysamen (Brynard & Hanekom, 2005:69).
As the report is the only basis on which the success of the research is judged the
researcher submitted the report to a language editor to edit the manuscript for
grammatical and technical correctness. The report constituted of 6 chapters as
detailed in the index of the thesis.
137
4.12 CONCLUSION
This chapter on research methodology provided an explanation on what scientific
research is and made an attempt to differentiate between research methods,
methodology and design. A traditional research design was briefly introduced and
the various steps were briefly explained, linking it to the study in question.
Qualitative and quantitative methods of data collection were elaborated upon, and
the reasons for using the mixed method approach were explained. A brief
explanation on the population and sample size was given, and the importance of
validity and reliability in scientific research was discussed in the chapter. The
statistical techniques involved in the quantitative data analysis were briefly
introduced as well as how the qualitative data analysis was conducted. The
chapter ended by making mention of the research report which is the logical
presentation of the complete thesis.
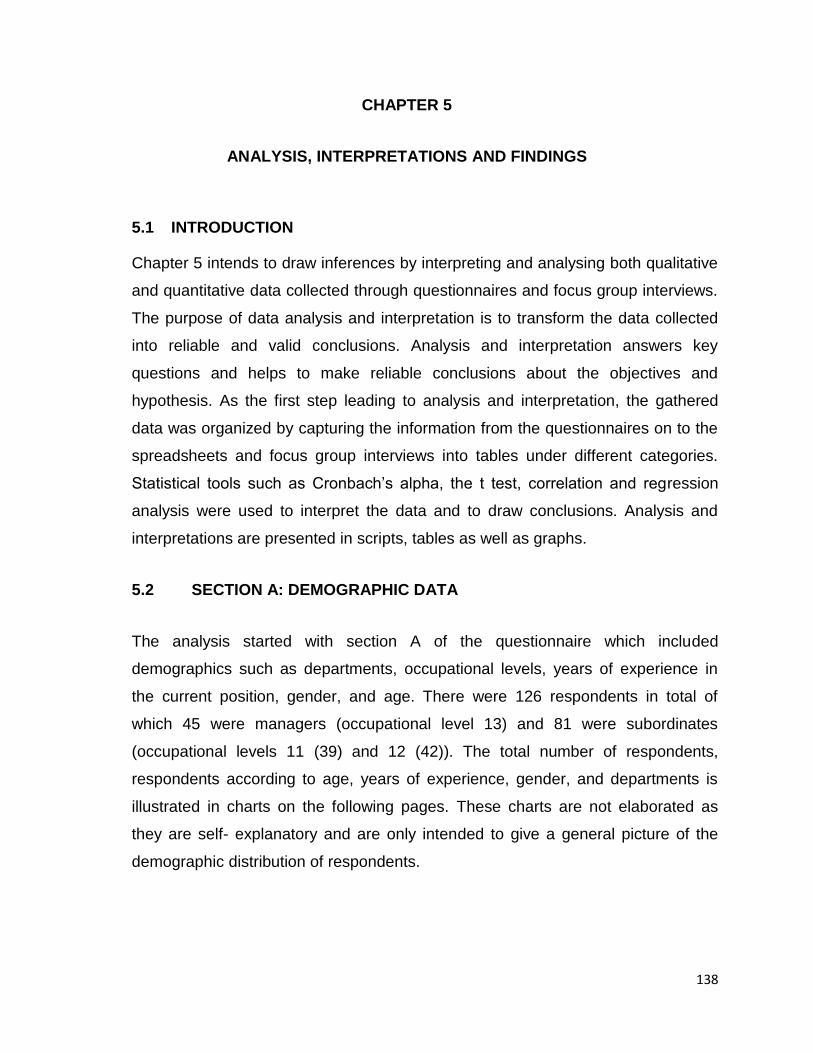
138
CHAPTER 5
ANALYSIS, INTERPRETATIONS AND FINDINGS
5.1 INTRODUCTION
Chapter 5 intends to draw inferences by interpreting and analysing both qualitative
and quantitative data collected through questionnaires and focus group interviews.
The purpose of data analysis and interpretation is to transform the data collected
into reliable and valid conclusions. Analysis and interpretation answers key
questions and helps to make reliable conclusions about the objectives and
hypothesis. As the first step leading to analysis and interpretation, the gathered
data was organized by capturing the information from the questionnaires on to the
spreadsheets and focus group interviews into tables under different categories.
Statistical tools such as Cronbach’s alpha, the t test, correlation and regression
analysis were used to interpret the data and to draw conclusions. Analysis and
interpretations are presented in scripts, tables as well as graphs.
5.2 SECTION A: DEMOGRAPHIC DATA
The analysis started with section A of the questionnaire which included
demographics such as departments, occupational levels, years of experience in
the current position, gender, and age. There were 126 respondents in total of
which 45 were managers (occupational level 13) and 81 were subordinates
(occupational levels 11 (39) and 12 (42)). The total number of respondents,
respondents according to age, years of experience, gender, and departments is
illustrated in charts on the following pages. These charts are not elaborated as
they are self- explanatory and are only intended to give a general picture of the
demographic distribution of respondents.
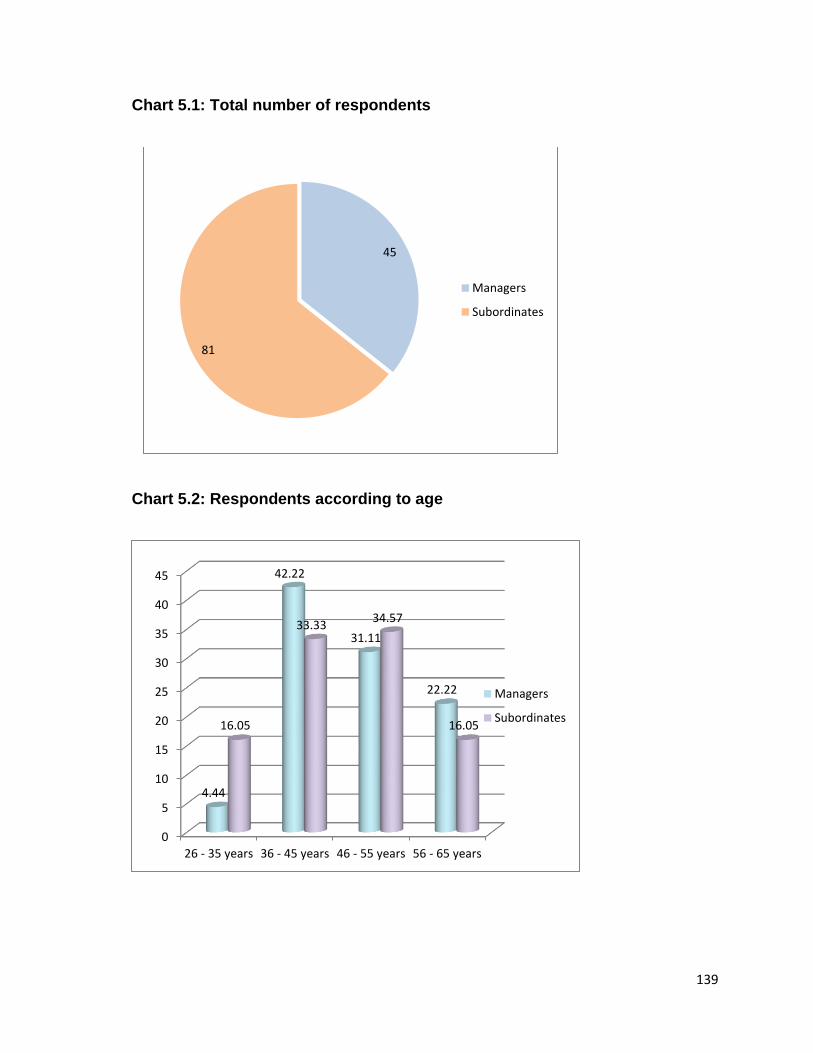
139
Chart 5.1: Total number of respondents
Chart 5.2: Respondents according to age
45
81
Managers
Subordinates
0
5
10
15
20
25
30
35
40
45
26 - 35 years 36 - 45 years 46 - 55 years 56 - 65 years
4.44
42.22
31.11
22.22
16.05
33.33 34.57
16.05
Managers
Subordinates

140
Chart 5.3: Respondents according to years of experience
Chart 5.4 : Respondents according to gender
0
5
10
15
20
25
30
35
40
45
50
Less than5 years
5 - 10years
11 - 15years
16 - 20years
21 - 25years
More than25 years
28.89
42.22
17.78
4.44 2.22
4.44
23.46
45.68
9.88 7.41
3.7
9.88
Managers
Subordinates
37.78
62.22
Female
Male
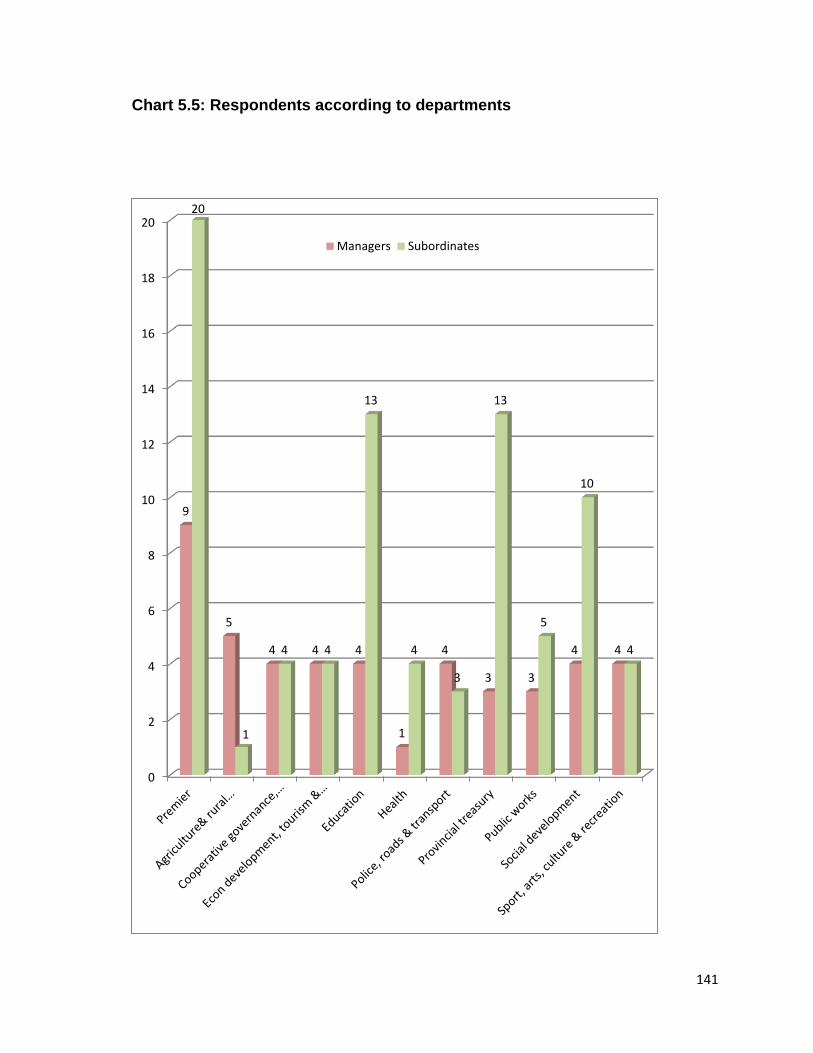
141
Chart 5.5: Respondents according to departments
0
2
4
6
8
10
12
14
16
18
20
9
5
4 4 4
1
4
3 3
4 4
20
1
4 4
13
4
3
13
5
10
4
Managers Subordinates
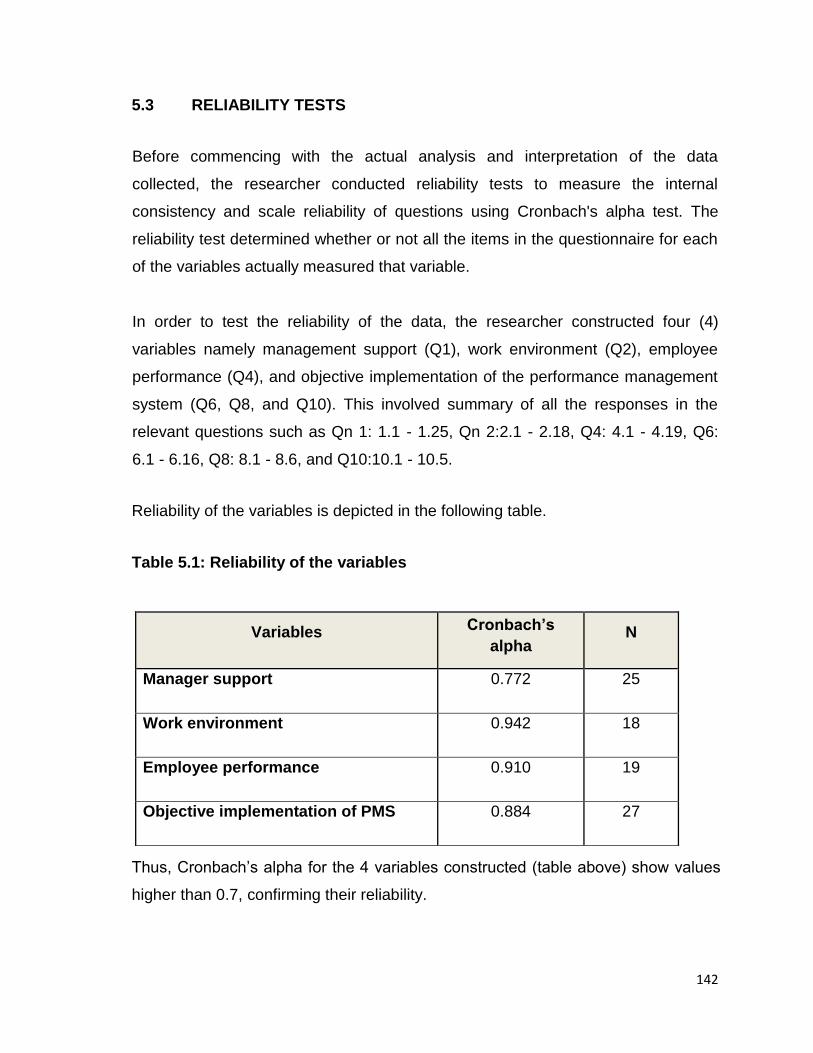
142
5.3 RELIABILITY TESTS
Before commencing with the actual analysis and interpretation of the data
collected, the researcher conducted reliability tests to measure the internal
consistency and scale reliability of questions using Cronbach's alpha test. The
reliability test determined whether or not all the items in the questionnaire for each
of the variables actually measured that variable.
In order to test the reliability of the data, the researcher constructed four (4)
variables namely management support (Q1), work environment (Q2), employee
performance (Q4), and objective implementation of the performance management
system (Q6, Q8, and Q10). This involved summary of all the responses in the
relevant questions such as Qn 1: 1.1 - 1.25, Qn 2:2.1 - 2.18, Q4: 4.1 - 4.19, Q6:
6.1 - 6.16, Q8: 8.1 - 8.6, and Q10:10.1 - 10.5.
Reliability of the variables is depicted in the following table.
Table 5.1: Reliability of the variables
Thus, Cronbach’s alpha for the 4 variables constructed (table above) show values
higher than 0.7, confirming their reliability.
Variables Cronbach’s
alpha N
Manager support 0.772 25
Work environment 0.942 18
Employee performance 0.910 19
Objective implementation of PMS 0.884 27
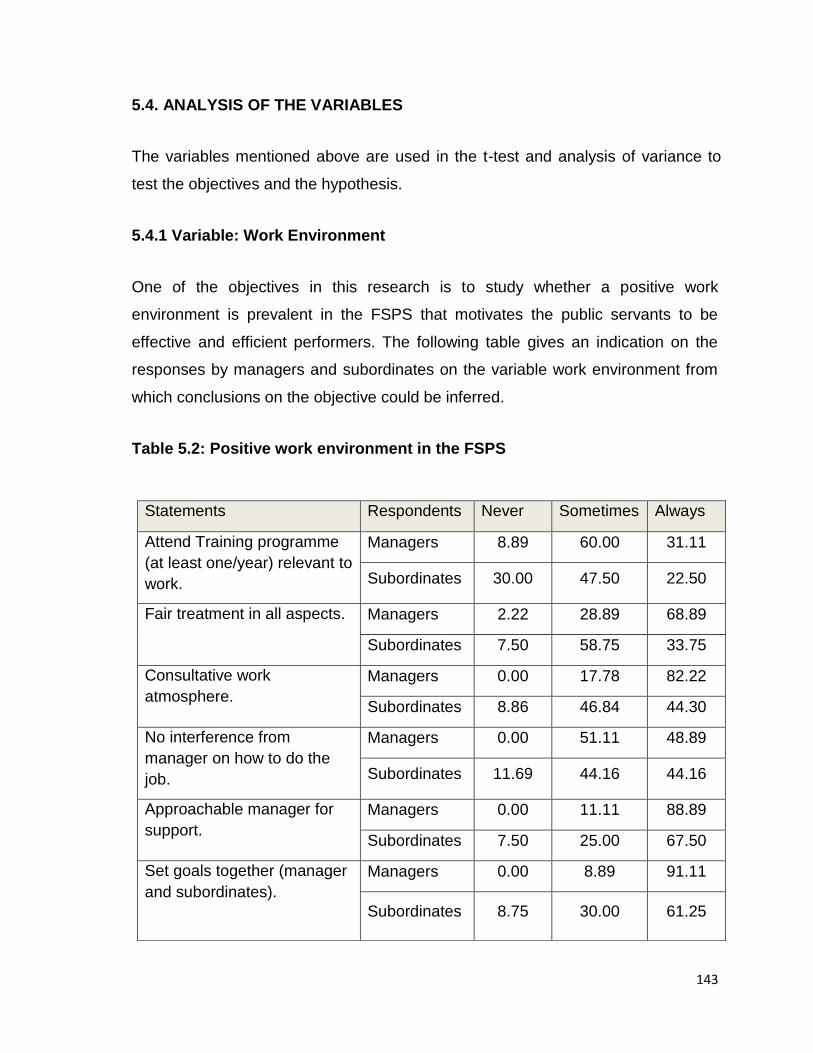
143
5.4. ANALYSIS OF THE VARIABLES
The variables mentioned above are used in the t-test and analysis of variance to
test the objectives and the hypothesis.
5.4.1 Variable: Work Environment
One of the objectives in this research is to study whether a positive work
environment is prevalent in the FSPS that motivates the public servants to be
effective and efficient performers. The following table gives an indication on the
responses by managers and subordinates on the variable work environment from
which conclusions on the objective could be inferred.
Table 5.2: Positive work environment in the FSPS
Statements Respondents Never Sometimes Always
Attend Training programme
(at least one/year) relevant to
work.
Managers 8.89 60.00 31.11
Subordinates 30.00 47.50 22.50
Fair treatment in all aspects. Managers 2.22 28.89 68.89
Subordinates 7.50 58.75 33.75
Consultative work
atmosphere.
Managers 0.00 17.78 82.22
Subordinates 8.86 46.84 44.30
No interference from
manager on how to do the
job.
Managers 0.00 51.11 48.89
Subordinates 11.69 44.16 44.16
Approachable manager for
support.
Managers 0.00 11.11 88.89
Subordinates 7.50 25.00 67.50
Set goals together (manager
and subordinates).
Managers 0.00 8.89 91.11
Subordinates 8.75 30.00 61.25
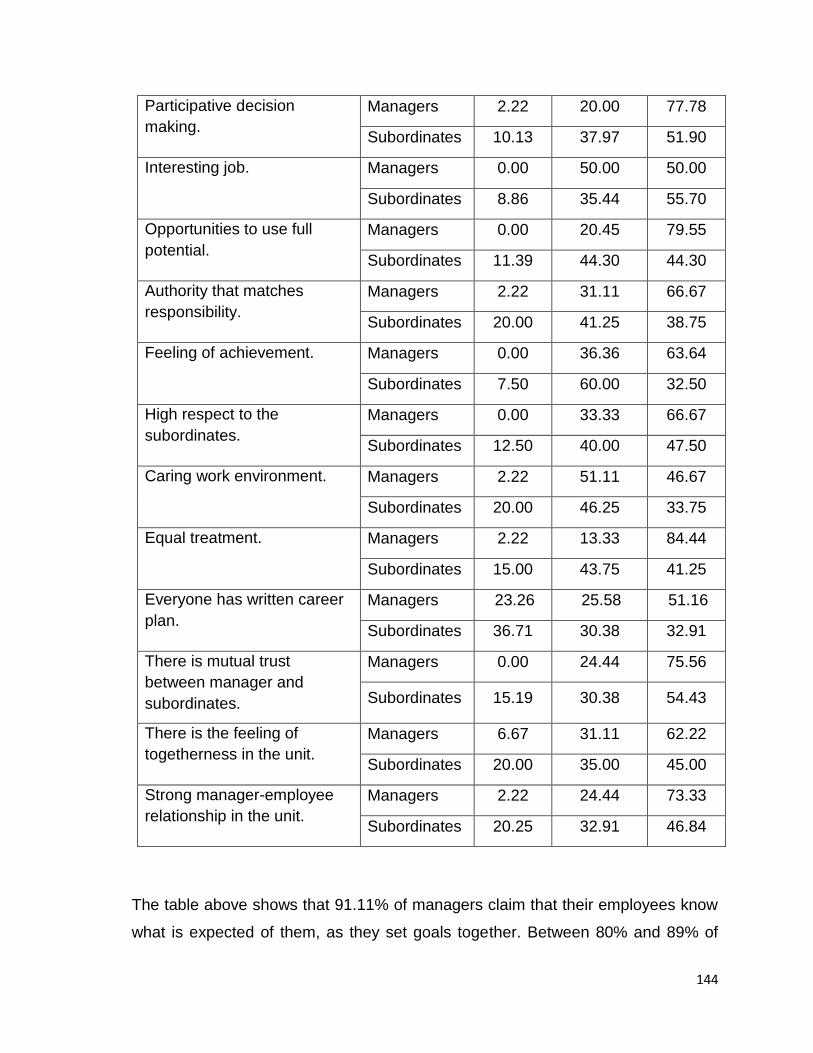
144
The table above shows that 91.11% of managers claim that their employees know
what is expected of them, as they set goals together. Between 80% and 89% of
Participative decision
making.
Managers 2.22 20.00 77.78
Subordinates 10.13 37.97 51.90
Interesting job. Managers 0.00 50.00 50.00
Subordinates 8.86 35.44 55.70
Opportunities to use full
potential.
Managers 0.00 20.45 79.55
Subordinates 11.39 44.30 44.30
Authority that matches
responsibility.
Managers 2.22 31.11 66.67
Subordinates 20.00 41.25 38.75
Feeling of achievement. Managers 0.00 36.36 63.64
Subordinates 7.50 60.00 32.50
High respect to the
subordinates.
Managers 0.00 33.33 66.67
Subordinates 12.50 40.00 47.50
Caring work environment. Managers 2.22 51.11 46.67
Subordinates 20.00 46.25 33.75
Equal treatment. Managers 2.22 13.33 84.44
Subordinates 15.00 43.75 41.25
Everyone has written career
plan.
Managers 23.26 25.58 51.16
Subordinates 36.71 30.38 32.91
There is mutual trust
between manager and
subordinates.
Managers 0.00 24.44 75.56
Subordinates 15.19 30.38 54.43
There is the feeling of
togetherness in the unit.
Managers 6.67 31.11 62.22
Subordinates 20.00 35.00 45.00
Strong manager-employee
relationship in the unit.
Managers 2.22 24.44 73.33
Subordinates 20.25 32.91 46.84
145
managers are certain that they consult their subordinates in matters that affect
them, are always approachable and available to support their subordinates, and
treat their employees equally. Between 70% - 79% of managers agreed that there
is a strong manager-subordinate relationship as well as mutual trust in their unit.
They added that they encourage participative decision making and provide
opportunities to subordinates to use their full potential. Furthermore, 60% - 69% of
managers commented that there is a feeling of togetherness in the unit, high
respect is afforded to subordinates, everyone has the feeling of achievement, and
everyone has sufficient authority that matches responsibility.
With regard to the subordinates, only 67.50% of subordinates (in contrast with
88.89% of managers) acknowledged that their managers are approachable and
available at all times for any support, and 61.25% (in opposition to 91.11% of
managers) stated that they set goals together and therefore know what is expected
of them. While 51.90% of subordinates (at variance with 77.78% of managers)
agreed that their managers provide them with opportunities to participate in
decision making, only 54.43% of subordinates (contrary to 75.56% of managers)
agreed that there is mutual trust between managers and subordinates. Only a
disappointing 46.84% of subordinates (against 73.33% of managers) were positive
about the strong manager-subordinate relationship, while a mere 45% (compared
to 62.22% of managers) were positive about the feeling of togetherness. 47.50% of
subordinates (counter to 66.67% of managers) were confident about high respect
afforded to subordinates, 44.30% (at odds with 79.55% of managers) were
affirmative about opportunities provided to use full potential, and 44.30% (in
contrast with 82.22% of managers) were optimistic about a consultative work
environment. Only 33.75% of subordinates (against 68.89% of managers) felt that
they receive fair treatment in all aspects and 58.75% of subordinates claimed that
they only sometimes receive fair treatment. Similarly, only 31.11% of managers
and 22.50% of subordinates felt that opportunities are given to attend at least one
training program per year that is relevant to the work situation. However, the
concern is that 30% of subordinates were apprehensive that they were never given
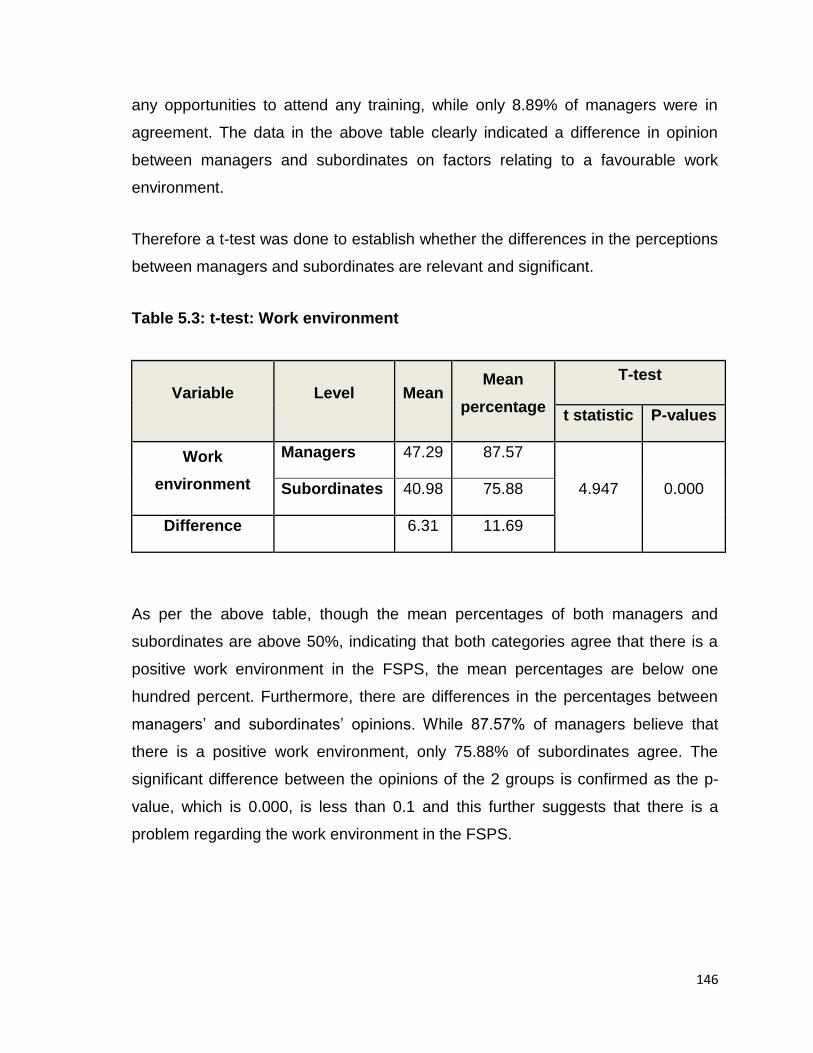
146
any opportunities to attend any training, while only 8.89% of managers were in
agreement. The data in the above table clearly indicated a difference in opinion
between managers and subordinates on factors relating to a favourable work
environment.
Therefore a t-test was done to establish whether the differences in the perceptions
between managers and subordinates are relevant and significant.
Table 5.3: t-test: Work environment
Variable Level Mean Mean
percentage
T-test
t statistic P-values
Work
environment
Managers 47.29 87.57
4.947 0.000 Subordinates 40.98 75.88
Difference 6.31 11.69
As per the above table, though the mean percentages of both managers and
subordinates are above 50%, indicating that both categories agree that there is a
positive work environment in the FSPS, the mean percentages are below one
hundred percent. Furthermore, there are differences in the percentages between
managers’ and subordinates’ opinions. While 87.57% of managers believe that
there is a positive work environment, only 75.88% of subordinates agree. The
significant difference between the opinions of the 2 groups is confirmed as the p-
value, which is 0.000, is less than 0.1 and this further suggests that there is a
problem regarding the work environment in the FSPS.
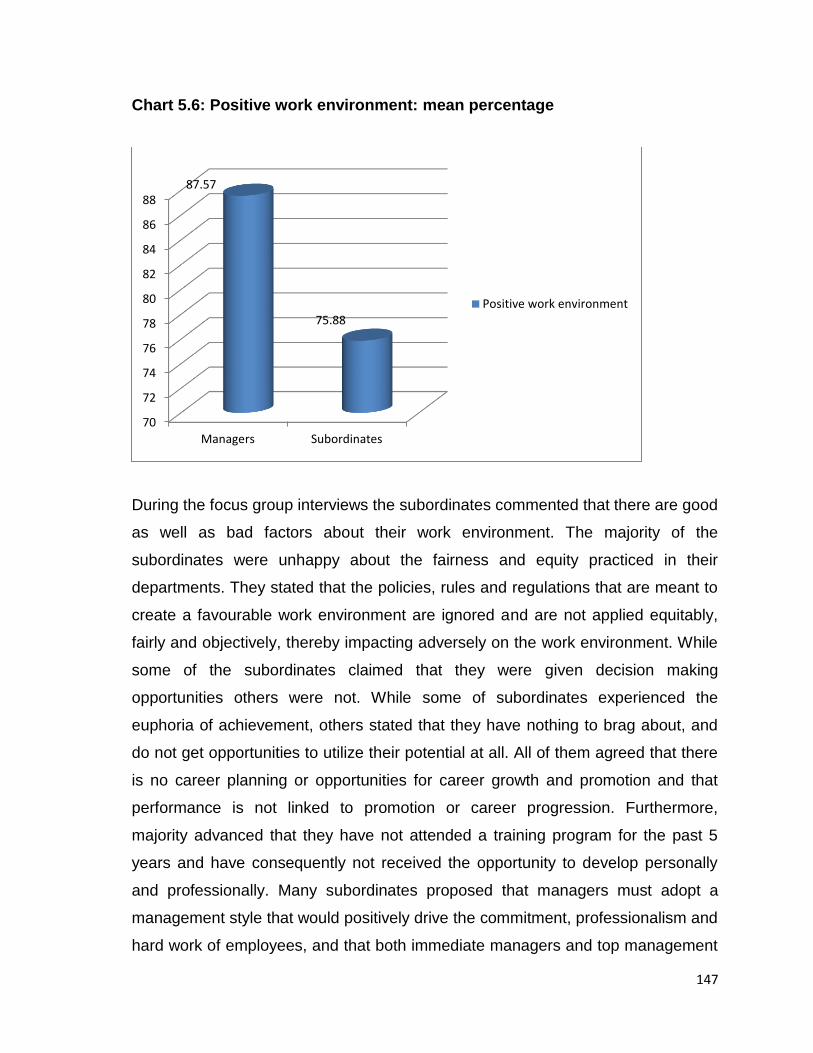
147
Chart 5.6: Positive work environment: mean percentage
During the focus group interviews the subordinates commented that there are good
as well as bad factors about their work environment. The majority of the
subordinates were unhappy about the fairness and equity practiced in their
departments. They stated that the policies, rules and regulations that are meant to
create a favourable work environment are ignored and are not applied equitably,
fairly and objectively, thereby impacting adversely on the work environment. While
some of the subordinates claimed that they were given decision making
opportunities others were not. While some of subordinates experienced the
euphoria of achievement, others stated that they have nothing to brag about, and
do not get opportunities to utilize their potential at all. All of them agreed that there
is no career planning or opportunities for career growth and promotion and that
performance is not linked to promotion or career progression. Furthermore,
majority advanced that they have not attended a training program for the past 5
years and have consequently not received the opportunity to develop personally
and professionally. Many subordinates proposed that managers must adopt a
management style that would positively drive the commitment, professionalism and
hard work of employees, and that both immediate managers and top management
70
72
74
76
78
80
82
84
86
88
Managers Subordinates
87.57
75.88 Positive work environment
148
must be role models to the employees. Both the subordinates and the managers
claimed that selection and recruitment is not objectively and transparently done, as
individuals are appointed in positions not based on their skills and capabilities. In
most cases subordinates have to teach their newly appointed
managers/supervisors. This frustrates employees who have been performing those
duties for many years, and they feel that their hard work, commitment and
experience are not valued, respected, recognized and appreciated. This has
created a negative attitude and work culture amongst employees, as it has created
the perception that hard work and commitment do not pay off.
Managers were also unanimous that some policies are not applied fairly, equitably
and objectively. Managers added that a lack of organizational support to implement
policies and procedures inhibits them from creating favourable work environment
for their subordinates to perform. Another concern of some managers was the
organizational structures which are meant to contribute to a positive work
environment, but in fact contribute to the creation of a negative work environment.
Absence of a functional organizational structure contributes to confusion in the
work environment, as roles and responsibilities and channels of communication
are unclear.
5.4.2 Variable: Management Support
The Objective 1:8.2 of the proposal was meant to compare the perceptions of
managers about management support given to employees, and the expectations
or perceptions by employees about management support they receive from the
managers and establish whether management support contributes to the effective
and efficient performance of employees. The questionnaire included statements
that reflected management support. The responses of managers and subordinates
to those statements were captured in a tabular form, and analysis was done to
establish how the two groups view this particular variable of management support.
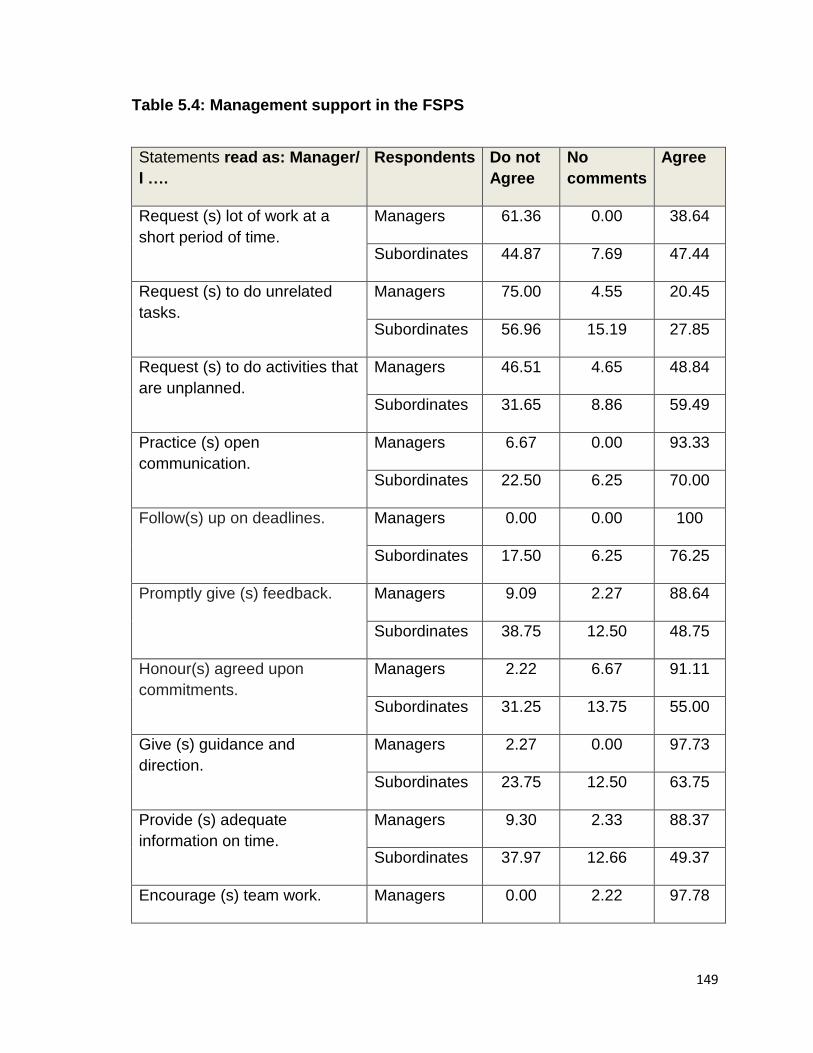
149
Table 5.4: Management support in the FSPS
Statements read as: Manager/
I ….
Respondents Do not
Agree
No
comments
Agree
Request (s) lot of work at a
short period of time.
Managers 61.36 0.00 38.64
Subordinates 44.87 7.69 47.44
Request (s) to do unrelated
tasks.
Managers 75.00 4.55 20.45
Subordinates 56.96 15.19 27.85
Request (s) to do activities that
are unplanned.
Managers 46.51 4.65 48.84
Subordinates 31.65 8.86 59.49
Practice (s) open
communication.
Managers 6.67 0.00 93.33
Subordinates 22.50 6.25 70.00
Follow(s) up on deadlines. Managers 0.00 0.00 100
Subordinates 17.50 6.25 76.25
Promptly give (s) feedback. Managers 9.09 2.27 88.64
Subordinates 38.75 12.50 48.75
Honour(s) agreed upon
commitments.
Managers 2.22 6.67 91.11
Subordinates 31.25 13.75 55.00
Give (s) guidance and
direction.
Managers 2.27 0.00 97.73
Subordinates 23.75 12.50 63.75
Provide (s) adequate
information on time.
Managers 9.30 2.33 88.37
Subordinates 37.97 12.66 49.37
Encourage (s) team work. Managers 0.00 2.22 97.78
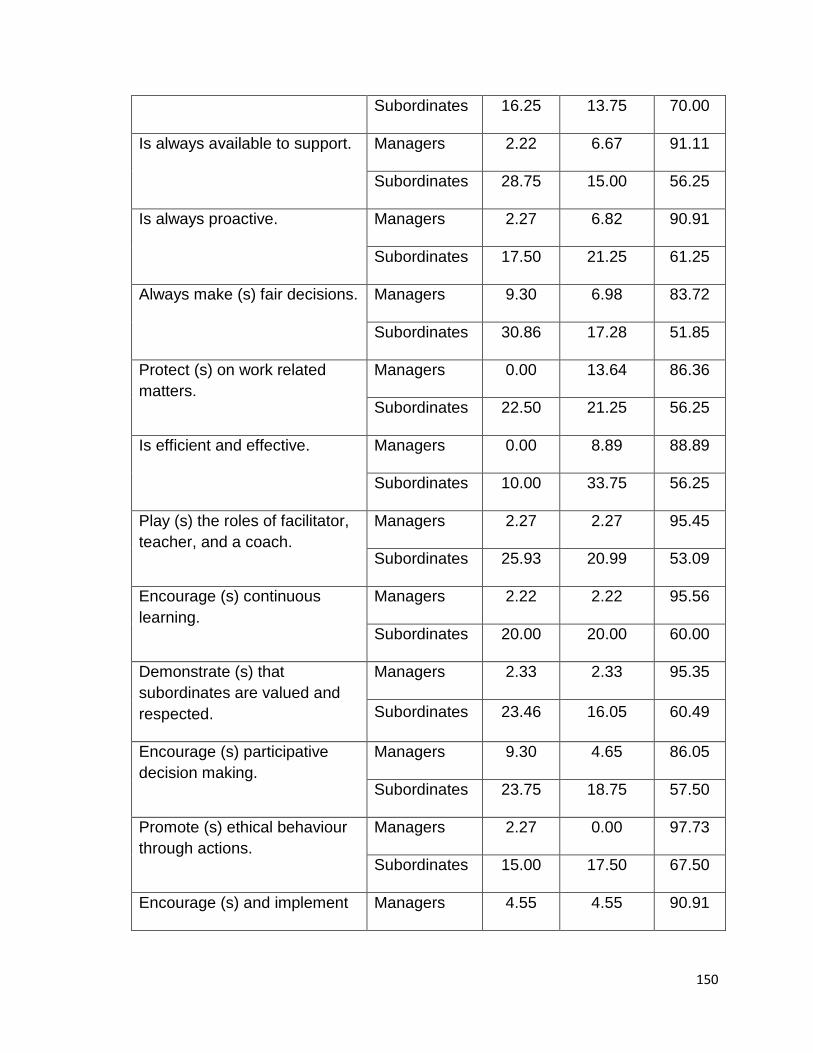
150
Subordinates 16.25 13.75 70.00
Is always available to support. Managers 2.22 6.67 91.11
Subordinates 28.75 15.00 56.25
Is always proactive. Managers 2.27 6.82 90.91
Subordinates 17.50 21.25 61.25
Always make (s) fair decisions. Managers 9.30 6.98 83.72
Subordinates 30.86 17.28 51.85
Protect (s) on work related
matters.
Managers 0.00 13.64 86.36
Subordinates 22.50 21.25 56.25
Is efficient and effective. Managers 0.00 8.89 88.89
Subordinates 10.00 33.75 56.25
Play (s) the roles of facilitator,
teacher, and a coach.
Managers 2.27 2.27 95.45
Subordinates 25.93 20.99 53.09
Encourage (s) continuous
learning.
Managers 2.22 2.22 95.56
Subordinates 20.00 20.00 60.00
Demonstrate (s) that
subordinates are valued and
respected.
Managers 2.33 2.33 95.35
Subordinates 23.46 16.05 60.49
Encourage (s) participative
decision making.
Managers 9.30 4.65 86.05
Subordinates 23.75 18.75 57.50
Promote (s) ethical behaviour
through actions.
Managers 2.27 0.00 97.73
Subordinates 15.00 17.50 67.50
Encourage (s) and implement Managers 4.55 4.55 90.91

151
(s ) best practices in the unit. Subordinates 20.25 12.66 67.09
Delegate(s) work according to
individual capabilities.
Managers 4.65 0.00 95.35
Subordinates 23.46 13.58 62.96
Give (s) recognition for good
work on time every time.
Managers 2.22 11.11 86.67
Subordinates 33.33 13.58 53.09
Encourage(s) creativity and
initiative.
Managers 0.00 0.00 100
Subordinates 22.22 17.28 60.49
The table above illustrates that, only 38.64% of managers thought that they
requested large amounts of work from the subordinates at short notice, while
47.44% of subordinates thought otherwise. Almost half (48.44%) of the managers
confessed that they request activities that are unplanned, and 59.49% of
subordinates agreed. While 93.33% of managers boasted that they practice open
communication, only 70% of subordinates agreed, which is 23.33% less than the
managers. Similarly, while 100% of the managers were positive that they follow up
on deadlines, only 76.25% (23.75% less) of subordinates agreed. The majority
(88.64%) of managers were confident that they give prompt feedback although
only 48.75% (39.89% less) of subordinates agreed. Furthermore, while 91.11% of
managers suggested that they follow through on agreed-upon commitments, only
55% (36.11% less) of subordinates were of the same opinion.
Almost all (97.73%) of the managers thought that they give guidance and direction
to their subordinates, while only 63.75% (33.98% less) of subordinates could
agree. The majority (88.37%) of managers were also confident that they provide
adequate information on time, while only 49.37% of subordinates thought so.
Similarly, although 97.78% of managers felt that they encourage team work, only
70% of subordinates were in agreement. Though 91.11% of managers held the
belief that they are always available to support their subordinates; only 56.25%

152
(34.86% less) of subordinates accepted that claim. Furthermore, 90.91% of
managers assumed that they are always proactive, although only 61.25% of
subordinates agreed. While 80 - 89% of managers believed that they are efficient
and effective, always make fair decisions, give recognition for good work on time
every time, protect subordinates on work related matters, and encourage
participative decision making, only between 50 - 58% of subordinates agreed.
Similarly, while 95.45% of managers held that they play the roles of facilitator,
teacher and coach, only 53.09% (42.36% less) of subordinates agreed.
The majority (95.56%) of managers stated that they encourage continuous
learning, whereas only 60% (35.56% less) of subordinates accepted this. While
according to 95.35% of managers they demonstrate that their subordinates are
valued and respected, only 60.49% (34.86% less) of subordinates supported this.
Similarly, 97.73% of managers suggested that they promote ethical behaviour
through their actions, though only 67.50% of subordinates accepted the claim.
Furthermore, 90.91% of managers said that they encourage and implement best
practices in their unit, while only 67.09% of subordinates agreed. While 95.35% of
managers believed that they delegate work to their subordinates according to
individual capabilities, only 62.96% of subordinates believed so. All (100%)
managers claimed that they encourage creativity and initiative, although only
60.49% of subordinates supported the claim. Three quarters (75%) of managers
said that they do not request their subordinates to complete unrelated tasks, while
only 56.96% of subordinates agreed. It must also be noted that only less than 10%
of managers expressed their short coming on majority of the aspects of
management support given in the above table. In this instance also the analysis
showed a difference of opinion on all the statements by managers and
subordinates. This was confirmed through the t-test explained hereafter.
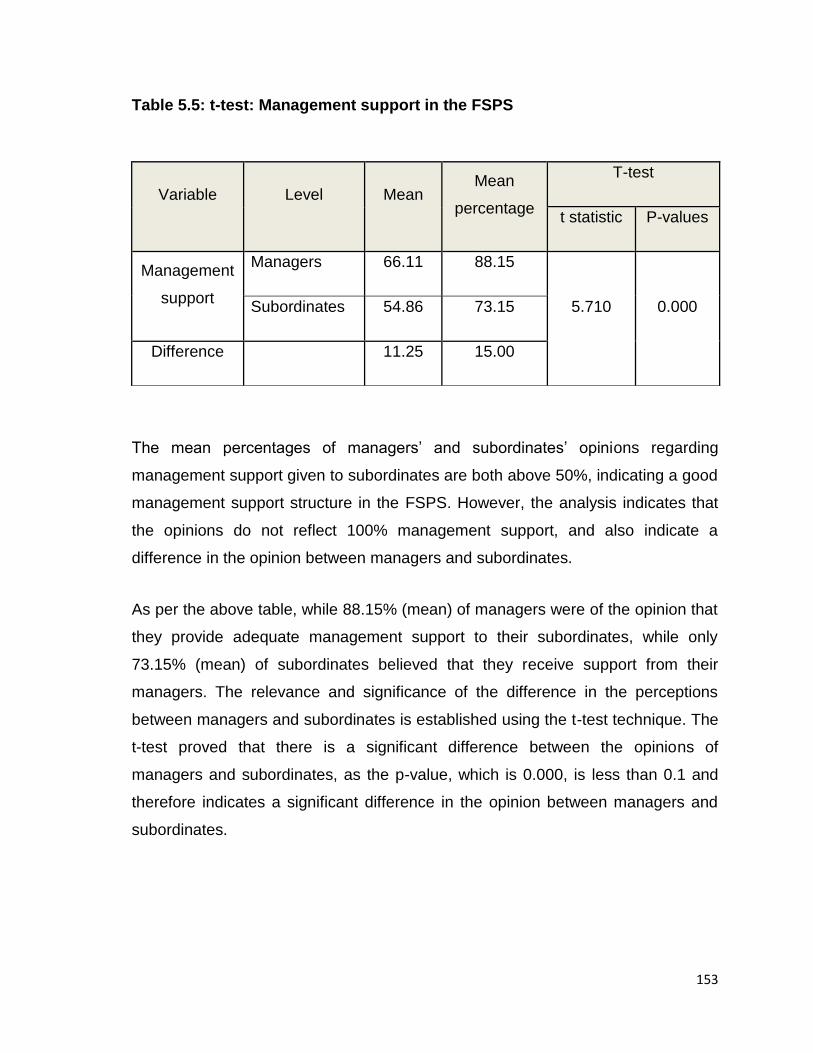
153
Table 5.5: t-test: Management support in the FSPS
The mean percentages of managers’ and subordinates’ opinions regarding
management support given to subordinates are both above 50%, indicating a good
management support structure in the FSPS. However, the analysis indicates that
the opinions do not reflect 100% management support, and also indicate a
difference in the opinion between managers and subordinates.
As per the above table, while 88.15% (mean) of managers were of the opinion that
they provide adequate management support to their subordinates, while only
73.15% (mean) of subordinates believed that they receive support from their
managers. The relevance and significance of the difference in the perceptions
between managers and subordinates is established using the t-test technique. The
t-test proved that there is a significant difference between the opinions of
managers and subordinates, as the p-value, which is 0.000, is less than 0.1 and
therefore indicates a significant difference in the opinion between managers and
subordinates.
Variable Level Mean Mean
percentage
T-test
t statistic P-values
Management
support
Managers 66.11 88.15
5.710 0.000 Subordinates 54.86 73.15
Difference 11.25 15.00

154
Chart 5.7: Management support: mean percentage
The responses from the focus groups also supported the aforementioned findings
that management support is not 100% in the FSPS. Furthermore, the subordinates
in the focus groups commented that the absence of appropriate delegated powers
to managers make them inefficient and ineffective, as they do not have the
authority that accompanies their responsibility to make the right decisions at the
right time. Consequently, a lack of delegated authority limits the level of support
that managers can provide to their employees. For example, even if the employees
are performing effectively and efficiently, managers cannot ensure that they are
recognized through promotion, career progression or even through performance
rewards.
Managers also agreed with the subordinates that lack of delegated powers and
lack of sufficient resources including money to do the job restrict them from
providing the necessary management support. While some managers enjoy
financial delegations, other managers have to write submissions requesting
permission, which requires the signature of 3 to 5 senior managers even if the
budget implication is very little. At times these managers have to abort projects
altogether due to the turnaround time to get approval.
0
10
20
30
40
50
60
70
80
90
Managers Subordinates
88.15
73.15
Management support

155
Another concern of subordinates was that managers do not have the necessary
management skills, knowledge and competencies, and consequently cannot
provide adequate management support to the subordinates. Such managers are
unable to lead in the right direction, do not encourage open communication and do
not provide timeous feedback. They added that reporting to inefficient and
inexperienced managers radically decreases trust and respect in the efficiency of
the management. They blamed the subjective selection and recruitment processes
that do not abide by policies and procedures or focus on skills and competencies,
for this status quo.
Most of the subordinates added that sometimes they have to abort their plans to
accommodate others’ lack of planning, and at times they have to perform activities
that are not related to their actual mandates.
Managers however did not agree that they do not have management skills and that
their lack of skills contributes to the lack in support to their subordinates. All the
managers in the focus group were of the opinion that they are efficient and
effective, are always available to support their subordinates, encourage
participative decision making, maintain an open communication system and
provide feedback on time. However, they highlighted that they are not able to do
everything to support their subordinates and blamed the organizational culture and
environment for the same.
5.4.3 Variable: Objective Implementation of the Current Performance
Management System
The objective as stated in Chapter 1:8.3 reads to study the existing performance
management system in the FSPS departments to establish whether it is
implemented objectively to motivate employees to perform effectively and
efficiently. The respondents were asked questions regarding the implementation of
the current performance management system in the FSPS with the aid of a
questionnaire.
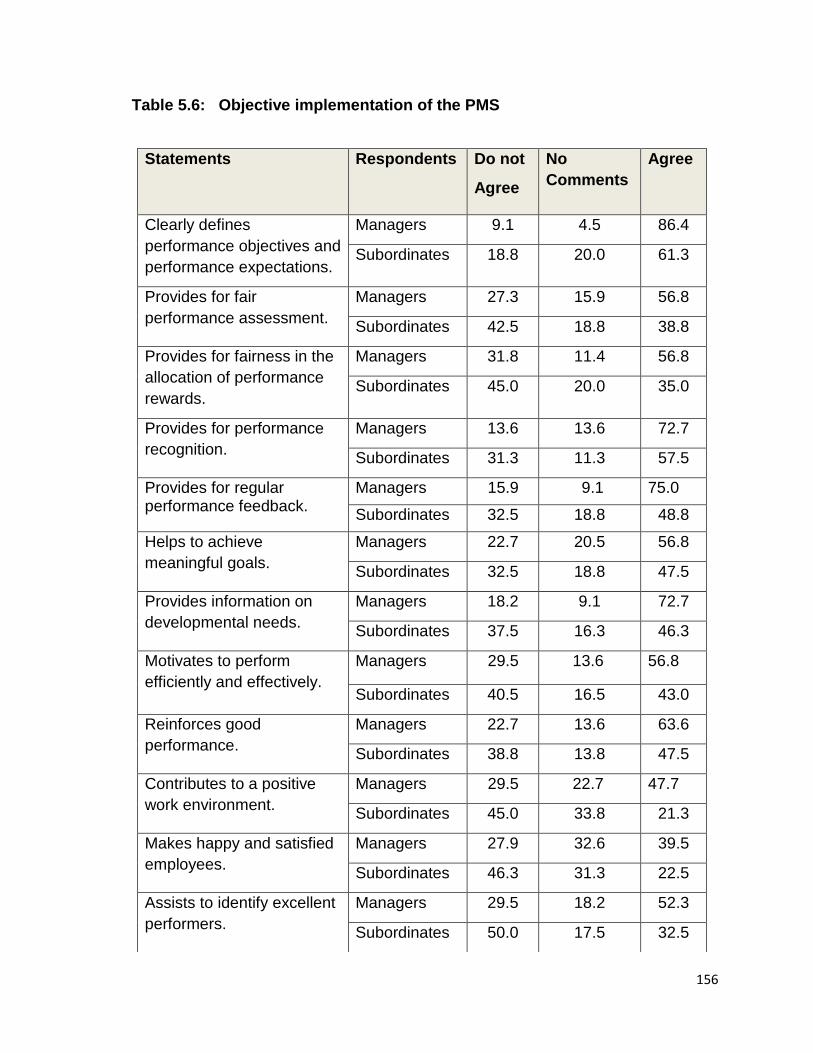
156
Table 5.6: Objective implementation of the PMS
Statements Respondents Do not
Agree
No
Comments
Agree
Clearly defines
performance objectives and
performance expectations.
Managers 9.1 4.5 86.4
Subordinates 18.8 20.0 61.3
Provides for fair
performance assessment.
Managers 27.3 15.9 56.8
Subordinates 42.5 18.8 38.8
Provides for fairness in the
allocation of performance
rewards.
Managers 31.8 11.4 56.8
Subordinates 45.0 20.0 35.0
Provides for performance
recognition.
Managers 13.6 13.6 72.7
Subordinates 31.3 11.3 57.5
Provides for regular performance feedback.
Managers 15.9 9.1 75.0
Subordinates 32.5 18.8 48.8
Helps to achieve
meaningful goals.
Managers 22.7 20.5 56.8
Subordinates 32.5 18.8 47.5
Provides information on
developmental needs.
Managers 18.2 9.1 72.7
Subordinates 37.5 16.3 46.3
Motivates to perform
efficiently and effectively.
Managers 29.5 13.6 56.8
Subordinates 40.5 16.5 43.0
Reinforces good
performance.
Managers 22.7 13.6 63.6
Subordinates 38.8 13.8 47.5
Contributes to a positive
work environment.
Managers 29.5 22.7 47.7
Subordinates 45.0 33.8 21.3
Makes happy and satisfied
employees.
Managers 27.9 32.6 39.5
Subordinates 46.3 31.3 22.5
Assists to identify excellent
performers.
Managers 29.5 18.2 52.3
Subordinates 50.0 17.5 32.5
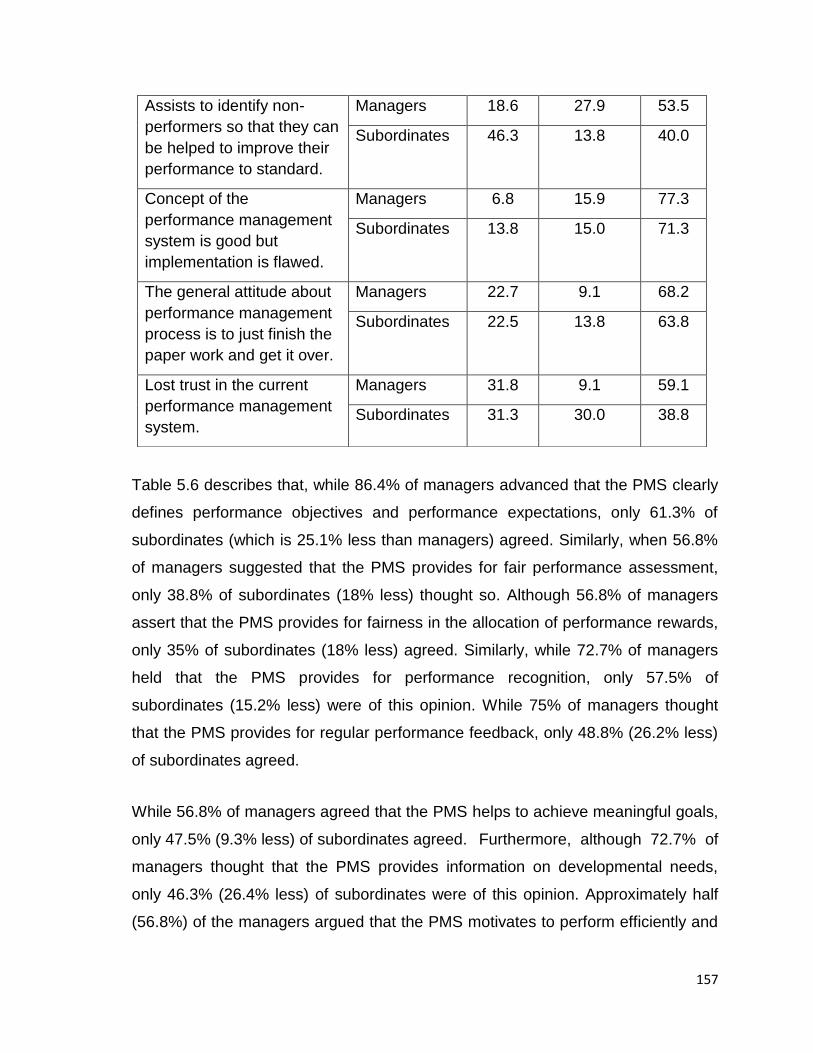
157
Table 5.6 describes that, while 86.4% of managers advanced that the PMS clearly
defines performance objectives and performance expectations, only 61.3% of
subordinates (which is 25.1% less than managers) agreed. Similarly, when 56.8%
of managers suggested that the PMS provides for fair performance assessment,
only 38.8% of subordinates (18% less) thought so. Although 56.8% of managers
assert that the PMS provides for fairness in the allocation of performance rewards,
only 35% of subordinates (18% less) agreed. Similarly, while 72.7% of managers
held that the PMS provides for performance recognition, only 57.5% of
subordinates (15.2% less) were of this opinion. While 75% of managers thought
that the PMS provides for regular performance feedback, only 48.8% (26.2% less)
of subordinates agreed.
While 56.8% of managers agreed that the PMS helps to achieve meaningful goals,
only 47.5% (9.3% less) of subordinates agreed. Furthermore, although 72.7% of
managers thought that the PMS provides information on developmental needs,
only 46.3% (26.4% less) of subordinates were of this opinion. Approximately half
(56.8%) of the managers argued that the PMS motivates to perform efficiently and
Assists to identify non-
performers so that they can
be helped to improve their
performance to standard.
Managers 18.6 27.9 53.5
Subordinates 46.3 13.8 40.0
Concept of the
performance management
system is good but
implementation is flawed.
Managers 6.8 15.9 77.3
Subordinates 13.8 15.0 71.3
The general attitude about
performance management
process is to just finish the
paper work and get it over.
Managers 22.7 9.1 68.2
Subordinates 22.5 13.8 63.8
Lost trust in the current
performance management
system.
Managers 31.8 9.1 59.1
Subordinates 31.3 30.0 38.8

158
effectively, even though only 43% (13.8% less) of subordinates supported this.
Although 63.6% of managers believed that the PMS reinforces good performance,
only 47.5% (16.1% less) of subordinates agreed. When roughly half (47.7%) of the
managers held that the PMS contributes to a positive work environment, only
21.3% of subordinates agreed. While 39.5% of managers agreed that the PMS
produces happy and satisfied employees, 46.3% of subordinates disagreed with
the statement. Although 52.3% of managers suggested that the PMS assists in
identifying excellent performers, 50% of subordinates disagreed. While 53.5% of
managers advanced that the PMS assists to identify non-performers so that they
can be helped to improve their performance, 46.3% of subordinates disagreed.
Both managers and subordinates agreed to a great extent that the concept of the
performance management system is good although implementation is flawed.
They also agreed that the general attitude towards the performance management
process is that it is mere paper work. While 59.1% of managers agreed that their
subordinates have lost trust in the current performance management system, only
38.8% (20.3% less) of subordinates supported this.
The role of performance reward is an integral and crucial part in the objective
implementation of the PMS. Therefore, the objectivity of the performance rewards
is assessed with the help of the table below. In this table strongly disagree and
disagree are added together for ease of comparison, as are agree and strongly
agree.
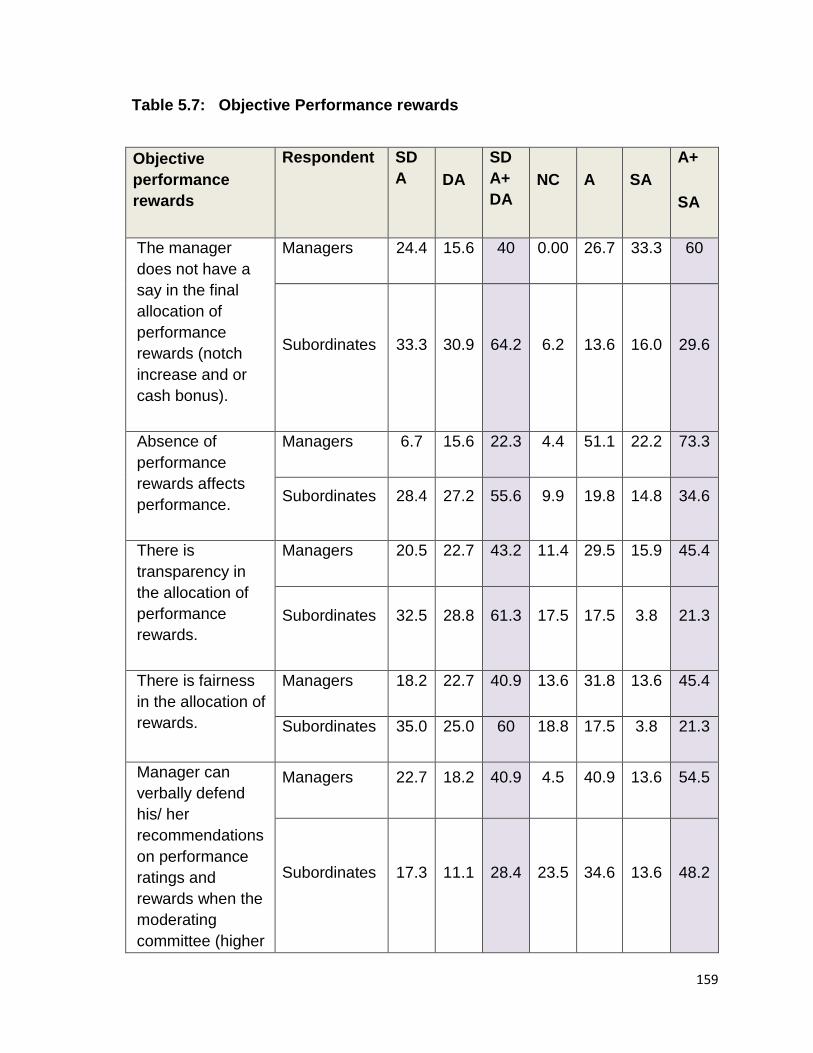
159
Table 5.7: Objective Performance rewards
Objective
performance
rewards
Respondent
SD
A DA
SD
A+
DA
NC A SA
A+
SA
The manager
does not have a
say in the final
allocation of
performance
rewards (notch
increase and or
cash bonus).
Managers 24.4 15.6 40 0.00 26.7 33.3 60
Subordinates 33.3 30.9 64.2 6.2 13.6 16.0 29.6
Absence of
performance
rewards affects
performance.
Managers 6.7 15.6 22.3 4.4 51.1 22.2 73.3
Subordinates 28.4 27.2 55.6 9.9 19.8 14.8 34.6
There is
transparency in
the allocation of
performance
rewards.
Managers 20.5 22.7 43.2 11.4 29.5 15.9 45.4
Subordinates 32.5 28.8 61.3 17.5 17.5 3.8 21.3
There is fairness
in the allocation of
rewards.
Managers 18.2 22.7 40.9 13.6 31.8 13.6 45.4
Subordinates 35.0 25.0 60 18.8 17.5 3.8 21.3
Manager can
verbally defend
his/ her
recommendations
on performance
ratings and
rewards when the
moderating
committee (higher
Managers 22.7 18.2 40.9 4.5 40.9 13.6 54.5
Subordinates 17.3 11.1 28.4 23.5 34.6 13.6 48.2
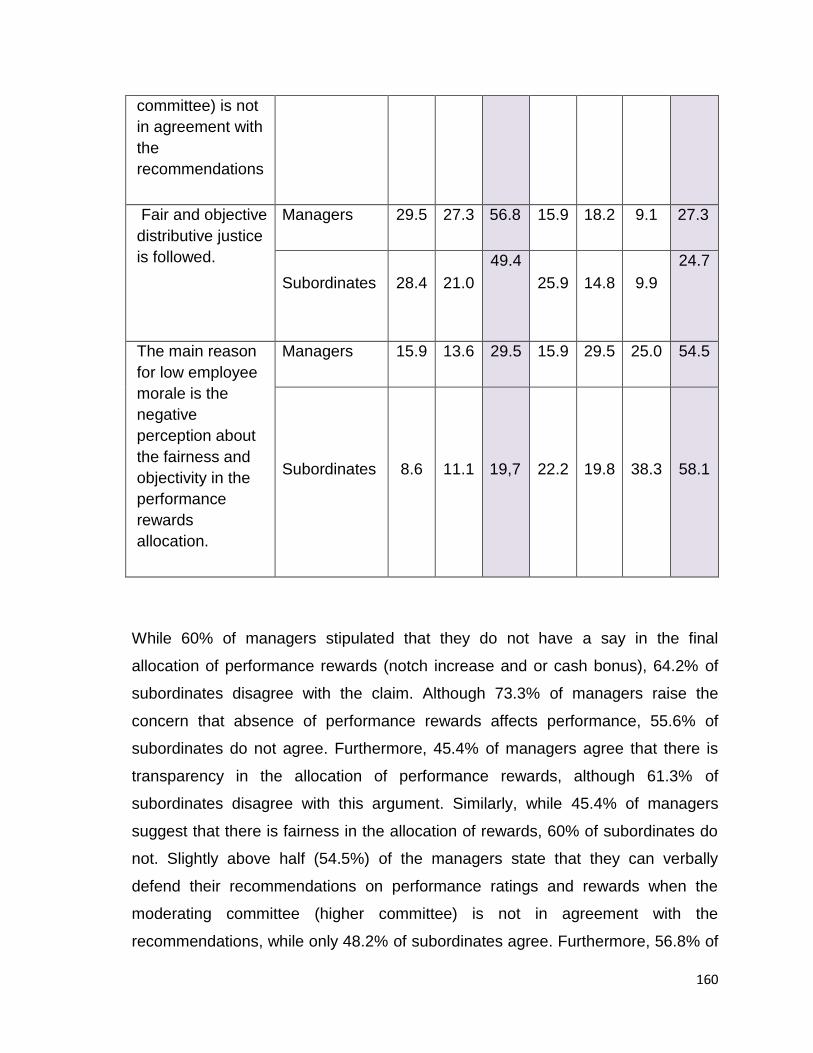
160
committee) is not
in agreement with
the
recommendations
Fair and objective
distributive justice
is followed.
Managers 29.5 27.3 56.8 15.9 18.2 9.1 27.3
Subordinates 28.4 21.0
49.4
25.9 14.8 9.9
24.7
The main reason
for low employee
morale is the
negative
perception about
the fairness and
objectivity in the
performance
rewards
allocation.
Managers 15.9 13.6 29.5 15.9 29.5 25.0 54.5
Subordinates 8.6 11.1 19,7 22.2 19.8 38.3 58.1
While 60% of managers stipulated that they do not have a say in the final
allocation of performance rewards (notch increase and or cash bonus), 64.2% of
subordinates disagree with the claim. Although 73.3% of managers raise the
concern that absence of performance rewards affects performance, 55.6% of
subordinates do not agree. Furthermore, 45.4% of managers agree that there is
transparency in the allocation of performance rewards, although 61.3% of
subordinates disagree with this argument. Similarly, while 45.4% of managers
suggest that there is fairness in the allocation of rewards, 60% of subordinates do
not. Slightly above half (54.5%) of the managers state that they can verbally
defend their recommendations on performance ratings and rewards when the
moderating committee (higher committee) is not in agreement with the
recommendations, while only 48.2% of subordinates agree. Furthermore, 56.8% of
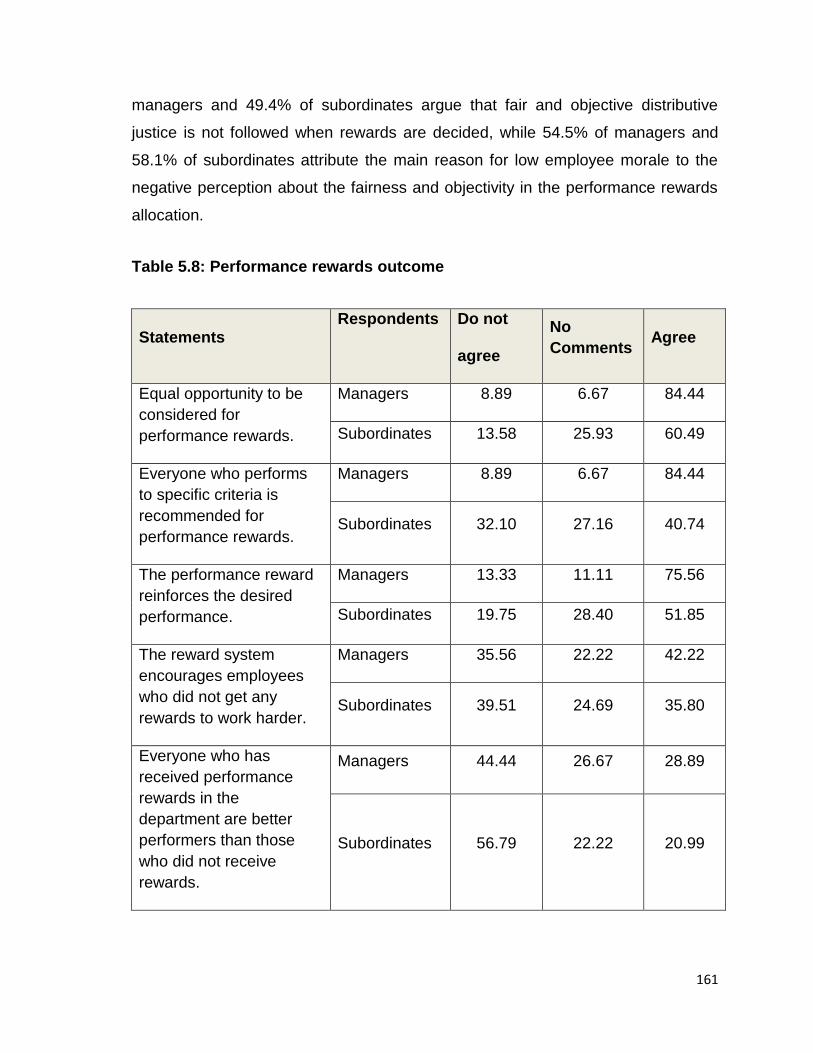
161
managers and 49.4% of subordinates argue that fair and objective distributive
justice is not followed when rewards are decided, while 54.5% of managers and
58.1% of subordinates attribute the main reason for low employee morale to the
negative perception about the fairness and objectivity in the performance rewards
allocation.
Table 5.8: Performance rewards outcome
Statements Respondents Do not
agree
No
Comments Agree
Equal opportunity to be
considered for
performance rewards.
Managers 8.89 6.67 84.44
Subordinates 13.58 25.93 60.49
Everyone who performs
to specific criteria is
recommended for
performance rewards.
Managers 8.89 6.67 84.44
Subordinates 32.10 27.16 40.74
The performance reward
reinforces the desired
performance.
Managers 13.33 11.11 75.56
Subordinates 19.75 28.40 51.85
The reward system
encourages employees
who did not get any
rewards to work harder.
Managers 35.56 22.22 42.22
Subordinates 39.51 24.69 35.80
Everyone who has
received performance
rewards in the
department are better
performers than those
who did not receive
rewards.
Managers 44.44 26.67 28.89
Subordinates 56.79 22.22 20.99
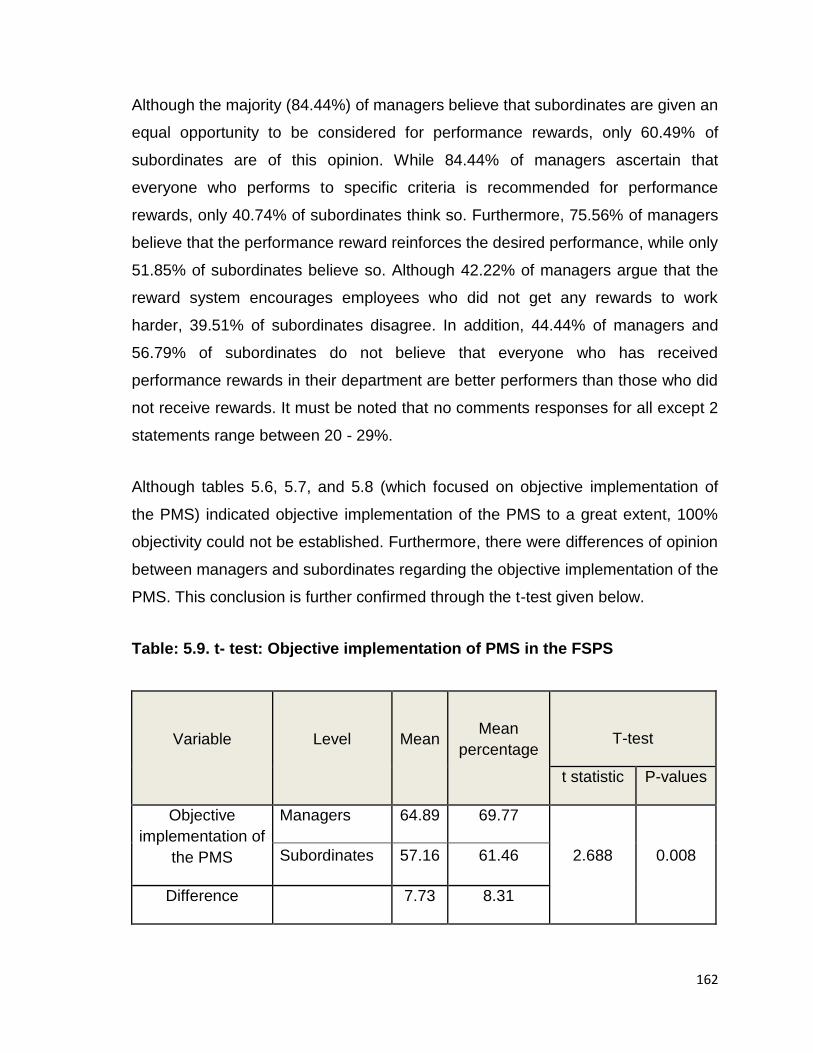
162
Although the majority (84.44%) of managers believe that subordinates are given an
equal opportunity to be considered for performance rewards, only 60.49% of
subordinates are of this opinion. While 84.44% of managers ascertain that
everyone who performs to specific criteria is recommended for performance
rewards, only 40.74% of subordinates think so. Furthermore, 75.56% of managers
believe that the performance reward reinforces the desired performance, while only
51.85% of subordinates believe so. Although 42.22% of managers argue that the
reward system encourages employees who did not get any rewards to work
harder, 39.51% of subordinates disagree. In addition, 44.44% of managers and
56.79% of subordinates do not believe that everyone who has received
performance rewards in their department are better performers than those who did
not receive rewards. It must be noted that no comments responses for all except 2
statements range between 20 - 29%.
Although tables 5.6, 5.7, and 5.8 (which focused on objective implementation of
the PMS) indicated objective implementation of the PMS to a great extent, 100%
objectivity could not be established. Furthermore, there were differences of opinion
between managers and subordinates regarding the objective implementation of the
PMS. This conclusion is further confirmed through the t-test given below.
Table: 5.9. t- test: Objective implementation of PMS in the FSPS
Variable Level Mean Mean
percentage
T-test
t statistic P-values
Objective
implementation of
the PMS
Managers 64.89 69.77
2.688 0.008 Subordinates 57.16 61.46
Difference 7.73 8.31
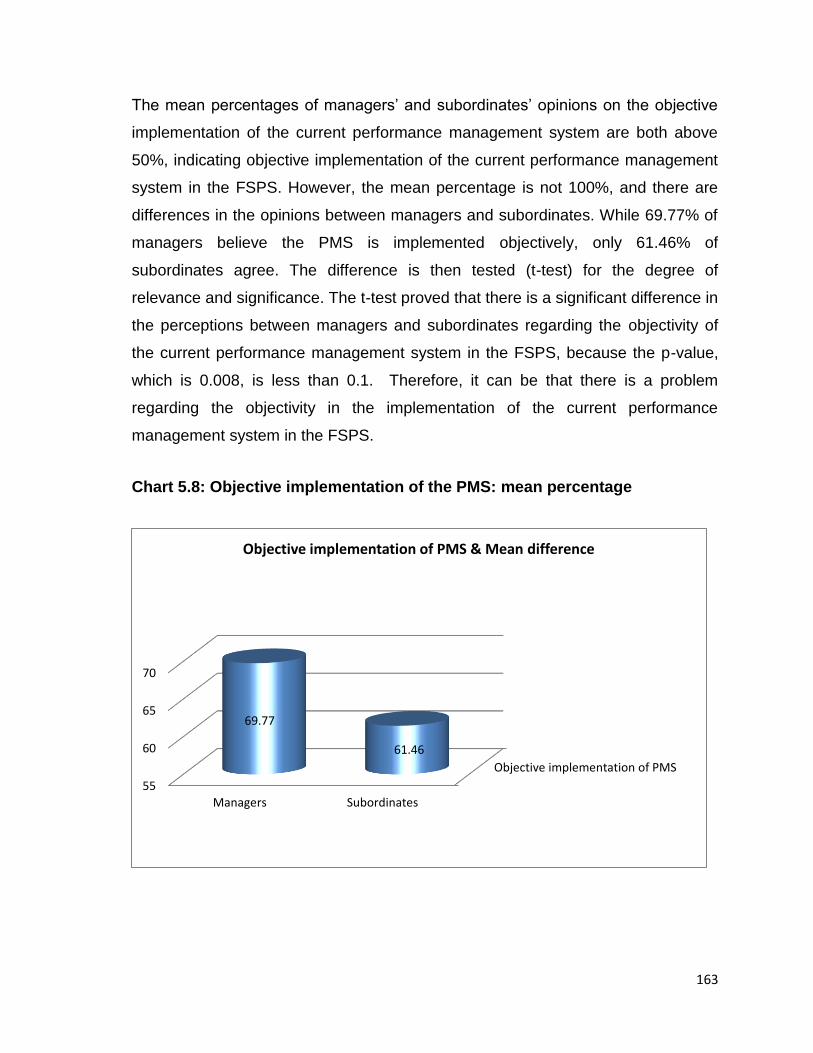
163
The mean percentages of managers’ and subordinates’ opinions on the objective
implementation of the current performance management system are both above
50%, indicating objective implementation of the current performance management
system in the FSPS. However, the mean percentage is not 100%, and there are
differences in the opinions between managers and subordinates. While 69.77% of
managers believe the PMS is implemented objectively, only 61.46% of
subordinates agree. The difference is then tested (t-test) for the degree of
relevance and significance. The t-test proved that there is a significant difference in
the perceptions between managers and subordinates regarding the objectivity of
the current performance management system in the FSPS, because the p-value,
which is 0.008, is less than 0.1. Therefore, it can be that there is a problem
regarding the objectivity in the implementation of the current performance
management system in the FSPS.
Chart 5.8: Objective implementation of the PMS: mean percentage
Objective implementation of PMS
55
60
65
70
Managers Subordinates
69.77
61.46
Objective implementation of PMS & Mean difference
164
All 4 focus groups were very vocal on this point and raised the concern that the
implementation of the current performance management system needs to be
improved, and that it must be implemented as prescribed by the system to be
objective. In addition, most of the subordinates indicated that only top management
can make a positive impact on the objectivity of the PMS implementation.
Furthermore, they indicated that real performance is not measured, as performance
assessment is not done objectively, fairly, systematically and regularly. They added
that managers do not consider PM their key responsibility, do not discuss
performance with their employees, and that the system is just followed for the sake
of compliance. The attitude of mere compliance is applicable to both managers and
subordinates. As the performance assessment rating is not a true reflection of real
performance, hardworking employees have lost trust in the system. Furthermore,
the current PMS system has lost its credibility as there are no consequences for
non-performance. Below-average performers are neither reprimanded nor sent for
training, mentoring or coaching.
A lack of quality control at top management, regarding how the processes are
followed, is yet another contributing factor to the lack of its objectivity according to
many subordinates. Supervisors/managers do not take responsibility for
performance plans and performance assessment. Managers/ supervisors fear
reprisals from subordinates, and as a result give high ratings to all, while those
who follow performance management processes objectively give ratings that are
proportionate to performance. Such managers are unwittingly disadvantaging their
employees, as others give high scores to their subordinates. As a result the wrong
employees receive performance rewards for the wrong reasons. A lack of
transparency and objectivity in awarding performance rewards has also added to
the lack of trust in the system. Thus, the PDMS system has lost its credibility
amongst many of the public servants. In addition, majority of subordinates held that
the current performance management system is not implemented the way it should
be, and therefore does not yield the results it is expected to. For example, it does
165
not act as a motivator, does not help to give the necessary recognition, and does
not reinforce good behaviour.
Most of the managers felt that employees expect additional rewards for doing work
for which they receive a salary. Managers suggested that training managers and
their subordinates together as a team on the implementation of PMS would help
the team to understand the system the same way, and would thereby curb
employees’ unrealistic expectations for rewards. In addition, the managers agreed
that assessments are not done as they should be, creating expectations for
rewards (cash bonus) in many employees. When the number of such instances
increases it creates budgetary constraints on departments. Some departments
thus resort to the practice of rotational rewards, where for example 5 employees
receive performance bonuses one particular year and another 5 employees the
following year, which again does not reflect rewards based on performance.
Another challenge the managers identified is that the moderating committee
sometimes makes decisions on ratings given by managers without consulting
them. As such, managers cannot ensure that hard working employees will
definitely be recognized through performance rewards. Another strong concern
raised by all managers is that performance assessment is not linked to other
human resource activities such as promotion, career growth, career planning, and
succession planning, and as such the PMS does not really contribute to effective
and efficient performance.
The majority of the managers in the focus groups again blamed the organizational
culture for the PMS systems failure to be completely effective. They argued that
the final allocation of performance rewards is not in their hands, and that when the
moderating committee feels the need to cut down the number of employees
recommended for notch increases and cash bonuses, they do not consult the
concerned managers, and explanations are not given to employees as to why they
do not quality for rewards although their scores reflect that they are performing
above the normal requirements.
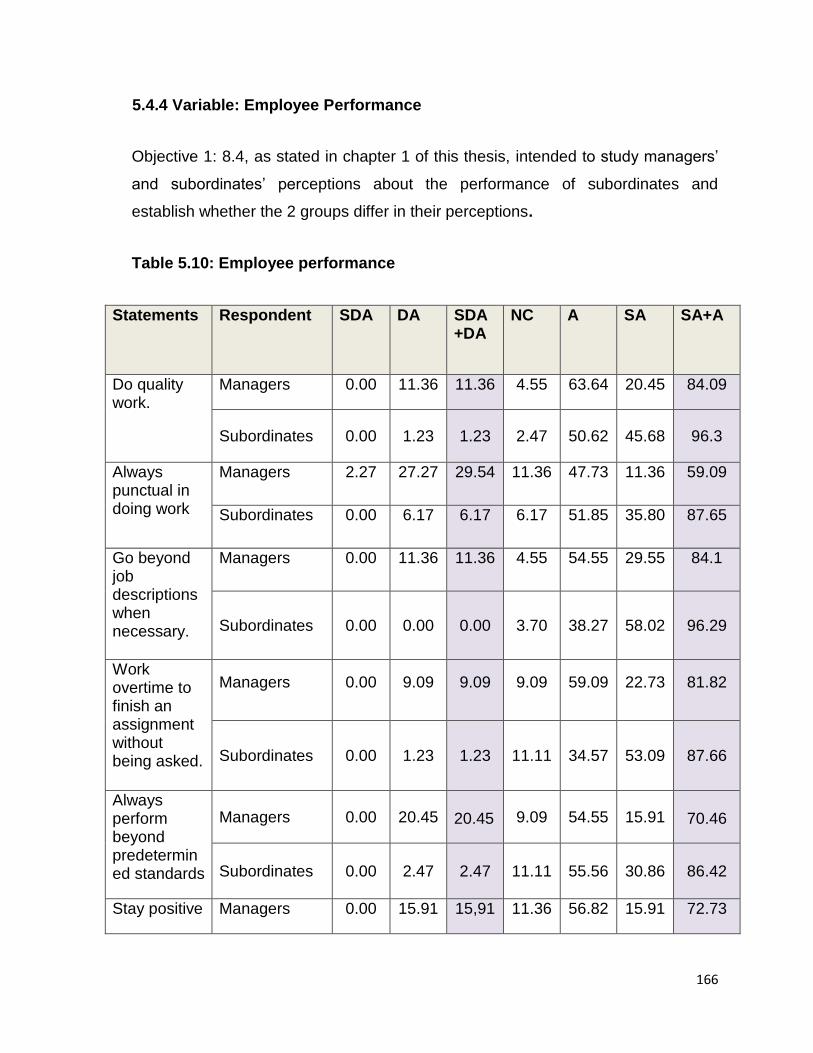
166
5.4.4 Variable: Employee Performance
Objective 1: 8.4, as stated in chapter 1 of this thesis, intended to study managers’
and subordinates’ perceptions about the performance of subordinates and
establish whether the 2 groups differ in their perceptions.
Table 5.10: Employee performance
Statements Respondent SDA DA SDA+DA
NC A SA SA+A
Do quality work.
Managers 0.00 11.36 11.36 4.55 63.64 20.45 84.09
Subordinates 0.00 1.23 1.23 2.47 50.62 45.68 96.3
Always punctual in doing work
Managers 2.27 27.27 29.54 11.36 47.73 11.36 59.09
Subordinates 0.00 6.17 6.17 6.17 51.85 35.80 87.65
Go beyond job descriptions when necessary.
Managers 0.00 11.36 11.36 4.55 54.55 29.55 84.1
Subordinates 0.00 0.00 0.00 3.70 38.27 58.02
96.29
Work overtime to finish an assignment without being asked.
Managers 0.00 9.09 9.09 9.09 59.09 22.73 81.82
Subordinates 0.00 1.23 1.23 11.11 34.57 53.09 87.66
Always perform beyond predetermined standards
Managers 0.00 20.45 20.45 9.09 54.55 15.91
70.46
Subordinates 0.00 2.47 2.47 11.11 55.56 30.86 86.42
Stay positive Managers 0.00 15.91 15,91 11.36 56.82 15.91 72.73
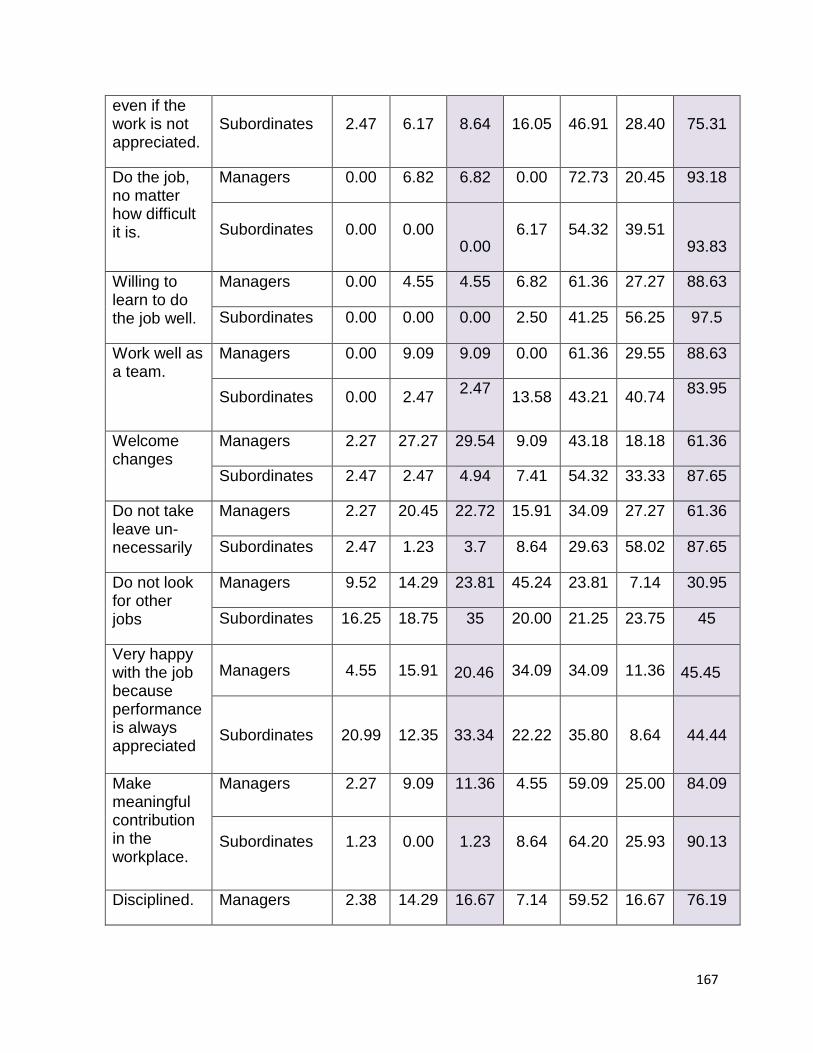
167
even if the work is not appreciated.
Subordinates 2.47 6.17 8.64 16.05 46.91 28.40 75.31
Do the job, no matter how difficult it is.
Managers 0.00 6.82 6.82 0.00 72.73 20.45 93.18
Subordinates 0.00 0.00
0.00 6.17 54.32 39.51
93.83
Willing to learn to do the job well.
Managers 0.00 4.55 4.55 6.82 61.36 27.27 88.63
Subordinates 0.00 0.00 0.00 2.50 41.25 56.25 97.5
Work well as a team.
Managers 0.00 9.09 9.09 0.00 61.36 29.55 88.63
Subordinates 0.00 2.47 2.47
13.58 43.21 40.74 83.95
Welcome changes
Managers 2.27 27.27 29.54 9.09 43.18 18.18 61.36
Subordinates 2.47 2.47 4.94 7.41 54.32 33.33 87.65
Do not take leave un- necessarily
Managers 2.27 20.45 22.72 15.91 34.09 27.27 61.36
Subordinates 2.47 1.23 3.7 8.64 29.63 58.02 87.65
Do not look for other jobs
Managers 9.52 14.29 23.81 45.24 23.81 7.14 30.95
Subordinates 16.25 18.75 35 20.00 21.25 23.75 45
Very happy with the job because performance is always appreciated
Managers 4.55 15.91 20.46 34.09 34.09 11.36
45.45
Subordinates 20.99 12.35 33.34 22.22 35.80 8.64 44.44
Make meaningful contribution in the workplace.
Managers 2.27 9.09 11.36 4.55 59.09 25.00 84.09
Subordinates 1.23 0.00 1.23 8.64 64.20 25.93 90.13
Disciplined. Managers 2.38 14.29 16.67 7.14 59.52 16.67 76.19
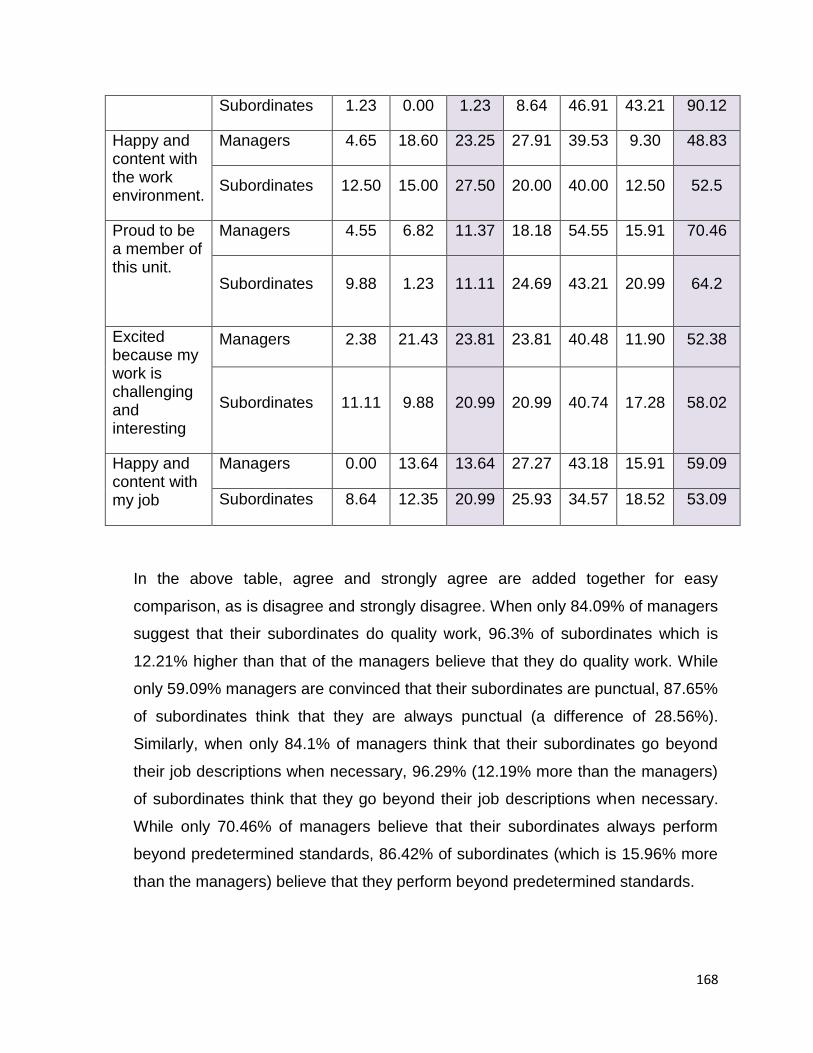
168
Subordinates 1.23 0.00 1.23 8.64 46.91 43.21 90.12
Happy and content with the work environment.
Managers 4.65 18.60 23.25 27.91 39.53 9.30 48.83
Subordinates 12.50 15.00 27.50 20.00 40.00 12.50 52.5
Proud to be a member of this unit.
Managers 4.55 6.82 11.37 18.18 54.55 15.91 70.46
Subordinates 9.88 1.23 11.11 24.69 43.21 20.99 64.2
Excited because my work is challenging and interesting
Managers 2.38 21.43 23.81 23.81 40.48 11.90 52.38
Subordinates 11.11 9.88 20.99 20.99 40.74 17.28 58.02
Happy and content with my job
Managers 0.00 13.64 13.64 27.27 43.18 15.91 59.09
Subordinates 8.64 12.35 20.99 25.93 34.57 18.52 53.09
In the above table, agree and strongly agree are added together for easy
comparison, as is disagree and strongly disagree. When only 84.09% of managers
suggest that their subordinates do quality work, 96.3% of subordinates which is
12.21% higher than that of the managers believe that they do quality work. While
only 59.09% managers are convinced that their subordinates are punctual, 87.65%
of subordinates think that they are always punctual (a difference of 28.56%).
Similarly, when only 84.1% of managers think that their subordinates go beyond
their job descriptions when necessary, 96.29% (12.19% more than the managers)
of subordinates think that they go beyond their job descriptions when necessary.
While only 70.46% of managers believe that their subordinates always perform
beyond predetermined standards, 86.42% of subordinates (which is 15.96% more
than the managers) believe that they perform beyond predetermined standards.
169
While only 88.63% of managers suggested that the subordinates are willing to
learn to do a job well, 97.5% of subordinates think that they are willing to learn in
order to do a better job. While only 61.36% of managers believe that their
subordinates welcome change, and do not take leave unnecessarily, the
percentages of subordinates who think along those lines are 26.29% more than the
managers (87.65% of subordinates). While 30.95% of managers are confident that
their subordinates are not looking for any other jobs, and 45.24% of managers did
not want to comment, 45% of subordinates admitted that they are not looking for
other jobs. Although 45.45% of managers thought that the subordinates are very
happy at work because their performance is always appreciated, 33.34% of
subordinates disagreed. However, it must be noted that both managers and
subordinates had high scores (34.09% and 22.22% respectively) on no comments
for this particular statement. When only 76.19% of managers think that their
subordinates are disciplined, 90.12% of subordinates (which is 13.93% higher than
the managers) think that they are disciplined. Both managers and subordinates
differed to a certain extent regarding how happy and content with the job and in the
work environment subordinates are, as well as how proud they are to be members
of the unit and how excited they are as the work is challenging and interesting.
It must be stated at this point that, in some instances both the managers and
subordinates were more or less in agreement in their opinions on employee
performance although, the subordinates’ ratings were still higher than that of the
managers’. 81.62% managers and 87.66% subordinates claim that subordinates
work overtime to finish an assignment without being asked. 72.73% managers and
75.32% subordinates agree that the subordinates stay positive even if the work is
not appreciated. 93.18% managers and 93.83% subordinates concur that the
subordinates do their jobs no matter how difficult it is. In addition, 88.63% of
managers and 83.95% of subordinates agree that they work well as a team.
84.09% of managers and 90.13% of subordinates agreed that subordinates’ make
meaningful contribution in the workplace.

170
Although the above analysis indicated reasonable employee performance in the
FSPS, it did not reflect a 100% employee performance. Furthermore, the analysis
reflected a difference in the opinions between managers and subordinates with
regard to employee performance. A t-test was done to determine whether
differences in perceptions between managers and subordinates regarding
performance are relevant and significant. The t-test results concluded that there is
a significant difference between the managers’ and subordinates’ opinions
regarding the subordinates’ performance because the p-value, which is 0.010, is
less than 0.1.
Table 5.11: t-test: Employee performance in the FSPS
Variable Level Mean Mean
percentage
T-test
t statistic P-values
Employee
performance
Managers 69.61 73.28
-2.632 0.010 Subordinates 75.43 79.40
Difference -5.82 -6.12
With regard to the mean percentages, both managers and subordinates have
scored above 50%, indicating positive employee performance in the FSPS,
however not 100%. There are differences between managers’ and subordinates’
opinions, where in this instance employees scored a higher mean percentage
(79.4%), indicating that they perceive their own performance to be high whereas
the managers’ percentage (73.28%) do not match.
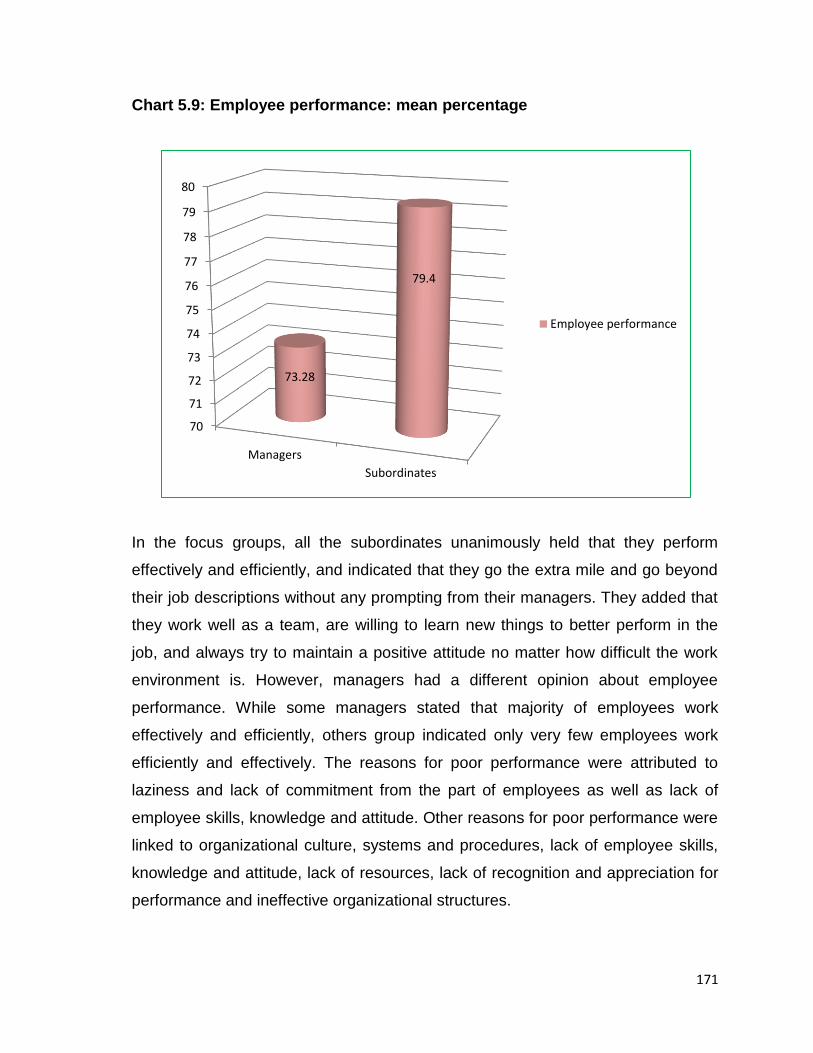
171
Chart 5.9: Employee performance: mean percentage
In the focus groups, all the subordinates unanimously held that they perform
effectively and efficiently, and indicated that they go the extra mile and go beyond
their job descriptions without any prompting from their managers. They added that
they work well as a team, are willing to learn new things to better perform in the
job, and always try to maintain a positive attitude no matter how difficult the work
environment is. However, managers had a different opinion about employee
performance. While some managers stated that majority of employees work
effectively and efficiently, others group indicated only very few employees work
efficiently and effectively. The reasons for poor performance were attributed to
laziness and lack of commitment from the part of employees as well as lack of
employee skills, knowledge and attitude. Other reasons for poor performance were
linked to organizational culture, systems and procedures, lack of employee skills,
knowledge and attitude, lack of resources, lack of recognition and appreciation for
performance and ineffective organizational structures.
70
71
72
73
74
75
76
77
78
79
80
Managers
Subordinates
73.28
79.4
Employee performance
172
The analysis of the variables management support, work environment, objective
implementation of PMS and employee performance assisted in testing the
hypothesis.
5.5. HYPOTHESIS TESTING
The hypothesis stated in chapter 1 of this thesis reads the FSPS employees will
give effective and efficient performance if their managers are able to create and
manage a positive work environment by providing management support and by
implementing the current performance management system objectively. Thus, the
analysis and interpretation of the data collected intends to establish whether or not
the following relationships exist:
Positive relationship between management support and work environment.
Positive relationship between objective implementation of the performance
system and work environment.
Positive relationship between management support and employee
performance.
Positive relationship between objective implementation of the performance
system and employee performance.
Positive relationship between work environment and employee performance.
In order to test the hypothesis, the correlation coefficients as well as regression
analysis were used. These are explained in the upcoming pages.
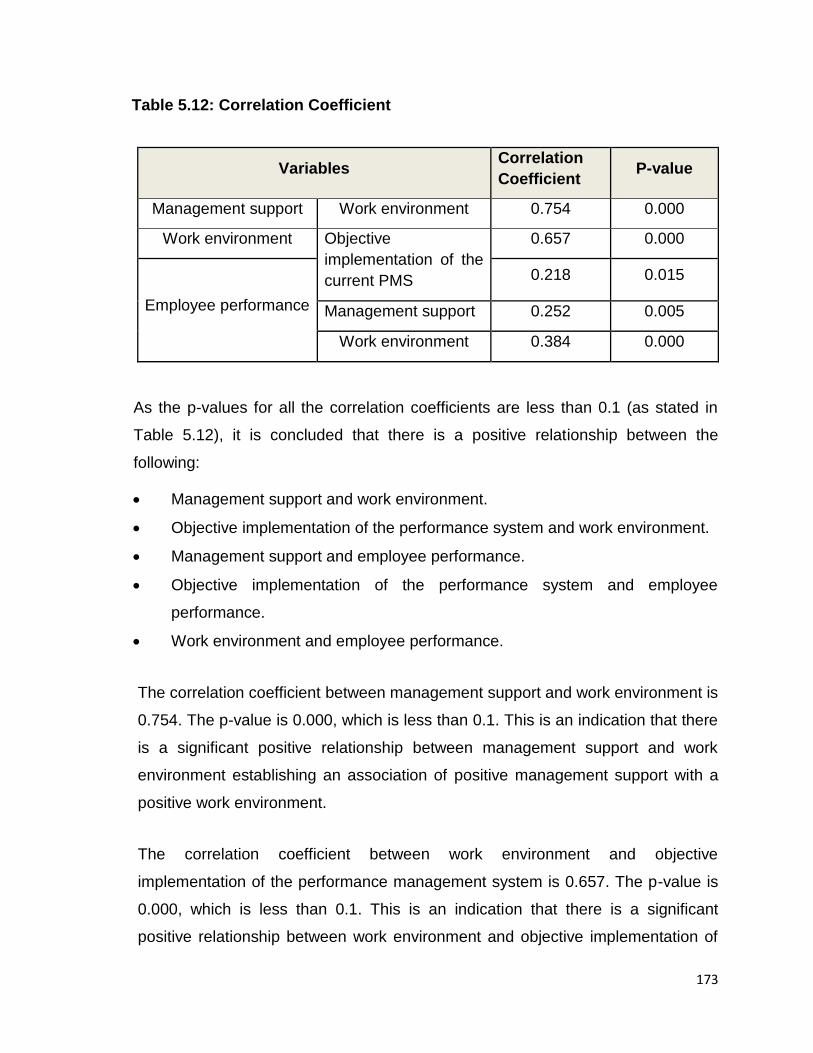
173
Table 5.12: Correlation Coefficient
Variables Correlation
Coefficient P-value
Management support Work environment 0.754 0.000
Work environment Objective
implementation of the
current PMS
0.657 0.000
Employee performance
0.218 0.015
Management support 0.252 0.005
Work environment 0.384 0.000
As the p-values for all the correlation coefficients are less than 0.1 (as stated in
Table 5.12), it is concluded that there is a positive relationship between the
following:
Management support and work environment.
Objective implementation of the performance system and work environment.
Management support and employee performance.
Objective implementation of the performance system and employee
performance.
Work environment and employee performance.
The correlation coefficient between management support and work environment is
0.754. The p-value is 0.000, which is less than 0.1. This is an indication that there
is a significant positive relationship between management support and work
environment establishing an association of positive management support with a
positive work environment.
The correlation coefficient between work environment and objective
implementation of the performance management system is 0.657. The p-value is
0.000, which is less than 0.1. This is an indication that there is a significant
positive relationship between work environment and objective implementation of
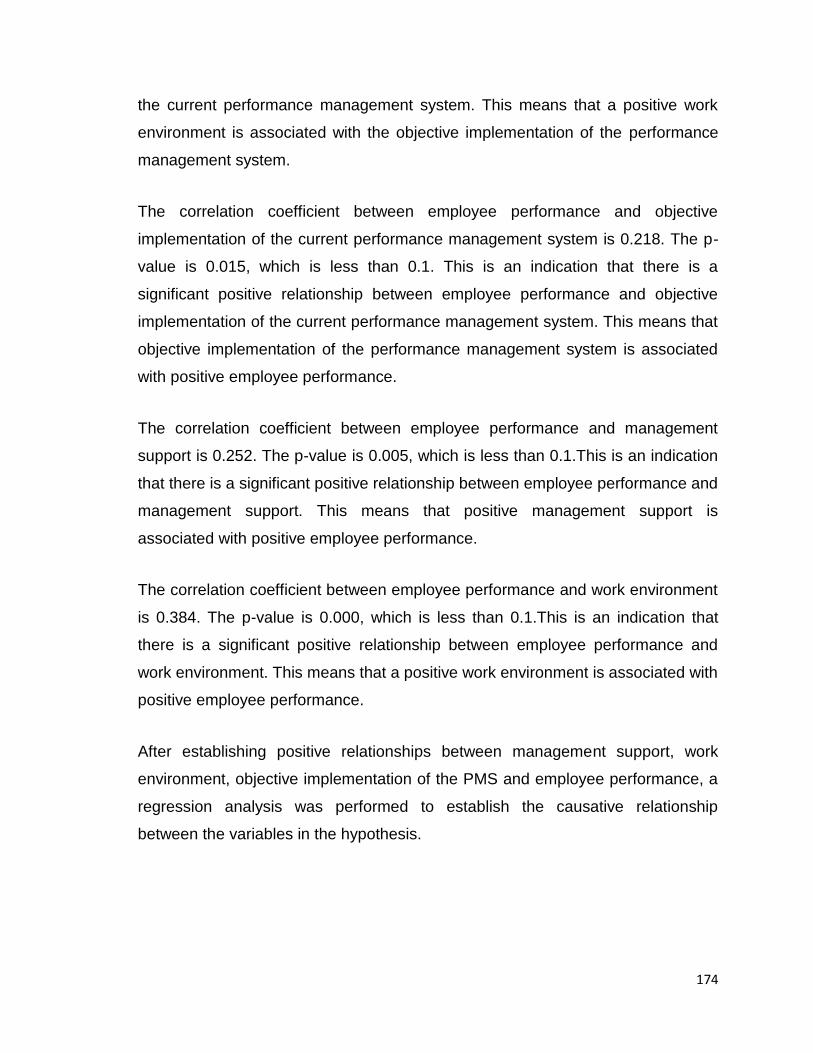
174
the current performance management system. This means that a positive work
environment is associated with the objective implementation of the performance
management system.
The correlation coefficient between employee performance and objective
implementation of the current performance management system is 0.218. The p-
value is 0.015, which is less than 0.1. This is an indication that there is a
significant positive relationship between employee performance and objective
implementation of the current performance management system. This means that
objective implementation of the performance management system is associated
with positive employee performance.
The correlation coefficient between employee performance and management
support is 0.252. The p-value is 0.005, which is less than 0.1.This is an indication
that there is a significant positive relationship between employee performance and
management support. This means that positive management support is
associated with positive employee performance.
The correlation coefficient between employee performance and work environment
is 0.384. The p-value is 0.000, which is less than 0.1.This is an indication that
there is a significant positive relationship between employee performance and
work environment. This means that a positive work environment is associated with
positive employee performance.
After establishing positive relationships between management support, work
environment, objective implementation of the PMS and employee performance, a
regression analysis was performed to establish the causative relationship
between the variables in the hypothesis.
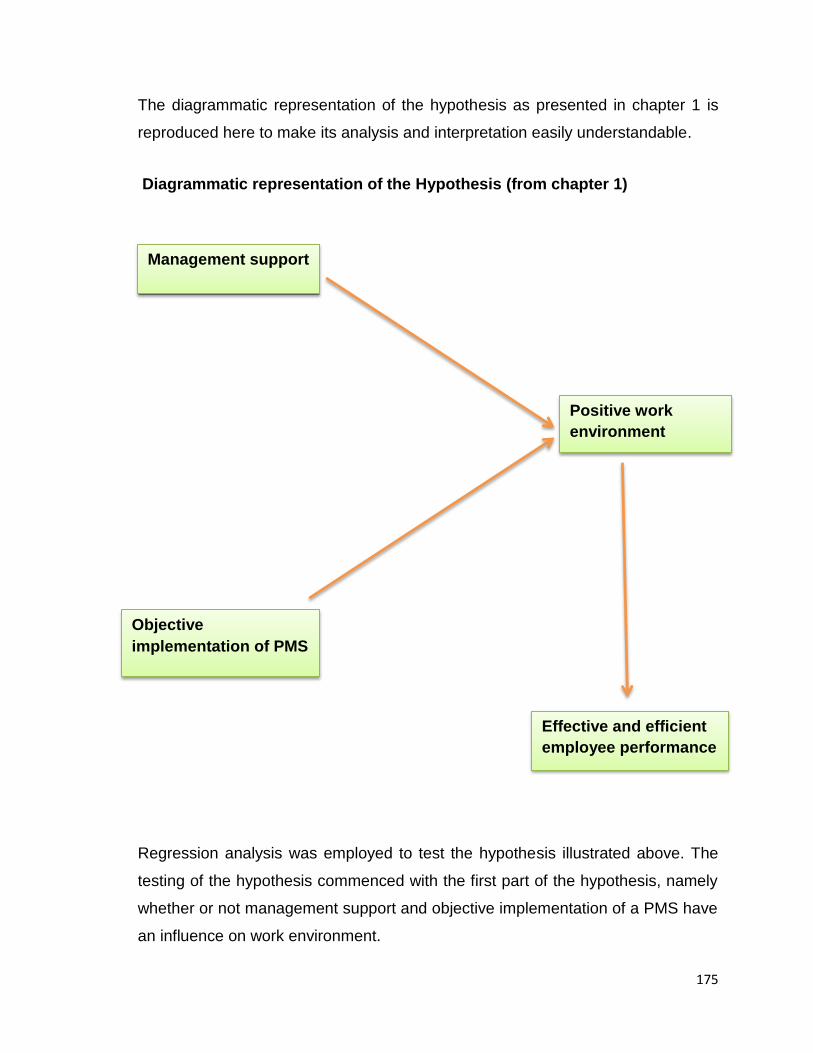
175
The diagrammatic representation of the hypothesis as presented in chapter 1 is
reproduced here to make its analysis and interpretation easily understandable.
Diagrammatic representation of the Hypothesis (from chapter 1)
Regression analysis was employed to test the hypothesis illustrated above. The
testing of the hypothesis commenced with the first part of the hypothesis, namely
whether or not management support and objective implementation of a PMS have
an influence on work environment.
Management support
Objective
implementation of PMS
Positive work
environment
Effective and efficient
employee performance
176
Work environment is the dependent variable (Y), while management support and
objective implementation of the performance management system are the
independent variables (X). For this purpose the p-values of each coefficient were
compared with a significance level of 0.1. If the p-values are less than 0.1 it can
be concluded that management support and objective implementation of a PMS
have an influence on work environment, whilst management support and objective
implementation of a PMS do not have an influence on work environment if the p-
values are greater than 0.1.
Table 5:13: Regression analysis: Management Support, Objective
Implementation of PMS and Work Environment.
Table above shows that the p-value for the coefficient of management support
(0.412) is 0.000, which is less than 0.1. The coefficient of 0.412 means that if
management support increases by 1%, work environment will become more
favourable by 0.412%. This means that management support has a significant,
positive effect on work environment in the FSPS. The p-value for the coefficient of
objective implementation of PMS (0.128) is 0.000, which is less than 0.1. The
coefficient of 0.128 means that if implementation of a PMS is more objective by
1% then work environment will become more favourable by 0.128%. This means
that objective implementation of a PMS has a significant, positive effect on work
environment in the FSPS.
Dependent
variable
Independent
variable(s) Co-
efficient
t-
statistic P-value R Square
Work
environment
Intercept 11.369 5.666 0.000 0.682
Management
support 0.412 11.226 0.000
Objective
implementatio
n of PMS
0.128 4.052 0.000
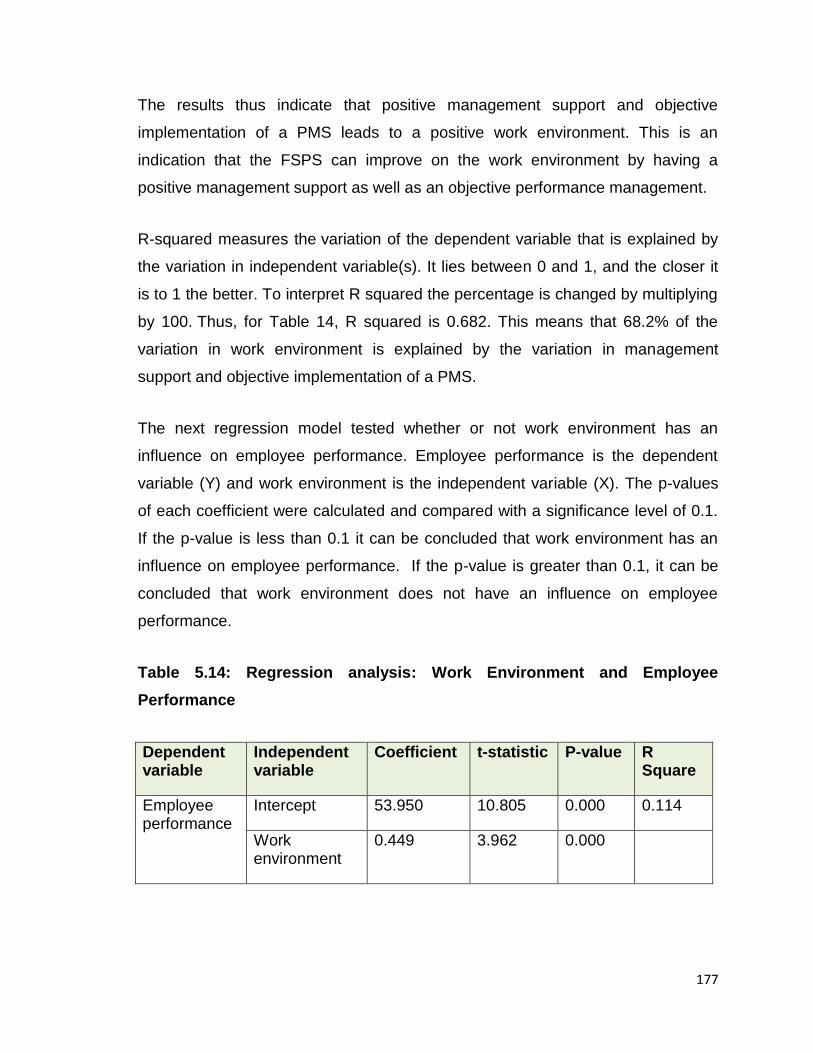
177
The results thus indicate that positive management support and objective
implementation of a PMS leads to a positive work environment. This is an
indication that the FSPS can improve on the work environment by having a
positive management support as well as an objective performance management.
R-squared measures the variation of the dependent variable that is explained by
the variation in independent variable(s). It lies between 0 and 1, and the closer it
is to 1 the better. To interpret R squared the percentage is changed by multiplying
by 100. Thus, for Table 14, R squared is 0.682. This means that 68.2% of the
variation in work environment is explained by the variation in management
support and objective implementation of a PMS.
The next regression model tested whether or not work environment has an
influence on employee performance. Employee performance is the dependent
variable (Y) and work environment is the independent variable (X). The p-values
of each coefficient were calculated and compared with a significance level of 0.1.
If the p-value is less than 0.1 it can be concluded that work environment has an
influence on employee performance. If the p-value is greater than 0.1, it can be
concluded that work environment does not have an influence on employee
performance.
Table 5.14: Regression analysis: Work Environment and Employee
Performance
Dependent variable
Independent variable
Coefficient t-statistic P-value R Square
Employee performance
Intercept 53.950 10.805 0.000 0.114
Work environment
0.449 3.962 0.000

178
The p-value for the coefficient of work environment (0.449) is 0.000, which is less
than 0.1. The coefficient of 0.449 means that if work environment become positive
by 1%, employee performance will become 0.449% more effective and efficient.
This means that positive work environment has a significant, positive effect on
effective and efficient employee performance. Therefore, the results indicate that
a positive work environment leads to positive employee performance.
R squared as in the above table is 0.114 which means that 11.4% of the variation
in employee performance can be explained by the variation in work environment.
This suggests that there are other variables that influence employee performance
that are not included in the model estimated and are therefore accounted for by
the 88.6%. That could be an item for future research to find out what other factors
influence employee performance in the FSPS.
Thus, based on the analysis above, the hypothesis which states that ‘the FSPS
employees (public servants) will give effective and efficient performance if their
managers are able to create and manage a positive work environment by
providing management support and by implementing the current performance
management system objectively’ is proven to be true.
5.6 CONCLUSION
Chapter five statistically analysed and interpreted the data collected through
questionnaires and focus interviews. The reliability of the questions was
established through Cronbach’s alpha method. Four variables including work
environment, management support, objective implementation of a PMS, and
employee performance were developed and were used to test the objectives and
the hypothesis. Conclusions were drawn on each objective and the hypothesis
after elaborate analysis and interpretation of results were discussed and reported.
The general analysis is that while managers gave themselves high scores for
management support and favourable work environment, employees gave
themselves high scores on their performance. This indicates that managers and
subordinates are living in their own separate worlds without understanding the
179
expectations and aspirations of one another, which needs to be managed to have
effective and efficient employee performance in the FSPS. The conclusions and
recommendations based on the findings of the study will be brought forward in the
next chapter (chapter 6).

180
CHAPTER 6
EFFECTIVE AND EFFICIENT EMPLOYEE PERFORMANCE
IN THE FREE STATE PUBLIC SERVICE:
RECOMMENDATIONS
6.1 INTRODUCTION
Chapter 6 focuses on presenting recommendations that answer the research
question, the aim and objectives and the hypothesis of the study. These
recommendations are based on chapters 1, 2, 3 and 5 of this thesis that deal with
the introduction, overview and demarcation of the study field (chapter 1), a
literature review on favourable work environment (chapter 2), a literature review
on employee performance management (chapter 3), as well as analysis,
interpretations and conclusions drawn from data collected through questionnaires
and focus group interviews (chapter 5).
Chapter 1 attempted to create a background for the study by highlighting the need
to study factors such as management support, objective employee performance
management, and favourable work environment as contributors to the effective
and efficient performance of employees in the FSPS. It elaborated on the need for
management of employees by those entrusted with the responsibility (managers)
through support and management of employee performance. This chapter also
discussed the impact of performance management as a management tool to
empower and motivate employees. It indicated the significance of creating a
favourable work environment through day-to-day management practices that use
employee potential and provide employee satisfaction towards contributing to
effective and efficient performance.
The recommendations discussed in this chapter therefore respond to the research
question, aim and objectives as well as the hypothesis as presented in chapter 1.
181
6.2 RECOMMENDATIONS: FAVOURABLE WORK ENVIRONMENT
(OBJECTIVE 1)
The conclusion drawn from the analysis and interpretation of data presented in
chapter 5 suggested a positive work environment in the FSPS, though not a
perfect one. In addition, the mean averages of the opinions and perceptions of
managers and subordinates indicated that managers think highly about the work
environment that they provide while subordinates are not as sure. A completely
positive work environment can be attained, and the divergence in the opinion
between managers and subordinates can be eliminated, by paying attention to the
recommendations given below as identified in the analysis of data collected for
questions that related to favourable work environment, focus group interviews and
the literature review. The recommendations derived from the analysis of the
questionnaires require managers to do the following:
create opportunities for the subordinates to attend training and development
programmes (at least one/year) relevant to their work;
provide equal and fair treatment to employees;
work on creating a better consultative work atmosphere by setting goals
together and encouraging participative decision making;
be readily available to support their subordinates;
ensure that subordinates have the necessary authority to do the work when
they are delegated responsibilities;
use and develop their subordinates’ full potential;
use every opportunity to appreciate and recognize their subordinates’
contribution so they get the feeling of achievement;
ensure that every employee has a written career plan;
develop the culture of showing respect to the subordinates;
cultivate mutual trust and a strong manager-employee relationship in the unit
demonstrate that they care about their subordinates;
create the feeling of togetherness; and
182
During the focus groups interviews both managers and subordinates
recommended equitable, fair and objective application of policies, rules and
regulations to create a favourable work environment. Subordinates further
recommended the following to improve the favourableness of the work
environment:
managers must practice fairness and equity;
managers must provide appropriate decision making opportunities to their
subordinates;
there must be career planning, and opportunities for career growth or
promotions;
performance must be linked to promotion or career progression;
managers must provide opportunities for their subordinates to attend training
programs to develop personally and professionally;
managers must adopt a management style that would positively drive the
commitment, professionalism and hard work of employees;
management, including top management, must be role models to the
employees;
there must be objective selection and recruitment processes that abide by
policies and procedures, and focus on appropriate skills and competencies;
individuals must be appointed in high positions based on their skills,
competencies and capabilities, as it is frustrating for employees to work for
managers who are not skilled, not knowledgeable and do not have the right
attitude;
employees need opportunities to grow in their jobs as opposed to placing
young inexperienced and incorrectly skilled personnel at high positions; and
internal promotion for at least levels 1-12 should be based on objective
performance assessment, as this will indicate to employees that they are
valued and cared for. This will increase their morale, commitment and
citizenship behaviour.

183
Managers in the focus groups recommended the following:
there must be organizational support to implement policies and procedures
so that managers can create a favourable environment;
managers must have appropriate delegated powers and sufficient resources;
there must be a functional organizational structure that clarifies roles and
responsibilities and channels of communication; and
new recruits must be allowed to grow in the system through appropriate
training, mentoring and coaching so that they develop the right skills,
knowledge and attitude, as it is frustrating for managers to manage efficient
and effective performance from their employees otherwise.
The detailed literature review presented in Chapter 2 of this thesis, which
elaborated on the importance of a favourable/positive work environment in
producing effective and efficient employee performance, has incorporated many
recommendations that can be used by the managers for the benefits of their work
environment. The chapter recommended that a favourable work environment be
the goal of all managers, as it motivates employees for better performance
through positively impacting on employee morale, productivity, the quality of work,
level of innovation, teamwork and the length of their employment with the
organization.
Other recommendations include the following:
managers’ actions must echo their words to instil trust and confidence in their
subordinates, and to prove that managers will do what they have promised
and that their intentions are sincere;
managers must show genuine appreciation for the employees’ achievement;
managers must design work in such a way that it becomes a source of pride
for employees; and
184
managers must provide the opportunity for their employees to ‘experience
the feel of success.
The literature review presented in this thesis further suggests that emulating
theories such as the Equity Theory and Reinforcement Theory can help managers
to create a favourable work environment. The application of the Equity Theory by
Adams helps managers to practice equity and fairness in their day to day
management. Managers can also use the Reinforcement Theory to contribute to a
positive work environment, as Reinforcement Theory helps them to understand
how an individual learns behaviour and how it can be moulded. An understanding
of the Reinforcement Theory will therefore help managers to reinforce the
desirable behaviour immediately so that the employee can link the reinforcement
to the acceptable behaviour, and strive to maintain the acceptable behaviour
which is effective and efficient performance. Furthermore, McGregor’s Theory X
and Y, which expands on manager’s assumptions about their subordinates, can
also help managers to adopt a suitable management style that would bring out the
best in their subordinates.
If the organization can support managers to implement the aforementioned
recommendations, managers will be able to create a workplace where employees
want to stay, grow and contribute their knowledge, experience and expertise to
the success of the organization.
6.3 RECOMMENDATIONS: MANAGEMENT SUPPORT (OBJECTIVE 2)
Objective 1.8.2 of Chapter 1 was meant to compare the perceptions of managers
about management support given to employees, and the expectations or
perceptions by employees about management support they receive from the
managers and establish whether management support contributes to the effective
and efficient performance of employees. This objective intended to formulate
recommendations to close the gap between the perceptions of managers and
subordinates if identified.
185
The analysis of the data collected, as explained in Chapter 5 of this thesis, shows
the status of management support in the FSPS. Though the analysis indicated a
good management support structure in the FSPS, it did not show a 100%
management support. It further showed a difference in the opinion between
managers and subordinates, indicating that managers perceive themselves to be
successful at management and in providing good management support. In
contrast, subordinates exhibited low opinions regarding the support given by the
managers.
This difference in perception needs to be managed, and the mean percentage of
management support must be raised to 100% to safely demonstrate that
management support in the FSPS is at the desired level, and that it manifests in
effective and efficient employee performance. Thus, recommendations from the
analysis of the questionnaires, focus group interviews as explained in Chapter 5,
and the literature elaborated on in chapters 2 and 3, can help managers to
improve their management support.
Based on the analysis of the data collected by the questionnaires, subordinates
have made recommendations stipulating that managers must show support by
means of the following:
practicing open communication;
giving prompt feedback;
providing adequate information on time;
honouring agreed upon commitments;
following up on deadlines;
being proactive;
giving support, guidance and direction;
encouraging team work;
making fair decisions;
protecting employees on work related matters;
186
being efficient and effective;
being a facilitator, teacher, and a coach;
encouraging continuous learning;
demonstrating that the subordinates are valued and respected;
encouraging participative decision making;
promoting ethical behaviour through actions;
encouraging best practices in the unit;
delegating work according to individual capabilities;
giving recognition for good work on time, every time; and
encouraging creativity and initiative.
The subordinates in the focus groups also recommended the following:
managers must have appropriate delegated powers to match authority and
responsibility to render them efficient and effective so that they can make the
right decisions at the right time; and
managers must have the necessary management skills, knowledge and
competencies so that they can provide adequate management support to the
subordinates.
The Managers in the focus groups recommended the following:
the organizational culture and environment needs to change first to enable
them to give necessary support to their subordinates.
The literature review in Chapter 2 provides the following recommendations on
how to improve management support, stipulating that managers must do the
following:
do their jobs conscientiously and meticulously;
be held accountable for their actions;

187
give their subordinates the opportunity to perform a wide range of challenging
and stimulating work;
breed innovation, enthusiasm, initiative and commitment amongst
employees;
be easy to work with, knowledgeable and competent;
be sincere;
demonstrate trust in their subordinates’ capabilities and potential;
be supportive, encouraging, interactive and engaging;
respect, value, care for, and treat employees as partners working together;
be exemplars;
display a positive attitude towards employees; and
provide open, safe, and welcoming environment in which employees are
encouraged to grow and learn.
Furthermore, managers are urged to study the implications of motivational
theories in work situations and implement them so that they can support their
subordinates to derive effective and efficient performance.
As such, managers must implement the following:
Maslow’s Theory to motivate employees by providing job security,
recognizing employees’ performance accomplishments, providing
opportunities to socialize, and providing opportunities for growth and
development. They must develop their employees to their full potential and
make the work more meaningful and challenging for them, as they seek
meaning and a sense of accomplishment in work irrespective of their skills,
knowledge and status;
Alderfer’s Theory to satisfy the three needs such as existence, relatedness,
and growth that can motivate employees to improve performance;

188
Herzberg’s Theory to provide their subordinates with the feeling of
achievement, recognition, an interesting and challenging job, and
opportunities to progress; and
McClelland’s Theory of Needs, including the need for achievement (nAch),
the need for power (nPow), and the need for affiliation (nAff), helps managers
to understand at what needs level their subordinates are, and then support
them to achieve those needs.
Thus, managers need to implement the above recommendations, so that they can
provide appropriate and timeous management support to derive effective and
efficient performance from employees.
6.4 RECOMMENDATIONS: OBJECTIVE PERFORMANCE MANAGEMENT
(OBJECTIVE 3)
The analysis of data, as presented in Chapter 5 of this thesis, has indicated
objective implementation of the current performance management system in the
FSPS, though not the best. The analysis further indicated a difference in the
opinions between managers and subordinates, as more managers compared to
subordinates believed that the PMS is implemented objectively in the FSPS.
Accordingly, it is recommended that managers use the PMS as suggested below
to make it more objective, as objective implementation of the PMS assists to
develop effective and efficient employee performance.
Analysis of the questionnaire recommends that managers must use the PMS to
do the following:
clearly define performance objectives and performance expectations (the
performance needed by the employees to achieve the defined objectives);
provide for fair performance assessment;
provide for fair performance rewards allocation;
provide for performance recognition;
189
provide for regular performance feedback;
achieve meaningful goals;
provide information on developmental needs;
motivate employees to perform efficiently and effectively;
reinforce good performance;
contribute to a positive work environment;
create happy and satisfied employees;
identify excellent performers; and
identify non-performers so that they can be helped to improve their
performance to standard.
The analysis of the questionnaires also recommended that managers work
towards the following:
rectifying the flaws in the implementation of the PMS;
changing the general negative attitude about the performance management
process that it is a burden and or just for compliance;
regaining the trust in the current performance management system; and
changing the negative perception about the fairness and objectivity in the
performance rewards allocation and improve the morale amongst employees.
The responses from the questionnaire further recommended that the following
conditions need to be satisfied for the PMS in the FSPS to be objective:
managers must be given a say in the final allocation of performance rewards;
there must be transparency in the allocation of performance rewards;
managers must be given the opportunity to verbally defend their
recommendations on performance ratings and rewards when the moderating
committee (higher committee) is not in agreement with the recommendations.
fair and objective distributive justice must be followed;
190
equal opportunity must be given to everyone to be considered for
performance rewards;
everyone who performs to specific criteria must be recommended for
performance rewards; and
the performance reward must reinforce the desired performance.
The questionnaires for both managers and subordinates further included
questions that sought recommendations for increased objectivity of the current
PMS in the FSPS, in order of importance. The respondents recommended the
following as the first 5 ways to ensure performance:
Fairness in the process of allocating rewards.
The immediate manager should be consulted if the moderating committee
feels the need to change the ratings and rewards recommendations.
Training on performance management should be done as a team to ensure a
uniform understanding of the process by all.
Assessment must be done by the individual, the manager, colleagues and
subordinates (360 degree).
Presence of an independent observer at the moderating committee sittings.
Though the data clearly demarcated the first 5 recommendations, the next 5
recommendations in the order of importance were as follows:
Publicly pronounce the recipients for performance rewards and the criteria
used (transparency).
Moderating committee must be external to the department so that the
decisions are made based purely on motivations provided in the performance
assessment form.
All heads of branches (Deputy Director Generals or Chief Directors) must be
part of the moderating committee.
191
Introduce non-monetary rewards such as complimentary letters, employee of
the week, month, annual awards.
The decision must be based purely on the recommendations by the
manager.
However, both groups recommended that rewarding the team instead of
individuals should not be considered an option for increasing the efficiency and
effectiveness of employee performance in the FSPS.
All 4 focus groups were very vocal on this topic, and raised the concern that the
implementation of the current performance management system needs to be
improved, and that it must be implemented as prescribed by the system to yield
the desired results. The subordinates’ focus groups recommended the following:
Top management must get involved to make a positive impact on the
objectivity of the PMS implementation.
There must be quality control at top management level on how the processes
are followed.
Assessment must be done objectively, fairly, systematically and regularly.
Managers must consider PM as their key responsibility.
Managers must discuss performance with their employees.
Managers and subordinates must change their attitude that the system is
followed purely for compliance.
Performance assessment ratings must be a true reflection of real
performance.
Transparency and objectivity must be maintained in awarding performance
rewards.
There must be consequences for non-performance to ensure the credibility of
PMS.
Below average performers must be managed (reprimanded/ trained/
mentored/ coached).
192
Managers must take responsibility for performance plans and performance
assessment.
Managers must not fear reprisals from subordinates for being objective in
their assessments and ratings.
Furthermore, Manager’s focus groups recommended the following:
Managers and their subordinates together as a team must be trained on the
PMS and its implementation, so that both the managers and subordinates
have the same understanding about the system which shall help to curb
employees’ unrealistic expectations for rewards. Currently the reality is that,
employees expect performance rewards for doing work at the expected level
for which they are paid a salary.
Rotational reward systems followed by some departments must be stopped
as they defeat the purpose of the PMS.
Managers must be supported to reward hard working and performing
employees.
The organizational culture must change for the PMS system to be objective
and 100% effective.
Managers must have a say in the final allocation of performance rewards
even when the moderating committee feels the need to cut down the number
of employees who would receive notch increases and cash bonuses.
Top management must give valid explanations to employees as to why they
did not qualify for rewards though their scores reflected performance above
normal requirements.
Performance assessment must be linked to other human resource activities
such as promotion and career growth, career planning, and succession
planning.
193
The literature review in chapters 2 and 3 affirms some of the above
recommendations as well as adds new recommendations. The literature endorses
that managers must use the PMS to do the following:
Manage employee behaviour and attitudes, and also create good
relationships between individuals and teams.
Open up channels of communication and facilitate ongoing communications
between employees and their immediate supervisors to establish priorities
and expectations and other elements that lead to effective and efficient
employee performance.
Facilitate a clear understanding on the meaning of a well performed job.
Establish the standards by which the job performance is assessed and
measured.
Identify the barriers that hinder performance and institute measures to
eliminate them.
Attract and retain skilled staff.
Provide information for other human resource functions.
Create the awareness that individual performance must not be left to chance,
but must be facilitated, supported and managed. Therefore, managers take
responsibility for performance management and the development of
employees, and this forms part of managers’ day to day management of their
subordinates.
Yield information about skills, abilities, promotional potential, and
performance histories of employees to be used in manpower planning as well
as in assessing training needs and evaluating performance achievements.
Establish a performance and learning culture in the Public Service.
Help both manager and subordinate to understand the significance of
performance management, how it is conducted in the organization, and what
influence it could have on the employee’s future and the performance of
individuals and organization.
194
Understand that behaviour is encouraged or discouraged depending on the
consequences attached to the behaviour, and therefore managers must not
reward mediocre or poor performance.
Ensure that performance is clearly linked to rewards and rewards have value
to employees.
Ensure that rewards are proportionate to the importance of the desired
behaviour.
A clear understanding and implementation of various motivation theories is also
recommended. Adams’ Equity Theory and Vroom’s Expectancy Theory are very
important in this instance. Managers must understand and implement Adams’
Equity Theory to do the following:
Ensure that there is fairness between efforts of employees and associated
rewards. Employees must also feel the fairness when they compare their
input outcome ratio with the input outcome ratio of relevant others.
Manage organizational justice to inculcate the feeling of equity and fairness
in employees, as organizational justice is a personal evaluation about the
ethical and moral standing of managerial conduct.
Refrain from making the mistake of assuming that employees will believe in
organizational justice if they receive desirable outcomes.
Understand that outcome favourability is different from outcome justice,
where outcome favourability is a judgment of personal worth or value and
outcome justice is a judgment of moral correctness.
Ensure the practice of distributive justice (perceptions of outcome) and
procedural justice (perceptions about the processes) – the two significant
dimensions of organizational justice.
195
Managers must understand and implement Vroom’s Expectancy Theory to do the
following:
Understand that the behaviour, though the individual’s decision, is influenced
by both internal (needs) and external (environment) factors.
Understand the strength of the individual’s expectations regarding the
outcome as well as the desirability and attractiveness of rewards.
Establish the performance-reward link and the effort-performance link.
Set attainable performance standards and provide the necessary support and
assistance in achieving these standards.
Ensure a clear link between rewards and set performance standards.
6.5 RECCOMMENDATIONS: EMPLOYEE PERFORMANCE (OBJECTIVE 4)
The analysis of the questions related to objective 1.8.4 (as stated in chapter 1),
that was intended to study managers’ and subordinates’ perceptions about
employee performance and to establish whether the 2 groups differ in their
perceptions, indicated positive employee performance in the FSPS, though not
100% effective as well as differences of opinions between managers and
subordinates. In this instance, employees scored a higher percentage, indicating
that they perceive their own performance to be excellent, whereas the manager’s
perceptions about the performance of their subordinates did not match.
Question number 13 on the questionnaire explicitly requested that the
respondents rank their recommendations regarding how performance can be
improved to be effective and efficient in the FSPS. However, the managers and
subordinates differed in ranking their recommendations. The five most important
factors according to the 2 groups are presented below.
196
Managers recommended the following in order of importance from 1 to 5:
1) An environment that develops employees’ knowledge, skills and potential.
2) Managers who have authority that matches their responsibility.
3) Fair, objective, equitable and transparent performance rewards.
4) Fair, equitable and transparent application of rules and procedures.
5) Sufficient resources.
Subordinates recommended the following in order of importance from 1 to 5:
1) Mutual trust and respect between management and employees.
2) An environment that develops employees’ knowledge, skills and potential.
3) Fair, equitable and transparent application of rules and procedures.
4) Sufficient resources.
5) Sufficient information.
In the focus groups the subordinates (100%) were also unanimous in that they
perform effectively and efficiently. The majority indicated that they go the extra
mile and beyond their job descriptions, without any prompting from their managers
to finish an assignment. They added that they work well as a team, are willing to
learn new things towards doing a better job, and always try to maintain a positive
attitude no matter how difficult the work environment is.
However, managers had a different opinion regarding employee performance.
One group of managers stated that 60% of employees work effectively and
efficiently, while another group indicated only 30%. The reasons for poor
performance attributed by managers included laziness, lack of commitment from
employees as well as a lack of employee skills, knowledge and attitude. This
197
coincides with Schein and Mc Gregor’s theories on assumptions managers make
about their subordinates.
Mc Gregor’s Theory X and Y described two types of employees. Managers who
believe in Theory X assume that employees are inherently lazy, do not like their
jobs and have no ambition. Such managers make assumptions about employees
without understanding them and try to manage them accordingly. This way of
management does not yield the desired outcomes for the following reason. As
employees differ in their nature and attitudes, and are complex and dynamic,
several needs operate at different levels of importance to them which change
according to time and situation.
As a result, employees react differently to management styles depending on their
own needs, goals, abilities, and the nature of their work at a given time. Therefore,
the recommendation is that, as there could never be one correct managerial
strategy/style that will work for all individuals at all times, managers should be able
to understand their employees, their strengths and weaknesses, capabilities and
shortcomings and develop appropriate management styles that will suit the
situation. Adopting Schein’s Theory on managerial assumptions such as the
social man assumption, the self-actualization assumption and complex man
assumption, as well as McGregor’s Theory Y, and Maslow’s Self-actualization
Level of Need Theory would assist managers to adopt a suitable management
style that would bring out the best in their employees.
A further recommendation from the literature review is that managers strive to
develop individual abilities and provide sufficient resources and ensure employees
are motivated, as effective and efficient performance is not a stand-alone factor
but a combination of those three factors. In addition, Managers must live up to
subordinates’ expectations and assumptions. As such, the literature review in
Chapter 2 suggests that managers satisfy the qualities that employees search for
in them and these qualities are incorporated in this chapter under various
198
objectives already. However, they are repeated to emphasize the importance in
deriving efficient and effective performance from FSPS employees.
The managers are expected to be:
easy going and fun to work with;
knowledgeable and competent;
exhibit sincere interest in their employees;
have trust in the capabilities and competencies of their employees;
believe in engaging with employees, and in relationship building;
supportive and encouraging;
interactive and engaging;
respect, value, care for, and treat employees as partners working
together towards common goals;
be exemplars, thus role models setting examples through words and
deeds, including those who display a positive attitude towards
employees;
providing employees with the opportunity and ability to perform a wide
range of challenging and stimulating work; and
breeding innovation, enthusiasm, initiative and commitment amongst
employees.
A lack of resources, less supportive organizational culture, systems and
procedures that are not fairly and equitably implemented, a lack of recognition and
appreciation for real performance, and ineffective organizational structures were
all again identified by focus groups as some of the deterrents to effective and
efficient employee performance. Rectification and proper management of these
negative factors could greatly improve FSPS employee performance.
199
6.6 RECOMMENDATIONS: HYPOTHESIS
Based on the analysis as presented in Chapter 5, the hypothesis stated in chapter
1 (the FSPS employees will be effective and efficient performers if their managers
are able to create and manage a positive work environment by providing
management support and by implementing the current performance management
system objectively) is proven to be true. However, an analysis of the managers’
and subordinates’ opinions regarding the creation of a favourable work
environment by managers, the management support given to subordinates,
objective implementation of the current PMS, and the perception on employee
performance, these variables are not sufficiently positive in the FSPS. Opinions
from managers and subordinates further suggested a difference in their
perceptions on the above mentioned variables. Therefore, recommendations
suggested earlier are applicable to improve the efficiency and effectiveness of
employee performance.
6.7 TOPICS FOR FUTURE RESEARCH
Based on the comments from the respondents, the following could be ideal topics
for future research.
Whether the FSPS’s organizational culture enables the managers to give
necessary management support to their subordinates.
Whether top management provides the necessary support to managers for
fair, equitable and objective implementation of the various policies in the
FSPS, which in turn enables managers to provide the necessary
management support to their subordinates.
Whether the organizational in the FSPS has any role in the objective
implementation of the PMS system in the FSPS.
Variables other than the positive work environment, management support and
objective implementation of PMS that contribute to effective and efficient
employee performance in the FSPS.
200
6.8 CONCLUSION
The call for a change in organizational culture, for a culture where rules and
regulations are adhered to as a precursor to effective and efficient employee
performance, was echoed clearly in the data collected. This can be a topic for
future research to establish how the organizational culture impacts on the
effective and efficient performance of employees. Instituting quality control
systems at top management level of the processes followed in the PMS was yet
another strong recommendation. The quality control system is expected to ensure
that supervisors and managers take responsibility for each and every step of the
PMS, starting from the performance plan, the performance assessment and
rewards, and corrective measures. The quality control system must ensure that
only effective and efficient performance is rewarded, and that poor performance
will never be rewarded. A further recommendation was that the PMS must link to
human resource processes such as career planning and career progression,
promotion, recruitment, selection and appointments.
Understanding and instituting the various motivational theories in the work
situation was a further recommendation, as those theories speak directly to the
critical variables in the study such as management support, work environment,
and objective implementation of the PMS and employee performance.
The analysis of the variables management support, work environment, objective
implementation of the PMS and employee performance assisted in testing the
hypothesis. Though the hypothesis is proven to be true, it must be borne in mind
that all the recommendations given above must be followed to ensure 100%
management support, a positive work environment and the objective
implementation of the PMS that would lead to 100% effective and efficient FSPS
employees.
201
BIBLIOGRAPHY
Abdullah, N.A. (2009). Performance Measurement in British Central Government.
Available from: [email protected]. (Accessed 18 October 2012).
Aguinis, H. (2009). Chapter 1: An Expanded View of Performance Management.
Available from:http://media.johnwiley.com.au/product_data/excerpt/21/04701923/
0470192321.pdf (Accessed 12 March 2013).
Akintayo, D. (March 2012). Working Environment, Workers’ Morale and Perceived
Productivity in Industrial Organizations in Nigeria. Education Research Journal
Vol. 2(3) pp. 87-93. Available from: http://www.resjournals.com/ERJ. (Accessed12
March 2013).
Amos,T., Ristow, A., & Ristow, L. (2004). Human Resource Management, 2nd
edn., Cape Town: Juta & Co. Ltd.
Anyim, C.F., Chidi, O.C., & Badejo, E.A. (January 2012). Motivation and
Employees’ Performance in the Public and Private Sectors in Nigeria.
International Journal of Business Administration, Vol. 3 (1), pp. 31-40. Available
from: http://www.sciedu.ca/journal/index.php/ijba/article/view/696/333 (accessed
12 March 2013).
Australian Bureau of Statistics. (2013). What are Variables. Available from:
http://www.abs.gov.au/websitedbs/a3121120.nsf/home/statistical+language+-
+what+are+variables (Accessed 13 December 2014).
Babbie, E. (2010). The Practice of Social Research, 12th edn., USA: Belmont.
Babbie, E. & Mouton, J. (2001). The Practice of Social Research, South African
edition. Cape Town: Oxford University Press.
202
Bailey, S (2012). Reasons: Why Performance Management Fails. Available from:
http://www.forbes.com/sites/sebastianbailey/2012/12/20/5-reasons-why-
performance-management-fails/ (Accessed 13 August 2013).
Bakotić, D. & Babić, T. (February 2013). Relationship between Working
Conditions and Job Satisfaction: The Case of Croatian Shipbuilding Company.
International Journal of Business and Social Science, 4:206. Available from:
ijbssnet.com/journals/Vol_4_No_2_February_2013/22.pdf. (Accessed 22February
2014).
Bell, R.L. & Martin, J.S. (2012). The Relevance of Scientific Management and
Equity Theory in Everyday Managerial Communication Situations. Journal of
Management Policy and Practice, 13(3):106-115. Available from:
http://papers.ssm.com/sol3/papers.cfm?abstractid=2372166. (Accessed 16 March
2013).
Bergh, Z., Theron A., Werner, A., Ngokha, G., May, M., Naidu, V. (2009).
Psychology in the work context, 4th edn., SA: Oxford university press.
Besdziek, D., Buccus, I., Daniel, J., Gumede, V., Hicks, J., Holtshausen, N.,
Jolobe, Z., Landsberg, C., Malherbe, R., Schoeman, M., Sadie, Y., Taljaard, R.,
Venter, A., & Zybrands, W. (2011). Government and Politics in South Africa, 4th
edn., Pretoria: Van Schaik Publishers.
Bhattacherjee, A. (2012). Social Science Research: Principles, Methods, and
Practices. Available from: http://scholarcommons.usf.edu/oa_textbooks/3
(Accessed 23 January 2014).
Boote, D.N. & Beile, P. (2005). Scholars before Researchers: On the Centrality of
the Dissertation Literature Review in Research preparation (Abstract). Educational
Researcher, 34(6):3–15. Available from: http://edr.sagepub.com/cqi/content/
abstract/34/6/3. (Accessed 30 March 2014).
203
Bourgon, J. (2005). Human Resources for Effective Public Administration in a
Globalized World. United Nations. Available from: unpan1.un.org/intradoc/
groups/public/documents/.../UNPAN021329.pdf. (Accessed 18 September 2015).
Boutellier, R., Gassmann, O., Raeder, S., & Zeschky, M. (2013). Research
Methodology, Topic 22, What is the purpose of regression and how is it done.
Available from: http://www.tim.ethz.ch/education/courses/ courses_fs_2013/
DocSem_Fall13/22_presentation. (Accessed 12 December 2014).
Brevis, T., Ngambi,H.C., Vrba,M.J., & Naickar, K.S. (2002). Management
Principles: A contemporary Edition for Africa, 3rd edn., South Africa: Juta & Co.
Ltd.
Brynard, P.A. & Hanekom, S.X. (2006). Introduction to Research in Management-
related Fields, 2nd edn. Pretoria: Van Schaik Publishers.
Burney, S.M.A. (2008). Inductive and Deductive Research Approach. Available
from: www.drburney.net. (Accessed 23 March 2014).
Callaghan, A.O. (2005). Performance Management: SDFs in the FASSET Sector,
Performance Management – An Introduction. Available from: www.fasset.org.za/
downloads/SDF9_article_performance_mangement.doc. (Accessed 18 March
2012).
Chabane, C. (2013). Questions from Delegates at the Government Leadership
Summit to Minister in the Presidency. Available from:
www.govsummit.gov.za/.../DPSA%20Minister%20Chabane%20Leadersh...
(Accessed 25 November 2013).
204
Chandrasekar, K. (2011). Workplace Environment and its Impact on
Organisational Performance in Public Sector Organisations. International Journal
of Enterprise Computing and Business Systems, 1(1):1-18. Available from:
http://www.ijecbs.com. (Accessed 12 January 2012).
Chaudhary, P. (2014). A Study over Expectancy Theory of Motivation in Small
Scale Industries in NCR. International Journal of Research & Development in
Technology and Management Science, 21(1):1-9. Available from:
http://www.ijrdtm.com. (Accessed 5 January 2015).
Cloete, J.J.N. (2012). South African Public Administrative Management, 10th
edn., Pretoria: Van Schaik Publishers.
Coan, G. (nd). How to Create a Positive Work Atmosphere. Available from:
http://www.selfgrowth.com/articles/how_to_create_a_positive_work_atmosphere.h
tml (Accessed 18 January 2013).
Cohen, L., Manion, L., & Morrison, K. (2007). Research Methods in Education, 6th
edn., New York: Routledge publishing.
Colquitt, J., Lepine, J.A., & Wesson, M.J. (2010). Organizational Behaviour:
Improving Performance and Commitment in the Workplace, 2nd edn., McGraw-
Hill Higher Education.
Creswell, J.W. (2006). Understanding Mixed Methods Research. Available from:
www.sagepub.com/upm-data/10981_Chapter_1.pdf . (Accessed 18 January
2012).
205
Creswell, J.W., Klassen, A., Plano Clark, V.L., & Smith, K.C. (2011). Best
Practices for Mixed Methods Research in the Health Sciences. Office of
Behavioural and Social Sciences Research (OBSSR), U.S department of Health &
Human Services. Available from: http://obssr.od.nih.gov/ mixed_methods_
research/pdf/Best_Practices_for_Mixed_Methods_Research.pdf (Accessed 23
March 2014).
Cropanzano, R., Bowen, E.D., & Gilliland, W.S., (2007). The Management of
Organizational Justice.: Academy of Management Perspectives. Available from:
http://www.wku.edu/cebs/doctorate/documents/readings /cropan zano etal_2007_
organizational_justice.pdf. (Accessed 16 March 2013).
Denhardt J. V., & Denhardt R. B., (2007). The New Public Service Expanded
Edition: Serving, not Steering. M.E.Sharpe , Inc. USA.
Department of Economic and Social Affairs. (2005). United Nations, World Public
Sector Report 2005: Unlocking the Human Potential for Public Sector
Performance. Available from: unpan1.un.org/intradoc/groups/ public/documents/
un/unpan021616.pdf . (Accessed 25 January 2011).
Department of Public Service and Administration. (1995). White Paper on the
Transformation of Public Service. Available from:
www.info.gov.za/whitepapers/1995 /transformation.htm. (Accessed 12 April
2012).
Department of Public Service and Administration. (1997). White Paper on Human
Resource Management in the Public Service, Staatskoerant, 31 December 1997
No. 13594 3.
Department of the Premier, Free State Province (2007). Free State Provincial
Growth and Development Strategy (FSGDS), Free State Provincial Government,
South Africa.
206
Department of the Premier, Free State Province. (2012). Draft Provincial Growth
and Development Strategy: Free State Vision 2030. Available
from:http://fspg.fs.gov.za/Premier/Documents/F/FSGDS%20Draft%2008%20May
%202012.pdf. (Accessed 14 December 2012).
Department of Performance Monitoring and Evaluation. (2012). Management
Performance Assessment Tool, State of Management Practices in the Public
Service. Available from: http://www.gov.za/sites/www.gov.za/files/MPAT%
20Report%202012_combined.pdf. (Accessed 27 August 2013).
Dessler, G., Barkhuizen,N., Bezuidenhout,A., De Braine,R., Du Plessis,Y., Nel,
P., Schultz,C., Stanz, K., & Van Der Walt, H. (2011). Human Resource
Management: Global and South African Perspectives. Cape Town: Pearson
Education South Africa.
de Vos, A.S., Strydom, H., Fouche, C.B., & Delport, C.S.L. (2011). Research at
Grass Roots for the Social Sciences and Human Service Professions, 4th edn.,
Pretoria: Van Schaik publishers.
Doody O, Slevin E, Taggart L. (August 2013). Focus group interviews part 3:
Analysis. MAG online library, British Journal of Nursing, 22(5):266-9. Available
from: http://www.magonlinelibrary.com/doi/abs/10.12968/bjon.2013.22.5.266?
url_ver=Z39.88-2003&rfr_id=ori:rid:crossref.org&rfr_dat=cr_pub%3dpubmed
(Accessed 13 March 2014).
Dutta,T. (2013). Research Design simplified. Available from:
www.slideshare.net/tanimaadutta/research-design-25329675. (Accessed 13
March 2014).
207
Eiselen, R.J. & Uys, T. (2005). Questionnaire Design. (adapted from: Eiselen, R.,
Uys, T., Potgieter, N. (2005).Analysing survey data using SPSS13: A workbook) :
University of Johannesburg. Available from:
http://www.uj.ac.za/EN/postgrad/pgh/Statkon/Documents/Statkon%20Questionair
e%20Design.pdf (Accessed 13 April 2014).
Encyclopedia of Management, (2009). Reinforcement Theory. Available from:
http://www.encyclopedia.com/doc/1G2-3273100250.html. (Accessed 14 March
2014.
Esu. B.B. & Inyang, B.J. (2009). A Case for Performance Management in the
Public Sector in Nigeria. International Journal of Business Management, 4(4):98-
105. Available from: http://www.ccsenet.org/journal/index.php/ijbm/article/viewFile
/1182/1135. (Accessed 23 July 2013).
Forbes, D.A. (2012). What is a p vlaue and what does it mean: Research made
simple. Journal of Evidence Based Nursing, 15(2). Available from:
http://ebn.bmj.com/content/15/2/34.extract, accessed on 8/01/15. (Accessed 12
March 2013).
Fox, W. & Bayat, M.S. (2007). A Guide to Managing Research. Cape Town: Juta
& Co Ltd.
Free State Provincial Government, (2001). Policy Framework: performance and
development management system levels 1-12, Available from:
http://fspg.fs.gov.za. (Accessed 16 July 2012).
Ghazanfar, F., Chuanmin, S., Khan, M.M., & Bashir, M. (January 2011). A Study
of Relationship between Satisfaction with Compensation and Work Motivation.
International Journal of Business and Social Science, 2(1):120-131. Available
from: www.ijbssnet.com/journals/Vol._2_No._1%3B_January.../ 11.pdf. (Accessed
3 April 2013).
208
Gildenhuys, J.S.H. (2004). The Philosophy of public administration, a Holistic
Approach. An introduction for undergraduate students, Stellenbosch: Sun Press.
Girish, K.J; 2012, Research Methodology in Ayurveda: Introductory Note.
Available from: http://www.ayurvedahealthcare.info/sites/default/ files/images/
Dr%20Girish%20KJResearch%20Methodology%20in%20Ayurveda%20-%20An
%20introduction.pdf (Accessed 12 December 2014).
Golafshani, N. (2003). Understanding Reliability and Validity in Qualitative
Research. The Qualitative Report Journal, 8(4):597-607. Available from:
http://www.nova.edu/ssss/QR/QR8-4/golafshani.pdf. (Accessed 28 March 2014).
Good, D.A. & Carin, B. (2004). Individual and Organizational Performance
Arrangements. Available from: http://www.docstoc.com/docs/32455834/
Individual-and-organizational performance-arrangements. (Accessed 18 March
2011).
Greenberg, J. (2005). Managing Behavior in Organizations, 4th edn., Pearson
New Jersey: Prentice Hall.
Greener, S. (2008). Business Research Methods, Ventus Publishing Aps. London:
Bookboon.
Grobler, P.A., Wärnich, S., Carrell, M.R., Elbert, N.F., & Hatfield, R.D. (2011).
Human Resource Management in South Africa, 4th edn., EMEA: Cengage
Learning.
Hassan, A. (July 2002). Organizational Justice as a Determinant of Organizational
Commitment and Intention to Leave. Asian Academy of Management Journal,
7(2):55–66. Available from: http://web.usm.my/aamj/7.2.2002/AAMJ%207-2-4.pdf.
(Accessed 3 June 2013).
209
Hellriegel, D., Jackson, E.S., Slocum, J., Staude, G., Amos, T., Klopper, H.B.,
Louw, L., & Oosthuizen, T. (2008). Management, 3rd edn., South Africa: Oxford
university press.
Hewitt, A. (2015). Say, Stay, or Strive: Unleash the Engagement Outcome You
Need. Available from: http://www.aon.com/attachments/human-capital-
consulting/2015-Drivers-of-Say-Stay-Strive.pdf. (Accessed 1 October 2015).
Hindle, T. (2008). Guide to Management Ideas and Gurus. The Economist.
Available from: http://www.economist.com/contact-info. (Accessed 3 April 2012).
Howitt, D. & Cramer, D. (2011). Introduction to Research Methods in Psychology,
3rd edn. England: Pearson Education Limited.
Hood, C. (1991). Public Management for All Seasons. Journal of Public
Administration, Vol. 69 :3-19. Available from: www.ipf.se/static/files/12/hood_
the_paper.pdf. (Accessed 18 September 2015).
Hurley, T., Kliebenstein, J., Orazem, P., & Miller, D. (2005). Work Environment:
Job Satisfaction Top Employee Priority Lists. Available from:
www.econ.iastate.edu/faculty/orazem/porksatis_2005.pdf. (Accessed 6 June
2013).
Indiana University Human Resources. (2006). Performance Feedback. Available
from: www.indiana.edu › ... ›. (Accessed 14 March 2013).
Johnson, J.S. (2007). Organizational Justice, Moral Ideology and Moral
Evaluation as Antecedents of Moral Intent. Virginia: Virginia Polytechnic Institute
and State University. Available from: scholar.lib.vt.edu/theses/available/etd-
04202007.../JSJohnson.pdf. (Accessed 14 March 2013).
210
Kabir, N.M.M. & Mahamuda, M.P. (December, 2011). Factors Affecting Employee
Job Satisfaction of Pharmaceutical Sector. Australian Journal of Business and
Management Research, 1(9):113-123. Available from: www.ajbmr.com/articlepdf/
AJBMR_19_23i1n9a13a.pdf. (Accessed 18 March 2013).
Karim, R. (2012). Creating Healthy Workplace Environment. Available from:
http://writing.wikinut.com/Creating-healthy-workplace-environment/1zuuqbl_/.
(Accessed 11 May 2014).
Katsamunska, P. (2012). Classical and Modern Approaches to Public
Administration. Economic Alternatives, issue 1, 2012. P.74-81. Available from:
http://www.unwe.bg/uploads/Alternatives/BROI_1_ECONOMIC_ALTERNATIVES
_ENGLISH_2012-06.pdf. (Accessed 26 September 2015).
Kaur, A. (2013). Maslow’s Need Hierarchy Theory: Applications and Criticisms,
Global Journal of Management and Business Studies, 3(10):1061-1064. Available
from: http://www.ripublication.com/gjmbs.htm. (Accessed 18 June 2014).
Kauzya, J. M. (2002). Approaches, Processes and Methodologies for
Reconstructing Public Administration in Post-conflict Countries. 4th Global Forum
on Reinventing Government: Capacity Development Workshops Marakkech,
Morocco. Available from: http://unpan1.un.org/intradoc/
groups/public/documents/un/unpan007003.pdf. (Accessed 25 September 2015).
Kelman, S. & Friedman, J.N. (2009). Performance Improvement and Performance
Dysfunction: An Empirical Examination of Distortionary Impacts of the Emergency
Room Wait-Time Target in the English National Health Service. Journal of Public
Administration Research and Theory, 19(4):917-946. Available from:
http://jpart.oxfordjournals.org/content/19/4/917.abstract% 20(GATED). (Accessed
18 June 2014).
211
Khan, A. (2012). Rating Errors in Human Resource Performance Management
system. Instructor-College of Business & Economics, United Arab Emirates
University. Available from: http://www.indianmba.com/ Faculty_Column/
FC1460/fc1460.html. (Accessed 18 June 2014).
Kothari, C.R. (2004). Research Methodology, Methods and Techniques, 2nd edn.,
New Delhi: New Age International (P) Ltd.
Krishnaswamy, K.N., Sivakumar, A.I., & Mathirajan, M. (2006). Management
Research Methodology: Integration of Methods and Techniques. Delhi: Dorling
Kindersley.
Kumari, N. (2011). Job Satisfaction of Employees at the Workplace. European
Journal of Business and Management, 3(4):11-30. Available from: www.iiste.org.
(Accessed 18 March 2013).
Lambert, G.E. & Hogan, L.N. (2011). Association between Distributive and
Procedural Justice and Life Satisfaction among Correctional Staff. Professional
Issues in Criminal Justice, 6(3)(4):31-42. Available from:
https://kucampus.kaplan.edu/DocumentStore/Docs11/pdf/CJ/PICJ/PICJ_V6N3_4
_Lambert_31_42.pdf. (Accessed 22 June 2014).
Leblebici, D. (2012). Impact of Workplace Quality on Employee’s Productivity:
Case Study of a Bank in Turkey. Journal of Business, Economics & Finance,
1(1):pp.38-49. Available from http://sosyalbilimler.okan.edu.tr/ media/06/
50ed303d150ba0f350000006/4-Demet_Leblebici.pdf .(Accessed17January2013).
Lee, C., Scheunemann, J., Hall, R., Payne, L. (2012). Low Staff Morale &
Burnout: Causes & Solutions. Office of Recreation & Park Resources, Department
of Recreation: Sport & Tourism, University of Illinois. Available from:
https://illinois.edu/lb/files/2012/06/01/39974.pdf. (Accessed 28 March 2013).
212
Legget, A.N. (2011). Constructs, Variables and Operationalization. Available from:
anleggett.weebly.com/.../7_5_constructs_variables_and_operationalizatio...
(Accessed 18 January 2014).
Lench, H. (2010). t test for independent samples. Available from:
heatherlench.com/wp content/uploads/2010/.../5-Independent-T-Test.pdf.
(Accessed 27 October 2014).
Locke, A.E. & Latham, P.G. (2006). New Directions in Goal-Setting Theory.
Current Directions in Psychological Science, 15(5):265-268. Available from:
cdp.sagepub.com/content/15/5/265.abstract. (Accessed 14 August 2013).
Lunenburg, F.C. (2012). Performance Appraisal: Methods and Rating Errors.
International Journal of Scholarly Academic Intellectual Diversity, 14 (1), pp:1-9.
Available from: www.nationalforum.com/.../Lunenburg,%20Fred%20C.%20
Performance... (Accessed 19 July 2013).
Mafini, C. & Pooe, D.R.I. (2013). The relationship between employee satisfaction
and organizational performance: Evidence from a South African government
department. SA Journal of Industrial Psychology/SA Tydskrif vir Bedryfsielkunde,
39(1):9. Available from: http://dx.doi.org/10.4102/ sajip.v39i1.1090. (Accessed 14
January 2014).
Mandela, R.N. (1999). ‘Closing Address by President Nelson Mandela in the
debate on the State of the Nation Address’. Available from: www.gov.za/speeches
/son/index.html . (Accessed 16 April 2011).
Marczyk, G., DeMatteo, D., & Festinger, D. (2005). Essentials of Research
Design and Methodology. New Jersey: John Wiley & Sons.
213
Massachusetts Institute of Technology (MIT), (nd), Personnel Policy Manual:
Performance Feedback, Performance Reviews and Corrective Action. Available
from: Hrweb.Mit.Edu/Policy/3-3. (Accessed 14 August 2013).
Mathison, D.L., & Vinja, V.N. (December 2010). The Annual Performance Review
as a Positive source for Employee Motivation. Journal of Business & Economics
Research, 8(12):111-120. Available from: journals.cluteonline.com/index.php/
JBER/article/download/787/771. (Accessed 22 April 2012).
Matshiqi, A. (2007). Public Service Performance: Towards a better life for all.
Policy: issues and actors, Vol. 20(5), pp1-25. Available from:
http://cps.org.za/cps%20pdf/pia20_5.pdf. (Accessed 20 December 2011).
Meyer, M. & Kirsten, M. (2005). Introduction to Human Resource Management.
Claremont: New Africa Books (Pty) ltd.
Mbeki, T. (2004, 2006). State of the Nation address by the President of South
Africa, Thabo Mbeki, to the Joint Sitting of the Houses of Parliament, Cape Town.
Available from: www.dfa.gov.za/docs/speeches/mbeki.htm. (Accessed 22 October
2012).
McLeod, S. (2007). Skinner - Operant Conditioning. Available from:
http://www.simplypsychology.org/operant-conditioning.html. (Accessed 8 January
2015).
McPheat, S. 2010. Performance Management, MTD Training and Ventus
Publishing, ApS. UK.
Merriam Webster Learner’s Dictionary, An Encyclopaedia Britannica Company
(2015: np). Available from: http://www.learnersdictionary.com/definition/
subordinate (Accessed 12 April 2015).
214
Minnaar, F. & Bekker, J.C.O. (2005).Public management in the information age.
Pretoria: Van Schaik.
Mol, A. (2012). Creating Winners in the Workplace. Vereeniging: Christian Art
Publishers.
Nel, P., Werner, A., Poisat, P., Sono, T., Du Plessis, A., Ngalo, O., Van Hoek, L. &
Botha, C. (2011). Human Resource Management, 8th edn. South Africa: Oxford
University Press.
Nel, P.S., van Dyk, P.S., Haasbroek, G.D., Schultz, H.B., Sono, T.J., & Werner, A.
(2004). Human Resource Management, 6th edn. South Africa: Oxford University
Press.
Nel, P.S., Werner, A., Botha, C., Du Plessis, A., Mey, M., Ngalo, O., Poisat, P.,
Van Hoek, L. (2014). Human Resource Management, 9th edn. South Africa:
Oxford University Press.
Neville, C. (2007). Introduction to Research and Research Methods. Available
from: www.brad.ac.uk/.../Introduction-to-Research-and-Research-Methods.pdf .
(Accessed 16 March 2014).
Ngambi, H.C. (February 2011). The Relationship between Leadership and
Employee Morale in Higher Education. African Journal of Business Management,
5(3):762-776. Available from: http://www.academicjournals.org/AJBM. (Accessed
11 February 2012).
Noe, R.A., Hollenbeck, J.R., Gerhart, B., & Wright, P.M. (2011). Fundamentals of
Human Resource Management, 4th edn. Available from:
wweb.uta.edu/management/Wilensky/Fall2012/.../Chap008.ppt . (Accessed 12
January 2012).
215
Nyanjui, P.J. (2013). Introduction to Research. Kenya Institute of Education.
Available from: http://wikieducator.org/Research. (Accessed 2 December 2014).
Office of Financial Management, State of Washington (2014). Performance
Measure Guide. Available from: http://www.ofm.wa.gov/budget/instructions/
other/performancemeasureguide.pdf. (Accessed 18 January 2015).
Opu, S (January, 2008). Motivation and Work Performance: Complexities in
Achieving Good Performance Outcomes; a Study Focusing on Motivation
Measures and Improving Workers Performance in Kitgum District Local
Government. Human Resources and Employment (HRE). Available from:
http://hdl.handle.net/2105/7011. (Accessed 14 August 2013).
Oracle White Paper, (2012). Goal Setting: A Fresh Perspective. Available from:
http://www.oracle.com/us/media1/goal-setting-fresh-perspective-ee-1679275.pdf.
(Accessed 12 June 2014).
Paile, NJ. ( 2012). Staff Perceptions on the Implementation of a Performance
Management and Development System: Father Smangaliso Mkhatswa Case
Study. South Africa: University Of South Africa. Available from:
uir.unisa.ac.za/bitstream/handle/10500/7655/disertation_paile_nj.pdf?...
(Accessed 14 March 2013).
Parisi-Carew, E. & Guthrie, L. (2009). Creating a Motivating Work Environment.-
The Ken Blanchard Companies. Available from:
http://www.kenblanchard.com/img/pub/blanchard_creating_a_motivating_work_en
vironment.pdf (Accessed 11 January 2012).
Patidar, J. (2013). Research Approaches and Design. Introduction to research
design. Available from: http://www.slideshare.net/drjayeshpatidar/introduction-to-
research-design?related =1. (Accessed 13 March 2014).
216
Public Service Commission (2002). Explanatory Manual on the Code of Conduct
for the Public Service: A Practical Guide to Ethical Dilemmas in the Workplace.
Available from: http://www.psc.gov.za/documents/docs/guidelines/
Explanatory%20Manual%20on%20the%20Code%20of%20Conduct%20for%20th
e%20Public%20Service.pdf. (Accessed 4 March 2012).
Public Service Co-Ordinating Bargaining Council (Resolution 10 of 1999). Adoption of
Incapacity Code and Procedures. Available from: http://www.dpsa.gov.za/
dpsa2g/documents/pscbc/1999/10.PDF (Accessed 14 August 2013).
Public Service Coordinating Bargaining Council, (Resolution No3 of 1999).
Agreement on Remunerative Allowances and Benefits. Available from:
http://www.pscbc.org.za/wp-content/uploads/Res-3-of-1999.pdf (Accessed 14
August 2013).
Rabiee, F. (November 2004). Focus Group Interview and Data Analysis.
Cambridge Journal, 63(4):655-660. Available from: journals.cambridge.org/
abstract_S0029665 104000874. (Accessed 23 March 2014).
Rajasekar, S., Philominathan, P., & Chinnathambi, V. (2013). Research
Methodology. Available from: arxiv.org/pdf/physics/0601009. (Accessed 1January
2014).
Readers Digest Illustrated Oxford Dictionary, 1998, Dorling Kindersley Limited
(London), Oxford University Press (Oxford) and Readers Digest Association
South Africa (Cape Town)
Republic of South Africa. (1994). Public Service Act (No. 103 of 1994), National
Gazette No. 15791, South Africa.
217
Republic of South Africa. (1996). Constitution of the Republic of South Africa.
Available from: www.gov.za/documents/constitution/1996/a108-96.pdf.
(Accessed 12 February 2011).
Republic of South Africa. (1998). Skills Development Act (No. 97 of 1998).
Available from: www.gov.za/documents/download.php?f=70755. (Accessed 12
February 2011).
Republic of South Africa. (1999). Skills Development Levies Act (No. 9 of 1999).
Available from: www.labour.gov.za/.../acts/skills-development/skills-development-
levies-... (Accessed 12 February 2011).
Roberts, P., Priest, H., & Traynor, M. (July 2006). Reliability and Validity in
Research. Nursing Standard, 20(44):41-45. Available from: rcnpublishing.com/
doi/pdfplus/10.7748/ns2006.07.20.44.41.c6560. (Accessed 18 January 2014).
Royal Melbourne Institute of Technology (RMIT). (2014). Literature Review.
Available from: www.rmit.edu.au/library/literature/review . (Accessed 23 March
2014).
Rubin, A. (2012). Statistics for Evidence-Based Practice and Evaluation. 2nd
edition. Available from: https://books.google.co.za/books?isbn=0840029144.
(Accessed 26 October 2014).
Rumsey, D.J. (2011). What a p-Value Tells You about Statistical Data, Statistics
For Dummies, 2nd edn., http://www.dummies.com/how-to/content/what-a-pvalue-
tells-you-about-statistical-data.html. (Accessed 26 January 2015).
Rumsey, D.J. (2015). How to Interpret a Correlation Coefficient r: Statistics For
Dummies, 2nd edn., Available from: http://www.dummies.com/how-
to/content/how-to-interpret-a-correlation-coefficient-r.html. (Accessed 26 January
2015).
218
Ruth, A.M., Crawford, C., Wysocki, A.F., & Kepner, K.W. (2012). Creating a
Positive Workplace for your Associates. Florida: Institute of Food and Agricultural
Sciences, University of Florida. Available from: edis.ifas.ufl.edu/hr012. (Accessed
18 January 2013).
Sageer, A., Rafat, S., & Agarwal P. ( Sept- Oct 2012). Identification of Variables
affecting Employee Satisfaction and their Impact on the Organization.
International Organization of Scientific Research Journal of Business and
Management ((IOSR-JBM), 5(1) pp 32-39. Available from: www.iosrjournals.org
(Accessed 15 March 2013).
Saks, M.A. (2006). Antecedents and Consequences of Employee Engagement.
Journal of Managerial Psychology, 21(7):pp 600-619. Available from:
www.emeraldinsight.com/0268-3946.htm. (Accessed 12 March 2012).
Santos, J.R.A. (1999). Cronbach's Alpha: A Tool for Assessing the Reliability of
Scales. Journal of Extension, 37(2): Available from:
http://www.joe.org/joe/1999april/tt3.php?ref. (Accessed 28 October 2014).
Saravanja , M; 2011, 10 Reasons Why Performance Management Fails and how
to remedy them. Regenesys Business School, Sandton, Johannesburg. Available
from: http://regenesys.co.za/2011/03/10-reasons-why-performance-management-
fails-and-how-to-remedy-them/. (Accessed 14 December 2014.
Scarlett, B. (June 2013). Paper C03, Fundamentals of Business Mathematics,
Financial Management. Available from: http://www.cimaglobal.com/
Documents/Student%20docs/2010%20syllabus%20docs/P1/C03_Correlation%20
Analysis.pdf. (Accessed 12 January 2015).
Scarlett, B. (June 2013). Back to basics – the use of Regression Analysis in
Management Accounting. Velocity, the e magazine for Chartered Institute of
Management Accountants (CIMA) students. Available from:
219
http://www.cimaglobal.com/Students/Student-e-magazine/Velocity-June-2013/
C03-Back-to-basics--the-use-of-regression-analysis-in-management-accounting/.
(Accessed 12 January 2015).
Schein, E. H. (2004). Organizational Culture and Leadership, 3rd edn. John Wiley
& Sons, Inc. USA.
Seidenfeld, (2013). Using Positive Reinforcement in Employee Motivation.
Forensic on the Scene and in the Lab Magazine. Available from:
www.forensicmag.com/articles/.../using-positive-reinforcement-employe...
(Accessed 6 October 2014).
Senyucel, Z. (2009). Managing Human Resources in the 21st Century, London:
Ventus Publishing ApS.
Shahu, R. (2011). Study and Analysis of Employee Morale and its relationship
with Performance, Work life and Home. International journal of management
research and review, 1(2):50-63. Available from: http://ijmrr.com/admin/
upload_data/journal_rashmi%205.pdf. (Accessed 6 October 2014).
Singh, Y.K. (2006). Fundamentals of Research Methodology and Statistics. New
Delhi: New Age International (P) Ltd.
Smit, P.J., Cronije, G.J., Brevis, T., & Vrba, M.J. (2011). Management Principles,
A contemporary edition for Africa, 5th edn., Claremont: Juta & Co. Ltd.
Society for Human Resource Management (SHRM) Research Quarterly (2010).
Motivation in Today’s Workplace: the Link to Performance. Available from:
http://www.shrm.org/research/articles/articles/documents/10-0235%20research
%20 quarterly-q2-fnl.pdf. (Accessed 31 October 2014).

220
Solidarity Research Institute. (2010). Skills Shortage in South Africa: Summary of
facts per sector regarding this issue. Available from:
www.solidarityresearch.co.za/.../2010/.../16-Skills-Shortage-in-South-Afr...
(Accessed 12 April 2012).
Sourabh; Jake; Minjeong; Diemand, Connor; Berdine, Currin; Kumar Nikhil (MSG
Experts), 2013, Reinforcement theory of motivation, Management Study Guide,
(MSG): Available from: www.managementstudyguide.com/ reinforcement-theory-
motivation.htm. (Accessed 14 August 2014).
South African Government News Agency. (2013). National School of Government
Officially Unveiled. Available from: SAnews.gov.za. (Accessed 24 September
2014).
Spratt, C., Walker, R., & Robinson, B. (2004). Mixed research methods: Module
A5, Practitioner Research and Evaluation Skills Training in Open and Distance
Learning (PREST), Commonwealth of Learning. Available from:
http://hdl.handle.net/123456789/346. (Accessed 16 March 2014).
Sridevi M.S., & Markos, S. (2010). Employee Engagement: The Key to Improving
Performance. International Journal of Business and Management, 5(12):89-96.
Available from: http://www.myopinionatbesix.com/BesixSurvey/ media/Besix-
Survey/pdf/4.-Employee-engagement-The-Key-to-Improving-Performance.pdf.
(Accessed 22 September 2013).
Sundaray, B.K. (2011). Employee Engagement: A Driver of Organizational
Effectiveness. European Journal of Business and Management, 3(8):53-59.
Available from: www.iiste.org. (Accessed 22 September 2013).
Swanepoel, B.J., Erasmus, B.J., & Schenk, H.W. (2008). South African Human
Resource Management: Theory and Practice, 4th edn. Cape Town: Juta & Co. Ltd.
221
Tanner, R. (2014). Equity Theory – Why Employee Perceptions about Fairness do
Matter. Available from: http://managementisajourney.com/equity-theory-why-
employee-perceptions-about-fairness-do-matter/. (Accessed 14 January 2015).
Tavakol, M., & Dennick, R. (2011). Making sense of Cronbach alpha.
International. Journal of Medical Education, 2:53-55, Available from:
http://www.ijme.net/archive/2/cronbachs-alpha.pdf. (Accessed 28 October 2015).
Tella, A., Ayeni, C.O., & Popoola, S.O. (April 2007). Work Motivation, Job
Satisfaction, and Organisational Commitment of Library Personnel in Academic
and Research Libraries in Oyo State, Nigeria. Library Philosophy and Practice (e-
journal), 1-17. Available from: http://digitalcommons.unl.edu/libphilprac/118.
(Accessed 19 September 2012).
Tewksbury, R. (2009). Qualitative versus Quantitative Methods: Understanding
Why Qualitative Methods are Superior for Criminology and Criminal Justice.
Journal of Theoretical and Philosophical Criminology, 1(1):38-58. Available from:
jtpcrim.org/January.../Qualitative_Vs_Quantitave_Richard_Tewksbury.p.
(Accessed 8 January 2014).
The Bill of Rights of the Constitution of the Republic of South Africa, 1996,
Government Gazette. (No 17678).
The Massachusetts Institute of Technology (MIT). (n.d.). Personnel Policy
Manual: Performance Feedback, Performance Reviews and Corrective Action.
Available from: Hrweb.Mit.Edu/Policy/3-3. (Accessed 14 September 2013).
Thornhill,C., and van Dijk, G. (2010). Public Administration Theory: Justification
for Conceptualization. Journal of Public Administration, Vol 45 no 1.1 pp. 95-110.
Available from: http://repository.up.ac.za/bitstream/handle/2263/14976/
Thornhill_Public(2010).pdf?sequence=1. (Accessed 2 October 2015).
222
Transport Distribution Training South Australia (TDTSA). (2008). Providing
Feedback and Addressing Performance Concerns. Available from:
www.skills.sa.gov.au/dmx?Command=Core...EntryId. (Accessed 14 September
2013).
Uduji. I.J. (2013). Positive Reinforcement: A Conditional Link to a Functional
Salesforce Behaviour. International Institute for Science, Technology & Education:
Accelerating Global Knowledge Creation and Sharing, 3(8): pp139-149. Available
from: www.iiste.org/Journals/index.php/DCS/article/ download/7068/7220.
(Accessed 7 January 2014).
United Nations Development Programme, 2009, Handbook on Planning,
Monitoring and Evaluating for Development Results. Available from:
Www.Undg.Org/Docs/11653/UNDP-PME-Handbook-(2009).Pdf. (Accessed 14
November 2013)
U.S Office of Personnel Management. (n.d). Performance management: overview
and history. Available from: https://www.opm.gov/policy-data-oversight/
performance-management/overview-history/ (Accessed 7 January 2015).
Van Der Westhuizen, E., & Wessels, J., (Editors), Swanepoel, B.,Erasmus, B.,
Van Wyk, M., Schenk ,H., (Contributors), 2011. South African Human Resource
Management For The Public Sector, 2nd Edition, Juta & Co Ltd, South Africa.
van Fleet, D.D., Ricky, W., & Griffin, R.W. (2006). Dysfunctional Organization
Culture: The Role of Leadership in Motivating Dysfunctional Work Behaviours.
Journal of Managerial Psychology, 21(8):698-708. Available from:
http://www.parsproje.com/tarjome/modiriyat/26.pdf. (Accessed 26 November
2013).
223
Van Aswegen, S.(Editor). (2012). Introduction To Human Resource Management:
Fresh Perspectives, 2nd edn., South Africa: Pearson Education South Africa (Pty)
Ltd.
Victorian Public Sector Commission, (2014). Australia: Supporting Government,
Serving Victorians. Available from: http://www.ssa.vic.gov.au/behaviours-aamp-
culture/positive-work-environment.html. (Accessed 28 December 2014).
Welman, C., Kruger, F., & Mitchell, B., 2005, Research Methodology, 3rd edn.,
Southern Africa: Oxford University Press.
Werner, A.,(ed), Bagraim, J., Cunningham, P., Landman, E.P., Potgieter, T.,
Viedge, C., 2011, Organizational Behavior: A contemporary South African
Perspective, 3rd edn., Pretoria: Van Schaik Publishers.
Wilson, W. (1887). The Study of Administration. Political Science Quarterly, Vol.
2, No. 2 (Jun., 1887), pp. 197-222 Published by: The Academy of Political
Science. Available from: http://www.commentary.com/admin_thoughts_ 1887.pdf.
(Accessed 18 September 2015)
Zuma, J.G. (2009, 2010). ‘State of the Nation Address by His Excellency JG
Zuma, President of the Republic of South Africa, at the Joint Sitting of Parliament,
Cape Town’. Available from: www.gov.za/speeches/son/index.html (Accessed 14
August 2011).
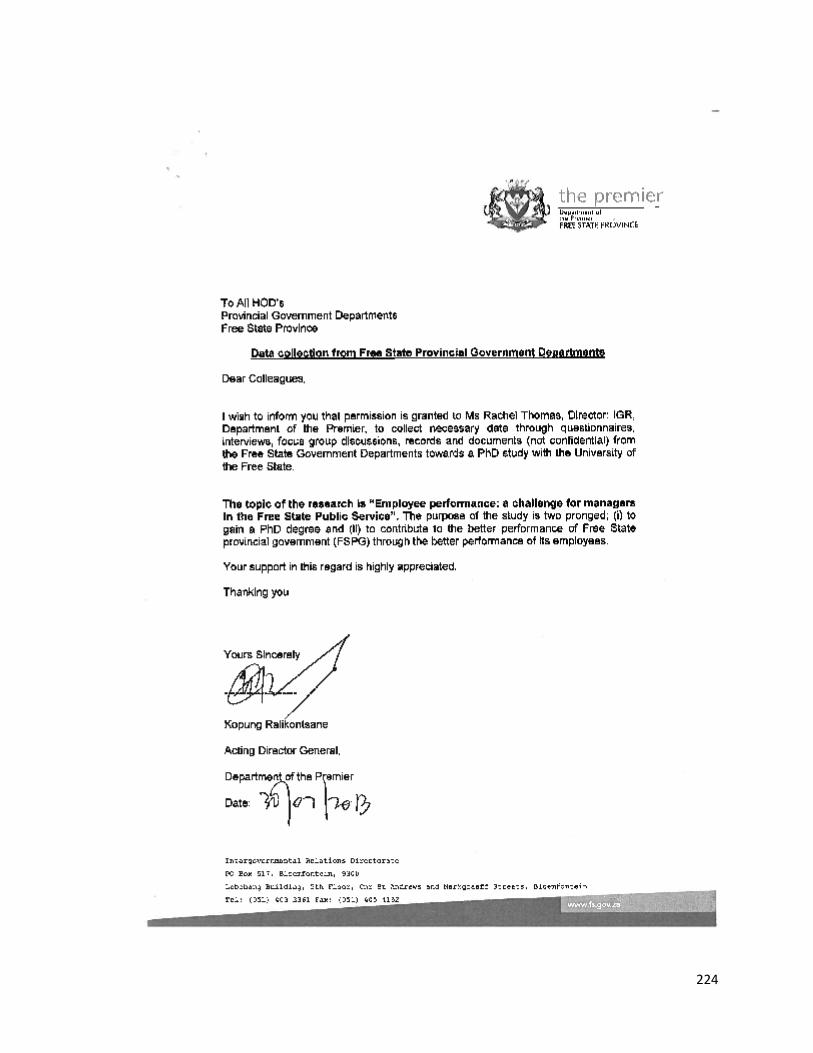
224
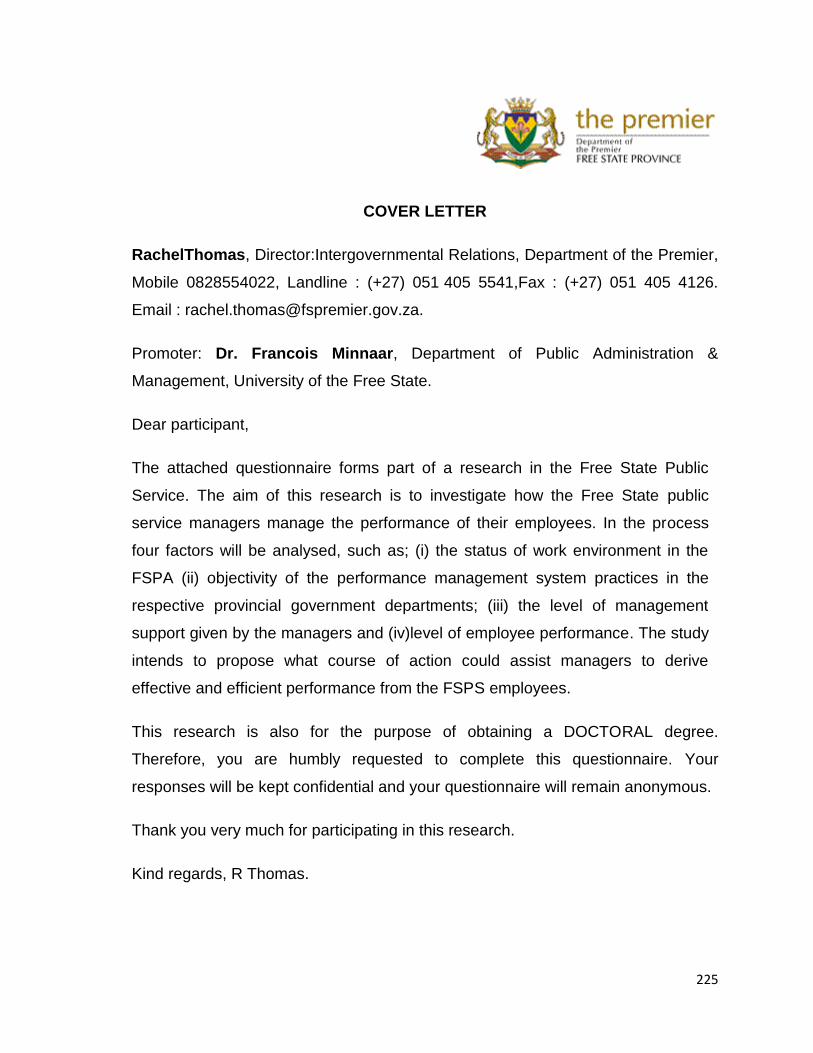
225
COVER LETTER
RachelThomas, Director:Intergovernmental Relations, Department of the Premier,
Mobile 0828554022, Landline : (+27) 051 405 5541,Fax : (+27) 051 405 4126.
Email : [email protected].
Promoter: Dr. Francois Minnaar, Department of Public Administration &
Management, University of the Free State.
Dear participant,
The attached questionnaire forms part of a research in the Free State Public
Service. The aim of this research is to investigate how the Free State public
service managers manage the performance of their employees. In the process
four factors will be analysed, such as; (i) the status of work environment in the
FSPA (ii) objectivity of the performance management system practices in the
respective provincial government departments; (iii) the level of management
support given by the managers and (iv)level of employee performance. The study
intends to propose what course of action could assist managers to derive
effective and efficient performance from the FSPS employees.
This research is also for the purpose of obtaining a DOCTORAL degree.
Therefore, you are humbly requested to complete this questionnaire. Your
responses will be kept confidential and your questionnaire will remain anonymous.
Thank you very much for participating in this research.
Kind regards, R Thomas.

226
INSTRUCTIONS FOR COMPLETING THE QUETIONNAIRE
Employee performance, the challenge for managers in the Free State Public
Service
1. You are to choose from options given. There is no right or wrong answer.
2. Mark the response that you agree with x
3. It will take only 20-30 minutes to complete the questionnaire.
4. You are welcome to direct any queries about the contents of this
questionnaire to the contacts on the previous page.
Please also note:
‘Work environment’ for this questionnaire denotes; fairness in the
systems and processes, job satisfaction, motivation, morale, management
support, teamwork, interpersonal relationship, mutual trust and respect
between manager and employees.
‘Employees’ for this questionnaire refer to subordinates.
‘Rewards’ for this questionnaire refer to notch increase and /
performance bonus.
‘Distributive justice’ for this questionnaire refers to the fairness in which
the rewards are distributed (ie: reward is proportionate to performance of
an employee as well as, performance and reward of an employee is
proportionate to the performance and rewards of another employee who
does similar job).
‘Procedural justice’ for this questionnaire refers to the fairness in the
systems and processes that lead to the decision regarding performance
rewards.
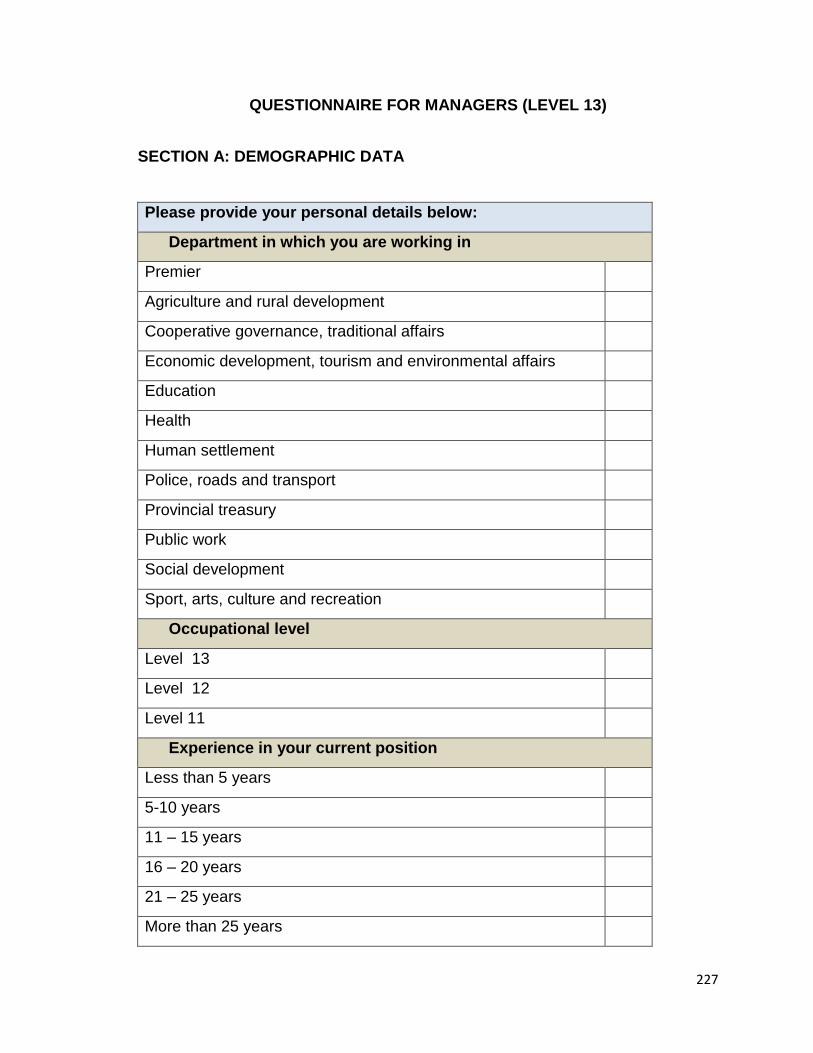
227
QUESTIONNAIRE FOR MANAGERS (LEVEL 13)
SECTION A: DEMOGRAPHIC DATA
Please provide your personal details below:
Department in which you are working in
Premier
Agriculture and rural development
Cooperative governance, traditional affairs
Economic development, tourism and environmental affairs
Education
Health
Human settlement
Police, roads and transport
Provincial treasury
Public work
Social development
Sport, arts, culture and recreation
Occupational level
Level 13
Level 12
Level 11
Experience in your current position
Less than 5 years
5-10 years
11 – 15 years
16 – 20 years
21 – 25 years
More than 25 years
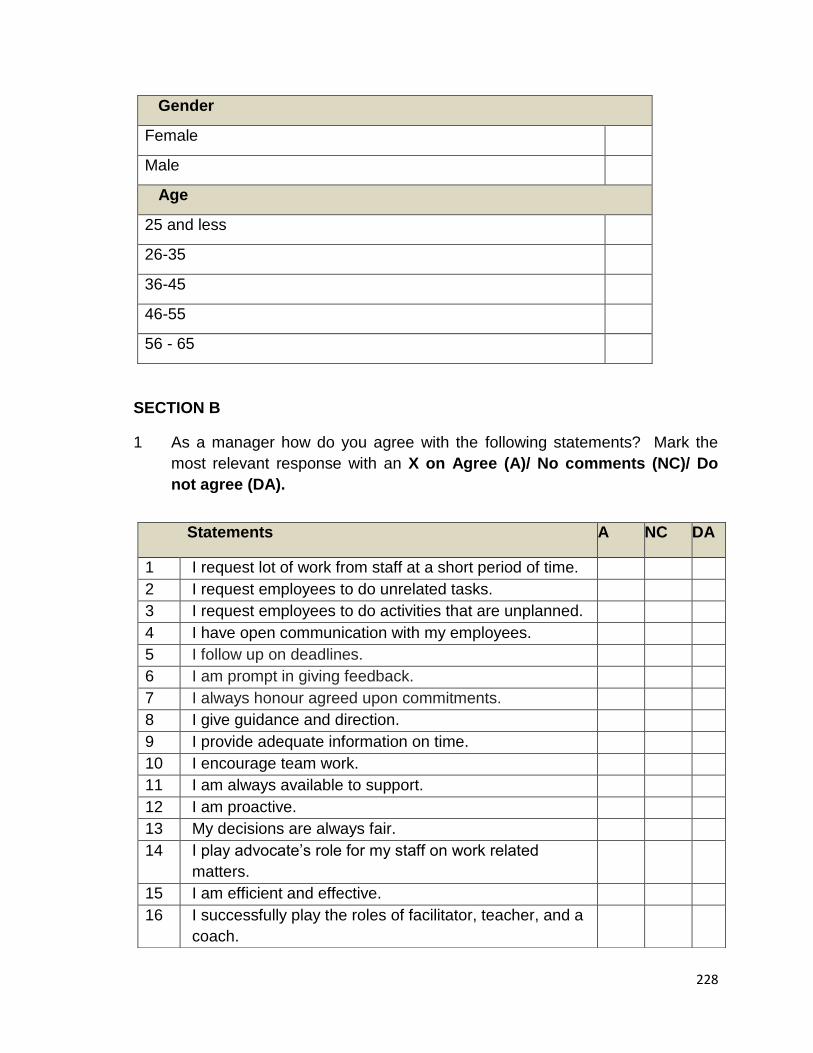
228
Gender
Female
Male
Age
25 and less
26-35
36-45
46-55
56 - 65
SECTION B
1 As a manager how do you agree with the following statements? Mark the
most relevant response with an X on Agree (A)/ No comments (NC)/ Do
not agree (DA).
Statements A NC DA
1 I request lot of work from staff at a short period of time.
2 I request employees to do unrelated tasks.
3 I request employees to do activities that are unplanned.
4 I have open communication with my employees.
5 I follow up on deadlines.
6 I am prompt in giving feedback.
7 I always honour agreed upon commitments.
8 I give guidance and direction.
9 I provide adequate information on time.
10 I encourage team work.
11 I am always available to support.
12 I am proactive.
13 My decisions are always fair.
14 I play advocate’s role for my staff on work related
matters.
15 I am efficient and effective.
16 I successfully play the roles of facilitator, teacher, and a
coach.
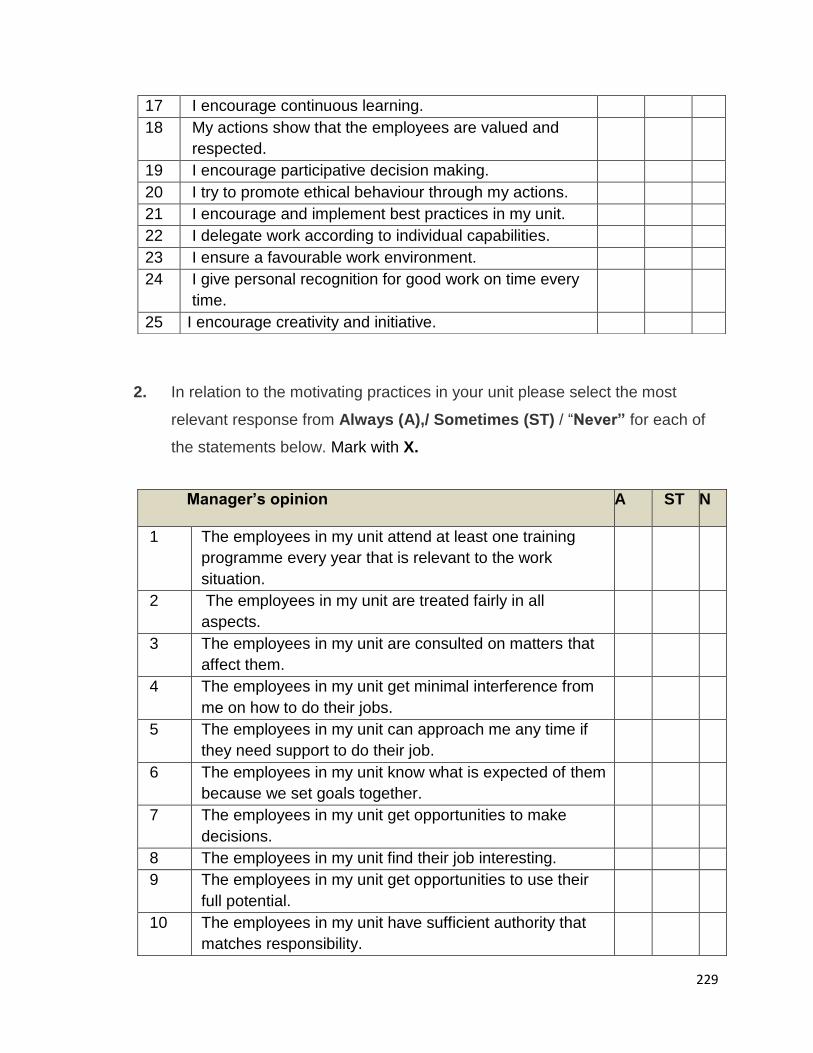
229
2. In relation to the motivating practices in your unit please select the most
relevant response from Always (A),/ Sometimes (ST) / “Never” for each of
the statements below. Mark with X.
Manager’s opinion
A ST N
1 The employees in my unit attend at least one training
programme every year that is relevant to the work
situation.
2 The employees in my unit are treated fairly in all
aspects.
3 The employees in my unit are consulted on matters that
affect them.
4 The employees in my unit get minimal interference from
me on how to do their jobs.
5 The employees in my unit can approach me any time if
they need support to do their job.
6 The employees in my unit know what is expected of them
because we set goals together.
7 The employees in my unit get opportunities to make
decisions.
8 The employees in my unit find their job interesting.
9 The employees in my unit get opportunities to use their
full potential.
10 The employees in my unit have sufficient authority that
matches responsibility.
17 I encourage continuous learning.
18 My actions show that the employees are valued and
respected.
19 I encourage participative decision making.
20 I try to promote ethical behaviour through my actions.
21 I encourage and implement best practices in my unit.
22 I delegate work according to individual capabilities.
23 I ensure a favourable work environment.
24 I give personal recognition for good work on time every
time.
25 I encourage creativity and initiative.
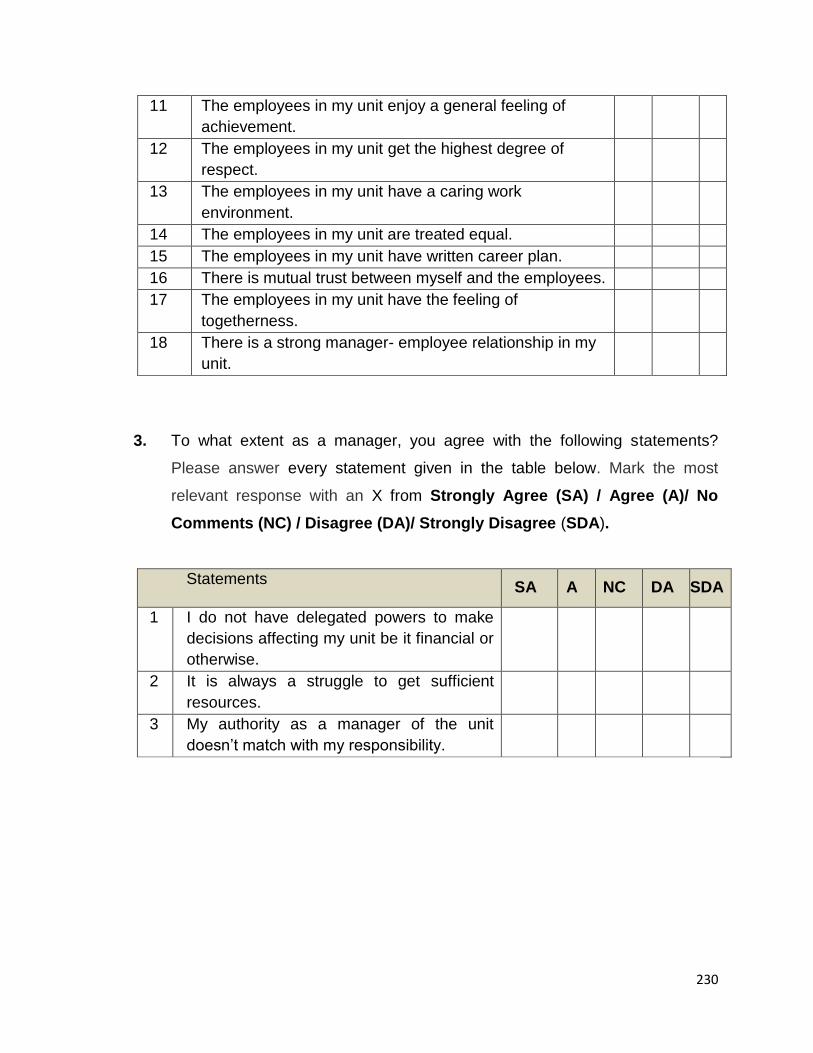
230
11 The employees in my unit enjoy a general feeling of
achievement.
12 The employees in my unit get the highest degree of
respect.
13 The employees in my unit have a caring work
environment.
14 The employees in my unit are treated equal.
15 The employees in my unit have written career plan.
16 There is mutual trust between myself and the employees.
17 The employees in my unit have the feeling of
togetherness.
18 There is a strong manager- employee relationship in my
unit.
3. To what extent as a manager, you agree with the following statements?
Please answer every statement given in the table below. Mark the most
relevant response with an X from Strongly Agree (SA) / Agree (A)/ No
Comments (NC) / Disagree (DA)/ Strongly Disagree (SDA).
Statements SA A NC DA SDA
1 I do not have delegated powers to make
decisions affecting my unit be it financial or
otherwise.
2 It is always a struggle to get sufficient
resources.
3 My authority as a manager of the unit
doesn’t match with my responsibility.
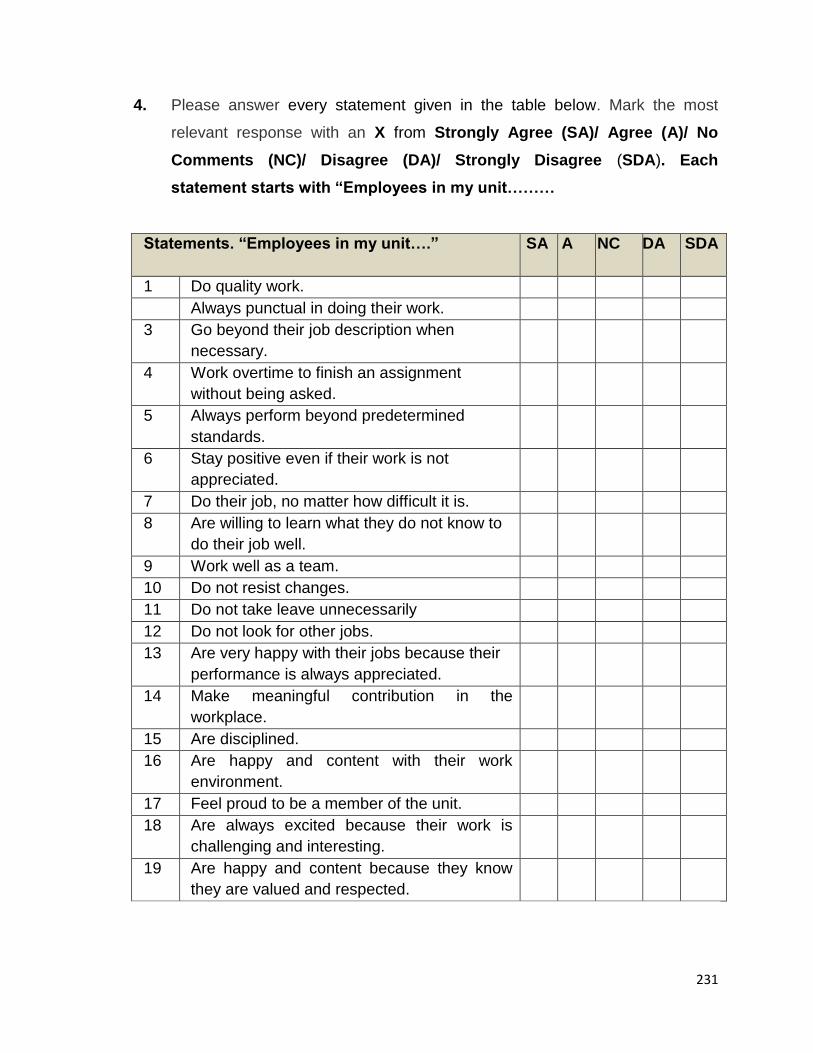
231
4. Please answer every statement given in the table below. Mark the most
relevant response with an X from Strongly Agree (SA)/ Agree (A)/ No
Comments (NC)/ Disagree (DA)/ Strongly Disagree (SDA). Each
statement starts with “Employees in my unit………
Statements. “Employees in my unit….” SA A NC DA SDA
1 Do quality work.
2 Always punctual in doing their work.
3 Go beyond their job description when
necessary.
4 Work overtime to finish an assignment
without being asked.
5 Always perform beyond predetermined
standards.
6 Stay positive even if their work is not
appreciated.
7 Do their job, no matter how difficult it is.
8 Are willing to learn what they do not know to
do their job well.
9 Work well as a team.
10 Do not resist changes.
11 Do not take leave unnecessarily
12 Do not look for other jobs.
13 Are very happy with their jobs because their
performance is always appreciated.
14 Make meaningful contribution in the
workplace.
15 Are disciplined.
16 Are happy and content with their work
environment.
17 Feel proud to be a member of the unit.
18 Are always excited because their work is
challenging and interesting.
19 Are happy and content because they know
they are valued and respected.
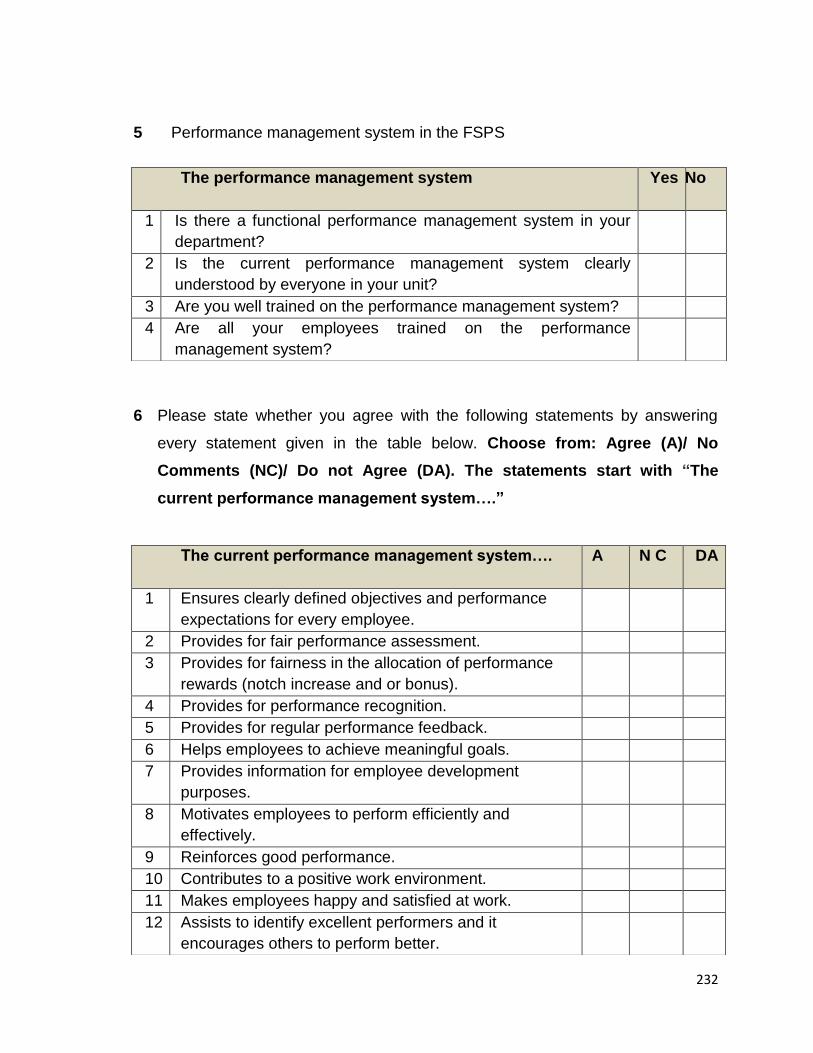
232
5 Performance management system in the FSPS
6 Please state whether you agree with the following statements by answering
every statement given in the table below. Choose from: Agree (A)/ No
Comments (NC)/ Do not Agree (DA). The statements start with “The
current performance management system….”
The performance management system Yes No
1 Is there a functional performance management system in your
department?
2 Is the current performance management system clearly
understood by everyone in your unit?
3 Are you well trained on the performance management system?
4 Are all your employees trained on the performance
management system?
The current performance management system…. A N C DA
1 Ensures clearly defined objectives and performance
expectations for every employee.
2 Provides for fair performance assessment.
3 Provides for fairness in the allocation of performance
rewards (notch increase and or bonus).
4 Provides for performance recognition.
5 Provides for regular performance feedback.
6 Helps employees to achieve meaningful goals.
7 Provides information for employee development
purposes.
8 Motivates employees to perform efficiently and
effectively.
9 Reinforces good performance.
10 Contributes to a positive work environment.
11 Makes employees happy and satisfied at work.
12 Assists to identify excellent performers and it
encourages others to perform better.
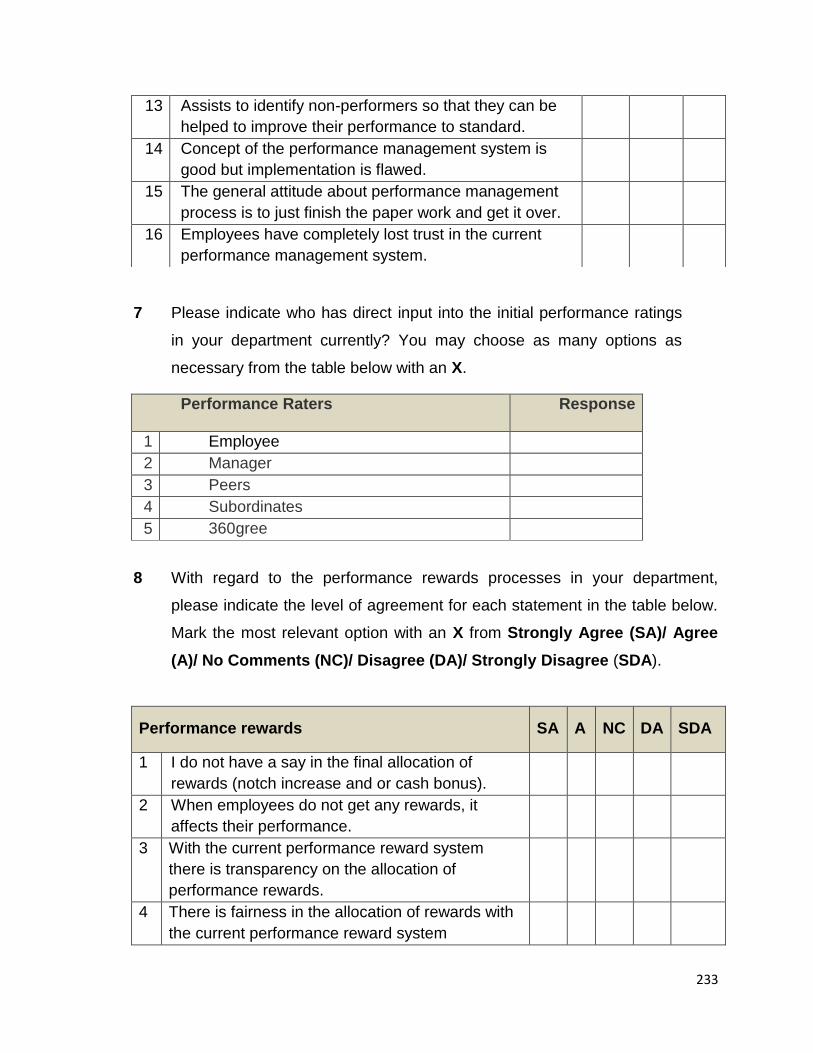
233
7 Please indicate who has direct input into the initial performance ratings
in your department currently? You may choose as many options as
necessary from the table below with an X.
Performance Raters Response
1 Employee
2 Manager
3 Peers
4 Subordinates
5 360 gree
8 With regard to the performance rewards processes in your department,
please indicate the level of agreement for each statement in the table below.
Mark the most relevant option with an X from Strongly Agree (SA)/ Agree
(A)/ No Comments (NC)/ Disagree (DA)/ Strongly Disagree (SDA).
Performance rewards SA A NC DA SDA
1 I do not have a say in the final allocation of
rewards (notch increase and or cash bonus).
2 When employees do not get any rewards, it
affects their performance.
3 With the current performance reward system
there is transparency on the allocation of
performance rewards.
4 There is fairness in the allocation of rewards with
the current performance reward system
13 Assists to identify non-performers so that they can be
helped to improve their performance to standard.
14 Concept of the performance management system is
good but implementation is flawed.
15 The general attitude about performance management
process is to just finish the paper work and get it over.
16 Employees have completely lost trust in the current
performance management system.

234
5 Managers who are responsible for the
performance of their staff are given the
opportunity to verbally defend their
recommendations on performance ratings and
rewards when the moderating is not in agreement
with their recommendations.
6 Even those employees who do not get any
performance rewards are satisfied because they
are convinced that the processes (procedural
justice) followed are fair and objective.
7 The main reason for low employee morale is the
negative perception about the fairness and
objectivity in the performance rewards allocation.
9 In your opinion, when do performance rewards contribute to increased
performance of employees? Please indicate the level of agreement for each
statement in the table below. Mark the most relevant option with an X from
Strongly Agree (SA)/ Agree (A)/ No Comments (NC)/ Disagree (DA)/
Strongly Disagree (SDA).
Factors contributing to increased
performance by employees SA A NC DA SDA
1 When performance reward is attached to
"real" performance accomplishments.
2 When there is organizational oversight to
make sure that the performance rewards
criteria are applied fairly, equitably and
consistently.
3 When the performance reward system build
positive morale in the work environment.
4 When top management doesn’t allow any
bias or subjectivity in awarding rewards.
5 When poor performance is never rewarded.
6 When there is clarity and transparency
regarding procedures that lead to
performance reward.
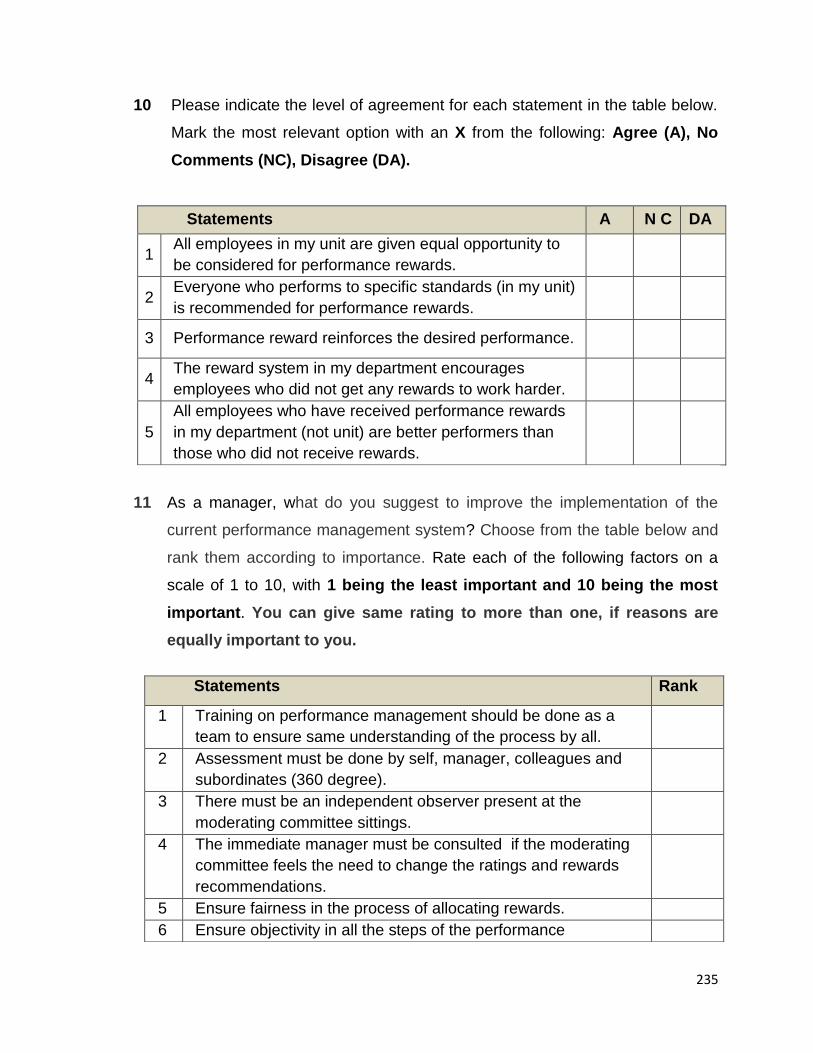
235
10 Please indicate the level of agreement for each statement in the table below.
Mark the most relevant option with an X from the following: Agree (A), No
Comments (NC), Disagree (DA).
Statements A N C DA
1 All employees in my unit are given equal opportunity to
be considered for performance rewards.
2 Everyone who performs to specific standards (in my unit)
is recommended for performance rewards.
3 Performance reward reinforces the desired performance.
4 The reward system in my department encourages
employees who did not get any rewards to work harder.
5
All employees who have received performance rewards
in my department (not unit) are better performers than
those who did not receive rewards.
11 As a manager, what do you suggest to improve the implementation of the
current performance management system? Choose from the table below and
rank them according to importance. Rate each of the following factors on a
scale of 1 to 10, with 1 being the least important and 10 being the most
important. You can give same rating to more than one, if reasons are
equally important to you.
Statements Rank
1 Training on performance management should be done as a
team to ensure same understanding of the process by all.
2 Assessment must be done by self, manager, colleagues and
subordinates (360 degree).
3 There must be an independent observer present at the
moderating committee sittings.
4 The immediate manager must be consulted if the moderating
committee feels the need to change the ratings and rewards
recommendations.
5 Ensure fairness in the process of allocating rewards.
6 Ensure objectivity in all the steps of the performance
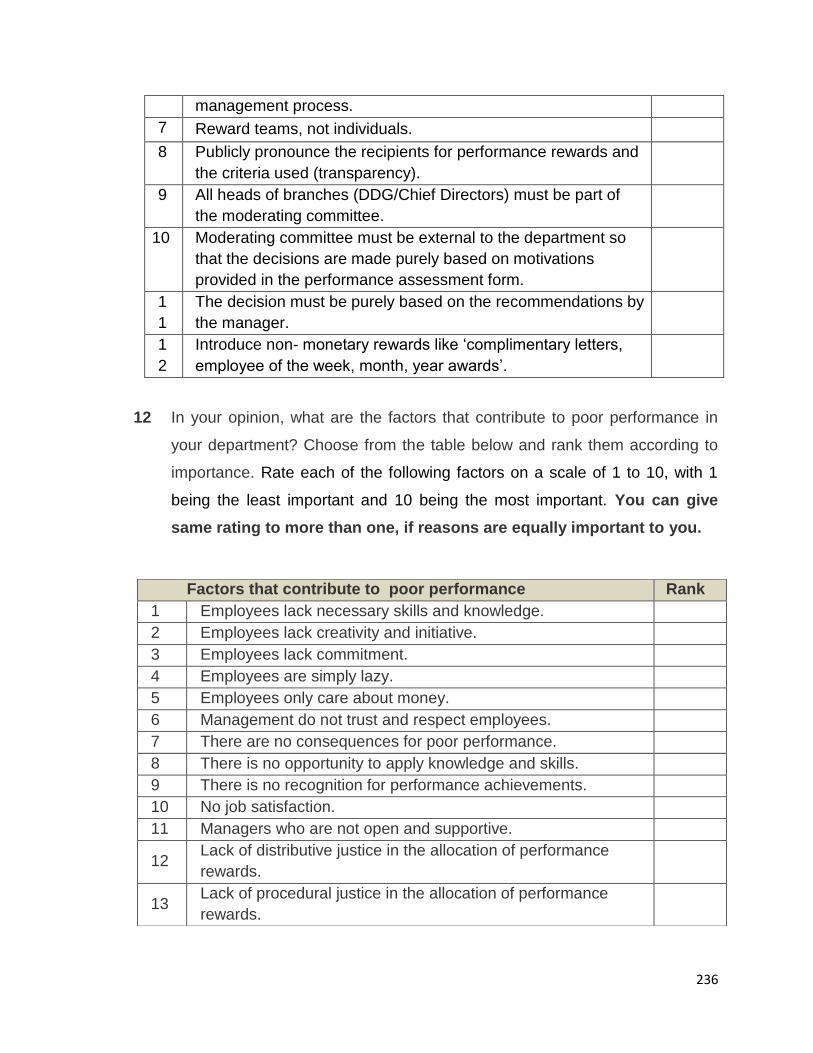
236
12 In your opinion, what are the factors that contribute to poor performance in
your department? Choose from the table below and rank them according to
importance. Rate each of the following factors on a scale of 1 to 10, with 1
being the least important and 10 being the most important. You can give
same rating to more than one, if reasons are equally important to you.
management process.
7 Reward teams, not individuals.
8 Publicly pronounce the recipients for performance rewards and
the criteria used (transparency).
9 All heads of branches (DDG/Chief Directors) must be part of
the moderating committee.
10 Moderating committee must be external to the department so
that the decisions are made purely based on motivations
provided in the performance assessment form.
1
1
The decision must be purely based on the recommendations by
the manager.
1
2
Introduce non- monetary rewards like ‘complimentary letters,
employee of the week, month, year awards’.
Factors that contribute to poor performance Rank
1 Employees lack necessary skills and knowledge.
2 Employees lack creativity and initiative.
3 Employees lack commitment.
4 Employees are simply lazy.
5 Employees only care about money.
6 Management do not trust and respect employees.
7 There are no consequences for poor performance.
8 There is no opportunity to apply knowledge and skills.
9 There is no recognition for performance achievements.
10 No job satisfaction.
11 Managers who are not open and supportive.
12 Lack of distributive justice in the allocation of performance
rewards.
13 Lack of procedural justice in the allocation of performance
rewards.
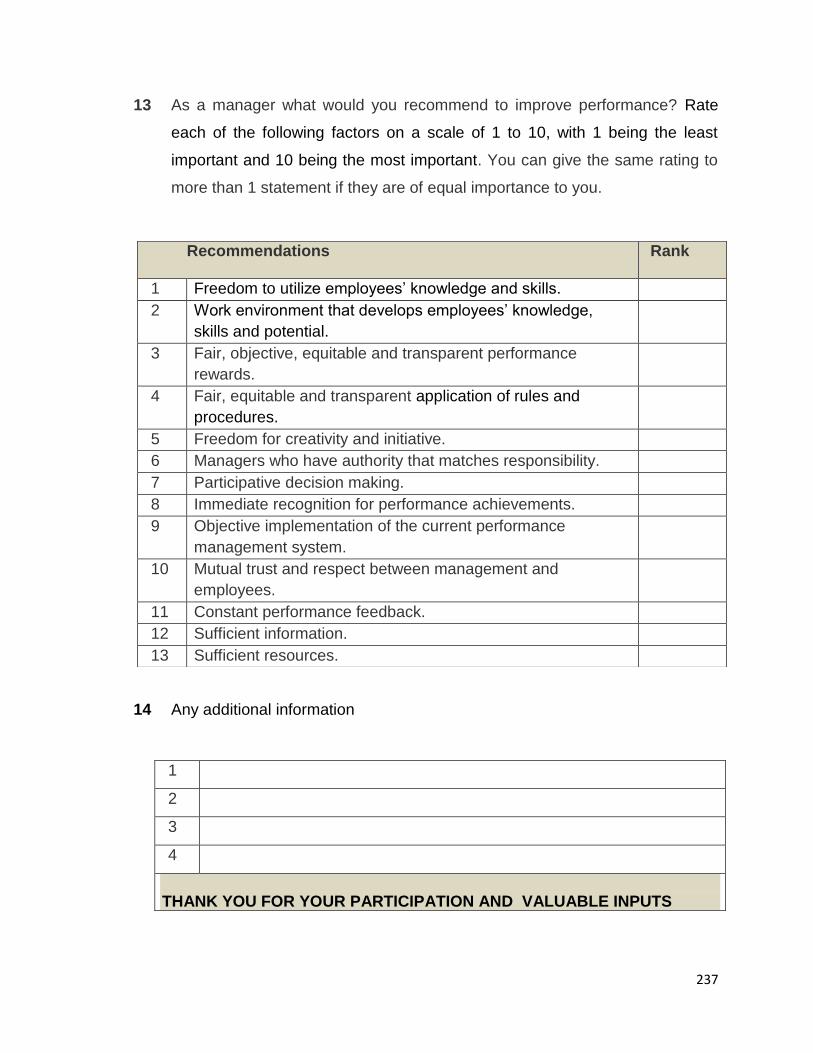
237
13 As a manager what would you recommend to improve performance? Rate
each of the following factors on a scale of 1 to 10, with 1 being the least
important and 10 being the most important. You can give the same rating to
more than 1 statement if they are of equal importance to you.
14 Any additional information
Recommendations Rank
1 Freedom to utilize employees’ knowledge and skills.
2 Work environment that develops employees’ knowledge,
skills and potential.
3 Fair, objective, equitable and transparent performance
rewards.
4 Fair, equitable and transparent application of rules and
procedures.
5 Freedom for creativity and initiative.
6 Managers who have authority that matches responsibility.
7 Participative decision making.
8 Immediate recognition for performance achievements.
9 Objective implementation of the current performance
management system.
10 Mutual trust and respect between management and
employees.
11 Constant performance feedback.
12 Sufficient information.
13 Sufficient resources.
1
2
3
4
THANK YOU FOR YOUR PARTICIPATION AND VALUABLE INPUTS

238
QUESTIONNAIRE FOR SUBORDINATES (LEVELS 11&12)
SECTION A: DEMOGRAPHIC DATA
Please provide your personal details below:
Department in which you are working in
Premier
Agriculture and rural development
Cooperative governance, traditional affairs
economic development, tourism and environmental affairs
Education
Health
Human settlement
Police, roads and transport
Provincial treasury
Public work
Social development
Sport, arts, culture and recreation
Occupational level
Level 13
Level 12
Level 11
Experience in your current position
Less than 5 years
5-10 years
11 – 15 years
16 – 20 years
21 – 25 years
More than 25 years
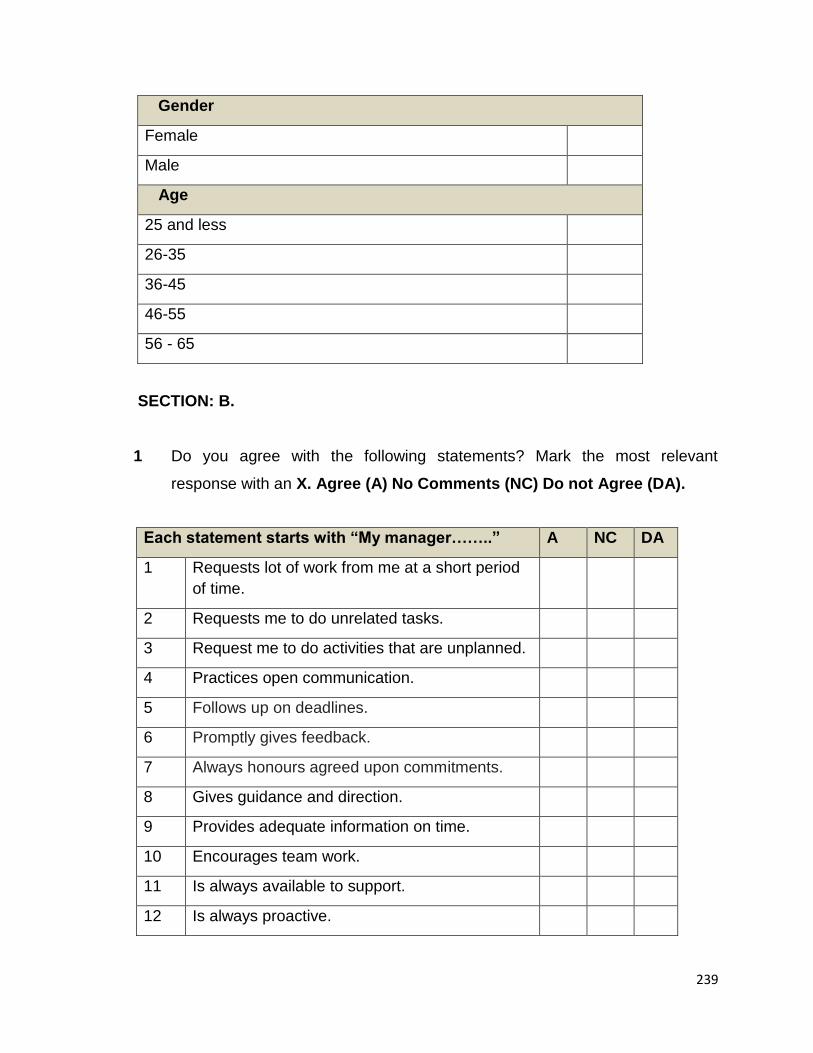
239
Gender
Female
Male
Age
25 and less
26-35
36-45
46-55
56 - 65
SECTION: B.
1 Do you agree with the following statements? Mark the most relevant
response with an X. Agree (A) No Comments (NC) Do not Agree (DA).
Each statement starts with “My manager……..” A NC DA
1 Requests lot of work from me at a short period
of time.
2 Requests me to do unrelated tasks.
3 Request me to do activities that are unplanned.
4 Practices open communication.
5 Follows up on deadlines.
6 Promptly gives feedback.
7 Always honours agreed upon commitments.
8 Gives guidance and direction.
9 Provides adequate information on time.
10 Encourages team work.
11 Is always available to support.
12 Is always proactive.
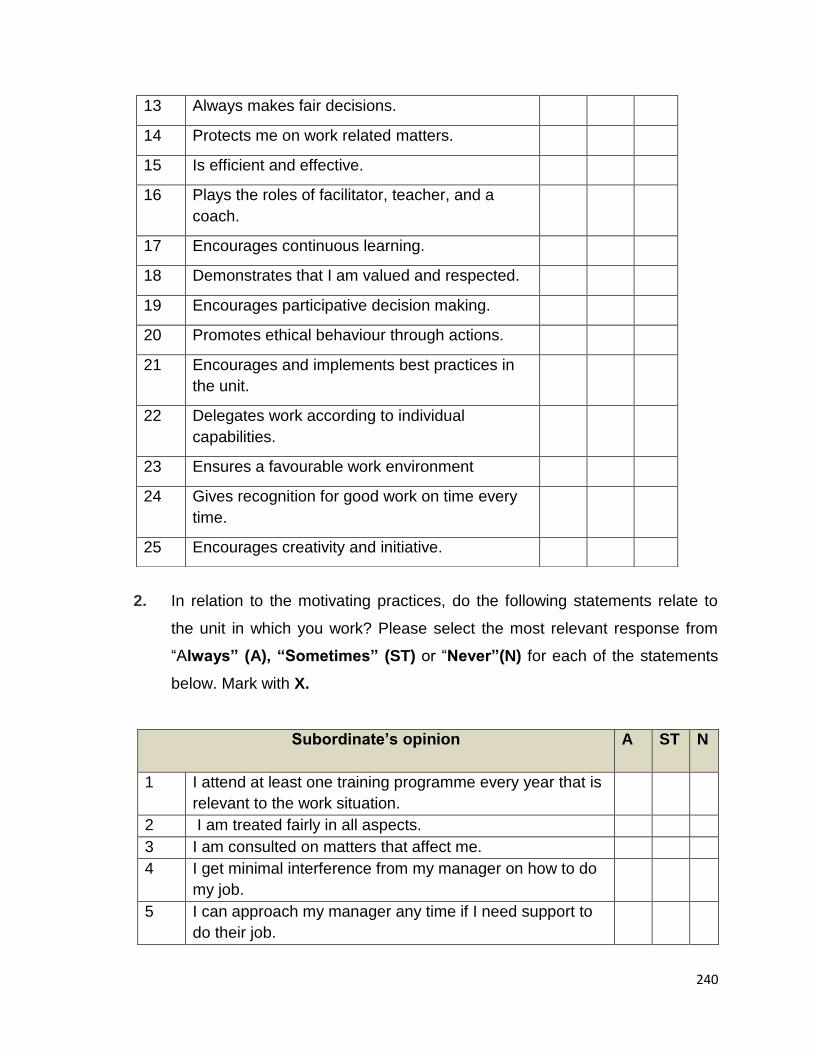
240
2. In relation to the motivating practices, do the following statements relate to
the unit in which you work? Please select the most relevant response from
“Always” (A), “Sometimes” (ST) or “Never”(N) for each of the statements
below. Mark with X.
Subordinate’s opinion
A ST N
1 I attend at least one training programme every year that is
relevant to the work situation.
2 I am treated fairly in all aspects.
3 I am consulted on matters that affect me.
4 I get minimal interference from my manager on how to do
my job.
5 I can approach my manager any time if I need support to
do their job.
13 Always makes fair decisions.
14 Protects me on work related matters.
15 Is efficient and effective.
16 Plays the roles of facilitator, teacher, and a
coach.
17 Encourages continuous learning.
18 Demonstrates that I am valued and respected.
19 Encourages participative decision making.
20 Promotes ethical behaviour through actions.
21 Encourages and implements best practices in
the unit.
22 Delegates work according to individual
capabilities.
23 Ensures a favourable work environment
24 Gives recognition for good work on time every
time.
25 Encourages creativity and initiative.
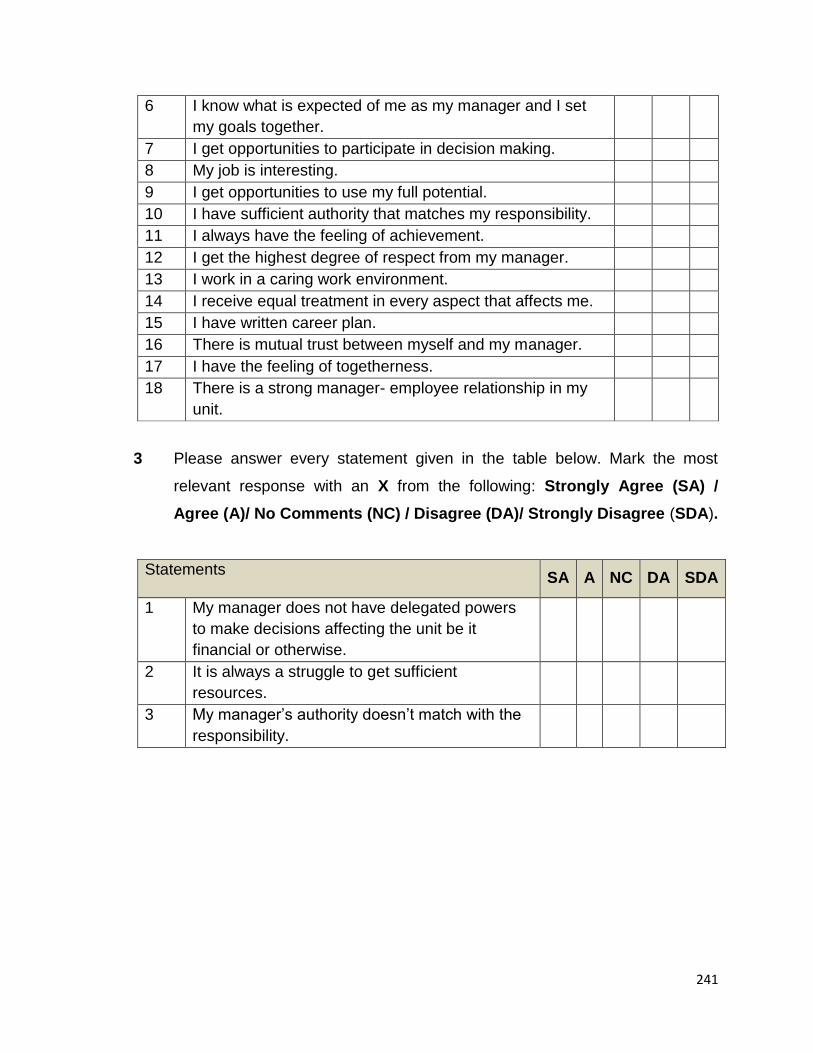
241
6 I know what is expected of me as my manager and I set
my goals together.
7 I get opportunities to participate in decision making.
8 My job is interesting.
9 I get opportunities to use my full potential.
10 I have sufficient authority that matches my responsibility.
11 I always have the feeling of achievement.
12 I get the highest degree of respect from my manager.
13 I work in a caring work environment.
14 I receive equal treatment in every aspect that affects me.
15 I have written career plan.
16 There is mutual trust between myself and my manager.
17 I have the feeling of togetherness.
18 There is a strong manager- employee relationship in my
unit.
3 Please answer every statement given in the table below. Mark the most
relevant response with an X from the following: Strongly Agree (SA) /
Agree (A)/ No Comments (NC) / Disagree (DA)/ Strongly Disagree (SDA).
Statements SA A NC DA SDA
1 My manager does not have delegated powers
to make decisions affecting the unit be it
financial or otherwise.
2 It is always a struggle to get sufficient
resources.
3 My manager’s authority doesn’t match with the
responsibility.
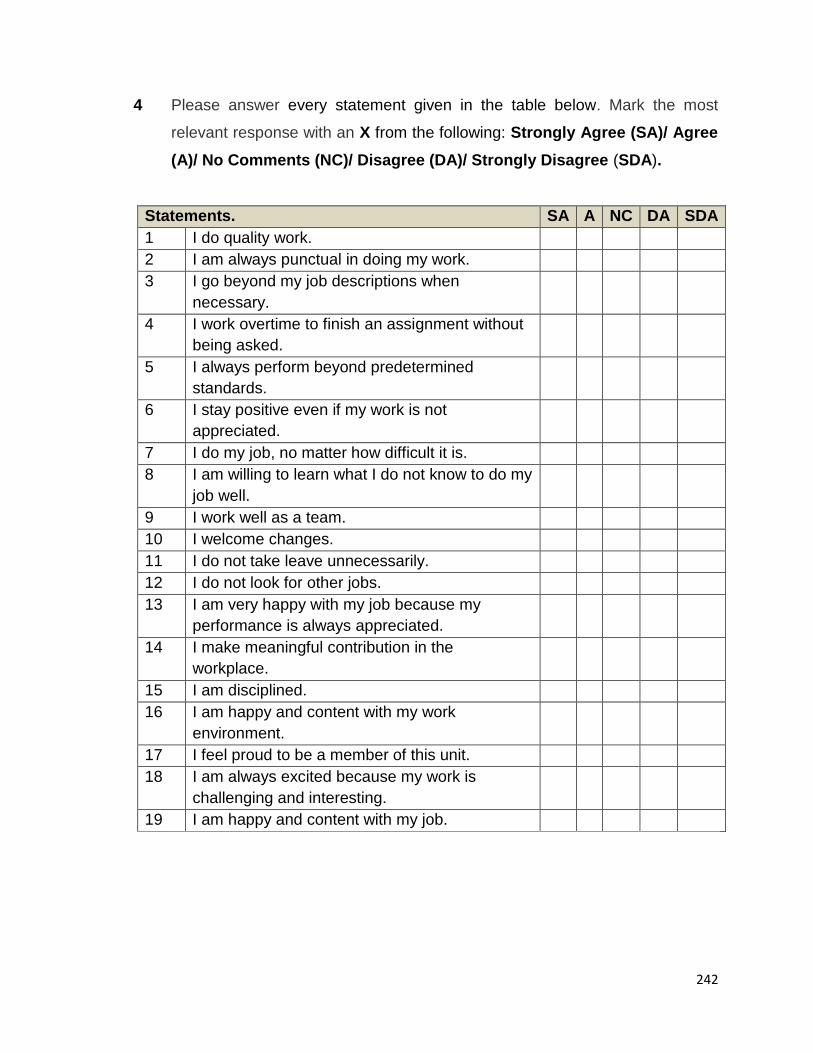
242
4 Please answer every statement given in the table below. Mark the most
relevant response with an X from the following: Strongly Agree (SA)/ Agree
(A)/ No Comments (NC)/ Disagree (DA)/ Strongly Disagree (SDA).
Statements. SA A NC DA SDA
1 I do quality work.
2 I am always punctual in doing my work.
3 I go beyond my job descriptions when
necessary.
4 I work overtime to finish an assignment without
being asked.
5 I always perform beyond predetermined
standards.
6 I stay positive even if my work is not
appreciated.
7 I do my job, no matter how difficult it is.
8 I am willing to learn what I do not know to do my
job well.
9 I work well as a team.
10 I welcome changes.
11 I do not take leave unnecessarily.
12 I do not look for other jobs.
13 I am very happy with my job because my
performance is always appreciated.
14 I make meaningful contribution in the
workplace.
15 I am disciplined.
16 I am happy and content with my work
environment.
17 I feel proud to be a member of this unit.
18 I am always excited because my work is
challenging and interesting.
19 I am happy and content with my job.
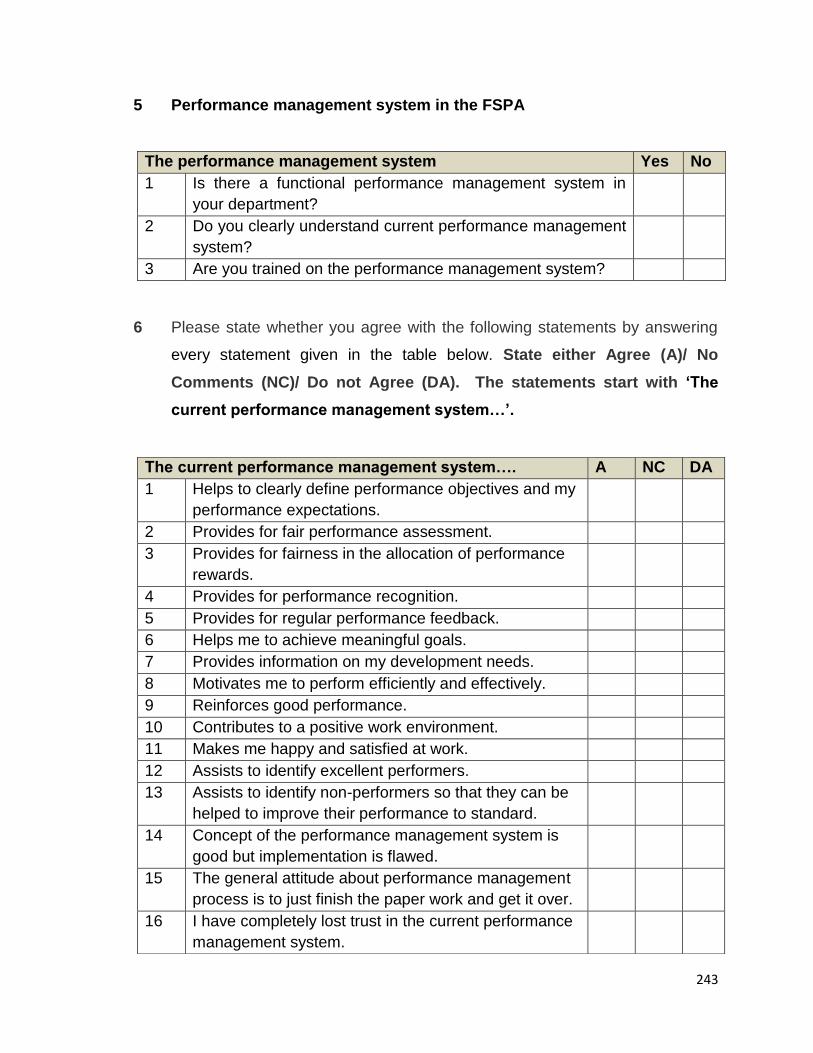
243
5 Performance management system in the FSPA
6 Please state whether you agree with the following statements by answering
every statement given in the table below. State either Agree (A)/ No
Comments (NC)/ Do not Agree (DA). The statements start with ‘The
current performance management system…’.
The performance management system Yes No
1 Is there a functional performance management system in
your department?
2 Do you clearly understand current performance management
system?
3 Are you trained on the performance management system?
The current performance management system…. A NC DA
1 Helps to clearly define performance objectives and my
performance expectations.
2 Provides for fair performance assessment.
3 Provides for fairness in the allocation of performance
rewards.
4 Provides for performance recognition.
5 Provides for regular performance feedback.
6 Helps me to achieve meaningful goals.
7 Provides information on my development needs.
8 Motivates me to perform efficiently and effectively.
9 Reinforces good performance.
10 Contributes to a positive work environment.
11 Makes me happy and satisfied at work.
12 Assists to identify excellent performers.
13 Assists to identify non-performers so that they can be
helped to improve their performance to standard.
14 Concept of the performance management system is
good but implementation is flawed.
15 The general attitude about performance management
process is to just finish the paper work and get it over.
16 I have completely lost trust in the current performance
management system.

244
7 Please indicate who has direct input into the initial performance ratings in
your department currently? You may choose as many options as
necessary from the table below with an X
8 With regard to the performance rewards processes in your department,
please indicate the level of agreement with an X for each statement in the
table below. Mark the most relevant option from Strongly Agree (SA)/ Agree
(A)/ No Comments (NC)/ Disagree (DA)/ Strongly Disagree (SDA).
Performance rewards SA A NC DA SDA
1 My manager does not have a say in the final
allocation of my performance rewards (notch
increase and or cash bonus).
2 When I fail to get any rewards, it affects my
performance.
3 With the current performance reward system
there is transparency on the allocation of
performance rewards.
4 There is fairness in the allocation of rewards
with the current performance reward system
5 My manager is given the opportunity to
verbally defend his/ her recommendations on
performance ratings and rewards when the
moderating committee (higher committee) is
not in agreement with the recommendations.
6 I am satisfied even if I do not get any
performance rewards because I am convinced
Performance Raters response
1 Employee
2 Manager
3 Peers
4 Subordinates
5 360 degree
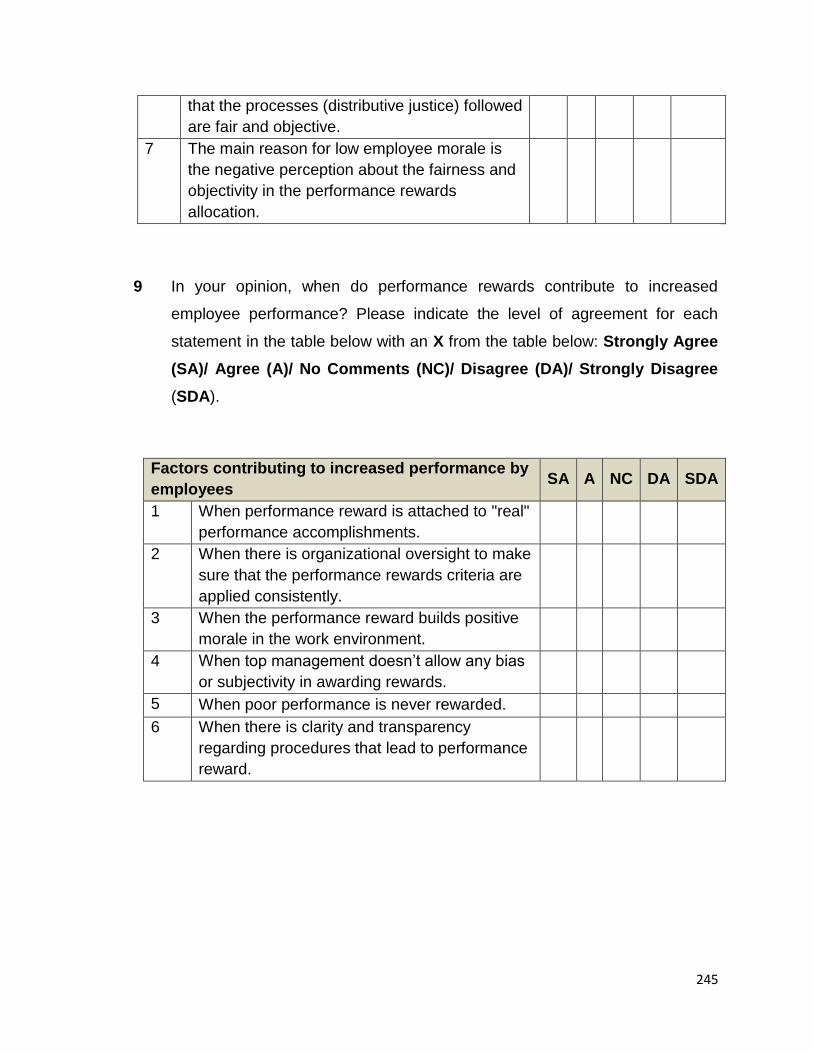
245
that the processes (distributive justice) followed
are fair and objective.
7 The main reason for low employee morale is
the negative perception about the fairness and
objectivity in the performance rewards
allocation.
9 In your opinion, when do performance rewards contribute to increased
employee performance? Please indicate the level of agreement for each
statement in the table below with an X from the table below: Strongly Agree
(SA)/ Agree (A)/ No Comments (NC)/ Disagree (DA)/ Strongly Disagree
(SDA).
Factors contributing to increased performance by
employees SA A NC DA SDA
1 When performance reward is attached to "real"
performance accomplishments.
2 When there is organizational oversight to make
sure that the performance rewards criteria are
applied consistently.
3 When the performance reward builds positive
morale in the work environment.
4 When top management doesn’t allow any bias
or subjectivity in awarding rewards.
5 When poor performance is never rewarded.
6 When there is clarity and transparency
regarding procedures that lead to performance
reward.
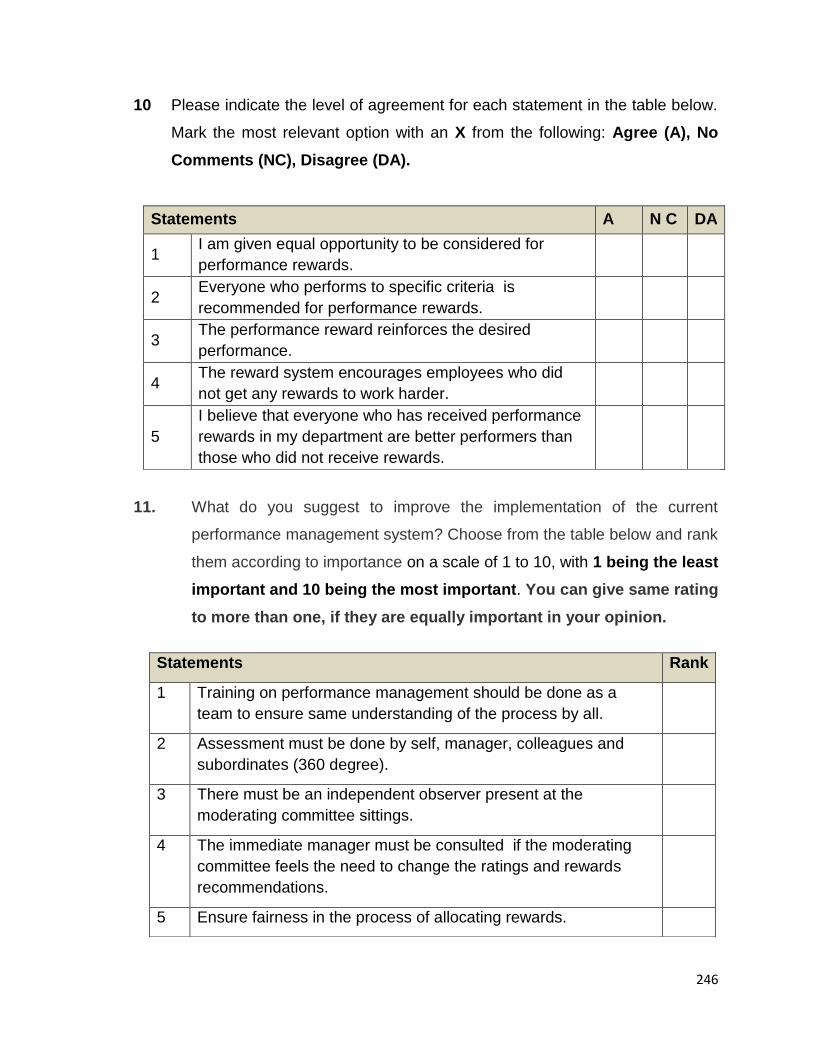
246
10 Please indicate the level of agreement for each statement in the table below.
Mark the most relevant option with an X from the following: Agree (A), No
Comments (NC), Disagree (DA).
Statements A N C DA
1 I am given equal opportunity to be considered for
performance rewards.
2 Everyone who performs to specific criteria is
recommended for performance rewards.
3 The performance reward reinforces the desired
performance.
4 The reward system encourages employees who did
not get any rewards to work harder.
5
I believe that everyone who has received performance
rewards in my department are better performers than
those who did not receive rewards.
11. What do you suggest to improve the implementation of the current
performance management system? Choose from the table below and rank
them according to importance on a scale of 1 to 10, with 1 being the least
important and 10 being the most important. You can give same rating
to more than one, if they are equally important in your opinion.
Statements Rank
1 Training on performance management should be done as a
team to ensure same understanding of the process by all.
2 Assessment must be done by self, manager, colleagues and
subordinates (360 degree).
3 There must be an independent observer present at the
moderating committee sittings.
4 The immediate manager must be consulted if the moderating
committee feels the need to change the ratings and rewards
recommendations.
5 Ensure fairness in the process of allocating rewards.
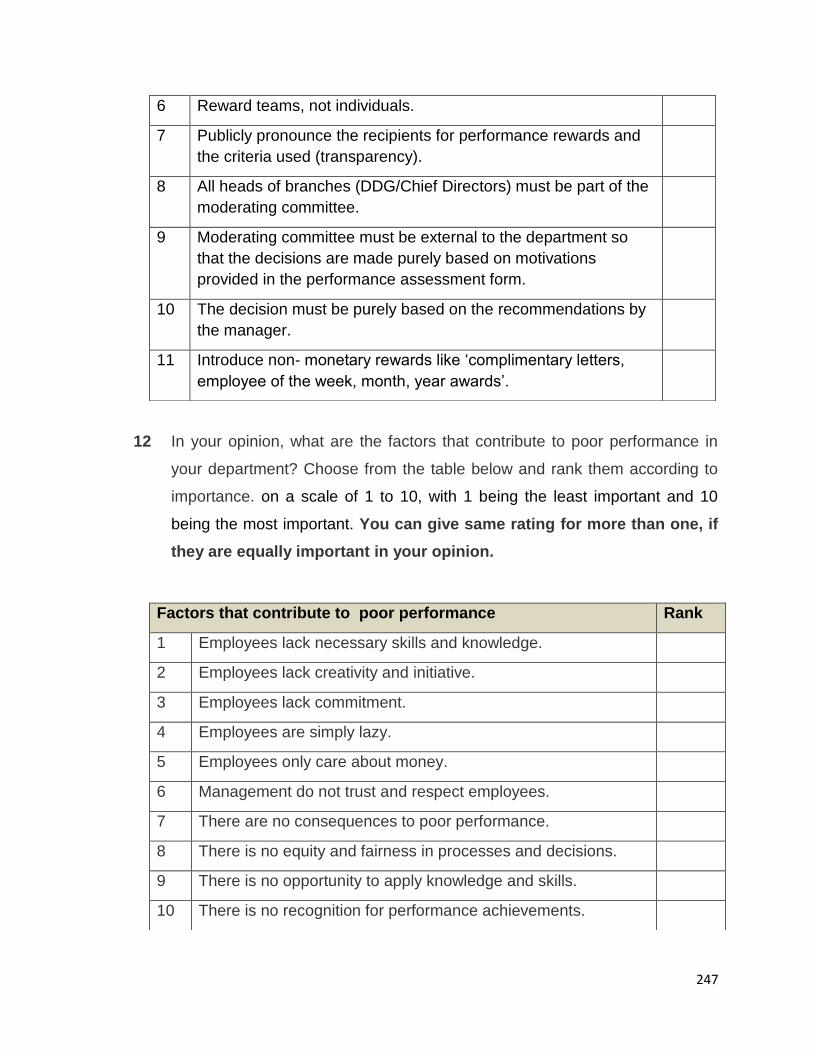
247
12 In your opinion, what are the factors that contribute to poor performance in
your department? Choose from the table below and rank them according to
importance. on a scale of 1 to 10, with 1 being the least important and 10
being the most important. You can give same rating for more than one, if
they are equally important in your opinion.
6 Reward teams, not individuals.
7 Publicly pronounce the recipients for performance rewards and
the criteria used (transparency).
8 All heads of branches (DDG/Chief Directors) must be part of the
moderating committee.
9 Moderating committee must be external to the department so
that the decisions are made purely based on motivations
provided in the performance assessment form.
10 The decision must be purely based on the recommendations by
the manager.
11 Introduce non- monetary rewards like ‘complimentary letters,
employee of the week, month, year awards’.
Factors that contribute to poor performance Rank
1 Employees lack necessary skills and knowledge.
2 Employees lack creativity and initiative.
3 Employees lack commitment.
4 Employees are simply lazy.
5 Employees only care about money.
6 Management do not trust and respect employees.
7 There are no consequences to poor performance.
8 There is no equity and fairness in processes and decisions.
9 There is no opportunity to apply knowledge and skills.
10 There is no recognition for performance achievements.
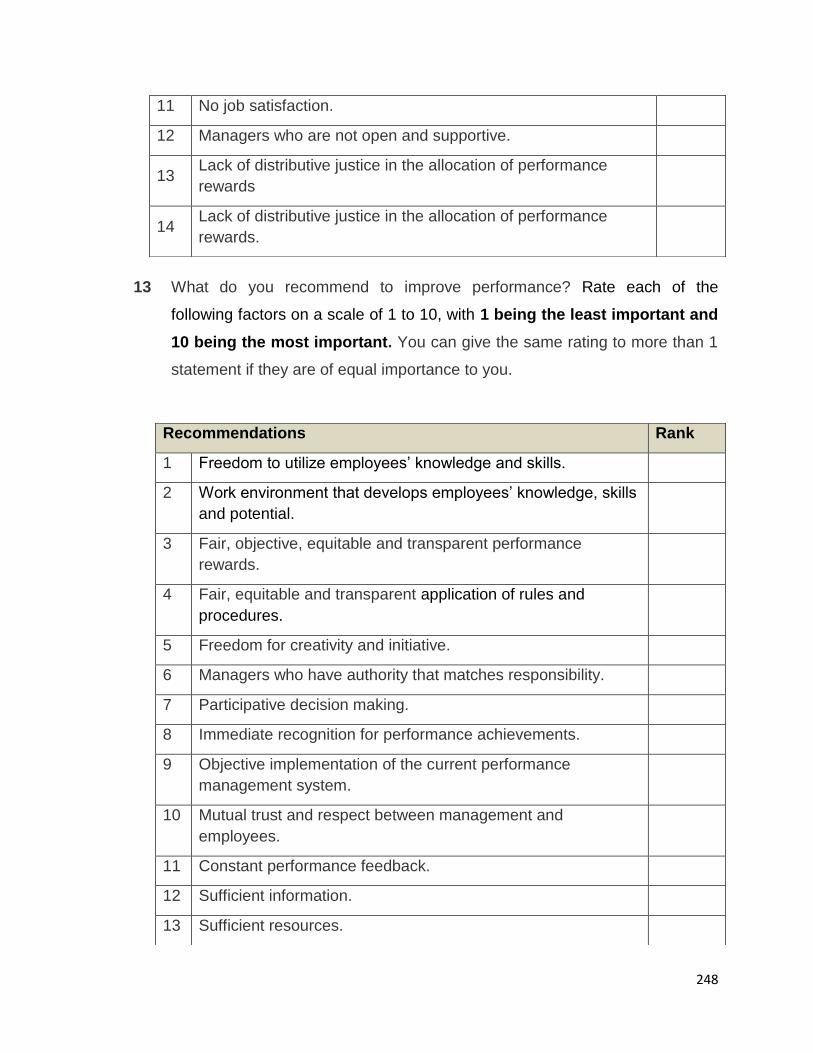
248
13 What do you recommend to improve performance? Rate each of the
following factors on a scale of 1 to 10, with 1 being the least important and
10 being the most important. You can give the same rating to more than 1
statement if they are of equal importance to you.
11 No job satisfaction.
12 Managers who are not open and supportive.
13 Lack of distributive justice in the allocation of performance
rewards
14 Lack of distributive justice in the allocation of performance
rewards.
Recommendations Rank
1 Freedom to utilize employees’ knowledge and skills.
2 Work environment that develops employees’ knowledge, skills
and potential.
3 Fair, objective, equitable and transparent performance
rewards.
4 Fair, equitable and transparent application of rules and
procedures.
5 Freedom for creativity and initiative.
6 Managers who have authority that matches responsibility.
7 Participative decision making.
8 Immediate recognition for performance achievements.
9 Objective implementation of the current performance
management system.
10 Mutual trust and respect between management and
employees.
11 Constant performance feedback.
12 Sufficient information.
13 Sufficient resources.
249
14 Any additional information
THANK YOU FOR YOUR PARTICIPATION AND VALUABLE INPUTS
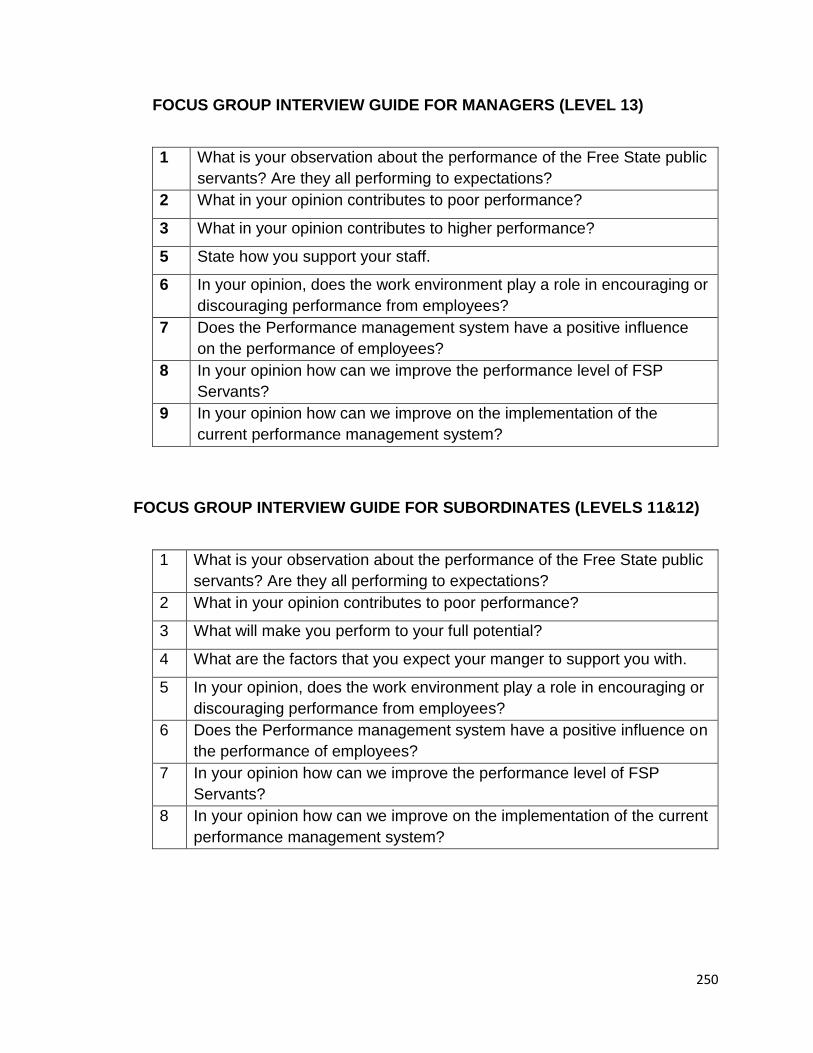
250
FOCUS GROUP INTERVIEW GUIDE FOR MANAGERS (LEVEL 13)
1 What is your observation about the performance of the Free State public
servants? Are they all performing to expectations?
2 What in your opinion contributes to poor performance?
3 What in your opinion contributes to higher performance?
5 State how you support your staff.
6 In your opinion, does the work environment play a role in encouraging or
discouraging performance from employees?
7 Does the Performance management system have a positive influence
on the performance of employees?
8 In your opinion how can we improve the performance level of FSP
Servants?
9 In your opinion how can we improve on the implementation of the
current performance management system?
FOCUS GROUP INTERVIEW GUIDE FOR SUBORDINATES (LEVELS 11&12)
1 What is your observation about the performance of the Free State public
servants? Are they all performing to expectations?
2 What in your opinion contributes to poor performance?
3 What will make you perform to your full potential?
4 What are the factors that you expect your manger to support you with.
5 In your opinion, does the work environment play a role in encouraging or
discouraging performance from employees?
6 Does the Performance management system have a positive influence on
the performance of employees?
7 In your opinion how can we improve the performance level of FSP
Servants?
8 In your opinion how can we improve on the implementation of the current
performance management system?


![Winning Employee Retention Tactics for Managers [webcast]](https://img.pdfslide.net/doc/110x75/58f28cc71a28abb2368b4589/winning-employee-retention-tactics-for-managers-webcast.jpg)