Embed Size (px)
Citation preview
Employees’ Retirement System of the State of Hawaii GASB Statement No. 67 and 68 Accounting and Financial Reporting for Pensions June 30, 2017
Employees’ Retirement System of the State of Hawaii
Table of Contents
Section/Page
Cover Letter
Section A Executive Summary
Executive Summary Table ......................................................................................... A-1 Discussion ......................................................................................................... A-2 – A-4
Section B Financial Statements
Statement of Fiduciary Net Position .......................................................................... B-1 Statement of Changes in Fiduciary Net Position ....................................................... B-2
Section C Required Supplementary Information
Schedule of Changes in Net Pension Liability and Related Ratios ............................. C-1 Schedule of the Employers’ Net Pension Liability ..................................................... C-2 Schedule of Changes in the Employers’ Net Pension Liability ................................... C-3
Section D Notes to Financial Statements
Sensitivity of the Net Pension Liability to the Discount Rate Assumption ............... D-1 Summary of Population Statistics ............................................................................. D-1
Section E Calculation of the Single Discount Rate
Calculation of the Single Discount Rate ..................................................................... E-1 Projection of Contributions ............................................................................... E-2 – E-3 Projection of Plan Fiduciary Net Position ......................................................... E-4 – E-5 Present Values of Projected Benefit Payments ................................................ E-6 – E-7 Projection of Plan Net Position and Benefit Payments ............................................. E-8 Section F GASB No. 68 Information
Aggregate Pension Expense ........................................................................................ F1 Schedule of Current Period Deferred Outflows and Inflows ...................................... F2 Schedule of Current and Prior Period Deferred Outflows and Inflows ...................... F3 Net Deferred Outflows and (Inflows) to be Recognized in Future Years ................... F3 Schedule of Employer Allocations .................................................................... F-4 – F-6 Section G Glossary of Terms
Glossary of Terms............................................................................................. G-1 – G-4
March 16, 2018 The Board of Trustees Employees' Retirement System of
The State of Hawaii City Financial Tower 201 Merchant St., Ste. 1400 Honolulu, HI 96813-9280 Dear Trustees: This report provides information required by the Employees' Retirement System of the State of Hawaii (“ERS”) in connection with the Governmental Accounting Standards Board (GASB) Statement No. 67 “Financial Reporting for Pension Plans.” Additionally, this report provides information required by the employers covered by ERS in connection with the GASB Statement No. 68, “Accounting and Financial Reporting for Pensions.” The GASB 68 information shown was determined as of June 30, 2017, but it is intended that the employers covered by ERS will use this information in financial reporting for their fiscal years ending June 30, 2018. Our calculation of the liability associated with the benefits described in this report was performed for the purpose of satisfying the requirements of GASB Statement Nos. 67 and 68. The calculation of the plan’s liability for this report may not be applicable for funding purposes of the plan. A calculation of the plan’s liability for purposes other than satisfying the requirements of GASB Nos. 67 and 68 may produce significantly different results. This report may be provided to parties other than the ERS only in its entirety and only with the permission of ERS. This report is based upon information, furnished to us by ERS, concerning retirement and ancillary benefits, active members, deferred vested members, retirees and beneficiaries, and financial data. This information was checked for internal consistency, but it was not otherwise audited. Certain tables included in the Required Supplementary Information should include a 10-year history of information. As provided for in GASB No. 67, this historical information is only presented for the years in which the information was measured in conformity with the requirements of GASB No. 67. The historical information in this report will begin with the information presented for the fiscal year ending June 30, 2014. Section E of the report details the calculation of the single discount rate and is not required to be included in your financial statements. However, this information may be requested by your auditors, therefore, we have included it in this report. It should be noted that we reflected the enactment of SB936.SD2.HD1.CD1 in the single discount rate determination. In particular we reflected the increasing employer contributions rates over the next four fiscal years.
The Board of Trustees March 16, 2018 Page 2
Section F currently contains both the aggregate GASB No. 68 information on a plan wide level and the schedules with the individual employers’ information. This report complements the actuarial valuation report that was provided to ERS and should be considered in conjunction with that report. Please see the actuarial valuation report as of June 30, 2017 for additional discussion of the nature of actuarial calculations and more information related to participant data, economic and demographic assumptions, and benefit provisions. To the best of our knowledge, this report is complete, accurate, and in accordance with generally recognized actuarial methods. One or more of the undersigned are members of the American Academy of Actuaries and meet the Qualification Standards of the Academy of Actuaries to render the actuarial opinion herein. The signing actuaries are independent of the plan sponsor. Respectfully submitted,
By By Lewis Ward Joe Newton Consultant FSA, EA, MAAA

SECTION A
EXECUTIVE SUMMARY
Employees’ Retirement System of the State of Hawaii
A-1
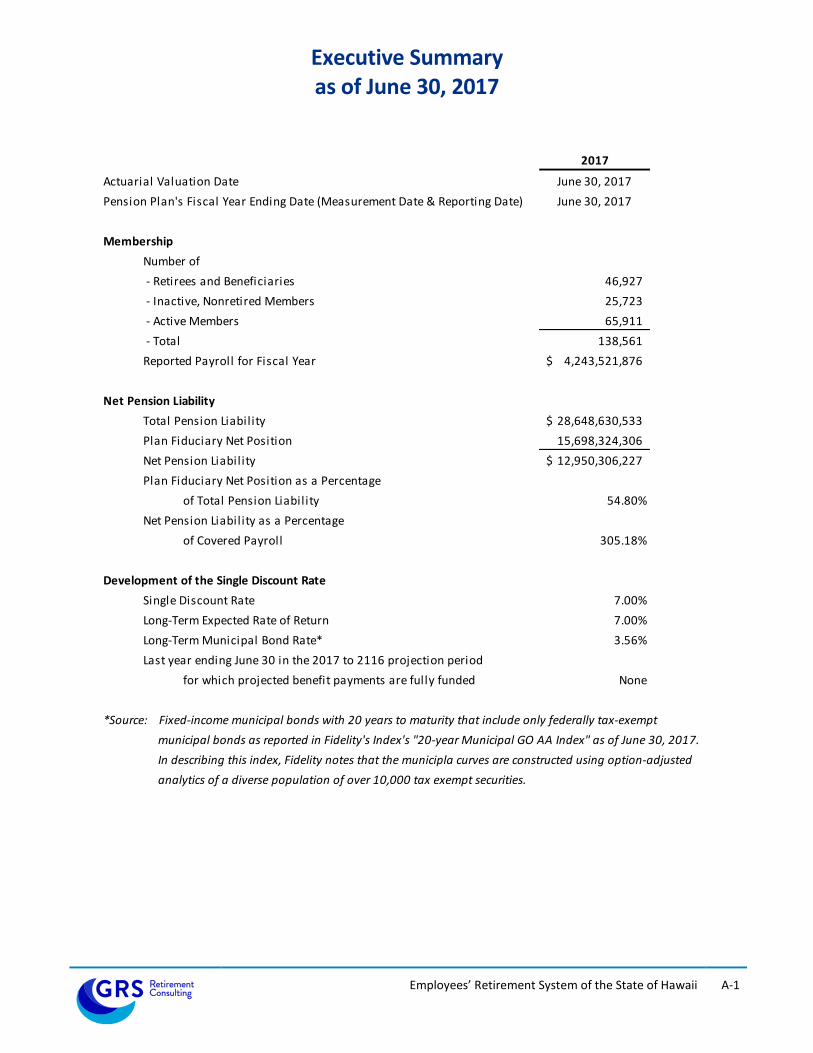
Executive Summary as of June 30, 2017
2017
Actuarial Valuation Date June 30, 2017
Pension Plan's Fiscal Year Ending Date (Measurement Date & Reporting Date) June 30, 2017
Membership
Number of
- Retirees and Beneficiaries 46,927
- Inactive, Nonretired Members 25,723
- Active Members 65,911
- Total 138,561
Reported Payroll for Fiscal Year 4,243,521,876$
Net Pension Liability
Total Pension Liability 28,648,630,533$
Plan Fiduciary Net Position 15,698,324,306
Net Pension Liability 12,950,306,227$
Plan Fiduciary Net Position as a Percentage
of Total Pension Liability 54.80%
Net Pension Liability as a Percentage
of Covered Payroll 305.18%
Development of the Single Discount Rate
Single Discount Rate 7.00%
Long-Term Expected Rate of Return 7.00%
Long-Term Municipal Bond Rate* 3.56%
Last year ending June 30 in the 2017 to 2116 projection period
for which projected benefit payments are fully funded None
*Source: Fixed-income municipal bonds with 20 years to maturity that include only federally tax-exempt
municipal bonds as reported in Fidelity's Index's "20-year Municipal GO AA Index" as of June 30, 2017.
In describing this index, Fidelity notes that the municipla curves are constructed using option-adjusted
analytics of a diverse population of over 10,000 tax exempt securities.
Employees’ Retirement System of the State of Hawaii
A-2
Discussion
Accounting Standard
For pension plans that are administered through trusts or equivalent arrangements, Governmental Accounting Standards Board (GASB) Statement No. 67, “Financial Reporting for Pension Plans,” replaces the requirements of GASB Statement No. 25, “Financial Reporting for Defined Benefit Pension Plans and Note Disclosures for Defined Contribution Plans,” and GASB Statement No. 50, “Pension Disclosures.” GASB Statement No. 67 establishes standards of financial reporting for separately issued financial reports and specifies the required approach for measuring the pension liability of employers and non-employer contributing entities for benefits provided through the pension plan. The following discussion provides a summary of the information that is required to be disclosed under these accounting standards. A number of these disclosure items are provided in this report. However, certain information, such as notes regarding accounting policies and investments, is not included in this report and the retirement system will be responsible for preparing and disclosing that information to comply with these accounting standards.
Financial Statements
GASB Statement No. 67 requires defined benefit pension plans to present two financial statements – a statement of fiduciary net position and a statement of changes in fiduciary net position. The statement of fiduciary net position presents the following items as of the end of the pension plan’s reporting period, such as:
assets;
deferred inflows and outflows of resources;
liabilities; and
fiduciary net position (assets, plus deferred outflows, minus liabilities, minus deferred inflows). The statement of changes in fiduciary net position presents the following for the plan’s reporting period:
additions, such as contributions and investment income;
deductions, such as benefit payments and expenses; and
net increase or decrease in the fiduciary net position (the difference between additions and deductions).
Employees’ Retirement System of the State of Hawaii
A-3
Notes to Financial Statements
GASB Statement No. 67 also requires the notes of the plan’s financial statements to include additional disclosure information. This disclosure information should include:
a description of the types of benefits provided by the plan, as well as automatic or ad hoc COLAs;
the number and classes of employees covered by the benefit terms;
the composition of the pension plan’s Board and the authority under which benefit terms may be amended;
a description of the plan’s funding policy, which includes member and employer contribution requirements;
the pension plan’s investment policies;
a description of how fair value is determined;
concentrations of investments greater than or equal to 5%;
annual money-weighted rate of return on pension plan investments;
the portion of the present value of benefits to be provided through the pension plan to current active and inactive plan members;
the pension plan’s fiduciary net position;
the net pension liability;
the pension plan’s fiduciary net position as a percentage of the total pension liability;
significant assumptions and methods used to calculate the total pension liability;
inputs to the discount rates; and
certain information about mortality assumptions and the dates of experience studies.
Required Supplementary Information
Statement No. 67 requires a 10-year fiscal history of:
sources of changes in the net pension liability;
information about the components of the net pension liability and related ratios, including the pension plan’s fiduciary net position as a percentage of the total pension liability, and the net pension liability as a percent of covered-employee payroll;
comparison of the actual employer contributions to the actuarially determined contributions based on the plan’s funding policy; and
the annual money-weighted rate of return on pension plan investments for each year. As shown above, you will need to include a determination of the annual money-weighted rate of return for your Notes to Financial Statements and Required Supplementary Information. Statement No. 67 requires that this information be determined using cash-flows with a frequency of not less than a monthly basis. We do not have the detailed financial information to determine this number. If you need our assistance please let us know.
Measurement of the Net Pension Liability
The net pension liability is to be measured as the total pension liability, less the amount of the pension plan’s fiduciary net position. In actuarial terms, this will be the accrued liability less the market value of assets (not the smoothed actuarial value of assets that is often encountered in actuarial valuations performed to determine the employer’s contribution requirement).
Employees’ Retirement System of the State of Hawaii
A-4
Timing of the Valuation
An actuarial valuation to determine the total pension liability is required to be performed at least every two years. The net pension liability and pension expense should be measured as of the pension plan’s fiscal year end (measurement date) on a date that is within the employer’s prior fiscal year. If the actuarial valuation used to determine the total pension liability is not calculated as of the measurement date, the total pension liability is required to be rolled forward from the actuarial valuation date to the measurement date. The total pension liability shown in this report is based on an actuarial valuation performed as of June 30, 2017 and a measurement date of June 30, 2017. Single Discount Rate Projected benefit payments are required to be discounted to their actuarial present values using a single discount rate that reflects (1) a long-term expected rate of return on pension plan investments (to the extent that the plan’s fiduciary net position is projected to be sufficient to pay benefits) and (2) tax-exempt municipal bond rate based on an index of 20-year general obligation bonds with an average AA credit rating as of the measurement date (to the extent that the contributions for use with the long-term expected rate of return are not met). For the purpose of this valuation, the expected rate of return on pension plan investments is 7.00% the municipal bond rate is 3.56% (based on the daily rate closest to but not later than the measurement date of the Fidelity “20-Year Municipal GO AA Index”); and the resulting single discount rate is 7.00%. Effective Date and Transition GASB Statements No. 67 is effective for a pension plan’s fiscal years beginning after June 15, 2013, however, earlier application is encouraged by the GASB. GASB Statement No. 68 is effective for an employer’s fiscal year beginning after June 30, 2014.

SECTION B
FINANCIAL STATEMENTS
Employees’ Retirement System of the State of Hawaii
B-1
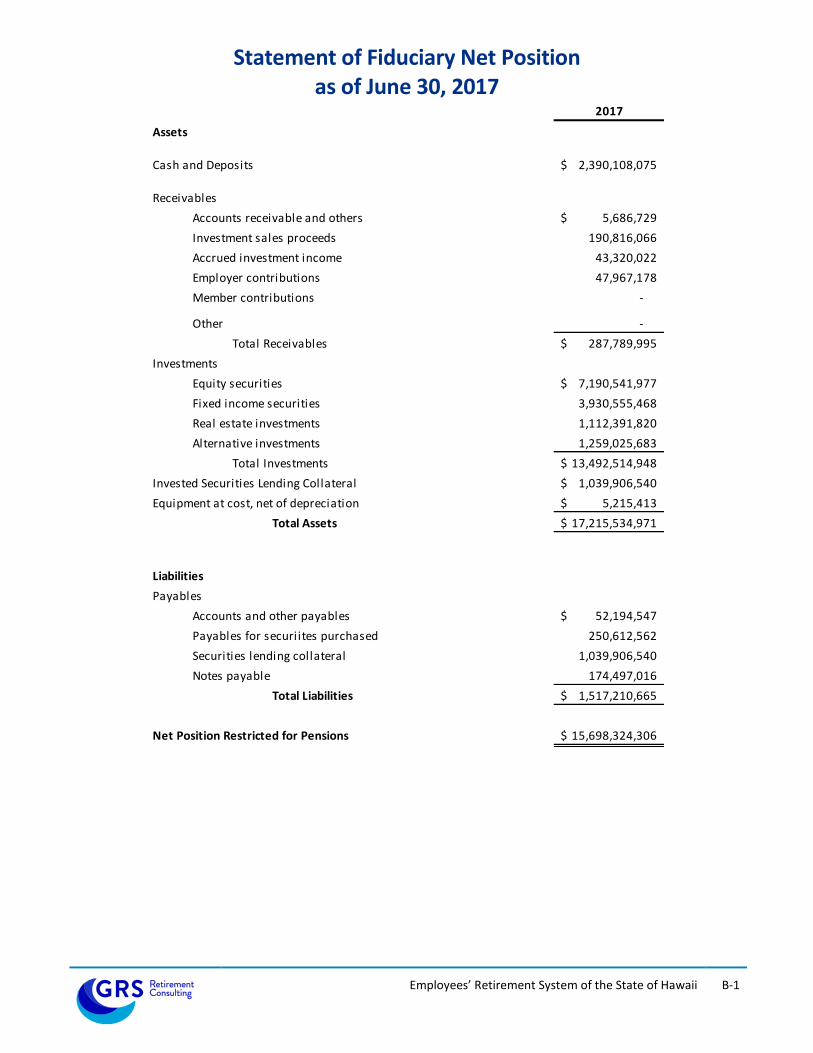
Statement of Fiduciary Net Position as of June 30, 2017
2017
Assets
Cash and Deposits 2,390,108,075$
Receivables
Accounts receivable and others 5,686,729$
Investment sales proceeds 190,816,066
Accrued investment income 43,320,022
Employer contributions 47,967,178
Member contributions -
Other -
Total Receivables 287,789,995$
Investments
Equity securities 7,190,541,977$
Fixed income securities 3,930,555,468
Real estate investments 1,112,391,820
Alternative investments 1,259,025,683
Total Investments 13,492,514,948$
Invested Securities Lending Collateral 1,039,906,540$
Equipment at cost, net of depreciation 5,215,413$
Total Assets 17,215,534,971$
Liabilities
Payables
Accounts and other payables 52,194,547$
Payables for securiites purchased 250,612,562
Securities lending collateral 1,039,906,540
Notes payable 174,497,016
Total Liabilities 1,517,210,665$
Net Position Restricted for Pensions 15,698,324,306$
Employees’ Retirement System of the State of Hawaii
B-2
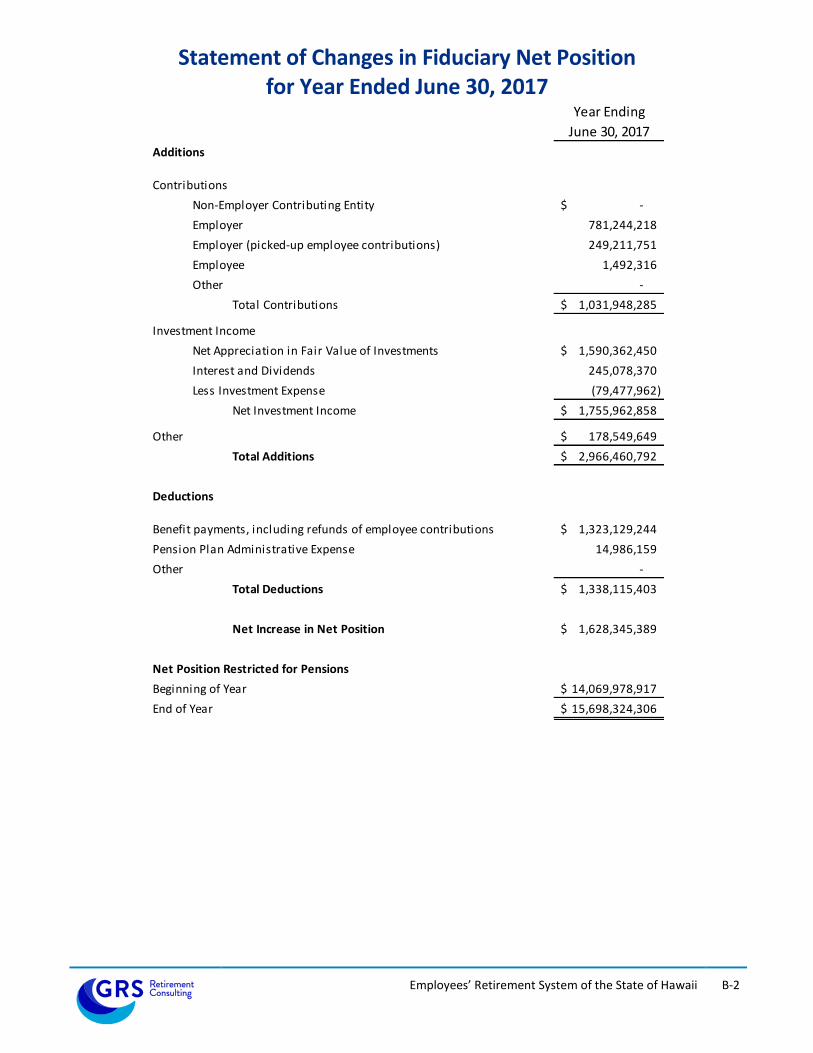
Statement of Changes in Fiduciary Net Position for Year Ended June 30, 2017
Year Ending
June 30, 2017
Additions
Contributions
Non-Employer Contributing Entity -$
Employer 781,244,218
Employer (picked-up employee contributions) 249,211,751
Employee 1,492,316
Other -
Total Contributions 1,031,948,285$
Investment Income
Net Appreciation in Fair Value of Investments 1,590,362,450$
Interest and Dividends 245,078,370
Less Investment Expense (79,477,962)
Net Investment Income 1,755,962,858$
Other 178,549,649$
Total Additions 2,966,460,792$
Deductions
Benefit payments, including refunds of employee contributions 1,323,129,244$
Pension Plan Administrative Expense 14,986,159
Other -
Total Deductions 1,338,115,403$
Net Increase in Net Position 1,628,345,389$
Net Position Restricted for Pensions
Beginning of Year 14,069,978,917$
End of Year 15,698,324,306$

SECTION C
REQUIRED SUPPLEMENTARY INFORMATION
Employees’ Retirement System of the State of Hawaii
C-1
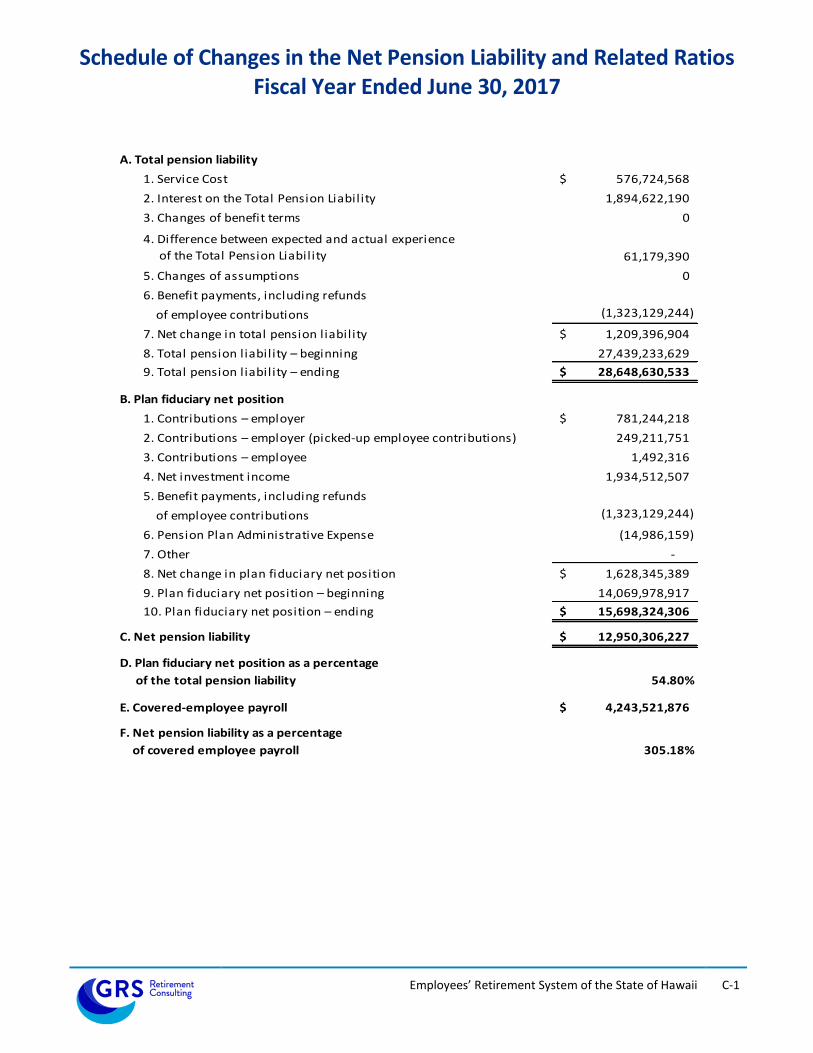
Schedule of Changes in the Net Pension Liability and Related Ratios Fiscal Year Ended June 30, 2017
A. Total pension liability
1. Service Cost 576,724,568$
2. Interest on the Total Pension Liability 1,894,622,190
3. Changes of benefit terms 0
4. Difference between expected and actual experience
of the Total Pension Liability 61,179,390
5. Changes of assumptions 0
6. Benefit payments, including refunds
of employee contributions (1,323,129,244)
7. Net change in total pension liability 1,209,396,904$
8. Total pension liability – beginning 27,439,233,629
9. Total pension liability – ending 28,648,630,533$
B. Plan fiduciary net position
1. Contributions – employer 781,244,218$
2. Contributions – employer (picked-up employee contributions) 249,211,751
3. Contributions – employee 1,492,316
4. Net investment income 1,934,512,507
5. Benefit payments, including refunds
of employee contributions (1,323,129,244)
6. Pension Plan Administrative Expense (14,986,159)
7. Other -
8. Net change in plan fiduciary net position 1,628,345,389$
9. Plan fiduciary net position – beginning 14,069,978,917
10. Plan fiduciary net position – ending 15,698,324,306$
C. Net pension liability 12,950,306,227$
D. Plan fiduciary net position as a percentage
of the total pension liability 54.80%
E. Covered-employee payroll 4,243,521,876$
F. Net pension liability as a percentage
of covered employee payroll 305.18%
Employees’ Retirement System of the State of Hawaii
C-2
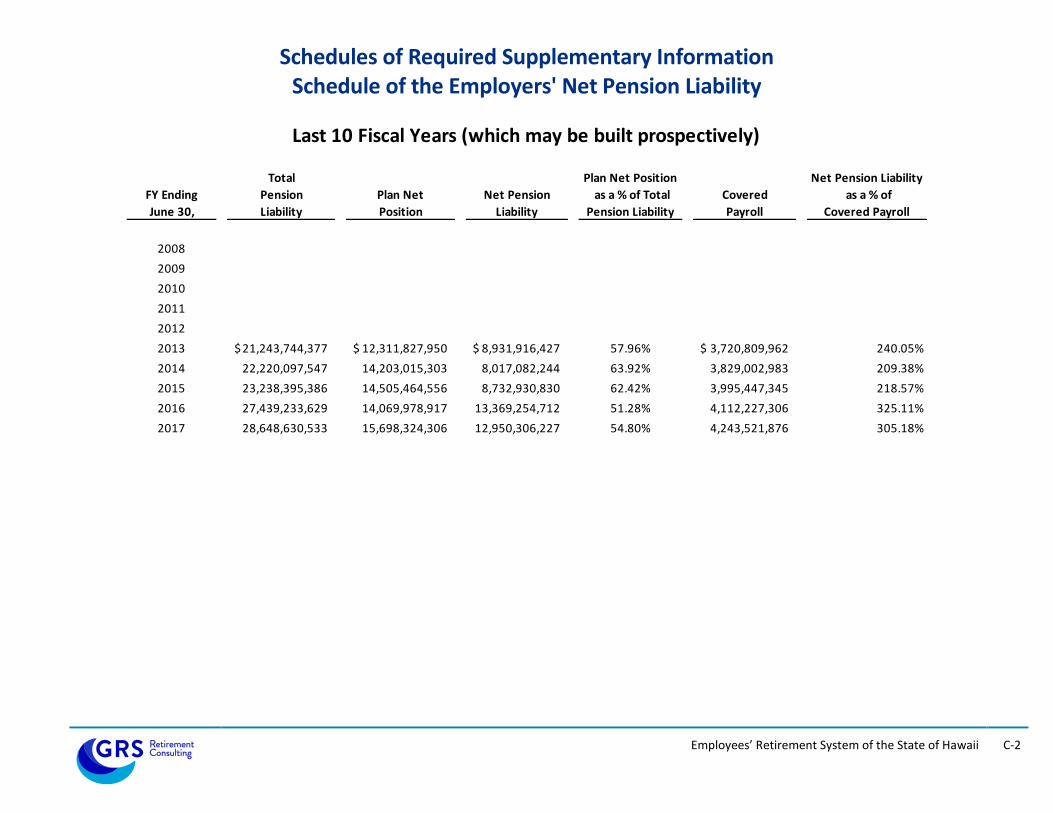
Schedules of Required Supplementary Information Schedule of the Employers' Net Pension Liability
Total Plan Net Position Net Pension Liability
FY Ending Pension Plan Net Net Pension as a % of Total Covered as a % of
June 30, Liability Position Liability Pension Liability Payroll Covered Payroll
2008
2009
2010
2011
2012
2013 21,243,744,377$ 12,311,827,950$ 8,931,916,427$ 57.96% 3,720,809,962$ 240.05%
2014 22,220,097,547 14,203,015,303 8,017,082,244 63.92% 3,829,002,983 209.38%
2015 23,238,395,386 14,505,464,556 8,732,930,830 62.42% 3,995,447,345 218.57%
2016 27,439,233,629 14,069,978,917 13,369,254,712 51.28% 4,112,227,306 325.11%
2017 28,648,630,533 15,698,324,306 12,950,306,227 54.80% 4,243,521,876 305.18%
Last 10 Fiscal Years (which may be built prospectively)
Employees’ Retirement System of the State of Hawaii
C-3
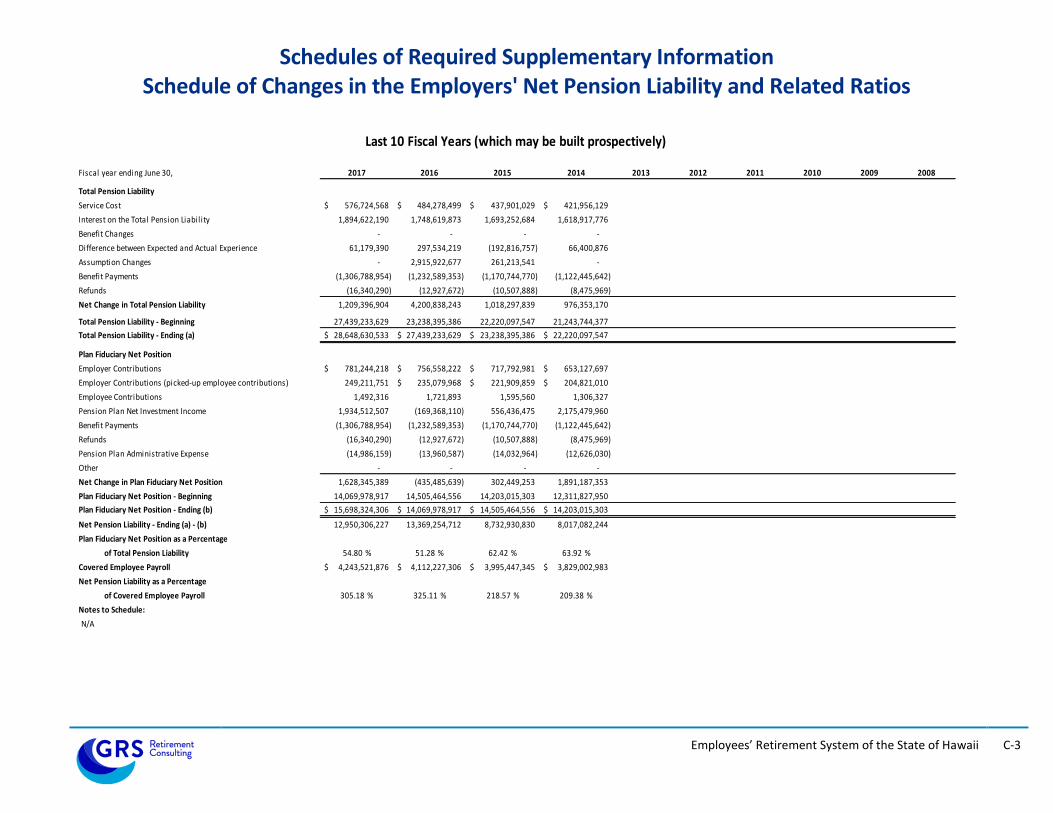
Schedules of Required Supplementary Information Schedule of Changes in the Employers' Net Pension Liability and Related Ratios
Fiscal year ending June 30, 2017 2016 2015 2014 2013 2012 2011 2010 2009 2008
Total Pension Liability
Service Cost 576,724,568$ 484,278,499$ 437,901,029$ 421,956,129$
Interest on the Total Pension Liability 1,894,622,190 1,748,619,873 1,693,252,684 1,618,917,776
Benefit Changes - - - -
61,179,390 297,534,219 (192,816,757) 66,400,876
Assumption Changes - 2,915,922,677 261,213,541 -
Benefit Payments (1,306,788,954) (1,232,589,353) (1,170,744,770) (1,122,445,642)
Refunds (16,340,290) (12,927,672) (10,507,888) (8,475,969)
Net Change in Total Pension Liability 1,209,396,904 4,200,838,243 1,018,297,839 976,353,170
Total Pension Liability - Beginning 27,439,233,629 23,238,395,386 22,220,097,547 21,243,744,377
Total Pension Liability - Ending (a) 28,648,630,533$ 27,439,233,629$ 23,238,395,386$ 22,220,097,547$
Plan Fiduciary Net Position
Employer Contributions 781,244,218$ 756,558,222$ 717,792,981$ 653,127,697$
Employer Contributions (picked-up employee contributions) 249,211,751 235,079,968$ 221,909,859$ 204,821,010$
Employee Contributions 1,492,316 1,721,893 1,595,560 1,306,327
Pension Plan Net Investment Income 1,934,512,507 (169,368,110) 556,436,475 2,175,479,960
Benefit Payments (1,306,788,954) (1,232,589,353) (1,170,744,770) (1,122,445,642)
Refunds (16,340,290) (12,927,672) (10,507,888) (8,475,969)
Pension Plan Administrative Expense (14,986,159) (13,960,587) (14,032,964) (12,626,030)
Other - - - -
Net Change in Plan Fiduciary Net Position 1,628,345,389 (435,485,639) 302,449,253 1,891,187,353
Plan Fiduciary Net Position - Beginning 14,069,978,917 14,505,464,556 14,203,015,303 12,311,827,950
Plan Fiduciary Net Position - Ending (b) 15,698,324,306$ 14,069,978,917$ 14,505,464,556$ 14,203,015,303$
Net Pension Liability - Ending (a) - (b) 12,950,306,227 13,369,254,712 8,732,930,830 8,017,082,244
Plan Fiduciary Net Position as a Percentage
of Total Pension Liability 54.80 % 51.28 % 62.42 % 63.92 %
Covered Employee Payroll 4,243,521,876$ 4,112,227,306$ 3,995,447,345$ 3,829,002,983$
Net Pension Liability as a Percentage
of Covered Employee Payroll 305.18 % 325.11 % 218.57 % 209.38 %
Notes to Schedule:
N/A
Last 10 Fiscal Years (which may be built prospectively)
Difference between Expected and Actual Experience

SECTION D
NOTES TO FINANCIAL STATEMENTS
Employees’ Retirement System of the State of Hawaii
D-1
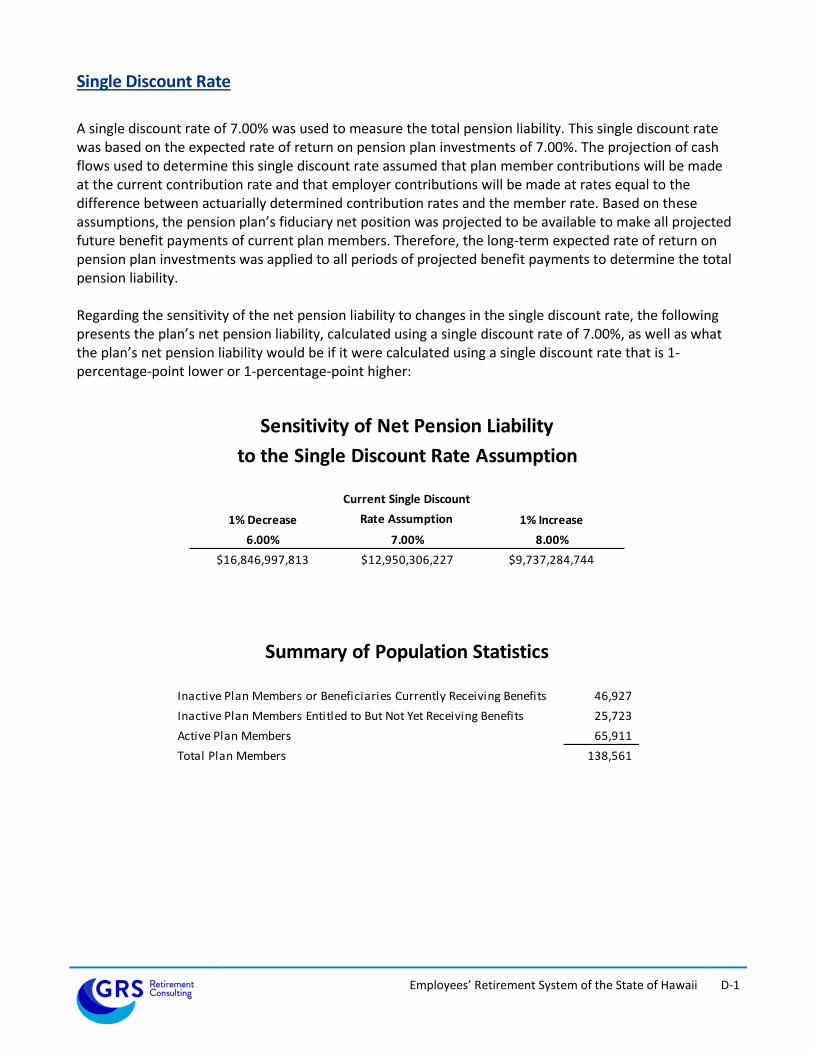
Single Discount Rate
A single discount rate of 7.00% was used to measure the total pension liability. This single discount rate was based on the expected rate of return on pension plan investments of 7.00%. The projection of cash flows used to determine this single discount rate assumed that plan member contributions will be made at the current contribution rate and that employer contributions will be made at rates equal to the difference between actuarially determined contribution rates and the member rate. Based on these assumptions, the pension plan’s fiduciary net position was projected to be available to make all projected future benefit payments of current plan members. Therefore, the long-term expected rate of return on pension plan investments was applied to all periods of projected benefit payments to determine the total pension liability. Regarding the sensitivity of the net pension liability to changes in the single discount rate, the following presents the plan’s net pension liability, calculated using a single discount rate of 7.00%, as well as what the plan’s net pension liability would be if it were calculated using a single discount rate that is 1-percentage-point lower or 1-percentage-point higher:
Current Single Discount
1% Decrease Rate Assumption 1% Increase
6.00% 7.00% 8.00%
$16,846,997,813 $12,950,306,227 $9,737,284,744
Sensitivity of Net Pension Liability
to the Single Discount Rate Assumption
Inactive Plan Members or Beneficiaries Currently Receiving Benefits 46,927
Inactive Plan Members Entitled to But Not Yet Receiving Benefits 25,723
Active Plan Members 65,911
Total Plan Members 138,561
Summary of Population Statistics
SECTION E
CALCULATION OF THE SINGLE DISCOUNT RATE
Employees’ Retirement System of the State of Hawaii
E-1
Calculation of the Single Discount Rate
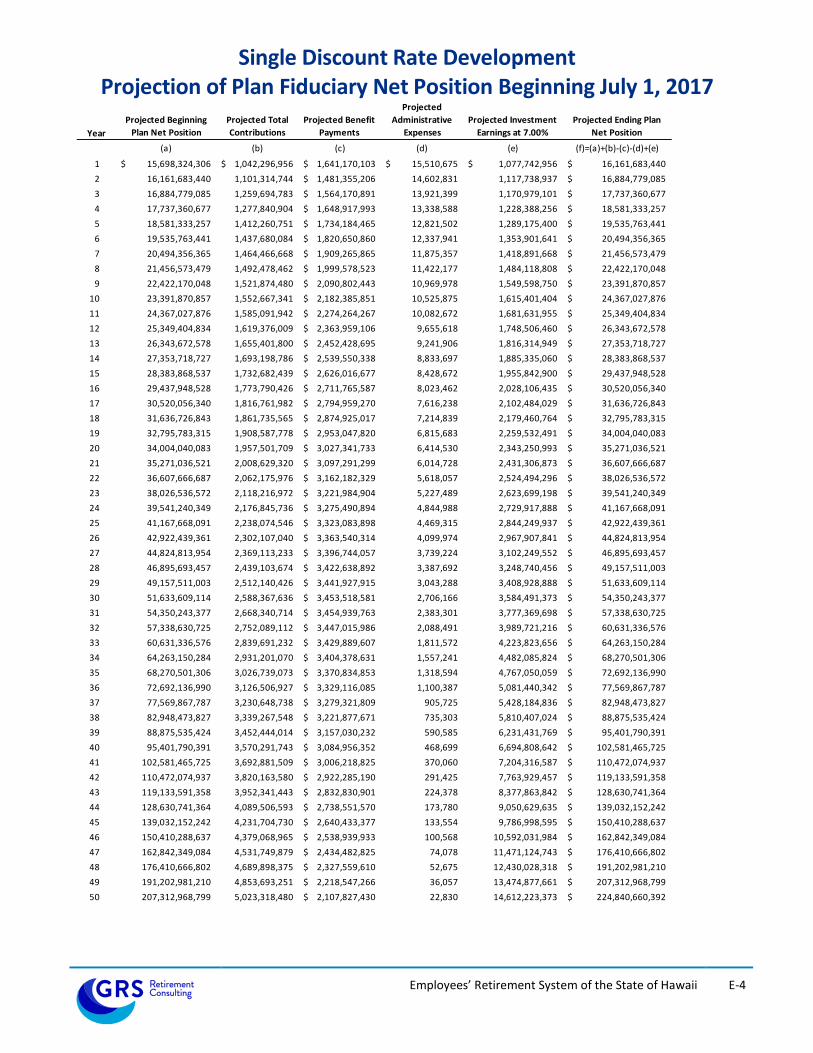
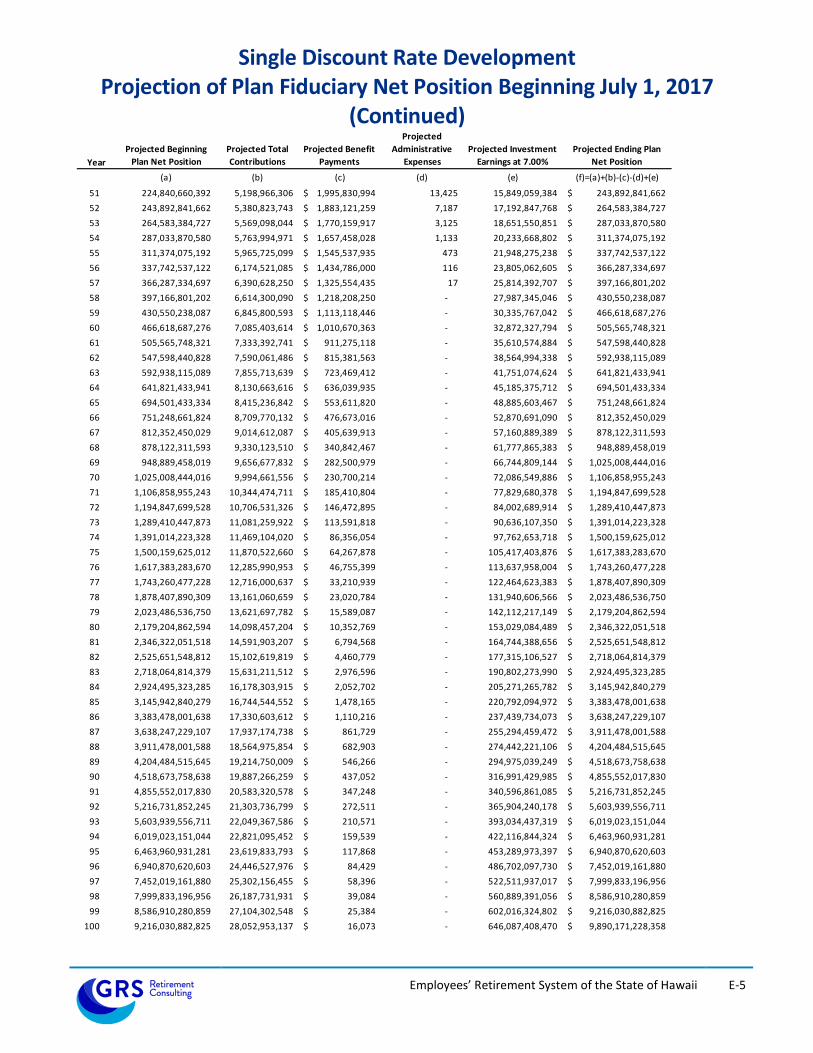
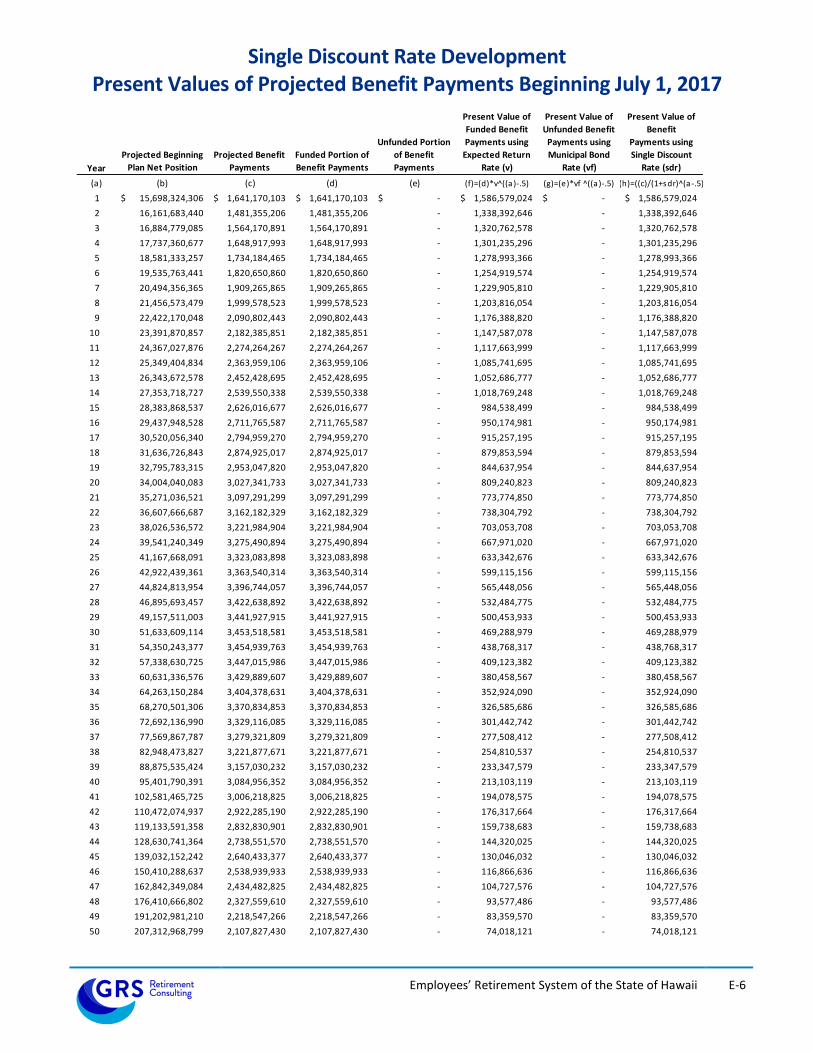
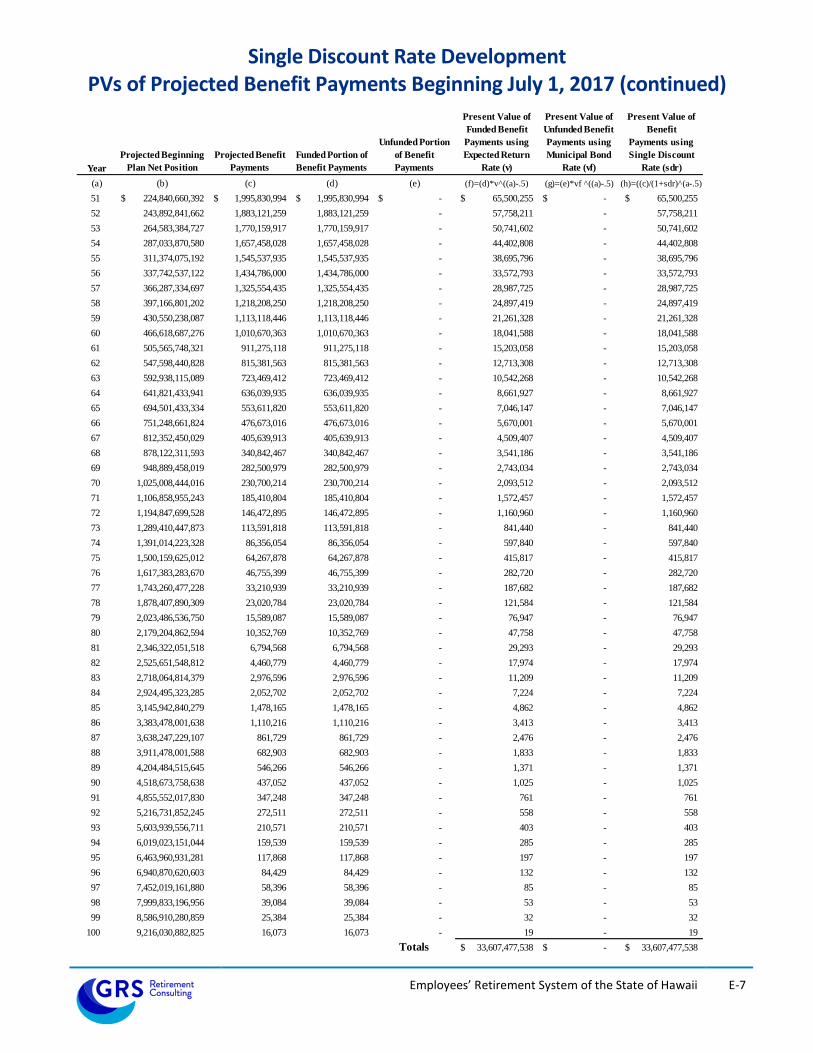
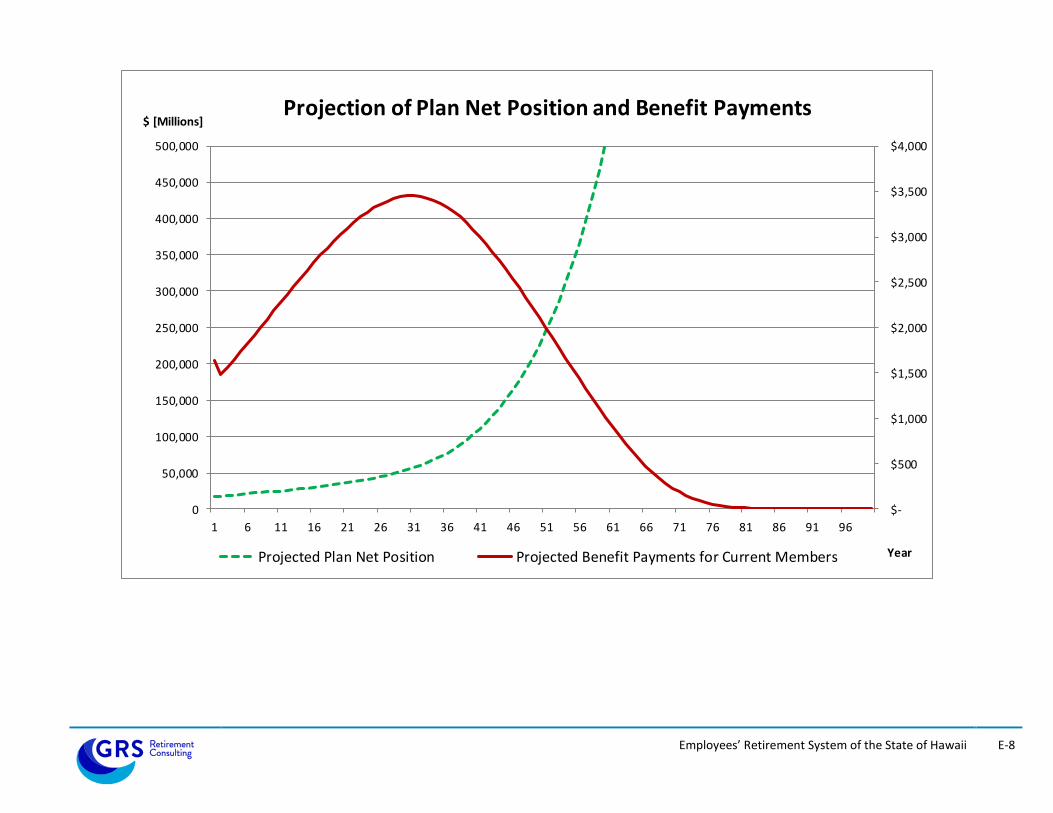
GASB Statement No. 67 includes a specific requirement for the discount rate that is used for the purpose of the measurement of the Total Pension Liability. This rate considers the ability of the fund to meet benefit obligations in the future. To make this determination, employer contributions, employee contributions, benefit payments, expenses and investment returns are projected into the future. The Plan Net Position (assets) in future years can then be determined and compared to its obligation to make benefit payments in those years. As long as assets are projected to be on hand in a future year, the assumed valuation discount rate is used. In years where assets are not projected to be sufficient to meet benefit payments, the use of a tax-exempt municipal bond rate is required, as described in the following paragraph. The single discount rate (SDR) is equivalent to applying these two rates to the benefits that are projected to be paid during the different time periods. The SDR reflects (1) the long-term expected rate of return on pension plan investments (during the period in which the fiduciary net position is projected to be sufficient to pay benefits) and (2) tax-exempt municipal bond rate based on an index of 20-year general obligation bonds with an average AA credit rating as of the measurement date (to the extent that the contributions for use with the long-term expected rate of return are not met). For the purpose of this valuation, the expected rate of return on pension plan investments is 7.00%; the municipal bond rate is 2.85% (based on the daily rate closest to but not later than the measurement date of the Fidelity “20-Year Municipal GO AA Index”); and the resulting single discount rate is 7.00%. The tables in this section provide background for the development of the single discount rate. The Projection of Contributions table shows the development of expected contributions in future years. Normal Cost contributions for future hires are not included (nor are their liabilities). The Projection of Plan Fiduciary Net Position table shows the development of expected asset levels in future years. The Present Values of Projected Benefit Payments table shows the development of the Single Discount Rate (SDR). It breaks down the benefit payments into present values for funded and unfunded portions and shows the equivalent total at the SDR. As noted in the cover letter, in determining the single discount rate we reflected the enactment of SB936.SD2.HD1.CD1. In particular we reflected the increasing employer contributions rates over the next four fiscal years
Employees’ Retirement System of the State of Hawaii
E-2
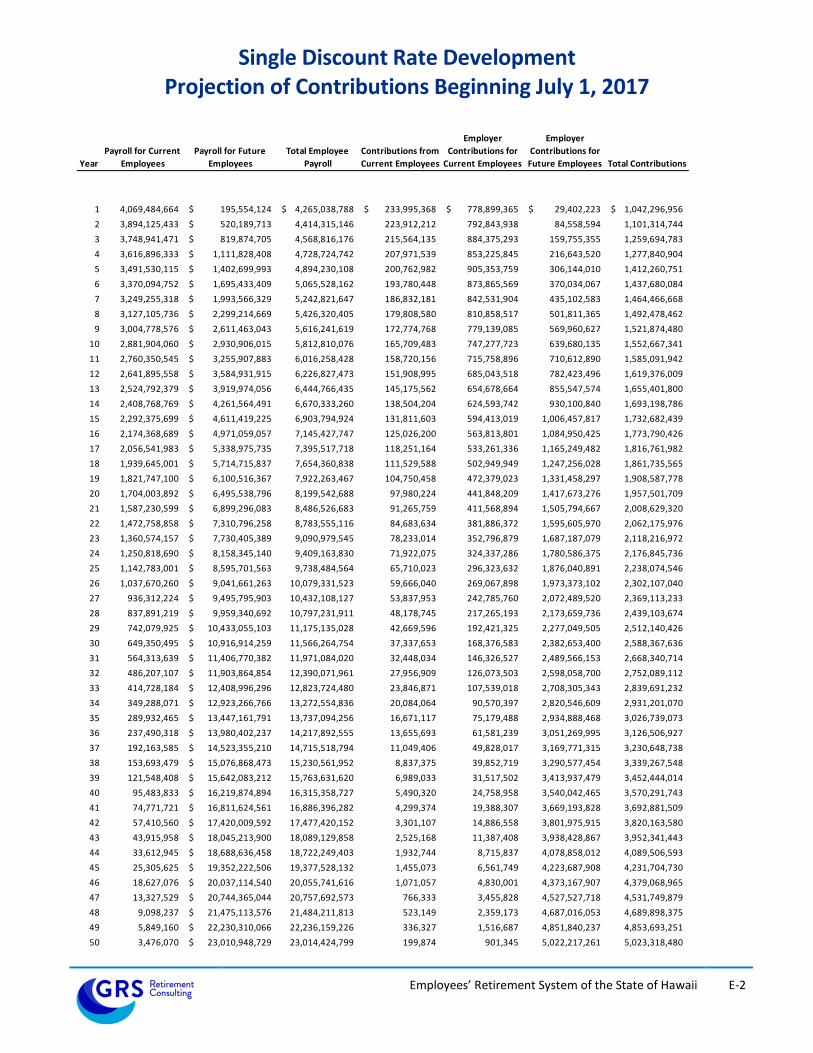
Single Discount Rate Development Projection of Contributions Beginning July 1, 2017
Year
Payroll for Current
Employees
Payroll for Future
Employees
Total Employee
Payroll
Contributions from
Current Employees
Employer
Contributions for
Current Employees
Employer
Contributions for
Future Employees Total Contributions
1 4,069,484,664 195,554,124$ 4,265,038,788$ 233,995,368$ 778,899,365$ 29,402,223$ 1,042,296,956$
2 3,894,125,433 520,189,713$ 4,414,315,146 223,912,212 792,843,938 84,558,594 1,101,314,744
3 3,748,941,471 819,874,705$ 4,568,816,176 215,564,135 884,375,293 159,755,355 1,259,694,783
4 3,616,896,333 1,111,828,408$ 4,728,724,742 207,971,539 853,225,845 216,643,520 1,277,840,904
5 3,491,530,115 1,402,699,993$ 4,894,230,108 200,762,982 905,353,759 306,144,010 1,412,260,751
6 3,370,094,752 1,695,433,409$ 5,065,528,162 193,780,448 873,865,569 370,034,067 1,437,680,084
7 3,249,255,318 1,993,566,329$ 5,242,821,647 186,832,181 842,531,904 435,102,583 1,464,466,668
8 3,127,105,736 2,299,214,669$ 5,426,320,405 179,808,580 810,858,517 501,811,365 1,492,478,462
9 3,004,778,576 2,611,463,043$ 5,616,241,619 172,774,768 779,139,085 569,960,627 1,521,874,480
10 2,881,904,060 2,930,906,015$ 5,812,810,076 165,709,483 747,277,723 639,680,135 1,552,667,341
11 2,760,350,545 3,255,907,883$ 6,016,258,428 158,720,156 715,758,896 710,612,890 1,585,091,942
12 2,641,895,558 3,584,931,915$ 6,226,827,473 151,908,995 685,043,518 782,423,496 1,619,376,009
13 2,524,792,379 3,919,974,056$ 6,444,766,435 145,175,562 654,678,664 855,547,574 1,655,401,800
14 2,408,768,769 4,261,564,491$ 6,670,333,260 138,504,204 624,593,742 930,100,840 1,693,198,786
15 2,292,375,699 4,611,419,225$ 6,903,794,924 131,811,603 594,413,019 1,006,457,817 1,732,682,439
16 2,174,368,689 4,971,059,057$ 7,145,427,747 125,026,200 563,813,801 1,084,950,425 1,773,790,426
17 2,056,541,983 5,338,975,735$ 7,395,517,718 118,251,164 533,261,336 1,165,249,482 1,816,761,982
18 1,939,645,001 5,714,715,837$ 7,654,360,838 111,529,588 502,949,949 1,247,256,028 1,861,735,565
19 1,821,747,100 6,100,516,367$ 7,922,263,467 104,750,458 472,379,023 1,331,458,297 1,908,587,778
20 1,704,003,892 6,495,538,796$ 8,199,542,688 97,980,224 441,848,209 1,417,673,276 1,957,501,709
21 1,587,230,599 6,899,296,083$ 8,486,526,683 91,265,759 411,568,894 1,505,794,667 2,008,629,320
22 1,472,758,858 7,310,796,258$ 8,783,555,116 84,683,634 381,886,372 1,595,605,970 2,062,175,976
23 1,360,574,157 7,730,405,389$ 9,090,979,545 78,233,014 352,796,879 1,687,187,079 2,118,216,972
24 1,250,818,690 8,158,345,140$ 9,409,163,830 71,922,075 324,337,286 1,780,586,375 2,176,845,736
25 1,142,783,001 8,595,701,563$ 9,738,484,564 65,710,023 296,323,632 1,876,040,891 2,238,074,546
26 1,037,670,260 9,041,661,263$ 10,079,331,523 59,666,040 269,067,898 1,973,373,102 2,302,107,040
27 936,312,224 9,495,795,903$ 10,432,108,127 53,837,953 242,785,760 2,072,489,520 2,369,113,233
28 837,891,219 9,959,340,692$ 10,797,231,911 48,178,745 217,265,193 2,173,659,736 2,439,103,674
29 742,079,925 10,433,055,103$ 11,175,135,028 42,669,596 192,421,325 2,277,049,505 2,512,140,426
30 649,350,495 10,916,914,259$ 11,566,264,754 37,337,653 168,376,583 2,382,653,400 2,588,367,636
31 564,313,639 11,406,770,382$ 11,971,084,020 32,448,034 146,326,527 2,489,566,153 2,668,340,714
32 486,207,107 11,903,864,854$ 12,390,071,961 27,956,909 126,073,503 2,598,058,700 2,752,089,112
33 414,728,184 12,408,996,296$ 12,823,724,480 23,846,871 107,539,018 2,708,305,343 2,839,691,232
34 349,288,071 12,923,266,766$ 13,272,554,836 20,084,064 90,570,397 2,820,546,609 2,931,201,070
35 289,932,465 13,447,161,791$ 13,737,094,256 16,671,117 75,179,488 2,934,888,468 3,026,739,073
36 237,490,318 13,980,402,237$ 14,217,892,555 13,655,693 61,581,239 3,051,269,995 3,126,506,927
37 192,163,585 14,523,355,210$ 14,715,518,794 11,049,406 49,828,017 3,169,771,315 3,230,648,738
38 153,693,479 15,076,868,473$ 15,230,561,952 8,837,375 39,852,719 3,290,577,454 3,339,267,548
39 121,548,408 15,642,083,212$ 15,763,631,620 6,989,033 31,517,502 3,413,937,479 3,452,444,014
40 95,483,833 16,219,874,894$ 16,315,358,727 5,490,320 24,758,958 3,540,042,465 3,570,291,743
41 74,771,721 16,811,624,561$ 16,886,396,282 4,299,374 19,388,307 3,669,193,828 3,692,881,509
42 57,410,560 17,420,009,592$ 17,477,420,152 3,301,107 14,886,558 3,801,975,915 3,820,163,580
43 43,915,958 18,045,213,900$ 18,089,129,858 2,525,168 11,387,408 3,938,428,867 3,952,341,443
44 33,612,945 18,688,636,458$ 18,722,249,403 1,932,744 8,715,837 4,078,858,012 4,089,506,593
45 25,305,625 19,352,222,506$ 19,377,528,132 1,455,073 6,561,749 4,223,687,908 4,231,704,730
46 18,627,076 20,037,114,540$ 20,055,741,616 1,071,057 4,830,001 4,373,167,907 4,379,068,965
47 13,327,529 20,744,365,044$ 20,757,692,573 766,333 3,455,828 4,527,527,718 4,531,749,879
48 9,098,237 21,475,113,576$ 21,484,211,813 523,149 2,359,173 4,687,016,053 4,689,898,375
49 5,849,160 22,230,310,066$ 22,236,159,226 336,327 1,516,687 4,851,840,237 4,853,693,251
50 3,476,070 23,010,948,729$ 23,014,424,799 199,874 901,345 5,022,217,261 5,023,318,480
Employees’ Retirement System of the State of Hawaii
E-3
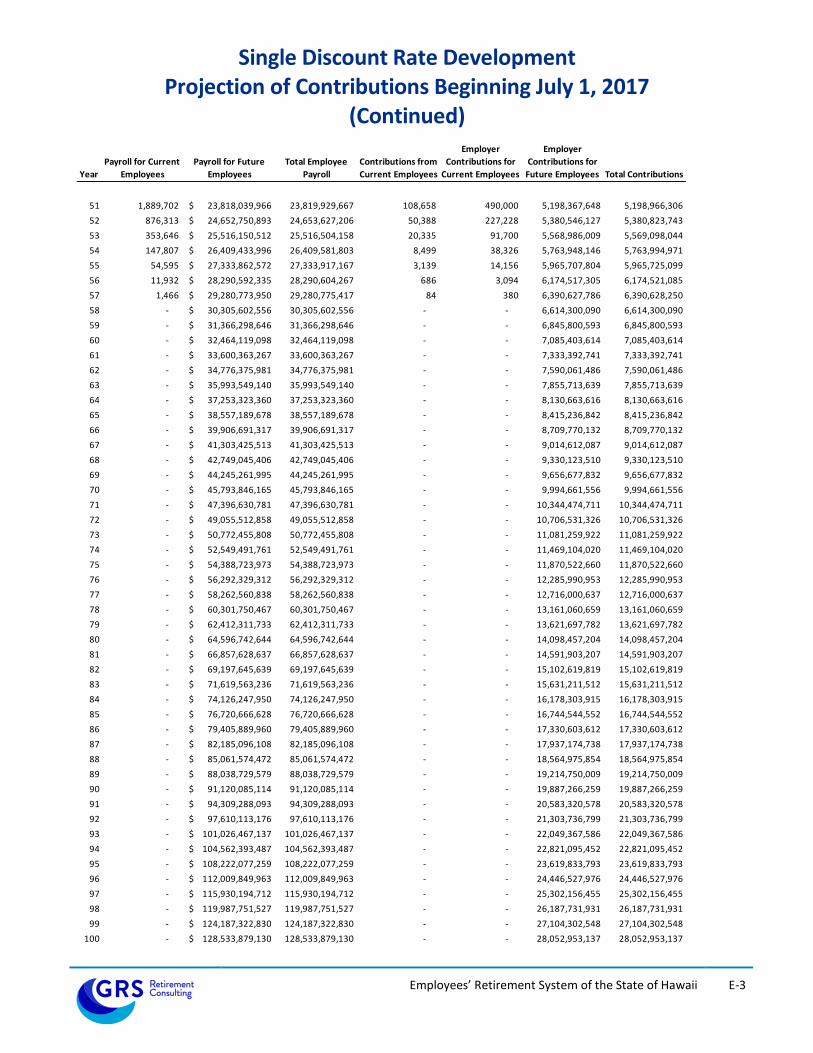
Single Discount Rate Development Projection of Contributions Beginning July 1, 2017
(Continued)
Year
Payroll for Current
Employees
Payroll for Future
Employees
Total Employee
Payroll
Contributions from
Current Employees
Employer
Contributions for
Current Employees
Employer
Contributions for
Future Employees Total Contributions
51 1,889,702 23,818,039,966$ 23,819,929,667 108,658 490,000 5,198,367,648 5,198,966,306
52 876,313 24,652,750,893$ 24,653,627,206 50,388 227,228 5,380,546,127 5,380,823,743
53 353,646 25,516,150,512$ 25,516,504,158 20,335 91,700 5,568,986,009 5,569,098,044
54 147,807 26,409,433,996$ 26,409,581,803 8,499 38,326 5,763,948,146 5,763,994,971
55 54,595 27,333,862,572$ 27,333,917,167 3,139 14,156 5,965,707,804 5,965,725,099
56 11,932 28,290,592,335$ 28,290,604,267 686 3,094 6,174,517,305 6,174,521,085
57 1,466 29,280,773,950$ 29,280,775,417 84 380 6,390,627,786 6,390,628,250
58 - 30,305,602,556$ 30,305,602,556 - - 6,614,300,090 6,614,300,090
59 - 31,366,298,646$ 31,366,298,646 - - 6,845,800,593 6,845,800,593
60 - 32,464,119,098$ 32,464,119,098 - - 7,085,403,614 7,085,403,614
61 - 33,600,363,267$ 33,600,363,267 - - 7,333,392,741 7,333,392,741
62 - 34,776,375,981$ 34,776,375,981 - - 7,590,061,486 7,590,061,486
63 - 35,993,549,140$ 35,993,549,140 - - 7,855,713,639 7,855,713,639
64 - 37,253,323,360$ 37,253,323,360 - - 8,130,663,616 8,130,663,616
65 - 38,557,189,678$ 38,557,189,678 - - 8,415,236,842 8,415,236,842
66 - 39,906,691,317$ 39,906,691,317 - - 8,709,770,132 8,709,770,132
67 - 41,303,425,513$ 41,303,425,513 - - 9,014,612,087 9,014,612,087
68 - 42,749,045,406$ 42,749,045,406 - - 9,330,123,510 9,330,123,510
69 - 44,245,261,995$ 44,245,261,995 - - 9,656,677,832 9,656,677,832
70 - 45,793,846,165$ 45,793,846,165 - - 9,994,661,556 9,994,661,556
71 - 47,396,630,781$ 47,396,630,781 - - 10,344,474,711 10,344,474,711
72 - 49,055,512,858$ 49,055,512,858 - - 10,706,531,326 10,706,531,326
73 - 50,772,455,808$ 50,772,455,808 - - 11,081,259,922 11,081,259,922
74 - 52,549,491,761$ 52,549,491,761 - - 11,469,104,020 11,469,104,020
75 - 54,388,723,973$ 54,388,723,973 - - 11,870,522,660 11,870,522,660
76 - 56,292,329,312$ 56,292,329,312 - - 12,285,990,953 12,285,990,953
77 - 58,262,560,838$ 58,262,560,838 - - 12,716,000,637 12,716,000,637
78 - 60,301,750,467$ 60,301,750,467 - - 13,161,060,659 13,161,060,659
79 - 62,412,311,733$ 62,412,311,733 - - 13,621,697,782 13,621,697,782
80 - 64,596,742,644$ 64,596,742,644 - - 14,098,457,204 14,098,457,204
81 - 66,857,628,637$ 66,857,628,637 - - 14,591,903,207 14,591,903,207
82 - 69,197,645,639$ 69,197,645,639 - - 15,102,619,819 15,102,619,819
83 - 71,619,563,236$ 71,619,563,236 - - 15,631,211,512 15,631,211,512
84 - 74,126,247,950$ 74,126,247,950 - - 16,178,303,915 16,178,303,915
85 - 76,720,666,628$ 76,720,666,628 - - 16,744,544,552 16,744,544,552
86 - 79,405,889,960$ 79,405,889,960 - - 17,330,603,612 17,330,603,612
87 - 82,185,096,108$ 82,185,096,108 - - 17,937,174,738 17,937,174,738
88 - 85,061,574,472$ 85,061,574,472 - - 18,564,975,854 18,564,975,854
89 - 88,038,729,579$ 88,038,729,579 - - 19,214,750,009 19,214,750,009
90 - 91,120,085,114$ 91,120,085,114 - - 19,887,266,259 19,887,266,259
91 - 94,309,288,093$ 94,309,288,093 - - 20,583,320,578 20,583,320,578
92 - 97,610,113,176$ 97,610,113,176 - - 21,303,736,799 21,303,736,799
93 - 101,026,467,137$ 101,026,467,137 - - 22,049,367,586 22,049,367,586
94 - 104,562,393,487$ 104,562,393,487 - - 22,821,095,452 22,821,095,452
95 - 108,222,077,259$ 108,222,077,259 - - 23,619,833,793 23,619,833,793
96 - 112,009,849,963$ 112,009,849,963 - - 24,446,527,976 24,446,527,976
97 - 115,930,194,712$ 115,930,194,712 - - 25,302,156,455 25,302,156,455
98 - 119,987,751,527$ 119,987,751,527 - - 26,187,731,931 26,187,731,931
99 - 124,187,322,830$ 124,187,322,830 - - 27,104,302,548 27,104,302,548
100 - 128,533,879,130$ 128,533,879,130 - - 28,052,953,137 28,052,953,137
Employees’ Retirement System of the State of Hawaii
E-4
Single Discount Rate Development Projection of Plan Fiduciary Net Position Beginning July 1, 2017
Projected Beginning
Plan Net Position
Projected Total
Contributions
Projected Benefit
Payments
Projected
Administrative
Expenses
Projected Investment
Earnings at 7.00%
Projected Ending Plan
Net Position
(a) (b) (c) (d) (e) (f)=(a)+(b)-(c)-(d)+(e)
Year
1 15,698,324,306$ 1,042,296,956$ 1,641,170,103$ 15,510,675$ 1,077,742,956$ 16,161,683,440$
2 16,161,683,440 1,101,314,744 1,481,355,206$ 14,602,831 1,117,738,937 16,884,779,085$
3 16,884,779,085 1,259,694,783 1,564,170,891$ 13,921,399 1,170,979,101 17,737,360,677$
4 17,737,360,677 1,277,840,904 1,648,917,993$ 13,338,588 1,228,388,256 18,581,333,257$
5 18,581,333,257 1,412,260,751 1,734,184,465$ 12,821,502 1,289,175,400 19,535,763,441$
6 19,535,763,441 1,437,680,084 1,820,650,860$ 12,337,941 1,353,901,641 20,494,356,365$
7 20,494,356,365 1,464,466,668 1,909,265,865$ 11,875,357 1,418,891,668 21,456,573,479$
8 21,456,573,479 1,492,478,462 1,999,578,523$ 11,422,177 1,484,118,808 22,422,170,048$
9 22,422,170,048 1,521,874,480 2,090,802,443$ 10,969,978 1,549,598,750 23,391,870,857$
10 23,391,870,857 1,552,667,341 2,182,385,851$ 10,525,875 1,615,401,404 24,367,027,876$
11 24,367,027,876 1,585,091,942 2,274,264,267$ 10,082,672 1,681,631,955 25,349,404,834$
12 25,349,404,834 1,619,376,009 2,363,959,106$ 9,655,618 1,748,506,460 26,343,672,578$
13 26,343,672,578 1,655,401,800 2,452,428,695$ 9,241,906 1,816,314,949 27,353,718,727$
14 27,353,718,727 1,693,198,786 2,539,550,338$ 8,833,697 1,885,335,060 28,383,868,537$
15 28,383,868,537 1,732,682,439 2,626,016,677$ 8,428,672 1,955,842,900 29,437,948,528$
16 29,437,948,528 1,773,790,426 2,711,765,587$ 8,023,462 2,028,106,435 30,520,056,340$
17 30,520,056,340 1,816,761,982 2,794,959,270$ 7,616,238 2,102,484,029 31,636,726,843$
18 31,636,726,843 1,861,735,565 2,874,925,017$ 7,214,839 2,179,460,764 32,795,783,315$
19 32,795,783,315 1,908,587,778 2,953,047,820$ 6,815,683 2,259,532,491 34,004,040,083$
20 34,004,040,083 1,957,501,709 3,027,341,733$ 6,414,530 2,343,250,993 35,271,036,521$
21 35,271,036,521 2,008,629,320 3,097,291,299$ 6,014,728 2,431,306,873 36,607,666,687$
22 36,607,666,687 2,062,175,976 3,162,182,329$ 5,618,057 2,524,494,296 38,026,536,572$
23 38,026,536,572 2,118,216,972 3,221,984,904$ 5,227,489 2,623,699,198 39,541,240,349$
24 39,541,240,349 2,176,845,736 3,275,490,894$ 4,844,988 2,729,917,888 41,167,668,091$
25 41,167,668,091 2,238,074,546 3,323,083,898$ 4,469,315 2,844,249,937 42,922,439,361$
26 42,922,439,361 2,302,107,040 3,363,540,314$ 4,099,974 2,967,907,841 44,824,813,954$
27 44,824,813,954 2,369,113,233 3,396,744,057$ 3,739,224 3,102,249,552 46,895,693,457$
28 46,895,693,457 2,439,103,674 3,422,638,892$ 3,387,692 3,248,740,456 49,157,511,003$
29 49,157,511,003 2,512,140,426 3,441,927,915$ 3,043,288 3,408,928,888 51,633,609,114$
30 51,633,609,114 2,588,367,636 3,453,518,581$ 2,706,166 3,584,491,373 54,350,243,377$
31 54,350,243,377 2,668,340,714 3,454,939,763$ 2,383,301 3,777,369,698 57,338,630,725$
32 57,338,630,725 2,752,089,112 3,447,015,986$ 2,088,491 3,989,721,216 60,631,336,576$
33 60,631,336,576 2,839,691,232 3,429,889,607$ 1,811,572 4,223,823,656 64,263,150,284$
34 64,263,150,284 2,931,201,070 3,404,378,631$ 1,557,241 4,482,085,824 68,270,501,306$
35 68,270,501,306 3,026,739,073 3,370,834,853$ 1,318,594 4,767,050,059 72,692,136,990$
36 72,692,136,990 3,126,506,927 3,329,116,085$ 1,100,387 5,081,440,342 77,569,867,787$
37 77,569,867,787 3,230,648,738 3,279,321,809$ 905,725 5,428,184,836 82,948,473,827$
38 82,948,473,827 3,339,267,548 3,221,877,671$ 735,303 5,810,407,024 88,875,535,424$
39 88,875,535,424 3,452,444,014 3,157,030,232$ 590,585 6,231,431,769 95,401,790,391$
40 95,401,790,391 3,570,291,743 3,084,956,352$ 468,699 6,694,808,642 102,581,465,725$
41 102,581,465,725 3,692,881,509 3,006,218,825$ 370,060 7,204,316,587 110,472,074,937$
42 110,472,074,937 3,820,163,580 2,922,285,190$ 291,425 7,763,929,457 119,133,591,358$
43 119,133,591,358 3,952,341,443 2,832,830,901$ 224,378 8,377,863,842 128,630,741,364$
44 128,630,741,364 4,089,506,593 2,738,551,570$ 173,780 9,050,629,635 139,032,152,242$
45 139,032,152,242 4,231,704,730 2,640,433,377$ 133,554 9,786,998,595 150,410,288,637$
46 150,410,288,637 4,379,068,965 2,538,939,933$ 100,568 10,592,031,984 162,842,349,084$
47 162,842,349,084 4,531,749,879 2,434,482,825$ 74,078 11,471,124,743 176,410,666,802$
48 176,410,666,802 4,689,898,375 2,327,559,610$ 52,675 12,430,028,318 191,202,981,210$
49 191,202,981,210 4,853,693,251 2,218,547,266$ 36,057 13,474,877,661 207,312,968,799$
50 207,312,968,799 5,023,318,480 2,107,827,430$ 22,830 14,612,223,373 224,840,660,392$
Employees’ Retirement System of the State of Hawaii
E-5
Single Discount Rate Development Projection of Plan Fiduciary Net Position Beginning July 1, 2017
(Continued) Projected Beginning
Plan Net Position
Projected Total
Contributions
Projected Benefit
Payments
Projected
Administrative
Expenses
Projected Investment
Earnings at 7.00%
Projected Ending Plan
Net Position
(a) (b) (c) (d) (e) (f)=(a)+(b)-(c)-(d)+(e)
Year
51 224,840,660,392 5,198,966,306 1,995,830,994$ 13,425 15,849,059,384 243,892,841,662$
52 243,892,841,662 5,380,823,743 1,883,121,259$ 7,187 17,192,847,768 264,583,384,727$
53 264,583,384,727 5,569,098,044 1,770,159,917$ 3,125 18,651,550,851 287,033,870,580$
54 287,033,870,580 5,763,994,971 1,657,458,028$ 1,133 20,233,668,802 311,374,075,192$
55 311,374,075,192 5,965,725,099 1,545,537,935$ 473 21,948,275,238 337,742,537,122$
56 337,742,537,122 6,174,521,085 1,434,786,000$ 116 23,805,062,605 366,287,334,697$
57 366,287,334,697 6,390,628,250 1,325,554,435$ 17 25,814,392,707 397,166,801,202$
58 397,166,801,202 6,614,300,090 1,218,208,250$ - 27,987,345,046 430,550,238,087$
59 430,550,238,087 6,845,800,593 1,113,118,446$ - 30,335,767,042 466,618,687,276$
60 466,618,687,276 7,085,403,614 1,010,670,363$ - 32,872,327,794 505,565,748,321$
61 505,565,748,321 7,333,392,741 911,275,118$ - 35,610,574,884 547,598,440,828$
62 547,598,440,828 7,590,061,486 815,381,563$ - 38,564,994,338 592,938,115,089$
63 592,938,115,089 7,855,713,639 723,469,412$ - 41,751,074,624 641,821,433,941$
64 641,821,433,941 8,130,663,616 636,039,935$ - 45,185,375,712 694,501,433,334$
65 694,501,433,334 8,415,236,842 553,611,820$ - 48,885,603,467 751,248,661,824$
66 751,248,661,824 8,709,770,132 476,673,016$ - 52,870,691,090 812,352,450,029$
67 812,352,450,029 9,014,612,087 405,639,913$ - 57,160,889,389 878,122,311,593$
68 878,122,311,593 9,330,123,510 340,842,467$ - 61,777,865,383 948,889,458,019$
69 948,889,458,019 9,656,677,832 282,500,979$ - 66,744,809,144 1,025,008,444,016$
70 1,025,008,444,016 9,994,661,556 230,700,214$ - 72,086,549,886 1,106,858,955,243$
71 1,106,858,955,243 10,344,474,711 185,410,804$ - 77,829,680,378 1,194,847,699,528$
72 1,194,847,699,528 10,706,531,326 146,472,895$ - 84,002,689,914 1,289,410,447,873$
73 1,289,410,447,873 11,081,259,922 113,591,818$ - 90,636,107,350 1,391,014,223,328$
74 1,391,014,223,328 11,469,104,020 86,356,054$ - 97,762,653,718 1,500,159,625,012$
75 1,500,159,625,012 11,870,522,660 64,267,878$ - 105,417,403,876 1,617,383,283,670$
76 1,617,383,283,670 12,285,990,953 46,755,399$ - 113,637,958,004 1,743,260,477,228$
77 1,743,260,477,228 12,716,000,637 33,210,939$ - 122,464,623,383 1,878,407,890,309$
78 1,878,407,890,309 13,161,060,659 23,020,784$ - 131,940,606,566 2,023,486,536,750$
79 2,023,486,536,750 13,621,697,782 15,589,087$ - 142,112,217,149 2,179,204,862,594$
80 2,179,204,862,594 14,098,457,204 10,352,769$ - 153,029,084,489 2,346,322,051,518$
81 2,346,322,051,518 14,591,903,207 6,794,568$ - 164,744,388,656 2,525,651,548,812$
82 2,525,651,548,812 15,102,619,819 4,460,779$ - 177,315,106,527 2,718,064,814,379$
83 2,718,064,814,379 15,631,211,512 2,976,596$ - 190,802,273,990 2,924,495,323,285$
84 2,924,495,323,285 16,178,303,915 2,052,702$ - 205,271,265,782 3,145,942,840,279$
85 3,145,942,840,279 16,744,544,552 1,478,165$ - 220,792,094,972 3,383,478,001,638$
86 3,383,478,001,638 17,330,603,612 1,110,216$ - 237,439,734,073 3,638,247,229,107$
87 3,638,247,229,107 17,937,174,738 861,729$ - 255,294,459,472 3,911,478,001,588$
88 3,911,478,001,588 18,564,975,854 682,903$ - 274,442,221,106 4,204,484,515,645$
89 4,204,484,515,645 19,214,750,009 546,266$ - 294,975,039,249 4,518,673,758,638$
90 4,518,673,758,638 19,887,266,259 437,052$ - 316,991,429,985 4,855,552,017,830$
91 4,855,552,017,830 20,583,320,578 347,248$ - 340,596,861,085 5,216,731,852,245$
92 5,216,731,852,245 21,303,736,799 272,511$ - 365,904,240,178 5,603,939,556,711$
93 5,603,939,556,711 22,049,367,586 210,571$ - 393,034,437,319 6,019,023,151,044$
94 6,019,023,151,044 22,821,095,452 159,539$ - 422,116,844,324 6,463,960,931,281$
95 6,463,960,931,281 23,619,833,793 117,868$ - 453,289,973,397 6,940,870,620,603$
96 6,940,870,620,603 24,446,527,976 84,429$ - 486,702,097,730 7,452,019,161,880$
97 7,452,019,161,880 25,302,156,455 58,396$ - 522,511,937,017 7,999,833,196,956$
98 7,999,833,196,956 26,187,731,931 39,084$ - 560,889,391,056 8,586,910,280,859$
99 8,586,910,280,859 27,104,302,548 25,384$ - 602,016,324,802 9,216,030,882,825$
100 9,216,030,882,825 28,052,953,137 16,073$ - 646,087,408,470 9,890,171,228,358$
Employees’ Retirement System of the State of Hawaii
E-6
Single Discount Rate Development Present Values of Projected Benefit Payments Beginning July 1, 2017
Projected Beginning
Plan Net Position
Projected Benefit
Payments
Funded Portion of
Benefit Payments
Unfunded Portion
of Benefit
Payments
Present Value of
Funded Benefit
Payments using
Expected Return
Rate (v)
Present Value of
Unfunded Benefit
Payments using
Municipal Bond
Rate (vf)
Present Value of
Benefit
Payments using
Single Discount
Rate (sdr)
(b) (c) (d) (e) (f)=(d)*v^((a)-.5) (g)=(e)*vf ^((a)-.5) (h)=((c)/(1+sdr)^(a-.5)
1 15,698,324,306$ 1,641,170,103$ 1,641,170,103$ -$ 1,586,579,024$ -$ 1,586,579,024$
2 16,161,683,440 1,481,355,206 1,481,355,206 - 1,338,392,646 - 1,338,392,646
3 16,884,779,085 1,564,170,891 1,564,170,891 - 1,320,762,578 - 1,320,762,578
4 17,737,360,677 1,648,917,993 1,648,917,993 - 1,301,235,296 - 1,301,235,296
5 18,581,333,257 1,734,184,465 1,734,184,465 - 1,278,993,366 - 1,278,993,366
6 19,535,763,441 1,820,650,860 1,820,650,860 - 1,254,919,574 - 1,254,919,574
7 20,494,356,365 1,909,265,865 1,909,265,865 - 1,229,905,810 - 1,229,905,810
8 21,456,573,479 1,999,578,523 1,999,578,523 - 1,203,816,054 - 1,203,816,054
9 22,422,170,048 2,090,802,443 2,090,802,443 - 1,176,388,820 - 1,176,388,820
10 23,391,870,857 2,182,385,851 2,182,385,851 - 1,147,587,078 - 1,147,587,078
11 24,367,027,876 2,274,264,267 2,274,264,267 - 1,117,663,999 - 1,117,663,999
12 25,349,404,834 2,363,959,106 2,363,959,106 - 1,085,741,695 - 1,085,741,695
13 26,343,672,578 2,452,428,695 2,452,428,695 - 1,052,686,777 - 1,052,686,777
14 27,353,718,727 2,539,550,338 2,539,550,338 - 1,018,769,248 - 1,018,769,248
15 28,383,868,537 2,626,016,677 2,626,016,677 - 984,538,499 - 984,538,499
16 29,437,948,528 2,711,765,587 2,711,765,587 - 950,174,981 - 950,174,981
17 30,520,056,340 2,794,959,270 2,794,959,270 - 915,257,195 - 915,257,195
18 31,636,726,843 2,874,925,017 2,874,925,017 - 879,853,594 - 879,853,594
19 32,795,783,315 2,953,047,820 2,953,047,820 - 844,637,954 - 844,637,954
20 34,004,040,083 3,027,341,733 3,027,341,733 - 809,240,823 - 809,240,823
21 35,271,036,521 3,097,291,299 3,097,291,299 - 773,774,850 - 773,774,850
22 36,607,666,687 3,162,182,329 3,162,182,329 - 738,304,792 - 738,304,792
23 38,026,536,572 3,221,984,904 3,221,984,904 - 703,053,708 - 703,053,708
24 39,541,240,349 3,275,490,894 3,275,490,894 - 667,971,020 - 667,971,020
25 41,167,668,091 3,323,083,898 3,323,083,898 - 633,342,676 - 633,342,676
26 42,922,439,361 3,363,540,314 3,363,540,314 - 599,115,156 - 599,115,156
27 44,824,813,954 3,396,744,057 3,396,744,057 - 565,448,056 - 565,448,056
28 46,895,693,457 3,422,638,892 3,422,638,892 - 532,484,775 - 532,484,775
29 49,157,511,003 3,441,927,915 3,441,927,915 - 500,453,933 - 500,453,933
30 51,633,609,114 3,453,518,581 3,453,518,581 - 469,288,979 - 469,288,979
31 54,350,243,377 3,454,939,763 3,454,939,763 - 438,768,317 - 438,768,317
32 57,338,630,725 3,447,015,986 3,447,015,986 - 409,123,382 - 409,123,382
33 60,631,336,576 3,429,889,607 3,429,889,607 - 380,458,567 - 380,458,567
34 64,263,150,284 3,404,378,631 3,404,378,631 - 352,924,090 - 352,924,090
35 68,270,501,306 3,370,834,853 3,370,834,853 - 326,585,686 - 326,585,686
36 72,692,136,990 3,329,116,085 3,329,116,085 - 301,442,742 - 301,442,742
37 77,569,867,787 3,279,321,809 3,279,321,809 - 277,508,412 - 277,508,412
38 82,948,473,827 3,221,877,671 3,221,877,671 - 254,810,537 - 254,810,537
39 88,875,535,424 3,157,030,232 3,157,030,232 - 233,347,579 - 233,347,579
40 95,401,790,391 3,084,956,352 3,084,956,352 - 213,103,119 - 213,103,119
41 102,581,465,725 3,006,218,825 3,006,218,825 - 194,078,575 - 194,078,575
42 110,472,074,937 2,922,285,190 2,922,285,190 - 176,317,664 - 176,317,664
43 119,133,591,358 2,832,830,901 2,832,830,901 - 159,738,683 - 159,738,683
44 128,630,741,364 2,738,551,570 2,738,551,570 - 144,320,025 - 144,320,025
45 139,032,152,242 2,640,433,377 2,640,433,377 - 130,046,032 - 130,046,032
46 150,410,288,637 2,538,939,933 2,538,939,933 - 116,866,636 - 116,866,636
47 162,842,349,084 2,434,482,825 2,434,482,825 - 104,727,576 - 104,727,576
48 176,410,666,802 2,327,559,610 2,327,559,610 - 93,577,486 - 93,577,486
49 191,202,981,210 2,218,547,266 2,218,547,266 - 83,359,570 - 83,359,570
50 207,312,968,799 2,107,827,430 2,107,827,430 - 74,018,121 - 74,018,121
Year
(a)
Employees’ Retirement System of the State of Hawaii
E-7
Single Discount Rate Development PVs of Projected Benefit Payments Beginning July 1, 2017 (continued)
Projected Beginning
Plan Net Position
Projected Benefit
Payments
Funded Portion of
Benefit Payments
Unfunded Portion
of Benefit
Payments
Present Value of
Funded Benefit
Payments using
Expected Return
Rate (v)
Present Value of
Unfunded Benefit
Payments using
Municipal Bond
Rate (vf)
Present Value of
Benefit
Payments using
Single Discount
Rate (sdr)
(b) (c) (d) (e) (f)=(d)*v^((a)-.5) (g)=(e)*vf ^((a)-.5) (h)=((c)/(1+sdr)^(a-.5)
51 224,840,660,392$ 1,995,830,994$ 1,995,830,994$ -$ 65,500,255$ -$ 65,500,255$
52 243,892,841,662 1,883,121,259 1,883,121,259 - 57,758,211 - 57,758,211
53 264,583,384,727 1,770,159,917 1,770,159,917 - 50,741,602 - 50,741,602
54 287,033,870,580 1,657,458,028 1,657,458,028 - 44,402,808 - 44,402,808
55 311,374,075,192 1,545,537,935 1,545,537,935 - 38,695,796 - 38,695,796
56 337,742,537,122 1,434,786,000 1,434,786,000 - 33,572,793 - 33,572,793
57 366,287,334,697 1,325,554,435 1,325,554,435 - 28,987,725 - 28,987,725
58 397,166,801,202 1,218,208,250 1,218,208,250 - 24,897,419 - 24,897,419
59 430,550,238,087 1,113,118,446 1,113,118,446 - 21,261,328 - 21,261,328
60 466,618,687,276 1,010,670,363 1,010,670,363 - 18,041,588 - 18,041,588
61 505,565,748,321 911,275,118 911,275,118 - 15,203,058 - 15,203,058
62 547,598,440,828 815,381,563 815,381,563 - 12,713,308 - 12,713,308
63 592,938,115,089 723,469,412 723,469,412 - 10,542,268 - 10,542,268
64 641,821,433,941 636,039,935 636,039,935 - 8,661,927 - 8,661,927
65 694,501,433,334 553,611,820 553,611,820 - 7,046,147 - 7,046,147
66 751,248,661,824 476,673,016 476,673,016 - 5,670,001 - 5,670,001
67 812,352,450,029 405,639,913 405,639,913 - 4,509,407 - 4,509,407
68 878,122,311,593 340,842,467 340,842,467 - 3,541,186 - 3,541,186
69 948,889,458,019 282,500,979 282,500,979 - 2,743,034 - 2,743,034
70 1,025,008,444,016 230,700,214 230,700,214 - 2,093,512 - 2,093,512
71 1,106,858,955,243 185,410,804 185,410,804 - 1,572,457 - 1,572,457
72 1,194,847,699,528 146,472,895 146,472,895 - 1,160,960 - 1,160,960
73 1,289,410,447,873 113,591,818 113,591,818 - 841,440 - 841,440
74 1,391,014,223,328 86,356,054 86,356,054 - 597,840 - 597,840
75 1,500,159,625,012 64,267,878 64,267,878 - 415,817 - 415,817
76 1,617,383,283,670 46,755,399 46,755,399 - 282,720 - 282,720
77 1,743,260,477,228 33,210,939 33,210,939 - 187,682 - 187,682
78 1,878,407,890,309 23,020,784 23,020,784 - 121,584 - 121,584
79 2,023,486,536,750 15,589,087 15,589,087 - 76,947 - 76,947
80 2,179,204,862,594 10,352,769 10,352,769 - 47,758 - 47,758
81 2,346,322,051,518 6,794,568 6,794,568 - 29,293 - 29,293
82 2,525,651,548,812 4,460,779 4,460,779 - 17,974 - 17,974
83 2,718,064,814,379 2,976,596 2,976,596 - 11,209 - 11,209
84 2,924,495,323,285 2,052,702 2,052,702 - 7,224 - 7,224
85 3,145,942,840,279 1,478,165 1,478,165 - 4,862 - 4,862
86 3,383,478,001,638 1,110,216 1,110,216 - 3,413 - 3,413
87 3,638,247,229,107 861,729 861,729 - 2,476 - 2,476
88 3,911,478,001,588 682,903 682,903 - 1,833 - 1,833
89 4,204,484,515,645 546,266 546,266 - 1,371 - 1,371
90 4,518,673,758,638 437,052 437,052 - 1,025 - 1,025
91 4,855,552,017,830 347,248 347,248 - 761 - 761
92 5,216,731,852,245 272,511 272,511 - 558 - 558
93 5,603,939,556,711 210,571 210,571 - 403 - 403
94 6,019,023,151,044 159,539 159,539 - 285 - 285
95 6,463,960,931,281 117,868 117,868 - 197 - 197
96 6,940,870,620,603 84,429 84,429 - 132 - 132
97 7,452,019,161,880 58,396 58,396 - 85 - 85
98 7,999,833,196,956 39,084 39,084 - 53 - 53
99 8,586,910,280,859 25,384 25,384 - 32 - 32
100 9,216,030,882,825 16,073 16,073 - 19 - 19
Totals 33,607,477,538$ -$ 33,607,477,538$
Year
(a)
Employees’ Retirement System of the State of Hawaii
E-8
$-
$500
$1,000
$1,500
$2,000
$2,500
$3,000
$3,500
$4,000
0
50,000
100,000
150,000
200,000
250,000
300,000
350,000
400,000
450,000
500,000
1 6 11 16 21 26 31 36 41 46 51 56 61 66 71 76 81 86 91 96
$ [Millions]
Year
Projection of Plan Net Position and Benefit Payments
Projected Plan Net Position Projected Benefit Payments for Current Members
SECTION F
GASB NO. 68 INFORMATION
Employees’ Retirement System of the State of Hawaii
F-1
GASB No. 68 Disclosure Information
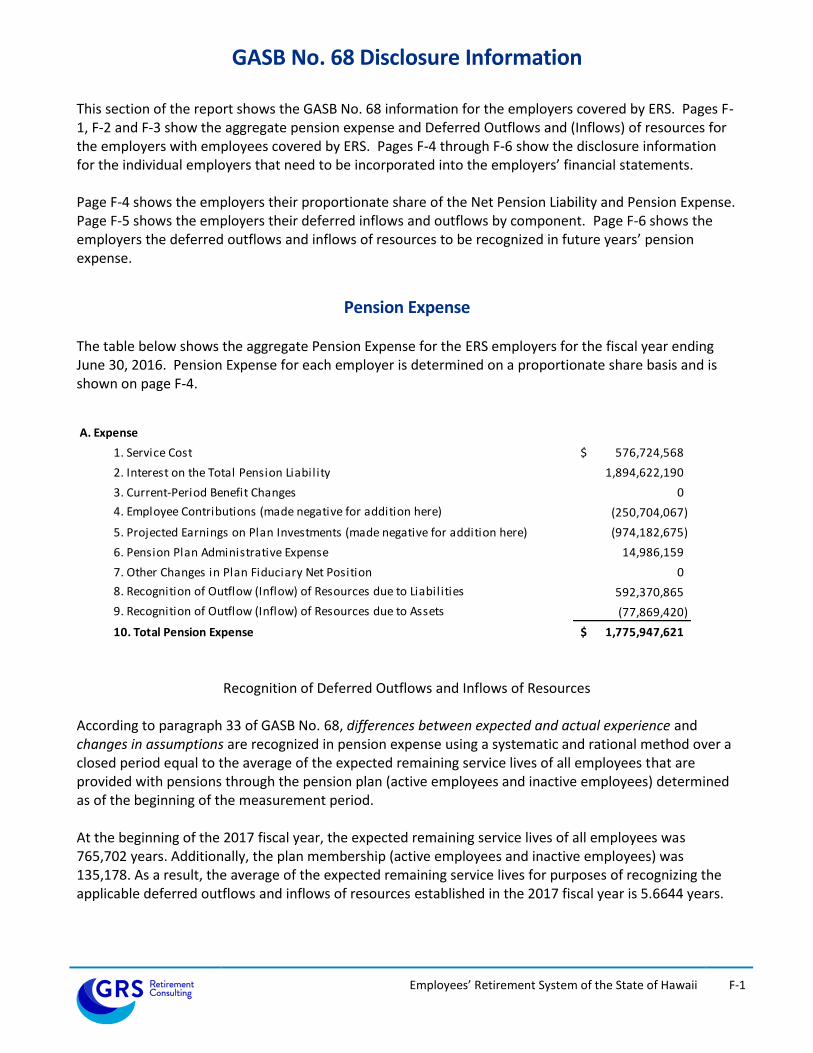
This section of the report shows the GASB No. 68 information for the employers covered by ERS. Pages F-1, F-2 and F-3 show the aggregate pension expense and Deferred Outflows and (Inflows) of resources for the employers with employees covered by ERS. Pages F-4 through F-6 show the disclosure information for the individual employers that need to be incorporated into the employers’ financial statements. Page F-4 shows the employers their proportionate share of the Net Pension Liability and Pension Expense. Page F-5 shows the employers their deferred inflows and outflows by component. Page F-6 shows the employers the deferred outflows and inflows of resources to be recognized in future years’ pension expense.
Pension Expense The table below shows the aggregate Pension Expense for the ERS employers for the fiscal year ending June 30, 2016. Pension Expense for each employer is determined on a proportionate share basis and is shown on page F-4.
A. Expense
1. Service Cost 576,724,568$
2. Interest on the Total Pension Liability 1,894,622,190
3. Current-Period Benefit Changes 0
4. Employee Contributions (made negative for addition here) (250,704,067)
5. Projected Earnings on Plan Investments (made negative for addition here) (974,182,675)
6. Pension Plan Administrative Expense 14,986,159
7. Other Changes in Plan Fiduciary Net Position 0
8. Recognition of Outflow (Inflow) of Resources due to Liabilities 592,370,865
9. Recognition of Outflow (Inflow) of Resources due to Assets (77,869,420)
10. Total Pension Expense 1,775,947,621$
Recognition of Deferred Outflows and Inflows of Resources
According to paragraph 33 of GASB No. 68, differences between expected and actual experience and changes in assumptions are recognized in pension expense using a systematic and rational method over a closed period equal to the average of the expected remaining service lives of all employees that are provided with pensions through the pension plan (active employees and inactive employees) determined as of the beginning of the measurement period. At the beginning of the 2017 fiscal year, the expected remaining service lives of all employees was 765,702 years. Additionally, the plan membership (active employees and inactive employees) was 135,178. As a result, the average of the expected remaining service lives for purposes of recognizing the applicable deferred outflows and inflows of resources established in the 2017 fiscal year is 5.6644 years.
Employees’ Retirement System of the State of Hawaii
F-2
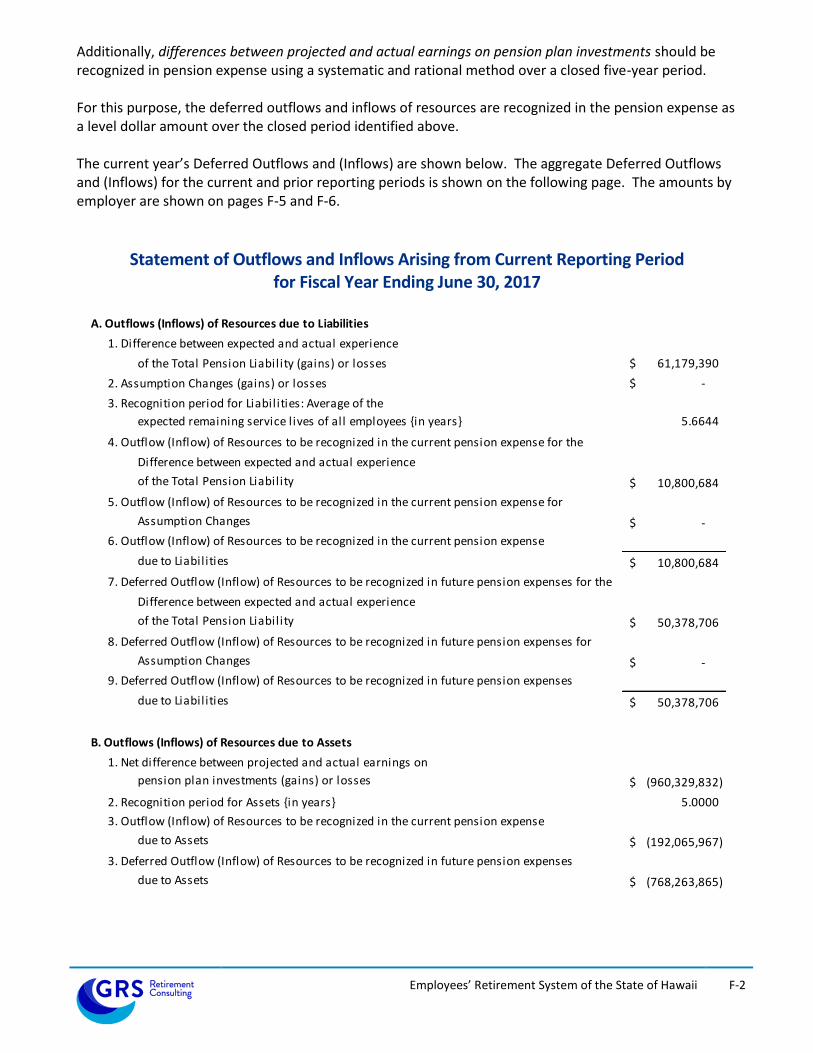
Additionally, differences between projected and actual earnings on pension plan investments should be recognized in pension expense using a systematic and rational method over a closed five-year period. For this purpose, the deferred outflows and inflows of resources are recognized in the pension expense as a level dollar amount over the closed period identified above. The current year’s Deferred Outflows and (Inflows) are shown below. The aggregate Deferred Outflows and (Inflows) for the current and prior reporting periods is shown on the following page. The amounts by employer are shown on pages F-5 and F-6.
Statement of Outflows and Inflows Arising from Current Reporting Period for Fiscal Year Ending June 30, 2017
A. Outflows (Inflows) of Resources due to Liabilities
1. Difference between expected and actual experience
of the Total Pension Liability (gains) or losses 61,179,390$
2. Assumption Changes (gains) or losses -$
3. Recognition period for Liabilities: Average of the
expected remaining service lives of all employees {in years} 5.6644
4. Outflow (Inflow) of Resources to be recognized in the current pension expense for the
Difference between expected and actual experience
of the Total Pension Liability 10,800,684$
5. Outflow (Inflow) of Resources to be recognized in the current pension expense for
Assumption Changes -$
6. Outflow (Inflow) of Resources to be recognized in the current pension expense
due to Liabilities 10,800,684$
7. Deferred Outflow (Inflow) of Resources to be recognized in future pension expenses for the
Difference between expected and actual experience
of the Total Pension Liability 50,378,706$
8. Deferred Outflow (Inflow) of Resources to be recognized in future pension expenses for
Assumption Changes -$
9. Deferred Outflow (Inflow) of Resources to be recognized in future pension expenses
due to Liabilities 50,378,706$
B. Outflows (Inflows) of Resources due to Assets
1. Net difference between projected and actual earnings on
pension plan investments (gains) or losses (960,329,832)$
2. Recognition period for Assets {in years} 5.0000
3. Outflow (Inflow) of Resources to be recognized in the current pension expense
due to Assets (192,065,967)$
3. Deferred Outflow (Inflow) of Resources to be recognized in future pension expenses
due to Assets (768,263,865)$
Employees’ Retirement System of the State of Hawaii
F-3
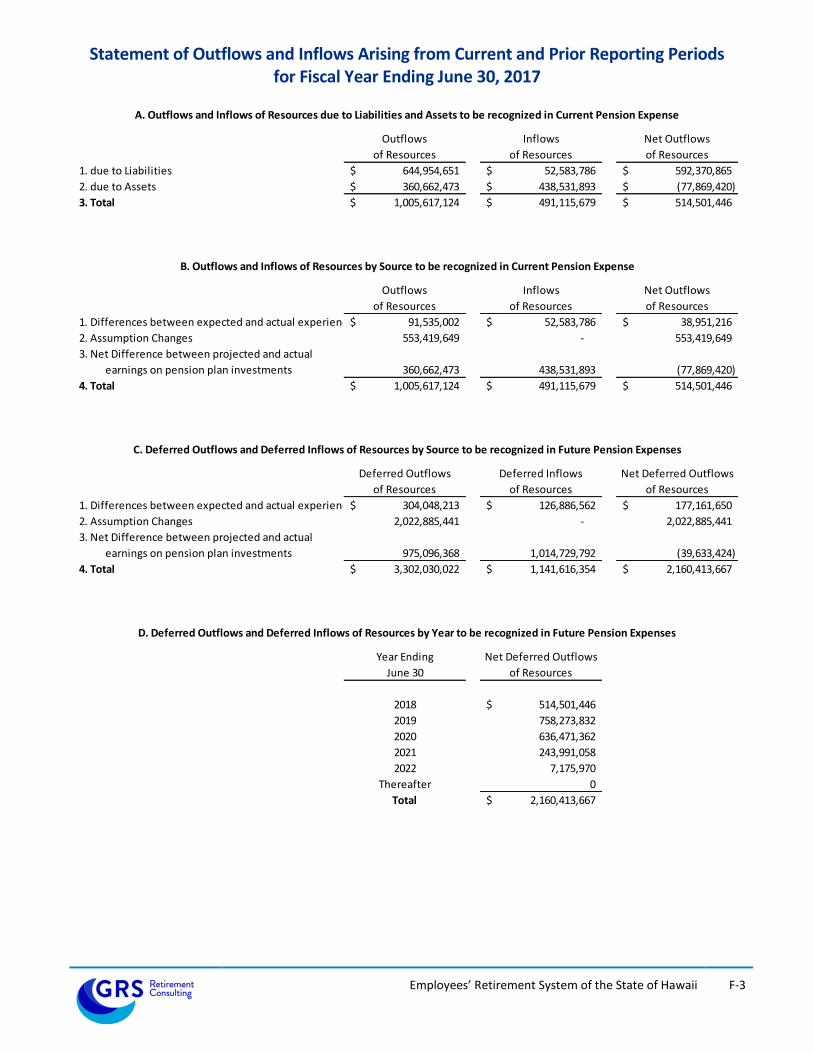
Statement of Outflows and Inflows Arising from Current and Prior Reporting Periods for Fiscal Year Ending June 30, 2017
Outflows Inflows Net Outflows
of Resources of Resources of Resources
1. due to Liabilities 644,954,651$ 52,583,786$ 592,370,865$
2. due to Assets 360,662,473$ 438,531,893$ (77,869,420)$
3. Total 1,005,617,124$ 491,115,679$ 514,501,446$
Outflows Inflows Net Outflows
of Resources of Resources of Resources
1. Differences between expected and actual experience 91,535,002$ 52,583,786$ 38,951,216$
2. Assumption Changes 553,419,649 - 553,419,649
3. Net Difference between projected and actual
earnings on pension plan investments 360,662,473 438,531,893 (77,869,420)
4. Total 1,005,617,124$ 491,115,679$ 514,501,446$
Deferred Outflows Deferred Inflows Net Deferred Outflows
of Resources of Resources of Resources
1. Differences between expected and actual experience 304,048,213$ 126,886,562$ 177,161,650$
2. Assumption Changes 2,022,885,441 - 2,022,885,441
3. Net Difference between projected and actual
earnings on pension plan investments 975,096,368 1,014,729,792 (39,633,424)
4. Total 3,302,030,022$ 1,141,616,354$ 2,160,413,667$
Year Ending Net Deferred Outflows
June 30 of Resources
2018 514,501,446$
2019 758,273,832
2020 636,471,362
2021 243,991,058
2022 7,175,970
Thereafter 0
Total 2,160,413,667$
C. Deferred Outflows and Deferred Inflows of Resources by Source to be recognized in Future Pension Expenses
D. Deferred Outflows and Deferred Inflows of Resources by Year to be recognized in Future Pension Expenses
A. Outflows and Inflows of Resources due to Liabilities and Assets to be recognized in Current Pension Expense
B. Outflows and Inflows of Resources by Source to be recognized in Current Pension Expense
Employees’ Retirement System of the State of Hawaii
F-4
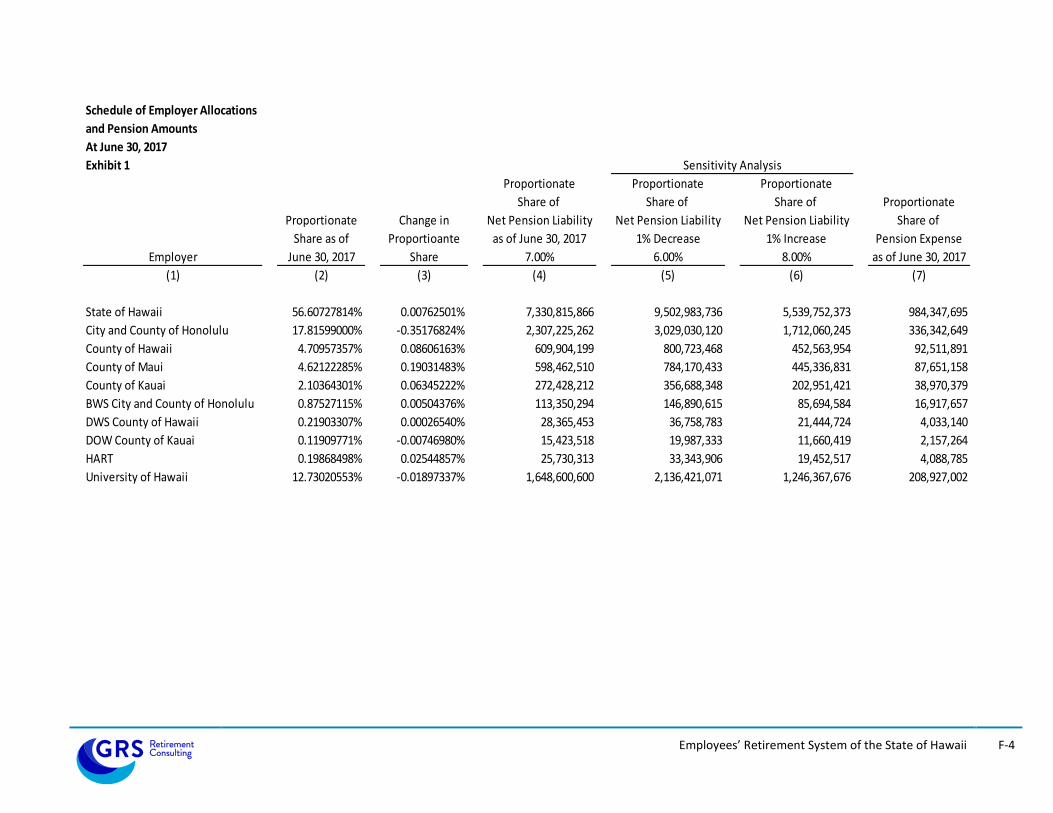
Schedule of Employer Allocations
and Pension Amounts
At June 30, 2017
Exhibit 1 Sensitivity Analysis
Proportionate Proportionate Proportionate
Share of Share of Share of Proportionate
Proportionate Change in Net Pension Liability Net Pension Liability Net Pension Liability Share of
Share as of Proportioante as of June 30, 2017 1% Decrease 1% Increase Pension Expense
Employer June 30, 2017 Share 7.00% 6.00% 8.00% as of June 30, 2017
(1) (2) (3) (4) (5) (6) (7)
State of Hawaii 56.60727814% 0.00762501% 7,330,815,866 9,502,983,736 5,539,752,373 984,347,695
City and County of Honolulu 17.81599000% -0.35176824% 2,307,225,262 3,029,030,120 1,712,060,245 336,342,649
County of Hawaii 4.70957357% 0.08606163% 609,904,199 800,723,468 452,563,954 92,511,891
County of Maui 4.62122285% 0.19031483% 598,462,510 784,170,433 445,336,831 87,651,158
County of Kauai 2.10364301% 0.06345222% 272,428,212 356,688,348 202,951,421 38,970,379
BWS City and County of Honolulu 0.87527115% 0.00504376% 113,350,294 146,890,615 85,694,584 16,917,657
DWS County of Hawaii 0.21903307% 0.00026540% 28,365,453 36,758,783 21,444,724 4,033,140
DOW County of Kauai 0.11909771% -0.00746980% 15,423,518 19,987,333 11,660,419 2,157,264
HART 0.19868498% 0.02544857% 25,730,313 33,343,906 19,452,517 4,088,785
University of Hawaii 12.73020553% -0.01897337% 1,648,600,600 2,136,421,071 1,246,367,676 208,927,002
Employees’ Retirement System of the State of Hawaii
F-5
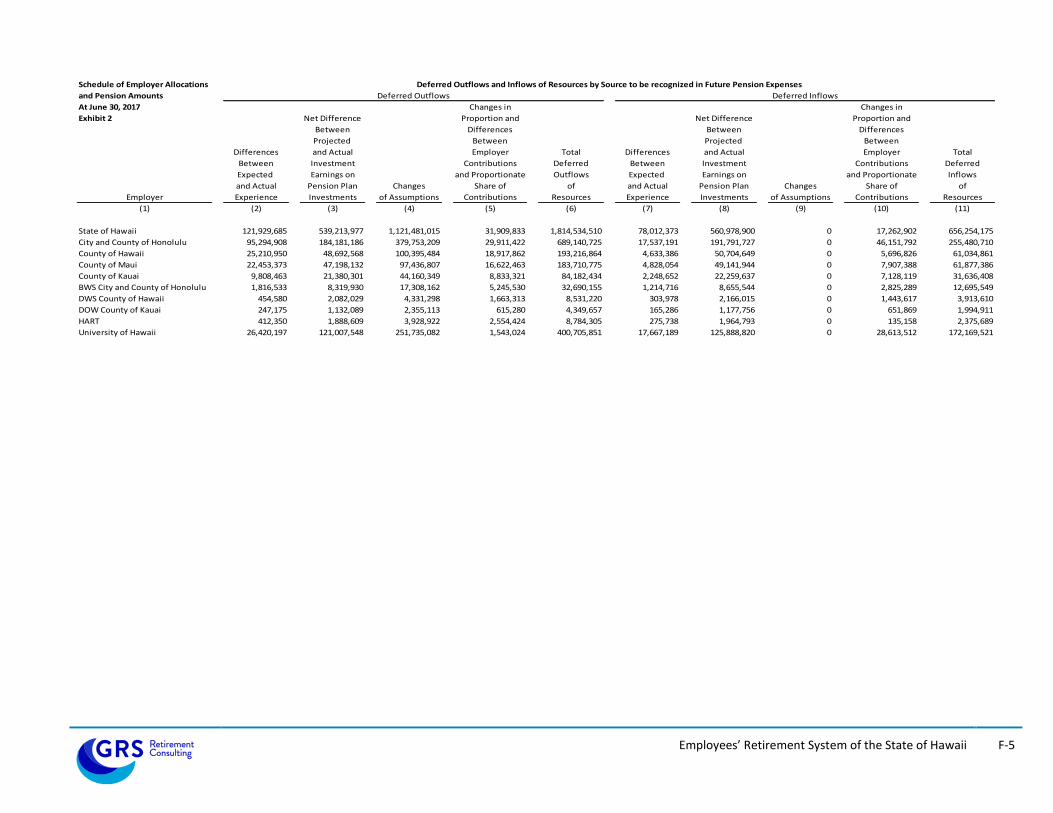
Schedule of Employer Allocations
and Pension Amounts Deferred Outflows Deferred Inflows
At June 30, 2017 Changes in Changes in
Exhibit 2 Net Difference Proportion and Net Difference Proportion and
Between Differences Between Differences
Projected Between Projected Between
Differences and Actual Employer Total Differences and Actual Employer Total
Between Investment Contributions Deferred Between Investment Contributions Deferred
Expected Earnings on and Proportionate Outflows Expected Earnings on and Proportionate Inflows
and Actual Pension Plan Changes Share of of and Actual Pension Plan Changes Share of of
Employer Experience Investments of Assumptions Contributions Resources Experience Investments of Assumptions Contributions Resources
(1) (2) (3) (4) (5) (6) (7) (8) (9) (10) (11)
State of Hawaii 121,929,685 539,213,977 1,121,481,015 31,909,833 1,814,534,510 78,012,373 560,978,900 0 17,262,902 656,254,175
City and County of Honolulu 95,294,908 184,181,186 379,753,209 29,911,422 689,140,725 17,537,191 191,791,727 0 46,151,792 255,480,710
County of Hawaii 25,210,950 48,692,568 100,395,484 18,917,862 193,216,864 4,633,386 50,704,649 0 5,696,826 61,034,861
County of Maui 22,453,373 47,198,132 97,436,807 16,622,463 183,710,775 4,828,054 49,141,944 0 7,907,388 61,877,386
County of Kauai 9,808,463 21,380,301 44,160,349 8,833,321 84,182,434 2,248,652 22,259,637 0 7,128,119 31,636,408
BWS City and County of Honolulu 1,816,533 8,319,930 17,308,162 5,245,530 32,690,155 1,214,716 8,655,544 0 2,825,289 12,695,549
DWS County of Hawaii 454,580 2,082,029 4,331,298 1,663,313 8,531,220 303,978 2,166,015 0 1,443,617 3,913,610
DOW County of Kauai 247,175 1,132,089 2,355,113 615,280 4,349,657 165,286 1,177,756 0 651,869 1,994,911
HART 412,350 1,888,609 3,928,922 2,554,424 8,784,305 275,738 1,964,793 0 135,158 2,375,689
University of Hawaii 26,420,197 121,007,548 251,735,082 1,543,024 400,705,851 17,667,189 125,888,820 0 28,613,512 172,169,521
Deferred Outflows and Inflows of Resources by Source to be recognized in Future Pension Expenses
Employees’ Retirement System of the State of Hawaii
F-6
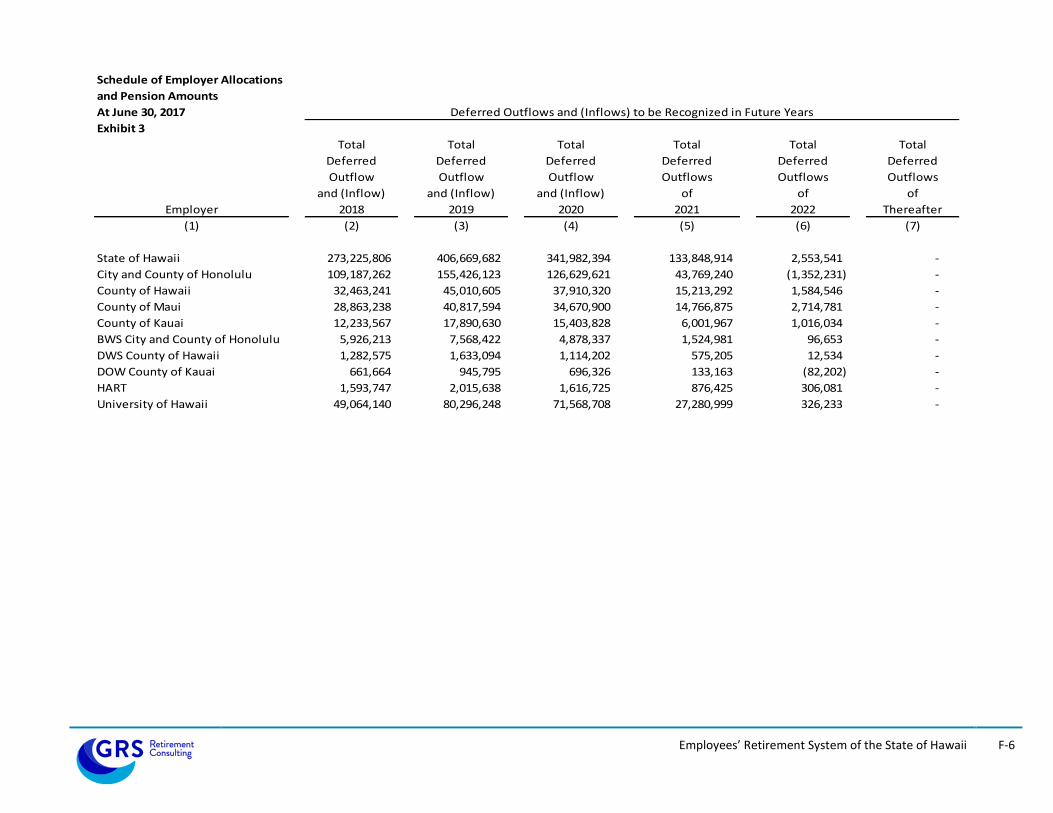
Schedule of Employer Allocations
and Pension Amounts
At June 30, 2017 Deferred Outflows and (Inflows) to be Recognized in Future Years
Exhibit 3
Total Total Total Total Total Total
Deferred Deferred Deferred Deferred Deferred Deferred
Outflow Outflow Outflow Outflows Outflows Outflows
and (Inflow) and (Inflow) and (Inflow) of of of
Employer 2018 2019 2020 2021 2022 Thereafter
(1) (2) (3) (4) (5) (6) (7)
State of Hawaii 273,225,806 406,669,682 341,982,394 133,848,914 2,553,541 -
City and County of Honolulu 109,187,262 155,426,123 126,629,621 43,769,240 (1,352,231) -
County of Hawaii 32,463,241 45,010,605 37,910,320 15,213,292 1,584,546 -
County of Maui 28,863,238 40,817,594 34,670,900 14,766,875 2,714,781 -
County of Kauai 12,233,567 17,890,630 15,403,828 6,001,967 1,016,034 -
BWS City and County of Honolulu 5,926,213 7,568,422 4,878,337 1,524,981 96,653 -
DWS County of Hawaii 1,282,575 1,633,094 1,114,202 575,205 12,534 -
DOW County of Kauai 661,664 945,795 696,326 133,163 (82,202) -
HART 1,593,747 2,015,638 1,616,725 876,425 306,081 -
University of Hawaii 49,064,140 80,296,248 71,568,708 27,280,999 326,233 -
SECTION G
GLOSSARY OF TERMS

Employees’ Retirement System of the State of Hawaii
G-1
Glossary of Terms Actuarial Accrued Liability (AAL) The AAL is the difference between the actuarial present value of all benefits and the actuarial value of future normal costs. The definition comes from the fundamental equation of funding which states that the present value of all benefits is the sum of the Actuarial Accrued Liability and the present value of future normal costs. The AAL may also be referred to as "accrued liability" or "actuarial liability". Actuarial Assumptions These assumptions are estimates of future experience with respect to rates of mortality, disability, turnover, retirement, rate or rates of investment income and compensation increases. Actuarial assumptions are generally based on past experience, often modified for projected changes in conditions. Economic assumptions (compensation increases, payroll growth, inflation and investment return) consist of an underlying real rate of return plus an assumption for a long-term average rate of inflation. Accrued Service Service credited under the system which was rendered before the date of the actuarial valuation. Actuarial Equivalent A single amount or series of amounts of equal actuarial value to another single amount or series of amounts, computed on the basis of appropriate actuarial assumptions. Actuarial Cost Method A mathematical budgeting procedure for allocating the dollar amount of the actuarial present value of the pension trust benefits between future normal cost and actuarial accrued liability. The actuarial cost method may also be referred to as the actuarial funding method. Actuarial Gain (Loss) The difference in liabilities between actual experience and expected experience during the period between two actuarial valuations is the gain (loss) on the accrued liabilities. Actuarial Present Value The amount of funds currently required to provide a payment or series of payments in the future. The present value is determined by discounting future payments at predetermined rates of interest and probabilities of payment. Actuarial Valuation The actuarial valuation report determines, as of the actuarial valuation date, the service cost, total pension liability, and related actuarial present value of projected benefit payments for pensions. Actuarial Valuation Date The date as of which an actuarial valuation is performed. Actuarially Determined Contribution (ADC) or Annual Required Contribution (ARC) A calculated contribution into a defined benefit pension plan for the reporting period, most often determined based on the funding policy of the plan. Typically the Actuarially Determined Contribution has a normal cost payment and an amortization payment.
Employees’ Retirement System of the State of Hawaii
G-2
Glossary of Terms (continued) Amortization Payment The amortization payment is the periodic payment required to pay off an interest-discounted amount with payments of interest and principal. Amortization Method The method used to determine the periodic amortization payment may be a level dollar amount, or a level percent of pay amount. The period will typically be expressed in years, and the method will either be “open” (meaning, reset each year) or “closed” (the number of years remaining will decline each year. Cost-of-Living Adjustments Postemployment benefit changes intended to adjust benefit payments for the effects of inflation. Cost-Sharing Multiple-Employer Defined Benefit Pension Plan (cost-sharing pension plan) A multiple-employer defined benefit pension plan in which the pension obligations to the employees of more than one employer are pooled and pension plan assets can be used to pay the benefits of the employees of any employer that provides pensions through the pension plan. Covered-Employee Payroll The payroll of covered employees, which is typically only the pensionable pay and does not include pay above any pay cap. Deferred Retirement Option Program (DROP) A program that permits a plan member to elect a calculation of benefit payments based on service credits and salary, as applicable, as of the DROP entry date. The plan member continues to provide service to the employer and is paid for the service by the employer after the DROP entry date; however, the pensions that would have been paid to the plan member are credited to an individual member account within the defined benefit pension plan until the end of the DROP period. Other variations for DROP exist and will be more fully detailed in the plan provision section of the valuation report. Deferred Inflows and Outflows The deferred inflows and outflows of pension resources are amounts used under GASB Statement No. 68 in developing the annual pension expense. Deferred inflows and outflows arise with differences between expected and actual experiences; changes of assumptions. The portion of these amounts not included in pension expense should be included in the deferred inflows or outflows of resources. Discount Rate For GASB purposes, the discount rate is the single rate of return that results in the present value of all projected benefit payments to be equal to the sum of the funded and unfunded projected benefit payments, specifically:
1. The benefit payments to be made while the pension plans’ fiduciary net position is projected to be greater than the benefit payments that are projected to be made in the period and;
2. The present value of the benefit payments not in (1) above, discounted using the municipal bond rate.
Employees’ Retirement System of the State of Hawaii
G-3
Glossary of Terms (continued) Entry Age Actuarial Cost Method (EAN) The EAN is a funding method for allocating the costs of the plan between the normal cost and the accrued liability. The actuarial present value of the projected benefits of each individual included in an actuarial valuation is allocated on a level basis (either level dollar or level percent of pay) over the earnings or service of the individual between entry age and assumed exit ages(s). The portion of the actuarial present value allocated to a valuation year is the normal cost. The portion of this actuarial present value not provided for at a valuation date by the actuarial present value of future normal costs is the actuarial accrued liability. The sum of the accrued liability plus the present value of all future normal costs is the present value of all benefits. GASB The Governmental Accounting Standards Board is an organization that exists in order to promulgate accounting standards for governmental entities. Fiduciary Net Position The fiduciary net position is the value of the assets of the trust. Long-Term Expected Rate of Return The long-term rate of return is the expected return to be earned over the entire trust portfolio based on the asset allocation of the portfolio. Money-Weighted Rate of Return The money-weighted rate of return is a method of calculating the returns that adjusts for the changing amounts actually invested. For purposes of GASB Statement No. 67, money-weighted rate of return is calculated as the internal rate of return on pension plan investments, net of pension plan investment expense. Multiple-Employer Defined Benefit Pension Plan A multiple-employer plan is a defined benefit pension plan that is used to provide pensions to the employees of more than one employer. Municipal Bond Rate The Municipal Bond Rate is the discount rate to be used for those benefit payments that occur after the assets of the trust have been depleted. Net Pension Liability (NPL) The NPL is the liability of employers and nonemployer contribution entities to plan members for benefits provided through a defined benefit pension plan. Nonemployer Contribution Entities Nonemployer contribution entities are entities that make contributions to a pension plan that is used to provide pensions to the employees of other entities. For purposes of the GASB Accounting statement plan members are not considered nonemployer contribution entities.
Employees’ Retirement System of the State of Hawaii
G-4
Glossary of Terms (continued) Normal Cost The actuarial present value of the pension trust benefits allocated to the current year by the actuarial cost method. Other Postemployment Benefits (OPEB) All postemployment benefits other than retirement income (such as death benefits, life insurance, disability, and long-term care) that are provided separately from a pension plan, as well as postemployment healthcare benefits regardless of the manner in which they are provided. Other post-employment benefits do not include termination benefits. Real Rate of Return The real rate of return is the rate of return on an investment after adjustment to eliminate inflation. Service Cost The service cost is the portion of the actuarial present value of projected benefit payments that is attributed to a valuation year. Total Pension Expense The total pension expense is the sum of the following pension expense items that are recognized from the beginning to the end of the employer’s fiscal year:
1. Total service cost; 2. Interest on total pension liability; 3. Current-period benefit changes; 4. Member contributions; 5. Projected earnings on plan investments; 6. Administrative expense; 7. Other Changes in Plan Fiduciary Net Position; 8. Recognition of beginning deferred outflows (inflows) due to liabilities; and 9. Recognition of beginning deferred outflows (inflows) due to assets.
Total Pension Liability (TPL) The TPL is the portion of the actuarial present value of projected benefit payments that is attributed to past periods of member service. Unfunded Actuarial Accrued Liability (UAAL) The UAAL is the difference between actuarial accrued liability and valuation assets. Valuation Assets The valuation assets are the assets used in determining the unfunded liability of the plan. For purposes of the GASB Statement No. 67, the valuation asset is equal to the market value of assets.