Embed Size (px)
Citation preview
E M P L O Y E E S ’ R E T I R E M E N T S Y S T E M O F T H E S T A T E O F
H A W A I I
R E P O R T T O B O A R D O F T R U S T E E S O N T H E 9 1S T
A N N U A L
A C T U A R I A L V A L U A T I O N
F O R T H E Y E A R E N D I N G J U N E 3 0 , 2 0 1 6
January 9, 2017
Board of Trustees
Employees’ Retirement System of
The State of Hawaii
City Financial Tower
201 Merchant St., Ste. 1400
Honolulu, HI 96813-2980
Dear Trustees:
SUBJECT: ACTUARIAL VALUATION AS OF JUNE 30, 2016
We certify that the information contained in the 2016 actuarial valuation report is accurate and
fairly presents the actuarial position of the Employees’ Retirement System of the State of Hawaii
(ERS) as of June 30, 2016. There have been no adjustments for events which occurred after this
date.
All calculations have been made in conformity with generally accepted actuarial principles and
practices and with the Actuarial Standards of Practice issued by the Actuarial Standards Board.
In our opinion, the results presented comply with the requirements of the Hawaii statutes and,
where applicable, the Internal Revenue Code, ERISA, and the Statements of the Governmental
Accounting Standards Board. The undersigned are independent actuaries. One or more of them
are an Enrolled Actuary and/or a Member of the American Academy of Actuaries. All are
experienced in performing valuations for large public retirement systems.
ACTUARIAL VALUATIONS
The primary purpose of the valuation report is to determine the adequacy of the current employer
contribution rate through measuring the resulting funding period, to describe the current financial
condition of ERS, and to analyze changes in ERS’s condition. In addition, the report provides
various summaries of the data. This report may not be appropriate for other purposes. The
information required by ERS in connection with Governmental Accounting Standards Board
Statement No. 67(GASB No.67) will be provided in a separate report.
Valuations are prepared annually, as of June 30th of each year, the last day of ERS’s plan year
and fiscal year.
Board of Trustees
January 9, 2017
Page 2
FINANCING OBJECTIVES
Contribution rates are established by Law that, over time, are intended to remain level as a percent
of payroll. The employee and employer contribution rates have been set by Law and are intended
to provide for the normal cost plus the level percentage of payroll required to amortize the
unfunded actuarial accrued liability (UAAL) over a reasonable amount of time, which will ensure
benefit security and intergenerational equity.
PROGRESS TOWARD REALIZATION OF FINANCING OBJECTIVES
We have determined that the funding period for paying off the UAAL of the System (in
aggregate) is 66 years. Because this period exceeds 30 years, the objectives set in State statute
are currently not being realized. (Hawaii Revised Statutes §88-122(e)(1) state that the employer
contribution rates are subject to adjustment when the funding period is in excess of 30 years.)
The funded ratio (the ratio of the actuarial value of assets to the actuarial accrued liability) is a
standard measure of a plan’s funded status. The funded status alone is not appropriate for
assessing the need for future contributions nor assessing the sufficiency of plan assets to cover
the estimated cost of settling the plan's benefit obligations. However, the trend (historical and
projected) of the funded ratio is a strong metric to use for assessing the dependability of the
current funding policy and its ability to accumulate assets to pay benefits when due. The funded
ratio is currently 54.7% and this is lower than the funded ratio from the previous valuation,
primarily due to the impact of the new actuarial assumptions.
The 2011 Legislature made significant changes to the future employer contribution rates. The
employer contribution rate for Police and Fire employees increased to 25.00% in FY2016, and
the employer contribution rate for All Other Employees increased to 17.00% in FY2016. Under
current law, the contribution rates are expected to stay at these levels until the System is fully
funded. The Legislature also made changes to the benefits and member contribution rates for
employees hired after June 30, 2012. Because these changes result in significantly higher
contributions towards the unfunded liability in the future than in the current year, we believe it is
more appropriate to determine the funding period using an open group projection rather than a
static mathematical formula, which assumes that all amortization payments in the future will be
the same percentage of pay as in the current year.
The actuarial accrued liability, the unfunded actuarial accrued liability (UAAL), and the
determination of the resulting funding period illustrate the progress toward the realization of
financing objectives. The System’s UAAL was expected to increase from the prior year based
on the recognition of the new actuarial assumptions. In addition, the System had a liability
experience loss which was caused by individual salary increases being larger than expected by
the assumptions. The System also experienced a loss on its investments. As a result, the UAAL
grew based on this actuarial valuation as of June 30, 2016, ERS’s underfunded status as
measured by the UAAL is now $12.441 billion.
Board of Trustees
January 9, 2017
Page 3
Because of the less favorable investment performance in FY2016, the System is now deferring
$929 million in investment losses (compared with $42 million in deferred gains last year). If
there are no significant investment gains or other actuarial gains over the next three years, the
funded status of the System would be expected to decrease, as the remaining deferred investment
losses are recognized.
Thus, given the plan’s current contribution rates and the new tier of benefits, if all actuarial
assumptions are met (including the assumption of the plan earning 7.00% on the actuarial
valuation of assets), it is expected that:
1. The employer normal cost as a percentage of pay will decrease to the level of the newest
tier as the old tier population declines and is replaced by new tier members,
2. The employer contribution will remain level throughout the amortization period,
3. Thus, the net amount available to amortize the UAAL will increase over time,
4. The unfunded actuarial accrued liability will increase in nominal dollars until the net
amount for amortization is large enough to cover the interest charges, or approximately
2062, and then begin to decrease
5. The unfunded actuarial accrued liability will be fully amortized after 66 years, and
6. In the absence of benefit improvements, the funded ratio will remain relatively flat for
30-40 years before beginning to increase until it reaches 100%.
However, based on our professional experience and current industry standards, 66 years is an
inappropriate amount of time to allow for amortizing the current UAAL. This amount of time
would push significant costs into several future generations, and does not allow for any future
adverse experience that may arise. In fact, a 66 year funding period would push funding for the
current membership well past the point in which a large majority of them would have died. We
recommend the contribution rates be increased to bring the funding period into a more
appropriate range, with a target of 25 years.
BENEFIT PROVISIONS AND LEGISLATIVE CHANGES
This is the fourth valuation with members covered under the new benefit tier.
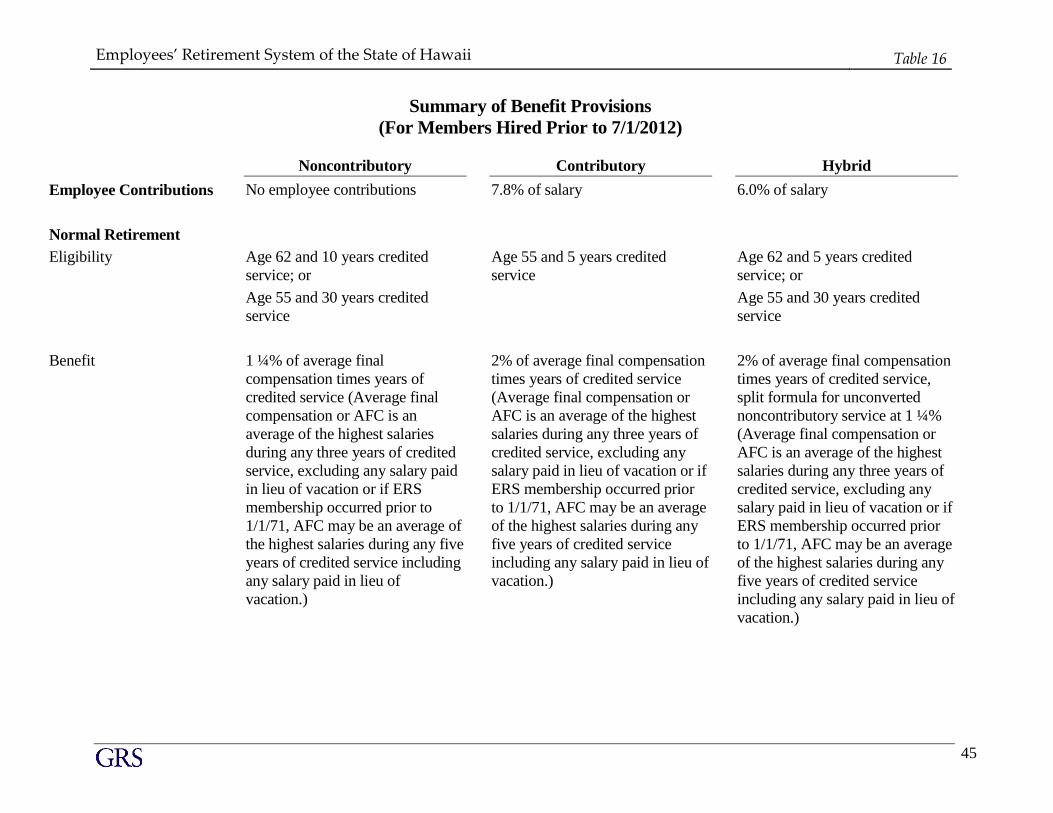
There have been no changes in the benefit provisions since the prior valuation. See Table 16 of
this report for more details on the benefit provisions for members of the System.
ASSUMPTIONS AND METHODS
The actuarial assumptions used were adopted by the Board in December of 2016 based on the
recommendations provided by an Experience Study performed by GRS.
Our Experience Study report dated July 5, 2016 provides details on the changes to the actuarial
assumptions. A brief summary of the significant changes are shown below.
Board of Trustees
January 9, 2017
Page 4
Decrease the nominal investment return assumption to 7.00%.
Decrease the inflation assumption from 3.00% to 2.5%.
No change to the 1.00% general productivity component of the general wage inflation
assumptions. However, consistent with the decrease in inflation, the nominal general
wage inflation assumption will decrease from 4.00% to 3.50%.Extend the step-rate
component in the salary assumption for General Employees and Teachers to 25 years.
Replace the base mortality tables with client-specific mortality tables developing using
the actual mortality experience of non-disabled retirees in ERS. Recommend to project
the rates on a fully generational basis by Scale BB to account for future mortality
improvements.
Minor adjustments to the retirement, termination, and disability patterns for members
consistent with experience and future expectations for active employees.
There was no change to the use of a 4-year smoothing technique to determine the actuarial value
of assets, used for determining the funding period. However, we did add a provision to ensure
that the gain or loss from an individual year is fully recognized within 4 years.
There was no change to the actuarial funding method. The Entry Age Normal cost method
(EAN) is the current funding method being used to allocate the actuarial costs of the System. The
Entry Age Normal method will generally produce relatively level contribution amounts as a
percentage of payroll from year to year, and allocates costs among various generations of
taxpayers in a reasonable manner. It is by far the most commonly used actuarial cost method for
large public retirement systems.
Further detail on the assumptions and methods may be found in Table 18 of this report.
The actuarial assumptions represent estimates of future experience and are not market measures.
The results of the actuarial valuation are dependent on the actuarial assumptions used. Actual
results can and almost certainly will differ, as actual experience deviates from the
assumptions. Even seemingly minor changes in the assumptions can materially change the
liabilities, calculated contribution rates and funding periods. Based on the scope of this
engagement, we have not performed analysis on the potential range of future measurements
based on other factors. The actuarial calculations are intended to provide information for rational
decision making.
In our opinion, the assumptions are internally consistent and are reasonably based on the actual
experience of ERS.
DATA
Member data for retired, active, and inactive participants was supplied as of March 31, 2016, by
ERS’s staff. We have not subjected this data to any auditing procedures, but have examined the
data for reasonableness and consistency with the prior year's data. Asset information was
supplied by ERS’s staff.
Board of Trustees
January 9, 2017
Page 5
RESPONSIBILITY FOR TABLES AND SCHEDULES
The actuary is responsible for the information with respect to years after 1999 in the Required
Supplementary Information, and the Notes to Required Supplementary Information in the
Financial Section of the ERS’s Comprehensive Annual Financial Report (CAFR). Information
with respect to years prior to 2000 was supplied by ERS.
Tables and schedules in the Actuarial Section of the CAFR were generally prepared directly by
the Actuary. However, certain of these tables were prepared by ERS utilizing information from
this report. When the tables were prepared by ERS from our report, they are so noted.
The undersigned are independent actuaries and consultants. Mr. Newton is an Enrolled Actuary,
a Member of the American Academy of Actuaries and meets the Qualification Standards of the
American Academy of Actuaries. Finally, all of the undersigned are experienced in performing
valuations for large public retirement systems.
Sincerely,
Joseph P. Newton, FSA, EA Lewis Ward Linna Ye, ASA, MAAA
Senior Consultant & Actuary Consultant Actuary
J:\3046\2016\Val\2016_Val updated.doc
Employees’ Retirement System of the State of Hawaii Table of Contents
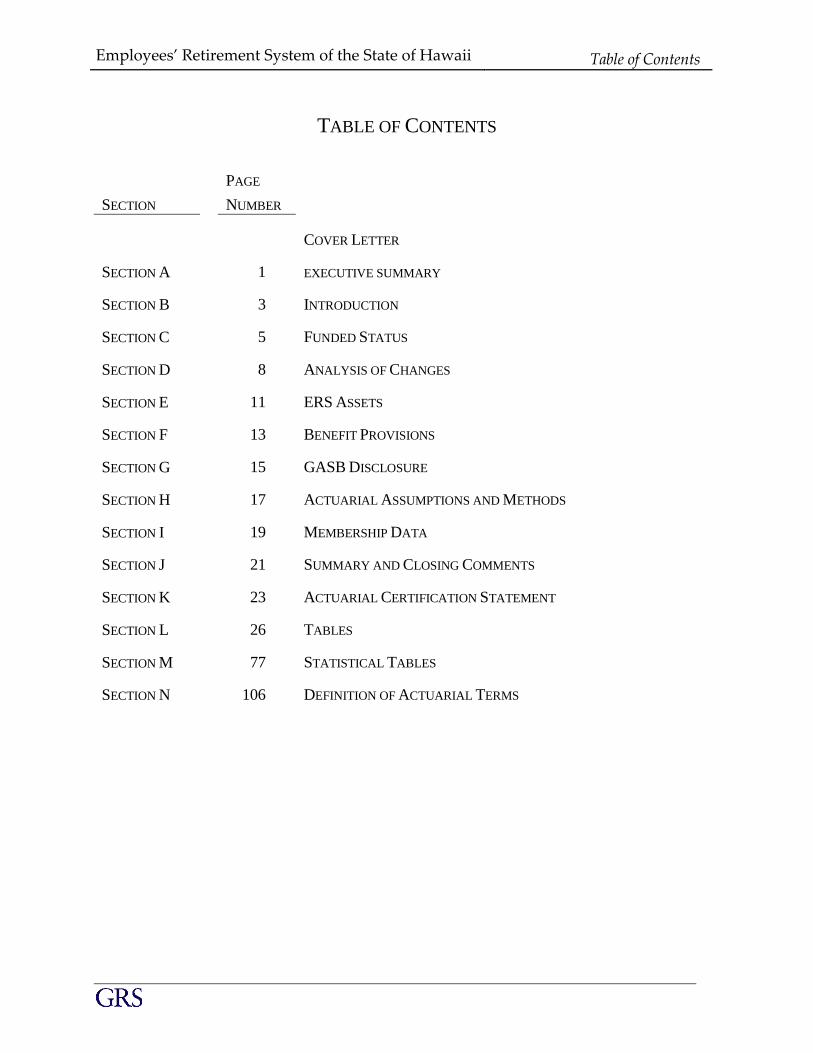
TABLE OF CONTENTS
PAGE
SECTION NUMBER
COVER LETTER
SECTION A 1 EXECUTIVE SUMMARY
SECTION B 3 INTRODUCTION
SECTION C 5 FUNDED STATUS
SECTION D 8 ANALYSIS OF CHANGES
SECTION E 11 ERS ASSETS
SECTION F 13 BENEFIT PROVISIONS
SECTION G 15 GASB DISCLOSURE
SECTION H 17 ACTUARIAL ASSUMPTIONS AND METHODS
SECTION I 19 MEMBERSHIP DATA
SECTION J 21 SUMMARY AND CLOSING COMMENTS
SECTION K 23 ACTUARIAL CERTIFICATION STATEMENT
SECTION L 26 TABLES
SECTION M 77 STATISTICAL TABLES
SECTION N 106 DEFINITION OF ACTUARIAL TERMS

SECTION A
EX EC U TIV E S U MMA RY
Employees’ Retirement System of the State of Hawaii Section A
1
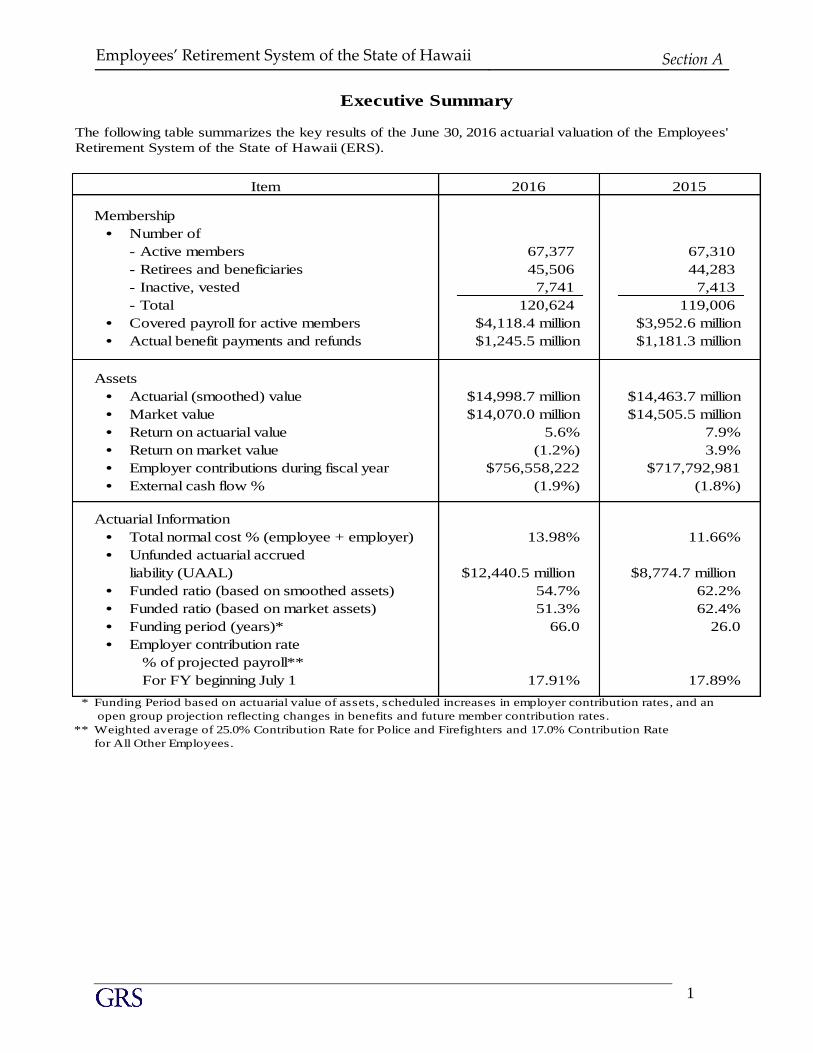
The following table summarizes the key results of the June 30, 2016 actuarial valuation of the Employees'
Retirement System of the State of Hawaii (ERS).
2015
Membership
• Number of
- Active members 67,377 67,310
- Retirees and beneficiaries 45,506 44,283
- Inactive, vested 7,741 7,413
- Total 120,624 119,006
• Covered payroll for active members $4,118.4 million $3,952.6 million
• Actual benefit payments and refunds $1,245.5 million $1,181.3 million
Assets
• Actuarial (smoothed) value $14,998.7 million $14,463.7 million
• Market value $14,070.0 million $14,505.5 million
• Return on actuarial value 5.6% 7.9%
• Return on market value (1.2%) 3.9%
• Employer contributions during fiscal year $756,558,222 $717,792,981
• External cash flow % (1.9%) (1.8%)
Actuarial Information
• Total normal cost % (employee + employer) 13.98% 11.66%
• Unfunded actuarial accrued
liability (UAAL) $12,440.5 million $8,774.7 million
• Funded ratio (based on smoothed assets) 54.7% 62.2%
• Funded ratio (based on market assets) 51.3% 62.4%
• Funding period (years)* 66.0 26.0
• Employer contribution rate
% of projected payroll**
For FY beginning July 1 17.91% 17.89%
* Funding Period based on actuarial value of assets, scheduled increases in employer contribution rates, and an
for All Other Employees beginning July 1, 2008. open group projection reflecting changes in benefits and future member contribution rates.
** Weighted average of 25.0% Contribution Rate for Police and Firefighters and 17.0% Contribution Rate
for All Other Employees.
Item
Executive Summary
2016

SECTION B
IN TR O D U C TIO N
Employees’ Retirement System of the State of Hawaii Section B
3
Introduction
The results of the June 30, 2016 actuarial valuation of ERS are presented in this report.
The primary purpose of the valuation report is to determine the adequacy of the current employer
contribution rates through measuring the resulting funding period, to describe the current financial
condition of ERS, and to analyze changes in ERS’s condition.
In preparing this valuation, Gabriel, Roeder, Smith & Company (GRS) has relied on employee
data and asset information provided by the staff of ERS. While not verifying the data at their
source, GRS has performed such tests for consistency and reasonableness as has been deemed
necessary to be satisfied with the appropriateness of using the data supplied.
Section C discusses the funded status of ERS. Section D analyzes the change in the UAAL.
Section G discusses the disclosure requirements of GASB No. 67.
Sections E, F, H, and I discuss background information used in the preparation of this report--
benefit provisions, actuarial assumptions and methods, financial information, and membership
data. Section K contains the actuarial certification.
All the tables referenced by the other sections appear in Section L.

SECTION C
F U N D ED S TATU S
Employees’ Retirement System of the State of Hawaii Section C
5
Funded Status
Table 1 shows the development of the Plan's liabilities and funded status for the current year and
compares it with those of the prior year.
The calculation of the funded status involves the following steps and includes the following
comments:
The actuarial present value of future benefits is determined for the present members,
including retired members, beneficiaries, inactive members, and active members. This
amounts to $32.4 billion. Table 2 shows the development of this total for the current year
and the prior year.
The individual entry age normal funding method is used to allocate the actuarial present
value of future benefits between that portion due for the current year (the normal cost),
prior years (the actuarial accrued liability) and future years (the present value of future
normal cost). Under the individual entry age normal cost method, the current and future
normal costs are determined as a level percentage of payroll. Table 3 shows an analysis of
the normal cost for the current year and the prior year. The amount needed to fund the
current and future normal costs is 25.72% of pay for Police and Fire employees and
12.46% for All Other employees. It includes all of the employees’ contribution (if any)
and the employers’ normal cost rate.
In previous valuations, the impact of the new tier of benefits could be seen in the decline of
the normal cost for Police and Fire Employees from one valuation to the next. However,
the impact cannot be seen this year due to the impact of the new actuarial assumptions.
Next year, we would expect the year-to-year decrease in the normal cost to resume.
A part of the normal cost is paid by the employee contributions of 12.40% of pay for Police
and Firefighters, leaving 13.32% of pay to be funded by the employers. Thus the current
year's employer normal cost for Police and Firefighters is deemed to be 13.32% of the
valuation payroll. As for the All Other Employees group, the average weighted effective
employee contribution rate is 4.89% of pay, leaving 7.57% of pay to be funded by the
employers. This is shown in Line 3 of Table 1.
Employees’ Retirement System of the State of Hawaii
Section C
(continued)
6
The UAAL is $12.441 billion for 2016, an increase from $8.775 billion in 2015. As
indicated in Table 1, the UAAL equals the difference between the total actuarial accrued
liability (Item 7) and current actuarial assets (Item 8).
In determining the number of years that will be required to amortize the UAAL, an
assumption is made concerning future growth of the ERS covered payroll. Payroll can
grow from intrinsic growth in the pay of individual members and it can also grow due to
active membership growth. In determining the funding period of the System, we have
assumed that the number of active members will remain constant in our open group
projection.
As shown in Item 10 of Table 1 and on Table 9c, the period to fund the UAAL is Infinite
(i.e. the UAAL is never expected to be paid off) for Police and Fire and 59 years for the
All Other Employees group. The aggregate funding period for ERS is 66 years. Since the
aggregate funding period based on the contribution rates exceeds 30 years, the rates are
not adequate to meet the requirements of Hawaii Revised Statutes §88-122(e)(1).
As of the valuation date, ERS has a funded ratio of 54.7%, based on the actuarial value of assets.
Due to the significant changes in the future contribution rates and benefits for employees hired
after June 30, 2012, the ERS funding policy uses an open group projection for determining how
many years it will take to eliminate the unfunded liabilities of the System. The System is expected
to be fully funded in 2082 which is 66 years from now. Therefore, the funding period is equal to 66
years. The open group projection assumes that the number of active members will remain constant
and that there will be no actuarial gains or losses on liabilities or investments.
SECTION D
A N A LY S IS OF C H A N G ES
Employees’ Retirement System of the State of Hawaii Section D
8
Analysis of Changes
Section C has noted that the unfunded actuarial accrued liability (UAAL) is $12.441 billion as of
June 30, 2016 compared to the $8.775 billion UAAL for 2015.
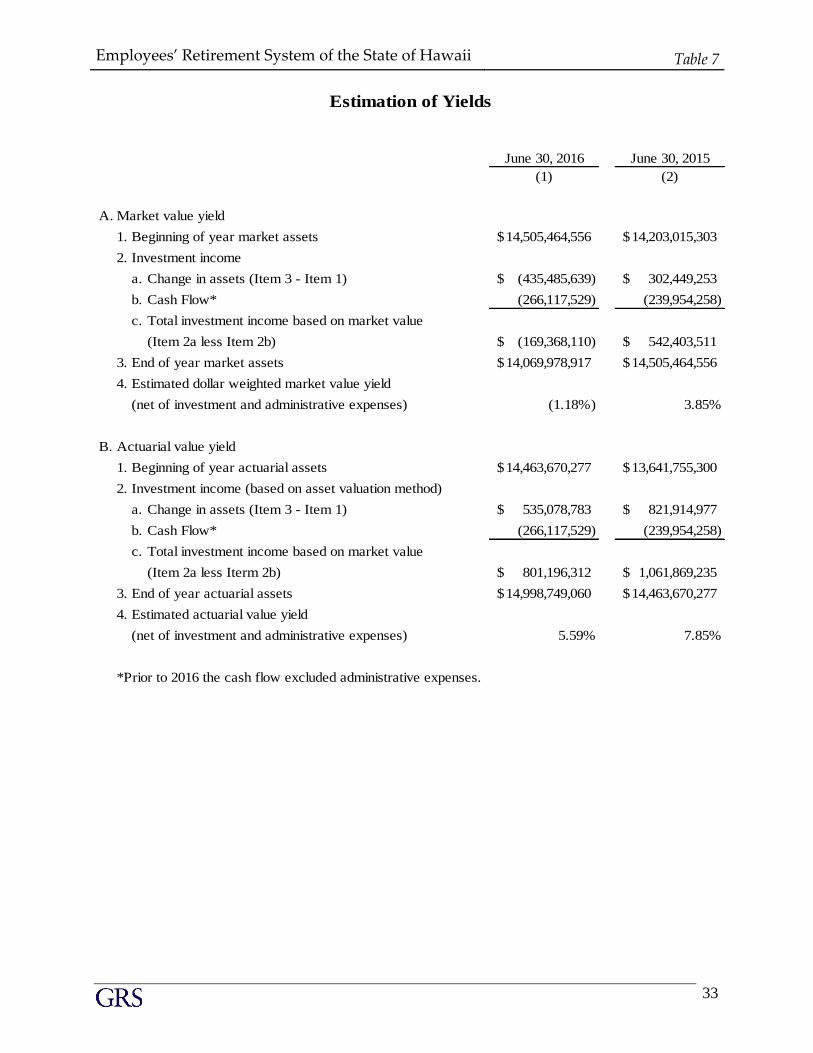
Table 7 develops the estimated yield for the year based on two measures of asset values. Table
9b takes the information contained in Table 6 and develops the expected value of actuarial assets
for this valuation, based on the prior year’s investment return assumption of 7.65%.
As shown in Item 5 of Table 9b, the expected value of actuarial assets as of June 30, 2016 is
$15.308 billion. As developed in Table 6, the actual value of actuarial assets as of the valuation
date is $14.999 billion (as repeated in Item 6 of Table 9b). Thus the asset loss for the year is the
difference between the actual value and the expected value, or $310 million (as shown in Item 7).
This asset loss for the year is a direct reflection of the estimated yield for the year based on the
value of actuarial assets, namely 5.59% (as shown in Item B4 of Table 7) being less than the
assumed rate of return.
The actuarial asset valuation method is intended to smooth out year-to-year fluctuations in the
market return. The expected actuarial value of assets is calculated and compared to the actual
market value of assets. One fourth of the difference between these numbers is then recognized
and added to the expected actuarial value of assets to get the final actuarial value of assets. This
method has the advantage of more quickly converging towards the market value in years when
the returns go in the opposite direction of the prior years, as was the case this year. It is
important to point out that the UAAL and the funded ratio disclosed in this report would be
significantly different if measured on the market value instead of the actuarial value of assets.
However, over time, the two values will converge.
After a mediocre year in FY 2015, the investment markets did poorly in FY 2016 with a return of
-1.18% on the market value of assets. The rate of return for the actuarial value was 5.59%, which
is more than the market return due to the smoothing methodology used in the determination of
the actuarial value of assets. The actuarial value of assets exceeds the market value of assets by
$929 million, so there are $929 million in deferred investment losses still to be recognized in the
actuarial value of assets. Please note that as of the last valuation there was $42 million in
deferred gains, and all of the deferred investment gains were recognized or offset by investment
losses in this valuation.
Table 9a indicates that there was an increase in the liabilities of the System of $2.916 billion due
to the adoption of new actuarial assumptions. Since the total unanticipated change in the
unfunded actuarial accrued liability was $3.523 billion (item 7), this means there was a total
actuarial experience loss for the 2015/2016 plan year of $607 million. As noted above, the
actuarial investment loss was equal to $310 million. This means that there was a liability loss
during the year equal to $297 million. This experience loss is due to larger than expected salary
increases for both employee groups.
Employees’ Retirement System of the State of Hawaii
Section D
(continued)
9
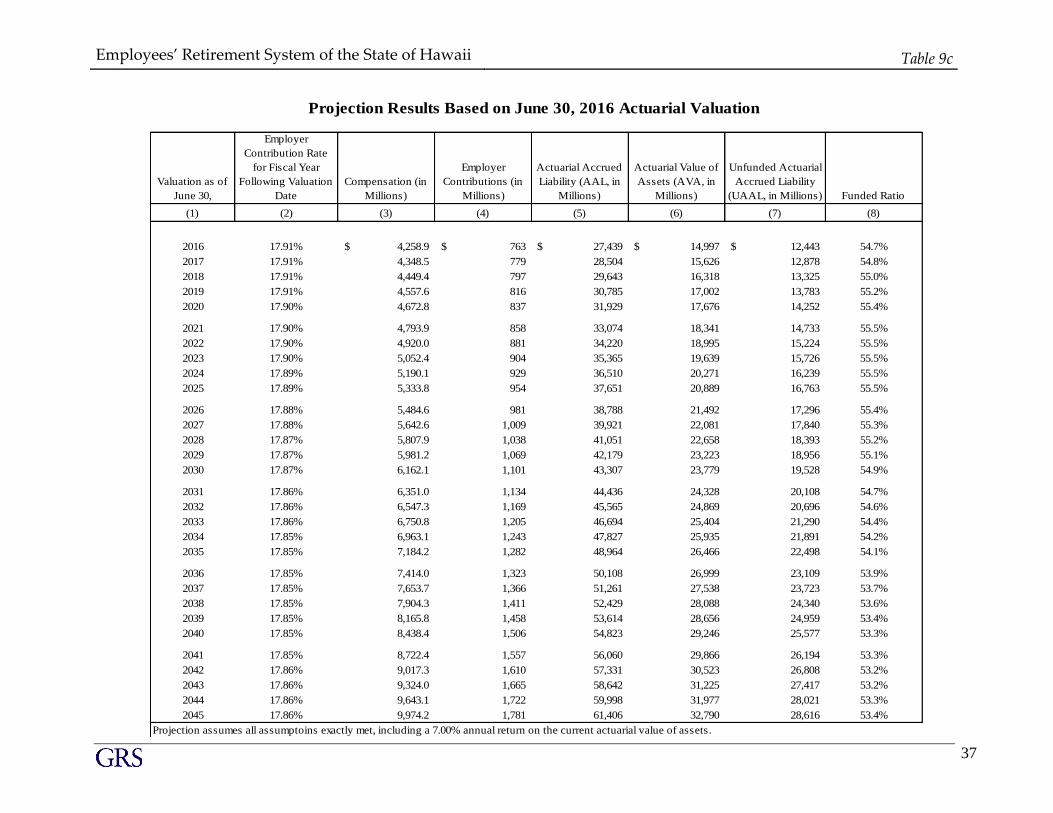
Table 9c shows the current year’s valuation results plus a 30-year open group projection of the
System’s assets and liabilities. As discussed previously, this projection assumes no actuarial
gains or losses in the actuarial liabilities or the actuarial value of assets. In addition, the
projection assumes the current employer contribution rates will continue and reflects the changes
to the benefits and member contribution rates of employees hired after June 30, 2012. As may be
seen by examining this table, the unfunded liability of the System (Column 7) is expected to
continually grow throughout the 30 years shown in the projection. If more years of the
projection were shown, the reader would see the UAAL is expected to be eliminated in fiscal
year 2082, which is 66 years from this valuation. Therefore, for the purpose of satisfying Hawaii
Revised Statutes §88-122(e)(1) the funding period is considered to be 66 years.

SECTION E
ER S A S S ETS
Employees’ Retirement System of the State of Hawaii Section E
11
ERS Assets
Table 4 presents a summary of the market value of assets held by the ERS. About 74% of the total
assets available for benefits are held in equities (including alternative investments) and real estate
compared to about 77% last year. Table 5 shows a reconciliation of the assets from the beginning
of the prior year to the valuation date.
Table 6 shows the development of the Actuarial Value of Assets (AVA). An actuarial value is
used in order to dampen some of the year-to-year fluctuations which would occur if the market
value were used instead. The method used, determines the actuarial value of assets as the expected
actuarial value of assets plus 25% of the difference between the actual market value of assets and
the expected actuarial value of assets.
Table 7 shows an estimate of the ERS’s dollar-weighted rate of return for the year. This is shown
on (i) the market value of assets (reflecting all realized and unrealized gains and losses), and (ii) the
actuarial value of assets. While the dollar-weighted market return this year was -1.18%, the return
on the actuarial value was 5.59%. The difference between these is due to the smoothing effect of
the AVA valuation method.
Table 9b determines the asset gain or loss for the year, based on the difference between the actual
fund return and the prior year’s assumed rate of 7.65%.
Finally, Table 13 shows a history of cash flows for the trust.
SECTION F
B EN EF IT P R OV IS IO N S
Employees’ Retirement System of the State of Hawaii Section F
13
Benefit Provisions
Table 16 summarizes the provisions of ERS used in this valuation. Table 17 is a historical record
of prior legislative changes starting with changes effective in 1999. There were significant
changes made by the 2011 Legislature to the benefit provisions of the System for employees hired
after June 30, 2012. Because the Board has chosen to use the Individual Entry Age Normal Cost
method, the normal cost and the growth of the accrued liabilities will be slowly impacted by the
changes in the benefit provisions, as members under the new tier are hired to replace members who
are covered under the older tier of benefits.
There have been no changes to the benefit provisions since the last valuation that had an actuarial
impact on the valuation.
Legislation was also enacted in 2011 that impacted the employer contribution rates beginning in
fiscal year 2013. The employer contribution rates for Police and Fire employees are 25.00% in
FY 2016 and beyond while the employer contribution rates for All Other Employees will
increase according to the following schedule are 17.00% in FY 2016 and beyond.
This valuation reflects benefits promised to members by the ERS’s statutes. There are no ancillary
benefits - retirement type benefits not required by the ERS’s statutes but which might be deemed
an ERS liability if continued beyond the availability of funding by the current funding source.
Act 179/2004 was adopted during FY2003/2004 and established the new Hybrid class that became
effective on July 1, 2006. Current participants had the choice to elect to move to the new class or
stay in the current plan. There were 26,228 plan members who elected to so transfer. The Hybrid
class membership has since grown to more than 46,000 members.
SECTION G
G A S B D IS C LO S U R E
Employees’ Retirement System of the State of Hawaii Section G
15
GASB Disclosure
The Governmental Accounting Standards Board (GASB) has issued Statement No. 67 which
provides the manner in which the actuarial condition of a public sector retirement plan is to be
disclosed in the system’s financial statements. This new standard replaces GASB No. 25, and
went into effect for the ERS for fiscal years ending on or after June 30, 2014.
Similar to last year, we will provide a separate accounting report with the required disclosures
under this new standard.
SECTION H
A C TU A R IA L A S S U MP TIO N S A N D METH O D S
Employees’ Retirement System of the State of Hawaii Section H
17
Actuarial Assumptions and Methods
In determining costs and liabilities, actuaries use assumptions about the future, such as rates of
salary increase, probabilities of retirement, termination, death and disability, and an investment
return assumption. The ERS’s Board adopts the assumptions used, taking into account the
actuary's recommendations.
In addition to the actuarial assumptions, the actuary also makes use of an actuarial funding method
to allocate costs to particular years. In common with most public sector plans, ERS uses the entry
age normal method (individual normal cost). This method produces a relatively level pattern of
funding for individual employees over time. We believe this method is appropriate for ERS.
As discussed previously, ERS’s Board adopted new actuarial assumptions in December 2016 to
be used effective with the June 30, 2016 actuarial valuation.
The changes in the actuarial assumptions resulted in a $2,916 million increase in the liabilities of
the system.
Please see Table 18 for a complete description of the actuarial assumptions and methods.

SECTION I
MEMB ER S H IP D ATA
Employees’ Retirement System of the State of Hawaii Section I
19
Membership Data
Membership data was provided in electronic files, via a secured file transfer protocol, by the staff.
Data for active members include sex, birthdate, service, pay rate as of March 2016, employer entity
and accumulated employee contributions. Data for inactive, nonretired members was similar, but
also includes the members' unreduced benefit. For retired members, data includes status (service
retiree, disabled retiree or beneficiary), sex, birthdate, pension amount, pension COLA amount,
form of payment, beneficiary sex and birthdate if applicable, and date of retirement.
While not verifying the correctness of the data at the source, we performed various tests to ensure
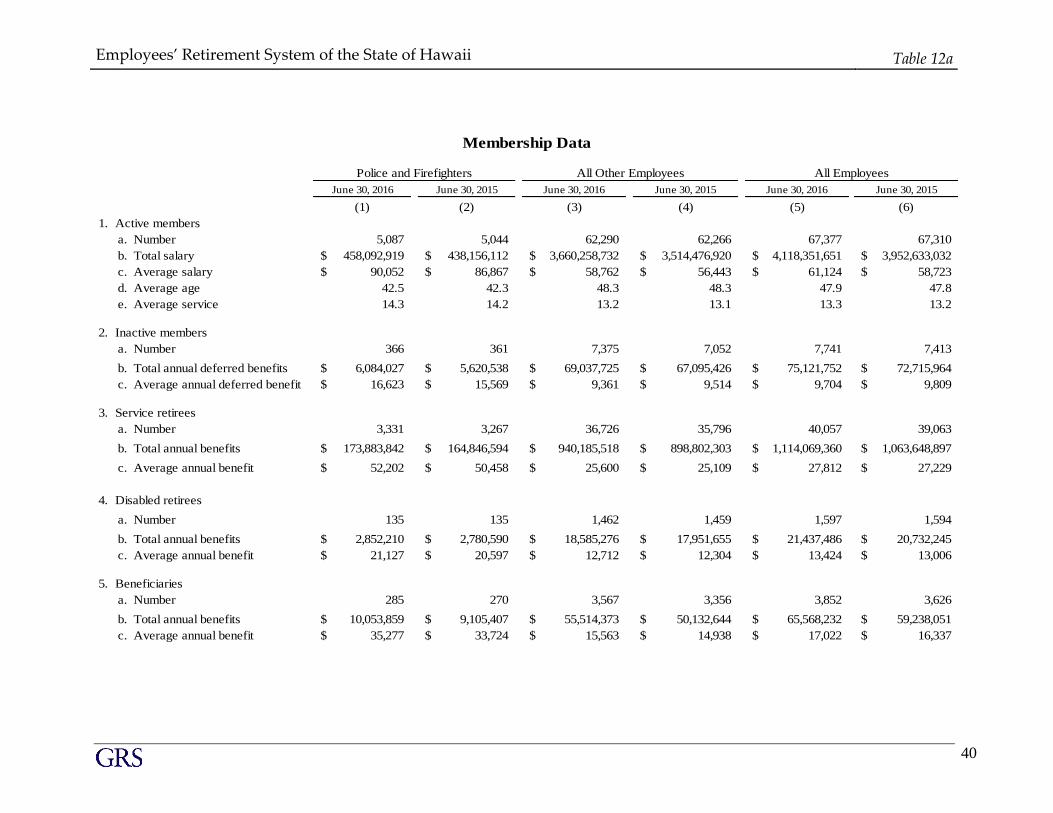
the internal consistency of the data and its overall reasonableness. Membership statistics are
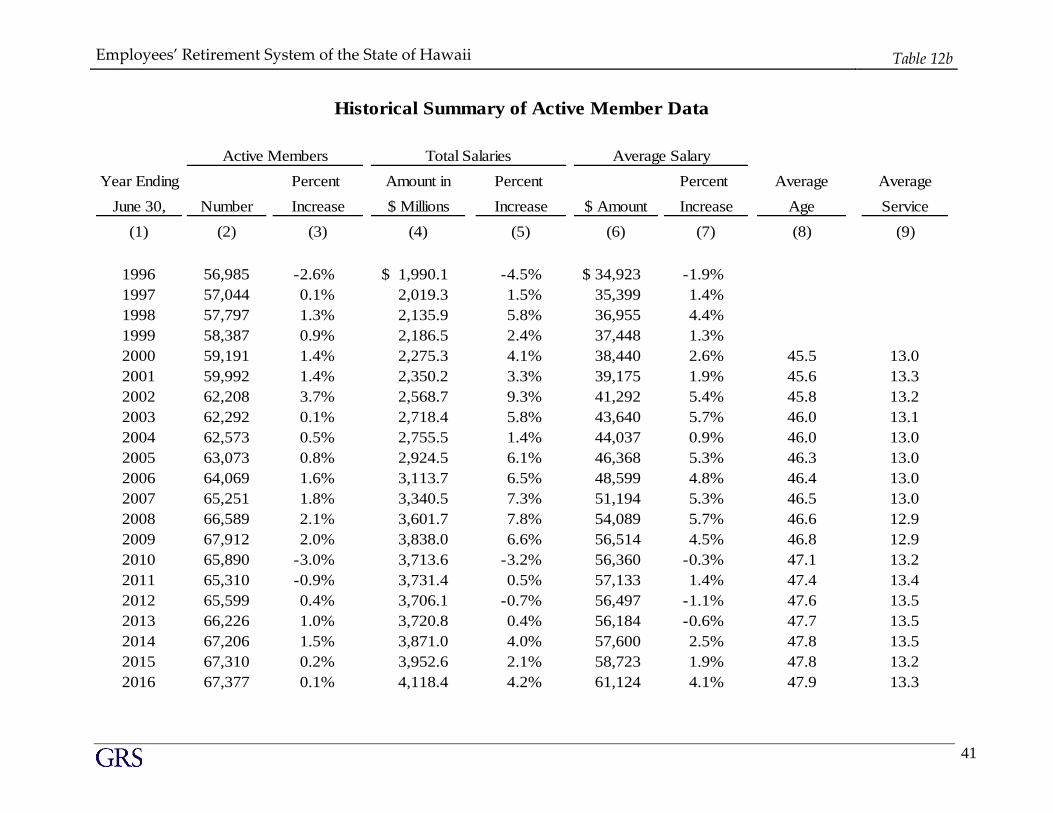
summarized in Table 12a. Table 12b summarizes certain active member data, and the age/service
distribution of active members is shown in Table 19. Tables 30-43 show various distributions of
retirees.
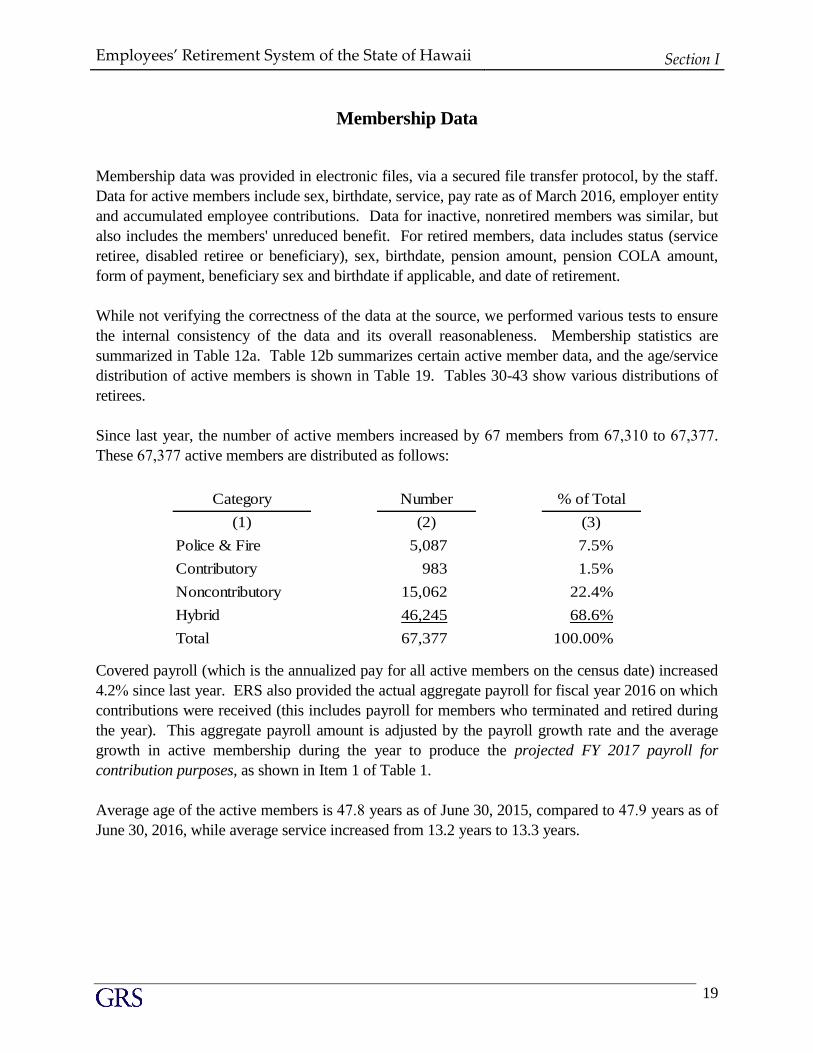
Since last year, the number of active members increased by 67 members from 67,310 to 67,377.
These 67,377 active members are distributed as follows:
Category Number % of Total
(1) (2) (3)
Police & Fire 5,087 7.5%
Contributory 983 1.5%
Noncontributory 15,062 22.4%
Hybrid 46,245 68.6%
Total 67,377 100.00%
Covered payroll (which is the annualized pay for all active members on the census date) increased
4.2% since last year. ERS also provided the actual aggregate payroll for fiscal year 2016 on which
contributions were received (this includes payroll for members who terminated and retired during
the year). This aggregate payroll amount is adjusted by the payroll growth rate and the average
growth in active membership during the year to produce the projected FY 2017 payroll for
contribution purposes, as shown in Item 1 of Table 1.
Average age of the active members is 47.8 years as of June 30, 2015, compared to 47.9 years as of
June 30, 2016, while average service increased from 13.2 years to 13.3 years.
SECTION J
S U MMA RY AN D C LO S IN G C O MMEN TS
Employees’ Retirement System of the State of Hawaii Section J
21
Summary and Closing Comments
To summarize the results of the actuarial valuation of the Employees’ Retirement System as of
June 30, 2016, it is our opinion that if all assumptions are met going forward, the present assets
plus future required contributions will be sufficient to provide the benefits specified in the law.
However, the new actuarial assumptions have resulted in pushing out the year at which the plan is
expected to be fully funded. Last year the ERS was expected to eliminate the unfunded liability of
the System (be fully funded) in 2041 which was 26 years from the valuation date. This year’s
valuation shows that the ERS is expected to be fully funded in 2082, which is forty-one years later
than last year (66 years from this year’s valuation date).
Thus, the current contribution rates are not sufficient to eliminate the UAAL over a period of 30
years or less as specified by Hawaii Revised Statute 88-122(e)(1).
Based on our professional experience and current industry standards, 66 years is an inappropriate
amount of time to allow for amortizing the current UAAL. This amount of time would push
significant costs into several future generations, and does not allow for any future adverse
experience that may arise. We recommend the contribution rates be increased to bring the funding
period into a more appropriate range, with a target of at least 25 years.
.
SECTION K
A C TU A R IA L C ERTIF IC AT IO N S TATEME N T
Employees’ Retirement System of the State of Hawaii Section K
23
Police and
Firefighters
All Other
Employees All Employees
June 30, 2016 June 30, 2016 June 30, 2016
(1) (2) (3)
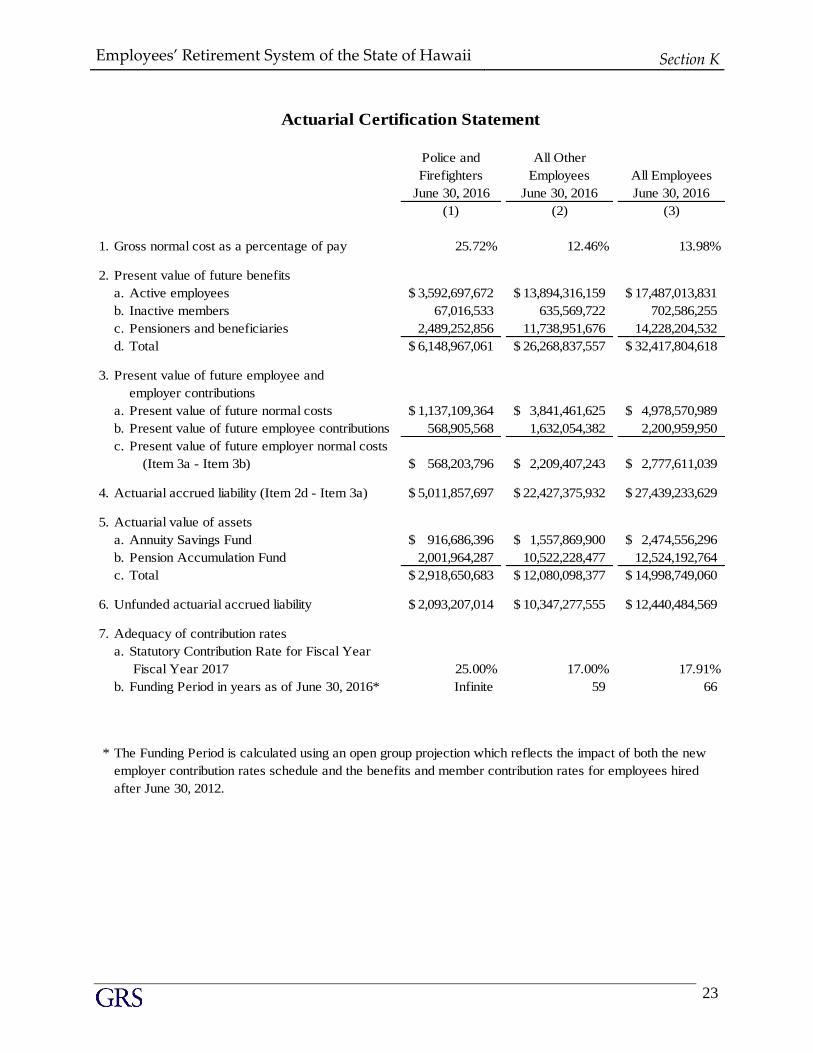
1. Gross normal cost as a percentage of pay 25.72% 12.46% 13.98%
2. Present value of future benefits
a. Active employees 3,592,697,672$ 13,894,316,159$ 17,487,013,831$
b. Inactive members 67,016,533 635,569,722 702,586,255
c. Pensioners and beneficiaries 2,489,252,856 11,738,951,676 14,228,204,532
d. Total 6,148,967,061$ 26,268,837,557$ 32,417,804,618$
3. Present value of future employee and
employer contributions
a. Present value of future normal costs 1,137,109,364$ 3,841,461,625$ 4,978,570,989$
b. Present value of future employee contributions 568,905,568 1,632,054,382 2,200,959,950
c. Present value of future employer normal costs
(Item 3a - Item 3b) 568,203,796$ 2,209,407,243$ 2,777,611,039$
4. Actuarial accrued liability (Item 2d - Item 3a) 5,011,857,697$ 22,427,375,932$ 27,439,233,629$
5. Actuarial value of assets
a. Annuity Savings Fund 916,686,396$ 1,557,869,900$ 2,474,556,296$
b. Pension Accumulation Fund 2,001,964,287 10,522,228,477 12,524,192,764
c. Total 2,918,650,683$ 12,080,098,377$ 14,998,749,060$
6. Unfunded actuarial accrued liability 2,093,207,014$ 10,347,277,555$ 12,440,484,569$
7. Adequacy of contribution rates
a. Statutory Contribution Rate for Fiscal Year
Fiscal Year 2017 25.00% 17.00% 17.91%
b. Funding Period in years as of June 30, 2016* Infinite 59 66
* The Funding Period is calculated using an open group projection which reflects the impact of both the new
employer contribution rates schedule and the benefits and member contribution rates for employees hired
after June 30, 2012.
Actuarial Certification Statement
Employees’ Retirement System of the State of Hawaii
Section K
(continued)
24
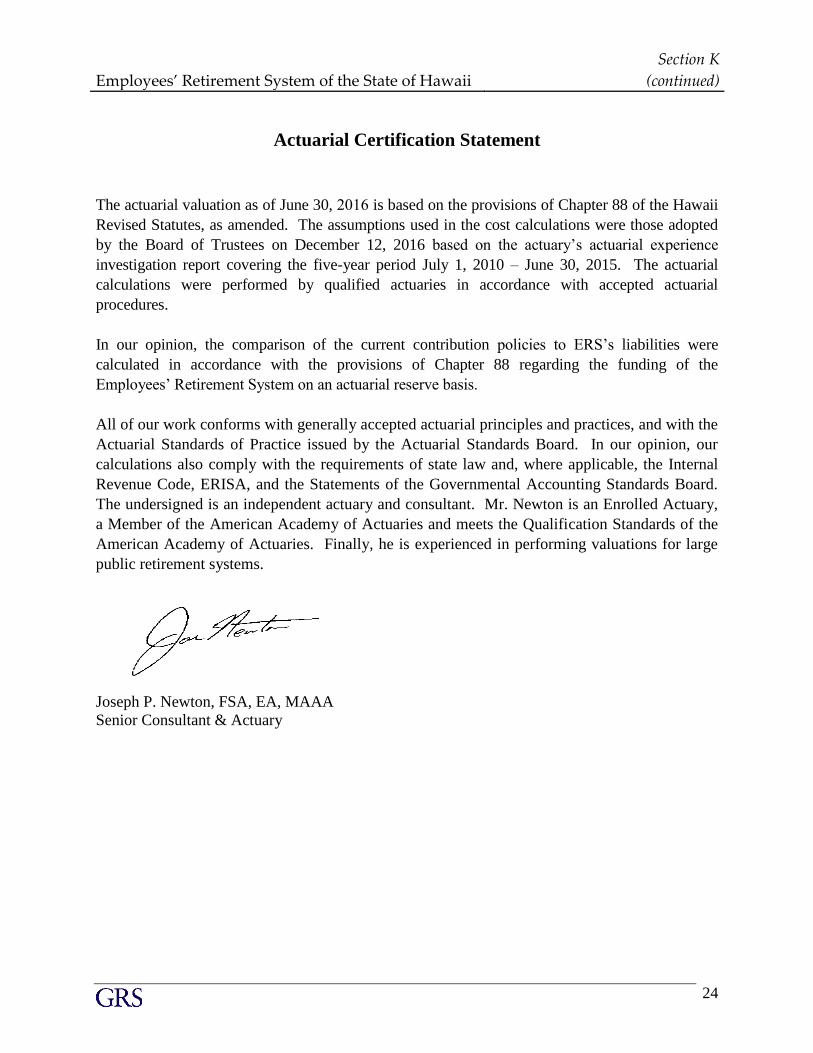
Actuarial Certification Statement
The actuarial valuation as of June 30, 2016 is based on the provisions of Chapter 88 of the Hawaii
Revised Statutes, as amended. The assumptions used in the cost calculations were those adopted
by the Board of Trustees on December 12, 2016 based on the actuary’s actuarial experience
investigation report covering the five-year period July 1, 2010 – June 30, 2015. The actuarial
calculations were performed by qualified actuaries in accordance with accepted actuarial
procedures.
In our opinion, the comparison of the current contribution policies to ERS’s liabilities were
calculated in accordance with the provisions of Chapter 88 regarding the funding of the
Employees’ Retirement System on an actuarial reserve basis.
All of our work conforms with generally accepted actuarial principles and practices, and with the
Actuarial Standards of Practice issued by the Actuarial Standards Board. In our opinion, our
calculations also comply with the requirements of state law and, where applicable, the Internal
Revenue Code, ERISA, and the Statements of the Governmental Accounting Standards Board.
The undersigned is an independent actuary and consultant. Mr. Newton is an Enrolled Actuary,
a Member of the American Academy of Actuaries and meets the Qualification Standards of the
American Academy of Actuaries. Finally, he is experienced in performing valuations for large
public retirement systems.
Joseph P. Newton, FSA, EA, MAAA
Senior Consultant & Actuary

SECTION L
TA B LES
Employees’ Retirement System of the State of Hawaii Section L
26
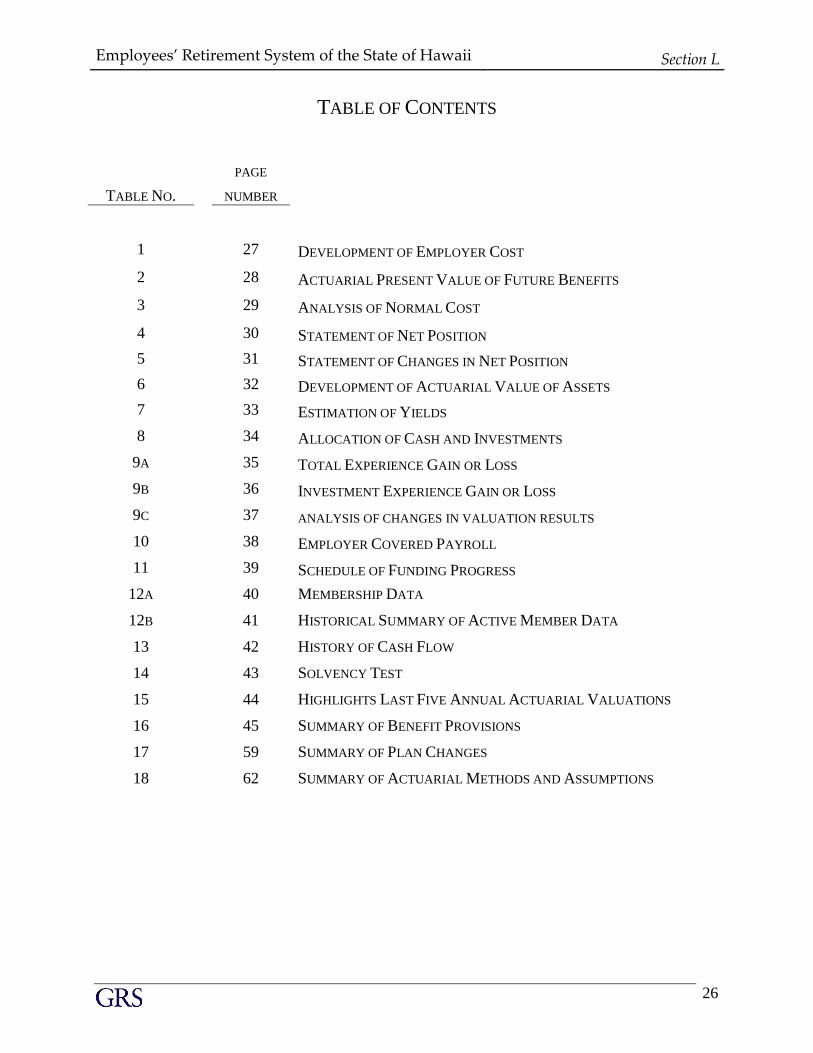
TABLE OF CONTENTS
PAGE
TABLE NO. NUMBER
1 27 DEVELOPMENT OF EMPLOYER COST
2 28 ACTUARIAL PRESENT VALUE OF FUTURE BENEFITS
3 29 ANALYSIS OF NORMAL COST
4 30 STATEMENT OF NET POSITION
5 31 STATEMENT OF CHANGES IN NET POSITION
6 32 DEVELOPMENT OF ACTUARIAL VALUE OF ASSETS
7 33 ESTIMATION OF YIELDS
8 34 ALLOCATION OF CASH AND INVESTMENTS
9A 35 TOTAL EXPERIENCE GAIN OR LOSS
9B 36 INVESTMENT EXPERIENCE GAIN OR LOSS
9C 37 ANALYSIS OF CHANGES IN VALUATION RESULTS
10 38 EMPLOYER COVERED PAYROLL
11 39 SCHEDULE OF FUNDING PROGRESS
12A 40 MEMBERSHIP DATA
12B 41 HISTORICAL SUMMARY OF ACTIVE MEMBER DATA
13 42 HISTORY OF CASH FLOW
14 43 SOLVENCY TEST
15 44 HIGHLIGHTS LAST FIVE ANNUAL ACTUARIAL VALUATIONS
16 45 SUMMARY OF BENEFIT PROVISIONS
17 59 SUMMARY OF PLAN CHANGES
18 62 SUMMARY OF ACTUARIAL METHODS AND ASSUMPTIONS

Employees’ Retirement System of the State of Hawaii Table 1
27
Police and
Firefighters All Other Employees All Employees
June 30, 2016 June 30, 2016
(1) (2) (3)
1. Projected FY 2017 payroll for contribution purposes 484,128,704$ 3,774,799,913$ 4,258,928,617$
2. Gross normal cost (Table 3) 25.72% 12.46% 13.98%
3. Employer normal cost rate (Table 3) 13.32% 7.57% 8.23%
4. Present value future benefits (Table 2) 6,148,967,061$ 26,268,837,557$ 32,417,804,618$
5. Present value future employer normal cost 568,203,796$ 2,209,407,243$ 2,777,611,039$
6. Present value future employee contributions 568,905,568$ 1,632,054,382$ 2,200,959,950$
7. Actuarial accrued liability (Item 4 - Item 5 - Item 6) 5,011,857,697$ 22,427,375,932$ 27,439,233,629$
8. Actuarial value of assets 2,918,650,683$ 12,080,098,377$ 14,998,749,060$
9. Unfunded actuarial accrued liability (UAAL)
(Item 7 - Item 8) 2,093,207,014$ 10,347,277,555$ 12,440,484,569$
10. Funding Period* Infinite 59 66
Police and
Firefighters All Other Employees All Employees
June 30, 2015 June 30, 2015 June 30, 2015
(1) (2) (3)
1. Projected FY 2016 payroll for contribution purposes 463,302,817$ 3,708,099,091$ 4,171,401,908$
2. Gross normal cost (Table 3) 20.39% 10.53% 11.66%
3. Employer normal cost rate (Table 3) 8.04% 5.76% 6.02%
4. Present value future benefits (Table 2) 4,977,235,226$ 22,062,844,503$ 27,040,079,729$
5. Present value future employer normal cost 318,529,975$ 1,550,192,702$ 1,868,722,677$
6. Present value future employee contributions 516,410,798$ 1,416,550,868$ 1,932,961,666$
7. Actuarial accrued liability (Item 4 - Item 5 - Item 6) 4,142,294,453$ 19,096,100,933$ 23,238,395,386$
8. Actuarial value of assets 2,775,337,302$ 11,688,332,975$ 14,463,670,277$
9. Unfunded actuarial accrued liability (UAAL)
(Item 7 - Item 8) 1,366,957,151$ 7,407,767,958$ 8,774,725,109$
10. Funding Period* 27 25 26
* The Funding Period is calculated using an open group projection which reflects the impact of both the new employer
contribution rates schedule and the benefits and member contribution rates for employees hired after June 30, 2012.
Please refer to Table 9c for the full projection.
June 30, 2016
Development of Employer Cost
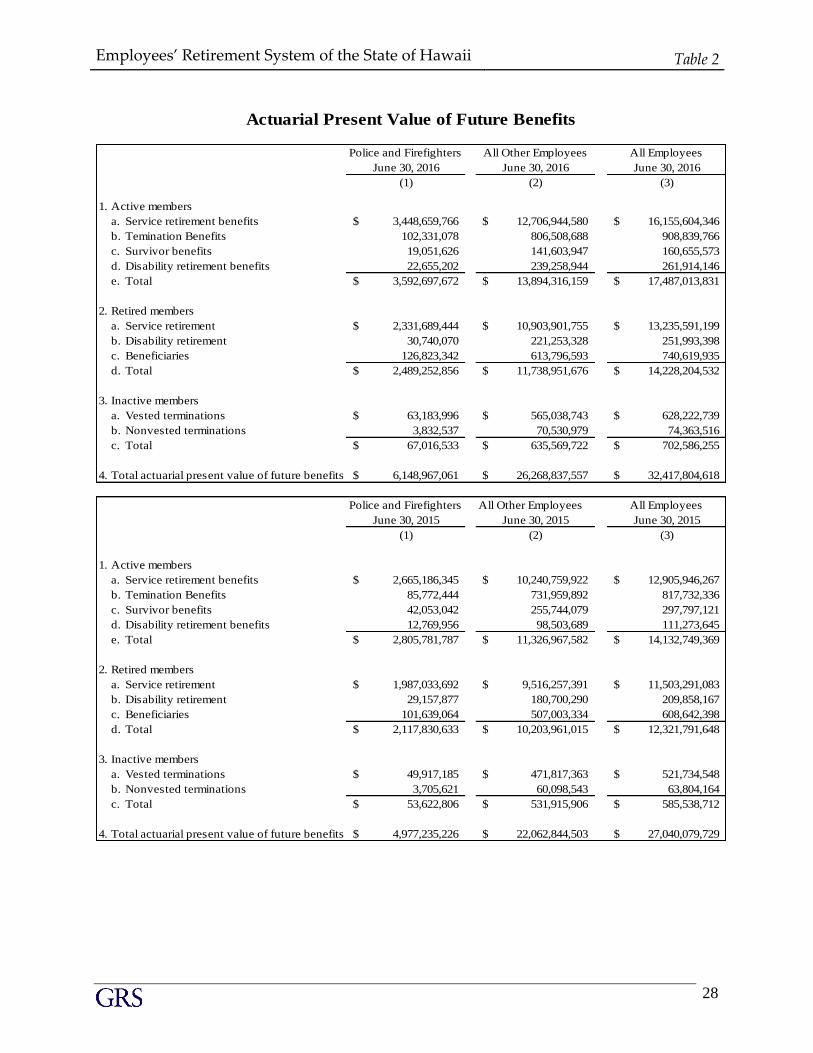
Employees’ Retirement System of the State of Hawaii Table 2
28
Police and Firefighters All Other Employees All Employees
June 30, 2016 June 30, 2016 June 30, 2016
(1) (2) (3)
1. Active members
a. Service retirement benefits 3,448,659,766$ 12,706,944,580$ 16,155,604,346$
b. Temination Benefits 102,331,078 806,508,688 908,839,766
c. Survivor benefits 19,051,626 141,603,947 160,655,573
d. Disability retirement benefits 22,655,202 239,258,944 261,914,146
e. Total 3,592,697,672$ 13,894,316,159$ 17,487,013,831$
2. Retired members
a. Service retirement 2,331,689,444$ 10,903,901,755$ 13,235,591,199$
b. Disability retirement 30,740,070 221,253,328 251,993,398
c. Beneficiaries 126,823,342 613,796,593 740,619,935
d. Total 2,489,252,856$ 11,738,951,676$ 14,228,204,532$
3. Inactive members
a. Vested terminations 63,183,996$ 565,038,743$ 628,222,739$
b. Nonvested terminations 3,832,537 70,530,979 74,363,516
c. Total 67,016,533$ 635,569,722$ 702,586,255$
4. Total actuarial present value of future benefits 6,148,967,061$ 26,268,837,557$ 32,417,804,618$
Police and Firefighters All Other Employees All Employees
June 30, 2015 June 30, 2015 June 30, 2015
(1) (2) (3)
1. Active members
a. Service retirement benefits 2,665,186,345$ 10,240,759,922$ 12,905,946,267$
b. Temination Benefits 85,772,444 731,959,892 817,732,336
c. Survivor benefits 42,053,042 255,744,079 297,797,121
d. Disability retirement benefits 12,769,956 98,503,689 111,273,645
e. Total 2,805,781,787$ 11,326,967,582$ 14,132,749,369$
2. Retired members
a. Service retirement 1,987,033,692$ 9,516,257,391$ 11,503,291,083$
b. Disability retirement 29,157,877 180,700,290 209,858,167
c. Beneficiaries 101,639,064 507,003,334 608,642,398
d. Total 2,117,830,633$ 10,203,961,015$ 12,321,791,648$
3. Inactive members
a. Vested terminations 49,917,185$ 471,817,363$ 521,734,548$
b. Nonvested terminations 3,705,621 60,098,543 63,804,164
c. Total 53,622,806$ 531,915,906$ 585,538,712$
4. Total actuarial present value of future benefits 4,977,235,226$ 22,062,844,503$ 27,040,079,729$
Actuarial Present Value of Future Benefits

Employees’ Retirement System of the State of Hawaii Table 3
29
Police and
Firefighters
All Other
Employees All Employees
June 30, 2016 June 30, 2016 June 30, 2016
(1) (2) (3)
1. Normal cost as a percent of pay
a. Service retirement benefits 22.83% 9.35% 10.90%
b. Deferred termination benefits 1.15% 0.95% 0.97%
c. Refunds 0.89% 1.28% 1.24%
d. Disability retirement benefits 0.31% 0.38% 0.37%
e. Survivor benefits 0.19% 0.15% 0.15%
f. Administrative Expenses 0.35% 0.35% 0.35%
g. Total 25.72% 12.46% 13.98%
2. Employee contribution rate 12.40% 4.89% 5.75%
3. Effective employer normal cost rate
(Item 1g - Item 2) 13.32% 7.57% 8.23%
Police and
Firefighters
All Other
Employees All Employees
June 30, 2015 June 30, 2015 June 30, 2015
(1) (2) (3)
1. Normal cost as a percent of pay
a. Service retirement benefits 17.56% 8.00% 9.10%
b. Deferred termination benefits 0.84% 0.69% 0.71%
c. Refunds 1.32% 1.36% 1.35%
d. Disability retirement benefits 0.18% 0.17% 0.17%
e. Survivor benefits 0.49% 0.31% 0.33%
f. Administrative Expenses N/A N/A N/A
g. Total 20.39% 10.53% 11.66%
2. Employee contribution rate 12.35% 4.77% 5.64%
3. Effective employer normal cost rate
(Item 1g - Item 2) 8.04% 5.76% 6.02%
Analysis of Normal Cost
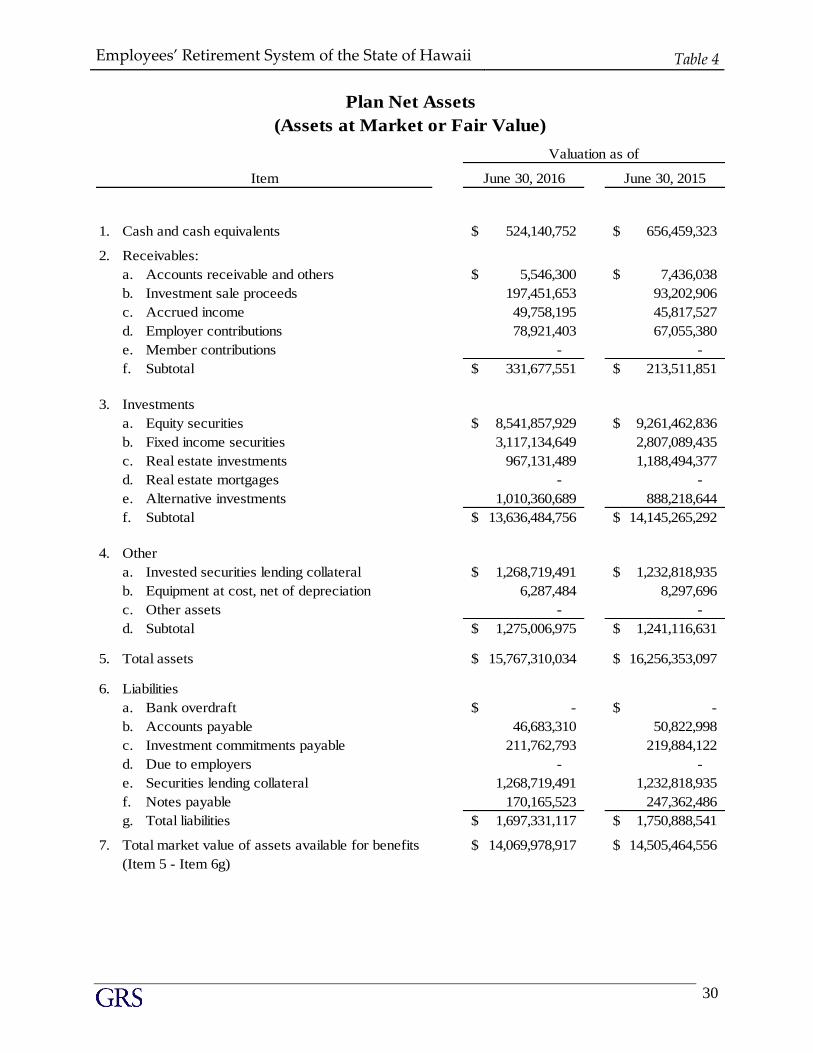
Employees’ Retirement System of the State of Hawaii Table 4
30
June 30, 2016 June 30, 2015
1. Cash and cash equivalents 524,140,752$ 656,459,323$
2. Receivables:
a. Accounts receivable and others 5,546,300$ 7,436,038$
b. Investment sale proceeds 197,451,653 93,202,906
c. Accrued income 49,758,195 45,817,527
d. Employer contributions 78,921,403 67,055,380
e. Member contributions - -
f. Subtotal 331,677,551$ 213,511,851$
3. Investments
a. Equity securities 8,541,857,929$ 9,261,462,836$
b. Fixed income securities 3,117,134,649 2,807,089,435
c. Real estate investments 967,131,489 1,188,494,377
d. Real estate mortgages - -
e. Alternative investments 1,010,360,689 888,218,644
f. Subtotal 13,636,484,756$ 14,145,265,292$
4. Other
a. Invested securities lending collateral 1,268,719,491$ 1,232,818,935$
b. Equipment at cost, net of depreciation 6,287,484 8,297,696
c. Other assets - -
d. Subtotal 1,275,006,975$ 1,241,116,631$
5. Total assets 15,767,310,034$ 16,256,353,097$
6. Liabilities
a. Bank overdraft -$ -$
b. Accounts payable 46,683,310 50,822,998
c. Investment commitments payable 211,762,793 219,884,122
d. Due to employers - -
e. Securities lending collateral 1,268,719,491 1,232,818,935
f. Notes payable 170,165,523 247,362,486
g. Total liabilities 1,697,331,117$ 1,750,888,541$
7. Total market value of assets available for benefits 14,069,978,917$ 14,505,464,556$
(Item 5 - Item 6g)
Valuation as of
Item
Plan Net Assets
(Assets at Market or Fair Value)
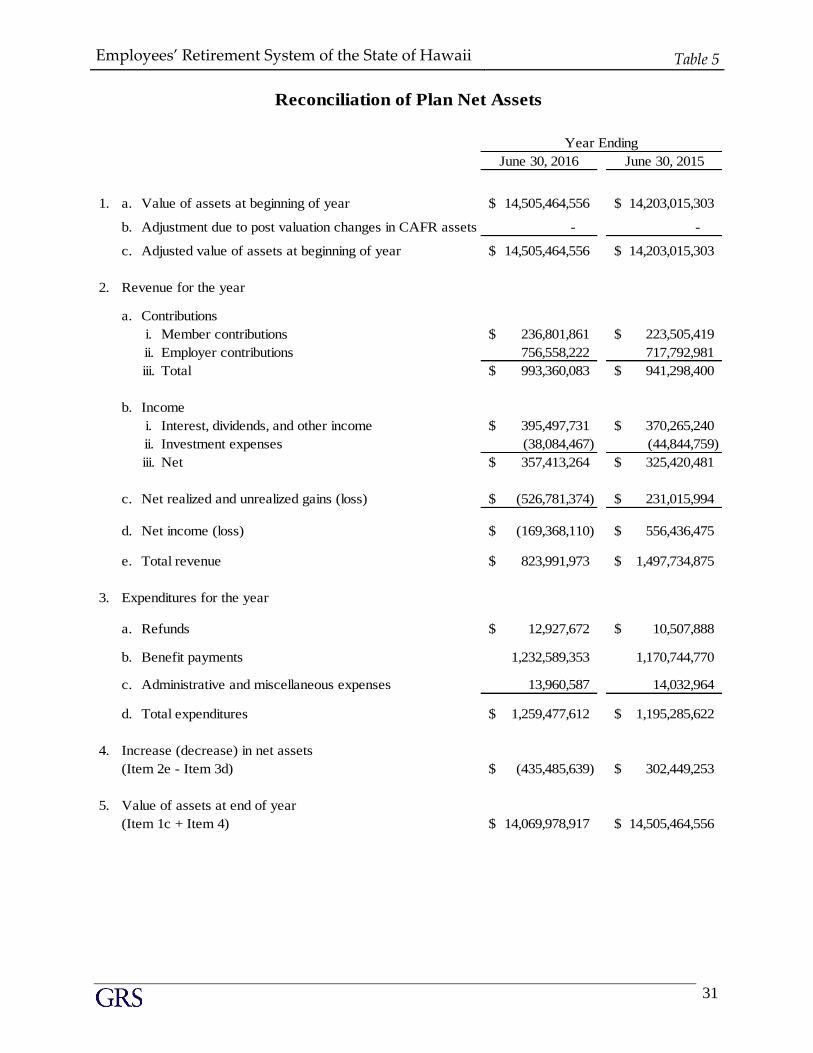
Employees’ Retirement System of the State of Hawaii Table 5
31
June 30, 2016 June 30, 2015
1. a. Value of assets at beginning of year 14,505,464,556$ 14,203,015,303$
b. Adjustment due to post valuation changes in CAFR assets - -
c. Adjusted value of assets at beginning of year 14,505,464,556$ 14,203,015,303$
2. Revenue for the year
a. Contributions
i. Member contributions 236,801,861$ 223,505,419$
ii. Employer contributions 756,558,222 717,792,981
iii. Total 993,360,083$ 941,298,400$
b. Income
i. Interest, dividends, and other income 395,497,731$ 370,265,240$
ii. Investment expenses (38,084,467) (44,844,759)
iii. Net 357,413,264$ 325,420,481$
c. Net realized and unrealized gains (loss) (526,781,374)$ 231,015,994$
d. Net income (loss) (169,368,110)$ 556,436,475$
e. Total revenue 823,991,973$ 1,497,734,875$
3. Expenditures for the year
a. Refunds 12,927,672$ 10,507,888$
b. Benefit payments 1,232,589,353 1,170,744,770
c. Administrative and miscellaneous expenses 13,960,587 14,032,964
d. Total expenditures 1,259,477,612$ 1,195,285,622$
4. Increase (decrease) in net assets
(Item 2e - Item 3d) (435,485,639)$ 302,449,253$
5. Value of assets at end of year
(Item 1c + Item 4) 14,069,978,917$ 14,505,464,556$
Year Ending
Reconciliation of Plan Net Assets
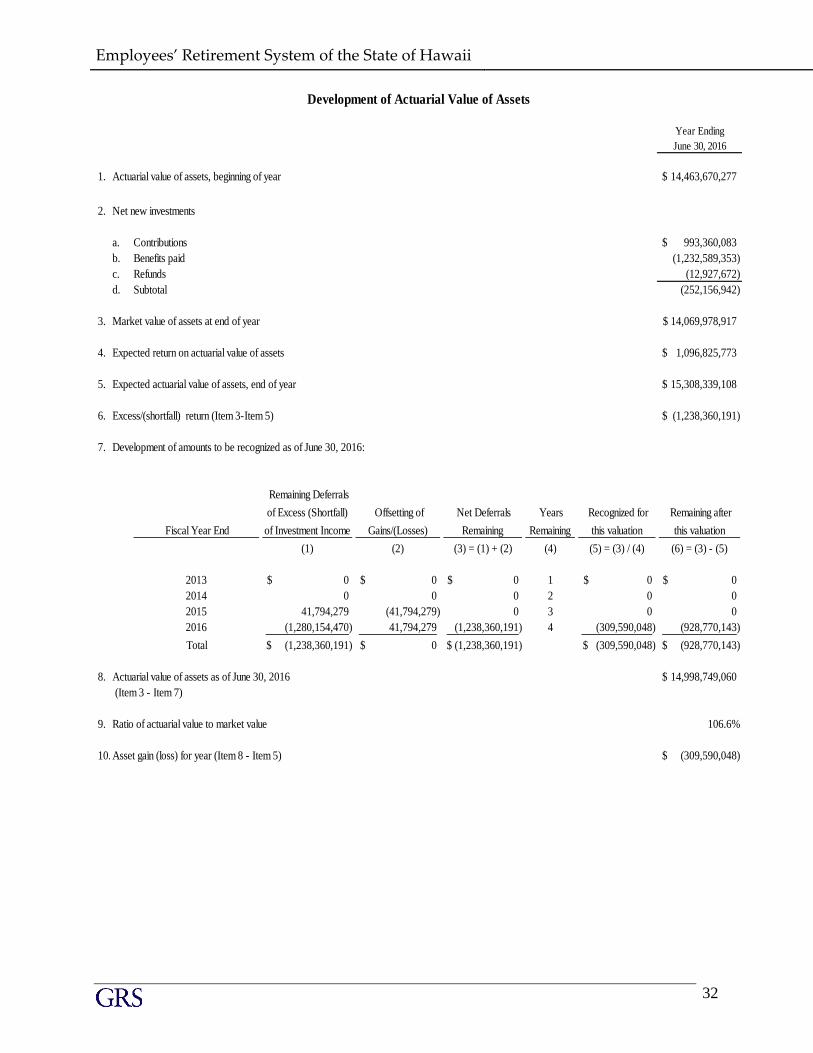
Employees’ Retirement System of the State of Hawaii Table 6
32
Year Ending
June 30, 2016
1. Actuarial value of assets, beginning of year 14,463,670,277$
2. Net new investments
a. Contributions 993,360,083$
b. Benefits paid (1,232,589,353)
c. Refunds (12,927,672)
d. Subtotal (252,156,942)
3. Market value of assets at end of year 14,069,978,917$
4. Expected return on actuarial value of assets 1,096,825,773$
5. Expected actuarial value of assets, end of year 15,308,339,108$
6. Excess/(shortfall) return (Item 3-Item 5) (1,238,360,191)$
7.
Fiscal Year End
Remaining Deferrals
of Excess (Shortfall)
of Investment Income
Offsetting of
Gains/(Losses)
Net Deferrals
Remaining
Years
Remaining
Recognized for
this valuation
Remaining after
this valuation
(1) (2) (3) = (1) + (2) (4) (5) = (3) / (4) (6) = (3) - (5)
2013 0$ 0$ 0$ 1 0$ 0$
2014 0 0 0 2 0 0
2015 41,794,279 (41,794,279) 0 3 0 0
2016 (1,280,154,470) 41,794,279 (1,238,360,191) 4 (309,590,048) (928,770,143)
Total (1,238,360,191)$ 0$ (1,238,360,191)$ (309,590,048)$ (928,770,143)$
8. Actuarial value of assets as of June 30, 2016 14,998,749,060$
(Item 3 - Item 7)
9. Ratio of actuarial value to market value 106.6%
10. Asset gain (loss) for year (Item 8 - Item 5) (309,590,048)$
Development of amounts to be recognized as of June 30, 2016:
Development of Actuarial Value of Assets
Employees’ Retirement System of the State of Hawaii Table 7
33
June 30, 2016 June 30, 2015
(1) (2)
A. Market value yield
1. Beginning of year market assets 14,505,464,556$ 14,203,015,303$
2. Investment income
a. Change in assets (Item 3 - Item 1) (435,485,639)$ 302,449,253$
b. Cash Flow* (266,117,529) (239,954,258)
c. Total investment income based on market value
(Item 2a less Item 2b) (169,368,110)$ 542,403,511$
3. End of year market assets 14,069,978,917$ 14,505,464,556$
4. Estimated dollar weighted market value yield
(net of investment and administrative expenses) (1.18%) 3.85%
B. Actuarial value yield
1. Beginning of year actuarial assets 14,463,670,277$ 13,641,755,300$
2. Investment income (based on asset valuation method)
a. Change in assets (Item 3 - Item 1) 535,078,783$ 821,914,977$
b. Cash Flow* (266,117,529) (239,954,258)
c. Total investment income based on market value
(Item 2a less Iterm 2b) 801,196,312$ 1,061,869,235$
3. End of year actuarial assets 14,998,749,060$ 14,463,670,277$
4. Estimated actuarial value yield
(net of investment and administrative expenses) 5.59% 7.85%
*Prior to 2016 the cash flow excluded administrative expenses.
Estimation of Yields
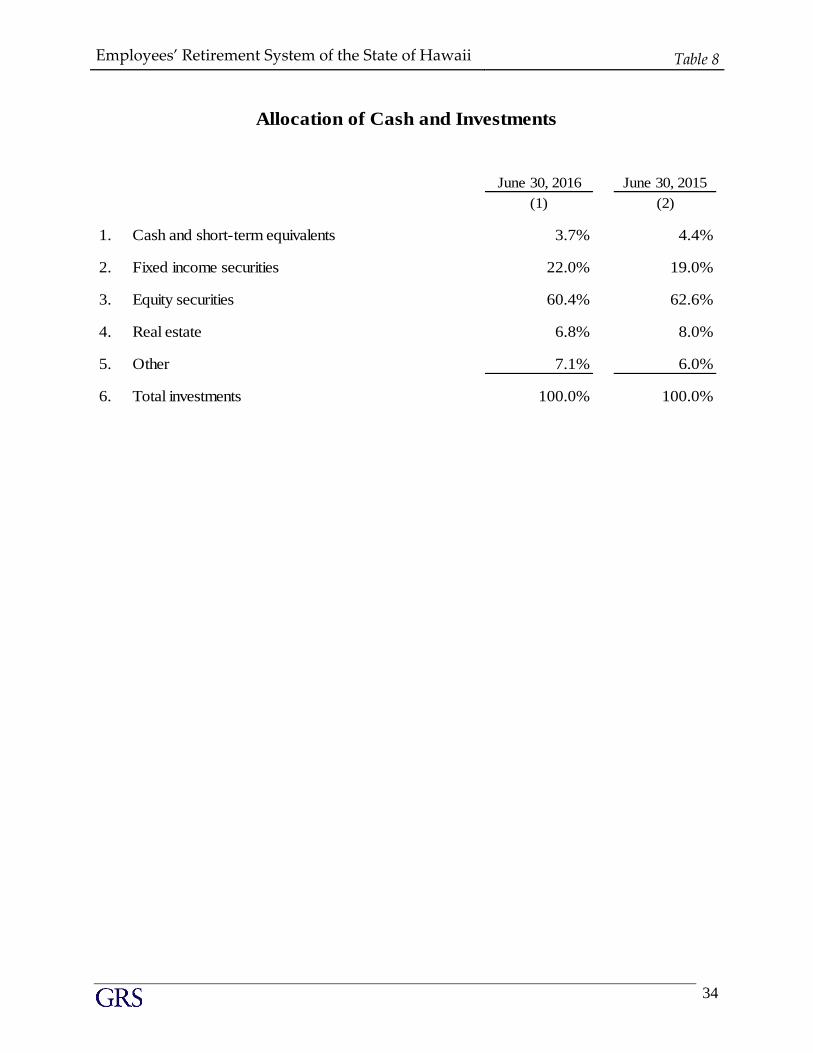
Employees’ Retirement System of the State of Hawaii Table 8
34
June 30, 2016 June 30, 2015
(1) (2)
1. Cash and short-term equivalents 3.7% 4.4%
2. Fixed income securities 22.0% 19.0%
3. Equity securities 60.4% 62.6%
4. Real estate 6.8% 8.0%
5. Other 7.1% 6.0%
6. Total investments 100.0% 100.0%
Allocation of Cash and Investments
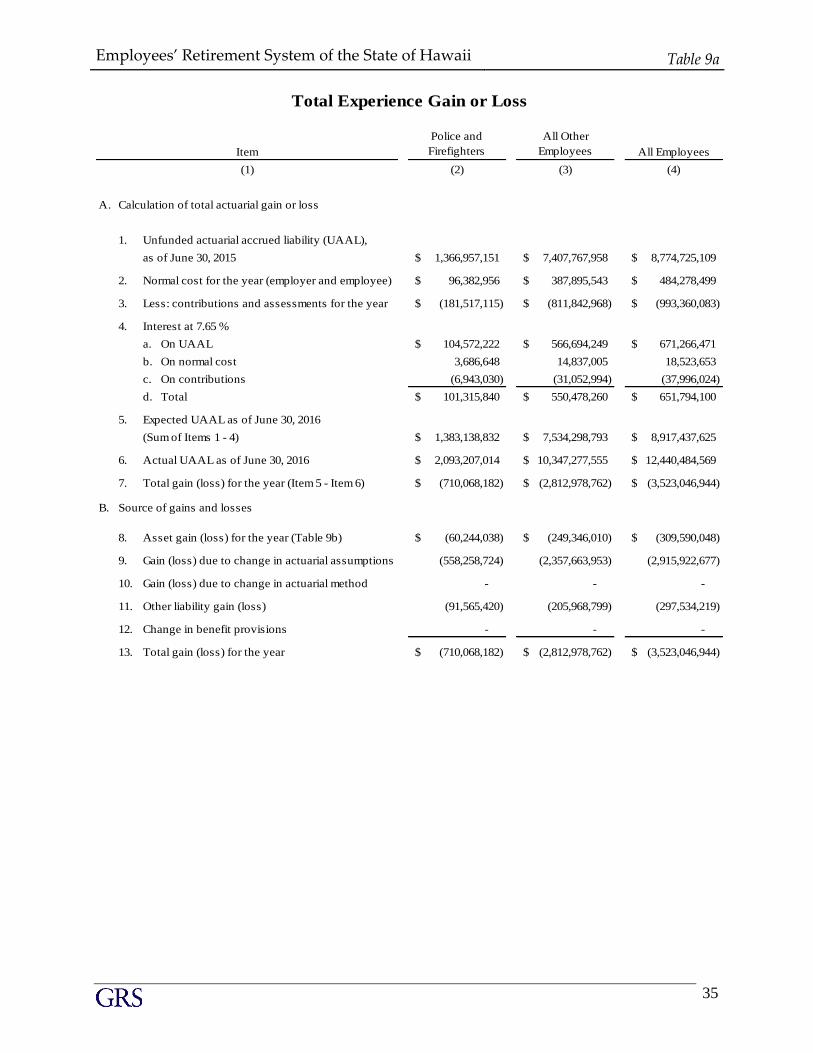
Employees’ Retirement System of the State of Hawaii Table 9a
35
Police and
Firefighters
All Other
Employees All Employees
(2) (3) (4)
A. Calculation of total actuarial gain or loss
1. Unfunded actuarial accrued liability (UAAL),
as of June 30, 2015 1,366,957,151$ 7,407,767,958$ 8,774,725,109$
2. Normal cost for the year (employer and employee) 96,382,956$ 387,895,543$ 484,278,499$
3. Less: contributions and assessments for the year (181,517,115)$ (811,842,968)$ (993,360,083)$
4. Interest at 7.65 %
a. On UAAL 104,572,222$ 566,694,249$ 671,266,471$
b. On normal cost 3,686,648 14,837,005 18,523,653
c. On contributions (6,943,030) (31,052,994) (37,996,024)
d. Total 101,315,840$ 550,478,260$ 651,794,100$
5. Expected UAAL as of June 30, 2016
(Sum of Items 1 - 4) 1,383,138,832$ 7,534,298,793$ 8,917,437,625$
6. Actual UAAL as of June 30, 2016 2,093,207,014$ 10,347,277,555$ 12,440,484,569$
7. Total gain (loss) for the year (Item 5 - Item 6) (710,068,182)$ (2,812,978,762)$ (3,523,046,944)$
B. Source of gains and losses
8. Asset gain (loss) for the year (Table 9b) (60,244,038)$ (249,346,010)$ (309,590,048)$
9. Gain (loss) due to change in actuarial assumptions (558,258,724) (2,357,663,953) (2,915,922,677)
10. Gain (loss) due to change in actuarial method - - -
11. Other liability gain (loss) (91,565,420) (205,968,799) (297,534,219)
12. Change in benefit provisions - - -
13. Total gain (loss) for the year (710,068,182)$ (2,812,978,762)$ (3,523,046,944)$
Item
(1)
Total Experience Gain or Loss
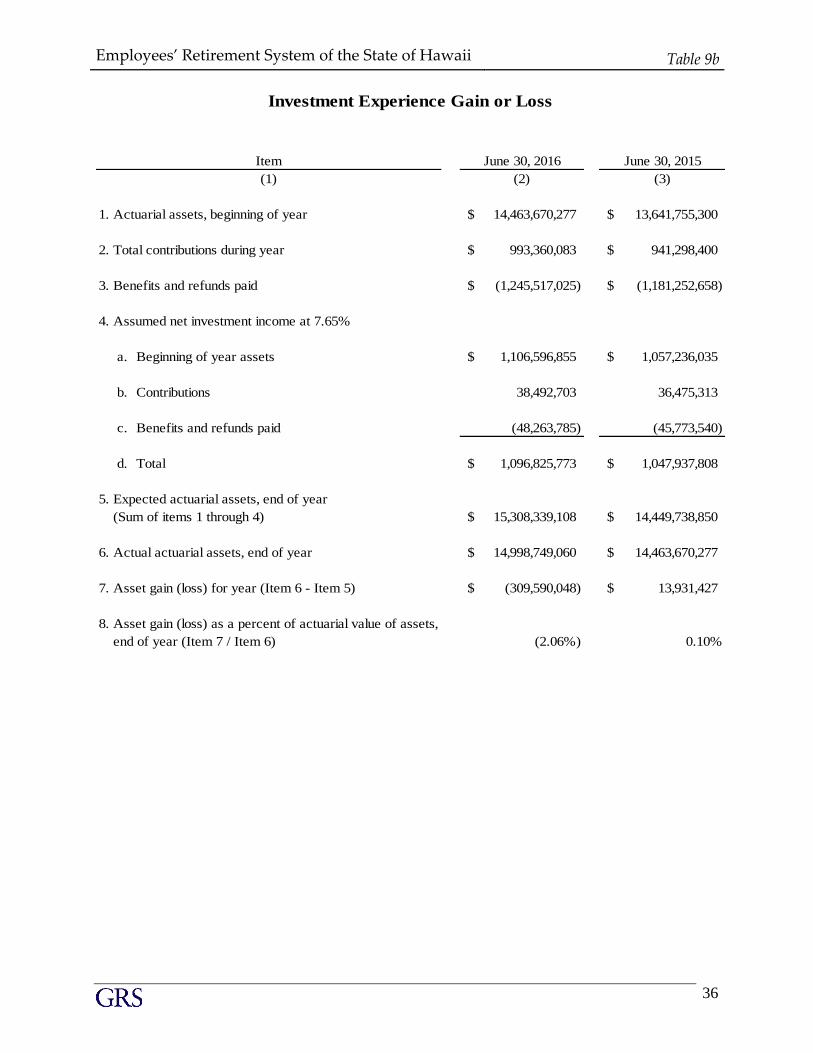
Employees’ Retirement System of the State of Hawaii Table 9b
36
June 30, 2016 June 30, 2015
(2) (3)
1. Actuarial assets, beginning of year 14,463,670,277$ 13,641,755,300$
2. Total contributions during year 993,360,083$ 941,298,400$
3. Benefits and refunds paid (1,245,517,025)$ (1,181,252,658)$
4. Assumed net investment income at 7.65%
a. Beginning of year assets 1,106,596,855$ 1,057,236,035$
b. Contributions 38,492,703 36,475,313
c. Benefits and refunds paid (48,263,785) (45,773,540)
d. Total 1,096,825,773$ 1,047,937,808$
5. Expected actuarial assets, end of year
(Sum of items 1 through 4) 15,308,339,108$ 14,449,738,850$
6. Actual actuarial assets, end of year 14,998,749,060$ 14,463,670,277$
7. Asset gain (loss) for year (Item 6 - Item 5) (309,590,048)$ 13,931,427$
8. Asset gain (loss) as a percent of actuarial value of assets,
end of year (Item 7 / Item 6) (2.06%) 0.10%
Item
(1)
Investment Experience Gain or Loss
Employees’ Retirement System of the State of Hawaii Table 9c
37
Projection Results Based on June 30, 2016 Actuarial Valuation
Valuation as of
June 30,
Employer
Contribution Rate
for Fiscal Year
Following Valuation
Date
Compensation (in
Millions)
Employer
Contributions (in
Millions)
Actuarial Accrued
Liability (AAL, in
Millions)
Actuarial Value of
Assets (AVA, in
Millions)
Unfunded Actuarial
Accrued Liability
(UAAL, in Millions) Funded Ratio
(1) (2) (3) (4) (5) (6) (7) (8)
2016 17.91% 4,258.9$ 763$ 27,439$ 14,997$ 12,443$ 54.7%
2017 17.91% 4,348.5 779 28,504 15,626 12,878 54.8%
2018 17.91% 4,449.4 797 29,643 16,318 13,325 55.0%
2019 17.91% 4,557.6 816 30,785 17,002 13,783 55.2%
2020 17.90% 4,672.8 837 31,929 17,676 14,252 55.4%
2021 17.90% 4,793.9 858 33,074 18,341 14,733 55.5%
2022 17.90% 4,920.0 881 34,220 18,995 15,224 55.5%
2023 17.90% 5,052.4 904 35,365 19,639 15,726 55.5%
2024 17.89% 5,190.1 929 36,510 20,271 16,239 55.5%
2025 17.89% 5,333.8 954 37,651 20,889 16,763 55.5%
2026 17.88% 5,484.6 981 38,788 21,492 17,296 55.4%
2027 17.88% 5,642.6 1,009 39,921 22,081 17,840 55.3%
2028 17.87% 5,807.9 1,038 41,051 22,658 18,393 55.2%
2029 17.87% 5,981.2 1,069 42,179 23,223 18,956 55.1%
2030 17.87% 6,162.1 1,101 43,307 23,779 19,528 54.9%
2031 17.86% 6,351.0 1,134 44,436 24,328 20,108 54.7%
2032 17.86% 6,547.3 1,169 45,565 24,869 20,696 54.6%
2033 17.86% 6,750.8 1,205 46,694 25,404 21,290 54.4%
2034 17.85% 6,963.1 1,243 47,827 25,935 21,891 54.2%
2035 17.85% 7,184.2 1,282 48,964 26,466 22,498 54.1%
2036 17.85% 7,414.0 1,323 50,108 26,999 23,109 53.9%
2037 17.85% 7,653.7 1,366 51,261 27,538 23,723 53.7%
2038 17.85% 7,904.3 1,411 52,429 28,088 24,340 53.6%
2039 17.85% 8,165.8 1,458 53,614 28,656 24,959 53.4%
2040 17.85% 8,438.4 1,506 54,823 29,246 25,577 53.3%
2041 17.85% 8,722.4 1,557 56,060 29,866 26,194 53.3%
2042 17.86% 9,017.3 1,610 57,331 30,523 26,808 53.2%
2043 17.86% 9,324.0 1,665 58,642 31,225 27,417 53.2%
2044 17.86% 9,643.1 1,722 59,998 31,977 28,021 53.3%
2045 17.86% 9,974.2 1,781 61,406 32,790 28,616 53.4%
Projection assumes all assumptoins exactly met, including a 7.00% annual return on the current actuarial value of assets.
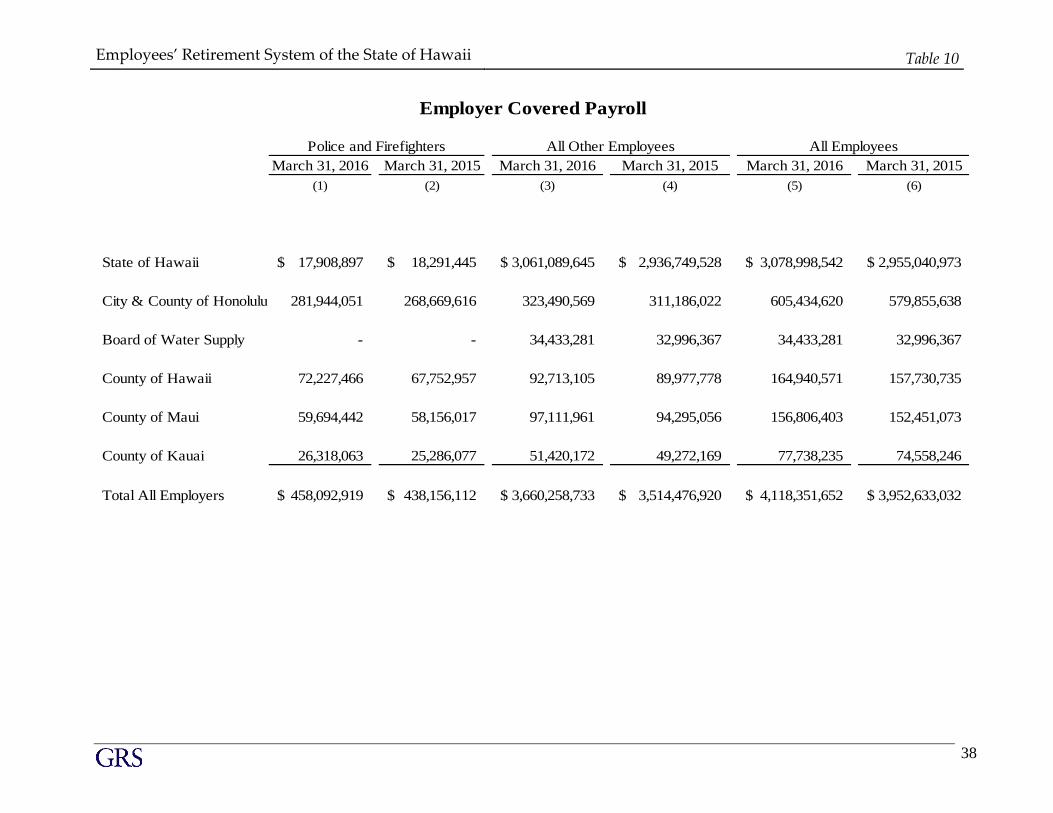
Employees’ Retirement System of the State of Hawaii Table 10
38
March 31, 2016 March 31, 2015 March 31, 2016 March 31, 2015 March 31, 2016 March 31, 2015
(1) (2) (3) (4) (5) (6)
State of Hawaii 17,908,897$ 18,291,445$ 3,061,089,645$ 2,936,749,528$ 3,078,998,542$ 2,955,040,973$
City & County of Honolulu 281,944,051 268,669,616 323,490,569 311,186,022 605,434,620 579,855,638
Board of Water Supply - - 34,433,281 32,996,367 34,433,281 32,996,367
County of Hawaii 72,227,466 67,752,957 92,713,105 89,977,778 164,940,571 157,730,735
County of Maui 59,694,442 58,156,017 97,111,961 94,295,056 156,806,403 152,451,073
County of Kauai 26,318,063 25,286,077 51,420,172 49,272,169 77,738,235 74,558,246
Total All Employers 458,092,919$ 438,156,112$ 3,660,258,733$ 3,514,476,920$ 4,118,351,652$ 3,952,633,032$
Police and Firefighters All Other Employees All Employees
Employer Covered Payroll
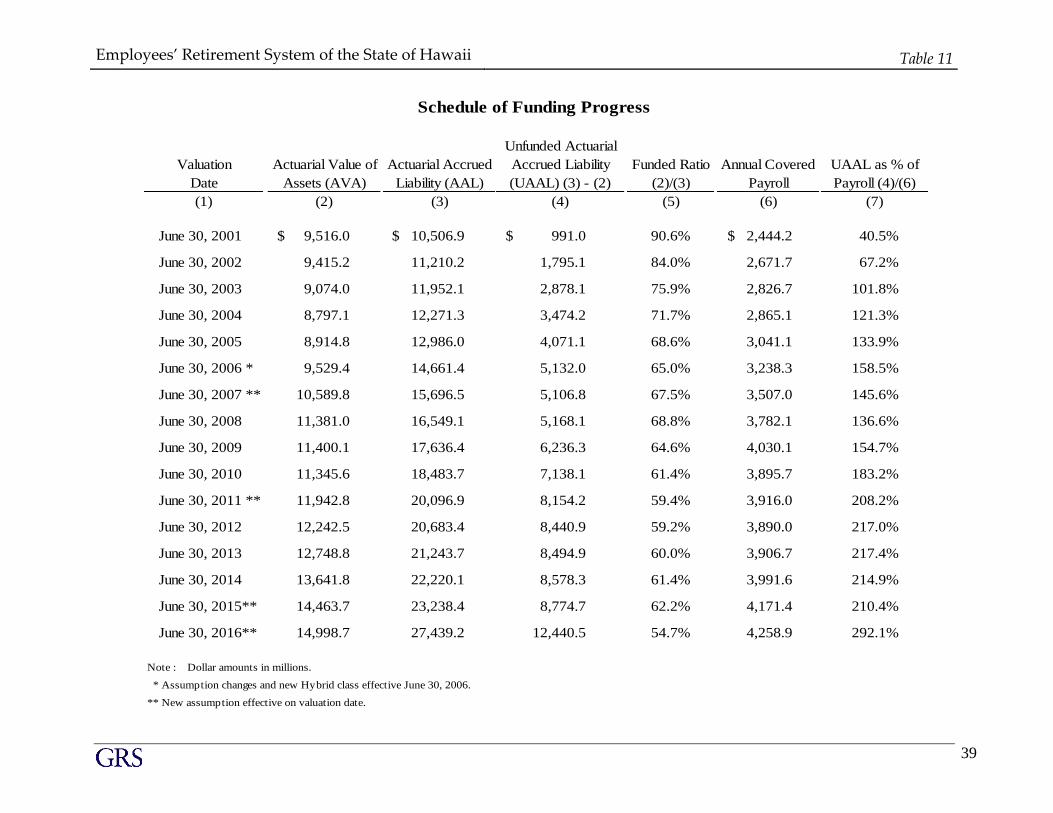
Employees’ Retirement System of the State of Hawaii Table 11
39
Unfunded Actuarial
Valuation Actuarial Value of Actuarial Accrued Accrued Liability Funded Ratio Annual Covered UAAL as % of
Date Assets (AVA) Liability (AAL) (UAAL) (3) - (2) (2)/(3) Payroll Payroll (4)/(6)
(1) (2) (3) (4) (5) (6) (7)
June 30, 2001 9,516.0 $ 10,506.9 $ 991.0 $ 90.6% 2,444.2 $ 40.5%
June 30, 2002 9,415.2 11,210.2 1,795.1 84.0% 2,671.7 67.2%
June 30, 2003 9,074.0 11,952.1 2,878.1 75.9% 2,826.7 101.8%
June 30, 2004 8,797.1 12,271.3 3,474.2 71.7% 2,865.1 121.3%
June 30, 2005 8,914.8 12,986.0 4,071.1 68.6% 3,041.1 133.9%
June 30, 2006 * 9,529.4 14,661.4 5,132.0 65.0% 3,238.3 158.5%
June 30, 2007 ** 10,589.8 15,696.5 5,106.8 67.5% 3,507.0 145.6%
June 30, 2008 11,381.0 16,549.1 5,168.1 68.8% 3,782.1 136.6%
June 30, 2009 11,400.1 17,636.4 6,236.3 64.6% 4,030.1 154.7%
June 30, 2010 11,345.6 18,483.7 7,138.1 61.4% 3,895.7 183.2%
June 30, 2011 ** 11,942.8 20,096.9 8,154.2 59.4% 3,916.0 208.2%
June 30, 2012 12,242.5 20,683.4 8,440.9 59.2% 3,890.0 217.0%
June 30, 2013 12,748.8 21,243.7 8,494.9 60.0% 3,906.7 217.4%
June 30, 2014 13,641.8 22,220.1 8,578.3 61.4% 3,991.6 214.9%
June 30, 2015** 14,463.7 23,238.4 8,774.7 62.2% 4,171.4 210.4%
June 30, 2016** 14,998.7 27,439.2 12,440.5 54.7% 4,258.9 292.1%
Note : Dollar amounts in millions.
* Assumption changes and new Hybrid class effective June 30, 2006.
** New assumption effective on valuation date.
Schedule of Funding Progress
Employees’ Retirement System of the State of Hawaii Table 12a
40
June 30, 2016 June 30, 2015 June 30, 2016 June 30, 2015 June 30, 2016 June 30, 2015
(1) (2) (3) (4) (5) (6)
1. Active members
a. Number 5,087 5,044 62,290 62,266 67,377 67,310
b. Total salary 458,092,919$ 438,156,112$ 3,660,258,732$ 3,514,476,920$ 4,118,351,651$ 3,952,633,032$
c. Average salary 90,052$ 86,867$ 58,762$ 56,443$ 61,124$ 58,723$
d. Average age 42.5 42.3 48.3 48.3 47.9 47.8
e. Average service 14.3 14.2 13.2 13.1 13.3 13.2
2. Inactive members
a. Number 366 361 7,375 7,052 7,741 7,413
b. Total annual deferred benefits 6,084,027$ 5,620,538$ 69,037,725$ 67,095,426$ 75,121,752$ 72,715,964$
c. Average annual deferred benefit 16,623$ 15,569$ 9,361$ 9,514$ 9,704$ 9,809$
3. Service retirees
a. Number 3,331 3,267 36,726 35,796 40,057 39,063
b. Total annual benefits 173,883,842$ 164,846,594$ 940,185,518$ 898,802,303$ 1,114,069,360$ 1,063,648,897$
c. Average annual benefit 52,202$ 50,458$ 25,600$ 25,109$ 27,812$ 27,229$
4. Disabled retirees
a. Number 135 135 1,462 1,459 1,597 1,594
b. Total annual benefits 2,852,210$ 2,780,590$ 18,585,276$ 17,951,655$ 21,437,486$ 20,732,245$
c. Average annual benefit 21,127$ 20,597$ 12,712$ 12,304$ 13,424$ 13,006$
5. Beneficiaries
a. Number 285 270 3,567 3,356 3,852 3,626
b. Total annual benefits 10,053,859$ 9,105,407$ 55,514,373$ 50,132,644$ 65,568,232$ 59,238,051$
c. Average annual benefit 35,277$ 33,724$ 15,563$ 14,938$ 17,022$ 16,337$
All Employees
Membership Data
Police and Firefighters All Other Employees
Employees’ Retirement System of the State of Hawaii Table 12b
41
Year Ending Percent Amount in Percent Percent Average Average
June 30, Number Increase $ Millions Increase $ Amount Increase Age Service
(1) (2) (3) (4) (5) (6) (7) (8) (9)
1996 56,985 -2.6% 1,990.1 $ -4.5% 34,923 $ -1.9%
1997 57,044 0.1% 2,019.3 1.5% 35,399 1.4%
1998 57,797 1.3% 2,135.9 5.8% 36,955 4.4%
1999 58,387 0.9% 2,186.5 2.4% 37,448 1.3%
2000 59,191 1.4% 2,275.3 4.1% 38,440 2.6% 45.5 13.0
2001 59,992 1.4% 2,350.2 3.3% 39,175 1.9% 45.6 13.3
2002 62,208 3.7% 2,568.7 9.3% 41,292 5.4% 45.8 13.2
2003 62,292 0.1% 2,718.4 5.8% 43,640 5.7% 46.0 13.1
2004 62,573 0.5% 2,755.5 1.4% 44,037 0.9% 46.0 13.0
2005 63,073 0.8% 2,924.5 6.1% 46,368 5.3% 46.3 13.0
2006 64,069 1.6% 3,113.7 6.5% 48,599 4.8% 46.4 13.0
2007 65,251 1.8% 3,340.5 7.3% 51,194 5.3% 46.5 13.0
2008 66,589 2.1% 3,601.7 7.8% 54,089 5.7% 46.6 12.9
2009 67,912 2.0% 3,838.0 6.6% 56,514 4.5% 46.8 12.9
2010 65,890 -3.0% 3,713.6 -3.2% 56,360 -0.3% 47.1 13.2
2011 65,310 -0.9% 3,731.4 0.5% 57,133 1.4% 47.4 13.4
2012 65,599 0.4% 3,706.1 -0.7% 56,497 -1.1% 47.6 13.5
2013 66,226 1.0% 3,720.8 0.4% 56,184 -0.6% 47.7 13.5
2014 67,206 1.5% 3,871.0 4.0% 57,600 2.5% 47.8 13.5
2015 67,310 0.2% 3,952.6 2.1% 58,723 1.9% 47.8 13.2
2016 67,377 0.1% 4,118.4 4.2% 61,124 4.1% 47.9 13.3
Active Members Total Salaries Average Salary
Historical Summary of Active Member Data

Employees’ Retirement System of the State of Hawaii Table 13
42
External External Cash
Year Ending Benefit Administrative Cash Flow Market Value Flow as Percent
June 30, Employee Employer Total Payments Refunds Expenses1
Total for the Year2
of Assets of Market Value
(1) (2) (3) (4) (5) (6) (7) (8) (9) (10) (11)
2004 55.1 $ 235.7 $ 290.8 $ (636.2) $ (2.3) $ (10.5) $ (649.0) $ (358.2) $ 8,565.4 $ (4.2%)
2005 57.1 328.7 385.8 (676.3) (3.4) (7.3) (687.0) (301.2) 9,195.9 (3.3%)
2006 56.3 423.4 479.7 (720.5) (2.5) (8.5) (731.5) (251.8) 9,932.4 (2.5%)
2007 144.7 454.5 599.2 (761.0) (3.5) (9.6) (774.1) (174.9) 11,434.3 (1.5%)
2008 163.4 488.8 652.2 (792.3) (3.7) (10.7) (806.7) (154.5) 10,846.8 (1.4%)
2009 184.5 578.6 763.1 (839.1) (3.5) (12.3) (854.9) (91.8) 8,818.0 (1.0%)
2010 360.0 547.6 907.6 (906.4) (7.8) (12.2) (926.4) (18.8) 9,821.6 (0.2%)
2011 231.0 534.9 765.9 (960.2) (7.9) (13.3) (981.4) (215.5) 11,642.3 (1.9%)
2012 178.8 548.4 727.2 (1,015.4) (7.2) (11.6) (1,034.2) (307.0) 11,285.9 (2.7%)
2013 185.8 581.4 767.2 (1,060.6) (7.2) (12.3) (1,080.1) (312.9) 12,357.8 (2.5%)
2014 206.1 653.1 859.2 (1,122.4) (8.5) (12.6) (1,143.5) (284.3) 14,203.0 (2.0%)
2015 223.5 717.8 941.3 (1,170.7) (10.5) (14.0) (1,195.2) (253.9) 14,505.5 (1.8%)
2016 236.8 $ 756.6 $ 993.4 $ (1,232.6) $ (12.9) $ (14.0) $ (1,259.5) $ (266.1) $ 14,070.0 $ (1.9%)
Amounts in $ millions
1Excludes investment expenses
2Column (9) = Column (4) + Column (8)
History of Cash Flow
ExpendituresContributions
Employees’ Retirement System of the State of Hawaii Table 14
43
June 30, 2016 June 30, 2015
(1) (2)
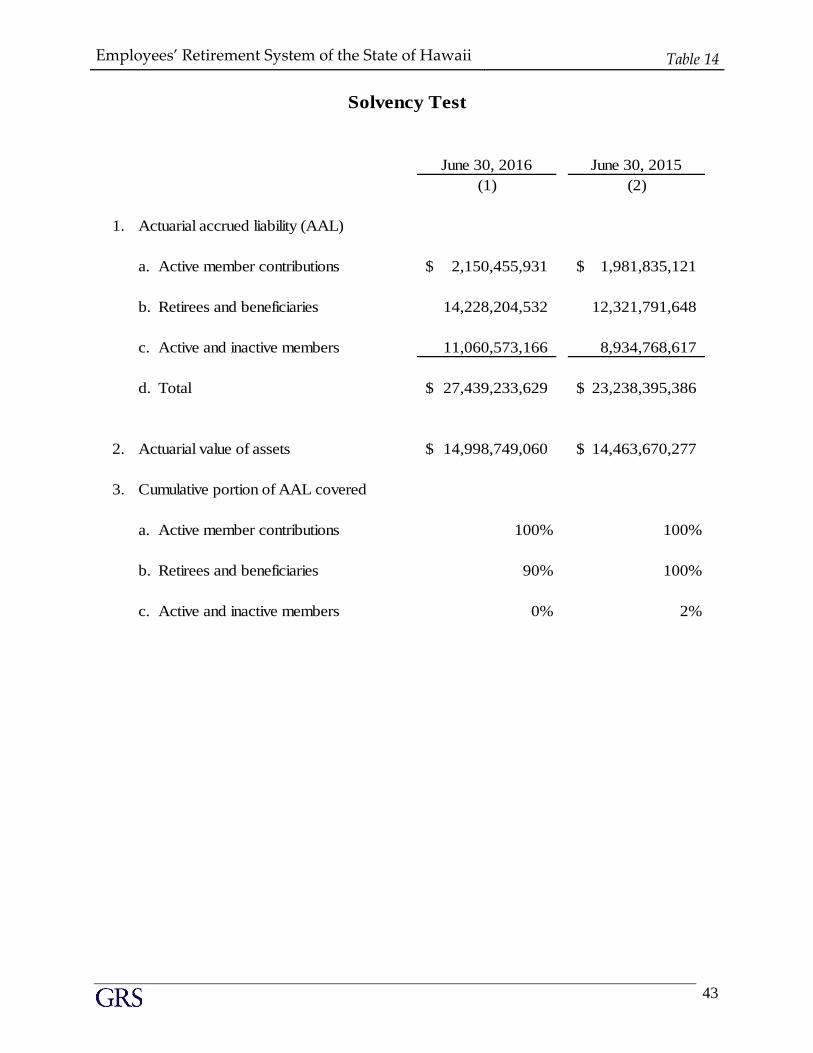
1. Actuarial accrued liability (AAL)
a. Active member contributions 2,150,455,931$ 1,981,835,121$
b. Retirees and beneficiaries 14,228,204,532 12,321,791,648
c. Active and inactive members 11,060,573,166 8,934,768,617
d. Total 27,439,233,629$ 23,238,395,386$
2. Actuarial value of assets 14,998,749,060$ 14,463,670,277$
3. Cumulative portion of AAL covered
a. Active member contributions 100% 100%
b. Retirees and beneficiaries 90% 100%
c. Active and inactive members 0% 2%
Solvency Test
Employees’ Retirement System of the State of Hawaii Table 15
44
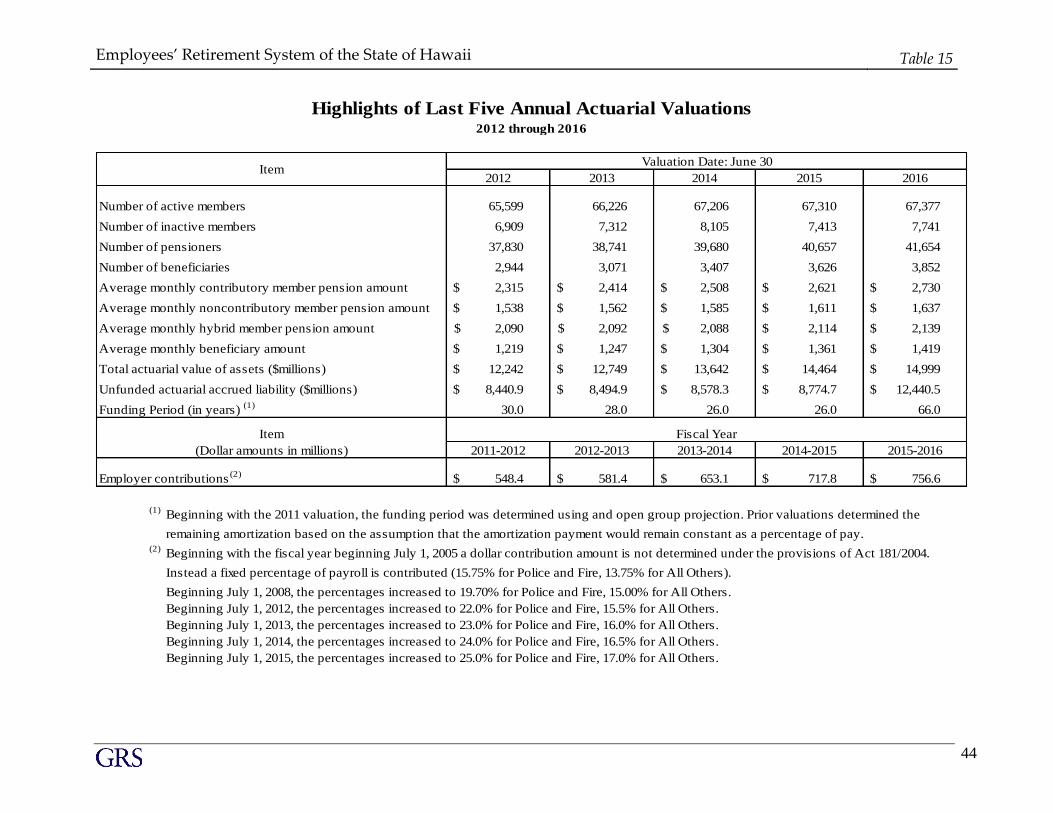
Number of active members 65,599 66,226 67,206 67,310 67,377
Number of inactive members 6,909 7,312 8,105 7,413 7,741
Number of pensioners 37,830 38,741 39,680 40,657 41,654
Number of beneficiaries 2,944 3,071 3,407 3,626 3,852
Average monthly contributory member pension amount 2,315$ 2,414$ 2,508$ 2,621$ 2,730$
Average monthly noncontributory member pension amount 1,538$ 1,562$ 1,585$ 1,611$ 1,637$
Average monthly hybrid member pension amount 2,090$ 2,092$ 2,088$ 2,114$ 2,139$
Average monthly beneficiary amount 1,219$ 1,247$ 1,304$ 1,361$ 1,419$
Total actuarial value of assets ($millions) 12,242$ 12,749$ 13,642$ 14,464$ 14,999$
Unfunded actuarial accrued liability ($millions) 8,440.9$ 8,494.9$ 8,578.3$ 8,774.7$ 12,440.5$
Funding Period (in years) (1)
30.0 28.0 26.0 26.0 66.0
2011-2012 2012-2013 2013-2014 2014-2015 2015-2016
Employer contributions(2)
548.4$ 581.4$ 653.1$ 717.8$ 756.6$
(1)Beginning with the 2011 valuation, the funding period was determined using and open group projection. Prior valuations determined the
remaining amortization based on the assumption that the amortization payment would remain constant as a percentage of pay.(2)
Beginning with the fiscal year beginning July 1, 2005 a dollar contribution amount is not determined under the provisions of Act 181/2004.
Instead a fixed percentage of payroll is contributed (15.75% for Police and Fire, 13.75% for All Others).
Beginning July 1, 2008, the percentages increased to 19.70% for Police and Fire, 15.00% for All Others.
Beginning July 1, 2012, the percentages increased to 22.0% for Police and Fire, 15.5% for All Others.
Beginning July 1, 2013, the percentages increased to 23.0% for Police and Fire, 16.0% for All Others.
Beginning July 1, 2014, the percentages increased to 24.0% for Police and Fire, 16.5% for All Others.
Beginning July 1, 2015, the percentages increased to 25.0% for Police and Fire, 17.0% for All Others.
Highlights of Last Five Annual Actuarial Valuations
2012 2013 2014 2015 2016Item
(Dollar amounts in millions)
2012 through 2016
Fiscal Year
Valuation Date: June 30
Item
Employees’ Retirement System of the State of Hawaii Table 16
45
Summary of Benefit Provisions
(For Members Hired Prior to 7/1/2012)
Noncontributory Contributory Hybrid
Employee Contributions No employee contributions 7.8% of salary 6.0% of salary
Normal Retirement
Eligibility Age 62 and 10 years credited
service; or
Age 55 and 30 years credited
service
Age 55 and 5 years credited
service
Age 62 and 5 years credited
service; or
Age 55 and 30 years credited
service
Benefit 1 ¼% of average final
compensation times years of
credited service (Average final
compensation or AFC is an
average of the highest salaries
during any three years of credited
service, excluding any salary paid
in lieu of vacation or if ERS
membership occurred prior to
1/1/71, AFC may be an average of
the highest salaries during any five
years of credited service including
any salary paid in lieu of
vacation.)
2% of average final compensation
times years of credited service
(Average final compensation or
AFC is an average of the highest
salaries during any three years of
credited service, excluding any
salary paid in lieu of vacation or if
ERS membership occurred prior
to 1/1/71, AFC may be an average
of the highest salaries during any
five years of credited service
including any salary paid in lieu of
vacation.)
2% of average final compensation
times years of credited service,
split formula for unconverted
noncontributory service at 1 ¼%
(Average final compensation or
AFC is an average of the highest
salaries during any three years of
credited service, excluding any
salary paid in lieu of vacation or if
ERS membership occurred prior
to 1/1/71, AFC may be an average
of the highest salaries during any
five years of credited service
including any salary paid in lieu of
vacation.)
Employees’ Retirement System of the State of Hawaii
Table 16
(continued)
46
Noncontributory Contributory Hybrid
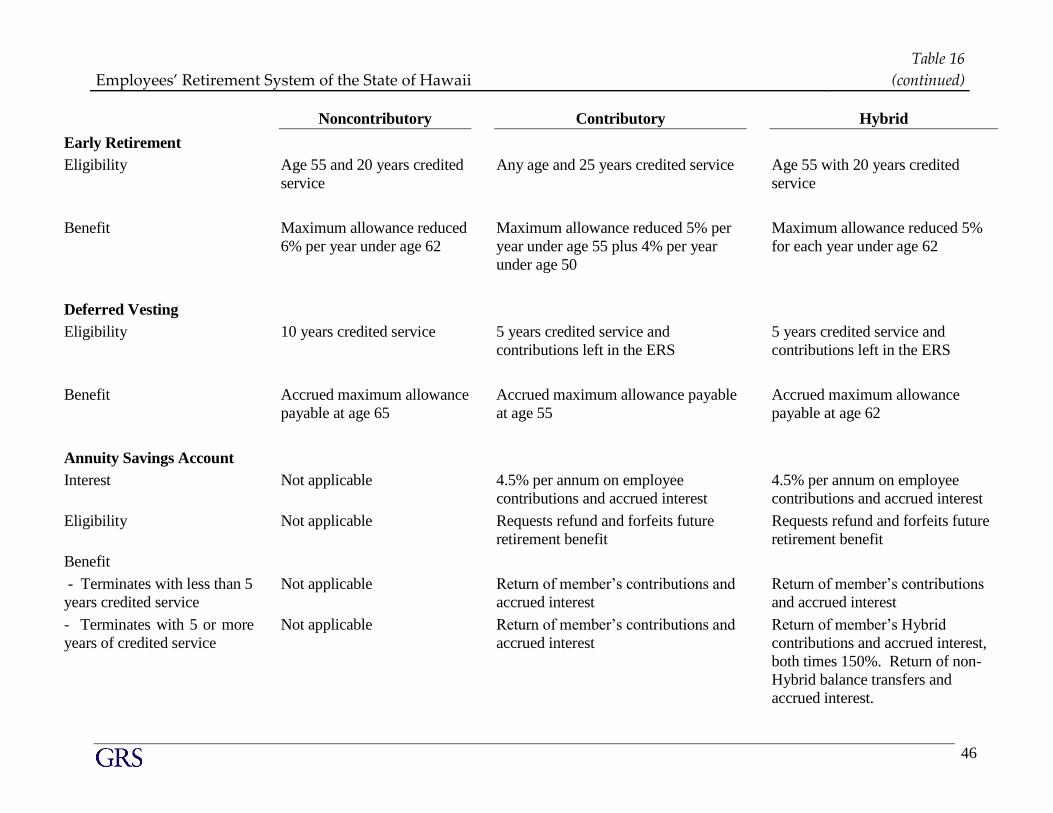
Early Retirement
Eligibility Age 55 and 20 years credited
service
Any age and 25 years credited service Age 55 with 20 years credited
service
Benefit Maximum allowance reduced
6% per year under age 62
Maximum allowance reduced 5% per
year under age 55 plus 4% per year
under age 50
Maximum allowance reduced 5%
for each year under age 62
Deferred Vesting
Eligibility 10 years credited service 5 years credited service and
contributions left in the ERS
5 years credited service and
contributions left in the ERS
Benefit Accrued maximum allowance
payable at age 65
Accrued maximum allowance payable
at age 55
Accrued maximum allowance
payable at age 62
Annuity Savings Account
Interest Not applicable 4.5% per annum on employee
contributions and accrued interest
4.5% per annum on employee
contributions and accrued interest
Eligibility Not applicable Requests refund and forfeits future
retirement benefit
Requests refund and forfeits future
retirement benefit
Benefit
- Terminates with less than 5
years credited service
Not applicable Return of member’s contributions and
accrued interest
Return of member’s contributions
and accrued interest
- Terminates with 5 or more
years of credited service
Not applicable Return of member’s contributions and
accrued interest
Return of member’s Hybrid
contributions and accrued interest,
both times 150%. Return of non-
Hybrid balance transfers and
accrued interest.
Employees’ Retirement System of the State of Hawaii
Table 16
(continued)
47
Noncontributory Contributory Hybrid
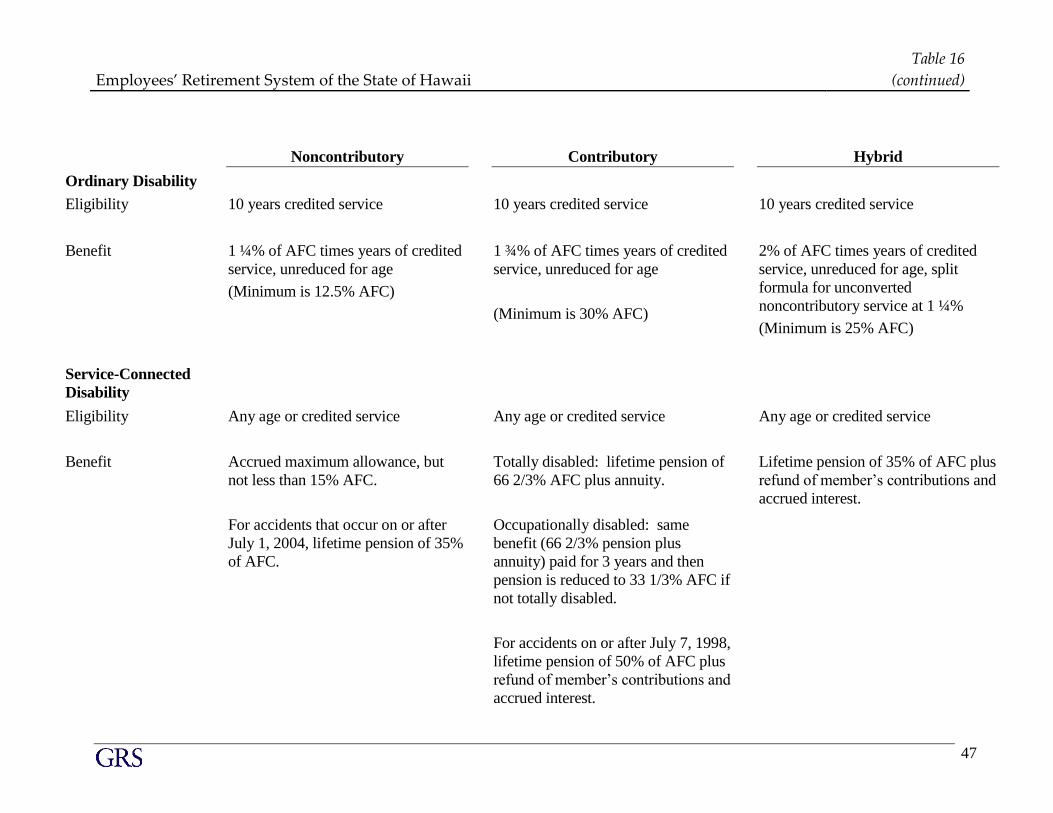
Ordinary Disability
Eligibility 10 years credited service 10 years credited service 10 years credited service
Benefit 1 ¼% of AFC times years of credited
service, unreduced for age
(Minimum is 12.5% AFC)
1 ¾% of AFC times years of credited
service, unreduced for age
(Minimum is 30% AFC)
2% of AFC times years of credited
service, unreduced for age, split
formula for unconverted
noncontributory service at 1 ¼%
(Minimum is 25% AFC)
Service-Connected
Disability
Eligibility Any age or credited service Any age or credited service Any age or credited service
Benefit Accrued maximum allowance, but
not less than 15% AFC.
For accidents that occur on or after
July 1, 2004, lifetime pension of 35%
of AFC.
Totally disabled: lifetime pension of
66 2/3% AFC plus annuity.
Occupationally disabled: same
benefit (66 2/3% pension plus
annuity) paid for 3 years and then
pension is reduced to 33 1/3% AFC if
not totally disabled.
For accidents on or after July 7, 1998,
lifetime pension of 50% of AFC plus
refund of member’s contributions and
accrued interest.
Lifetime pension of 35% of AFC plus
refund of member’s contributions and
accrued interest.
Employees’ Retirement System of the State of Hawaii
Table 16
(continued)
48
Noncontributory Contributory Hybrid
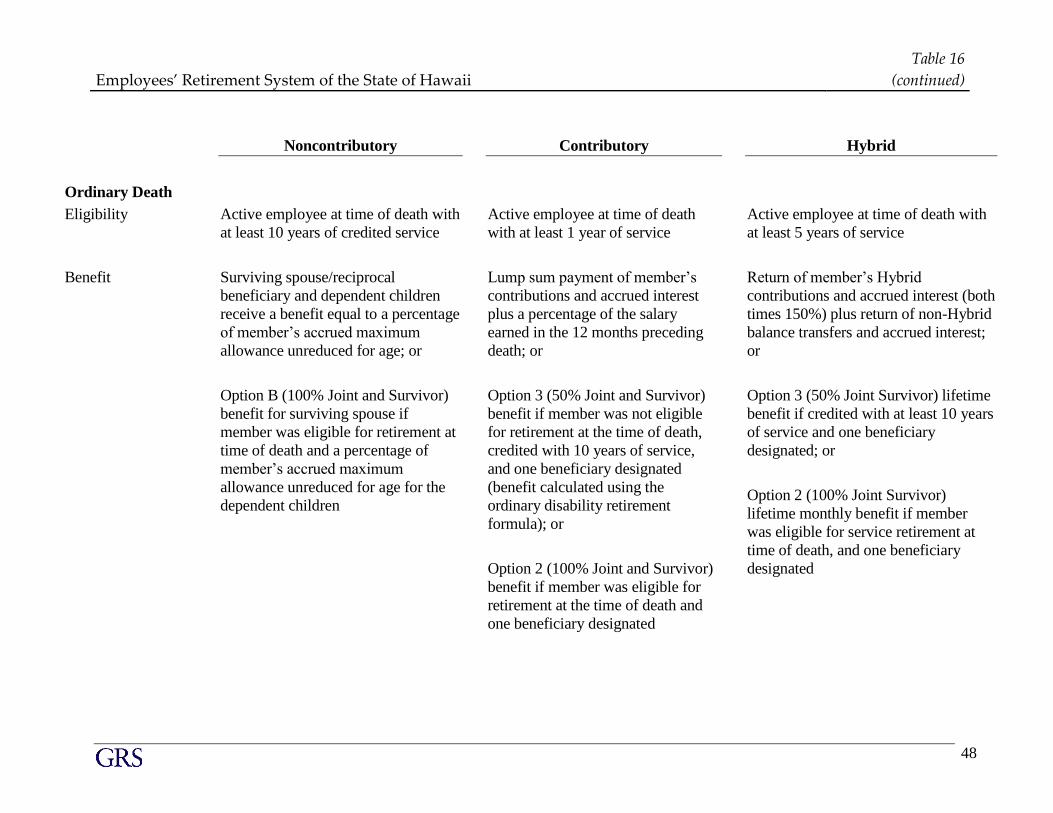
Ordinary Death
Eligibility Active employee at time of death with
at least 10 years of credited service
Active employee at time of death
with at least 1 year of service
Active employee at time of death with
at least 5 years of service
Benefit Surviving spouse/reciprocal
beneficiary and dependent children
receive a benefit equal to a percentage
of member’s accrued maximum
allowance unreduced for age; or
Option B (100% Joint and Survivor)
benefit for surviving spouse if
member was eligible for retirement at
time of death and a percentage of
member’s accrued maximum
allowance unreduced for age for the
dependent children
Lump sum payment of member’s
contributions and accrued interest
plus a percentage of the salary
earned in the 12 months preceding
death; or
Option 3 (50% Joint and Survivor)
benefit if member was not eligible
for retirement at the time of death,
credited with 10 years of service,
and one beneficiary designated
(benefit calculated using the
ordinary disability retirement
formula); or
Option 2 (100% Joint and Survivor)
benefit if member was eligible for
retirement at the time of death and
one beneficiary designated
Return of member’s Hybrid
contributions and accrued interest (both
times 150%) plus return of non-Hybrid
balance transfers and accrued interest;
or
Option 3 (50% Joint Survivor) lifetime
benefit if credited with at least 10 years
of service and one beneficiary
designated; or
Option 2 (100% Joint Survivor)
lifetime monthly benefit if member
was eligible for service retirement at
time of death, and one beneficiary
designated
Employees’ Retirement System of the State of Hawaii
Table 16
(continued)
49
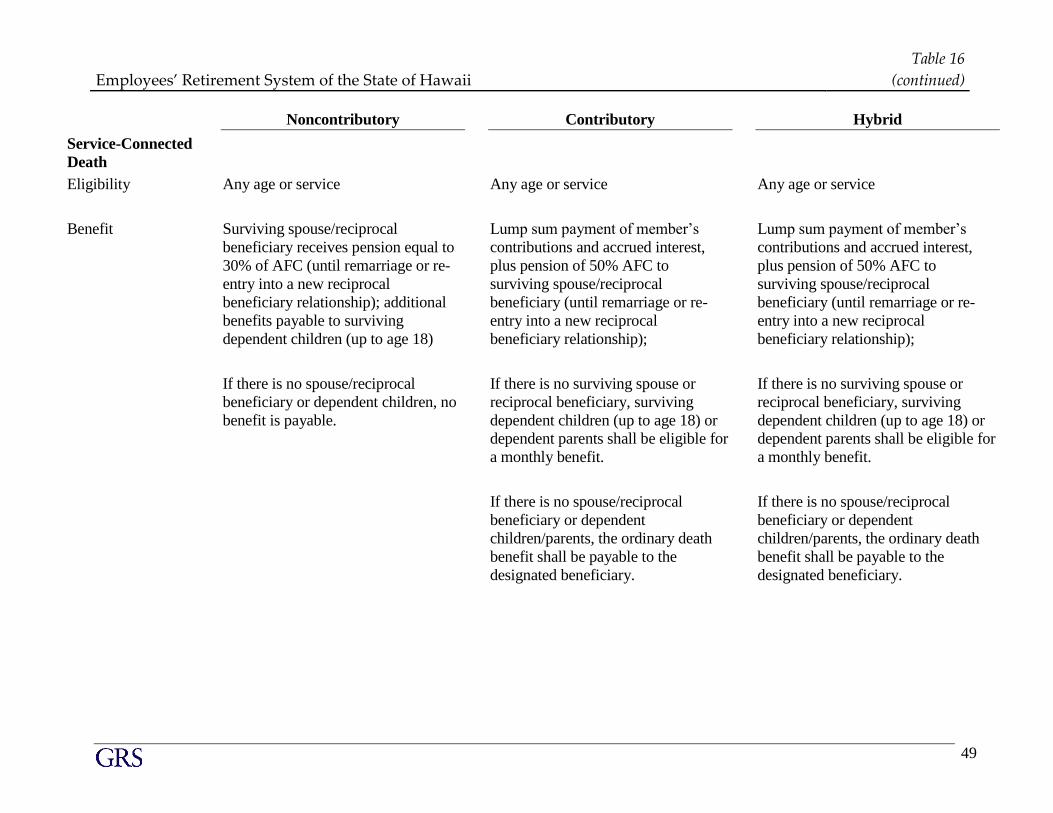
Noncontributory Contributory Hybrid
Service-Connected
Death
Eligibility Any age or service Any age or service Any age or service
Benefit Surviving spouse/reciprocal
beneficiary receives pension equal to
30% of AFC (until remarriage or re-
entry into a new reciprocal
beneficiary relationship); additional
benefits payable to surviving
dependent children (up to age 18)
If there is no spouse/reciprocal
beneficiary or dependent children, no
benefit is payable.
Lump sum payment of member’s
contributions and accrued interest,
plus pension of 50% AFC to
surviving spouse/reciprocal
beneficiary (until remarriage or re-
entry into a new reciprocal
beneficiary relationship);
If there is no surviving spouse or
reciprocal beneficiary, surviving
dependent children (up to age 18) or
dependent parents shall be eligible for
a monthly benefit.
If there is no spouse/reciprocal
beneficiary or dependent
children/parents, the ordinary death
benefit shall be payable to the
designated beneficiary.
Employees’ Retirement System of the State of Hawaii
Table 16
(continued)
50
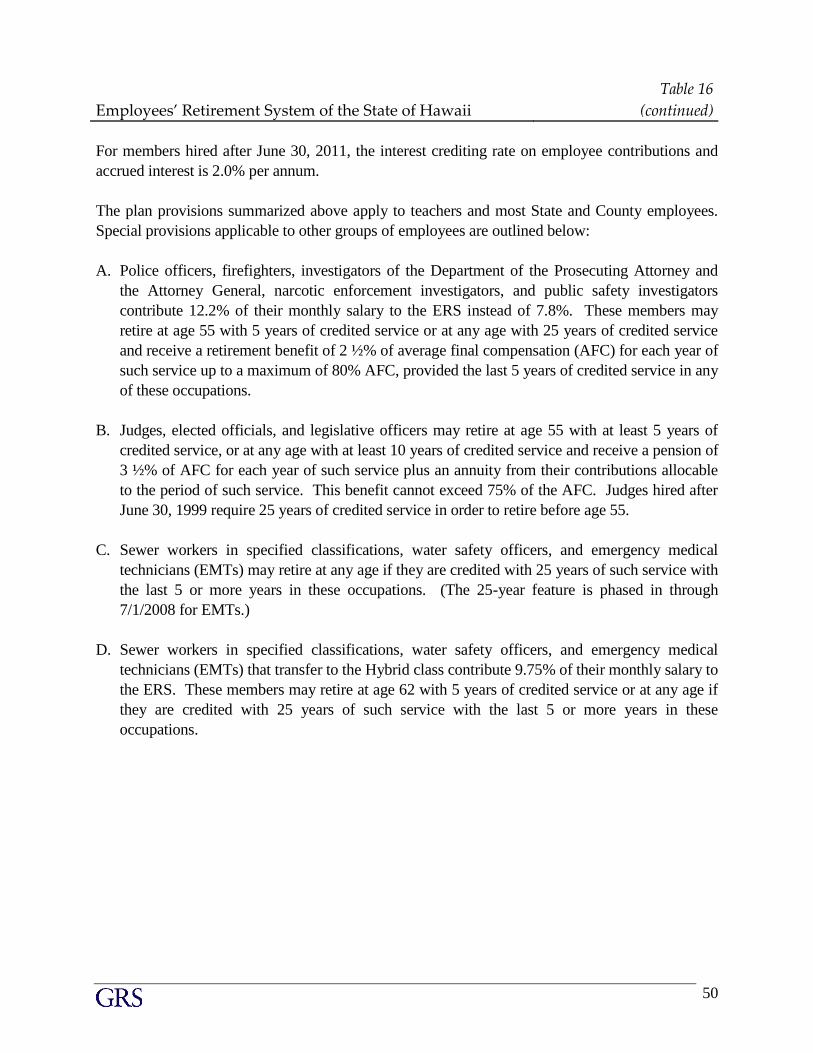
For members hired after June 30, 2011, the interest crediting rate on employee contributions and
accrued interest is 2.0% per annum.
The plan provisions summarized above apply to teachers and most State and County employees.
Special provisions applicable to other groups of employees are outlined below:
A. Police officers, firefighters, investigators of the Department of the Prosecuting Attorney and
the Attorney General, narcotic enforcement investigators, and public safety investigators
contribute 12.2% of their monthly salary to the ERS instead of 7.8%. These members may
retire at age 55 with 5 years of credited service or at any age with 25 years of credited service
and receive a retirement benefit of 2 ½% of average final compensation (AFC) for each year of
such service up to a maximum of 80% AFC, provided the last 5 years of credited service in any
of these occupations.
B. Judges, elected officials, and legislative officers may retire at age 55 with at least 5 years of
credited service, or at any age with at least 10 years of credited service and receive a pension of
3 ½% of AFC for each year of such service plus an annuity from their contributions allocable
to the period of such service. This benefit cannot exceed 75% of the AFC. Judges hired after
June 30, 1999 require 25 years of credited service in order to retire before age 55.
C. Sewer workers in specified classifications, water safety officers, and emergency medical
technicians (EMTs) may retire at any age if they are credited with 25 years of such service with
the last 5 or more years in these occupations. (The 25-year feature is phased in through
7/1/2008 for EMTs.)
D. Sewer workers in specified classifications, water safety officers, and emergency medical
technicians (EMTs) that transfer to the Hybrid class contribute 9.75% of their monthly salary to
the ERS. These members may retire at age 62 with 5 years of credited service or at any age if
they are credited with 25 years of such service with the last 5 or more years in these
occupations.
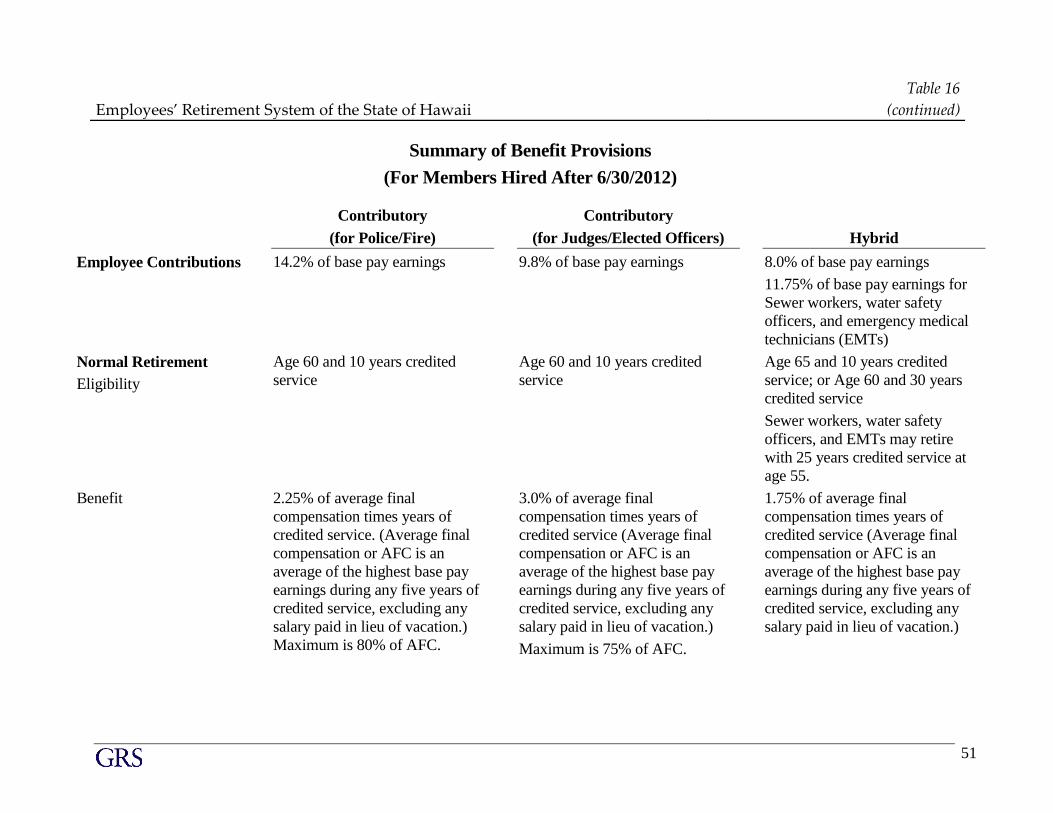
Employees’ Retirement System of the State of Hawaii
Table 16
(continued)
51
Summary of Benefit Provisions
(For Members Hired After 6/30/2012)
Contributory
(for Police/Fire)
Contributory
(for Judges/Elected Officers)
Hybrid
Employee Contributions 14.2% of base pay earnings 9.8% of base pay earnings 8.0% of base pay earnings
11.75% of base pay earnings for
Sewer workers, water safety
officers, and emergency medical
technicians (EMTs)
Normal Retirement
Eligibility
Age 60 and 10 years credited
service
Age 60 and 10 years credited
service
Age 65 and 10 years credited
service; or Age 60 and 30 years
credited service
Sewer workers, water safety
officers, and EMTs may retire
with 25 years credited service at
age 55.
Benefit 2.25% of average final
compensation times years of
credited service. (Average final
compensation or AFC is an
average of the highest base pay
earnings during any five years of
credited service, excluding any
salary paid in lieu of vacation.)
Maximum is 80% of AFC.
3.0% of average final
compensation times years of
credited service (Average final
compensation or AFC is an
average of the highest base pay
earnings during any five years of
credited service, excluding any
salary paid in lieu of vacation.)
Maximum is 75% of AFC.
1.75% of average final
compensation times years of
credited service (Average final
compensation or AFC is an
average of the highest base pay
earnings during any five years of
credited service, excluding any
salary paid in lieu of vacation.)
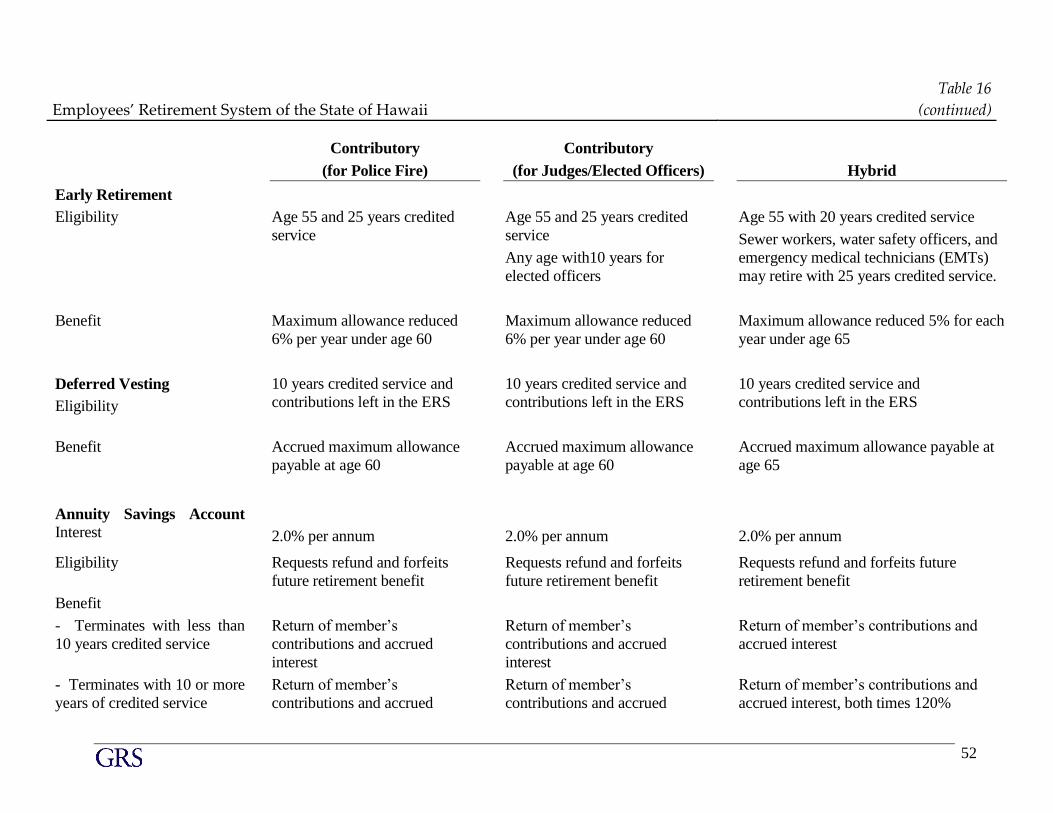
Employees’ Retirement System of the State of Hawaii
Table 16
(continued)
52
Contributory
(for Police Fire)
Contributory
(for Judges/Elected Officers)
Hybrid
Early Retirement
Eligibility
Age 55 and 25 years credited
service
Age 55 and 25 years credited
service
Any age with10 years for
elected officers
Age 55 with 20 years credited service
Sewer workers, water safety officers, and
emergency medical technicians (EMTs)
may retire with 25 years credited service.
Benefit Maximum allowance reduced
6% per year under age 60
Maximum allowance reduced
6% per year under age 60
Maximum allowance reduced 5% for each
year under age 65
Deferred Vesting
Eligibility
10 years credited service and
contributions left in the ERS
10 years credited service and
contributions left in the ERS
10 years credited service and
contributions left in the ERS
Benefit Accrued maximum allowance
payable at age 60
Accrued maximum allowance
payable at age 60
Accrued maximum allowance payable at
age 65
Annuity Savings Account Interest
2.0% per annum
2.0% per annum
2.0% per annum
Eligibility Requests refund and forfeits
future retirement benefit
Requests refund and forfeits
future retirement benefit
Requests refund and forfeits future
retirement benefit
Benefit
- Terminates with less than
10 years credited service
Return of member’s
contributions and accrued
interest
Return of member’s
contributions and accrued
interest
Return of member’s contributions and
accrued interest
- Terminates with 10 or more
years of credited service
Return of member’s
contributions and accrued
Return of member’s
contributions and accrued
Return of member’s contributions and
accrued interest, both times 120%
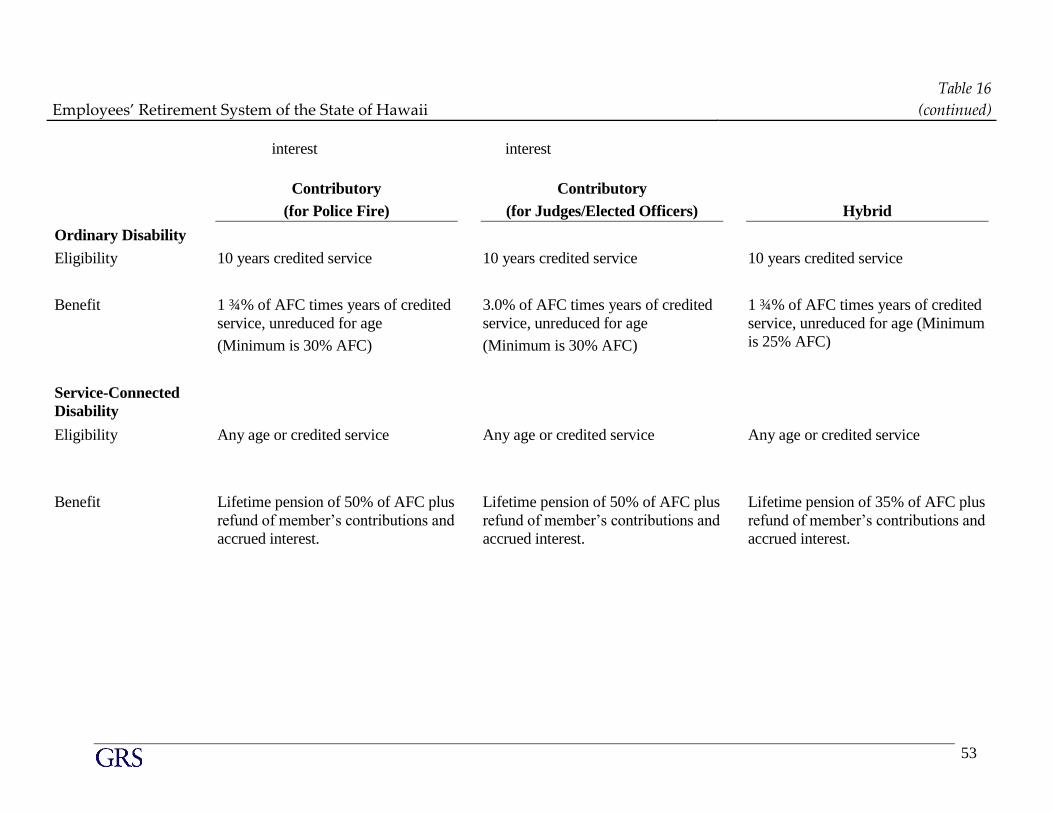
Employees’ Retirement System of the State of Hawaii
Table 16
(continued)
53
interest interest
Contributory
(for Police Fire)
Contributory
(for Judges/Elected Officers)
Hybrid
Ordinary Disability
Eligibility 10 years credited service 10 years credited service 10 years credited service
Benefit 1 ¾% of AFC times years of credited
service, unreduced for age
(Minimum is 30% AFC)
3.0% of AFC times years of credited
service, unreduced for age
(Minimum is 30% AFC)
1 ¾% of AFC times years of credited
service, unreduced for age (Minimum
is 25% AFC)
Service-Connected
Disability
Eligibility Any age or credited service Any age or credited service Any age or credited service
Benefit Lifetime pension of 50% of AFC plus
refund of member’s contributions and
accrued interest.
Lifetime pension of 50% of AFC plus
refund of member’s contributions and
accrued interest.
Lifetime pension of 35% of AFC plus
refund of member’s contributions and
accrued interest.
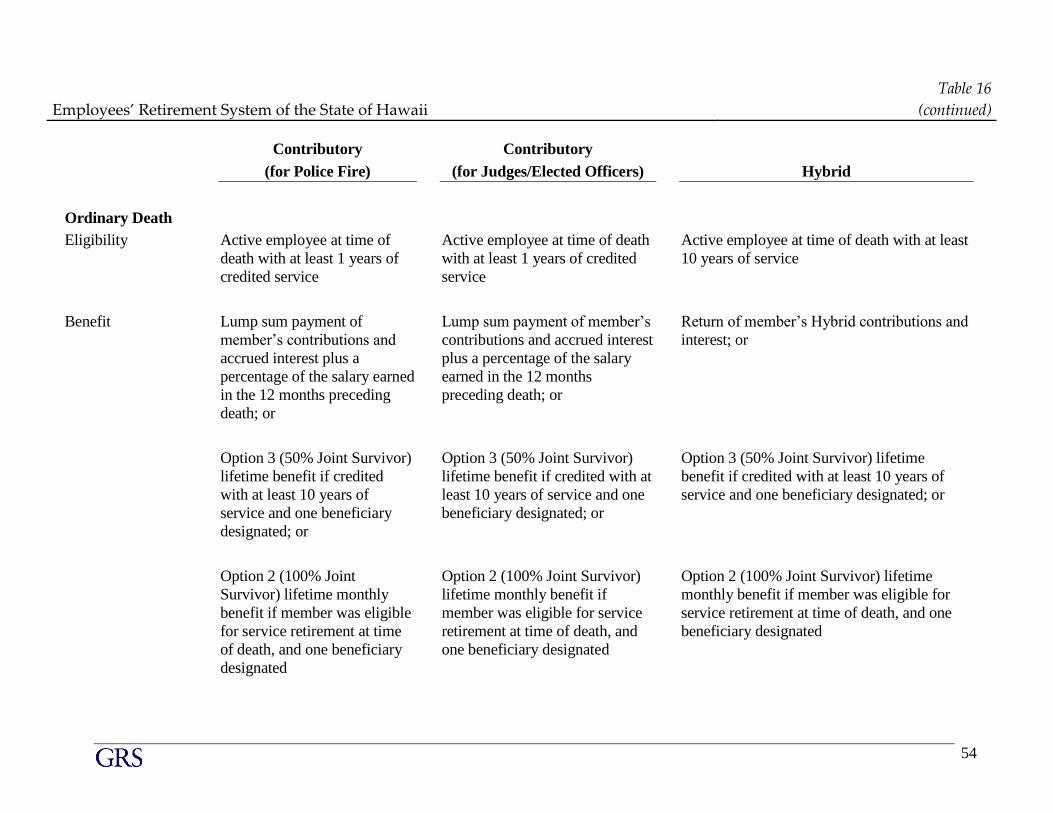
Employees’ Retirement System of the State of Hawaii
Table 16
(continued)
54
Contributory
(for Police Fire)
Contributory
(for Judges/Elected Officers)
Hybrid
Ordinary Death
Eligibility Active employee at time of
death with at least 1 years of
credited service
Active employee at time of death
with at least 1 years of credited
service
Active employee at time of death with at least
10 years of service
Benefit Lump sum payment of
member’s contributions and
accrued interest plus a
percentage of the salary earned
in the 12 months preceding
death; or
Lump sum payment of member’s
contributions and accrued interest
plus a percentage of the salary
earned in the 12 months
preceding death; or
Return of member’s Hybrid contributions and
interest; or
Option 3 (50% Joint Survivor)
lifetime benefit if credited
with at least 10 years of
service and one beneficiary
designated; or
Option 3 (50% Joint Survivor)
lifetime benefit if credited with at
least 10 years of service and one
beneficiary designated; or
Option 3 (50% Joint Survivor) lifetime
benefit if credited with at least 10 years of
service and one beneficiary designated; or
Option 2 (100% Joint
Survivor) lifetime monthly
benefit if member was eligible
for service retirement at time
of death, and one beneficiary
designated
Option 2 (100% Joint Survivor)
lifetime monthly benefit if
member was eligible for service
retirement at time of death, and
one beneficiary designated
Option 2 (100% Joint Survivor) lifetime
monthly benefit if member was eligible for
service retirement at time of death, and one
beneficiary designated
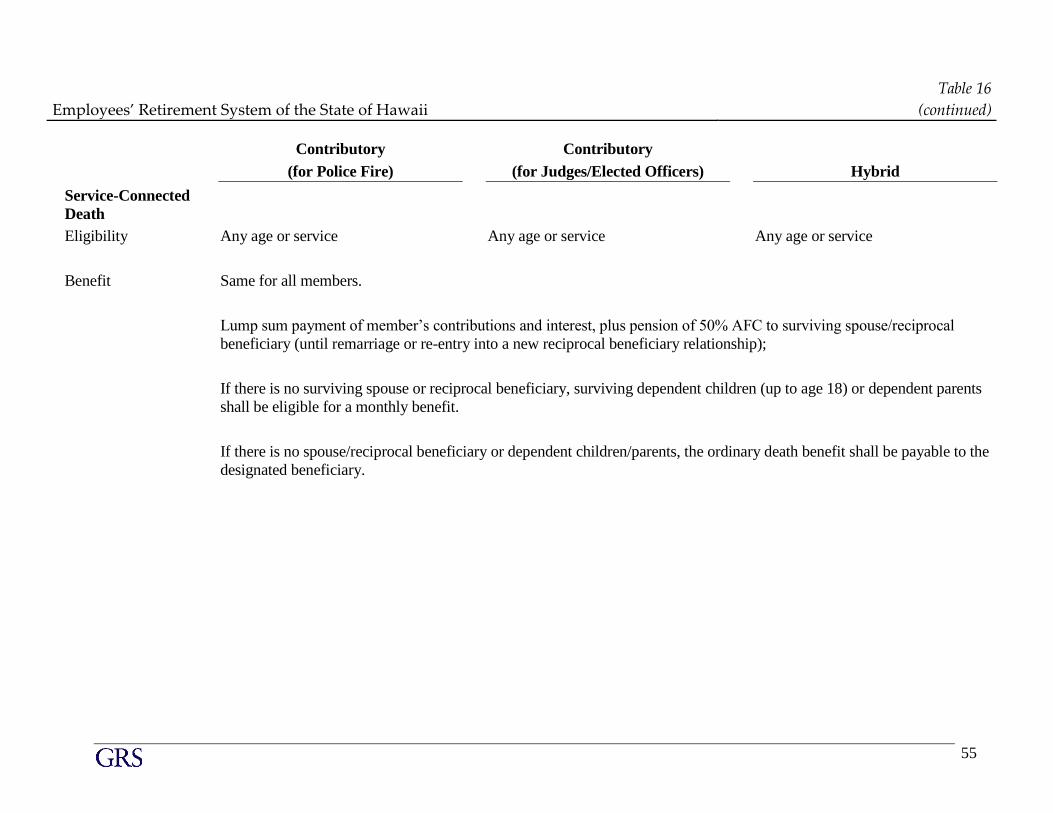
Employees’ Retirement System of the State of Hawaii
Table 16
(continued)
55
Contributory
(for Police Fire)
Contributory
(for Judges/Elected Officers)
Hybrid
Service-Connected
Death
Eligibility Any age or service Any age or service Any age or service
Benefit Same for all members.
Lump sum payment of member’s contributions and interest, plus pension of 50% AFC to surviving spouse/reciprocal
beneficiary (until remarriage or re-entry into a new reciprocal beneficiary relationship);
If there is no surviving spouse or reciprocal beneficiary, surviving dependent children (up to age 18) or dependent parents
shall be eligible for a monthly benefit.
If there is no spouse/reciprocal beneficiary or dependent children/parents, the ordinary death benefit shall be payable to the
designated beneficiary.

Employees’ Retirement System of the State of Hawaii
Table 16
(continued)
56
Post Retirement Benefit
Each retiree’s original retirement allowance is increased by 1 ½% (if their membership date is
after June 30, 2012) or 2 ½% (if their membership date is before July 1, 2012) on each July 1
beginning the calendar year after retirement. This cumulative benefit is not compounded.
Retirement Options
Contributory or Hybrid Member
Maximum Allowance: The member receives a lifetime maximum allowance and at death the
difference between the value of the member’s contributions at the time of retirement and the
retirement allowance paid prior to death is paid to the designated beneficiary(ies) or estate.
Option One: The member receives a reduced lifetime allowance based on age and at death, the
difference between the initial insurance reserve and the retirement allowance paid prior to death is
paid to the designated beneficiary(ies) or estate.
Option Two (100% Joint and Survivor with Pop-Up): The member receives a reduced lifetime
allowance based on ages of both the member and the sole beneficiary and at death of the member;
the same allowance is paid to the designated beneficiary for life. Should the designated beneficiary
predecease the retiree, another beneficiary cannot be named, the benefit will revert back to the
Maximum Allowance, and all payments will cease at the retiree’s death.
Option Three (50% Joint and Survivor with Pop-Up): This allowance is similar to Option
Two. The member receives a reduced lifetime allowance which is higher than Option Two and is
based on ages of both the member and the sole beneficiary; however, at death of the member one-
half of the allowance is paid to the designated beneficiary for life. Like Option Two, should the
designated beneficiary predecease the retiree, another beneficiary cannot be named, the benefit will
revert back to the Maximum Allowance, and all payments will cease at the retiree’s death.
Option Four: This option allows the member to devise an allowance that will provide a benefit
according to the member’s specifications. It requires certification by the Actuary and approval of
the Board of Trustees. The following Option Four allowances have been approved:
Combination of Options Five and Maximum Allowance: The member receives a reduced lifetime
allowance and is allowed to withdraw the pre-1987 nontaxable contribution, 50% of accumulated
contributions, or 75% of accumulated contributions (Hybrid class members are not allowed the
75% option); at death, the difference between the value of the member’s contributions at the time
of retirement and the retirement allowance paid prior to death is paid to the designated
beneficiary(ies) or estate.
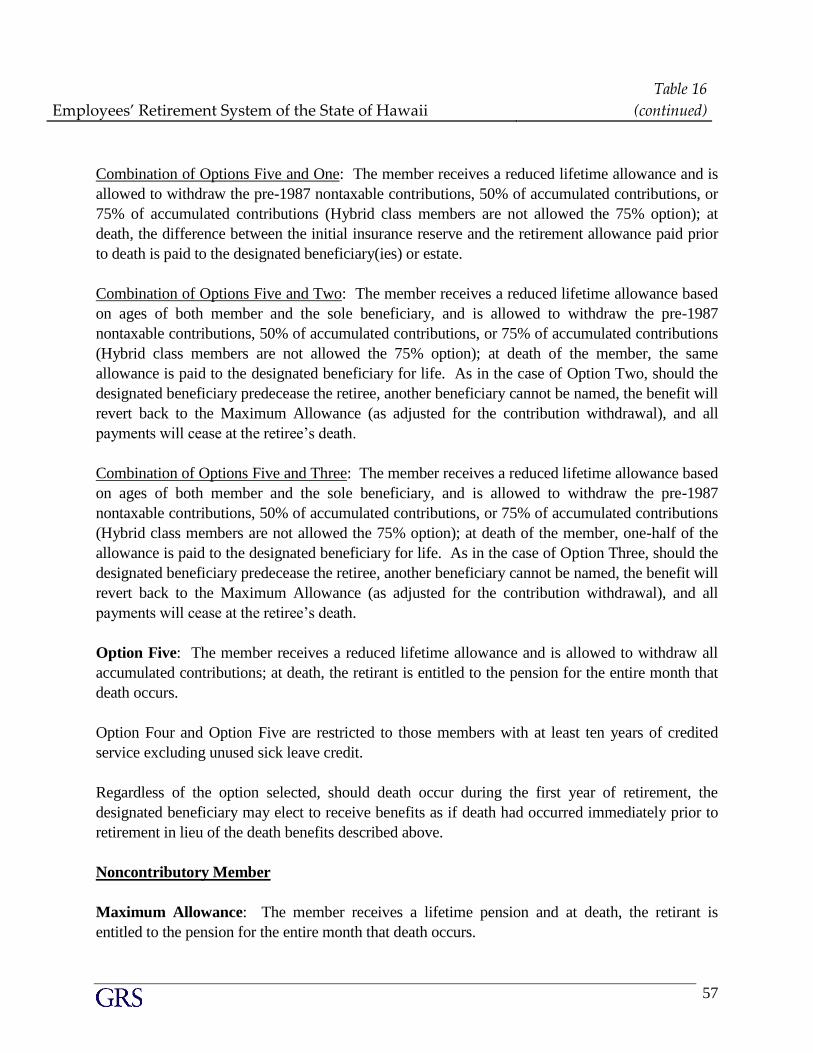
Employees’ Retirement System of the State of Hawaii
Table 16
(continued)
57
Combination of Options Five and One: The member receives a reduced lifetime allowance and is
allowed to withdraw the pre-1987 nontaxable contributions, 50% of accumulated contributions, or
75% of accumulated contributions (Hybrid class members are not allowed the 75% option); at
death, the difference between the initial insurance reserve and the retirement allowance paid prior
to death is paid to the designated beneficiary(ies) or estate.
Combination of Options Five and Two: The member receives a reduced lifetime allowance based
on ages of both member and the sole beneficiary, and is allowed to withdraw the pre-1987
nontaxable contributions, 50% of accumulated contributions, or 75% of accumulated contributions
(Hybrid class members are not allowed the 75% option); at death of the member, the same
allowance is paid to the designated beneficiary for life. As in the case of Option Two, should the
designated beneficiary predecease the retiree, another beneficiary cannot be named, the benefit will
revert back to the Maximum Allowance (as adjusted for the contribution withdrawal), and all
payments will cease at the retiree’s death.
Combination of Options Five and Three: The member receives a reduced lifetime allowance based
on ages of both member and the sole beneficiary, and is allowed to withdraw the pre-1987
nontaxable contributions, 50% of accumulated contributions, or 75% of accumulated contributions
(Hybrid class members are not allowed the 75% option); at death of the member, one-half of the
allowance is paid to the designated beneficiary for life. As in the case of Option Three, should the
designated beneficiary predecease the retiree, another beneficiary cannot be named, the benefit will
revert back to the Maximum Allowance (as adjusted for the contribution withdrawal), and all
payments will cease at the retiree’s death.
Option Five: The member receives a reduced lifetime allowance and is allowed to withdraw all
accumulated contributions; at death, the retirant is entitled to the pension for the entire month that
death occurs.
Option Four and Option Five are restricted to those members with at least ten years of credited
service excluding unused sick leave credit.
Regardless of the option selected, should death occur during the first year of retirement, the
designated beneficiary may elect to receive benefits as if death had occurred immediately prior to
retirement in lieu of the death benefits described above.
Noncontributory Member
Maximum Allowance: The member receives a lifetime pension and at death, the retirant is
entitled to the pension for the entire month that death occurs.
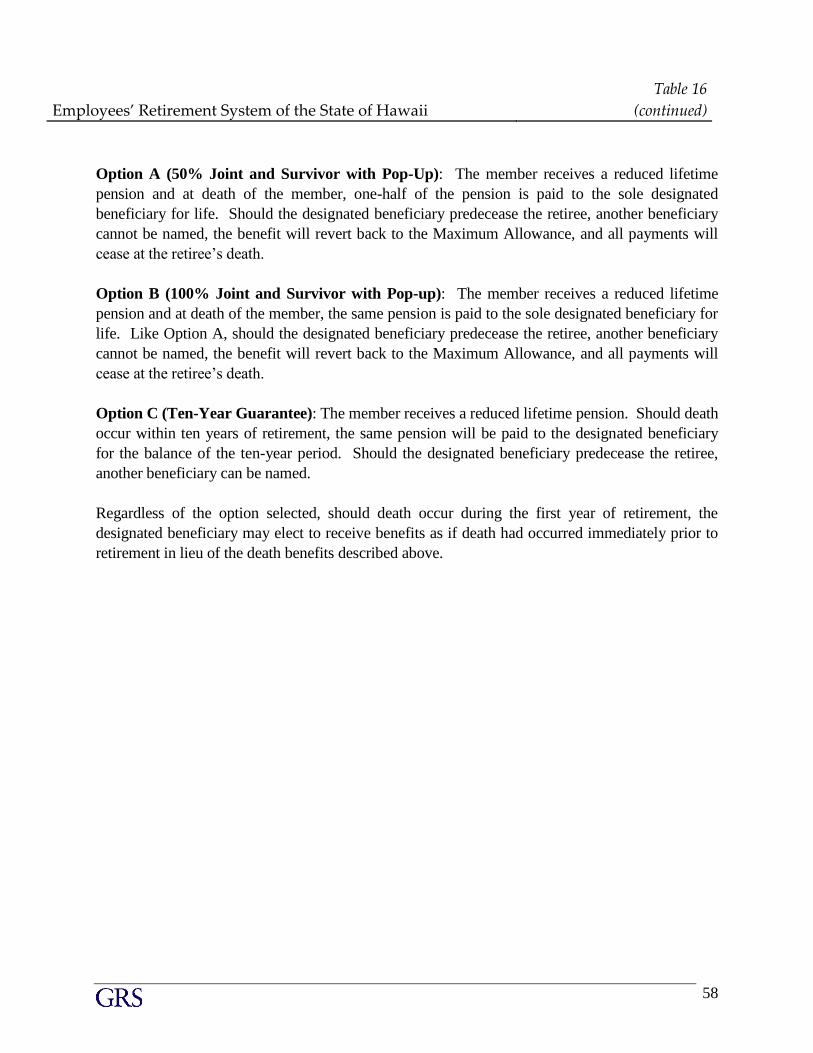
Employees’ Retirement System of the State of Hawaii
Table 16
(continued)
58
Option A (50% Joint and Survivor with Pop-Up): The member receives a reduced lifetime
pension and at death of the member, one-half of the pension is paid to the sole designated
beneficiary for life. Should the designated beneficiary predecease the retiree, another beneficiary
cannot be named, the benefit will revert back to the Maximum Allowance, and all payments will
cease at the retiree’s death.
Option B (100% Joint and Survivor with Pop-up): The member receives a reduced lifetime
pension and at death of the member, the same pension is paid to the sole designated beneficiary for
life. Like Option A, should the designated beneficiary predecease the retiree, another beneficiary
cannot be named, the benefit will revert back to the Maximum Allowance, and all payments will
cease at the retiree’s death.
Option C (Ten-Year Guarantee): The member receives a reduced lifetime pension. Should death
occur within ten years of retirement, the same pension will be paid to the designated beneficiary
for the balance of the ten-year period. Should the designated beneficiary predecease the retiree,
another beneficiary can be named.
Regardless of the option selected, should death occur during the first year of retirement, the
designated beneficiary may elect to receive benefits as if death had occurred immediately prior to
retirement in lieu of the death benefits described above.
Employees’ Retirement System of the State of Hawaii Table 17
59
Summary of Plan Changes
Act 65, effective July 1, 1999
Requires judges who enter or re-enter service after June 30, 1999 to be at least 55 years old and
five years of service or have 25 years of service to rehire.
Act 100, effective June 30, 1999
Uses actuarial investment earnings in excess of a ten percent (10%) actuarial investment yield rate
to reduce the employer’s contribution requirements by $147.0 million and $50.6 million for fiscal
years ending June 30, 2000 and 2001, respectively.
Act 284, effective June 30, 2001
Provide an increase in pension benefits for current retirees with military service who retired prior
to July 2, 1989. A retirant who rendered honorable active military service could be granted up to 4
years of military service credits based upon his/her years of credited service under the ERS, not to
exceed his/her actual years of military service. The years of military service credits granted are
based on the following schedule:
0 years for retirants with less than 8 years of credited service
Up to 2 years of retirants with 8 years or more of credited service
Up to 3 years of retirants with 20 years or more of credited service
Up to 4 years of retirants with 25 years or more of credited service
For each year of military service credits granted on the schedule above, the retirant will be
provided a $36.00 increase in his/her monthly pension or retirement allowance.
Act 199, effective June 30, 2003
Emergency Medical Technicians (EMTs) are allowed to retire with an unreduced benefit after 25
years of service regardless of age, of which the last five or more years prior to retirement must be
in that capacity. This feature is phased in one year at a time, July 1, 2003 through June 30, 2008.
Act 177, effective July 1, 2004
This Act allows police officers with a permanent service-connected disability to retain the 2-
1/2% benefit multiplier for each year of service as a police officer.
Employees’ Retirement System of the State of Hawaii
Table 17
(continued)
60
Act 179, effective July 1, 2004
This Act increased the Noncontributory service-connected disability formula to 35% of average
final compensation. The Act also changed the methodology for crediting interest on
contributions for terminated members so that interest continues to accrue until the date of refund.
The Act adds a “pop-up” feature to the joint & survivor benefit options if the beneficiary pre-
deceases the retiree.
This Act also created the new Hybrid class which became effective July 1, 2006.
Act 181, effective July 1, 2004
This Act establishes fixed employer contribution rates as a percentage of compensation effective
July 1, 2005. Employers will contribute 15.75% for their police officers and firefighters and
13.75% for other employees.
Act 183, effective July 1, 2004
This Act amends the ERS statutes to comply with the federal tax limits on compensation
retroactive to July 1, 1996.
Act 56, effective December 1, 2004
This Act amends the ERS statutes to allow the automatic cost-of-living-adjustment to be
reflected when determining actuarial equivalent optional forms of payment.
Act 256, effective July 5, 2007
Legislation was enacted to remove the statutory salary increase assumption from the statutes and
to grant the System’s Board of Trustees the authority to set the salary increase assumption. As a
result of this legislation, the Board has adopted effective with this valuation the salary increase
assumption recommended by GRS as a result of the Experience Study performed in 2006.
Legislation was also enacted to increase the employer contribution rates to the System. Effective
July 1, 2008, the employer contribution rate for Police and Fire employees will increase from
15.75% to 19.70% and the rate for All Other employees will increase from 13.75% to 15.00%.
Act 163, effective June 23, 2011
Legislation was enacted that increased the future employer contribution rates to ERS. Employers
of Police and Fire employees will contribute 22% of pay in FY 2013, 23% in FY 2014, 24% in
FY 2015, and 25% in FY 2016 and beyond. Employers of All Other Employees will contribute
15.5% of pay in FY 2013, 16.0% in FY 2014, 16.5% in FY 2015, and 17.0% in FY 2016 and
beyond.
Employees’ Retirement System of the State of Hawaii
Table 17
(continued)
61
Legislation was enacted that made numerous changes to the benefits and member contribution
rates for employees hired after June 30, 2012. Key changes are shown below:
Benefit Provision Police & Fire Employees All Other Employees
Benefit Multiplier 2.25% 1.75%
Normal Retirement Age 55 with 25 years of
service, or age 60 with 10
years of service
Age 60 with 30 years of
service, or age 65 with 10
years of service
Post-Retirement Increase 1.5% 1.5%
Hybrid Match N/A 120%
Average Final Compensation Highest 5 annual base
salaries
Highest 5 annual base
salaries
Eligibility for Deferred Benefit 10 years of service 10 years of service
Member Contribution Rate 14.20% 8.00%
Similar changes were also made to the benefits of Judges, Legislative Officers, etc.
Similar changes were also made to those employees in the All Other Employees group who are
eligible to retire at 25 years of service including the addition of a minimum age requirement (55).
Finally, legislation was enacted that set the investment return assumption for the June 30, 2011
valuation at 7.75% (the rate recommended in the Experience Study presented to the Board in
December of 2010). In addition, the legislation granted ERS’s Board the authority to set this
assumption for valuations after 2011.
Act 152, effective June 26, 2012
Legislation was enacted to require employers to pay additional contributions if a retiring
employee, who was first employed prior to July 1, 2012 and who was last employed by the
employer, has significant non-base pay increases included in their average final compensation.
The additional contribution is equal to the actuarial present value of the additional benefits
earned due to the “excessive” non-base pay increases.
Act 153, effective June 26, 2012
Legislation was enacted to eliminate most types of non-base pay from the definition of
compensation for employees hired after June 30, 2012. For the impacted employees, non-base
pay compensation will be excluded in determining both the contributions made by and on behalf
of these employees and the benefits they will earn in the System.
Employees’ Retirement System of the State of Hawaii Table 18
62
Summary of Actuarial Methods and Assumptions
Basis for assumption setting: The actuarial assumptions were adopted by the Board on December
12, 2016. Rationale for the recommendations are in the most recent experience study dated July
5, 2016.
I. Valuation Date
The valuation date is June 30th of each plan year. This is the date as of which the
actuarial present value of future benefits and the actuarial value of assets are determined.
II. Actuarial Cost Method
The normal cost and actuarial accrued liability are determined using the Entry Age
Actuarial Cost Method. The actuarial accrued liability is assigned to years prior to the
valuation, and the normal cost is assigned to the year following the valuation. The
remaining costs are assigned to future years. The normal cost and accrued liability are
determined on an individual basis.
The normal cost is the level percentage of payroll contribution required to accumulate the
needed funds to pay all expected benefits. This percentage of payroll is then applied to
the total compensation for the prior year for all active members, and is then adjusted for
the payroll growth assumption.
The actuarial accrued liability is the difference between the total present value of future
benefits and the actuarial present value of future normal costs. The unfunded actuarial
accrued liability (UAAL) is the excess of the actuarial accrued liability over the actuarial
value of assets.
III. Funding of Unfunded Actuarial Accrued Liability
Since the State statutes governing the System establish the employee and employer
contribution rates, the actuarial valuation determines the number of years required to
amortize (or fund) the UAAL. Because of the legislated increases in future employer
contribution rates and the new tier of benefits for employees hired after June 30, 2012, an
open group projection of liabilities and assets was used to determine the length of time
until the UAAL is eliminated. The open group projection assumed that the number of
active members would remain static (i.e. each active employee who leaves employment
due to termination, retirement, death or disability, would be replaced by exactly one new
employee.
Because of this methodology for determining the funding period, any change in the
unfunded actuarial accrued liability due to (i) actuarial gains and losses, (ii) changes in
actuarial assumptions, or (iii) amendments, affects the funding period.
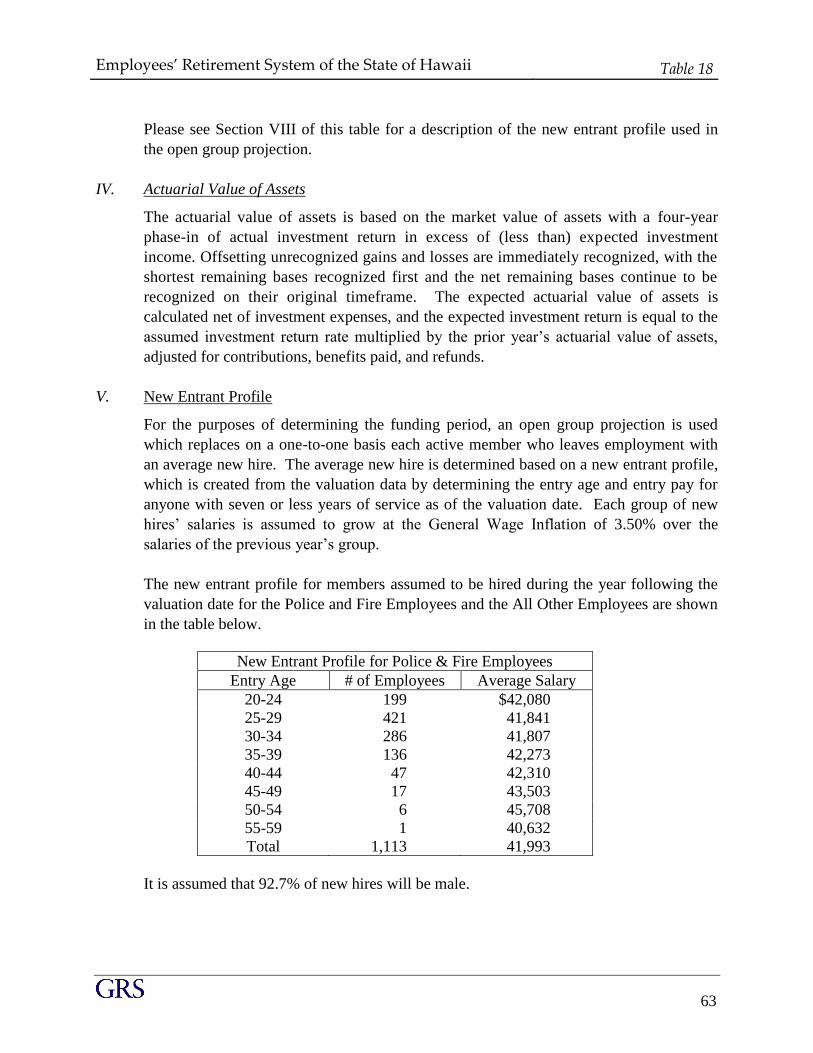
Employees’ Retirement System of the State of Hawaii Table 18
63
Please see Section VIII of this table for a description of the new entrant profile used in
the open group projection.
IV. Actuarial Value of Assets
The actuarial value of assets is based on the market value of assets with a four-year
phase-in of actual investment return in excess of (less than) expected investment
income. Offsetting unrecognized gains and losses are immediately recognized, with the
shortest remaining bases recognized first and the net remaining bases continue to be
recognized on their original timeframe. The expected actuarial value of assets is
calculated net of investment expenses, and the expected investment return is equal to the
assumed investment return rate multiplied by the prior year’s actuarial value of assets,
adjusted for contributions, benefits paid, and refunds.
V. New Entrant Profile
For the purposes of determining the funding period, an open group projection is used
which replaces on a one-to-one basis each active member who leaves employment with
an average new hire. The average new hire is determined based on a new entrant profile,
which is created from the valuation data by determining the entry age and entry pay for
anyone with seven or less years of service as of the valuation date. Each group of new
hires’ salaries is assumed to grow at the General Wage Inflation of 3.50% over the
salaries of the previous year’s group.
The new entrant profile for members assumed to be hired during the year following the
valuation date for the Police and Fire Employees and the All Other Employees are shown
in the table below.
New Entrant Profile for Police & Fire Employees
Entry Age # of Employees Average Salary
20-24 199 $42,080
25-29 421 41,841
30-34 286 41,807
35-39 136 42,273
40-44 47 42,310
45-49 17 43,503
50-54 6 45,708
55-59 1 40,632
Total 1,113 41,993
It is assumed that 92.7% of new hires will be male.
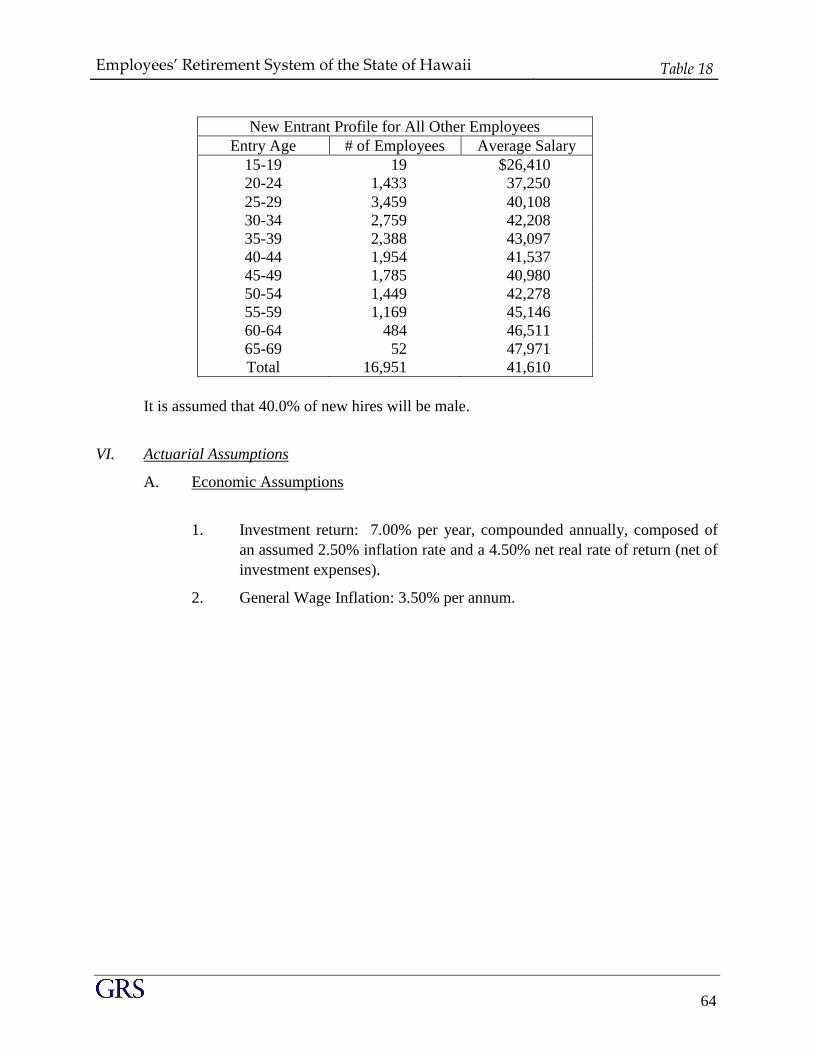
Employees’ Retirement System of the State of Hawaii Table 18
64
New Entrant Profile for All Other Employees
Entry Age # of Employees Average Salary
15-19 19 $26,410
20-24 1,433 37,250
25-29 3,459 40,108
30-34 2,759 42,208
35-39 2,388 43,097
40-44 1,954 41,537
45-49 1,785 40,980
50-54 1,449 42,278
55-59 1,169 45,146
60-64 484 46,511
65-69 52 47,971
Total 16,951 41,610
It is assumed that 40.0% of new hires will be male.
VI. Actuarial Assumptions
A. Economic Assumptions
1. Investment return: 7.00% per year, compounded annually, composed of
an assumed 2.50% inflation rate and a 4.50% net real rate of return (net of
investment expenses).
2. General Wage Inflation: 3.50% per annum.
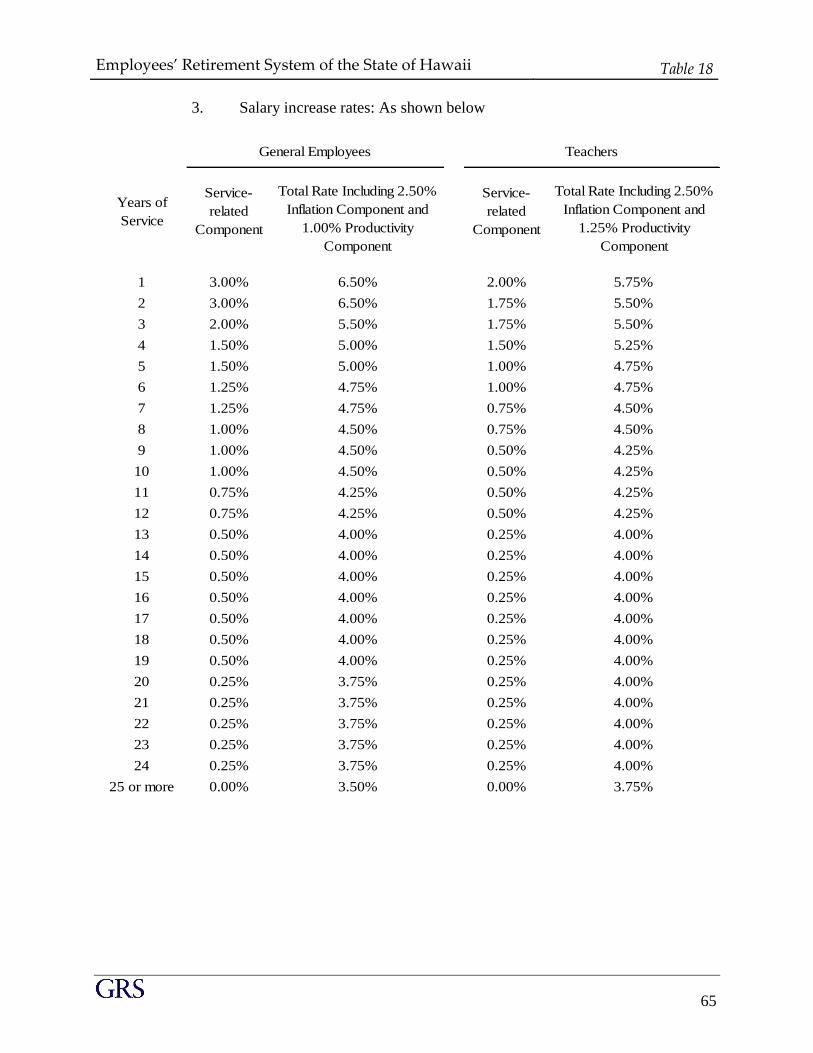
Employees’ Retirement System of the State of Hawaii Table 18
65
3. Salary increase rates: As shown below
Years of
Service
Service-
related
Component
Total Rate Including 2.50%
Inflation Component and
1.00% Productivity
Component
Service-
related
Component
Total Rate Including 2.50%
Inflation Component and
1.25% Productivity
Component
1 3.00% 6.50% 2.00% 5.75%
2 3.00% 6.50% 1.75% 5.50%
3 2.00% 5.50% 1.75% 5.50%
4 1.50% 5.00% 1.50% 5.25%
5 1.50% 5.00% 1.00% 4.75%
6 1.25% 4.75% 1.00% 4.75%
7 1.25% 4.75% 0.75% 4.50%
8 1.00% 4.50% 0.75% 4.50%
9 1.00% 4.50% 0.50% 4.25%
10 1.00% 4.50% 0.50% 4.25%
11 0.75% 4.25% 0.50% 4.25%
12 0.75% 4.25% 0.50% 4.25%
13 0.50% 4.00% 0.25% 4.00%
14 0.50% 4.00% 0.25% 4.00%
15 0.50% 4.00% 0.25% 4.00%
16 0.50% 4.00% 0.25% 4.00%
17 0.50% 4.00% 0.25% 4.00%
18 0.50% 4.00% 0.25% 4.00%
19 0.50% 4.00% 0.25% 4.00%
20 0.25% 3.75% 0.25% 4.00%
21 0.25% 3.75% 0.25% 4.00%
22 0.25% 3.75% 0.25% 4.00%
23 0.25% 3.75% 0.25% 4.00%
24 0.25% 3.75% 0.25% 4.00%
25 or more 0.00% 3.50% 0.00% 3.75%
General Employees Teachers
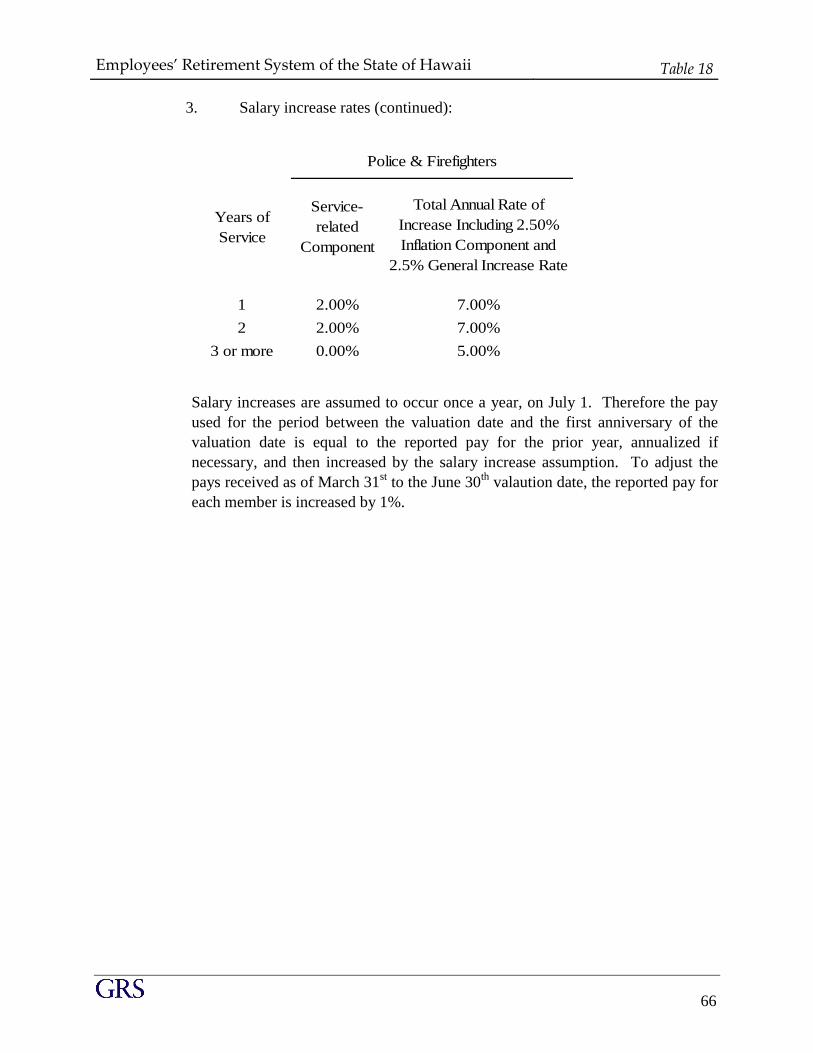
Employees’ Retirement System of the State of Hawaii Table 18
66
3. Salary increase rates (continued):
Years of
Service
Service-
related
Component
Total Annual Rate of
Increase Including 2.50%
Inflation Component and
2.5% General Increase Rate
1 2.00% 7.00%
2 2.00% 7.00%
3 or more 0.00% 5.00%
Police & Firefighters
Salary increases are assumed to occur once a year, on July 1. Therefore the pay
used for the period between the valuation date and the first anniversary of the
valuation date is equal to the reported pay for the prior year, annualized if
necessary, and then increased by the salary increase assumption. To adjust the
pays received as of March 31st to the June 30
th valaution date, the reported pay for
each member is increased by 1%.
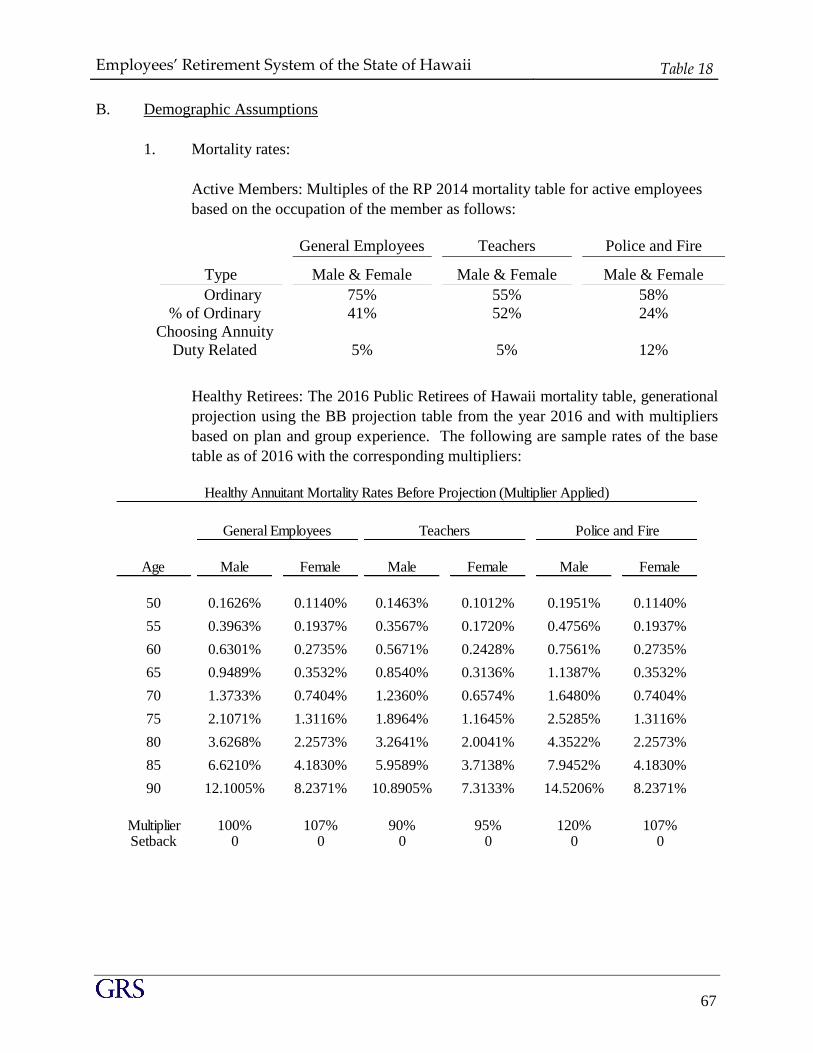
Employees’ Retirement System of the State of Hawaii Table 18
67
B. Demographic Assumptions
1. Mortality rates:
Active Members: Multiples of the RP 2014 mortality table for active employees
based on the occupation of the member as follows:
General Employees Teachers Police and Fire
Type Male & Female Male & Female Male & Female
Ordinary 75% 55% 58%
% of Ordinary
Choosing Annuity
41% 52% 24%
Duty Related 5% 5%
12%
Healthy Retirees: The 2016 Public Retirees of Hawaii mortality table, generational
projection using the BB projection table from the year 2016 and with multipliers
based on plan and group experience. The following are sample rates of the base
table as of 2016 with the corresponding multipliers:
Age Male Female Male Female Male Female
50 0.1626% 0.1140% 0.1463% 0.1012% 0.1951% 0.1140%
55 0.3963% 0.1937% 0.3567% 0.1720% 0.4756% 0.1937%
60 0.6301% 0.2735% 0.5671% 0.2428% 0.7561% 0.2735%
65 0.9489% 0.3532% 0.8540% 0.3136% 1.1387% 0.3532%
70 1.3733% 0.7404% 1.2360% 0.6574% 1.6480% 0.7404%
75 2.1071% 1.3116% 1.8964% 1.1645% 2.5285% 1.3116%
80 3.6268% 2.2573% 3.2641% 2.0041% 4.3522% 2.2573%
85 6.6210% 4.1830% 5.9589% 3.7138% 7.9452% 4.1830%
90 12.1005% 8.2371% 10.8905% 7.3133% 14.5206% 8.2371%
Multiplier 100% 107% 90% 95% 120% 107%Setback 0 0 0 0 0 0
Police and Fire
Healthy Annuitant Mortality Rates Before Projection (Multiplier Applied)
General Employees Teachers
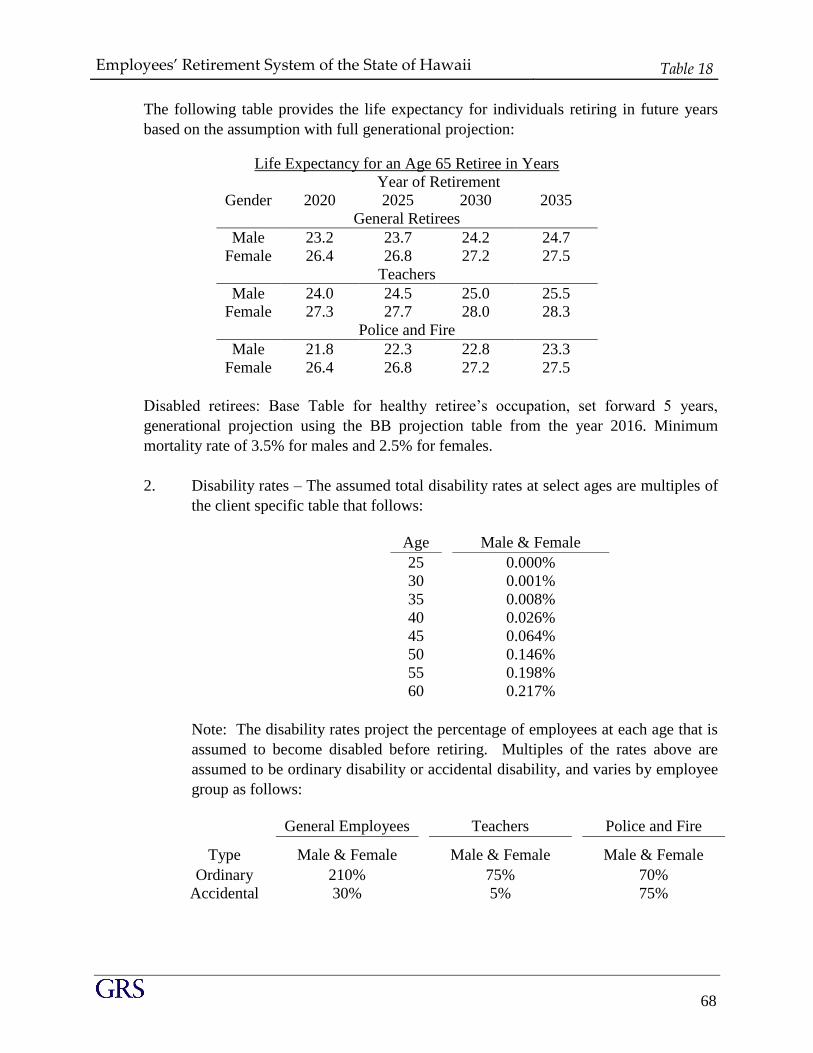
Employees’ Retirement System of the State of Hawaii Table 18
68
The following table provides the life expectancy for individuals retiring in future years
based on the assumption with full generational projection:
Life Expectancy for an Age 65 Retiree in Years
Year of Retirement
Gender 2020 2025 2030 2035
General Retirees
Male 23.2 23.7 24.2 24.7
Female 26.4 26.8 27.2 27.5
Teachers
Male 24.0 24.5 25.0 25.5
Female 27.3 27.7 28.0 28.3
Police and Fire
Male 21.8 22.3 22.8 23.3
Female 26.4 26.8 27.2 27.5
Disabled retirees: Base Table for healthy retiree’s occupation, set forward 5 years,
generational projection using the BB projection table from the year 2016. Minimum
mortality rate of 3.5% for males and 2.5% for females.
2. Disability rates – The assumed total disability rates at select ages are multiples of
the client specific table that follows:
Age Male & Female
25 0.000%
30 0.001%
35 0.008%
40 0.026%
45 0.064%
50 0.146%
55 0.198%
60 0.217%
Note: The disability rates project the percentage of employees at each age that is
assumed to become disabled before retiring. Multiples of the rates above are
assumed to be ordinary disability or accidental disability, and varies by employee
group as follows:
General Employees Teachers Police and Fire
Type Male & Female Male & Female Male & Female
Ordinary 210% 75% 70%
Accidental 30% 5%
75%
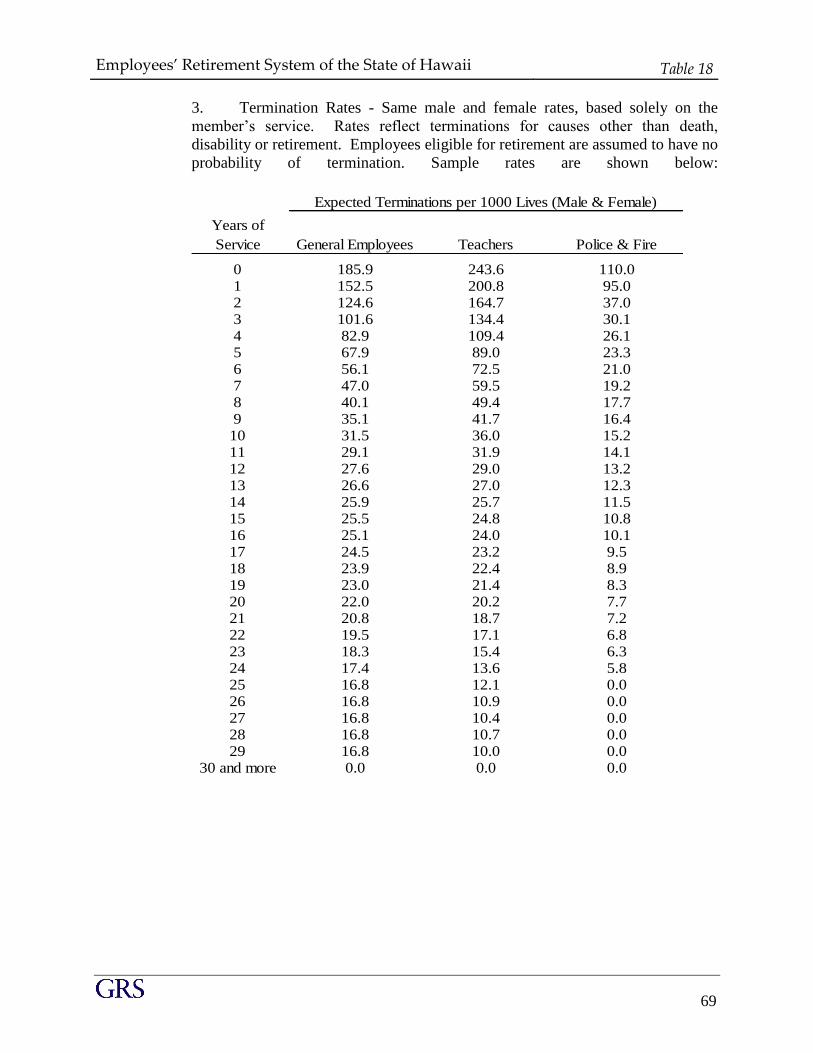
Employees’ Retirement System of the State of Hawaii Table 18
69
3. Termination Rates - Same male and female rates, based solely on the
member’s service. Rates reflect terminations for causes other than death,
disability or retirement. Employees eligible for retirement are assumed to have no
probability of termination. Sample rates are shown below:
Years of
Service General Employees Teachers Police & Fire
0 185.9 243.6 110.01 152.5 200.8 95.02 124.6 164.7 37.03 101.6 134.4 30.14 82.9 109.4 26.15 67.9 89.0 23.36 56.1 72.5 21.07 47.0 59.5 19.28 40.1 49.4 17.79 35.1 41.7 16.4
10 31.5 36.0 15.211 29.1 31.9 14.112 27.6 29.0 13.213 26.6 27.0 12.314 25.9 25.7 11.515 25.5 24.8 10.816 25.1 24.0 10.117 24.5 23.2 9.518 23.9 22.4 8.919 23.0 21.4 8.320 22.0 20.2 7.721 20.8 18.7 7.222 19.5 17.1 6.823 18.3 15.4 6.324 17.4 13.6 5.825 16.8 12.1 0.026 16.8 10.9 0.027 16.8 10.4 0.028 16.8 10.7 0.029 16.8 10.0 0.0
30 and more 0.0 0.0 0.0
Expected Terminations per 1000 Lives (Male & Female)

Employees’ Retirement System of the State of Hawaii Table 18
70
4. Retirement rates - Separate male and female rates, based on age. Sample
rates are shown below:
Contributory Members
Police/Fire
Unreduced
Retirement
Age Male Female Male Female Male Female Male Female
Male &
Female
45 0 0 0 0 0 0 0 0 12.5 46 0 0 0 0 0 0 0 0 12.5 47 0 0 0 0 0 0 0 0 12.5 48 0 0 0 0 0 0 0 0 12.5 49 0 0 0 0 0 0 0 0 12.5 50 0 0 0 0 0 0 1 0 15.0 51 0 0 2 1 0 0 1 1 15.0 52 0 0 2 1 0 0 1 1 15.0 53 0 0 2 1 0 0 2 2 15.0 54 0 0 3 2 0 0 3 3 15.0 55 25 20 3 2 20 18 20.0 56 25 20 15 16 20.0 57 16 13 15 16 20.0 58 16 13 15 16 22.0 59 13 13 15 16 25.0 60 13 15 14 18 30.0 61 13 15 14 18 30.0 62 28 25 14 25 30.0 63 20 20 14 20 30.0 64 20 20 14 15 30.0 65 20 20 20 25 100.0 66 18 20 15 2567 18 20 15 2068 18 20 15 2069 18 20 15 2070 20 20 15 2071 20 20 15 2072 20 20 15 2073 20 20 15 2074 20 20 15 2075 100 100 100 100
Unreduced
Retirement
Reduced
Retirement
General Employees
Expected Retirements per 100 Lives
Unreduced
Retirement
Reduced
Retirement
Teachers
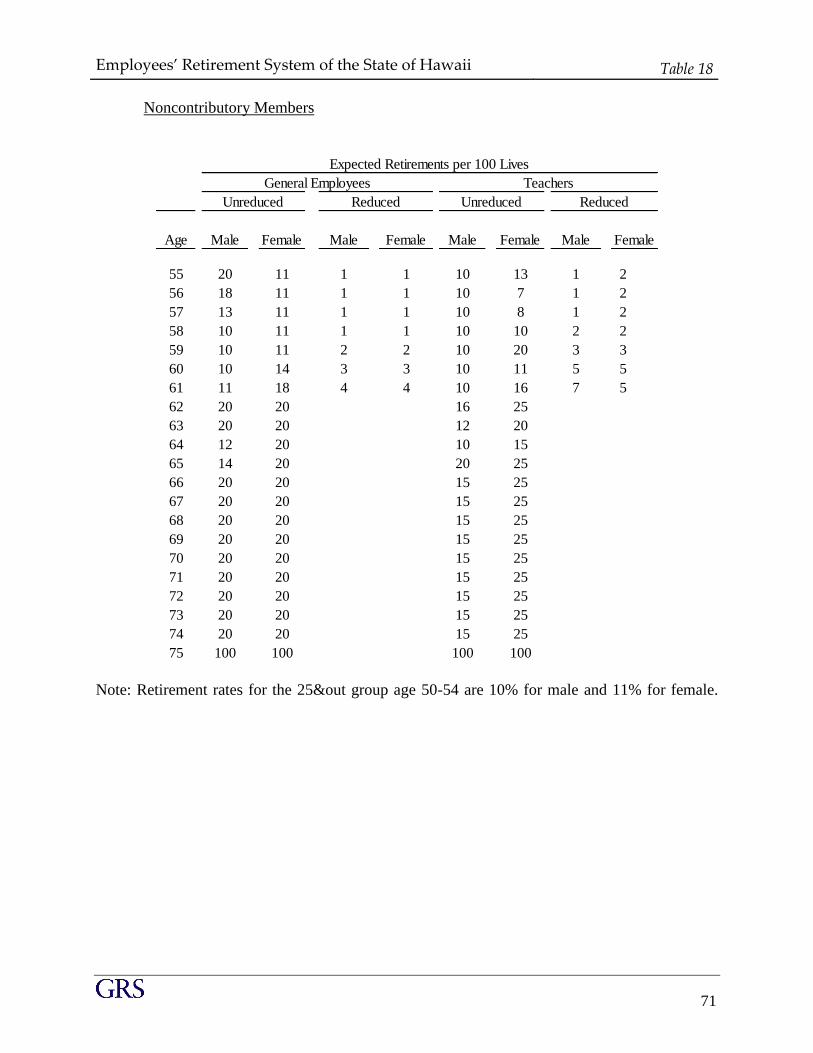
Employees’ Retirement System of the State of Hawaii Table 18
71
Noncontributory Members
Note: Retirement rates for the 25&out group age 50-54 are 10% for male and 11% for female.
Age Male Female Male Female Male Female Male Female
55 20 11 1 1 10 13 1 2
56 18 11 1 1 10 7 1 2
57 13 11 1 1 10 8 1 2
58 10 11 1 1 10 10 2 2
59 10 11 2 2 10 20 3 3
60 10 14 3 3 10 11 5 5
61 11 18 4 4 10 16 7 5
62 20 20 16 25
63 20 20 12 20
64 12 20 10 15
65 14 20 20 25
66 20 20 15 25
67 20 20 15 25
68 20 20 15 25
69 20 20 15 25
70 20 20 15 25
71 20 20 15 25
72 20 20 15 25
73 20 20 15 25
74 20 20 15 25
75 100 100 100 100
General Employees Teachers
Expected Retirements per 100 Lives
Reduced Unreduced Unreduced Reduced
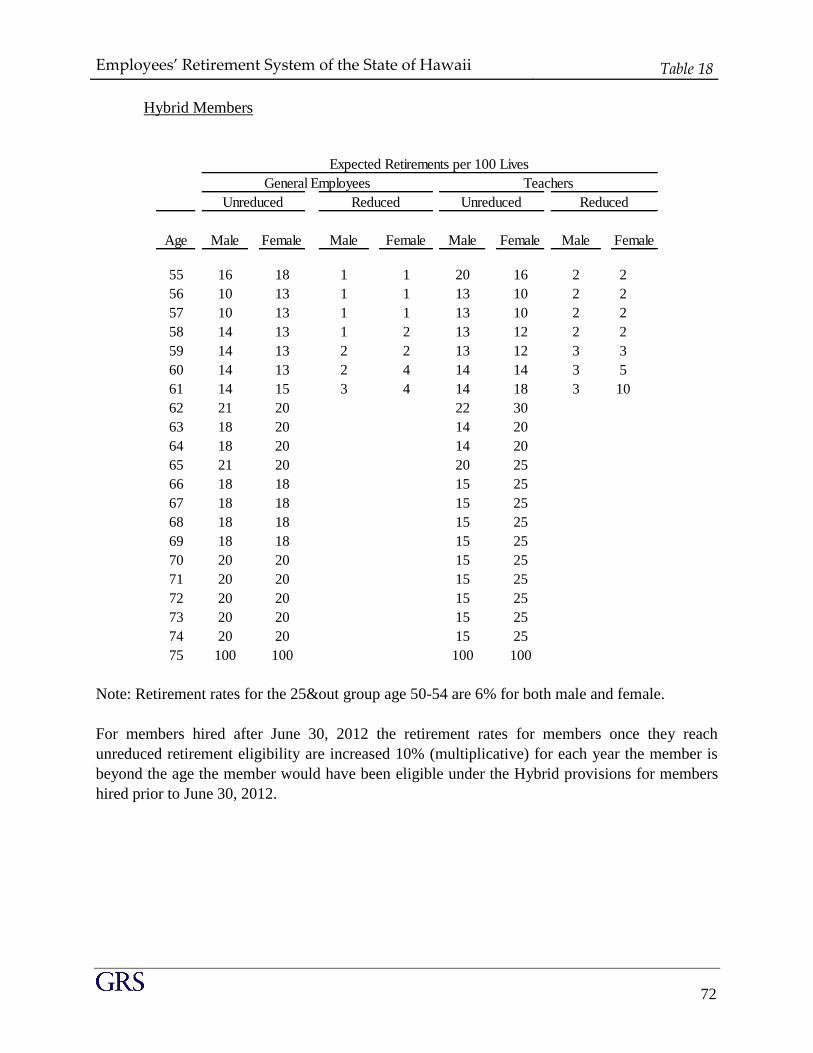
Employees’ Retirement System of the State of Hawaii Table 18
72
Hybrid Members
Note: Retirement rates for the 25&out group age 50-54 are 6% for both male and female.
For members hired after June 30, 2012 the retirement rates for members once they reach
unreduced retirement eligibility are increased 10% (multiplicative) for each year the member is
beyond the age the member would have been eligible under the Hybrid provisions for members
hired prior to June 30, 2012.
Age Male Female Male Female Male Female Male Female
55 16 18 1 1 20 16 2 2
56 10 13 1 1 13 10 2 2
57 10 13 1 1 13 10 2 2
58 14 13 1 2 13 12 2 2
59 14 13 2 2 13 12 3 3
60 14 13 2 4 14 14 3 5
61 14 15 3 4 14 18 3 10
62 21 20 22 30
63 18 20 14 20
64 18 20 14 20
65 21 20 20 25
66 18 18 15 25
67 18 18 15 25
68 18 18 15 25
69 18 18 15 25
70 20 20 15 25
71 20 20 15 25
72 20 20 15 25
73 20 20 15 25
74 20 20 15 25
75 100 100 100 100
Unreduced Unreduced Reduced
General Employees
Reduced
Teachers
Expected Retirements per 100 Lives
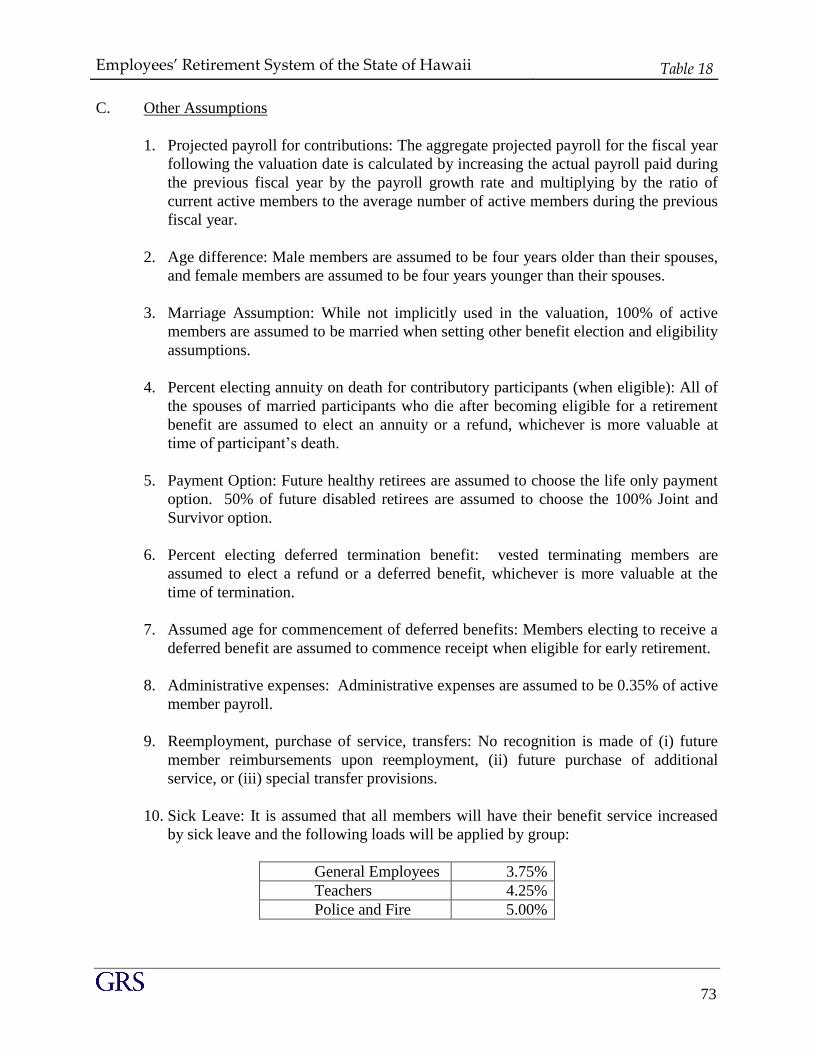
Employees’ Retirement System of the State of Hawaii Table 18
73
C. Other Assumptions
1. Projected payroll for contributions: The aggregate projected payroll for the fiscal year
following the valuation date is calculated by increasing the actual payroll paid during
the previous fiscal year by the payroll growth rate and multiplying by the ratio of
current active members to the average number of active members during the previous
fiscal year.
2. Age difference: Male members are assumed to be four years older than their spouses,
and female members are assumed to be four years younger than their spouses.
3. Marriage Assumption: While not implicitly used in the valuation, 100% of active
members are assumed to be married when setting other benefit election and eligibility
assumptions.
4. Percent electing annuity on death for contributory participants (when eligible): All of
the spouses of married participants who die after becoming eligible for a retirement
benefit are assumed to elect an annuity or a refund, whichever is more valuable at
time of participant’s death.
5. Payment Option: Future healthy retirees are assumed to choose the life only payment
option. 50% of future disabled retirees are assumed to choose the 100% Joint and
Survivor option.
6. Percent electing deferred termination benefit: vested terminating members are
assumed to elect a refund or a deferred benefit, whichever is more valuable at the
time of termination.
7. Assumed age for commencement of deferred benefits: Members electing to receive a
deferred benefit are assumed to commence receipt when eligible for early retirement.
8. Administrative expenses: Administrative expenses are assumed to be 0.35% of active
member payroll.
9. Reemployment, purchase of service, transfers: No recognition is made of (i) future
member reimbursements upon reemployment, (ii) future purchase of additional
service, or (iii) special transfer provisions.
10. Sick Leave: It is assumed that all members will have their benefit service increased
by sick leave and the following loads will be applied by group:
General Employees 3.75%
Teachers 4.25%
Police and Fire 5.00%
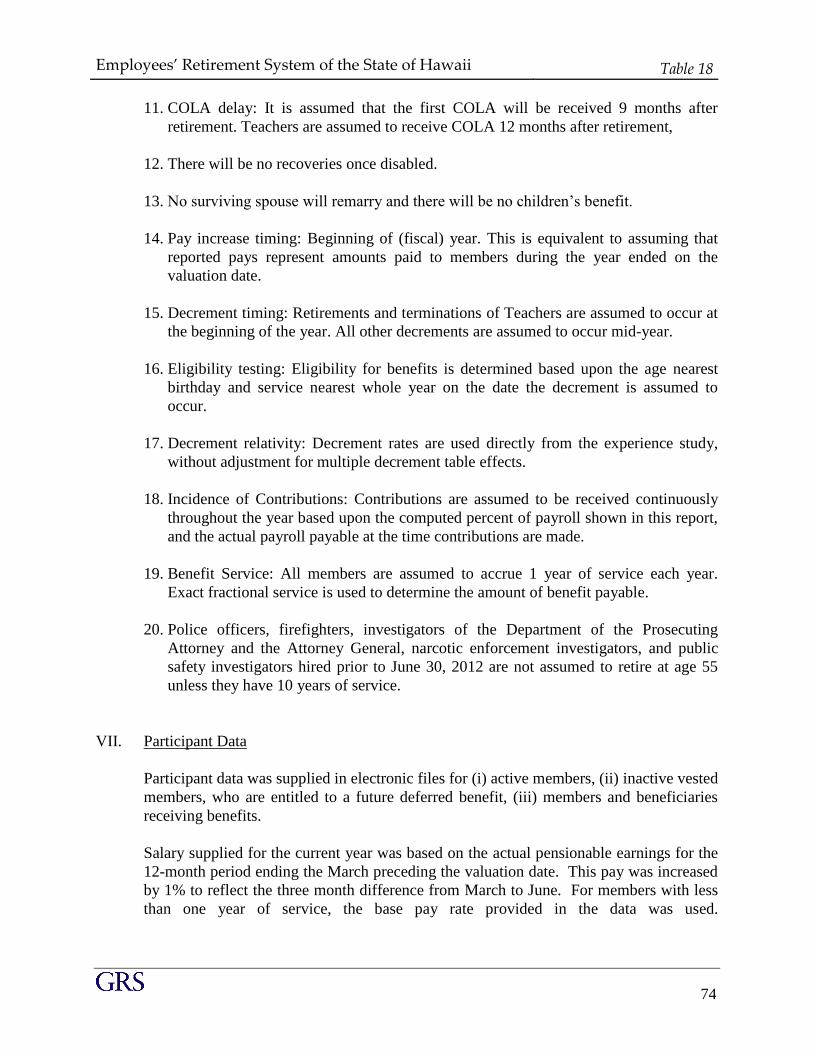
Employees’ Retirement System of the State of Hawaii Table 18
74
11. COLA delay: It is assumed that the first COLA will be received 9 months after
retirement. Teachers are assumed to receive COLA 12 months after retirement,
12. There will be no recoveries once disabled.
13. No surviving spouse will remarry and there will be no children’s benefit.
14. Pay increase timing: Beginning of (fiscal) year. This is equivalent to assuming that
reported pays represent amounts paid to members during the year ended on the
valuation date.
15. Decrement timing: Retirements and terminations of Teachers are assumed to occur at
the beginning of the year. All other decrements are assumed to occur mid-year.
16. Eligibility testing: Eligibility for benefits is determined based upon the age nearest
birthday and service nearest whole year on the date the decrement is assumed to
occur.
17. Decrement relativity: Decrement rates are used directly from the experience study,
without adjustment for multiple decrement table effects.
18. Incidence of Contributions: Contributions are assumed to be received continuously
throughout the year based upon the computed percent of payroll shown in this report,
and the actual payroll payable at the time contributions are made.
19. Benefit Service: All members are assumed to accrue 1 year of service each year.
Exact fractional service is used to determine the amount of benefit payable.
20. Police officers, firefighters, investigators of the Department of the Prosecuting
Attorney and the Attorney General, narcotic enforcement investigators, and public
safety investigators hired prior to June 30, 2012 are not assumed to retire at age 55
unless they have 10 years of service.
VII. Participant Data
Participant data was supplied in electronic files for (i) active members, (ii) inactive vested
members, who are entitled to a future deferred benefit, (iii) members and beneficiaries
receiving benefits.
Salary supplied for the current year was based on the actual pensionable earnings for the
12-month period ending the March preceding the valuation date. This pay was increased
by 1% to reflect the three month difference from March to June. For members with less
than one year of service, the base pay rate provided in the data was used.
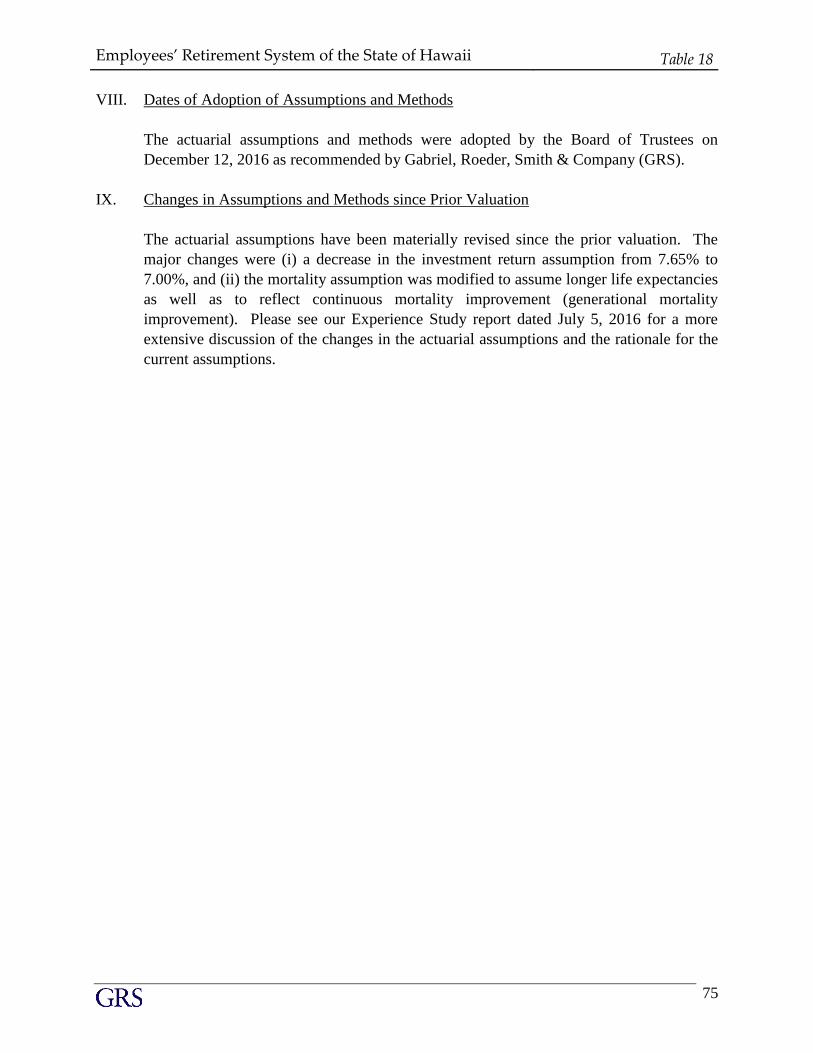
Employees’ Retirement System of the State of Hawaii Table 18
75
VIII. Dates of Adoption of Assumptions and Methods
The actuarial assumptions and methods were adopted by the Board of Trustees on
December 12, 2016 as recommended by Gabriel, Roeder, Smith & Company (GRS).
IX. Changes in Assumptions and Methods since Prior Valuation
The actuarial assumptions have been materially revised since the prior valuation. The
major changes were (i) a decrease in the investment return assumption from 7.65% to
7.00%, and (ii) the mortality assumption was modified to assume longer life expectancies
as well as to reflect continuous mortality improvement (generational mortality
improvement). Please see our Experience Study report dated July 5, 2016 for a more
extensive discussion of the changes in the actuarial assumptions and the rationale for the
current assumptions.

SECTION M
S TATIS TIC A L TA B LES
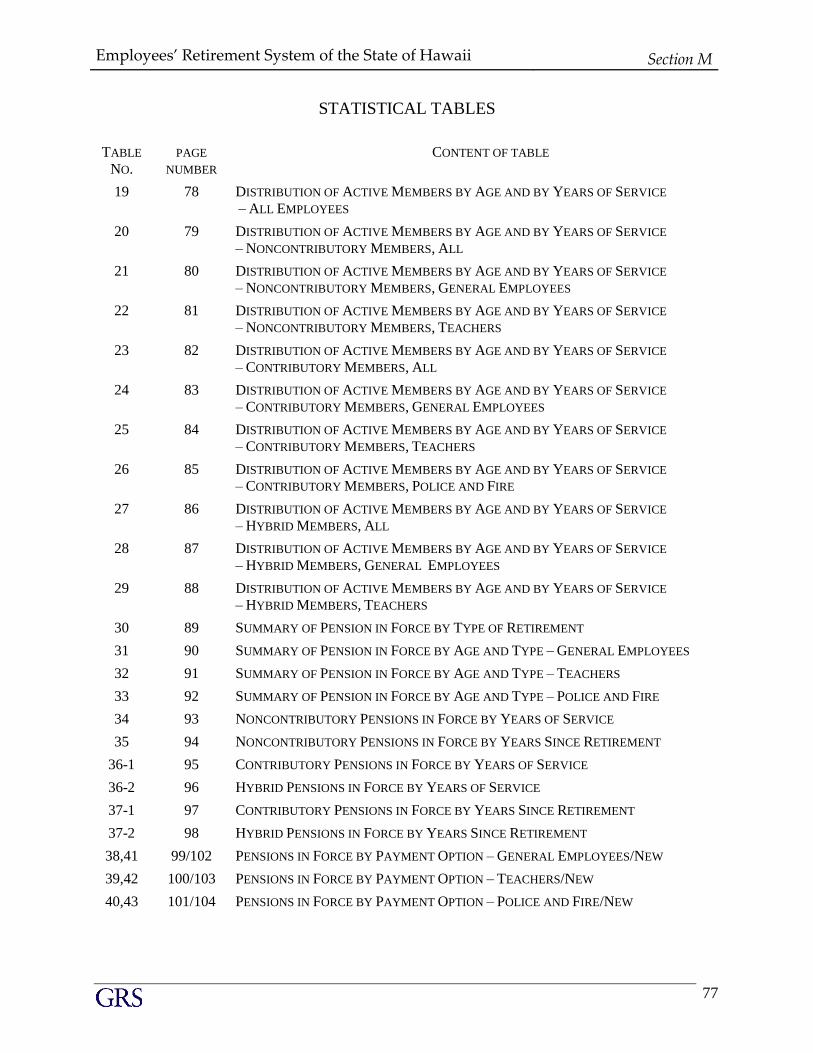
Employees’ Retirement System of the State of Hawaii Section M
77
STATISTICAL TABLES
TABLE
NO.
PAGE
NUMBER
CONTENT OF TABLE
19 78 DISTRIBUTION OF ACTIVE MEMBERS BY AGE AND BY YEARS OF SERVICE
– ALL EMPLOYEES
20 79 DISTRIBUTION OF ACTIVE MEMBERS BY AGE AND BY YEARS OF SERVICE
– NONCONTRIBUTORY MEMBERS, ALL
21 80 DISTRIBUTION OF ACTIVE MEMBERS BY AGE AND BY YEARS OF SERVICE
– NONCONTRIBUTORY MEMBERS, GENERAL EMPLOYEES
22 81 DISTRIBUTION OF ACTIVE MEMBERS BY AGE AND BY YEARS OF SERVICE
– NONCONTRIBUTORY MEMBERS, TEACHERS
23 82 DISTRIBUTION OF ACTIVE MEMBERS BY AGE AND BY YEARS OF SERVICE
– CONTRIBUTORY MEMBERS, ALL
24 83 DISTRIBUTION OF ACTIVE MEMBERS BY AGE AND BY YEARS OF SERVICE
– CONTRIBUTORY MEMBERS, GENERAL EMPLOYEES
25 84 DISTRIBUTION OF ACTIVE MEMBERS BY AGE AND BY YEARS OF SERVICE
– CONTRIBUTORY MEMBERS, TEACHERS
26 85 DISTRIBUTION OF ACTIVE MEMBERS BY AGE AND BY YEARS OF SERVICE
– CONTRIBUTORY MEMBERS, POLICE AND FIRE
27 86 DISTRIBUTION OF ACTIVE MEMBERS BY AGE AND BY YEARS OF SERVICE
– HYBRID MEMBERS, ALL
28 87 DISTRIBUTION OF ACTIVE MEMBERS BY AGE AND BY YEARS OF SERVICE
– HYBRID MEMBERS, GENERAL EMPLOYEES
29 88 DISTRIBUTION OF ACTIVE MEMBERS BY AGE AND BY YEARS OF SERVICE
– HYBRID MEMBERS, TEACHERS
30 89 SUMMARY OF PENSION IN FORCE BY TYPE OF RETIREMENT
31 90 SUMMARY OF PENSION IN FORCE BY AGE AND TYPE – GENERAL EMPLOYEES
32 91 SUMMARY OF PENSION IN FORCE BY AGE AND TYPE – TEACHERS
33 92 SUMMARY OF PENSION IN FORCE BY AGE AND TYPE – POLICE AND FIRE
34 93 NONCONTRIBUTORY PENSIONS IN FORCE BY YEARS OF SERVICE
35 94 NONCONTRIBUTORY PENSIONS IN FORCE BY YEARS SINCE RETIREMENT
36-1 95 CONTRIBUTORY PENSIONS IN FORCE BY YEARS OF SERVICE
36-2 96 HYBRID PENSIONS IN FORCE BY YEARS OF SERVICE
37-1 97 CONTRIBUTORY PENSIONS IN FORCE BY YEARS SINCE RETIREMENT
37-2 98 HYBRID PENSIONS IN FORCE BY YEARS SINCE RETIREMENT
38,41 99/102 PENSIONS IN FORCE BY PAYMENT OPTION – GENERAL EMPLOYEES/NEW
39,42 100/103 PENSIONS IN FORCE BY PAYMENT OPTION – TEACHERS/NEW
40,43 101/104 PENSIONS IN FORCE BY PAYMENT OPTION – POLICE AND FIRE/NEW
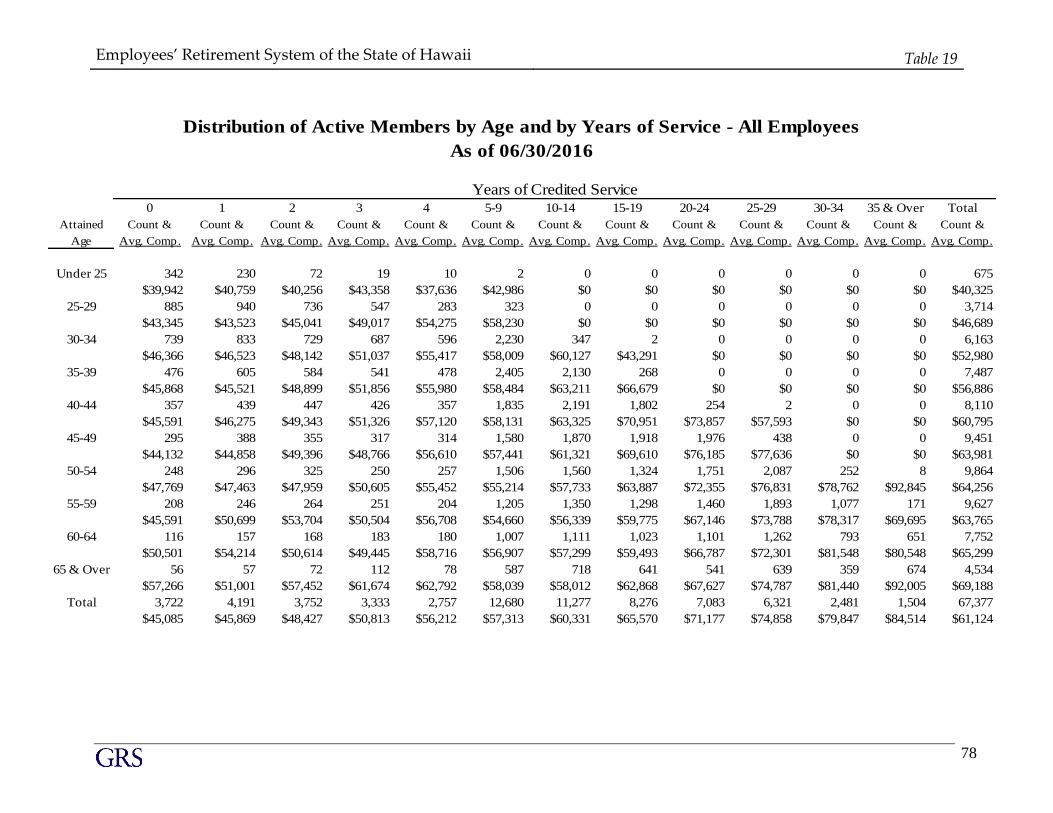
Employees’ Retirement System of the State of Hawaii Table 19
78
0 1 2 3 4 5-9 10-14 15-19 20-24 25-29 30-34 35 & Over Total
Attained Count & Count & Count & Count & Count & Count & Count & Count & Count & Count & Count & Count & Count &
Age Avg. Comp. Avg. Comp. Avg. Comp. Avg. Comp. Avg. Comp. Avg. Comp. Avg. Comp. Avg. Comp. Avg. Comp. Avg. Comp. Avg. Comp. Avg. Comp. Avg. Comp.
Under 25 342 230 72 19 10 2 0 0 0 0 0 0 675
$39,942 $40,759 $40,256 $43,358 $37,636 $42,986 $0 $0 $0 $0 $0 $0 $40,325
25-29 885 940 736 547 283 323 0 0 0 0 0 0 3,714
$43,345 $43,523 $45,041 $49,017 $54,275 $58,230 $0 $0 $0 $0 $0 $0 $46,689
30-34 739 833 729 687 596 2,230 347 2 0 0 0 0 6,163
$46,366 $46,523 $48,142 $51,037 $55,417 $58,009 $60,127 $43,291 $0 $0 $0 $0 $52,980
35-39 476 605 584 541 478 2,405 2,130 268 0 0 0 0 7,487
$45,868 $45,521 $48,899 $51,856 $55,980 $58,484 $63,211 $66,679 $0 $0 $0 $0 $56,886
40-44 357 439 447 426 357 1,835 2,191 1,802 254 2 0 0 8,110
$45,591 $46,275 $49,343 $51,326 $57,120 $58,131 $63,325 $70,951 $73,857 $57,593 $0 $0 $60,795
45-49 295 388 355 317 314 1,580 1,870 1,918 1,976 438 0 0 9,451
$44,132 $44,858 $49,396 $48,766 $56,610 $57,441 $61,321 $69,610 $76,185 $77,636 $0 $0 $63,981
50-54 248 296 325 250 257 1,506 1,560 1,324 1,751 2,087 252 8 9,864
$47,769 $47,463 $47,959 $50,605 $55,452 $55,214 $57,733 $63,887 $72,355 $76,831 $78,762 $92,845 $64,256
55-59 208 246 264 251 204 1,205 1,350 1,298 1,460 1,893 1,077 171 9,627
$45,591 $50,699 $53,704 $50,504 $56,708 $54,660 $56,339 $59,775 $67,146 $73,788 $78,317 $69,695 $63,765
60-64 116 157 168 183 180 1,007 1,111 1,023 1,101 1,262 793 651 7,752
$50,501 $54,214 $50,614 $49,445 $58,716 $56,907 $57,299 $59,493 $66,787 $72,301 $81,548 $80,548 $65,299
65 & Over 56 57 72 112 78 587 718 641 541 639 359 674 4,534
$57,266 $51,001 $57,452 $61,674 $62,792 $58,039 $58,012 $62,868 $67,627 $74,787 $81,440 $92,005 $69,188
Total 3,722 4,191 3,752 3,333 2,757 12,680 11,277 8,276 7,083 6,321 2,481 1,504 67,377
$45,085 $45,869 $48,427 $50,813 $56,212 $57,313 $60,331 $65,570 $71,177 $74,858 $79,847 $84,514 $61,124
Distribution of Active Members by Age and by Years of Service - All Employees
As of 06/30/2016
Years of Credited Service
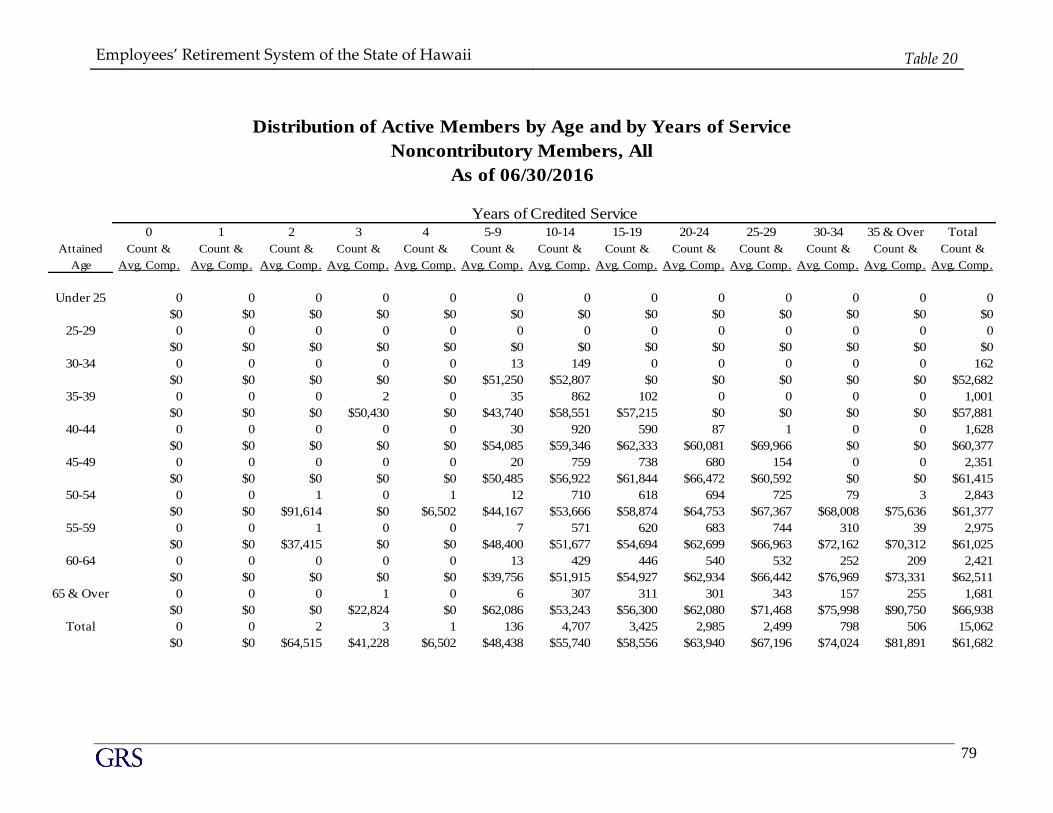
Employees’ Retirement System of the State of Hawaii Table 20
79
0 1 2 3 4 5-9 10-14 15-19 20-24 25-29 30-34 35 & Over Total
Attained Count & Count & Count & Count & Count & Count & Count & Count & Count & Count & Count & Count & Count &
Age Avg. Comp. Avg. Comp. Avg. Comp. Avg. Comp. Avg. Comp. Avg. Comp. Avg. Comp. Avg. Comp. Avg. Comp. Avg. Comp. Avg. Comp. Avg. Comp. Avg. Comp.
Under 25 0 0 0 0 0 0 0 0 0 0 0 0 0
$0 $0 $0 $0 $0 $0 $0 $0 $0 $0 $0 $0 $0
25-29 0 0 0 0 0 0 0 0 0 0 0 0 0
$0 $0 $0 $0 $0 $0 $0 $0 $0 $0 $0 $0 $0
30-34 0 0 0 0 0 13 149 0 0 0 0 0 162
$0 $0 $0 $0 $0 $51,250 $52,807 $0 $0 $0 $0 $0 $52,682
35-39 0 0 0 2 0 35 862 102 0 0 0 0 1,001
$0 $0 $0 $50,430 $0 $43,740 $58,551 $57,215 $0 $0 $0 $0 $57,881
40-44 0 0 0 0 0 30 920 590 87 1 0 0 1,628
$0 $0 $0 $0 $0 $54,085 $59,346 $62,333 $60,081 $69,966 $0 $0 $60,377
45-49 0 0 0 0 0 20 759 738 680 154 0 0 2,351
$0 $0 $0 $0 $0 $50,485 $56,922 $61,844 $66,472 $60,592 $0 $0 $61,415
50-54 0 0 1 0 1 12 710 618 694 725 79 3 2,843
$0 $0 $91,614 $0 $6,502 $44,167 $53,666 $58,874 $64,753 $67,367 $68,008 $75,636 $61,377
55-59 0 0 1 0 0 7 571 620 683 744 310 39 2,975
$0 $0 $37,415 $0 $0 $48,400 $51,677 $54,694 $62,699 $66,963 $72,162 $70,312 $61,025
60-64 0 0 0 0 0 13 429 446 540 532 252 209 2,421
$0 $0 $0 $0 $0 $39,756 $51,915 $54,927 $62,934 $66,442 $76,969 $73,331 $62,511
65 & Over 0 0 0 1 0 6 307 311 301 343 157 255 1,681
$0 $0 $0 $22,824 $0 $62,086 $53,243 $56,300 $62,080 $71,468 $75,998 $90,750 $66,938
Total 0 0 2 3 1 136 4,707 3,425 2,985 2,499 798 506 15,062
$0 $0 $64,515 $41,228 $6,502 $48,438 $55,740 $58,556 $63,940 $67,196 $74,024 $81,891 $61,682
Distribution of Active Members by Age and by Years of Service
As of 06/30/2016
Years of Credited Service
Noncontributory Members, All
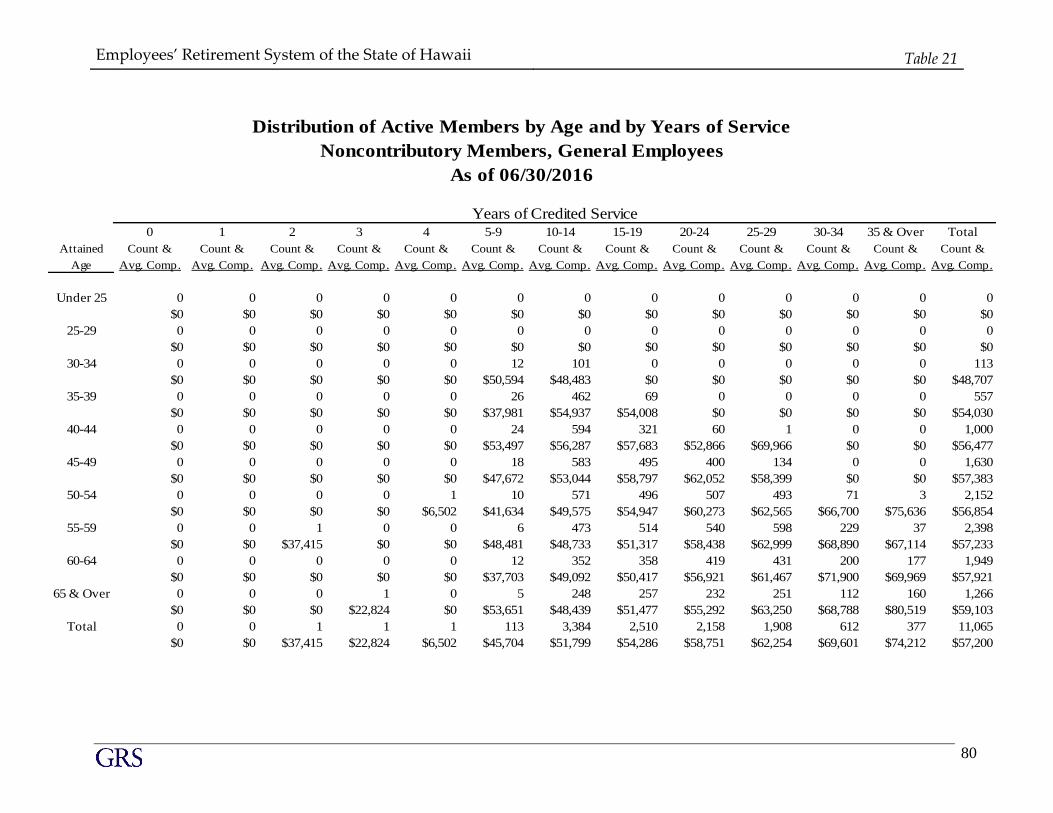
Employees’ Retirement System of the State of Hawaii Table 21
80
0 1 2 3 4 5-9 10-14 15-19 20-24 25-29 30-34 35 & Over Total
Attained Count & Count & Count & Count & Count & Count & Count & Count & Count & Count & Count & Count & Count &
Age Avg. Comp. Avg. Comp. Avg. Comp. Avg. Comp. Avg. Comp. Avg. Comp. Avg. Comp. Avg. Comp. Avg. Comp. Avg. Comp. Avg. Comp. Avg. Comp. Avg. Comp.
Under 25 0 0 0 0 0 0 0 0 0 0 0 0 0
$0 $0 $0 $0 $0 $0 $0 $0 $0 $0 $0 $0 $0
25-29 0 0 0 0 0 0 0 0 0 0 0 0 0
$0 $0 $0 $0 $0 $0 $0 $0 $0 $0 $0 $0 $0
30-34 0 0 0 0 0 12 101 0 0 0 0 0 113
$0 $0 $0 $0 $0 $50,594 $48,483 $0 $0 $0 $0 $0 $48,707
35-39 0 0 0 0 0 26 462 69 0 0 0 0 557
$0 $0 $0 $0 $0 $37,981 $54,937 $54,008 $0 $0 $0 $0 $54,030
40-44 0 0 0 0 0 24 594 321 60 1 0 0 1,000
$0 $0 $0 $0 $0 $53,497 $56,287 $57,683 $52,866 $69,966 $0 $0 $56,477
45-49 0 0 0 0 0 18 583 495 400 134 0 0 1,630
$0 $0 $0 $0 $0 $47,672 $53,044 $58,797 $62,052 $58,399 $0 $0 $57,383
50-54 0 0 0 0 1 10 571 496 507 493 71 3 2,152
$0 $0 $0 $0 $6,502 $41,634 $49,575 $54,947 $60,273 $62,565 $66,700 $75,636 $56,854
55-59 0 0 1 0 0 6 473 514 540 598 229 37 2,398
$0 $0 $37,415 $0 $0 $48,481 $48,733 $51,317 $58,438 $62,999 $68,890 $67,114 $57,233
60-64 0 0 0 0 0 12 352 358 419 431 200 177 1,949
$0 $0 $0 $0 $0 $37,703 $49,092 $50,417 $56,921 $61,467 $71,900 $69,969 $57,921
65 & Over 0 0 0 1 0 5 248 257 232 251 112 160 1,266
$0 $0 $0 $22,824 $0 $53,651 $48,439 $51,477 $55,292 $63,250 $68,788 $80,519 $59,103
Total 0 0 1 1 1 113 3,384 2,510 2,158 1,908 612 377 11,065
$0 $0 $37,415 $22,824 $6,502 $45,704 $51,799 $54,286 $58,751 $62,254 $69,601 $74,212 $57,200
Distribution of Active Members by Age and by Years of Service
As of 06/30/2016
Years of Credited Service
Noncontributory Members, General Employees

Employees’ Retirement System of the State of Hawaii Table 22
81
0 1 2 3 4 5-9 10-14 15-19 20-24 25-29 30-34 35 & Over Total
Attained Count & Count & Count & Count & Count & Count & Count & Count & Count & Count & Count & Count & Count &
Age Avg. Comp. Avg. Comp. Avg. Comp. Avg. Comp. Avg. Comp. Avg. Comp. Avg. Comp. Avg. Comp. Avg. Comp. Avg. Comp. Avg. Comp. Avg. Comp. Avg. Comp.
Under 25 0 0 0 0 0 0 0 0 0 0 0 0 0
$0 $0 $0 $0 $0 $0 $0 $0 $0 $0 $0 $0 $0
25-29 0 0 0 0 0 0 0 0 0 0 0 0 0
$0 $0 $0 $0 $0 $0 $0 $0 $0 $0 $0 $0 $0
30-34 0 0 0 0 0 1 48 0 0 0 0 0 49
$0 $0 $0 $0 $0 $59,119 $61,905 $0 $0 $0 $0 $0 $61,848
35-39 0 0 0 2 0 9 400 33 0 0 0 0 444
$0 $0 $0 $50,430 $0 $60,378 $62,725 $63,920 $0 $0 $0 $0 $62,711
40-44 0 0 0 0 0 6 326 269 27 0 0 0 628
$0 $0 $0 $0 $0 $56,437 $64,919 $67,881 $76,113 $0 $0 $0 $66,588
45-49 0 0 0 0 0 2 176 243 280 20 0 0 721
$0 $0 $0 $0 $0 $75,810 $69,769 $68,049 $72,786 $75,285 $0 $0 $70,531
50-54 0 0 1 0 0 2 139 122 187 232 8 0 691
$0 $0 $91,614 $0 $0 $56,834 $70,468 $74,836 $76,899 $77,571 $79,615 $0 $75,461
55-59 0 0 0 0 0 1 98 106 143 146 81 2 577
$0 $0 $0 $0 $0 $47,917 $65,887 $71,067 $78,788 $83,200 $81,413 $129,476 $76,786
60-64 0 0 0 0 0 1 77 88 121 101 52 32 472
$0 $0 $0 $0 $0 $64,385 $64,820 $73,274 $83,755 $87,672 $96,465 $91,923 $81,463
65 & Over 0 0 0 0 0 1 59 54 69 92 45 95 415
$0 $0 $0 $0 $0 $104,263 $73,434 $79,257 $84,904 $93,890 $93,942 $107,982 $90,840
Total 0 0 1 2 0 23 1,323 915 827 591 186 129 3,997
$0 $0 $91,614 $50,430 $0 $61,869 $65,820 $70,269 $77,478 $83,151 $88,575 $104,332 $74,091
Distribution of Active Members by Age and by Years of Service
As of 06/30/2016
Years of Credited Service
Noncontributory Members, Teachers
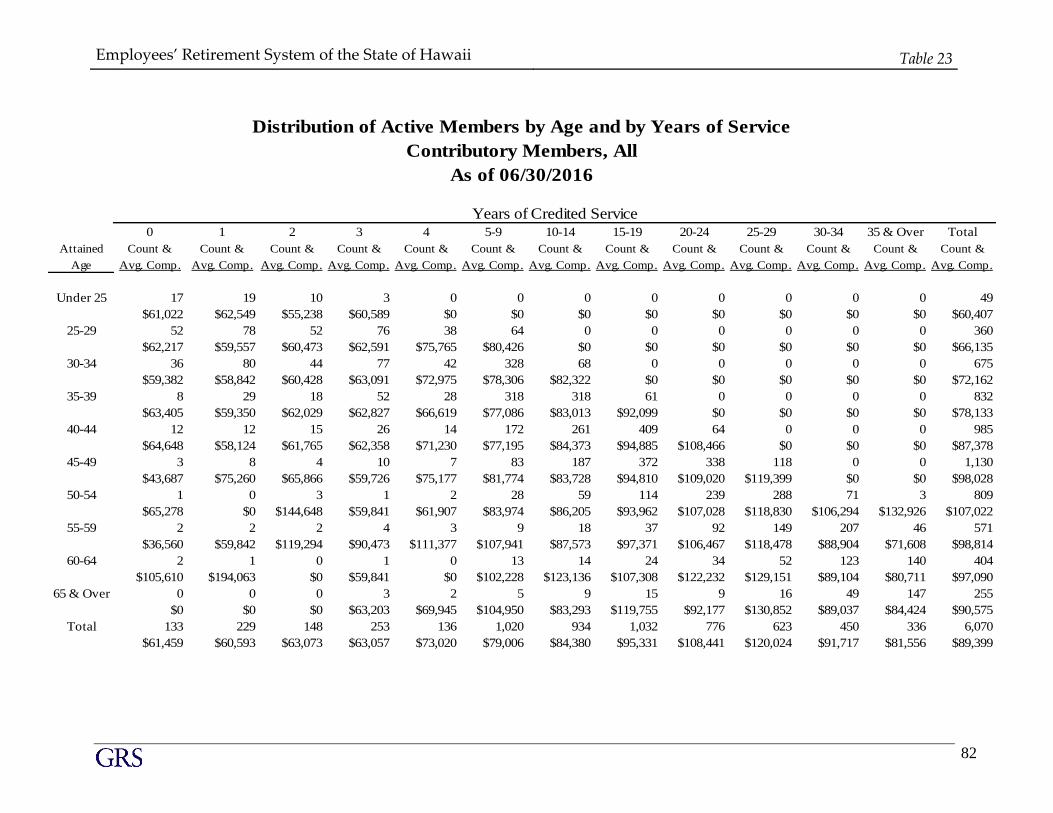
Employees’ Retirement System of the State of Hawaii Table 23
82
0 1 2 3 4 5-9 10-14 15-19 20-24 25-29 30-34 35 & Over Total
Attained Count & Count & Count & Count & Count & Count & Count & Count & Count & Count & Count & Count & Count &
Age Avg. Comp. Avg. Comp. Avg. Comp. Avg. Comp. Avg. Comp. Avg. Comp. Avg. Comp. Avg. Comp. Avg. Comp. Avg. Comp. Avg. Comp. Avg. Comp. Avg. Comp.
Under 25 17 19 10 3 0 0 0 0 0 0 0 0 49
$61,022 $62,549 $55,238 $60,589 $0 $0 $0 $0 $0 $0 $0 $0 $60,407
25-29 52 78 52 76 38 64 0 0 0 0 0 0 360
$62,217 $59,557 $60,473 $62,591 $75,765 $80,426 $0 $0 $0 $0 $0 $0 $66,135
30-34 36 80 44 77 42 328 68 0 0 0 0 0 675
$59,382 $58,842 $60,428 $63,091 $72,975 $78,306 $82,322 $0 $0 $0 $0 $0 $72,162
35-39 8 29 18 52 28 318 318 61 0 0 0 0 832
$63,405 $59,350 $62,029 $62,827 $66,619 $77,086 $83,013 $92,099 $0 $0 $0 $0 $78,133
40-44 12 12 15 26 14 172 261 409 64 0 0 0 985
$64,648 $58,124 $61,765 $62,358 $71,230 $77,195 $84,373 $94,885 $108,466 $0 $0 $0 $87,378
45-49 3 8 4 10 7 83 187 372 338 118 0 0 1,130
$43,687 $75,260 $65,866 $59,726 $75,177 $81,774 $83,728 $94,810 $109,020 $119,399 $0 $0 $98,028
50-54 1 0 3 1 2 28 59 114 239 288 71 3 809
$65,278 $0 $144,648 $59,841 $61,907 $83,974 $86,205 $93,962 $107,028 $118,830 $106,294 $132,926 $107,022
55-59 2 2 2 4 3 9 18 37 92 149 207 46 571
$36,560 $59,842 $119,294 $90,473 $111,377 $107,941 $87,573 $97,371 $106,467 $118,478 $88,904 $71,608 $98,814
60-64 2 1 0 1 0 13 14 24 34 52 123 140 404
$105,610 $194,063 $0 $59,841 $0 $102,228 $123,136 $107,308 $122,232 $129,151 $89,104 $80,711 $97,090
65 & Over 0 0 0 3 2 5 9 15 9 16 49 147 255
$0 $0 $0 $63,203 $69,945 $104,950 $83,293 $119,755 $92,177 $130,852 $89,037 $84,424 $90,575
Total 133 229 148 253 136 1,020 934 1,032 776 623 450 336 6,070
$61,459 $60,593 $63,073 $63,057 $73,020 $79,006 $84,380 $95,331 $108,441 $120,024 $91,717 $81,556 $89,399
Distribution of Active Members by Age and by Years of Service
As of 06/30/2016
Years of Credited Service
Contributory Members, All
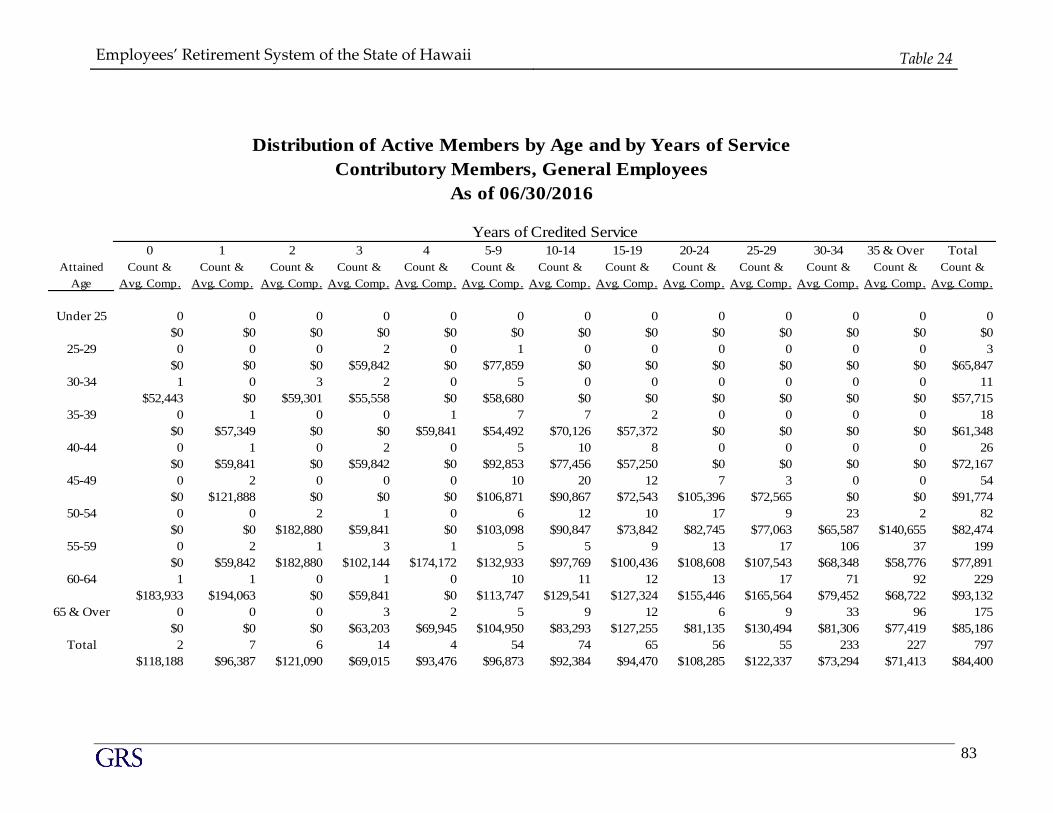
Employees’ Retirement System of the State of Hawaii Table 24
83
0 1 2 3 4 5-9 10-14 15-19 20-24 25-29 30-34 35 & Over Total
Attained Count & Count & Count & Count & Count & Count & Count & Count & Count & Count & Count & Count & Count &
Age Avg. Comp. Avg. Comp. Avg. Comp. Avg. Comp. Avg. Comp. Avg. Comp. Avg. Comp. Avg. Comp. Avg. Comp. Avg. Comp. Avg. Comp. Avg. Comp. Avg. Comp.
Under 25 0 0 0 0 0 0 0 0 0 0 0 0 0
$0 $0 $0 $0 $0 $0 $0 $0 $0 $0 $0 $0 $0
25-29 0 0 0 2 0 1 0 0 0 0 0 0 3
$0 $0 $0 $59,842 $0 $77,859 $0 $0 $0 $0 $0 $0 $65,847
30-34 1 0 3 2 0 5 0 0 0 0 0 0 11
$52,443 $0 $59,301 $55,558 $0 $58,680 $0 $0 $0 $0 $0 $0 $57,715
35-39 0 1 0 0 1 7 7 2 0 0 0 0 18
$0 $57,349 $0 $0 $59,841 $54,492 $70,126 $57,372 $0 $0 $0 $0 $61,348
40-44 0 1 0 2 0 5 10 8 0 0 0 0 26
$0 $59,841 $0 $59,842 $0 $92,853 $77,456 $57,250 $0 $0 $0 $0 $72,167
45-49 0 2 0 0 0 10 20 12 7 3 0 0 54
$0 $121,888 $0 $0 $0 $106,871 $90,867 $72,543 $105,396 $72,565 $0 $0 $91,774
50-54 0 0 2 1 0 6 12 10 17 9 23 2 82
$0 $0 $182,880 $59,841 $0 $103,098 $90,847 $73,842 $82,745 $77,063 $65,587 $140,655 $82,474
55-59 0 2 1 3 1 5 5 9 13 17 106 37 199
$0 $59,842 $182,880 $102,144 $174,172 $132,933 $97,769 $100,436 $108,608 $107,543 $68,348 $58,776 $77,891
60-64 1 1 0 1 0 10 11 12 13 17 71 92 229
$183,933 $194,063 $0 $59,841 $0 $113,747 $129,541 $127,324 $155,446 $165,564 $79,452 $68,722 $93,132
65 & Over 0 0 0 3 2 5 9 12 6 9 33 96 175
$0 $0 $0 $63,203 $69,945 $104,950 $83,293 $127,255 $81,135 $130,494 $81,306 $77,419 $85,186
Total 2 7 6 14 4 54 74 65 56 55 233 227 797
$118,188 $96,387 $121,090 $69,015 $93,476 $96,873 $92,384 $94,470 $108,285 $122,337 $73,294 $71,413 $84,400
Distribution of Active Members by Age and by Years of Service
As of 06/30/2016
Years of Credited Service
Contributory Members, General Employees
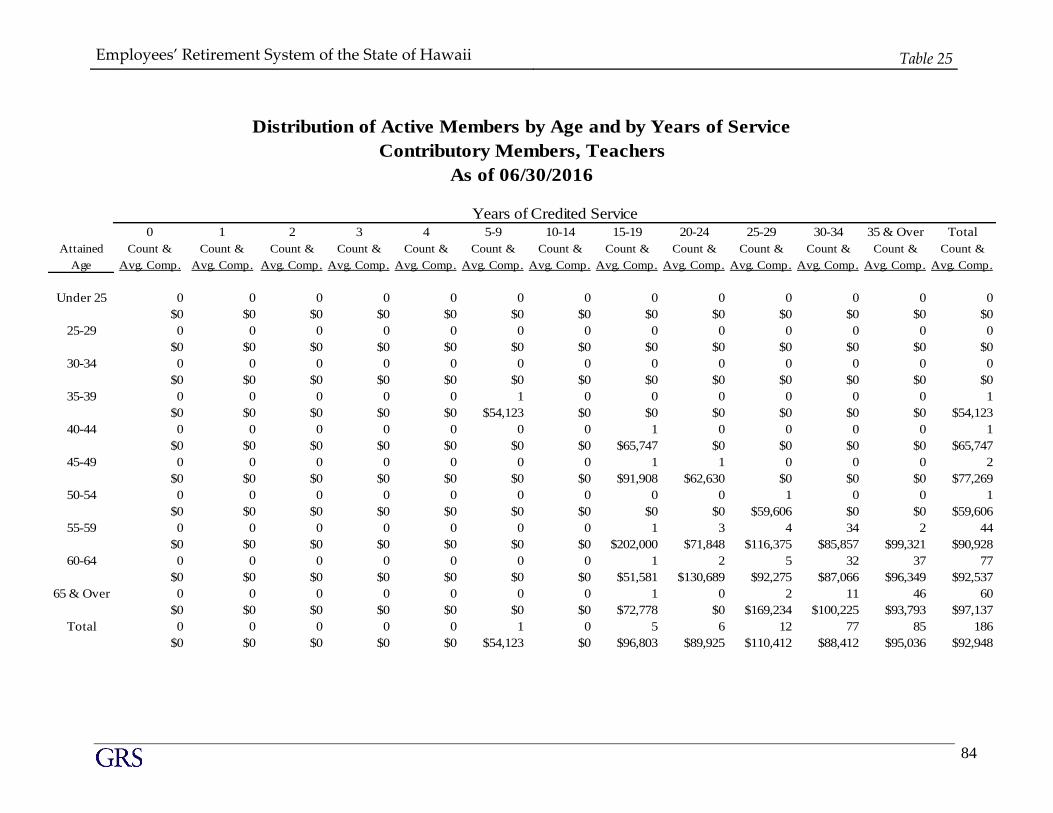
Employees’ Retirement System of the State of Hawaii Table 25
84
0 1 2 3 4 5-9 10-14 15-19 20-24 25-29 30-34 35 & Over Total
Attained Count & Count & Count & Count & Count & Count & Count & Count & Count & Count & Count & Count & Count &
Age Avg. Comp. Avg. Comp. Avg. Comp. Avg. Comp. Avg. Comp. Avg. Comp. Avg. Comp. Avg. Comp. Avg. Comp. Avg. Comp. Avg. Comp. Avg. Comp. Avg. Comp.
Under 25 0 0 0 0 0 0 0 0 0 0 0 0 0
$0 $0 $0 $0 $0 $0 $0 $0 $0 $0 $0 $0 $0
25-29 0 0 0 0 0 0 0 0 0 0 0 0 0
$0 $0 $0 $0 $0 $0 $0 $0 $0 $0 $0 $0 $0
30-34 0 0 0 0 0 0 0 0 0 0 0 0 0
$0 $0 $0 $0 $0 $0 $0 $0 $0 $0 $0 $0 $0
35-39 0 0 0 0 0 1 0 0 0 0 0 0 1
$0 $0 $0 $0 $0 $54,123 $0 $0 $0 $0 $0 $0 $54,123
40-44 0 0 0 0 0 0 0 1 0 0 0 0 1
$0 $0 $0 $0 $0 $0 $0 $65,747 $0 $0 $0 $0 $65,747
45-49 0 0 0 0 0 0 0 1 1 0 0 0 2
$0 $0 $0 $0 $0 $0 $0 $91,908 $62,630 $0 $0 $0 $77,269
50-54 0 0 0 0 0 0 0 0 0 1 0 0 1
$0 $0 $0 $0 $0 $0 $0 $0 $0 $59,606 $0 $0 $59,606
55-59 0 0 0 0 0 0 0 1 3 4 34 2 44
$0 $0 $0 $0 $0 $0 $0 $202,000 $71,848 $116,375 $85,857 $99,321 $90,928
60-64 0 0 0 0 0 0 0 1 2 5 32 37 77
$0 $0 $0 $0 $0 $0 $0 $51,581 $130,689 $92,275 $87,066 $96,349 $92,537
65 & Over 0 0 0 0 0 0 0 1 0 2 11 46 60
$0 $0 $0 $0 $0 $0 $0 $72,778 $0 $169,234 $100,225 $93,793 $97,137
Total 0 0 0 0 0 1 0 5 6 12 77 85 186
$0 $0 $0 $0 $0 $54,123 $0 $96,803 $89,925 $110,412 $88,412 $95,036 $92,948
Distribution of Active Members by Age and by Years of Service
As of 06/30/2016
Years of Credited Service
Contributory Members, Teachers
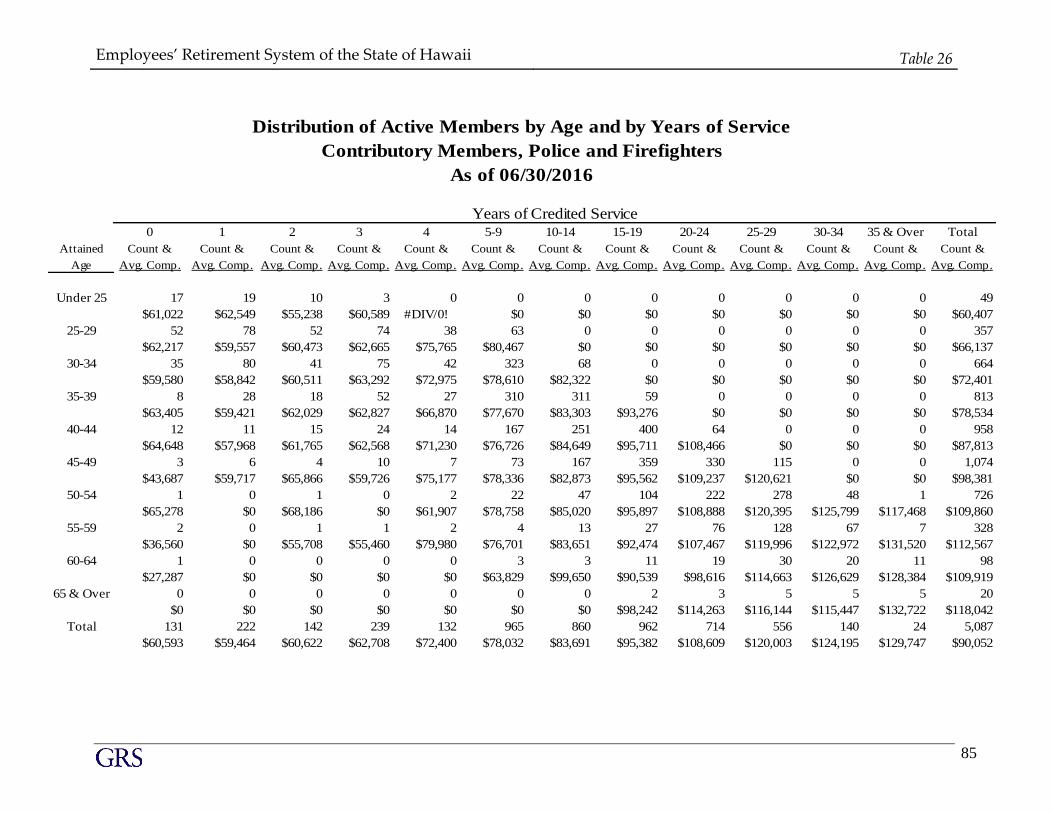
Employees’ Retirement System of the State of Hawaii Table 26
85
0 1 2 3 4 5-9 10-14 15-19 20-24 25-29 30-34 35 & Over Total
Attained Count & Count & Count & Count & Count & Count & Count & Count & Count & Count & Count & Count & Count &
Age Avg. Comp. Avg. Comp. Avg. Comp. Avg. Comp. Avg. Comp. Avg. Comp. Avg. Comp. Avg. Comp. Avg. Comp. Avg. Comp. Avg. Comp. Avg. Comp. Avg. Comp.
Under 25 17 19 10 3 0 0 0 0 0 0 0 0 49
$61,022 $62,549 $55,238 $60,589 #DIV/0! $0 $0 $0 $0 $0 $0 $0 $60,407
25-29 52 78 52 74 38 63 0 0 0 0 0 0 357
$62,217 $59,557 $60,473 $62,665 $75,765 $80,467 $0 $0 $0 $0 $0 $0 $66,137
30-34 35 80 41 75 42 323 68 0 0 0 0 0 664
$59,580 $58,842 $60,511 $63,292 $72,975 $78,610 $82,322 $0 $0 $0 $0 $0 $72,401
35-39 8 28 18 52 27 310 311 59 0 0 0 0 813
$63,405 $59,421 $62,029 $62,827 $66,870 $77,670 $83,303 $93,276 $0 $0 $0 $0 $78,534
40-44 12 11 15 24 14 167 251 400 64 0 0 0 958
$64,648 $57,968 $61,765 $62,568 $71,230 $76,726 $84,649 $95,711 $108,466 $0 $0 $0 $87,813
45-49 3 6 4 10 7 73 167 359 330 115 0 0 1,074
$43,687 $59,717 $65,866 $59,726 $75,177 $78,336 $82,873 $95,562 $109,237 $120,621 $0 $0 $98,381
50-54 1 0 1 0 2 22 47 104 222 278 48 1 726
$65,278 $0 $68,186 $0 $61,907 $78,758 $85,020 $95,897 $108,888 $120,395 $125,799 $117,468 $109,860
55-59 2 0 1 1 2 4 13 27 76 128 67 7 328
$36,560 $0 $55,708 $55,460 $79,980 $76,701 $83,651 $92,474 $107,467 $119,996 $122,972 $131,520 $112,567
60-64 1 0 0 0 0 3 3 11 19 30 20 11 98
$27,287 $0 $0 $0 $0 $63,829 $99,650 $90,539 $98,616 $114,663 $126,629 $128,384 $109,919
65 & Over 0 0 0 0 0 0 0 2 3 5 5 5 20
$0 $0 $0 $0 $0 $0 $0 $98,242 $114,263 $116,144 $115,447 $132,722 $118,042
Total 131 222 142 239 132 965 860 962 714 556 140 24 5,087
$60,593 $59,464 $60,622 $62,708 $72,400 $78,032 $83,691 $95,382 $108,609 $120,003 $124,195 $129,747 $90,052
Distribution of Active Members by Age and by Years of Service
As of 06/30/2016
Years of Credited Service
Contributory Members, Police and Firefighters
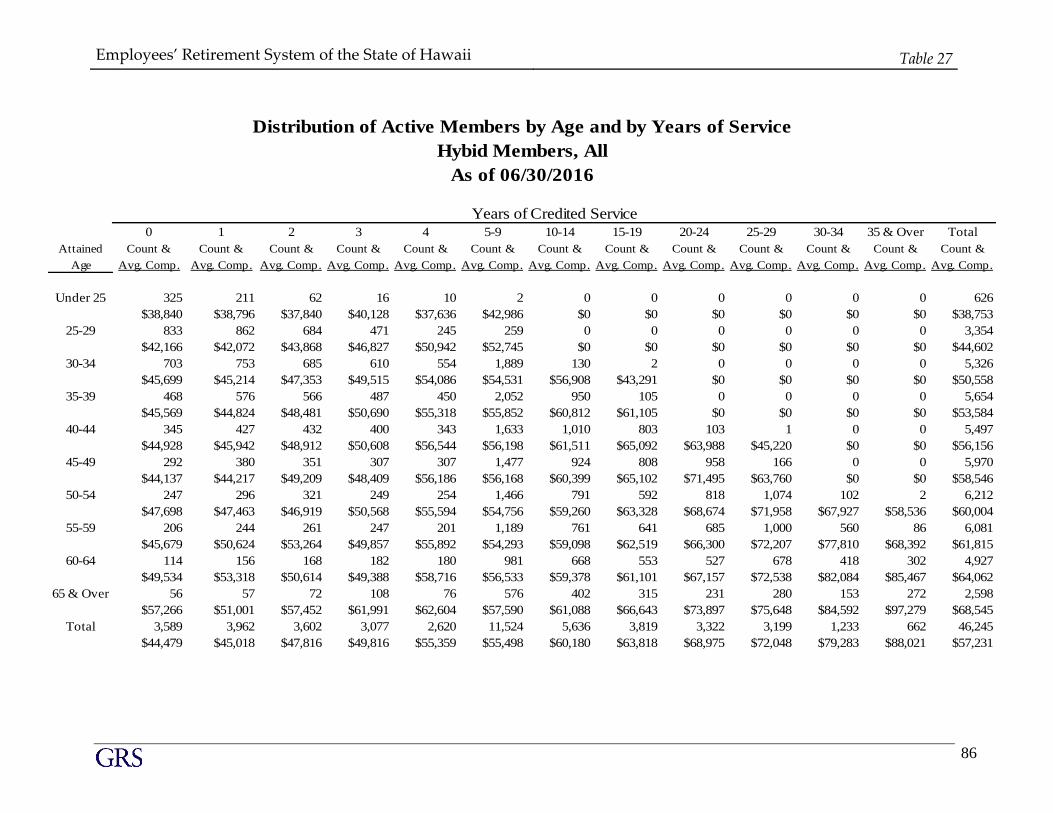
Employees’ Retirement System of the State of Hawaii Table 27
86
0 1 2 3 4 5-9 10-14 15-19 20-24 25-29 30-34 35 & Over Total
Attained Count & Count & Count & Count & Count & Count & Count & Count & Count & Count & Count & Count & Count &
Age Avg. Comp. Avg. Comp. Avg. Comp. Avg. Comp. Avg. Comp. Avg. Comp. Avg. Comp. Avg. Comp. Avg. Comp. Avg. Comp. Avg. Comp. Avg. Comp. Avg. Comp.
Under 25 325 211 62 16 10 2 0 0 0 0 0 0 626
$38,840 $38,796 $37,840 $40,128 $37,636 $42,986 $0 $0 $0 $0 $0 $0 $38,753
25-29 833 862 684 471 245 259 0 0 0 0 0 0 3,354
$42,166 $42,072 $43,868 $46,827 $50,942 $52,745 $0 $0 $0 $0 $0 $0 $44,602
30-34 703 753 685 610 554 1,889 130 2 0 0 0 0 5,326
$45,699 $45,214 $47,353 $49,515 $54,086 $54,531 $56,908 $43,291 $0 $0 $0 $0 $50,558
35-39 468 576 566 487 450 2,052 950 105 0 0 0 0 5,654
$45,569 $44,824 $48,481 $50,690 $55,318 $55,852 $60,812 $61,105 $0 $0 $0 $0 $53,584
40-44 345 427 432 400 343 1,633 1,010 803 103 1 0 0 5,497
$44,928 $45,942 $48,912 $50,608 $56,544 $56,198 $61,511 $65,092 $63,988 $45,220 $0 $0 $56,156
45-49 292 380 351 307 307 1,477 924 808 958 166 0 0 5,970
$44,137 $44,217 $49,209 $48,409 $56,186 $56,168 $60,399 $65,102 $71,495 $63,760 $0 $0 $58,546
50-54 247 296 321 249 254 1,466 791 592 818 1,074 102 2 6,212
$47,698 $47,463 $46,919 $50,568 $55,594 $54,756 $59,260 $63,328 $68,674 $71,958 $67,927 $58,536 $60,004
55-59 206 244 261 247 201 1,189 761 641 685 1,000 560 86 6,081
$45,679 $50,624 $53,264 $49,857 $55,892 $54,293 $59,098 $62,519 $66,300 $72,207 $77,810 $68,392 $61,815
60-64 114 156 168 182 180 981 668 553 527 678 418 302 4,927
$49,534 $53,318 $50,614 $49,388 $58,716 $56,533 $59,378 $61,101 $67,157 $72,538 $82,084 $85,467 $64,062
65 & Over 56 57 72 108 76 576 402 315 231 280 153 272 2,598
$57,266 $51,001 $57,452 $61,991 $62,604 $57,590 $61,088 $66,643 $73,897 $75,648 $84,592 $97,279 $68,545
Total 3,589 3,962 3,602 3,077 2,620 11,524 5,636 3,819 3,322 3,199 1,233 662 46,245
$44,479 $45,018 $47,816 $49,816 $55,359 $55,498 $60,180 $63,818 $68,975 $72,048 $79,283 $88,021 $57,231
Distribution of Active Members by Age and by Years of Service
As of 06/30/2016
Years of Credited Service
Hybid Members, All
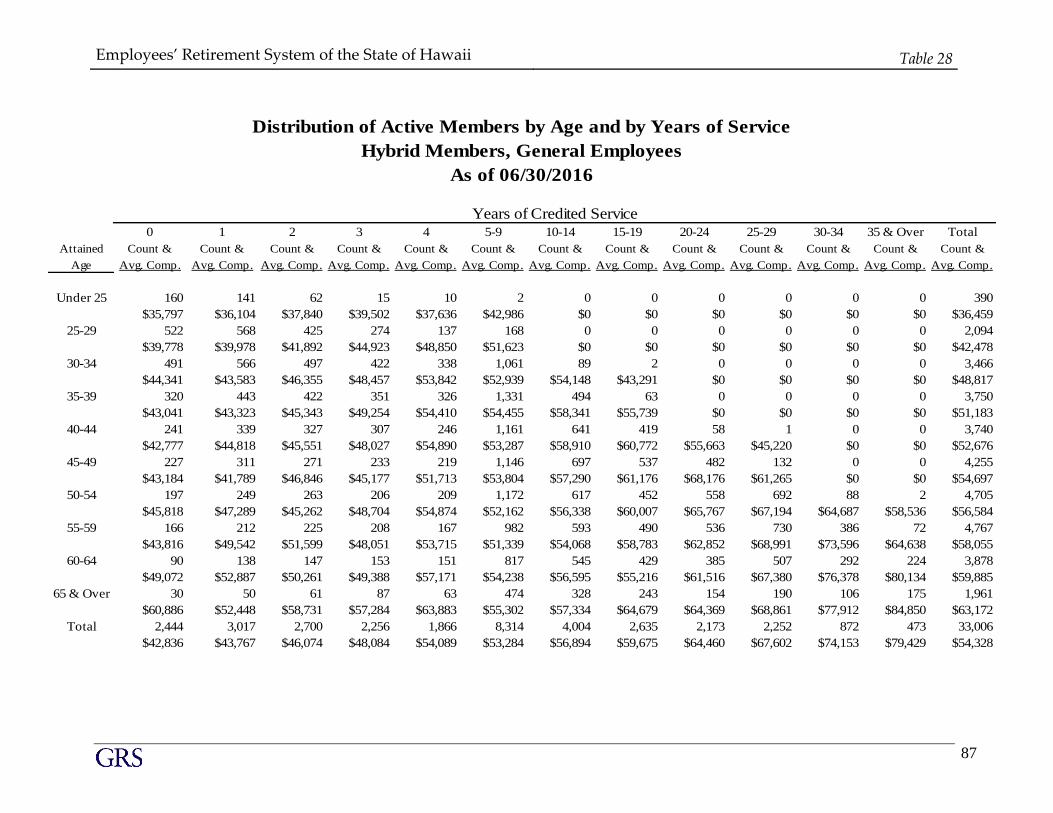
Employees’ Retirement System of the State of Hawaii Table 28
87
0 1 2 3 4 5-9 10-14 15-19 20-24 25-29 30-34 35 & Over Total
Attained Count & Count & Count & Count & Count & Count & Count & Count & Count & Count & Count & Count & Count &
Age Avg. Comp. Avg. Comp. Avg. Comp. Avg. Comp. Avg. Comp. Avg. Comp. Avg. Comp. Avg. Comp. Avg. Comp. Avg. Comp. Avg. Comp. Avg. Comp. Avg. Comp.
Under 25 160 141 62 15 10 2 0 0 0 0 0 0 390
$35,797 $36,104 $37,840 $39,502 $37,636 $42,986 $0 $0 $0 $0 $0 $0 $36,459
25-29 522 568 425 274 137 168 0 0 0 0 0 0 2,094
$39,778 $39,978 $41,892 $44,923 $48,850 $51,623 $0 $0 $0 $0 $0 $0 $42,478
30-34 491 566 497 422 338 1,061 89 2 0 0 0 0 3,466
$44,341 $43,583 $46,355 $48,457 $53,842 $52,939 $54,148 $43,291 $0 $0 $0 $0 $48,817
35-39 320 443 422 351 326 1,331 494 63 0 0 0 0 3,750
$43,041 $43,323 $45,343 $49,254 $54,410 $54,455 $58,341 $55,739 $0 $0 $0 $0 $51,183
40-44 241 339 327 307 246 1,161 641 419 58 1 0 0 3,740
$42,777 $44,818 $45,551 $48,027 $54,890 $53,287 $58,910 $60,772 $55,663 $45,220 $0 $0 $52,676
45-49 227 311 271 233 219 1,146 697 537 482 132 0 0 4,255
$43,184 $41,789 $46,846 $45,177 $51,713 $53,804 $57,290 $61,176 $68,176 $61,265 $0 $0 $54,697
50-54 197 249 263 206 209 1,172 617 452 558 692 88 2 4,705
$45,818 $47,289 $45,262 $48,704 $54,874 $52,162 $56,338 $60,007 $65,767 $67,194 $64,687 $58,536 $56,584
55-59 166 212 225 208 167 982 593 490 536 730 386 72 4,767
$43,816 $49,542 $51,599 $48,051 $53,715 $51,339 $54,068 $58,783 $62,852 $68,991 $73,596 $64,638 $58,055
60-64 90 138 147 153 151 817 545 429 385 507 292 224 3,878
$49,072 $52,887 $50,261 $49,388 $57,171 $54,238 $56,595 $55,216 $61,516 $67,380 $76,378 $80,134 $59,885
65 & Over 30 50 61 87 63 474 328 243 154 190 106 175 1,961
$60,886 $52,448 $58,731 $57,284 $63,883 $55,302 $57,334 $64,679 $64,369 $68,861 $77,912 $84,850 $63,172
Total 2,444 3,017 2,700 2,256 1,866 8,314 4,004 2,635 2,173 2,252 872 473 33,006
$42,836 $43,767 $46,074 $48,084 $54,089 $53,284 $56,894 $59,675 $64,460 $67,602 $74,153 $79,429 $54,328
Distribution of Active Members by Age and by Years of Service
As of 06/30/2016
Years of Credited Service
Hybrid Members, General Employees
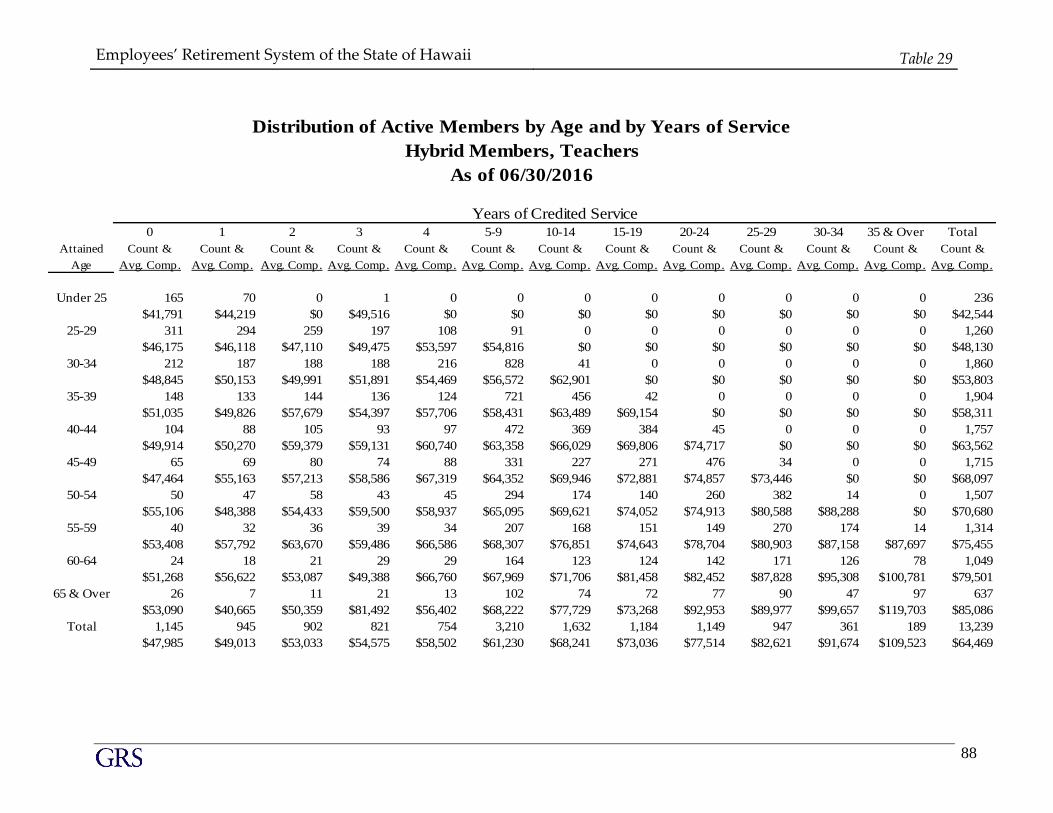
Employees’ Retirement System of the State of Hawaii Table 29
88
0 1 2 3 4 5-9 10-14 15-19 20-24 25-29 30-34 35 & Over Total
Attained Count & Count & Count & Count & Count & Count & Count & Count & Count & Count & Count & Count & Count &
Age Avg. Comp. Avg. Comp. Avg. Comp. Avg. Comp. Avg. Comp. Avg. Comp. Avg. Comp. Avg. Comp. Avg. Comp. Avg. Comp. Avg. Comp. Avg. Comp. Avg. Comp.
Under 25 165 70 0 1 0 0 0 0 0 0 0 0 236
$41,791 $44,219 $0 $49,516 $0 $0 $0 $0 $0 $0 $0 $0 $42,544
25-29 311 294 259 197 108 91 0 0 0 0 0 0 1,260
$46,175 $46,118 $47,110 $49,475 $53,597 $54,816 $0 $0 $0 $0 $0 $0 $48,130
30-34 212 187 188 188 216 828 41 0 0 0 0 0 1,860
$48,845 $50,153 $49,991 $51,891 $54,469 $56,572 $62,901 $0 $0 $0 $0 $0 $53,803
35-39 148 133 144 136 124 721 456 42 0 0 0 0 1,904
$51,035 $49,826 $57,679 $54,397 $57,706 $58,431 $63,489 $69,154 $0 $0 $0 $0 $58,311
40-44 104 88 105 93 97 472 369 384 45 0 0 0 1,757
$49,914 $50,270 $59,379 $59,131 $60,740 $63,358 $66,029 $69,806 $74,717 $0 $0 $0 $63,562
45-49 65 69 80 74 88 331 227 271 476 34 0 0 1,715
$47,464 $55,163 $57,213 $58,586 $67,319 $64,352 $69,946 $72,881 $74,857 $73,446 $0 $0 $68,097
50-54 50 47 58 43 45 294 174 140 260 382 14 0 1,507
$55,106 $48,388 $54,433 $59,500 $58,937 $65,095 $69,621 $74,052 $74,913 $80,588 $88,288 $0 $70,680
55-59 40 32 36 39 34 207 168 151 149 270 174 14 1,314
$53,408 $57,792 $63,670 $59,486 $66,586 $68,307 $76,851 $74,643 $78,704 $80,903 $87,158 $87,697 $75,455
60-64 24 18 21 29 29 164 123 124 142 171 126 78 1,049
$51,268 $56,622 $53,087 $49,388 $66,760 $67,969 $71,706 $81,458 $82,452 $87,828 $95,308 $100,781 $79,501
65 & Over 26 7 11 21 13 102 74 72 77 90 47 97 637
$53,090 $40,665 $50,359 $81,492 $56,402 $68,222 $77,729 $73,268 $92,953 $89,977 $99,657 $119,703 $85,086
Total 1,145 945 902 821 754 3,210 1,632 1,184 1,149 947 361 189 13,239
$47,985 $49,013 $53,033 $54,575 $58,502 $61,230 $68,241 $73,036 $77,514 $82,621 $91,674 $109,523 $64,469
Distribution of Active Members by Age and by Years of Service
As of 06/30/2016
Years of Credited Service
Hybrid Members, Teachers
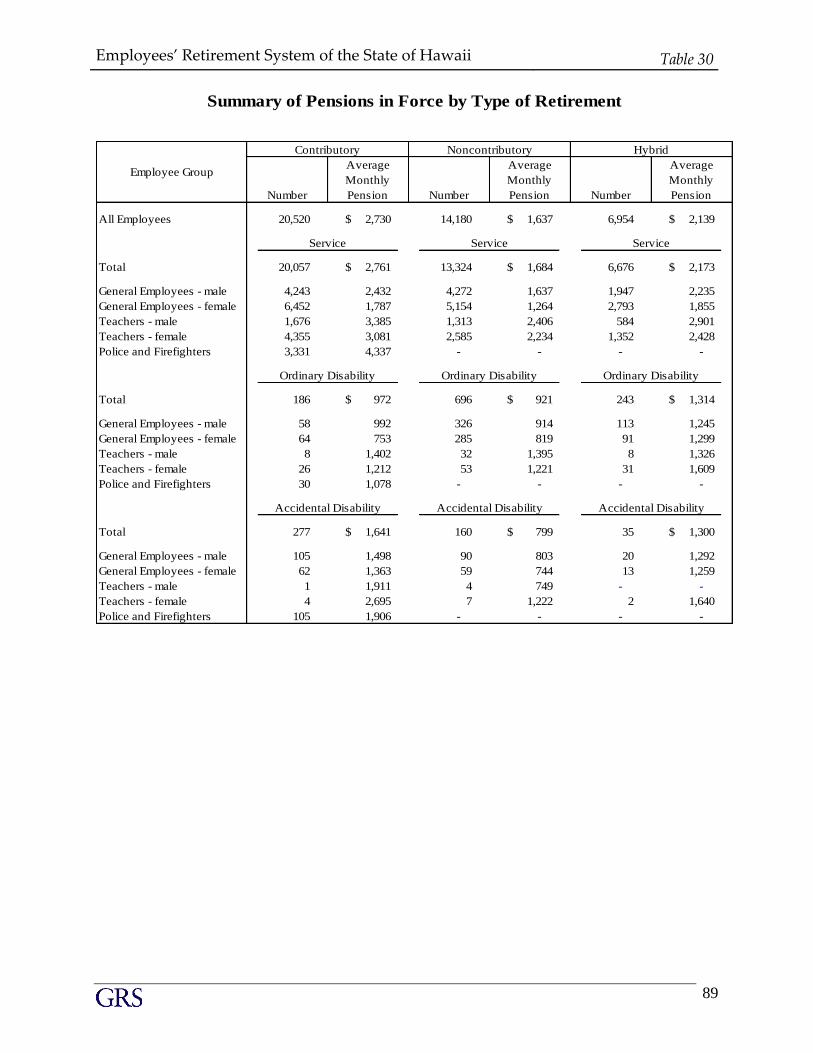
Employees’ Retirement System of the State of Hawaii Table 30
89
Number
Average
Monthly
Pension Number
Average
Monthly
Pension Number
Average
Monthly
Pension
All Employees 20,520 2,730$ 14,180 1,637$ 6,954 2,139$
Total 20,057 2,761$ 13,324 1,684$ 6,676 2,173$
General Employees - male 4,243 2,432 4,272 1,637 1,947 2,235
General Employees - female 6,452 1,787 5,154 1,264 2,793 1,855
Teachers - male 1,676 3,385 1,313 2,406 584 2,901
Teachers - female 4,355 3,081 2,585 2,234 1,352 2,428
Police and Firefighters 3,331 4,337 - - - -
Total 186 972$ 696 921$ 243 1,314$
General Employees - male 58 992 326 914 113 1,245
General Employees - female 64 753 285 819 91 1,299
Teachers - male 8 1,402 32 1,395 8 1,326
Teachers - female 26 1,212 53 1,221 31 1,609
Police and Firefighters 30 1,078 - - - -
Total 277 1,641$ 160 799$ 35 1,300$
General Employees - male 105 1,498 90 803 20 1,292
General Employees - female 62 1,363 59 744 13 1,259
Teachers - male 1 1,911 4 749 - -
Teachers - female 4 2,695 7 1,222 2 1,640
Police and Firefighters 105 1,906 - - - -
Accidental Disability Accidental Disability Accidental Disability
Hybrid
Service
Ordinary Disability
Summary of Pensions in Force by Type of Retirement
Employee Group
Service
Contributory Noncontributory
Service
Ordinary Disability Ordinary Disability
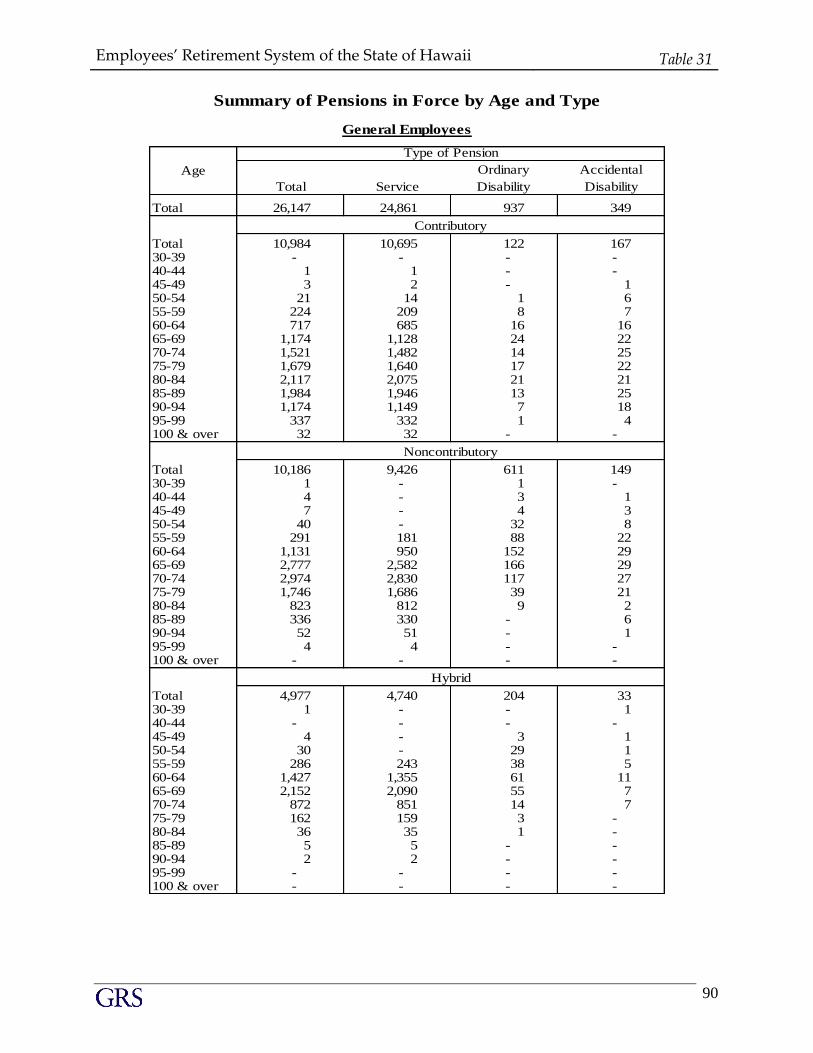
Employees’ Retirement System of the State of Hawaii Table 31
90
Total 26,147 24,861 937 349
Total 10,984 10,695 122 167 30-39 - - - - 40-44 1 1 - - 45-49 3 2 - 1 50-54 21 14 1 6 55-59 224 209 8 7 60-64 717 685 16 16 65-69 1,174 1,128 24 22 70-74 1,521 1,482 14 25 75-79 1,679 1,640 17 22 80-84 2,117 2,075 21 21 85-89 1,984 1,946 13 25 90-94 1,174 1,149 7 18 95-99 337 332 1 4 100 & over 32 32 - -
Total 10,186 9,426 611 149 30-39 1 - 1 - 40-44 4 - 3 1 45-49 7 - 4 3 50-54 40 - 32 8 55-59 291 181 88 22 60-64 1,131 950 152 29 65-69 2,777 2,582 166 29 70-74 2,974 2,830 117 27 75-79 1,746 1,686 39 21 80-84 823 812 9 2 85-89 336 330 - 6 90-94 52 51 - 1 95-99 4 4 - - 100 & over - - - -
Total 4,977 4,740 204 33 30-39 1 - - 1 40-44 - - - - 45-49 4 - 3 1 50-54 30 - 29 1 55-59 286 243 38 5 60-64 1,427 1,355 61 11 65-69 2,152 2,090 55 7 70-74 872 851 14 7 75-79 162 159 3 - 80-84 36 35 1 - 85-89 5 5 - - 90-94 2 2 - - 95-99 - - - - 100 & over - - - -
Noncontributory
Hybrid
Service
Ordinary
Disability
Accidental
Disability
Contributory
Age
Total
Type of Pension
Summary of Pensions in Force by Age and Type
General Employees
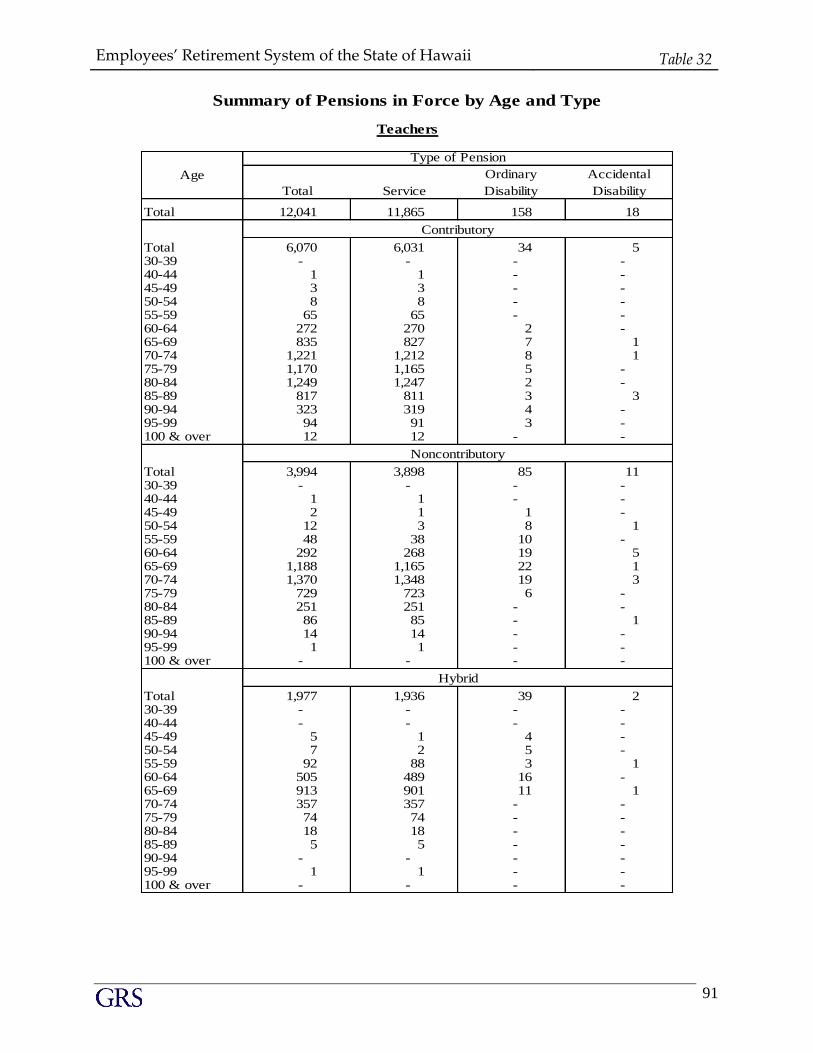
Employees’ Retirement System of the State of Hawaii Table 32
91
Total 12,041 11,865 158 18
Total 6,070 6,031 34 5 30-39 - - - - 40-44 1 1 - - 45-49 3 3 - - 50-54 8 8 - - 55-59 65 65 - - 60-64 272 270 2 - 65-69 835 827 7 1 70-74 1,221 1,212 8 1 75-79 1,170 1,165 5 - 80-84 1,249 1,247 2 - 85-89 817 811 3 3 90-94 323 319 4 - 95-99 94 91 3 - 100 & over 12 12 - -
Total 3,994 3,898 85 11 30-39 - - - - 40-44 1 1 - - 45-49 2 1 1 - 50-54 12 3 8 1 55-59 48 38 10 - 60-64 292 268 19 5 65-69 1,188 1,165 22 1 70-74 1,370 1,348 19 3 75-79 729 723 6 - 80-84 251 251 - - 85-89 86 85 - 1 90-94 14 14 - - 95-99 1 1 - - 100 & over - - - -
Total 1,977 1,936 39 2 30-39 - - - - 40-44 - - - - 45-49 5 1 4 - 50-54 7 2 5 - 55-59 92 88 3 1 60-64 505 489 16 - 65-69 913 901 11 1 70-74 357 357 - - 75-79 74 74 - - 80-84 18 18 - - 85-89 5 5 - - 90-94 - - - - 95-99 1 1 - - 100 & over - - - -
Hybrid
Summary of Pensions in Force by Age and Type
Teachers
Noncontributory
Age
Total Service
Ordinary
Disability
Accidental
Disability
Type of Pension
Contributory
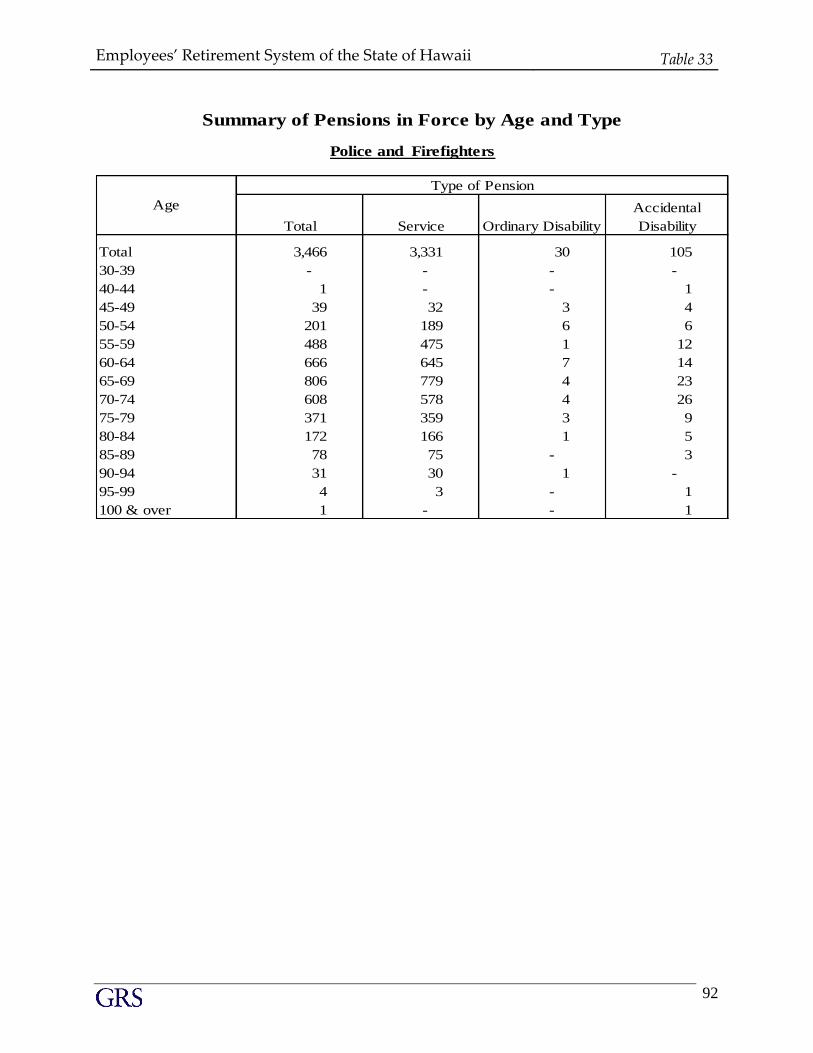
Employees’ Retirement System of the State of Hawaii Table 33
92
Total 3,466 3,331 30 105
30-39 - - - -
40-44 1 - - 1
45-49 39 32 3 4
50-54 201 189 6 6
55-59 488 475 1 12
60-64 666 645 7 14
65-69 806 779 4 23
70-74 608 578 4 26
75-79 371 359 3 9
80-84 172 166 1 5
85-89 78 75 - 3
90-94 31 30 1 -
95-99 4 3 - 1
100 & over 1 - - 1
Summary of Pensions in Force by Age and Type
Police and Firefighters
Type of Pension
Age
Total Service Ordinary Disability
Accidental
Disability
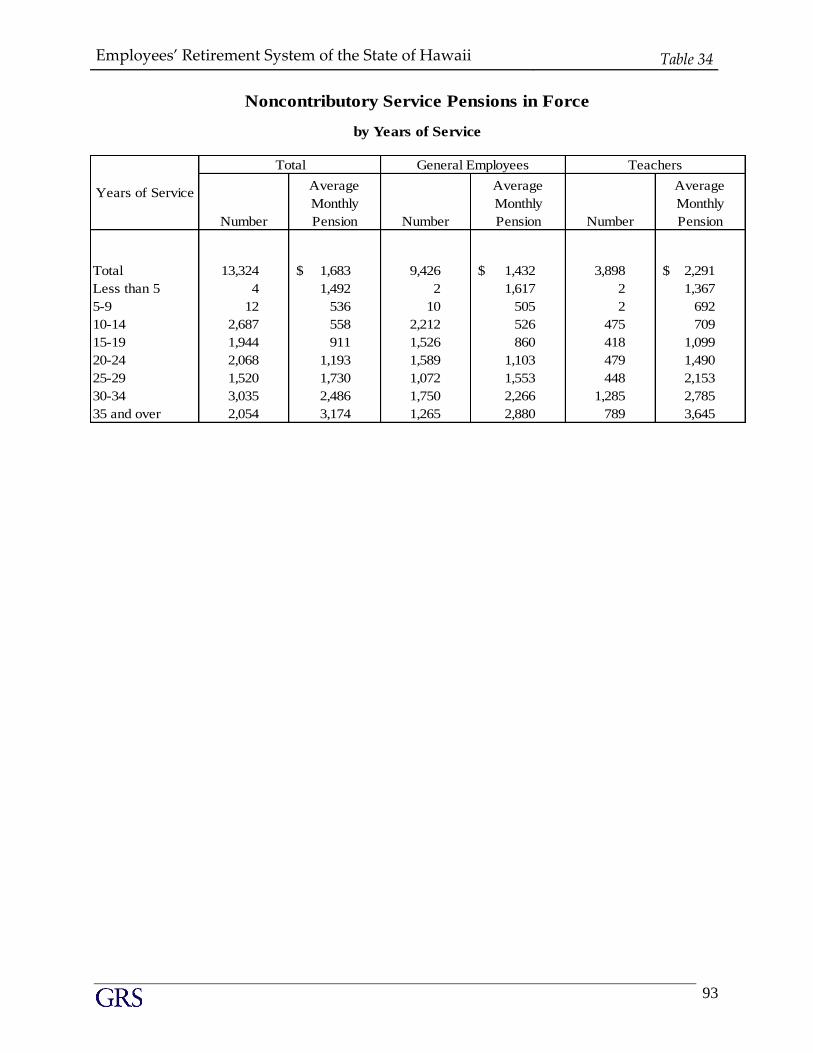
Employees’ Retirement System of the State of Hawaii Table 34
93
Total 13,324 1,683$ 9,426 1,432$ 3,898 2,291$
Less than 5 4 1,492 2 1,617 2 1,367
5-9 12 536 10 505 2 692
10-14 2,687 558 2,212 526 475 709
15-19 1,944 911 1,526 860 418 1,099
20-24 2,068 1,193 1,589 1,103 479 1,490
25-29 1,520 1,730 1,072 1,553 448 2,153
30-34 3,035 2,486 1,750 2,266 1,285 2,785
35 and over 2,054 3,174 1,265 2,880 789 3,645
Noncontributory Service Pensions in Force
by Years of Service
Teachers
Years of Service
Number
Average
Monthly
Pension
Total General Employees
Average
Monthly
PensionNumber Number
Average
Monthly
Pension
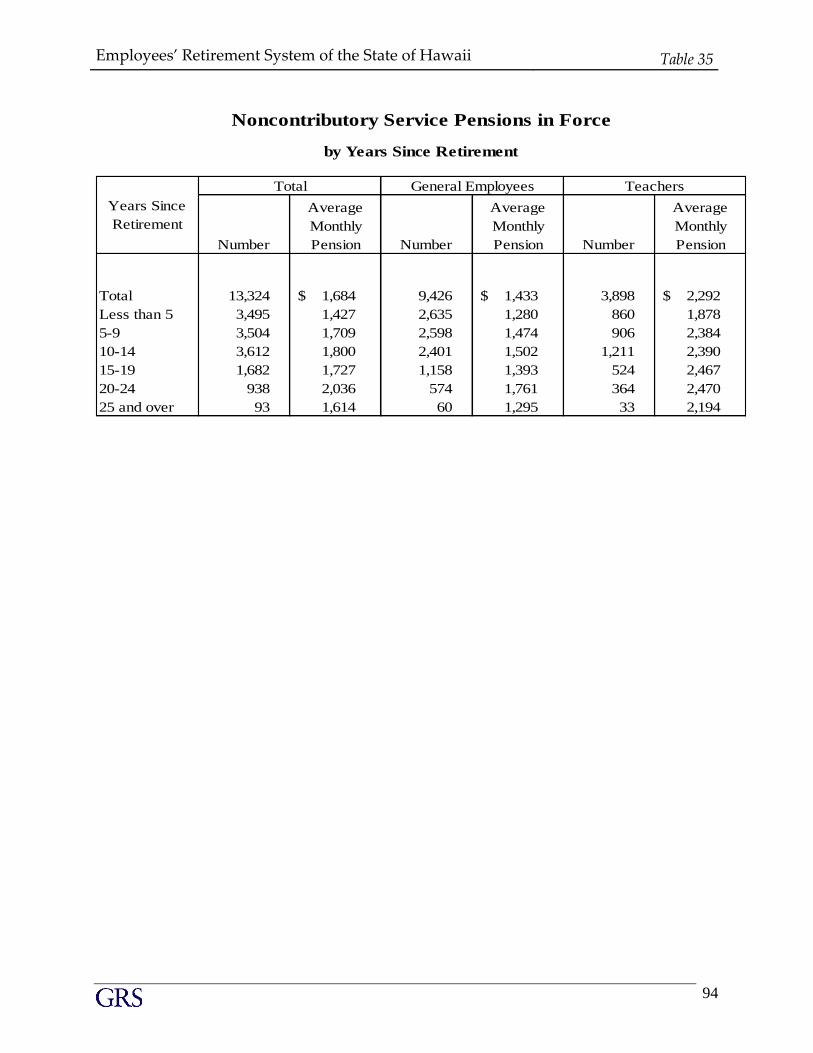
Employees’ Retirement System of the State of Hawaii Table 35
94
Total 13,324 1,684$ 9,426 1,433$ 3,898 2,292$
Less than 5 3,495 1,427 2,635 1,280 860 1,878
5-9 3,504 1,709 2,598 1,474 906 2,384
10-14 3,612 1,800 2,401 1,502 1,211 2,390
15-19 1,682 1,727 1,158 1,393 524 2,467
20-24 938 2,036 574 1,761 364 2,470
25 and over 93 1,614 60 1,295 33 2,194
Number
Noncontributory Service Pensions in Force
by Years Since Retirement
Years Since
Retirement
Total General Employees Teachers
Average
Monthly
PensionNumber
Average
Monthly
PensionNumber
Average
Monthly
Pension

Employees’ Retirement System of the State of Hawaii Table 36-1
95
Total 20,057 2,761$ 10,695 2,042$ 6,031 3,166$ 3,331 4,337$
Less than 5 8 1,136 5 976 2 713 1 2,784
5-9 644 400 489 375 149 479 6 529
10-14 1,232 751 951 642 234 1,114 47 1,139
15-19 1,649 1,239 1,265 1,058 317 1,789 67 2,058
20-24 2,273 1,727 1,629 1,476 500 2,186 144 2,977
25-29 6,106 2,947 2,566 2,166 1,579 2,847 1,961 4,050
30-34 5,814 3,583 2,397 2,901 2,417 3,554 1,000 5,290
35 and over 2,331 4,029 1,393 3,440 833 4,817 105 5,594
Number
Average
Monthly
Pension
Contributory Service Pensions in Force
by Years of Service
Police and Firefighters
Years of Service Average
Monthly
PensionNumber
Average
Monthly
Pension Number
Average
Monthly
Pension
Total TeachersGeneral Employees
Number
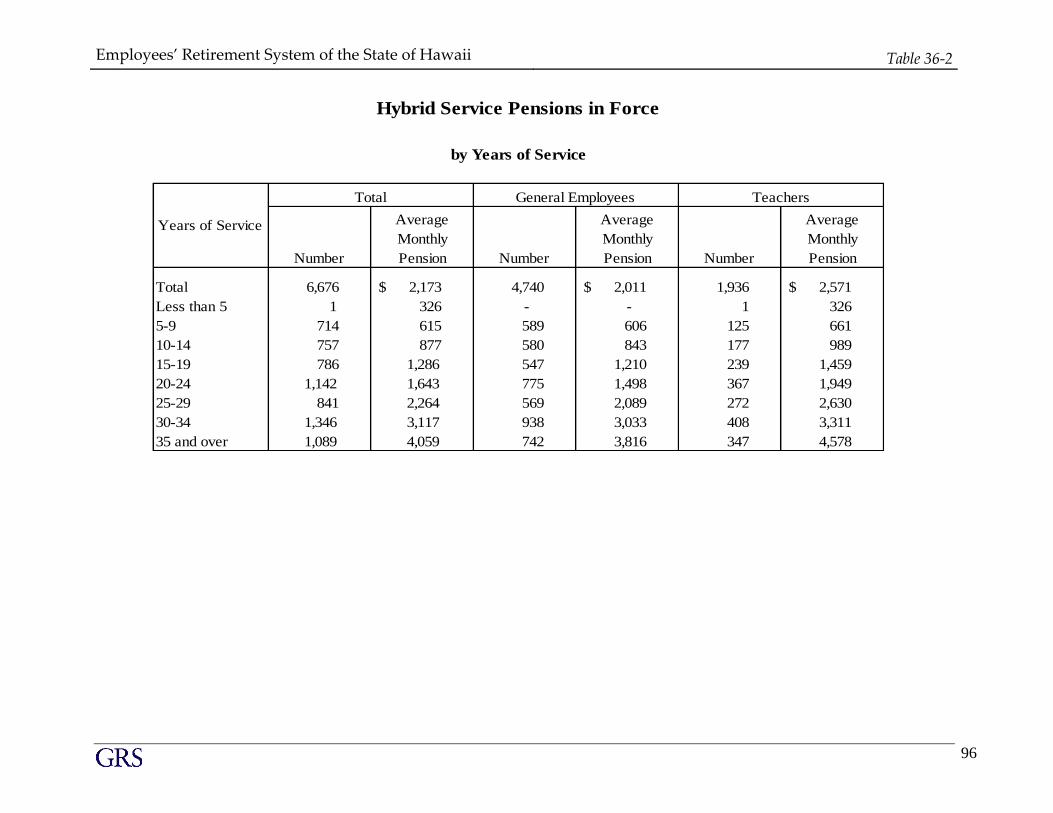
Employees’ Retirement System of the State of Hawaii Table 36-2
96
Total 6,676 2,173$ 4,740 2,011$ 1,936 2,571$
Less than 5 1 326 - - 1 326
5-9 714 615 589 606 125 661
10-14 757 877 580 843 177 989
15-19 786 1,286 547 1,210 239 1,459
20-24 1,142 1,643 775 1,498 367 1,949
25-29 841 2,264 569 2,089 272 2,630
30-34 1,346 3,117 938 3,033 408 3,311
35 and over 1,089 4,059 742 3,816 347 4,578
Hybrid Service Pensions in Force
by Years of Service
Years of Service
Number
Average
Monthly
PensionNumber
Average
Monthly
Pension
General EmployeesTotal
Average
Monthly
Pension Number
Teachers
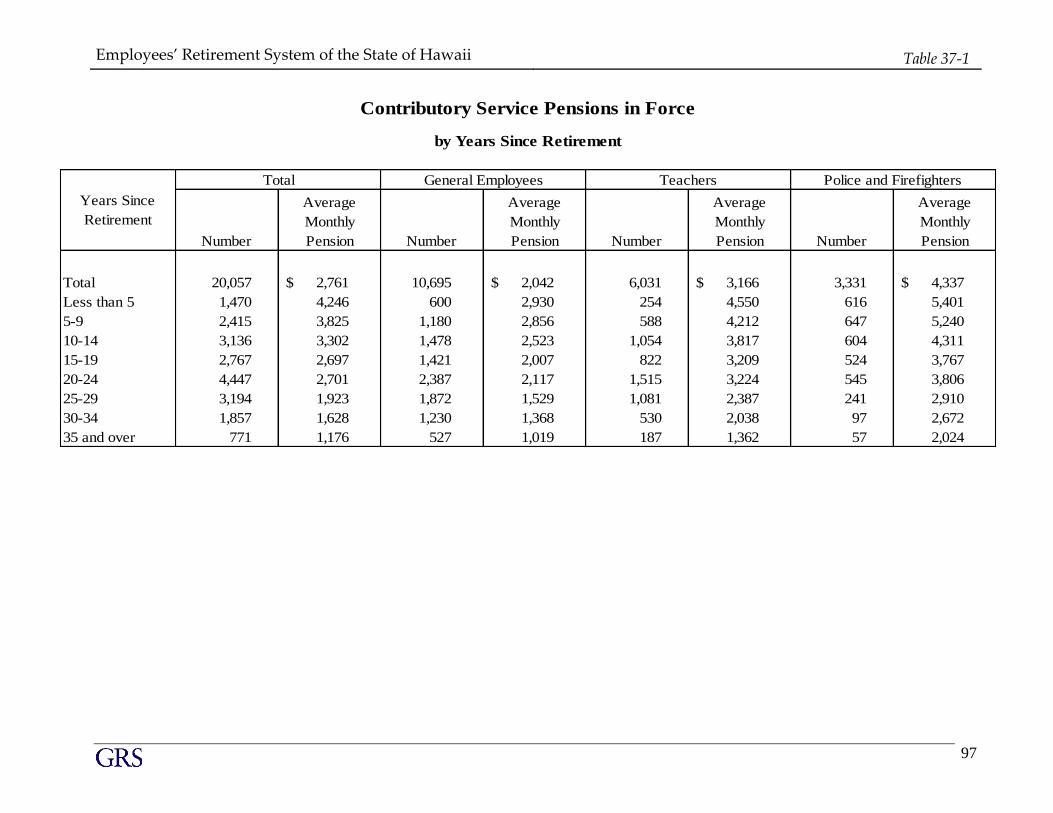
Employees’ Retirement System of the State of Hawaii Table 37-1
97
Total 20,057 2,761$ 10,695 2,042$ 6,031 3,166$ 3,331 4,337$
Less than 5 1,470 4,246 600 2,930 254 4,550 616 5,401
5-9 2,415 3,825 1,180 2,856 588 4,212 647 5,240
10-14 3,136 3,302 1,478 2,523 1,054 3,817 604 4,311
15-19 2,767 2,697 1,421 2,007 822 3,209 524 3,767
20-24 4,447 2,701 2,387 2,117 1,515 3,224 545 3,806
25-29 3,194 1,923 1,872 1,529 1,081 2,387 241 2,910
30-34 1,857 1,628 1,230 1,368 530 2,038 97 2,672
35 and over 771 1,176 527 1,019 187 1,362 57 2,024
Contributory Service Pensions in Force
by Years Since Retirement
Number
Average
Monthly
PensionNumber
Average
Monthly
Pension
Total General Employees Teachers
Average
Monthly
Pension
Years Since
Retirement
Police and Firefighters
Average
Monthly
PensionNumberNumber
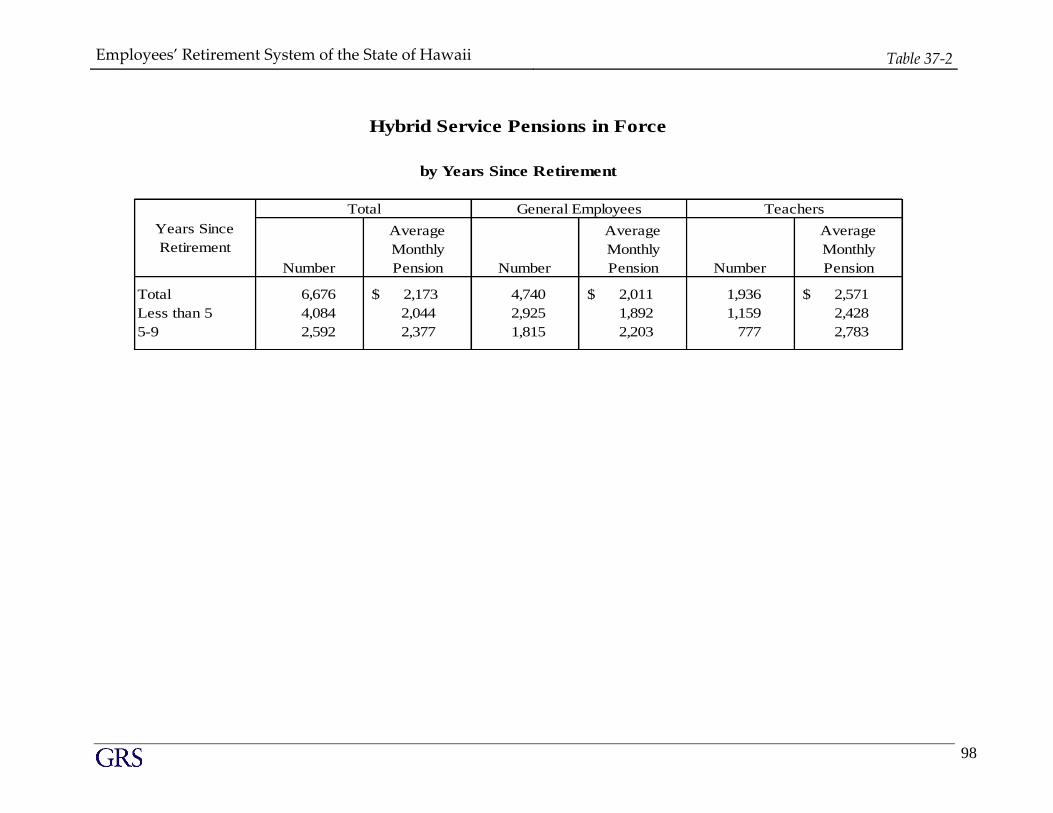
Employees’ Retirement System of the State of Hawaii Table 37-2
98
Total 6,676 2,173$ 4,740 2,011$ 1,936 2,571$
Less than 5 4,084 2,044 2,925 1,892 1,159 2,428
5-9 2,592 2,377 1,815 2,203 777 2,783
Number
Average
Monthly
Pension Number
Years Since
Retirement
Total Teachers
by Years Since Retirement
General Employees
Hybrid Service Pensions in Force
Average
Monthly
Pension Number
Average
Monthly
Pension
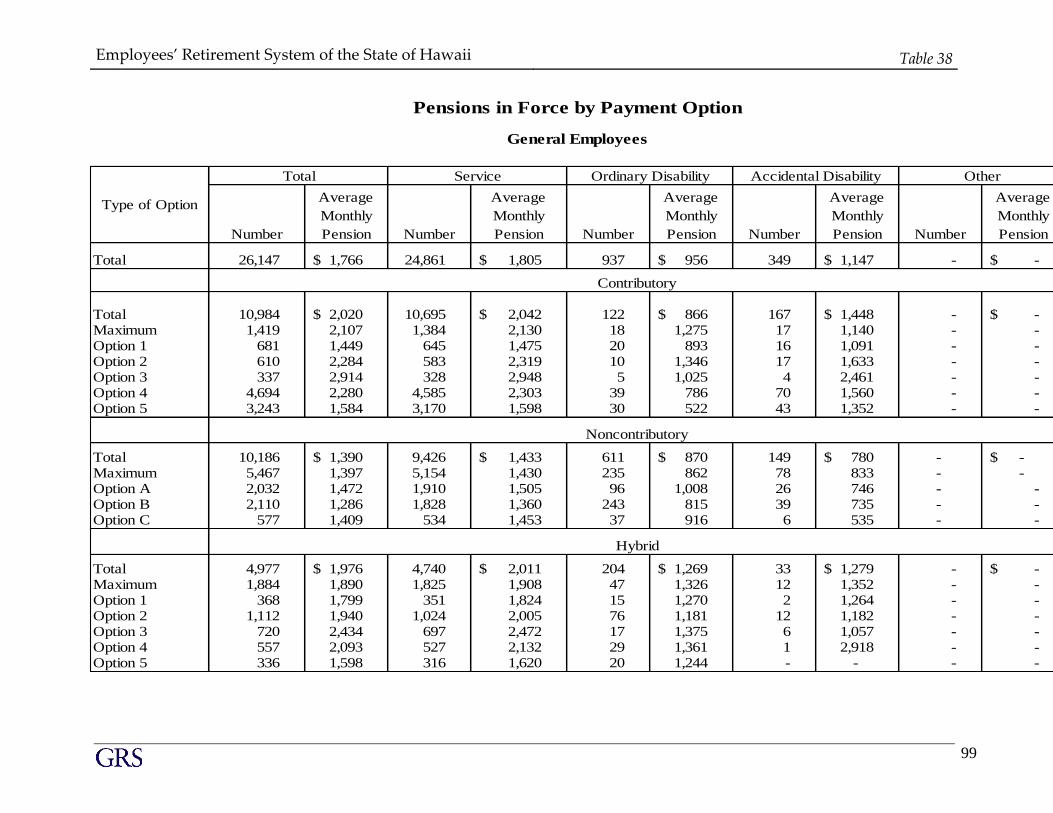
Employees’ Retirement System of the State of Hawaii Table 38
99
Total 26,147 1,766$ 24,861 1,805$ 937 956$ 349 1,147$ - -$
Total 10,984 2,020$ 10,695 2,042$ 122 866$ 167 1,448$ - -$ Maximum 1,419 2,107 1,384 2,130 18 1,275 17 1,140 - - Option 1 681 1,449 645 1,475 20 893 16 1,091 - - Option 2 610 2,284 583 2,319 10 1,346 17 1,633 - - Option 3 337 2,914 328 2,948 5 1,025 4 2,461 - - Option 4 4,694 2,280 4,585 2,303 39 786 70 1,560 - - Option 5 3,243 1,584 3,170 1,598 30 522 43 1,352 - -
Total 10,186 1,390$ 9,426 1,433$ 611 870$ 149 780$ - -$ Maximum 5,467 1,397 5,154 1,430 235 862 78 833 - - Option A 2,032 1,472 1,910 1,505 96 1,008 26 746 - - Option B 2,110 1,286 1,828 1,360 243 815 39 735 - - Option C 577 1,409 534 1,453 37 916 6 535 - -
Total 4,977 1,976$ 4,740 2,011$ 204 1,269$ 33 1,279$ - -$ Maximum 1,884 1,890 1,825 1,908 47 1,326 12 1,352 - - Option 1 368 1,799 351 1,824 15 1,270 2 1,264 - - Option 2 1,112 1,940 1,024 2,005 76 1,181 12 1,182 - - Option 3 720 2,434 697 2,472 17 1,375 6 1,057 - - Option 4 557 2,093 527 2,132 29 1,361 1 2,918 - - Option 5 336 1,598 316 1,620 20 1,244 - - - -
Pensions in Force by Payment Option
General Employees
Ordinary Disability Accidental Disability Other
Type of Option
Hybrid
Total
Average
Monthly
Pension
Noncontributory
Contributory
Average
Monthly
PensionNumber
Average
Monthly
Pension
Average
Monthly
Pension
Service
NumberNumberNumber
Average
Monthly
PensionNumber
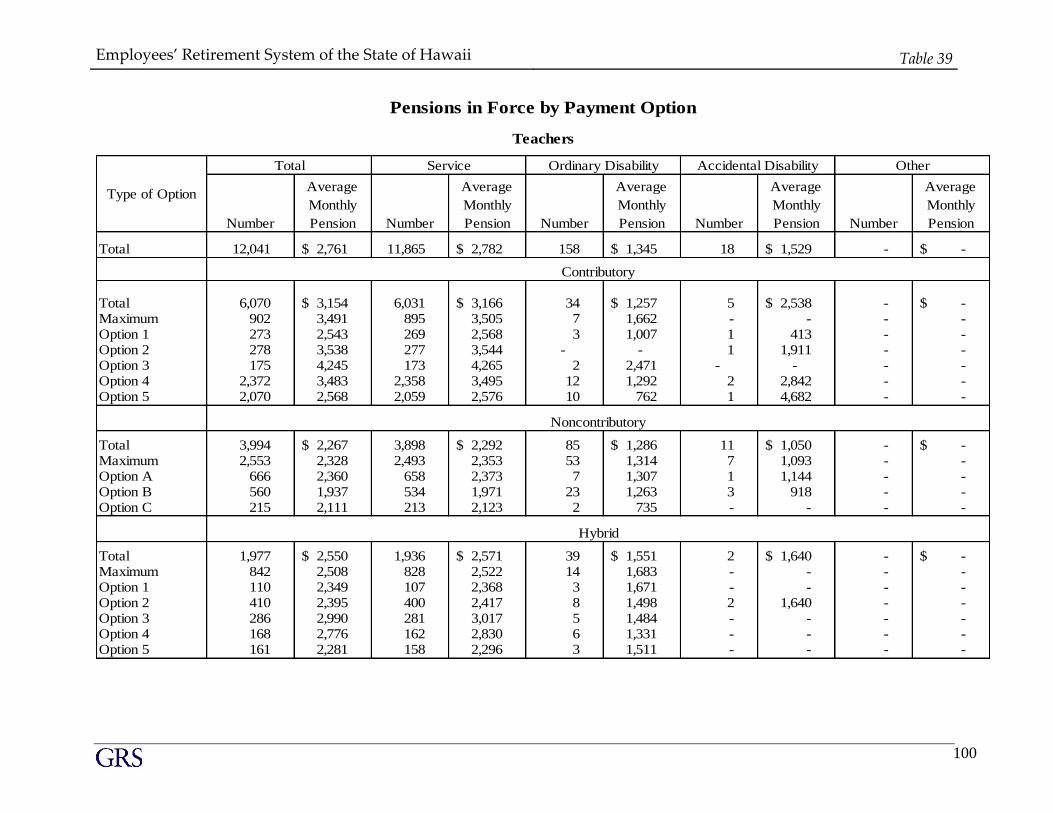
Employees’ Retirement System of the State of Hawaii Table 39
100
Total 12,041 2,761$ 11,865 2,782$ 158 1,345$ 18 1,529$ - -$
Total 6,070 3,154$ 6,031 3,166$ 34 1,257$ 5 2,538$ - -$ Maximum 902 3,491 895 3,505 7 1,662 - - - - Option 1 273 2,543 269 2,568 3 1,007 1 413 - - Option 2 278 3,538 277 3,544 - - 1 1,911 - - Option 3 175 4,245 173 4,265 2 2,471 - - - - Option 4 2,372 3,483 2,358 3,495 12 1,292 2 2,842 - - Option 5 2,070 2,568 2,059 2,576 10 762 1 4,682 - -
Total 3,994 2,267$ 3,898 2,292$ 85 1,286$ 11 1,050$ - -$ Maximum 2,553 2,328 2,493 2,353 53 1,314 7 1,093 - - Option A 666 2,360 658 2,373 7 1,307 1 1,144 - - Option B 560 1,937 534 1,971 23 1,263 3 918 - - Option C 215 2,111 213 2,123 2 735 - - - -
Total 1,977 2,550$ 1,936 2,571$ 39 1,551$ 2 1,640$ - -$ Maximum 842 2,508 828 2,522 14 1,683 - - - - Option 1 110 2,349 107 2,368 3 1,671 - - - - Option 2 410 2,395 400 2,417 8 1,498 2 1,640 - - Option 3 286 2,990 281 3,017 5 1,484 - - - - Option 4 168 2,776 162 2,830 6 1,331 - - - - Option 5 161 2,281 158 2,296 3 1,511 - - - -
Hybrid
Noncontributory
Number
Average
Monthly
Pension Number
Contributory
Average
Monthly
Pension
Average
Monthly
Pension
Average
Monthly
Pension NumberNumber Number
Pensions in Force by Payment Option
Teachers
Type of Option
Total
Average
Monthly
Pension
OtherAccidental DisabilityOrdinary DisabilityService
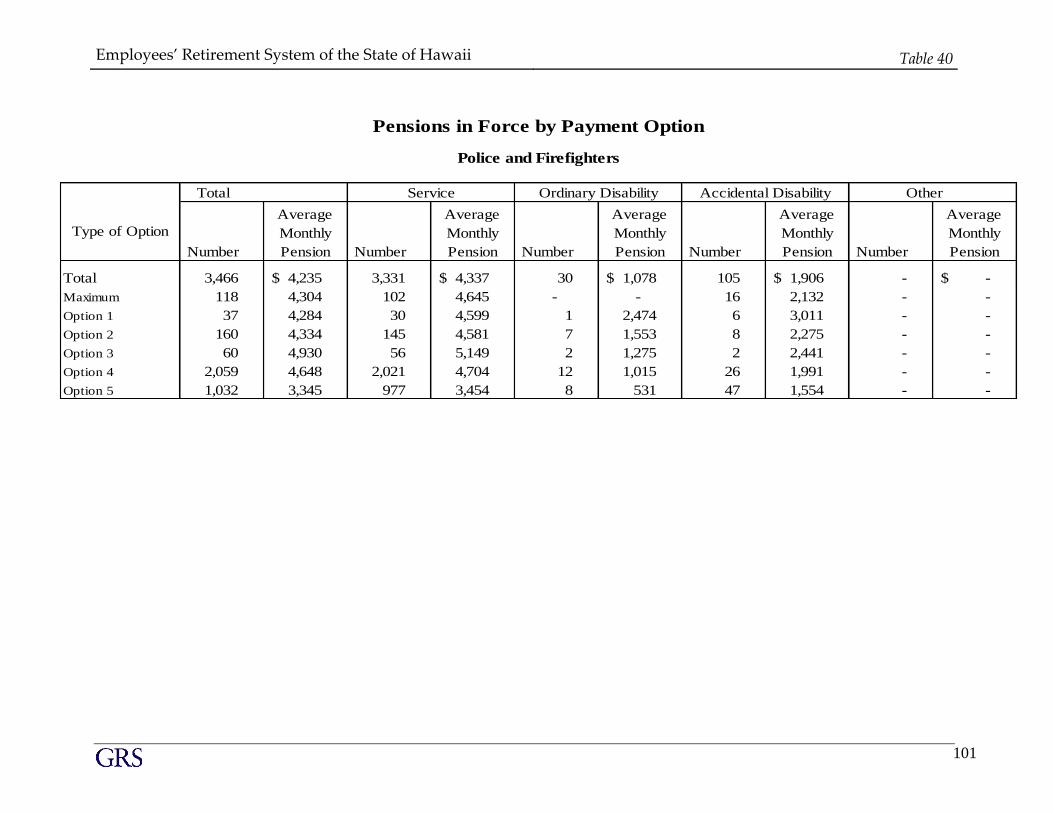
Employees’ Retirement System of the State of Hawaii Table 40
101
Total
Type of Option
Number Number Number Number Number
Total 3,466 4,235$ 3,331 4,337$ 30 1,078$ 105 1,906$ - -$
Maximum 118 4,304 102 4,645 - - 16 2,132 - -
Option 1 37 4,284 30 4,599 1 2,474 6 3,011 - -
Option 2 160 4,334 145 4,581 7 1,553 8 2,275 - -
Option 3 60 4,930 56 5,149 2 1,275 2 2,441 - -
Option 4 2,059 4,648 2,021 4,704 12 1,015 26 1,991 - -
Option 5 1,032 3,345 977 3,454 8 531 47 1,554 - -
Average
Monthly
Pension
Average
Monthly
Pension
Average
Monthly
Pension
Average
Monthly
Pension
Average
Monthly
Pension
Pensions in Force by Payment Option
Police and Firefighters
Service Ordinary Disability Accidental Disability Other
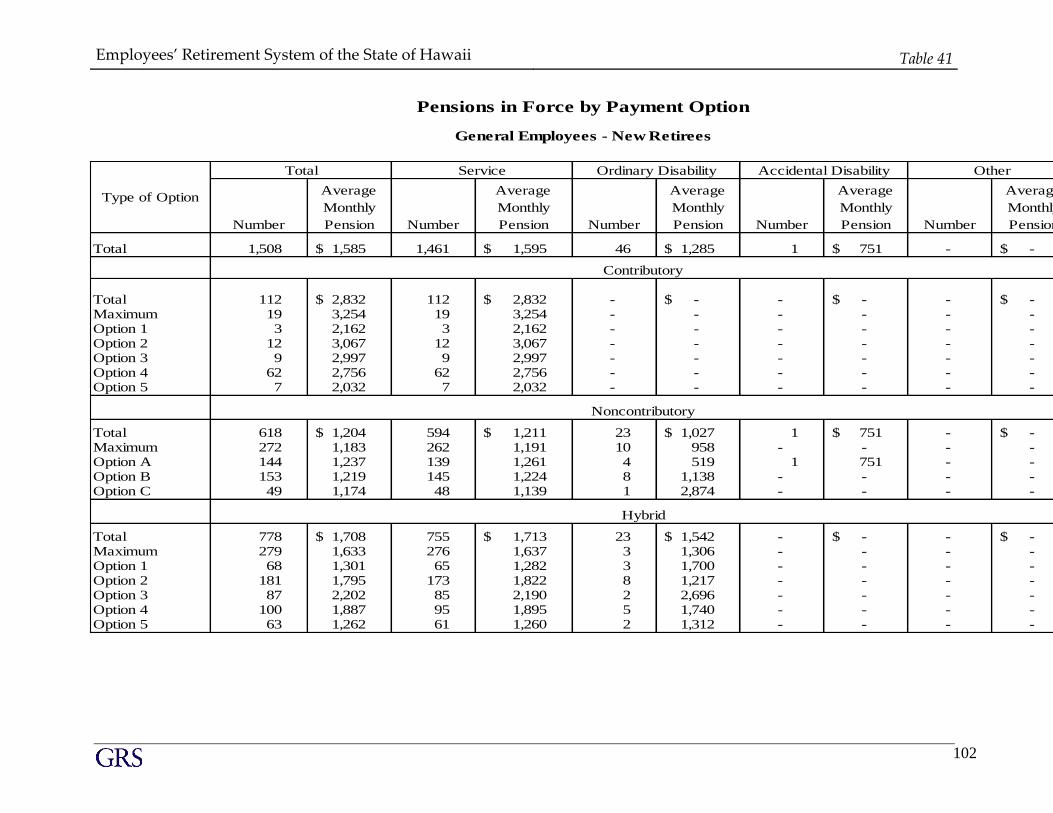
Employees’ Retirement System of the State of Hawaii Table 41
102
Total 1,508 1,585$ 1,461 1,595$ 46 1,285$ 1 751$ - -$
Total 112 2,832$ 112 2,832$ - -$ - -$ - -$ Maximum 19 3,254 19 3,254 - - - - - - Option 1 3 2,162 3 2,162 - - - - - - Option 2 12 3,067 12 3,067 - - - - - - Option 3 9 2,997 9 2,997 - - - - - - Option 4 62 2,756 62 2,756 - - - - - - Option 5 7 2,032 7 2,032 - - - - - -
Total 618 1,204$ 594 1,211$ 23 1,027$ 1 751$ - -$ Maximum 272 1,183 262 1,191 10 958 - - - - Option A 144 1,237 139 1,261 4 519 1 751 - - Option B 153 1,219 145 1,224 8 1,138 - - - - Option C 49 1,174 48 1,139 1 2,874 - - - -
Total 778 1,708$ 755 1,713$ 23 1,542$ - -$ - -$ Maximum 279 1,633 276 1,637 3 1,306 - - - - Option 1 68 1,301 65 1,282 3 1,700 - - - - Option 2 181 1,795 173 1,822 8 1,217 - - - - Option 3 87 2,202 85 2,190 2 2,696 - - - - Option 4 100 1,887 95 1,895 5 1,740 - - - - Option 5 63 1,262 61 1,260 2 1,312 - - - -
Noncontributory
Hybrid
Average
Monthly
Pension Number
Average
Monthly
Pension NumberNumber
Average
Monthly
Pension Number
Average
Monthly
Pension
Contributory
Average
Monthly
Pension Number
Pensions in Force by Payment Option
General Employees - New Retirees
Type of Option
Total Service Ordinary Disability Accidental Disability Other
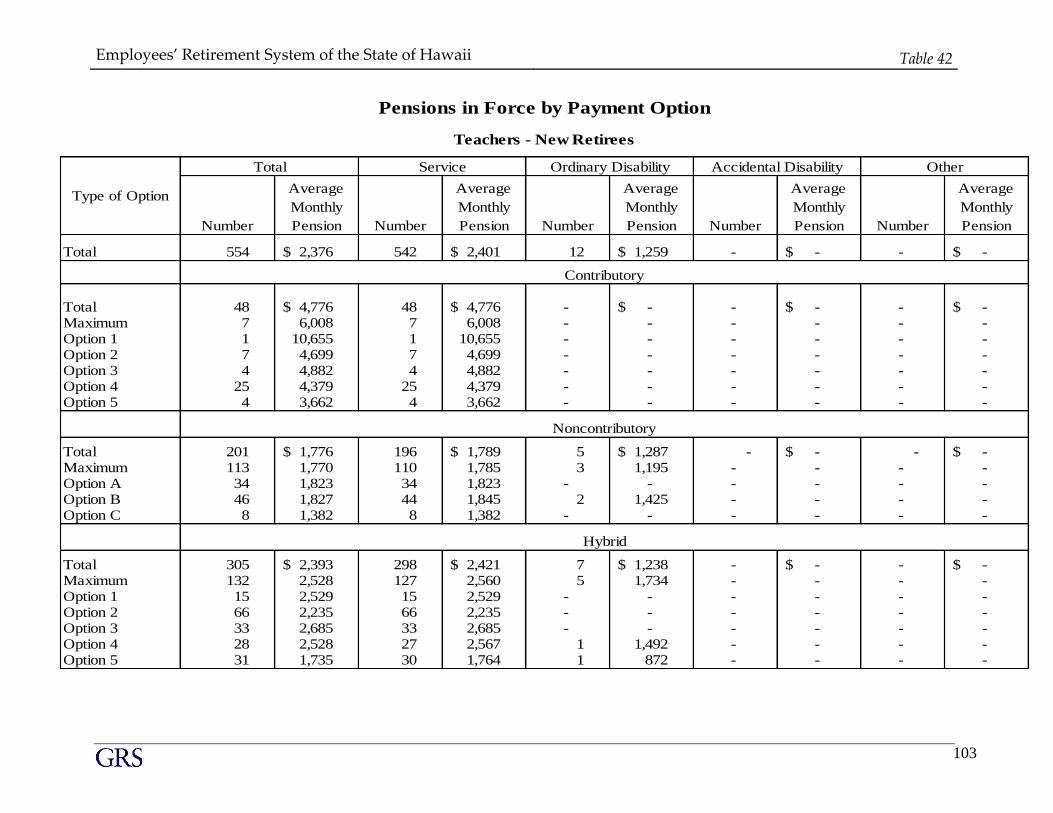
Employees’ Retirement System of the State of Hawaii Table 42
103
Total 554 2,376$ 542 2,401$ 12 1,259$ - -$ - -$
Total 48 4,776$ 48 4,776$ - -$ - -$ - -$ Maximum 7 6,008 7 6,008 - - - - - - Option 1 1 10,655 1 10,655 - - - - - - Option 2 7 4,699 7 4,699 - - - - - - Option 3 4 4,882 4 4,882 - - - - - - Option 4 25 4,379 25 4,379 - - - - - - Option 5 4 3,662 4 3,662 - - - - - -
Total 201 1,776$ 196 1,789$ 5 1,287$ - -$ - -$ Maximum 113 1,770 110 1,785 3 1,195 - - - - Option A 34 1,823 34 1,823 - - - - - - Option B 46 1,827 44 1,845 2 1,425 - - - - Option C 8 1,382 8 1,382 - - - - - -
Total 305 2,393$ 298 2,421$ 7 1,238$ - -$ - -$ Maximum 132 2,528 127 2,560 5 1,734 - - - - Option 1 15 2,529 15 2,529 - - - - - - Option 2 66 2,235 66 2,235 - - - - - - Option 3 33 2,685 33 2,685 - - - - - - Option 4 28 2,528 27 2,567 1 1,492 - - - - Option 5 31 1,735 30 1,764 1 872 - - - -
Noncontributory
Hybrid
Average
Monthly
Pension Number
Average
Monthly
Pension NumberNumber
Average
Monthly
Pension Number
Average
Monthly
Pension
Contributory
Average
Monthly
Pension Number
Pensions in Force by Payment Option
Teachers - New Retirees
Type of Option
Total Service Ordinary Disability Accidental Disability Other
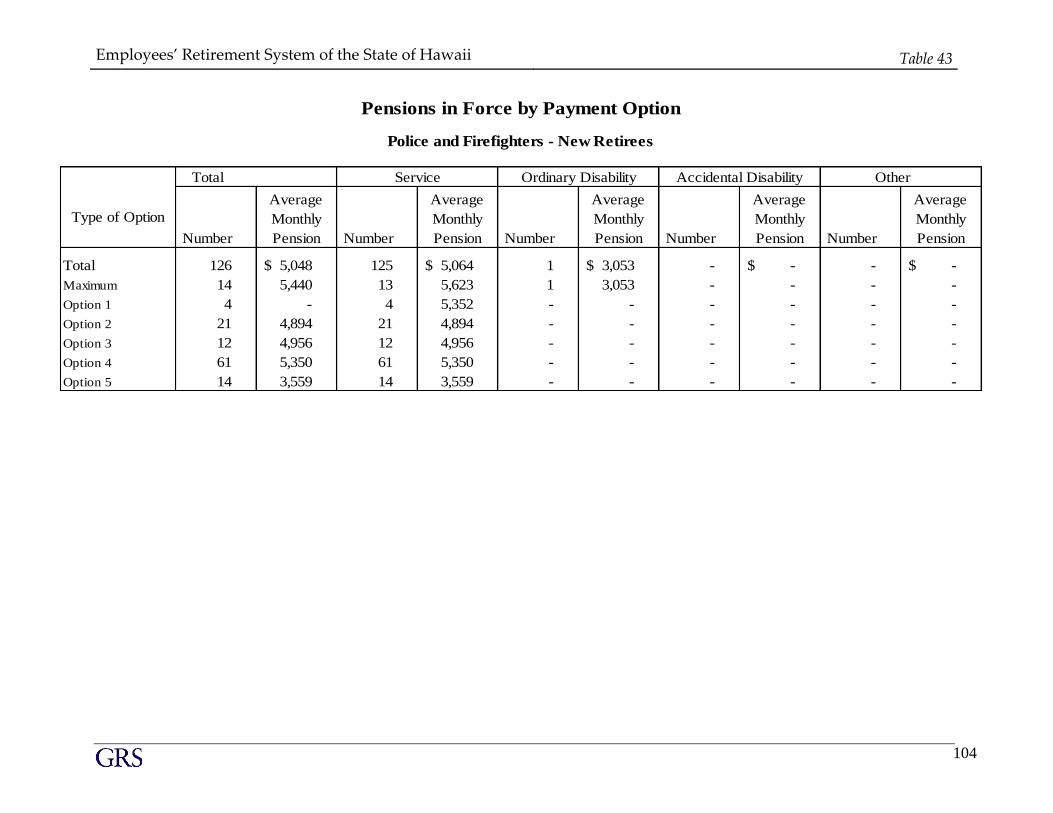
Employees’ Retirement System of the State of Hawaii Table 43
104
Total
Type of Option
Number Number Number Number Number
Total 126 5,048$ 125 5,064$ 1 3,053$ - -$ - -$
Maximum 14 5,440 13 5,623 1 3,053 - - - -
Option 1 4 - 4 5,352 - - - - - -
Option 2 21 4,894 21 4,894 - - - - - -
Option 3 12 4,956 12 4,956 - - - - - -
Option 4 61 5,350 61 5,350 - - - - - -
Option 5 14 3,559 14 3,559 - - - - - -
Average
Monthly
Pension
Average
Monthly
Pension
Average
Monthly
Pension
Average
Monthly
Pension
Average
Monthly
Pension
Pensions in Force by Payment Option
Police and Firefighters - New Retirees
Service Ordinary Disability Accidental Disability Other
SECTION N
D EF IN ITIO N O F A C TU A R IA L TER MS
Employees’ Retirement System of the State of Hawaii Section N
106
Definition of Actuarial Terms
1. Actuarial Accrued Liability – for benefits payable in the future to present members, it will
equal the present value of benefits payable in the future to them less the present value of future
normal costs.
2. Actuarial Assumptions – assumptions as to future experience under the ERS. Current actuarial
assumptions are detailed in Table 21 of the current annual valuation report. Assumptions
include future fund earnings rate, rates of future salary increases, and rates of death (both
before and after retirement), disability, retirement, and withdrawal.
3. Actuarial Gain or Actuarial Loss - a measure of the difference between actual experience and
assumed experience of the ERS. Through the actuarial assumptions, rates of decrements, rates
of salary increases, and rates of fund earnings have been forecasted. To the extent that actual
experience differs from that assumed, actuarial liabilities emerge which may be the same as
forecasted, or they may be larger or smaller than projected. Actuarial gains are due to
favorable experience, e.g., the ERS's assets earn more than projected, salaries do not increase
as fast as assumed, members retire later than assumed, etc. Favorable experience means actual
results produce actuarial liabilities not as large as projected by the actuarial assumptions. On
the other hand, actuarial losses are the result of unfavorable experience, i.e., actual results that
produce actuarial liabilities which are larger than projected. Actuarial gains will shorten the
time required for funding of the actuarial balance sheet deficiency while actuarial losses will
lengthen the funding period.
4. Actuarial Liabilities - the actuarially determined present value of future benefits to be provided
by the ERS. There are separate actuarially determined present values for retired members and
non-retired members (either active or inactive). When applied to active members, it takes into
account benefits which will be earned through future service and future salary increases.
5. Actuarial Value of Present Assets - the value of present ERS assets for valuation purposes. This
value is calculated under a four-year phase-in of the excess (shortfall) between expected and
actual income return.
6. Actuarially Determined - values which have been determined utilizing the principles of
actuarial science. An actuarially determined value is derived by application of the appropriate
actuarial assumptions to specified values determined by provisions of the law.
7. Decrements - those types of activities by members of the ERS which cause them no longer to
be members, i.e., death, retirement, disability, and withdrawal. It is a general term referring to
any or all of these membership-terminating events.
Employees’ Retirement System of the State of Hawaii
Section N (continued)
107
8. Defined Benefits - in a retirement plan, benefits which are defined by a specific formula applied
to specific member compensation and/or specific years of service. The amount of the benefit is
not a function of contributions or actual earnings on those contributions.
9. Defined Contributions - in a retirement plan, periodic contributions to the plan which are
defined as a specific percent of compensation.
10. Experience Study - a periodic review and analysis of the actual experience of the ERS which
may lead to a revision of one or more actuarial assumptions. Actual rates of decrement and
salary increases are compared to the actuarially assumed values and modified as deemed
appropriate by the Actuary.
11. Funding Period - the number of years in the future that will be required to fund (i.e., pay off or
eliminate) the unfunded actuarial accrued liability, based on the actuarial assumptions and
assuming no future actuarial gains or losses.
12. Future Benefits - benefits specified in the law which will become payable at some time in the
future when the member satisfies the requirement to receive such benefits.
13. Future Contributions - contributions to be made by the member or the employers in the future.
14. Normal Cost - the actuarial cost to fund the benefits provided by the ERS were the funding to
begin at date of hire.
15. Present Value - the actuarially determined lump sum value as of the valuation date of a series
of payments to be made in the future, where the lump sum value is equal to the sum of the
discounted value of each future payment. The discounted value of each payment is the product
of (a) the amount of the payment, (b) the probability that the payment will be made (based on
the current actuarial assumptions as to future experience), and (c) the time value of money
(based on the current assumed interest rate).
16. Unfunded Actuarial Accrued Liability - that portion of the actuarial accrued liability (including
the present value of benefits presently being paid to retired members) that exceeds the value of
current assets.
17. Covered Payroll - the total annualized payroll of active members as of the valuation date. Used
to project individual members pay and benefits.
18. Projected Payroll for Contributions Purposes - The aggregate projected payroll for the fiscal
year following the valuation date is calculated by increasing the actual payroll paid during the
previous fiscal year by the payroll growth rate and multiplying by the ratio of current active
members to the average number of active members during the previous fiscal year.