Embed Size (px)
Citation preview
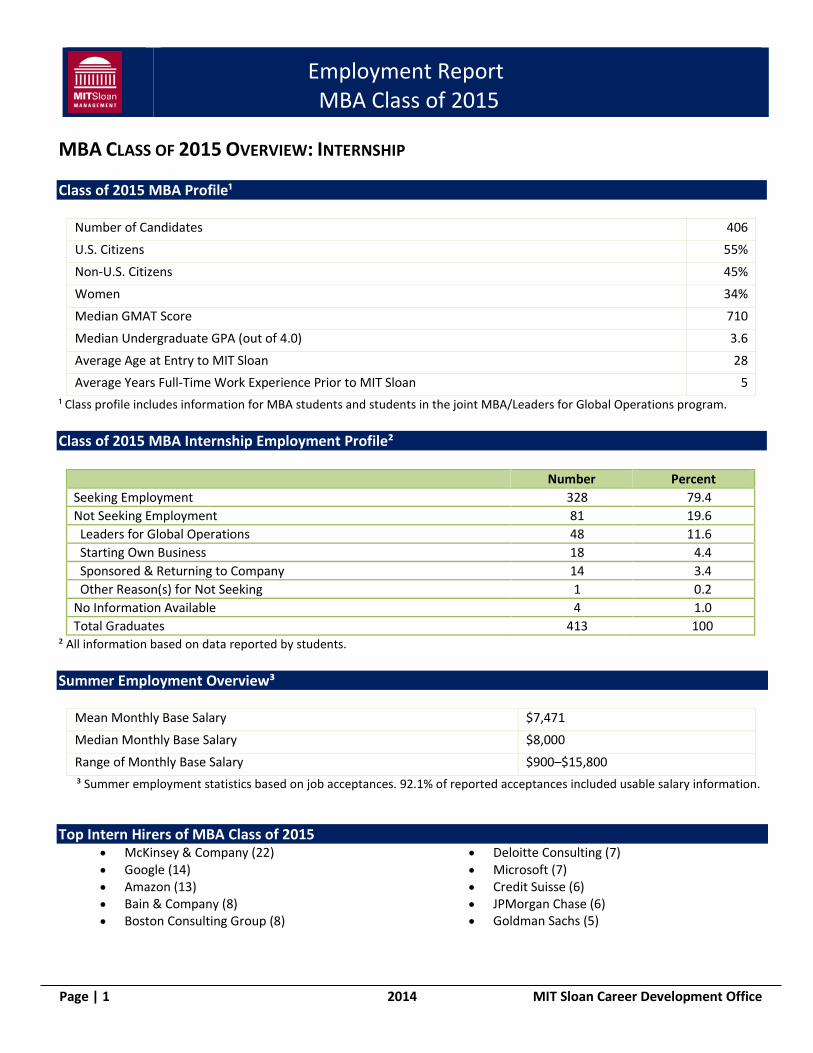
Employment Report MBA Class of 2015
MBA CLASS OF 2015 OVERVIEW: INTERNSHIP
Class of 2015 MBA Profile¹
Number of Candidates 406 U.S. Citizens 55% Non-U.S. Citizens 45% Women 34% Median GMAT Score 710 Median Undergraduate GPA (out of 4.0) 3.6 Average Age at Entry to MIT Sloan 28 Average Years Full-Time Work Experience Prior to MIT Sloan 5
¹ Class profile includes information for MBA students and students in the joint MBA/Leaders for Global Operations program.
Class of 2015 MBA Internship Employment Profile²
Number Percent Seeking Employment 328 79.4 Not Seeking Employment 81 19.6 Leaders for Global Operations 48 11.6 Starting Own Business 18 04.4 Sponsored & Returning to Company 14 03.4 Other Reason(s) for Not Seeking 1 00.2 No Information Available 4 01.0 Total Graduates 413 100
² All information based on data reported by students.
Summer Employment Overview³
Mean Monthly Base Salary $7,471 Median Monthly Base Salary $8,000 Range of Monthly Base Salary $900–$15,800 ³ Summer employment statistics based on job acceptances. 92.1% of reported acceptances included usable salary information.
Top Intern Hirers of MBA Class of 2015 • McKinsey & Company (22) • Google (14) • Amazon (13) • Bain & Company (8) • Boston Consulting Group (8)
• Deloitte Consulting (7) • Microsoft (7) • Credit Suisse (6) • JPMorgan Chase (6) • Goldman Sachs (5)
Page | 1 2014 MIT Sloan Career Development Office
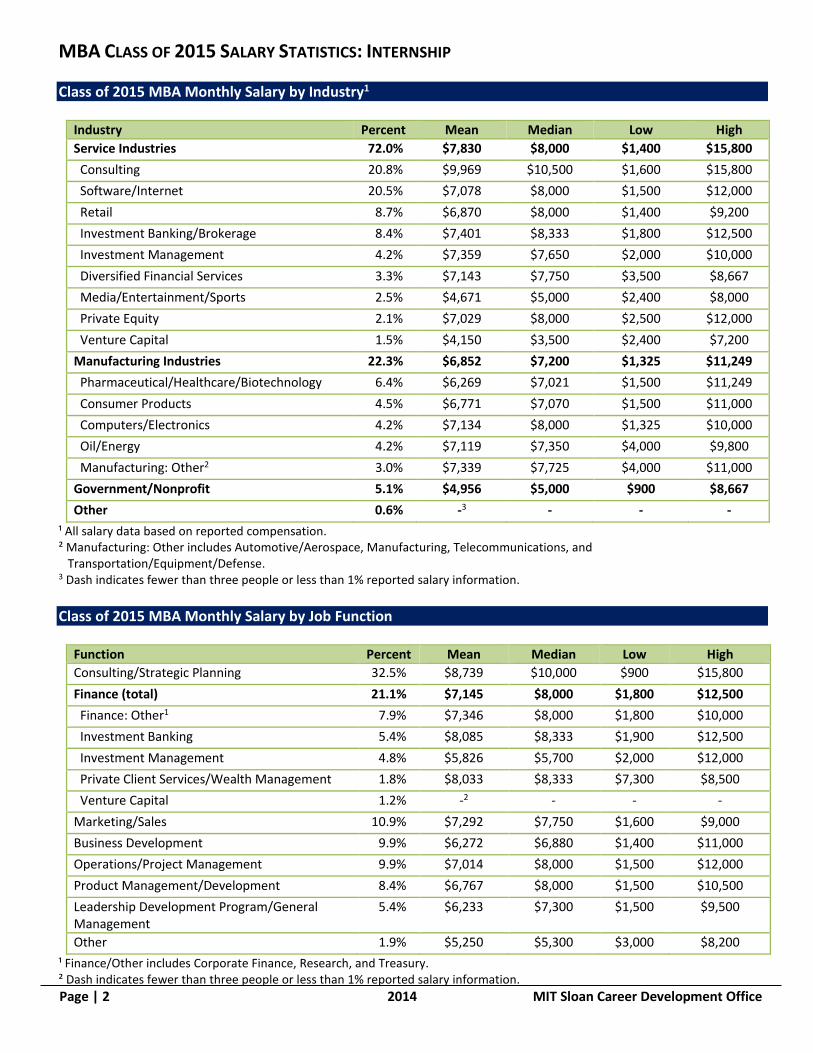
MBA CLASS OF 2015 SALARY STATISTICS: INTERNSHIP
Class of 2015 MBA Monthly Salary by Industry1
Industry Percent Mean Median Low High Service Industries 72.0% $7,830 $8,000 $1,400 $15,800 Consulting 20.8% $9,969 $10,500 $1,600 $15,800 Software/Internet 20.5% $7,078 $8,000 $1,500 $12,000 Retail 08.7% $6,870 $8,000 $1,400 $9,200 Investment Banking/Brokerage 08.4% $7,401 $8,333 $1,800 $12,500 Investment Management 04.2% $7,359 $7,650 $2,000 $10,000 Diversified Financial Services 03.3% $7,143 $7,750 $3,500 $8,667 Media/Entertainment/Sports 02.5% $4,671 $5,000 $2,400 $8,000 Private Equity 02.1% $7,029 $8,000 $2,500 $12,000 Venture Capital 01.5% $4,150 $3,500 $2,400 $7,200 Manufacturing Industries 22.3% $6,852 $7,200 $1,325 $11,249 Pharmaceutical/Healthcare/Biotechnology 06.4% $6,269 $7,021 $1,500 $11,249 Consumer Products 04.5% $6,771 $7,070 $1,500 $11,000 Computers/Electronics 04.2% $7,134 $8,000 $1,325 $10,000 Oil/Energy 04.2% $7,119 $7,350 $4,000 $9,800 Manufacturing: Other2 03.0% $7,339 $7,725 $4,000 $11,000 Government/Nonprofit 05.1% $4,956 $5,000 $900 $8,667 Other 00.6% -3 - - -
¹ All salary data based on reported compensation. ² Manufacturing: Other includes Automotive/Aerospace, Manufacturing, Telecommunications, and Transportation/Equipment/Defense. 3 Dash indicates fewer than three people or less than 1% reported salary information.
Class of 2015 MBA Monthly Salary by Job Function
Function Percent Mean Median Low High Consulting/Strategic Planning 32.5% $8,739 $10,000 $900 $15,800 Finance (total) 21.1% $7,145 $8,000 $1,800 $12,500 Finance: Other1 07.9% $7,346 $8,000 $1,800 $10,000 Investment Banking 05.4% $8,085 $8,333 $1,900 $12,500 Investment Management 04.8% $5,826 $5,700 $2,000 $12,000 Private Client Services/Wealth Management 01.8% $8,033 $8,333 $7,300 $8,500 Venture Capital 01.2% -2 - - - Marketing/Sales 10.9% $7,292 $7,750 $1,600 $9,000 Business Development 09.9% $6,272 $6,880 $1,400 $11,000 Operations/Project Management 09.9% $7,014 $8,000 $1,500 $12,000 Product Management/Development 08.4% $6,767 $8,000 $1,500 $10,500 Leadership Development Program/General Management
05.4% $6,233 $7,300 $1,500 $9,500
Other 01.9% $5,250 $5,300 $3,000 $8,200 ¹ Finance/Other includes Corporate Finance, Research, and Treasury. ² Dash indicates fewer than three people or less than 1% reported salary information.
Page | 2 2014 MIT Sloan Career Development Office
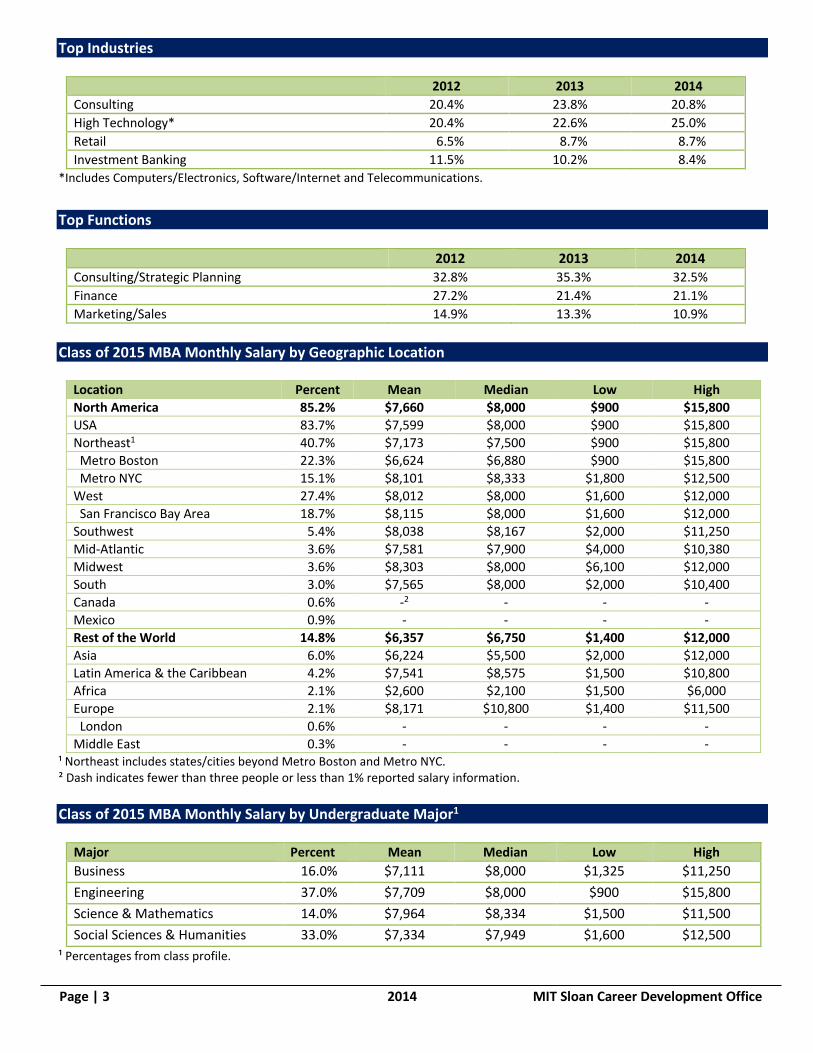
Top Industries
2012 2013 2014 Consulting 20.4% 23.8% 20.8% High Technology* 20.4% 22.6% 25.0% Retail 06.5% 08.7% 08.7% Investment Banking 11.5% 10.2% 08.4%
*Includes Computers/Electronics, Software/Internet and Telecommunications.
Top Functions
2012 2013 2014 Consulting/Strategic Planning 32.8% 35.3% 32.5% Finance 27.2% 21.4% 21.1% Marketing/Sales 14.9% 13.3% 10.9%
Class of 2015 MBA Monthly Salary by Geographic Location
Location Percent Mean Median Low High North America 85.2% $7,660 $8,000 $900 $15,800 USA 83.7% $7,599 $8,000 $900 $15,800 Northeast1 40.7% $7,173 $7,500 $900 $15,800 Metro Boston 22.3% $6,624 $6,880 $900 $15,800 Metro NYC 15.1% $8,101 $8,333 $1,800 $12,500 West 27.4% $8,012 $8,000 $1,600 $12,000 San Francisco Bay Area 18.7% $8,115 $8,000 $1,600 $12,000 Southwest 05.4% $8,038 $8,167 $2,000 $11,250 Mid-Atlantic 03.6% $7,581 $7,900 $4,000 $10,380 Midwest 03.6% $8,303 $8,000 $6,100 $12,000 South 03.0% $7,565 $8,000 $2,000 $10,400 Canada 00.6% -2 - - - Mexico 00.9% - - - - Rest of the World 14.8% $6,357 $6,750 $1,400 $12,000 Asia 06.0% $6,224 $5,500 $2,000 $12,000 Latin America & the Caribbean 04.2% $7,541 $8,575 $1,500 $10,800 Africa 02.1% $2,600 $2,100 $1,500 $6,000 Europe 02.1% $8,171 $10,800 $1,400 $11,500 London 00.6% - - - - Middle East 00.3% - - - -
¹ Northeast includes states/cities beyond Metro Boston and Metro NYC. ² Dash indicates fewer than three people or less than 1% reported salary information.
Class of 2015 MBA Monthly Salary by Undergraduate Major1
Major Percent Mean Median Low High Business 16.0% $7,111 $8,000 $1,325 $11,250 Engineering 37.0% $7,709 $8,000 $900 $15,800 Science & Mathematics 14.0% $7,964 $8,334 $1,500 $11,500 Social Sciences & Humanities 33.0% $7,334 $7,949 $1,600 $12,500
¹ Percentages from class profile.
Page | 3 2014 MIT Sloan Career Development Office
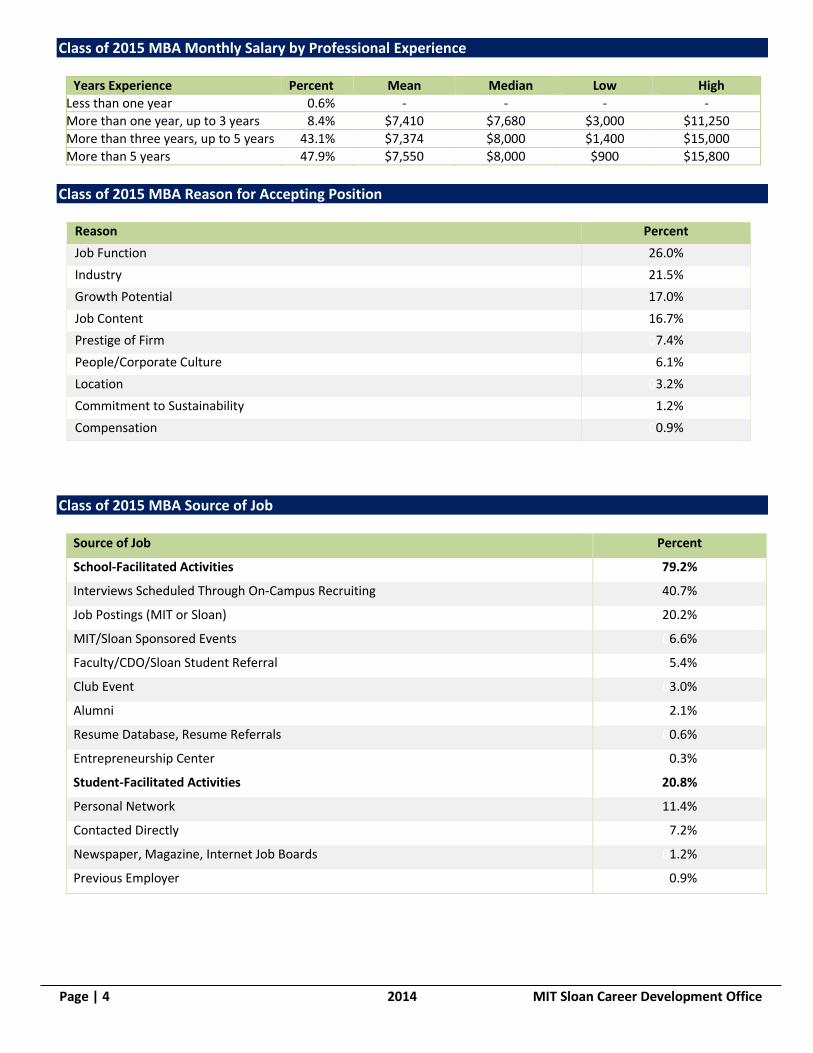
Class of 2015 MBA Monthly Salary by Professional Experience
Years Experience Percent Mean Median Low High Less than one year 00.6% - - - - More than one year, up to 3 years 08.4% $7,410 $7,680 $3,000 $11,250 More than three years, up to 5 years 43.1% $7,374 $8,000 $1,400 $15,000 More than 5 years 47.9% $7,550 $8,000 $900 $15,800
Class of 2015 MBA Reason for Accepting Position
Reason Percent Job Function 26.0% Industry 21.5% Growth Potential 17.0% Job Content 16.7% Prestige of Firm 07.4% People/Corporate Culture 06.1% Location 03.2% Commitment to Sustainability 01.2% Compensation 00.9%
Class of 2015 MBA Source of Job
Source of Job Percent
School-Facilitated Activities 79.2%
Interviews Scheduled Through On-Campus Recruiting 40.7%
Job Postings (MIT or Sloan) 20.2%
MIT/Sloan Sponsored Events 06.6%
Faculty/CDO/Sloan Student Referral 05.4%
Club Event 03.0%
Alumni 02.1%
Resume Database, Resume Referrals 00.6%
Entrepreneurship Center 00.3%
Student-Facilitated Activities 20.8%
Personal Network 11.4%
Contacted Directly 07.2%
Newspaper, Magazine, Internet Job Boards 01.2%
Previous Employer 00.9%
Page | 4 2014 MIT Sloan Career Development Office
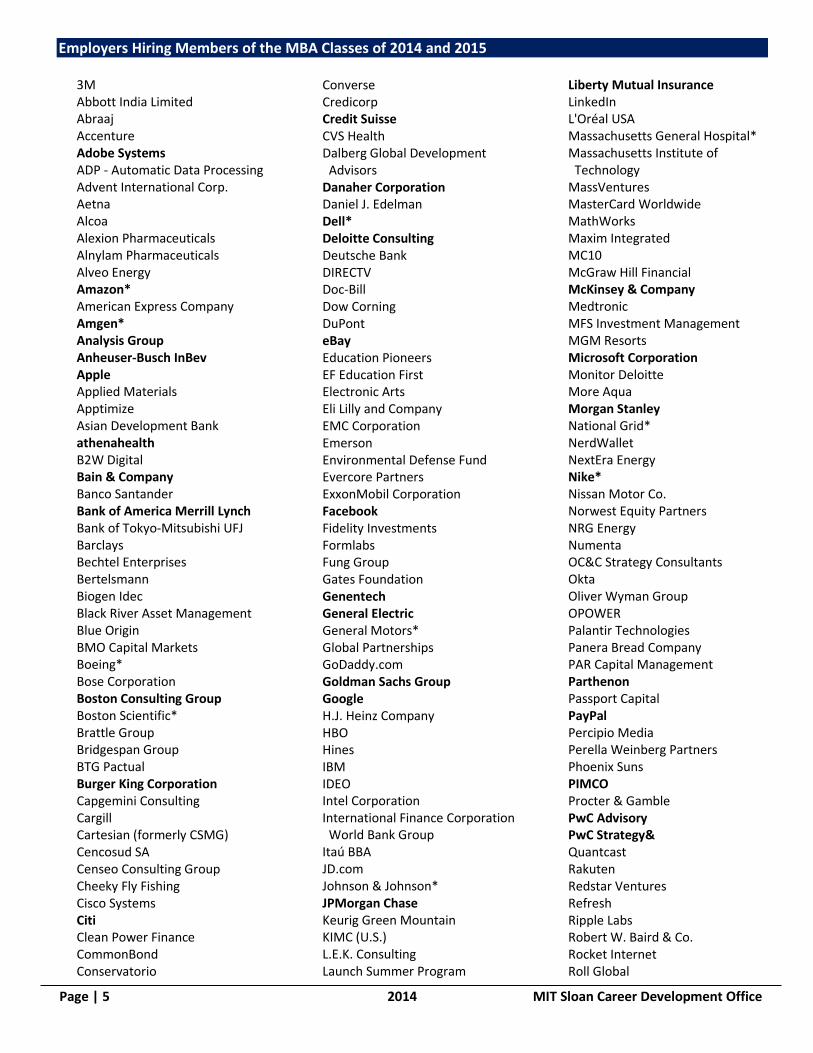
Employers Hiring Members of the MBA Classes of 2014 and 2015
3M Abbott India Limited Abraaj Accenture Adobe Systems ADP - Automatic Data Processing Advent International Corp. Aetna Alcoa Alexion Pharmaceuticals Alnylam Pharmaceuticals Alveo Energy Amazon* American Express Company Amgen* Analysis Group Anheuser-Busch InBev Apple Applied Materials Apptimize Asian Development Bank athenahealth B2W Digital Bain & Company Banco Santander Bank of America Merrill Lynch Bank of Tokyo-Mitsubishi UFJ Barclays Bechtel Enterprises Bertelsmann Biogen Idec Black River Asset Management Blue Origin BMO Capital Markets Boeing* Bose Corporation Boston Consulting Group Boston Scientific* Brattle Group Bridgespan Group BTG Pactual Burger King Corporation Capgemini Consulting Cargill Cartesian (formerly CSMG) Cencosud SA Censeo Consulting Group Cheeky Fly Fishing Cisco Systems Citi Clean Power Finance CommonBond Conservatorio
Converse Credicorp Credit Suisse CVS Health Dalberg Global Development Advisors Danaher Corporation Daniel J. Edelman Dell* Deloitte Consulting Deutsche Bank DIRECTV Doc-Bill Dow Corning DuPont eBay Education Pioneers EF Education First Electronic Arts Eli Lilly and Company EMC Corporation Emerson Environmental Defense Fund Evercore Partners ExxonMobil Corporation Facebook Fidelity Investments Formlabs Fung Group Gates Foundation Genentech General Electric General Motors* Global Partnerships GoDaddy.com Goldman Sachs Group Google H.J. Heinz Company HBO Hines IBM IDEO Intel Corporation International Finance Corporation World Bank Group Itaú BBA JD.com Johnson & Johnson* JPMorgan Chase Keurig Green Mountain KIMC (U.S.) L.E.K. Consulting Launch Summer Program
Liberty Mutual Insurance LinkedIn L'Oréal USA Massachusetts General Hospital* Massachusetts Institute of Technology MassVentures MasterCard Worldwide MathWorks Maxim Integrated MC10 McGraw Hill Financial McKinsey & Company Medtronic MFS Investment Management MGM Resorts Microsoft Corporation Monitor Deloitte More Aqua Morgan Stanley National Grid* NerdWallet NextEra Energy Nike* Nissan Motor Co. Norwest Equity Partners NRG Energy Numenta OC&C Strategy Consultants Okta Oliver Wyman Group OPOWER Palantir Technologies Panera Bread Company PAR Capital Management Parthenon Passport Capital PayPal Percipio Media Perella Weinberg Partners Phoenix Suns PIMCO Procter & Gamble PwC Advisory PwC Strategy& Quantcast Rakuten Redstar Ventures Refresh Ripple Labs Robert W. Baird & Co. Rocket Internet Roll Global
Page | 5 2014 MIT Sloan Career Development Office
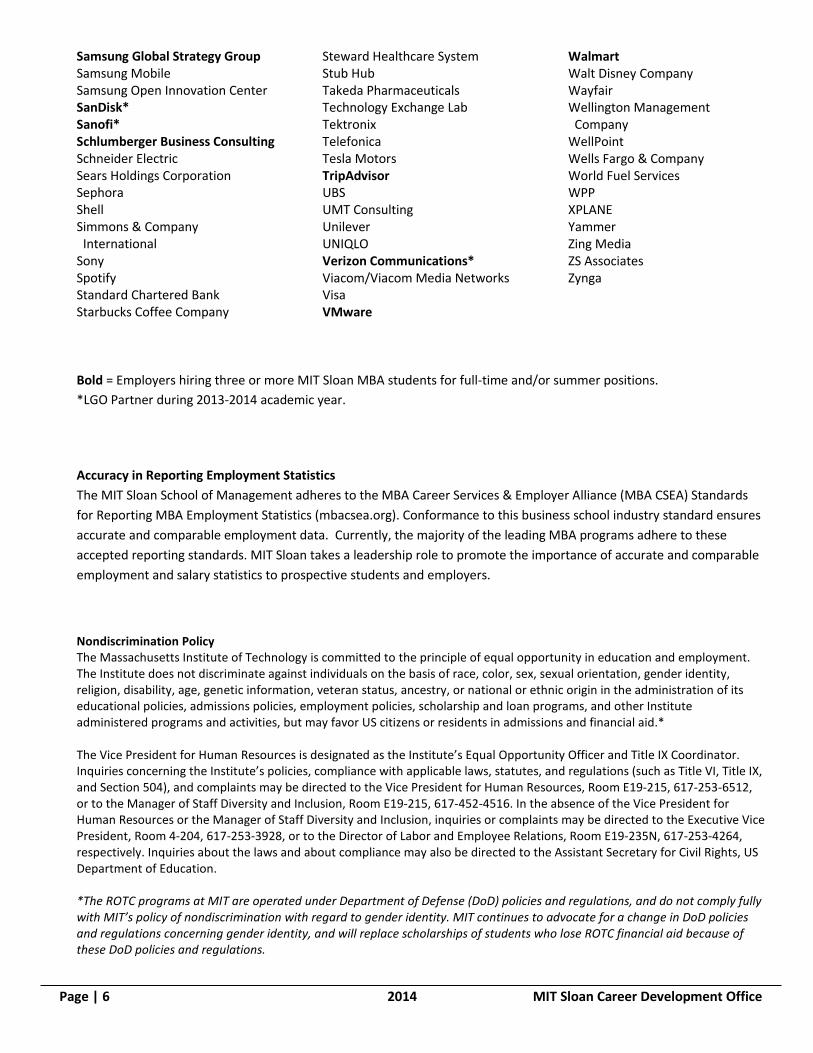
Samsung Global Strategy Group Samsung Mobile Samsung Open Innovation Center SanDisk* Sanofi* Schlumberger Business Consulting Schneider Electric Sears Holdings Corporation Sephora Shell Simmons & Company International Sony Spotify Standard Chartered Bank Starbucks Coffee Company
Steward Healthcare System Stub Hub Takeda Pharmaceuticals Technology Exchange Lab Tektronix Telefonica Tesla Motors TripAdvisor UBS UMT Consulting Unilever UNIQLO Verizon Communications* Viacom/Viacom Media Networks Visa VMware
Walmart Walt Disney Company Wayfair Wellington Management Company WellPoint Wells Fargo & Company World Fuel Services WPP XPLANE Yammer Zing Media ZS Associates Zynga
Bold = Employers hiring three or more MIT Sloan MBA students for full-time and/or summer positions. *LGO Partner during 2013-2014 academic year.
Accuracy in Reporting Employment Statistics The MIT Sloan School of Management adheres to the MBA Career Services & Employer Alliance (MBA CSEA) Standards for Reporting MBA Employment Statistics (mbacsea.org). Conformance to this business school industry standard ensures accurate and comparable employment data. Currently, the majority of the leading MBA programs adhere to these accepted reporting standards. MIT Sloan takes a leadership role to promote the importance of accurate and comparable employment and salary statistics to prospective students and employers. Nondiscrimination Policy The Massachusetts Institute of Technology is committed to the principle of equal opportunity in education and employment. The Institute does not discriminate against individuals on the basis of race, color, sex, sexual orientation, gender identity, religion, disability, age, genetic information, veteran status, ancestry, or national or ethnic origin in the administration of its educational policies, admissions policies, employment policies, scholarship and loan programs, and other Institute administered programs and activities, but may favor US citizens or residents in admissions and financial aid.* The Vice President for Human Resources is designated as the Institute’s Equal Opportunity Officer and Title IX Coordinator. Inquiries concerning the Institute’s policies, compliance with applicable laws, statutes, and regulations (such as Title VI, Title IX, and Section 504), and complaints may be directed to the Vice President for Human Resources, Room E19-215, 617-253-6512, or to the Manager of Staff Diversity and Inclusion, Room E19-215, 617-452-4516. In the absence of the Vice President for Human Resources or the Manager of Staff Diversity and Inclusion, inquiries or complaints may be directed to the Executive Vice President, Room 4-204, 617-253-3928, or to the Director of Labor and Employee Relations, Room E19-235N, 617-253-4264, respectively. Inquiries about the laws and about compliance may also be directed to the Assistant Secretary for Civil Rights, US Department of Education. *The ROTC programs at MIT are operated under Department of Defense (DoD) policies and regulations, and do not comply fully with MIT’s policy of nondiscrimination with regard to gender identity. MIT continues to advocate for a change in DoD policies and regulations concerning gender identity, and will replace scholarships of students who lose ROTC financial aid because of these DoD policies and regulations.
Page | 6 2014 MIT Sloan Career Development Office


![Mba employment statistics[1]](https://img.pdfslide.net/doc/110x75/54c190cc4a795995228b4656/mba-employment-statistics1.jpg)

![LBS MBA Employment Report 2010[1]](https://img.pdfslide.net/doc/110x75/577d253c1a28ab4e1e9e560b/lbs-mba-employment-report-20101.jpg)