Embed Size (px)
Citation preview
2019 Annual Report
Empowering and enabling the world’s supply chainsone innovation at a time
Contents
This annual report is a summary of WiseTech Global and its subsidiary companies’ operations, activities and financial position as at 30 June 2019.References to “WiseTech”, “the Company”, “the Group”, “we”, “us” and “our” refer to WiseTech Global Limited (ABN 41 065 894 724) unless otherwise stated.Where stated, financial measures for the periods FY15 and FY16 have been prepared on a pro forma (“PF”) basis. For details, see page 116. Pro forma information in this report is unaudited. This document is dated 24 September 2019.
Financial highlights 02
Delivering on our strategy 04
Chair’s letter 06
CEO’s message 08
Our business 10
Our innovation pipeline 12
Our expansion pipeline 18
Environment, social and governance 22
Board of Directors 34
Operating and financial review 36
Remuneration report 44
Directors’ report 58
Lead auditor’s independence declaration 61
Risk management 62
Financial report 65
Independent auditor’s report 110
Shareholder information 117
Glossary 119
Corporate directory 120
WiseTech Global | 2019 Annual Report
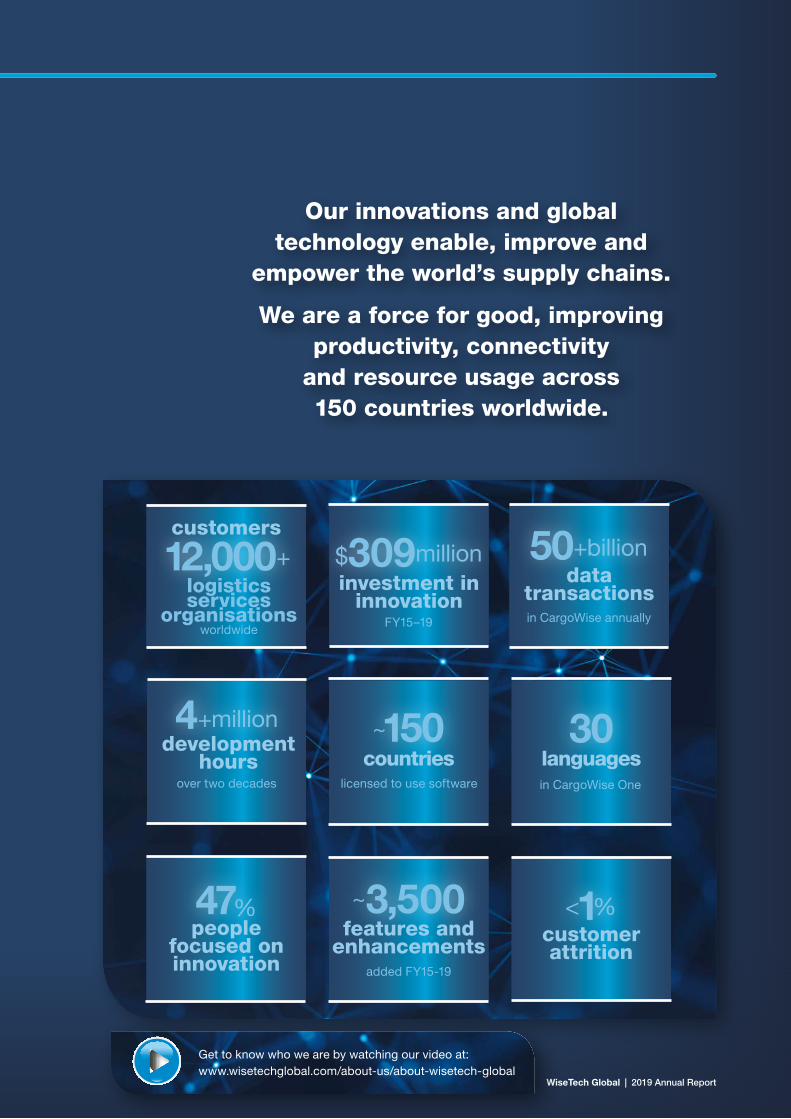
Our innovations and global technology enable, improve and
empower the world’s supply chains.
We are a force for good, improving productivity, connectivity
and resource usage across 150 countries worldwide.
FY15–19
$309millioninvestment in
innovation
~150countries
~3,500
added FY15-19
features andenhancements
licensed to use software
12,000+logistics services
organisations worldwide
47%
over two decades
4+million
customers
development hours
people focused on innovation
in CargoWise annually
50+billiondata
transactions
30languages
<1%customer attrition
in CargoWise One
Get to know who we are by watching our video at: www.wisetechglobal.com/about-us/about-wisetech-global
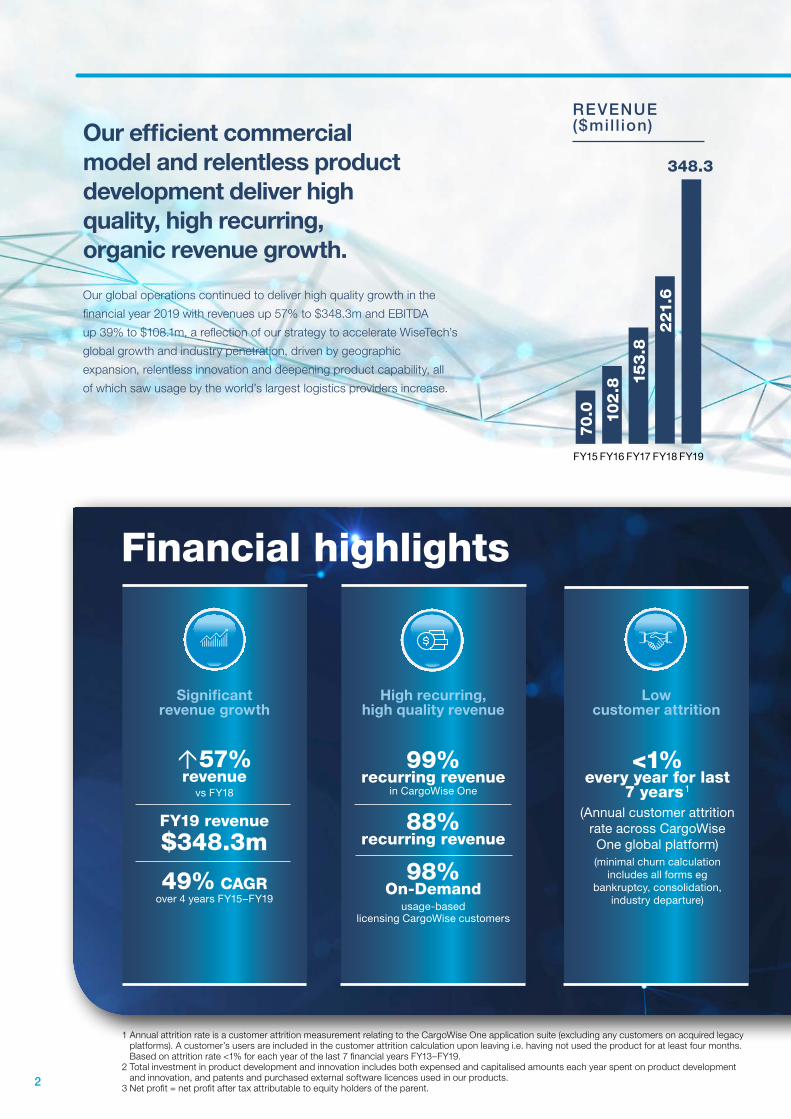
Financial highlights
Significant revenue growth
57% revenue
vs FY18
FY19 revenue
$348.3m
49% CAGR over 4 years FY15–FY19
High recurring, high quality revenue
99% recurring revenue
in CargoWise One
88% recurring revenue
98% On-Demand
usage-based licensing CargoWise customers
Low customer attrition
<1% every year for last
7 years1 (Annual customer attrition
rate across CargoWise One global platform)(minimal churn calculation
includes all forms eg bankruptcy, consolidation,
industry departure)
2
Our efficient commercial model and relentless product development deliver high quality, high recurring, organic revenue growth.
Our global operations continued to deliver high quality growth in the
financial year 2019 with revenues up 57% to $348.3m and EBITDA
up 39% to $108.1m, a reflection of our strategy to accelerate WiseTech’s
global growth and industry penetration, driven by geographic
expansion, relentless innovation and deepening product capability, all
of which saw usage by the world’s largest logistics providers increase.
REVENUE ($mil l ion)
FY15 FY16 FY17 FY18 FY19
70.0 10
2.8 15
3.8
221
.6
348.3
1 Annual attrition rate is a customer attrition measurement relating to the CargoWise One application suite (excluding any customers on acquired legacy platforms). A customer’s users are included in the customer attrition calculation upon leaving i.e. having not used the product for at least four months. Based on attrition rate <1% for each year of the last 7 financial years FY13–FY19.
2 Total investment in product development and innovation includes both expensed and capitalised amounts each year spent on product development and innovation, and patents and purchased external software licences used in our products.
3 Net profit = net profit after tax attributable to equity holders of the parent.
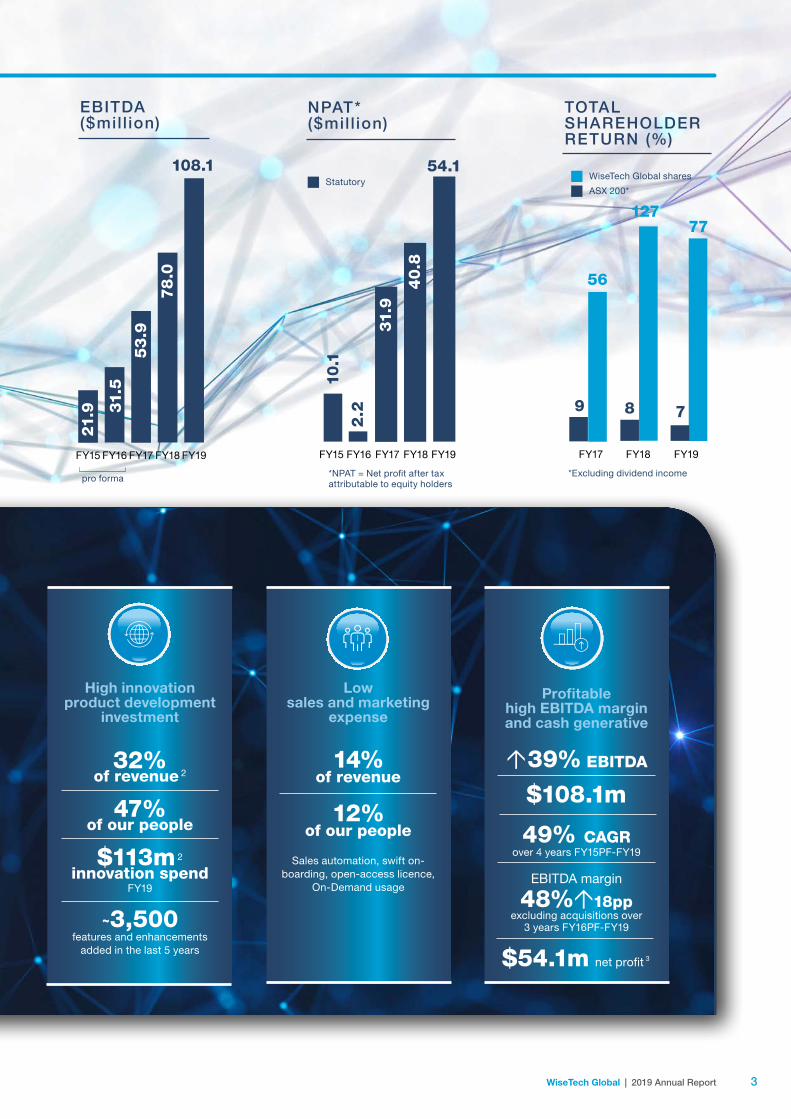
Profitable high EBITDA margin and cash generative
39% EBITDA
$108.1m
49% CAGR over 4 years FY15PF-FY19
EBITDA margin 48%18pp
excluding acquisitions over 3 years FY16PF-FY19
$54.1m net profit 3
Low sales and marketing
expense
14% of revenue
12% of our people
Sales automation, swift on-boarding, open-access licence,
On-Demand usage
High innovation product development
investment
32% of revenue 2
47% of our people
$113m 2 innovation spend
FY19
~3,500 features and enhancements
added in the last 5 years
3WiseTech Global | 2019 Annual Report
pro forma
EBITDA ($mil l ion)
FY15 FY16 FY17 FY18 FY19
21.9 31
.5
53
.9
78
.0108.1
*Excluding dividend income
TOTAL SHAREHOLDER RETURN (%)
FY17 FY18 FY19
9
56
ASX 200*
WiseTech Global shares
12777
8 7
*NPAT = Net profit after tax attributable to equity holders
NPAT* ($mil l ion)
FY15 FY16
10.1
FY18
40.8
FY19
Statutory
FY17
31.9
2.2
54.1
44
1 From FY19 the ‘product upgrades and enhancements’ count includes global plus specialised enhancements and upgrades specific to an individual region.
2 Total investment in product development and innovation includes both expensed and capitalised amounts each year spent on product development and innovation, and patents and purchased external software licences used in our products.
3 Armstrong & Associates: Top 50 Global Third Party Logistics Providers List ranked by 2017 logistics gross revenue/turnover. Armstrong & Associates: Top 25 Global Freight Forwarders List ranked by 2017 logistics gross revenue/turnover.
4 Including acquisitions announced or completed to 21 August 2019.
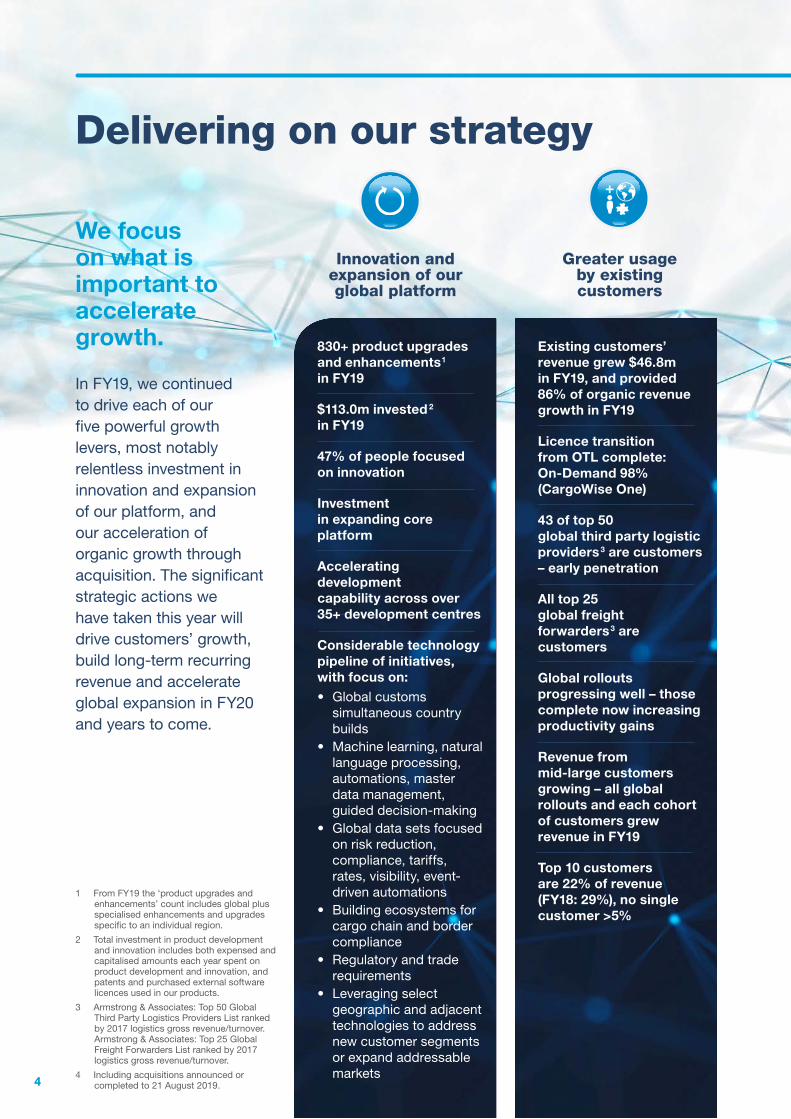
We focus on what is important to accelerate growth.
In FY19, we continued to drive each of our five powerful growth levers, most notably relentless investment in innovation and expansion of our platform, and our acceleration of organic growth through acquisition. The significant strategic actions we have taken this year will drive customers’ growth, build long-term recurring revenue and accelerate global expansion in FY20 and years to come.
Innovation and expansion of our global platform
Greater usage by existing customers
Delivering on our strategy
830+ product upgrades and enhancements1 in FY19
$113.0m invested 2 in FY19
47% of people focused on innovation
Investment in expanding core platform
Accelerating development capability across over 35+ development centres
Considerable technology pipeline of initiatives, with focus on:• Global customs
simultaneous country builds
• Machine learning, natural language processing, automations, master data management, guided decision-making
• Global data sets focused on risk reduction, compliance, tariffs, rates, visibility, event-driven automations
• Building ecosystems for cargo chain and border compliance
• Regulatory and trade requirements
• Leveraging select geographic and adjacent technologies to address new customer segments or expand addressable markets
Existing customers’ revenue grew $46.8m in FY19, and provided 86% of organic revenue growth in FY19
Licence transition from OTL complete: On-Demand 98% (CargoWise One)
43 of top 50 global third party logistic providers3 are customers – early penetration
All top 25 global freight forwarders3 are customers
Global rollouts progressing well – those complete now increasing productivity gains
Revenue from mid-large customers growing – all global rollouts and each cohort of customers grew revenue in FY19
Top 10 customers are 22% of revenue (FY18: 29%), no single customer >5%
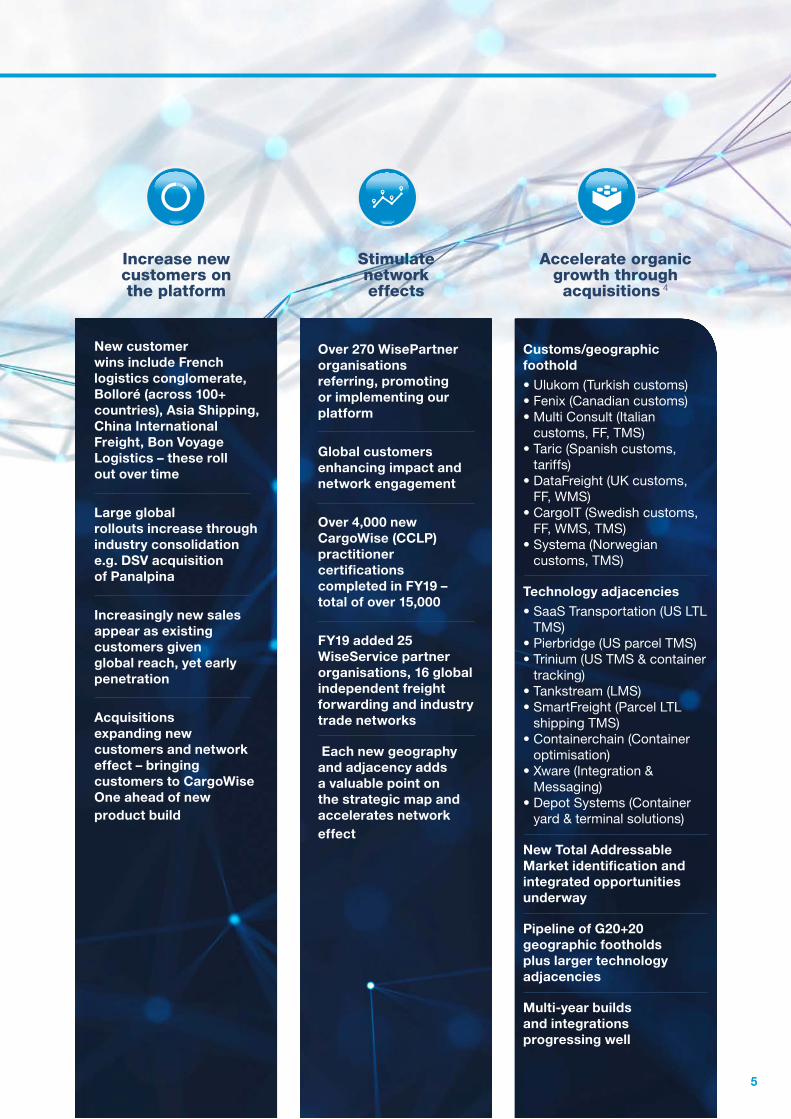
55
Accelerate organic growth through acquisitions 4
Increase new customers on the platform
Stimulate network effects
Delivering on our strategy
New customer wins include French logistics conglomerate, Bolloré (across 100+ countries), Asia Shipping, China International Freight, Bon Voyage Logistics – these roll out over time
Large global rollouts increase through industry consolidation e.g. DSV acquisition of Panalpina
Increasingly new sales appear as existing customers given global reach, yet early penetration
Acquisitions expanding new customers and network effect – bringing customers to CargoWise One ahead of new product build
Over 270 WisePartner organisations referring, promoting or implementing our platform
Global customers enhancing impact and network engagement
Over 4,000 new CargoWise (CCLP) practitioner certifications completed in FY19 – total of over 15,000
FY19 added 25 WiseService partner organisations, 16 global independent freight forwarding and industry trade networks
Each new geography and adjacency adds a valuable point on the strategic map and accelerates network effect
Customs/geographic foothold• Ulukom (Turkish customs)• Fenix (Canadian customs)• Multi Consult (Italian
customs, FF, TMS)• Taric (Spanish customs,
tariffs)• DataFreight (UK customs,
FF, WMS)• CargoIT (Swedish customs,
FF, WMS, TMS)• Systema (Norwegian
customs, TMS)
Technology adjacencies• SaaS Transportation (US LTL
TMS)• Pierbridge (US parcel TMS)• Trinium (US TMS & container
tracking)• Tankstream (LMS)• SmartFreight (Parcel LTL
shipping TMS)• Containerchain (Container
optimisation)• Xware (Integration &
Messaging)• Depot Systems (Container
yard & terminal solutions)
New Total Addressable Market identification and integrated opportunities underway
Pipeline of G20+20 geographic footholds plus larger technology adjacencies
Multi-year builds and integrations progressing well
6 7WiseTech Global | 2019 Annual Report
High quality revenue and delivery on strategy
Our business continued to experience strong growth during FY19, with revenues up 57% to $348.3m, EBITDA up 39% to $108.1m, and net profit attributable to equity holders increasing to $54.1m. These results were fuelled by significant organic growth in revenues across our global business, plus the development of hundreds of product enhancements and features for our CargoWise One technology platform, and the acquisition of many strategic assets in new geographies and adjacent technologies.
Importantly, our revenues are high quality. For CargoWise One, our recurring revenue is 99% of total revenue with 98% usage-based and our customer attrition rate remains well below 1% for the seventh year in succession.
In FY19, we continued our relentless innovation, investing 32% of our revenue and over 47% of our people in product development and innovation, further expanding our pipeline of commercialisable innovations and delivering over 830 product upgrades seamlessly across the CargoWise One platform to our customers across 150 countries. Our total investment in product development and innovation over the last five years totalled $309m and we are accelerating our development capability within our innovation teams across 35+ development centres.
Investing deeply, and innovating continuously over the very long term, makes our products easier to sell so revenues grow faster and make our sales and marketing efforts highly efficient, consuming just 14% of revenue and 12% of our people.
During FY19, and in the months since, the 15 valuable geographic and adjacent acquisitions we have announced across Europe, Asia, Australasia and the Americas will allow WiseTech to access market positions and key technologies that would otherwise take years to build,
and then integrate the acquired industry and developer talent and customers over time to accelerate our long-term organic growth. We further utilise acquisitions in key adjacent technologies to facilitate our development of globally scalable innovations, to fuel the convergence of technologies that add to our next generation of automations and machine learning, and to grow and enhance our extensive global data and transaction sets. In addition, each new geography and adjacency we acquire adds a valuable point on our strategic map, accelerates the network effects and makes CargoWise One even more compelling to local and global logistics providers and their customers. In FY19, we continued to leverage our acquired business relationships with key global customers and explored connections between the adjacent acquisitions, CargoWise One and our geographic footholds.
With our strategic execution and strong organic growth in FY19, the power of our CargoWise One platform, annual attrition rate of less than 1% and continued relentless investment in innovation and expansion across our global business, we are well positioned for the future. Our FY20 guidance, subject to currency movements, is for revenue of $440m-$460m and EBITDA of $145m-$153m, representing growth of 26%-32% and 34%-42% respectively.
Shareholder returns, dividends and financial strength
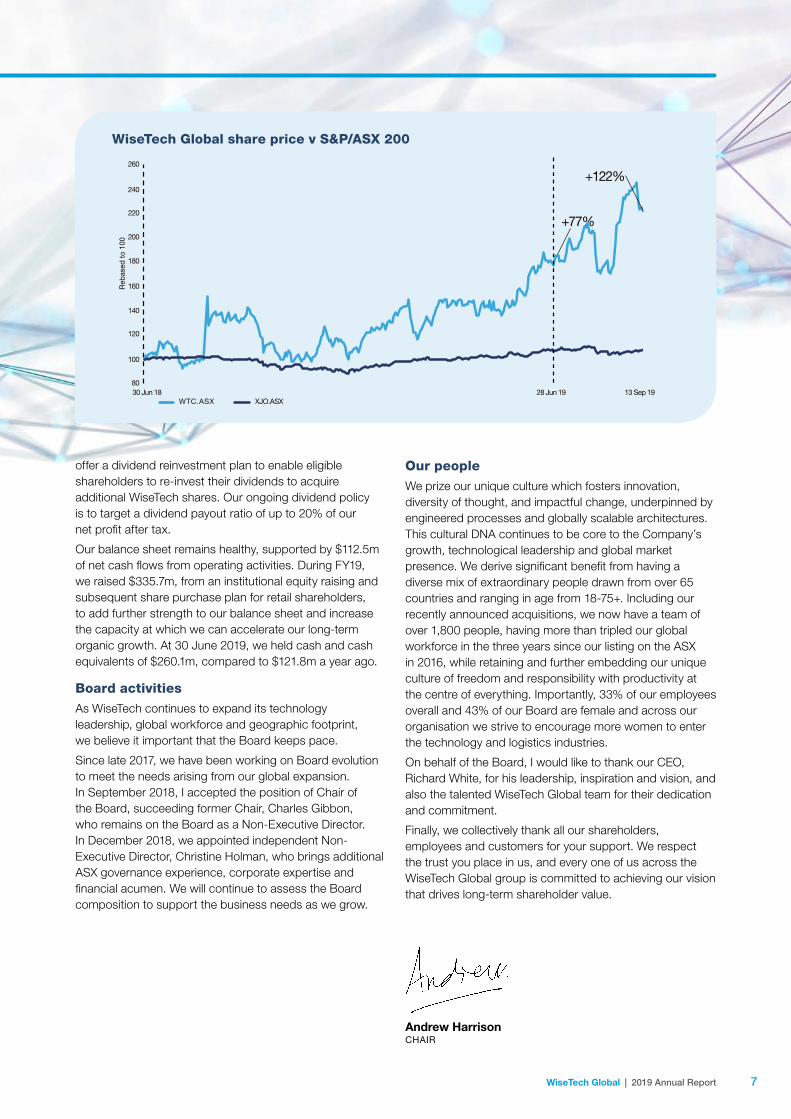
In the full year to 30 June 2019, WiseTech provided shareholders with a Total Shareholder Return of 77.1%. The WTC share price rose 76.9% and outperformed the ASX 200 by 70.1% for the year.
We have declared a fully franked final dividend of 1.95 cents per share for FY19, payable on 4 October 2019. This is in addition to the 1.50 cent interim dividend paid to shareholders on 5 April 2019. We also
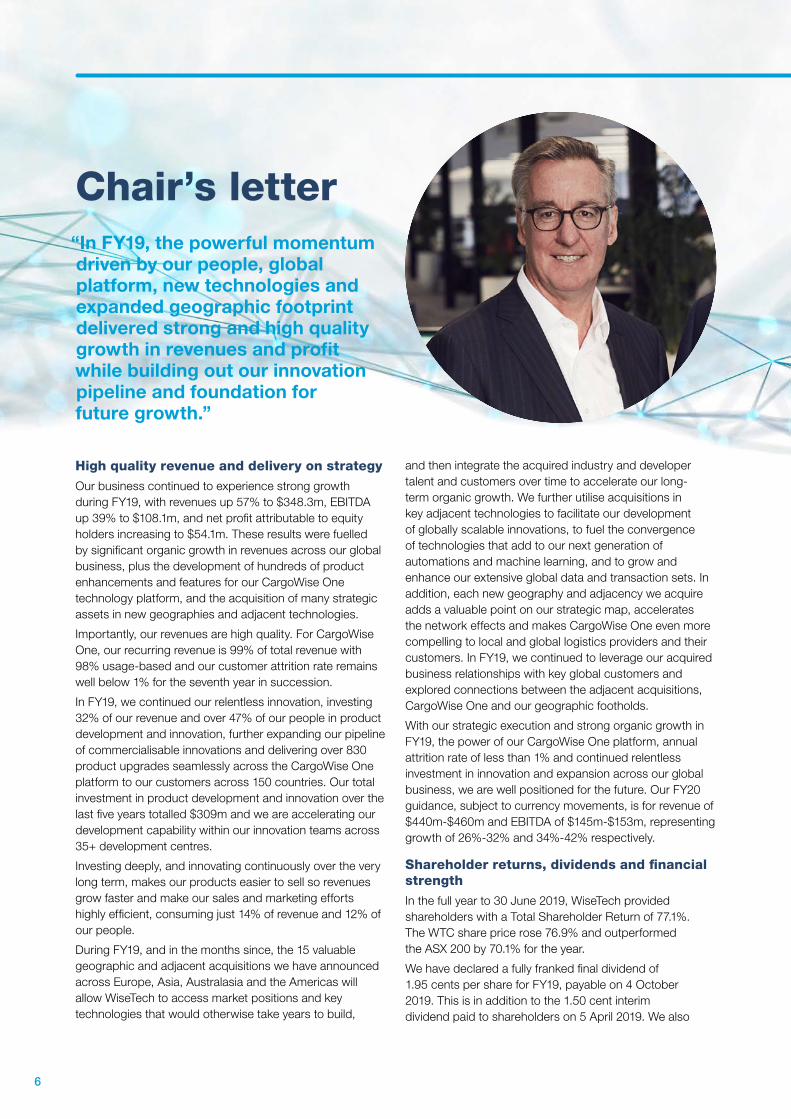
Chair’s letter“In FY19, the powerful momentum driven by our people, global platform, new technologies and expanded geographic footprint delivered strong and high quality growth in revenues and profit while building out our innovation pipeline and foundation for future growth.”
6 7WiseTech Global | 2019 Annual Report
WiseTech Global share price v S&P/ASX 200
+77%
WTC.ASX XJO.ASX
80
100
120
140
160
180
200
220
240
260
Reb
ased
to
100
30 Jun 18 28 Jun 19 13 Sep 19
+122%
Andrew HarrisonCHAIR
offer a dividend reinvestment plan to enable eligible shareholders to re-invest their dividends to acquire additional WiseTech shares. Our ongoing dividend policy is to target a dividend payout ratio of up to 20% of our net profit after tax.
Our balance sheet remains healthy, supported by $112.5m of net cash flows from operating activities. During FY19, we raised $335.7m, from an institutional equity raising and subsequent share purchase plan for retail shareholders, to add further strength to our balance sheet and increase the capacity at which we can accelerate our long-term organic growth. At 30 June 2019, we held cash and cash equivalents of $260.1m, compared to $121.8m a year ago.
Board activities
As WiseTech continues to expand its technology leadership, global workforce and geographic footprint, we believe it important that the Board keeps pace.
Since late 2017, we have been working on Board evolution to meet the needs arising from our global expansion. In September 2018, I accepted the position of Chair of the Board, succeeding former Chair, Charles Gibbon, who remains on the Board as a Non-Executive Director. In December 2018, we appointed independent Non-Executive Director, Christine Holman, who brings additional ASX governance experience, corporate expertise and financial acumen. We will continue to assess the Board composition to support the business needs as we grow.
Our people
We prize our unique culture which fosters innovation, diversity of thought, and impactful change, underpinned by engineered processes and globally scalable architectures. This cultural DNA continues to be core to the Company’s growth, technological leadership and global market presence. We derive significant benefit from having a diverse mix of extraordinary people drawn from over 65 countries and ranging in age from 18-75+. Including our recently announced acquisitions, we now have a team of over 1,800 people, having more than tripled our global workforce in the three years since our listing on the ASX in 2016, while retaining and further embedding our unique culture of freedom and responsibility with productivity at the centre of everything. Importantly, 33% of our employees overall and 43% of our Board are female and across our organisation we strive to encourage more women to enter the technology and logistics industries.
On behalf of the Board, I would like to thank our CEO, Richard White, for his leadership, inspiration and vision, and also the talented WiseTech Global team for their dedication and commitment.
Finally, we collectively thank all our shareholders, employees and customers for your support. We respect the trust you place in us, and every one of us across the WiseTech Global group is committed to achieving our vision that drives long-term shareholder value.
8 9WiseTech Global | 2019 Annual Report
For FY19, in addition to executing on our key strategic actions, we also delivered revenue of $348.3m up 57% year on year – in fact, we once again earnt more in this half than we did for a full year only 18 months ago, such is the power of our platform and growth in usage by our customers – and we expect to grow revenue 26-32% this coming year.
You can see the strength of our powerhouse CargoWise One platform and the innovative commercial model we have built over the long term in our revenue trajectory with a compound annual growth rate of 49% over the last four years and the jump in EBITDA margin for CargoWise One from 30% to 48% in the last three years. Year after year, CargoWise One’s 99% recurring revenue continues to grow, robust through business transformation, licence conversions, economic cycles and industry consolidations.
Disciplined execution of our levers of growth
More important than our strong FY19 financial performance is the continued execution of our five levers of growth: innovation and expansion of our global platform, greater usage by existing customers, increasing new customers on the platform, stimulating network effects and accelerating organic growth through acquisitions. Together, these levers work to build long-term revenue, drive customer growth,
and accelerate our global expansion. You can read more on these on pages 4-5.
We remain relentless about innovation, investing $113m in further expanding our pipeline of commercialisable innovations and delivering over 830 product enhancements and upgrades across our global platform. Hundreds of upgrades include initiatives around global data sets, regulatory and trade requirements, building the ecosystems for the cargo and compliance chains, and leveraging select geographic and adjacent technologies to address new customer segments and expand our addressable markets. You can read more on these on pages 12-17.
We also drive greater usage by our existing customers across transactions, modules and geographies with revenue growth from that channel of $46.8m, providing 86% of our organic revenue growth in FY19. This growth was generated by our large and diverse customer base adding transactions, users and geographies and moving into more modules. Usage by many of the world’s largest freight forwarding groups and revenue from our very large customers continue to grow and we continue to attract more of the world’s largest logistics organisations onto our platform – including signing Bolloré Logistics in April for a full global rollout. Bolloré is a global logistics leader, ranked in the world’s top 10 with an integrated network of 609 offices in 107 countries.
From a network effect perspective, we now have over 270 external WisePartner organisations across the world, actively referring, promoting or implementing our platform along with over 15,000 highly motivated CargoWise One Certified Practitioners currently working within our customers’ organisations and across the industry.
We have also implemented development partnerships with large regional and global rollout customers on pilot developments or technological expansions of our platform capabilities that will drive product value and network effects across the customer base.
CEO’s message“The opportunity available to us is vast and while our growth rates to date have been strong, our penetration of both customers and addressable markets is still in the early stages. We are moving swiftly with determination to build upon our lead. Our powerful innovation capacity across our 35+ development centres worldwide, expanded geographic footprint, and significant operational capacity to support new entry markets, present an incredible opportunity for efficient future growth – benefiting new segments across the global supply chain and the 12,000 organisations using WiseTech logistics solutions across the world.”
8 9WiseTech Global | 2019 Annual Report
Richard WhiteFOUNDER & CEO
In FY19, we progressed product development in China, Italy, Germany, Brazil, Ireland, the US, and Australasia and across our global adjacencies including global rates management, border compliance, warehousing including transit, bonded and contract modes and land transport. As a result of the progress we have made in scaling the business, in FY20 we will further lift our rate of R&D investment an additional 30-40% in order to maximise the vast opportunity set we are targeting.
In addition, since 1 July 2018, we have announced a further 15 valuable geographic and adjacent acquisitions across Turkey, North America, Spain, Italy, Australia, the UK, Sweden, Norway and Singapore. Small, targeted acquisitions are a risk reduction and expansion strategy, providing safer, faster, strong entry to new key markets along with talented industry experts and developers, local management, local infrastructure and high quality customer bases. See pages 18-21 for more detail.
With our global reach, we see into the world’s supply chains at a breadth and depth that allow us to identify and build large, deeper next-generation functionality, global data sets and powerful transactional execution capabilities. We have established the development capacity, geographic footprint and global integrated platform, which together give us a strong foundation to build the critical international and domestic cargo chain adding deeper border compliance, container automations, customs entry automations and ecommerce ecosystems. Our reach now extends out from international freight forwarding and 3PL logistics, making inroads into 2PL, 1PL and domestic transportation globally. In order to become the operating system for global logistics, we continue to evolve rapidly, expanding into more products, deeper functionality, more geographies and more adjacencies, driving our long-term growth, market position and brand recognition with each new innovation and acquisition.
We are the architects of the solution to the logistics industry pain points
Throughout the world, the dynamics inherent in the logistics industry causing pain points for operators worldwide are cycling up faster. This is creating a Gordian Knot across the supply chain: increasing regulation, tariffs and taxes, trade wars, capital constraints, economic changes, the tsunami of ecommerce volumes and margin pressures to name just a few of the many pain points, all of which create ever stronger tailwinds for greater adoption and use of CargoWise One.
Each one of these negatives that potentially beset and derail even the largest of logistics providers and their customers are opportunities for WiseTech Global as we are the architects of the solutions for industry.
Our vision and commitment
We know the work we do is valuable for the world. Our vision is of a comprehensive global logistics execution solution for our customers, capable of managing from the first-mile road movement, connecting to long-haul air, sea, rail and road, crossing domestic routes and international borders, all while navigating complex regulatory burdens
with improved compliance, safety, visibility, predictability, manageability and productivity.
With our 35+ development centres and over 1,800 staff in 50+ offices around the world, we are well placed to move swiftly to create the compute engines, global data and transaction sets to address the needs of all logistics providers and their customers for real-time visibility, control over margins, faster multi-modal movement, error reduction and more efficient use of resources. We are delivering this on a scale and quality that are leading improvements in logistics execution, and we are committed to enabling, not disrupting, this important global industry.
Our people and teams across the world are aligned in our strong vision to create the operating system for global logistics. Now, in our 25th year, we are moving swiftly with precision ever closer to this goal. Our long-term focus and discipline have enabled us to make the deep investments in technology, product, organisational structure and commercial model over many years in order to be able to develop the four formidable components on which we are building the operating system for global logistics. First, we have solved for the global integrated platform, CargoWise, to which we apply our relentless technology development in the pursuit of digital straight-through processing. Second, we build vast, cleansed and verified data sets to which we can apply machine learning, automations and event-driven automation and exception management. Third, we’ve built a hyper-scalable, efficient commercial model that speeds onboarding and disciplined resource usage. Lastly, we have a powerful network of CargoWise connections, drawing in thousands of nodes that bring millions of further connections – every new customer, every customer’s customer, every party to a transaction, every module, every geography, every technology and every strategic asset create further nodes, and with them, exponential connections.
With the addressable market in technology for global logistics in the hundreds of billions, and the spend on digital transformation itself hundreds of millions more again, we are moving fast to leverage these components and build out our technology lead.
My team and I are deeply committed to this long-term trajectory and we continue to grow our unique workforce of diverse, intelligent, motivated and experienced people, who work together to solve the deep and complex pain points of the logistics industry.
I encourage you to read pages 22-31 to understand more about our extraordinary innovation culture, commitment to changing the world for the better and our Credo that gives us purpose and meaning.
On behalf of our WiseTech Global team, I thank each of our shareholders for their investment and support as we strive to build an even more powerful and valuable organisation.
10 11WiseTech Global | 2019 Annual Report
Our businessWe are a leading provider of software solutions to the logistics industry globally. We develop the software solutions that enable logistics service providers to facilitate the movement and storage of goods and information, domestically and internationally. We provide our solutions to 12,000 organisations across 150 countries supported by over 50 offices across the globe.
CargoWise One and customers
Our industry-leading flagship technology, CargoWise One, is a deeply-integrated global software solution that enables customers to execute highly complex logistics transactions and manage their operations on one database across multiple users, functions, offices, countries and languages.
We operate our own data centres and deliver our CargoWise One software principally through the cloud, which customers access as needed, without limitation, and pay for usage as they execute on the platform. Our customers are ‘the people who move the world’, ranging from large multi-national companies to small and mid-sized regional and domestic enterprises. They include all of the top 25 global freight forwarders and 43 of the top 50 global 3PLs such as DSV, DHL Global Forwarding, Toll, Yusen Logistics, Bolloré Logistics and GEODIS.
Innovation and productivity are at the core of what we do, we invest relentlessly in product development building the best technology and prioritising highly scalable long-term solutions.
Our software is designed to assist our customers to better address the complexities of the logistics industry while
dramatically increasing productivity, reducing costs and mitigating risks. We believe our customers stay, and grow transactions and users, due to the power, depth and productivity of our global platform.
We are actively expanding CargoWise One through innovation and acquisitions. Every new geography and adjacency we acquire adds a valuable point on our strategic map, accelerates the network effects and makes CargoWise One even more compelling to local and global logistics providers and their customers.
In FY19, we leveraged our acquired business relationships with key global customers and explored connections between the adjacent acquisitions, CargoWise One, and geographic footholds. We also implemented development partnerships with large regional and global rollout customers on pilot technology developments, which will further drive network effects across the customer base.
We harness important natural network effects that exist because of the necessarily collaborative nature of supply chain execution and the inherent effect of our deeply-integrated global platform.
These effects are further stimulated with targeted partner programs through WisePartners, CargoWise Certified Professionals, and deeper WiseIndustry programs for freight forwarding network groups globally. We have over 270 external WisePartner organisations across the world, actively referring, promoting or implementing our platform and over 15,000 CargoWise One practitioners who work within the logistics industry across our customer or partner organisations.
The efficiency of our CargoWise operations is the result of innovation in our business model and internal architectures and focus on building globally scalable processes to systematically remove the constraints to growth. We customise through configuration tools, offer a single global price list and we service our customers through a deep education and content platform and our partner organisations. These are but a few of many elements that scale out efficiency and help to drive our CargoWise EBTIDA margin from 30% to 48% in the last 3 years.
Customers
Our 12,000 existing customers = significant runway for increased usage in transactions, geographic expansion and entering new verticals across the supply chain.
Growth opportunities from:
X 43 of top 50 global 3PLs;
X 25 of top 25 global freight forwarders;
X global rollouts progressing for largest freight forwarders; and
X top 10 customers represent 22% of FY19 revenue.
10 11WiseTech Global | 2019 Annual Report
` Scalable to any size of business
` Global reach – 150 countries ` Deeply integrated with real-
time visibility ` Reduces risks, costs and
data entry ` Detailed compliance ` 30 languages ` Data entered only once ` Automations and delegations ` Built-in productivity tools ` On-Demand / transaction
based licensing ` Global data sets and
execution engines ` Swift on-boarding, efficient
sales process ` Open-access, cloud enabled ` Available anywhere, anytime
CargoWise One
$
¥€
Freight forwarding Warehousing Land transportCustoms clearance Liner & Agency Containerstation/yard
Ecommerce
BorderWise Geo compliance Schedules Rates Booking Tracking Netting & Reconciliation
Accounting& Invoicing
Customer relationshipmanagement
Work�ows &Automations
Integratedmessaging
Documentmanager
Human capitalmanagement
Integrated modules covering key logistics transactions
Integrated modules for enterprise wide...
Integrated identity management, security and SSO
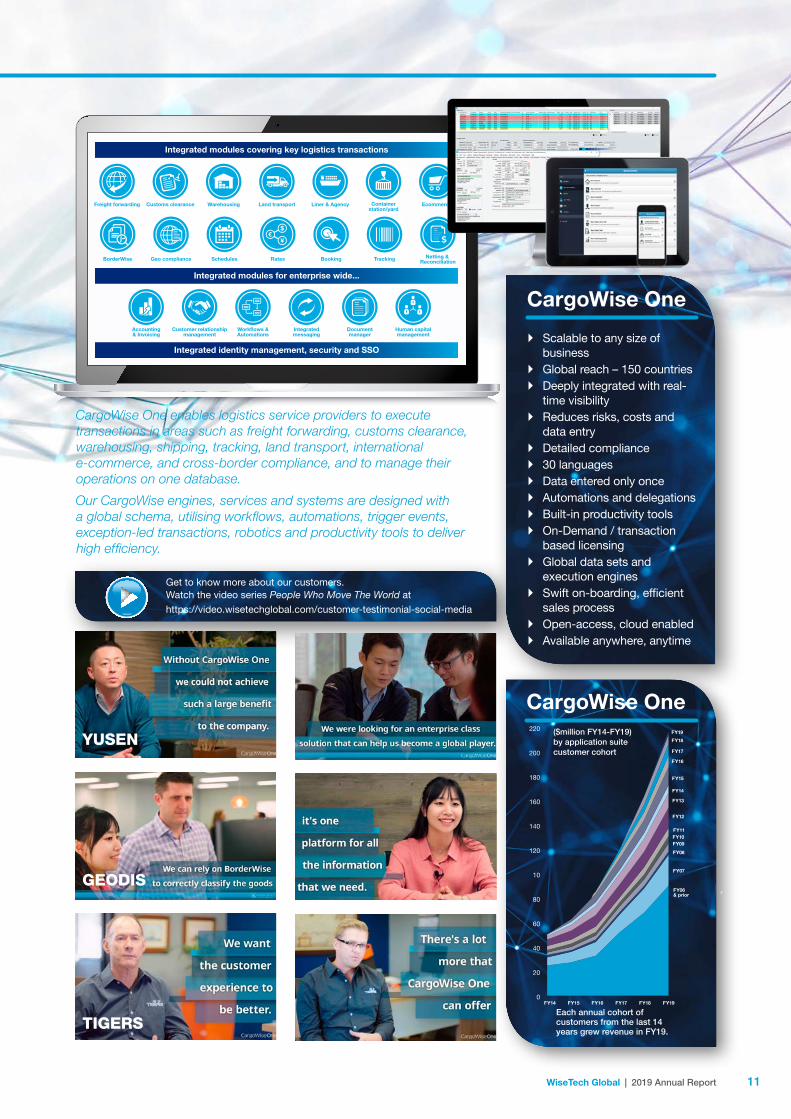
CargoWise One enables logistics service providers to execute transactions in areas such as freight forwarding, customs clearance, warehousing, shipping, tracking, land transport, international e-commerce, and cross-border compliance, and to manage their operations on one database.
Our CargoWise engines, services and systems are designed with a global schema, utilising workflows, automations, trigger events, exception-led transactions, robotics and productivity tools to deliver high efficiency.
Get to know more about our customers. Watch the video series People Who Move The World athttps://video.wisetechglobal.com/customer-testimonial-social-media
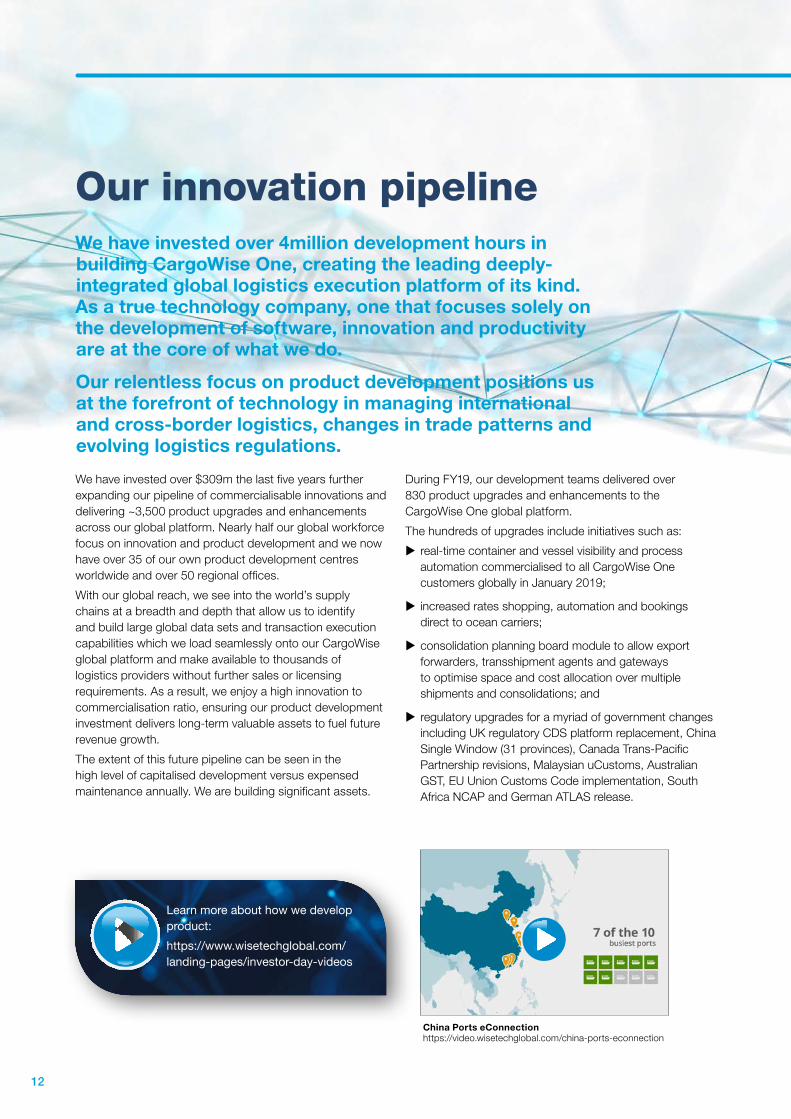
Each annual cohort of customers from the last 14 years grew revenue in FY19.
r
($million FY14-FY19)by application suite customer cohort
CargoWise One
YUSEN
GEODIS
TIGERS
FY14 FY15 FY16 FY17 FY18
FY06& prior
FY07
FY08
FY09FY10FY11
FY12
FY13
FY14
FY15
FY16
FY17
FY18
FY19
FY19
220
200
180
160
140
120
10
80
60
40
20
0
12 13WiseTech Global | 2019 Annual Report
We have invested over $309m the last five years further expanding our pipeline of commercialisable innovations and delivering ~3,500 product upgrades and enhancements across our global platform. Nearly half our global workforce focus on innovation and product development and we now have over 35 of our own product development centres worldwide and over 50 regional offices.
With our global reach, we see into the world’s supply chains at a breadth and depth that allow us to identify and build large global data sets and transaction execution capabilities which we load seamlessly onto our CargoWise global platform and make available to thousands of logistics providers without further sales or licensing requirements. As a result, we enjoy a high innovation to commercialisation ratio, ensuring our product development investment delivers long-term valuable assets to fuel future revenue growth.
The extent of this future pipeline can be seen in the high level of capitalised development versus expensed maintenance annually. We are building significant assets.
During FY19, our development teams delivered over 830 product upgrades and enhancements to the CargoWise One global platform.
The hundreds of upgrades include initiatives such as:
X real-time container and vessel visibility and process automation commercialised to all CargoWise One customers globally in January 2019;
X increased rates shopping, automation and bookings direct to ocean carriers;
X consolidation planning board module to allow export forwarders, transshipment agents and gateways to optimise space and cost allocation over multiple shipments and consolidations; and
X regulatory upgrades for a myriad of government changes including UK regulatory CDS platform replacement, China Single Window (31 provinces), Canada Trans-Pacific Partnership revisions, Malaysian uCustoms, Australian GST, EU Union Customs Code implementation, South Africa NCAP and German ATLAS release.
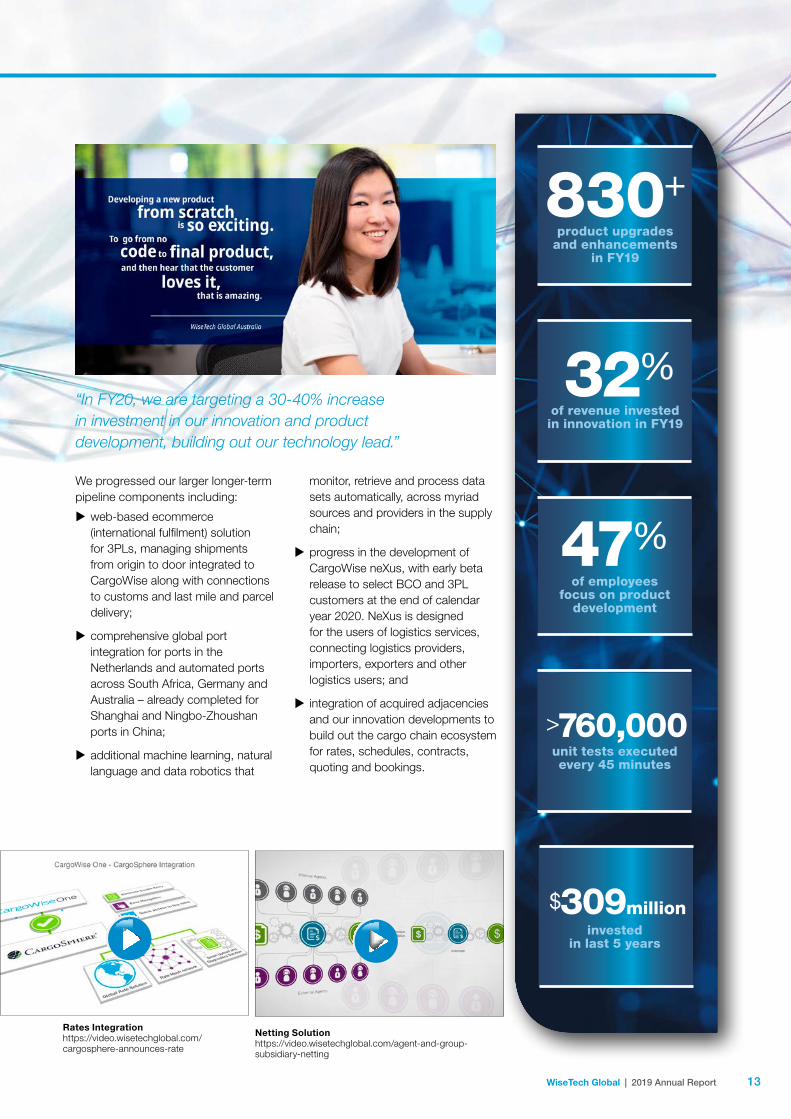
Our innovation pipelineWe have invested over 4million development hours in building CargoWise One, creating the leading deeply-integrated global logistics execution platform of its kind. As a true technology company, one that focuses solely on the development of software, innovation and productivity are at the core of what we do.
Our relentless focus on product development positions us at the forefront of technology in managing international and cross-border logistics, changes in trade patterns and evolving logistics regulations.
Learn more about how we develop product:
https://www.wisetechglobal.com/landing-pages/investor-day-videos
China Ports eConnectionhttps://video.wisetechglobal.com/china-ports-econnection
12 13WiseTech Global | 2019 Annual Report
“In FY20, we are targeting a 30-40% increase in investment in our innovation and product development, building out our technology lead.”
We progressed our larger longer-term pipeline components including:
X web-based ecommerce (international fulfilment) solution for 3PLs, managing shipments from origin to door integrated to CargoWise along with connections to customs and last mile and parcel delivery;
X comprehensive global port integration for ports in the Netherlands and automated ports across South Africa, Germany and Australia – already completed for Shanghai and Ningbo-Zhoushan ports in China;
X additional machine learning, natural language and data robotics that
monitor, retrieve and process data sets automatically, across myriad sources and providers in the supply chain;
X progress in the development of CargoWise neXus, with early beta release to select BCO and 3PL customers at the end of calendar year 2020. NeXus is designed for the users of logistics services, connecting logistics providers, importers, exporters and other logistics users; and
X integration of acquired adjacencies and our innovation developments to build out the cargo chain ecosystem for rates, schedules, contracts, quoting and bookings.
47%of employees
focus on product development
$309millioninvested
in last 5 years
>760,000unit tests executed every 45 minutes
32%of revenue invested in innovation in FY19
830+product upgrades
and enhancements in FY19
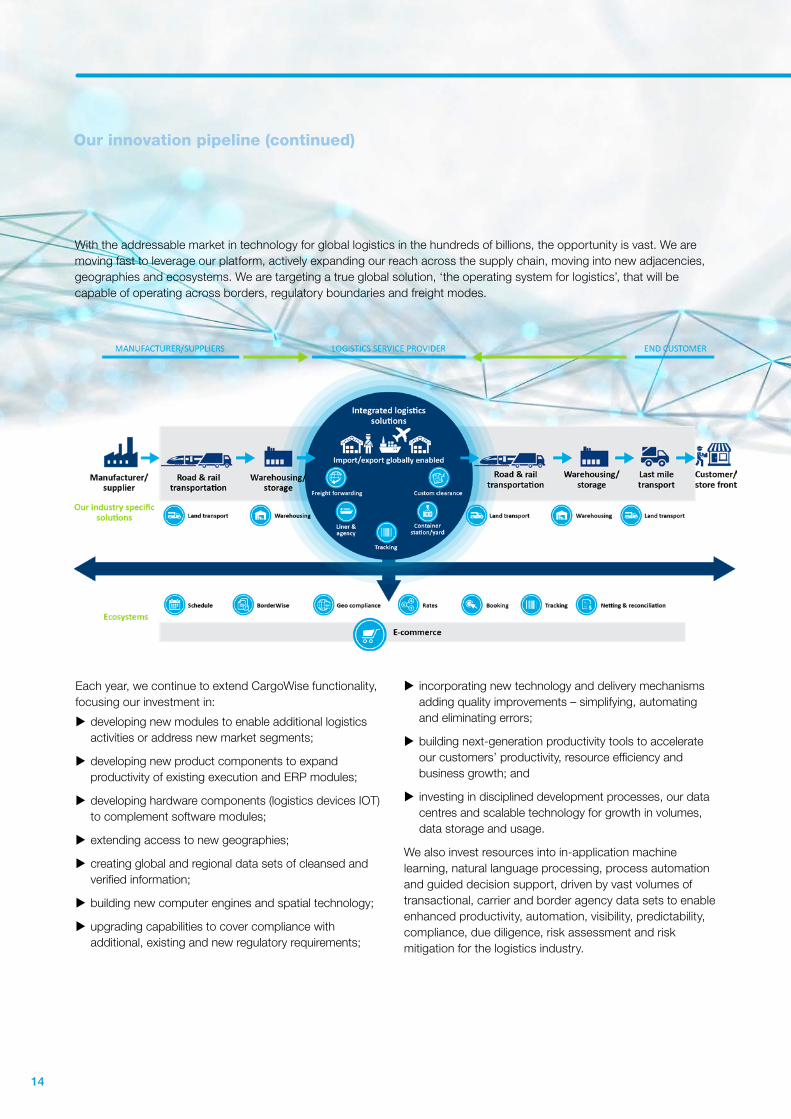
Netting Solutionhttps://video.wisetechglobal.com/agent-and-group-subsidiary-netting
Rates Integrationhttps://video.wisetechglobal.com/cargosphere-announces-rate
14 15WiseTech Global | 2019 Annual Report
Our innovation pipeline (continued)
With the addressable market in technology for global logistics in the hundreds of billions, the opportunity is vast. We are moving fast to leverage our platform, actively expanding our reach across the supply chain, moving into new adjacencies, geographies and ecosystems. We are targeting a true global solution, ‘the operating system for logistics’, that will be capable of operating across borders, regulatory boundaries and freight modes.
Each year, we continue to extend CargoWise functionality, focusing our investment in:
X developing new modules to enable additional logistics activities or address new market segments;
X developing new product components to expand productivity of existing execution and ERP modules;
X developing hardware components (logistics devices IOT) to complement software modules;
X extending access to new geographies;
X creating global and regional data sets of cleansed and verified information;
X building new computer engines and spatial technology;
X upgrading capabilities to cover compliance with additional, existing and new regulatory requirements;
X incorporating new technology and delivery mechanisms adding quality improvements – simplifying, automating and eliminating errors;
X building next-generation productivity tools to accelerate our customers’ productivity, resource efficiency and business growth; and
X investing in disciplined development processes, our data centres and scalable technology for growth in volumes, data storage and usage.
We also invest resources into in-application machine learning, natural language processing, process automation and guided decision support, driven by vast volumes of transactional, carrier and border agency data sets to enable enhanced productivity, automation, visibility, predictability, compliance, due diligence, risk assessment and risk mitigation for the logistics industry.
14 15WiseTech Global | 2019 Annual Report
Just as we have created a truly modeless and borderless international freight forwarding global platform used by the world’s largest logistics providers, our teams are similarly building out globally integrated platform capability for customs and border compliance, landside logistics optimisation and Transportation Management Systems (TMS) and international ecommerce along with our neXus platform, which is designed for the users of logistics services.
Every key technology component is assessed on ‘build’, ‘buy’, ‘licence’ or ‘partner’ execution method as we focus on the most effective resource utilisation to expand our technology pipeline. Build utilises the development capability and capacity of our own development centres worldwide with our deep domain knowledge for complex verticals and interdependencies, whereas in select areas we acquire strategic assets in the form of software companies and specialist technology teams. These bring additional skills, increase in speed to market and access to IP to converge with our own technology.
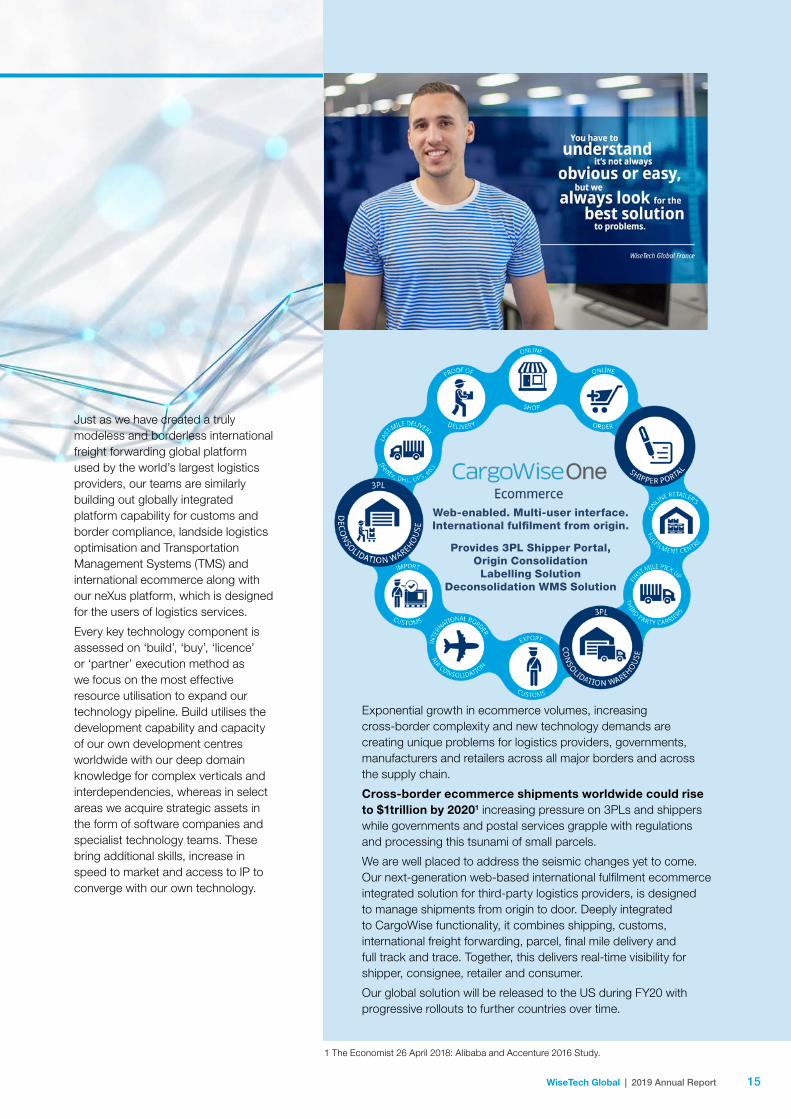
Exponential growth in ecommerce volumes, increasing cross-border complexity and new technology demands are creating unique problems for logistics providers, governments, manufacturers and retailers across all major borders and across the supply chain.
Cross-border ecommerce shipments worldwide could rise to $1trillion by 20201 increasing pressure on 3PLs and shippers while governments and postal services grapple with regulations and processing this tsunami of small parcels.
We are well placed to address the seismic changes yet to come. Our next-generation web-based international fulfilment ecommerce integrated solution for third-party logistics providers, is designed to manage shipments from origin to door. Deeply integrated to CargoWise functionality, it combines shipping, customs, international freight forwarding, parcel, final mile delivery and full track and trace. Together, this delivers real-time visibility for shipper, consignee, retailer and consumer.
Our global solution will be released to the US during FY20 with progressive rollouts to further countries over time.
1 The Economist 26 April 2018: Alibaba and Accenture 2016 Study.
Web-enabled. Multi-user interface.International fulfilment from origin.
Provides 3PL Shipper Portal, Origin Consolidation
Labelling Solution Deconsolidation WMS Solution
16 17WiseTech Global | 2019 Annual Report
Our innovation pipeline (continued)
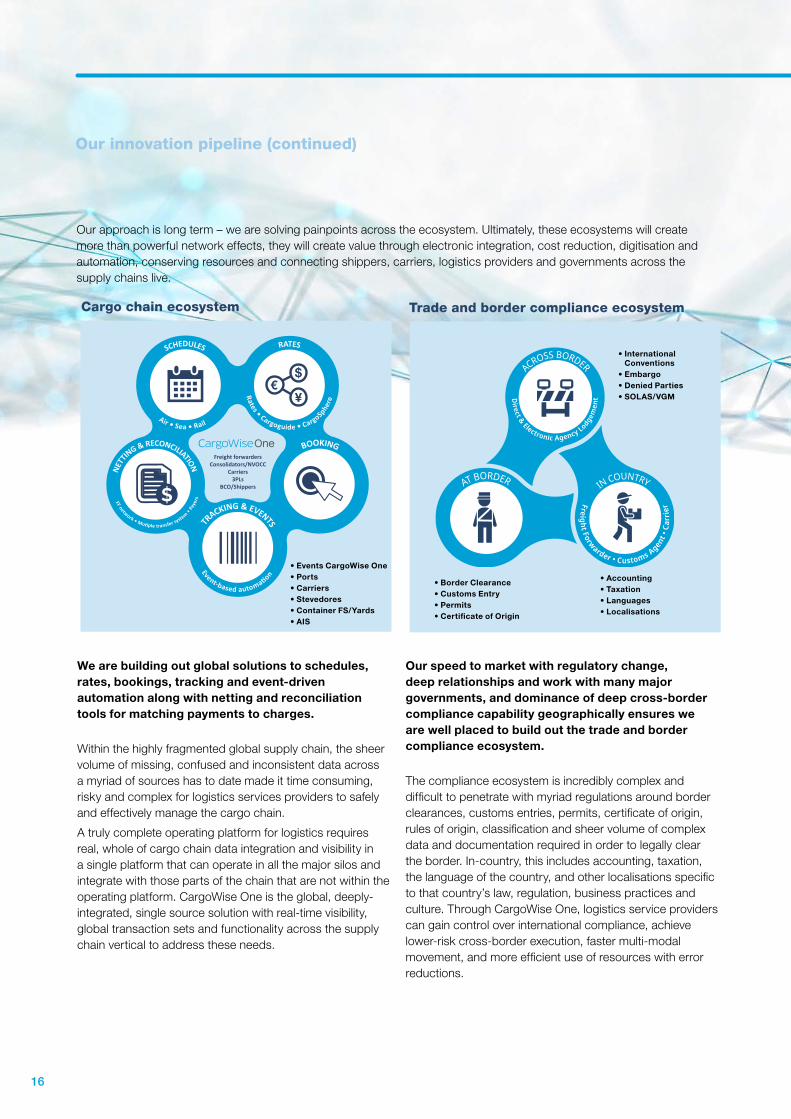
Our approach is long term – we are solving painpoints across the ecosystem. Ultimately, these ecosystems will create more than powerful network effects, they will create value through electronic integration, cost reduction, digitisation and automation, conserving resources and connecting shippers, carriers, logistics providers and governments across the supply chains live.
We are building out global solutions to schedules, rates, bookings, tracking and event-driven automation along with netting and reconciliation tools for matching payments to charges.
Within the highly fragmented global supply chain, the sheer volume of missing, confused and inconsistent data across a myriad of sources has to date made it time consuming, risky and complex for logistics services providers to safely and effectively manage the cargo chain.
A truly complete operating platform for logistics requires real, whole of cargo chain data integration and visibility in a single platform that can operate in all the major silos and integrate with those parts of the chain that are not within the operating platform. CargoWise One is the global, deeply-integrated, single source solution with real-time visibility, global transaction sets and functionality across the supply chain vertical to address these needs.
Our speed to market with regulatory change, deep relationships and work with many major governments, and dominance of deep cross-border compliance capability geographically ensures we are well placed to build out the trade and border compliance ecosystem.
The compliance ecosystem is incredibly complex and difficult to penetrate with myriad regulations around border clearances, customs entries, permits, certificate of origin, rules of origin, classification and sheer volume of complex data and documentation required in order to legally clear the border. In-country, this includes accounting, taxation, the language of the country, and other localisations specific to that country’s law, regulation, business practices and culture. Through CargoWise One, logistics service providers can gain control over international compliance, achieve lower-risk cross-border execution, faster multi-modal movement, and more efficient use of resources with error reductions.
SCHEDULES
Air • Sea • Rail
RATES
Rates • Cargoguide • CargoSphere
BOOKING
TRACKING & EVENTS
Event-based automati
on
NETT
ING & RECONCILIATION
FF network • Mutiple transfer system • Paye
rs
Freight forwardersConsolidators/NVOCC
Carriers3PLs
BCO/Shippers
ACROSS BORDER
AT BORDER IN COUNTRY
Direct & Electronic Agency Lodge
men
t
Freight Forwarder • Customs Agent •
Carr
ier
Cargo chain ecosystem Trade and border compliance ecosystem
• International Conventions
• Embargo• Denied Parties• SOLAS/VGM
• Border Clearance• Customs Entry• Permits• Certificate of Origin
• Accounting• Taxation• Languages• Localisations
• Events CargoWise One• Ports• Carriers• Stevedores• Container FS/Yards• AIS
16 17WiseTech Global | 2019 Annual Report
WAREHOUSES
CON
TAIN
ER FR
EIGHT STATION & PORTS & YARD
Air · Sea · Road
CARRIERS
TE
RMINALS & PORTS
LTL · FTL · Parcel · PortTRAN
SP
ORT MANAGEMENT SYSTEMS
GATE & YARD MANAGEMENT SYST
EMS
CON
SUM
ER
s of
logis
tics s
ervices
PROVIDERs of
logi
stic
s se
rvic
es
neXus
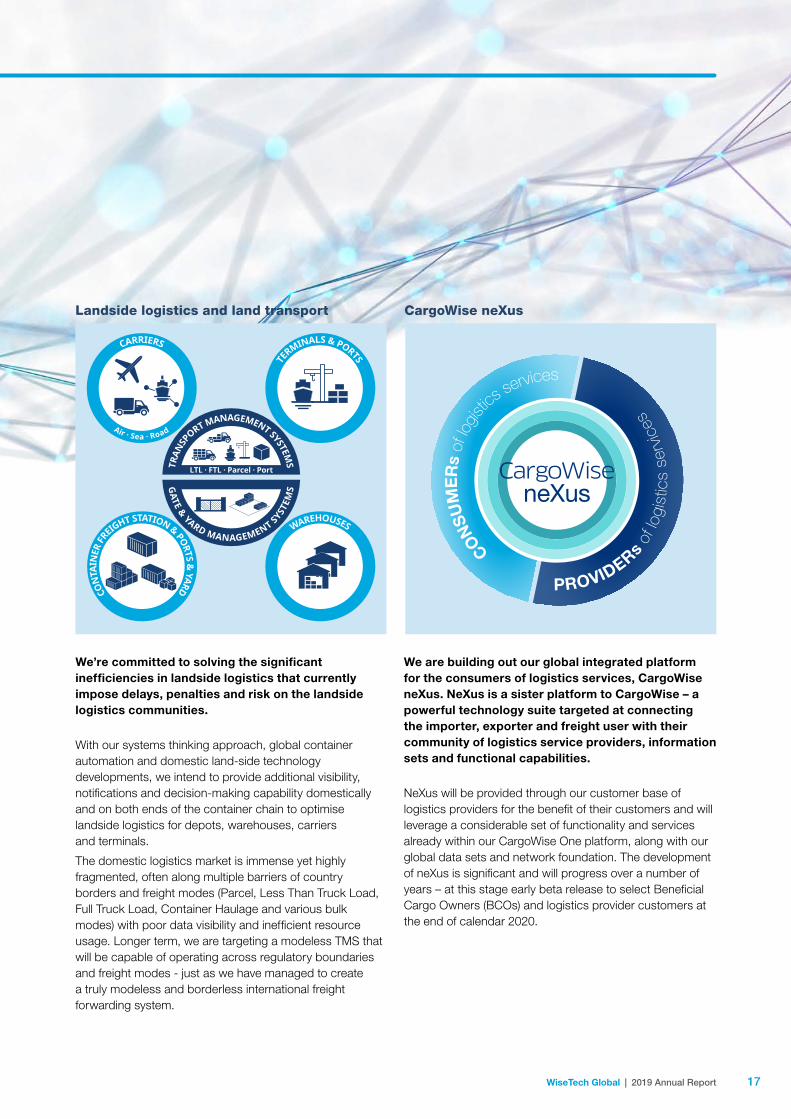
We’re committed to solving the significant inefficiencies in landside logistics that currently impose delays, penalties and risk on the landside logistics communities.
With our systems thinking approach, global container automation and domestic land-side technology developments, we intend to provide additional visibility, notifications and decision-making capability domestically and on both ends of the container chain to optimise landside logistics for depots, warehouses, carriers and terminals.
The domestic logistics market is immense yet highly fragmented, often along multiple barriers of country borders and freight modes (Parcel, Less Than Truck Load, Full Truck Load, Container Haulage and various bulk modes) with poor data visibility and inefficient resource usage. Longer term, we are targeting a modeless TMS that will be capable of operating across regulatory boundaries and freight modes - just as we have managed to create a truly modeless and borderless international freight forwarding system.
We are building out our global integrated platform for the consumers of logistics services, CargoWise neXus. NeXus is a sister platform to CargoWise – a powerful technology suite targeted at connecting the importer, exporter and freight user with their community of logistics service providers, information sets and functional capabilities.
NeXus will be provided through our customer base of logistics providers for the benefit of their customers and will leverage a considerable set of functionality and services already within our CargoWise One platform, along with our global data sets and network foundation. The development of neXus is significant and will progress over a number of years – at this stage early beta release to select Beneficial Cargo Owners (BCOs) and logistics provider customers at the end of calendar 2020.
Landside logistics and land transport CargoWise neXus
18 19WiseTech Global | 2019 Annual Report
We originate our own acquisition pipeline and execute with our own internally built M&A engine. These acquisitions are at various stages of completion and integration and, once fully integrated, they will expand the functionality, scope and value of our industry-leading technology and provide strong bases for further accelerating our long-term organic growth.
Together with our significant innovation pipeline and powerful CargoWise platform, these acquisitions will ensure we are best placed to build the ecosystems necessary to become the operating system for global logistics.
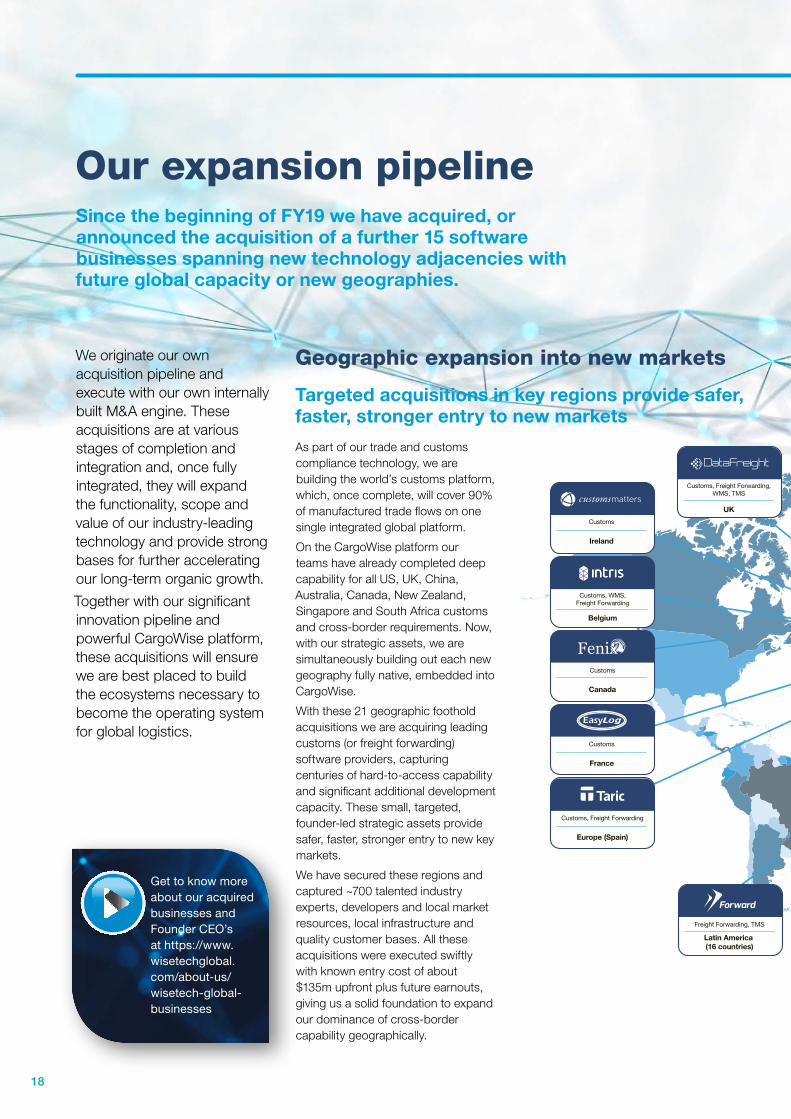
As part of our trade and customs compliance technology, we are building the world’s customs platform, which, once complete, will cover 90% of manufactured trade flows on one single integrated global platform.
On the CargoWise platform our teams have already completed deep capability for all US, UK, China, Australia, Canada, New Zealand, Singapore and South Africa customs and cross-border requirements. Now, with our strategic assets, we are simultaneously building out each new geography fully native, embedded into CargoWise.
With these 21 geographic foothold acquisitions we are acquiring leading customs (or freight forwarding) software providers, capturing centuries of hard-to-access capability and significant additional development capacity. These small, targeted, founder-led strategic assets provide safer, faster, stronger entry to new key markets.
We have secured these regions and captured ~700 talented industry experts, developers and local market resources, local infrastructure and quality customer bases. All these acquisitions were executed swiftly with known entry cost of about $135m upfront plus future earnouts, giving us a solid foundation to expand our dominance of cross-border capability geographically.
Our expansion pipelineSince the beginning of FY19 we have acquired, or announced the acquisition of a further 15 software businesses spanning new technology adjacencies with future global capacity or new geographies.
Geographic expansion into new markets
Targeted acquisitions in key regions provide safer, faster, stronger entry to new markets
Customs
GermanyCustoms, Freight Forwarding
Europe (Spain)
Customs, TMS
Norway, Sweden, Denmark
Customs, Warehousing
Netherlands
Customs, WMS,Freight Forwarding
Belgium
Customs
Canada
Customs
France
Customs, Freight Forwarding,WMS, TMS
UK
Customs, Freight Fowarding,WMS, TMS
Sweden
Customs, Bonded WMS, Freight Forwarding
Italy
Customs, TMS
Ireland, Netherlands, Belgium, UK, Switzerland,
Sweden, Germany
Freight Forwarding, TMS
Latin America (16 countries)
Freight Forwarding, TMS, WMS
Uruguay, Chile,Mexico, Argentina
Customs, WMS, Freight Forwarding
South Africa
Customs, Freight Forwarding
Brazil
Customs
Turkey
Freight Forwarding,TMS, WMS
China
Customs, TMS,Freight Forwarding, WMS
Taiwan
Customs, Freight Forwarding,TMS, WMS
Italy
Multi Consult
Customs
Ireland
Get to know more about our acquired businesses and Founder CEO’s at https://www.wisetechglobal.com/about-us/wisetech-global-businesses
18 19WiseTech Global | 2019 Annual Report
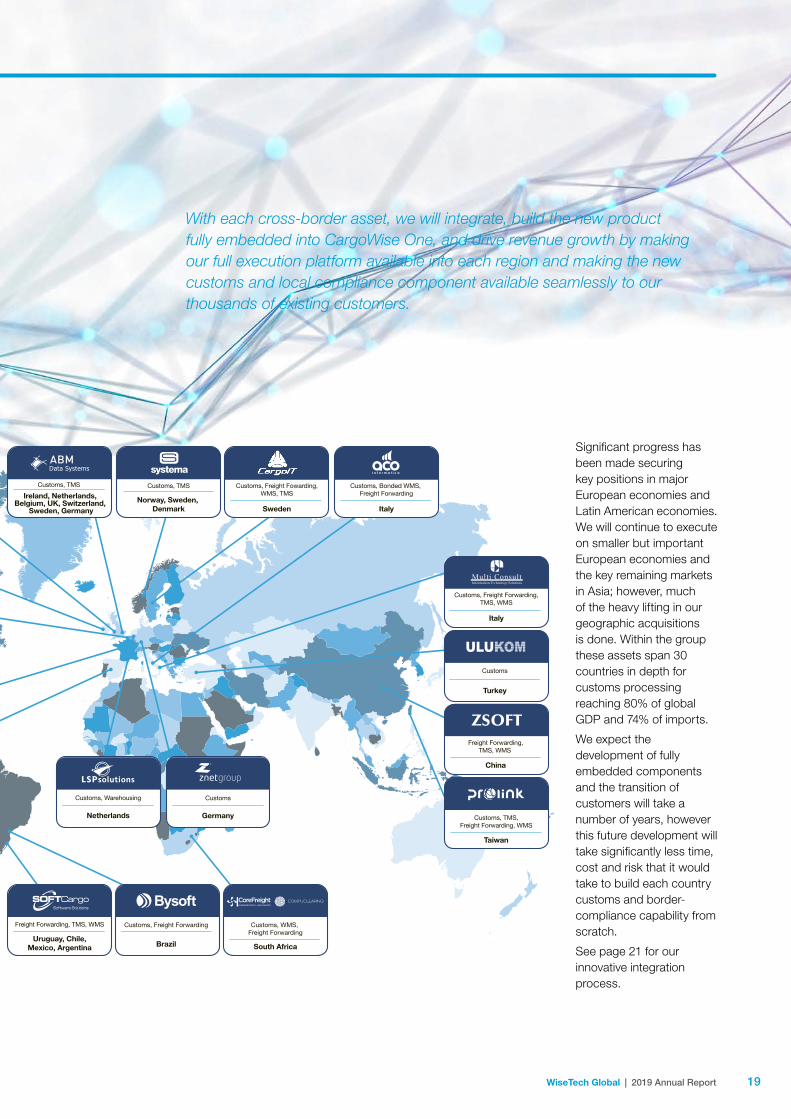
Significant progress has been made securing key positions in major European economies and Latin American economies. We will continue to execute on smaller but important European economies and the key remaining markets in Asia; however, much of the heavy lifting in our geographic acquisitions is done. Within the group these assets span 30 countries in depth for customs processing reaching 80% of global GDP and 74% of imports.
We expect the development of fully embedded components and the transition of customers will take a number of years, however this future development will take significantly less time, cost and risk that it would take to build each country customs and border-compliance capability from scratch.
See page 21 for our innovative integration process.
Customs
GermanyCustoms, Freight Forwarding
Europe (Spain)
Customs, TMS
Norway, Sweden, Denmark
Customs, Warehousing
Netherlands
Customs, WMS,Freight Forwarding
Belgium
Customs
Canada
Customs
France
Customs, Freight Forwarding,WMS, TMS
UK
Customs, Freight Fowarding,WMS, TMS
Sweden
Customs, Bonded WMS, Freight Forwarding
Italy
Customs, TMS
Ireland, Netherlands, Belgium, UK, Switzerland,
Sweden, Germany
Freight Forwarding, TMS
Latin America (16 countries)
Freight Forwarding, TMS, WMS
Uruguay, Chile,Mexico, Argentina
Customs, WMS, Freight Forwarding
South Africa
Customs, Freight Forwarding
Brazil
Customs
Turkey
Freight Forwarding,TMS, WMS
China
Customs, TMS,Freight Forwarding, WMS
Taiwan
Customs, Freight Forwarding,TMS, WMS
Italy
Multi Consult
Customs
Ireland
With each cross-border asset, we will integrate, build the new product fully embedded into CargoWise One, and drive revenue growth by making our full execution platform available into each region and making the new customs and local compliance component available seamlessly to our thousands of existing customers.
20 21WiseTech Global | 2019 Annual Report
Our expansion pipeline (continued)
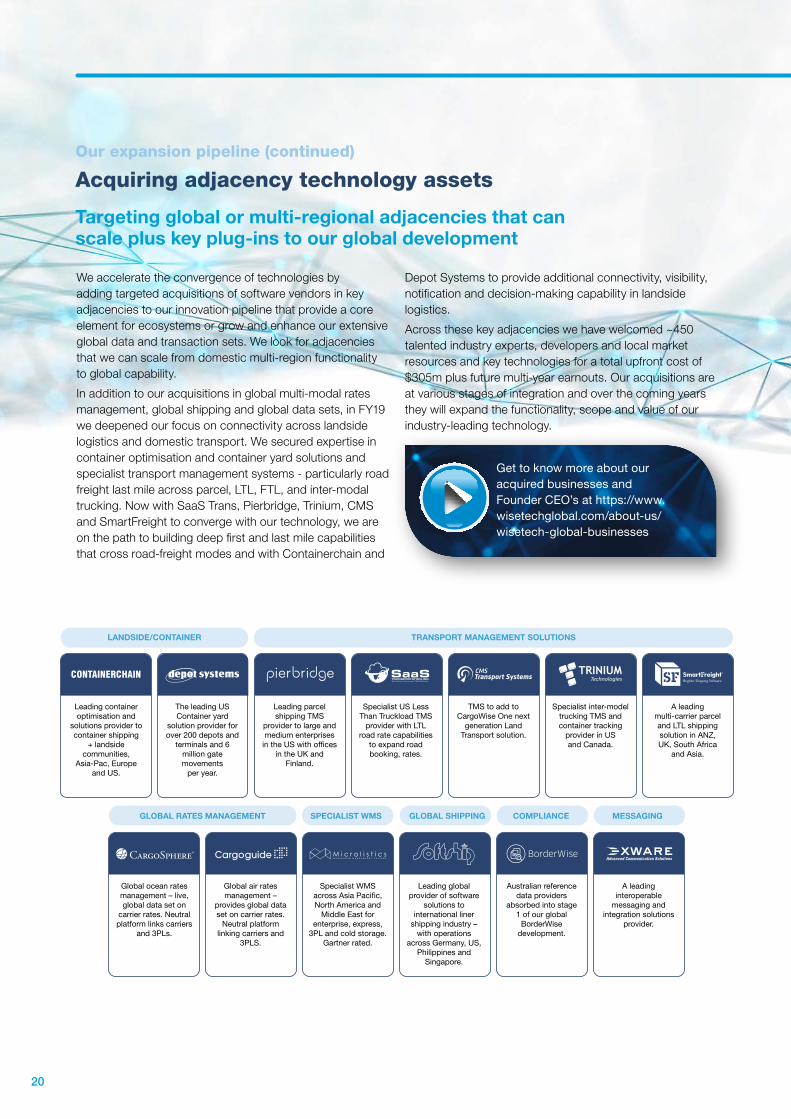
We accelerate the convergence of technologies by adding targeted acquisitions of software vendors in key adjacencies to our innovation pipeline that provide a core element for ecosystems or grow and enhance our extensive global data and transaction sets. We look for adjacencies that we can scale from domestic multi-region functionality to global capability.
In addition to our acquisitions in global multi-modal rates management, global shipping and global data sets, in FY19 we deepened our focus on connectivity across landside logistics and domestic transport. We secured expertise in container optimisation and container yard solutions and specialist transport management systems - particularly road freight last mile across parcel, LTL, FTL, and inter-modal trucking. Now with SaaS Trans, Pierbridge, Trinium, CMS and SmartFreight to converge with our technology, we are on the path to building deep first and last mile capabilities that cross road-freight modes and with Containerchain and
Depot Systems to provide additional connectivity, visibility, notification and decision-making capability in landside logistics.
Across these key adjacencies we have welcomed ~450 talented industry experts, developers and local market resources and key technologies for a total upfront cost of $305m plus future multi-year earnouts. Our acquisitions are at various stages of integration and over the coming years they will expand the functionality, scope and value of our industry-leading technology.
Acquiring adjacency technology assets
Targeting global or multi-regional adjacencies that can scale plus key plug-ins to our global development
Get to know more about our acquired businesses and Founder CEO’s at https://www.wisetechglobal.com/about-us/wisetech-global-businesses
GLOBAL RATES MANAGEMENT SPECIALIST WMS GLOBAL SHIPPING COMPLIANCE MESSAGING
Global ocean rates management – live, global data set on
carrier rates. Neutral platform links carriers
and 3PLs.
Global air rates management –
provides global data set on carrier rates.
Neutral platform linking carriers and
3PLS.
Specialist WMS across Asia Paci�c, North America and
Middle East for enterprise, express,
3PL and cold storage. Gartner rated.
Leading global provider of software
solutions to international liner
shipping industry – with operations
across Germany, US, Philippines and
Singapore.
Australian reference data providers
absorbed into stage 1 of our global
BorderWise development.
A leading interoperable
messaging and integration solutions
provider.
LANDSIDE/CONTAINER TRANSPORT MANAGEMENT SOLUTIONS
Leading container optimisation and
solutions provider to container shipping
+ landside communities,
Asia-Pac, Europe and US.
The leading US Container yard
solution provider for over 200 depots and
terminals and 6 million gate movements
per year.
Leading parcel shipping TMS
provider to large and medium enterprises
in the US with of�ces in the UK and
Finland.
Specialist US Less Than Truckload TMS
provider with LTL road rate capabilities
to expand road booking, rates.
TMS to add to CargoWise One next
generation Land Transport solution.
Specialist inter-model trucking TMS and container tracking
provider in US and Canada.
A leading multi-carrier parcel and LTL shipping solution in ANZ, UK, South Africa
and Asia.
20 21WiseTech Global | 2019 Annual Report
Innovative integration process for our strategic assets
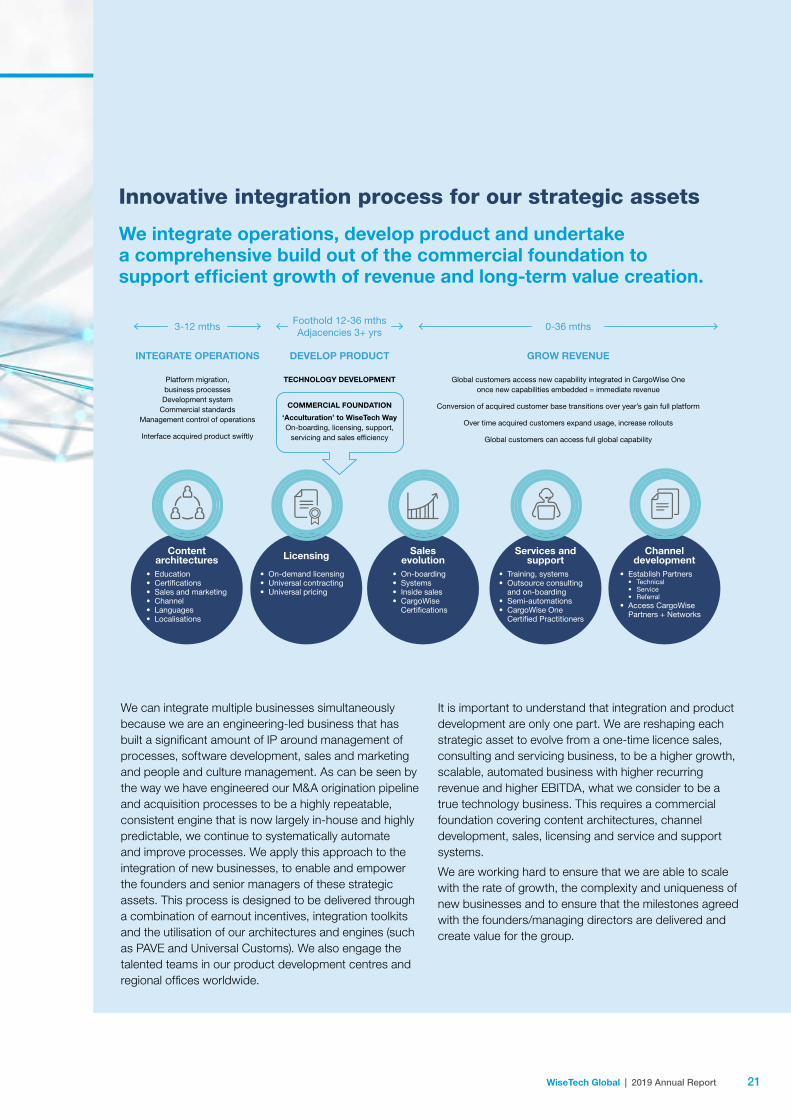
We integrate operations, develop product and undertake a comprehensive build out of the commercial foundation to support efficient growth of revenue and long-term value creation.
• On-demand licensing• Universal contracting• Universal pricing
Licensing
• Training, systems• Outsource consulting and on-boarding• Semi-automations• CargoWise One Certi�ed Practitioners
Services and support
• Education• Certi�cations• Sales and marketing• Channel • Languages• Localisations
Content architectures
INTEGRATE OPERATIONS
Platform migration,business processes
Development system Commercial standards
Management control of operations
Interface acquired product swiftly
3-12 mths
DEVELOP PRODUCT
TECHNOLOGY DEVELOPMENT
COMMERCIAL FOUNDATION
‘Acculturation’ to WiseTech WayOn-boarding, licensing, support,
servicing and sales ef�ciency
Foothold 12-36 mthsAdjacencies 3+ yrs
GROW REVENUE
Global customers access new capability integrated in CargoWise One once new capabilities embedded = immediate revenue
Conversion of acquired customer base transitions over year’s gain full platform
Over time acquired customers expand usage, increase rollouts
Global customers can access full global capability
0-36 mths
• On-boarding• Systems• Inside sales• CargoWise Certi�cations
Salesevolution
• Establish Partners• Technical • Service• Referral
• Access CargoWise Partners + Networks
Channeldevelopment
We can integrate multiple businesses simultaneously because we are an engineering-led business that has built a significant amount of IP around management of processes, software development, sales and marketing and people and culture management. As can be seen by the way we have engineered our M&A origination pipeline and acquisition processes to be a highly repeatable, consistent engine that is now largely in-house and highly predictable, we continue to systematically automate and improve processes. We apply this approach to the integration of new businesses, to enable and empower the founders and senior managers of these strategic assets. This process is designed to be delivered through a combination of earnout incentives, integration toolkits and the utilisation of our architectures and engines (such as PAVE and Universal Customs). We also engage the talented teams in our product development centres and regional offices worldwide.
It is important to understand that integration and product development are only one part. We are reshaping each strategic asset to evolve from a one-time licence sales, consulting and servicing business, to be a higher growth, scalable, automated business with higher recurring revenue and higher EBITDA, what we consider to be a true technology business. This requires a commercial foundation covering content architectures, channel development, sales, licensing and service and support systems.
We are working hard to ensure that we are able to scale with the rate of growth, the complexity and uniqueness of new businesses and to ensure that the milestones agreed with the founders/managing directors are delivered and create value for the group.
22 23WiseTech Global | 2019 Annual Report
Environment, social and governanceWe are a force for good and remain committed to changing the world of logistics while also enhancing the quality of life of our employees, communities, and industry partners. Our philosophy is one of enablement and empowerment, not disruption. Our long-term focus on technological advancement enables the global logistics supply chain to work more efficiently and improve resource usage, speed, quality, and accuracy. We are committed to the communities and environments in which we operate. We are dedicated to building and protecting value across our global operations while maintaining quality governance.
Our employees help identify and contribute to our environmental, social, and governance (ESG) responsibilities by sharing interests and identifying issues. As we grow, we will continue to refine our ESG communication based on our global footprint and ethical, cultural, business, and shareholder needs.
Our people Our people are at the core of who we are. The accumulation of our collective experience, shared values, and individual skills has allowed our business to deliver industry-leading solutions. We work to enhance the industry and to help educate and nurture its people.
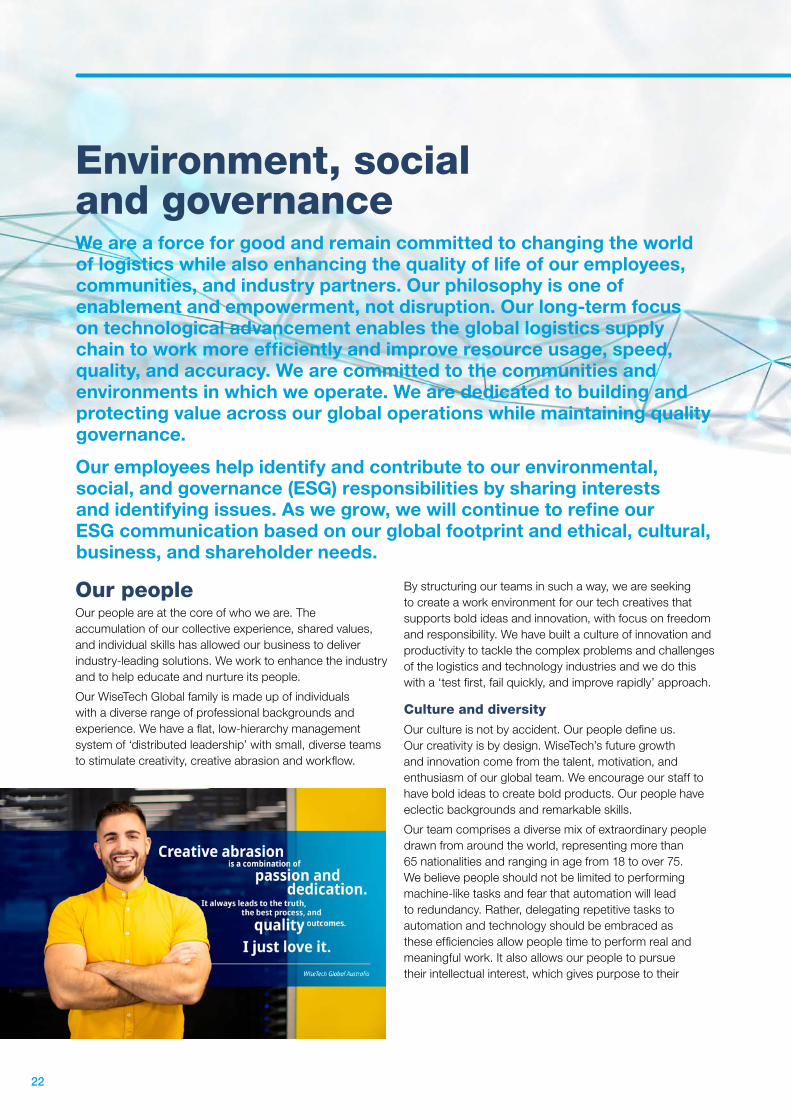
Our WiseTech Global family is made up of individuals with a diverse range of professional backgrounds and experience. We have a flat, low-hierarchy management system of ‘distributed leadership’ with small, diverse teams to stimulate creativity, creative abrasion and workflow.
By structuring our teams in such a way, we are seeking to create a work environment for our tech creatives that supports bold ideas and innovation, with focus on freedom and responsibility. We have built a culture of innovation and productivity to tackle the complex problems and challenges of the logistics and technology industries and we do this with a ‘test first, fail quickly, and improve rapidly’ approach.
Culture and diversity
Our culture is not by accident. Our people define us. Our creativity is by design. WiseTech’s future growth and innovation come from the talent, motivation, and enthusiasm of our global team. We encourage our staff to have bold ideas to create bold products. Our people have eclectic backgrounds and remarkable skills.
Our team comprises a diverse mix of extraordinary people drawn from around the world, representing more than 65 nationalities and ranging in age from 18 to over 75. We believe people should not be limited to performing machine-like tasks and fear that automation will lead to redundancy. Rather, delegating repetitive tasks to automation and technology should be embraced as these efficiencies allow people time to perform real and meaningful work. It also allows our people to pursue their intellectual interest, which gives purpose to their
22 23WiseTech Global | 2019 Annual Report
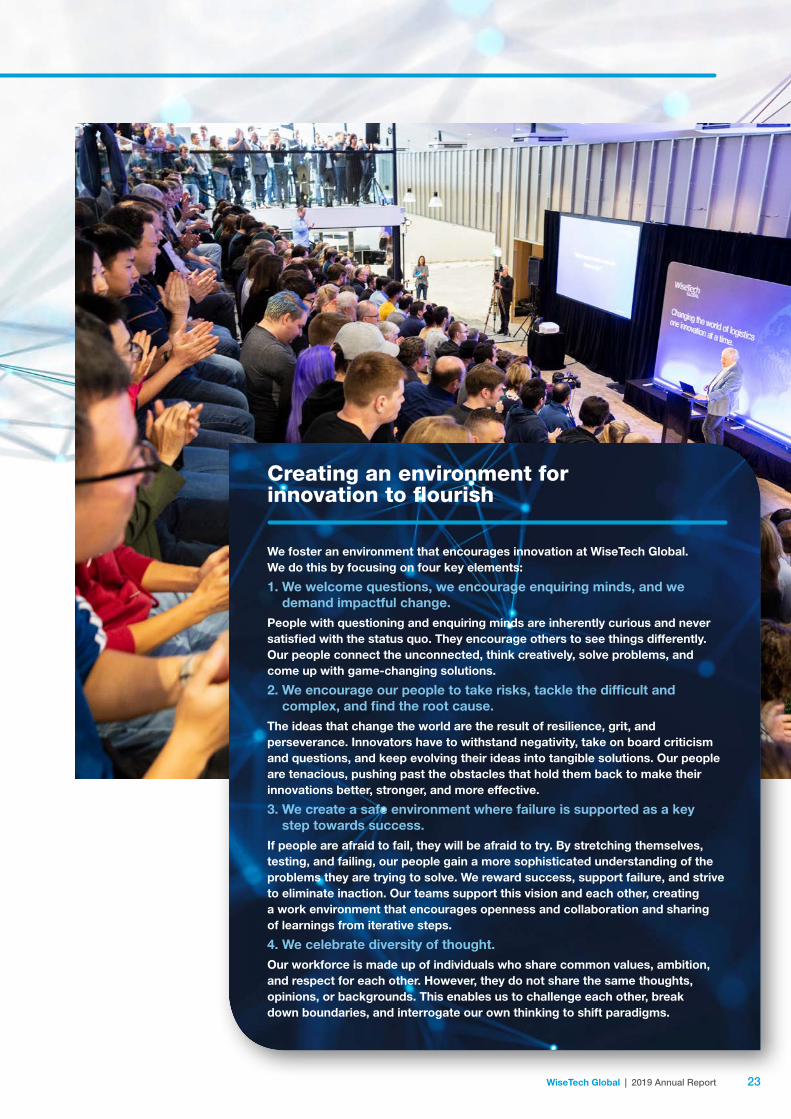
Creating an environment for innovation to flourish
We foster an environment that encourages innovation at WiseTech Global. We do this by focusing on four key elements:
1. We welcome questions, we encourage enquiring minds, and we demand impactful change.
People with questioning and enquiring minds are inherently curious and never satisfied with the status quo. They encourage others to see things differently. Our people connect the unconnected, think creatively, solve problems, and come up with game-changing solutions.
2. We encourage our people to take risks, tackle the difficult and complex, and find the root cause.
The ideas that change the world are the result of resilience, grit, and perseverance. Innovators have to withstand negativity, take on board criticism and questions, and keep evolving their ideas into tangible solutions. Our people are tenacious, pushing past the obstacles that hold them back to make their innovations better, stronger, and more effective.
3. We create a safe environment where failure is supported as a key step towards success.
If people are afraid to fail, they will be afraid to try. By stretching themselves, testing, and failing, our people gain a more sophisticated understanding of the problems they are trying to solve. We reward success, support failure, and strive to eliminate inaction. Our teams support this vision and each other, creating a work environment that encourages openness and collaboration and sharing of learnings from iterative steps.
4. We celebrate diversity of thought.Our workforce is made up of individuals who share common values, ambition, and respect for each other. However, they do not share the same thoughts, opinions, or backgrounds. This enables us to challenge each other, break down boundaries, and interrogate our own thinking to shift paradigms.
24 25WiseTech Global | 2019 Annual Report
work, boosts morale, and increases individual productivity. Encouraging creativity, problem-solving and continuous skill improvement is essential to innovation. Our universal values are part of our cultural DNA and the related mantras are spoken frequently in our offices: “lead with content”, “anyone can ask anyone anything at any time”, “lead others, manage yourself”, “win-win or no deal” and “productivity at the centre of everything”. These phrases are the basis for an environment that is empowering and fulfilling, where the work we do is important not just for ourselves, but for the world.
Ethics and integrity
Our culture is built on honesty, respect, and transparency. Ethics and integrity run through all parts of WiseTech Global. We promote ethical and responsible decision-making by our employees and Directors. Everyone at WiseTech Global is required to complete training and testing on our policies, including our Code of Conduct, Respect and Dignity at Work, Securities Trading Policy, and Whistleblower Protection Principles.
Growing our global workforce
WiseTech Global is growing organically and through acquisition of strategic assets – these are software companies with talented people, technologists and industry experts that we bring into our global group. We target assets for business alignment and strategic value, but we also consider if they are a strong cultural fit. We respect the skill and talent businesses bring with them. Our acquisitions are predominantly founder-led and have unique industry experts, developers, capable local managers, and attractive customer bases. We look for that cultural alignment in the origination and acquisition process, whether the new members of our WiseTech Global family are geographic acquisitions in non-English-speaking regions, or adjacent technology solution providers. We work with
newly acquired teams to embed and integrate our WiseTech culture into their operations. We work to integrate the transformative elements of the WiseTech way, including our highly engineered approach to technology development and commercial foundation components. We allow staff and teams to grow by encouraging them to ‘self-integrate’ and, while respecting their local heritage and culture, introduce the best aspects of our cultural DNA. We allow a high degree of freedom to use our communication and engagement activities, integration tool kits, and technology architectures. We focus on working cohesively and respectfully together with new members in the WiseTech family, aligning together to integrate and grow our teams with a mutual vision.
Since 2016 we have added more than 1,000 talented people to our
global workforce through these strategic assets – a vital component in managing the high competition for technology resources as we grow.
Employee wellbeing
Through our policies, support services, and wellbeing initiatives, we encourage each member of our WiseTech family to take personal responsibility for their wellbeing, health, and relationships. In our global headquarters, wellness initiatives include in-house fitness classes, nutritional advice, free breakfasts and healthy snacks, lunchtime sport, our family-friendly working week, health campaigns, and company-funded social activities. Our offices worldwide offer a mixture of these, with some providing healthy snacks and fruit, access to local sporting activities, transportation support and subsidised gym memberships.
Our values
XWe work continuously to improve our culture so that it empowers and drives us
XWe work hard to improve ourselves, our colleagues, our teams, our products and our business
XWe have a clear purpose and a shared vision
XWe manage ourselves and focus on results
XWe lead when we see the need and inspire and support each other always
XWe strive for excellence
XWe focus on the deeper needs of real customers in our chosen markets
XWe invent things our customers did not know they needed and cannot live without
24 25WiseTech Global | 2019 Annual Report
At WiseTech, a long-held tradition is a monthly Cake Day. These events are held at offices across the group for employees to attend. Every new employee is welcomed, and birthdays and long service is celebrated. We discuss ideas, share stories on our business and ask questions. Every Friday, our employees – including in our newly acquired businesses – meet to socialise and unwind with food and refreshments. We work hard at WiseTech and we like to celebrate our efforts and achievements in a fun, friendly environment.
We have support systems in place to promote the safety and wellbeing of our employees. Our global Employee Assistance Program offers short-term, solution-focused counselling to employees who may be experiencing issues or concerns, whether at home or at work, and additional professional guidance counselling. This service is offered at no cost to the employee and is delivered by external, qualified, experienced professionals.
WiseTech’s Workplace Health and Safety Policy is designed to ensure that we provide a safe and healthy workplace for our people and visitors. As a software development company, we do not place any employees in
positions in which hazardous work is required and we operate our business in a safe and environmentally responsible manner to protect employees, the community and the environment. Ergonomics is a part of the workday environment with ergonomics assessments, sit-to-stand desks, large computer monitors, and high quality chairs available as appropriate. Employees are encouraged to observe and practise safe working methods to support a healthy and safe work culture and environment.
Developing our people
At the centre of everything we do is our talented workforce. We provide programs to help our people continually develop. We encourage continuing industry education. WiseTech has an education and training professional certification program and employee education assistance for doctorate, master, and bachelor degrees. We also assist employee development with mentoring programs (for new starters), facilitated rotations though multiple development teams, and theory of constraints training. We also operate a program of international placements/
global mobility. This helps build understanding of technological and cultural diversity while also building skills.
Remuneration
Our innovation and growth strategy is dependent on recruiting and retaining talent, and we compete in a highly mobile global market for our skill sets. We offer remuneration designed to attract, motivate and retain leaders and talented employees who drive our success. The remuneration can include a mix of cash and deferred equity in fixed pay and performance incentives, along with education support and staff benefits. Our remuneration approach focuses on performance outcomes and is applied without bias.
Our Remuneration Committee oversees and receives periodic reports regarding our remuneration structure, succession plans, recruitment and retention policies, and achievements against diversity objectives in relation to remuneration. For more information, and to learn more about our approach to remuneration, see our Remuneration Report on pages 44-57.
26 27WiseTech Global | 2019 Annual Report
Environment, social and governance (continued)
Share ownership
Our goal is for all our employees to be shareholders. Many of our longer-term employees were WiseTech Global shareholders for years prior to our ASX listing in 2016. Since then, we have provided further opportunities for our growing global workforce to invest through the purchase of shares and participation in equity awards or in remuneration equity as part of their remuneration package.
Since 2018, we have provided an ‘Invest As You Earn’ (“IAYE”) program whereby employees can purchase WiseTech Global shares via monthly deductions from their salary. The program has been very well received by employees and during FY19 we were able to roll out the IAYE program to more countries as we expanded our footprint globally. In FY19, the number of IAYE participants accounted for 20% of eligible employees in 19 countries, a significant increase of over 60% compared with the participant number in the beginning of 2018.
Our WiseTech employees receive compliance training to ensure they understand and abide by our Securities Trading Policy and Market Disclosure and Communications Principles.
Diversity and inclusion
We are proud of our highly diverse and inclusive workforce. We are strongly committed to diversity and inclusion. We foster a culture that values and achieves diversity in our workforce and on our Board and is reflected in our Diversity and Inclusion Principles.
Diversity refers to all the characteristics that make individuals different from each other. They include attributes or characteristics such as religion, race, ethnicity, language, gender, sexual orientation, disability, age and any other ground for potential unlawful discrimination. We are committed to treating everyone equally and with respect; this is what diversity is all about.
We believe our current levels of female representation compare well to other technology companies and are positive in the context of both the logistics industry and technology for business-to-business software. This level of female participation reflects our commitment to merit-based employment and promotion. We continue to encourage more women to enter technology and logistics – the industries from which we draw our talent. In the short-term, our objective is to broadly maintain levels of female representation in our business at, or above, the following levels:
X 30% of our Board
X 20% of our senior managers
X 30% of our workforce
We believe it’s essential to further develop the potential for qualified females to enter our industry: software development for logistics execution. This issue requires comprehensive and multi-faceted effort at the early education stage to encourage greater technology industry participation across both genders. Our objectives include a requirement to identify and support suitable initiatives to encourage girls and young women to pursue a career in technology, with
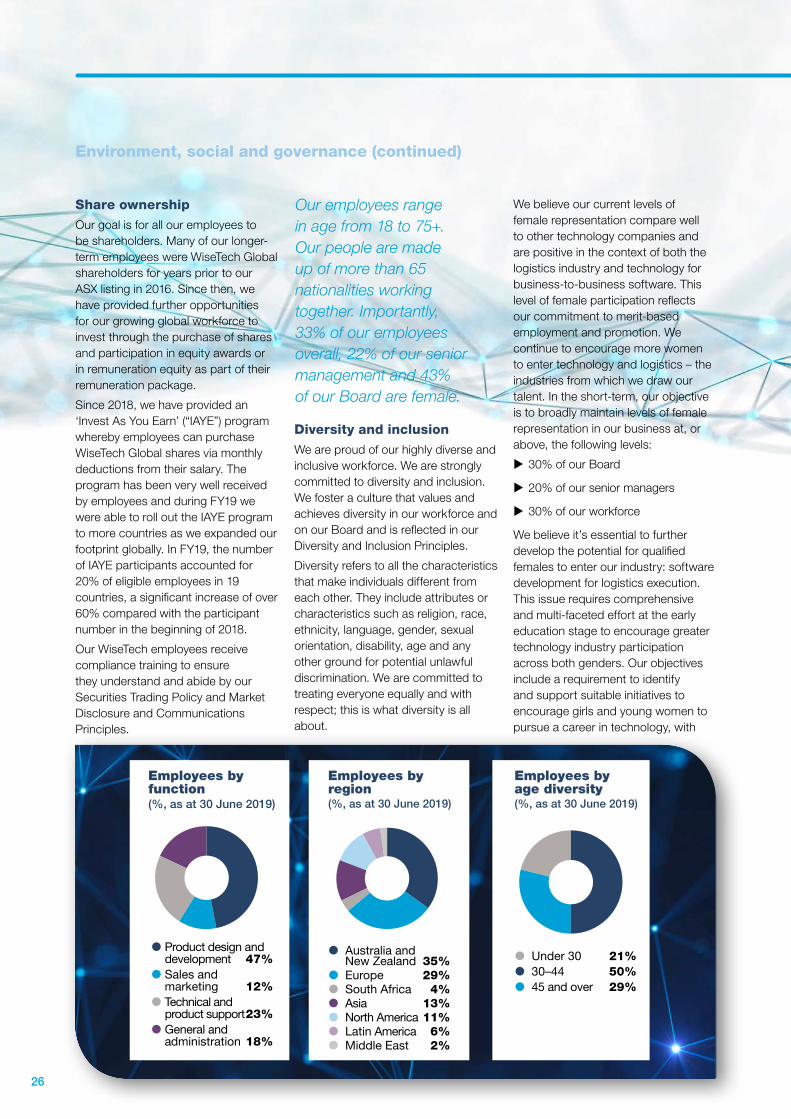
Employees by function(%, as at 30 June 2019)
Product design and development 47%
Sales and marketing 12%
Technical and product support 23%
General and administration 18%
Employees by region(%, as at 30 June 2019)
Australia and New Zealand 35%
Europe 29% South Africa 4% Asia 13% North America 11% Latin America 6% Middle East 2%
Under 30 21% 30–44 50% 45 and over 29%
Employees by age diversity(%, as at 30 June 2019)
Our employees range in age from 18 to 75+. Our people are made up of more than 65 nationalities working together. Importantly, 33% of our employees overall, 22% of our senior management and 43% of our Board are female.
26 27WiseTech Global | 2019 Annual Report
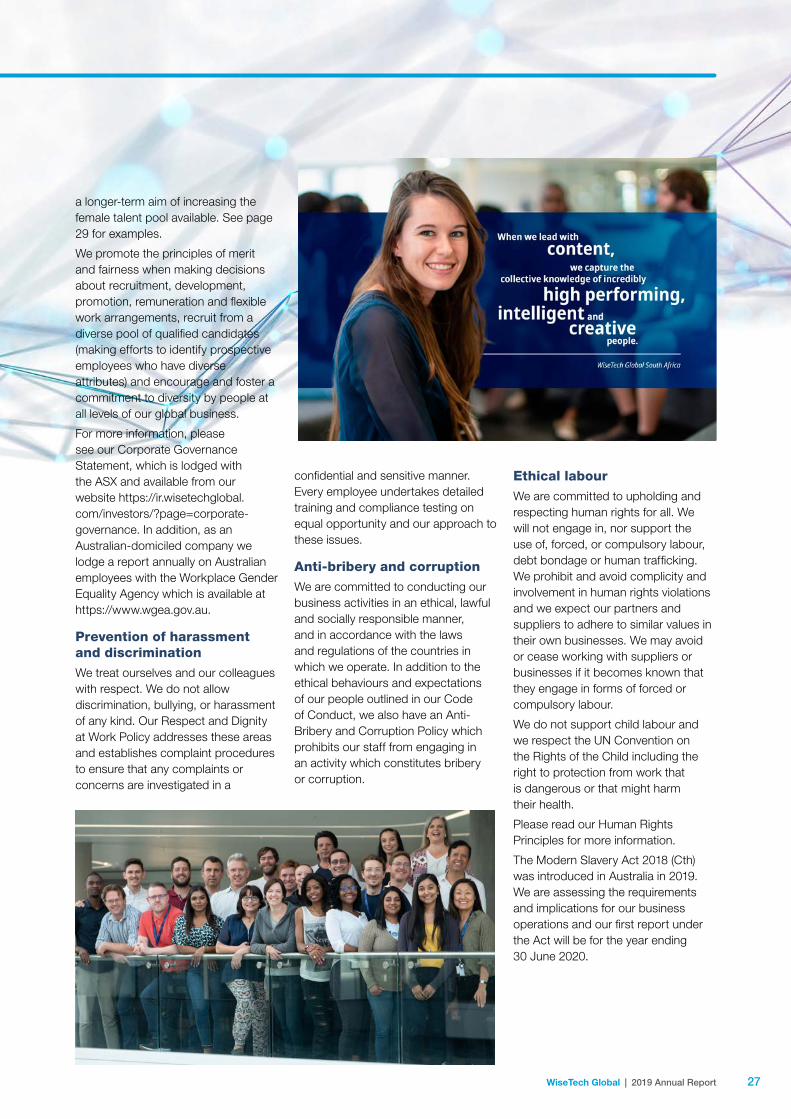
a longer-term aim of increasing the female talent pool available. See page 29 for examples.
We promote the principles of merit and fairness when making decisions about recruitment, development, promotion, remuneration and flexible work arrangements, recruit from a diverse pool of qualified candidates (making efforts to identify prospective employees who have diverse attributes) and encourage and foster a commitment to diversity by people at all levels of our global business.
For more information, please see our Corporate Governance Statement, which is lodged with the ASX and available from our website https://ir.wisetechglobal.com/investors/?page=corporate-governance. In addition, as an Australian-domiciled company we lodge a report annually on Australian employees with the Workplace Gender Equality Agency which is available at https://www.wgea.gov.au.
Prevention of harassment and discrimination
We treat ourselves and our colleagues with respect. We do not allow discrimination, bullying, or harassment of any kind. Our Respect and Dignity at Work Policy addresses these areas and establishes complaint procedures to ensure that any complaints or concerns are investigated in a
confidential and sensitive manner. Every employee undertakes detailed training and compliance testing on equal opportunity and our approach to these issues.
Anti-bribery and corruption
We are committed to conducting our business activities in an ethical, lawful and socially responsible manner, and in accordance with the laws and regulations of the countries in which we operate. In addition to the ethical behaviours and expectations of our people outlined in our Code of Conduct, we also have an Anti-Bribery and Corruption Policy which prohibits our staff from engaging in an activity which constitutes bribery or corruption.
Ethical labour
We are committed to upholding and respecting human rights for all. We will not engage in, nor support the use of, forced, or compulsory labour, debt bondage or human trafficking. We prohibit and avoid complicity and involvement in human rights violations and we expect our partners and suppliers to adhere to similar values in their own businesses. We may avoid or cease working with suppliers or businesses if it becomes known that they engage in forms of forced or compulsory labour.
We do not support child labour and we respect the UN Convention on the Rights of the Child including the right to protection from work that is dangerous or that might harm their health.
Please read our Human Rights Principles for more information.
The Modern Slavery Act 2018 (Cth) was introduced in Australia in 2019. We are assessing the requirements and implications for our business operations and our first report under the Act will be for the year ending 30 June 2020.
28 29WiseTech Global | 2019 Annual Report
EnvironmentGlobal logistics is one of the world’s oldest and largest industries with annual revenues of $16trillion1 and our software is designed to maximise performance, minimise energy and resource use, and reduce risks across this global supply chain. Through our innovations, we drive business efficiencies that enhance logistics execution worldwide. The CargoWise One platform is used in 150 countries to digitise and integrate the data that enables goods to move through the supply chain. CargoWise also assists customers by bringing together global data sets, which have been cleansed and verified. That information is then used to facilitate key parts of the global cargo chain, including the management of rates, schedules, bookings, tracking, and reconciliation.
Increased productivity can have widespread environmental benefits. Examples include:
X reduction in futile road trips,
X improvement in land transport impact on local communities,
X elimination of delays in intermodal transportation, and
X optimised load configuration.
Efficiency improvements available through the software we provide also allow automation and the removal of numerous manual tasks. This reduces paper, electricity usage, human labour, commercial costs, and wasted resources.
Therefore, we believe our global footprint and operational activities contribute positively and significantly to the improvement of resource usage that impacts climate change.
As a leading software solutions provider, WiseTech Global is not directly involved in the manufacture or physical transport of goods. Thus, our environmental footprint is relatively small across our global workforce of more than 1,840. Our environmental footprint primarily comprises the energy used by our offices and data centres, and office consumables typical of an office-based business. Our environmental risks are not significant.
All our businesses around the world comply with local environmental
regulations. We seek to recycle as much waste as possible and reduce energy use through energy-efficient devices and power management systems. Our offices use energy efficient lighting and occupancy detection sensors to conserve energy for lighting and air-conditioning. We invest in and utilise our own technology to efficiently link our 50 offices and global workforce through our PAVE workflow management system, videoconferencing, team-ware tools and communication software, thus significantly reducing the need for commercial air and road travel between our geographies and customer’s locations.
In our Sydney headquarters we process all discarded electronic devices in a secure and environmentally responsible manner, in partnership with Sims Recycling Solutions.
We optimise the energy efficiency of our 3 data-centres that we operate in Australia, United States and the United Kingdom, notably in relation to cooling requirements and actively evolving components of our software to reduce the data storage required for transactions executed on our CargoWise One platform.
Environment, social and governance (continued)
1 World Bank, Performance and Prospects of Logistics (May 2017): on average, logistics is 13% of GDP.
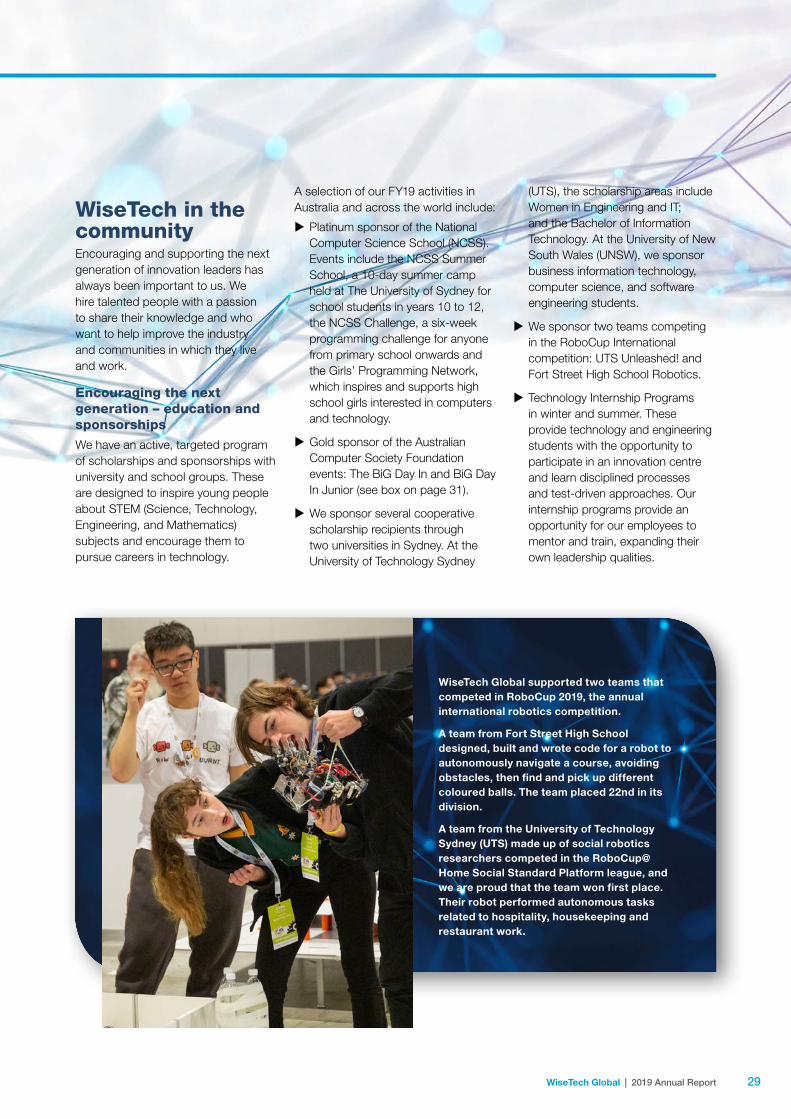
28 29WiseTech Global | 2019 Annual Report
WiseTech Global supported two teams that competed in RoboCup 2019, the annual international robotics competition.
A team from Fort Street High School designed, built and wrote code for a robot to autonomously navigate a course, avoiding obstacles, then find and pick up different coloured balls. The team placed 22nd in its division.
A team from the University of Technology Sydney (UTS) made up of social robotics researchers competed in the RoboCup@Home Social Standard Platform league, and we are proud that the team won first place. Their robot performed autonomous tasks related to hospitality, housekeeping and restaurant work.
WiseTech in the community Encouraging and supporting the next generation of innovation leaders has always been important to us. We hire talented people with a passion to share their knowledge and who want to help improve the industry and communities in which they live and work.
Encouraging the next generation – education and sponsorships
We have an active, targeted program of scholarships and sponsorships with university and school groups. These are designed to inspire young people about STEM (Science, Technology, Engineering, and Mathematics) subjects and encourage them to pursue careers in technology.
A selection of our FY19 activities in Australia and across the world include:
X Platinum sponsor of the National Computer Science School (NCSS). Events include the NCSS Summer School, a 10-day summer camp held at The University of Sydney for school students in years 10 to 12, the NCSS Challenge, a six-week programming challenge for anyone from primary school onwards and the Girls’ Programming Network, which inspires and supports high school girls interested in computers and technology.
X Gold sponsor of the Australian Computer Society Foundation events: The BiG Day In and BiG Day In Junior (see box on page 31).
X We sponsor several cooperative scholarship recipients through two universities in Sydney. At the University of Technology Sydney
(UTS), the scholarship areas include Women in Engineering and IT; and the Bachelor of Information Technology. At the University of New South Wales (UNSW), we sponsor business information technology, computer science, and software engineering students.
X We sponsor two teams competing in the RoboCup International competition: UTS Unleashed! and Fort Street High School Robotics.
X Technology Internship Programs in winter and summer. These provide technology and engineering students with the opportunity to participate in an innovation centre and learn disciplined processes and test-driven approaches. Our internship programs provide an opportunity for our employees to mentor and train, expanding their own leadership qualities.
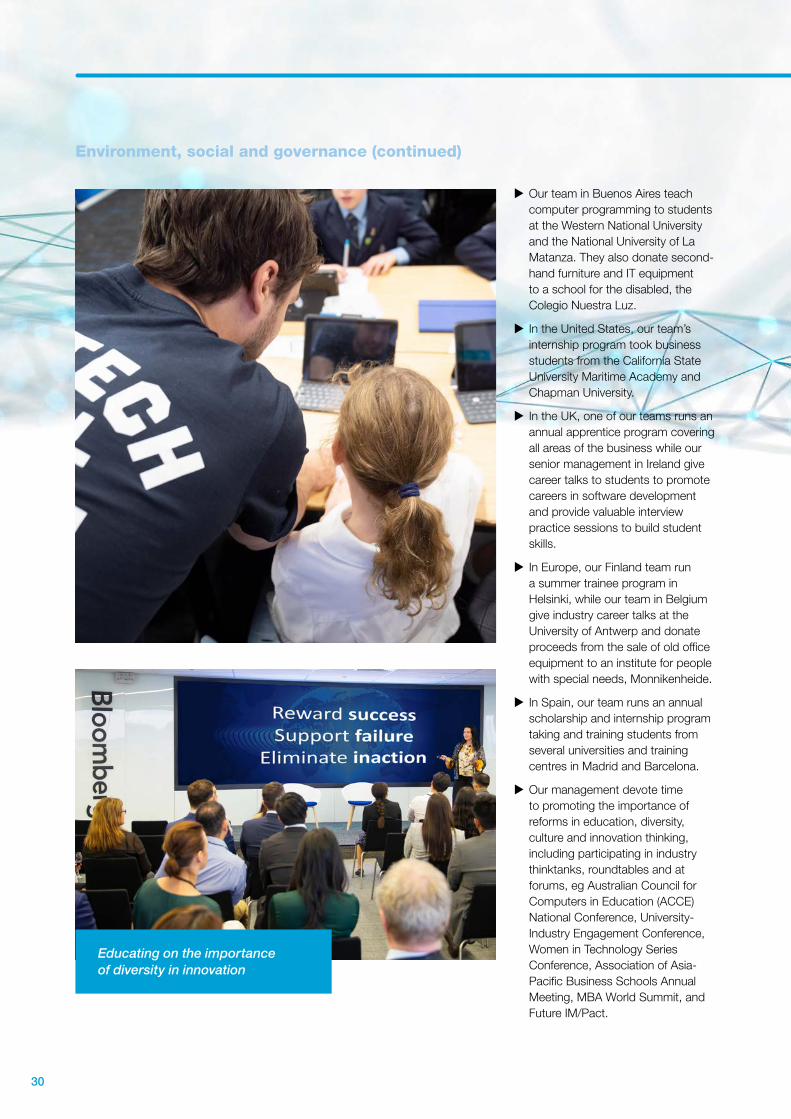
30 31WiseTech Global | 2019 Annual Report
X Our team in Buenos Aires teach computer programming to students at the Western National University and the National University of La Matanza. They also donate second-hand furniture and IT equipment to a school for the disabled, the Colegio Nuestra Luz.
X In the United States, our team’s internship program took business students from the California State University Maritime Academy and Chapman University.
X In the UK, one of our teams runs an annual apprentice program covering all areas of the business while our senior management in Ireland give career talks to students to promote careers in software development and provide valuable interview practice sessions to build student skills.
X In Europe, our Finland team run a summer trainee program in Helsinki, while our team in Belgium give industry career talks at the University of Antwerp and donate proceeds from the sale of old office equipment to an institute for people with special needs, Monnikenheide.
X In Spain, our team runs an annual scholarship and internship program taking and training students from several universities and training centres in Madrid and Barcelona.
X Our management devote time to promoting the importance of reforms in education, diversity, culture and innovation thinking, including participating in industry thinktanks, roundtables and at forums, eg Australian Council for Computers in Education (ACCE) National Conference, University-Industry Engagement Conference, Women in Technology Series Conference, Association of Asia-Pacific Business Schools Annual Meeting, MBA World Summit, and Future IM/Pact.
Environment, social and governance (continued)
Educating on the importance of diversity in innovation
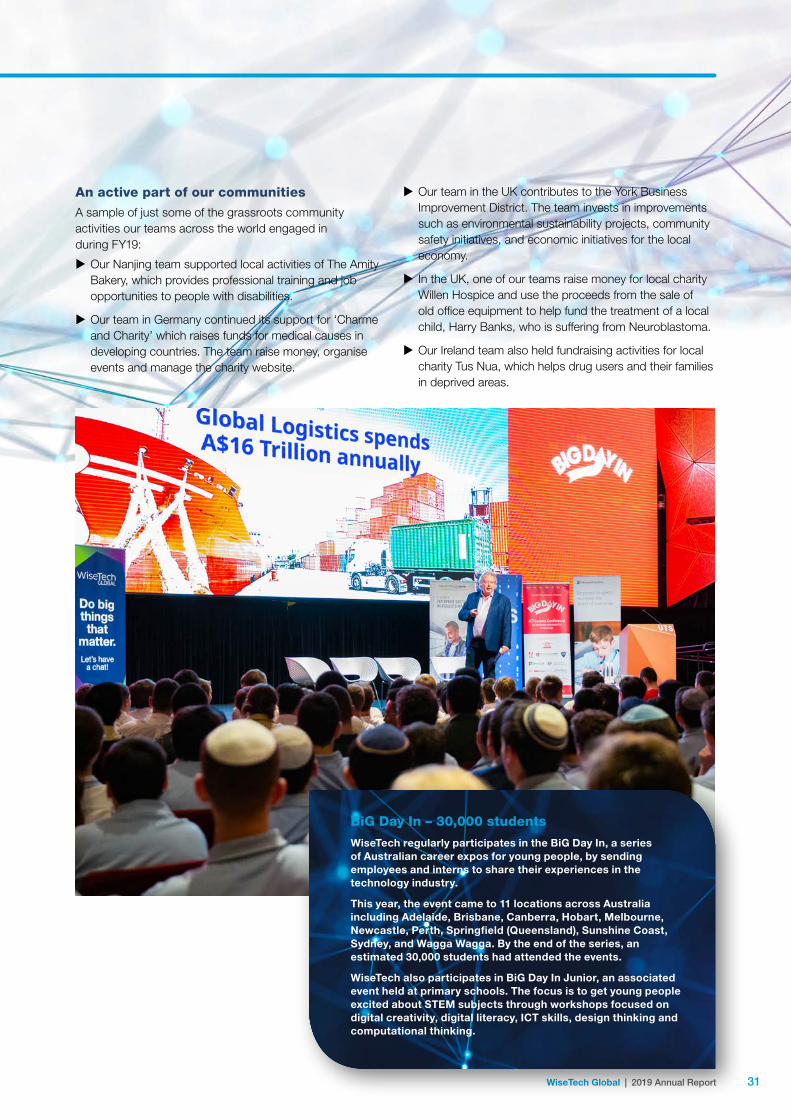
30 31WiseTech Global | 2019 Annual Report
BiG Day In – 30,000 students
WiseTech regularly participates in the BiG Day In, a series of Australian career expos for young people, by sending employees and interns to share their experiences in the technology industry.
This year, the event came to 11 locations across Australia including Adelaide, Brisbane, Canberra, Hobart, Melbourne, Newcastle, Perth, Springfield (Queensland), Sunshine Coast, Sydney, and Wagga Wagga. By the end of the series, an estimated 30,000 students had attended the events.
WiseTech also participates in BiG Day In Junior, an associated event held at primary schools. The focus is to get young people excited about STEM subjects through workshops focused on digital creativity, digital literacy, ICT skills, design thinking and computational thinking.
An active part of our communities
A sample of just some of the grassroots community activities our teams across the world engaged in during FY19:
X Our Nanjing team supported local activities of The Amity Bakery, which provides professional training and job opportunities to people with disabilities.
X Our team in Germany continued its support for ‘Charme and Charity’ which raises funds for medical causes in developing countries. The team raise money, organise events and manage the charity website.
X Our team in the UK contributes to the York Business Improvement District. The team invests in improvements such as environmental sustainability projects, community safety initiatives, and economic initiatives for the local economy.
X In the UK, one of our teams raise money for local charity Willen Hospice and use the proceeds from the sale of old office equipment to help fund the treatment of a local child, Harry Banks, who is suffering from Neuroblastoma.
X Our Ireland team also held fundraising activities for local charity Tus Nua, which helps drug users and their families in deprived areas.
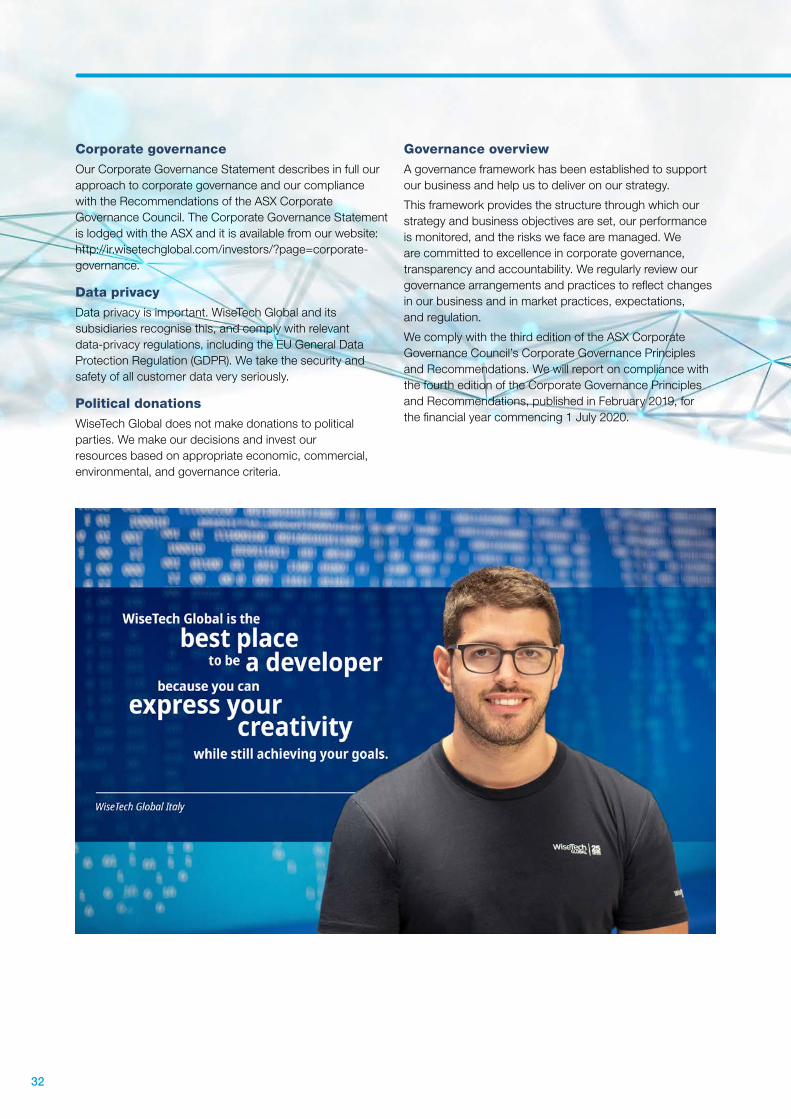
32 33WiseTech Global | 2019 Annual Report
Corporate governance
Our Corporate Governance Statement describes in full our approach to corporate governance and our compliance with the Recommendations of the ASX Corporate Governance Council. The Corporate Governance Statement is lodged with the ASX and it is available from our website: http://ir.wisetechglobal.com/investors/?page=corporate-governance.
Data privacy
Data privacy is important. WiseTech Global and its subsidiaries recognise this, and comply with relevant data-privacy regulations, including the EU General Data Protection Regulation (GDPR). We take the security and safety of all customer data very seriously.
Political donations
WiseTech Global does not make donations to political parties. We make our decisions and invest our resources based on appropriate economic, commercial, environmental, and governance criteria.
Governance overview
A governance framework has been established to support our business and help us to deliver on our strategy.
This framework provides the structure through which our strategy and business objectives are set, our performance is monitored, and the risks we face are managed. We are committed to excellence in corporate governance, transparency and accountability. We regularly review our governance arrangements and practices to reflect changes in our business and in market practices, expectations, and regulation.
We comply with the third edition of the ASX Corporate Governance Council’s Corporate Governance Principles and Recommendations. We will report on compliance with the fourth edition of the Corporate Governance Principles and Recommendations, published in February 2019, for the financial year commencing 1 July 2020.
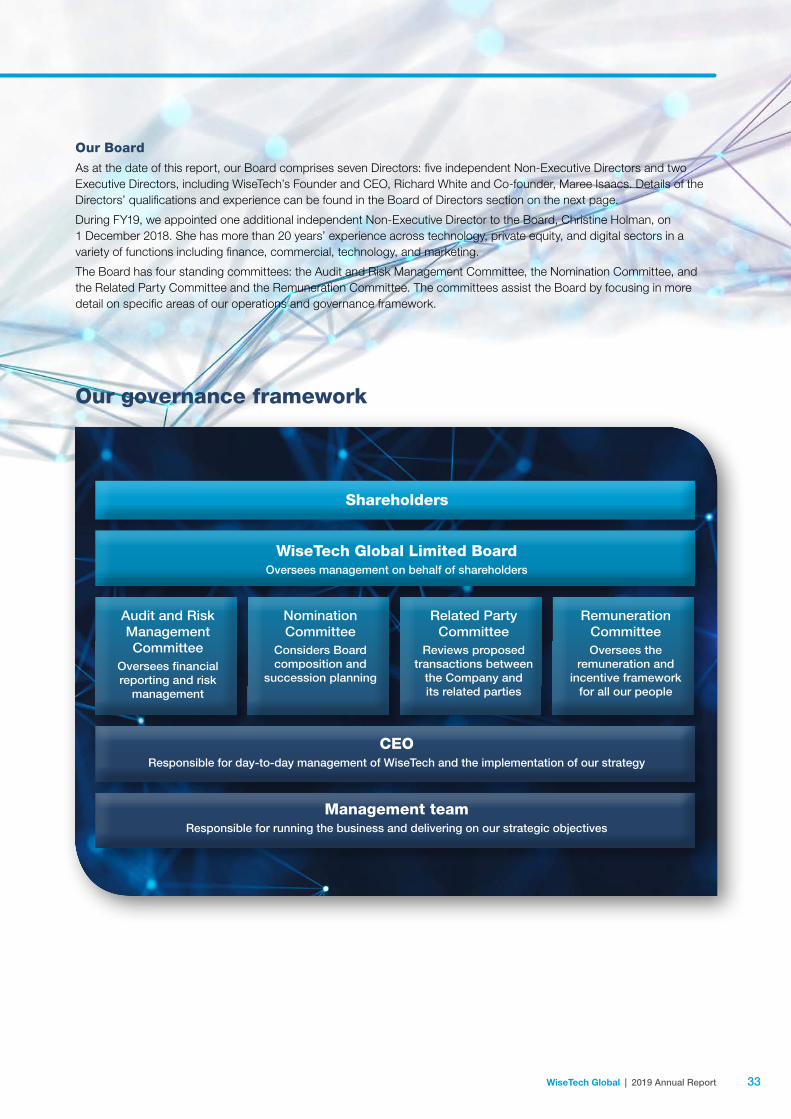
32 33WiseTech Global | 2019 Annual Report
Shareholders
WiseTech Global Limited BoardOversees management on behalf of shareholders
CEOResponsible for day-to-day management of WiseTech and the implementation of our strategy
Management teamResponsible for running the business and delivering on our strategic objectives
Audit and Risk Management Committee
Oversees �nancial reporting and risk
management
Nomination Committee
Considers Board composition and
succession planning
Remuneration CommitteeOversees the
remuneration and incentive framework
for all our people
Related Party Committee
Reviews proposed transactions between
the Company and its related parties
Our governance framework
Our Board
As at the date of this report, our Board comprises seven Directors: five independent Non-Executive Directors and two Executive Directors, including WiseTech’s Founder and CEO, Richard White and Co-founder, Maree Isaacs. Details of the Directors’ qualifications and experience can be found in the Board of Directors section on the next page.
During FY19, we appointed one additional independent Non-Executive Director to the Board, Christine Holman, on 1 December 2018. She has more than 20 years’ experience across technology, private equity, and digital sectors in a variety of functions including finance, commercial, technology, and marketing.
The Board has four standing committees: the Audit and Risk Management Committee, the Nomination Committee, and the Related Party Committee and the Remuneration Committee. The committees assist the Board by focusing in more detail on specific areas of our operations and governance framework.
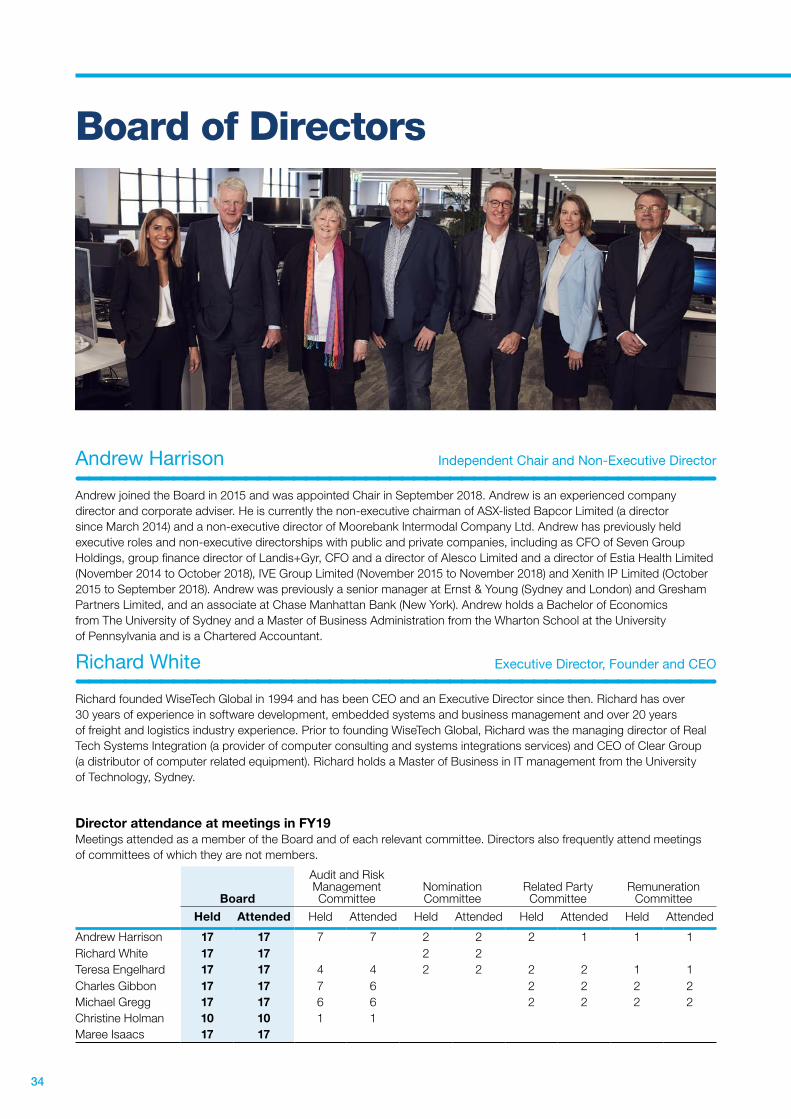
Andrew Harrison Independent Chair and Non‑Executive Director
Andrew joined the Board in 2015 and was appointed Chair in September 2018. Andrew is an experienced company director and corporate adviser. He is currently the non‑executive chairman of ASX‑listed Bapcor Limited (a director since March 2014) and a non‑executive director of Moorebank Intermodal Company Ltd. Andrew has previously held executive roles and non‑executive directorships with public and private companies, including as CFO of Seven Group Holdings, group finance director of Landis+Gyr, CFO and a director of Alesco Limited and a director of Estia Health Limited (November 2014 to October 2018), IVE Group Limited (November 2015 to November 2018) and Xenith IP Limited (October 2015 to September 2018). Andrew was previously a senior manager at Ernst & Young (Sydney and London) and Gresham Partners Limited, and an associate at Chase Manhattan Bank (New York). Andrew holds a Bachelor of Economics from The University of Sydney and a Master of Business Administration from the Wharton School at the University of Pennsylvania and is a Chartered Accountant.
Richard White Executive Director, Founder and CEO
Richard founded WiseTech Global in 1994 and has been CEO and an Executive Director since then. Richard has over 30 years of experience in software development, embedded systems and business management and over 20 years of freight and logistics industry experience. Prior to founding WiseTech Global, Richard was the managing director of Real Tech Systems Integration (a provider of computer consulting and systems integrations services) and CEO of Clear Group (a distributor of computer related equipment). Richard holds a Master of Business in IT management from the University of Technology, Sydney.
Board of Directors
Director attendance at meetings in FY19Meetings attended as a member of the Board and of each relevant committee. Directors also frequently attend meetings of committees of which they are not members.
Board
Audit and Risk Management Committee
Nomination Committee
Related Party Committee
Remuneration Committee
Held Attended Held Attended Held Attended Held Attended Held Attended
Andrew Harrison 17 17 7 7 2 2 2 1 1 1Richard White 17 17 2 2Teresa Engelhard 17 17 4 4 2 2 2 2 1 1Charles Gibbon 17 17 7 6 2 2 2 2Michael Gregg 17 17 6 6 2 2 2 2Christine Holman 10 10 1 1Maree Isaacs 17 17
34
Teresa Engelhard Independent Non‑Executive Director
Teresa joined the Board in March 2018 and is chair of the Nomination Committee and the Remuneration Committee. Teresa has more than 20 years’ experience as a director, executive and venture capitalist in the information, communication, technology and energy sectors. Teresa is a currently a non‑executive director of ASX‑listed Origin Energy Limited (since May 2017). She is also a non‑executive director of Planet Innovation and two non‑profit organisations: StartupAUS and Redkite. She is also a former director of ASX‑listed Redbubble Limited (August 2011 to October 2017) and a former managing partner of Jolimont Capital. Teresa holds a Bachelor of Science (Hons) from the California Institute of Technology (Caltech), a Master of Business Administration from Stanford University and is a graduate of the Australian Institute of Company Directors.
Charles Gibbon Independent Non‑Executive Director
Charles joined the Board in 2006, served as Chair from 2006 to September 2018, and has been a shareholder since 2005. Charles is currently a director of Shearwater Growth Equity Pty Ltd and has previously been a director of Monbeef Pty Ltd, Photolibrary Pty Ltd and the former ASX‑listed Health Communication Network Limited. Charles has over 20 years of experience in institutional funds management, has previously been a member of the Investment Committee of Quadrant Capital Funds I, II and III for Quadrant Private Equity and has held roles as the CEO of Russell Private Equity, CEO of Risk Averse Money Managers Pty Ltd, a director of Morgan Grenfell Australia, and an associate director of Schroders Australia. Charles holds a Bachelor of Science in Mathematics from Otago University and Master of Commerce (Hons) from the University of Canterbury.
Michael Gregg Independent Non‑Executive Director
Michael joined the Board in 2006 and has been a shareholder since 2005. Michael is also chair of the Related Party Committee. Michael currently serves as a director of Jeenee Communications Pty Ltd and Shearwater Growth Equity Pty Ltd, is the chairman of Community Connections Australia and is a former director of Playground (XYZ) Holdings Pty Ltd. Previously, Michael was the managing director of the former ASX‑listed Health Communication Network Limited. Michael has also held executive positions in the telecommunications, transport and retail industries. Michael holds a Bachelor of Science from The University of Sydney and a Master of Business Administration from the Australian Graduate School of Management and is a Graduate of the Australian Institute of Company Directors.
Christine Holman Independent Non‑Executive Director
Christine joined the Board in December 2018 and is chair of the Audit and Risk Management Committee. Christine has over 20 years’ experience across technology, private equity and digital sectors in a variety of functions including finance, commercial, technology and marketing. Her former executive roles include those as CFO and Commercial Director of Globecast Australia, Commercial Director at Telstra Broadcast Services, and in strategy, business development and mergers and acquisitions with Capital Investment Group. Christine is currently a non‑executive director of ASX‑listed Blackmores Ltd (since March 2019) and CSR Limited (since October 2016). She is also a non‑executive director of Moorebank Intermodal Company Limited, The Bradman Foundation, The State Library of NSW Foundation and the T20 World Cup Cricket Board. Christine is a former director of HT&E Limited (November 2015 to December 2018) and Vocus Group Limited (August 2017 to November 2017). Christine has a Master of Business Administration and a Post Graduate Diploma in Management from Macquarie University, is a Graduate of the Australian Institute of Company Directors and a member of Chief Executive Women.
Maree Isaacs Executive Director, Co‑founder and Head of Invoicing & Licensing
Maree co‑founded WiseTech with Richard White in 1994 and has been an Executive Director since then. Maree is focused on invoicing and licensing, group operations, quality control and administration. Maree is also a Company Secretary of WiseTech Global. Prior to co‑founding WiseTech Global, Maree worked with Richard at Real Tech Systems Integration and Clear Group.
35WiseTech Global | Annual Report 2019
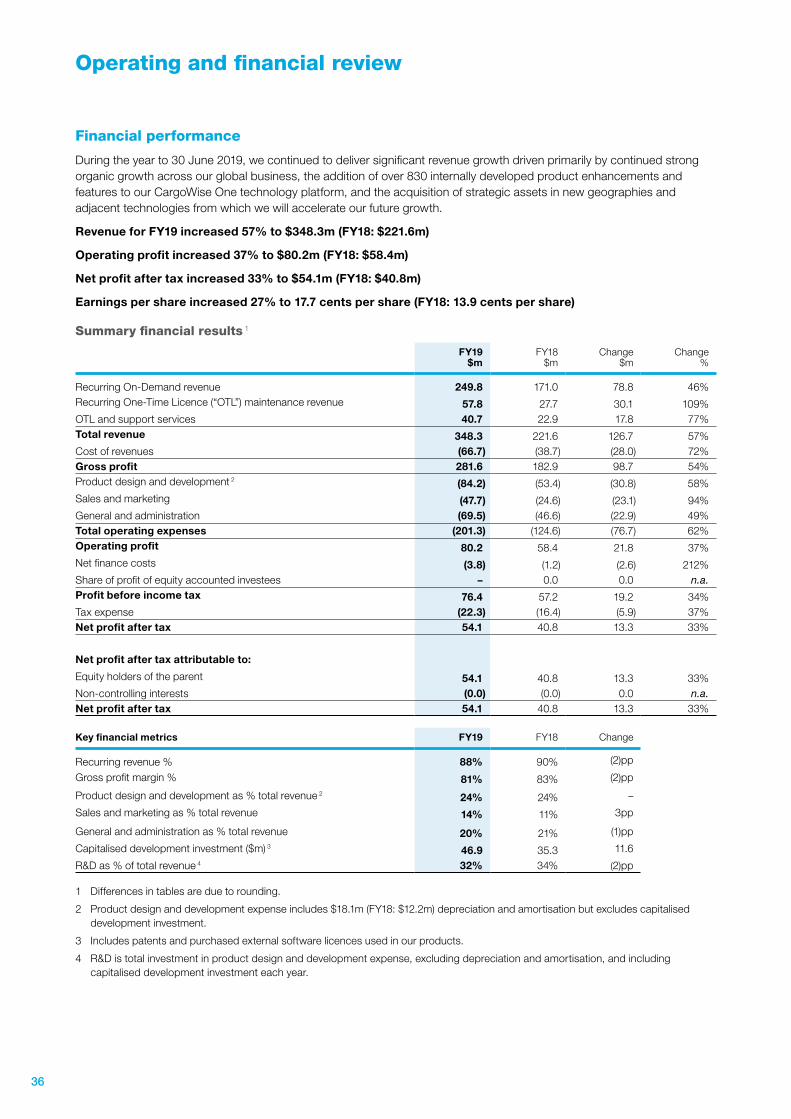
Operating and financial review
Financial performance
During the year to 30 June 2019, we continued to deliver significant revenue growth driven primarily by continued strong organic growth across our global business, the addition of over 830 internally developed product enhancements and features to our CargoWise One technology platform, and the acquisition of strategic assets in new geographies and adjacent technologies from which we will accelerate our future growth.
Revenue for FY19 increased 57% to $348.3m (FY18: $221.6m)
Operating profit increased 37% to $80.2m (FY18: $58.4m)
Net profit after tax increased 33% to $54.1m (FY18: $40.8m)
Earnings per share increased 27% to 17.7 cents per share (FY18: 13.9 cents per share)
Summary financial results 1
FY19 $m
FY18 $m
Change $m
Change %
Recurring On-Demand revenue 249.8 171.0 78.8 46%Recurring One-Time Licence (“OTL”) maintenance revenue 57.8 27.7 30.1 109%OTL and support services 40.7 22.9 17.8 77%Total revenue 348.3 221.6 126.7 57%Cost of revenues (66.7) (38.7) (28.0) 72%Gross profit 281.6 182.9 98.7 54%Product design and development 2 (84.2) (53.4) (30.8) 58%Sales and marketing (47.7) (24.6) (23.1) 94%General and administration (69.5) (46.6) (22.9) 49%Total operating expenses (201.3) (124.6) (76.7) 62%Operating profit 80.2 58.4 21.8 37%Net finance costs (3.8) (1.2) (2.6) 212%Share of profit of equity accounted investees – 0.0 0.0 n.a.Profit before income tax 76.4 57.2 19.2 34%Tax expense (22.3) (16.4) (5.9) 37%Net profit after tax 54.1 40.8 13.3 33%
Net profit after tax attributable to:
Equity holders of the parent 54.1 40.8 13.3 33%Non-controlling interests (0.0) (0.0) 0.0 n.a.Net profit after tax 54.1 40.8 13.3 33%
Key financial metrics FY19 FY18 Change
Recurring revenue % 88% 90% (2)pp
Gross profit margin % 81% 83% (2)pp
Product design and development as % total revenue 2 24% 24% –
Sales and marketing as % total revenue 14% 11% 3pp
General and administration as % total revenue 20% 21% (1)pp
Capitalised development investment ($m) 3 46.9 35.3 11.6
R&D as % of total revenue 4 32% 34% (2)pp
1 Differences in tables are due to rounding.
2 Product design and development expense includes $18.1m (FY18: $12.2m) depreciation and amortisation but excludes capitalised development investment.
3 Includes patents and purchased external software licences used in our products.
4 R&D is total investment in product design and development expense, excluding depreciation and amortisation, and including capitalised development investment each year.
36
Operating and financial review
Revenue
Total revenue grew 57% to $348.3m (FY18: $221.6m). Increased revenue growth came from:
• increased transaction and user growth within the existing customer base;
• new customers won in the year and growth from customers won in FY18 and FY17; and
• strategic acquisitions completed in FY19 and the full year impact of FY18 acquisitions.
Organic revenues from our existing and new customers delivered $54.5m of growth on FY18. Growth in organic revenue from existing and new customers was driven by:
• continued increased usage of the CargoWise One platform by existing customer organisations – adding transactions, users, new sites, moving into new modules, and consolidating operations;
• transition of customer licensing to standard transaction-based licensing;
• revenue from new products and features; and
• onboarding of new sales and increased usage by new customers.
Revenue from existing customers increased by $46.8m (FY18: $32.1m) and revenue from new customers increased by $7.7m (FY18: $12.5m). Given our growing global reach across thousands of logistics organisations, many new sales will appear in the existing customer category due to an existing relationship for a select component or region.
Existing and new customer growth included $9.2m of favourable foreign exchange movements.
In FY19, once again, revenue growth for CargoWise One was achieved across all existing customer cohorts (from FY06 through to FY19).
Revenue from customers on acquired platforms increased by $72.2m, up over 200% year on year, primarily $69.0m from the 29 acquisitions completed in FY18 and FY19. Our strategic acquisitions bring seamless entry into new markets, local leadership, quality customer bases and local infrastructure and development teams which, over time, we will utilise to expand the reach of CargoWise One geographically and build globally scalable adjacencies. Initially, as we reshape these businesses the revenue from strategic acquisitions may not be as high growth as our CargoWise One business, nor can they have our high recurring revenue levels as their revenues tend to have higher levels of OTL and/or support services revenue, from which we will transition over time.
Revenue from customers on acquired platforms included $0.8m of favourable foreign exchange movements.
Revenue from OTL and support services rose to $40.7m (FY18: $22.9m), reflecting the contribution of revenue from strategically acquired businesses as they typically have higher proportions of consulting or OTL revenue.
Recurring revenue 99% of our CargoWise One revenue is recurring revenue. The change from 100% in 1H19 reflects increases in revenue from development of new technologies to meet specific customer pain points (paid feature requests) which we will ultimately deploy across the global platform and make available to all customers. Even with our significant volume of acquisitions in FY18 and FY19, which have higher levels of OTL and support services revenue, our recurring revenue for the Group overall was 88% of total revenue (FY18: 90%).
Customer attrition The attrition rate for the CargoWise One technology platform continued to be extremely low at under 1%, as it had been for the previous seven years since we started measuring. Our customers stay and grow their transaction usage due to the productivity of our platform.
Licensing and transition All new CargoWise One customers use our transaction-based Seat Plus Transaction Licensing (“STL”) revenue model. We have transitioned customers from historical OTL agreements to On-Demand licence models and are focusing on the transition of customers from:
• our Module User Licence (“MUL”) model to STL; and
• acquired platforms, over time, to CargoWise One.
For the CargoWise One application suite for FY19, the percentage of revenue from our On-Demand licensing was 98%. Overall, including acquisitions, the percentage of On-Demand licence model revenue is 72% of total revenue (FY18: 77%), reflecting the higher levels of OTL and support services revenue in acquisitions compared to our CargoWise One platform.
Foreign exchange Our revenue is invoiced in a range of currencies, reflecting the global nature of our customer base, and as a result, may be positively or negatively impacted by movements in foreign exchange rates. As we continue to acquire businesses in new geographies, the range of currencies in which we invoice and incur costs expands.
37WiseTech Global | Annual Report 2019
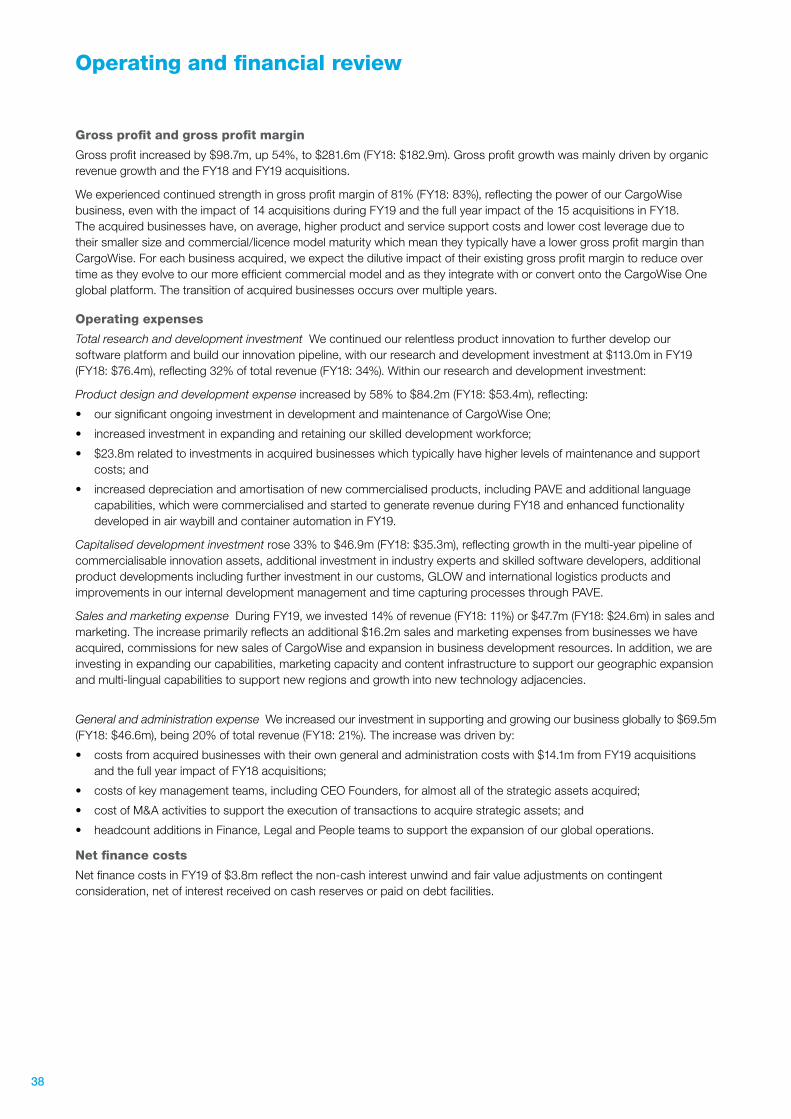
Operating and financial review
Gross profit and gross profit margin
Gross profit increased by $98.7m, up 54%, to $281.6m (FY18: $182.9m). Gross profit growth was mainly driven by organic revenue growth and the FY18 and FY19 acquisitions.
We experienced continued strength in gross profit margin of 81% (FY18: 83%), reflecting the power of our CargoWise business, even with the impact of 14 acquisitions during FY19 and the full year impact of the 15 acquisitions in FY18. The acquired businesses have, on average, higher product and service support costs and lower cost leverage due to their smaller size and commercial/licence model maturity which mean they typically have a lower gross profit margin than CargoWise. For each business acquired, we expect the dilutive impact of their existing gross profit margin to reduce over time as they evolve to our more efficient commercial model and as they integrate with or convert onto the CargoWise One global platform. The transition of acquired businesses occurs over multiple years.
Operating expenses
Total research and development investment We continued our relentless product innovation to further develop our software platform and build our innovation pipeline, with our research and development investment at $113.0m in FY19 (FY18: $76.4m), reflecting 32% of total revenue (FY18: 34%). Within our research and development investment:
Product design and development expense increased by 58% to $84.2m (FY18: $53.4m), reflecting:
• our significant ongoing investment in development and maintenance of CargoWise One;
• increased investment in expanding and retaining our skilled development workforce;
• $23.8m related to investments in acquired businesses which typically have higher levels of maintenance and support costs; and
• increased depreciation and amortisation of new commercialised products, including PAVE and additional language capabilities, which were commercialised and started to generate revenue during FY18 and enhanced functionality developed in air waybill and container automation in FY19.
Capitalised development investment rose 33% to $46.9m (FY18: $35.3m), reflecting growth in the multi-year pipeline of commercialisable innovation assets, additional investment in industry experts and skilled software developers, additional product developments including further investment in our customs, GLOW and international logistics products and improvements in our internal development management and time capturing processes through PAVE.
Sales and marketing expense During FY19, we invested 14% of revenue (FY18: 11%) or $47.7m (FY18: $24.6m) in sales and marketing. The increase primarily reflects an additional $16.2m sales and marketing expenses from businesses we have acquired, commissions for new sales of CargoWise and expansion in business development resources. In addition, we are investing in expanding our capabilities, marketing capacity and content infrastructure to support our geographic expansion and multi-lingual capabilities to support new regions and growth into new technology adjacencies.
General and administration expense We increased our investment in supporting and growing our business globally to $69.5m (FY18: $46.6m), being 20% of total revenue (FY18: 21%). The increase was driven by:
• costs from acquired businesses with their own general and administration costs with $14.1m from FY19 acquisitions and the full year impact of FY18 acquisitions;
• costs of key management teams, including CEO Founders, for almost all of the strategic assets acquired;
• cost of M&A activities to support the execution of transactions to acquire strategic assets; and
• headcount additions in Finance, Legal and People teams to support the expansion of our global operations.
Net finance costs
Net finance costs in FY19 of $3.8m reflect the non-cash interest unwind and fair value adjustments on contingent consideration, net of interest received on cash reserves or paid on debt facilities.
38
Operating and financial review
Cash flow
We continued to generate positive cash flows, with $112.5m of net cash flows from operating activities. Investing activities included:
• $237.2m in new acquisitions, as well as contingent payments for acquisitions made in prior years (FY18: $104.2m);
• $43.7m in intangible assets as we further developed and expanded our global platform, resulting in capitalised development investment for both commercialised products and those yet to be launched (FY18: $32.7m); and
• $6.7m in assets mostly related to our IT infrastructure to enhance the scalability and reliability of our platform and increase capacity for future growth and facilities upgrade for acquired businesses.
Financing activities included:
• $335.7m in proceeds for our Institutional Equity Raising and subsequent Share Purchase Plan for retail shareholders, completed in March and April 2019; and
• replacing our previous debt facility with a $190m unsecured syndicated debt facility (and a further $200m accordion facility) in January 2019. See note 16 to the financial statements.
Dividends of $9.0m (FY18: $6.0m) were paid during FY19, with shareholders choosing to reinvest an additional $0.5m of dividends via the dividend reinvestment plan.
Delivery on our growth strategy
The key strategic focal points, investment areas and developments in FY19 were:
Expansion of our global platform
We invested $113.0m and 47% of our people in product development, further expanding our pipeline of commercialisable innovations and delivering over 830 product enhancements seamlessly across the CargoWise One global platform. We are accelerating our development capability within our development teams in over 30 countries.
The hundreds of upgrades include initiatives such as:
• real-time container and vessel visibility along with expanded and embedded global automation covering air waybills movement and flight tracking and process automation;
• additional China solution interface and localised CargoWise One platform;
• extension of localisation of our comprehensive accounting solution to further countries;
• increased rates shopping, automation and bookings direct to ocean carriers;
• completion of border compliance engine, BorderWise, for the US market;
• consolidation planning board module to allow export forwarders, transshipment agents and gateways to optimise space and cost allocation over multiple shipments and consolidations; and
• regulatory upgrades for a myriad of government changes including UK regulatory CDS platform replacement, China Single Window (31 provinces), Canada Trans-Pacific Partnership revisions, Malaysian uCustoms, Australian GST, EU Union Customs Code implementation, South Africa NCAP and German ATLAS release.
We progressed our larger pipeline components including:
• web-based international fulfilment ecommerce integrated solution for 3PLs, managing shipments from origin to door with Shipper Portal, export consolidation warehouse and import deconsolidation warehouse automations and optimisations all deeply integrated to CargoWise functionality along with connections to customs and last mile and parcel delivery;
• comprehensive global port integration for all ports in the Netherlands and all automated ports across South Africa, Germany and Australia. This was completed for Shanghai and Ningbo-Zhoushan covering the majority of ports in China (with the world’s largest global forwarder, DHL Global Forwarding, already live);
• additional machine learning, natural language and data robotics that monitor, retrieve and process data sets automatically, across myriad sources and providers in the supply chain;
• expansion of the Universal Customs Engine designed to deliver complex, multi-year localisations;
• progress in the development of CargoWise neXus, with early beta release to select BCO and 3PL customers at the end calendar year 2020. NeXus is designed for the users of logistics services, connecting logistics providers, importers, exporters and other logistics users;
• integration of acquired adjacencies and our innovation developments to build out the cargo chain ecosystem for rates, schedules, contracts, quoting and bookings; and
• commenced scaling of database models (including new SQL and non-SQL database structures), sharding and decoupling projects to further scale WiseCloud infrastructure, increasing redundancy and expanding performance capacity.
39WiseTech Global | Annual Report 2019
Operating and financial review
In addition, we have also invested resources into in-application machine learning, natural language processing, process automation and guided decision support, driven by vast volumes of transactional, carrier and border agency data sets to enable enhanced productivity, automation, visibility, predictability, compliance, due diligence, risk assessment and risk mitigation for the logistics industry.
Within our acquired strategic assets, significant development work is progressing. A sample of activities include:
• commencing integration between our specialist Transport Management Solutions (“TMS”) adjacencies and direct integration with CargoWise One and our international ecommerce;
• simultaneous build-out of embedded customs for acquired geographies and expansion of European customs solutions to encompass bonded warehousing;
• our Spanish subsidiary, Taric, was re-appointed as European Commission content provider for the development of the commercial exchange of goods between the EU and other countries;
• multiple-solution design development ahead of Brexit to accommodate potential outcomes for the UK and key countries across Europe;
• expanding CargoSphere capability and integration to CargoWise One, with 3 of the world’s largest global ocean carriers, including Maersk and Hapag Lloyd, along with other key regional players, now live on the global rates platform;
• integration of Taiwan customs and compliance modules expanding our CargoWise Asian capability;
• utilising our local acquired operations to build out regional components for our global engines; and
• leveraging select geographic and adjacent technology acquisitions to address new customer segments or expand regional presence.
Greater usage by existing customers
We experienced continuing existing customer revenue growth of $46.8m in addition to:
• our large customer base increasing its use of the CargoWise One platform, adding transactions, users and geographies and moving into more modules;
• increasing usage by many of the world’s largest freight forwarding groups. We have 25 of the top 25 global freight forwarders as customers and seven of the top 25 are in progress, or have completed, global forwarding rollouts, including DSV, DHL, Toll and Yusen. The DHL Global Forwarding rollout continues to make significant progress with strong increase in both core users and countries;
• continued transition of customer licensing (excluding acquisitions), with 98% of CargoWise One revenues generated from On-Demand licensing, an access-as-needed, monthly payment based on usage licence. Our transaction-based licensing (STL) now accounts for 81% of CargoWise One revenues (FY18: 57%);
• further growth in revenue from larger multi-region customers with 43 of the top 50 global 3PLs now customers, yet even our global relationships are still in early penetration and our top 10 customers contribute only 22% of revenue (FY18: 29%); and
• each cohort of customers from FY06 to FY19 grew revenue in the period.
Increasing the number of new customers on the platform
We continue to bring new customers onto the platform with new regional customer deals including Bon Voyage Logistics, HAVI Freight Management and a full global rollout for Bolloré Logistics. Bolloré Logistics, the global forwarding operating unit of Bolloré Transport & Logistics, a global leader in supply chain management ranking among the world’s top 10 in transport and logistics with an integrated network of 609 offices in 107 countries.
New customers take time to roll out and then transaction revenue grows over time. Our Delta team builds relationships with global 3PLs and international freight forwarders. As we increase our global penetration, we also continue to sign new deals with customers where we have a pre-existing relationship which add to our existing customers’ revenue. We are seeing larger potential global logistics organisations engaging with us and we expect to see this trend expand into further major new customer contracts.
In addition, through industry consolidation, CargoWise is capable of capturing large global rollouts without further sales activity – e.g.: DSV’s acquisition of UTi and recent acquisition of Panalpina. However, we are still in early penetration of both new and existing customers.
40
Operating and financial review
Stimulated network effects
We harness important natural network effects that exist because of the necessarily collaborative nature of supply chain execution and the inherent effect of our deeply integrated global software platform. We further stimulate these effects with targeted partner programs through Wise Partners, CargoWise Certified Professional and deeper WiseIndustry programs for freight forwarding network groups globally.
We now have over 270 external WisePartner organisations across the world, actively referring, promoting or implementing our platform. In FY19, we certified a further 4,000 CargoWise One practitioners, who work within the logistics industry across our customer or partner organisations. We now have over 15,000 who utilise and promote the features of our platform. We also added 25 WiseService Partner organisations, fortifying our capability to support growing customer bases in expanding markets. In FY19, we added 16 global independent freight forwarding and industry trade networks as WiseIndustry Partners. We now have 47 partner networks with member base of over 8,700 logistics service professionals.
In addition, each new geography and adjacency we acquire adds a valuable point on our strategic map, accelerates the network effects and makes CargoWise One even more compelling to local and global logistics providers and their customers. In FY19, we continued to leverage our acquired business relationships with key global customers and explored connections between the adjacent acquisitions, CargoWise One and geographic footholds.
Our reach now extends out from international freight forwarding and 3PL logistics, making inroads into the 2PL, 1PL and domestic transportation globally. We also implemented five development partnerships with large regional and global rollout customers on pilot developments or technological expansions of our platform capabilities that will drive product value and network effects across the customer base.
Accelerating organic growth through acquisitions
In expanding geographically, we buy into market positions that would take years to build, and we then integrate the acquired industry and developer talent and customers over time to accelerate our organic growth. We further utilise acquisitions in key adjacent technologies to facilitate our development of globally scalable innovations, to fuel the convergence of technologies that add to our next generation of automations and machine learning and to grow and enhance our extensive global data and transaction sets.
In FY19, we have progressed product development in China, Italy, Germany, Brazil, Ireland, the US, and Australasia and across our global adjacencies. In addition, since 1 July 2018, we have announced a further 15 valuable geographic and adjacent acquisitions across Turkey, North America, Spain, Italy, Australia, the United Kingdom, Sweden, Norway and Singapore.
In FY19, our acquisitions for geographic expansion comprised:
• on 2 July 2018, we completed the acquisition of Ulukom, a leading logistics and customs solutions provider in Turkey – one of Europe’s largest trading partners bridging Europe, Middle East and Asia;
• on 2 July 2018, we completed the acquisition of Fenix, a Canadian customs management solutions provider with specialised focus on cross-border road and rail movements;
• on 19 September 2018, we completed the acquisition of Multi Consult, the leading Italian customs and freight forwarding solution provider with domestic TMS capabilities;
• on 2 October 2018, we completed the acquisition of Taric, a leading provider of customs management solutions in Spain who will assist to extend customs and compliance capabilities for our recent acquisitions of freight forwarding solutions providers across Latin America;
• on 1 November 2018, we completed the acquisition of DataFreight, a leading provider of customs, freight forwarding and warehouse management software solutions in the UK who will strengthen our development capacity in preparation for Brexit;
• on 1 November 2018, we completed the acquisition of CargoIT, a leading customs management and logistics solutions provider in Sweden; and
• on 1 February 2019, we completed the acquisition of Systema, a leading customs management solutions provider in Norway.
41WiseTech Global | Annual Report 2019
Operating and financial review
In FY19 and to 21 August 2019, our acquisitions for adjacencies and technologies convergent with our innovation pipeline comprised:
• on 2 July 2018, we completed the acquisition of SaaS Transportation, a specialist Less Than Truckload (“LTL”) TMS provider in the US with LTL road rate capabilities which will expand our road booking and rates offering;
• on 2 July 2018, we completed the acquisition of Pierbridge, a leading parcel TMS provider whose enterprise-class, multi-carrier, parcel shipping solution, allows freight forwarders, warehouses and shippers, such as online retailers, to more efficiently manage high volumes of parcel shipments, and will enable our customers to ship with US-based global couriers;
• on 1 October 2018, we completed the acquisition of Trinium, a leading intermodal trucking TMS and container tracking provider in the US and Canada;
• on 8 October 2018, we completed the acquisition of Tankstream, a learning management system provider in Australia;
• on 1 November 2018, we completed the acquisition of SmartFreight, a leading parcel and LTL shipping software provider in Australia;
• on 1 April 2019, we completed the acquisition of Containerchain, a leading container optimisation solutions provider to the shipping and landside logistics communities in Asia Pacific, Europe and the US;
• on 1 May 2019, we completed the acquisition of Xware, a leading messaging integration solutions provider in Sweden; and
• on 19 August 2019, we announced the acquisition of Depot Systems, the leading provider of container yard and terminal management logistics solutions in the US.
Our acquisitions are at various stages of integration and, once fully embedded over the coming years, they will expand the functionality, scope and value of our industry-leading technology and provide a strong base for further accelerating our long-term organic growth. Accordingly, we will continue to execute on our considerable pipeline of near-term, mid-term and long-term acquisition opportunities in our target areas of Asia, Europe and North America.
Expectation for year ending 30 June 2020
The strong momentum and significant organic growth of the Group during FY19, the power of the CargoWise One platform, annual customer attrition rate of less than 1% and continued relentless investment in innovation and expansion across our global business and the full year impact of FY19 acquisitions give us the confidence to expect, subject to currency movements 1: FY20 revenue of $440m–$460m, revenue growth of 26%–32%, EBITDA 2 of $145m–$153m and EBITDA growth of 34%–42%.
1 Our revenue is invoiced in a range of currencies, reflecting the global nature of our customer base and as a result is impacted by movements in foreign exchange rates. Our FY20 guidance is based on rates provided within the Investor briefing materials released to the ASX on 21 August 2019.
2 The application of AASB 16 Leases, brought into effect from 1 July 2019, is expected to add $6m to EBITDA for FY20 with no change to revenue. The total is reflected in the guidance provided.
42
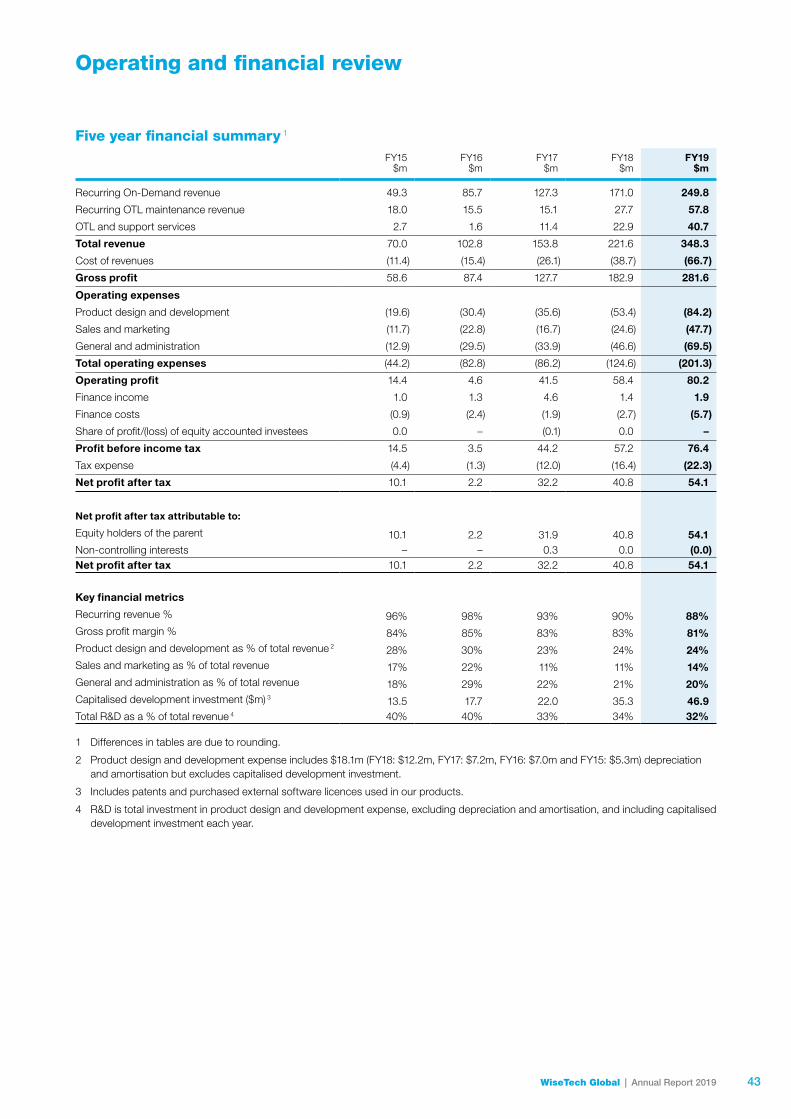
Operating and financial review
Five year financial summary 1
FY15$m
FY16$m
FY17$m
FY18$m
FY19$m
Recurring On-Demand revenue 49.3 85.7 127.3 171.0 249.8
Recurring OTL maintenance revenue 18.0 15.5 15.1 27.7 57.8
OTL and support services 2.7 1.6 11.4 22.9 40.7
Total revenue 70.0 102.8 153.8 221.6 348.3
Cost of revenues (11.4) (15.4) (26.1) (38.7) (66.7)
Gross profit 58.6 87.4 127.7 182.9 281.6
Operating expenses
Product design and development (19.6) (30.4) (35.6) (53.4) (84.2)
Sales and marketing (11.7) (22.8) (16.7) (24.6) (47.7)
General and administration (12.9) (29.5) (33.9) (46.6) (69.5)
Total operating expenses (44.2) (82.8) (86.2) (124.6) (201.3)
Operating profit 14.4 4.6 41.5 58.4 80.2
Finance income 1.0 1.3 4.6 1.4 1.9
Finance costs (0.9) (2.4) (1.9) (2.7) (5.7)
Share of profit/(loss) of equity accounted investees 0.0 – (0.1) 0.0 –
Profit before income tax 14.5 3.5 44.2 57.2 76.4
Tax expense (4.4) (1.3) (12.0) (16.4) (22.3)
Net profit after tax 10.1 2.2 32.2 40.8 54.1
Net profit after tax attributable to:
Equity holders of the parent 10.1 2.2 31.9 40.8 54.1Non-controlling interests – – 0.3 0.0 (0.0)Net profit after tax 10.1 2.2 32.2 40.8 54.1
Key financial metrics
Recurring revenue % 96% 98% 93% 90% 88%Gross profit margin % 84% 85% 83% 83% 81%Product design and development as % of total revenue 2 28% 30% 23% 24% 24%Sales and marketing as % of total revenue 17% 22% 11% 11% 14%General and administration as % of total revenue 18% 29% 22% 21% 20%Capitalised development investment ($m) 3 13.5 17.7 22.0 35.3 46.9Total R&D as a % of total revenue 4 40% 40% 33% 34% 32%
1 Differences in tables are due to rounding.
2 Product design and development expense includes $18.1m (FY18: $12.2m, FY17: $7.2m, FY16: $7.0m and FY15: $5.3m) depreciation and amortisation but excludes capitalised development investment.
3 Includes patents and purchased external software licences used in our products.
4 R&D is total investment in product design and development expense, excluding depreciation and amortisation, and including capitalised development investment each year.
43WiseTech Global | Annual Report 2019
Remuneration Report
WiseTech’s future growth and innovation come from the talent, motivation and enthusiasm of our people across the world and we aim to align and reward our high‑performance global workforce with a remuneration and incentive program matched to our specialised operations and aspirations.
This Remuneration Report sets out the Board’s approach to the remuneration of our key management personnel (“KMP”). The report covers company performance and remuneration outcomes for the period from 1 July 2018 to 30 June 2019. The information provided in this report has been audited as required by section 308(3C) of the Corporations Act 2001.
In the interests of clear communication, we have included some additional, simplified tables showing the total remuneration awarded for FY19 and the actual remuneration received in FY19 for our Executive KMP. These additional disclosures are intended to supplement the statutory disclosures contained later in the report.
Remuneration policy and governance
Our remuneration policy is designed to:
• support our business strategy and reinforce our culture and values;
• link financial rewards directly to employee contributions and WiseTech’s performance; and
• provide market competitive remuneration to attract, motivate and retain highly skilled people.
Remuneration Committee
The Board is responsible for ensuring that WiseTech’s remuneration strategy and frameworks support the Group’s performance and ensure Executives and Non-Executive Directors are rewarded fairly and responsibly with regard to legal compliance and corporate governance requirements. The Remuneration Committee monitors and reviews remuneration matters and, where appropriate, makes recommendations to the Board. The Committee comprises three independent Non-Executive Directors, including the Committee Chair.
Further information on the Committee’s responsibilities is set out in the Remuneration Committee Charter available at: http://ir.wisetechglobal.com/investors/?page=corporate-governance
Annual remuneration review
The Remuneration Committee and the Board review Executive KMP remuneration annually to ensure there is an appropriate balance between fixed and at-risk pay and that it reflects short-term performance objectives linked to WiseTech’s strategy.
Independent remuneration consultants
WiseTech Global has protocols in place to ensure that any external advice is provided in an appropriate manner and is free from undue influence of management. No remuneration consultants were engaged during FY19.
Details of Directors and Executives
KMP comprises all Directors and those executives who have specific authority and responsibility for planning, directing and controlling material activities of the Group. In this report, the term “Executive KMP” refers to the KMP excluding Non-Executive Directors.
The KMP for the period from 1 July 2018 to 30 June 2019 were:
Andrew Harrison Chair and Non-Executive Director
Teresa Engelhard Non-Executive Director
Charles Gibbon Non-Executive Director
Michael Gregg Non-Executive Director
Christine Holman Non-Executive Director, appointed 1 December 2018
Richard White (“RW”) Executive Director, Founder and Chief Executive Officer (“CEO”)
Maree Isaacs (“MI”) Executive Director, Co-founder and Head of Invoicing & Licensing
Andrew Cartledge (“AC”) Chief Financial Officer (“CFO”)
Brett Shearer (“BS”) Chief Technology Officer (“CTO”)
Following a review, in the context of the global expansion and growth of the Group, the Board determined that Chief Productivity Officer,
James Powell, no longer meets the definition of KMP with effect from FY19.
44
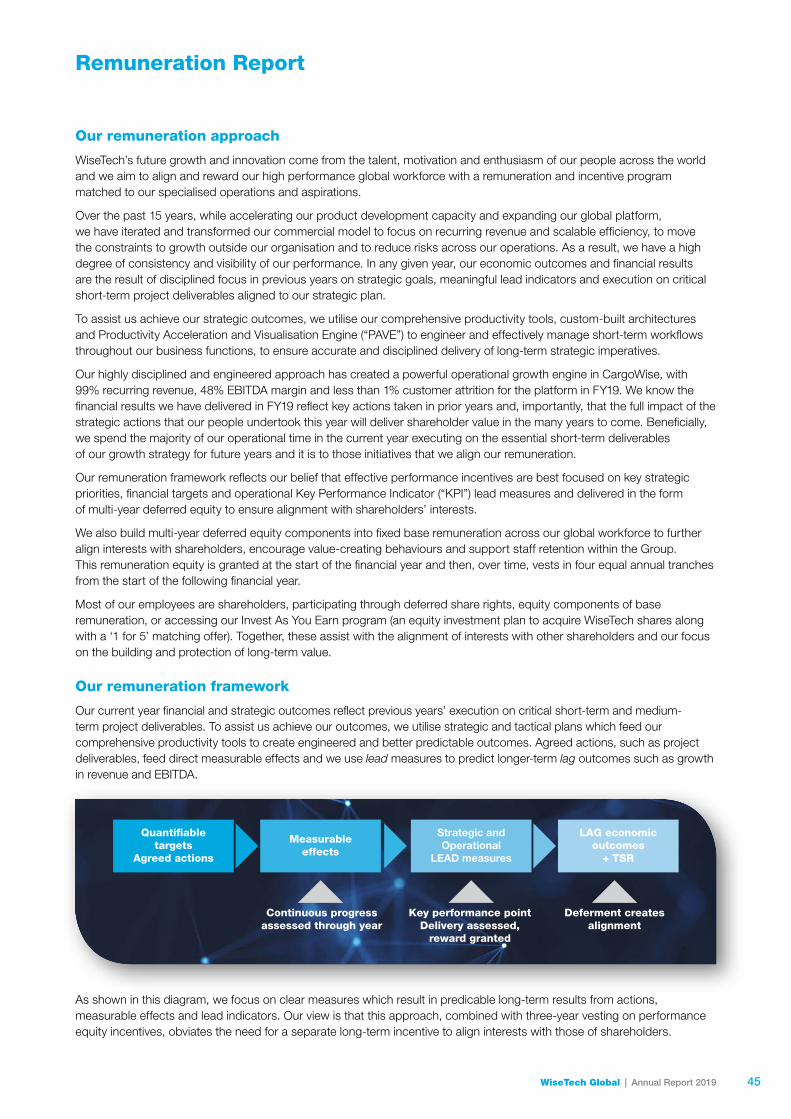
Remuneration Report
Our remuneration approach
WiseTech’s future growth and innovation come from the talent, motivation and enthusiasm of our people across the world and we aim to align and reward our high performance global workforce with a remuneration and incentive program matched to our specialised operations and aspirations.
Over the past 15 years, while accelerating our product development capacity and expanding our global platform, we have iterated and transformed our commercial model to focus on recurring revenue and scalable efficiency, to move the constraints to growth outside our organisation and to reduce risks across our operations. As a result, we have a high degree of consistency and visibility of our performance. In any given year, our economic outcomes and financial results are the result of disciplined focus in previous years on strategic goals, meaningful lead indicators and execution on critical short-term project deliverables aligned to our strategic plan.
To assist us achieve our strategic outcomes, we utilise our comprehensive productivity tools, custom-built architectures and Productivity Acceleration and Visualisation Engine (“PAVE”) to engineer and effectively manage short-term workflows throughout our business functions, to ensure accurate and disciplined delivery of long-term strategic imperatives.
Our highly disciplined and engineered approach has created a powerful operational growth engine in CargoWise, with 99% recurring revenue, 48% EBITDA margin and less than 1% customer attrition for the platform in FY19. We know the financial results we have delivered in FY19 reflect key actions taken in prior years and, importantly, that the full impact of the strategic actions that our people undertook this year will deliver shareholder value in the many years to come. Beneficially, we spend the majority of our operational time in the current year executing on the essential short-term deliverables of our growth strategy for future years and it is to those initiatives that we align our remuneration.
Our remuneration framework reflects our belief that effective performance incentives are best focused on key strategic priorities, financial targets and operational Key Performance Indicator (“KPI”) lead measures and delivered in the form of multi-year deferred equity to ensure alignment with shareholders’ interests.
We also build multi-year deferred equity components into fixed base remuneration across our global workforce to further align interests with shareholders, encourage value-creating behaviours and support staff retention within the Group. This remuneration equity is granted at the start of the financial year and then, over time, vests in four equal annual tranches from the start of the following financial year.
Most of our employees are shareholders, participating through deferred share rights, equity components of base remuneration, or accessing our Invest As You Earn program (an equity investment plan to acquire WiseTech shares along with a ‘1 for 5’ matching offer). Together, these assist with the alignment of interests with other shareholders and our focus on the building and protection of long-term value.
Our remuneration framework
Our current year financial and strategic outcomes reflect previous years’ execution on critical short-term and medium-term project deliverables. To assist us achieve our outcomes, we utilise strategic and tactical plans which feed our comprehensive productivity tools to create engineered and better predictable outcomes. Agreed actions, such as project deliverables, feed direct measurable effects and we use lead measures to predict longer-term lag outcomes such as growth in revenue and EBITDA.
Quanti�abletargets
Agreed actions
Deferment createsalignment
LAG economicoutcomes
+ TSR
Key performance pointDelivery assessed,
reward granted
Strategic andOperational
LEAD measures
Continuous progressassessed through year
Measurableeffects
As shown in this diagram, we focus on clear measures which result in predicable long-term results from actions, measurable effects and lead indicators. Our view is that this approach, combined with three-year vesting on performance equity incentives, obviates the need for a separate long-term incentive to align interests with those of shareholders.
45WiseTech Global | Annual Report 2019
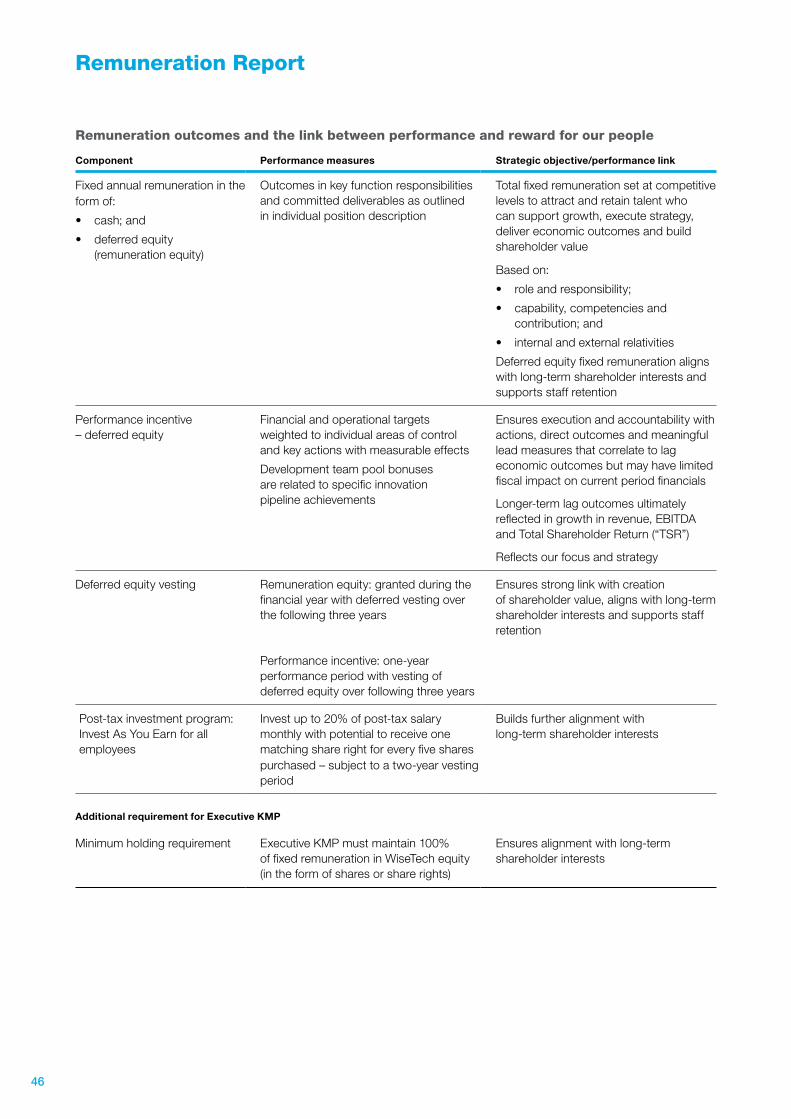
Remuneration Report
Remuneration outcomes and the link between performance and reward for our people
Component Performance measures Strategic objective/performance link
Fixed annual remuneration in the form of:
• cash; and
• deferred equity (remuneration equity)
Outcomes in key function responsibilities and committed deliverables as outlined in individual position description
Total fixed remuneration set at competitive levels to attract and retain talent who can support growth, execute strategy, deliver economic outcomes and build shareholder value
Based on:
• role and responsibility;
• capability, competencies and contribution; and
• internal and external relativities
Deferred equity fixed remuneration aligns with long-term shareholder interests and supports staff retention
Performance incentive – deferred equity
Financial and operational targets weighted to individual areas of control and key actions with measurable effects
Development team pool bonuses are related to specific innovation pipeline achievements
Ensures execution and accountability with actions, direct outcomes and meaningful lead measures that correlate to lag economic outcomes but may have limited fiscal impact on current period financials
Longer-term lag outcomes ultimately reflected in growth in revenue, EBITDA and Total Shareholder Return (“TSR”)
Reflects our focus and strategy
Deferred equity vesting Remuneration equity: granted during the financial year with deferred vesting over the following three years
Performance incentive: one-year performance period with vesting of deferred equity over following three years
Ensures strong link with creation of shareholder value, aligns with long-term shareholder interests and supports staff retention
Post-tax investment program: Invest As You Earn for all employees
Invest up to 20% of post-tax salary monthly with potential to receive one matching share right for every five shares purchased – subject to a two-year vesting period
Builds further alignment with long-term shareholder interests
Additional requirement for Executive KMP
Minimum holding requirement Executive KMP must maintain 100% of fixed remuneration in WiseTech equity (in the form of shares or share rights)
Ensures alignment with long-term shareholder interests
46
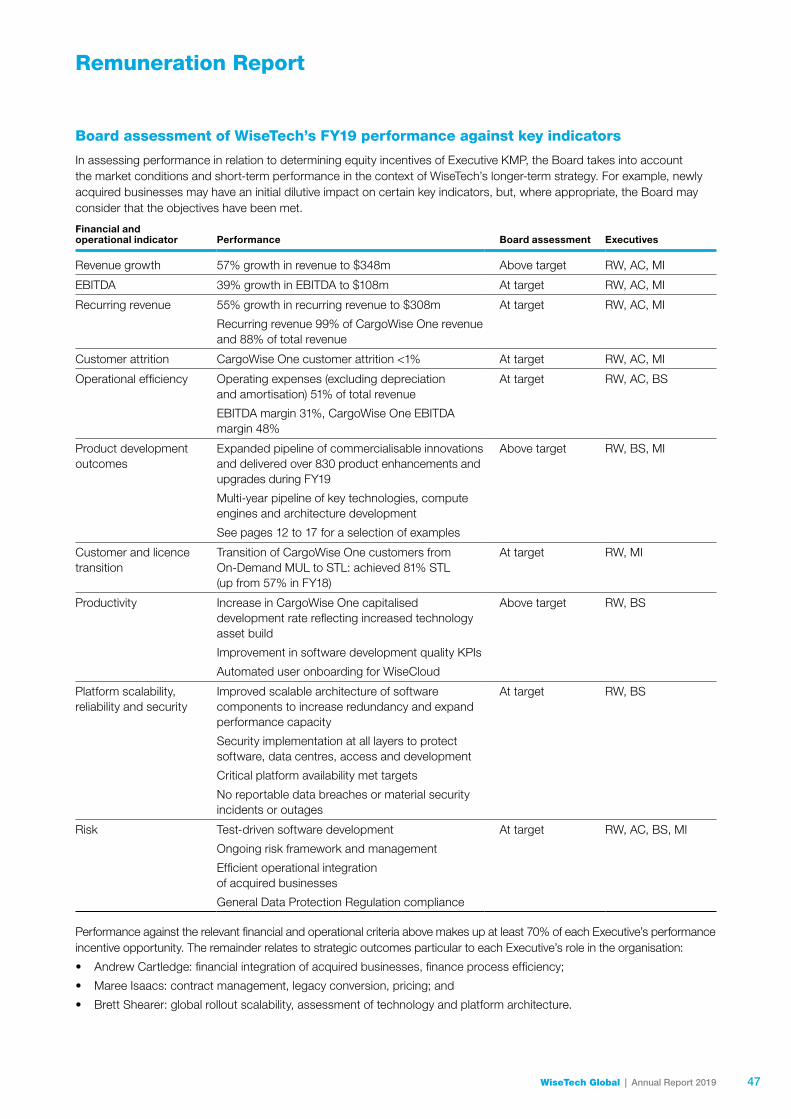
Remuneration Report
Board assessment of WiseTech’s FY19 performance against key indicators
In assessing performance in relation to determining equity incentives of Executive KMP, the Board takes into account the market conditions and short-term performance in the context of WiseTech’s longer-term strategy. For example, newly acquired businesses may have an initial dilutive impact on certain key indicators, but, where appropriate, the Board may consider that the objectives have been met.
Financial and operational indicator Performance Board assessment Executives
Revenue growth 57% growth in revenue to $348m Above target RW, AC, MI
EBITDA 39% growth in EBITDA to $108m At target RW, AC, MI
Recurring revenue 55% growth in recurring revenue to $308m
Recurring revenue 99% of CargoWise One revenue and 88% of total revenue
At target RW, AC, MI
Customer attrition CargoWise One customer attrition <1% At target RW, AC, MI
Operational efficiency Operating expenses (excluding depreciation and amortisation) 51% of total revenue
EBITDA margin 31%, CargoWise One EBITDA margin 48%
At target RW, AC, BS
Product development outcomes
Expanded pipeline of commercialisable innovations and delivered over 830 product enhancements and upgrades during FY19
Multi-year pipeline of key technologies, compute engines and architecture development
See pages 12 to 17 for a selection of examples
Above target RW, BS, MI
Customer and licence transition
Transition of CargoWise One customers from On-Demand MUL to STL: achieved 81% STL (up from 57% in FY18)
At target RW, MI
Productivity Increase in CargoWise One capitalised development rate reflecting increased technology asset build
Improvement in software development quality KPIs
Automated user onboarding for WiseCloud
Above target RW, BS
Platform scalability, reliability and security
Improved scalable architecture of software components to increase redundancy and expand performance capacity
Security implementation at all layers to protect software, data centres, access and development
Critical platform availability met targets
No reportable data breaches or material security incidents or outages
At target RW, BS
Risk Test-driven software development
Ongoing risk framework and management
Efficient operational integration of acquired businesses
General Data Protection Regulation compliance
At target RW, AC, BS, MI
Performance against the relevant financial and operational criteria above makes up at least 70% of each Executive’s performance incentive opportunity. The remainder relates to strategic outcomes particular to each Executive’s role in the organisation:
• Andrew Cartledge: financial integration of acquired businesses, finance process efficiency;
• Maree Isaacs: contract management, legacy conversion, pricing; and
• Brett Shearer: global rollout scalability, assessment of technology and platform architecture.
47WiseTech Global | Annual Report 2019
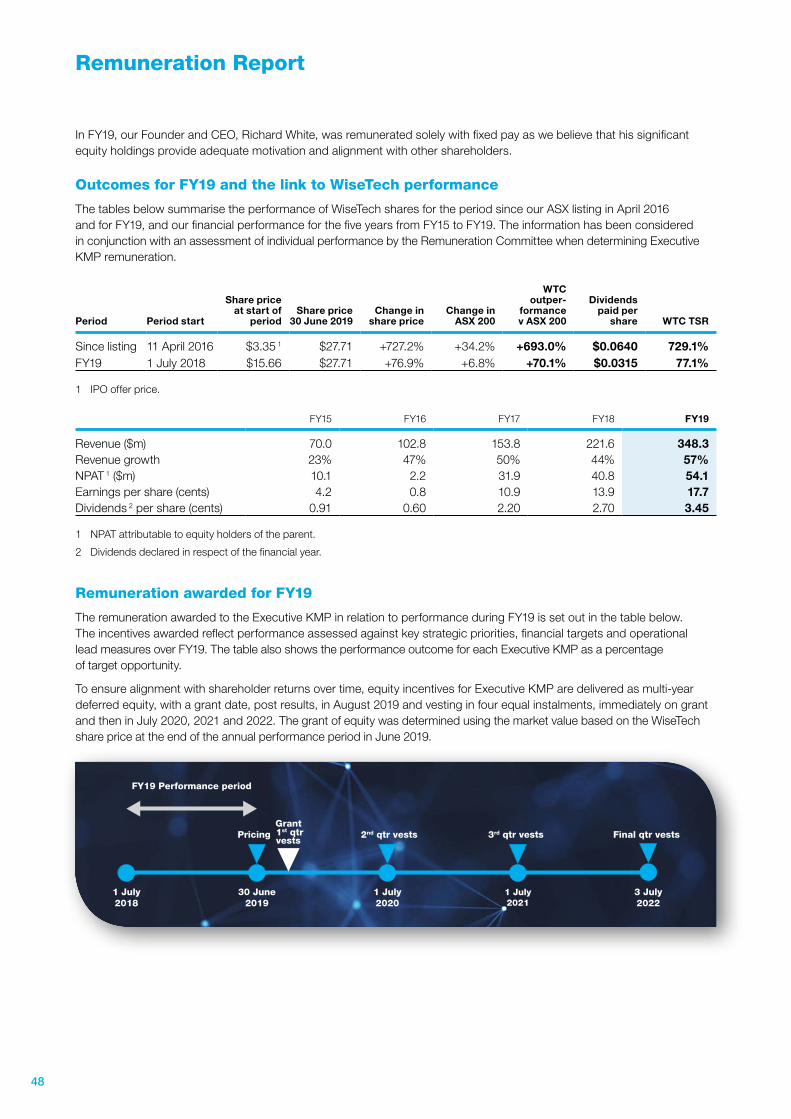
Remuneration Report
In FY19, our Founder and CEO, Richard White, was remunerated solely with fixed pay as we believe that his significant equity holdings provide adequate motivation and alignment with other shareholders.
Outcomes for FY19 and the link to WiseTech performance
The tables below summarise the performance of WiseTech shares for the period since our ASX listing in April 2016 and for FY19, and our financial performance for the five years from FY15 to FY19. The information has been considered in conjunction with an assessment of individual performance by the Remuneration Committee when determining Executive KMP remuneration.
Period Period start
Share price at start of
periodShare price
30 June 2019Change in
share price Change in
ASX 200
WTC outper-
formance v ASX 200
Dividends paid per
share WTC TSR
Since listing 11 April 2016 $3.35 1 $27.71 +727.2% +34.2% +693.0% $0.0640 729.1%FY19 1 July 2018 $15.66 $27.71 +76.9% +6.8% +70.1% $0.0315 77.1%
1 IPO offer price.
FY15 FY16 FY17 FY18 FY19
Revenue ($m) 70.0 102.8 153.8 221.6 348.3Revenue growth 23% 47% 50% 44% 57%NPAT 1 ($m) 10.1 2.2 31.9 40.8 54.1Earnings per share (cents) 4.2 0.8 10.9 13.9 17.7Dividends 2 per share (cents) 0.91 0.60 2.20 2.70 3.45
1 NPAT attributable to equity holders of the parent.
2 Dividends declared in respect of the financial year.
Remuneration awarded for FY19
The remuneration awarded to the Executive KMP in relation to performance during FY19 is set out in the table below. The incentives awarded reflect performance assessed against key strategic priorities, financial targets and operational lead measures over FY19. The table also shows the performance outcome for each Executive KMP as a percentage of target opportunity.
To ensure alignment with shareholder returns over time, equity incentives for Executive KMP are delivered as multi-year deferred equity, with a grant date, post results, in August 2019 and vesting in four equal instalments, immediately on grant and then in July 2020, 2021 and 2022. The grant of equity was determined using the market value based on the WiseTech share price at the end of the annual performance period in June 2019.
Pricing
1 July2018
30 June2019
1 July2020
1 July2021
3 July2022
Grant2nd qtr vests1st qtr
vests
FY19 Performance period
3rd qtr vests Final qtr vests
48
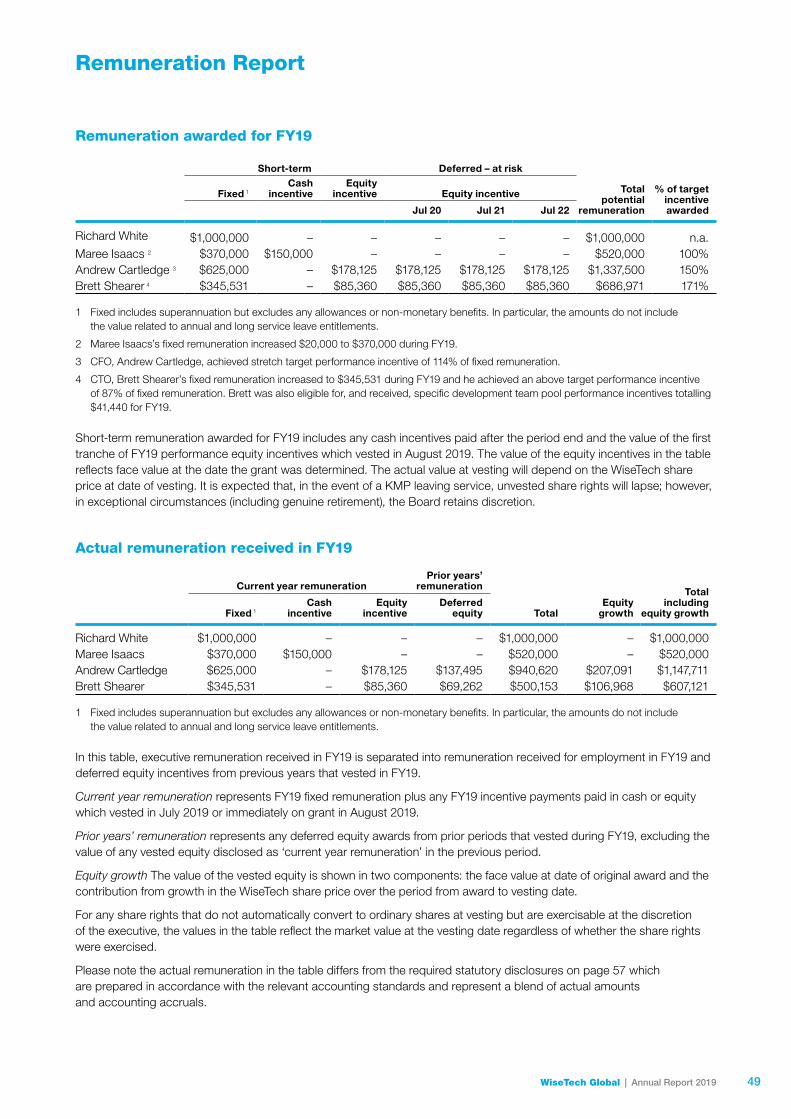
Remuneration Report
Remuneration awarded for FY19
Short-term Deferred – at risk
Total potential
remuneration
% of target incentive awarded
Fixed 1Cash
incentiveEquity
incentive Equity incentive
Jul 20 Jul 21 Jul 22
Richard White $1,000,000 – – – – – $1,000,000 n.a.Maree Isaacs 2 $370,000 $150,000 – – – – $520,000 100%Andrew Cartledge 3 $625,000 – $178,125 $178,125 $178,125 $178,125 $1,337,500 150%Brett Shearer 4 $345,531 – $85,360 $85,360 $85,360 $85,360 $686,971 171%
1 Fixed includes superannuation but excludes any allowances or non-monetary benefits. In particular, the amounts do not include the value related to annual and long service leave entitlements.
2 Maree Isaacs’s fixed remuneration increased $20,000 to $370,000 during FY19.
3 CFO, Andrew Cartledge, achieved stretch target performance incentive of 114% of fixed remuneration.
4 CTO, Brett Shearer’s fixed remuneration increased to $345,531 during FY19 and he achieved an above target performance incentive of 87% of fixed remuneration. Brett was also eligible for, and received, specific development team pool performance incentives totalling $41,440 for FY19.
Short-term remuneration awarded for FY19 includes any cash incentives paid after the period end and the value of the first tranche of FY19 performance equity incentives which vested in August 2019. The value of the equity incentives in the table reflects face value at the date the grant was determined. The actual value at vesting will depend on the WiseTech share price at date of vesting. It is expected that, in the event of a KMP leaving service, unvested share rights will lapse; however, in exceptional circumstances (including genuine retirement), the Board retains discretion.
Actual remuneration received in FY19
Current year remunerationPrior years’
remuneration
TotalEquity
growth
Total including
equity growthFixed 1Cash
incentiveEquity
incentiveDeferred
equity
Richard White $1,000,000 – – – $1,000,000 – $1,000,000Maree Isaacs $370,000 $150,000 – – $520,000 – $520,000Andrew Cartledge $625,000 – $178,125 $137,495 $940,620 $207,091 $1,147,711Brett Shearer $345,531 – $85,360 $69,262 $500,153 $106,968 $607,121
1 Fixed includes superannuation but excludes any allowances or non-monetary benefits. In particular, the amounts do not include the value related to annual and long service leave entitlements.
In this table, executive remuneration received in FY19 is separated into remuneration received for employment in FY19 and deferred equity incentives from previous years that vested in FY19.
Current year remuneration represents FY19 fixed remuneration plus any FY19 incentive payments paid in cash or equity which vested in July 2019 or immediately on grant in August 2019.
Prior years’ remuneration represents any deferred equity awards from prior periods that vested during FY19, excluding the value of any vested equity disclosed as ‘current year remuneration’ in the previous period.
Equity growth The value of the vested equity is shown in two components: the face value at date of original award and the contribution from growth in the WiseTech share price over the period from award to vesting date.
For any share rights that do not automatically convert to ordinary shares at vesting but are exercisable at the discretion of the executive, the values in the table reflect the market value at the vesting date regardless of whether the share rights were exercised.
Please note the actual remuneration in the table differs from the required statutory disclosures on page 57 which are prepared in accordance with the relevant accounting standards and represent a blend of actual amounts and accounting accruals.
49WiseTech Global | Annual Report 2019
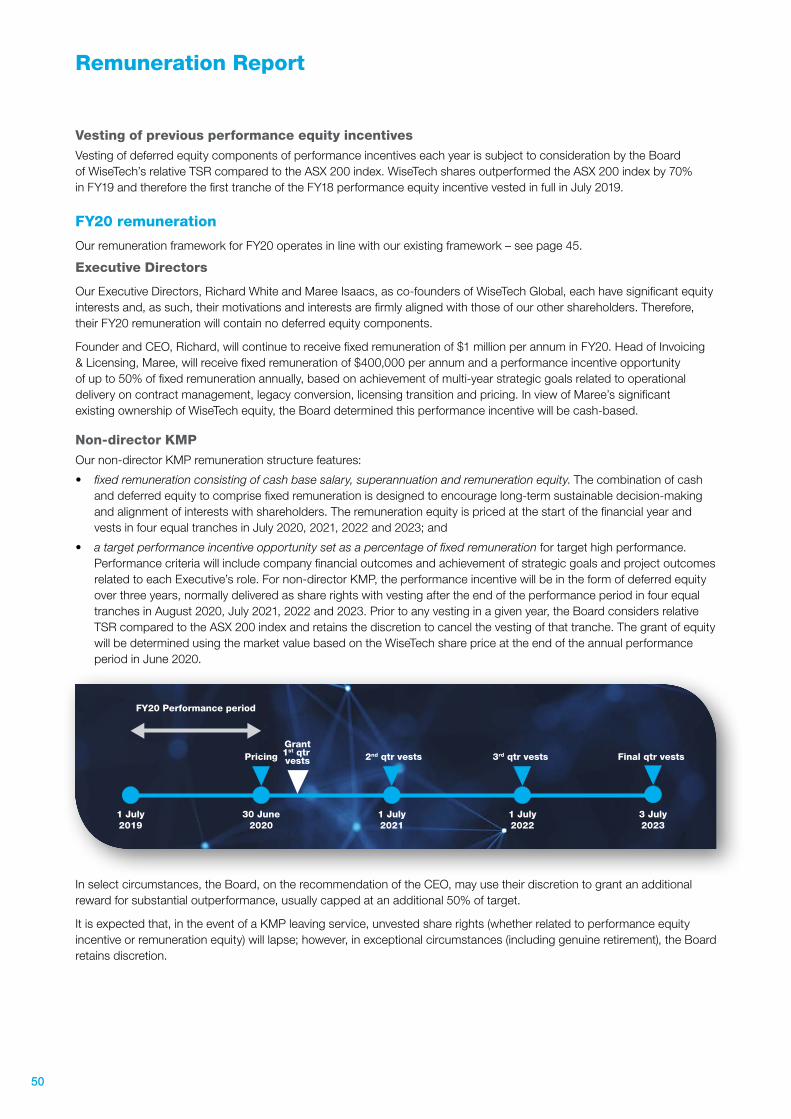
Remuneration Report
Vesting of previous performance equity incentives
Vesting of deferred equity components of performance incentives each year is subject to consideration by the Board of WiseTech’s relative TSR compared to the ASX 200 index. WiseTech shares outperformed the ASX 200 index by 70% in FY19 and therefore the first tranche of the FY18 performance equity incentive vested in full in July 2019.
FY20 remuneration
Our remuneration framework for FY20 operates in line with our existing framework – see page 45.
Executive Directors
Our Executive Directors, Richard White and Maree Isaacs, as co-founders of WiseTech Global, each have significant equity interests and, as such, their motivations and interests are firmly aligned with those of our other shareholders. Therefore, their FY20 remuneration will contain no deferred equity components.
Founder and CEO, Richard, will continue to receive fixed remuneration of $1 million per annum in FY20. Head of Invoicing & Licensing, Maree, will receive fixed remuneration of $400,000 per annum and a performance incentive opportunity of up to 50% of fixed remuneration annually, based on achievement of multi-year strategic goals related to operational delivery on contract management, legacy conversion, licensing transition and pricing. In view of Maree’s significant existing ownership of WiseTech equity, the Board determined this performance incentive will be cash-based.
Non-director KMP
Our non-director KMP remuneration structure features:
• fixed remuneration consisting of cash base salary, superannuation and remuneration equity. The combination of cash and deferred equity to comprise fixed remuneration is designed to encourage long-term sustainable decision-making and alignment of interests with shareholders. The remuneration equity is priced at the start of the financial year and vests in four equal tranches in July 2020, 2021, 2022 and 2023; and
• a target performance incentive opportunity set as a percentage of fixed remuneration for target high performance. Performance criteria will include company financial outcomes and achievement of strategic goals and project outcomes related to each Executive’s role. For non-director KMP, the performance incentive will be in the form of deferred equity over three years, normally delivered as share rights with vesting after the end of the performance period in four equal tranches in August 2020, July 2021, 2022 and 2023. Prior to any vesting in a given year, the Board considers relative TSR compared to the ASX 200 index and retains the discretion to cancel the vesting of that tranche. The grant of equity will be determined using the market value based on the WiseTech share price at the end of the annual performance period in June 2020.
Pricing
1 July2019
30 June2020
1 July2021
1 July2022
3 July2023
2nd qtr vestsGrant1st qtr vests
FY20 Performance period
3rd qtr vests Final qtr vests
In select circumstances, the Board, on the recommendation of the CEO, may use their discretion to grant an additional reward for substantial outperformance, usually capped at an additional 50% of target.
It is expected that, in the event of a KMP leaving service, unvested share rights (whether related to performance equity incentive or remuneration equity) will lapse; however, in exceptional circumstances (including genuine retirement), the Board retains discretion.
50
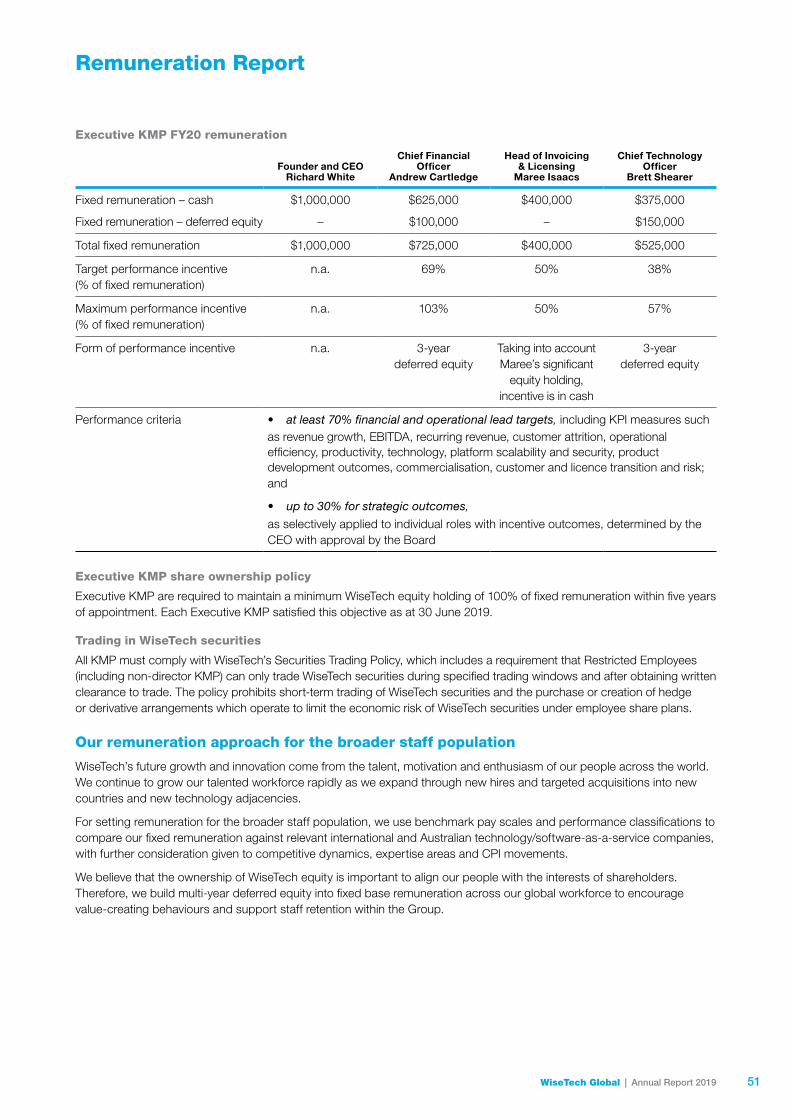
Remuneration Report
Executive KMP FY20 remuneration
Founder and CEO Richard White
Chief Financial Officer
Andrew Cartledge
Head of Invoicing & Licensing
Maree Isaacs
Chief Technology Officer
Brett Shearer
Fixed remuneration – cash $1,000,000 $625,000 $400,000 $375,000
Fixed remuneration – deferred equity – $100,000 – $150,000
Total fixed remuneration $1,000,000 $725,000 $400,000 $525,000
Target performance incentive (% of fixed remuneration)
n.a. 69% 50% 38%
Maximum performance incentive (% of fixed remuneration)
n.a. 103% 50% 57%
Form of performance incentive n.a. 3-year deferred equity
Taking into account Maree’s significant
equity holding, incentive is in cash
3-year deferred equity
Performance criteria • at least 70% financial and operational lead targets, including KPI measures such as revenue growth, EBITDA, recurring revenue, customer attrition, operational efficiency, productivity, technology, platform scalability and security, product development outcomes, commercialisation, customer and licence transition and risk; and
• up to 30% for strategic outcomes,
as selectively applied to individual roles with incentive outcomes, determined by the CEO with approval by the Board
Executive KMP share ownership policy
Executive KMP are required to maintain a minimum WiseTech equity holding of 100% of fixed remuneration within five years of appointment. Each Executive KMP satisfied this objective as at 30 June 2019.
Trading in WiseTech securities
All KMP must comply with WiseTech’s Securities Trading Policy, which includes a requirement that Restricted Employees (including non-director KMP) can only trade WiseTech securities during specified trading windows and after obtaining written clearance to trade. The policy prohibits short-term trading of WiseTech securities and the purchase or creation of hedge or derivative arrangements which operate to limit the economic risk of WiseTech securities under employee share plans.
Our remuneration approach for the broader staff population
WiseTech’s future growth and innovation come from the talent, motivation and enthusiasm of our people across the world. We continue to grow our talented workforce rapidly as we expand through new hires and targeted acquisitions into new countries and new technology adjacencies.
For setting remuneration for the broader staff population, we use benchmark pay scales and performance classifications to compare our fixed remuneration against relevant international and Australian technology/software-as-a-service companies, with further consideration given to competitive dynamics, expertise areas and CPI movements.
We believe that the ownership of WiseTech equity is important to align our people with the interests of shareholders. Therefore, we build multi-year deferred equity into fixed base remuneration across our global workforce to encourage value-creating behaviours and support staff retention within the Group.
51WiseTech Global | Annual Report 2019
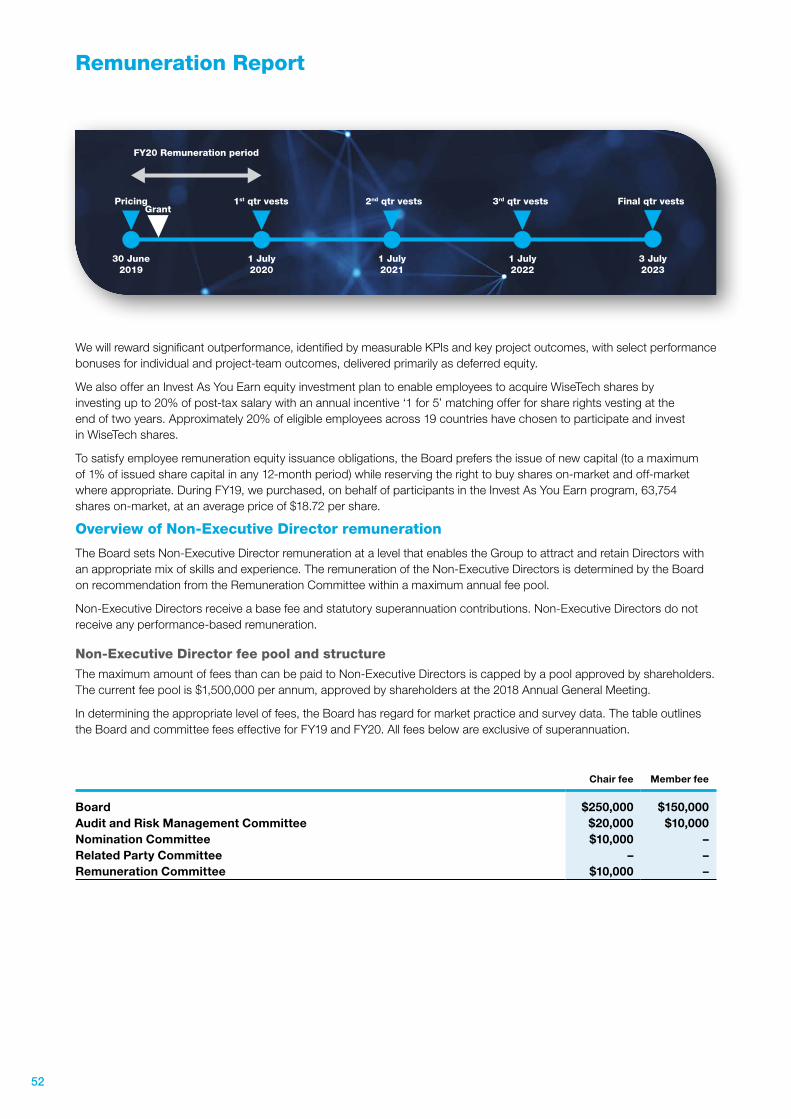
Remuneration Report
Pricing
30 June2019
1 July2020
1 July2021
1 July2022
3 July2023
Grant2nd qtr vests1st qtr vests
FY20 Remuneration period
3rd qtr vests Final qtr vests
We will reward significant outperformance, identified by measurable KPIs and key project outcomes, with select performance bonuses for individual and project-team outcomes, delivered primarily as deferred equity.
We also offer an Invest As You Earn equity investment plan to enable employees to acquire WiseTech shares by investing up to 20% of post-tax salary with an annual incentive ‘1 for 5’ matching offer for share rights vesting at the end of two years. Approximately 20% of eligible employees across 19 countries have chosen to participate and invest in WiseTech shares.
To satisfy employee remuneration equity issuance obligations, the Board prefers the issue of new capital (to a maximum of 1% of issued share capital in any 12-month period) while reserving the right to buy shares on-market and off-market where appropriate. During FY19, we purchased, on behalf of participants in the Invest As You Earn program, 63,754 shares on-market, at an average price of $18.72 per share.
Overview of Non-Executive Director remuneration
The Board sets Non-Executive Director remuneration at a level that enables the Group to attract and retain Directors with an appropriate mix of skills and experience. The remuneration of the Non-Executive Directors is determined by the Board on recommendation from the Remuneration Committee within a maximum annual fee pool.
Non-Executive Directors receive a base fee and statutory superannuation contributions. Non-Executive Directors do not receive any performance-based remuneration.
Non-Executive Director fee pool and structure
The maximum amount of fees than can be paid to Non-Executive Directors is capped by a pool approved by shareholders. The current fee pool is $1,500,000 per annum, approved by shareholders at the 2018 Annual General Meeting.
In determining the appropriate level of fees, the Board has regard for market practice and survey data. The table outlines the Board and committee fees effective for FY19 and FY20. All fees below are exclusive of superannuation.
Chair fee Member fee
Board $250,000 $150,000Audit and Risk Management Committee $20,000 $10,000Nomination Committee $10,000 –Related Party Committee – –Remuneration Committee $10,000 –
52
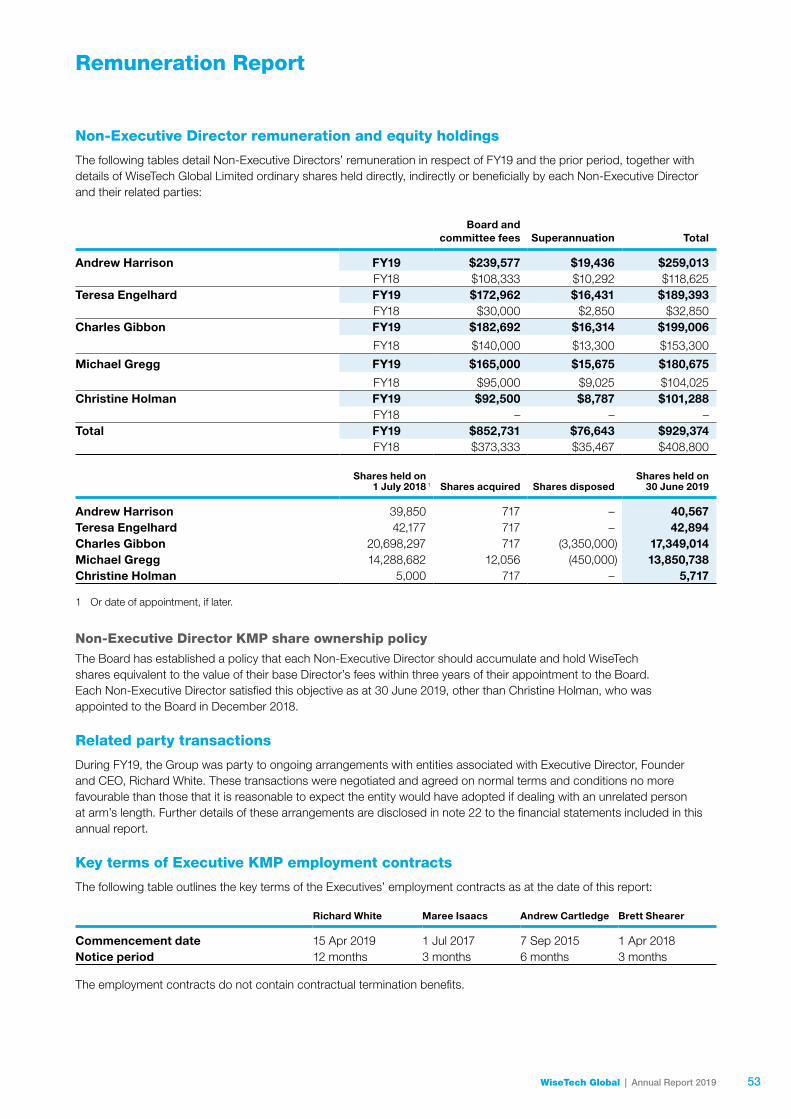
Remuneration Report
Non-Executive Director remuneration and equity holdings
The following tables detail Non-Executive Directors’ remuneration in respect of FY19 and the prior period, together with details of WiseTech Global Limited ordinary shares held directly, indirectly or beneficially by each Non-Executive Director and their related parties:
Board and committee fees Superannuation Total
Andrew Harrison FY19 $239,577 $19,436 $259,013FY18 $108,333 $10,292 $118,625
Teresa Engelhard FY19 $172,962 $16,431 $189,393FY18 $30,000 $2,850 $32,850
Charles Gibbon FY19 $182,692 $16,314 $199,006
FY18 $140,000 $13,300 $153,300
Michael Gregg FY19 $165,000 $15,675 $180,675
FY18 $95,000 $9,025 $104,025Christine Holman FY19 $92,500 $8,787 $101,288
FY18 – – –Total FY19 $852,731 $76,643 $929,374
FY18 $373,333 $35,467 $408,800
Shares held on1 July 2018 1 Shares acquired Shares disposed
Shares held on 30 June 2019
Andrew Harrison 39,850 717 – 40,567Teresa Engelhard 42,177 717 – 42,894Charles Gibbon 20,698,297 717 (3,350,000) 17,349,014Michael Gregg 14,288,682 12,056 (450,000) 13,850,738Christine Holman 5,000 717 – 5,717
1 Or date of appointment, if later.
Non-Executive Director KMP share ownership policy
The Board has established a policy that each Non-Executive Director should accumulate and hold WiseTech shares equivalent to the value of their base Director’s fees within three years of their appointment to the Board. Each Non-Executive Director satisfied this objective as at 30 June 2019, other than Christine Holman, who was appointed to the Board in December 2018.
Related party transactions
During FY19, the Group was party to ongoing arrangements with entities associated with Executive Director, Founder and CEO, Richard White. These transactions were negotiated and agreed on normal terms and conditions no more favourable than those that it is reasonable to expect the entity would have adopted if dealing with an unrelated person at arm’s length. Further details of these arrangements are disclosed in note 22 to the financial statements included in this annual report.
Key terms of Executive KMP employment contracts
The following table outlines the key terms of the Executives’ employment contracts as at the date of this report:
Richard White Maree Isaacs Andrew Cartledge Brett Shearer
Commencement date 15 Apr 2019 1 Jul 2017 7 Sep 2015 1 Apr 2018Notice period 12 months 3 months 6 months 3 months
The employment contracts do not contain contractual termination benefits.
53WiseTech Global | Annual Report 2019
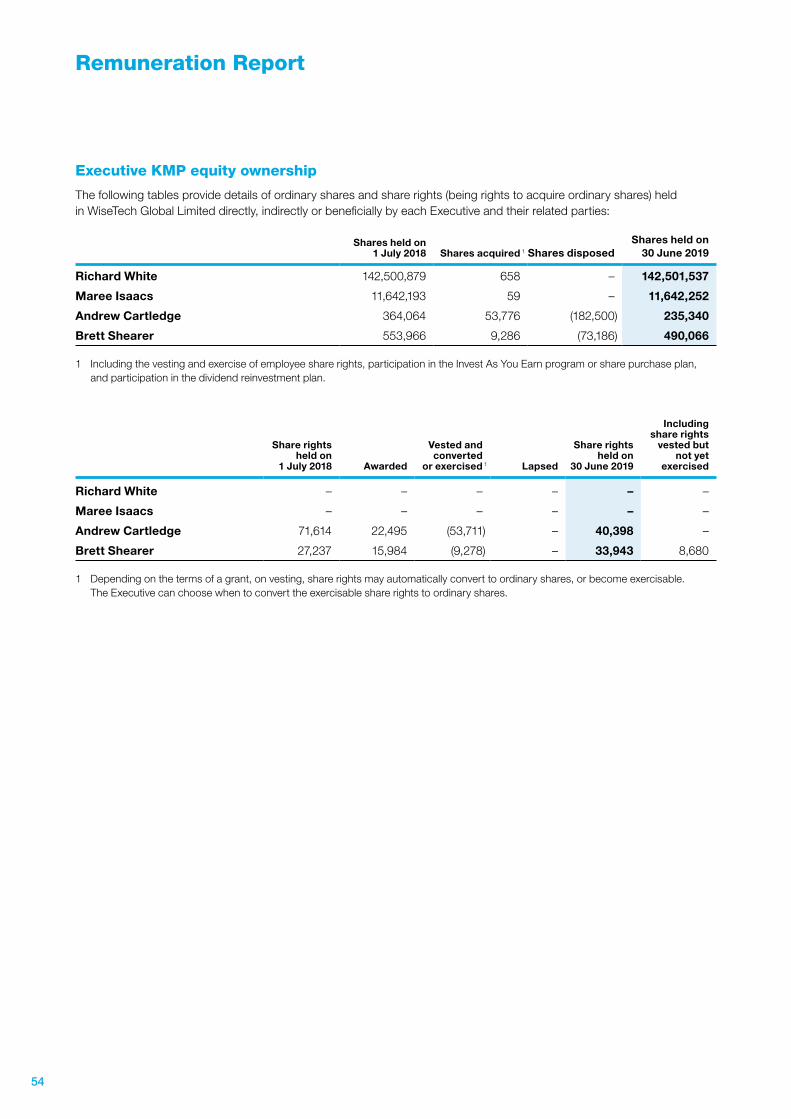
Remuneration Report
Executive KMP equity ownership
The following tables provide details of ordinary shares and share rights (being rights to acquire ordinary shares) held in WiseTech Global Limited directly, indirectly or beneficially by each Executive and their related parties:
Shares held on 1 July 2018 Shares acquired 1 Shares disposed
Shares held on 30 June 2019
Richard White 142,500,879 658 – 142,501,537
Maree Isaacs 11,642,193 59 – 11,642,252
Andrew Cartledge 364,064 53,776 (182,500) 235,340
Brett Shearer 553,966 9,286 (73,186) 490,066
1 Including the vesting and exercise of employee share rights, participation in the Invest As You Earn program or share purchase plan, and participation in the dividend reinvestment plan.
Share rights held on
1 July 2018 Awarded
Vested and converted
or exercised 1 Lapsed
Share rights held on
30 June 2019
Including share rights
vested but not yet
exercised
Richard White – – – – – –
Maree Isaacs – – – – – –
Andrew Cartledge 71,614 22,495 (53,711) – 40,398 –
Brett Shearer 27,237 15,984 (9,278) – 33,943 8,680
1 Depending on the terms of a grant, on vesting, share rights may automatically convert to ordinary shares, or become exercisable. The Executive can choose when to convert the exercisable share rights to ordinary shares.
54
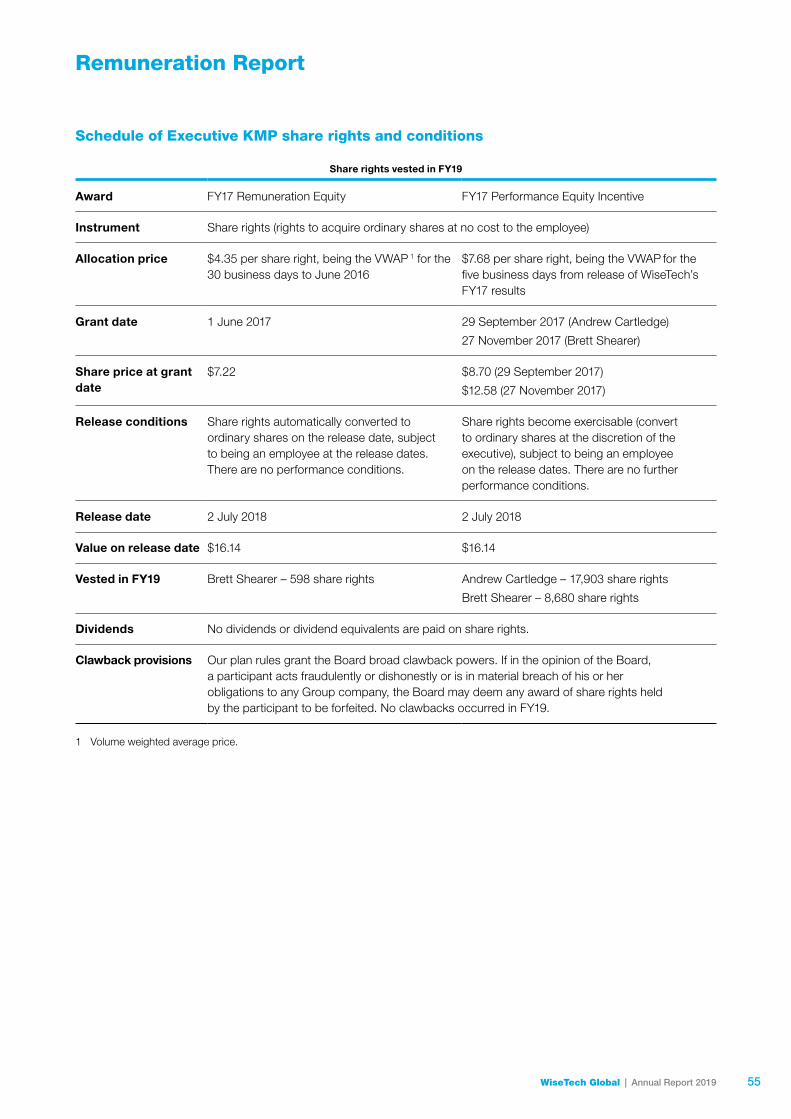
Remuneration Report
Schedule of Executive KMP share rights and conditions
Share rights vested in FY19
Award FY17 Remuneration Equity FY17 Performance Equity Incentive
Instrument Share rights (rights to acquire ordinary shares at no cost to the employee)
Allocation price $4.35 per share right, being the VWAP 1 for the 30 business days to June 2016
$7.68 per share right, being the VWAP for the five business days from release of WiseTech’s FY17 results
Grant date 1 June 2017 29 September 2017 (Andrew Cartledge)
27 November 2017 (Brett Shearer)
Share price at grant date
$7.22 $8.70 (29 September 2017)
$12.58 (27 November 2017)
Release conditions Share rights automatically converted to ordinary shares on the release date, subject to being an employee at the release dates. There are no performance conditions.
Share rights become exercisable (convert to ordinary shares at the discretion of the executive), subject to being an employee on the release dates. There are no further performance conditions.
Release date 2 July 2018 2 July 2018
Value on release date $16.14 $16.14
Vested in FY19 Brett Shearer – 598 share rights Andrew Cartledge – 17,903 share rights
Brett Shearer – 8,680 share rights
Dividends No dividends or dividend equivalents are paid on share rights.
Clawback provisions Our plan rules grant the Board broad clawback powers. If in the opinion of the Board, a participant acts fraudulently or dishonestly or is in material breach of his or her obligations to any Group company, the Board may deem any award of share rights held by the participant to be forfeited. No clawbacks occurred in FY19.
1 Volume weighted average price.
55WiseTech Global | Annual Report 2019
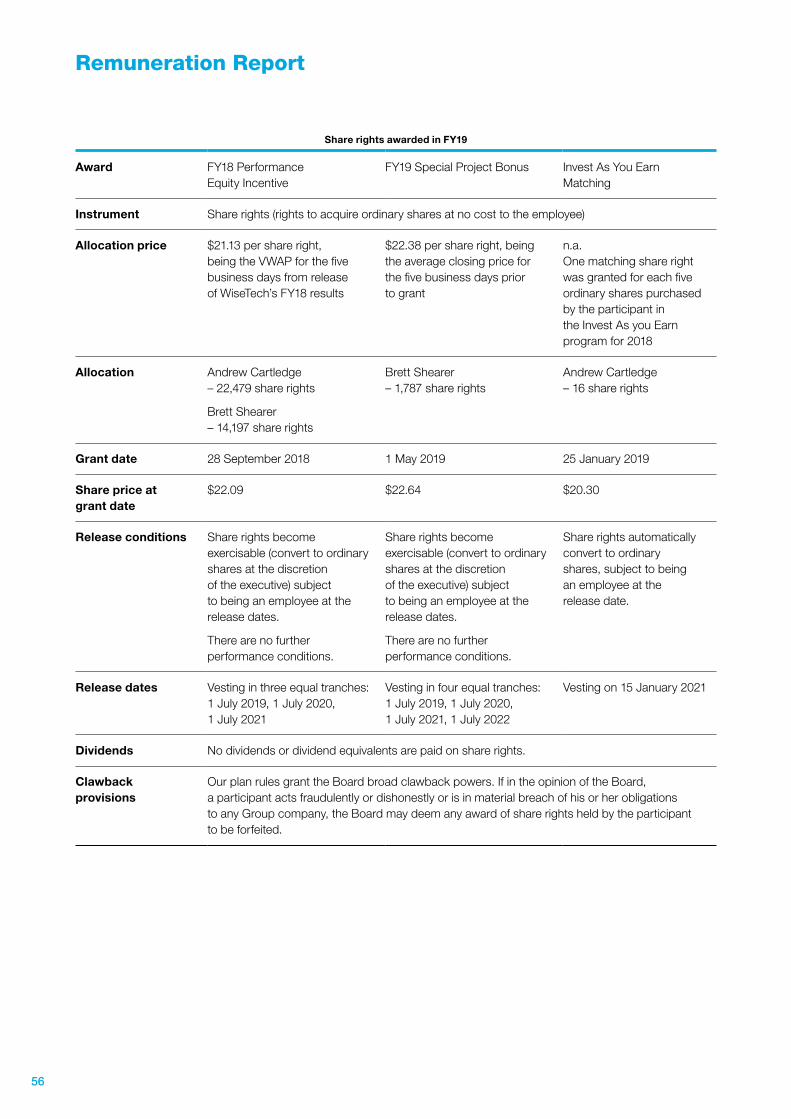
Remuneration Report
Share rights awarded in FY19
Award FY18 Performance Equity Incentive
FY19 Special Project Bonus Invest As You Earn Matching
Instrument Share rights (rights to acquire ordinary shares at no cost to the employee)
Allocation price $21.13 per share right, being the VWAP for the five business days from release of WiseTech’s FY18 results
$22.38 per share right, being the average closing price for the five business days prior to grant
n.a. One matching share right was granted for each five ordinary shares purchased by the participant in the Invest As you Earn program for 2018
Allocation Andrew Cartledge – 22,479 share rights
Brett Shearer – 14,197 share rights
Brett Shearer – 1,787 share rights
Andrew Cartledge – 16 share rights
Grant date 28 September 2018 1 May 2019 25 January 2019
Share price at grant date
$22.09 $22.64 $20.30
Release conditions Share rights become exercisable (convert to ordinary shares at the discretion of the executive) subject to being an employee at the release dates.
There are no further performance conditions.
Share rights become exercisable (convert to ordinary shares at the discretion of the executive) subject to being an employee at the release dates.
There are no further performance conditions.
Share rights automatically convert to ordinary shares, subject to being an employee at the release date.
Release dates Vesting in three equal tranches: 1 July 2019, 1 July 2020, 1 July 2021
Vesting in four equal tranches: 1 July 2019, 1 July 2020, 1 July 2021, 1 July 2022
Vesting on 15 January 2021
Dividends No dividends or dividend equivalents are paid on share rights.
Clawback provisions
Our plan rules grant the Board broad clawback powers. If in the opinion of the Board, a participant acts fraudulently or dishonestly or is in material breach of his or her obligations to any Group company, the Board may deem any award of share rights held by the participant to be forfeited.
56
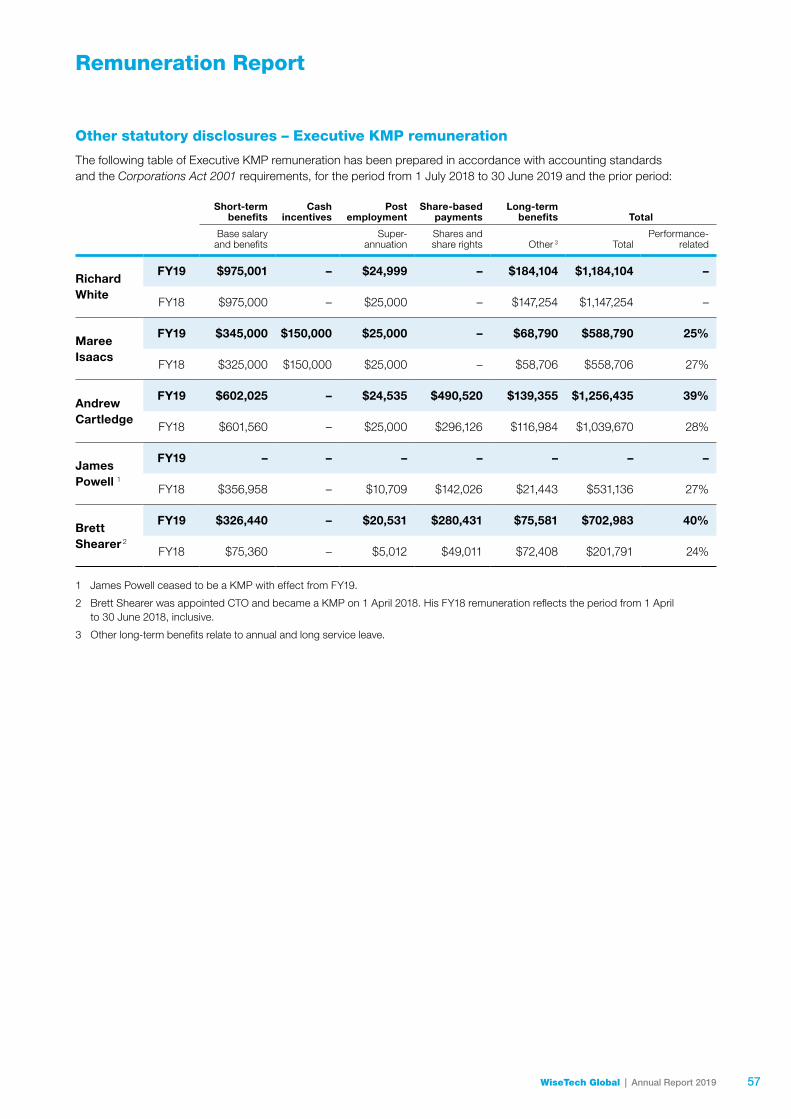
Remuneration Report
Other statutory disclosures – Executive KMP remuneration
The following table of Executive KMP remuneration has been prepared in accordance with accounting standards and the Corporations Act 2001 requirements, for the period from 1 July 2018 to 30 June 2019 and the prior period:
Short-term benefits
Cash incentives
Post employment
Share-based payments
Long-term benefits Total
Base salary and benefits
Super-annuation
Shares and share rights Other 3 Total
Performance-related
Richard White
FY19 $975,001 – $24,999 – $184,104 $1,184,104 –
FY18 $975,000 – $25,000 – $147,254 $1,147,254 –
Maree Isaacs
FY19 $345,000 $150,000 $25,000 – $68,790 $588,790 25%
FY18 $325,000 $150,000 $25,000 – $58,706 $558,706 27%
Andrew Cartledge
FY19 $602,025 – $24,535 $490,520 $139,355 $1,256,435 39%
FY18 $601,560 – $25,000 $296,126 $116,984 $1,039,670 28%
James Powell 1
FY19 – – – – – – –
FY18 $356,958 – $10,709 $142,026 $21,443 $531,136 27%
Brett Shearer 2
FY19 $326,440 – $20,531 $280,431 $75,581 $702,983 40%
FY18 $75,360 – $5,012 $49,011 $72,408 $201,791 24%
1 James Powell ceased to be a KMP with effect from FY19.
2 Brett Shearer was appointed CTO and became a KMP on 1 April 2018. His FY18 remuneration reflects the period from 1 April to 30 June 2018, inclusive.
3 Other long-term benefits relate to annual and long service leave.
57WiseTech Global | Annual Report 2019
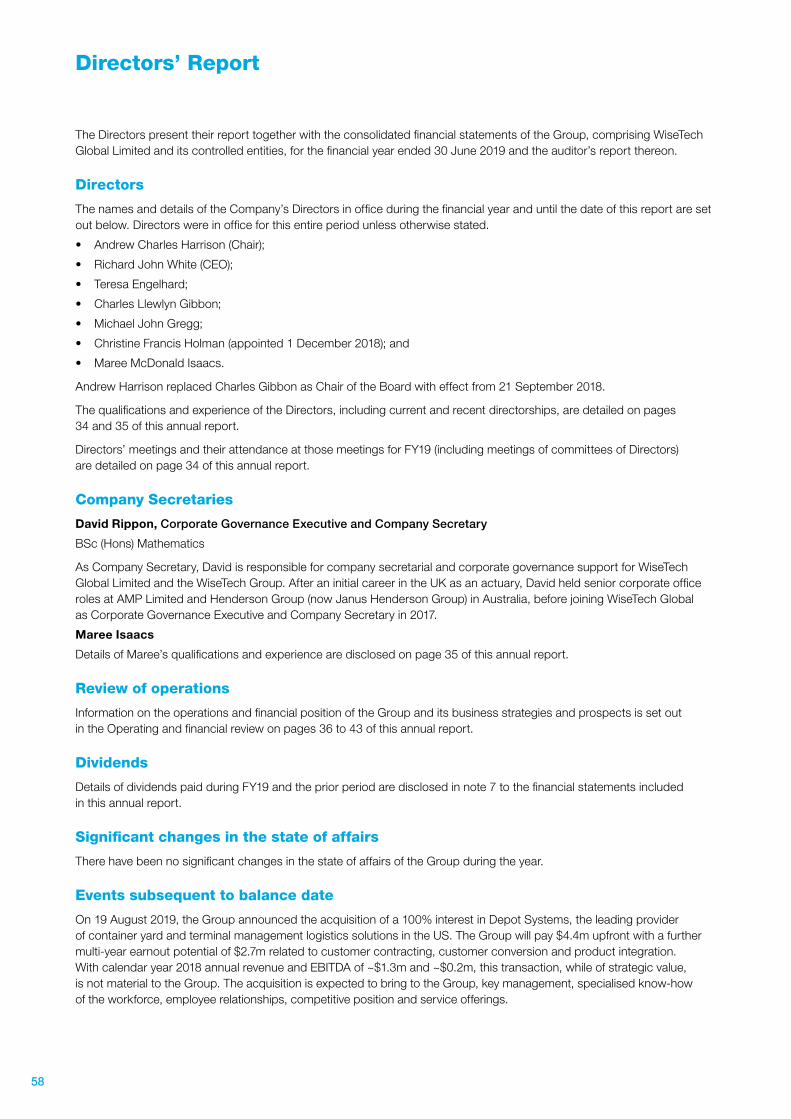
Directors’ Report
The Directors present their report together with the consolidated financial statements of the Group, comprising WiseTech Global Limited and its controlled entities, for the financial year ended 30 June 2019 and the auditor’s report thereon.
Directors
The names and details of the Company’s Directors in office during the financial year and until the date of this report are set out below. Directors were in office for this entire period unless otherwise stated.
• Andrew Charles Harrison (Chair);
• Richard John White (CEO);
• Teresa Engelhard;
• Charles Llewlyn Gibbon;
• Michael John Gregg;
• Christine Francis Holman (appointed 1 December 2018); and
• Maree McDonald Isaacs.
Andrew Harrison replaced Charles Gibbon as Chair of the Board with effect from 21 September 2018.
The qualifications and experience of the Directors, including current and recent directorships, are detailed on pages 34 and 35 of this annual report.
Directors’ meetings and their attendance at those meetings for FY19 (including meetings of committees of Directors) are detailed on page 34 of this annual report.
Company Secretaries
David Rippon, Corporate Governance Executive and Company Secretary
BSc (Hons) Mathematics
As Company Secretary, David is responsible for company secretarial and corporate governance support for WiseTech Global Limited and the WiseTech Group. After an initial career in the UK as an actuary, David held senior corporate office roles at AMP Limited and Henderson Group (now Janus Henderson Group) in Australia, before joining WiseTech Global as Corporate Governance Executive and Company Secretary in 2017.
Maree Isaacs
Details of Maree’s qualifications and experience are disclosed on page 35 of this annual report.
Review of operations
Information on the operations and financial position of the Group and its business strategies and prospects is set out in the Operating and financial review on pages 36 to 43 of this annual report.
Dividends
Details of dividends paid during FY19 and the prior period are disclosed in note 7 to the financial statements included in this annual report.
Significant changes in the state of affairs
There have been no significant changes in the state of affairs of the Group during the year.
Events subsequent to balance date
On 19 August 2019, the Group announced the acquisition of a 100% interest in Depot Systems, the leading provider of container yard and terminal management logistics solutions in the US. The Group will pay $4.4m upfront with a further multi-year earnout potential of $2.7m related to customer contracting, customer conversion and product integration. With calendar year 2018 annual revenue and EBITDA of ~$1.3m and ~$0.2m, this transaction, while of strategic value, is not material to the Group. The acquisition is expected to bring to the Group, key management, specialised know-how of the workforce, employee relationships, competitive position and service offerings.
58
Directors’ Report
Since the period end, the Directors have declared a fully franked final dividend of 1.95 cents per share, payable 4 October 2019. The dividend will be recognised in subsequent financial statements.
Other than the matters discussed above, there has not arisen in the interval between the end of the financial year and the date of this report any item, transaction or event of a material and unusual nature, likely, in the opinion of the Directors of the Company, to affect significantly the operations of the Group, the results of those operations or the state of affairs of the Group in future financial years.
Likely developments and expected results
For further information about likely developments in the operations of the Group, refer to the Operating and financial review on pages 36 to 43 of this annual report.
Environmental regulation and performance
The operations of the Group are not subject to any particular or significant environmental regulations under a Commonwealth, State or Territory law of Australia.
Indemnification and insurance of Directors and other officersInsurance
The Group’s officers consist of the Directors of the Company, the Company Secretaries and other officers of the Company, including certain executive officers whose functions include the management of operations, financial management, strategic development, risk management and human resources management of the Company and its related parties.
During FY19, the Company paid a premium under a contract insuring each of certain officers of the Group against liability incurred in that capacity. Disclosure of the nature of the liability and the amount of the premium is prohibited by the confidentiality clause of the contract of insurance.
Indemnification
WiseTech’s constitution provides that every person who is or has been a director or company secretary of the Company or a subsidiary of the Company is indemnified by the Company to the maximum extent permitted by law. The indemnity covers liabilities and legal costs incurred by the person as a director or company secretary.
Share rights
At the date of this report, WiseTech had 1,576,770 share rights outstanding across 1,343 holders. The share rights relate to grants of deferred equity to employees under the Equity Incentives Plan and have a range of vesting dates through to July 2023. The share rights are not subject to further performance conditions, but may be subject to employment conditions. On vesting, the holder is entitled to receive one ordinary share at no cost to the holder.
907,303 share rights were converted to ordinary shares during the financial year.
Proceedings on behalf of the Group
Under section 237 of the Corporations Act 2001, no application has been made in respect of the Group and no proceedings have been brought or intervened in or on behalf of the Group under that section.
Remuneration Report
Information on WiseTech’s remuneration framework and the outcomes for FY19 for the KMP and framework for FY20, is included in the Remuneration Report on pages 44 to 57 of this annual report.
Corporate governance
Our Corporate Governance Statement for FY19 is available from our website, www.wisetechglobal.com.
Non-audit services
During the year, KPMG, the Company’s auditor, performed certain other services in addition to the audit and review of the financial statements. Details of the amounts paid to the auditor of the Group, KPMG, and its network firms for audit and non-audit services are provided in note 23 to the financial statements included in this annual report.
The Board has considered the non-audit services provided during FY19 by the auditor and in accordance with written advice provided by resolution of the Audit and Risk Management Committee, is satisfied that the provision of those
59WiseTech Global | Annual Report 2019
Directors’ Report
non-audit services during FY19 by the auditor is compatible with, and did not compromise, the auditor independence requirements of the Corporations Act 2001 for the following reasons:
• all non-audit services were subject to the corporate governance procedures adopted by the Group and have been reviewed by the Audit and Risk Management Committee to ensure they do not impact the integrity and objectivity of the auditor; and
• the non-audit services provided did not undermine the general principles relating to auditor independence as set out in APES 110 Code of Ethics for Professional Accountants, as they did not involve reviewing or auditing the auditor’s own work, acting in a management or decision-making capacity for the Company, acting as an advocate for the Group or jointly sharing risks and rewards.
Lead auditor’s independence declaration
The lead auditor’s independence declaration is set out on page 61 of this annual report and forms part of the Directors’ Report for the financial year ended 30 June 2019.
Signed in accordance with a resolution of the Directors.
Andrew Harrison Chair
Richard White Executive Director, Founder and CEO
24 September 2019 24 September 2019
60
Lead auditor’s independence declarationunder section 307C of the Corporations Act 2001
61
KPMG, an Australian partnership and a member firm of the KPMG network of independent member firms affiliated with KPMG International Cooperative (“KPMG International”), a Swiss entity.
Liability limited by a scheme approved under Professional Standards Legislation
Lead Auditor’s Independence Declaration under
Section 307C of the Corporations Act 2001
To the Directors of WiseTech Global Limited
I declare that, to the best of my knowledge and belief, in relation to the audit of WiseTech Global Limited for the financial year ended 30 June 2019 there have been:
i. no contraventions of the auditor independence requirements as set out in the Corporations Act 2001 in relation to the audit; and
ii. no contraventions of any applicable code of professional conduct in relation to the audit.
KPMG Chris Hollis
Partner
Sydney
24 September 2019
61WiseTech Global | Annual Report 2019
Risk management
We recognise and manage a variety of business risks that could affect our operations and financial results. The main risks affecting WiseTech, and the steps we take to manage or mitigate these risks, are described below.
Ability to attract and retain key personnel
Our success is dependent on attracting and retaining key personnel, in particular, our Founder and CEO, Richard White and members of the senior management and product development teams. In addition, we need to attract and retain highly skilled software development engineers.
The loss of key personnel or delay in replacement could adversely impact our ability to operate our business and increase the potential loss of business process knowledge.
To mitigate this risk, we have invested, and continue to invest in our workforce by recruiting key individuals and also in processes and systems to ensure knowledge and skills are maintained within the Group to enable its continued and stable growth. Our remuneration framework also delivers flexible components designed to support the recruitment, motivation and retention of our staff.
Execution of integration of acquired businesses
In recent years, we have completed a number of strategic acquisitions, the integration of which can include product development and transitioning of customers to our CargoWise One platform. There is a risk that customers do not transition (or require more financial and management resources, or time to complete, than originally planned) or that the acquisitions fail to generate the benefits that we expected or provide an adequate return on the resources invested in them.
Our acquisition strategy has resulted, and is likely to continue to result, in us expanding our presence in new international jurisdictions with exposure to greater risk of political, legal and economic instability or different legal and regulatory systems and frameworks compared to the regions in which we currently operate.
To mitigate our risks, we tailor the acquisition and integration approach to each acquisition to address geographic and political risk and the region in which the acquisition business is based.
We have adopted an integration framework characterised by a three-phased approach to:
• integrate the target: operations and workforce;
• develop the product capability and commercial foundation; and
• grow revenue from new capabilities and conversion of the acquired customer base.
This process is designed to be delivered through a combination of earnout incentives, self-integration toolkits and the utilisation of our architectures and engines (such as PAVE). We also engage the talented teams in our 35+ product development centres and over 50 regional offices worldwide. See page 21 for information on integration. When considering a target for potential acquisition, we also assess the capabilities of the business to support the integration and product development phases mentioned above.
WiseTech operation in a competitive industry
We compete against other commercial logistics service software providers and within the marketplace face the risk that:
• competitors could increase their competitive position through product innovation or expansion, aggressive marketing campaigns, product innovation, price discounting or acquisitions;
• our software products may fail to meet our customers’ expectations;
• we may fail to anticipate and respond to technology changes as quickly as our competitors;
• logistics service providers may continue to operate in-house developed systems in preference to commercial logistics software; and
• new competitors could emerge and develop products (including cloud-based software) which compete with our products.
We believe that our deeply integrated, open-access platform, which provides an efficient platform for global rollouts and an efficient consolidation tool for large 3PLs, and our commitment to relentlessly invest in product development are the most effective mitigants to this risk. We continue to invest significantly in product development and innovation, investing $309m in the period FY15–FY19. In FY19, we reinvested 32% of our revenues in product development and innovation and delivered over 830 product upgrades and enhancements to the platform. We also acquire smaller software vendors in key geographic regions and technology adjacencies, enlarging our global footprint and technology capacity and capability.
62
Risk management
Failure to retain existing customers and attract new customers
Our business success depends on our ability to retain and grow usage by our existing customers and our ability to attract further business from new customers. There is a risk that our customers reduce their use of our software, in terms of the users and volume of transactions, or that they cease to use our software altogether. There is a risk that, if customers reduce their usage of our software, our revenue could decrease.
We mitigate this risk by:
• providing our customers with open access to our platform to new sites/geographies;
• continuing to innovate and add more modules and functionality which drive productivity benefits for our customers and respond to industry and regulatory changes faced by customers; and
• providing a platform which enables rapid onboarding of users without additional contract negotiations.
Our success in managing this risk is characterised by our high (99%) level of recurring revenue for our CargoWise One platform and our low (<1%) level of annual customer attrition (by CargoWise One customers).
Decline in trade volumes and economic conditions
Our customers are logistics service providers whose business operations depend on regional and global logistics activities which are closely linked to regional and global trade volumes. A decline in regional and global trade volumes and recessionary economic conditions, including in the logistics service market, may adversely affect our financial performance.
Our software provides an integrated logistics execution solution which increases productivity and drives efficiency in a complex, highly regulated and competitive industry. We believe that risks associated with a reduction in trade volumes and economic conditions would be offset by the opportunities which present themselves from changes in trade routes, regulation, trade patterns and increased competition among our customers.
Impact of foreign currency on financial results
As a global business, the majority of our revenue (FY19: 77%) is invoiced in currencies other than Australian dollars; therefore, our financial results are influenced by movements in the foreign exchange rates of currencies including the US dollars, pound sterling, South African rand and euro.
This risk is partially offset by natural hedges where we also incur operational costs in the same foreign currency. Where appropriate, we also seek to denominate new customer contracts in Australian dollars.
Disruption or failure of technology systems
The performance, reliability and availability of our technology platforms, data centres and global communications systems (including servers, the internet, hosting services and the cloud environment in which we provide our products) are critical to our business. There is a risk that these systems may be adversely affected by disruption, failure, service outages or data corruption.
Prolonged disruption to our IT platform, or operational or business delays, could damage our reputation and potentially lead to a loss of customers, legal claims by customers, and an inability to attract new customers.
We mitigate this risk by operating separate data centres in three distinct regions around the world to reduce reliance on any individual data centre, a global network of support centres providing 24/7 365 support internally and for our customers, automated replication of data as well as disaster recovery planning and testing. Our technology framework provides for segregation of data, backups stored on independent infrastructures and critical access monitoring.
63WiseTech Global | Annual Report 2019

Risk management
Security breach and data privacy
Our products involve the storage and transmission of our customers’ confidential and proprietary information and risks include security breaches of our customers’ data and information by unauthorised access, theft, destruction, loss of information or misappropriation or release of confidential customer data.
To mitigate this risk, we have adopted a layered approach to protecting customer data that includes physical security, system security, policy, governance, logging and auditing. We have completed an independent Service Organisation Control audit of our key WiseCloud systems in Australia, the United States and the United Kingdom. We perform penetration testing on our key business systems (including our acquired businesses) and remediate any potential issues identified by the testing.
WiseTech Global and its subsidiaries recognise the importance of data privacy, and comply with relevant data privacy regulations, including the EU General Data Protection Regulation, to safeguard the security and privacy of all customer data.
64
65WiseTech Global | Annual Report 2019
Financial Report contents for the year ended 30 June 2019
Consolidated statement of profit or loss and other comprehensive income 66Consolidated statement of financial position 67Consolidated statement of changes in equity 68Consolidated statement of cash flows 70
Notes to the financial statements
1. Corporate information 71
2. Basis of preparation 71
3. Revenue 74
4. Finance income 74
5. Income tax 74
6. Earnings per share 77
7. Dividends 77
8. Intangible assets 78
9. Property, plant and equipment 81
10. Cash and cash equivalents 82
11. Trade receivables 82
12. Other assets 83
13. Trade and other payables 83
14. Deferred revenue 84
15. Other liabilities 84
16. Borrowings 85
17. Share capital and reserves 86
18. Parent entity information 87
19. Group information 88
20. Business combinations and acquisition of non-controlling interests 90
21. Employee benefits 94
22. Key management personnel transactions 95
23. Auditor’s remuneration 96
24. Reconciliation of net cash flows from operating activities 97
25. Segment information 98
26. Financial instruments 99
27. Leasing and capital commitments 103
28. Non-controlling interests 104
29. Deed of Cross Guarantee 105
30. Other disclosures 106
Directors’ declaration 109
Independent auditor’s report 110
Reconciliation of statutory revenue and NPAT to pro forma revenue and NPAT 116
65
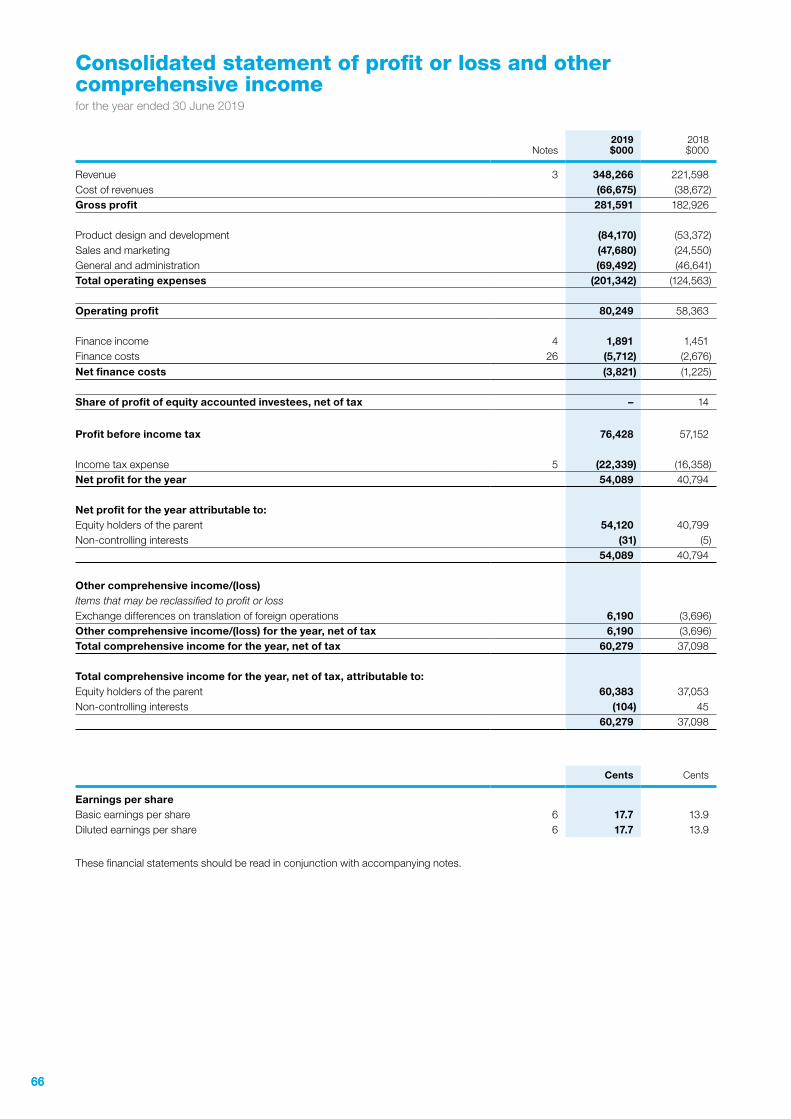
Consolidated statement of profit or loss and other comprehensive incomefor the year ended 30 June 2019
Notes2019$000
2018$000
Revenue 3 348,266 221,598Cost of revenues (66,675) (38,672)Gross profit 281,591 182,926
Product design and development (84,170) (53,372)Sales and marketing (47,680) (24,550)General and administration (69,492) (46,641)Total operating expenses (201,342) (124,563)
Operating profit 80,249 58,363
Finance income 4 1,891 1,451Finance costs 26 (5,712) (2,676)Net finance costs (3,821) (1,225)
Share of profit of equity accounted investees, net of tax – 14
Profit before income tax 76,428 57,152
Income tax expense 5 (22,339) (16,358)Net profit for the year 54,089 40,794
Net profit for the year attributable to:Equity holders of the parent 54,120 40,799Non-controlling interests (31) (5)
54,089 40,794
Other comprehensive income/(loss)Items that may be reclassified to profit or lossExchange differences on translation of foreign operations 6,190 (3,696)Other comprehensive income/(loss) for the year, net of tax 6,190 (3,696)Total comprehensive income for the year, net of tax 60,279 37,098
Total comprehensive income for the year, net of tax, attributable to:Equity holders of the parent 60,383 37,053Non-controlling interests (104) 45
60,279 37,098
Cents Cents
Earnings per shareBasic earnings per share 6 17.7 13.9Diluted earnings per share 6 17.7 13.9
These financial statements should be read in conjunction with accompanying notes.
6666
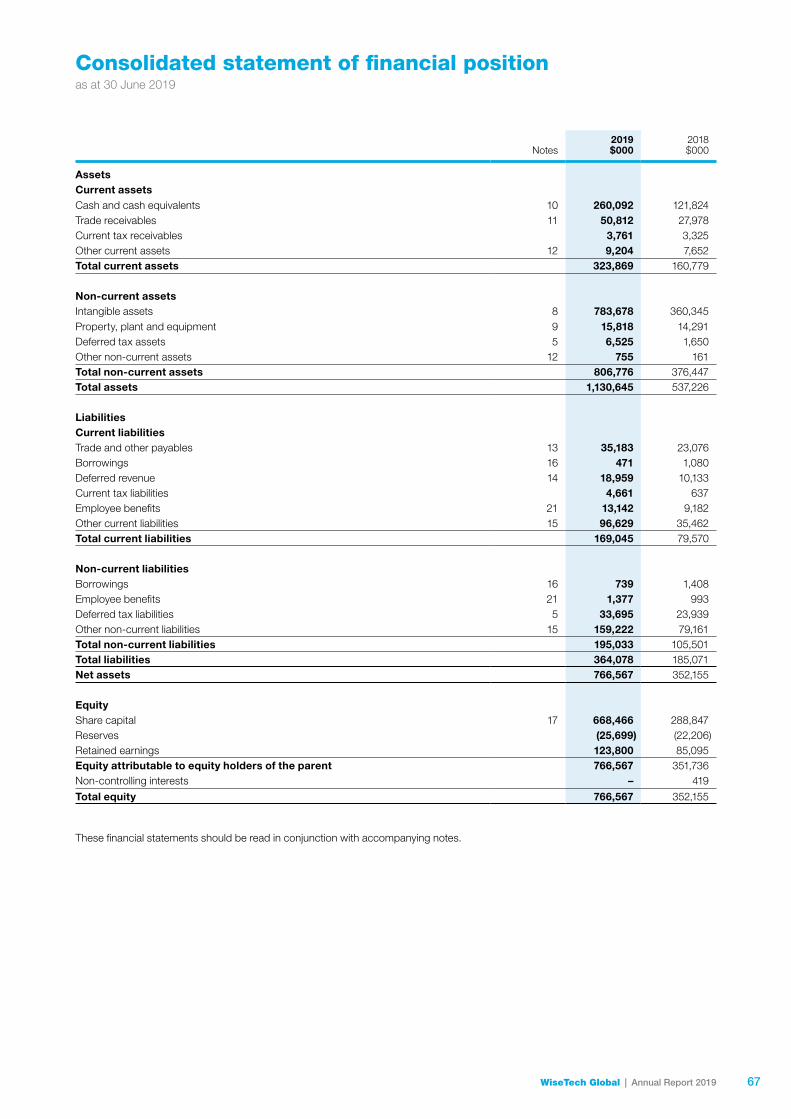
Consolidated statement of financial positionas at 30 June 2019
Notes2019$000
2018$000
AssetsCurrent assetsCash and cash equivalents 10 260,092 121,824Trade receivables 11 50,812 27,978Current tax receivables 3,761 3,325Other current assets 12 9,204 7,652Total current assets 323,869 160,779
Non-current assetsIntangible assets 8 783,678 360,345Property, plant and equipment 9 15,818 14,291Deferred tax assets 5 6,525 1,650Other non-current assets 12 755 161Total non-current assets 806,776 376,447Total assets 1,130,645 537,226
LiabilitiesCurrent liabilitiesTrade and other payables 13 35,183 23,076Borrowings 16 471 1,080Deferred revenue 14 18,959 10,133Current tax liabilities 4,661 637Employee benefits 21 13,142 9,182Other current liabilities 15 96,629 35,462Total current liabilities 169,045 79,570
Non-current liabilitiesBorrowings 16 739 1,408Employee benefits 21 1,377 993Deferred tax liabilities 5 33,695 23,939Other non-current liabilities 15 159,222 79,161Total non-current liabilities 195,033 105,501Total liabilities 364,078 185,071Net assets 766,567 352,155
EquityShare capital 17 668,466 288,847Reserves (25,699) (22,206)Retained earnings 123,800 85,095Equity attributable to equity holders of the parent 766,567 351,736Non-controlling interests – 419
Total equity 766,567 352,155
These financial statements should be read in conjunction with accompanying notes.
67WiseTech Global | Annual Report 2019
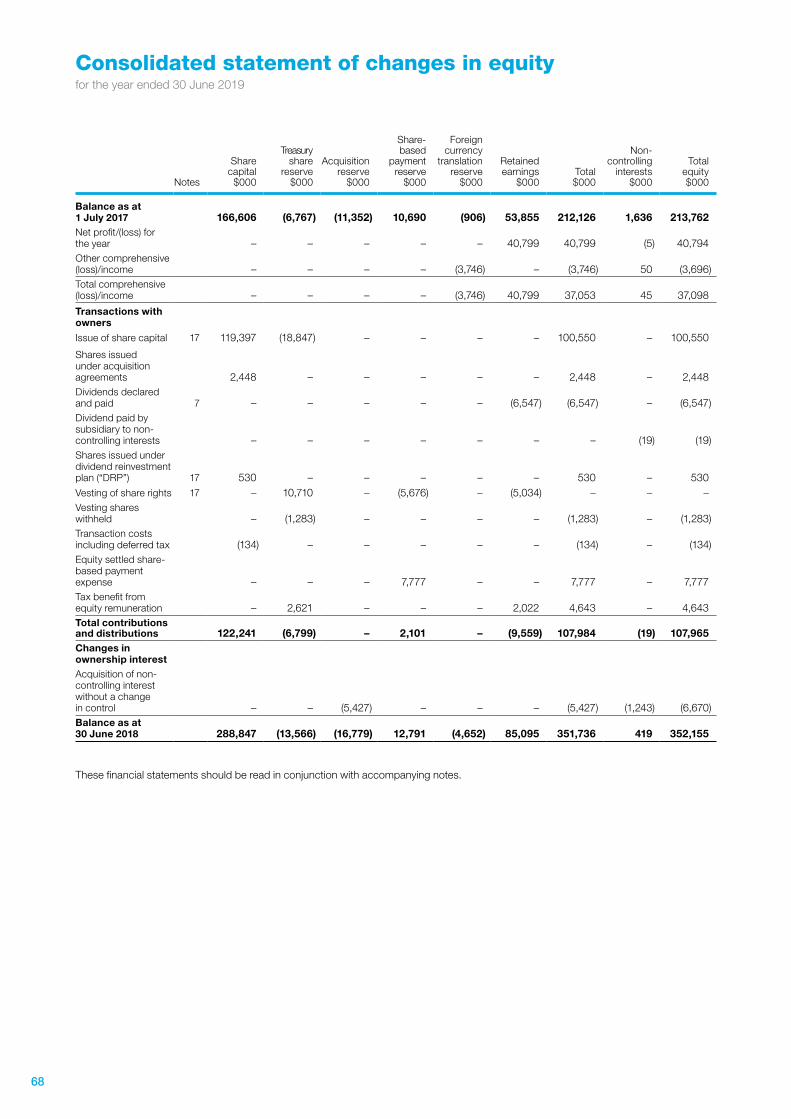
Consolidated statement of changes in equityfor the year ended 30 June 2019
Notes
Share capital
$000
Treasury share
reserve$000
Acquisition reserve
$000
Share- based
payment reserve
$000
Foreign currency
translation reserve
$000
Retained earnings
$000Total $000
Non-controlling
interests$000
Total equity$000
Balance as at 1 July 2017 166,606 (6,767) (11,352) 10,690 (906) 53,855 212,126 1,636 213,762Net profit/(loss) for the year – – – – – 40,799 40,799 (5) 40,794Other comprehensive(loss)/income – – – – (3,746) – (3,746) 50 (3,696)Total comprehensive(loss)/income – – – – (3,746) 40,799 37,053 45 37,098
Transactions with owners
Issue of share capital 17 119,397 (18,847) – – – – 100,550 – 100,550
Shares issued under acquisition agreements 2,448 – – – – – 2,448 – 2,448Dividends declared and paid 7 – – – – – (6,547) (6,547) – (6,547)Dividend paid by subsidiary to non-controlling interests – – – – – – – (19) (19)Shares issued under dividend reinvestment plan (“DRP”) 17 530 – – – – – 530 – 530Vesting of share rights 17 – 10,710 – (5,676) – (5,034) – – –Vesting shares withheld – (1,283) – – – – (1,283) – (1,283)Transaction costs including deferred tax (134) – – – – – (134) – (134)Equity settled share-based payment expense – – – 7,777 – – 7,777 – 7,777 Tax benefit from equity remuneration – 2,621 – – – 2,022 4,643 – 4,643Total contributions and distributions 122,241 (6,799) – 2,101 – (9,559) 107,984 (19) 107,965Changes in ownership interestAcquisition of non-controlling interest without a change in control – – (5,427) – – – (5,427) (1,243) (6,670)Balance as at 30 June 2018 288,847 (13,566) (16,779) 12,791 (4,652) 85,095 351,736 419 352,155
These financial statements should be read in conjunction with accompanying notes.
68
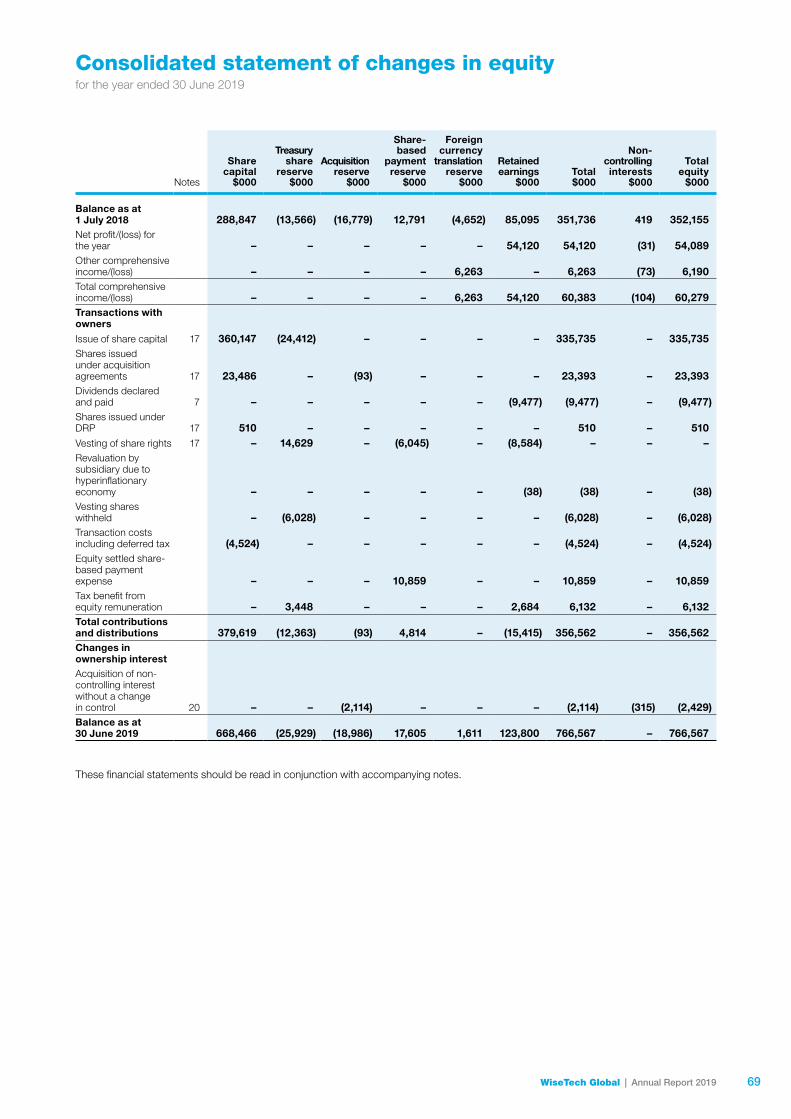
Consolidated statement of changes in equityfor the year ended 30 June 2019
Notes
Share capital
$000
Treasury share
reserve$000
Acquisition reserve
$000
Share- based
payment reserve
$000
Foreign currency
translation reserve
$000
Retained earnings
$000Total $000
Non-controlling interests
$000
Total equity
$000
Balance as at 1 July 2018 288,847 (13,566) (16,779) 12,791 (4,652) 85,095 351,736 419 352,155Net profit/(loss) for the year – – – – – 54,120 54,120 (31) 54,089Other comprehensive income/(loss) – – – – 6,263 – 6,263 (73) 6,190Total comprehensiveincome/(loss) – – – – 6,263 54,120 60,383 (104) 60,279Transactions with owners
Issue of share capital 17 360,147 (24,412) – – – – 335,735 – 335,735Shares issued under acquisition agreements 17 23,486 – (93) – – – 23,393 – 23,393Dividends declared and paid 7 – – – – – (9,477) (9,477) – (9,477)Shares issued under DRP 17 510 – – – – – 510 – 510Vesting of share rights 17 – 14,629 – (6,045) – (8,584) – – –Revaluation by subsidiary due to hyperinflationary economy – – – – – (38) (38) – (38)Vesting shares withheld – (6,028) – – – – (6,028) – (6,028)Transaction costs including deferred tax (4,524) – – – – – (4,524) – (4,524)Equity settled share-based payment expense – – – 10,859 – – 10,859 – 10,859Tax benefit from equity remuneration – 3,448 – – – 2,684 6,132 – 6,132Total contributions and distributions 379,619 (12,363) (93) 4,814 – (15,415) 356,562 – 356,562Changes in ownership interestAcquisition of non-controlling interest without a change in control 20 – – (2,114) – – – (2,114) (315) (2,429)Balance as at 30 June 2019 668,466 (25,929) (18,986) 17,605 1,611 123,800 766,567 – 766,567
These financial statements should be read in conjunction with accompanying notes.
69WiseTech Global | Annual Report 2019
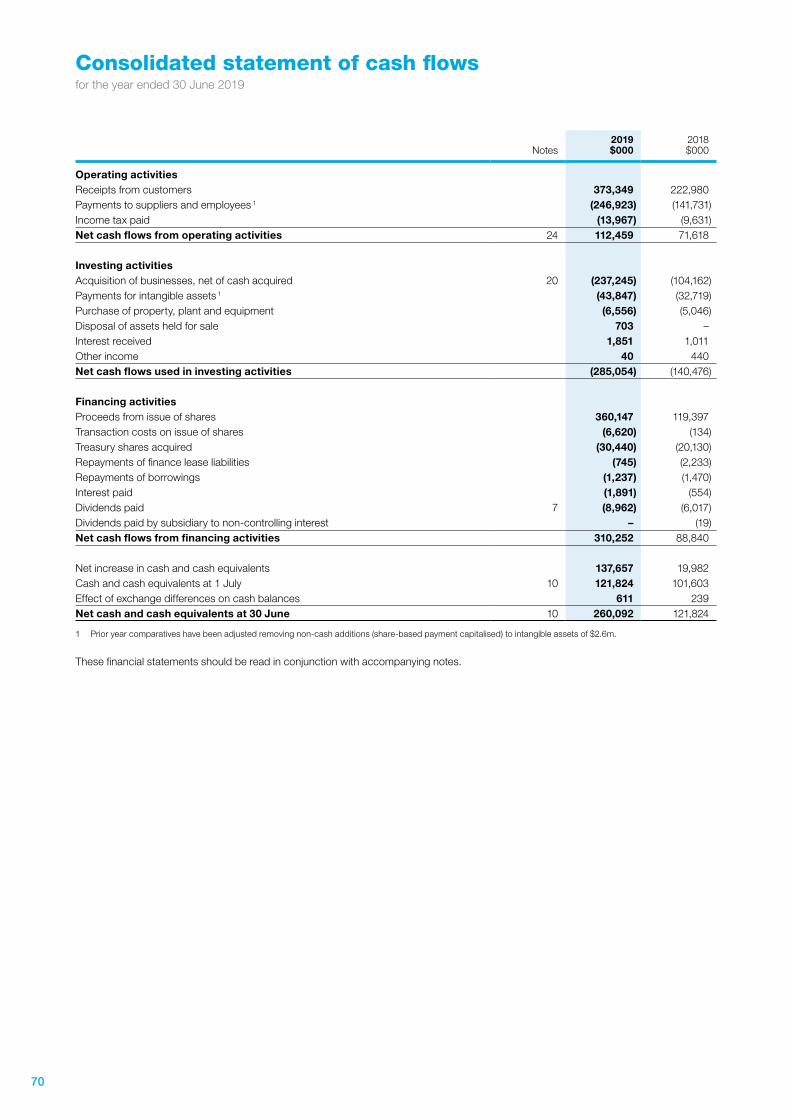
Consolidated statement of cash flowsfor the year ended 30 June 2019
Notes2019$000
2018$000
Operating activitiesReceipts from customers 373,349 222,980Payments to suppliers and employees 1 (246,923) (141,731)Income tax paid (13,967) (9,631)Net cash flows from operating activities 24 112,459 71,618
Investing activitiesAcquisition of businesses, net of cash acquired 20 (237,245) (104,162)Payments for intangible assets 1 (43,847) (32,719)Purchase of property, plant and equipment (6,556) (5,046)Disposal of assets held for sale 703 –Interest received 1,851 1,011Other income 40 440Net cash flows used in investing activities (285,054) (140,476)
Financing activitiesProceeds from issue of shares 360,147 119,397Transaction costs on issue of shares (6,620) (134)Treasury shares acquired (30,440) (20,130)Repayments of finance lease liabilities (745) (2,233)Repayments of borrowings (1,237) (1,470)Interest paid (1,891) (554)Dividends paid 7 (8,962) (6,017)Dividends paid by subsidiary to non-controlling interest – (19)Net cash flows from financing activities 310,252 88,840
Net increase in cash and cash equivalents 137,657 19,982Cash and cash equivalents at 1 July 10 121,824 101,603Effect of exchange differences on cash balances 611 239Net cash and cash equivalents at 30 June 10 260,092 121,824
1 Prior year comparatives have been adjusted removing non-cash additions (share-based payment capitalised) to intangible assets of $2.6m.
These financial statements should be read in conjunction with accompanying notes.
70
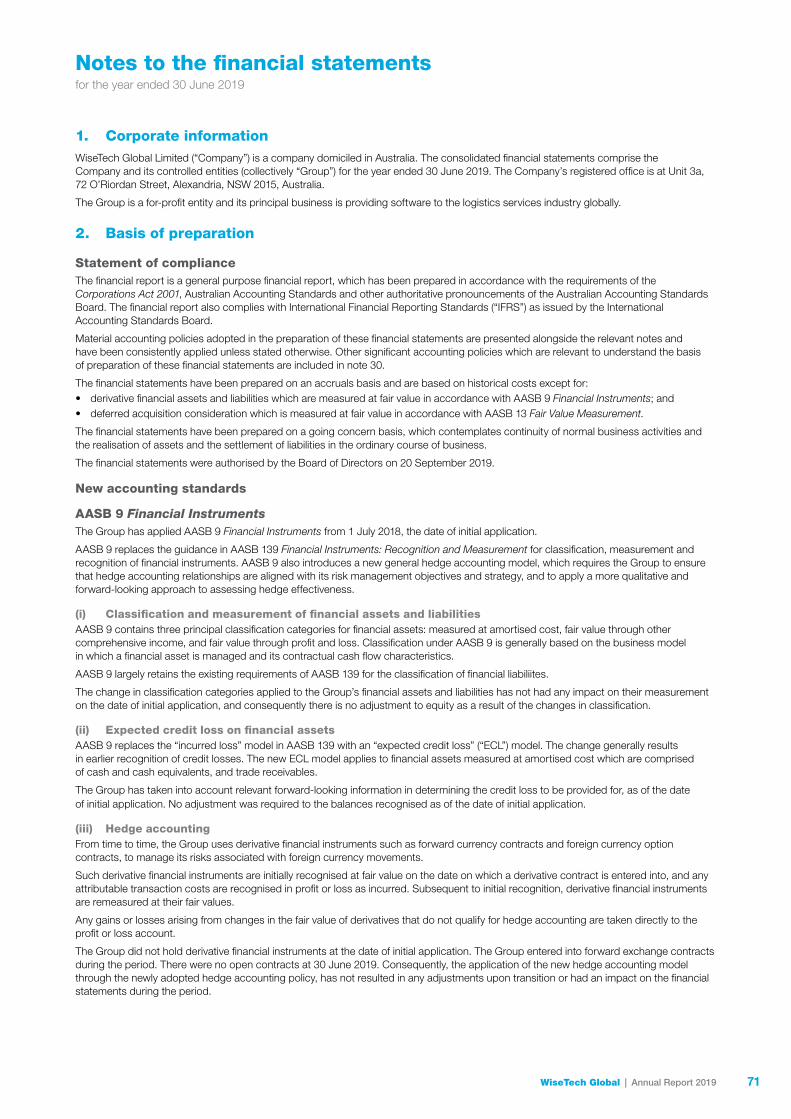
Notes to the financial statementsfor the year ended 30 June 2019
1. Corporate informationWiseTech Global Limited (“Company”) is a company domiciled in Australia. The consolidated financial statements comprise the Company and its controlled entities (collectively “Group”) for the year ended 30 June 2019. The Company’s registered office is at Unit 3a, 72 O’Riordan Street, Alexandria, NSW 2015, Australia.
The Group is a for-profit entity and its principal business is providing software to the logistics services industry globally.
2. Basis of preparation
Statement of complianceThe financial report is a general purpose financial report, which has been prepared in accordance with the requirements of the Corporations Act 2001, Australian Accounting Standards and other authoritative pronouncements of the Australian Accounting Standards Board. The financial report also complies with International Financial Reporting Standards (“IFRS”) as issued by the International Accounting Standards Board.
Material accounting policies adopted in the preparation of these financial statements are presented alongside the relevant notes and have been consistently applied unless stated otherwise. Other significant accounting policies which are relevant to understand the basis of preparation of these financial statements are included in note 30.
The financial statements have been prepared on an accruals basis and are based on historical costs except for:• derivative financial assets and liabilities which are measured at fair value in accordance with AASB 9 Financial Instruments; and• deferred acquisition consideration which is measured at fair value in accordance with AASB 13 Fair Value Measurement.
The financial statements have been prepared on a going concern basis, which contemplates continuity of normal business activities and the realisation of assets and the settlement of liabilities in the ordinary course of business.
The financial statements were authorised by the Board of Directors on 20 September 2019.
New accounting standards
AASB 9 Financial InstrumentsThe Group has applied AASB 9 Financial Instruments from 1 July 2018, the date of initial application.
AASB 9 replaces the guidance in AASB 139 Financial Instruments: Recognition and Measurement for classification, measurement and recognition of financial instruments. AASB 9 also introduces a new general hedge accounting model, which requires the Group to ensure that hedge accounting relationships are aligned with its risk management objectives and strategy, and to apply a more qualitative and forward-looking approach to assessing hedge effectiveness.
(i) Classification and measurement of financial assets and liabilitiesAASB 9 contains three principal classification categories for financial assets: measured at amortised cost, fair value through other comprehensive income, and fair value through profit and loss. Classification under AASB 9 is generally based on the business model in which a financial asset is managed and its contractual cash flow characteristics.
AASB 9 largely retains the existing requirements of AASB 139 for the classification of financial liabiliites.
The change in classification categories applied to the Group’s financial assets and liabilities has not had any impact on their measurement on the date of initial application, and consequently there is no adjustment to equity as a result of the changes in classification.
(ii) Expected credit loss on financial assetsAASB 9 replaces the “incurred loss” model in AASB 139 with an “expected credit loss” (“ECL”) model. The change generally results in earlier recognition of credit losses. The new ECL model applies to financial assets measured at amortised cost which are comprised of cash and cash equivalents, and trade receivables.
The Group has taken into account relevant forward-looking information in determining the credit loss to be provided for, as of the date of initial application. No adjustment was required to the balances recognised as of the date of initial application.
(iii) Hedge accountingFrom time to time, the Group uses derivative financial instruments such as forward currency contracts and foreign currency option contracts, to manage its risks associated with foreign currency movements.
Such derivative financial instruments are initially recognised at fair value on the date on which a derivative contract is entered into, and any attributable transaction costs are recognised in profit or loss as incurred. Subsequent to initial recognition, derivative financial instruments are remeasured at their fair values.
Any gains or losses arising from changes in the fair value of derivatives that do not qualify for hedge accounting are taken directly to the profit or loss account.
The Group did not hold derivative financial instruments at the date of initial application. The Group entered into forward exchange contracts during the period. There were no open contracts at 30 June 2019. Consequently, the application of the new hedge accounting model through the newly adopted hedge accounting policy, has not resulted in any adjustments upon transition or had an impact on the financial statements during the period.
71WiseTech Global | Annual Report 2019 71
Notes to the financial statementsfor the year ended 30 June 2019
AASB 15 Revenue from Contracts with CustomersThe Group has applied AASB 15 Revenue from Contracts with Customers from 1 July 2018, the date of initial application.
AASB 15 replaces all existing revenue requirements in Australian Accounting Standards, which included AASB 118 Revenue, AASB 111 Construction Contracts, and related interpretations. The previously effective accounting standards required a consideration of the timing of transfer of risks and rewards when determining revenue recognition, whereas AASB 15 aligns revenue recognition with the pattern for transfer of control of the output from satisfying a performance obligation to a customer. In order to achieve this, the standard requires the application of a five-step model in recognising revenue from contracts with customers:1. Identify the contract with the customer;2. Identify the performance obligations in the contract;3. Determine the transaction price;4. Allocate the transaction price to performance obligations based on their relative standalone selling price; and5. Recognise revenue when, or as, performance obligations are satisfied.
Revenue is recognised upon transfer of control of promised products and services to customers in the amount that reflects the consideration expected to be received in exchange.
The Group’s revenue primarily consists of licence fees from customers to access or to use the computing software.
Revenue recognition approach
Recurring On-Demand Licence revenueThe majority of revenue is derived from recurring On-Demand Licences, where customers are provided the right to access the Group’s software as a service, without taking possession of the software. These arrangements include the ongoing provision of standard customer support and software maintenance services.
Revenue is recognised over the contract period and is based on the utilisation of the software (numbers of users and transactions). Customers are typically billed on a monthly basis in arrears and revenue is recognised for the amount billed.
Recurring One-Time Licence (“OTL”) maintenance revenueAdditional recurring revenue is derived from the recurring maintenance fees charged to customers on OTL arrangements and is recognised over time during the maintenance period.
OTL revenue and support servicesOTL fee revenue is derived when the Group sells, in a one-off transaction, the perpetual right to use the software. This licence revenue is recognised at the point in time when access is granted to the customer and the one-off billing is raised.
Support services revenue mainly consists of fees charged for business consultancy and paid feature services delivered upon specific customer requests. These contracts are typically short-term (less than 12 months) and are charged on a fixed-fee basis. Consulting revenue is recognised on a proportional performance basis and ratably over the contract term. Paid features service revenue is recognised at the time when the requested feature is completed and can be accessed by customers.
TransitionThe Group has adopted the modified retrospective transition method, whereby the comparative period is not required to be restated to align with the new accounting policy. The new accounting policy does not result in a change in the amount and timing of revenue recognition or changes the opening cumulative retained earnings.
Comparative revenue disaggregation has been presented in notes 3 and 25 for illustrative purposes only and is not required under the modified retrospective transition method.
Significant judgements
Contracts with multiple performance obligationsThe Company enters into contracts with its customers that can include promises to transfer multiple performance obligations. A performance obligation is a promise in a contract with a customer to transfer products or services that are distinct.
For On-Demand licensing contracts, there are a series of distinct goods and services including access to software maintenance and support provided to customers that are treated as a single performance obligation because they are delivered in the same pattern over a period of time.
Material rights in the form of contract renewal options or incremental discountsContracts may involve customers having the option to obtain discounts upon renewal of existing arrangements. AASB 15 considers a material right to be a separate performance obligation in a customer contract which gives the customer an option to acquire additional goods or services at a discount or free of charge. The inclusion of these clauses may give rise to deferral or earlier recognition of revenue.
The Group assessed renewal options on current contracts. Based on this assessment, there were no renewal options which gave rise to material rights, which would need to be accounted for as separate performance obligations.
2. Basis of preparation (continued)
7272
Notes to the financial statementsfor the year ended 30 June 2019
2. Basis of preparation (continued)
Costs of obtaining a customer contractAASB 15 requires that incremental costs associated with acquiring a customer contract, such as sales commissions, be recognised as an asset and amortised over a period that corresponds with the period of benefit.
An assessment of commissions paid by the Group was performed in connection with the sale of software products. This assessment concluded that as these commissions were conditional on future performance or service by the recipient of the commission, and therefore were not incremental to obtaining the contract. Consequently, under current arrangements costs of obtaining a contract are expensed in the period incurred.
Disaggregation of revenueAASB 15 requires that an entity shall disaggregate revenue recognised from contracts with customers into categories that depict how the nature, amount, timing and uncertainty of revenue and cash flows are affected by economic factors. This required a review of industry practice and Group contractual terms.
Principal versus agentWhere the Group has arrangements involving multiple parties to provide goods and services to customers, judgement is required to determine if the Group acts as a principal or an agent.
The Group is an agent if its role is to arrange a third party to provide the goods or service; or it is to deliver a third party’s goods or service on their behalves. The Group is a principal if it has the primary responsibility for fulfilling the promised goods or service delivery; and has the discretion in establishing the price for the specified goods or service.
Where the Group is acting as a principal, revenue is recognised on a gross basis in accordance with the transaction price defined in contracts with customers. Where the Group is acting as an agent, revenue is recognised at a net amount reflecting the commission or margin earned.
Contract balancesThe timing of revenue recognition, customer billings and cash collections results in trade receivables, unbilled receivables (contract assets) and deferred revenue (contract liabilities) on the Group’s Consolidated statement of financial position.
Generally, the Group invoices customers as service is provided in accordance with the agreed-upon contract terms, either at periodic intervals (e.g. monthly or quarterly) or upon completion; also at times, billing occurs after the revenue recognition, resulting in contract assets (unbilled receivables). For certain customer contracts, the Group receive advance payments before revenue is recognised, resulting in contract liabilities (deferred revenue). These balances, as well as their movements from the prior reporting period are disclosed in notes 12 and 14 respectively.
Functional and presentational currencyThe financial report is presented in Australian dollars.
Rounding of amountsThe Group is of a kind referred to in Australian Securities and Investments Commission (“ASIC”) Corporations (Rounding in Financial/Directors’ Reports) Instrument 2016/191 issued by ASIC, relating to the ‘rounding off’ of amounts in the financial statements. Amounts in the financial statements have been rounded off in accordance with this Instrument to the nearest thousand dollars unless otherwise stated.
Presentation of resultsThe Group has presented the expense categories within the Consolidated statement of profit or loss on a functional basis. The categories used are cost of revenues, product design and development, sales and marketing and general and administration. This presentation style provides insight into the Company’s business model and enables users to consider the results of the Group compared to other major Software as a Service (“SaaS”) companies. The methodology and the nature of costs within each category are further described below.
Cost of revenuesCost of revenues consists of expenses directly associated with securely hosting the Group’s services and providing support to customers. Costs include data centre costs, personnel and related costs (including salaries, benefits, bonuses and share-based payments) directly associated with cloud infrastructure and customer consulting, implementation and customer support, contracted third party costs, related depreciation and amortisation and allocated overheads.
Product design and development expensesProduct design and development expenses consist primarily of personnel and related costs (including salaries, benefits, bonuses and share-based payments) directly associated with the Company’s product design and development employees, as well as allocated overheads. When future economic benefits from development of an intangible asset are determined probable and the development activities are capable of being reliably measured, the costs are capitalised as an intangible asset and then amortised to profit or loss over the estimated life of the asset created. The development activities comprise the design, coding and testing of a chosen alternative for new or improved software products, processes, systems and services. The amortisation of those costs capitalised is included as a product design and development expense.
73WiseTech Global | Annual Report 2019 73
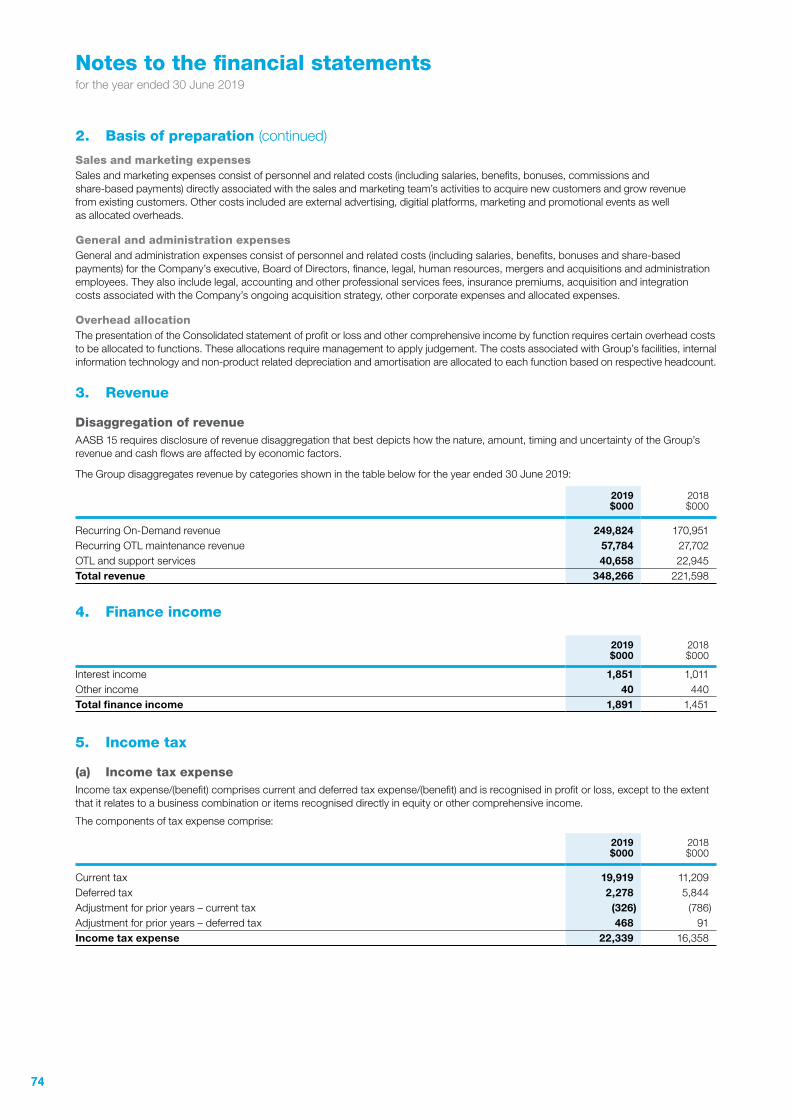
Notes to the financial statementsfor the year ended 30 June 2019
Sales and marketing expensesSales and marketing expenses consist of personnel and related costs (including salaries, benefits, bonuses, commissions and share-based payments) directly associated with the sales and marketing team’s activities to acquire new customers and grow revenue from existing customers. Other costs included are external advertising, digitial platforms, marketing and promotional events as well as allocated overheads.
General and administration expensesGeneral and administration expenses consist of personnel and related costs (including salaries, benefits, bonuses and share-based payments) for the Company’s executive, Board of Directors, finance, legal, human resources, mergers and acquisitions and administration employees. They also include legal, accounting and other professional services fees, insurance premiums, acquisition and integration costs associated with the Company’s ongoing acquisition strategy, other corporate expenses and allocated expenses.
Overhead allocationThe presentation of the Consolidated statement of profit or loss and other comprehensive income by function requires certain overhead costs to be allocated to functions. These allocations require management to apply judgement. The costs associated with Group’s facilities, internal information technology and non-product related depreciation and amortisation are allocated to each function based on respective headcount.
3. Revenue
Disaggregation of revenueAASB 15 requires disclosure of revenue disaggregation that best depicts how the nature, amount, timing and uncertainty of the Group’s revenue and cash flows are affected by economic factors.
The Group disaggregates revenue by categories shown in the table below for the year ended 30 June 2019:
2019 $000
2018 $000
Recurring On-Demand revenue 249,824 170,951Recurring OTL maintenance revenue 57,784 27,702OTL and support services 40,658 22,945Total revenue 348,266 221,598
4. Finance income
2019 $000
2018 $000
Interest income 1,851 1,011Other income 40 440Total finance income 1,891 1,451
5. Income tax
(a) Income tax expenseIncome tax expense/(benefit) comprises current and deferred tax expense/(benefit) and is recognised in profit or loss, except to the extent that it relates to a business combination or items recognised directly in equity or other comprehensive income.
The components of tax expense comprise:
2019 $000
2018$000
Current tax 19,919 11,209Deferred tax 2,278 5,844Adjustment for prior years – current tax (326) (786)Adjustment for prior years – deferred tax 468 91Income tax expense 22,339 16,358
2. Basis of preparation (continued)
7474
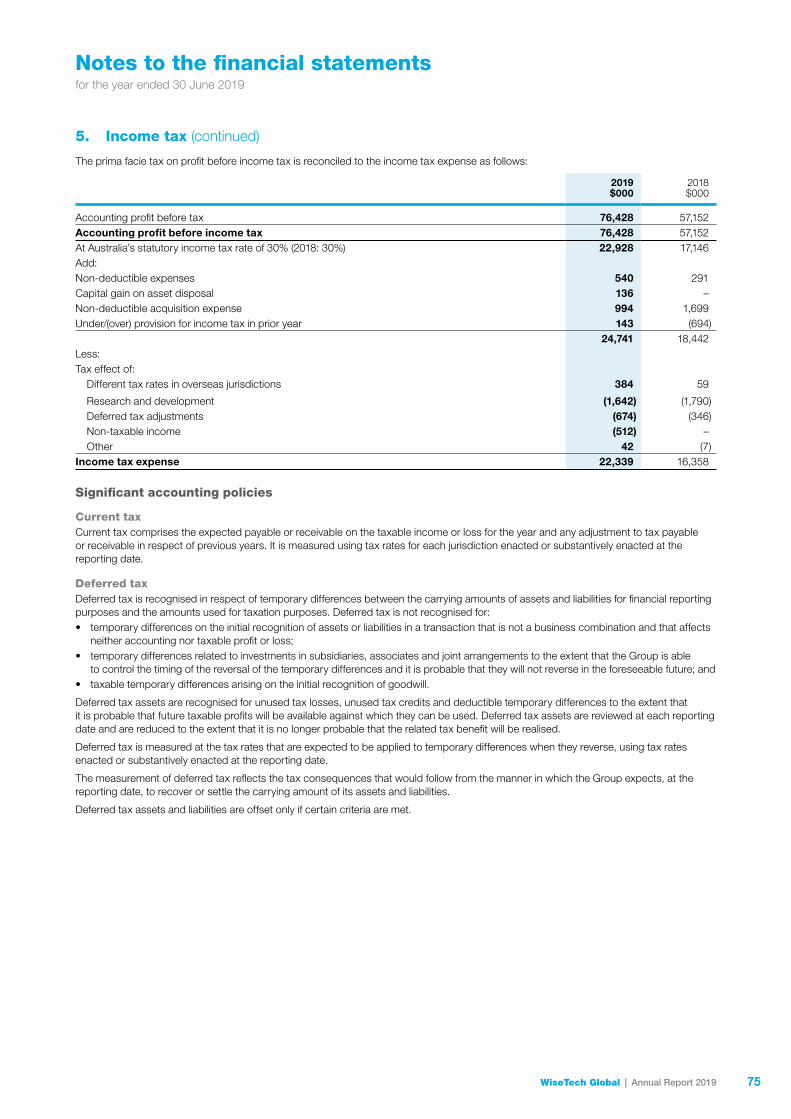
Notes to the financial statementsfor the year ended 30 June 2019
The prima facie tax on profit before income tax is reconciled to the income tax expense as follows:
2019 $000
2018 $000
Accounting profit before tax 76,428 57,152Accounting profit before income tax 76,428 57,152At Australia’s statutory income tax rate of 30% (2018: 30%) 22,928 17,146Add:Non-deductible expenses 540 291Capital gain on asset disposal 136 –Non-deductible acquisition expense 994 1,699Under/(over) provision for income tax in prior year 143 (694)
24,741 18,442Less:Tax effect of:
Different tax rates in overseas jurisdictions 384 59
Research and development (1,642) (1,790)Deferred tax adjustments (674) (346)Non-taxable income (512) –Other 42 (7)
Income tax expense 22,339 16,358
Significant accounting policies
Current taxCurrent tax comprises the expected payable or receivable on the taxable income or loss for the year and any adjustment to tax payable or receivable in respect of previous years. It is measured using tax rates for each jurisdiction enacted or substantively enacted at the reporting date.
Deferred taxDeferred tax is recognised in respect of temporary differences between the carrying amounts of assets and liabilities for financial reporting purposes and the amounts used for taxation purposes. Deferred tax is not recognised for:• temporary differences on the initial recognition of assets or liabilities in a transaction that is not a business combination and that affects
neither accounting nor taxable profit or loss;• temporary differences related to investments in subsidiaries, associates and joint arrangements to the extent that the Group is able
to control the timing of the reversal of the temporary differences and it is probable that they will not reverse in the foreseeable future; and• taxable temporary differences arising on the initial recognition of goodwill.
Deferred tax assets are recognised for unused tax losses, unused tax credits and deductible temporary differences to the extent that it is probable that future taxable profits will be available against which they can be used. Deferred tax assets are reviewed at each reporting date and are reduced to the extent that it is no longer probable that the related tax benefit will be realised.
Deferred tax is measured at the tax rates that are expected to be applied to temporary differences when they reverse, using tax rates enacted or substantively enacted at the reporting date.
The measurement of deferred tax reflects the tax consequences that would follow from the manner in which the Group expects, at the reporting date, to recover or settle the carrying amount of its assets and liabilities.
Deferred tax assets and liabilities are offset only if certain criteria are met.
5. Income tax (continued)
75WiseTech Global | Annual Report 2019 75
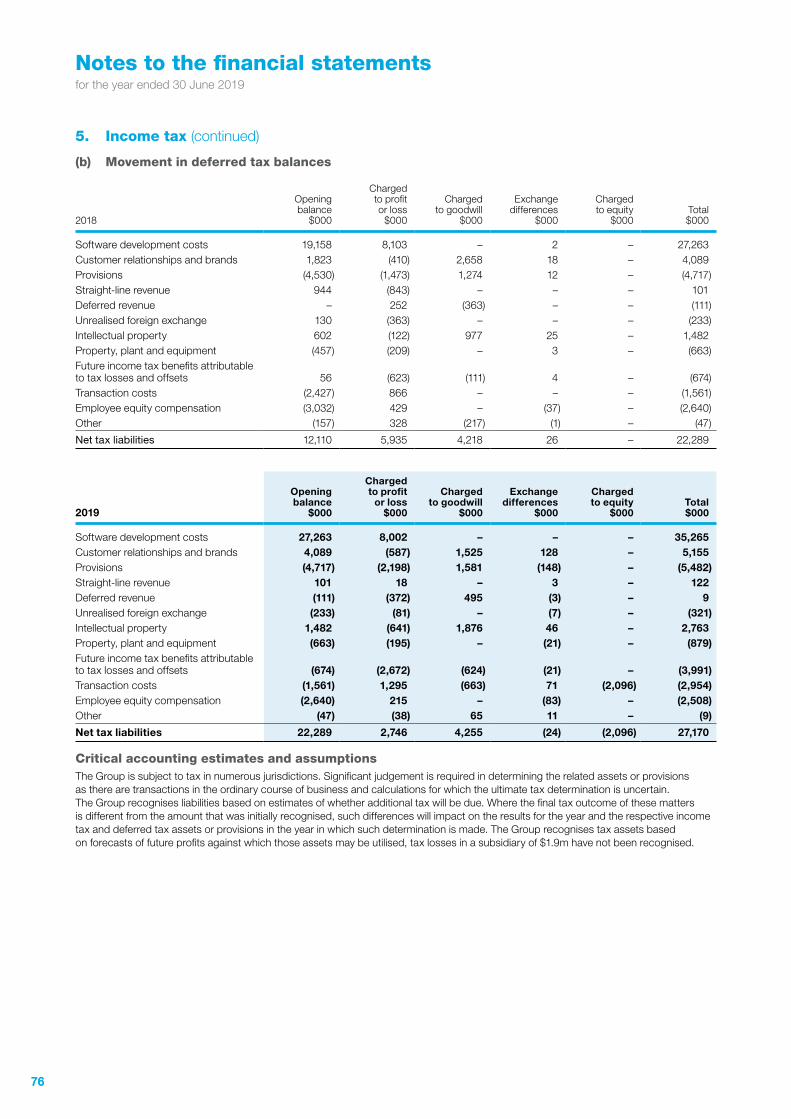
Notes to the financial statementsfor the year ended 30 June 2019
(b) Movement in deferred tax balances
2018
Opening balance
$000
Charged to profit or loss
$000
Charged to goodwill
$000
Exchange differences
$000
Charged to equity
$000Total$000
Software development costs 19,158 8,103 – 2 – 27,263Customer relationships and brands 1,823 (410) 2,658 18 – 4,089Provisions (4,530) (1,473) 1,274 12 – (4,717)Straight-line revenue 944 (843) – – – 101Deferred revenue – 252 (363) – – (111)Unrealised foreign exchange 130 (363) – – – (233)Intellectual property 602 (122) 977 25 – 1,482Property, plant and equipment (457) (209) – 3 – (663)Future income tax benefits attributable to tax losses and offsets 56 (623) (111) 4 – (674)Transaction costs (2,427) 866 – – – (1,561)Employee equity compensation (3,032) 429 – (37) – (2,640)Other (157) 328 (217) (1) – (47)
Net tax liabilities 12,110 5,935 4,218 26 – 22,289
2019
Opening balance
$000
Charged to profit
or loss$000
Charged to goodwill
$000
Exchange differences
$000
Charged to equity
$000Total$000
Software development costs 27,263 8,002 – – – 35,265Customer relationships and brands 4,089 (587) 1,525 128 – 5,155Provisions (4,717) (2,198) 1,581 (148) – (5,482)Straight-line revenue 101 18 – 3 – 122Deferred revenue (111) (372) 495 (3) – 9Unrealised foreign exchange (233) (81) – (7) – (321)Intellectual property 1,482 (641) 1,876 46 – 2,763Property, plant and equipment (663) (195) – (21) – (879)Future income tax benefits attributable to tax losses and offsets (674) (2,672) (624) (21) – (3,991)Transaction costs (1,561) 1,295 (663) 71 (2,096) (2,954)Employee equity compensation (2,640) 215 – (83) – (2,508)Other (47) (38) 65 11 – (9)
Net tax liabilities 22,289 2,746 4,255 (24) (2,096) 27,170
Critical accounting estimates and assumptionsThe Group is subject to tax in numerous jurisdictions. Significant judgement is required in determining the related assets or provisions as there are transactions in the ordinary course of business and calculations for which the ultimate tax determination is uncertain. The Group recognises liabilities based on estimates of whether additional tax will be due. Where the final tax outcome of these matters is different from the amount that was initially recognised, such differences will impact on the results for the year and the respective income tax and deferred tax assets or provisions in the year in which such determination is made. The Group recognises tax assets based on forecasts of future profits against which those assets may be utilised, tax losses in a subsidiary of $1.9m have not been recognised.
5. Income tax (continued)
7676
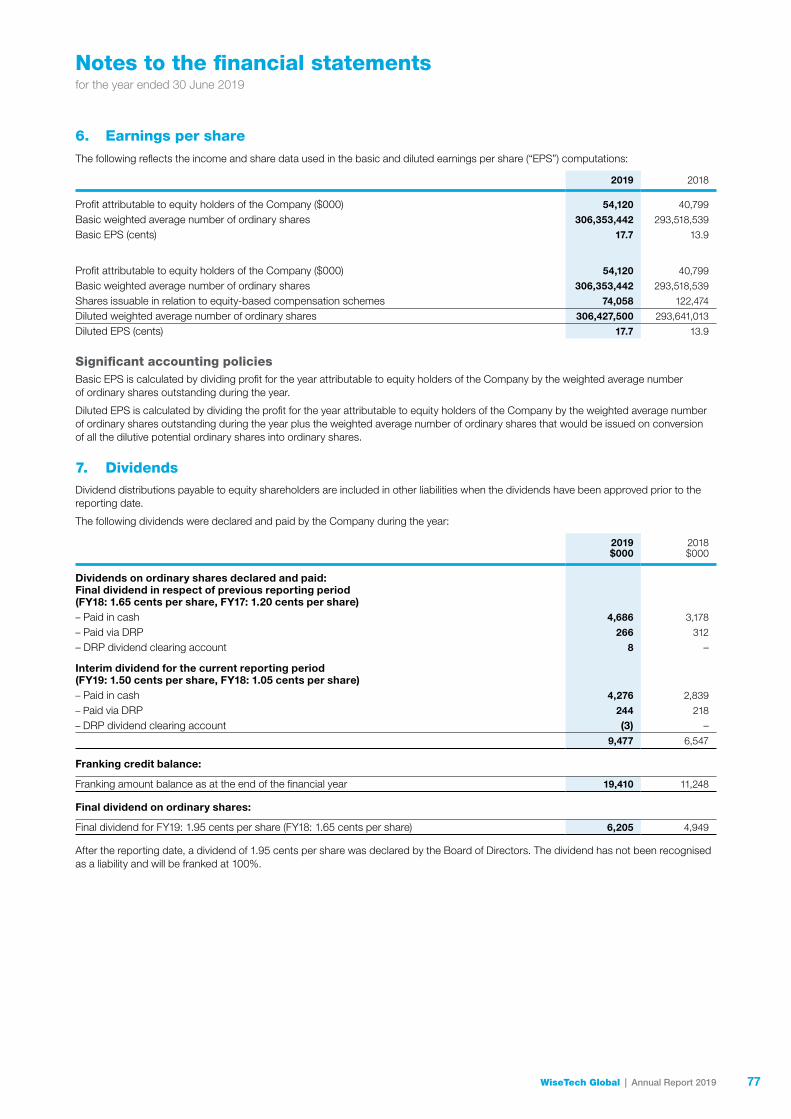
Notes to the financial statementsfor the year ended 30 June 2019
6. Earnings per shareThe following reflects the income and share data used in the basic and diluted earnings per share (“EPS”) computations:
2019 2018
Profit attributable to equity holders of the Company ($000) 54,120 40,799
Basic weighted average number of ordinary shares 306,353,442 293,518,539
Basic EPS (cents) 17.7 13.9
Profit attributable to equity holders of the Company ($000) 54,120 40,799
Basic weighted average number of ordinary shares 306,353,442 293,518,539
Shares issuable in relation to equity-based compensation schemes 74,058 122,474
Diluted weighted average number of ordinary shares 306,427,500 293,641,013
Diluted EPS (cents) 17.7 13.9
Significant accounting policiesBasic EPS is calculated by dividing profit for the year attributable to equity holders of the Company by the weighted average number of ordinary shares outstanding during the year.
Diluted EPS is calculated by dividing the profit for the year attributable to equity holders of the Company by the weighted average number of ordinary shares outstanding during the year plus the weighted average number of ordinary shares that would be issued on conversion of all the dilutive potential ordinary shares into ordinary shares.
7. DividendsDividend distributions payable to equity shareholders are included in other liabilities when the dividends have been approved prior to the reporting date.
The following dividends were declared and paid by the Company during the year:
2019 $000
2018 $000
Dividends on ordinary shares declared and paid:Final dividend in respect of previous reporting period(FY18: 1.65 cents per share, FY17: 1.20 cents per share)– Paid in cash 4,686 3,178
– Paid via DRP 266 312
– DRP dividend clearing account 8 –
Interim dividend for the current reporting period(FY19: 1.50 cents per share, FY18: 1.05 cents per share)– Paid in cash 4,276 2,839
– Paid via DRP 244 218
– DRP dividend clearing account (3) –9,477 6,547
Franking credit balance:
Franking amount balance as at the end of the financial year 19,410 11,248
Final dividend on ordinary shares:
Final dividend for FY19: 1.95 cents per share (FY18: 1.65 cents per share) 6,205 4,949
After the reporting date, a dividend of 1.95 cents per share was declared by the Board of Directors. The dividend has not been recognised as a liability and will be franked at 100%.
77WiseTech Global | Annual Report 2019 77
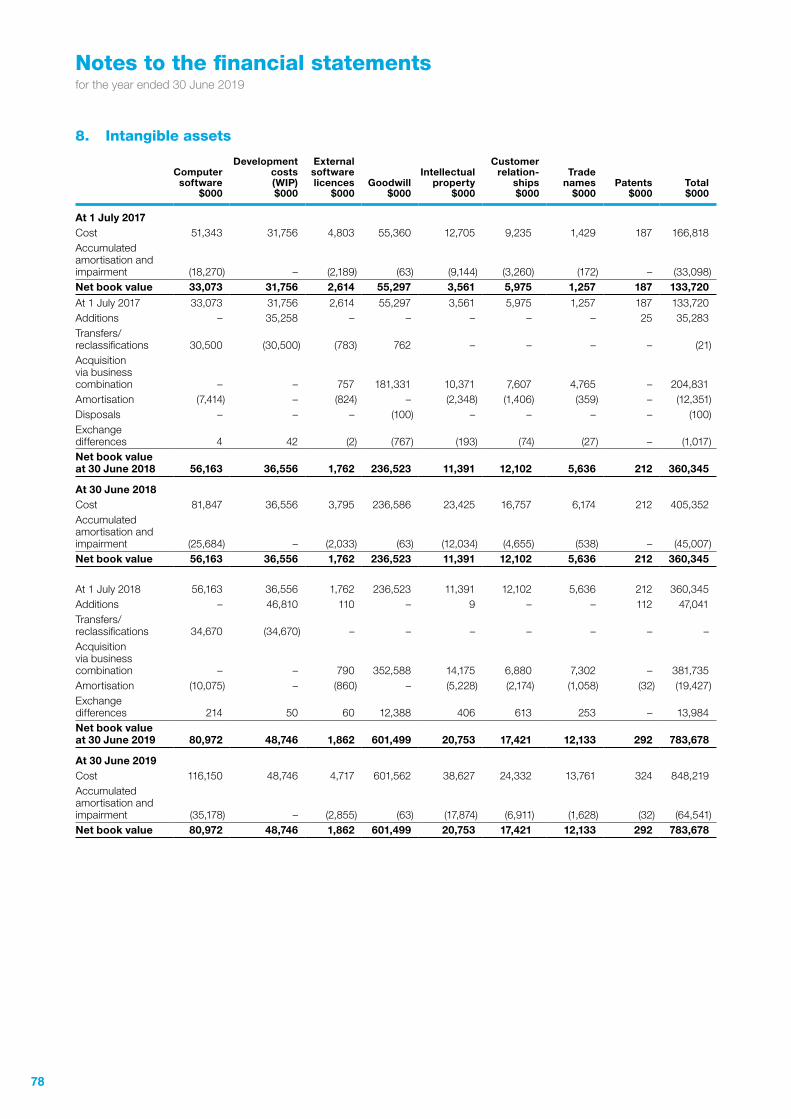
Notes to the financial statementsfor the year ended 30 June 2019
8. Intangible assets
Computersoftware
$000
Developmentcosts (WIP)$000
External softwarelicences
$000Goodwill
$000
Intellectualproperty
$000
Customerrelation-
ships$000
Tradenames
$000Patents
$000Total$000
At 1 July 2017Cost 51,343 31,756 4,803 55,360 12,705 9,235 1,429 187 166,818Accumulated amortisation and impairment (18,270) – (2,189) (63) (9,144) (3,260) (172) – (33,098)Net book value 33,073 31,756 2,614 55,297 3,561 5,975 1,257 187 133,720
At 1 July 2017 33,073 31,756 2,614 55,297 3,561 5,975 1,257 187 133,720Additions – 35,258 – – – – – 25 35,283Transfers/reclassifications 30,500 (30,500) (783) 762 – – – – (21)Acquisition via business combination – – 757 181,331 10,371 7,607 4,765 – 204,831Amortisation (7,414) – (824) – (2,348) (1,406) (359) – (12,351)Disposals – – – (100) – – – – (100)Exchange differences 4 42 (2) (767) (193) (74) (27) – (1,017)Net book value at 30 June 2018 56,163 36,556 1,762 236,523 11,391 12,102 5,636 212 360,345
At 30 June 2018Cost 81,847 36,556 3,795 236,586 23,425 16,757 6,174 212 405,352Accumulated amortisation and impairment (25,684) – (2,033) (63) (12,034) (4,655) (538) – (45,007)Net book value 56,163 36,556 1,762 236,523 11,391 12,102 5,636 212 360,345
At 1 July 2018 56,163 36,556 1,762 236,523 11,391 12,102 5,636 212 360,345Additions – 46,810 110 – 9 – – 112 47,041Transfers/reclassifications 34,670 (34,670) – – – – – – –Acquisition via business combination – – 790 352,588 14,175 6,880 7,302 – 381,735Amortisation (10,075) – (860) – (5,228) (2,174) (1,058) (32) (19,427)Exchange differences 214 50 60 12,388 406 613 253 – 13,984Net book value at 30 June 2019 80,972 48,746 1,862 601,499 20,753 17,421 12,133 292 783,678
At 30 June 2019Cost 116,150 48,746 4,717 601,562 38,627 24,332 13,761 324 848,219Accumulated amortisation and impairment (35,178) – (2,855) (63) (17,874) (6,911) (1,628) (32) (64,541)Net book value 80,972 48,746 1,862 601,499 20,753 17,421 12,133 292 783,678
7878
Notes to the financial statementsfor the year ended 30 June 2019
Significant accounting policies
Computer softwareDevelopment costs for products which are considered ready for their intended use are transferred to the computer software balance. The computer software balance comprises the historic cost of development activities for products that have been transferred and the historic cost of acquired software, less accumulated amortisation and any accumulated impairment losses.
Development costs (WIP)Development costs are capitalised where future economic benefits from development of a chosen alternative for new or improved software products, processes, systems or services are considered probable, and expenditure in relation to such activities is capable of reliable measurement. Future economic benefits are considered probable where commercial benefit and technical feasibility have been established. The expenditure capitalised comprises all directly attributable costs, including external direct costs of materials, services, direct labour and overheads.
Other development expenditure that does not meet these criteria, which includes research activities and the expenditure on maintenance of computer software, is expensed as incurred.
External software licencesExternal software licences costs relate to fees paid to an external provider for licences relating to specific components of software.
GoodwillGoodwill arising on the acquisition of subsidiaries is measured at cost less accumulated impairment losses.
The Group tests goodwill for impairment annually or more frequently if events or changes in circumstances indicate that goodwill may be impaired. The recoverable amount of the collective cash generating units (“CGUs”), which is the lowest level within the Group for which information about goodwill is monitored by internal management, is determined based on a value in use calculation which requires the use of cash flow projections based on approved financial budgets, which is extrapolated over a five year period. The growth rate used does not exceed the long-term average growth rate for the market in which the segment operates. The discount rate used reflects the Group’s pre-tax weighted average cost of capital. No individual CGUs contain goodwill. Goodwill is maintained and monitored at the Group segment level.
Intellectual propertyIntellectual property acquired as part of a business combination is recognised separately from goodwill. The intellectual property assets are carried at their fair value at the date of acquisition less accumulated amortisation and impairment losses.
Customer relationshipsCustomer relationships acquired as part of a business combination are recognised separately from goodwill. The customer relationships are carried at their fair value at the date of acquisition less accumulated amortisation and impairment losses.
Trade namesTrade names acquired as part of a business combination are recognised separately from goodwill. They are carried at their fair value at the date of acquisition less accumulated amortisation and impairment losses.
PatentsPatents comprise filing costs for the Group’s patents. These are subsequently amortised from the point at which the asset is ready for use. They are stated at cost less accumulated amortisation and impairment losses.
Subsequent expenditureSubsequent expenditure is capitalised only when it increases the future economic benefits embodied in the specific asset to which it relates. All other expenditure, including expenditure on internally generated goodwill, is recognised in profit or loss as incurred.
AmortisationAmortisation is calculated to write off the cost of intangible assets less their estimated residual values using the straight-line method over their estimated useful lives and is recognised in profit or loss. Goodwill is not amortised.
Intangible assets, other than goodwill, have finite useful lives. Goodwill has an indefinite useful life. The estimated useful lives are as follows:
Class of intangible Amortisation periodComputer software 3–10 years;External software licences 3–10 years;Intellectual property 3–8 years;Customer relationships 10 years;Trade names 10 years; andPatents 10 years.
8. Intangible assets (continued)
79WiseTech Global | Annual Report 2019 79
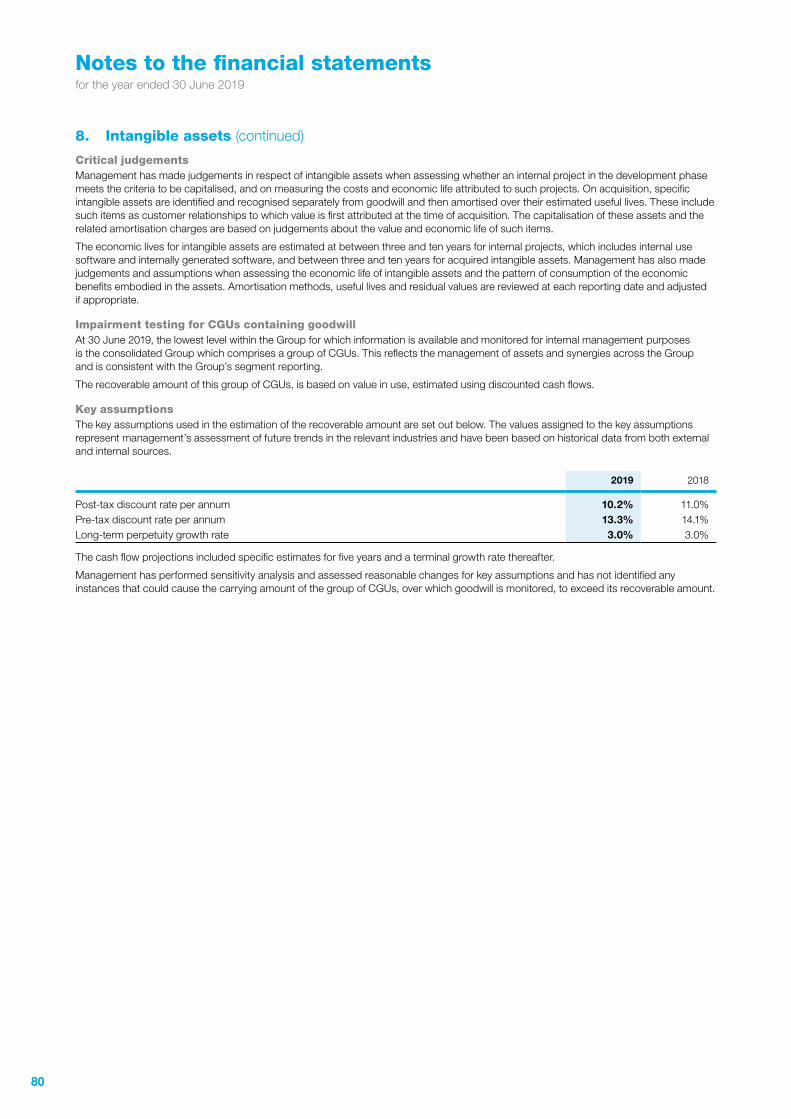
Notes to the financial statementsfor the year ended 30 June 2019
Critical judgementsManagement has made judgements in respect of intangible assets when assessing whether an internal project in the development phase meets the criteria to be capitalised, and on measuring the costs and economic life attributed to such projects. On acquisition, specific intangible assets are identified and recognised separately from goodwill and then amortised over their estimated useful lives. These include such items as customer relationships to which value is first attributed at the time of acquisition. The capitalisation of these assets and the related amortisation charges are based on judgements about the value and economic life of such items.
The economic lives for intangible assets are estimated at between three and ten years for internal projects, which includes internal use software and internally generated software, and between three and ten years for acquired intangible assets. Management has also made judgements and assumptions when assessing the economic life of intangible assets and the pattern of consumption of the economic benefits embodied in the assets. Amortisation methods, useful lives and residual values are reviewed at each reporting date and adjusted if appropriate.
Impairment testing for CGUs containing goodwillAt 30 June 2019, the lowest level within the Group for which information is available and monitored for internal management purposes is the consolidated Group which comprises a group of CGUs. This reflects the management of assets and synergies across the Group and is consistent with the Group’s segment reporting.
The recoverable amount of this group of CGUs, is based on value in use, estimated using discounted cash flows.
Key assumptionsThe key assumptions used in the estimation of the recoverable amount are set out below. The values assigned to the key assumptions represent management’s assessment of future trends in the relevant industries and have been based on historical data from both external and internal sources.
2019 2018
Post-tax discount rate per annum 10.2% 11.0%Pre-tax discount rate per annum 13.3% 14.1%Long-term perpetuity growth rate 3.0% 3.0%
The cash flow projections included specific estimates for five years and a terminal growth rate thereafter.
Management has performed sensitivity analysis and assessed reasonable changes for key assumptions and has not identified any instances that could cause the carrying amount of the group of CGUs, over which goodwill is monitored, to exceed its recoverable amount.
8. Intangible assets (continued)
8080
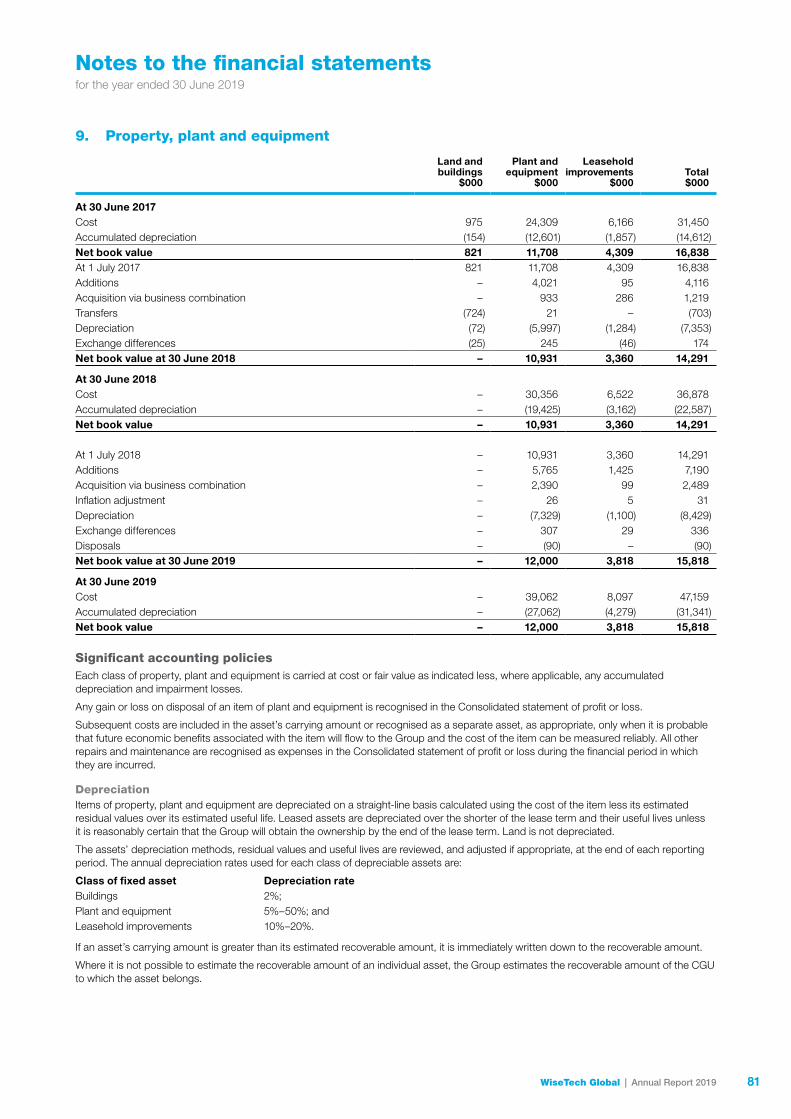
Notes to the financial statementsfor the year ended 30 June 2019
9. Property, plant and equipment
Land and buildings
$000
Plant and equipment
$000
Leasehold improvements
$000Total $000
At 30 June 2017Cost 975 24,309 6,166 31,450Accumulated depreciation (154) (12,601) (1,857) (14,612)Net book value 821 11,708 4,309 16,838At 1 July 2017 821 11,708 4,309 16,838Additions – 4,021 95 4,116Acquisition via business combination – 933 286 1,219Transfers (724) 21 – (703)Depreciation (72) (5,997) (1,284) (7,353)Exchange differences (25) 245 (46) 174Net book value at 30 June 2018 – 10,931 3,360 14,291
At 30 June 2018Cost – 30,356 6,522 36,878Accumulated depreciation – (19,425) (3,162) (22,587)Net book value – 10,931 3,360 14,291
At 1 July 2018 – 10,931 3,360 14,291Additions – 5,765 1,425 7,190Acquisition via business combination – 2,390 99 2,489Inflation adjustment – 26 5 31Depreciation – (7,329) (1,100) (8,429)Exchange differences – 307 29 336Disposals – (90) – (90)Net book value at 30 June 2019 – 12,000 3,818 15,818
At 30 June 2019Cost – 39,062 8,097 47,159Accumulated depreciation – (27,062) (4,279) (31,341)Net book value – 12,000 3,818 15,818
Significant accounting policiesEach class of property, plant and equipment is carried at cost or fair value as indicated less, where applicable, any accumulated depreciation and impairment losses.
Any gain or loss on disposal of an item of plant and equipment is recognised in the Consolidated statement of profit or loss.
Subsequent costs are included in the asset’s carrying amount or recognised as a separate asset, as appropriate, only when it is probable that future economic benefits associated with the item will flow to the Group and the cost of the item can be measured reliably. All other repairs and maintenance are recognised as expenses in the Consolidated statement of profit or loss during the financial period in which they are incurred.
DepreciationItems of property, plant and equipment are depreciated on a straight-line basis calculated using the cost of the item less its estimated residual values over its estimated useful life. Leased assets are depreciated over the shorter of the lease term and their useful lives unless it is reasonably certain that the Group will obtain the ownership by the end of the lease term. Land is not depreciated.
The assets’ depreciation methods, residual values and useful lives are reviewed, and adjusted if appropriate, at the end of each reporting period. The annual depreciation rates used for each class of depreciable assets are:
Class of fixed asset Depreciation rateBuildings 2%;Plant and equipment 5%–50%; and Leasehold improvements 10%–20%.
If an asset’s carrying amount is greater than its estimated recoverable amount, it is immediately written down to the recoverable amount.
Where it is not possible to estimate the recoverable amount of an individual asset, the Group estimates the recoverable amount of the CGU to which the asset belongs.
81WiseTech Global | Annual Report 2019 81
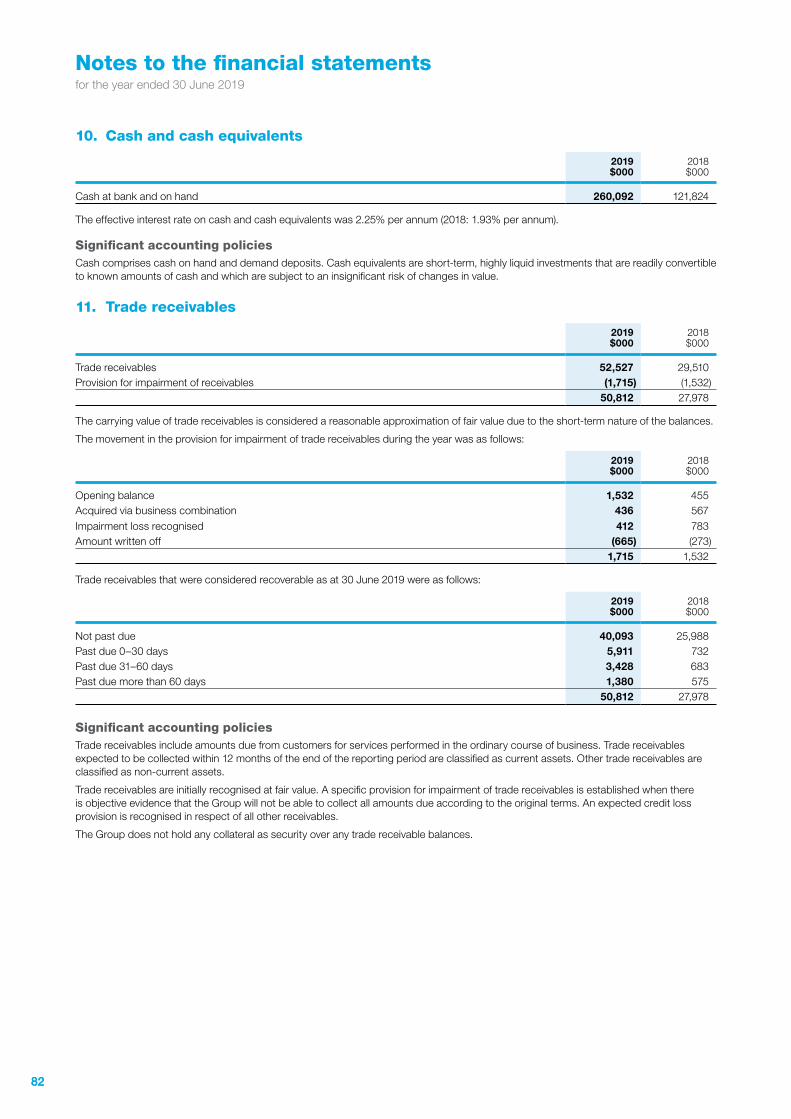
Notes to the financial statementsfor the year ended 30 June 2019
10. Cash and cash equivalents
2019 $000
2018 $000
Cash at bank and on hand 260,092 121,824
The effective interest rate on cash and cash equivalents was 2.25% per annum (2018: 1.93% per annum).
Significant accounting policiesCash comprises cash on hand and demand deposits. Cash equivalents are short-term, highly liquid investments that are readily convertible to known amounts of cash and which are subject to an insignificant risk of changes in value.
11. Trade receivables
2019 $000
2018 $000
Trade receivables 52,527 29,510Provision for impairment of receivables (1,715) (1,532)
50,812 27,978
The carrying value of trade receivables is considered a reasonable approximation of fair value due to the short-term nature of the balances.
The movement in the provision for impairment of trade receivables during the year was as follows:
2019 $000
2018 $000
Opening balance 1,532 455Acquired via business combination 436 567Impairment loss recognised 412 783Amount written off (665) (273)
1,715 1,532
Trade receivables that were considered recoverable as at 30 June 2019 were as follows:
2019$000
2018 $000
Not past due 40,093 25,988Past due 0–30 days 5,911 732Past due 31–60 days 3,428 683Past due more than 60 days 1,380 575
50,812 27,978
Significant accounting policiesTrade receivables include amounts due from customers for services performed in the ordinary course of business. Trade receivables expected to be collected within 12 months of the end of the reporting period are classified as current assets. Other trade receivables are classified as non-current assets.
Trade receivables are initially recognised at fair value. A specific provision for impairment of trade receivables is established when there is objective evidence that the Group will not be able to collect all amounts due according to the original terms. An expected credit loss provision is recognised in respect of all other receivables.
The Group does not hold any collateral as security over any trade receivable balances.
8282
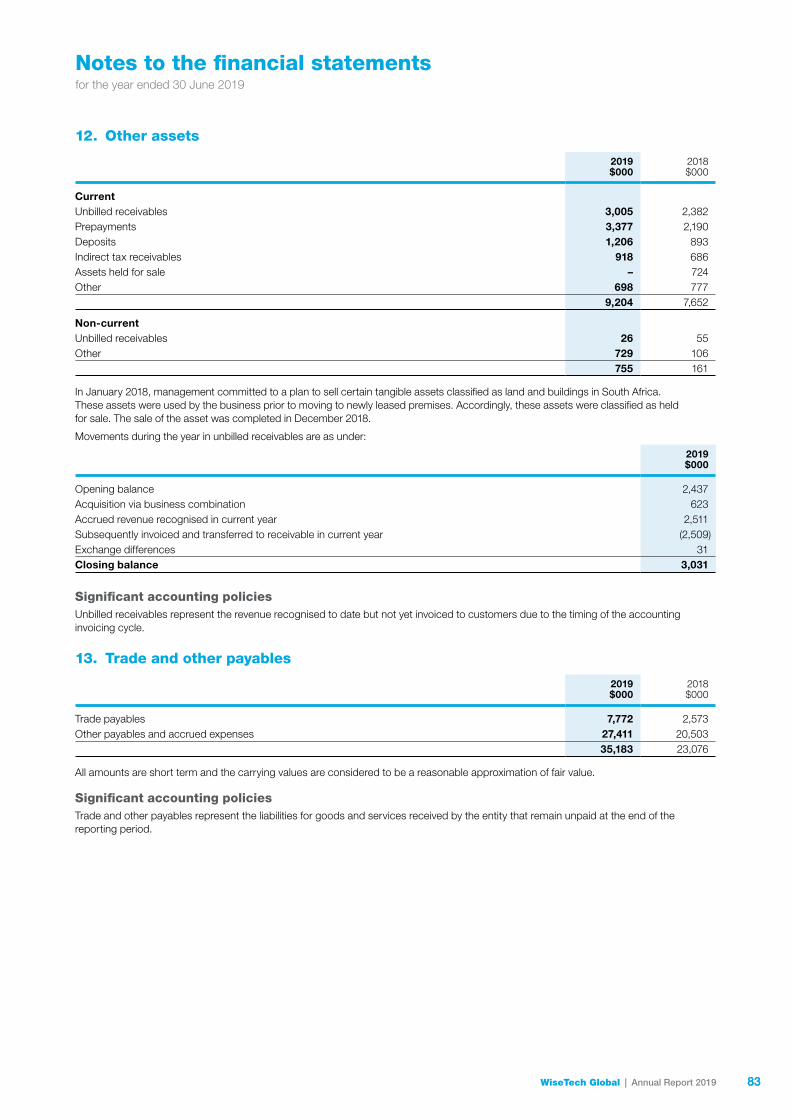
Notes to the financial statementsfor the year ended 30 June 2019
12. Other assets
2019 $000
2018$000
CurrentUnbilled receivables 3,005 2,382Prepayments 3,377 2,190Deposits 1,206 893Indirect tax receivables 918 686Assets held for sale – 724Other 698 777
9,204 7,652
Non-currentUnbilled receivables 26 55Other 729 106
755 161
In January 2018, management committed to a plan to sell certain tangible assets classified as land and buildings in South Africa. These assets were used by the business prior to moving to newly leased premises. Accordingly, these assets were classified as held for sale. The sale of the asset was completed in December 2018.
Movements during the year in unbilled receivables are as under:
2019 $000
Opening balance 2,437Acquisition via business combination 623Accrued revenue recognised in current year 2,511Subsequently invoiced and transferred to receivable in current year (2,509)Exchange differences 31Closing balance 3,031
Significant accounting policiesUnbilled receivables represent the revenue recognised to date but not yet invoiced to customers due to the timing of the accounting invoicing cycle.
13. Trade and other payables
2019 $000
2018 $000
Trade payables 7,772 2,573Other payables and accrued expenses 27,411 20,503
35,183 23,076
All amounts are short term and the carrying values are considered to be a reasonable approximation of fair value.
Significant accounting policiesTrade and other payables represent the liabilities for goods and services received by the entity that remain unpaid at the end of the reporting period.
83WiseTech Global | Annual Report 2019 83
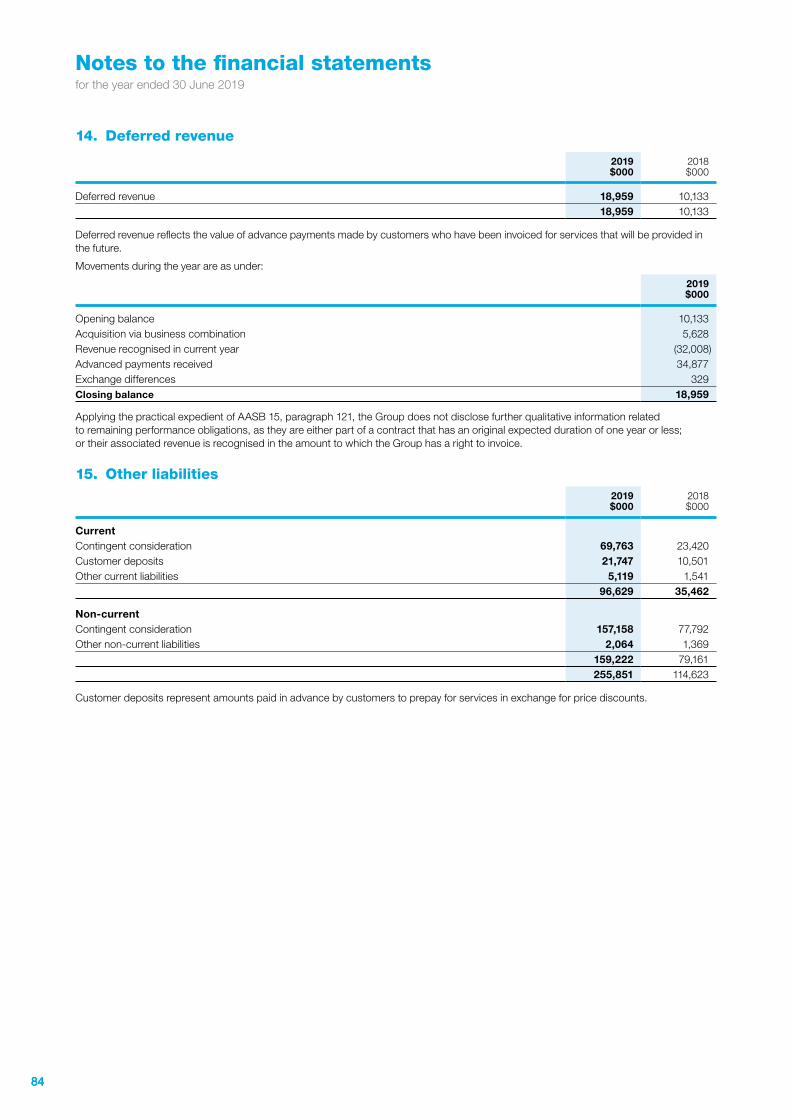
Notes to the financial statementsfor the year ended 30 June 2019
14. Deferred revenue
2019 $000
2018 $000
Deferred revenue 18,959 10,13318,959 10,133
Deferred revenue reflects the value of advance payments made by customers who have been invoiced for services that will be provided in the future.
Movements during the year are as under:
2019 $000
Opening balance 10,133Acquisition via business combination 5,628Revenue recognised in current year (32,008)Advanced payments received 34,877Exchange differences 329Closing balance 18,959
Applying the practical expedient of AASB 15, paragraph 121, the Group does not disclose further qualitative information related to remaining performance obligations, as they are either part of a contract that has an original expected duration of one year or less; or their associated revenue is recognised in the amount to which the Group has a right to invoice.
15. Other liabilities2019 $000
2018 $000
CurrentContingent consideration 69,763 23,420Customer deposits 21,747 10,501Other current liabilities 5,119 1,541
96,629 35,462
Non-currentContingent consideration 157,158 77,792Other non-current liabilities 2,064 1,369
159,222 79,161255,851 114,623
Customer deposits represent amounts paid in advance by customers to prepay for services in exchange for price discounts.
8484
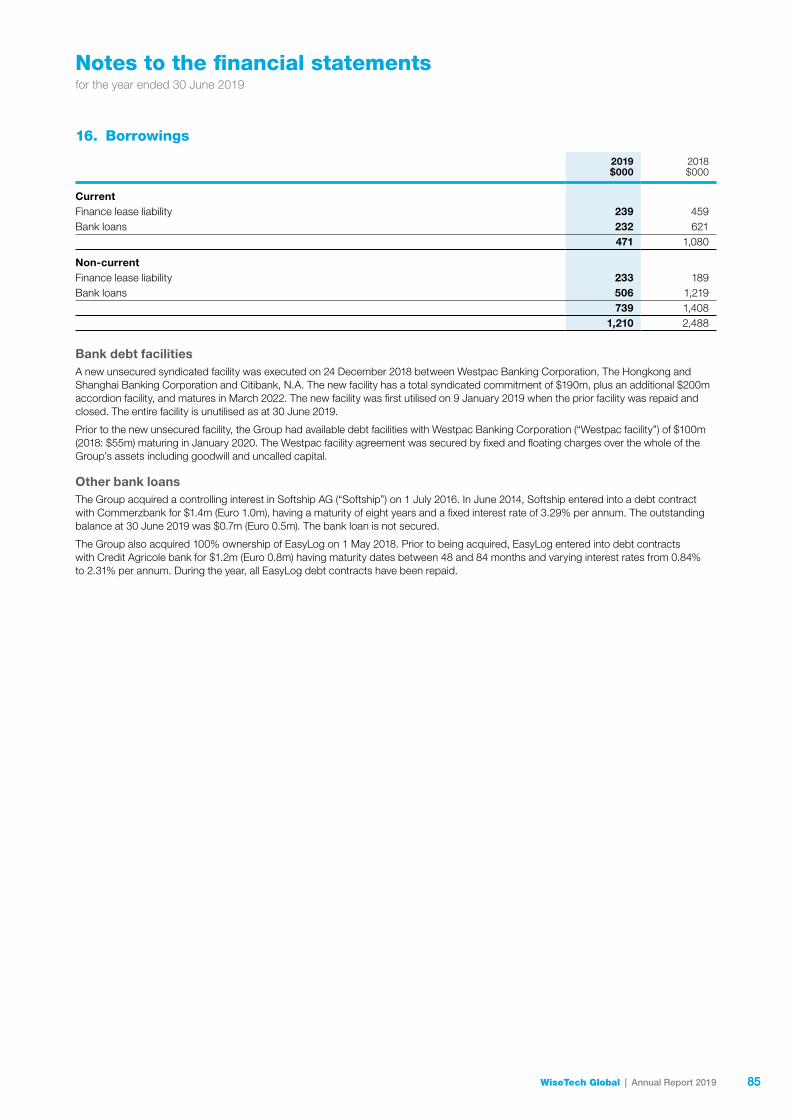
Notes to the financial statementsfor the year ended 30 June 2019
16. Borrowings
2019 $000
2018 $000
CurrentFinance lease liability 239 459Bank loans 232 621
471 1,080
Non-currentFinance lease liability 233 189Bank loans 506 1,219
739 1,4081,210 2,488
Bank debt facilitiesA new unsecured syndicated facility was executed on 24 December 2018 between Westpac Banking Corporation, The Hongkong and Shanghai Banking Corporation and Citibank, N.A. The new facility has a total syndicated commitment of $190m, plus an additional $200m accordion facility, and matures in March 2022. The new facility was first utilised on 9 January 2019 when the prior facility was repaid and closed. The entire facility is unutilised as at 30 June 2019.
Prior to the new unsecured facility, the Group had available debt facilities with Westpac Banking Corporation (“Westpac facility”) of $100m (2018: $55m) maturing in January 2020. The Westpac facility agreement was secured by fixed and floating charges over the whole of the Group’s assets including goodwill and uncalled capital.
Other bank loansThe Group acquired a controlling interest in Softship AG (“Softship”) on 1 July 2016. In June 2014, Softship entered into a debt contract with Commerzbank for $1.4m (Euro 1.0m), having a maturity of eight years and a fixed interest rate of 3.29% per annum. The outstanding balance at 30 June 2019 was $0.7m (Euro 0.5m). The bank loan is not secured.
The Group also acquired 100% ownership of EasyLog on 1 May 2018. Prior to being acquired, EasyLog entered into debt contracts with Credit Agricole bank for $1.2m (Euro 0.8m) having maturity dates between 48 and 84 months and varying interest rates from 0.84% to 2.31% per annum. During the year, all EasyLog debt contracts have been repaid.
85WiseTech Global | Annual Report 2019 85
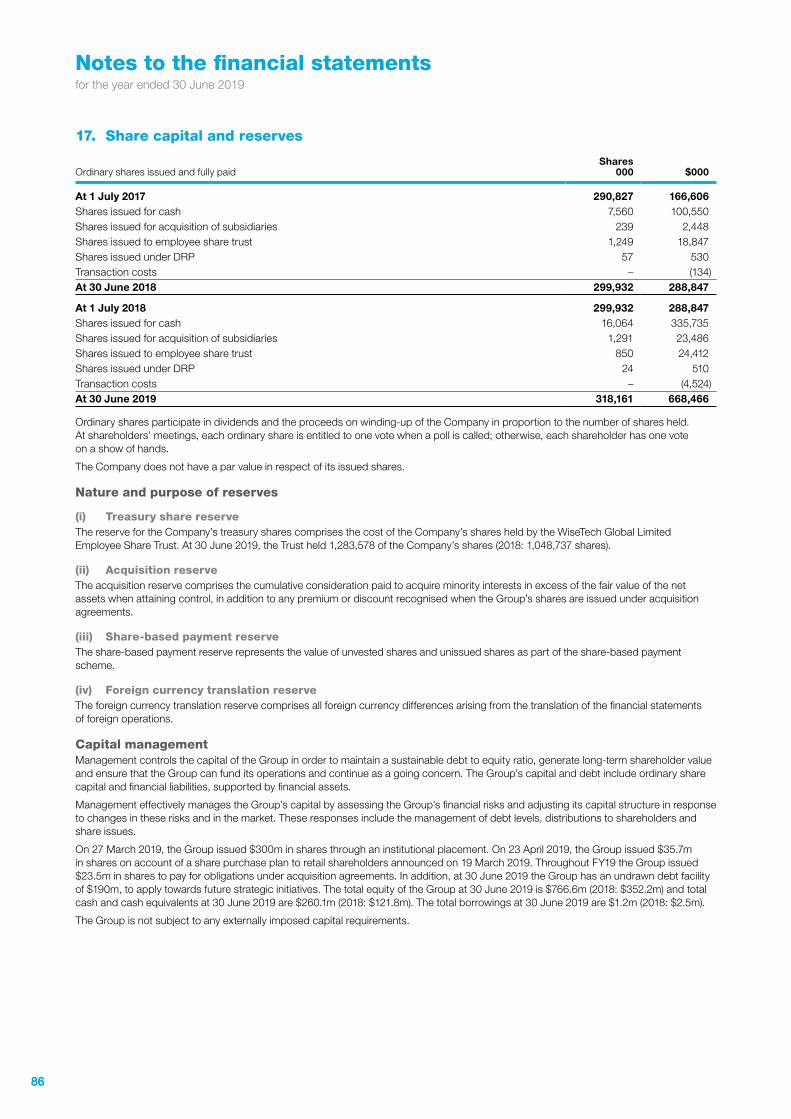
Notes to the financial statementsfor the year ended 30 June 2019
17. Share capital and reserves
Ordinary shares issued and fully paidShares
000 $000
At 1 July 2017 290,827 166,606Shares issued for cash 7,560 100,550Shares issued for acquisition of subsidiaries 239 2,448Shares issued to employee share trust 1,249 18,847Shares issued under DRP 57 530Transaction costs – (134)At 30 June 2018 299,932 288,847
At 1 July 2018 299,932 288,847Shares issued for cash 16,064 335,735Shares issued for acquisition of subsidiaries 1,291 23,486Shares issued to employee share trust 850 24,412Shares issued under DRP 24 510Transaction costs – (4,524)At 30 June 2019 318,161 668,466
Ordinary shares participate in dividends and the proceeds on winding-up of the Company in proportion to the number of shares held. At shareholders’ meetings, each ordinary share is entitled to one vote when a poll is called; otherwise, each shareholder has one vote on a show of hands.
The Company does not have a par value in respect of its issued shares.
Nature and purpose of reserves
(i) Treasury share reserveThe reserve for the Company’s treasury shares comprises the cost of the Company’s shares held by the WiseTech Global Limited Employee Share Trust. At 30 June 2019, the Trust held 1,283,578 of the Company’s shares (2018: 1,048,737 shares).
(ii) Acquisition reserveThe acquisition reserve comprises the cumulative consideration paid to acquire minority interests in excess of the fair value of the net assets when attaining control, in addition to any premium or discount recognised when the Group’s shares are issued under acquisition agreements.
(iii) Share-based payment reserveThe share-based payment reserve represents the value of unvested shares and unissued shares as part of the share-based payment scheme.
(iv) Foreign currency translation reserveThe foreign currency translation reserve comprises all foreign currency differences arising from the translation of the financial statements of foreign operations.
Capital managementManagement controls the capital of the Group in order to maintain a sustainable debt to equity ratio, generate long-term shareholder value and ensure that the Group can fund its operations and continue as a going concern. The Group’s capital and debt include ordinary share capital and financial liabilities, supported by financial assets.
Management effectively manages the Group’s capital by assessing the Group’s financial risks and adjusting its capital structure in response to changes in these risks and in the market. These responses include the management of debt levels, distributions to shareholders and share issues.
On 27 March 2019, the Group issued $300m in shares through an institutional placement. On 23 April 2019, the Group issued $35.7m in shares on account of a share purchase plan to retail shareholders announced on 19 March 2019. Throughout FY19 the Group issued $23.5m in shares to pay for obligations under acquisition agreements. In addition, at 30 June 2019 the Group has an undrawn debt facility of $190m, to apply towards future strategic initiatives. The total equity of the Group at 30 June 2019 is $766.6m (2018: $352.2m) and total cash and cash equivalents at 30 June 2019 are $260.1m (2018: $121.8m). The total borrowings at 30 June 2019 are $1.2m (2018: $2.5m).
The Group is not subject to any externally imposed capital requirements.
8686
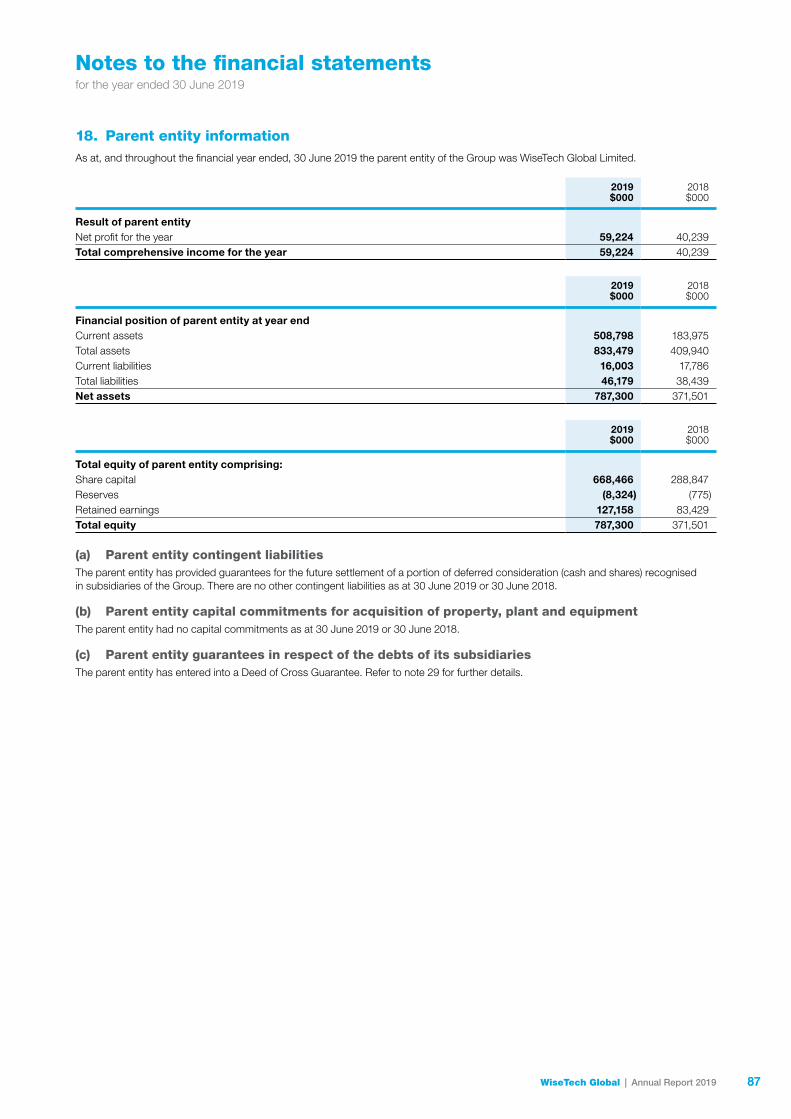
Notes to the financial statementsfor the year ended 30 June 2019
18. Parent entity informationAs at, and throughout the financial year ended, 30 June 2019 the parent entity of the Group was WiseTech Global Limited.
2019 $000
2018 $000
Result of parent entityNet profit for the year 59,224 40,239Total comprehensive income for the year 59,224 40,239
2019$000
2018 $000
Financial position of parent entity at year endCurrent assets 508,798 183,975Total assets 833,479 409,940Current liabilities 16,003 17,786Total liabilities 46,179 38,439Net assets 787,300 371,501
2019 $000
2018 $000
Total equity of parent entity comprising:Share capital 668,466 288,847Reserves (8,324) (775)Retained earnings 127,158 83,429Total equity 787,300 371,501
(a) Parent entity contingent liabilitiesThe parent entity has provided guarantees for the future settlement of a portion of deferred consideration (cash and shares) recognised in subsidiaries of the Group. There are no other contingent liabilities as at 30 June 2019 or 30 June 2018.
(b) Parent entity capital commitments for acquisition of property, plant and equipmentThe parent entity had no capital commitments as at 30 June 2019 or 30 June 2018.
(c) Parent entity guarantees in respect of the debts of its subsidiariesThe parent entity has entered into a Deed of Cross Guarantee. Refer to note 29 for further details.
87WiseTech Global | Annual Report 2019 87
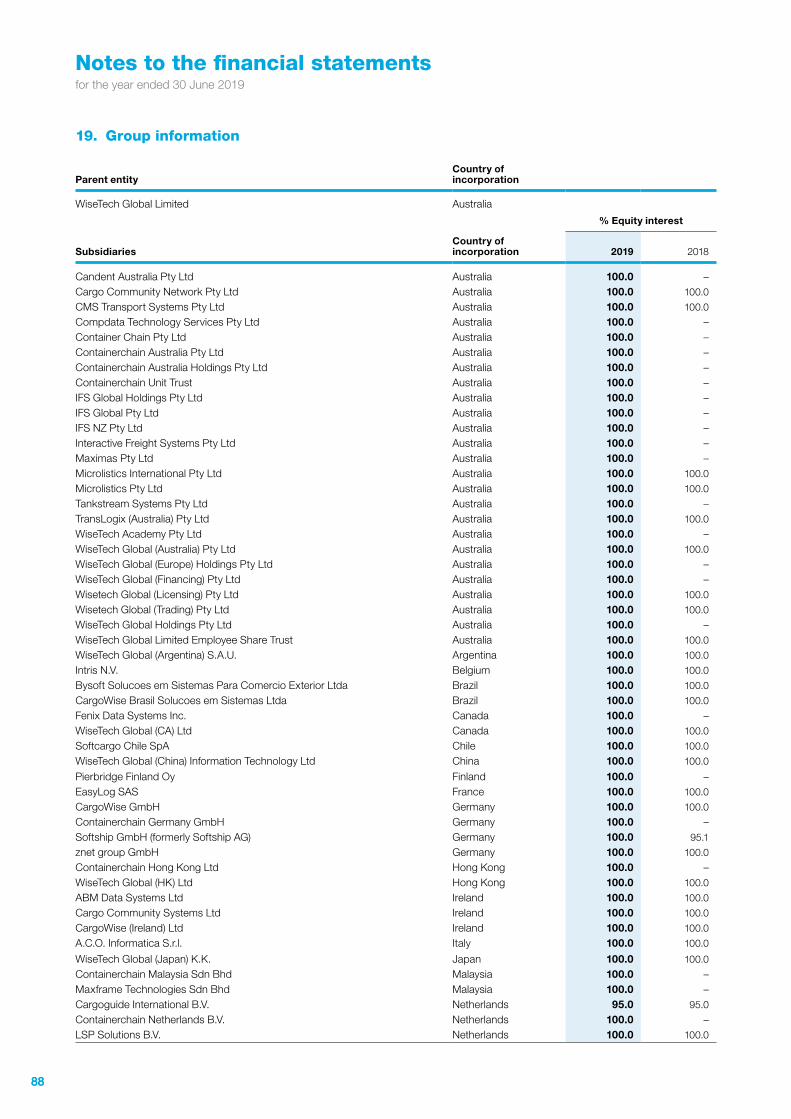
Notes to the financial statementsfor the year ended 30 June 2019
19. Group information
Parent entityCountry of incorporation
WiseTech Global Limited Australia
% Equity interest
SubsidiariesCountry of incorporation 2019 2018
Candent Australia Pty Ltd Australia 100.0 –Cargo Community Network Pty Ltd Australia 100.0 100.0
CMS Transport Systems Pty Ltd Australia 100.0 100.0
Compdata Technology Services Pty Ltd Australia 100.0 –Container Chain Pty Ltd Australia 100.0 –Containerchain Australia Pty Ltd Australia 100.0 –Containerchain Australia Holdings Pty Ltd Australia 100.0 –Containerchain Unit Trust Australia 100.0 –IFS Global Holdings Pty Ltd Australia 100.0 –IFS Global Pty Ltd Australia 100.0 –IFS NZ Pty Ltd Australia 100.0 –Interactive Freight Systems Pty Ltd Australia 100.0 –Maximas Pty Ltd Australia 100.0 –Microlistics International Pty Ltd Australia 100.0 100.0
Microlistics Pty Ltd Australia 100.0 100.0
Tankstream Systems Pty Ltd Australia 100.0 –TransLogix (Australia) Pty Ltd Australia 100.0 100.0
WiseTech Academy Pty Ltd Australia 100.0 –WiseTech Global (Australia) Pty Ltd Australia 100.0 100.0
WiseTech Global (Europe) Holdings Pty Ltd Australia 100.0 –WiseTech Global (Financing) Pty Ltd Australia 100.0 –Wisetech Global (Licensing) Pty Ltd Australia 100.0 100.0
Wisetech Global (Trading) Pty Ltd Australia 100.0 100.0
WiseTech Global Holdings Pty Ltd Australia 100.0 –WiseTech Global Limited Employee Share Trust Australia 100.0 100.0
WiseTech Global (Argentina) S.A.U. Argentina 100.0 100.0
Intris N.V. Belgium 100.0 100.0
Bysoft Solucoes em Sistemas Para Comercio Exterior Ltda Brazil 100.0 100.0
CargoWise Brasil Solucoes em Sistemas Ltda Brazil 100.0 100.0
Fenix Data Systems Inc. Canada 100.0 –WiseTech Global (CA) Ltd Canada 100.0 100.0
Softcargo Chile SpA Chile 100.0 100.0
WiseTech Global (China) Information Technology Ltd China 100.0 100.0
Pierbridge Finland Oy Finland 100.0 –EasyLog SAS France 100.0 100.0
CargoWise GmbH Germany 100.0 100.0
Containerchain Germany GmbH Germany 100.0 –Softship GmbH (formerly Softship AG) Germany 100.0 95.1
znet group GmbH Germany 100.0 100.0
Containerchain Hong Kong Ltd Hong Kong 100.0 –WiseTech Global (HK) Ltd Hong Kong 100.0 100.0
ABM Data Systems Ltd Ireland 100.0 100.0
Cargo Community Systems Ltd Ireland 100.0 100.0
CargoWise (Ireland) Ltd Ireland 100.0 100.0
A.C.O. Informatica S.r.l. Italy 100.0 100.0
WiseTech Global (Japan) K.K. Japan 100.0 100.0
Containerchain Malaysia Sdn Bhd Malaysia 100.0 –Maxframe Technologies Sdn Bhd Malaysia 100.0 –Cargoguide International B.V. Netherlands 95.0 95.0
Containerchain Netherlands B.V. Netherlands 100.0 –LSP Solutions B.V. Netherlands 100.0 100.0
8888
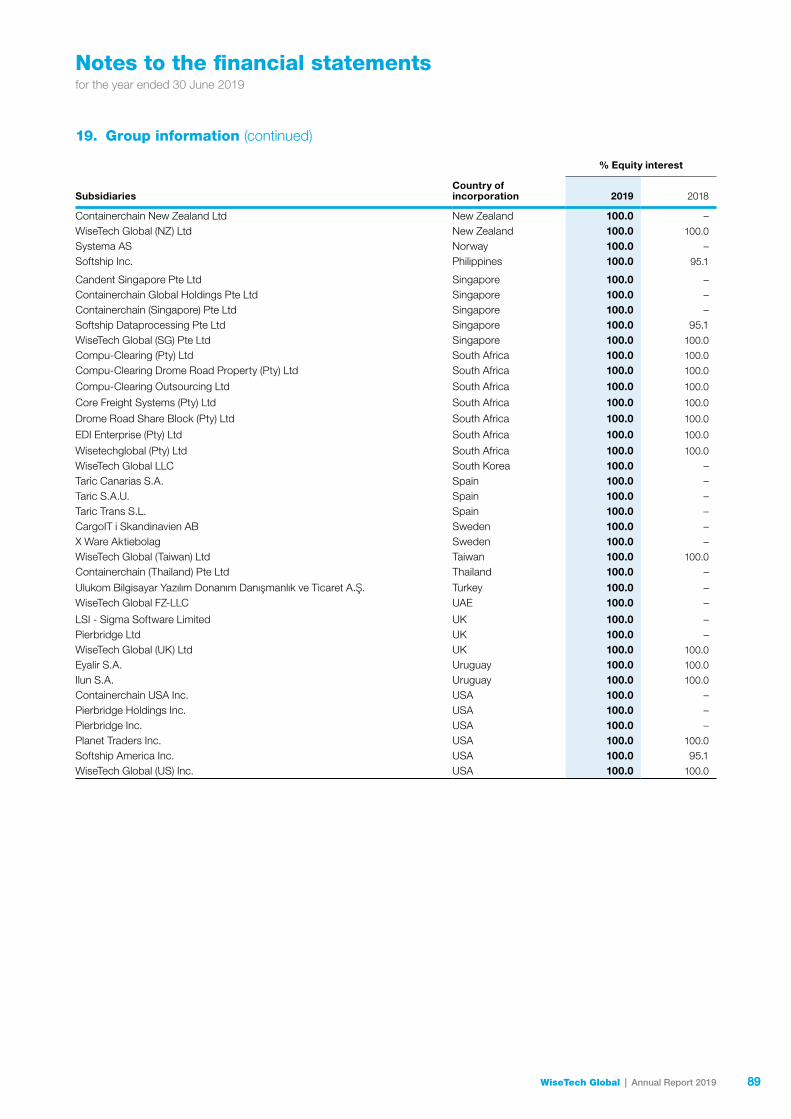
Notes to the financial statementsfor the year ended 30 June 2019
% Equity interest
SubsidiariesCountry of incorporation 2019 2018
Containerchain New Zealand Ltd New Zealand 100.0 –WiseTech Global (NZ) Ltd New Zealand 100.0 100.0
Systema AS Norway 100.0 –Softship Inc. Philippines 100.0 95.1
Candent Singapore Pte Ltd Singapore 100.0 –Containerchain Global Holdings Pte Ltd Singapore 100.0 –Containerchain (Singapore) Pte Ltd Singapore 100.0 –Softship Dataprocessing Pte Ltd Singapore 100.0 95.1WiseTech Global (SG) Pte Ltd Singapore 100.0 100.0
Compu-Clearing (Pty) Ltd South Africa 100.0 100.0
Compu-Clearing Drome Road Property (Pty) Ltd South Africa 100.0 100.0
Compu-Clearing Outsourcing Ltd South Africa 100.0 100.0
Core Freight Systems (Pty) Ltd South Africa 100.0 100.0
Drome Road Share Block (Pty) Ltd South Africa 100.0 100.0
EDI Enterprise (Pty) Ltd South Africa 100.0 100.0
Wisetechglobal (Pty) Ltd South Africa 100.0 100.0
WiseTech Global LLC South Korea 100.0 –Taric Canarias S.A. Spain 100.0 –Taric S.A.U. Spain 100.0 –Taric Trans S.L. Spain 100.0 –CargoIT i Skandinavien AB Sweden 100.0 –X Ware Aktiebolag Sweden 100.0 –WiseTech Global (Taiwan) Ltd Taiwan 100.0 100.0
Containerchain (Thailand) Pte Ltd Thailand 100.0 –
Ulukom Bilgisayar Yazılım Donanım Danışmanlık ve Ticaret A.Ş. Turkey 100.0 –WiseTech Global FZ-LLC UAE 100.0 –
LSI - Sigma Software Limited UK 100.0 –Pierbridge Ltd UK 100.0 –WiseTech Global (UK) Ltd UK 100.0 100.0
Eyalir S.A. Uruguay 100.0 100.0
Ilun S.A. Uruguay 100.0 100.0
Containerchain USA Inc. USA 100.0 –Pierbridge Holdings Inc. USA 100.0 –Pierbridge Inc. USA 100.0 –Planet Traders Inc. USA 100.0 100.0
Softship America Inc. USA 100.0 95.1WiseTech Global (US) Inc. USA 100.0 100.0
19. Group information (continued)
89WiseTech Global | Annual Report 2019 89
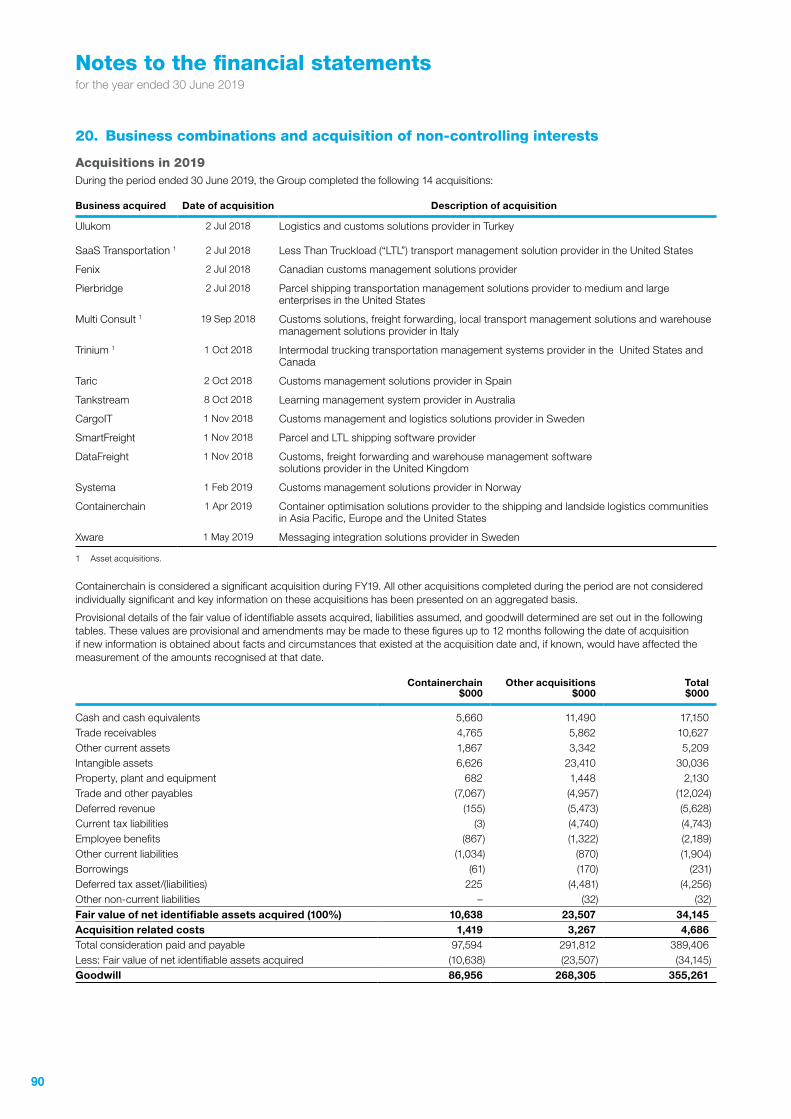
Notes to the financial statementsfor the year ended 30 June 2019
20. Business combinations and acquisition of non-controlling interests
Acquisitions in 2019During the period ended 30 June 2019, the Group completed the following 14 acquisitions:
Business acquired Date of acquisition Description of acquisition
Ulukom 2 Jul 2018 Logistics and customs solutions provider in Turkey
SaaS Transportation 1 2 Jul 2018 Less Than Truckload (“LTL”) transport management solution provider in the United States
Fenix 2 Jul 2018 Canadian customs management solutions provider
Pierbridge 2 Jul 2018 Parcel shipping transportation management solutions provider to medium and large enterprises in the United States
Multi Consult 1 19 Sep 2018 Customs solutions, freight forwarding, local transport management solutions and warehouse management solutions provider in Italy
Trinium 1 1 Oct 2018 Intermodal trucking transportation management systems provider in the United States and Canada
Taric 2 Oct 2018 Customs management solutions provider in Spain
Tankstream 8 Oct 2018 Learning management system provider in Australia
CargoIT 1 Nov 2018 Customs management and logistics solutions provider in Sweden
SmartFreight 1 Nov 2018 Parcel and LTL shipping software provider
DataFreight 1 Nov 2018 Customs, freight forwarding and warehouse management softwaresolutions provider in the United Kingdom
Systema 1 Feb 2019 Customs management solutions provider in Norway
Containerchain 1 Apr 2019 Container optimisation solutions provider to the shipping and landside logistics communities in Asia Pacific, Europe and the United States
Xware 1 May 2019 Messaging integration solutions provider in Sweden
1 Asset acquisitions.
Containerchain is considered a significant acquisition during FY19. All other acquisitions completed during the period are not considered individually significant and key information on these acquisitions has been presented on an aggregated basis.
Provisional details of the fair value of identifiable assets acquired, liabilities assumed, and goodwill determined are set out in the following tables. These values are provisional and amendments may be made to these figures up to 12 months following the date of acquisition if new information is obtained about facts and circumstances that existed at the acquisition date and, if known, would have affected the measurement of the amounts recognised at that date.
Containerchain $000
Other acquisitions$000
Total$000
Cash and cash equivalents 5,660 11,490 17,150Trade receivables 4,765 5,862 10,627Other current assets 1,867 3,342 5,209Intangible assets 6,626 23,410 30,036Property, plant and equipment 682 1,448 2,130Trade and other payables (7,067) (4,957) (12,024)Deferred revenue (155) (5,473) (5,628)Current tax liabilities (3) (4,740) (4,743)Employee benefits (867) (1,322) (2,189)Other current liabilities (1,034) (870) (1,904)Borrowings (61) (170) (231)Deferred tax asset/(liabilities) 225 (4,481) (4,256)Other non-current liabilities – (32) (32)Fair value of net identifiable assets acquired (100%) 10,638 23,507 34,145Acquisition related costs 1,419 3,267 4,686Total consideration paid and payable 97,594 291,812 389,406Less: Fair value of net identifiable assets acquired (10,638) (23,507) (34,145)Goodwill 86,956 268,305 355,261
9090
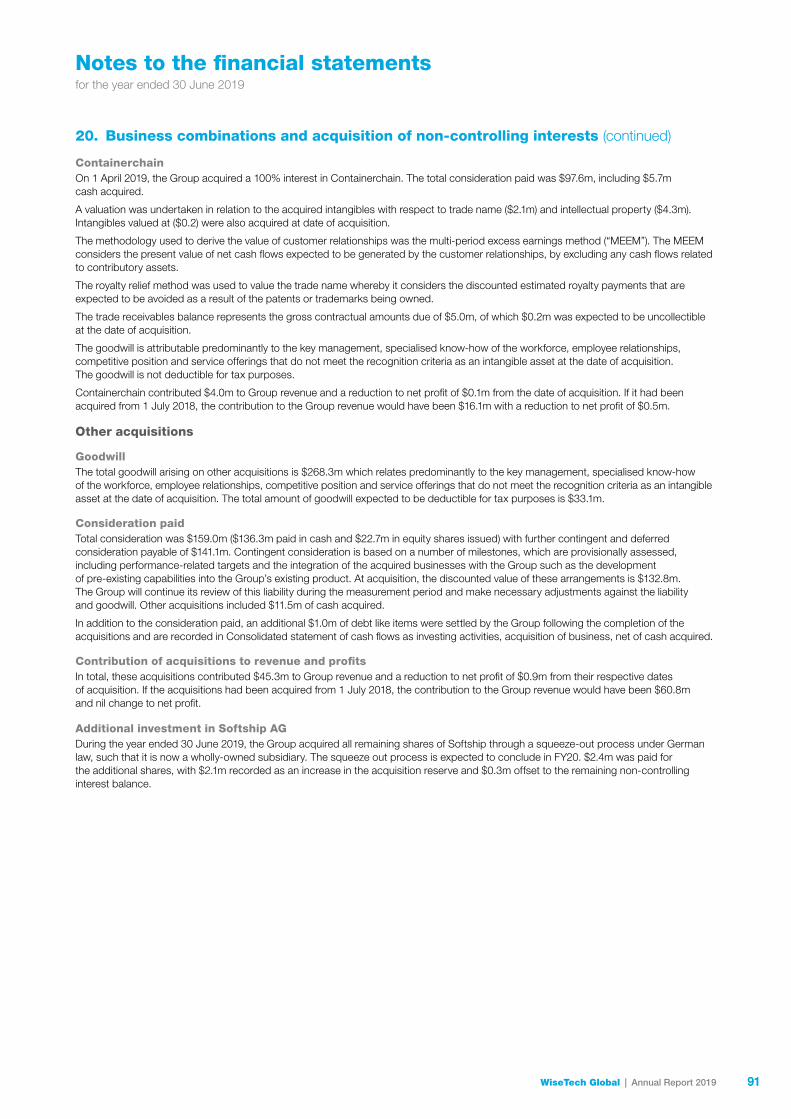
Notes to the financial statementsfor the year ended 30 June 2019
ContainerchainOn 1 April 2019, the Group acquired a 100% interest in Containerchain. The total consideration paid was $97.6m, including $5.7m cash acquired.
A valuation was undertaken in relation to the acquired intangibles with respect to trade name ($2.1m) and intellectual property ($4.3m). Intangibles valued at ($0.2) were also acquired at date of acquisition.
The methodology used to derive the value of customer relationships was the multi-period excess earnings method (“MEEM”). The MEEM considers the present value of net cash flows expected to be generated by the customer relationships, by excluding any cash flows related to contributory assets.
The royalty relief method was used to value the trade name whereby it considers the discounted estimated royalty payments that are expected to be avoided as a result of the patents or trademarks being owned.
The trade receivables balance represents the gross contractual amounts due of $5.0m, of which $0.2m was expected to be uncollectible at the date of acquisition.
The goodwill is attributable predominantly to the key management, specialised know-how of the workforce, employee relationships, competitive position and service offerings that do not meet the recognition criteria as an intangible asset at the date of acquisition. The goodwill is not deductible for tax purposes.
Containerchain contributed $4.0m to Group revenue and a reduction to net profit of $0.1m from the date of acquisition. If it had been acquired from 1 July 2018, the contribution to the Group revenue would have been $16.1m with a reduction to net profit of $0.5m.
Other acquisitions
GoodwillThe total goodwill arising on other acquisitions is $268.3m which relates predominantly to the key management, specialised know-how of the workforce, employee relationships, competitive position and service offerings that do not meet the recognition criteria as an intangible asset at the date of acquisition. The total amount of goodwill expected to be deductible for tax purposes is $33.1m.
Consideration paidTotal consideration was $159.0m ($136.3m paid in cash and $22.7m in equity shares issued) with further contingent and deferred consideration payable of $141.1m. Contingent consideration is based on a number of milestones, which are provisionally assessed, including performance-related targets and the integration of the acquired businesses with the Group such as the development of pre-existing capabilities into the Group’s existing product. At acquisition, the discounted value of these arrangements is $132.8m. The Group will continue its review of this liability during the measurement period and make necessary adjustments against the liability and goodwill. Other acquisitions included $11.5m of cash acquired.
In addition to the consideration paid, an additional $1.0m of debt like items were settled by the Group following the completion of the acquisitions and are recorded in Consolidated statement of cash flows as investing activities, acquisition of business, net of cash acquired.
Contribution of acquisitions to revenue and profitsIn total, these acquisitions contributed $45.3m to Group revenue and a reduction to net profit of $0.9m from their respective dates of acquisition. If the acquisitions had been acquired from 1 July 2018, the contribution to the Group revenue would have been $60.8m and nil change to net profit.
Additional investment in Softship AGDuring the year ended 30 June 2019, the Group acquired all remaining shares of Softship through a squeeze-out process under German law, such that it is now a wholly-owned subsidiary. The squeeze out process is expected to conclude in FY20. $2.4m was paid for the additional shares, with $2.1m recorded as an increase in the acquisition reserve and $0.3m offset to the remaining non-controlling interest balance.
20. Business combinations and acquisition of non-controlling interests (continued)
91WiseTech Global | Annual Report 2019 91
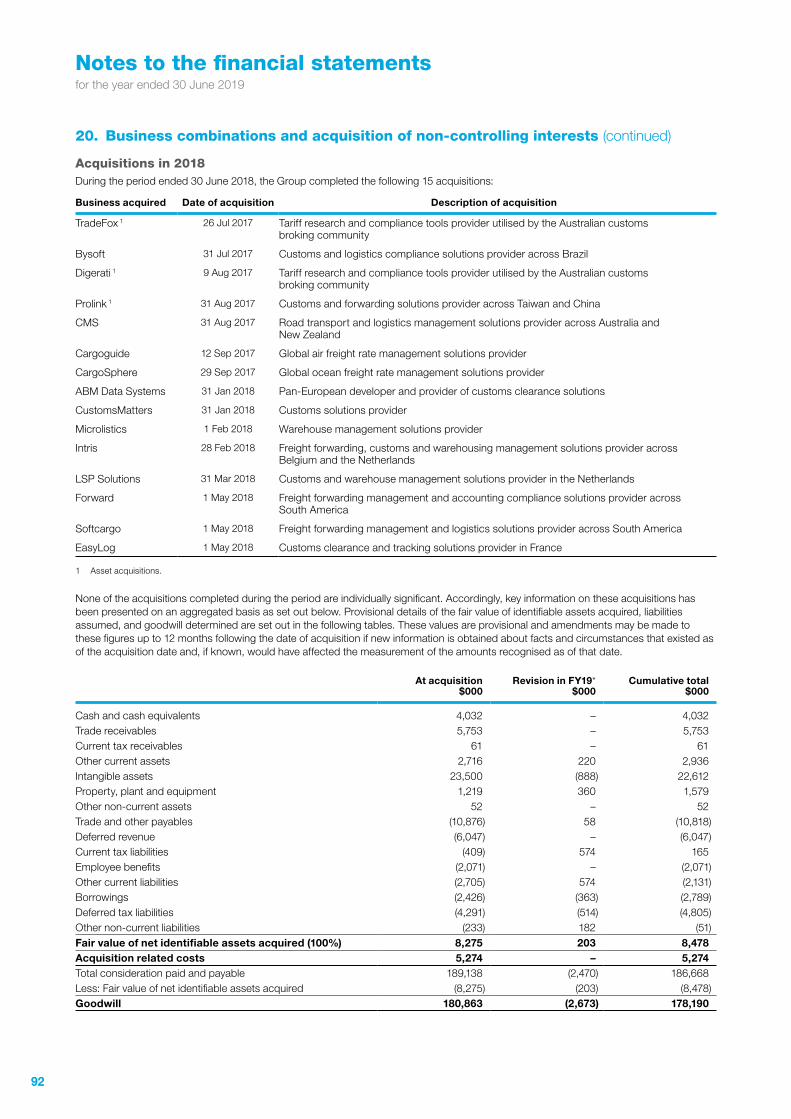
Notes to the financial statementsfor the year ended 30 June 2019
Acquisitions in 2018During the period ended 30 June 2018, the Group completed the following 15 acquisitions:
Business acquired Date of acquisition Description of acquisition
TradeFox 1 26 Jul 2017 Tariff research and compliance tools provider utilised by the Australian customs broking community
Bysoft 31 Jul 2017 Customs and logistics compliance solutions provider across Brazil
Digerati 1 9 Aug 2017 Tariff research and compliance tools provider utilised by the Australian customs broking community
Prolink 1 31 Aug 2017 Customs and forwarding solutions provider across Taiwan and China
CMS 31 Aug 2017 Road transport and logistics management solutions provider across Australia and New Zealand
Cargoguide 12 Sep 2017 Global air freight rate management solutions provider
CargoSphere 29 Sep 2017 Global ocean freight rate management solutions provider
ABM Data Systems 31 Jan 2018 Pan-European developer and provider of customs clearance solutions
CustomsMatters 31 Jan 2018 Customs solutions provider
Microlistics 1 Feb 2018 Warehouse management solutions provider
Intris 28 Feb 2018 Freight forwarding, customs and warehousing management solutions provider across Belgium and the Netherlands
LSP Solutions 31 Mar 2018 Customs and warehouse management solutions provider in the Netherlands
Forward 1 May 2018 Freight forwarding management and accounting compliance solutions provider across South America
Softcargo 1 May 2018 Freight forwarding management and logistics solutions provider across South America
EasyLog 1 May 2018 Customs clearance and tracking solutions provider in France
1 Asset acquisitions.
None of the acquisitions completed during the period are individually significant. Accordingly, key information on these acquisitions has been presented on an aggregated basis as set out below. Provisional details of the fair value of identifiable assets acquired, liabilities assumed, and goodwill determined are set out in the following tables. These values are provisional and amendments may be made to these figures up to 12 months following the date of acquisition if new information is obtained about facts and circumstances that existed as of the acquisition date and, if known, would have affected the measurement of the amounts recognised as of that date.
At acquisition $000
Revision in FY19*$000
Cumulative total$000
Cash and cash equivalents 4,032 – 4,032Trade receivables 5,753 – 5,753Current tax receivables 61 – 61Other current assets 2,716 220 2,936Intangible assets 23,500 (888) 22,612Property, plant and equipment 1,219 360 1,579Other non-current assets 52 – 52Trade and other payables (10,876) 58 (10,818)Deferred revenue (6,047) – (6,047)Current tax liabilities (409) 574 165Employee benefits (2,071) – (2,071)Other current liabilities (2,705) 574 (2,131)Borrowings (2,426) (363) (2,789)Deferred tax liabilities (4,291) (514) (4,805)Other non-current liabilities (233) 182 (51)Fair value of net identifiable assets acquired (100%) 8,275 203 8,478Acquisition related costs 5,274 – 5,274Total consideration paid and payable 189,138 (2,470) 186,668Less: Fair value of net identifiable assets acquired (8,275) (203) (8,478)Goodwill 180,863 (2,673) 178,190
20. Business combinations and acquisition of non-controlling interests (continued)
9292
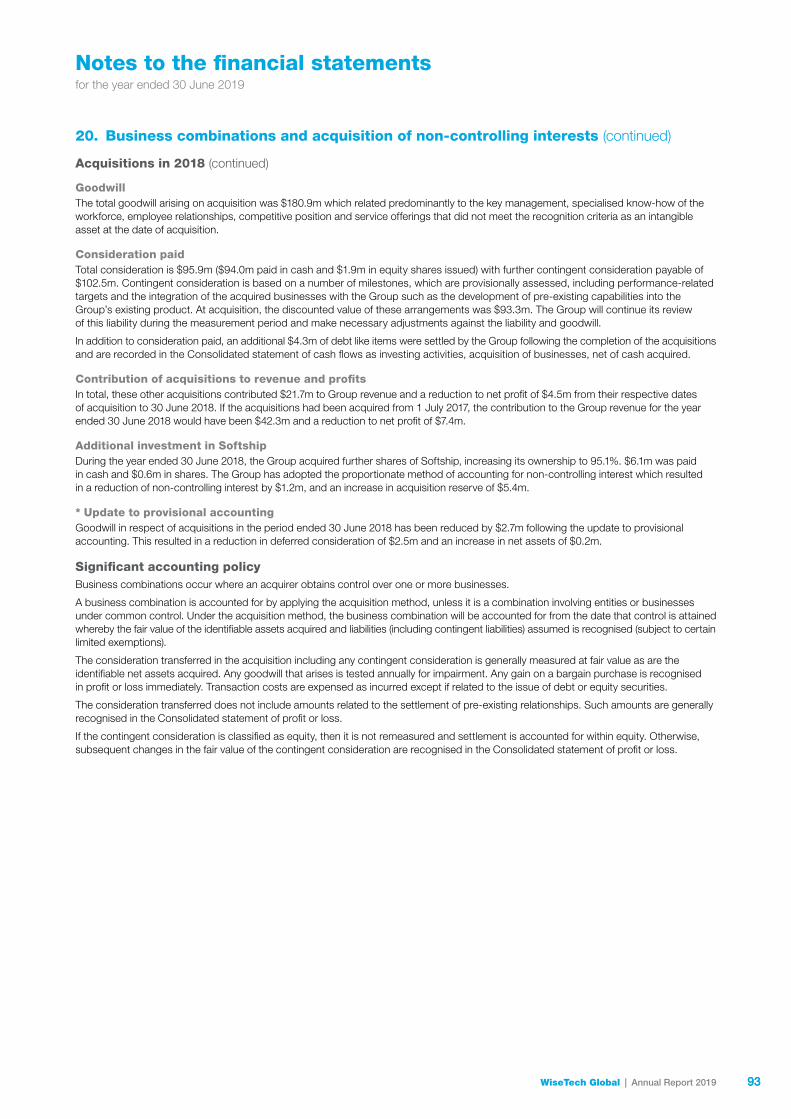
Notes to the financial statementsfor the year ended 30 June 2019
Acquisitions in 2018 (continued)
GoodwillThe total goodwill arising on acquisition was $180.9m which related predominantly to the key management, specialised know-how of the workforce, employee relationships, competitive position and service offerings that did not meet the recognition criteria as an intangible asset at the date of acquisition.
Consideration paidTotal consideration is $95.9m ($94.0m paid in cash and $1.9m in equity shares issued) with further contingent consideration payable of $102.5m. Contingent consideration is based on a number of milestones, which are provisionally assessed, including performance-related targets and the integration of the acquired businesses with the Group such as the development of pre-existing capabilities into the Group’s existing product. At acquisition, the discounted value of these arrangements was $93.3m. The Group will continue its review of this liability during the measurement period and make necessary adjustments against the liability and goodwill.
In addition to consideration paid, an additional $4.3m of debt like items were settled by the Group following the completion of the acquisitions and are recorded in the Consolidated statement of cash flows as investing activities, acquisition of businesses, net of cash acquired.
Contribution of acquisitions to revenue and profitsIn total, these other acquisitions contributed $21.7m to Group revenue and a reduction to net profit of $4.5m from their respective dates of acquisition to 30 June 2018. If the acquisitions had been acquired from 1 July 2017, the contribution to the Group revenue for the year ended 30 June 2018 would have been $42.3m and a reduction to net profit of $7.4m.
Additional investment in SoftshipDuring the year ended 30 June 2018, the Group acquired further shares of Softship, increasing its ownership to 95.1%. $6.1m was paid in cash and $0.6m in shares. The Group has adopted the proportionate method of accounting for non-controlling interest which resulted in a reduction of non-controlling interest by $1.2m, and an increase in acquisition reserve of $5.4m.
* Update to provisional accountingGoodwill in respect of acquisitions in the period ended 30 June 2018 has been reduced by $2.7m following the update to provisional accounting. This resulted in a reduction in deferred consideration of $2.5m and an increase in net assets of $0.2m.
Significant accounting policyBusiness combinations occur where an acquirer obtains control over one or more businesses.
A business combination is accounted for by applying the acquisition method, unless it is a combination involving entities or businesses under common control. Under the acquisition method, the business combination will be accounted for from the date that control is attained whereby the fair value of the identifiable assets acquired and liabilities (including contingent liabilities) assumed is recognised (subject to certain limited exemptions).
The consideration transferred in the acquisition including any contingent consideration is generally measured at fair value as are the identifiable net assets acquired. Any goodwill that arises is tested annually for impairment. Any gain on a bargain purchase is recognised in profit or loss immediately. Transaction costs are expensed as incurred except if related to the issue of debt or equity securities.
The consideration transferred does not include amounts related to the settlement of pre-existing relationships. Such amounts are generally recognised in the Consolidated statement of profit or loss.
If the contingent consideration is classified as equity, then it is not remeasured and settlement is accounted for within equity. Otherwise, subsequent changes in the fair value of the contingent consideration are recognised in the Consolidated statement of profit or loss.
20. Business combinations and acquisition of non-controlling interests (continued)
93WiseTech Global | Annual Report 2019 93
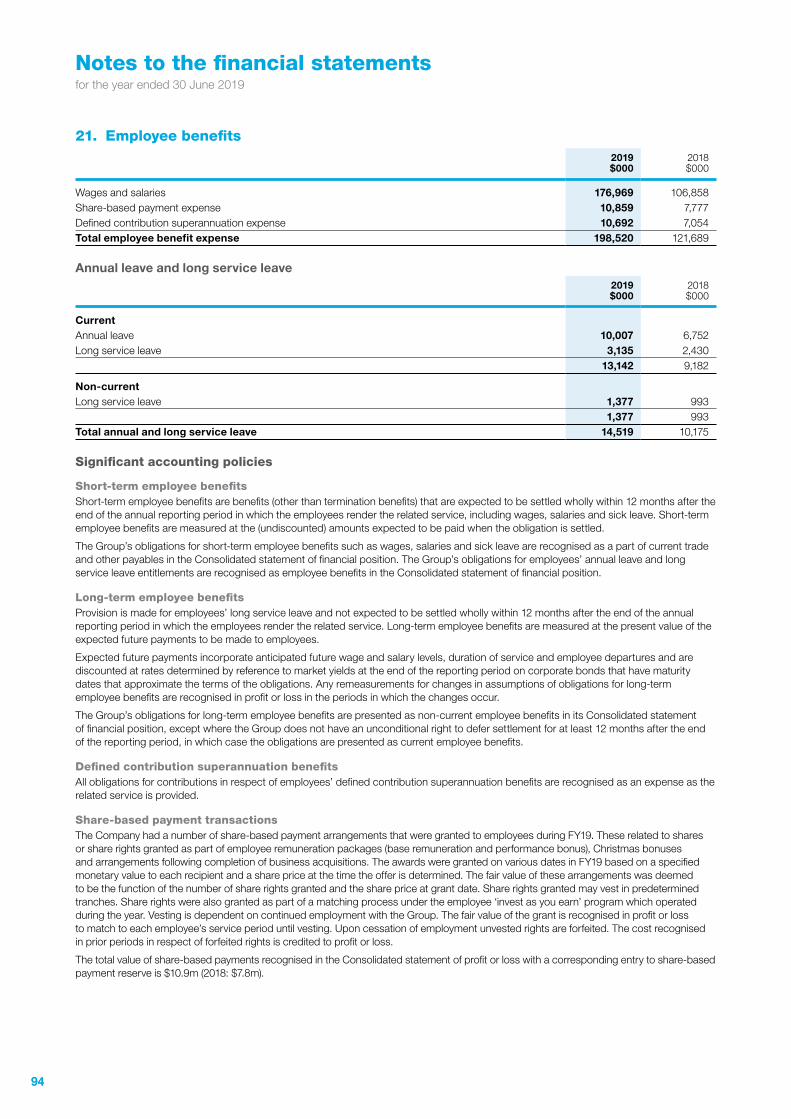
Notes to the financial statementsfor the year ended 30 June 2019
21. Employee benefits2019 $000
2018 $000
Wages and salaries 176,969 106,858Share-based payment expense 10,859 7,777Defined contribution superannuation expense 10,692 7,054Total employee benefit expense 198,520 121,689
Annual leave and long service leave2019 $000
2018 $000
CurrentAnnual leave 10,007 6,752Long service leave 3,135 2,430
13,142 9,182
Non-currentLong service leave 1,377 993
1,377 993Total annual and long service leave 14,519 10,175
Significant accounting policies
Short-term employee benefitsShort-term employee benefits are benefits (other than termination benefits) that are expected to be settled wholly within 12 months after the end of the annual reporting period in which the employees render the related service, including wages, salaries and sick leave. Short-term employee benefits are measured at the (undiscounted) amounts expected to be paid when the obligation is settled.
The Group’s obligations for short-term employee benefits such as wages, salaries and sick leave are recognised as a part of current trade and other payables in the Consolidated statement of financial position. The Group’s obligations for employees’ annual leave and long service leave entitlements are recognised as employee benefits in the Consolidated statement of financial position.
Long-term employee benefitsProvision is made for employees’ long service leave and not expected to be settled wholly within 12 months after the end of the annual reporting period in which the employees render the related service. Long-term employee benefits are measured at the present value of the expected future payments to be made to employees.
Expected future payments incorporate anticipated future wage and salary levels, duration of service and employee departures and are discounted at rates determined by reference to market yields at the end of the reporting period on corporate bonds that have maturity dates that approximate the terms of the obligations. Any remeasurements for changes in assumptions of obligations for long-term employee benefits are recognised in profit or loss in the periods in which the changes occur.
The Group’s obligations for long-term employee benefits are presented as non-current employee benefits in its Consolidated statement of financial position, except where the Group does not have an unconditional right to defer settlement for at least 12 months after the end of the reporting period, in which case the obligations are presented as current employee benefits.
Defined contribution superannuation benefitsAll obligations for contributions in respect of employees’ defined contribution superannuation benefits are recognised as an expense as the related service is provided.
Share-based payment transactionsThe Company had a number of share-based payment arrangements that were granted to employees during FY19. These related to shares or share rights granted as part of employee remuneration packages (base remuneration and performance bonus), Christmas bonuses and arrangements following completion of business acquisitions. The awards were granted on various dates in FY19 based on a specified monetary value to each recipient and a share price at the time the offer is determined. The fair value of these arrangements was deemed to be the function of the number of share rights granted and the share price at grant date. Share rights granted may vest in predetermined tranches. Share rights were also granted as part of a matching process under the employee ‘invest as you earn’ program which operated during the year. Vesting is dependent on continued employment with the Group. The fair value of the grant is recognised in profit or loss to match to each employee’s service period until vesting. Upon cessation of employment unvested rights are forfeited. The cost recognised in prior periods in respect of forfeited rights is credited to profit or loss.
The total value of share-based payments recognised in the Consolidated statement of profit or loss with a corresponding entry to share-based payment reserve is $10.9m (2018: $7.8m).
9494
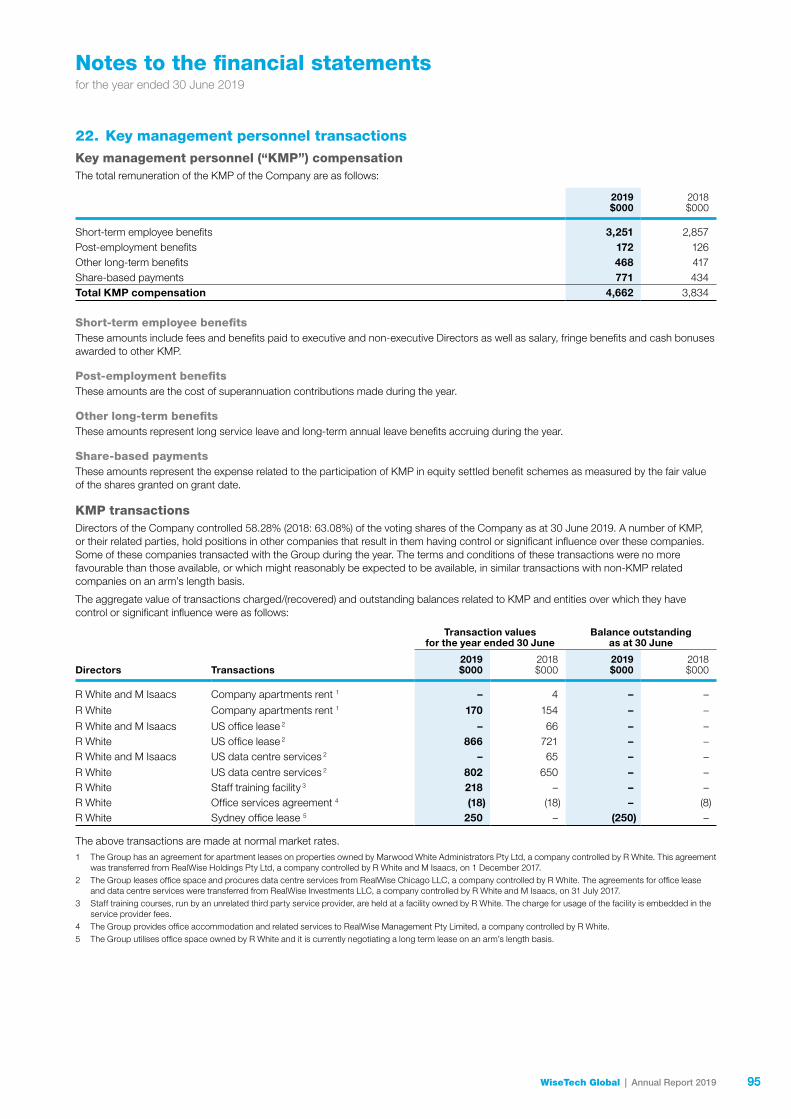
Notes to the financial statementsfor the year ended 30 June 2019
22. Key management personnel transactionsKey management personnel (“KMP”) compensationThe total remuneration of the KMP of the Company are as follows:
2019 $000
2018 $000
Short-term employee benefits 3,251 2,857Post-employment benefits 172 126Other long-term benefits 468 417Share-based payments 771 434Total KMP compensation 4,662 3,834
Short-term employee benefitsThese amounts include fees and benefits paid to executive and non-executive Directors as well as salary, fringe benefits and cash bonuses awarded to other KMP.
Post-employment benefitsThese amounts are the cost of superannuation contributions made during the year.
Other long-term benefitsThese amounts represent long service leave and long-term annual leave benefits accruing during the year.
Share-based paymentsThese amounts represent the expense related to the participation of KMP in equity settled benefit schemes as measured by the fair value of the shares granted on grant date.
KMP transactionsDirectors of the Company controlled 58.28% (2018: 63.08%) of the voting shares of the Company as at 30 June 2019. A number of KMP, or their related parties, hold positions in other companies that result in them having control or significant influence over these companies. Some of these companies transacted with the Group during the year. The terms and conditions of these transactions were no more favourable than those available, or which might reasonably be expected to be available, in similar transactions with non-KMP related companies on an arm’s length basis.
The aggregate value of transactions charged/(recovered) and outstanding balances related to KMP and entities over which they have control or significant influence were as follows:
Transaction values for the year ended 30 June
Balance outstandingas at 30 June
Directors Transactions2019$000
2018$000
2019$000
2018$000
R White and M Isaacs Company apartments rent 1 – 4 – –
R White Company apartments rent 1 170 154 – –
R White and M Isaacs US office lease 2 – 66 – –R White US office lease 2 866 721 – –R White and M Isaacs US data centre services 2 – 65 – –
R White US data centre services 2 802 650 – –R White Staff training facility 3 218 – – –R White Office services agreement 4 (18) (18) – (8)R White Sydney office lease 5 250 – (250) –
The above transactions are made at normal market rates.1 The Group has an agreement for apartment leases on properties owned by Marwood White Administrators Pty Ltd, a company controlled by R White. This agreement
was transferred from RealWise Holdings Pty Ltd, a company controlled by R White and M Isaacs, on 1 December 2017.2 The Group leases office space and procures data centre services from RealWise Chicago LLC, a company controlled by R White. The agreements for office lease
and data centre services were transferred from RealWise Investments LLC, a company controlled by R White and M Isaacs, on 31 July 2017.3 Staff training courses, run by an unrelated third party service provider, are held at a facility owned by R White. The charge for usage of the facility is embedded in the
service provider fees.4 The Group provides office accommodation and related services to RealWise Management Pty Limited, a company controlled by R White.5 The Group utilises office space owned by R White and it is currently negotiating a long term lease on an arm’s length basis.
95WiseTech Global | Annual Report 2019 95
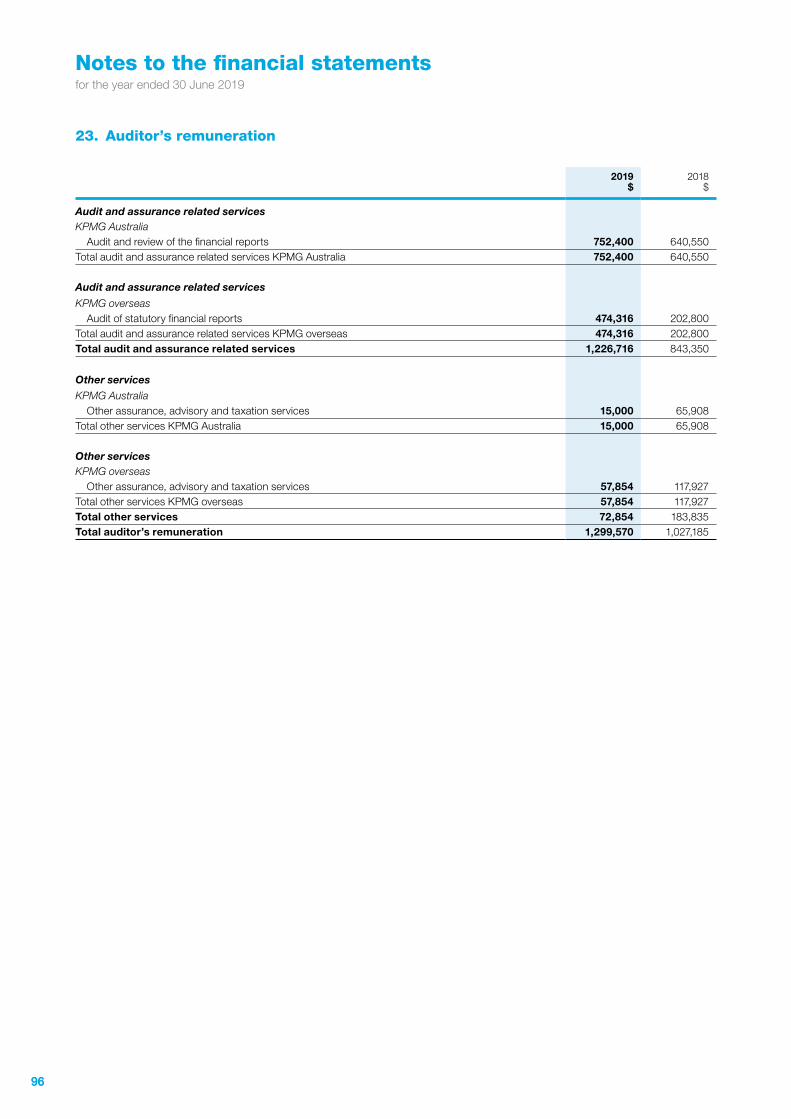
Notes to the financial statementsfor the year ended 30 June 2019
23. Auditor’s remuneration
2019 $
2018 $
Audit and assurance related servicesKPMG Australia
Audit and review of the financial reports 752,400 640,550Total audit and assurance related services KPMG Australia 752,400 640,550
Audit and assurance related services
KPMG overseasAudit of statutory financial reports 474,316 202,800
Total audit and assurance related services KPMG overseas 474,316 202,800Total audit and assurance related services 1,226,716 843,350
Other services
KPMG AustraliaOther assurance, advisory and taxation services 15,000 65,908
Total other services KPMG Australia 15,000 65,908
Other servicesKPMG overseas
Other assurance, advisory and taxation services 57,854 117,927Total other services KPMG overseas 57,854 117,927Total other services 72,854 183,835Total auditor’s remuneration 1,299,570 1,027,185
9696
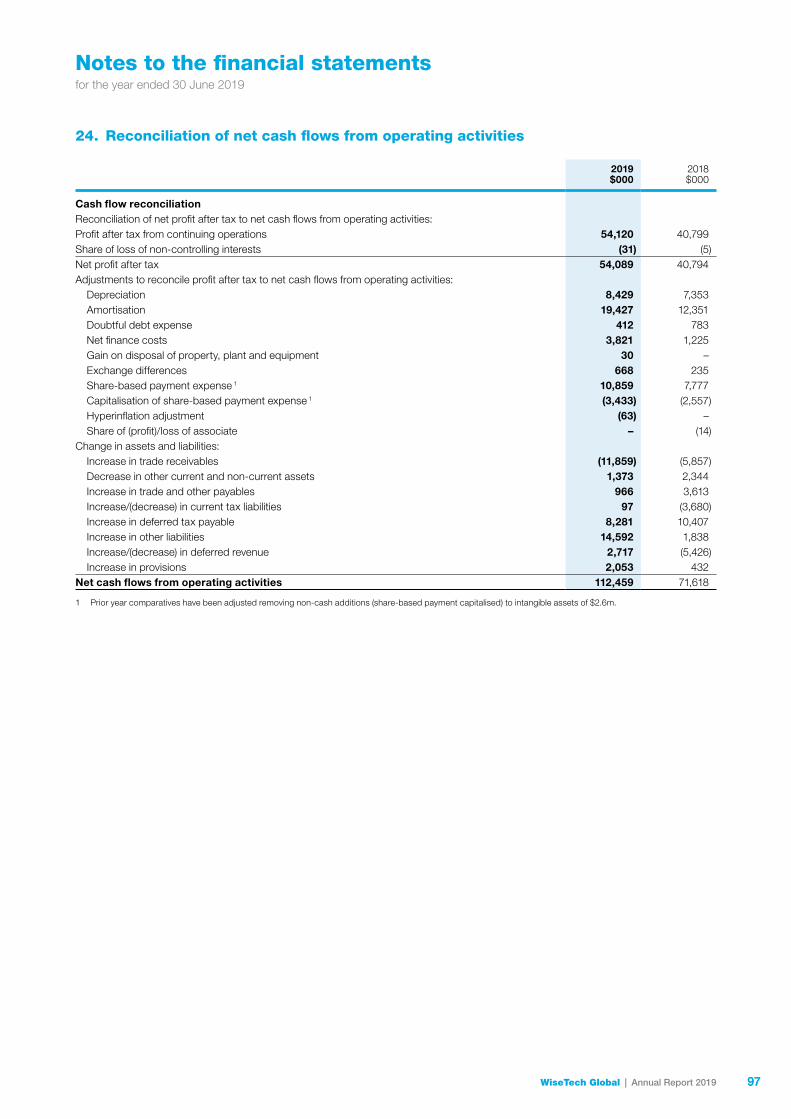
Notes to the financial statementsfor the year ended 30 June 2019
24. Reconciliation of net cash flows from operating activities
2019 $000
2018$000
Cash flow reconciliationReconciliation of net profit after tax to net cash flows from operating activities:Profit after tax from continuing operations 54,120 40,799Share of loss of non-controlling interests (31) (5)Net profit after tax 54,089 40,794Adjustments to reconcile profit after tax to net cash flows from operating activities:
Depreciation 8,429 7,353Amortisation 19,427 12,351Doubtful debt expense 412 783Net finance costs 3,821 1,225Gain on disposal of property, plant and equipment 30 –Exchange differences 668 235Share-based payment expense 1 10,859 7,777Capitalisation of share-based payment expense 1 (3,433) (2,557)Hyperinflation adjustment (63) –Share of (profit)/loss of associate – (14)
Change in assets and liabilities:Increase in trade receivables (11,859) (5,857)Decrease in other current and non-current assets 1,373 2,344Increase in trade and other payables 966 3,613Increase/(decrease) in current tax liabilities 97 (3,680)Increase in deferred tax payable 8,281 10,407Increase in other liabilities 14,592 1,838Increase/(decrease) in deferred revenue 2,717 (5,426)Increase in provisions 2,053 432
Net cash flows from operating activities 112,459 71,618
1 Prior year comparatives have been adjusted removing non-cash additions (share-based payment capitalised) to intangible assets of $2.6m.
97WiseTech Global | Annual Report 2019 97
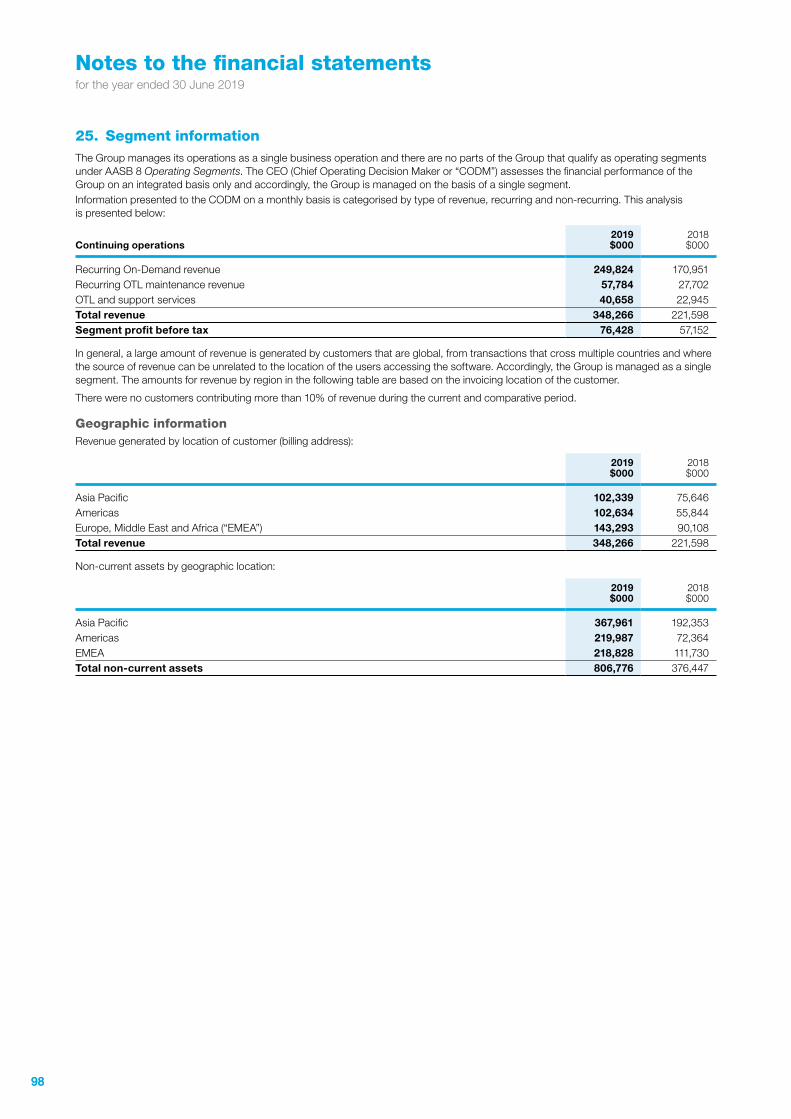
Notes to the financial statementsfor the year ended 30 June 2019
25. Segment informationThe Group manages its operations as a single business operation and there are no parts of the Group that qualify as operating segments under AASB 8 Operating Segments. The CEO (Chief Operating Decision Maker or “CODM”) assesses the financial performance of the Group on an integrated basis only and accordingly, the Group is managed on the basis of a single segment.Information presented to the CODM on a monthly basis is categorised by type of revenue, recurring and non-recurring. This analysis is presented below:
Continuing operations2019 $000
2018 $000
Recurring On-Demand revenue 249,824 170,951Recurring OTL maintenance revenue 57,784 27,702OTL and support services 40,658 22,945Total revenue 348,266 221,598Segment profit before tax 76,428 57,152
In general, a large amount of revenue is generated by customers that are global, from transactions that cross multiple countries and where the source of revenue can be unrelated to the location of the users accessing the software. Accordingly, the Group is managed as a single segment. The amounts for revenue by region in the following table are based on the invoicing location of the customer.
There were no customers contributing more than 10% of revenue during the current and comparative period.
Geographic informationRevenue generated by location of customer (billing address):
2019 $000
2018 $000
Asia Pacific 102,339 75,646Americas 102,634 55,844Europe, Middle East and Africa (“EMEA”) 143,293 90,108Total revenue 348,266 221,598
Non-current assets by geographic location:
2019 $000
2018 $000
Asia Pacific 367,961 192,353Americas 219,987 72,364EMEA 218,828 111,730Total non-current assets 806,776 376,447
9898
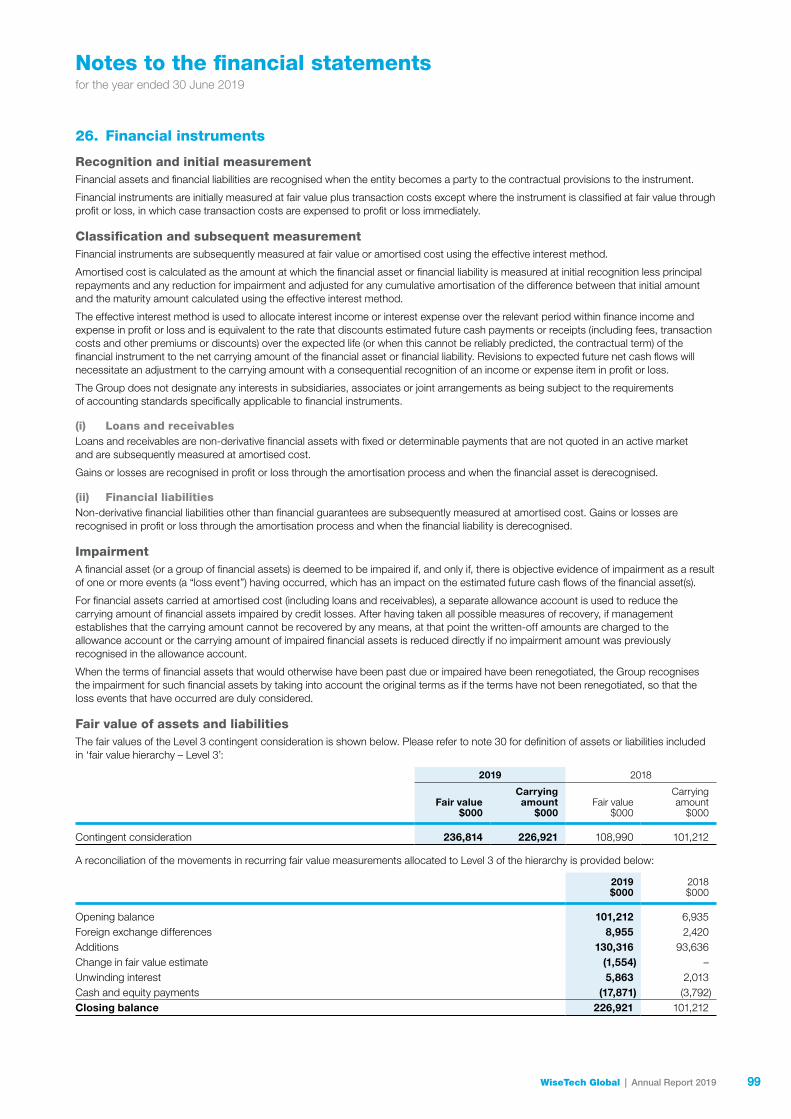
Notes to the financial statementsfor the year ended 30 June 2019
26. Financial instruments
Recognition and initial measurementFinancial assets and financial liabilities are recognised when the entity becomes a party to the contractual provisions to the instrument.
Financial instruments are initially measured at fair value plus transaction costs except where the instrument is classified at fair value through profit or loss, in which case transaction costs are expensed to profit or loss immediately.
Classification and subsequent measurementFinancial instruments are subsequently measured at fair value or amortised cost using the effective interest method.
Amortised cost is calculated as the amount at which the financial asset or financial liability is measured at initial recognition less principal repayments and any reduction for impairment and adjusted for any cumulative amortisation of the difference between that initial amount and the maturity amount calculated using the effective interest method.
The effective interest method is used to allocate interest income or interest expense over the relevant period within finance income and expense in profit or loss and is equivalent to the rate that discounts estimated future cash payments or receipts (including fees, transaction costs and other premiums or discounts) over the expected life (or when this cannot be reliably predicted, the contractual term) of the financial instrument to the net carrying amount of the financial asset or financial liability. Revisions to expected future net cash flows will necessitate an adjustment to the carrying amount with a consequential recognition of an income or expense item in profit or loss.
The Group does not designate any interests in subsidiaries, associates or joint arrangements as being subject to the requirements of accounting standards specifically applicable to financial instruments.
(i) Loans and receivablesLoans and receivables are non-derivative financial assets with fixed or determinable payments that are not quoted in an active market and are subsequently measured at amortised cost.
Gains or losses are recognised in profit or loss through the amortisation process and when the financial asset is derecognised.
(ii) Financial liabilitiesNon-derivative financial liabilities other than financial guarantees are subsequently measured at amortised cost. Gains or losses are recognised in profit or loss through the amortisation process and when the financial liability is derecognised.
ImpairmentA financial asset (or a group of financial assets) is deemed to be impaired if, and only if, there is objective evidence of impairment as a result of one or more events (a “loss event”) having occurred, which has an impact on the estimated future cash flows of the financial asset(s).
For financial assets carried at amortised cost (including loans and receivables), a separate allowance account is used to reduce the carrying amount of financial assets impaired by credit losses. After having taken all possible measures of recovery, if management establishes that the carrying amount cannot be recovered by any means, at that point the written-off amounts are charged to the allowance account or the carrying amount of impaired financial assets is reduced directly if no impairment amount was previously recognised in the allowance account.
When the terms of financial assets that would otherwise have been past due or impaired have been renegotiated, the Group recognises the impairment for such financial assets by taking into account the original terms as if the terms have not been renegotiated, so that the loss events that have occurred are duly considered.
Fair value of assets and liabilitiesThe fair values of the Level 3 contingent consideration is shown below. Please refer to note 30 for definition of assets or liabilities included in ‘fair value hierarchy – Level 3’:
2019 2018
Fair value$000
Carrying amount
$000Fair value
$000
Carrying amount
$000
Contingent consideration 236,814 226,921 108,990 101,212
A reconciliation of the movements in recurring fair value measurements allocated to Level 3 of the hierarchy is provided below:
2019$000
2018$000
Opening balance 101,212 6,935Foreign exchange differences 8,955 2,420Additions 130,316 93,636Change in fair value estimate (1,554) –Unwinding interest 5,863 2,013Cash and equity payments (17,871) (3,792)Closing balance 226,921 101,212
99WiseTech Global | Annual Report 2019 99
Notes to the financial statementsfor the year ended 30 June 2019
The Group has recognised a liability measured at fair value at 30 June 2019 in relation to contingent consideration arising out of various acquisitions made by the Group. The contingent consideration is deemed to be a Level 3 measurement of fair value which will be paid over various periods from the acquisition date. It has been discounted accordingly based on estimated time to complete a number of milestones including the successful integration of customers into CargoWise One and in certain acquisitions it’s performance in future periods based on revenue and profitability targets. These targets take account of the performance expectations of the acquisition. As part of the assessment at each reporting date, the Group has determined the fair value of contingent consideration considering a range of reasonably possible changes including historical and expected future performance. Changes in the fair value of contingent consideration after the acquisition date are recognised in profit or loss.
The effect on the Consolidated statement of profit or loss is due to unwinding of interest, change in fair value estimates and foreign exchange differences as indicated in the above reconciliation.
Financial risk management objectives and policiesThe Group has exposure to the following risks arising from financial instruments:• credit risk;• liquidity risk; and• market risk.
(a) Risk management frameworkThe Board of Directors has overall responsibility for the establishment and oversight of the Group’s risk management framework. The Board of Directors has established an Audit and Risk Management Committee, which is responsible for developing and monitoring the Group’s risk management policies. The Committee reports regularly to the Board of Directors on its activities.
The Group’s risk management policies are established to identify and analyse the risks faced by the Group, to set appropriate risk limits and controls and to monitor risks and adherence to limits. Risk management policies and systems are reviewed regularly to reflect changes in market conditions and the Group’s activities. The Group, through its training and management standards and procedures, aims to maintain a disciplined and constructive control environment in which all employees understand their roles and obligations.
The Board oversees how management monitors compliance with the Group’s risk management policies and procedures and reviews the adequacy of the risk management framework in relation to risks faced by the Group.
In FY19, the Audit and Risk Committee has reviewed the financial risks of the business, the controls and mitigations in place to address those financial risks. The Committee also determined that in order to fulfil its obligations in relation to the review and oversight of internal controls, an internal audit function would be established in FY20 which was approved by the Committee and the Board.
(b) Credit riskCredit risk is the risk of financial loss to the Group if a customer fails to meet its contractual obligations, and arises principally from the Group’s receivables from customers.
The Group’s standard payment and delivery terms and conditions are that payment is generally due within 30 days on receipt of any invoice and the preferred payment options are by direct debit from a bank account or credit card. No limits are used and the Group’s receivables are carefully managed by the credit management team. This includes establishing customer deposits (refer to note 15).
Trade receivablesThe Group’s exposure to credit risk is influenced mainly by the individual characteristics of each customer. However, management also considers the factors that may influence the credit risk of its customer base including the default risk of the industry and country in which customers operate.
The maximum exposure to credit risk at balance date to recognised financial assets, is the carrying amount, net of any provision for impairment of those assets, as disclosed in the Consolidated statement of financial position. These predominantly relate to trade receivables. Refer to note 11 for further details.
Cash and cash equivalentsThe Group held cash and cash equivalents of $260.1m at 30 June 2019 (2018: $121.8m). The cash and cash equivalents are held with creditworthy bank and financial institution counterparties.
(c) Liquidity riskLiquidity risk is the risk that the Group will encounter difficulty in meeting the obligations associated with its financial liabilities that are settled by delivering cash or another financial asset. The Group’s approach to managing liquidity is to ensure, as far as possible, that it will always have sufficient liquidity to meet its liabilities when they are due, under both normal and stressed conditions, without incurring unacceptable losses or risking damage to the Group’s reputation. The Group manages liquidity risk by monitoring net cash balances, actual and forecast operating cash flows and unutilised debt facilities.
26. Financial instruments (continued)
100100
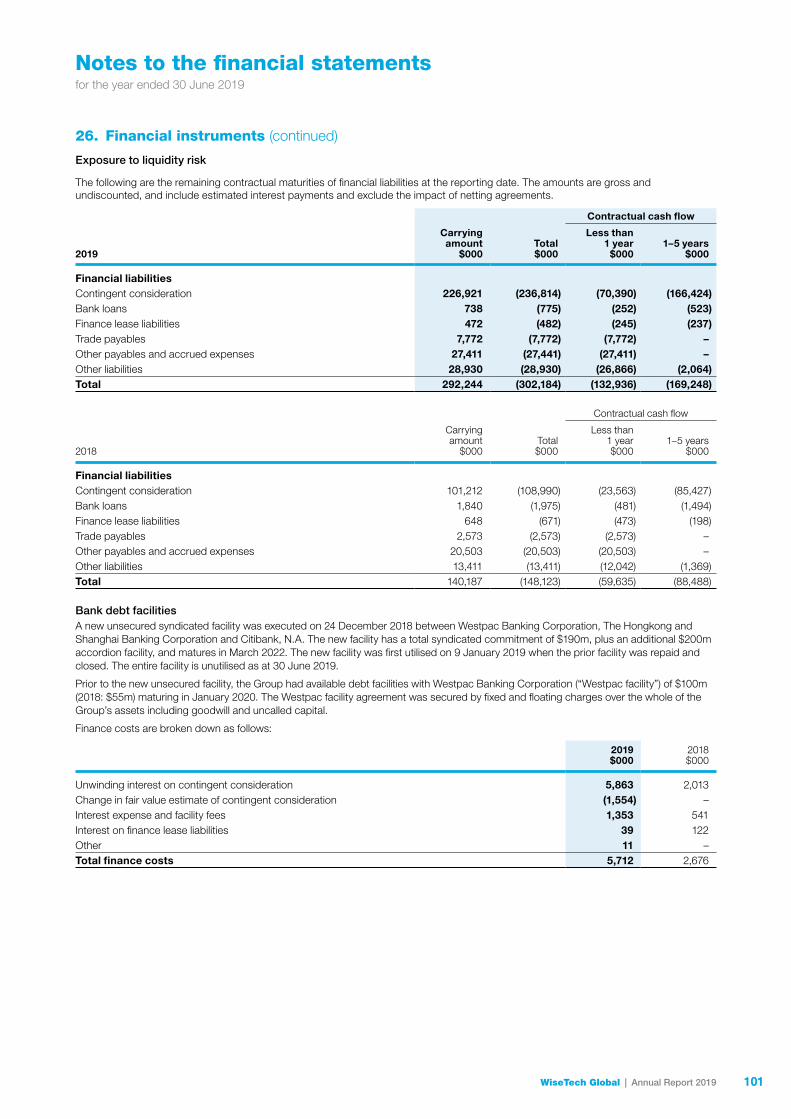
Notes to the financial statementsfor the year ended 30 June 2019
Exposure to liquidity risk
The following are the remaining contractual maturities of financial liabilities at the reporting date. The amounts are gross and undiscounted, and include estimated interest payments and exclude the impact of netting agreements.
Contractual cash flow
2019
Carrying amount
$000Total $000
Less than 1 year
$0001–5 years
$000
Financial liabilitiesContingent consideration 226,921 (236,814) (70,390) (166,424)Bank loans 738 (775) (252) (523)Finance lease liabilities 472 (482) (245) (237)Trade payables 7,772 (7,772) (7,772) –Other payables and accrued expenses 27,411 (27,441) (27,411) –Other liabilities 28,930 (28,930) (26,866) (2,064)Total 292,244 (302,184) (132,936) (169,248)
Contractual cash flow
2018
Carrying amount
$000Total $000
Less than 1 year $000
1–5 years $000
Financial liabilitiesContingent consideration 101,212 (108,990) (23,563) (85,427)Bank loans 1,840 (1,975) (481) (1,494)Finance lease liabilities 648 (671) (473) (198)Trade payables 2,573 (2,573) (2,573) –Other payables and accrued expenses 20,503 (20,503) (20,503) – Other liabilities 13,411 (13,411) (12,042) (1,369)Total 140,187 (148,123) (59,635) (88,488)
Bank debt facilitiesA new unsecured syndicated facility was executed on 24 December 2018 between Westpac Banking Corporation, The Hongkong and Shanghai Banking Corporation and Citibank, N.A. The new facility has a total syndicated commitment of $190m, plus an additional $200m accordion facility, and matures in March 2022. The new facility was first utilised on 9 January 2019 when the prior facility was repaid and closed. The entire facility is unutilised as at 30 June 2019.
Prior to the new unsecured facility, the Group had available debt facilities with Westpac Banking Corporation (“Westpac facility”) of $100m (2018: $55m) maturing in January 2020. The Westpac facility agreement was secured by fixed and floating charges over the whole of the Group’s assets including goodwill and uncalled capital.
Finance costs are broken down as follows:
2019 $000
2018 $000
Unwinding interest on contingent consideration 5,863 2,013Change in fair value estimate of contingent consideration (1,554) –Interest expense and facility fees 1,353 541Interest on finance lease liabilities 39 122Other 11 –Total finance costs 5,712 2,676
26. Financial instruments (continued)
101WiseTech Global | Annual Report 2019 101
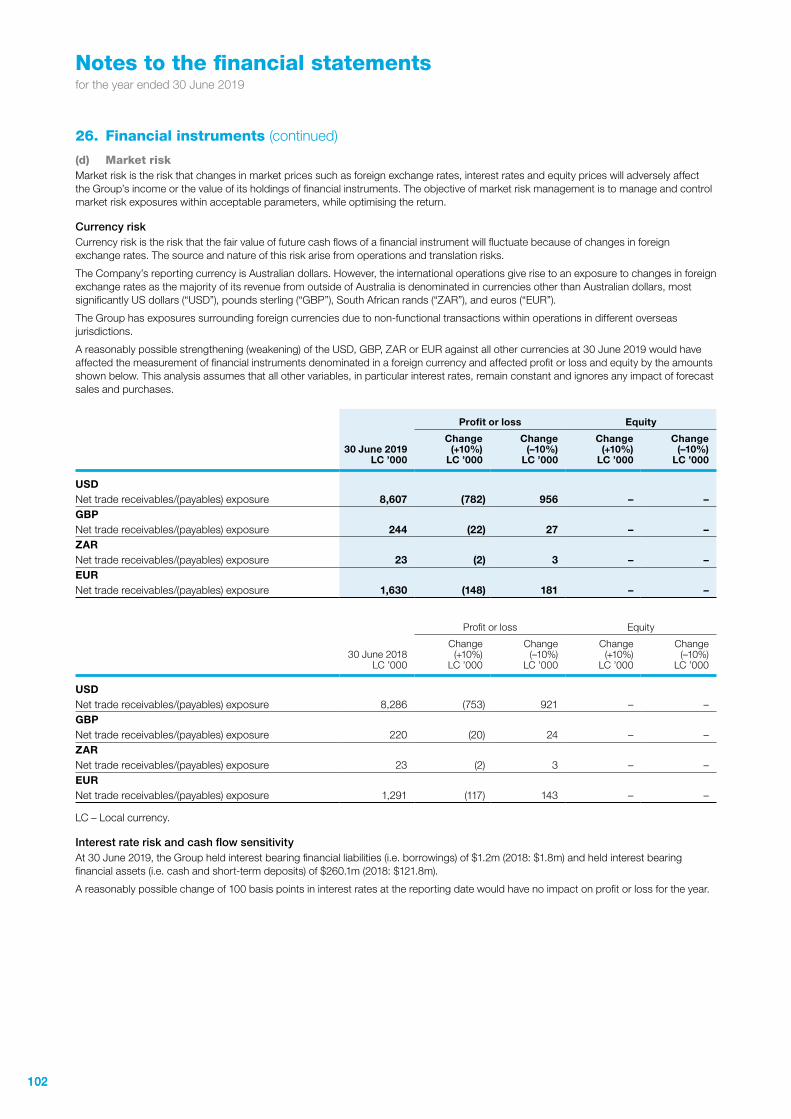
Notes to the financial statementsfor the year ended 30 June 2019
(d) Market riskMarket risk is the risk that changes in market prices such as foreign exchange rates, interest rates and equity prices will adversely affect the Group’s income or the value of its holdings of financial instruments. The objective of market risk management is to manage and control market risk exposures within acceptable parameters, while optimising the return.
Currency riskCurrency risk is the risk that the fair value of future cash flows of a financial instrument will fluctuate because of changes in foreign exchange rates. The source and nature of this risk arise from operations and translation risks.
The Company’s reporting currency is Australian dollars. However, the international operations give rise to an exposure to changes in foreign exchange rates as the majority of its revenue from outside of Australia is denominated in currencies other than Australian dollars, most significantly US dollars (“USD”), pounds sterling (“GBP”), South African rands (“ZAR”), and euros (“EUR”).
The Group has exposures surrounding foreign currencies due to non-functional transactions within operations in different overseas jurisdictions.
A reasonably possible strengthening (weakening) of the USD, GBP, ZAR or EUR against all other currencies at 30 June 2019 would have affected the measurement of financial instruments denominated in a foreign currency and affected profit or loss and equity by the amounts shown below. This analysis assumes that all other variables, in particular interest rates, remain constant and ignores any impact of forecast sales and purchases.
Profit or loss Equity
30 June 2019LC ’000
Change (+10%)
LC ’000
Change (–10%)
LC ’000
Change (+10%)
LC ’000
Change (–10%)
LC ’000
USDNet trade receivables/(payables) exposure 8,607 (782) 956 – –GBPNet trade receivables/(payables) exposure 244 (22) 27 – –ZARNet trade receivables/(payables) exposure 23 (2) 3 – –EURNet trade receivables/(payables) exposure 1,630 (148) 181 – –
Profit or loss Equity
30 June 2018 LC ’000
Change (+10%)
LC ’000
Change (–10%)
LC ’000
Change (+10%)
LC ’000
Change (–10%)
LC ’000
USDNet trade receivables/(payables) exposure 8,286 (753) 921 – –GBPNet trade receivables/(payables) exposure 220 (20) 24 – –ZARNet trade receivables/(payables) exposure 23 (2) 3 – –EURNet trade receivables/(payables) exposure 1,291 (117) 143 – –
LC – Local currency.
Interest rate risk and cash flow sensitivityAt 30 June 2019, the Group held interest bearing financial liabilities (i.e. borrowings) of $1.2m (2018: $1.8m) and held interest bearing financial assets (i.e. cash and short-term deposits) of $260.1m (2018: $121.8m).
A reasonably possible change of 100 basis points in interest rates at the reporting date would have no impact on profit or loss for the year.
26. Financial instruments (continued)
102102
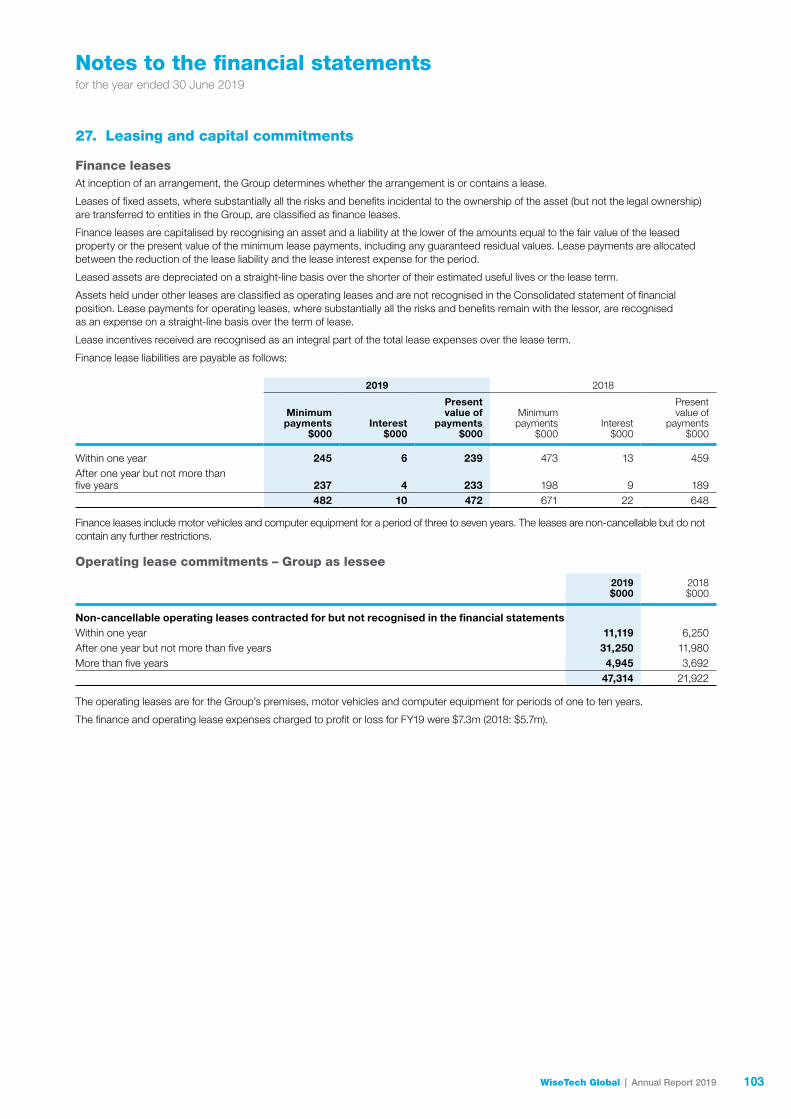
Notes to the financial statementsfor the year ended 30 June 2019
27. Leasing and capital commitments
Finance leasesAt inception of an arrangement, the Group determines whether the arrangement is or contains a lease.
Leases of fixed assets, where substantially all the risks and benefits incidental to the ownership of the asset (but not the legal ownership) are transferred to entities in the Group, are classified as finance leases.
Finance leases are capitalised by recognising an asset and a liability at the lower of the amounts equal to the fair value of the leased property or the present value of the minimum lease payments, including any guaranteed residual values. Lease payments are allocated between the reduction of the lease liability and the lease interest expense for the period.
Leased assets are depreciated on a straight-line basis over the shorter of their estimated useful lives or the lease term.
Assets held under other leases are classified as operating leases and are not recognised in the Consolidated statement of financial position. Lease payments for operating leases, where substantially all the risks and benefits remain with the lessor, are recognised as an expense on a straight-line basis over the term of lease.
Lease incentives received are recognised as an integral part of the total lease expenses over the lease term.
Finance lease liabilities are payable as follows:
2019 2018
Minimumpayments
$000Interest
$000
Presentvalue of
payments$000
Minimumpayments
$000Interest
$000
Presentvalue of
payments$000
Within one year 245 6 239 473 13 459After one year but not more than five years 237 4 233 198 9 189
482 10 472 671 22 648
Finance leases include motor vehicles and computer equipment for a period of three to seven years. The leases are non-cancellable but do not contain any further restrictions.
Operating lease commitments – Group as lessee
2019 $000
2018 $000
Non-cancellable operating leases contracted for but not recognised in the financial statementsWithin one year 11,119 6,250After one year but not more than five years 31,250 11,980More than five years 4,945 3,692
47,314 21,922
The operating leases are for the Group’s premises, motor vehicles and computer equipment for periods of one to ten years.
The finance and operating lease expenses charged to profit or loss for FY19 were $7.3m (2018: $5.7m).
103WiseTech Global | Annual Report 2019 103
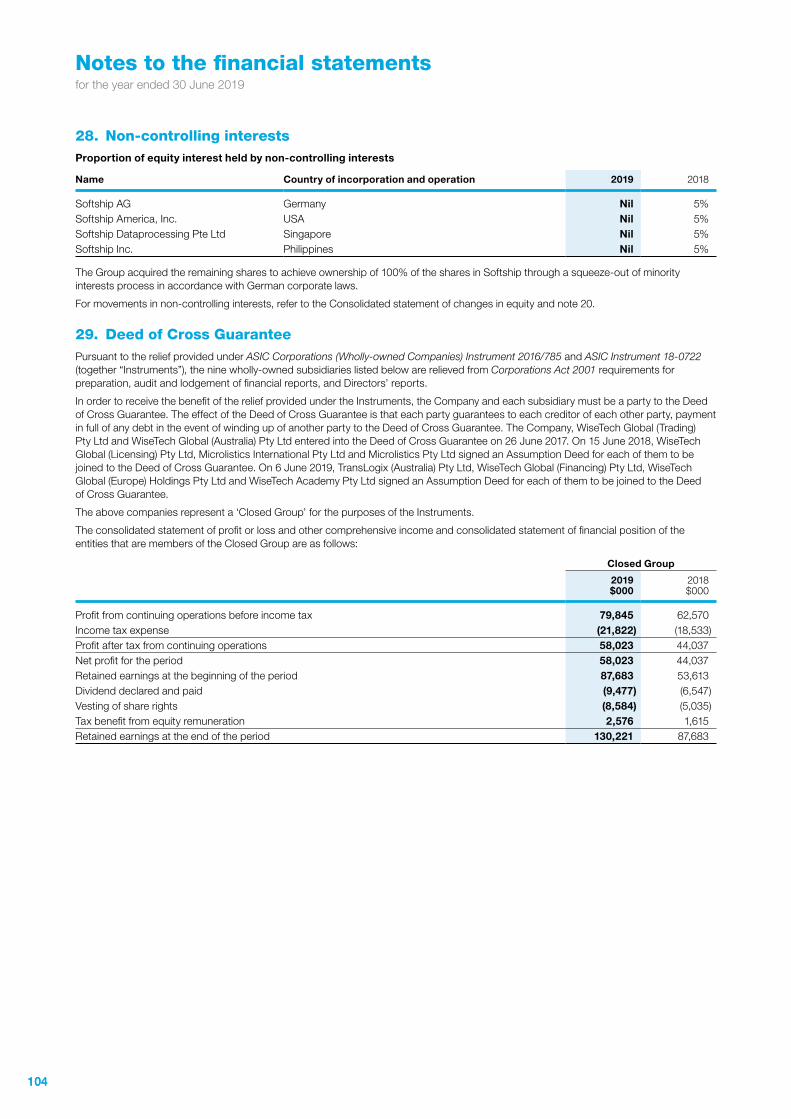
Notes to the financial statementsfor the year ended 30 June 2019
28. Non-controlling interestsProportion of equity interest held by non-controlling interests
Name Country of incorporation and operation 2019 2018
Softship AG Germany Nil 5%Softship America, Inc. USA Nil 5%Softship Dataprocessing Pte Ltd Singapore Nil 5%Softship Inc. Philippines Nil 5%
The Group acquired the remaining shares to achieve ownership of 100% of the shares in Softship through a squeeze-out of minority interests process in accordance with German corporate laws.
For movements in non-controlling interests, refer to the Consolidated statement of changes in equity and note 20.
29. Deed of Cross GuaranteePursuant to the relief provided under ASIC Corporations (Wholly-owned Companies) Instrument 2016/785 and ASIC Instrument 18-0722 (together “Instruments”), the nine wholly-owned subsidiaries listed below are relieved from Corporations Act 2001 requirements for preparation, audit and lodgement of financial reports, and Directors’ reports.
In order to receive the benefit of the relief provided under the Instruments, the Company and each subsidiary must be a party to the Deed of Cross Guarantee. The effect of the Deed of Cross Guarantee is that each party guarantees to each creditor of each other party, payment in full of any debt in the event of winding up of another party to the Deed of Cross Guarantee. The Company, WiseTech Global (Trading) Pty Ltd and WiseTech Global (Australia) Pty Ltd entered into the Deed of Cross Guarantee on 26 June 2017. On 15 June 2018, WiseTech Global (Licensing) Pty Ltd, Microlistics International Pty Ltd and Microlistics Pty Ltd signed an Assumption Deed for each of them to be joined to the Deed of Cross Guarantee. On 6 June 2019, TransLogix (Australia) Pty Ltd, WiseTech Global (Financing) Pty Ltd, WiseTech Global (Europe) Holdings Pty Ltd and WiseTech Academy Pty Ltd signed an Assumption Deed for each of them to be joined to the Deed of Cross Guarantee.
The above companies represent a ‘Closed Group’ for the purposes of the Instruments.
The consolidated statement of profit or loss and other comprehensive income and consolidated statement of financial position of the entities that are members of the Closed Group are as follows:
Closed Group
2019 $000
2018 $000
Profit from continuing operations before income tax 79,845 62,570Income tax expense (21,822) (18,533)Profit after tax from continuing operations 58,023 44,037Net profit for the period 58,023 44,037Retained earnings at the beginning of the period 87,683 53,613Dividend declared and paid (9,477) (6,547)Vesting of share rights (8,584) (5,035)Tax benefit from equity remuneration 2,576 1,615Retained earnings at the end of the period 130,221 87,683
104104
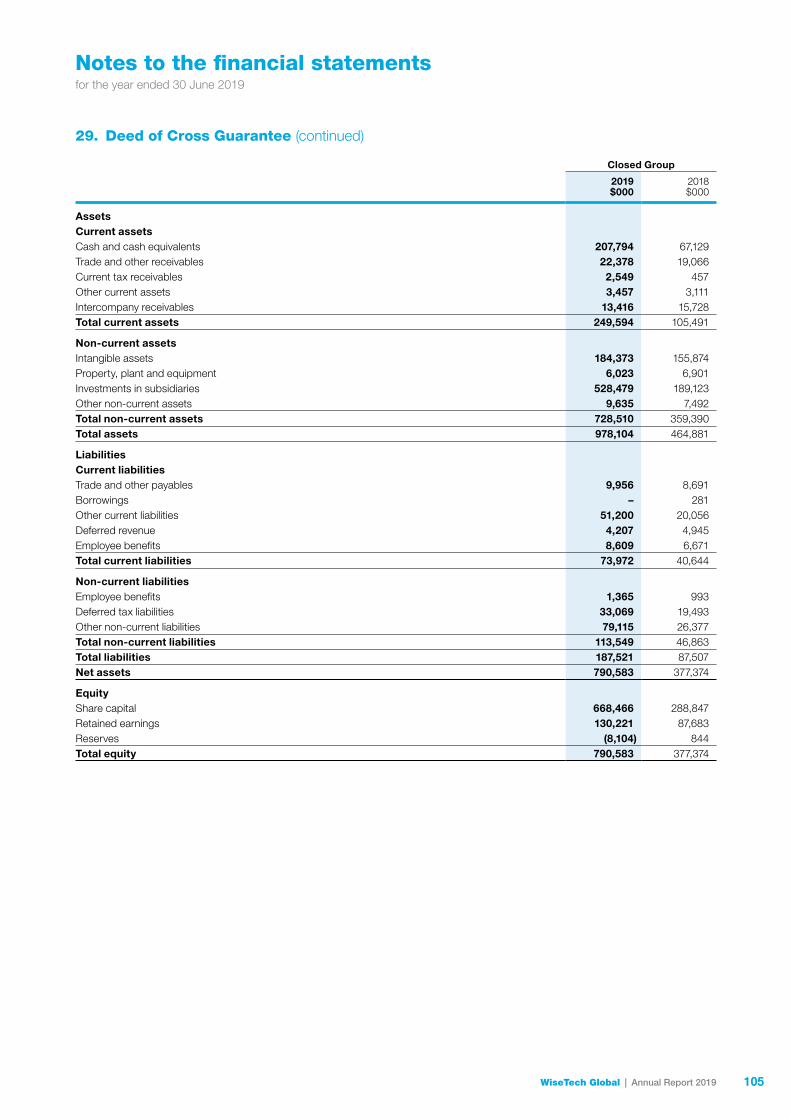
Notes to the financial statementsfor the year ended 30 June 2019
Closed Group
2019 $000
2018 $000
AssetsCurrent assetsCash and cash equivalents 207,794 67,129Trade and other receivables 22,378 19,066Current tax receivables 2,549 457Other current assets 3,457 3,111Intercompany receivables 13,416 15,728Total current assets 249,594 105,491
Non-current assetsIntangible assets 184,373 155,874Property, plant and equipment 6,023 6,901Investments in subsidiaries 528,479 189,123Other non-current assets 9,635 7,492Total non-current assets 728,510 359,390Total assets 978,104 464,881
LiabilitiesCurrent liabilitiesTrade and other payables 9,956 8,691Borrowings – 281Other current liabilities 51,200 20,056Deferred revenue 4,207 4,945Employee benefits 8,609 6,671Total current liabilities 73,972 40,644
Non-current liabilitiesEmployee benefits 1,365 993Deferred tax liabilities 33,069 19,493Other non-current liabilities 79,115 26,377Total non-current liabilities 113,549 46,863Total liabilities 187,521 87,507Net assets 790,583 377,374
EquityShare capital 668,466 288,847Retained earnings 130,221 87,683Reserves (8,104) 844Total equity 790,583 377,374
29. Deed of Cross Guarantee (continued)
105WiseTech Global | Annual Report 2019 105
Notes to the financial statementsfor the year ended 30 June 2019
30. Other disclosures
(a) Principles of consolidationThe consolidated financial statements incorporate all of the assets, liabilities and results of WiseTech Global Limited and all of the subsidiaries. Subsidiaries are entities controlled by the Group. The Group controls an entity when it is exposed to, or has rights to, variable returns from its involvement with the entity and has the ability to affect those returns through its power over the entity.
The assets, liabilities and results of all subsidiaries are fully consolidated into the financial statements of the Group from the date on which control is obtained by the Group. The consolidation of a subsidiary is discontinued from the date that control ceases. When the Group loses control over a subsidiary, it derecognises the assets and liabilities of the subsidiary, and any related non-controlling interest and other components of equity. Any resulting gain or loss is recognised in profit or loss. Any interest retained in the former subsidiary is measured at fair value when control is lost.
Intercompany transactions, balances and unrealised gains or losses on transactions between Group entities are fully eliminated on consolidation. Accounting policies of subsidiaries have been changed and adjustments made where necessary to ensure uniformity of the accounting policies adopted by the Group.
(b) Foreign currency transactions and balances
Transactions and balancesForeign currency transactions are translated into the functional currency using the exchange rates prevailing at the date of the transaction. Foreign currency monetary items are translated at the exchange rate at the reporting date. Non-monetary items measured at historical cost continue to be carried at the exchange rate at the date of the transaction. Non-monetary items measured at fair value in a foreign currency are translated to the functional currency at the exchange rate when fair values were determined.
Exchange differences arising on the translation of monetary items are recognised in profit or loss, except where deferred in equity as a qualifying cash flow or net investment hedge.
Exchange differences arising on the translation of non-monetary items are recognised directly in other comprehensive income to the extent that the underlying gain or loss is recognised in other comprehensive income; otherwise, the exchange difference is recognised in profit or loss.
Group companiesThe financial results and position of foreign operations whose functional currency is different from the Group’s presentation currency are translated as follows:• assets and liabilities including goodwill and fair value adjustments arising on acquisition are translated at exchange rates prevailing
at the reporting date;• income and expenses are translated at average exchange rates for the period; and• retained earnings are translated at the exchange rates prevailing at the date of the transactions.
Exchange differences arising on translation of foreign operations with functional currencies other than Australian dollars are recognised in other comprehensive income and included in the foreign currency translation reserve in the Consolidated statement of financial position. The cumulative amount of these differences is reclassified into profit or loss in the period in which the operation is disposed of.
Currency of hyperinflationary economyIf the functional currency of a foreign operation is the currency of a hyperinflationary economy, then its financial information are first adjusted to reflect the purchasing power at the current reporting date and then translated into the presentation currency using the exchange rate at the current reporting date.
(c) ProvisionsProvisions are recognised when the Group has a legal or constructive obligation as a result of past events, for which it is probable that an outflow of economic benefits will result and that outflow can be reliably measured.
Provisions are determined by discounting the expected future cash flows at a pre-tax rate that reflects current market assessments of the time value of money and the risks specific to the liability. The unwinding of the discount is recognised as a finance cost.
(d) Significant accounting judgements, estimates and assumptionsIn preparing the Group financial statements, management is required to make estimates and assumptions that affect the reported amount of revenues, expenses, assets and liabilities and the disclosure of contingent liabilities. The resulting accounting estimates, which are based on management’s best judgement at the date of the Group financial statements, will, by definition, seldom equal the related actual results. The estimates and assumptions that have a significant risk of causing a material adjustment to the carrying amounts of assets and liabilities within the next financial year relate to tax and goodwill which are disclosed in notes 5 and 8 respectively. Critical judgements relate to intangible assets which are disclosed in note 8.
106106
Notes to the financial statementsfor the year ended 30 June 2019
(e) Assets held for saleNon-current assets, or disposal groups comprising assets and liabilities, are classified as held for sale if it is highly probable that they will be recovered primarily through sale rather than through continuing use.
Such assets, or disposal groups, are generally measured at the lower of their carrying amount, and fair value less costs to sell. Any impairment loss on a disposal group is allocated first to goodwill, and then to the remaining assets and liabilities on a pro rata basis, except that no loss is allocated to inventories, financial assets, deferred tax assets, employee benefit assets, investment property or biological assets, which continue to be measured in accordance with the Group’s other accounting policies. Impairment losses on initial classification as held for sale or held for distribution and subsequent gains and losses on remeasurement are recognised in profit or loss.
Once classified as held for sale, intangible assets and property, plant and equipment are no longer amortised or depreciated, and any equity accounted investee is no longer equity accounted.
(f) Measurement of fair valuesFair value is the price the Group would receive to sell an asset or would have to pay to transfer a liability in an orderly (i.e. unforced) transaction between independent, knowledgeable and willing market participants at the measurement date.
As fair value is a market-based measure, the closest equivalent observable market pricing information is used to determine fair value. Adjustments to market values may be made having regard to the characteristics of the specific asset or liability. The fair values of assets and liabilities that are not traded in an active market are determined using one or more valuation techniques. These valuation techniques maximise, to the extent possible, the use of observable market data.
To the extent possible, market information is extracted from either the principal market for the asset or liability (i.e. the market with the greatest volume and level of activity for the asset of liability), or, in the absence of such a market, the most advantageous market available to the entity at reporting date (i.e. the market that maximises the receipts from the sale of the asset or minimises the payment made to transfer the liability, after taking into account transaction costs and transport costs).
For non-financial assets, the fair value measurement also takes into account a market participant’s ability to use the asset in its highest and best use or to sell it to another market participant that would use the asset in its highest and best use.
The fair value of liabilities and the entity’s own equity instruments (excluding those related to share-based payment arrangements) may be valued, where there is no observable market price in relation to the transfer of such financial instrument, by reference to observable market information where such instruments are held as assets. Where this information is not available, other valuation techniques are adopted and where significant, are detailed in the respective note to the financial statements.
Fair value hierarchySignificant valuation issues are reported to the Audit and Risk Management Committee.
When measuring the fair value of an asset or a liability, the Group uses market observable data as far as possible. Fair values are categorised into different levels in a fair value hierarchy based on the inputs used in the valuation techniques as follows:
• Level 1: quoted prices (unadjusted) in active markets for identical assets or liabilities;• Level 2: inputs other than quoted prices included in Level 1 that are observable for the asset or liability, either directly (i.e. as prices)
or indirectly (i.e. derived from prices); and• Level 3: inputs for the asset or liability that are not based on observable market data (unobservable inputs).
If the inputs used to measure the fair value of an asset or a liability might be categorised in different levels of the fair value hierarchy, then the fair value measurement is categorised in its entirety in the same level of the fair value hierarchy as the lowest level input that is significant to the entire measurement.
The Group recognises transfers between levels of the fair value hierarchy at the end of the reporting period during which the change has occurred.
The Group does not have any debt securities or derivative financial instruments which require measurement at fair value.
30. Other disclosures (continued)
107WiseTech Global | Annual Report 2019 107
Notes to the financial statementsfor the year ended 30 June 2019
(g) Standards issued but not yet effectiveA number of new standards, amendments to standards and interpretations are effective for annual periods beginning after 1 July 2019 and have not been applied in preparing these consolidated financial statements. Those which may be relevant to the Group are set out below:
AASB 16 LeasesThe application of AASB 16 Leases is mandatory for the first interim period beginning on or after 1 July 2019. The standard removes the classification of leases as either operating or finance lease, and effectively introduces a single, on-balance sheet lease accounting model for leases. Under the new standard, a right-of-use asset representing the right to the underlying leased assets will be recognised along with a lease liability representing the obligation to make future lease payments.
The Group intends to adopt the modified retrospective transition method, which requires the recognition of the cumulative effect of the initial application of AASB 16, as of 1 July 2019, to retained earnings and not to restate prior year comparative financials. The Group also intends to apply practical expedients available under the standard, including:
• “grandfathering” previously recognised lease arrangements;• applying a single discount rate to a portfolio of leases with reasonably similar characteristics;• assessing whether a lease is onerous prior to applying the standard; and• not recognising right-of-use assets and lease liabilities for short-term leases (<12 months) and low-value asset leases.
In light of the intended transition method, the Group has performed a comprehensive impact assessment based on lease data collated across the Group, including reviews of lease contracts.
Based on these assessments, the primary impact of the new lease standard will be from the existing operating leases (those committed as at 30 June 2019, as disclosed in note 27), which mainly consist of leased premises and motor vehicles. The anticipated impact on the Group’s consolidated financial statements on 1 July 2019 is estimated to be as follows:• $43.0m increase in lease liabilities, measured at the present value of the remaining lease payments, discounted using the Group’s
incremental borrowing rate;• $41.0m increase in right-of-use assets, measured at the amount equal to the above lease liabilities, plus the carrying value of lease
incentives and make-good obligations related to leasehold improvements as at 30 June 2019; and• $0.1m increase in opening retained earnings, as a result of the transitional adjustment of existing finance liability value.
Based on the current lease portfolio as at 30 June 2019, after the transition to AASB 16 on 1 July 2019, the Group would expect an increase in the annual operating profit by approximately $1.0m; and an increase in the annual finance cost by approximately $1.5m. Overall, the Group would expect a decrease in the profit before tax for the next financial year by approximately $0.5m.
There will be no impact on cash flow resulting from the new standard. Also there will be no impact on acquisition deferred consideration and banking covenants will continue to be calculated based on the previous lease accounting standard.
When applying AASB 16 from 1 July 2019, the Group will also make various changes in the financial statement presentation to reflect the aforementioned transition impact, which will be disclosed in the next interim reporting.
(h) Events after reporting period
AcquisitionsOn 19 August 2019, the Group announced the acquisition of a 100% interest in Depot Systems, the leading provider of container yard and terminal management logistics solutions in the US. The Company will pay $4.4m upfront with a further multi-year earn-out potential of $2.7m related to customer contracting, customer conversion and product integration. With calendar year 2018 annual revenue and EBITDA of ~$1.3m and ~$0.2m, this transaction, while of strategic value, is not material to the Group.
DividendSince the period end, the Directors have declared a fully franked final dividend of 1.95 cents per share, payable 4 October 2019. The dividend will be recognised in subsequent financial statements.
(i) Contingent assets and contingent liabilitiesThere were no contingent assets or liabilities that have been recognised by the Group in relation to FY19 or FY18.
30. Other disclosures (continued)
108108
Directors’ declarationfor the year ended 30 June 2019
1. In the opinion of the Directors of WiseTech Global Limited:(a) the consolidated financial statements and notes that are set out on pages 66 to 108 and the Remuneration Report set out
on pages 44 to 57, are in accordance with the Corporations Act 2001, including:
(i) giving a true and fair view of the Group’s financial position as at 30 June 2019 and of its performance for the financial year ended on that date; and
(ii) complying with Australian Accounting Standards and the Corporations Regulations 2001; and
(b) there are reasonable grounds to believe that the Company will be able to pay its debts as and when they become due and payable.
2. There are reasonable grounds to believe that the Company and the group entities identified in Note 29 will be able to meet any obligations or liabilities to which they are or may become subject to by virtue of the Deed of Cross Guarantee between the Company and those group entities pursuant to ASIC Corporations (Wholly-owned Companies) Instrument 2016/785.
3. The Directors have been given the declarations required by section 295A of the Corporations Act 2001 from the Chief Executive Officer and Chief Financial Officer for the financial year ended 30 June 2019.
4. The Directors draw attention to Note 2 to the Consolidated financial statements, which includes a statement of compliance with International Financial Reporting Standards.
Signed in accordance with a resolution of the Directors:
Andrew Harrison Chair
Richard White Executive Director, Founder and CEO
24 September 2019 24 September 2019
109WiseTech Global | Annual Report 2019
Independent auditor’s reportfor the year ended 30 June 2019
110
KPMG, an Australian partnership and a member firm of the KPMG network of independent member firms affiliated with KPMG International Cooperative (“KPMG International”), a Swiss entity.
Liability limited by a scheme approved under Professional Standards Legislation
Independent Auditor’s Report
To the shareholders of WiseTech Global Limited
Report on the audit of the Financial Report
Opinion
We have audited the Financial Report of WiseTech Global Limited (the Company).
In our opinion, the accompanying Financial Report of the Company is in accordance with the Corporations Act 2001, including:
• giving a true and fair view of the Group's financial position as at 30 June 2019 and of its financial performance for the year ended on that date; and
• complying with Australian Accounting Standards and the Corporations Regulations 2001.
The Financial Report comprises:
• Consolidated statement of financial position as at 30 June 2019
• Consolidated statement of profit or loss and other comprehensive income, Consolidated statement of changes in equity, and Consolidated statement of cash flows for the year then ended
• Notes including a summary of significant accounting policies
• Directors' Declaration.
The Group consists of WiseTech Global Limited (the Company) and the entities it controlled at the year end or from time to time during the financial year.
Basis for opinion
We conducted our audit in accordance with Australian Auditing Standards. We believe that the audit evidence we have obtained is sufficient and appropriate to provide a basis for our opinion.
Our responsibilities under those standards are further described in the Auditor’s responsibilities for the audit of the Financial Report section of our report.
We are independent of the Group in accordance with the Corporations Act 2001 and the ethical requirements of the Accounting Professional and Ethical Standards Board’s APES 110 Code of Ethics for Professional Accountants (the Code) that are relevant to our audit of the Financial Report in Australia. We have fulfilled our other ethical responsibilities in accordance with the Code.
110110
Independent auditor’s reportfor the year ended 30 June 2019
111
Key Audit Matters
The Key Audit Matters we identified are:
• Recognition of revenue;
• Capitalisation of software development costs; and
• Acquisition accounting.
Key Audit Matters are those matters that, in our professional judgement, were of most significance in our audit of the Financial Report of the current period.
These matters were addressed in the context of our audit of the Financial Report as a whole, and in forming our opinion thereon, and we do not provide a separate opinion on these matters.
Recognition of revenue
Refer to Note 3 ‘Revenue’ ($348.3m), Note 12 ‘Other assets’ (unbilled receivables $3.0m) and Note 14 ‘Deferred revenue’ ($19.0m).
The key audit matter How the matter was addressed in our audit
The recognition of revenue is considered to be a key audit matter due to:
• the significance of revenue to the financial statements;
• the majority of revenue being derived from customers’ usage of WiseTech’s software;
• revenue earned through usage is calculated with reference to price lists and complex discount structures;
• there being high volumes of customer transaction data recorded using a highly automated billing system. Auditing this data requires significant effort, including the use of IT and data specialists;
• one off transactions involving multiple elements, requiring judgement in applying the revenue recognition criterion to each element; and
• the requirement to align the accounting policies and practices of acquired businesses.
Our procedures included:
• we tested the Group’s key manual revenue recognition controls including:
– approval of new customer contracts;
– review and approval of initial billing invoice, including checking prices to signed customer contracts; and
– review of monthly billing data.
• we stratified the revenue population into homogenous revenue streams for the purposes of performing our testing;
• for certain revenue streams, where we determined that the timing of billing and cash receipt is consistent with the expected timing for revenue recognition, we formed an estimate of revenue expected and compared this estimate to the amount recorded by the Company;
• for certain revenue streams, where revenue is recognised based customer usage of the software, with the assistance of our Data Specialists, we formed an estimate of the revenue recognised for a sample of transaction types and compared this to the amount recorded by the Company. The formation of this estimation involved:
– developing a detailed understanding of the process for collection of transaction data, and the application of price lists and discount structures to this data;
– assessing the completeness and accuracy of
111WiseTech Global | Annual Report 2019 111
Independent auditor’s reportfor the year ended 30 June 2019
112
transaction data interfaced with the billing module;
– inspecting transaction data which is not subject to billing;
– with the assistance of our IT Specialists, testing controls over access to billing module, price lists and discount structures;
– with the assistance of our IT Specialists, testing the interface of the output from the billing module to the general ledger; and
– assessing whether customers were subject to an appropriate price list based on their contract.
• for acquired businesses, we obtained an understanding of management’s process for aligning revenue recognition policies and practices to those adopted by the Group. We tested a sample of transactions for appropriateness of revenue recognition at year end.
Capitalisation of software development costs
Refer to Note 8: Computer software ($81.0m) and Development costs (WIP) ($48.7m)
The key audit matter How the matter was addressed in our audit
Capitalisation of software development costs is considered to be a key audit matter due to:
• the high volume of software developer hours to be considered;
• the calculation of the amount capitalised is performed using data extracts from the Company’s automated software workflow tool (PAVE) used for monitoring and recording the activities of software developers;
• WiseTech develops its software products using an iterative development methodology. This approach requires more judgement in assessing WiseTech’s application of the requirements of the accounting standards. These assessments include:
– whether a project can be completed and produce a viable software
Our procedures included:
• inspecting WiseTech’s documentation on the status of projects and the evaluation of the future economic return of the software under development. We assessed WiseTech’s positions using our knowledge of the business and projects, and through discussions with various stakeholders, including: Project Managers, Chief Technology Officer, the Chief Executive Officer and the Chief Financial Officer. We also inspected price lists, development partner contracts and Board of Director’s papers to evaluate these assertions;
• obtaining an understanding of WiseTech’s software development processes and how software developers use PAVE to record activities;
• inspecting the information recorded in PAVE and assessing management’s identification of activities that constitute development;
• testing a statistical sample of developer time capitalised, to check the activities being performed related to a project in development or an enhancement to an existing software product, as opposed to research or maintenance;
112112
Independent auditor’s reportfor the year ended 30 June 2019
113
product;
– whether an activity is eligible for capitalisation;
– determination of the appropriate rate per hour for developers’ time eligible for capitalisation; and
– whether a project is available for its intended use and, accordingly, commence amortisation.
• using our IT specialists to test the computer system controls that are in place to safeguard information recorded in PAVE;
• We performed additional testing to assess the capitalisation of time to projects including:
– evaluating task descriptions logged against the criteria in the accounting standards;
– inspecting role identification in employee contracts for development related positions and developer allocation listings;
– investigated task nature with project managers.
• assessing the rate per hour calculations applied to time eligible for capitalisation. This included testing a sample of key inputs to underlying records. We also assessed the Group’s allocation of directly attributable overhead costs against the criteria within the accounting standards.
Accounting for acquired businesses
Refer to Note 20: Goodwill ($355.3m) and Fair value of net identifiable assets acquired ($34.1m)
The key audit matter How the matter was addressed in our audit
The accounting for acquired businesses is a key audit matter due to:
• the significant number of business acquisitions during the year;
• the high level of judgement for each acquisition that is required in determining:
– when control of the acquired business was obtained;
– identification of acquired intangible assets, such as customer contracts, software and brands;
– the assumptions and estimates used when performing intangible asset valuations, including estimated future cash flows, growth rates and discount rates;
– fair value adjustments to tangible assets acquired and liabilities assumed;
Our procedures included:
• evaluating documentation underlying the Group’s assessments of when control is obtained of the acquired businesses.
• assessing the scope, objectivity and competency of independent valuation specialists engaged by the Company;
• working with our valuation specialists, we reviewed the Group’s valuation of identifiable intangible assets by:
– evaluating the Group’s assessment of identified intangible assets, using the diligence information and information from similar business acquisitions; and
– evaluating the Group’s earnings and growth forecasts by comparing to the past performance of the acquired businesses, due diligence information and our knowledge of the industry trends.
• evaluating the Group’s fair value accounting adjustments to the tangible assets acquired and liabilities assumed by checking these to due diligence information, board papers, and subsequent transactions;
• evaluating management’s conclusions as to whether any
113WiseTech Global | Annual Report 2019 113
Independent auditor’s reportfor the year ended 30 June 2019
114
– the fair value of any contingent consideration; and
– whether the acquisition accounting remains provisional at reporting date. Also, whether any new information has been obtained about facts and circumstances that existed as of relevant acquisition dates that, if known, would have affected the valuations.
element of the acquisition accounting is incomplete and provisional;
• evaluating management’s conclusions whether information that has become available during the 12 months following acquisition provides evidence of conditions or circumstances that existed at the date of an acquisition and requires adjustment.
Other Information
Other Information is financial and non-financial information in WiseTech Global Limited’s annual reporting which is provided in addition to the Financial Report and the Auditor’s Report. The Directors are responsible for the Other Information.
Our opinion on the Financial Report does not cover the Other Information and, accordingly, we do not express an audit opinion or any form of assurance conclusion thereon, with the exception of the Remuneration Report and our related assurance opinion.
In connection with our audit of the Financial Report, our responsibility is to read the Other Information. In doing so, we consider whether the Other Information is materially inconsistent with the Financial Report or our knowledge obtained in the audit, or otherwise appears to be materially misstated.
We are required to report if we conclude that there is a material misstatement of this Other Information, and based on the work we have performed on the Other Information that we obtained prior to the date of this Auditor’s Report we have nothing to report.
Responsibilities of the Directors for the Financial Report
The Directors are responsible for:
• preparing the Financial Report that gives a true and fair view in accordance with Australian Accounting Standards and the Corporations Act 2001
• implementing necessary internal control to enable the preparation of a Financial Report that gives a true and fair view and is free from material misstatement, whether due to fraud or error
• assessing the Group and Company's ability to continue as a going concern and whether the use of the going concern basis of accounting is appropriate. This includes disclosing, as applicable, matters related to going concern and using the going concern basis of accounting unless they either intend to liquidate the Group and Company or to cease operations, or have no realistic alternative but to do so.
114114
Independent auditor’s reportfor the year ended 30 June 2019
115
Auditor’s responsibilities for the audit of the Financial Report
Our objective is:
• to obtain reasonable assurance about whether the Financial Report as a whole is free from material misstatement, whether due to fraud or error; and
• to issue an Auditor’s Report that includes our opinion.
Reasonable assurance is a high level of assurance, but is not a guarantee that an audit conducted in accordance with Australian Auditing Standards will always detect a material misstatement when it exists.
Misstatements can arise from fraud or error. They are considered material if, individually or in the aggregate, they could reasonably be expected to influence the economic decisions of users taken on the basis of the Financial Report.
A further description of our responsibilities for the audit of the Financial Report is located at the Auditing and Assurance Standards Board website at: http://www.auasb.gov.au/auditors_responsibilities/ar1.pdf. This description forms part of our Auditor’s Report.
Report on the Remuneration Report
Opinion
In our opinion, the Remuneration Report of WiseTech Global Limited for the year ended 30 June 2019, complies with Section 300A of the Corporations Act 2001.
Directors’ responsibilities
The Directors of the Company are responsible for the preparation and presentation of the Remuneration Report in accordance with Section 300A of the Corporations Act 2001.
Our responsibilities
We have audited the Remuneration Report included in pages 40 to 53 of the Annual Report for the year ended 30 June 2019.
Our responsibility is to express an opinion on the Remuneration Report, based on our audit conducted in accordance with Australian Auditing Standards.
KPMG Chris Hollis
Partner
Sydney
24 September 2019
115WiseTech Global | Annual Report 2019 115
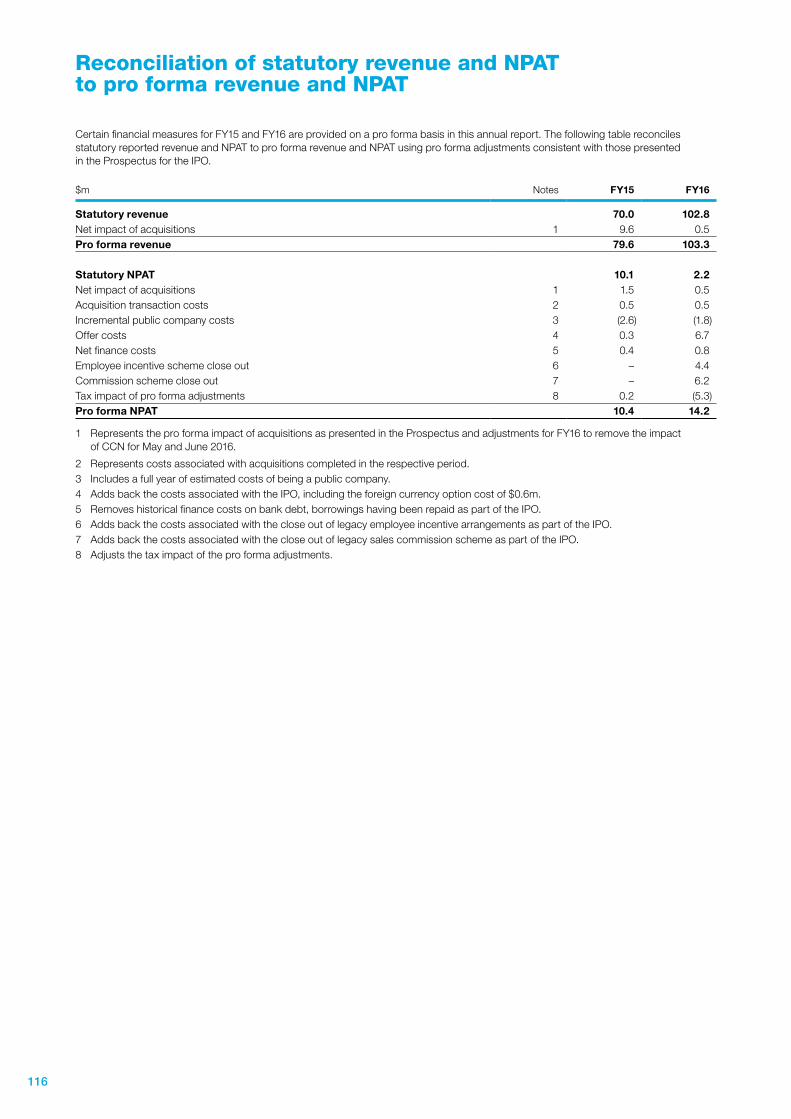
Reconciliation of statutory revenue and NPAT to pro forma revenue and NPAT
Certain financial measures for FY15 and FY16 are provided on a pro forma basis in this annual report. The following table reconciles statutory reported revenue and NPAT to pro forma revenue and NPAT using pro forma adjustments consistent with those presented in the Prospectus for the IPO.
$m Notes FY15 FY16
Statutory revenue 70.0 102.8Net impact of acquisitions 1 9.6 0.5Pro forma revenue 79.6 103.3
Statutory NPAT 10.1 2.2Net impact of acquisitions 1 1.5 0.5Acquisition transaction costs 2 0.5 0.5Incremental public company costs 3 (2.6) (1.8)Offer costs 4 0.3 6.7Net finance costs 5 0.4 0.8Employee incentive scheme close out 6 – 4.4Commission scheme close out 7 – 6.2Tax impact of pro forma adjustments 8 0.2 (5.3)Pro forma NPAT 10.4 14.2
1 Represents the pro forma impact of acquisitions as presented in the Prospectus and adjustments for FY16 to remove the impact of CCN for May and June 2016.
2 Represents costs associated with acquisitions completed in the respective period.3 Includes a full year of estimated costs of being a public company.4 Adds back the costs associated with the IPO, including the foreign currency option cost of $0.6m.5 Removes historical finance costs on bank debt, borrowings having been repaid as part of the IPO.6 Adds back the costs associated with the close out of legacy employee incentive arrangements as part of the IPO.7 Adds back the costs associated with the close out of legacy sales commission scheme as part of the IPO.8 Adjusts the tax impact of the pro forma adjustments.
116
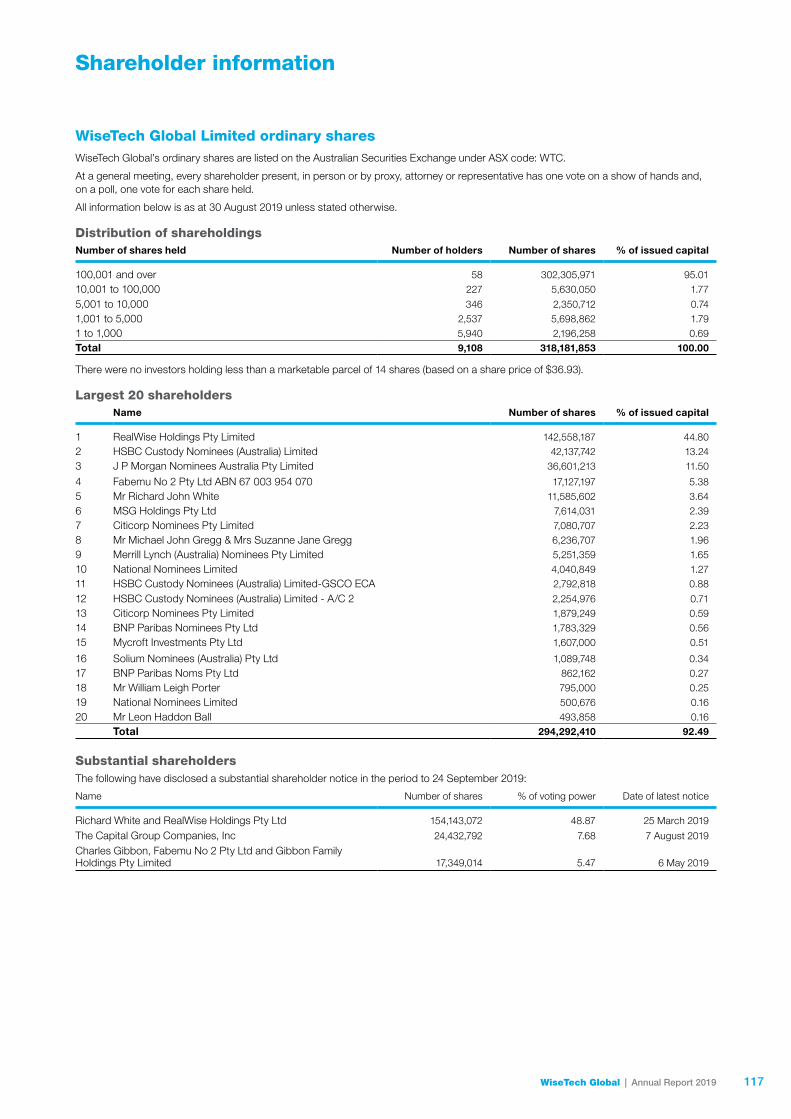
Shareholder information
WiseTech Global Limited ordinary sharesWiseTech Global’s ordinary shares are listed on the Australian Securities Exchange under ASX code: WTC.
At a general meeting, every shareholder present, in person or by proxy, attorney or representative has one vote on a show of hands and, on a poll, one vote for each share held.
All information below is as at 30 August 2019 unless stated otherwise.
Distribution of shareholdingsNumber of shares held Number of holders Number of shares % of issued capital
100,001 and over 58 302,305,971 95.0110,001 to 100,000 227 5,630,050 1.77
5,001 to 10,000 346 2,350,712 0.741,001 to 5,000 2,537 5,698,862 1.791 to 1,000 5,940 2,196,258 0.69Total 9,108 318,181,853 100.00
There were no investors holding less than a marketable parcel of 14 shares (based on a share price of $36.93).
Largest 20 shareholdersName Number of shares % of issued capital
1 RealWise Holdings Pty Limited 142,558,187 44.802 HSBC Custody Nominees (Australia) Limited 42,137,742 13.243 J P Morgan Nominees Australia Pty Limited 36,601,213 11.50
4 Fabemu No 2 Pty Ltd ABN 67 003 954 070 17,127,197 5.385 Mr Richard John White 11,585,602 3.646 MSG Holdings Pty Ltd 7,614,031 2.397 Citicorp Nominees Pty Limited 7,080,707 2.238 Mr Michael John Gregg & Mrs Suzanne Jane Gregg 6,236,707 1.969 Merrill Lynch (Australia) Nominees Pty Limited 5,251,359 1.6510 National Nominees Limited 4,040,849 1.2711 HSBC Custody Nominees (Australia) Limited-GSCO ECA 2,792,818 0.88
12 HSBC Custody Nominees (Australia) Limited - A/C 2 2,254,976 0.7113 Citicorp Nominees Pty Limited 1,879,249 0.5914 BNP Paribas Nominees Pty Ltd 1,783,329 0.5615 Mycroft Investments Pty Ltd 1,607,000 0.51
16 Solium Nominees (Australia) Pty Ltd 1,089,748 0.3417 BNP Paribas Noms Pty Ltd 862,162 0.2718 Mr William Leigh Porter 795,000 0.2519 National Nominees Limited 500,676 0.1620 Mr Leon Haddon Ball 493,858 0.16
Total 294,292,410 92.49
Substantial shareholdersThe following have disclosed a substantial shareholder notice in the period to 24 September 2019:
Name Number of shares % of voting power Date of latest notice
Richard White and RealWise Holdings Pty Ltd 154,143,072 48.87 25 March 2019
The Capital Group Companies, Inc 24,432,792 7.68 7 August 2019
Charles Gibbon, Fabemu No 2 Pty Ltd and Gibbon Family Holdings Pty Limited 17,349,014 5.47 6 May 2019
117WiseTech Global | Annual Report 2019
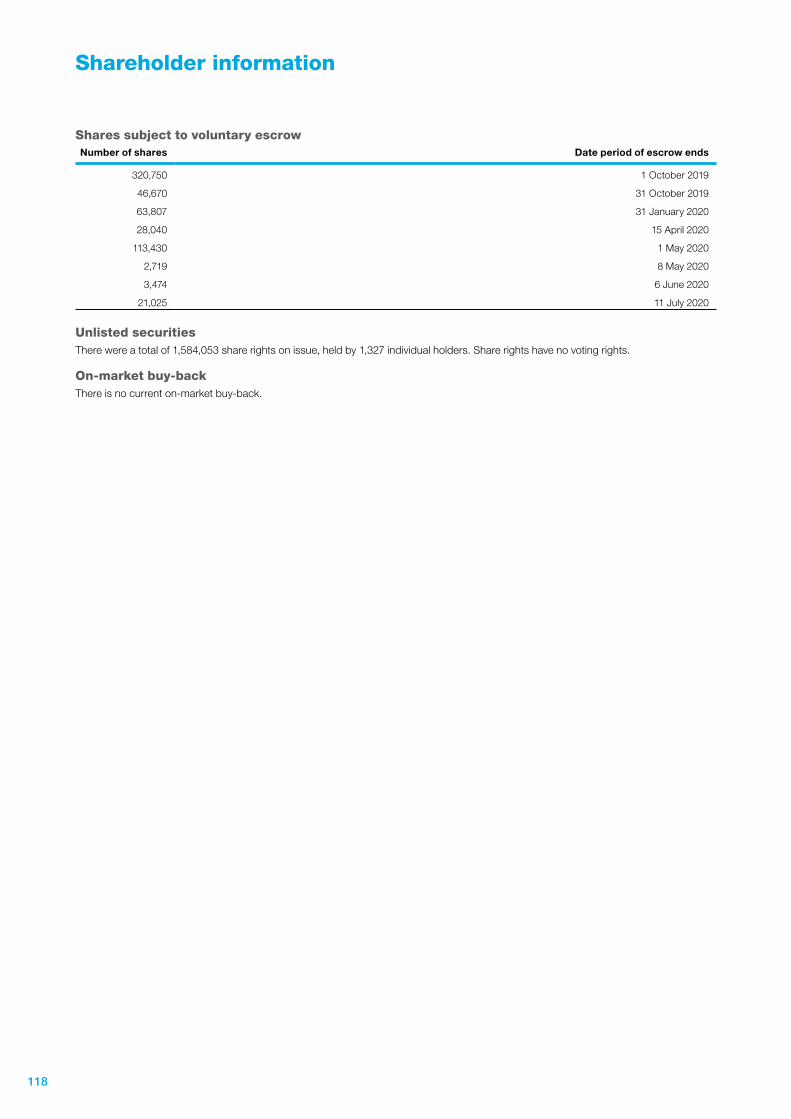
Shareholder information
Shares subject to voluntary escrowNumber of shares Date period of escrow ends
320,750 1 October 2019
46,670 31 October 2019
63,807 31 January 2020
28,040 15 April 2020
113,430 1 May 2020
2,719 8 May 2020
3,474 6 June 2020
21,025 11 July 2020
Unlisted securitiesThere were a total of 1,584,053 share rights on issue, held by 1,327 individual holders. Share rights have no voting rights.
On-market buy-backThere is no current on-market buy-back.
118
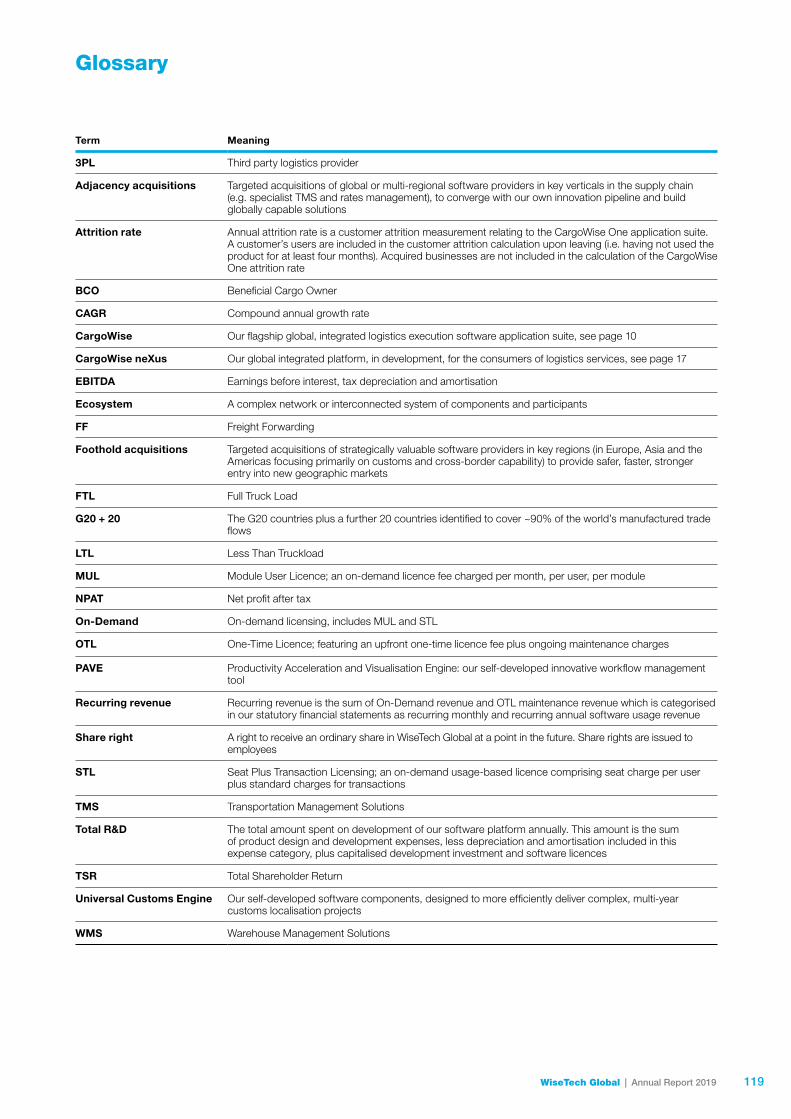
Glossary
Term Meaning
3PL Third party logistics provider
Adjacency acquisitions Targeted acquisitions of global or multi-regional software providers in key verticals in the supply chain (e.g. specialist TMS and rates management), to converge with our own innovation pipeline and build globally capable solutions
Attrition rate Annual attrition rate is a customer attrition measurement relating to the CargoWise One application suite. A customer’s users are included in the customer attrition calculation upon leaving (i.e. having not used the product for at least four months). Acquired businesses are not included in the calculation of the CargoWise One attrition rate
BCO Beneficial Cargo Owner
CAGR Compound annual growth rate
CargoWise Our flagship global, integrated logistics execution software application suite, see page 10
CargoWise neXus Our global integrated platform, in development, for the consumers of logistics services, see page 17
EBITDA Earnings before interest, tax depreciation and amortisation
Ecosystem A complex network or interconnected system of components and participants
FF Freight Forwarding
Foothold acquisitions Targeted acquisitions of strategically valuable software providers in key regions (in Europe, Asia and the Americas focusing primarily on customs and cross-border capability) to provide safer, faster, stronger entry into new geographic markets
FTL Full Truck Load
G20 + 20 The G20 countries plus a further 20 countries identified to cover ~90% of the world’s manufactured trade flows
LTL Less Than Truckload
MUL Module User Licence; an on-demand licence fee charged per month, per user, per module
NPAT Net profit after tax
On-Demand On-demand licensing, includes MUL and STL
OTL One-Time Licence; featuring an upfront one-time licence fee plus ongoing maintenance charges
PAVE Productivity Acceleration and Visualisation Engine: our self-developed innovative workflow management tool
Recurring revenue Recurring revenue is the sum of On-Demand revenue and OTL maintenance revenue which is categorised in our statutory financial statements as recurring monthly and recurring annual software usage revenue
Share right A right to receive an ordinary share in WiseTech Global at a point in the future. Share rights are issued to employees
STL Seat Plus Transaction Licensing; an on-demand usage-based licence comprising seat charge per user plus standard charges for transactions
TMS Transportation Management Solutions
Total R&D The total amount spent on development of our software platform annually. This amount is the sum of product design and development expenses, less depreciation and amortisation included in this expense category, plus capitalised development investment and software licences
TSR Total Shareholder Return
Universal Customs Engine Our self-developed software components, designed to more efficiently deliver complex, multi-year customs localisation projects
WMS Warehouse Management Solutions
119WiseTech Global | Annual Report 2019
Corporate directory
Shareholder enquiries
Enquiries about shareholdings in WiseTechPlease direct all correspondence to WiseTech’s share registry:
Link Market ServicesLevel 12, 680 George Street Sydney NSW 2000
Telephone: 1300 554 474
Email: [email protected]
Website: www.linkmarketservices.com.au
Further information about WiseTech
Websitewww.wisetechglobal.com/investors
Investor relationsEmail: [email protected]
Telephone: +61 (0)2 8001 2200
Registered officeUnit 3a, 72 O’Riordan Street Alexandria NSW 2015
Telephone: +61 (0)2 8001 2200
Company SecretaryEmail: [email protected]
Telephone: +61 (0)2 8001 2200
Auditor
KPMGLevel 38, Tower Three International Towers Sydney 300 Barangaroo Avenue Sydney NSW 2000
Telephone: +61 (0)2 9335 7000
120


www.wisetechglobal.com/investors


![Storyboard | Empowering [industry] · to an available video on the slide itself. Dixons Carphone helps customers find what they want using Chatbots ... Storyboard | Empowering [industry]](https://img.pdfslide.net/doc/110x75/5c974ac709d3f2720a8bf4d2/storyboard-empowering-industry-to-an-available-video-on-the-slide-itself.jpg)