Embed Size (px)
Citation preview
a
Empowering and enabling the world’s supply chainsAnnual Report 2020
wisetechglobal.com
Our innovations and global technology enable, improve and empower the world’s supply chains.
WiseTech’s technology improves productivity, connectivity and resource usage worldwide.
Contents
Financial highlights 2FY20 progress 4Chair’s letter 6CEO’s message 8Our vision and strategy 10Our business 12Our customers 14Our innovation pipeline 16Our expansion pipeline 18Environment, social and governance 20Board of Directors 42
VIDEO HIGHLIGHT For over 25 years, our mission has been to improve the world by creating technology to empower and enable the logistics industry globally. Find out more about us at: https://wisetechglobal.com/who-we-are/about-us/
This annual report is a summary of WiseTech Global and its subsidiary companies’ operations, activities and financial position as at 30 June 2020. References to “WiseTech”, “the Company”, “the Group”,“we”, “us” and “our” refer to WiseTech Global Limited (ABN 41 065 894 724) unless otherwise stated. This document is dated 14 October 2020.
Operating and financial review 44Remuneration Report 51Directors’ Report 65Lead Auditor’s Independence Declaration 68Risk management 69Financial Report 71Independent Auditor’s Report 125Shareholder information 133Glossary 135Corporate directory 136
1W I S E T E C H G L O B A L A N N U A L R E P O R T 2 0 2 0
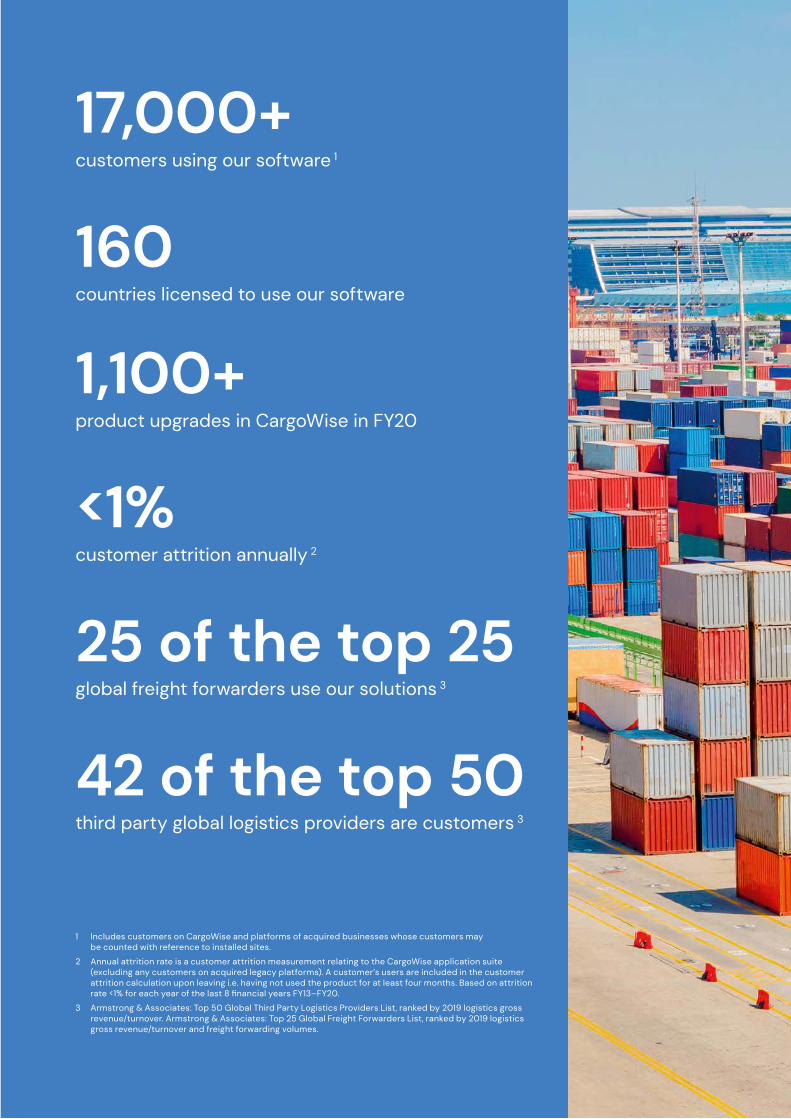
17,000+customers using our software 1
160countries licensed to use our software
1,100+product upgrades in CargoWise in FY20
<1%customer attrition annually 2
25 of the top 25global freight forwarders use our solutions 3
42 of the top 50third party global logistics providers are customers 3
1 Includes customers on CargoWise and platforms of acquired businesses whose customers may be counted with reference to installed sites.
2 Annual attrition rate is a customer attrition measurement relating to the CargoWise application suite (excluding any customers on acquired legacy platforms). A customer’s users are included in the customer attrition calculation upon leaving i.e. having not used the product for at least four months. Based on attrition rate <1% for each year of the last 8 financial years FY13–FY20.
3 Armstrong & Associates: Top 50 Global Third Party Logistics Providers List, ranked by 2019 logistics gross revenue/turnover. Armstrong & Associates: Top 25 Global Freight Forwarders List, ranked by 2019 logistics gross revenue/turnover and freight forwarding volumes.
2
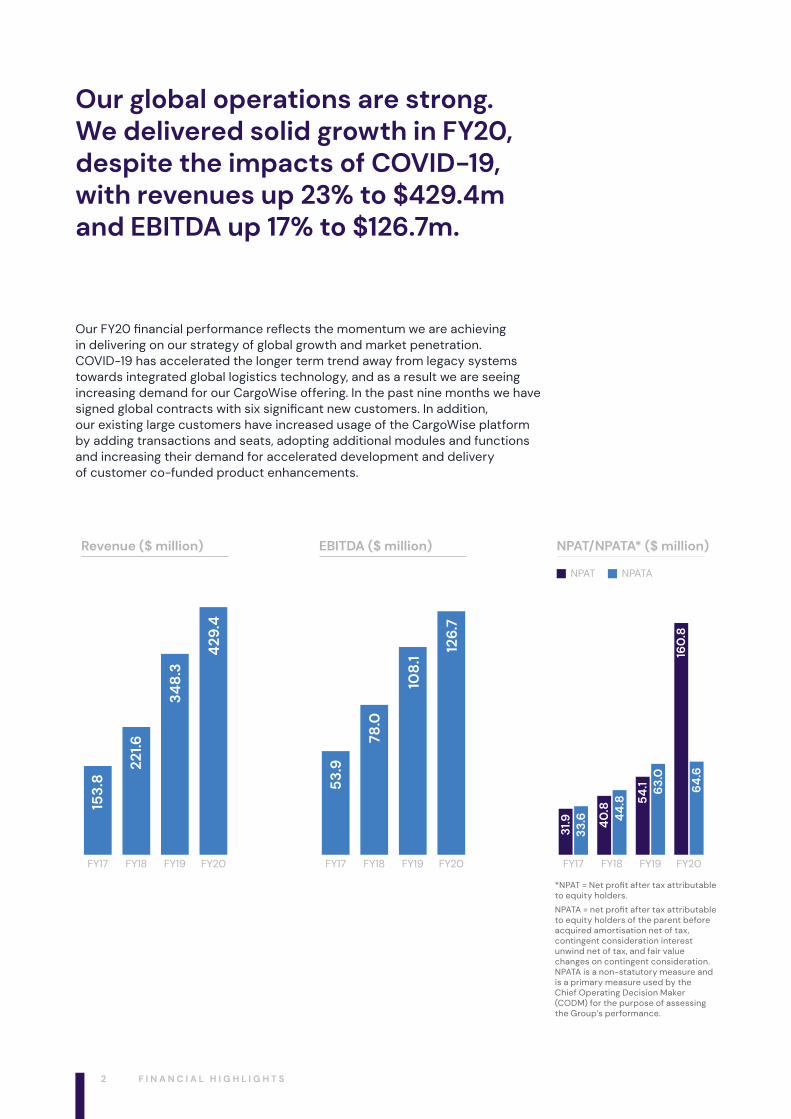
Our global operations are strong. We delivered solid growth in FY20, despite the impacts of COVID-19, with revenues up 23% to $429.4m and EBITDA up 17% to $126.7m.
Our FY20 financial performance reflects the momentum we are achieving in delivering on our strategy of global growth and market penetration. COVID-19 has accelerated the longer term trend away from legacy systems towards integrated global logistics technology, and as a result we are seeing increasing demand for our CargoWise offering. In the past nine months we have signed global contracts with six significant new customers. In addition, our existing large customers have increased usage of the CargoWise platform by adding transactions and seats, adopting additional modules and functions and increasing their demand for accelerated development and delivery of customer co-funded product enhancements.
Revenue ($ million)
FY20FY19FY18FY17
153.
8
221.6
348
.3
429
.4
EBITDA ($ million)
FY20FY19FY18FY17
53.9
78.0
108
.1
126.
7
NPAT/NPATA* ($ million)
NPAT
FY20FY19FY18FY17
31.9
33.6 40
.84
4.8 54
.1 63.
0
160
.86
4.6
NPATA
NPAT* = Net profit after tax attributable to equity holders
*NPAT = Net profit after tax attributable to equity holders.
NPATA = net profit after tax attributable to equity holders of the parent before acquired amortisation net of tax, contingent consideration interest unwind net of tax, and fair value changes on contingent consideration. NPATA is a non-statutory measure and is a primary measure used by the Chief Operating Decision Maker (CODM) for the purpose of assessing the Group’s performance.
F I N A N C I A L H I G H L I G H T S
3W I S E T E C H G L O B A L A N N U A L R E P O R T 2 0 2 0
1 Annual attrition rate is a customer attrition measurement relating to the CargoWise platform (excluding any customers on acquired legacy platforms). A customer’s users are included in the customer attrition calculation upon leaving i.e. having not used the product for at least four months. Based on attrition rate of <1% for each year of the last 8 financial years FY13–FY20.
2 Total investment in product development and innovation includes both expensed and capitalised amounts each year spent on product development and innovation, patents and purchased external software licences used in our products.
3 The Group applied AASB 16 Leases from 1 July 2019 resulting in a positive $6.4 million EBITDA increase, minimal impact on NPAT and no change to revenue in FY20.
4 NPATA – net profit after tax attributable to equity holders of the parent before acquired amortisation net of tax, contingent consideration interest unwind (net of tax) and fair value changes to contingent consideration. NPATA is a non‑statutory measure and is a primary measure used by the Chief Operating Decision Maker (CODM) for the purpose of assessing the Group’s performance.
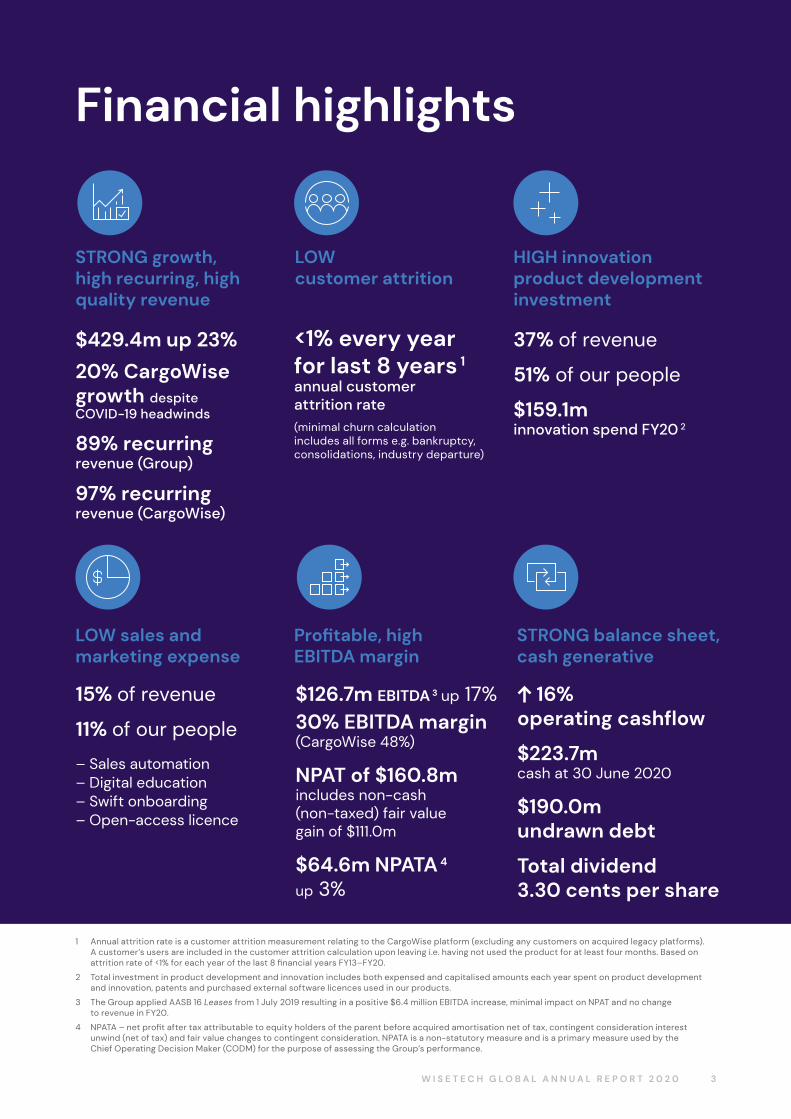
Financial highlights
STRONG growth, high recurring, high quality revenue
$429.4m up 23%
20% CargoWise growth despite COVID-19 headwinds
89% recurring revenue (Group)
97% recurring revenue (CargoWise)
37% of revenue
51% of our people
$159.1m innovation spend FY20 2
HIGH innovation product development investment
<1% every year for last 8 years 1
annual customer attrition rate(minimal churn calculation includes all forms e.g. bankruptcy, consolidations, industry departure)
LOW customer attrition
$126.7m EBITDA 3 up 17%30% EBITDA margin (CargoWise 48%)
NPAT of $160.8m includes non-cash (non-taxed) fair value gain of $111.0m
$64.6m NPATA 4 up 3%
Profitable, high EBITDA margin
LOW sales and marketing expense
15% of revenue
11% of our people
– Sales automation – Digital education– Swift onboarding– Open‑access licence
16% operating cashflow
$223.7m cash at 30 June 2020
$190.0m undrawn debt
Total dividend 3.30 cents per share
STRONG balance sheet, cash generative
4
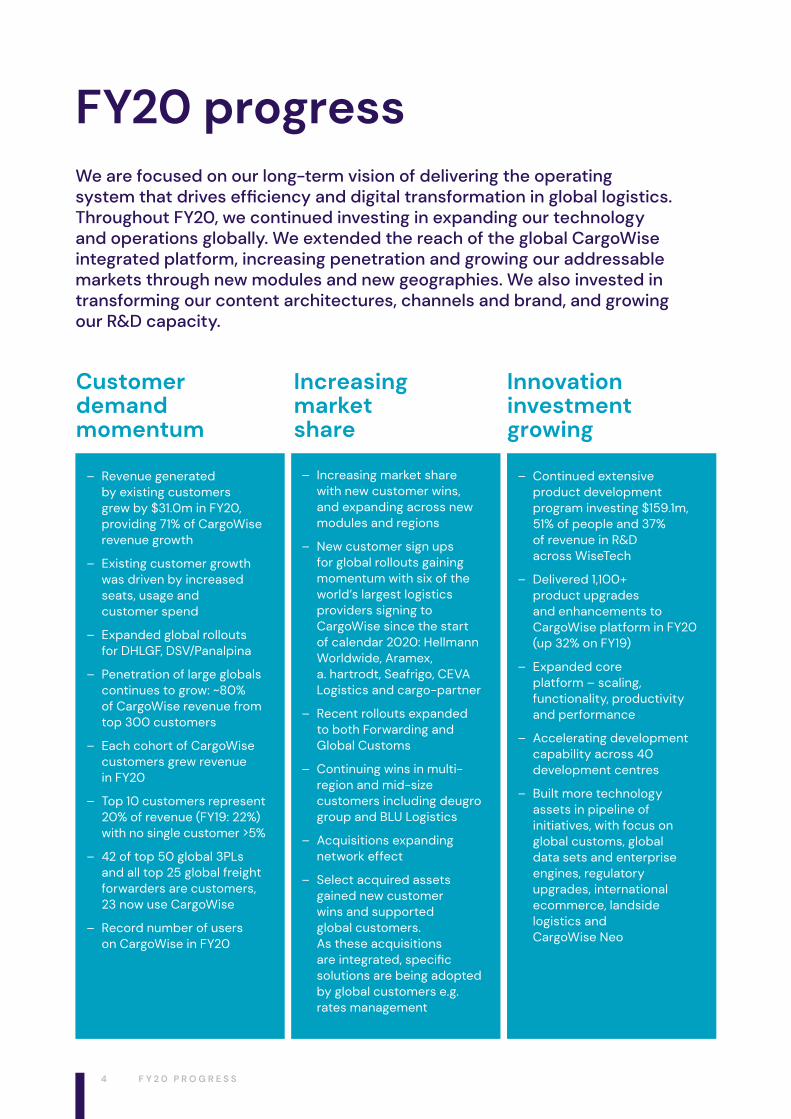
FY20 progressWe are focused on our long-term vision of delivering the operating system that drives efficiency and digital transformation in global logistics. Throughout FY20, we continued investing in expanding our technology and operations globally. We extended the reach of the global CargoWise integrated platform, increasing penetration and growing our addressable markets through new modules and new geographies. We also invested in transforming our content architectures, channels and brand, and growing our R&D capacity.
Increasing market share
Innovation investment growing
Customer demand momentum
– Revenue generated by existing customers grew by $31.0m in FY20, providing 71% of CargoWise revenue growth
– Existing customer growth was driven by increased seats, usage and customer spend
– Expanded global rollouts for DHLGF, DSV/Panalpina
– Penetration of large globals continues to grow: ~80% of CargoWise revenue from top 300 customers
– Each cohort of CargoWise customers grew revenue in FY20
– Top 10 customers represent 20% of revenue (FY19: 22%) with no single customer >5%
– 42 of top 50 global 3PLs and all top 25 global freight forwarders are customers, 23 now use CargoWise
– Record number of users on CargoWise in FY20
– Increasing market share with new customer wins, and expanding across new modules and regions
– New customer sign ups for global rollouts gaining momentum with six of the world’s largest logistics providers signing to CargoWise since the start of calendar 2020: Hellmann Worldwide, Aramex, a. hartrodt, Seafrigo, CEVA Logistics and cargo-partner
– Recent rollouts expanded to both Forwarding and Global Customs
– Continuing wins in multi-region and mid-size customers including deugro group and BLU Logistics
– Acquisitions expanding network effect
– Select acquired assets gained new customer wins and supported global customers. As these acquisitions are integrated, specific solutions are being adopted by global customers e.g. rates management
– Continued extensive product development program investing $159.1m, 51% of people and 37% of revenue in R&D across WiseTech
– Delivered 1,100+ product upgrades and enhancements to CargoWise platform in FY20 (up 32% on FY19)
– Expanded core platform – scaling, functionality, productivity and performance
– Accelerating development capability across 40 development centres
– Built more technology assets in pipeline of initiatives, with focus on global customs, global data sets and enterprise engines, regulatory upgrades, international ecommerce, landside logistics and CargoWise Neo
F Y 2 0 P R O G R E S S
5W I S E T E C H G L O B A L A N N U A L R E P O R T 2 0 2 0
Disciplined financial management
Building scale
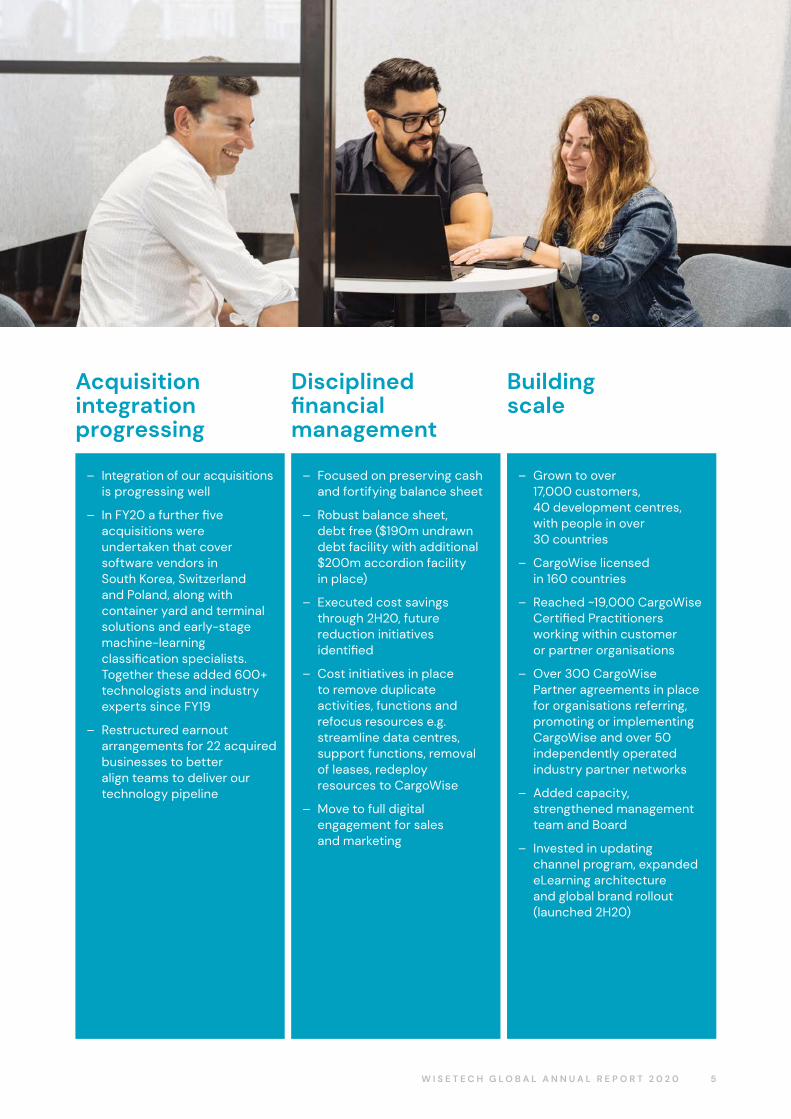
Acquisition integration progressing
– Integration of our acquisitions is progressing well
– In FY20 a further five acquisitions were undertaken that cover software vendors in South Korea, Switzerland and Poland, along with container yard and terminal solutions and early-stage machine-learning classification specialists. Together these added 600+ technologists and industry experts since FY19
– Restructured earnout arrangements for 22 acquired businesses to better align teams to deliver our technology pipeline
– Focused on preserving cash and fortifying balance sheet
– Robust balance sheet, debt free ($190m undrawn debt facility with additional $200m accordion facility in place)
– Executed cost savings through 2H20, future reduction initiatives identified
– Cost initiatives in place to remove duplicate activities, functions and refocus resources e.g. streamline data centres, support functions, removal of leases, redeploy resources to CargoWise
– Move to full digital engagement for sales and marketing
– Grown to over 17,000 customers, 40 development centres, with people in over 30 countries
– CargoWise licensed in 160 countries
– Reached ~19,000 CargoWise Certified Practitioners working within customer or partner organisations
– Over 300 CargoWise Partner agreements in place for organisations referring, promoting or implementing CargoWise and over 50 independently operated industry partner networks
– Added capacity, strengthened management team and Board
– Invested in updating channel program, expanded eLearning architecture and global brand rollout (launched 2H20)
6
Chair’s letter
Our position as a leading global provider of logistics execution software gave us early insight into the impact of COVID‑19 on trade flows and supply chains across the world. Our foremost priority was, and continues to be, keeping our people, partners and the communities we operate in as safe and productive as possible.
We are proud of our employees and customers in their efforts to keep global supply chains moving across the world and within countries. Our people moved seamlessly to remote working and delivered outstanding productivity, increased product innovation and growth in market share, along with strong, high-quality revenue growth.
We initially saw volatility in logistics markets and a marked slowdown in the movement of goods across all modes of transport, with lower transaction volumes recorded in late January through to May. In response, we implemented cost saving initiatives and deferred certain planned new product launches. By June, however, a moderate recovery was experienced with momentum improving and continuing into July. By the end of July, CargoWise user numbers were close to pre-COVID-19 levels.
Throughout this period, we have seen continuing demand amongst CargoWise’s larger customers to accelerate development and delivery of customer co-funded product enhancements to enable them to better navigate challenges posed by the pandemic.
Focus on strategy driving strong performanceOur business remained resilient during FY20, rising above the challenges of COVID-19, with our revenues growing 23% to $429.4m.
Importantly, our core CargoWise offering continued to achieve strong growth delivering FY20 revenue of $263.0m, up 20% on FY19, reflecting new customer signings and increased usage by existing customers. Recurring revenue was strong at 97% and the attrition rate remained below 1% for the eighth consecutive year.
Our strategic acquisitions also contributed to our revenue growth, with revenue attributable to acquisitions up 29% in FY20 to $166.4m. In FY20, we undertook five strategic acquisitions across North America, South Korea, Switzerland and Poland.
Our acquisitions deliver additional skills in the form of specialist technology teams and access to intellectual property that we can converge with our own technology as well as faster entry into new markets and relevant customer bases.
EBITDA for the year was up 17% to $126.7m and our EBITDA margin was strong at 30%, reflecting continued revenue growth and 2H20 cost savings.
Our statutory NPAT was up 197% to $160.8m, reflecting a non‑cash, non‑taxed fair value gain of $111.0m from restructuring 22 acquisition earnout obligations and other adjustments. Excluding this fair value gain and $2.9m of contingent consideration interest unwind (net of tax), FY20 underlying NPAT was flat at $52.6m. This reflects increased depreciation and amortisation expenses in FY20 due to greater investment in R&D and new product development.
Financial strength and dividendsOur balance sheet and cash flows are strong. As at 30 June 2020, cash and cash equivalents was $223.7m, and we had no outstanding debt. With a $190.0m undrawn debt facility in place plus a further $200.0m accordion facility available to us, we are well positioned to fund our growth and leverage opportunities. Importantly, cash flows from our operating activities was $146.3m demonstrating the ability of our business to generate cash.
The Board declared a fully franked final dividend of 1.60 cents per share (cps) for FY20, payable on 2 October 2020. Coupled with the FY20 interim dividend of 1.70 cps, the total FY20 dividend was 3.30 cps and represents a payout ratio of 20% of underlying NPAT.
We continue to offer a dividend reinvestment plan that enables eligible shareholders to reinvest their dividends to acquire additional WiseTech shares. Our ongoing dividend policy is to target a dividend payout ratio of up to 20% of our NPAT.
The resilience and productivity of our people in the face of COVID-19 challenges were exceptional and instrumental in achieving our FY20 performance and expanding our strong foundation for our future growth.
COVID-19: impact and our response
C H A I R ’ S L E T T E R
7W I S E T E C H G L O B A L A N N U A L R E P O R T 2 0 2 0
Outlook Looking ahead, the COVID-19 challenges faced by the logistics industry are accelerating the longer-term trend towards consolidation and integration. We are seeing increased demand amongst large global logistics service providers for our technology to drive efficiencies and productivity improvements.
We are gaining momentum in our market penetration and have a strong foundation for long-term growth. Looking ahead, our strategic focus is on investment in innovation across our CargoWise platform and accelerated integration of our acquired businesses.
In terms of our FY21 guidance, given the ongoing impacts of COVID-19 are still unknown, our guidance is subject to assumptions set out in detail in our FY20 Results presentation. Based on these assumptions, and subject to no material adverse events, we expect FY21 revenue to grow between 9% to 19%, to $470m to $510m, and our EBITDA to grow between 22% to 42%, to $155m to $180m.
Board activitiesAs WiseTech continues to expand its technology leadership, global reach and geographic footprint, we are aligning the Board composition to support the business’ needs as we grow.
During FY20, we appointed an additional independent Non-Executive Director to the Board, Arlene Tansey, on 1 June 2020. Arlene brings considerable ASX-listed company governance experience, corporate expertise and financial acumen along with more than 30 years’ international experience in financial services and investment banking.
Independent Non-Executive Director, Christine Holman, resigned from the Board on 18 October 2019. We will continue to work on our Board evolution with the recruitment of an additional independent Non-Executive Director in FY21 to support the business objectives and long-term growth strategy.
Environment, social and governance – corporate social responsibilityThe Board places significant importance on corporate social responsibility, culture, governance and accountability. We are committed to ensuring that the high corporate governance standards are achieved. Our corporate governance policies and practices are set out in our Corporate Governance Statement (available on pages 32 to 41).
The Board believes that to have a sustainable business, WiseTech needs to continue to make a positive contribution to the communities that it is part of. Our technology solutions have an important role to play in solving the complex pain points of the logistics industry and improving resource usage. See pages 20 to 41 for details of our ESG performance.
Our peopleWith a team of over 2,100 people globally, spanning more than 60 nationalities and ranging in age from 18 to 75+, we are proud of our highly diverse and inclusive workforce. At WiseTech, 33% of our employees and 43% of our Board are female and we remain dedicated to encouraging and supporting more women to enter the technology and logistics industries.
Our people are driven by a culture that enables and empowers innovation, encourages bold ideas, and underpins our shared vision of building the operating system for global logistics. The resilience and productivity of our people in the face of COVID-19 challenges were exceptional and instrumental in achieving our FY20 performance and expanding our strong foundation for our future growth.
On behalf of the Board, I would like to thank our CEO, Richard White, for his inspiring leadership and vision, and the adept WiseTech Global teams for their agility and dedication as we navigate unchartered territory together.
Finally, we thank our shareholders, employees, customers and the communities in which we operate for their support and the continued trust placed in us.
The WiseTech Global team is committed to delivering on our strategic objectives and vision, while driving long-term shareholder value.
Andrew Harrison Chair
8
CEO’s message
Emerging stronger from the challenges of the COVID-19 environmentI want to thank our dedicated people for their resilience and focus during these challenging times. They have been the embodiment of our culture, which makes me extremely proud to be a part of the WiseTech family.
As COVID-19 swept across the world earlier this year, the logistics industry and the technology we provide became of critical importance. Our real-time data sets allowed us to be amongst the first companies to call out the dramatic impact COVID-19 would have on industrial production and global trade and the likely impact on many businesses, including our own.
Our ability to deliver FY20 revenue growth of 23% and EBITDA growth of 17%, in line with our guidance, despite the disruption of the pandemic is a testament to our people, the strength of our product offering, business model, our value proposition and to the many logistics customers that drove their businesses despite harsh lockdowns and other adversity.
Throughout FY20, our software platform and data centres powerfully supported our customers across the world. Our people exemplified our culture, focusing on execution, delivering significant increases in productivity. Despite this challenging environment, we took necessary actions to prioritise critical technology development, improve cost efficiencies, safeguard our financial strength, and continue to build our competitive position.
Our investment in R&D increased by 41% to $159.1m, representing 37% of our revenue. We added more than 1,100 new product features and enhancements to our CargoWise platform, an increase of 32% on last year. Through these enhancements, we are increasing the scalability, security and reach of our global platform. Across our development teams, we are expanding our technology lead at a rapid rate, building more global capabilities, data sets and adjacent technologies to expand our addressable market. Read more on pages 12 to 19.
Importantly, we continued to increase the penetration of our CargoWise product. Demand is accelerating
for our technology that enables data visibility across the entire supply chain, automation, and deep integration on a single platform.
It took us more than a decade to sign up our first seven global customers but momentum has been gaining pace. In the past nine months, we have signed six new customers who have committed to CargoWise global rollouts. These include Aramex, Seafrigo, a. hartrodt, cargo-partner and top 25 global freight forwarders, Hellmann Worldwide Logistics and CEVA Logistics.
This is in addition to our 17 existing global rollout customers which include the world’s largest logistics organisations DHL Global Forwarding, DSV/Panalpina, and Bolloré. Given large global customers take multiple years to roll out the CargoWise platform across their sites globally, usage and transaction revenues are expected to continue to grow over time.
Strategic acquisition integrationIn recent years, we have completed over 40 acquisitions. These acquisitions have delivered significant knowledge and development resources to optimise and accelerate our technology pipeline and expand our geographic footprint.
COVID-19 provided the impetus to renegotiate and fully or partially close out earnout obligations for 22 of our acquisitions by replacing nearly all cash payments with equity. This has not only improved liquidity but also, given the impacts of COVID-19 on supply chains and business, better aligned these acquisitions to evolving business needs and the fine‑tuning of the CargoWise technology pipeline.
Our acquisition integration is a multi-staged, multi-year process. The operational integration of most acquisition assets is well progressed with the focus now on leveraging the acquired technology and skill sets to expand CargoWise with native components and to convert customers onto the CargoWise platform. The final stage of integration will involve taking action to deliver operational and cost efficiencies including eliminating duplication and
We are building a world-leading technology organisation, with a clear goal to empower and enable the world’s supply chains. There has never been a greater need for the digitisation and globally integrated logistics technology that CargoWise provides.
C E O ’ S M E S S A G E
9W I S E T E C H G L O B A L A N N U A L R E P O R T 2 0 2 0
inefficiencies across all functions, growing revenues, enhancing margins and bringing all our acquired platforms into our data centres.
Structural sector changes accelerated by COVID-19Never before has logistics and the global supply chain been more critical and visible in ensuring the movement of goods around the world. And we have seen this become even more evident during this pandemic period.
Apart from the immediate short-term challenges posed by COVID-19 in terms of disruption to supply chains, the pandemic, which was initially a headwind, has provided our business with a unique opportunity.
It has accelerated the long-term trend away from legacy systems littered with bolt-together micro-point systems and inherent cyber security risks, towards integrated global logistics technology that facilitates the ability of our customers to navigate the new world normal.
WiseTech is ideally placed to address this growing demand. CargoWise provides a highly integrated, fully digital, global logistics execution platform that increases productivity and visibility and provides functional depth and rich data-driven automation. Our technology enables logistics service providers to better plan, visualise and control their global operations, whilst mitigating risk and facilitating regulatory compliance.
The move to working remotely has further reinforced our value proposition with many of our customers moving swiftly and successfully to a working from home environment facilitated by our technology.
The next horizon - Product, Penetration and Profitability Looking ahead, we are taking clear steps to build upon our solid foundation for future growth. Given our market position, product strength and industry tailwinds from COVID-19 pressures, we are focused on Product, Penetration and Profitability.
Over the next three years, we will concentrate on expanding our technology lead, by realigning additional resources to our CargoWise product suite. We will accelerate key native customs projects, prioritising the largest markets and major customer pain points.
With the penetration of fully digital and highly automated global logistics solutions still in the early stages, the opportunity for growth is vast.
We will drive market penetration by refining and focusing our high-performance sales team to drive further global rollouts across the top 25 global freight forwarders and the top 200 logistics
providers. This will be complemented by our significant channel partner footprint across 46 countries, which is focused on referring, promoting or implementing our platform and supporting our global rollouts in expansion activities.
In addition, our continued digital‑first approach will further expand digital sales tools and processes for our valuable customers and key markets.
We have a solid financial foundation and will continue to focus on driving profitability across our global operations. This will include automating our manual customer facing and internal functions that are high volume and automatable via a self-service portal. We will also look at removing duplication and centralising or regionalising where possible and aligning product teams to key development resources and scale in Sydney.
I encourage you to read more about our long-term vision and FY21 management focus on pages 10 and 11. Collectively, these actions and objectives will further stimulate customer growth, increase existing customer usage, accelerate and build our global presence and drive operational efficiencies.
Our vision and commitmentOur vision is unwavering – to be the operating system for global logistics. There has never been a greater need for the digitisation and globally integrated logistics technology that CargoWise provides.
We are ideally positioned for continued growth and further market penetration. We have a well-considered, comprehensive plan to deliver on our strategic objectives, and our strong balance sheet, strong cash flows and robust liquidity mean we have significant financial firepower to fund our growth.
Importantly, we have a product pipeline and R&D program that will ensure we have a competitive edge and significant opportunity to continue to improve margins and profitability. We have an exciting future ahead of us and the entire WiseTech Global team and I are committed to our long-term vision.
On behalf of the WiseTech Global team, I want to thank each of our shareholders for your investment and support as we continue to build a world-leading organisation, with a clear goal to empower and enable the world’s supply chains.
Richard White Founder and CEO
1 0
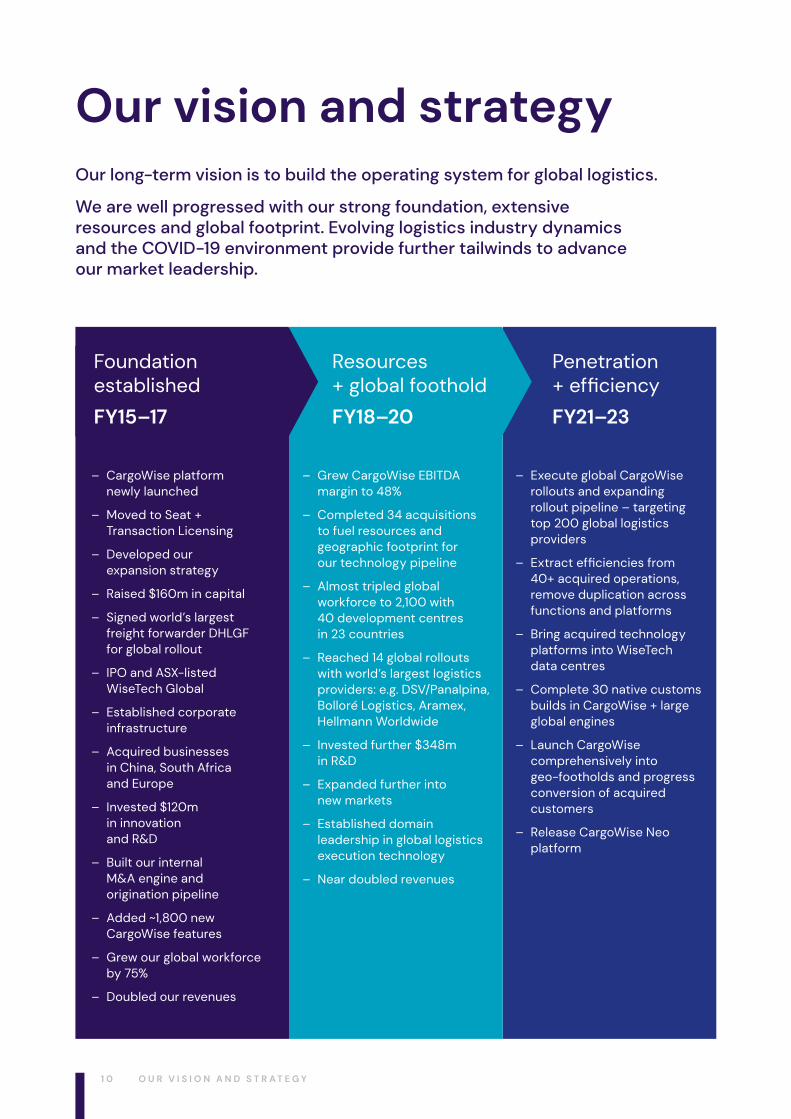
Our vision and strategyOur long-term vision is to build the operating system for global logistics.
We are well progressed with our strong foundation, extensive resources and global footprint. Evolving logistics industry dynamics and the COVID-19 environment provide further tailwinds to advance our market leadership.
Resources + global foothold
FY18–20
Penetration + efficiency
FY21–23
Foundation established
FY15–17
– CargoWise platform newly launched
– Moved to Seat + Transaction Licensing
– Developed our expansion strategy
– Raised $160m in capital
– Signed world’s largest freight forwarder DHLGF for global rollout
– IPO and ASX‑listed WiseTech Global
– Established corporate infrastructure
– Acquired businesses in China, South Africa and Europe
– Invested $120m in innovation and R&D
– Built our internal M&A engine and origination pipeline
– Added ~1,800 new CargoWise features
– Grew our global workforce by 75%
– Doubled our revenues
– Grew CargoWise EBITDA margin to 48%
– Completed 34 acquisitions to fuel resources and geographic footprint for our technology pipeline
– Almost tripled global workforce to 2,100 with 40 development centres in 23 countries
– Reached 14 global rollouts with world’s largest logistics providers: e.g. DSV/Panalpina, Bolloré Logistics, Aramex, Hellmann Worldwide
– Invested further $348m in R&D
– Expanded further into new markets
– Established domain leadership in global logistics execution technology
– Near doubled revenues
– Execute global CargoWise rollouts and expanding rollout pipeline – targeting top 200 global logistics providers
– Extract efficiencies from 40+ acquired operations, remove duplication across functions and platforms
– Bring acquired technology platforms into WiseTech data centres
– Complete 30 native customs builds in CargoWise + large global engines
– Launch CargoWise comprehensively into geo-footholds and progress conversion of acquired customers
– Release CargoWise Neo platform
O U R V I S I O N A N D S T R A T E G Y
1 1W I S E T E C H G L O B A L A N N U A L R E P O R T 2 0 2 0
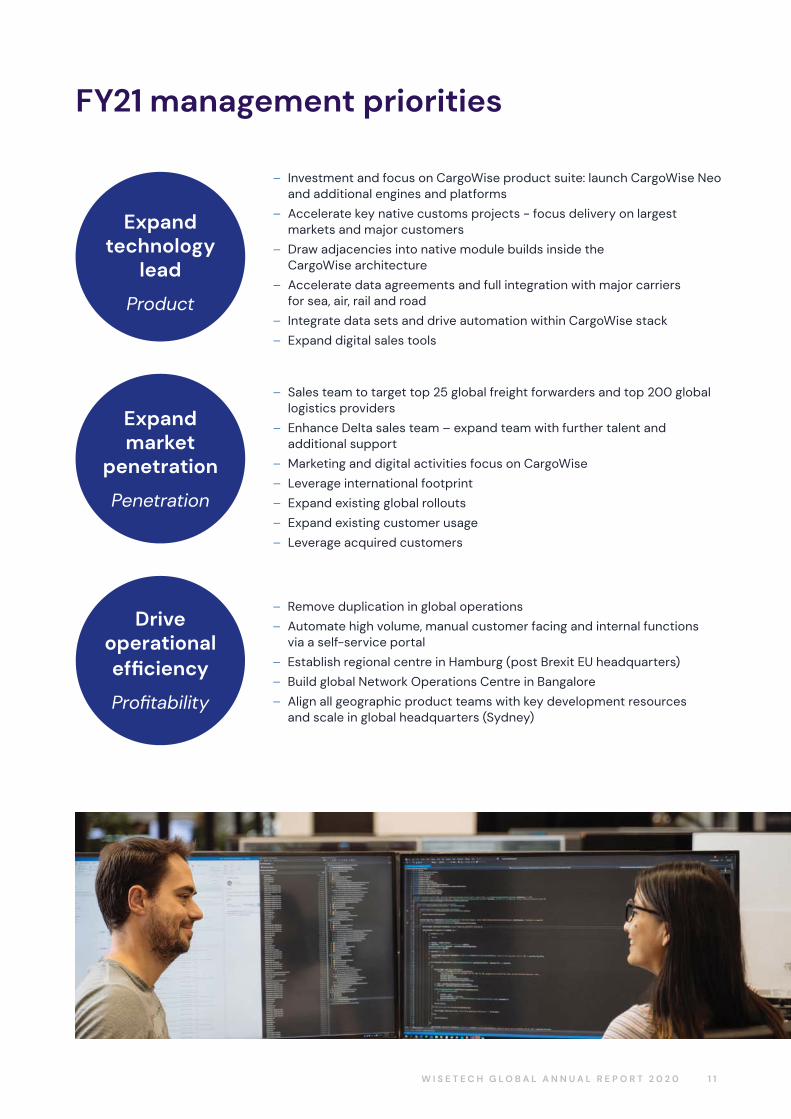
FY21 management priorities
– Investment and focus on CargoWise product suite: launch CargoWise Neo and additional engines and platforms
– Accelerate key native customs projects - focus delivery on largest markets and major customers
– Draw adjacencies into native module builds inside the CargoWise architecture
– Accelerate data agreements and full integration with major carriers for sea, air, rail and road
– Integrate data sets and drive automation within CargoWise stack
– Expand digital sales tools
– Sales team to target top 25 global freight forwarders and top 200 global logistics providers
– Enhance Delta sales team – expand team with further talent and additional support
– Marketing and digital activities focus on CargoWise
– Leverage international footprint
– Expand existing global rollouts
– Expand existing customer usage
– Leverage acquired customers
– Remove duplication in global operations
– Automate high volume, manual customer facing and internal functions via a self-service portal
– Establish regional centre in Hamburg (post Brexit EU headquarters)
– Build global Network Operations Centre in Bangalore
– Align all geographic product teams with key development resources and scale in global headquarters (Sydney)
Expand technology
lead
Product
Expand market
penetration
Penetration
Drive operational efficiency
Profitability
1 2
Our industry‑leading flagship product, CargoWise, is a cloud-based, global platform, purpose-built to meet the diverse needs of the logistics industry. CargoWise enables our customers to execute highly complex logistics transactions in areas such as freight forwarding, customs, warehousing, shipping, tracking, land transport, international ecommerce and cross-border compliance as well as manage their operations on one database across multiple users, functions, offices and countries.
Translated into 30 languages and operating across multiple currencies, CargoWise offers truly global capabilities for a global industry. Our customers stay, and grow transactions and users, due to the power, depth and productivity of CargoWise. The efficiency of our CargoWise operations is the result of innovation in our business model and internal architectures and focus on building globally scalable processes to systematically remove the constraints to growth.
We customise through configuration engines, offer a single global SaaS price list and we support our customers through a digitally delivered global education and content platform, along with external partner organisations based in 46 countries. These are a few of the many elements that scale out efficiency and help to drive and maintain our 48% CargoWise EBITDA margin.
We are actively expanding CargoWise through relentless innovation and acquiring software vendors to fuel our resources and technology pipeline. Every new geography and adjacency we acquire add a valuable point on our strategic map, accelerate the network effects and make CargoWise even more compelling to local and global logistics providers and their customers.
Our businessWe are a leading developer and provider of software solutions to the logistics execution industry globally. Our mission is to change the world by creating breakthrough products that empower those that own, enable and operate the supply chains of the world. We create software products that are renowned for their productivity, functional depth, data integration, regulatory compliance, global capability and value.
THE NETWORK EFFECT
In FY20, we further enhanced our global network effect with targeted partner programs through CargoWise Partners, Certified Practitioners and industry partners for freight forwarding. We have over 300 CargoWise Partner agreements in place for organisations referring, promoting or implementing CargoWise, and have qualified ~19,000 CargoWise Certified Practitioners who work within the logistics industry and across our customer or partner organisations.
CARGOWISE BENEFITS
– Cost reduction
– Productivity gains
– Ease of scalability and expansion
– Intelligent automation
– Risk mitigation
– Sustainability and maintainability
O U R B U S I N E S S
1 3W I S E T E C H G L O B A L A N N U A L R E P O R T 2 0 2 0
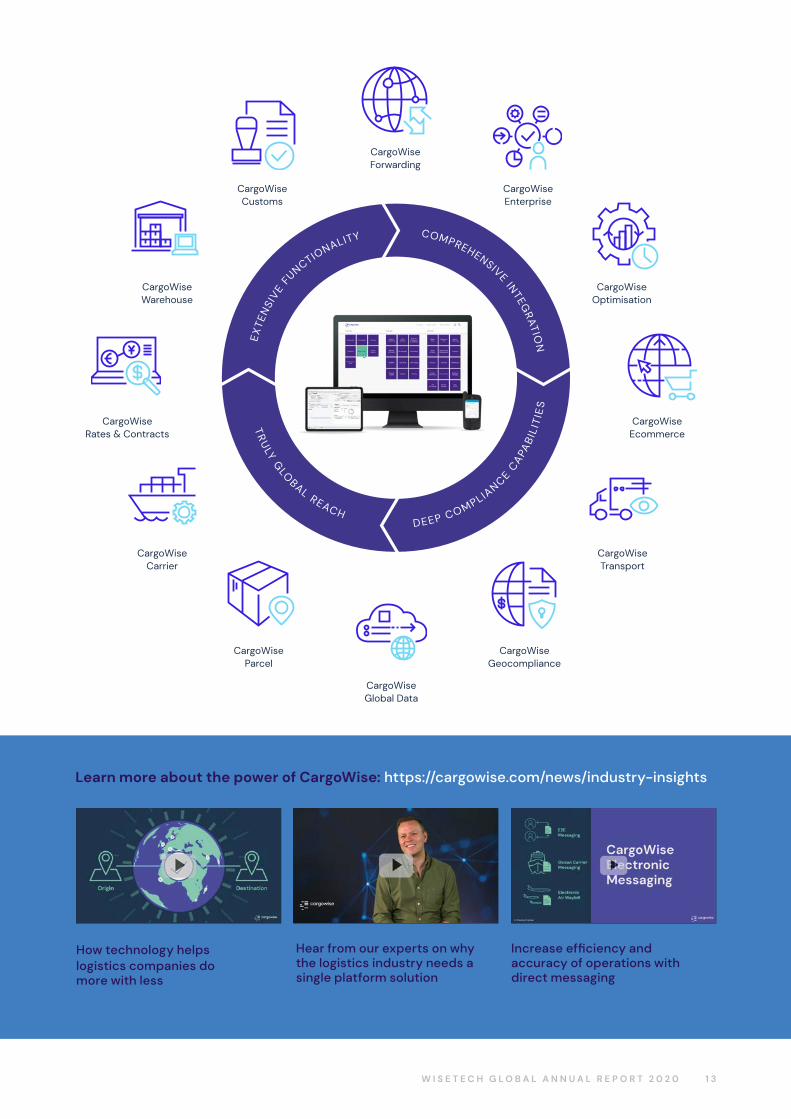
EXTE
NSI
VE FUNCTIO
NALITY COMPREHENSIVE INTEGRATIO
N
DEEP COMPLIANCE C
APA
BIL
ITIE
S
TR
ULY G
LO
BAL REACH
Productivityat the centre of everything
CargoWiseForwarding
CargoWiseEnterprise
CargoWiseCustoms
CargoWiseOptimisation
CargoWiseWarehouse
CargoWiseEcommerce
CargoWiseRates & Contracts
CargoWiseTransport
CargoWiseCarrier
CargoWiseGeocompliance
CargoWiseGlobal Data
CargoWiseParcel
Learn more about the power of CargoWise: https://cargowise.com/news/industry-insights
Increase efficiency and accuracy of operations with direct messaging
How technology helps logistics companies do more with less
Hear from our experts on why the logistics industry needs a single platform solution
1 4
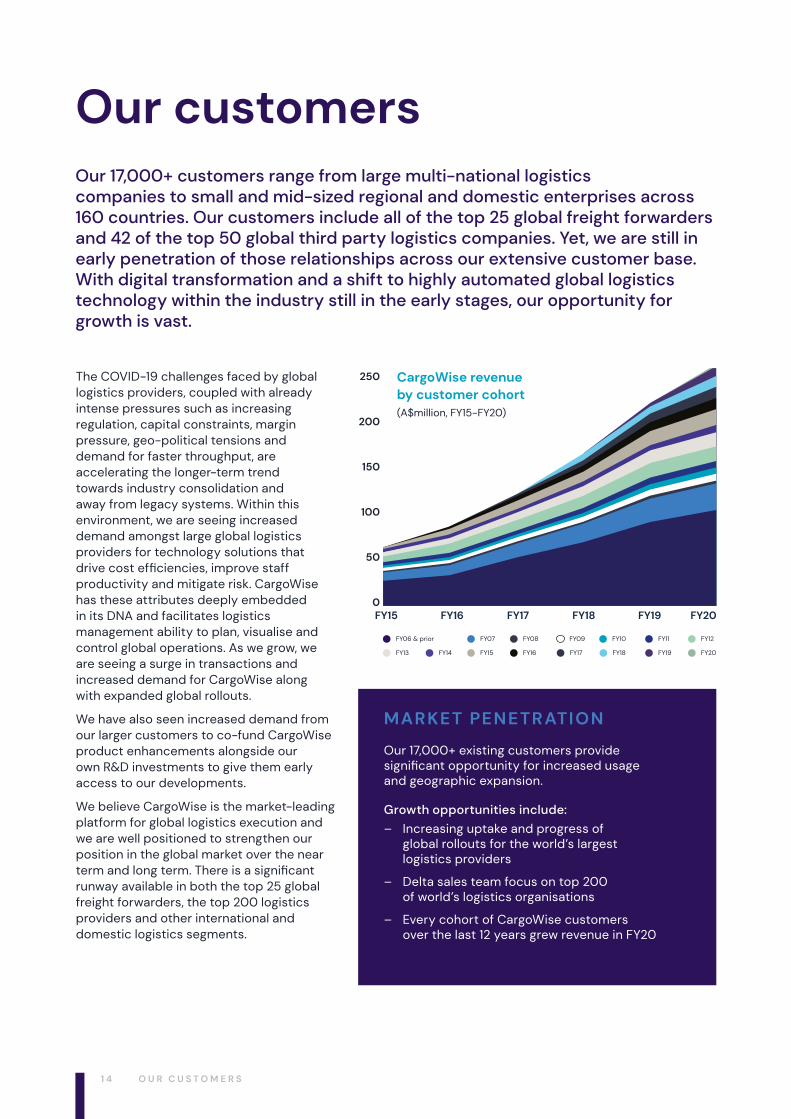
The COVID-19 challenges faced by global logistics providers, coupled with already intense pressures such as increasing regulation, capital constraints, margin pressure, geo-political tensions and demand for faster throughput, are accelerating the longer-term trend towards industry consolidation and away from legacy systems. Within this environment, we are seeing increased demand amongst large global logistics providers for technology solutions that drive cost efficiencies, improve staff productivity and mitigate risk. CargoWise has these attributes deeply embedded in its DNA and facilitates logistics management ability to plan, visualise and control global operations. As we grow, we are seeing a surge in transactions and increased demand for CargoWise along with expanded global rollouts.
We have also seen increased demand from our larger customers to co-fund CargoWise product enhancements alongside our own R&D investments to give them early access to our developments.
We believe CargoWise is the market-leading platform for global logistics execution and we are well positioned to strengthen our position in the global market over the near term and long term. There is a significant runway available in both the top 25 global freight forwarders, the top 200 logistics providers and other international and domestic logistics segments.
Our customersOur 17,000+ customers range from large multi-national logistics companies to small and mid-sized regional and domestic enterprises across 160 countries. Our customers include all of the top 25 global freight forwarders and 42 of the top 50 global third party logistics companies. Yet, we are still in early penetration of those relationships across our extensive customer base. With digital transformation and a shift to highly automated global logistics technology within the industry still in the early stages, our opportunity for growth is vast.
MARKET PENETRATION
Our 17,000+ existing customers provide significant opportunity for increased usage and geographic expansion.
Growth opportunities include:– Increasing uptake and progress of
global rollouts for the world’s largest logistics providers
– Delta sales team focus on top 200 of world’s logistics organisations
– Every cohort of CargoWise customers over the last 12 years grew revenue in FY20
CargoWise revenue by customer cohort(A$million, FY15-FY20)
250
200
150
100
50
0FY15 FY16 FY17 FY18 FY19 FY20
FY06 & prior FY07 FY08 FY09 FY10 FY11 FY12
FY13 FY14 FY15 FY16 FY17 FY18 FY19 FY20
O U R C U S T O M E R S
1 5W I S E T E C H G L O B A L A N N U A L R E P O R T 2 0 2 0
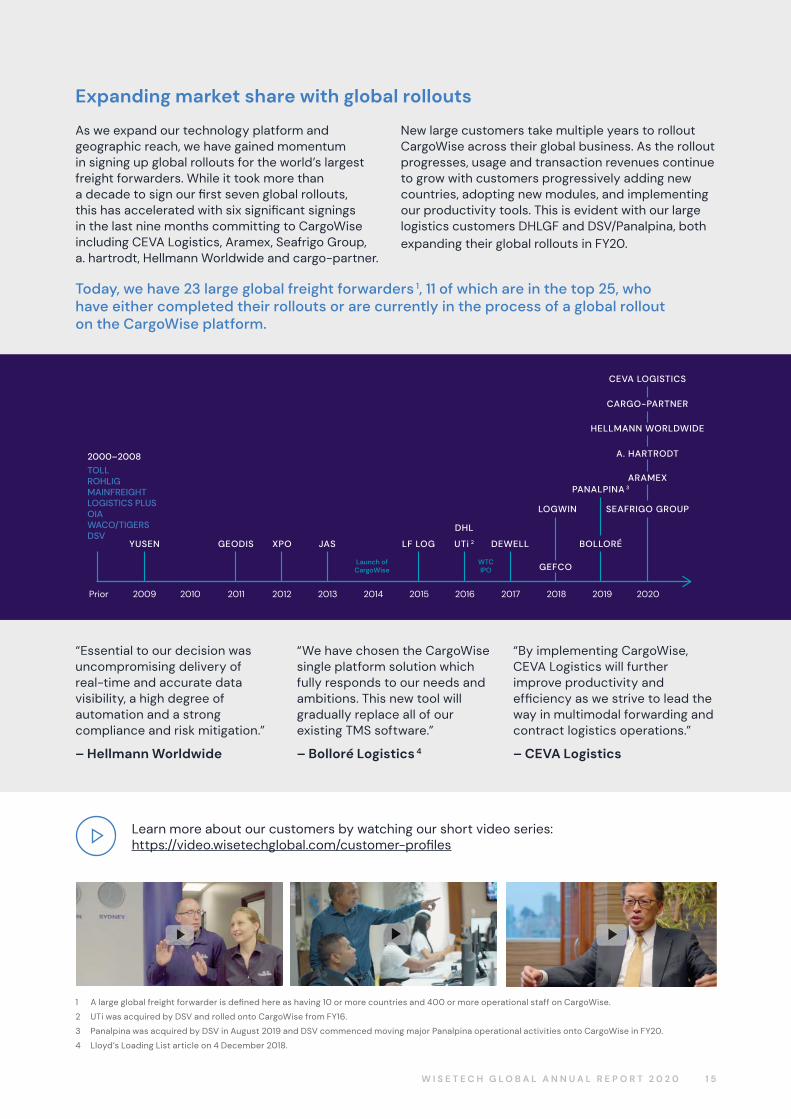
As we expand our technology platform and geographic reach, we have gained momentum in signing up global rollouts for the world’s largest freight forwarders. While it took more than a decade to sign our first seven global rollouts, this has accelerated with six significant signings in the last nine months committing to CargoWise including CEVA Logistics, Aramex, Seafrigo Group, a. hartrodt, Hellmann Worldwide and cargo-partner.
New large customers take multiple years to rollout CargoWise across their global business. As the rollout progresses, usage and transaction revenues continue to grow with customers progressively adding new countries, adopting new modules, and implementing our productivity tools. This is evident with our large logistics customers DHLGF and DSV/Panalpina, both expanding their global rollouts in FY20.
“Essential to our decision was uncompromising delivery of real-time and accurate data visibility, a high degree of automation and a strong compliance and risk mitigation.”
– Hellmann Worldwide
“By implementing CargoWise, CEVA Logistics will further improve productivity and efficiency as we strive to lead the way in multimodal forwarding and contract logistics operations.”
– CEVA Logistics
“We have chosen the CargoWise single platform solution which fully responds to our needs and ambitions. This new tool will gradually replace all of our existing TMS software.”
– Bolloré Logistics 4
Learn more about our customers by watching our short video series: https://video.wisetechglobal.com/customer‑profiles
Launch ofCargoWise
WTCIPO
Prior 2009 2010 2011 2012 2013 2014 2015 2016 2017 2018 2019 2020
2000–2008TOLLROHLIGMAINFREIGHTLOGISTICS PLUSOIAWACO/TIGERSDSV
YUSEN GEODIS XPO JAS LF LOG UTi 2
DHL
DEWELL
GEFCO
LOGWIN
PANALPINA 3
BOLLORÉ
SEAFRIGO GROUP
ARAMEX
A. HARTRODT
HELLMANN WORLDWIDE
CARGO-PARTNER
CEVA LOGISTICS
1 A large global freight forwarder is defined here as having 10 or more countries and 400 or more operational staff on CargoWise.
2 UTi was acquired by DSV and rolled onto CargoWise from FY16.
3 Panalpina was acquired by DSV in August 2019 and DSV commenced moving major Panalpina operational activities onto CargoWise in FY20.
4 Lloyd’s Loading List article on 4 December 2018.
Expanding market share with global rollouts
Today, we have 23 large global freight forwarders 1, 11 of which are in the top 25, who have either completed their rollouts or are currently in the process of a global rollout on the CargoWise platform.
1 6
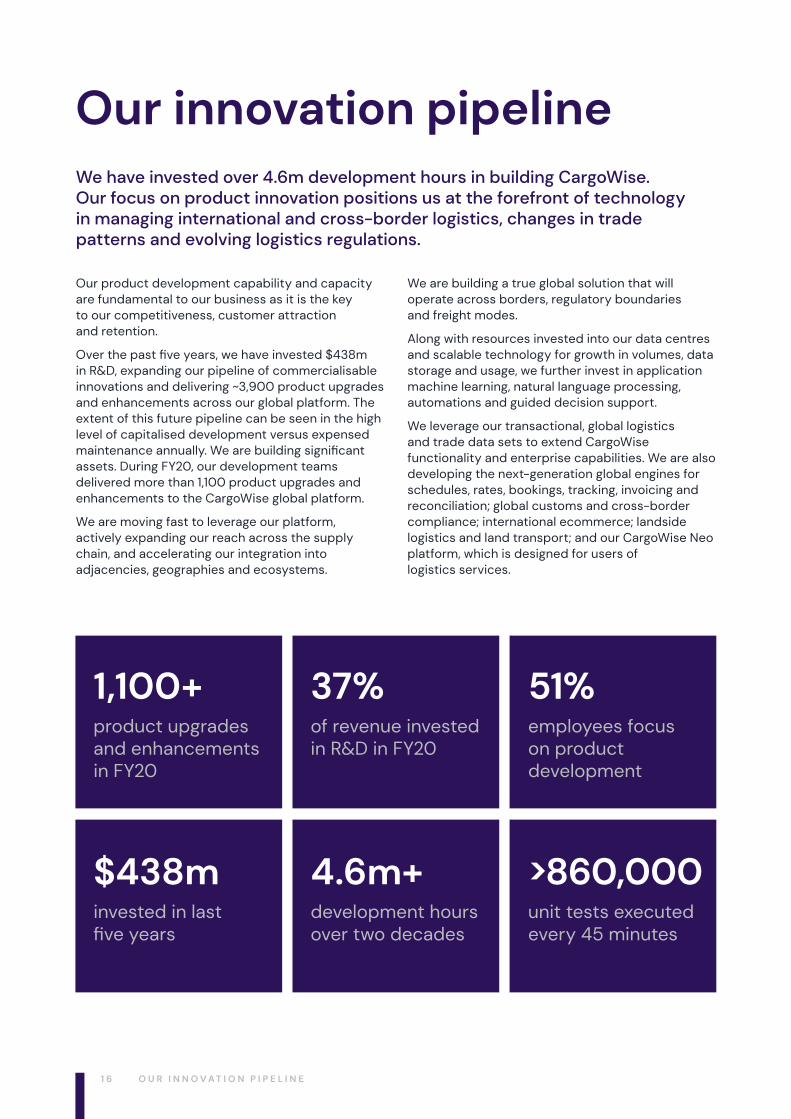
We have invested over 4.6m development hours in building CargoWise. Our focus on product innovation positions us at the forefront of technology in managing international and cross-border logistics, changes in trade patterns and evolving logistics regulations.
Our product development capability and capacity are fundamental to our business as it is the key to our competitiveness, customer attraction and retention.
Over the past five years, we have invested $438m in R&D, expanding our pipeline of commercialisable innovations and delivering ~3,900 product upgrades and enhancements across our global platform. The extent of this future pipeline can be seen in the high level of capitalised development versus expensed maintenance annually. We are building significant assets. During FY20, our development teams delivered more than 1,100 product upgrades and enhancements to the CargoWise global platform.
We are moving fast to leverage our platform, actively expanding our reach across the supply chain, and accelerating our integration into adjacencies, geographies and ecosystems.
We are building a true global solution that will operate across borders, regulatory boundaries and freight modes.
Along with resources invested into our data centres and scalable technology for growth in volumes, data storage and usage, we further invest in application machine learning, natural language processing, automations and guided decision support.
We leverage our transactional, global logistics and trade data sets to extend CargoWise functionality and enterprise capabilities. We are also developing the next-generation global engines for schedules, rates, bookings, tracking, invoicing and reconciliation; global customs and cross-border compliance; international ecommerce; landside logistics and land transport; and our CargoWise Neo platform, which is designed for users of logistics services.
1,100+product upgrades and enhancements in FY20
37%of revenue invested in R&D in FY20
51% employees focus on product development
$438minvested in last five years
4.6m+ development hours over two decades
>860,000unit tests executed every 45 minutes
Our innovation pipeline
O U R I N N O V A T I O N P I P E L I N E
1 7W I S E T E C H G L O B A L A N N U A L R E P O R T 2 0 2 0
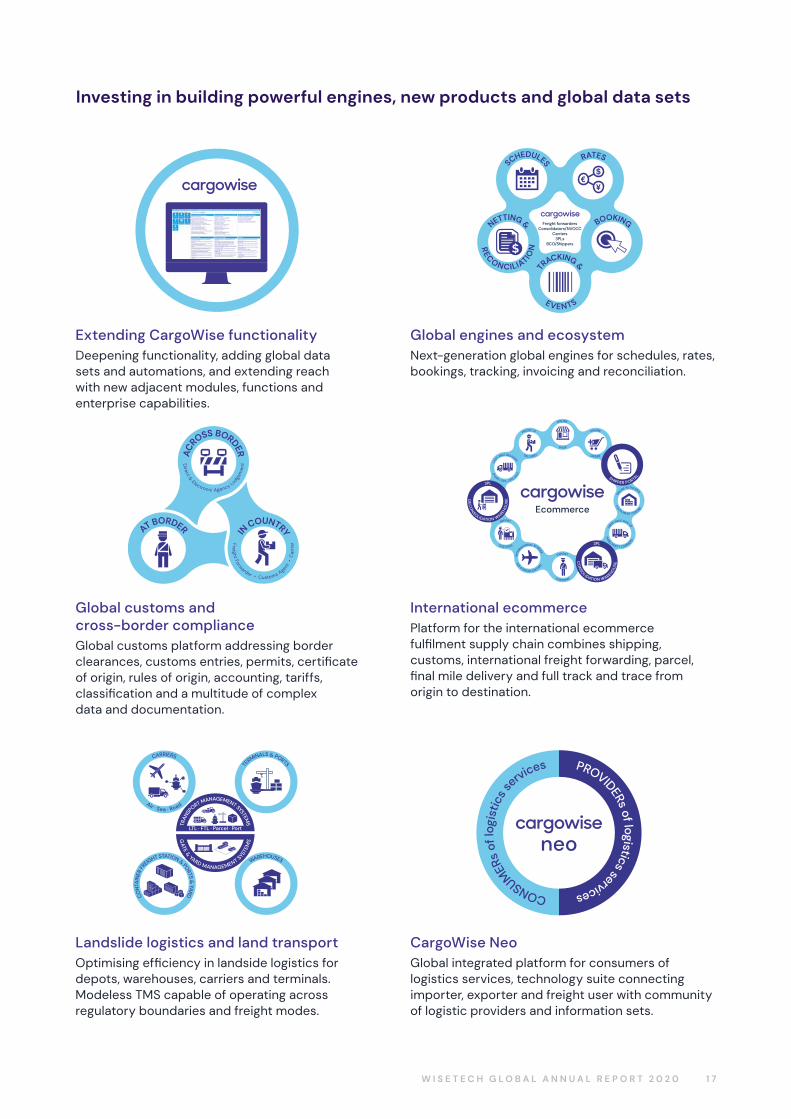
Investing in building powerful engines, new products and global data sets
SCHEDULES RATES
BOOKINGNETTING & Freight forwardersConsolidators/NVOCC
Carriers3PLs
BCO/ShippersREC
ONCILIATION
TRACKING &
EVENTS
Extending CargoWise functionalityDeepening functionality, adding global data sets and automations, and extending reach with new adjacent modules, functions and enterprise capabilities.
Global engines and ecosystemNext-generation global engines for schedules, rates, bookings, tracking, invoicing and reconciliation.
ACROSS BORDER
AT BORDER IN COUNTRY
Direct & Electronic Agency Lodge
men
t
Freight Forwarder • Customs Agent •
Car
rier
FIRST-MILE PICK UP
THIRD PARTY CARRIE
RS
ONLINE RETAILER’S
FULFILMENT CENTRE
EXPORT
CUSTOMS
INTE
RNATIONAL BORDER
AIR CONSOLIDATIO
N
IMPORT
CUSTOMS
LAST
-MILE DELIVERY
(FedEx, DHL, UPS, etc
)
PROOF OF
DELIVERY
ONLINE
ORDER
ONLINE
SHOP
3PL
DE
CO
NSOLIDATION WAREH
OU
SE
Ecommerce
SHIPPER PORTAL
3PL
CO
NSO
LIDATION WAREHOU
SE
Global customs and cross-border complianceGlobal customs platform addressing border clearances, customs entries, permits, certificate of origin, rules of origin, accounting, tariffs, classification and a multitude of complex data and documentation.
International ecommercePlatform for the international ecommerce fulfilment supply chain combines shipping, customs, international freight forwarding, parcel, final mile delivery and full track and trace from origin to destination.
WAREHOUSES
CON
TAIN
ER FR
EIGHT STATION & PORTS &
YARD
Air · Sea · Road
CARRIERS
TERMINALS & PORTS
LTL · FTL · Parcel · Port
TRAN
SP
ORT MANAGEMENT SYSTEMS
GATE & YARD MANAGEMENT SYST
EMS neo
CONSUMER
s of
logi
stic
s s
ervices PROVIDERs of logistics services
Landslide logistics and land transportOptimising efficiency in landside logistics for depots, warehouses, carriers and terminals. Modeless TMS capable of operating across regulatory boundaries and freight modes.
CargoWise NeoGlobal integrated platform for consumers of logistics services, technology suite connecting importer, exporter and freight user with community of logistic providers and information sets.
1 8
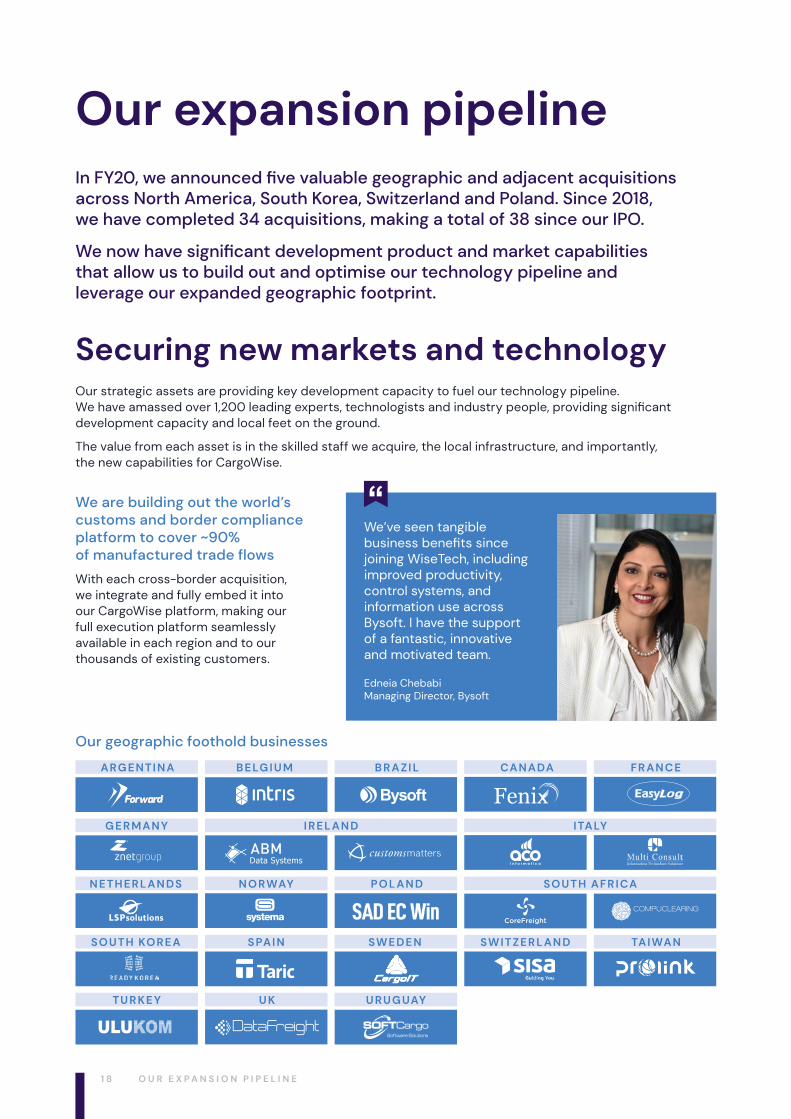
Our expansion pipelineIn FY20, we announced five valuable geographic and adjacent acquisitions across North America, South Korea, Switzerland and Poland. Since 2018, we have completed 34 acquisitions, making a total of 38 since our IPO.
We now have significant development product and market capabilities that allow us to build out and optimise our technology pipeline and leverage our expanded geographic footprint.
Our strategic assets are providing key development capacity to fuel our technology pipeline. We have amassed over 1,200 leading experts, technologists and industry people, providing significant development capacity and local feet on the ground.
The value from each asset is in the skilled staff we acquire, the local infrastructure, and importantly, the new capabilities for CargoWise.
Securing new markets and technology
O U R E X P A N S I O N P I P E L I N E
Our geographic foothold businesses
SWE D E NSO UTH KO R E A SWIT ZE R L AN DS PAI N TAIWAN
G E R MAN Y ITALYI R E L AN D
B E LG I U M B R A ZI L FR AN C EARG E NTI NA CANADA
TU R KE Y U RU G UAYU K
N E TH E R L AN DS N O RWAY PO L AN D SO UTH AFR I CA
We are building out the world’s customs and border compliance platform to cover ~90% of manufactured trade flows
With each cross-border acquisition, we integrate and fully embed it into our CargoWise platform, making our full execution platform seamlessly available in each region and to our thousands of existing customers.
We’ve seen tangible business benefits since joining WiseTech, including improved productivity, control systems, and information use across Bysoft. I have the support of a fantastic, innovative and motivated team.
Edneia ChebabiManaging Director, Bysoft
1 9W I S E T E C H G L O B A L A N N U A L R E P O R T 2 0 2 0
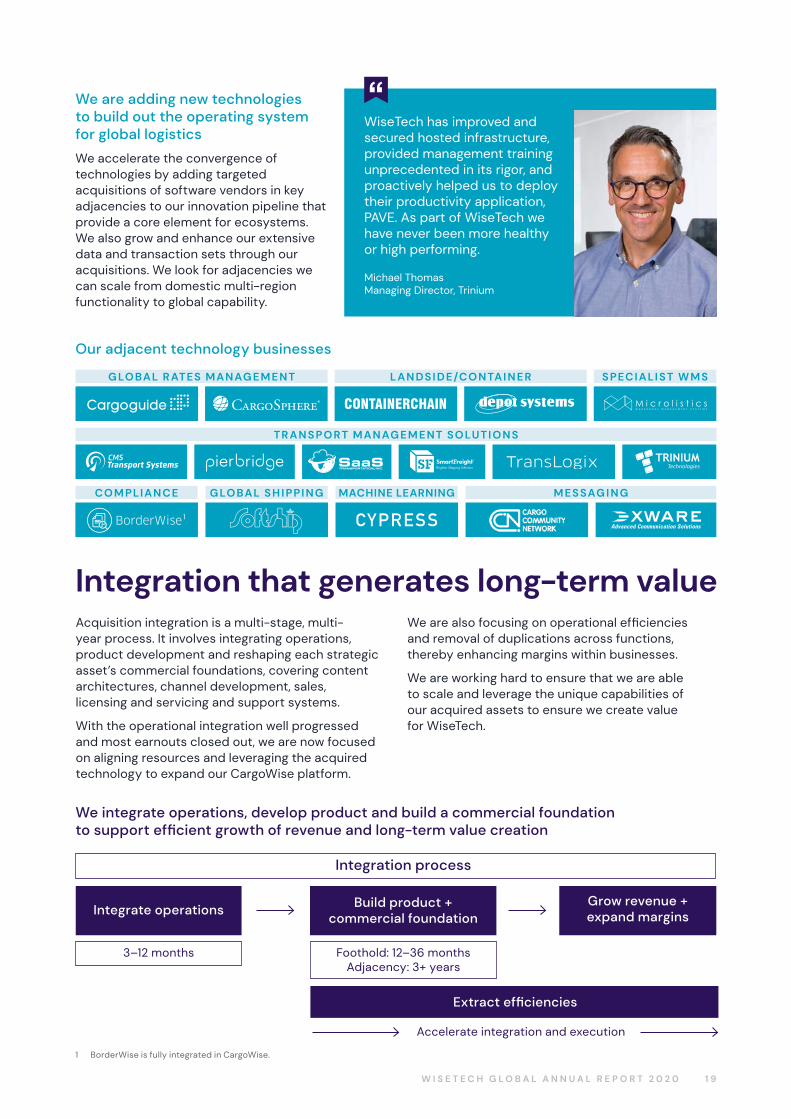
We integrate operations, develop product and build a commercial foundation to support efficient growth of revenue and long-term value creation
Integration process
3–12 months Foothold: 12–36 months Adjacency: 3+ years
Accelerate integration and execution
Integrate operations Build product + commercial foundation
Extract efficiencies
Grow revenue + expand margins
Acquisition integration is a multi-stage, multi-year process. It involves integrating operations, product development and reshaping each strategic asset’s commercial foundations, covering content architectures, channel development, sales, licensing and servicing and support systems.
With the operational integration well progressed and most earnouts closed out, we are now focused on aligning resources and leveraging the acquired technology to expand our CargoWise platform.
We are also focusing on operational efficiencies and removal of duplications across functions, thereby enhancing margins within businesses.
We are working hard to ensure that we are able to scale and leverage the unique capabilities of our acquired assets to ensure we create value for WiseTech.
Integration that generates long-term value
1 BorderWise is fully integrated in CargoWise.
Our adjacent technology businesses
MACHINE LEARNINGCO M PLIAN C E G LO BAL S H I PPI N G
TR AN S PO RT MANAG E M E NT SO LUTI O N S
M ES SAG I N G
L AN DS I D E/CO NTAI N E R S PEC IALI ST WM SG LO BAL R ATES MANAG E M E NT
We are adding new technologies to build out the operating system for global logistics
We accelerate the convergence of technologies by adding targeted acquisitions of software vendors in key adjacencies to our innovation pipeline that provide a core element for ecosystems. We also grow and enhance our extensive data and transaction sets through our acquisitions. We look for adjacencies we can scale from domestic multi-region functionality to global capability.
WiseTech has improved and secured hosted infrastructure, provided management training unprecedented in its rigor, and proactively helped us to deploy their productivity application, PAVE. As part of WiseTech we have never been more healthy or high performing.
Michael ThomasManaging Director, Trinium
1
2 0
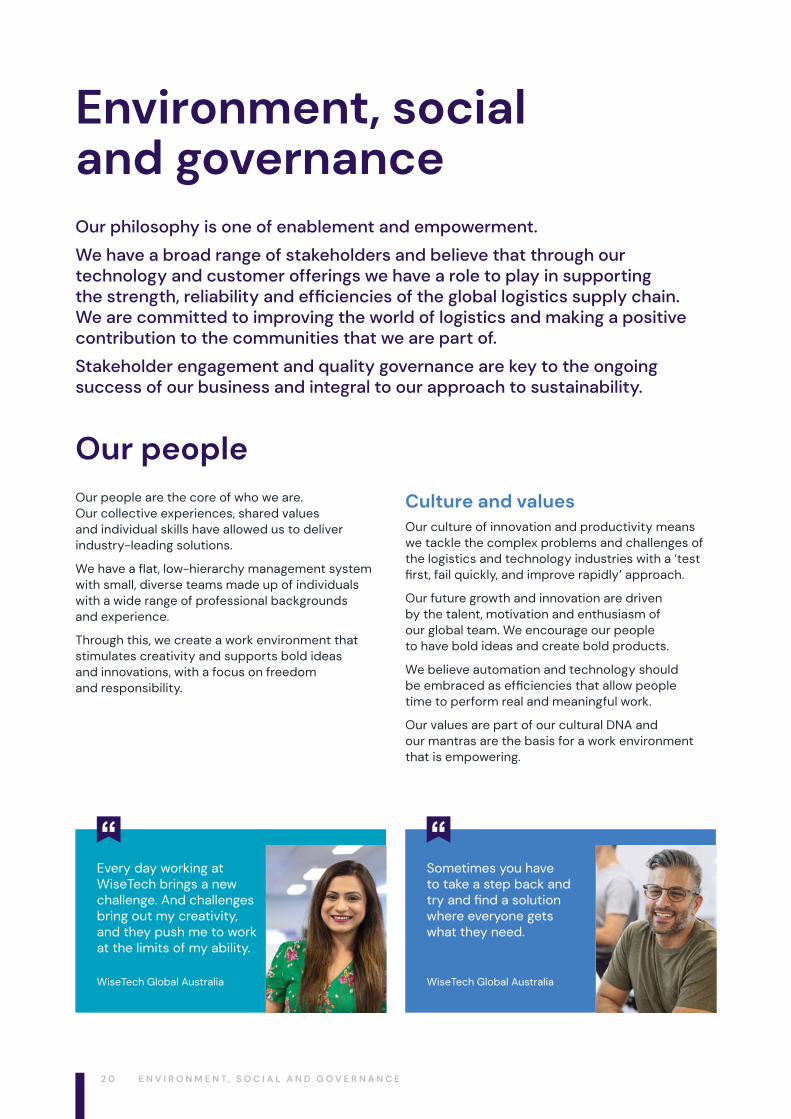
Environment, social and governanceOur philosophy is one of enablement and empowerment.
We have a broad range of stakeholders and believe that through our technology and customer offerings we have a role to play in supporting the strength, reliability and efficiencies of the global logistics supply chain. We are committed to improving the world of logistics and making a positive contribution to the communities that we are part of.
Stakeholder engagement and quality governance are key to the ongoing success of our business and integral to our approach to sustainability.
Our people are the core of who we are. Our collective experiences, shared values and individual skills have allowed us to deliver industry-leading solutions.
We have a flat, low‑hierarchy management system with small, diverse teams made up of individuals with a wide range of professional backgrounds and experience.
Through this, we create a work environment that stimulates creativity and supports bold ideas and innovations, with a focus on freedom and responsibility.
Culture and valuesOur culture of innovation and productivity means we tackle the complex problems and challenges of the logistics and technology industries with a ‘test first, fail quickly, and improve rapidly’ approach.
Our future growth and innovation are driven by the talent, motivation and enthusiasm of our global team. We encourage our people to have bold ideas and create bold products.
We believe automation and technology should be embraced as efficiencies that allow people time to perform real and meaningful work.
Our values are part of our cultural DNA and our mantras are the basis for a work environment that is empowering.
Every day working at WiseTech brings a new challenge. And challenges bring out my creativity, and they push me to work at the limits of my ability.
Sometimes you have to take a step back and try and find a solution where everyone gets what they need.
WiseTech Global Australia WiseTech Global Australia
Our people
E N V I R O N M E N T , S O C I A L A N D G O V E R N A N C E
2 1W I S E T E C H G L O B A L A N N U A L R E P O R T 2 0 2 0
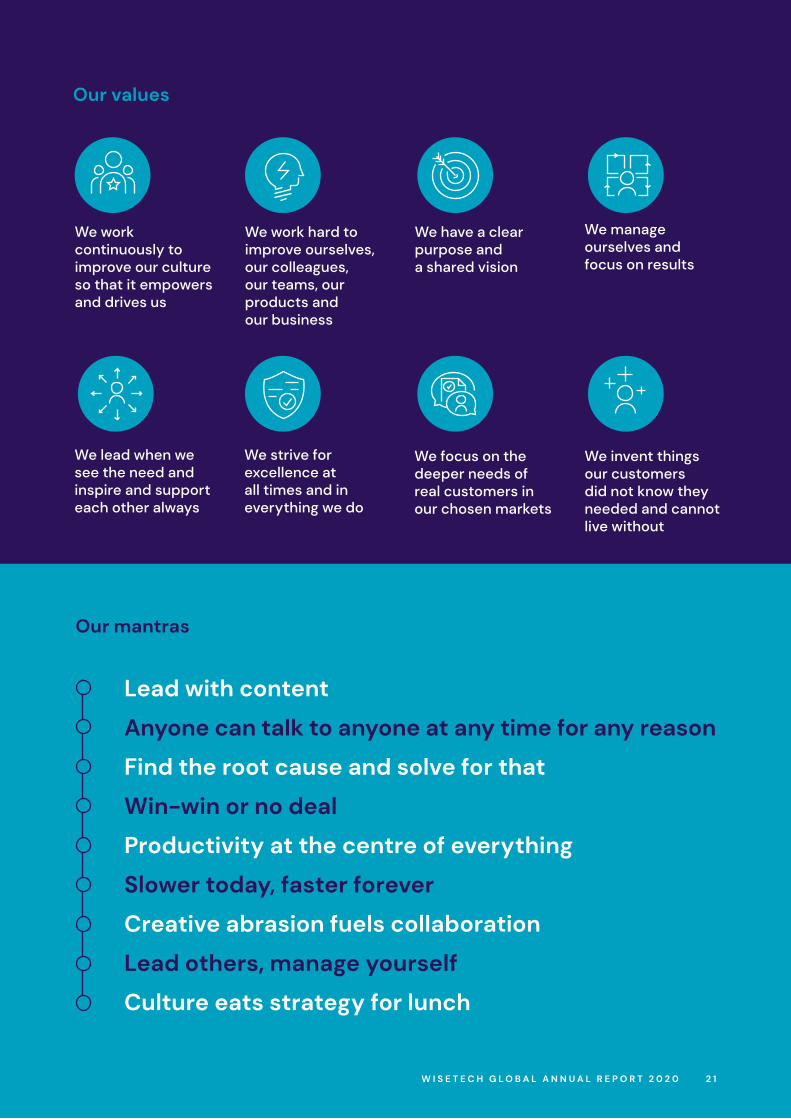
Our values
Our mantras
Lead with content
Anyone can talk to anyone at any time for any reason
Find the root cause and solve for that
Win-win or no deal
Productivity at the centre of everything
Slower today, faster forever
Creative abrasion fuels collaboration
Lead others, manage yourself
Culture eats strategy for lunch
We work continuously to improve our culture so that it empowers and drives us
We manage ourselves and focus on results
We focus on the deeper needs of real customers in our chosen markets
We work hard to improve ourselves, our colleagues, our teams, our products and our business
We lead when we see the need and inspire and support each other always
We invent things our customers did not know they needed and cannot live without
We have a clear purpose and a shared vision
We strive for excellence at all times and in everything we do
2 2
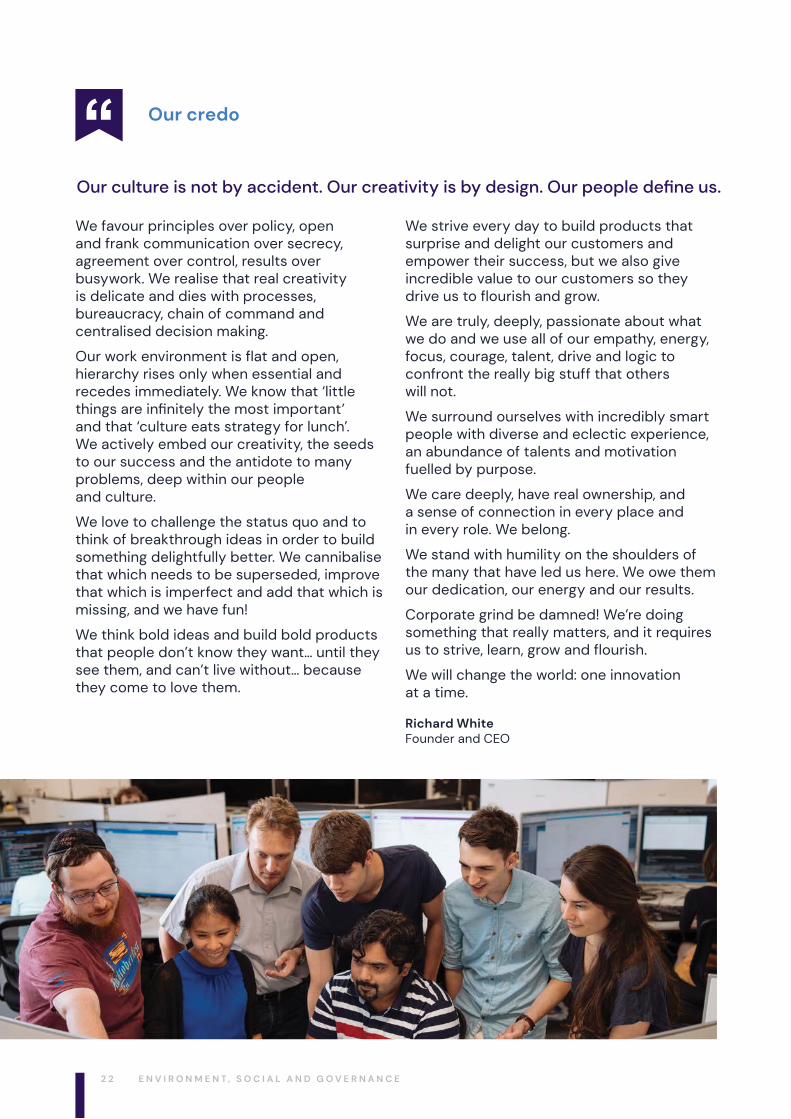
We favour principles over policy, open and frank communication over secrecy, agreement over control, results over busywork. We realise that real creativity is delicate and dies with processes, bureaucracy, chain of command and centralised decision making.
Our work environment is flat and open, hierarchy rises only when essential and recedes immediately. We know that ‘little things are infinitely the most important’ and that ‘culture eats strategy for lunch’. We actively embed our creativity, the seeds to our success and the antidote to many problems, deep within our people and culture.
We love to challenge the status quo and to think of breakthrough ideas in order to build something delightfully better. We cannibalise that which needs to be superseded, improve that which is imperfect and add that which is missing, and we have fun!
We think bold ideas and build bold products that people don’t know they want… until they see them, and can’t live without… because they come to love them.
We strive every day to build products that surprise and delight our customers and empower their success, but we also give incredible value to our customers so they drive us to flourish and grow.
We are truly, deeply, passionate about what we do and we use all of our empathy, energy, focus, courage, talent, drive and logic to confront the really big stuff that others will not.
We surround ourselves with incredibly smart people with diverse and eclectic experience, an abundance of talents and motivation fuelled by purpose.
We care deeply, have real ownership, and a sense of connection in every place and in every role. We belong.
We stand with humility on the shoulders of the many that have led us here. We owe them our dedication, our energy and our results.
Corporate grind be damned! We’re doing something that really matters, and it requires us to strive, learn, grow and flourish.
We will change the world: one innovation at a time.
Richard White Founder and CEO
Our credo
Our culture is not by accident. Our creativity is by design. Our people define us.
E N V I R O N M E N T , S O C I A L A N D G O V E R N A N C E
2 3W I S E T E C H G L O B A L A N N U A L R E P O R T 2 0 2 0
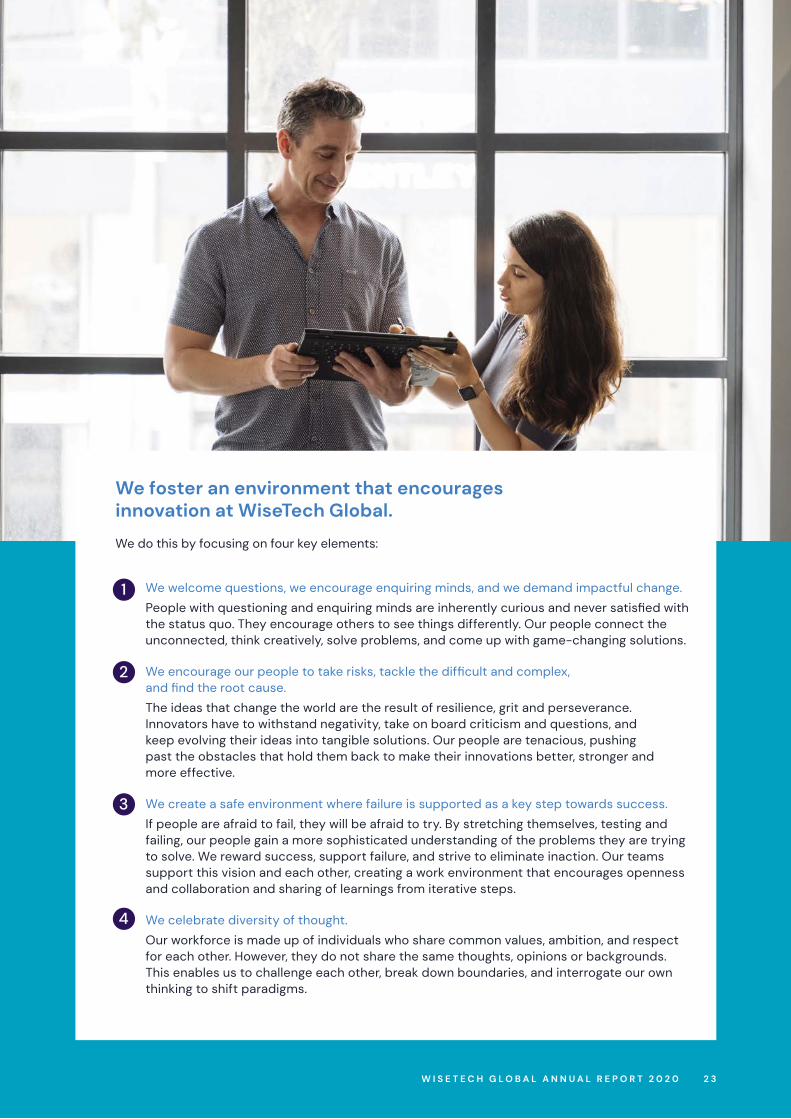
We foster an environment that encourages innovation at WiseTech Global.
We do this by focusing on four key elements:
We welcome questions, we encourage enquiring minds, and we demand impactful change.
People with questioning and enquiring minds are inherently curious and never satisfied with the status quo. They encourage others to see things differently. Our people connect the unconnected, think creatively, solve problems, and come up with game-changing solutions.
We encourage our people to take risks, tackle the difficult and complex, and find the root cause.
The ideas that change the world are the result of resilience, grit and perseverance. Innovators have to withstand negativity, take on board criticism and questions, and keep evolving their ideas into tangible solutions. Our people are tenacious, pushing past the obstacles that hold them back to make their innovations better, stronger and more effective.
We create a safe environment where failure is supported as a key step towards success.
If people are afraid to fail, they will be afraid to try. By stretching themselves, testing and failing, our people gain a more sophisticated understanding of the problems they are trying to solve. We reward success, support failure, and strive to eliminate inaction. Our teams support this vision and each other, creating a work environment that encourages openness and collaboration and sharing of learnings from iterative steps.
We celebrate diversity of thought.
Our workforce is made up of individuals who share common values, ambition, and respect for each other. However, they do not share the same thoughts, opinions or backgrounds. This enables us to challenge each other, break down boundaries, and interrogate our own thinking to shift paradigms.
1
2
3
4
2 4
Ethics and integrityHonesty, respect and transparency are the foundations of our culture. Ethics and integrity run through all parts of WiseTech Global and we promote ethical and responsible decision-making by our employees and Directors.
Everyone at WiseTech is required to complete training and testing on our policies, including our Code of Conduct, Respect and Dignity at Work Policy, Securities Trading Policy, Whistleblower Protection Principles, and Anti‑Bribery and Corruption Policy.
Diversity and inclusionWe are proud of our highly diverse and inclusive workforce and are strongly committed to diversity and inclusion.
We foster a culture that values and achieves diversity in our workforce and on our Board and this is reflected in our Diversity and Inclusion Principles.
We are committed to treating everyone equally and with respect. We believe our current levels of female representation compare well to those of other technology companies and are positive in the context of both the logistics industry and technology for business-to-business software.
These levels of female participation reflect our commitment to merit-based employment and promotion. We continue to encourage more women to enter technology and logistics – the industries from which we draw our talent.
Achieving a gender diversity outcome of >40% on the board has not required significant incremental effort, specific actions undertaken include a requirement for recruitment firms to present 50/50 candidate lists.
In the short term, our objective is to broadly maintain levels of female representation in our business at, or above, the following levels:
In FY21, we will conduct analysis to consider opportunities to increase gender diversity across the company, including whether to increase targets.
We believe it’s essential to further develop the potential for qualified females to enter our industry: software development for logistics execution. Through a comprehensive and multi-faceted effort at the early education stage, greater technology industry participation across genders will be encouraged.
To enable this, we identify and support suitable initiatives to encourage girls and young women to pursue a career in technology, with a longer-term aim of increasing the female talent pool available. See pages 29 to 31 for examples.
We promote the principles of merit and fairness when making decisions about recruitment, development, promotion, remuneration and flexible work arrangements, recruit from a diverse pool of qualified candidates (making efforts to identify prospective employees who have diverse attributes) and encourage and foster a commitment to diversity by people at all levels of our global business.
For more information, please see our Corporate Governance Statement on pages 32 to 41 . In addition, as an Australian-based company, we lodge a report annually on Australian employees, with the Workplace Gender Equality Agency which is available at: https://www.wgea.gov.au.
30% OF OU R BOARD 20% OF OU R SEN I OR MANAG EM ENT30% OF OU R WORKFORCE
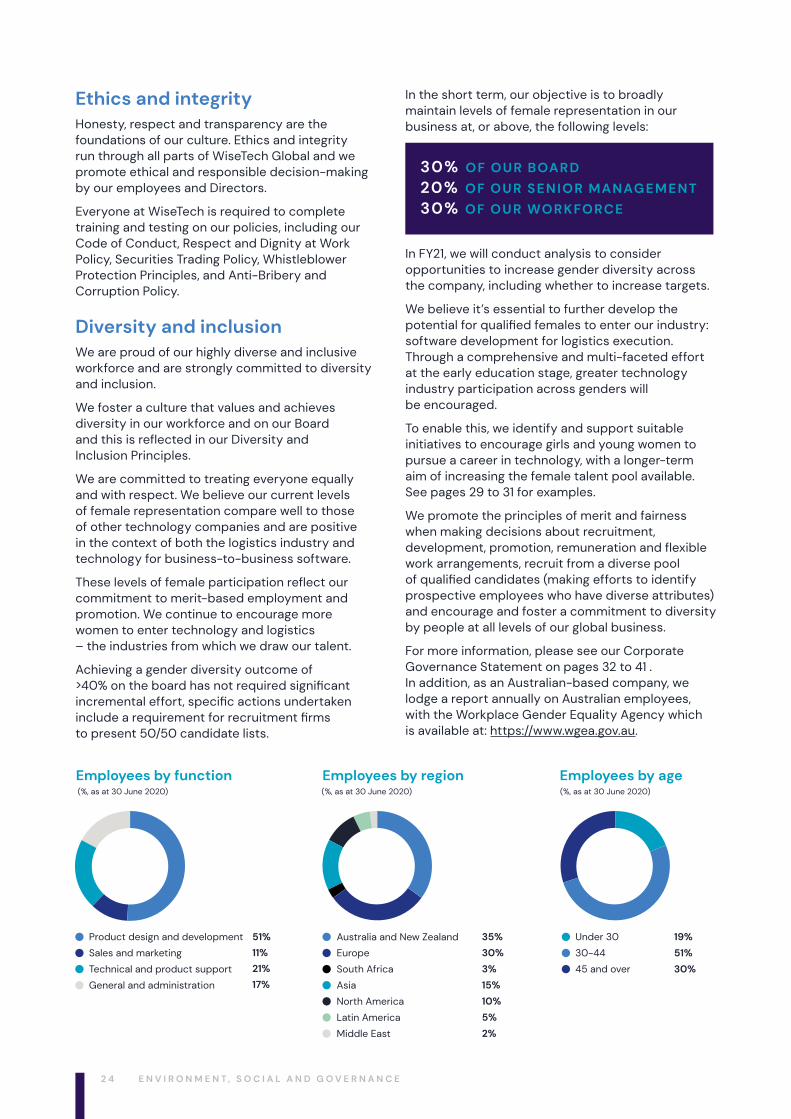
Employees by function Employees by region Employees by age(%, as at 30 June 2020)
Product design and development
Sales and marketing
Technical and product support
General and administration
Australia and New Zealand
Europe
South Africa
Asia
North America
Latin America
Middle East
Under 30
30-44
45 and over
(%, as at 30 June 2020) (%, as at 30 June 2020)
51%
11%
21%
17%
35%
30%
3%
15%
10%
5%
2%
19%
51%
30%
E N V I R O N M E N T , S O C I A L A N D G O V E R N A N C E
2 5W I S E T E C H G L O B A L A N N U A L R E P O R T 2 0 2 0
Growing our global workforceSince 2016, we have added more than 1,200 talented people to our global workforce through strategic acquisitions – a vital component in managing the high competition for technology resources as we grow.
Our global workforce spans across more than 55 offices worldwide with highly skilled people, technologists and industry experts that are part of the WiseTech Global Group. Our acquisition businesses are not only chosen for their business alignment and strategic value but their strong cultural fit. Predominantly founder‑led businesses, they bring unique industry experts and developers, along with local knowledge and a strong customer base.
Working closely with our businesses to embed and unify our WiseTech culture into their operations, we integrate transformative elements of the WiseTech Way. With our highly engineered approach to technology development and commercial foundation components, we encourage teams to grow through self-integration, while respecting their local heritage and culture and introducing the best aspects of our cultural DNA.
Employee wellbeingWe take the health, safety and wellbeing of our people seriously. As the impacts of COVID-19 became clear, our digital platforms and architectures, including PAVE, allowed WiseTech’s global offices and teams to move rapidly and successfully to a remote work environment.
And due to the productivity gains we experienced in 2H20, we have committed to a hybrid remote working model from 2021.
Through our policies, support services and wellbeing initiatives, we empower team members of our WiseTech family to take personal responsibility for their wellbeing, health and relationships.
Prior to our remote work arrangements, our wellness initiatives in our global headquarters included subsidised gym memberships, free breakfasts and healthy snacks, lunchtime sport, health campaigns, and company-funded social activities. Our global offices also offer a mixture of these, with some providing healthy snacks and fruit, access to local sporting activities, transportation support and subsidised gym memberships.
Our global teams have embraced our new virtual environment with team cooking classes, fancy dress meetings, meet and greets for new staff members, and Friday social gatherings, all while introducing their home life to their global colleagues.
Our focus is on empowering our people with the skills needed to face new challenges. One of the practical ways we did this at the start of COVID-19, was rapidly implementing a concentrated resilience training program for selected team leaders delivered in short daily sessions online. This enabled a refocus on long-term objectives, understanding physiological and psychological impacts, and practical tools to manage self-care and support teams.
We continue to expand this program, now rolling out across our core innovation and product development workforce in key regions.
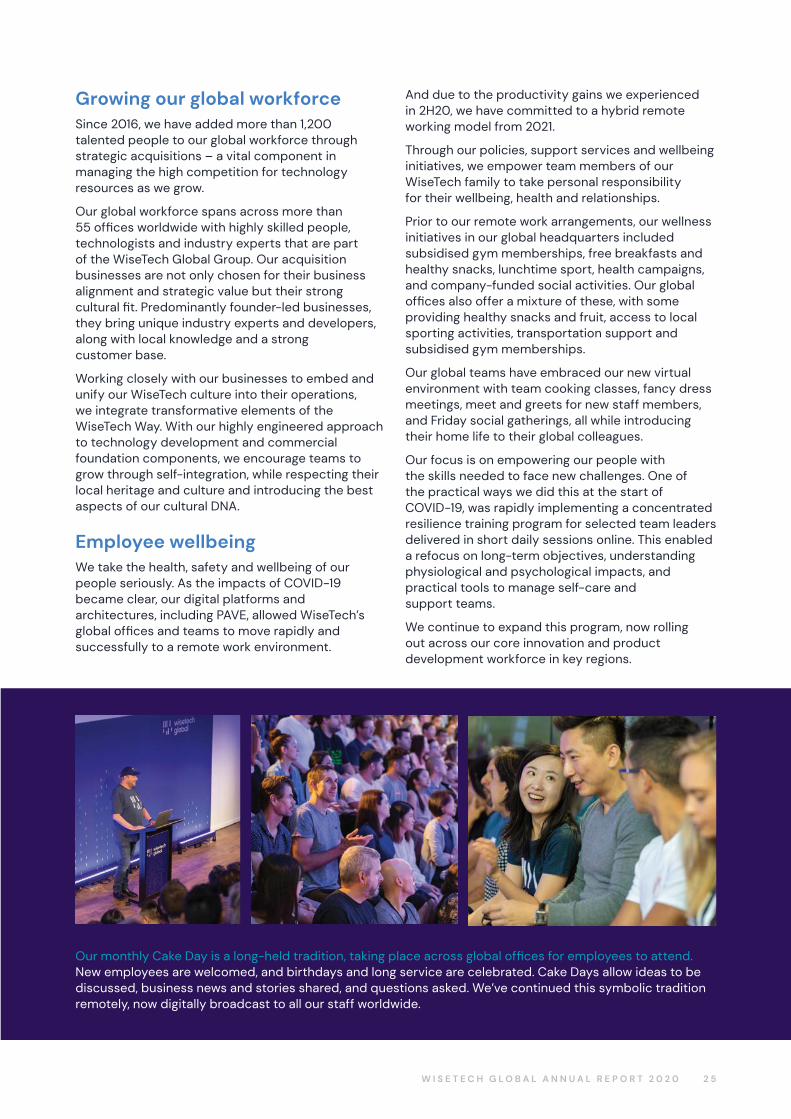
Our monthly Cake Day is a long‑held tradition, taking place across global offices for employees to attend. New employees are welcomed, and birthdays and long service are celebrated. Cake Days allow ideas to be discussed, business news and stories shared, and questions asked. We’ve continued this symbolic tradition remotely, now digitally broadcast to all our staff worldwide.
2 6
We have strong support systems in place including our global Employee Assistance Program that offers short-term, solution-focused counselling to employees who may be experiencing issues, concerns or anxiety, whether at home or work-related, as well as additional professional guidance counselling. This is offered at no cost to our people and is delivered by external, qualified professionals.
We value and support family life, and in FY20 we introduced an improved global paid parental leave policy for our people globally. Primary caregivers will be provided with four months leave at full pay and secondary caregivers will be provided at least two weeks of parental leave at full pay, regardless of which country they live.
Our Workplace Health and Safety Policy is designed to ensure that we provide a safe and healthy workplace for our people (in‑office or remote) and visitors. As a software development company, our employees are not exposed to hazardous work and we operate our business in a safe and environmentally responsive manner to protect our employees, the community and the environment.
Ergonomics are a part of the workday environment in the office with ergonomics assessments, sit‑to‑stand desks, large computer monitors, and high-quality chairs available as needed.
In our remote work environment, we are introducing processes to ensure our people have access to ergonomic equipment and resources to enable a safe remote work environment. Employees are encouraged to observe and practise safe working methods to support a healthy and safe work culture and environment.
Developing our peopleOur talented workforce is at the centre of everything we do. We provide a range of programs that encourage and help our people continually develop their skills and knowledge.
WiseTech has an education and training professional certification program and employee education assistance for doctorate, master and bachelor degrees. We also assist employee development with mentoring programs (for new starters), facilitated rotations through multiple development teams, and theory of constraints training.
Our people believe in knowledge-sharing and have implemented learning sessions to provide their global team members with insights into topics that support skill development.
We also introduced LinkedIn Learning to all our employees, providing global access to over 10,000 video tutorials in a variety of languages and on an extensive range of topics that can be viewed anywhere, anytime, on any device, online and offline.
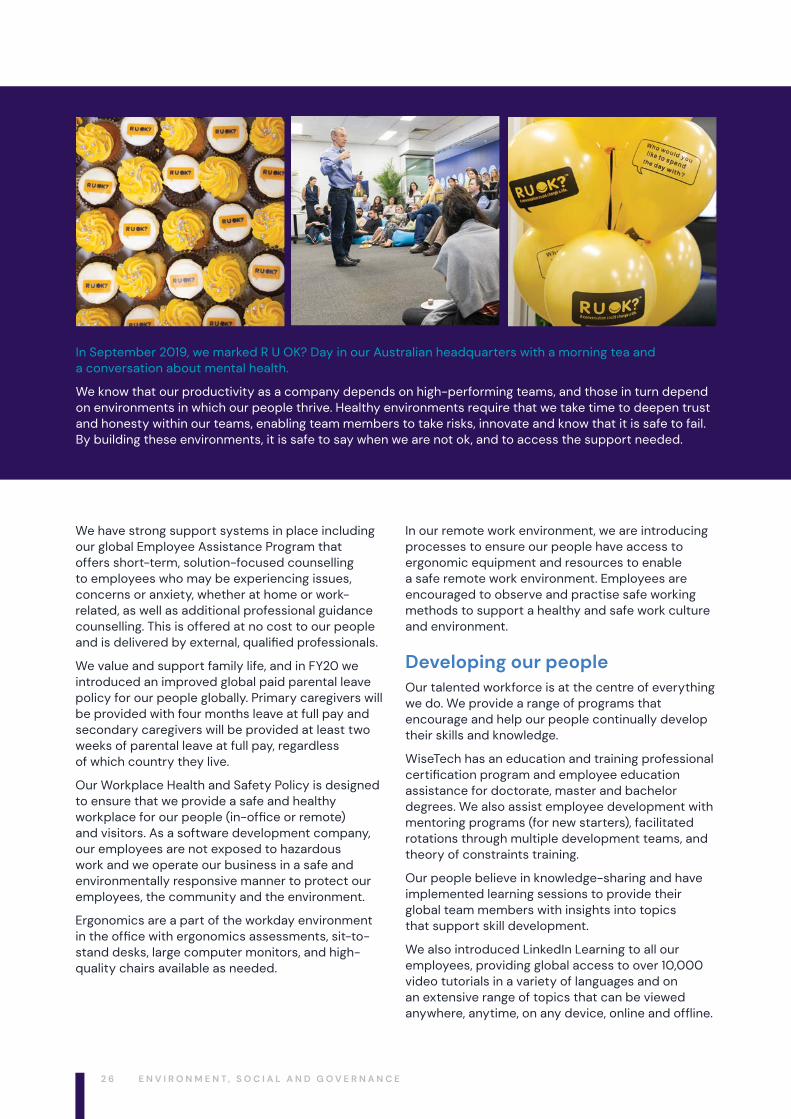
In September 2019, we marked R U OK? Day in our Australian headquarters with a morning tea and a conversation about mental health.
We know that our productivity as a company depends on high-performing teams, and those in turn depend on environments in which our people thrive. Healthy environments require that we take time to deepen trust and honesty within our teams, enabling team members to take risks, innovate and know that it is safe to fail. By building these environments, it is safe to say when we are not ok, and to access the support needed.
E N V I R O N M E N T , S O C I A L A N D G O V E R N A N C E
2 7W I S E T E C H G L O B A L A N N U A L R E P O R T 2 0 2 0
As we moved to remote working, we further enhanced our digital offering by providing our employees with access to Stack Overflow, an online Q&A platform that allows our teams and people to share knowledge and lead with content.
RemunerationOur innovation and growth strategy is dependent on recruiting and retaining talent. We compete in a highly mobile global market for our skill sets, so we offer remuneration designed to attract, motivate and retain leaders and talented employees who drive our success.
Remuneration can include a mix of cash and deferred equity in fixed pay and performance incentives, along with education support and staff benefits. Our remuneration approach focuses on performance outcomes and is applied without bias.
Our Remuneration Committee oversees and receives periodic reports regarding our remuneration structure, succession plans, recruitment and retention policies, and achievements against diversity objectives. For more information, and to learn more about our approach to remuneration, see our Remuneration Report on pages 51 to 64.
Share ownershipOur goal is for all our employees to be shareholders. Many of our longer-term employees were WiseTech Global shareholders for years prior to our ASX listing in 2016. Since then, we have provided further opportunities for our growing global workforce to invest through the purchase of shares and participation in equity awards or in remuneration equity as part of their remuneration package.
Since 2018, we have provided an ‘Invest As You Earn’ (“IAYE”) program where employees can purchase WiseTech Global shares via monthly deductions from their salary. In FY20, the number of IAYE participants accounted for 21% of eligible employees in 19 countries, an increase of over 16% compared with the participant number in the beginning of 2019.
Our WiseTech employees receive compliance training to ensure they understand and abide by our Securities Trading Policy and Market Disclosure and Communications Principles.
Prevention of harassment and discriminationRespect for ourselves and our colleagues is part of the WiseTech DNA. Discrimination, bullying, or harassment of any kind is not accepted. Our Respect and Dignity at Work Policy addresses these areas and establishes complaint procedures to ensure that any complaints or concerns are investigated in a confidential and sensitive manner. Our employees undertake detailed training and compliance testing on equal opportunity and our approach to these issues.
Anti-bribery and corruptionOur Anti‑Bribery and Corruption Policy prohibits our staff from engaging in any activity which constitutes bribery or corruption. We are committed to conducting our business activities in an ethical, lawful and socially responsible manner, and in accordance with the laws and regulations of the countries in which we operate.
Ethical labour and the Modern Slavery ActWiseTech Global is committed to upholding and respecting human rights for all people as articulated in the UN Guiding Principles on Business and Human Rights, the Universal Declaration of Human Rights, the International Covenant on Civil and Political Rights, the International Covenant on Economic, Social and Cultural Rights, and the International Labour Organization’s Declaration on Fundamental Principles and Rights at Work.
We take a zero-tolerance approach towards any form of forced or compulsory labour, debt bondage, child labour or human trafficking and expect our partners and suppliers to do the same. We may avoid or cease working with suppliers or businesses that are known or suspected to engage in forms of forced or compulsory labour if other avenues such as engagement with the supplier fail to address root causes and produce improvements in the supplier’s practices.
We have implemented education channels and a remediation framework to address our obligations under Australia’s Modern Slavery Act 2018 (Cth) and will publish our first Modern Slavery Statement in due course.
In the meantime, please read our Human Rights Principles for more information.
2 8
EnvironmentGlobal logistics is one of the world’s oldest and largest industries worth US$9 trillion 1. Our software is designed to maximise performance, minimise energy and resource use, and reduce risks across the global supply chain.
Our innovations drive business efficiencies that enhance logistics execution worldwide. The CargoWise platform is used across 160 countries to digitise and integrate the data that enables goods to move through the supply chain.
Bringing together cleansed and verified global data sets, this information is used to facilitate key parts of the global cargo chain, including the management of rates, schedules, bookings, tracking, and reconciliation.
Increased productivity can have widespread environmental benefits.
Efficiency improvements available through CargoWise also facilitate the removal of numerous manual tasks through automation. This reduces paper, electricity usage, commercial costs, and wasted resources.
We believe our global footprint and operational activities contribute significantly to the improvement of resource usage that impacts climate change.
As a leading software solutions provider, WiseTech Global is not directly involved in the manufacture or physical transport of goods. As a result, our environmental footprint is relatively small across our global workforce and primarily comprises the energy consumption, GHG emissions relating to business travel and employee commute to and from the office (although this has reduced during COVID‑19), water consumption and waste relating to and office consumables typical of an office‑based business. As we move to a hybrid work model, this impact will further reduce.
All our businesses around the world comply with local environmental regulations. We seek to recycle as much waste as possible and reduce energy use through energy‑efficient devices and power management systems. Our offices use energy‑efficient lighting and occupancy detection sensors to conserve energy for lighting and air-conditioning.
We invest in and utilise our own technology to efficiently link our more than 55 offices and global workforce through our productivity workflow management system, video conferencing, team ware tools and communication software. In our Sydney headquarters, we process all discarded electronic devices in a secure and environmentally responsible manner.
We optimise the energy efficiency of our three data centres that we operate in Australia, the United States and the United Kingdom, notably in relation to cooling requirements and actively evolving components of our software to reduce the data storage required for transactions executed on our CargoWise platform.
Going forward we will look at ways to measure the environmental impact of our operations, take steps to further reduce our environmental footprint and report back to investors on an annual basis on our progress.
Examples include:
– reduction in road trips
– reduced carbon emissions
– improvement in land transport impact on local communities
– optimised load configuration.
1 Armstrong & Associates Global 3PL Market Size Estimates as of March 2020.
E N V I R O N M E N T , S O C I A L A N D G O V E R N A N C E
2 9W I S E T E C H G L O B A L A N N U A L R E P O R T 2 0 2 0
WiseTech in the community We believe it is critical to encourage and support the next generation of innovation leaders. Our people are passionate about knowledge-sharing, and through their actions help improve the industry and communities in which they live and work.
The WiseTech Academy In FY20, we further enhanced our professional development offering (for both our employees and the broader community) through the launch of WiseTech Academy.
The purpose of the Academy is to upskill the global supply chain industry through accessible and affordable online learning, providing a steppingstone to individuals looking to launch or build their career in the dynamic world of supply chain logistics.
WiseTech Academy is an approved Registered Training Organisation and can deliver nationally recognised courses within their scope. We provide WiseTech Academy courses free for our people.
Building the next generation of technology innovatorsThrough an active, targeted program of scholarships and sponsorships with university and school groups, we are helping inspire young people about Science, Technology, Engineering and Maths (“STEM”) subjects. Our purpose is to encourage young people to pursue careers in technology.
Some of our FY20 activities in Australia and across our global offices include:
– Titanium sponsor of the Australian Computer Society Foundation events: The BiG Day In and BiG Day In Junior. This year, the BiG Day In went digital and we were able to connect with thousands of school students from around Australia, talking about how they can advance their potential through a career in technology.
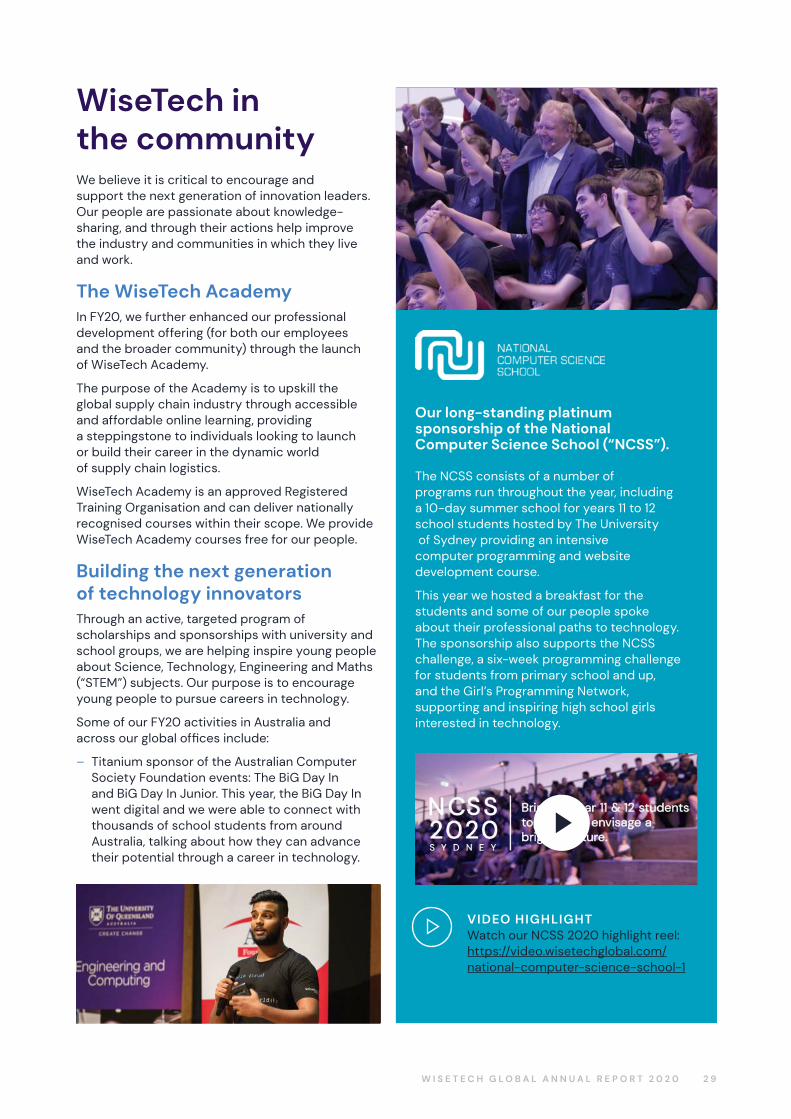
Our long-standing platinum sponsorship of the National Computer Science School (“NCSS”).
The NCSS consists of a number of programs run throughout the year, including a 10-day summer school for years 11 to 12 school students hosted by The University of Sydney providing an intensive computer programming and website development course.
This year we hosted a breakfast for the students and some of our people spoke about their professional paths to technology. The sponsorship also supports the NCSS challenge, a six-week programming challenge for students from primary school and up, and the Girl’s Programming Network, supporting and inspiring high school girls interested in technology.
VIDEO HIGHLIGHT Watch our NCSS 2020 highlight reel: https://video.wisetechglobal.com/national-computer-science-school-1
3 0
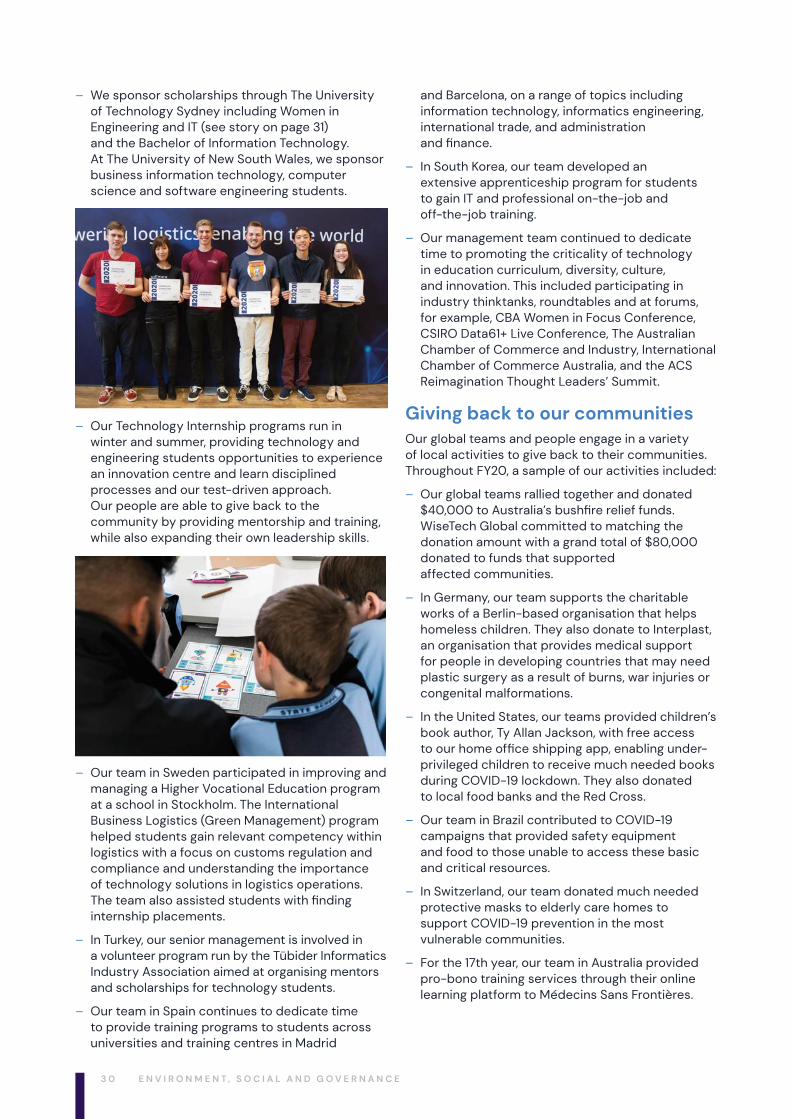
– We sponsor scholarships through The University of Technology Sydney including Women in Engineering and IT (see story on page 31) and the Bachelor of Information Technology. At The University of New South Wales, we sponsor business information technology, computer science and software engineering students.
– Our Technology Internship programs run in winter and summer, providing technology and engineering students opportunities to experience an innovation centre and learn disciplined processes and our test-driven approach. Our people are able to give back to the community by providing mentorship and training, while also expanding their own leadership skills.
– Our team in Sweden participated in improving and managing a Higher Vocational Education program at a school in Stockholm. The International Business Logistics (Green Management) program helped students gain relevant competency within logistics with a focus on customs regulation and compliance and understanding the importance of technology solutions in logistics operations. The team also assisted students with finding internship placements.
– In Turkey, our senior management is involved in a volunteer program run by the Tübider Informatics Industry Association aimed at organising mentors and scholarships for technology students.
– Our team in Spain continues to dedicate time to provide training programs to students across universities and training centres in Madrid
and Barcelona, on a range of topics including information technology, informatics engineering, international trade, and administration and finance.
– In South Korea, our team developed an extensive apprenticeship program for students to gain IT and professional on-the-job and off-the-job training.
– Our management team continued to dedicate time to promoting the criticality of technology in education curriculum, diversity, culture, and innovation. This included participating in industry thinktanks, roundtables and at forums, for example, CBA Women in Focus Conference, CSIRO Data61+ Live Conference, The Australian Chamber of Commerce and Industry, International Chamber of Commerce Australia, and the ACS Reimagination Thought Leaders’ Summit.
Giving back to our communities Our global teams and people engage in a variety of local activities to give back to their communities. Throughout FY20, a sample of our activities included:
– Our global teams rallied together and donated $40,000 to Australia’s bushfire relief funds. WiseTech Global committed to matching the donation amount with a grand total of $80,000 donated to funds that supported affected communities.
– In Germany, our team supports the charitable works of a Berlin-based organisation that helps homeless children. They also donate to Interplast, an organisation that provides medical support for people in developing countries that may need plastic surgery as a result of burns, war injuries or congenital malformations.
– In the United States, our teams provided children’s book author, Ty Allan Jackson, with free access to our home office shipping app, enabling under-privileged children to receive much needed books during COVID-19 lockdown. They also donated to local food banks and the Red Cross.
– Our team in Brazil contributed to COVID-19 campaigns that provided safety equipment and food to those unable to access these basic and critical resources.
– In Switzerland, our team donated much needed protective masks to elderly care homes to support COVID-19 prevention in the most vulnerable communities.
– For the 17th year, our team in Australia provided pro-bono training services through their online learning platform to Médecins Sans Frontières.
E N V I R O N M E N T , S O C I A L A N D G O V E R N A N C E
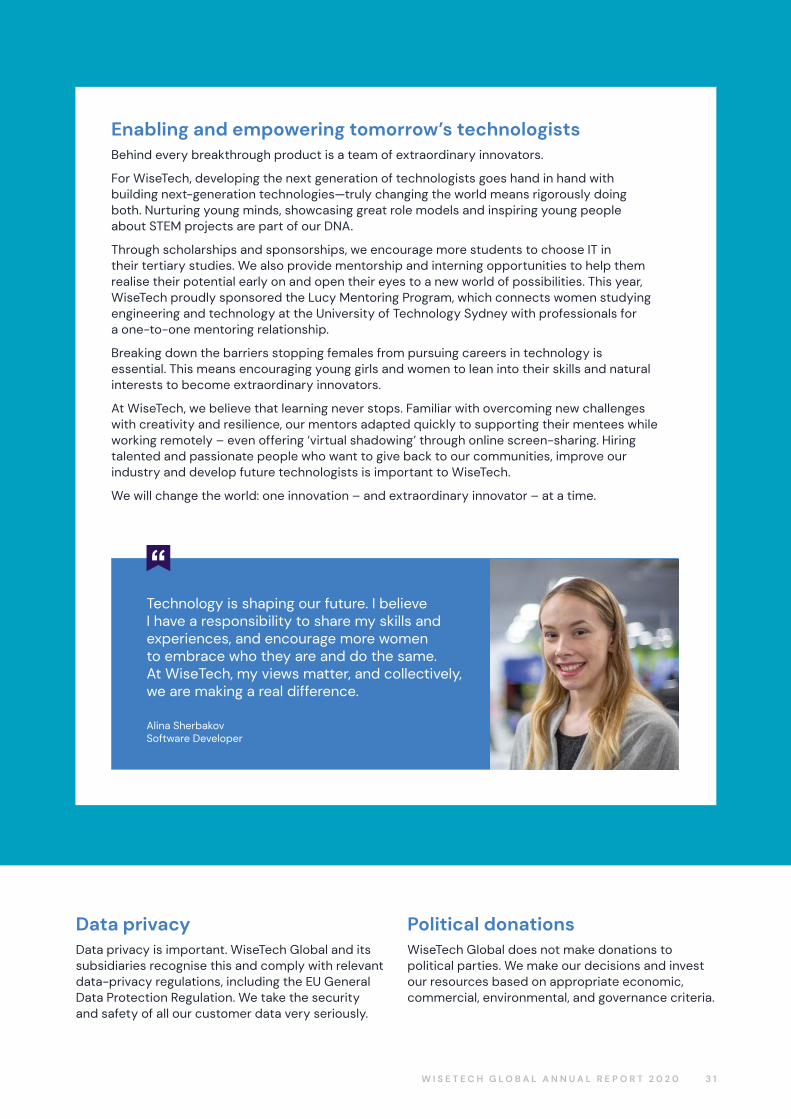
3 1W I S E T E C H G L O B A L A N N U A L R E P O R T 2 0 2 0
Enabling and empowering tomorrow’s technologistsBehind every breakthrough product is a team of extraordinary innovators.
For WiseTech, developing the next generation of technologists goes hand in hand with building next-generation technologies—truly changing the world means rigorously doing both. Nurturing young minds, showcasing great role models and inspiring young people about STEM projects are part of our DNA.
Through scholarships and sponsorships, we encourage more students to choose IT in their tertiary studies. We also provide mentorship and interning opportunities to help them realise their potential early on and open their eyes to a new world of possibilities. This year, WiseTech proudly sponsored the Lucy Mentoring Program, which connects women studying engineering and technology at the University of Technology Sydney with professionals for a one-to-one mentoring relationship.
Breaking down the barriers stopping females from pursuing careers in technology is essential. This means encouraging young girls and women to lean into their skills and natural interests to become extraordinary innovators.
At WiseTech, we believe that learning never stops. Familiar with overcoming new challenges with creativity and resilience, our mentors adapted quickly to supporting their mentees while working remotely – even offering ‘virtual shadowing’ through online screen‑sharing. Hiring talented and passionate people who want to give back to our communities, improve our industry and develop future technologists is important to WiseTech.
We will change the world: one innovation – and extraordinary innovator – at a time.
Technology is shaping our future. I believe I have a responsibility to share my skills and experiences, and encourage more women to embrace who they are and do the same. At WiseTech, my views matter, and collectively, we are making a real difference.
Alina Sherbakov Software Developer
Data privacyData privacy is important. WiseTech Global and its subsidiaries recognise this and comply with relevant data-privacy regulations, including the EU General Data Protection Regulation. We take the security and safety of all our customer data very seriously.
Political donationsWiseTech Global does not make donations to political parties. We make our decisions and invest our resources based on appropriate economic, commercial, environmental, and governance criteria.
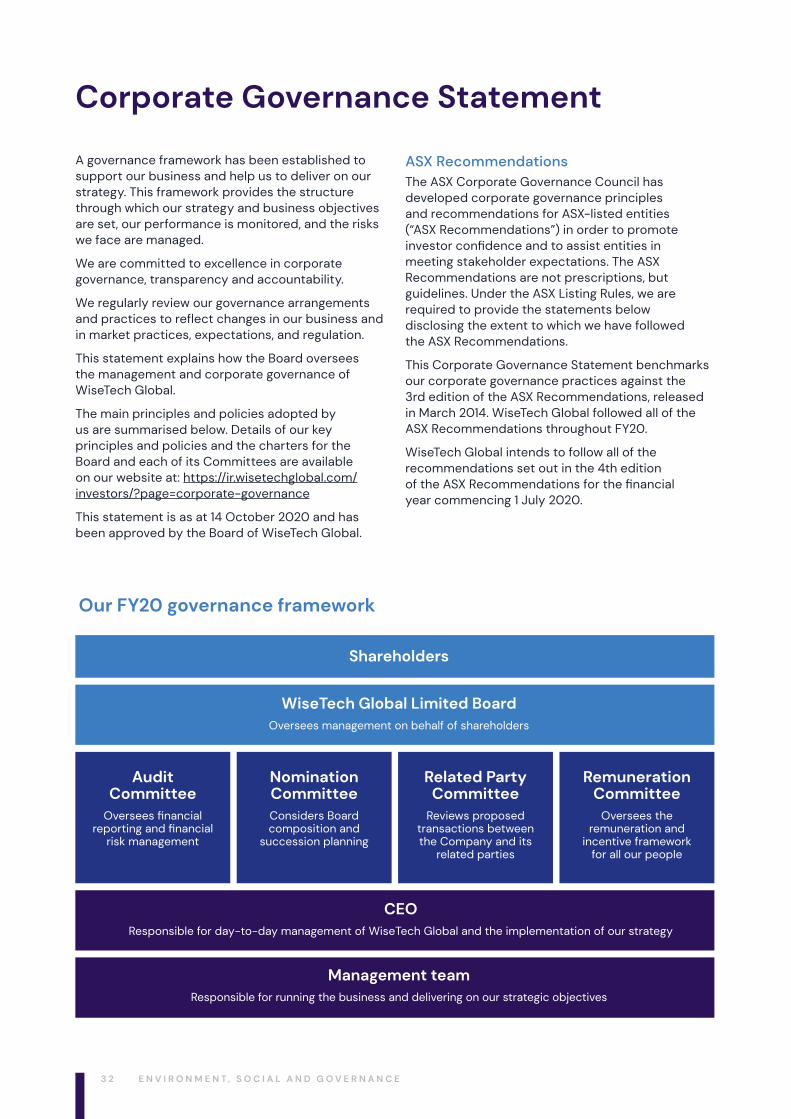
3 2
Corporate Governance Statement
A governance framework has been established to support our business and help us to deliver on our strategy. This framework provides the structure through which our strategy and business objectives are set, our performance is monitored, and the risks we face are managed.
We are committed to excellence in corporate governance, transparency and accountability.
We regularly review our governance arrangements and practices to reflect changes in our business and in market practices, expectations, and regulation.
This statement explains how the Board oversees the management and corporate governance of WiseTech Global.
The main principles and policies adopted by us are summarised below. Details of our key principles and policies and the charters for the Board and each of its Committees are available on our website at: https://ir.wisetechglobal.com/investors/?page=corporate‑governance
This statement is as at 14 October 2020 and has been approved by the Board of WiseTech Global.
ASX RecommendationsThe ASX Corporate Governance Council has developed corporate governance principles and recommendations for ASX-listed entities (“ASX Recommendations”) in order to promote investor confidence and to assist entities in meeting stakeholder expectations. The ASX Recommendations are not prescriptions, but guidelines. Under the ASX Listing Rules, we are required to provide the statements below disclosing the extent to which we have followed the ASX Recommendations.
This Corporate Governance Statement benchmarks our corporate governance practices against the 3rd edition of the ASX Recommendations, released in March 2014. WiseTech Global followed all of the ASX Recommendations throughout FY20.
WiseTech Global intends to follow all of the recommendations set out in the 4th edition of the ASX Recommendations for the financial year commencing 1 July 2020.
Shareholders
WiseTech Global Limited BoardOversees management on behalf of shareholders
Management teamResponsible for running the business and delivering on our strategic objectives
CEOResponsible for day-to-day management of WiseTech Global and the implementation of our strategy
AuditCommittee
Oversees financial reporting and financial
risk management
Nomination CommitteeConsiders Board composition and
succession planning
Related Party Committee
Reviews proposed transactions between the Company and its
related parties
Remuneration Committee
Oversees the remuneration and
incentive frameworkfor all our people
Our FY20 governance framework
E N V I R O N M E N T , S O C I A L A N D G O V E R N A N C E
3 3W I S E T E C H G L O B A L A N N U A L R E P O R T 2 0 2 0
Board compositionOur Board currently comprises a total of seven Directors — five independent Non‑Executive Directors (including our Chair) and two Executive Directors.
Biographies of the Board members, including details of their qualifications, tenure and experience, can be found on pages 42 and 43, and on our website.
Board CommitteesThe Board may from time to time establish appropriate committees to assist in performing its responsibilities. Four Committees operated throughout FY20:
– the Audit Committee;
– the Nomination Committee;
– the Related Party Committee; and
– the Remuneration Committee.
Please refer to page 43 for further information regarding the Committee meetings (including the number of times each Committee met throughout the reporting period and the individual attendances of the members at those meetings).
Corporate governance principles and policiesWe have implemented a principles-based governance model whereby practical sets of principles are provided to guide behaviour. These principles are designed to give direction on our approach to business conduct. More structured policies are implemented where appropriate.
This combination of principles and policies provides us with a governance model that we believe both provides shareholders with confidence in the responsible management of WiseTech Global and at the same time allows creativity to flourish by minimising bureaucracy, multiple chains of command and centralised decision-making where appropriate and in the best interests of the Company.
You can find copies of our corporate policies and principles on our website at: https://ir.wisetechglobal.com/investors/?page=corporate‑governance
Principle 1: Lay solid foundations for management and oversight
Responsibilities of the BoardThe Board is responsible for our overall corporate governance, including establishing and monitoring key performance goals, and is committed to maximising performance, generating appropriate levels of shareholder value and financial returns, and sustaining our long-term growth and success. In conducting business in accordance with these objectives, the Board seeks to ensure that we are properly managed to protect and enhance shareholder interests, and that we and our Directors, officers and staff, operate in an appropriate environment of corporate governance. Accordingly, the Board has created a framework for managing WiseTech Global, which includes relevant internal controls, risk management processes and corporate governance principles, policies and practices which the Board believes are appropriate for our business and which are designed to promote the responsible management and conduct of WiseTech Global.
The Board has approved a Board Charter which governs the operations of the Board, its role and responsibilities, composition, structure and membership requirements.
The Board’s role is to:
– represent and serve the interests of shareholders by overseeing and appraising our strategies, policies and performance;
– optimise our performance and build sustainable value for shareholders;
– set, review and ensure compliance with our values and governance framework (including establishing and observing high ethical standards); and
– ensure that shareholders are kept informed of our performance and major developments.
Matters which are specifically reserved for the Board or its Committees include:
– appointing the Chair;
– determining the size, composition and structure of the Board;
– appointing the CEO and overseeing the performance review of the CEO;
– establishing and monitoring succession planning for the CEO and senior management;
– approving the overall remuneration policy, including non-executive director, executive director and senior management remuneration;
– overseeing compliance with continuous disclosure obligations;
3 4
– approving the annual report and financial statements;
– overseeing and approving strategies for WiseTech Global to maintain a strong balance sheet and sound credit rating;
– approving the dividend policy and authorising payment of dividends; and
– approving and monitoring the systems and policies to ensure integrity of budgets, financial statements and other reporting.
The CEO is responsible for running the day-to-day affairs of WiseTech Global under delegated authority from the Board and to implement the strategies and policies approved by the Board. The CEO has systems of risk management and controls in place and those risks are monitored and managed by management, and material exceptions or issues are reported to the Board.
In carrying out management responsibilities, the CEO must report to the Board in a timely and clear manner and ensure all reports to the Board present a true and fair view of our financial condition and operational results. The role of management is to support the CEO and implement the running of the general operations and financial business of WiseTech Global in accordance with the delegated authority of the Board.
Appointment of DirectorsPrior to the appointment of any new Non-Executive Director, appropriate checks are conducted to determine whether the candidate has the capabilities needed, and is fit and proper, to undertake the responsibilities of the role. On appointment, each Director receives a formal letter, outlining the key terms, conditions and expectations of their appointment. All new Directors, other than the CEO, must stand for election by shareholders at the first Annual General Meeting (“AGM”) after their appointment and all Directors, other than the CEO, must stand for re-election no later than the third AGM after their previous election or re-election.
Before each AGM, the Board reviews the performance of each Director standing for election or re-election and advises shareholders if it recommends their election or re-election.
Arlene Tansey, having been appointed to the Board in June 2020, together with Maree Isaacs, who is retiring by rotation, will stand for re-election at the 2020 AGM. The Notice of AGM will provide information on each Director’s background, skills and experience. The Board considers that each candidate continues to make a valuable contribution to the Board.
CEO and senior executivesThe CEO and senior executives have clearly understood goals and accountabilities and employment contracts setting out their terms of employment, duties, rights and responsibilities, and entitlements on termination of employment.
Company secretariesWiseTech Global Limited has two company secretaries, appointed by the Board. The company secretaries are directly accountable to the Board, through the Chair, on all matters related to the proper functioning of the Board. This includes advising the Board and its Committees on governance matters and procedures, coordinating Board business (including preparing and maintaining Board and Committee papers) and providing a point of reference for dealings between the Board and management.
Diversity and Inclusion PrinciplesWe value a strong and diverse workforce and are committed to diversity and inclusion in our workplace. We have implemented Diversity and Inclusion Principles, designed to foster a culture that values and achieves diversity in our workforce and on our Board. The main objectives are to ensure that we:
– promote the principles of merit and fairness when making decisions about recruitment, development, promotion, remuneration and flexible work arrangements;
– recruit from a diverse pool of qualified candidates, making efforts to identify prospective employees who have diverse attributes and seeking to ensure diversity of those involved in selection processes when selecting and appointing new employees and Board members;
– embed the importance of diversity within our culture by encouraging and fostering a commitment to diversity by people at all levels of our global business;
– leverage our employees’ unique skills, values, backgrounds and experiences, which will assist with understanding our customer needs across our global business; and
– develop an inclusive work environment that helps enable each employee to show their full potential, regardless of their background, gender, age, work status, marital status, religious or cultural identity.
Our Diversity and Inclusion Principles include a requirement for the Board to set measurable objectives for achieving gender diversity and to assess annually both the objectives and the Company’s progress in achieving them.
E N V I R O N M E N T , S O C I A L A N D G O V E R N A N C E
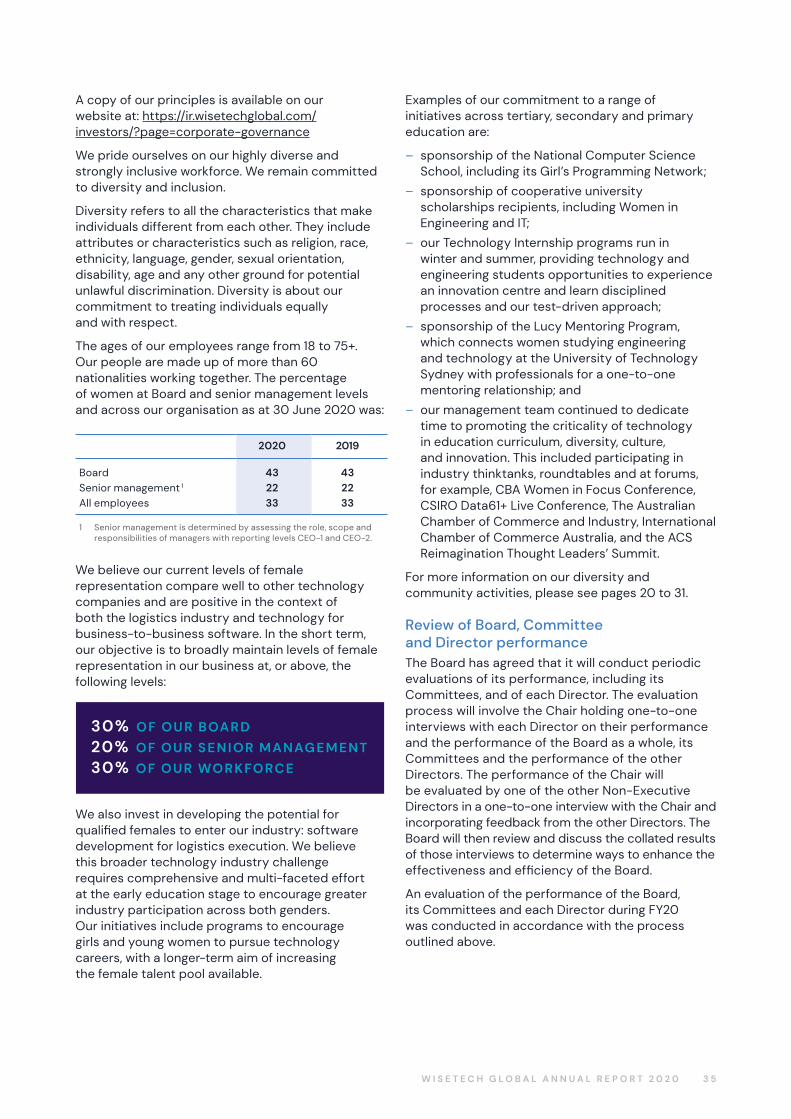
3 5W I S E T E C H G L O B A L A N N U A L R E P O R T 2 0 2 0
A copy of our principles is available on our website at: https://ir.wisetechglobal.com/investors/?page=corporate‑governance
We pride ourselves on our highly diverse and strongly inclusive workforce. We remain committed to diversity and inclusion.
Diversity refers to all the characteristics that make individuals different from each other. They include attributes or characteristics such as religion, race, ethnicity, language, gender, sexual orientation, disability, age and any other ground for potential unlawful discrimination. Diversity is about our commitment to treating individuals equally and with respect.
The ages of our employees range from 18 to 75+. Our people are made up of more than 60 nationalities working together. The percentage of women at Board and senior management levels and across our organisation as at 30 June 2020 was:
2020 2019
BoardSenior management 1
All employees
432233
432233
1 Senior management is determined by assessing the role, scope and responsibilities of managers with reporting levels CEO-1 and CEO-2.
We believe our current levels of female representation compare well to other technology companies and are positive in the context of both the logistics industry and technology for business-to-business software. In the short term, our objective is to broadly maintain levels of female representation in our business at, or above, the following levels:
We also invest in developing the potential for qualified females to enter our industry: software development for logistics execution. We believe this broader technology industry challenge requires comprehensive and multi-faceted effort at the early education stage to encourage greater industry participation across both genders. Our initiatives include programs to encourage girls and young women to pursue technology careers, with a longer-term aim of increasing the female talent pool available.
Examples of our commitment to a range of initiatives across tertiary, secondary and primary education are:
– sponsorship of the National Computer Science School, including its Girl’s Programming Network;
– sponsorship of cooperative university scholarships recipients, including Women in Engineering and IT;
– our Technology Internship programs run in winter and summer, providing technology and engineering students opportunities to experience an innovation centre and learn disciplined processes and our test-driven approach;
– sponsorship of the Lucy Mentoring Program, which connects women studying engineering and technology at the University of Technology Sydney with professionals for a one-to-one mentoring relationship; and
– our management team continued to dedicate time to promoting the criticality of technology in education curriculum, diversity, culture, and innovation. This included participating in industry thinktanks, roundtables and at forums, for example, CBA Women in Focus Conference, CSIRO Data61+ Live Conference, The Australian Chamber of Commerce and Industry, International Chamber of Commerce Australia, and the ACS Reimagination Thought Leaders’ Summit.
For more information on our diversity and community activities, please see pages 20 to 31.
Review of Board, Committee and Director performanceThe Board has agreed that it will conduct periodic evaluations of its performance, including its Committees, and of each Director. The evaluation process will involve the Chair holding one-to-one interviews with each Director on their performance and the performance of the Board as a whole, its Committees and the performance of the other Directors. The performance of the Chair will be evaluated by one of the other Non-Executive Directors in a one-to-one interview with the Chair and incorporating feedback from the other Directors. The Board will then review and discuss the collated results of those interviews to determine ways to enhance the effectiveness and efficiency of the Board.
An evaluation of the performance of the Board, its Committees and each Director during FY20 was conducted in accordance with the process outlined above.
30% OF OU R BOARD 20% OF OU R SEN I OR MANAG EM ENT30% OF OU R WORKFORCE
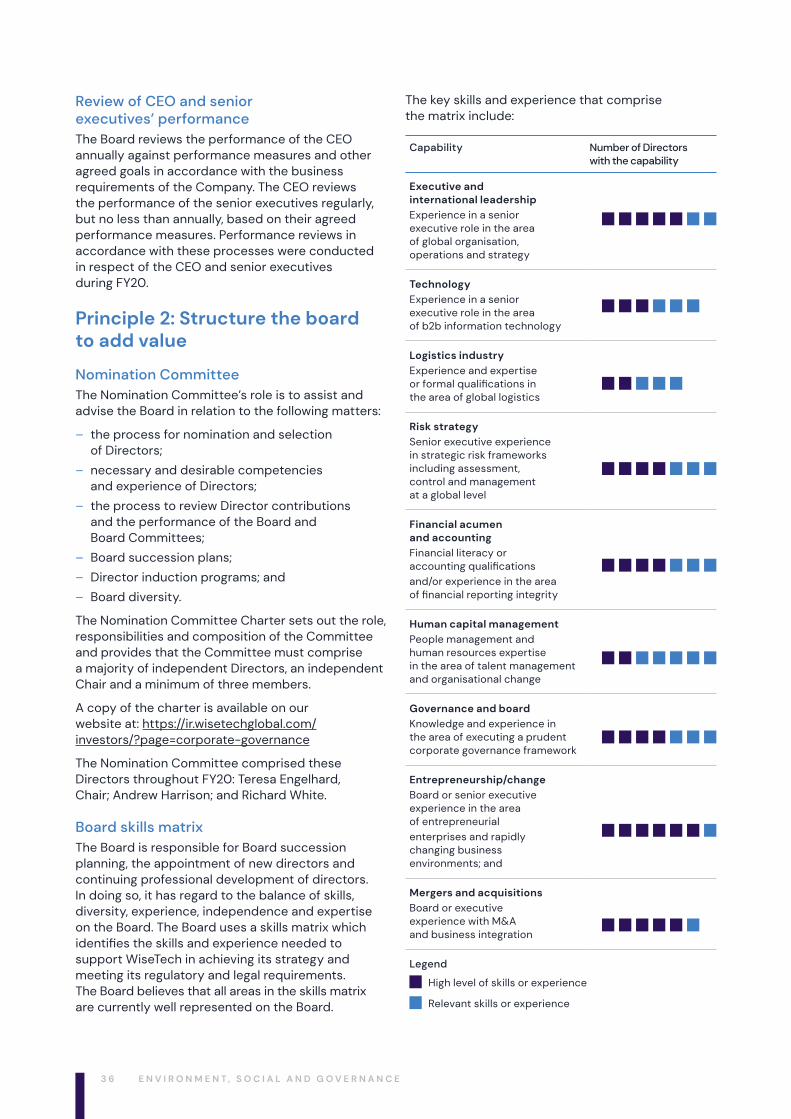
3 6
Review of CEO and senior executives’ performanceThe Board reviews the performance of the CEO annually against performance measures and other agreed goals in accordance with the business requirements of the Company. The CEO reviews the performance of the senior executives regularly, but no less than annually, based on their agreed performance measures. Performance reviews in accordance with these processes were conducted in respect of the CEO and senior executives during FY20.
Principle 2: Structure the board to add value
Nomination CommitteeThe Nomination Committee’s role is to assist and advise the Board in relation to the following matters:
– the process for nomination and selection of Directors;
– necessary and desirable competencies and experience of Directors;
– the process to review Director contributions and the performance of the Board and Board Committees;
– Board succession plans;
– Director induction programs; and
– Board diversity.
The Nomination Committee Charter sets out the role, responsibilities and composition of the Committee and provides that the Committee must comprise a majority of independent Directors, an independent Chair and a minimum of three members.
A copy of the charter is available on our website at: https://ir.wisetechglobal.com/investors/?page=corporate‑governance
The Nomination Committee comprised these Directors throughout FY20: Teresa Engelhard, Chair; Andrew Harrison; and Richard White.
Board skills matrixThe Board is responsible for Board succession planning, the appointment of new directors and continuing professional development of directors. In doing so, it has regard to the balance of skills, diversity, experience, independence and expertise on the Board. The Board uses a skills matrix which identifies the skills and experience needed to support WiseTech in achieving its strategy and meeting its regulatory and legal requirements. The Board believes that all areas in the skills matrix are currently well represented on the Board.
The key skills and experience that comprise the matrix include:
Capability Number of Directors with the capability
Executive and international leadershipExperience in a senior executive role in the area of global organisation, operations and strategy
TechnologyExperience in a senior executive role in the area of b2b information technology
Logistics industryExperience and expertise or formal qualifications in the area of global logistics
Risk strategySenior executive experience in strategic risk frameworks including assessment, control and management at a global level
Financial acumen and accountingFinancial literacy or accounting qualificationsand/or experience in the area of financial reporting integrity
Human capital managementPeople management and human resources expertise in the area of talent management and organisational change
Governance and boardKnowledge and experience in the area of executing a prudent corporate governance framework
Entrepreneurship/changeBoard or senior executive experience in the area of entrepreneurialenterprises and rapidly changing business environments; and
Mergers and acquisitionsBoard or executive experience with M&A and business integration
Legend
High level of skills or experience
Relevant skills or experience
E N V I R O N M E N T , S O C I A L A N D G O V E R N A N C E
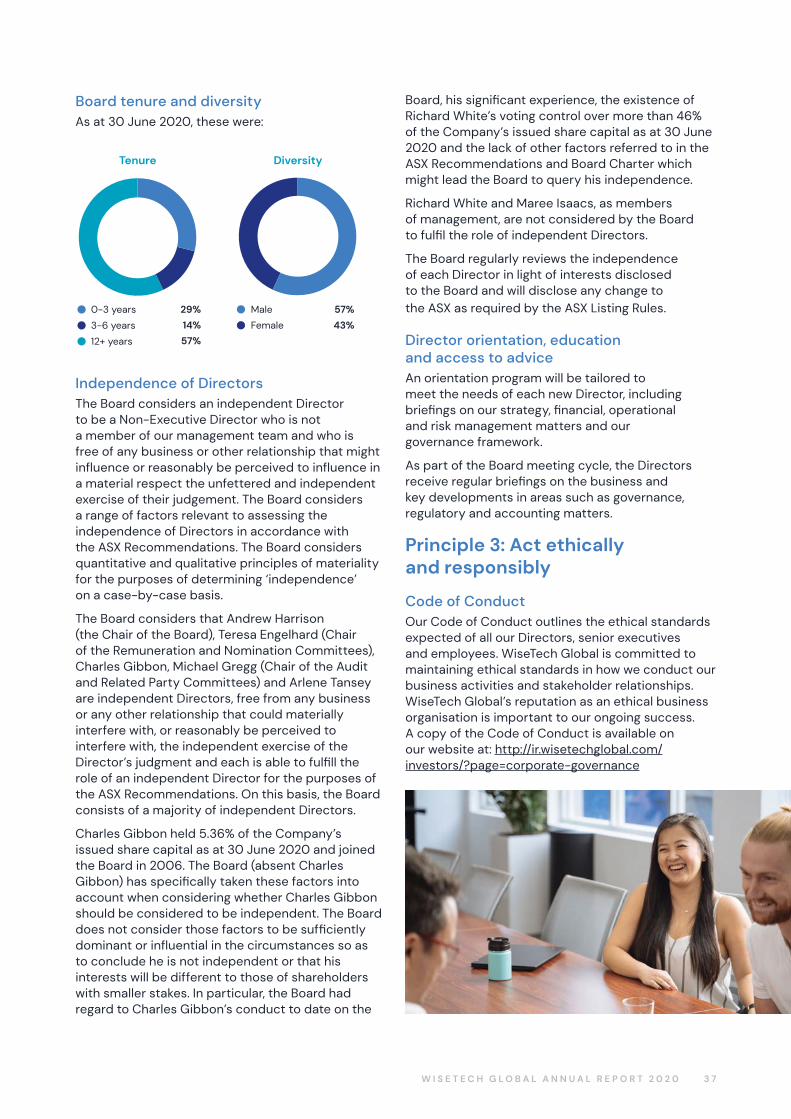
3 7W I S E T E C H G L O B A L A N N U A L R E P O R T 2 0 2 0
Board tenure and diversityAs at 30 June 2020, these were:
Tenure Diversity
29%
14%
57%
0-3 years
3-6 years
12+ years
57%
43%
Male
Female
Tenure Diversity
29%
14%
57%
0-3 years
3-6 years
12+ years
57%
43%
Male
Female
Independence of DirectorsThe Board considers an independent Director to be a Non-Executive Director who is not a member of our management team and who is free of any business or other relationship that might influence or reasonably be perceived to influence in a material respect the unfettered and independent exercise of their judgement. The Board considers a range of factors relevant to assessing the independence of Directors in accordance with the ASX Recommendations. The Board considers quantitative and qualitative principles of materiality for the purposes of determining ‘independence’ on a case-by-case basis.
The Board considers that Andrew Harrison (the Chair of the Board), Teresa Engelhard (Chair of the Remuneration and Nomination Committees), Charles Gibbon, Michael Gregg (Chair of the Audit and Related Party Committees) and Arlene Tansey are independent Directors, free from any business or any other relationship that could materially interfere with, or reasonably be perceived to interfere with, the independent exercise of the Director’s judgment and each is able to fulfill the role of an independent Director for the purposes of the ASX Recommendations. On this basis, the Board consists of a majority of independent Directors.
Charles Gibbon held 5.36% of the Company’s issued share capital as at 30 June 2020 and joined the Board in 2006. The Board (absent Charles Gibbon) has specifically taken these factors into account when considering whether Charles Gibbon should be considered to be independent. The Board does not consider those factors to be sufficiently dominant or influential in the circumstances so as to conclude he is not independent or that his interests will be different to those of shareholders with smaller stakes. In particular, the Board had regard to Charles Gibbon’s conduct to date on the
Board, his significant experience, the existence of Richard White’s voting control over more than 46% of the Company’s issued share capital as at 30 June 2020 and the lack of other factors referred to in the ASX Recommendations and Board Charter which might lead the Board to query his independence.
Richard White and Maree Isaacs, as members of management, are not considered by the Board to fulfil the role of independent Directors.
The Board regularly reviews the independence of each Director in light of interests disclosed to the Board and will disclose any change to the ASX as required by the ASX Listing Rules.
Director orientation, education and access to adviceAn orientation program will be tailored to meet the needs of each new Director, including briefings on our strategy, financial, operational and risk management matters and our governance framework.
As part of the Board meeting cycle, the Directors receive regular briefings on the business and key developments in areas such as governance, regulatory and accounting matters.
Principle 3: Act ethically and responsibly
Code of ConductOur Code of Conduct outlines the ethical standards expected of all our Directors, senior executives and employees. WiseTech Global is committed to maintaining ethical standards in how we conduct our business activities and stakeholder relationships. WiseTech Global’s reputation as an ethical business organisation is important to our ongoing success. A copy of the Code of Conduct is available on our website at: http://ir.wisetechglobal.com/investors/?page=corporate‑governance
3 8
Principle 4: Safeguard integrity of corporate reporting
Audit CommitteeThe Audit Committee assists the Board in fulfilling its corporate governance and oversight responsibilities in relation to our financial reports and financial reporting process and internal control structure, management of financial risks and the external audit processes.
In October 2019, Michael Gregg was appointed Chair of the Audit Committee following Christine Holman’s resignation from the Board. Also in October 2019, the Board approved an amended charter and renamed the Audit and Risk Management Committee as the Audit Committee.
The Committee’s role is to assist the Board to carry out its responsibilities, including:
– review and monitoring of the Company’s financial reports and statements;
– review and oversight of systems of financial and tax risk management, internal financial controls and regulatory compliance;
– review of the adequacy of the Group’s corporate reporting processes; and
– liaison with, and monitoring the performance and independence of, the external auditor.
The Audit Committee Charter sets out the role, responsibilities and composition of the Committee and provides that the Committee must comprise only Non-Executive Directors, a majority of independent Directors, an independent Chair who is not Chair of the Board, and a minimum of three members. In accordance with its charter, it is intended that all members of the Committee should have familiarity with general financial and accounting practices, and at least one member must have accounting or related financial management expertise. A copy of the charter is available on our website at: https://ir.wisetechglobal.com/investors/?page=corporate‑governance
The composition of the Committee during FY20 is set out below:
– Michael Gregg, joined the Committee as Chair with effect from 24 October 2019;
– Charles Gibbon;
– Andrew Harrison; and
– Christine Holman, Chair until 18 October 2019.
Non-committee members, including members of management and our external auditor, may attend meetings of the Audit Committee by invitation of the Committee Chair.
WiseTech Global Australia
Whenever we’re working on a project we never take the quickest or easiest way out. We go for the solution that is best.
E N V I R O N M E N T , S O C I A L A N D G O V E R N A N C E
3 9W I S E T E C H G L O B A L A N N U A L R E P O R T 2 0 2 0
Related Party CommitteeTaking into account existing long-standing related party transactions for property and data centres between WiseTech Global and its co-founders, and the potential for future transactions, the Board has a Related Party Committee comprising independent Directors to consider and review transactions.
The Related Party Committee’s role is to support the Company’s compliance with related party rules and disclosure obligations.
The Related Party Committee Charter sets out the role, responsibilities and composition of the Committee and provides that the Committee must comprise only independent Directors, an independent Chair who is not Chair of the Board, and a minimum of three members. A copy of the charter is available on our website at: https://ir.wisetechglobal.com/investors/?page=corporate‑governance
The composition of the Committee during FY20 is set out below:
– Michael Gregg, Chair;
– Charles Gibbon, from 24 October 2019;
– Andrew Harrison; and
– Christine Holman, until 18 October 2019.
CEO and Chief Financial Officer assuranceThe Board receives regular reports about the operational results and financial condition of WiseTech Global.
The Board has received and considered a declaration from each of the CEO and the Chief Financial Officer in relation to the financial statements in accordance with ASX Recommendation 4.2. The declaration states that, in their opinion, the financial records of WiseTech Global have been properly maintained and that the financial statements comply with the appropriate accounting standards and give a true and fair view of the financial position and performance of the Company and that the opinion has been formed on the basis of a sound system of risk management and internal control which is operating effectively.
External auditorKPMG has been appointed as WiseTech Global’s external auditor. The terms of appointment of the auditor include a requirement to attend our AGM and be available at the AGM to answer any questions from shareholders relevant to the audit.
Principle 5: Make timely and balanced disclosure
Market Disclosure and Communications PrinciplesOur Market Disclosure and Communications Principles establish procedures to help ensure that:
– we comply with our continuous disclosure obligations contained in the ASX Listing Rules and the Corporations Act 2001; and
– all our stakeholders have equal and timely access to information we make available.
A copy of the principles is available on our website at: https://ir.wisetechglobal.com/investors/?page=corporate‑governance
Principle 6: Respect the rights of security holders
Investor relationsThe Company also has an investor relations program to facilitate effective communication with investors – primarily through our AGMs and our website.
Our AGM is an excellent opportunity for the Company to provide information to shareholders and to receive feedback from shareholders (including opportunity for shareholders to ask questions about the business operations and management of the Company). Our AGM is typically held in November in Sydney.
In response to the potential health risks arising from the COVID-19 pandemic, our 2020 AGM will be held as a virtual meeting online. There will not be a physical meeting, but shareholders and proxyholders can participate online, ask questions and vote in real time during the AGM by logging on to the online platform at: https://agmlive.link/WTC20
Our website includes a separate ‘Investors’ section, where shareholders and other stakeholders can access information about WiseTech Global, including annual reports and presentations, ASX announcements and share price information.
Shareholders can elect to receive their annual reports, notices of meeting and dividend statements online or in print. In addition, shareholders are able to communicate electronically with us and our share registry, Link Market Services, including being able to lodge proxy forms online.
4 0
Principle 7: Recognise and manage risk
Risk Management PrinciplesWe view risk management as a continual process, integral to achieving our corporate objectives, effectively managing our assets and creating and maintaining shareholder value.
Our Board is responsible for overseeing the risk management framework and has reviewed specific risks in FY20, such as cyber risk, whistleblower provisions, insurance risks, succession planning and M&A transactions and integration risks. Risk management is also delegated to the Risk Committee, a management committee for which the CEO is responsible, and which oversees a system of internal controls and risk management and monitors and manages those risks. Members of the Risk Committee hold regular meetings with the CEO during which risks are discussed and analysed, and any necessary actions are determined.
Material exceptions or issues are reported to the Board. In FY20, the Audit Committee has reviewed the financial risks of the business and the controls and mitigations in place to address those financial risks. A review of the risk management framework was conducted during FY20. Going forward, the Company intends to review its risk management framework annually to ensure the framework remains sound and continues to achieve the above objectives.
Our 2020 annual report includes a discussion of the main risks affecting WiseTech Global.
Internal auditDuring FY20, as a consequence of the growth of the Group and the increased proportion of the business outside Australia, the Audit Committee determined that it was appropriate to form an internal audit and risk management function. Prior to the establishment of an internal audit function, the Board has continued to review internal controls and risk management processes in conjunction with the oversight provided by senior management, including the CEO and Chief Financial Officer. Although the establishment of an internal audit function has been delayed by the COVID-19 pandemic, since the end of FY20, an external provider has been engaged to assist in the performance of the delivery of internal audit and risk management services.
Whistleblower Protection PrinciplesOur Whistleblower Protection Principles establish mechanisms and procedures for employees to report suspected unethical or illegal conduct in a manner which protects the whistleblower and gathers the necessary information for us to investigate such reports and act appropriately.
E N V I R O N M E N T , S O C I A L A N D G O V E R N A N C E
4 1W I S E T E C H G L O B A L A N N U A L R E P O R T 2 0 2 0
Principle 8: Remunerate fairly and responsibly
Remuneration CommitteeThe Remuneration Committee’s role is to assist and advise the Board in relation to:
– our remuneration policy and incentive framework, including its application to Directors;
– the process for overseeing performance accountability and effective monitoring of management, including setting and evaluating performance against goals and targets;
– recruitment, retention and termination strategies;
– achievement against diversity objectives in relation to remuneration; and
– the annual Remuneration Report to shareholders.
The Remuneration Committee Charter sets out the role, responsibilities and composition of the committee and provides that the committee must comprise a majority of independent Directors, an independent Chair who is not Chair of the Board, and a minimum of three members.
A copy of the charter is available on our website at: https://ir.wisetechglobal.com/investors/?page=corporate‑governance
The Remuneration Committee comprised these Directors throughout FY20:
– Teresa Engelhard, Chair;
– Charles Gibbon; and
– Michael Gregg.
Remuneration ReportOur Remuneration Report describes the policies and practices regarding the remuneration of Non-Executive Directors and the remuneration of Executive Directors and senior executives.
Securities Trading PolicyOur Securities Trading Policy outlines the rules for Directors and employees trading in WiseTech Global securities. The purpose of the policy is to assist Directors and employees to comply with their obligations under the insider trading provisions of the Corporations Act 2001 and to protect the reputation of the Company, its Directors and employees.
Our policy establishes staff trading windows and prohibits the use of hedges or derivatives which operate to limit the economic risk of unvested, or vested but subject to disposal restrictions, WiseTech Global securities including securities issued in connection with equity-based remuneration schemes.

4 2
Board of DirectorsAndrew Harrison, Independent Chair and Non-Executive Director
Andrew joined the Board in 2015 and was appointed Chair in September 2018. Andrew is an experienced company director and corporate adviser. He is currently the non-executive chairman of ASX-listed Bapcor Limited (a director since March 2014) and a non-executive director of Moorebank Intermodal Company Ltd and Vend Ltd. Andrew has previously held executive roles and non-executive directorships with public and private companies, including as CFO of Seven Group Holdings, group finance director of Landis+Gyr, CFO and a director of Alesco Limited and a director of Estia Health Limited (November 2014 to October 2018), IVE Group Limited (November 2015 to November 2018) and Xenith IP Limited (October 2015 to September 2018). Andrew’s experience includes senior manager at Ernst & Young (Sydney and London) and Gresham Partners Limited, and an associate at Chase Manhattan Bank (New York). Andrew holds a Bachelor of Economics from The University of Sydney and a Master of Business Administration from the Wharton School at the University of Pennsylvania and is a Chartered Accountant.
Richard White, Executive Director, Founder and CEO
Richard founded WiseTech Global in 1994 and has been CEO and an Executive Director since then. Richard has over 30 years of experience in software development, embedded systems and business management and over 20 years of freight and logistics industry experience. Prior to founding WiseTech Global, Richard was the managing director of Real Tech Systems Integration (a provider of computer consulting and systems integrations services) and CEO of Clear Group (a distributor of computer related equipment). Richard holds a Master of Business in IT management from the University of Technology, Sydney.
Teresa Engelhard, Independent Non-Executive Director
Teresa joined the Board in 2018 and is chair of the Nomination Committee and the Remuneration Committee. Teresa has more than 20 years’ international experience as a director, executive and venture capitalist in the technology, software and energy sectors. Teresa is currently a non-executive director of ASX-listed Origin Energy Limited (since May 2017) and two non‑profit organisations: StartupAUS and LaunchVic. She is also a former director of ASX-listed Redbubble Limited (August 2011 to October 2017) and a former managing partner of Jolimont Capital. Teresa holds a Bachelor of Science (Hons) from the California Institute of Technology (Caltech) and a Master of Business Administration from Stanford University and is a graduate of the Australian Institute of Company Directors.
Charles Gibbon, Independent Non-Executive Director
Charles joined the Board in 2006, served as Chair from 2006 to 2018, and has been a shareholder since 2005. Charles is a director of Shearwater Growth Equity Pty Ltd and has previously been a director of Monbeef Pty Ltd, Photolibrary Pty Ltd and the former ASX-listed Health Communication Network Limited. Charles has over 20 years of experience in institutional funds management, has previously been a member of the Investment Committee of Quadrant Capital Funds I, II and III for Quadrant Private Equity and has held roles as the CEO of Russell Private Equity, CEO of Risk Averse Money Managers Pty Ltd, a director of Morgan Grenfell Australia, and an associate director of Schroders Australia. Charles holds a Bachelor of Science in Mathematics from Otago University and Master of Commerce (Hons) from the University of Canterbury.
B O A R D O F D I R E C T O R S
4 3W I S E T E C H G L O B A L A N N U A L R E P O R T 2 0 2 0
Director attendance at meetings in FY20
The number of Directors’ meetings and meetings of Committees of Directors held during the financial year and the number of meetings attended by each Director are set out below. The table reflects the number of meetings held during the time the Director held office, or was a member of the Committee, during the year. Directors also frequently attend meetings of Committees of which they are not members.
Michael Gregg, Independent Non-Executive Director
Michael joined the Board in 2006 and has been a shareholder since 2005. Michael is also chair of the Audit Committee and the Related Party Committee. Michael is a director of Shearwater Growth Equity Pty Ltd, is the chairman of Community Connections Australia and is a former director of Jeenee Communications Pty Ltd and Playground (XYZ) Holdings Pty Ltd. Previously, Michael was the managing director of the former ASX‑listed Health Communication Network Limited. Michael has also held executive positions in the telecommunications, transport and retail industries. Michael holds a Bachelor of Science from The University of Sydney and a Master of Business Administration from the Australian Graduate School of Management and is a Graduate of the Australian Institute of Company Directors.
Arlene Tansey, Independent Non-Executive Director
Arlene joined the Board in June 2020 and is a professional director with more than 30 years’ international experience in financial services and investment banking. Arlene is currently a non‑executive director of ASX‑listed Aristocrat Leisure Limited (since July 2016), Healius Limited (since August 2012) and TPG Telecom Ltd (since July 2020). She is also a non-executive director of Infrastructure NSW, Lendlease Investment Management Limited and the Australian National Maritime Museum Foundation and Council. She is a former non-executive director of Adelaide Brighton Limited (April 2011 to October 2019). Arlene has a Juris Doctor from the University of Southern California Law Center and an MBA Finance and International Business from New York University and is a Fellow of the Australian Institute of Company Directors and a member of Chief Executive Women and the International Women’s Forum Australia.
Maree Isaacs, Executive Director, Co‑founder and Head of Invoicing & Licensing
Maree co-founded WiseTech Global with Richard White in 1994 and has been an Executive Director since 1996. Maree is focused on invoicing and licensing, group operations, quality control and administration. Maree is also a Company Secretary of WiseTech Global. Prior to co‑founding WiseTech Global, Maree worked at Real Tech Systems Integration and Clear Group.
BoardAudit
CommitteeNomination Committee
Related Party Committee
Remuneration Committee
Held Attended Held Attended Held Attended Held Attended Held Attended
Andrew HarrisonRichard WhiteTeresa EngelhardCharles GibbonMichael GreggChristine Holman 1
Maree IsaacsArlene Tansey 2
18181818184182
18181818184182
6--642--
6--642--
222-----
222-----
5--55---
5--55---
--333---
--333---
1 Christine Holman resigned from the Board on 18 October 2019.
2 Arlene Tansey was appointed to the Board on 1 June 2020.
Operating and financial reviewfor the year ended 30 June 2020
Review of operations
Principal activities We are a leading provider of software solutions to the logistics industry globally. We develop, sell and implement software solutions that enable logistics service providers to facilitate the movement and storage of goods and information, domestically and internationally. We provide our solutions to over 17,000 customers across 160 countries.
Our industry‑leading flagship technology, CargoWise, is a deeply integrated, global software platform for logistics service providers that enables them to execute highly complex logistics transactions and manage their operations on one database across multiple users, functions, offices, corporations, currencies, countries and languages. We operate our own data centres in Europe, Australasia and the Americas and deliver our CargoWise platform principally through the cloud. We predominantly provide our platform on demand, as a service, which customers can access any and all functionality as needed and pay for such usage monthly.
Our customers range from small and mid-sized domestic and regional logistics providers to large multi-national and global logistics providers, including all of the top 25 global freight forwarders and 42 of the top 50 global third party logistics providers (3PLs) 1. Our software solutions are designed to assist our customers to better address the complexities of the logistics industry. Our flagship solution, CargoWise can dramatically increase productivity, reduce costs and mitigate risks and is delivered as a single, global, highly integrated software platform.
Innovation and productivity are at the core of what we do. We invest significantly in product development and have achieved strong and profitable growth throughout our history. Through product development and our targeted strategic acquisitions, we are expanding CargoWise’s integrated global platform. Our vision is of a comprehensive global logistics execution solution for our customers, capable of managing from the first‑mile road movement, connecting to long‑haul air, sea, rail and road, crossing international borders, all while navigating complex regulatory frameworks with improved compliance, safety, visibility, predictability, manageability and productivity.
In addition to the strong organic growth from our existing CargoWise platform, since the beginning of FY20, we have completed the acquisition of five additional software businesses – either spanning new geographies focusing primarily on customs or new adjacencies with the potential to grow to global capacity. These acquisitions are at various stages of integration and, once fully integrated, they will expand the functionality, scope and value of our industry-leading technology to provide a strong base to further accelerate our growth.
We have now secured a strong foundation for future technology development and geographic expansion, with 40 product development centres worldwide and our people in more than 55 offices across Australia, Argentina, Belgium, Brazil, Canada, Chile, China, Finland, France, Germany, Ireland, Italy, Japan, Malaysia, the Netherlands, New Zealand, Norway, Poland, the Philippines, Singapore, South Africa, South Korea, Spain, Sweden, Switzerland, Taiwan, Turkey, the United Arab Emirates, the United Kingdom, the United States and Uruguay.
Summary of statutory financial performanceDuring the year to 30 June 2020, despite the impact of COVID‑19 on industry volumes and deferred product rollout, we delivered significant revenue growth driven by continued strong organic growth across our global business as we increased market penetration, customer usage and increased adoption of our technology. We continued our significant investment in innovation and development, expanding our global footprint and securing strategic assets in new geographies and adjacent technologies which together will accelerate our future growth.
Revenue for FY20 increased 23% to $429.4m (FY19: $348.3m)
Operating profit increased $0.3m to $80.5m (FY19: $80.2m)
Net profit after tax increased 197% to $160.8m (FY19: $54.1m)
NPATA 2 increased 3% to $64.6m (FY19: $63.0m)
Basic earnings per share increased 185% to 50.3 cents (FY19: 17.7 cents)
1 Armstrong & Associates: Top 50 Global Third Party Logistics Providers List ranked by 2019 logistics gross revenue/turnover. Armstrong & Associates: Top 25 Global Freight Forwarders List ranked by 2019 logistics gross revenue/turnover and freight forwarding volumes.
2 NPATA – net profit after tax attributable to equity holders of the parent before: acquired amortisation net of tax, contingent consideration interest unwind net of tax, and fair value changes on contingent consideration. NPATA is a non‑statutory measure and is a primary measure used by the Chief Operating Decision Maker (CODM) for the purpose of assessing the Group’s performance.
4 4 O P E R A T I N G A N D F I N A N C I A L R E V I E W
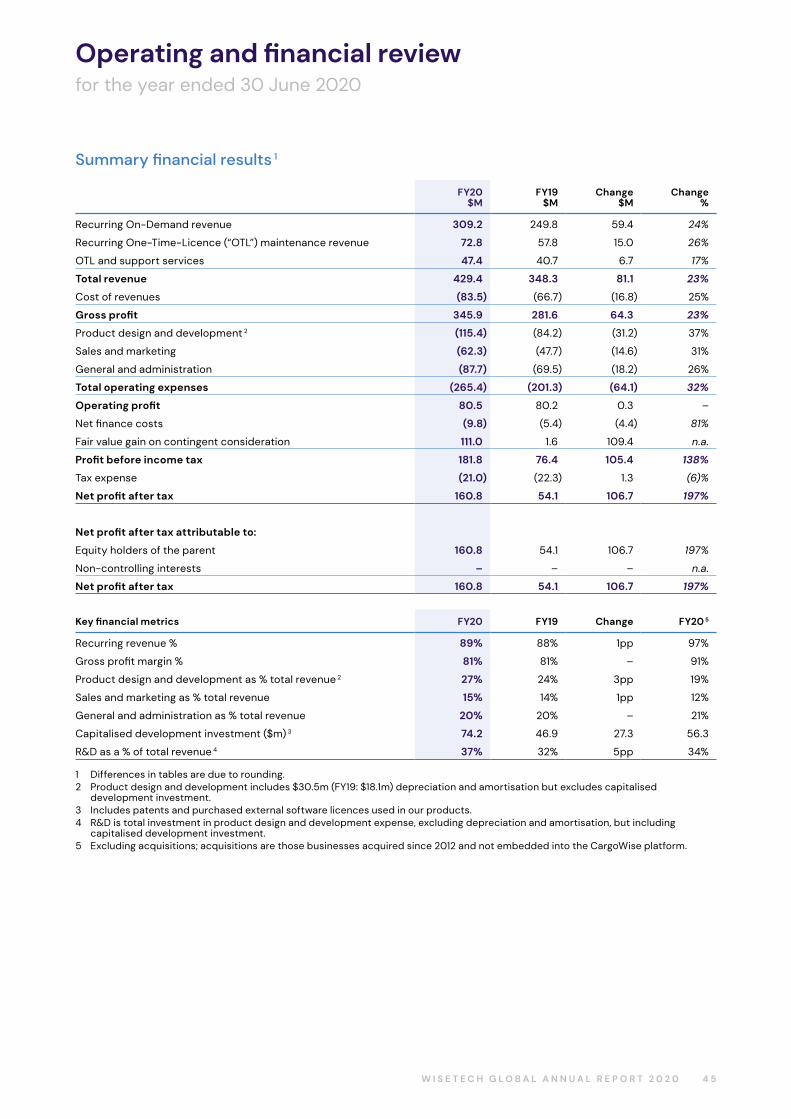
Operating and financial reviewfor the year ended 30 June 2020
Summary financial results 1
FY20$M
FY19$M
Change$M
Change%
Recurring On-Demand revenue 309.2 249.8 59.4 24%
Recurring One-Time-Licence (“OTL”) maintenance revenue 72.8 57.8 15.0 26%
OTL and support services 47.4 40.7 6.7 17%
Total revenue 429.4 348.3 81.1 23%
Cost of revenues (83.5) (66.7) (16.8) 25%
Gross profit 345.9 281.6 64.3 23%
Product design and development 2 (115.4) (84.2) (31.2) 37%
Sales and marketing (62.3) (47.7) (14.6) 31%
General and administration (87.7) (69.5) (18.2) 26%
Total operating expenses (265.4) (201.3) (64.1) 32%
Operating profit 80.5 80.2 0.3 –
Net finance costs (9.8) (5.4) (4.4) 81%
Fair value gain on contingent consideration 111.0 1.6 109.4 n.a.
Profit before income tax 181.8 76.4 105.4 138%
Tax expense (21.0) (22.3) 1.3 (6)%
Net profit after tax 160.8 54.1 106.7 197%
Net profit after tax attributable to:
Equity holders of the parent 160.8 54.1 106.7 197%
Non-controlling interests – – – n.a.
Net profit after tax 160.8 54.1 106.7 197%
Key financial metrics FY20 FY19 Change FY20 5
Recurring revenue % 89% 88% 1pp 97%
Gross profit margin % 81% 81% – 91%
Product design and development as % total revenue 2 27% 24% 3pp 19%
Sales and marketing as % total revenue 15% 14% 1pp 12%
General and administration as % total revenue 20% 20% – 21%
Capitalised development investment ($m) 3 74.2 46.9 27.3 56.3
R&D as a % of total revenue 4 37% 32% 5pp 34%
1 Differences in tables are due to rounding.2 Product design and development includes $30.5m (FY19: $18.1m) depreciation and amortisation but excludes capitalised
development investment.3 Includes patents and purchased external software licences used in our products.4 R&D is total investment in product design and development expense, excluding depreciation and amortisation, but including
capitalised development investment.5 Excluding acquisitions; acquisitions are those businesses acquired since 2012 and not embedded into the CargoWise platform.
4 5W I S E T E C H G L O B A L A N N U A L R E P O R T 2 0 2 0
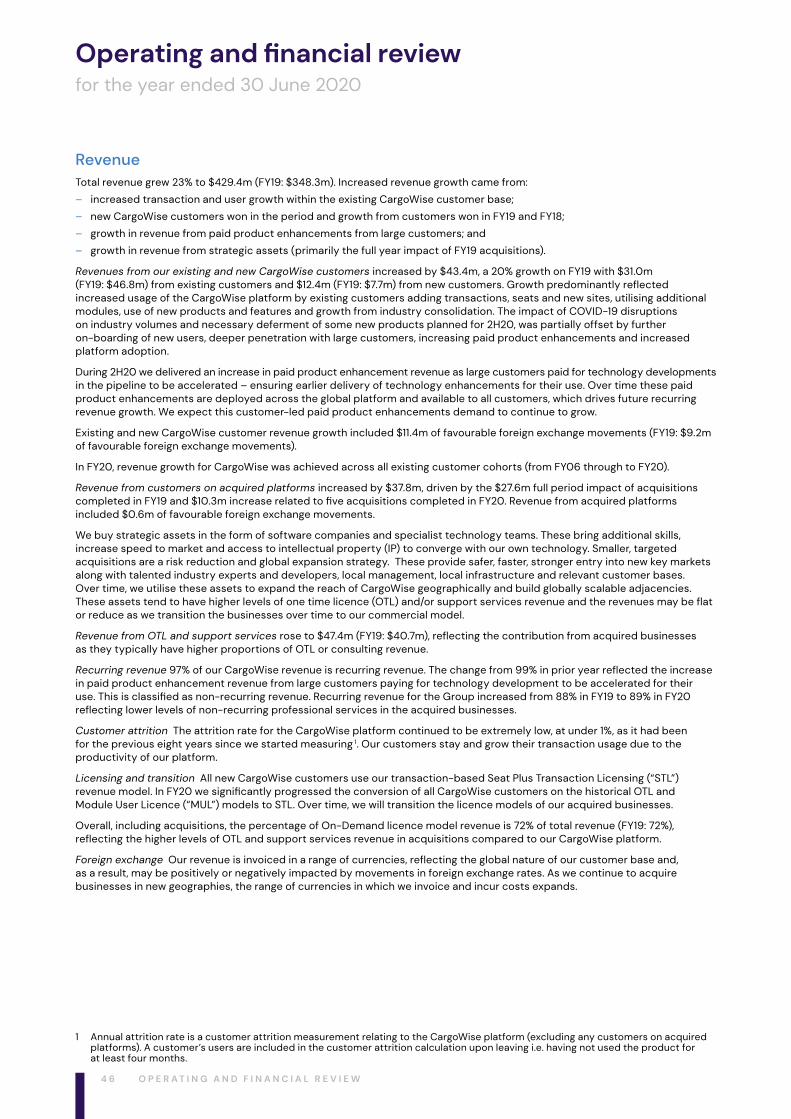
Operating and financial reviewfor the year ended 30 June 2020
RevenueTotal revenue grew 23% to $429.4m (FY19: $348.3m). Increased revenue growth came from:
– increased transaction and user growth within the existing CargoWise customer base;
– new CargoWise customers won in the period and growth from customers won in FY19 and FY18;
– growth in revenue from paid product enhancements from large customers; and
– growth in revenue from strategic assets (primarily the full year impact of FY19 acquisitions).
Revenues from our existing and new CargoWise customers increased by $43.4m, a 20% growth on FY19 with $31.0m (FY19: $46.8m) from existing customers and $12.4m (FY19: $7.7m) from new customers. Growth predominantly reflected increased usage of the CargoWise platform by existing customers adding transactions, seats and new sites, utilising additional modules, use of new products and features and growth from industry consolidation. The impact of COVID-19 disruptions on industry volumes and necessary deferment of some new products planned for 2H20, was partially offset by further on-boarding of new users, deeper penetration with large customers, increasing paid product enhancements and increased platform adoption.
During 2H20 we delivered an increase in paid product enhancement revenue as large customers paid for technology developments in the pipeline to be accelerated – ensuring earlier delivery of technology enhancements for their use. Over time these paid product enhancements are deployed across the global platform and available to all customers, which drives future recurring revenue growth. We expect this customer-led paid product enhancements demand to continue to grow.
Existing and new CargoWise customer revenue growth included $11.4m of favourable foreign exchange movements (FY19: $9.2m of favourable foreign exchange movements).
In FY20, revenue growth for CargoWise was achieved across all existing customer cohorts (from FY06 through to FY20).
Revenue from customers on acquired platforms increased by $37.8m, driven by the $27.6m full period impact of acquisitions completed in FY19 and $10.3m increase related to five acquisitions completed in FY20. Revenue from acquired platforms included $0.6m of favourable foreign exchange movements.
We buy strategic assets in the form of software companies and specialist technology teams. These bring additional skills, increase speed to market and access to intellectual property (IP) to converge with our own technology. Smaller, targeted acquisitions are a risk reduction and global expansion strategy. These provide safer, faster, stronger entry into new key markets along with talented industry experts and developers, local management, local infrastructure and relevant customer bases. Over time, we utilise these assets to expand the reach of CargoWise geographically and build globally scalable adjacencies. These assets tend to have higher levels of one time licence (OTL) and/or support services revenue and the revenues may be flat or reduce as we transition the businesses over time to our commercial model.
Revenue from OTL and support services rose to $47.4m (FY19: $40.7m), reflecting the contribution from acquired businesses as they typically have higher proportions of OTL or consulting revenue.
Recurring revenue 97% of our CargoWise revenue is recurring revenue. The change from 99% in prior year reflected the increase in paid product enhancement revenue from large customers paying for technology development to be accelerated for their use. This is classified as non‑recurring revenue. Recurring revenue for the Group increased from 88% in FY19 to 89% in FY20 reflecting lower levels of non‑recurring professional services in the acquired businesses.
Customer attrition The attrition rate for the CargoWise platform continued to be extremely low, at under 1%, as it had been for the previous eight years since we started measuring 1. Our customers stay and grow their transaction usage due to the productivity of our platform.
Licensing and transition All new CargoWise customers use our transaction‑based Seat Plus Transaction Licensing (“STL”) revenue model. In FY20 we significantly progressed the conversion of all CargoWise customers on the historical OTL and Module User Licence (“MUL”) models to STL. Over time, we will transition the licence models of our acquired businesses.
Overall, including acquisitions, the percentage of On-Demand licence model revenue is 72% of total revenue (FY19: 72%), reflecting the higher levels of OTL and support services revenue in acquisitions compared to our CargoWise platform.
Foreign exchange Our revenue is invoiced in a range of currencies, reflecting the global nature of our customer base and, as a result, may be positively or negatively impacted by movements in foreign exchange rates. As we continue to acquire businesses in new geographies, the range of currencies in which we invoice and incur costs expands.
1 Annual attrition rate is a customer attrition measurement relating to the CargoWise platform (excluding any customers on acquired platforms). A customer’s users are included in the customer attrition calculation upon leaving i.e. having not used the product for at least four months.
4 6 O P E R A T I N G A N D F I N A N C I A L R E V I E W
Operating and financial reviewfor the year ended 30 June 2020
Gross profit and gross profit marginGross profit increased by $64.3m, up 23%, to $345.9m (FY19: $281.6m). Gross profit growth was mainly driven by organic revenue growth and the full period impact of the FY19 acquisitions.
Gross profit margin remained steady at 81% (FY19: 81%), reflecting the power and efficiency of the CargoWise platform, even with the impact of over 40 lower margin acquisitions and COVID‑19. During FY20 CargoWise gross profit margin rose to 91% (FY19: 89%). The acquired businesses have, on average, higher product and service support costs and lower cost leverage due to their smaller size and commercial/licence model maturity, which means they typically have a lower gross profit margin than CargoWise. For each business acquired, we expect the dilutive impact of their existing gross profit margin to reduce over time as they evolve to our more efficient commercial model and as they integrate with or convert onto the CargoWise platform. The transition of acquired businesses occurs over multiple years.
Operating expensesTotal research and development investment In FY20 we continued our significant investment in product innovation to further develop our software platform and to build our innovation pipeline. Our research and development investment for the year was $159.1m (FY19: $113.0m), reflecting 37% of total revenue (FY19: 32%). With our research and development investment we delivered over 1,100 product upgrades to our CargoWise platform in FY20, further improving the scalability, functionality, productivity and performance, and also building out more technology assets across our businesses utilising our 40 product development centres worldwide.
Product design and development expense increased by 37% to $115.4m (FY19: $84.2m), reflecting:
– our significant ongoing and accelerated investment in the development and maintenance of CargoWise;
– increased investment in expanding and retaining our skilled development workforce;
– increased amortisation, primarily due to continued capitalised development investment, the full-year impact of FY19 and newly commercialised products including GLOW; and
– $17.7m increase in FY20 for acquired businesses which typically have relatively higher levels of maintenance and support costs.
Capitalised development investment rose significantly, up 58% to $74.2m (FY19: $46.9m) reflecting increased commercialisable technology assets from product developments focused on extending CargoWise functionality, building out our global customs capability (including native customs builds in Asia, Europe and LATAM), international logistics, international ecommerce and acquisition product integrations. Costs related to development activity that is not commercialisable and maintenance costs are expensed.
Sales and marketing expense During FY20, we invested 15% of revenue (FY19: 14%) or $62.3m (FY19: $47.7m) in sales and marketing. The increase reflects $7.6m from acquisitions (mostly driven by the full period impact of FY19 acquisitions). The remainder of the spend relates to investments to support CargoWise’s geographic expansion, multi-lingual capabilities and growth into new technologies.
General and administration expense We increased our investment in supporting and growing our business globally to $87.7m (FY19: $69.5m), representing 20% of total revenue (FY19: 20%). The increase was driven by:
– the full period impact of FY19 acquisitions and costs from newly acquired businesses in FY20 with their own general and administration costs;
– costs of key management teams, including Founder MDs, for almost all of the strategic assets acquired; and
– headcount additions in finance, people, administration and IT to support the expansion of our global operations in addition to increase in global compliance and corporate governance costs (such as increased D&O Insurance premiums).
Our G&A expense, excluding M&A costs, was 19% of revenue in FY20.
The Group applied AASB 16 Leases from 1 July 2019. Refer to note 3 to the financial statements for further information.
Throughout FY20 we did not receive any material benefit from any COVID‑19 government support programs globally.
Net finance incomeFair value gain on contingent consideration This reflects the impact of contingent consideration liability reassessment in 1H20 and the renegotiated earnout arrangements completed in May and July 2020. In FY20, these arrangements resulted in a reduction of the contingent consideration liability and a corresponding fair value gain of $111.0m (FY19: $1.6m).
Other net finance costs Net finance costs in FY20 of $9.8m (FY19: $5.4m) included $10.0m of non‑cash interest unwind on contingent consideration of which $4.1m ($2.9m net of tax) relates to the closeout of earnouts relating to 22 acquisitions as disclosed by the Company in May and July 2020. Finance income of $3.1m (FY19: $1.9m) reflected interest received on cash reserves.
4 7W I S E T E C H G L O B A L A N N U A L R E P O R T 2 0 2 0
Operating and financial reviewfor the year ended 30 June 2020
Cash flow We continued to generate positive operating cash flows, with $146.3m of operating cash flow, up 16% on FY19. FY20 net cash flows from operating activities were $129.9m (FY19: $112.5m). Investing activities in long‑term assets to fund future growth included:
– $57.0m in new acquisitions as well as contingent payments for acquisitions made in prior years (FY19: $237.2m);
– $70.4m in intangible assets as we further developed and expanded our commercialisable technology, resulting in capitalised development investment for both commercialised products and those yet to be launched (FY19: $43.8m); and
– $20.1m in assets mostly related to spend on data centres and IT infrastructure to enhance the scalability and reliability of our platform, increase capacity for future growth and for upgrades to our facilities (FY19: $6.6m).
Dividends of $11.1m (FY19: $9.0m) were paid in cash during FY20, with shareholders choosing to reinvest an additional $0.5m of their dividends via the dividend reinvestment plan.
Our closing cash balance of $223.7m at 30 June 2020 provides significant liquidity and ability to fund our strategic growth opportunities.
FY20 strategic highlights We are focused on our long term vision of delivering the operating system to drive efficiency and digital transformation in global logistics, and throughout FY20 we have continued investing to expand our technology and operations globally. We are extending the reach of the global CargoWise integrated platform, expanding technology to increase market penetration and new addressable markets, growing our commercial foundation to new geographies, investing in transforming our content architectures, channels and brand while also growing our R&D capacity.
– Overall, 42 of the top 50 global 3PLs 1 are now WiseTech Global customers, as are all of the top 25 Global Freight Forwarders 2 with 23 of those on CargoWise, yet global penetration is still in the early stage with significant growth runway for years to come. Additionally, of the top 25 Global Freight Forwarders, 10 have either rolled out or are currently in the process of global rollouts on CargoWise with current rollouts for DHL Global Forwarding and DSV/Panalpina progressing well. Recent multi‑year contract signings include freight forwarding and customs global rollout UAE‑based Aramex International (35 countries), Seafrigo Group (12 countries) and top-25 global forwarder Hellmann Worldwide (42 countries).
– Throughout FY20 we continued our extensive product development program, investing $159.1m and 51% of our people in product development delivering over 1,100 product upgrades (up 32% on FY19) and enhancements to the CargoWise platform. We also progressed innovations in Australasia, Brazil, China, Taiwan, Europe, and the United States and across our global adjacencies including global rates management, border compliance, transport management solutions and landside logistics. We invested resources into machine learning, natural language processing, process automation and guided decision support, driven by vast volumes of transactional and global data sets to enable enhanced compliance, due diligence, risk assessment and risk mitigation.
– We invested over $60m in sales and marketing, continuing to drive adoption of our technologies while also investing in our global re-brand of WiseTech and CargoWise along with expansion of our content and digital delivery platforms.
– Throughout FY20 we progressed the integration of our strategic acquisition assets. These businesses are performing to our expectations through various stages of operational integration, product and technology development, and reshaping their commercial foundation, while managing their day-to-day operations. In 2H20, we worked collaboratively with 22 of our acquisitions to close out or restructure earnouts, with equity replacing cash payments to provide the Company additional liquidity. This action will allow us now to better align resources into the core, ensure prioritisation of our CargoWise technology development and facilitate future actions to drive group efficiency.
– In FY20 we completed a further five valuable geographic and adjacent acquisitions across North America, South Korea, Poland and Switzerland covering customs, machine learning and container yard and terminal management. Having completed over 40 acquisitions in recent years, we have now assembled the significant resources and development capability to fuel our CargoWise technology pipeline and therefore we intend to slow our pace of acquisitions for the near term.
1 Armstrong & Associates: Top 50 Global Third Party Logistics Providers List, ranked by 2019 logistics gross revenue/turnover.2 Armstrong & Associates: Top 25 Global Freight Forwarders List, ranked by 2019 logistics gross revenue/turnover and freight
forwarding volumes.
4 8 O P E R A T I N G A N D F I N A N C I A L R E V I E W
Operating and financial reviewfor the year ended 30 June 2020
Post balance date eventsSince period end, the Directors have declared a fully franked final dividend of 1.60 cents per share, payable on 2 October 2020. The dividend will be recognised in subsequent period financial statements.
Outlook for 2021 The impacts of COVID‑19 are continuing to evolve with the situation remaining fluid. Whilst there has been a marked short‑term recovery as economies reopen, considerable uncertainty remains given recent COVID-19 outbreaks and the ongoing risk of a second wave. There is also prevailing uncertainty in relation to sovereign risk and geopolitical risk.
WiseTech provides the following guidance on the basis that market conditions do not materially change, noting in particular that declines in industrial production and/or global goods trade may adversely impact guidance and vice versa. Based on and subject to the underlying assumptions set out in the WiseTech FY20 Results Investor Presentation the Company currently anticipates FY21 revenue growth in the range of 9% to 19% (representing revenue of $470m to $510m) and EBITDA growth of 22% to 42% (representing $155m to $180m).
4 9W I S E T E C H G L O B A L A N N U A L R E P O R T 2 0 2 0
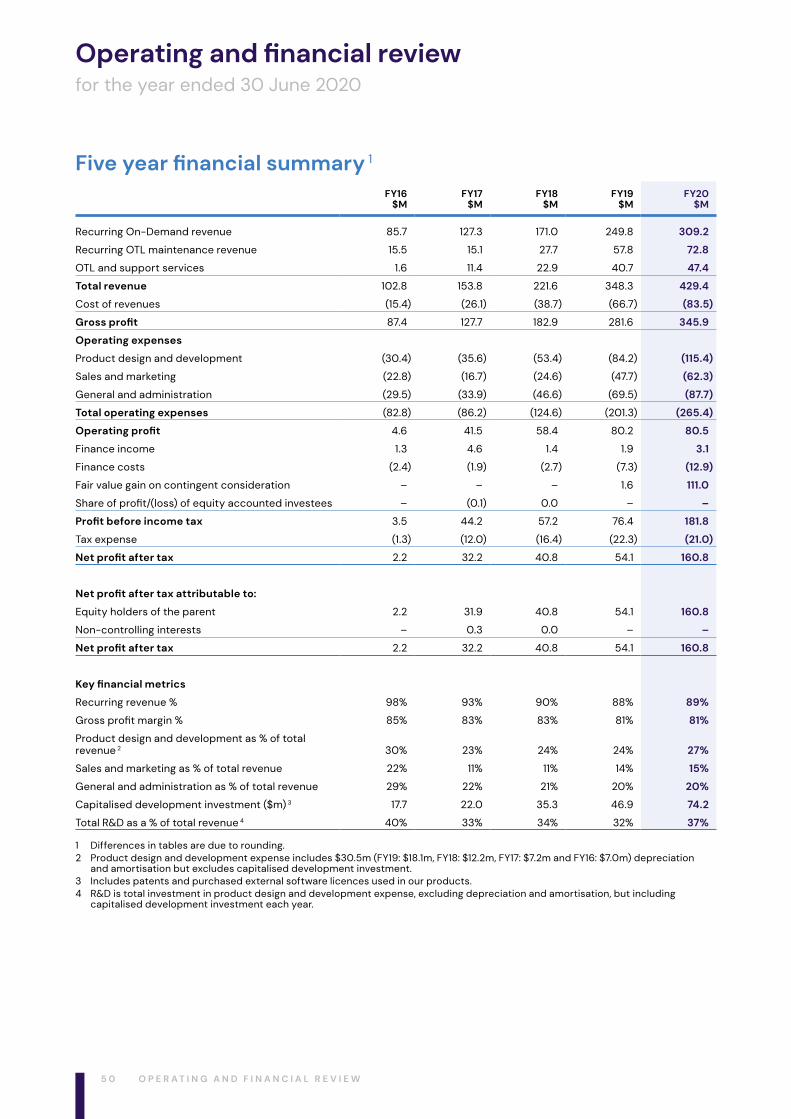
Operating and financial reviewfor the year ended 30 June 2020
Five year financial summary 1
FY16$M
FY17$M
FY18$M
FY19$M
FY20$M
Recurring On-Demand revenue 85.7 127.3 171.0 249.8 309.2
Recurring OTL maintenance revenue 15.5 15.1 27.7 57.8 72.8
OTL and support services 1.6 11.4 22.9 40.7 47.4
Total revenue 102.8 153.8 221.6 348.3 429.4
Cost of revenues (15.4) (26.1) (38.7) (66.7) (83.5)
Gross profit 87.4 127.7 182.9 281.6 345.9
Operating expenses
Product design and development (30.4) (35.6) (53.4) (84.2) (115.4)
Sales and marketing (22.8) (16.7) (24.6) (47.7) (62.3)
General and administration (29.5) (33.9) (46.6) (69.5) (87.7)
Total operating expenses (82.8) (86.2) (124.6) (201.3) (265.4)
Operating profit 4.6 41.5 58.4 80.2 80.5
Finance income 1.3 4.6 1.4 1.9 3.1
Finance costs (2.4) (1.9) (2.7) (7.3) (12.9)
Fair value gain on contingent consideration – – – 1.6 111.0
Share of profit/(loss) of equity accounted investees – (0.1) 0.0 – –
Profit before income tax 3.5 44.2 57.2 76.4 181.8
Tax expense (1.3) (12.0) (16.4) (22.3) (21.0)
Net profit after tax 2.2 32.2 40.8 54.1 160.8
Net profit after tax attributable to:
Equity holders of the parent 2.2 31.9 40.8 54.1 160.8
Non-controlling interests – 0.3 0.0 – –
Net profit after tax 2.2 32.2 40.8 54.1 160.8
Key financial metrics
Recurring revenue % 98% 93% 90% 88% 89%
Gross profit margin % 85% 83% 83% 81% 81%
Product design and development as % of total revenue 2 30% 23% 24% 24% 27%
Sales and marketing as % of total revenue 22% 11% 11% 14% 15%
General and administration as % of total revenue 29% 22% 21% 20% 20%
Capitalised development investment ($m) 3 17.7 22.0 35.3 46.9 74.2
Total R&D as a % of total revenue 4 40% 33% 34% 32% 37%
1 Differences in tables are due to rounding.2 Product design and development expense includes $30.5m (FY19: $18.1m, FY18: $12.2m, FY17: $7.2m and FY16: $7.0m) depreciation
and amortisation but excludes capitalised development investment.3 Includes patents and purchased external software licences used in our products.4 R&D is total investment in product design and development expense, excluding depreciation and amortisation, but including
capitalised development investment each year.
5 0 O P E R A T I N G A N D F I N A N C I A L R E V I E W
Remuneration Report
This Remuneration Report sets out our approach to remuneration for key management personnel (“KMP”) in accordance with the requirements of section 300A of the Corporations Act 2001. The report covers company performance and remuneration outcomes for the period from 1 July 2019 to 30 June 2020. The information provided in this report has been audited as required by section 308(3C) of the Corporations Act 2001.
Remuneration Committee and governanceThe Board is responsible for ensuring that WiseTech’s remuneration strategy and framework support the Group’s performance and that executives and Non-Executive Directors are rewarded fairly and responsibly with regard to legal and corporate governance requirements. The Remuneration Committee oversees remuneration matters and, where appropriate, makes recommendations to the Board. The Committee comprises three independent Non-Executive Directors: Teresa Engelhard (Chair), Charles Gibbon and Michael Gregg. Further information on the Committee’s responsibilities is set out in the Remuneration Committee Charter available at: http://ir.wisetechglobal.com/investors/?page=corporate‑governance
Annual remuneration reviewThe Remuneration Committee and the Board review remuneration annually to ensure there is an appropriate balance between fixed and at‑risk pay and that it reflects both short and long‑term performance objectives linked to WiseTech’s strategy.
Independent remuneration consultantsWiseTech Global has protocols in place to ensure that any external advice is provided in an appropriate manner and is free from undue influence of management. To inform remuneration policy reviews, during FY20, the Remuneration Committee engaged Ernst & Young to advise on market practices. For the purposes of section 206L of the Corporations Act 2001, Ernst & Young did not provide remuneration recommendations in relation to KMP.
Key management personnel WiseTech’s KMP comprise all Directors and those executives who have specific authority and responsibility for planning, directing and controlling the activities of the Group. In this report, the term “Executive KMP” refers to the KMP excluding Non-Executive Directors.
The KMP for the period from 1 July 2019 to 30 June 2020 were:
Andrew Harrison Chair and Non-Executive Director
Teresa Engelhard Non-Executive Director
Charles Gibbon Non-Executive Director
Michael Gregg Non-Executive Director
Christine Holman Non-Executive Director, resigned 18 October 2019
Arlene Tansey Non‑Executive Director, appointed 1 June 2020
Richard White (“RW”) Executive Director, Founder and Chief Executive Officer (“CEO”)
Maree Isaacs (“MI”) Executive Director, Co‑founder and Head of Invoicing & Licensing
Andrew Cartledge (“AC”) Chief Financial Officer
Brett Shearer (“BS”) Chief Technology Officer
5 1W I S E T E C H G L O B A L A N N U A L R E P O R T 2 0 2 0
Remuneration Report
Our remuneration strategy and frameworkWiseTech’s future growth and innovation rely on the talent, motivation and enthusiasm of our people across the world. We aim to reward our high-performance global workforce with a remuneration and incentive program aligned to our business strategy, specialised operations, and aspirations for sustained growth.
Our remuneration framework reflects our goals to:
– attract, develop, motivate and retain highly skilled people;
– drive a culture where financial rewards are directly linked to contributions and performance;
– ensure all reward decisions are made free from bias and in a way that supports diversity;
– drive commercially responsible decisions on remuneration; and
– deliver market competitive fixed remuneration across our workforce.
As a priority, we build multi‑year deferred equity components into fixed base remuneration across our global workforce to further align employees’ interests with those of shareholders, encourage value-creating behaviours and support staff retention within the Group. This equity is granted at the start of the financial year and vests in four equal annual tranches.
During FY20, WiseTech has sought to further increase the proportion of total remuneration that is delivered as a multi-year deferred equity component across our global team members. Where appropriate, deferred equity is also used to deliver a component of sales incentives and for sign-on or retention awards for key team members. Development team bonus pool incentives related to specific innovation achievements that require extra discretionary effort from team members are also delivered as deferred equity.
Our Invest As You Earn equity investment program enables employees to acquire WiseTech shares by investing up to 20% of their post‑tax salary with an annual incentive of one free share right for each five shares acquired during the year. The free share rights vest two years after grant. In FY20, approximately 21% of eligible employees across 19 countries have chosen to participate and invest in WiseTech shares via this program.
5 2 R E M U N E R A T I O N R E P O R T
Remuneration Report
Executive performance incentive frameworkOur executive team’s performance incentive framework is focused on annual financial targets and operational Key Performance Indicators (“KPIs”) that are lead measures for key strategic priorities. In any year, our financial and strategic outcomes reflect the successful execution of many prior years’ deliverables. Conversely, the operational and strategic actions undertaken this year are expected to deliver shareholder value for many years into the future. Product development deliverables are examples of leading operational KPIs focused on strategic priorities.
To ensure alignment with shareholders’ interests, we aim for 100% of performance incentives to be paid in deferred equity (other than for Executive Director, Maree Isaacs, due to the size of her co-founder equity holding). Our view is that this approach: fixed‑remuneration equity vesting over four years, combined with performance equity incentives vesting over three years, removes the need for a separate long-term incentive.
Remuneration outcomes and the link between performance and reward for our peopleComponent Structure Strategic objective/performance link
Fixed annual remuneration Cash and deferred equity (Remuneration equity: granted during the financial year with deferred vesting over the following three years)
Total fixed remuneration set at competitive levels to attract and retain talent who can support growth, execute strategy, deliver economic outcomes and build shareholder value
Based on:
– role and responsibility;
– capability, competencies and contribution; and
– internal and external relativities
Deferred equity fixed remuneration aligns with long-term shareholder interests and supports staff retention
Performance equity incentives Deferred equity with a one-year performance period and vesting over the following three years
Performance measures:
– financial and operational targets weighted to individual areas of control and key actions with measurable effects; and
– development team pool bonuses are related to specific innovation pipeline achievements
Ensures execution and accountability with actions, direct outcomes and meaningful lead measures that correlate to lag economic outcomes but may have limited fiscal impact on current period financials
Longer-term lag outcomes ultimately reflected in growth in revenue, EBITDA and Total Shareholder Return (“TSR”)
Reflects our focus and strategy
Deferred equity ensures strong link with creation of shareholder value, aligns with long-term shareholder interests and supports staff retention
Optional post-tax investment program: Invest As You Earn (“IAYE”)
Invest up to 20% of post-tax salary monthly with potential to receive one free share right for every five shares purchased – the share rights have a two-year vesting period
Available for all employees (subject to local regulations)
Builds further alignment with long-term shareholder interests
Minimum equity holding requirement
Executive KMP must maintain 100% of fixed remuneration in WiseTech equity (in the form of shares or share rights)
Ensures alignment with long-term shareholder interests
It is expected that, in the event of an employee (including Executive KMP) ceasing employment, unvested share rights (whether related to performance incentives or remuneration equity) will lapse; however, in exceptional circumstances (including genuine retirement), the Board retains discretion to determine that some, or all, of the unvested share rights will not lapse.
5 3W I S E T E C H G L O B A L A N N U A L R E P O R T 2 0 2 0
Remuneration Report
Executive KMP share ownership policyExecutive KMP are required to maintain a minimum WiseTech equity holding equal to 100% of fixed remuneration within five years of appointment. Each Executive KMP satisfied this objective as at 30 June 2020.
Trading in WiseTech securitiesAll KMP must comply with WiseTech’s Securities Trading Policy, which includes a requirement that Restricted Employees (including non‑director Executive KMP) can only trade WiseTech securities during specified trading windows and after obtaining written clearance to trade. The policy prohibits short-term trading of WiseTech securities and the purchase or creation of hedge or derivative arrangements which operate to limit the economic risk of WiseTech securities under employee share plans.
New share issuesTo meet the Company’s obligations when share rights vest, the Board prefers the issue of new shares (to a maximum of 1% of issued share capital in any 12-month period) while reserving the right to buy shares on-market and off-market where appropriate. During FY20, 76,122 shares were purchased on‑market, at an average price of $22.92 per share, primarily on behalf of participants in the IAYE program.
Outcomes for FY20 and the link to WiseTech performanceThe tables below summarise the performance of WiseTech shares for the period since our ASX listing in April 2016 and for FY20, and our financial performance for the five years from FY16 to FY20. The information has been considered in conjunction with an assessment of individual performance of senior managers by the CEO, which is reviewed by the Remuneration Committee, when determining Executive KMP remuneration.
Period Period start
Share priceat start of
periodShare price
30 June 2020Change in
share priceChange in
ASX 200
WTCperformance
v ASX 200
Dividendspaid per
share WTC TSR 2
Since listing 11 April 2016 $3.35 1 $19.35 477.6% 19.6% 458.0% $0.1005 482.0%
FY20 1 July 2019 $27.71 $19.35 ‑30.2% -10.9% ‑19.3% $0.0365 ‑30.0%
1 IPO offer price.2 Total shareholder return with dividends reinvested.
FY16 FY17 FY18 FY19 FY20
Revenue ($m) 102.8 153.8 221.6 348.3 429.4
Revenue growth 47% 50% 44% 57% 23%
EBITDA ($m) 15.8 53.9 78.0 108.1 126.7
NPAT 1 ($m) 2.2 31.9 40.8 54.1 160.8
NPATA 2 ($m) 3.7 33.6 44.8 63.0 64.6
Earnings per share (cents) 0.8 10.9 13.9 17.7 50.3
Dividends 3 per share (cents) 0.60 2.20 2.70 3.45 3.30
Change in share price during the year 4 32% 56% 126% 77% -30%
1 NPAT attributable to equity holders of the parent.2 NPATA is net profit after tax attributable to equity holders of the parent before acquired amortisation and contingent
consideration interest unwind (net of tax) and before contingent consideration fair value changes. NPATA is a non‑statutory measure and is a primary measure used for the purpose of assessing the performance of the Group. It is derived from audited financial statements.
3 Dividends declared in respect of the financial year.4 Percentage change in the closing share price on the last business day in the current year over that on the last business day
in the prior year. FY16 share price change is calculated based on the change in the closing price on 30 June 2016 over the IPO offer price of $3.35.
5 4 R E M U N E R A T I O N R E P O R T
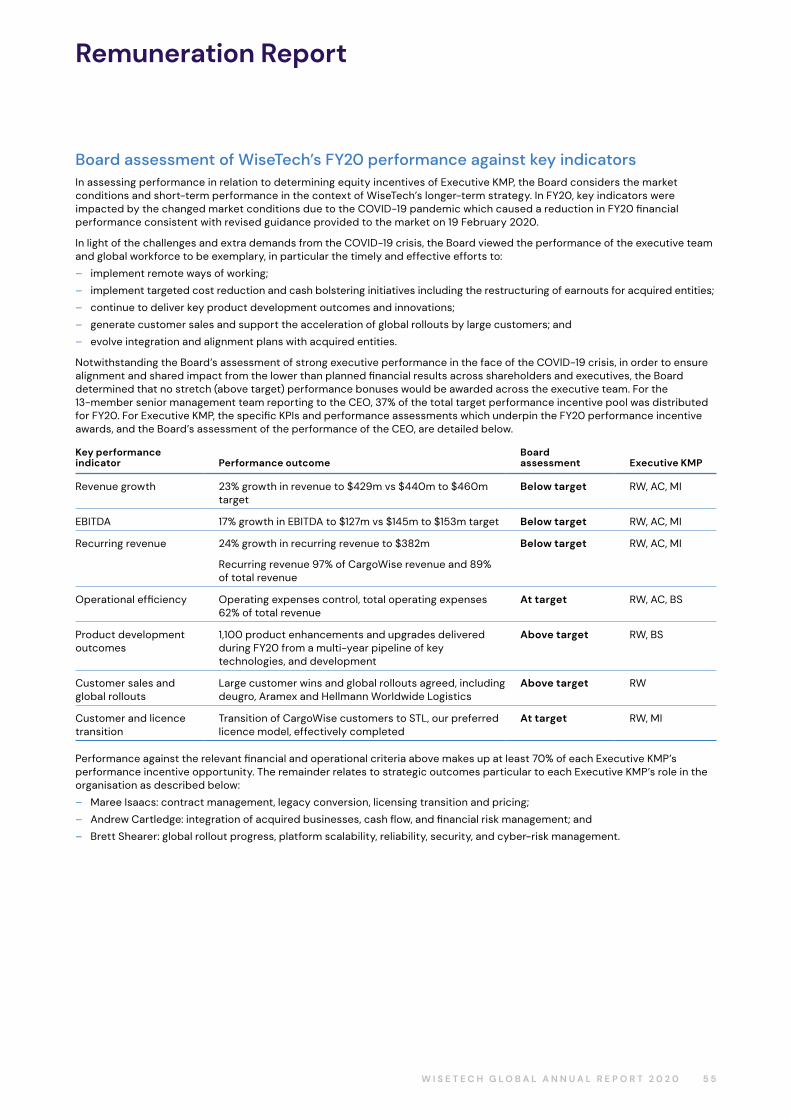
Remuneration Report
Board assessment of WiseTech’s FY20 performance against key indicatorsIn assessing performance in relation to determining equity incentives of Executive KMP, the Board considers the market conditions and short-term performance in the context of WiseTech’s longer-term strategy. In FY20, key indicators were impacted by the changed market conditions due to the COVID‑19 pandemic which caused a reduction in FY20 financial performance consistent with revised guidance provided to the market on 19 February 2020.
In light of the challenges and extra demands from the COVID-19 crisis, the Board viewed the performance of the executive team and global workforce to be exemplary, in particular the timely and effective efforts to:
– implement remote ways of working;
– implement targeted cost reduction and cash bolstering initiatives including the restructuring of earnouts for acquired entities;
– continue to deliver key product development outcomes and innovations;
– generate customer sales and support the acceleration of global rollouts by large customers; and
– evolve integration and alignment plans with acquired entities.
Notwithstanding the Board’s assessment of strong executive performance in the face of the COVID-19 crisis, in order to ensure alignment and shared impact from the lower than planned financial results across shareholders and executives, the Board determined that no stretch (above target) performance bonuses would be awarded across the executive team. For the 13‑member senior management team reporting to the CEO, 37% of the total target performance incentive pool was distributed for FY20. For Executive KMP, the specific KPIs and performance assessments which underpin the FY20 performance incentive awards, and the Board’s assessment of the performance of the CEO, are detailed below.
Key performance indicator Performance outcome
Board assessment Executive KMP
Revenue growth 23% growth in revenue to $429m vs $440m to $460m target
Below target RW, AC, MI
EBITDA 17% growth in EBITDA to $127m vs $145m to $153m target Below target RW, AC, MI
Recurring revenue 24% growth in recurring revenue to $382m
Recurring revenue 97% of CargoWise revenue and 89% of total revenue
Below target RW, AC, MI
Operational efficiency Operating expenses control, total operating expenses 62% of total revenue
At target RW, AC, BS
Product development outcomes
1,100 product enhancements and upgrades delivered during FY20 from a multi-year pipeline of key technologies, and development
Above target RW, BS
Customer sales and global rollouts
Large customer wins and global rollouts agreed, including deugro, Aramex and Hellmann Worldwide Logistics
Above target RW
Customer and licence transition
Transition of CargoWise customers to STL, our preferred licence model, effectively completed
At target RW, MI
Performance against the relevant financial and operational criteria above makes up at least 70% of each Executive KMP’s performance incentive opportunity. The remainder relates to strategic outcomes particular to each Executive KMP’s role in the organisation as described below:
– Maree Isaacs: contract management, legacy conversion, licensing transition and pricing;
– Andrew Cartledge: integration of acquired businesses, cash flow, and financial risk management; and
– Brett Shearer: global rollout progress, platform scalability, reliability, security, and cyber-risk management.
5 5W I S E T E C H G L O B A L A N N U A L R E P O R T 2 0 2 0
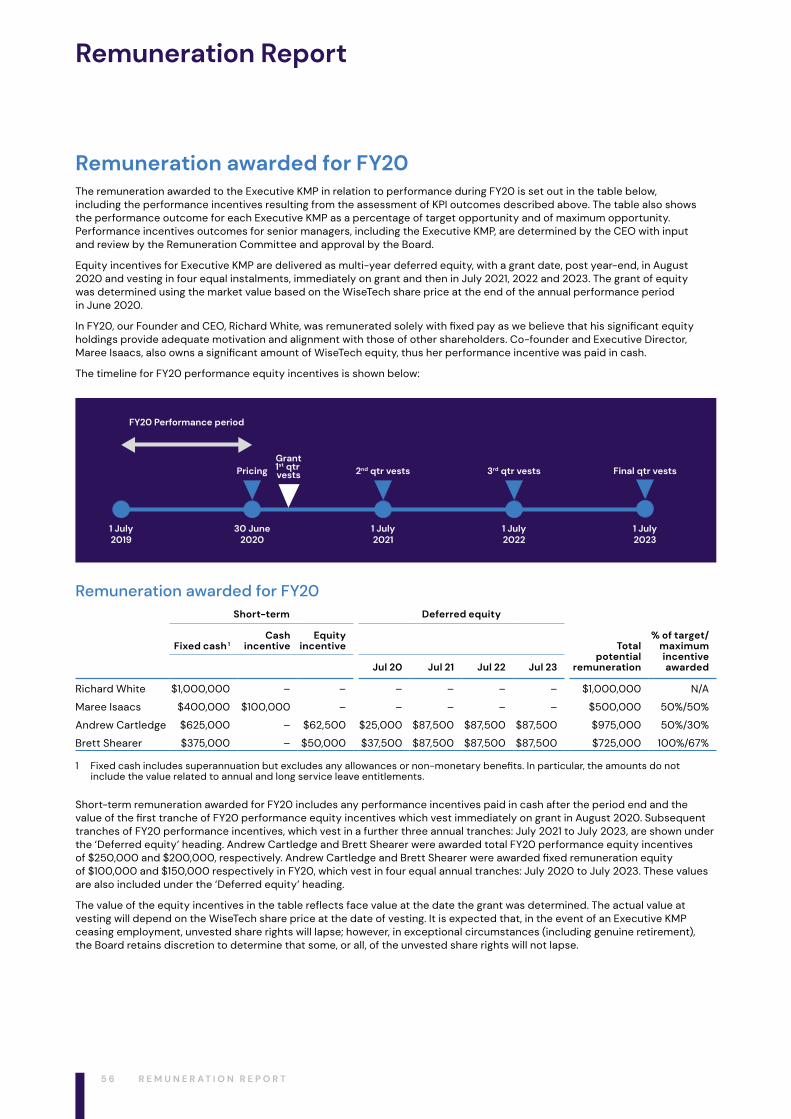
Remuneration Report
Remuneration awarded for FY20The remuneration awarded to the Executive KMP in relation to performance during FY20 is set out in the table below, including the performance incentives resulting from the assessment of KPI outcomes described above. The table also shows the performance outcome for each Executive KMP as a percentage of target opportunity and of maximum opportunity. Performance incentives outcomes for senior managers, including the Executive KMP, are determined by the CEO with input and review by the Remuneration Committee and approval by the Board.
Equity incentives for Executive KMP are delivered as multi‑year deferred equity, with a grant date, post year‑end, in August 2020 and vesting in four equal instalments, immediately on grant and then in July 2021, 2022 and 2023. The grant of equity was determined using the market value based on the WiseTech share price at the end of the annual performance period in June 2020.
In FY20, our Founder and CEO, Richard White, was remunerated solely with fixed pay as we believe that his significant equity holdings provide adequate motivation and alignment with those of other shareholders. Co-founder and Executive Director, Maree Isaacs, also owns a significant amount of WiseTech equity, thus her performance incentive was paid in cash.
The timeline for FY20 performance equity incentives is shown below:
Pricing
1 July2019
30 June2020
1 July2021
1 July2022
1 July2023
2nd qtr vestsGrant1st qtr vests
FY20 Performance period
3rd qtr vests Final qtr vests
Remuneration awarded for FY20 Short-term Deferred equity
Total potential
remuneration
% of target/ maximum incentive awarded
Fixed cash 1Cash
incentiveEquity
incentive
Jul 20 Jul 21 Jul 22 Jul 23
Richard White $1,000,000 – – – – – – $1,000,000 N/A
Maree Isaacs $400,000 $100,000 – – – – – $500,000 50%/50%
Andrew Cartledge $625,000 – $62,500 $25,000 $87,500 $87,500 $87,500 $975,000 50%/30%
Brett Shearer $375,000 – $50,000 $37,500 $87,500 $87,500 $87,500 $725,000 100%/67%
1 Fixed cash includes superannuation but excludes any allowances or non‑monetary benefits. In particular, the amounts do not include the value related to annual and long service leave entitlements.
Short-term remuneration awarded for FY20 includes any performance incentives paid in cash after the period end and the value of the first tranche of FY20 performance equity incentives which vest immediately on grant in August 2020. Subsequent tranches of FY20 performance incentives, which vest in a further three annual tranches: July 2021 to July 2023, are shown under the ‘Deferred equity’ heading. Andrew Cartledge and Brett Shearer were awarded total FY20 performance equity incentives of $250,000 and $200,000, respectively. Andrew Cartledge and Brett Shearer were awarded fixed remuneration equity of $100,000 and $150,000 respectively in FY20, which vest in four equal annual tranches: July 2020 to July 2023. These values are also included under the ‘Deferred equity’ heading.
The value of the equity incentives in the table reflects face value at the date the grant was determined. The actual value at vesting will depend on the WiseTech share price at the date of vesting. It is expected that, in the event of an Executive KMP ceasing employment, unvested share rights will lapse; however, in exceptional circumstances (including genuine retirement), the Board retains discretion to determine that some, or all, of the unvested share rights will not lapse.
5 6 R E M U N E R A T I O N R E P O R T
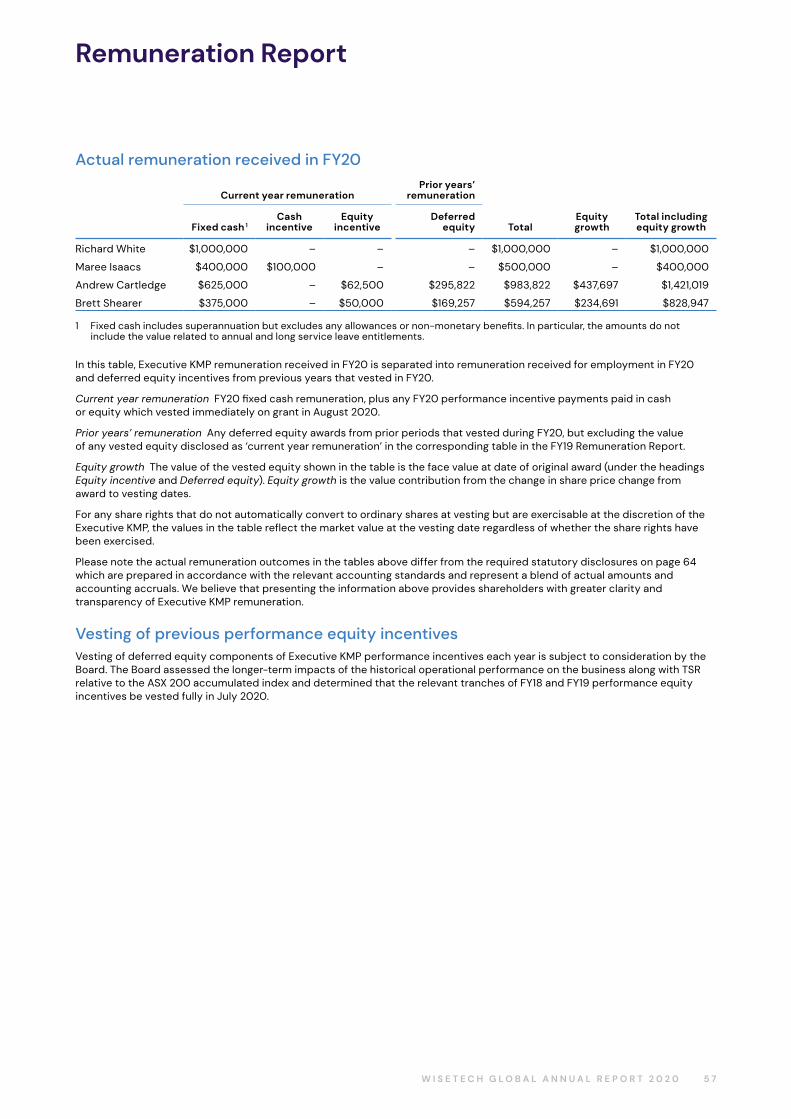
Remuneration Report
Actual remuneration received in FY20
Current year remunerationPrior years’
remuneration
Fixed cash 1Cash
incentiveEquity
incentiveDeferred
equity TotalEquity growth
Total including equity growth
Richard White $1,000,000 – – – $1,000,000 – $1,000,000
Maree Isaacs $400,000 $100,000 – – $500,000 – $400,000
Andrew Cartledge $625,000 – $62,500 $295,822 $983,822 $437,697 $1,421,019
Brett Shearer $375,000 – $50,000 $169,257 $594,257 $234,691 $828,947
1 Fixed cash includes superannuation but excludes any allowances or non‑monetary benefits. In particular, the amounts do not include the value related to annual and long service leave entitlements.
In this table, Executive KMP remuneration received in FY20 is separated into remuneration received for employment in FY20 and deferred equity incentives from previous years that vested in FY20.
Current year remuneration FY20 fixed cash remuneration, plus any FY20 performance incentive payments paid in cash or equity which vested immediately on grant in August 2020.
Prior years’ remuneration Any deferred equity awards from prior periods that vested during FY20, but excluding the value of any vested equity disclosed as ‘current year remuneration’ in the corresponding table in the FY19 Remuneration Report.
Equity growth The value of the vested equity shown in the table is the face value at date of original award (under the headings Equity incentive and Deferred equity). Equity growth is the value contribution from the change in share price change from award to vesting dates.
For any share rights that do not automatically convert to ordinary shares at vesting but are exercisable at the discretion of the Executive KMP, the values in the table reflect the market value at the vesting date regardless of whether the share rights have been exercised.
Please note the actual remuneration outcomes in the tables above differ from the required statutory disclosures on page 64 which are prepared in accordance with the relevant accounting standards and represent a blend of actual amounts and accounting accruals. We believe that presenting the information above provides shareholders with greater clarity and transparency of Executive KMP remuneration.
Vesting of previous performance equity incentivesVesting of deferred equity components of Executive KMP performance incentives each year is subject to consideration by the Board. The Board assessed the longer-term impacts of the historical operational performance on the business along with TSR relative to the ASX 200 accumulated index and determined that the relevant tranches of FY18 and FY19 performance equity incentives be vested fully in July 2020.
5 7W I S E T E C H G L O B A L A N N U A L R E P O R T 2 0 2 0
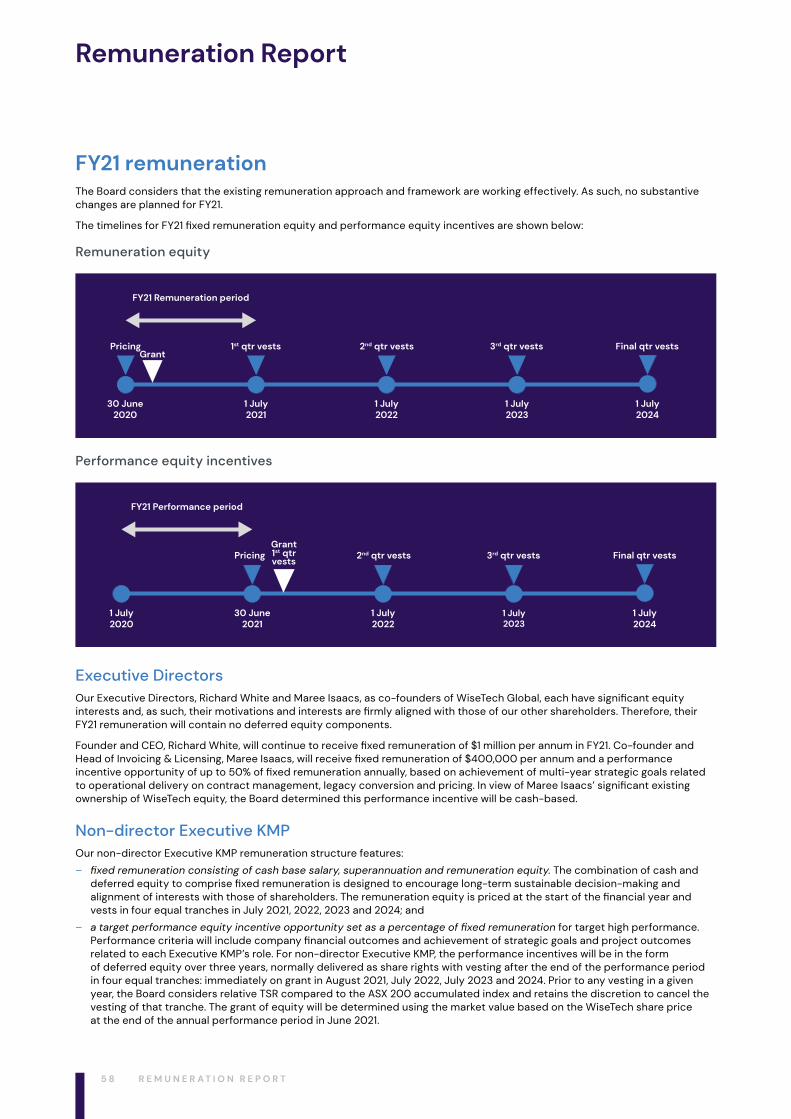
Remuneration Report
FY21 remunerationThe Board considers that the existing remuneration approach and framework are working effectively. As such, no substantive changes are planned for FY21.
The timelines for FY21 fixed remuneration equity and performance equity incentives are shown below:
Remuneration equity
Pricing
30 June2020
1 July2021
1 July2022
1 July2023
1 July2024
Grant2nd qtr vests1st qtr vests
FY21 Remuneration period
3rd qtr vests Final qtr vests
Performance equity incentives
Pricing
1 July2020
30 June2021
1 July2022
1 July2023
1 July2024
Grant2nd qtr vests1st qtr
vests
FY21 Performance period
3rd qtr vests Final qtr vests
Executive DirectorsOur Executive Directors, Richard White and Maree Isaacs, as co‑founders of WiseTech Global, each have significant equity interests and, as such, their motivations and interests are firmly aligned with those of our other shareholders. Therefore, their FY21 remuneration will contain no deferred equity components.
Founder and CEO, Richard White, will continue to receive fixed remuneration of $1 million per annum in FY21. Co‑founder and Head of Invoicing & Licensing, Maree Isaacs, will receive fixed remuneration of $400,000 per annum and a performance incentive opportunity of up to 50% of fixed remuneration annually, based on achievement of multi‑year strategic goals related to operational delivery on contract management, legacy conversion and pricing. In view of Maree Isaacs’ significant existing ownership of WiseTech equity, the Board determined this performance incentive will be cash-based.
Non-director Executive KMPOur non‑director Executive KMP remuneration structure features:
– fixed remuneration consisting of cash base salary, superannuation and remuneration equity. The combination of cash and deferred equity to comprise fixed remuneration is designed to encourage long‑term sustainable decision‑making and alignment of interests with those of shareholders. The remuneration equity is priced at the start of the financial year and vests in four equal tranches in July 2021, 2022, 2023 and 2024; and
– a target performance equity incentive opportunity set as a percentage of fixed remuneration for target high performance. Performance criteria will include company financial outcomes and achievement of strategic goals and project outcomes related to each Executive KMP’s role. For non‑director Executive KMP, the performance incentives will be in the form of deferred equity over three years, normally delivered as share rights with vesting after the end of the performance period in four equal tranches: immediately on grant in August 2021, July 2022, July 2023 and 2024. Prior to any vesting in a given year, the Board considers relative TSR compared to the ASX 200 accumulated index and retains the discretion to cancel the vesting of that tranche. The grant of equity will be determined using the market value based on the WiseTech share price at the end of the annual performance period in June 2021.
5 8 R E M U N E R A T I O N R E P O R T
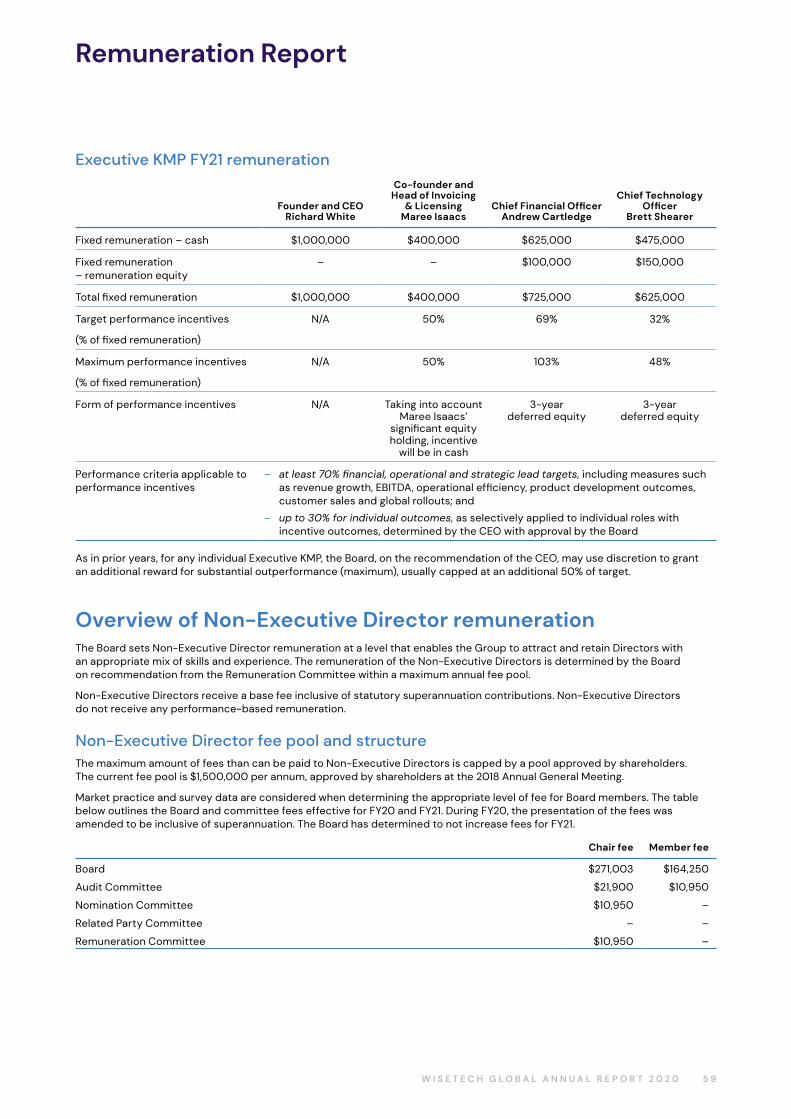
Remuneration Report
Executive KMP FY21 remuneration
Founder and CEO Richard White
Co-founder and Head of Invoicing
& Licensing Maree Isaacs
Chief Financial OfficerAndrew Cartledge
Chief Technology Officer
Brett Shearer
Fixed remuneration – cash $1,000,000 $400,000 $625,000 $475,000
Fixed remuneration – remuneration equity
– – $100,000 $150,000
Total fixed remuneration $1,000,000 $400,000 $725,000 $625,000
Target performance incentives
(% of fixed remuneration)
N/A 50% 69% 32%
Maximum performance incentives
(% of fixed remuneration)
N/A 50% 103% 48%
Form of performance incentives N/A Taking into account Maree Isaacs’
significant equity holding, incentive
will be in cash
3‑year deferred equity
3‑yeardeferred equity
Performance criteria applicable to performance incentives
– at least 70% financial, operational and strategic lead targets, including measures such as revenue growth, EBITDA, operational efficiency, product development outcomes, customer sales and global rollouts; and
– up to 30% for individual outcomes, as selectively applied to individual roles with incentive outcomes, determined by the CEO with approval by the Board
As in prior years, for any individual Executive KMP, the Board, on the recommendation of the CEO, may use discretion to grant an additional reward for substantial outperformance (maximum), usually capped at an additional 50% of target.
Overview of Non-Executive Director remunerationThe Board sets Non-Executive Director remuneration at a level that enables the Group to attract and retain Directors with an appropriate mix of skills and experience. The remuneration of the Non-Executive Directors is determined by the Board on recommendation from the Remuneration Committee within a maximum annual fee pool.
Non-Executive Directors receive a base fee inclusive of statutory superannuation contributions. Non-Executive Directors do not receive any performance-based remuneration.
Non-Executive Director fee pool and structureThe maximum amount of fees than can be paid to Non-Executive Directors is capped by a pool approved by shareholders. The current fee pool is $1,500,000 per annum, approved by shareholders at the 2018 Annual General Meeting.
Market practice and survey data are considered when determining the appropriate level of fee for Board members. The table below outlines the Board and committee fees effective for FY20 and FY21. During FY20, the presentation of the fees was amended to be inclusive of superannuation. The Board has determined to not increase fees for FY21.
Chair fee Member fee
Board $271,003 $164,250
Audit Committee $21,900 $10,950
Nomination Committee $10,950 –
Related Party Committee – –
Remuneration Committee $10,950 –
5 9W I S E T E C H G L O B A L A N N U A L R E P O R T 2 0 2 0
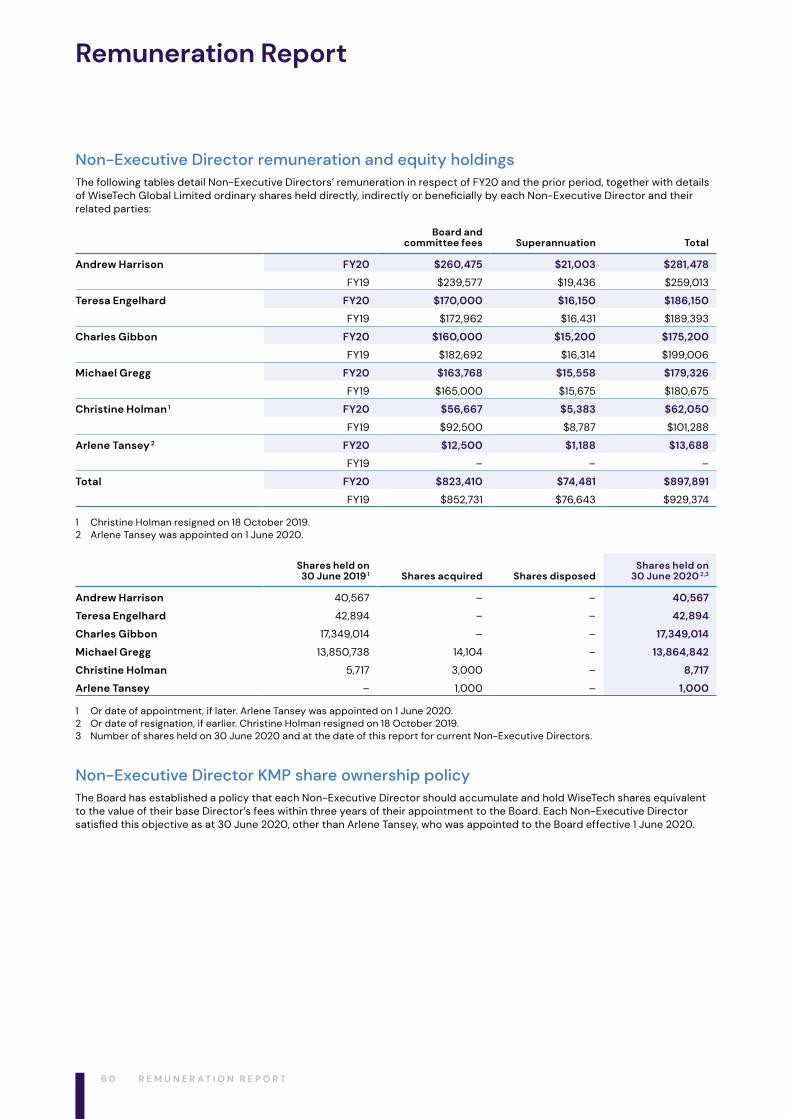
Remuneration Report
Non-Executive Director remuneration and equity holdingsThe following tables detail Non-Executive Directors’ remuneration in respect of FY20 and the prior period, together with details of WiseTech Global Limited ordinary shares held directly, indirectly or beneficially by each Non‑Executive Director and their related parties:
Board andcommittee fees Superannuation Total
Andrew Harrison FY20 $260,475 $21,003 $281,478
FY19 $239,577 $19,436 $259,013
Teresa Engelhard FY20 $170,000 $16,150 $186,150
FY19 $172,962 $16,431 $189,393
Charles Gibbon FY20 $160,000 $15,200 $175,200
FY19 $182,692 $16,314 $199,006
Michael Gregg FY20 $163,768 $15,558 $179,326
FY19 $165,000 $15,675 $180,675
Christine Holman 1 FY20 $56,667 $5,383 $62,050
FY19 $92,500 $8,787 $101,288
Arlene Tansey 2 FY20 $12,500 $1,188 $13,688
FY19 – – –
Total FY20 $823,410 $74,481 $897,891
FY19 $852,731 $76,643 $929,374
1 Christine Holman resigned on 18 October 2019.2 Arlene Tansey was appointed on 1 June 2020.
Shares held on30 June 2019 1 Shares acquired Shares disposed
Shares held on 30 June 2020 2,3
Andrew Harrison 40,567 – – 40,567
Teresa Engelhard 42,894 – – 42,894
Charles Gibbon 17,349,014 – – 17,349,014
Michael Gregg 13,850,738 14,104 – 13,864,842
Christine Holman 5,717 3,000 – 8,717
Arlene Tansey – 1,000 – 1,000
1 Or date of appointment, if later. Arlene Tansey was appointed on 1 June 2020.2 Or date of resignation, if earlier. Christine Holman resigned on 18 October 2019.3 Number of shares held on 30 June 2020 and at the date of this report for current Non‑Executive Directors.
Non-Executive Director KMP share ownership policyThe Board has established a policy that each Non-Executive Director should accumulate and hold WiseTech shares equivalent to the value of their base Director’s fees within three years of their appointment to the Board. Each Non-Executive Director satisfied this objective as at 30 June 2020, other than Arlene Tansey, who was appointed to the Board effective 1 June 2020.
6 0 R E M U N E R A T I O N R E P O R T
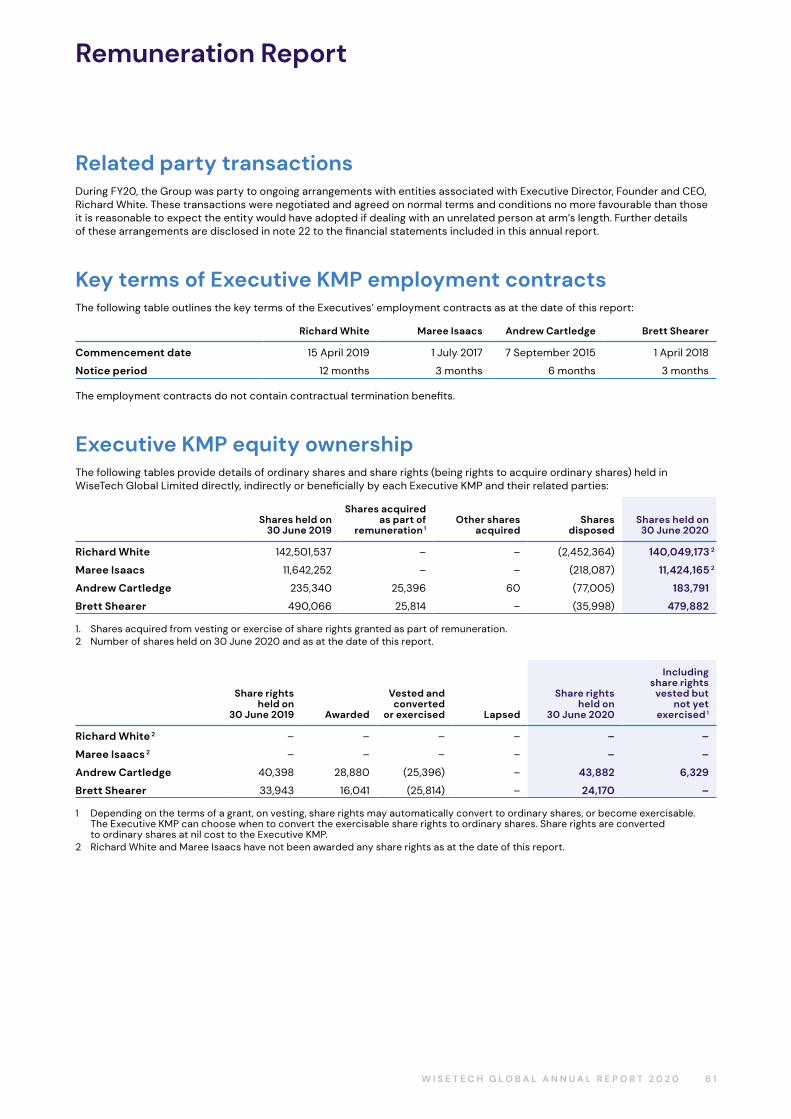
Remuneration Report
Related party transactionsDuring FY20, the Group was party to ongoing arrangements with entities associated with Executive Director, Founder and CEO, Richard White. These transactions were negotiated and agreed on normal terms and conditions no more favourable than those it is reasonable to expect the entity would have adopted if dealing with an unrelated person at arm’s length. Further details of these arrangements are disclosed in note 22 to the financial statements included in this annual report.
Key terms of Executive KMP employment contractsThe following table outlines the key terms of the Executives’ employment contracts as at the date of this report:
Richard White Maree Isaacs Andrew Cartledge Brett Shearer
Commencement date 15 April 2019 1 July 2017 7 September 2015 1 April 2018
Notice period 12 months 3 months 6 months 3 months
The employment contracts do not contain contractual termination benefits.
Executive KMP equity ownershipThe following tables provide details of ordinary shares and share rights (being rights to acquire ordinary shares) held in WiseTech Global Limited directly, indirectly or beneficially by each Executive KMP and their related parties:
Shares held on30 June 2019
Shares acquired as part of
remuneration 1Other shares
acquiredShares
disposedShares held on
30 June 2020
Richard White 142,501,537 – – (2,452,364) 140,049,173 2
Maree Isaacs 11,642,252 – – (218,087) 11,424,165 2
Andrew Cartledge 235,340 25,396 60 (77,005) 183,791
Brett Shearer 490,066 25,814 – (35,998) 479,882
1. Shares acquired from vesting or exercise of share rights granted as part of remuneration.2 Number of shares held on 30 June 2020 and as at the date of this report.
Share rightsheld on
30 June 2019 Awarded
Vested andconverted
or exercised Lapsed
Share rightsheld on
30 June 2020
Includingshare rights
vested butnot yet
exercised 1
Richard White 2 – – – – – –
Maree Isaacs 2 – – – – – –
Andrew Cartledge 40,398 28,880 (25,396) – 43,882 6,329
Brett Shearer 33,943 16,041 (25,814) – 24,170 –
1 Depending on the terms of a grant, on vesting, share rights may automatically convert to ordinary shares, or become exercisable. The Executive KMP can choose when to convert the exercisable share rights to ordinary shares. Share rights are converted to ordinary shares at nil cost to the Executive KMP.
2 Richard White and Maree Isaacs have not been awarded any share rights as at the date of this report.
6 1W I S E T E C H G L O B A L A N N U A L R E P O R T 2 0 2 0
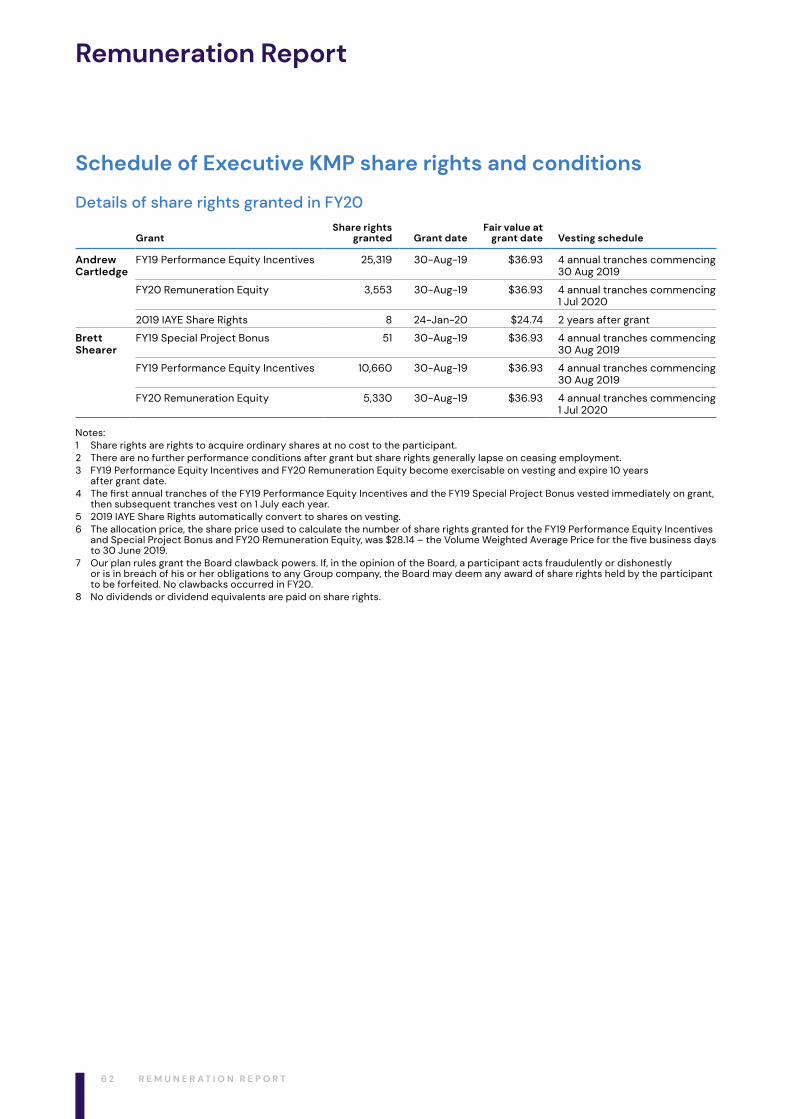
Remuneration Report
Schedule of Executive KMP share rights and conditions
Details of share rights granted in FY20
GrantShare rights
granted Grant dateFair value at
grant date Vesting schedule
Andrew Cartledge
FY19 Performance Equity Incentives 25,319 30‑Aug‑19 $36.93 4 annual tranches commencing 30 Aug 2019
FY20 Remuneration Equity 3,553 30‑Aug‑19 $36.93 4 annual tranches commencing 1 Jul 2020
2019 IAYE Share Rights 8 24‑Jan‑20 $24.74 2 years after grant
Brett Shearer
FY19 Special Project Bonus 51 30‑Aug‑19 $36.93 4 annual tranches commencing 30 Aug 2019
FY19 Performance Equity Incentives 10,660 30‑Aug‑19 $36.93 4 annual tranches commencing 30 Aug 2019
FY20 Remuneration Equity 5,330 30‑Aug‑19 $36.93 4 annual tranches commencing 1 Jul 2020
Notes:1 Share rights are rights to acquire ordinary shares at no cost to the participant.2 There are no further performance conditions after grant but share rights generally lapse on ceasing employment.3 FY19 Performance Equity Incentives and FY20 Remuneration Equity become exercisable on vesting and expire 10 years
after grant date.4 The first annual tranches of the FY19 Performance Equity Incentives and the FY19 Special Project Bonus vested immediately on grant,
then subsequent tranches vest on 1 July each year.5 2019 IAYE Share Rights automatically convert to shares on vesting.6 The allocation price, the share price used to calculate the number of share rights granted for the FY19 Performance Equity Incentives
and Special Project Bonus and FY20 Remuneration Equity, was $28.14 – the Volume Weighted Average Price for the five business days to 30 June 2019.
7 Our plan rules grant the Board clawback powers. If, in the opinion of the Board, a participant acts fraudulently or dishonestly or is in breach of his or her obligations to any Group company, the Board may deem any award of share rights held by the participant to be forfeited. No clawbacks occurred in FY20.
8 No dividends or dividend equivalents are paid on share rights.
6 2 R E M U N E R A T I O N R E P O R T
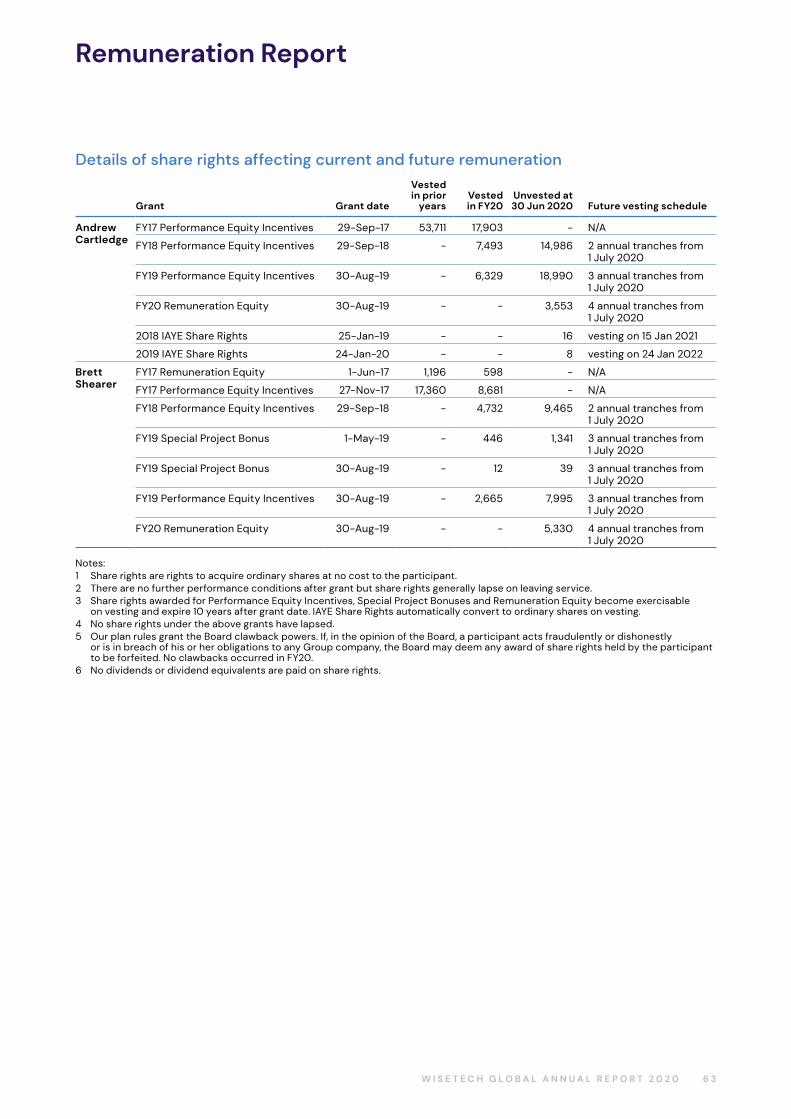
Remuneration Report
Details of share rights affecting current and future remuneration
Grant Grant date
Vested in prior
yearsVested in FY20
Unvested at 30 Jun 2020 Future vesting schedule
Andrew Cartledge
FY17 Performance Equity Incentives 29-Sep-17 53,711 17,903 - N/A
FY18 Performance Equity Incentives 29-Sep-18 - 7,493 14,986 2 annual tranches from 1 July 2020
FY19 Performance Equity Incentives 30‑Aug‑19 - 6,329 18,990 3 annual tranches from 1 July 2020
FY20 Remuneration Equity 30‑Aug‑19 - - 3,553 4 annual tranches from 1 July 2020
2018 IAYE Share Rights 25‑Jan‑19 - - 16 vesting on 15 Jan 2021
2019 IAYE Share Rights 24‑Jan‑20 - - 8 vesting on 24 Jan 2022
Brett Shearer
FY17 Remuneration Equity 1‑Jun‑17 1,196 598 - N/A
FY17 Performance Equity Incentives 27-Nov-17 17,360 8,681 - N/A
FY18 Performance Equity Incentives 29-Sep-18 - 4,732 9,465 2 annual tranches from 1 July 2020
FY19 Special Project Bonus 1-May-19 - 446 1,341 3 annual tranches from 1 July 2020
FY19 Special Project Bonus 30‑Aug‑19 - 12 39 3 annual tranches from 1 July 2020
FY19 Performance Equity Incentives 30‑Aug‑19 - 2,665 7,995 3 annual tranches from 1 July 2020
FY20 Remuneration Equity 30‑Aug‑19 - - 5,330 4 annual tranches from 1 July 2020
Notes:1 Share rights are rights to acquire ordinary shares at no cost to the participant. 2 There are no further performance conditions after grant but share rights generally lapse on leaving service.3 Share rights awarded for Performance Equity Incentives, Special Project Bonuses and Remuneration Equity become exercisable
on vesting and expire 10 years after grant date. IAYE Share Rights automatically convert to ordinary shares on vesting.4 No share rights under the above grants have lapsed.5 Our plan rules grant the Board clawback powers. If, in the opinion of the Board, a participant acts fraudulently or dishonestly
or is in breach of his or her obligations to any Group company, the Board may deem any award of share rights held by the participant to be forfeited. No clawbacks occurred in FY20.
6 No dividends or dividend equivalents are paid on share rights.
6 3W I S E T E C H G L O B A L A N N U A L R E P O R T 2 0 2 0
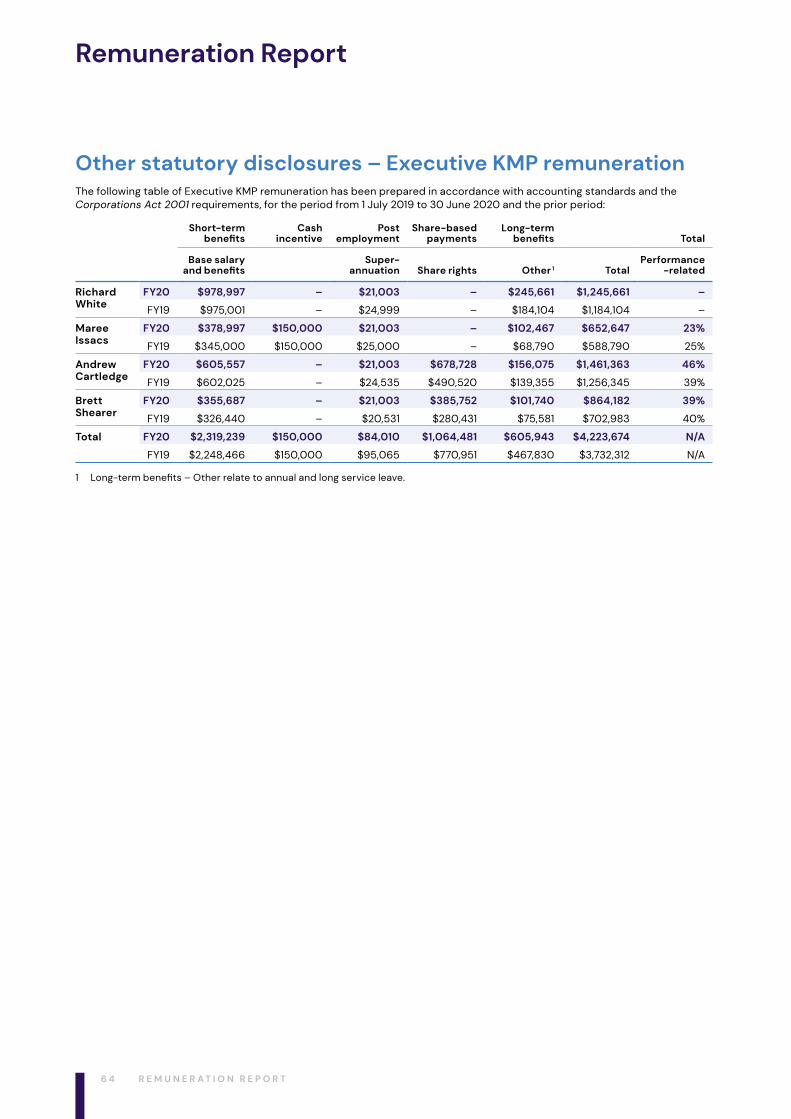
Remuneration Report
Other statutory disclosures – Executive KMP remunerationThe following table of Executive KMP remuneration has been prepared in accordance with accounting standards and the Corporations Act 2001 requirements, for the period from 1 July 2019 to 30 June 2020 and the prior period:
Short-termbenefits
Cashincentive
Postemployment
Share-basedpayments
Long-termbenefits Total
Base salaryand benefits
Super-annuation Share rights Other 1 Total
Performance-related
Richard White
FY20 $978,997 – $21,003 – $245,661 $1,245,661 –
FY19 $975,001 – $24,999 – $184,104 $1,184,104 –
MareeIssacs
FY20 $378,997 $150,000 $21,003 – $102,467 $652,647 23%
FY19 $345,000 $150,000 $25,000 – $68,790 $588,790 25%
AndrewCartledge
FY20 $605,557 – $21,003 $678,728 $156,075 $1,461,363 46%
FY19 $602,025 – $24,535 $490,520 $139,355 $1,256,345 39%
BrettShearer
FY20 $355,687 – $21,003 $385,752 $101,740 $864,182 39%
FY19 $326,440 – $20,531 $280,431 $75,581 $702,983 40%
Total FY20 $2,319,239 $150,000 $84,010 $1,064,481 $605,943 $4,223,674 N/A
FY19 $2,248,466 $150,000 $95,065 $770,951 $467,830 $3,732,312 N/A
1 Long‑term benefits – Other relate to annual and long service leave.
6 4 R E M U N E R A T I O N R E P O R T
Directors’ Report
The Directors present their report together with the consolidated financial statements of the Group, comprising WiseTech Global Limited and its controlled entities, for the financial year ended 30 June 2020 and the auditor’s report thereon. Information in the Financial Report referred to in this report, including the Operating and financial review and the Remuneration Report, or contained in a note to the financial statements referred to in this report, forms part of, and is to be read as part of, this report.
DirectorsThe names and details of the Company’s Directors in office during the financial year and until the date of this report are set out below. Directors were in office for this entire period unless otherwise stated.
– Andrew Charles Harrison (Chair);
– Richard John White (Founder & CEO);
– Teresa Engelhard;
– Charles Llewlyn Gibbon;
– Michael John Gregg;
– Christine Francis Holman (resigned 18 October 2019);
– Maree McDonald Isaacs; and
– Arlene Mary Tansey (appointed 1 June 2020)
The qualifications, experience and special responsibilities of the Directors, including details of other listed company directorships held during the last three years, are detailed on pages 42 and 43 of this report.
Directors’ meetings and their attendance at those meetings for FY20 (including meetings of committees of Directors) are detailed on page 43 of this report.
Company SecretariesDavid Rippon, Corporate Governance Executive and Company Secretary BSc (Hons) Mathematics
As Company Secretary, David is responsible for company secretarial and corporate governance support for WiseTech Global Limited and the WiseTech Group. After an initial career in the UK as an actuary, David held senior corporate office roles at AMP Limited and Henderson Group (now Janus Henderson Group plc) in Australia, before joining WiseTech Global as Corporate Governance Executive and Company Secretary in 2017.
Maree Isaacs
Details of Maree’s qualifications and experience are disclosed on page 43 of this report.
Review of operationsInformation on the principal activities, operations and financial position of the Group and its business strategies and prospects is set out in the Operating and financial review on pages 44 to 50 of this report.
DividendsDetails of dividends paid during FY20 and the prior period are disclosed in note 8 to the financial statements included in this report.
Significant changes in the state of affairsThere have been no significant changes in the state of affairs of the Group during the year.
6 5W I S E T E C H G L O B A L A N N U A L R E P O R T 2 0 2 0
Directors’ Report
Events subsequent to balance dateSince the period end, the Directors have declared a fully franked final dividend of 1.60 cents per share, payable on 2 October 2020. The dividend will be recognised in subsequent financial statements.
Other than the matters discussed above, there has not arisen in the interval between the end of the financial year and the date of this report any item, transaction or event of a material and unusual nature, likely, in the opinion of the Directors of the Company, to affect significantly the operations of the Group, the results of those operations or the state of affairs of the Group in future financial years.
Likely developments and expected resultsFor further information about likely developments in the operations of the Group, refer to the Operating and financial review on pages 44 to 50 of this report.
Environmental regulation and performanceThe operations of the Group are not subject to any particular or significant environmental regulations under a Commonwealth, State or Territory law of Australia.
Indemnification and insurance of Directors and other officersWiseTech’s constitution provides that every person who is or has been a Director or Company Secretary of the Company or a subsidiary of the Company is indemnified by the Company to the maximum extent permitted by law. The indemnity covers liabilities and legal costs incurred by the person as a director or company secretary.
In accordance with the Company’s constitution, the Company has entered into deeds with each of the Directors providing indemnity, insurance and access. No Director has received benefits under an indemnity from the Company during or since the end of the financial year.
During FY20, the Company paid a premium under a contract insuring certain current and former officers of the Group (including the Directors) against liability that they may incur as an officer of the Company. Disclosure of the nature of the liability and the amount of the premium is prohibited by the confidentiality clause of the contract of insurance.
Share rightsAt the date of this report, WiseTech had 2,339,252 share rights outstanding across 1,099 holders. The share rights relate to grants of deferred equity to employees under the Equity Incentives Plan and have a range of vesting dates through to July 2024. The share rights are not subject to further performance conditions, but are subject to employment conditions. On vesting, the holder is entitled to receive one ordinary share at no cost to the holder. 1,059,940 share rights were converted to ordinary shares during the financial year.
Proceedings on behalf of the GroupUnder section 237 of the Corporations Act 2001, no application has been made in respect of the Group and no proceedings have been brought or intervened in or on behalf of the Group under that section.
Remuneration ReportInformation on WiseTech’s remuneration framework and the outcomes for FY20 for key management personnel and the proposed framework for FY21, is included in the Remuneration Report on pages 51 to 64 of this report.
6 6 D I R E C T O R S ’ R E P O R T
Directors’ Report
Corporate governanceOur Corporate Governance Statement for FY19 is available from our website: https://ir.wisetechglobal.com/investors/?page=corporate‑governance
Our FY20 statement will be published in September 2020.
Non-audit servicesDuring the year, KPMG, the Company’s auditor, performed certain other services in addition to the audit and review of the financial statements. Details of the amounts paid to the auditor of the Group, KPMG, and its network firms for audit and non‑audit services are provided in note 23 to the financial statements included in this report.
The Board has considered the non-audit services provided during FY20 by the auditor and in accordance with written advice provided by resolution of the Audit Committee, is satisfied that the provision of those non‑audit services during FY20 by the auditor is compatible with, and did not compromise, the auditor independence requirements of the Corporations Act 2001 for the following reasons:
– all non-audit services were subject to the corporate governance procedures adopted by the Group and have been reviewed by the Audit Committee to ensure they do not impact the integrity and objectivity of the auditor; and
– the non-audit services provided did not undermine the general principles relating to auditor independence as set out in APES 110 Code of Ethics for Professional Accountants, as they did not involve reviewing or auditing the auditor’s own work, acting in a management or decision-making capacity for the Company, acting as an advocate for the Group or jointly sharing risks and rewards.
Lead auditor’s independence declarationThe lead auditor’s independence declaration is set out on page 68 of this report and forms part of the Directors’ Report for the financial year ended 30 June 2020.
Signed in accordance with a resolution of the Directors.
Andrew Harrison Chair
Richard White Executive Director, Founder and CEO
18 August 2020 18 August 2020
6 7W I S E T E C H G L O B A L A N N U A L R E P O R T 2 0 2 0

Lead Auditor’s Independence Declaration under Section 307C of the Corporations Act 2001
Liability limited by a scheme approved under Professional Standards Legislation.
KPMG, an Australian partnership and a member firm of the KPMG network of independent member firms affiliated with KPMG International Cooperative (“KPMG International”), a Swiss entity.
Lead Auditor’s Independence Declaration under
Section 307C of the Corporations Act 2001
To the Directors of WiseTech Global Limited
I declare that, to the best of my knowledge and belief, in relation to the audit of WiseTech Global Limited for the financial year ended 30 June 2020 there have been:
i. no contraventions of the auditor independence requirements as set out in the Corporations Act 2001 in relation to the audit; and
ii. no contraventions of any applicable code of professional conduct in relation to the audit.
KPMG Caoimhe Toouli
Partner
Sydney
18 August 2020
6 8 L E A D A U D I T O R ’ S I N D E P E N D E N C E D E C L A R A T I O N
Risk management
We recognise and manage a variety of business risks that could affect our operations and financial results. The main risks affecting WiseTech Global, and the steps we take to manage or mitigate these risks, are described below.
Ability to attract and retain key personnelOur success is dependent on attracting and retaining key personnel, in particular, our Founder and CEO, Richard White and members of the senior management and product development teams. In addition, we need to attract and retain highly skilled software development engineers.
The loss of key personnel or delay in their replacement could adversely impact our ability to operate our business and increase the potential loss of business process knowledge.
To mitigate this risk, we have invested and continue to invest, in our workforce by recruiting key individuals and also in processes and systems to ensure knowledge and skills are maintained within the Group to enable its continued and stable growth. Our remuneration framework also delivers flexible components designed to support the recruitment, motivation and retention of our staff.
Execution of integration of acquired businessesIn recent years, we have completed a number of strategic acquisitions, the integration of which can include product development and transitioning of customers to our CargoWise platform. There is a risk that customers do not transition (or require more financial and management resources, or time to complete, than originally planned) or that the acquisitions fail to generate the benefits that we expected or provide an adequate return on the resources invested in them.
Our acquisition strategy has resulted, and is likely to continue to result, in us expanding our presence in new international jurisdictions with exposure to greater risk of political, legal and economic instability or different legal and regulatory systems and frameworks compared to the regions in which we currently operate.
To mitigate our risks, we tailor the acquisition and integration approach to each acquisition to address geographic and political risk and the region in which the acquisition business is based.
We have adopted an integration framework characterised by a three-phased approach to:
– integrate the target: operations and workforce;
– develop the product capability and commercial foundation; and
– grow revenue from new capabilities and conversion of the acquired customer base.
This process is designed to be delivered through a combination of self-integration toolkits and the utilisation of our architectures and engines (such as PAVE). We also engage the talented teams in our 40 product development centres and over 55 offices worldwide. When considering a target for potential acquisition, we also assess the capabilities of the business to support the integration and product development phases mentioned above.
WiseTech Global operation in a competitive industry We compete against other commercial logistics service software providers and within the marketplace face the risk that:
– competitors could increase their competitive position through product innovation or expansion, aggressive marketing campaigns, product innovation, price discounting or acquisitions;
– our software products may fail to meet our customers’ expectations;
– we may fail to anticipate and respond to technology changes as quickly as our competitors;
– logistics service providers may continue to operate in-house developed systems in preference to commercial logistics software; and
– new competitors could emerge and develop products (including cloud-based software) which compete with our products.
We believe that our deeply integrated, open‑access platform, which provides an efficient platform for global rollouts and an efficient consolidation tool for large 3PLs and our commitment to relentlessly invest in product development, are the most effective mitigants to this risk. We continue to invest significantly in product development and innovation, investing $438m since FY16. In FY20, we invested 37% of our revenues in product development and innovation and delivered over 1,100 product upgrades to the platform. We also acquire smaller software vendors in key geographic regions and technology adjacencies, enlarging our global footprint and technology capacity and capability.
6 9W I S E T E C H G L O B A L A N N U A L R E P O R T 2 0 2 0
Risk management
Failure to retain existing customers and attract new customersOur business success depends on our ability to retain and grow usage by our existing customers and our ability to attract new customers. There is a risk that our customers reduce their use of our software, in terms of the users and volume of transactions, or that they cease to use our software altogether. There is a risk that if customers reduce their usage of our software, our revenue could decrease.
We mitigate this risk by:
– providing our customers with open access to our platform to new sites/geographies;
– continuing to innovate and add more modules and functionality which drive productivity benefits for our customers and respond to industry and regulatory changes faced by customers; and
– providing a platform which enables rapid onboarding of users without additional contract negotiations.
Our success in managing this risk is characterised by our high (97%) level of recurring revenue for our CargoWise platform and our low (<1%) level of annual customer attrition (by CargoWise customers).
Decline in trade volumes and economic conditionsOur customers are logistics service providers whose business operations depend on regional and global logistics activities which are closely linked to regional and global trade volumes. A decline in regional and global trade volumes and recessionary economic conditions, including, but not limited to, the effects of the COVID‑19 pandemic, may adversely affect our financial performance.
Our software provides an integrated logistics execution solution which increases productivity and drives efficiency in a complex, highly regulated and competitive industry. We believe that risks associated with a reduction in trade volumes and economic conditions would be offset by the opportunities which present themselves from changes in trade routes, regulation, trade patterns and increased competition amongst our customers.
Impact of foreign currency on financial resultsAs a global business, the majority of our revenue (FY20: 75%) is invoiced in currencies other than Australian dollars; therefore, our financial results are influenced by movements in the foreign exchange rates of currencies including the US dollar, pound sterling and euro.
This risk is partially offset by natural hedges where we also incur operational costs in the same foreign currency. Where appropriate, we also seek to denominate new customer contracts in Australian dollars and may also utilise foreign exchange contracts to hedge the currency risks on a portion of forecast exposures.
Disruption or failure of technology systemsThe performance, reliability and availability of our technology platform, data centre and global communication systems (including servers, the internet, hosting services and the cloud environment in which we provide our products) are critical to our business. There is a risk that these systems may be adversely affected by disruption, failure, service outages or data corruption.
Prolonged disruption to our IT platform, or operational or business delays, could damage our reputation and potentially lead to a loss of customers, legal claims by customers, and an inability to attract new customers.
We mitigate this risk by operating: separate data centres in three distinct regions around the world to reduce reliance on any individual data centre; a global network of support centres providing 24/7 365 support internally; and for our customers, automated replication of data as well as disaster recovery planning and testing. Our technology framework provides for segregation of data, backups stored on independent infrastructures and critical access monitoring.
Security breach and data privacyOur products involve the storage and transmission of our customers’ confidential and proprietary information and our risks include security breaches of our customers’ data and information by unauthorised access, theft, destruction, loss of information or misappropriation or release of confidential customer data.
To mitigate our risks, we have adopted a layered approach to protecting customer data that includes physical security, system security, policy, governance, logging and auditing. We have completed an independent Service Organization Control audit of our key WiseCloud systems in Australia, the United States and the United Kingdom. We perform penetration testing on our key business systems (including our acquired businesses) and remediate any potential issues identified by the testing.
WiseTech Global and its subsidiaries recognise the importance of data privacy, and comply with relevant data privacy regulations, including the EU General Data Protection Regulation, to safeguard the security and privacy of all customer data.
7 0 R I S K M A N A G E M E N T
Financial Report contentsfor the year ended 30 June 2020
Consolidated statement of profit or loss and other comprehensive income 72
Consolidated statement of financial position 73
Consolidated statement of changes in equity 74
Consolidated statement of cash flows 76
Notes to the financial statements
1. Corporate information 77
2. Basis of preparation 77
3. Changes in accounting policies 79
4. Revenue 79
5. Finance income 81
6. Income tax 81
7. Earnings per share 84
8. Dividends 84
9. Intangible assets 85
10. Property, plant and equipment 88
11. Cash and cash equivalents 89
12. Trade receivables 89
13. Other assets 91
14. Trade and other payables 91
15. Deferred revenue 92
16. Other liabilities 92
17. Borrowings 93
18. Lease liabilities 93
19. Share capital and reserves 96
20. Business combinations and acquisition of non-controlling interests 98
21. Employee benefits 102
22. Key management personnel transactions 104
23. Auditor’s remuneration 105
24. Reconciliation of net cash flows from operating activities 106
25. Segment information 107
26. Financial instruments 108
27. Group information 1 1 6
28. Deed of Cross Guarantee 1 1 9
29. Parent entity information 12 1
30. Other policies and disclosures 122
Directors’ declaration 124
Independent Auditor’s Report 125
7 1W I S E T E C H G L O B A L A N N U A L R E P O R T 2 0 2 0
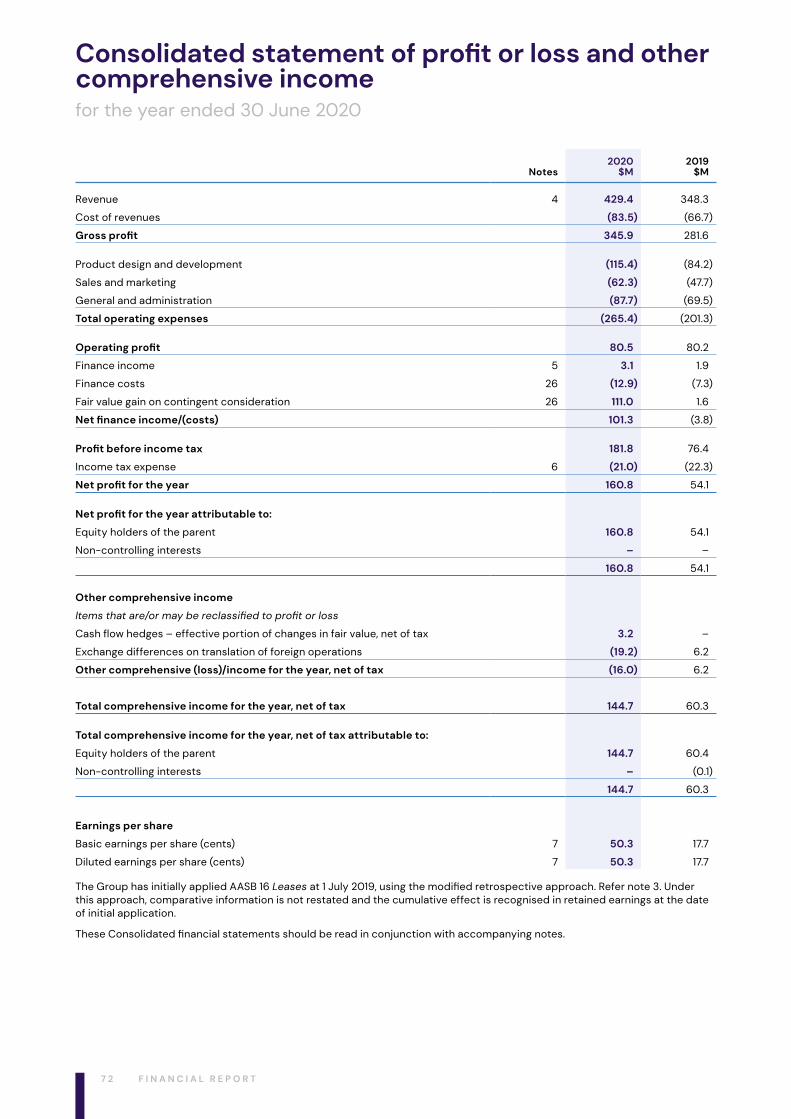
Consolidated statement of profit or loss and other comprehensive incomefor the year ended 30 June 2020
Notes2020
$M2019
$M
Revenue 4 429.4 348.3
Cost of revenues (83.5) (66.7)
Gross profit 345.9 281.6
Product design and development (115.4) (84.2)
Sales and marketing (62.3) (47.7)
General and administration (87.7) (69.5)
Total operating expenses (265.4) (201.3)
Operating profit 80.5 80.2
Finance income 5 3.1 1.9
Finance costs 26 (12.9) (7.3)
Fair value gain on contingent consideration 26 111.0 1.6
Net finance income/(costs) 101.3 (3.8)
Profit before income tax 181.8 76.4
Income tax expense 6 (21.0) (22.3)
Net profit for the year 160.8 54.1
Net profit for the year attributable to:
Equity holders of the parent 160.8 54.1
Non-controlling interests – –
160.8 54.1
Other comprehensive income
Items that are/or may be reclassified to profit or loss
Cash flow hedges – effective portion of changes in fair value, net of tax 3.2 –
Exchange differences on translation of foreign operations (19.2) 6.2
Other comprehensive (loss)/income for the year, net of tax (16.0) 6.2
Total comprehensive income for the year, net of tax 144.7 60.3
Total comprehensive income for the year, net of tax attributable to:
Equity holders of the parent 144.7 60.4
Non-controlling interests – (0.1)
144.7 60.3
Earnings per share
Basic earnings per share (cents) 7 50.3 17.7
Diluted earnings per share (cents) 7 50.3 17.7
The Group has initially applied AASB 16 Leases at 1 July 2019, using the modified retrospective approach. Refer note 3. Under this approach, comparative information is not restated and the cumulative effect is recognised in retained earnings at the date of initial application.
These Consolidated financial statements should be read in conjunction with accompanying notes.
7 2 F I N A N C I A L R E P O R T
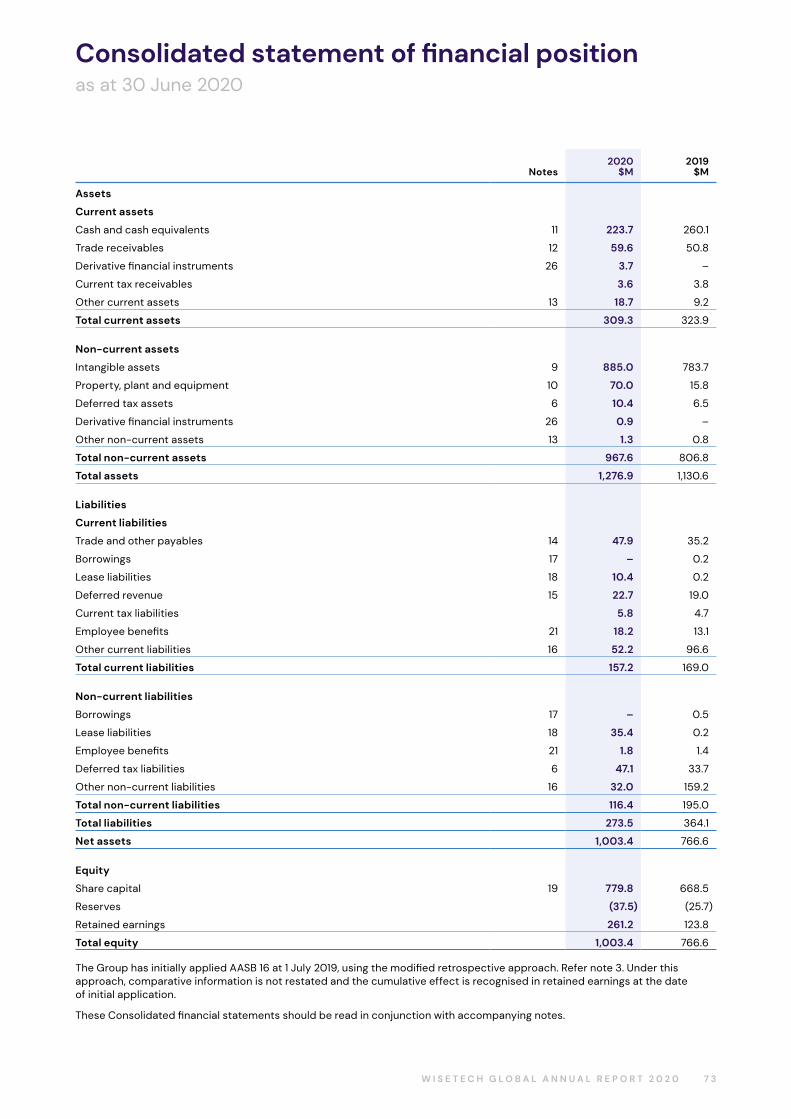
Consolidated statement of financial positionas at 30 June 2020
Notes2020
$M2019
$M
Assets
Current assets
Cash and cash equivalents 11 223.7 260.1
Trade receivables 12 59.6 50.8
Derivative financial instruments 26 3.7 –
Current tax receivables 3.6 3.8
Other current assets 13 18.7 9.2
Total current assets 309.3 323.9
Non-current assets
Intangible assets 9 885.0 783.7
Property, plant and equipment 10 70.0 15.8
Deferred tax assets 6 10.4 6.5
Derivative financial instruments 26 0.9 –
Other non-current assets 13 1.3 0.8
Total non-current assets 967.6 806.8
Total assets 1,276.9 1,130.6
Liabilities
Current liabilities
Trade and other payables 14 47.9 35.2
Borrowings 17 – 0.2
Lease liabilities 18 10.4 0.2
Deferred revenue 15 22.7 19.0
Current tax liabilities 5.8 4.7
Employee benefits 21 18.2 13.1
Other current liabilities 16 52.2 96.6
Total current liabilities 157.2 169.0
Non-current liabilities
Borrowings 17 – 0.5
Lease liabilities 18 35.4 0.2
Employee benefits 21 1.8 1.4
Deferred tax liabilities 6 47.1 33.7
Other non-current liabilities 16 32.0 159.2
Total non-current liabilities 116.4 195.0
Total liabilities 273.5 364.1
Net assets 1,003.4 766.6
Equity
Share capital 19 779.8 668.5
Reserves (37.5) (25.7)
Retained earnings 261.2 123.8
Total equity 1,003.4 766.6
The Group has initially applied AASB 16 at 1 July 2019, using the modified retrospective approach. Refer note 3. Under this approach, comparative information is not restated and the cumulative effect is recognised in retained earnings at the date of initial application.
These Consolidated financial statements should be read in conjunction with accompanying notes.
7 3W I S E T E C H G L O B A L A N N U A L R E P O R T 2 0 2 0
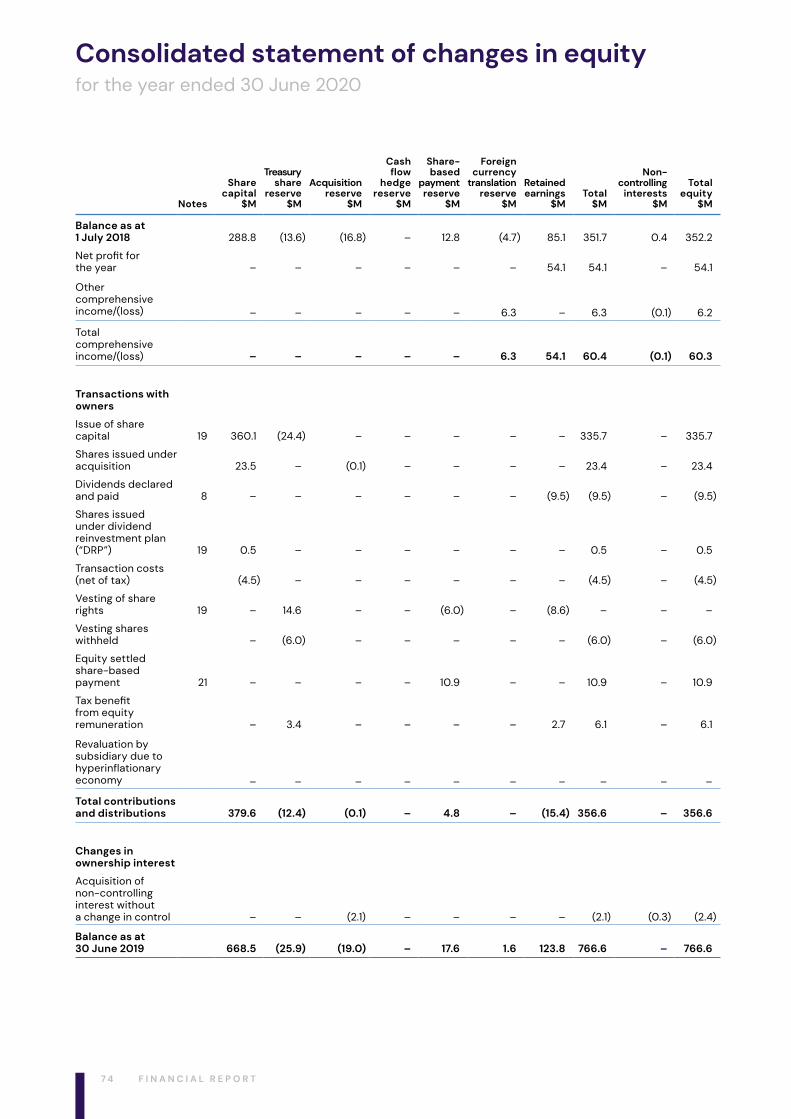
Consolidated statement of changes in equityfor the year ended 30 June 2020
Notes
Share capital
$M
Treasury share
reserve$M
Acquisition reserve
$M
Cash flow
hedge reserve
$M
Share- based
payment reserve
$M
Foreign currency
translation reserve
$M
Retained earnings
$MTotal
$M
Non-controlling
interests$M
Total equity
$M
Balance as at 1 July 2018 288.8 (13.6) (16.8) – 12.8 (4.7) 85.1 351.7 0.4 352.2
Net profit for the year – – – – – – 54.1 54.1 – 54.1
Other comprehensive income/(loss) – – – – – 6.3 – 6.3 (0.1) 6.2
Total comprehensive income/(loss) – – – – – 6.3 54.1 60.4 (0.1) 60.3
Transactions with owners
Issue of share capital 19 360.1 (24.4) – – – – – 335.7 – 335.7
Shares issued under acquisition 23.5 – (0.1) – – – – 23.4 – 23.4
Dividends declared and paid 8 – – – – – – (9.5) (9.5) – (9.5)
Shares issued under dividend reinvestment plan (“DRP”) 19 0.5 – – – – – – 0.5 – 0.5
Transaction costs (net of tax) (4.5) – – – – – – (4.5) – (4.5)
Vesting of share rights 19 – 14.6 – – (6.0) – (8.6) – – –
Vesting shares withheld – (6.0) – – – – – (6.0) – (6.0)
Equity settled share-based payment 21 – – – – 10.9 – – 10.9 – 10.9
Tax benefit from equity remuneration – 3.4 – – – – 2.7 6.1 – 6.1
Revaluation by subsidiary due to hyperinflationary economy – – – – – – – – – –
Total contributions and distributions 379.6 (12.4) (0.1) – 4.8 – (15.4) 356.6 – 356.6
Changes in ownership interest
Acquisition of non-controlling interest without a change in control – – (2.1) – – – – (2.1) (0.3) (2.4)
Balance as at 30 June 2019 668.5 (25.9) (19.0) – 17.6 1.6 123.8 766.6 – 766.6
7 4 F I N A N C I A L R E P O R T
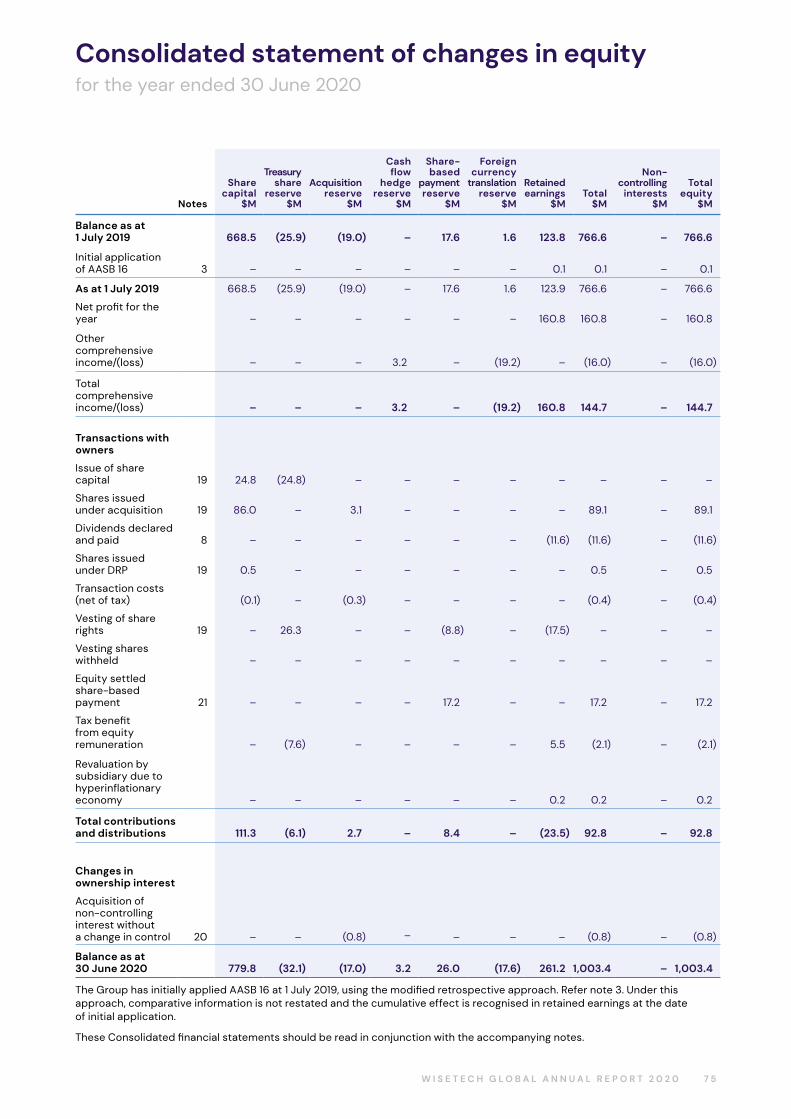
Consolidated statement of changes in equityfor the year ended 30 June 2020
Notes
Share capital
$M
Treasury share
reserve$M
Acquisition reserve
$M
Cash flow
hedge reserve
$M
Share- based
payment reserve
$M
Foreign currency
translation reserve
$M
Retained earnings
$MTotal
$M
Non-controlling
interests$M
Total equity
$M
Balance as at 1 July 2019 668.5 (25.9) (19.0) – 17.6 1.6 123.8 766.6 – 766.6
Initial application of AASB 16 3 – – – – – – 0.1 0.1 – 0.1
As at 1 July 2019 668.5 (25.9) (19.0) – 17.6 1.6 123.9 766.6 – 766.6
Net profit for the year – – – – – – 160.8 160.8 – 160.8
Other comprehensive income/(loss) – – – 3.2 – (19.2) – (16.0) – (16.0)
Total comprehensive income/(loss) – – – 3.2 – (19.2) 160.8 144.7 – 144.7
Transactions with owners
Issue of share capital 19 24.8 (24.8) – – – – – – – –
Shares issued under acquisition 19 86.0 – 3.1 – – – – 89.1 – 89.1
Dividends declared and paid 8 – – – – – – (11.6) (11.6) – (11.6)
Shares issued under DRP 19 0.5 – – – – – – 0.5 – 0.5
Transaction costs (net of tax) (0.1) – (0.3) – – – – (0.4) – (0.4)
Vesting of share rights 19 – 26.3 – – (8.8) – (17.5) – – –
Vesting shares withheld – – – – – – – – – –
Equity settled share-based payment 21 – – – – 17.2 – – 17.2 – 17.2
Tax benefit from equity remuneration – (7.6) – – – – 5.5 (2.1) – (2.1)
Revaluation by subsidiary due to hyperinflationary economy – – – – – – 0.2 0.2 – 0.2
Total contributions and distributions 111.3 (6.1) 2.7 – 8.4 – (23.5) 92.8 – 92.8
Changes in ownership interest
Acquisition of non-controlling interest without a change in control 20 – – (0.8) – – – – (0.8) – (0.8)
Balance as at 30 June 2020 779.8 (32.1) (17.0) 3.2 26.0 (17.6) 261.2 1,003.4 – 1,003.4
The Group has initially applied AASB 16 at 1 July 2019, using the modified retrospective approach. Refer note 3. Under this approach, comparative information is not restated and the cumulative effect is recognised in retained earnings at the date of initial application.
These Consolidated financial statements should be read in conjunction with the accompanying notes.
7 5W I S E T E C H G L O B A L A N N U A L R E P O R T 2 0 2 0
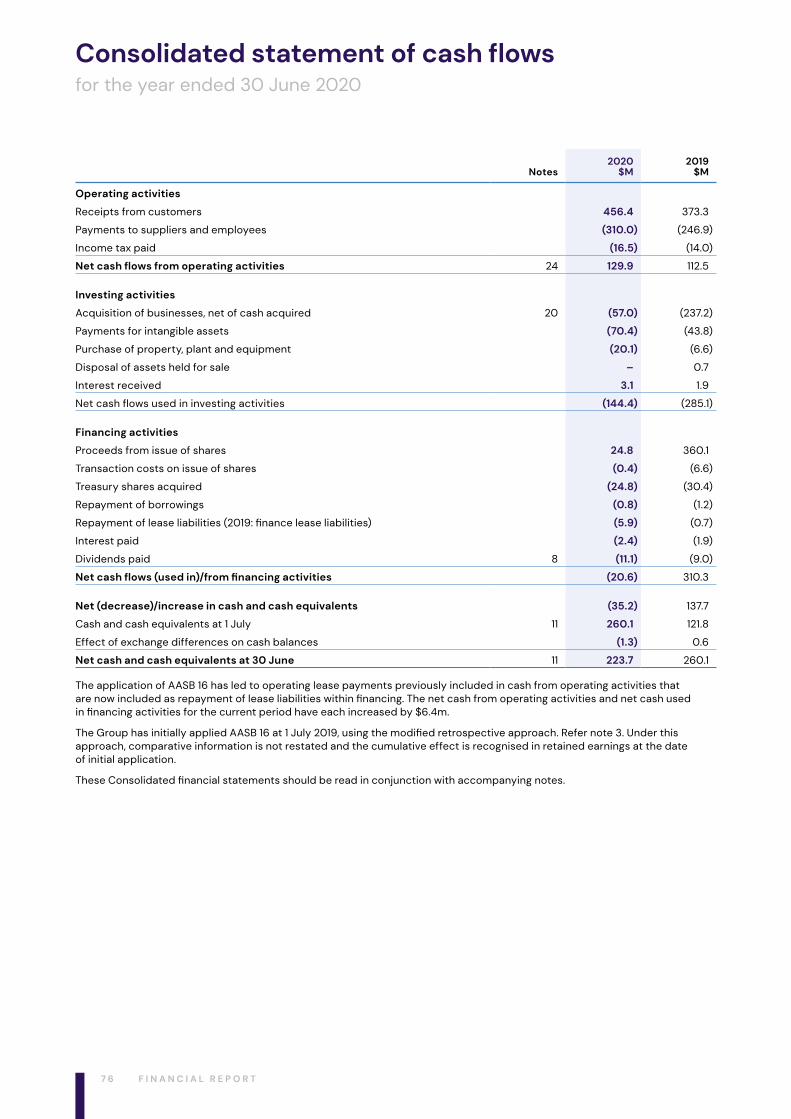
Consolidated statement of cash flowsfor the year ended 30 June 2020
Notes2020
$M2019
$M
Operating activities
Receipts from customers 456.4 373.3
Payments to suppliers and employees (310.0) (246.9)
Income tax paid (16.5) (14.0)
Net cash flows from operating activities 24 129.9 112.5
Investing activities
Acquisition of businesses, net of cash acquired 20 (57.0) (237.2)
Payments for intangible assets (70.4) (43.8)
Purchase of property, plant and equipment (20.1) (6.6)
Disposal of assets held for sale – 0.7
Interest received 3.1 1.9
Net cash flows used in investing activities (144.4) (285.1)
Financing activities
Proceeds from issue of shares 24.8 360.1
Transaction costs on issue of shares (0.4) (6.6)
Treasury shares acquired (24.8) (30.4)
Repayment of borrowings (0.8) (1.2)
Repayment of lease liabilities (2019: finance lease liabilities) (5.9) (0.7)
Interest paid (2.4) (1.9)
Dividends paid 8 (11.1) (9.0)
Net cash flows (used in)/from financing activities (20.6) 310.3
Net (decrease)/increase in cash and cash equivalents (35.2) 137.7
Cash and cash equivalents at 1 July 11 260.1 121.8
Effect of exchange differences on cash balances (1.3) 0.6
Net cash and cash equivalents at 30 June 11 223.7 260.1
The application of AASB 16 has led to operating lease payments previously included in cash from operating activities that are now included as repayment of lease liabilities within financing. The net cash from operating activities and net cash used in financing activities for the current period have each increased by $6.4m.
The Group has initially applied AASB 16 at 1 July 2019, using the modified retrospective approach. Refer note 3. Under this approach, comparative information is not restated and the cumulative effect is recognised in retained earnings at the date of initial application.
These Consolidated financial statements should be read in conjunction with accompanying notes.
7 6 F I N A N C I A L R E P O R T
Notes to the financial statementsfor the year ended 30 June 2020
1. Corporate informationWiseTech Global Limited (“Company”) is a company domiciled in Australia. These Consolidated financial statements comprise the Company and its controlled entities (collectively “Group”) for the year ended 30 June 2020. The Company’s registered office is at Unit 3a, 72 O’Riordan Street, Alexandria, NSW 2015, Australia.
The Group is a for‑profit entity and its principal business is providing software to the logistics services industry globally.
2. Basis of preparation
Statement of complianceThese Consolidated financial statements are general purpose financial statements, which have been prepared in accordance with the requirements of the Corporations Act 2001, Australian Accounting Standards (AASBs) and other authoritative pronouncements of the Australian Accounting Standards Board. The Consolidated financial statements also comply with International Financial Reporting Standards (“IFRS”) and interpretations (“IFRICs”) adopted by the International Accounting Standards Board.
Material accounting policies adopted in the preparation of these financial statements are presented alongside the relevant notes and have been consistently applied unless stated otherwise. Other significant accounting policies which are relevant to understand the basis of preparation of these Consolidated financial statements are included in note 30.
The Consolidated financial statements have been prepared on an accruals basis and are based on historical costs except for:
– Derivative financial assets which are measured at fair value in accordance with AASB 9 Financial Instruments; and
– Contingent consideration which is measured at fair value in accordance with AASB 13 Fair Value Measurement.
The Consolidated financial statements have been prepared on a going concern basis, which contemplates continuity of normal business activities and the realisation of assets and the settlement of liabilities in the ordinary course of business.
The Consolidated financial statements were authorised by the Board of Directors on 18 August 2020.
Accounting policiesWith the exception of the impact of the first time application of AASB 16 Leases, the impact of which is described in note 3, the accounting policies applied in these Consolidated financial statements are the same as those applied in the Group’s Consolidated financial statements as at, and for the year ended 30 June 2019.
Going concernThe accompanying Consolidated financial statements have been prepared assuming the Company will continue as a going concern. The ability of the Company to continue as a going concern has not been impacted by the outbreak of the COVID-19 pandemic.
The Company supplies software as a service (“SaaS”) to the logistics industry which is a critical service to that market sector. The logistics sector continues to be a critical element of the global economy. The Company’s customer base is significant and comprises large, medium and small operators. The Company is not subject to concentration of credit risk. The Company has no borrowings at 30 June 2020 and has sufficient cash to meet all committed liabilities and future expected liabilities.
Key accounting estimates and judgementsIn preparing these Consolidated financial statements, management has made judgements, estimates and assumptions that affect the application of accounting policies and the reported amounts of assets and liabilities, income and expenses including accompanying disclosures. Changes in these judgements, estimates and assumptions could result in outcomes that require a material adjustment in future periods. Information on key accounting estimates and judgements can be found in the following notes:
Accounting judgements, estimates and assumptions Note Page
Income tax determination in relation to assets and liabilities 6 83
Recognition and recoverability of other intangible assets 9 86
Recoverability of goodwill 9 87
Trade receivables expected credit losses 12 90
Lease terms 18 94
Valuation of contingent consideration 26 1 1 1
Revenue recognition is excluded on the grounds that the policy adopted in the area is sufficiently objective.
7 7W I S E T E C H G L O B A L A N N U A L R E P O R T 2 0 2 0
Notes to the financial statementsfor the year ended 30 June 2020
Functional and presentational currencyThese Consolidated financial statements are presented in Australian dollars.
Rounding of amountsUnless otherwise expressly stated, amounts have been rounded off to the nearest whole number of millions of dollars and one place of decimals representing hundreds of thousands of dollars in accordance with ASIC Corporations Instrument 2016/191, dated 24 March 2016. Amounts shown as “‑” represent zero amounts and amounts less than $50,000 which have been rounded down. There may be differences in casting the values in the Consolidated financial statements due to rounding in millions to one place of decimals.
Presentation of resultsThe Group has presented the expense categories within the Consolidated statement of profit or loss on a functional basis. The categories used are cost of revenues, product design and development, sales and marketing and general and administration. This presentation style provides insight into the Company’s business model and enables users to consider the results of the Group compared to other major SaaS companies. The methodology and the nature of costs within each category are further described below.
Cost of revenuesCost of revenues consists of expenses directly associated with securely hosting the Group’s services and providing support to customers. Costs include data centre costs, personnel and related costs (including salaries, benefits, bonuses and share-based payments) directly associated with cloud infrastructure and customer consulting, implementation and customer support, contracted third party costs, related depreciation and amortisation and allocated overheads.
Product design and development expensesProduct design and development expenses consist primarily of personnel and related costs (including salaries, benefits, bonuses and share-based payments) directly associated with the Company’s product design and development employees, as well as allocated overheads. When future economic benefits from development of an intangible asset are determined probable and the development activities are capable of being reliably measured, the costs are capitalised as an intangible asset and then amortised to profit or loss over the estimated life of the asset created. The development activities comprise the design, coding and testing of a chosen alternative for new or improved software products, processes, systems and services. The amortisation of those costs capitalised is included as a product design and development expense.
Sales and marketing expensesSales and marketing expenses consist of personnel and related costs (including salaries, benefits, bonuses, commissions and share-based payments) directly associated with the sales and marketing team’s activities to acquire new customers and grow revenue from existing customers. Other costs included are external advertising, digital platforms, marketing and promotional events, as well as allocated overheads.
General and administration expensesGeneral and administration expenses consist of personnel and related costs (including salaries, benefits, bonuses and share‑based payments) for the Company’s executive, Board of Directors, finance, legal, human resources, mergers and acquisitions and administration employees. They also include legal, accounting and other professional services fees, insurance premiums, acquisition and integration costs associated with the Company’s ongoing acquisition strategy, other corporate expenses and allocated overheads.
Overhead allocationThe presentation of the Consolidated statement of profit or loss and other comprehensive income by function requires certain overhead costs to be allocated to functions. These allocations require management to apply judgement. The costs associated with Group’s facilities, internal information technology and non-product related depreciation and amortisation are allocated to each function based on respective headcount.
2. Basis of preparation (continued)
7 8 F I N A N C I A L R E P O R T
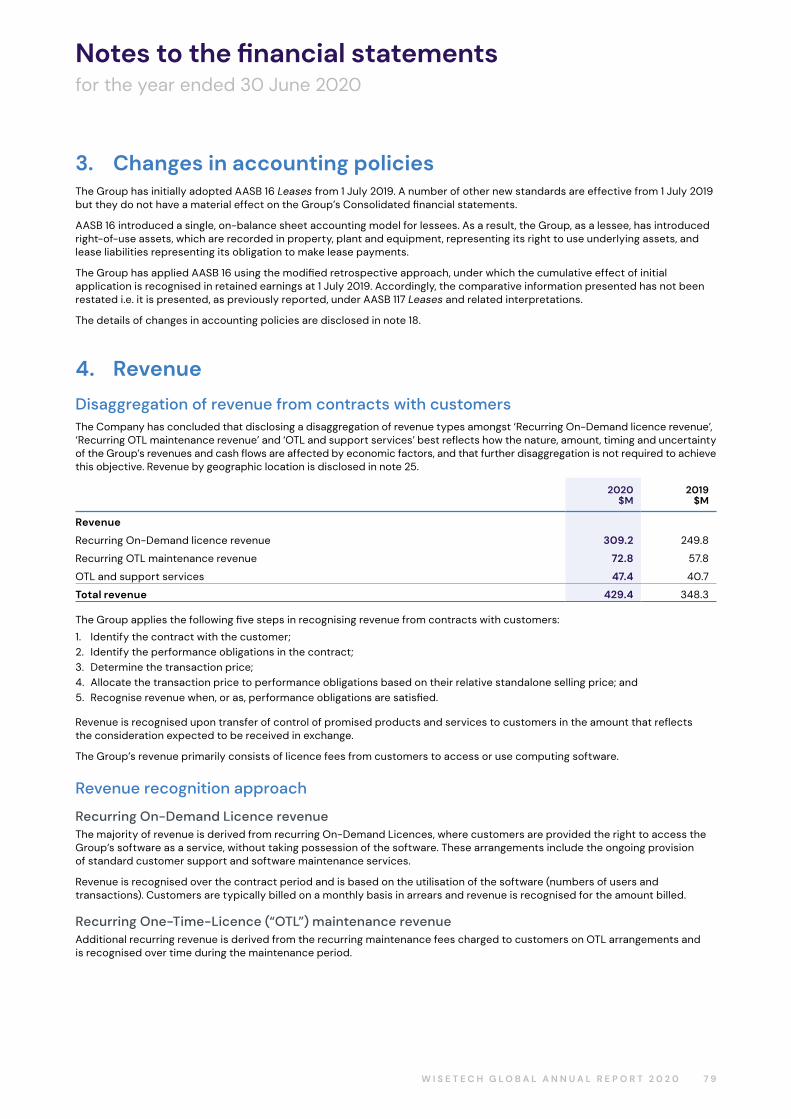
Notes to the financial statementsfor the year ended 30 June 2020
3. Changes in accounting policiesThe Group has initially adopted AASB 16 Leases from 1 July 2019. A number of other new standards are effective from 1 July 2019 but they do not have a material effect on the Group’s Consolidated financial statements.
AASB 16 introduced a single, on-balance sheet accounting model for lessees. As a result, the Group, as a lessee, has introduced right-of-use assets, which are recorded in property, plant and equipment, representing its right to use underlying assets, and lease liabilities representing its obligation to make lease payments.
The Group has applied AASB 16 using the modified retrospective approach, under which the cumulative effect of initial application is recognised in retained earnings at 1 July 2019. Accordingly, the comparative information presented has not been restated i.e. it is presented, as previously reported, under AASB 117 Leases and related interpretations.
The details of changes in accounting policies are disclosed in note 18.
4. Revenue
Disaggregation of revenue from contracts with customersThe Company has concluded that disclosing a disaggregation of revenue types amongst ‘Recurring On-Demand licence revenue’, ‘Recurring OTL maintenance revenue’ and ‘OTL and support services’ best reflects how the nature, amount, timing and uncertainty of the Group’s revenues and cash flows are affected by economic factors, and that further disaggregation is not required to achieve this objective. Revenue by geographic location is disclosed in note 25.
2020$M
2019$M
Revenue
Recurring On-Demand licence revenue 309.2 249.8
Recurring OTL maintenance revenue 72.8 57.8
OTL and support services 47.4 40.7
Total revenue 429.4 348.3
The Group applies the following five steps in recognising revenue from contracts with customers:
1. Identify the contract with the customer;2. Identify the performance obligations in the contract;3. Determine the transaction price;4. Allocate the transaction price to performance obligations based on their relative standalone selling price; and5. Recognise revenue when, or as, performance obligations are satisfied.
Revenue is recognised upon transfer of control of promised products and services to customers in the amount that reflects the consideration expected to be received in exchange.
The Group’s revenue primarily consists of licence fees from customers to access or use computing software.
Revenue recognition approach
Recurring On-Demand Licence revenueThe majority of revenue is derived from recurring On-Demand Licences, where customers are provided the right to access the Group’s software as a service, without taking possession of the software. These arrangements include the ongoing provision of standard customer support and software maintenance services.
Revenue is recognised over the contract period and is based on the utilisation of the software (numbers of users and transactions). Customers are typically billed on a monthly basis in arrears and revenue is recognised for the amount billed.
Recurring One-Time-Licence (“OTL”) maintenance revenueAdditional recurring revenue is derived from the recurring maintenance fees charged to customers on OTL arrangements and is recognised over time during the maintenance period.
7 9W I S E T E C H G L O B A L A N N U A L R E P O R T 2 0 2 0
Notes to the financial statementsfor the year ended 30 June 2020
OTL and support servicesOTL fee revenue is derived when the Group sells, in a one-off transaction, the perpetual right to use the software. This licence revenue is recognised at the point in time when access is granted to the customer and the one-off billing is raised.
Support services revenue mainly consists of fees charged for business consultancy and paid feature services delivered upon specific customer requests. These contracts are typically short‑term (less than 12 months) and are charged on a fixed‑fee basis. Consulting revenue is recognised on a proportional performance basis and ratably over the contract term. Paid features service revenue is recognised at the time when the requested feature is completed and can be accessed by customers.
Contracts with multiple performance obligationsThe Company enters into contracts with its customers that can include promises to transfer multiple performance obligations. A performance obligation is a promise in a contract with a customer to transfer products or services that are distinct.
Revenue (including any discounts) is allocated between separate goods and services on a relative basis of a standalone selling prices. The standalone selling prices reflect the price that would be charged for a specific product or service if it was sold separately.
For On-Demand licensing contracts, there are a series of distinct goods and services including access to software maintenance and support provided to customers that are treated as a single performance obligation because they are delivered in the same pattern over a period of time.
Material rights in the form of contract renewal options or incremental discountsContracts may involve customers having the option to obtain discounts upon renewal of existing arrangements. AASB 15 Revenue from Contracts with Customers considers a material right to be a separate performance obligation in a customer contract which gives the customer an option to acquire additional goods or services at a discount or free of charge. The inclusion of these clauses may give rise to a change in the timing of revenue recognition.
The Group assessed renewal options on current contracts. Based on this assessment, there were no renewal options which gave rise to material rights, which would need to be accounted for as separate performance obligations.
Costs of obtaining a customer contractAASB 15 requires that incremental costs associated with acquiring a customer contract, such as sales commissions, be recognised as an asset and amortised over a period that corresponds with the period of benefit.
An assessment of commissions paid by the Group was performed in connection with the sale of software products.
This assessment concluded that as these commissions were conditional on future performance or service by the recipient of the commission, and therefore were not incremental to obtaining the contract. Consequently, under current arrangements costs of obtaining a contract are expensed in the period incurred.
Principal versus agentWhere the Group has arrangements involving multiple parties to provide goods and services to customers, judgement is required to determine if the Group acts as a principal or an agent.
The Group is an agent if its role is to arrange a third party to provide the goods or service; or it is to deliver a third party’s goods or service on their behalves. The Group is a principal if it has the primary responsibility for fulfilling the promised goods or service delivery; and has the discretion in establishing the price for the specified goods or service.
Where the Group is acting as a principal, revenue is recognised on a gross basis in accordance with the transaction price defined in contracts with customers. Where the Group is acting as an agent, revenue is recognised at a net amount reflecting the commission or margin earned.
Contract balancesThe timing of revenue recognition, customer billings and cash collections results in trade receivables, unbilled receivables (contract assets) and deferred revenue (contract liabilities) recognised on the Group’s Consolidated statement of financial position.
Generally, the Group invoices customers as service is provided in accordance with the agreed-upon contract terms, either at periodic intervals (e.g. monthly or quarterly) or upon completion; also at times, billing occurs after the revenue recognition, resulting in contract assets (unbilled receivables). For certain customer contracts, the Group receives advance payments before revenue is recognised, resulting in contract liabilities (deferred revenue). These balances, as well as their movements from the prior reporting period, are disclosed in notes 13 and 15 respectively.
4. Revenue (continued)
8 0 F I N A N C I A L R E P O R T

Notes to the financial statementsfor the year ended 30 June 2020
5. Finance income
2020
$M2019
$M
Interest income 3.1 1.9
Total finance income 3.1 1.9
6. Income tax
(a) Income tax expenseIncome tax expense/(benefit) comprises current and deferred tax expense/(benefit) and is recognised in profit or loss, except to the extent that it relates to a business combination or items recognised directly in equity or other comprehensive income.
The components of tax expense comprise:
2020$M
2019$M
Current tax 10.6 19.9
Deferred tax 10.0 2.3
Adjustment for prior years – current tax 4.4 (0.3)
Adjustment for prior years – deferred tax (4.0) 0.5
Income tax expense 21.0 22.3
The prima facie tax on profit before income tax is reconciled to the income tax expense as follows:
2020$M
2019$M
Accounting profit before income tax 181.8 76.4
Accounting profit before income tax 181.8 76.4
At Australia’s statutory income tax rate of 30% (2019: 30%) 54.5 22.9
Adjusted for:
Other assessable income 0.7 0.5
Non-deductible expenses 1.3 0.6
Capital gain on asset disposal – 0.1
Non-deductible acquisition expense 0.4 1.0
Under provision for income tax in prior year 0.1 0.1
57.0 25.2
Adjusted for:
Tax effect of:
Earnout adjustments (33.3) (0.5)
Different tax rates in overseas jurisdictions 0.5 0.4
Research and development (2.5) (1.6)
Deferred tax adjustments – (0.7)
Non-taxable income (0.6) (0.5)
Income tax expense 21.0 22.3
8 1W I S E T E C H G L O B A L A N N U A L R E P O R T 2 0 2 0
Notes to the financial statementsfor the year ended 30 June 2020
Significant accounting policies
Current taxCurrent tax comprises the expected payable or receivable on the taxable income or loss for the year and any adjustment to tax payable or receivable in respect of previous years.
The amount of current tax payable or receivable is the best estimate of the tax amount expected to be paid or received. That reflects uncertainty related to income taxes.
It is measured using tax rates for each jurisdiction enacted or substantively enacted at the reporting date. Current tax assets and liabilities are offset only if certain criteria are met.
Deferred taxDeferred tax is recognised in respect of temporary differences between the carrying amounts of assets and liabilities for financial reporting purposes and the amounts used for taxation purposes. Deferred tax is not recognised for:
– Temporary differences on the initial recognition of assets or liabilities in a transaction that is not a business combination and that affects neither accounting nor taxable profit or loss;
– Temporary differences related to investments in subsidiaries, associates and joint arrangements to the extent that the Group is able to control the timing of the reversal of the temporary differences and it is probable that they will not reverse in the foreseeable future; and
– Taxable temporary differences arising on the initial recognition of goodwill.
Deferred tax assets are recognised for unused tax losses, unused tax credits and deductible temporary differences to the extent that it is probable that future taxable profits will be available against which they can be used.
Future taxable profits are determined based on the reversal of relevant taxable temporary differences. If the amount of taxable temporary differences is insufficient to recognise a deferred tax asset in full, then future taxable profits, adjusted for rewards of existing temporary differences are considered, based on the business plans for the individual subsidiaries in the Group. Deferred tax assets are reviewed at each reporting date and are reduced to the extent that it is no longer probable that the related tax benefit will be realised. Such reductions are revised when the probability of future taxable profit improves.
Unrecognised deferred tax assets are reassessed at each reporting date and recognised to the extent that it has become probable that future taxable profits will be available against which they can be used.
Deferred tax is measured at the tax rates that are expected to be applied to temporary differences when they reverse, using tax rates enacted or substantively enacted at the reporting date, and reflects uncertainty related to income taxes, if any.
The measurement of deferred tax reflects the tax consequences that would follow from the manner in which the Group expects, at the reporting date, to recover or settle the carrying amount of its assets and liabilities.
Deferred tax assets and liabilities are offset only if certain criteria are met.
6. Income tax (continued)
8 2 F I N A N C I A L R E P O R T
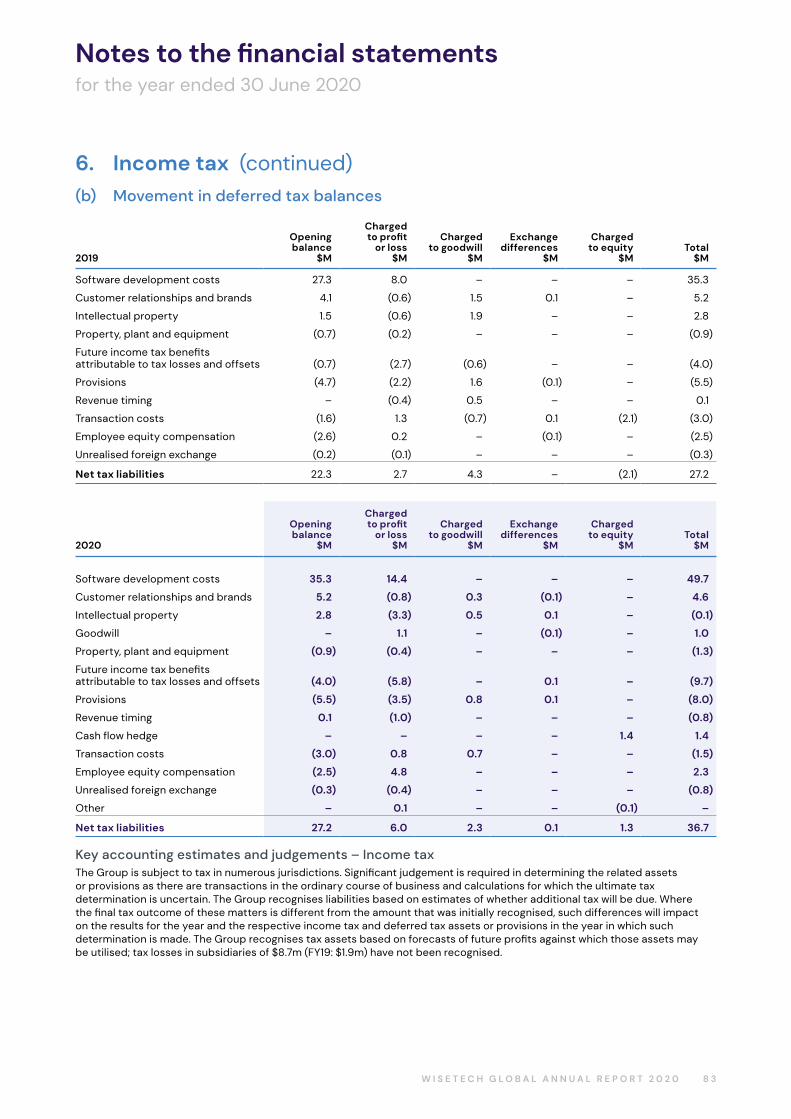
Notes to the financial statementsfor the year ended 30 June 2020
(b) Movement in deferred tax balances
2019
Openingbalance
$M
Charged to profit
or loss$M
Charged to goodwill
$M
Exchangedifferences
$M
Charged to equity
$MTotal
$M
Software development costs 27.3 8.0 – – – 35.3
Customer relationships and brands 4.1 (0.6) 1.5 0.1 – 5.2
Intellectual property 1.5 (0.6) 1.9 – – 2.8
Property, plant and equipment (0.7) (0.2) – – – (0.9)
Future income tax benefits attributable to tax losses and offsets (0.7) (2.7) (0.6) – – (4.0)
Provisions (4.7) (2.2) 1.6 (0.1) – (5.5)
Revenue timing – (0.4) 0.5 – – 0.1
Transaction costs (1.6) 1.3 (0.7) 0.1 (2.1) (3.0)
Employee equity compensation (2.6) 0.2 – (0.1) – (2.5)
Unrealised foreign exchange (0.2) (0.1) – – – (0.3)
Net tax liabilities 22.3 2.7 4.3 – (2.1) 27.2
2020
Openingbalance
$M
Charged to profit
or loss$M
Charged to goodwill
$M
Exchangedifferences
$M
Charged to equity
$MTotal
$M
Software development costs 35.3 14.4 – – – 49.7
Customer relationships and brands 5.2 (0.8) 0.3 (0.1) – 4.6
Intellectual property 2.8 (3.3) 0.5 0.1 – (0.1)
Goodwill – 1.1 – (0.1) – 1.0
Property, plant and equipment (0.9) (0.4) – – – (1.3)
Future income tax benefits attributable to tax losses and offsets (4.0) (5.8) – 0.1 – (9.7)
Provisions (5.5) (3.5) 0.8 0.1 – (8.0)
Revenue timing 0.1 (1.0) – – – (0.8)
Cash flow hedge – – – – 1.4 1.4
Transaction costs (3.0) 0.8 0.7 – – (1.5)
Employee equity compensation (2.5) 4.8 – – – 2.3
Unrealised foreign exchange (0.3) (0.4) – – – (0.8)
Other – 0.1 – – (0.1) –
Net tax liabilities 27.2 6.0 2.3 0.1 1.3 36.7
Key accounting estimates and judgements – Income taxThe Group is subject to tax in numerous jurisdictions. Significant judgement is required in determining the related assets or provisions as there are transactions in the ordinary course of business and calculations for which the ultimate tax determination is uncertain. The Group recognises liabilities based on estimates of whether additional tax will be due. Where the final tax outcome of these matters is different from the amount that was initially recognised, such differences will impact on the results for the year and the respective income tax and deferred tax assets or provisions in the year in which such determination is made. The Group recognises tax assets based on forecasts of future profits against which those assets may be utilised; tax losses in subsidiaries of $8.7m (FY19: $1.9m) have not been recognised.
6. Income tax (continued)
8 3W I S E T E C H G L O B A L A N N U A L R E P O R T 2 0 2 0
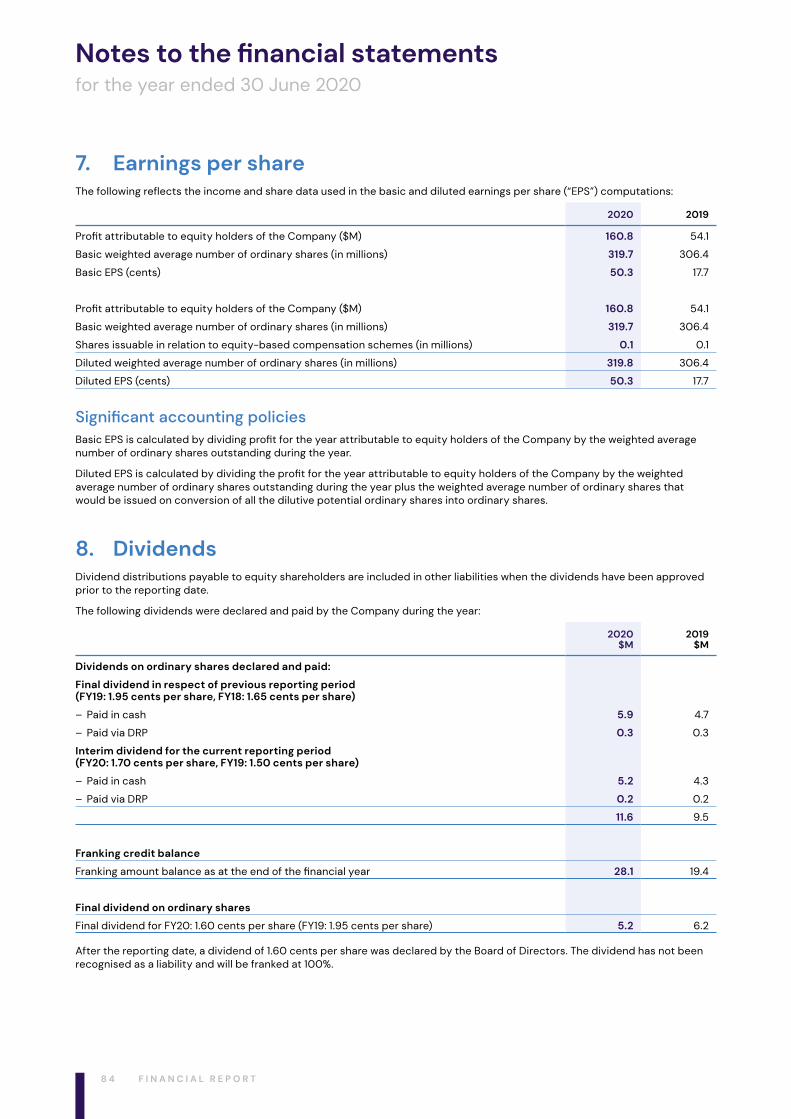
Notes to the financial statementsfor the year ended 30 June 2020
7. Earnings per shareThe following reflects the income and share data used in the basic and diluted earnings per share (“EPS”) computations:
2020 2019
Profit attributable to equity holders of the Company ($M) 160.8 54.1
Basic weighted average number of ordinary shares (in millions) 319.7 306.4
Basic EPS (cents) 50.3 17.7
Profit attributable to equity holders of the Company ($M) 160.8 54.1
Basic weighted average number of ordinary shares (in millions) 319.7 306.4
Shares issuable in relation to equity-based compensation schemes (in millions) 0.1 0.1
Diluted weighted average number of ordinary shares (in millions) 319.8 306.4
Diluted EPS (cents) 50.3 17.7
Significant accounting policiesBasic EPS is calculated by dividing profit for the year attributable to equity holders of the Company by the weighted average number of ordinary shares outstanding during the year.
Diluted EPS is calculated by dividing the profit for the year attributable to equity holders of the Company by the weighted average number of ordinary shares outstanding during the year plus the weighted average number of ordinary shares that would be issued on conversion of all the dilutive potential ordinary shares into ordinary shares.
8. DividendsDividend distributions payable to equity shareholders are included in other liabilities when the dividends have been approved prior to the reporting date.
The following dividends were declared and paid by the Company during the year:
2020$M
2019$M
Dividends on ordinary shares declared and paid:
Final dividend in respect of previous reporting period(FY19: 1.95 cents per share, FY18: 1.65 cents per share)
– Paid in cash 5.9 4.7
– Paid via DRP 0.3 0.3
Interim dividend for the current reporting period(FY20: 1.70 cents per share, FY19: 1.50 cents per share)
– Paid in cash 5.2 4.3
– Paid via DRP 0.2 0.2
11.6 9.5
Franking credit balance
Franking amount balance as at the end of the financial year 28.1 19.4
Final dividend on ordinary shares
Final dividend for FY20: 1.60 cents per share (FY19: 1.95 cents per share) 5.2 6.2
After the reporting date, a dividend of 1.60 cents per share was declared by the Board of Directors. The dividend has not been recognised as a liability and will be franked at 100%.
8 4 F I N A N C I A L R E P O R T
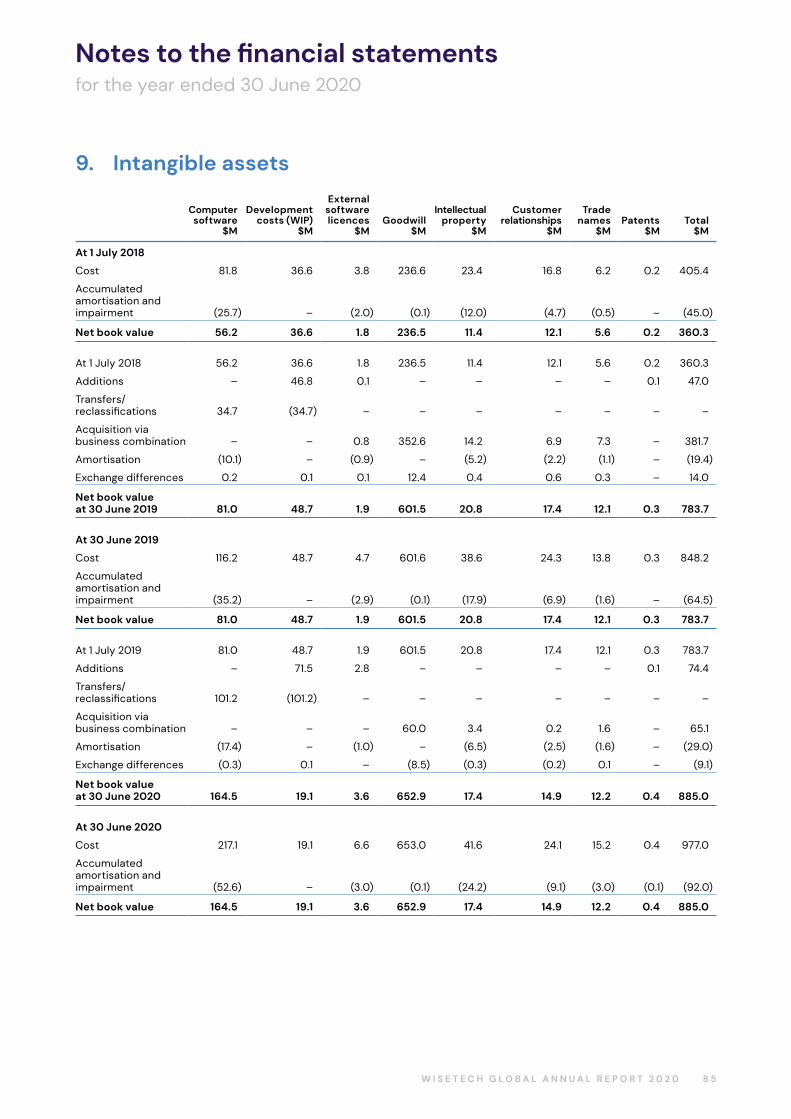
Notes to the financial statementsfor the year ended 30 June 2020
9. Intangible assets
Computersoftware
$M
Developmentcosts (WIP)
$M
External softwarelicences
$MGoodwill
$M
Intellectualproperty
$M
Customerrelationships
$M
Tradenames
$MPatents
$MTotal
$M
At 1 July 2018
Cost 81.8 36.6 3.8 236.6 23.4 16.8 6.2 0.2 405.4
Accumulated amortisation and impairment (25.7) – (2.0) (0.1) (12.0) (4.7) (0.5) – (45.0)
Net book value 56.2 36.6 1.8 236.5 11.4 12.1 5.6 0.2 360.3
At 1 July 2018 56.2 36.6 1.8 236.5 11.4 12.1 5.6 0.2 360.3
Additions – 46.8 0.1 – – – – 0.1 47.0
Transfers/reclassifications 34.7 (34.7) – – – – – – –
Acquisition via business combination – – 0.8 352.6 14.2 6.9 7.3 – 381.7
Amortisation (10.1) – (0.9) – (5.2) (2.2) (1.1) – (19.4)
Exchange differences 0.2 0.1 0.1 12.4 0.4 0.6 0.3 – 14.0
Net book value at 30 June 2019 81.0 48.7 1.9 601.5 20.8 17.4 12.1 0.3 783.7
At 30 June 2019
Cost 116.2 48.7 4.7 601.6 38.6 24.3 13.8 0.3 848.2
Accumulated amortisation and impairment (35.2) – (2.9) (0.1) (17.9) (6.9) (1.6) – (64.5)
Net book value 81.0 48.7 1.9 601.5 20.8 17.4 12.1 0.3 783.7
At 1 July 2019 81.0 48.7 1.9 601.5 20.8 17.4 12.1 0.3 783.7
Additions – 71.5 2.8 – – – – 0.1 74.4
Transfers/reclassifications 101.2 (101.2) – – – – – – –
Acquisition via business combination – – – 60.0 3.4 0.2 1.6 – 65.1
Amortisation (17.4) – (1.0) – (6.5) (2.5) (1.6) – (29.0)
Exchange differences (0.3) 0.1 – (8.5) (0.3) (0.2) 0.1 – (9.1)
Net book value at 30 June 2020 164.5 19.1 3.6 652.9 17.4 14.9 12.2 0.4 885.0
At 30 June 2020
Cost 217.1 19.1 6.6 653.0 41.6 24.1 15.2 0.4 977.0
Accumulated amortisation and impairment (52.6) – (3.0) (0.1) (24.2) (9.1) (3.0) (0.1) (92.0)
Net book value 164.5 19.1 3.6 652.9 17.4 14.9 12.2 0.4 885.0
8 5W I S E T E C H G L O B A L A N N U A L R E P O R T 2 0 2 0
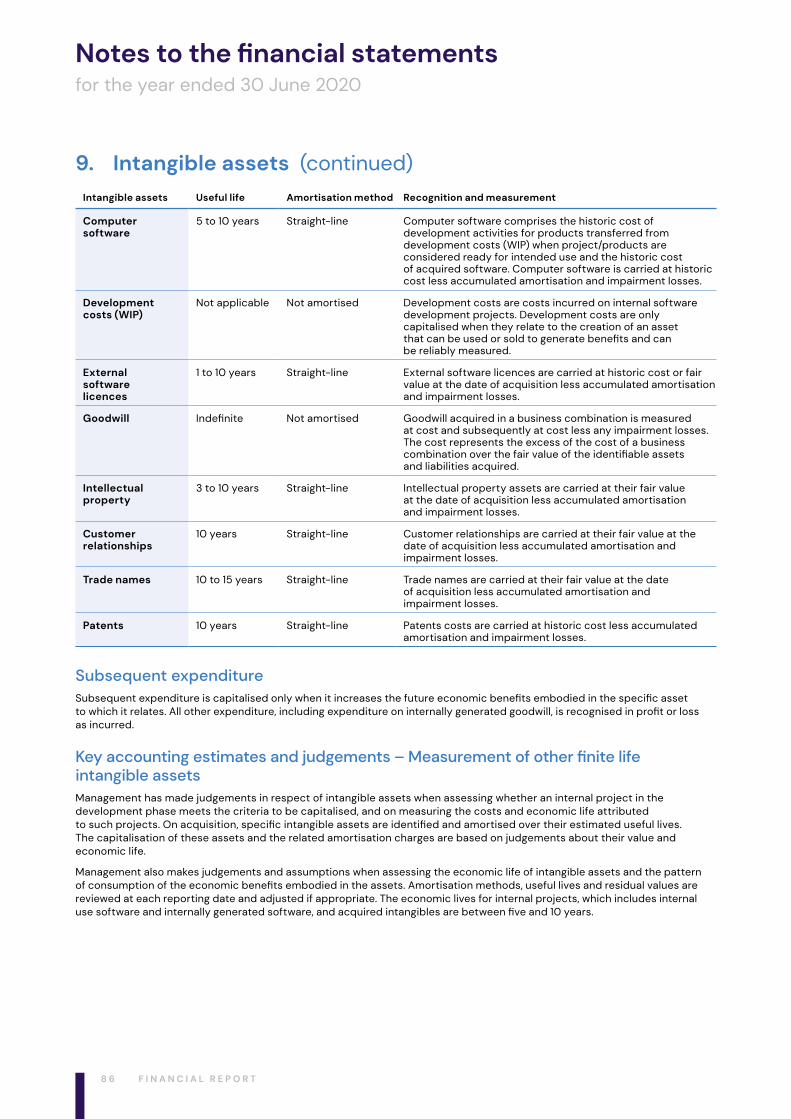
Notes to the financial statementsfor the year ended 30 June 2020
Intangible assets Useful life Amortisation method Recognition and measurement
Computer software
5 to 10 years Straight-line Computer software comprises the historic cost of development activities for products transferred from development costs (WIP) when project/products are considered ready for intended use and the historic cost of acquired software. Computer software is carried at historic cost less accumulated amortisation and impairment losses.
Development costs (WIP)
Not applicable Not amortised Development costs are costs incurred on internal software development projects. Development costs are only capitalised when they relate to the creation of an asset that can be used or sold to generate benefits and can be reliably measured.
External software licences
1 to 10 years Straight-line External software licences are carried at historic cost or fair value at the date of acquisition less accumulated amortisation and impairment losses.
Goodwill Indefinite Not amortised Goodwill acquired in a business combination is measured at cost and subsequently at cost less any impairment losses. The cost represents the excess of the cost of a business combination over the fair value of the identifiable assets and liabilities acquired.
Intellectual property
3 to 10 years Straight-line Intellectual property assets are carried at their fair value at the date of acquisition less accumulated amortisation and impairment losses.
Customer relationships
10 years Straight-line Customer relationships are carried at their fair value at the date of acquisition less accumulated amortisation and impairment losses.
Trade names 10 to 15 years Straight-line Trade names are carried at their fair value at the date of acquisition less accumulated amortisation and impairment losses.
Patents 10 years Straight-line Patents costs are carried at historic cost less accumulated amortisation and impairment losses.
Subsequent expenditureSubsequent expenditure is capitalised only when it increases the future economic benefits embodied in the specific asset to which it relates. All other expenditure, including expenditure on internally generated goodwill, is recognised in profit or loss as incurred.
Key accounting estimates and judgements – Measurement of other finite life intangible assetsManagement has made judgements in respect of intangible assets when assessing whether an internal project in the development phase meets the criteria to be capitalised, and on measuring the costs and economic life attributed to such projects. On acquisition, specific intangible assets are identified and amortised over their estimated useful lives. The capitalisation of these assets and the related amortisation charges are based on judgements about their value and economic life.
Management also makes judgements and assumptions when assessing the economic life of intangible assets and the pattern of consumption of the economic benefits embodied in the assets. Amortisation methods, useful lives and residual values are reviewed at each reporting date and adjusted if appropriate. The economic lives for internal projects, which includes internal use software and internally generated software, and acquired intangibles are between five and 10 years.
9. Intangible assets (continued)
8 6 F I N A N C I A L R E P O R T
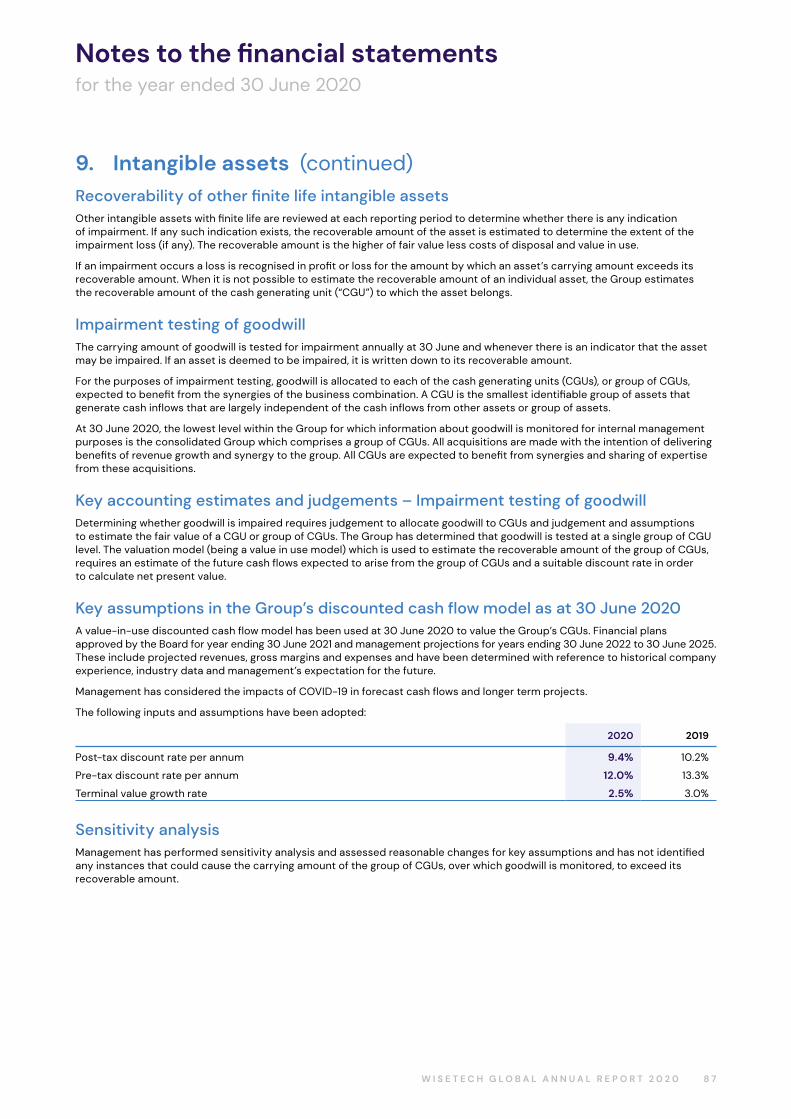
Notes to the financial statementsfor the year ended 30 June 2020
Recoverability of other finite life intangible assetsOther intangible assets with finite life are reviewed at each reporting period to determine whether there is any indication of impairment. If any such indication exists, the recoverable amount of the asset is estimated to determine the extent of the impairment loss (if any). The recoverable amount is the higher of fair value less costs of disposal and value in use.
If an impairment occurs a loss is recognised in profit or loss for the amount by which an asset’s carrying amount exceeds its recoverable amount. When it is not possible to estimate the recoverable amount of an individual asset, the Group estimates the recoverable amount of the cash generating unit (“CGU”) to which the asset belongs.
Impairment testing of goodwillThe carrying amount of goodwill is tested for impairment annually at 30 June and whenever there is an indicator that the asset may be impaired. If an asset is deemed to be impaired, it is written down to its recoverable amount.
For the purposes of impairment testing, goodwill is allocated to each of the cash generating units (CGUs), or group of CGUs, expected to benefit from the synergies of the business combination. A CGU is the smallest identifiable group of assets that generate cash inflows that are largely independent of the cash inflows from other assets or group of assets.
At 30 June 2020, the lowest level within the Group for which information about goodwill is monitored for internal management purposes is the consolidated Group which comprises a group of CGUs. All acquisitions are made with the intention of delivering benefits of revenue growth and synergy to the group. All CGUs are expected to benefit from synergies and sharing of expertise from these acquisitions.
Key accounting estimates and judgements – Impairment testing of goodwillDetermining whether goodwill is impaired requires judgement to allocate goodwill to CGUs and judgement and assumptions to estimate the fair value of a CGU or group of CGUs. The Group has determined that goodwill is tested at a single group of CGU level. The valuation model (being a value in use model) which is used to estimate the recoverable amount of the group of CGUs, requires an estimate of the future cash flows expected to arise from the group of CGUs and a suitable discount rate in order to calculate net present value.
Key assumptions in the Group’s discounted cash flow model as at 30 June 2020A value‑in‑use discounted cash flow model has been used at 30 June 2020 to value the Group’s CGUs. Financial plans approved by the Board for year ending 30 June 2021 and management projections for years ending 30 June 2022 to 30 June 2025. These include projected revenues, gross margins and expenses and have been determined with reference to historical company experience, industry data and management’s expectation for the future.
Management has considered the impacts of COVID‑19 in forecast cash flows and longer term projects.
The following inputs and assumptions have been adopted:
2020 2019
Post‑tax discount rate per annum 9.4% 10.2%
Pre‑tax discount rate per annum 12.0% 13.3%
Terminal value growth rate 2.5% 3.0%
Sensitivity analysisManagement has performed sensitivity analysis and assessed reasonable changes for key assumptions and has not identified any instances that could cause the carrying amount of the group of CGUs, over which goodwill is monitored, to exceed its recoverable amount.
9. Intangible assets (continued)
8 7W I S E T E C H G L O B A L A N N U A L R E P O R T 2 0 2 0
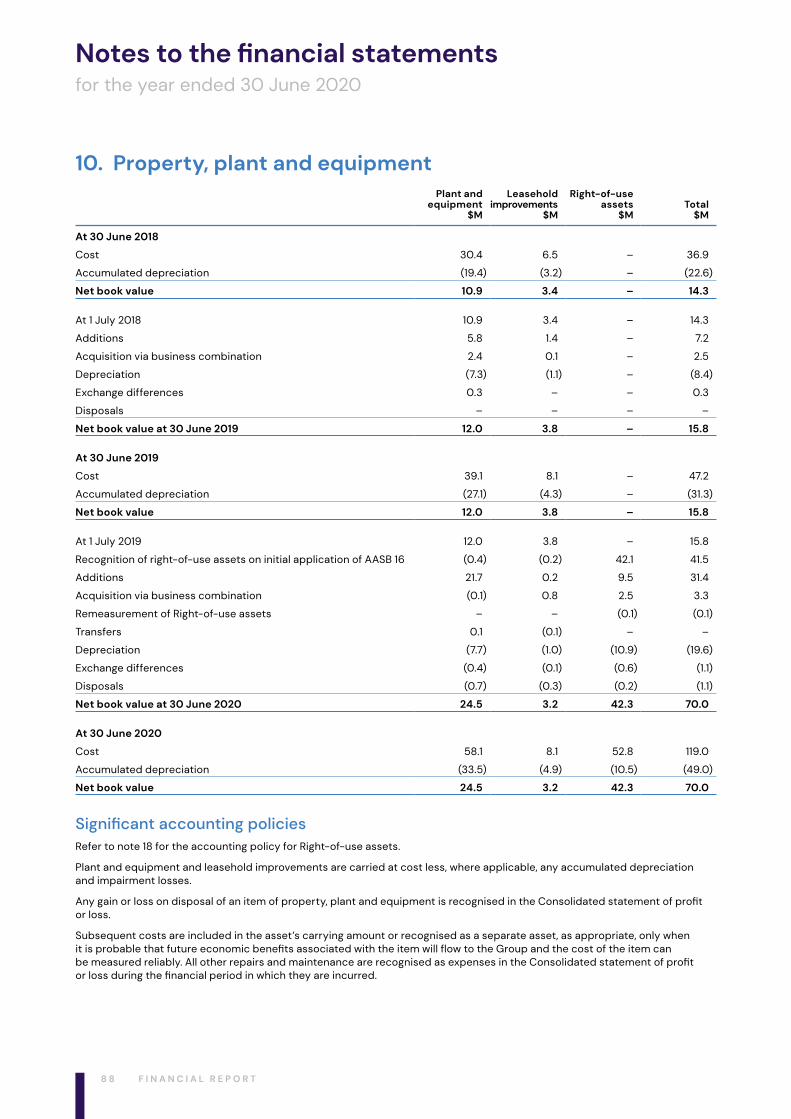
Notes to the financial statementsfor the year ended 30 June 2020
10. Property, plant and equipmentPlant and
equipment$M
Leasehold improvements
$M
Right-of-use assets
$MTotal
$M
At 30 June 2018
Cost 30.4 6.5 – 36.9
Accumulated depreciation (19.4) (3.2) – (22.6)
Net book value 10.9 3.4 – 14.3
At 1 July 2018 10.9 3.4 – 14.3
Additions 5.8 1.4 – 7.2
Acquisition via business combination 2.4 0.1 – 2.5
Depreciation (7.3) (1.1) – (8.4)
Exchange differences 0.3 – – 0.3
Disposals – – – –
Net book value at 30 June 2019 12.0 3.8 – 15.8
At 30 June 2019
Cost 39.1 8.1 – 47.2
Accumulated depreciation (27.1) (4.3) – (31.3)
Net book value 12.0 3.8 – 15.8
At 1 July 2019 12.0 3.8 – 15.8
Recognition of right-of-use assets on initial application of AASB 16 (0.4) (0.2) 42.1 41.5
Additions 21.7 0.2 9.5 31.4
Acquisition via business combination (0.1) 0.8 2.5 3.3
Remeasurement of Right-of-use assets – – (0.1) (0.1)
Transfers 0.1 (0.1) – –
Depreciation (7.7) (1.0) (10.9) (19.6)
Exchange differences (0.4) (0.1) (0.6) (1.1)
Disposals (0.7) (0.3) (0.2) (1.1)
Net book value at 30 June 2020 24.5 3.2 42.3 70.0
At 30 June 2020
Cost 58.1 8.1 52.8 119.0
Accumulated depreciation (33.5) (4.9) (10.5) (49.0)
Net book value 24.5 3.2 42.3 70.0
Significant accounting policiesRefer to note 18 for the accounting policy for Right-of-use assets.
Plant and equipment and leasehold improvements are carried at cost less, where applicable, any accumulated depreciation and impairment losses.
Any gain or loss on disposal of an item of property, plant and equipment is recognised in the Consolidated statement of profit or loss.
Subsequent costs are included in the asset’s carrying amount or recognised as a separate asset, as appropriate, only when it is probable that future economic benefits associated with the item will flow to the Group and the cost of the item can be measured reliably. All other repairs and maintenance are recognised as expenses in the Consolidated statement of profit or loss during the financial period in which they are incurred.
8 8 F I N A N C I A L R E P O R T
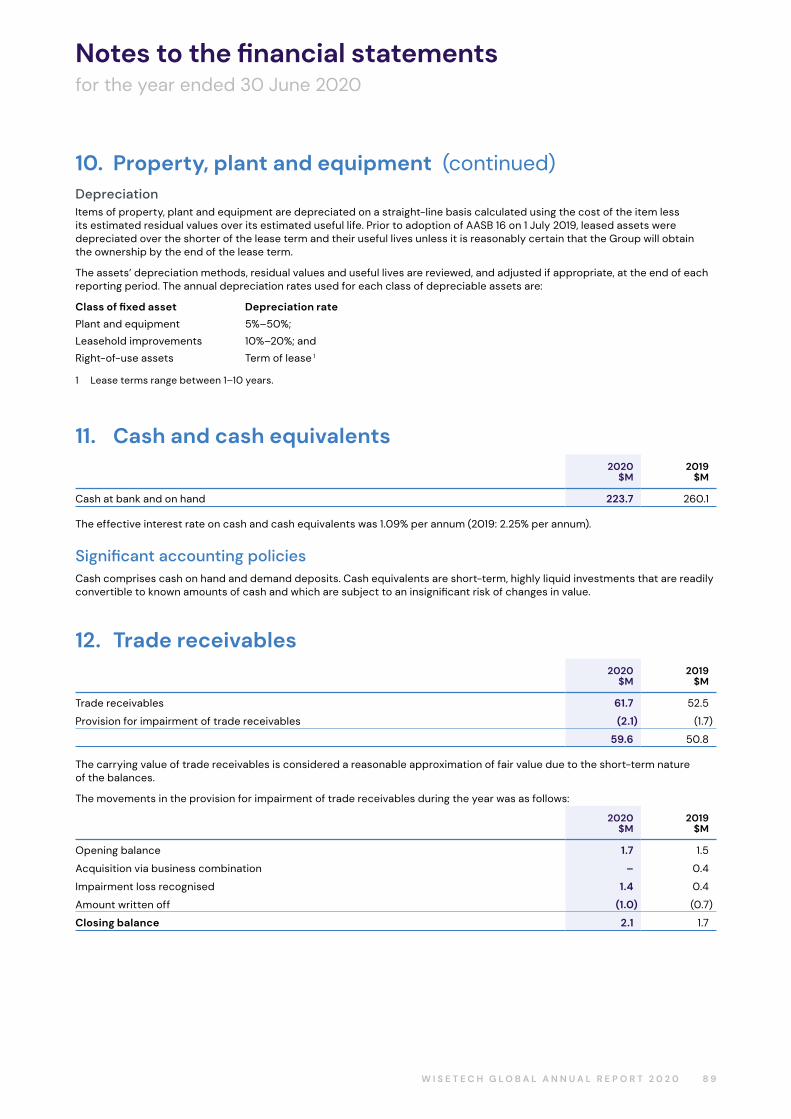
Notes to the financial statementsfor the year ended 30 June 2020
DepreciationItems of property, plant and equipment are depreciated on a straight-line basis calculated using the cost of the item less its estimated residual values over its estimated useful life. Prior to adoption of AASB 16 on 1 July 2019, leased assets were depreciated over the shorter of the lease term and their useful lives unless it is reasonably certain that the Group will obtain the ownership by the end of the lease term.
The assets’ depreciation methods, residual values and useful lives are reviewed, and adjusted if appropriate, at the end of each reporting period. The annual depreciation rates used for each class of depreciable assets are:
Class of fixed asset Depreciation rate
Plant and equipment 5%–50%;
Leasehold improvements 10%–20%; and
Right-of-use assets Term of lease 1
1 Lease terms range between 1–10 years.
11. Cash and cash equivalents
2020
$M2019
$M
Cash at bank and on hand 223.7 260.1
The effective interest rate on cash and cash equivalents was 1.09% per annum (2019: 2.25% per annum).
Significant accounting policiesCash comprises cash on hand and demand deposits. Cash equivalents are short-term, highly liquid investments that are readily convertible to known amounts of cash and which are subject to an insignificant risk of changes in value.
12. Trade receivables2020
$M2019
$M
Trade receivables 61.7 52.5
Provision for impairment of trade receivables (2.1) (1.7)
59.6 50.8
The carrying value of trade receivables is considered a reasonable approximation of fair value due to the short-term nature of the balances.
The movements in the provision for impairment of trade receivables during the year was as follows:
2020$M
2019$M
Opening balance 1.7 1.5
Acquisition via business combination – 0.4
Impairment loss recognised 1.4 0.4
Amount written off (1.0) (0.7)
Closing balance 2.1 1.7
10. Property, plant and equipment (continued)
8 9W I S E T E C H G L O B A L A N N U A L R E P O R T 2 0 2 0
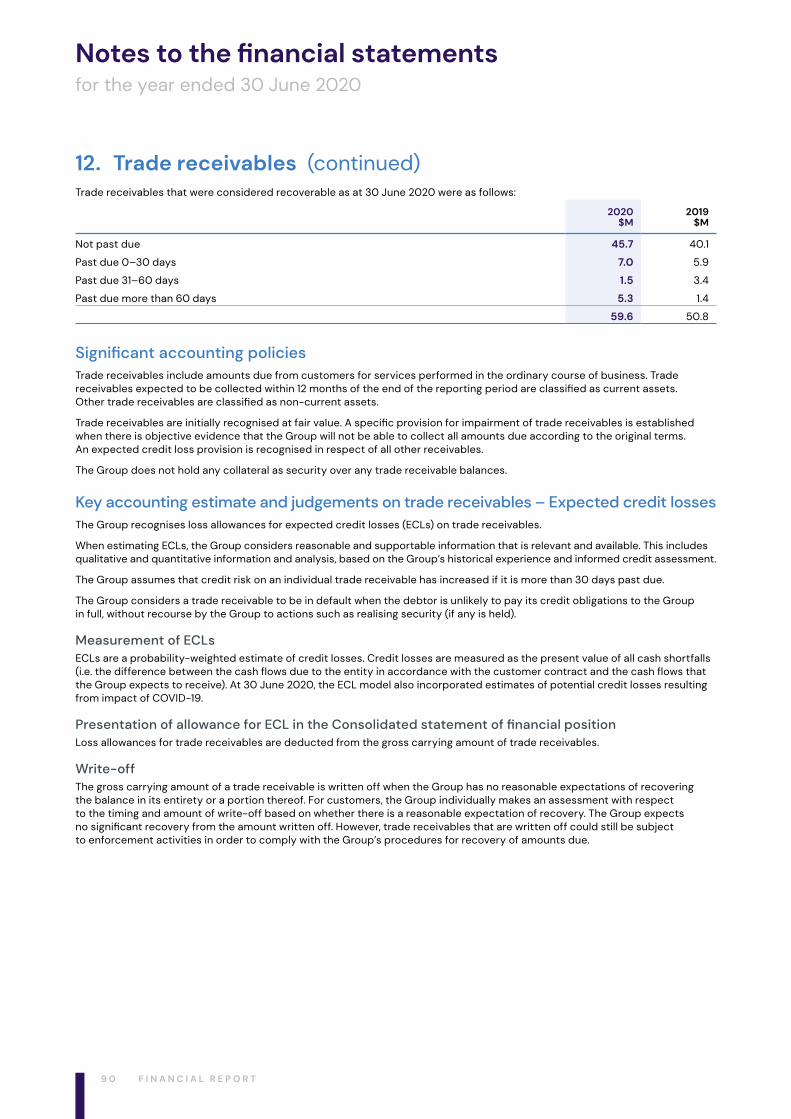
Notes to the financial statementsfor the year ended 30 June 2020
Trade receivables that were considered recoverable as at 30 June 2020 were as follows:
2020$M
2019$M
Not past due 45.7 40.1
Past due 0–30 days 7.0 5.9
Past due 31–60 days 1.5 3.4
Past due more than 60 days 5.3 1.4
59.6 50.8
Significant accounting policiesTrade receivables include amounts due from customers for services performed in the ordinary course of business. Trade receivables expected to be collected within 12 months of the end of the reporting period are classified as current assets. Other trade receivables are classified as non‑current assets.
Trade receivables are initially recognised at fair value. A specific provision for impairment of trade receivables is established when there is objective evidence that the Group will not be able to collect all amounts due according to the original terms. An expected credit loss provision is recognised in respect of all other receivables.
The Group does not hold any collateral as security over any trade receivable balances.
Key accounting estimate and judgements on trade receivables – Expected credit lossesThe Group recognises loss allowances for expected credit losses (ECLs) on trade receivables.
When estimating ECLs, the Group considers reasonable and supportable information that is relevant and available. This includes qualitative and quantitative information and analysis, based on the Group’s historical experience and informed credit assessment.
The Group assumes that credit risk on an individual trade receivable has increased if it is more than 30 days past due.
The Group considers a trade receivable to be in default when the debtor is unlikely to pay its credit obligations to the Group in full, without recourse by the Group to actions such as realising security (if any is held).
Measurement of ECLsECLs are a probability-weighted estimate of credit losses. Credit losses are measured as the present value of all cash shortfalls (i.e. the difference between the cash flows due to the entity in accordance with the customer contract and the cash flows that the Group expects to receive). At 30 June 2020, the ECL model also incorporated estimates of potential credit losses resulting from impact of COVID-19.
Presentation of allowance for ECL in the Consolidated statement of financial positionLoss allowances for trade receivables are deducted from the gross carrying amount of trade receivables.
Write-offThe gross carrying amount of a trade receivable is written off when the Group has no reasonable expectations of recovering the balance in its entirety or a portion thereof. For customers, the Group individually makes an assessment with respect to the timing and amount of write-off based on whether there is a reasonable expectation of recovery. The Group expects no significant recovery from the amount written off. However, trade receivables that are written off could still be subject to enforcement activities in order to comply with the Group’s procedures for recovery of amounts due.
12. Trade receivables (continued)
9 0 F I N A N C I A L R E P O R T
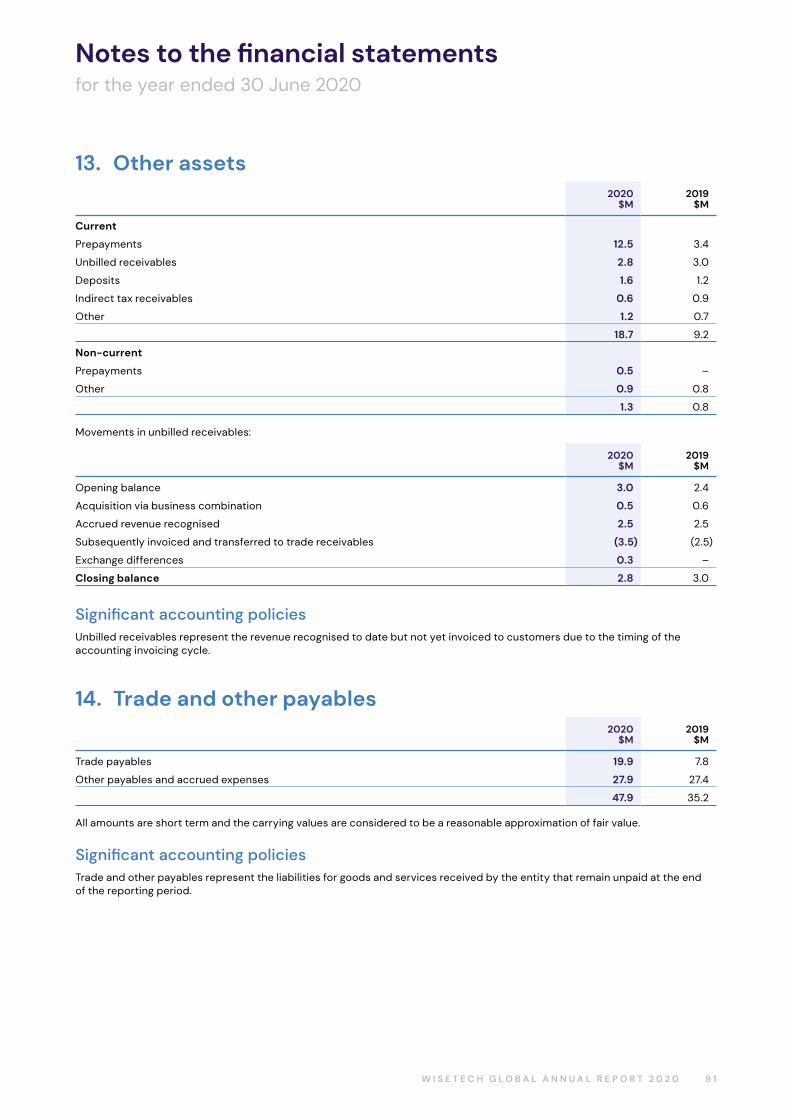
Notes to the financial statementsfor the year ended 30 June 2020
13. Other assets2020
$M2019
$M
Current
Prepayments 12.5 3.4
Unbilled receivables 2.8 3.0
Deposits 1.6 1.2
Indirect tax receivables 0.6 0.9
Other 1.2 0.7
18.7 9.2
Non-current
Prepayments 0.5 –
Other 0.9 0.8
1.3 0.8
Movements in unbilled receivables:
2020$M
2019$M
Opening balance 3.0 2.4
Acquisition via business combination 0.5 0.6
Accrued revenue recognised 2.5 2.5
Subsequently invoiced and transferred to trade receivables (3.5) (2.5)
Exchange differences 0.3 –
Closing balance 2.8 3.0
Significant accounting policiesUnbilled receivables represent the revenue recognised to date but not yet invoiced to customers due to the timing of the accounting invoicing cycle.
14. Trade and other payables2020
$M2019
$M
Trade payables 19.9 7.8
Other payables and accrued expenses 27.9 27.4
47.9 35.2
All amounts are short term and the carrying values are considered to be a reasonable approximation of fair value.
Significant accounting policiesTrade and other payables represent the liabilities for goods and services received by the entity that remain unpaid at the end of the reporting period.
9 1W I S E T E C H G L O B A L A N N U A L R E P O R T 2 0 2 0
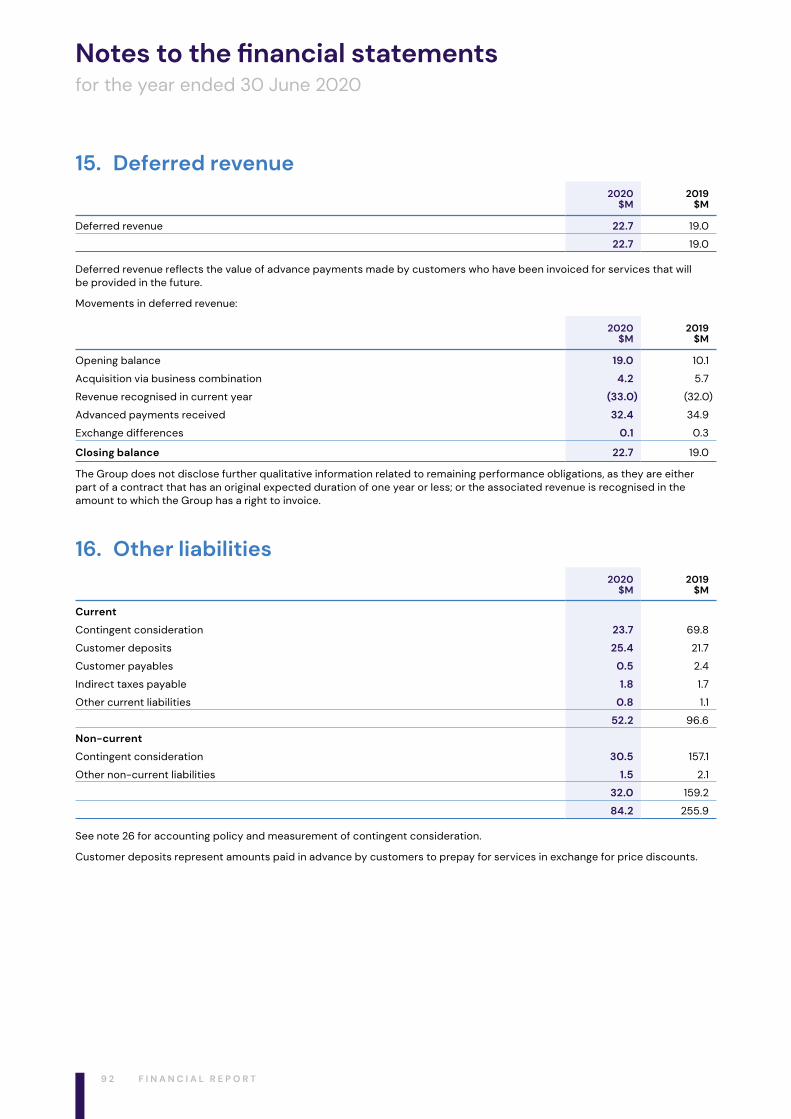
Notes to the financial statementsfor the year ended 30 June 2020
15. Deferred revenue
2020
$M2019
$M
Deferred revenue 22.7 19.0
22.7 19.0
Deferred revenue reflects the value of advance payments made by customers who have been invoiced for services that will be provided in the future.
Movements in deferred revenue:
2020
$M2019
$M
Opening balance 19.0 10.1
Acquisition via business combination 4.2 5.7
Revenue recognised in current year (33.0) (32.0)
Advanced payments received 32.4 34.9
Exchange differences 0.1 0.3
Closing balance 22.7 19.0
The Group does not disclose further qualitative information related to remaining performance obligations, as they are either part of a contract that has an original expected duration of one year or less; or the associated revenue is recognised in the amount to which the Group has a right to invoice.
16. Other liabilities
2020
$M2019
$M
Current
Contingent consideration 23.7 69.8
Customer deposits 25.4 21.7
Customer payables 0.5 2.4
Indirect taxes payable 1.8 1.7
Other current liabilities 0.8 1.1
52.2 96.6
Non-current
Contingent consideration 30.5 157.1
Other non-current liabilities 1.5 2.1
32.0 159.2
84.2 255.9
See note 26 for accounting policy and measurement of contingent consideration.
Customer deposits represent amounts paid in advance by customers to prepay for services in exchange for price discounts.
9 2 F I N A N C I A L R E P O R T
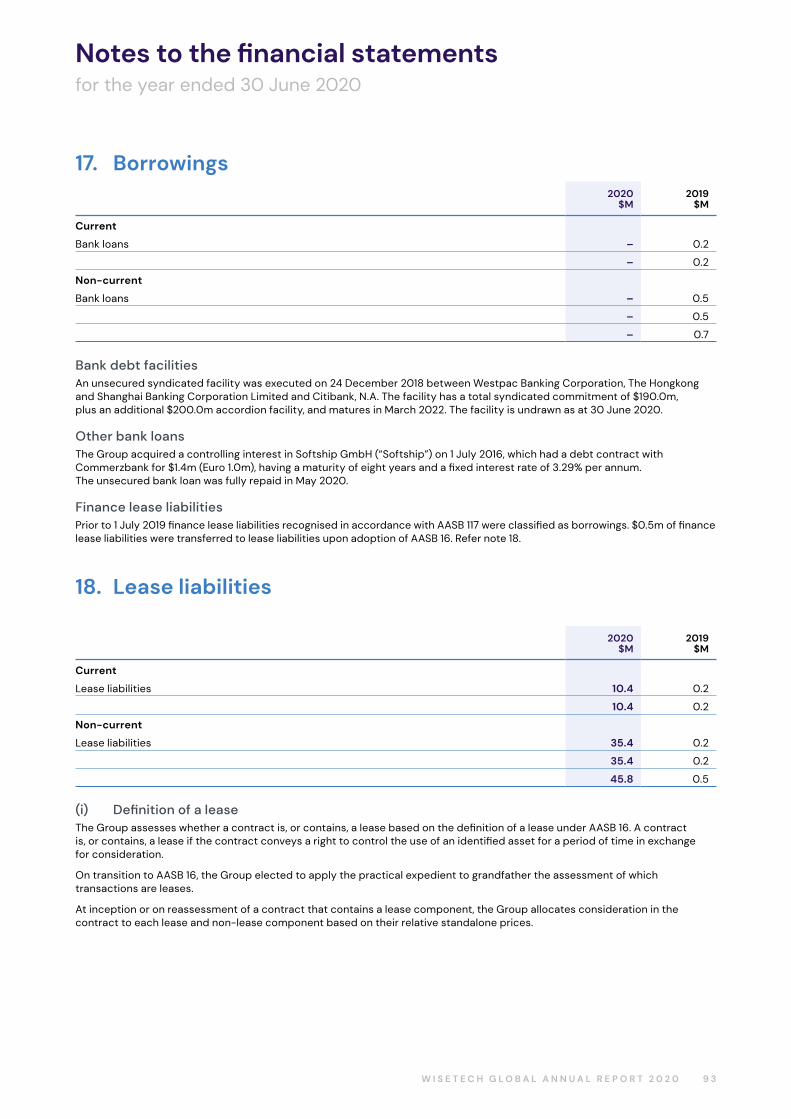
Notes to the financial statementsfor the year ended 30 June 2020
17. Borrowings
2020
$M2019
$M
Current
Bank loans – 0.2
– 0.2
Non-current
Bank loans – 0.5
– 0.5
– 0.7
Bank debt facilitiesAn unsecured syndicated facility was executed on 24 December 2018 between Westpac Banking Corporation, The Hongkong and Shanghai Banking Corporation Limited and Citibank, N.A. The facility has a total syndicated commitment of $190.0m, plus an additional $200.0m accordion facility, and matures in March 2022. The facility is undrawn as at 30 June 2020.
Other bank loansThe Group acquired a controlling interest in Softship GmbH (“Softship”) on 1 July 2016, which had a debt contract with Commerzbank for $1.4m (Euro 1.0m), having a maturity of eight years and a fixed interest rate of 3.29% per annum. The unsecured bank loan was fully repaid in May 2020.
Finance lease liabilitiesPrior to 1 July 2019 finance lease liabilities recognised in accordance with AASB 117 were classified as borrowings. $0.5m of finance lease liabilities were transferred to lease liabilities upon adoption of AASB 16. Refer note 18.
18. Lease liabilities
2020
$M2019
$M
Current
Lease liabilities 10.4 0.2
10.4 0.2
Non-current
Lease liabilities 35.4 0.2
35.4 0.2
45.8 0.5
(i) Definition of a leaseThe Group assesses whether a contract is, or contains, a lease based on the definition of a lease under AASB 16. A contract is, or contains, a lease if the contract conveys a right to control the use of an identified asset for a period of time in exchange for consideration.
On transition to AASB 16, the Group elected to apply the practical expedient to grandfather the assessment of which transactions are leases.
At inception or on reassessment of a contract that contains a lease component, the Group allocates consideration in the contract to each lease and non-lease component based on their relative standalone prices.
9 3W I S E T E C H G L O B A L A N N U A L R E P O R T 2 0 2 0
Notes to the financial statementsfor the year ended 30 June 2020
(ii) As a lesseeThe Group leases properties, motor vehicles and office equipment. As a lessee, the Group previously classified leases as operating or finance leases based on its assessment of whether the lease transferred substantially all of the risks and rewards of ownership. Under AASB 16, the Group recognises right-of-use assets and lease liabilities for most leases.
However, the Group has elected not to recognise right-of-use assets and lease liabilities for leases of low-value assets (e.g. office equipment) and leases with lease terms with less than 12 months. The Group recognises the lease payments associated with these leases as an expense on a straight-line basis over lease term.
The Group presents right-of-use assets in “property, plant and equipment”.
The Group presents lease liabilities separately on the face of the Consolidated statement of financial position.
The Group recognises a right-of-use asset and a lease liability at the lease commencement date. The right-of-use asset is initially measured at cost which comprises the initial amount of the lease liability adjusted for any lease payments made at or before the commencement date, plus any initial direct costs incurred and an estimate of costs to dismantle and remove the underlying asset or to restore the underlying asset or the site on which it is located, less any incentives received.
The right-of-use asset is subsequently depreciated using the straight-line method from the commencement date to the end of the lease term. In addition, the right-of-use asset is periodically reduced by impairment losses, if any, and adjusted for certain remeasurements of the lease liability.
The lease liability is initially measured at the present value of the lease payments that are not paid at the commencement date, discounted using the interest rate implicit in the lease or, if that rate implicit in the lease or, if that rate cannot be readily determined, the Group’s incremental borrowing rate. Generally, the Group uses its incremental borrowing rate as the discount rate.
The Group determines its incremental borrowing rate by obtaining interest rates from various external financing sources and makes certain adjustments to reflect the terms of the lease and the type of asset leased.
Lease payments included in the measurement of the lease liability comprise the following:
– Fixed payments, including in substance fixed payments;
– Variable lease payments that depend on an index variation, initially measured using the index or value as at the commencement date;
– Amounts expected to be payable under a residual value guarantee; and
– The exercise price under a purchase option that the Group is reasonably certain to exercise, lease payments in an optional renewal period if the Group is reasonably certain to exercise an extension option, and penalties for early termination of a lease unless the Group is reasonably certain not to terminate early.
The lease liability is subsequently increased by the interest cost on the lease liability and decreased by lease payments made. It is remeasured when there is a change in future lease payments arising from a change in an index or rate, a change in the estimate of the amount expected to be payable under a residual value guarantee, or as appropriate, changes in the assessment of whether a purchase or extension option is reasonably certain to be exercised or a termination option is reasonably certain not to be exercised.
When the lease liability is remeasured in this way, a corresponding adjustment is made to the right-of-use asset carrying amount, or is recorded in profit or loss if the right‑of‑use carrying amount has been reduced to nil.
Key accounting estimates and judgements – Lease termThe Group has applied judgement to determine the lease term for some lease contracts in which it is a lessee that include renewal options. The assessment of whether the Group is reasonably certain to exercise such options impacts the lease term, which affects the amount of lease liabilities and right-of-use assets recognised.
TransitionAt transition, for leases classified as operating leases under AASB 117, lease liabilities were measured at present values of the remaining lease payments, discounted at the Group’s incremental borrowing rate as at 1 July 2019.
At transition, for leases classified as operating leases under AASB 117, right‑of‑use assets are measured at either:
– Their carrying amount as if AASB 16 had been applied since the commencement date, discounted using the Group’s incremental borrowing rate at the date of initial application; or
– An amount equal to the lease liability, adjusted by the amount of any prepaid or accrued lease payments.
18. Lease liabilities (continued)
9 4 F I N A N C I A L R E P O R T
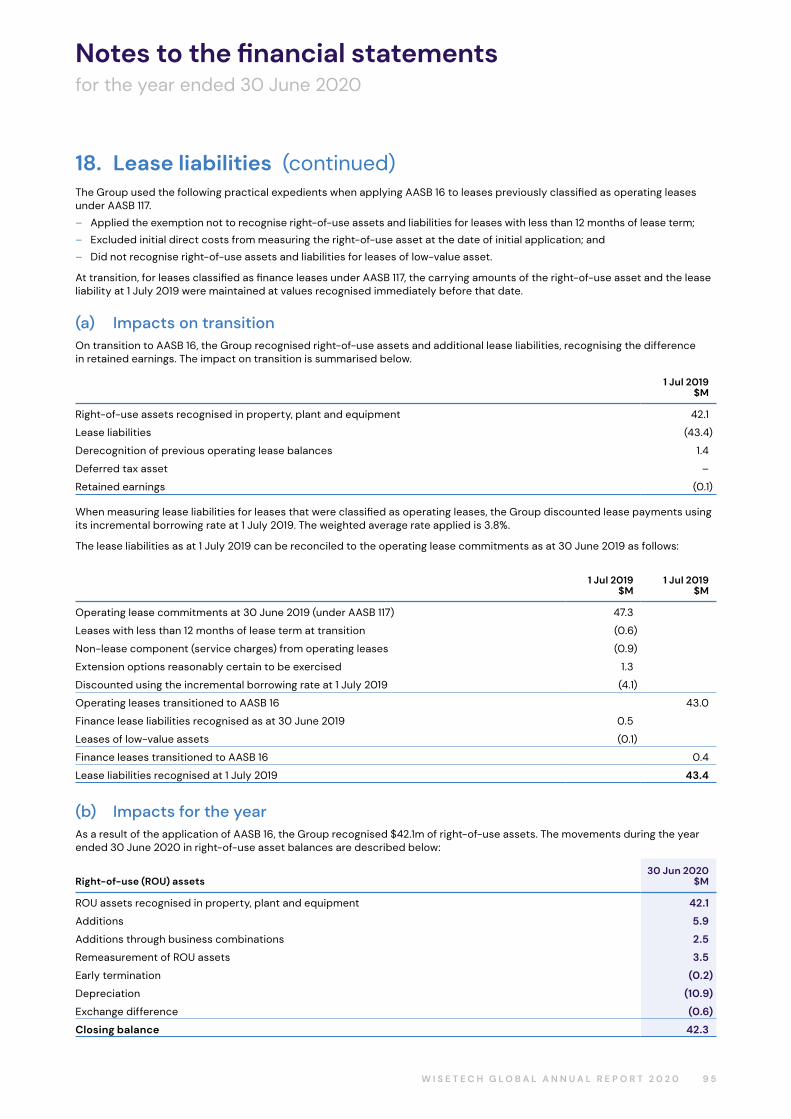
Notes to the financial statementsfor the year ended 30 June 2020
The Group used the following practical expedients when applying AASB 16 to leases previously classified as operating leases under AASB 117.
– Applied the exemption not to recognise right-of-use assets and liabilities for leases with less than 12 months of lease term;
– Excluded initial direct costs from measuring the right-of-use asset at the date of initial application; and
– Did not recognise right-of-use assets and liabilities for leases of low-value asset.
At transition, for leases classified as finance leases under AASB 117, the carrying amounts of the right‑of‑use asset and the lease liability at 1 July 2019 were maintained at values recognised immediately before that date.
(a) Impacts on transitionOn transition to AASB 16, the Group recognised right-of-use assets and additional lease liabilities, recognising the difference in retained earnings. The impact on transition is summarised below.
1 Jul 2019$M
Right-of-use assets recognised in property, plant and equipment 42.1
Lease liabilities (43.4)
Derecognition of previous operating lease balances 1.4
Deferred tax asset –
Retained earnings (0.1)
When measuring lease liabilities for leases that were classified as operating leases, the Group discounted lease payments using its incremental borrowing rate at 1 July 2019. The weighted average rate applied is 3.8%.
The lease liabilities as at 1 July 2019 can be reconciled to the operating lease commitments as at 30 June 2019 as follows:
1 Jul 2019
$M1 Jul 2019
$M
Operating lease commitments at 30 June 2019 (under AASB 117) 47.3
Leases with less than 12 months of lease term at transition (0.6)
Non-lease component (service charges) from operating leases (0.9)
Extension options reasonably certain to be exercised 1.3
Discounted using the incremental borrowing rate at 1 July 2019 (4.1)
Operating leases transitioned to AASB 16 43.0
Finance lease liabilities recognised as at 30 June 2019 0.5
Leases of low-value assets (0.1)
Finance leases transitioned to AASB 16 0.4
Lease liabilities recognised at 1 July 2019 43.4
(b) Impacts for the yearAs a result of the application of AASB 16, the Group recognised $42.1m of right‑of‑use assets. The movements during the year ended 30 June 2020 in right‑of‑use asset balances are described below:
Right-of-use (ROU) assets 30 Jun 2020
$M
ROU assets recognised in property, plant and equipment 42.1
Additions 5.9
Additions through business combinations 2.5
Remeasurement of ROU assets 3.5
Early termination (0.2)
Depreciation (10.9)
Exchange difference (0.6)
Closing balance 42.3
18. Lease liabilities (continued)
9 5W I S E T E C H G L O B A L A N N U A L R E P O R T 2 0 2 0
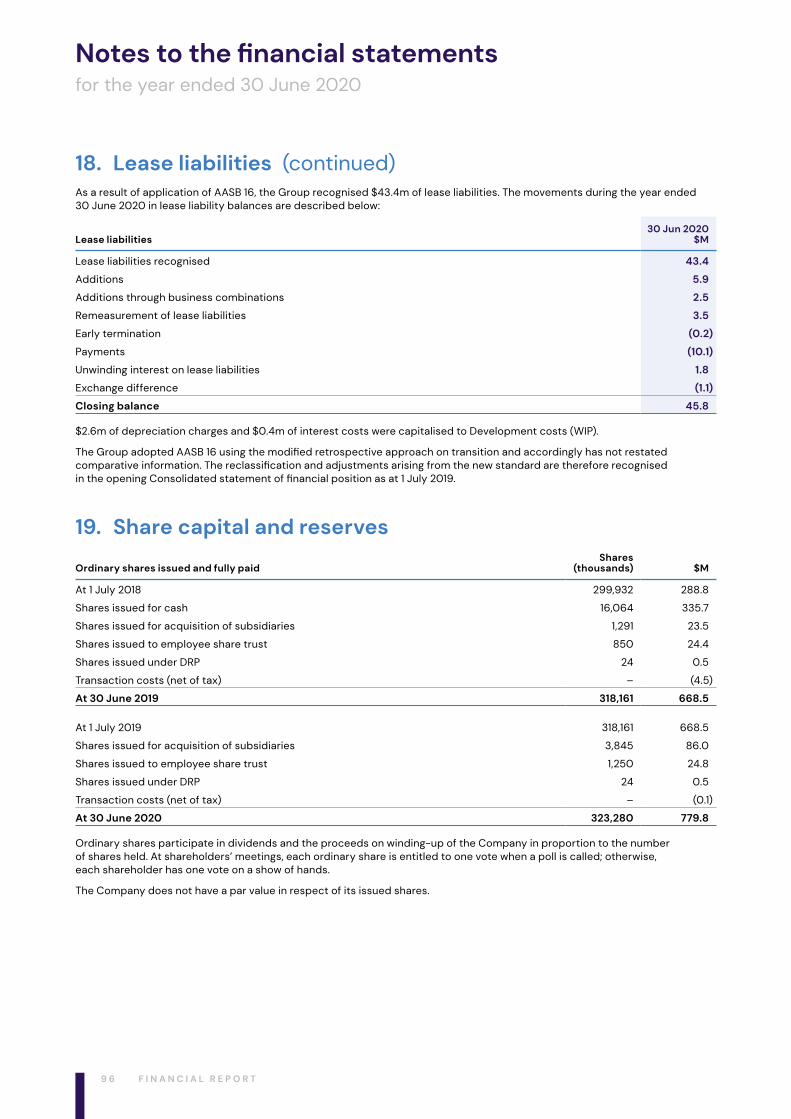
Notes to the financial statementsfor the year ended 30 June 2020
As a result of application of AASB 16, the Group recognised $43.4m of lease liabilities. The movements during the year ended 30 June 2020 in lease liability balances are described below:
Lease liabilities 30 Jun 2020
$M
Lease liabilities recognised 43.4
Additions 5.9
Additions through business combinations 2.5
Remeasurement of lease liabilities 3.5
Early termination (0.2)
Payments (10.1)
Unwinding interest on lease liabilities 1.8
Exchange difference (1.1)
Closing balance 45.8
$2.6m of depreciation charges and $0.4m of interest costs were capitalised to Development costs (WIP).
The Group adopted AASB 16 using the modified retrospective approach on transition and accordingly has not restated comparative information. The reclassification and adjustments arising from the new standard are therefore recognised in the opening Consolidated statement of financial position as at 1 July 2019.
19. Share capital and reserves
Ordinary shares issued and fully paidShares
(thousands) $M
At 1 July 2018 299,932 288.8
Shares issued for cash 16,064 335.7
Shares issued for acquisition of subsidiaries 1,291 23.5
Shares issued to employee share trust 850 24.4
Shares issued under DRP 24 0.5
Transaction costs (net of tax) – (4.5)
At 30 June 2019 318,161 668.5
At 1 July 2019 318,161 668.5
Shares issued for acquisition of subsidiaries 3,845 86.0
Shares issued to employee share trust 1,250 24.8
Shares issued under DRP 24 0.5
Transaction costs (net of tax) – (0.1)
At 30 June 2020 323,280 779.8
Ordinary shares participate in dividends and the proceeds on winding-up of the Company in proportion to the number of shares held. At shareholders’ meetings, each ordinary share is entitled to one vote when a poll is called; otherwise, each shareholder has one vote on a show of hands.
The Company does not have a par value in respect of its issued shares.
18. Lease liabilities (continued)
9 6 F I N A N C I A L R E P O R T
Notes to the financial statementsfor the year ended 30 June 2020
Nature and purpose of reserves
(i) Treasury share reserveThe reserve for the Company’s treasury shares comprises the cost of the Company’s shares held by the WiseTech Global Limited Employee Share Trust. At 30 June 2020, the Trust held 1,474,894 shares of the Company (2019: 1,283,578 shares).
(ii) Acquisition reserveThe acquisition reserve comprises the cumulative consideration paid to acquire minority interests in excess of the fair value of the net assets when attaining control, in addition to the difference between the share price at the time of the agreement to issue shares and the share price on the date of issue when the Group’s shares are issued under acquisition agreements.
(iii) Cash flow hedge reserveThe cash flow hedge reserve comprises the effective portion of the cumulative net change in the fair value of cash flow hedging instruments.
(iv) Share-based payment reserveThe share-based payment reserve represents the value of unvested shares and unissued shares as part of the share-based payment scheme.
(v) Foreign currency translation reserveThe foreign currency translation reserve comprises all foreign currency differences arising from the translation of the financial statements not in Australian dollar functional currency.
Capital managementManagement controls the capital of the Group in order to maintain a sustainable debt to equity ratio, generate long-term shareholder value and ensure that the Group can fund its operations and continue as a going concern. The Group’s capital and debt include ordinary share capital and financial liabilities, supported by financial assets.
Management effectively manages the Group’s capital by assessing the Group’s financial risks and adjusting its capital structure in response to changes in these risks and in the market. These responses include the management of debt levels, distributions to shareholders and share issues.
Throughout FY20 the Group issued $86.0m in shares to pay for obligations under acquisition agreements. In addition, at 30 June 2020 the Group has an undrawn debt facility of $190.0m, to apply towards future strategic initiatives. The total equity of the Group at 30 June 2020 is $1,003.4m (2019: $766.6m) and total cash and cash equivalents at 30 June 2020 are $223.7m (2019: $260.1m). The total bank loans at 30 June 2020 are $nil (2019: $0.7m).
The Group is not subject to any externally imposed capital requirements.
19. Share capital and reserves (continued)
9 7W I S E T E C H G L O B A L A N N U A L R E P O R T 2 0 2 0
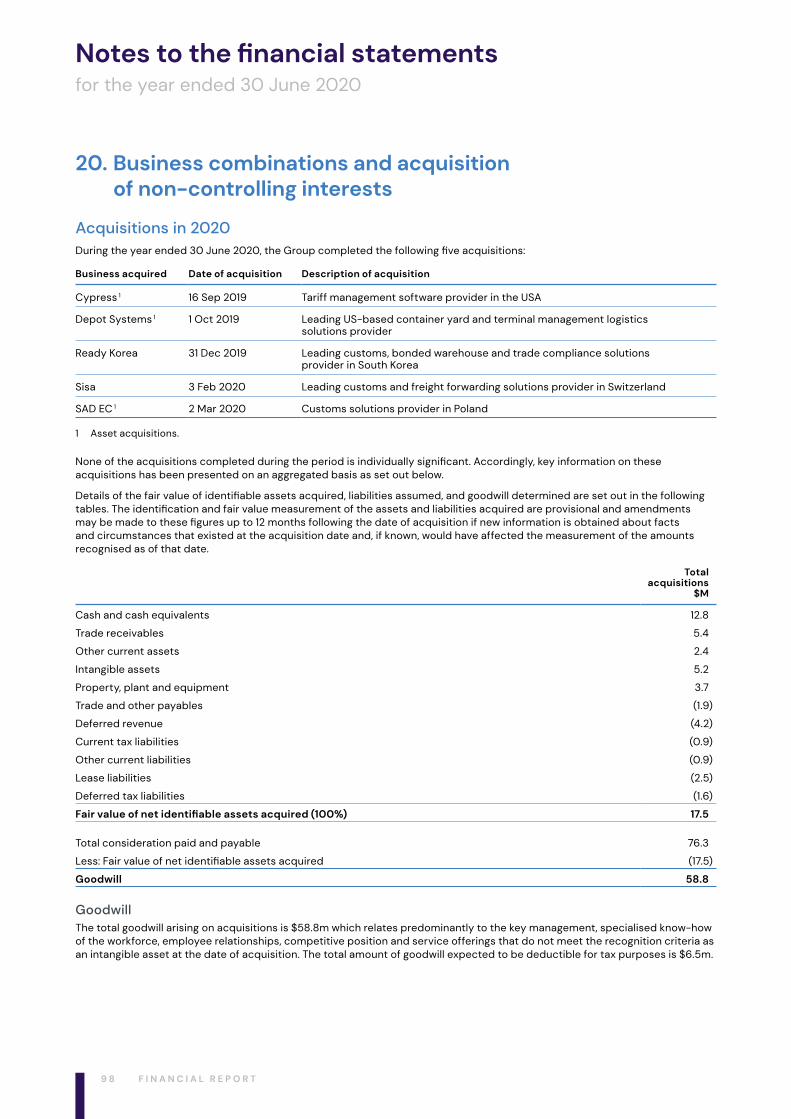
Notes to the financial statementsfor the year ended 30 June 2020
20. Business combinations and acquisition of non-controlling interests
Acquisitions in 2020During the year ended 30 June 2020, the Group completed the following five acquisitions:
Business acquired Date of acquisition Description of acquisition
Cypress 1 16 Sep 2019 Tariff management software provider in the USA
Depot Systems 1 1 Oct 2019 Leading US-based container yard and terminal management logistics solutions provider
Ready Korea 31 Dec 2019 Leading customs, bonded warehouse and trade compliance solutions provider in South Korea
Sisa 3 Feb 2020 Leading customs and freight forwarding solutions provider in Switzerland
SAD EC 1 2 Mar 2020 Customs solutions provider in Poland
1 Asset acquisitions.
None of the acquisitions completed during the period is individually significant. Accordingly, key information on these acquisitions has been presented on an aggregated basis as set out below.
Details of the fair value of identifiable assets acquired, liabilities assumed, and goodwill determined are set out in the following tables. The identification and fair value measurement of the assets and liabilities acquired are provisional and amendments may be made to these figures up to 12 months following the date of acquisition if new information is obtained about facts and circumstances that existed at the acquisition date and, if known, would have affected the measurement of the amounts recognised as of that date.
Total acquisitions
$M
Cash and cash equivalents 12.8
Trade receivables 5.4
Other current assets 2.4
Intangible assets 5.2
Property, plant and equipment 3.7
Trade and other payables (1.9)
Deferred revenue (4.2)
Current tax liabilities (0.9)
Other current liabilities (0.9)
Lease liabilities (2.5)
Deferred tax liabilities (1.6)
Fair value of net identifiable assets acquired (100%) 17.5
Total consideration paid and payable 76.3
Less: Fair value of net identifiable assets acquired (17.5)
Goodwill 58.8
GoodwillThe total goodwill arising on acquisitions is $58.8m which relates predominantly to the key management, specialised know‑how of the workforce, employee relationships, competitive position and service offerings that do not meet the recognition criteria as an intangible asset at the date of acquisition. The total amount of goodwill expected to be deductible for tax purposes is $6.5m.
9 8 F I N A N C I A L R E P O R T
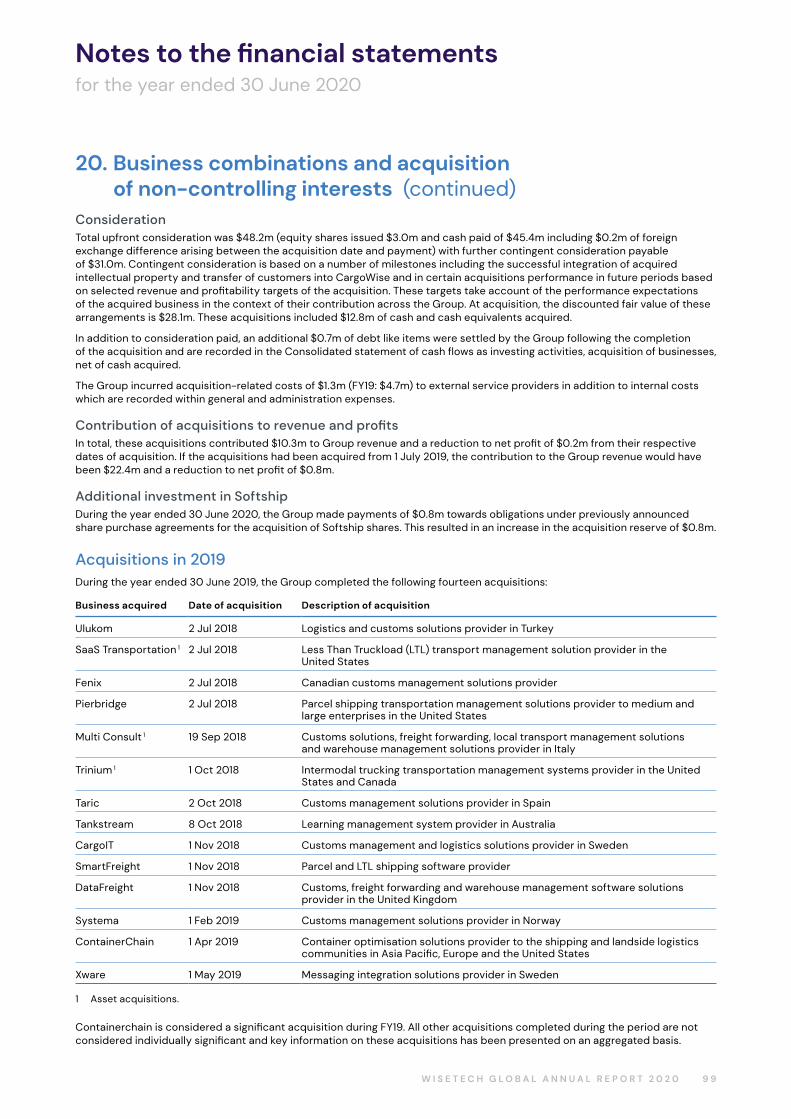
Notes to the financial statementsfor the year ended 30 June 2020
ConsiderationTotal upfront consideration was $48.2m (equity shares issued $3.0m and cash paid of $45.4m including $0.2m of foreign exchange difference arising between the acquisition date and payment) with further contingent consideration payable of $31.0m. Contingent consideration is based on a number of milestones including the successful integration of acquired intellectual property and transfer of customers into CargoWise and in certain acquisitions performance in future periods based on selected revenue and profitability targets of the acquisition. These targets take account of the performance expectations of the acquired business in the context of their contribution across the Group. At acquisition, the discounted fair value of these arrangements is $28.1m. These acquisitions included $12.8m of cash and cash equivalents acquired.
In addition to consideration paid, an additional $0.7m of debt like items were settled by the Group following the completion of the acquisition and are recorded in the Consolidated statement of cash flows as investing activities, acquisition of businesses, net of cash acquired.
The Group incurred acquisition‑related costs of $1.3m (FY19: $4.7m) to external service providers in addition to internal costs which are recorded within general and administration expenses.
Contribution of acquisitions to revenue and profitsIn total, these acquisitions contributed $10.3m to Group revenue and a reduction to net profit of $0.2m from their respective dates of acquisition. If the acquisitions had been acquired from 1 July 2019, the contribution to the Group revenue would have been $22.4m and a reduction to net profit of $0.8m.
Additional investment in SoftshipDuring the year ended 30 June 2020, the Group made payments of $0.8m towards obligations under previously announced share purchase agreements for the acquisition of Softship shares. This resulted in an increase in the acquisition reserve of $0.8m.
Acquisitions in 2019During the year ended 30 June 2019, the Group completed the following fourteen acquisitions:
Business acquired Date of acquisition Description of acquisition
Ulukom 2 Jul 2018 Logistics and customs solutions provider in Turkey
SaaS Transportation 1 2 Jul 2018 Less Than Truckload (LTL) transport management solution provider in the United States
Fenix 2 Jul 2018 Canadian customs management solutions provider
Pierbridge 2 Jul 2018 Parcel shipping transportation management solutions provider to medium and large enterprises in the United States
Multi Consult 1 19 Sep 2018 Customs solutions, freight forwarding, local transport management solutions and warehouse management solutions provider in Italy
Trinium 1 1 Oct 2018 Intermodal trucking transportation management systems provider in the United States and Canada
Taric 2 Oct 2018 Customs management solutions provider in Spain
Tankstream 8 Oct 2018 Learning management system provider in Australia
CargoIT 1 Nov 2018 Customs management and logistics solutions provider in Sweden
SmartFreight 1 Nov 2018 Parcel and LTL shipping software provider
DataFreight 1 Nov 2018 Customs, freight forwarding and warehouse management software solutions provider in the United Kingdom
Systema 1 Feb 2019 Customs management solutions provider in Norway
ContainerChain 1 Apr 2019 Container optimisation solutions provider to the shipping and landside logistics communities in Asia Pacific, Europe and the United States
Xware 1 May 2019 Messaging integration solutions provider in Sweden
1 Asset acquisitions.
Containerchain is considered a significant acquisition during FY19. All other acquisitions completed during the period are not considered individually significant and key information on these acquisitions has been presented on an aggregated basis.
20. Business combinations and acquisition of non-controlling interests (continued)
9 9W I S E T E C H G L O B A L A N N U A L R E P O R T 2 0 2 0
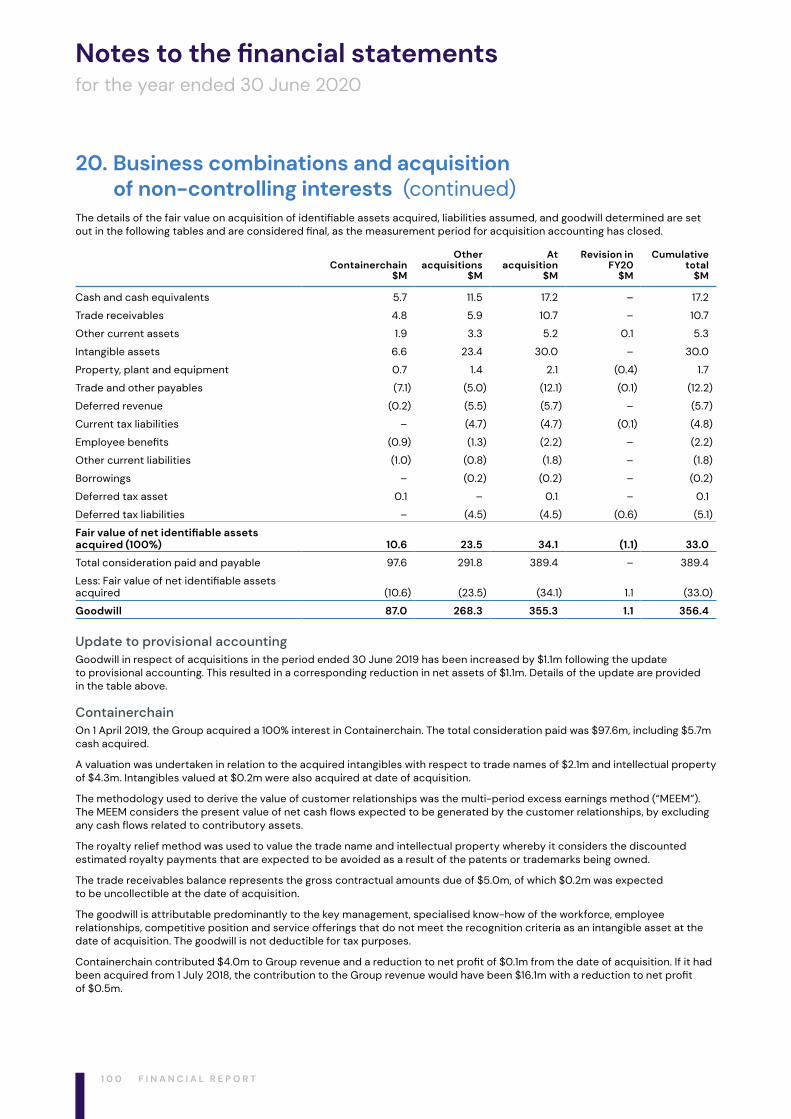
Notes to the financial statementsfor the year ended 30 June 2020
The details of the fair value on acquisition of identifiable assets acquired, liabilities assumed, and goodwill determined are set out in the following tables and are considered final, as the measurement period for acquisition accounting has closed.
Containerchain$M
Otheracquisitions
$M
Atacquisition
$M
Revision inFY20
$M
Cumulativetotal
$M
Cash and cash equivalents 5.7 11.5 17.2 – 17.2
Trade receivables 4.8 5.9 10.7 – 10.7
Other current assets 1.9 3.3 5.2 0.1 5.3
Intangible assets 6.6 23.4 30.0 – 30.0
Property, plant and equipment 0.7 1.4 2.1 (0.4) 1.7
Trade and other payables (7.1) (5.0) (12.1) (0.1) (12.2)
Deferred revenue (0.2) (5.5) (5.7) – (5.7)
Current tax liabilities – (4.7) (4.7) (0.1) (4.8)
Employee benefits (0.9) (1.3) (2.2) – (2.2)
Other current liabilities (1.0) (0.8) (1.8) – (1.8)
Borrowings – (0.2) (0.2) – (0.2)
Deferred tax asset 0.1 – 0.1 – 0.1
Deferred tax liabilities – (4.5) (4.5) (0.6) (5.1)
Fair value of net identifiable assets acquired (100%) 10.6 23.5 34.1 (1.1) 33.0
Total consideration paid and payable 97.6 291.8 389.4 – 389.4
Less: Fair value of net identifiable assets acquired (10.6) (23.5) (34.1) 1.1 (33.0)
Goodwill 87.0 268.3 355.3 1.1 356.4
Update to provisional accountingGoodwill in respect of acquisitions in the period ended 30 June 2019 has been increased by $1.1m following the update to provisional accounting. This resulted in a corresponding reduction in net assets of $1.1m. Details of the update are provided in the table above.
ContainerchainOn 1 April 2019, the Group acquired a 100% interest in Containerchain. The total consideration paid was $97.6m, including $5.7m cash acquired.
A valuation was undertaken in relation to the acquired intangibles with respect to trade names of $2.1m and intellectual property of $4.3m. Intangibles valued at $0.2m were also acquired at date of acquisition.
The methodology used to derive the value of customer relationships was the multi-period excess earnings method (“MEEM”). The MEEM considers the present value of net cash flows expected to be generated by the customer relationships, by excluding any cash flows related to contributory assets.
The royalty relief method was used to value the trade name and intellectual property whereby it considers the discounted estimated royalty payments that are expected to be avoided as a result of the patents or trademarks being owned.
The trade receivables balance represents the gross contractual amounts due of $5.0m, of which $0.2m was expected to be uncollectible at the date of acquisition.
The goodwill is attributable predominantly to the key management, specialised know-how of the workforce, employee relationships, competitive position and service offerings that do not meet the recognition criteria as an intangible asset at the date of acquisition. The goodwill is not deductible for tax purposes.
Containerchain contributed $4.0m to Group revenue and a reduction to net profit of $0.1m from the date of acquisition. If it had been acquired from 1 July 2018, the contribution to the Group revenue would have been $16.1m with a reduction to net profit of $0.5m.
20. Business combinations and acquisition of non-controlling interests (continued)
1 0 0 F I N A N C I A L R E P O R T
Notes to the financial statementsfor the year ended 30 June 2020
Other acquisitions
GoodwillThe total goodwill arising on other acquisitions is $268.3m which relates predominantly to the key management, specialised know‑how of the workforce, employee relationships, competitive position and service offerings that do not meet the recognition criteria as an intangible asset at the date of acquisition. The total amount of goodwill expected to be deductible for tax purposes is $33.1m.
ConsiderationTotal upfront consideration was $159.0m ($136.3m paid in cash and $22.7m in equity shares issued) with further contingent and deferred consideration payable of $141.1m. Contingent consideration, consisting of fixed and variable components are based on a number of milestones, including performance-related targets and the integration of the acquired businesses with the Group such as the development of pre-existing capabilities into the Group’s existing product. Deferred consideration represents the calculation of the final upfront consideration made subsequent to the completion date. At acquisition, the discounted value of these arrangements is $132.8m. Other acquisitions included $11.5m of cash and cash equivalents acquired.
In addition to the consideration paid, an additional $1.0m of debt like items were settled by the Group following the completion of the acquisitions and are recorded in Consolidated statement of cash flows as investing activities, acquisition of businesses, net of cash acquired.
Contribution of acquisitions to revenue and profitsIn total, these acquisitions contributed $45.3m to Group revenue and a reduction to net profit of $0.9m from their respective dates of acquisition. If the acquisitions had been acquired from 1 July 2018, the contribution to the Group revenue would have been $60.8m and nil change to net profit.
Additional investment in SoftshipDuring the year ended 30 June 2019, the Group acquired all remaining shares of Softship through a squeeze‑out process under German law, such that it is now a wholly-owned subsidiary. The squeeze-out process is expected to conclude in FY20. $2.4m was paid for the additional shares, with $2.1m recorded as an increase in the acquisition reserve and $0.3m offset to the remaining non-controlling interest balance.
Significant accounting policyBusiness combinations occur where an acquirer obtains control over one or more businesses.
A business combination is accounted for by applying the acquisition method, unless it is a combination involving entities or businesses under common control. Under the acquisition method, the business combination will be accounted for from the date that control is attained whereby the fair value of the identifiable assets acquired and liabilities (including contingent liabilities) assumed is recognised (subject to certain limited exemptions).
Consideration transferred, including any contingent consideration is required to be measured at fair value on the date of acquisition which takes into account the perspective of a ‘market participant’ and is a measurement of the amount that the Group would have to pay to such a participant for them to assume the remaining obligations under the contracts to acquire these businesses.
Contingent consideration obligations are classified as equity or liability in accordance with AASB 132 Financial Instruments: Presentation. If an obligation to pay contingent consideration that meets the definition of a financial instrument is classified as equity, it is not remeasured and settlement is accounted for within equity. Otherwise, other contingent consideration is remeasured at fair value at each reporting date and subsequent changes in the fair value of the contingent consideration are recognised in profit or loss. Where the accounting standards require that an obligation to be settled in shares is classified as a liability, changes in measurement from the point of initial recognition through to when the milestone is achieved and the number of shares to be granted is determined, are recognised in profit or loss. Subsequently, once the number of shares is fixed and determined, any changes in the value of the shares to be granted between the milestone being achieved and the point of settlement, are recognised in acquisition reserve within equity (see note 19).
The Group only has contingent consideration obligations classified as liabilities at the reporting date.
As a consequence any changes in the fair value of contingent consideration that do not meet the requirements above, such as a subsequent renegotiation and settlement of the obligation, does not result in any change to the measurement of goodwill. Instead, changes to the fair value of contingent consideration classified as a liability is recognised in the profit or loss.
Any goodwill that arises is tested annually for impairment. Any gain on a bargain purchase is recognised in profit or loss immediately. Transaction costs are expensed as incurred except if related to the issue of debt or equity securities.
The consideration transferred does not include amounts related to the settlement of pre-existing relationships. Such amounts are generally recognised in the Consolidated statement of profit or loss.
20. Business combinations and acquisition of non-controlling interests (continued)
1 0 1W I S E T E C H G L O B A L A N N U A L R E P O R T 2 0 2 0
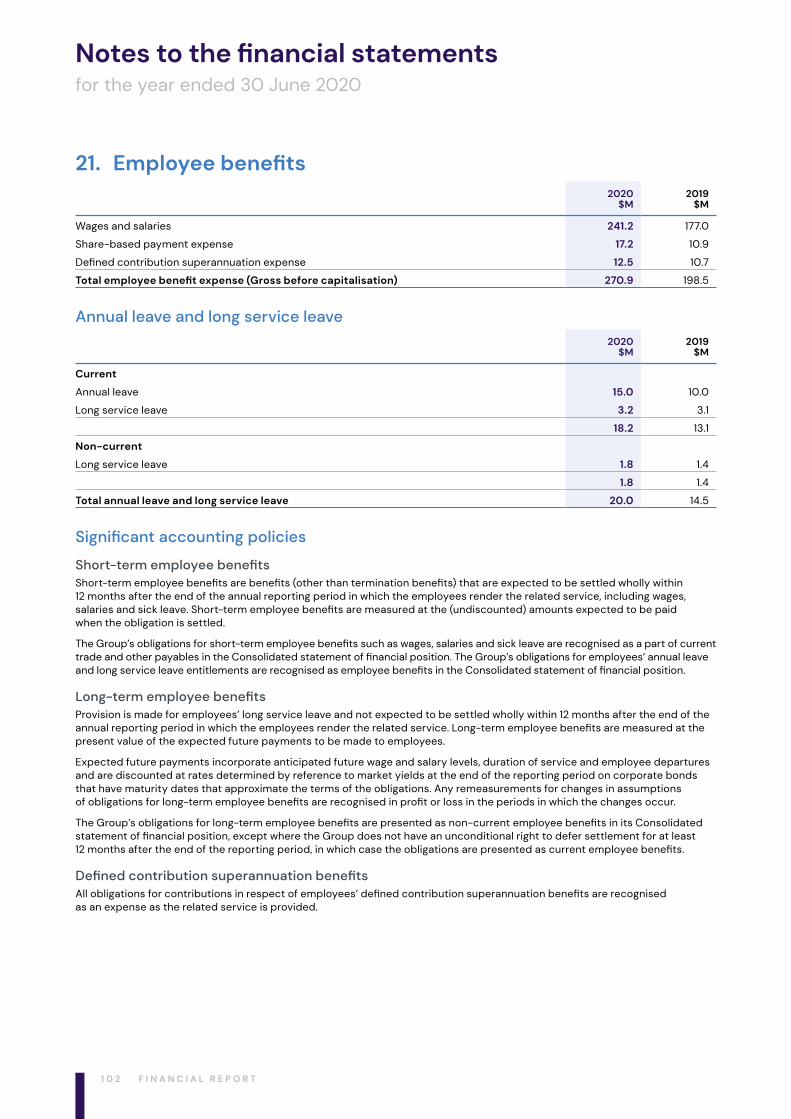
Notes to the financial statementsfor the year ended 30 June 2020
21. Employee benefits2020
$M2019
$M
Wages and salaries 241.2 177.0
Share-based payment expense 17.2 10.9
Defined contribution superannuation expense 12.5 10.7
Total employee benefit expense (Gross before capitalisation) 270.9 198.5
Annual leave and long service leave2020
$M2019
$M
Current
Annual leave 15.0 10.0
Long service leave 3.2 3.1
18.2 13.1
Non-current
Long service leave 1.8 1.4
1.8 1.4
Total annual leave and long service leave 20.0 14.5
Significant accounting policies
Short-term employee benefitsShort‑term employee benefits are benefits (other than termination benefits) that are expected to be settled wholly within 12 months after the end of the annual reporting period in which the employees render the related service, including wages, salaries and sick leave. Short‑term employee benefits are measured at the (undiscounted) amounts expected to be paid when the obligation is settled.
The Group’s obligations for short‑term employee benefits such as wages, salaries and sick leave are recognised as a part of current trade and other payables in the Consolidated statement of financial position. The Group’s obligations for employees’ annual leave and long service leave entitlements are recognised as employee benefits in the Consolidated statement of financial position.
Long-term employee benefitsProvision is made for employees’ long service leave and not expected to be settled wholly within 12 months after the end of the annual reporting period in which the employees render the related service. Long‑term employee benefits are measured at the present value of the expected future payments to be made to employees.
Expected future payments incorporate anticipated future wage and salary levels, duration of service and employee departures and are discounted at rates determined by reference to market yields at the end of the reporting period on corporate bonds that have maturity dates that approximate the terms of the obligations. Any remeasurements for changes in assumptions of obligations for long‑term employee benefits are recognised in profit or loss in the periods in which the changes occur.
The Group’s obligations for long‑term employee benefits are presented as non‑current employee benefits in its Consolidated statement of financial position, except where the Group does not have an unconditional right to defer settlement for at least 12 months after the end of the reporting period, in which case the obligations are presented as current employee benefits.
Defined contribution superannuation benefitsAll obligations for contributions in respect of employees’ defined contribution superannuation benefits are recognised as an expense as the related service is provided.
1 0 2 F I N A N C I A L R E P O R T
Notes to the financial statementsfor the year ended 30 June 2020
Share-based payment transactionsThe Company has a number of share-based payment arrangements that were granted to employees during FY20. These related to shares or share rights granted as part of employee remuneration packages (base remuneration and performance bonus), Christmas bonuses and arrangements following completion of business acquisitions. The awards were granted on various dates in FY20 based on a specified monetary value to each recipient and a share price at the time the offer is determined. The fair value of these arrangements was deemed to be the function of the number of share rights granted and the share price at grant date. Share rights granted may vest in predetermined tranches. Share rights were also granted as part of a matching process under the employee ‘invest as you earn’ programme which operated during the year. Vesting is dependent on continued employment with the Group. The fair value of the grant is recognised in profit or loss to match to each employee’s service period until vesting. Upon cessation of employment unvested rights are forfeited. The cost recognised in prior periods in respect of forfeited rights is credited to profit or loss.
The total value of share‑based payments recognised in the share‑based payment reserve during the year was $17.2m (2019: $10.9m) of which $13.3m was recognised in profit and loss and $3.9m was capitalised as part of directly attributable development costs which are required to be recognised as internally developed intangibles (refer note 9).
21. Employee benefits (continued)
1 0 3W I S E T E C H G L O B A L A N N U A L R E P O R T 2 0 2 0
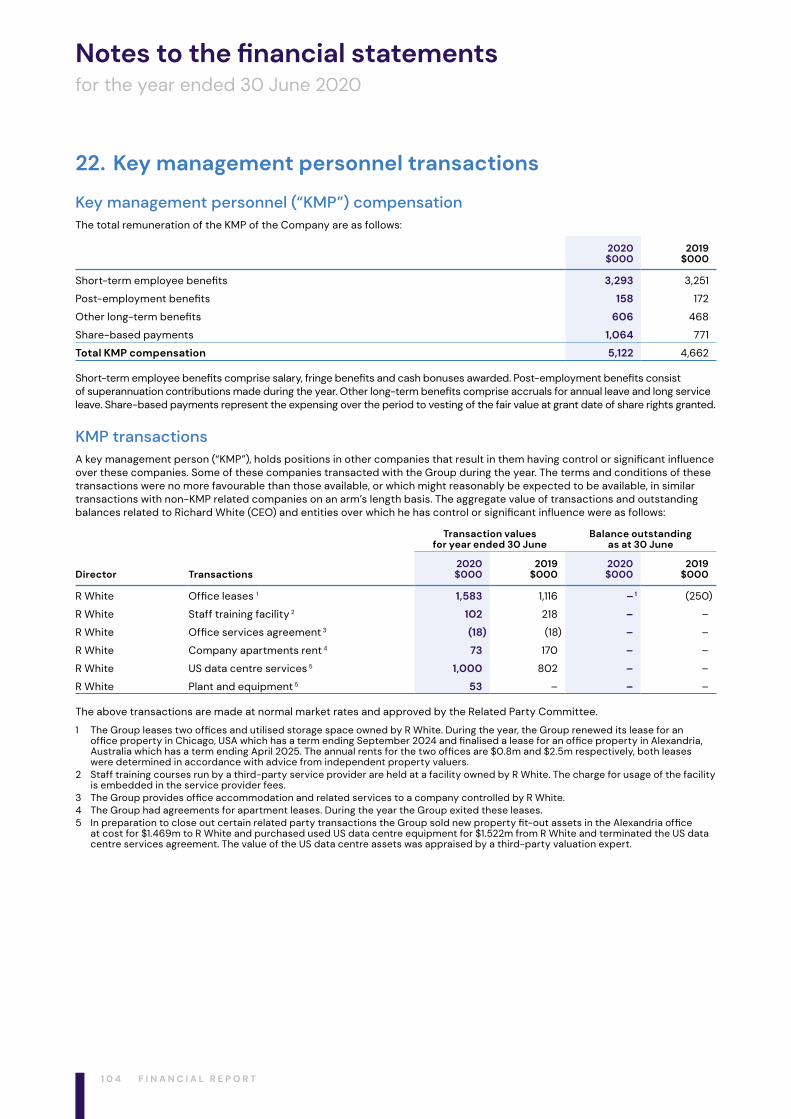
Notes to the financial statementsfor the year ended 30 June 2020
22. Key management personnel transactions
Key management personnel (“KMP”) compensationThe total remuneration of the KMP of the Company are as follows:
2020$000
2019$000
Short‑term employee benefits 3,293 3,251
Post‑employment benefits 158 172
Other long‑term benefits 606 468
Share-based payments 1,064 771
Total KMP compensation 5,122 4,662
Short‑term employee benefits comprise salary, fringe benefits and cash bonuses awarded. Post‑employment benefits consist of superannuation contributions made during the year. Other long‑term benefits comprise accruals for annual leave and long service leave. Share-based payments represent the expensing over the period to vesting of the fair value at grant date of share rights granted.
KMP transactionsA key management person (“KMP”), holds positions in other companies that result in them having control or significant influence over these companies. Some of these companies transacted with the Group during the year. The terms and conditions of these transactions were no more favourable than those available, or which might reasonably be expected to be available, in similar transactions with non‑KMP related companies on an arm’s length basis. The aggregate value of transactions and outstanding balances related to Richard White (CEO) and entities over which he has control or significant influence were as follows:
Director Transactions
Transaction values for year ended 30 June
Balance outstanding as at 30 June
2020$000
2019$000
2020$000
2019$000
R White Office leases 1 1,583 1,116 – 1 (250)
R White Staff training facility 2 102 218 – –
R White Office services agreement 3 (18) (18) – –
R White Company apartments rent 4 73 170 – –
R White US data centre services 5 1,000 802 – –
R White Plant and equipment 5 53 – – –
The above transactions are made at normal market rates and approved by the Related Party Committee.
1 The Group leases two offices and utilised storage space owned by R White. During the year, the Group renewed its lease for an office property in Chicago, USA which has a term ending September 2024 and finalised a lease for an office property in Alexandria, Australia which has a term ending April 2025. The annual rents for the two offices are $0.8m and $2.5m respectively, both leases were determined in accordance with advice from independent property valuers.
2 Staff training courses run by a third-party service provider are held at a facility owned by R White. The charge for usage of the facility is embedded in the service provider fees.
3 The Group provides office accommodation and related services to a company controlled by R White.4 The Group had agreements for apartment leases. During the year the Group exited these leases.5 In preparation to close out certain related party transactions the Group sold new property fit‑out assets in the Alexandria office
at cost for $1.469m to R White and purchased used US data centre equipment for $1.522m from R White and terminated the US data centre services agreement. The value of the US data centre assets was appraised by a third-party valuation expert.
1 0 4 F I N A N C I A L R E P O R T
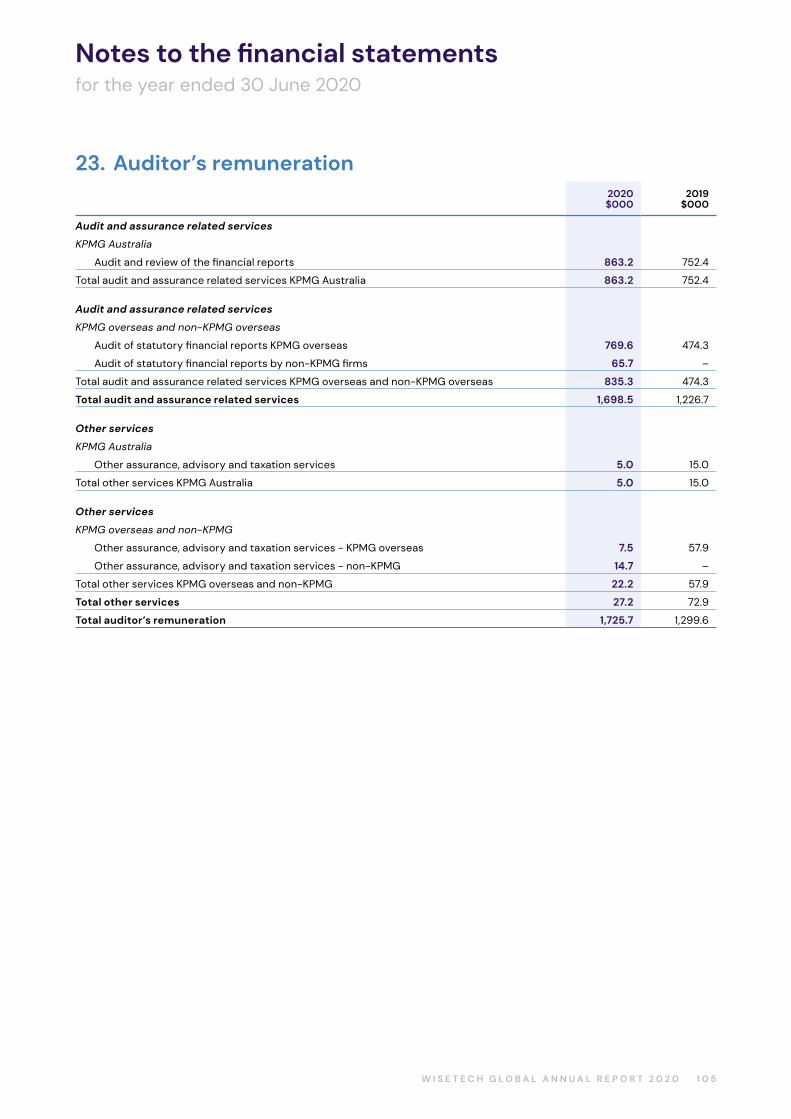
Notes to the financial statementsfor the year ended 30 June 2020
23. Auditor’s remuneration2020$000
2019$000
Audit and assurance related services
KPMG Australia
Audit and review of the financial reports 863.2 752.4
Total audit and assurance related services KPMG Australia 863.2 752.4
Audit and assurance related services
KPMG overseas and non-KPMG overseas
Audit of statutory financial reports KPMG overseas 769.6 474.3
Audit of statutory financial reports by non‑KPMG firms 65.7 –
Total audit and assurance related services KPMG overseas and non‑KPMG overseas 835.3 474.3
Total audit and assurance related services 1,698.5 1,226.7
Other services
KPMG Australia
Other assurance, advisory and taxation services 5.0 15.0
Total other services KPMG Australia 5.0 15.0
Other services
KPMG overseas and non-KPMG
Other assurance, advisory and taxation services ‑ KPMG overseas 7.5 57.9
Other assurance, advisory and taxation services ‑ non‑KPMG 14.7 –
Total other services KPMG overseas and non‑KPMG 22.2 57.9
Total other services 27.2 72.9
Total auditor’s remuneration 1,725.7 1,299.6
1 0 5W I S E T E C H G L O B A L A N N U A L R E P O R T 2 0 2 0
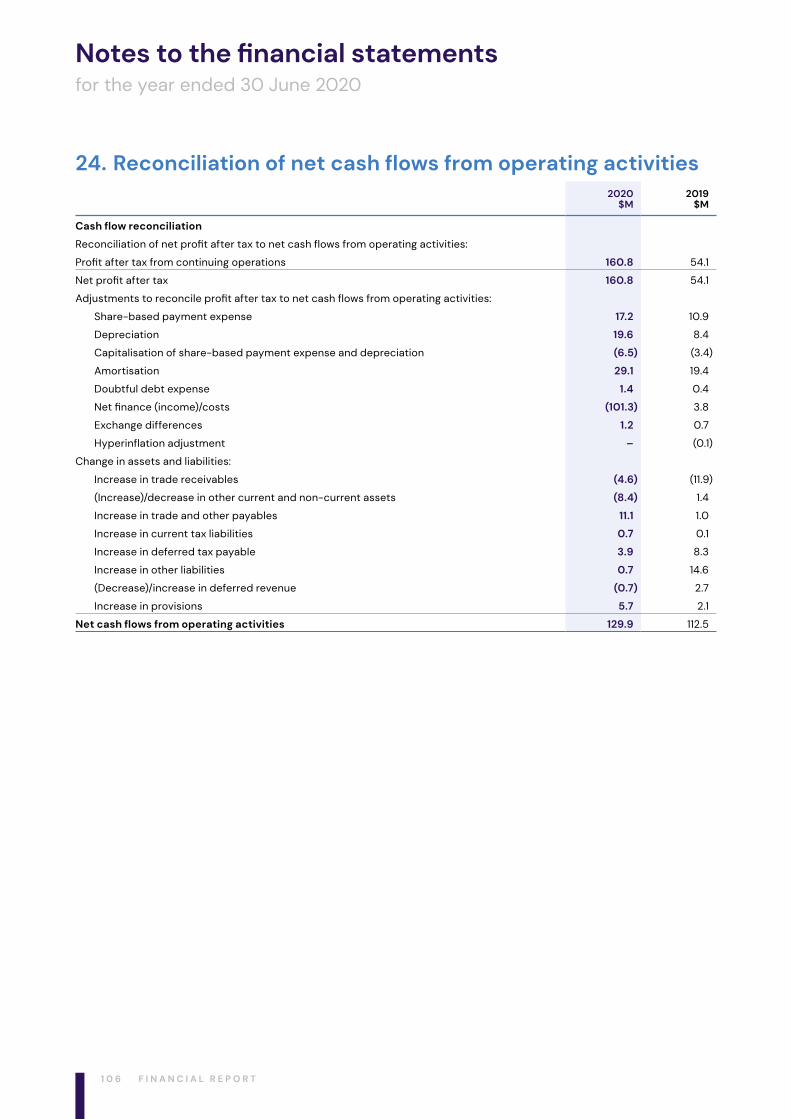
Notes to the financial statementsfor the year ended 30 June 2020
24. Reconciliation of net cash flows from operating activities2020
$M2019
$M
Cash flow reconciliation
Reconciliation of net profit after tax to net cash flows from operating activities:
Profit after tax from continuing operations 160.8 54.1
Net profit after tax 160.8 54.1
Adjustments to reconcile profit after tax to net cash flows from operating activities:
Share-based payment expense 17.2 10.9
Depreciation 19.6 8.4
Capitalisation of share-based payment expense and depreciation (6.5) (3.4)
Amortisation 29.1 19.4
Doubtful debt expense 1.4 0.4
Net finance (income)/costs (101.3) 3.8
Exchange differences 1.2 0.7
Hyperinflation adjustment – (0.1)
Change in assets and liabilities:
Increase in trade receivables (4.6) (11.9)
(Increase)/decrease in other current and non-current assets (8.4) 1.4
Increase in trade and other payables 11.1 1.0
Increase in current tax liabilities 0.7 0.1
Increase in deferred tax payable 3.9 8.3
Increase in other liabilities 0.7 14.6
(Decrease)/increase in deferred revenue (0.7) 2.7
Increase in provisions 5.7 2.1
Net cash flows from operating activities 129.9 112.5
1 0 6 F I N A N C I A L R E P O R T
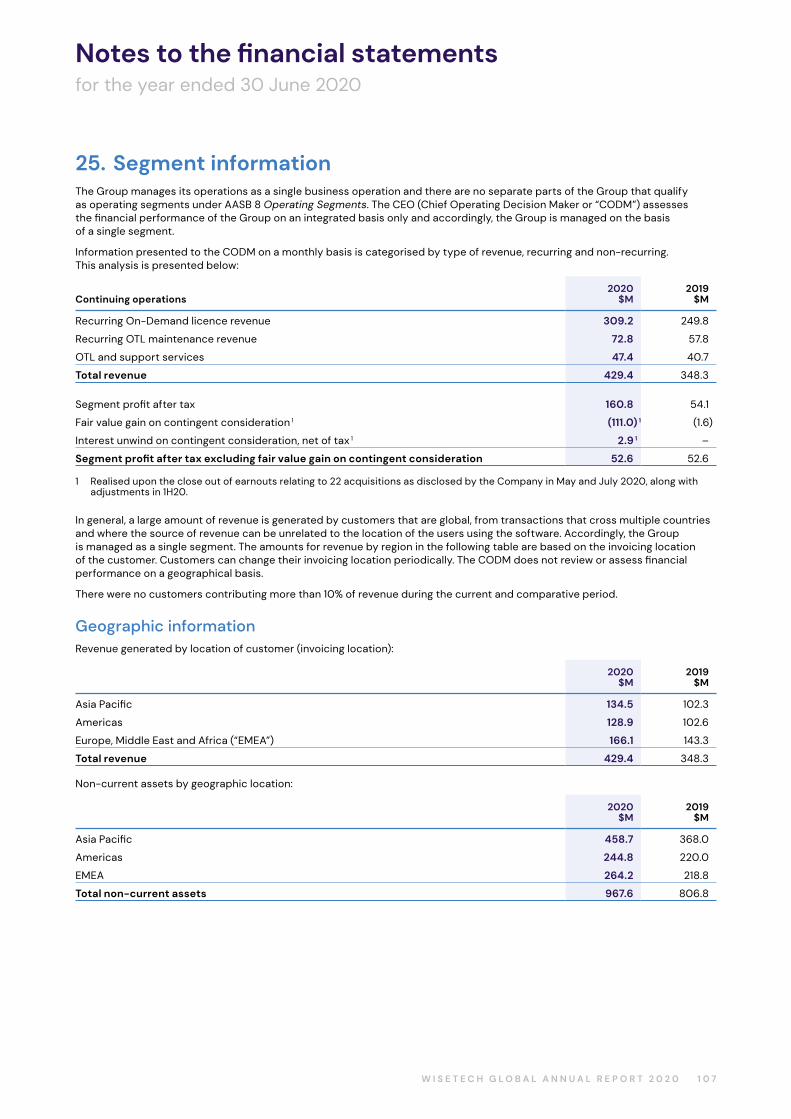
Notes to the financial statementsfor the year ended 30 June 2020
25. Segment informationThe Group manages its operations as a single business operation and there are no separate parts of the Group that qualify as operating segments under AASB 8 Operating Segments. The CEO (Chief Operating Decision Maker or “CODM”) assesses the financial performance of the Group on an integrated basis only and accordingly, the Group is managed on the basis of a single segment.
Information presented to the CODM on a monthly basis is categorised by type of revenue, recurring and non-recurring. This analysis is presented below:
Continuing operations2020
$M2019
$M
Recurring On-Demand licence revenue 309.2 249.8
Recurring OTL maintenance revenue 72.8 57.8
OTL and support services 47.4 40.7
Total revenue 429.4 348.3
Segment profit after tax 160.8 54.1
Fair value gain on contingent consideration 1 (111.0) 1 (1.6)
Interest unwind on contingent consideration, net of tax 1 2.9 1 –
Segment profit after tax excluding fair value gain on contingent consideration 52.6 52.6
1 Realised upon the close out of earnouts relating to 22 acquisitions as disclosed by the Company in May and July 2020, along with adjustments in 1H20.
In general, a large amount of revenue is generated by customers that are global, from transactions that cross multiple countries and where the source of revenue can be unrelated to the location of the users using the software. Accordingly, the Group is managed as a single segment. The amounts for revenue by region in the following table are based on the invoicing location of the customer. Customers can change their invoicing location periodically. The CODM does not review or assess financial performance on a geographical basis.
There were no customers contributing more than 10% of revenue during the current and comparative period.
Geographic informationRevenue generated by location of customer (invoicing location):
2020$M
2019$M
Asia Pacific 134.5 102.3
Americas 128.9 102.6
Europe, Middle East and Africa (“EMEA”) 166.1 143.3
Total revenue 429.4 348.3
Non-current assets by geographic location:
2020$M
2019$M
Asia Pacific 458.7 368.0
Americas 244.8 220.0
EMEA 264.2 218.8
Total non-current assets 967.6 806.8
1 0 7W I S E T E C H G L O B A L A N N U A L R E P O R T 2 0 2 0
Notes to the financial statementsfor the year ended 30 June 2020
26. Financial instruments
(i) Recognition and initial measurementTrade receivables are initially recognised when customers are invoiced. All other financial assets and financial liabilities are initially recognised when the Group becomes a party to the contractual obligations.
A financial asset (unless it is a trade receivable) or financial liability is initially measured at fair value plus transaction costs that are directly attributable to its acquisition. Trade receivables are initially measured at the transaction price.
(ii) Derecognition
Financial assetsThe Group derecognises a financial asset when the contractual rights to the cash flows from a financial asset expire, or it transfers the rights to receive the contractual cash flows in a transaction in which substantially all of the risks and rewards of ownership of the financial asset are transferred or in which the Group neither transfers nor retains substantially all of the risks and rewards of ownership and it does not retain control of the financial asset.
Financial liabilitiesThe Group derecognises a financial liability when its contractual obligations are discharged or cancelled, or expire. The Group also derecognises a financial liability when its terms are modified and the cash flows of the modified financial liability are substantially different, in which case a new financial liability based on the modified terms is recognised at fair value.
On derecognition of a financial liability, the difference between the carrying amount extinguished and the consideration paid (including any non‑cash assets transferred or liabilities assumed) is recognised in profit or loss.
(iii) OffsettingFinancial assets and financial liabilities are offset and the net amount presented in the Consolidated statement of financial position when, and only when, the Group currently has a legally enforceable right to set off the amounts and it intends either to settle them on a net basis or to realise the asset and settle the liability simultaneously.
(iv) Derivative financial instruments and hedge accountingThe Group holds derivative financial instruments to hedge some of its foreign currency risk exposures.
Derivatives are initially measured at fair value. Subsequent to initial recognition, derivatives are measured at fair value, and changes therein are generally recognised in profit or loss.
The Group designates certain derivatives as hedging instruments to hedge the variability in cash flows associated with highly probable forecast transactions arising from changes in foreign exchange rates.
At inception of designated hedging relationships, the Group documents the risk management objective and strategy for undertaking the hedge. The Group also documents the economic relationship between the hedged item and the hedging instrument, including whether the changes in cash flows of the hedged item and hedging instrument are expected to offset each other.
Cash flow hedgesWhen a derivative is designated as a cash flow hedging instrument, the effective portion of changes in the fair value of the derivative is recognised in other comprehensive income (OCI) and accumulated in the cash flow hedge reserve. The effective portion of changes in the fair value of the derivative that is recognised in OCI is limited to the cumulative change in fair value of the hedged item, determined on a present value basis, from inception of the hedge. Any ineffective portion of changes in the fair value of the derivative is recognised immediately in profit and loss.
The Group designates only the change in fair value of the spot element of forward exchange contracts as the hedging instrument in cash flow hedging relationships. The change in fair value of the forward element of forward exchange contracts (forward points) is separately accounted for as a cost of hedging and recognised in a hedging reserve within equity.
When the hedged forecast transaction subsequently results in the recognition of a non‑financial item, the amount accumulated in the hedging reserve and the cost of hedging reserve is included directly in the initial cost of the non‑financial item when it is recognised.
For all other hedged forecast transactions, the amount accumulated in the hedging reserve and the cost of hedging reserve is reclassified to profit or loss in the same period or periods during which the hedged expected future cash flows affect profit or loss.
1 0 8 F I N A N C I A L R E P O R T
Notes to the financial statementsfor the year ended 30 June 2020
If the hedge no longer meets the criteria for hedge accounting or the hedging instrument is sold, expires, is terminated or is exercised, then hedge accounting is discontinued prospectively. When hedge accounting for cash flow hedges is discontinued, the amount that has been accumulated in the hedging reserve remains in equity until, for a hedge of a transaction resulting in the recognition of a non‑financial item, it is included in the non‑financial item’s cost on its initial recognition or, for other cash flow hedges, it is reclassified to profit or loss in the same period or periods as the hedged expected future cash flows affect profit or loss.
If the hedged future cash flows are no longer expected to occur, then the amounts that have been accumulated in the hedging reserve and the hedging reserve are immediately reclassified to profit or loss.
(v) Credit impaired trade receivablesAt each reporting date, the Group assesses whether trade receivables are credit-impaired. A trade receivable is ‘credit-impaired’ when one or more events that have a detrimental impact on the estimated future cash flows have occurred.
Evidence that a trade receivable is credit-impaired includes the following observable data:
– Significant financial difficulty of the debtor;
– A breach of contract such as a default; or
– It is probable that the debtor will enter bankruptcy or other financial reorganisation.
(vi) Measurement of fair valuesFair value is the price the Group would receive to sell an asset or would have to pay to transfer a liability in an orderly (i.e. unforced) transaction between independent, knowledgeable and willing market participants at the measurement date.
As fair value is a market-based measure, the closest equivalent observable market pricing information is used to determine fair value. Adjustments to market values may be made having regard to the characteristics of the specific asset or liability. The fair values of assets and liabilities that are not traded in an active market are determined using one or more valuation techniques. These valuation techniques maximise, to the extent possible, the use of observable market data.
To the extent possible, market information is extracted from either the principal market for the asset or liability (i.e. the market with the greatest volume and level of activity for the asset of liability), or, in the absence of such a market, the most advantageous market available to the entity at reporting date (i.e. the market that maximises the receipts from the sale of the asset or minimises the payment made to transfer the liability, after taking into account transaction costs).
For non‑financial assets, the fair value measurement also takes into account a market participant’s ability to use the asset in its highest and best use or to sell it to another market participant that would use the asset in its highest and best use.
The fair value of liabilities and the entity’s own equity instruments (excluding those related to share-based payment arrangements) may be valued, where there is no observable market price in relation to the transfer of such financial instrument, by reference to observable market information where such instruments are held as assets. Where this information is not available, other valuation techniques are adopted and where significant, are detailed in the respective note to the financial statements.
Fair value hierarchySignificant valuation issues are reported to the Audit Committee.
When measuring the fair value of an asset or a liability, the Group uses market observable data as far as possible. Fair values are categorised into different levels in a fair value hierarchy based on the inputs used in the valuation techniques as follows:
– Level 1: quoted prices (unadjusted) in active markets for identical assets or liabilities;
– Level 2: inputs other than quoted prices included in Level 1 that are observable for the asset or liability, either directly (i.e. as prices) or indirectly (i.e. derived from prices); and
– Level 3: inputs for the asset or liability that are not based on observable market data (unobservable inputs).
If the inputs used to measure the fair value of an asset or a liability might be categorised in different levels of the fair value hierarchy, then the fair value measurement is categorised in its entirety in the same level of the fair value hierarchy as the lowest level input that is significant to the entire measurement.
The Group recognises transfers between levels of the fair value hierarchy at the end of the reporting period during which the change has occurred.
26. Financial instruments (continued)
1 0 9W I S E T E C H G L O B A L A N N U A L R E P O R T 2 0 2 0
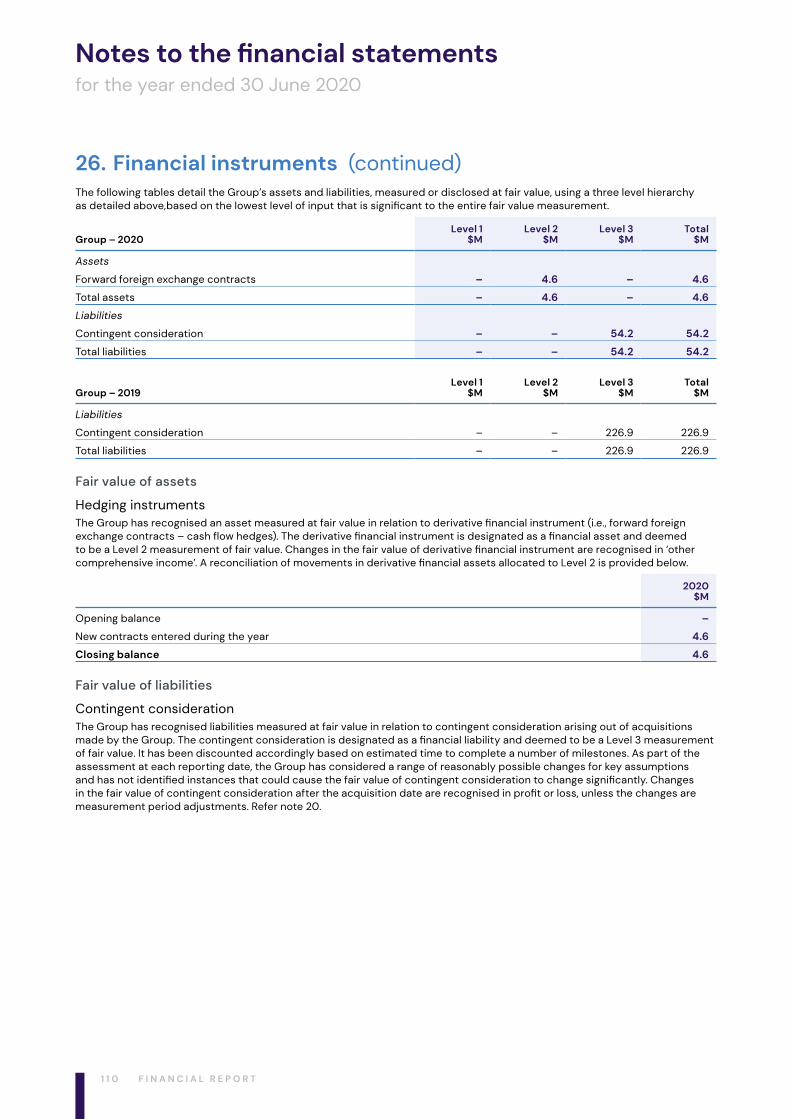
Notes to the financial statementsfor the year ended 30 June 2020
The following tables detail the Group’s assets and liabilities, measured or disclosed at fair value, using a three level hierarchy as detailed above,based on the lowest level of input that is significant to the entire fair value measurement.
Group – 2020Level 1
$MLevel 2
$MLevel 3
$MTotal
$M
Assets
Forward foreign exchange contracts – 4.6 – 4.6
Total assets – 4.6 – 4.6
Liabilities
Contingent consideration – – 54.2 54.2
Total liabilities – – 54.2 54.2
Group – 2019Level 1
$MLevel 2
$MLevel 3
$MTotal
$M
Liabilities
Contingent consideration – – 226.9 226.9
Total liabilities – – 226.9 226.9
Fair value of assets
Hedging instrumentsThe Group has recognised an asset measured at fair value in relation to derivative financial instrument (i.e., forward foreign exchange contracts – cash flow hedges). The derivative financial instrument is designated as a financial asset and deemed to be a Level 2 measurement of fair value. Changes in the fair value of derivative financial instrument are recognised in ‘other comprehensive income’. A reconciliation of movements in derivative financial assets allocated to Level 2 is provided below.
2020$M
Opening balance –
New contracts entered during the year 4.6
Closing balance 4.6
Fair value of liabilities
Contingent considerationThe Group has recognised liabilities measured at fair value in relation to contingent consideration arising out of acquisitions made by the Group. The contingent consideration is designated as a financial liability and deemed to be a Level 3 measurement of fair value. It has been discounted accordingly based on estimated time to complete a number of milestones. As part of the assessment at each reporting date, the Group has considered a range of reasonably possible changes for key assumptions and has not identified instances that could cause the fair value of contingent consideration to change significantly. Changes in the fair value of contingent consideration after the acquisition date are recognised in profit or loss, unless the changes are measurement period adjustments. Refer note 20.
26. Financial instruments (continued)
1 1 0 F I N A N C I A L R E P O R T
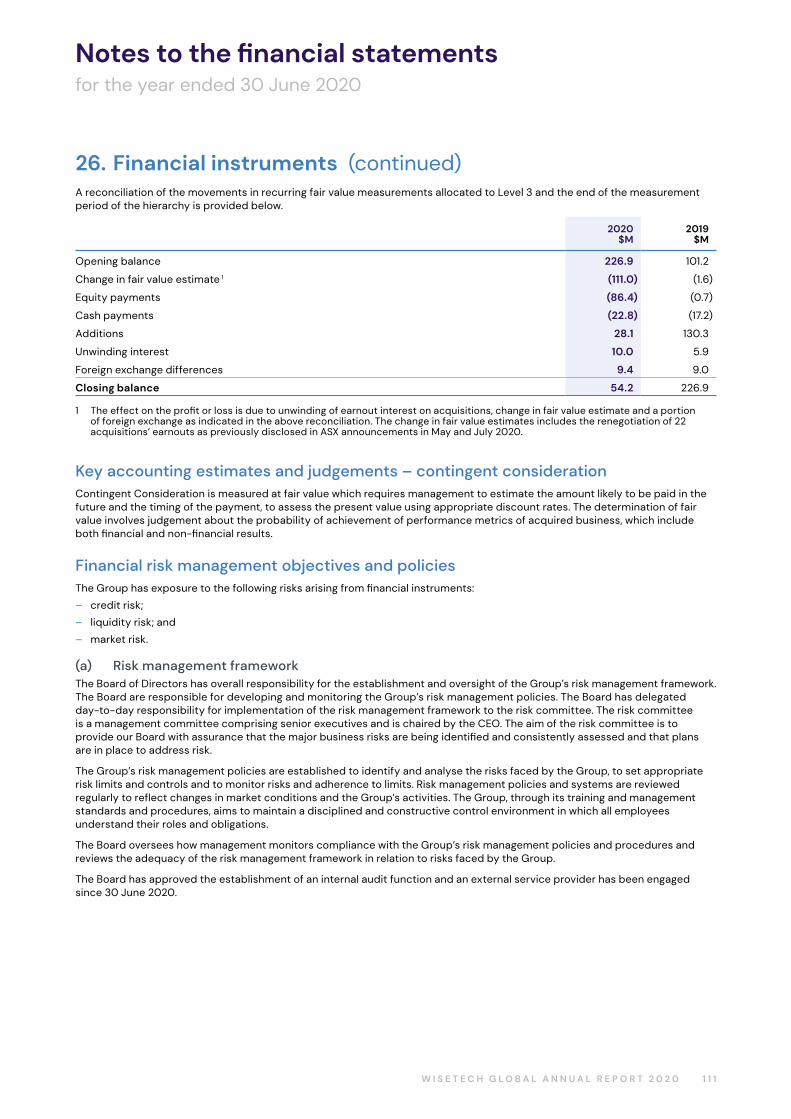
Notes to the financial statementsfor the year ended 30 June 2020
A reconciliation of the movements in recurring fair value measurements allocated to Level 3 and the end of the measurement period of the hierarchy is provided below.
2020$M
2019$M
Opening balance 226.9 101.2
Change in fair value estimate 1 (111.0) (1.6)
Equity payments (86.4) (0.7)
Cash payments (22.8) (17.2)
Additions 28.1 130.3
Unwinding interest 10.0 5.9
Foreign exchange differences 9.4 9.0
Closing balance 54.2 226.9
1 The effect on the profit or loss is due to unwinding of earnout interest on acquisitions, change in fair value estimate and a portion of foreign exchange as indicated in the above reconciliation. The change in fair value estimates includes the renegotiation of 22 acquisitions’ earnouts as previously disclosed in ASX announcements in May and July 2020.
Key accounting estimates and judgements – contingent considerationContingent Consideration is measured at fair value which requires management to estimate the amount likely to be paid in the future and the timing of the payment, to assess the present value using appropriate discount rates. The determination of fair value involves judgement about the probability of achievement of performance metrics of acquired business, which include both financial and non‑financial results.
Financial risk management objectives and policiesThe Group has exposure to the following risks arising from financial instruments:
– credit risk;
– liquidity risk; and
– market risk.
(a) Risk management frameworkThe Board of Directors has overall responsibility for the establishment and oversight of the Group’s risk management framework. The Board are responsible for developing and monitoring the Group’s risk management policies. The Board has delegated day-to-day responsibility for implementation of the risk management framework to the risk committee. The risk committee is a management committee comprising senior executives and is chaired by the CEO. The aim of the risk committee is to provide our Board with assurance that the major business risks are being identified and consistently assessed and that plans are in place to address risk.
The Group’s risk management policies are established to identify and analyse the risks faced by the Group, to set appropriate risk limits and controls and to monitor risks and adherence to limits. Risk management policies and systems are reviewed regularly to reflect changes in market conditions and the Group’s activities. The Group, through its training and management standards and procedures, aims to maintain a disciplined and constructive control environment in which all employees understand their roles and obligations.
The Board oversees how management monitors compliance with the Group’s risk management policies and procedures and reviews the adequacy of the risk management framework in relation to risks faced by the Group.
The Board has approved the establishment of an internal audit function and an external service provider has been engaged since 30 June 2020.
26. Financial instruments (continued)
1 1 1W I S E T E C H G L O B A L A N N U A L R E P O R T 2 0 2 0
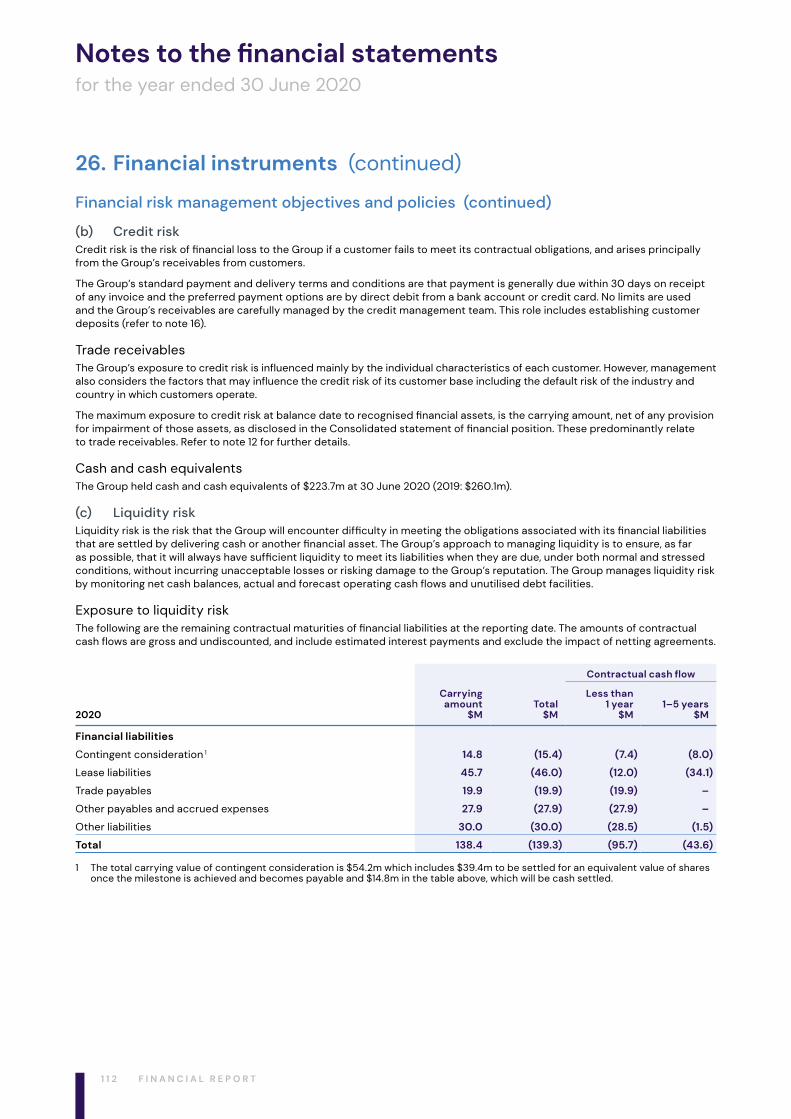
Notes to the financial statementsfor the year ended 30 June 2020
(b) Credit riskCredit risk is the risk of financial loss to the Group if a customer fails to meet its contractual obligations, and arises principally from the Group’s receivables from customers.
The Group’s standard payment and delivery terms and conditions are that payment is generally due within 30 days on receipt of any invoice and the preferred payment options are by direct debit from a bank account or credit card. No limits are used and the Group’s receivables are carefully managed by the credit management team. This role includes establishing customer deposits (refer to note 16).
Trade receivablesThe Group’s exposure to credit risk is influenced mainly by the individual characteristics of each customer. However, management also considers the factors that may influence the credit risk of its customer base including the default risk of the industry and country in which customers operate.
The maximum exposure to credit risk at balance date to recognised financial assets, is the carrying amount, net of any provision for impairment of those assets, as disclosed in the Consolidated statement of financial position. These predominantly relate to trade receivables. Refer to note 12 for further details.
Cash and cash equivalentsThe Group held cash and cash equivalents of $223.7m at 30 June 2020 (2019: $260.1m).
(c) Liquidity riskLiquidity risk is the risk that the Group will encounter difficulty in meeting the obligations associated with its financial liabilities that are settled by delivering cash or another financial asset. The Group’s approach to managing liquidity is to ensure, as far as possible, that it will always have sufficient liquidity to meet its liabilities when they are due, under both normal and stressed conditions, without incurring unacceptable losses or risking damage to the Group’s reputation. The Group manages liquidity risk by monitoring net cash balances, actual and forecast operating cash flows and unutilised debt facilities.
Exposure to liquidity riskThe following are the remaining contractual maturities of financial liabilities at the reporting date. The amounts of contractual cash flows are gross and undiscounted, and include estimated interest payments and exclude the impact of netting agreements.
2020
Carrying amount
$MTotal
$M
Contractual cash flow
Less than 1 year
$M1–5 years
$M
Financial liabilities
Contingent consideration 1 14.8 (15.4) (7.4) (8.0)
Lease liabilities 45.7 (46.0) (12.0) (34.1)
Trade payables 19.9 (19.9) (19.9) –
Other payables and accrued expenses 27.9 (27.9) (27.9) –
Other liabilities 30.0 (30.0) (28.5) (1.5)
Total 138.4 (139.3) (95.7) (43.6)
1 The total carrying value of contingent consideration is $54.2m which includes $39.4m to be settled for an equivalent value of shares once the milestone is achieved and becomes payable and $14.8m in the table above, which will be cash settled.
26. Financial instruments (continued)
Financial risk management objectives and policies (continued)
1 1 2 F I N A N C I A L R E P O R T
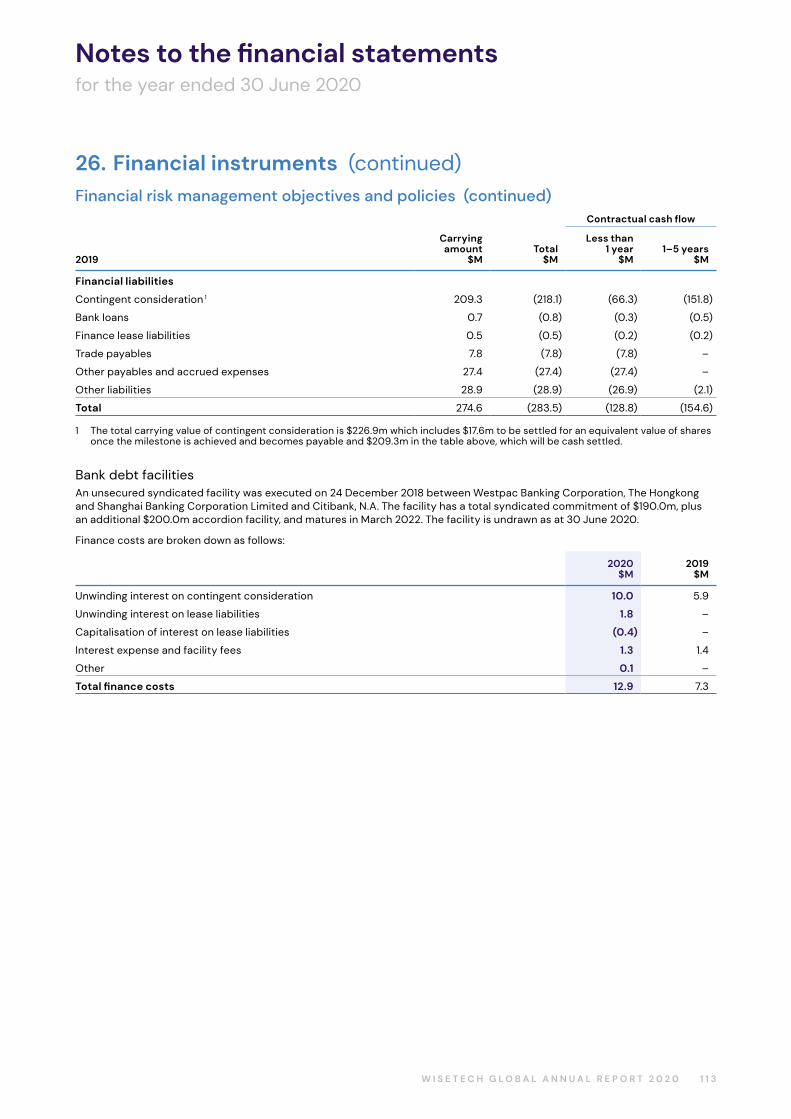
Notes to the financial statementsfor the year ended 30 June 2020
Financial risk management objectives and policies (continued)
2019
Carrying amount
$MTotal
$M
Contractual cash flow
Less than 1 year
$M1–5 years
$M
Financial liabilities
Contingent consideration 1 209.3 (218.1) (66.3) (151.8)
Bank loans 0.7 (0.8) (0.3) (0.5)
Finance lease liabilities 0.5 (0.5) (0.2) (0.2)
Trade payables 7.8 (7.8) (7.8) –
Other payables and accrued expenses 27.4 (27.4) (27.4) –
Other liabilities 28.9 (28.9) (26.9) (2.1)
Total 274.6 (283.5) (128.8) (154.6)
1 The total carrying value of contingent consideration is $226.9m which includes $17.6m to be settled for an equivalent value of shares once the milestone is achieved and becomes payable and $209.3m in the table above, which will be cash settled.
Bank debt facilitiesAn unsecured syndicated facility was executed on 24 December 2018 between Westpac Banking Corporation, The Hongkong and Shanghai Banking Corporation Limited and Citibank, N.A. The facility has a total syndicated commitment of $190.0m, plus an additional $200.0m accordion facility, and matures in March 2022. The facility is undrawn as at 30 June 2020.
Finance costs are broken down as follows:
2020$M
2019$M
Unwinding interest on contingent consideration 10.0 5.9
Unwinding interest on lease liabilities 1.8 –
Capitalisation of interest on lease liabilities (0.4) –
Interest expense and facility fees 1.3 1.4
Other 0.1 –
Total finance costs 12.9 7.3
26. Financial instruments (continued)
1 1 3W I S E T E C H G L O B A L A N N U A L R E P O R T 2 0 2 0
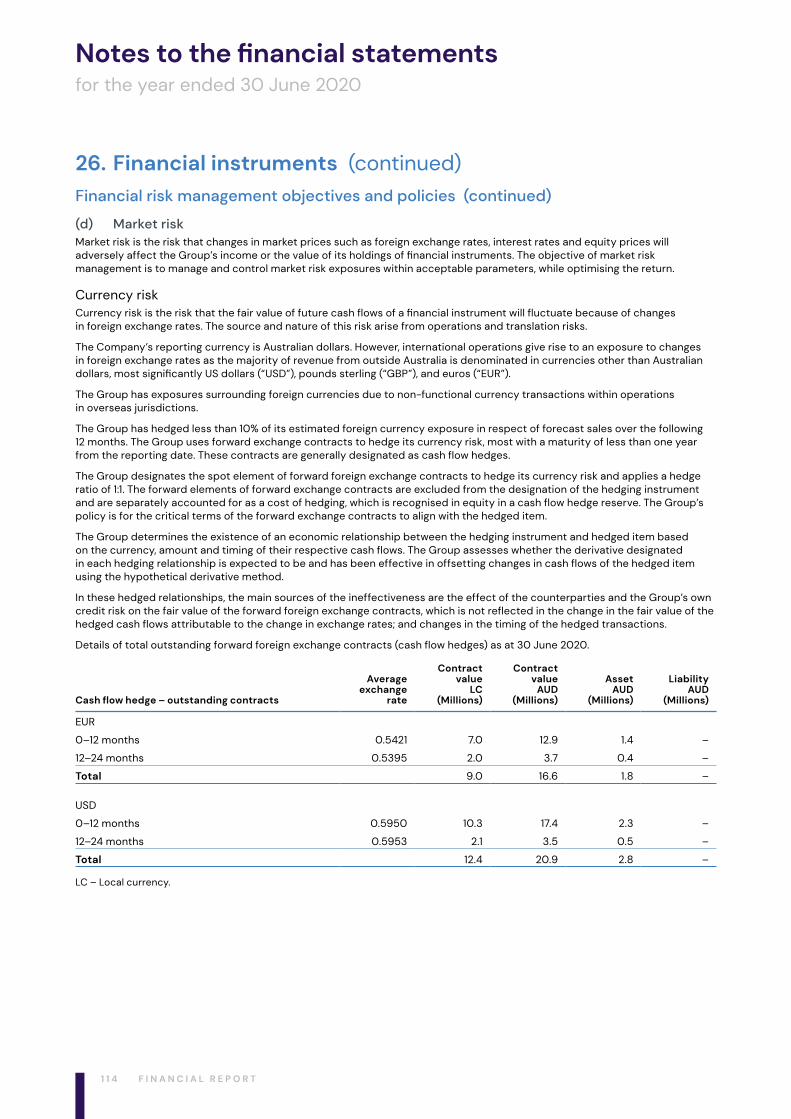
Notes to the financial statementsfor the year ended 30 June 2020
Financial risk management objectives and policies (continued)
(d) Market riskMarket risk is the risk that changes in market prices such as foreign exchange rates, interest rates and equity prices will adversely affect the Group’s income or the value of its holdings of financial instruments. The objective of market risk management is to manage and control market risk exposures within acceptable parameters, while optimising the return.
Currency riskCurrency risk is the risk that the fair value of future cash flows of a financial instrument will fluctuate because of changes in foreign exchange rates. The source and nature of this risk arise from operations and translation risks.
The Company’s reporting currency is Australian dollars. However, international operations give rise to an exposure to changes in foreign exchange rates as the majority of revenue from outside Australia is denominated in currencies other than Australian dollars, most significantly US dollars (“USD”), pounds sterling (“GBP”), and euros (“EUR”).
The Group has exposures surrounding foreign currencies due to non-functional currency transactions within operations in overseas jurisdictions.
The Group has hedged less than 10% of its estimated foreign currency exposure in respect of forecast sales over the following 12 months. The Group uses forward exchange contracts to hedge its currency risk, most with a maturity of less than one year from the reporting date. These contracts are generally designated as cash flow hedges.
The Group designates the spot element of forward foreign exchange contracts to hedge its currency risk and applies a hedge ratio of 1:1. The forward elements of forward exchange contracts are excluded from the designation of the hedging instrument and are separately accounted for as a cost of hedging, which is recognised in equity in a cash flow hedge reserve. The Group’s policy is for the critical terms of the forward exchange contracts to align with the hedged item.
The Group determines the existence of an economic relationship between the hedging instrument and hedged item based on the currency, amount and timing of their respective cash flows. The Group assesses whether the derivative designated in each hedging relationship is expected to be and has been effective in offsetting changes in cash flows of the hedged item using the hypothetical derivative method.
In these hedged relationships, the main sources of the ineffectiveness are the effect of the counterparties and the Group’s own credit risk on the fair value of the forward foreign exchange contracts, which is not reflected in the change in the fair value of the hedged cash flows attributable to the change in exchange rates; and changes in the timing of the hedged transactions.
Details of total outstanding forward foreign exchange contracts (cash flow hedges) as at 30 June 2020.
Cash flow hedge – outstanding contracts
Average exchange
rate
Contract value
LC(Millions)
Contract value
AUD (Millions)
Asset AUD
(Millions)
Liability AUD
(Millions)
EUR
0–12 months 0.5421 7.0 12.9 1.4 –
12–24 months 0.5395 2.0 3.7 0.4 –
Total 9.0 16.6 1.8 –
USD
0–12 months 0.5950 10.3 17.4 2.3 –
12–24 months 0.5953 2.1 3.5 0.5 –
Total 12.4 20.9 2.8 –
LC – Local currency.
26. Financial instruments (continued)
1 1 4 F I N A N C I A L R E P O R T
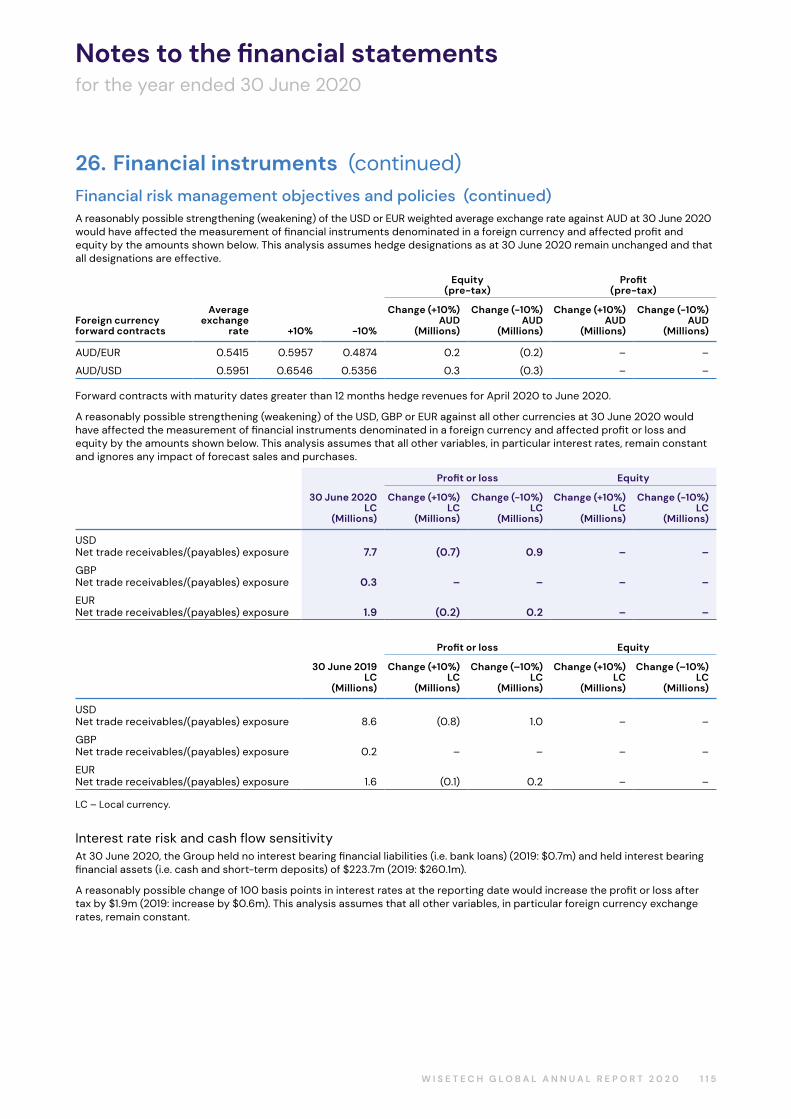
Notes to the financial statementsfor the year ended 30 June 2020
Financial risk management objectives and policies (continued)A reasonably possible strengthening (weakening) of the USD or EUR weighted average exchange rate against AUD at 30 June 2020 would have affected the measurement of financial instruments denominated in a foreign currency and affected profit and equity by the amounts shown below. This analysis assumes hedge designations as at 30 June 2020 remain unchanged and that all designations are effective.
Foreign currency forward contracts
Average exchange
rate
Equity(pre-tax)
Profit(pre-tax)
+10% -10%
Change (+10%) AUD
(Millions)
Change (-10%) AUD
(Millions)
Change (+10%) AUD
(Millions)
Change (-10%) AUD
(Millions)
AUD/EUR 0.5415 0.5957 0.4874 0.2 (0.2) – –
AUD/USD 0.5951 0.6546 0.5356 0.3 (0.3) – –
Forward contracts with maturity dates greater than 12 months hedge revenues for April 2020 to June 2020.
A reasonably possible strengthening (weakening) of the USD, GBP or EUR against all other currencies at 30 June 2020 would have affected the measurement of financial instruments denominated in a foreign currency and affected profit or loss and equity by the amounts shown below. This analysis assumes that all other variables, in particular interest rates, remain constant and ignores any impact of forecast sales and purchases.
30 June 2020LC
(Millions)
Profit or loss Equity
Change (+10%)LC
(Millions)
Change (-10%)LC
(Millions)
Change (+10%)LC
(Millions)
Change (-10%)LC
(Millions)
USDNet trade receivables/(payables) exposure 7.7 (0.7) 0.9 – –
GBPNet trade receivables/(payables) exposure 0.3 – – – –
EURNet trade receivables/(payables) exposure 1.9 (0.2) 0.2 – –
30 June 2019LC
(Millions)
Profit or loss Equity
Change (+10%)LC
(Millions)
Change (–10%)LC
(Millions)
Change (+10%)LC
(Millions)
Change (–10%)LC
(Millions)
USDNet trade receivables/(payables) exposure 8.6 (0.8) 1.0 – –
GBPNet trade receivables/(payables) exposure 0.2 – – – –
EURNet trade receivables/(payables) exposure 1.6 (0.1) 0.2 – –
LC – Local currency.
Interest rate risk and cash flow sensitivityAt 30 June 2020, the Group held no interest bearing financial liabilities (i.e. bank loans) (2019: $0.7m) and held interest bearing financial assets (i.e. cash and short‑term deposits) of $223.7m (2019: $260.1m).
A reasonably possible change of 100 basis points in interest rates at the reporting date would increase the profit or loss after tax by $1.9m (2019: increase by $0.6m). This analysis assumes that all other variables, in particular foreign currency exchange rates, remain constant.
26. Financial instruments (continued)
1 1 5W I S E T E C H G L O B A L A N N U A L R E P O R T 2 0 2 0
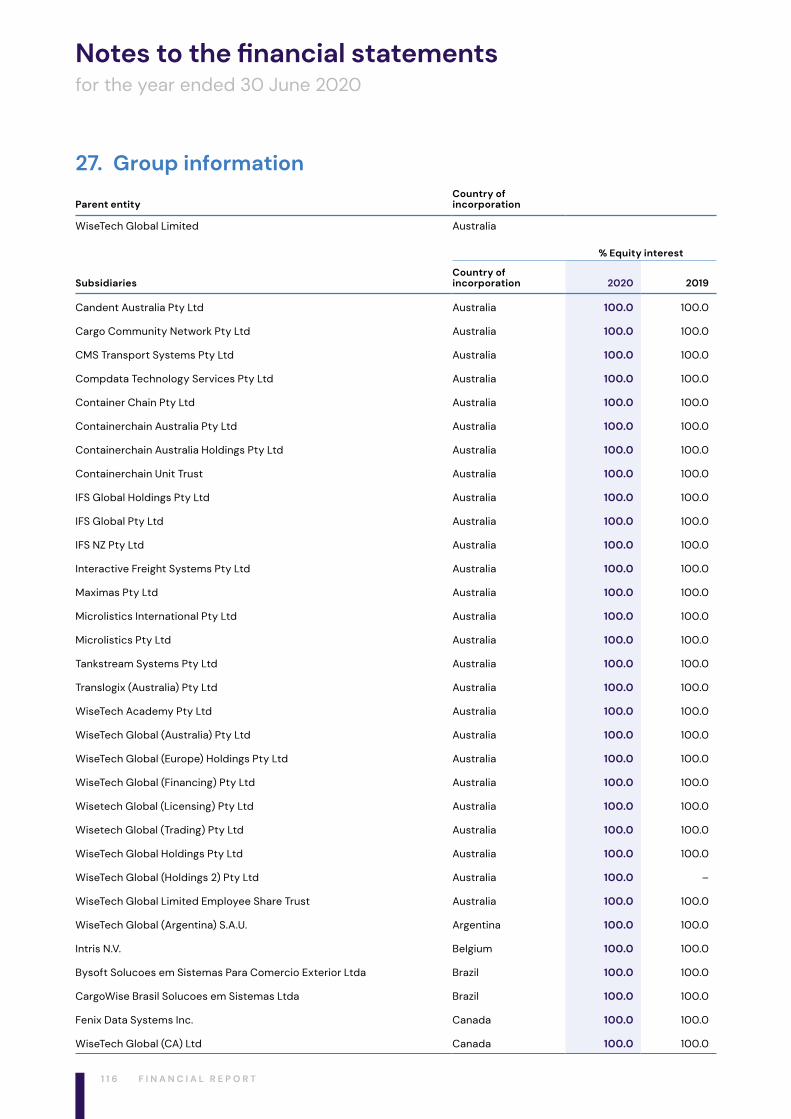
Notes to the financial statementsfor the year ended 30 June 2020
27. Group information
Parent entityCountry of incorporation
WiseTech Global Limited Australia
% Equity interest
SubsidiariesCountry of incorporation 2020 2019
Candent Australia Pty Ltd Australia 100.0 100.0
Cargo Community Network Pty Ltd Australia 100.0 100.0
CMS Transport Systems Pty Ltd Australia 100.0 100.0
Compdata Technology Services Pty Ltd Australia 100.0 100.0
Container Chain Pty Ltd Australia 100.0 100.0
Containerchain Australia Pty Ltd Australia 100.0 100.0
Containerchain Australia Holdings Pty Ltd Australia 100.0 100.0
Containerchain Unit Trust Australia 100.0 100.0
IFS Global Holdings Pty Ltd Australia 100.0 100.0
IFS Global Pty Ltd Australia 100.0 100.0
IFS NZ Pty Ltd Australia 100.0 100.0
Interactive Freight Systems Pty Ltd Australia 100.0 100.0
Maximas Pty Ltd Australia 100.0 100.0
Microlistics International Pty Ltd Australia 100.0 100.0
Microlistics Pty Ltd Australia 100.0 100.0
Tankstream Systems Pty Ltd Australia 100.0 100.0
Translogix (Australia) Pty Ltd Australia 100.0 100.0
WiseTech Academy Pty Ltd Australia 100.0 100.0
WiseTech Global (Australia) Pty Ltd Australia 100.0 100.0
WiseTech Global (Europe) Holdings Pty Ltd Australia 100.0 100.0
WiseTech Global (Financing) Pty Ltd Australia 100.0 100.0
Wisetech Global (Licensing) Pty Ltd Australia 100.0 100.0
Wisetech Global (Trading) Pty Ltd Australia 100.0 100.0
WiseTech Global Holdings Pty Ltd Australia 100.0 100.0
WiseTech Global (Holdings 2) Pty Ltd Australia 100.0 –
WiseTech Global Limited Employee Share Trust Australia 100.0 100.0
WiseTech Global (Argentina) S.A.U. Argentina 100.0 100.0
Intris N.V. Belgium 100.0 100.0
Bysoft Solucoes em Sistemas Para Comercio Exterior Ltda Brazil 100.0 100.0
CargoWise Brasil Solucoes em Sistemas Ltda Brazil 100.0 100.0
Fenix Data Systems Inc. Canada 100.0 100.0
WiseTech Global (CA) Ltd Canada 100.0 100.0
1 1 6 F I N A N C I A L R E P O R T
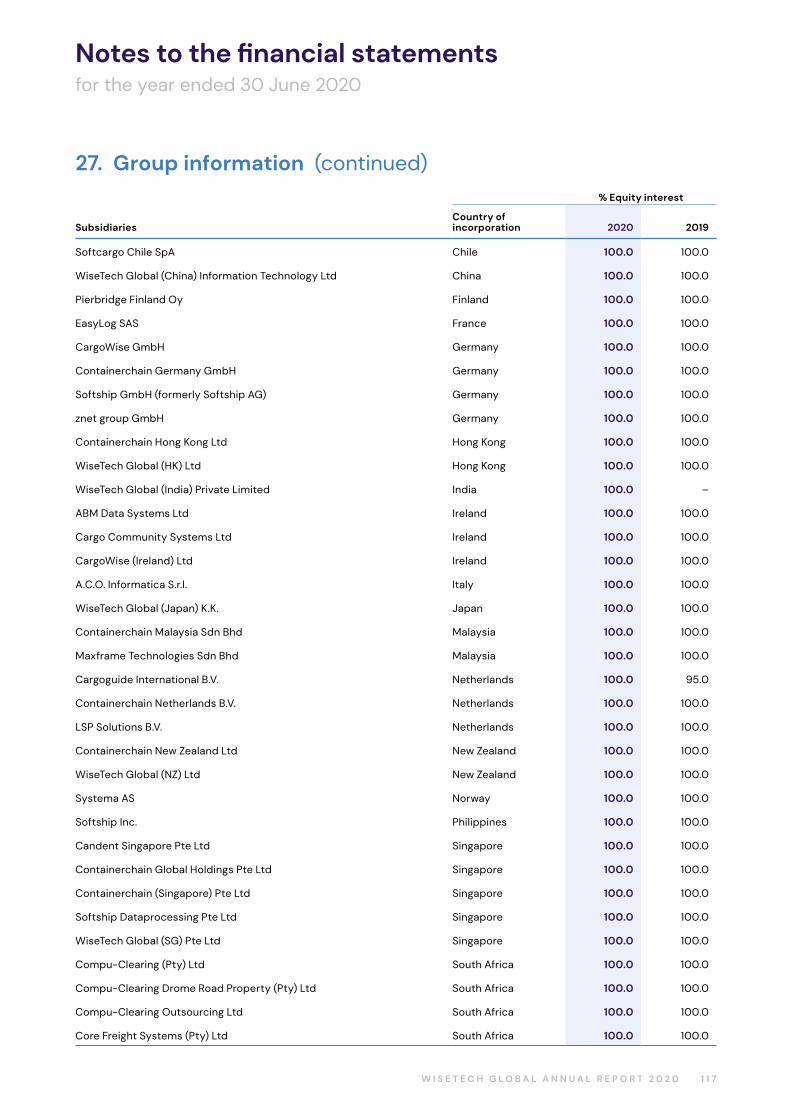
Notes to the financial statementsfor the year ended 30 June 2020
% Equity interest
SubsidiariesCountry of incorporation 2020 2019
Softcargo Chile SpA Chile 100.0 100.0
WiseTech Global (China) Information Technology Ltd China 100.0 100.0
Pierbridge Finland Oy Finland 100.0 100.0
EasyLog SAS France 100.0 100.0
CargoWise GmbH Germany 100.0 100.0
Containerchain Germany GmbH Germany 100.0 100.0
Softship GmbH (formerly Softship AG) Germany 100.0 100.0
znet group GmbH Germany 100.0 100.0
Containerchain Hong Kong Ltd Hong Kong 100.0 100.0
WiseTech Global (HK) Ltd Hong Kong 100.0 100.0
WiseTech Global (India) Private Limited India 100.0 –
ABM Data Systems Ltd Ireland 100.0 100.0
Cargo Community Systems Ltd Ireland 100.0 100.0
CargoWise (Ireland) Ltd Ireland 100.0 100.0
A.C.O. Informatica S.r.l. Italy 100.0 100.0
WiseTech Global (Japan) K.K. Japan 100.0 100.0
Containerchain Malaysia Sdn Bhd Malaysia 100.0 100.0
Maxframe Technologies Sdn Bhd Malaysia 100.0 100.0
Cargoguide International B.V. Netherlands 100.0 95.0
Containerchain Netherlands B.V. Netherlands 100.0 100.0
LSP Solutions B.V. Netherlands 100.0 100.0
Containerchain New Zealand Ltd New Zealand 100.0 100.0
WiseTech Global (NZ) Ltd New Zealand 100.0 100.0
Systema AS Norway 100.0 100.0
Softship Inc. Philippines 100.0 100.0
Candent Singapore Pte Ltd Singapore 100.0 100.0
Containerchain Global Holdings Pte Ltd Singapore 100.0 100.0
Containerchain (Singapore) Pte Ltd Singapore 100.0 100.0
Softship Dataprocessing Pte Ltd Singapore 100.0 100.0
WiseTech Global (SG) Pte Ltd Singapore 100.0 100.0
Compu‑Clearing (Pty) Ltd South Africa 100.0 100.0
Compu‑Clearing Drome Road Property (Pty) Ltd South Africa 100.0 100.0
Compu-Clearing Outsourcing Ltd South Africa 100.0 100.0
Core Freight Systems (Pty) Ltd South Africa 100.0 100.0
27. Group information (continued)
1 1 7W I S E T E C H G L O B A L A N N U A L R E P O R T 2 0 2 0
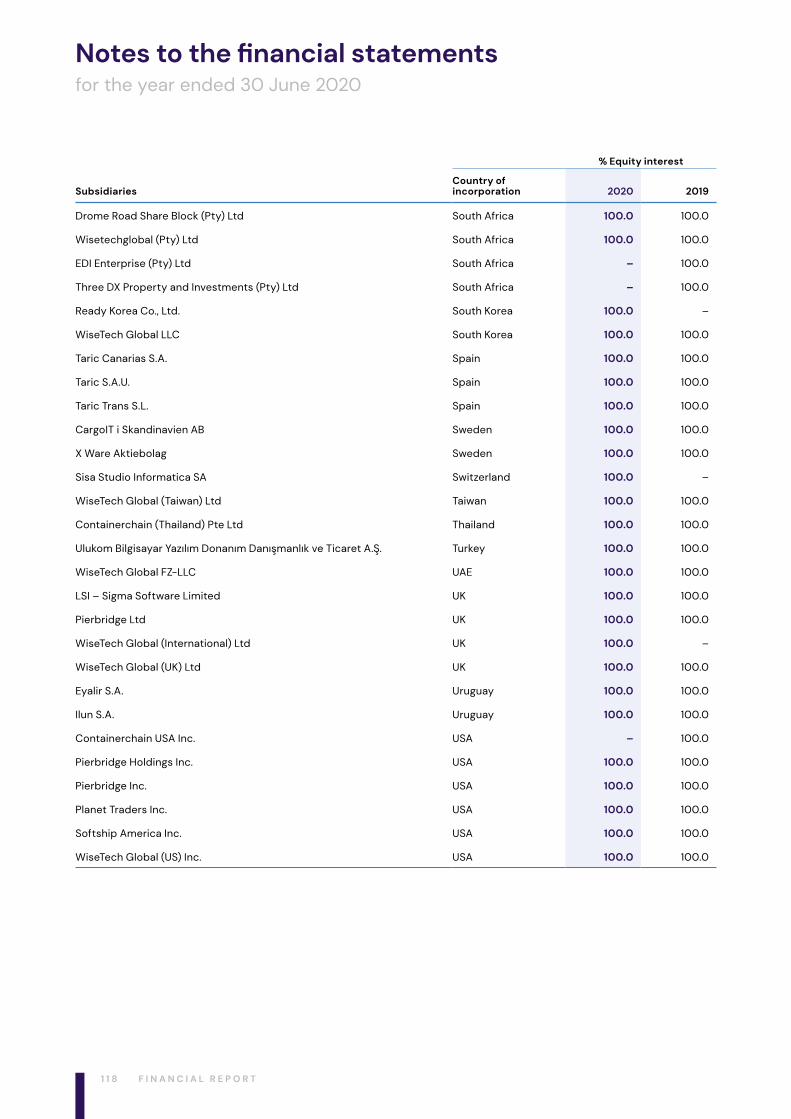
Notes to the financial statementsfor the year ended 30 June 2020
% Equity interest
SubsidiariesCountry of incorporation 2020 2019
Drome Road Share Block (Pty) Ltd South Africa 100.0 100.0
Wisetechglobal (Pty) Ltd South Africa 100.0 100.0
EDI Enterprise (Pty) Ltd South Africa – 100.0
Three DX Property and Investments (Pty) Ltd South Africa – 100.0
Ready Korea Co., Ltd. South Korea 100.0 –
WiseTech Global LLC South Korea 100.0 100.0
Taric Canarias S.A. Spain 100.0 100.0
Taric S.A.U. Spain 100.0 100.0
Taric Trans S.L. Spain 100.0 100.0
CargoIT i Skandinavien AB Sweden 100.0 100.0
X Ware Aktiebolag Sweden 100.0 100.0
Sisa Studio Informatica SA Switzerland 100.0 –
WiseTech Global (Taiwan) Ltd Taiwan 100.0 100.0
Containerchain (Thailand) Pte Ltd Thailand 100.0 100.0
Ulukom Bilgisayar Yazılım Donanım Danışmanlık ve Ticaret A.Ş. Turkey 100.0 100.0
WiseTech Global FZ‑LLC UAE 100.0 100.0
LSI – Sigma Software Limited UK 100.0 100.0
Pierbridge Ltd UK 100.0 100.0
WiseTech Global (International) Ltd UK 100.0 –
WiseTech Global (UK) Ltd UK 100.0 100.0
Eyalir S.A. Uruguay 100.0 100.0
Ilun S.A. Uruguay 100.0 100.0
Containerchain USA Inc. USA – 100.0
Pierbridge Holdings Inc. USA 100.0 100.0
Pierbridge Inc. USA 100.0 100.0
Planet Traders Inc. USA 100.0 100.0
Softship America Inc. USA 100.0 100.0
WiseTech Global (US) Inc. USA 100.0 100.0
1 1 8 F I N A N C I A L R E P O R T
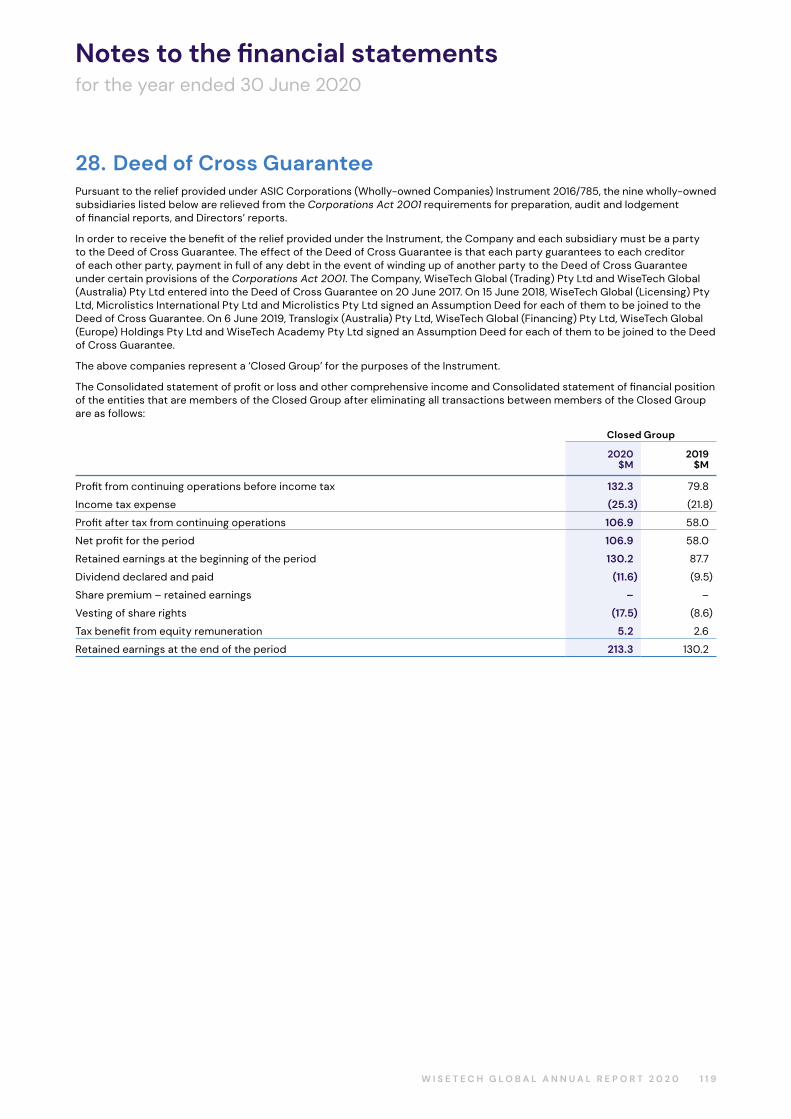
Notes to the financial statementsfor the year ended 30 June 2020
28. Deed of Cross GuaranteePursuant to the relief provided under ASIC Corporations (Wholly‑owned Companies) Instrument 2016/785, the nine wholly‑owned subsidiaries listed below are relieved from the Corporations Act 2001 requirements for preparation, audit and lodgement of financial reports, and Directors’ reports.
In order to receive the benefit of the relief provided under the Instrument, the Company and each subsidiary must be a party to the Deed of Cross Guarantee. The effect of the Deed of Cross Guarantee is that each party guarantees to each creditor of each other party, payment in full of any debt in the event of winding up of another party to the Deed of Cross Guarantee under certain provisions of the Corporations Act 2001. The Company, WiseTech Global (Trading) Pty Ltd and WiseTech Global (Australia) Pty Ltd entered into the Deed of Cross Guarantee on 20 June 2017. On 15 June 2018, WiseTech Global (Licensing) Pty Ltd, Microlistics International Pty Ltd and Microlistics Pty Ltd signed an Assumption Deed for each of them to be joined to the Deed of Cross Guarantee. On 6 June 2019, Translogix (Australia) Pty Ltd, WiseTech Global (Financing) Pty Ltd, WiseTech Global (Europe) Holdings Pty Ltd and WiseTech Academy Pty Ltd signed an Assumption Deed for each of them to be joined to the Deed of Cross Guarantee.
The above companies represent a ‘Closed Group’ for the purposes of the Instrument.
The Consolidated statement of profit or loss and other comprehensive income and Consolidated statement of financial position of the entities that are members of the Closed Group after eliminating all transactions between members of the Closed Group are as follows:
Closed Group
2020$M
2019$M
Profit from continuing operations before income tax 132.3 79.8
Income tax expense (25.3) (21.8)
Profit after tax from continuing operations 106.9 58.0
Net profit for the period 106.9 58.0
Retained earnings at the beginning of the period 130.2 87.7
Dividend declared and paid (11.6) (9.5)
Share premium – retained earnings – –
Vesting of share rights (17.5) (8.6)
Tax benefit from equity remuneration 5.2 2.6
Retained earnings at the end of the period 213.3 130.2
1 1 9W I S E T E C H G L O B A L A N N U A L R E P O R T 2 0 2 0
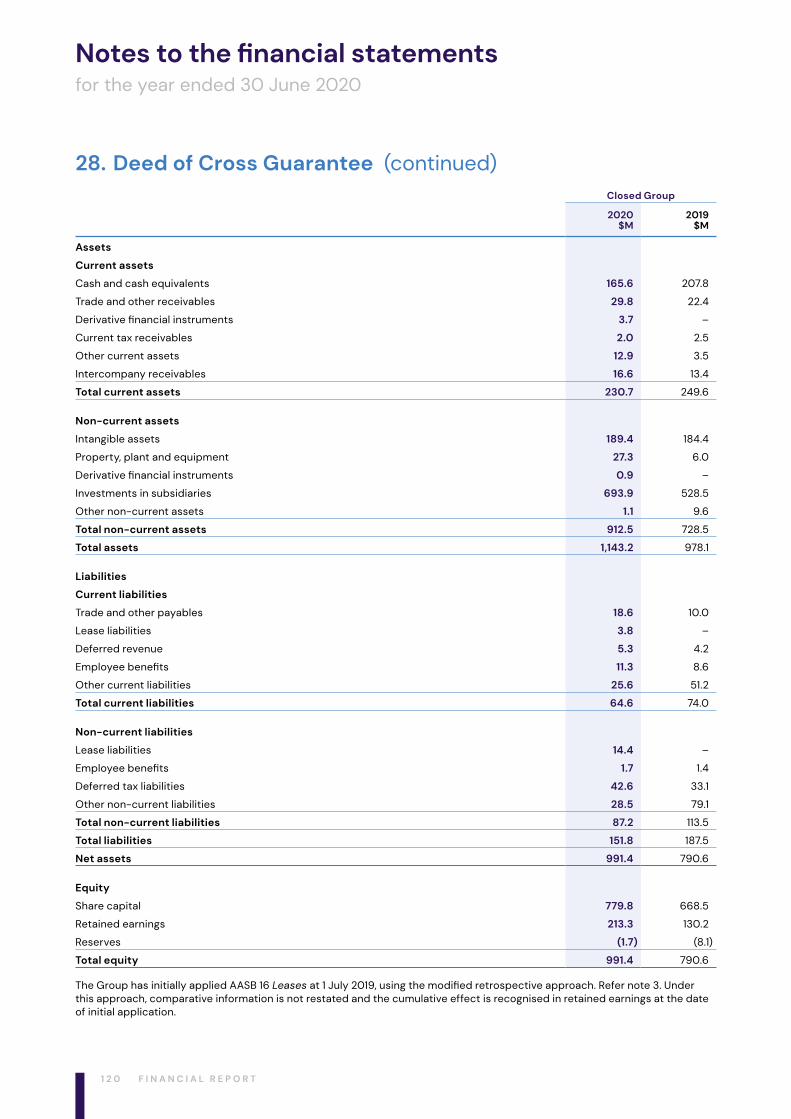
Notes to the financial statementsfor the year ended 30 June 2020
Closed Group
2020$M
2019$M
Assets
Current assets
Cash and cash equivalents 165.6 207.8
Trade and other receivables 29.8 22.4
Derivative financial instruments 3.7 –
Current tax receivables 2.0 2.5
Other current assets 12.9 3.5
Intercompany receivables 16.6 13.4
Total current assets 230.7 249.6
Non-current assets
Intangible assets 189.4 184.4
Property, plant and equipment 27.3 6.0
Derivative financial instruments 0.9 –
Investments in subsidiaries 693.9 528.5
Other non-current assets 1.1 9.6
Total non-current assets 912.5 728.5
Total assets 1,143.2 978.1
Liabilities
Current liabilities
Trade and other payables 18.6 10.0
Lease liabilities 3.8 –
Deferred revenue 5.3 4.2
Employee benefits 11.3 8.6
Other current liabilities 25.6 51.2
Total current liabilities 64.6 74.0
Non-current liabilities
Lease liabilities 14.4 –
Employee benefits 1.7 1.4
Deferred tax liabilities 42.6 33.1
Other non-current liabilities 28.5 79.1
Total non-current liabilities 87.2 113.5
Total liabilities 151.8 187.5
Net assets 991.4 790.6
Equity
Share capital 779.8 668.5
Retained earnings 213.3 130.2
Reserves (1.7) (8.1)
Total equity 991.4 790.6
The Group has initially applied AASB 16 Leases at 1 July 2019, using the modified retrospective approach. Refer note 3. Under this approach, comparative information is not restated and the cumulative effect is recognised in retained earnings at the date of initial application.
28. Deed of Cross Guarantee (continued)
1 2 0 F I N A N C I A L R E P O R T
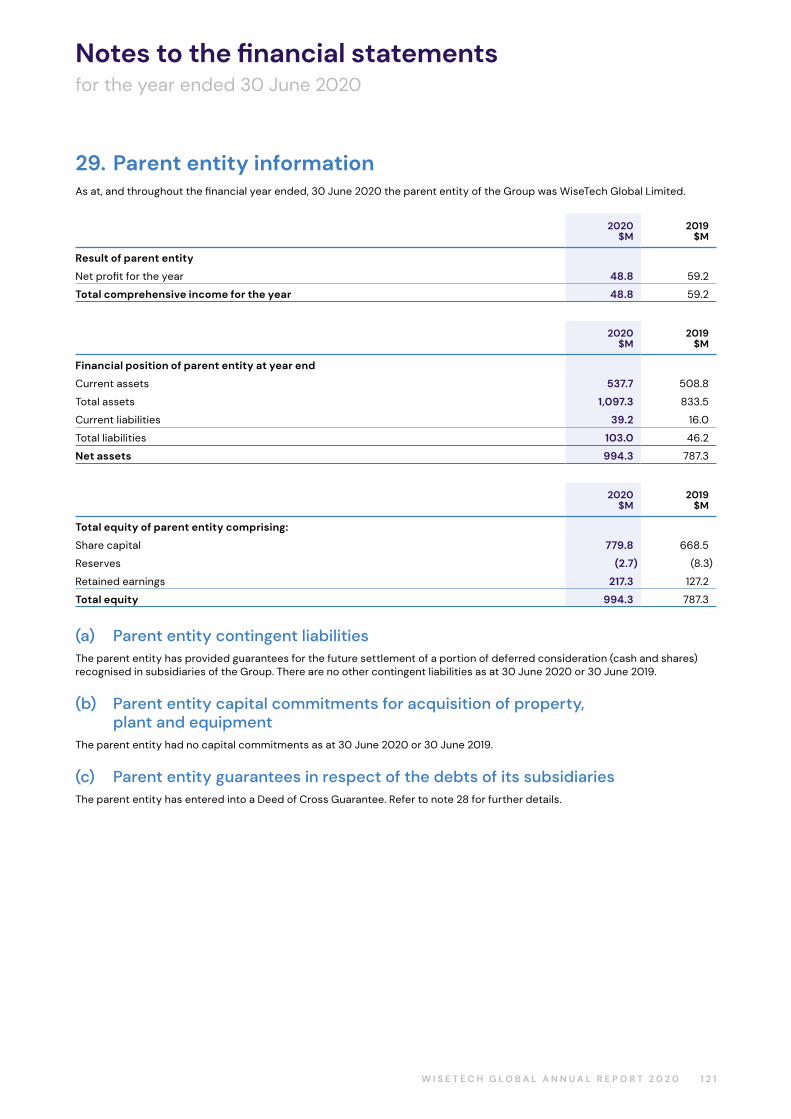
Notes to the financial statementsfor the year ended 30 June 2020
29. Parent entity informationAs at, and throughout the financial year ended, 30 June 2020 the parent entity of the Group was WiseTech Global Limited.
2020
$M2019
$M
Result of parent entity
Net profit for the year 48.8 59.2
Total comprehensive income for the year 48.8 59.2
2020$M
2019$M
Financial position of parent entity at year end
Current assets 537.7 508.8
Total assets 1,097.3 833.5
Current liabilities 39.2 16.0
Total liabilities 103.0 46.2
Net assets 994.3 787.3
2020$M
2019$M
Total equity of parent entity comprising:
Share capital 779.8 668.5
Reserves (2.7) (8.3)
Retained earnings 217.3 127.2
Total equity 994.3 787.3
(a) Parent entity contingent liabilitiesThe parent entity has provided guarantees for the future settlement of a portion of deferred consideration (cash and shares) recognised in subsidiaries of the Group. There are no other contingent liabilities as at 30 June 2020 or 30 June 2019.
(b) Parent entity capital commitments for acquisition of property, plant and equipment
The parent entity had no capital commitments as at 30 June 2020 or 30 June 2019.
(c) Parent entity guarantees in respect of the debts of its subsidiariesThe parent entity has entered into a Deed of Cross Guarantee. Refer to note 28 for further details.
1 2 1W I S E T E C H G L O B A L A N N U A L R E P O R T 2 0 2 0
Notes to the financial statementsfor the year ended 30 June 2020
30. Other policies and disclosures
(a) Principles of consolidationThe Consolidated financial statements incorporate all of the assets, liabilities and results of WiseTech Global Limited and all of the subsidiaries. Subsidiaries are entities controlled by the Group. The Group controls an entity when it is exposed to, or has rights to, variable returns from its involvement with the entity and has the ability to affect those returns through its power over the entity.
The assets, liabilities and results of all subsidiaries are fully consolidated into the financial statements of the Group from the date on which control is obtained by the Group. The consolidation of a subsidiary is discontinued from the date that control ceases. When the Group loses control over a subsidiary, it derecognises the assets and liabilities of the subsidiary, and any related non‑controlling interest and other components of equity. Any resulting gain or loss is recognised in profit or loss. Any interest retained in the former subsidiary is measured at fair value when control is lost.
Intercompany transactions, balances and unrealised gains or losses on transactions between Group entities are fully eliminated on consolidation. Accounting policies of subsidiaries have been changed and adjustments made where necessary to ensure uniformity of the accounting policies adopted by the Group.
(b) Foreign currency transactions and balances
Transactions and balancesForeign currency transactions are translated into the functional currency using the exchange rates prevailing at the date of the transaction. Foreign currency monetary items are translated at the exchange rate at the reporting date. Non-monetary items measured at historical cost continue to be carried at the exchange rate at the date of the transaction. Non-monetary items measured at fair value in a foreign currency are translated to the functional currency at the exchange rate when fair values were determined.
Exchange differences arising on the translation of monetary items are recognised in profit or loss, except where deferred in equity as a qualifying cash flow or net investment hedge.
Exchange differences arising on the translation of non-monetary items are recognised directly in other comprehensive income to the extent that the underlying gain or loss is recognised in other comprehensive income; otherwise, the exchange difference is recognised in profit or loss.
Group companiesThe financial results and position of foreign operations whose functional currency is different from the Group’s presentation currency are translated as follows:
– assets and liabilities including goodwill and fair value adjustments arising on acquisition are translated at exchange rates prevailing at the reporting date;
– income and expenses are translated at average exchange rates for the period; and
– retained earnings are translated at the exchange rates prevailing at the date of the transactions.
Exchange differences arising on translation of foreign operations with functional currencies other than Australian dollars are recognised in other comprehensive income and included in the foreign currency translation reserve in the Consolidated statement of financial position. The cumulative amount of these differences is reclassified into profit or loss in the period in which the operation is disposed of.
Currency of hyperinflationary economyIf the functional currency of a foreign operation is the currency of a hyperinflationary economy, then its financial information is first adjusted to reflect the purchasing power at the current reporting date and then translated into the presentation currency using the exchange rate at the current reporting date.
(c) ProvisionsProvisions are recognised when the Group has a legal or constructive obligation as a result of past events, for which it is probable that an outflow of economic benefits will result and that outflow can be reliably measured.
Provisions are determined by discounting the expected future cash flows at a pre‑tax rate that reflects current market assessments of the time value of money and the risks specific to the liability. The unwinding of the discount is recognised as a finance cost.
1 2 2 F I N A N C I A L R E P O R T
Notes to the financial statementsfor the year ended 30 June 2020
(d) Standards issued but not yet effectiveA number of new standards, amendments to standards and interpretations are effective for annual periods beginning after 1 July 2020 and have not been applied in preparing these Consolidated financial statements.
The following amended standards and interpretations are not expected to have a significant impact on the Group’s Consolidated financial statements:
– Amendments to references to conceptual framework in IFRS;
– Definition of a Business (Amendments to IFRS 3); and
– Definition of Material (Amendments to AASB 101 and AASB 108).
(e) Contingent assets and contingent liabilitiesThere were no contingent assets or liabilities of the Group in relation to FY20 or FY19.
(f) Events after reporting period
DividendSince the period end, the Directors have declared a fully franked final dividend of 1.60 cents per share, payable 2 October 2020. The dividend will be recognised in subsequent financial statements.
30. Other policies and disclosures (continued)
1 2 3W I S E T E C H G L O B A L A N N U A L R E P O R T 2 0 2 0
Directors’ declarationfor the year ended 30 June 2020
In accordance with a resolution of the Directors of WiseTech Global Limited, we state that:
1. In the opinion of the Directors:
(a) the consolidated financial statements and notes that are set out on pages 72 to 123 and the Remuneration Report on pages 51 to 64 in the report are in accordance with the Corporations Act 2001, including:
(i) giving a true and fair view of the consolidated entity’s financial position as at 30 June 2020 and of its performance for the year ended on that date; and
(ii) complying with Australian Accounting Standards and the Corporations Regulations 2001; and
(b) there are reasonable grounds to believe that the Company will be able to pay its debts as and when they become due and payable.
2. There are reasonable grounds to believe that the Company and the Group entities identified in note 28 to the financial statements will be able to meet any obligations or liabilities to which they are or may become subject to by virtue of the Deed of Cross Guarantee between the Company and those Group entities pursuant to ASIC Corporations (Wholly owned Companies) Instrument 2016/785.
3. This declaration has been made after receiving the declarations required to be made to the Directors by the chief executive officer and chief financial officer in accordance with section 295A of the Corporations Act 2001 for the financial year ended 30 June 2020.
4. The Directors draw attention to note 2 to the financial statements, which includes a statement of compliance with the International Financial Reporting Standards.
On behalf of the Board
Andrew Harrison Chair
Richard White Executive Director, Founder and CEO
18 August 2020 18 August 2020
1 2 4 F I N A N C I A L R E P O R T
Independent Auditor’s Reportfor the year ended 30 June 2020
Liability limited by a scheme approved under Professional Standards Legislation.
KPMG, an Australian partnership and a member firm of the KPMG network of independent member firms affiliated with KPMG International Cooperative (“KPMG International”), a Swiss entity.
Independent Auditor’s Report
To the shareholders of WiseTech Global Limited
Report on the audit of the Financial Report
Opinion
We have audited the Financial Report of WiseTech Global Limited (the Company).
In our opinion, the accompanying Financial Report of the Company is in accordance with the Corporations Act 2001, including:
• giving a true and fair view of the Group's financial position as at 30 June 2020 and of its financial performance for the year ended on that date; and
• complying with Australian Accounting Standards and the Corporations Regulations 2001.
The Financial Report comprises:
• Consolidated statement of financial position as at 30 June 2020
• Consolidated statement of profit or loss and other comprehensive income, Consolidated statement of changes in equity, and Consolidated statement of cash flows for the year then ended
• Notes including a summary of significant accounting policies
• Directors' Declaration.
The Group consists of the Company and the entities it controlled at the year end or from time to time during the financial year.
Basis for opinion
We conducted our audit in accordance with Australian Auditing Standards. We believe that the audit evidence we have obtained is sufficient and appropriate to provide a basis for our opinion.
Our responsibilities under those standards are further described in the Auditor’s responsibilities for the audit of the Financial Report section of our report.
We are independent of the Group in accordance with the Corporations Act 2001 and the ethical requirements of the Accounting Professional and Ethical Standards Board’s APES 110 Code of Ethics for Professional Accountants (including Independence Standards) (the Code) that are relevant to our audit of the Financial Report in Australia. We have fulfilled our other ethical responsibilities in accordance with the Code.
This is the original version of the audit report over the financial statements signed by the directors on 18 August 2020. Page references in relation to the Remuneration Report should be read as referring to pages 51 to 64 as opposed to 8 to 20, to reflect the correct references now that the financial statements have been presented in the context of the annual report in its entirety.
1 2 5W I S E T E C H G L O B A L A N N U A L R E P O R T 2 0 2 0
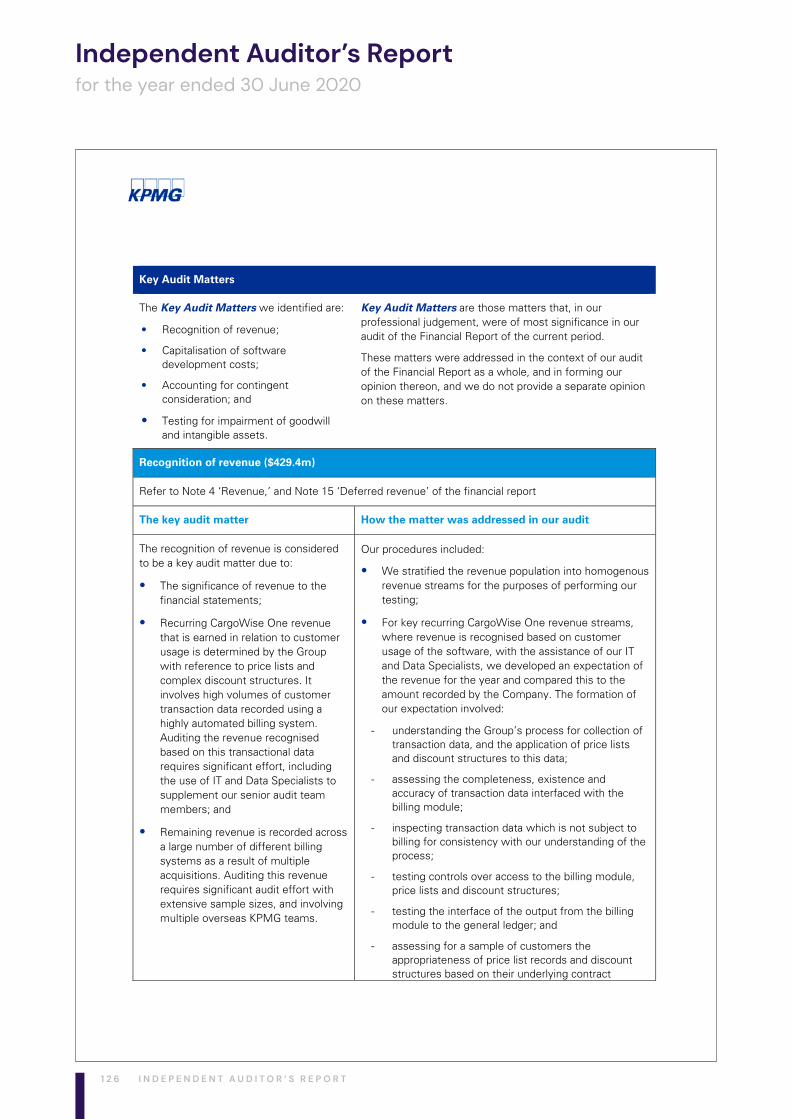
Independent Auditor’s Reportfor the year ended 30 June 2020
94
Key Audit Matters
The Key Audit Matters we identified are:
• Recognition of revenue;
• Capitalisation of software development costs;
• Accounting for contingent consideration; and
• Testing for impairment of goodwill and intangible assets.
Key Audit Matters are those matters that, in our professional judgement, were of most significance in our audit of the Financial Report of the current period.
These matters were addressed in the context of our audit of the Financial Report as a whole, and in forming our opinion thereon, and we do not provide a separate opinion on these matters.
Recognition of revenue ($429.4m)
Refer to Note 4 ‘Revenue,’ and Note 15 ‘Deferred revenue’ of the financial report
The key audit matter How the matter was addressed in our audit
The recognition of revenue is considered to be a key audit matter due to:
• The significance of revenue to the financial statements;
• Recurring CargoWise One revenue that is earned in relation to customer usage is determined by the Group with reference to price lists and complex discount structures. It involves high volumes of customer transaction data recorded using a highly automated billing system. Auditing the revenue recognised based on this transactional data requires significant effort, including the use of IT and Data Specialists to supplement our senior audit team members; and
• Remaining revenue is recorded across a large number of different billing systems as a result of multiple acquisitions. Auditing this revenue requires significant audit effort with extensive sample sizes, and involving multiple overseas KPMG teams.
Our procedures included:
• We stratified the revenue population into homogenous revenue streams for the purposes of performing our testing;
• For key recurring CargoWise One revenue streams, where revenue is recognised based on customer usage of the software, with the assistance of our IT and Data Specialists, we developed an expectation of the revenue for the year and compared this to the amount recorded by the Company. The formation of our expectation involved:
- understanding the Group’s process for collection of transaction data, and the application of price lists and discount structures to this data;
- assessing the completeness, existence and accuracy of transaction data interfaced with the billing module;
- inspecting transaction data which is not subject to billing for consistency with our understanding of the process;
- testing controls over access to the billing module, price lists and discount structures;
- testing the interface of the output from the billing module to the general ledger; and
- assessing for a sample of customers the appropriateness of price list records and discount structures based on their underlying contract
1 2 6 I N D E P E N D E N T A U D I T O R ’ S R E P O R T
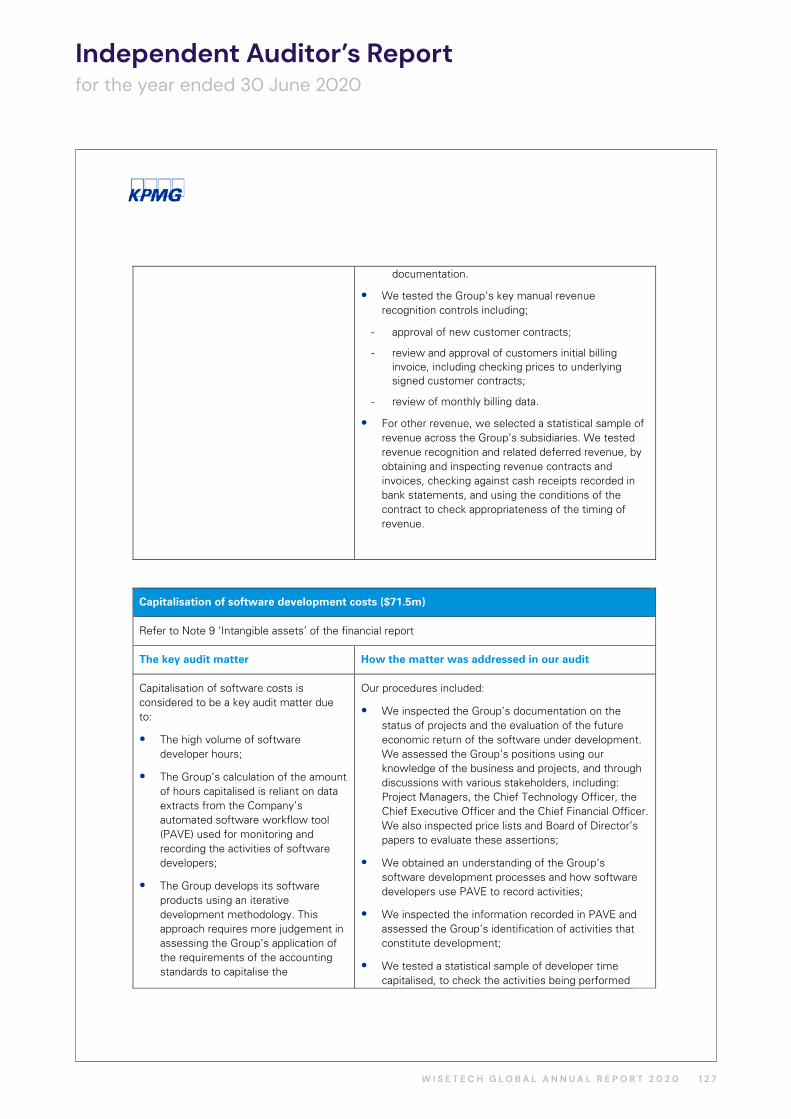
Independent Auditor’s Reportfor the year ended 30 June 2020
95
documentation.
• We tested the Group’s key manual revenue recognition controls including;
- approval of new customer contracts;
- review and approval of customers initial billing invoice, including checking prices to underlying signed customer contracts;
- review of monthly billing data.
• For other revenue, we selected a statistical sample of revenue across the Group’s subsidiaries. We tested revenue recognition and related deferred revenue, by obtaining and inspecting revenue contracts and invoices, checking against cash receipts recorded in bank statements, and using the conditions of the contract to check appropriateness of the timing of revenue.
Capitalisation of software development costs ($71.5m)
Refer to Note 9 ‘Intangible assets’ of the financial report
The key audit matter How the matter was addressed in our audit
Capitalisation of software costs is considered to be a key audit matter due to:
• The high volume of software developer hours;
• The Group’s calculation of the amount of hours capitalised is reliant on data extracts from the Company’s automated software workflow tool (PAVE) used for monitoring and recording the activities of software developers;
• The Group develops its software products using an iterative development methodology. This approach requires more judgement in assessing the Group’s application of the requirements of the accounting standards to capitalise the
Our procedures included:
• We inspected the Group’s documentation on the status of projects and the evaluation of the future economic return of the software under development. We assessed the Group’s positions using our knowledge of the business and projects, and through discussions with various stakeholders, including: Project Managers, the Chief Technology Officer, the Chief Executive Officer and the Chief Financial Officer. We also inspected price lists and Board of Director’s papers to evaluate these assertions;
• We obtained an understanding of the Group’s software development processes and how software developers use PAVE to record activities;
• We inspected the information recorded in PAVE and assessed the Group’s identification of activities that constitute development;
• We tested a statistical sample of developer time capitalised, to check the activities being performed
1 2 7W I S E T E C H G L O B A L A N N U A L R E P O R T 2 0 2 0
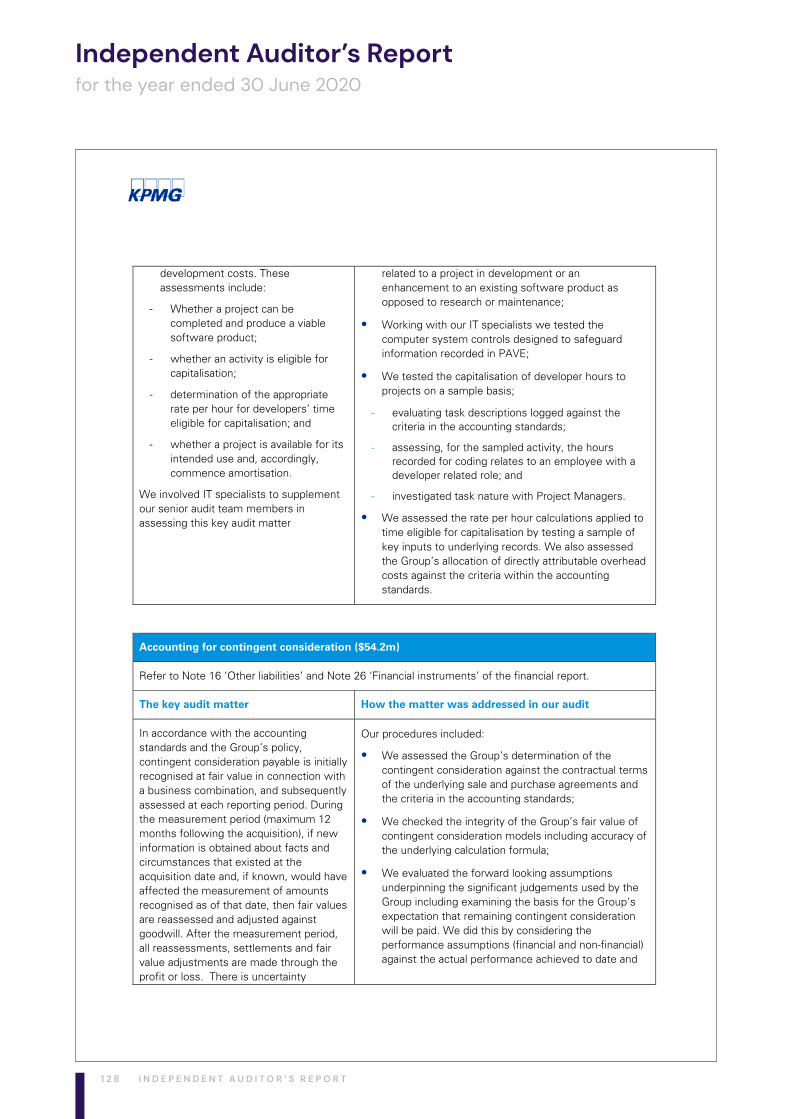
Independent Auditor’s Reportfor the year ended 30 June 2020
96
development costs. These assessments include:
- Whether a project can be completed and produce a viable software product;
- whether an activity is eligible for capitalisation;
- determination of the appropriate rate per hour for developers’ time eligible for capitalisation; and
- whether a project is available for its intended use and, accordingly, commence amortisation.
We involved IT specialists to supplement our senior audit team members in assessing this key audit matter
related to a project in development or an enhancement to an existing software product as opposed to research or maintenance;
• Working with our IT specialists we tested the computer system controls designed to safeguard information recorded in PAVE;
• We tested the capitalisation of developer hours to projects on a sample basis;
- evaluating task descriptions logged against the criteria in the accounting standards;
- assessing, for the sampled activity, the hours recorded for coding relates to an employee with a developer related role; and
- investigated task nature with Project Managers.
• We assessed the rate per hour calculations applied to time eligible for capitalisation by testing a sample of key inputs to underlying records. We also assessed the Group’s allocation of directly attributable overhead costs against the criteria within the accounting standards.
Accounting for contingent consideration ($54.2m)
Refer to Note 16 ‘Other liabilities’ and Note 26 ‘Financial instruments’ of the financial report.
The key audit matter How the matter was addressed in our audit
In accordance with the accounting standards and the Group’s policy, contingent consideration payable is initially recognised at fair value in connection with a business combination, and subsequently assessed at each reporting period. During the measurement period (maximum 12 months following the acquisition), if new information is obtained about facts and circumstances that existed at the acquisition date and, if known, would have affected the measurement of amounts recognised as of that date, then fair values are reassessed and adjusted against goodwill. After the measurement period, all reassessments, settlements and fair value adjustments are made through the profit or loss. There is uncertainty
Our procedures included:
• We assessed the Group’s determination of the contingent consideration against the contractual terms of the underlying sale and purchase agreements and the criteria in the accounting standards;
• We checked the integrity of the Group’s fair value of contingent consideration models including accuracy of the underlying calculation formula;
• We evaluated the forward looking assumptions underpinning the significant judgements used by the Group including examining the basis for the Group’s expectation that remaining contingent consideration will be paid. We did this by considering the performance assumptions (financial and non-financial) against the actual performance achieved to date and
1 2 8 I N D E P E N D E N T A U D I T O R ’ S R E P O R T
Independent Auditor’s Reportfor the year ended 30 June 2020
97
regarding the actual contingent consideration payments that will be made by the Group, as they are subject to financial and non-financial metrics and targets occurring in the future.
The fair value of contingent consideration is a key audit matter due to the significant quantum of contingent consideration arrangements which were renegotiated by the Group during the current financial year and the judgement applied by us when evaluating the Group’s assessment of fair value of these arrangements. We focused on:
assessing the feasibility of forward looking assumptions in relation to the achievement of financial and non-financial metrics;
assessing whether for accounting purposes contingent consideration obligations that are settled in shares, are classified as either a liability or equity; and
assessing whether remeasurement of the liability is to be accounted for as a measurement period adjustment to business combination accounting.
our understanding of the business and economic environment relevant in the forecast period;
• Where contingent consideration obligations are to be settled through the issuance of shares, we assessed the Group’s classification of those obligations as either a liability or equity for appropriateness. We did this by inspecting the terms of the sale and purchase agreement and considering the application of the criteria in the accounting standards. We evaluated the amounts recognised in the acquisition reserve and the profit or loss by assessing contractual terms and amended agreement terms, and applying relevant share prices and foreign exchange rates, with reference to the requirements of the accounting standards;
• We assessed the remeasurement of contingent consideration not being treated as a measurement period adjustment to business combination accounting (i.e. which would have been adjusted against goodwill), by evaluating the factors giving rise to the renegotiations, along with information contained in Board papers, and the sale and purchase contractual terms and amendments thereof;
• We assessed the impact of renegotiations to earnouts against signed contract amendments to the sale and purchase agreements. Where cash payments were agreed by the Group to settle the contingent consideration obligations, we checked the payment to bank statements. Where issuance of shares was agreed by the Group to settle contingent consideration obligations, we checked the calculation of the number of shares to be issued for consistency with the formulas contained in the underlying signed agreements; and
• We assessed the disclosures in the financial report using our understanding of the issue obtained from our testing and against the requirements of the accounting standards.
1 2 9W I S E T E C H G L O B A L A N N U A L R E P O R T 2 0 2 0
Independent Auditor’s Reportfor the year ended 30 June 2020
98
Testing for impairment of goodwill and other intangible assets ($885.0m)
Refer to Note 9 ‘Intangible assets’ of the financial report.
The key audit matter How the matter was addressed in our audit
The Group’s annual testing of goodwill and intangible assets for impairment is a key audit matter, given the size of the balance relative to total assets and the judgements applied by us in assessing the Group’s identification of Cash Generating Units (CGUs), allocation of goodwill and the forward-looking assumptions the Group applied in their value in use model.
We focused on:
• Identification of CGUs – non-financial assets (other than goodwill) are required to be assessed for impairment separately, or as part of a CGU where the assets do not generate independent cash inflows. As the Group is pursuing a strategy for the integration of acquired businesses, assessing whether an acquired business generates substantially independent cash inflows during the process of integration with the global platform requires judgement;
• Allocation of goodwill to CGUs – goodwill is required to be allocated to the CGU or group of CGUs that is expected to benefit from the synergies of the business combination. As the Group is acquiring businesses for the purposes of integrating functionality into a global platform, determining which of the CGUs that these synergies will be obtained, and the amount of goodwill to be allocated to them requires judgement; and
• Forward looking assumptions - forecast cash flows, growth rates, discount rates and terminal growth rates used by the Group given their inherent uncertainty.
We involved valuation specialists to supplement our senior audit team members in assessing this key audit matter.
Working with our valuation specialists, our procedures included:
• We assessed the Group’s determination of the CGUs used in the impairment model and the determination that goodwill is tested at the single group of CGU level, based on our understanding of the Group’s business, acquisition strategy, and examination of cash inflows. We assessed these against the criteria in the accounting standards. We also considered internal reporting of the Group’s results to assess how earnings and goodwill are monitored and reported;
• We assessed the impairment testing methodology used by the Group against the requirements of Australian Accounting Standards;
• We tested the mathematical accuracy of the Group’s value in use model;
• We assessed the Group’s cash flow forecasts including;
- Consideration of the historical accuracy of previous estimates
- Reconciled the underlying cash flow projections to Board approved forecasts
• We assessed the cash flows and related growth rates applied in the model by comparing them to external analysts’ reports. We checked the consistency of the growth rates to the Group’s stated plan and strategy, past performance of the Group, and our experience regarding the feasibility of these in the industry in which they operate;
• We assessed the Group’s assumptions for terminal growth rates in comparison to economic and industry forecasts;
• Working with our valuation specialists we analysed the discount rates against publicly available data of a group of comparable entities, adjusted by risk factors specific to the Group;
1 3 0 I N D E P E N D E N T A U D I T O R ’ S R E P O R T
Independent Auditor’s Reportfor the year ended 30 June 2020
99
• We performed sensitivity analyses on the key assumptions used in the model and applied other values within a range that we assessed as being reasonably possible, to focus our further work; and
• We assessed the disclosures in the financial report using our understanding of the Group’s testing for impairment obtained from our procedures and against the requirements of the accounting standards.
Other Information
Other Information is financial and non-financial information in WiseTech Global Limited’s annual reporting which is provided in addition to the Financial Report and the Auditor’s Report. The Directors are responsible for the Other Information.
The Other Information we obtained prior to the date of this Auditor’s Report was the Operating and Financial Review, Board of Directors, and the Directors’ Report. The Financial Highlights, Delivering on our Strategy, Five year financial summary, Chair’s Letter, CEO’s message, Our business, Our innovation pipeline, Our expansion pipeline, Environment, social and governance, Shareholder information, Glossary and Corporate Directory are expected to be made available to us after the date of the Auditor's Report.
Our opinion on the Financial Report does not cover the Other Information and, accordingly, we do not and will not express an audit opinion or any form of assurance conclusion thereon, with the exception of the Remuneration Report and our related assurance opinion.
In connection with our audit of the Financial Report, our responsibility is to read the Other Information. In doing so, we consider whether the Other Information is materially inconsistent with the Financial Report or our knowledge obtained in the audit, or otherwise appears to be materially misstated.
We are required to report if we conclude that there is a material misstatement of this Other Information, and based on the work we have performed on the Other Information that we obtained prior to the date of this Auditor’s Report we have nothing to report.
Responsibilities of the Directors for the Financial Report
The Directors are responsible for:
• preparing the Financial Report that gives a true and fair view in accordance with Australian Accounting Standards and the Corporations Act 2001
• implementing necessary internal control to enable the preparation of a Financial Report that gives a true and fair view and is free from material misstatement, whether due to fraud or error
• assessing the Group and Company's ability to continue as a going concern and whether the use of the going concern basis of accounting is appropriate. This includes disclosing, as applicable, matters related to going concern and using the going concern basis of accounting unless they either intend to liquidate the Group and Company or to cease operations, or have no realistic alternative but to do so.
1 3 1W I S E T E C H G L O B A L A N N U A L R E P O R T 2 0 2 0
Independent Auditor’s Reportfor the year ended 30 June 2020
100
Auditor’s responsibilities for the audit of the Financial Report
Our objective is:
• to obtain reasonable assurance about whether the Financial Report as a whole is free from material misstatement, whether due to fraud or error; and
• to issue an Auditor’s Report that includes our opinion.
Reasonable assurance is a high level of assurance, but is not a guarantee that an audit conducted in accordance with Australian Auditing Standards will always detect a material misstatement when it exists.
Misstatements can arise from fraud or error. They are considered material if, individually or in the aggregate, they could reasonably be expected to influence the economic decisions of users taken on the basis of the Financial Report.
A further description of our responsibilities for the audit of the Financial Report is located at the Auditing and Assurance Standards Board website at: https://www.auasb.gov.au/admin/file/content102/c3/ar1_2020.pdf. This description forms part of our Auditor’s Report.
Report on the Remuneration Report
Opinion
In our opinion, the Remuneration Report of WiseTech Global Limited for the year ended 30 June 2020, complies with Section 300A of the Corporations Act 2001.
Directors’ responsibilities
The Directors of the Company are responsible for the preparation and presentation of the Remuneration Report in accordance with Section 300A of the Corporations Act 2001.
Our responsibilities
We have audited the Remuneration Report included in pages 8 to 20 of the Directors’ report for the year ended 30 June 2020.
Our responsibility is to express an opinion on the Remuneration Report, based on our audit conducted in accordance with Australian Auditing Standards.
KPMG Caoimhe Toouli
Partner
Sydney
18 August 2020
1 3 2 I N D E P E N D E N T A U D I T O R ’ S R E P O R T
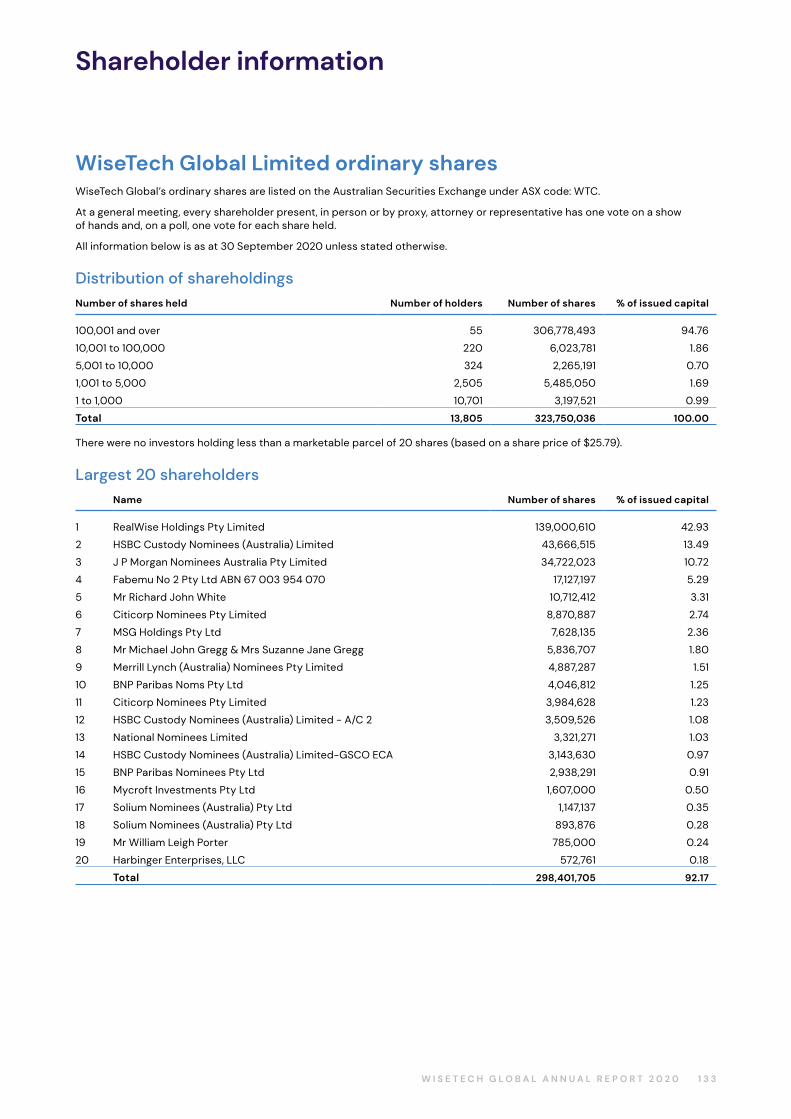
Shareholder information
WiseTech Global Limited ordinary sharesWiseTech Global’s ordinary shares are listed on the Australian Securities Exchange under ASX code: WTC.
At a general meeting, every shareholder present, in person or by proxy, attorney or representative has one vote on a show of hands and, on a poll, one vote for each share held.
All information below is as at 30 September 2020 unless stated otherwise.
Distribution of shareholdingsNumber of shares held Number of holders Number of shares % of issued capital
100,001 and over 55 306,778,493 94.76
10,001 to 100,000 220 6,023,781 1.86
5,001 to 10,000 324 2,265,191 0.70
1,001 to 5,000 2,505 5,485,050 1.69
1 to 1,000 10,701 3,197,521 0.99
Total 13,805 323,750,036 100.00
There were no investors holding less than a marketable parcel of 20 shares (based on a share price of $25.79).
Largest 20 shareholdersName Number of shares % of issued capital
1 RealWise Holdings Pty Limited 139,000,610 42.93
2 HSBC Custody Nominees (Australia) Limited 43,666,515 13.49
3 J P Morgan Nominees Australia Pty Limited 34,722,023 10.72
4 Fabemu No 2 Pty Ltd ABN 67 003 954 070 17,127,197 5.29
5 Mr Richard John White 10,712,412 3.31
6 Citicorp Nominees Pty Limited 8,870,887 2.74
7 MSG Holdings Pty Ltd 7,628,135 2.36
8 Mr Michael John Gregg & Mrs Suzanne Jane Gregg 5,836,707 1.80
9 Merrill Lynch (Australia) Nominees Pty Limited 4,887,287 1.51
10 BNP Paribas Noms Pty Ltd 4,046,812 1.25
11 Citicorp Nominees Pty Limited 3,984,628 1.23
12 HSBC Custody Nominees (Australia) Limited - A/C 2 3,509,526 1.08
13 National Nominees Limited 3,321,271 1.03
14 HSBC Custody Nominees (Australia) Limited-GSCO ECA 3,143,630 0.97
15 BNP Paribas Nominees Pty Ltd 2,938,291 0.91
16 Mycroft Investments Pty Ltd 1,607,000 0.50
17 Solium Nominees (Australia) Pty Ltd 1,147,137 0.35
18 Solium Nominees (Australia) Pty Ltd 893,876 0.28
19 Mr William Leigh Porter 785,000 0.24
20 Harbinger Enterprises, LLC 572,761 0.18
Total 298,401,705 92.17
1 3 3W I S E T E C H G L O B A L A N N U A L R E P O R T 2 0 2 0
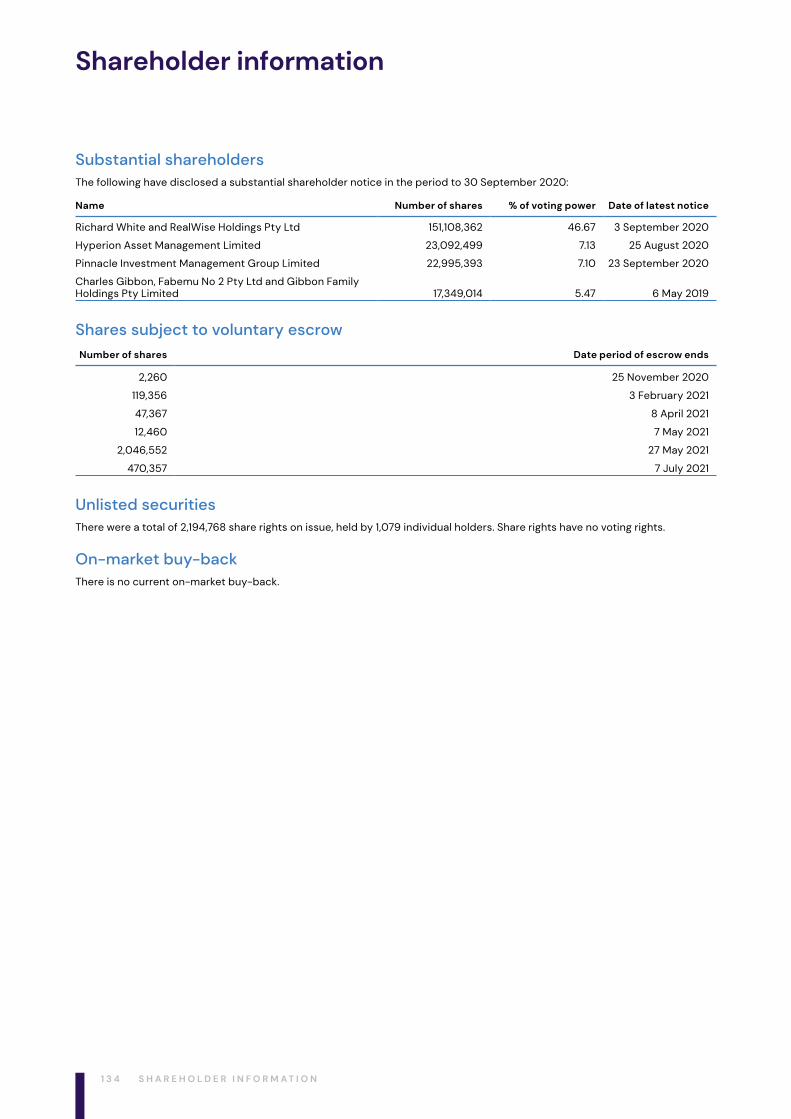
Shareholder information
Substantial shareholdersThe following have disclosed a substantial shareholder notice in the period to 30 September 2020:
Name Number of shares % of voting power Date of latest notice
Richard White and RealWise Holdings Pty Ltd 151,108,362 46.67 3 September 2020
Hyperion Asset Management Limited 23,092,499 7.13 25 August 2020
Pinnacle Investment Management Group Limited 22,995,393 7.10 23 September 2020
Charles Gibbon, Fabemu No 2 Pty Ltd and Gibbon Family Holdings Pty Limited 17,349,014 5.47 6 May 2019
Shares subject to voluntary escrowNumber of shares Date period of escrow ends
2,260 25 November 2020
119,356 3 February 2021
47,367 8 April 2021
12,460 7 May 2021
2,046,552 27 May 2021
470,357 7 July 2021
Unlisted securitiesThere were a total of 2,194,768 share rights on issue, held by 1,079 individual holders. Share rights have no voting rights.
On-market buy-backThere is no current on-market buy-back.
1 3 4 S H A R E H O L D E R I N F O R M A T I O N
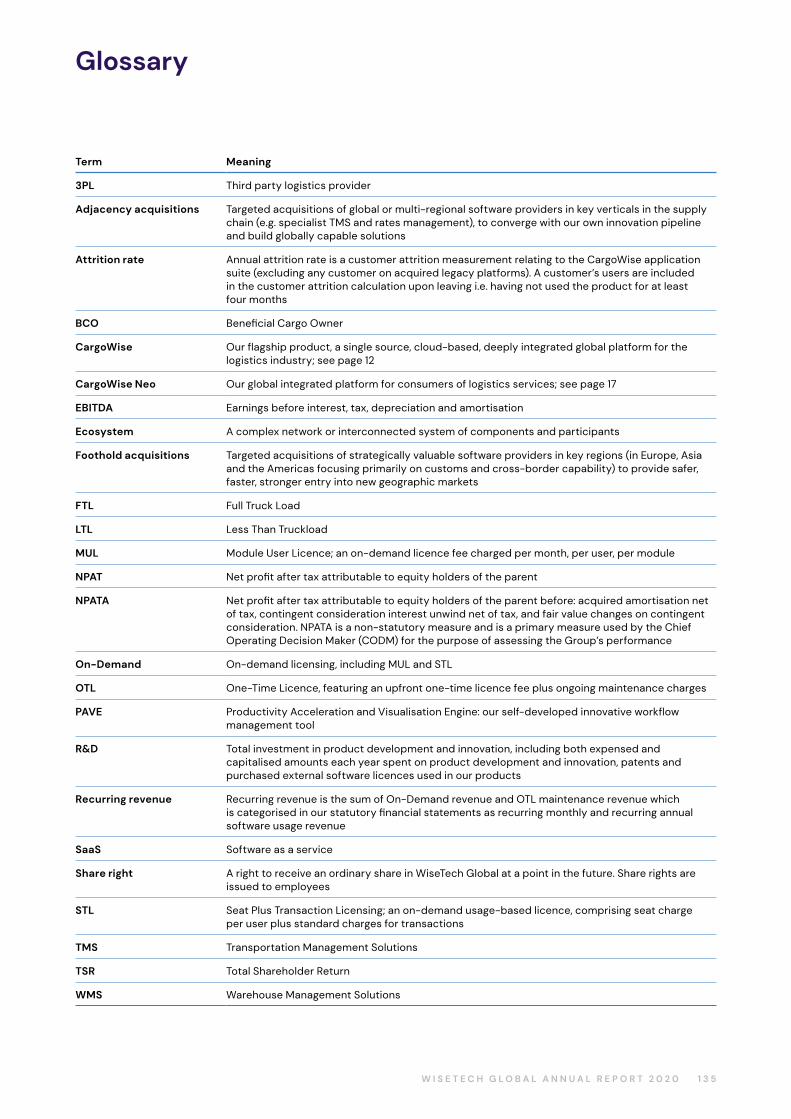
Glossary
Term Meaning
3PL Third party logistics provider
Adjacency acquisitions Targeted acquisitions of global or multi-regional software providers in key verticals in the supply chain (e.g. specialist TMS and rates management), to converge with our own innovation pipeline and build globally capable solutions
Attrition rate Annual attrition rate is a customer attrition measurement relating to the CargoWise application suite (excluding any customer on acquired legacy platforms). A customer’s users are included in the customer attrition calculation upon leaving i.e. having not used the product for at least four months
BCO Beneficial Cargo Owner
CargoWise Our flagship product, a single source, cloud‑based, deeply integrated global platform for the logistics industry; see page 12
CargoWise Neo Our global integrated platform for consumers of logistics services; see page 17
EBITDA Earnings before interest, tax, depreciation and amortisation
Ecosystem A complex network or interconnected system of components and participants
Foothold acquisitions Targeted acquisitions of strategically valuable software providers in key regions (in Europe, Asia and the Americas focusing primarily on customs and cross-border capability) to provide safer, faster, stronger entry into new geographic markets
FTL Full Truck Load
LTL Less Than Truckload
MUL Module User Licence; an on-demand licence fee charged per month, per user, per module
NPAT Net profit after tax attributable to equity holders of the parent
NPATA Net profit after tax attributable to equity holders of the parent before: acquired amortisation net of tax, contingent consideration interest unwind net of tax, and fair value changes on contingent consideration. NPATA is a non‑statutory measure and is a primary measure used by the Chief Operating Decision Maker (CODM) for the purpose of assessing the Group’s performance
On-Demand On-demand licensing, including MUL and STL
OTL One-Time Licence, featuring an upfront one-time licence fee plus ongoing maintenance charges
PAVE Productivity Acceleration and Visualisation Engine: our self‑developed innovative workflow management tool
R&D Total investment in product development and innovation, including both expensed and capitalised amounts each year spent on product development and innovation, patents and purchased external software licences used in our products
Recurring revenue Recurring revenue is the sum of On-Demand revenue and OTL maintenance revenue which is categorised in our statutory financial statements as recurring monthly and recurring annual software usage revenue
SaaS Software as a service
Share right A right to receive an ordinary share in WiseTech Global at a point in the future. Share rights are issued to employees
STL Seat Plus Transaction Licensing; an on‑demand usage‑based licence, comprising seat charge per user plus standard charges for transactions
TMS Transportation Management Solutions
TSR Total Shareholder Return
WMS Warehouse Management Solutions
1 3 5W I S E T E C H G L O B A L A N N U A L R E P O R T 2 0 2 0
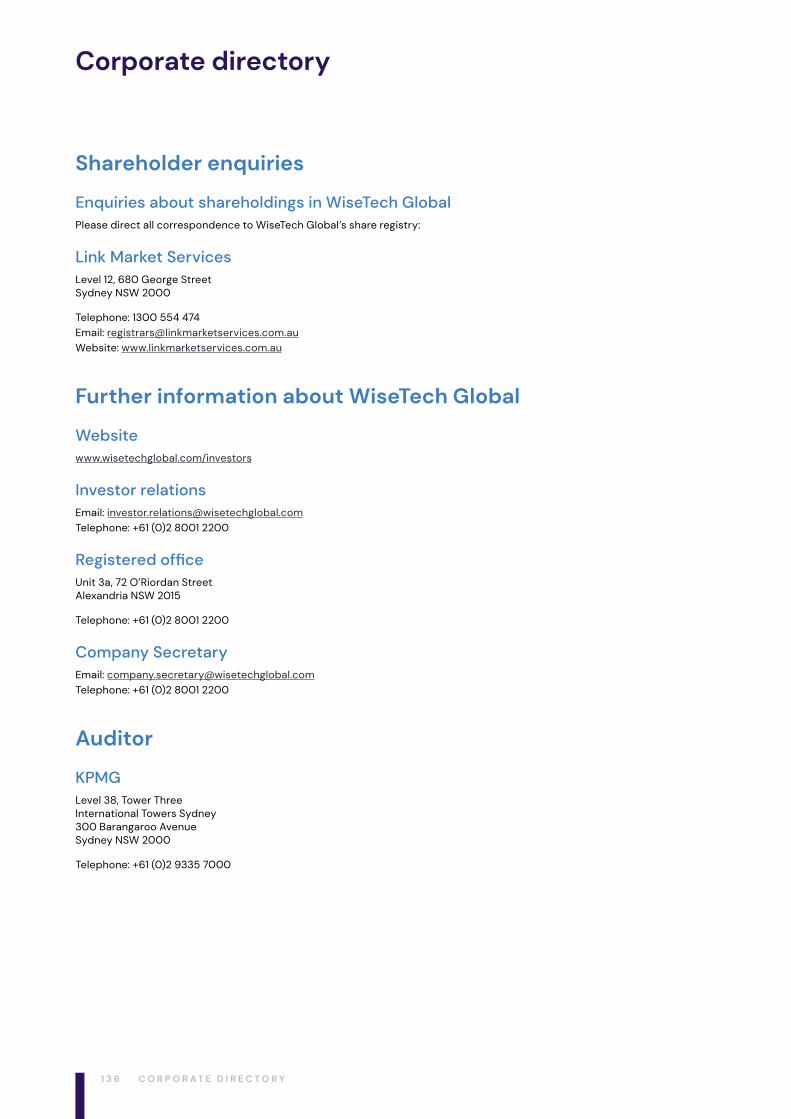
Corporate directory
Shareholder enquiries
Enquiries about shareholdings in WiseTech GlobalPlease direct all correspondence to WiseTech Global’s share registry:
Link Market ServicesLevel 12, 680 George Street Sydney NSW 2000
Telephone: 1300 554 474Email: [email protected]: www.linkmarketservices.com.au
Further information about WiseTech Global
Websitewww.wisetechglobal.com/investors
Investor relationsEmail: [email protected]: +61 (0)2 8001 2200
Registered officeUnit 3a, 72 O’Riordan Street Alexandria NSW 2015
Telephone: +61 (0)2 8001 2200
Company SecretaryEmail: [email protected]: +61 (0)2 8001 2200
Auditor
KPMGLevel 38, Tower Three International Towers Sydney 300 Barangaroo Avenue Sydney NSW 2000
Telephone: +61 (0)2 9335 7000
1 3 6 C O R P O R A T E D I R E C T O R Y


wisetechglobal.com/investors wisetechglobal.com/investors