Embed Size (px)
Citation preview

EN EN
EN

EN EN
COMMISSION OF THE EUROPEAN COMMUNITIES
Brussels, 15.05.2008 D000343/03
Draft
COMMISSION DECISION
of [Day Month 2008]
establishing, pursuant to Directive 2000/60/EC of the European Parliament and of the Council, the values of the Member State monitoring system classifications as a result of the
intercalibration exercise
.
.

EN 2 EN
Draft
COMMISSION DECISION
of [Day Month 2008]
establishing, pursuant to Directive 2000/60/EC of the European Parliament and of the Council, the values of the Member State monitoring system classifications as a result of the
intercalibration exercise
THE COMMISSION OF THE EUROPEAN COMMUNITIES,
Having regard to the Treaty establishing the European Community,
Having regard to Directive 2000/60/EC of the European Parliament and of the Council of 23 October 2000 establishing a framework for Community action in the field of water policy1, and in particular section 1.4.1 (ix) of Annex V thereof,
Whereas:
(1) Article 4 (1) (a) (ii) of Directive 2000/60/EC requires the Member States to protect, enhance and restore all bodies of surface water with the aim of achieving good surface water status at the latest fifteen years after the date of entry into force of the Directive, subject to certain exceptions, in accordance with the provisions laid down in Annex V thereto. Article 4 (1) (a) (iii) of Directive 2000/60/EC requires the Member States to protect and enhance all artificial and heavily modified bodies of water, with the aim of achieving good ecological potential and good surface water chemical status at the latest fifteen years from the date of entry into force of that Directive, subject to certain exceptions, in accordance with the provisions laid down in Annex V thereto. In accordance with point (i) of section 1.4.1 of Annex V to Directive 2000/60/EC the references to ecological status should be construed as references to ecological potential as regards artificial and heavily modified water bodies.
(2) Section 1.4.1 of Annex V to Directive 2000/60/EC provides a process to ensure the comparability between Member States of biological monitoring results, being a central part of the ecological status classification. This requires the results of the Member States’ monitoring and classification systems to be compared through an intercalibration network comprised of monitoring sites in each Member State and in each ecoregion of the Community. Directive 2000/60/EC requires the Member States to collect, as appropriate, the necessary information for the sites included in the intercalibration network, in order to enable the assessment of the consistency of the national classification system with the normative definitions of section 1.2 of Annex V to Directive 2000/60/EC and the comparability of the results of classification systems between the Member States.
(3) Commission Decision of 17 August 2005 on the establishment of a register of sites to form the intercalibration network in accordance with Directive 2000/60/EC of the European Parliament and of the Council2 established the register of sites to form the
1 OJ L 327, 22.12.2000, p. 1. Directive as last amended by Directive 2008/32/EC (OJ L 81, 20.03.2008, p.
60). 2 OJ L 243, 19.9.2005, p. 1.

EN 3 EN
intercalibration network referred to in section 1.4.1 (vii) of Annex V to Directive 2000/60/EC.
(4) In order to carry out the intercalibration exercise Member States are organised in Geographical Intercalibration Groups, consisting of Member States sharing particular surface water body types, as defined in Section 2 of the Annex to Decision 2005/646/EC. This has allowed each group to compare its results and to perform the intercalibration exercise among its members.
(5) The intercalibration exercise is carried out at biological element level, comparing the classification results of the national monitoring systems for each biological element and for each common surface water body type among Member States in the same Geographical Intercalibration Group, and assessing the consistency of the results with the aforementioned normative definitions.
(6) The “Technical report on the Water Framework Directive intercalibration exercise” describes in detail how the intercalibration exercise has been carried out for the water categories and biological quality elements included in the Annex to this Decision.
(7) The Commission has facilitated the intercalibration exercise through the Institute of Environment and Sustainability of the Joint Research Centre in Ispra (Italy) that has coordinated the technical work.
(8) The intercalibration exercise is a complex scientific and technical task. The Geographical Intercalibration Groups have used different methodological options to carry out the exercise depending on the availability of monitoring data for the various biological quality elements and the status of development of the national monitoring and classification systems. In order to increase the statistical robustness of the results, most of the methodologies used by Geographical Intercalibration Groups involve the use of data from as many monitoring points as possible, covering the whole range of status classes, from high to bad status. Therefore, monitoring data has been used from sites that are not part of the intercalibration network, as this comprises only a limited number of sites of high, good or moderate status.
(9) The Commission has received intercalibration results for a number of biological quality elements that comprise the definition of ecological status. In some cases results have been provided for only some parameters of the biological elements or for only some of the Member States participating in a Geographical Intercalibration Group. Hence, the Commission considers that, for those cases, comparability is not fully ensured. Further intercalibration results may therefore be subject to a future Decision when the relevant information in accordance with Section 1.4.1 of Annex V to Directive 2000/60/EC will have been provided by Member States.
(10) It is necessary to adopt the available results of the intercalibration exercise on time to inform the development of the first river basin management plans and programmes of measures in accordance with Articles 11 and 13 of Directive 2000/60/EC.
(11) As a result of the intercalibration exercise, the values of the ecological quality ratios for the boundaries between ecological status classes for the Member States classification systems should represent an equivalent ecological status. The differences in values for the same biological quality element are due to differences in national methods. In addition, due to the differences in calculation methods and other reasons, it is not possible to compare the values of the ecological quality ratios across different biological quality elements.
EN 4 EN
(12) Parameters like chlorophyll-a concentration, phytoplankton biovolume, percentage of cyanobacteria or depth limits of macroalgae and angiosperms do not cover full biological quality elements. However, due to the availability of data and assessment methods, they are one of the basis of the current intercalibration exercise for lakes and coastal waters. The values of those parameters are directly comparable across Member States, provided the differences in sampling and analytical methods are taken into account. For these reasons, in addition to the ecological quality ratios, absolute values for these parameters should be included in the Annex to this Decision as part of the results of the intercalibration exercise.
(13) The results should refer to the ecological status. If water bodies corresponding to the intercalibrated types are designated as heavily modified water bodies in accordance with Article 4(3) of Directive 2000/60/EC, the results presented in the Annex to this Decision may be used to derive their good ecological potential, taken into account their physical modifications and their associated water use, in accordance with the normative definitions in Annex V, section 1.2.5, of Directive 2000/60/EC.
(14) As established in section 1.4.1 (iii) of Annex V to Directive 2000/60/EC, Member States will have to translate the results of the intercalibration exercise into their national classification systems in order to set the boundaries between high and good status and between good and moderate status for all their national types. Guidelines to translate the intercalibration results into the national classification systems and to derive reference conditions have been developed to support the application of the results.
(15) The information that will be made available through the implementation of the monitoring programmes provided for in Article 8 of Directive 2000/60/EC and the review and update of the characteristics of river basin districts provided for in Article 5 of Directive 2000/60/EC can bring new evidence that may lead to the adaptation to scientific and technical progress of the Member States’ monitoring and classification systems and eventually to a review of the results of the intercalibration exercise in order to improve their quality.
(16) The measures provided for in this Decision are in accordance with the opinion of the Committee referred to in Article 21(1) of Directive 2000/60/EC,
HAS ADOPTED THIS DECISION:
Article 1
For the purpose of section 1.4.1(iii) of Annex V to Directive 2000/60/EC, Member States shall use in their monitoring systems classification the values of the boundaries between classes that are set out in the Annex to this Decision.
Article 2
This Decision is addressed to the Member States.
Done at Brussels,
For the Commission Member of the Commission

EN 5 EN
Stravros DIMAS

EN 6 EN
Annex Water category Rivers
Geographical Intercalibration Group Alpine
Description of types that have been intercalibrated
Type River characterisation
Catchment (km2)
Altitude and geomorphology
Alkalinity Flow regime
R-A1 Small to medium, high altitude calcareous
10-1000 800-2500 m (catchment),
boulders/cobble
high (but not extremely high) alkalinity
R-A2 Small to medium, high altitude,
siliceous
10-1000 500-1000m (max. altitude of
catchment 3000m, mean 1500m),
boulders
Non-calcareous (granite, metamorphic). medium to
low alkalinity
nival-glacial flow regime
Countries sharing the types that have been intercalibrated
Type R-A1: Germany, Austria, France, Italy, Slovenia
Type R-A2: Austria, France, Italy, Spain, Slovenia
RESULTS
Biological Quality Element Benthic invertebrate fauna
Results: Ecological quality ratios of the national classification systems intercalibrated
Ecological Quality Ratios Type and country
National classification systems intercalibrated
High-Good boundary
Good-Moderate boundary
Type R-A1
Austria
Austrian System for Ecological River Status Assessment (Worst case between Multimetric Indices for
General Degradation and Saprobic Index)
0.80 0.60
France
Classification française DCE Indice Biologique Global Normalisé (IBGN). Norme AFNOR NF T 90 350 (1992)
and circular MEDD/DE/MAGE/BEMA 05 n°14 of 28 July 2005 modified on
13 June 2007
0.93 0.79
Germany PERLODES – Bewertungsverfahren von Fließgewässern auf Basis des
Makrozoobenthos 0.80 0.60
Italy STAR Intercalibration Common Metric Index (STAR_ICMi) 0.97 0.73
Slovenia
Slovenian Benthic Invertebrate Assessment System:
Multimetric index (Hydromorphology/ General degradation), Saprobic Index
0.80 0.60

EN 7 EN
Type R-A2
Austria
Austrian System for Ecological River Status Assessment (Worst case between Multimetric Indices for
General Degradation and Saprobic Index) 0.80 0.60
France (Alps)
Classification française DCE Indice Biologique Global Normalisé (IBGN). Norme AFNOR NF T 90 350 (1992)
and circular MEDD/DE/MAGE/BEMA 05 n°14 of 28 July 2005 modified on
13 June 2007 0.93 0.71
France (Pyrenees)
Classification française DCE Indice Biologique Global Normalisé (IBGN). Norme AFNOR NF T 90 350 (1992)
and circular MEDD/DE/MAGE/BEMA 05 n°14 of 28 July 2005 modified on
13 June 2007 0.94 0.81
Italy STAR Intercalibration Common Metric
Index (STAR_ICMi) 0.95 0.71 Spain Iberian BMWP (IBMWP) 0.83 0.53
Biological Quality Element Phytobenthos
Results: Ecological quality ratios of the national classification systems intercalibrated
Ecological Quality Ratios Type and country National classification systems intercalibrated High-Good
boundary Good-Moderate
boundary Type R-A1
Austria
Multimetric method consisting of 3 modules/metrics (Trophic Index,
Saprobic Index, Reference Species) 0.87 0.56
France
Classification française DCE Indice Biologique Diatomées (IBD)
norme AFNOR NF T 90-354 (2000) and circular
MEDD/DE/MAGE/BEMA 05 n°14 of 28 July 2005 modified on 13
June 2007 0.86 0.71
Germany
Deutsches Bewertungsverfahren für Makrophyten und
Phytobenthos (PHYLIB) 0.73 0.54
Slovenia Multimetric method consisting of 2
modules/metrics 0.80 0.60 Type R-A2
Austria
Multimetric method consisting of 3 modules/metrics (Trophic Index,
Saprobic Index, Reference Species) 0.87 0.56
France
Classification française DCE Indice Biologique Diatomées (IBD)
norme AFNOR NF T 90-354 (2000) and circular
MEDD/DE/MAGE/BEMA 05 n°14 of 28 July 2005 modified on 13
June 2007 0.86 0.71

EN 8 EN
Spain
Indice de Polluosensibilité Spécifique (IPS) (Lenoir &Coste,
1996) 0.94 0.74
EN 9 EN
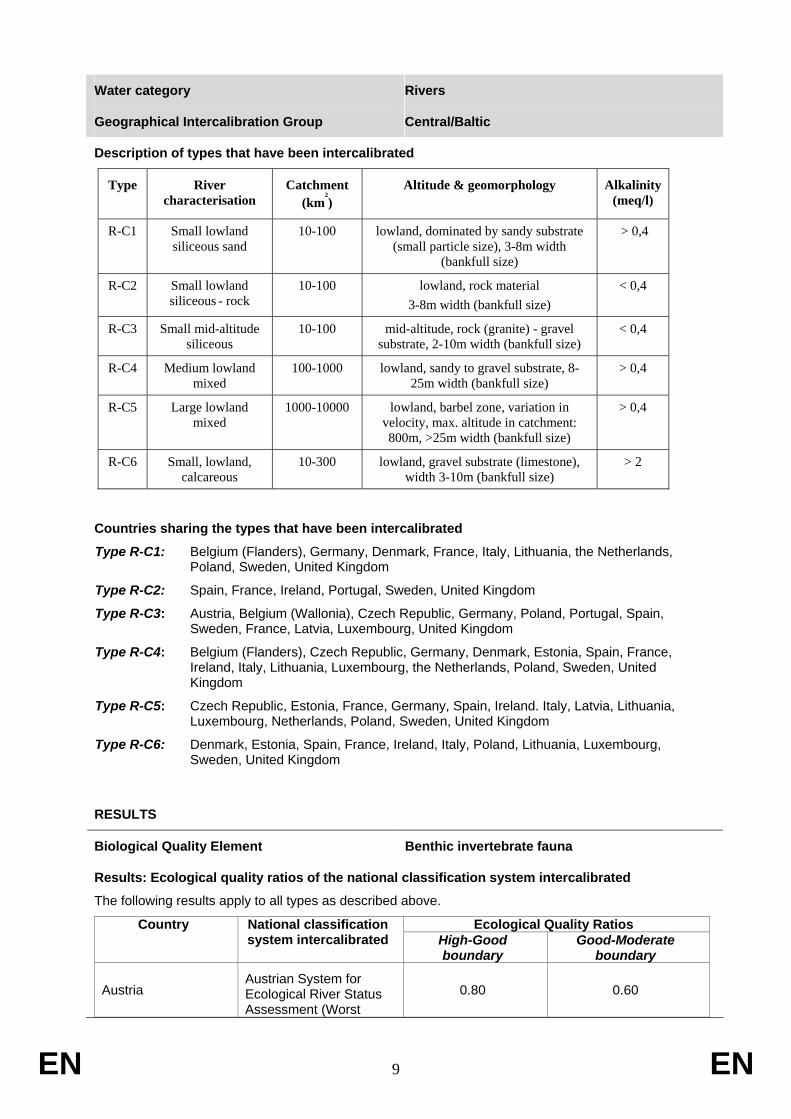
Water category Rivers
Geographical Intercalibration Group Central/Baltic
Description of types that have been intercalibrated
Type River characterisation
Catchment (km²)
Altitude & geomorphology Alkalinity (meq/l)
R-C1 Small lowland siliceous sand
10-100 lowland, dominated by sandy substrate (small particle size), 3-8m width
(bankfull size)
> 0,4
R-C2 Small lowland siliceous - rock
10-100 lowland, rock material 3-8m width (bankfull size)
< 0,4
R-C3 Small mid-altitude siliceous
10-100 mid-altitude, rock (granite) - gravel substrate, 2-10m width (bankfull size)
< 0,4
R-C4 Medium lowland mixed
100-1000 lowland, sandy to gravel substrate, 8-25m width (bankfull size)
> 0,4
R-C5 Large lowland mixed
1000-10000
lowland, barbel zone, variation in
velocity, max. altitude in catchment: 800m, >25m width (bankfull size)
> 0,4
R-C6 Small, lowland, calcareous
10-300 lowland, gravel substrate (limestone), width 3-10m (bankfull size)
> 2
Countries sharing the types that have been intercalibrated
Type R-C1: Belgium (Flanders), Germany, Denmark, France, Italy, Lithuania, the Netherlands, Poland, Sweden, United Kingdom
Type R-C2: Spain, France, Ireland, Portugal, Sweden, United Kingdom
Type R-C3: Austria, Belgium (Wallonia), Czech Republic, Germany, Poland, Portugal, Spain, Sweden, France, Latvia, Luxembourg, United Kingdom
Type R-C4: Belgium (Flanders), Czech Republic, Germany, Denmark, Estonia, Spain, France, Ireland, Italy, Lithuania, Luxembourg, the Netherlands, Poland, Sweden, United Kingdom
Type R-C5: Czech Republic, Estonia, France, Germany, Spain, Ireland. Italy, Latvia, Lithuania, Luxembourg, Netherlands, Poland, Sweden, United Kingdom
Type R-C6: Denmark, Estonia, Spain, France, Ireland, Italy, Poland, Lithuania, Luxembourg, Sweden, United Kingdom
RESULTS
Biological Quality Element Benthic invertebrate fauna
Results: Ecological quality ratios of the national classification system intercalibrated
The following results apply to all types as described above.
Ecological Quality Ratios Country National classification system intercalibrated High-Good
boundary Good-Moderate
boundary
Austria Austrian System for Ecological River Status Assessment (Worst
0.80 0.60

EN 10 EN
case between Multimetric Indices for General Degradation and Saprobic Index
Belgium (Flanders) Multimetric Macroinvertebrate Index Flanders (MMIF)
0.90 0.70
Belgium (Wallonia)
Indice Biologique Global Normalisé (IBGN) (Norme AFNOR NF T 90 350, 1992) and ‘Provisional Definition of the Good Status’, Ministry of the Walloon Region (2007)
0.97 0.74
Denmark Danish Stream Fauna Index (DSFI) 1.00 0.71
Germany
PERLODES –Bewertungsverfahren von Fließgewässern auf Basis des Makrozoobenthos
0.80 0.60
France
Classification française DCE Indice Biologique Global Normalisé (IBGN). Norme AFNOR NF T 90 350 (1992) and circular MEDD/DE/MAGE/BEMA 05 n°14 of 28 July 2005 modified on 13 June 2007
0.94 0.80
Ireland Quality Rating System (Q-value) 0.85 0.75
Italy STAR Intercalibration Common Metric Index (STAR_ICMi)
0.96 0.72
Luxembourg
Classification luxembourgeoise DCE, Indice Biologique Global Normalisé (IBGN), Norme AFNOR NF T 90 350, 1992) and circular MEDD/DE/MAGE/BEMA 07 N°4 of 11 April 2007
0.96 0.72
Netherlands KRW-maatlat 0.80 0.60
Poland BMWP (BMWP-PL) verified by modified Margalef diversity index
0.89 0.68
EN 11 EN
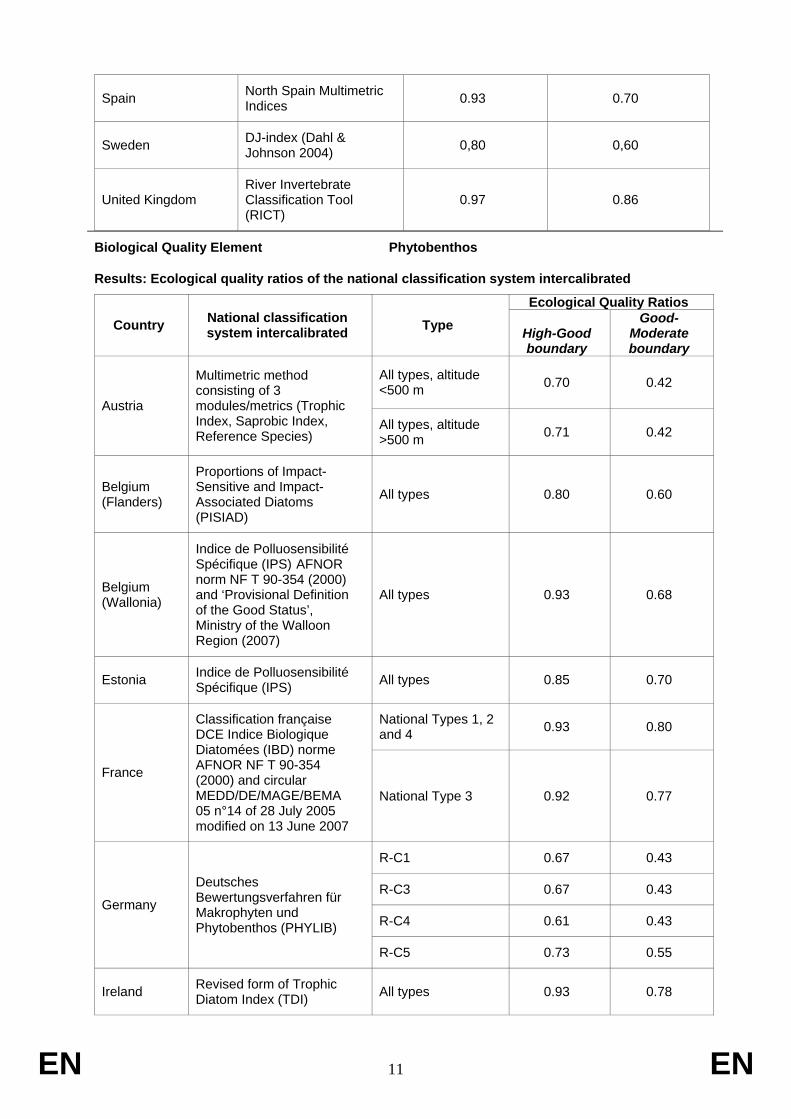
Spain North Spain Multimetric Indices 0.93 0.70
Sweden DJ-index (Dahl & Johnson 2004) 0,80 0,60
United Kingdom River Invertebrate Classification Tool (RICT)
0.97 0.86
Biological Quality Element Phytobenthos
Results: Ecological quality ratios of the national classification system intercalibrated
Ecological Quality Ratios Country National classification
system intercalibrated Type High-Good boundary
Good-Moderate boundary
All types, altitude <500 m 0.70 0.42
Austria
Multimetric method consisting of 3 modules/metrics (Trophic Index, Saprobic Index, Reference Species)
All types, altitude >500 m 0.71 0.42
Belgium (Flanders)
Proportions of Impact-Sensitive and Impact-Associated Diatoms (PISIAD)
All types 0.80 0.60
Belgium (Wallonia)
Indice de Polluosensibilité Spécifique (IPS) AFNOR norm NF T 90-354 (2000) and ‘Provisional Definition of the Good Status’, Ministry of the Walloon Region (2007)
All types 0.93 0.68
Estonia Indice de Polluosensibilité Spécifique (IPS) All types 0.85 0.70
National Types 1, 2 and 4 0.93 0.80
France
Classification française DCE Indice Biologique Diatomées (IBD) norme AFNOR NF T 90-354 (2000) and circular MEDD/DE/MAGE/BEMA 05 n°14 of 28 July 2005 modified on 13 June 2007
National Type 3 0.92 0.77
R-C1 0.67 0.43
R-C3 0.67 0.43
R-C4 0.61 0.43 Germany
Deutsches Bewertungsverfahren für Makrophyten und Phytobenthos (PHYLIB)
R-C5 0.73 0.55
Ireland Revised form of Trophic Diatom Index (TDI) All types 0.93 0.78
EN 12 EN
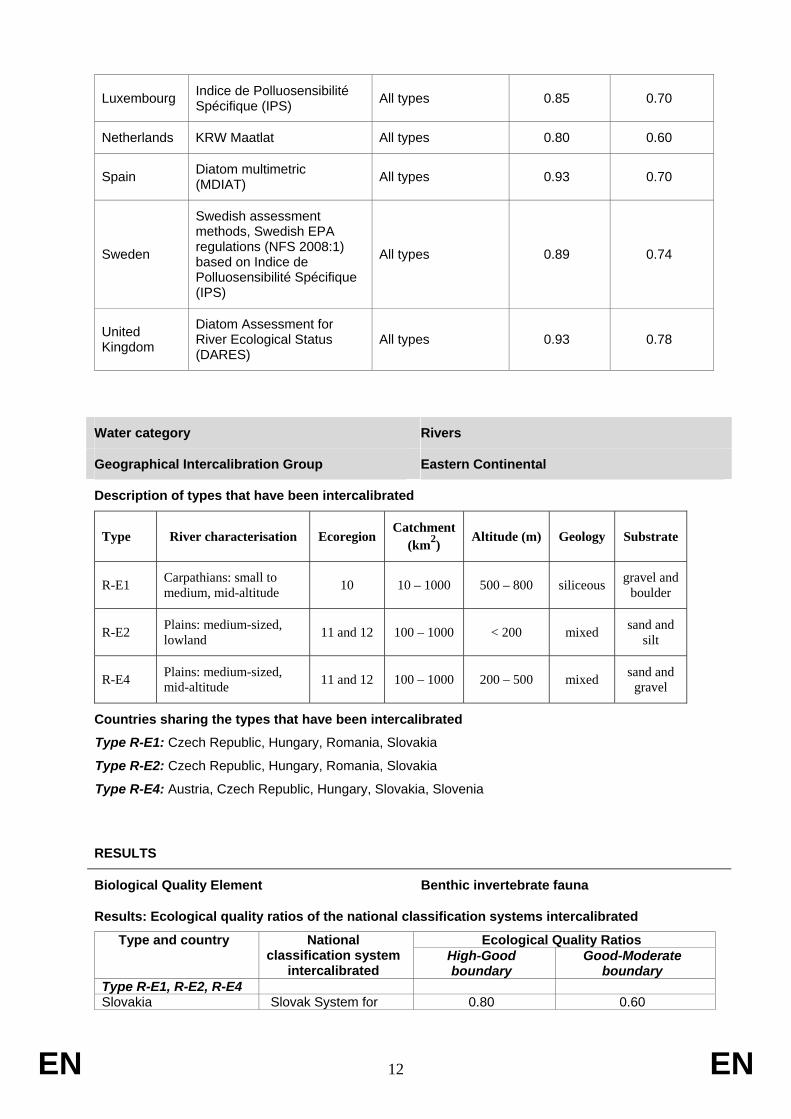
Luxembourg Indice de Polluosensibilité Spécifique (IPS) All types 0.85 0.70
Netherlands KRW Maatlat All types 0.80 0.60
Spain Diatom multimetric (MDIAT) All types 0.93 0.70
Sweden
Swedish assessment methods, Swedish EPA regulations (NFS 2008:1) based on Indice de Polluosensibilité Spécifique (IPS)
All types 0.89 0.74
United Kingdom
Diatom Assessment for River Ecological Status (DARES)
All types 0.93 0.78
Water category Rivers
Geographical Intercalibration Group Eastern Continental
Description of types that have been intercalibrated
Type River characterisation Ecoregion Catchment
(km2) Altitude (m) Geology Substrate
R-E1 Carpathians: small to medium, mid-altitude 10 10 – 1000 500 – 800 siliceous gravel and
boulder
R-E2 Plains: medium-sized, lowland 11 and 12 100 – 1000 < 200 mixed sand and
silt
R-E4 Plains: medium-sized, mid-altitude 11 and 12 100 – 1000 200 – 500 mixed sand and
gravel
Countries sharing the types that have been intercalibrated
Type R-E1: Czech Republic, Hungary, Romania, Slovakia
Type R-E2: Czech Republic, Hungary, Romania, Slovakia
Type R-E4: Austria, Czech Republic, Hungary, Slovakia, Slovenia
RESULTS
Biological Quality Element Benthic invertebrate fauna
Results: Ecological quality ratios of the national classification systems intercalibrated
Ecological Quality Ratios Type and country National classification system
intercalibrated High-Good boundary
Good-Moderate boundary
Type R-E1, R-E2, R-E4 Slovakia Slovak System for 0.80 0.60

EN 13 EN
Ecological River Status Assessment
Type R-E4
Austria
Austrian System for Ecological River Status Assessment (Worst case between Multimetric Indices for General Degradation and Saprobic Index)
0.80 0.60
EN 14 EN
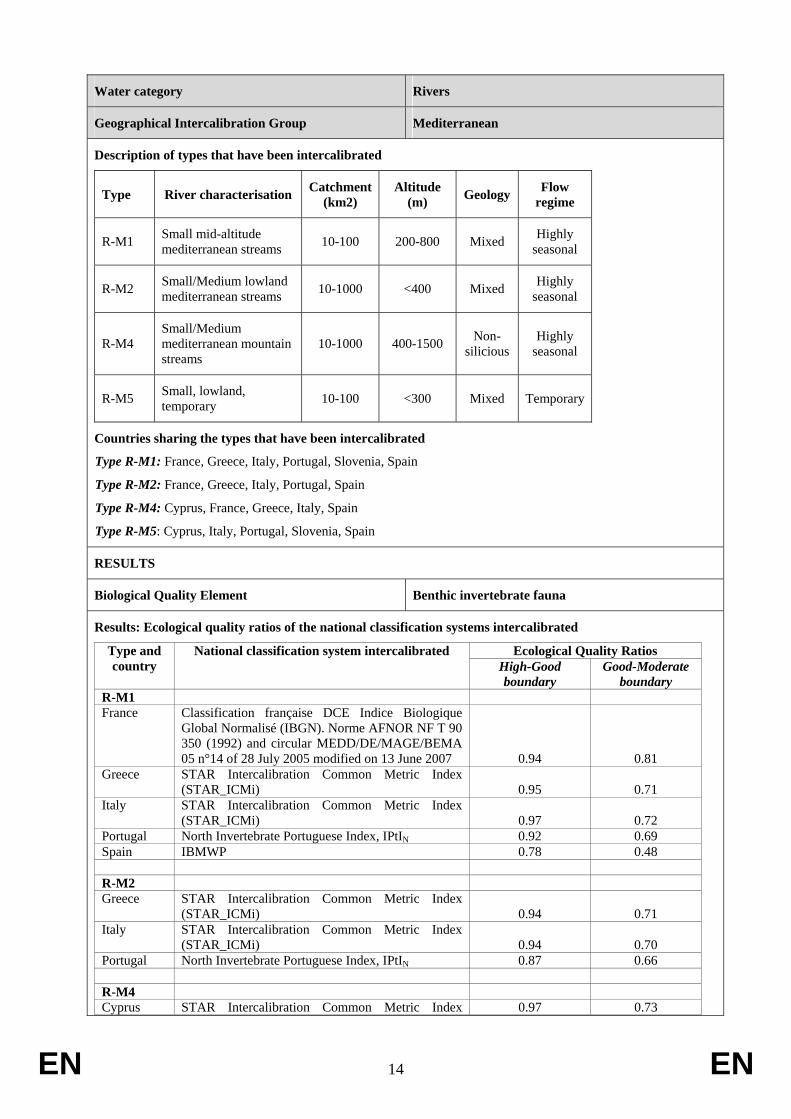
Water category Rivers
Geographical Intercalibration Group Mediterranean
Description of types that have been intercalibrated
Type River characterisation Catchment (km2)
Altitude (m) Geology Flow
regime
R-M1 Small mid-altitude mediterranean streams 10-100 200-800 Mixed Highly
seasonal
R-M2 Small/Medium lowland mediterranean streams 10-1000 <400 Mixed Highly
seasonal
R-M4 Small/Medium mediterranean mountain streams
10-1000 400-1500 Non-silicious
Highly seasonal
R-M5 Small, lowland, temporary 10-100 <300 Mixed Temporary
Countries sharing the types that have been intercalibrated
Type R-M1: France, Greece, Italy, Portugal, Slovenia, Spain
Type R-M2: France, Greece, Italy, Portugal, Spain
Type R-M4: Cyprus, France, Greece, Italy, Spain
Type R-M5: Cyprus, Italy, Portugal, Slovenia, Spain
RESULTS
Biological Quality Element Benthic invertebrate fauna
Results: Ecological quality ratios of the national classification systems intercalibrated
Ecological Quality Ratios Type and country
National classification system intercalibrated High-Good boundary
Good-Moderate boundary
R-M1 France Classification française DCE Indice Biologique
Global Normalisé (IBGN). Norme AFNOR NF T 90 350 (1992) and circular MEDD/DE/MAGE/BEMA 05 n°14 of 28 July 2005 modified on 13 June 2007 0.94 0.81
Greece STAR Intercalibration Common Metric Index (STAR_ICMi) 0.95 0.71
Italy STAR Intercalibration Common Metric Index (STAR_ICMi) 0.97 0.72
Portugal North Invertebrate Portuguese Index, IPtIN 0.92 0.69 Spain IBMWP 0.78 0.48 R-M2 Greece STAR Intercalibration Common Metric Index
(STAR_ICMi) 0.94 0.71 Italy STAR Intercalibration Common Metric Index
(STAR_ICMi) 0.94 0.70 Portugal North Invertebrate Portuguese Index, IPtIN 0.87 0.66 R-M4 Cyprus STAR Intercalibration Common Metric Index 0.97 0.73

EN 15 EN
(STAR_ICMi)
Greece STAR Intercalibration Common Metric Index (STAR_ICMi) 0.96 0.72
Italy STAR Intercalibration Common Metric Index (STAR_ICMi) 0.94 0.70
Spain IBMWP 0.83 0.51 R-M5
Italy STAR Intercalibration Common Metric Index (STAR_ICMi) 0.97 0.73
Portugal South Invertebrate Portuguese Index, IPtIS 0.98 0.72 Spain IBMWP 0.91 0.55
Biological Quality Element Phytobenthos
Results: Ecological quality ratios of the national classification systems intercalibrated
Ecological Quality Ratios Type and country National classification system intercalibrated High-Good
boundary Good-Moderate
boundary R-M1 France Classification française DCE Indice Biologique
Diatomées (IBD) norme AFNOR NF T 90-354 (2000) and circular MEDD/DE/MAGE/BEMA 05 n°14 of 28 July 2005 modified on 13 June 2007 0.93 0.80
Portugal Indice de Polluosensibilité Spécifique (IPS) 0.84 0.62 Spain Indice de Polluosensibilité Spécifique (IPS) 0.90 0.67 R-M2 France Classification française DCE Indice Biologique
Diatomées (IBD) norme AFNOR NF T 90-354 (2000) and circular MEDD/DE/MAGE/BEMA 05 n°14 of 28 July 2005 modified on 13 June 2007 0.93 0.80
Portugal Indice de Polluosensibilité Spécifique (IPS) 0.84 0.62 Spain Indice de Polluosensibilité Spécifique (IPS) 0.93 0.70 R-M4 Spain Indice de Polluosensibilité Spécifique (IPS) 0.91 0.68 R-M5 Portugal European Index (CEE) 0.85 0.64 Spain Indice de Polluosensibilité Spécifique (IPS) 0.95 0.71
EN 16 EN
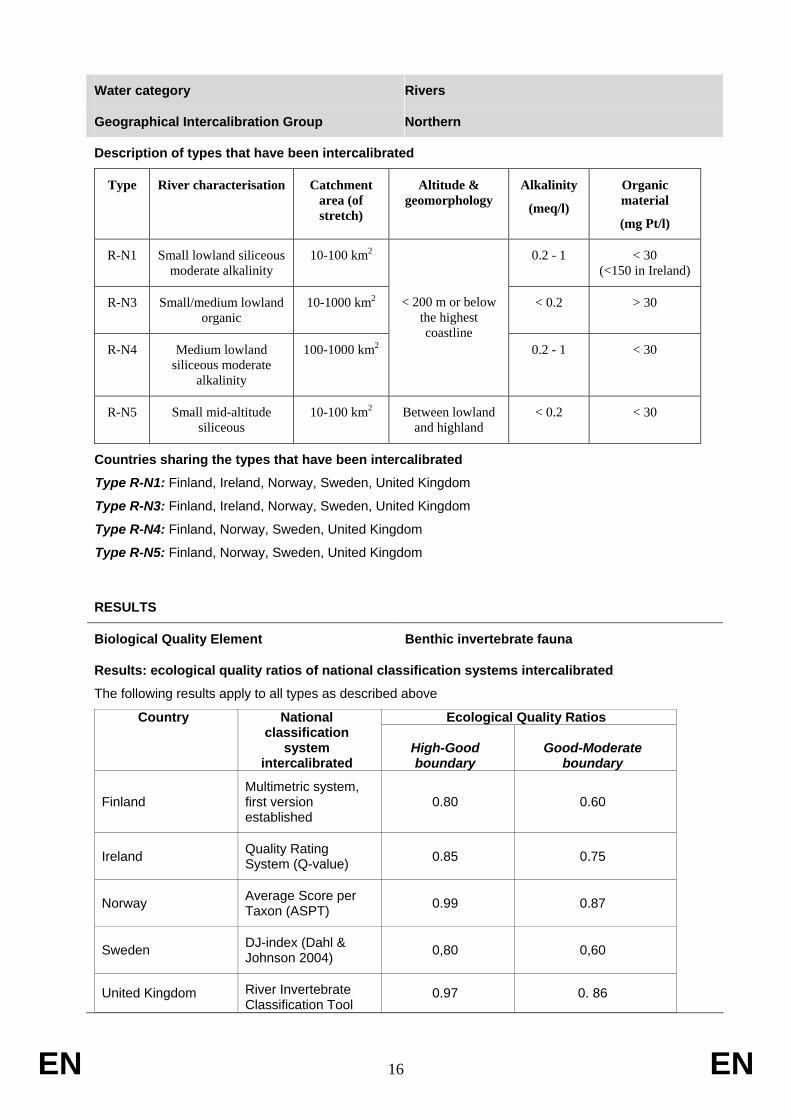
Water category Rivers
Geographical Intercalibration Group Northern
Description of types that have been intercalibrated
Type River characterisation Catchment area (of stretch)
Altitude & geomorphology
Alkalinity
(meq/l)
Organic material
(mg Pt/l)
R-N1 Small lowland siliceous moderate alkalinity
10-100 km2 0.2 - 1 < 30 (<150 in Ireland)
R-N3 Small/medium lowland organic
10-1000 km2 < 0.2 > 30
R-N4 Medium lowland siliceous moderate
alkalinity
100-1000 km2
< 200 m or below the highest coastline
0.2 - 1 < 30
R-N5 Small mid-altitude siliceous
10-100 km2 Between lowland and highland
< 0.2 < 30
Countries sharing the types that have been intercalibrated
Type R-N1: Finland, Ireland, Norway, Sweden, United Kingdom
Type R-N3: Finland, Ireland, Norway, Sweden, United Kingdom
Type R-N4: Finland, Norway, Sweden, United Kingdom
Type R-N5: Finland, Norway, Sweden, United Kingdom
RESULTS
Biological Quality Element Benthic invertebrate fauna
Results: ecological quality ratios of national classification systems intercalibrated
The following results apply to all types as described above
Ecological Quality Ratios Country National classification
system intercalibrated
High-Good boundary
Good-Moderate boundary
Finland Multimetric system, first version established
0.80 0.60
Ireland Quality Rating System (Q-value) 0.85 0.75
Norway Average Score per Taxon (ASPT) 0.99 0.87
Sweden DJ-index (Dahl & Johnson 2004) 0,80 0,60
United Kingdom River Invertebrate Classification Tool
0.97 0. 86
EN 17 EN
(RICT)
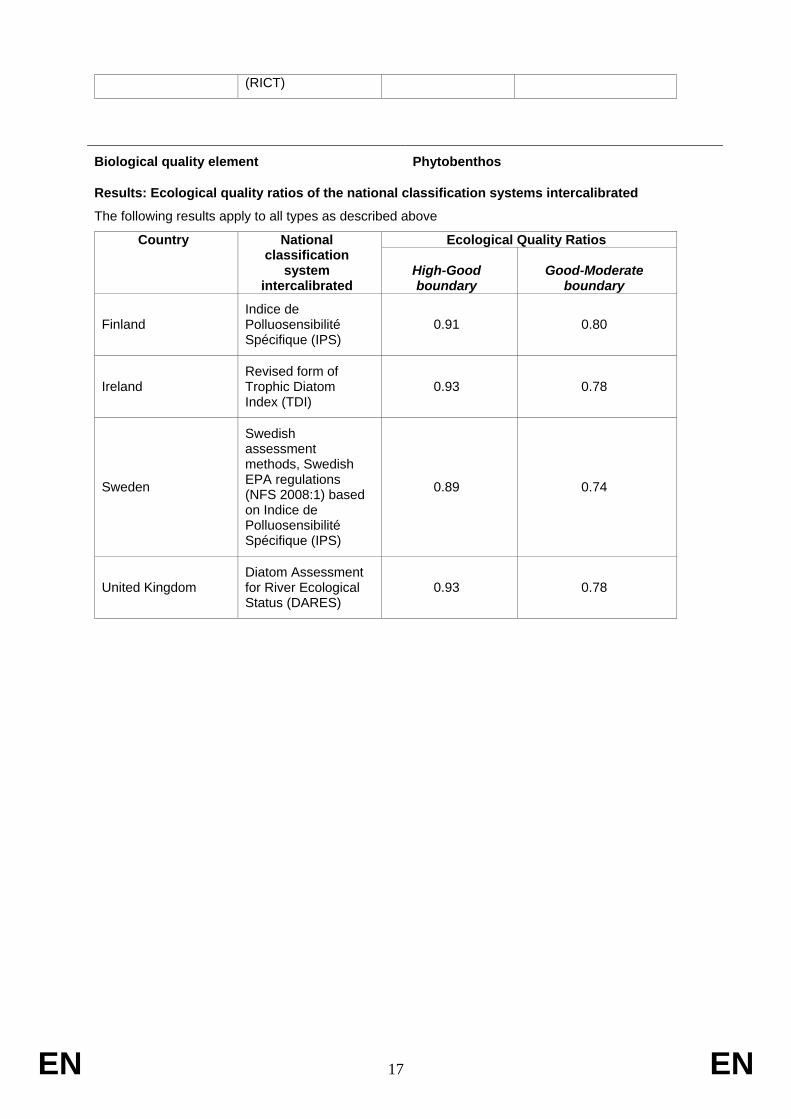
Biological quality element Phytobenthos
Results: Ecological quality ratios of the national classification systems intercalibrated
The following results apply to all types as described above
Ecological Quality Ratios Country National classification
system intercalibrated
High-Good boundary
Good-Moderate boundary
Finland Indice de Polluosensibilité Spécifique (IPS)
0.91 0.80
Ireland Revised form of Trophic Diatom Index (TDI)
0.93 0.78
Sweden
Swedish assessment methods, Swedish EPA regulations (NFS 2008:1) based on Indice de Polluosensibilité Spécifique (IPS)
0.89 0.74
United Kingdom Diatom Assessment for River Ecological Status (DARES)
0.93 0.78
EN 18 EN
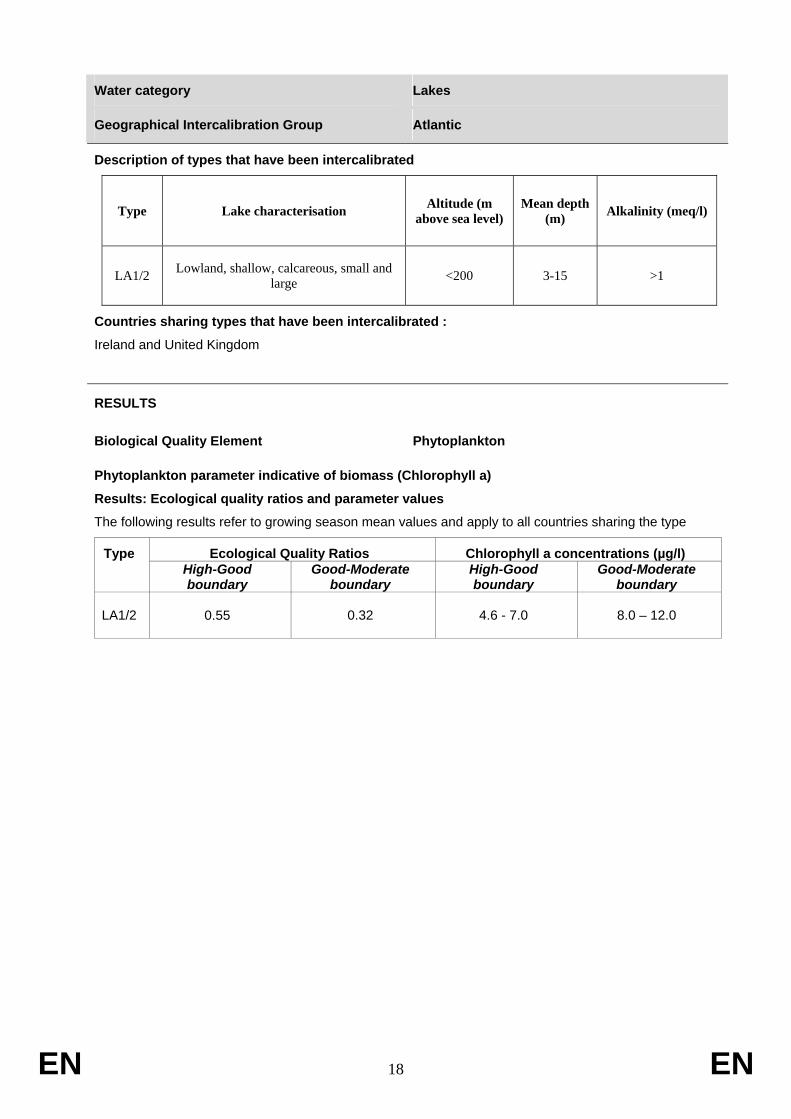
Water category Lakes
Geographical Intercalibration Group Atlantic
Description of types that have been intercalibrated
Type Lake characterisation Altitude (m above sea level)
Mean depth (m) Alkalinity (meq/l)
LA1/2 Lowland, shallow, calcareous, small and large <200 3-15 >1
Countries sharing types that have been intercalibrated :
Ireland and United Kingdom
RESULTS
Biological Quality Element Phytoplankton
Phytoplankton parameter indicative of biomass (Chlorophyll a)
Results: Ecological quality ratios and parameter values
The following results refer to growing season mean values and apply to all countries sharing the type
Ecological Quality Ratios Chlorophyll a concentrations (µg/l) Type High-Good boundary
Good-Moderate boundary
High-Good boundary
Good-Moderate boundary
LA1/2
0.55
0.32 4.6 - 7.0 8.0 – 12.0

EN 19 EN
Water category Lakes
Geographical Intercalibration Group Alpine
Description of types that have been intercalibrated
Type Lake characterisation Altitude (m above sea
level)
Mean depth (m)
Alkalinity (meq/l)
Lake size (km2)
L-AL3
Lowland or mid-altitude, deep, moderate to high alkalinity (alpine influence), large
50 - 800 >15 >1 > 0.5
L-AL4 Mid-altitude, shallow, moderate to high alkalinity (alpine influence), large
200 - 800 3 - 15 >1 > 0.5
Countries sharing types that have been intercalibrated :
Types L-AL3 and L-AL4: Austria, France, Germany, Italy and Slovenia
RESULTS
Biological Quality Element Phytoplankton
Phytoplankton: parameters indicative of biomass
Results: Ecological quality ratios and parameter values
The following results refer to annual mean values and apply to all countries sharing the type. Member States may choose to use Chlorophyll a, total biovolume, or both parameters.
Chlorophyll a:
Ecological Quality Ratios Chlorophyll a concentrations (µg/l)
Type
High-Good boundary
Good-Moderate boundary
High-Good boundary
Good-Moderate boundary
L-AL3 0.70 0.40 2.1 - 2.7 3.8 - 4.7
L-AL4 0.75 0.41 3.6 - 4.4 6.6 - 8.0
Total biovolume:
Ecological Quality Ratios Total biovolumes (mm3/l) Type
High-Good boundary
Good-Moderate boundary
High-Good boundary
Good-Moderate boundary
L-AL3 0.60 0.25 0.3 - 0.5 0.8 - 1.2
L-AL4 0.64 0.26 0.8 - 1.1 1.9 - 2.7
Phytoplankton: parameters indicative of taxonomic composition and abundance
Results: Ecological quality ratios of the national parameters intercalibrated
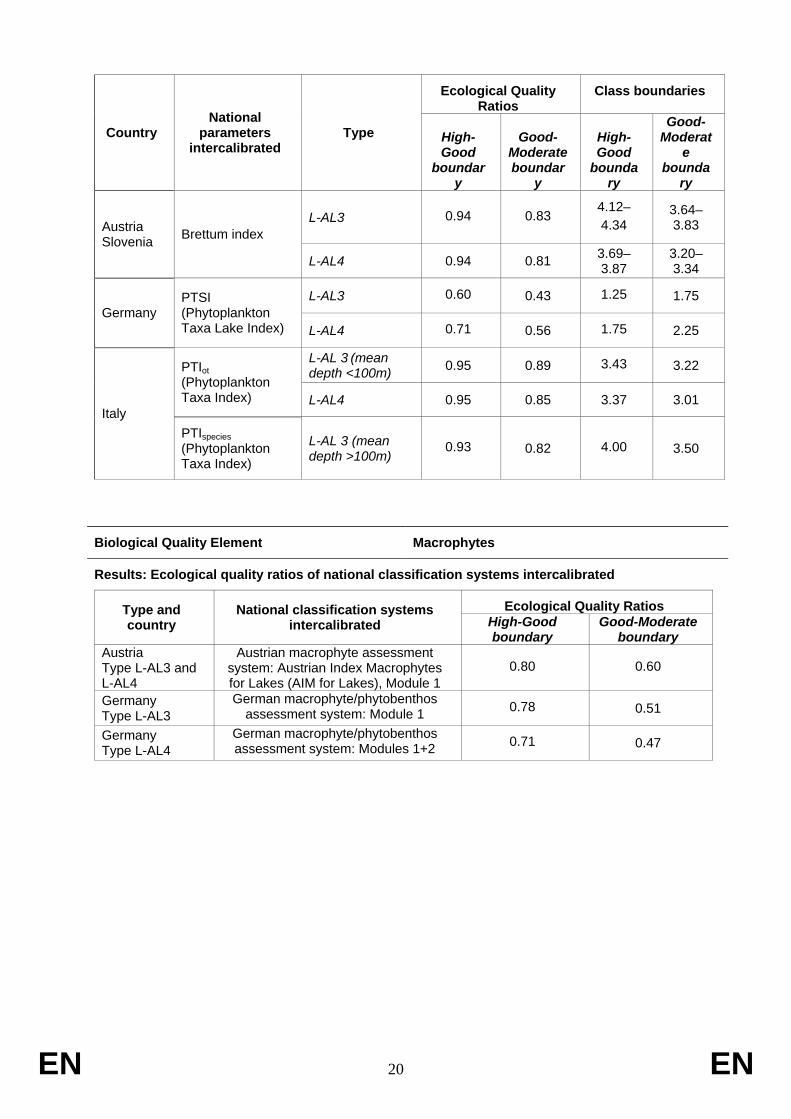
EN 20 EN
Ecological Quality Ratios
Class boundaries
Country National
parameters intercalibrated
Type High-Good
boundary
Good-Moderate boundar
y
High-Good
boundary
Good-Moderat
e bounda
ry
L-AL3 0.94 0.83 4.12–4.34
3.64–3.83 Austria
Slovenia Brettum index
L-AL4 0.94 0.81 3.69–3.87
3.20–3.34
L-AL3 0.60 0.43 1.25 1.75 Germany
PTSI (Phytoplankton Taxa Lake Index) L-AL4 0.71 0.56 1.75 2.25
L-AL 3 (mean depth <100m) 0.95 0.89 3.43 3.22 PTIot
(Phytoplankton Taxa Index) L-AL4 0.95 0.85 3.37 3.01
Italy PTIspecies (Phytoplankton Taxa Index)
L-AL 3 (mean depth >100m)
0.93 0.82 4.00 3.50
Biological Quality Element Macrophytes
Results: Ecological quality ratios of national classification systems intercalibrated
Ecological Quality Ratios Type and country
National classification systems intercalibrated High-Good
boundary Good-Moderate
boundary Austria Type L-AL3 and L-AL4
Austrian macrophyte assessment system: Austrian Index Macrophytes for Lakes (AIM for Lakes), Module 1
0.80 0.60
Germany Type L-AL3
German macrophyte/phytobenthos assessment system: Module 1 0.78 0.51
Germany Type L-AL4
German macrophyte/phytobenthos assessment system: Modules 1+2 0.71 0.47

EN 21 EN
Water category Lakes
Geographical Intercalibration Group Central / Baltic
Description of types that have been intercalibrated
Type Lake characterisation Altitude (m above sea
level)
Mean depth (m)
Alkalinity (meq/l)
Hydrological residence
time (years)
L-CB1 Lowland, shallow, calcareous < 200 3 - 15 > 1 1 - 10
L-CB2 Lowland, very shallow, calcareous < 200 <3 > 1 0.1 - 1
L-CB3 Lowland, shallow, small, siliceous (moderate alkalinity)
< 200 3 - 15 0.2 - 1 1 - 10
Countries sharing types that have been intercalibrated
Types L-CB1 and L-CB2: Belgium, Germany, Denmark, Estonia, France, Lithuania, Latvia, Netherlands, Poland, United Kingdom.
Type L-CB3: Belgium, Denmark, Estonia, France, Latvia, Poland.
RESULTS
Biological Quality Element Phytoplankton
Phytoplankton: parameter indicative of biomass
Results: Ecological quality ratios and parameter values
The following results refer to growing season mean values and apply to all countries sharing the type.
Ecological Quality Ratios Chlorophyll a concentrations (µg/l)
Type
High-Good boundary
Good-Moderate boundary
High-Good boundary
Good-Moderate boundary
L-CB1 0.55 0.32 4.6 - 7.0 8.0 – 12.0 L-CB2 0.63 0.30 9.9 - 11.7 21.0 – 25.0 L-CB3 0.57 0.31 4.3 – 6.5 8.0 – 12.0
Biological Quality Element Macrophytes
Results: Ecological quality ratios of national classification systems intercalibrated
The following results apply to LCB1 and LCB2 types
Ecological Quality Ratios Country National classification systems
intercalibrated High-Good boundary
Good-Moderate boundary
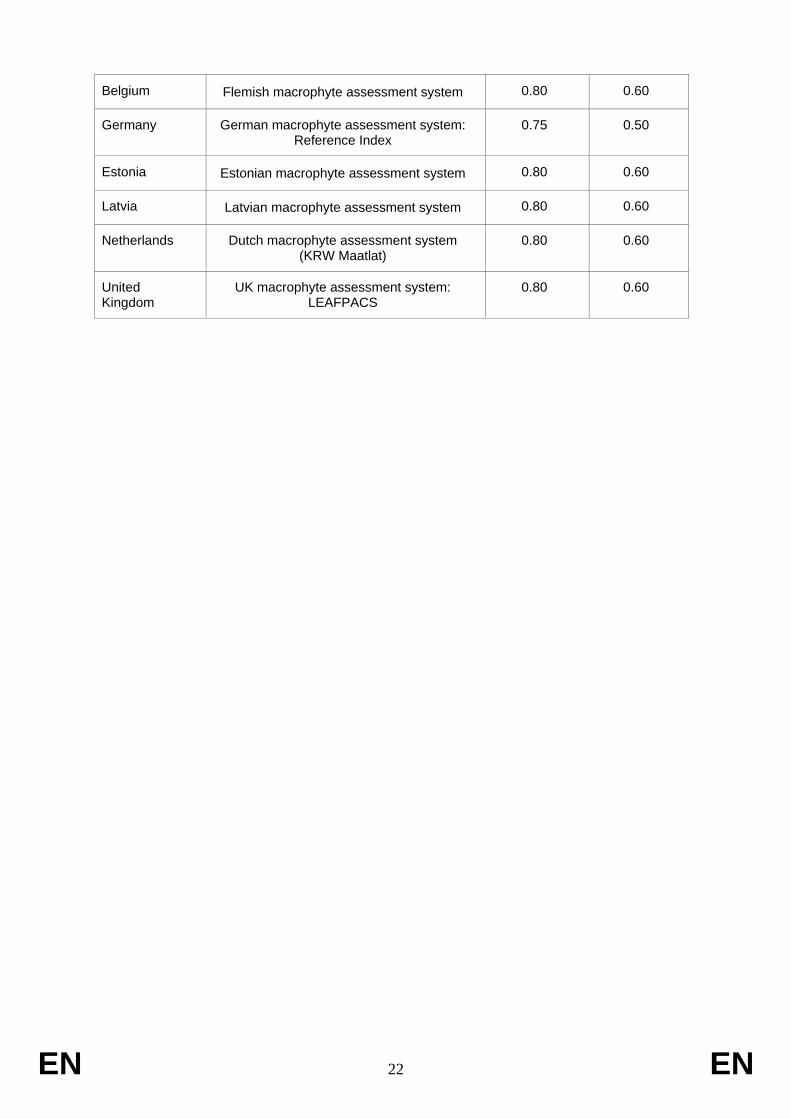
EN 22 EN
Belgium Flemish macrophyte assessment system 0.80 0.60
Germany German macrophyte assessment system: Reference Index
0.75 0.50
Estonia Estonian macrophyte assessment system 0.80 0.60
Latvia Latvian macrophyte assessment system 0.80 0.60
Netherlands Dutch macrophyte assessment system (KRW Maatlat)
0.80 0.60
United Kingdom
UK macrophyte assessment system: LEAFPACS
0.80 0.60

EN 23 EN
Water category Lakes
Geographical Intercalibration Group Mediterranean
Description of types that have been intercalibrated
Type Lake characterization
Altitude (m)
Annual mean Precipitation (mm) and T (ºC)
Mean depth (m)
Alkalinity (meq/l)
Lake size (km2)
L-M5/7
Reservoirs, deep, large, siliceous, “wet areas”, catchment < 20 000km²
0 - 800 >800 or <15 >15 <1 > 0.5
L-M8
Reservoirs, deep, large, calcareous, catchment < 20 000km²
0 - 800 - >15 >1 > 0.5
Countries sharing types that have been intercalibrated
Type L-M5/7: Greece, France, Portugal, Spain, Romania.
Type L-M8: Cyprus, Greece, France, Italy, Spain, Romania.
RESULTS
Biological Quality Element Phytoplankton
Phytoplankton: parameters indicative of biomass
Results: Ecological quality ratios and parameter values
The following results refer to summer mean values, euphotic depth and apply to all countries sharing the type. Member States may choose to use Chlorophyll a, total biovolume, or both parameters.
Chlorophyll a:
Ecological Quality Ratios Chlorophyll a concentrations (µg/l)
Type
Good-Moderate boundary Good-Moderate boundary
L-M5/7 0.21 6.7 - 9.5 L-M8 0.43 4.2 - 6.0
Total biovolume:
Ecological Quality Ratios Total biovolumes (mm3/l) Type
Good-Moderate boundary Good-Moderate boundary L-M5/7 0.19 1.9 L-M8 0.36 2.1
Phytoplankton: parameters indicative of taxonomic composition and abundance
Results: Ecological quality ratios and parameter values
The following results refer to summer mean values, euphotic depth and apply to all countries sharing the type. . Member States must use at least one of the intercalibrated parameters (percentage of
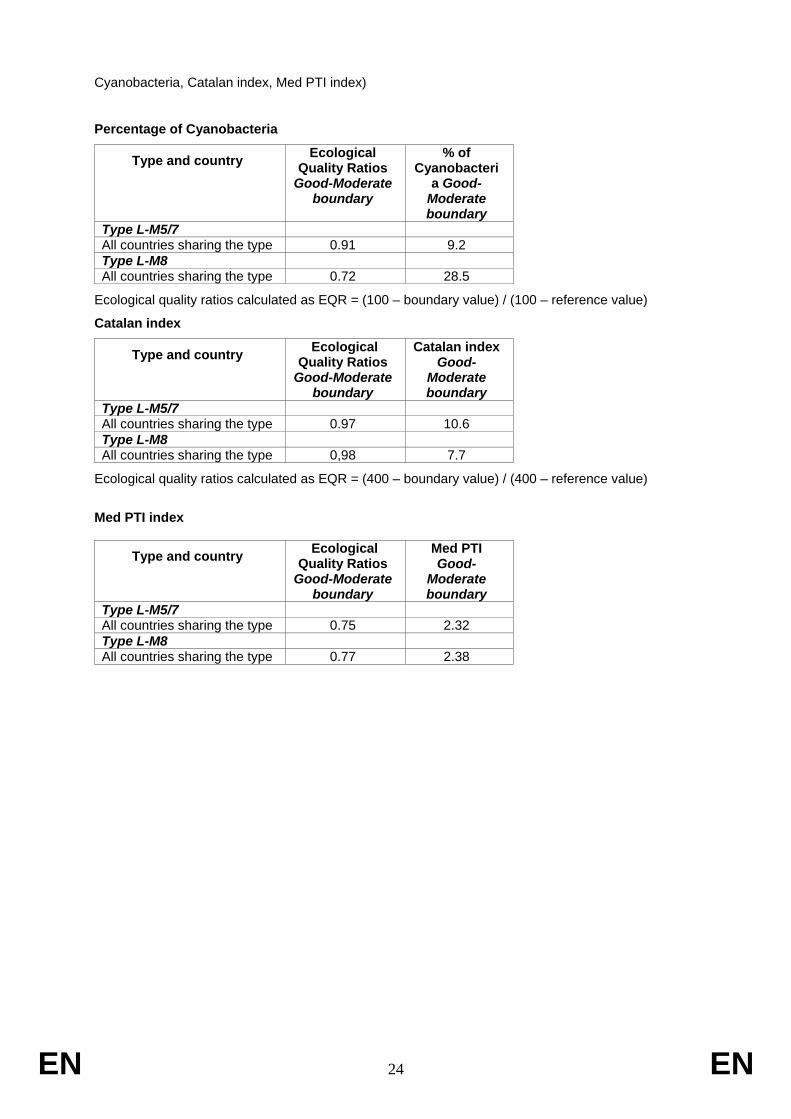
EN 24 EN
Cyanobacteria, Catalan index, Med PTI index)
Percentage of Cyanobacteria
Type and country Ecological Quality Ratios
Good-Moderate boundary
% of Cyanobacteri
a Good-Moderate boundary
Type L-M5/7 All countries sharing the type 0.91 9.2 Type L-M8 All countries sharing the type 0.72 28.5
Ecological quality ratios calculated as EQR = (100 – boundary value) / (100 – reference value)
Catalan index
Type and country Ecological Quality Ratios
Good-Moderate boundary
Catalan index Good-
Moderate boundary
Type L-M5/7 All countries sharing the type 0.97 10.6 Type L-M8 All countries sharing the type 0,98 7.7
Ecological quality ratios calculated as EQR = (400 – boundary value) / (400 – reference value)
Med PTI index
Type and country Ecological Quality Ratios
Good-Moderate boundary
Med PTI Good-
Moderate boundary
Type L-M5/7 All countries sharing the type 0.75 2.32 Type L-M8 All countries sharing the type 0.77 2.38

EN 25 EN
Water category Lakes
Geographical Intercalibration Group Northern
Description of the types that have been intercalibrated
Type Lake characterisation Altitude (m above sea
level)
Mean depth (m)
Alkalinity (meq/l)
Colour (mg Pt/l)
LN1 Lowland, shallow, moderate alkalinity, clear < 200 3 - 15 0.2 - 1 < 30
LN2a Lowland, shallow, low alkalinity, clear < 200 3 - 15 < 0.2 < 30
LN2b Lowland, deep, low alkalinity, clear < 200 > 15 < 0.2 < 30
LN3a Lowland, shallow, low alkalinity, meso-humic < 200 3 - 15 <0.2 30 - 90
LN5 Mid-altitude, shallow, low alkalinity, clear 200-800 3 - 15 <0.2 < 30
LN6a Mid-altitude, shallow, low alkalinity meso-humic
200-800 3 - 15 <0.2 30 - 90
LN8a Lowland, shallow, moderate alkalinity, meso-humic < 200 3 - 15 0.2 - 1 30 - 90
Countries sharing types that have been intercalibrated
Types LN1, LN2a, LN3a, LN8a: Ireland, Finland, Norway, Sweden, United Kingdom.
Types LN2b, LN5 and LN6a:Norway, Sweden, United Kingdom.
Biological Quality Element Phytoplankton
Phytoplankton: parameter indicative of biomass
Results: Ecological quality ratios and parameter values
The following results refer to growing season mean values and apply to all countries sharing the type
Ecological Quality Ratios Chlorophyll a concentrations (µg/l)
Type
High-Good boundary
Good-Moderate boundary
High-Good boundary
Good-Moderate
boundary a LN1 0.50 0.33 5.0 – 7.0 7.5 – 10.5 LN2a 0.50 0.29 3.0 – 5.0 5.0 – 8.5 LN2b 0.50 0.33 3.0 – 5.0 4.5 – 7.5 LN3a 0.50 0.30 5.0 – 7.0 8.0 – 12.0 LN5 0.50 0.33 2.0 – 4.0 3.0 – 6.0 LN6a 0.50 0.33 4.0 – 6.0 6.0 – 9.0 LN8a 0.50 0.33 7.0 – 10.0 10.5 – 15.0
Biological Quality Element Macrophytes
Description of the types that have been intercalibrated (for macrophytes intercalibration only)
Type Lake characterisation Alkalinity (meq/l) Color(mg Pt/l)
101 Low alkalinity, clear 0.05 - 0.2 < 30
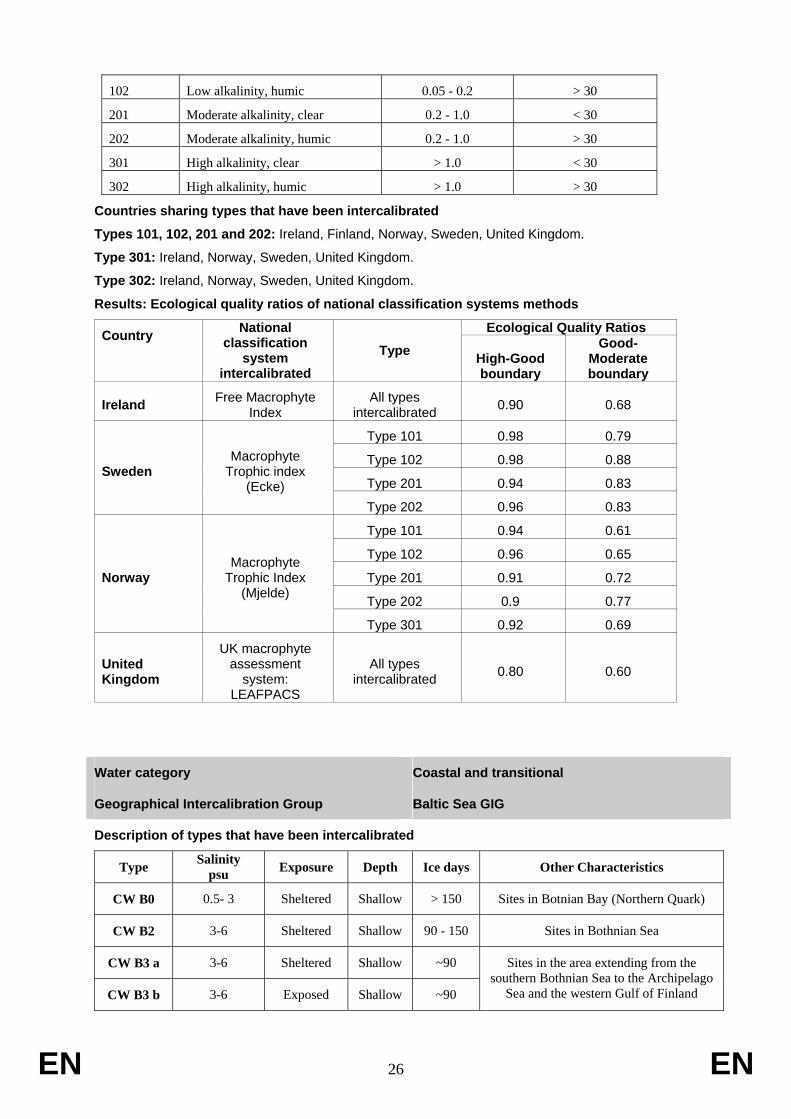
EN 26 EN
102 Low alkalinity, humic 0.05 - 0.2 > 30
201 Moderate alkalinity, clear 0.2 - 1.0 < 30
202 Moderate alkalinity, humic 0.2 - 1.0 > 30
301 High alkalinity, clear > 1.0 < 30
302 High alkalinity, humic > 1.0 > 30
Countries sharing types that have been intercalibrated
Types 101, 102, 201 and 202: Ireland, Finland, Norway, Sweden, United Kingdom.
Type 301: Ireland, Norway, Sweden, United Kingdom.
Type 302: Ireland, Norway, Sweden, United Kingdom.
Results: Ecological quality ratios of national classification systems methods
Ecological Quality Ratios Country National classification
system intercalibrated
Type High-Good boundary
Good-Moderate boundary
Ireland Free Macrophyte Index
All types intercalibrated 0.90 0.68
Type 101 0.98 0.79
Type 102 0.98 0.88
Type 201 0.94 0.83 Sweden
Macrophyte Trophic index
(Ecke) Type 202 0.96 0.83
Type 101 0.94 0.61
Type 102 0.96 0.65
Type 201 0.91 0.72
Type 202 0.9 0.77
Norway Macrophyte
Trophic Index (Mjelde)
Type 301 0.92 0.69
United Kingdom
UK macrophyte assessment
system: LEAFPACS
All types intercalibrated 0.80 0.60
Water category Coastal and transitional
Geographical Intercalibration Group Baltic Sea GIG
Description of types that have been intercalibrated
Type Salinity psu Exposure Depth Ice days Other Characteristics
CW B0 0.5- 3 Sheltered Shallow > 150 Sites in Botnian Bay (Northern Quark)
CW B2 3-6 Sheltered Shallow 90 - 150 Sites in Bothnian Sea
CW B3 a 3-6 Sheltered Shallow ~90
CW B3 b 3-6 Exposed Shallow ~90
Sites in the area extending from the southern Bothnian Sea to the Archipelago
Sea and the western Gulf of Finland

EN 27 EN
CW B12 a
Eastern Baltic Sea
5-8
Sheltered
Shallow
-
Sites in the Gulf of Riga,
CW B12 b
Western Baltic Sea
8 - 22 Sheltered Shallow - Sites at the Southern Swedish coast and the South western Baltic Sea open coast
along Denmark and Germany
CW B13 6-22 Exposed Shallow - Sites along the coast of the Estonia, Latvia and Lithuania, the Polish coast and the
Danish island “Bornholm”
CW B 14 6-22 Sheltered Shallow - Lagoons
TW B 13 6-22 Exposed Shallow Transitional water. Sites along the coast of Lithuania and Poland
Countries sharing types that have been intercalibrated:
Types CWB0, CWB2, CWB3a, CWB3b: Finland, Sweden.
Type CWB12a: Estonia
Type CWB12b: Germany, Denmark, Sweden.
Type CWB13: Denmark, Estonia, Lithuania, Latvia, Poland.
Type CWB14: Denmark, Poland
Type TWB13: Lithuania, Poland.
RESULTS
Biological Quality Element Benthic invertebrate fauna
Results: Ecological quality ratios of the national classification systems intercalibrated
Ecological Quality Ratios Type and country
National classification system intercalibrated High-Good
boundary
Good-Moderate boundary
CW B0
Finland BBI- Finnish Brackish water Benthic Index 0.99 0.59
Sweden BQI–Swedish multimetric
biological quality index (soft sediment infauna)
0.77 0.31
CW B2
Finland BBI- Finnish Brackish water Benthic Index 0.95 0.57
Sweden BQI–Swedish multimetric
biological quality index (soft sediment infauna)
0.76 0.29
CW B3 a
Finland BBI- Finnish Brackish water Benthic Index 0.89 0.53
Sweden BQI–Swedish multimetric
biological quality index (soft sediment infauna)
0.76 0.29

EN 28 EN
CW B3 b
Finland BBI- Finnish Brackish water Benthic Index 0.90 0.54
Sweden BQI–Swedish multimetric
biological quality index (soft sediment infauna)
0.76 0.29 Biological Quality Element Phytoplankton
Phytoplankton: parameter indicative of biomass (Chlorophyll a)
Results: Ecological quality ratios and parameter values
The following results refer to summer mean May/June – September
Ecological Quality Ratios for the national classification
systems
Parameter values/ranges Chlorophyll a µg/l Type and country
High-Good boundary
Good-Moderate boundary
High/-Good boundary
Good-Moderate boundary
CW B0 All countries sharing the type
0.76 0.56 1.7 (1.5 – 1.8) 2.3 (2.0 -2.7)
CW B2 All countries sharing the type
0.78 0.56 1.8 2.5 (2.3 -2.6)
CW B3 a Sheltered All countries sharing the type
0.71 0.49 2.4 (2.2 - 2.6) 3.5 (2.9 – 4.0)
CW B3 b Exposed All countries sharing the type
0.81 0.68 1.5 1.8
CW B 12 a Eastern Baltic Sea Salinity 5-8 psu All countries sharing the type
0.82
0.66
2.2
2.7
CW B 12 b Western Baltic Sea Salinity 8 -22 psu All countries sharing the type
0.92 0.63 1.3 (1.1 – 1.5) 1.9
CW B 13 Denmark, Estonia and Latvia
0.92 0.75 1.3 1.6
CW B 14 Denmark 0.82 0.56 1.1 1.6
TW B 13 All countries sharing the type
0.90 0.66 4.2 5.8 Biological Quality Element Angiosperms
Angiosperms: parameter indicative of abundance (Depth limit of Eelgrass Zostera marina)
Results: Ecological quality ratios and parameter values

EN 29 EN
Ecological Quality Ratios for the national classification systems
Parameter values/ranges Depth limit (m) Eelgrass Zostera
marina Type and country
High-Good boundary
Good-Moderate boundary
High/-Good boundary
Good-Moderate boundary
CW B 12 b Denmark and Germany Open coast
0.90 0.74 8.5 (8.0 – 9.4) 7 (6.6 – 7.1)

EN 30 EN
Water category Coastal and transitional
Geographical Intercalibration Group North East Atlantic
Description of types that have been intercalibrated
Type Characterisation Salinity (psu) Tidal Range(m)
Depth(m)
Current Velocity (knots) Exposure
Mixing Residence Time
NEA1/26a Open oceanic, exposed or sheltered, euhaline, shallow
>30 Mesotidal 1 – 5
<30
Medium 1 – 3 Exposed or sheltered
Fully mixed Days
NEA1/26b Enclosed seas, exposed or sheltered, euhaline, shallow
>30 Mesotidal 1 – 5
<30
Medium 1 – 3 Exposed or sheltered
Fully mixed Days
NEA1/26c Enclosed seas, enclosed or sheltered, partly stratified
>30 Microtidal/Mesotidal
<1 – 5 <30
Medium 1 – 3 Exposed or sheltered
Partly stratified Days to weeks
NEA1/26d Scandinavian coast, exposed or sheltered, shallow
>30 Microtidal <1
<30
Low <1 Exposed or moderately
exposed
Partly stratified Days to weeks
NEA1/26e Areas of upwelling, exposed or sheltered, euhaline, shallow
>30 Mesotidal 1 – 5
<30
Medium 1 – 3 Exposed or sheltered
Fully mixed Days
NEA3/4 Polyhaline, Exposed or moderately exposed (Wadden Sea type)
Polyhaline 18 - 30 Mesotidal 1 - 5
<30
Medium 1 - 3 Exposed or moderately
exposed
Fully mixed Days
NEA7 Deep fjordic and sea loch systems
>30 Mesotidal 1 -5
>30
Low <1 Sheltered
Fully mixed Days
NEA8 Skagerrak Inner Arc Type, polyhaline, microtidal, sheltered, shallow
Polyhaline 18 - 30 Microtidal <1
<30
Low <1 Sheltered
Partly stratified Days to weeks
NEA9 Fjord with a shallow sill at the mouth with a very deep maximum depth in the central basin with poor deepwater exchange
Polyhaline 18 - 30 Microtidal <1
>30
Low <1 Sheltered
Partly stratified Weeks
NEA10 Skagerrak Outer Arc Type, polyhaline, microtidal,
Polyhaline 18 - 30 Microtidal <1
>30
Low <1 Exposed
Partly stratified Days
EN 31 EN
exposed, deep
NEA11 Transitional Waters
Oligohaline 0 - 35 Micro to macrotidal
<30
Variable Sheltered or moderately
exposed
Partly or permanently
stratified Days to weeks
Countries sharing the types that have been intercalibrated
Type NEA1/26a: Spain, France, Ireland, Norway, United Kingdom
Type NEA1/26b: Belgium, France, Netherlands, United Kingdom
Type NEA1/26c: Germany, Denmark
Type NEA1/26d: Denmark
Type NEA1/26e: Portugal, Spain
Type NEA3/4: Germany, Netherlands
Type NEA7: Norway, United Kingdom
Type NEA8: Denmark, Norway, Sweden
Type NEA9: Norway, Sweden
Type NEA10: Norway, Sweden
Type NEA11: Belgium, Germany, Spain, France, Ireland, Netherlands, Portugal, United Kingdom
RESULTS
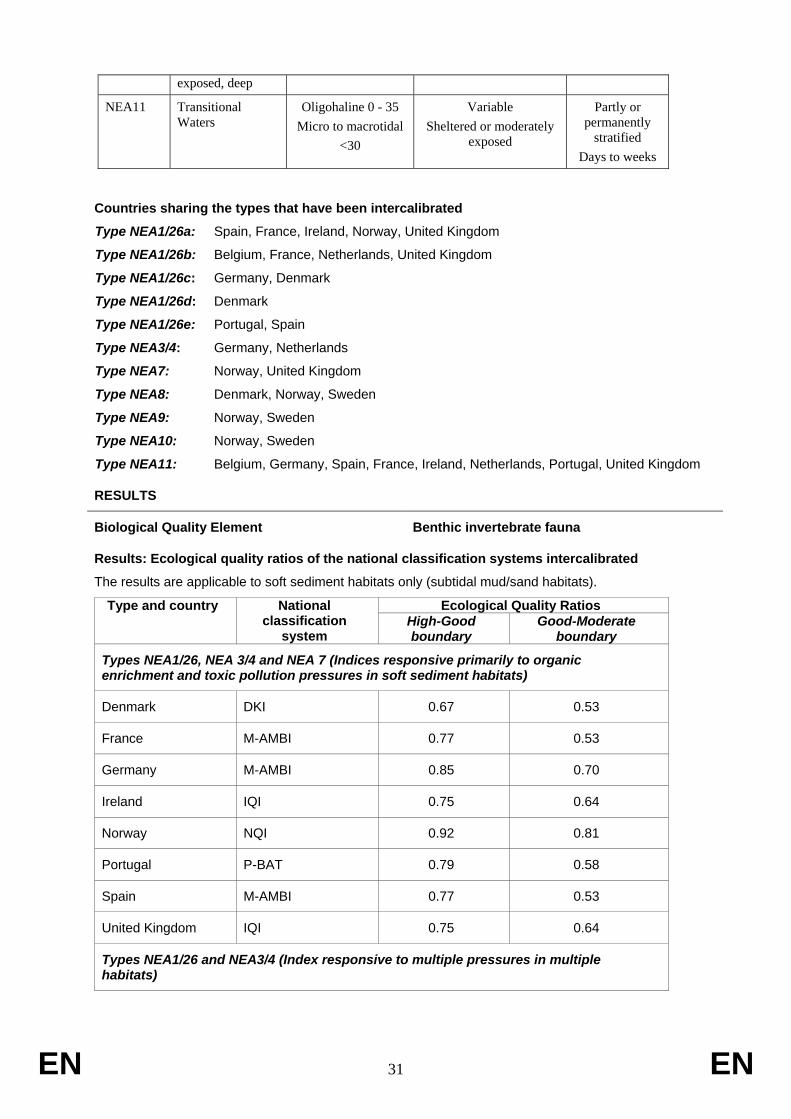
Biological Quality Element Benthic invertebrate fauna
Results: Ecological quality ratios of the national classification systems intercalibrated
The results are applicable to soft sediment habitats only (subtidal mud/sand habitats).
Ecological Quality Ratios Type and country National classification
system High-Good boundary
Good-Moderate boundary
Types NEA1/26, NEA 3/4 and NEA 7 (Indices responsive primarily to organic enrichment and toxic pollution pressures in soft sediment habitats)
Denmark DKI 0.67 0.53
France M-AMBI 0.77 0.53
Germany M-AMBI 0.85 0.70
Ireland IQI 0.75 0.64
Norway NQI 0.92 0.81
Portugal P-BAT 0.79 0.58
Spain M-AMBI 0.77 0.53
United Kingdom IQI 0.75 0.64
Types NEA1/26 and NEA3/4 (Index responsive to multiple pressures in multiple habitats)

EN 32 EN
Belgium BEQI 0.80 0.60
Netherlands BEQI 0.80 0.60
Types NEA8/9/10
Denmark DKI 0.82 0.63
Norway NQI 0.92 0.81
Sweden BQI 0.89 0.68 Biological Quality Element Phytoplankton
Phytoplankton: parameter indicative of biomass parameter (Chlorophyll a)
Results: Ecological quality ratios and parameter values
The following results apply to all countries sharing the types. Parameter values are expressed in µg/l as the 90%ile value calculated over the defined growing season in a six year period. The results relate to geographic areas within the types as described in the technical report.
Ecological Quality Ratios Values (µg/l, 90%ile) Type
High-Good boundary
Good-Moderate boundary
High-Good boundary
Good-Moderate boundary
NEA1/26a 0.67 0.33 1 – 5 2 – 10 NEA1/26b 0.67 0.44 6 – 10 9 – 15 NEA1/26c 0.67 0.44 5 7.5 NEA1/26d 0.67 0.50 3 4 NEA1/26e 0.67 0.44 6 – 8 9 – 12 NEA8 0.67 0.33 1.5 3 NEA9 0.67 0.33 2.5 5 NEA10 0.67 0.33 3 6
Phytoplankton: parameter indicative of blooms
Results: Ecological quality ratios and parameter values
Ecological Quality Ratios Values (% single taxa counts above thresholds)
Type and country
National parameter
intercalibrated High-Good boundary
Good-Moderate boundary
High-Good boundary
Good-Moderate boundary
NEA1/26a/b, NEA3/4 Belgium Germany Netherlands UK
Phaeocystis Blooms 0.92 0.49 9 17
NEA1/26a/b Spain France Ireland UK
Taxa cell counts 0.84 0.43 20 39
NEA1/26e Portugal Spain
Taxa cell counts 0.83 0.51 30 49
EN 33 EN
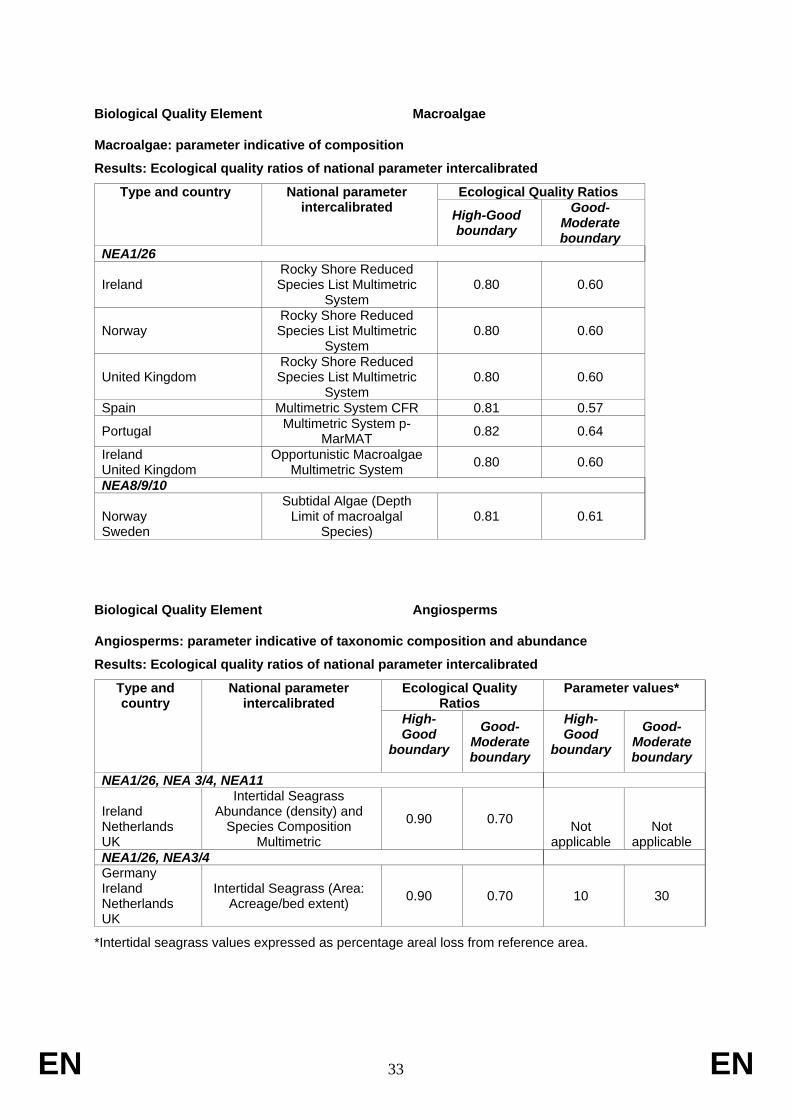
Biological Quality Element Macroalgae
Macroalgae: parameter indicative of composition
Results: Ecological quality ratios of national parameter intercalibrated
Ecological Quality Ratios Type and country National parameter intercalibrated High-Good
boundary
Good-Moderate boundary
NEA1/26
Ireland Rocky Shore Reduced Species List Multimetric
System 0.80 0.60
Norway Rocky Shore Reduced Species List Multimetric
System 0.80 0.60
United Kingdom Rocky Shore Reduced Species List Multimetric
System 0.80 0.60
Spain Multimetric System CFR 0.81 0.57
Portugal Multimetric System p-MarMAT 0.82 0.64
Ireland United Kingdom
Opportunistic Macroalgae Multimetric System 0.80 0.60
NEA8/9/10
Norway Sweden
Subtidal Algae (Depth Limit of macroalgal
Species) 0.81 0.61
Biological Quality Element Angiosperms
Angiosperms: parameter indicative of taxonomic composition and abundance
Results: Ecological quality ratios of national parameter intercalibrated
Ecological Quality Ratios
Parameter values* Type and country
National parameter intercalibrated
High-Good
boundary
Good-Moderate boundary
High-Good
boundary
Good-Moderate boundary
NEA1/26, NEA 3/4, NEA11
Ireland Netherlands UK
Intertidal Seagrass Abundance (density) and
Species Composition Multimetric
0.90 0.70 Not applicable
Not applicable
NEA1/26, NEA3/4 Germany Ireland Netherlands UK
Intertidal Seagrass (Area: Acreage/bed extent) 0.90 0.70 10 30
*Intertidal seagrass values expressed as percentage areal loss from reference area.

EN 34 EN
Water category Coastal and transitional
Geographical Intercalibration Group Mediterranean
Results apply to coastal waters only.
Typology has been developed for specific quality elements only (see below).
RESULTS
Biological Quality Element Benthic invertebrate fauna
Results: Ecological quality ratios of national classification systems
The following results apply to soft sediments only
Ecological Quality Ratios Country National classification
systems intercalibrated
High-Good boundary
Good-Moderate boundary
Cyprus Bentix 0.75 0.58
Greece Bentix 0.75 0.58
Slovenia M-AMBI 0.83 0.62
Spain MEDOCC index 0.73 0.47 Biological Quality Element Phytoplankton
Description of types that have been intercalibrated (applicable for phytoplankton only)
Type Description Density (kg/m³) Annual mean Salinity (psu)
Type I Highly influenced by freshwater input <25 <34.5
Type IIA Moderately influenced by
freshwater input (continent influence)
25-27 34.5-37.5
Type IIIW Continental coast, not influenced
by freshwater input (Western Basin).
>27 >37.5
Type IIIE Not influenced by freshwater input (Eastern Basin) >27 >37.5
Countries sharing the types that have been intercalibrated
Type I: France, Italy
Type IIA: France, Spain, Italy, Slovenia
Type IIIW: France, Spain, Italy
Type IIIE: Greece, Cyprus
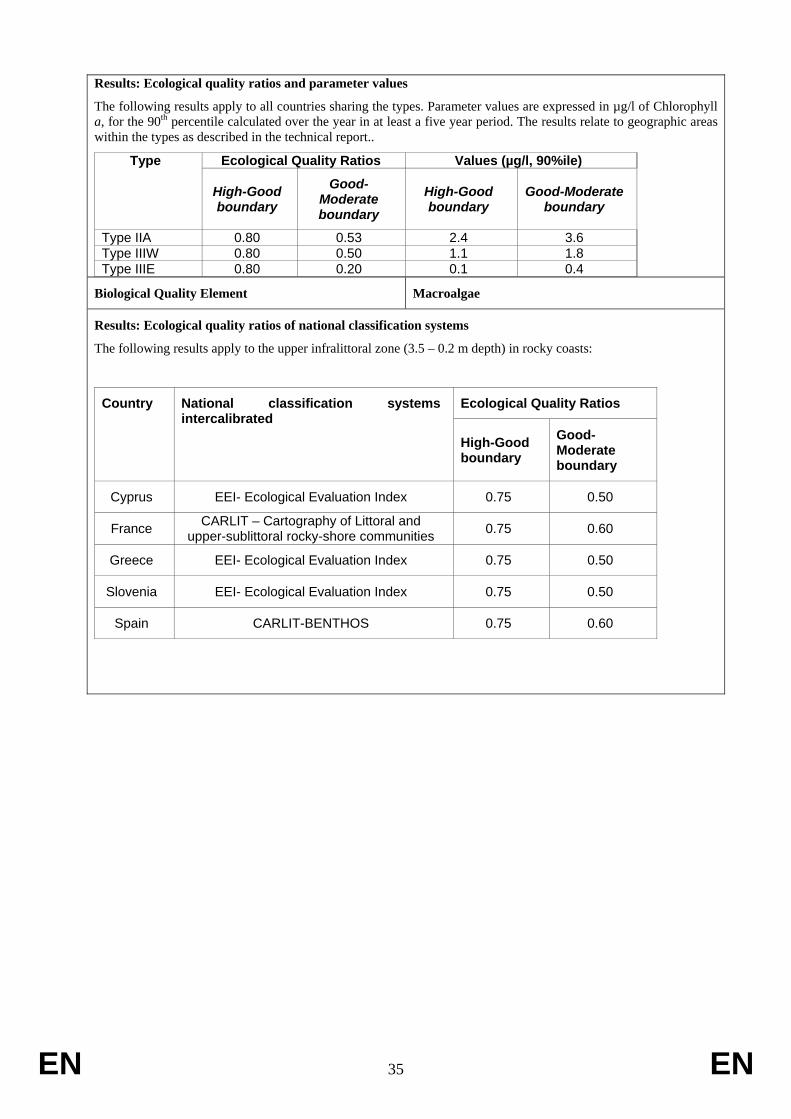
Phytoplankton: parameter indicative of biomass (Chlorophyll a)
EN 35 EN
Results: Ecological quality ratios and parameter values
The following results apply to all countries sharing the types. Parameter values are expressed in µg/l of Chlorophyll a, for the 90th percentile calculated over the year in at least a five year period. The results relate to geographic areas within the types as described in the technical report..
Ecological Quality Ratios Values (µg/l, 90%ile) Type
High-Good boundary
Good-Moderate boundary
High-Good boundary
Good-Moderate boundary
Type IIA 0.80 0.53 2.4 3.6 Type IIIW 0.80 0.50 1.1 1.8 Type IIIE 0.80 0.20 0.1 0.4
Biological Quality Element Macroalgae
Results: Ecological quality ratios of national classification systems
The following results apply to the upper infralittoral zone (3.5 – 0.2 m depth) in rocky coasts:
Ecological Quality Ratios Country National classification systems intercalibrated
High-Good boundary
Good-Moderate boundary
Cyprus EEI- Ecological Evaluation Index 0.75 0.50
France CARLIT – Cartography of Littoral and upper-sublittoral rocky-shore communities 0.75 0.60
Greece EEI- Ecological Evaluation Index 0.75 0.50
Slovenia EEI- Ecological Evaluation Index 0.75 0.50
Spain CARLIT-BENTHOS 0.75 0.60

EN 36 EN
Water category Coastal and transitional
Geographical Intercalibration Group Black Sea
Description of types that have been intercalibrated
Type Description CW-BL1 Mesohaline, microtidal (< 1 m), shallow (< 30 m), moderately exposed,
mixed substratum
Countries sharing the types that have been intercalibrated
Bulgaria and Romania
RESULTS
Biological Quality Element Phytoplankton
Phytoplankton: parameter indicative of biomass
Results: Ecological quality ratios and parameter values
Ecological Quality Ratios Biomass values (mg/m3) Season
High-Good boundary
Good-Moderate boundary
High-Good boundary
Good-Moderate boundary
Winter 0.93 0.78 1770 3420 Spring 0.93 0.78 3515 5690 Summer 0.93 0.78 1281 2526 Autumn 0.93 0.78 1840 3640
Biological Quality Element Benthic invertebrates fauna
Results: Ecological quality ratios of national parameters intercalibrated
Member States must use at least one of the intercalibrated parameters (Shannon diversity index H’, AMBI, M-AMBI)
Ecological Quality Ratios National parameters intercalibrated High-Good
boundary Good-Moderate
boundary Shannon diversity index H' 0.89 0.69
AMBI 0.83 0.53 M-AMBI 0.85 0.55