Embed Size (px)
Citation preview
Enable Midstream Partners, LP
NAPTP 2015 MLP Investor Conference
May 20, 2015

Forward-looking Statements
This presentation and the oral statements made in connection herewith may contain “forward-looking statements” within the
meaning of the securities laws. All statements, other than statements of historical fact, regarding Enable Midstream Partners’
(“Enable”) strategy, future operations, financial position, estimated revenues, projected costs, prospects, plans and objectives of
management are forward-looking statements. These statements often include the words “could,” “believe,” “anticipate,” “intend,”
“estimate,” “expect,” “project,” “forecast” and similar expressions and are intended to identify forward-looking statements, although
not all forward-looking statements contain such identifying words. These forward-looking statements are based on Enable’s current
expectations and assumptions about future events and are based on currently available information as to the outcome and timing of
future events. Enable assumes no obligation to and does not intend to update any forward-looking statements included
herein. When considering forward-looking statements, you should keep in mind the risk factors and other cautionary statements
described under the heading “Risk Factors” included in our SEC filings. Enable cautions you that these forward-looking statements
are subject to all of the risks and uncertainties, most of which are difficult to predict and many of which are beyond its control,
incident to the ownership, operation and development of natural gas and crude oil infrastructure assets. These risks include, but
are not limited to, contract renewal risk, commodity price risk, environmental risks, operating risks, regulatory changes and the other
risks described under “Risk Factors” in our SEC filings. Should one or more of these risks or uncertainties occur, or should
underlying assumptions prove incorrect, Enable’s actual results and plans could differ materially from those expressed in any
forward-looking statements.
2
Enable Highlights
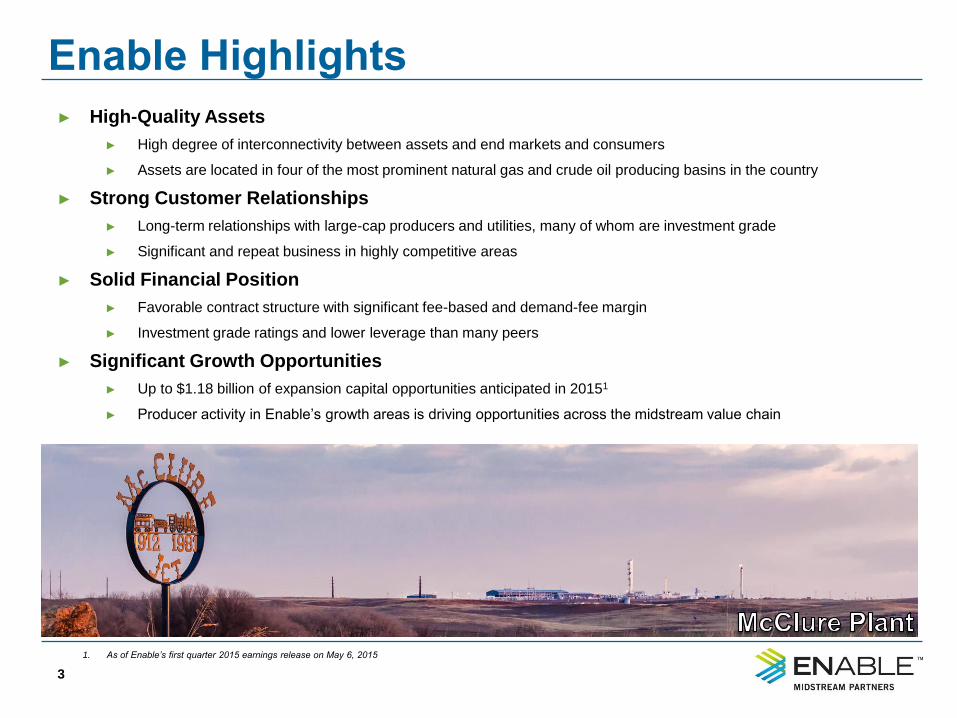
► High-Quality Assets
► High degree of interconnectivity between assets and end markets and consumers
► Assets are located in four of the most prominent natural gas and crude oil producing basins in the country
► Strong Customer Relationships
► Long-term relationships with large-cap producers and utilities, many of whom are investment grade
► Significant and repeat business in highly competitive areas
► Solid Financial Position
► Favorable contract structure with significant fee-based and demand-fee margin
► Investment grade ratings and lower leverage than many peers
► Significant Growth Opportunities
► Up to $1.18 billion of expansion capital opportunities anticipated in 20151
► Producer activity in Enable’s growth areas is driving opportunities across the midstream value chain
3
1. As of Enable’s first quarter 2015 earnings release on May 6, 2015
Interconnected, Diverse and Strategically Located
4
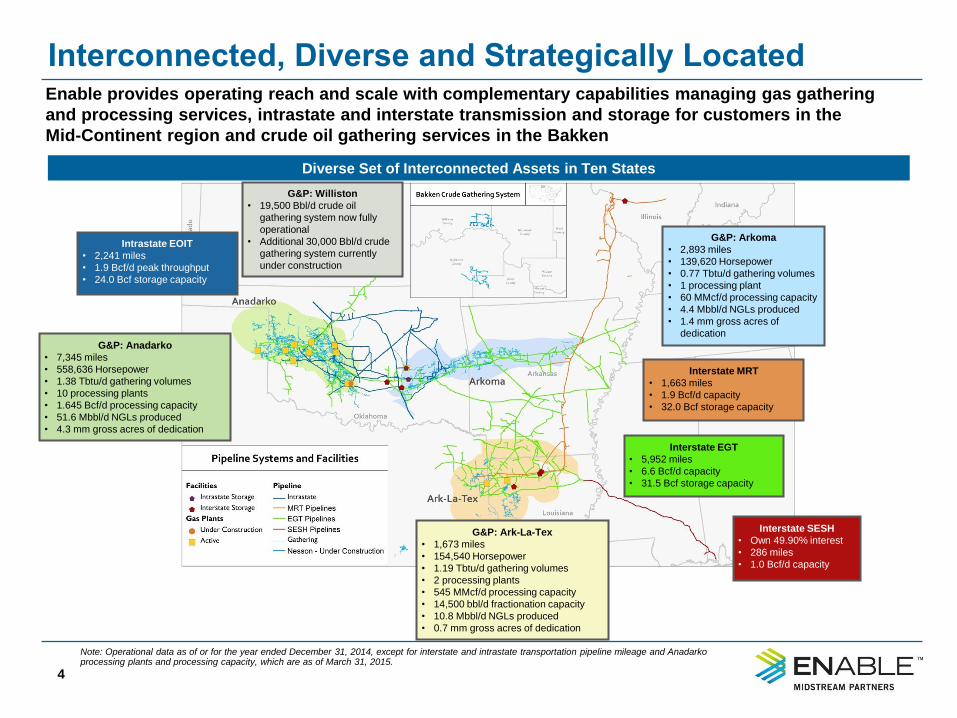
Diverse Set of Interconnected Assets in Ten States
Note: Operational data as of or for the year ended December 31, 2014, except for interstate and intrastate transportation pipeline mileage and Anadarko processing plants and processing capacity, which are as of March 31, 2015.
Enable provides operating reach and scale with complementary capabilities managing gas gathering
and processing services, intrastate and interstate transmission and storage for customers in the
Mid-Continent region and crude oil gathering services in the Bakken
Interstate MRT
• 1,663 miles
• 1.9 Bcf/d capacity
• 32.0 Bcf storage capacity
G&P: Arkoma
• 2,893 miles
• 139,620 Horsepower
• 0.77 Tbtu/d gathering volumes
• 1 processing plant
• 60 MMcf/d processing capacity
• 4.4 Mbbl/d NGLs produced
• 1.4 mm gross acres of
dedication
G&P: Ark-La-Tex
• 1,673 miles
• 154,540 Horsepower
• 1.19 Tbtu/d gathering volumes
• 2 processing plants
• 545 MMcf/d processing capacity
• 14,500 bbl/d fractionation capacity
• 10.8 Mbbl/d NGLs produced
• 0.7 mm gross acres of dedication
Intrastate EOIT
• 2,241 miles
• 1.9 Bcf/d peak throughput
• 24.0 Bcf storage capacity
G&P: Anadarko
• 7,345 miles
• 558,636 Horsepower
• 1.38 Tbtu/d gathering volumes
• 10 processing plants
• 1.645 Bcf/d processing capacity
• 51.6 Mbbl/d NGLs produced
• 4.3 mm gross acres of dedication
Interstate EGT
• 5,952 miles
• 6.6 Bcf/d capacity
• 31.5 Bcf storage capacity
G&P: Williston
• 19,500 Bbl/d crude oil
gathering system now fully
operational
• Additional 30,000 Bbl/d crude
gathering system currently
under construction
Interstate SESH
• Own 49.90% interest
• 286 miles
• 1.0 Bcf/d capacity
Enable Ownership Structure
5
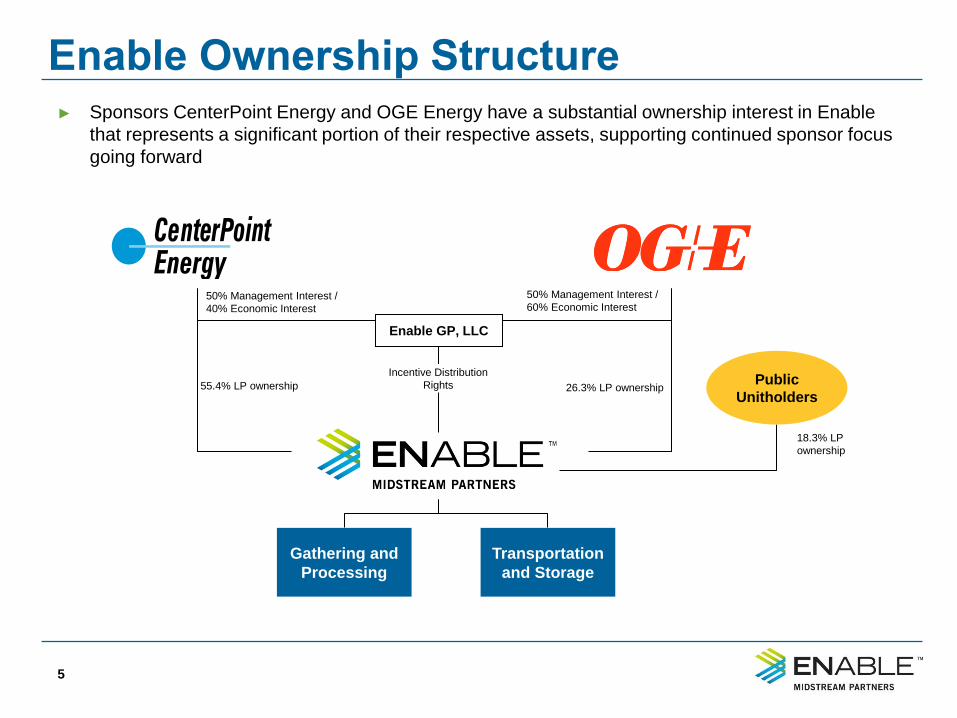
18.3% LP
ownership
Enable Midstream Partners, LP
NYSE: ENBL
Transportation
and Storage
Gathering and
Processing
50% Management Interest /
60% Economic Interest 50% Management Interest /
40% Economic Interest
Incentive Distribution
Rights Public
Unitholders 26.3% LP ownership 55.4% LP ownership
Enable GP, LLC
► Sponsors CenterPoint Energy and OGE Energy have a substantial ownership interest in Enable
that represents a significant portion of their respective assets, supporting continued sponsor focus
going forward
Large and Diverse Customer Base
6
High Quality Customers
Enable’s revenues are strengthened by a diverse, high-quality customer base, many of whom are
investment grade
(Investment Grade)
(Investment Grade)
(Investment Grade) (Investment Grade)
(Investment Grade)
(Investment Grade)
(Investment Grade) (Investment Grade)
QEP Resources, Inc.QEP Resources, Inc.
(Investment Grade)
(Investment Grade)
► Many of our customers rely on us for multiple midstream services across both G&P and T&S
► Loyal customer base through exemplary customer service and reliable project execution
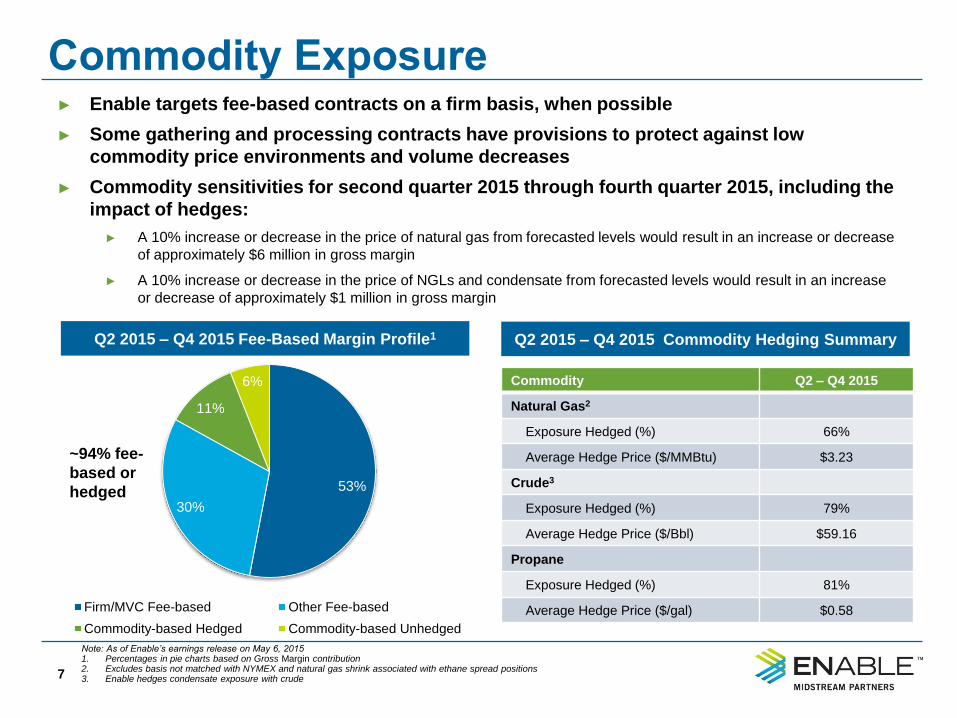
Commodity Exposure ► Enable targets fee-based contracts on a firm basis, when possible
► Some gathering and processing contracts have provisions to protect against low
commodity price environments and volume decreases
► Commodity sensitivities for second quarter 2015 through fourth quarter 2015, including the
impact of hedges:
► A 10% increase or decrease in the price of natural gas from forecasted levels would result in an increase or decrease
of approximately $6 million in gross margin
► A 10% increase or decrease in the price of NGLs and condensate from forecasted levels would result in an increase
or decrease of approximately $1 million in gross margin
Note: As of Enable’s earnings release on May 6, 2015 1. Percentages in pie charts based on Gross Margin contribution 2. Excludes basis not matched with NYMEX and natural gas shrink associated with ethane spread positions 3. Enable hedges condensate exposure with crude
Q2 2015 – Q4 2015 Fee-Based Margin Profile1
7
~94% fee-
based or
hedged
Q2 2015 – Q4 2015 Commodity Hedging Summary
Commodity Q2 – Q4 2015
Natural Gas2
Exposure Hedged (%) 66%
Average Hedge Price ($/MMBtu) $3.23
Crude3
Exposure Hedged (%) 79%
Average Hedge Price ($/Bbl) $59.16
Propane
Exposure Hedged (%) 81%
Average Hedge Price ($/gal) $0.58
53%
30%
11%
6%
Firm/MVC Fee-based Other Fee-based
Commodity-based Hedged Commodity-based Unhedged
Appendix Gathering and Processing Segment
8
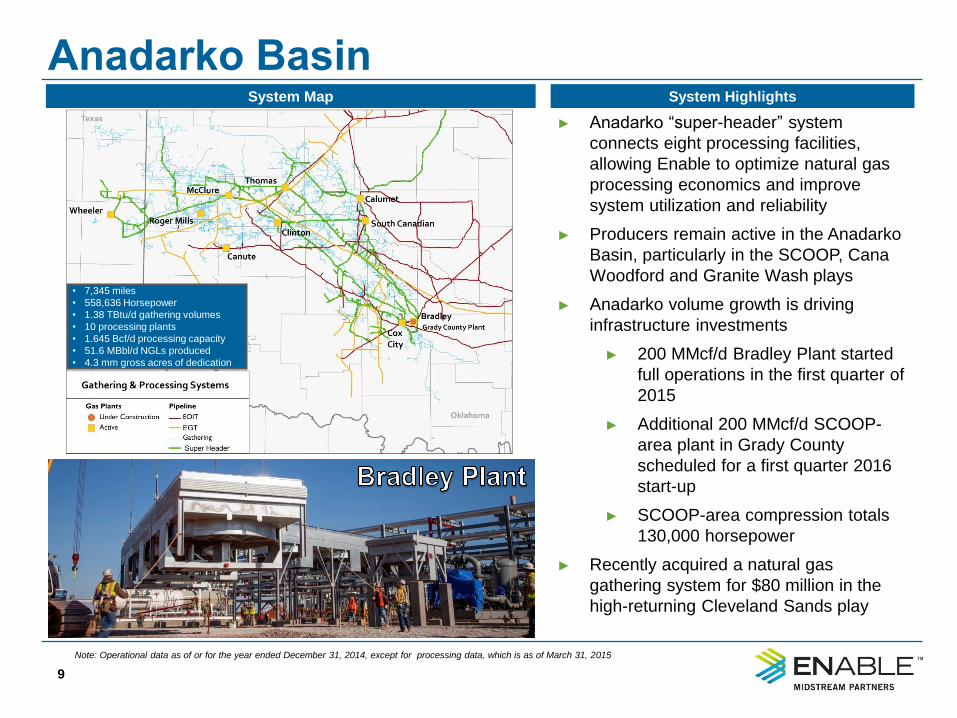
Anadarko Basin
9
► Anadarko “super-header” system
connects eight processing facilities,
allowing Enable to optimize natural gas
processing economics and improve
system utilization and reliability
► Producers remain active in the Anadarko
Basin, particularly in the SCOOP, Cana
Woodford and Granite Wash plays
► Anadarko volume growth is driving
infrastructure investments
► 200 MMcf/d Bradley Plant started
full operations in the first quarter of
2015
► Additional 200 MMcf/d SCOOP-
area plant in Grady County
scheduled for a first quarter 2016
start-up
► SCOOP-area compression totals
130,000 horsepower
► Recently acquired a natural gas
gathering system for $80 million in the
high-returning Cleveland Sands play
System Map System Highlights
• 7,345 miles
• 558,636 Horsepower
• 1.38 TBtu/d gathering volumes
• 10 processing plants
• 1.645 Bcf/d processing capacity
• 51.6 MBbl/d NGLs produced
• 4.3 mm gross acres of dedication
Note: Operational data as of or for the year ended December 31, 2014, except for processing data, which is as of March 31, 2015
$19
$13
$6 $7 $8
$5 $3 $3
$1
SC
OO
P C
ore
ST
AC
K
Cana W
DF
DC
ore
SC
OO
PA
rdm
ore
WD
FD
SC
OO
P W
DF
DC
onden
sate
SC
OO
PW
DF
D O
il
Cana W
DF
DD
ry G
as
SC
OO
PW
DF
D G
as
Cana W
DF
DLiq
uid
s-R
ich
SCOOP Remains a Top Play
10
Source: Wood Mackenzie
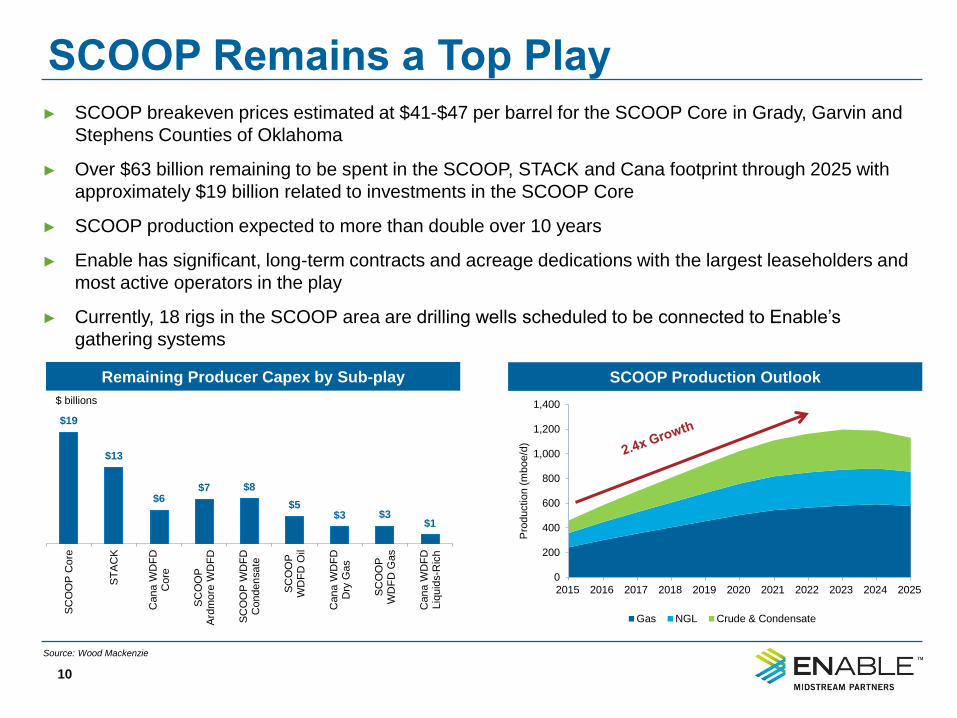
► SCOOP breakeven prices estimated at $41-$47 per barrel for the SCOOP Core in Grady, Garvin and
Stephens Counties of Oklahoma
► Over $63 billion remaining to be spent in the SCOOP, STACK and Cana footprint through 2025 with
approximately $19 billion related to investments in the SCOOP Core
► SCOOP production expected to more than double over 10 years
► Enable has significant, long-term contracts and acreage dedications with the largest leaseholders and
most active operators in the play
► Currently, 18 rigs in the SCOOP area are drilling wells scheduled to be connected to Enable’s
gathering systems
0
200
400
600
800
1,000
1,200
1,400
2015 2016 2017 2018 2019 2020 2021 2022 2023 2024 2025
Pro
ductio
n (
mboe/d
)
Gas NGL Crude & Condensate
Remaining Producer Capex by Sub-play SCOOP Production Outlook
$ billions
Ark-La-Tex and Arkoma Basins
11
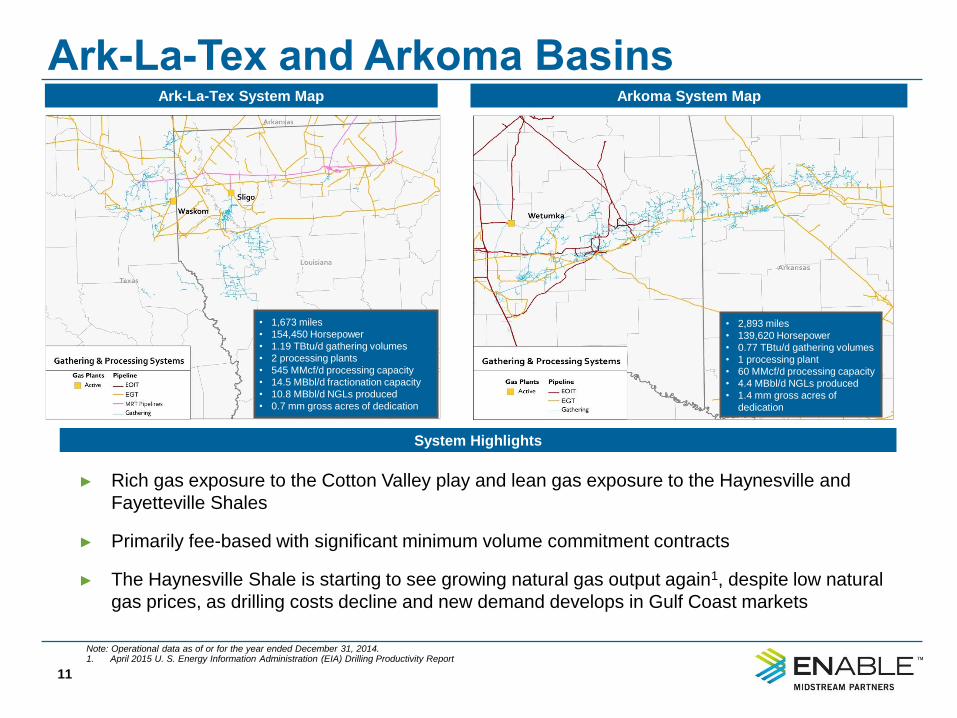
► Rich gas exposure to the Cotton Valley play and lean gas exposure to the Haynesville and
Fayetteville Shales
► Primarily fee-based with significant minimum volume commitment contracts
► The Haynesville Shale is starting to see growing natural gas output again1, despite low natural
gas prices, as drilling costs decline and new demand develops in Gulf Coast markets
Ark-La-Tex System Map
System Highlights
Arkoma System Map
• 2,893 miles
• 139,620 Horsepower
• 0.77 TBtu/d gathering volumes
• 1 processing plant
• 60 MMcf/d processing capacity
• 4.4 MBbl/d NGLs produced
• 1.4 mm gross acres of
dedication
• 1,673 miles
• 154,450 Horsepower
• 1.19 TBtu/d gathering volumes
• 2 processing plants
• 545 MMcf/d processing capacity
• 14.5 MBbl/d fractionation capacity
• 10.8 MBbl/d NGLs produced
• 0.7 mm gross acres of dedication
Note: Operational data as of or for the year ended December 31, 2014. 1. April 2015 U. S. Energy Information Administration (EIA) Drilling Productivity Report
Williston Basin
12
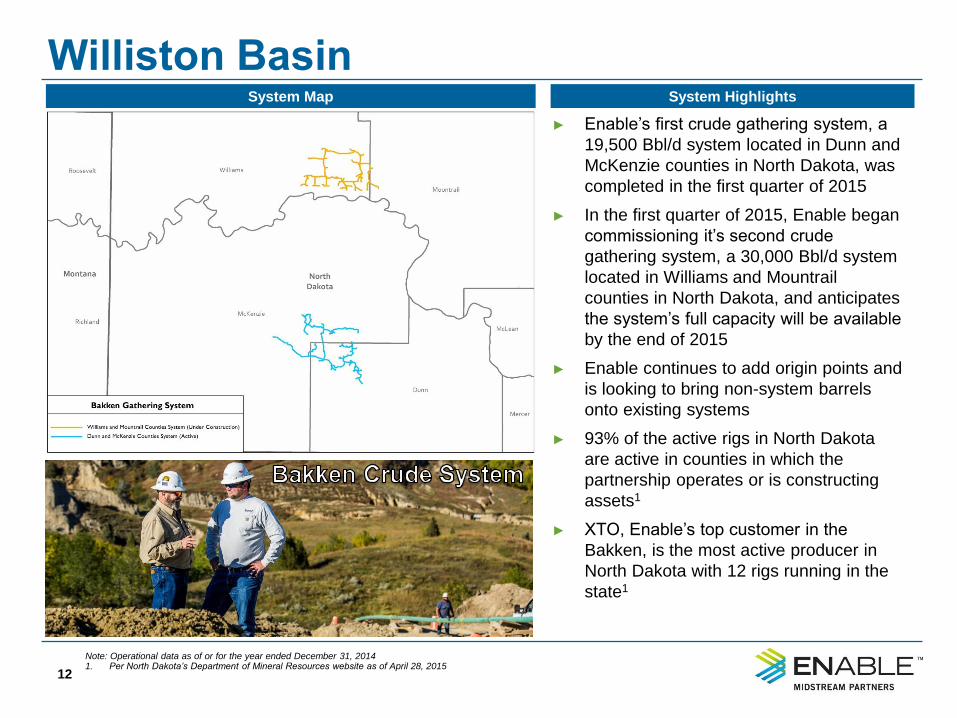
► Enable’s first crude gathering system, a
19,500 Bbl/d system located in Dunn and
McKenzie counties in North Dakota, was
completed in the first quarter of 2015
► In the first quarter of 2015, Enable began
commissioning it’s second crude
gathering system, a 30,000 Bbl/d system
located in Williams and Mountrail
counties in North Dakota, and anticipates
the system’s full capacity will be available
by the end of 2015
► Enable continues to add origin points and
is looking to bring non-system barrels
onto existing systems
► 93% of the active rigs in North Dakota
are active in counties in which the
partnership operates or is constructing
assets1
► XTO, Enable’s top customer in the
Bakken, is the most active producer in
North Dakota with 12 rigs running in the
state1
System Map System Highlights
Note: Operational data as of or for the year ended December 31, 2014 1. Per North Dakota’s Department of Mineral Resources website as of April 28, 2015
-5%
0%
5%
10%
15%
20%
25%
30%
Base Case 20% Completed Well Costs Reduction
Return Analysis by Play
13
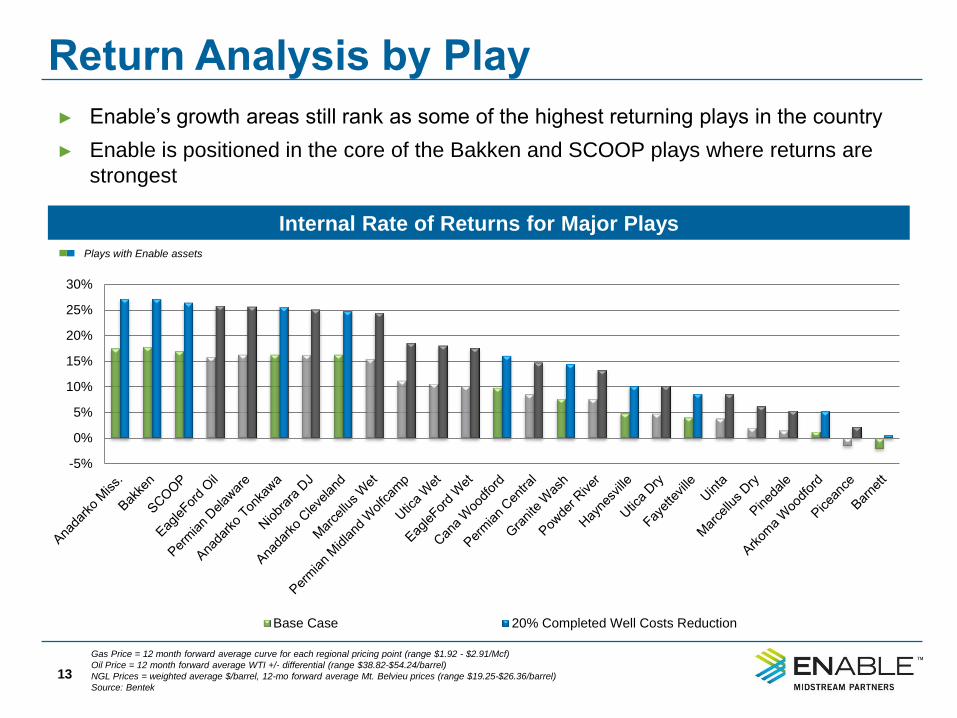
Gas Price = 12 month forward average curve for each regional pricing point (range $1.92 - $2.91/Mcf)
Oil Price = 12 month forward average WTI +/- differential (range $38.82-$54.24/barrel)
NGL Prices = weighted average $/barrel, 12-mo forward average Mt. Belvieu prices (range $19.25-$26.36/barrel)
Source: Bentek
Internal Rate of Returns for Major Plays
► Enable’s growth areas still rank as some of the highest returning plays in the country
► Enable is positioned in the core of the Bakken and SCOOP plays where returns are
strongest
Plays with Enable assets

Appendix Transportation and Storage Segment
14
Enable Gas Transmission (EGT)
15
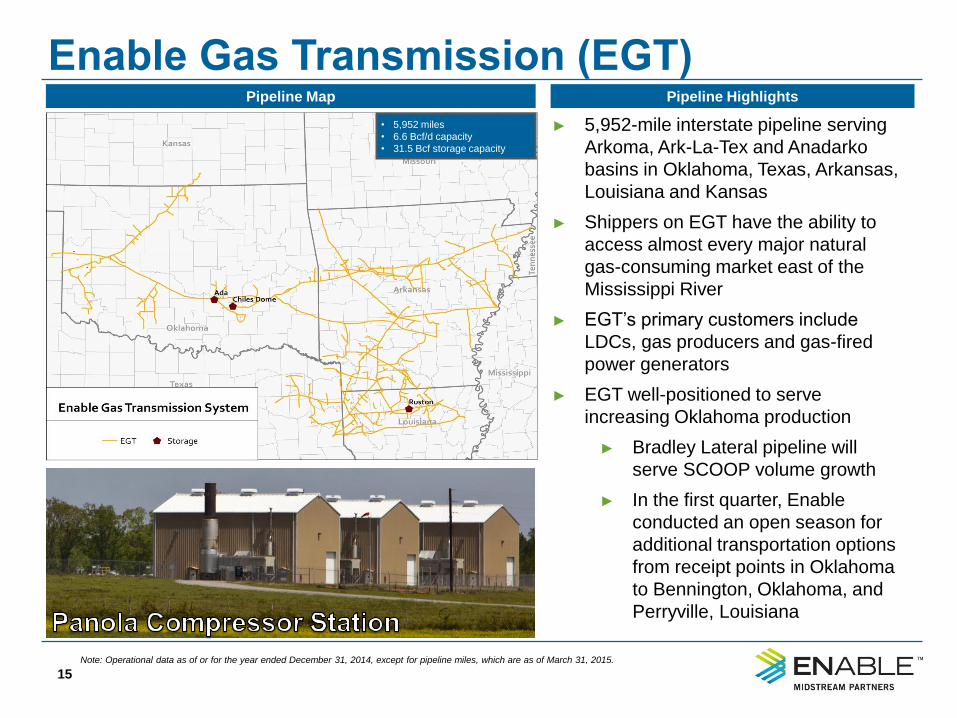
► 5,952-mile interstate pipeline serving
Arkoma, Ark-La-Tex and Anadarko
basins in Oklahoma, Texas, Arkansas,
Louisiana and Kansas
► Shippers on EGT have the ability to
access almost every major natural
gas-consuming market east of the
Mississippi River
► EGT’s primary customers include
LDCs, gas producers and gas-fired
power generators
► EGT well-positioned to serve
increasing Oklahoma production
► Bradley Lateral pipeline will
serve SCOOP volume growth
► In the first quarter, Enable
conducted an open season for
additional transportation options
from receipt points in Oklahoma
to Bennington, Oklahoma, and
Perryville, Louisiana
Pipeline Map Pipeline Highlights
• 5,952 miles
• 6.6 Bcf/d capacity
• 31.5 Bcf storage capacity
Note: Operational data as of or for the year ended December 31, 2014, except for pipeline miles, which are as of March 31, 2015.
Mississippi River Transmission (MRT)
16
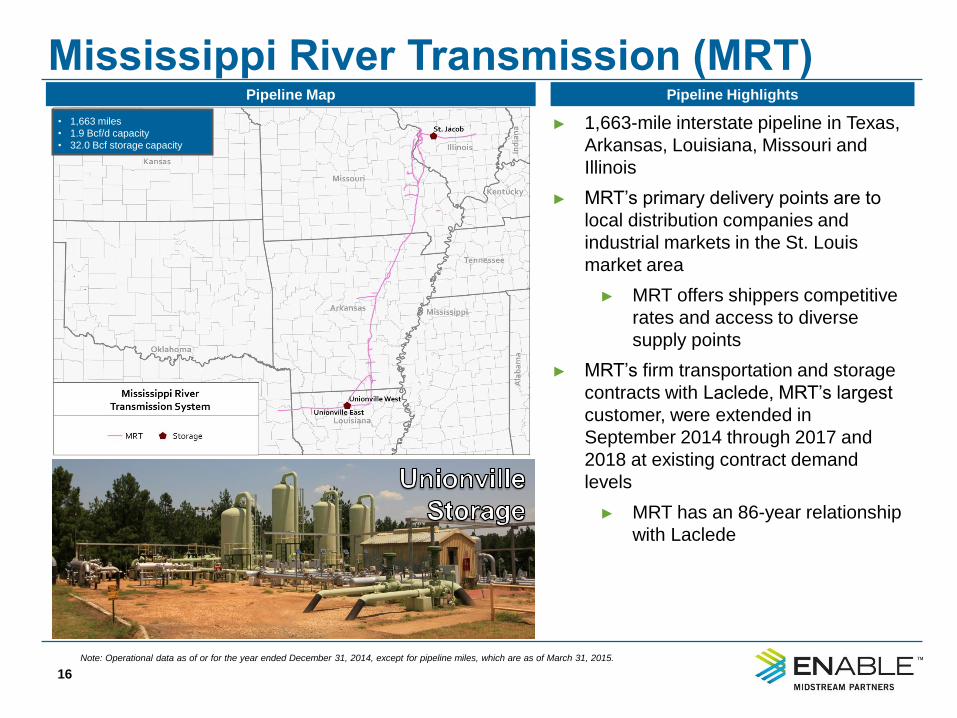
► 1,663-mile interstate pipeline in Texas,
Arkansas, Louisiana, Missouri and
Illinois
► MRT’s primary delivery points are to
local distribution companies and
industrial markets in the St. Louis
market area
► MRT offers shippers competitive
rates and access to diverse
supply points
► MRT’s firm transportation and storage
contracts with Laclede, MRT’s largest
customer, were extended in
September 2014 through 2017 and
2018 at existing contract demand
levels
► MRT has an 86-year relationship
with Laclede
Pipeline Map Pipeline Highlights
• 1,663 miles
• 1.9 Bcf/d capacity
• 32.0 Bcf storage capacity
Note: Operational data as of or for the year ended December 31, 2014, except for pipeline miles, which are as of March 31, 2015.
Southeast Supply Header (SESH)
17
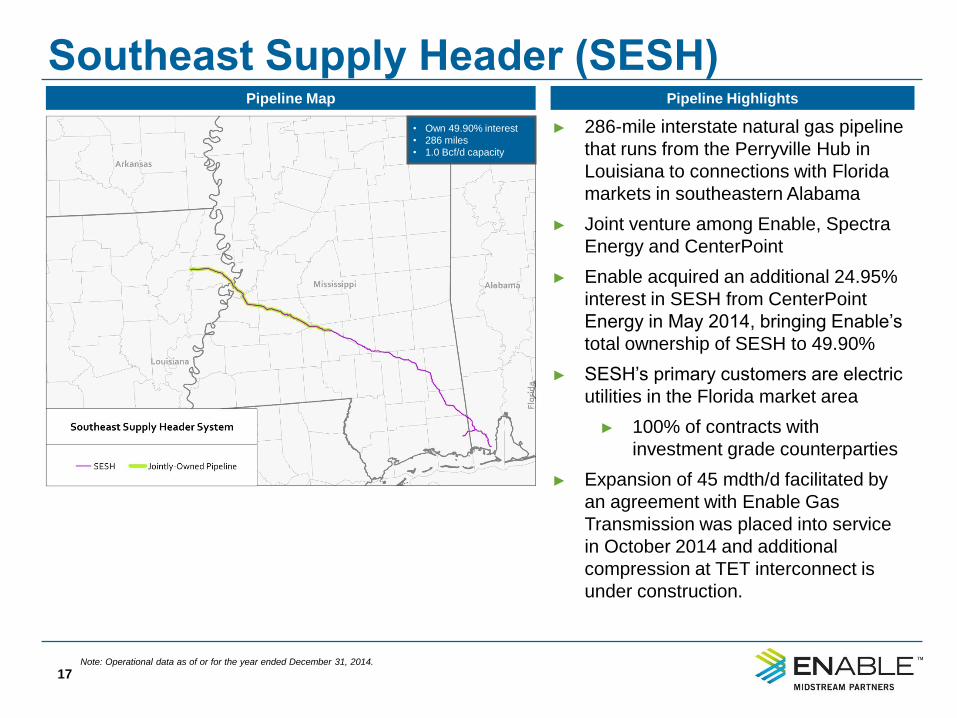
► 286-mile interstate natural gas pipeline
that runs from the Perryville Hub in
Louisiana to connections with Florida
markets in southeastern Alabama
► Joint venture among Enable, Spectra
Energy and CenterPoint
► Enable acquired an additional 24.95%
interest in SESH from CenterPoint
Energy in May 2014, bringing Enable’s
total ownership of SESH to 49.90%
► SESH’s primary customers are electric
utilities in the Florida market area
► 100% of contracts with
investment grade counterparties
► Expansion of 45 mdth/d facilitated by
an agreement with Enable Gas
Transmission was placed into service
in October 2014 and additional
compression at TET interconnect is
under construction.
Pipeline Map Pipeline Highlights
• Own 49.90% interest
• 286 miles
• 1.0 Bcf/d capacity
Note: Operational data as of or for the year ended December 31, 2014.
Enable Oklahoma Intrastate Transmission (EOIT)
18
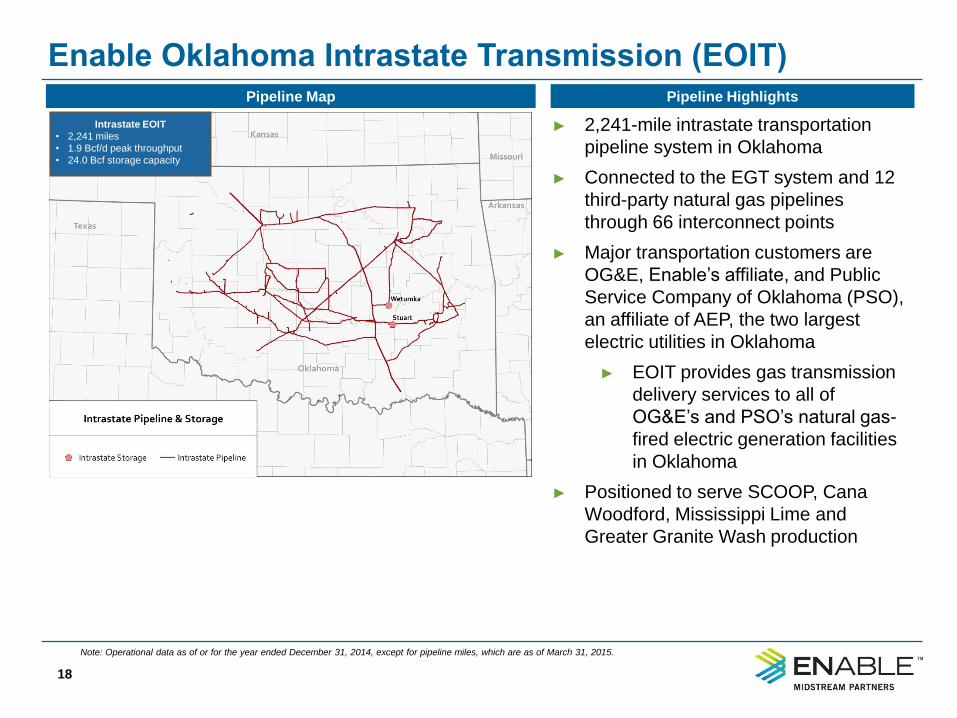
► 2,241-mile intrastate transportation
pipeline system in Oklahoma
► Connected to the EGT system and 12
third-party natural gas pipelines
through 66 interconnect points
► Major transportation customers are
OG&E, Enable’s affiliate, and Public
Service Company of Oklahoma (PSO),
an affiliate of AEP, the two largest
electric utilities in Oklahoma
► EOIT provides gas transmission
delivery services to all of
OG&E’s and PSO’s natural gas-
fired electric generation facilities
in Oklahoma
► Positioned to serve SCOOP, Cana
Woodford, Mississippi Lime and
Greater Granite Wash production
Pipeline Map Pipeline Highlights
Intrastate EOIT
• 2,241 miles
• 1.9 Bcf/d peak throughput
• 24.0 Bcf storage capacity
Note: Operational data as of or for the year ended December 31, 2014, except for pipeline miles, which are as of March 31, 2015.
T&S Well-Positioned for Growth
19
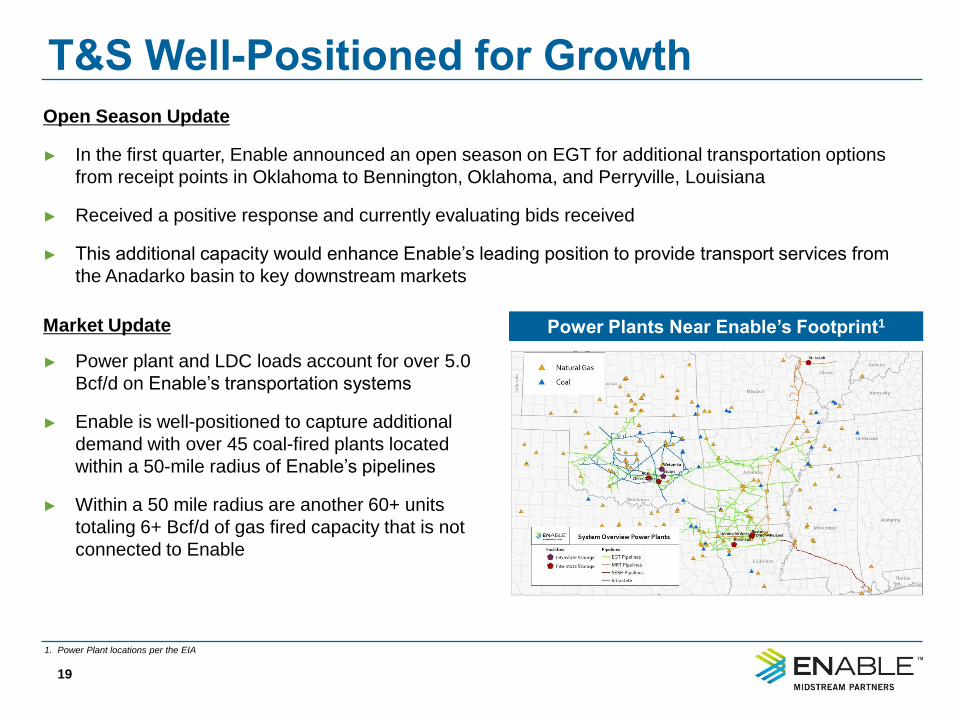
Open Season Update
► In the first quarter, Enable announced an open season on EGT for additional transportation options
from receipt points in Oklahoma to Bennington, Oklahoma, and Perryville, Louisiana
► Received a positive response and currently evaluating bids received
► This additional capacity would enhance Enable’s leading position to provide transport services from
the Anadarko basin to key downstream markets
Power Plants Near Enable’s Footprint1 Market Update
► Power plant and LDC loads account for over 5.0
Bcf/d on Enable’s transportation systems
► Enable is well-positioned to capture additional
demand with over 45 coal-fired plants located
within a 50-mile radius of Enable’s pipelines
► Within a 50 mile radius are another 60+ units
totaling 6+ Bcf/d of gas fired capacity that is not
connected to Enable
1. Power Plant locations per the EIA
Appendix Growth Strategy and Outlook
20
Growth Strategy
21
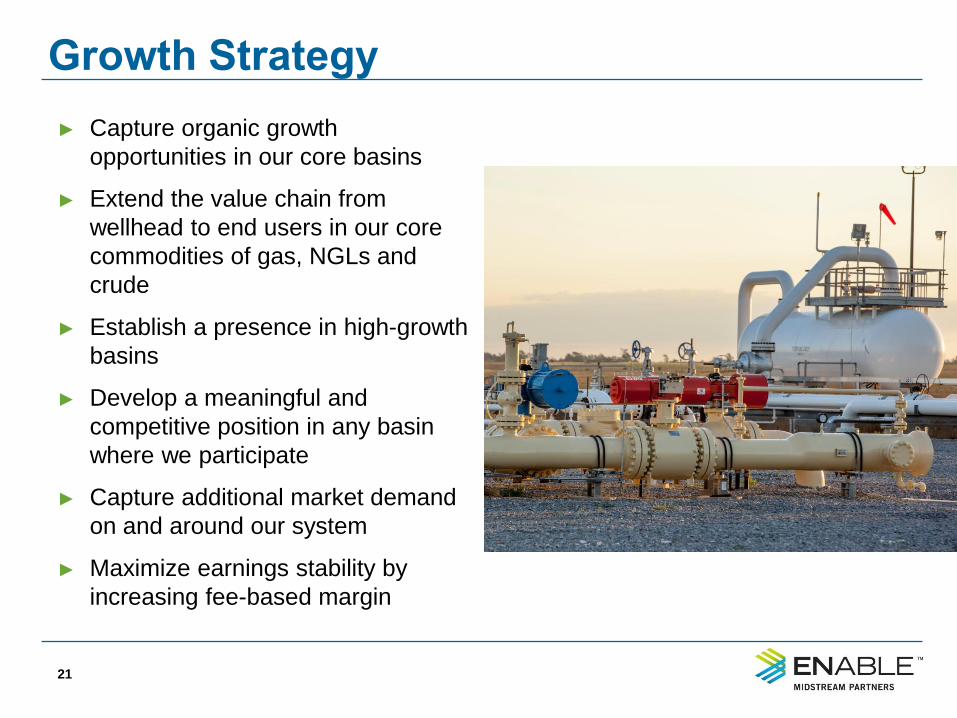
► Capture organic growth
opportunities in our core basins
► Extend the value chain from
wellhead to end users in our core
commodities of gas, NGLs and
crude
► Establish a presence in high-growth
basins
► Develop a meaningful and
competitive position in any basin
where we participate
► Capture additional market demand
on and around our system
► Maximize earnings stability by
increasing fee-based margin
Acquisition Philosophy
22
► Enable’s balance sheet provides the opportunity to
pursue acquisitions to complement the partnership’s
organic growth strategy
► Enable will prioritize acquisition opportunities that provide
entry into new high-growth basins, increase Enable’s
footprint in current basins or extend the value chain
► Enable will remain disciplined, ensuring that acquisitions
meet strategic and financial goals
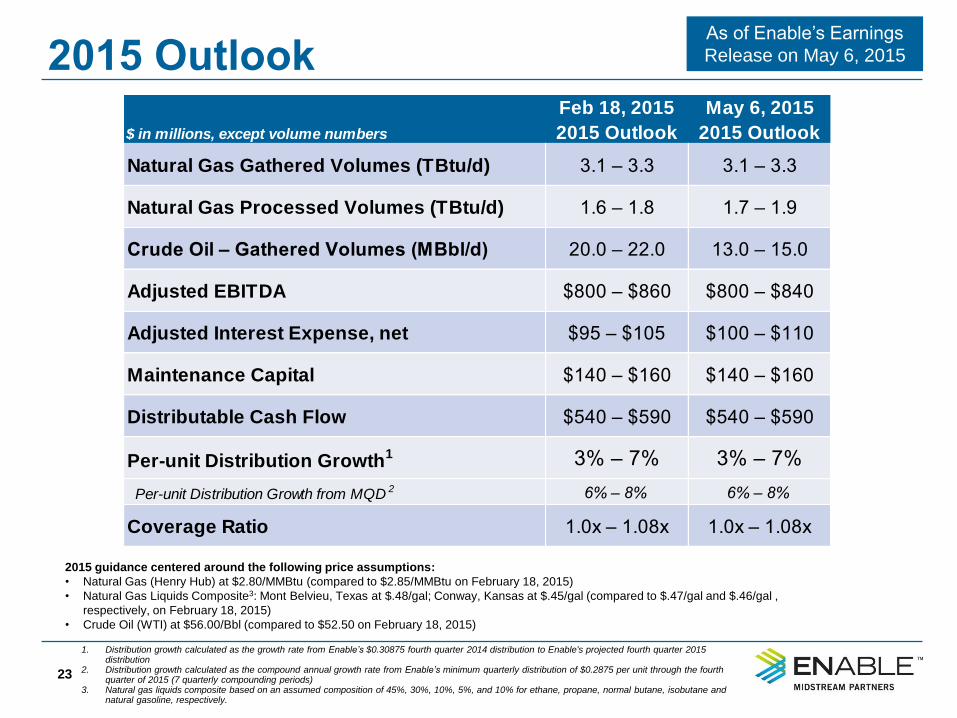
2015 Outlook
23
1. Distribution growth calculated as the growth rate from Enable’s $0.30875 fourth quarter 2014 distribution to Enable's projected fourth quarter 2015 distribution
2. Distribution growth calculated as the compound annual growth rate from Enable’s minimum quarterly distribution of $0.2875 per unit through the fourth quarter of 2015 (7 quarterly compounding periods)
3. Natural gas liquids composite based on an assumed composition of 45%, 30%, 10%, 5%, and 10% for ethane, propane, normal butane, isobutane and natural gasoline, respectively.
Feb 18, 2015 May 6, 2015
$ in millions, except volume numbers 2015 Outlook 2015 Outlook
Natural Gas Gathered Volumes (TBtu/d) 3.1 – 3.3 3.1 – 3.3
Natural Gas Processed Volumes (TBtu/d) 1.6 – 1.8 1.7 – 1.9
Crude Oil – Gathered Volumes (MBbl/d) 20.0 – 22.0 13.0 – 15.0
Adjusted EBITDA $800 – $860 $800 – $840
Adjusted Interest Expense, net $95 – $105 $100 – $110
Maintenance Capital $140 – $160 $140 – $160
Distributable Cash Flow $540 – $590 $540 – $590
Per-unit Distribution Growth1 3% – 7% 3% – 7%
Per-unit Distribution Growth from MQD 2 6% – 8% 6% – 8%
Coverage Ratio 1.0x – 1.08x 1.0x – 1.08x
2015 guidance centered around the following price assumptions:
• Natural Gas (Henry Hub) at $2.80/MMBtu (compared to $2.85/MMBtu on February 18, 2015)
• Natural Gas Liquids Composite3: Mont Belvieu, Texas at $.48/gal; Conway, Kansas at $.45/gal (compared to $.47/gal and $.46/gal ,
respectively, on February 18, 2015)
• Crude Oil (WTI) at $56.00/Bbl (compared to $52.50 on February 18, 2015)
As of Enable’s Earnings
Release on May 6, 2015
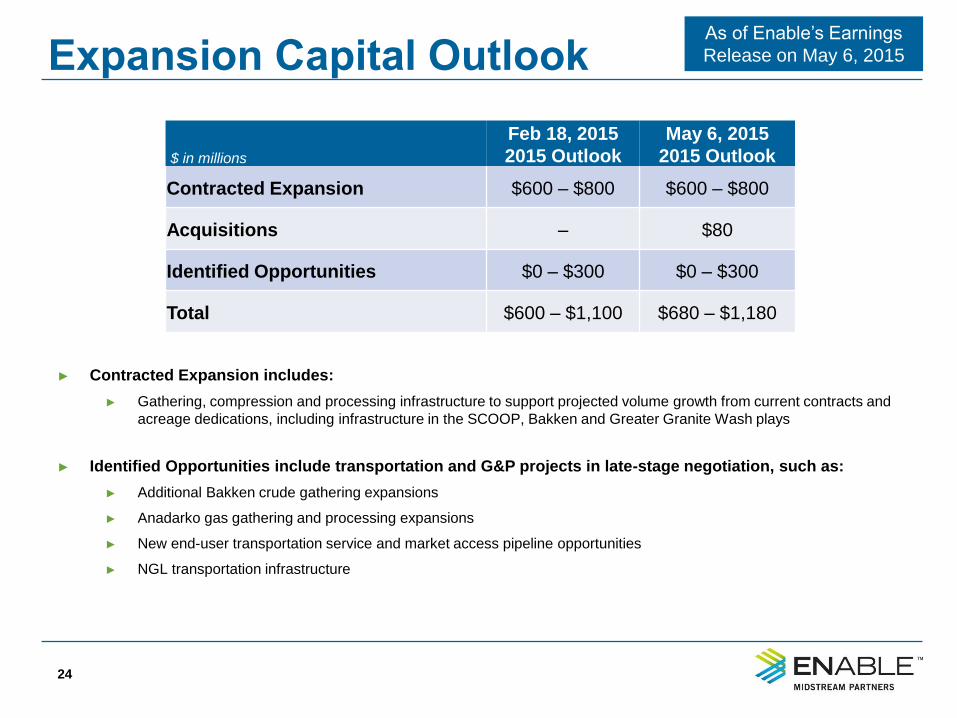
Expansion Capital Outlook
24
► Contracted Expansion includes:
► Gathering, compression and processing infrastructure to support projected volume growth from current contracts and
acreage dedications, including infrastructure in the SCOOP, Bakken and Greater Granite Wash plays
► Identified Opportunities include transportation and G&P projects in late-stage negotiation, such as:
► Additional Bakken crude gathering expansions
► Anadarko gas gathering and processing expansions
► New end-user transportation service and market access pipeline opportunities
► NGL transportation infrastructure
$ in millions
Feb 18, 2015
2015 Outlook
May 6, 2015
2015 Outlook
Contracted Expansion $600 – $800 $600 – $800
Acquisitions – $80
Identified Opportunities $0 – $300 $0 – $300
Total $600 – $1,100 $680 – $1,180
As of Enable’s Earnings
Release on May 6, 2015
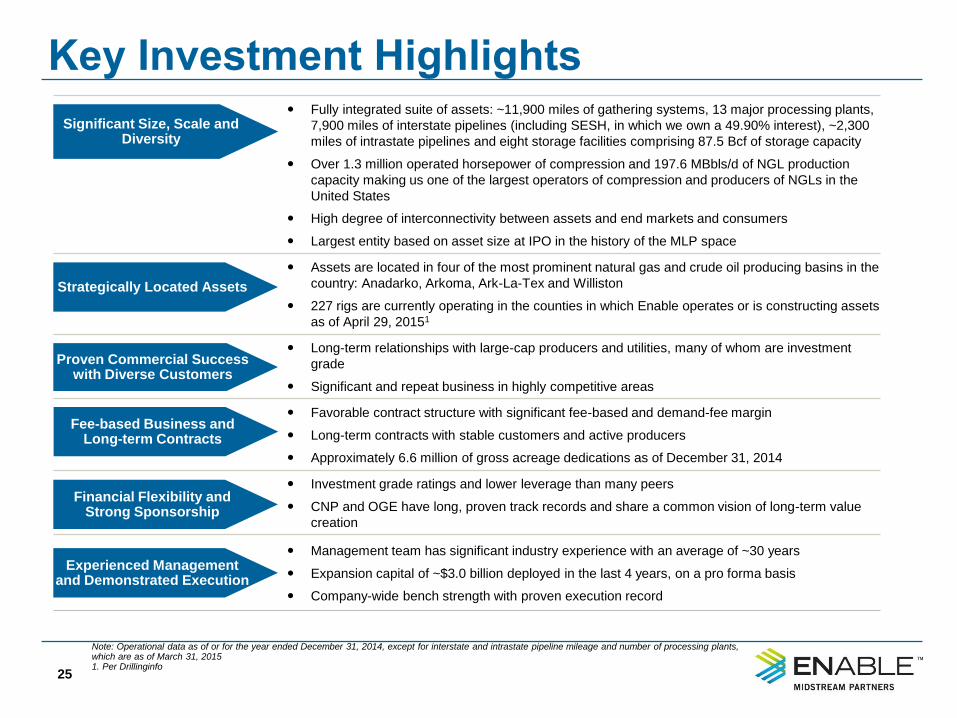
Key Investment Highlights
25
Fully integrated suite of assets: ~11,900 miles of gathering systems, 13 major processing plants,
7,900 miles of interstate pipelines (including SESH, in which we own a 49.90% interest), ~2,300
miles of intrastate pipelines and eight storage facilities comprising 87.5 Bcf of storage capacity
Over 1.3 million operated horsepower of compression and 197.6 MBbls/d of NGL production
capacity making us one of the largest operators of compression and producers of NGLs in the
United States
High degree of interconnectivity between assets and end markets and consumers
Largest entity based on asset size at IPO in the history of the MLP space
Assets are located in four of the most prominent natural gas and crude oil producing basins in the
country: Anadarko, Arkoma, Ark-La-Tex and Williston
227 rigs are currently operating in the counties in which Enable operates or is constructing assets
as of April 29, 20151
Long-term relationships with large-cap producers and utilities, many of whom are investment
grade
Significant and repeat business in highly competitive areas
Favorable contract structure with significant fee-based and demand-fee margin
Long-term contracts with stable customers and active producers
Approximately 6.6 million of gross acreage dedications as of December 31, 2014
Investment grade ratings and lower leverage than many peers
CNP and OGE have long, proven track records and share a common vision of long-term value
creation
Management team has significant industry experience with an average of ~30 years
Expansion capital of ~$3.0 billion deployed in the last 4 years, on a pro forma basis
Company-wide bench strength with proven execution record
Proven Commercial Success with Diverse Customers
Fee-based Business and Long-term Contracts
Significant Size, Scale and Diversity
Strategically Located Assets
Financial Flexibility and Strong Sponsorship
Experienced Management and Demonstrated Execution
Note: Operational data as of or for the year ended December 31, 2014, except for interstate and intrastate pipeline mileage and number of processing plants, which are as of March 31, 2015 1. Per Drillinginfo
Question and Answer Question & Answer
26