Embed Size (px)
Citation preview
Enable Midstream Partners, LP
Forward-looking Statements
This presentation and the oral statements made in connection herewith may contain “forward-looking statements” within the
meaning of the securities laws. All statements, other than statements of historical fact, regarding Enable Midstream Partners’
(“Enable”) strategy, future operations, financial position, estimated revenues, projected costs, prospects, plans and objectives of
management are forward-looking statements. These statements often include the words “could,” “believe,” “anticipate,” “intend,”
“estimate,” “expect,” “project,” “forecast” and similar expressions and are intended to identify forward-looking statements, although
not all forward-looking statements contain such identifying words. These forward-looking statements are based on Enable’s current
expectations and assumptions about future events and are based on currently available information as to the outcome and timing of
future events. Enable assumes no obligation to and does not intend to update any forward-looking statements included
herein. When considering forward-looking statements, you should keep in mind the risk factors and other cautionary statements
described under the heading “Risk Factors” included in our SEC filings. Enable cautions you that these forward-looking statements
are subject to all of the risks and uncertainties, most of which are difficult to predict and many of which are beyond its control,
incident to the ownership, operation and development of natural gas and crude oil infrastructure assets. These risks include, but
are not limited to, contract renewal risk, commodity price risk, environmental risks, operating risks, regulatory changes and the other
risks described under “Risk Factors” in our SEC filings. Should one or more of these risks or uncertainties occur, or should
underlying assumptions prove incorrect, Enable’s actual results and plans could differ materially from those expressed in any
forward-looking statements.
2
Enable Highlights
► High-Quality Assets
► High degree of interconnectivity between assets and end markets
► Assets are located in four of the most prominent natural gas and crude oil producing basins in the country
► Strong Customer Relationships
► Long-term relationships with large-cap producers and utilities, many of whom are investment grade
► Significant and repeat business in highly competitive areas
► Solid Financial Position
► Favorable contract structure with significant fee-based and demand-fee margin
► Investment grade ratings and lower leverage than many peers
► Significant Growth Opportunities
► Up to $3.5 billion of expansion capital opportunities anticipated from 2015 to 20171
► Producer activity in Enable’s growth areas is driving opportunities across the midstream value chain
3
1. As of Enable’s third quarter 2015 earnings release on November 4, 2015
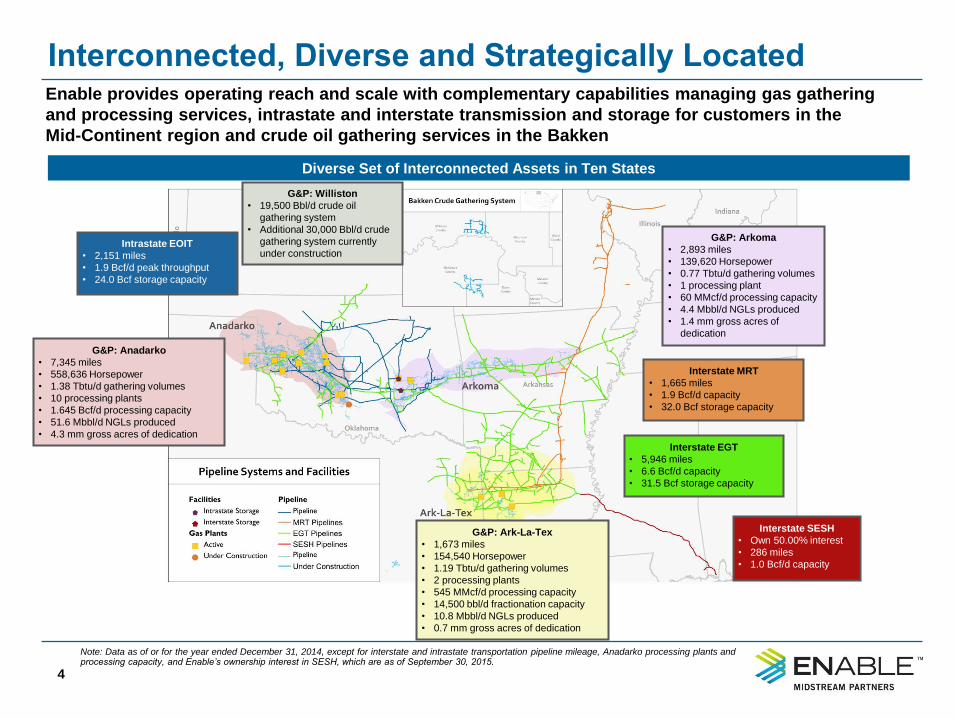
Interconnected, Diverse and Strategically Located
4
Diverse Set of Interconnected Assets in Ten States
Note: Data as of or for the year ended December 31, 2014, except for interstate and intrastate transportation pipeline mileage, Anadarko processing plants and processing capacity, and Enable’s ownership interest in SESH, which are as of September 30, 2015.
Enable provides operating reach and scale with complementary capabilities managing gas gathering
and processing services, intrastate and interstate transmission and storage for customers in the
Mid-Continent region and crude oil gathering services in the Bakken
Interstate MRT
• 1,665 miles
• 1.9 Bcf/d capacity
• 32.0 Bcf storage capacity
G&P: Arkoma
• 2,893 miles
• 139,620 Horsepower
• 0.77 Tbtu/d gathering volumes
• 1 processing plant
• 60 MMcf/d processing capacity
• 4.4 Mbbl/d NGLs produced
• 1.4 mm gross acres of
dedication
G&P: Ark-La-Tex
• 1,673 miles
• 154,540 Horsepower
• 1.19 Tbtu/d gathering volumes
• 2 processing plants
• 545 MMcf/d processing capacity
• 14,500 bbl/d fractionation capacity
• 10.8 Mbbl/d NGLs produced
• 0.7 mm gross acres of dedication
Intrastate EOIT
• 2,151 miles
• 1.9 Bcf/d peak throughput
• 24.0 Bcf storage capacity
G&P: Anadarko
• 7,345 miles
• 558,636 Horsepower
• 1.38 Tbtu/d gathering volumes
• 10 processing plants
• 1.645 Bcf/d processing capacity
• 51.6 Mbbl/d NGLs produced
• 4.3 mm gross acres of dedication
Interstate EGT
• 5,946 miles
• 6.6 Bcf/d capacity
• 31.5 Bcf storage capacity
G&P: Williston
• 19,500 Bbl/d crude oil
gathering system
• Additional 30,000 Bbl/d crude
gathering system currently
under construction
Interstate SESH
• Own 50.00% interest
• 286 miles
• 1.0 Bcf/d capacity
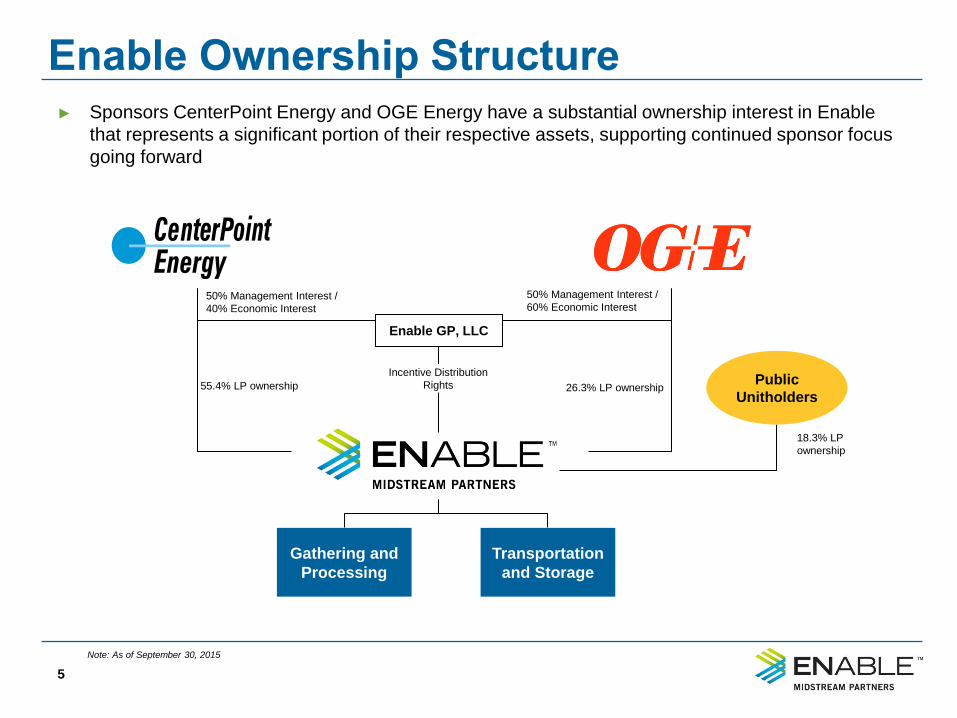
Enable Ownership Structure
5
18.3% LP
ownership
Enable Midstream Partners, LP
NYSE: ENBL
Transportation
and Storage
Gathering and
Processing
50% Management Interest /
60% Economic Interest 50% Management Interest /
40% Economic Interest
Incentive Distribution
Rights Public
Unitholders 26.3% LP ownership 55.4% LP ownership
Enable GP, LLC
► Sponsors CenterPoint Energy and OGE Energy have a substantial ownership interest in Enable
that represents a significant portion of their respective assets, supporting continued sponsor focus
going forward
Note: As of September 30, 2015
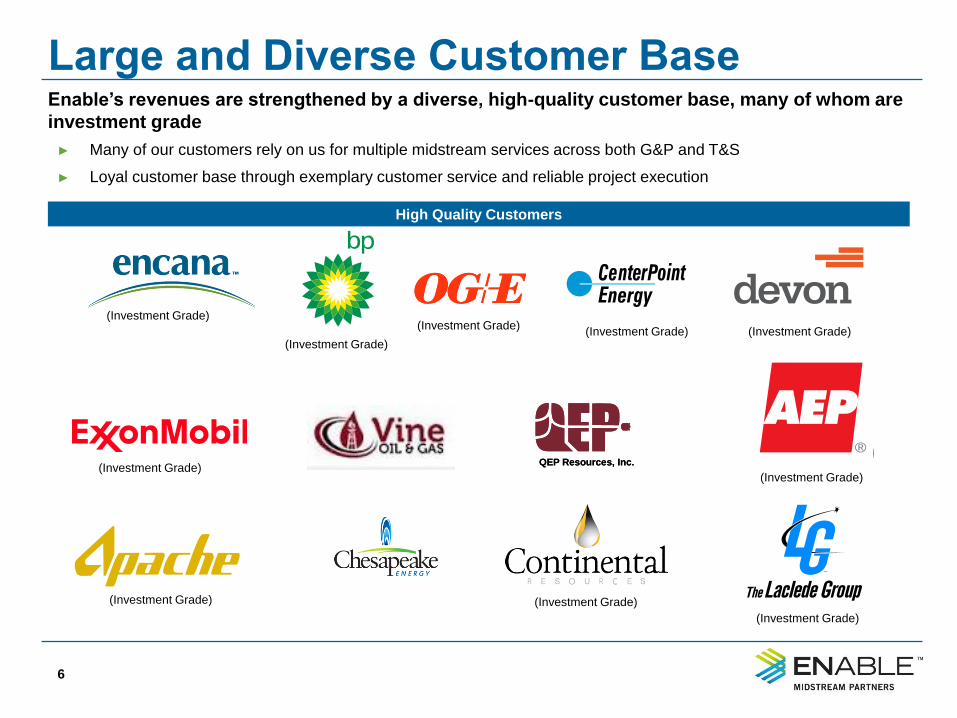
Large and Diverse Customer Base
6
High Quality Customers
Enable’s revenues are strengthened by a diverse, high-quality customer base, many of whom are
investment grade
(Investment Grade)
(Investment Grade)
(Investment Grade) (Investment Grade)
(Investment Grade)
(Investment Grade)
(Investment Grade) (Investment Grade)
QEP Resources, Inc.QEP Resources, Inc.
(Investment Grade)
(Investment Grade)
► Many of our customers rely on us for multiple midstream services across both G&P and T&S
► Loyal customer base through exemplary customer service and reliable project execution
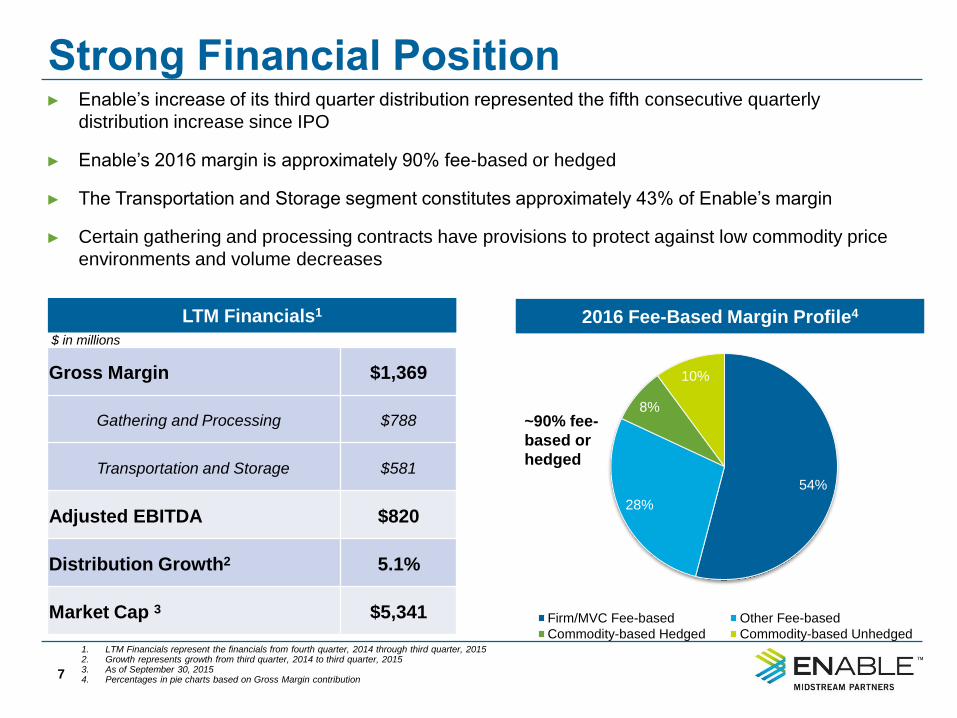
Strong Financial Position ► Enable’s increase of its third quarter distribution represented the fifth consecutive quarterly
distribution increase since IPO
► Enable’s 2016 margin is approximately 90% fee-based or hedged
► The Transportation and Storage segment constitutes approximately 43% of Enable’s margin
► Certain gathering and processing contracts have provisions to protect against low commodity price
environments and volume decreases
1. LTM Financials represent the financials from fourth quarter, 2014 through third quarter, 2015 2. Growth represents growth from third quarter, 2014 to third quarter, 2015 3. As of September 30, 2015 4. Percentages in pie charts based on Gross Margin contribution
7
2016 Fee-Based Margin Profile4
54%
28%
8%
10%
53% 30% 11% 6% Firm/MVC Fee-based Other Fee-based
Commodity-based Hedged Commodity-based Unhedged
~90% fee-
based or
hedged
Gross Margin $1,369
Gathering and Processing $788
Transportation and Storage $581
Adjusted EBITDA $820
Distribution Growth2 5.1%
Market Cap 3 $5,341
LTM Financials1
$ in millions

Appendix Gathering and Processing Segment
8
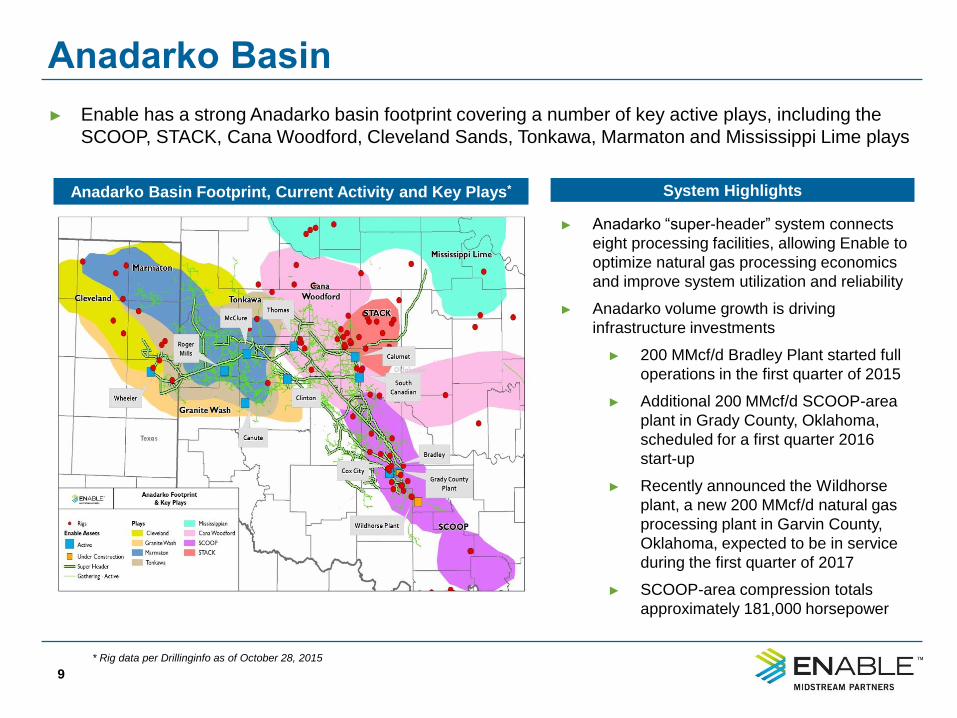
► Enable has a strong Anadarko basin footprint covering a number of key active plays, including the
SCOOP, STACK, Cana Woodford, Cleveland Sands, Tonkawa, Marmaton and Mississippi Lime plays
9
Anadarko Basin Footprint, Current Activity and Key Plays*
Anadarko Basin
* Rig data per Drillinginfo as of October 28, 2015
► Anadarko “super-header” system connects
eight processing facilities, allowing Enable to
optimize natural gas processing economics
and improve system utilization and reliability
► Anadarko volume growth is driving
infrastructure investments
► 200 MMcf/d Bradley Plant started full
operations in the first quarter of 2015
► Additional 200 MMcf/d SCOOP-area
plant in Grady County, Oklahoma,
scheduled for a first quarter 2016
start-up
► Recently announced the Wildhorse
plant, a new 200 MMcf/d natural gas
processing plant in Garvin County,
Oklahoma, expected to be in service
during the first quarter of 2017
► SCOOP-area compression totals
approximately 181,000 horsepower
System Highlights
SCOOP Remains a Top Play
10
1. As of Enable’s third quarter 2015 earnings release on November 4, 2015
Source: Wood Mackenzie
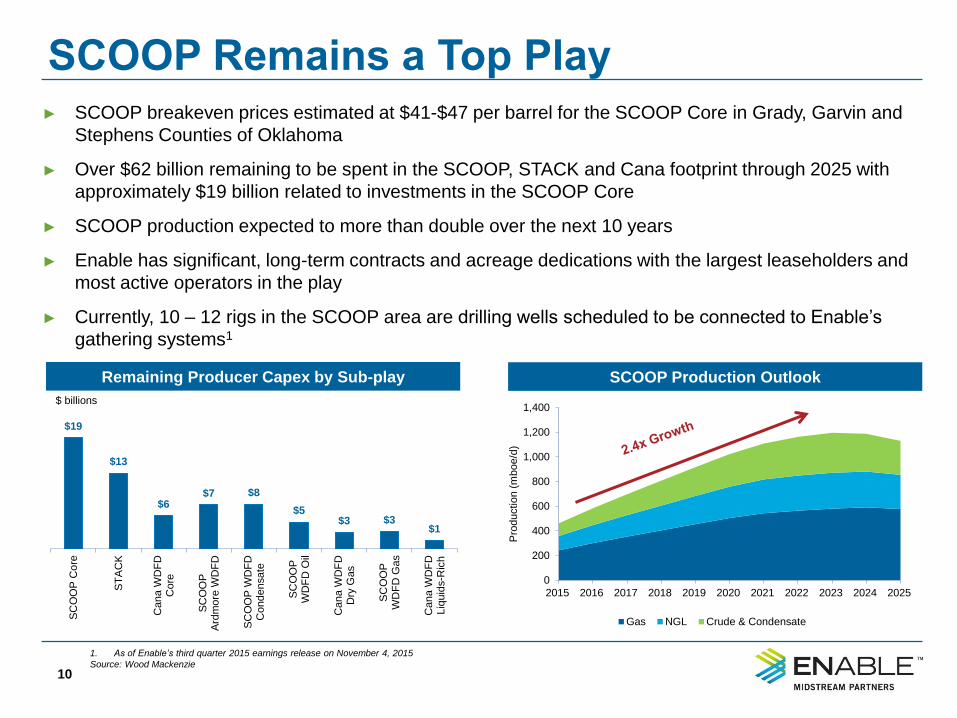
► SCOOP breakeven prices estimated at $41-$47 per barrel for the SCOOP Core in Grady, Garvin and
Stephens Counties of Oklahoma
► Over $62 billion remaining to be spent in the SCOOP, STACK and Cana footprint through 2025 with
approximately $19 billion related to investments in the SCOOP Core
► SCOOP production expected to more than double over the next 10 years
► Enable has significant, long-term contracts and acreage dedications with the largest leaseholders and
most active operators in the play
► Currently, 10 – 12 rigs in the SCOOP area are drilling wells scheduled to be connected to Enable’s
gathering systems1
Remaining Producer Capex by Sub-play SCOOP Production Outlook
$ billions
$19
$13
$6 $7 $8
$5 $3 $3
$1
SC
OO
P C
ore
ST
AC
K
Cana W
DF
DC
ore
SC
OO
PA
rdm
ore
WD
FD
SC
OO
P W
DF
DC
onden
sate
SC
OO
PW
DF
D O
il
Cana W
DF
DD
ry G
as
SC
OO
PW
DF
D G
as
Cana W
DF
DLiq
uid
s-R
ich
0
200
400
600
800
1,000
1,200
1,400
2015 2016 2017 2018 2019 2020 2021 2022 2023 2024 2025
Pro
duction (
mboe/d
)
Gas NGL Crude & Condensate
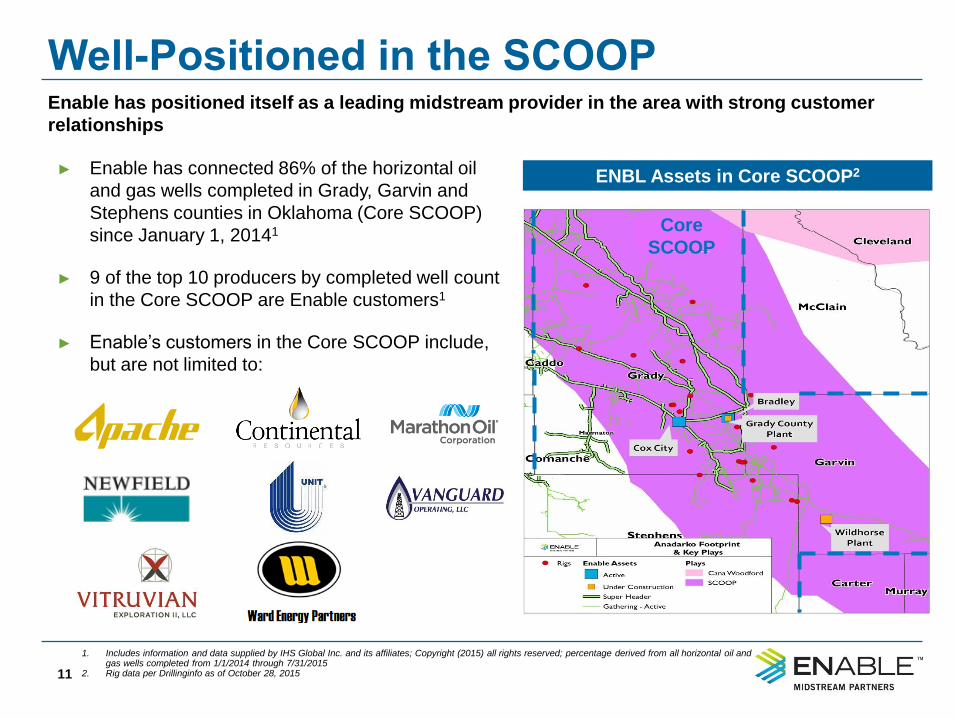
Well-Positioned in the SCOOP Enable has positioned itself as a leading midstream provider in the area with strong customer
relationships
11
► Enable has connected 86% of the horizontal oil
and gas wells completed in Grady, Garvin and
Stephens counties in Oklahoma (Core SCOOP)
since January 1, 20141
► 9 of the top 10 producers by completed well count
in the Core SCOOP are Enable customers1
► Enable’s customers in the Core SCOOP include,
but are not limited to:
1. Includes information and data supplied by IHS Global Inc. and its affiliates; Copyright (2015) all rights reserved; percentage derived from all horizontal oil and gas wells completed from 1/1/2014 through 7/31/2015
2. Rig data per Drillinginfo as of October 28, 2015
ENBL Assets in Core SCOOP2
Core
SCOOP
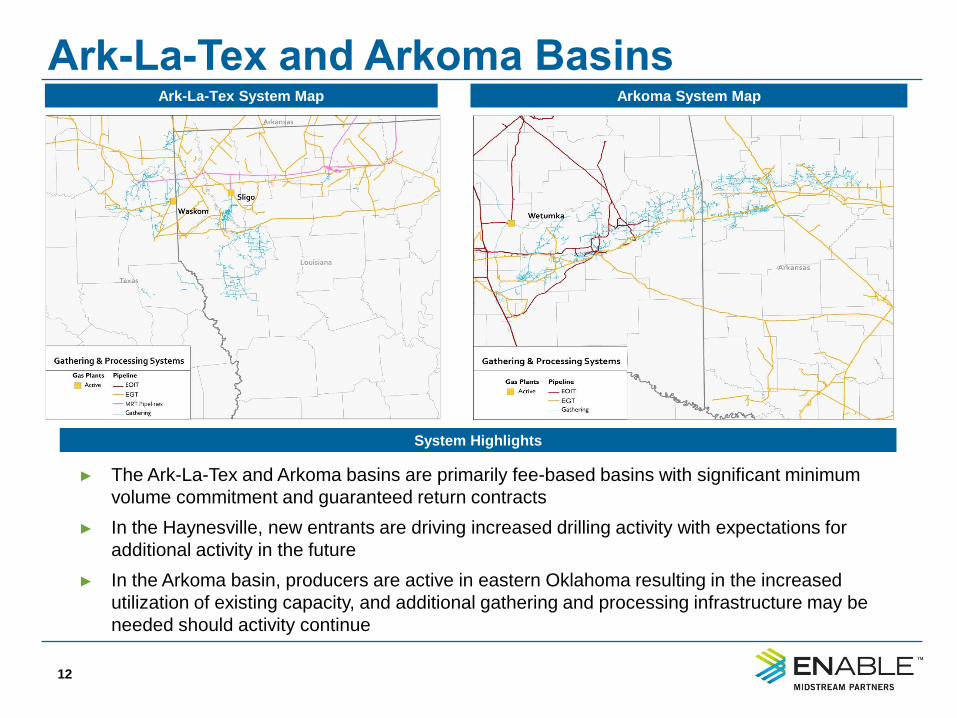
Ark-La-Tex and Arkoma Basins
12
► The Ark-La-Tex and Arkoma basins are primarily fee-based basins with significant minimum
volume commitment and guaranteed return contracts
► In the Haynesville, new entrants are driving increased drilling activity with expectations for
additional activity in the future
► In the Arkoma basin, producers are active in eastern Oklahoma resulting in the increased
utilization of existing capacity, and additional gathering and processing infrastructure may be
needed should activity continue
Ark-La-Tex System Map
System Highlights
Arkoma System Map
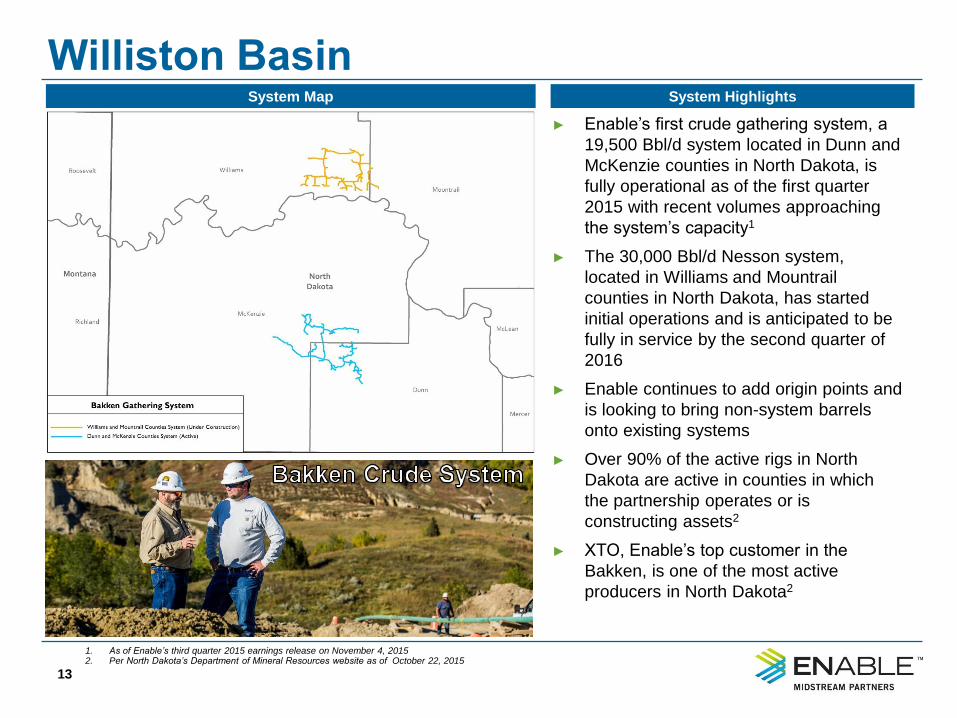
Williston Basin
13
► Enable’s first crude gathering system, a
19,500 Bbl/d system located in Dunn and
McKenzie counties in North Dakota, is
fully operational as of the first quarter
2015 with recent volumes approaching
the system’s capacity1
► The 30,000 Bbl/d Nesson system,
located in Williams and Mountrail
counties in North Dakota, has started
initial operations and is anticipated to be
fully in service by the second quarter of
2016
► Enable continues to add origin points and
is looking to bring non-system barrels
onto existing systems
► Over 90% of the active rigs in North
Dakota are active in counties in which
the partnership operates or is
constructing assets2
► XTO, Enable’s top customer in the
Bakken, is one of the most active
producers in North Dakota2
System Map System Highlights
1. As of Enable’s third quarter 2015 earnings release on November 4, 2015 2. Per North Dakota’s Department of Mineral Resources website as of October 22, 2015
Appendix Transportation and Storage Segment
14
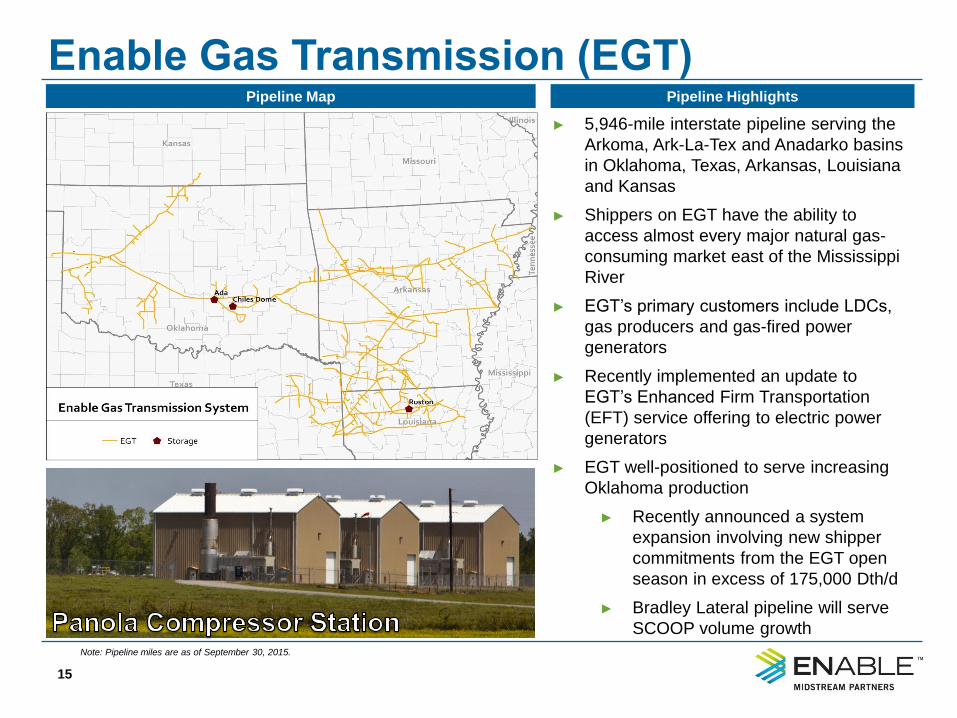
Enable Gas Transmission (EGT)
15
► 5,946-mile interstate pipeline serving the
Arkoma, Ark-La-Tex and Anadarko basins
in Oklahoma, Texas, Arkansas, Louisiana
and Kansas
► Shippers on EGT have the ability to
access almost every major natural gas-
consuming market east of the Mississippi
River
► EGT’s primary customers include LDCs,
gas producers and gas-fired power
generators
► Recently implemented an update to
EGT’s Enhanced Firm Transportation
(EFT) service offering to electric power
generators
► EGT well-positioned to serve increasing
Oklahoma production
► Recently announced a system
expansion involving new shipper
commitments from the EGT open
season in excess of 175,000 Dth/d
► Bradley Lateral pipeline will serve
SCOOP volume growth
Pipeline Map Pipeline Highlights
Note: Pipeline miles are as of September 30, 2015.
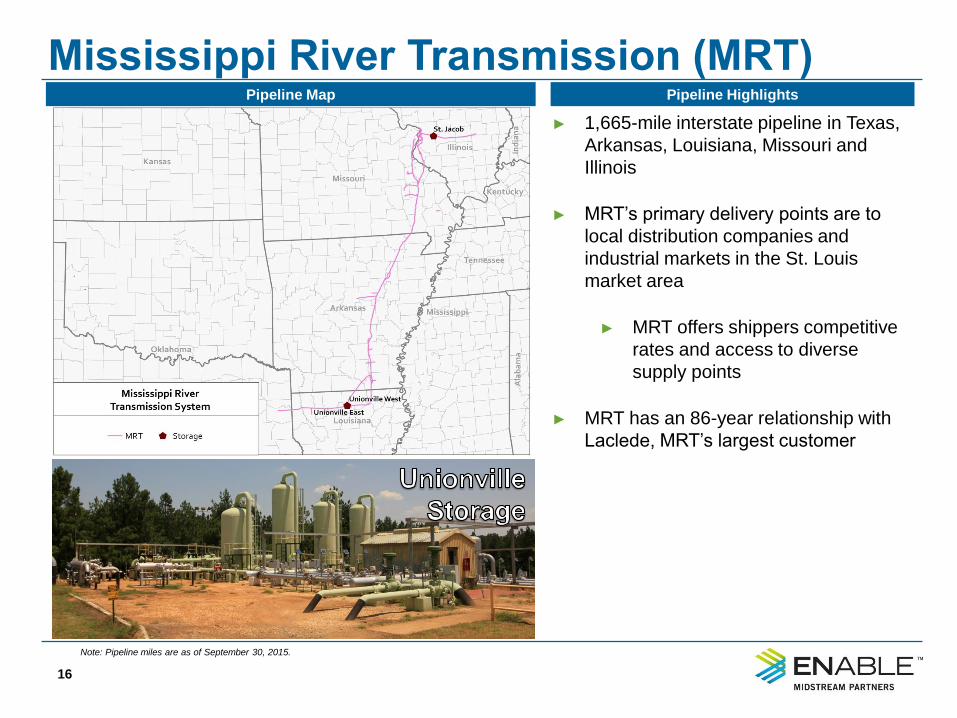
Mississippi River Transmission (MRT)
16
► 1,665-mile interstate pipeline in Texas,
Arkansas, Louisiana, Missouri and
Illinois
► MRT’s primary delivery points are to
local distribution companies and
industrial markets in the St. Louis
market area
► MRT offers shippers competitive
rates and access to diverse
supply points
► MRT has an 86-year relationship with
Laclede, MRT’s largest customer
Pipeline Map Pipeline Highlights
Note: Pipeline miles are as of September 30, 2015.
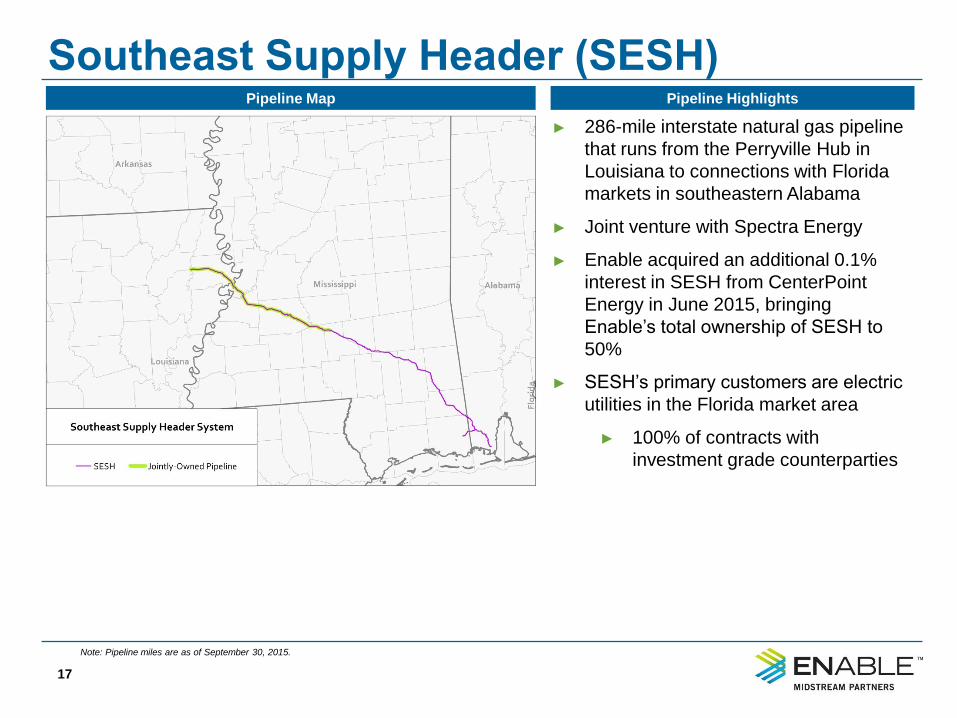
Southeast Supply Header (SESH)
17
► 286-mile interstate natural gas pipeline
that runs from the Perryville Hub in
Louisiana to connections with Florida
markets in southeastern Alabama
► Joint venture with Spectra Energy
► Enable acquired an additional 0.1%
interest in SESH from CenterPoint
Energy in June 2015, bringing
Enable’s total ownership of SESH to
50%
► SESH’s primary customers are electric
utilities in the Florida market area
► 100% of contracts with
investment grade counterparties
Pipeline Map Pipeline Highlights
Note: Pipeline miles are as of September 30, 2015.
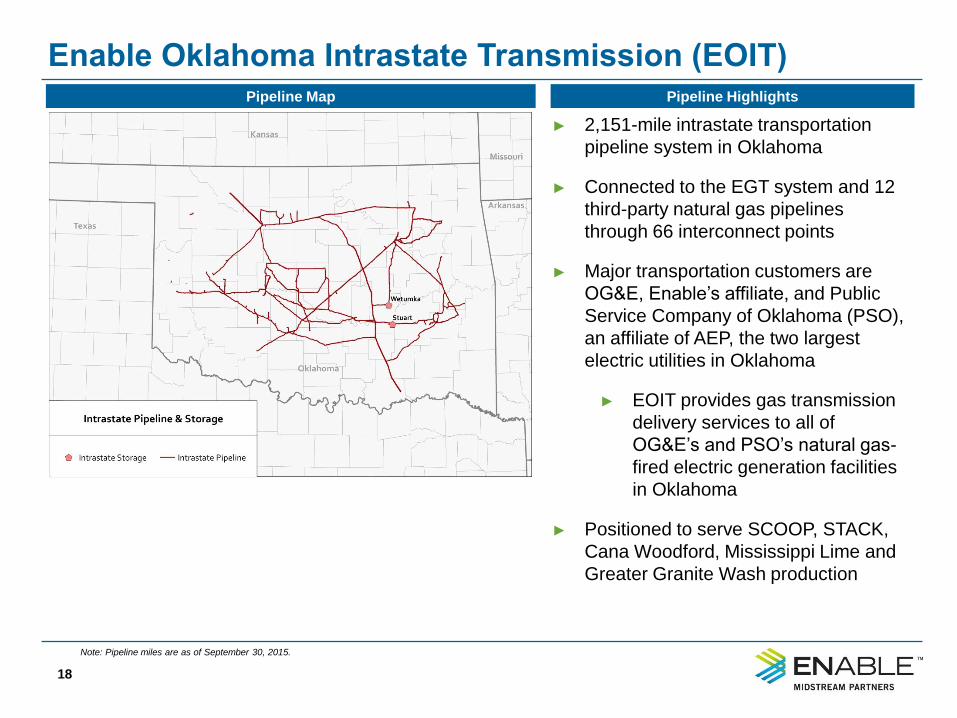
Enable Oklahoma Intrastate Transmission (EOIT)
18
► 2,151-mile intrastate transportation
pipeline system in Oklahoma
► Connected to the EGT system and 12
third-party natural gas pipelines
through 66 interconnect points
► Major transportation customers are
OG&E, Enable’s affiliate, and Public
Service Company of Oklahoma (PSO),
an affiliate of AEP, the two largest
electric utilities in Oklahoma
► EOIT provides gas transmission
delivery services to all of
OG&E’s and PSO’s natural gas-
fired electric generation facilities
in Oklahoma
► Positioned to serve SCOOP, STACK,
Cana Woodford, Mississippi Lime and
Greater Granite Wash production
Pipeline Map Pipeline Highlights
Note: Pipeline miles are as of September 30, 2015.
T&S Well-Positioned for Growth
19
Growth Highlights
► Announced an EGT system expansion involving new shipper commitments from the EGT open
season in excess of 175,000 Dth/d
► Enable was recently awarded almost 300,000 Dth/d of firm natural gas transportation business as
lower natural gas prices continue to drive demand for natural gas transportation infrastructure
► The EOIT intrastate system in Oklahoma continues to see increased interruptible transportation fees
as a result of increased Oklahoma production
► Enable is currently responding to requests for proposals for end user projects developing around
Enable’s transportation system
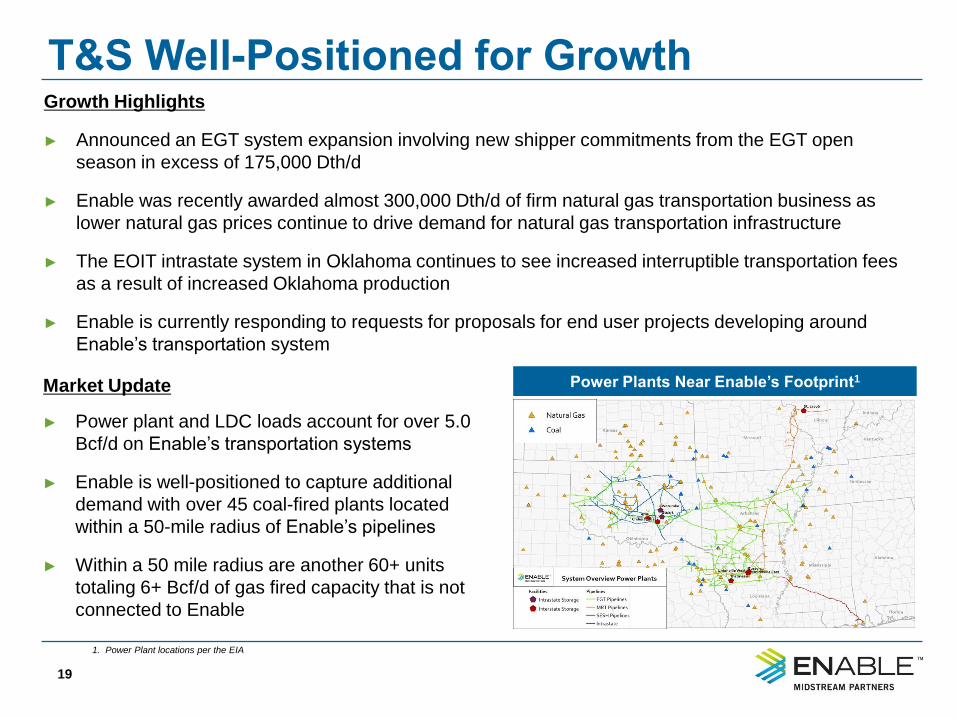
Power Plants Near Enable’s Footprint1 Market Update
► Power plant and LDC loads account for over 5.0
Bcf/d on Enable’s transportation systems
► Enable is well-positioned to capture additional
demand with over 45 coal-fired plants located
within a 50-mile radius of Enable’s pipelines
► Within a 50 mile radius are another 60+ units
totaling 6+ Bcf/d of gas fired capacity that is not
connected to Enable
1. Power Plant locations per the EIA
Appendix Growth Strategy
20
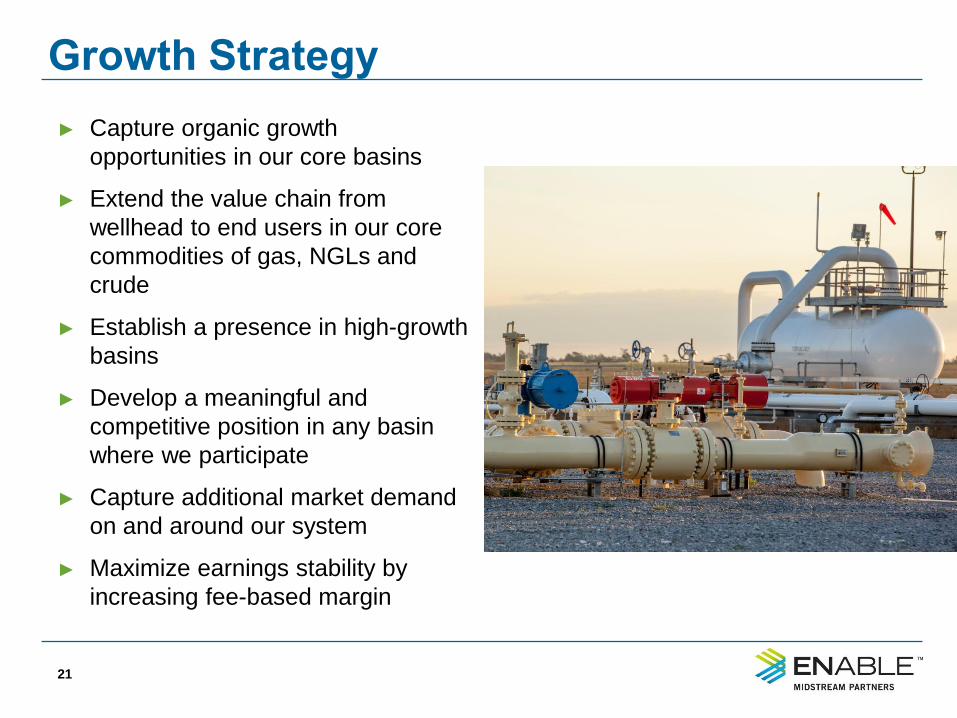
Growth Strategy
21
► Capture organic growth
opportunities in our core basins
► Extend the value chain from
wellhead to end users in our core
commodities of gas, NGLs and
crude
► Establish a presence in high-growth
basins
► Develop a meaningful and
competitive position in any basin
where we participate
► Capture additional market demand
on and around our system
► Maximize earnings stability by
increasing fee-based margin