Embed Size (px)
Citation preview
2014-15 School Accountability Report Card for Encina Preparatory 6-12 High School Page 1 of 20
Encina Preparatory 6-12 High School
School Accountability Report Card
Reported Using Data from the 2014-15 School Year
Published During 2015-16
By February 1 of each year, every school in California is required by state law to publish a School Accountability Report Card (SARC). The SARC contains information about the condition and performance of each California public school. Under the Local Control Funding Formula (LCFF) all local educational agencies (LEAs) are required to prepare a Local Control Accountability Plan (LCAP), which describes how they intend to meet annual school-specific goals for all pupils, with specific activities to address state and local priorities. Additionally, data reported in an LCAP is to be consistent with data reported in the SARC. • For more information about SARC requirements, see the California Department of Education (CDE) SARC Web page at
http://www.cde.ca.gov/ta/ac/sa/. • For more information about the LCFF or LCAP, see the CDE LCFF Web page at http://www.cde.ca.gov/fg/aa/lc/. • For additional information about the school, parents/guardians and community members should contact the school principal or
the district office. DataQuest DataQuest is an online data tool located on the CDE DataQuest Web page at http://dq.cde.ca.gov/dataquest/ that contains additional information about this school and comparisons of the school to the district, the county, and the state. Specifically, DataQuest is a dynamic system that provides reports for accountability (e.g., test data, enrollment, high school graduates, dropouts, course enrollments, staffing, and data regarding English learners. Internet Access Internet access is available at public libraries and other locations that are publicly accessible (e.g., the California State Library). Access to the Internet at libraries and public locations is generally provided on a first-come, first-served basis. Other use restrictions may include the hours of operation, the length of time that a workstation may be used (depending on availability), the types of software programs available on a workstation, and the ability to print documents.
About This School Contact Information (Most Recent Year)
School Contact Information
School Name------- Encina Preparatory 6-12 High School
Street------- 1400 Bell Street
City, State, Zip------- Sacramento CA, 95825
Phone Number------- (916) 971-7538
Principal------- Richard Judge
E-mail Address------- [email protected]
Web Site------- http://www.sanjuan.edu/encina
Grades Served 6-12
CDS Code 34-67447-3432838
2014-15 School Accountability Report Card for Encina Preparatory 6-12 High School Page 2 of 20
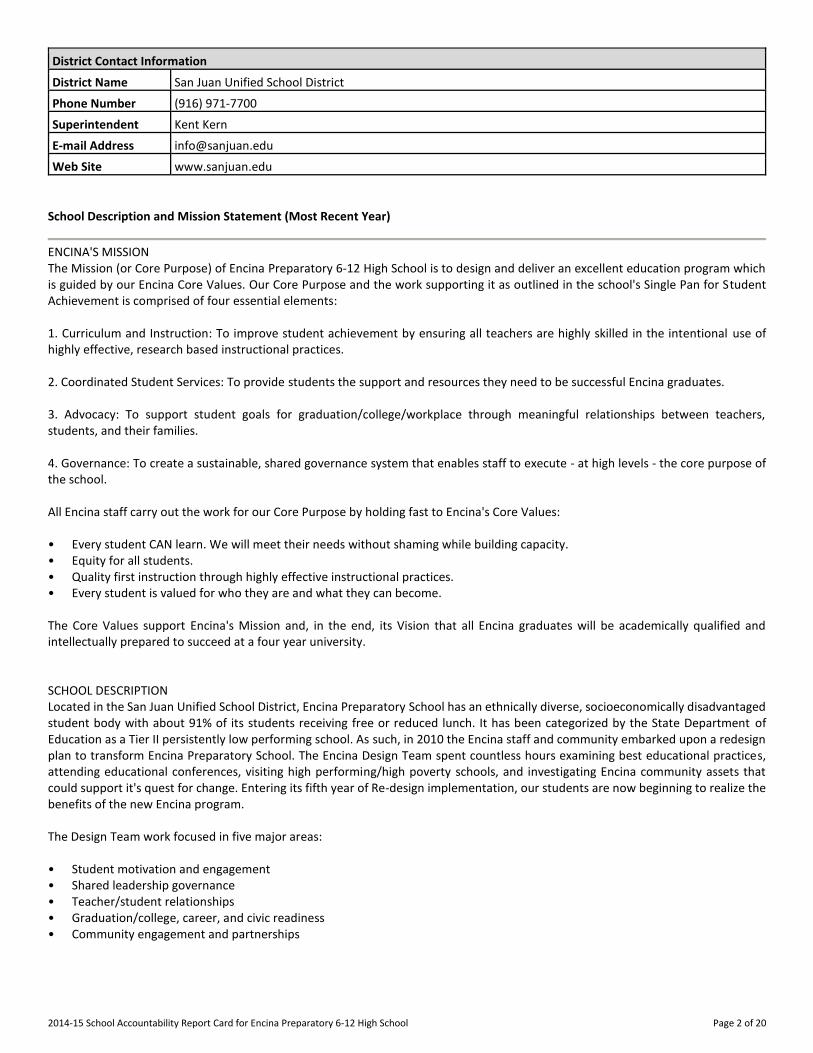
District Contact Information
District Name------- San Juan Unified School District
Phone Number------- (916) 971-7700
Superintendent-------
Kent Kern
E-mail Address------- [email protected]
Web Site------- www.sanjuan.edu
School Description and Mission Statement (Most Recent Year)
ENCINA'S MISSION The Mission (or Core Purpose) of Encina Preparatory 6-12 High School is to design and deliver an excellent education program which is guided by our Encina Core Values. Our Core Purpose and the work supporting it as outlined in the school's Single Pan for Student Achievement is comprised of four essential elements: 1. Curriculum and Instruction: To improve student achievement by ensuring all teachers are highly skilled in the intentional use of highly effective, research based instructional practices. 2. Coordinated Student Services: To provide students the support and resources they need to be successful Encina graduates. 3. Advocacy: To support student goals for graduation/college/workplace through meaningful relationships between teachers, students, and their families. 4. Governance: To create a sustainable, shared governance system that enables staff to execute - at high levels - the core purpose of the school. All Encina staff carry out the work for our Core Purpose by holding fast to Encina's Core Values: • Every student CAN learn. We will meet their needs without shaming while building capacity. • Equity for all students. • Quality first instruction through highly effective instructional practices. • Every student is valued for who they are and what they can become. The Core Values support Encina's Mission and, in the end, its Vision that all Encina graduates will be academically qualified and intellectually prepared to succeed at a four year university. SCHOOL DESCRIPTION Located in the San Juan Unified School District, Encina Preparatory School has an ethnically diverse, socioeconomically disadvantaged student body with about 91% of its students receiving free or reduced lunch. It has been categorized by the State Department of Education as a Tier II persistently low performing school. As such, in 2010 the Encina staff and community embarked upon a redesign plan to transform Encina Preparatory School. The Encina Design Team spent countless hours examining best educational practices, attending educational conferences, visiting high performing/high poverty schools, and investigating Encina community assets that could support it's quest for change. Entering its fifth year of Re-design implementation, our students are now beginning to realize the benefits of the new Encina program. The Design Team work focused in five major areas: • Student motivation and engagement • Shared leadership governance • Teacher/student relationships • Graduation/college, career, and civic readiness • Community engagement and partnerships
2014-15 School Accountability Report Card for Encina Preparatory 6-12 High School Page 3 of 20
Encina's "Big Idea" that emerged from this work was that “all Encina graduates [will be] academically qualified and intellectually prepared to succeed at a four-year university”. This ‘Big Idea’ is grounded in a set of moral imperatives that guide all decision-making at Encina as it relates to students, staff, parents and community: • Doing whatever it takes to ensure success for ALL students • Committing personal and community resources equitably • Structures must be flexible and adaptive • A pyramid of interventions must be employed, beginning with a foundation of ‘excellent first instruction’ • All students must have equitable access to all resources to meet Encina’s ‘big idea’ • All staff must hold high expectations for all students As a result, the 2011-2012 school year brought several changes to the Encina campus. One was the incorporation of grades six, seven, and eight creating a seamless transition for students from primary to secondary education. The second change was the introduction of a daily advocacy program designed to ensure that all students have a trusting adult who can and will advocate for their academic and social-emotional needs. Additionally, the Encina Family Resource center opened in March 2012. During 2013-14 school year, with the assistance of Dialogos Consulting to help the school begin the move towards a teacher-led model, 3 more teams were developed to oversee their corresponding major initiatives taking place at Encina and furthering the effectuation of the Action Plan. In addition to the Advocacy and BARKS leadership teams put in place the previous years to oversee implementation of those programs, the following Teams were created: The Community Partnerships team (over the CFRC and related work); the Department Chairs team (over curriculum and instruction, and head by a Coach of Coaches), and the Activities Team (over extra-curricular activities on campus). These teams, all composed of and headed by non-administrative faculty members, became the "containers" for the work of their initiatives and - guided by the site leadership team to ensure their work aligned with the Encina Redesign Plan, Action Plan, and was supported with appropriate professional development - moved the school forward on several fronts. In 2014-15 staff continued the work of turning the school around. It began with 24 hours of professional development before the start of the school, and that work continued through a variety of school and district professional development opportunities during the school year, in the afternoons and evenings, and on weekends. In total, Encina faculty engaged individually engaged in over 100 hours of professional development over the course of the year. The focus of this PD was threefold: beginning the implementation of the Common Core State Standards and related instructional and assessment practices; reviewing and revising the Advocacy program; further extending the scope and influence of the BARKS program to ensure a a positive, safe, and respectful culture and learning environment for our students; and researching and implementing tiered intervention supports (academic and behavioral) for our struggling students. Much of the work taken on since 2010 and carried on through last year will continue to be a focus of the school's PD in 2015-16. The primary themes of that PD will be: • Lesson design aligned to Common Core State Standards in English/Language Arts, English Language Development, mathematics
(as well as in other core content areas as they evolve) • Clearly stated content and language objectives and learning targets • Structured student Interaction, self-reflection, self-assessment and goal setting • Formative classroom assessments for learning, including on-going, in-class checks for understanding • Examination of student work/student achievement data The 2014-15 data on Encina's climate and culture showed continued and substantial improvement over previous years. Student referrals overall were down by 5% over the previous year. Suspensions due to defiance and/or disobedience (that is, those offences covered by CEC 48900k and historically the offences that make up the majority of all reasons students are suspended) were down by 7% at Encina. Much of this can be attributed to the implementation of Positive Behavior Interventions and Supports (PBIS). Encina implemented a BARKS (Bulldogs are Responsible, Respectful, Kind, and Safe) team to actively examine climate and culture data, and to use that data to implement research based practices to support students in making good decisions. Additionally, the school leadership team (SLT) made significant progress with the construction of the Encina Action Plan which addresses three key aspects of the original Design Plan: Curriculum, Instruction, and Assessment, Coordinated Student Services, and site governance. Encina 6-12 Preparatory High School is a Program Improvement (PI) Year 2 school. Our district and school are working closely to improve curriculum, instruction, and student performance. The district provides information, special help, and access to resources for program improvement schools including No Child Left Behind (NCLB) parent notification on public school choice and Supplemental Educational Services (SES). Program improvement schools receive technical assistance in analyzing various data reports for revising the school plan, strengthening core academic instruction, and collaborating with parents to increase student academic achievement.
2014-15 School Accountability Report Card for Encina Preparatory 6-12 High School Page 4 of 20
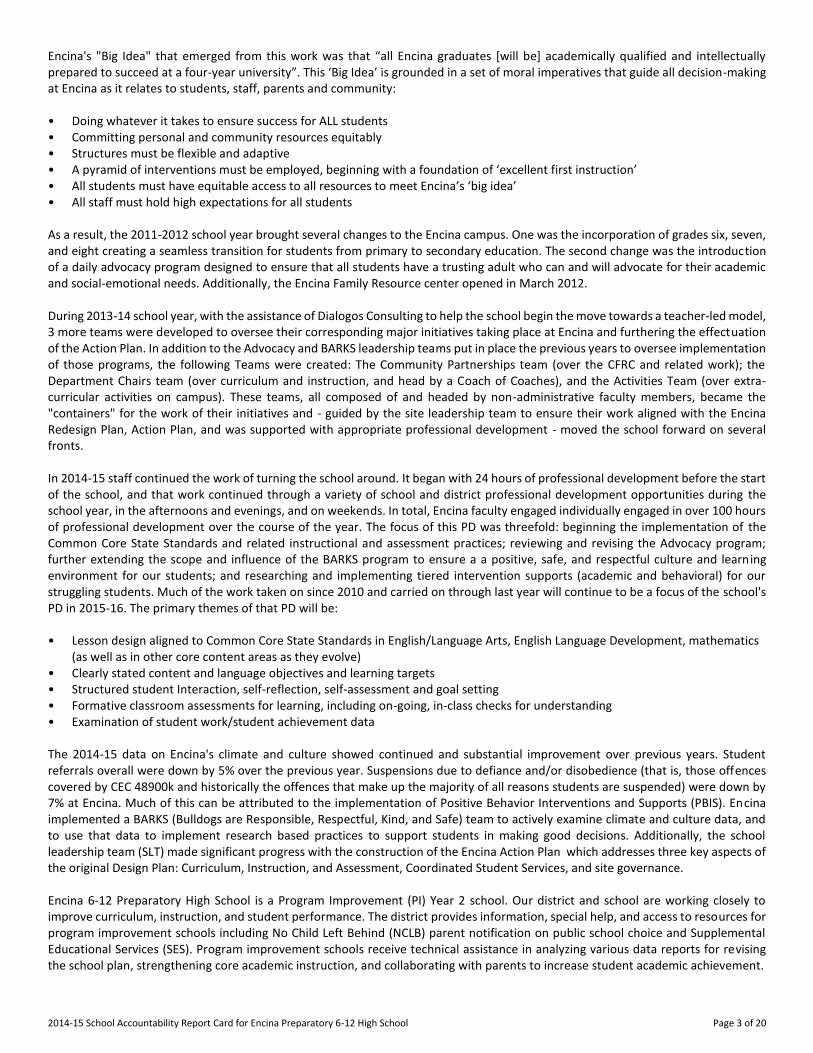
Student Enrollment by Grade Level (School Year 2014-15)
Grade Number of
Level Students
Grade 6 134
Grade 7 111
Grade 8 126
Grade 9 135
Grade 10 116
Grade 11 142
Grade 12 196
Total Enrollment 960
Student Enrollment by Group (School Year 2014-15)
Student Percent of
Group Total Enrollment
Black or African American 30
American Indian or Alaska Native 1.7
Asian 4.8
Filipino 1.1
Hispanic or Latino 39.7
Native Hawaiian or Pacific Islander 1.7
White 17
Two or More Races 4.1
Socioeconomically Disadvantaged 92.2
English Learners 30.3
Students with Disabilities 14
Foster Youth 1
A. Conditions of Learning
State Priority: Basic The SARC provides the following information relevant to the Basic State Priority (Priority 1): • Degree to which teachers are appropriately assigned and fully credentialed in the subject area and for the pupils they are
teaching; • Pupils have access to standards-aligned instructional materials; and • School facilities are maintained in good repair. Teacher Credentials
Teachers School District
2013-14 2014-15 2015-16 2015-16
With Full Credential 50 46 54 1840
Without Full Credential 1 3 2 28
Teaching Outside Subject Area of Competence (with full credential) 1 1 2 46
2014-15 School Accountability Report Card for Encina Preparatory 6-12 High School Page 5 of 20
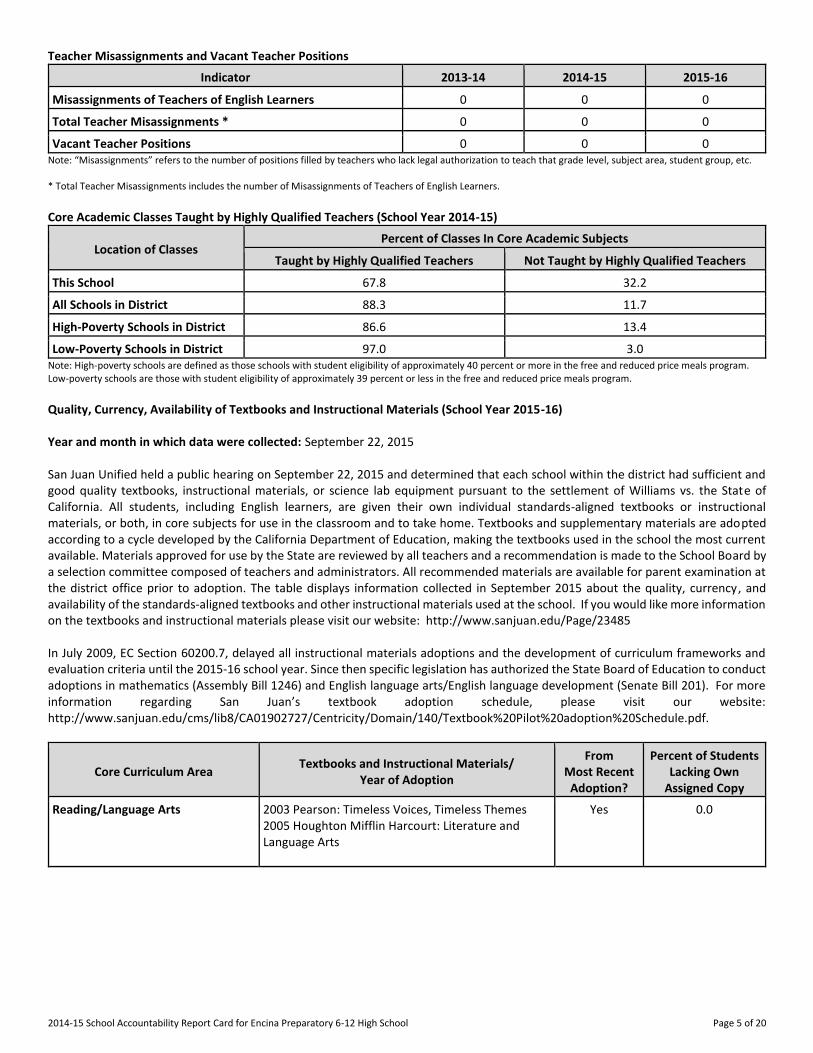
Teacher Misassignments and Vacant Teacher Positions
Indicator 2013-14 2014-15 2015-16
Misassignments of Teachers of English Learners 0 0 0
Total Teacher Misassignments * 0 0 0
Vacant Teacher Positions 0 0 0 Note: “Misassignments” refers to the number of positions filled by teachers who lack legal authorization to teach that grade level, subject area, student group, etc. * Total Teacher Misassignments includes the number of Misassignments of Teachers of English Learners. Core Academic Classes Taught by Highly Qualified Teachers (School Year 2014-15)
Location of Classes Percent of Classes In Core Academic Subjects
Taught by Highly Qualified Teachers Not Taught by Highly Qualified Teachers
This School 67.8 32.2
All Schools in District 88.3 11.7
High-Poverty Schools in District 86.6 13.4
Low-Poverty Schools in District 97.0 3.0 Note: High-poverty schools are defined as those schools with student eligibility of approximately 40 percent or more in the free and reduced price meals program. Low-poverty schools are those with student eligibility of approximately 39 percent or less in the free and reduced price meals program. Quality, Currency, Availability of Textbooks and Instructional Materials (School Year 2015-16) Year and month in which data were collected: September 22, 2015 San Juan Unified held a public hearing on September 22, 2015 and determined that each school within the district had sufficient and good quality textbooks, instructional materials, or science lab equipment pursuant to the settlement of Williams vs. the State of California. All students, including English learners, are given their own individual standards-aligned textbooks or instructional materials, or both, in core subjects for use in the classroom and to take home. Textbooks and supplementary materials are adopted according to a cycle developed by the California Department of Education, making the textbooks used in the school the most current available. Materials approved for use by the State are reviewed by all teachers and a recommendation is made to the School Board by a selection committee composed of teachers and administrators. All recommended materials are available for parent examination at the district office prior to adoption. The table displays information collected in September 2015 about the quality, currency, and availability of the standards-aligned textbooks and other instructional materials used at the school. If you would like more information on the textbooks and instructional materials please visit our website: http://www.sanjuan.edu/Page/23485 In July 2009, EC Section 60200.7, delayed all instructional materials adoptions and the development of curriculum frameworks and evaluation criteria until the 2015-16 school year. Since then specific legislation has authorized the State Board of Education to conduct adoptions in mathematics (Assembly Bill 1246) and English language arts/English language development (Senate Bill 201). For more information regarding San Juan’s textbook adoption schedule, please visit our website: http://www.sanjuan.edu/cms/lib8/CA01902727/Centricity/Domain/140/Textbook%20Pilot%20adoption%20Schedule.pdf.
Core Curriculum Area Textbooks and Instructional Materials/
Year of Adoption
From Most Recent
Adoption?
Percent of Students Lacking Own
Assigned Copy
Reading/Language Arts 2003 Pearson: Timeless Voices, Timeless Themes
2005 Houghton Mifflin Harcourt: Literature and Language Arts
Yes 0.0
2014-15 School Accountability Report Card for Encina Preparatory 6-12 High School Page 6 of 20
Core Curriculum Area Textbooks and Instructional Materials/
Year of Adoption
From Most Recent
Adoption?
Percent of Students Lacking Own
Assigned Copy
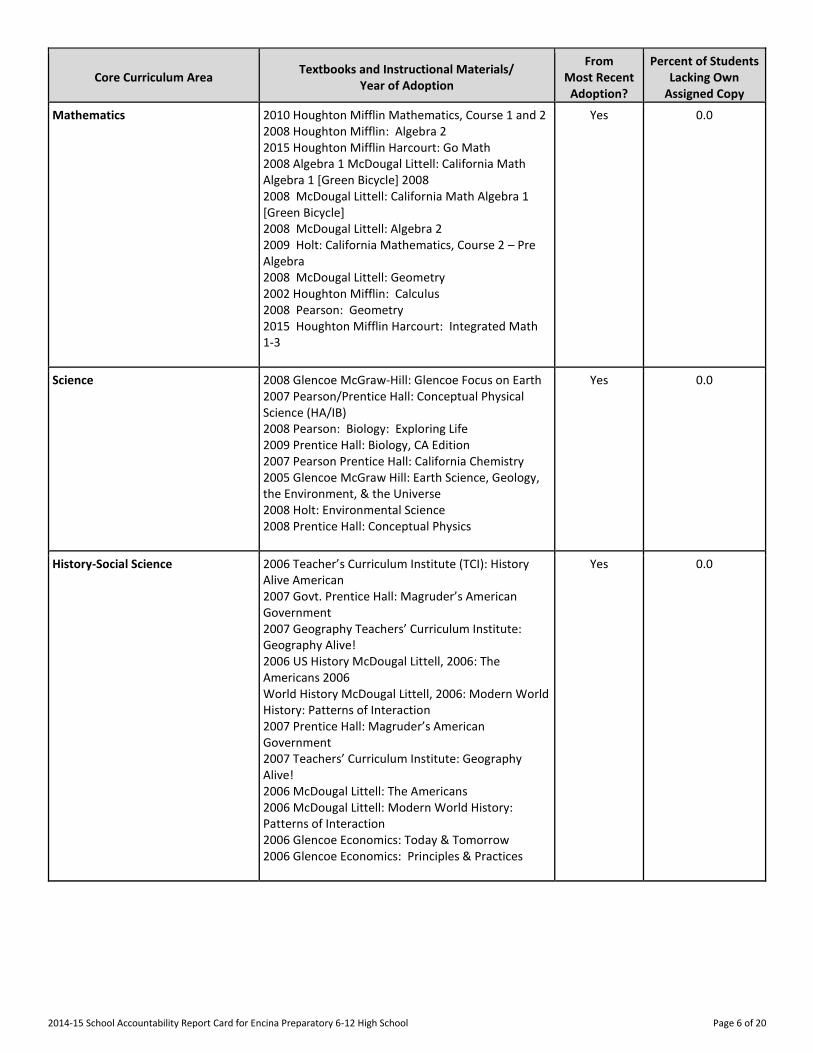
Mathematics 2010 Houghton Mifflin Mathematics, Course 1 and 2
2008 Houghton Mifflin: Algebra 2
2015 Houghton Mifflin Harcourt: Go Math
2008 Algebra 1 McDougal Littell: California Math Algebra 1 [Green Bicycle] 2008
2008 McDougal Littell: California Math Algebra 1 [Green Bicycle]
2008 McDougal Littell: Algebra 2
2009 Holt: California Mathematics, Course 2 – Pre Algebra
2008 McDougal Littell: Geometry
2002 Houghton Mifflin: Calculus
2008 Pearson: Geometry
2015 Houghton Mifflin Harcourt: Integrated Math 1-3
Yes 0.0
Science 2008 Glencoe McGraw-Hill: Glencoe Focus on Earth
2007 Pearson/Prentice Hall: Conceptual Physical Science (HA/IB)
2008 Pearson: Biology: Exploring Life
2009 Prentice Hall: Biology, CA Edition
2007 Pearson Prentice Hall: California Chemistry
2005 Glencoe McGraw Hill: Earth Science, Geology, the Environment, & the Universe
2008 Holt: Environmental Science
2008 Prentice Hall: Conceptual Physics
Yes 0.0
History-Social Science 2006 Teacher’s Curriculum Institute (TCI): History Alive American
2007 Govt. Prentice Hall: Magruder’s American Government
2007 Geography Teachers’ Curriculum Institute: Geography Alive!
2006 US History McDougal Littell, 2006: The Americans 2006
World History McDougal Littell, 2006: Modern World History: Patterns of Interaction
2007 Prentice Hall: Magruder’s American Government
2007 Teachers’ Curriculum Institute: Geography Alive!
2006 McDougal Littell: The Americans
2006 McDougal Littell: Modern World History: Patterns of Interaction
2006 Glencoe Economics: Today & Tomorrow
2006 Glencoe Economics: Principles & Practices
Yes 0.0
2014-15 School Accountability Report Card for Encina Preparatory 6-12 High School Page 7 of 20
Core Curriculum Area Textbooks and Instructional Materials/
Year of Adoption
From Most Recent
Adoption?
Percent of Students Lacking Own
Assigned Copy
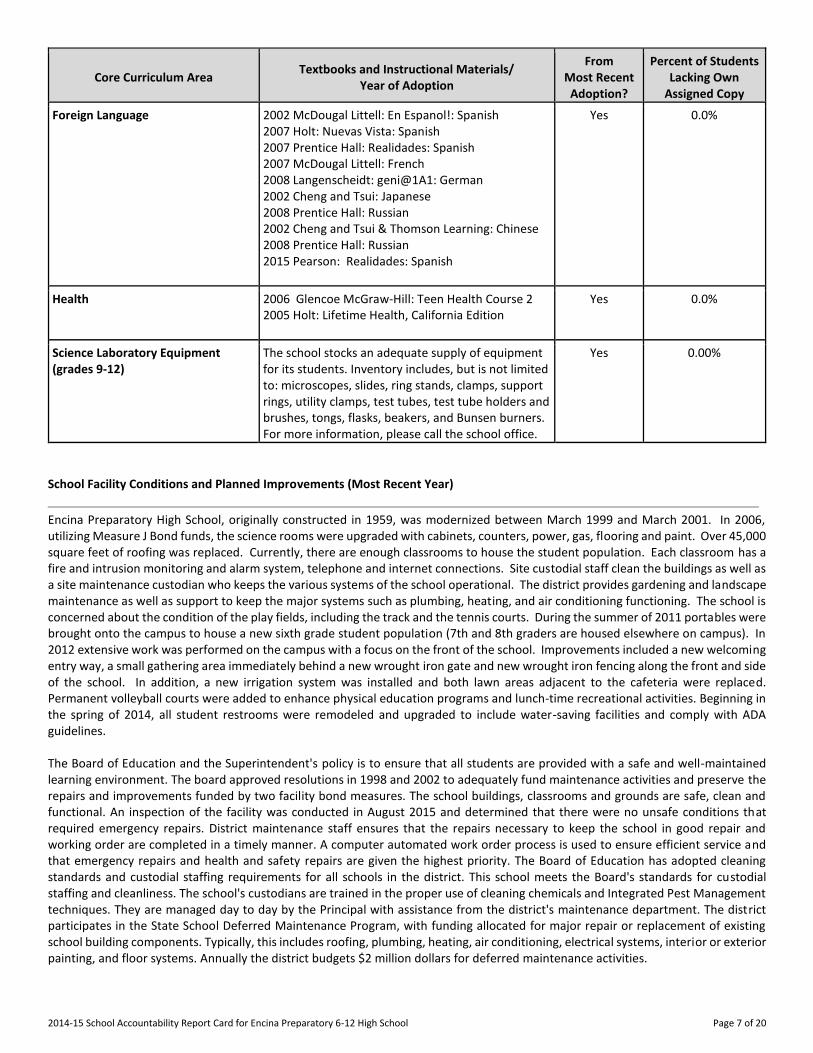
Foreign Language 2002 McDougal Littell: En Espanol!: Spanish
2007 Holt: Nuevas Vista: Spanish
2007 Prentice Hall: Realidades: Spanish
2007 McDougal Littell: French
2008 Langenscheidt: geni@1A1: German
2002 Cheng and Tsui: Japanese
2008 Prentice Hall: Russian
2002 Cheng and Tsui & Thomson Learning: Chinese
2008 Prentice Hall: Russian
2015 Pearson: Realidades: Spanish
Yes 0.0%
Health 2006 Glencoe McGraw-Hill: Teen Health Course 2
2005 Holt: Lifetime Health, California Edition
Yes 0.0%
Science Laboratory Equipment (grades 9-12)
The school stocks an adequate supply of equipment for its students. Inventory includes, but is not limited to: microscopes, slides, ring stands, clamps, support rings, utility clamps, test tubes, test tube holders and brushes, tongs, flasks, beakers, and Bunsen burners. For more information, please call the school office.
Yes 0.00%
School Facility Conditions and Planned Improvements (Most Recent Year)
Encina Preparatory High School, originally constructed in 1959, was modernized between March 1999 and March 2001. In 2006, utilizing Measure J Bond funds, the science rooms were upgraded with cabinets, counters, power, gas, flooring and paint. Over 45,000 square feet of roofing was replaced. Currently, there are enough classrooms to house the student population. Each classroom has a fire and intrusion monitoring and alarm system, telephone and internet connections. Site custodial staff clean the buildings as well as a site maintenance custodian who keeps the various systems of the school operational. The district provides gardening and landscape maintenance as well as support to keep the major systems such as plumbing, heating, and air conditioning functioning. The school is concerned about the condition of the play fields, including the track and the tennis courts. During the summer of 2011 portables were brought onto the campus to house a new sixth grade student population (7th and 8th graders are housed elsewhere on campus). In 2012 extensive work was performed on the campus with a focus on the front of the school. Improvements included a new welcoming entry way, a small gathering area immediately behind a new wrought iron gate and new wrought iron fencing along the front and side of the school. In addition, a new irrigation system was installed and both lawn areas adjacent to the cafeteria were replaced. Permanent volleyball courts were added to enhance physical education programs and lunch-time recreational activities. Beginning in the spring of 2014, all student restrooms were remodeled and upgraded to include water-saving facilities and comply with ADA guidelines. The Board of Education and the Superintendent's policy is to ensure that all students are provided with a safe and well-maintained learning environment. The board approved resolutions in 1998 and 2002 to adequately fund maintenance activities and preserve the repairs and improvements funded by two facility bond measures. The school buildings, classrooms and grounds are safe, clean and functional. An inspection of the facility was conducted in August 2015 and determined that there were no unsafe conditions that required emergency repairs. District maintenance staff ensures that the repairs necessary to keep the school in good repair and working order are completed in a timely manner. A computer automated work order process is used to ensure efficient service and that emergency repairs and health and safety repairs are given the highest priority. The Board of Education has adopted cleaning standards and custodial staffing requirements for all schools in the district. This school meets the Board's standards for custodial staffing and cleanliness. The school's custodians are trained in the proper use of cleaning chemicals and Integrated Pest Management techniques. They are managed day to day by the Principal with assistance from the district's maintenance department. The district participates in the State School Deferred Maintenance Program, with funding allocated for major repair or replacement of existing school building components. Typically, this includes roofing, plumbing, heating, air conditioning, electrical systems, interior or exterior painting, and floor systems. Annually the district budgets $2 million dollars for deferred maintenance activities.
2014-15 School Accountability Report Card for Encina Preparatory 6-12 High School Page 8 of 20
School Facility Good Repair Status (Most Recent Year)
School Facility Good Repair Status (Most Recent Year) Year and month in which data were collected: 09/09/2015
System Inspected Repair Status Repair Needed and
Action Taken or Planned Good Fair Poor
Systems: Gas Leaks, Mechanical/HVAC, Sewer
X
Interior: Interior Surfaces X
Cleanliness: Overall Cleanliness, Pest/ Vermin Infestation
X
Electrical: Electrical X
Restrooms/Fountains: Restrooms, Sinks/ Fountains
X
Safety: Fire Safety, Hazardous Materials X
Structural: Structural Damage, Roofs X
External: Playground/School Grounds, Windows/ Doors/Gates/Fences
X
Overall Facility Rating (Most Recent Year)
Year and month in which data were collected: 09/09/2015
Overall Rating Exemplary Good Fair Poor
X
B. Pupil Outcomes
State Priority: Pupil Achievement The SARC provides the following information relevant to the State priority: Pupil Achievement (Priority 4): • Statewide assessments (i.e., California Assessment of Student Performance and Progress [CAASPP], Science California Standards
Tests); and • The percentage of pupils who have successfully completed courses that satisfy the requirements for entrance to the University
of California and the California State University, or career technical education sequences or programs of study California Assessment of Student Performance and Progress Results for All Students (School Year 2014-15)
Subject
Percent of Students Meeting or Exceeding the State Standards (grades 3-8 and 11)
School District State
English Language Arts/Literacy 8 42 44
Mathematics 2 32 33 Note: Percentages are not calculated when the number of students tested is ten or less, either because the number of students in this category is too small for statistical accuracy or to protect student privacy.
2014-15 School Accountability Report Card for Encina Preparatory 6-12 High School Page 9 of 20
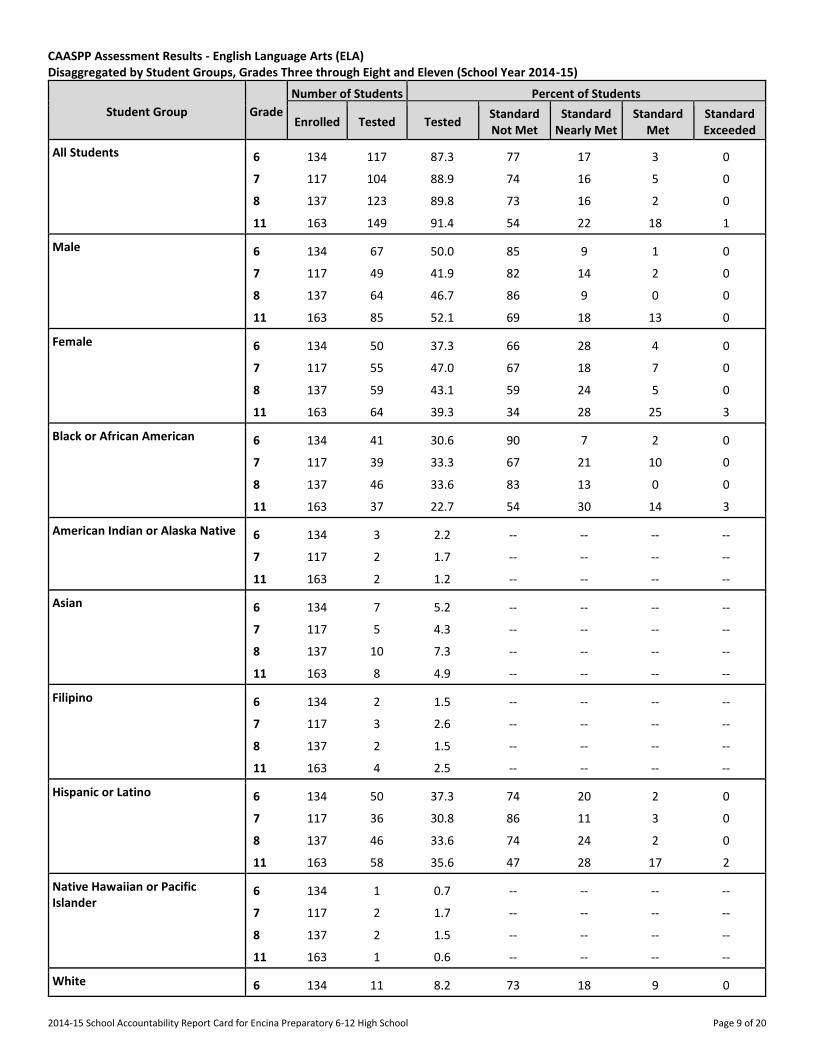
CAASPP Assessment Results - English Language Arts (ELA) Disaggregated by Student Groups, Grades Three through Eight and Eleven (School Year 2014-15)
Student Group Grade
Number of Students Percent of Students
Enrolled Tested Tested Standard Not Met
Standard Nearly Met
Standard Met
Standard Exceeded
All Students 6 134 117 87.3 77 17 3 0
7 117 104 88.9 74 16 5 0
8 137 123 89.8 73 16 2 0
11 163 149 91.4 54 22 18 1
Male 6 134 67 50.0 85 9 1 0
7 117 49 41.9 82 14 2 0
8 137 64 46.7 86 9 0 0
11 163 85 52.1 69 18 13 0
Female 6 134 50 37.3 66 28 4 0
7 117 55 47.0 67 18 7 0
8 137 59 43.1 59 24 5 0
11 163 64 39.3 34 28 25 3
Black or African American 6 134 41 30.6 90 7 2 0
7 117 39 33.3 67 21 10 0
8 137 46 33.6 83 13 0 0
11 163 37 22.7 54 30 14 3
American Indian or Alaska Native 6 134 3 2.2 -- -- -- --
7 117 2 1.7 -- -- -- --
11 163 2 1.2 -- -- -- --
Asian 6 134 7 5.2 -- -- -- --
7 117 5 4.3 -- -- -- --
8 137 10 7.3 -- -- -- --
11 163 8 4.9 -- -- -- --
Filipino 6 134 2 1.5 -- -- -- --
7 117 3 2.6 -- -- -- --
8 137 2 1.5 -- -- -- --
11 163 4 2.5 -- -- -- --
Hispanic or Latino 6 134 50 37.3 74 20 2 0
7 117 36 30.8 86 11 3 0
8 137 46 33.6 74 24 2 0
11 163 58 35.6 47 28 17 2
Native Hawaiian or Pacific Islander
6 134 1 0.7 -- -- -- --
7 117 2 1.7 -- -- -- --
8 137 2 1.5 -- -- -- --
11 163 1 0.6 -- -- -- --
White 6 134 11 8.2 73 18 9 0
2014-15 School Accountability Report Card for Encina Preparatory 6-12 High School Page 10 of 20
Student Group Grade
Number of Students Percent of Students
Enrolled Tested Tested Standard Not Met
Standard Nearly Met
Standard Met
Standard Exceeded
7 117 17 14.5 82 18 0 0
8 137 17 12.4 59 12 12 0
11 163 39 23.9 69 5 23 0
Two or More Races 6 134 2 1.5 -- -- -- --
7 117 0 0.0 -- -- -- --
8 137 0 0.0 -- -- -- --
Socioeconomically Disadvantaged 6 134 104 77.6 77 19 2 0
7 117 90 76.9 78 16 6 0
8 137 106 77.4 75 18 2 0
11 163 119 73.0 53 24 18 2
Students with Disabilities 6 134 19 14.2 89 5 0 0
7 117 8 6.8 -- -- -- --
8 137 21 15.3 100 0 0 0
11 163 14 8.6 79 7 0 0
Foster Youth 6 -- -- -- -- -- -- --
7 -- -- -- -- -- -- --
8 -- -- -- -- -- -- --
11 -- -- -- -- -- -- --
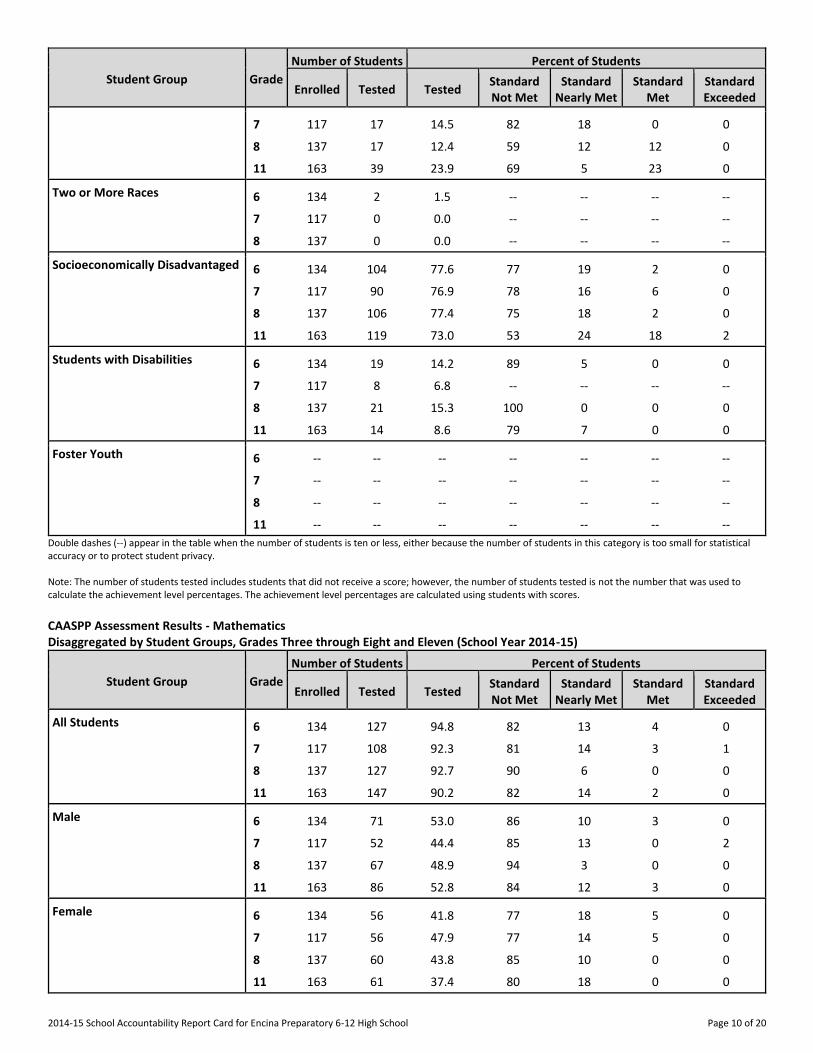
Double dashes (--) appear in the table when the number of students is ten or less, either because the number of students in this category is too small for statistical accuracy or to protect student privacy. Note: The number of students tested includes students that did not receive a score; however, the number of students tested is not the number that was used to calculate the achievement level percentages. The achievement level percentages are calculated using students with scores.
CAASPP Assessment Results - Mathematics Disaggregated by Student Groups, Grades Three through Eight and Eleven (School Year 2014-15)
Student Group Grade
Number of Students Percent of Students
Enrolled Tested Tested Standard Not Met
Standard Nearly Met
Standard Met
Standard Exceeded
All Students 6 134 127 94.8 82 13 4 0
7 117 108 92.3 81 14 3 1
8 137 127 92.7 90 6 0 0
11 163 147 90.2 82 14 2 0
Male 6 134 71 53.0 86 10 3 0
7 117 52 44.4 85 13 0 2
8 137 67 48.9 94 3 0 0
11 163 86 52.8 84 12 3 0
Female 6 134 56 41.8 77 18 5 0
7 117 56 47.9 77 14 5 0
8 137 60 43.8 85 10 0 0
11 163 61 37.4 80 18 0 0
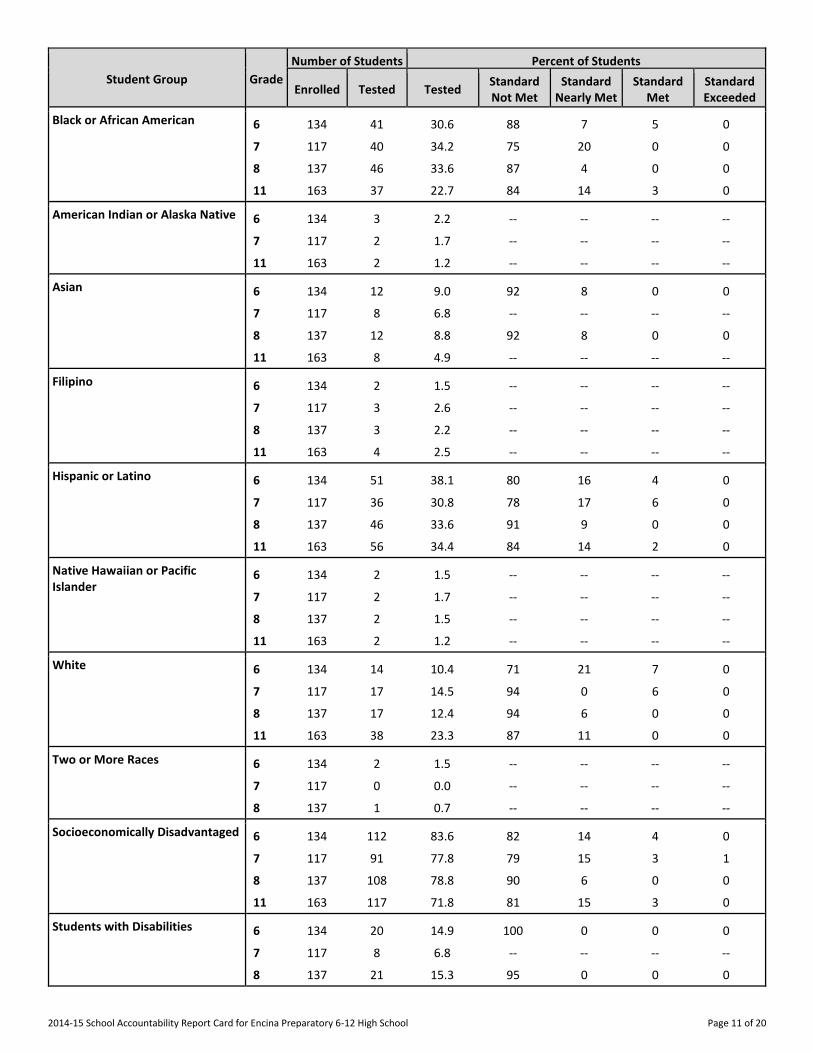
2014-15 School Accountability Report Card for Encina Preparatory 6-12 High School Page 11 of 20
Student Group Grade
Number of Students Percent of Students
Enrolled Tested Tested Standard Not Met
Standard Nearly Met
Standard Met
Standard Exceeded
Black or African American 6 134 41 30.6 88 7 5 0
7 117 40 34.2 75 20 0 0
8 137 46 33.6 87 4 0 0
11 163 37 22.7 84 14 3 0
American Indian or Alaska Native 6 134 3 2.2 -- -- -- --
7 117 2 1.7 -- -- -- --
11 163 2 1.2 -- -- -- --
Asian 6 134 12 9.0 92 8 0 0
7 117 8 6.8 -- -- -- --
8 137 12 8.8 92 8 0 0
11 163 8 4.9 -- -- -- --
Filipino 6 134 2 1.5 -- -- -- --
7 117 3 2.6 -- -- -- --
8 137 3 2.2 -- -- -- --
11 163 4 2.5 -- -- -- --
Hispanic or Latino 6 134 51 38.1 80 16 4 0
7 117 36 30.8 78 17 6 0
8 137 46 33.6 91 9 0 0
11 163 56 34.4 84 14 2 0
Native Hawaiian or Pacific Islander
6 134 2 1.5 -- -- -- --
7 117 2 1.7 -- -- -- --
8 137 2 1.5 -- -- -- --
11 163 2 1.2 -- -- -- --
White 6 134 14 10.4 71 21 7 0
7 117 17 14.5 94 0 6 0
8 137 17 12.4 94 6 0 0
11 163 38 23.3 87 11 0 0
Two or More Races 6 134 2 1.5 -- -- -- --
7 117 0 0.0 -- -- -- --
8 137 1 0.7 -- -- -- --
Socioeconomically Disadvantaged 6 134 112 83.6 82 14 4 0
7 117 91 77.8 79 15 3 1
8 137 108 78.8 90 6 0 0
11 163 117 71.8 81 15 3 0
Students with Disabilities 6 134 20 14.9 100 0 0 0
7 117 8 6.8 -- -- -- --
8 137 21 15.3 95 0 0 0
2014-15 School Accountability Report Card for Encina Preparatory 6-12 High School Page 12 of 20
Student Group Grade
Number of Students Percent of Students
Enrolled Tested Tested Standard Not Met
Standard Nearly Met
Standard Met
Standard Exceeded
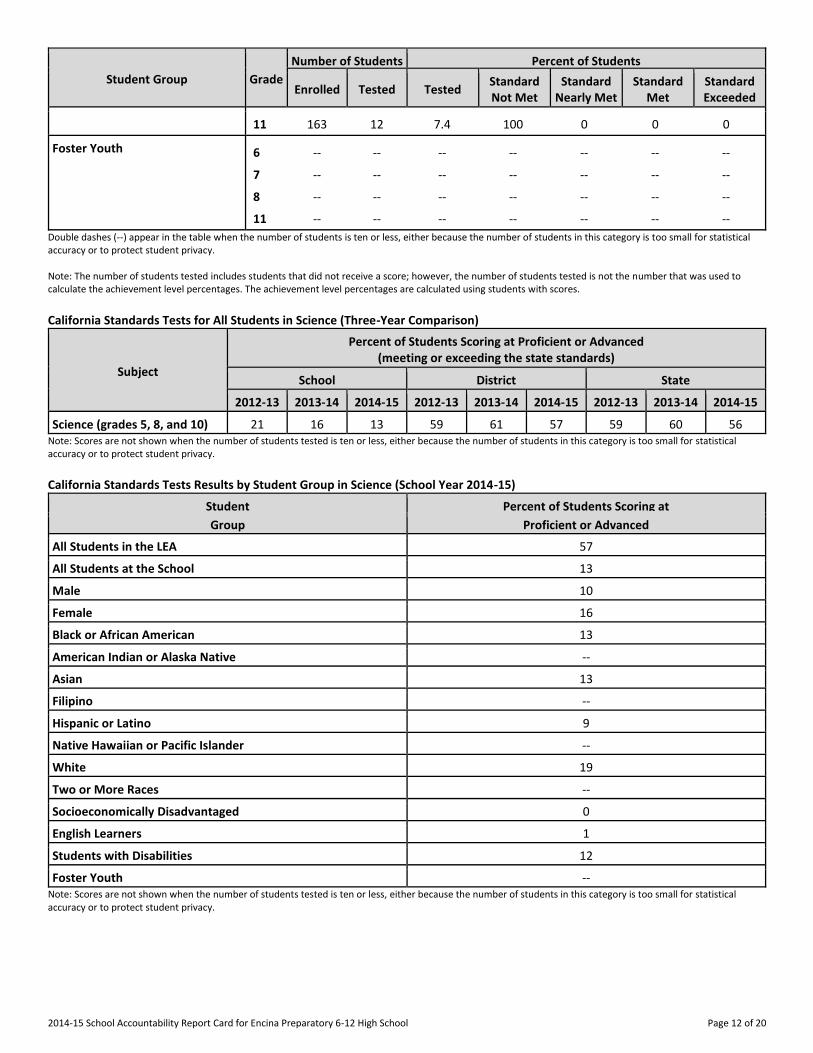
11 163 12 7.4 100 0 0 0
Foster Youth 6 -- -- -- -- -- -- --
7 -- -- -- -- -- -- --
8 -- -- -- -- -- -- --
11 -- -- -- -- -- -- --
Double dashes (--) appear in the table when the number of students is ten or less, either because the number of students in this category is too small for statistical accuracy or to protect student privacy. Note: The number of students tested includes students that did not receive a score; however, the number of students tested is not the number that was used to calculate the achievement level percentages. The achievement level percentages are calculated using students with scores.
California Standards Tests for All Students in Science (Three-Year Comparison)
Subject
Percent of Students Scoring at Proficient or Advanced (meeting or exceeding the state standards)
School District State
2012-13 2013-14 2014-15 2012-13 2013-14 2014-15 2012-13 2013-14 2014-15
Science (grades 5, 8, and 10) 21 16 13 59 61 57 59 60 56 Note: Scores are not shown when the number of students tested is ten or less, either because the number of students in this category is too small for statistical accuracy or to protect student privacy.
California Standards Tests Results by Student Group in Science (School Year 2014-15)
Student Percent of Students Scoring at
Group Proficient or Advanced
All Students in the LEA 57
All Students at the School 13
Male 10
Female 16
Black or African American 13
American Indian or Alaska Native --
Asian 13
Filipino --
Hispanic or Latino 9
Native Hawaiian or Pacific Islander --
White 19
Two or More Races --
Socioeconomically Disadvantaged 0
English Learners 1
Students with Disabilities 12
Foster Youth -- Note: Scores are not shown when the number of students tested is ten or less, either because the number of students in this category is too small for statistical accuracy or to protect student privacy.
2014-15 School Accountability Report Card for Encina Preparatory 6-12 High School Page 13 of 20
Career Technical Education Programs (School Year 2014-15)
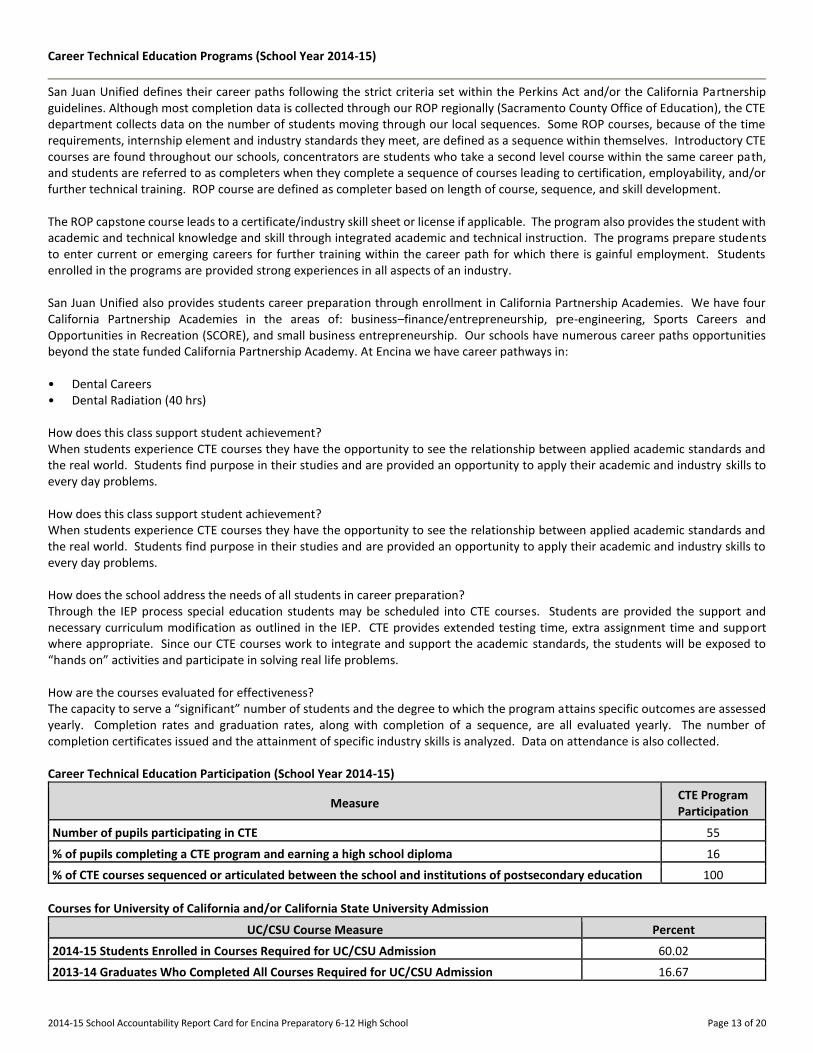
San Juan Unified defines their career paths following the strict criteria set within the Perkins Act and/or the California Partnership guidelines. Although most completion data is collected through our ROP regionally (Sacramento County Office of Education), the CTE department collects data on the number of students moving through our local sequences. Some ROP courses, because of the time requirements, internship element and industry standards they meet, are defined as a sequence within themselves. Introductory CTE courses are found throughout our schools, concentrators are students who take a second level course within the same career path, and students are referred to as completers when they complete a sequence of courses leading to certification, employability, and/or further technical training. ROP course are defined as completer based on length of course, sequence, and skill development. The ROP capstone course leads to a certificate/industry skill sheet or license if applicable. The program also provides the student with academic and technical knowledge and skill through integrated academic and technical instruction. The programs prepare students to enter current or emerging careers for further training within the career path for which there is gainful employment. Students enrolled in the programs are provided strong experiences in all aspects of an industry. San Juan Unified also provides students career preparation through enrollment in California Partnership Academies. We have four California Partnership Academies in the areas of: business–finance/entrepreneurship, pre-engineering, Sports Careers and Opportunities in Recreation (SCORE), and small business entrepreneurship. Our schools have numerous career paths opportunities beyond the state funded California Partnership Academy. At Encina we have career pathways in: • Dental Careers • Dental Radiation (40 hrs) How does this class support student achievement? When students experience CTE courses they have the opportunity to see the relationship between applied academic standards and the real world. Students find purpose in their studies and are provided an opportunity to apply their academic and industry skills to every day problems. How does this class support student achievement? When students experience CTE courses they have the opportunity to see the relationship between applied academic standards and the real world. Students find purpose in their studies and are provided an opportunity to apply their academic and industry skills to every day problems. How does the school address the needs of all students in career preparation? Through the IEP process special education students may be scheduled into CTE courses. Students are provided the support and necessary curriculum modification as outlined in the IEP. CTE provides extended testing time, extra assignment time and support where appropriate. Since our CTE courses work to integrate and support the academic standards, the students will be exposed to “hands on” activities and participate in solving real life problems. How are the courses evaluated for effectiveness? The capacity to serve a “significant” number of students and the degree to which the program attains specific outcomes are assessed yearly. Completion rates and graduation rates, along with completion of a sequence, are all evaluated yearly. The number of completion certificates issued and the attainment of specific industry skills is analyzed. Data on attendance is also collected. Career Technical Education Participation (School Year 2014-15)
Measure CTE Program Participation
Number of pupils participating in CTE 55
% of pupils completing a CTE program and earning a high school diploma 16
% of CTE courses sequenced or articulated between the school and institutions of postsecondary education 100
Courses for University of California and/or California State University Admission
UC/CSU Course Measure Percent
2014-15 Students Enrolled in Courses Required for UC/CSU Admission 60.02
2013-14 Graduates Who Completed All Courses Required for UC/CSU Admission 16.67
2014-15 School Accountability Report Card for Encina Preparatory 6-12 High School Page 14 of 20
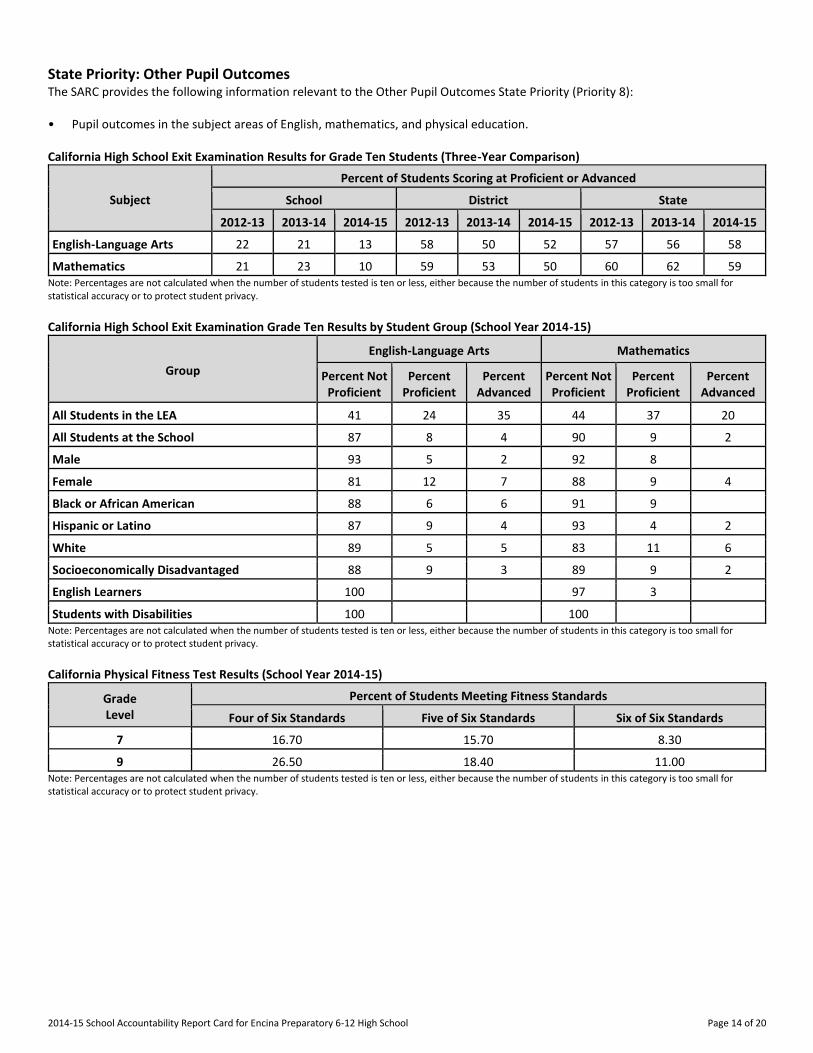
State Priority: Other Pupil Outcomes The SARC provides the following information relevant to the Other Pupil Outcomes State Priority (Priority 8): • Pupil outcomes in the subject areas of English, mathematics, and physical education. California High School Exit Examination Results for Grade Ten Students (Three-Year Comparison)
Subject
Percent of Students Scoring at Proficient or Advanced
School District State
2012-13 2013-14 2014-15 2012-13 2013-14 2014-15 2012-13 2013-14 2014-15
English-Language Arts 22 21 13 58 50 52 57 56 58
Mathematics 21 23 10 59 53 50 60 62 59 Note: Percentages are not calculated when the number of students tested is ten or less, either because the number of students in this category is too small for statistical accuracy or to protect student privacy.
California High School Exit Examination Grade Ten Results by Student Group (School Year 2014-15)
Group
English-Language Arts Mathematics
Percent Not Proficient
Percent Proficient
Percent Advanced
Percent Not Proficient
Percent Proficient
Percent Advanced
All Students in the LEA 41 24 35 44 37 20
All Students at the School 87 8 4 90 9 2
Male 93 5 2 92 8
Female 81 12 7 88 9 4
Black or African American 88 6 6 91 9
Hispanic or Latino 87 9 4 93 4 2
White 89 5 5 83 11 6
Socioeconomically Disadvantaged 88 9 3 89 9 2
English Learners 100 97 3
Students with Disabilities 100 100 Note: Percentages are not calculated when the number of students tested is ten or less, either because the number of students in this category is too small for statistical accuracy or to protect student privacy.
California Physical Fitness Test Results (School Year 2014-15)
Grade Level
Percent of Students Meeting Fitness Standards
Four of Six Standards Five of Six Standards Six of Six Standards
---7--- 16.70 15.70 8.30
---9--- 26.50 18.40 11.00 Note: Percentages are not calculated when the number of students tested is ten or less, either because the number of students in this category is too small for statistical accuracy or to protect student privacy.
2014-15 School Accountability Report Card for Encina Preparatory 6-12 High School Page 15 of 20
C. Engagement
State Priority: Parental Involvement The SARC provides the following information relevant to the Parental Involvement State Priority (Priority 3): • Efforts the school district makes to seek parent input in making decisions for the school district and each schoolsite. Opportunities for Parental Involvement (Most Recent Year)
As called for in Encina's Re-Design Plan, Encina's Community Partnerships Center continues to create, execute, and promote a variety of activities and initiatives to strengthen the school's collaboration with families and the community. Community Partnerships focuses on 6 specific areas: • Building Relationships - Actions that welcome, honor and connect families to the school. • Build Awareness - Actions that promote understanding and inclusion across all cultures and family. • Two-Way Communication - Actions that improve the connectivity between the school, teachers, students, families, and the
community. • Family Engagement - Actions that support families as decision makers and advocates. • Access - Actions that provide families with access to information and community resources. • Environment: Actions that build a welcoming school environment and climate. Lead by the Coordinator for Community Partnerships and its Team of parents, students and staff, the program is expanding the work initiated these last few years. Some specific actions that highlight this year's implementation include: • Outreach to local apartments complexes to reach out to Encina families • Establish Food Closet and Clothes Closet to help families in need • Facilitate families' access to health care providers • Expansion of a family/parent contact program • Collaborate with parent education services like Parent University and the Parent Project to support healthy family dynamics • Further implementation of the Parent Connection, a parent volunteer organization The Encina Booster Club provides opportunities for parent involvement in its efforts to support a wide variety of extra-curricular and enrichment activities for the students. Monthly meetings are held to support ongoing academic, cultural and athletic events. The Community Liaison solicits volunteers to serve on the following parent committees: • ELAC • School Site Council (elected) • Special Education Parent Advisory Committee (SEPAC) • Superintendent’s Parent Advisory Committee Finally, the school's Advocacy Program offers a robust parent-school relationship opportunity for all Encina families through the execution of Student-Led Conferences held twice annually for all grade levels. These conferences allow teachers, students, and parents to collaborate on their children's academic and behavior goals for the school year, and facilitate open, honest, and deep dialogue between the school and individual families on an on-going basis. Parents or community members who wish to participate in leadership teams, school committees, school activities, or become a volunteer may contact Barry Roth, Encina's Community Partnerships Coordinator, at 971.7538 or at [email protected]
State Priority: Pupil Engagement The SARC provides the following information relevant to the Pupil Engagement State Priority (Priority 5): • High school dropout rates; and • High school graduation rates.
2014-15 School Accountability Report Card for Encina Preparatory 6-12 High School Page 16 of 20
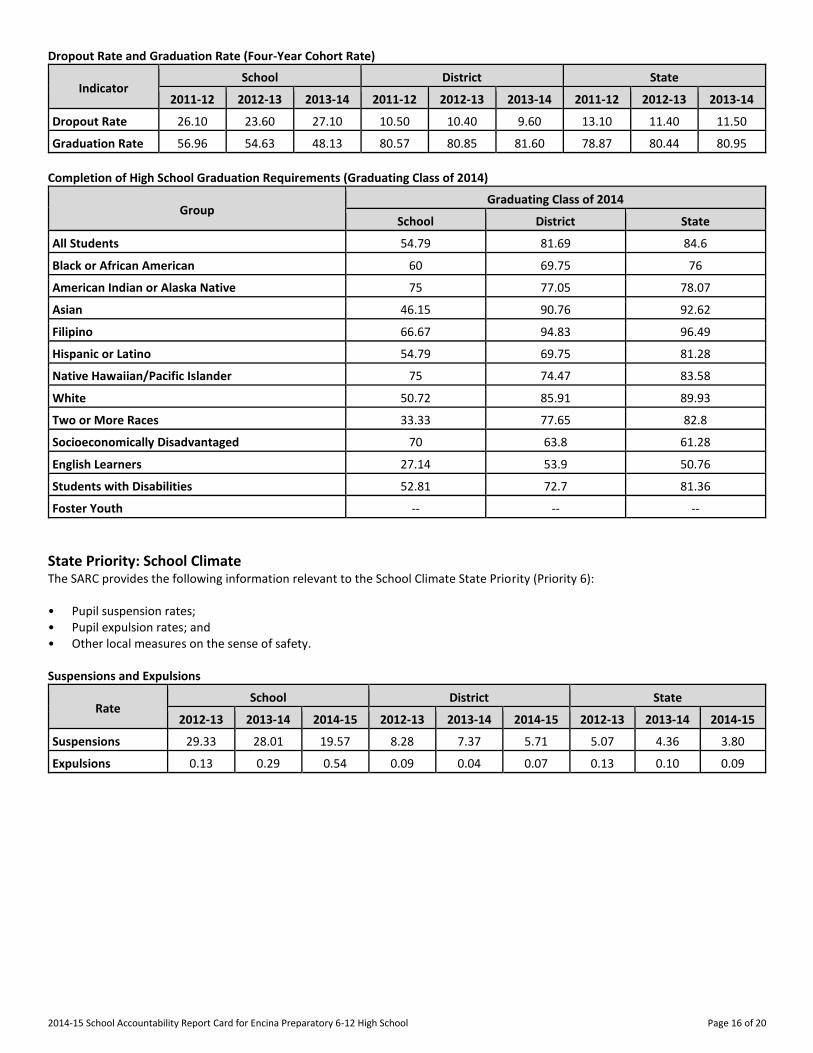
Dropout Rate and Graduation Rate (Four-Year Cohort Rate)
Indicator School District State
2011-12 2012-13 2013-14 2011-12 2012-13 2013-14 2011-12 2012-13 2013-14
Dropout Rate 26.10 23.60 27.10 10.50 10.40 9.60 13.10 11.40 11.50
Graduation Rate 56.96 54.63 48.13 80.57 80.85 81.60 78.87 80.44 80.95
Completion of High School Graduation Requirements (Graduating Class of 2014)
Group Graduating Class of 2014
School District State
All Students 54.79 81.69 84.6
Black or African American 60 69.75 76
American Indian or Alaska Native 75 77.05 78.07
Asian 46.15 90.76 92.62
Filipino 66.67 94.83 96.49
Hispanic or Latino 54.79 69.75 81.28
Native Hawaiian/Pacific Islander 75 74.47 83.58
White 50.72 85.91 89.93
Two or More Races 33.33 77.65 82.8
Socioeconomically Disadvantaged 70 63.8 61.28
English Learners 27.14 53.9 50.76
Students with Disabilities 52.81 72.7 81.36
Foster Youth -- -- --
State Priority: School Climate The SARC provides the following information relevant to the School Climate State Priority (Priority 6): • Pupil suspension rates; • Pupil expulsion rates; and • Other local measures on the sense of safety. Suspensions and Expulsions
Rate School District State
2012-13 2013-14 2014-15 2012-13 2013-14 2014-15 2012-13 2013-14 2014-15
Suspensions------- 29.33 28.01 19.57 8.28 7.37 5.71 5.07 4.36 3.80
Expulsions------- 0.13 0.29 0.54 0.09 0.04 0.07 0.13 0.10 0.09
2014-15 School Accountability Report Card for Encina Preparatory 6-12 High School Page 17 of 20
School Safety Plan (Most Recent Year)
This school is linked directly to the San Juan Unified School District’s Safe Schools Program. In partnership with the Sacramento County Sheriff’s Department and the City of Citrus Heights Police Department (CHPD), each school becomes part of a safety zone that is patrolled daily by a sheriff’s deputy or CHPD officer. The Deputy Sheriffs are assigned to a specific schools which are identified by geographic zones. The Deputy Sheriffs may move from one the geographic zone to another as safety needs dictate. The CHPD Police Officers work identified schools within the City of Citrus Heights and respond as safety needs dictate. In addition to daily support from a designated Sheriff’s deputy or CHPD officer, this school is a part of the San Juan Unified School District’s Safe Schools Task Force, which is comprised of safety teams from each of the school sites. Each school safety team meets regularly to discuss safety issues, update their site emergency plans, and to take steps to be proactive in preventing various types of school-related safety issues. Law enforcement provides speakers to address students, staff and community groups. Our safety team receives regular training through the Safe Schools Task Force. Each school site is responsible for updating their Comprehensive School Safety Plan by March 1st of every year. The plan must be approved by the School Site Council before being submitted to the district Safe Schools Manager. Every San Juan classroom has a standardized “Safety Folder” which serves as a guide for teachers, includes the site specific crisis response procedures and a district standardized emergency flip chart. This school meets or exceeds the Education Code requirements for fire drills and lock down drills. The Safety plan was last reviewed, updated, and approved by SSC on March 17, 2015. For the 2015-16 school year, the plan was reviewed with staff at the September staff meeting. It will be reviewed and revised by the school's Safety Committee and School Site council again in the Spring of the 2015-16 school year.
D. Other SARC Information
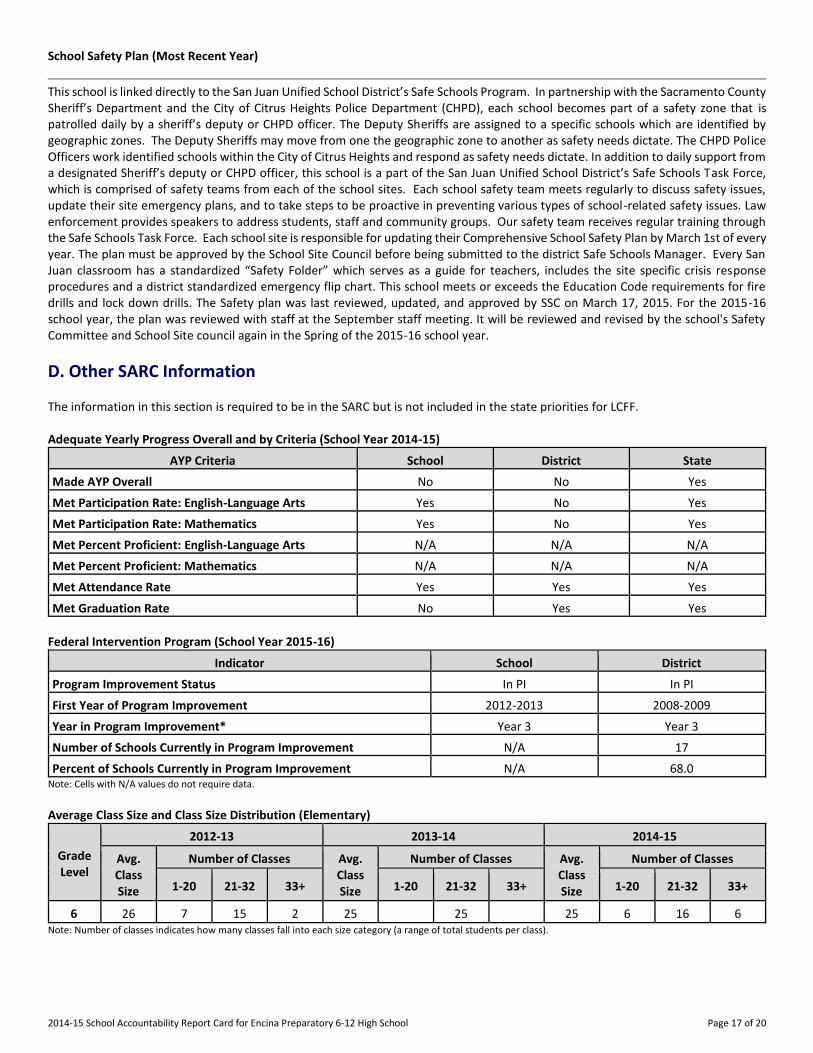
The information in this section is required to be in the SARC but is not included in the state priorities for LCFF. Adequate Yearly Progress Overall and by Criteria (School Year 2014-15)
AYP Criteria School District State
Made AYP Overall No No Yes
Met Participation Rate: English-Language Arts Yes No Yes
Met Participation Rate: Mathematics Yes No Yes
Met Percent Proficient: English-Language Arts N/A N/A N/A
Met Percent Proficient: Mathematics N/A N/A N/A
Met Attendance Rate Yes Yes Yes
Met Graduation Rate No Yes Yes
Federal Intervention Program (School Year 2015-16)
Indicator School District
Program Improvement Status In PI In PI
First Year of Program Improvement 2012-2013 2008-2009
Year in Program Improvement* Year 3 Year 3
Number of Schools Currently in Program Improvement N/A 17
Percent of Schools Currently in Program Improvement N/A 68.0 Note: Cells with N/A values do not require data.
Average Class Size and Class Size Distribution (Elementary)
Grade Level
2012-13 2013-14 2014-15
Avg. Class Size
Number of Classes Avg. Class Size
Number of Classes Avg. Class Size
Number of Classes
1-20 21-32 33+ 1-20 21-32 33+ 1-20 21-32 33+
6
26 7 15 2 25 25 25 6 16 6 Note: Number of classes indicates how many classes fall into each size category (a range of total students per class).
2014-15 School Accountability Report Card for Encina Preparatory 6-12 High School Page 18 of 20
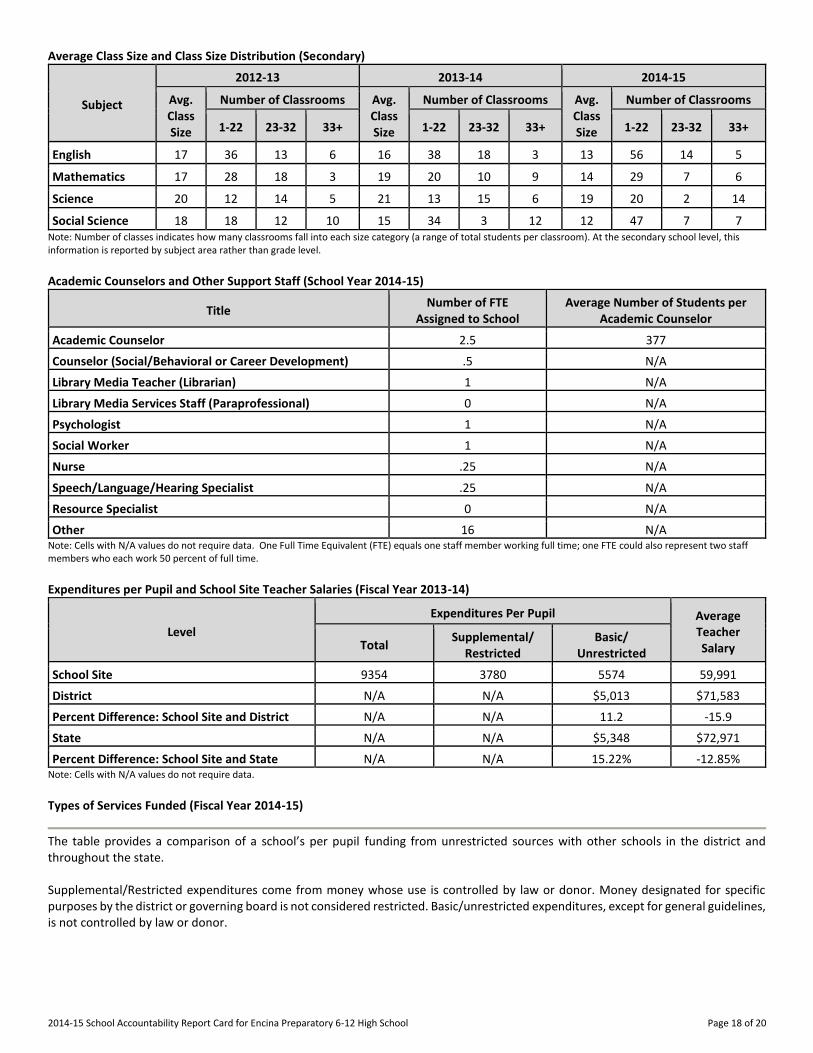
Average Class Size and Class Size Distribution (Secondary)
Subject
2012-13 2013-14 2014-15
Avg. Class Size
Number of Classrooms Avg. Class Size
Number of Classrooms Avg. Class Size
Number of Classrooms
1-22 23-32 33+ 1-22 23-32 33+ 1-22 23-32 33+
English------- ----------
17 36 13 6 16 38 18 3 13 56 14 5
Mathematics ----------
17 28 18 3 19 20 10 9 14 29 7 6
Science------- ----------
20 12 14 5 21 13 15 6 19 20 2 14
Social Science ----------
18 18 12 10 15 34 3 12 12 47 7 7 Note: Number of classes indicates how many classrooms fall into each size category (a range of total students per classroom). At the secondary school level, this information is reported by subject area rather than grade level. Academic Counselors and Other Support Staff (School Year 2014-15)
Title Number of FTE
Assigned to School Average Number of Students per
Academic Counselor
Academic Counselor------- 2.5 377
Counselor (Social/Behavioral or Career Development) .5 N/A
Library Media Teacher (Librarian) 1 N/A
Library Media Services Staff (Paraprofessional) 0 N/A
Psychologist------- 1 N/A
Social Worker------- 1 N/A
Nurse------- .25 N/A
Speech/Language/Hearing Specialist .25 N/A
Resource Specialist------- 0 N/A
Other------- 16 N/A Note: Cells with N/A values do not require data. One Full Time Equivalent (FTE) equals one staff member working full time; one FTE could also represent two staff members who each work 50 percent of full time.
Expenditures per Pupil and School Site Teacher Salaries (Fiscal Year 2013-14)
Level
Expenditures Per Pupil Average Teacher Salary Total
Supplemental/ Restricted
Basic/ Unrestricted
School Site------- 9354 3780 5574 59,991
District------- N/A N/A $5,013 $71,583
Percent Difference: School Site and District N/A N/A 11.2 -15.9
State------- N/A N/A $5,348 $72,971
Percent Difference: School Site and State N/A N/A 15.22% -12.85% Note: Cells with N/A values do not require data.
Types of Services Funded (Fiscal Year 2014-15)
The table provides a comparison of a school’s per pupil funding from unrestricted sources with other schools in the district and throughout the state. Supplemental/Restricted expenditures come from money whose use is controlled by law or donor. Money designated for specific purposes by the district or governing board is not considered restricted. Basic/unrestricted expenditures, except for general guidelines, is not controlled by law or donor.
2014-15 School Accountability Report Card for Encina Preparatory 6-12 High School Page 19 of 20
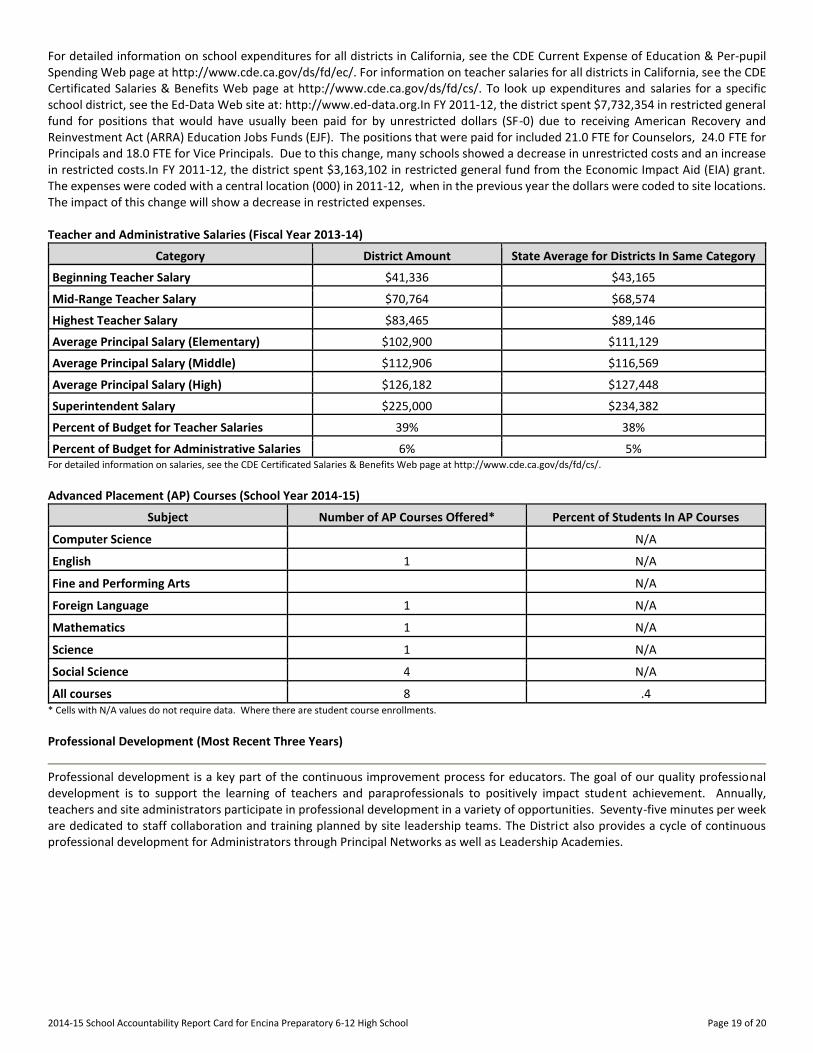
For detailed information on school expenditures for all districts in California, see the CDE Current Expense of Education & Per-pupil Spending Web page at http://www.cde.ca.gov/ds/fd/ec/. For information on teacher salaries for all districts in California, see the CDE Certificated Salaries & Benefits Web page at http://www.cde.ca.gov/ds/fd/cs/. To look up expenditures and salaries for a specific school district, see the Ed-Data Web site at: http://www.ed-data.org.In FY 2011-12, the district spent $7,732,354 in restricted general fund for positions that would have usually been paid for by unrestricted dollars (SF-0) due to receiving American Recovery and Reinvestment Act (ARRA) Education Jobs Funds (EJF). The positions that were paid for included 21.0 FTE for Counselors, 24.0 FTE for Principals and 18.0 FTE for Vice Principals. Due to this change, many schools showed a decrease in unrestricted costs and an increase in restricted costs.In FY 2011-12, the district spent $3,163,102 in restricted general fund from the Economic Impact Aid (EIA) grant. The expenses were coded with a central location (000) in 2011-12, when in the previous year the dollars were coded to site locations. The impact of this change will show a decrease in restricted expenses. Teacher and Administrative Salaries (Fiscal Year 2013-14)
Category District Amount State Average for Districts In Same Category
Beginning Teacher Salary $41,336 $43,165
Mid-Range Teacher Salary $70,764 $68,574
Highest Teacher Salary $83,465 $89,146
Average Principal Salary (Elementary) $102,900 $111,129
Average Principal Salary (Middle) $112,906 $116,569
Average Principal Salary (High) $126,182 $127,448
Superintendent Salary $225,000 $234,382
Percent of Budget for Teacher Salaries 39% 38%
Percent of Budget for Administrative Salaries 6% 5% For detailed information on salaries, see the CDE Certificated Salaries & Benefits Web page at http://www.cde.ca.gov/ds/fd/cs/. Advanced Placement (AP) Courses (School Year 2014-15)
Subject Number of AP Courses Offered* Percent of Students In AP Courses
Computer Science N/A
English------- 1 N/A
Fine and Performing Arts N/A
Foreign Language 1 N/A
Mathematics 1 N/A
Science------- 1 N/A
Social Science 4 N/A
All courses 8 .4 * Cells with N/A values do not require data. Where there are student course enrollments.
Professional Development (Most Recent Three Years)
Professional development is a key part of the continuous improvement process for educators. The goal of our quality professional development is to support the learning of teachers and paraprofessionals to positively impact student achievement. Annually, teachers and site administrators participate in professional development in a variety of opportunities. Seventy-five minutes per week are dedicated to staff collaboration and training planned by site leadership teams. The District also provides a cycle of continuous professional development for Administrators through Principal Networks as well as Leadership Academies.
2014-15 School Accountability Report Card for Encina Preparatory 6-12 High School Page 20 of 20
The District provides professional development opportunities for teachers and administrators that support the implementation of Common Core State Standards in English language arts and mathematics, and the ELA/ELD Framework. Specific professional development initiatives include: Critical Literacy, K-1 Reading, Making Meaning Through Close Reading and Writing, Engineering and Mathematics Inspiring Thinking Solutions (EMITS), Math to the Core, Expository Reading and Writing Course (ERWC), and ELD Foundations. District departments, Center for Teacher Support, grant-funded projects, and the San Juan Teacher’s Association sponsor additional training opportunities. Professional development opportunities are voluntary for teachers and are provided throughout the year in a variety of formats: during the school day, after school, on Saturdays, and during summer and vacation breaks. Many teachers and administrators also take advantage of opportunities with Sacramento County Office of Education, California Department of Education, the college/university programs, state/national education organizations, and private educational institutes. What grounds the professional development in the district is the District Strategic Plan and the Local Control Accountability Plan. Professional Development is further determined using one or more of the following: (a) student achievement data, (b) staff survey data, and (c) district-identified goals. Professional development addresses the Common Core State Standards (CCSS), teaching strategies, curriculum, assessment, technology, classroom management, safety, and leadership. Administrator training accompanies professional development in district focus areas, providing implementation support for teachers on site. Content-area coaches are available at some schools. Additional classroom support is provided to new and struggling teachers by consulting teachers from the Center for Teacher Support. Paraprofessionals are encouraged to participate in professional development at the district and site level. Specifically designed training is also offered to non-instructional support staff such as clerical and custodial staff that includes both operational and instructional topics.

![[XLS] · Web viewStockport Brabyns Preparatory School Brabyns Preparatory School Ltd Greenbank Preparatory School Greenbank School Limited Lady Barn House School Ladybarn House School](https://img.pdfslide.net/doc/110x75/5abf70567f8b9a5d718e4273/xls-viewstockport-brabyns-preparatory-school-brabyns-preparatory-school-ltd-greenbank.jpg)