Embed Size (px)
Citation preview
INTERNATIONAL JOURNAL OF CLIMATOLOGY, VOL, 12, 193-203 (1992) 551.52:551 .551.8:551.584.4(712.7)
ENERGY BALANCE DIFFERENCES AND HYDROLOGIC IMPACTS ACROSS THE NORTHERN TREELINE
PETER M. LAFLEUR
Department of Geography, Trent University, Peterborough, Ontario K9J 7B8, Canada
AND
WAYNE R. ROUSE AND DEREK W. CARLSON
Department qf Geogruphy. McMaster University. Hamilton. Ontario L8S 4K1, Canada
Received I 2 April I991 Revised I July 1991
ABSTRACT
Energy balance measurements were made over wet tundra and a nearby open conifer forest near Churchill, Manitoba during the summer periods of 1989 and 1990. Little difference was found between net radiation, Q*, and ground heat fluxes, QG, for the two sites: Q* at the forest exceeded Q* at the tundra by only 2-5 per cent; QG averaged 9 and 12 per cent of Q* for the forest and tundra, respectively.
The sensible, QH, and latent, QE, heat fluxes showed the greatest differences between the sites. When surface moisture was not limiting, QE was largest for the tundra and QH was largest at the forest. During a drying cycle in 1989 the energy balances for the two sites were similar. An analysis of wind direction on energy partitioning suggests that the tundra was more responsive to meteorological changes than the forest. The implications of this study for surface water balances in the subarctic are discussed.
KEY WORDS Treeline Tundra Forest Energy balance Evaporation
INTRODUCTION
The relationship between the northern treeline and climate has been a subject of much interest. Attempts have been made to link the treeline location with features of atmospheric general circulation, such as frequency of air mass occurrences (Bryson, 1966). However, as Hare and Ritchie (1972) suggest, the problem is not simply one of the control of vegetation by climate, but vegetation and climate are an interlocking system. Transition across the treeline is often perceived as an abrupt change in microclimate. The step change in surface characteristics such as albedo, roughness, moisture availability, and surface temperature are reflected in the conversion of solar energy into the components of the surface energy balance. The energy balance drives the global climate system and is linked with the surface water balance through the latent heat flux.
This study compares the summertime surface energy balances of a contiguous open conifer forest and wet tundra located at treeline near Churchill, Manitoba. Simultaneous measurements of energy balance components were made at both sites during the summer periods (June-August) in 1989 and 1990. The purpose of the study was to compare the relative magnitudes and ranges of energy fluxes at these sites, giving particular attention to energy partitioning between sensible and latent heat fluxes. The hydrological implications of these comparisons are considered in terms of changes in the treeline position.
Previously, the microclimates of tundra surfaces have received much more attention than those of subarctic forests (Ohmura, 1982a). There are several well-documented studies of the energy balance of tundra
0899-841 8/92/020193-11$05.50 0 1992 by the Royal Meteorological Society
194 P. M. LAFLEUR ET A L
(e.g. Weller and Holmgren, 1974; Ohmura, 1982b; Rouse, 1984c; Rouse and Bello, 1985; Weick and Rouse, 1991). Estimates of energy balance components of subarctic forest are available from Pugsley (1970) and Rouse et al. (1977). The only direct comparisons of forest and tundra microclimates, which we are aware of, were concerned with the radiation balance (Rouse, 1984a; Rouse and Bello, 1983) and the soil microclimate (Rouse, 1984b).
STUDY SITES
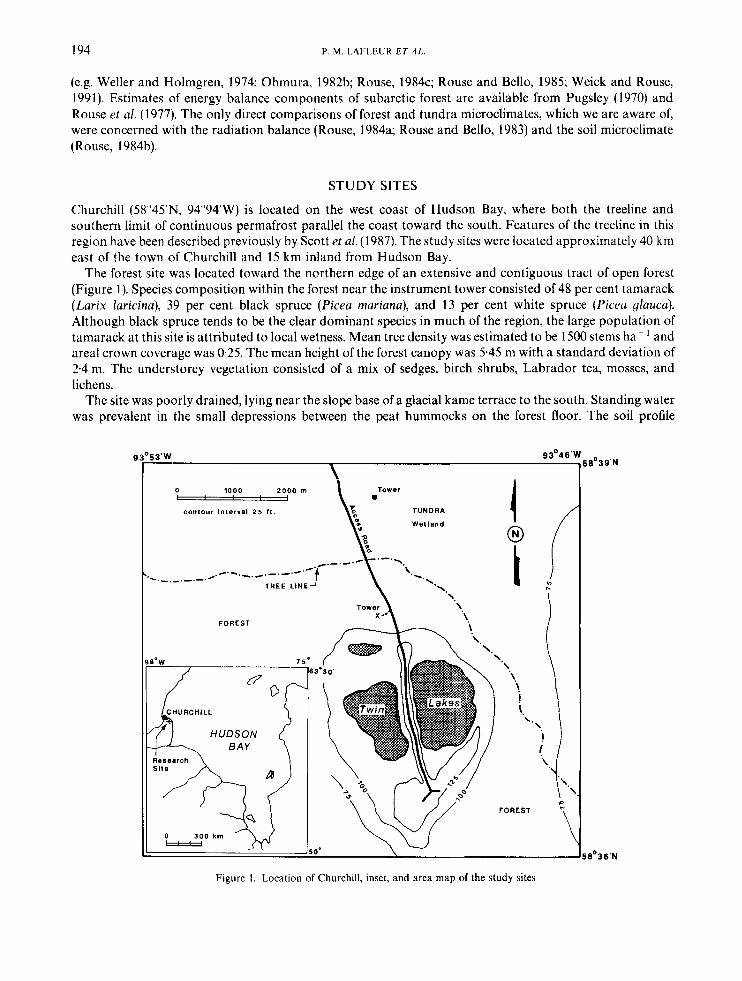
Churchill (58"45'N, 94"94'W) is located on the west coast of Hudson Bay, where both the treeline and southern limit of continuous permafrost parallel the coast toward the south. Features of the treeline in this region have been described previously by Scott et al. (1987). The study sites were located approximately 40 km east of the town of Churchill and 15 km inland from Hudson Bay.
The forest site was located toward the northern edge of an extensive and contiguous tract of open forest (Figure 1). Species composition within the forest near the instrument tower consisted of 48 per cent tamarack (Larix laricina), 39 per cent black spruce (Picea mariana), and 13 per cent white spruce (Piceu yluucu). Although black spruce tends to be the clear dominant species in much of the region, the large population of tamarack at this site is attributed to local wetness. Mean tree density was estimated to be 1500 stems ha- and areal crown coverage was 0.25. The mean height of the forest canopy was 5.45 m with a standard deviation of 2.4 m. The understorey vegetation consisted of a mix of sedges, birch shrubs, Labrador tea, mosses, and lichens.
The site was poorly drained, lying near the slope base of a glacial kame terrace to the south. Standing water was prevalent in the small depressions between the peat hummocks on the forest floor. The soil profile
53 'W 93'46.l
0 1000 2000 m Tower I I
TUNDRA
Wetland
contour interval 2 5 11.
FOREST
5- W T ! I
0 3 0 0 km -
'. Tower \. '.
I
0'39"
0'36.N
Figure 1. Location of Churchill, inset, and area map of the study sites
ENERGY BALANCE DIFFERENCES IN CANADA 195
contained 0.2-43 m of fibrous peat overlying a marine clay/silt stratum. Permafrost was discontinuous within the forest. Perennially frozen ground was found only within the larger peat hummocks with substantial moss and lichen covers. The low lying, wetter areas of the forest experienced freezing to a depth of about 0.60 m, which, on average, melted out by midJuly.
The tundra site lay to the north of the forest (Figure I). Slopes in the area were very small, leading to a level and extensive surface of poorly drained, hummocky terrain. Although the water table never covered the tops of the hummocks, standing water was present in the depressions between hummocks. The mean depth of the standing water between the hummocks was about 0.05 m. During extended dry periods, the water table receded below the bottom of the depressions. All of this area was underlain by permafrost. The seasonal active layer reached an average maximum depth of greater than 1.0m by late August. Vegetation at the site consisted of a sparse canopy of sedges (Carex spp.) in the wet depressions, while various mosses and lichens dominated the tops of the hummocks. Soils at this site were similar to the forest soils.
INSTRUMENTS AND METHODS
This study is concerned with comparing the components of the surface energy balance, which is given as
(1)
where Q* is the sum of net solar and net longwave radiation fluxes, K 1 is incoming solar radiation, c( is the surface albedo, L* is the net longwave flux, QH is the sensible heat flux, QE is the latent (evaporative) heat flux, and Qti is the ground heat flux. All components of equation (1) were measured continuously at both sites via the methods outlined below.
Instrument towers were erected at each site (Figure 1). The instrumentation and procedures were similar at both sites, unless otherwise specified. Q* was measured with net radiometers (Model CN1, Middleton, Melbourne, Australia). Incoming and reflected solar radiation fluxes, K 1 and K f respectively, were measured with pyranometers (Model 8-48, Eppley Laboratories, Newport, Rhode Island). The radiation instruments were suspended from the top of the instrument towers at heights of 18 m and 2.5 m for the forest and tundra sites, respectively. The measured radiation fluxes are generally accurate to within 25 per cent. L* was determined by residual and, as such, assumes the combined errors of the measured fluxes.
The ground heat flux ( Q G ) was computed from measurements with heat flux plates (Model CN3, Middleton, Melbourne, Australia) corrected by a calorimetric method that uses soil temperature measurements and estimates of soil heat capacity. This procedure is described in full by Halliwell and Rouse (1987). As these authors suggest, the errors associated with QG measurements can be considerable. Based on our overall knowledge we assign an accuracy of f 20 per cent to the measurements in this study. Heat storage in the forest tree crowns was found to be small ( < 2 per cent of Q*), largely because of the small mass of the forest, and, therefore, was neglected in the energy balance calculations.
The convective fluxes, QH and QE, were calculated using the Bowen ratio energy balance (BREB) method. Bowen’s ratio, p, is calculated as
Q* = K1( 1 -a) + L*=QH + QE + QG
p = X Y (A T/Ae) (2) where y is the psychrometer constant, and ATand Ae are vertical profiles of temperature and vapour pressure, respectively. j? is then combined with equation (1) to solve for Q H and QE. AT and Ae were measured with wet and dry bulb aspirated psychrometers. The psychrometer design has been described in full elsewhere (Lafleur and Rouse, 1988). The psychrometers were placed at heights of 0*5,0.9, 1.3, 1.7, 2.1, and 2.5 m at the tundra site and at heights of 9.5, 11,12.5,14 and 15.5 m at the forest. Fetch to height ratio for the tundra site exceeded 500: 1 in all directions. The minimum fetch to height ratio for the forest tower was 100: 1 in a line to the north and greater than 200: 1 in all other directions.
Wind speed profiles were measured at the same levels as the temperature measurements with three-cup analogue output anemometers (Model 12101, R. M. Young, Michigan). Wind direction was measured with vanes mounted at the top of the towers. Signals from all instruments were recorded on data loggers (Model CR7, Campbell Sci., Logan, Utah) and were averaged every 30 minutes.
196 P. M. LAFLEUR E 7 A L
The BREB determinations of QH and QE include the errors associated with measurements of Q*, Qc, and p. An analysis of the error in f l indicated that at most times f l could be assigned a maximum error of f 15 per cent. Combining this with the errors in Q* and Qc, we assign a probable error of 12 per cent to QE. At times when the BREB approach proved unreliable (e.g. near sunrise and sunset and during some rainy periods) heat fluxes were calculated from the wind and temperature profiles by an aerodynamic approach. Halliwell and Rouse (1989) showed that QH and QE calculated by Bowen ratio and aerodynamic methods give good agreement in the tundra environment.
Data were collected simultaneously at both sites during 28 June to 31 August 1989 and during 19 June to 22 August 1990. The 1989 data record was virtually continuous at both sites, yielding a total of 63 complete days of data at each site. During 1990 instrument failures occurred at the forest site, resulting in a discon- tinuous record. Forty-four comparable days of data at both sites were available that year. In the following analyses 24-h daily energy totals were used.
CLIMATE OF CHURCHILL
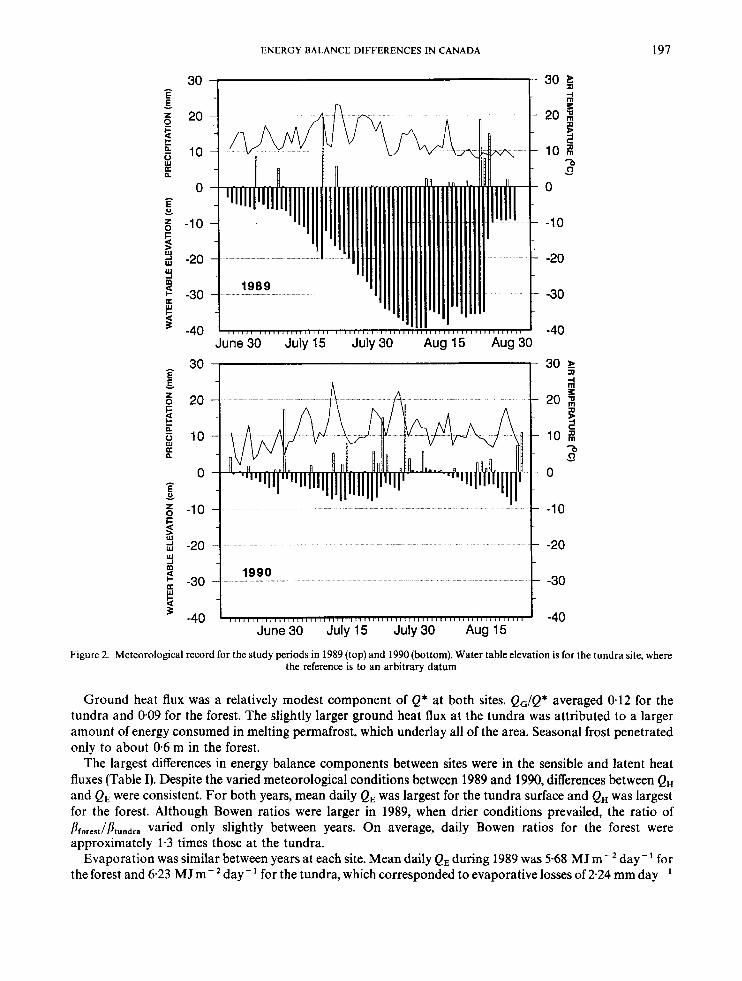
The climatological normal summertime (June-August) mean daily temperature at Churchill is 9.7"C and mean rainfall is 52 mmmonth-'. Daily precipitation, temperature and water table records for the 1989 and 1990 study periods are shown in Figure 2. Although the water table elevations in Figure 2 are for the tundra site only, the forest water table followed somewhat damped but similar seasonal patterns.
The two summers exhibited distinctly different meteorological conditions. Compared with the long-term normals, 1989 was characterized as a warm, dry summer and 1990 was wet with normal temperatures. Temperatures during the study period in 1989 averaged 2.2"C above normal, largely owing to an abnormally warm July, the hottest since records began in 1932. Although total precipitation during July and August of 1989 was near normal, 80 per cent of this total was received during three events. This distribution of rainfall resulted in a dramatic lowering of the water table through late July until August 24 (Figure 2(a)). By 16 July 1989 standing water was no longer present at the tundra site and only a small amount remained at the forest site.
During 1990 summer temperatures were near normal, averaging 0.6"C above the normal. Although precipitation in June was 12 mm below normal, precipitation for July and August was 25 mm above normal. An even distribution of precipitation maintained high water tables at both sites for the duration of the study (Figure 2(b)).
RESULTS
Meun duily energy balance
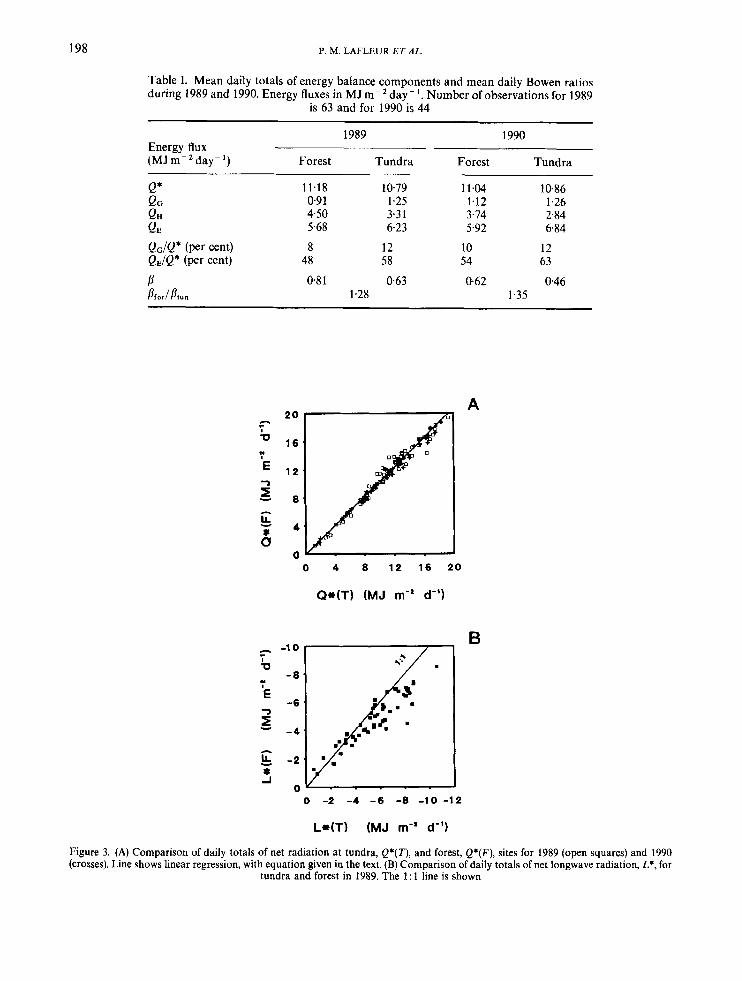
Average daily totals of energy balance components for 1989 and 1990 are presented in Table I. Net radiation varied little between the two sites and was slightly larger (2-5 per cent) at the forest site. The close relationship between daily totals of net radiation for the forest, Q*(F), and tundra, Q*(T), is shown in Figure 3(a). Linear regression for all data (n= 107) in Figure 3(a) produced the following relationship;
Q*(T)=0.27+0.95[Q*(F)] MJm-'day-', r2=0.98, s.e.=0.625. (3)
No statistically significant difference was found between the 1989 and 1990 data sets. Given the close proximity of these sites, it is reasonable that incoming solar and incoming longwave radiation were similar for the two surfaces. Thus, the difference between Q * ( F ) and Q*(T) was derived from variations in radiation interaction with the surfaces. Albedo accounted for only a small part of this difference. Daily albedos for the tundra ranged between 0.10 and 0.15, with a mean of 0.13. Forest albedos ranged from 0.11 to 0.14 with a mean of 0.12. Figure 3(b) shows that when net longwave losses were large (25.0 MJm-2day-'), which occurred predominantly on sunny days, L*( T ) usually exceeded L*(F). This suggests that surface radiative temperatures were larger on the tundra.
ENERGY BALANCE DIFFERENCES IN CANADA 197
30
0
I
I , , , , , , , , I , , , , , , , , , , , , , , , , , , , , / , , , , , , , I ,,,,,,,,,,~-,a,, I
June30 July 15 July30 Aug 15 Aug30 -...
30
2 - 0
-1 0
-20
-30
-40
Figure 2. Meteorological record for the study periods in 1989 (top) and 1990 (bottom). Water table elevation is for the tundra site, where the reference is to an arbitrary datum
Ground heat flux was a relatively modest component of Q* at both sites. QG/Q* averaged 012 for the tundra and 0.09 for the forest. The slightly larger ground heat flux at the tundra was attributed to a larger amount of energy consumed in melting permafrost, which underlay all of the area. Seasonal frost penetrated only to about 0.6 m in the forest.
The largest differences in energy balance components between sites were in the sensible and latent heat fluxes (Table I). Despite the varied meteorological conditions between 1989 and 1990, differences between QH and QE were consistent. For both years, mean daily QE was largest for the tundra surface and QH was largest for the forest. Although Bowen ratios were larger in 1989, when drier conditions prevailed, the ratio of
vaned only slightly between years. On average, daily Bowen ratios for the forest were approximately 1.3 times those at the tundra.
Evaporation was similar between years at each site. Mean daily QE during 1989 was 5-68 MJ m-' day- for the forest and 6.23 MJ m-* day- for the tundra, which corresponded to evaporative losses of 2.24 mm day-'
198 P. M. LAFLEUR ET A L
Table I. Mean daily totals of energy balance components and mean daily Bowen ratios during 1989 and 1990. Energy fluxes in MJ rn-' day- '. Number of observations for 1989
is 63 and for 1990 is 44
1989 1990 Energy flux (MJm-2day-') Forest Tundra Forest Tundra
11.18 10.79 0.9 1 1.25 4.50 3.3 1 5.68 6.23
8 12 48 58
0.8 1 0-63 1.28
11.04 10.86 1.12 1.26 3.74 2.84 5.92 6.84
10 12 54 63
062 0.46 1.35
A 2 0
u 16
12
- 8
L
A r
I
2 A
Y
8 4
CL
U v - -~ .
0 4 8 12 16 2 0
- -1 0
-8
r
u
€ -6
- 4 Y 5 A
& -2 8 4
0
B
L*(T) (MJ m-* d-'1
Figure 3. (A) Comparison of daily totals of net radiation at tundra, Q*(T), and forest, Q*(F) , sites for 1989 (open squares) and 1990 (crosses). Line shows linear regression, with equation given in the text. (B) Comparison of daily totals of net longwave radiation, I,*, for
tundra and forest in 1989. The 1 : 1 line is shown
ENERGY BALANCE DIFFERENCES IN CANADA 199
and 2.45 mmday-', respectively. During 1990, daily QE averaged 5.92 MJ day-' at the forest and 6.84 MJ m-2 day-' at the tundra, giving daily water losses of 2.33 and 2.69 mmday-', respectively.
Seasonal behauiour
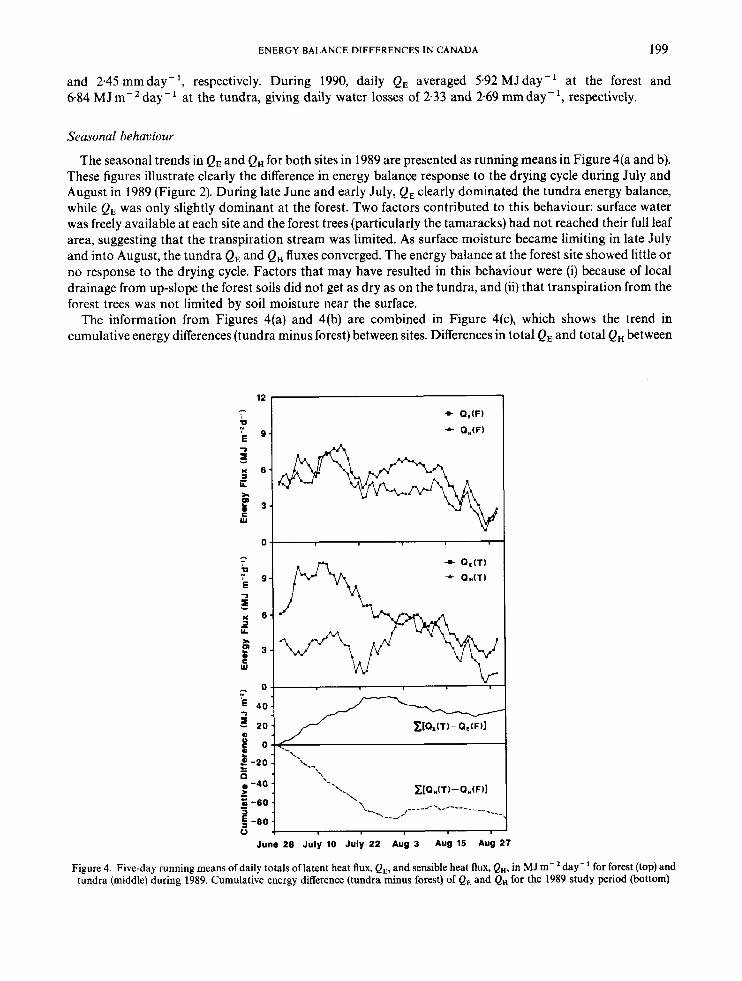
The seasonal trends in QE and QH for both sites in 1989 are presented as running means in Figure 4(a and b). These figures illustrate clearly the difference in energy balance response to the drying cycle during July and August in 1989 (Figure 2). During late June and early July, QE clearly dominated the tundra energy balance, while QE was only slightly dominant at the forest. Two factors contributed to this behaviour: surface water was freely available at each site and the forest trees (particularly the tamaracks) had not reached their full leaf area, suggesting that the transpiration stream was limited. As surface moisture became limiting in late July and into August, the tundra QE and QH fluxes converged. The energy balance at the forest site showed little or no response to the drying cycle. Factors that may have resulted in this behaviour were (i) because of local drainage from up-slope the forest soils did not get as dry as on the tundra, and (ii) that transpiration from the forest trees was not limited by soil moisture near the surface.
The information from Figures 4(a) and 4(b) are combined in Figure 4(c), which shows the trend in cumulative energy differences (tundra minus forest) between sites. Differences in total QE and total QH between
12 1
June 28 July 10 July 22 Aug 3 Aug 15 Aug 27
Figure 4. Five-day running means of daily totals of latent heat flux, QE, and sensible heat flux, QH, in MJ m-2 day-' for forest (top) and tundra (middle) during 1989. Cumulative energy difference (tundra minus forest) of Qe and QH for the 1989 study period (bottom)
200 P. M. LAFLEUR ET AL.
tundra and forest were largely accumulated during the first half of the study, when water tables were high. As surface drying continued the energy difference between sites decreased slightly. For the study period, the tundra used about 35 MJm-2 more energy as QE, while the forest generated about 70 MJ m-' more energy as QH.
Sensitivity of QE to meteorological changes
It is well documented that for sites near the subarctic coast, partitioning of Q* is highly correlated with wind direction (Rouse et al., 1987; Lafleur and Rouse, 1988). This phenomenon is chiefly a function of variations in air temperature and vapour pressure deficit, D,, associated with source areas for onshore and offshore winds. Table I1 gives the mean fl for days dominated by onshore and offshore winds. Two important features are
Table 11. Mean Bowen ratios, B, with standard deviations, u, in brackets for days dominated by onshore and offshore winds. T, is mean air temperature ("C), D, is mean vapour pressure deficit (kPa) of the sites, and n is the number of
days used.
Year
1989 Onshore Offshore Offshore/onshore
1990 Onshore Offshore Offshore/onshore
092 (0.357) 082 (0.508) 37 12.6 0.45 0.67 (0.297) 034 (0327) 22 15.4 0.81 0.73 0.4 1 066 (0292) 054 (0373) 27 10.6 0.35 0.56 (0.232) 0.33 (0.297) 17 13.6 0.62 0.85 0.6 1
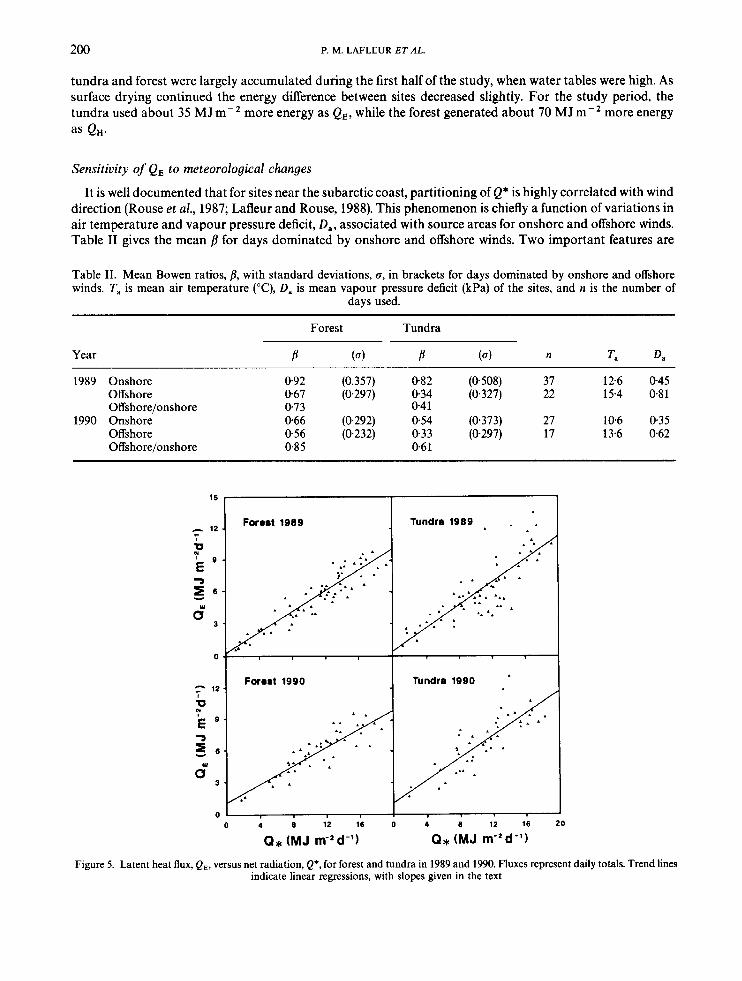
0 0 4 6 12 16 0 4 8 12 16 20
Q* (MJ rn-? d-'1 Q* (MJ rn-*d-')
Figure 5. Latent heat flux, QE, versus net radiation, Q*, for forest and tundra in 1989 and 1990. Fluxes represent daily totals. Trend lines indicate linear regressions, with slopes given in the text
ENERGY BALANCE DIFFERENCES IN CANADA 20 1
I
U
I /
C
I I
0.00 0.30 0.60 0.90 1.20 0.00 0.30 0.60 0.90 1.20 1.50
D, (kPa) DB (kPa)
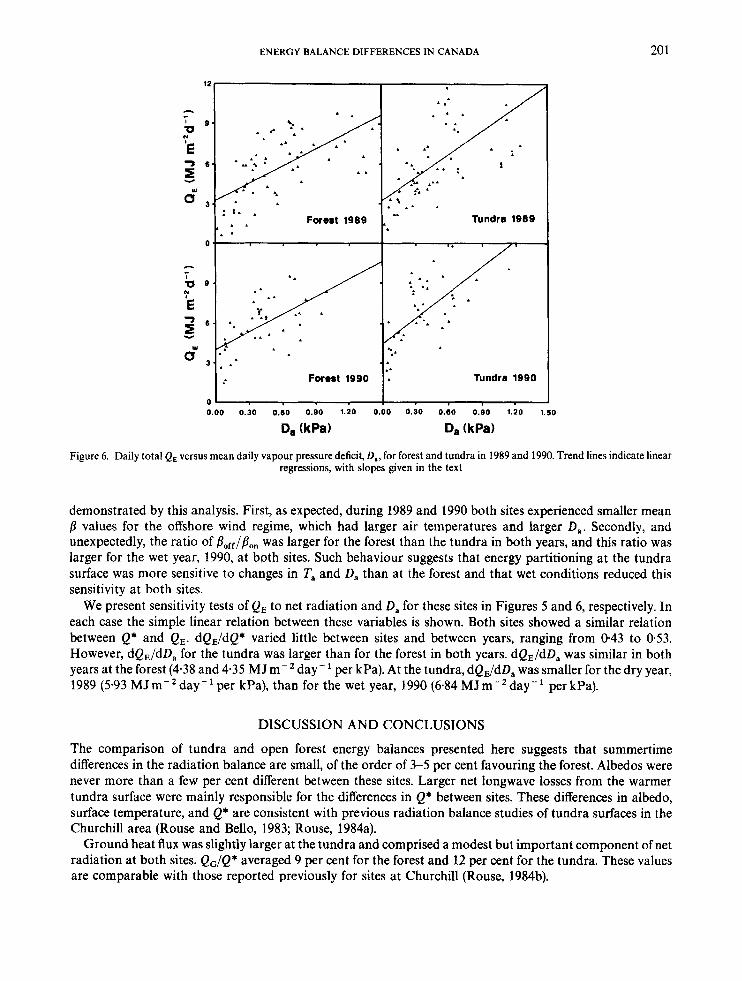
Figure 6. Daily total QE versus mean daily vapour pressure deficit, D,, for forest and tundra in 1989 and 1990. Trend lines indicate linear regressions, with slopes given in the text
demonstrated by this analysis. First, as expected, during 1989 and 1990 both sites experienced smaller mean fi values for the offshore wind regime, which had larger air temperatures and larger Da. Secondly, and unexpectedly, the ratio of poff/Pon was larger for the forest than the tundra in both years, and this ratio was larger for the wet year, 1990, at both sites. Such behaviour suggests that energy partitioning at the tundra surface was more sensitive to changes in T, and D, than at the forest and that wet conditions reduced this sensitivity at both sites.
We present sensitivity tests of QE to net radiation and D, for these sites in Figures 5 and 6, respectively. In each case the simple linear relation between these variables is shown. Both sites showed a similar relation between Q* and QE. dQ,/dQ* varied little between sites and between years, ranging from 0.43 to 0.53. However, dQ,/dD, for the tundra was larger than for the forest in both years. dQ,/dD, was similar in both years at the forest (4.38 and 4.35 MJ m-' day- ' per kPa). At the tundra, dQJdD, was smaller for the dry year, 1989 (5.93 MJm-2day-1per kPa), than for the wet year, 1990 (6-84 MJm-2day-' perkpa).
DISCUSSION AND CONCLUSIONS
The comparison of tundra and open forest energy balances presented here suggests that summertime differences in the radiation balance are small, of the order of 3-5 per cent favouring the forest. Albedos were never more than a few per cent different between these sites. Larger net longwave losses from the warmer tundra surface were mainly responsible for the differences in Q* between sites. These differences in albedo, surface temperature, and Q* are consistent with previous radiation balance studies of tundra surfaces in the Churchill area (Rouse and Bello, 1983; Rouse, 1984a).
Ground heat flux was slightly larger at the tundra and comprised a modest but important component of net radiation at both sites. QG/Q* averaged 9 per cent for the forest and 12 per cent for the tundra. These values are comparable with those reported previously for sites at Churchill (Rouse, 1984b).
202 P. M. LAFLEUR ET A L
It appears that surface wetness was the single most important factor in determining contrasts in the energy balance components between tundra and forest. When standing water was prevalent on both surfaces, during late June and early July 1989 and throughout 1990, the tundra returned more latent heat to the atmosphere than forest, while the forest returned more sensible heat to the atmosphere (Figure 4). During the dry period in late July and early August 1989, forest Bowen ratios were comparable to the tundra values. For both years of the study, average f l at both sites was less than unity, which is consistent with previous studies for tundra (Weller and Holmgren, 1974; Ohmura, 1982b; Rouse, 1984c) and subarctic forest (Pugsley, 1970; Rouse et al., 1977).
The results of this study have important climatological and hydrological implications. The climatic significance of differences in energy partitioning is that QH generally warms the lower troposphere, while QE goes into heating the middle and upper troposphere. Both mechanisms are important for air mass modification and could have implications for the observed geographical associations between treeline and general circulation (Bryson, 1966). Further speculation on this matter, however, is beyond the scope of this study.
The hydrological implications of this study are more direct. Evaporation losses from subarctic basins with forests are probably smaller than those from wet non-forested subarctic basins, which has direct implications for basin runoff. The difference in the latent heat flux between tundra and forest (35 MJmP2) in 1989 represented a difference of about 14 mm (0.21 mmday-l) more evaporation loss from the tundra. This amount corresponds to about 12 per cent of the normal precipitation total for the period. During the wet year, 1990, daily evaporation losses from the tundra averaged 0.33 mm day-' more than at the forest, correspond- ing to about 20 per cent of the mean daily summer precipitation (1.66 mm day-') at Churchill.
The larger evaporation rate from wet tundra is a result of the greater sensitivity of tundra surfaces to changes in D, (Figure 6). This behaviour is in direct contrast to typical forest<rop micrometeorological thinking. Studies of mid-latitude biomes have indicated that forest canopies are usually well coupled to the atmosphere and QE responds more strongly to changes in D, than changes in Q*, whereas crops or grassland are generally poorly coupled to the atmosphere and the behaviour of QE is most closely linked with Q* (McNaughton and Jarvis, 1983). A possible explanation for the anomalous behaviour of this subarctic forest is that the canopy plays only a small role in total QE. as has been suggested elsewhere (Lafleur, 1992). Evaporation from the forest floor would be subject to gradients and aerodynamic processes within the canopy before reaching the overhead air stream. If substrate evaporation is the dominant stream of total QE, the subarctic forest might be expected to be more poorly coupled to the regional air stream than the tundra. Given this reasoning, it might be expected that climate warming (with large D,) would have a greater impact on tundra environments than on subarctic forest.
The results of this study suggest that changes in treeline position could have significant impacts on northern hydrology. Treeline shifts could clearly affect the water balance of basins, perhaps making more water available for runoff. It is not yet clear how changes in forest parameters, such as tree density and species, would influence such impacts. Infilling of the subarctic open forests, which has been documented in northern Quebec (Payette and Filion, 1985), could in all likelihood further decrease evaporation losses from the forests (Lafleur, 1992) increasing the difference between tundra and forest.
In conclusion, the results of this study suggest that energy balance differences across the northern treeline are confined largely to the convective fluxes of sensible and latent heat. Differences in latent heat fluxes found in this study were significant enough to suggest that the treeline represents an important climatological and hydrological discontinuity. This then has important implications for possible climate and/or vegetation changes.
ACKNOWLEDGEMENTS
This research was supported by grants from the Natural Sciences and Engineering Research Council of Canada to both W. R. Rouse and P. M. Lafleur. Support in the form of northern training grants was provided by the Canadian Department of Indian and Northern Affairs. Logistical and monetary support from the Churchill Northern Studies Centre was greatly appreciated. P. Blanken, W. G. Dicks, S. Holland, L. Kadonaga, and D. Wessel provided assistance with the data collection.
ENERGY BALANCE DIFFERENCES IN CANADA 203
REFERENCES
Bryson, R. A. 1966. ‘Air masses, streamlines and the boreal forest’, Geogr. Bull., 8, 228-269. Halliwell, D. H. and Rouse, W. R. 1987. ‘Soil heat flux in permafrost: characteristics and accuracy of measurement’, Znt. J . Climatol., 7,
Halliwell, D. H. and Rouse, W. R. 1989. ‘A comparison of sensible and latent heat flux calculations using the Bowen ratio and
Hare, K. F. and Ritchie, J. C. 1972. ‘Boreal bioclimates’, Geogr. Rev., 62, 333-365. Lafleur, P. M. 1992. ‘Energy balance and evaporation of a subarctic forest’, Agric. Forest Meteorol. (in press). Laneur, P. M. and Rouse, W. R. 1988. ‘The influence of surface cover and climate on energy partitioning and evaporation in a subarctic
McNaughton, K. G. and Jarvis, P. G. 1983. ‘Predicting the effects of vegetation changes on transpiration and evaporation’, in Kozlowski
Ohmura, A. 1982a. ‘A historical review of studies of the surface energy balance of Arctic tundra’, J . Climatol., 2, 185-195. Ohmura, A. 1982b. ‘Climate and energy balance on the Arctic tundra’, J . Climatol., 2, 65-84. Payette, S. and Filion, L. 1985. ‘White spruce expansion at the tree line and recent climatic change’, Can. J . Forest Res., 15, 241-251. Pugsley, W. I. 1970. The Surface Energy Budget of Central Canada, Publications in Meteorology No. 96, Department of Meteorology,
Rouse, W. R. 1984a. ‘Microclimate at the Arctic treeline. 1. Radiation balance of tundra and forest’, Water Resour. Res., 20, 57-66. Rouse, W. R. 1984b. ‘Microclimate at the Arctic treeline. 2. Soil microclimate of tundra and forest’, Water Resour. Res., 20, 67-73. Rouse, W. R., 1984c. ‘Microclimate at the Arctic treeline. 3. The effects of regional advection on the surface energy balance of upland
Rouse, W. R. and Bello, R. L. 1983. ‘The radiation balance of typical terrain units in the low arctic’, Ann. Assoc. Am. Geogr., 73, 538-549. Rouse, W. R. and Bello, R. L. 1985. ‘Impact of Hudson Bay on the energy balance in the Hudson Bay Lowlands and potential for climatic
Rouse, W. R., Mills, P. F. and Stewart, R. B. 1977. ‘Evaporation in high latitudes’, Water Resour. Res., 13, 909-914. Rouse, W. R., Hardill, S. G. and Lafleur, P. M. 1987. ‘The energy balance in the coastal environment ofJames and Hudson Bay during the
Scott, P. A,, Bentley, C. V., Fayle, D. C. F. and Hansel], R. I. C. 1987. ‘Crown forms and shoot elongation of white spruce at the treeline,
Weick, E. J. and Rouse, W. R. 1991. ‘Advection in the coastal Hudson Bay Lowlands: 1. The terrestrial surface energy balance’, Arctic
Weller, G. and Holmgren, B. 1974. ‘The microclimates of the arctic tundra’, J . Appl. Meteorol., 13, 854-862.
571 -584.
aerodynamic methods’, J . Atmos. Oceanic Technol., 6, 563-574.
wetland‘, Boundary-Layer Meteorol., 44, 327-341.
T. T. (ed.) Water Deficits and Plant Growth, Academic Press, New York, pp. 247 .
McGill University, Montreal, 58 pp.
tundra’, Water Resour. Rex, 20, 74-78.
modification’, Atmos. Ocean, 23, 375-384.
growing season’, J . Climatol., 7, 165-179.
Churchill, Manitoba, Canada’, Arctic Alpine Res., 19, 175-186.
Alpine Rex, 23, 328-337.