Embed Size (px)
Citation preview
Energy Efficiency for Materials and Manufacturing Industry in India
Rangan BanerjeeDepartment of Energy Science and Engineering
IIT Bombay
Invited talk at National Seminar Technology Thrusts on Materials & Manufacturing Sector in India, Kolkatta, July 28, 2016
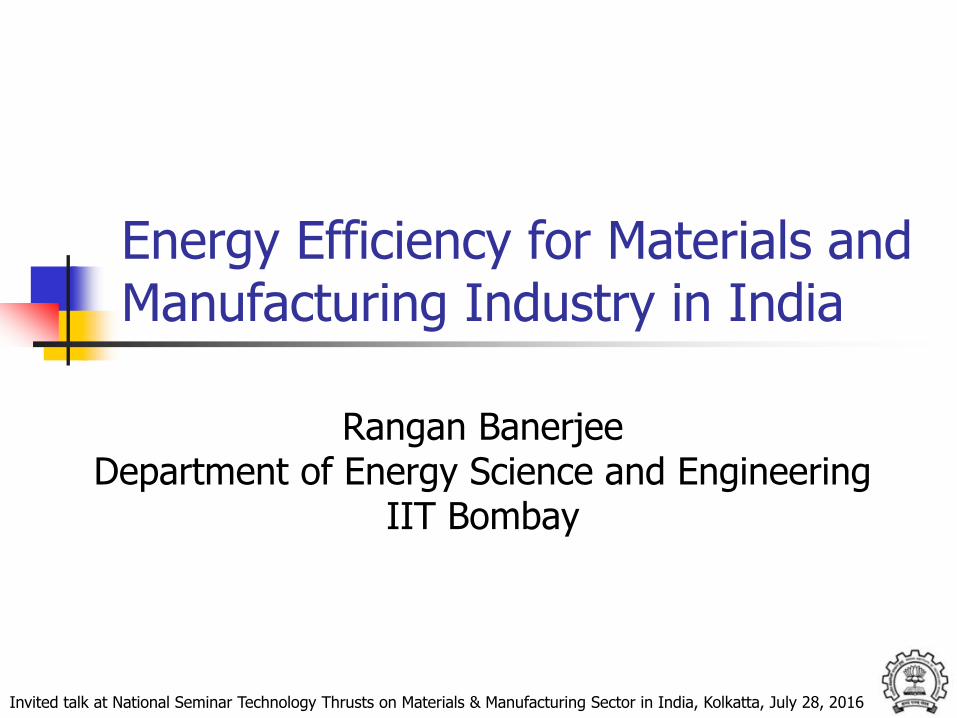
Non-metallic minerals
10%
Paper, pulp and print
6%
Food and tobacco
5%
Non-ferrous metals
3%
Machinery
4%
Textile and leather
2%
Mining and quarrying
2%
Construction
1%
Transport equipment
1%
Wood and wood products
1%
Iron and Steel
20%
Others
16%
Chemical and Petrochemical
29%
World India
45%
0%
1%
1%
1%
1%
6%
7%
18%
20% Iron and Steel
Chemical and Petrochemical
Non-metallic minerals
Food and Tobacco
Paper, pulp an print
Textile and LeatherMining and Quarrying
Non-ferrous metals
Machinery
Others
Source: ETP, 2008
Share of industrial final energy use by different sectors in 2005
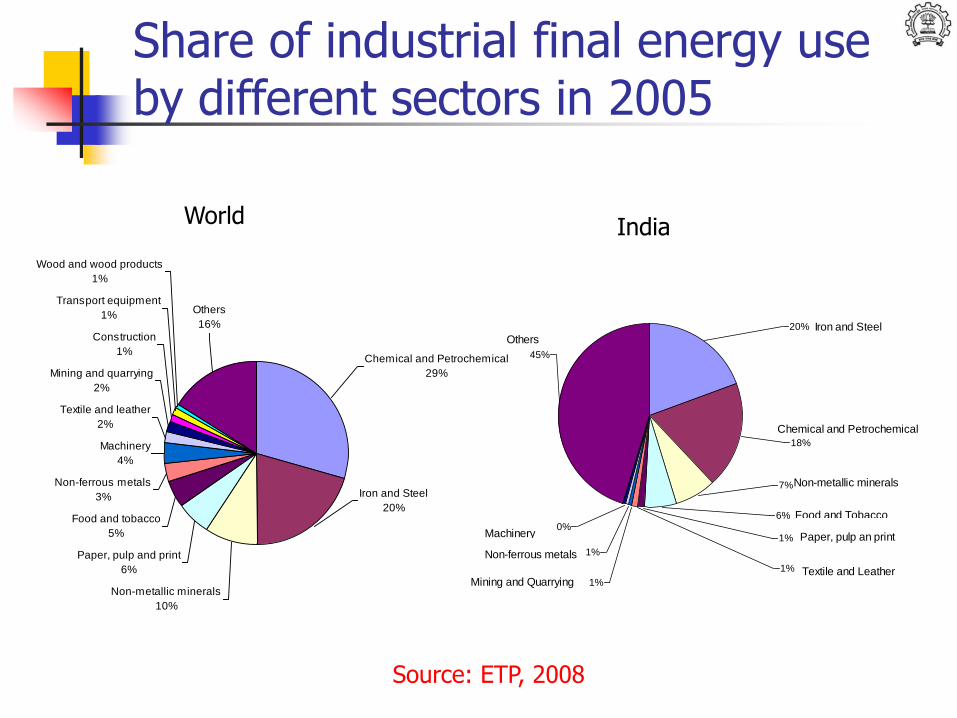
3
Total Material Production (Million Tons) - 2005
Regions Steel Cement Paper Ammonia Aluminium
US 95 101 91 10 2.5
China 355 1060 62 46.3 8.5
India 45 153 7 12 0.9
Brazil 31.6 36.7 10 0.95 1.4
South Africa 9.5 13 - 0.5 0.85
World 1146 2310 361 151 41
Regional Variation of Material Production in 2005
India (2012) 63 200 9.5 12 1.2
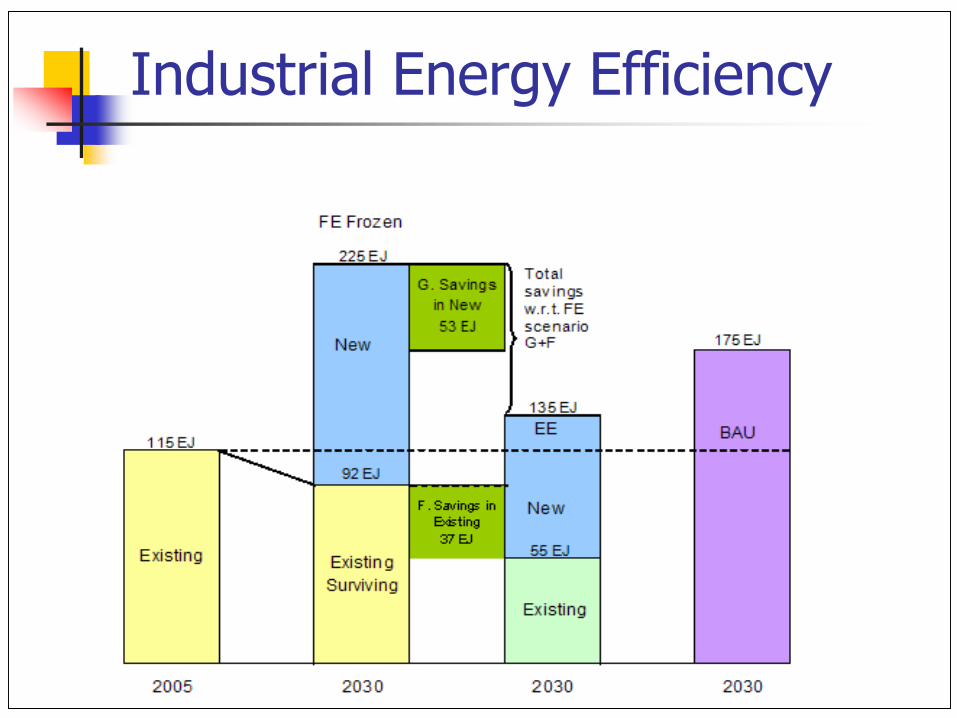
Industrial Energy Efficiency
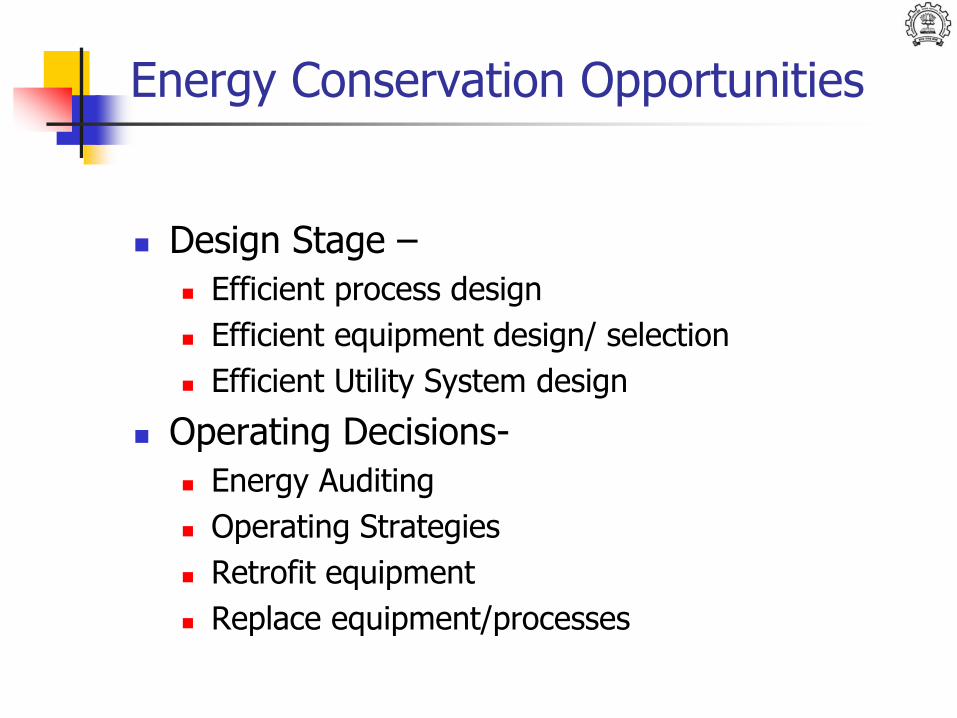
Energy Conservation Opportunities
Design Stage –
Efficient process design
Efficient equipment design/ selection
Efficient Utility System design
Operating Decisions-
Energy Auditing
Operating Strategies
Retrofit equipment
Replace equipment/processes
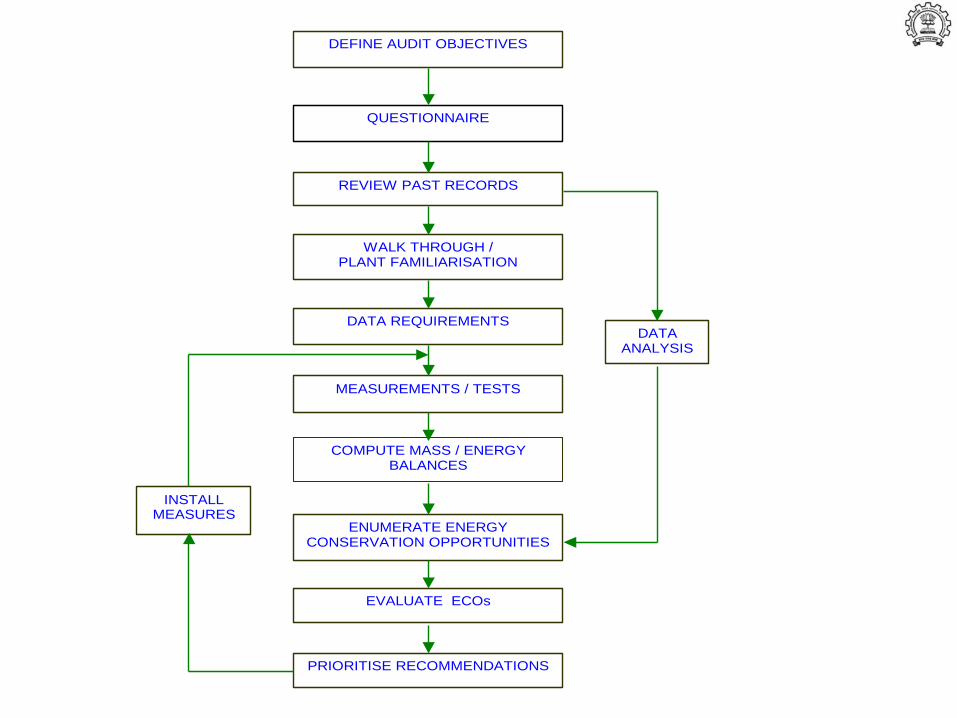
DEFINE AUDIT OBJECTIVES
QUESTIONNAIRE
REVIEW PAST RECORDS
WALK THROUGH / PLANT FAMILIARISATION
DATA REQUIREMENTS
MEASUREMENTS / TESTS
COMPUTE MASS / ENERGY BALANCES
ENUMERATE ENERGY CONSERVATION OPPORTUNITIES
EVALUATE ECOs
PRIORITISE RECOMMENDATIONS
DATA ANALYSIS
INSTALL MEASURES
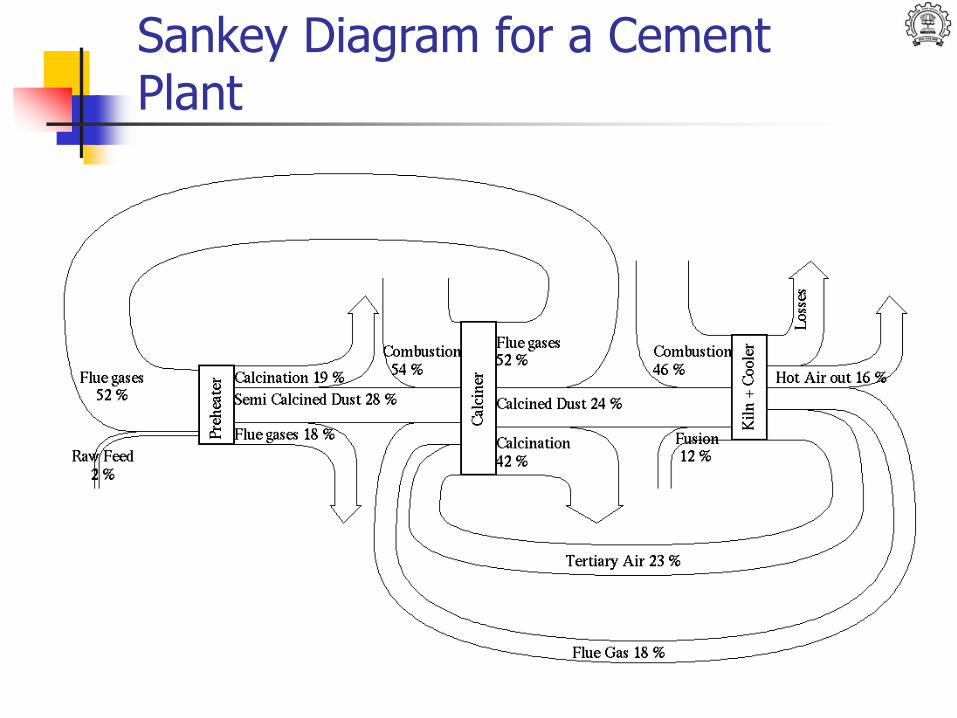
Sankey Diagram for a Cement Plant
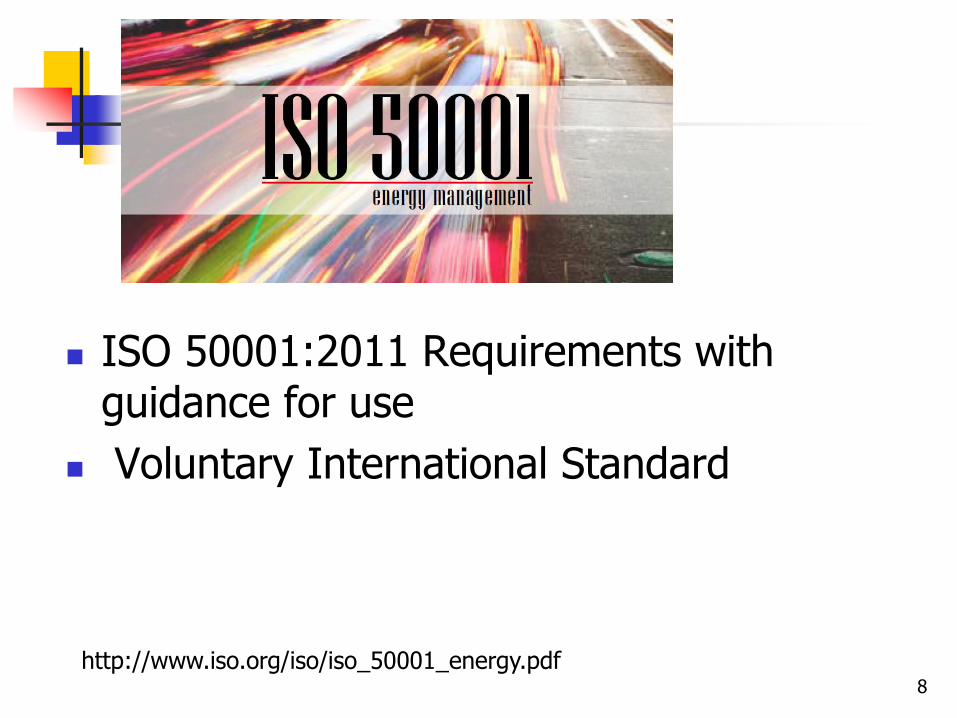
ISO 50001:2011 Requirements with guidance for use
Voluntary International Standard
8
http://www.iso.org/iso/iso_50001_energy.pdf
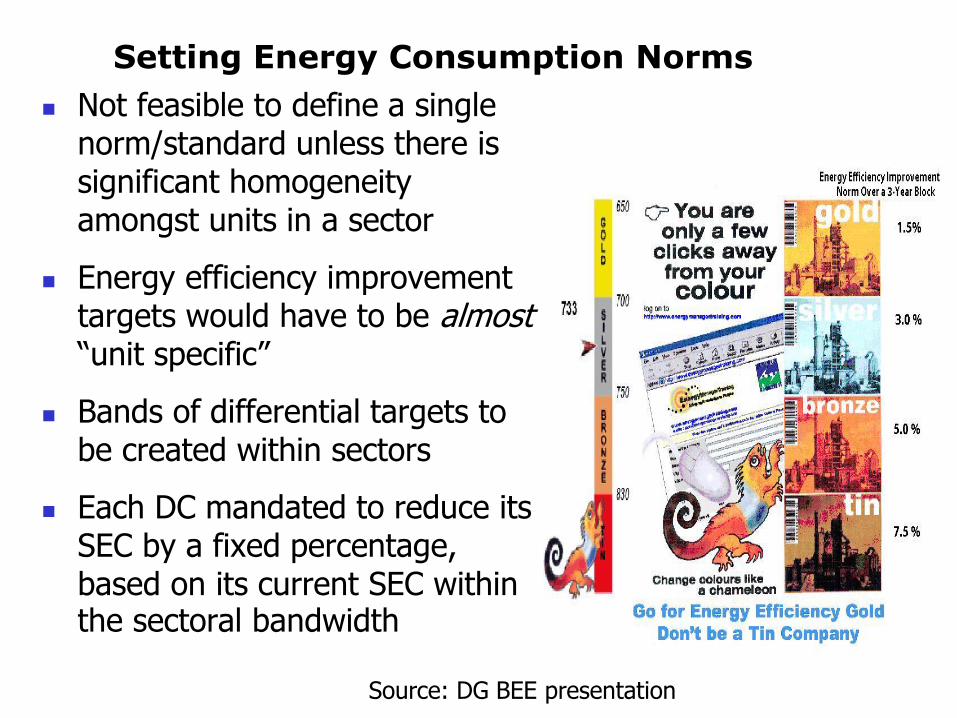
Not feasible to define a single norm/standard unless there is significant homogeneity amongst units in a sector
Energy efficiency improvement targets would have to be almost“unit specific”
Bands of differential targets to be created within sectors
Each DC mandated to reduce its SEC by a fixed percentage, based on its current SEC within the sectoral bandwidth
Setting Energy Consumption Norms
Source: DG BEE presentation
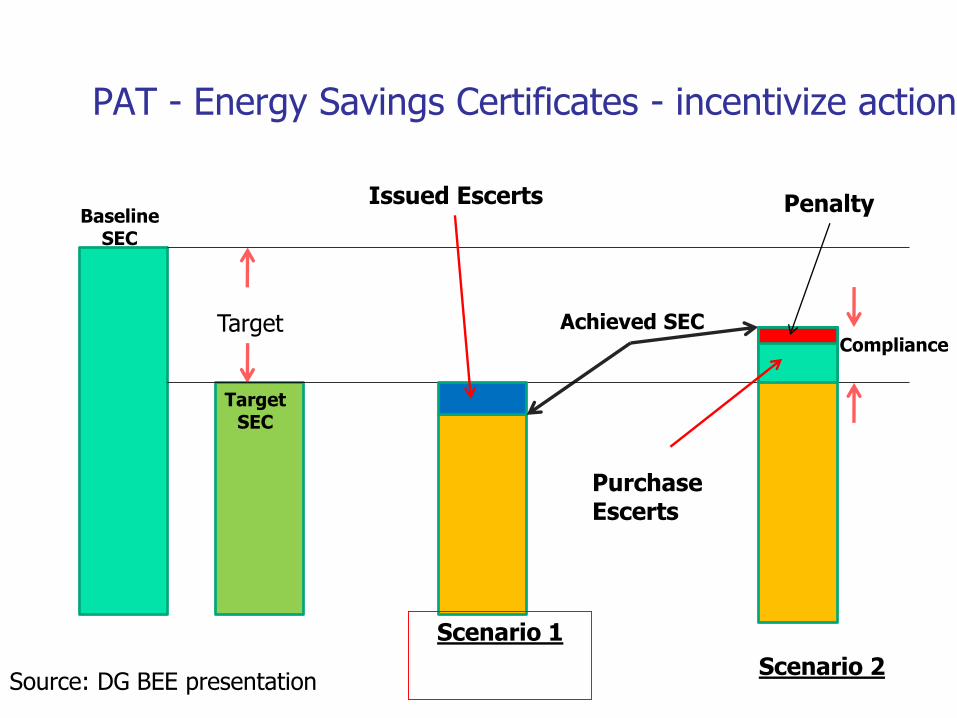
Target
Baseline SEC
Target SEC
Achieved SEC
Scenario 1
Scenario 2
Compliance
Issued Escerts
Purchase Escerts
Penalty
PAT - Energy Savings Certificates - incentivize actions
Source: DG BEE presentation
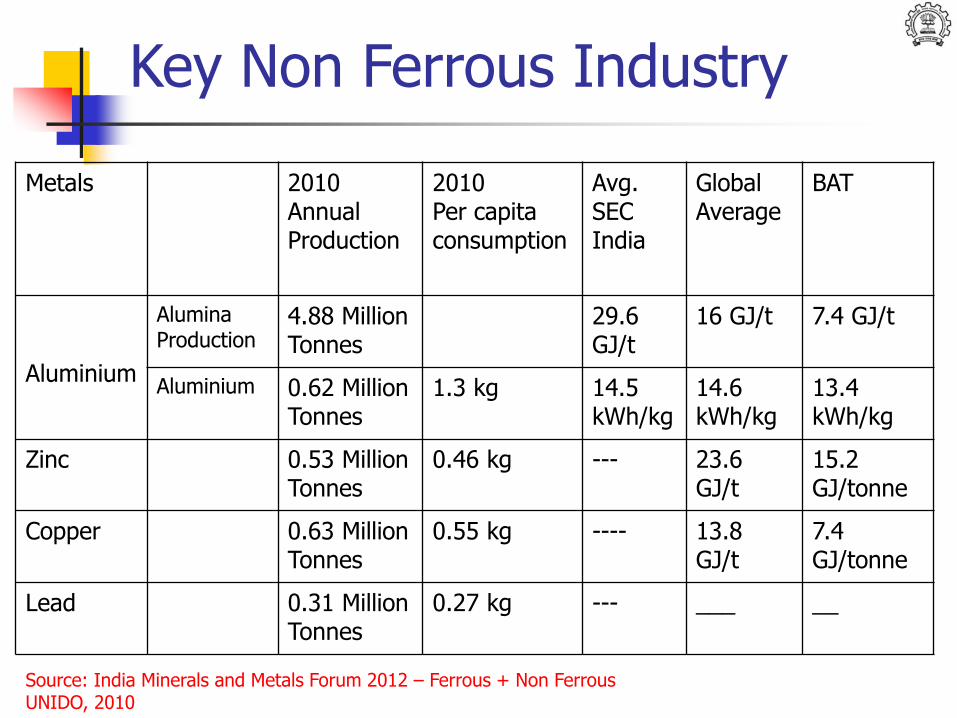
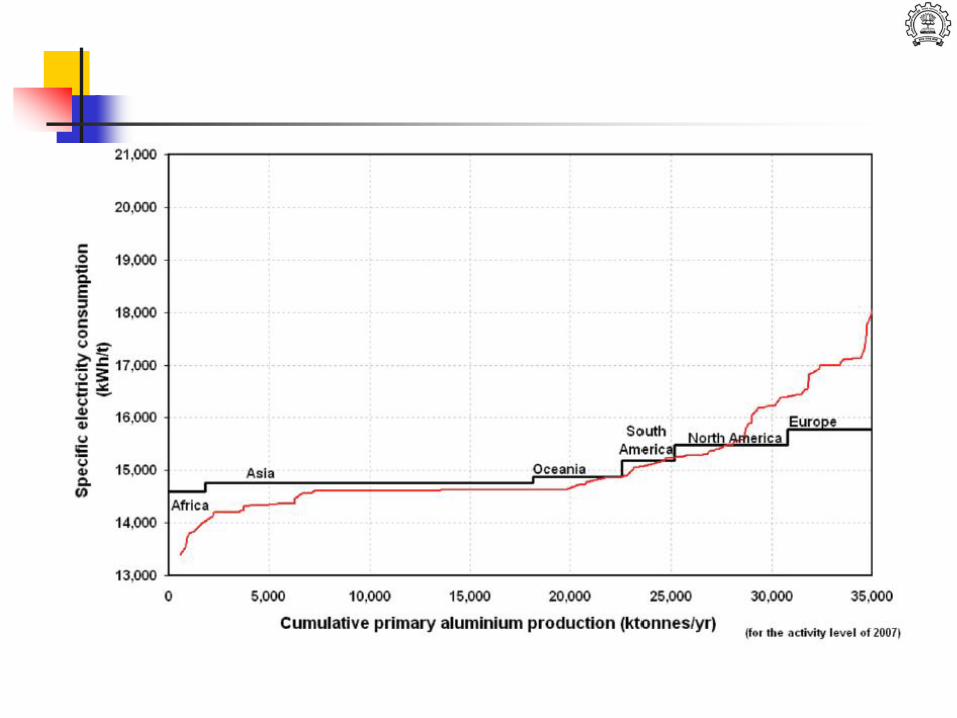
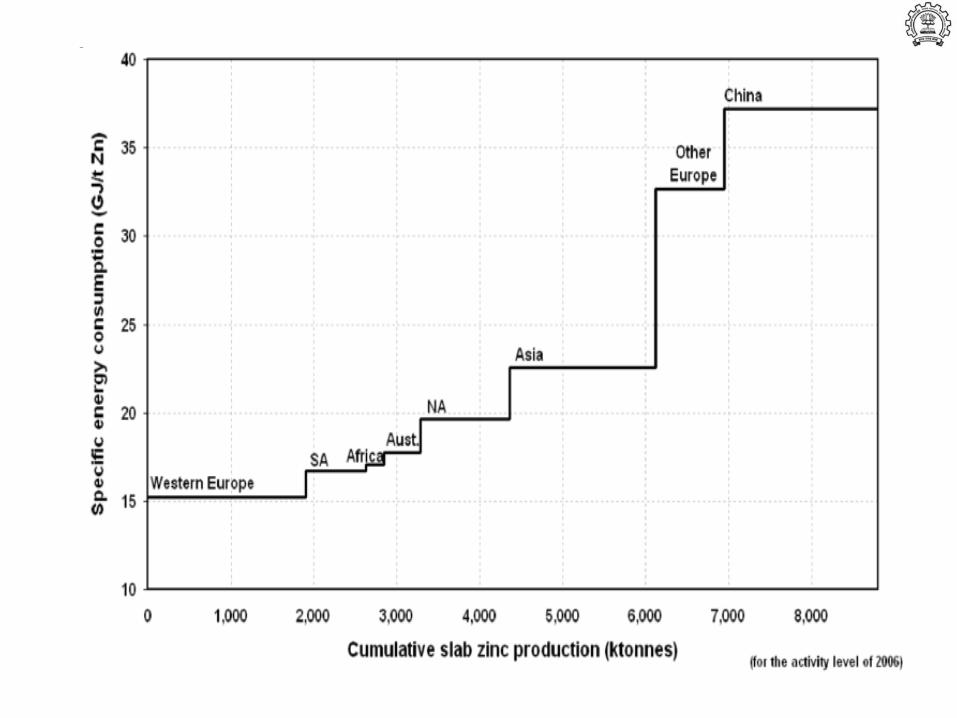
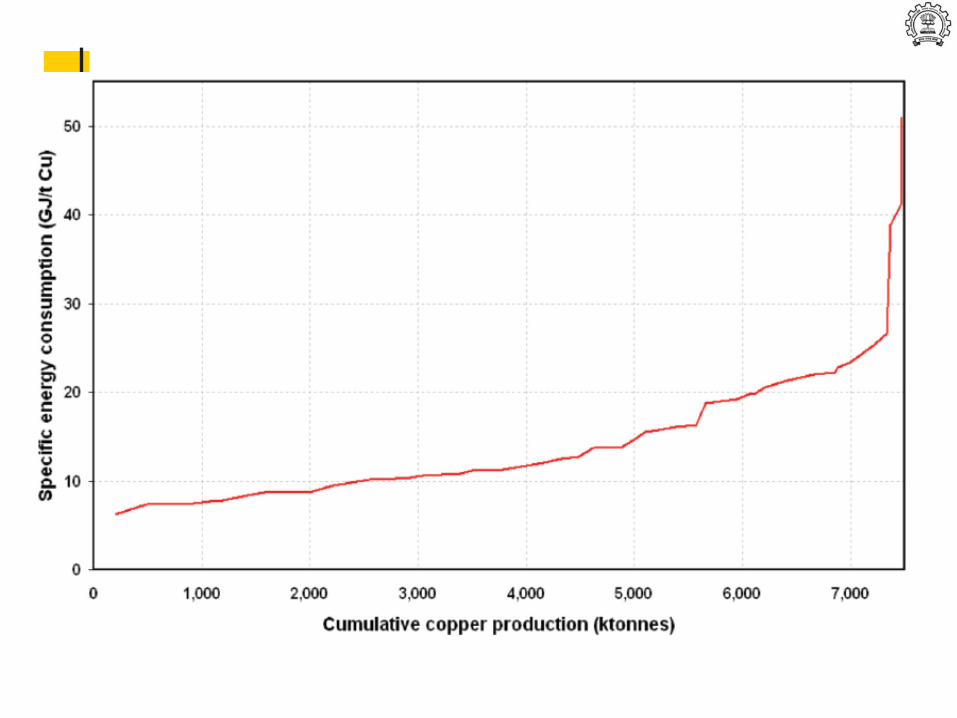
Metals 2010Annual Production
2010Per capita consumption
Avg.SEC India
Global Average
BAT
Aluminium
AluminaProduction
4.88 Million Tonnes
29.6 GJ/t
16 GJ/t 7.4 GJ/t
Aluminium 0.62 Million Tonnes
1.3 kg 14.5 kWh/kg
14.6kWh/kg
13.4 kWh/kg
Zinc 0.53 Million Tonnes
0.46 kg --- 23.6 GJ/t
15.2 GJ/tonne
Copper 0.63 Million Tonnes
0.55 kg ---- 13.8 GJ/t
7.4 GJ/tonne
Lead 0.31 Million Tonnes
0.27 kg --- ___ __
Source: India Minerals and Metals Forum 2012 – Ferrous + Non FerrousUNIDO, 2010
Key Non Ferrous Industry
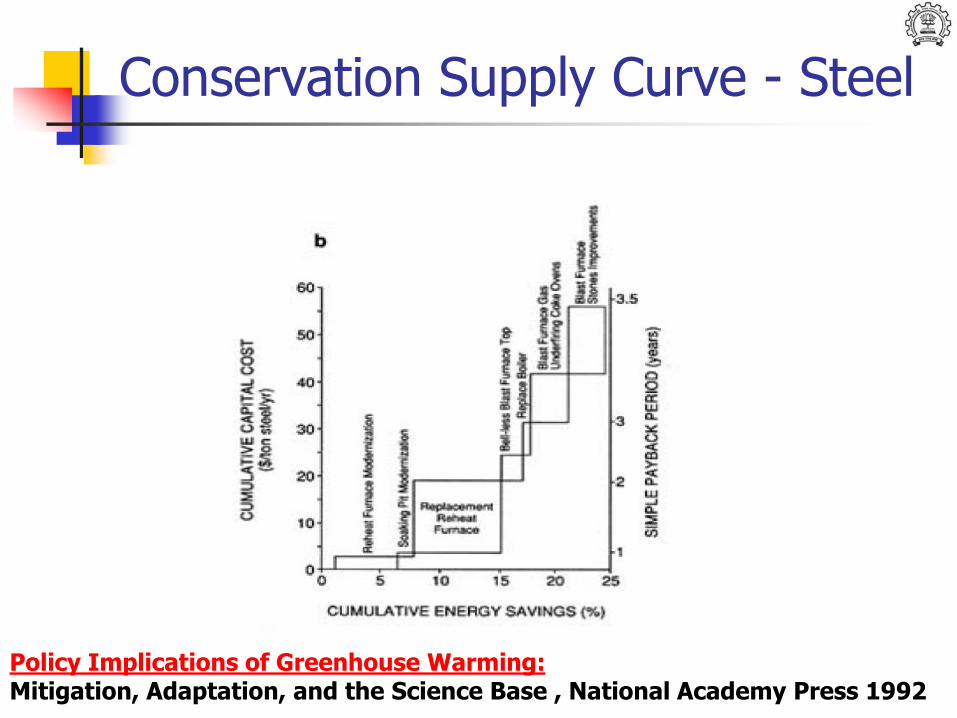
Conservation Supply Curve - Steel
Policy Implications of Greenhouse Warming: Mitigation, Adaptation, and the Science Base , National Academy Press 1992
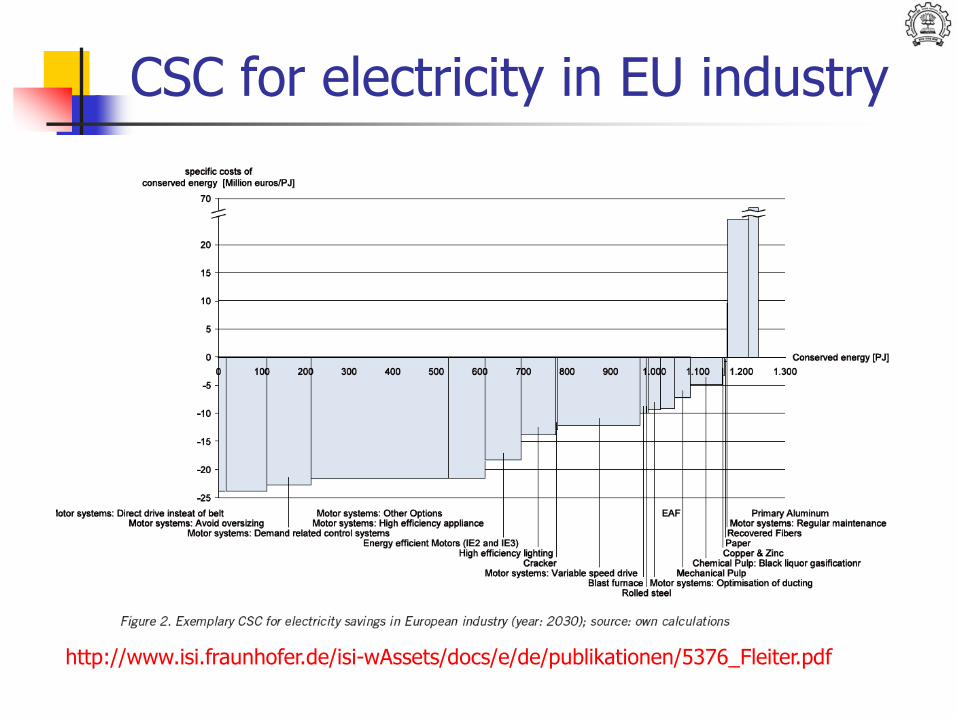
CSC for electricity in EU industry
http://www.isi.fraunhofer.de/isi-wAssets/docs/e/de/publikationen/5376_Fleiter.pdf
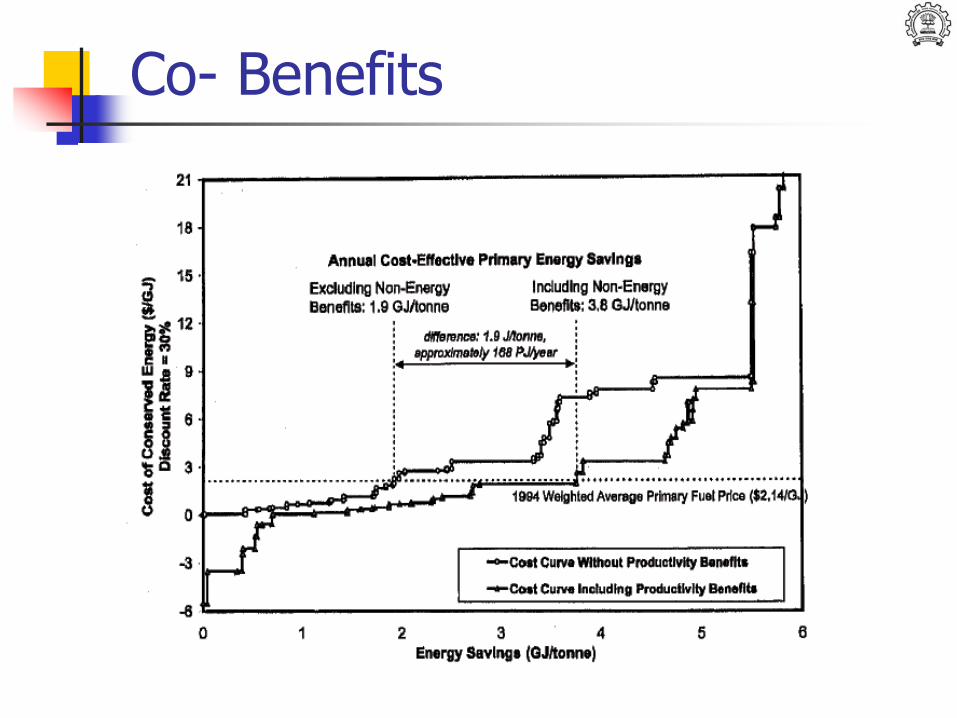
Co- Benefits
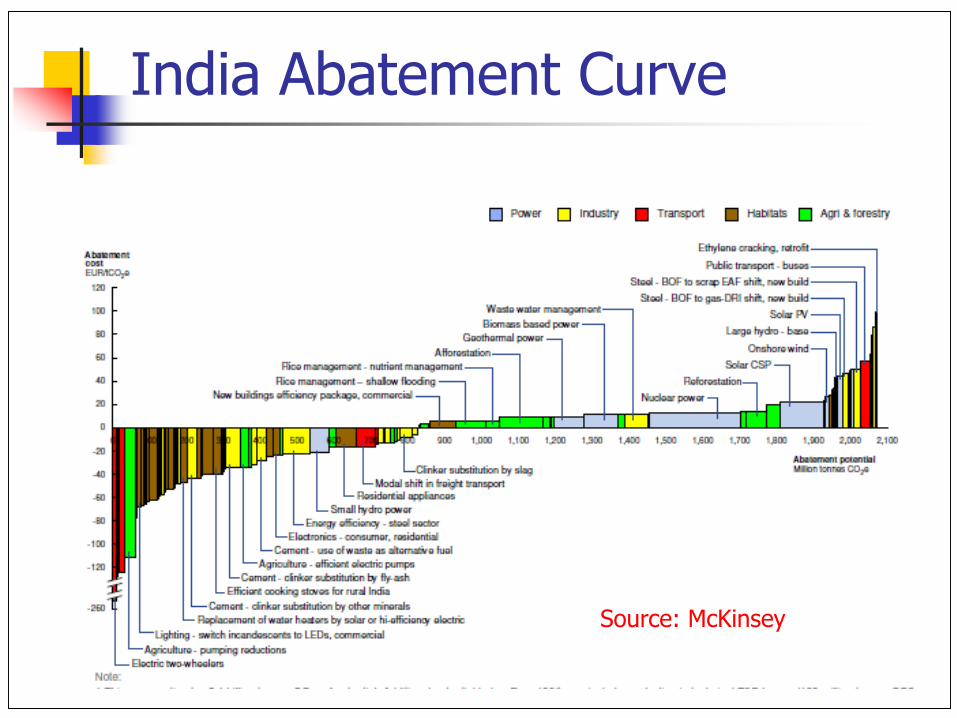
India Abatement Curve
Source: McKinsey
https://www.worldsteel.org/publications/factsheets/content/02/text_files/file0/document/fact_energy_2016.pdf
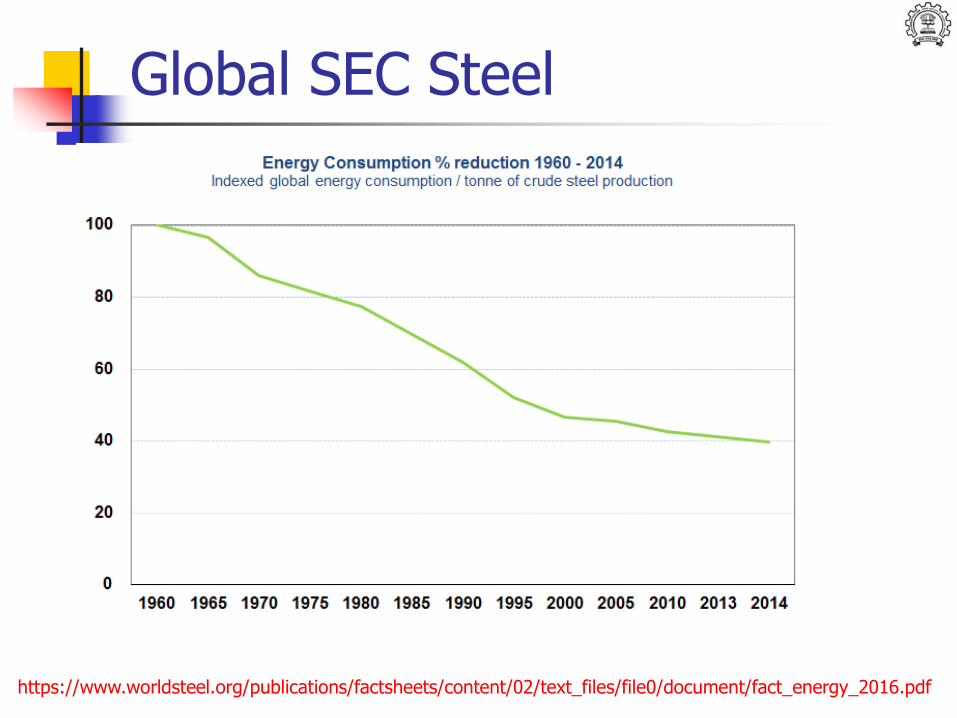
Global SEC Steel
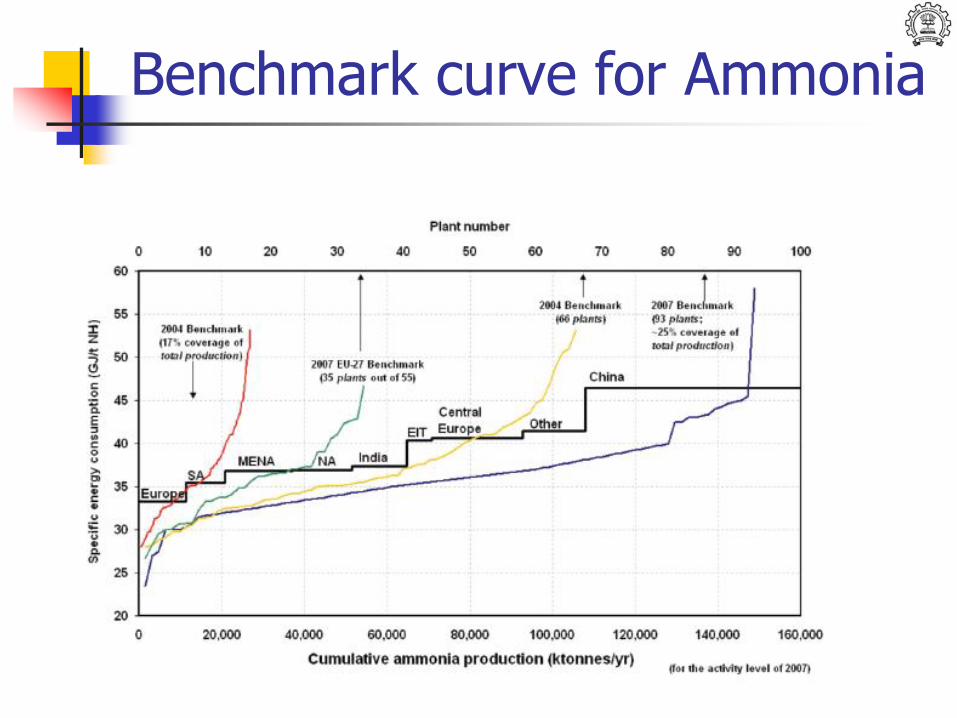
Benchmark curve for Ammonia
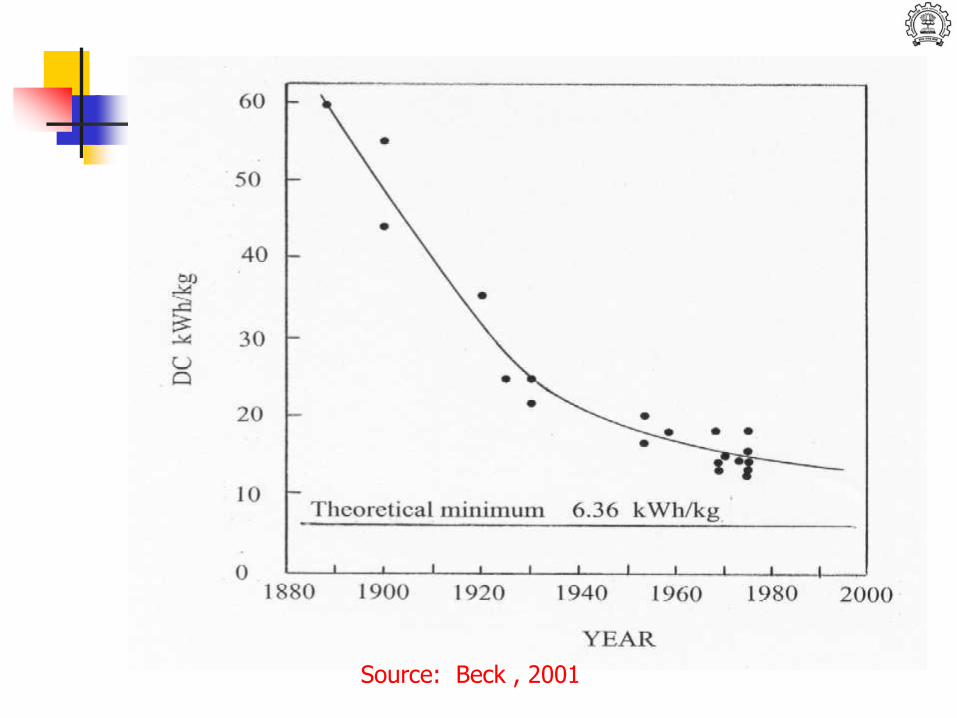
Source: Beck , 2001
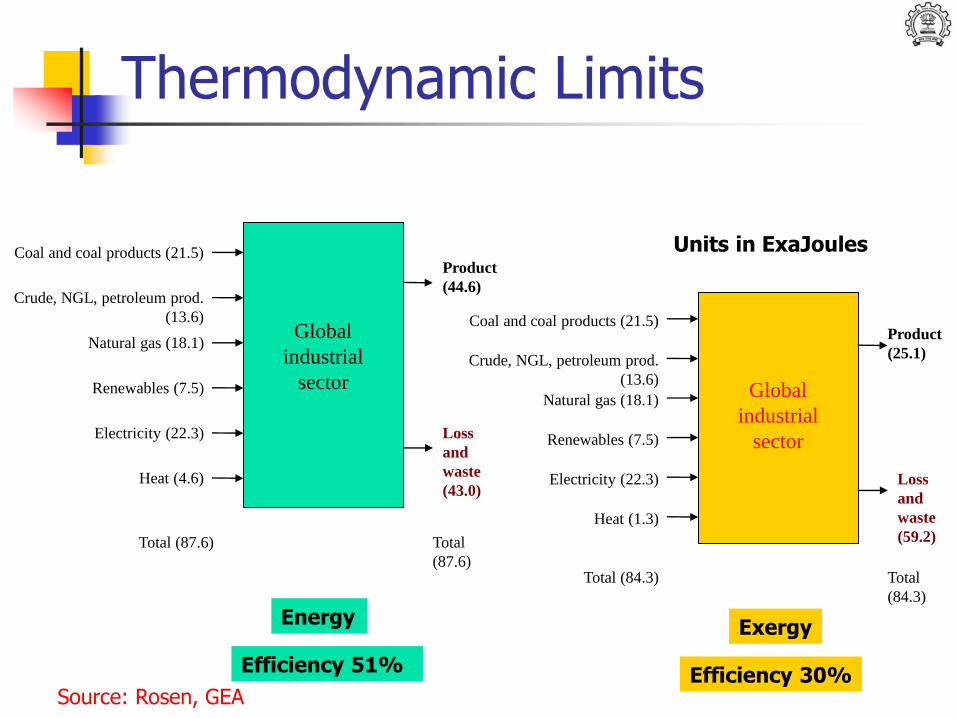
Thermodynamic Limits
Coal and coal products (21.5)
Crude, NGL, petroleum prod.
(13.6)
Natural gas (18.1)
Renewables (7.5)
Product
(44.6)
Loss
and
waste
(43.0)
Global
industrial
sector
Electricity (22.3)
Heat (4.6)
Total (87.6) Total
(87.6)
Coal and coal products (21.5)
Crude, NGL, petroleum prod.
(13.6)
Natural gas (18.1)
Renewables (7.5)
Product
(25.1)
Loss
and
waste
(59.2)
Global
industrial
sector
Electricity (22.3)
Heat (1.3)
Total (84.3) Total
(84.3)
Units in ExaJoules
Efficiency 51% Efficiency 30%
Energy Exergy
Source: Rosen, GEA
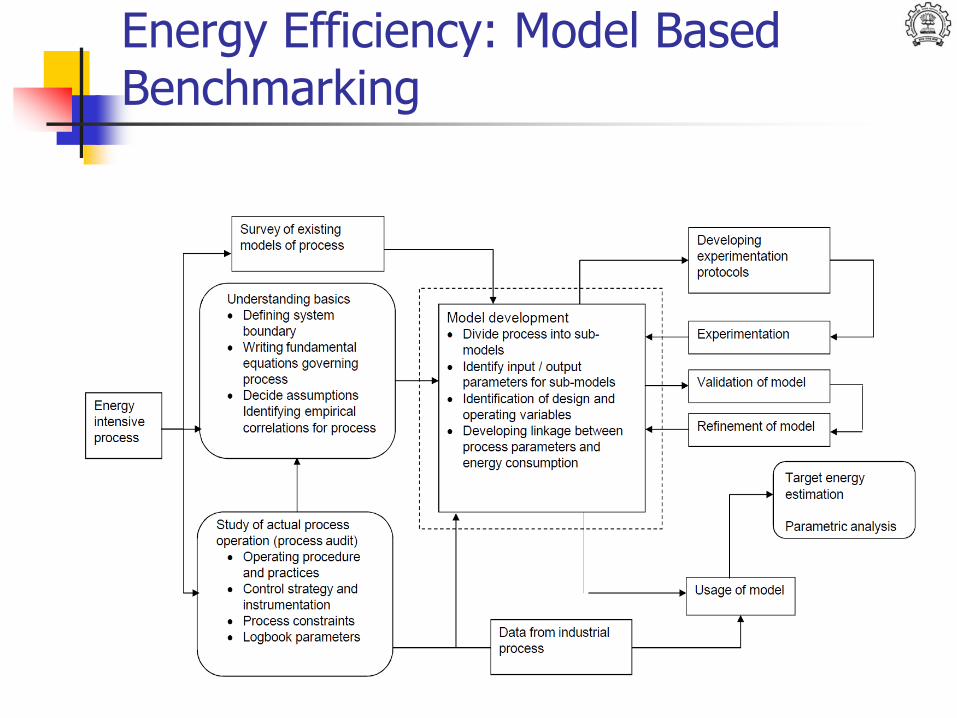
Energy Efficiency: Model Based Benchmarking
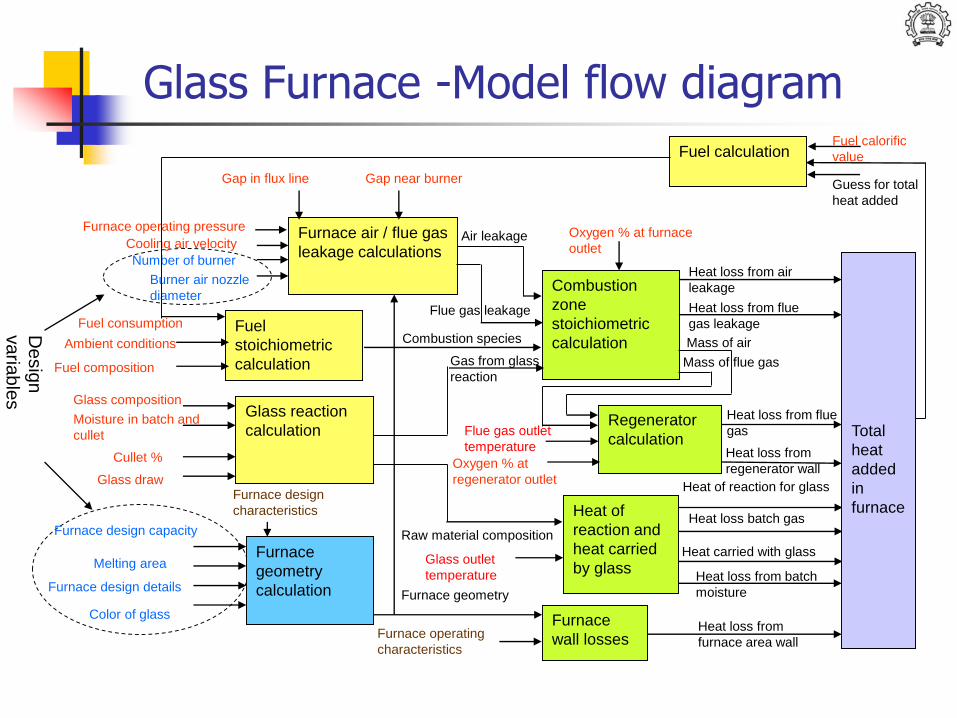
Glass Furnace -Model flow diagram
Mass of air
Flue gas leakage
Oxygen % at
regenerator outlet
De
sig
n
va
riab
les
Guess for total
heat added
Fuel
stoichiometric
calculation
Glass reaction
calculation
Furnace air / flue gas
leakage calculations
Gap in flux line Gap near burner
Furnace operating pressure
Cooling air velocity
Number of burner
Burner air nozzle
diameter
Furnace design capacity
Melting area
Furnace design details
Color of glass
Furnace geometry
Air leakage
Regenerator
calculationFlue gas outlet
temperature
Heat loss from flue
gas
Heat loss from
regenerator wall
Oxygen % at furnace
outlet
Combustion
zone
stoichiometric
calculation
Furnace
wall lossesFurnace operating
characteristics
Heat of
reaction and
heat carried
by glass
Mass of flue gas
Heat loss from
furnace area wall
Gas from glass
reaction
Raw material composition
Furnace
geometry
calculation
Furnace design
characteristics
Heat carried with glass
Heat of reaction for glass
Heat loss batch gas
Heat loss from batch
moisture
Total
heat
added
in
furnace
Fuel calculationFuel calorific
value
Fuel composition
Glass composition
Moisture in batch and
cullet
Cullet %
Glass draw
Fuel consumptionCombustion species
Heat loss from flue
gas leakage
Heat loss from air
leakage
Ambient conditions
Glass outlet
temperature
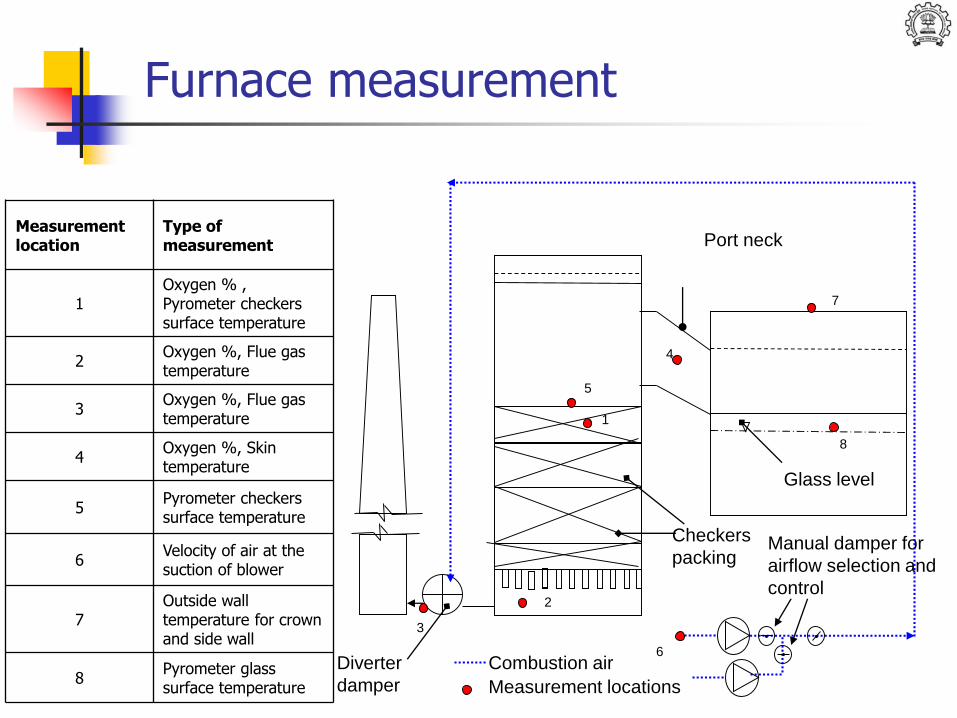
Port neck
Checkers
packing
Glass level
1
2
5
Manual damper for
airflow selection and
control
6
7
Diverter
damper
3
4
8
Measurement locations
Combustion air
Furnace measurement
Measurementlocation
Type of measurement
1Oxygen % , Pyrometer checkers surface temperature
2Oxygen %, Flue gas temperature
3Oxygen %, Flue gas temperature
4Oxygen %, Skin temperature
5Pyrometer checkers surface temperature
6Velocity of air at the suction of blower
7Outside wall temperature for crown and side wall
8Pyrometer glass surface temperature
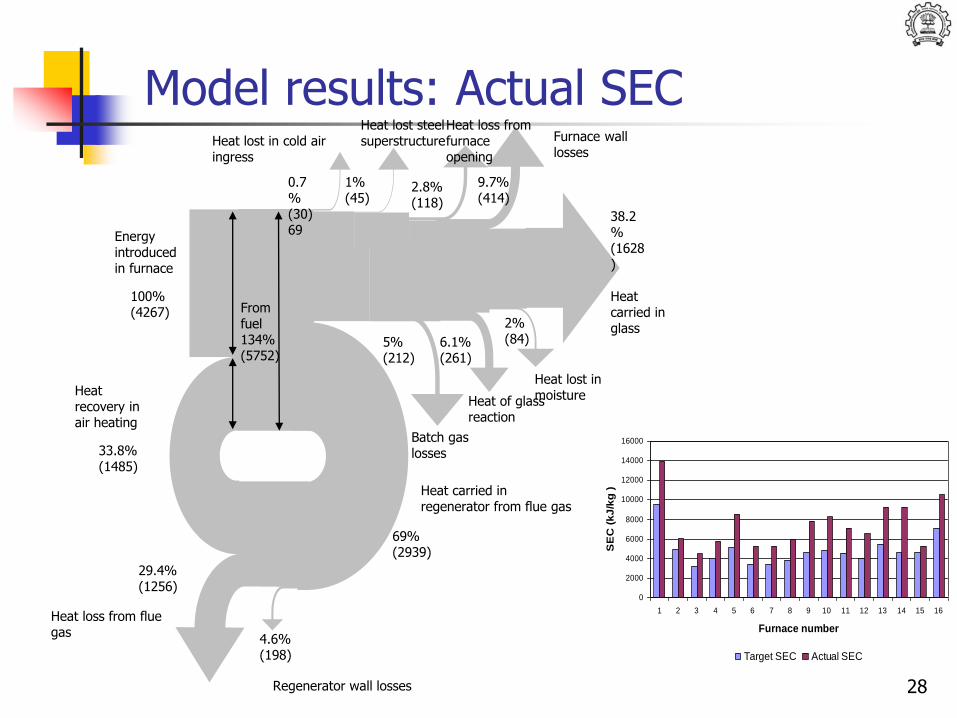
28
Model results: Actual SEC
2.8%(118)
0.7%(30)69
1%(45)
9.7%(414)
38.2 % (1628)
2%(84)6.1%
(261)5% (212)
4.6% (198)
29.4%(1256)
33.8%(1485)
69% (2939)
Heat carried in glass
Furnace wall losses
Heat lost in moistureHeat of glass
reaction
Batch gas losses
Heat loss from furnace opening
Heat lost steel superstructure
Regenerator wall losses
Heat loss from flue gas
Heat lost in cold air ingress
Heat recovery in air heating
100%(4267)
Energy introduced in furnace
From fuel 134% (5752)
Heat carried in regenerator from flue gas
0
2000
4000
6000
8000
10000
12000
14000
16000
1 2 3 4 5 6 7 8 9 10 11 12 13 14 15 16
Furnace number
SE
C (
kJ
/kg
)
Target SEC Actual SEC
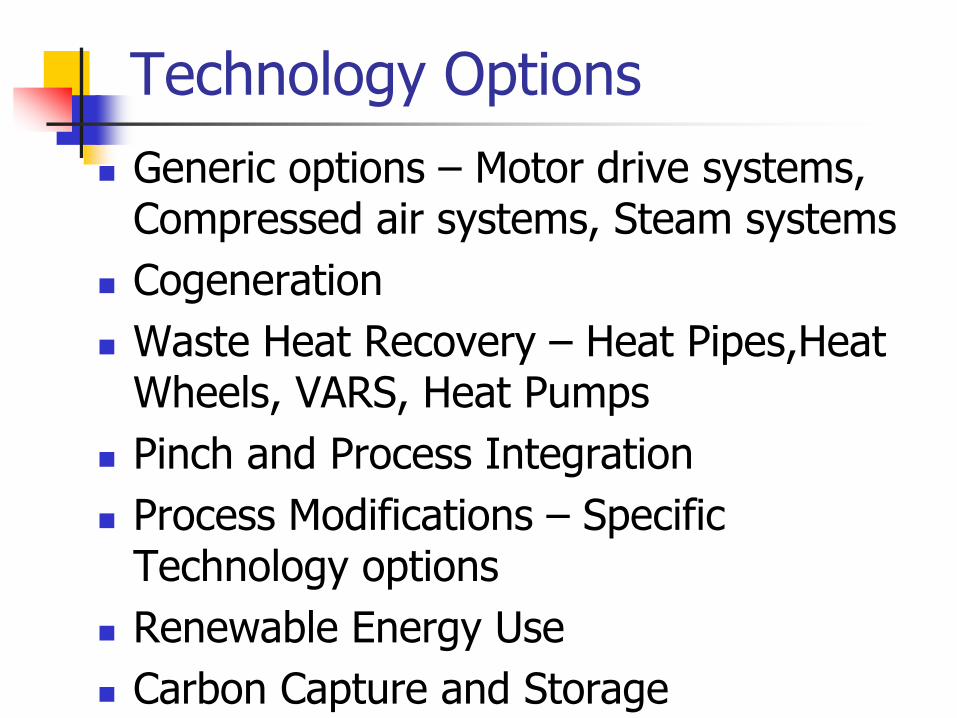
Technology Options
Generic options – Motor drive systems, Compressed air systems, Steam systems
Cogeneration
Waste Heat Recovery – Heat Pipes,Heat Wheels, VARS, Heat Pumps
Pinch and Process Integration
Process Modifications – Specific Technology options
Renewable Energy Use
Carbon Capture and Storage
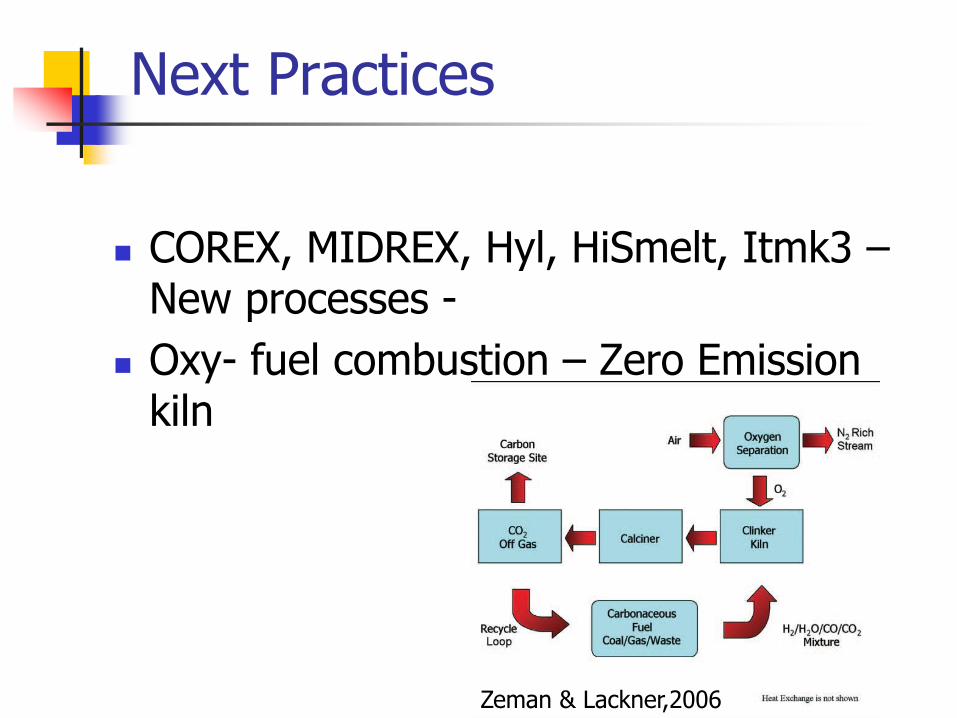
Next Practices
COREX, MIDREX, Hyl, HiSmelt, Itmk3 –New processes -
Oxy- fuel combustion – Zero Emission kiln
Zeman & Lackner,2006
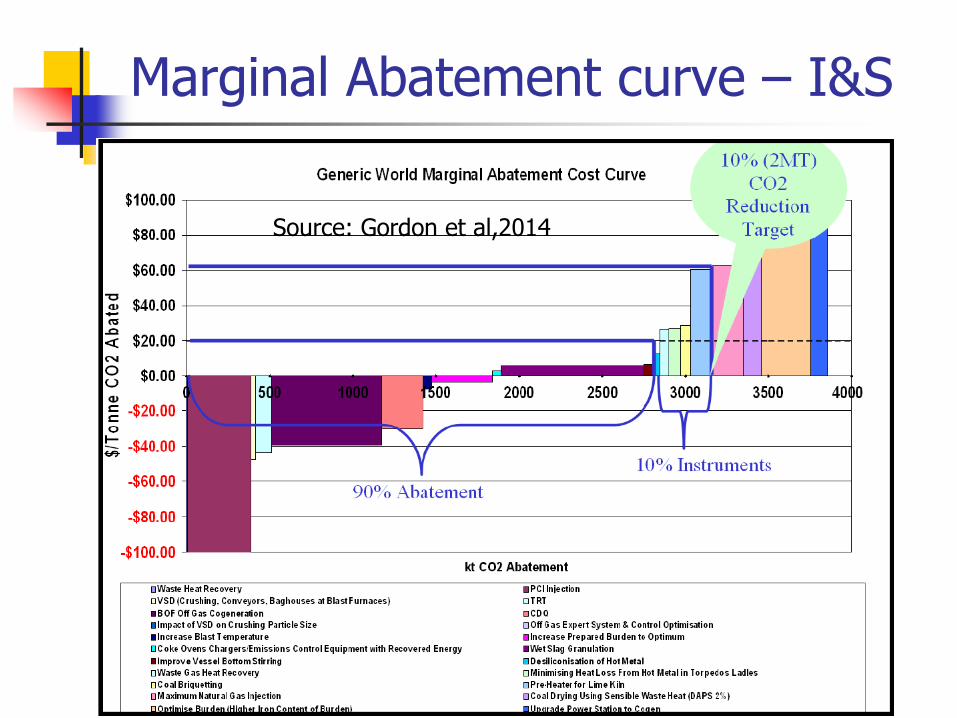
Marginal Abatement curve – I&S
Source: Gordon et al,2014
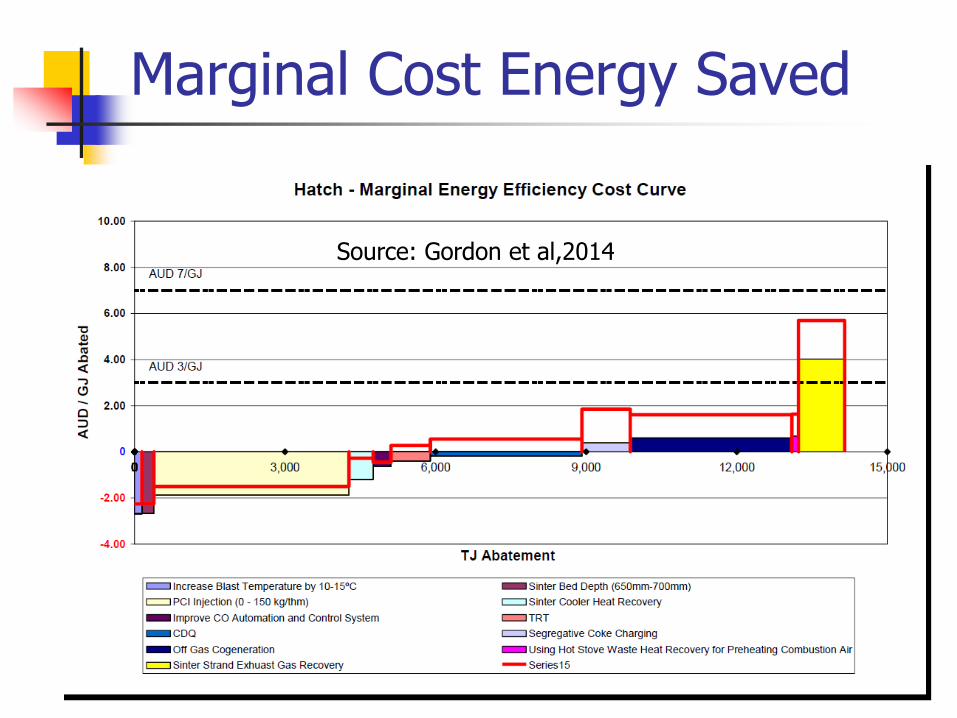
Marginal Cost Energy Saved
Source: Gordon et al,2014
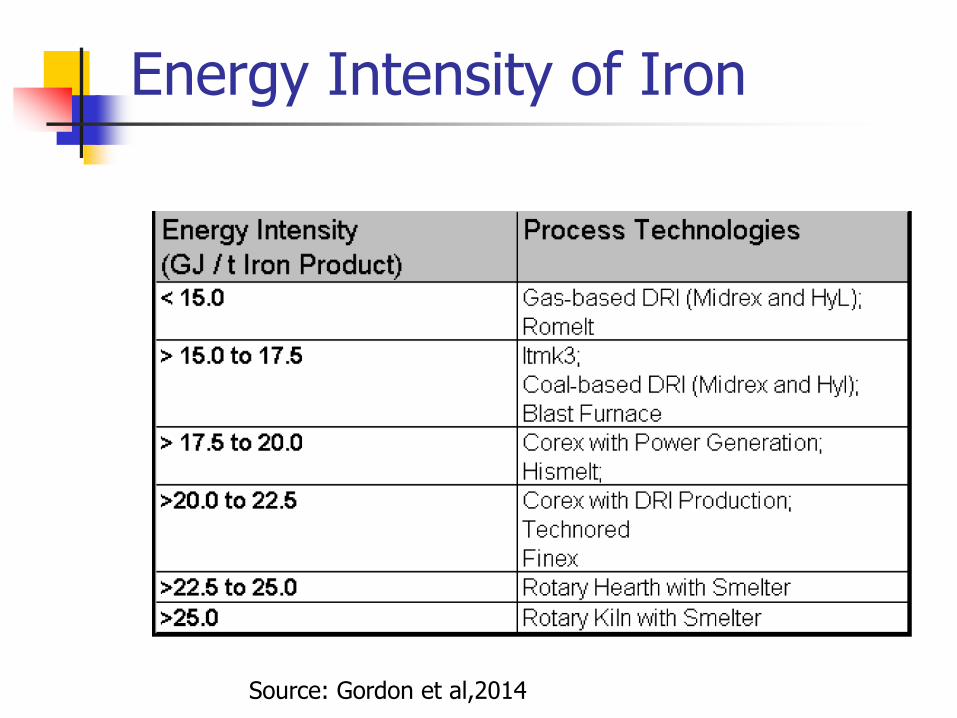
Energy Intensity of Iron
Source: Gordon et al,2014
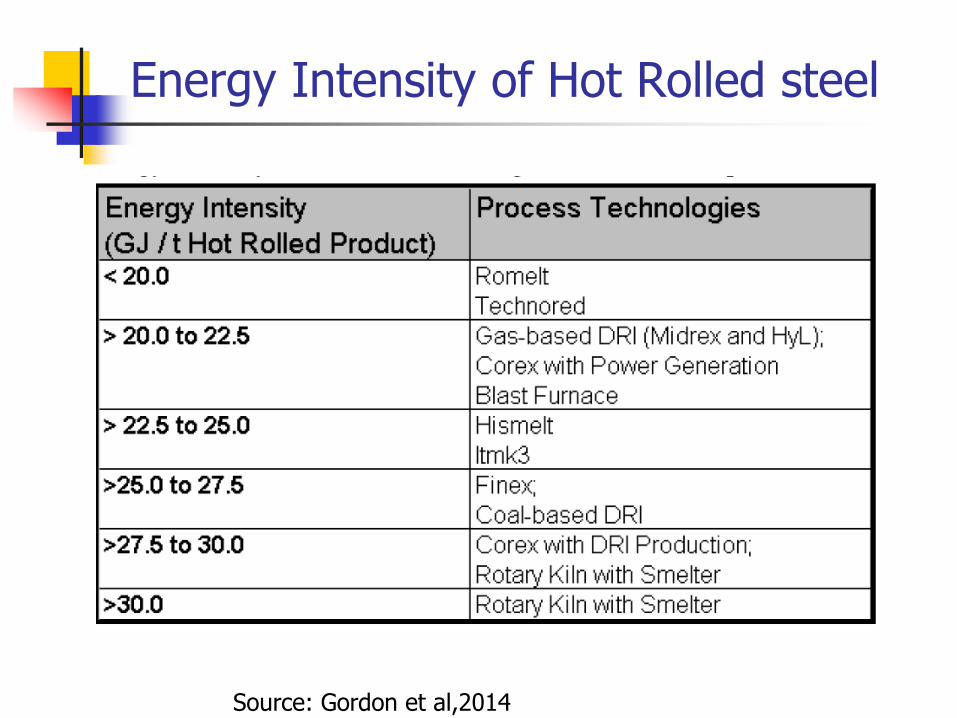
Energy Intensity of Hot Rolled steel
Source: Gordon et al,2014
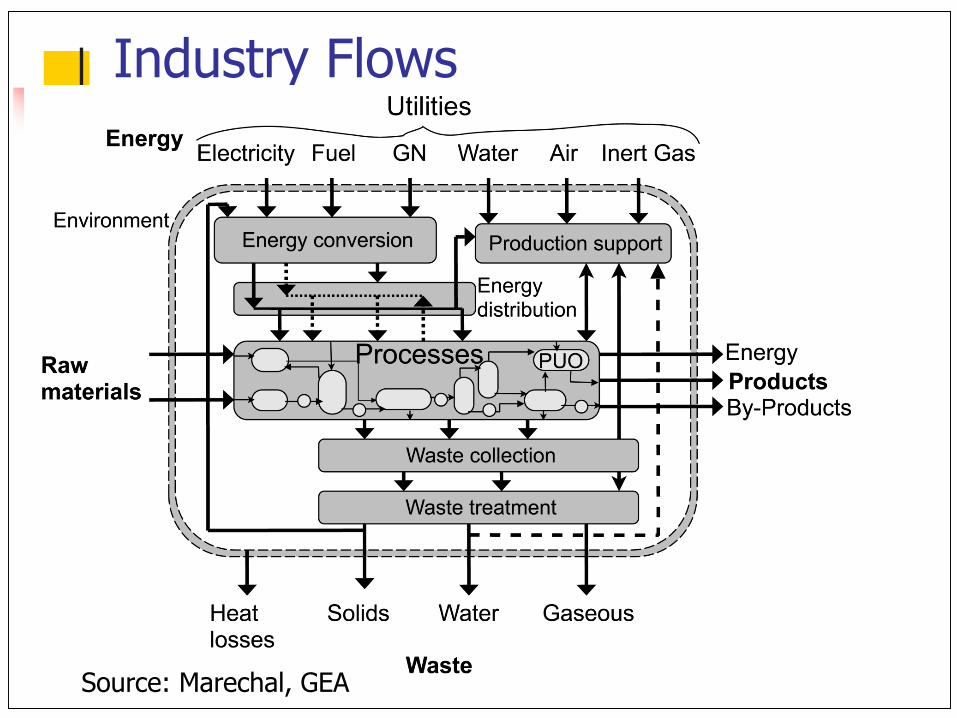
Industry Flows
Source: Marechal, GEA
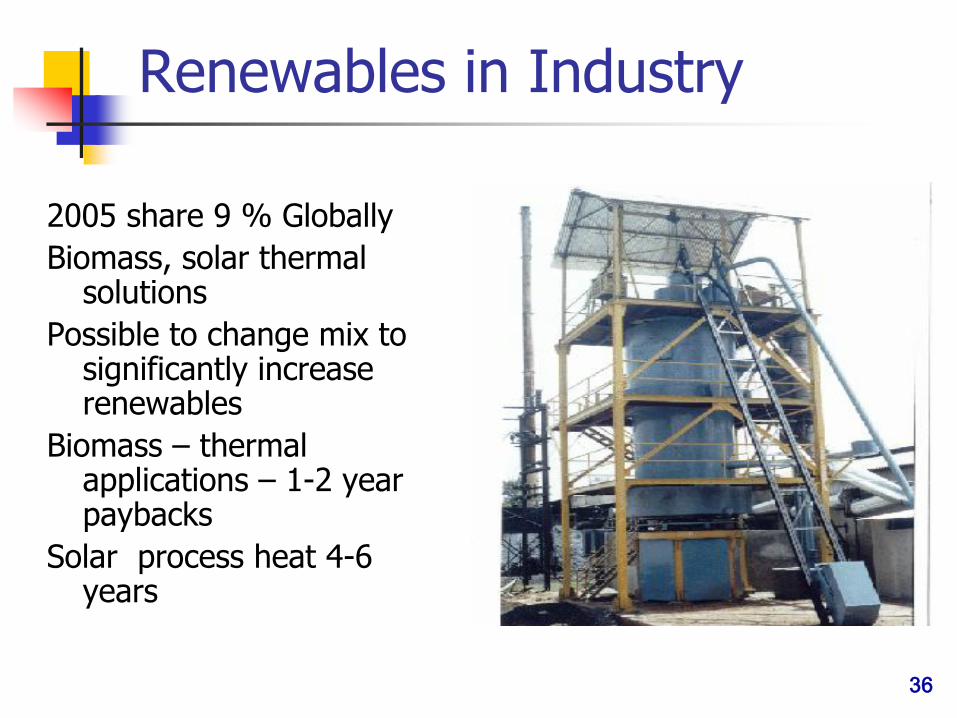
Renewables in Industry
2005 share 9 % Globally
Biomass, solar thermal solutions
Possible to change mix to significantly increase renewables
Biomass – thermal applications – 1-2 year paybacks
Solar process heat 4-6 years
36
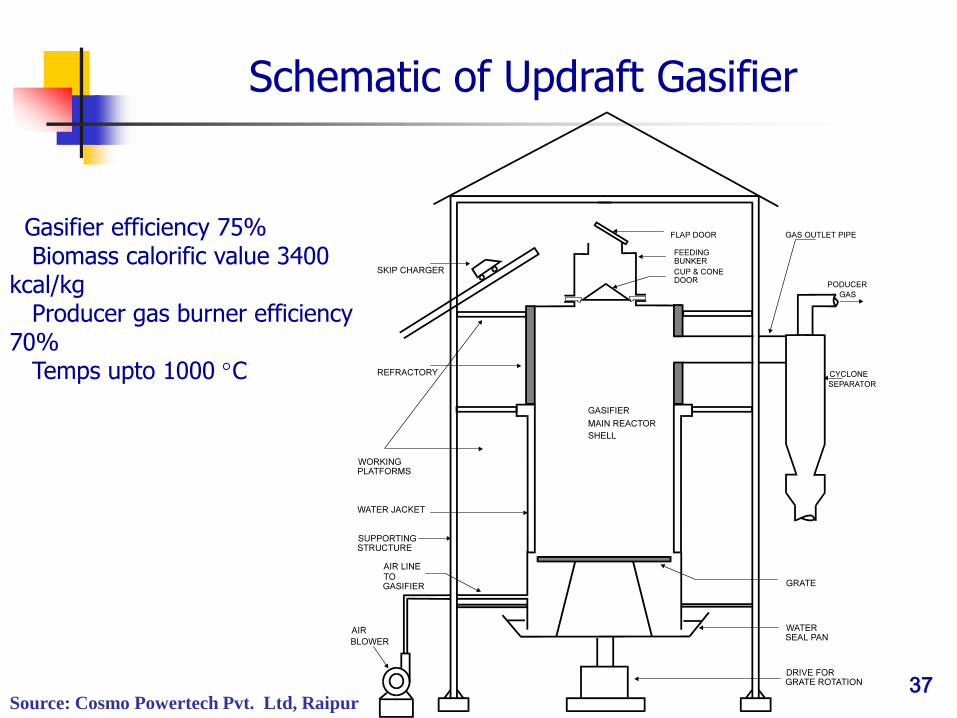
Schematic of Updraft Gasifier
Source: Cosmo Powertech Pvt. Ltd, Raipur
Gasifier efficiency 75%Biomass calorific value 3400
kcal/kgProducer gas burner efficiency
70%Temps upto 1000 C
37
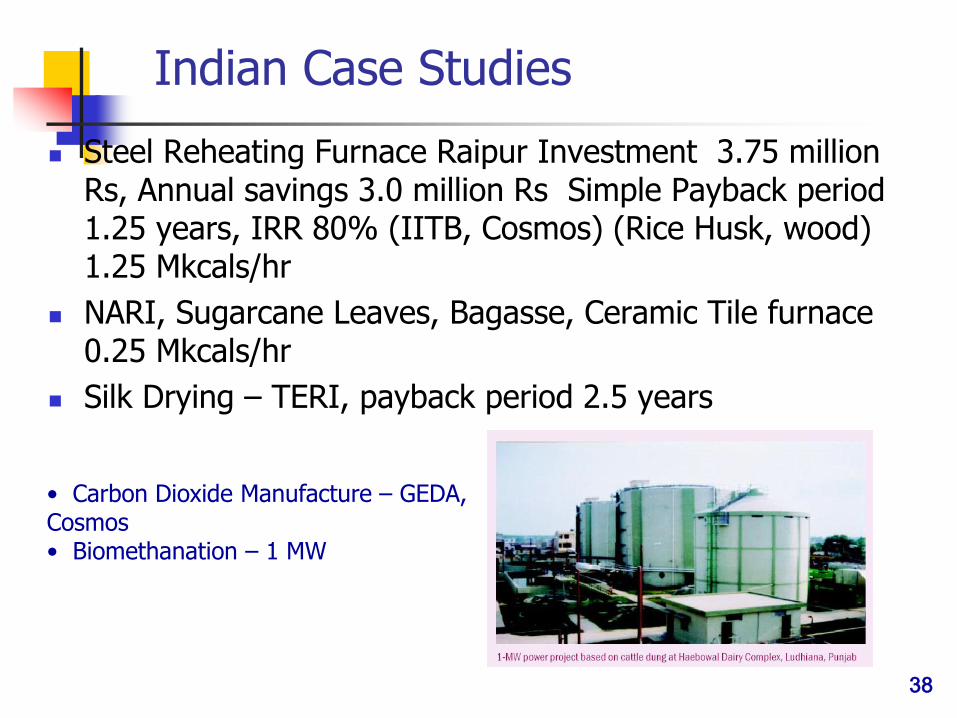
Indian Case Studies
Steel Reheating Furnace Raipur Investment 3.75 million Rs, Annual savings 3.0 million Rs Simple Payback period 1.25 years, IRR 80% (IITB, Cosmos) (Rice Husk, wood) 1.25 Mkcals/hr
NARI, Sugarcane Leaves, Bagasse, Ceramic Tile furnace 0.25 Mkcals/hr
Silk Drying – TERI, payback period 2.5 years
• Carbon Dioxide Manufacture – GEDA, Cosmos• Biomethanation – 1 MW
38
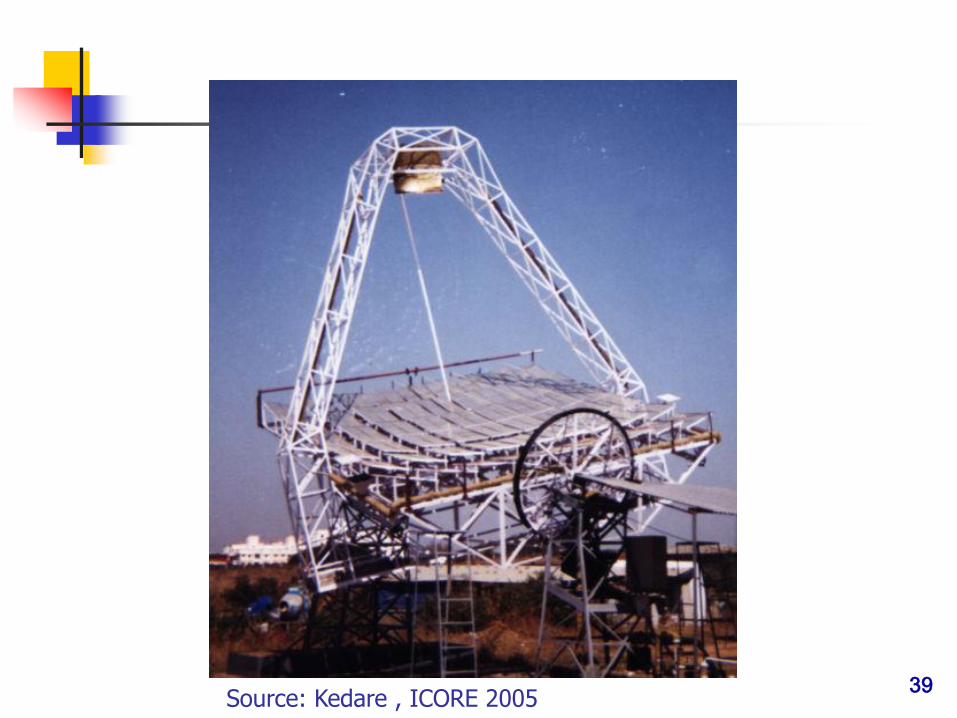
Source: Kedare , ICORE 200539
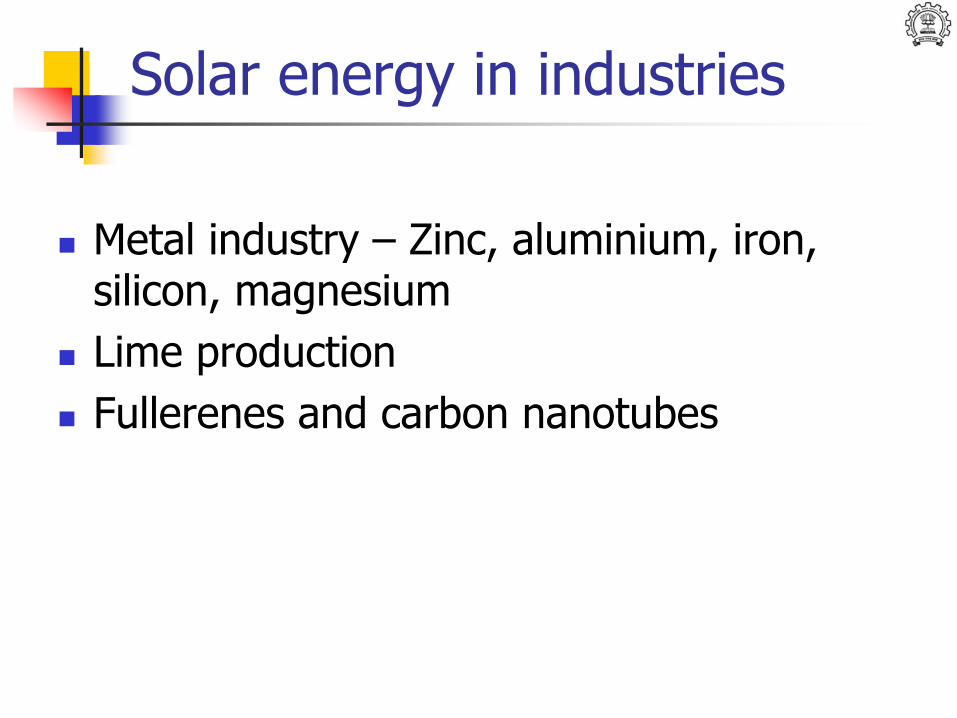
Solar energy in industries
Metal industry – Zinc, aluminium, iron, silicon, magnesium
Lime production
Fullerenes and carbon nanotubes
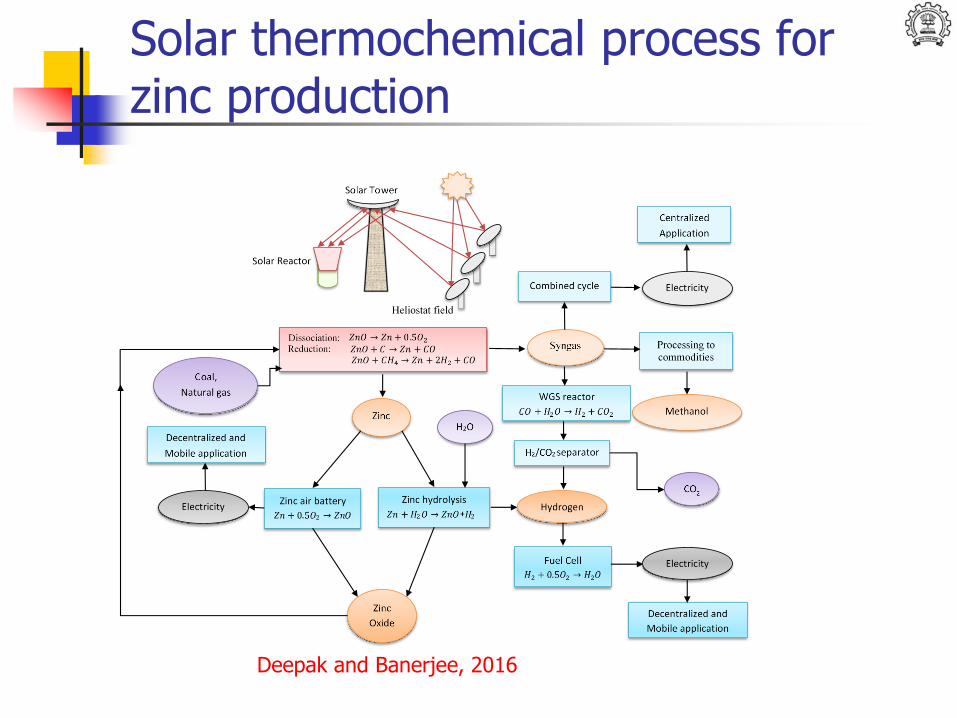
Solar thermochemical process for zinc production
Deepak and Banerjee, 2016
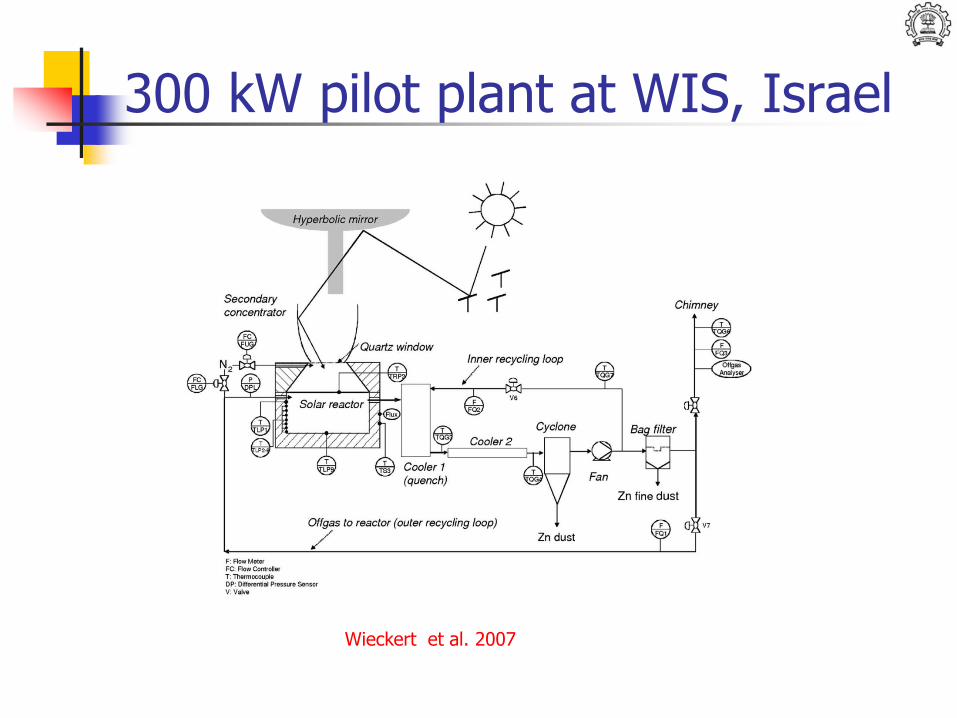
300 kW pilot plant at WIS, Israel
Wieckert et al. 2007
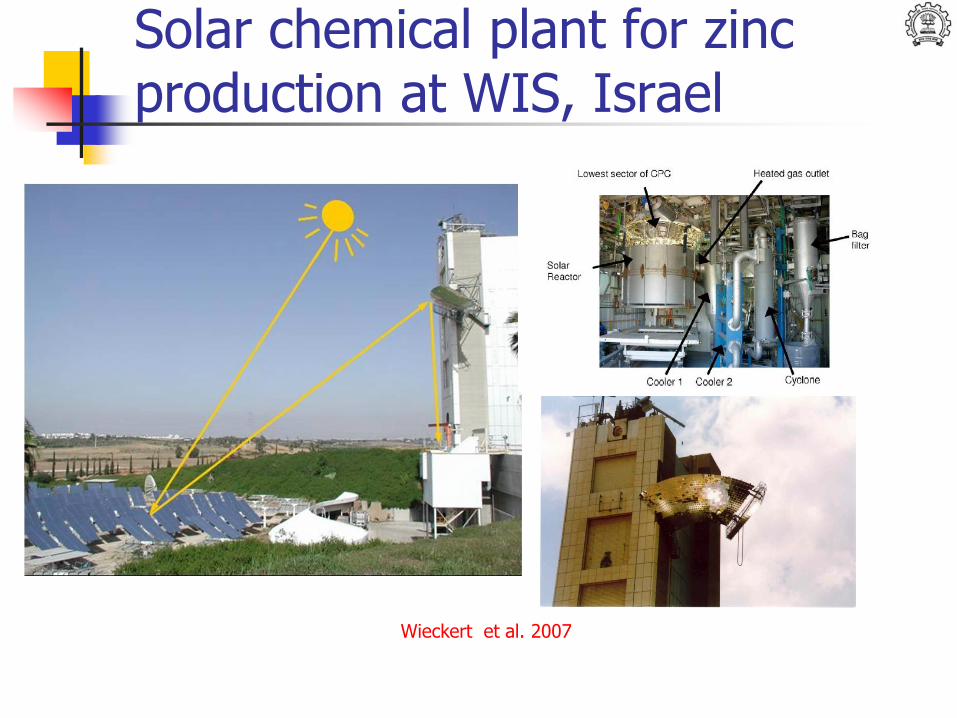
Solar chemical plant for zinc production at WIS, Israel
Wieckert et al. 2007
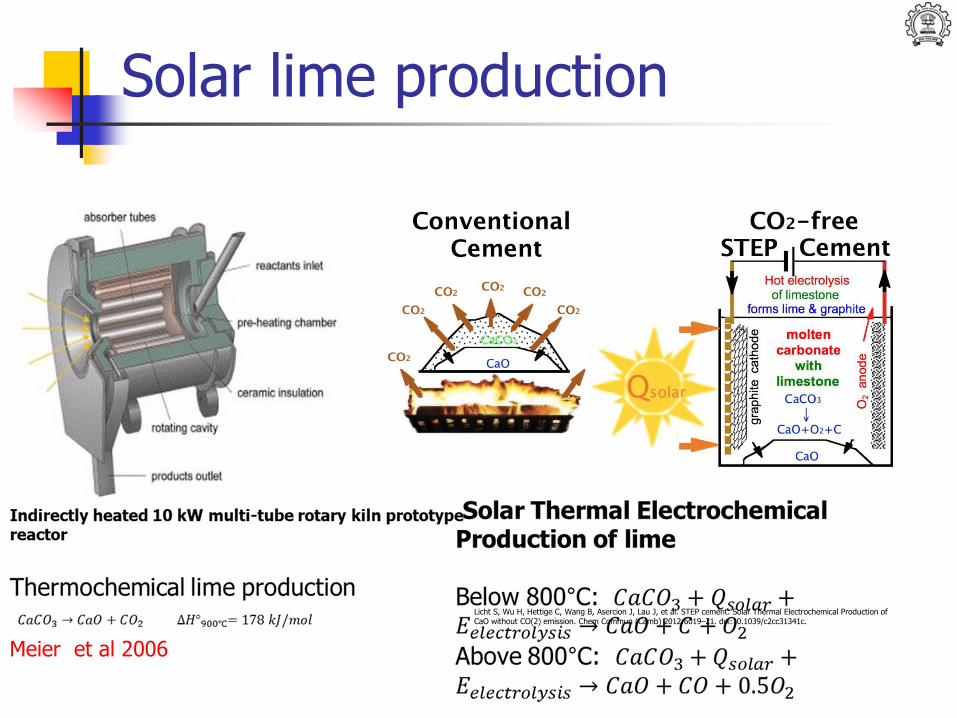
Solar lime production
Meier et al 2006
Licht S, Wu H, Hettige C, Wang B, Asercion J, Lau J, et al. STEP cement: Solar Thermal Electrochemical Production of CaO without CO(2) emission. Chem Commun (Camb) 2012:6019–21. doi:10.1039/c2cc31341c.
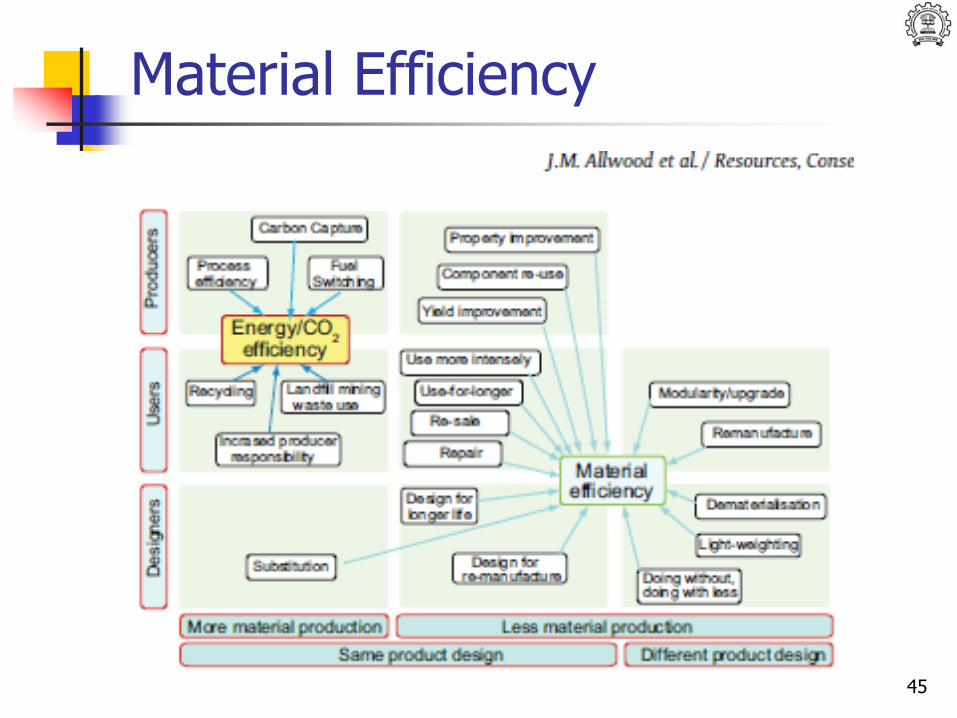
Material Efficiency
45
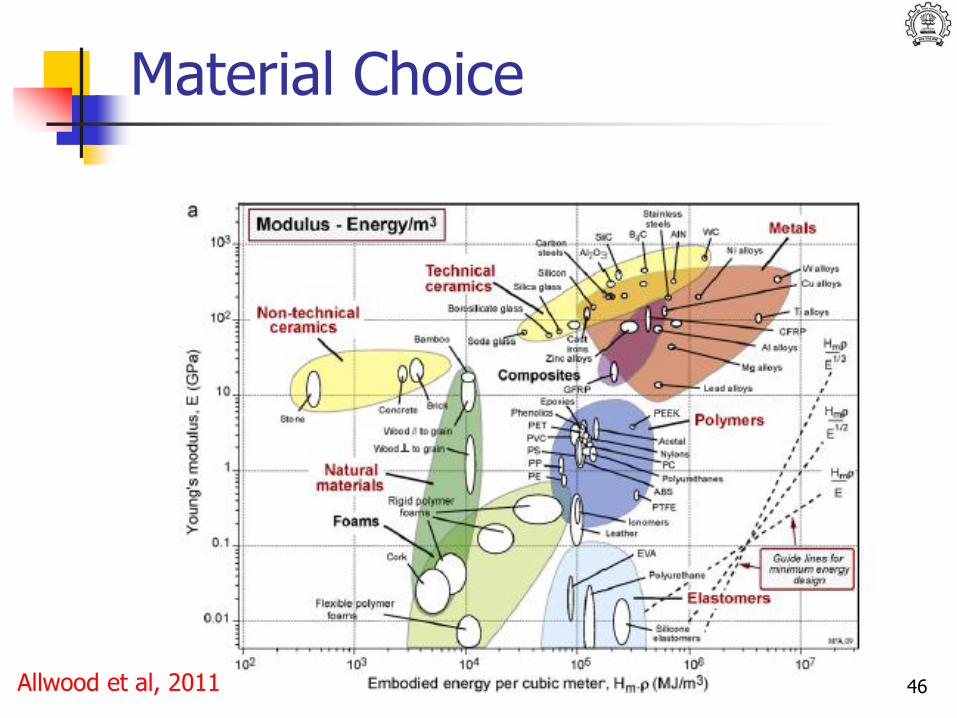
Material Choice
46Allwood et al, 2011
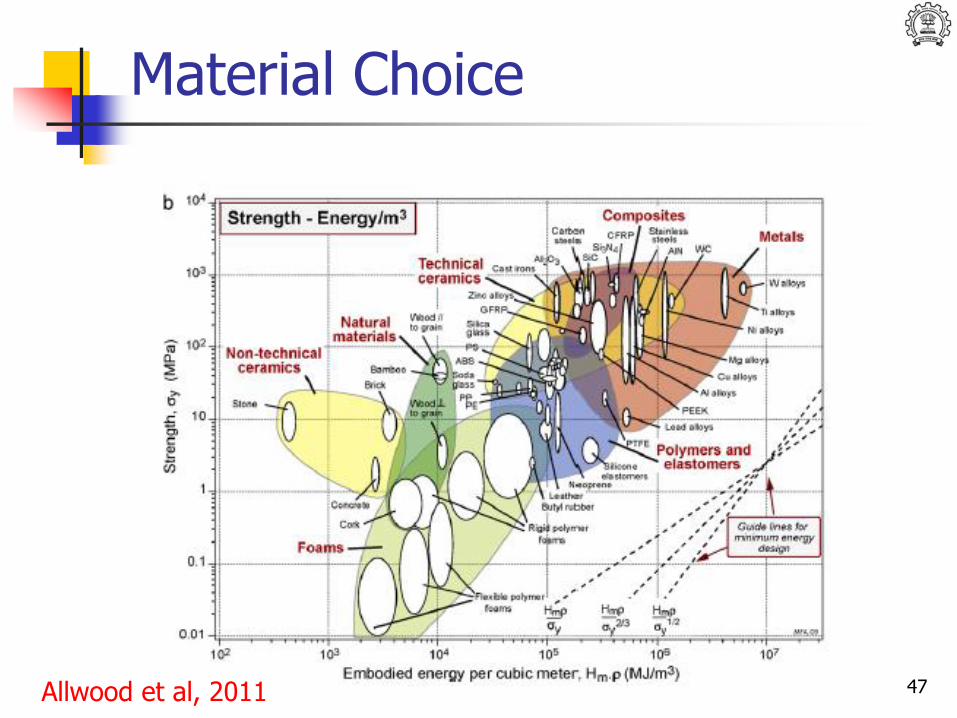
Material Choice
47Allwood et al, 2011
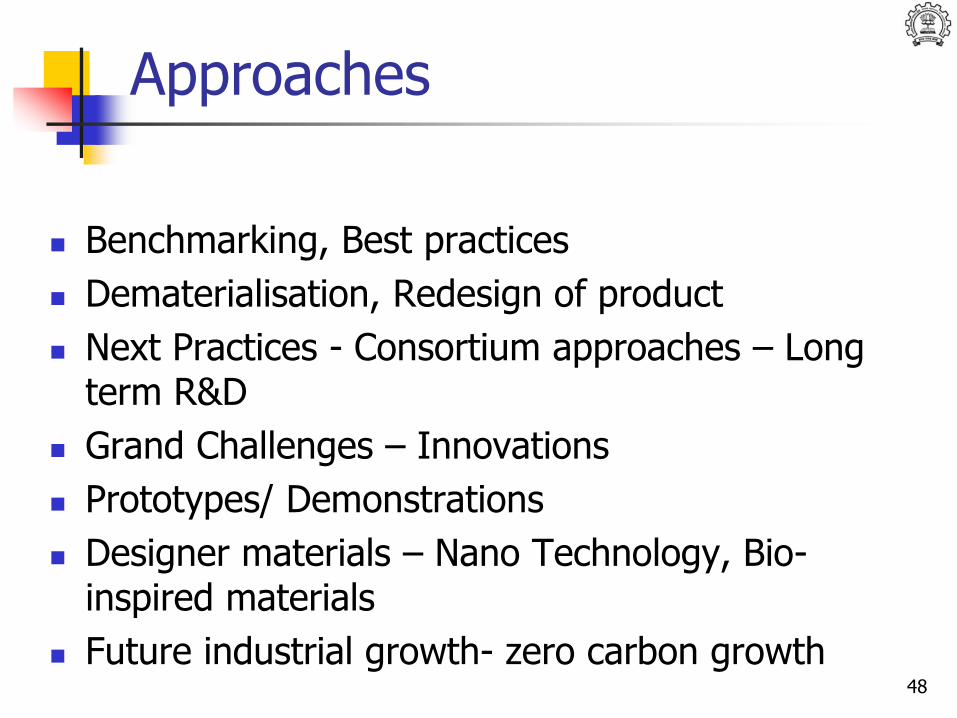
48
Approaches
Benchmarking, Best practices
Dematerialisation, Redesign of product
Next Practices - Consortium approaches – Long term R&D
Grand Challenges – Innovations
Prototypes/ Demonstrations
Designer materials – Nano Technology, Bio-inspired materials
Future industrial growth- zero carbon growth
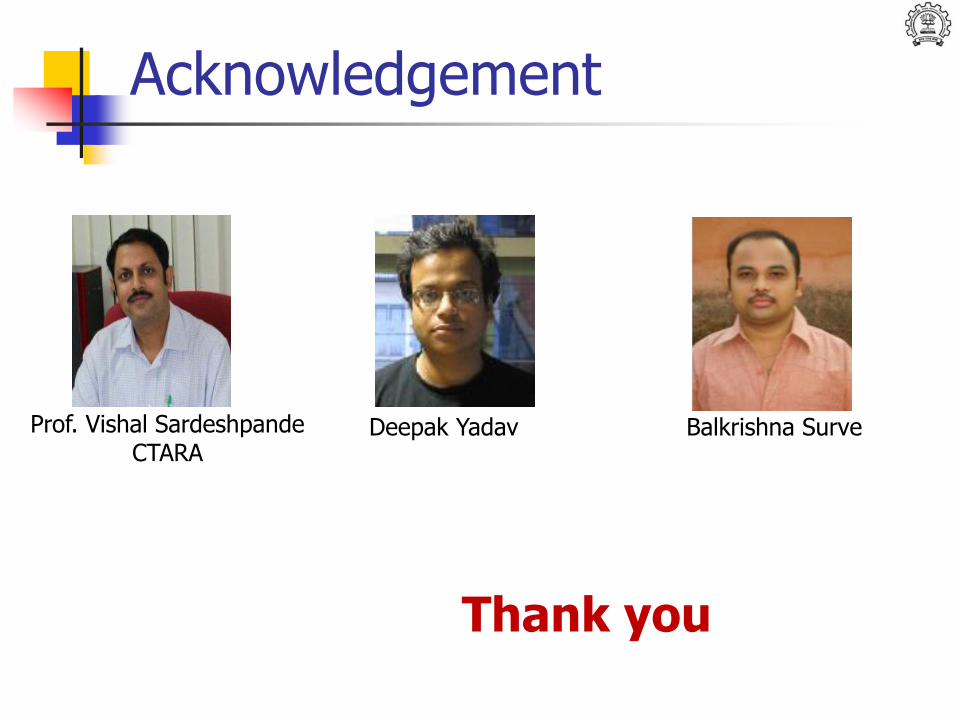
Acknowledgement
Balkrishna SurveDeepak YadavProf. Vishal SardeshpandeCTARA
Thank you
References
S.Khurana, R.Banerjee, U. N. Gaitonde, Applied Thermal Engineering, Vol22, p485-494,2002 E. Worrell,Potential for Improved Industrial Energy Use andMaterials,Ultrecht,1994 Allwood, JM and Ashby, MF and Gutowski, TG and Worrell, E (2011) Material efficiency: A white
paper. RESOUR CONSERV RECY, 55. pp. 362-381. ISSN 0921-3449 Allwood, JM and Ashby, MF and Gutowski, TG and Worrell, E (2013) Material efficiency:
providing material services with less material production. Philos Trans A Math Phys Eng Sci, 371. 20120496-. ISSN 1364-503X
Rangan Banerjee et al: Chapter 8 - Energy End Use: Industry. In Global Energy Assessment -Toward a Sustainable Future, Cambridge University Press, Cambridge, UK and New York, NY, USA and the International Institute for Applied Systems Analysis, Laxenburg, Austria
UNIDO, 2010: Global Industrial Energy Efficiency Benchmarking-An Energy Policy Tool, Working Paper, United Nations Industrial Development Organisation (UNIDO), November, 2010.
Yadav and Banerjee, 2015: Yadav D, Banerjee R. A review of solar thermochemical processes. Renew Sustain Energy Rev 2016;54:497–532. doi:10.1016/j.rser.2015.10.026.
Wieckert et al. 2007 : Wieckert C, Frommherz U, Kraupl S, Guillot E, Olalde G, Epstein M, et al. A 300 kW Solar Chemical Pilot Plant for the Carbothermic Production of Zinc. J Sol Energy Eng 2007;129:190–6. doi:10.1115/1.2711471.
Meier et al 2006: Meier A, Bonaldi E, Cella GM, Lipinski W, Wuillemin D. Solar chemical reactor technology for industrial production of lime. Sol Energy 2006;80:1355–62. http://dx.doi.org/10.1016/j.solener.2005.05.017