Embed Size (px)
Citation preview
INTERNATIONAL ATOMIC ENERGY AGENCYVIENNA
ISBN 978-92-0-111910-0ISSN 1011-2642 @
REFERENCE DATA SERIES No. 12013 Edition
Energy, Electricity and Nuclear PowerEstimatesfor the Periodup to 2050
REFERENCE DATA SERIES No. 1
energy, electricity and nuclear power estimates for the period up to 2050
2013 Edition
INTERNATIONAL ATOMIC ENERGY AGENCYVIENNA, 2013

ENERGY, ELECTRICITY AND NuCLEAR pOwER ESTIMATES FOR ThE pERIOD up TO 2050
IAEA-RDS-1/33ISBN 978–92–0–111910–0
ISSN 1011–2642
printed by the IAEA in AustriaAugust 2013
Cover photo credit:EDF-MEDIAThEQuE / ALEXIS MORIN / 2013
contents
Introduction . . . . . . . . . . . . . . . . . . . . . . . . . . . . . . . . . . 5Grouping of countries and areas . . . . . . . . . . . . . . . . . . 9
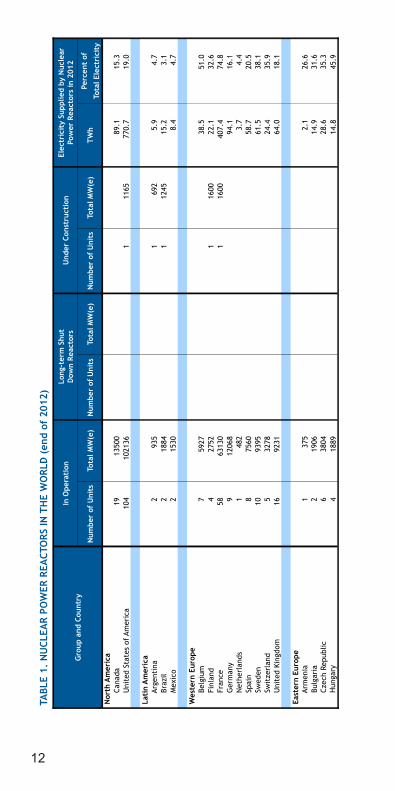
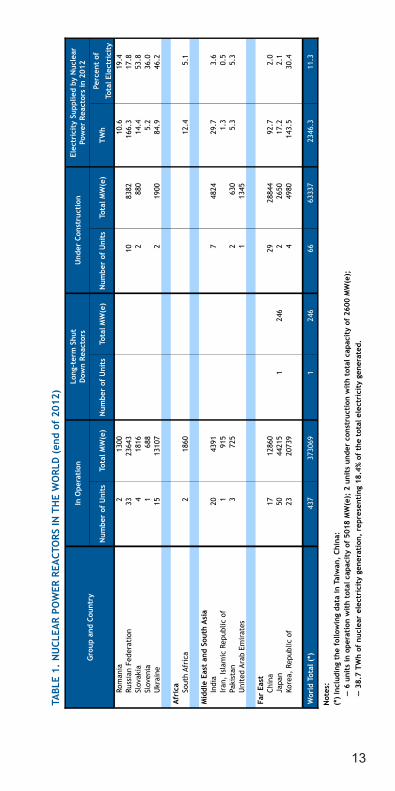
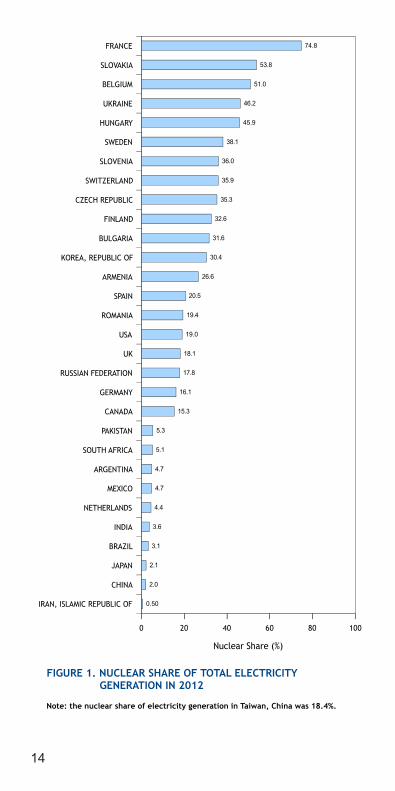
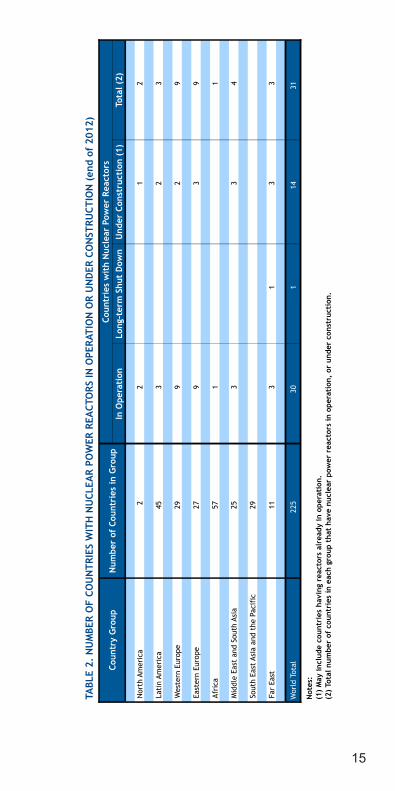
Table 1. Nuclear power reactors in the world (end of 2012) . . . . . . . . . . . . . . . . . . . . . . . . 12Figure 1. Nuclear share of total electricity generation in 2012 . . . . . . . . . . . . . . . . . . . 14Table 2. Number of countries with nuclear power reactors in operation or under construction (end of 2012) . . . . . . . . . 15Table 3. Estimates of total and nuclear electrical generating capacity . . . . . . . . . . . . 17Figure 2. Total and nuclear electrical generating capacity . . . . . . . . . . . . . . . . . . . . . . . . . . . . 18Table 4. Estimates of total electricity generation and contribution by nuclear power . . . . . . . 21Figure 3. percentage of electricity supplied by nuclear power . . . . . . . . . . . . . . . . . . . . . 22Table 5. Estimates of total energy requirement (EJ), percentage used for electricity generation, and percentage supplied by nuclear energy . . . . . . . . . . . . . . . . . . . . 25Figure 4. Estimates of total energy requirement . . . . . 26Table 6. Total energy requirement (EJ) by type of fuel in 2012 . . . . . . . . . . . . . . . . . . . . . . . 29Figure 5. Total energy requirement by fuel type in 2012 . . . . . . . . . . . . . . . . . . . . . . . . . . . . 30Figure 6. Breakdown of world total energy requirement during the period 1970–2012 . . . . . . . . . . . . . . . . . . . . . . . . . . 32Table 7. Fuel shares (%) of total energy requirement in 2012 . . . . . . . . . . . . . . . . . . 35Table 8. Fuel use (EJ) for electricity generation by type of fuel in 2012 . . . . . . . . 36Table 9. percentage contribution of each fuel type to electricity generation in 2012 . . . . . . . . . . . . . . . . . . . . . . . . . . . . 37Table 10. Estimates of population growth by region . . 39Figure 7. population estimates . . . . . . . . . . . . . . . . . . 40Table 11. Estimates of total energy and electricity requirement per capita . . . . . . . . . . . . . . . . . 43
Figure 8. Total energy requirement per capita . . . . . . . 44Figure 9. Total electricity requirement per capita . . . . . 46Table 12. Average annual growth rates during the period 2002–2012 (%) . . . . . . . . . . . . . . . . . 49Figure 10. Average annual growth rates during the period 2002–2012 . . . . . . . . . . . . . . . . . . . . 50Table 13. Estimates of average annual
growth rates during the period 2012–2030 (%) . . . . . . . . . . . . . . . . . . . . . . . 53
5
introductionReference Data Series No. 1 (RDS-1) is an annual
publication — currently in its thirty-third edition — containing estimates of energy, electricity and nuclear power trends up to the year 2050.
RDS-1 starts with a summary of the situation of nuclear power in IAEA Member States as of the end of 2012. The data on nuclear power presented in Tables 1 and 2 are based on actual statistical data collected by the IAEA’s power Reactor Information System (pRIS). however, energy and electricity data for 2012 are estimated, as the latest information available from the united Nations Department of Economic and Social Affairs is for 2010 only. population data originate from the world population prospects (2010 revision), published by the population Division of the united Nations Department of Economic and Social Affairs. The 2012 values again are estimates.
As in previous editions, projections of future energy and electricity demand and the role of nuclear power are presented as low and high estimates encompassing the inherent uncertainties involved in projecting trends. The RDS-1 estimates should be viewed as very general growth trends whose validity must be constantly subjected to critical review.
Many international, national and private organizations routinely engage in energy demand and supply projections, including nuclear power. These projections are based on a multitude of different assumptions and aggregating procedures, which make a straightforward comparison and synthesis very difficult. The basic differences refer to such fundamental input assumptions as:
• Economic growth;• Correlation of economic growth and energy use;• Technology performance and costs;• Energy resource availability and future fuel prices;• Energy policy and physical, environmental and
economic constraints.
The projections presented in this publication are based on a compromise between:
• National projections supplied by each country for a recent OECD/NEA study;
6
• Indicators of development published by the world Bank in its world Development Indicators;
• Global and regional energy, electricity and nuclear power projections made by other international organizations.
More specifically, the estimates of future nuclear generating capacity presented in Table 3 are derived from a country by country ‘bottom up’ approach. They are established by a group of experts participating each year in the IAEA’s consultancy on Nuclear Capacity projections and based upon a review of nuclear power projects and programmes in Member States. The experts consider all the operating reactors, possible licence renewals, planned shutdowns and plausible construction projects foreseen for the next several decades. They build the projections project by project by assessing the plausibility of each in light of, first, the low projection’s assumptions and, second, the high projection’s assumptions.
The low and high estimates reflect contrasting, but not extreme, underlying assumptions on the different driving factors that have an impact on nuclear power deployment. These factors, and the ways they might evolve, vary from country to country. The estimates presented provide a plausible range of nuclear capacity growth by region and worldwide. They are not intended to be predictive nor to reflect the whole range of possible futures from the lowest to the highest feasible.
The low case represents expectations about the future if current market, technology and resource trends continue and there are few additional changes in explicit laws, policies and regulations affecting nuclear power. This case was explicitly designed to produce a ‘conservative but plausible’ set of projections. Additionally, the low case does not automatically assume that targets for nuclear power growth in a particular country will necessarily be achieved. These assumptions are relaxed in the high case.
The high case projections are much more optimistic, but still plausible and technically feasible. The high case assumes that current rates of economic and electricity demand growth, especially in the Far East, continue. Changes in country policies toward climate change are also included in the high case.
7
Over the short term, the low price of natural gas and the impact of increasing capacities of subsidized renewable energy sources are expected to impact nuclear growth prospects in some regions of the developed world. These low natural gas prices are partly due to low demand as a result of macroeconomic conditions as well as technological advances. Moreover, the ongoing financial crisis continues to present challenges for capital intensive projects such as nuclear power. The assumption adopted by the expert group was that the above mentioned challenges, in addition to the accident at the Fukushima Daiichi nuclear power plant, are expected to temporarily delay deployment of some nuclear power plants. In the longer run, the underlying fundamentals of population growth and demand for electricity in the developing world, as well as climate change concerns, security of energy supply and price volatility for other fuels, continue to point to nuclear generating capacity playing an important role in the energy mix.
Over the past year, most countries have finalized their nuclear safety reviews, providing greater clarity with respect to nuclear power development. Nevertheless, challenges remain, given that policy responses to the Fukushima Daiichi accident are still evolving in some key regions. Once greater certainty about the policy and regulatory responses is established, these projections will likely need to be refined.
Compared with the 2012 projections to 2030, the 2013 projections were reduced by about 20 Gw(e)1 in both the low and high cases. These reductions continue to reflect responses to the Fukushima Daiichi accident and factors noted above, although the decline this year is less than in the two previous years. Some of the effects of the Fukushima Daiichi accident have included earlier than anticipated retirements, delayed or possibly cancelled new build, and increased costs owing to changing regulatory requirements. Nevertheless, interest in nuclear power remains strong in some regions, particularly in the developing world.
1 It should be kept in mind that there is a distinction between available capacity (supplying electricity to the grid) and installed nominal capacity not supplying electricity that may not be recognized in the published data.
8
energy units
1 Mw(e) = 106 watts (electrical)1 Gw(e) = 1000 Mw(e) = 109 watts (electrical)1 GJ = 1 gigajoule = 109 joules1 EJ = 1 exajoule = 1018 joules1 EJ = 23.9 megatonnes of oil equivalent (Mtoe)1 Tw·h = 1 terawatt-hour = 109 kw·h = 3.6 × 10⁻³ EJ
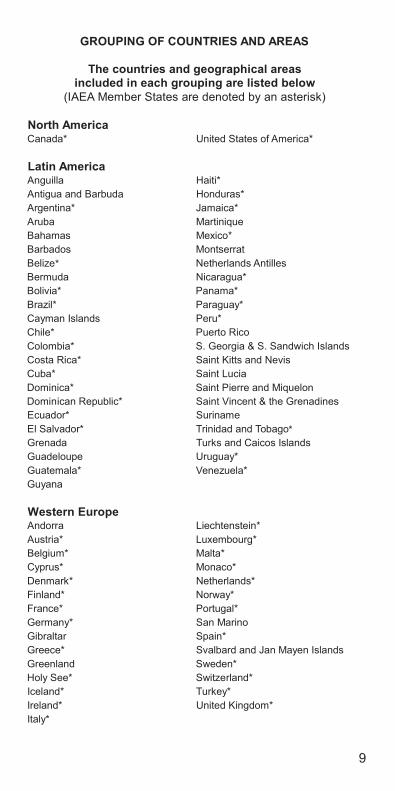
N o r t h A m e r i c a C a n a d a * U n i t e d S t a t e s o f A m e r i c a *
L a t i n A m e r i c a A n g u i l l a H a i t i * A n t i g u a a n d B a r b u d a H o n d u r a s * A r g e n t i n a * J a m a i c a * A r u b a M a r t i n i q u e B a h a m a s M e x i c o * B a r b a d o s M o n t s e r r a t B e l i z e N e t h e r l a n d s A n t i l l e s B e r m u d a N i c a r a g u a * B o l i v i a * P a n a m a * B r a z i l * P a r a g u a y * C a y m a n I s l a n d s P e r u * C h i l e * P u e r t o R i c o C o l o m b i a * S. Georgia & S. Sandwich Islands C o s t a R i c a * S a i n t K i t t s a n d N e v i s C u b a * S a i n t L u c i a D o m i n i c a* S a i n t P i e r r e a n d M i q u e l o n D o m i n i c a n R e p u b l i c * S a i n t V i n c e n t & t h e G r e n a d i n e s E c u a d o r * S u r i n a m e E l S a l v a d o r * T r i n i d a d a n d T o b a g o G r e n a d a T u r k s a n d C a i c o s I s l a n d s G u a d e l o u p e U r u g u a y * G u a t e m a l a * V e n e z u e l a * G u y a n a
W e s t e r n E u r o p e A n d o r r a L i e c h t e n s t e i n * A u s t r i a * L u x e m b o u r g * B e l g i u m * M a l t a * C y p r u s * M o n a c o * D e n m a r k * N e t h e r l a n d s * F i n l a n d * N o r w a y * F r a n c e * P o r t u g a l * G e r m a n y * S a n M a r i n o G i b r a l t a r S p a i n * G r e e c e * S v a l b a r d a n d J a n M a y e n I s l a n d s G r e e n l a n d S w e d e n * H o l y S e e * S w i t z e r l a n d * I c e l a n d * T u r k e y * I r e l a n d * U n i t e d K i n g d o m * I t a l y *
G R O U P I N G O F C O U N T R I E S A N D A R E A S
T h e c o u n t r i e s a n d g e o g r a p h i c a l a r e a s i n c l u d e d i n e a c h g r o u p i n g a r e l i s t e d b e l o w
( I A E A M e m b e r S t a t e s a r e d e n o t e d b y a n a s t e r i s k )
*
*
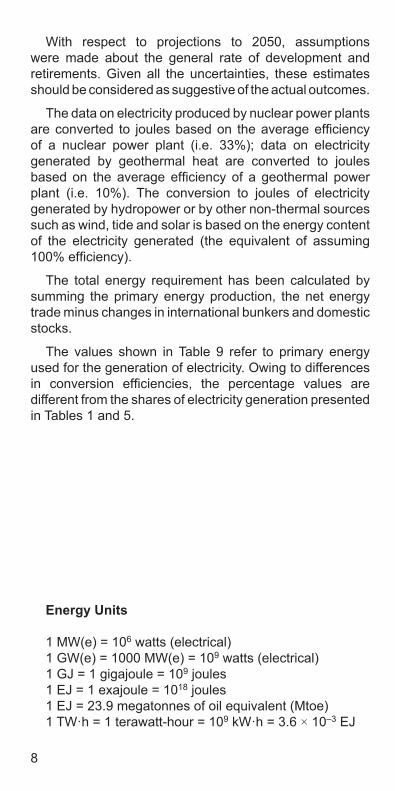
with respect to projections to 2050, assumptions were made about the general rate of development and retirements. Given all the uncertainties, these estimates should be considered as suggestive of the actual outcomes.
The data on electricity produced by nuclear power plants are converted to joules based on the average efficiency of a nuclear power plant (i.e. 33%); data on electricity generated by geothermal heat are converted to joules based on the average efficiency of a geothermal power plant (i.e. 10%). The conversion to joules of electricity generated by hydropower or by other non-thermal sources such as wind, tide and solar is based on the energy content of the electricity generated (the equivalent of assuming 100% efficiency).
The total energy requirement has been calculated by summing the primary energy production, the net energy trade minus changes in international bunkers and domestic stocks.
The values shown in Table 9 refer to primary energy used for the generation of electricity. Owing to differences in conversion efficiencies, the percentage values are different from the shares of electricity generation presented in Tables 1 and 5.
9
N o r t h A m e r i c a C a n a d a * U n i t e d S t a t e s o f A m e r i c a *
L a t i n A m e r i c a A n g u i l l a H a i t i * A n t i g u a a n d B a r b u d a H o n d u r a s * A r g e n t i n a * J a m a i c a * A r u b a M a r t i n i q u e B a h a m a s M e x i c o * B a r b a d o s M o n t s e r r a t B e l i z e N e t h e r l a n d s A n t i l l e s B e r m u d a N i c a r a g u a * B o l i v i a * P a n a m a * B r a z i l * P a r a g u a y * C a y m a n I s l a n d s P e r u * C h i l e * P u e r t o R i c o C o l o m b i a * S. Georgia & S. Sandwich Islands C o s t a R i c a * S a i n t K i t t s a n d N e v i s C u b a * S a i n t L u c i a D o m i n i c a* S a i n t P i e r r e a n d M i q u e l o n D o m i n i c a n R e p u b l i c * S a i n t V i n c e n t & t h e G r e n a d i n e s E c u a d o r * S u r i n a m e E l S a l v a d o r * T r i n i d a d a n d T o b a g o G r e n a d a T u r k s a n d C a i c o s I s l a n d s G u a d e l o u p e U r u g u a y * G u a t e m a l a * V e n e z u e l a * G u y a n a
W e s t e r n E u r o p e A n d o r r a L i e c h t e n s t e i n * A u s t r i a * L u x e m b o u r g * B e l g i u m * M a l t a * C y p r u s * M o n a c o * D e n m a r k * N e t h e r l a n d s * F i n l a n d * N o r w a y * F r a n c e * P o r t u g a l * G e r m a n y * S a n M a r i n o G i b r a l t a r S p a i n * G r e e c e * S v a l b a r d a n d J a n M a y e n I s l a n d s G r e e n l a n d S w e d e n * H o l y S e e * S w i t z e r l a n d * I c e l a n d * T u r k e y * I r e l a n d * U n i t e d K i n g d o m * I t a l y *
G R O U P I N G O F C O U N T R I E S A N D A R E A S
T h e c o u n t r i e s a n d g e o g r a p h i c a l a r e a s i n c l u d e d i n e a c h g r o u p i n g a r e l i s t e d b e l o w
( I A E A M e m b e r S t a t e s a r e d e n o t e d b y a n a s t e r i s k )
*
*
10
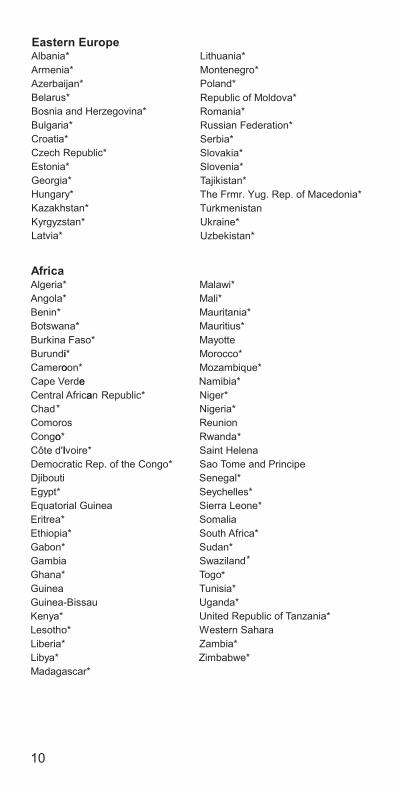
AfricaAlgeria* Malawi*Angola* Mali*Benin* Mauritania*Botswana* Mauritius*Burkina Faso* MayotteBurundii* Morocco*Cameroo o n * Mozambique*Cape Verdee Namibia*Central Africaa n Republic* Niger*Chad Nigeria*Comoros ReunionCongoo* RwandaCôte d'II voire* Saint HelenaDemocratic Rep. of the Congo* Sao Tome and PrincipeDjibouti Senegal*Egypt* Seychelles*Equatorial Guinea Sierra Leone*Eritrea* SomaliaEthiopia* South Africa*Gabon* Sudan*Gambia SwazilandGhana* TogoGuinea Tunisia*Guinea-Bissau Uganda*Kenya* United Republic of Tanzania*Lesotho* Western SaharaLiberia* Zambia*Libya* Zimbabwe*Madagascar*
Eastern EuropeAlbania* Lithuania*Armenia* Montenegro*
Poland*Azerbaijan*Republic of Moldova*Belarus*Romania*Bosnia and Herzegovina*Russian Federation*Bulgaria*Serbia*Croatia*Slovakia*Czech Republic*Slovenia*Estonia*Tajikistan*Georgia*The Frmr. Yug. Rep. of Macedonia*Hungary*TurkmenistanKazakhstan*Ukraine*Kyrgyzstan*Uzbekistan*Latvia*
*
*
*
*
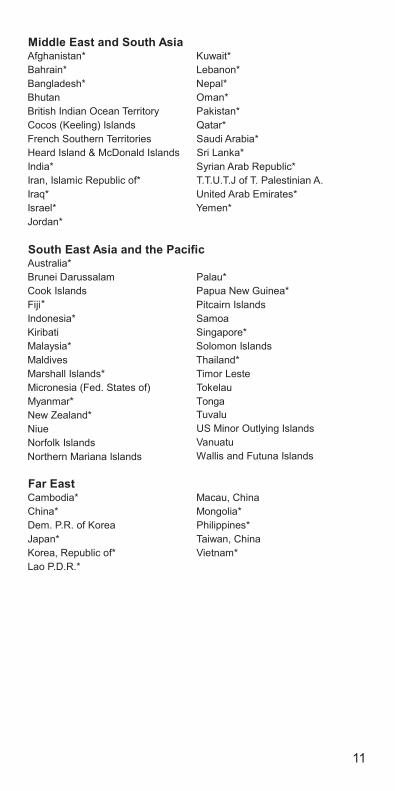
M i d d l e E a s t a n d S o u t h A s i a A f g h a n i s t a n * K u w a i t * B a h r a i n* L e b a n o n * B a n g l a d e s h * N e p a l* B h u t a n O m a n* B r i t i s h I n d i a n O c e a n T e r r i t o r y P a k i s t a n * C o c o s ( K e e l i n g ) I s l a n d s Q a t a r * F r e n c h S o u t h e r n T e r r i t o r i e s S a u d i A r a b i a * Heard Island & McDonald Islands S r i L a n k a * I n d i a * S y r i a n A r a b R e p u b l i c * I r a n , I s l a m i c R e p u b l i c o f * T . T . U . T . J o f T . P a l e s t i n i a n A . I r a q * U n i t e d A r a b E m i r a t e s * I s r a e l * Y e m e n * J o r d a n *
S o u t h E a s t A s i a a n d t h e P a c i f i c A u s t r a l i a *
N o r t h e r n M a r i a n a I s l a n d s
B r u n e i D a r u s s a l a m P a l a u* C o o k I s l a n d s P a p u a N e w G u i n e a* F i j i P i t c a i r n I s l a n d s I n d o n e s i a * S a m o a K i r i b a t i S i n g a p o r e * M a l a y s i a * S o l o m o n I s l a n d s M a l d i v e s T h a i l a n d * M a r s h a l l I s l a n d s * T i m o r L e s t e M i c r o n e s i a ( F e d . S t a t e s o f ) T o k e l a u M y a n m a r *
T u v a l u N e w Z e a l a n d * U S M i n o r O u t l y i n g I s l a n d s N i u e V a n u a t u N o r f o l k I s l a n d s W a l l i s a n d F u t u n a I s l a n d s
F a r E a s t C a m b o d i a* M a c a u , C h i n a C h i n a * M o n g o l i a * D e m . P . R . o f K o r e a P h i l i p p i n e s * J a p a n * T a i w a n , C h i n a K o r e a , R e p u b l i c o f * V i e t n a m * L a o P . D . R *.
*
Tonga
11
AfricaAlgeria* Malawi*Angola* Mali*Benin* Mauritania*Botswana* Mauritius*Burkina Faso* MayotteBurundii* Morocco*Cameroo o n * Mozambique*Cape Verdee Namibia*Central Africaa n Republic* Niger*Chad Nigeria*Comoros ReunionCongoo* RwandaCôte d'II voire* Saint HelenaDemocratic Rep. of the Congo* Sao Tome and PrincipeDjibouti Senegal*Egypt* Seychelles*Equatorial Guinea Sierra Leone*Eritrea* SomaliaEthiopia* South Africa*Gabon* Sudan*Gambia SwazilandGhana* TogoGuinea Tunisia*Guinea-Bissau Uganda*Kenya* United Republic of Tanzania*Lesotho* Western SaharaLiberia* Zambia*Libya* Zimbabwe*Madagascar*
Eastern EuropeAlbania* Lithuania*Armenia* Montenegro*
Poland*Azerbaijan*Republic of Moldova*Belarus*Romania*Bosnia and Herzegovina*Russian Federation*Bulgaria*Serbia*Croatia*Slovakia*Czech Republic*Slovenia*Estonia*Tajikistan*Georgia*The Frmr. Yug. Rep. of Macedonia*Hungary*TurkmenistanKazakhstan*Ukraine*Kyrgyzstan*Uzbekistan*Latvia*
*
*
*
*
M i d d l e E a s t a n d S o u t h A s i a A f g h a n i s t a n * K u w a i t * B a h r a i n* L e b a n o n * B a n g l a d e s h * N e p a l* B h u t a n O m a n* B r i t i s h I n d i a n O c e a n T e r r i t o r y P a k i s t a n * C o c o s ( K e e l i n g ) I s l a n d s Q a t a r * F r e n c h S o u t h e r n T e r r i t o r i e s S a u d i A r a b i a * Heard Island & McDonald Islands S r i L a n k a * I n d i a * S y r i a n A r a b R e p u b l i c * I r a n , I s l a m i c R e p u b l i c o f * T . T . U . T . J o f T . P a l e s t i n i a n A . I r a q * U n i t e d A r a b E m i r a t e s * I s r a e l * Y e m e n * J o r d a n *
S o u t h E a s t A s i a a n d t h e P a c i f i c A u s t r a l i a *
N o r t h e r n M a r i a n a I s l a n d s
B r u n e i D a r u s s a l a m P a l a u* C o o k I s l a n d s P a p u a N e w G u i n e a* F i j i P i t c a i r n I s l a n d s I n d o n e s i a * S a m o a K i r i b a t i S i n g a p o r e * M a l a y s i a * S o l o m o n I s l a n d s M a l d i v e s T h a i l a n d * M a r s h a l l I s l a n d s * T i m o r L e s t e M i c r o n e s i a ( F e d . S t a t e s o f ) T o k e l a u M y a n m a r *
T u v a l u N e w Z e a l a n d * U S M i n o r O u t l y i n g I s l a n d s N i u e V a n u a t u N o r f o l k I s l a n d s W a l l i s a n d F u t u n a I s l a n d s
F a r E a s t C a m b o d i a* M a c a u , C h i n a C h i n a * M o n g o l i a * D e m . P . R . o f K o r e a P h i l i p p i n e s * J a p a n * T a i w a n , C h i n a K o r e a , R e p u b l i c o f * V i e t n a m * L a o P . D . R *.
*
Tonga
12
TABL
E 1.
NU
CLEA
R PO
WER
REA
CTO
RS IN
TH
E W
ORL
D (
end
of 2
012)
Gro
up a
nd C
ount
ry
In O
pera
tion
Und
er C
onst
ruct
ion
Num
ber
of U
nits
Tota
l MW
(e)
Num
ber
of U
nits
Tota
l MW
(e)
Num
ber
of U
nits
Tota
l MW
(e)
TWh
Perc
ent
of
Tota
l Ele
ctri
city
Nor
th A
mer
ica
C
anad
a19
1350
0
89
.1
15
.3
Uni
ted
Stat
es o
f Am
eric
a10
4
10
2136
1
11
65
77
0.7
19.0
Lati
n A
mer
ica
A
rgen
tina
2
93
5
1
692
5.9
4.7
B
razi
l2
1884
1
12
45
15
.2
3.
1
Mex
ico
2
15
30
8.
4
4.
7
W
este
rn E
urop
e
Bel
gium
7
59
27
38
.5
51
.0
Fin
land
4
27
52
1
1600
22.1
32.6
F
ranc
e58
6313
0
1
1600
407.
4
74
.8
Ger
man
y9
1206
8
94
.1
16
.1
Net
herl
ands
1
48
2
3.
7
4.
4
Spa
in8
7560
58.7
20.5
S
wed
en10
9395
61.5
38.1
S
wit
zerl
and
5
32
78
24
.4
35
.9
Uni
ted
King
dom
16
92
31
64
.0
18
.1
Ea
ster
n Eu
rope
A
rmen
ia1
375
2.1
26.6
B
ulga
ria
2
19
06
14
.9
31
.6
Cze
ch R
epub
lic6
3804
28.6
35.3
H
unga
ry4
1889
14.8
45.9
Long
-ter
m S
hut
Dow
n Re
acto
rsEl
ectr
icit
y Su
pplie
d by
Nuc
lear
Pow
er R
eact
ors
in 2
012
13
TABL
E 1.
NU
CLEA
R PO
WER
REA
CTO
RS IN
TH
E W
ORL
D (
end
of 2
012)
Gro
up a
nd C
ount
ry
In O
pera
tion
Und
er C
onst
ruct
ion
Num
ber
of U
nits
Tota
l MW
(e)
Num
ber
of U
nits
Tota
l MW
(e)
Num
ber
of U
nits
Tota
l MW
(e)
TWh
Perc
ent
of
Tota
l Ele
ctri
city
Nor
th A
mer
ica
C
anad
a19
1350
0
89
.1
15
.3
Uni
ted
Stat
es o
f Am
eric
a10
4
10
2136
1
11
65
77
0.7
19.0
Lati
n A
mer
ica
A
rgen
tina
2
93
5
1
692
5.9
4.7
B
razi
l2
1884
1
12
45
15
.2
3.
1
Mex
ico
2
15
30
8.
4
4.
7
W
este
rn E
urop
e
Bel
gium
7
59
27
38
.5
51
.0
Fin
land
4
27
52
1
1600
22.1
32.6
F
ranc
e58
6313
0
1
1600
407.
4
74
.8
Ger
man
y9
1206
8
94
.1
16
.1
Net
herl
ands
1
48
2
3.
7
4.
4
Spa
in8
7560
58.7
20.5
S
wed
en10
9395
61.5
38.1
S
wit
zerl
and
5
32
78
24
.4
35
.9
Uni
ted
King
dom
16
92
31
64
.0
18
.1
Ea
ster
n Eu
rope
A
rmen
ia1
375
2.1
26.6
B
ulga
ria
2
19
06
14
.9
31
.6
Cze
ch R
epub
lic6
3804
28.6
35.3
H
unga
ry4
1889
14.8
45.9
Long
-ter
m S
hut
Dow
n Re
acto
rsEl
ectr
icit
y Su
pplie
d by
Nuc
lear
Pow
er R
eact
ors
in 2
012
TABL
E 1.
NU
CLEA
R PO
WER
REA
CTO
RS IN
TH
E W
ORL
D (
end
of 2
012)
Gro
up a
nd C
ount
ry
In O
pera
tion
Und
er C
onst
ruct
ion
Num
ber
of U
nits
Tota
l MW
(e)
Num
ber
of U
nits
Tota
l MW
(e)
Num
ber
of U
nits
Tota
l MW
(e)
TWh
Perc
ent
of
Tota
l Ele
ctri
city
R
oman
ia2
1300
10.6
19.4
R
ussi
an F
eder
atio
n33
2364
3
10
8382
166.
3
17
.8
Slo
vaki
a4
1816
2
88
0
14
.4
53
.8
Slo
veni
a1
688
5.2
36.0
U
krai
ne15
1310
7
2
1900
84.9
46.2
Afr
ica
S
outh
Afr
ica
2
18
60
12
.4
5.
1
M
iddl
e Ea
st a
nd S
outh
Asi
a
Ind
ia20
4391
7
48
24
29
.7
3.
6
Ira
n, Is
lam
ic R
epub
lic o
f1
915
1.3
0.5
P
akis
tan
3
72
5
2
630
5.3
5.3
U
nite
d Ar
ab E
mir
ates
1
13
45
Fa
r Ea
st
Chi
na17
1286
0
29
2884
4
92
.7
2.
0
Jap
an50
4421
5
1
246
2
26
50
17
.2
2.
1
Kor
ea,
Repu
blic
of
23
20
739
4
49
80
14
3.5
30.4
Wor
ld T
otal
(*)
437
3730
69
1
246
66
63
337
2346
.3
11
.3
Not
es:
(*)
Incl
udin
g th
e fo
llow
ing
data
in T
aiw
an,
Chin
a:
— 6
uni
ts in
ope
rati
on w
ith
tota
l cap
acit
y of
501
8 M
W(e
); 2
uni
ts u
nder
con
stru
ctio
n w
ith
tota
l cap
acit
y of
260
0 M
W(e
);
Long
-ter
m S
hut
Dow
n Re
acto
rsEl
ectr
icit
y Su
pplie
d by
Nuc
lear
Pow
er R
eact
ors
in 2
012
—
38.
7 TW
h of
nuc
lear
ele
ctri
city
gen
erat
ion,
rep
rese
ntin
g 18
.4%
of
the
tota
l ele
ctri
city
gen
erat
ed.
14
TABL
E 2.
NU
MBE
R O
F CO
UN
TRIE
S W
ITH
NU
CLEA
R PO
WER
REA
CTO
RS IN
OPE
RATI
ON
OR
UN
DER
CO
NST
RUCT
ION
(en
d of
201
2)
Coun
try
Gro
upN
umbe
r of
Cou
ntri
es in
Gro
upCo
untr
ies
wit
h N
ucle
ar P
ower
Rea
ctor
sIn
Ope
rati
onLo
ng-t
erm
Shu
t D
own
Und
er C
onst
ruct
ion
(1)
Tota
l (2)
Nor
th A
mer
ica
2
2
1
2
Lati
n Am
eric
a45
3
2
3
Wes
tern
Eur
ope
29
9
2
9
East
ern
Euro
pe27
9
3
9
Afri
ca57
1
1
Mid
dle
East
and
Sou
th A
sia
25
3
3
4
Sout
h Ea
st A
sia
and
the
Paci
fic
29
Far
East
11
3
1
3
3
Wor
ld T
otal
225
30
1
14
31
Not
es:
(1)
May
incl
ude
coun
trie
s ha
ving
rea
ctor
s al
read
y in
ope
rati
on.
(2)
Tota
l num
ber
of c
ount
ries
in e
ach
grou
p th
at h
ave
nucl
ear
pow
er r
eact
ors
in o
pera
tion
, or
und
er c
onst
ruct
ion.
Note: the nuclear share of electricity generation in Taiwan, China was 18.4%.
FIGURE 1. NUCLEAR SHARE OF TOTAL ELECTRICITY GENERATION IN 2012
FRANCE
SLOVAKIA
BELGIUM
UKRAINE
HUNGARY
SWEDEN
SLOVENIA
SWITZERLAND
CZECH REPUBLIC
FINLAND
BULGARIA
KOREA, REPUBLIC OF
ARMENIA
SPAIN
ROMANIA
USA
UK
RUSSIAN FEDERATION
GERMANY
CANADA
PAKISTAN
SOUTH AFRICA
ARGENTINA
MEXICO
NETHERLANDS
INDIA
BRAZIL
JAPAN
CHINA
IRAN, ISLAMIC REPUBLIC OF
0 20 40 60 80 100
74.8
53.8
51.0
46.2
45.9
38.1
36.0
35.9
35.3
32.6
31.6
30.4
26.6
20.5
19.4
19.0
18.1
17.8
16.1
15.3
5.3
5.1
4.7
4.7
4.4
3.6
3.1
2.1
2.0
0.50
Nuclear Share (%)
15
TABL
E 2.
NU
MBE
R O
F CO
UN
TRIE
S W
ITH
NU
CLEA
R PO
WER
REA
CTO
RS IN
OPE
RATI
ON
OR
UN
DER
CO
NST
RUCT
ION
(en
d of
201
2)
Coun
try
Gro
upN
umbe
r of
Cou
ntri
es in
Gro
upCo
untr
ies
wit
h N
ucle
ar P
ower
Rea
ctor
sIn
Ope
rati
onLo
ng-t
erm
Shu
t D
own
Und
er C
onst
ruct
ion
(1)
Tota
l (2)
Nor
th A
mer
ica
2
2
1
2
Lati
n Am
eric
a45
3
2
3
Wes
tern
Eur
ope
29
9
2
9
East
ern
Euro
pe27
9
3
9
Afri
ca57
1
1
Mid
dle
East
and
Sou
th A
sia
25
3
3
4
Sout
h Ea
st A
sia
and
the
Paci
fic
29
Far
East
11
3
1
3
3
Wor
ld T
otal
225
30
1
14
31
Not
es:
(1)
May
incl
ude
coun
trie
s ha
ving
rea
ctor
s al
read
y in
ope
rati
on.
(2)
Tota
l num
ber
of c
ount
ries
in e
ach
grou
p th
at h
ave
nucl
ear
pow
er r
eact
ors
in o
pera
tion
, or
und
er c
onst
ruct
ion.
Note: the nuclear share of electricity generation in Taiwan, China was 18.4%.
FIGURE 1. NUCLEAR SHARE OF TOTAL ELECTRICITY GENERATION IN 2012
FRANCE
SLOVAKIA
BELGIUM
UKRAINE
HUNGARY
SWEDEN
SLOVENIA
SWITZERLAND
CZECH REPUBLIC
FINLAND
BULGARIA
KOREA, REPUBLIC OF
ARMENIA
SPAIN
ROMANIA
USA
UK
RUSSIAN FEDERATION
GERMANY
CANADA
PAKISTAN
SOUTH AFRICA
ARGENTINA
MEXICO
NETHERLANDS
INDIA
BRAZIL
JAPAN
CHINA
IRAN, ISLAMIC REPUBLIC OF
0 20 40 60 80 100
74.8
53.8
51.0
46.2
45.9
38.1
36.0
35.9
35.3
32.6
31.6
30.4
26.6
20.5
19.4
19.0
18.1
17.8
16.1
15.3
5.3
5.1
4.7
4.7
4.4
3.6
3.1
2.1
2.0
0.50
Nuclear Share (%)

17
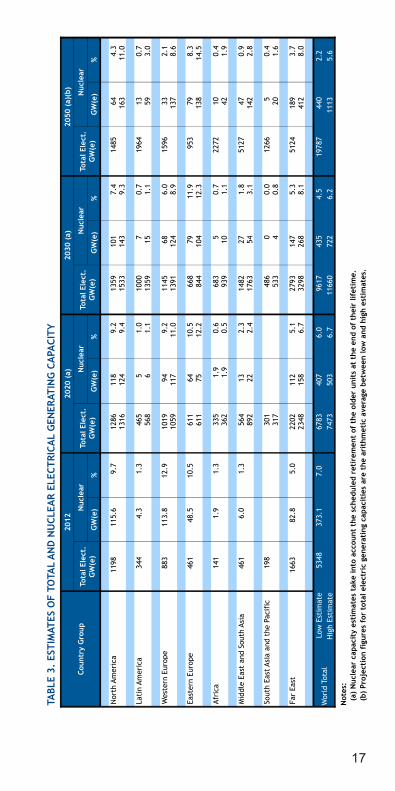
TABL
E 3.
EST
IMAT
ES O
F TO
TAL
AN
D N
UCL
EAR
ELEC
TRIC
AL
GEN
ERAT
ING
CA
PACI
TY
Coun
try
Gro
up
2012
2020
(a)
2030
(a)
2050
(a)
(b)
Nuc
lear
Nuc
lear
Nuc
lear
Nuc
lear
GW
(e)
%G
W(e
)%
GW
(e)
%G
W(e
)%
Nor
th A
mer
ica
1198
115.
6
9.7
12
86
11
8
9.
2
1359
101
7.4
14
85
64
4.3
13
16
12
4
9.
4
1533
143
9.3
16
3
11
.0
Lati
n Am
eric
a34
4
4.
3
1.3
46
5
5
1.0
10
00
7
0.7
19
64
13
0.7
56
8
6
1.1
13
59
15
1.1
59
3.0
Wes
tern
Eur
ope
883
113.
8
12.9
1019
94
9.
2
1145
68
6.
0
1596
33
2.
1
1059
117
11.0
13
91
12
4
8.
9
137
8.6
East
ern
Euro
pe46
1
48
.5
10
.5
61
1
64
10
.5
668
79
11.9
95
3
79
8.
3
611
75
12.2
84
4
104
12.3
13
8
14
.5
Afri
ca14
1
1.
9
1.3
33
5
1.9
0.
6
683
5
0.7
22
72
10
0.4
36
2
1.9
0.
5
939
10
1.1
42
1.9
Mid
dle
East
and
Sou
th A
sia
461
6.0
1.
3
564
13
2.3
14
82
27
1.8
51
27
47
0.9
89
2
22
2.
4
1763
54
3.
1
142
2.8
Sout
h Ea
st A
sia
and
the
Paci
fic
198
301
48
6
0
0.0
12
66
5
0.4
31
7
533
4
0.8
20
1.6
Far
East
1663
82.8
5.0
22
02
11
2
5.
1
2793
147
5.3
51
24
18
9
3.
7
2348
158
6.7
32
98
26
8
8.
1
412
8.0
Wor
ld T
otal
Low
Est
imat
e53
48
37
3.1
7.
0
67
83
40
7
6.
0
96
17
43
5
4.
5
19
787
44
0
2.
2
H
igh
Esti
mat
e74
73
50
3
6.
7
11
660
72
2
6.
2
11
13
5.
6
Not
es:
(a)
Nuc
lear
cap
acit
y es
tim
ates
tak
e in
to a
ccou
nt t
he s
ched
uled
ret
irem
ent
of t
he o
lder
uni
ts a
t th
e en
d of
the
ir li
feti
me.
(b)
Pro
ject
ion
figu
res
for
tota
l ele
ctri
c ge
nera
ting
cap
acit
ies
are
the
arit
hmet
ic a
vera
ge b
etw
een
low
and
hig
h es
tim
ates
.
Tota
l Ele
ct.
GW
(e)
Tota
l Ele
ct.
GW
(e)
Tota
l Ele
ct.
GW
(e)
Tota
l Ele
ct.
GW
(e)
18
North Latin Western Eastern Africa Middle East & South East Asia Far East
America America Europe Europe South Asia & the Pacific
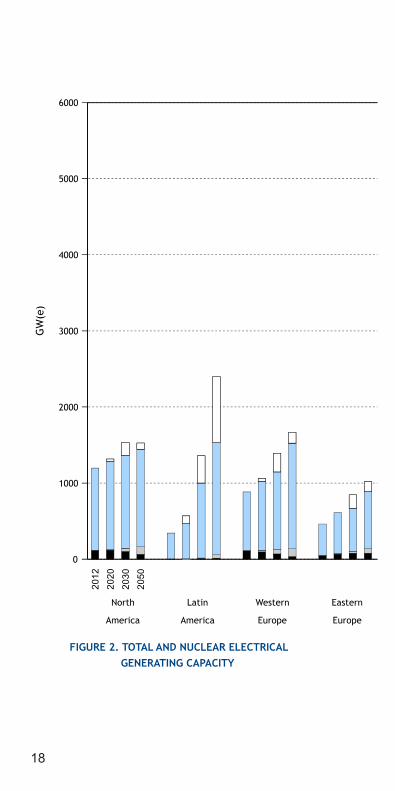
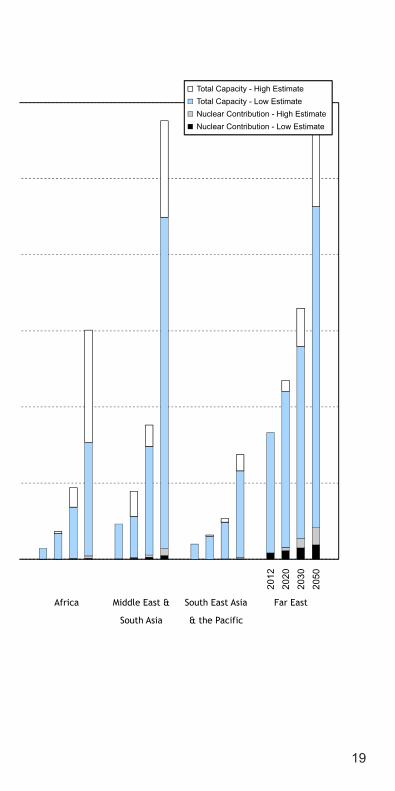
FIGURE 2. TOTAL AND NUCLEAR ELECTRICAL GENERATING CAPACITY
2012
2020
2030
2050
2012
2020
2030
2050
0
1000
2000
3000
4000
5000
6000
Total Capacity - High EstimateTotal Capacity - Low EstimateNuclear Contribution - High Estimate Nuclear Contribution - Low Estimate
GW
(e)
North Latin Western Eastern Africa Middle East & South East Asia Far East
America America Europe Europe South Asia & the Pacific
FIGURE 2. TOTAL AND NUCLEAR ELECTRICAL GENERATING CAPACITY
2012
2020
2030
2050
2012
2020
2030
2050
0
1000
2000
3000
4000
5000
6000
Total Capacity - High EstimateTotal Capacity - Low EstimateNuclear Contribution - High Estimate Nuclear Contribution - Low Estimate
GW
(e)
19
North Latin Western Eastern Africa Middle East & South East Asia Far East
America America Europe Europe South Asia & the Pacific
FIGURE 2. TOTAL AND NUCLEAR ELECTRICAL GENERATING CAPACITY
2012
2020
2030
2050
2012
2020
2030
2050
0
1000
2000
3000
4000
5000
6000
Total Capacity - High EstimateTotal Capacity - Low EstimateNuclear Contribution - High Estimate Nuclear Contribution - Low Estimate
GW
(e)

TABL
E 4.
EST
IMAT
ES O
F TO
TAL
ELEC
TRIC
ITY
GEN
ERAT
ION
AN
D C
ON
TRIB
UTI
ON
BY
NU
CLEA
R PO
WER
(*)
Coun
try
Gro
up
2012
2020
2030
2050
(a)
Nuc
lear
Nuc
lear
Nuc
lear
Nuc
lear
TWh
%TW
h%
TWh
%TW
h%
Nor
th A
mer
ica
4645
859.
8
18.5
4904
928
18.9
5144
794
15.4
5675
514
9.1
4934
979
19.8
5254
1125
21.4
1312
23.1
Lati
n Am
eric
a14
04
29
.5
2.
1
20
46
35
1.
7
34
10
56
1.6
7134
105
1.5
2219
45
2.0
5017
115
2.3
475
6.7
Wes
tern
Eur
ope
3135
774.
4
24.7
3532
700
19.8
4006
537
13.4
5804
267
4.6
3681
869
23.6
4721
979
20.7
1106
19.1
East
ern
Euro
pe18
13
34
1.8
18
.8
21
52
47
9
22
.3
25
43
62
5
24
.6
36
65
63
7
17
.4
22
22
55
6
25
.0
30
63
81
6
26
.7
11
13
30
.4
Afri
ca68
8
12
.4
1.
8
11
93
14
1.
2
23
32
40
1.7
8476
82
1.
0
13
80
14
1.
0
32
33
78
2.4
342
4.0
Mid
dle
East
and
Sou
th A
sia
1927
36.3
1.9
2462
91
3.
7
54
25
21
5
4.
0
19
207
37
7
2.
0
30
76
15
2
4.
9
63
52
42
9
6.
8
11
42
5.
9
Sout
h Ea
st A
sia
and
the
Paci
fic
827
1062
1689
0
0.0
4449
40
0.
9
11
02
19
43
32
1.6
161
3.6
Far
East
6417
292.
1
4.6
7516
830
11.0
9910
1160
11.7
2002
3
1525
7.6
8596
1176
13.7
1270
4
2115
16.6
3319
16.6
Wor
ld T
otal
Low
Est
imat
e20
855
23
46.3
11.3
2486
7
3078
12.4
3445
8
3426
9.9
7443
3
3548
4.8
Hig
h Es
tim
ate
2721
0
3790
13.9
4228
7
5689
13.5
8971
12.1
Not
es:
(*)
The
nuc
lear
gen
erat
ion
data
pre
sent
ed in
thi
s ta
ble
and
the
nucl
ear
capa
city
dat
a pr
esen
ted
in T
able
3 c
anno
t be
use
d to
cal
cula
te a
vera
ge a
nnua
l cap
acit
y fa
ctor
s
for
nuc
lear
pla
nts,
as
Tabl
e 3
pres
ents
yea
r-en
d ca
paci
ty a
nd n
ot t
he e
ffec
tive
cap
acit
y av
erag
e ov
er t
he y
ear.
(a)
Pro
ject
ion
figu
res
for
tota
l ele
ctri
city
gen
erat
ion
are
the
arit
hmet
ic a
vera
ge b
etw
een
low
and
hig
h es
tim
ates
.
Tota
l Ele
ct.
TWh
Tota
l Ele
ct.
TWh
Tota
l Ele
ct.
TWh
Tota
l Ele
ct.
TWh
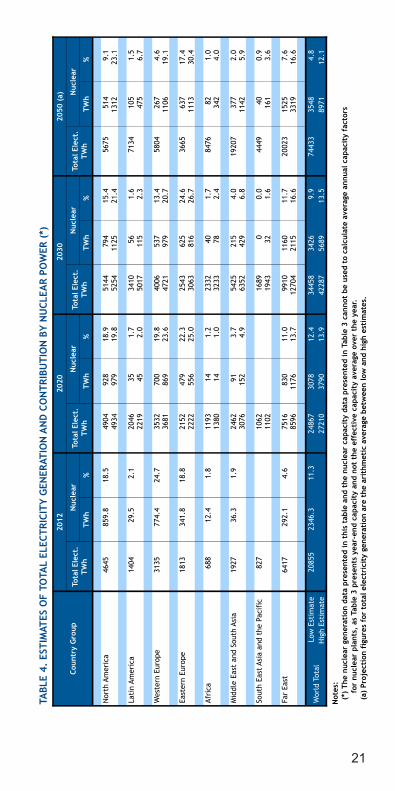
21
TABL
E 4.
EST
IMAT
ES O
F TO
TAL
ELEC
TRIC
ITY
GEN
ERAT
ION
AN
D C
ON
TRIB
UTI
ON
BY
NU
CLEA
R PO
WER
(*)
Coun
try
Gro
up
2012
2020
2030
2050
(a)
Nuc
lear
Nuc
lear
Nuc
lear
Nuc
lear
TWh
%TW
h%
TWh
%TW
h%
Nor
th A
mer
ica
4645
859.
8
18.5
4904
928
18.9
5144
794
15.4
5675
514
9.1
4934
979
19.8
5254
1125
21.4
1312
23.1
Lati
n Am
eric
a14
04
29
.5
2.
1
20
46
35
1.
7
34
10
56
1.6
7134
105
1.5
2219
45
2.0
5017
115
2.3
475
6.7
Wes
tern
Eur
ope
3135
774.
4
24.7
3532
700
19.8
4006
537
13.4
5804
267
4.6
3681
869
23.6
4721
979
20.7
1106
19.1
East
ern
Euro
pe18
13
34
1.8
18
.8
21
52
47
9
22
.3
25
43
62
5
24
.6
36
65
63
7
17
.4
22
22
55
6
25
.0
30
63
81
6
26
.7
11
13
30
.4
Afri
ca68
8
12
.4
1.
8
11
93
14
1.
2
23
32
40
1.7
8476
82
1.
0
13
80
14
1.
0
32
33
78
2.4
342
4.0
Mid
dle
East
and
Sou
th A
sia
1927
36.3
1.9
2462
91
3.
7
54
25
21
5
4.
0
19
207
37
7
2.
0
30
76
15
2
4.
9
63
52
42
9
6.
8
11
42
5.
9
Sout
h Ea
st A
sia
and
the
Paci
fic
827
1062
1689
0
0.0
4449
40
0.
9
11
02
19
43
32
1.6
161
3.6
Far
East
6417
292.
1
4.6
7516
830
11.0
9910
1160
11.7
2002
3
1525
7.6
8596
1176
13.7
1270
4
2115
16.6
3319
16.6
Wor
ld T
otal
Low
Est
imat
e20
855
23
46.3
11.3
2486
7
3078
12.4
3445
8
3426
9.9
7443
3
3548
4.8
Hig
h Es
tim
ate
2721
0
3790
13.9
4228
7
5689
13.5
8971
12.1
Not
es:
(*)
The
nuc
lear
gen
erat
ion
data
pre
sent
ed in
thi
s ta
ble
and
the
nucl
ear
capa
city
dat
a pr
esen
ted
in T
able
3 c
anno
t be
use
d to
cal
cula
te a
vera
ge a
nnua
l cap
acit
y fa
ctor
s
for
nuc
lear
pla
nts,
as
Tabl
e 3
pres
ents
yea
r-en
d ca
paci
ty a
nd n
ot t
he e
ffec
tive
cap
acit
y av
erag
e ov
er t
he y
ear.
(a)
Pro
ject
ion
figu
res
for
tota
l ele
ctri
city
gen
erat
ion
are
the
arit
hmet
ic a
vera
ge b
etw
een
low
and
hig
h es
tim
ates
.
Tota
l Ele
ct.
TWh
Tota
l Ele
ct.
TWh
Tota
l Ele
ct.
TWh
Tota
l Ele
ct.
TWh
22
North Latin Western Eastern Africa Middle East & South East Asia Far East
America America Europe Europe South Asia & the Pacific
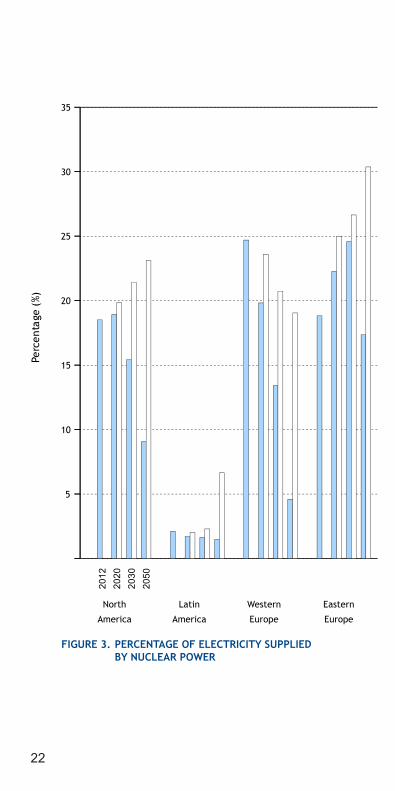
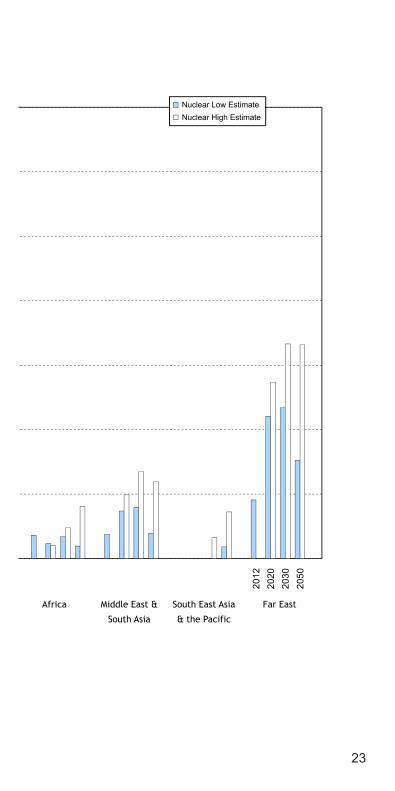
FIGURE 3. PERCENTAGE OF ELECTRICITY SUPPLIED BY NUCLEAR POWER
20
1220
2020
3020
50
2012
2020
2030
2050
5
10
15
20
25
30
35 Nuclear Low EstimateNuclear High Estimate
Perc
enta
ge (
%)
North Latin Western Eastern Africa Middle East & South East Asia Far East
America America Europe Europe South Asia & the Pacific
FIGURE 3. PERCENTAGE OF ELECTRICITY SUPPLIED BY NUCLEAR POWER
20
1220
2020
3020
50
2012
2020
2030
2050
5
10
15
20
25
30
35 Nuclear Low EstimateNuclear High Estimate
Perc
enta
ge (
%)
23
North Latin Western Eastern Africa Middle East & South East Asia Far East
America America Europe Europe South Asia & the Pacific
FIGURE 3. PERCENTAGE OF ELECTRICITY SUPPLIED BY NUCLEAR POWER
20
1220
2020
3020
50
2012
2020
2030
2050
5
10
15
20
25
30
35 Nuclear Low EstimateNuclear High Estimate
Perc
enta
ge (
%)

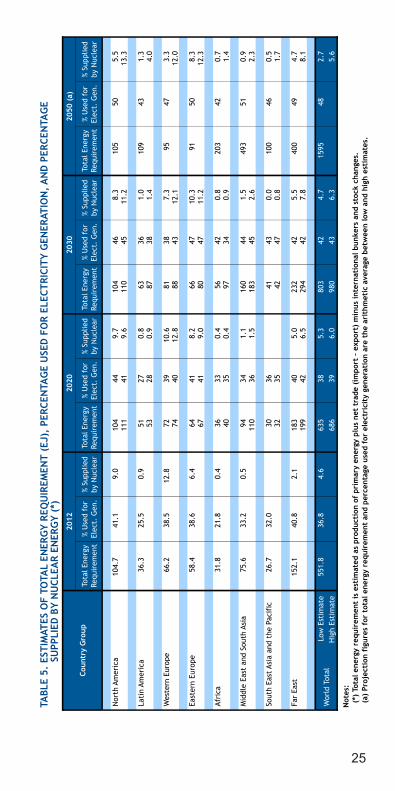
TABL
E 5.
EST
IMAT
ES O
F TO
TAL
ENER
GY
REQ
UIR
EMEN
T (E
J),
PERC
ENTA
GE
USE
D F
OR
ELEC
TRIC
ITY
GEN
ERAT
ION
, AN
D P
ERCE
NTA
GE
SU
PPLI
ED B
Y N
UCL
EAR
ENER
GY
(*)
Coun
try
Gro
up
2012
2020
2030
2050
(a)
Nor
th A
mer
ica
104.
7
41
.1
9.
0
10
4
44
9.7
104
46
8.
3
10
5
50
5.5
111
41
9.
6
11
0
45
11.2
13.3
Lati
n Am
eric
a36
.3
25
.5
0.
9
51
27
0.
8
63
36
1.
0
10
9
43
1.3
53
28
0.9
87
38
1.4
4.0
Wes
tern
Eur
ope
66.2
38.5
12.8
72
39
10.6
81
38
7.3
95
47
3.3
74
40
12.8
88
43
12.1
12.0
East
ern
Euro
pe58
.4
38
.6
6.
4
64
41
8.
2
66
47
10
.3
91
50
8.
3
67
41
9.
0
80
47
11
.2
12
.3
Afri
ca31
.8
21
.8
0.
4
36
33
0.
4
56
42
0.
8
20
3
42
0.7
40
35
0.4
97
34
0.9
1.4
Mid
dle
East
and
Sou
th A
sia
75.6
33.2
0.5
94
34
1.1
160
44
1.
5
49
3
51
0.9
110
36
1.
5
18
3
45
2.6
2.3
Sout
h Ea
st A
sia
and
the
Paci
fic
26.7
32.0
30
36
41
43
0.0
100
46
0.
5
32
35
42
47
0.
8
1.
7
Far
East
152.
1
40
.8
2.
1
18
3
40
5.0
232
42
5.
5
40
0
49
4.7
199
42
6.
5
29
4
42
7.8
8.1
Wor
ld T
otal
Low
Est
imat
e55
1.8
36.8
4.6
635
38
5.
3
80
3
42
4.7
1595
48
2.
7
H
igh
Esti
mat
e68
6
39
6.0
980
43
6.
3
5.
6
Not
es:
(*)
Tot
al e
nerg
y re
quir
emen
t is
est
imat
ed a
s pr
oduc
tion
of
prim
ary
ener
gy p
lus
net
trad
e (i
mpo
rt –
exp
ort)
min
us in
tern
atio
nal b
unke
rs a
nd s
tock
cha
nges
. (
a) P
roje
ctio
n fi
gure
s fo
r to
tal e
nerg
y re
quir
emen
t an
d pe
rcen
tage
use
d fo
r el
ectr
icit
y ge
nera
tion
are
the
ari
thm
etic
ave
rage
bet
wee
n lo
w a
nd h
igh
esti
mat
es.
Tota
l Ene
rgy
Requ
irem
ent
% U
sed
for
Elec
t. G
en.
% Su
pplie
dby
Nuc
lear
Tota
l Ene
rgy
Requ
irem
ent
% U
sed
for
Elec
t. G
en.
% Su
pplie
dby
Nuc
lear
Tota
l Ene
rgy
Requ
irem
ent
% U
sed
for
Elec
t. G
en.
% Su
pplie
dby
Nuc
lear
Tota
l Ene
rgy
Requ
irem
ent
% U
sed
for
Elec
t. G
en.
% Su
pplie
dby
Nuc
lear
25
TABL
E 5.
EST
IMAT
ES O
F TO
TAL
ENER
GY
REQ
UIR
EMEN
T (E
J),
PERC
ENTA
GE
USE
D F
OR
ELEC
TRIC
ITY
GEN
ERAT
ION
, AN
D P
ERCE
NTA
GE
SU
PPLI
ED B
Y N
UCL
EAR
ENER
GY
(*)
Coun
try
Gro
up
2012
2020
2030
2050
(a)
Nor
th A
mer
ica
104.
7
41
.1
9.
0
10
4
44
9.7
104
46
8.
3
10
5
50
5.5
111
41
9.
6
11
0
45
11.2
13.3
Lati
n Am
eric
a36
.3
25
.5
0.
9
51
27
0.
8
63
36
1.
0
10
9
43
1.3
53
28
0.9
87
38
1.4
4.0
Wes
tern
Eur
ope
66.2
38.5
12.8
72
39
10.6
81
38
7.3
95
47
3.3
74
40
12.8
88
43
12.1
12.0
East
ern
Euro
pe58
.4
38
.6
6.
4
64
41
8.
2
66
47
10
.3
91
50
8.
3
67
41
9.
0
80
47
11
.2
12
.3
Afri
ca31
.8
21
.8
0.
4
36
33
0.
4
56
42
0.
8
20
3
42
0.7
40
35
0.4
97
34
0.9
1.4
Mid
dle
East
and
Sou
th A
sia
75.6
33.2
0.5
94
34
1.1
160
44
1.
5
49
3
51
0.9
110
36
1.
5
18
3
45
2.6
2.3
Sout
h Ea
st A
sia
and
the
Paci
fic
26.7
32.0
30
36
41
43
0.0
100
46
0.
5
32
35
42
47
0.
8
1.
7
Far
East
152.
1
40
.8
2.
1
18
3
40
5.0
232
42
5.
5
40
0
49
4.7
199
42
6.
5
29
4
42
7.8
8.1
Wor
ld T
otal
Low
Est
imat
e55
1.8
36.8
4.6
635
38
5.
3
80
3
42
4.7
1595
48
2.
7
H
igh
Esti
mat
e68
6
39
6.0
980
43
6.
3
5.
6
Not
es:
(*)
Tot
al e
nerg
y re
quir
emen
t is
est
imat
ed a
s pr
oduc
tion
of
prim
ary
ener
gy p
lus
net
trad
e (i
mpo
rt –
exp
ort)
min
us in
tern
atio
nal b
unke
rs a
nd s
tock
cha
nges
. (
a) P
roje
ctio
n fi
gure
s fo
r to
tal e
nerg
y re
quir
emen
t an
d pe
rcen
tage
use
d fo
r el
ectr
icit
y ge
nera
tion
are
the
ari
thm
etic
ave
rage
bet
wee
n lo
w a
nd h
igh
esti
mat
es.
Tota
l Ene
rgy
Requ
irem
ent
% U
sed
for
Elec
t. G
en.
% Su
pplie
dby
Nuc
lear
Tota
l Ene
rgy
Requ
irem
ent
% U
sed
for
Elec
t. G
en.
% Su
pplie
dby
Nuc
lear
Tota
l Ene
rgy
Requ
irem
ent
% U
sed
for
Elec
t. G
en.
% Su
pplie
dby
Nuc
lear
Tota
l Ene
rgy
Requ
irem
ent
% U
sed
for
Elec
t. G
en.
% Su
pplie
dby
Nuc
lear
26
North Latin Western Eastern Africa Middle East & South East Asia Far East
America America Europe Europe South Asia & the Pacific
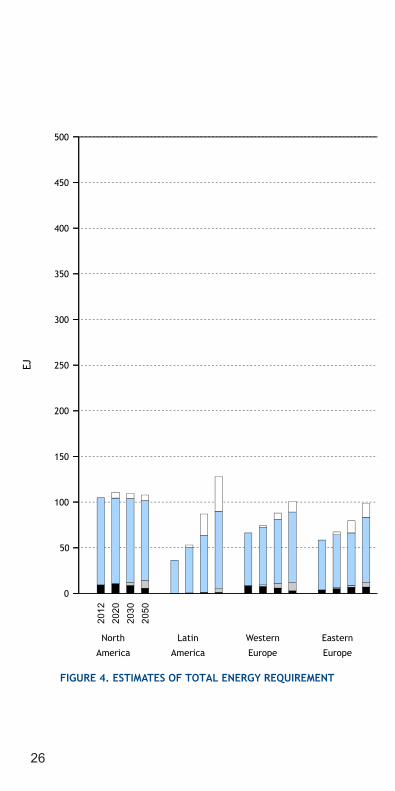
FIGURE 4. ESTIMATES OF TOTAL ENERGY REQUIREMENT
20
1220
2020
3020
50
2012
2020
2030
2050
0
50
100
150
200
250
300
350
400
450
500 Total - High EstimateTotal – Low EstimateNuclear – High EstimateNuclear - Low Estimate
EJ
North Latin Western Eastern Africa Middle East & South East Asia Far East
America America Europe Europe South Asia & the Pacific
FIGURE 4. ESTIMATES OF TOTAL ENERGY REQUIREMENT
20
1220
2020
3020
50
2012
2020
2030
2050
0
50
100
150
200
250
300
350
400
450
500 Total - High EstimateTotal – Low EstimateNuclear – High EstimateNuclear - Low Estimate
EJ
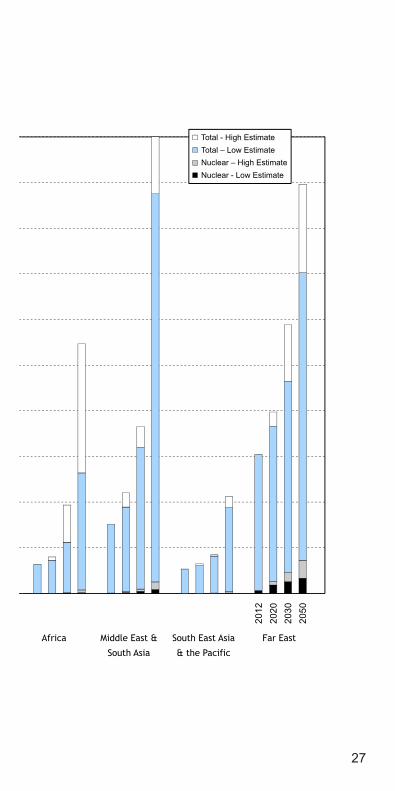
27
North Latin Western Eastern Africa Middle East & South East Asia Far East
America America Europe Europe South Asia & the Pacific
FIGURE 4. ESTIMATES OF TOTAL ENERGY REQUIREMENT
20
1220
2020
3020
50
2012
2020
2030
2050
0
50
100
150
200
250
300
350
400
450
500 Total - High EstimateTotal – Low EstimateNuclear – High EstimateNuclear - Low Estimate
EJ


29
TABL
E 6.
TO
TAL
ENER
GY
REQ
UIR
EMEN
T (E
J) B
Y TY
PE O
F FU
EL IN
201
2 (*
) Co
untr
y G
roup
Solid
s (a
)Li
quid
sG
ases
Biof
uels
(b)
Hyd
roN
ucle
arRe
new
able
s (c
)To
tal
Nor
th A
mer
ica
19.0
3
34.9
9
31.8
6
5.86
2.
47
9.38
1.
12
104.
71
Lati
n Am
eric
a1.
68
16.3
8
9.11
5.
66
2.74
0.
32
0.45
36
.34
Wes
tern
Eur
ope
9.67
21
.65
18
.17
4.
74
2.10
8.
45
1.44
66
.21
East
ern
Euro
pe11
.94
12
.32
27
.94
1.
41
1.00
3.
73
0.04
58
.38
Afri
ca4.
89
8.54
4.
68
13.0
5
0.42
0.
14
0.12
31
.83
Mid
dle
East
and
Sou
th A
sia
19.1
6
24.6
9
20.2
5
10.3
3
0.66
0.
40
0.11
75
.61
Sout
h Ea
st A
sia
and
the
Paci
fic
6.15
9.
25
6.27
4.
27
0.26
0.
46
26.6
6
Far
East
89.6
0
36.3
9
14.0
4
4.29
3.
74
3.19
0.
84
152.
09
Wor
ld T
otal
162.
12
164.
22
132.
32
49.6
0
13.4
0
25.6
0
4.57
55
1.83
Not
es:
(*)
Tota
l ene
rgy
requ
irem
ent
is e
stim
ated
as
prod
ucti
on o
f pr
imar
y en
ergy
plu
s ne
t tr
ade
(im
port
– e
xpor
t) m
inus
inte
rnat
iona
l bun
kers
and
sto
ck c
hang
es.
(a)
Solid
s do
not
incl
ude
com
mer
cial
woo
d.(b
) Th
e co
lum
n he
aded
'Bio
fuel
s' in
clud
es c
omm
erci
al w
ood,
cha
rcoa
l, c
ombu
stib
le r
enew
able
s, w
aste
and
oth
er e
nerg
y pr
oduc
ts d
eriv
ed d
irec
tly
or in
dire
ctly
fro
m b
iom
ass.
(c)
The
colu
mn
head
ed 'R
enew
able
s' in
clud
es g
eoth
erm
al,
win
d, s
olar
, ti
de e
nerg
y an
d ne
t el
ectr
icit
y tr
ade.
30
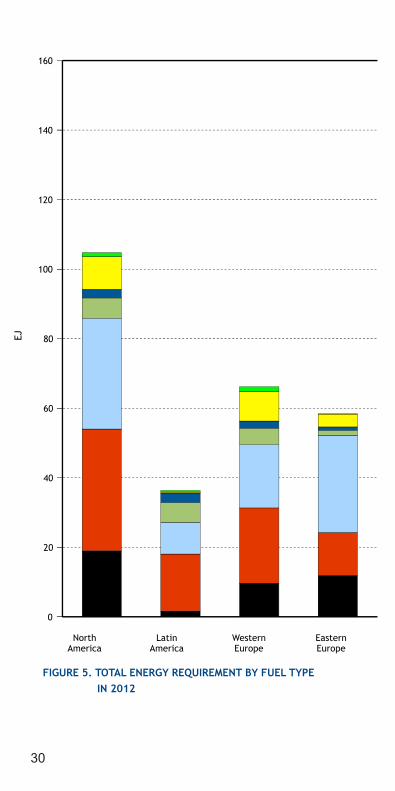
North Latin Western Eastern Africa Middle East & South East Asia Far EastAmerica America Europe Europe South Asia & the Pacific
FIGURE 5. TOTAL ENERGY REQUIREMENT BY FUEL TYPE IN 2012
0
20
40
60
80
100
120
140
160 Renewables
Nuclear
Hydro
Biofuels
Gases
Liquids
Solids
EJ
North Latin Western Eastern Africa Middle East & South East Asia Far EastAmerica America Europe Europe South Asia & the Pacific
FIGURE 5. TOTAL ENERGY REQUIREMENT BY FUEL TYPE IN 2012
0
20
40
60
80
100
120
140
160 Renewables
Nuclear
Hydro
Biofuels
Gases
Liquids
Solids
EJ
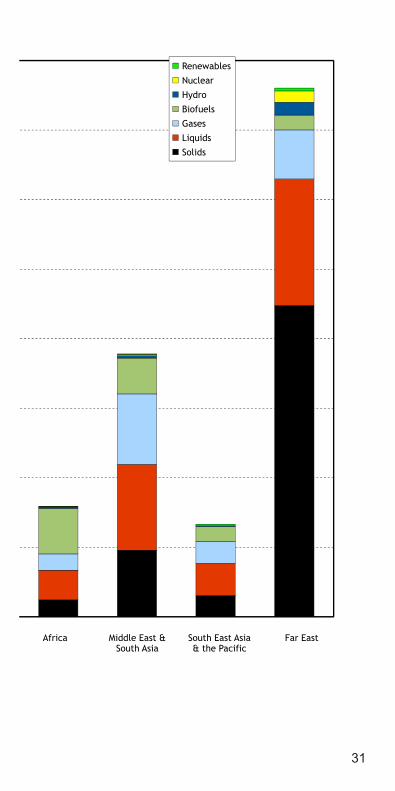
31
North Latin Western Eastern Africa Middle East & South East Asia Far EastAmerica America Europe Europe South Asia & the Pacific
FIGURE 5. TOTAL ENERGY REQUIREMENT BY FUEL TYPE IN 2012
0
20
40
60
80
100
120
140
160 Renewables
Nuclear
Hydro
Biofuels
Gases
Liquids
Solids
EJ
32
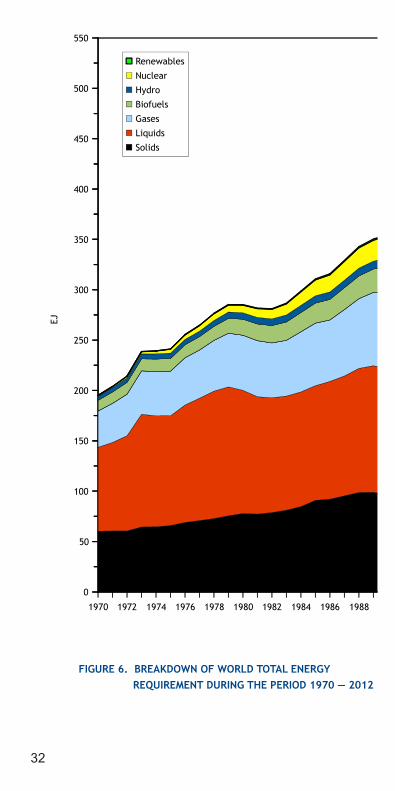
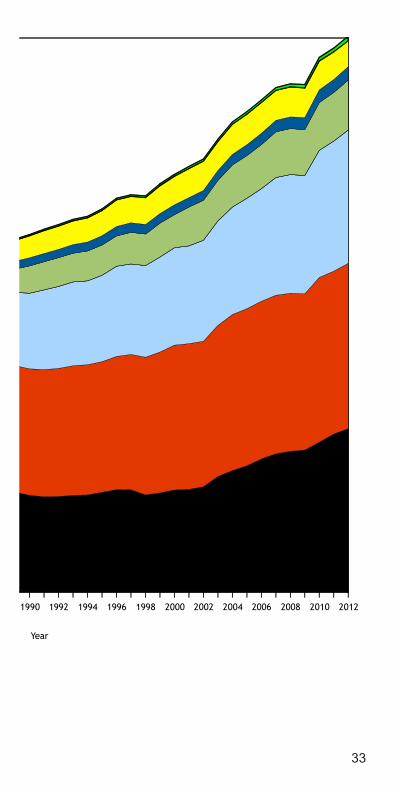
FIGURE 6. BREAKDOWN OF WORLD TOTAL ENERGY REQUIREMENT DURING THE PERIOD 1970 — 2012
1970 1972 1974 1976 1978 1980 1982 1984 1986 1988 1990 1992 1994 1996 1998 2000 2002 2004 2006 2008 2010 2012
0
50
100
150
200
250
300
350
400
450
500
550
Renewables
Nuclear
Hydro
Biofuels
Gases
Liquids
Solids
Year
EJ
33
FIGURE 6. BREAKDOWN OF WORLD TOTAL ENERGY REQUIREMENT DURING THE PERIOD 1970 — 2012
1970 1972 1974 1976 1978 1980 1982 1984 1986 1988 1990 1992 1994 1996 1998 2000 2002 2004 2006 2008 2010 2012
0
50
100
150
200
250
300
350
400
450
500
550
Renewables
Nuclear
Hydro
Biofuels
Gases
Liquids
Solids
Year
EJ

TABL
E 7.
FU
EL S
HA
RES
(%)
OF
TOTA
L EN
ERG
Y RE
QU
IREM
ENT
IN 2
012
(*)
Coun
try
Gro
upSo
lids
(a)
Liqu
ids
Gas
esBi
ofue
ls (
b)H
ydro
Nuc
lear
Rene
wab
les
(c)
Tota
l
Nor
th A
mer
ica
18.2
33
.4
30.4
5.
6
2.4
9.
0
1.1
10
0.0
Lati
n Am
eric
a4.
6
45.1
25
.1
15.6
7.
5
0.9
1.
2
100.
0
Wes
tern
Eur
ope
14.6
32
.7
27.4
7.
2
3.2
12
.8
2.2
10
0.0
East
ern
Euro
pe20
.4
21.1
47
.8
2.4
1.
7
6.4
0.
1
100.
0
Afri
ca15
.4
26.8
14
.7
41.0
1.
3
0.4
0.
4
100.
0
Mid
dle
East
and
Sou
th A
sia
25.3
32
.7
26.8
13
.7
0.9
0.
5
0.1
10
0.0
Sout
h Ea
st A
sia
and
the
Paci
fic
23.1
34
.7
23.5
16
.0
1.0
1.
7
100.
0
Far
East
58.9
23
.9
9.2
2.
8
2.5
2.
1
0.6
10
0.0
Wor
ld T
otal
29.4
29
.8
24.0
9.
0
2.4
4.
6
0.8
10
0.0
Not
es:
(*)
Tota
l ene
rgy
requ
irem
ent
is e
stim
ated
as
prod
ucti
on o
f pr
imar
y en
ergy
plu
s ne
t tr
ade
(im
port
– e
xpor
t) m
inus
inte
rnat
iona
l bun
kers
and
sto
ck c
hang
es.
(a)
Solid
s do
not
incl
ude
com
mer
cial
woo
d.(b
) Th
e co
lum
n he
aded
'Bio
fuel
s' in
clud
es c
omm
erci
al w
ood,
cha
rcoa
l, c
ombu
stib
le r
enew
able
s, w
aste
and
oth
er e
nerg
y pr
oduc
ts d
eriv
ed d
irec
tly
or in
dire
ctly
fro
m b
iom
ass.
(c)
The
colu
mn
head
ed 'R
enew
able
s' in
clud
es g
eoth
erm
al,
win
d, s
olar
, ti
de e
nerg
y an
d ne
t el
ectr
icit
y tr
ade.
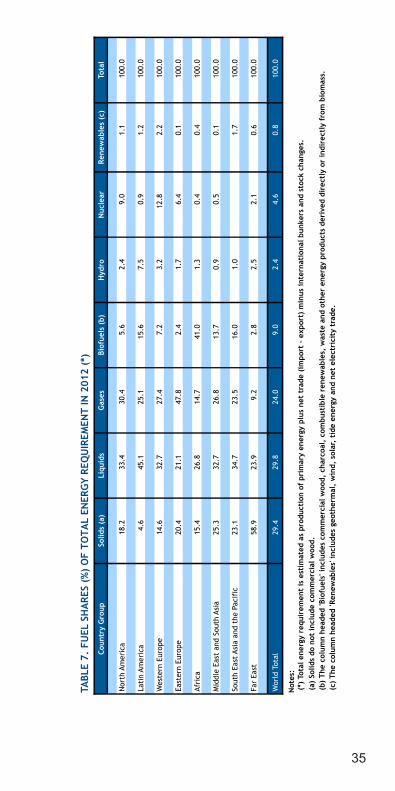
35
TABL
E 7.
FU
EL S
HA
RES
(%)
OF
TOTA
L EN
ERG
Y RE
QU
IREM
ENT
IN 2
012
(*)
Coun
try
Gro
upSo
lids
(a)
Liqu
ids
Gas
esBi
ofue
ls (
b)H
ydro
Nuc
lear
Rene
wab
les
(c)
Tota
l
Nor
th A
mer
ica
18.2
33
.4
30.4
5.
6
2.4
9.
0
1.1
10
0.0
Lati
n Am
eric
a4.
6
45.1
25
.1
15.6
7.
5
0.9
1.
2
100.
0
Wes
tern
Eur
ope
14.6
32
.7
27.4
7.
2
3.2
12
.8
2.2
10
0.0
East
ern
Euro
pe20
.4
21.1
47
.8
2.4
1.
7
6.4
0.
1
100.
0
Afri
ca15
.4
26.8
14
.7
41.0
1.
3
0.4
0.
4
100.
0
Mid
dle
East
and
Sou
th A
sia
25.3
32
.7
26.8
13
.7
0.9
0.
5
0.1
10
0.0
Sout
h Ea
st A
sia
and
the
Paci
fic
23.1
34
.7
23.5
16
.0
1.0
1.
7
100.
0
Far
East
58.9
23
.9
9.2
2.
8
2.5
2.
1
0.6
10
0.0
Wor
ld T
otal
29.4
29
.8
24.0
9.
0
2.4
4.
6
0.8
10
0.0
Not
es:
(*)
Tota
l ene
rgy
requ
irem
ent
is e
stim
ated
as
prod
ucti
on o
f pr
imar
y en
ergy
plu
s ne
t tr
ade
(im
port
– e
xpor
t) m
inus
inte
rnat
iona
l bun
kers
and
sto
ck c
hang
es.
(a)
Solid
s do
not
incl
ude
com
mer
cial
woo
d.(b
) Th
e co
lum
n he
aded
'Bio
fuel
s' in
clud
es c
omm
erci
al w
ood,
cha
rcoa
l, c
ombu
stib
le r
enew
able
s, w
aste
and
oth
er e
nerg
y pr
oduc
ts d
eriv
ed d
irec
tly
or in
dire
ctly
fro
m b
iom
ass.
(c)
The
colu
mn
head
ed 'R
enew
able
s' in
clud
es g
eoth
erm
al,
win
d, s
olar
, ti
de e
nerg
y an
d ne
t el
ectr
icit
y tr
ade.
36
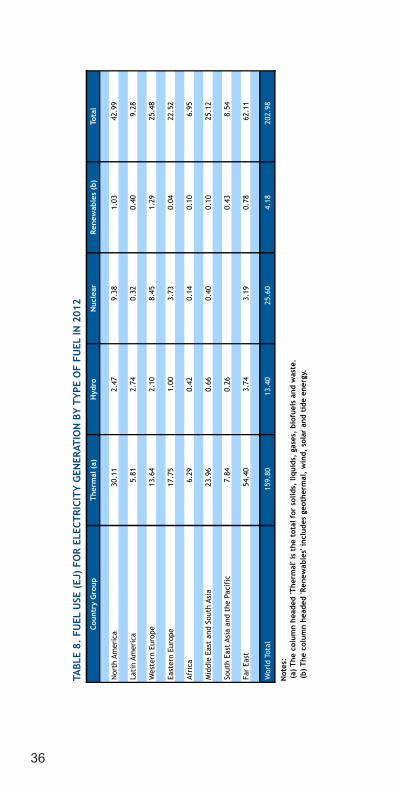
TABL
E 8.
FU
EL U
SE (
EJ)
FOR
ELEC
TRIC
ITY
GEN
ERAT
ION
BY
TYPE
OF
FUEL
IN 2
012
Coun
try
Gro
upTh
erm
al (
a)H
ydro
Nuc
lear
Rene
wab
les
(b)
Tota
l
Nor
th A
mer
ica
30.1
1
2.47
9.
38
1.03
42
.99
Lati
n Am
eric
a5.
81
2.74
0.
32
0.40
9.
28
Wes
tern
Eur
ope
13.6
4
2.10
8.
45
1.29
25
.48
East
ern
Euro
pe17
.75
1.
00
3.73
0.
04
22.5
2
Afri
ca6.
29
0.42
0.
14
0.10
6.
95
Mid
dle
East
and
Sou
th A
sia
23.9
6
0.66
0.
40
0.10
25
.12
Sout
h Ea
st A
sia
and
the
Paci
fic
7.84
0.
26
0.43
8.
54
Far
East
54.4
0
3.74
3.
19
0.78
62
.11
Wor
ld T
otal
159.
80
13.4
0
25.6
0
4.18
20
2.98
Not
es:
(a)
The
colu
mn
head
ed 'T
herm
al' i
s th
e to
tal f
or s
olid
s, li
quid
s, g
ases
, bi
ofue
ls a
nd w
aste
.(b
) Th
e co
lum
n he
aded
'Ren
ewab
les'
incl
udes
geo
ther
mal
, w
ind,
sol
ar a
nd t
ide
ener
gy.
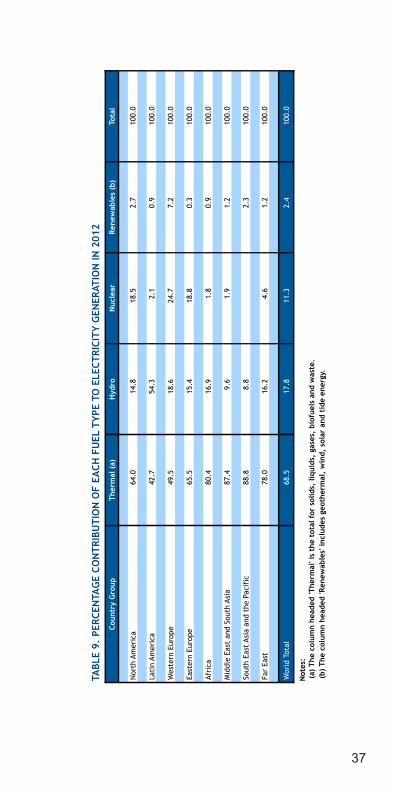
37
TABL
E 9.
PER
CEN
TAG
E CO
NTR
IBU
TIO
N O
F EA
CH F
UEL
TYP
E TO
ELE
CTRI
CITY
GEN
ERAT
ION
IN 2
012
Coun
try
Gro
upTh
erm
al (
a)H
ydro
Nuc
lear
Rene
wab
les
(b)
Tota
l
Nor
th A
mer
ica
64.0
14
.8
18.5
2.
7
100.
0
Lati
n Am
eric
a42
.7
54.3
2.
1
0.9
10
0.0
Wes
tern
Eur
ope
49.5
18
.6
24.7
7.
2
100.
0
East
ern
Euro
pe65
.5
15.4
18
.8
0.3
10
0.0
Afri
ca80
.4
16.9
1.
8
0.9
10
0.0
Mid
dle
East
and
Sou
th A
sia
87.4
9.
6
1.9
1.
2
100.
0
Sout
h Ea
st A
sia
and
the
Paci
fic
88.8
8.
8
2.3
10
0.0
Far
East
78.0
16
.2
4.6
1.
2
100.
0
Wor
ld T
otal
68.5
17
.8
11.3
2.
4
100.
0
Not
es:
(a)
The
colu
mn
head
ed 'T
herm
al' i
s th
e to
tal f
or s
olid
s, li
quid
s, g
ases
, bi
ofue
ls a
nd w
aste
.(b
) Th
e co
lum
n he
aded
'Ren
ewab
les'
incl
udes
geo
ther
mal
, w
ind,
sol
ar a
nd t
ide
ener
gy.

TABL
E 10
. ES
TIM
ATES
OF
POPU
LATI
ON
GRO
WTH
BY
REG
ION
(*)
Coun
try
Gro
up
2012
2020
2030
2050
Mill
ion
Inha
bita
nts
Mill
ion
Inha
bita
nts
Mill
ion
Inha
bita
nts
Mill
ion
Inha
bita
nts
Nor
th A
mer
ica
358
1.
13
37
4
0.56
402
0.
71
44
7
0.53
Lati
n Am
eric
a60
1
1.24
652
1.
03
70
2
0.73
751
0.
34
Wes
tern
Eur
ope
489
0.
54
50
4
0.37
515
0.
21
52
0
0.05
East
ern
Euro
pe39
1
-0.3
8
389
-0
.07
38
1
-0.2
1
356
-0
.34
Afri
ca10
81
2.
69
12
78
2.
12
15
62
2.
03
21
92
1.
71
Mid
dle
East
and
Sou
th A
sia
1910
1.96
2119
1.31
2357
1.07
2679
0.64
Sout
h Ea
st A
sia
and
the
Paci
fic
431
1.
07
48
8
1.56
526
0.
75
56
4
0.35
Far
East
1791
0.63
1852
0.42
1878
0.14
1798
-0.2
2
Wor
ld T
otal
7052
1.42
7657
1.03
8321
0.84
9306
0.56
(*)
Proj
ecti
on f
igur
es a
re t
he a
rith
met
ic a
vera
ge b
etw
een
low
and
hig
h es
tim
ates
.
Gro
wth
Rat
e (%
/a)
2000
— 2
012
Gro
wth
Rat
e (%
/a)
2012
— 2
020
Gro
wth
Rat
e (%
/a)
2020
— 2
030
Gro
wth
Rat
e (%
/a)
2030
— 2
050
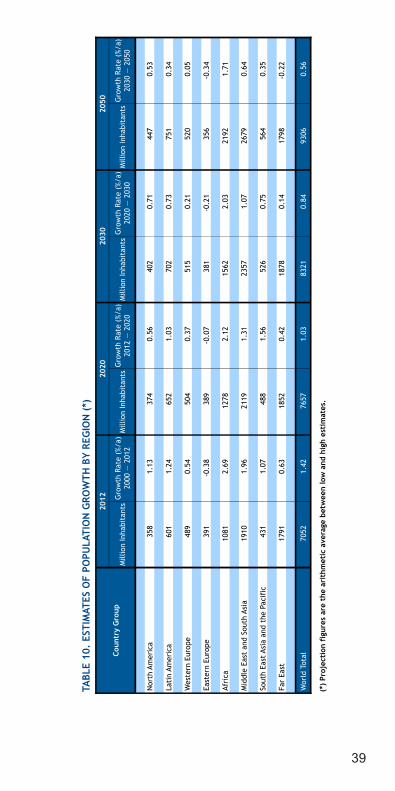
39
TABL
E 10
. ES
TIM
ATES
OF
POPU
LATI
ON
GRO
WTH
BY
REG
ION
(*)
Coun
try
Gro
up
2012
2020
2030
2050
Mill
ion
Inha
bita
nts
Mill
ion
Inha
bita
nts
Mill
ion
Inha
bita
nts
Mill
ion
Inha
bita
nts
Nor
th A
mer
ica
358
1.
13
37
4
0.56
402
0.
71
44
7
0.53
Lati
n Am
eric
a60
1
1.24
652
1.
03
70
2
0.73
751
0.
34
Wes
tern
Eur
ope
489
0.
54
50
4
0.37
515
0.
21
52
0
0.05
East
ern
Euro
pe39
1
-0.3
8
389
-0
.07
38
1
-0.2
1
356
-0
.34
Afri
ca10
81
2.
69
12
78
2.
12
15
62
2.
03
21
92
1.
71
Mid
dle
East
and
Sou
th A
sia
1910
1.96
2119
1.31
2357
1.07
2679
0.64
Sout
h Ea
st A
sia
and
the
Paci
fic
431
1.
07
48
8
1.56
526
0.
75
56
4
0.35
Far
East
1791
0.63
1852
0.42
1878
0.14
1798
-0.2
2
Wor
ld T
otal
7052
1.42
7657
1.03
8321
0.84
9306
0.56
(*)
Proj
ecti
on f
igur
es a
re t
he a
rith
met
ic a
vera
ge b
etw
een
low
and
hig
h es
tim
ates
.
Gro
wth
Rat
e (%
/a)
2000
— 2
012
Gro
wth
Rat
e (%
/a)
2012
— 2
020
Gro
wth
Rat
e (%
/a)
2020
— 2
030
Gro
wth
Rat
e (%
/a)
2030
— 2
050
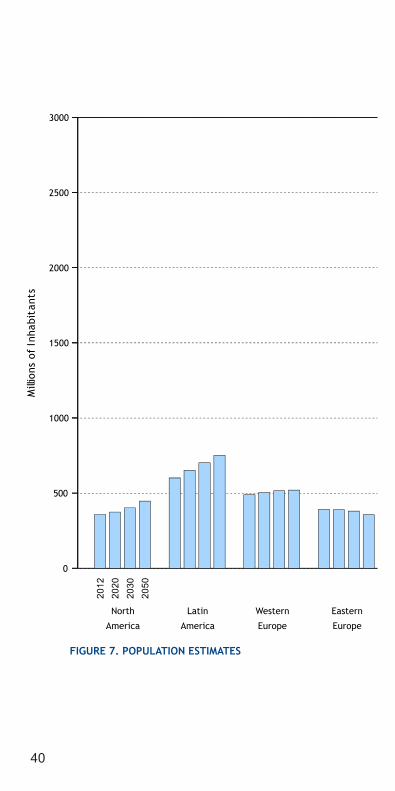
40
North Latin Western Eastern Africa Middle East & South East Asia Far East
America America Europe Europe South Asia & the Pacific
FIGURE 7. POPULATION ESTIMATES
20
1220
2020
3020
50
2012
2020
2030
2050
0
500
1000
1500
2000
2500
3000
Mill
ions
of
Inha
bita
nts
North Latin Western Eastern Africa Middle East & South East Asia Far East
America America Europe Europe South Asia & the Pacific
FIGURE 7. POPULATION ESTIMATES
20
1220
2020
3020
50
2012
2020
2030
2050
0
500
1000
1500
2000
2500
3000
Mill
ions
of
Inha
bita
nts
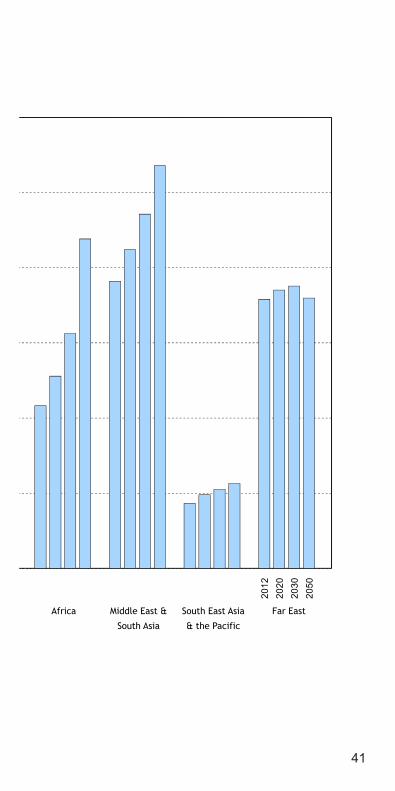
41
North Latin Western Eastern Africa Middle East & South East Asia Far East
America America Europe Europe South Asia & the Pacific
FIGURE 7. POPULATION ESTIMATES
20
1220
2020
3020
50
2012
2020
2030
2050
0
500
1000
1500
2000
2500
3000
Mill
ions
of
Inha
bita
nts

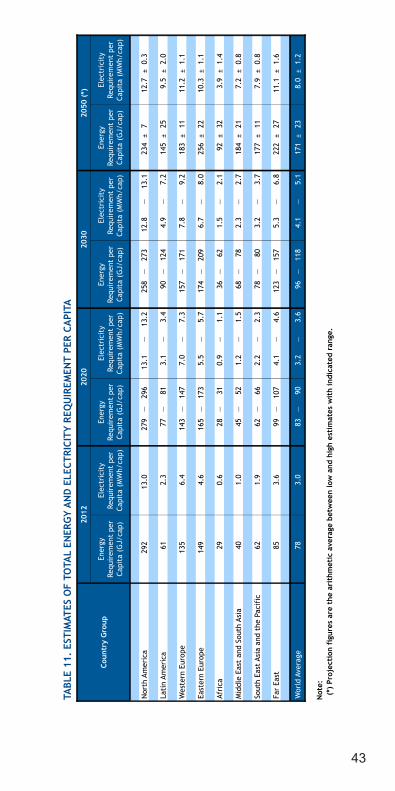
43
TABL
E 11
. ES
TIM
ATES
OF
TOTA
L EN
ERG
Y A
ND
ELE
CTRI
CITY
REQ
UIR
EMEN
T PE
R CA
PITA
Coun
try
Gro
up
2012
2020
2030
2050
(*)
Nor
th A
mer
ica
292
13.0
279
—29
6
13.1
—
13.2
25
8—
273
12
.8
—13
.1
234
±7
12.7
±
0.3
Lati
n Am
eric
a61
2.3
77—
81
3.1
—3.
4 90
—12
4
4.9
—7.
2 14
5 ±
25
9.5
±2.
0
Wes
tern
Eur
ope
135
6.4
143
—14
7
7.0
—7.
3 15
7—
171
7.
8 —
9.2
183
±11
11
.2
±1.
1
East
ern
Euro
pe14
9
4.
6
16
5—
173
5.
5 —
5.7
174
—20
9
6.7
—8.
0 25
6 ±
22
10.3
±
1.1
Afri
ca29
0.6
28—
31
0.9
—1.
1 36
—62
1.
5 —
2.1
92
±32
3.
9 ±
1.4
Mid
dle
East
and
Sou
th A
sia
40
1.
0
45
—52
1.
2 —
1.5
68—
78
2.3
—2.
7 18
4 ±
21
7.2
±0.
8
Sout
h Ea
st A
sia
and
the
Paci
fic
62
1.
9
62
—66
2.
2 —
2.3
78—
80
3.2
—3.
7 17
7 ±
11
7.9
±0.
8
Far
East
85
3.
6
99
—10
7
4.1
—4.
6 12
3—
157
5.
3 —
6.8
222
±27
11
.1
±1.
6
Wor
ld A
vera
ge78
3.0
83—
90
3.2
—3.
6 96
—11
8
4.1
—5.
1 17
1 ±
23
8.0
±1.
2
Not
e: (
*) P
roje
ctio
n fi
gure
s ar
e th
e ar
ithm
etic
ave
rage
bet
wee
n lo
w a
nd h
igh
esti
mat
es w
ith
indi
cate
d ra
nge.
Ener
gy
Requ
irem
ent
per
Capi
ta (
GJ/
cap)
Elec
tric
ity
Requ
irem
ent
per
Capi
ta (
MW
h/ca
p)
Ener
gy
Requ
irem
ent
per
Capi
ta (
GJ/
cap)
Elec
tric
ity
Requ
irem
ent
per
Capi
ta (
MW
h/ca
p)
Ener
gy
Requ
irem
ent
per
Capi
ta (
GJ/
cap)
Elec
tric
ity
Requ
irem
ent
per
Capi
ta (
MW
h/ca
p)
Ener
gy
Requ
irem
ent
per
Capi
ta (
GJ/
cap)
Elec
tric
ity
Requ
irem
ent
per
Capi
ta (
MW
h/ca
p)
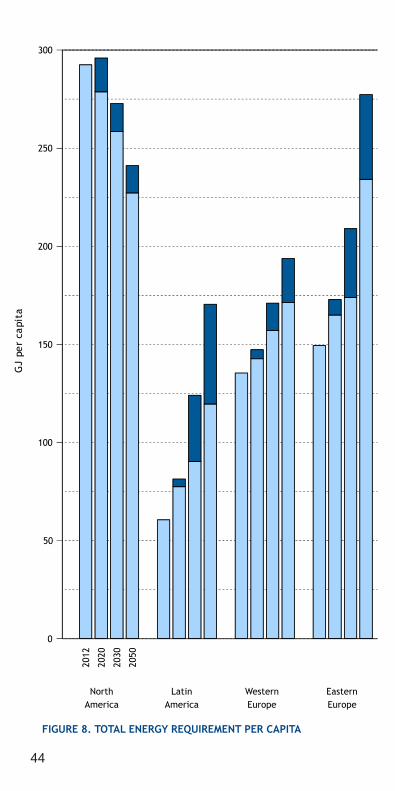
44
North Latin Western Eastern Africa Middle East & South East Asia Far EastAmerica America Europe Europe South Asia & the Pacific
FIGURE 8. TOTAL ENERGY REQUIREMENT PER CAPITA
2012
2020
2030
2050
2012
2020
2030
2050
0
50
100
150
200
250
300 High EstimateLow Estimate
GJ
per
capi
ta
North Latin Western Eastern Africa Middle East & South East Asia Far EastAmerica America Europe Europe South Asia & the Pacific
FIGURE 8. TOTAL ENERGY REQUIREMENT PER CAPITA
2012
2020
2030
2050
2012
2020
2030
2050
0
50
100
150
200
250
300 High EstimateLow Estimate
GJ
per
capi
ta
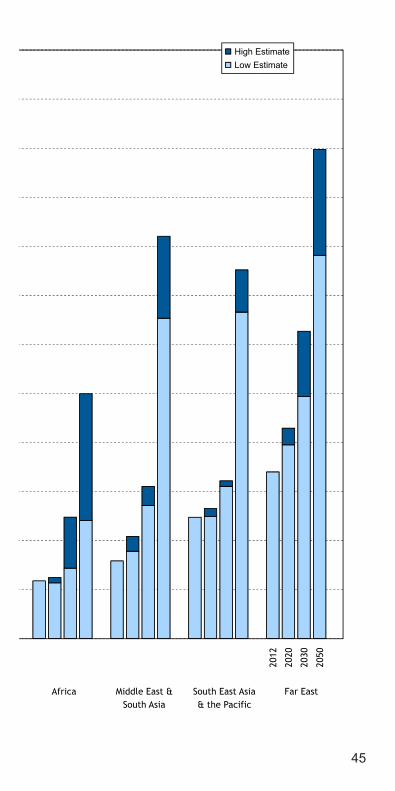
45
North Latin Western Eastern Africa Middle East & South East Asia Far EastAmerica America Europe Europe South Asia & the Pacific
FIGURE 8. TOTAL ENERGY REQUIREMENT PER CAPITA
2012
2020
2030
2050
2012
2020
2030
2050
0
50
100
150
200
250
300 High EstimateLow Estimate
GJ
per
capi
ta
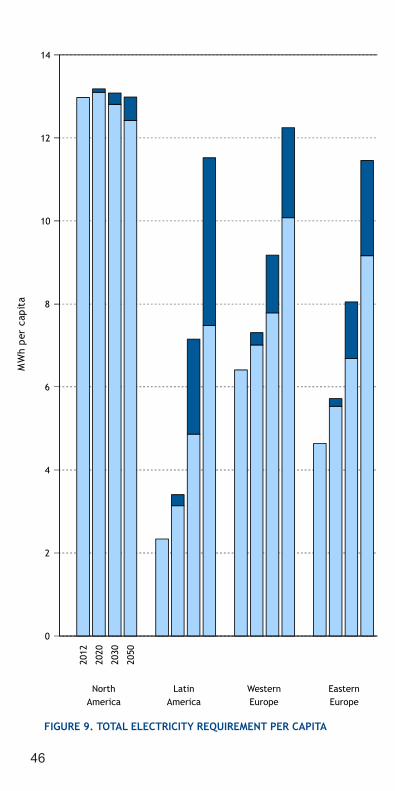
46
North Latin Western Eastern Africa Middle East & South East Asia Far EastAmerica America Europe Europe South Asia & the Pacific
FIGURE 9. TOTAL ELECTRICITY REQUIREMENT PER CAPITA
2012
2020
2030
2050
2012
2020
2030
2050
0
2
4
6
8
10
12
14High Estimate Low Estimate
MW
h p
er c
apit
a
North Latin Western Eastern Africa Middle East & South East Asia Far EastAmerica America Europe Europe South Asia & the Pacific
FIGURE 9. TOTAL ELECTRICITY REQUIREMENT PER CAPITA
2012
2020
2030
2050
2012
2020
2030
2050
0
2
4
6
8
10
12
14High Estimate Low Estimate
MW
h p
er c
apit
a
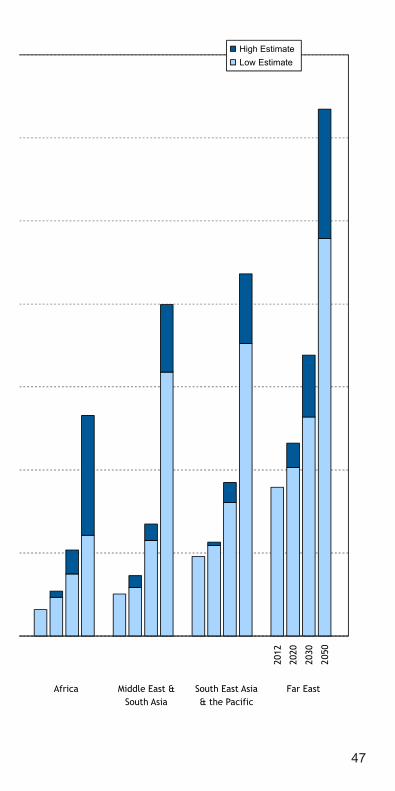
47
North Latin Western Eastern Africa Middle East & South East Asia Far EastAmerica America Europe Europe South Asia & the Pacific
FIGURE 9. TOTAL ELECTRICITY REQUIREMENT PER CAPITA
2012
2020
2030
2050
2012
2020
2030
2050
0
2
4
6
8
10
12
14High Estimate Low Estimate
MW
h p
er c
apit
a

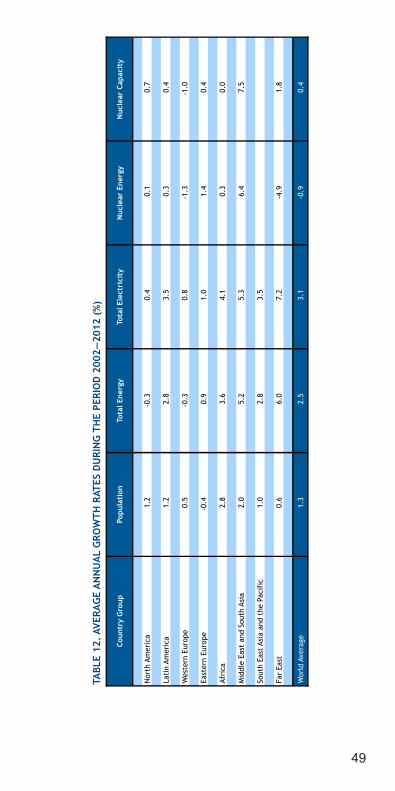
49
TABL
E 12
. AVE
RAG
E A
NN
UA
L G
ROW
TH R
ATES
DU
RIN
G T
HE
PERI
OD
200
2—20
12 (
%)
Coun
try
Gro
upPo
pula
tion
Tota
l Ene
rgy
Tota
l Ele
ctri
city
Nuc
lear
Ene
rgy
Nuc
lear
Cap
acit
y
Nor
th A
mer
ica
1.2
-0.3
0.
4
0.
1
0.
7
Lati
n Am
eric
a1.
2
2.
8
3.
5
0.
3
0.
4
Wes
tern
Eur
ope
0.5
-0.3
0.
8
-1
.3
-1.0
East
ern
Euro
pe-0
.4
0.9
1.0
1.4
0.4
Afri
ca2.
8
3.
6
4.
1
0.
3
0.
0
Mid
dle
East
and
Sou
th A
sia
2.0
5.2
5.3
6.4
7.5
Sout
h Ea
st A
sia
and
the
Paci
fic
1.0
2.8
3.5
Far
East
0.6
6.0
7.2
-4.9
1.
8
Wor
ld A
vera
ge1.
3
2.
5
3.
1
-0
.9
0.4
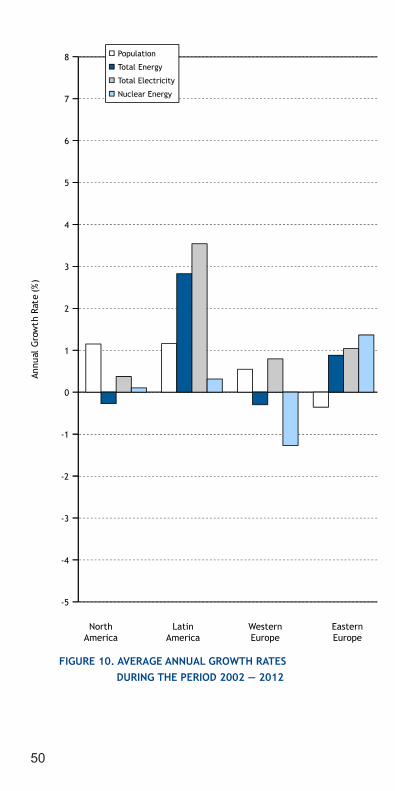
50
North Latin Western Eastern Africa Middle East & South East Asia Far EastAmerica America Europe Europe South Asia & the Pacific
FIGURE 10. AVERAGE ANNUAL GROWTH RATES DURING THE PERIOD 2002 — 2012
-5
-4
-3
-2
-1
0
1
2
3
4
5
6
7
8 Population
Total Energy
Total Electricity
Nuclear Energy
Annu
al G
row
th R
ate
(%)
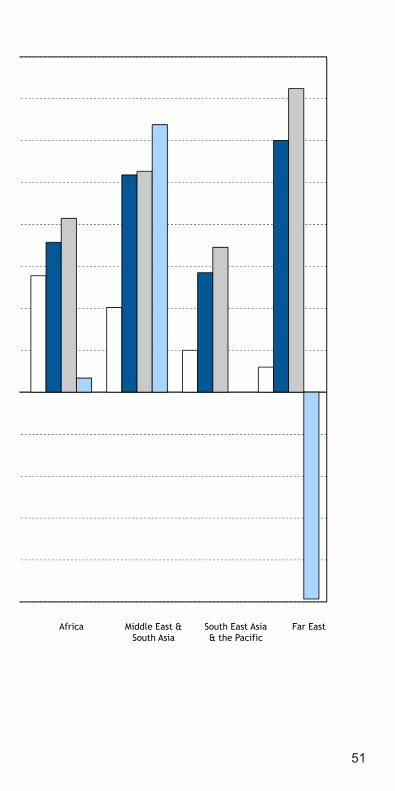
51
North Latin Western Eastern Africa Middle East & South East Asia Far EastAmerica America Europe Europe South Asia & the Pacific
FIGURE 10. AVERAGE ANNUAL GROWTH RATES DURING THE PERIOD 2002 — 2012
-5
-4
-3
-2
-1
0
1
2
3
4
5
6
7
8 Population
Total Energy
Total Electricity
Nuclear Energy
Annu
al G
row
th R
ate
(%)

TABL
E 13
. ES
TIM
ATES
OF
AVER
AG
E A
NN
UA
L G
ROW
TH R
ATES
DU
RIN
G T
HE
PERI
OD
201
2—20
30 (
%)
Coun
try
Gro
upPo
pula
tion
Tota
l Ene
rgy
Tota
l Ele
ctri
city
Nuc
lear
Ene
rgy
Nuc
lear
Cap
acit
y
Nor
th A
mer
ica
0.6
0.
0 —
0.3
0.
6 —
0.7
-0
.4
—1.
5
-0.8
—
1.2
Lati
n Am
eric
a0.
9
3.1
—5.
0
5.1
—7.
3
3.6
—7.
9
2.7
—7.
0
Wes
tern
Eur
ope
0.3
1.
1 —
1.6
1.
4 —
2.3
-2
.0
—1.
3
-2.8
—
0.5
East
ern
Euro
pe-0
.1
0.
7 —
1.7
1.
9 —
3.0
3.
4 —
5.0
2.
8 —
4.3
Afri
ca2.
1
3.2
—6.
4
7.0
—9.
0
6.7
—10
.7
5.7
—9.
7
Mid
dle
East
and
Sou
th A
sia
1.2
4.
3 —
5.0
5.
9 —
6.9
10
.4
—14
.7
8.7
—13
.0
Sout
h Ea
st A
sia
and
the
Paci
fic
1.1
2.
4 —
2.6
4.
0 —
4.9
Far
East
0.3
2.
4 —
3.7
2.
4 —
3.9
8.
0 —
11.6
3.
2 —
6.7
Wor
ld A
vera
ge0.
9
2.1
—3.
2
2.8
—4.
0
2.1
—5.
0
0.9
—3.
7
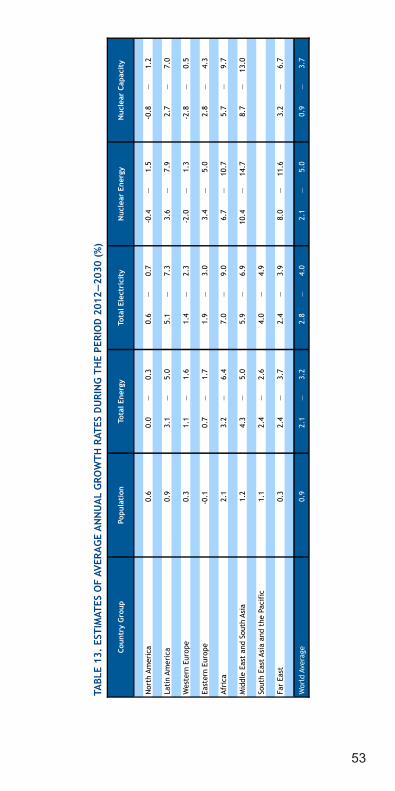
53
TABL
E 13
. ES
TIM
ATES
OF
AVER
AG
E A
NN
UA
L G
ROW
TH R
ATES
DU
RIN
G T
HE
PERI
OD
201
2—20
30 (
%)
Coun
try
Gro
upPo
pula
tion
Tota
l Ene
rgy
Tota
l Ele
ctri
city
Nuc
lear
Ene
rgy
Nuc
lear
Cap
acit
y
Nor
th A
mer
ica
0.6
0.
0 —
0.3
0.
6 —
0.7
-0
.4
—1.
5
-0.8
—
1.2
Lati
n Am
eric
a0.
9
3.1
—5.
0
5.1
—7.
3
3.6
—7.
9
2.7
—7.
0
Wes
tern
Eur
ope
0.3
1.
1 —
1.6
1.
4 —
2.3
-2
.0
—1.
3
-2.8
—
0.5
East
ern
Euro
pe-0
.1
0.
7 —
1.7
1.
9 —
3.0
3.
4 —
5.0
2.
8 —
4.3
Afri
ca2.
1
3.2
—6.
4
7.0
—9.
0
6.7
—10
.7
5.7
—9.
7
Mid
dle
East
and
Sou
th A
sia
1.2
4.
3 —
5.0
5.
9 —
6.9
10
.4
—14
.7
8.7
—13
.0
Sout
h Ea
st A
sia
and
the
Paci
fic
1.1
2.
4 —
2.6
4.
0 —
4.9
Far
East
0.3
2.
4 —
3.7
2.
4 —
3.9
8.
0 —
11.6
3.
2 —
6.7
Wor
ld A
vera
ge0.
9
2.1
—3.
2
2.8
—4.
0
2.1
—5.
0
0.9
—3.
7

@ No. 22
Where to order IAEA publicationsIn the following countries IAEA publications may be purchased from the sources listed below, or from major local booksellers. Payment may be made in local currency or with UNESCO coupons.
AUSTRALIADA Information Services, 648 Whitehorse Road, MITCHAM 3132 Telephone: +61 3 9210 7777 • Fax: +61 3 9210 7788 Email: [email protected] • Web site: http://www.dadirect.com.au
BELGIUMJean de Lannoy, avenue du Roi 202, B-1190 Brussels Telephone: +32 2 538 43 08 • Fax: +32 2 538 08 41 Email: [email protected] • Web site: http://www.jean-de-lannoy.be
CANADABernan Associates, 4501 Forbes Blvd, Suite 200, Lanham, MD 20706-4346, USA Telephone: 1-800-865-3457 • Fax: 1-800-865-3450 Email: [email protected] • Web site: http://www.bernan.com
Renouf Publishing Company Ltd., 1-5369 Canotek Rd., Ottawa, Ontario, K1J 9J3 Telephone: +613 745 2665 • Fax: +613 745 7660 Email: [email protected] • Web site: http://www.renoufbooks.com
CHINAIAEA Publications in Chinese: China Nuclear Energy Industry Corporation, Translation Section, P.O. Box 2103, Beijing
CZECH REPUBLICSuweco CZ, S.R.O., Klecakova 347, 180 21 Praha 9 Telephone: +420 26603 5364 • Fax: +420 28482 1646 Email: [email protected] • Web site: http://www.suweco.cz
FINLANDAkateeminen Kirjakauppa, PO BOX 128 (Keskuskatu 1), FIN-00101 Helsinki Telephone: +358 9 121 41 • Fax: +358 9 121 4450 Email: [email protected] • Web site: http://www.akateeminen.com
FRANCEForm-Edit, 5, rue Janssen, P.O. Box 25, F-75921 Paris Cedex 19 Telephone: +33 1 42 01 49 49 • Fax: +33 1 42 01 90 90 Email: [email protected] • Web site: http://www. formedit.fr
Lavoisier SAS, 145 rue de Provigny, 94236 Cachan Cedex Telephone: + 33 1 47 40 67 02 • Fax +33 1 47 40 67 02 Email: [email protected] • Web site: http://www.lavoisier.fr
GERMANYUNO-Verlag, Vertriebs- und Verlags GmbH, Am Hofgarten 10, D-53113 Bonn Telephone: + 49 228 94 90 20 • Fax: +49 228 94 90 20 or +49 228 94 90 222 Email: [email protected] • Web site: http://www.uno-verlag.de
HUNGARYLibrotrade Ltd., Book Import, P.O. Box 126, H-1656 Budapest Telephone: +36 1 257 7777 • Fax: +36 1 257 7472 • Email: [email protected]
INDIAAllied Publishers Group, 1st Floor, Dubash House, 15, J. N. Heredia Marg, Ballard Estate, Mumbai 400 001, Telephone: +91 22 22617926/27 • Fax: +91 22 22617928 Email: [email protected] • Web site: http://www.alliedpublishers.com
Bookwell, 2/72, Nirankari Colony, Delhi 110009 Telephone: +91 11 23268786, +91 11 23257264 • Fax: +91 11 23281315 Email: [email protected]
ITALYLibreria Scientifica Dott. Lucio di Biasio “AEIOU”, Via Coronelli 6, I-20146 Milan Telephone: +39 02 48 95 45 52 or 48 95 45 62 • Fax: +39 02 48 95 45 48 Email: [email protected] • Website: www.libreriaaeiou.eu

JAPANMaruzen Company Ltd, 1-9-18, Kaigan, Minato-ku, Tokyo, 105-0022 Telephone: +81 3 6367 6079 • Fax: +81 3 6367 6207 Email: [email protected] • Web site: http://www.maruzen.co.jp
REPUBLIC OF KOREAKINS Inc., Information Business Dept. Samho Bldg. 2nd Floor, 275-1 Yang Jae-dong SeoCho-G, Seoul 137-130 Telephone: +02 589 1740 • Fax: +02 589 1746 • Web site: http://www.kins.re.kr
NETHERLANDSDe Lindeboom Internationale Publicaties B.V., M.A. de Ruyterstraat 20A, NL-7482 BZ Haaksbergen Telephone: +31 (0) 53 5740004 • Fax: +31 (0) 53 5729296 Email: [email protected] • Web site: http://www.delindeboom.com
Martinus Nijhoff International, Koraalrood 50, P.O. Box 1853, 2700 CZ Zoetermeer Telephone: +31 793 684 400 • Fax: +31 793 615 698 Email: [email protected] • Web site: http://www.nijhoff.nl
Swets and Zeitlinger b.v., P.O. Box 830, 2160 SZ Lisse Telephone: +31 252 435 111 • Fax: +31 252 415 888 Email: [email protected] • Web site: http://www.swets.nl
NEW ZEALANDDA Information Services, 648 Whitehorse Road, MITCHAM 3132, Australia Telephone: +61 3 9210 7777 • Fax: +61 3 9210 7788 Email: [email protected] • Web site: http://www.dadirect.com.au
SLOVENIACankarjeva Zalozba d.d., Kopitarjeva 2, SI-1512 Ljubljana Telephone: +386 1 432 31 44 • Fax: +386 1 230 14 35 Email: [email protected] • Web site: http://www.cankarjeva-z.si/uvoz
SPAINDíaz de Santos, S.A., c/ Juan Bravo, 3A, E-28006 Madrid Telephone: +34 91 781 94 80 • Fax: +34 91 575 55 63 Email: [email protected], [email protected], [email protected], [email protected] Web site: http://www.diazdesantos.es
UNITED KINGDOMThe Stationery Office Ltd, International Sales Agency, PO Box 29, Norwich, NR3 1 GN Telephone (orders): +44 870 600 5552 • (enquiries): +44 207 873 8372 • Fax: +44 207 873 8203 Email (orders): [email protected] • (enquiries): [email protected] • Web site: http://www.tso.co.uk
On-line orders DELTA Int. Book Wholesalers Ltd., 39 Alexandra Road, Addlestone, Surrey, KT15 2PQ Email: [email protected] • Web site: http://www.profbooks.com
Books on the Environment Earthprint Ltd., P.O. Box 119, Stevenage SG1 4TP Telephone: +44 1438748111 • Fax: +44 1438748844 Email: [email protected] • Web site: http://www.earthprint.com
UNITED NATIONSDept. I004, Room DC2-0853, First Avenue at 46th Street, New York, N.Y. 10017, USA (UN) Telephone: +800 253-9646 or +212 963-8302 • Fax: +212 963-3489 Email: [email protected] • Web site: http://www.un.org
UNITED STATES OF AMERICABernan Associates, 4501 Forbes Blvd., Suite 200, Lanham, MD 20706-4346 Telephone: 1-800-865-3457 • Fax: 1-800-865-3450 Email: [email protected] · Web site: http://www.bernan.com
Renouf Publishing Company Ltd., 812 Proctor Ave., Ogdensburg, NY, 13669 Telephone: +888 551 7470 (toll-free) • Fax: +888 568 8546 (toll-free) Email: [email protected] • Web site: http://www.renoufbooks.com
Orders and requests for information may also be addressed directly to: Marketing and Sales Unit, International Atomic Energy Agency Vienna International Centre, PO Box 100, 1400 Vienna, Austria Telephone: +43 1 2600 22529 (or 22530) • Fax: +43 1 2600 29302 Email: [email protected] • Web site: http://www.iaea.org/books
13-3
0361
INTERNATIONAL ATOMIC ENERGY AGENCYVIENNA
ISBN 978-92-0-111910-0ISSN 1011-2642 @
REFERENCE DATA SERIES No. 12013 Edition
Energy, Electricity and Nuclear PowerEstimatesfor the Periodup to 2050


![Energy, Electricity and Nuclear Power Estimates for the ...Nuclear Energy Agency study [5] and (iii) estimates of the expert group participating in an annual IAEA consultancy meeting](https://img.pdfslide.net/doc/110x75/6017edb42daa4467bf3ccb95/energy-electricity-and-nuclear-power-estimates-for-the-nuclear-energy-agency.jpg)