Embed Size (px)
Citation preview
University of WollongongResearch Online
Faculty of Engineering and Information Sciences -Papers: Part A Faculty of Engineering and Information Sciences
2015
Energy loss at bends in the pneumatic conveying offly ashNaveen TripathiThapar University
A SharmaQueensland University of Technology
Soumya Suddha MallickThapar University, [email protected]
Peter W. WypychUniversity of Wollongong, [email protected]
Research Online is the open access institutional repository for the University of Wollongong. For further information contact the UOW Library:[email protected]
Publication DetailsTripathi, N., Sharma, A., Mallick, S. S. & Wypych, P. W. (2015). Energy loss at bends in the pneumatic conveying of fly ash.Particuology: science and technology of particles, 21 65-73.
Energy loss at bends in the pneumatic conveying of fly ash
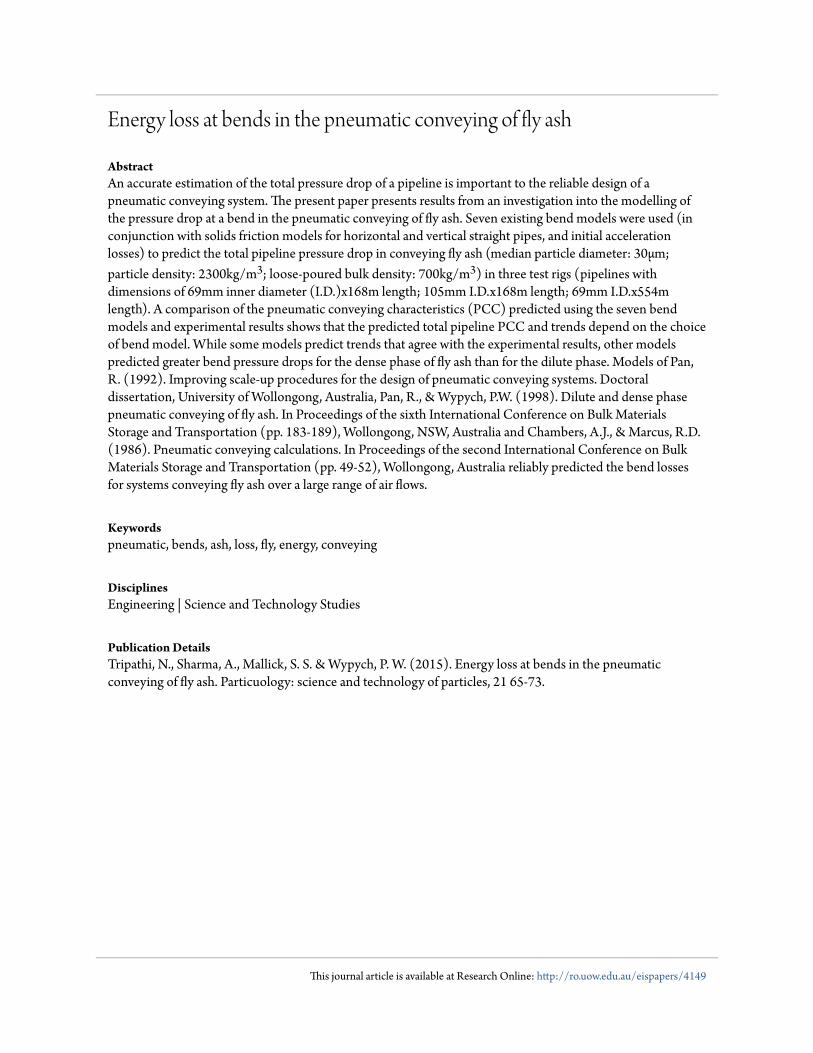
AbstractAn accurate estimation of the total pressure drop of a pipeline is important to the reliable design of apneumatic conveying system. The present paper presents results from an investigation into the modelling ofthe pressure drop at a bend in the pneumatic conveying of fly ash. Seven existing bend models were used (inconjunction with solids friction models for horizontal and vertical straight pipes, and initial accelerationlosses) to predict the total pipeline pressure drop in conveying fly ash (median particle diameter: 30μm;particle density: 2300kg/m3; loose-poured bulk density: 700kg/m3) in three test rigs (pipelines withdimensions of 69mm inner diameter (I.D.)x168m length; 105mm I.D.x168m length; 69mm I.D.x554mlength). A comparison of the pneumatic conveying characteristics (PCC) predicted using the seven bendmodels and experimental results shows that the predicted total pipeline PCC and trends depend on the choiceof bend model. While some models predict trends that agree with the experimental results, other modelspredicted greater bend pressure drops for the dense phase of fly ash than for the dilute phase. Models of Pan,R. (1992). Improving scale-up procedures for the design of pneumatic conveying systems. Doctoraldissertation, University of Wollongong, Australia, Pan, R., & Wypych, P.W. (1998). Dilute and dense phasepneumatic conveying of fly ash. In Proceedings of the sixth International Conference on Bulk MaterialsStorage and Transportation (pp. 183-189), Wollongong, NSW, Australia and Chambers, A.J., & Marcus, R.D.(1986). Pneumatic conveying calculations. In Proceedings of the second International Conference on BulkMaterials Storage and Transportation (pp. 49-52), Wollongong, Australia reliably predicted the bend lossesfor systems conveying fly ash over a large range of air flows.
Keywordspneumatic, bends, ash, loss, fly, energy, conveying
DisciplinesEngineering | Science and Technology Studies
Publication DetailsTripathi, N., Sharma, A., Mallick, S. S. & Wypych, P. W. (2015). Energy loss at bends in the pneumaticconveying of fly ash. Particuology: science and technology of particles, 21 65-73.
This journal article is available at Research Online: http://ro.uow.edu.au/eispapers/4149
An Investigation into Energy Loss in Bends for Pneumatic Conveying of Fly Ash
Naveen Tripathia, Atul Sharmaa, S.S.Mallicka and P.W.Wypychb
aDepartment of Mechanical Engineering, Thapar University, Patiala, Punjab-147004, India bFaculty of Engineering and Information Sciences, University of Wollongong,
Wollongong, NSW-2500, Australia
Abstract
An accurate estimation of the total pipeline pressure drop is of significant importance for the
reliable design of a pneumatic conveying system. The present paper presents results from an
investigation into the modelling of bend pressure drop for pneumatic conveying of fly ash.
Seven existing bend models were used (in conjunction with solids friction models for straight
pipes, verticals and initial acceleration losses) to predict the total pipeline pressure drop for
conveying of fly ash (median particle diameter: 30 m; particle density: 2300 kg/m 3; loose-
poured bulk density: 700 kg/m3) in three test rigs: 69 mm I.D. x 168 m long; 105 mm I.D. x
168 m long; 69 mm I.D. x 554 m long pipes. A comparison amongst the predicted pneumatic
conveying characteristics (PCC) using all seven bend models (and the experimental plots)
indicated that the values of predicted total pipeline PCC and trends significantly depend to
the choice of bend models. While some models have provided trends confirming to the
experimental plots, some other models resulted in prediction of higher bend pressure drop
values in dense-phase than in dilute-phase. Pan (1992), Pan and Wypych (1998) and
Chambers and Marcus (1986) models are found to be suitable to reliably predict the bend
losses for fly ash conveying systems over a large range of air flows.
Keywords: Pneumatic conveying; fluidised dense-phase; bend; pressure drop; bend model
1. Introduction
Pneumatic conveying is the process of transportation of dry bulk materials through pipelines
with the help of air or other non-reacting gases. This process is being used in several
industries, such as in thermal power plants (to convey pulverised coal and fly ash), cement,
chemical, food, petrochemical plants etc. The various reasons to use this mode of transport
are ease of totally enclosed system, flexible layout, automation and control, dust free,
hygienic and being environmental friendly. The conventional mode of conveying is known as
the dilute phase (suspension flow) conveying, where the velocity of gas is sufficiently high to
suspend the particles in the pipeline. However, to obtain the increasingly demand of
industries such as new product and process, improved quality etc, several modes of dense
phase (non-suspension flow)have been developed to take the advantage of particular product
properties (e.g. aeration characteristics). An accurate estimation of minimum transport
boundary and total pipeline pressure drop are important criteria for thereliable design of
pneumatic conveying systems. Under-prediction of minimum transport boundary (i.e.
minimum conveying air requirement) would result in either reduced throughput or line
blockage. Total pipeline pressure drop consists of losses due to horizontal straight pipes,
bends, verticals and initial acceleration of particles from the rest. Accurate prediction of
pressure loss for each, especially the horizontal pipe, vertical and bend losses, is very
important as they form the significant share of total pipeline losses. For straight pipe losses
Barth (1958) proposed equation (1) for pressure drop (P) for solid-gas flow. This equation
is believed to be originally proposed for dilute phase transport of coarse particles. However,
various researchers such as Stegmaier (1978), Weber (1981), Pan (1992), Pan and Wypych
(1998) and Jones et al. (2003) employed this expression to predict the pressure loss for dense-
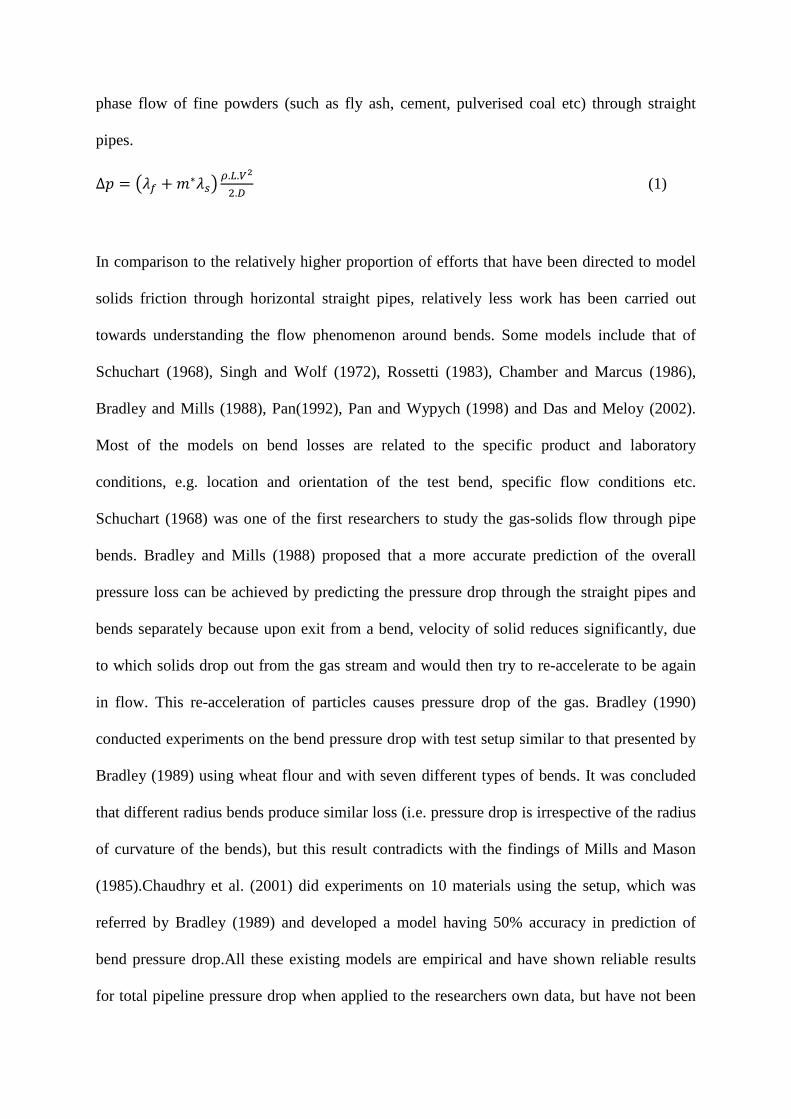
phase flow of fine powders (such as fly ash, cement, pulverised coal etc) through straight
pipes.
∆𝑝 = �𝜆𝑓 + 𝑚∗𝜆𝑠�𝜌.𝐿.𝑉2
2.𝐷 (1)
In comparison to the relatively higher proportion of efforts that have been directed to model
solids friction through horizontal straight pipes, relatively less work has been carried out
towards understanding the flow phenomenon around bends. Some models include that of
Schuchart (1968), Singh and Wolf (1972), Rossetti (1983), Chamber and Marcus (1986),
Bradley and Mills (1988), Pan(1992), Pan and Wypych (1998) and Das and Meloy (2002).
Most of the models on bend losses are related to the specific product and laboratory
conditions, e.g. location and orientation of the test bend, specific flow conditions etc.
Schuchart (1968) was one of the first researchers to study the gas-solids flow through pipe
bends. Bradley and Mills (1988) proposed that a more accurate prediction of the overall
pressure loss can be achieved by predicting the pressure drop through the straight pipes and
bends separately because upon exit from a bend, velocity of solid reduces significantly, due
to which solids drop out from the gas stream and would then try to re-accelerate to be again
in flow. This re-acceleration of particles causes pressure drop of the gas. Bradley (1990)
conducted experiments on the bend pressure drop with test setup similar to that presented by
Bradley (1989) using wheat flour and with seven different types of bends. It was concluded
that different radius bends produce similar loss (i.e. pressure drop is irrespective of the radius
of curvature of the bends), but this result contradicts with the findings of Mills and Mason
(1985).Chaudhry et al. (2001) did experiments on 10 materials using the setup, which was
referred by Bradley (1989) and developed a model having 50% accuracy in prediction of
bend pressure drop.All these existing models are empirical and have shown reliable results
for total pipeline pressure drop when applied to the researchers own data, but have not been
adequately examined for accuracy and reliability for different products and set up conditions.
The aim of the present paper is to investigate into the effects of different bend models on the
prediction of total pipeline pneumatic conveying characteristics for different pipelines.
2. Experimental Setup
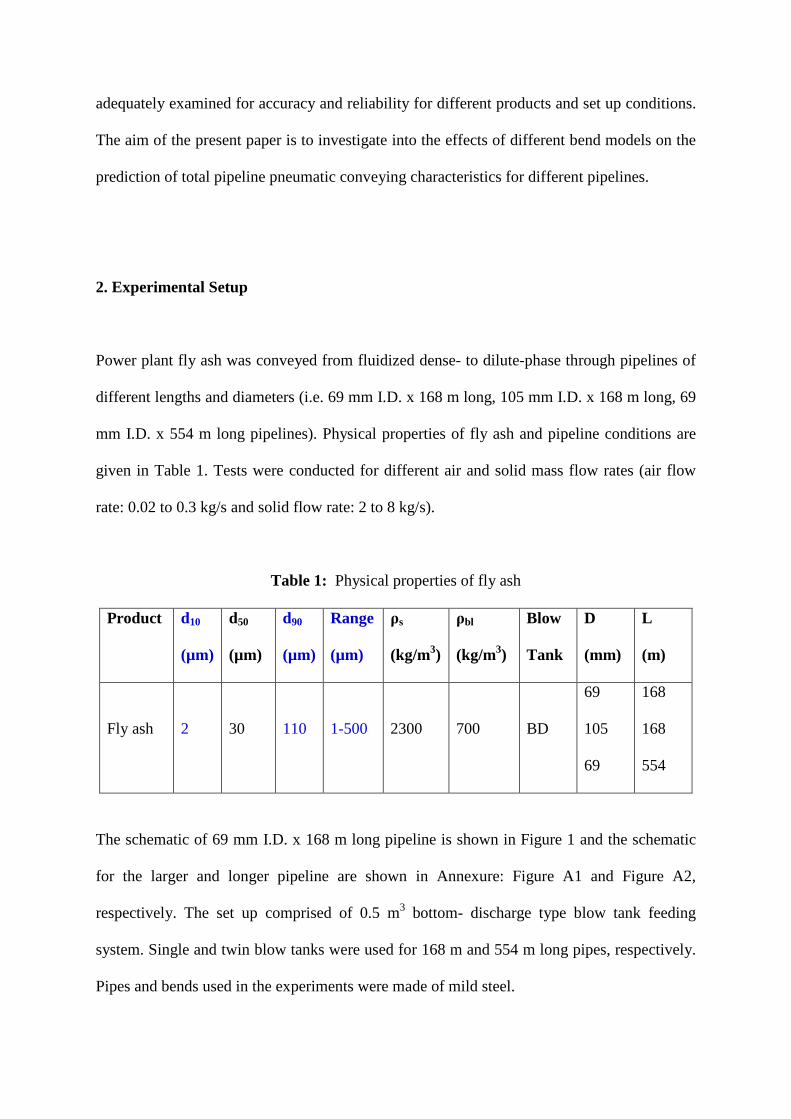
Power plant fly ash was conveyed from fluidized dense- to dilute-phase through pipelines of
different lengths and diameters (i.e. 69 mm I.D. x 168 m long, 105 mm I.D. x 168 m long, 69
mm I.D. x 554 m long pipelines). Physical properties of fly ash and pipeline conditions are
given in Table 1. Tests were conducted for different air and solid mass flow rates (air flow
rate: 0.02 to 0.3 kg/s and solid flow rate: 2 to 8 kg/s).
Table 1: Physical properties of fly ash
Product d10
(µm)
d50
(µm)
d90
(µm)
Range
(µm)
ρs
(kg/m3)
ρbl
(kg/m3)
Blow
Tank
D
(mm)
L
(m)
Fly ash 2 30 110 1-500 2300 700 BD
69
105
69
168
168
554
The schematic of 69 mm I.D. x 168 m long pipeline is shown in Figure 1 and the schematic
for the larger and longer pipeline are shown in Annexure: Figure A1 and Figure A2,
respectively. The set up comprised of 0.5 m3 bottom- discharge type blow tank feeding
system. Single and twin blow tanks were used for 168 m and 554 m long pipes, respectively.
Pipes and bends used in the experiments were made of mild steel.
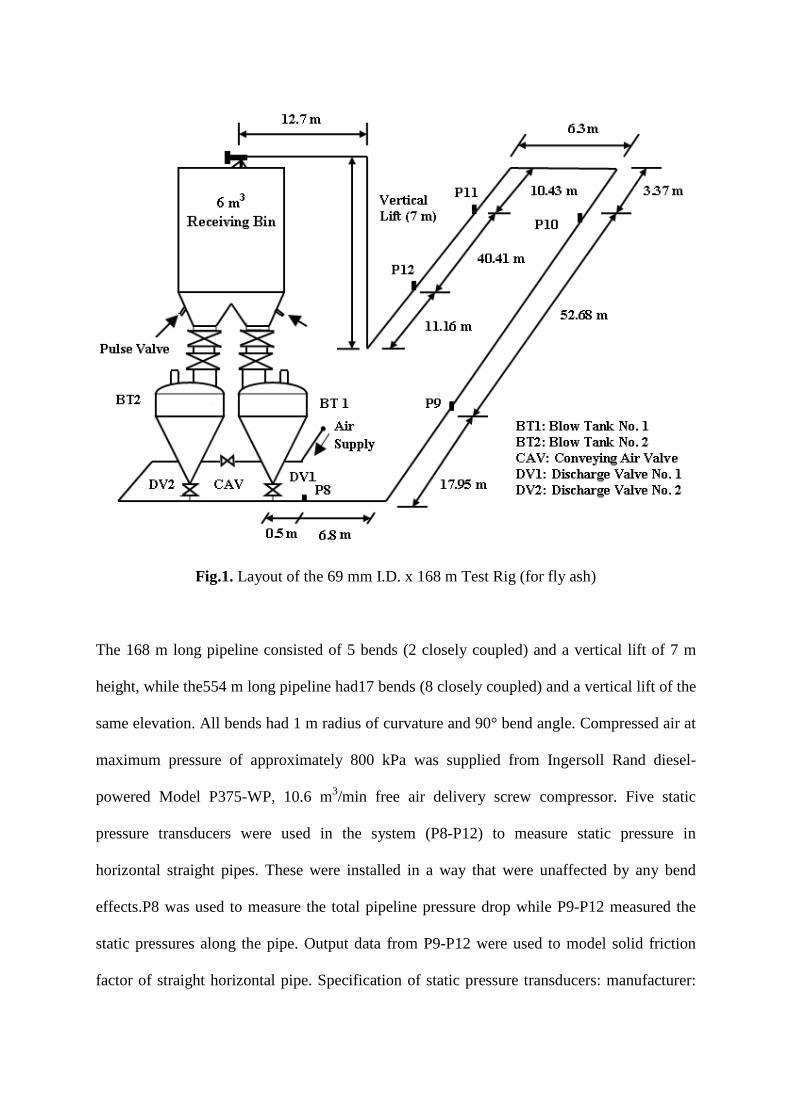
Fig.1. Layout of the 69 mm I.D. x 168 m Test Rig (for fly ash)
The 168 m long pipeline consisted of 5 bends (2 closely coupled) and a vertical lift of 7 m
height, while the554 m long pipeline had17 bends (8 closely coupled) and a vertical lift of the
same elevation. All bends had 1 m radius of curvature and 90° bend angle. Compressed air at
maximum pressure of approximately 800 kPa was supplied from Ingersoll Rand diesel-
powered Model P375-WP, 10.6 m3/min free air delivery screw compressor. Five static
pressure transducers were used in the system (P8-P12) to measure static pressure in
horizontal straight pipes. These were installed in a way that were unaffected by any bend
effects.P8 was used to measure the total pipeline pressure drop while P9-P12 measured the
static pressures along the pipe. Output data from P9-P12 were used to model solid friction
factor of straight horizontal pipe. Specification of static pressure transducers: manufacturer:
Endress and Hauser, model: Cerabar PMC133, pressure range: 0-6 and 0-2 bar, maximum
pressure: 40 bar (absolute), current signal: 4-20 mA. Receiver bin of capacity 6 m3was
installed with pulse-jet type dust filter. All other required instruments, such as PRV (pressure
reducing valve), flow meter, NRV (non-return valve), blow valve, pressure gauge and load
cells (shear beam type) were suitably placed. Calibration of the transducer, load cells and
flow meter were performed using the standardized calibration procedure (Pan, 1992). To
record the electrical output signals from the load cells, pressure transducer and flow meters, a
portable PC compatible data logger (Datataker 800 of Data electronics) was used, having 24
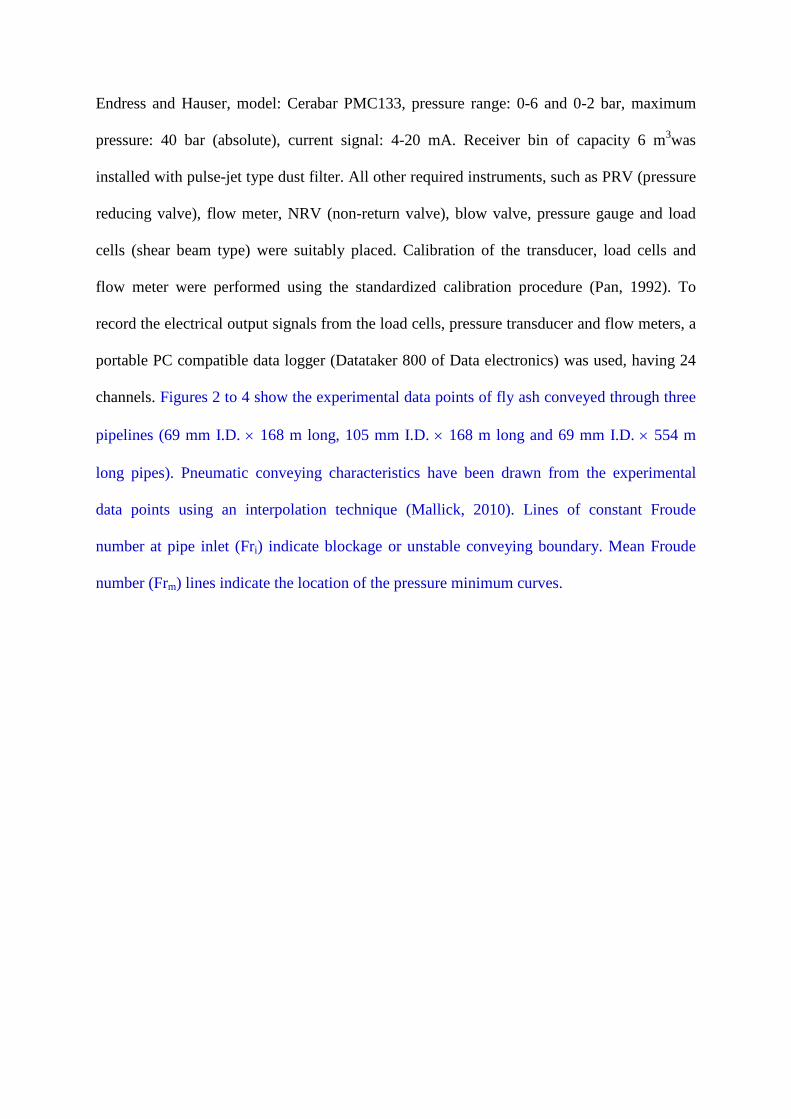
channels. Figures 2 to 4 show the experimental data points of fly ash conveyed through three
pipelines (69 mm I.D. × 168 m long, 105 mm I.D. × 168 m long and 69 mm I.D. × 554 m
long pipes). Pneumatic conveying characteristics have been drawn from the experimental
data points using an interpolation technique (Mallick, 2010). Lines of constant Froude
number at pipe inlet (Fri) indicate blockage or unstable conveying boundary. Mean Froude
number (Frm) lines indicate the location of the pressure minimum curves.
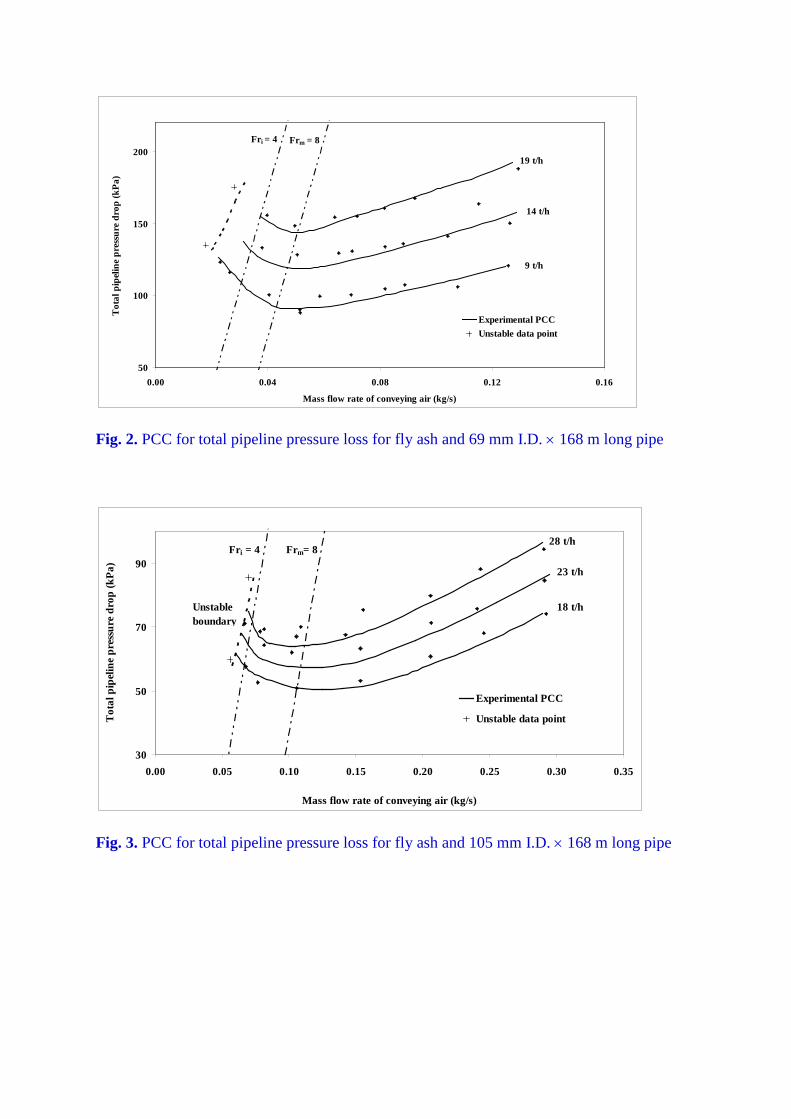
Fig. 2. PCC for total pipeline pressure loss for fly ash and 69 mm I.D. × 168 m long pipe
Fig. 3. PCC for total pipeline pressure loss for fly ash and 105 mm I.D. × 168 m long pipe
50
100
150
200
0.00 0.04 0.08 0.12 0.16
Mass flow rate of conveying air (kg/s)
Tot
al p
ipel
ine
pres
sure
dro
p (k
Pa)
Experimental PCCUnstable data point
Fri = 4
9 t/h
14 t/h
19 t/h
Frm = 8
30
50
70
90
0.00 0.05 0.10 0.15 0.20 0.25 0.30 0.35
Mass flow rate of conveying air (kg/s)
Tot
al p
ipel
ine
pres
sure
dro
p (k
Pa)
Experimental PCC
Unstable data point
28 t/h
23 t/h
18 t/h
Fri = 4 Frm= 8
Unstable boundary
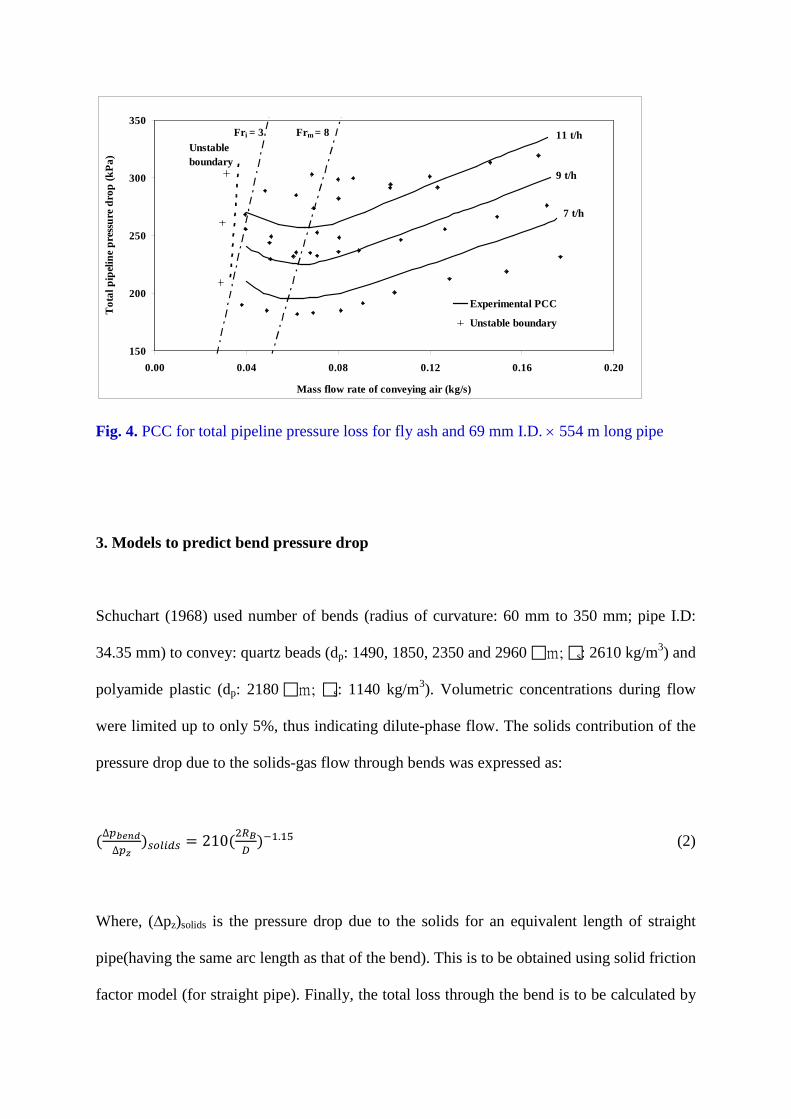
Fig. 4. PCC for total pipeline pressure loss for fly ash and 69 mm I.D. × 554 m long pipe
3. Models to predict bend pressure drop
Schuchart (1968) used number of bends (radius of curvature: 60 mm to 350 mm; pipe I.D:
34.35 mm) to convey: quartz beads (dp: 1490, 1850, 2350 and 2960 m; s: 2610 kg/m3) and
polyamide plastic (dp: 2180 m; s: 1140 kg/m3). Volumetric concentrations during flow
were limited up to only 5%, thus indicating dilute-phase flow. The solids contribution of the
pressure drop due to the solids-gas flow through bends was expressed as:
(∆𝑝𝑏𝑏𝑏𝑏∆𝑝𝑧
)𝑠𝑠𝑠𝑠𝑠𝑠 = 210(2𝑅𝐵𝐷
)−1.15 (2)
Where, (∆pz)solids is the pressure drop due to the solids for an equivalent length of straight
pipe(having the same arc length as that of the bend). This is to be obtained using solid friction
factor model (for straight pipe). Finally, the total loss through the bend is to be calculated by
150
200
250
300
350
0.00 0.04 0.08 0.12 0.16 0.20
Mass flow rate of conveying air (kg/s)
Tot
al p
ipel
ine
pres
sure
dro
p (k
Pa)
Experimental PCC
Unstable boundary
11 t/h
9 t/h
7 t/h
Fri = 3 Frm = 8Unstable boundary
adding the pressure drop due gas-only friction term with (∆pz)solids. Schuchart (1968)
mentioned that for pressure drop calculation of straight pipe due to solids only, Barth (1958)
equation (1) and for gas only pressure drop, Ito’s (1959) expression (4) is to be used. It has
been considered that Barth (1958) expression would be valid for dense-phase mode, whereas
it is believed that the Barth (1958) model was originally proposed for coarse particles in
dilute-phase flow. However, several researchers such as Pan (1992), Pan and Wypych (1998)
and Mallick (2010) have used this model for fine powders conveying in dense-phase. Hence,
this model has been evaluated for the fluidized dense-phase conveying of fine powders in the
present paper. It is to be noted that the equation (2) includes the (∆pz)solids term. Therefore,
there liability of Schuchart (1968) bend model would depend on the accuracy of modelling
solids friction through straight pipes, which in itself is an area of active research (Mallick,
2010).
(∆𝑝𝑏𝑏𝑏𝑠)𝑎𝑠𝑎 = �0.029+0.304�𝑅𝑏(𝑎 𝑅𝐵⁄ )2�−0.25
(𝑅𝐵 𝑎⁄ )12
� 𝐿𝜌𝑜𝑉𝑜2
2𝐷 (3)
Total bend pressure drop due to bend: ∆𝑝𝑏𝑠 = (Δ𝑝𝑏𝑏𝑏𝑠)𝑠𝑠𝑠𝑠𝑠 + (Δ𝑝𝑏𝑏𝑏𝑠)𝑎𝑠𝑎 (4)
Singh and Wolf (1972) performed 108 number of experiments on 3 bends (radius of
curvature: 381, 762 and 1220 mm; pipeI.D: 150mm) by using granular chopped forged as the
conveying material. Using non-dimensional approach, in following grouping were arrived at:
∆𝑝𝑏𝑏𝜌𝑓𝑜𝑉𝑓𝑜
2 = 𝑓(𝑅𝐷
, 𝑚𝑏𝜌𝑓𝑜𝑉𝑓𝑜𝐷2
,𝛽𝑎) (5)
Where, βa is bend angle. It was assumed that a generalised power function law would be
valid; a relationship was developed between ∆𝑝𝑏𝑏𝜌𝑓𝑜𝑉𝑓𝑜
2 and 𝑚𝑏𝜌𝑓𝑜𝑉𝑓𝑜𝐷2
, resulting in the following
model for bend pressure drop:
∆𝑝𝑏0 = 𝑎𝑐 + 𝑎𝑠𝑚𝑏.𝑉𝑜𝐷2
(𝑅𝐷
)𝑎𝑏 (6)
Where, ac is the bend loss due to air only. Using least square method and large number of
experimental data, the following expression was obtained:
∆𝑝𝑏0 = 0.13 + 𝑎𝑠𝑚𝑏.𝑉𝑜𝐷2
�𝑅𝐷�−0.18
(7)
For bend angles of 45° and 90°, the values of as were found to be 0.00334 and 0.00537,
respectively. The model assumes that the bend pressure drop decreases with increase in the
radius of curvature of bend, although increase in radius of curvature implies the powders
would need to traverse along a longer curvilinear path through the bend (hence, higher
amount of particle to wall friction). The model considers the importance of gas velocity at the
exit to the bend (indicting the contribution of the particle reacceleration phenomenon at bend
outlet as an important contributor of bend loss).
Rossetti (1983) performed experiments using coarse and fine particles for different bends
(pipe diameter to bend diameter ratio 2 to 8.4) and gave equation (9) for bend pressure loss.
Coarse particles tend to lose energy through wall collisions, resulting in re-acceleration
energy loss (Pan, 1992).
∆𝑝𝑏𝑠 = �𝜆𝑓 + 𝜆𝑠�𝜌𝑜𝑉𝑜2
2 (8)
The primary contributor to bend loss is believed to be due to re acceleration of particles at the
outlet to the bends (Pan, 1992). Re-acceleration loss takes place at the outlet of the bends.
Hence, in this equation (8), the use of bend outlet conditions (such as gas density and velocity
at outlet of the bend) appear justified. Westman et al. (1987) suggested following correlations
of λf and λs. This model has also assumed that condition at the exit to the bend is more
important due to the slowing down of particles at the outlet of bends (because of particle
friction against the bend wall) and the subsequent energy requirement to reaccelerate the
particles.
𝜆𝑓 = 0.167 �1 + 17.062 �2𝑅𝐵𝐷�−1.219
� 𝑅𝑅−0.17 �2𝑅𝐵𝐷�0.84
(9)
𝜆𝑠 = 5.4 𝑚∗1.293
𝐹𝑎𝑜0.84�2𝑅𝐵𝐷 �0.39 (10)
Chamber and Marcus (1986) provided expression (11) for total bend pressure loss in the
conveying pipeline. This expression (11) was used by Jones and Williams (2003), Williams
and Jones (2004) in the back calculation method of deriving an expression for the solid
friction factor for straight pipe length. This model does not take into account particle
properties, location of bends, etc. The value of bend loss factor (accounting for the radius of
curvature of bends) has been considered as 0.5 (Mallick, 2010). The air density and velocity
have been considered corresponding to the bend outlet conditions. Considering the popularity
of this model (Mallick, 2010), the same has been evaluated in the present study.
∆𝑝𝑏𝑠 = 𝑁𝑁(1 + 𝑚∗) 𝜌𝑉2
2 (11)
Bradley (1989) did experiments using fly ash and wheat flour for pipeline of I.D: 50, 75 and
100 mm and 7 types of bends of different radius of curvature. A wide range of conveying
conditions were employed; flow velocity varied from 4 to 45 m/sec and solid loading ratio
was up to 130. He proposed the following format (equation 12):
∆𝑝𝑏 = 12� 𝐾𝑏𝜌𝑠𝑠𝑠𝑉2 (12)
In the earlier work of Westman et al. (1987), a mass loading ratio (m*)was used to model
solids friction through the bends. However, Bradley (1989) questioned the applicability of
using a mass ratio term. According to Bradley (1989), instead of mass ratio, solids volume
occupancy (similar to the volumetric concentration in pipeline) is more important for accurate
description of the flow phenomenon. According to him, it is the inter-particulate gaps through
which the air has to travel and the air creates a slip for the solids to be dragged in the
direction of flow. Therefore, a volumetric term (such as suspension density) has been
considered to be more reliable in describing the dense-phase flow conditions. The velocity
term in the above equation is believed to be representing suspension or non-suspension
condition of flow. Bradly (1989) expressed Kb as a function of suspension density. A review
of Bradley (1989) by Pan (1992) mentioned that the pressure drop caused by bend is the sum
of two components. One component of the loss happens in the bend itself and other
component occurs in the straight section of pipe just after the bend (due to the re-acceleration
of the particles).
Pan (1992) evaluated Bradley (1989) slope concept of bend loss estimation, in which pressure
drop due to bend could be calculated by the difference profiles of pressure transducer values
(before and after the bend). Pan (1992) argued that a small fluctuation in measured static
pressure is expected to create a great influence on the value of estimated bend pressure drop,
e.g. ±1.81% change in static pressure can result in a ±62.8% change in bend pressure drop.
Pan (1992) performed experiments on five type of bends: one blind Tee and four radius bends
and used fly ash as the conveying material with properties:s: 634 kg/m3; b: 2197 kg/m3;
mean dp: 15.5 m . Based on mathematical and dimensional analysis, semi-empirical
correlation (14) was derived to predict the solids friction factor through bends:
Δ𝑝𝑏𝑠 = 𝑚∗𝜆𝑠𝜌𝑜𝑉𝑜2
2 (13)
𝜆𝑠 = 𝑌1𝑚∗𝑌2𝐹𝐹𝑠𝑌3 (14)
Values of the exponents Y1, Y2 and Y3 (equation 14) were determined by minimising the sum
of squared errors of pressure along the downstream pipe because the bend outlet conditions
are the effective for the major portion of bend loss. Based on his empirical data, Pan (1992)
proposed the value of Y1, Y2 and Y3 (for 90° bend angle) as 0.0052, 0.49 and 1.1182
respectively.
Pan and Wypych (1998) did experiments with four samples of fly ash having properties:
particle size: 3.5 to 58 m; particle density: 2180 to 2540 kg/m3; loose poured bulk density:
634 to 955 kg/m3; velocity range: 3 to 25m/s; solid loading ratio up to 130. They derived
bend loss expression (15) due to solids only. Both Pan (1992) and Pan and Wypych (1998)
have considered that the bend outlet conditions are more important to represent the losses
through the bends.
∆𝑝𝑏𝑠 = 0.5𝑚∗𝜆𝑏𝑠𝜌𝑏𝑠𝑉𝑏𝑠2 (15)
Where 𝜆𝑏𝑠 = 0.0097𝑚∗0.5676𝐹𝐹𝑠0.9647𝜌𝑠−0.6232 (16)
Das and Meloy (2002) performed tests with a pipeline of 63.5 mm I.D. x 169.8 m long, with
six samples of fly ash and compared the pressure drop across close-coupled to isolated 90°
bends. Six ash samples of different properties were used in the test. The following correlation
(18) was derived for the purpose of comparison between the single and close-coupled bends:
Δ𝑝𝑏𝑜𝑠𝑠𝑏𝑏𝑚∗ = 𝑋1𝑉𝑠𝑋2 (17)
Where,X1 and X2 are constants specified for a particular ash and bend geometry. For single
(isolated) bends and certain type of fly ash, value of X1 andX2 was 0.3 x 10⁻⁷and 3.4
respectively and for double (close-coupled) bends value of X1 and X2 was 2.2 x 10⁻⁷ and 3.0
respectively. This model does not consider a separate solids friction factor term for bends (as
used by Pan, 1992 and Pan and Wypych, 1998) and have considered the solids contribution to
bend loss is a linear function of solids loading ratio.
4. Model for solid friction factor for horizontal straight pipe
For the evaluation of bends models using total pipeline pneumatic conveying characteristics
(PCC), straight pipe pressure drop are to be first calculated and then are to be added to the
bend pressure drop calculated by different bend models. For the purpose of solid fiction
factor modelling for straight pipes, following general power function format (18) was
employed. This format has been previously used by other researchers, such as Pan and
Wypych (1998), Jones and Williams (2003) and Williams and Jones (2004).
𝜆𝑠 = 𝐾(𝑚∗)𝑎(𝐹𝐹)𝑏 (18)
Using static pressure data obtained from straight pipe points (P9-P10) across straight
horizontal pipe section of length 52.68 m for a wide range of conveying data from dense to
dilute-phase, following power function correlation (19) for solid friction factor has been
derived using least square method. The high value of R2 suggests that the model of solid
fiction factor is a good fit with experimental data.
𝜆𝑠 = 20.807(𝑚∗)−0.71(𝐹𝐹𝑚)−2.1131 [R2 = 0.998] (19)
5. Evaluation of bend models
The effects of selecting different bend models on the prediction of total pipeline pressure
drop conveying characteristics were evaluated by estimating the total pipeline conveying
characteristics for fly ash for different solids flow rates for the three test rigs(69 mm I.D. x
168 m long, 105 mm I.D. x 168 m long,69 mm I.D. x 554 m long pipelines) by using each of
seven bend models (equation: 2, 7, 8, 11, 13, 15, 17) and comparing the predicted PCC
against experimental data. This model (equation 19) was used to calculate the pressure drop
in straight pipe lengths. In all losses, losses due to initial acceleration and verticals were
calculated as per Marcus et al. (1990). As the same set of models were used to estimate
pressure drop in horizontal pipes, vertical and for initial acceleration, therefore any variation
in magnitude (and trend) of the predicted total pipeline conveying characteristics should have
occurred only due to the difference in selection of bend models. Results are shown in Figure
5 to 7.
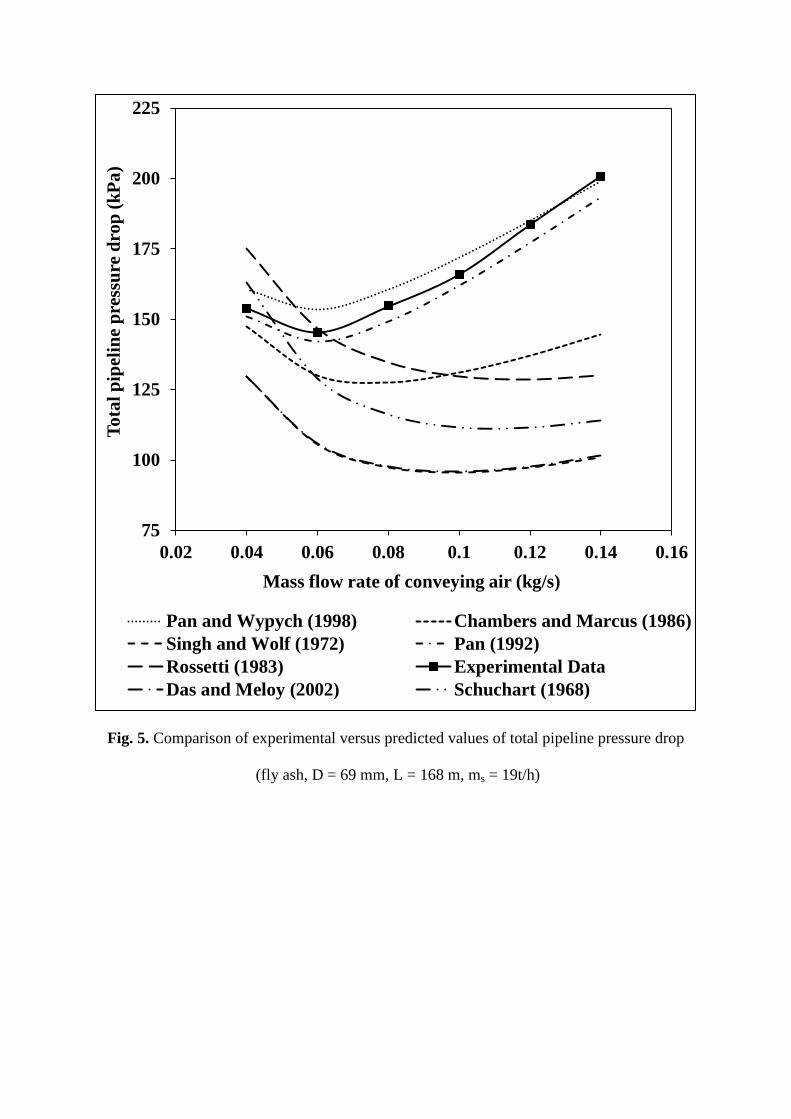
Fig. 5. Comparison of experimental versus predicted values of total pipeline pressure drop
(fly ash, D = 69 mm, L = 168 m, ms = 19t/h)
75
100
125
150
175
200
225
0.02 0.04 0.06 0.08 0.1 0.12 0.14 0.16
Tota
l pip
elin
e pr
essu
re d
rop
(kPa
)
Mass flow rate of conveying air (kg/s)
Pan and Wypych (1998) Chambers and Marcus (1986)Singh and Wolf (1972) Pan (1992)Rossetti (1983) Experimental DataDas and Meloy (2002) Schuchart (1968)
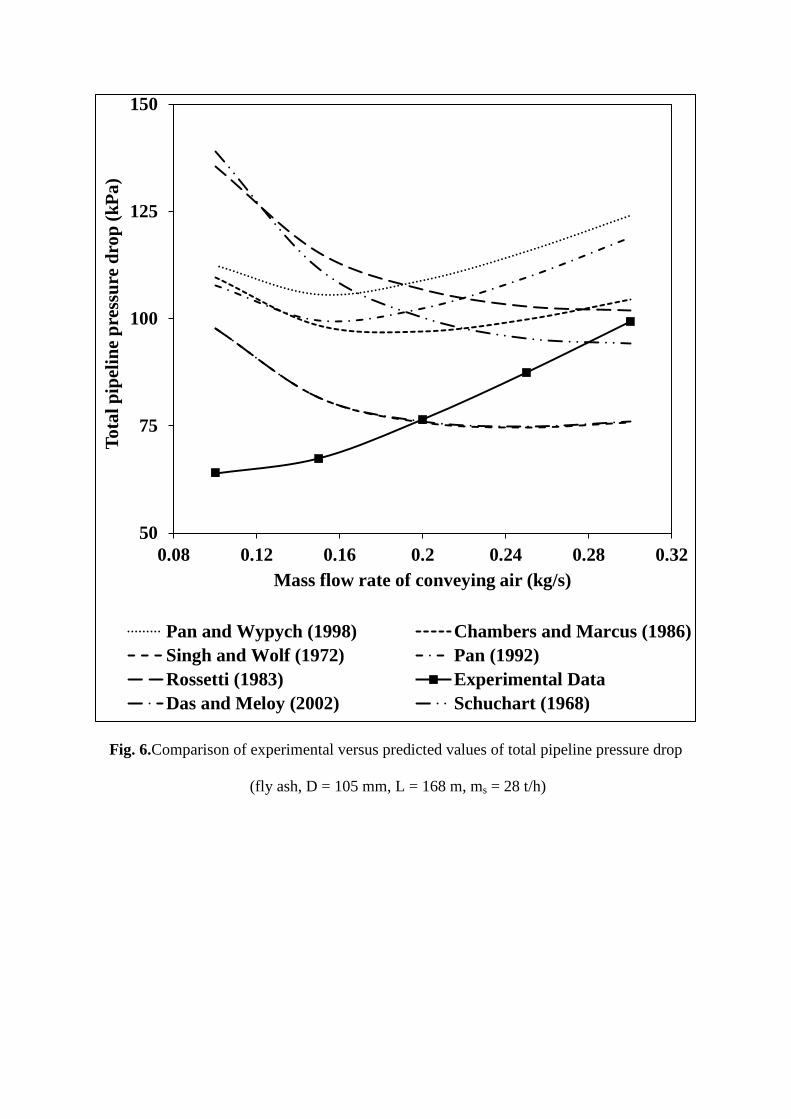
Fig. 6.Comparison of experimental versus predicted values of total pipeline pressure drop
(fly ash, D = 105 mm, L = 168 m, ms = 28 t/h)
50
75
100
125
150
0.08 0.12 0.16 0.2 0.24 0.28 0.32
Tota
l pip
elin
e pr
essu
re d
rop
(kPa
)
Mass flow rate of conveying air (kg/s)
Pan and Wypych (1998) Chambers and Marcus (1986)Singh and Wolf (1972) Pan (1992)Rossetti (1983) Experimental DataDas and Meloy (2002) Schuchart (1968)
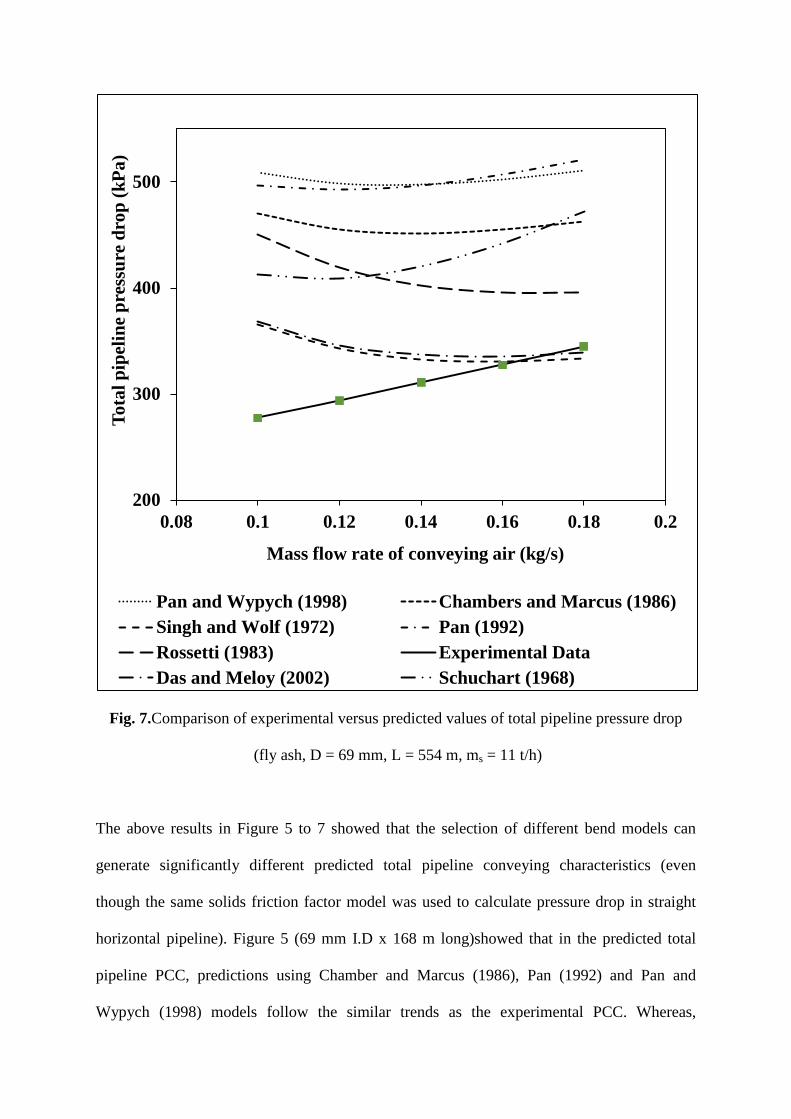
Fig. 7.Comparison of experimental versus predicted values of total pipeline pressure drop
(fly ash, D = 69 mm, L = 554 m, ms = 11 t/h)
The above results in Figure 5 to 7 showed that the selection of different bend models can
generate significantly different predicted total pipeline conveying characteristics (even
though the same solids friction factor model was used to calculate pressure drop in straight
horizontal pipeline). Figure 5 (69 mm I.D x 168 m long)showed that in the predicted total
pipeline PCC, predictions using Chamber and Marcus (1986), Pan (1992) and Pan and
Wypych (1998) models follow the similar trends as the experimental PCC. Whereas,
200
300
400
500
0.08 0.1 0.12 0.14 0.16 0.18 0.2
Tota
l pip
elin
e pr
essu
re d
rop
(kPa
)
Mass flow rate of conveying air (kg/s)
Pan and Wypych (1998) Chambers and Marcus (1986)Singh and Wolf (1972) Pan (1992)Rossetti (1983) Experimental DataDas and Meloy (2002) Schuchart (1968)
predictions using Rossetti (1983), Schuchart (1968), Singh and Wolf (1972) and Das and
Meloy (2002) models follow the reverse trend, i.e. instead of ‘U’ shaped PCC, the predicted
total pipeline pressure drop values decline with increase in air flows. There was significant
difference in prediction of total pipeline conveying characteristics in the dilute phase region
between Pan and Wypych (1998) and Das and Meloy (2002). On the other hand, the total
pipeline PCC of Pan (1992) and Pan and Wypych (1998) seem to follow the experimental
trends much better. However, the model presented by other researchers is shown to under-
predict in the dilute-phase region. Figure 6 (larger pipe) shows that the selection of Pan and
Wypych (1998) and Das and Meloy (2002) model results in significant differences in total
pipeline pressure drop in the dilute phase regime. When the predicted total pipeline PCC
were compared with the experimental plots, Pan and Wypych (1998) and Pan (1992)
provided over-predictions, whereas Das and Meloy (2002) and Singh and Wolf (1972)
resulted in under-predictions. Schuchart (1968),Rossetti (1983) and Chamber and Marcus
(1986) provided reliable estimations for dilute phase. From Figure 7, it can be seen that there
are significant differences between the predictions from Pan and Wypych (1998) and Das and
Meloy (2002) model and the experimental data for total pipeline pressure drop in dilute
phase. When compared to the experimental total pipeline PCC, all bend models gave over
prediction, except Das and Meloy (2002) and Singh and Wolf (1972) which offered good
prediction of pressure drop in dilute phase. Schuchart (1968) model uses a ∆pz term (straight
pipe pressure drop in the equivalent straight length for the bend). To accurately estimate the
values of ∆pz, solids friction factor (𝜆𝑠) needs to be accurately modelled and predicted first.
However, modelling of solids friction factor (𝜆𝑠) on its own is a matter of active research
(Mallick, 2010). As the prediction of bend loss depends on the value of calculated ∆pz (in
turn on the estimated value of λs), hence any limitation in modelling solids friction factor
would also affect the predicted value of bend loss. Also, with increase in air flow rate, the
value of solids friction factor decreases and subsequently ∆pz in the given range of air flow
rates. Hence, as per the Schuchart (1968) model given by equation (2), with increase in air
velocity, the predicted values of bend pressure loss have decreased, which is in contradiction
to the expected experimental trend. Similarly for the Rossetti (1983) model, the estimated
values of solids friction factor (λs) decrease with increase in air flow rates in the range of
PCC, which suppresses the predicted bend loss. As a result, the above models (Schuchart,
1968 and Rosetti, 1983) have provided predictions that contradicted the experimental trends.
The Singh and Wolf (1972) model was originally developed for granular product and the Das
and Meloy (2002) model was developed for closely coupled bends. As a result, these models
could not perform well fine powders and for isolated single bends (i.e. bends that are not
closely spaced). Prediction of bend only loss for each of seven bend models in 69 mm I.D. x
168 m long pipeline, for a range of low velocity (dense-phase) to high velocity flow (dilute-
phase) regimes are compared in Figure 8 for a constant solid flow rate of fly ash.
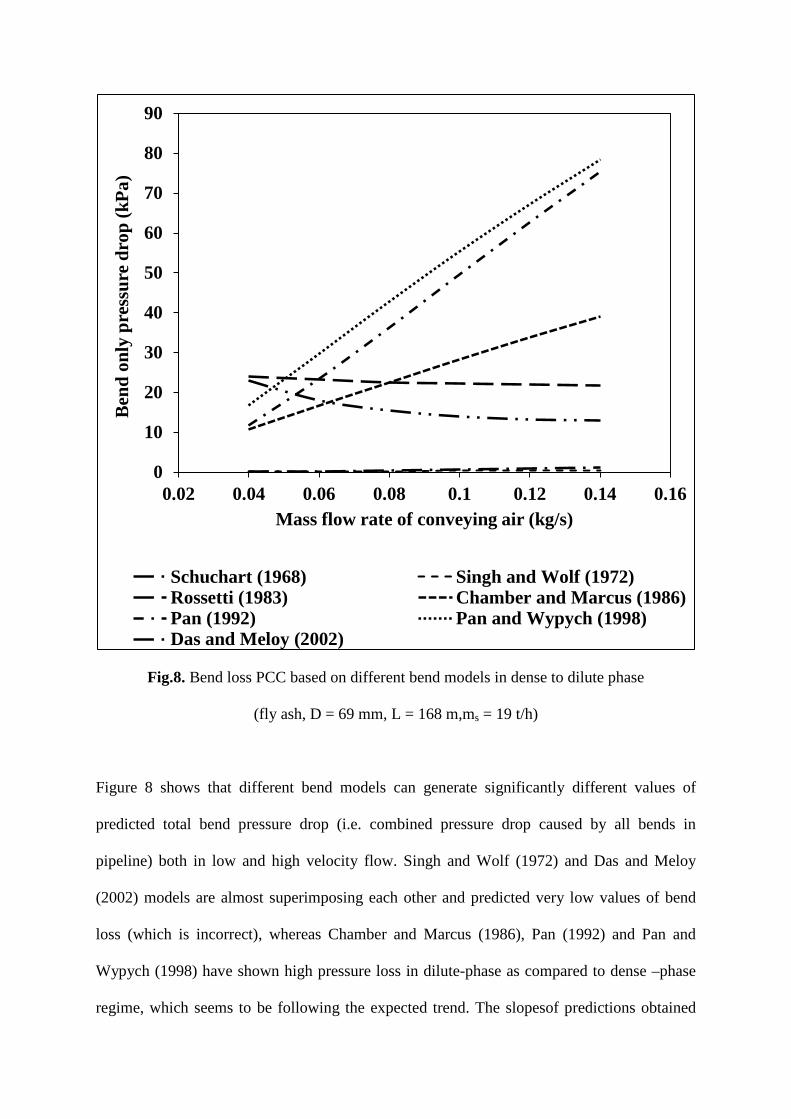
Fig.8. Bend loss PCC based on different bend models in dense to dilute phase
(fly ash, D = 69 mm, L = 168 m,ms = 19 t/h)
Figure 8 shows that different bend models can generate significantly different values of
predicted total bend pressure drop (i.e. combined pressure drop caused by all bends in
pipeline) both in low and high velocity flow. Singh and Wolf (1972) and Das and Meloy
(2002) models are almost superimposing each other and predicted very low values of bend
loss (which is incorrect), whereas Chamber and Marcus (1986), Pan (1992) and Pan and
Wypych (1998) have shown high pressure loss in dilute-phase as compared to dense –phase
regime, which seems to be following the expected trend. The slopesof predictions obtained
0
10
20
30
40
50
60
70
80
90
0.02 0.04 0.06 0.08 0.1 0.12 0.14 0.16
Ben
d on
ly p
ress
ure
drop
(kPa
)
Mass flow rate of conveying air (kg/s)
Schuchart (1968) Singh and Wolf (1972)Rossetti (1983) Chamber and Marcus (1986)Pan (1992) Pan and Wypych (1998)Das and Meloy (2002)
using Pan (1992) and Pan and Wypych (1998) models are very steep. Pressure loss in dense-
phase is more than the dilute phase regime by using Schuchart (1968) model and there is very
little change in bend pressure loss due to Rossetti (1983) model in dilute phase as compared
to dense phase, which does not follow the expected trend (Pan, 1992). This indicates that
Schuchart (1968), Singh and Wolf (1972), Rossetti (1983) and Das and Meloy (2002) are not
suitable for the case of fine powder conveying from dense- to dilute-phase flow. This is due
to the reduced predicted values of the straight-pipe pressure drop component of Schuchart
(1968) model with increase in air flow rates. Also, the estimated values of solids friction
factor of Rosetti (1983) model decrease with rise in air flow rates. As a result, these models
provide under-prediction in dilute-phase. The prediction capabilities of Singh and Wolf
(1972) model and Das and Meloy (2002) are limited as these models were generated
empirically from the conveying data of granular materials or for closely coupled bends,
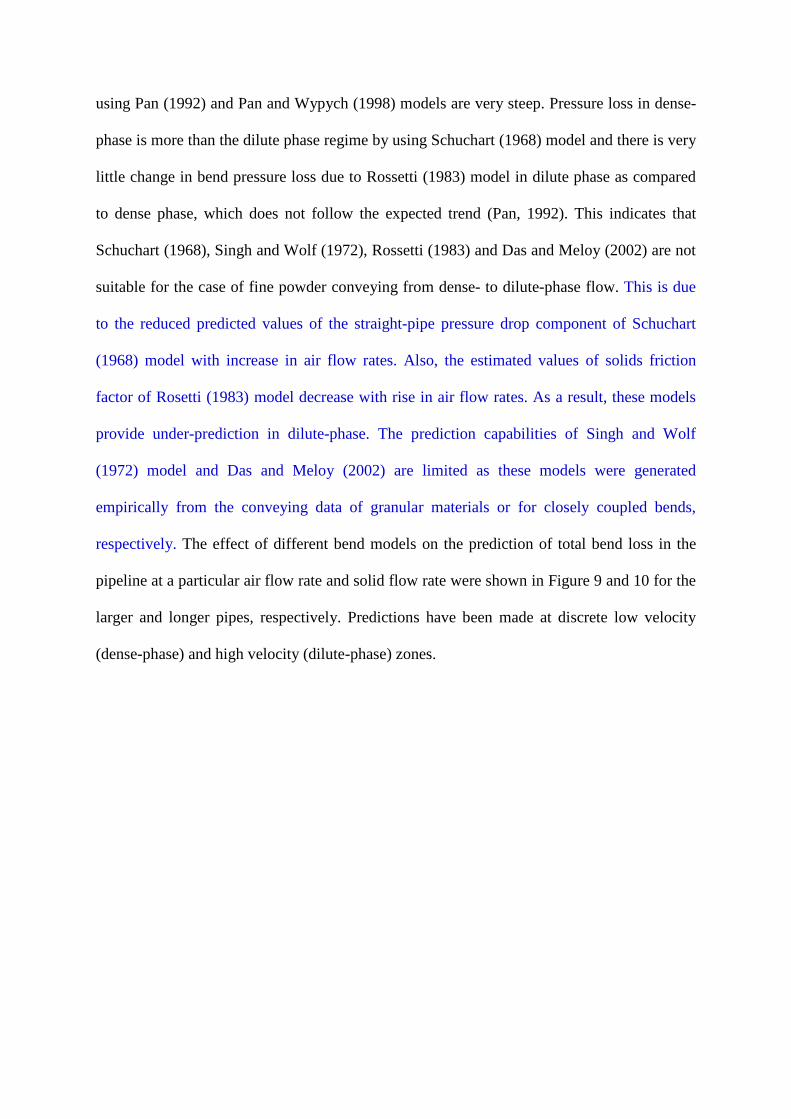
respectively. The effect of different bend models on the prediction of total bend loss in the
pipeline at a particular air flow rate and solid flow rate were shown in Figure 9 and 10 for the
larger and longer pipes, respectively. Predictions have been made at discrete low velocity
(dense-phase) and high velocity (dilute-phase) zones.
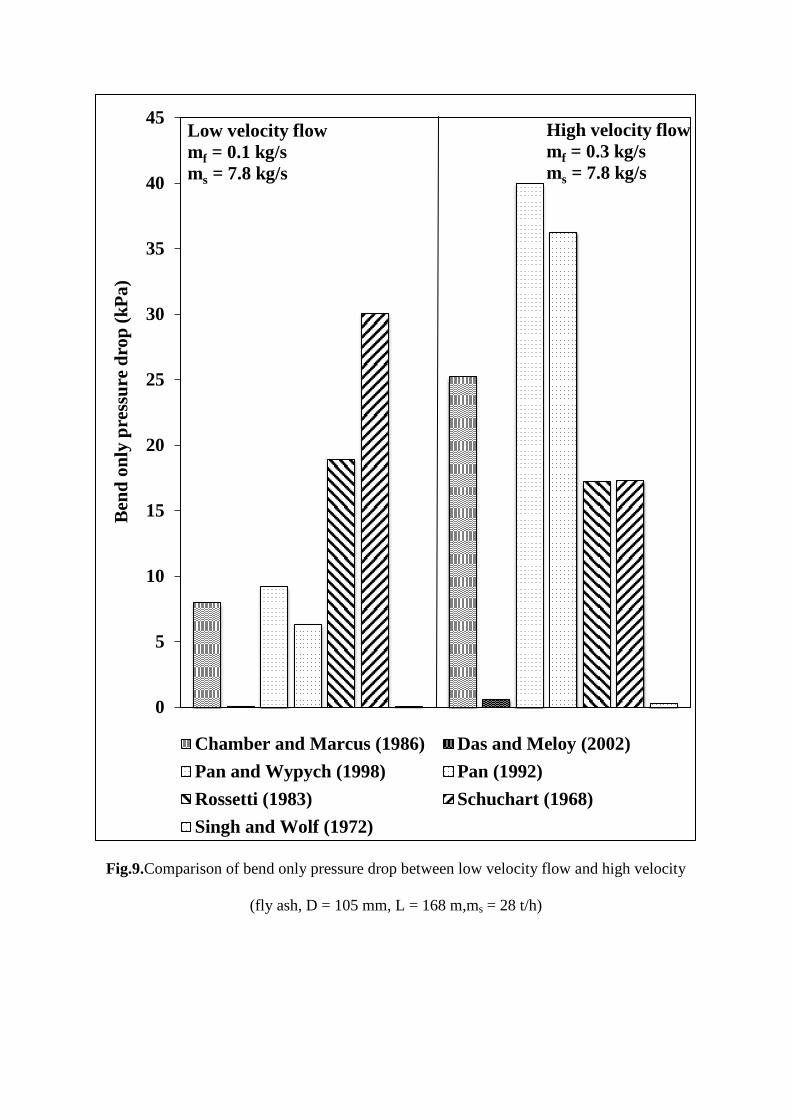
Fig.9.Comparison of bend only pressure drop between low velocity flow and high velocity
(fly ash, D = 105 mm, L = 168 m,ms = 28 t/h)
0
5
10
15
20
25
30
35
40
45
1 2
Ben
d on
ly p
ress
ure
drop
(kPa
)
Chamber and Marcus (1986) Das and Meloy (2002)Pan and Wypych (1998) Pan (1992)Rossetti (1983) Schuchart (1968)Singh and Wolf (1972)
Low velocity flow mf = 0.1 kg/s ms = 7.8 kg/s
High velocity flow mf = 0.3 kg/s ms = 7.8 kg/s
Fig.10. Comparison of bend only pressure drop between low velocity flow and high velocity
(fly ash, D = 69 mm, L = 554 m,ms = 11 t/h)
0
10
20
30
40
50
60
70
80
90
1 2
Ben
d on
ly p
ress
ure
drop
(kPa
)
Chamber and Marcus (1986) Das and Meloy (2002)Pan and Wypych (1998) Pan (1992)Rossetti (1983) Schuchart (1968)Singh and Wolf (1972)
High velocity flow mf = 0.18 kg/s ms = 3.06 kg/s
Low velocity flow mf = 0.06 kg/s ms = 3.06 kg/s
In Figure 9 and 10, Schuhart (1968), Singh and Wolf (1972) and Das and Meloy (2002)
model shows higher predicted bend pressure drop in low velocity range than that at high
velocity, as these models over-estimate solids friction in dense-phase. Again, this seems to
contradict the general perception of higher bend loss at dilute-phase regime. Predictions using
Pan (1992) and Pan and Wypych (1998) bend models seem to follow the expected trends due
to the overall dominating effect of positive exponents of gas velocity towards estimation of
bend pressure losses (i.e. predicted pressure drops in bend rise with increase in air velocities).
6. Conclusion
Seven existing bend models were evaluated for their accuracy and suitability by comparing
the predicted bend losses and total pipeline conveying characteristics using different models
in various pipelines. Results indicate that the Schuchart (1968) and Rosetti (1983) models
provide larger pressure drops in dense-phase compared to the dilute-phase regime, which
contradicts the experimental trends. The Singh and Wolf (1972) and Das and Meloy (2002)
models provide gross under-predictions. Pan (1992), Pan and Wypych (1998) and Chambers
and Marcus (1986) have provided trends of predictions that matched with experimental plots.
These models incorporate the gas velocity and density terms corresponding to the bend outlet
conditions, which seem to suggest that these models are able to address the momentum loss,
roping and reacceleration phenomenon of powder stream at the outlet of bends. Chambers
and Marcus (1986) model do not follow the trend of sharp rise in bend loss with increase in
air mass flow rates (similar to Pan and Wypych, 1998 and Pan, 1992), but follows a rather
steady rise in estimated pressure drop values in dilute-phase (i.e. following a moderate slope).
Chambers and Marcus (1986) Pan (1992) and pan and Wypych (1998) models are
recommended to estimate the bend losses for fly ash conveying systems from dense- to
dilute-phase systems. Pan (1992), Pan and Wypych (1998) models could provide some over-
prediction in dilute-phase zone, but these may be accepted as safety margins in design.
List of Symbols and Abbreviations
B Bend loss factor
D Internal diameter of pipe [m]
Fr = V/(gD)0.5 Froud number of flow
g Acceleration due to gravity [m/sec2]
L Length of pipe [m]
mf Mass flow rate of air [kg/sec]
ms Mass flow rate of solids [kg/sec]
m* = ms/mf Solid loading Ratio
K Constant of power function
N Number of bends
∆P Pressure drop through a straight horizontal pipe [Pa]
∆Pbo Pressure drop through bend [Pa]
(∆Pz)solid Pressure drop due to solids for an equivalent straight length
of the bend [Pa]
RB Radius of curvature bend [m]
r Radius of bend pipe [m]
Re = VD/ Reynolds number
V Superficial air velocity [m/sec]
Vo Velocity at bend outlet [m/sec]
ρ Density of air [kg/m3]
ρo Density of air at bend outlet
ρf Air/gas only friction factor
ρbs Solid friction factor at bend
ρs Solid friction factor
ρ Fluid viscosity [Pa.sec]
Subscripts
b Bend
f Fluid (air)
i Inlet condition
o Outlet condition
s Solids
sus Suspension
z Straight Horizontal Pipe
Abbreviations
BD Bottom Discharge
I.D. Internal diameter of pipe
PCC Pneumatic conveying characteristics
Acknowledgement
The authors would like to thank Department of Science and Technology, Science and
Engineering Research Board, Ministry of Science and Technology (Government of India) for
the financial assistance provided under the Young Scientist Scheme No: SR/FTP/ETA-
15/2011.
References
Barth, W.(1958).Stromungsvorgangebeim Transport von Festteilchen and
Flussigkeitsteilchen in Gasen.Chemie-Ing.-Techn.,30(3),171-180.
Bradley, M. S. A. and Mills, D. (1988). Approaches to dealing with the problem of energy
loss due to bends. In the proceedings of 13th Powder and Bulk SolidsConference. 705-
715.
Bradley, M. S. A. 1989. An improved method of predicting pressure drop along pneumatic
conveying pipelines. In the proceedings of 3rd International Conference on Bulk
Materials Storage and Transportation, Newcastle, Australia. 282-288.
Bradley, MSA. (1990).Prediction of pressure losses in pneumatic conveying
pipelines.Doctoral Dissertation, Thames Polytechnic, London, UK.
Bradley, MSA. (1990).Pressure losses caused by bends in pneumatic conveying pipelines
effects of bend geometry and fittings.Powder Handling and Processing, 2, 315-321.
Chambers, A.J., and Marcus, R.D. (1986). Pneumatic conveying calculations.2nd
International Conference on Bulk Materials Storage and Transportation, Wollongong,
Australia. 49-52.
Chaudhry, A.R., Bradley, MSA, Hyder, LM, Reed, AR and Farnish, RJ. (2001). Analysis
and modelling of bend pressure losses in lean phase pneumatic conveyors, for a range
of particulate material. 7th International conference on bulk materials storage, handling
and transportation, Newcastle, Australia. 899-906.
Das, P.K. and Meloy, J.R. (2002). Effect of close-coupled bends in pneumatic conveying.
Particulate science and technology, 20, 253-266.
Ito, H. 1959. Pressure losses in smooth pipe bends. Trans. ASME, Paper 59- Hyd-4.
Jones, M.G., and Williams, K.C. (2003). Solids friction factors for fluidized dense phase
conveying. Particulate Science and Technology, 21,45-56
Marcus, R. D., Hilbert Jr, J.D. and Klinzing, G.E. 1984. The flow through bends in
pneumatic conveying systems. Journal of Pipelines. (4), 103-112.
Klinzing, G.E., Marcus, R.D., Rizk, F., and Leung, L.S. (1997).Pneumatic Conveying of
Solids -A Theoretical and Practical Approach. Publ. Chapman & Hall.
Mills, D. and Mason, J.S. 1985. The influence of bend geometry on pressure drop in
pneumatic conveying system pipelines. In the proceedings of 10International
Conference Powder and Bulk Solids Handling, Chicago, IL, USA. Cahners Exhibition
Group, Des Plaines, IL. 203-214.
Mills, D. (2004).Pneumatic conveying design guide (2nded.).Oxford:Elsevier/Butterworth-
Heinemann.
Mallick, S.S. (2010). Modelling of fluidised dense-phase pneumatic conveying of
powders.Doctoral Dissertation, University of Wollongong, Australia.
Pan, R. (1992). Improving scale-up procedures for the design of pneumatic
conveyingsystems. Doctoral Dissertation, University of Wollongong, Australia.
Pan, R., and Wypych, P.W. (1998) Dilute and dense phase pneumatic conveying of fly ash,
6th International Conference on Bulk Materials Storage and Transportation.
Wollongong, NSW, Australia. 183-189.
Rossetti, S.J. (1983) Concepts and criteria for gas-solids flow, Handbook of fluids in
motion, Ed. Nicholas P.Cheremisinoff and Remesh Gupta.Ann Arbor: Ann Arbor
Science Publishers. 635-652.
Stegmaier, W. (1978). Zurberechnung der horinental enpneumatischen for de
rungfeinkornigerfeststoffe - for the calculation of horizontal pneumatic conveying of
fine grained solids.Fordern and Heben, 28. 363-366.
Schuchart, P. (1968). Widerstansgesetzebeimpneumatischen Transport in
Rohrkrummern.Symposium series no. 27 (The Institution of Chemical Engineers). 65 –
72.
Singh, B., and Wolfe, R.R. (1972). Pressure losses due to bends in pneumatic forage
handling.Transaction of the ASAE. 246-248.
Weber, M. (1981). Principles of hydraulic and pneumatic conveying in pipes.Bulk Solids
Handling, 1, 57-63.
Williams, K.C. and Jones, M.G. (2004), Numerical model velocity profile of fluidised dense
phase pneumatic conveying.8thInternational Conference on Bulk Materials Storage and
Transportation, Wollongong, NSW, Australia. 354-358.
Annexure A
Fig. A1.Schematic of the 105 mm I.D. × 168 m Long Test Rig (for fly ash)
BT 2 BT 1
21 m
40.1 m
12.9 m
6.3 m
11.7 m
44.5 m
5.8 m
6.95 m (V) 12.7 m
P 9
P 10 P 11
P 12
P 8
P 7 P 6
P 5
1.3 m 0.5 m 6.8 m
BT : Blow tank V : Vertical P : Pressure tapping
i
Silo
Fig. A2.Schematic of the 69 mm I.D. × 554 m Long Test Rig (for fly ash)
BT 2 BT 1
44 m
26.91 m
3.4 m
6.95 m (Vertical) 12.7 m
P 8
P 7 P 6
P 5
1.3 m 0.5 m 6.8 m
Silo
10 m
29 m
20 m
P 11
P 12
P 10
P 9
6 m
62 m
BT : Blow tank P : Pressure tapping point