Embed Size (px)
Citation preview
CENTRAL STATISTICS OFFICE NATIONAL STATISTICAL ORGANISATION
MINISTRY OF STATISTICS AND PROGRAMME IMPLEMENTATION GOVERNMENT OF INDIA www.mospi.gov.in
ENERGY STATISTICS
Energy Statistics 2015
ENERGY STATISTICS
2015
(Twenty Second Issue)
CENTRAL STATISTICS OFFICE MINISTRY OF STATISTICS AND PROGRAMME IMPLEMENTATION
GOVERNMENT OF INDIA NEW DELHI
C E N T R A L S T A T I S T I C S O F F I C E
i
Energy Statistics 2015
FOREWORD
Energy is one of the most fundamental parts of our universe. Energy has come to be known as a `strategic commodity’ and any uncertainty about its supply can threaten the functioning of the entire economy, particularly in developing economies. India’s substantial and sustained economic growth is placing enormous demand on its energy resources. The demand and supply imbalance in energy sources is pervasive requiring serious efforts by Government of India to augment energy supplies as India faces possible severe energy supply constraints. Energy requirement in our country is increasing at a very rapid rate. Achieving energy security in this strategic sense is of fundamental importance not only to India’s economic growth but also for the human development objectives that aim at alleviation of poverty, unemployment and meeting the Millennium Development Goals (MDGs). Holistic planning for achieving these objectives requires quality energy statistics that is able to address the issues related to energy demand, energy poverty and environmental effects of energy growth.
This publication titled “Energy Statistics” is brought out every year by Central Statistics Office (CSO) and the present one is the 22nd in the series. The latest data on reserves, installed capacity, potential for generation, production, consumption, import, export and wholesale price of different energy commodities are included in the publication. The publication also includes analytical indicators viz. Growth Rates, Compound Annual Growth Rates (CAGR) & Percentage Distributions, in relevant tables to increase the utility of the publication. The data has been sourced from the concerned subject matter Ministries of the Government of India, in respect of different energy sources as per their mandate. The Energy Balance in the chapter 7 is provisional and efforts are being made to reduce the statistical difference.
I wish to use this opportunity to express my appreciation and convey my thanks to all those who worked hard in Ministry of Petroleum and Natural Gas, Central Electricity Authority, Office of Coal Controller, Ministry of New and Renewable Energy and Office of the Economic Advisor, Ministry of Commerce and Industry, to provide the requisite information for this publication in time.
I would like to put on record my appreciation to the team of officers in the Economic Statistics Division for their dedicated services in bringing out this publication in time.
This publication is an attempt to cater to the needs of the planners, policy makers and researchers by making available the entire energy data at a single place. I hope that “Energy Statistics 2015” will fulfill the expectations of all.
(Ashish Kumar) DIRECTOR GENERAL (In-charge)
Central Statistics Office New Delhi March 2015.
C E N T R A L S T A T I S T I C S O F F I C E
ii
Energy Statistics 2015
Officers associated with the publication:
Dr. G.C. Manna Additional Director General
Shri Baljeet Singh Chhabra Deputy Director General
Smt Geeta Singh Rathore Director
Shri Sushil Kumar Senior Statistical Officer
Shri Aditya Singh Hada Junior Statistical Officer
C E N T R A L S T A T I S T I C S O F F I C E
iii
Energy Statistics 2015
CONTENTS PAGE
Energy Maps of India vi-viii Metadata-Energy Statistics ix-xi Chapter 1 : Reserves and Potential for Generation 1-8 Highlights Table 1.1: State-wise Estimated Reserves of Coal Table 1.1(A): State-wise Estimated Reserves of Lignite Table 1.2:State-wise Estimated Reserves of Crude Oil and Natural Gas Table 1.3: Source wise and State wise Estimated Potential of Renewable Power Chapter 2 : Installed Capacity and Capacity Utilization 9-21 Highlights Table 2.1 : Installed Capacity of Coal Washeries in India Table 2.2 : Installed Capacity and Capacity Utilization of Refineries of Crude Oil Table 2.3 : Trends in Installed Generating Capacity of Electricity in Utilities and Non Utilities
Table 2.4 : Regionwise and State wise Installed Generating Capacity of Electricity(Utilities)
Table 2.5 : State wise and Source wise Total Installed Capacity of Grid Interactive Renewable Power
Table 2.6: Installation of Off-grid/ Decentralised Renewable Energy Systems/ Devices Chapter 3: Production 22-29 Highlights Table 3.1 : Trends in Production of Primary Sources of Conventional Energy Table 3.2 :Trends in Production of Energy (in Peta Joules) by Primary Sources Table 3.3 :Trends in Production of Coal and Lignite Table 3.4 : Trends in Domestic Production of Petroleum Products Table 3.5 : Trends in Gross and Net Production of Natural Gas Table 3.6 : Trends in Gross Generation of Electricity in Utilities and Non-utilities Chapter 4 : Foreign Trade 30-32 Highlights Table 4.1 :Trends of Foreign Trade in Coal, Crude Oil and Petroleum Products in India Chapter 5 : Availability 33-36 Highlights Table 5.1: Trends in Availability of Primary Sources of Conventional Energy Table 5.2: Trends in Availability of Raw Coal and Lignite for Consumption Table 5.3: Trends in Availability of Crude Oil, Petroleum Products and natural gas
C E N T R A L S T A T I S T I C S O F F I C E
iv
Energy Statistics 2015
PAGE Chapter 6 : Consumption 37-54 Highlights Table 6.1: Trends in Consumption of Conventional Sources of Energy Table 6.2: Trends in Growth in Energy Consumption and Energy intensity Table 6.3: Trends in Consumption of Conventional Energy ( Peta Joules) Table 6.4: Trends in Industry wise Consumption of Raw Coal Table 6.5: Trends in Industry wise Consumption of Lignite Table 6.6: Trends in Consumption of Petroleum Products Table 6.7: Sector-wise(end use) Consumption of Selected Petroleum Products Table 6.8: Industry-wise Off-take of Natural Gas Table 6.9: Consumption of Electricity (from utilities) by Sectors Table 6.10: Electricity Generated(from Utilities), Distributed, Sold and Lost Chapter 7 : Energy Commodity Balance 55-60 Highlights Table 7.1: Energy Commodity Balance Table 7.2: Energy Balance Chapter 8 : Price Indices 61-63 Highlights Table 8.1: Wholesale Price Indices of Energy Commodities Chapter 9 : World Production and Consumption of Crude Oil & Natural Gas 64-74 Highlights Table 9.1: Country wise Estimates of Production of Crude Oil Table 9.2: Country-wise Estimates of Consumption of Crude Oil Table 9.3: Country-wise Estimates of Production of Natural Gas Table 9.4: Country-wise Estimates of Consumption of Natural Gas Annexures to Metadata Annex I : Definitions of Energy Products adopted by India 75-80 Annex II : Conversion Factors 81 Annex III : Abbreviations 82 Annex IV : Energy Data Collection Mechanisms-Country Practice 83-90
C E N T R A L S T A T I S T I C S O F F I C E
v
Energy Statistics 2015
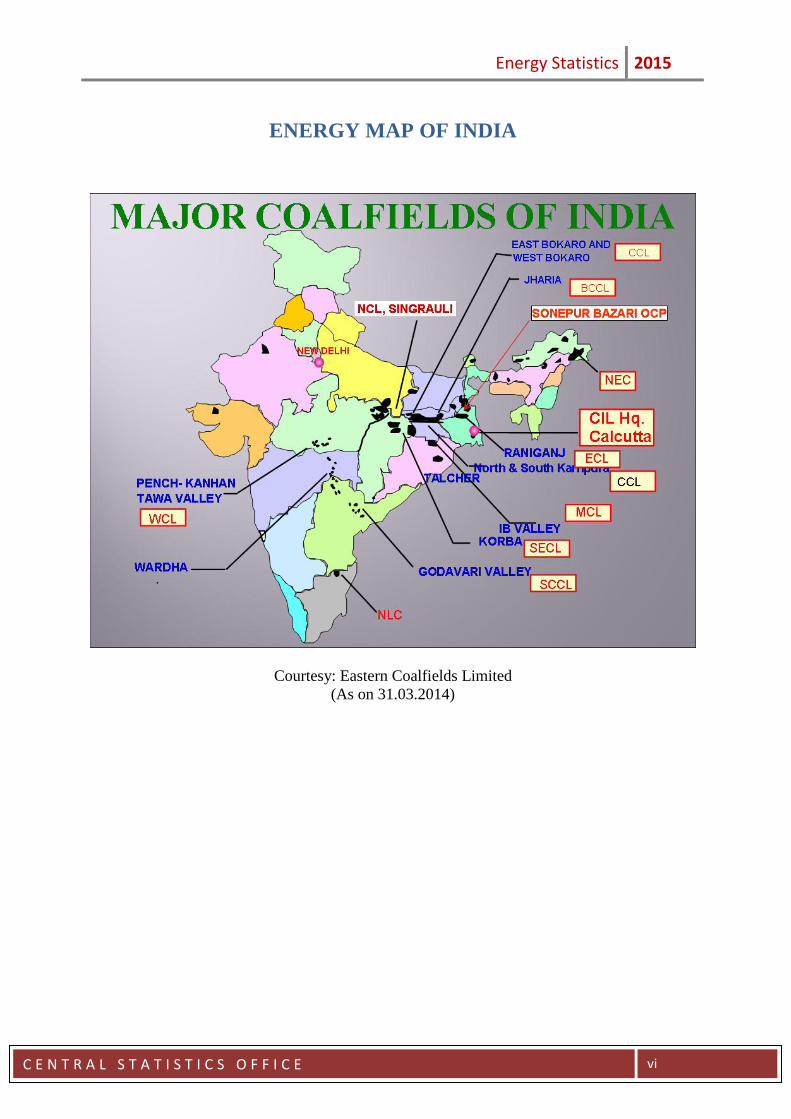
ENERGY MAP OF INDIA
Courtesy: Eastern Coalfields Limited (As on 31.03.2014)
C E N T R A L S T A T I S T I C S O F F I C E
vi
Energy Statistics 2015
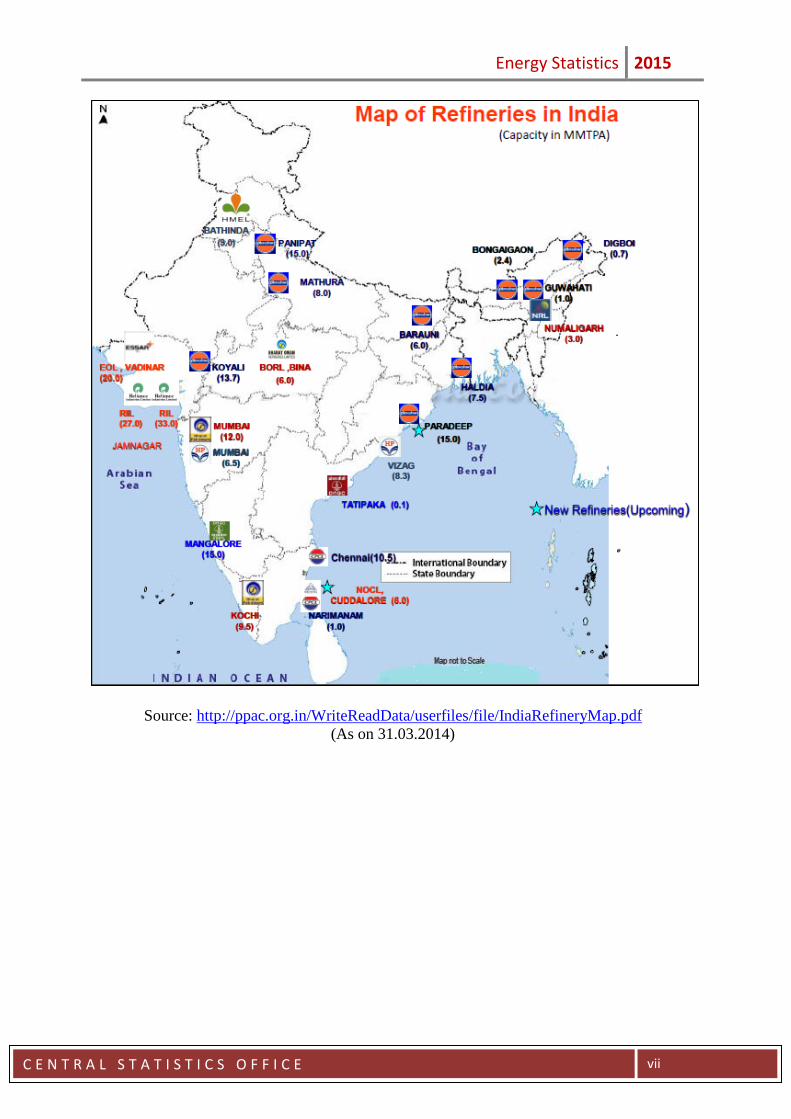
Source: http://ppac.org.in/WriteReadData/userfiles/file/IndiaRefineryMap.pdf (As on 31.03.2014)
C E N T R A L S T A T I S T I C S O F F I C E
vii
Energy Statistics 2015
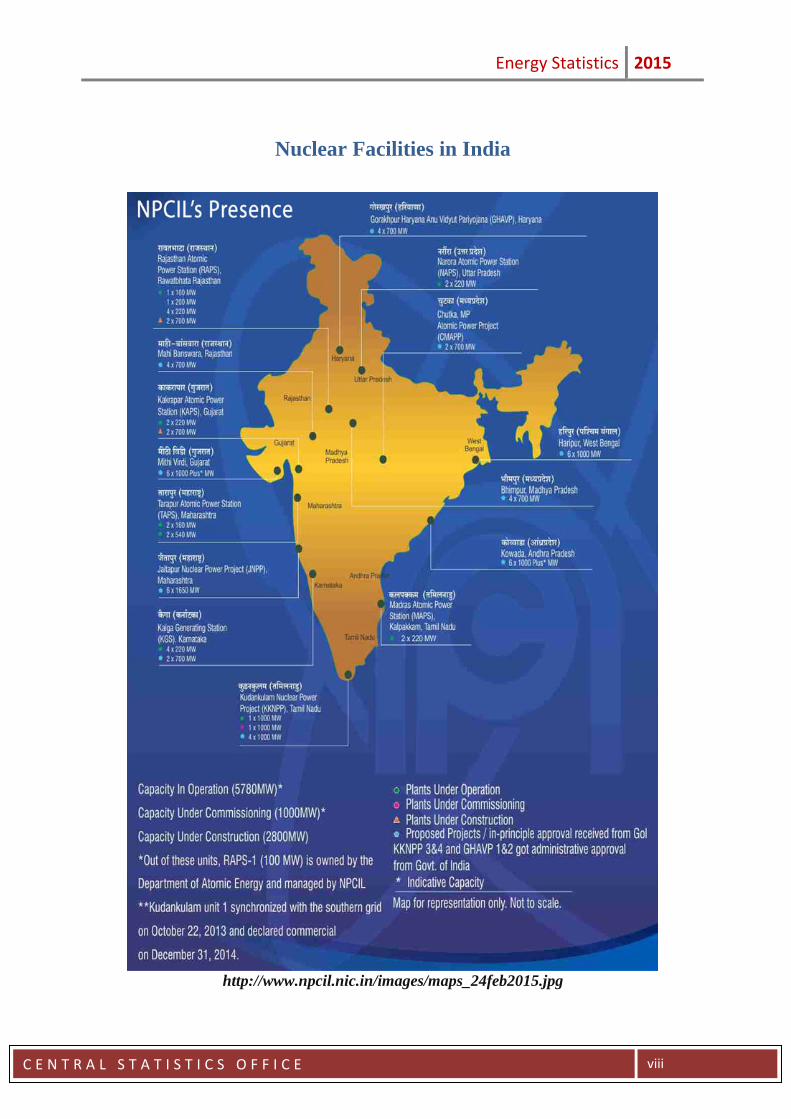
Nuclear Facilities in India
http://www.npcil.nic.in/images/maps_24feb2015.jpg
C E N T R A L S T A T I S T I C S O F F I C E
viii
Energy Statistics 2015
METADATA-ENERGY STATISTICS
1. Contact
1.1. Contact organisation Central Statistics Office (CSO), M/o Statistics & Programme Implementation (MOSPI)
1.2. Contact organisation unit Economic Statistics Division, CSO
1.3. Contact mail address 9th Floor, Jeevan Prakash Building, 25 K. G. Marg, New Delhi-110 001
1.4. Contact emails [email protected] [email protected] [email protected]
1.5. Homepage http:// www.mospi.gov.in 2. Statistical presentation
2.1 Data sources The data has been sourced from the concerned subject matter Ministries of the Government of India in respect of different energy sources as per their mandate. These Ministries are Ministry of Petroleum and Natural Gas, Central Electricity Authority, Office of Coal Controller, Ministry of New and Renewable Energy and Office of the Economic Advisor, Ministry of Commerce and Industry.
2.2. Data description The statistics present information about the reserves, installed capacity, potential for generation, production, consumption, import, export and wholesale price of different energy commodities.
2.3. Sector coverage Coal & Lignite, Petroleum & Natural Gas, Renewable Energy Resources and Electricity.(Data collection Mechanism is given in Annex: IV
2.4. Data content The Statistics are given by type of fuel and energy source. The publication includes analytical indicators viz. Growth Rates, Compound Annual Growth Rates (CAGR) and Percentage Distributions.
2.5. Statistical unit Data are aggregated appropriately at national and state level.
2.6. Statistical population Data covers all the energy commodity sources. 2.7. Reference area The energy industries of the entire country are covered.
2.8. Time coverage In the current publication the data given is for the period 2005-06 to 2013-14.
2.9. Base period 2004-05 2.10. Statistical concepts and definitions The main Concepts and Definitions are given in Annex: I.(Annex. II & Annex. III respectively give certain Conversion Factors and Abbreviations used)
C E N T R A L S T A T I S T I C S O F F I C E
ix
Energy Statistics 2015 3. Unit of measure
Energy quantities data are recorded in physical units relevant to the product in question (GWh for electricity, 1000 Tons for petroleum products etc.). Prices are indicated by Wholesale Price Index. The Energy Balance is given in ktoe. Consumption and Production of the Energy resources is also given in petajoules.
4. Reference period
Reference period of the Publication of “Energy Statistics -2015" is the financial year 2013-14 and the previous financial years since 2005-06. 5. Institutional mandate
6.1. Legal acts and other agreements No legal acts, however this statistics is collected in view of the mandate of the Ministry in allocation of Business rules.
6.2. Data sharing The publication is disseminated on the website of the Ministry(MOSPI) and is available free of cost.
6. Confidentiality
7.1. Confidentiality – policy and data treatment Confidentiality of the data is maintained by the data source ministries.
7. Release policy
7.1. Release calendar Publication of Energy Statistics is released on MOSPI’s web-site in March every year. 7.2. User access MOSPI disseminates Economic statistics on its website in an objective, professional and transparent manner in which all users are treated equitably. The detailed arrangements are governed by the dissemination policy of Government of India.
8. Dissemination format
8.1. News release Publication on Energy Statistics is released annually.
8.2. Publications Annual publication in pdf format is available on the website of MOSPI. 9. Accessibility of documentation
9.1. Documentation on methodology Information on the relevant Energy indicators methodology can be found in the publication. 10. Accuracy and reliability
10.1. Overall accuracy Data on energy is published on the basis of information received from the source agencies. This Division compiles and analyses data received from the source agencies and then presents in the form of publication.
C E N T R A L S T A T I S T I C S O F F I C E
x
Energy Statistics 2015 11. Timeliness and punctuality
11.1. Timeliness Preliminary data on energy production, consumption statistics and few energy indicators are available 12 months after the reference year. Preliminary data on energy consumption and supply are complete and published before the end of the next financial year. Final data for the year are published 24 months after the end of the statistical reference year.
11.2. Punctuality Annual publication on Energy Statistics is released by the end of March every year.
12. Data revision
12.1. Data revision – policy The annual publication provides data on the last reference year and revisions for the year before. Revisions of entire time series when made by source agencies due to specific survey or data revision are incorporated in due time.
12.2. Data revision - practice Preliminary data on energy production and consumption statistics is published in current publication. Final data will be given in the next publication in March 2016. 13. Statistical processing
13.1. Source data Energy data are collected from the source agencies at national level and presented in publication. It is published in the ministry’s web-site.
13.2. Frequency of data collection Annual. 13.3. Data collection Data is collected through e-mail or by post from the source ministries. 13.4. Data validation Checks are carried out to the data before publishing it.
13.5.5. Data compilation Data is calculated by summing up the national figures. 13.6. Adjustment No seasonal adjustment or temperature correction of the energy consumption is applied.
C E N T R A L S T A T I S T I C S O F F I C E
xi
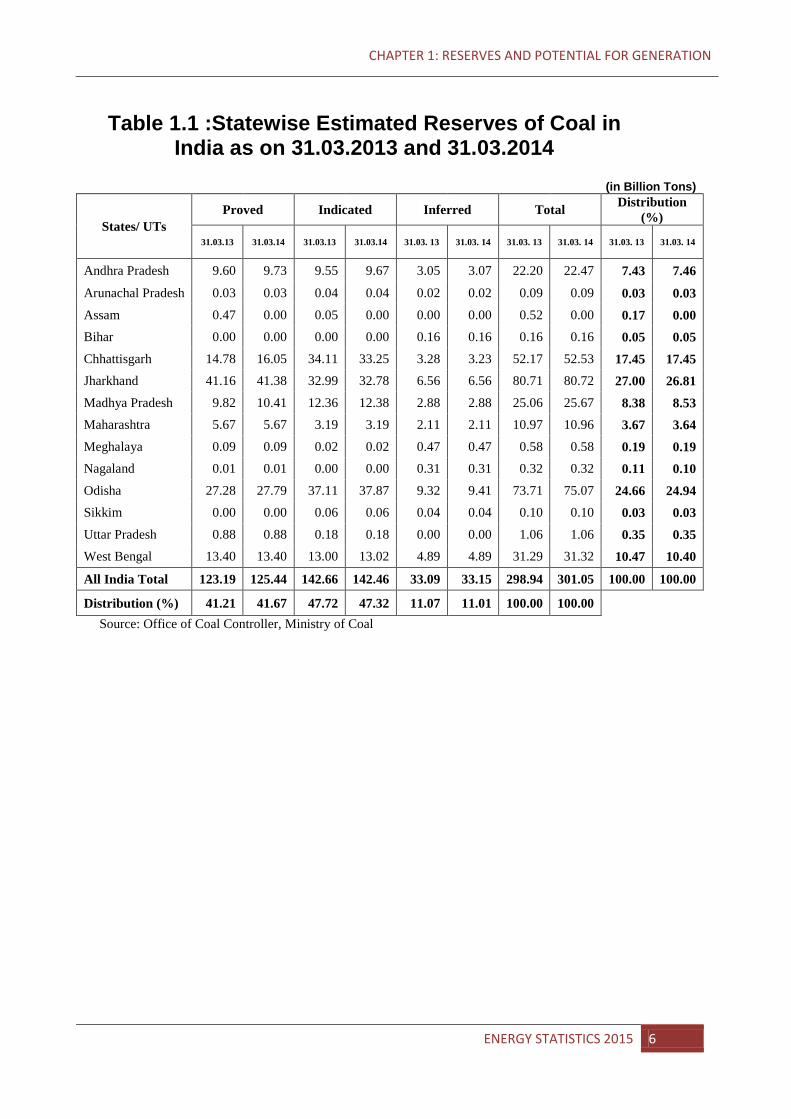
CHAPTER 1: RESERVES AND POTENTIAL FOR GENERATION
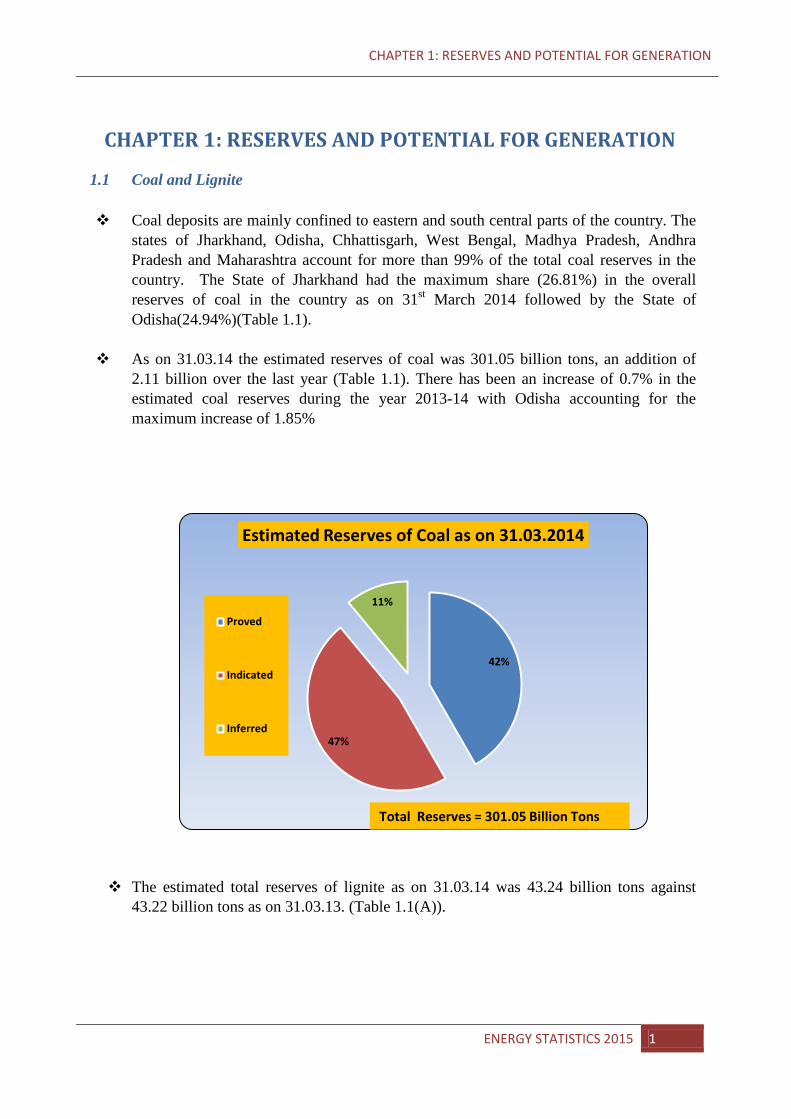
CHAPTER 1: RESERVES AND POTENTIAL FOR GENERATION 1.1 Coal and Lignite
Coal deposits are mainly confined to eastern and south central parts of the country. The
states of Jharkhand, Odisha, Chhattisgarh, West Bengal, Madhya Pradesh, Andhra Pradesh and Maharashtra account for more than 99% of the total coal reserves in the country. The State of Jharkhand had the maximum share (26.81%) in the overall reserves of coal in the country as on 31st March 2014 followed by the State of Odisha(24.94%)(Table 1.1).
As on 31.03.14 the estimated reserves of coal was 301.05 billion tons, an addition of
2.11 billion over the last year (Table 1.1). There has been an increase of 0.7% in the estimated coal reserves during the year 2013-14 with Odisha accounting for the maximum increase of 1.85%
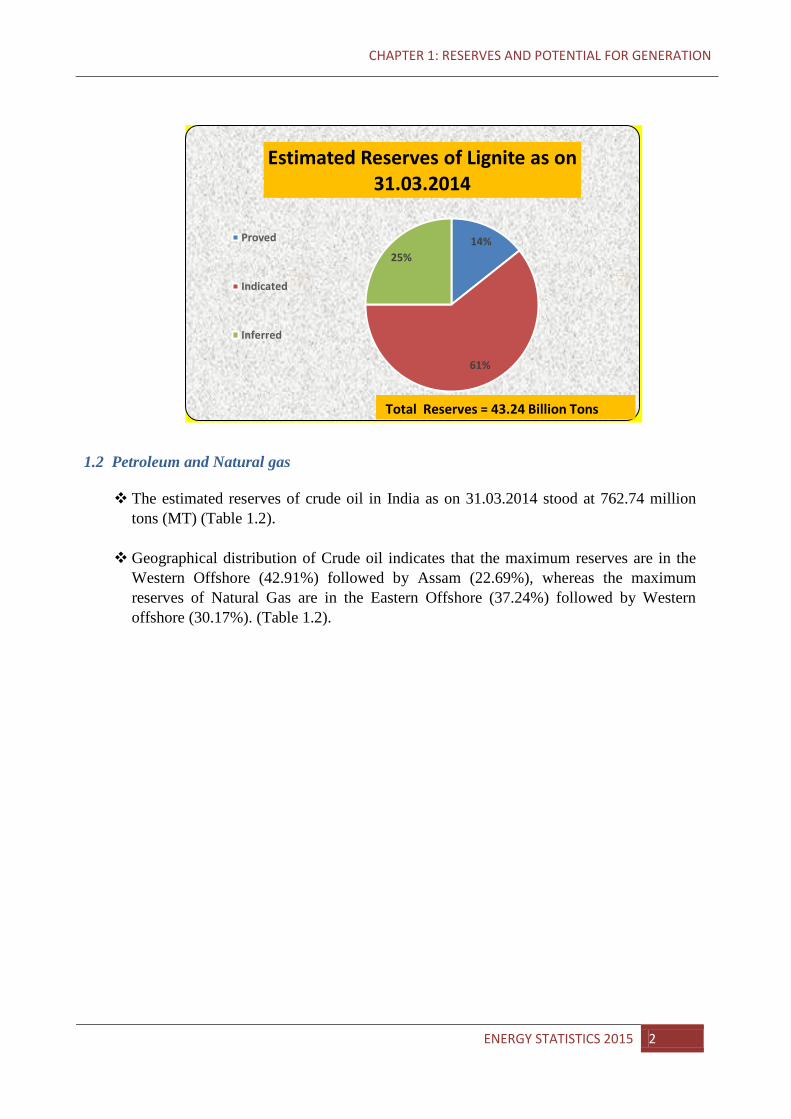
The estimated total reserves of lignite as on 31.03.14 was 43.24 billion tons against
43.22 billion tons as on 31.03.13. (Table 1.1(A)).
42%
47%
11%
Estimated Reserves of Coal as on 31.03.2014
Proved
Indicated
Inferred
Total Reserves = 301.05 Billion Tons
ENERGY STATISTICS 2015 1
CHAPTER 1: RESERVES AND POTENTIAL FOR GENERATION
1.2 Petroleum and Natural gas
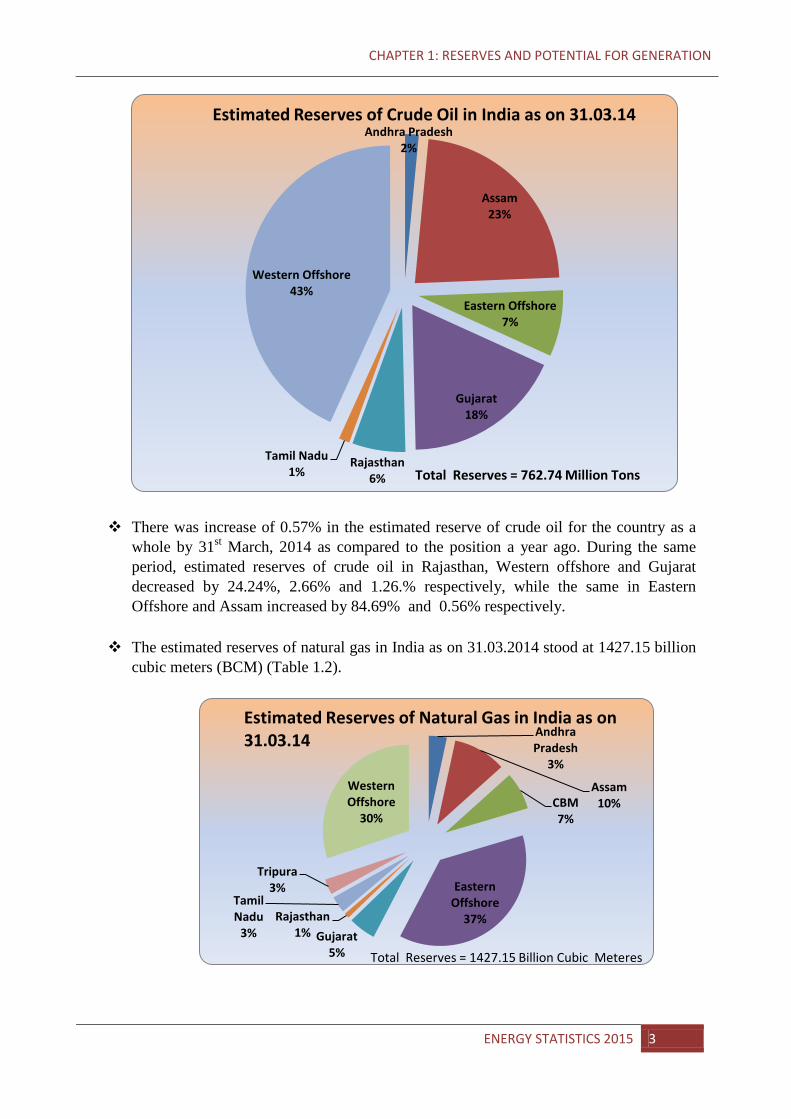
The estimated reserves of crude oil in India as on 31.03.2014 stood at 762.74 million tons (MT) (Table 1.2).
Geographical distribution of Crude oil indicates that the maximum reserves are in the
Western Offshore (42.91%) followed by Assam (22.69%), whereas the maximum reserves of Natural Gas are in the Eastern Offshore (37.24%) followed by Western offshore (30.17%). (Table 1.2).
14%
61%
25%
Estimated Reserves of Lignite as on 31.03.2014
Proved
Indicated
Inferred
Total Reserves = 43.24 Billion Tons
ENERGY STATISTICS 2015 2
CHAPTER 1: RESERVES AND POTENTIAL FOR GENERATION
There was increase of 0.57% in the estimated reserve of crude oil for the country as a whole by 31st March, 2014 as compared to the position a year ago. During the same period, estimated reserves of crude oil in Rajasthan, Western offshore and Gujarat decreased by 24.24%, 2.66% and 1.26.% respectively, while the same in Eastern Offshore and Assam increased by 84.69% and 0.56% respectively.
The estimated reserves of natural gas in India as on 31.03.2014 stood at 1427.15 billion
cubic meters (BCM) (Table 1.2).
Andhra Pradesh 2%
Assam 23%
Eastern Offshore 7%
Gujarat 18%
Rajasthan 6%
Tamil Nadu 1%
Western Offshore 43%
Estimated Reserves of Crude Oil in India as on 31.03.14
Total Reserves = 762.74 Million Tons
Andhra Pradesh
3%
Assam 10% CBM
7%
Eastern Offshore
37% Gujarat
5%
Rajasthan 1%
Tamil Nadu
3%
Tripura 3%
Western Offshore
30%
Total Reserves = 1427.15 Billion Cubic Meteres
Estimated Reserves of Natural Gas in India as on 31.03.14
ENERGY STATISTICS 2015 3
CHAPTER 1: RESERVES AND POTENTIAL FOR GENERATION
In case of Natural Gas, the increase in the estimated reserves over the same period was
5.34%. The maximum contribution to this increase has been from Eastern Offshore (12.26%), followed by Western Offshore (3.6%).
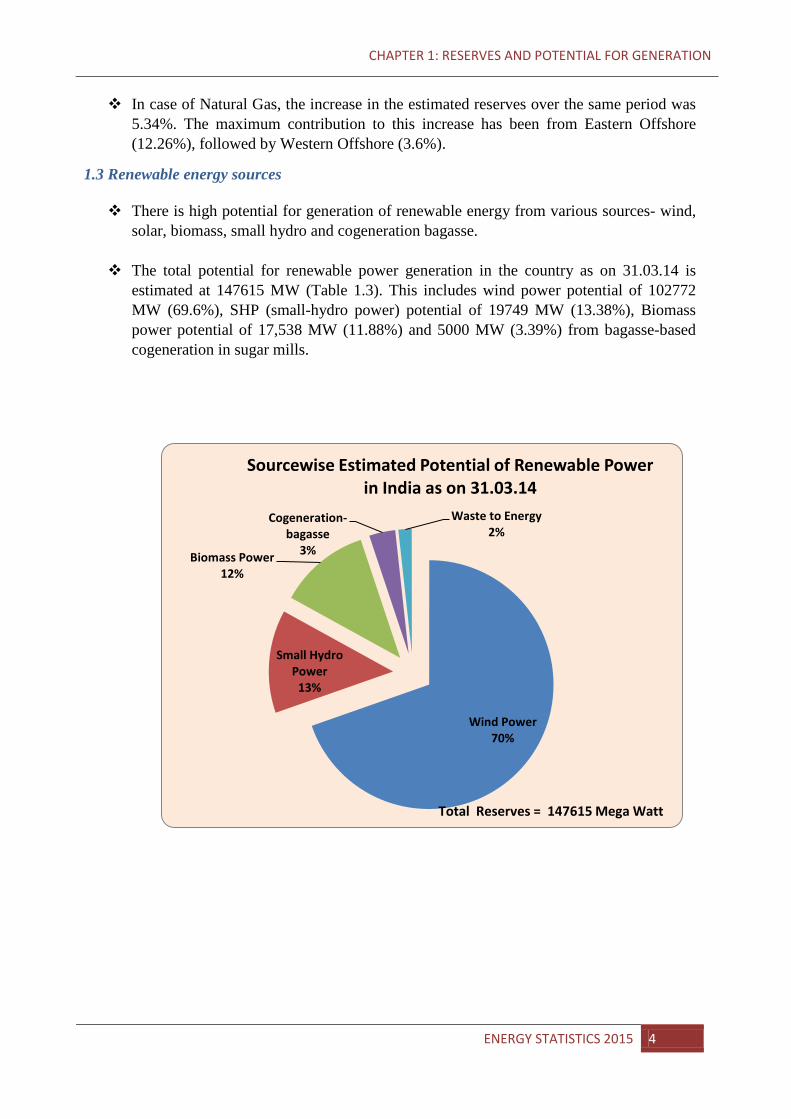
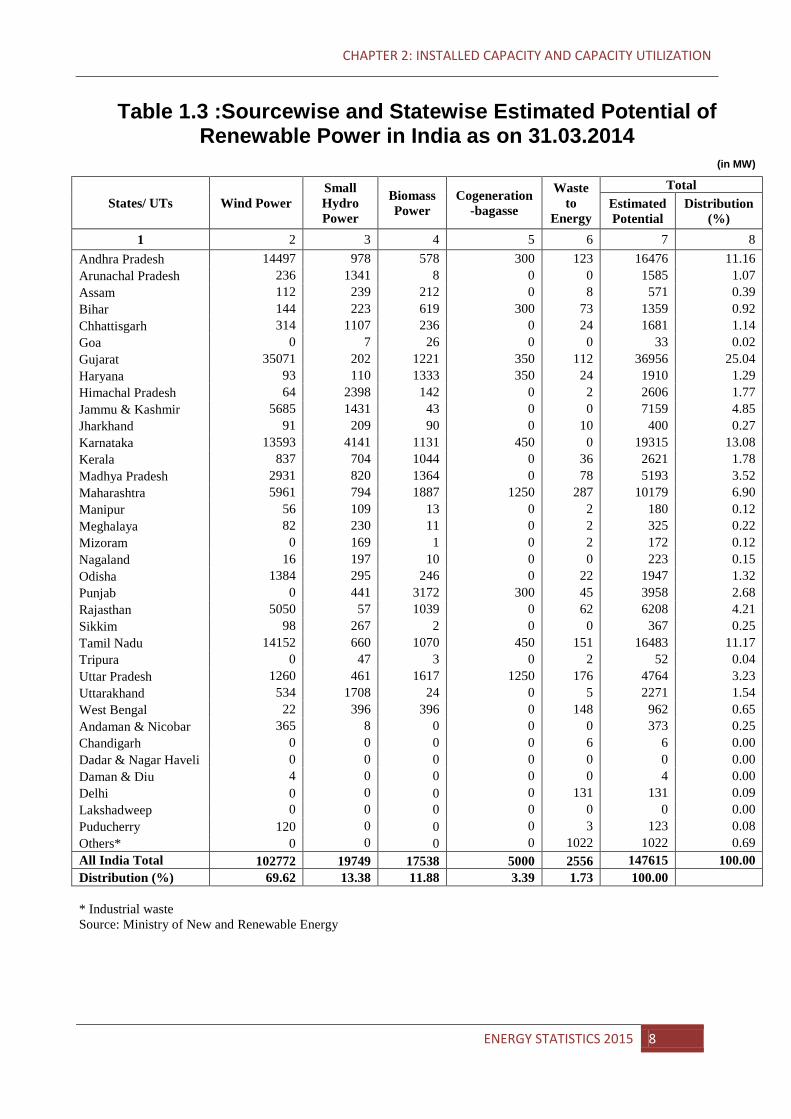
1.3 Renewable energy sources There is high potential for generation of renewable energy from various sources- wind,
solar, biomass, small hydro and cogeneration bagasse. The total potential for renewable power generation in the country as on 31.03.14 is
estimated at 147615 MW (Table 1.3). This includes wind power potential of 102772 MW (69.6%), SHP (small-hydro power) potential of 19749 MW (13.38%), Biomass power potential of 17,538 MW (11.88%) and 5000 MW (3.39%) from bagasse-based cogeneration in sugar mills.
Wind Power 70%
Small Hydro Power
13%
Biomass Power 12%
Cogeneration-bagasse
3%
Waste to Energy 2%
Sourcewise Estimated Potential of Renewable Power in India as on 31.03.14
Total Reserves = 147615 Mega Watt
ENERGY STATISTICS 2015 4
CHAPTER 1: RESERVES AND POTENTIAL FOR GENERATION
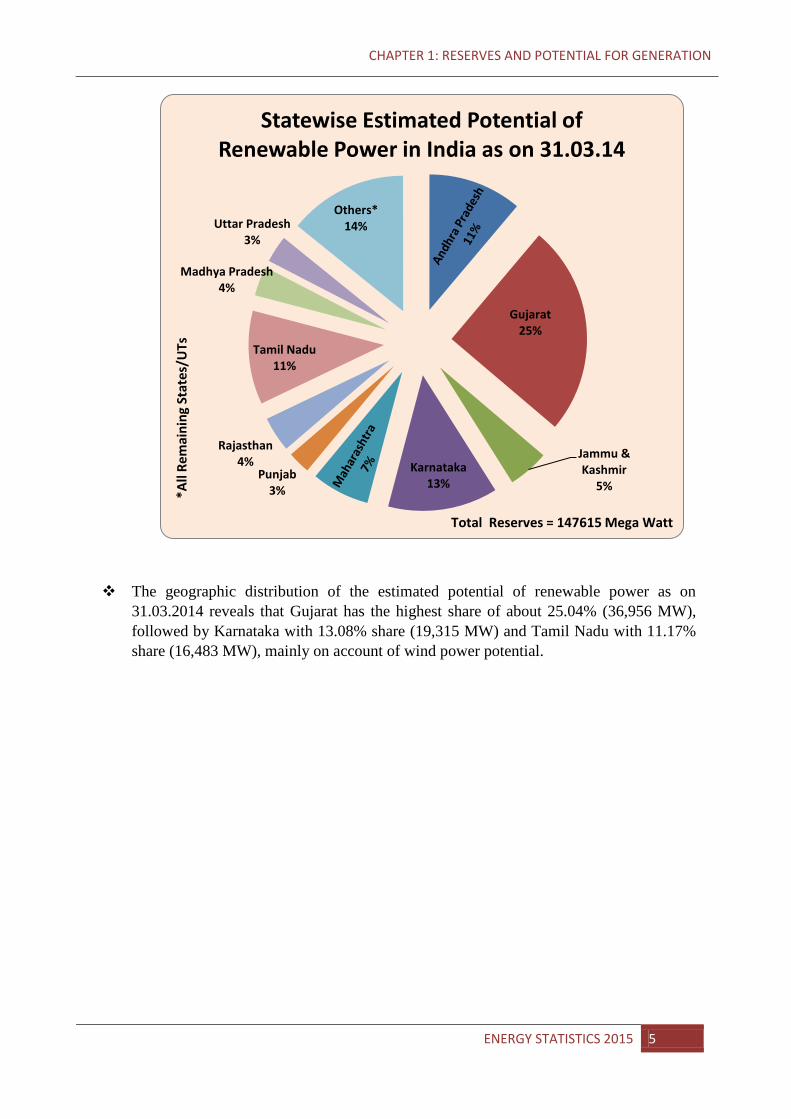
The geographic distribution of the estimated potential of renewable power as on 31.03.2014 reveals that Gujarat has the highest share of about 25.04% (36,956 MW), followed by Karnataka with 13.08% share (19,315 MW) and Tamil Nadu with 11.17% share (16,483 MW), mainly on account of wind power potential.
Gujarat 25%
Jammu & Kashmir
5% Karnataka
13% Punjab
3%
Rajasthan 4%
Tamil Nadu 11%
Madhya Pradesh 4%
Uttar Pradesh 3%
Others* 14%
Statewise Estimated Potential of Renewable Power in India as on 31.03.14
Total Reserves = 147615 Mega Watt
*
All R
emai
ning
Sta
tes/
UTs
ENERGY STATISTICS 2015 5
CHAPTER 1: RESERVES AND POTENTIAL FOR GENERATION
Table 1.1 :Statewise Estimated Reserves of Coal in India as on 31.03.2013 and 31.03.2014
(in Billion Tons)
States/ UTs Proved Indicated Inferred Total Distribution
(%)
31.03.13 31.03.14 31.03.13 31.03.14 31.03. 13 31.03. 14 31.03. 13 31.03. 14 31.03. 13 31.03. 14
Andhra Pradesh 9.60 9.73 9.55 9.67 3.05 3.07 22.20 22.47 7.43 7.46
Arunachal Pradesh 0.03 0.03 0.04 0.04 0.02 0.02 0.09 0.09 0.03 0.03 Assam 0.47 0.00 0.05 0.00 0.00 0.00 0.52 0.00 0.17 0.00 Bihar 0.00 0.00 0.00 0.00 0.16 0.16 0.16 0.16 0.05 0.05 Chhattisgarh 14.78 16.05 34.11 33.25 3.28 3.23 52.17 52.53 17.45 17.45 Jharkhand 41.16 41.38 32.99 32.78 6.56 6.56 80.71 80.72 27.00 26.81 Madhya Pradesh 9.82 10.41 12.36 12.38 2.88 2.88 25.06 25.67 8.38 8.53 Maharashtra 5.67 5.67 3.19 3.19 2.11 2.11 10.97 10.96 3.67 3.64 Meghalaya 0.09 0.09 0.02 0.02 0.47 0.47 0.58 0.58 0.19 0.19 Nagaland 0.01 0.01 0.00 0.00 0.31 0.31 0.32 0.32 0.11 0.10 Odisha 27.28 27.79 37.11 37.87 9.32 9.41 73.71 75.07 24.66 24.94 Sikkim 0.00 0.00 0.06 0.06 0.04 0.04 0.10 0.10 0.03 0.03 Uttar Pradesh 0.88 0.88 0.18 0.18 0.00 0.00 1.06 1.06 0.35 0.35 West Bengal 13.40 13.40 13.00 13.02 4.89 4.89 31.29 31.32 10.47 10.40
All India Total 123.19 125.44 142.66 142.46 33.09 33.15 298.94 301.05 100.00 100.00
Distribution (%) 41.21 41.67 47.72 47.32 11.07 11.01 100.00 100.00 Source: Office of Coal Controller, Ministry of Coal
ENERGY STATISTICS 2015 6
CHAPTER 1: RESERVES AND POTENTIAL FOR GENERATION
Table 1.1(A) :Statewise Estimated Reserves of Lignite in India as on 31.03.2013 and 31.03.2014
(in Billion Tons)
States/ UTs Proved Indicated Inferred Total Distribution
(%)
31.03.13 31.03.14 31.03.13 31.03.14 31.03. 13 31.03. 14 31.03. 13 31.03. 14 31.03. 13 31.03. 14
Gujarat 1.28 1.28 0.28 0.28 1.16 1.16 2.72 2.72 6.29 6.29 Jammu & Kashmir 0.00 0.00 0.02 0.02 0.01 0.01 0.03 0.03 0.07 0.06
Kerala 0.00 0.00 0.00 0.00 0.01 0.01 0.01 0.01 0.02 0.02 Pondicherry 0.00 0.00 0.41 0.41 0.01 0.01 0.42 0.42 0.97 0.96 Rajasthan 1.17 1.17 2.67 2.67 1.85 1.88 5.69 5.72 13.17 13.23 TamilNadu 3.74 3.74 22.90 22.90 7.71 7.71 34.35 34.35 79.48 79.43
India 6.19 6.18 26.28 26.28 10.75 10.78 43.22 43.24 100.00 100.00 Distribution (%) 14.32 14.29 60.81 60.78 24.87 24.93 100.00 100.00 Source: Office of Coal Controller, Ministry of Coal
Table 1.2 :Statewise Estimated Reserves@ of Crude Oil and Natural Gas in India as on in 31.03.2013 and 31.03.2014
States/ UTs/ Region
Crude Petroleum (Million Tons) Natural Gas (Billion Cubic Metres) 31.03.2013 31.03.2014 31.03.2013 31.03.2014
Estimated
Reserves
Distribution (%)
Estimated
Reserves
Distribution (%)
Estimated
Reserves
Distribution (%)
Estimated
Reserves
Distribution (%)
Andhra Pradesh 7.42 0.98 11.45 1.50 48.21 3.56 48.20 3.38 Arunachal Pradesh 3.37 0.44 2.95 0.39 1.96 0.14 0.72 0.05
Assam 172.11 22.69 173.08 22.69 142.77 10.54 142.19 9.96 CBM 0.00 0.00 0.00 0.00 100.76 7.44 100.59 7.05 Eastern Offshore1 30.43 4.01 56.09 7.35 473.51 34.95 531.54 37.24
Gujarat 136.73 18.03 135.01 17.70 77.53 5.72 72.96 5.11 Nagaland 2.69 0.35 2.69 0.35 0.12 0.01 0.12 0.01 Rajasthan 60.19 7.94 45.00 5.90 11.50 0.85 14.02 0.98 Tamil Nadu 9.21 1.21 9.12 1.20 45.83 3.38 44.92 3.15 Tripura 0.07 0.01 0.07 0.01 36.92 2.73 41.28 2.89 Western Offshore2 336.22 44.33 327.28 42.91 415.65 30.68 430.61 30.17
Total 758.44 100.00 762.74 100.00 1354.76 100.00 1427.15 100.00 CBM : Cold Bed Methane
@ Proved and indicated Balance Recoverable Reserves. 1 Includes JVC/Pvt. Parties for Crude Oil and includes West Bengal for Natural Gas 2 Includes Bombay High offshore, Rajasthan and JVC for Crude Oil and Bombay High offshore, Rajasthan and Madhya Pradesh (Coal Bed Mathane) for Natural Gas Source: Ministry of Petroleum & Natural Gas
ENERGY STATISTICS 2015 7
CHAPTER 2: INSTALLED CAPACITY AND CAPACITY UTILIZATION
Table 1.3 :Sourcewise and Statewise Estimated Potential of Renewable Power in India as on 31.03.2014
(in MW)
States/ UTs Wind Power Small Hydro Power
Biomass Power
Cogeneration-bagasse
Waste to
Energy
Total Estimated Potential
Distribution (%)
1 2 3 4 5 6 7 8 Andhra Pradesh 14497 978 578 300 123 16476 11.16 Arunachal Pradesh 236 1341 8 0 0 1585 1.07 Assam 112 239 212 0 8 571 0.39 Bihar 144 223 619 300 73 1359 0.92 Chhattisgarh 314 1107 236 0 24 1681 1.14 Goa 0 7 26 0 0 33 0.02 Gujarat 35071 202 1221 350 112 36956 25.04 Haryana 93 110 1333 350 24 1910 1.29 Himachal Pradesh 64 2398 142 0 2 2606 1.77 Jammu & Kashmir 5685 1431 43 0 0 7159 4.85 Jharkhand 91 209 90 0 10 400 0.27 Karnataka 13593 4141 1131 450 0 19315 13.08 Kerala 837 704 1044 0 36 2621 1.78 Madhya Pradesh 2931 820 1364 0 78 5193 3.52 Maharashtra 5961 794 1887 1250 287 10179 6.90 Manipur 56 109 13 0 2 180 0.12 Meghalaya 82 230 11 0 2 325 0.22 Mizoram 0 169 1 0 2 172 0.12 Nagaland 16 197 10 0 0 223 0.15 Odisha 1384 295 246 0 22 1947 1.32 Punjab 0 441 3172 300 45 3958 2.68 Rajasthan 5050 57 1039 0 62 6208 4.21 Sikkim 98 267 2 0 0 367 0.25 Tamil Nadu 14152 660 1070 450 151 16483 11.17 Tripura 0 47 3 0 2 52 0.04 Uttar Pradesh 1260 461 1617 1250 176 4764 3.23 Uttarakhand 534 1708 24 0 5 2271 1.54 West Bengal 22 396 396 0 148 962 0.65 Andaman & Nicobar 365 8 0 0 0 373 0.25 Chandigarh 0 0 0 0 6 6 0.00 Dadar & Nagar Haveli 0 0 0 0 0 0 0.00 Daman & Diu 4 0 0 0 0 4 0.00 Delhi 0 0 0 0 131 131 0.09 Lakshadweep 0 0 0 0 0 0 0.00 Puducherry 120 0 0 0 3 123 0.08 Others* 0 0 0 0 1022 1022 0.69 All India Total 102772 19749 17538 5000 2556 147615 100.00 Distribution (%) 69.62 13.38 11.88 3.39 1.73 100.00
* Industrial waste Source: Ministry of New and Renewable Energy
ENERGY STATISTICS 2015 8
CHAPTER 2: INSTALLED CAPACITY AND CAPACITY UTILIZATION
CHAPTER 2: INSTALLED CAPACITY AND CAPACITY UTILIZATION
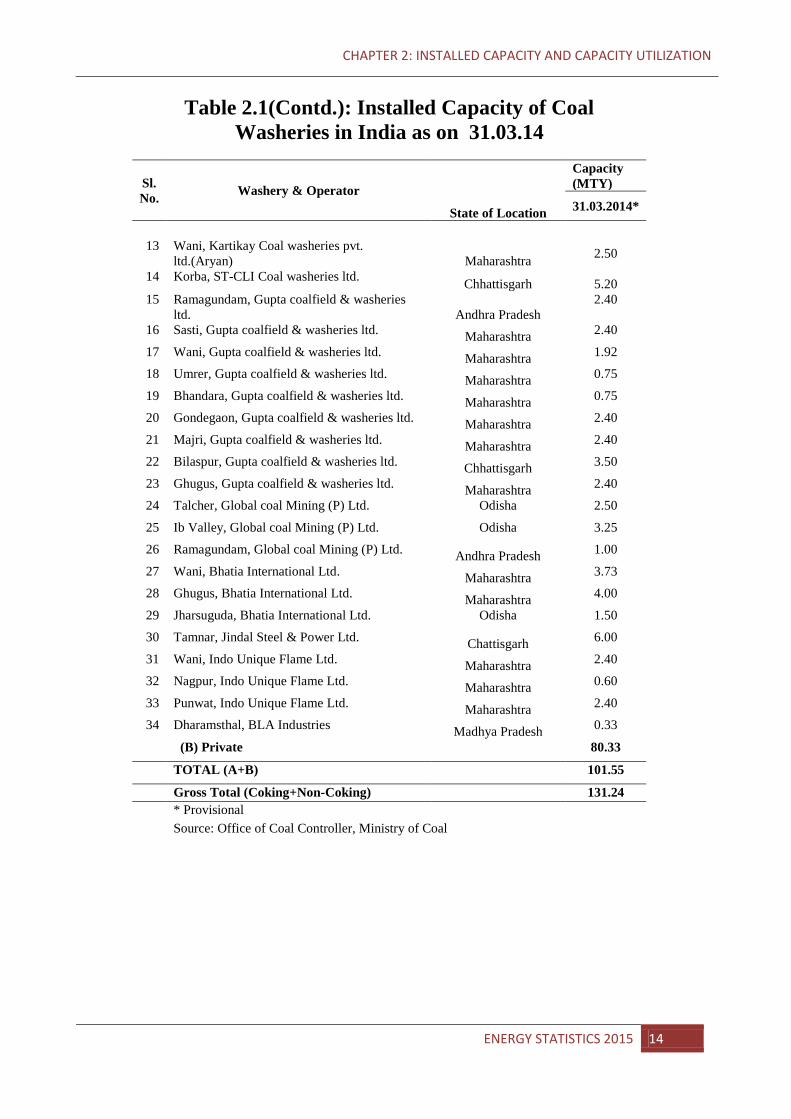
2.1 Coal Washeries Coal washing is an integral part of coal production. Raw coal coming from mines is
washed to remove the ash contents to make them fit for feeding into boilers, particularly those of steel plants. Barring a few instances, a coal washery does not form part of a coal mine in India.
As per the provisional estimates, total installed capacity of washeries in the country is
around 131.24 Million ton per year (MTY) as on 31.3.2014 (Table 2.1). As on 31.03.14, a total of 52 washeries, both PSUs and Private, were operating in the country considering both Coking (29.69 MTY) and Non-Coking Coal (101.55 MTY).
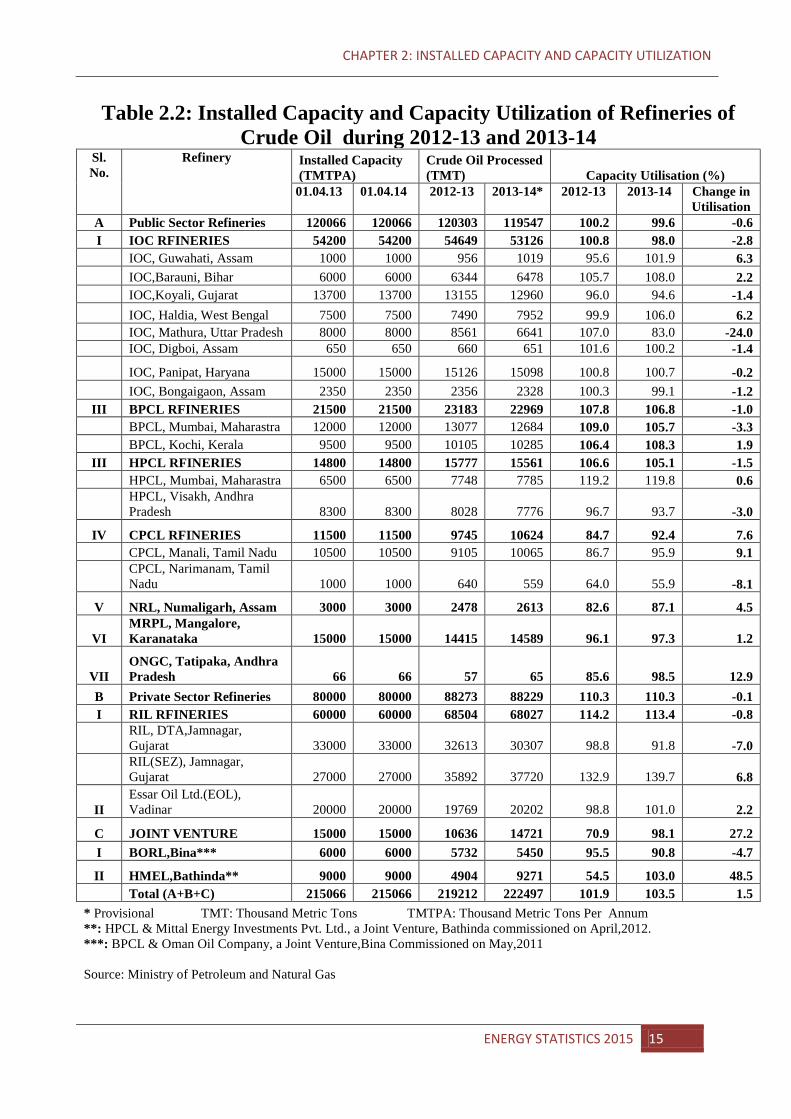
2.2 Refineries of crude oil
As on 31.03.14 there were a total of 22 refineries in the country (Table 2.2), 17 in the Public Sector, 3 in the private sector and 2 in joint venture.
There is no change in refining capacity in the country (215 MMTPA) over the period of
one year (Table 2.2).
The Refinery production (crude throughput) achievement was 222.497 MMT during 2013-14 which marks net increase of 1.5% over 2012-13 (219.212 MMT)
Capacity utilization of the refineries was 101.9% during 2012-13 which increased to
103.5% during 2013-14. In the Public Sector the maximum increase in capacity utilization (12.9%) was at ONGC, Tatipaka, Andhra Pradesh.
In the Private Sector the highest increase (6.8%) in capacity utilization was at
RIL(SEZ), Jamnagar, Gujarat. Indian Oil Corporation, the state owned corporation had highest refining capacity of
53,126 TMTY. All units of IOC together processed 53,126 TMT during 2013-14 as compared to 54,649 TMT during 2012-13. The capacity utilization of these refineries was 98% during 2013-14 as against 100.8% during 2012-13.
All the private refineries taken together processed 88,229 TMT during 2013-14 as
compared to 88,273 TMT during 2012-13. The capacity utilization of these refineries during 2012-13 and 2013-14 was constant i.e. 110.3%.
2.3 Installed generating capacity of electricity
ENERGY STATISTICS 2015 9
CHAPTER 2: INSTALLED CAPACITY AND CAPACITY UTILIZATION
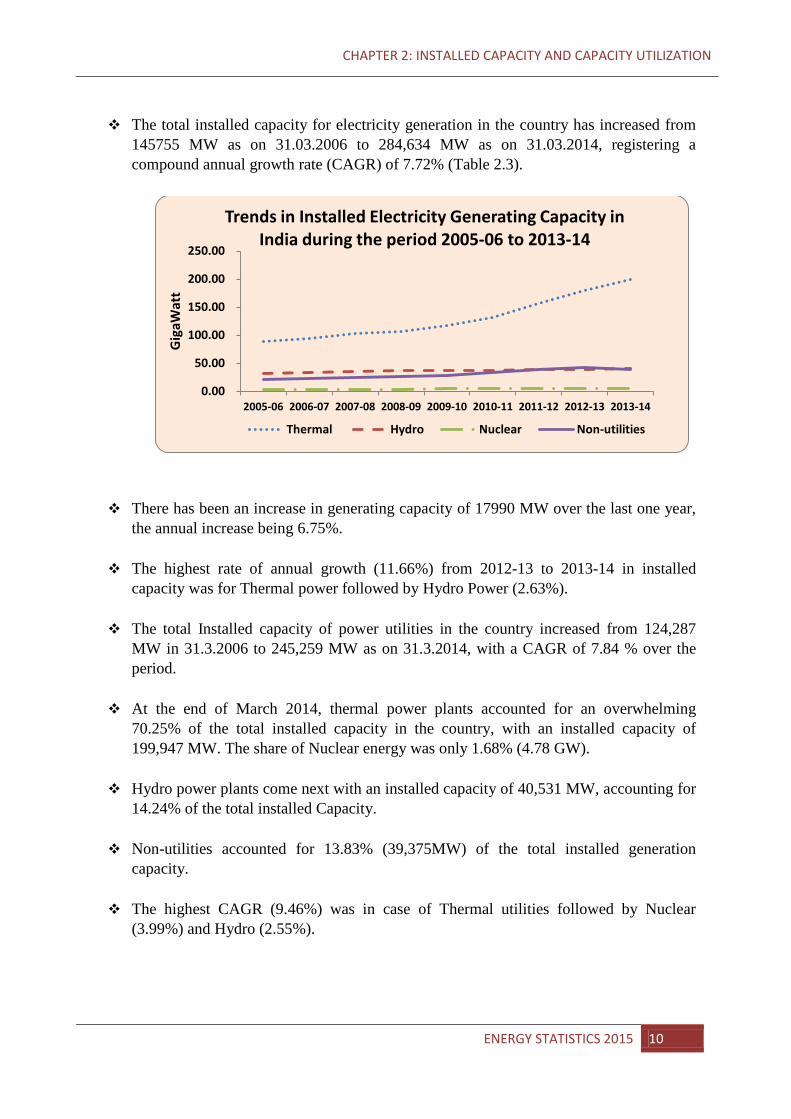
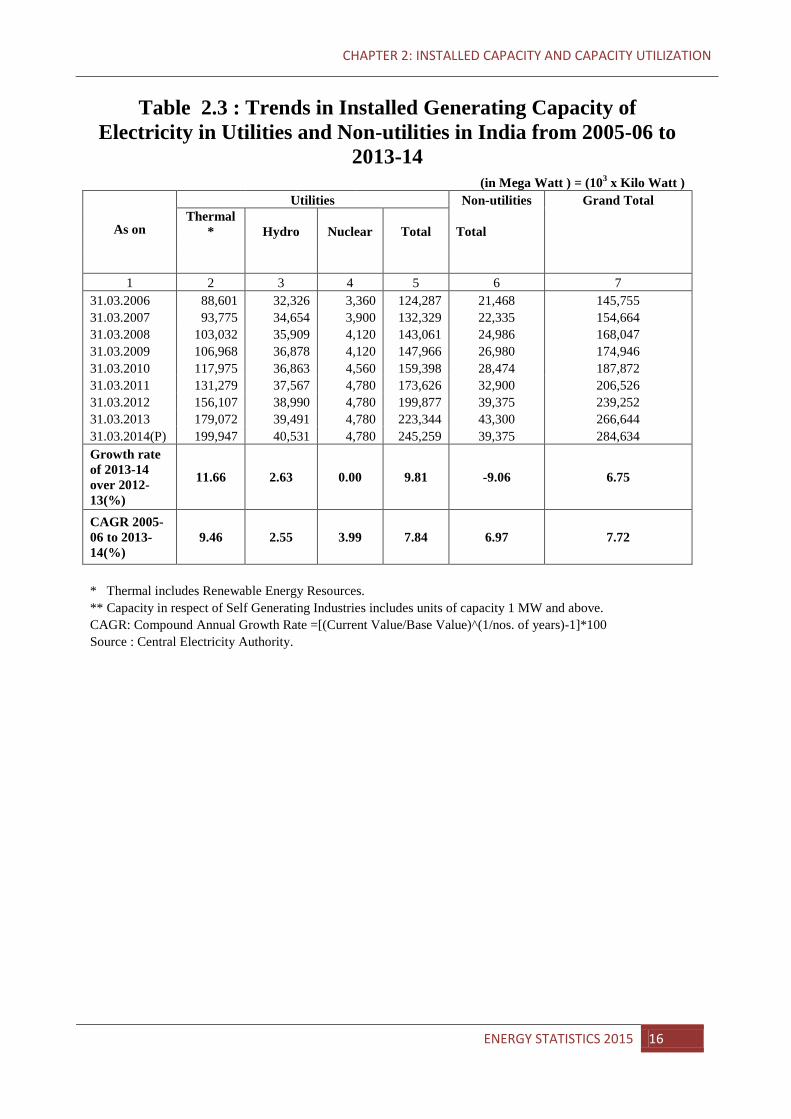
The total installed capacity for electricity generation in the country has increased from
145755 MW as on 31.03.2006 to 284,634 MW as on 31.03.2014, registering a compound annual growth rate (CAGR) of 7.72% (Table 2.3).
There has been an increase in generating capacity of 17990 MW over the last one year,
the annual increase being 6.75%. The highest rate of annual growth (11.66%) from 2012-13 to 2013-14 in installed
capacity was for Thermal power followed by Hydro Power (2.63%). The total Installed capacity of power utilities in the country increased from 124,287
MW in 31.3.2006 to 245,259 MW as on 31.3.2014, with a CAGR of 7.84 % over the period.
At the end of March 2014, thermal power plants accounted for an overwhelming
70.25% of the total installed capacity in the country, with an installed capacity of 199,947 MW. The share of Nuclear energy was only 1.68% (4.78 GW).
Hydro power plants come next with an installed capacity of 40,531 MW, accounting for 14.24% of the total installed Capacity.
Non-utilities accounted for 13.83% (39,375MW) of the total installed generation
capacity.
The highest CAGR (9.46%) was in case of Thermal utilities followed by Nuclear (3.99%) and Hydro (2.55%).
0.00
50.00
100.00
150.00
200.00
250.00
2005-06 2006-07 2007-08 2008-09 2009-10 2010-11 2011-12 2012-13 2013-14
Gig
aWat
t
Trends in Installed Electricity Generating Capacity in India during the period 2005-06 to 2013-14
Thermal Hydro Nuclear Non-utilities
ENERGY STATISTICS 2015 10
CHAPTER 2: INSTALLED CAPACITY AND CAPACITY UTILIZATION
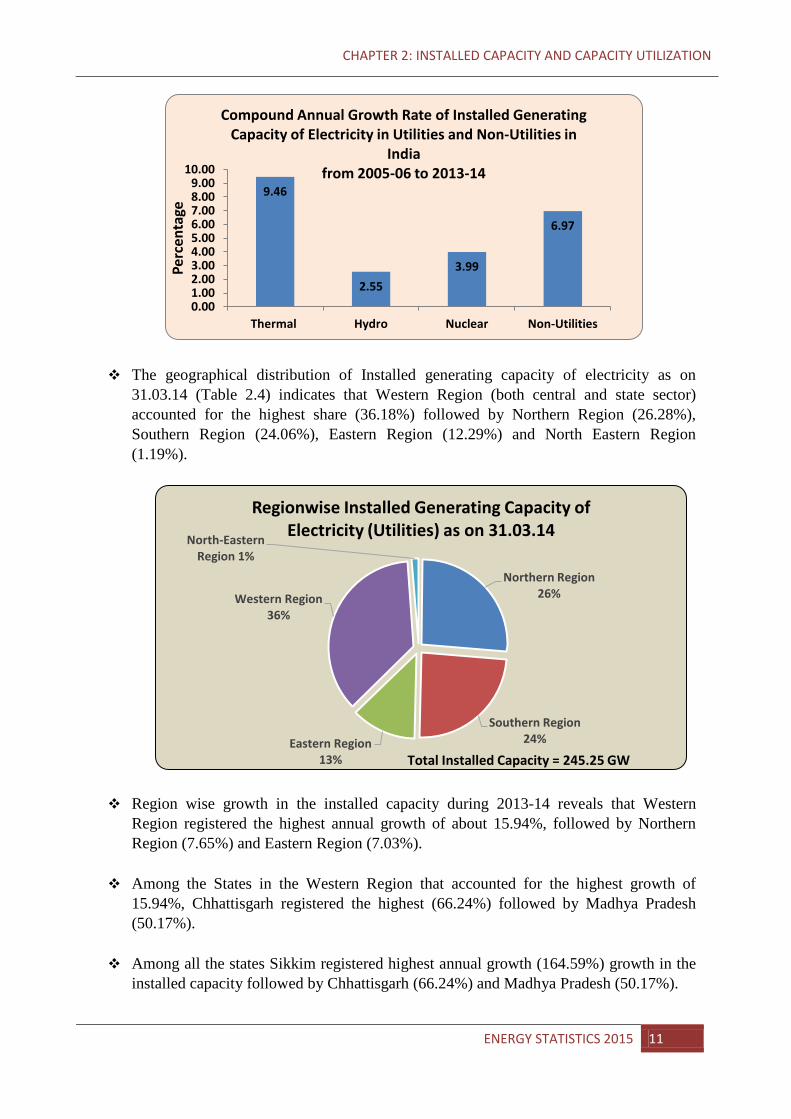
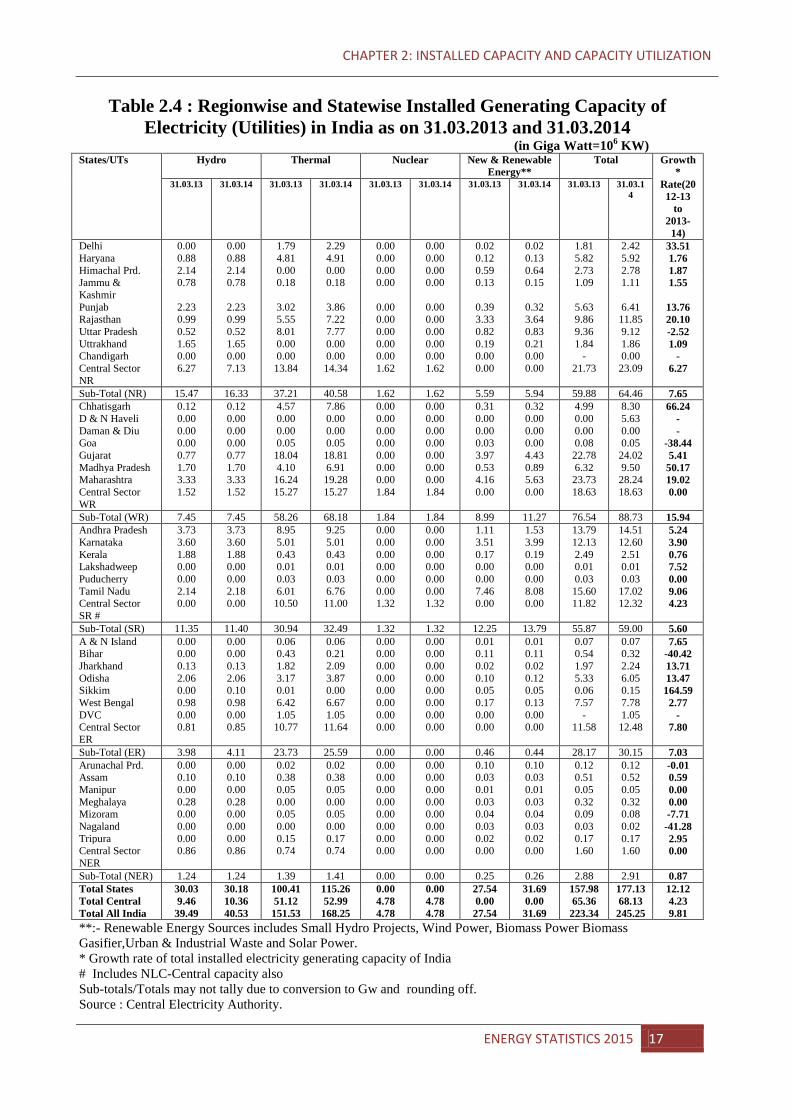
The geographical distribution of Installed generating capacity of electricity as on 31.03.14 (Table 2.4) indicates that Western Region (both central and state sector) accounted for the highest share (36.18%) followed by Northern Region (26.28%), Southern Region (24.06%), Eastern Region (12.29%) and North Eastern Region (1.19%).
Region wise growth in the installed capacity during 2013-14 reveals that Western Region registered the highest annual growth of about 15.94%, followed by Northern Region (7.65%) and Eastern Region (7.03%).
Among the States in the Western Region that accounted for the highest growth of
15.94%, Chhattisgarh registered the highest (66.24%) followed by Madhya Pradesh (50.17%).
Among all the states Sikkim registered highest annual growth (164.59%) growth in the
installed capacity followed by Chhattisgarh (66.24%) and Madhya Pradesh (50.17%).
9.46
2.55 3.99
6.97
0.00 1.00 2.00 3.00 4.00 5.00 6.00 7.00 8.00 9.00
10.00
Thermal Hydro Nuclear Non-Utilities
Perc
enta
ge
Compound Annual Growth Rate of Installed Generating Capacity of Electricity in Utilities and Non-Utilities in
India from 2005-06 to 2013-14
Northern Region 26%
Southern Region 24% Eastern Region
13%
Western Region 36%
North-Eastern Region 1%
Regionwise Installed Generating Capacity of Electricity (Utilities) as on 31.03.14
Total Installed Capacity = 245.25 GW
ENERGY STATISTICS 2015 11
CHAPTER 2: INSTALLED CAPACITY AND CAPACITY UTILIZATION
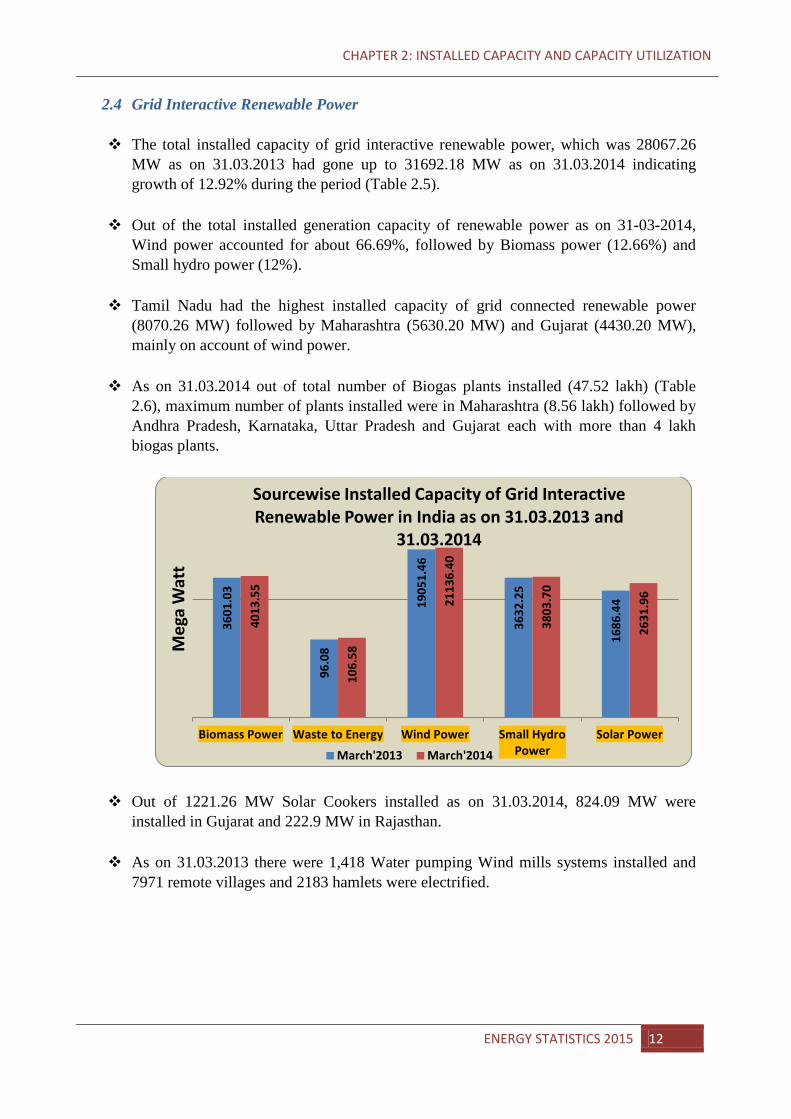
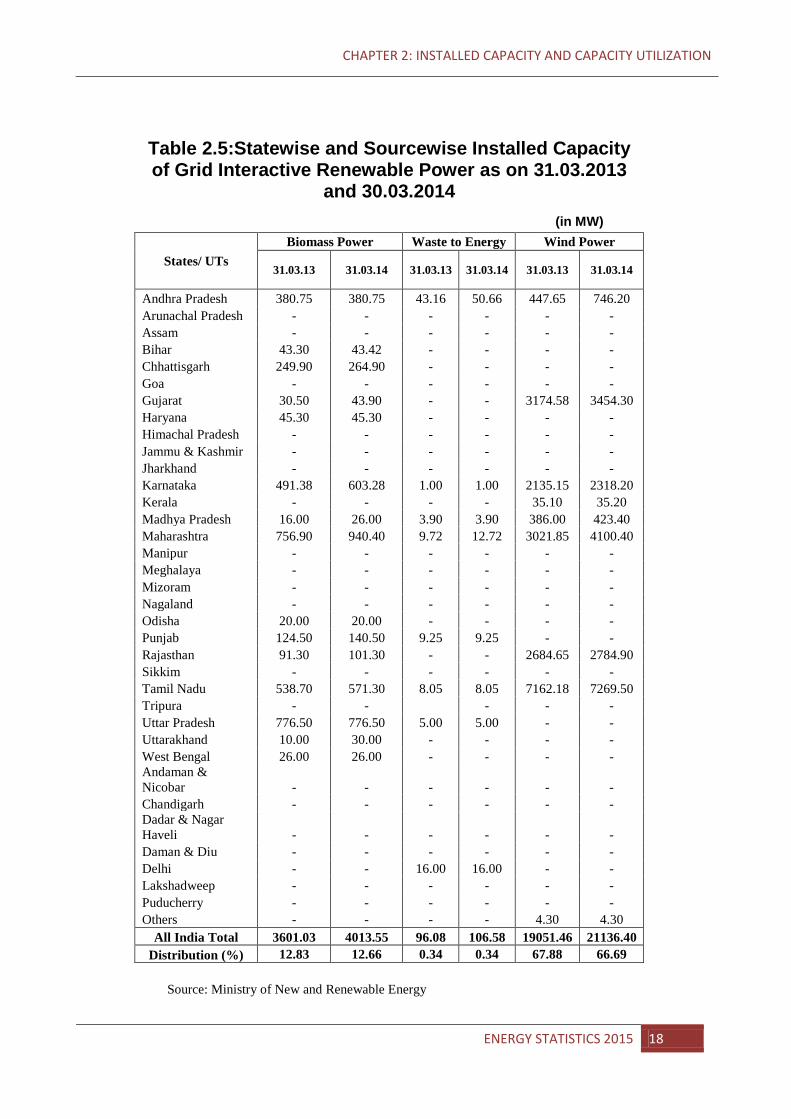
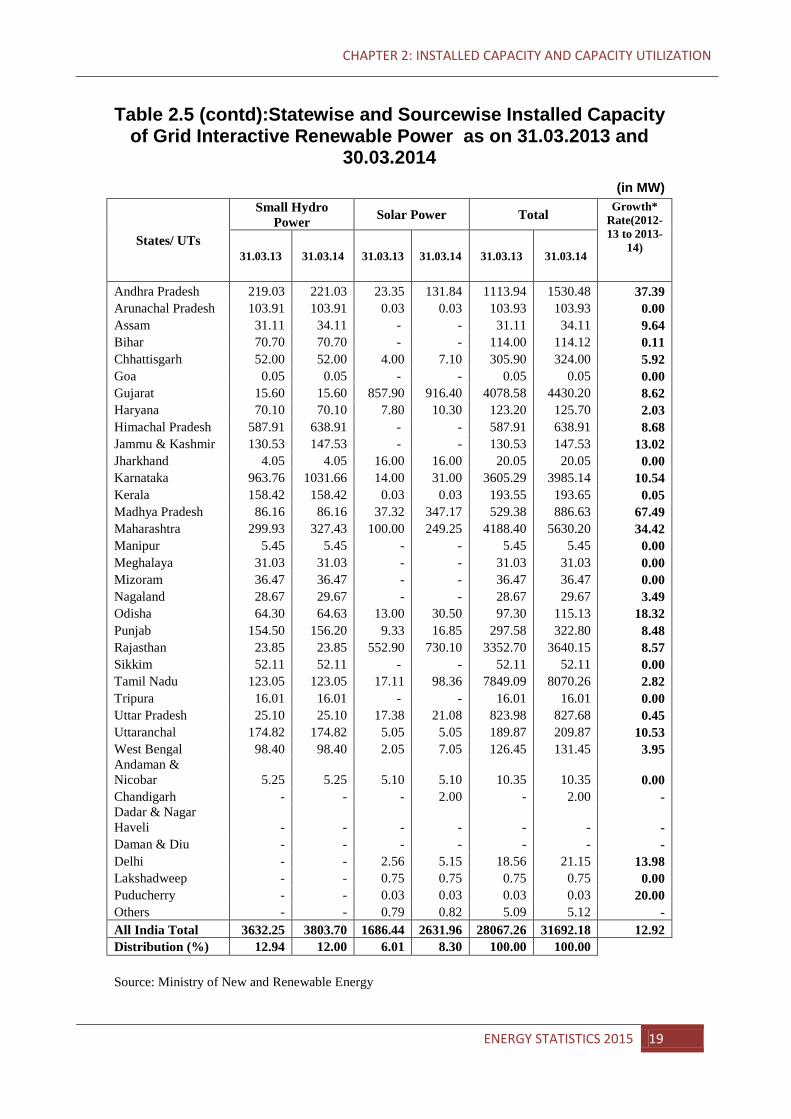
2.4 Grid Interactive Renewable Power The total installed capacity of grid interactive renewable power, which was 28067.26
MW as on 31.03.2013 had gone up to 31692.18 MW as on 31.03.2014 indicating growth of 12.92% during the period (Table 2.5).
Out of the total installed generation capacity of renewable power as on 31-03-2014,
Wind power accounted for about 66.69%, followed by Biomass power (12.66%) and Small hydro power (12%).
Tamil Nadu had the highest installed capacity of grid connected renewable power
(8070.26 MW) followed by Maharashtra (5630.20 MW) and Gujarat (4430.20 MW), mainly on account of wind power.
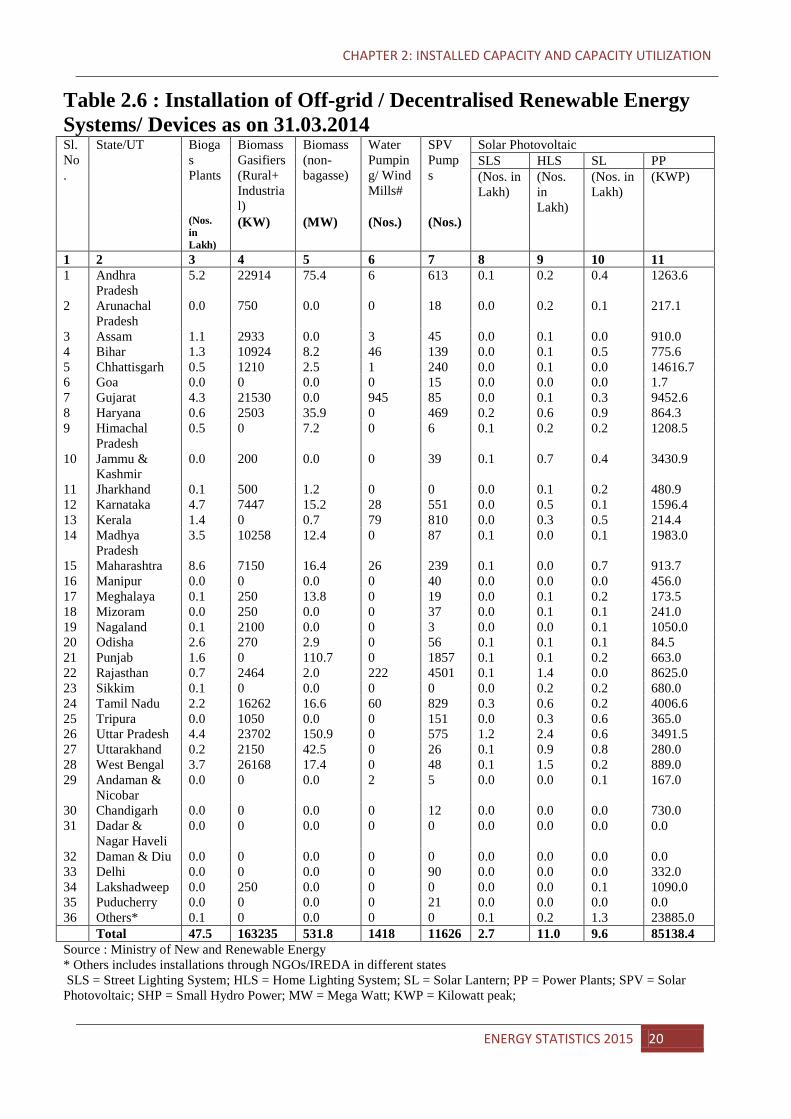
As on 31.03.2014 out of total number of Biogas plants installed (47.52 lakh) (Table
2.6), maximum number of plants installed were in Maharashtra (8.56 lakh) followed by Andhra Pradesh, Karnataka, Uttar Pradesh and Gujarat each with more than 4 lakh biogas plants.
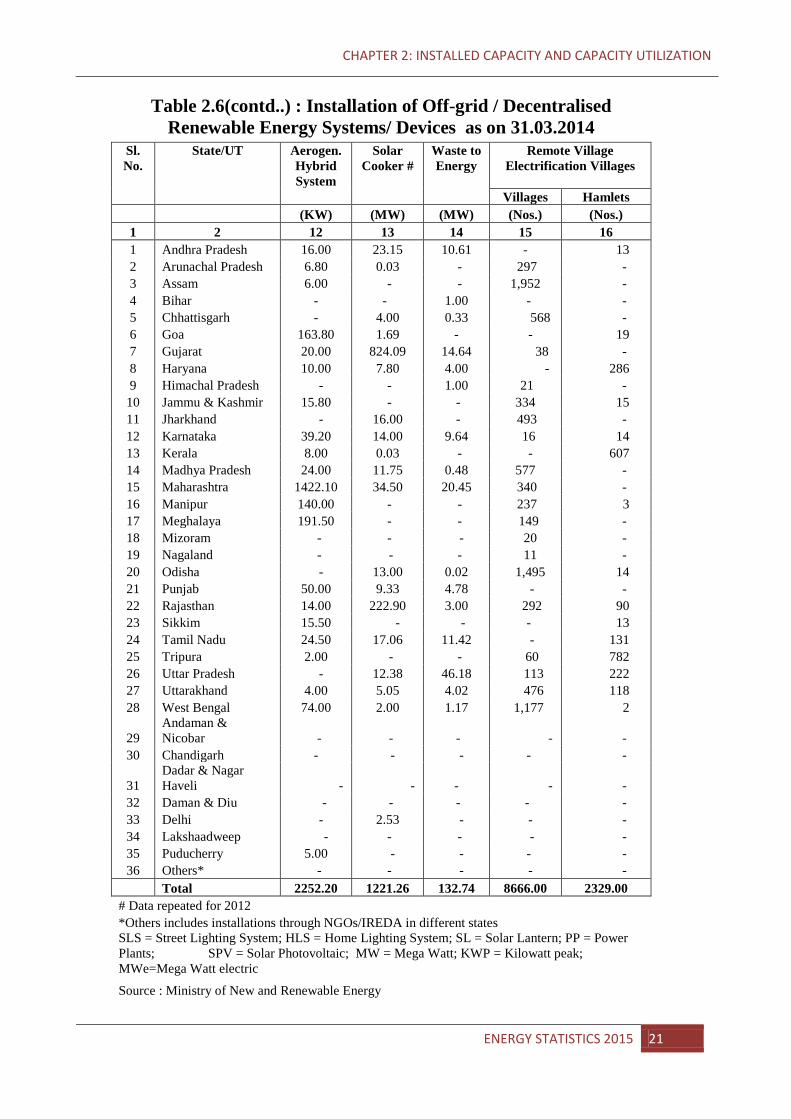
Out of 1221.26 MW Solar Cookers installed as on 31.03.2014, 824.09 MW were installed in Gujarat and 222.9 MW in Rajasthan.
As on 31.03.2013 there were 1,418 Water pumping Wind mills systems installed and
7971 remote villages and 2183 hamlets were electrified.
3601
.03
96.0
8
1905
1.46
3632
.25
1686
.44
4013
.55
106.
58
2113
6.40
3803
.70
2631
.96
Biomass Power Waste to Energy Wind Power Small Hydro Power
Solar Power
Meg
a W
att
Sourcewise Installed Capacity of Grid Interactive Renewable Power in India as on 31.03.2013 and
31.03.2014
March'2013 March'2014
ENERGY STATISTICS 2015 12
CHAPTER 2: INSTALLED CAPACITY AND CAPACITY UTILIZATION
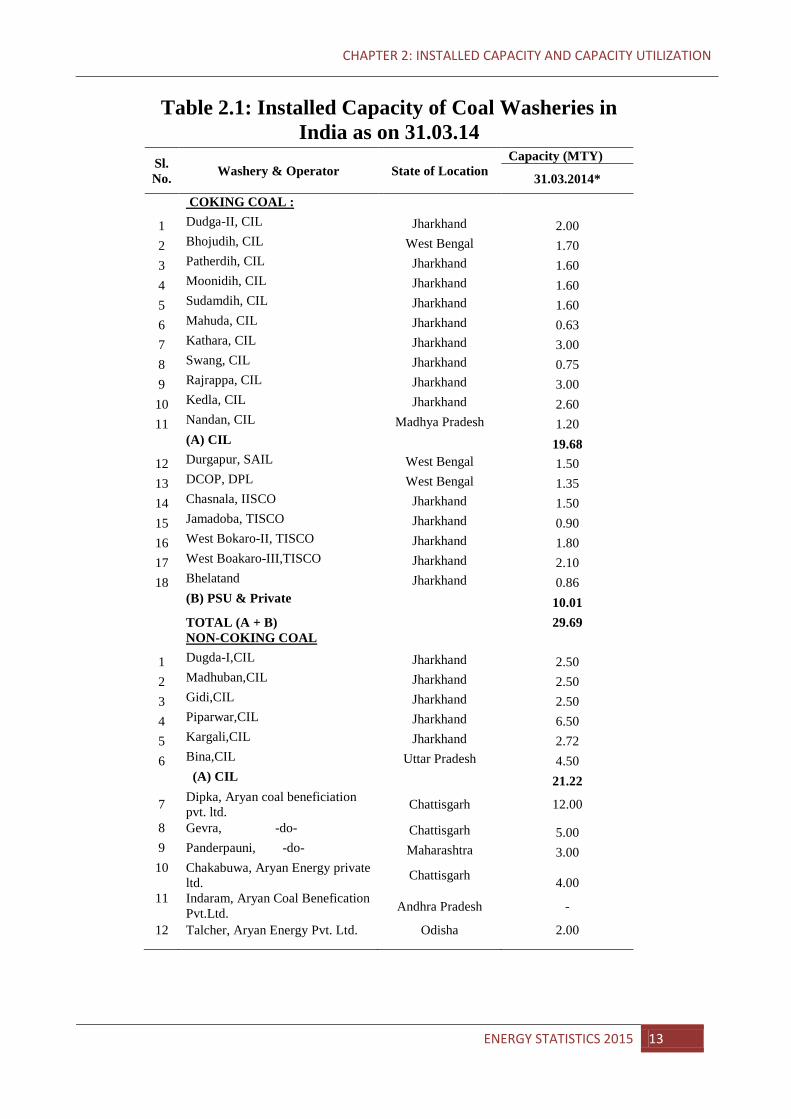
Table 2.1: Installed Capacity of Coal Washeries in India as on 31.03.14
Sl. No. Washery & Operator State of Location
Capacity (MTY)
31.03.2014*
COKING COAL :
1 Dudga-II, CIL Jharkhand 2.00 2 Bhojudih, CIL West Bengal 1.70 3 Patherdih, CIL Jharkhand 1.60 4 Moonidih, CIL Jharkhand 1.60 5 Sudamdih, CIL Jharkhand 1.60 6 Mahuda, CIL Jharkhand 0.63 7 Kathara, CIL Jharkhand 3.00 8 Swang, CIL Jharkhand 0.75 9 Rajrappa, CIL Jharkhand 3.00 10 Kedla, CIL Jharkhand 2.60 11 Nandan, CIL Madhya Pradesh 1.20
(A) CIL
19.68 12 Durgapur, SAIL West Bengal 1.50 13 DCOP, DPL West Bengal 1.35 14 Chasnala, IISCO Jharkhand 1.50 15 Jamadoba, TISCO Jharkhand 0.90 16 West Bokaro-II, TISCO Jharkhand 1.80 17 West Boakaro-III,TISCO Jharkhand 2.10 18 Bhelatand Jharkhand 0.86
(B) PSU & Private
10.01
TOTAL (A + B) 29.69
NON-COKING COAL
1 Dugda-I,CIL Jharkhand 2.50
2 Madhuban,CIL Jharkhand 2.50 3 Gidi,CIL Jharkhand 2.50 4 Piparwar,CIL Jharkhand 6.50 5 Kargali,CIL Jharkhand 2.72 6 Bina,CIL Uttar Pradesh 4.50
(A) CIL
21.22
7 Dipka, Aryan coal beneficiation pvt. ltd. Chattisgarh 12.00
8 Gevra, -do- Chattisgarh 5.00 9 Panderpauni, -do- Maharashtra 3.00 10 Chakabuwa, Aryan Energy private
ltd. Chattisgarh 4.00 11 Indaram, Aryan Coal Benefication
Pvt.Ltd. Andhra Pradesh -
12 Talcher, Aryan Energy Pvt. Ltd. Odisha 2.00
ENERGY STATISTICS 2015 13
CHAPTER 2: INSTALLED CAPACITY AND CAPACITY UTILIZATION
Table 2.1(Contd.): Installed Capacity of Coal Washeries in India as on 31.03.14
Sl. No. Washery & Operator
State of Location
Capacity (MTY)
31.03.2014*
13 Wani, Kartikay Coal washeries pvt. ltd.(Aryan) Maharashtra 2.50
14 Korba, ST-CLI Coal washeries ltd. Chhattisgarh 5.20 15 Ramagundam, Gupta coalfield & washeries
ltd. Andhra Pradesh 2.40
16 Sasti, Gupta coalfield & washeries ltd. Maharashtra 2.40
17 Wani, Gupta coalfield & washeries ltd. Maharashtra 1.92
18 Umrer, Gupta coalfield & washeries ltd. Maharashtra 0.75
19 Bhandara, Gupta coalfield & washeries ltd. Maharashtra 0.75
20 Gondegaon, Gupta coalfield & washeries ltd. Maharashtra 2.40
21 Majri, Gupta coalfield & washeries ltd. Maharashtra 2.40
22 Bilaspur, Gupta coalfield & washeries ltd. Chhattisgarh 3.50
23 Ghugus, Gupta coalfield & washeries ltd. Maharashtra 2.40
24 Talcher, Global coal Mining (P) Ltd. Odisha 2.50
25 Ib Valley, Global coal Mining (P) Ltd. Odisha 3.25
26 Ramagundam, Global coal Mining (P) Ltd. Andhra Pradesh 1.00
27 Wani, Bhatia International Ltd. Maharashtra 3.73
28 Ghugus, Bhatia International Ltd. Maharashtra 4.00
29 Jharsuguda, Bhatia International Ltd. Odisha 1.50
30 Tamnar, Jindal Steel & Power Ltd. Chattisgarh 6.00
31 Wani, Indo Unique Flame Ltd. Maharashtra 2.40
32 Nagpur, Indo Unique Flame Ltd. Maharashtra 0.60
33 Punwat, Indo Unique Flame Ltd. Maharashtra 2.40
34 Dharamsthal, BLA Industries Madhya Pradesh 0.33
(B) Private
80.33
TOTAL (A+B) 101.55
Gross Total (Coking+Non-Coking) 131.24
* Provisional
Source: Office of Coal Controller, Ministry of Coal
ENERGY STATISTICS 2015 14
CHAPTER 2: INSTALLED CAPACITY AND CAPACITY UTILIZATION
Table 2.2: Installed Capacity and Capacity Utilization of Refineries of Crude Oil during 2012-13 and 2013-14
Sl. No.
Refinery Installed Capacity (TMTPA)
Crude Oil Processed (TMT) Capacity Utilisation (%)
01.04.13 01.04.14 2012-13 2013-14* 2012-13 2013-14 Change in Utilisation
A Public Sector Refineries 120066 120066 120303 119547 100.2 99.6 -0.6 I IOC RFINERIES 54200 54200 54649 53126 100.8 98.0 -2.8 IOC, Guwahati, Assam 1000 1000 956 1019 95.6 101.9 6.3 IOC,Barauni, Bihar 6000 6000 6344 6478 105.7 108.0 2.2 IOC,Koyali, Gujarat 13700 13700 13155 12960 96.0 94.6 -1.4 IOC, Haldia, West Bengal 7500 7500 7490 7952 99.9 106.0 6.2 IOC, Mathura, Uttar Pradesh 8000 8000 8561 6641 107.0 83.0 -24.0 IOC, Digboi, Assam 650 650 660 651 101.6 100.2 -1.4
IOC, Panipat, Haryana 15000 15000 15126 15098 100.8 100.7 -0.2 IOC, Bongaigaon, Assam 2350 2350 2356 2328 100.3 99.1 -1.2
III BPCL RFINERIES 21500 21500 23183 22969 107.8 106.8 -1.0 BPCL, Mumbai, Maharastra 12000 12000 13077 12684 109.0 105.7 -3.3 BPCL, Kochi, Kerala 9500 9500 10105 10285 106.4 108.3 1.9
III HPCL RFINERIES 14800 14800 15777 15561 106.6 105.1 -1.5 HPCL, Mumbai, Maharastra 6500 6500 7748 7785 119.2 119.8 0.6
HPCL, Visakh, Andhra Pradesh 8300 8300 8028 7776 96.7 93.7 -3.0
IV CPCL RFINERIES 11500 11500 9745 10624 84.7 92.4 7.6 CPCL, Manali, Tamil Nadu 10500 10500 9105 10065 86.7 95.9 9.1
CPCL, Narimanam, Tamil Nadu 1000 1000 640 559 64.0 55.9 -8.1
V NRL, Numaligarh, Assam 3000 3000 2478 2613 82.6 87.1 4.5
VI MRPL, Mangalore, Karanataka 15000 15000 14415 14589 96.1 97.3 1.2
VII ONGC, Tatipaka, Andhra Pradesh 66 66 57 65 85.6 98.5 12.9
B Private Sector Refineries 80000 80000 88273 88229 110.3 110.3 -0.1 I RIL RFINERIES 60000 60000 68504 68027 114.2 113.4 -0.8
RIL, DTA,Jamnagar, Gujarat 33000 33000 32613 30307 98.8 91.8 -7.0
RIL(SEZ), Jamnagar, Gujarat 27000 27000 35892 37720 132.9 139.7 6.8
II Essar Oil Ltd.(EOL), Vadinar 20000 20000 19769 20202 98.8 101.0 2.2
C JOINT VENTURE 15000 15000 10636 14721 70.9 98.1 27.2 I BORL,Bina*** 6000 6000 5732 5450 95.5 90.8 -4.7
II HMEL,Bathinda** 9000 9000 4904 9271 54.5 103.0 48.5 Total (A+B+C) 215066 215066 219212 222497 101.9 103.5 1.5
* Provisional TMT: Thousand Metric Tons TMTPA: Thousand Metric Tons Per Annum **: HPCL & Mittal Energy Investments Pvt. Ltd., a Joint Venture, Bathinda commissioned on April,2012. ***: BPCL & Oman Oil Company, a Joint Venture,Bina Commissioned on May,2011 Source: Ministry of Petroleum and Natural Gas
ENERGY STATISTICS 2015 15
CHAPTER 2: INSTALLED CAPACITY AND CAPACITY UTILIZATION
Table 2.3 : Trends in Installed Generating Capacity of Electricity in Utilities and Non-utilities in India from 2005-06 to
2013-14
(in Mega Watt ) = (103 x Kilo Watt )
As on
Utilities Non-utilities Grand Total Thermal
* Hydro Nuclear Total Total
1 2 3 4 5 6 7
31.03.2006 88,601 32,326 3,360 124,287 21,468 145,755 31.03.2007 93,775 34,654 3,900 132,329 22,335 154,664 31.03.2008 103,032 35,909 4,120 143,061 24,986 168,047 31.03.2009 106,968 36,878 4,120 147,966 26,980 174,946 31.03.2010 117,975 36,863 4,560 159,398 28,474 187,872 31.03.2011 131,279 37,567 4,780 173,626 32,900 206,526 31.03.2012 156,107 38,990 4,780 199,877 39,375 239,252 31.03.2013 179,072 39,491 4,780 223,344 43,300 266,644 31.03.2014(P) 199,947 40,531 4,780 245,259 39,375 284,634 Growth rate of 2013-14 over 2012-13(%)
11.66 2.63 0.00 9.81 -9.06 6.75
CAGR 2005-06 to 2013-14(%)
9.46 2.55 3.99 7.84 6.97 7.72
* Thermal includes Renewable Energy Resources. ** Capacity in respect of Self Generating Industries includes units of capacity 1 MW and above.
CAGR: Compound Annual Growth Rate =[(Current Value/Base Value)^(1/nos. of years)-1]*100 Source : Central Electricity Authority.
ENERGY STATISTICS 2015 16
CHAPTER 2: INSTALLED CAPACITY AND CAPACITY UTILIZATION
Table 2.4 : Regionwise and Statewise Installed Generating Capacity of
Electricity (Utilities) in India as on 31.03.2013 and 31.03.2014 (in Giga Watt=106 KW)
States/UTs Hydro Thermal Nuclear New & Renewable Energy**
Total Growth*
Rate(2012-13
to 2013-
14)
31.03.13 31.03.14 31.03.13 31.03.14 31.03.13 31.03.14 31.03.13 31.03.14 31.03.13 31.03.14
Delhi 0.00 0.00 1.79 2.29 0.00 0.00 0.02 0.02 1.81 2.42 33.51 Haryana 0.88 0.88 4.81 4.91 0.00 0.00 0.12 0.13 5.82 5.92 1.76 Himachal Prd. 2.14 2.14 0.00 0.00 0.00 0.00 0.59 0.64 2.73 2.78 1.87 Jammu & Kashmir
0.78 0.78 0.18 0.18 0.00 0.00 0.13 0.15 1.09 1.11 1.55
Punjab 2.23 2.23 3.02 3.86 0.00 0.00 0.39 0.32 5.63 6.41 13.76 Rajasthan 0.99 0.99 5.55 7.22 0.00 0.00 3.33 3.64 9.86 11.85 20.10 Uttar Pradesh 0.52 0.52 8.01 7.77 0.00 0.00 0.82 0.83 9.36 9.12 -2.52 Uttrakhand 1.65 1.65 0.00 0.00 0.00 0.00 0.19 0.21 1.84 1.86 1.09 Chandigarh 0.00 0.00 0.00 0.00 0.00 0.00 0.00 0.00 - 0.00 - Central Sector NR
6.27 7.13 13.84 14.34 1.62 1.62 0.00 0.00 21.73 23.09 6.27
Sub-Total (NR) 15.47 16.33 37.21 40.58 1.62 1.62 5.59 5.94 59.88 64.46 7.65 Chhatisgarh 0.12 0.12 4.57 7.86 0.00 0.00 0.31 0.32 4.99 8.30 66.24 D & N Haveli 0.00 0.00 0.00 0.00 0.00 0.00 0.00 0.00 0.00 5.63 - Daman & Diu 0.00 0.00 0.00 0.00 0.00 0.00 0.00 0.00 0.00 0.00 - Goa 0.00 0.00 0.05 0.05 0.00 0.00 0.03 0.00 0.08 0.05 -38.44 Gujarat 0.77 0.77 18.04 18.81 0.00 0.00 3.97 4.43 22.78 24.02 5.41 Madhya Pradesh 1.70 1.70 4.10 6.91 0.00 0.00 0.53 0.89 6.32 9.50 50.17 Maharashtra 3.33 3.33 16.24 19.28 0.00 0.00 4.16 5.63 23.73 28.24 19.02 Central Sector WR
1.52 1.52 15.27 15.27 1.84 1.84 0.00 0.00 18.63 18.63 0.00
Sub-Total (WR) 7.45 7.45 58.26 68.18 1.84 1.84 8.99 11.27 76.54 88.73 15.94 Andhra Pradesh 3.73 3.73 8.95 9.25 0.00 0.00 1.11 1.53 13.79 14.51 5.24 Karnataka 3.60 3.60 5.01 5.01 0.00 0.00 3.51 3.99 12.13 12.60 3.90 Kerala 1.88 1.88 0.43 0.43 0.00 0.00 0.17 0.19 2.49 2.51 0.76 Lakshadweep 0.00 0.00 0.01 0.01 0.00 0.00 0.00 0.00 0.01 0.01 7.52 Puducherry 0.00 0.00 0.03 0.03 0.00 0.00 0.00 0.00 0.03 0.03 0.00 Tamil Nadu 2.14 2.18 6.01 6.76 0.00 0.00 7.46 8.08 15.60 17.02 9.06 Central Sector SR #
0.00 0.00 10.50 11.00 1.32 1.32 0.00 0.00 11.82 12.32 4.23
Sub-Total (SR) 11.35 11.40 30.94 32.49 1.32 1.32 12.25 13.79 55.87 59.00 5.60 A & N Island 0.00 0.00 0.06 0.06 0.00 0.00 0.01 0.01 0.07 0.07 7.65 Bihar 0.00 0.00 0.43 0.21 0.00 0.00 0.11 0.11 0.54 0.32 -40.42 Jharkhand 0.13 0.13 1.82 2.09 0.00 0.00 0.02 0.02 1.97 2.24 13.71 Odisha 2.06 2.06 3.17 3.87 0.00 0.00 0.10 0.12 5.33 6.05 13.47 Sikkim 0.00 0.10 0.01 0.00 0.00 0.00 0.05 0.05 0.06 0.15 164.59 West Bengal 0.98 0.98 6.42 6.67 0.00 0.00 0.17 0.13 7.57 7.78 2.77 DVC 0.00 0.00 1.05 1.05 0.00 0.00 0.00 0.00 - 1.05 - Central Sector ER
0.81 0.85 10.77 11.64 0.00 0.00 0.00 0.00 11.58 12.48 7.80
Sub-Total (ER) 3.98 4.11 23.73 25.59 0.00 0.00 0.46 0.44 28.17 30.15 7.03 Arunachal Prd. 0.00 0.00 0.02 0.02 0.00 0.00 0.10 0.10 0.12 0.12 -0.01 Assam 0.10 0.10 0.38 0.38 0.00 0.00 0.03 0.03 0.51 0.52 0.59 Manipur 0.00 0.00 0.05 0.05 0.00 0.00 0.01 0.01 0.05 0.05 0.00 Meghalaya 0.28 0.28 0.00 0.00 0.00 0.00 0.03 0.03 0.32 0.32 0.00 Mizoram 0.00 0.00 0.05 0.05 0.00 0.00 0.04 0.04 0.09 0.08 -7.71 Nagaland 0.00 0.00 0.00 0.00 0.00 0.00 0.03 0.03 0.03 0.02 -41.28 Tripura 0.00 0.00 0.15 0.17 0.00 0.00 0.02 0.02 0.17 0.17 2.95 Central Sector NER
0.86 0.86 0.74 0.74 0.00 0.00 0.00 0.00 1.60 1.60 0.00
Sub-Total (NER) 1.24 1.24 1.39 1.41 0.00 0.00 0.25 0.26 2.88 2.91 0.87 Total States 30.03 30.18 100.41 115.26 0.00 0.00 27.54 31.69 157.98 177.13 12.12 Total Central 9.46 10.36 51.12 52.99 4.78 4.78 0.00 0.00 65.36 68.13 4.23 Total All India 39.49 40.53 151.53 168.25 4.78 4.78 27.54 31.69 223.34 245.25 9.81 **:- Renewable Energy Sources includes Small Hydro Projects, Wind Power, Biomass Power Biomass Gasifier,Urban & Industrial Waste and Solar Power.
* Growth rate of total installed electricity generating capacity of India # Includes NLC-Central capacity also Sub-totals/Totals may not tally due to conversion to Gw and rounding off. Source : Central Electricity Authority.
ENERGY STATISTICS 2015 17
CHAPTER 2: INSTALLED CAPACITY AND CAPACITY UTILIZATION
Table 2.5:Statewise and Sourcewise Installed Capacity of Grid Interactive Renewable Power as on 31.03.2013
and 30.03.2014
(in MW)
States/ UTs Biomass Power Waste to Energy Wind Power
31.03.13 31.03.14 31.03.13 31.03.14 31.03.13 31.03.14
Andhra Pradesh 380.75 380.75 43.16 50.66 447.65 746.20 Arunachal Pradesh - - - - - - Assam - - - - - - Bihar 43.30 43.42 - - - - Chhattisgarh 249.90 264.90 - - - - Goa - - - - - - Gujarat 30.50 43.90 - - 3174.58 3454.30 Haryana 45.30 45.30 - - - - Himachal Pradesh - - - - - - Jammu & Kashmir - - - - - - Jharkhand - - - - - - Karnataka 491.38 603.28 1.00 1.00 2135.15 2318.20 Kerala - - - - 35.10 35.20 Madhya Pradesh 16.00 26.00 3.90 3.90 386.00 423.40 Maharashtra 756.90 940.40 9.72 12.72 3021.85 4100.40 Manipur - - - - - - Meghalaya - - - - - - Mizoram - - - - - - Nagaland - - - - - - Odisha 20.00 20.00 - - - - Punjab 124.50 140.50 9.25 9.25 - - Rajasthan 91.30 101.30 - - 2684.65 2784.90 Sikkim - - - - - - Tamil Nadu 538.70 571.30 8.05 8.05 7162.18 7269.50 Tripura - -
- - -
Uttar Pradesh 776.50 776.50 5.00 5.00 - - Uttarakhand 10.00 30.00 - - - - West Bengal 26.00 26.00 - - - - Andaman & Nicobar - - - - - - Chandigarh - - - - - - Dadar & Nagar Haveli - - - - - - Daman & Diu - - - - - - Delhi - - 16.00 16.00 - - Lakshadweep - - - - - - Puducherry - - - - - - Others - - - - 4.30 4.30
All India Total 3601.03 4013.55 96.08 106.58 19051.46 21136.40 Distribution (%) 12.83 12.66 0.34 0.34 67.88 66.69
Source: Ministry of New and Renewable Energy
ENERGY STATISTICS 2015 18
CHAPTER 2: INSTALLED CAPACITY AND CAPACITY UTILIZATION
Table 2.5 (contd):Statewise and Sourcewise Installed Capacity of Grid Interactive Renewable Power as on 31.03.2013 and
30.03.2014 (in MW)
States/ UTs
Small Hydro Power Solar Power Total Growth*
Rate(2012-13 to 2013-
14) 31.03.13 31.03.14 31.03.13 31.03.14 31.03.13 31.03.14
Andhra Pradesh 219.03 221.03 23.35 131.84 1113.94 1530.48 37.39 Arunachal Pradesh 103.91 103.91 0.03 0.03 103.93 103.93 0.00 Assam 31.11 34.11 - - 31.11 34.11 9.64 Bihar 70.70 70.70 - - 114.00 114.12 0.11 Chhattisgarh 52.00 52.00 4.00 7.10 305.90 324.00 5.92 Goa 0.05 0.05 - - 0.05 0.05 0.00 Gujarat 15.60 15.60 857.90 916.40 4078.58 4430.20 8.62 Haryana 70.10 70.10 7.80 10.30 123.20 125.70 2.03 Himachal Pradesh 587.91 638.91 - - 587.91 638.91 8.68 Jammu & Kashmir 130.53 147.53 - - 130.53 147.53 13.02 Jharkhand 4.05 4.05 16.00 16.00 20.05 20.05 0.00 Karnataka 963.76 1031.66 14.00 31.00 3605.29 3985.14 10.54 Kerala 158.42 158.42 0.03 0.03 193.55 193.65 0.05 Madhya Pradesh 86.16 86.16 37.32 347.17 529.38 886.63 67.49 Maharashtra 299.93 327.43 100.00 249.25 4188.40 5630.20 34.42 Manipur 5.45 5.45 - - 5.45 5.45 0.00 Meghalaya 31.03 31.03 - - 31.03 31.03 0.00 Mizoram 36.47 36.47 - - 36.47 36.47 0.00 Nagaland 28.67 29.67 - - 28.67 29.67 3.49 Odisha 64.30 64.63 13.00 30.50 97.30 115.13 18.32 Punjab 154.50 156.20 9.33 16.85 297.58 322.80 8.48 Rajasthan 23.85 23.85 552.90 730.10 3352.70 3640.15 8.57 Sikkim 52.11 52.11 - - 52.11 52.11 0.00 Tamil Nadu 123.05 123.05 17.11 98.36 7849.09 8070.26 2.82 Tripura 16.01 16.01 - - 16.01 16.01 0.00 Uttar Pradesh 25.10 25.10 17.38 21.08 823.98 827.68 0.45 Uttaranchal 174.82 174.82 5.05 5.05 189.87 209.87 10.53 West Bengal 98.40 98.40 2.05 7.05 126.45 131.45 3.95 Andaman & Nicobar 5.25 5.25 5.10 5.10 10.35 10.35 0.00 Chandigarh - - - 2.00 - 2.00 - Dadar & Nagar Haveli - - - - - - - Daman & Diu - - - - - - - Delhi - - 2.56 5.15 18.56 21.15 13.98 Lakshadweep - - 0.75 0.75 0.75 0.75 0.00 Puducherry - - 0.03 0.03 0.03 0.03 20.00 Others - - 0.79 0.82 5.09 5.12 - All India Total 3632.25 3803.70 1686.44 2631.96 28067.26 31692.18 12.92 Distribution (%) 12.94 12.00 6.01 8.30 100.00 100.00 Source: Ministry of New and Renewable Energy
ENERGY STATISTICS 2015 19
CHAPTER 2: INSTALLED CAPACITY AND CAPACITY UTILIZATION
Table 2.6 : Installation of Off-grid / Decentralised Renewable Energy Systems/ Devices as on 31.03.2014 Sl. No.
State/UT Biogas Plants
Biomass Gasifiers (Rural+ Industrial)
Biomass (non-bagasse)
Water Pumping/ Wind Mills#
SPV Pumps
Solar Photovoltaic SLS HLS SL PP (Nos. in Lakh)
(Nos. in Lakh)
(Nos. in Lakh)
(KWP)
(Nos. in Lakh)
(KW) (MW) (Nos.) (Nos.)
1 2 3 4 5 6 7 8 9 10 11 1 Andhra
Pradesh 5.2 22914 75.4 6 613 0.1 0.2 0.4 1263.6
2 Arunachal Pradesh
0.0 750 0.0 0 18 0.0 0.2 0.1 217.1
3 Assam 1.1 2933 0.0 3 45 0.0 0.1 0.0 910.0 4 Bihar 1.3 10924 8.2 46 139 0.0 0.1 0.5 775.6 5 Chhattisgarh 0.5 1210 2.5 1 240 0.0 0.1 0.0 14616.7 6 Goa 0.0 0 0.0 0 15 0.0 0.0 0.0 1.7 7 Gujarat 4.3 21530 0.0 945 85 0.0 0.1 0.3 9452.6 8 Haryana 0.6 2503 35.9 0 469 0.2 0.6 0.9 864.3 9 Himachal
Pradesh 0.5 0 7.2 0 6 0.1 0.2 0.2 1208.5
10 Jammu & Kashmir
0.0 200 0.0 0 39 0.1 0.7 0.4 3430.9
11 Jharkhand 0.1 500 1.2 0 0 0.0 0.1 0.2 480.9 12 Karnataka 4.7 7447 15.2 28 551 0.0 0.5 0.1 1596.4 13 Kerala 1.4 0 0.7 79 810 0.0 0.3 0.5 214.4 14 Madhya
Pradesh 3.5 10258 12.4 0 87 0.1 0.0 0.1 1983.0
15 Maharashtra 8.6 7150 16.4 26 239 0.1 0.0 0.7 913.7 16 Manipur 0.0 0 0.0 0 40 0.0 0.0 0.0 456.0 17 Meghalaya 0.1 250 13.8 0 19 0.0 0.1 0.2 173.5 18 Mizoram 0.0 250 0.0 0 37 0.0 0.1 0.1 241.0 19 Nagaland 0.1 2100 0.0 0 3 0.0 0.0 0.1 1050.0 20 Odisha 2.6 270 2.9 0 56 0.1 0.1 0.1 84.5 21 Punjab 1.6 0 110.7 0 1857 0.1 0.1 0.2 663.0 22 Rajasthan 0.7 2464 2.0 222 4501 0.1 1.4 0.0 8625.0 23 Sikkim 0.1 0 0.0 0 0 0.0 0.2 0.2 680.0 24 Tamil Nadu 2.2 16262 16.6 60 829 0.3 0.6 0.2 4006.6 25 Tripura 0.0 1050 0.0 0 151 0.0 0.3 0.6 365.0 26 Uttar Pradesh 4.4 23702 150.9 0 575 1.2 2.4 0.6 3491.5 27 Uttarakhand 0.2 2150 42.5 0 26 0.1 0.9 0.8 280.0 28 West Bengal 3.7 26168 17.4 0 48 0.1 1.5 0.2 889.0 29 Andaman &
Nicobar 0.0 0 0.0 2 5 0.0 0.0 0.1 167.0
30 Chandigarh 0.0 0 0.0 0 12 0.0 0.0 0.0 730.0 31 Dadar &
Nagar Haveli 0.0 0 0.0 0 0 0.0 0.0 0.0 0.0
32 Daman & Diu 0.0 0 0.0 0 0 0.0 0.0 0.0 0.0 33 Delhi 0.0 0 0.0 0 90 0.0 0.0 0.0 332.0 34 Lakshadweep 0.0 250 0.0 0 0 0.0 0.0 0.1 1090.0 35 Puducherry 0.0 0 0.0 0 21 0.0 0.0 0.0 0.0 36 Others* 0.1 0 0.0 0 0 0.1 0.2 1.3 23885.0 Total 47.5 163235 531.8 1418 11626 2.7 11.0 9.6 85138.4 Source : Ministry of New and Renewable Energy * Others includes installations through NGOs/IREDA in different states SLS = Street Lighting System; HLS = Home Lighting System; SL = Solar Lantern; PP = Power Plants; SPV = Solar Photovoltaic; SHP = Small Hydro Power; MW = Mega Watt; KWP = Kilowatt peak;
ENERGY STATISTICS 2015 20
CHAPTER 2: INSTALLED CAPACITY AND CAPACITY UTILIZATION
Table 2.6(contd..) : Installation of Off-grid / Decentralised
Renewable Energy Systems/ Devices as on 31.03.2014
Sl. No.
State/UT Aerogen. Hybrid System
Solar Cooker #
Waste to Energy
Remote Village Electrification Villages
Villages Hamlets (KW) (MW) (MW) (Nos.) (Nos.) 1 2 12 13 14 15 16 1 Andhra Pradesh 16.00 23.15 10.61 - 13 2 Arunachal Pradesh 6.80 0.03 - 297 - 3 Assam 6.00 - - 1,952 - 4 Bihar - - 1.00 - - 5 Chhattisgarh - 4.00 0.33 568 - 6 Goa 163.80 1.69 - - 19 7 Gujarat 20.00 824.09 14.64 38 - 8 Haryana 10.00 7.80 4.00 - 286 9 Himachal Pradesh - - 1.00 21 - 10 Jammu & Kashmir 15.80 - - 334 15 11 Jharkhand - 16.00 - 493 - 12 Karnataka 39.20 14.00 9.64 16 14 13 Kerala 8.00 0.03 - - 607 14 Madhya Pradesh 24.00 11.75 0.48 577 - 15 Maharashtra 1422.10 34.50 20.45 340 - 16 Manipur 140.00 - - 237 3 17 Meghalaya 191.50 - - 149 - 18 Mizoram - - - 20 - 19 Nagaland - - - 11 - 20 Odisha - 13.00 0.02 1,495 14 21 Punjab 50.00 9.33 4.78 - - 22 Rajasthan 14.00 222.90 3.00 292 90 23 Sikkim 15.50 - - - 13 24 Tamil Nadu 24.50 17.06 11.42 - 131 25 Tripura 2.00 - - 60 782 26 Uttar Pradesh - 12.38 46.18 113 222 27 Uttarakhand 4.00 5.05 4.02 476 118 28 West Bengal 74.00 2.00 1.17 1,177 2
29 Andaman & Nicobar - - - - -
30 Chandigarh - - - - -
31 Dadar & Nagar Haveli - -
- - -
32 Daman & Diu - - - - - 33 Delhi - 2.53 - - - 34 Lakshaadweep - - - - - 35 Puducherry 5.00 - - - - 36 Others* - - - - - Total 2252.20 1221.26 132.74 8666.00 2329.00 # Data repeated for 2012
*Others includes installations through NGOs/IREDA in different states SLS = Street Lighting System; HLS = Home Lighting System; SL = Solar Lantern; PP = Power
Plants; SPV = Solar Photovoltaic; MW = Mega Watt; KWP = Kilowatt peak; MWe=Mega Watt electric
Source : Ministry of New and Renewable Energy
ENERGY STATISTICS 2015 21
CHAPTER 3: PRODUCTION OF CONVENTIONAL ENERGY SOURCES
CHAPTER 3: PRODUCTION OF CONVENTIONAL ENERGY SOURCES
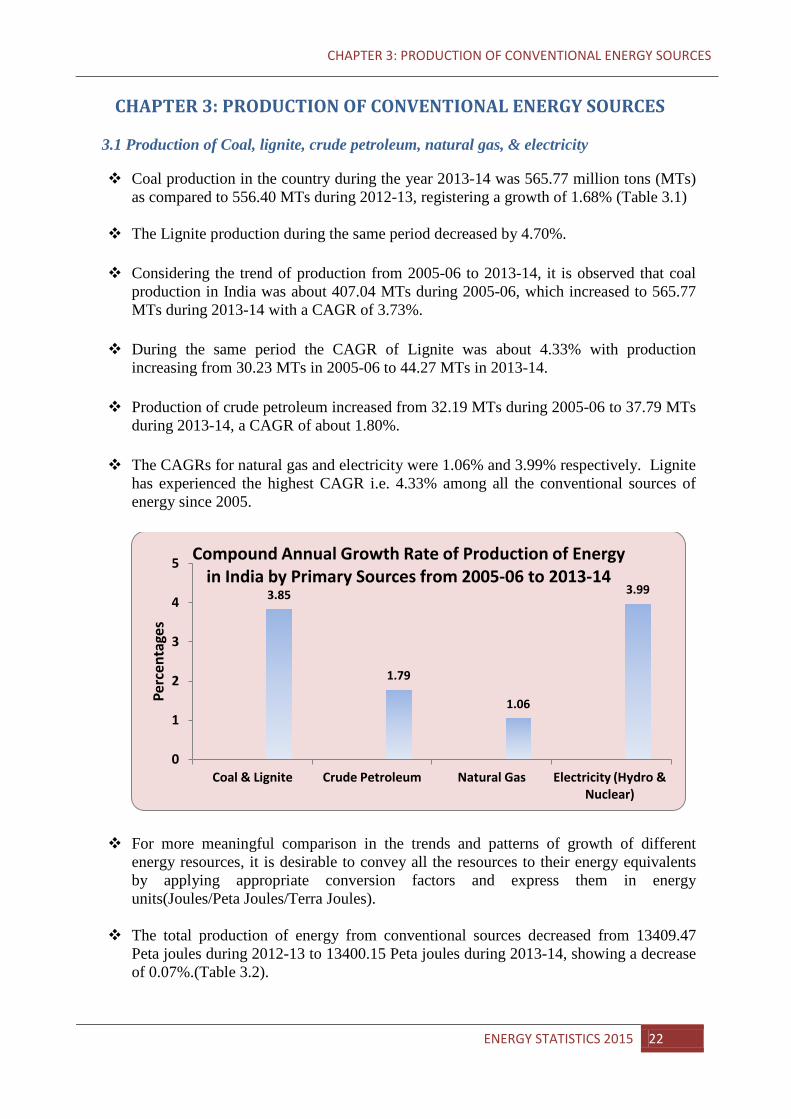
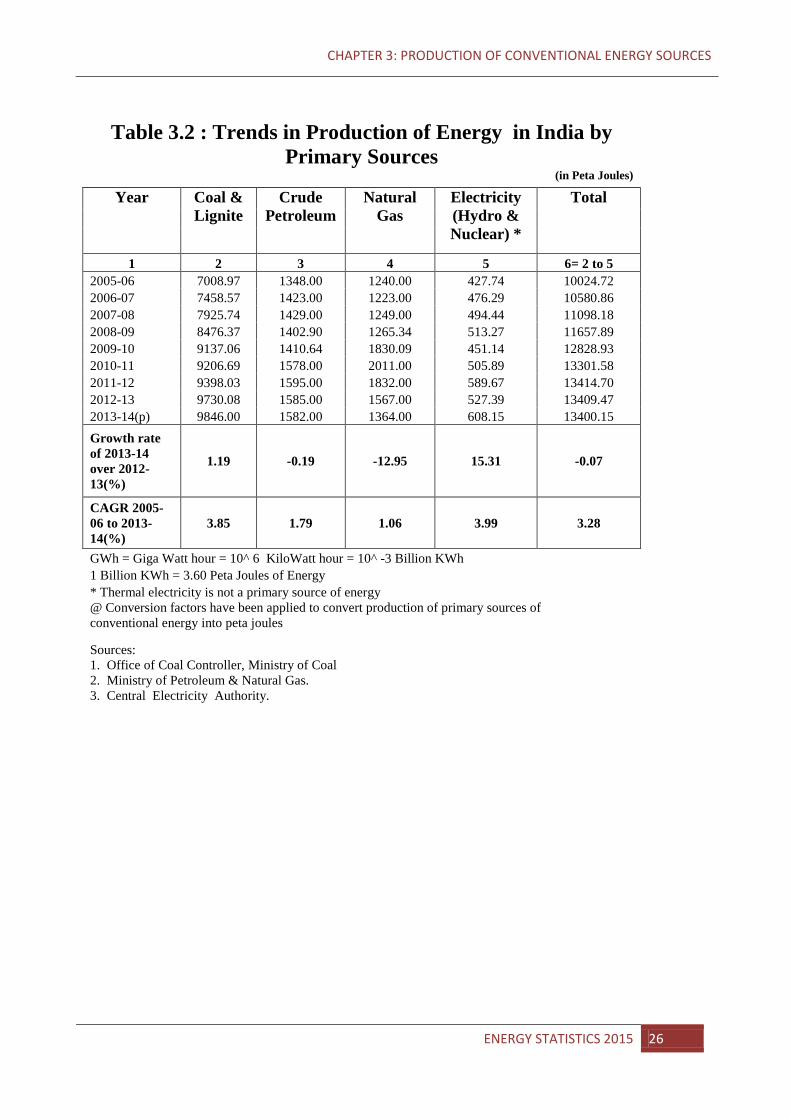
3.1 Production of Coal, lignite, crude petroleum, natural gas, & electricity
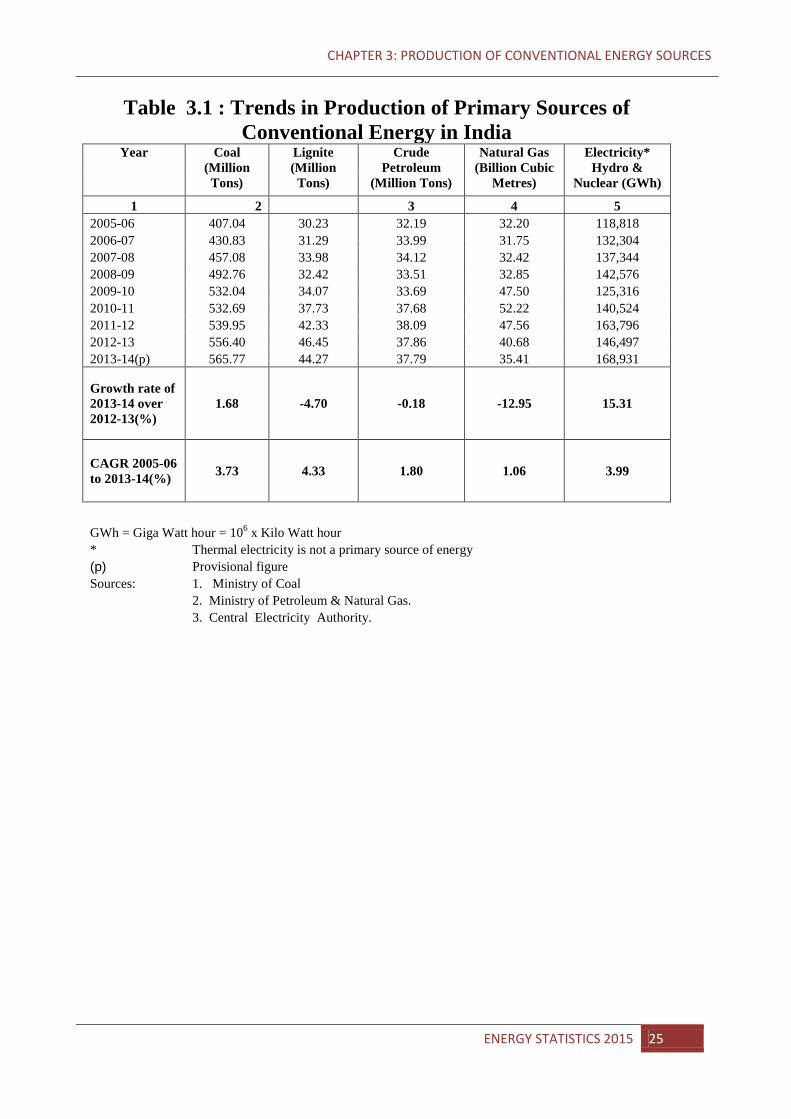
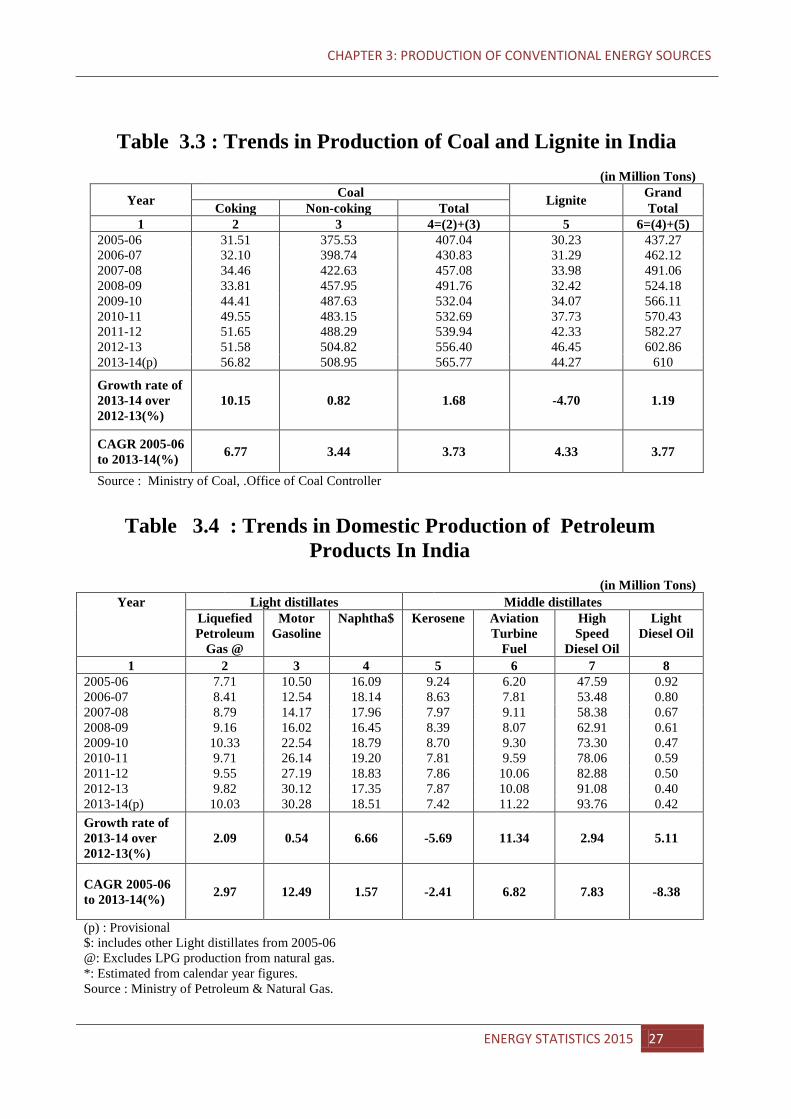
Coal production in the country during the year 2013-14 was 565.77 million tons (MTs) as compared to 556.40 MTs during 2012-13, registering a growth of 1.68% (Table 3.1)
The Lignite production during the same period decreased by 4.70%. Considering the trend of production from 2005-06 to 2013-14, it is observed that coal
production in India was about 407.04 MTs during 2005-06, which increased to 565.77 MTs during 2013-14 with a CAGR of 3.73%.
During the same period the CAGR of Lignite was about 4.33% with production
increasing from 30.23 MTs in 2005-06 to 44.27 MTs in 2013-14. Production of crude petroleum increased from 32.19 MTs during 2005-06 to 37.79 MTs
during 2013-14, a CAGR of about 1.80%. The CAGRs for natural gas and electricity were 1.06% and 3.99% respectively. Lignite
has experienced the highest CAGR i.e. 4.33% among all the conventional sources of energy since 2005.
For more meaningful comparison in the trends and patterns of growth of different energy resources, it is desirable to convey all the resources to their energy equivalents by applying appropriate conversion factors and express them in energy units(Joules/Peta Joules/Terra Joules).
The total production of energy from conventional sources decreased from 13409.47 Peta joules during 2012-13 to 13400.15 Peta joules during 2013-14, showing a decrease of 0.07%.(Table 3.2).
3.85
1.79
1.06
3.99
0
1
2
3
4
5
Coal & Lignite Crude Petroleum Natural Gas Electricity (Hydro & Nuclear)
Perc
enta
ges
Compound Annual Growth Rate of Production of Energy in India by Primary Sources from 2005-06 to 2013-14
ENERGY STATISTICS 2015 22
CHAPTER 3: PRODUCTION OF CONVENTIONAL ENERGY SOURCES
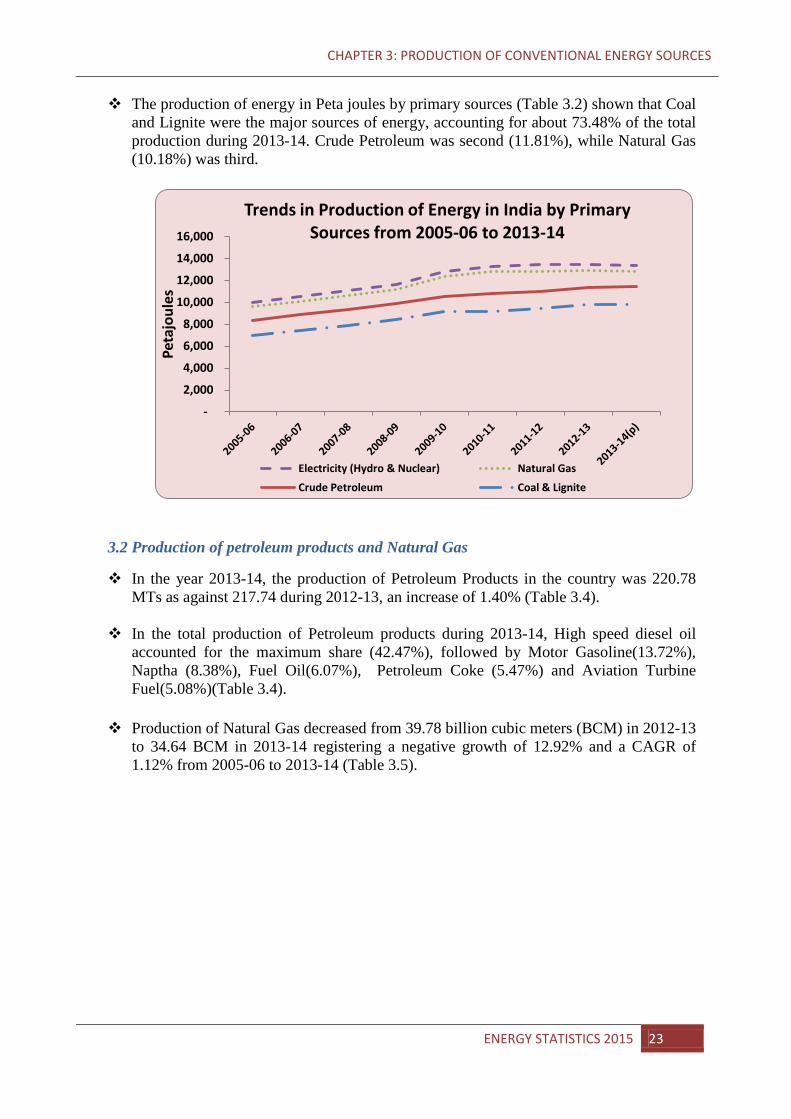
The production of energy in Peta joules by primary sources (Table 3.2) shown that Coal
and Lignite were the major sources of energy, accounting for about 73.48% of the total production during 2013-14. Crude Petroleum was second (11.81%), while Natural Gas (10.18%) was third.
3.2 Production of petroleum products and Natural Gas
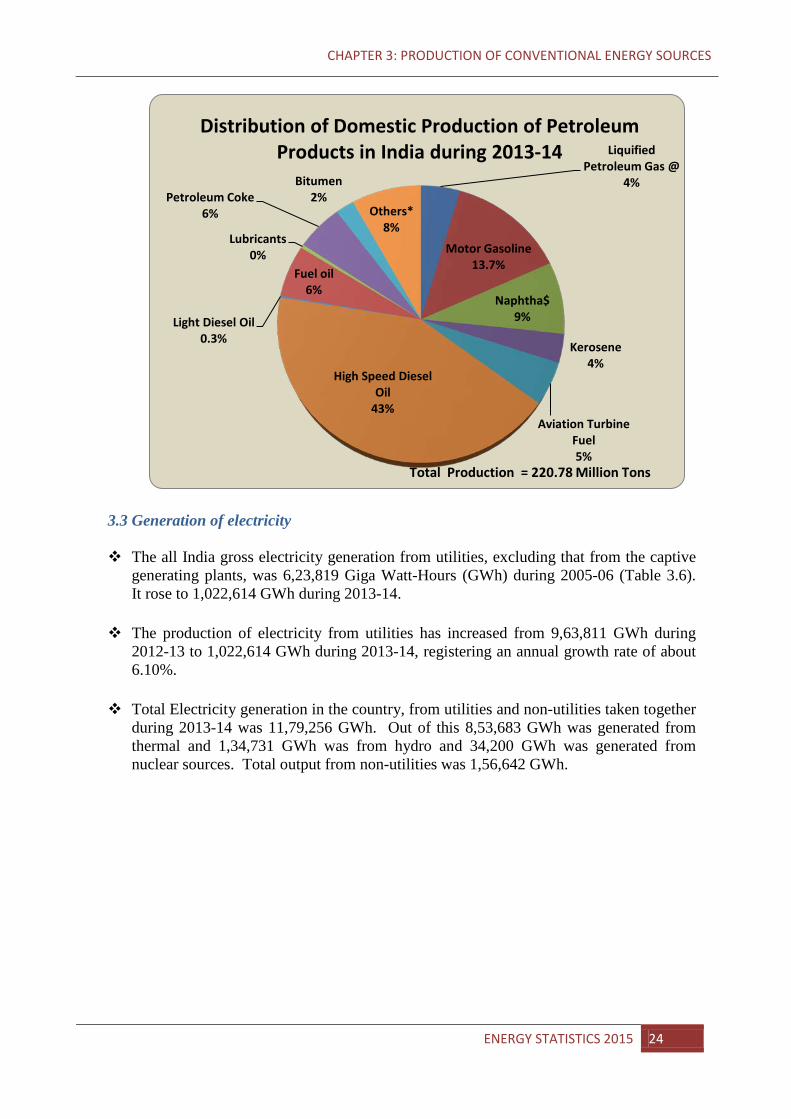
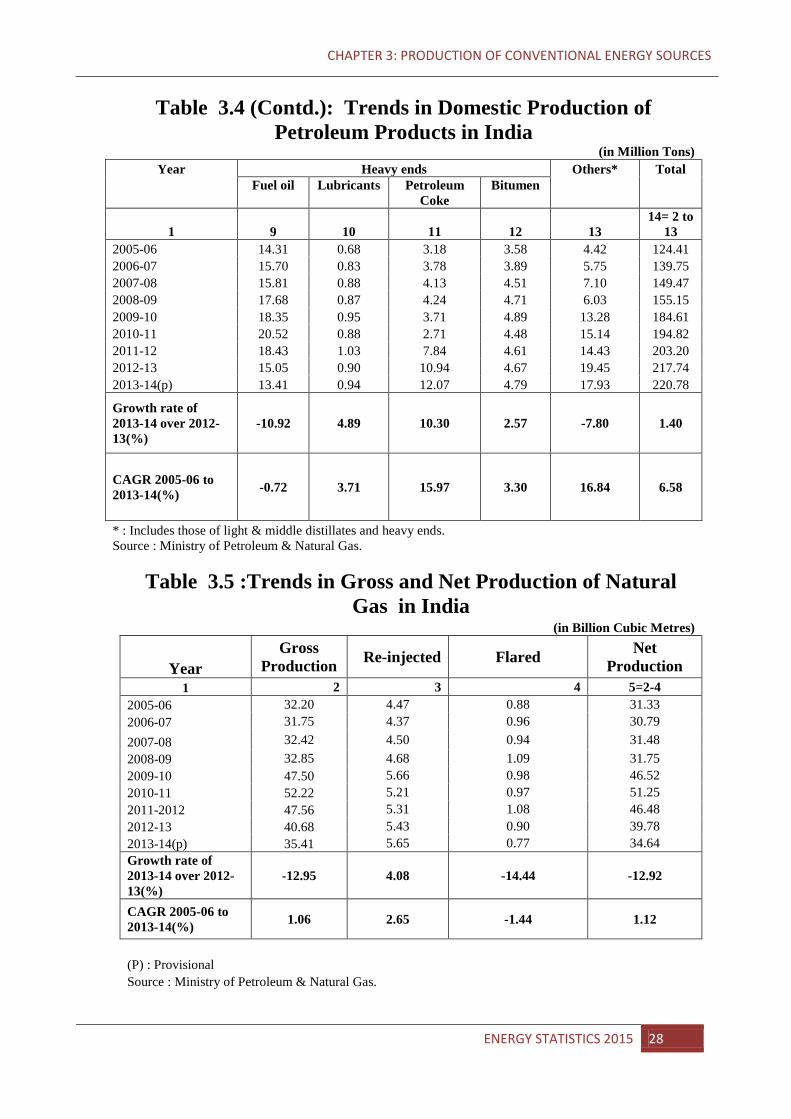
In the year 2013-14, the production of Petroleum Products in the country was 220.78 MTs as against 217.74 during 2012-13, an increase of 1.40% (Table 3.4).
In the total production of Petroleum products during 2013-14, High speed diesel oil
accounted for the maximum share (42.47%), followed by Motor Gasoline(13.72%), Naptha (8.38%), Fuel Oil(6.07%), Petroleum Coke (5.47%) and Aviation Turbine Fuel(5.08%)(Table 3.4).
Production of Natural Gas decreased from 39.78 billion cubic meters (BCM) in 2012-13
to 34.64 BCM in 2013-14 registering a negative growth of 12.92% and a CAGR of 1.12% from 2005-06 to 2013-14 (Table 3.5).
-
2,000
4,000
6,000
8,000
10,000
12,000
14,000
16,000
Peta
joul
es
Trends in Production of Energy in India by Primary Sources from 2005-06 to 2013-14
Electricity (Hydro & Nuclear) Natural Gas
Crude Petroleum Coal & Lignite
ENERGY STATISTICS 2015 23
CHAPTER 3: PRODUCTION OF CONVENTIONAL ENERGY SOURCES
3.3 Generation of electricity The all India gross electricity generation from utilities, excluding that from the captive
generating plants, was 6,23,819 Giga Watt-Hours (GWh) during 2005-06 (Table 3.6). It rose to 1,022,614 GWh during 2013-14.
The production of electricity from utilities has increased from 9,63,811 GWh during
2012-13 to 1,022,614 GWh during 2013-14, registering an annual growth rate of about 6.10%.
Total Electricity generation in the country, from utilities and non-utilities taken together
during 2013-14 was 11,79,256 GWh. Out of this 8,53,683 GWh was generated from thermal and 1,34,731 GWh was from hydro and 34,200 GWh was generated from nuclear sources. Total output from non-utilities was 1,56,642 GWh.
Liquified Petroleum Gas @
4%
Motor Gasoline 13.7%
Naphtha$ 9%
Kerosene 4%
Aviation Turbine Fuel 5%
High Speed Diesel Oil
43%
Light Diesel Oil 0.3%
Fuel oil 6%
Lubricants 0%
Petroleum Coke 6%
Bitumen 2%
Others* 8%
Total Production = 220.78 Million Tons
Distribution of Domestic Production of Petroleum Products in India during 2013-14
ENERGY STATISTICS 2015 24
CHAPTER 3: PRODUCTION OF CONVENTIONAL ENERGY SOURCES
Table 3.1 : Trends in Production of Primary Sources of Conventional Energy in India
Year Coal (Million Tons)
Lignite (Million
Tons)
Crude Petroleum
Natural Gas (Billion Cubic
Metres)
Electricity* Hydro &
Nuclear (GWh) (Million Tons)
1 2 3 4 5 2005-06 407.04 30.23 32.19 32.20 118,818 2006-07 430.83 31.29 33.99 31.75 132,304 2007-08 457.08 33.98 34.12 32.42 137,344 2008-09 492.76 32.42 33.51 32.85 142,576 2009-10 532.04 34.07 33.69 47.50 125,316 2010-11 532.69 37.73 37.68 52.22 140,524 2011-12 539.95 42.33 38.09 47.56 163,796 2012-13 556.40 46.45 37.86 40.68 146,497 2013-14(p) 565.77 44.27 37.79 35.41 168,931
Growth rate of 2013-14 over 2012-13(%)
1.68 -4.70 -0.18 -12.95 15.31
CAGR 2005-06 to 2013-14(%) 3.73 4.33 1.80 1.06 3.99
GWh = Giga Watt hour = 106 x Kilo Watt hour * Thermal electricity is not a primary source of energy
(p) Provisional figure Sources: 1. Ministry of Coal
2. Ministry of Petroleum & Natural Gas.
3. Central Electricity Authority.
ENERGY STATISTICS 2015 25
CHAPTER 3: PRODUCTION OF CONVENTIONAL ENERGY SOURCES
Table 3.2 : Trends in Production of Energy in India by
Primary Sources (in Peta Joules)
Year Coal & Lignite
Crude Petroleum
Natural Gas
Electricity (Hydro & Nuclear) *
Total
1 2 3 4 5 6= 2 to 5 2005-06 7008.97 1348.00 1240.00 427.74 10024.72 2006-07 7458.57 1423.00 1223.00 476.29 10580.86 2007-08 7925.74 1429.00 1249.00 494.44 11098.18 2008-09 8476.37 1402.90 1265.34 513.27 11657.89 2009-10 9137.06 1410.64 1830.09 451.14 12828.93 2010-11 9206.69 1578.00 2011.00 505.89 13301.58 2011-12 9398.03 1595.00 1832.00 589.67 13414.70 2012-13 9730.08 1585.00 1567.00 527.39 13409.47 2013-14(p) 9846.00 1582.00 1364.00 608.15 13400.15 Growth rate of 2013-14 over 2012-13(%)
1.19 -0.19 -12.95 15.31 -0.07
CAGR 2005-06 to 2013-14(%)
3.85 1.79 1.06 3.99 3.28
GWh = Giga Watt hour = 10^ 6 KiloWatt hour = 10^ -3 Billion KWh 1 Billion KWh = 3.60 Peta Joules of Energy
* Thermal electricity is not a primary source of energy @ Conversion factors have been applied to convert production of primary sources of
conventional energy into peta joules
Sources: 1. Office of Coal Controller, Ministry of Coal 2. Ministry of Petroleum & Natural Gas. 3. Central Electricity Authority.
ENERGY STATISTICS 2015 26
CHAPTER 3: PRODUCTION OF CONVENTIONAL ENERGY SOURCES
Table 3.3 : Trends in Production of Coal and Lignite in India
(in Million Tons)
Year Coal Lignite Grand Coking Non-coking Total Total
1 2 3 4=(2)+(3) 5 6=(4)+(5) 2005-06 31.51 375.53 407.04 30.23 437.27 2006-07 32.10 398.74 430.83 31.29 462.12 2007-08 34.46 422.63 457.08 33.98 491.06 2008-09 33.81 457.95 491.76 32.42 524.18 2009-10 44.41 487.63 532.04 34.07 566.11 2010-11 49.55 483.15 532.69 37.73 570.43 2011-12 51.65 488.29 539.94 42.33 582.27 2012-13 51.58 504.82 556.40 46.45 602.86 2013-14(p) 56.82 508.95 565.77 44.27 610
Growth rate of 2013-14 over 2012-13(%)
10.15 0.82 1.68 -4.70 1.19
CAGR 2005-06 to 2013-14(%) 6.77 3.44 3.73 4.33 3.77
Source : Ministry of Coal, .Office of Coal Controller
Table 3.4 : Trends in Domestic Production of Petroleum Products In India
(in Million Tons)
Year Light distillates Middle distillates
Liquefied Petroleum
Gas @
Motor Gasoline
Naphtha$ Kerosene Aviation Turbine
Fuel
High Speed
Diesel Oil
Light Diesel Oil
1 2 3 4 5 6 7 8 2005-06 7.71 10.50 16.09 9.24 6.20 47.59 0.92 2006-07 8.41 12.54 18.14 8.63 7.81 53.48 0.80 2007-08 8.79 14.17 17.96 7.97 9.11 58.38 0.67 2008-09 9.16 16.02 16.45 8.39 8.07 62.91 0.61 2009-10 10.33 22.54 18.79 8.70 9.30 73.30 0.47 2010-11 9.71 26.14 19.20 7.81 9.59 78.06 0.59 2011-12 9.55 27.19 18.83 7.86 10.06 82.88 0.50 2012-13 9.82 30.12 17.35 7.87 10.08 91.08 0.40 2013-14(p) 10.03 30.28 18.51 7.42 11.22 93.76 0.42 Growth rate of 2013-14 over 2012-13(%)
2.09 0.54 6.66 -5.69 11.34 2.94 5.11
CAGR 2005-06 to 2013-14(%) 2.97 12.49 1.57 -2.41 6.82 7.83 -8.38
(p) : Provisional $: includes other Light distillates from 2005-06
@: Excludes LPG production from natural gas. *: Estimated from calendar year figures.
Source : Ministry of Petroleum & Natural Gas.
ENERGY STATISTICS 2015 27
CHAPTER 3: PRODUCTION OF CONVENTIONAL ENERGY SOURCES
Table 3.4 (Contd.): Trends in Domestic Production of Petroleum Products in India
(in Million Tons) Year Heavy ends Others* Total
Fuel oil Lubricants Petroleum
Coke Bitumen
1 9 10 11 12 13 14= 2 to
13 2005-06 14.31 0.68 3.18 3.58 4.42 124.41 2006-07 15.70 0.83 3.78 3.89 5.75 139.75 2007-08 15.81 0.88 4.13 4.51 7.10 149.47 2008-09 17.68 0.87 4.24 4.71 6.03 155.15 2009-10 18.35 0.95 3.71 4.89 13.28 184.61 2010-11 20.52 0.88 2.71 4.48 15.14 194.82 2011-12 18.43 1.03 7.84 4.61 14.43 203.20 2012-13 15.05 0.90 10.94 4.67 19.45 217.74 2013-14(p) 13.41 0.94 12.07 4.79 17.93 220.78
Growth rate of 2013-14 over 2012-13(%)
-10.92 4.89 10.30 2.57 -7.80 1.40
CAGR 2005-06 to 2013-14(%) -0.72 3.71 15.97 3.30 16.84 6.58
* : Includes those of light & middle distillates and heavy ends. Source : Ministry of Petroleum & Natural Gas.
Table 3.5 :Trends in Gross and Net Production of Natural
Gas in India (in Billion Cubic Metres)
Year Gross
Production Re-injected Flared Net Production
1 2 3 4 5=2-4 2005-06 32.20 4.47 0.88 31.33 2006-07 31.75 4.37 0.96 30.79 2007-08 32.42 4.50 0.94 31.48 2008-09 32.85 4.68 1.09 31.75 2009-10 47.50 5.66 0.98 46.52 2010-11 52.22 5.21 0.97 51.25 2011-2012 47.56 5.31 1.08 46.48 2012-13 40.68 5.43 0.90 39.78 2013-14(p) 35.41 5.65 0.77 34.64 Growth rate of 2013-14 over 2012-13(%)
-12.95 4.08 -14.44 -12.92
CAGR 2005-06 to 2013-14(%) 1.06 2.65 -1.44 1.12
(P) : Provisional Source : Ministry of Petroleum & Natural Gas.
ENERGY STATISTICS 2015 28
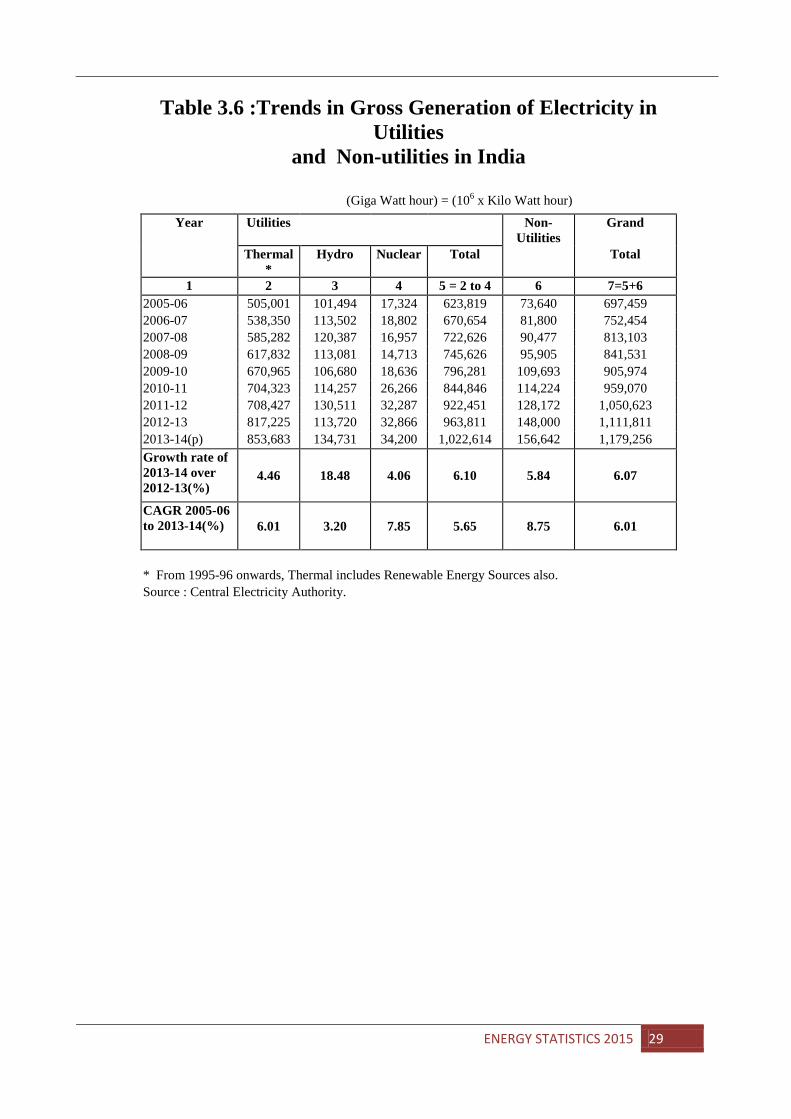
Table 3.6 :Trends in Gross Generation of Electricity in Utilities
and Non-utilities in India
(Giga Watt hour) = (106 x Kilo Watt hour)
Year Utilities Non-Utilities
Grand
Thermal *
Hydro Nuclear Total Total
1 2 3 4 5 = 2 to 4 6 7=5+6 2005-06 505,001 101,494 17,324 623,819 73,640 697,459 2006-07 538,350 113,502 18,802 670,654 81,800 752,454 2007-08 585,282 120,387 16,957 722,626 90,477 813,103 2008-09 617,832 113,081 14,713 745,626 95,905 841,531 2009-10 670,965 106,680 18,636 796,281 109,693 905,974 2010-11 704,323 114,257 26,266 844,846 114,224 959,070 2011-12 708,427 130,511 32,287 922,451 128,172 1,050,623 2012-13 817,225 113,720 32,866 963,811 148,000 1,111,811 2013-14(p) 853,683 134,731 34,200 1,022,614 156,642 1,179,256 Growth rate of 2013-14 over 2012-13(%)
4.46 18.48 4.06 6.10 5.84 6.07
CAGR 2005-06 to 2013-14(%) 6.01 3.20 7.85 5.65 8.75 6.01
* From 1995-96 onwards, Thermal includes Renewable Energy Sources also. Source : Central Electricity Authority.
ENERGY STATISTICS 2015 29
CHAPTER 4: FOREIGN TRADE IN ENERGY PRODUCTS
CHAPTER 4: FOREIGN TRADE IN ENERGY PRODUCTS
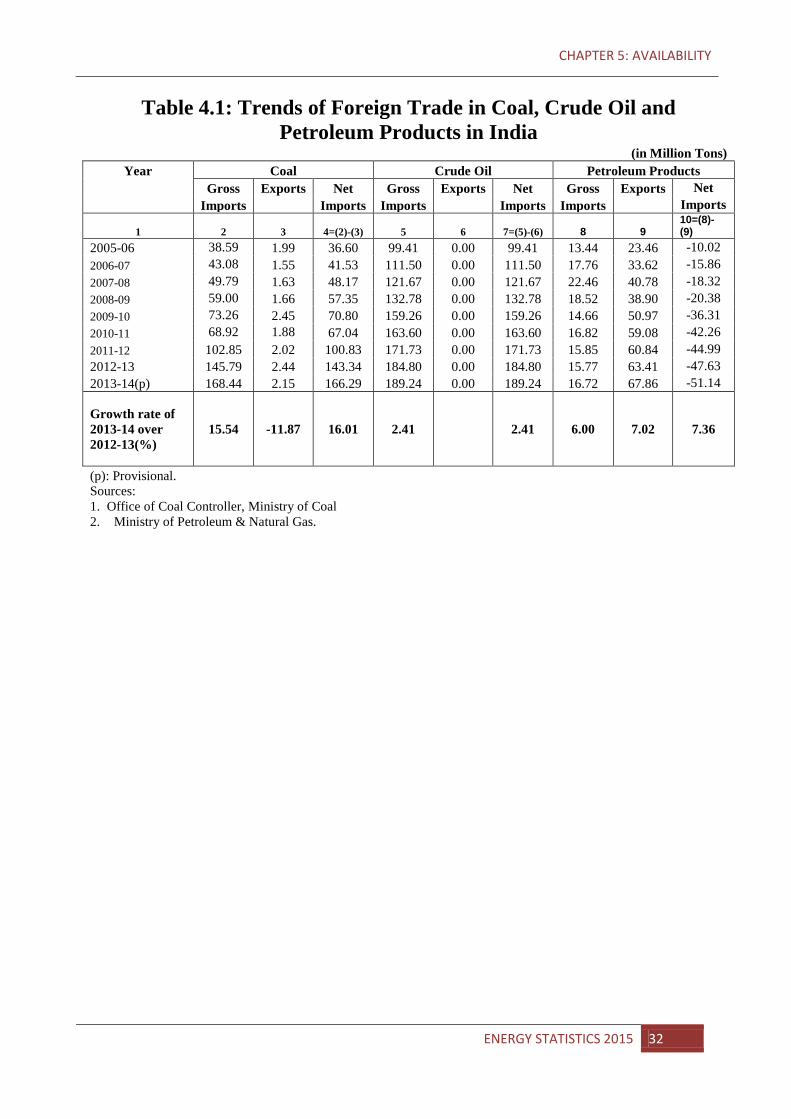
4.1 Import and export of coal
The average quality of the Indian coal is not very high and this necessitates the import of high quality coal to meet the requirements of steel plants. There has been an increasing trend in the import of coal.
Net Import of coal has steadily increased from 36.60 MTs during 2005-06 to 166.29
MTs during 2013-14(Table 4.1). During the said period, the quantum of coal exported increased from 1.99 MTs during 2005-06 to 2.15 MTs during 2013-14.
There is growth rate of 15.54% of gross import and 16.01% in net imports of coal in
2013-14 over the previous year. However there was decrease of 11.87% in export of coal during the same period.
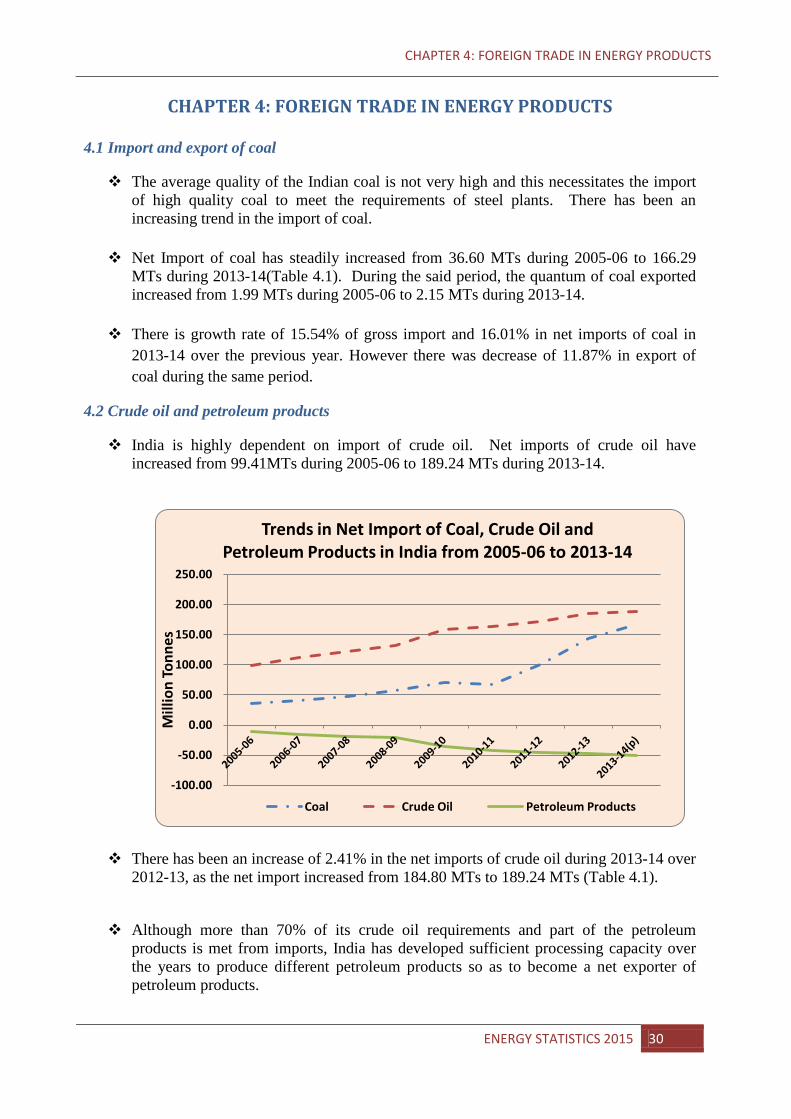
4.2 Crude oil and petroleum products
India is highly dependent on import of crude oil. Net imports of crude oil have increased from 99.41MTs during 2005-06 to 189.24 MTs during 2013-14.
There has been an increase of 2.41% in the net imports of crude oil during 2013-14 over 2012-13, as the net import increased from 184.80 MTs to 189.24 MTs (Table 4.1).
Although more than 70% of its crude oil requirements and part of the petroleum products is met from imports, India has developed sufficient processing capacity over the years to produce different petroleum products so as to become a net exporter of petroleum products.
-100.00
-50.00
0.00
50.00
100.00
150.00
200.00
250.00
Mill
ion
Tonn
es
Trends in Net Import of Coal, Crude Oil and Petroleum Products in India from 2005-06 to 2013-14
Coal Crude Oil Petroleum Products
ENERGY STATISTICS 2015 30
CHAPTER 4: FOREIGN TRADE IN ENERGY PRODUCTS
The export of petroleum product has increased from 23.46 MT during 2005-06 to 67.86
MTs during 2013-14. During 2013-14 exports recorded an increase of 7.02% from previous year (Table 4.1).
The import of petroleum products has increased from 13.44 MT in 2005-06 to 16.72
MT during 2013-14, although there are some fluctuations in the trend (Table 4.1). There is an increase of growth rate of 6% in import of petroleum products over the previous year.
ENERGY STATISTICS 2015 31
CHAPTER 5: AVAILABILITY
Table 4.1: Trends of Foreign Trade in Coal, Crude Oil and Petroleum Products in India
(in Million Tons) Year Coal Crude Oil Petroleum Products
Gross Exports Net Gross Exports Net Gross Exports Net Imports Imports Imports Imports Imports Imports
1 2 3 4=(2)-(3) 5 6 7=(5)-(6) 8 9 10=(8)-(9)
2005-06 38.59 1.99 36.60 99.41 0.00 99.41 13.44 23.46 -10.02 2006-07 43.08 1.55 41.53 111.50 0.00 111.50 17.76 33.62 -15.86 2007-08 49.79 1.63 48.17 121.67 0.00 121.67 22.46 40.78 -18.32 2008-09 59.00 1.66 57.35 132.78 0.00 132.78 18.52 38.90 -20.38 2009-10 73.26 2.45 70.80 159.26 0.00 159.26 14.66 50.97 -36.31 2010-11 68.92 1.88 67.04 163.60 0.00 163.60 16.82 59.08 -42.26 2011-12 102.85 2.02 100.83 171.73 0.00 171.73 15.85 60.84 -44.99 2012-13 145.79 2.44 143.34 184.80 0.00 184.80 15.77 63.41 -47.63 2013-14(p) 168.44 2.15 166.29 189.24 0.00 189.24 16.72 67.86 -51.14
Growth rate of 2013-14 over 2012-13(%)
15.54 -11.87 16.01 2.41 2.41 6.00 7.02 7.36
(p): Provisional. Sources:
1. Office of Coal Controller, Ministry of Coal
2. Ministry of Petroleum & Natural Gas.
ENERGY STATISTICS 2015 32
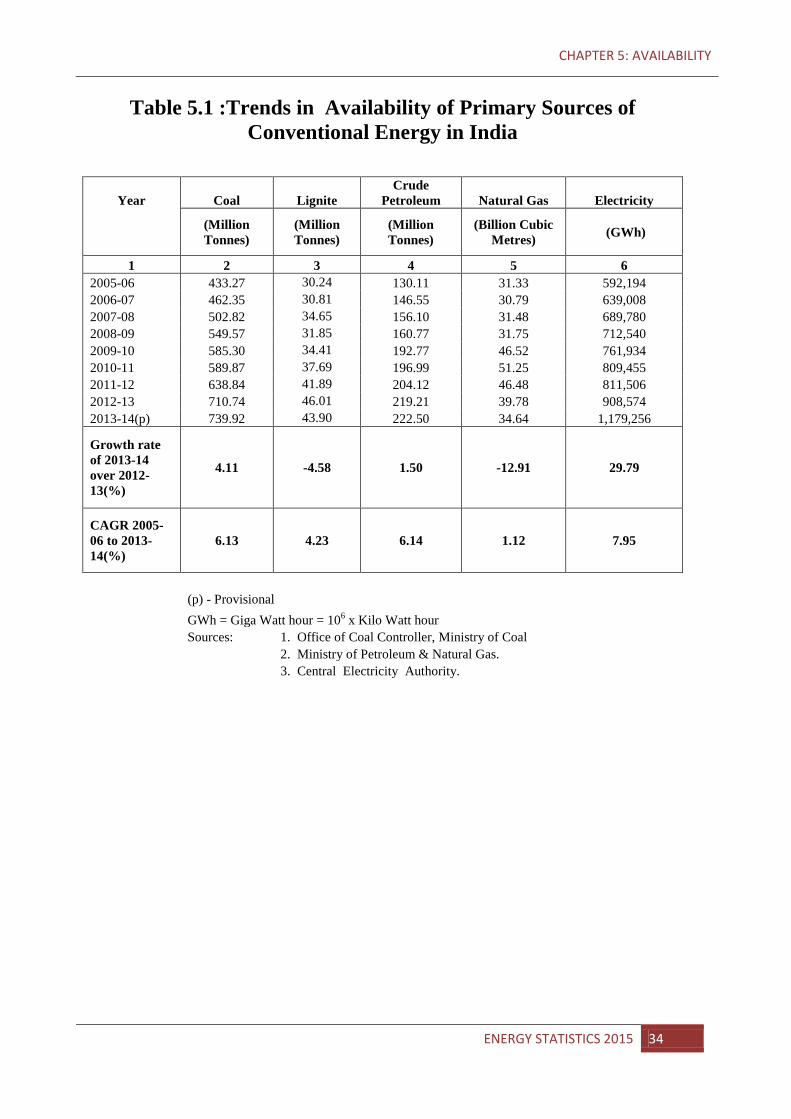
CHAPTER 5: AVAILABILITY
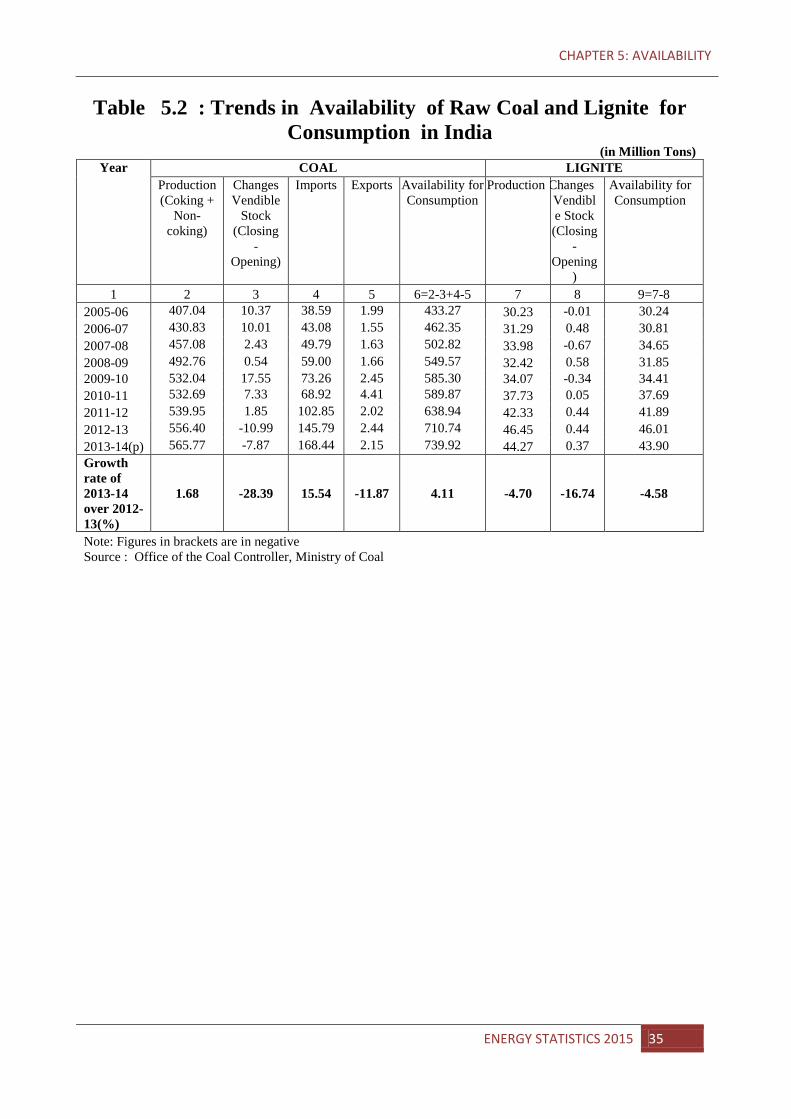
CHAPTER 5: AVAILABILITY 5.1 Availability of Coal and Lignite The total availability of raw coal in India in 2013-14 stood at 739.92 MTs and that of
lignite at 43.90 (Table 5.1). The availability of coal in the year 2013-14 increased by 4.11% compared to 2012-13.
The availability of lignite decreased by 4.59% during the same period. The availability of coal has increased at a CAGR of about 6.13% during the period from
2005-06 to 2013-14. This increased availability might be attributed to the secular increase in the coal production (407.04 MTs during 2005-06 to 565.77 MTs during 2013-14) supplemented by imports (Table 5.2).
The availability of lignite has increased at a CAGR of about 4.23% during the period
from 2005-06 to 2013-14(Table 5.1).
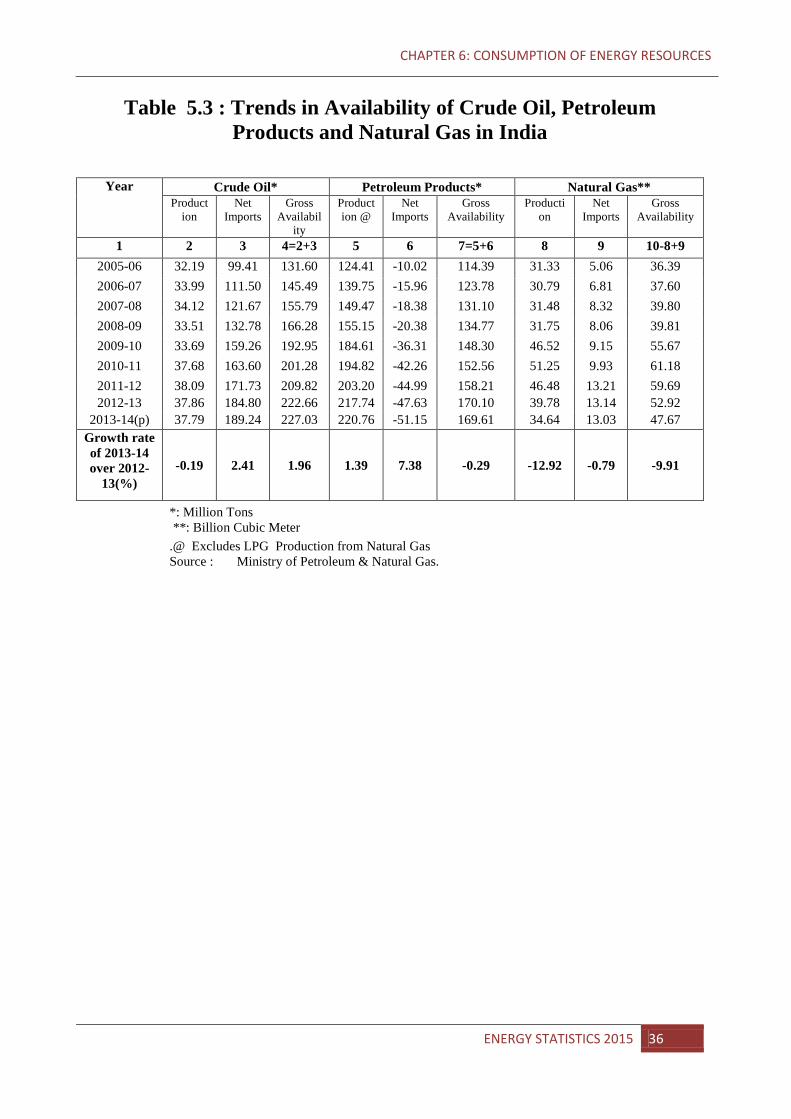
5.2 Availability of Natural Gas
The production of natural gas has steadily increased from a mere 31.33 BCMs during 2005-06 to 34.64 BCMs during 2013-14, registering a CAGR of 1.12%. Most of this increase in the indigenous production is due to discovery of new reserves.(Table 5.1)
5.3 Availability of Electricity
Since thermal electricity is not a primary source of energy, being produced either from
coal or natural gas in India, electricity availability is considered only for that electricity which is generated from Hydro and Nuclear sources.
Without taking into account the transmission and distribution losses, the total
availability is equal to the total generation, and this figure increased from 592194 GWh during 2005-06 to 11,79,256 GWh during 2013-14, registering a CAGR of 7.95% over the period (Table 5.1).
5.4 Availability of Crude Oil and Petroleum Products
The availability of crude oil in the country increased from 131.60 MTs during 2005-06
to 227.03 MTs during 2013-14 (Table 5.3). During this period crude oil production increased from 32.19 MTs to 37.79 MTs and
the net import increased from 99.41 MTs to 189.24 MTs during period from 2005-06 to 2013-14. There was 1.96% increase in availability of crude oil during 2013-14 over 2012-13.
ENERGY STATISTICS 2015 33
CHAPTER 5: AVAILABILITY
Table 5.1 :Trends in Availability of Primary Sources of Conventional Energy in India
Year Coal Lignite
Crude Petroleum Natural Gas Electricity
(Million Tonnes)
(Million Tonnes)
(Million Tonnes)
(Billion Cubic Metres) (GWh)
1 2 3 4 5 6 2005-06 433.27 30.24 130.11 31.33 592,194 2006-07 462.35 30.81 146.55 30.79 639,008 2007-08 502.82 34.65 156.10 31.48 689,780 2008-09 549.57 31.85 160.77 31.75 712,540 2009-10 585.30 34.41 192.77 46.52 761,934 2010-11 589.87 37.69 196.99 51.25 809,455 2011-12 638.84 41.89 204.12 46.48 811,506 2012-13 710.74 46.01 219.21 39.78 908,574 2013-14(p) 739.92 43.90 222.50 34.64 1,179,256
Growth rate of 2013-14 over 2012-13(%)
4.11 -4.58 1.50 -12.91 29.79
CAGR 2005-06 to 2013-14(%)
6.13 4.23 6.14 1.12 7.95
(p) - Provisional
GWh = Giga Watt hour = 106 x Kilo Watt hour
Sources: 1. Office of Coal Controller, Ministry of Coal
2. Ministry of Petroleum & Natural Gas.
3. Central Electricity Authority.
ENERGY STATISTICS 2015 34
CHAPTER 5: AVAILABILITY
Table 5.2 : Trends in Availability of Raw Coal and Lignite for Consumption in India
(in Million Tons) Year COAL LIGNITE
Production (Coking +
Non-coking)
Changes Vendible
Stock (Closing
- Opening)
Imports Exports Availability for Consumption
Production Changes Vendible Stock (Closing
- Opening
)
Availability for Consumption
1 2 3 4 5 6=2-3+4-5 7 8 9=7-8 2005-06 407.04 10.37 38.59 1.99 433.27 30.23 -0.01 30.24 2006-07 430.83 10.01 43.08 1.55 462.35 31.29 0.48 30.81 2007-08 457.08 2.43 49.79 1.63 502.82 33.98 -0.67 34.65 2008-09 492.76 0.54 59.00 1.66 549.57 32.42 0.58 31.85 2009-10 532.04 17.55 73.26 2.45 585.30 34.07 -0.34 34.41 2010-11 532.69 7.33 68.92 4.41 589.87 37.73 0.05 37.69 2011-12 539.95 1.85 102.85 2.02 638.94 42.33 0.44 41.89 2012-13 556.40 -10.99 145.79 2.44 710.74 46.45 0.44 46.01 2013-14(p) 565.77 -7.87 168.44 2.15 739.92 44.27 0.37 43.90 Growth rate of 2013-14 over 2012-13(%)
1.68 -28.39 15.54 -11.87 4.11 -4.70 -16.74 -4.58
Note: Figures in brackets are in negative Source : Office of the Coal Controller, Ministry of Coal
ENERGY STATISTICS 2015 35
CHAPTER 6: CONSUMPTION OF ENERGY RESOURCES
Table 5.3 : Trends in Availability of Crude Oil, Petroleum Products and Natural Gas in India
Year Crude Oil* Petroleum Products* Natural Gas**
Production
Net Imports
Gross Availabil
ity
Production @
Net Imports
Gross Availability
Production
Net Imports
Gross Availability
1 2 3 4=2+3 5 6 7=5+6 8 9 10-8+9 2005-06 32.19 99.41 131.60 124.41 -10.02 114.39 31.33 5.06 36.39 2006-07 33.99 111.50 145.49 139.75 -15.96 123.78 30.79 6.81 37.60 2007-08 34.12 121.67 155.79 149.47 -18.38 131.10 31.48 8.32 39.80 2008-09 33.51 132.78 166.28 155.15 -20.38 134.77 31.75 8.06 39.81 2009-10 33.69 159.26 192.95 184.61 -36.31 148.30 46.52 9.15 55.67 2010-11 37.68 163.60 201.28 194.82 -42.26 152.56 51.25 9.93 61.18 2011-12 38.09 171.73 209.82 203.20 -44.99 158.21 46.48 13.21 59.69 2012-13 37.86 184.80 222.66 217.74 -47.63 170.10 39.78 13.14 52.92
2013-14(p) 37.79 189.24 227.03 220.76 -51.15 169.61 34.64 13.03 47.67 Growth rate of 2013-14 over 2012-
13(%) -0.19 2.41 1.96 1.39 7.38 -0.29 -12.92 -0.79 -9.91
*: Million Tons **: Billion Cubic Meter
.@ Excludes LPG Production from Natural Gas Source : Ministry of Petroleum & Natural Gas.
ENERGY STATISTICS 2015 36
CHAPTER 6: CONSUMPTION OF ENERGY RESOURCES
CHAPTER 6: CONSUMPTION OF ENERGY RESOURCES 6.1 Consumption of Coal and Lignite
The estimated total consumption of raw coal by industry has increased from 407.04
MTs during 2005-06 to 571.89 MTs during 2013-14 with a CAGR of 3.85% (Table 6.1). The annual growth rate from 2012-13 to 2013-14 is 0.76%.
Consumption of Lignite increased from 30.23 MTs in 2005-06 to 43.90 MTs in 2013-14
registering a compound growth of 4.23%. Consumption of Lignite is highest in Electricity Generation sector, accounting for about 83.09% (Table 6.5) of the total lignite consumption.
Electricity generation is the biggest consumer of coal, followed by steel industries.
Industry-wise estimates of consumption of coal(Table 6.4) shows that during 2013-14 electricity generating units consumed 427.23 MTs of coal, followed by steel & washery industries (23.13 MTs), cement industries(11.96 MTs) and paper industries (1.67 MTs).
6.2 Consumption of Crude Oil and Natural Gas
The estimated consumption of crude oil has a steady increase, from 130.11 MMTs during 2005-06 to 222.50 MMTs during 2013-14 with CAGR of 6.14%. It increased from 219.21 MMTs in 2012-13 to 222.50 MMTs in 2013-14 (Table 6.1).
The maximum use of Natural Gas is in fertilizers industry (32.56%) followed by power
generation (31.02%) and 8.60% natural gas was used for domestic fuel (Table 6.8).
Industry wise off-take of natural gas shows that natural gas has been used both for Energy (59.42%) and Non-energy(40.58%) purposes (Table 6.8).
ENERGY STATISTICS 2015 37
CHAPTER 6: CONSUMPTION OF ENERGY RESOURCES
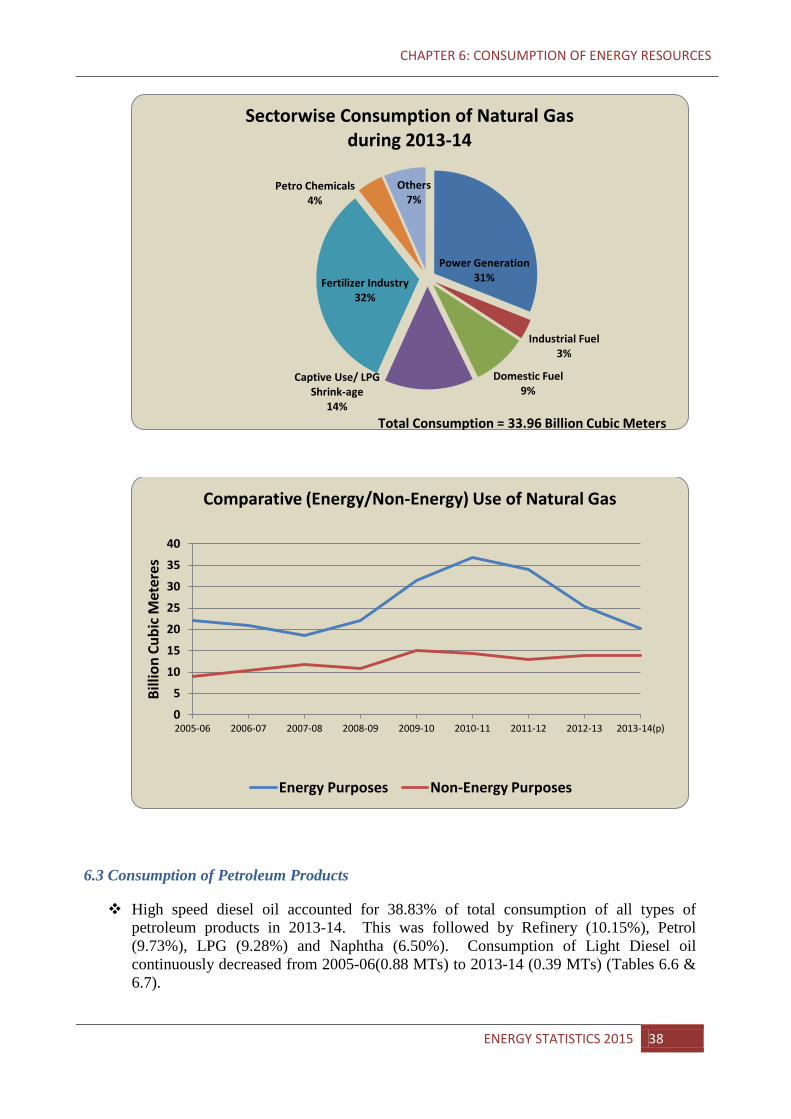
6.3 Consumption of Petroleum Products
High speed diesel oil accounted for 38.83% of total consumption of all types of petroleum products in 2013-14. This was followed by Refinery (10.15%), Petrol (9.73%), LPG (9.28%) and Naphtha (6.50%). Consumption of Light Diesel oil continuously decreased from 2005-06(0.88 MTs) to 2013-14 (0.39 MTs) (Tables 6.6 & 6.7).
Power Generation 31%
Industrial Fuel 3%
Domestic Fuel 9%
Captive Use/ LPG Shrink-age
14%
Fertilizer Industry 32%
Petro Chemicals 4%
Others 7%
Sectorwise Consumption of Natural Gas during 2013-14
Total Consumption = 33.96 Billion Cubic Meters
0
5
10
15
20
25
30
35
40
2005-06 2006-07 2007-08 2008-09 2009-10 2010-11 2011-12 2012-13 2013-14(p)
Billi
on C
ubic
Met
eres
Comparative (Energy/Non-Energy) Use of Natural Gas
Energy Purposes Non-Energy Purposes
ENERGY STATISTICS 2015 38
CHAPTER 6: CONSUMPTION OF ENERGY RESOURCES
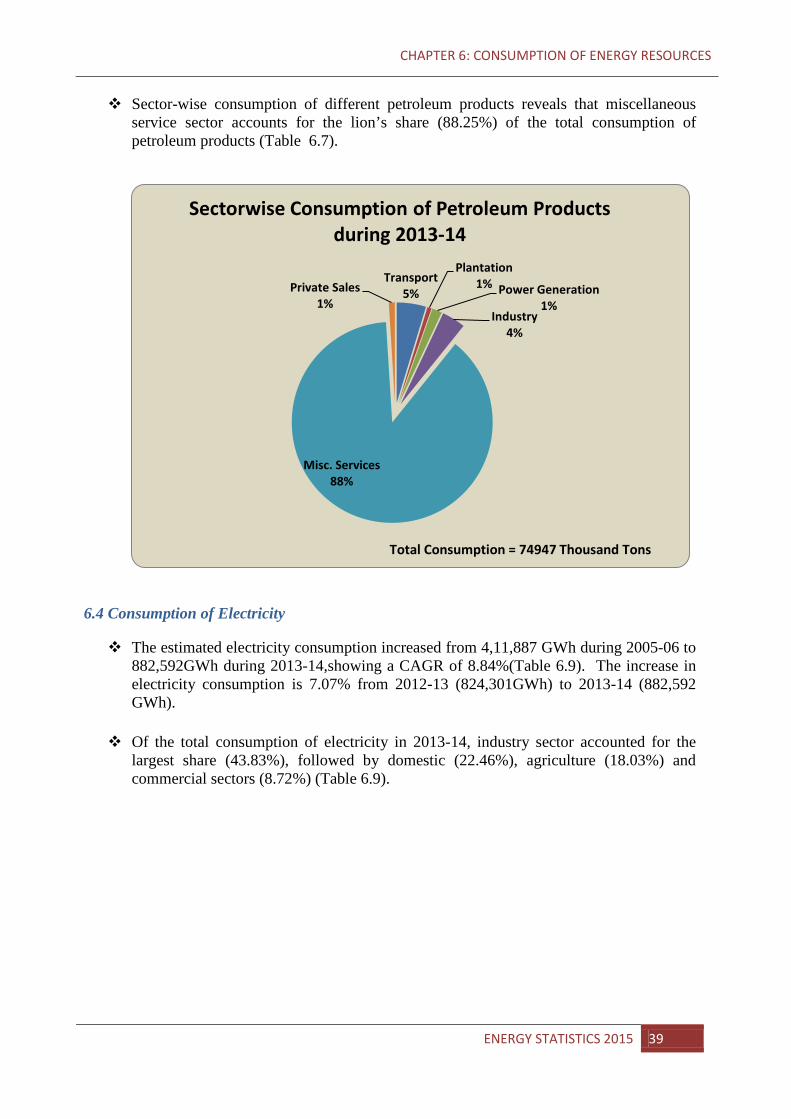
Sector-wise consumption of different petroleum products reveals that miscellaneous
service sector accounts for the lion’s share (88.25%) of the total consumption of petroleum products (Table 6.7).
6.4 Consumption of Electricity
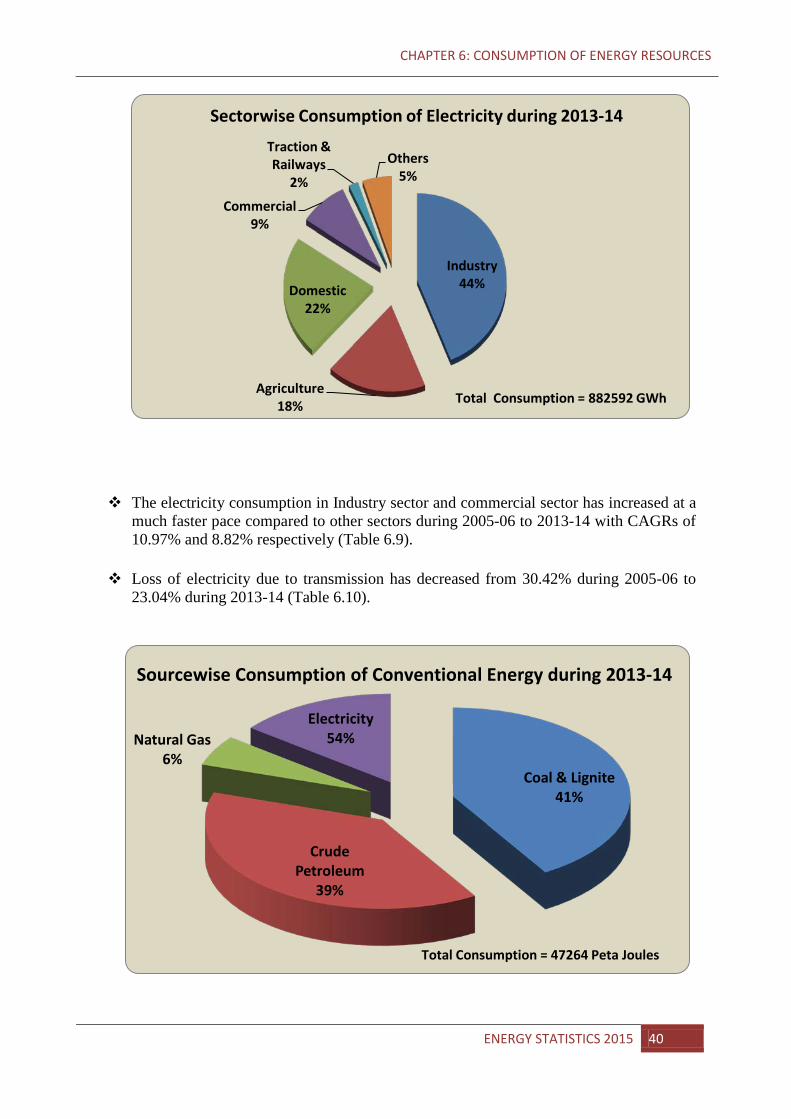
The estimated electricity consumption increased from 4,11,887 GWh during 2005-06 to 882,592GWh during 2013-14,showing a CAGR of 8.84%(Table 6.9). The increase in electricity consumption is 7.07% from 2012-13 (824,301GWh) to 2013-14 (882,592 GWh).
Of the total consumption of electricity in 2013-14, industry sector accounted for the
largest share (43.83%), followed by domestic (22.46%), agriculture (18.03%) and commercial sectors (8.72%) (Table 6.9).
Transport 5%
Plantation 1% Power Generation
1% Industry
4%
Misc. Services 88%
Private Sales 1%
Sectorwise Consumption of Petroleum Products during 2013-14
Total Consumption = 74947 Thousand Tons
ENERGY STATISTICS 2015 39
CHAPTER 6: CONSUMPTION OF ENERGY RESOURCES
The electricity consumption in Industry sector and commercial sector has increased at a much faster pace compared to other sectors during 2005-06 to 2013-14 with CAGRs of 10.97% and 8.82% respectively (Table 6.9).
Loss of electricity due to transmission has decreased from 30.42% during 2005-06 to
23.04% during 2013-14 (Table 6.10).
Industry 44%
Agriculture 18%
Domestic 22%
Commercial 9%
Traction & Railways
2%
Others 5%
Sectorwise Consumption of Electricity during 2013-14
Total Consumption = 882592 GWh
Coal & Lignite 41%
Crude Petroleum
39%
Natural Gas 6%
Electricity 54%
Sourcewise Consumption of Conventional Energy during 2013-14
Total Consumption = 47264 Peta Joules
ENERGY STATISTICS 2015 40
CHAPTER 6: CONSUMPTION OF ENERGY RESOURCES
6.5 Per-Capita Energy Consumption & Energy Intensity
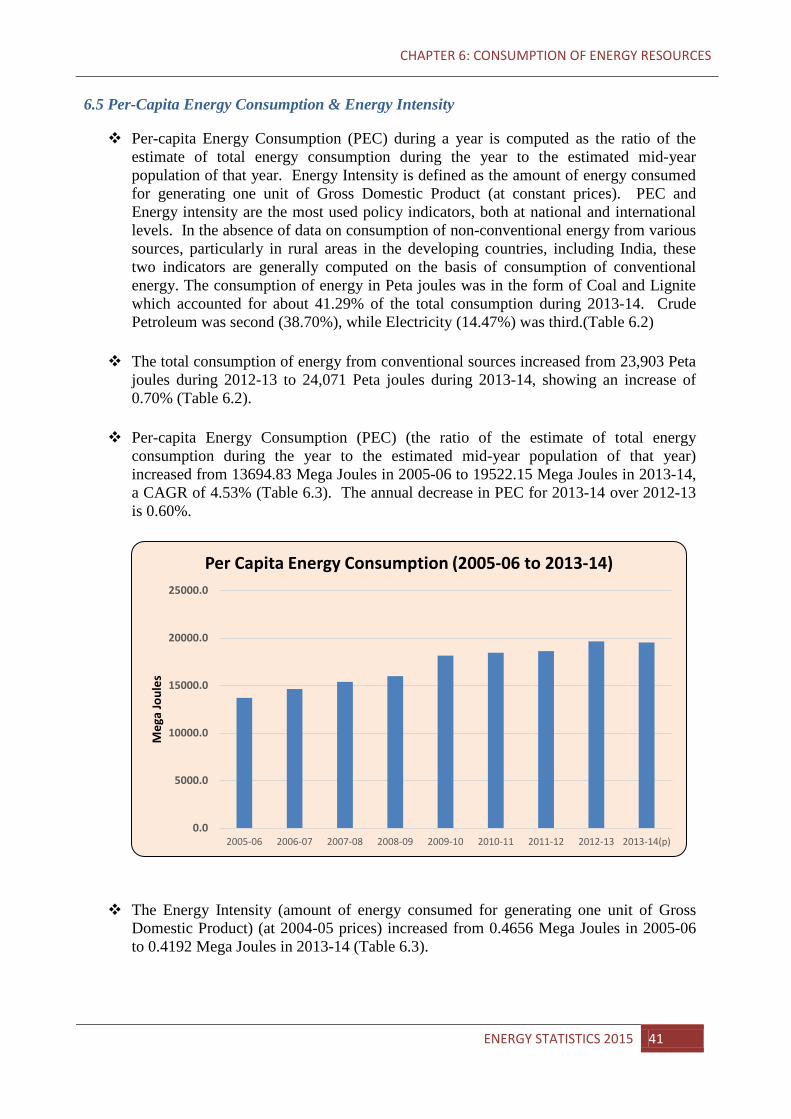
Per-capita Energy Consumption (PEC) during a year is computed as the ratio of the estimate of total energy consumption during the year to the estimated mid-year population of that year. Energy Intensity is defined as the amount of energy consumed for generating one unit of Gross Domestic Product (at constant prices). PEC and Energy intensity are the most used policy indicators, both at national and international levels. In the absence of data on consumption of non-conventional energy from various sources, particularly in rural areas in the developing countries, including India, these two indicators are generally computed on the basis of consumption of conventional energy. The consumption of energy in Peta joules was in the form of Coal and Lignite which accounted for about 41.29% of the total consumption during 2013-14. Crude Petroleum was second (38.70%), while Electricity (14.47%) was third.(Table 6.2)
The total consumption of energy from conventional sources increased from 23,903 Peta
joules during 2012-13 to 24,071 Peta joules during 2013-14, showing an increase of 0.70% (Table 6.2).
Per-capita Energy Consumption (PEC) (the ratio of the estimate of total energy consumption during the year to the estimated mid-year population of that year) increased from 13694.83 Mega Joules in 2005-06 to 19522.15 Mega Joules in 2013-14, a CAGR of 4.53% (Table 6.3). The annual decrease in PEC for 2013-14 over 2012-13 is 0.60%.
The Energy Intensity (amount of energy consumed for generating one unit of Gross
Domestic Product) (at 2004-05 prices) increased from 0.4656 Mega Joules in 2005-06 to 0.4192 Mega Joules in 2013-14 (Table 6.3).
0.0
5000.0
10000.0
15000.0
20000.0
25000.0
2005-06 2006-07 2007-08 2008-09 2009-10 2010-11 2011-12 2012-13 2013-14(p)
Meg
a Jo
ules
Per Capita Energy Consumption (2005-06 to 2013-14)
ENERGY STATISTICS 2015 41
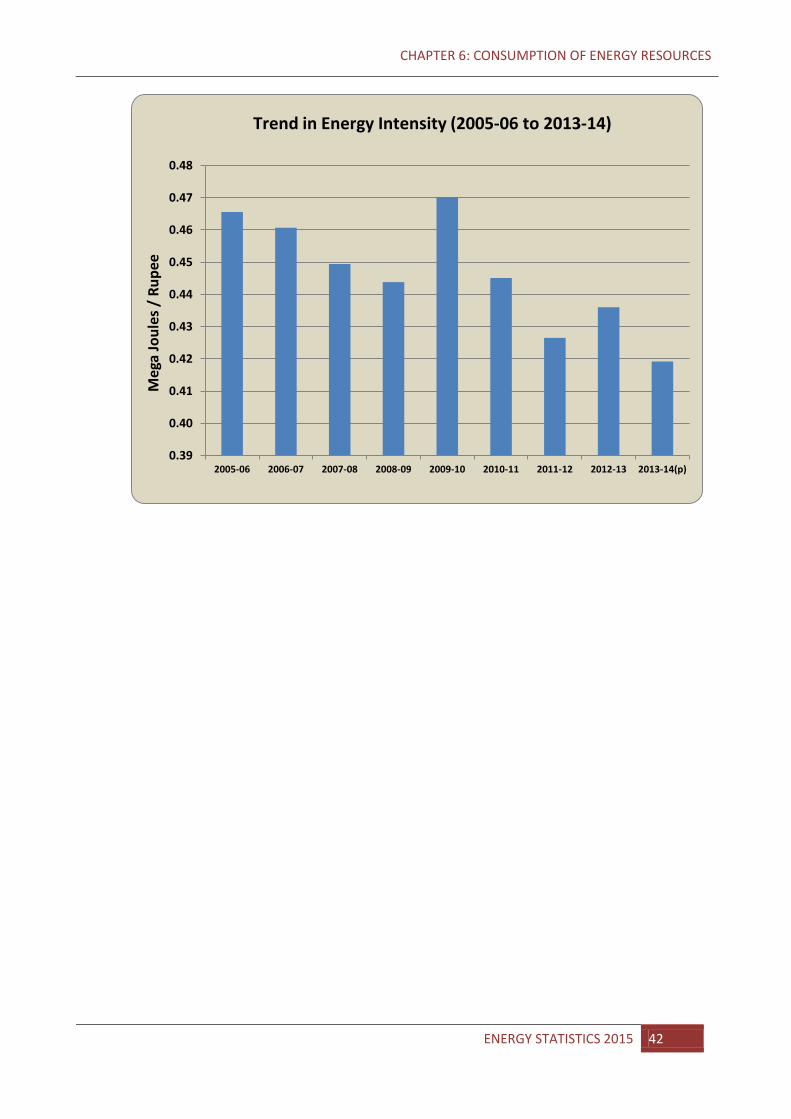
CHAPTER 6: CONSUMPTION OF ENERGY RESOURCES
0.39
0.40
0.41
0.42
0.43
0.44
0.45
0.46
0.47
0.48
2005-06 2006-07 2007-08 2008-09 2009-10 2010-11 2011-12 2012-13 2013-14(p)
Meg
a Jo
ules
/ R
upee
Trend in Energy Intensity (2005-06 to 2013-14)
ENERGY STATISTICS 2015 42
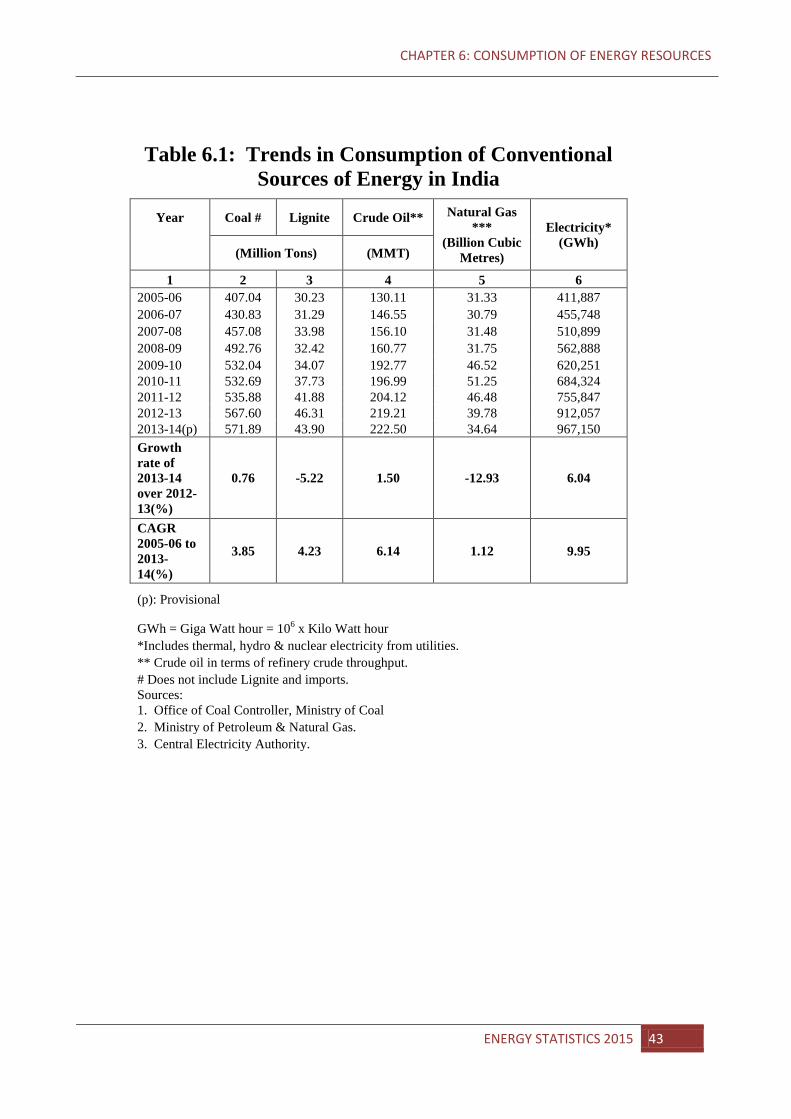
CHAPTER 6: CONSUMPTION OF ENERGY RESOURCES
Table 6.1: Trends in Consumption of Conventional Sources of Energy in India
Year Coal # Lignite Crude Oil** Natural Gas
*** (Billion Cubic
Metres)
Electricity* (GWh)
(Million Tons) (MMT) 1 2 3 4 5 6
2005-06 407.04 30.23 130.11 31.33 411,887 2006-07 430.83 31.29 146.55 30.79 455,748 2007-08 457.08 33.98 156.10 31.48 510,899 2008-09 492.76 32.42 160.77 31.75 562,888 2009-10 532.04 34.07 192.77 46.52 620,251 2010-11 532.69 37.73 196.99 51.25 684,324 2011-12 535.88 41.88 204.12 46.48 755,847 2012-13 567.60 46.31 219.21 39.78 912,057 2013-14(p) 571.89 43.90 222.50 34.64 967,150 Growth
rate of 2013-14 over 2012-13(%)
0.76 -5.22 1.50 -12.93 6.04
CAGR 2005-06 to 2013-14(%)
3.85 4.23 6.14 1.12 9.95
(p): Provisional GWh = Giga Watt hour = 106 x Kilo Watt hour
*Includes thermal, hydro & nuclear electricity from utilities. ** Crude oil in terms of refinery crude throughput. # Does not include Lignite and imports.
Sources: 1. Office of Coal Controller, Ministry of Coal
2. Ministry of Petroleum & Natural Gas. 3. Central Electricity Authority.
ENERGY STATISTICS 2015 43
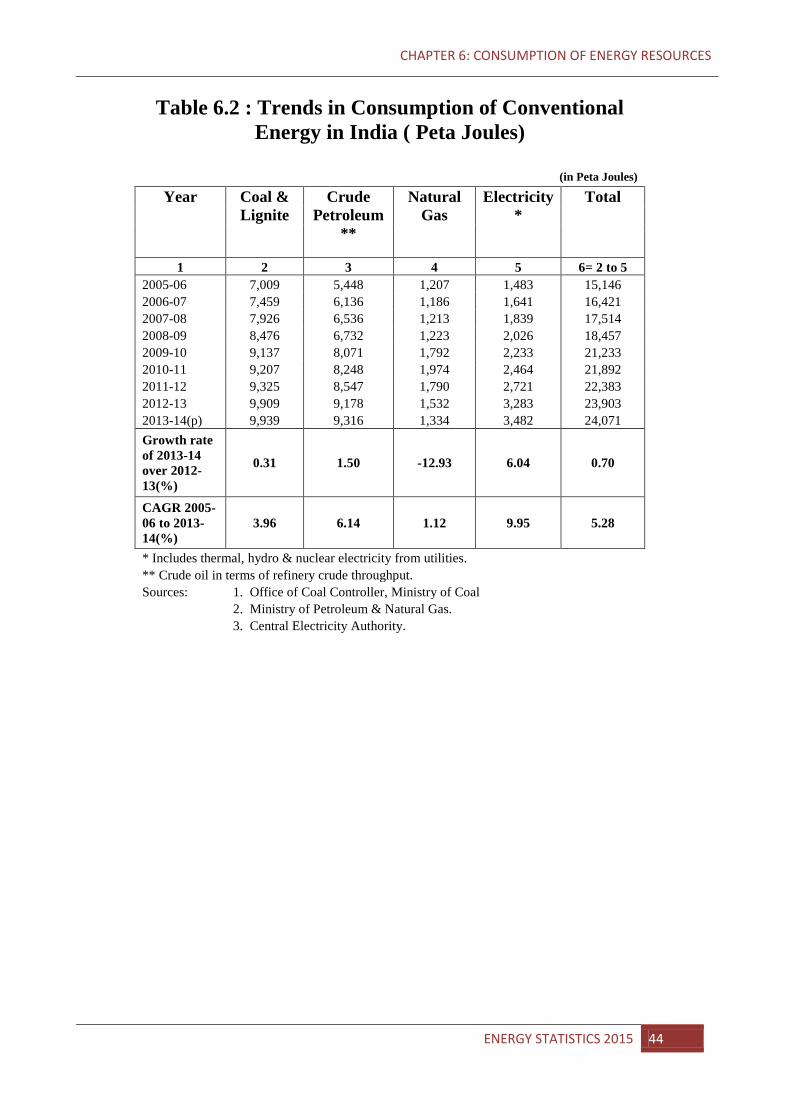
CHAPTER 6: CONSUMPTION OF ENERGY RESOURCES
Table 6.2 : Trends in Consumption of Conventional Energy in India ( Peta Joules)
(in Peta Joules)
Year Coal & Lignite
Crude Petroleum
**
Natural Gas
Electricity *
Total
1 2 3 4 5 6= 2 to 5 2005-06 7,009 5,448 1,207 1,483 15,146 2006-07 7,459 6,136 1,186 1,641 16,421 2007-08 7,926 6,536 1,213 1,839 17,514 2008-09 8,476 6,732 1,223 2,026 18,457 2009-10 9,137 8,071 1,792 2,233 21,233 2010-11 9,207 8,248 1,974 2,464 21,892 2011-12 9,325 8,547 1,790 2,721 22,383 2012-13 9,909 9,178 1,532 3,283 23,903 2013-14(p) 9,939 9,316 1,334 3,482 24,071 Growth rate of 2013-14 over 2012-13(%)
0.31 1.50 -12.93 6.04 0.70
CAGR 2005-06 to 2013-14(%)
3.96 6.14 1.12 9.95 5.28
* Includes thermal, hydro & nuclear electricity from utilities. ** Crude oil in terms of refinery crude throughput.
Sources: 1. Office of Coal Controller, Ministry of Coal
2. Ministry of Petroleum & Natural Gas.
3. Central Electricity Authority.
ENERGY STATISTICS 2015 44
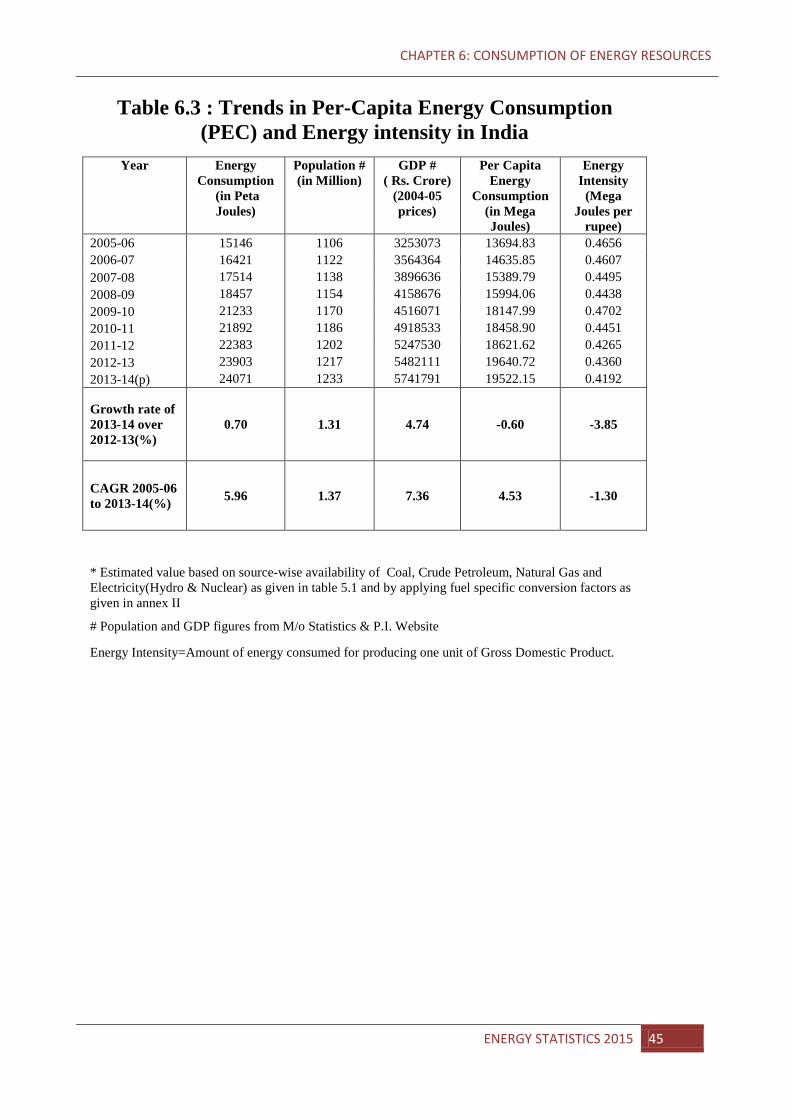
CHAPTER 6: CONSUMPTION OF ENERGY RESOURCES
Table 6.3 : Trends in Per-Capita Energy Consumption (PEC) and Energy intensity in India
Year Energy Consumption
(in Peta Joules)
Population # (in Million)
GDP # ( Rs. Crore)
(2004-05 prices)
Per Capita Energy
Consumption (in Mega Joules)
Energy Intensity
(Mega Joules per
rupee) 2005-06 15146 1106 3253073 13694.83 0.4656 2006-07 16421 1122 3564364 14635.85 0.4607 2007-08 17514 1138 3896636 15389.79 0.4495 2008-09 18457 1154 4158676 15994.06 0.4438 2009-10 21233 1170 4516071 18147.99 0.4702 2010-11 21892 1186 4918533 18458.90 0.4451 2011-12 22383 1202 5247530 18621.62 0.4265 2012-13 23903 1217 5482111 19640.72 0.4360 2013-14(p) 24071 1233 5741791 19522.15 0.4192
Growth rate of 2013-14 over 2012-13(%)
0.70 1.31 4.74 -0.60 -3.85
CAGR 2005-06 to 2013-14(%) 5.96 1.37 7.36 4.53 -1.30
* Estimated value based on source-wise availability of Coal, Crude Petroleum, Natural Gas and Electricity(Hydro & Nuclear) as given in table 5.1 and by applying fuel specific conversion factors as given in annex II
# Population and GDP figures from M/o Statistics & P.I. Website
Energy Intensity=Amount of energy consumed for producing one unit of Gross Domestic Product.
ENERGY STATISTICS 2015 45
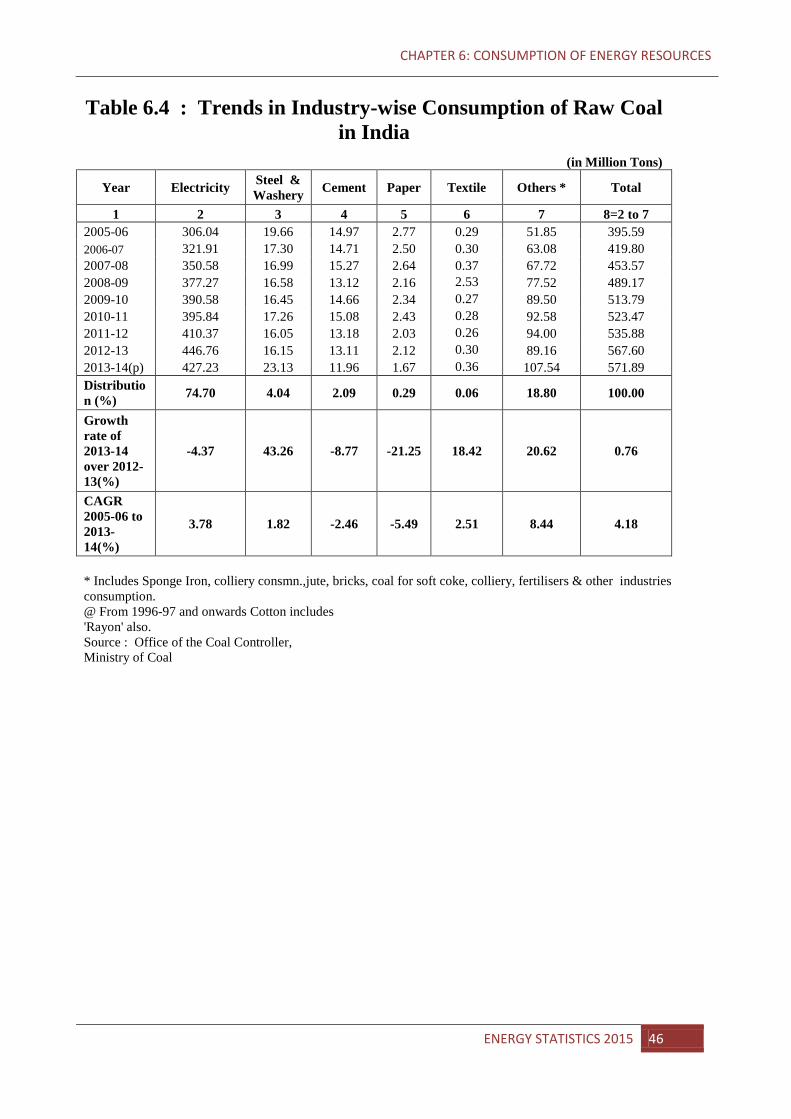
CHAPTER 6: CONSUMPTION OF ENERGY RESOURCES
Table 6.4 : Trends in Industry-wise Consumption of Raw Coal in India
(in Million Tons)
Year Electricity Steel & Washery Cement Paper Textile Others * Total
1 2 3 4 5 6 7 8=2 to 7 2005-06 306.04 19.66 14.97 2.77 0.29 51.85 395.59 2006-07 321.91 17.30 14.71 2.50 0.30 63.08 419.80 2007-08 350.58 16.99 15.27 2.64 0.37 67.72 453.57 2008-09 377.27 16.58 13.12 2.16 2.53 77.52 489.17 2009-10 390.58 16.45 14.66 2.34 0.27 89.50 513.79 2010-11 395.84 17.26 15.08 2.43 0.28 92.58 523.47 2011-12 410.37 16.05 13.18 2.03 0.26 94.00 535.88 2012-13 446.76 16.15 13.11 2.12 0.30 89.16 567.60 2013-14(p) 427.23 23.13 11.96 1.67 0.36 107.54 571.89 Distributio
n (%) 74.70 4.04 2.09 0.29 0.06 18.80 100.00
Growth rate of 2013-14 over 2012-13(%)
-4.37 43.26 -8.77 -21.25 18.42 20.62 0.76
CAGR 2005-06 to 2013-14(%)
3.78 1.82 -2.46 -5.49 2.51 8.44 4.18
* Includes Sponge Iron, colliery consmn.,jute, bricks, coal for soft coke, colliery, fertilisers & other industries consumption. @ From 1996-97 and onwards Cotton includes 'Rayon' also.
Source : Office of the Coal Controller, Ministry of Coal
ENERGY STATISTICS 2015 46
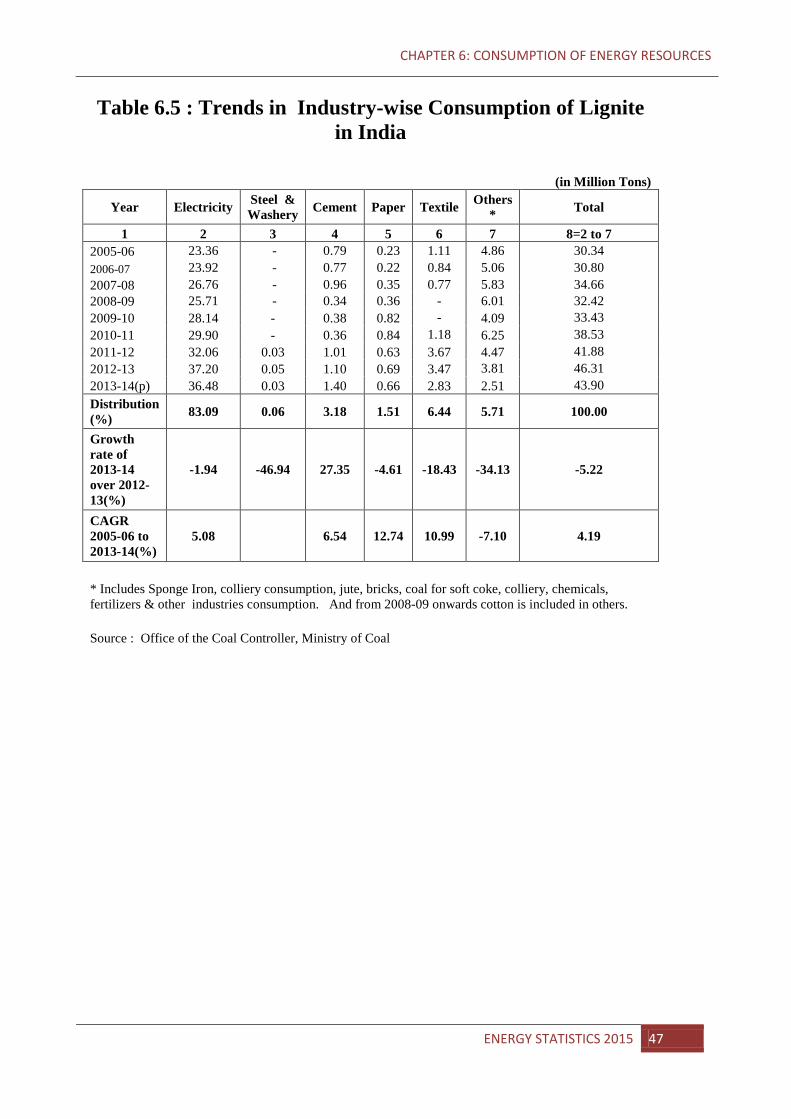
CHAPTER 6: CONSUMPTION OF ENERGY RESOURCES
Table 6.5 : Trends in Industry-wise Consumption of Lignite in India
(in Million Tons)
Year Electricity Steel & Washery Cement Paper Textile Others
* Total
1 2 3 4 5 6 7 8=2 to 7 2005-06 23.36 - 0.79 0.23 1.11 4.86 30.34 2006-07 23.92 - 0.77 0.22 0.84 5.06 30.80 2007-08 26.76 - 0.96 0.35 0.77 5.83 34.66 2008-09 25.71 - 0.34 0.36 - 6.01 32.42 2009-10 28.14 - 0.38 0.82 - 4.09 33.43 2010-11 29.90 - 0.36 0.84 1.18 6.25 38.53 2011-12 32.06 0.03 1.01 0.63 3.67 4.47 41.88 2012-13 37.20 0.05 1.10 0.69 3.47 3.81 46.31 2013-14(p) 36.48 0.03 1.40 0.66 2.83 2.51 43.90 Distribution (%) 83.09 0.06 3.18 1.51 6.44 5.71 100.00
Growth rate of 2013-14 over 2012-13(%)
-1.94 -46.94 27.35 -4.61 -18.43 -34.13 -5.22
CAGR 2005-06 to 2013-14(%)
5.08 6.54 12.74 10.99 -7.10 4.19
* Includes Sponge Iron, colliery consumption, jute, bricks, coal for soft coke, colliery, chemicals, fertilizers & other industries consumption. And from 2008-09 onwards cotton is included in others.
Source : Office of the Coal Controller, Ministry of Coal
ENERGY STATISTICS 2015 47
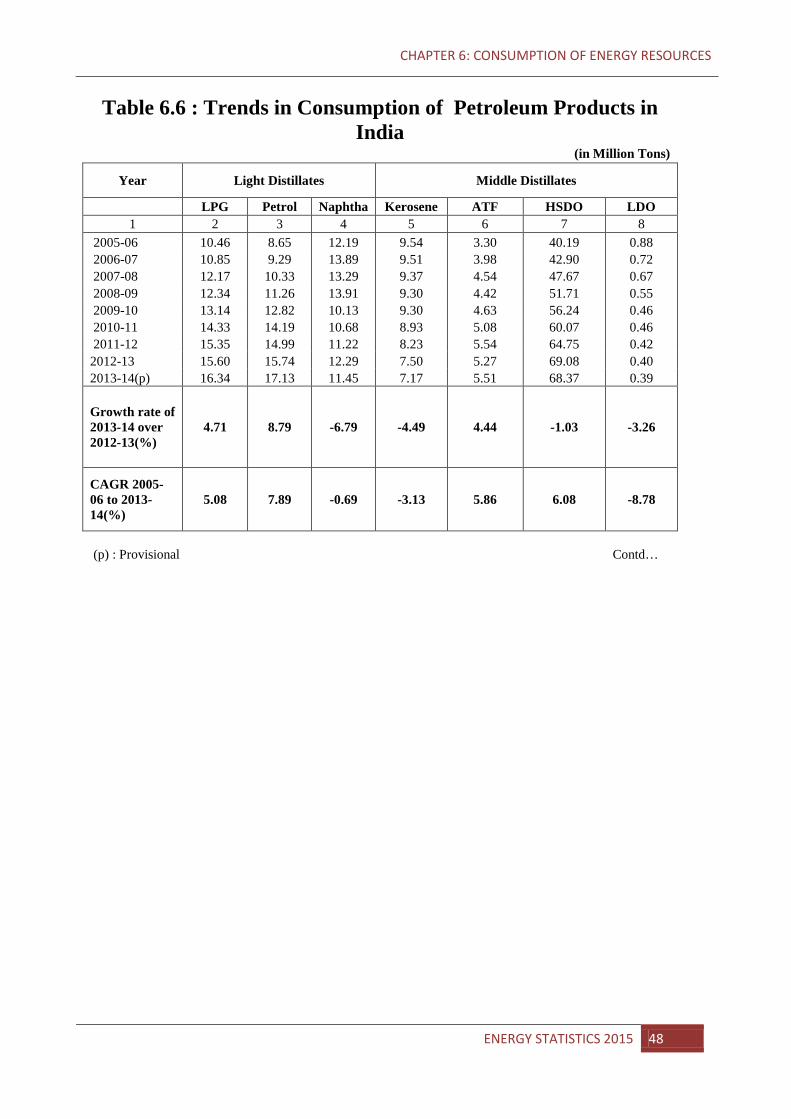
CHAPTER 6: CONSUMPTION OF ENERGY RESOURCES
Table 6.6 : Trends in Consumption of Petroleum Products in India
(in Million Tons)
Year Light Distillates Middle Distillates
LPG Petrol Naphtha Kerosene ATF HSDO LDO 1 2 3 4 5 6 7 8
2005-06 10.46 8.65 12.19 9.54 3.30 40.19 0.88 2006-07 10.85 9.29 13.89 9.51 3.98 42.90 0.72 2007-08 12.17 10.33 13.29 9.37 4.54 47.67 0.67 2008-09 12.34 11.26 13.91 9.30 4.42 51.71 0.55 2009-10 13.14 12.82 10.13 9.30 4.63 56.24 0.46 2010-11 14.33 14.19 10.68 8.93 5.08 60.07 0.46 2011-12 15.35 14.99 11.22 8.23 5.54 64.75 0.42 2012-13 15.60 15.74 12.29 7.50 5.27 69.08 0.40 2013-14(p) 16.34 17.13 11.45 7.17 5.51 68.37 0.39
Growth rate of 2013-14 over 2012-13(%)
4.71 8.79 -6.79 -4.49 4.44 -1.03 -3.26
CAGR 2005-06 to 2013-14(%)
5.08 7.89 -0.69 -3.13 5.86 6.08 -8.78
(p) : Provisional
Contd…
ENERGY STATISTICS 2015 48
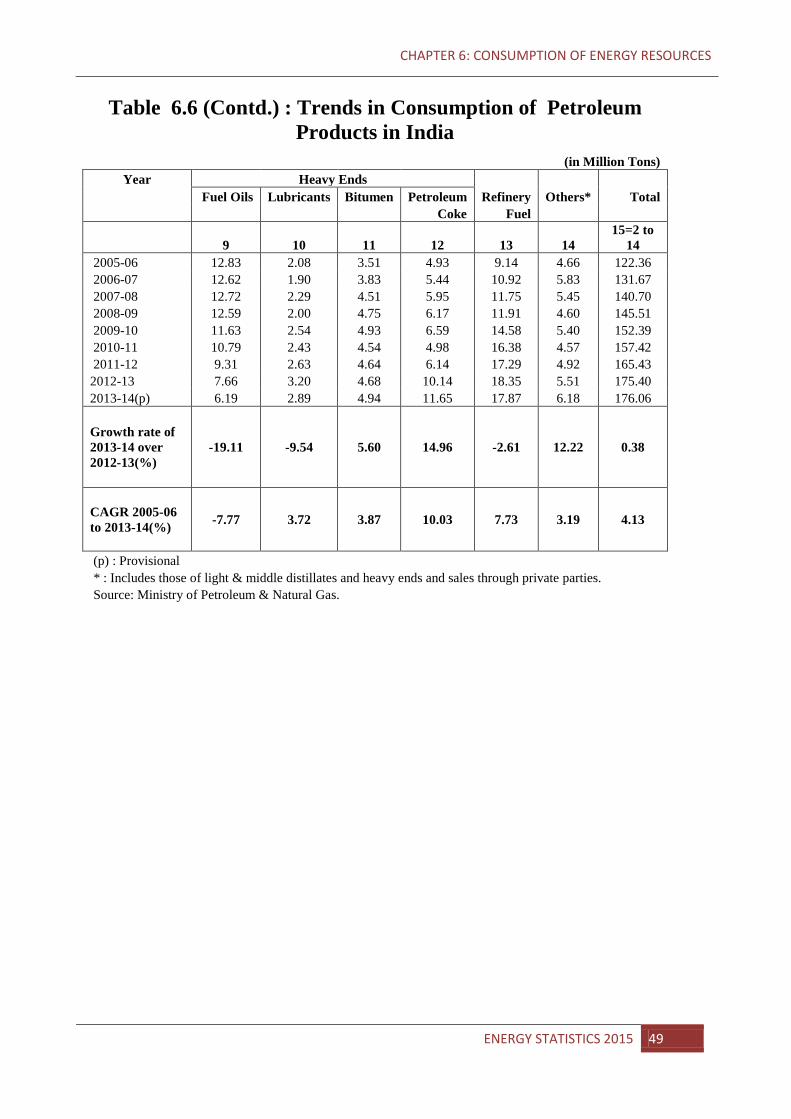
CHAPTER 6: CONSUMPTION OF ENERGY RESOURCES
Table 6.6 (Contd.) : Trends in Consumption of Petroleum Products in India
(in Million Tons) Year Heavy Ends
Fuel Oils Lubricants Bitumen Petroleum Refinery Others* Total Coke Fuel
9 10 11 12 13 14 15=2 to
14 2005-06 12.83 2.08 3.51 4.93 9.14 4.66 122.36 2006-07 12.62 1.90 3.83 5.44 10.92 5.83 131.67 2007-08 12.72 2.29 4.51 5.95 11.75 5.45 140.70 2008-09 12.59 2.00 4.75 6.17 11.91 4.60 145.51 2009-10 11.63 2.54 4.93 6.59 14.58 5.40 152.39 2010-11 10.79 2.43 4.54 4.98 16.38 4.57 157.42 2011-12 9.31 2.63 4.64 6.14 17.29 4.92 165.43 2012-13 7.66 3.20 4.68 10.14 18.35 5.51 175.40 2013-14(p) 6.19 2.89 4.94 11.65 17.87 6.18 176.06
Growth rate of 2013-14 over 2012-13(%)
-19.11 -9.54 5.60 14.96 -2.61 12.22 0.38
CAGR 2005-06 to 2013-14(%) -7.77 3.72 3.87 10.03 7.73 3.19 4.13
(p) : Provisional * : Includes those of light & middle distillates and heavy ends and sales through private parties.
Source: Ministry of Petroleum & Natural Gas.
ENERGY STATISTICS 2015 49
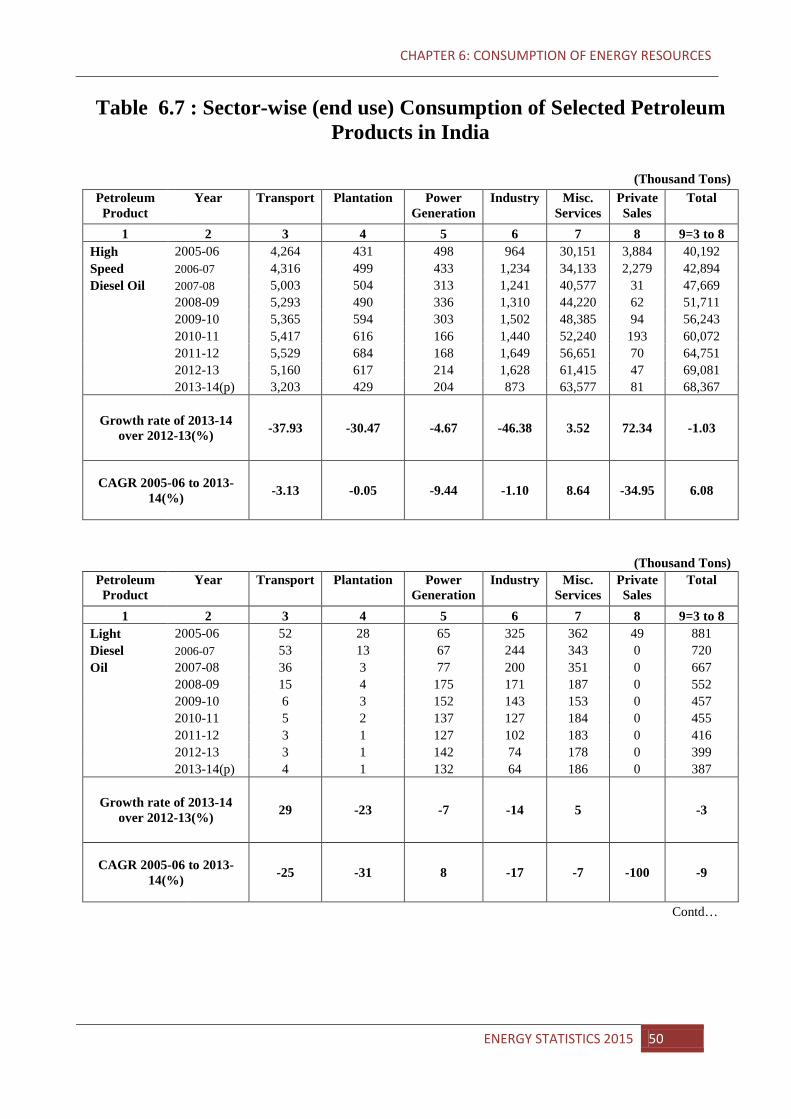
CHAPTER 6: CONSUMPTION OF ENERGY RESOURCES
Table 6.7 : Sector-wise (end use) Consumption of Selected Petroleum Products in India
(Thousand Tons)
Petroleum Product
Year Transport Plantation Power Generation
Industry Misc. Services
Private Sales
Total
1 2 3 4 5 6 7 8 9=3 to 8 High 2005-06 4,264 431 498 964 30,151 3,884 40,192 Speed 2006-07 4,316 499 433 1,234 34,133 2,279 42,894 Diesel Oil 2007-08 5,003 504 313 1,241 40,577 31 47,669 2008-09 5,293 490 336 1,310 44,220 62 51,711 2009-10 5,365 594 303 1,502 48,385 94 56,243 2010-11 5,417 616 166 1,440 52,240 193 60,072 2011-12 5,529 684 168 1,649 56,651 70 64,751 2012-13 5,160 617 214 1,628 61,415 47 69,081 2013-14(p) 3,203 429 204 873 63,577 81 68,367
Growth rate of 2013-14 over 2012-13(%) -37.93 -30.47 -4.67 -46.38 3.52 72.34 -1.03
CAGR 2005-06 to 2013-14(%) -3.13 -0.05 -9.44 -1.10 8.64 -34.95 6.08
(Thousand Tons) Petroleum Product
Year Transport Plantation Power Generation
Industry Misc. Services
Private Sales
Total
1 2 3 4 5 6 7 8 9=3 to 8 Light 2005-06 52 28 65 325 362 49 881 Diesel 2006-07 53 13 67 244 343 0 720 Oil 2007-08 36 3 77 200 351 0 667 2008-09 15 4 175 171 187 0 552 2009-10 6 3 152 143 153 0 457 2010-11 5 2 137 127 184 0 455 2011-12 3 1 127 102 183 0 416 2012-13 3 1 142 74 178 0 399 2013-14(p) 4 1 132 64 186 0 387
Growth rate of 2013-14 over 2012-13(%) 29 -23 -7 -14 5 -3
CAGR 2005-06 to 2013-14(%) -25 -31 8 -17 -7 -100 -9
Contd…
ENERGY STATISTICS 2015 50
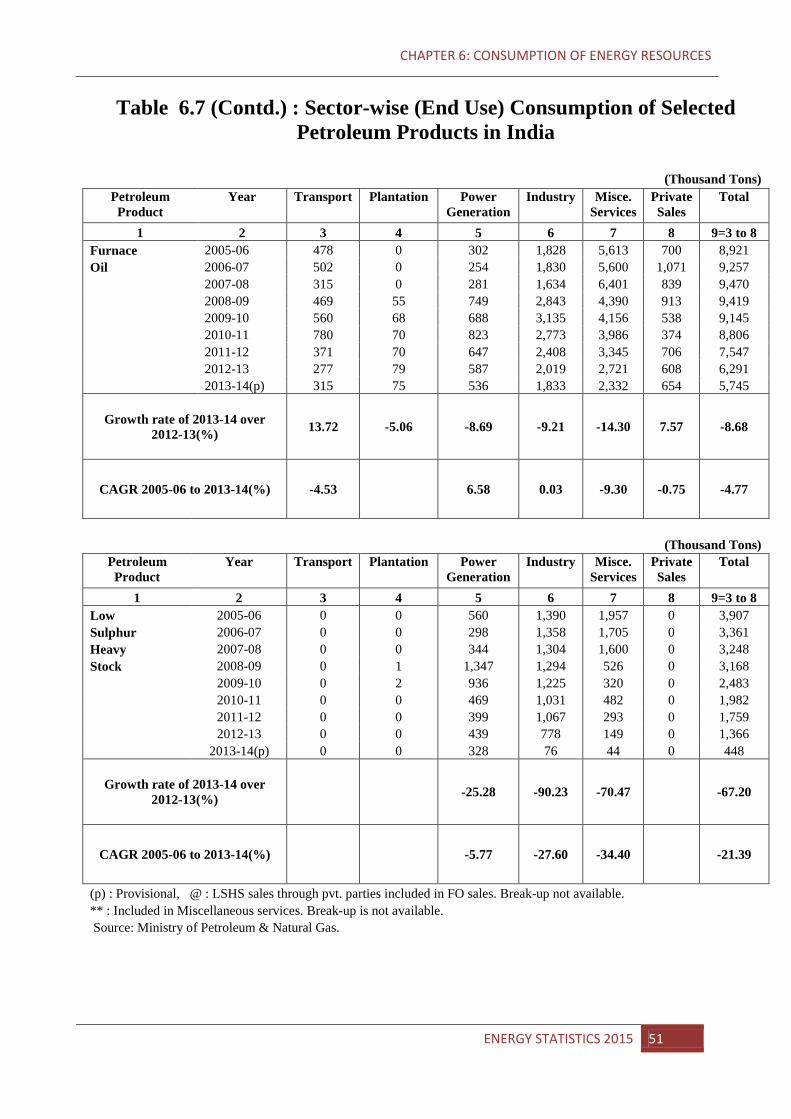
CHAPTER 6: CONSUMPTION OF ENERGY RESOURCES
Table 6.7 (Contd.) : Sector-wise (End Use) Consumption of Selected Petroleum Products in India
(Thousand Tons)
Petroleum Product
Year Transport Plantation Power Generation
Industry Misce. Services
Private Sales
Total
1 2 3 4 5 6 7 8 9=3 to 8 Furnace 2005-06 478 0 302 1,828 5,613 700 8,921 Oil 2006-07 502 0 254 1,830 5,600 1,071 9,257 2007-08 315 0 281 1,634 6,401 839 9,470 2008-09 469 55 749 2,843 4,390 913 9,419
2009-10 560 68 688 3,135 4,156 538 9,145 2010-11 780 70 823 2,773 3,986 374 8,806 2011-12 371 70 647 2,408 3,345 706 7,547 2012-13 277 79 587 2,019 2,721 608 6,291 2013-14(p) 315 75 536 1,833 2,332 654 5,745
Growth rate of 2013-14 over 2012-13(%) 13.72 -5.06 -8.69 -9.21 -14.30 7.57 -8.68
CAGR 2005-06 to 2013-14(%) -4.53 6.58 0.03 -9.30 -0.75 -4.77
(Thousand Tons)
Petroleum Product
Year Transport Plantation Power Generation
Industry Misce. Services
Private Sales
Total
1 2 3 4 5 6 7 8 9=3 to 8 Low 2005-06 0 0 560 1,390 1,957 0 3,907 Sulphur 2006-07 0 0 298 1,358 1,705 0 3,361 Heavy 2007-08 0 0 344 1,304 1,600 0 3,248 Stock 2008-09 0 1 1,347 1,294 526 0 3,168
2009-10 0 2 936 1,225 320 0 2,483 2010-11 0 0 469 1,031 482 0 1,982 2011-12 0 0 399 1,067 293 0 1,759 2012-13 0 0 439 778 149 0 1,366 2013-14(p) 0 0 328 76 44 0 448
Growth rate of 2013-14 over 2012-13(%) -25.28 -90.23 -70.47 -67.20
CAGR 2005-06 to 2013-14(%) -5.77 -27.60 -34.40 -21.39
(p) : Provisional, @ : LSHS sales through pvt. parties included in FO sales. Break-up not available. ** : Included in Miscellaneous services. Break-up is not available.
Source: Ministry of Petroleum & Natural Gas.
ENERGY STATISTICS 2015 51
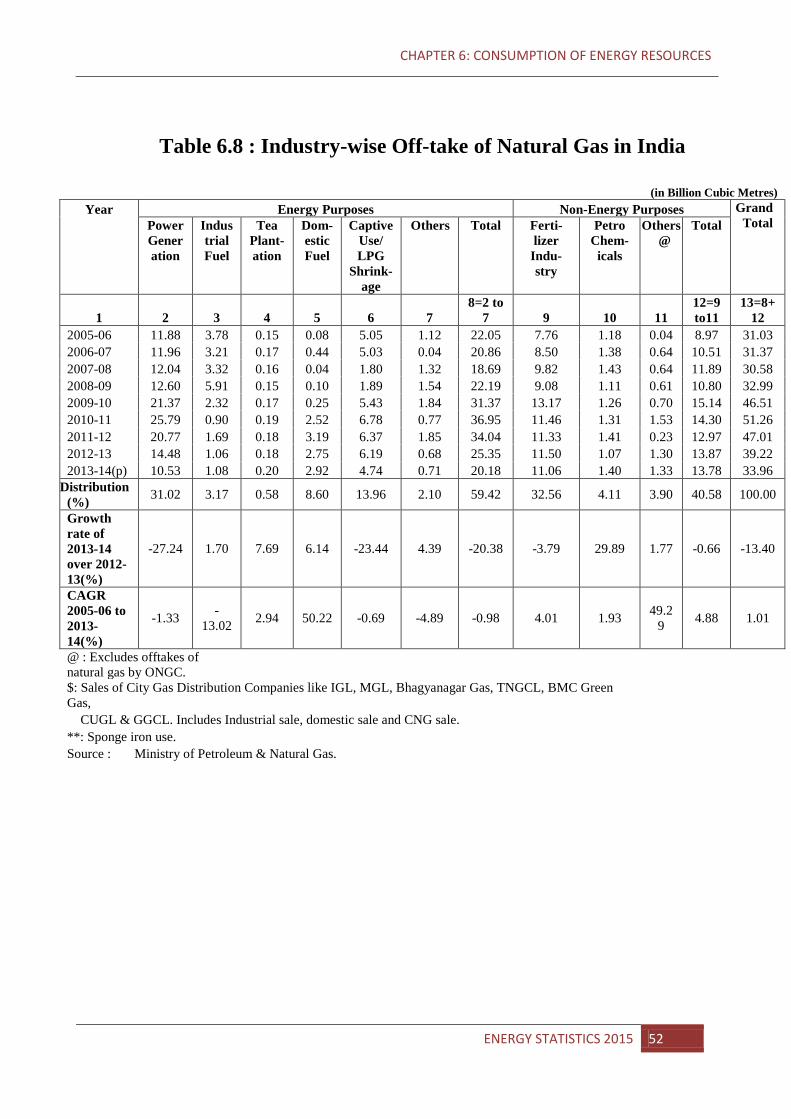
CHAPTER 6: CONSUMPTION OF ENERGY RESOURCES
Table 6.8 : Industry-wise Off-take of Natural Gas in India
(in Billion Cubic Metres) Year Energy Purposes Non-Energy Purposes Grand
Total
Power Generation
Industrial Fuel
Tea Plant-ation
Dom-estic Fuel
Captive Use/ LPG
Shrink-age
Others Total Ferti-lizer
Indu-stry
Petro Chem-
icals
Others @
Total
1 2 3 4 5 6 7 8=2 to
7 9 10 11 12=9 to11
13=8+12
2005-06 11.88 3.78 0.15 0.08 5.05 1.12 22.05 7.76 1.18 0.04 8.97 31.03 2006-07 11.96 3.21 0.17 0.44 5.03 0.04 20.86 8.50 1.38 0.64 10.51 31.37 2007-08 12.04 3.32 0.16 0.04 1.80 1.32 18.69 9.82 1.43 0.64 11.89 30.58 2008-09 12.60 5.91 0.15 0.10 1.89 1.54 22.19 9.08 1.11 0.61 10.80 32.99 2009-10 21.37 2.32 0.17 0.25 5.43 1.84 31.37 13.17 1.26 0.70 15.14 46.51 2010-11 25.79 0.90 0.19 2.52 6.78 0.77 36.95 11.46 1.31 1.53 14.30 51.26 2011-12 20.77 1.69 0.18 3.19 6.37 1.85 34.04 11.33 1.41 0.23 12.97 47.01 2012-13 14.48 1.06 0.18 2.75 6.19 0.68 25.35 11.50 1.07 1.30 13.87 39.22 2013-14(p) 10.53 1.08 0.20 2.92 4.74 0.71 20.18 11.06 1.40 1.33 13.78 33.96
Distribution (%) 31.02 3.17 0.58 8.60 13.96 2.10 59.42 32.56 4.11 3.90 40.58 100.00
Growth rate of 2013-14 over 2012-13(%)
-27.24 1.70 7.69 6.14 -23.44 4.39 -20.38 -3.79 29.89 1.77 -0.66 -13.40
CAGR 2005-06 to 2013-14(%)
-1.33 -13.02 2.94 50.22 -0.69 -4.89 -0.98 4.01 1.93 49.2
9 4.88 1.01
@ : Excludes offtakes of natural gas by ONGC.
$: Sales of City Gas Distribution Companies like IGL, MGL, Bhagyanagar Gas, TNGCL, BMC Green Gas,
CUGL & GGCL. Includes Industrial sale, domestic sale and CNG sale. **: Sponge iron use.
Source : Ministry of Petroleum & Natural Gas.
ENERGY STATISTICS 2015 52
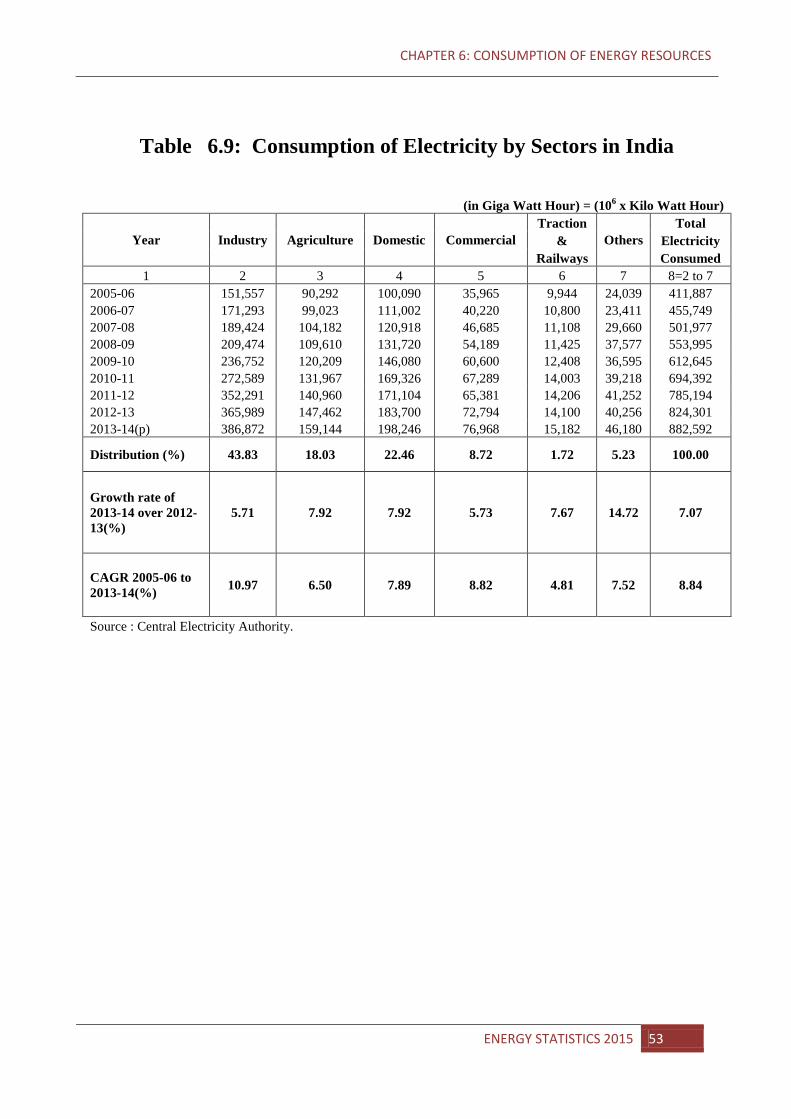
CHAPTER 6: CONSUMPTION OF ENERGY RESOURCES
Table 6.9: Consumption of Electricity by Sectors in India
(in Giga Watt Hour) = (106 x Kilo Watt Hour)
Year Industry Agriculture Domestic Commercial Traction
Others Total
& Electricity Railways Consumed
1 2 3 4 5 6 7 8=2 to 7 2005-06 151,557 90,292 100,090 35,965 9,944 24,039 411,887 2006-07 171,293 99,023 111,002 40,220 10,800 23,411 455,749 2007-08 189,424 104,182 120,918 46,685 11,108 29,660 501,977 2008-09 209,474 109,610 131,720 54,189 11,425 37,577 553,995 2009-10 236,752 120,209 146,080 60,600 12,408 36,595 612,645 2010-11 272,589 131,967 169,326 67,289 14,003 39,218 694,392 2011-12 352,291 140,960 171,104 65,381 14,206 41,252 785,194 2012-13 365,989 147,462 183,700 72,794 14,100 40,256 824,301 2013-14(p) 386,872 159,144 198,246 76,968 15,182 46,180 882,592
Distribution (%) 43.83 18.03 22.46 8.72 1.72 5.23 100.00
Growth rate of 2013-14 over 2012-13(%)
5.71 7.92 7.92 5.73 7.67 14.72 7.07
CAGR 2005-06 to 2013-14(%) 10.97 6.50 7.89 8.82 4.81 7.52 8.84
Source : Central Electricity Authority.
ENERGY STATISTICS 2015 53
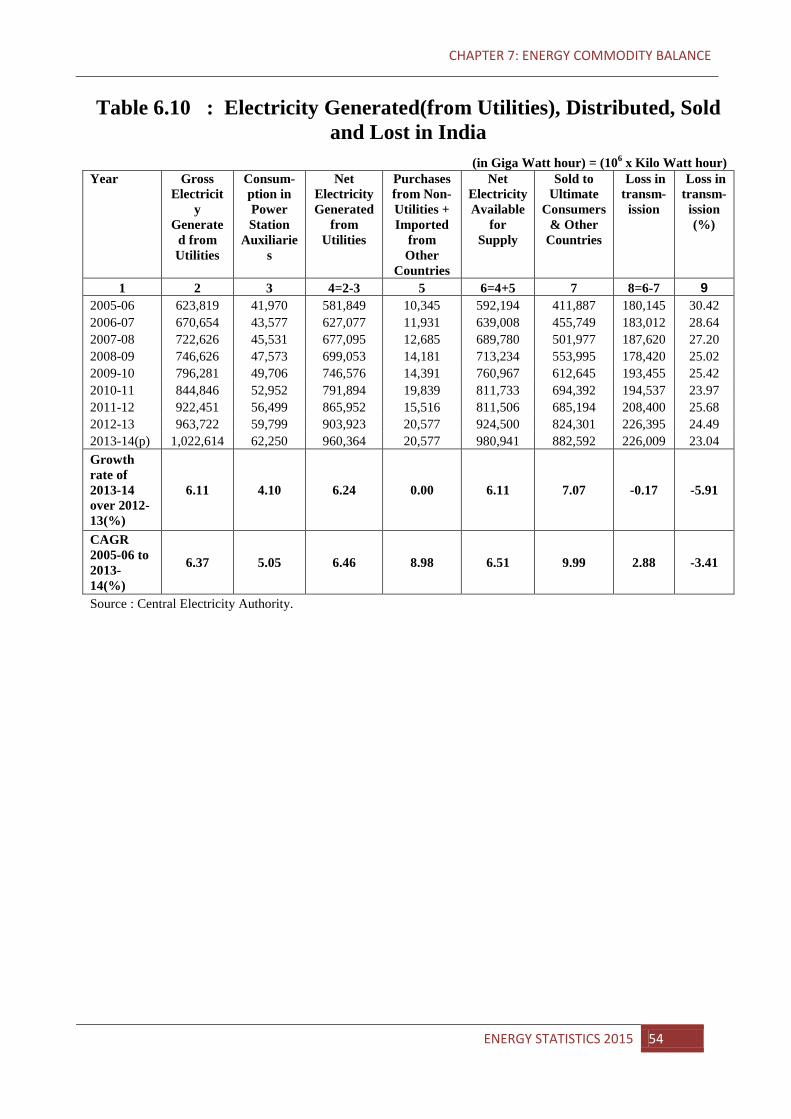
CHAPTER 7: ENERGY COMMODITY BALANCE
Table 6.10 : Electricity Generated(from Utilities), Distributed, Sold and Lost in India
(in Giga Watt hour) = (106 x Kilo Watt hour) Year Gross
Electricity
Generated from Utilities
Consum- ption in Power Station
Auxiliaries
Net Electricity Generated
from Utilities
Purchases from Non-Utilities + Imported
from Other
Countries
Net Electricity Available
for Supply
Sold to Ultimate
Consumers & Other
Countries
Loss in transm-
ission
Loss in transm-
ission (%)
1 2 3 4=2-3 5 6=4+5 7 8=6-7 9 2005-06 623,819 41,970 581,849 10,345 592,194 411,887 180,145 30.42 2006-07 670,654 43,577 627,077 11,931 639,008 455,749 183,012 28.64 2007-08 722,626 45,531 677,095 12,685 689,780 501,977 187,620 27.20 2008-09 746,626 47,573 699,053 14,181 713,234 553,995 178,420 25.02 2009-10 796,281 49,706 746,576 14,391 760,967 612,645 193,455 25.42 2010-11 844,846 52,952 791,894 19,839 811,733 694,392 194,537 23.97 2011-12 922,451 56,499 865,952 15,516 811,506 685,194 208,400 25.68 2012-13 963,722 59,799 903,923 20,577 924,500 824,301 226,395 24.49 2013-14(p) 1,022,614 62,250 960,364 20,577 980,941 882,592 226,009 23.04 Growth rate of 2013-14 over 2012-13(%)
6.11 4.10 6.24 0.00 6.11 7.07 -0.17 -5.91
CAGR 2005-06 to 2013-14(%)
6.37 5.05 6.46 8.98 6.51 9.99 2.88 -3.41
Source : Central Electricity Authority.
ENERGY STATISTICS 2015 54
CHAPTER 7: ENERGY COMMODITY BALANCE
CHAPTER 7: ENERGY COMMODITY BALANCE 7.1 Concept and Definition Commodity balance: The purpose of commodity balance is to show the sources of
supply and various uses of particular energy product with reference to national territory of the compiling country. The balance is compiled for any energy commodity provided that the commodity remains homogeneous at each point in the balance.
International Recommendations on Energy Statistics (IRES) recommends that the format of energy balance and all applicable concepts are consistently used in the compilation of a commodity balance to ensure data consistency. The major sources for commercial energy in India are coal, oil products, natural gas and electricity. Non-energy producing sectors derive energy from the resources available in primary form such as coal, crude oil, natural gas, hydro-power and nuclear power. Some of the energy resources are converted into other (final) energy products that are used for purposes other than energy generation.
Coal is used as a final product as well as intermediate product for power generation. Similarly, natural gas is also used directly or as an intermediate in power generation. Many petroleum products, such as HSDO, Naphtha etc. are used as a final product by the non-energy producing sectors and also used for power generation. This indicates that the same energy source can be used in various forms at various stages of consumption. This creates a possibility of over-estimation or under-estimation of energy consumption in totality as well as for different sources.
Energy Balance: An energy balance is a framework to compile data on all energy products entering, exiting and used within a given country during a reference period (e.g. a year). It expresses all data in a common energy unit, which makes it possible to define a “total” product.
The purposes of compiling an energy balance starting from the various commodity balances are numerous; they are to:
provide a comprehensive overview of the energy profile of a country, to monitor energy security, energy markets, relevant policy goals and to formulate adequate energy policies;
provide the basis for aggregate socio-economic indicators, as well as for estimates of CO2 emissions;
compare different reference periods and different countries; provide a tool to ensure completeness, consistency and comparability of basic
statistics; calculate efficiencies of transformation processes, as well as relative shares of
different sectors or products in the country’s total supply or consumption.
An energy balance generally takes the form of a matrix of products and flows, with varying levels of disaggregation, although graphical formats also exist (e.g. Sankey diagram).
ENERGY STATISTICS 2015 55
CHAPTER 7: ENERGY COMMODITY BALANCE
Two major components of the energy balance statistics are Total Primary Energy
Supply and Total Final Consumption of energy commodity. Within a balance, the total final consumption is disaggregated into sectors, like industry,
transport, residential, services and others. However, the level of disaggregation of such energy data is not enough to monitor energy efficiency, as no information is given for example on the residential or services end uses, nor on the transport vehicle types or segments. The energy balance will therefore be useful to assess the largest consuming sectors within a country where the energy saving potential will have more impact, before starting more detailed collection programmes on data for energy efficiency indicators.
7.2 Methodology used for Energy Balance Energy Balance (in ktoe) = Quantity of Commodity * Conversion factor
1 toe = 41868 MJ Conversion factor = Net Calori�ic Value (NCV)
mega joules per tonne of oil equivalent
where NCV is in kj per kg. Net Calorific Value (NCV) = Gross calorific value (GCV) - (% Moisture Content)
• The difference between net and gross calorific values are typically about 5% to 6% of the gross value of solid and liquid fuels and about 10% for Natural gas.
• Net Calorific Values are, as recommended by IEA for all commodities, except coal.
• NCV for Coal: As per publication “Provisional Coal Statistics 2013-14” : Average GCV of Coal in India = 4600 (Average of range 2200-7000)
Average Moisture Content in Coal in India = 12 (Ranges from 0 to 24 % )
The Energy Balance has been calculated using the NCVs:
Type of Fuel
Average Net Calorific Value (kj/kg)
Coal 19,259 Lignite 9,546
Crude Oil 42,789 Liquefied Petroleum Gases 47,300
Motor Gasoline 44,800 Kerosene Type Jet Fuel 44,600
Kerosene 43,800 Gas/Diesel Oil 43,300
Naphtha 45,000 Lubricants 42,000 Bitumen 39,000
Paraffin Waxes 40,000 Petroleum Coke 32,000
Non-specified Oil Products 40,000
ENERGY STATISTICS 2015 56
CHAPTER 7: ENERGY COMMODITY BALANCE
7.3 Highlights of Energy Balance:
In 2013-14, primary energy production added up to 596,352 Kilo Tons of Oil equivalent
(ktoe). The share of Crude oil accounted for 38.91% and the contribution of coal was 64.11%.(Table 7.2)
In 2013-14, national energy consumption was 424,509 ktoe. The industrial sector used 52.72% of the total final energy consumption. (Table 7.2)
Within the industry sector, the most energy-intensive industries were iron and steel, which accounted for 18.22% of the industrial energy use, construction (12.39%) and Chemical and petrochemicals (5.5%).(Table 7.2)
The transport sector accounted for 6.85% of total final consumption. The consumption of the residential, commercial and public sectors represented 11.81%.(Table 7.2).
Efforts are being made to reduce the Statistical Balance.
ENERGY STATISTICS 2015 57
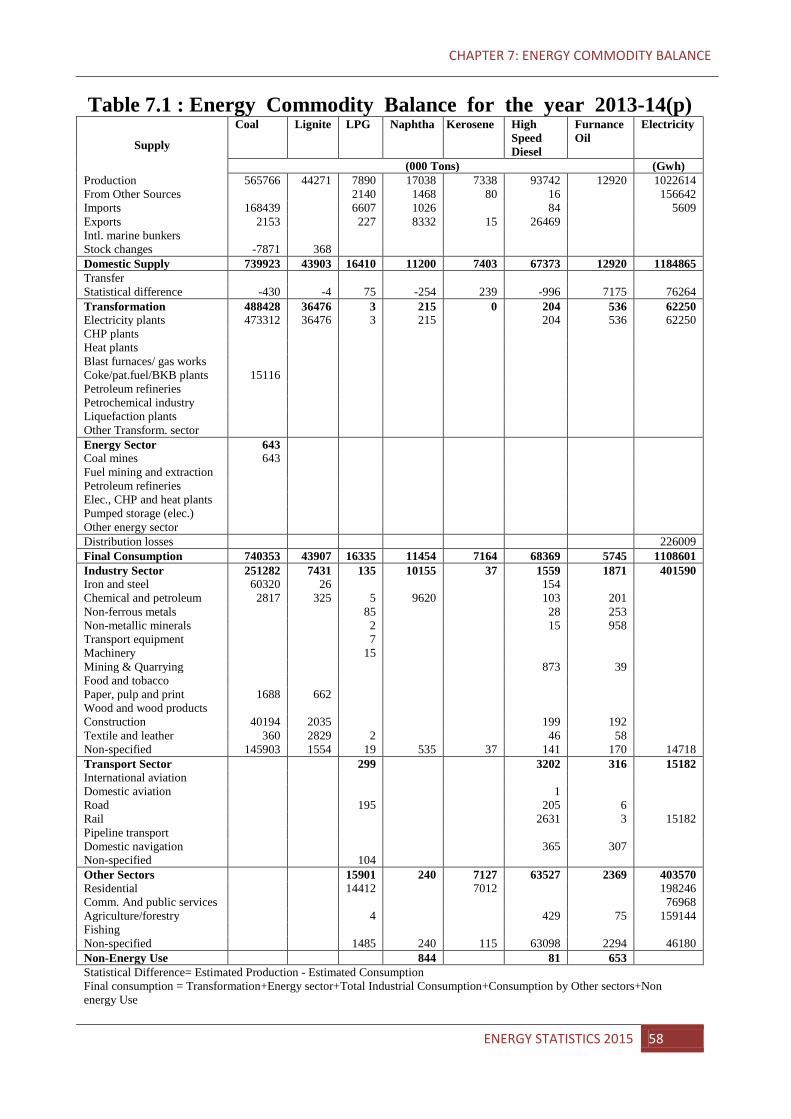
CHAPTER 7: ENERGY COMMODITY BALANCE
Table 7.1 : Energy Commodity Balance for the year 2013-14(p)
Supply
Coal Lignite LPG Naphtha Kerosene High Speed Diesel
Furnance Oil
Electricity
(000 Tons) (Gwh) Production 565766 44271 7890 17038 7338 93742 12920 1022614 From Other Sources 2140 1468 80 16 156642 Imports 168439 6607 1026 84 5609 Exports 2153 227 8332 15 26469 Intl. marine bunkers Stock changes -7871 368 Domestic Supply 739923 43903 16410 11200 7403 67373 12920 1184865 Transfer
Statistical difference -430 -4 75 -254 239 -996 7175 76264 Transformation 488428 36476 3 215 0 204 536 62250 Electricity plants 473312 36476 3 215 204 536 62250 CHP plants Heat plants Blast furnaces/ gas works Coke/pat.fuel/BKB plants 15116 Petroleum refineries Petrochemical industry Liquefaction plants Other Transform. sector Energy Sector 643 Coal mines 643 Fuel mining and extraction Petroleum refineries Elec., CHP and heat plants Pumped storage (elec.) Other energy sector Distribution losses 226009 Final Consumption 740353 43907 16335 11454 7164 68369 5745 1108601 Industry Sector 251282 7431 135 10155 37 1559 1871 401590 Iron and steel 60320 26 154 Chemical and petroleum 2817 325 5 9620 103 201 Non-ferrous metals 85 28 253 Non-metallic minerals 2 15 958 Transport equipment 7 Machinery 15 Mining & Quarrying 873 39 Food and tobacco Paper, pulp and print 1688 662 Wood and wood products Construction 40194 2035 199 192 Textile and leather 360 2829 2 46 58 Non-specified 145903 1554 19 535 37 141 170 14718 Transport Sector 299 3202 316 15182 International aviation Domestic aviation 1 Road 195 205 6 Rail 2631 3 15182 Pipeline transport Domestic navigation 365 307 Non-specified 104 Other Sectors 15901 240 7127 63527 2369 403570 Residential 14412 7012 198246 Comm. And public services 76968 Agriculture/forestry 4 429 75 159144 Fishing Non-specified 1485 240 115 63098 2294 46180 Non-Energy Use 844 81 653 Statistical Difference= Estimated Production - Estimated Consumption
Final consumption = Transformation+Energy sector+Total Industrial Consumption+Consumption by Other sectors+Non energy Use
ENERGY STATISTICS 2015 58
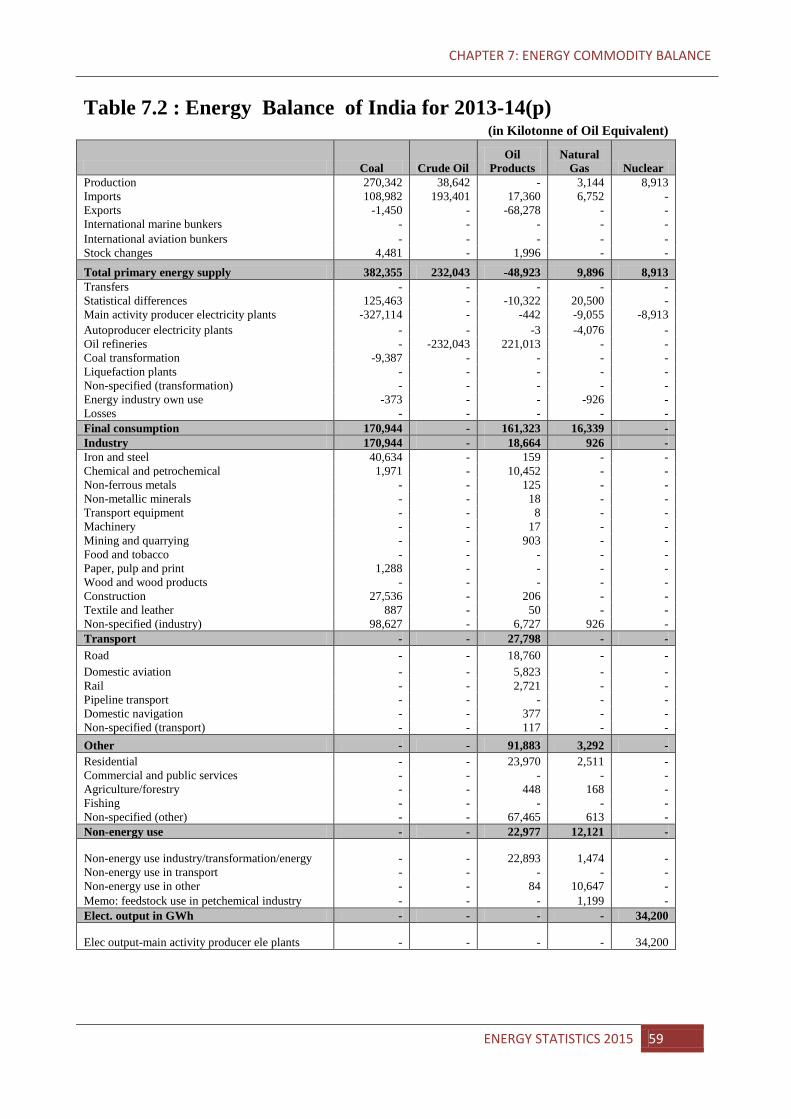
CHAPTER 7: ENERGY COMMODITY BALANCE
Table 7.2 : Energy Balance of India for 2013-14(p) (in Kilotonne of Oil Equivalent)
Coal Crude Oil Oil
Products Natural
Gas Nuclear
Production 270,342 38,642 - 3,144 8,913 Imports 108,982 193,401 17,360 6,752 - Exports -1,450 - -68,278 - - International marine bunkers - - - - - International aviation bunkers - - - - - Stock changes 4,481 - 1,996 - - Total primary energy supply 382,355 232,043 -48,923 9,896 8,913 Transfers - - - - - Statistical differences 125,463 - -10,322 20,500 - Main activity producer electricity plants -327,114 - -442 -9,055 -8,913 Autoproducer electricity plants - - -3 -4,076 - Oil refineries - -232,043 221,013 - - Coal transformation -9,387 - - - - Liquefaction plants - - - - - Non-specified (transformation) - - - - - Energy industry own use -373 - - -926 - Losses - - - - - Final consumption 170,944 - 161,323 16,339 - Industry 170,944 - 18,664 926 - Iron and steel 40,634 - 159 - - Chemical and petrochemical 1,971 - 10,452 - - Non-ferrous metals - - 125 - - Non-metallic minerals - - 18 - - Transport equipment - - 8 - - Machinery - - 17 - - Mining and quarrying - - 903 - - Food and tobacco - - - - - Paper, pulp and print 1,288 - - - - Wood and wood products - - - - - Construction 27,536 - 206 - - Textile and leather 887 - 50 - - Non-specified (industry) 98,627 - 6,727 926 - Transport - - 27,798 - - Road - - 18,760 - - Domestic aviation - - 5,823 - - Rail - - 2,721 - - Pipeline transport - - - - - Domestic navigation - - 377 - - Non-specified (transport) - - 117 - - Other - - 91,883 3,292 - Residential - - 23,970 2,511 - Commercial and public services - - - - - Agriculture/forestry - - 448 168 - Fishing - - - - - Non-specified (other) - - 67,465 613 - Non-energy use - - 22,977 12,121 -
Non-energy use industry/transformation/energy - - 22,893 1,474 -
Non-energy use in transport - - - - - Non-energy use in other - - 84 10,647 - Memo: feedstock use in petchemical industry - - - 1,199 - Elect. output in GWh - - - - 34,200
Elec output-main activity producer ele plants - - - - 34,200
ENERGY STATISTICS 2015 59
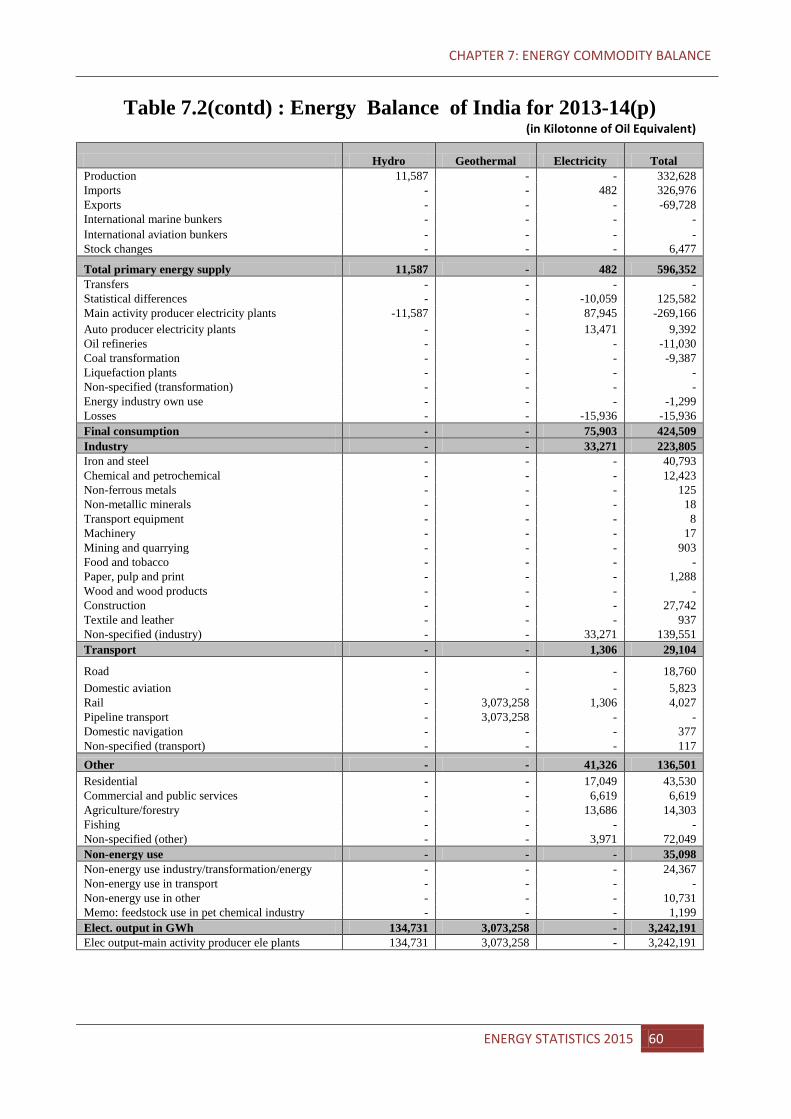
CHAPTER 7: ENERGY COMMODITY BALANCE
Table 7.2(contd) : Energy Balance of India for 2013-14(p) (in Kilotonne of Oil Equivalent)
Hydro Geothermal Electricity Total Production 11,587 - - 332,628 Imports - - 482 326,976 Exports - - - -69,728 International marine bunkers - - - - International aviation bunkers - - - - Stock changes - - - 6,477
Total primary energy supply 11,587 - 482 596,352 Transfers - - - - Statistical differences - - -10,059 125,582 Main activity producer electricity plants -11,587 - 87,945 -269,166 Auto producer electricity plants - - 13,471 9,392 Oil refineries - - - -11,030 Coal transformation - - - -9,387 Liquefaction plants - - - - Non-specified (transformation) - - - - Energy industry own use - - - -1,299 Losses - - -15,936 -15,936 Final consumption - - 75,903 424,509 Industry - - 33,271 223,805 Iron and steel - - - 40,793 Chemical and petrochemical - - - 12,423 Non-ferrous metals - - - 125 Non-metallic minerals - - - 18 Transport equipment - - - 8 Machinery - - - 17 Mining and quarrying - - - 903 Food and tobacco - - - - Paper, pulp and print - - - 1,288 Wood and wood products - - - - Construction - - - 27,742 Textile and leather - - - 937 Non-specified (industry) - - 33,271 139,551 Transport - - 1,306 29,104
Road - - - 18,760 Domestic aviation - - - 5,823 Rail - 3,073,258 1,306 4,027 Pipeline transport - 3,073,258 - - Domestic navigation - - - 377 Non-specified (transport) - - - 117 Other - - 41,326 136,501 Residential - - 17,049 43,530 Commercial and public services - - 6,619 6,619 Agriculture/forestry - - 13,686 14,303 Fishing - - - - Non-specified (other) - - 3,971 72,049 Non-energy use - - - 35,098 Non-energy use industry/transformation/energy - - - 24,367 Non-energy use in transport - - - - Non-energy use in other - - - 10,731 Memo: feedstock use in pet chemical industry - - - 1,199 Elect. output in GWh 134,731 3,073,258 - 3,242,191 Elec output-main activity producer ele plants 134,731 3,073,258 - 3,242,191
ENERGY STATISTICS 2015 60
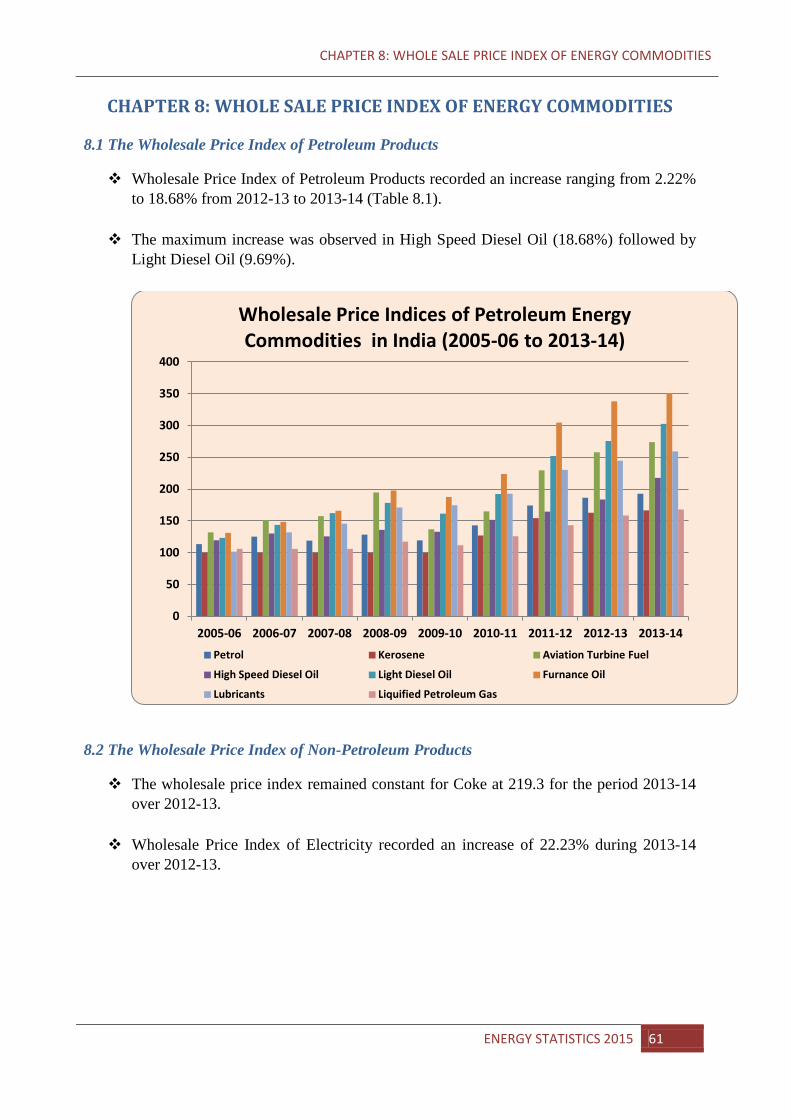
CHAPTER 8: WHOLE SALE PRICE INDEX OF ENERGY COMMODITIES
CHAPTER 8: WHOLE SALE PRICE INDEX OF ENERGY COMMODITIES
8.1 The Wholesale Price Index of Petroleum Products
Wholesale Price Index of Petroleum Products recorded an increase ranging from 2.22% to 18.68% from 2012-13 to 2013-14 (Table 8.1).
The maximum increase was observed in High Speed Diesel Oil (18.68%) followed by
Light Diesel Oil (9.69%).
8.2 The Wholesale Price Index of Non-Petroleum Products
The wholesale price index remained constant for Coke at 219.3 for the period 2013-14 over 2012-13.
Wholesale Price Index of Electricity recorded an increase of 22.23% during 2013-14
over 2012-13.
0
50
100
150
200
250
300
350
400
2005-06 2006-07 2007-08 2008-09 2009-10 2010-11 2011-12 2012-13 2013-14
Wholesale Price Indices of Petroleum Energy Commodities in India (2005-06 to 2013-14)
Petrol Kerosene Aviation Turbine Fuel
High Speed Diesel Oil Light Diesel Oil Furnance Oil
Lubricants Liquified Petroleum Gas
ENERGY STATISTICS 2015 61
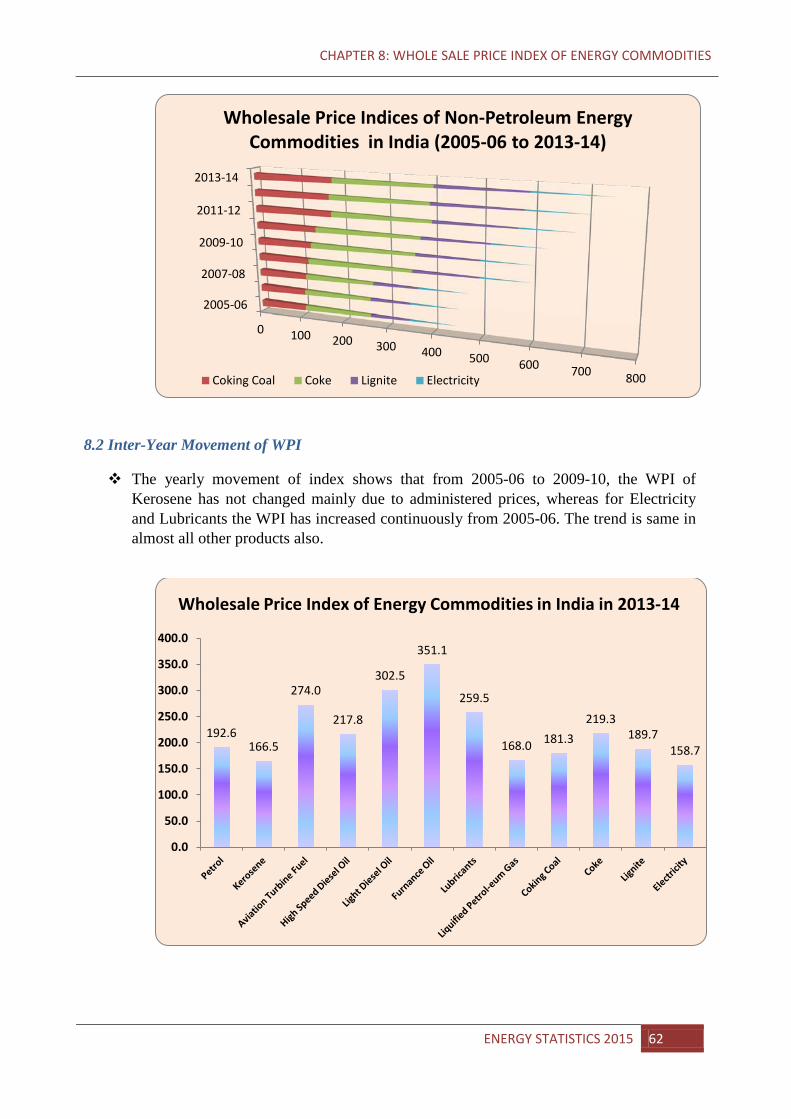
CHAPTER 8: WHOLE SALE PRICE INDEX OF ENERGY COMMODITIES
8.2 Inter-Year Movement of WPI
The yearly movement of index shows that from 2005-06 to 2009-10, the WPI of Kerosene has not changed mainly due to administered prices, whereas for Electricity and Lubricants the WPI has increased continuously from 2005-06. The trend is same in almost all other products also.
0 100 200 300 400 500 600 700 800
2005-06
2007-08
2009-10
2011-12
2013-14
Wholesale Price Indices of Non-Petroleum Energy Commodities in India (2005-06 to 2013-14)
Coking Coal Coke Lignite Electricity
192.6 166.5
274.0
217.8
302.5
351.1
259.5
168.0 181.3 219.3
189.7 158.7
0.0
50.0
100.0
150.0
200.0
250.0
300.0
350.0
400.0
Wholesale Price Index of Energy Commodities in India in 2013-14
ENERGY STATISTICS 2015 62
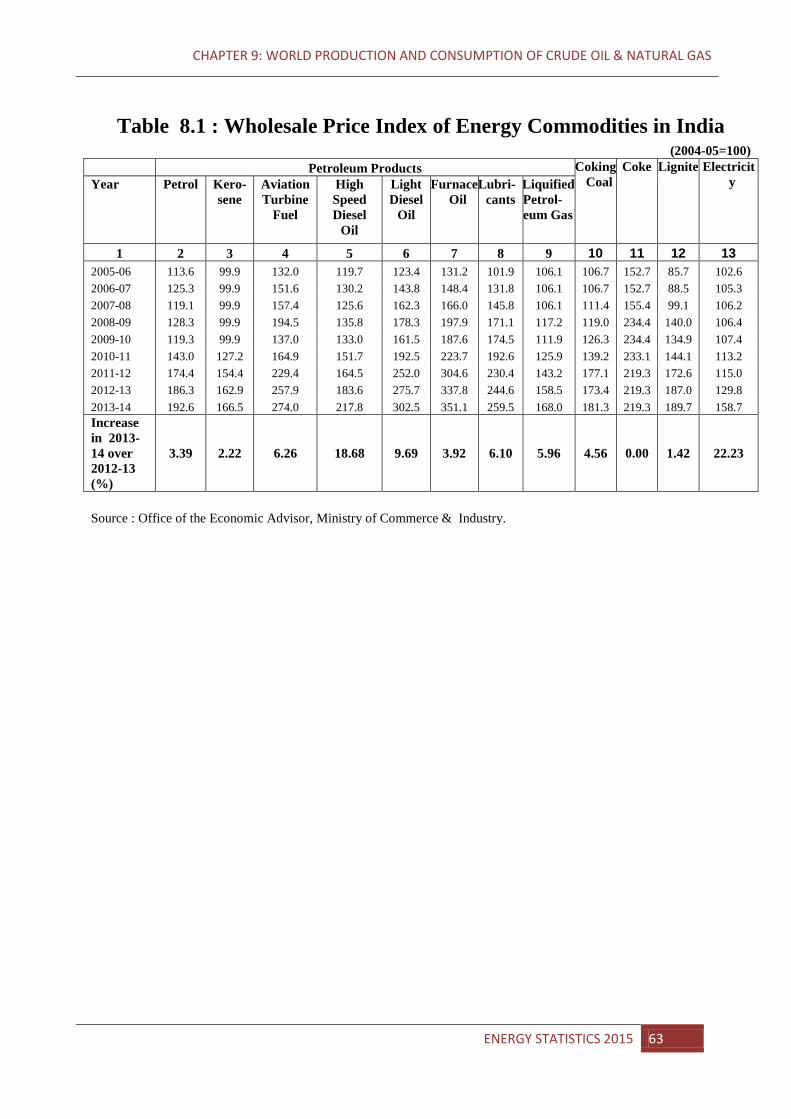
CHAPTER 9: WORLD PRODUCTION AND CONSUMPTION OF CRUDE OIL & NATURAL GAS
Table 8.1 : Wholesale Price Index of Energy Commodities in India (2004-05=100)
Petroleum Products Coking Coal
Coke Lignite Electricity Year Petrol Kero-
sene Aviation Turbine
Fuel
High Speed Diesel
Oil
Light Diesel
Oil
Furnace Oil
Lubri-cants
Liquified Petrol-eum Gas
1 2 3 4 5 6 7 8 9 10 11 12 13 2005-06 113.6 99.9 132.0 119.7 123.4 131.2 101.9 106.1 106.7 152.7 85.7 102.6 2006-07 125.3 99.9 151.6 130.2 143.8 148.4 131.8 106.1 106.7 152.7 88.5 105.3 2007-08 119.1 99.9 157.4 125.6 162.3 166.0 145.8 106.1 111.4 155.4 99.1 106.2 2008-09 128.3 99.9 194.5 135.8 178.3 197.9 171.1 117.2 119.0 234.4 140.0 106.4 2009-10 119.3 99.9 137.0 133.0 161.5 187.6 174.5 111.9 126.3 234.4 134.9 107.4 2010-11 143.0 127.2 164.9 151.7 192.5 223.7 192.6 125.9 139.2 233.1 144.1 113.2 2011-12 174.4 154.4 229.4 164.5 252.0 304.6 230.4 143.2 177.1 219.3 172.6 115.0 2012-13 186.3 162.9 257.9 183.6 275.7 337.8 244.6 158.5 173.4 219.3 187.0 129.8 2013-14 192.6 166.5 274.0 217.8 302.5 351.1 259.5 168.0 181.3 219.3 189.7 158.7 Increase in 2013-14 over 2012-13 (%)
3.39 2.22 6.26 18.68 9.69 3.92 6.10 5.96 4.56 0.00 1.42 22.23
Source : Office of the Economic Advisor, Ministry of Commerce & Industry.
ENERGY STATISTICS 2015 63
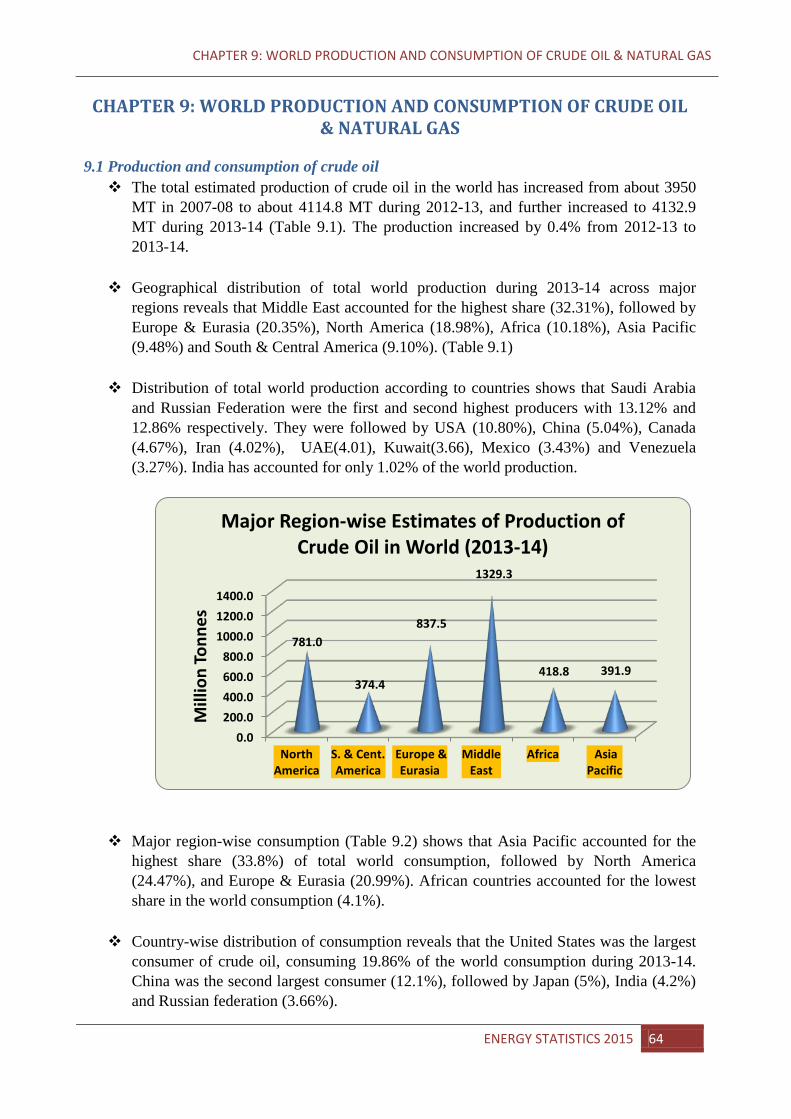
CHAPTER 9: WORLD PRODUCTION AND CONSUMPTION OF CRUDE OIL & NATURAL GAS
CHAPTER 9: WORLD PRODUCTION AND CONSUMPTION OF CRUDE OIL
& NATURAL GAS 9.1 Production and consumption of crude oil The total estimated production of crude oil in the world has increased from about 3950
MT in 2007-08 to about 4114.8 MT during 2012-13, and further increased to 4132.9 MT during 2013-14 (Table 9.1). The production increased by 0.4% from 2012-13 to 2013-14.
Geographical distribution of total world production during 2013-14 across major
regions reveals that Middle East accounted for the highest share (32.31%), followed by Europe & Eurasia (20.35%), North America (18.98%), Africa (10.18%), Asia Pacific (9.48%) and South & Central America (9.10%). (Table 9.1)
Distribution of total world production according to countries shows that Saudi Arabia
and Russian Federation were the first and second highest producers with 13.12% and 12.86% respectively. They were followed by USA (10.80%), China (5.04%), Canada (4.67%), Iran (4.02%), UAE(4.01), Kuwait(3.66), Mexico (3.43%) and Venezuela (3.27%). India has accounted for only 1.02% of the world production.
Major region-wise consumption (Table 9.2) shows that Asia Pacific accounted for the highest share (33.8%) of total world consumption, followed by North America (24.47%), and Europe & Eurasia (20.99%). African countries accounted for the lowest share in the world consumption (4.1%).
Country-wise distribution of consumption reveals that the United States was the largest
consumer of crude oil, consuming 19.86% of the world consumption during 2013-14. China was the second largest consumer (12.1%), followed by Japan (5%), India (4.2%) and Russian federation (3.66%).
0.0 200.0 400.0 600.0 800.0
1000.0 1200.0 1400.0
North America
S. & Cent. America
Europe & Eurasia
Middle East
Africa Asia Pacific
781.0
374.4
837.5
1329.3
418.8 391.9
Mill
ion
Tonn
es
Major Region-wise Estimates of Production of Crude Oil in World (2013-14)
ENERGY STATISTICS 2015 64
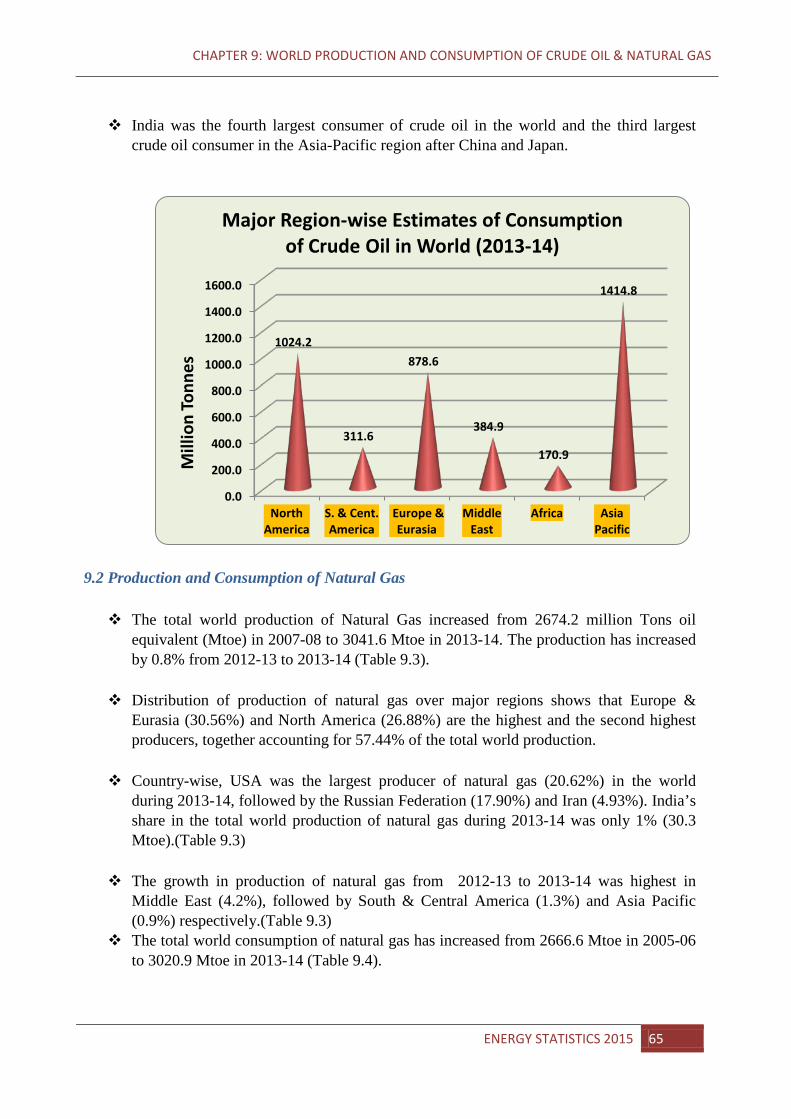
CHAPTER 9: WORLD PRODUCTION AND CONSUMPTION OF CRUDE OIL & NATURAL GAS
India was the fourth largest consumer of crude oil in the world and the third largest
crude oil consumer in the Asia-Pacific region after China and Japan.
9.2 Production and Consumption of Natural Gas The total world production of Natural Gas increased from 2674.2 million Tons oil
equivalent (Mtoe) in 2007-08 to 3041.6 Mtoe in 2013-14. The production has increased by 0.8% from 2012-13 to 2013-14 (Table 9.3).
Distribution of production of natural gas over major regions shows that Europe &
Eurasia (30.56%) and North America (26.88%) are the highest and the second highest producers, together accounting for 57.44% of the total world production.
Country-wise, USA was the largest producer of natural gas (20.62%) in the world
during 2013-14, followed by the Russian Federation (17.90%) and Iran (4.93%). India’s share in the total world production of natural gas during 2013-14 was only 1% (30.3 Mtoe).(Table 9.3)
The growth in production of natural gas from 2012-13 to 2013-14 was highest in
Middle East (4.2%), followed by South & Central America (1.3%) and Asia Pacific (0.9%) respectively.(Table 9.3)
The total world consumption of natural gas has increased from 2666.6 Mtoe in 2005-06 to 3020.9 Mtoe in 2013-14 (Table 9.4).
0.0
200.0
400.0
600.0
800.0
1000.0
1200.0
1400.0
1600.0
North America
S. & Cent. America
Europe & Eurasia
Middle East
Africa Asia Pacific
1024.2
311.6
878.6
384.9
170.9
1414.8
Mill
ion
Tonn
es
Major Region-wise Estimates of Consumption of Crude Oil in World (2013-14)
ENERGY STATISTICS 2015 65
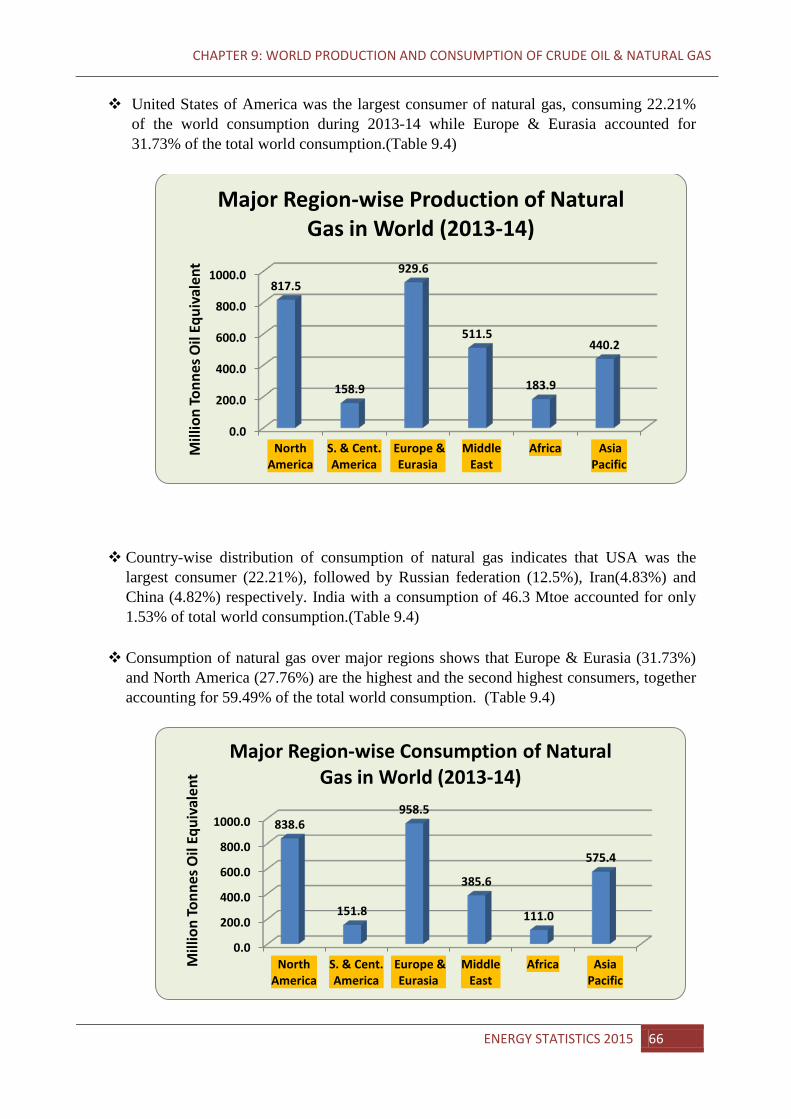
CHAPTER 9: WORLD PRODUCTION AND CONSUMPTION OF CRUDE OIL & NATURAL GAS
United States of America was the largest consumer of natural gas, consuming 22.21%
of the world consumption during 2013-14 while Europe & Eurasia accounted for 31.73% of the total world consumption.(Table 9.4)
Country-wise distribution of consumption of natural gas indicates that USA was the largest consumer (22.21%), followed by Russian federation (12.5%), Iran(4.83%) and China (4.82%) respectively. India with a consumption of 46.3 Mtoe accounted for only 1.53% of total world consumption.(Table 9.4)
Consumption of natural gas over major regions shows that Europe & Eurasia (31.73%)
and North America (27.76%) are the highest and the second highest consumers, together accounting for 59.49% of the total world consumption. (Table 9.4)
0.0
200.0
400.0
600.0
800.0
1000.0
North America
S. & Cent. America
Europe & Eurasia
Middle East
Africa Asia Pacific
817.5
158.9
929.6
511.5
183.9
440.2
Mill
ion
Tonn
es O
il Eq
uiva
lent
Major Region-wise Production of Natural
Gas in World (2013-14)
0.0
200.0
400.0
600.0
800.0
1000.0
North America
S. & Cent. America
Europe & Eurasia
Middle East
Africa Asia Pacific
838.6
151.8
958.5
385.6
111.0
575.4
Mill
ion
Tonn
es O
il Eq
uiva
lent
Major Region-wise Consumption of Natural Gas in World (2013-14)
ENERGY STATISTICS 2015 66
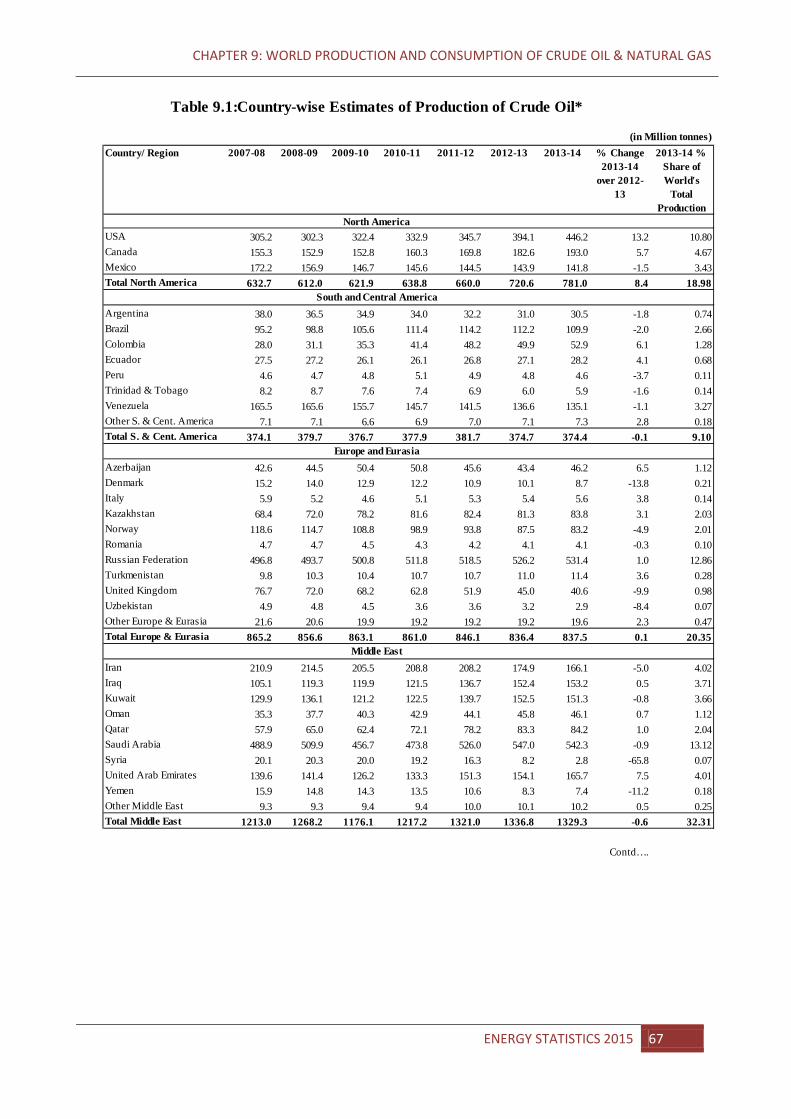
CHAPTER 9: WORLD PRODUCTION AND CONSUMPTION OF CRUDE OIL & NATURAL GAS
Country/ Region 2007-08 2008-09 2009-10 2010-11 2011-12 2012-13 2013-14
USA 305.2 302.3 322.4 332.9 345.7 394.1 446.2 13.2 10.80Canada 155.3 152.9 152.8 160.3 169.8 182.6 193.0 5.7 4.67Mexico 172.2 156.9 146.7 145.6 144.5 143.9 141.8 -1.5 3.43Total North America 632.7 612.0 621.9 638.8 660.0 720.6 781.0 8.4 18.98
Argentina 38.0 36.5 34.9 34.0 32.2 31.0 30.5 -1.8 0.74Brazil 95.2 98.8 105.6 111.4 114.2 112.2 109.9 -2.0 2.66Colombia 28.0 31.1 35.3 41.4 48.2 49.9 52.9 6.1 1.28Ecuador 27.5 27.2 26.1 26.1 26.8 27.1 28.2 4.1 0.68Peru 4.6 4.7 4.8 5.1 4.9 4.8 4.6 -3.7 0.11Trinidad & Tobago 8.2 8.7 7.6 7.4 6.9 6.0 5.9 -1.6 0.14Venezuela 165.5 165.6 155.7 145.7 141.5 136.6 135.1 -1.1 3.27Other S. & Cent. America 7.1 7.1 6.6 6.9 7.0 7.1 7.3 2.8 0.18Total S. & Cent. America 374.1 379.7 376.7 377.9 381.7 374.7 374.4 -0.1 9.10
Azerbaijan 42.6 44.5 50.4 50.8 45.6 43.4 46.2 6.5 1.12Denmark 15.2 14.0 12.9 12.2 10.9 10.1 8.7 -13.8 0.21Italy 5.9 5.2 4.6 5.1 5.3 5.4 5.6 3.8 0.14Kazakhstan 68.4 72.0 78.2 81.6 82.4 81.3 83.8 3.1 2.03Norway 118.6 114.7 108.8 98.9 93.8 87.5 83.2 -4.9 2.01Romania 4.7 4.7 4.5 4.3 4.2 4.1 4.1 -0.3 0.10Russian Federation 496.8 493.7 500.8 511.8 518.5 526.2 531.4 1.0 12.86Turkmenistan 9.8 10.3 10.4 10.7 10.7 11.0 11.4 3.6 0.28United Kingdom 76.7 72.0 68.2 62.8 51.9 45.0 40.6 -9.9 0.98Uzbekistan 4.9 4.8 4.5 3.6 3.6 3.2 2.9 -8.4 0.07Other Europe & Eurasia 21.6 20.6 19.9 19.2 19.2 19.2 19.6 2.3 0.47Total Europe & Eurasia 865.2 856.6 863.1 861.0 846.1 836.4 837.5 0.1 20.35
Iran 210.9 214.5 205.5 208.8 208.2 174.9 166.1 -5.0 4.02Iraq 105.1 119.3 119.9 121.5 136.7 152.4 153.2 0.5 3.71Kuwait 129.9 136.1 121.2 122.5 139.7 152.5 151.3 -0.8 3.66Oman 35.3 37.7 40.3 42.9 44.1 45.8 46.1 0.7 1.12Qatar 57.9 65.0 62.4 72.1 78.2 83.3 84.2 1.0 2.04Saudi Arabia 488.9 509.9 456.7 473.8 526.0 547.0 542.3 -0.9 13.12Syria 20.1 20.3 20.0 19.2 16.3 8.2 2.8 -65.8 0.07United Arab Emirates 139.6 141.4 126.2 133.3 151.3 154.1 165.7 7.5 4.01Yemen 15.9 14.8 14.3 13.5 10.6 8.3 7.4 -11.2 0.18Other Middle East 9.3 9.3 9.4 9.4 10.0 10.1 10.2 0.5 0.25Total Middle East 1213.0 1268.2 1176.1 1217.2 1321.0 1336.8 1329.3 -0.6 32.31
Contd….
Europe and Eurasia
Middle East
Table 9.1:Country-wise Estimates of Production of Crude Oil*
2013-14 % Share of World's
Total Production
North America
South and Central America
% Change 2013-14
over 2012-13
(in Million tonnes)
ENERGY STATISTICS 2015 67
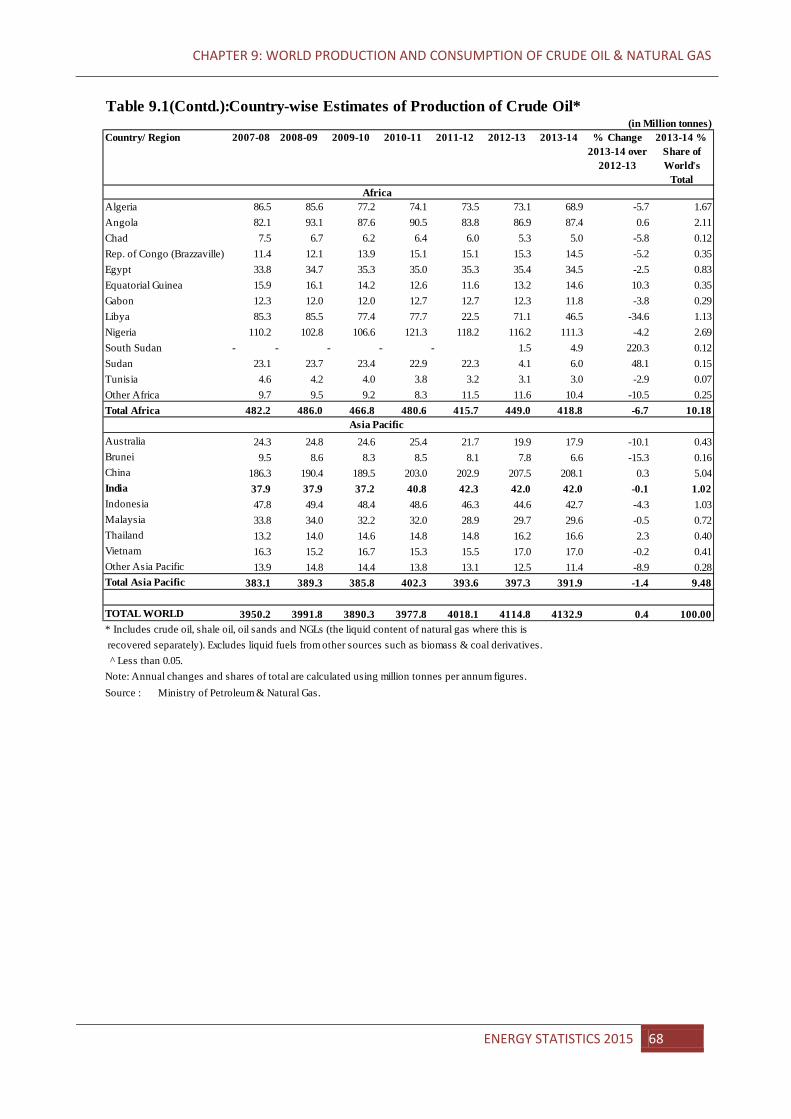
CHAPTER 9: WORLD PRODUCTION AND CONSUMPTION OF CRUDE OIL & NATURAL GAS
Table 9.1(Contd.):Country-wise Estimates of Production of Crude Oil*
Country/ Region 2007-08 2008-09 2009-10 2010-11 2011-12 2012-13 2013-14
Algeria 86.5 85.6 77.2 74.1 73.5 73.1 68.9 -5.7 1.67Angola 82.1 93.1 87.6 90.5 83.8 86.9 87.4 0.6 2.11Chad 7.5 6.7 6.2 6.4 6.0 5.3 5.0 -5.8 0.12Rep. of Congo (Brazzaville) 11.4 12.1 13.9 15.1 15.1 15.3 14.5 -5.2 0.35Egypt 33.8 34.7 35.3 35.0 35.3 35.4 34.5 -2.5 0.83Equatorial Guinea 15.9 16.1 14.2 12.6 11.6 13.2 14.6 10.3 0.35Gabon 12.3 12.0 12.0 12.7 12.7 12.3 11.8 -3.8 0.29Libya 85.3 85.5 77.4 77.7 22.5 71.1 46.5 -34.6 1.13Nigeria 110.2 102.8 106.6 121.3 118.2 116.2 111.3 -4.2 2.69South Sudan - - - - - 1.5 4.9 220.3 0.12Sudan 23.1 23.7 23.4 22.9 22.3 4.1 6.0 48.1 0.15Tunisia 4.6 4.2 4.0 3.8 3.2 3.1 3.0 -2.9 0.07Other Africa 9.7 9.5 9.2 8.3 11.5 11.6 10.4 -10.5 0.25Total Africa 482.2 486.0 466.8 480.6 415.7 449.0 418.8 -6.7 10.18
Australia 24.3 24.8 24.6 25.4 21.7 19.9 17.9 -10.1 0.43Brunei 9.5 8.6 8.3 8.5 8.1 7.8 6.6 -15.3 0.16China 186.3 190.4 189.5 203.0 202.9 207.5 208.1 0.3 5.04India 37.9 37.9 37.2 40.8 42.3 42.0 42.0 -0.1 1.02Indonesia 47.8 49.4 48.4 48.6 46.3 44.6 42.7 -4.3 1.03Malaysia 33.8 34.0 32.2 32.0 28.9 29.7 29.6 -0.5 0.72Thailand 13.2 14.0 14.6 14.8 14.8 16.2 16.6 2.3 0.40Vietnam 16.3 15.2 16.7 15.3 15.5 17.0 17.0 -0.2 0.41Other Asia Pacific 13.9 14.8 14.4 13.8 13.1 12.5 11.4 -8.9 0.28Total Asia Pacific 383.1 389.3 385.8 402.3 393.6 397.3 391.9 -1.4 9.48
TOTAL WORLD 3950.2 3991.8 3890.3 3977.8 4018.1 4114.8 4132.9 0.4 100.00* Includes crude oil, shale oil, oil sands and NGLs (the liquid content of natural gas where this is recovered separately). Excludes liquid fuels from other sources such as biomass & coal derivatives. ^ Less than 0.05.Note: Annual changes and shares of total are calculated using million tonnes per annum figures.
(in Million tonnes)
Africa
Asia Pacific
Source : Ministry of Petroleum & Natural Gas.
% Change 2013-14 over
2012-13
2013-14 % Share of World's
Total
ENERGY STATISTICS 2015 68
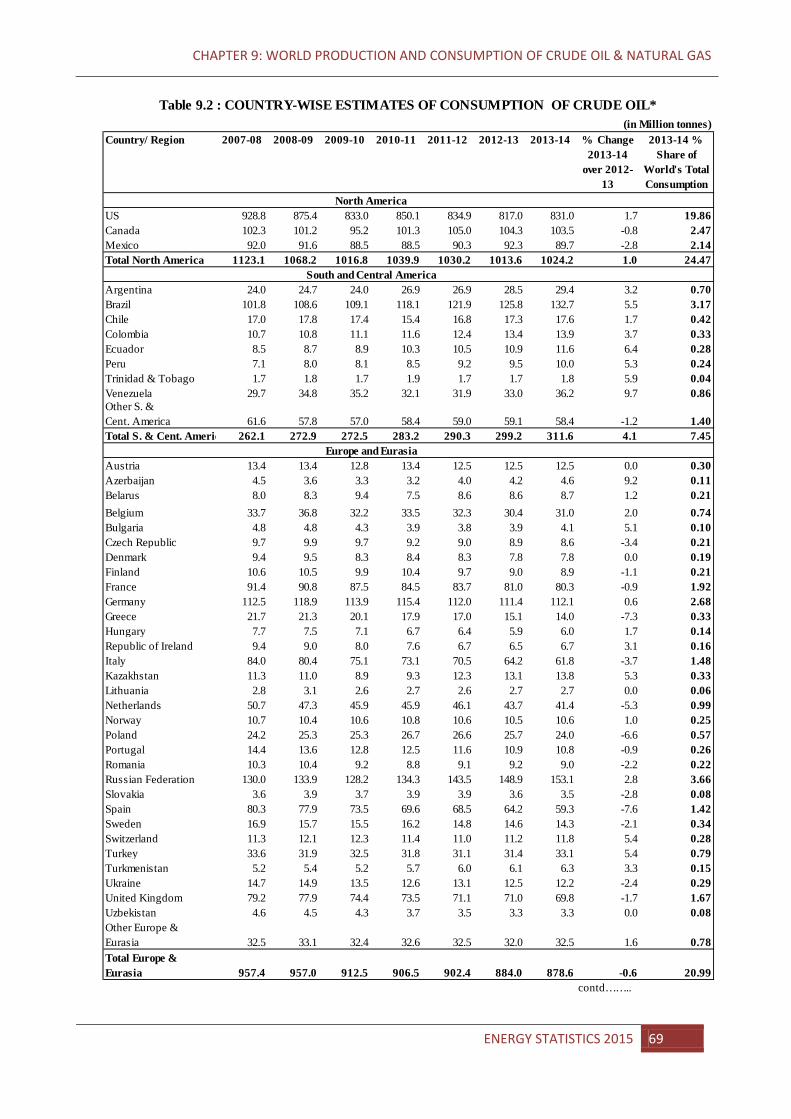
CHAPTER 9: WORLD PRODUCTION AND CONSUMPTION OF CRUDE OIL & NATURAL GAS
Country/ Region 2007-08 2008-09 2009-10 2010-11 2011-12 2012-13 2013-14 % Change 2013-14
over 2012-13
2013-14 % Share of
World's Total Consumption
US 928.8 875.4 833.0 850.1 834.9 817.0 831.0 1.7 19.86Canada 102.3 101.2 95.2 101.3 105.0 104.3 103.5 -0.8 2.47Mexico 92.0 91.6 88.5 88.5 90.3 92.3 89.7 -2.8 2.14Total North America 1123.1 1068.2 1016.8 1039.9 1030.2 1013.6 1024.2 1.0 24.47
Argentina 24.0 24.7 24.0 26.9 26.9 28.5 29.4 3.2 0.70Brazil 101.8 108.6 109.1 118.1 121.9 125.8 132.7 5.5 3.17Chile 17.0 17.8 17.4 15.4 16.8 17.3 17.6 1.7 0.42Colombia 10.7 10.8 11.1 11.6 12.4 13.4 13.9 3.7 0.33Ecuador 8.5 8.7 8.9 10.3 10.5 10.9 11.6 6.4 0.28Peru 7.1 8.0 8.1 8.5 9.2 9.5 10.0 5.3 0.24Trinidad & Tobago 1.7 1.8 1.7 1.9 1.7 1.7 1.8 5.9 0.04Venezuela 29.7 34.8 35.2 32.1 31.9 33.0 36.2 9.7 0.86Other S. & Cent. America 61.6 57.8 57.0 58.4 59.0 59.1 58.4 -1.2 1.40Total S. & Cent. Americ 262.1 272.9 272.5 283.2 290.3 299.2 311.6 4.1 7.45
Austria 13.4 13.4 12.8 13.4 12.5 12.5 12.5 0.0 0.30Azerbaijan 4.5 3.6 3.3 3.2 4.0 4.2 4.6 9.2 0.11Belarus 8.0 8.3 9.4 7.5 8.6 8.6 8.7 1.2 0.21Belgium 33.7 36.8 32.2 33.5 32.3 30.4 31.0 2.0 0.74Bulgaria 4.8 4.8 4.3 3.9 3.8 3.9 4.1 5.1 0.10Czech Republic 9.7 9.9 9.7 9.2 9.0 8.9 8.6 -3.4 0.21Denmark 9.4 9.5 8.3 8.4 8.3 7.8 7.8 0.0 0.19Finland 10.6 10.5 9.9 10.4 9.7 9.0 8.9 -1.1 0.21France 91.4 90.8 87.5 84.5 83.7 81.0 80.3 -0.9 1.92Germany 112.5 118.9 113.9 115.4 112.0 111.4 112.1 0.6 2.68Greece 21.7 21.3 20.1 17.9 17.0 15.1 14.0 -7.3 0.33Hungary 7.7 7.5 7.1 6.7 6.4 5.9 6.0 1.7 0.14Republic of Ireland 9.4 9.0 8.0 7.6 6.7 6.5 6.7 3.1 0.16Italy 84.0 80.4 75.1 73.1 70.5 64.2 61.8 -3.7 1.48Kazakhstan 11.3 11.0 8.9 9.3 12.3 13.1 13.8 5.3 0.33Lithuania 2.8 3.1 2.6 2.7 2.6 2.7 2.7 0.0 0.06Netherlands 50.7 47.3 45.9 45.9 46.1 43.7 41.4 -5.3 0.99Norway 10.7 10.4 10.6 10.8 10.6 10.5 10.6 1.0 0.25Poland 24.2 25.3 25.3 26.7 26.6 25.7 24.0 -6.6 0.57Portugal 14.4 13.6 12.8 12.5 11.6 10.9 10.8 -0.9 0.26Romania 10.3 10.4 9.2 8.8 9.1 9.2 9.0 -2.2 0.22Russian Federation 130.0 133.9 128.2 134.3 143.5 148.9 153.1 2.8 3.66Slovakia 3.6 3.9 3.7 3.9 3.9 3.6 3.5 -2.8 0.08Spain 80.3 77.9 73.5 69.6 68.5 64.2 59.3 -7.6 1.42Sweden 16.9 15.7 15.5 16.2 14.8 14.6 14.3 -2.1 0.34Switzerland 11.3 12.1 12.3 11.4 11.0 11.2 11.8 5.4 0.28Turkey 33.6 31.9 32.5 31.8 31.1 31.4 33.1 5.4 0.79Turkmenistan 5.2 5.4 5.2 5.7 6.0 6.1 6.3 3.3 0.15Ukraine 14.7 14.9 13.5 12.6 13.1 12.5 12.2 -2.4 0.29United Kingdom 79.2 77.9 74.4 73.5 71.1 71.0 69.8 -1.7 1.67Uzbekistan 4.6 4.5 4.3 3.7 3.5 3.3 3.3 0.0 0.08Other Europe & Eurasia 32.5 33.1 32.4 32.6 32.5 32.0 32.5 1.6 0.78Total Europe & Eurasia 957.4 957.0 912.5 906.5 902.4 884.0 878.6 -0.6 20.99
contd……..
Europe and Eurasia
North America
South and Central America
(in Million tonnes)Table 9.2 : COUNTRY-WISE ESTIMATES OF CONSUMPTION OF CRUDE OIL*
ENERGY STATISTICS 2015 69
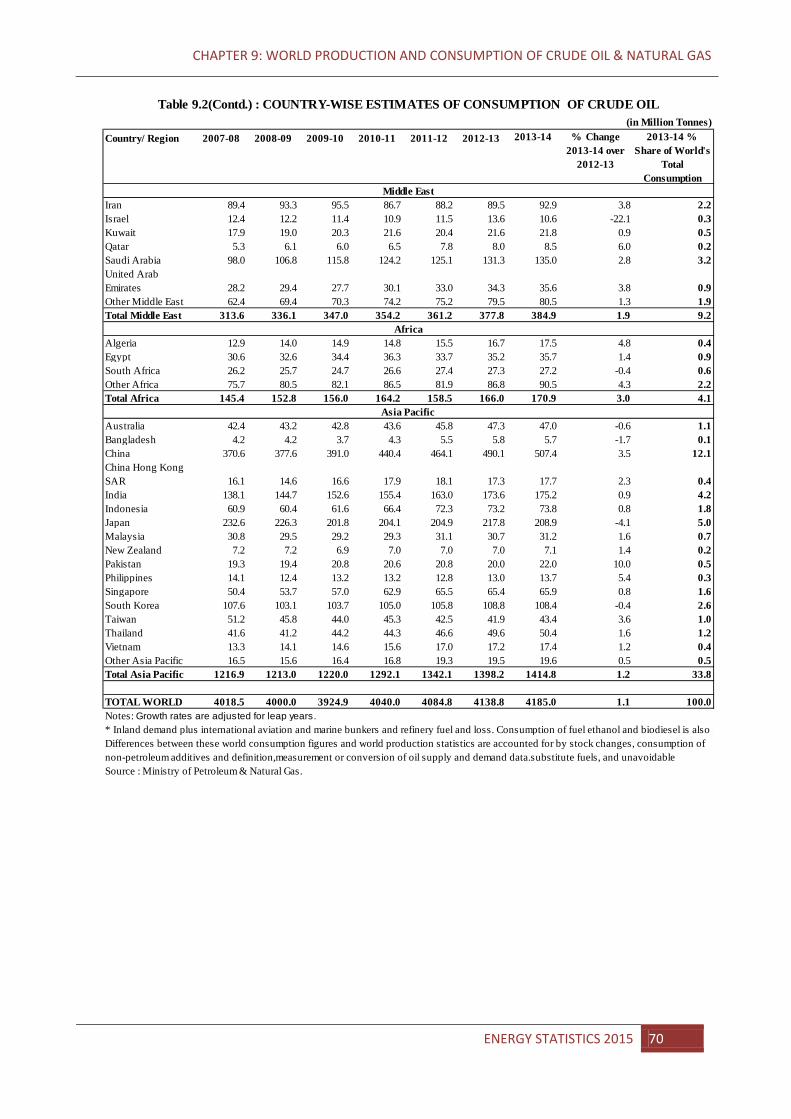
CHAPTER 9: WORLD PRODUCTION AND CONSUMPTION OF CRUDE OIL & NATURAL GAS
Country/ Region 2007-08 2008-09 2009-10 2010-11 2011-12 2012-13
Iran 89.4 93.3 95.5 86.7 88.2 89.5 92.9 3.8 2.2Israel 12.4 12.2 11.4 10.9 11.5 13.6 10.6 -22.1 0.3Kuwait 17.9 19.0 20.3 21.6 20.4 21.6 21.8 0.9 0.5Qatar 5.3 6.1 6.0 6.5 7.8 8.0 8.5 6.0 0.2Saudi Arabia 98.0 106.8 115.8 124.2 125.1 131.3 135.0 2.8 3.2United Arab Emirates 28.2 29.4 27.7 30.1 33.0 34.3 35.6 3.8 0.9Other Middle East 62.4 69.4 70.3 74.2 75.2 79.5 80.5 1.3 1.9Total Middle East 313.6 336.1 347.0 354.2 361.2 377.8 384.9 1.9 9.2
Algeria 12.9 14.0 14.9 14.8 15.5 16.7 17.5 4.8 0.4Egypt 30.6 32.6 34.4 36.3 33.7 35.2 35.7 1.4 0.9South Africa 26.2 25.7 24.7 26.6 27.4 27.3 27.2 -0.4 0.6Other Africa 75.7 80.5 82.1 86.5 81.9 86.8 90.5 4.3 2.2Total Africa 145.4 152.8 156.0 164.2 158.5 166.0 170.9 3.0 4.1
Australia 42.4 43.2 42.8 43.6 45.8 47.3 47.0 -0.6 1.1Bangladesh 4.2 4.2 3.7 4.3 5.5 5.8 5.7 -1.7 0.1China 370.6 377.6 391.0 440.4 464.1 490.1 507.4 3.5 12.1China Hong Kong SAR 16.1 14.6 16.6 17.9 18.1 17.3 17.7 2.3 0.4India 138.1 144.7 152.6 155.4 163.0 173.6 175.2 0.9 4.2Indonesia 60.9 60.4 61.6 66.4 72.3 73.2 73.8 0.8 1.8Japan 232.6 226.3 201.8 204.1 204.9 217.8 208.9 -4.1 5.0Malaysia 30.8 29.5 29.2 29.3 31.1 30.7 31.2 1.6 0.7New Zealand 7.2 7.2 6.9 7.0 7.0 7.0 7.1 1.4 0.2Pakistan 19.3 19.4 20.8 20.6 20.8 20.0 22.0 10.0 0.5Philippines 14.1 12.4 13.2 13.2 12.8 13.0 13.7 5.4 0.3Singapore 50.4 53.7 57.0 62.9 65.5 65.4 65.9 0.8 1.6South Korea 107.6 103.1 103.7 105.0 105.8 108.8 108.4 -0.4 2.6Taiwan 51.2 45.8 44.0 45.3 42.5 41.9 43.4 3.6 1.0Thailand 41.6 41.2 44.2 44.3 46.6 49.6 50.4 1.6 1.2Vietnam 13.3 14.1 14.6 15.6 17.0 17.2 17.4 1.2 0.4Other Asia Pacific 16.5 15.6 16.4 16.8 19.3 19.5 19.6 0.5 0.5Total Asia Pacific 1216.9 1213.0 1220.0 1292.1 1342.1 1398.2 1414.8 1.2 33.8
TOTAL WORLD 4018.5 4000.0 3924.9 4040.0 4084.8 4138.8 4185.0 1.1 100.0
Middle East
(in Million Tonnes)2013-14
Table 9.2(Contd.) : COUNTRY-WISE ESTIMATES OF CONSUMPTION OF CRUDE OIL
Differences between these world consumption figures and world production statistics are accounted for by stock changes, consumption of non-petroleum additives and definition,measurement or conversion of oil supply and demand data.substitute fuels, and unavoidable
* Inland demand plus international aviation and marine bunkers and refinery fuel and loss. Consumption of fuel ethanol and biodiesel is also i Notes: Growth rates are adjusted for leap years.
Source : Ministry of Petroleum & Natural Gas.
2013-14 % Share of World's
Total Consumption
% Change 2013-14 over
2012-13
Asia Pacific
Africa
ENERGY STATISTICS 2015 70
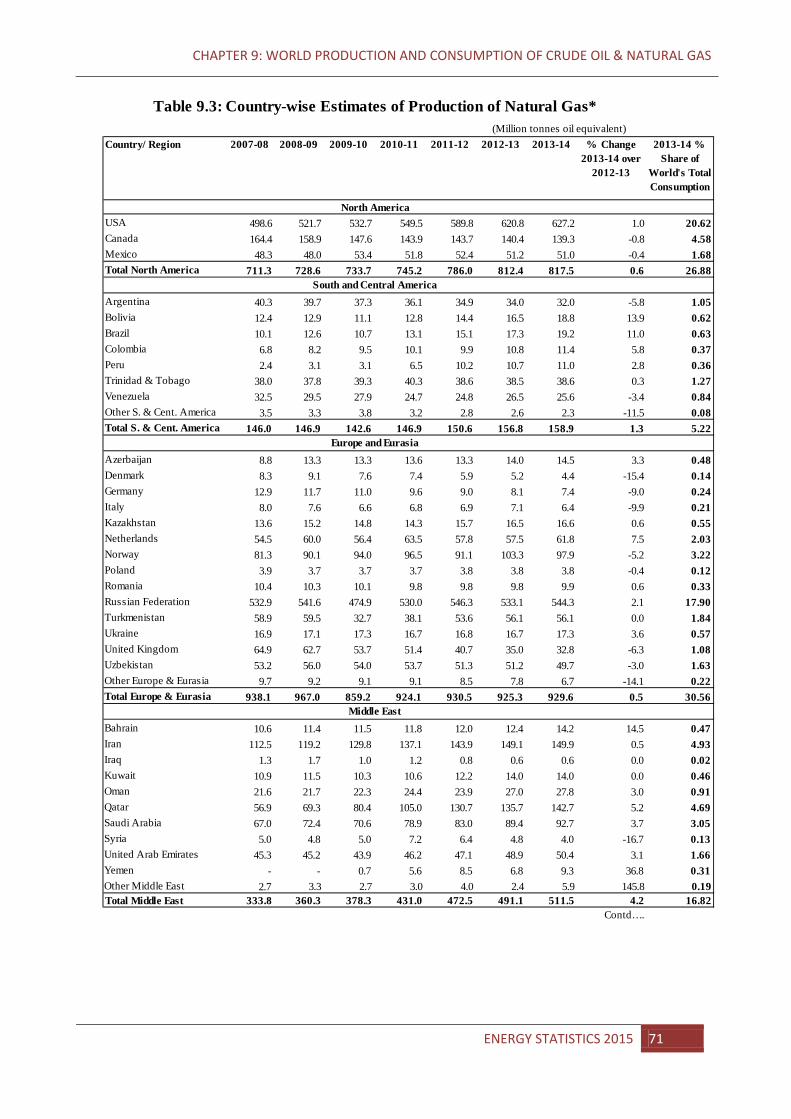
CHAPTER 9: WORLD PRODUCTION AND CONSUMPTION OF CRUDE OIL & NATURAL GAS
(Million tonnes oil equivalent)Country/ Region 2007-08 2008-09 2009-10 2010-11 2011-12 2012-13
USA 498.6 521.7 532.7 549.5 589.8 620.8 627.2 1.0 20.62Canada 164.4 158.9 147.6 143.9 143.7 140.4 139.3 -0.8 4.58Mexico 48.3 48.0 53.4 51.8 52.4 51.2 51.0 -0.4 1.68Total North America 711.3 728.6 733.7 745.2 786.0 812.4 817.5 0.6 26.88
Argentina 40.3 39.7 37.3 36.1 34.9 34.0 32.0 -5.8 1.05Bolivia 12.4 12.9 11.1 12.8 14.4 16.5 18.8 13.9 0.62Brazil 10.1 12.6 10.7 13.1 15.1 17.3 19.2 11.0 0.63Colombia 6.8 8.2 9.5 10.1 9.9 10.8 11.4 5.8 0.37Peru 2.4 3.1 3.1 6.5 10.2 10.7 11.0 2.8 0.36Trinidad & Tobago 38.0 37.8 39.3 40.3 38.6 38.5 38.6 0.3 1.27Venezuela 32.5 29.5 27.9 24.7 24.8 26.5 25.6 -3.4 0.84Other S. & Cent. America 3.5 3.3 3.8 3.2 2.8 2.6 2.3 -11.5 0.08Total S. & Cent. America 146.0 146.9 142.6 146.9 150.6 156.8 158.9 1.3 5.22
Azerbaijan 8.8 13.3 13.3 13.6 13.3 14.0 14.5 3.3 0.48Denmark 8.3 9.1 7.6 7.4 5.9 5.2 4.4 -15.4 0.14Germany 12.9 11.7 11.0 9.6 9.0 8.1 7.4 -9.0 0.24Italy 8.0 7.6 6.6 6.8 6.9 7.1 6.4 -9.9 0.21Kazakhstan 13.6 15.2 14.8 14.3 15.7 16.5 16.6 0.6 0.55Netherlands 54.5 60.0 56.4 63.5 57.8 57.5 61.8 7.5 2.03Norway 81.3 90.1 94.0 96.5 91.1 103.3 97.9 -5.2 3.22Poland 3.9 3.7 3.7 3.7 3.8 3.8 3.8 -0.4 0.12Romania 10.4 10.3 10.1 9.8 9.8 9.8 9.9 0.6 0.33Russian Federation 532.9 541.6 474.9 530.0 546.3 533.1 544.3 2.1 17.90Turkmenistan 58.9 59.5 32.7 38.1 53.6 56.1 56.1 0.0 1.84Ukraine 16.9 17.1 17.3 16.7 16.8 16.7 17.3 3.6 0.57United Kingdom 64.9 62.7 53.7 51.4 40.7 35.0 32.8 -6.3 1.08Uzbekistan 53.2 56.0 54.0 53.7 51.3 51.2 49.7 -3.0 1.63Other Europe & Eurasia 9.7 9.2 9.1 9.1 8.5 7.8 6.7 -14.1 0.22Total Europe & Eurasia 938.1 967.0 859.2 924.1 930.5 925.3 929.6 0.5 30.56
Bahrain 10.6 11.4 11.5 11.8 12.0 12.4 14.2 14.5 0.47Iran 112.5 119.2 129.8 137.1 143.9 149.1 149.9 0.5 4.93Iraq 1.3 1.7 1.0 1.2 0.8 0.6 0.6 0.0 0.02Kuwait 10.9 11.5 10.3 10.6 12.2 14.0 14.0 0.0 0.46Oman 21.6 21.7 22.3 24.4 23.9 27.0 27.8 3.0 0.91Qatar 56.9 69.3 80.4 105.0 130.7 135.7 142.7 5.2 4.69Saudi Arabia 67.0 72.4 70.6 78.9 83.0 89.4 92.7 3.7 3.05Syria 5.0 4.8 5.0 7.2 6.4 4.8 4.0 -16.7 0.13United Arab Emirates 45.3 45.2 43.9 46.2 47.1 48.9 50.4 3.1 1.66Yemen - - 0.7 5.6 8.5 6.8 9.3 36.8 0.31Other Middle East 2.7 3.3 2.7 3.0 4.0 2.4 5.9 145.8 0.19Total Middle East 333.8 360.3 378.3 431.0 472.5 491.1 511.5 4.2 16.82
Contd….
2013-14 % Share of
World's Total Consumption
South and Central America
Europe and Eurasia
Middle East
Table 9.3: Country-wise Estimates of Production of Natural Gas*
North America
% Change 2013-14 over
2012-13
2013-14
ENERGY STATISTICS 2015 71
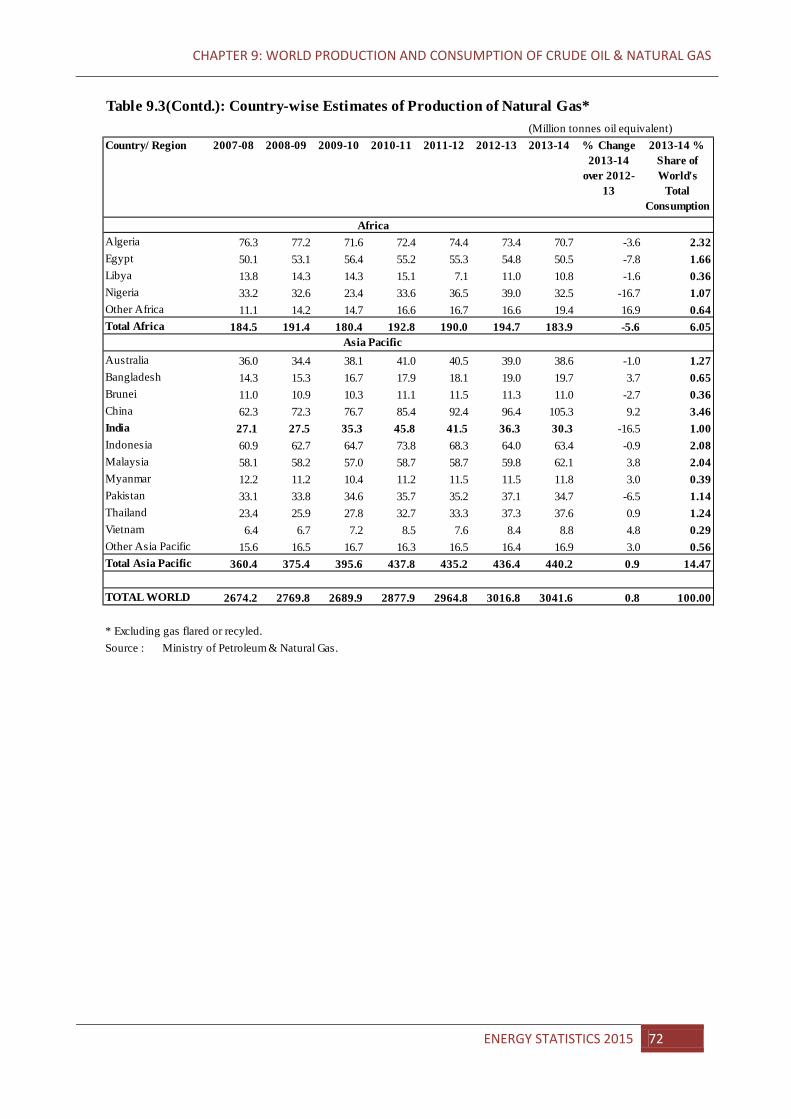
CHAPTER 9: WORLD PRODUCTION AND CONSUMPTION OF CRUDE OIL & NATURAL GAS
Table 9.3(Contd.): Country-wise Estimates of Production of Natural Gas*
Country/ Region 2007-08 2008-09 2009-10 2010-11 2011-12 2012-13
Algeria 76.3 77.2 71.6 72.4 74.4 73.4 70.7 -3.6 2.32Egypt 50.1 53.1 56.4 55.2 55.3 54.8 50.5 -7.8 1.66Libya 13.8 14.3 14.3 15.1 7.1 11.0 10.8 -1.6 0.36Nigeria 33.2 32.6 23.4 33.6 36.5 39.0 32.5 -16.7 1.07Other Africa 11.1 14.2 14.7 16.6 16.7 16.6 19.4 16.9 0.64Total Africa 184.5 191.4 180.4 192.8 190.0 194.7 183.9 -5.6 6.05
Australia 36.0 34.4 38.1 41.0 40.5 39.0 38.6 -1.0 1.27Bangladesh 14.3 15.3 16.7 17.9 18.1 19.0 19.7 3.7 0.65Brunei 11.0 10.9 10.3 11.1 11.5 11.3 11.0 -2.7 0.36China 62.3 72.3 76.7 85.4 92.4 96.4 105.3 9.2 3.46India 27.1 27.5 35.3 45.8 41.5 36.3 30.3 -16.5 1.00Indonesia 60.9 62.7 64.7 73.8 68.3 64.0 63.4 -0.9 2.08Malaysia 58.1 58.2 57.0 58.7 58.7 59.8 62.1 3.8 2.04Myanmar 12.2 11.2 10.4 11.2 11.5 11.5 11.8 3.0 0.39Pakistan 33.1 33.8 34.6 35.7 35.2 37.1 34.7 -6.5 1.14Thailand 23.4 25.9 27.8 32.7 33.3 37.3 37.6 0.9 1.24Vietnam 6.4 6.7 7.2 8.5 7.6 8.4 8.8 4.8 0.29Other Asia Pacific 15.6 16.5 16.7 16.3 16.5 16.4 16.9 3.0 0.56Total Asia Pacific 360.4 375.4 395.6 437.8 435.2 436.4 440.2 0.9 14.47
TOTAL WORLD 2674.2 2769.8 2689.9 2877.9 2964.8 3016.8 3041.6 0.8 100.00
* Excluding gas flared or recyled.Source : Ministry of Petroleum & Natural Gas.
2013-14 (Million tonnes oil equivalent)
Africa
Asia Pacific
% Change 2013-14
over 2012-13
2013-14 % Share of World's
Total Consumption
ENERGY STATISTICS 2015 72
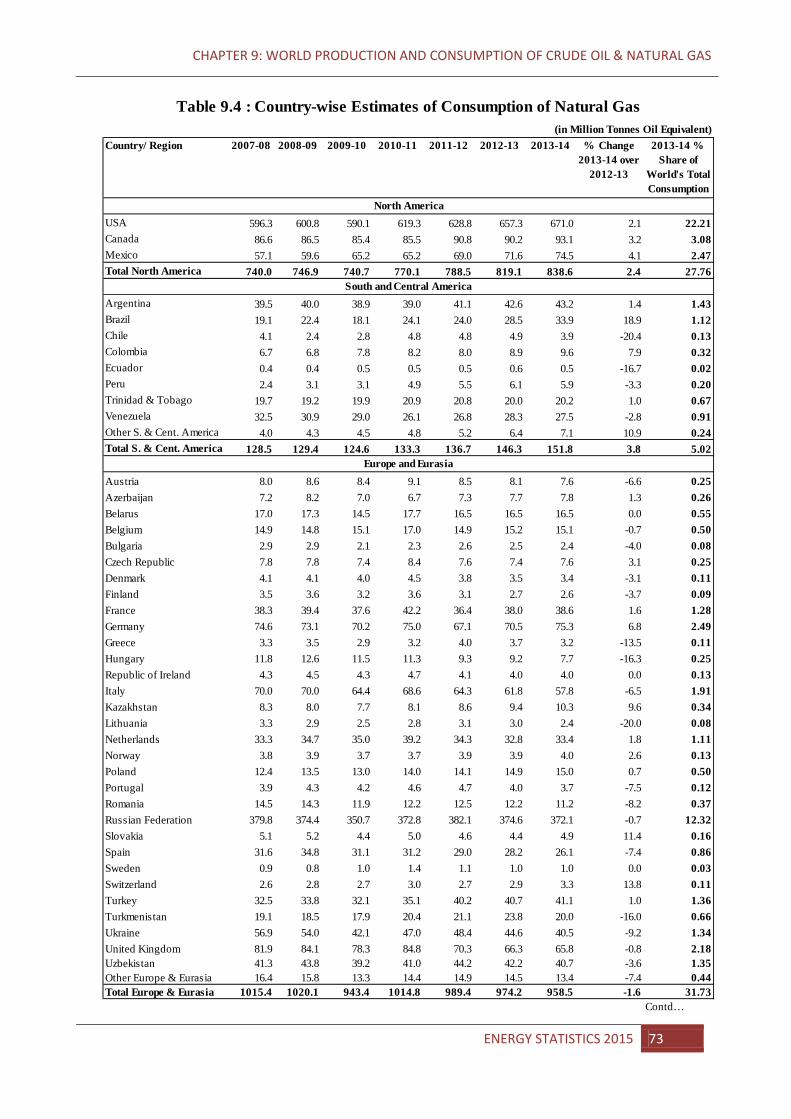
CHAPTER 9: WORLD PRODUCTION AND CONSUMPTION OF CRUDE OIL & NATURAL GAS
Country/ Region 2007-08 2008-09 2009-10 2010-11 2011-12 2012-13
USA 596.3 600.8 590.1 619.3 628.8 657.3 671.0 2.1 22.21Canada 86.6 86.5 85.4 85.5 90.8 90.2 93.1 3.2 3.08Mexico 57.1 59.6 65.2 65.2 69.0 71.6 74.5 4.1 2.47Total North America 740.0 746.9 740.7 770.1 788.5 819.1 838.6 2.4 27.76
Argentina 39.5 40.0 38.9 39.0 41.1 42.6 43.2 1.4 1.43Brazil 19.1 22.4 18.1 24.1 24.0 28.5 33.9 18.9 1.12Chile 4.1 2.4 2.8 4.8 4.8 4.9 3.9 -20.4 0.13Colombia 6.7 6.8 7.8 8.2 8.0 8.9 9.6 7.9 0.32Ecuador 0.4 0.4 0.5 0.5 0.5 0.6 0.5 -16.7 0.02Peru 2.4 3.1 3.1 4.9 5.5 6.1 5.9 -3.3 0.20Trinidad & Tobago 19.7 19.2 19.9 20.9 20.8 20.0 20.2 1.0 0.67Venezuela 32.5 30.9 29.0 26.1 26.8 28.3 27.5 -2.8 0.91Other S. & Cent. America 4.0 4.3 4.5 4.8 5.2 6.4 7.1 10.9 0.24Total S. & Cent. America 128.5 129.4 124.6 133.3 136.7 146.3 151.8 3.8 5.02
Austria 8.0 8.6 8.4 9.1 8.5 8.1 7.6 -6.6 0.25Azerbaijan 7.2 8.2 7.0 6.7 7.3 7.7 7.8 1.3 0.26Belarus 17.0 17.3 14.5 17.7 16.5 16.5 16.5 0.0 0.55Belgium 14.9 14.8 15.1 17.0 14.9 15.2 15.1 -0.7 0.50Bulgaria 2.9 2.9 2.1 2.3 2.6 2.5 2.4 -4.0 0.08Czech Republic 7.8 7.8 7.4 8.4 7.6 7.4 7.6 3.1 0.25Denmark 4.1 4.1 4.0 4.5 3.8 3.5 3.4 -3.1 0.11Finland 3.5 3.6 3.2 3.6 3.1 2.7 2.6 -3.7 0.09France 38.3 39.4 37.6 42.2 36.4 38.0 38.6 1.6 1.28Germany 74.6 73.1 70.2 75.0 67.1 70.5 75.3 6.8 2.49Greece 3.3 3.5 2.9 3.2 4.0 3.7 3.2 -13.5 0.11Hungary 11.8 12.6 11.5 11.3 9.3 9.2 7.7 -16.3 0.25Republic of Ireland 4.3 4.5 4.3 4.7 4.1 4.0 4.0 0.0 0.13Italy 70.0 70.0 64.4 68.6 64.3 61.8 57.8 -6.5 1.91Kazakhstan 8.3 8.0 7.7 8.1 8.6 9.4 10.3 9.6 0.34Lithuania 3.3 2.9 2.5 2.8 3.1 3.0 2.4 -20.0 0.08Netherlands 33.3 34.7 35.0 39.2 34.3 32.8 33.4 1.8 1.11Norway 3.8 3.9 3.7 3.7 3.9 3.9 4.0 2.6 0.13Poland 12.4 13.5 13.0 14.0 14.1 14.9 15.0 0.7 0.50Portugal 3.9 4.3 4.2 4.6 4.7 4.0 3.7 -7.5 0.12Romania 14.5 14.3 11.9 12.2 12.5 12.2 11.2 -8.2 0.37Russian Federation 379.8 374.4 350.7 372.8 382.1 374.6 372.1 -0.7 12.32Slovakia 5.1 5.2 4.4 5.0 4.6 4.4 4.9 11.4 0.16Spain 31.6 34.8 31.1 31.2 29.0 28.2 26.1 -7.4 0.86Sweden 0.9 0.8 1.0 1.4 1.1 1.0 1.0 0.0 0.03Switzerland 2.6 2.8 2.7 3.0 2.7 2.9 3.3 13.8 0.11Turkey 32.5 33.8 32.1 35.1 40.2 40.7 41.1 1.0 1.36Turkmenistan 19.1 18.5 17.9 20.4 21.1 23.8 20.0 -16.0 0.66Ukraine 56.9 54.0 42.1 47.0 48.4 44.6 40.5 -9.2 1.34United Kingdom 81.9 84.1 78.3 84.8 70.3 66.3 65.8 -0.8 2.18Uzbekistan 41.3 43.8 39.2 41.0 44.2 42.2 40.7 -3.6 1.35Other Europe & Eurasia 16.4 15.8 13.3 14.4 14.9 14.5 13.4 -7.4 0.44Total Europe & Eurasia 1015.4 1020.1 943.4 1014.8 989.4 974.2 958.5 -1.6 31.73
Contd…
South and Central America
Europe and Eurasia
Table 9.4 : Country-wise Estimates of Consumption of Natural Gas (in Million Tonnes Oil Equivalent)
North America
% Change 2013-14 over
2012-13
2013-14 % Share of
World's Total Consumption
2013-14
ENERGY STATISTICS 2015 73
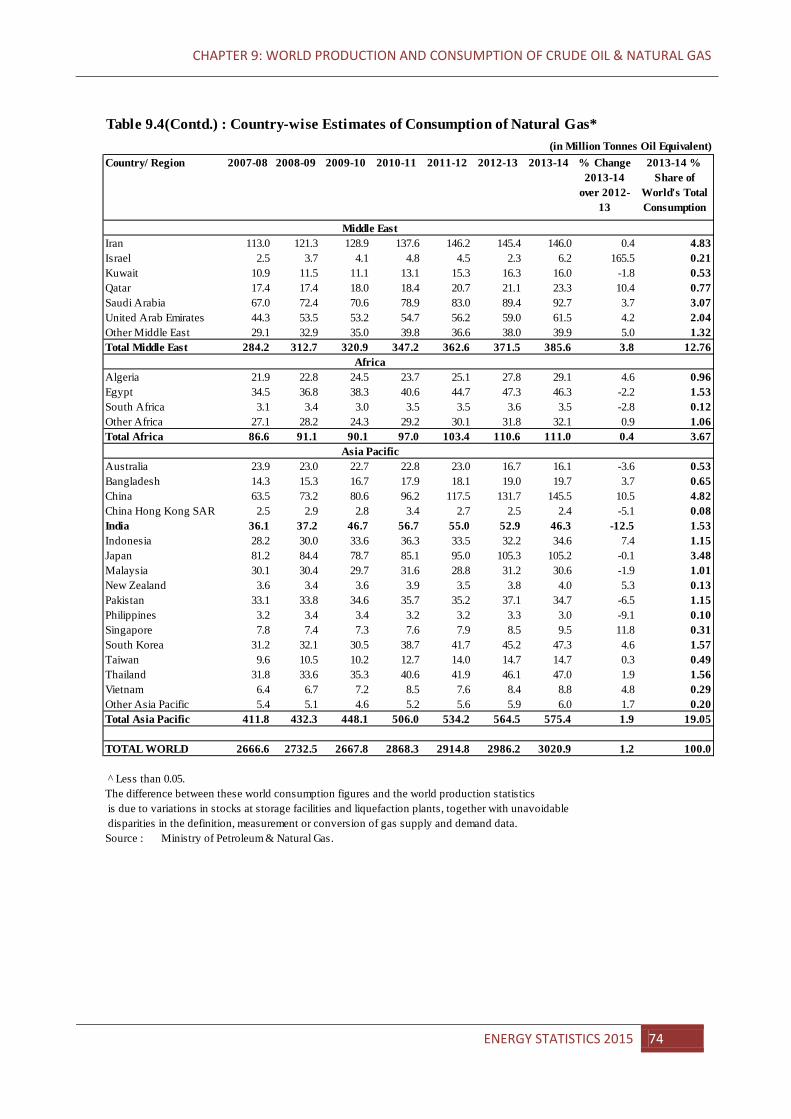
CHAPTER 9: WORLD PRODUCTION AND CONSUMPTION OF CRUDE OIL & NATURAL GAS
Table 9.4(Contd.) : Country-wise Estimates of Consumption of Natural Gas*
Country/ Region 2007-08 2008-09 2009-10 2010-11 2011-12 2012-13
Iran 113.0 121.3 128.9 137.6 146.2 145.4 146.0 0.4 4.83Israel 2.5 3.7 4.1 4.8 4.5 2.3 6.2 165.5 0.21Kuwait 10.9 11.5 11.1 13.1 15.3 16.3 16.0 -1.8 0.53Qatar 17.4 17.4 18.0 18.4 20.7 21.1 23.3 10.4 0.77Saudi Arabia 67.0 72.4 70.6 78.9 83.0 89.4 92.7 3.7 3.07United Arab Emirates 44.3 53.5 53.2 54.7 56.2 59.0 61.5 4.2 2.04Other Middle East 29.1 32.9 35.0 39.8 36.6 38.0 39.9 5.0 1.32Total Middle East 284.2 312.7 320.9 347.2 362.6 371.5 385.6 3.8 12.76
Algeria 21.9 22.8 24.5 23.7 25.1 27.8 29.1 4.6 0.96Egypt 34.5 36.8 38.3 40.6 44.7 47.3 46.3 -2.2 1.53South Africa 3.1 3.4 3.0 3.5 3.5 3.6 3.5 -2.8 0.12Other Africa 27.1 28.2 24.3 29.2 30.1 31.8 32.1 0.9 1.06Total Africa 86.6 91.1 90.1 97.0 103.4 110.6 111.0 0.4 3.67
Australia 23.9 23.0 22.7 22.8 23.0 16.7 16.1 -3.6 0.53Bangladesh 14.3 15.3 16.7 17.9 18.1 19.0 19.7 3.7 0.65China 63.5 73.2 80.6 96.2 117.5 131.7 145.5 10.5 4.82China Hong Kong SAR 2.5 2.9 2.8 3.4 2.7 2.5 2.4 -5.1 0.08India 36.1 37.2 46.7 56.7 55.0 52.9 46.3 -12.5 1.53Indonesia 28.2 30.0 33.6 36.3 33.5 32.2 34.6 7.4 1.15Japan 81.2 84.4 78.7 85.1 95.0 105.3 105.2 -0.1 3.48Malaysia 30.1 30.4 29.7 31.6 28.8 31.2 30.6 -1.9 1.01New Zealand 3.6 3.4 3.6 3.9 3.5 3.8 4.0 5.3 0.13Pakistan 33.1 33.8 34.6 35.7 35.2 37.1 34.7 -6.5 1.15Philippines 3.2 3.4 3.4 3.2 3.2 3.3 3.0 -9.1 0.10Singapore 7.8 7.4 7.3 7.6 7.9 8.5 9.5 11.8 0.31South Korea 31.2 32.1 30.5 38.7 41.7 45.2 47.3 4.6 1.57Taiwan 9.6 10.5 10.2 12.7 14.0 14.7 14.7 0.3 0.49Thailand 31.8 33.6 35.3 40.6 41.9 46.1 47.0 1.9 1.56Vietnam 6.4 6.7 7.2 8.5 7.6 8.4 8.8 4.8 0.29Other Asia Pacific 5.4 5.1 4.6 5.2 5.6 5.9 6.0 1.7 0.20Total Asia Pacific 411.8 432.3 448.1 506.0 534.2 564.5 575.4 1.9 19.05
TOTAL WORLD 2666.6 2732.5 2667.8 2868.3 2914.8 2986.2 3020.9 1.2 100.0
^ Less than 0.05.The difference between these world consumption figures and the world production statistics is due to variations in stocks at storage facilities and liquefaction plants, together with unavoidable disparities in the definition, measurement or conversion of gas supply and demand data.Source : Ministry of Petroleum & Natural Gas.
(in Million Tonnes Oil Equivalent)2013-14 %
Share of World's Total Consumption
Asia Pacific
Middle East
Africa
% Change 2013-14
over 2012-13
2013-14
ENERGY STATISTICS 2015 74
DEFINITIONS OF ENERGY PRODUCTS.
ANNEX- I
DEFINITIONS OF ENERGY PRODUCTS. 1. Solid fuels
i. Hard Coal: Coals with a gross calorific value (moist, ash-free basis) which is not less than 24 MJ/kg or which is less than 24 MJ/kg provided that the coal has a vitrinite mean random reflectance greater than or equal to 0.6 per cent. Hard coal comprises anthracite and bituminous coals.
ii. Lignite: Brown coal with a gross calorific value (moist, ash-free basis) less than 20
MJ/kg. iii. Coke: Products derived directly or indirectly from the various classes of coal by
carbonisation or pyrolysis processes, or by the aggregation of finely divided coal or by chemical reactions with oxidising agents, including water.
iv. Proved Reserves: The coal resource of an area falling within 200 m radius from a borehole. Point (or observation point).
v. Indicated Reserves: Those resources occurring in the area falling between radii of 200m and 1 Km from the borehole point.
vi. Inferred Reserves: Those resources occurring in the area falling between radii of 1 Km and 2 Km from the borehole point.
2. Liquid fuels
i. Crude petroleum A mineral oil of fossil origin extracted by conventional means from underground reservoirs, and comprises liquid or near-liquid hydrocarbons and associated impurities such as sulphur and metals. Remark: Conventional crude oil exists in the liquid phase under normal surface temperature and pressure, and usually flows to the surface under the pressure of the reservoir. This is termed “conventional” extraction. Crude oil includes condensate from condensate fields, and “field” or “lease” condensate extracted with the crude oil. The various crude oils may be classified according to their sulphur content (“sweet” or “sour”) and API gravity (“heavy” or “light”). There are no rigorous specifications for the classifications but a heavy crude oil may be assumed to have an API gravity of less than 20º and a sweet crude oil may be assumed to have less than 0.5% sulphur content.
ii. Liquefied petroleum LPG refers to liquefied propane (C3H8) and butane (C4H10) or
mixtures of both. Commercial grades are usually mixtures of the gases with small amounts of propylene, butylene, isobutene and isobutylene stored under pressure in containers. Remark: The mixture of propane and butane used varies according to purpose and season of the year. The gases may be extracted from natural gas at gas separation plants
ENERGY STATISTICS 2015 75
DEFINITIONS OF ENERGY PRODUCTS.
or at plants re-gasifying imported liquefied natural gas. They are also obtained during the refining of crude oil. LPG may be used for heating and as a vehicle fuel. Certain oil field practices also use the term LPG to describe the high vapour pressure components of natural gas liquids.
iii. Motor gasoline A mixture of some aromatics (e.g., benzene and toluene) and aliphatic hydrocarbons in the C5 to C12 range. The distillation range is 25ºC to 220ºC. Remark: Additives are blended to improve octane rating, improve combustion performance, reduce oxidation during storage, maintain cleanliness of the engine and improve capture of pollutants by catalytic converters in the exhaust system. Motor gasoline may also contain bio-gasoline products.
iv. Naphtha's Light or medium oils distilling between 30ºC and 210ºC which do not meet the specification for motor gasoline. Remark: Different naphthas are distinguished by their density and the content of paraffins, isoparaffins, olefins, naphthenes and aromatics. The main uses for naphthas are as feedstock for high octane gasolines and the manufacture of olefins in the petrochemical industry
v. Kerosene Mixtures of hydrocarbons in the range C9 to C16 and distilling over the temperature interval 145ºC to 300°C, but not usually above 250ºC and with a flash point above 38ºC. Remark: The chemical compositions of kerosenes depend on the nature of the crude oils from which they are derived and the refinery processes that they have undergone. Kerosenes obtained from crude oil by atmospheric distillation are known as straight-run kerosenes. Such streams may be treated by a variety of processes to produce kerosenes that are acceptable for blending as jet fuels. Kerosenes are primarily used as jet fuels. They are also used as domestic heating and cooking fuels, and as solvents. Kerosenes may include components or additives derived from biomass.
vi. Gasoline-type Jet fuels Light hydrocarbons for use in aviation turbine power units,
distilling between 100ºC and 250ºC. They are obtained by blending kerosene and gasoline or naphtha in such a way that the aromatic content does not exceed 25 per cent in volume, and the vapour pressure is between 13.7 kPa and 20.6 kPa. Remark: Gasoline-type jet fuel is also known as “aviation turbine fuel”.
vii. Gas oil / Diesel oil Gas oils are middle distillates, predominantly of carbon number range C11 to C25 and with a distillation range of 160ºC to 420°C. Remark: The principal marketed products are fuels for diesel engines (diesel oil), heating oils and marine fuel. Gas oils are also used as middle distillate feedstock for the petrochemical industry and as solvents.
viii. Fuel oil Comprises residual fuel oil and heavy fuel oil. Residual fuel oils have a distillation range of 350ºC to 650ºC and a kinematic viscosity in the range 6 to 55 cSt at 100ºC. Their flash point is always above 60ºC and their specific gravity is above
ENERGY STATISTICS 2015 76
DEFINITIONS OF ENERGY PRODUCTS.
0.95. Heavy fuel oil is a general term describing a blended product based on the residues from various refinery processes. Remark: Other names commonly used to describe fuel oil include: bunker fuel, bunker C, fuel oil No. 6, industrial fuel oil, marine fuel oil and black oil. Residual and heavy fuel oil are used in medium to large industrial plants, marine applications and power stations in combustion equipment such as boilers, furnaces and diesel engines. Residual fuel oil is also used as fuel within the refinery.
ix. Lubricants Oils, produced from crude oil, for which the principal use is to reduce
friction between sliding surfaces and during metal cutting operations. Remark: Lubricant base stocks are obtained from vacuum distillates which result from further distillation of the residue from atmospheric distillation of crude oil. The lubricant base stocks are then further processed to produce lubricants with the desired properties.
x. Petroleum coke Petroleum coke is a black solid obtained mainly by cracking and
carbonizing heavy hydrocarbon oils, tars and pitches. It consists mainly of carbon (90 to 95 per cent) and has a low ash content. The two most important categories are "green coke" and "calcined coke".
xi. Green coke (raw coke) is the primary solid carbonization product from high boiling hydrocarbon fractions obtained at temperatures below 630ºC. It contains 4-15 per cent by weight of matter that can be released as volatiles during subsequent heat treatment at temperatures up to approximately 1330ºC. Calcined coke is a petroleum coke or coal-derived pitch coke obtained by heat treatment of green coke to about 1330ºC. It will normally have a hydrogen content of less than 0.1 per cent by weight. Remark: In many catalytic operations (e.g., catalytic cracking) carbon or catalytic coke is deposited on the catalyst, thus deactivating it. The catalyst is reactivated by burning off the coke which is used as a fuel in the refining process. The coke is not recoverable in a concentrated form
xii. Bitumen (Asphalt) A solid, semi-solid or viscous hydrocarbon with a colloidal structure, being brown to black in color. Remark: It is obtained as a residue in the distillation of crude oil and by vacuum distillation of oil residues from atmospheric distillation. It should not be confused with the nonconventional primary extra heavy oils which may also be referred to as bitumen. In addition to its major use for road pavements, bitumen is also used as an adhesive, a waterproofing agent for roof coverings and as a binder in the manufacture of patent fuel. It may also be used for electricity generation in specially designed power plants. Bitumen is also known in some countries as asphalt but in others asphalt describes the mixture of bitumen and stone aggregate used for road pavements.
xiii. Refinery gas is a non-condensable gas collected in petroleum refineries (it is also known as still gas).
ENERGY STATISTICS 2015 77
DEFINITIONS OF ENERGY PRODUCTS.
3. Gaseous fuels
i. Natural Gas: A mixture of gaseous hydrocarbons, primarily methane, but generally also including ethane, propane and higher hydrocarbons in much smaller amounts and some noncombustible gases such as nitrogen and carbon dioxide. Remark: The majority of natural gas is separated from both "non-associated" gas originating from fields producing hydrocarbons only in gaseous form, and "associated" gas produced in association with crude oil. The separation process produces natural gas by removing or reducing the hydrocarbons other than methane to levels which are acceptable in the marketable gas. The natural gas The natural gasliquids (NGL) removed in the process are distributed separately.
ii. Coke-oven gas : A gas produced from coke ovens during the manufacture of coke oven coke.
iii. Biogases: Gases arising from the anaerobic fermentation of biomass and the
gasification of solid biomass (including biomass in wastes). Remark: The biogases from anaerobic fermentation are composed principally of methane and carbon dioxide and comprise landfill gas, sewage sludge gas and other biogases from anaerobic fermentation. Biogases can also be produced from thermal processes (by gasification or pyrolysis) of biomass and are mixtures containing hydrogen and carbon monoxide (usually known as syngas) along with other components. These gases may be further processed to modify their composition and can be further processed to produce substitute natural gas. The gases are divided into two groups according to their production: biogases from anaerobic fermentation and biogases from thermal processes. They are used mainly as a fuel but can be used as a chemical feedstock.
4. Electricity
i. Installed capacity: The net capacity measured at the terminals of the stations, i.e., after deduction of the power absorbed by the auxiliary installations and the losses in the station transformers.
ii. Utilities: undertakings of which the essential purpose is the production, transmission
and distribution of electric energy. These may be private companies, cooperative organisations, local or regional authorities, nationalised undertakings or governmental organisations.
iii. Non-Utilities: An Independent Power Producer which is not a public utility, but which owns facilities to generate electric power for sale to utilities and end users. They may be privately held facilities, corporations, cooperatives such as rural solar or wind energy producers, and non-energy industrial concerns capable of feeding excess energy into the system
iv. Hydro Electricity: refers to electricity produced from devices driven by fresh, flowing
or falling water.
ENERGY STATISTICS 2015 78
DEFINITIONS OF ENERGY PRODUCTS.
v. Thermal Electricity comprises conventional thermal plants of all types, whether or not equipped for the combined generation of heat and electric energy. Accordingly, they include steam-operated generating plants, with condensation (with or without extraction) or with back-pressure turbines, and plants using internal combustion engines or gas turbines whether or not these are equipped for heat recovery.
vi. Nuclear Electricity is defined as the heat released by the reactors during the accounting
period and is obtained by dividing the generation of nuclear electricity by average efficiency of all nuclear power stations.
vii. Production is defined as the capture, extraction or manufacture of fuels or energy in
forms which are ready for general use. In energy statistics, two types of production are distinguished, primary and secondary. Primary production is the capture or extraction of fuels or energy from natural energy flows, the biosphere and natural reserves of fossil fuels within the national territory in a form suitable for use. Inert matter removed from the extracted fuels and quantities reinjected flared or vented are not included. The resulting products are referred to as “primary” products. Secondary production is the manufacture of energy products through the process of transformation of primary fuels or energy. The quantities of secondary fuels reported as production include quantities lost through venting and flaring during and after production. In this manner, the mass, energy and carbon within the primary source(s) from which the fuels are manufactured may be balanced against the secondary fuels produced. Fuels, electricity and heat produced are usually sold but may be partly or entirely consumed by the producer. comprises gross production, i.e. the amount of electric energy produced, including that consumed by station auxiliaries and any losses in the transformers that are considered integral parts of the station. Included is the total production of electric energy produced by pump storage installations.
viii. Imports of energy products comprise all fuel and other energy products entering the
national territory. Goods simply being transported through a country (goods in transit) and goods temporarily admitted are excluded but re-imports, which are domestic goods exported but subsequently readmitted, are included. The bunkering of fuel outside the reference territory by national merchant ships and civil aircraft engaged in international travel is excluded from imports. Fuels delivered to national merchant ships and civil aircraft which are outside of the national territory and are engaged in international travel should be classified as “International Marine” or “Aviation Bunkers”, respectively, in the country where such bunkering is carried out (see paragraph 5.12). Note that the “country of origin” of energy products should be recorded as a country from which goods were imported.
ix. Exports of energy products comprise all fuel and other energy products leaving the national territory with the exception that exports exclude quantities of fuels delivered for use by merchant (including passenger) ships and civil aircraft, of all nationalities, during international transport of goods and passengers. Goods simply being transported through a country (goods in transit) and goods temporarily withdrawn are excluded but re-exports, foreign goods exported in the same state as previously imported, are included. Fuels delivered to foreign merchant ships and civil aircraft engaged in international travel are classified as “International Marine” or “Aviation Bunkers”, respectively. Note that “country of destination” of energy products (that is country of
ENERGY STATISTICS 2015 79
CONVERSION FACTORS
the last known destination as it is known at the time of exportation) should be recorded as a country to which these products are exported to.
x. Losses refer to losses during the transmission, distribution and transport of fuels, heat and electricity. Losses also include venting and flaring of manufactured gases, losses of geothermal heat after production and pilferage of fuels or electricity. Production of secondary gases includes quantities subsequently vented or flared. This ensures that a balance can be constructed between the use of the primary fuels from which the gases are derived and the production of the gases.
xi. Energy Industries Own Use refers to consumption of fuels and energy for the direct support of the production, and preparation for use of fuels and energy. Quantities of fuels which are transformed into other fuels or energy are not included here but within the transformation use. Neither are quantities which are used within parts of the energy industry not directly involved in the activities listed in the definition. These quantities are reported within final consumption.
5. Non-commercial Energy Sources
i. Fuelwood, wood residues and by-products: Fuel wood or firewood (in log, brushwood, pellet or chip form) obtained from natural or managed forests or isolated trees. Also included are wood residues used as fuel and in which the original composition of wood is retained. Remark: Charcoal and black liquor are excluded.
ii. Charcoal The solid residue from the carbonisation of wood or other vegetal matter through slow pyrolysis.
iii. Bagasse The fuel obtained from the fiber which remains after juice extraction in sugar cane processing.
ENERGY STATISTICS 2015 80
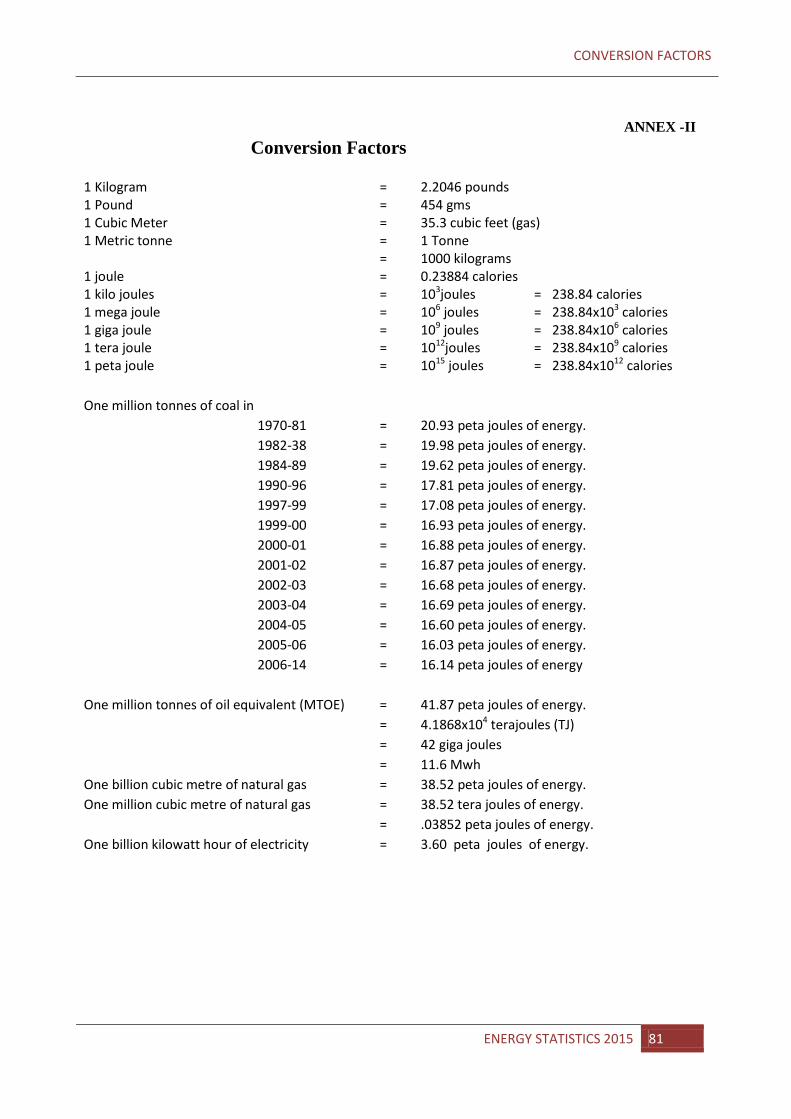
CONVERSION FACTORS
CONVERSION FACTORS
ANNEX -II
Conversion Factors
1 Kilogram = 2.2046 pounds 1 Pound = 454 gms 1 Cubic Meter = 35.3 cubic feet (gas) 1 Metric tonne = 1 Tonne = 1000 kilograms 1 joule = 0.23884 calories 1 kilo joules = 103joules = 238.84 calories 1 mega joule = 106 joules = 238.84x10³ calories 1 giga joule = 109 joules = 238.84x10⁶ calories 1 tera joule = 1012joules = 238.84x10⁹ calories 1 peta joule = 1015 joules = 238.84x10¹² calories
One million tonnes of coal in
1970-81 = 20.93 peta joules of energy.
1982-38 = 19.98 peta joules of energy.
1984-89 = 19.62 peta joules of energy.
1990-96 = 17.81 peta joules of energy.
1997-99 = 17.08 peta joules of energy.
1999-00 = 16.93 peta joules of energy.
2000-01 = 16.88 peta joules of energy.
2001-02 = 16.87 peta joules of energy.
2002-03 = 16.68 peta joules of energy.
2003-04 = 16.69 peta joules of energy.
2004-05 = 16.60 peta joules of energy.
2005-06 = 16.03 peta joules of energy.
2006-14 = 16.14 peta joules of energy
One million tonnes of oil equivalent (MTOE) = 41.87 peta joules of energy.
= 4.1868x10⁴ terajoules (TJ)
= 42 giga joules
= 11.6 Mwh One billion cubic metre of natural gas = 38.52 peta joules of energy.
One million cubic metre of natural gas = 38.52 tera joules of energy.
= .03852 peta joules of energy.
One billion kilowatt hour of electricity = 3.60 peta joules of energy.
ENERGY STATISTICS 2015 81
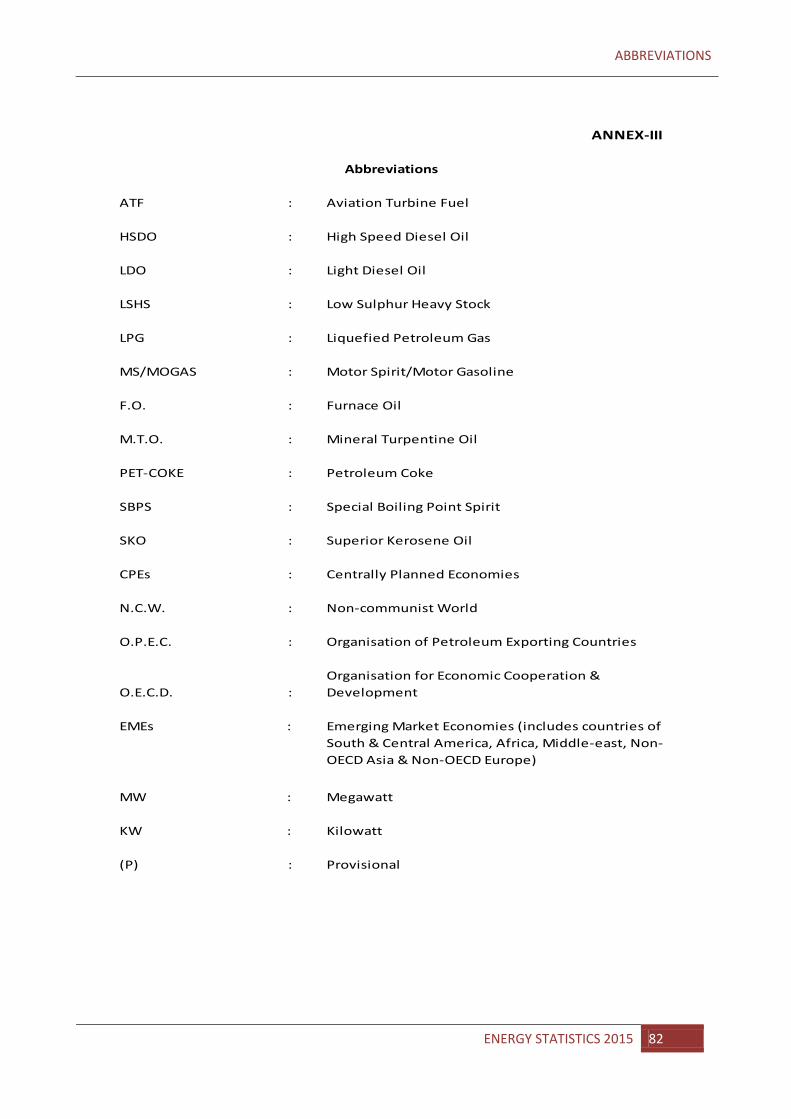
ABBREVIATIONS
ABBREVIATIONS
ANNEX-III
ATF : Aviation Turbine Fuel
HSDO : High Speed Diesel Oil
LDO : Light Diesel Oil
LSHS : Low Sulphur Heavy Stock
LPG : Liquefied Petroleum Gas
MS/MOGAS : Motor Spirit/Motor Gasoline
F.O. : Furnace Oil
M.T.O. : Mineral Turpentine Oil
PET-COKE : Petroleum Coke
SBPS : Special Boiling Point Spirit
SKO : Superior Kerosene Oil
CPEs : Centrally Planned Economies
N.C.W. : Non-communist World
O.P.E.C. : Organisation of Petroleum Exporting Countries
O.E.C.D. :Organisation for Economic Cooperation & Development
EMEs : Emerging Market Economies (includes countries of South & Central America, Africa, Middle-east, Non-OECD Asia & Non-OECD Europe)
MW : Megawatt
KW : Kilowatt
(P) : Provisional
Abbreviations
ENERGY STATISTICS 2015 82
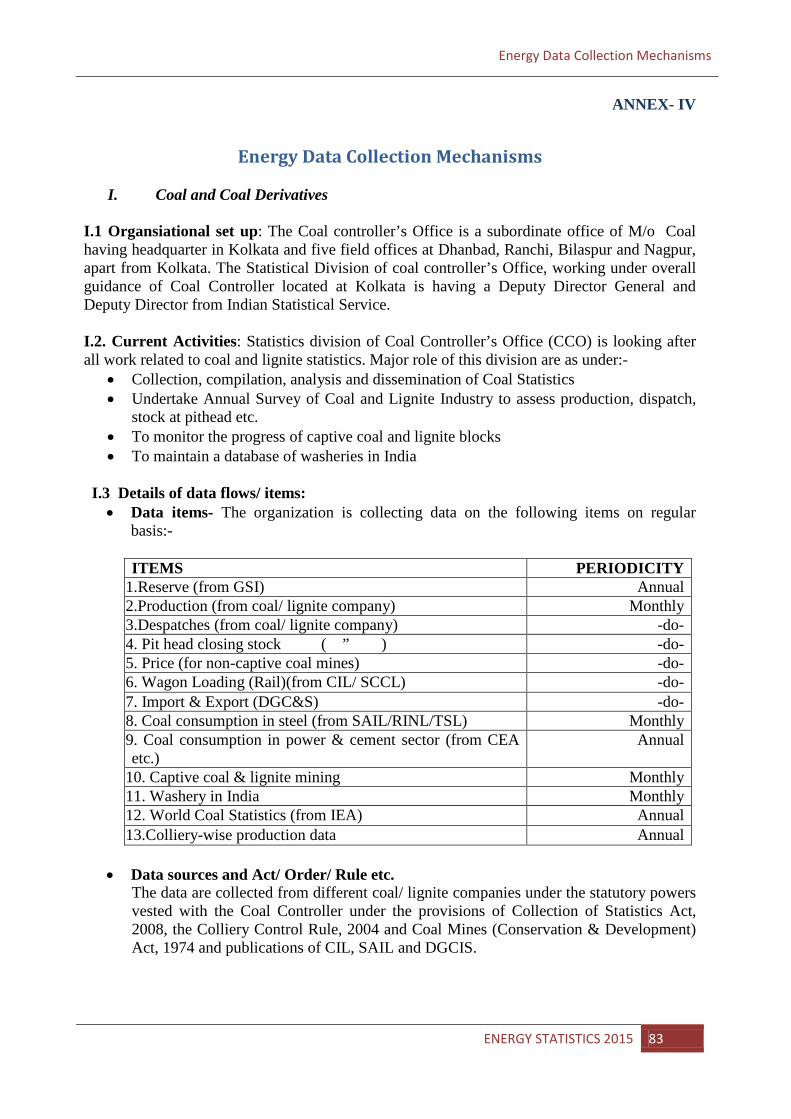
Energy Data Collection Mechanisms
ANNEX- IV
Energy Data Collection Mechanisms
I. Coal and Coal Derivatives
I.1 Organsiational set up: The Coal controller’s Office is a subordinate office of M/o Coal having headquarter in Kolkata and five field offices at Dhanbad, Ranchi, Bilaspur and Nagpur, apart from Kolkata. The Statistical Division of coal controller’s Office, working under overall guidance of Coal Controller located at Kolkata is having a Deputy Director General and Deputy Director from Indian Statistical Service. I.2. Current Activities: Statistics division of Coal Controller’s Office (CCO) is looking after all work related to coal and lignite statistics. Major role of this division are as under:-
• Collection, compilation, analysis and dissemination of Coal Statistics • Undertake Annual Survey of Coal and Lignite Industry to assess production, dispatch,
stock at pithead etc. • To monitor the progress of captive coal and lignite blocks • To maintain a database of washeries in India
I.3 Details of data flows/ items:
• Data items- The organization is collecting data on the following items on regular basis:- ITEMS PERIODICITY
1. Reserve (from GSI) Annual 2.Production (from coal/ lignite company) Monthly 3.Despatches (from coal/ lignite company) -do- 4. Pit head closing stock ( ” ) -do- 5. Price (for non-captive coal mines) -do- 6. Wagon Loading (Rail)(from CIL/ SCCL) -do- 7. Import & Export (DGC&S) -do- 8. Coal consumption in steel (from SAIL/RINL/TSL) Monthly 9. Coal consumption in power & cement sector (from CEA etc.)
Annual
10. Captive coal & lignite mining Monthly 11. Washery in India Monthly 12. World Coal Statistics (from IEA) Annual 13.Colliery-wise production data Annual
• Data sources and Act/ Order/ Rule etc. The data are collected from different coal/ lignite companies under the statutory powers vested with the Coal Controller under the provisions of Collection of Statistics Act, 2008, the Colliery Control Rule, 2004 and Coal Mines (Conservation & Development) Act, 1974 and publications of CIL, SAIL and DGCIS.
ENERGY STATISTICS 2015 83
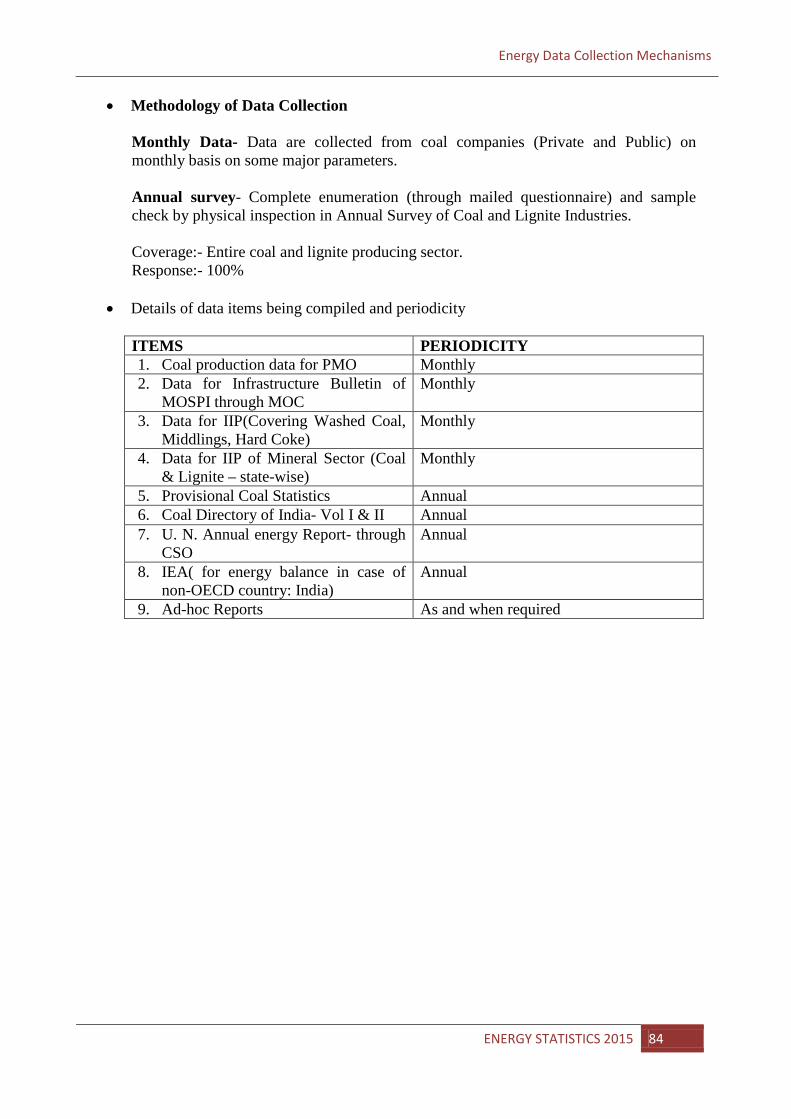
Energy Data Collection Mechanisms
• Methodology of Data Collection
Monthly Data- Data are collected from coal companies (Private and Public) on monthly basis on some major parameters. Annual survey- Complete enumeration (through mailed questionnaire) and sample check by physical inspection in Annual Survey of Coal and Lignite Industries. Coverage:- Entire coal and lignite producing sector. Response:- 100%
• Details of data items being compiled and periodicity ITEMS PERIODICITY 1. Coal production data for PMO Monthly 2. Data for Infrastructure Bulletin of
MOSPI through MOC Monthly
3. Data for IIP(Covering Washed Coal, Middlings, Hard Coke)
Monthly
4. Data for IIP of Mineral Sector (Coal & Lignite – state-wise)
Monthly
5. Provisional Coal Statistics Annual 6. Coal Directory of India- Vol I & II Annual 7. U. N. Annual energy Report- through
CSO Annual
8. IEA( for energy balance in case of non-OECD country: India)
Annual
9. Ad-hoc Reports As and when required
ENERGY STATISTICS 2015 84
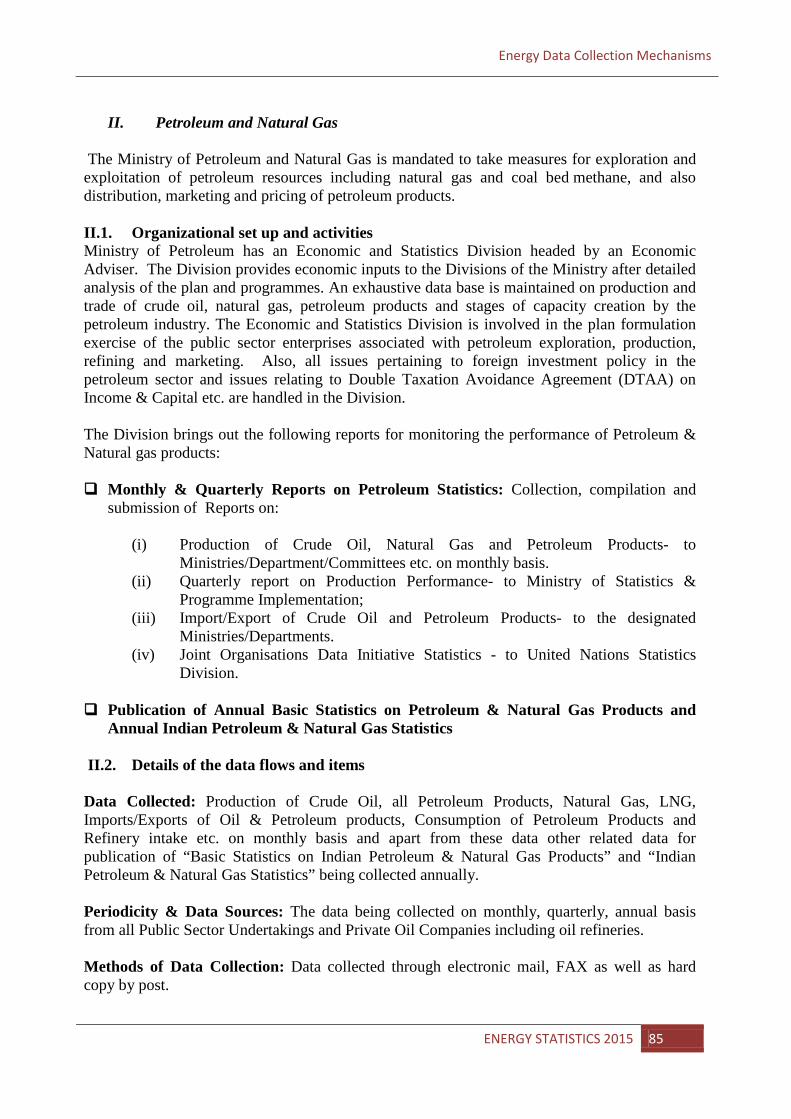
Energy Data Collection Mechanisms
II. Petroleum and Natural Gas The Ministry of Petroleum and Natural Gas is mandated to take measures for exploration and exploitation of petroleum resources including natural gas and coal bed methane, and also distribution, marketing and pricing of petroleum products. II.1. Organizational set up and activities Ministry of Petroleum has an Economic and Statistics Division headed by an Economic Adviser. The Division provides economic inputs to the Divisions of the Ministry after detailed analysis of the plan and programmes. An exhaustive data base is maintained on production and trade of crude oil, natural gas, petroleum products and stages of capacity creation by the petroleum industry. The Economic and Statistics Division is involved in the plan formulation exercise of the public sector enterprises associated with petroleum exploration, production, refining and marketing. Also, all issues pertaining to foreign investment policy in the petroleum sector and issues relating to Double Taxation Avoidance Agreement (DTAA) on Income & Capital etc. are handled in the Division. The Division brings out the following reports for monitoring the performance of Petroleum & Natural gas products: Monthly & Quarterly Reports on Petroleum Statistics: Collection, compilation and
submission of Reports on:
(i) Production of Crude Oil, Natural Gas and Petroleum Products- to Ministries/Department/Committees etc. on monthly basis.
(ii) Quarterly report on Production Performance- to Ministry of Statistics & Programme Implementation;
(iii) Import/Export of Crude Oil and Petroleum Products- to the designated Ministries/Departments.
(iv) Joint Organisations Data Initiative Statistics - to United Nations Statistics Division.
Publication of Annual Basic Statistics on Petroleum & Natural Gas Products and
Annual Indian Petroleum & Natural Gas Statistics II.2. Details of the data flows and items Data Collected: Production of Crude Oil, all Petroleum Products, Natural Gas, LNG, Imports/Exports of Oil & Petroleum products, Consumption of Petroleum Products and Refinery intake etc. on monthly basis and apart from these data other related data for publication of “Basic Statistics on Indian Petroleum & Natural Gas Products” and “Indian Petroleum & Natural Gas Statistics” being collected annually. Periodicity & Data Sources: The data being collected on monthly, quarterly, annual basis from all Public Sector Undertakings and Private Oil Companies including oil refineries. Methods of Data Collection: Data collected through electronic mail, FAX as well as hard copy by post.
ENERGY STATISTICS 2015 85
Energy Data Collection Mechanisms
Data Dissemination Methods: Monthly, Quarterly and Annual Progress Reports circulated to all concerned and also uploaded on Ministry’s web site for the public user. II.3. Provisions under which statutory returns are collected for the petroleum sector: (i) For returns on crude oil and natural gas Principal Legislation: THE OILFIELDS (REGULATION AND
DEVELOPMENT) ACT, 1948(53 of 1948) (8TH SEPTEMBER, 1948)
Subordinate Legislation: THE PETROLEUM AND NATURAL GAS RULES, 1959(As amended from time to time)
Section 14: Royalty on petroleum and furnishing of returns and particulars: (2) The lessee shall, within the first seven days of every month or within such further time as the Central Government or the State Government, as the case may be, may allow, furnish or cause to be furnished to the Central Government or the State Government as the case may be a full and proper return showing the quantity of all crude oil, casing head condensate and natural gas obtained during the preceding month from mining operations conducted pursuant to the lease. The monthly return required to be furnished shall be, as nearly as may be, in the form specified in the schedule annexed to these rules. (ii) For returns on refinery output (petrol, diesel etc)
Principal Legislation:THE INDUSTRIES (DEVELOPMENT AND REGULATION) ACT, 1951, (ACT NO. 65 OF 1951)
Subordinate Legislation:Scheduled Industries (Submission of Production Returns)
Rules, 1979. Section 6: However, collection of data is also governed by the Gazette of India (Extraordinary) Part II-Section 3-Sub Section (i) order No.G.S.R.272(E) dated 16.04.1999 wherein clause 8 states that “Every oil refining company shall furnish to the Central Government or an agency nominated by Central Government any and every information that may be asked for in regard to the procurement, stocking, movements (onshore or offshore), transfers, imports, exports and sales of crude oil and or all products at such period, in such manner and from such of the sources, as may be specified from time to time”.
ENERGY STATISTICS 2015 86
Energy Data Collection Mechanisms
III. Electricity
III.1 Organisational Setup The Central Electricity Authority (CEA) is the nodal authority for supply of electricity data. It is a statutory organization under M/o Power. constituted under Section 3 of the repealed Electricity (Supply) Act, 1948. It was established as a part-time body in the year 1951 and made a full-time body in the year 1975. With the objective of reforming the Power Sector, the Electricity Act, 2003 (No. 36 of 2003) has been enacted and the provisions of this Act have been brought into force with effect from 10th June, 2003. III.2 Functions As per section 73 of the Electricity Act, 2003, the Central Electricity Authority shall perform such functions and duties as the Central Government may prescribe or direct, and in particular to -
a) advise the Central Government on the matters relating to the national electricity policy, formulate short-term and perspective plans for development of the electricity system and coordinate the activities of the planning agencies for the optimal utilization of resources to sub serve the interests of the national economy and to provide reliable and affordable electricity to all consumers;
b) specify the technical standards for construction of electrical plants, electric lines and connectivity to the grid;
c) specify the safety requirements for construction, operation and maintenance of electrical plants and electric lines;
d) specify the Grid Standards for operation and maintenance of transmission lines; e) specify the conditions for installation of meters for transmission and supply of
electricity; f) promote and assist in the timely completion of schemes and projects for improving and
augmenting the electricity system; g) promote measures for advancing the skills of persons engaged in electricity industry; h) advise Central Government on any matter on which its advice is sought or make
recommendation to that Government on any matter if, in the opinion of the Authority, the recommendation would help in improving the generation, transmission, trading, distribution and utilization of electricity;
i) collect and record the data concerning the generation, transmission, trading, distribution and utilization of electricity and carry out studies relating to cost, efficiency, competitiveness and such like matters;
j) make public from time to time the information secured under this Act, and provide for the publication of reports and investigations;
k) promote research in matters affecting the generation, transmission, distribution and trading of electricity;
l) carry out, or cause to be carried out, any investigation for the purpose of generating or transmitting or distributing electricity;
m) advise any State Government, licensees or the generating companies on such matters which shall enable them to operate and maintain the electricity system under their ownership or control in an improved manner and where necessary, in coordination with any other Government, licensee or the generating company owning or having the control of another electricity system;
ENERGY STATISTICS 2015 87
Energy Data Collection Mechanisms
n) advise the Appropriate Government and the Appropriate Commission on all technical
matters relating to generation, transmission and distribution of electricity; and o) discharge such other functions as may be provided under this Act.
III.3. Details of the data Flows/ Items In exercise of the powers conferred by section 177, read with section 74 and clause (i) of section 73 of the Electricity Act, 2003, the Central Electricity Authority published the regulations vide Extra Ordinary Gazette notification dated 19th April 2007, namely:- Central Electricity Authority ( Furnishing of Statistics, Returns and Information) Regulations,2007
(a) Sources of Statistics, Returns and Information All licensees, generating companies and person(s) mentioned below, but not limited to, shall furnish to the Authority such statistics, returns or other information relating to generation, transmission, distribution, trading and utilization of electricity at such times and in such form and manner as specified under these regulations- Licensees (i) Transmission Licensees; (ii) Distribution Licensees;
(iii) Trading Licensees; (iv) Central Transmission Utility; (v) State Transmission Utilities; (vi) Appropriate Governments who are responsible for transmitting, distributing or
trading of electricity; (vii) Damodar Valley Corporation established under sub-section (1) of section 3 of
the Damodar Valley Corporation Act, 1948 (14 of 1948); (viii) Any person engaged in the business of transmission or supply of electricity
under the provisions of the repealed laws or any act specified in the Schedule; (ix) Any person who intends to generate and distribute electricity in a rural area as
notified by the State Government; (x) State Electricity Boards; (xi) Local authorities including Cantonment Boards; (xii) Deemed licensees and entities exempted from license. (xiii) Bhakra Beas Management Board.
Generating companies
(i) Generating companies established by appropriate Governments; (ii) Independent Power Producers; (iii) Appropriate Governments responsible for generating electricity; (iv) Bhakra Beas Management Board; (v) Any person engaged in the business of generating electricity under the
provisions of the repealed laws or any act specified in the Schedule; (vi) Damodar Valley Corporation.
ENERGY STATISTICS 2015 88
Energy Data Collection Mechanisms
Person(s) generating electricity for own use: (i) All captive power producers;
(ii) Any other person including Co-operative Society, Association of persons, body of individuals, etc. engaged in generating electricity for its or his own use.
Other entities
(i) National Load Despatch Centre; (ii) Regional Load Despatch Centre(s); (iii) State Load Despatch Centre(s); (iv) Regional Power Committee(s); (v) High voltage or extra high voltage consumers of electricity.
(b) Formats for furnishing of statistics, returns or information – The entities shall furnish the statistics, returns and information as per the formats
annexed to these regulations titled “List of formats, frequency(ies) and target date(s)”. These formats can also be obtained from the website of the Central Electricity Authority. (website www.cea.nic.in)
(c) Time schedule for furnishing of statistics, returns or information –
The time schedule or targets for furnishing of statistics, returns or information is specified by the Authority on its prescribed formats.
(d) Frequency of submission of statistics, returns or information –
The frequency of submission i.e. daily, weekly, monthly, quarterly or annually is specified by the Authority in its prescribed formats.
(e) Manner of furnishing the statistics, returns or information –
The statistics, returns or information in the prescribed formats shall be furnished to the Authority preferably electronically or by post or courier or fax.
III.4 Data collection problems
The Central Electricity Authority is receiving data from various Public and Private Entities/ Utilities / Organizations/Industries. Though, it is mandatory to these organizations to furnish the correct, complete data in time, yet the following problems are being faced in collection of data.
1. Delay in furnishing data. 2. Furnishing incomplete/ incorrect data. 3. Non submission of data.
For smooth collection of the electricity data, CEA is installing electronic data collection system titled as Information Management System (IMS), ,where all the returns of electricity data can be directly furnished by concerned party (licensees, generating companies, entities etc.)
ENERGY STATISTICS 2015 89
Energy Data Collection Mechanisms
IV. New and Renewable Energy IV.1. Nodal ministry Ministry of New and Renewable Energy (MNRE) is the nodal Ministry of the Government of India at the National level for all matters relating to new and renewable energy. The Ministry has been facilitating the implementation of broad spectrum programmes including harnessing renewable power, renewable energy to rural areas for lighting, cooking and motive power, use of renewable energy in urban, industrial and commercial applications and development of alternate fuels and applications. In addition, it supports research, design and development of new and renewable energy technologies, products and services.
IV.2. Organisational setup It is broadly organized into eight Groups dealing with ‘Bio-Energy, Research & Development and TIFAD(Technology Information Forecasting, Assessment and Databank ), Solar Energy’, and Remote Village Electrification’, Biomass and Wind Power’, ‘Energy for Urban, Industrial & Commercial Applications’, ‘Small Hydro and Information & Public Awareness’, ‘Hydrogen Energy’ and ‘Administration and Coordination’. In addition, the Ministry has an Integrated Finance Division, which is functioning under the Special Secretary and Financial Adviser. The Ministry is classified as a Scientific Ministry. IV.3. Current responsibilities Formulating policies and programmes for the development of new and renewable sources of energy;
(a) Coordinating and intensifying research and development activities in new and renewable sources of energy;
(b) Ensuring implementing of Government’s policies in regard to all matters concerning new and renewable sources of energy.
IV.4. Data flows The basic data being compiled includes year wise and month wise no. of systems installed, their capacities. locations, etc. and is obtained from various stakeholders i.e. State Government Departments/Nodal Agencies, NGOs, Private Entrepreneurs, etc. Annual statistical information regarding achievements under different programmes/schemes is being included in the yearly Annual Report of the Ministry.
ENERGY STATISTICS 2015 90
Energy Data Collection Mechanisms
CSO, SARDAR PATEL BHAVAN,
SANSAD MARG, NEW DELHI - 110 001 ENERGY STATISTICS 2015 91