Embed Size (px)
Citation preview

1 Engineering Field Notes
Administrative Distribution
Professional Development This publication is an administrative document that wasdeveloped for the guidance of employees of the ForestSer-vice-U.S.Department of Agriculture its contractors and its
Management cooperating Federal and State Government Agencies. The text
in the publication represents the personal opinions of therespective authors. This information has not been approved for
Data Retrieval distribution to the public and must not be construed asrecom-mendedor approved policy procedures or mandatoryinstruc-tionsexcept by Forest Service Manual references.
The Forest Service-U.S. Department of Agriculture assumesno responsibility for the interpretation or application of thisin-formation
by other than its own employees. The use of tradenames and identification of firmsor corporations is for thecon-venienceof the reader such use does not constitute an official
endorsement or approval by the United States Government of
any product or service to the exclusion of others that may besuitable.
This information is the sole property of the Government withunlimited rights in the usage thereof and cannot be copyrightedby private parties.
Please direct any comments or recommendations about this
publication to the following address
FOREST SERVICE-USDAEngineering Staff-Washington Office
Attn D.J. Carroll Editor
M.J. Baggett Editorial Assistant
P.O. Box 2417-Washington D.C. 20013
Telephone Area Code 703-235-8198

Ground-Penetrating Radar A Review forResource Managers
Jerry D. GreerProject LeaderNationwide Forestry Applications Program NFAP
INTRODUCTION Ground-penetrating radar GPR systems permit us tolook into the earth and see what lies beyond thelimits of our normal vision. GPR is as its namesuggests a radar-based system that transmits a
signal or beam into the earth. This beam isreflec-tedby subsurface interfaces. The reflected signalscan be analyzed to identify these features which wecan neither see nor touch. GPR also is calledsub-surfaceinterface radar ground profiling radaror electromagnetic subsurface profiling. Thetechnology has been available since about 1970.
WHAT GPR IS This technology is based on impulse radar systems.This type of radar system repeatedly radiates veryshort electromagnetic pulses into the earth. Thepulses are radiated from an antenna that is setclose to the ground.
The system operates similar to acoustic profilingsystems. The pulses each lasting only a fewbillionths of a second are reflected from theground surface and from subsurface interfaces. Thereflected signals are detected interpreted anddisplayed on a continuous-strip chart recorder.Depending upon the electromagnetic characteristicsof the geologic material the depth to reflectingdiscontinuities can be calculated accurately towithin a few inches.
WH ER E GPR Like many remote sensing systems GPR probably owesSTARTED its beginning to research conducted by the military.
They have been interested in developing the abilityto detect land mines and enemy tunnel works 4. Formany years now this technology has been used toprofile ice thickness 1.Researchers in the field of mine safety also haveworked to develop techniques that permit the routineuse of GPR to see clay veins and voids from 200 to400 feet into otherwise solid limestone 6.
1
%
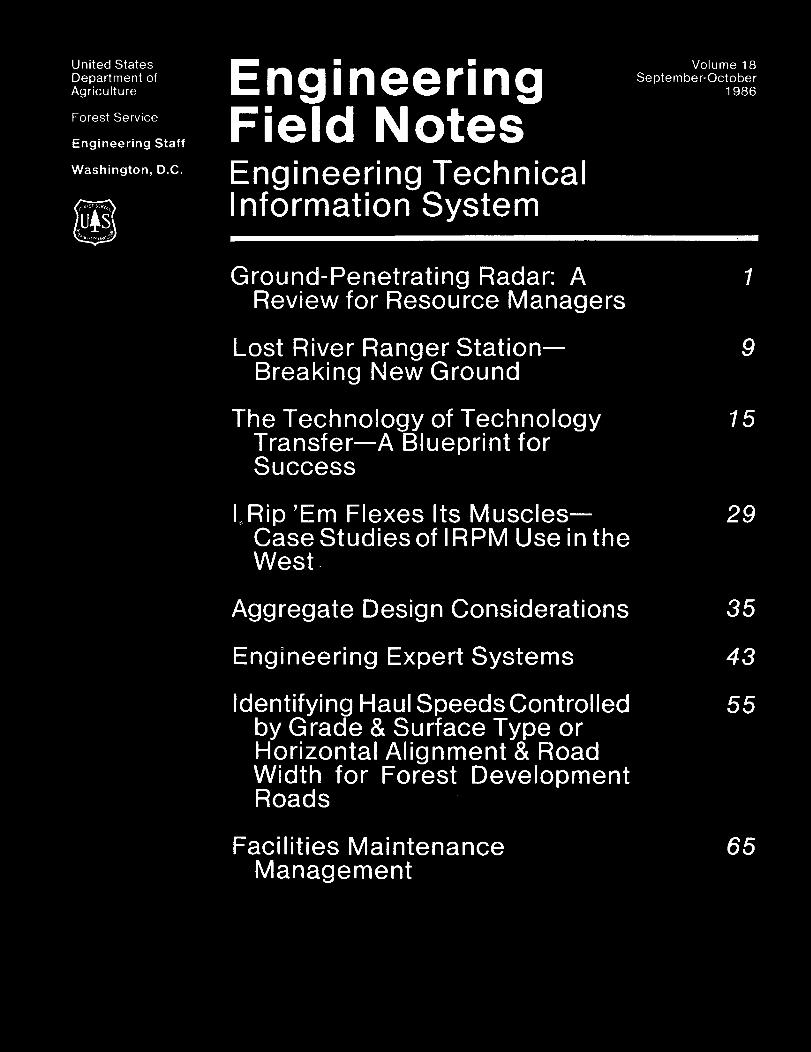
Figure 1.--The relationship of bedrock to the ground surface can be
mapped using GPR. This profile from near Salem New Hampshirereveals a very undulating bedrock surface. The darkest part of the
scan is the bedrock. The depth of penetration here exceeded 80 feet.
a--Tunnel Face
nt Between
oct and
Concrete Liner
5 Feet
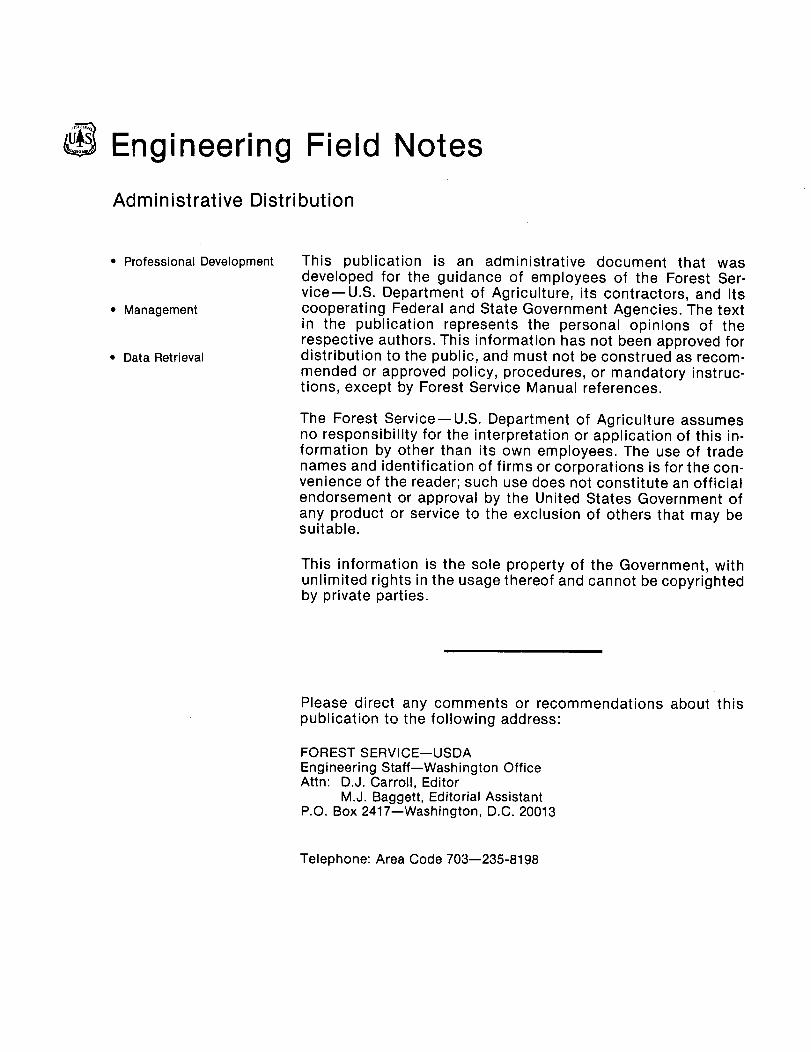
Figure 2.--Ground-penetrating radar can be
used to inspect critical cement structuressuch as dam facings railroad and auto tunnelwalls and a5uaducts. In this example GPR
was used to examine the concrete walls of aL 5L of
railroad tunnel in France. The boat-wake1J ectivc
pattern is a void within the solid rockbehind the tunnel facing at the top of this
Pe tration
figure. This void is about 5 feet back intothe rock.
2
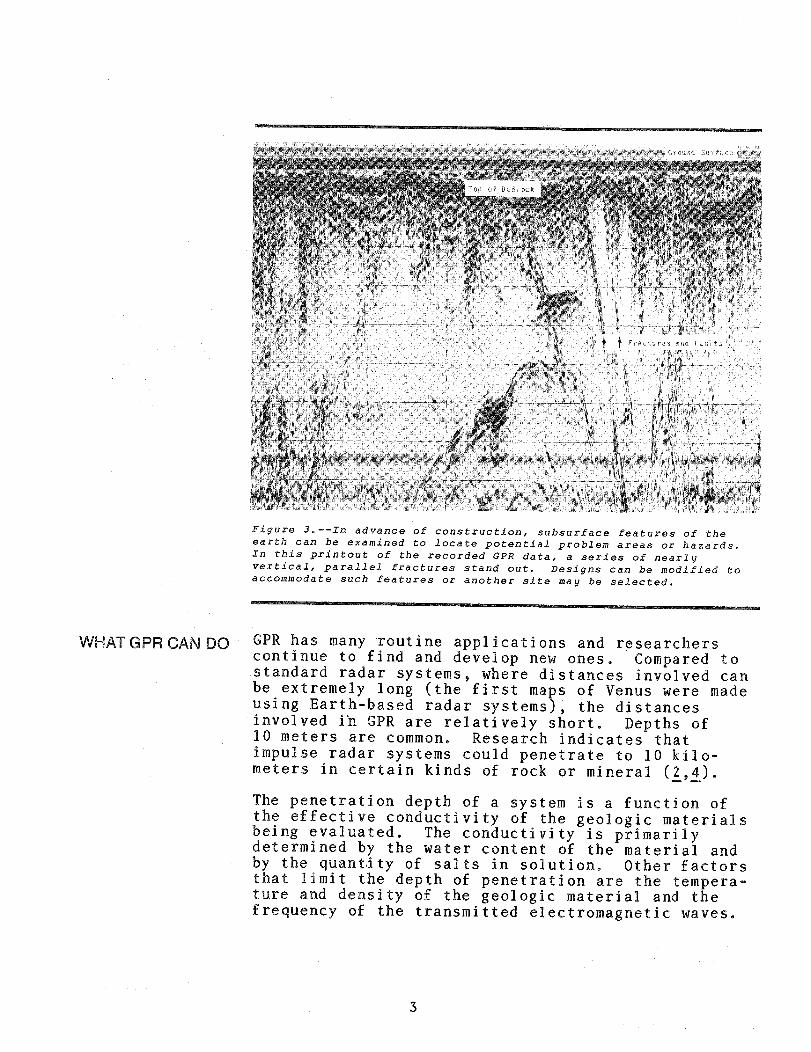
Figure 3.--In advance of construction subsurface features of the
earth can be examined to locate potential problem areas or hazards.In this printout of the recorded GPR data a series of nearlyvertical parallel fractures stand out. Designs can be modified toaccommodate such features or another site may be selected.
WHAT G PR CAN GPR has many routine applications and researcherscontinue to find and develop new ones. Compared tostandard radar systems where distances involved canbe extremely long the first maps of Venus were made
using Earth-based radar systems the distancesinvolved in GPR are relatively short. Depths of10 meters are common. Research indicates that
impulse radar systems could penetrate to 10kilo-metersin certain kinds of rock or mineral 24.The penetration depth of a system is a function ofthe effective conductivity of the geologic materialsbeing evaluated. The conductivity is primarilydetermined by the water content of the material and
by the quantity of salts in solution. Other factorsthat limit the depth of penetration are thetempera-tureand density of the geologic material and the
frequency of the transmitted electromagnetic waves.
3
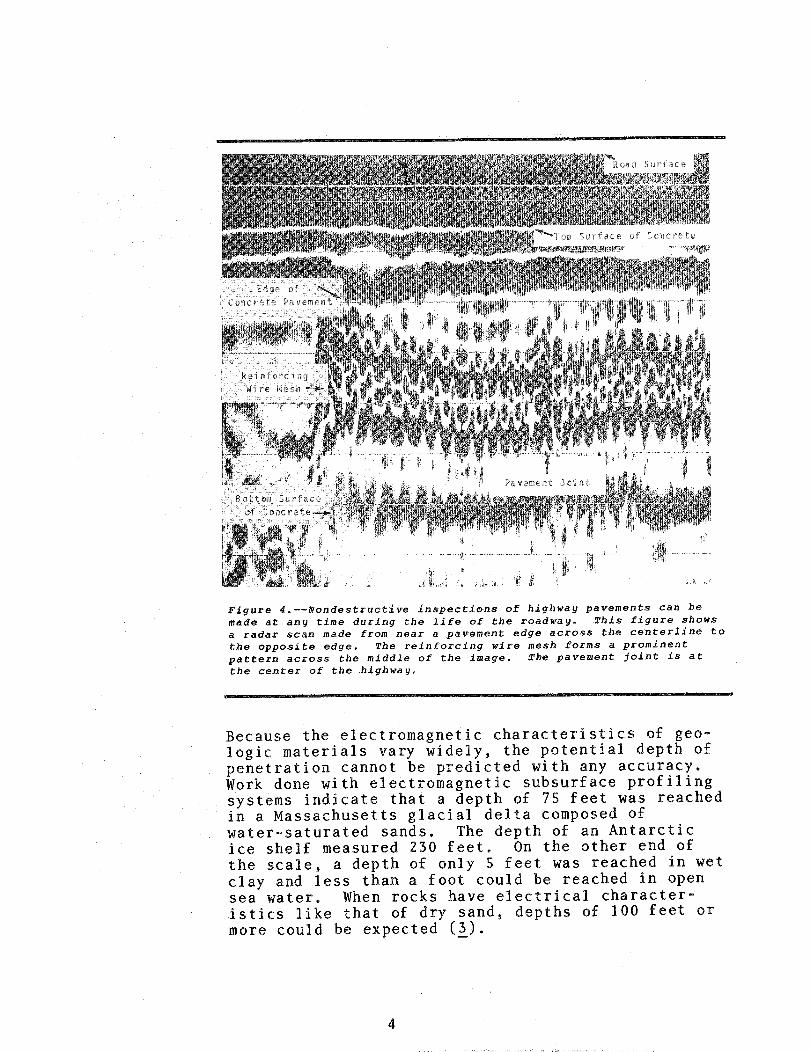
Figure 4.--Nondestructive inspections of highway pavements can be
made at any time during the life of the roadway. This figure showsrocs the centerline toa radar scan made from near a.pavement edge ac
the opposite edge. The reinforcing wire mesh forms a prominentpattern across the middle of the image. The pavement joint is at
the center of the.highway.
Because the electromagnetic characteristics ofgeo-logicmaterials vary widely the potential depth of
penetration cannot be predicted with any accuracy.Work done with electromagnetic subsurface profiling
systems indicate that a depth of 75 feet was reached
in a Massachusetts glacial delta composed of
water-saturated sands. The depth of an Antarctic
ice shelf measured 230 feet. On the other end of
the scale a depth of only 5 feet was reached in wet
clay and less than a foot could be reached in opensea water. When rocks have electricalcharacter-isticslike that of dry sand depths of 100 feet or
more could be expected 3.
4
S
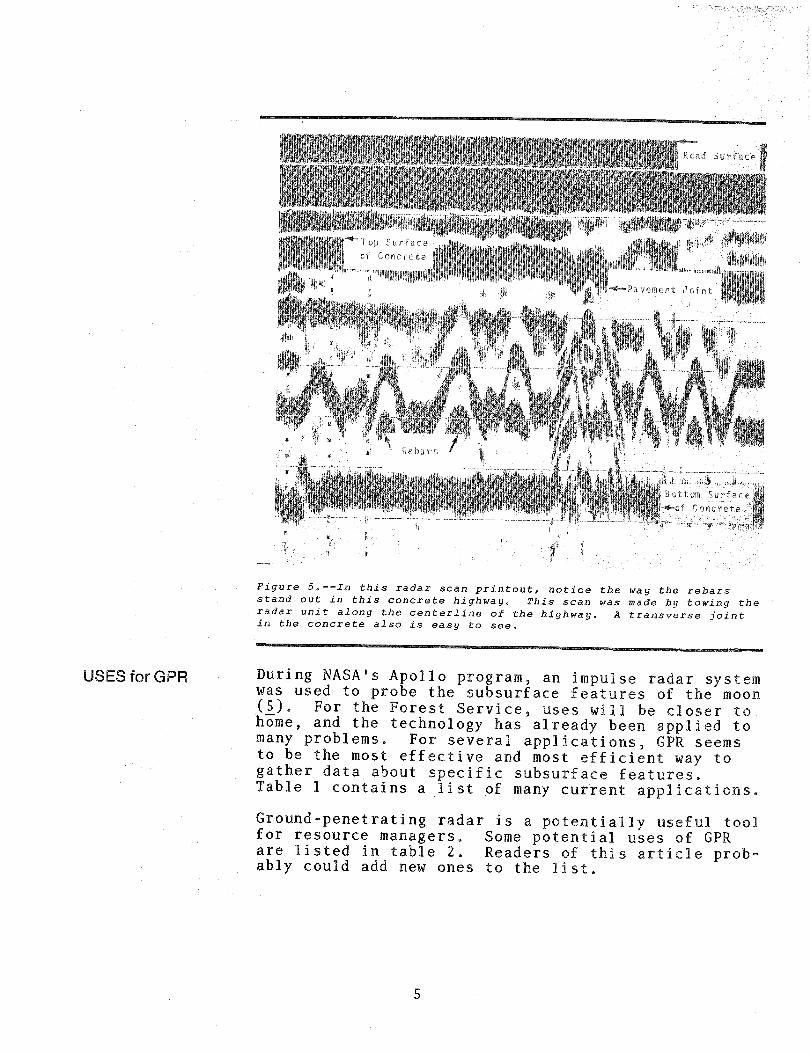
Figure 5.--In this radar scan printout notice the way the rebarsstand out in this concrete highway. This scan was made by towing the
radar unit along the centerline of the highway. A transverse jointin the concrete also is easy to see.
USESforGPR During NASAs Apollo program an impulse radar systemwas used to probe the subsurface features of the moon5. For the Forest Service uses will be closer tohome and the technology has already been applied to
many problems. For several applications GPR seemsto be the most effective and most efficient way to
gather data about specific subsurface features.Table 1 contains a list of many current applications.
Ground-penetrating radar is a potentially useful toolfor resource managers. Some potential uses of GPRare listed in table 2. Readers of this articleprob-ablycould add new ones to the list.
5
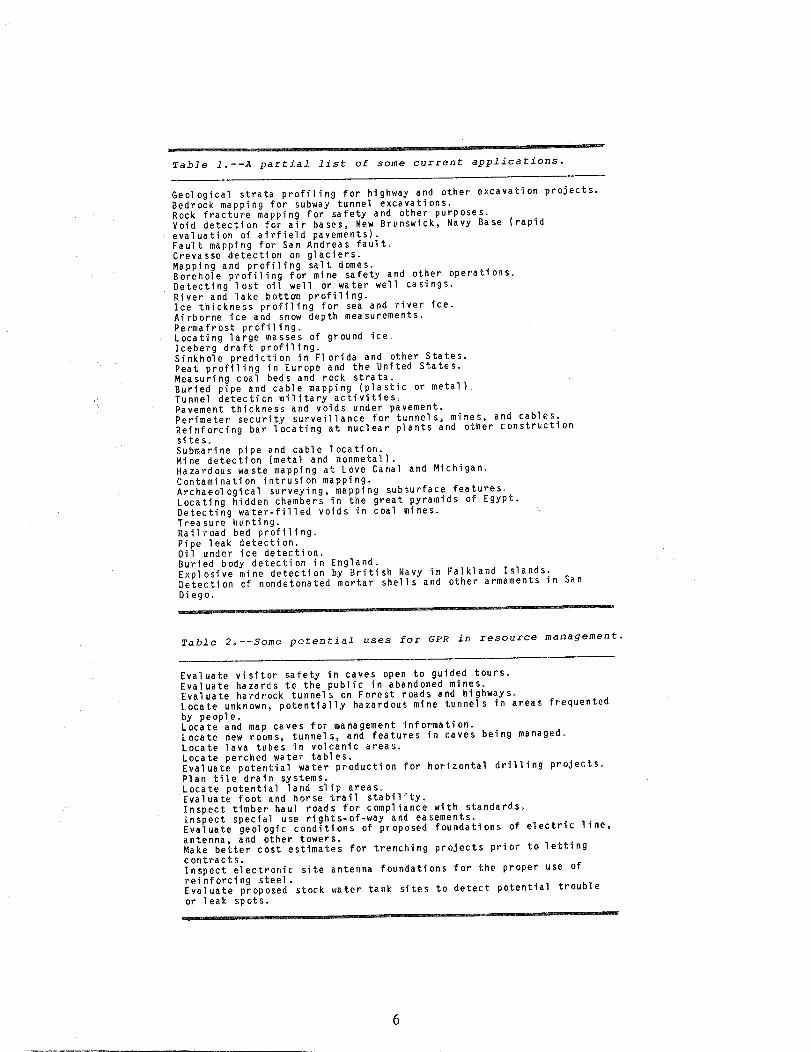
Table 1--A partial list of some current applications.
Geological strata profiling for highway and other excavation projects.Bedrock mapping for subway tunnel excavations.Rock fracture mapping for safety and other purposes.Void detection for air bases New Brunswick Navy Base rapidevaluation of airfield pavements.Fault mapping for San Andreas fault.Crevasse detection on glaciers.Mapping and profiling salt domes.Borehole profiling for mine safety and other operations.Detecting lost oil well or water well casings.River and lake bottom profiling.Ice thickness profiling for sea and river ice.Airborne ice and snow depth measurements.Permafrost profiling.Locating large masses of ground ice.
Iceberg draft profiling.Sinkhole prediction in Florida and other States.Peat profiling in Europe and the United States.
Measuring coal beds and rock strata.Buried pipe and cable mapping plastic or metal.Tunnel detection military activities.Pavement thickness and voids under pavement.Perimeter security surveillance for tunnels mines and cables.Reinforcing bar locating at nuclear plants and other constructionsites.Submarine pipe and cable location.Mine detection metal and nonmetal.Hazardous waste mapping at Love Canal and Michigan.Contamination intrusion mapping.Archaeological surveying mapping subsurface features.
Locating hidden chambers in the great pyramids of Egypt.Detecting water-filled voids in coal mines.Treasure hunting.Railroad bed profilingPipe leak detection.Oil under ice detection.Buried body detection in England.Explosive mine detection by British Navy in Falkland Islands.Detection of nondetonated mortar shells and other armaments in San
Diego.
Table 2--Some potential uses for GPR in resource management.
Evaluate visitor safety in caves open to guided tours.Evaluate hazards to the public in abandoned mines.Evaluate hardrock tunnels on Forest roads and highways.Locate unknown potentially hazardous mine tunnels in areas frequentedby people.Locate and map caves for management information.Locate new rooms tunnels and features in caves being managed.Locate lava tubes in volcanic areas.Locate perched water tables.Evaluate potential water production for horizontal drilling projects.Plan tile drain systems.Locate potential land slip areas.Evaluate foot and horse trail stability.Inspect timber haul roads for compliance with standards.
Inspect special use rights-of-way and easements.Evaluate geologic conditions of proposed foundations of electric lineantenna and other towers.Make better cost estimates for trenching projects prior to lettingcontracts.
Inspect electronic site antenna foundations for the proper use of
reinforcing steel.Evaluate proposed stock water tank sites to detect potential troubleor leak spots.
6
C
is
Bottom Surfa
of c.pcr t
I
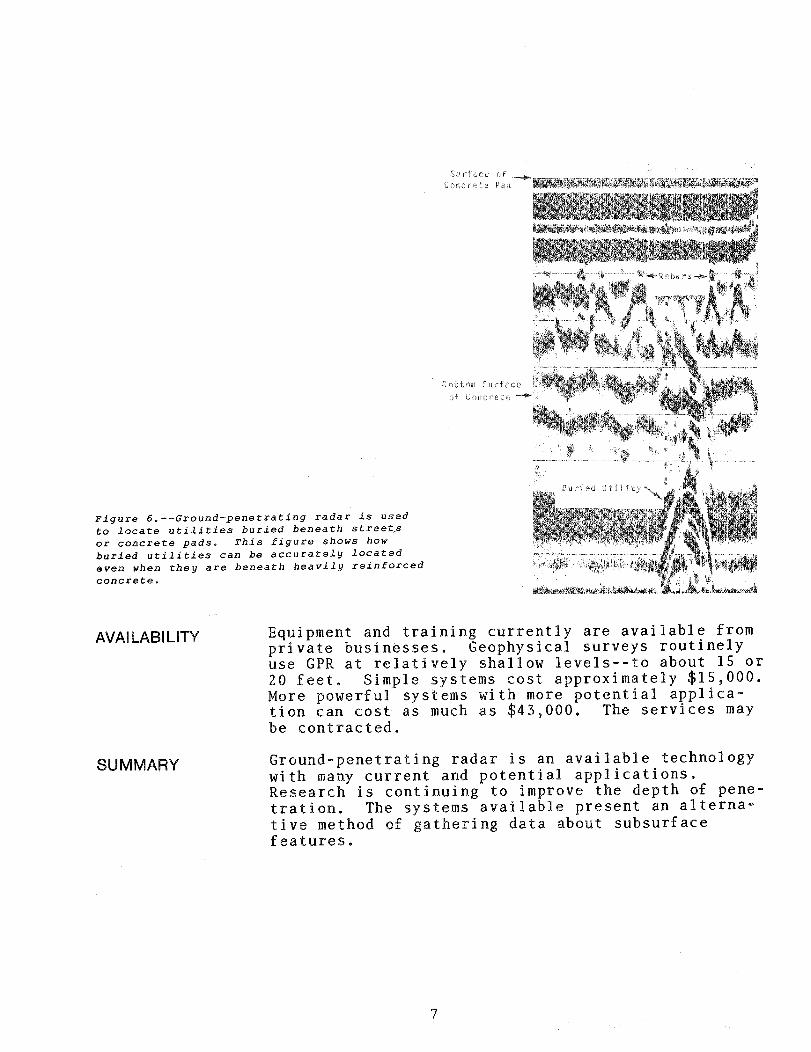
Figure 6.--Ground-penetrating radar is used
to locate utilities buried beneath streetsor concrete pads. This figure shows howburied utilities can be accurately located
even when they are beneath heavily reinforced
concrete.
AVAILABILITY Equipment and training currently are available from
private businesses. Geophysical surveys routinelyuse GPR at relatively shallow levels--to about 15 or
20 feet. Simple systems cost approximately $15000.More powerful systems with more potentialapplica-tioncan cost as much as $43000 The services maybe contracted.
SUMMARY Ground-penetrating radar is an available technologywith many current and potential applications.Research is continuing to improve the depth ofpene-tration.The systems available present analterna-tivemethod of gathering data about subsurfacefeatures.
7
REFERENCES 1. Campbell K. J. and A. S. Orange. A ContinuousProfile of Sea Ice and Freshwater Ice Thickness By
Impulse Radar. Polar Record 17106 31-44 1974.
2. Cook J. C. 1970. Electrical Properties of
Bituminous Coal Samples. Geophysics 3561079-1085 1970.
3. Geophysical Survey Systems Inc. ContinuousSubsurface Profiling By Impulse Radar. GeophysicalSurvey Systems 1974.
4. Pittman W. E. Jr. R. H. Church W. E. Webband J. T. McLendon. Ground Penetrating Radar AReview of its Applications in the Mining Industry.U.S. Bureau of Mines Information Circular 89641984.
5. Porcello L. J. The Apollo Lunar Sounder RadarSystem. Proceedings IEEE 626 769-783 1974.
6. Meyers. Personal communication Novenber 81984.
SUGGESTED 1. Ulriksen C. Application of Impulse Radar to
READING Civil Engineering. Geophysical Survey Systems Inc.Lund University of Technology Sweden 1983.
EFN
8
Lost River Ranger Station- i
New Ground
Wilden W. MoffettArchitectRegion 4
INTRODUCTION In the fall of 1982 when the first shovel of earthwas turned for the new Lost River Ranger Station onthe Challis National Forest at Mackay Idaho newground was broken on more than the construction of a
building.
Lost River is the first office in Region 4 to dependlargely on solar energy for heat. Designed as a
passive system the entire south wall of the officeis enclosed in a greenhouse. Energy from the suntraveling through the greenhouse is absorbed into a
special collector wall constructed of concrete blocks
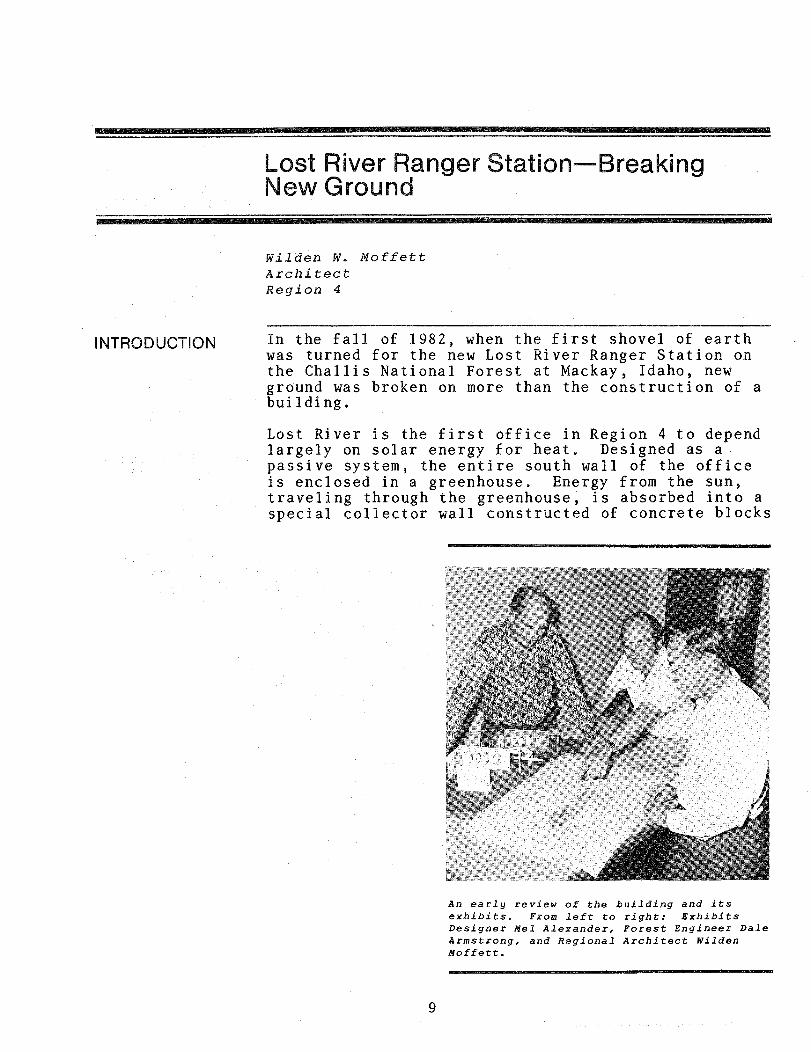
An early review of the building and its
exhibits. From left to right ExhibitsDesigner Mel Alexander Forest Engineer DaleArmstrong and Regional Architect WildenMoffett.
9
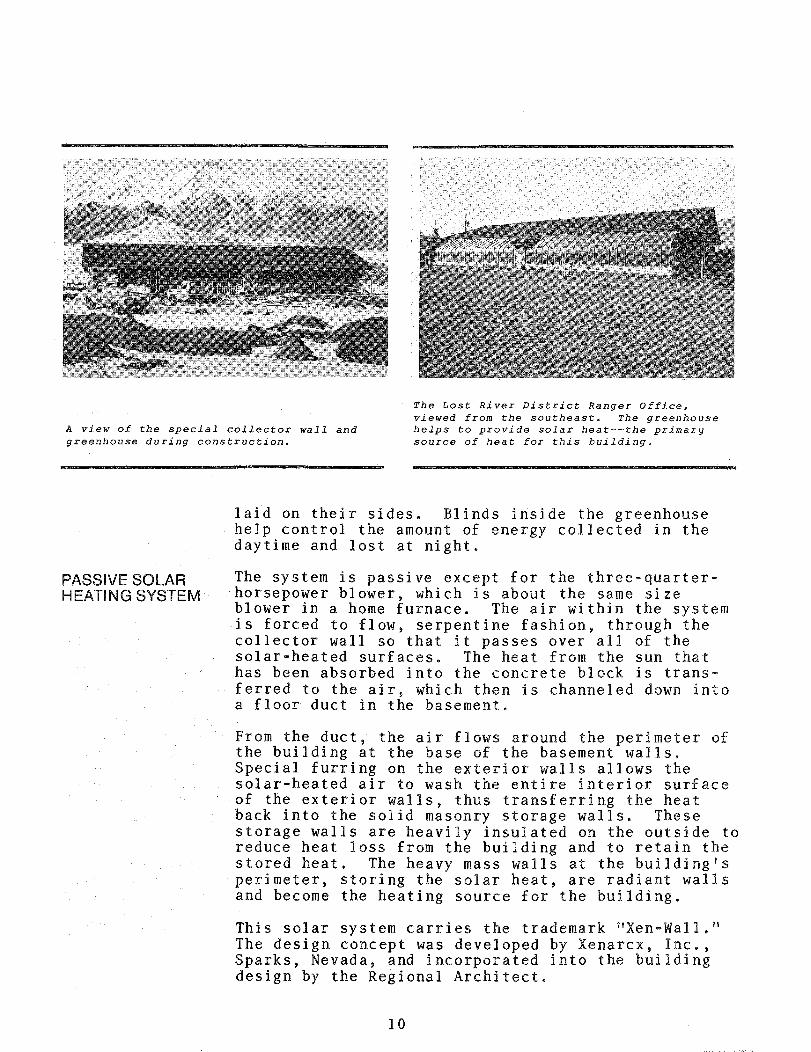
The Lost River District Ranger Officeviewed from the southeast. The greenhouse
A view of the special collector wall and helps to provide solar heat--the primarygreenhouse during construction. source of heat for this building.
laid on their sides. Blinds inside the greenhousehelp control the amount of energy collected in thedaytime and lost at night.
PASSIVE SOLAR The system is passive except for thethree-quarter-HEATINGSYSTEM horsepower blower which is about the same sizeblower in a home furnace. The air within the systemis forced to flow serpentine fashion through thecollector wall so that it passes over all of thesolar-heated surfaces. The heat from the sun thathas been absorbed into the concrete block istrans-ferredto the air which then is channeled down intoa floor duct in the basement.
From the duct the air flows around the perimeter ofthe building at the base of the basement walls.Special furring on the exterior walls allows thesolar-heated air to wash the entire interior surfaceof the exterior walls thus transferring the heatback into the solid masonry storage walls. Thesestorage walls are heavily insulated on the outside toreduce heat loss from the building and to retain thestored heat. The heavy mass walls at the buildingsperimeter storing the solar heat are radiant wallsand become the heating source for the building.
This solar system carries the trademark Xen-Wall.The design concept was developed by Xenarcx Inc.Sparks Nevada and incorporated into the buildingdesign by the Regional Architect.
10
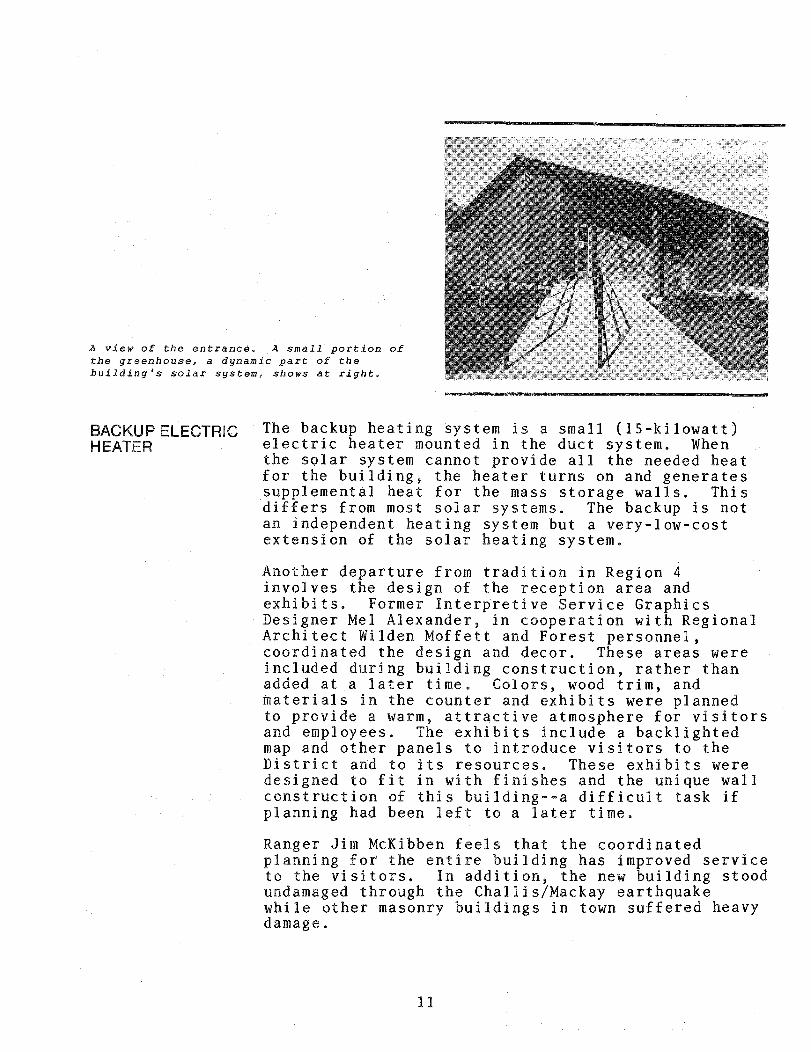
A view of the entrance. A small portion ofthe greenhouse a dynamic part of the
buildings solar system shows at right.
BACKUP ELECTRIC The backup heating system is a small 15-kilowattHEATER electric heater mounted in the duct system. When
the solar system cannot provide all the needed heatfor the building the heater turns on and generatessupplemental heat for the mass storage walls. Thisdiffers from most solar systems. The backup is notan independent heating system but a very-low-costextension of the solar heating system.
Another departure from tradition in Region 4
involves the design of the reception area andexhibits. Former Interpretive Service GraphicsDesigner Mel Alexander in cooperation with RegionalArchitect Wilden Moffett and Forest personnelcoordinated the design and decor. These areas wereincluded during building construction rather thanadded at a later time. Colors wood trim andmaterials in the counter and exhibits were plannedto provide a warm attractive atmosphere for visitorsand employees. The exhibits include a backlightedmap and other panels to introduce visitors to theDistrict and to its resources. These exhibits weredesigned to fit in with finishes and the unique wallconstruction of this building--a difficult task if
planning had been left to a later time.
Ranger Jim McKibben feels that the coordinatedplanning for the entire building has improved serviceto the visitors. In addition the new building stoodundamaged through the Challis/Mackay earthquakewhile other masonry buildings in town suffered heavydamage.
11
ROOF WALL FINISH NOT SHOWN
WALLFURRING
OFFICE FLOOR
SPACE FRAMING--soupERE MASONRY
WALL1HE
GREENHOUSE
SOLARIUMIm.
tiI
Uo CONC. FLOOR
CONC.FDN.
1 BASEMENT WALL
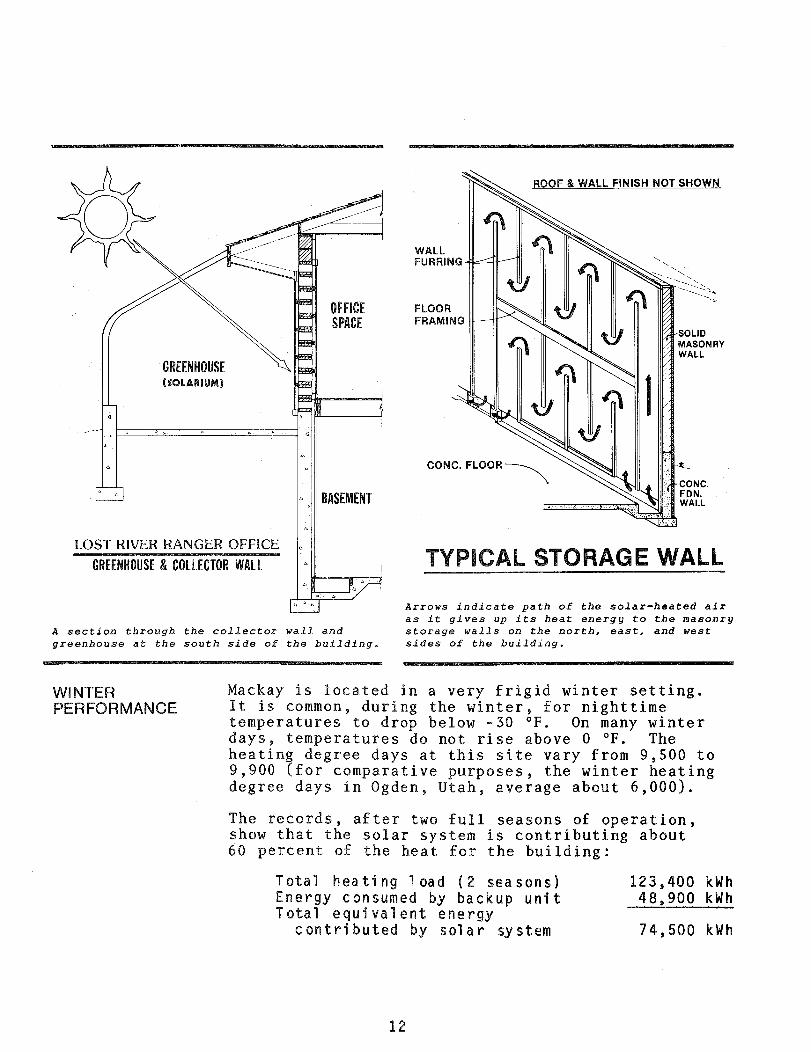
LOST RIVER RANGER OFFICE
GREENHOUSE COLLECTOR WALL
ýu
Arrows indicate path of the solar-heated air
as it gives up its heat energy to the masonryA section through the collector wall and storage walls on the north east and west
greenhouse at the south side of the building. sides of the building.
WINTER Mackay is located in a very frigid winter setting.PERFORMANCE It is common during the winter for nighttime
temperatures to drop below -30 F. On many winterdays temperatures do not rise above 0 F. Theheating degree days at this site vary from 9500 to9900 for comparative purposes the winter heatingdegree days in Ogden Utah average about 6000.
The records after two full seasons of operationshow that the solar system is contributing about60 percent of the heat for the building
Total heating load 2 seasons 123400 kWhEnergy consumed by backup unit 48900 kWhTotal equivalent energycontributed by solar system 74500 kWh
12
The building is alive and well. Because of someproblems encountered the first winter all employeesdid not keep as warm as expected. After theseproblems were identified and corrected performancethe second winter was very acceptable.
UTILITY SAVINGS The initial cost of the building including the solarsystem was approximately $30000 more than asimi-larbuilding with conventional construction andheating. A conventionally constructed office of thesame size would have a heating load of approximately154000 kWh. Using current electrical rates of
$0.04 per kWh we project that the additional costof construction will be offset by utility savings inabout 14 years discounted payback. This paybacktime would be significantly reduced in a milderclimate and in an area where power rates arecompar-ableto those found in the Rocky Mountain area.
FOR MORE If you have questions or desire more information
INFORMATION about this project or about Xen-Wall solar heatingsystems contact Wilden Moffett in the Region 4
Regional Office.EFN
IIII
13

The Technology of TechnologyTransfer-ABlueprint for Success
Connie ConnollyTechnical Information SpecialistWashington Office
INTRODUCTION The Engineering Road Technology Improvement Programand the related final action plan which were sentto Regional Foresters on April 18 1986 by DeputyChief Cargill focused on technology transfer TTas a solution to many of our problems. For most ofus however TT is still a nebulous term--anintan-giblegoal. For Engineering it must become a
reality.
The major reason we need to make TT a reality isthat we are now expected to be more productive--inan era of rapid change and dwindling resources.Look around. Budgets are shrinking personnel andresources are being spread thin. Most of us findourselves being asked to take on newactivities--oftenwithout the resources necessary to do thejob To meet this challenge--not just today but inthe next decade and next century--we have to adaptto changing circumstances.
Technology transfer is a tool--not just a floatingconcept--that can help us meet challenges. It canhelp us reduce costs and it can lead to moreeffi-cientmanagement of personnel budgets materialsand natural resources. It can allow us to pool ourknowledge and eliminate duplicated efforts.
The Forest Service has been attempting to transfertechnology for years--and with some success butuntil now we have been concentrating our efforts ongetting Research results applied by our cooperatorsthe public and field units.
We now need to expand our efforts and maketech-nologytransfer a tool that Engineering managers andtechnical specialists can understand and use. If weare to achieve efficiency and provide more services
15
we must look for accept and share not only new orinnovative ideas but existing tangible methods ortools that will help us be more productive.
Most of us are or have been involved in some formof a TT project. Weve all had ideas or seen a tooldemonstrated that we just know would make otherswork easier if we could just get them to try it.
Or weve had a problem that we knew there had to bea solution to--we just couldnt find someone elsewho had faced a similar problem. Some of us evenhave TT as a performance element and weve all triedto convince a group or an individual to support a
concept even that was a technology transfer effort.
This article is meant to help you take the giantleap from knowing TT simply as a concept tounder-standingTT as a tangible tool that you can then useto improve your or your units efficiency.
Lets see if we can build a blueprint that will helpus understand the technology of technology transferand how we can make it work so that we can attainthe benefits of reduced costs and more efficientmanagement.
UNDERSTANDING The first thing we need is a common understanding of
important terms.
nderstanding
Many times we think that we are transferringtech-nologywhen we are merely transferring information.
INFORMATION is KNOWLEDGE andINFORMATION TRANSFER is simplyMAKING THAT KNOWLEDGE AVAILABLETO OTHERS. On the other handTECHNOLOGY is APPLIED KNOWLEDGEand TECHNOLOGY TRANSFER IS THEART OF NOT ONLY MAKING PEOPLEAWARE OF TECHNOLOGY BUT GETTINGTHEM TO USE IT. When they acceptand apply the technologytechnology transfer has takenplace.
16
OPEN WORK The next thing we need is to create an open workENVIRONMENT environment that will allow technology transfer to
take place. There are several points we need toconsider here.
Open
Work
Environment
Change The first is change. We mentioned earlier that weare being forced to do a better job in an era ofrapid change and dwindling resources. We have to beable to manage that change in fact we need tocultivate it if it will help us do a better job. Wecant afford to waste a dollar or a minute doing anywork that is not necessary or doing work in any waythat doesnt allow us to maximize our resources. Tomake change work for us instead of against us wehave to change our outlook--the way we view ourselvesand our work environment. Once we do well be ableto make the real changes--the sharing of better waysof doing things that technology transfer can bringabout.
Change
Open
Work
Environment
If we want others to change their way of doingsomething we have to change first and thats notalways easy. We all react differently to change.Some of us actively seek out better ways to get ourwork done. Most of us dont seek better ways butwe will change if we can see the benefits of doingso. And then there are a few who resist change.But we all have to try. We have to create a workenvironment that welcomes change.
17
fI
Innovation Innovation is the second thing we need. We canfoster innovation by being innovative ourselves andby encouraging others to be innovative and shareinformation. The best way to do this is not toover-managethe flow of information or ideas. Restrictingthe flow of information not only stifles creativitybut increases the likelihood that information willbe held until its obsolete.
Change
Innovation Open
Work
Environment
Risk This brings us to the third element--risk. When wefoster a more open work environment we risk someloss of power and control. Staff who are betterinformed will become more independent and will relyon us less. But this is really more a perceivedthan an actual risk. The greatest risk--toindi-vidualsor to an organization--comes from stiflingthe flow of ideas and information the risk that theinformation or technology we should be using now tooperate more efficiently will be missed and neededchange will not take place in a timely way. Thatsthe risk thats not worth taking. As for the risk ofcarrying out an actual technology transfer there ispractically none if were operating in an open workenvironment and if the transfer is well planned.
Change
Innovation Open
Work
Environment
Risk
18
BENEFITS We can sell the concept of the open work environmentto ourselves and others by enumerating the benefits.We mentioned the two most important onesearlier--reducedcosts and more efficient management ofresources. Well there are also four less tangiblebut still very significant benefits--a betterinformed and motivated staff a more cohesiveorgani-zationrecognition for successful technologytransfer efforts and the challenge of discoveringand putting into practice ways to do our work moreefficiently.
Benefits MoreReduced
Efficient
CostsManagement
INDIVIDUAL What we have done so far is set the stage for anTECHNOLOGY open work environment that will encourage a freeTRANSFER EFFORTS flow of information technology transfer and the
adoption of new ideas. The next thing we need todiscuss is how to succeed in specific technologytransfer efforts.
Individual
Technology
Transfer
Efforts
There are three important areas we need to consider
1 How to plan a technology transfer.
2 How and where to find useful technology.
3 How to choose the most effective technologytransfer media.
Plan If technology transfer is going to happen it has tobe planned. We could argue that if we have that
open work environment weve been talking aboutwouldnt technology transfer just take place on itsown--through free exchange of information and ideas
19
Occasionally this will happen. For example whensomeone started using stick-on notes someone elsesaw them and started using them and now most of uswouldnt be without them. But most technologytransfer efforts involve a technology that is not aseasy to sell as stick-on notes.
Plan
Individual
Technology
Transfer
Efforts
So we need to put together a technology transfer
plan an outline of how we intend to carry out a
specific transfer and what we expect it toaccom-plish.It doesnt need to be long orelaborate--justfunctional. It should address the followingareas
Define the Problem. If we state the problem clearlyit will be easier to choose an effective technologyto solve it. On the other hand if we already knowabout a technology that could be useful to others weneed to define the problem so that others will knowwhy they should adopt that technology.
Identify the Technolo To Be Transferred.Tech-nologyis a broad term and the technology we aretrying to transfer may be something as specific and
easy to describe as a piece of equipment or somethinga little more involved like a process or method of
working.
Identify the Intended Users. If we dont know orhave only a fuzzy idea o who our users are wewont know how to get them interested. To win themover we have to know them--that is we have to knowtheir interests and needs. We have to view ourtechnology transfer effort from their perspective.
Establish the Objectives. We need to establishspecific objectives to design a plan that will meetthem and to evaluate the results of our efforts.
20
Select Appropriate Transfer Media. Selecting mediais crucial to technology trans er because it isthrough media that we sell our ideas. Because mediaare such an important and little understood partof a successful technology transfer they will bediscussed in more detail later.
Select a Team To Implement the Transfer and AssignTeam Members Responsibilities. We usually cannotdo it alone. The team consists of those people withthe special skills and knowledge needed to helpimplement the transfer. The team can be any size orconfiguration--whatever it takes to do the job.
Plan the Costs. There are four main considerationsin planning technology transfer costs 1 the costof implementing the technology transfer plan 2 thecost of implementing the technology on the ground3 annual operating costs and any other costsspeci-ficto the particular technology and 4 whether ornot the necessary resources--personnel funding andmaterials--are available. After we have estimatedall the costs we need to estimate the benefits thatwill be realized once the technology is accepted andused. If the benefits outweigh the costs and theresources are available we should go ahead with thetransfer.
Determine How the Technology Transfer Process WillBe Evaluated. We need to evaluate our effort so weknow if our objectives are being met. The lessonslearned in our evaluation also will help us to do abetter job next time.
Sources If we want our technology transfer efforts to
succeed we not only need to plan them but we needto know how to find transferable technology. Bytransferable technology we mean technology helpfulto end users.
Plan
Individual
TechnologySources
Transfer
Efforts
21
Sources of Technology
Technology Knownwithin
the Forest Service
New Technology
through Research Externaland Development Technology
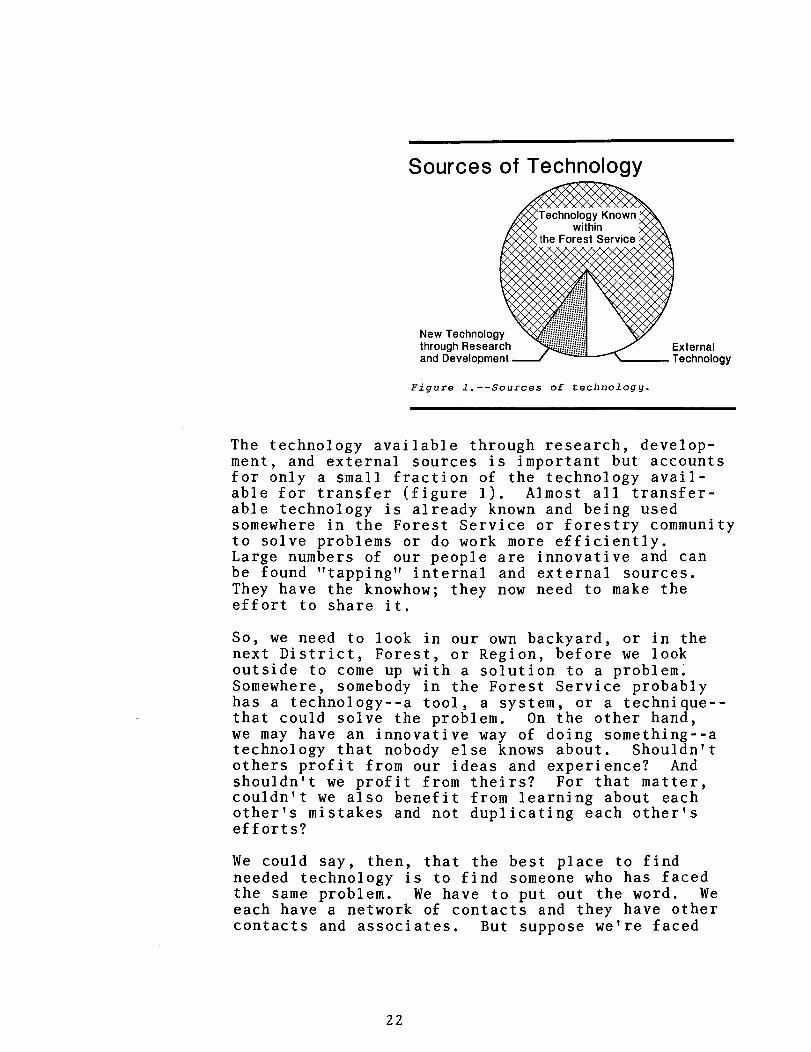
Figure 1.--Sources of technology.
The technology available through researchdevelop-mentand external sources is important but accountsfor only a small fraction of the technologyavail-ablefor transfer figure 1. Almost alltransfer-abletechnology is already known and being usedsomewhere in the Forest Service or forestry communityto solve problems or do work more efficiently.Large numbers of our people are innovative and canbe found tapping internal and external sources.They have the knowhow they now need to make theeffort to share it.
So we need to look in our own backyard or in thenext District Forest or Region before we lookoutside to come up with a solution to a problem.Somewhere somebody in the Forest Service probablyhas a technology--a tool a system or atechnique--thatcould solve the problem. On the other handwe may have an innovative way of doing something--atechnology that nobody else knows about. Shouldntothers profit from our ideas and experience Andshouldnt we profit from theirs For that mattercouldnt we also benefit from learning about eachothers mistakes and not duplicating each othersefforts
We could say then that the best place to findneeded technology is to find someone who has facedthe same problem. We have to put out the word. Weeach have a network of contacts and they have othercontacts and associates. But suppose were faced
22
with a problem new to us and to our contacts. Thatstill doesnt mean its new to the Forest Service.We need to develop a problem-oriented data base tointegrate the contacts we all have into a ForestService resource--one that would put people withwork-related problems in touch with people who havedealt with similar problems.
Media Perhaps the most important thing we need to know ishow to select the right medium or media to sell ourtechnology to intended users. When we transfertech-nologywe need to sell--that is to actively convinceothers to adopt our ideas. We need to get theaudi-encesattention and hold it.
Plan
Individual
TechnologySources
Transfer
Efforts
Media
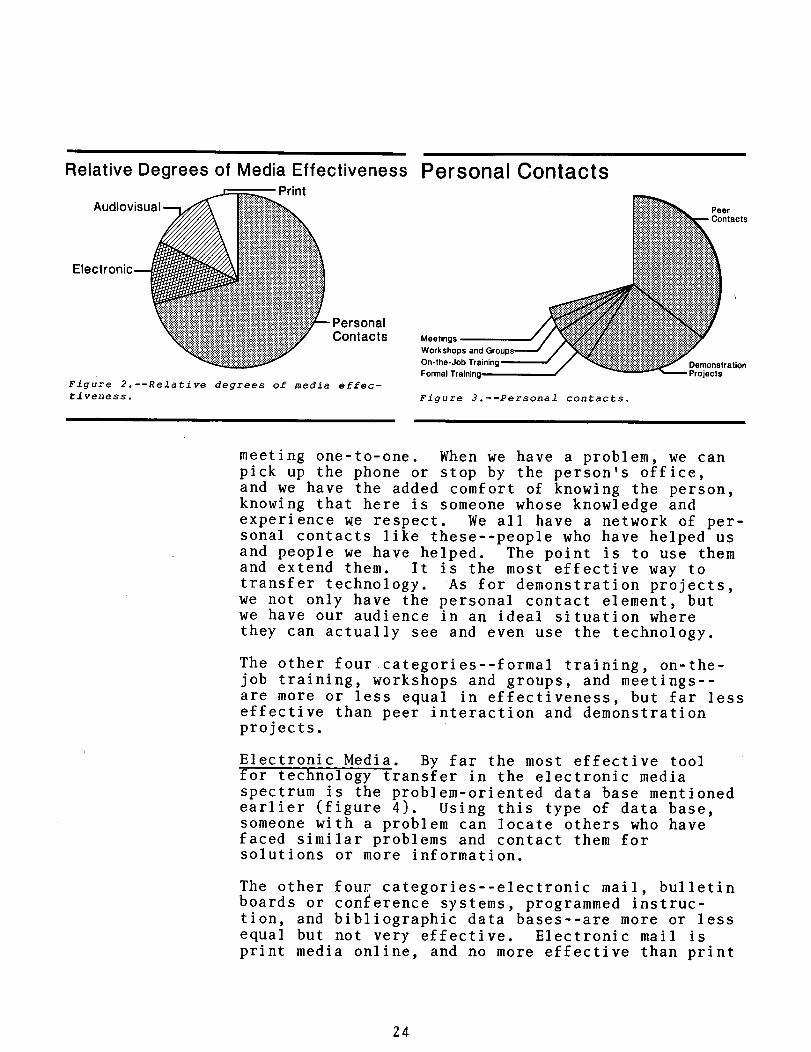
Most of us dont know which medium is best when itcomes to convincing users to adopt new or differenttechnology. For this reason the following dealswith the relative degrees of media effectiveness.
Personal contacts are more than 10 times aseffec-tiveas print media in transferring technology seefigure 2. In the case of the other twomedia--audiovisualand electronic--users find them morethan twice as effective as print media but theystill fall far short of personal contacts in overalleffectiveness. The people we need to reach areinfluenced more than twice as much by personalcontacts as by all other media combined.
Personal Contacts. There are six personal contactcategories and t e most effective by far are peersand demonstration projects figure 3. Peers aremore effective because we have the advantage of
23
Electronic
XProblem-Oriented Data Base
Electronic Mail
Bulletin Boards/ Conferenc
Systems
Programmed Instruction
Bibliographic Data Bases
Figure 4.--Electronic media.
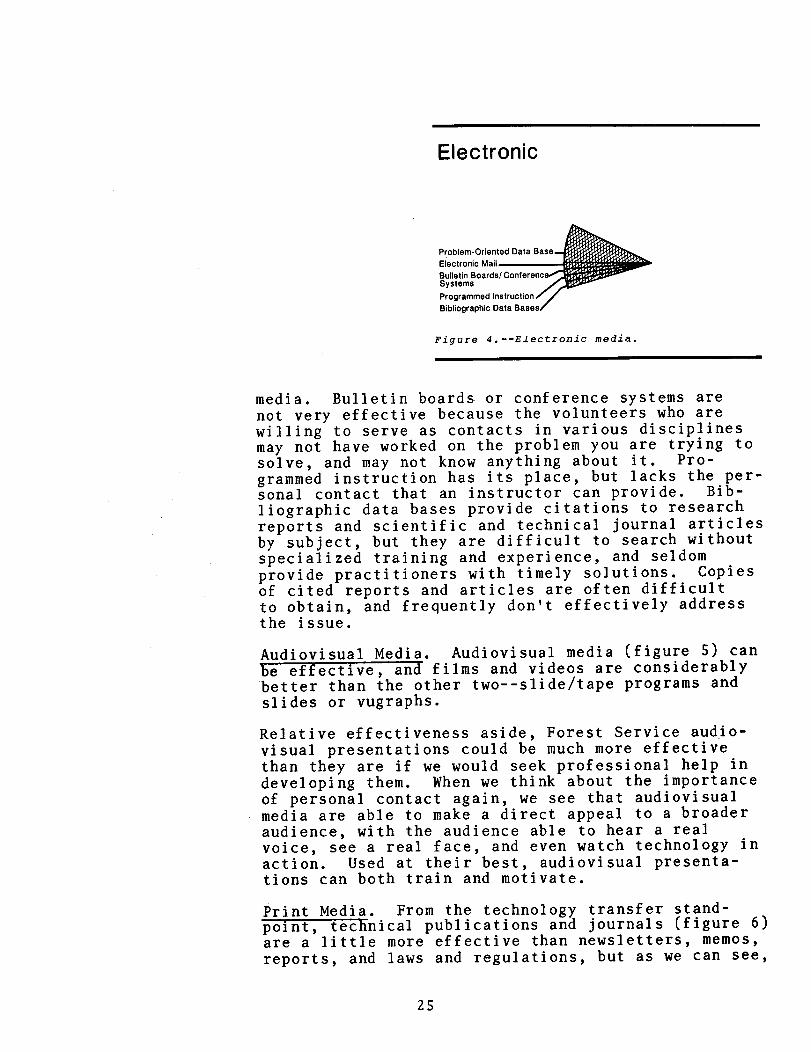
media. Bulletin boards or conference systems are
not very effective because the volunteers who are
willing to serve as contacts in various disciplines
may not have worked on the problem you are trying to
solve and may not know anything about it.Pro-grammedinstruction has its place but lacks theper-sonalcontact that an instructor can provide.Bib-liographicdata bases provide citations to research
reports and scientific and technical journal articles
by subject but they are difficult to search without
specialized training and experience and seldom
provide practitioners with timely solutions. Copiesof cited reports and articles are often difficult
to obtain and frequently dont effectively addressthe issue.
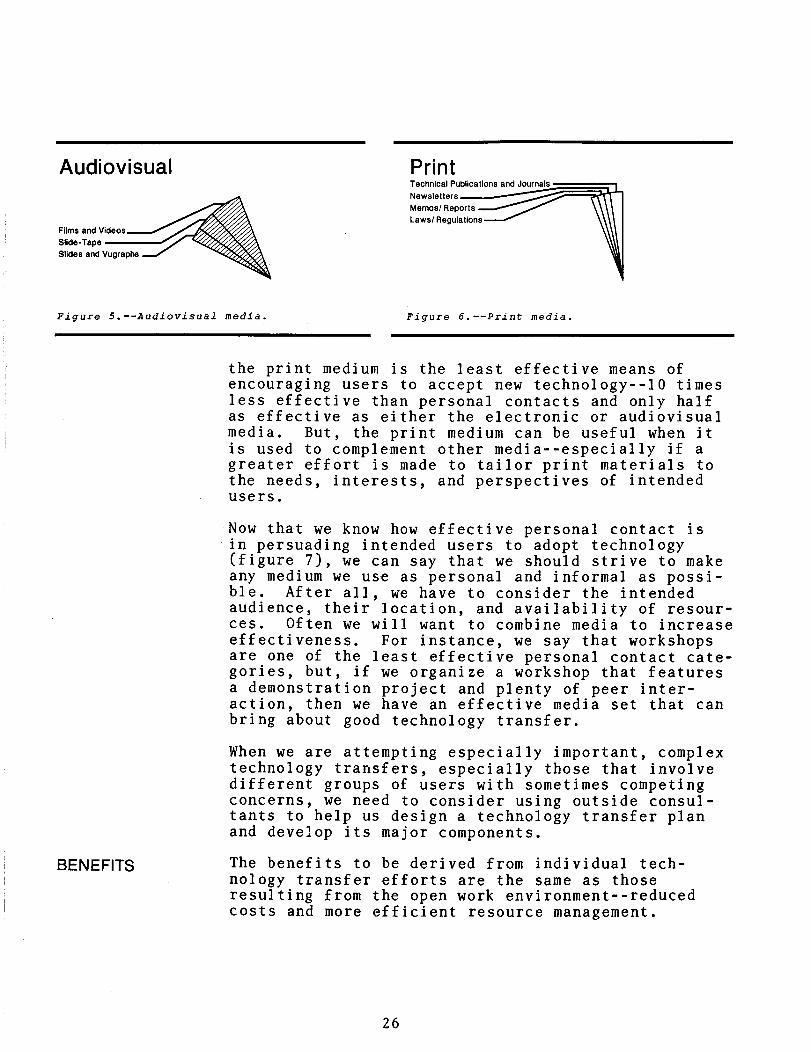
Audiovisual Media. Audiovisual media figure 5 can
be effective and films and videos are considerablybetter than the other two--slide/tape programs and
slides or vugraphs.
Relative effectiveness aside Forest Serviceaudio-visualpresentations could be much more effectivethan they are if we would seek professional help in
developing them. When we think about the importanceof personal contact again we see that audiovisual
media are able to make a direct appeal to a broader
audience with the audience able to hear a real
voice see a real face and even watch technology in
action. Used at their best audiovisualpresenta-tionscan both train and motivate.
Print Media. From the technology transferstand-pointtechnical publications and journals figure 6are a little more effective than newsletters memosreports and laws and regulations but as we can see
25
Audiovisual PrintTechnical Publications and Journals
Newsletters
Memos/ Reports
Laws/ Regulations
Films and Videos
Slide-Tape
Slides and Vugraphs
Figure 5.--Audiovisual media. Figure 6.--Print media.
the print medium is the least effective means ofencouraging users to accept new technology--10 timesless effective than personal contacts and only halfas effective as either the electronic or audiovisualmedia. But the print medium can be useful when itis used to complement other media--especially if a
greater effort is made to tailor print materials tothe needs interests and perspectives of intendedusers.
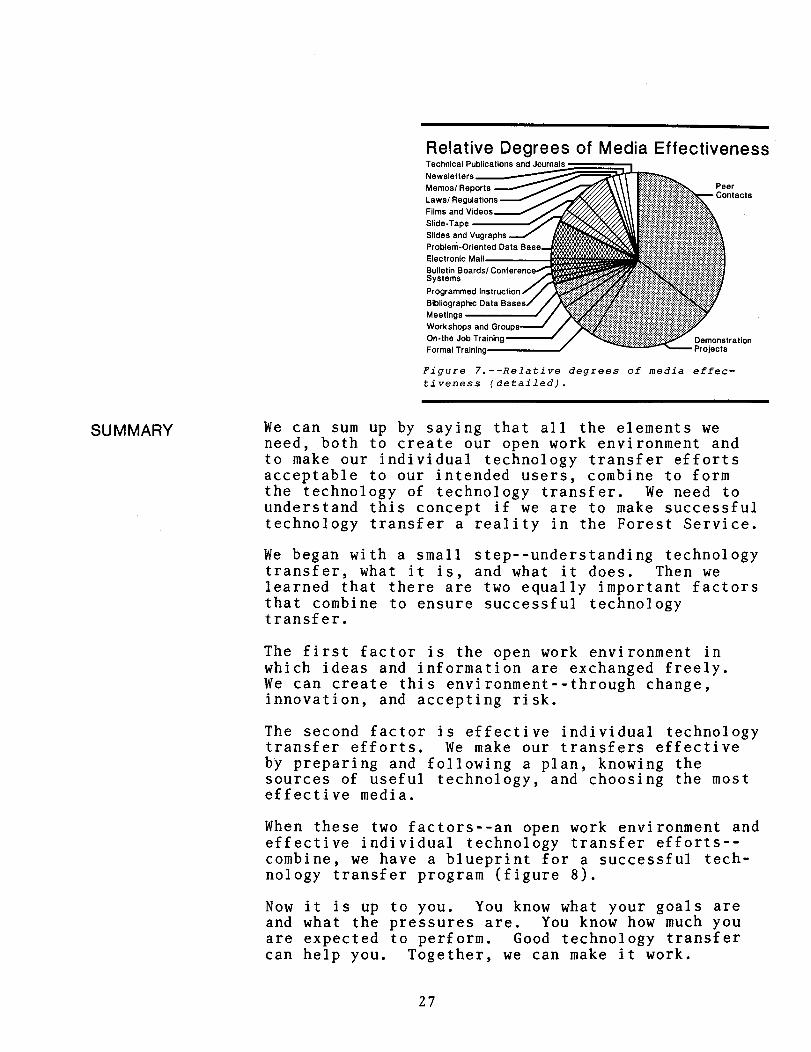
Now that we know how effective personal contact isin persuading intended users to adopt technologyfigure 7 we can say that we should strive to makeany medium we use as personal and informal aspossi-bleAfter all we have to consider the intendedaudience their location and availability ofresour-cesOften we will want to combine media to increaseeffectiveness. For instance we say that workshopsare one of the least effective personal contactcate-goriesbut if we organize a workshop that featuresa demonstration project and plenty of peerinter-actionthen we have an effective media set that canbring about good technology transfer.
When we are attempting especially important complextechnology transfers especially those that involvedifferent groups of users with sometimes competingconcerns we need to consider using outsideconsul-tantsto help us design a technology transfer planand develop its major components.
BENEFITS The benefits to be derived from individualtech-nologytransfer efforts are the same as thoseresulting from the open work environment--reducedcosts and more efficient resource management.
26
I
Relative Degrees of Media EffectivenessTechnical Publications and Journals
Newsletters
Memos/ Reports Peer
Laws/ RegulationsContacts
Films and Videos
Slide-Tape
Slides and Vugraphs
Problem Oriented Data Base
Electronic Mail
Bulletin Boards/ Canferenc
Systems
Programmed Instruction
Bibliographic Data Bases
Meetings ..
Workshops and Groups
On-the Job Training Demonstration
Formal Training Projects
Figure 7.--Relative degrees of mediaeffec-tivenessdetailed.
SUMMARY We can sum up by saying that all the elements weneed both to create our open work environment andto make our individual technology transfer effortsacceptable to our intended users combine to formthe technology of technology transfer. We need tounderstand this concept if we are to make successfultechnology transfer a reality in the Forest Service.
We began with a small step--understanding technologytransfer what it is and what it does. Then welearned that there are two equally important factorsthat combine to ensure successful technologytransfer.
The first factor is the open work environment inwhich ideas and information are exchanged freely.We can create this environment--through changeinnovation and accepting risk.
The second factor is effective individual technologytransfer efforts. We make our transfers effectiveby preparing and following a plan knowing thesources of useful technology and choosing the mosteffective media.
When these two factors--an open work environment andeffective individual technology transferefforts--combinewe have a blueprint for a successfultech-nologytransfer program figure 8.
Now it is up to you. You know what your goals areand what the pressures are. You know how much youare expected to perform. Good technology transfercan help you. Together we can make it work.
27
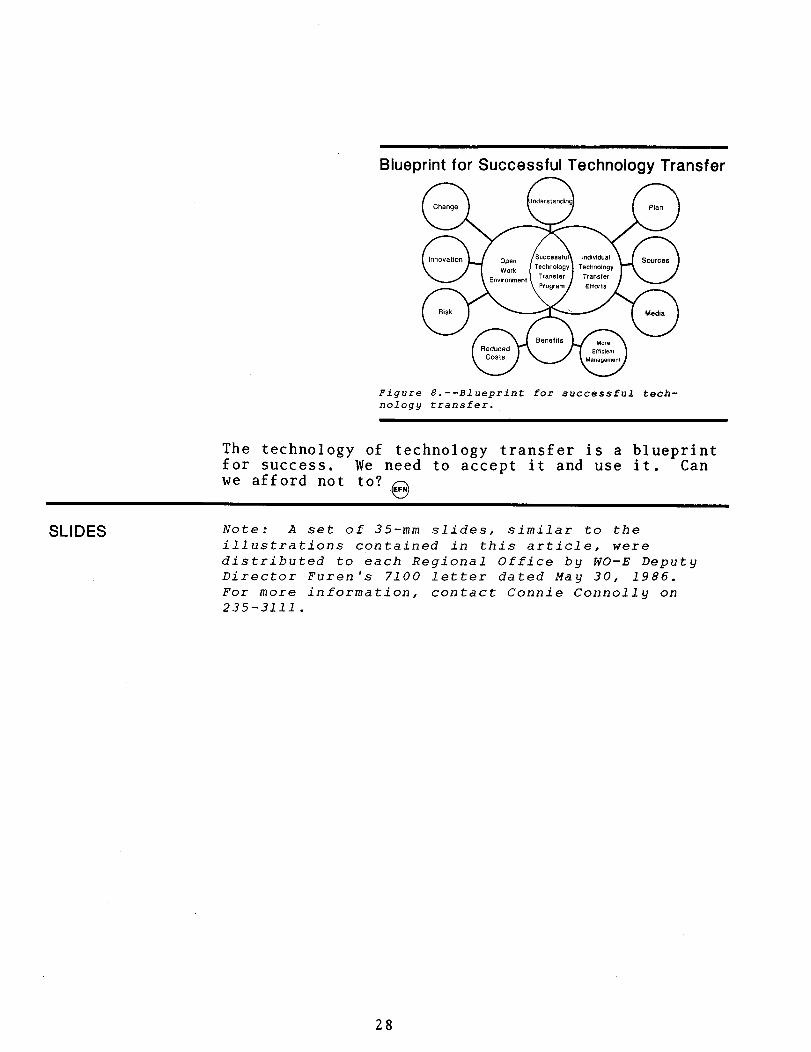
Blueprint for Successful Technology Transfer
nderstendingChange Plan
Innovation OpenSuccessful Individual Sources
WorkTechnology Technology
EnvironmentTransfer Transfer
Program Efforts
Risk Media
Benefits More
ReducedEfficient
CostsManagement
Figure 8.--Blueprint for successfultech-nologytransfer.
The technology of technology transfer is a blueprintfor success. We need to accept it and use it. Canwe afford not to
EFN
SLIDES Note A set of 35-mm slides similar to theillustrations contained in this article weredistributed to each Regional Office by WO-E DeputyDirector Furens 7100 letter dated May 30 1986.For more information contact Connie Connolly on235-3111.
28
I RipEm Flexes Its Muscles-CaseStudies of IRPM Use in the West
Wallace R. CoxRegional Transportation AnalystRegion 6
Designed as a long-haul eighteen-wheeler forhandling heavy cargo the Integrated ResourcesPlanning Model IRPM 5 is proving its ability to
perform like a cross between a sports car and anall-terrain vehicle. Built on an ADVENT chassisIRPM has a retooled drive train and a beefed uptranshipment suspension for handling rough curvymountain roads it is slipped into a classic bodyand comes complete with a slick personalized usersguide.
INTRODUCTION The mixed-integer mathematical Integrated ResourcesPlanning Model IRPM originally was designed toaddress resource and transportation issues for largearea plans and Forest planning simultaneously butas analysts became familiar with the model theyfound that it could be used in a variety of ways.Successful applications of the model to road systemmanagement have led to discoveries of even morepotential uses such as developing comprehensivemanagement plans for annual maintenance programsexploring tradeoffs between traffic service levelsanalyzing commensurate share maintenanceestablish-ingconstruction cost recovery schedules and
developing multiyear capital investment programs.In each case alternatives are easily developedunder a variety of program budget level constraints.
Further tests are now being conducted to link IRPMwith the Aggregate Transport Model 7. SinceTransagg currently does not have any means ofexam-iningnetwork efficiency in terms of operating costssome IRPM formulations use Transagg solutions to
manage both the rock resources and the road networkfor large tracts of National Forest land.
29
SUMMARY of
CASE STUDIES
Area Planning Seven area analyses have been completed using IRPMfor approximately 150000 acres of National Forestland in California Washington Idaho Montana andOregon representing several hundreds of millionss ofdollars in proposed transportation and timberhar-vestingactivities. Tests conducted in Region 6 and bythe Intermountain Research Station indicate thateco-nomicefficiency can be increased as much as 50 percentover conventional manual analysis methods 1.Although these applications used similar formulationtechniques each formulation was tailored to fit thelocal resource issues. A variety of resourcecon-straintsand investment opportunities were modeled
Wildlife. Deer and elk winter range with cover/forage relationship constraints indicator speciesconcerns and migration routes were modeled.
Visual Resources. Several alternative timberintensities and road densities were modeled whichreflected meeting visual quality objectives atdifferent levels and determining the associatedeconomic tradeoff.
Water Quality. In Umpqua National Forest a streamwas modeled as a network and threshold valueswere introduced as constraints on individual reachesof the stream to control delivered sediment.
Timber. Several alternative timber harvest andsilvicultural intensities and scheduling weremodeled.
Logging Methods. Alternative logging methods wereproposed including conventional as well as moreexotic methods. In some cases alternative loggingmethods required alternative entry points into thetransportation network as well as different roadstandard requirements.
Transportation Systems. Many alternative roadstandards road locations and road densities wereconsidered in the study areas.
30
While analyzing three areas in Idaho and Montanaresearchers from the Intermountain Research Stationproduced actual data on the below-cost sale issuethat were entered into congressional testimony 2.
Forest Planning Six National Forests in Region 6 have successfullylinked IRPM to FORPLAN solutions to test theirspatial feasibility and to estimate the effects of
projected FORPLAN outputs on the Forest road networkover time.
Analysis areas outputs of a FORPLAN solution weredisaggregated to individual watersheds. Eachwater-shedwas assigned to a centroid node representingthe transportation system entry points for thatwatershed.
Along with solving for the best transportationnetwork for the FORPLAN solution other tests aremade as well
Spatial Feasibility. Since constraints on harvestarea openings commonly referred to as dispersion oradjacency of harvest openings are expressed inFORPLAN as percent openings per decade over verylarge areas it cannot be known without furtheranalysis whether the results can be implemented onsmaller watersheds. The only known methods of
making this analysis are either mapping the FORPLANsolution and inspecting it visually or analyzing anIRPM solution which considers spatial arrangement.One Forest in Region 6 has found that the FORPLANconstraint on adjacency commonly breaks down at thesmaller area level in other words the FORPLANsolutions are technically infeasible. With theIRPM however Forests were able to modify theFORPLAN constraint and rerun the model therebyachieving some convergence of FORPLAN and IRPMsolutions. Full agreement between the two modelsindicates a technically feasible solution.
Cumulative Effects. Some Forests are investigatingcumulative effects of timber harvest on watershedswith IRPM. FORPLAN solutions are disaggregated towatershed levels to allow the analyst to estimateand evaluate cumulative effects associated withtimber harvest and transportation activities.
Road Management In Region 6 Deschutes and Umpqua National Forestsused IRPM as a road management tool. Results are
very promising and other Forests in the Region have
31
expressed interest in applying the model in asimi-lamanner. Since IRPM is a descendant of ADVENTprogram development and budgeting for atransporta-tion
system appears to be a promising naturalextension of its use. Following are two Region 6
examples.
In the first example two large developmentcorpora-tionsmade separate proposals to expand a major ski
area by building a new ski lodge with increasedparking space and a new feeder road. The total
impact on the connecting road was evaluated usingIRPM. The analysis proved that it would not befeas-ibleto expect the area to operate at full capacitybecause the existing access road to the area wouldnot provide the capacity without additional lanes.One corporation therefore decided to temporarilydrop the expansion plan. The corporation proposinga road to feed into the access road was grantedper-missioon the condition that a mandatory $300000deposit be made to construct an overpass at theintersection of the two roads for safety reasons.The State Highway Commission decided to constructsome passing lanes on the access highway as a
possible solution to the traffic congestion problem.
In the second road management example IRPM was usedto predict traffic across the Forest based ontimber harvest plans and observed recreation uselevels. As a result of the analysis annualmain-tenance
programs were developed commensurate sharesbetween cooperating parties were calculated and
multiyear capital investment programs have been
proposed. The user Forests now are formulatingmodels that will respond to budget funding levelsand address the issue of assigning traffic servicelevels.
CONCLUSION The Integrated Resources Planning Model has provedtrustworthy and reliable in the classicalapplica-tionsfor Forest planning and area analysis. Now it
is proving a tool for managing existingtransporta-tionsystems enabling land managers to respondquickly and responsibly to changing issues andcurrent management concerns.
EFN
32
REFERENCES 1. Jones J. G. J. F. C. Hyde III and M. L.
RECOMMENDED Meacham. Four Analytical Approaches for Integrating
READING Land Management and Transportation Planning onForest Lands. USDA Forest Service Research PaperINT-361 1986.
2. Jones J. G. and E. G. Schuster. An Analysis of
the Appropriateness of Below Cost Timber Sales on
National Forests. A report for policy analysisUSDA Forest Service Washington Office IntermountainResearch Station. In Economics of Federal Timber
Sales Hearing before the Subcommittee on ForestsFamily Farms and Energy of the Committee on
Agriculture House of Representatives 99th
Congress First Session Serial No. 99-4 U.S.Government Printing Office 1985.
3. Kirby M. Land Use Planning TransportationPlanning and Integer Programming. Proceedings of a
workshop on Systems Analysis and Resource
Management University of Georgia Athens GA 1975.
4. Kirby M. P. Wong and W. Cox. Optimization of
Rural Roads Networks--An Application of the Timber
Transhipment Model. Roads of Rural America USDA
Economics Statistics and Cooperative ServicesESCS-74 1979.
S. Kirby M. P. Wong and W. Hager. Guide to
Integrated Resources Planning Model. USDA Forest
Service Management Sciences Staff Berkeley CA1980.
6. Kirby M. P. Wong and W. Hager. Guide to
Transshipment Model. USDA Forest ServiceManagement Sciences Staff Berkeley CA 1981.
7. Kirby M. P. Wong and W. Hager. Guide to the
Transagg Model. USDA Forest Service ManagementSciences Staff Berkeley CA 1984.
8. Kirby M. D. Wegner and L. Visser. AdventUsers Guide. USDA Forest Service ManagementSciences Staff Berkeley CA.
9. Ou F. and W. Cox. Application of IntegratedResource Planning Model to Forest Planning.Proceedings of the Ninth World Congress Mexico City1985.
33

II
10. Ou F. W. Cox and L. Collett. AnOptimization Approach for Transportation SystemAnalysis. Proceedings of the Twelfth AnnualConference on Modeling and Simulation University ofPittsburgh Pittsburgh PA 1982.
11. Schuster E. G. and J. G. Jones. Below CostTimber Sales Analysis of a Forest Policy Issue.USDA Forest Service General Technical ReportINT-183 1985.
34
f
Aggregate Design Considerations
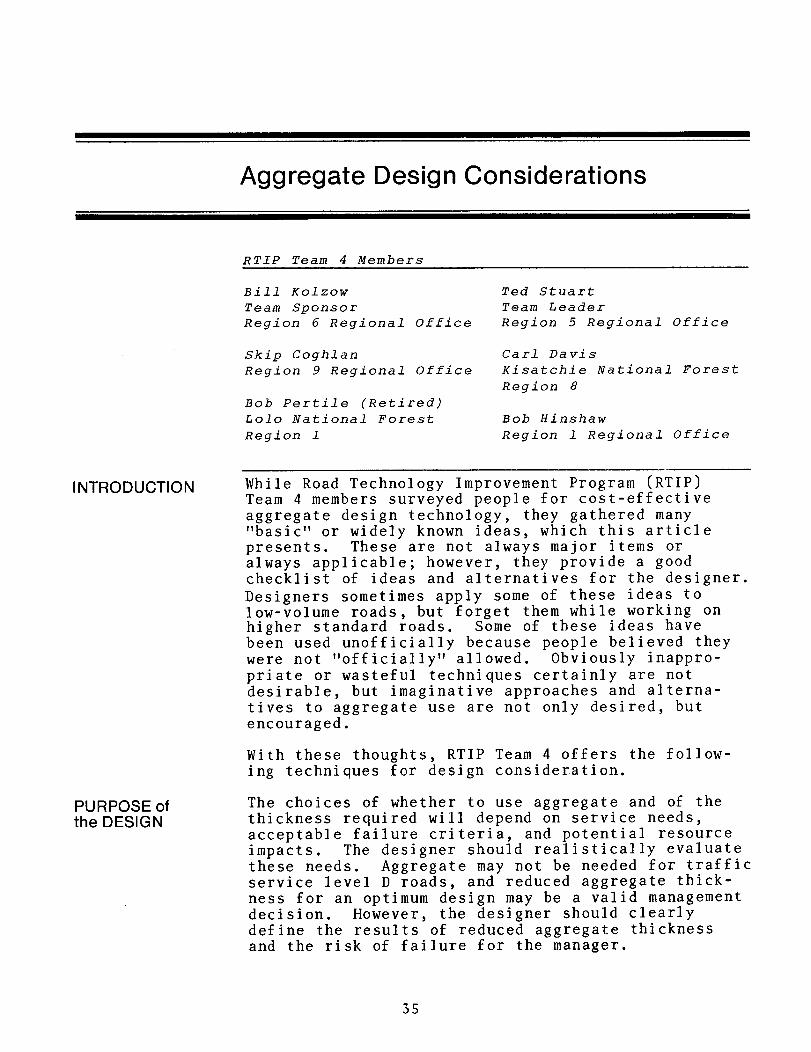
RTIP Team 4 Members
Bill Kolzow Ted StuartTeam Sponsor Team LeaderRegion 6 Regional Office Region 5 Regional Office
Skip Coghlan Carl DavisRegion 9 Regional Office Kisatchie National Forest
Region 8
Bob Pertile RetiredLobo National Forest Bob HinshawRegion 1 Region 1 Regional Office
INTRODUCTION While Road Technology Improvement Program RTIPTeam 4 members surveyed people for cost-effective
aggregate design technology they gathered manybasic or widely known ideas which this articlepresents. These are not always major items or
always applicable however they provide a goodchecklist of ideas and alternatives for the designer.Designers sometimes apply some of these ideas tolow-volume roads but forget them while working on
higher standard roads. Some of these ideas havebeen used unofficially because people believed theywere not officially allowed. Obviouslyinappro-priateor wasteful techniques certainly are not
desirable but imaginative approaches andalterna-tivesto aggregate use are not only desired but
encouraged.
With these thoughts RTIP Team 4 offers thefollow-ingtechniques for design consideration.
PURPOSE of The choices of whether to use aggregate and of the
the DESIGN thickness required will depend on service needsacceptable failure criteria and potential resourceimpacts. The designer should realistically evaluatethese needs. Aggregate may not be needed for trafficservice level D roads and reduced aggregatethick-nessfor an optimum design may be a valid managementdecision. However the designer should clearlydefine the results of reduced aggregate thicknessand the risk of failure for the manager.
35
The designer must also assess physical conditions inthe field and the natural variability of soils.
SEASONAL USE Keeping traffic off roads during wet periods canresult in considerable aggregate savings. Athickness design procedure for seasonal haulcondi-tionssoon will be available in the Forest ServiceSurfacing Design and Management System SDMSHandbook FSH 7709.56a. Regions have received draftcopies and the final version is scheduled forpublication in 1987. Currently designers mustestimate the seasonal variation of subgrade soil
strength for aggregate surfaced roads. Severalstudies have been made or are in progress to measurethese seasonal variations. However the resultshave not been fully analyzed and specific designguides for SDMS have not been developed.
On roads designed for seasonal use the Forestr designService must manage traffic to conform to the
assumptions. Timber sale contracts may specify orthe Forest Service may require seasonal haulrestric-tionon roads. Enforcement is a managementresponsibility and there are no simple ways tomeasure r ior verify field conditions related to roadclosures or hauling restrictions. Again there areseveral studies underway but until these data areavailable judgment must be used to make fielddecisions.
The designer should write aggregate specificationsALTERNATIVESPECIFICATIONS for the intended use considering economically
available materials and local experience. Marginalaggregates may be acceptable where high-qualitycommonly specified materials are not economicallyavailable. Forest Service standard specificationscontain several options on quality gradation and
processing. The designer should take care inselect-ingthe proper specifications for job conditions andshould examine the specifications to see that all
requirements are economically justified. Ifspecifi-cationrequirements can be reduced or waived withoutsacrificing performance the designer should writespecial project specifications.
One example of an alternative specification is the
plasticity index PI requirement for aggregatesurfacing. In many parts of the country naturallyoccurring materials meeting the PI requirement arenot available. However some rock types displayadequate binder that does not show up in the PI
36
test. A way to improve the binding properties withPI is to specify a finer or denser gradation. If PIwill not be required or tested for delete it fromthe specification.
Another example is the use of degrading aggregatewith marginally low durability index test resultsfor surfacing. If the rock is crushed to a coarsergradation initially it may degrade under trafficand provide satisfactory performance for some time.These same rock types may provide natural binderthrough degradation actually improving performance.
Tailoring the specifications to the source may makeotherwise adequate sources available. Blendingscalping certain sizes wasting certain sizes or
washing may make materials in a source acceptable if
these options are recognized in advance and providedfor in the specification.
SOIL STRENGTH/ A soil strength/soil type correlation is an aid
SOIL TYPE available to the designer of road base and surfacing.
CORRELATION This type of correlation is developed by catalogingall of the soil strength tests CBR R-Value and soon performed on the Forest with the correspondingsoil.type or soil classification. This allows the
designer to develop alternative designs using amini-mumamount of new testing. This would be mostbene-ficialduring the preliminary stage of design. Oncethe alternatives have been evaluated and reducedto a few a verification strength test could beper-formedfor the final design if investments and riskswarrant. The construction engineering personnelalso could use this correlation to evaluate actual
subgrade soils against what was anticipated duringdesign.
A refinement of this aid would be plotting theinfor-mationon a map of the Forest. With this graphicdisplay the locator could consider alternativesover the better soils.
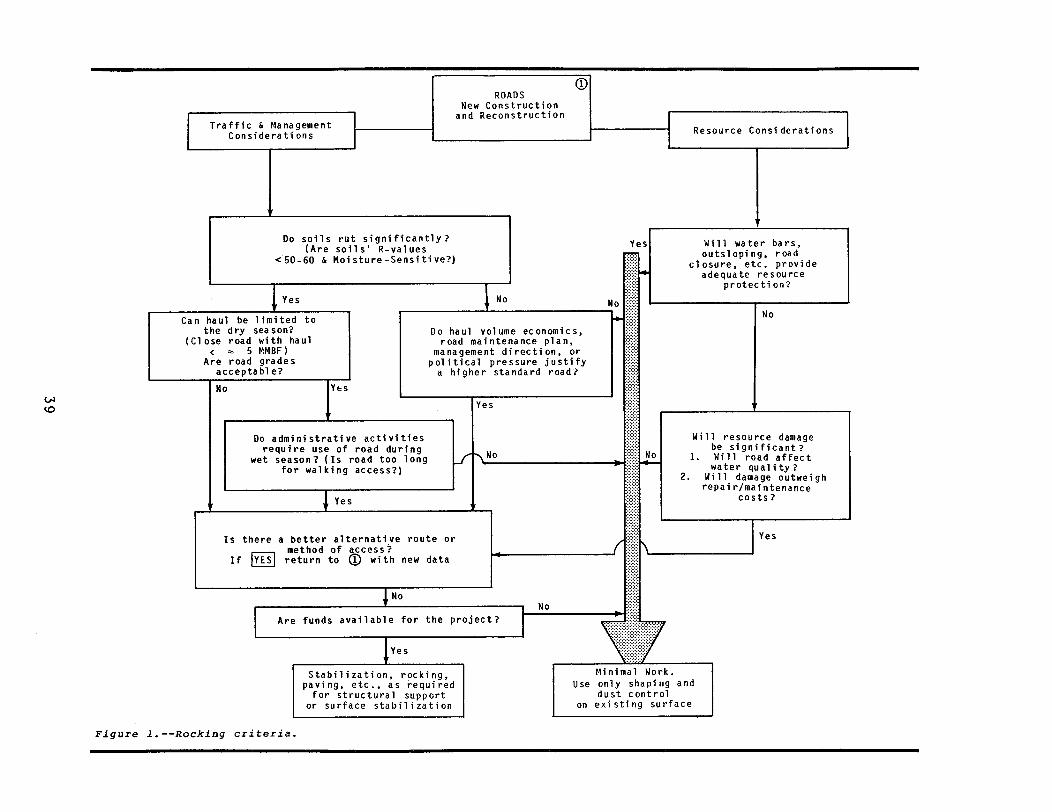
AGGREGATE The first step in designing an aggregate-surfacedDECISION TREE road is to make a rational determination of whether
surfacing is necessary. The two basic reasons for
surfacing are traffic and management structuralcon-siderationsand resource protection. Each reasonhas a set of factors that the designer shouldexamine.
Traffic and management considerations include
rutting potential of the soil anticipated traffic
37
or timber haul volume and timing of the traffictiming and amount of administrative activitiescommitment to road management such as seasonalclosures road surfacing economics road gradesrecreation use political pressures availability of
funds and management direction. Resourceconsider-ationsinclude whether road closures or roadwaysurface drainage and erosion protection adequatelymitigate impacts whether roadways willsignifi-cantlyaffect water quality and whether roadwayeffects outweigh repair and maintenance costs.
If traffic considerations do not dictate surfacingand if resource impacts are not significant or canotherwise be mitigated at lower cost then the roaddesign should not include aggregate stabilization.Instead it should use other measures such as
drainage and dust abatement. If eitherconsider-ationnecessitates stabilization use aggregatesurfacing or other methods such as paving.
A logic flow chart of some type can assist thedecisionmaker. Figure 1 is a chart that wasdevel-opedby a Geotechnical Engineer on the PlumasNational Forest and is being used on the Forest.
SURFACING Many designers provide only one or two surfacingTHICKNESS thicknesses for a road usually for the worstVARIATION ALONG conditions primarily because it is safe andthe ROAD because they believe it is inconvenient anduneco-nomicalfor contractors to vary thicknessfre-quently.However some Forests find that contractors
have no problem changing depths for 20-foot sectionsor spreading just a 2- or 3-inch layer. Typicallyworst conditions do not exist over a large portionof a given project. Also cut sections or compactedembankments of competent materials need lesssur-facingthan transition sections fills of lessade-quatematerials or low wet areas.
SPOT SURFACING Some planned new construction includes sections of
structurally adequate native soils that do not need
aggregate surfacing and soft sections that do needaggregate surfacing. The extent and boundary ofthese sections may not be reliably located withoutan extensive subsurface soils investigation.Esti-matingsections needing surfacing and the amountneeded may be adequate. The contractor can thenadjust the actual limits and amount of spotsur-facingduring construction.
38
ROADS
New
Construction
and
ReconstructionTrafficManagementResourceConsiderationsConsiderations
Do
soils
rut
significantly
Are
soils
R-values
Yes
Will
water
bars
50-60
Moisture-Sensitiveoutsloping
road
closure
etc.
provide
adequateresourceprotection
Yes
No No
Can
haul
be
limited to
No
the
dry
season
Do
haul
volume
economics
Close
road
with
haul
road
maintenance plan5 M
MBF
managementdirection or
Are
road
grades
politicalpressure justify
acceptable a higher
standard road
No
Yes
Yes
Do
administrativeactivities
Will
resource
damage
require
use
of
road
during No
No
be
significant
wet
season
Is road too
long
1.
Will
road
affect
water
qualityfor
walking
access 2. W
ill
damage
outweigh
repair/maintenance
Yes
costs
Is there
a better
alternative
route
or
Yes
method
of
access
If
YES
return
to
QI
with new
data
No
No
Are
funds
available for
the
project
IYes
Stabilization rocking
Minimal Work.
paving
etc. as
required
Use
only
shaping
and
for
structural
support
dust
control
or
surfacestabilization on
existing
surface
Figure
1.--Rockingcriteria.
TRACTION or Some native surfaced roads provided adequatestruc-EROSIONCONTROL tural support but need aggregate for traction orerosion control on steeper grades. In these casesthe design may include 1 to 2 inches of open gradedaggregate for the steeper grades.
SURFACING WHEEL Wheel path ruts often develop on old native surfacedPATHS roads. Placing aggregate in these wheel path ruts
provides additional traffic support and levels theroad for better driving and drainage while using a
minimum amount of aggregate. The contractortruck-spreadsmaterial along the road and uses a motorgrader crawler or wheel tractor to spread it intothe ruts. The working equipment and user vehiclescompact the aggregate.
NOT SURFACING Where traffic and subgrade conditions warrant the
TURNOUTS designer can save aggregate on low volume roads bynot surfacing turnouts or by reducing aggregatedepth on turnouts.
MARGINAL Marginal aggregates often exist in areas havingAGGREGATES little or no quality aggregate. Marginal aggregates
do not meet the common standards of qualityaggre-mayhave poor gradation excessive finesgate--theypoor resistance to traffic or weathering orexcessive deterioration to plastic fines. Howeverin some climates standard specified quality mayrepresent an excessive requirement. Greater depthsof marginal aggregate may adequately resist trafficwear. Mixing the marginal aggregate with qualityaggregate or other additives also may provide a morecost-effective alternative. The results ofweather-ingsuch as in sandstone may still be acceptable.ASTM Technical Publication 774 and FHWA ReportsRD-81-176 and RD-82-056 provide recommendations onusing a variety of marginal aggregates. The designeralso should evaluate local experience with localmarginal materials.
STABILIZATION Stabilization can improve a marginal aggregate forbase or surfacing or increase the engineeringchar-acteristicsof the subgrade material. The manydif-ferentypes of stabilization methods and materialsinclude Portland cement lime fly ash bitumenschlorides organic cationic compounds and others.In many cases simply mixing a poor material with a
higher quality material such as adding clean sandto a poor silt can provide stabilization.
40
The type and amount of stabilizing agent depends on
many factors and each agent has its own strengthsand limitations. The many sources of informationavailable for selection and use of these agentsinclude manufacturers associations such as thePortland Cement Association the Lime Associationand the Asphalt Institute textbooks such as Yoderand Witczaks Principles of Pavement Designprofessional publications such as AS M AASHTO andTRB Forest Service reports and manufacturerstechnical literature. Some of the publicationscontain aids such as charts and graphs for selectingthe type and approximate quantities of stabilizingagent. One such aid is table 9.1 in the Yoder andWitczak test. The designer also should not overlooklocal experience as a source of information.
SAND Sand can be an excellent road-building material ifSTABILIZATION stabilized or confined. Mixing topsoil and organicWITH TOPSOIL or duff during construction or maintenance helps to
PLASTIC CELLS stabilize sand. Plastic honeycomb cells filled withsand also provide a stable surface.
CRUSHED The Fernow Experimental Forest in West Virginia NEAGGREGATE Station evaluated erosion from unsurfaced roads and
from 1-inch crushed aggregate and 3-inch cleancrushed aggregate surfaced roads. They found thaterosion from the 3-inch clean aggregate was no worsethan from the 1-inch aggregate sections. Also theyfound that on minimum standard roads the 3-inchrock one layer deep stabilized the subgrade well.The rocks worked into the subgrade during wet periodsuntil the soil matrix firmly held the rocks and therocks adequately carried the traffic loads throughthe soft material to the more competent materialbelow. The 3-inch rock will not lend itself toroutine grader blading but these roads are notplanned for routine blading. They might be touched
up by a small dozer after several years of loggingtraffic. The soil-aggregate matrix is similar tocobblestone surfacing. Preferably the 3-inch.aggregate should not contain fines so that there isroom for the subgrade soil to move between the
aggregate particles. This proved to be an excellentspot surfacing technique for otherwise unsurfacedroads and this technique is particularly applicablefor soils that mud up under traffic but that arenot wetted from springs below the surface.
GEOTEXTILES In designing aggregate surfaced roads over poorsoils the designer should consider the use of
geotextiles also called filter fabrics. The two
41
uses of these materials in surface design aresepar-atioand subgrade restraint. In both cases the
required amount of aggregate surfacing material canbe reduced with the proper geotextile. The conceptof separation is a filter barrier preventing twodissimilar materials from mixing the most commonuse would be to prevent or minimize the movement ofweak subgrade soils into aggregate bases orsur-facing.Geotextiles as subgrade restraint reducesoil movement and soil strain by confinement.
Many publications can assist the designer in
selecting and specifying geotextiles in surfacingincluding manufacturers literature and thecom-prehensiveGuidelines for Use of Fabrics inConstruction and Maintenance of Low Volume RoadsReport No. FHWA-TS-78-205 USDA Forest Service andFHWA June 1977.
SUMMARY Members of the Road Technology Improvement ProgramTeam 4 gathered the aggregate design considerationspresented in this article by surveying people forcost-effective aggregate design technology. Thesetechniques and considerations should provide auseful checklist for road surface designers.
EPN
42
Engineering Expert Systems
Fong L. OuEngineer Systems Analysis DevelopmentWashington Office Engineering Staff
INTRODUCTION After 25 years of development artificialintelli-genceAI is becoming a promising tool to solvereal-world problems. AI has been defined as behavior
by a machine that would be called intelligent if
performed by a human being and that is used in
robotics expert systems general computing andresolving questions of intelligence and language.The worldwide AI market is predicted to reach$250 million in 1986 and $3 billion to $12 billionin 1990. From 1986 to 1990 AIs share of the
computer market will increase from 0.2 to 4 percent.This article discusses the potential of usingexpert systems to improve engineering performance.
Expert Systems An expert system is a computer program that performsat the level of a human expert in a complex butnarrow field or uses human traits like logic tosolve problems. Expert systems are not black boxesthat mysteriously arrive at conclusions to problemspresented to them. Instead they model theexperi-enceand expertise of human experts in a givendomain.
Expert systems have proven useful in diverse areassuch as medical diagnosis chemical analysisgeo-logicalexploration military operation and computersystem configuration. To model the problem-solvingexpertise of a human expert within a particularfield an expert system requires two types ofinfor-mationspecific knowledge or expertise of an
expert including factual knowledge and heuristic or
empirical knowledge and general problem-solvingstrategies such as drawing inferences andcon-trollingthe reasoning process.
METHODOLOGY The methods used for developing expert systems arerule-based technology frame-based technology or a
hybrid of the two.
43
I
Rule-Based The rule-based system gives an organization the
Technology ability to solve only clearly defined stand-aloneproblems. The basic assumption is that the skills an
expert uses to solve a given problem can be extractedeffectively and efficiently as rules of thumb andincorporated into an expert system through the
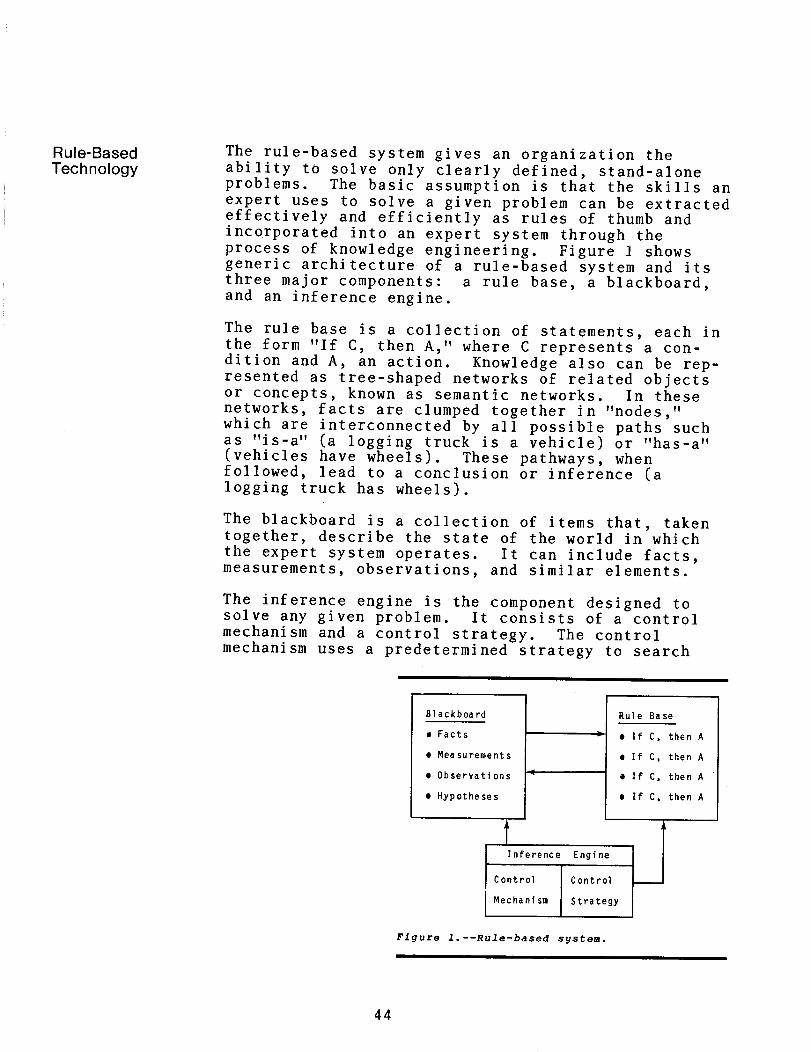
process of knowledge engineering. Figure 1 showsgeneric architecture of a rule-based system and itsthree major components a rule base a blackboardand an inference engine.
The rule base is a collection of statements each inthe form If C then A where C represents acon-ditionand A an action. Knowledge also can berep-resentedas tree-shaped networks of related objectsor concepts known as semantic networks. In thesenetworks facts are clumped together in nodeswhich are interconnected by all possible paths suchas is-a a logging truck is a vehicle or has-avehicles have wheels. These pathways whenfollowed lead to a conclusion or inference alogging truck has wheels.
The blackboard is a collection of items that takentogether describe the state of the world in whichthe expert system operates. It can include factsmeasurements observations and similar elements.
The inference engine is the component designed tosolve any given problem. It consists of a controlmechanism and a control strategy. The controlmechanism uses a predetermined strategy to search
Blackboard Rule Base
Facts If C then A
Measurements If C then A
Observations If C then A
Hypotheses If C then A
7_1Inference Engine
Control Control
Mechanism Strategy
Figure 1.--Rule-based system.
44
through the blackboard and the rule base forsolu-tionto a given problem and the control strategyimposes a set of constraints on the controlmechan-ismto prevent it from wasting time on stray leads.
The two strategies used in rule-based expert systemsfor solving search problems are calledforward-chainingand backward-chaining. Forward-chainingsystems also called data-driven reason frominitial data or facts contained in the rule base andthe blackboard to find a solution whilebackward-chainingalso called goal-directed systems startat a goal and work backward to find evidence tosupport that goal.
Forward-Chaining Control Mechanism. This strategybegins with a premise and looks t rough the rulebase and the blackboard to find possible solutions.The mechanism matches the condition C of everyrule against all the elements on the blackboard.The action A of any rule that matches the elementsadds to the blackboard as a newly inferred fact.This process continues until the control mechanismcan make no further inference.
Backward-Chaining Control Mechanism. This strategybegins with a tentative solution a hypothesis andlooks through the rule base and the blackboard tofind justifications for that solution.Backward-chainingcontrol mechanisms match the hypothesisagainst the action A of every rule the conditionC of any rule that matches the hypothesis getstested against the blackboard. Any match of a rulecondition to a blackboard element serves asjustifi-cationfor the hypothesis. All mismatches point outother possible hypotheses which the controlmechan-ismtests in turn.
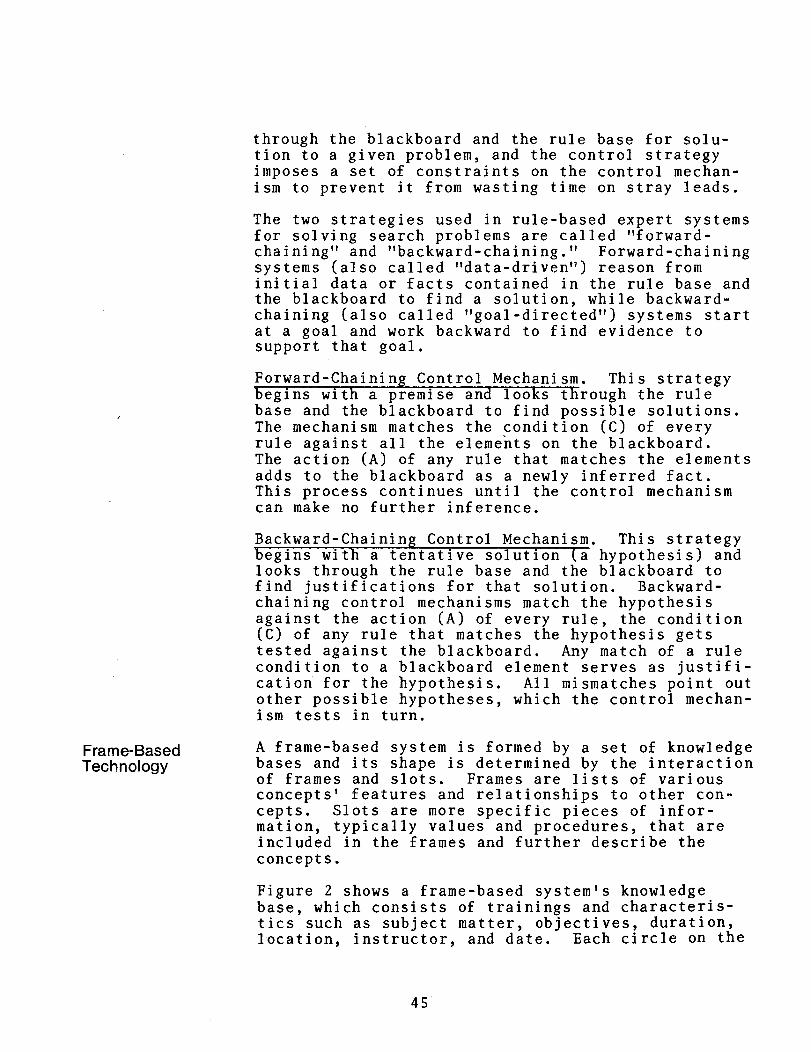
Frame-Based A frame-based system is formed by a set of knowledge
Technology bases and its shape is determined by the interactionof frames and slots. Frames are lists of variousconcepts features and relationships to othercon-cepts.Slots are more specific pieces ofinfor-mationtypically values and procedures that areincluded in the frames and further describe the
concepts.
Figure 2 shows a frame-based systems knowledgebase which consists of trainings andcharacteris-ticssuch as subject matter objectives durationlocation instructor and date. Each circle on the
45
Training
Semi na r
objectiveincrease knowledge of spreadsheetattendeemanagerial
One-Day-Trainingduration1
Seminar-Lotus 1-2-3subject matterLotus 1-2-3
Training-in-Washington DC
locationWashington DC
Seminar-Adate08/15instructorJohn
Figure 2.--Frame-based system.
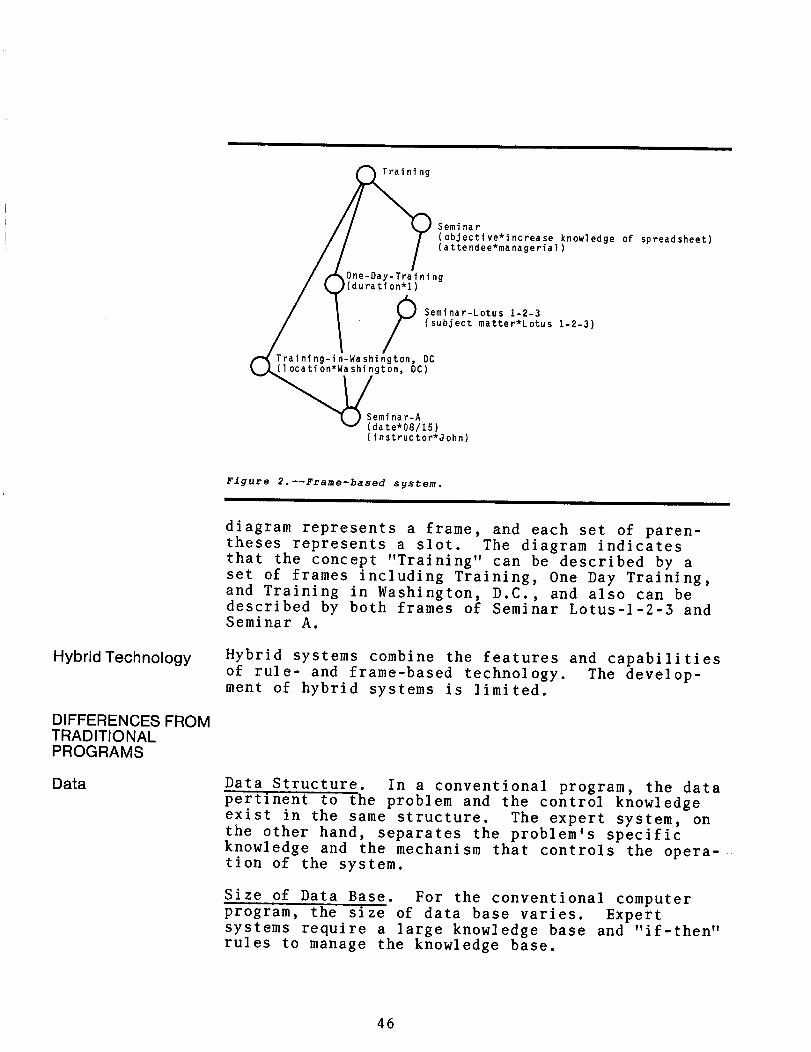
diagram represents a frame and each set ofparen-thesesrepresents a slot. The diagram indicatesthat the concept Training can be described by a
set of frames including Training One Day Trainingand Training in Washington D.C. and also can bedescribed by both frames of Seminar Lotus-1-2-3 andSeminar A.
Hybrid Technology Hybrid systems combine the features and capabilitiesof rule- and frame-based technology. Thedevelop-mentof hybrid systems is limited.
DIFFERENCES FROMTRADITIONALPROGRAMS
Data Data Structure. In a conventional program the datapertinent to the problem and the control knowledgeexist in the same structure. The expert system onthe other hand separates the problems specificknowledge and the mechanism that controls theopera-tioof the system.
Size of Data Base. For the conventional computerprogram the size of data base varies. Expertsystems require a large knowledge base and if-thenrules to manage the knowledge base.
46
Completion of Data Base. Many expert systems canhandle income ete or uncertain data by makinginfer-encesfrom the knowledge base.
Type of Data. Most traditional computer programsdeal with a numerical data base expert systems canaccommodate non-numeric qualitative or symbolicdata.
Language Conventional programming uses computer languageslike FORTRAN and PASCAL which were designed formanipulating numerical problems and not well suitedto expert system applications. Most expert systemsin the United States employ LISP for list processing.LISP operates by linking lists of data and can matchconcentrate shuttle or take apart lists as neededto get the desired information. Recently thecom-putersoftware industry has offered software such asEXSYS that allows users to communicate with expertsystems in normal or natural languages. Howeverin Europe and Japan a language called PROLOG isfavored. A PROLOG program starts with a logicalstatement and tries to determine whether it is trueor false.
Approach of An expert system does not need an explicitproblem-ProblemSolving solving algorithm because a separate knowledge
processor determines when where and how to applyevery individual knowledge element. In other wordsthe problem-solving approach is deterministic forthe traditional program and heuristic for the expertsystem.
Outcome Expert systems provide an explanation for theircon-Presentationclusions and offer a reasonably naturaluser-interfacedialogue.
ADVANTAGES Listed below are the advantages of an expert systemDISADVANTAGES over traditional approaches with and without the aid
of computer programs in solving engineeringproblems
1 The expert system provides reliable andconsis-tentdecisions.
2 The expert system explains or justifies finalanswers.
3 The construction of the expert systemformal-izesthe problem area.
47
4 The expert system serves as an expert colleagueor expert consultant on difficult problems.
5 The expert system is more easily expandable thanconventional software.
6 The symbolic language used by the expert systemfacilitates communication in natural English.
7 The expert system preserves expert knowledgethat would otherwise be lost through retiringkey personnel. The expert system can train newpersonnel in a tutorial context.
8 The expert system can pool the expertise of abody of human experts to produce a system thatis more effective than any one person workingalone.
9 The expertise of the expert system generally is
very high-level expertise which is very scarceand costly in human terms.
10 The expert system makes more expert knowledgeavailable because the program can be duplicatedand located in multiple locations and can solvemultiple problems simultaneously.
Like other computer software expert systems havedrawbacks. The following are some disadvantages
1 Expert systems are not as creative as realexperts.
2 They are not as adaptive as real experts. Attheir current stage of development expertsystems have difficulty learning from theirenvironment or adapting to new situations theway humans can.
3 Expert systems have difficulty understandingtheir own limitations and may attempt problemsthat they are not qualified to solve.
APPLICATIONS Expert systems are still in an embryonic stage ofdevelopment and successful applications of thesystem to solve engineering problems are few. Table1 shows systems in use or in development. Thefollowing two systems applied to bridge design andpavement rehabilitation illustrate uses of expertsystems.
48
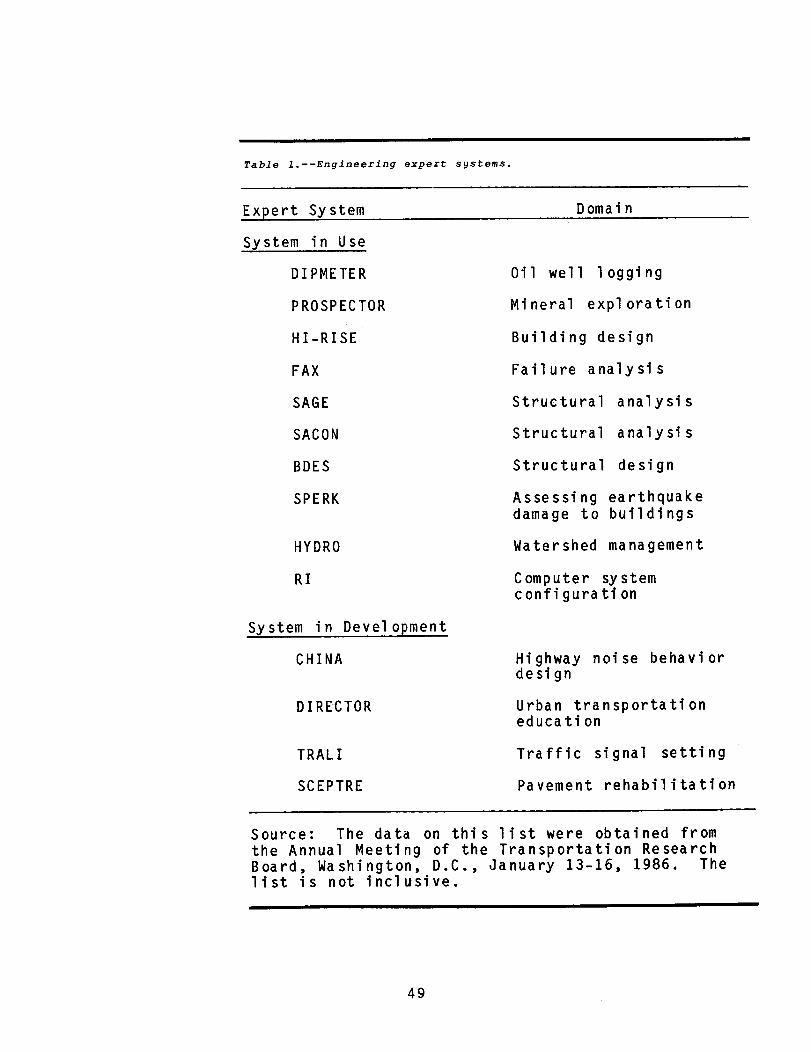
Table 1.--Engineering expert systems.
Expert System Domain
System in Use
DIPMETER Oil well logging
PROSPECTOR Mineral exploration
HI-RISE Building design
FAX Failure analysi s
SAGE Structural analysis
SACON Structural analysi s
BDES Structural design
SPERK Assessing earthquakedamage to buildings
HYDRO Watershed management
RI Computer systemconfiguration
System in Development
CHINA Highway noise behaviordesign
DIRECTOR Urban transportationeducation
TRALI Traffic signal setting
SCEPTRE Pavement rehabilitation
Source The data on this list were obtained fromthe Annual Meeting of the Transportation ResearchBoard Washington D.C. January 13-16 1986. The
list is not inclusive.
49
4
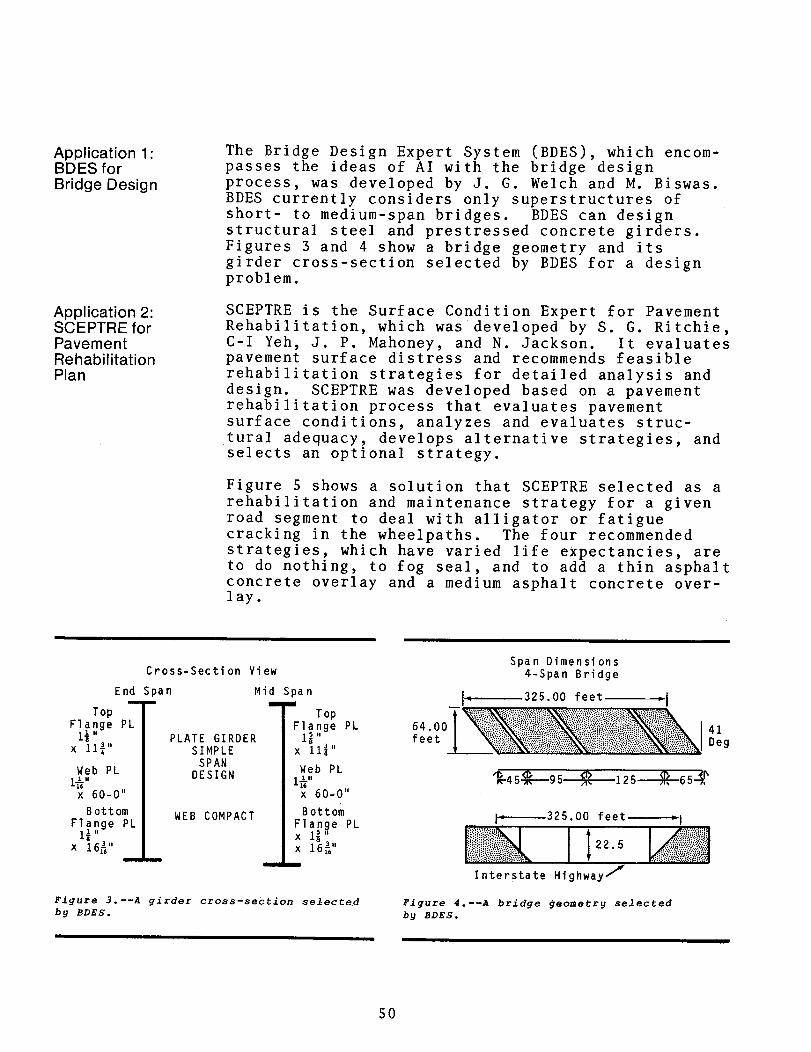
Application 1 The Bridge Design Expert System BDES whichencom-BDESforpasses the ideas of AI with the bridge designBridge Design process was developed by J. G. Welch and M. Biswas.
BDES currently considers only superstructures ofshort- to medium-span bridges. BDES can designstructural steel and prestressed concrete girders.Figures 3 and 4 show a bridge geometry and itsgirder cross-section selected by BDES for a designproblem.
Application 2 SCEPTRE is the Surface Condition Expert for PavementSCEPTRE for Rehabilitation which was developed by S. G. RitchiePavement C-I Yeh J. P. Mahoney and N. Jackson. It evaluatesRehabilitation pavement surface distress and recommends feasiblePlan rehabilitation strategies for detailed analysis and
design. SCEPTRE was developed based on a pavementrehabilitation process that evaluates pavementsurface conditions analyzes and evaluatesstruc-.turaladequacy develops alternative strategies andselects an optional strategy.
Figure 5 shows a solution that SCEPTRE selected as arehabilitation and maintenance strategy for a givenroad segment to deal with alligator or fatiguecracking in the wheelpaths. The four recommendedstrategies which have varied life expectancies areto do nothing to fog seal and to add a thin asphaltconcrete overlay and a medium asphalt concreteover-lay.
Span DimensionsCross-Section View 4-Span Bridge
End Span Mid Span f-325.00 feet ýITop Top
Flange PL Flange 6 4 .0 411 .
GIRDER feetDegI
PLATE 1
x 113 u
a3-SIMPLEx 11
SPAN
1WL 11
eb PL DESIGN 1WebPL
1-459--95 r-125jT6516 16
x 60-0 x 60-0
Bottom WEB COMPACT Bottomi. 325.00 feet-.jFlange PL Flange PL
111 x 1s
X 16- x 16- 22.5se16 T I
Interstate Highway /Figure 3.--A girder cross-section selected Figure 4.--A bridge geometry selectedby BDES. by BDES.
50
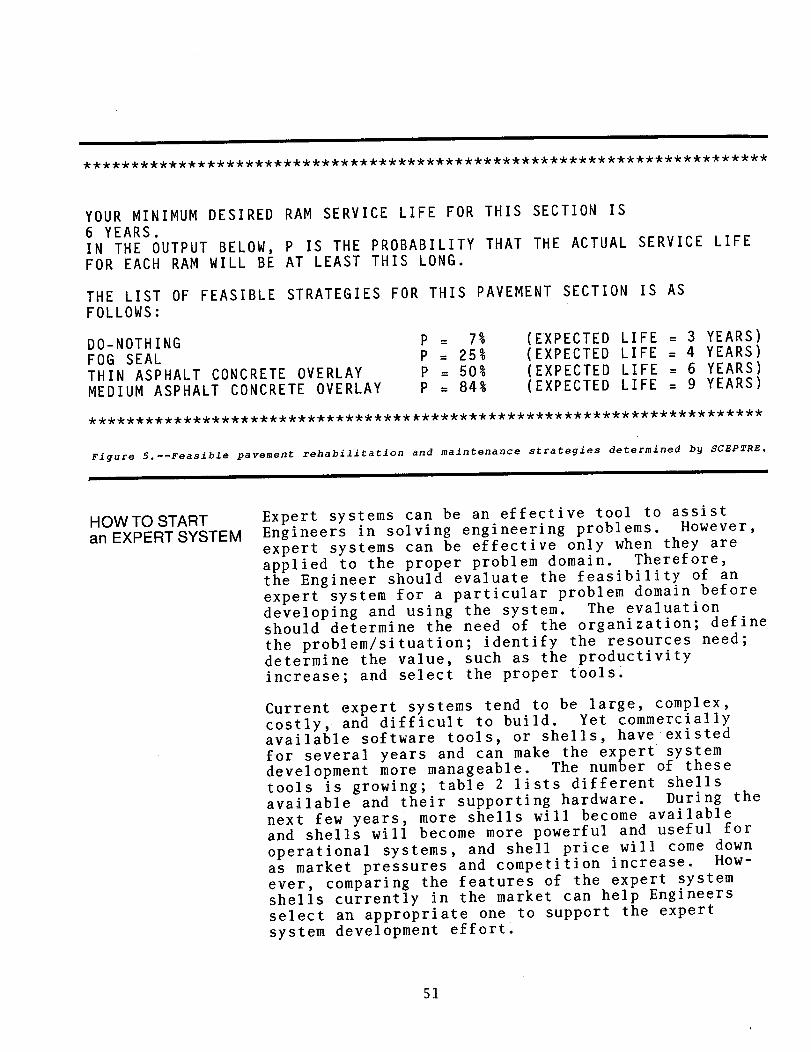
YOUR MINIMUM DESIRED RAM SERVICE LIFE FOR THIS SECTION IS
6 YEARS.IN THE OUTPUT BELOW P IS THE PROBABILITY THAT THE ACTUAL SERVICE LIFEFOR EACH RAM WILL BE AT LEAST THIS LONG.
THE LIST OF FEASIBLE STRATEGIES FOR THIS PAVEMENT SECTION IS ASFOLLOWS
DO-NOTHING P 7% EXPECTED LIFE 3 YEARSFOG SEAL P 25% EXPECTED LIFE 4 YEARSTHIN ASPHALT CONCRETE OVERLAY P 50% EXPECTED LIFE 6 YEARSMEDIUM ASPHALT CONCRETE OVERLAY P 84% EXPECTED LIFE 9 YEARS
Figure 5.--Feasible pavement rehabilitation and maintenance strategies determined by SCEPTRE.
HOW TO START Expert systems can be an effective tool to assist
an EXPERT SYSTEM Engineers in solving engineering problems. Howeverexpert systems can be effective only when they are
applied to the proper problem domain. Thereforethe Engineer should evaluate the feasibility of an
expert system for a particular problem domain before
developing and using the system. The evaluationshould determine the need of the organization definethe problem/situation identify the resources needdetermine the value such as the productivityincrease and select the proper tools.
Current expert systems tend to be large complexcostly and difficult to build. Yet commerciallyavailable software tools or shells have existedfor several years and can make the expert systemdevelopment more manageable. The number of thesetools is growing table 2 lists different shellsavailable and their supporting hardware. During thenext few years more shells will become availableand shells will become more powerful and useful for
operational systems and shell price will come downas market pressures and competition increase.How-evercomparing the features of the expert systemshells currently in the market can help Engineersselect an appropriate one to support the expertsystem development effort.
51
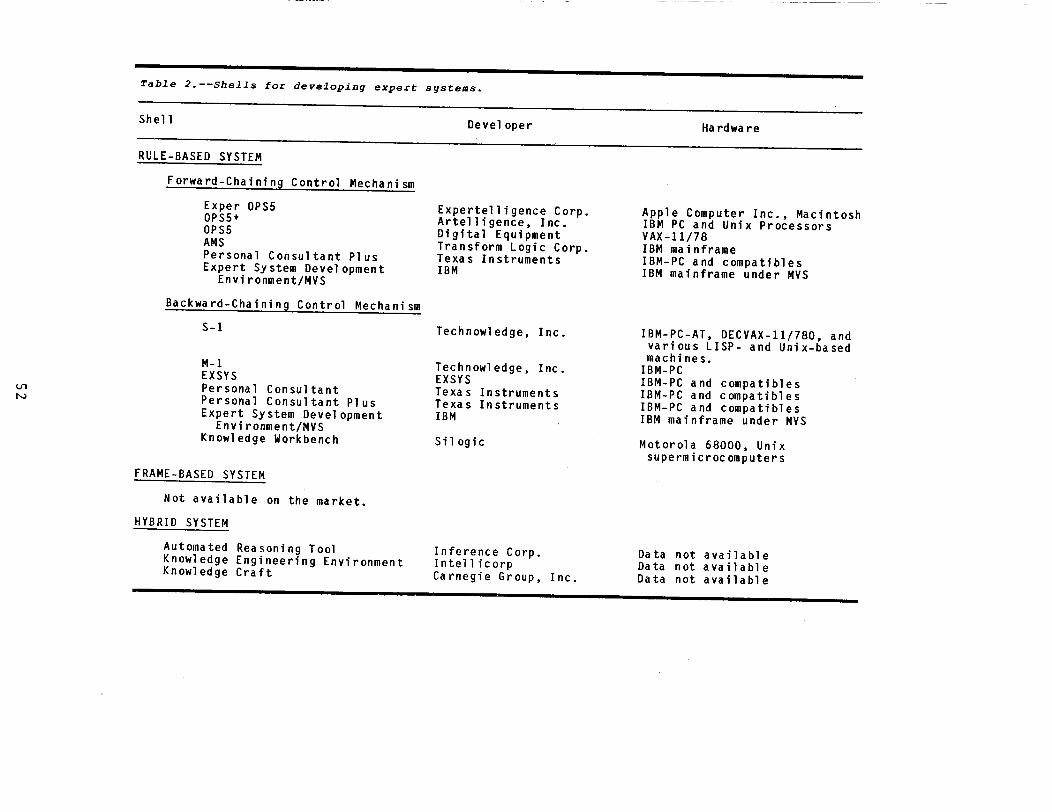
Table
2.--Shells for
developing
expert
systems.
Shell
Developer
HardwareRULE-BASED
SYSTE
M
Forward-Chaining Control
Mechanism
Exper
OPS5
Expertelligence Corp.
Apple
Com
puter
Inc.
Macintosh
OPS5
Artelligence Inc.
IBM
PC
and
Unix
Processors
OPS5
Digital
Equipm
ent
VAX-11/78
AMS
Transform Logic
Corp.
IBM
mainframePersonalConsultant
Plus
Texas
Instruments IBM-PC
and
compatibles
Expert
System
Development IBM
IBM
mainframe under
MVS
Environment/MVSBackward-Chaining
Control
Mechanism
S-1
Technowledge Inc.
IBM-PC-ATDECVAX-11/780 and
various
LISP-
and
Unix-basedmachines.
M-1
Technowledge Inc.
IBM-PC
EXSYS
EXSYS
IBM-PC
and
compatibles
Ln
Personal
Consultant Texas
Instruments IBM-PC
and
compatibles
N Personal
Consultant Plus
Texas
Instruments IBM-PC
and
compatibles
Expert
System
Development IBM
IBM
mainframe under
MVS
Environment/MVS
Know
ledge
Workbench Silogic
Motorola 68000
Unix
supermicrocomputersFRAME-BASED
SYSTE
M
Not
available
on
the
market.
HYBRID
SYSTE
M
Automated
Reasoning
Tool
Inference Corp.
Data
not
available
Know
ledge
EngineeringEnvironmentIntellicorp Data
not
available
Know
ledge
Craft
Carnegie
Group
Inc.
Data
not
available
SUMMARY This article has presented an overview of theappli-cationof expert systems to improve engineeringper-formance.Two engineering expert systems developedby the Virginia and Washington State HighwayDepartments illustrated expert system application.
Although expert systems offer opportunities toincrease productivity and reduce costs they cannotsolve all engineering problems. As with othercom-puterprograms the Engineers should perform a
feasibility study before initiating expert systemdevelopment.
REFERENCES 1. U.S. Department of Commerce National TechnicalInformation Service. Citations from the INSPECDatabase Expert Computer Systems Feb. 85 - Jan.
86. NTIS PB86-858244. 1986.
2. Ritchie S. G. C-I Yeh J. P. Mahoney and
N. Jackson. Development of an Expert System forPavement Rehabilitation Decision-Making. Paperpresented at the 65th Annual Meeting of
Transportation Research Board Washington D.C.January 1986.
3. Waterman R. D. A Guide to Expert Systems.Addison-Wesley 1986.
4. Welch J. G. and M. Biswas. Application of
Expert Systems in the Design of Bridges. Paperpresented at the 65th Annual Meeting of
Transportation Research Board Washington D.C.January 1986.
EfN
f4
53

Identifying Haul Speeds Controlled byGrade Surface Type or Horizontal
Alignment Road Width for ForestDevelopment Roads
Max E. EvansTransportation PlannerRegion 3
SYNOPSIS Travel time and thus haul costs used by the ForestService is based on the Logging Road Handbook by
Byrne Nelson and Googins hereafter referred to as
BNG published by the USDA Forest Service in 1960.
It states that the speed of a truck operating on a
Forest Development Road is controlled mainly by the
grade and surface type or the horizontal alignmentand number of lanes. FSH 7709.56.4.32 states that
speeds for loaded trucks are governed by gradesgreater than 8 percent for favorable haul and
3 percent for adverse hauls.
The current method used in Region 3 toýdeterminetravel times does not reflect this principle. Our
practice has been to assume that any improvement in
surface type width or horizontal alignment woulddecrease travel time and thus haul costs. The
break-even point occurs when an adequate volume of
timber hauled over the road at a reduced haul costoffsets the costs of improvements. Althoughimprov-inga road surface can reduce truck operating costsand road maintenance costs benefits from reducedhaul times are not as great.
Identifying which road characteristics when alteredwill affect travel times makes our method moreaccu-rate.Since this may result in less economicdiffer-encesbetween alternatives in a transportationanalysis the transportation analysis must displaycosts of concerns mitigated by each economicallyefficient alternative. ID teams and land managersmust base recommendations and selections on the
costs and benefits of mitigating the various
concerns in economically effective alternatives.
DISCUSSION Data for BNG were collected from March to August1948 during the winter of 1958-59 in the westernUnited States and in 1952 in the eastern UnitedStates. Most agree that this publication is the
55
most up-to-date study on operating logging trucks.BNG indicates that travel speeds when controlled bythe grade of the road and the surface type areincreased by less than 5 percent when a nativesurface is improved to an aggregate surface or an
aggregate surface is improved to an asphalt surface.BNG attributes this reduction in travel time to thechange in the rolling resistance between the various
type surfaces. Therefore if the horizontalalign-mentand road width control the speed improvementsto the road surface will have minimal effect on
decreasing travel times.
The current method of analyzing truck speeds andcosts in Region 3 is based on the latest edition ofthe Manual Network Analysis Method forTransporta-tionof Resources hereafter called Manual NetworkAnalysis y Ronald Tangemen Clyde Weller and BillWoodward published in October 1982 thispublica-tionalso is the basis for Region 3 MINCOST tablesat FCCC. Table 1 Haul Classes on page 36 of the
Manual Network Analysis divides roads into 320 haulclasses related to t e number of lanes road surfacehorizontal alignment and grade of the road. Table2 in the Manual Network Analysis gives the traveltimes in minutes per mile for each class of roaddescribed in Table 1. Table 2a in the Manual NetworkAnalysis gives the speeds of a loaded and emptytruck hauling on a road described in Table 1.
Tables 2 and 2a of the Manual Network Analysis weredeveloped using BNG corrected for a truckhaving 400 horsepower for the 55 mph speed limitand for a B value of 0.85.
The Manual Network Analysis originally was publishedas an aid to transportation planners to comparerelative transportation costs associated with roadimprovements in determining which improvements couldbe economical. However the Manual Network Analysisnow has been incorporated into Region 3s timberappraisal procedure by Amendment 33 to FSH 2409.22.Region 5 also is modifying Tables 1 2 and 2a inthe Manual Network Analysis to be included in theirappraisal process. Considering this added importancegiven the Manual Network Analysis travel timesderived from its use must be accurate.
ANALYSIS The travel speed for a truck traveling on the forestdevelopment system is controlled by design featuresof roads that limit the physical capabilities of thetruck and affect the drivers psychological comfort
56
level. Consider the case of a truck that can do
45 mph on a double-lane road with an excellentalign-ment.If this truck is operated on a 12-foot-wide
single-lane road without a ditch with the same gradesand alignment as the first road the driver willfeel less comfortable. As a result the driver will
operate the truck at a lesser speed than if the onlylimits were the physical capabilities of the truck.
This difference in operating speeds results from the
psychological effects of the different situations onthe drivers comfort level rather than on physicalchanges in the road.
Determining which characteristic primarily controlsthe speed of a truck is important when consideringthe economics of improving a road. Charts I and 2 in
the Manual Network Analysis indicate trucks operatingon a single-lane graded and drained road with a
poor alignment and an adverse haul of from 4 to
7 percent will require a travel time of 10.00 minutes
per mile min/mi. These charts also indicate that
an aggregate surface placed on this road would reduce
the travel time to 7.01 min/mi a reduction of
2.99 min/mi or 30 percent. If we assume the gradecontrols the speed of the truck operating on this
road as stated in FSH 7709.56 the travel timeshould be reduced by less than 5 percent or less
than I min/mi based on BNG. These charts alsoindi-catethat if the alignment were changed from poor to
fair the travel time would be reduced to 7.47 min/mi.
This would be true only if the alignment and width of
the road controlled the truck speed. If the gradecontrols the speed as in the first assumption the
travel time should not be reduced from improved road
alignment.
Data regarding travel time are contained in BNG as a
series of graphs. The first series of graphs in
Figures 3 through 8 in BNG relate travel time in
minutes per mile to the grade for roads with various
types of surfaces and a B values. The B valueis the relationship of the horsepower hp of the
truck to the gross vehicle weight GVW.
The second series of graphs in Figures 10 through
13 in BNG relate the travel time in minutes permile to various radius curves the number of curves
per mile and the width of the road. Road widths
are double lane lane and a half single lane with
ditch and single lane without ditch.
57
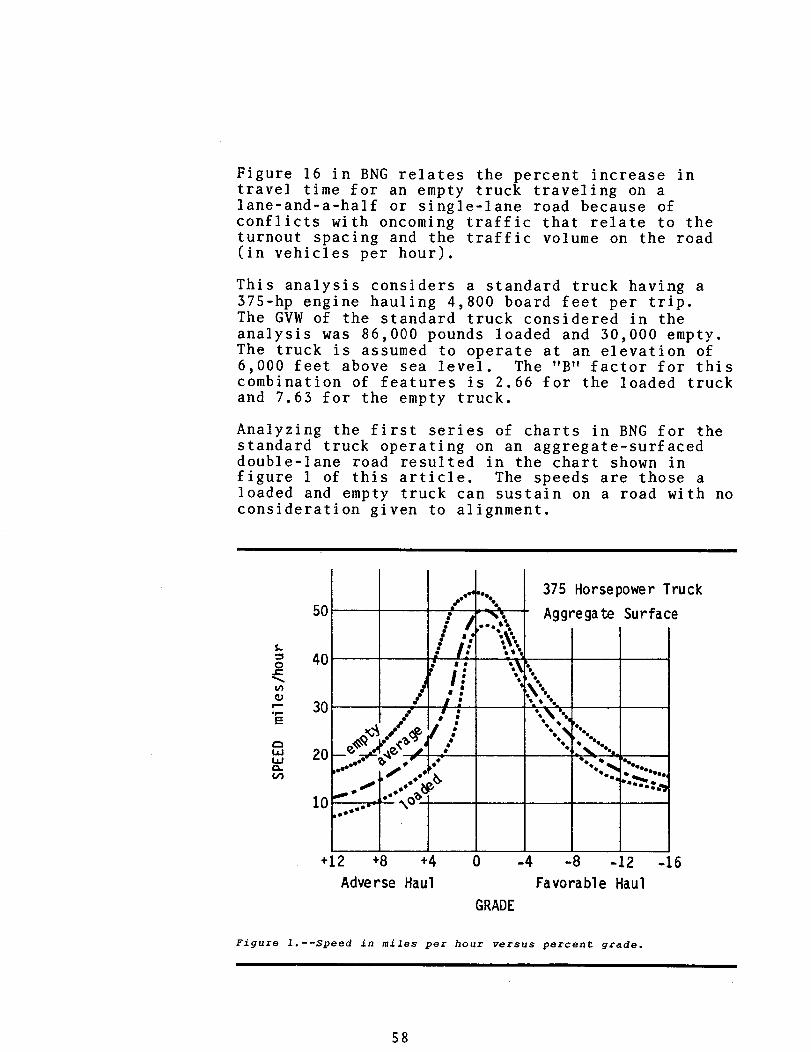
Figure 16 in BNG relates the percent increase intravel time for an empty truck traveling on alane-and-a-half or single-lane road because ofconflicts with oncoming traffic that relate to theturnout spacing and the traffic volume on the roadin vehicles per hour.
This analysis considers a standard truck having a
375-hp engine hauling 4800 board feet per trip.The GVW of the standard truck considered in theanalysis was 86000 pounds loaded and 30000 empty.The truck is assumed to operate at an elevation of6000 feet above sea level. The B factor for thiscombination of features is 2.66 for the loaded truckand 7.63 for the empty truck.
Analyzing the first series of charts in BNG for thestandard truck operating on an aggregate-surfaceddouble-lane road resulted in the chart shown infigure 1 of this article. The speeds are those aloaded and empty truck can sustain on a road with noconsideration given to alignment.
f..
375 Horsepower Truck
50 Aggregate Surface
400 I N N.r0.0
S. $430
Vý .ZIP
20 .ýIa 1. _110.0
000
10000 t
oa
12 8 4 0 -4 -8 -12 -16
Adverse Haul Favorable Haul
GRADE
Figure 1.--Speed in miles per hour versus percent grade.
58
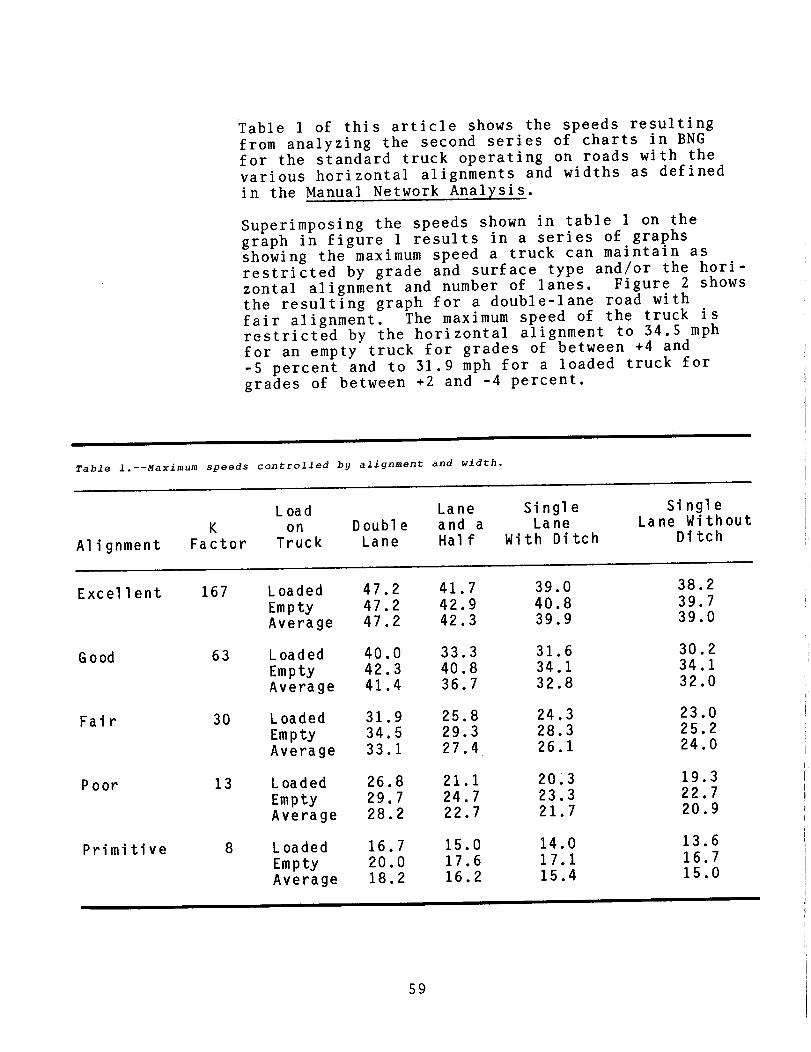
Table 1 of this article shows the speeds resultingfrom analyzing the second series of charts in BNGfor the standard truck operating on roads with thevarious horizontal alignments and widths as definedin the Manual Network Analysis.
Superimposing the speeds shown in table I on the
graph in figure 1 results in a series of graphsshowing the maximum speed a truck can maintain asrestricted by grade and surface type and/or thehori-zontalalignment and number of lanes. Figure 2 showsthe resulting graph for a double-lane road withfair alignment. The maximum speed of the truck isrestricted by the horizontal alignment to 34.5 mphfor an empty truck for grades of between 4 and
-5 percent and to 31.9 mph for a loaded truck for
grades of between 2 and -4 percent.
Table 1.--Maximum speeds controlled by alignment and width.
Load Lane Si ngl a Si ngl e
K on Double and a Lane Lane Without
Alignment Factor Truck Lane Half With Ditch Ditch
Excellent 167 Loaded 47.2 41.7 39.0 38.2
Empty 47.2 42.9 40.8 39.7
Average 47.2 42.3 39.9 39.0
Good 63 Loaded 40.0 33.3 31.6 30.2
Empty 42.3 40.8 34.1 34.1
Average 41.4 36.7 32.8 32.0
Fair 30 Loaded 31.9 25.8 24.3 23.0
Empty 34.5 29.3 28.3 25.2
Average 33.1 27.4 26.1 24.0
Poor 13 Loaded 26.8 21.1 20.3 19.3
Empty 29.7 24.7 23.3 22.7
Average 28.2 22.7 21.7 20.9
Primitive 8 Loaded 16.7 15.0 14.0 13.6
Empty 20.0 17.6 17.1 16.7
Average 18.2 16.2 15.4 15.0
59
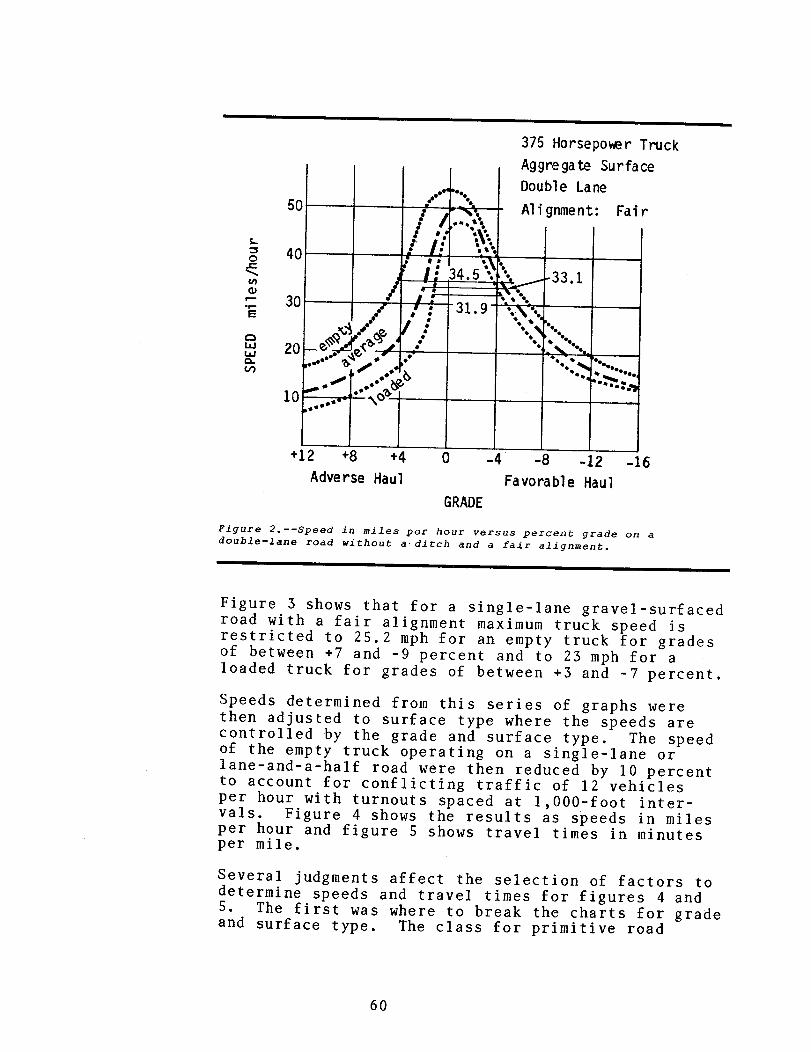
375 Horsepower Truck
Aggregate Surface
z4 Double Lane
50 Alignment Fair
top 0
0 40
34.5. 33.1
0 ý30 31.9
-6 . z i ý
20 . Jet .V wft
10 \O
12 8 4 0 -4 -8 -12 -16
Adverse Haul Favorable Haul
GRADE
Figure 2.--Speed in miles per hour versus percent grade on a
double-lane road without a ditch and a fair alignment.
Figure 3 shows that for a single-lane gravel-surfacedroad with a fair alignment maximum truck speed is
restricted to 25.2 mph for an empty truck for gradesof between 7 and -9 percent and to 23 mph for a
loaded truck for grades of between 3 and -7 percent.
Speeds determined from this series of graphs werethen adjusted to surface type where the speeds arecontrolled by the grade and surface type. The speedof the empty truck operating on a single-lane orlane-and-a-half road were then reduced by 10 percentto account for conflicting traffic of 12 vehiclesper hour with turnouts spaced at 1000-footinter-vals.Figure 4 shows the results as speeds in milesper hour and figure 5 shows travel times in minutesper mile.
Several judgments affect the selection of factors todetermine speeds and travel times for figures 4 and5. The first was where to break the charts for gradeand surface type. The class for primitive road
60
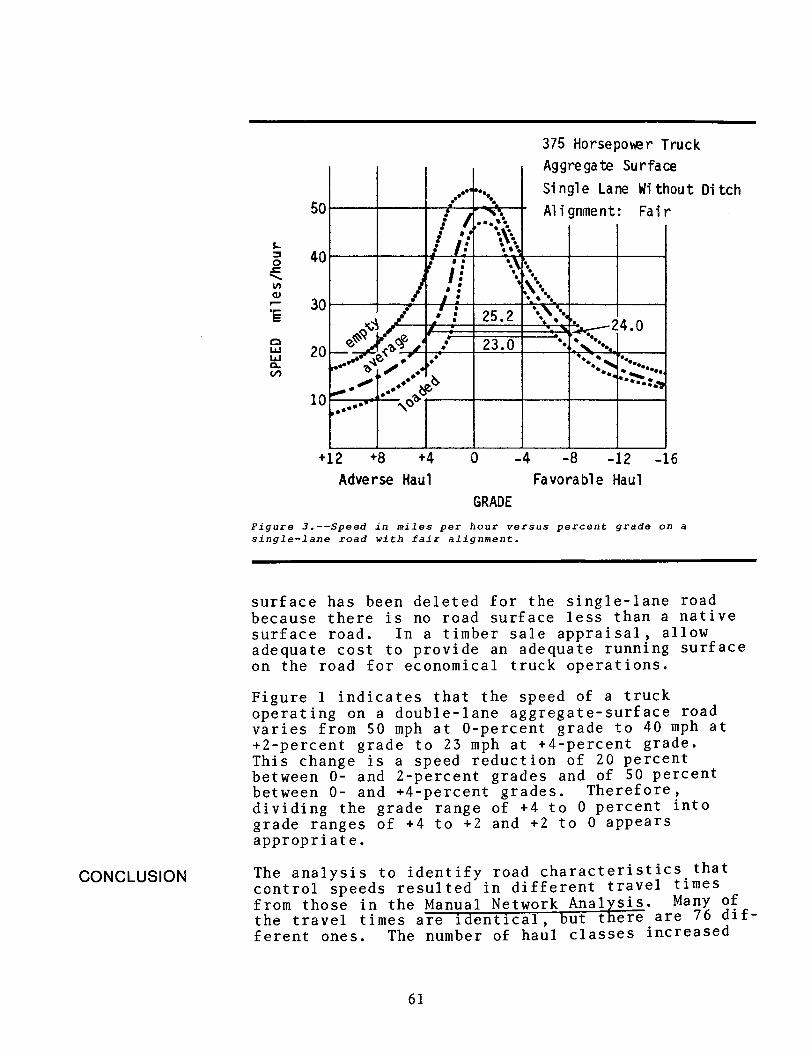
375 Horsepower Truck
Aggregate Surface
Single Lane Without Ditche--40976t.
50 Alignment Fair
L40 .0
30rE 25.2 ý
24.0%
W 20 eýaoQ 23.0
10 .NQ-128 4 0 -4 -8 -12 -16
Adverse Haul Favorable Haul
GRADE
Figure 3.--Speed in miles per hour versus percent grade on a
single-lane road with fair alignment.
surface has been deleted for the single-lane roadbecause there is no road surface less than a nativesurface road. In a timber sale appraisal allow
adequate cost to provide an adequate running surfaceon the road for economical truck operations.
Figure 1 indicates that the speed of a truck
operating on a double-lane aggregate-surface roadvaries from 50 mph at 0-percent grade to 40 mph at
2-percent grade to 23 mph at 4-percent grade.This change is a speed reduction of 20 percentbetween 0- and 2-percent grades and of 50 percentbetween 0- and 4-percent grades. Thereforedividing the grade range of 4 to 0 percent into
grade ranges of 4 to 2 and 2 to 0 appearsappropriate.
CONCLUSION The analysis to identify road characteristics that
control speeds resulted in different travel times
from those in the Manual Network Analsis. Many of
the travel times are identical but there are 76dif-ferentones. The number of haul classes increased
61
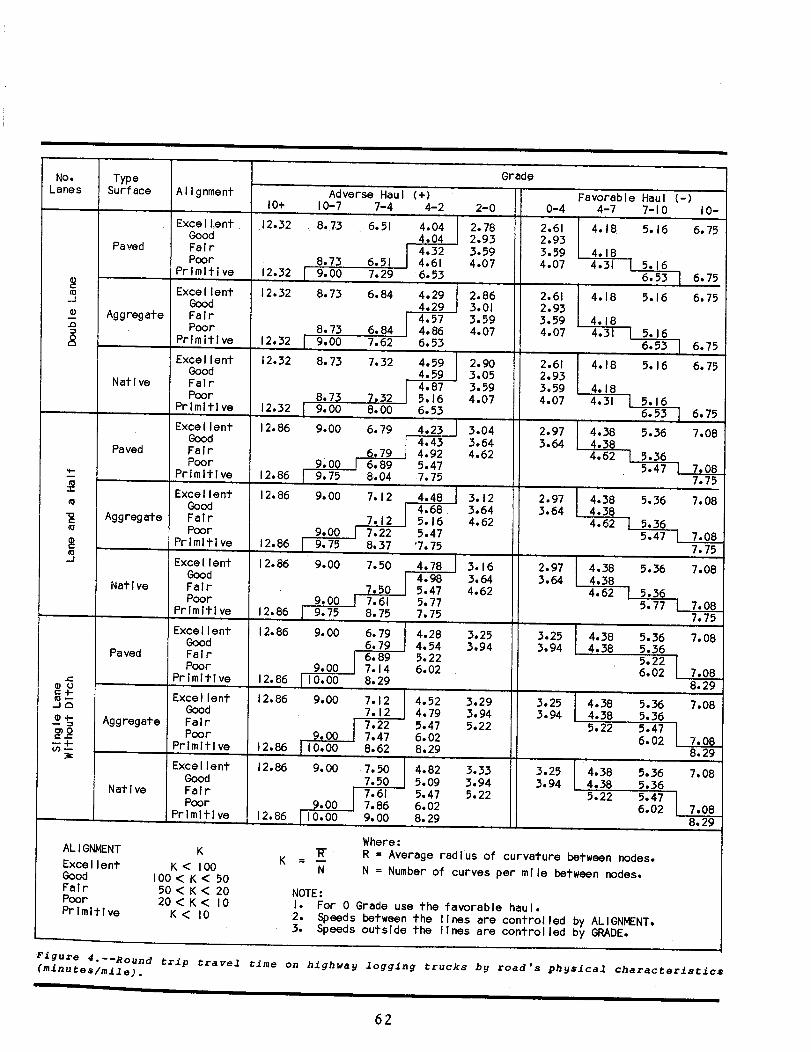
No.Grade
TypeLanes Surface Alignment Adverse Haul Favorable Haul -
10 10-7 7-4 4-2 2-0 0-4 4-7 7-1010-Exceiient12.32 8.73 6.51 4.04 2.78 2.61 4.18 5.16 6.75
Good 4.04 2.93 2.93
Paved Fair 4.32 3.59 3.59 4.18
Poor 8.73 6.51 4.61 4.07 4.07 4.31 5.16
Primitive 12.32 9.00 7.29 6.53 6.53 6.75
Excellent 12.32 8.73 6.84 4.29 2.86 2.61 4.18 5.16 6.75
Good 4.29 3.01 2.93
Aggregate Fair 4.57 3.59 3.59 4.18
Poor 8.73 6.84 4.86 4.07 4.07 4.31 5.16
Primitive 12.32 9.00 7.62 6.53 6.53 6.75
Excellent 12.32 8.73 7.32 4.59 2.90 2.61 4.18 5.16 6.75
Good 4.59 3.05 2.93
Native Fair 4.87 3.59 3.59 4.18
Poor 8.73 7.32 5.16 4.07 4.07 4.31 5.16
Primitive 12.32 9.00 8.00 6.53 6.53 6.75
Excellent 12.86 9.00 6.79 4.23 3.04 2.97 4.38 5.36 7.08
Good 4.43 3.64 3.64 4.38
Paved Fair 6.79 4.92 4.62 4.62 15.36
Poor 9.00 6.89 5.47 5.47 7.08
Primitive 12.86 9.75 8.04 7.75 7.75
Excellent 12.86 9.00 7.12 4.48 3.12 2.97 4.38 5.36 7.08
Good 4.68 3.64 3.64 4.38
Aggregate Fair 7.12 5.16 4.62 4.62 5.36
Poor 9.00 7.22 5.47 5.47 7.08
Primitive 12.86 9.75 8.37 7.75 7.75
Excellent 12.86 9.00 7.50 4.78 1 3.16 2.97 4.38 5.36 7.08
Good 4.98 3.64 3.64 4.38
Native Fair 7.50 5.47 4.62 4.62 5.36
Poor 9.00 7.61 5.77 5.77 7.08
Primitive 12.86 9.75 8.75 7.75 7.75
Excellent 12.86 9.00 6.79 4.28 3.25 3.25 4.38 5.36 7.08
Good 6.79 4.54 3.94 3.94 4.38 5.36
Paved Fair 6.89 5.22 5.22
Poor 9.00 7.14 6.02 6.02 7.08
Primitive 12.86 10.00 8.29 8.29
cm _ Excellent 12.86 9.00 7.12 4.52 3.29 3.25 4.38 5.36 7.08-jo Good 7.12 4.79 3.94 3.94 4.38 5.36
- Aggregate Fair 7.22 5.47 5.22 5.22 5.47
Poor 9.00 7.47 6.02 6.02 7.08
in Primitive 12.86 10.00 8.62 8.29 8.29
Excellent 12.86 9.00 7.50 4.82 3.33 3.25 4.38 5.36 7.08
Good 7.50 5.09 3.94 3.94 4.38 5.36
Native Fair 7.61 5.47 5.22 5.22 5.47
Poor 9.00 7.86 6.02 6.02 7.08
Primitive 12.86 110.00 9.00 8.29 8.29
WhereALIGNMENT K ý R Average radius of curvature between nodes.
Excellent K 100K
N N Number of curves per mile between nodes.
Good 100 K 50Fair 50 K 20 NOTEPoor 20 K 10 I. For 0 Grade use the favorable haul.
Primitive K 10 2. Speeds between the lines are controlled by ALIGNMENT.
3. Speeds outside the lines are controlled by GRADE.
Figure 4.--Round trip travel time on highway logging trucks by roads physical characteristicsminutes/mile.
62
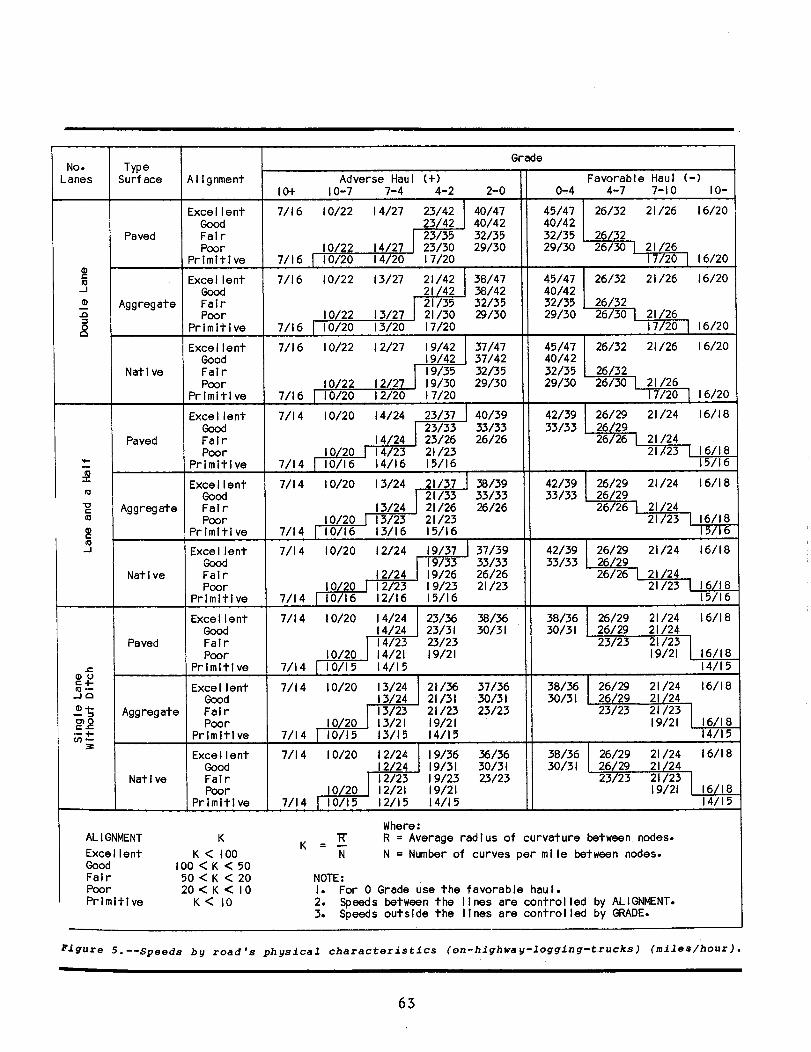
GradeNo. Type
Lanes Surface Alignment Adverse Haul Favorable Haul -10 10-7 7-4 4-2 2-0 0-4 4-7 7-1010-Excellent7/16 10/22 14/27 23/42 40/47 45/47 26/32 21/26 16/20
Good 23/42 40/42 40/42
Paved Fair 23/35 32/35 32/35 26/32
Poor 10/22 14/27 23/30 29/30 29/30 26/30 21/26
Primitive 7/16 10/20 14/20 17/20 17/20 16/20
Excellent 7/16 10/22 13/27 21/42 38/47 45/47 26/32 21/26 16/20
Good 21/42 38/42 40/42
Aggregate Fair 21/35 32/35 32/35 26/32Poor 10/22 13/27 21/30 29/30 29/30 26/30 21/26
Primitive 7/16 10/20 13/20 17/20 17/20 16/20
Excellent 7/16 10/22 12/27 19/42 37/47 45/47 26/32 21/26 16/20
Good 19/42 37/42 40/42
Native Fair 19/35 32/35 32/35 26/32
Poor 10/22 12/27 19/30 29/30 29/30 26/30 21/26
Primitive 7/16 10/20 12/20 17/20 17/20 16/20
Excellent 7/14 10/20 14/24 23/37 40/39 42/39 26/29 21/24 16/18
Good 23/33 33/33 33/33 26/29
Paved Fair 14/24 23/26 26/26 26/26 21/24
Poor 10/20 14/23 21/23 21/23 16/18
Primitive 7/14 10/16 14/16 15/16 15 16
Excellent 7/14 10/20 13/24 21/37 38/39 42/39 26/29 21/24 16/1810
Good 21/33 33/33 33/33 26/29
Aggregate Fair 13/24 21/26 26/26 26/26 21/24
Poor 10/20 13/23 21/23 21/23 16/18
Primitive 7/14 10/16 13/16 15/16 15 16
Excellent 7/14 10/20 12/24 19/37 37/39 42/39 26/29 21/24 16/18
GoodJ-1-9733
33/33 33/33 26/29
Native Fair 12/24 19/26 26/26 26/26 21 24
Poor 10/20 12/23 19/23 21/23 21/23 16/18
Primitive 7/14 10/16 12/16 15/16 15/16
Excellent 7/14 10/20 14/24 23/36 38/36 38/36 26/29 21/24 16/18
Good 14/24 23/31 30/31 30/31 26/29 21/24
Paved Fair 14/23 23/23 23/23 21/23
Poor 10/20 14/21 19/21 19/21 16/18
Primitive 7/14 10/15 14/15 14/15N Uo Excellent 7/14 10/20 13/24 21/36 37/36 38/36 26/29 21/24 16/18
Good 13/24 21/31 30/31 30/31 26/29 21 24
mg
Aggregate Fair 13/23 21/23 23/23 23/23 21/23
Poor 10/20 13/21 19/21 19/21 16/18
Primitive 7/14 10/15 13/15 14/15 14/15
Excellent 7/14 10/20 12/24 19/36 36/36 38/36 26/29 21/24 16/18
Good 12 24 19/31 30/31 30/31 26/29 21/24
Native Fair 12/23 19/23 23/23 23/23 21/23Poor 10/20 1 12/21 19/21 19/21 16/18
Primitive 7/14 10/15 12/15 14/15 14/1511
WhereALIGNMENT K
_KR R Average radius of curvature between nodes.
Excellent K 100 N N Number of curves per mile between nodes.Good 100 K 50Fair 50 K 20 NOTEPoor 20 K 10 I. For 0 Grade use the favorable haul.
Primitive K 10 2. Speeds between the lines are controlled by ALIGNMENT.
3. Speeds outside the lines are controlled by GRADE.
Figure 5.--Speeds by roads physical characteristics on-highway-logging-trucks miles/hour.
63
i
I
from 320 to 405. Determining the horizontalalign-mentof roads with grades of greater than 4 percentis less critical since the travel time is the samefor the excellent good fair and poor alignmentexcept on single-lane roads. Determining the gradefor single-lane roads with fair poor and primitivealignment also is less critical since the traveltimes generally are the same for the variousalign-mentsfor all grades of between 7 and -7 percent.
Figures 4 and 5 show the travel times and speeds forvarious haul classes by the physical characteristicsthis should make the tables easier to use. The haulclasses to use with MINCOST at FCCC can be codedwith 4-digit numbers as follows
1 The first digit represents the number of lanes1 double lane 2 lane and a half and3 single lane without a ditch.
2 The second digit represents the surface type1 paved 2 aggregate and 3 native.
3 The third digit represents the alignment1 excellent 2 good 3 fair 4 poorand 5 primitive.
4 The fourth digit represents the grade1 2 percent to 0 percent 2 0 percent to-4 percent 3 2 percent to 4 percent4 -4 percent to -7 percent 5 4 percentto 7 percent 6 -7 percent to -10 percent7 7 percent to 10 percent 8 less than710 percent and 9 greater than 10 percent.
As an example a single-lane road without a ditchand with an aggregate surface fair alignment and a
grade of between 4 and 2 percent will be haulclass 3233.
Remember that these tables apply to ForestDevelop-mentRoads FDRs. Generally alignment controlsthe maximum speed on low-standard roads. However ona few FDRs speeds in excess of 55 mph can besus-tainedfor long distances. This situation is similarto that of the Federal Aid System Roads where the55-mph speed limit is the limiting factor forcon-siderabledistances. Travel times on State andcounty roads and on FDRs where the alignment andgrades allow sustained high speeds should bedeter-minefrom observations of the legal speed limits.
64
FacilitiesMaintenance Management
George J. LippertChief Facilities EngineerWashington Office
This fall marks the formal start of a Service-wideemphasis to improve facilities maintenance.Imple-mentationof a structural maintenance managementprocess was one of the two recommendations providedby an inter-Region/Station team that reviewedbuilding maintenance practices Service-wide.
The first recommendation structured maintenancemanagement improvements will be implemented using a
videotape presentation and an EngineeringManage-mentEM series publication. The former will
provide an overview of maintenance managementprinci-palsand elements. This is for use at Supervisor/Ranger meetings workshops and other meetings toensure a broad understanding and support formain-tenancemanagement improvements.
The EM publication will provide further detailedinformation guidance and examples of existingmaintenance management systems. This publicationmay be distributed in conjunction with videotapepresentations.
The structured facilities maintenance managementframework is included in the draft revision of
FSH 7309.11. This handbook will be reissued to
replace Interim Directive 1 February 19 1986FSH 7309.11. This also is slated for distributionthis fall.
The second recommendation dealt with improvingmain-tenancetraining. This training aimed at improvinginspection skills is in the formative stages. Youwill be hearing more about this in the next fewmonths.
EFN
65

Ups Engineering TechnicalInformation System
The Series THE ENGINEERING FIELD NOTES SERIES is published
periodically as a means of exchanging engineering-relatedideas and information on activities problems encountered andsolutions developed or other data that may be of value to
Engineers Service-wide. Articles are usually less than six pagesand include material that is not appropriate for an EngineeringTechnical Report or suitable for Engineering Managementpublications FSM 1630 and 7113.
Distribution Each Field Notes edition is distributed to the Engineering Staff
at Regional Offices ForestsStations and Area Headquartersas well as to Forest Service Engineering Retirees. If your office
is not receiving the Field Notes ask your Office Manager or
Regional Information Coordinator to increase the number of
copies for your location. Copies of back issues are available in
limited quantities from the Washington Office EngineeringTechnical Information Center.
Submittals Every reader is a potential author of a Field Notes article. If youhave a news item or short description about your work that youwish to share with Forest Service Engineers we invite you to
submit the article for publication. Field Personnel should sendmaterial to their Regional Information Coordinator for review bythe Regional Office to assure inclusion of information that is
accurate timely and of interest Service-wide short articles andnews items are preferred. Type the manuscript double-spacedinclude original drawings and black-and-white photographs if
only color photographs are available send transparencies or
negatives and two machine copies of the manuscript.
Inquiries Regional Information Coordinators should send articles for
publication and direct questions concerning format editingpublishing schedules etc. to
FOREST SERVICE-USDAEngineering Staff-Washington Office
Attn D.J. Carroll Editor
M.J. Baggett Editorial Assistant
P.O. Box 2417-Washington D.C. 20013
Telephone Area Code 703-235-8198
regional R-1 Jim Hogan R-4 Ted Wood R-9 Fred Hintsala
Coordinators R-2 Ray Ollila R-5 Larry Gruver R-10 Ron Hayden
R-3 Art Marty R-6 Homer Chappell WO Al Colley
R-8 Jim Gilpin

roREST SRVCf
S1NENi0FAGICU
Volume 18
September-October 1986 Engineering Field Notes