Embed Size (px)
Citation preview
MSI_1605
Entry and technological performance in new technology domains: Technological opportunities, technology competition and technological relatedness Bart Leten, Rene Belderbos and Bart Van Looy
1
Entry and Technological Performance in New Technology
Domains: Technological Opportunities, Technology Competition
and Technological Relatedness
Bart Leten
Faculty of Business and Economics, Department of Managerial Economics, Strategy and Innovation, KU Leuven, Belgium
Naamsestraat 69, B-3000 Leuven, Belgium Phone: +3216326900; Fax: +3216326732
E-mail: [email protected] Technology and Operations Management Area, Vlerick Business School
Rene Belderbos
Faculty of Business and Economics, Department of Managerial Economics, Strategy and Innovation, KU Leuven, Belgium
Naamsestraat 69, B-3000 Leuven, Belgium Phone: +3216326912; Fax: +3216326732
E-mail: [email protected] UNU-MERIT, Maastricht, The Netherlands
School of Business and Economics Administration, Maastricht University, The Netherlands
Bart Van Looy Faculty of Business and Economics, Department of Managerial Economics, Strategy and
Innovation, KU Leuven, Belgium Naamsestraat 69, B-3000 Leuven, Belgium Phone: +3216326901: Fax: +3216326732
E-mail: [email protected] Expertise Centrum O&O Monitoring (ECOOM), KU Leuven, Belgium
INCENTIM, KU Leuven, Belgium
Acknowledgements This research was supported by FWO (Flemish Science Council) grant number G073013N. We are grateful to the editor Andrew Corbett and the three anonymous reviewers for comments on earlier drafts. We wish to thank ECOOM at KU Leuven for access to Thomson Reuters’ Web of Knowledge.
2
Entry and Technological Performance in New Technology
Domains: Technological Opportunities, Technology Competition
and Technological Relatedness
Abstract
Entry and success in new technology domains (NTDs) is essential for firms’ long-term performance.
We argue that firms' choices to enter NTDs and their subsequent performance in these domains are not
only governed by firm–level factors but also by environmental characteristics. Entry is encouraged by
the richness of opportunities for technology development, while technology competition by incumbent
firms discourages entry and render entries that do take place less successful. Firms are expected to be
positioned heterogeneously to recognize and capitalize on technological opportunities, depending on
the presence of a related technology base. We find qualified support for these conjectures in a
longitudinal analysis of entry and technological performance in NTDs by 176 R&D intensive firms.
While opportunity rich technology environments attract entries by firms even if these NTDs are distal
from firms’ existing technologies, firms require related technological expertise in order to exploit
technological opportunities post-entry.
Keywords
Competition, entry, innovation, relatedness, technological opportunities, technology search
3
Introduction
In ‘Schumpeterian’ industries, characterized by fast changes in products, technologies,
customers and competitors, firms cannot rely exclusively on the strength of their existing core
technological competences (Prahalad and Hamel, 1990). Firms have to continuously explore and exploit
new and promising technologies at a faster pace and lower cost than their competitors to remain viable
and successful in the longer term (Levinthal and March, 1993; Markides and Williamson, 1994; Teece
et al., 1997; Simsek, 2009; Uotila et al., 2009; Belderbos et al., 2010; Danneels and Sethi, 2011).
Building up capabilities in new technology domains (NTDs) enables firms to avoid lock-in dynamics
in times of competence-destroying technological change (Cooper and Schendel, 1976; Tushman and
Anderson, 1986; Tripsas, 1997) and provides them with a wider repertoire of problem-definition and
problem-solving capabilities instrumental for R&D activities (Hargadon and Sutton, 1997; Ahuja and
Lampert, 2001). Building up competences in NTDs is challenging as it involves considerable
investments with long horizons under uncertainty (March, 1991; Mitchell and Singh, 1992). Failed
attempts can disturb overall firm functioning and survival (Mitchell and Singh, 1993; Agarwal and
Helfat, 2009). Hence, it is important to study the conditions under which firms can increase their
chances of successfully entering NTDs.
Prior studies on the antecedents of the successful exploration of NTDs have focused on the
organizational antecedents of technology exploration, such as autonomous decision making in
organizational units (Tushman and O’Reilly 1996; McGrath, 2001; Jansen et al., 2006; O’Reilly and
Tushman, 2008) and the presence of existing technology resources providing synergetic potential in the
new domain (Van Looy et al. 2005; Breschi et al., 2003; Leten et al., 2007; Nesta and Saviotti, 2005).
In the current study, we argue that this view of entry into NTDs is incomplete. In addition to
organizational factors, the technology environment that firms face has crucial characteristics
influencing not only if but also in what direction firms will be able to successfully explore NTDs. The
role of organizational antecedents, in particular firms’ existing technology resources and synergetic
potential, can also differ substantially across heterogeneous technology environments. Considering
4
simultaneously organizational characteristics and the technology environment is therefore essential to
understand NTD entry and success.
We suggest that two characteristics of the technology environment have a salient influence on
the direction and success of entry into NTDs. First, exploring NTDs will deliver more value if these
NTDs hold the promise to spawn commercialization potential in the future. Such technology domains
are considered to be rich in technological opportunities, defined in our study as the set of possibilities
for exploitable technological advance in a technology domain (Scherer, 1965; Klevorick et al., 1995;
Levin et al., 1987), and enabled by progress in science. Second, firms do not explore technologies in
isolation but are competing with other firms in their attempts to establish a presence in NTDs. Just as
the presence of strong competitors in product markets renders successful entry less likely, the presence
of strong established competitors in a technology domain may present an important obstacle for newly
entering firms to carve out their proprietary share of technology in this domain.
We develop hypotheses on the role of technological opportunities and technology competition
in firms’ entry into NTDs and their subsequent performance in these domains, drawing on, and
integrating, insights stemming from the resource-based view of the firm and the industrial organization
literature on R&D incentives and technological entry barriers (e.g. Henderson & Mitchell, 1997). We
test these hypotheses in a longitudinal analysis (1996-2002) of entry and technological performance in
a broad range of NTDs by 176 R&D-intensive US, European and Japanese firms .
We find that technological opportunities in a technology domain attract entry in a rather
indiscriminate manner, while the relationship between technological opportunities and post-entry
performance is strongly moderated by firms’ related existing technological expertise. The presence of
strong technology positions held by incumbent firms in a technology domain both discourages entry
and renders less successful those entries that do take place.
Our study makes several contributions to the literature. First, we respond to prior calls for more
attention for the role of inter-firm dynamics in innovation studies by examining the role of technology
competition in NTD entry (McGahan and Silverman, 2006; Katila et al., 2008; Katila and Chen, 2009).
We demonstrate that building up a technological foothold is more difficult in concentrated NTDs in
which incumbent firms can leverage their portfolios of technology assets to create entry barriers and
5
obstacles to entrants’ post-entry growth in a domain.. Second, we contribute to the literature on
(technology) exploration by demonstrating the crucial influence of environmental characteristics in
determining the direction and success of search and by highlighting that organizational factors and the
(technological) environment can strengthen or weaken each other’s’ influences. Our findings thus
suggest complementarities between perspectives that stress the environment as a key determinant of
performance and resource-oriented theories that emphasize internal firm resources. Third, our findings
contribute to the recent debate on whether distal or proximate search provides most advantages to firms
(Gavetti, 2012; Winter, 2012). Our results can be interpreted as indicating that, while R&D intensive
firms’ responsiveness to technological opportunities is not constrained by prior technological expertise,
technological success is most assured in case of proximate technology search. Finally, we inform the
literature on technological opportunities (Teece et al., 1997; Shane, 2001; Klevorick et al., 1995) by
demonstrating that the recognition of relevant technological opportunities is less constrained than
effectively seizing these opportunities (e.g. Shane & Venkataraman, 2000; Zahra, 2008; Benner &
Tripsas, 2012).
Theory and Hypotheses
A generally accepted foundation for theorizing on the nature of entry activities in NTDs and
firms’ technological capabilities is the resource-based view of the firm. Early writings in this strand of
literature (Penrose, 1959; Wernerfelt, 1984; Barney, 1991; Peteraf, 1993) emphasized that firms could
achieve a competitive advantage by building up portfolios of valuable assets. Technology assets are
considered as valuable as they are rare, imperfectly tradable, and hard to imitate due to their (partly)
tacit nature and protection by intellectual property rights (Teece, 1980; Grant, 1996; Spender, 1996;
Granstrand, 1998). More recent contributions stress that in rapidly changing and unpredictable
environments a competitive advantage is only sustainable to the extent that firms continuously renew
their assets and technological skills (Markides and Williamson, 1994; Teece et al., 1997 and 2007;
Eisenhardt and Martin, 2000; Helfat et al., 2007). Crucial in this process are the abilities to sense and
seize emerging technological opportunities in the environment.
6
The specific role of the (technology) environment and the nature of opportunities has received
less attention in resource based theory and applications. The concept of opportunities instead has been
a focus of attention in two other streams of literature: the entrepreneurship literature and the industrial
organization literature. Within the entrepreneurship literature, opportunities are considered as
constitutive for the phenomenon of entrepreneurship (e.g. Kirzner, 1979; Alvarez & Barney, 2008).
New and potentially profitable ventures find their origin at the nexus of individual capabilities and
opportunities (Shane and Venkataraman, 2000).i
In the industrial organization literature, the notion of opportunities has been developed in the
specific context of R&D investments of firms and has an explicit focus on technologies. Technological
opportunities are defined as comprising the set of possibilities for (exploitable) technological advance
in a technology domain and, as such, provide an indication of the ‘richness’ of a technology domain
(Scherer, 1965). Given the state of demand and the existing state of technology, new knowledge
replenishes the set of technological opportunities and provides new possibilities to exploit in the future
(Klevorick et al., 1995). Technological opportunities are considered as an observable characteristic of
a technology domain that may change over time (e.g. as a function of technology life cycles). This
conceptualization is in line with the notion of ‘external enablers’, advanced by Davidsson (2015) as part
of an enriched re-conceptualization of entrepreneurial opportunities. External enablers are conceived as
changes – e.g. in the state of scientific knowledge, regulation, demographics – that might trigger
entrepreneurial initiative, i.e. the formation of new venture ideas (Davidsson, 2015).
In the present study on entry and success in NTDs, we focus on technological opportunities
and the importance of science as the external enabler of such opportunities. Unfolding technological
opportunities will affect entry and investment decisions of firms as they influence the incentives to
invest in R&D (Jaffe, 1986; Levin and Reiss, 1984; Belderbos et al., 2009). While technological
opportunities have been recognized as drivers of cross-industry variation in R&D intensity (Scherer,
1965; Levin et al., 1985), the impact of technological opportunities on the direction and success of
firms’ technology exploration efforts has not been examined.
A second environmental characteristic affecting entry into NTDs relates to the degree of
(expected) competition from incumbent rival firms. The industrial organization literature has a rich
7
tradition in examining the role of entry barriers raised by incumbent firms to thwart (market) entry and
maintain market power (Bain, 1956; Sutton, 1998). Models of R&D rivalry have suggested that firms
can use technology development – in particular, patent strategies – strategically to raise entry barriers
and to discourage entry by potential entrants (Gilbert and Newbery, 1982; Reinganum, 1983; Gilbert,
2005; Belderbos and Somers, 2015). Such entry deterring strategies can improve the profitability of the
incumbent firms (Ceccagnoli, 2009). The strength, incentives and behavior of incumbent firms are
therefore important factors to take into account by firms contemplating entry into specific NTDs.
In the remainder of this section, we develop hypotheses on the influence of these two
environmental characteristics of technology domains – technological opportunities and technology
competition- on the likelihood that firms enter into NTDs and their subsequent technological
performance in these NTDs. We draw on both the industrial organization literature and the resource-
based theory of the firm to formulate our hypotheses.
Entry into New Technology Domains
Firms scan their environments to identify newly emerging technological opportunities, in
particular technological developments with market potential (Breschi et al., 2000; Teece, 2007). In
technology-based industries, the discovery and exploitation of technological opportunities and
emerging trajectories can be considered a ‘dynamic’ capability underlying sustainable competitive
advantage (Katila and Chang, 2003; Teece, 2007; Zahra, 2008; Gavetti, 2012). High levels of
technological opportunities exist in a technology domain to the extent that there is a continuous supply
of new technological possibilities that can be exploited by firms to satisfy existing or latent market
demands (Scherer, 1965). In some technology domains, technological opportunities may become
depleted over time as cumulative resources are devoted to R&D and projects are completed, whilst in
other technology domains technological opportunities are continuously re-created by scientific and
technological discoveries (Breschi et al., 2000; Rosenberg, 1974; Zahra, 2008).
One important source of technological opportunities is scientific research (Levin et al., 1985;
Klevorick et al., 1995). There are two important ways through which science generates opportunities
for technological advance. First, it expands the pool of theory, data, technique and problem-solving
8
capability that can be employed in industrial R&D. Second, scientific insights can directly open up new
technological possibilities, proposing solutions to older practical problems, pointing to new avenues to
pursue and occasionally even providing prototypes for elaboration and refinement (Klevorick et al.,
1995; Rosenberg, 1990; Fleming and Sorenson, 2004). For example, successful scientific research on
genes and DNA opened up a wide range of opportunities to develop new therapies and treatments, new
seed varieties and new medical test devices (Klevorick et al., 1995). Likewise, recent scientific insights
in health and disease prevention, informed and spurred the growth of functional foods. Such scientific
research creating technological opportunities leaves traces in subsequent technology development
activities by firms in the form of references to scientific publications on patent documents (Van Looy
et al., 2003; 2006; Schmoch, 2007; Arts et al., 2013).
Firms learn about technological opportunities in various ways: by reading (scientific) journals,
examining patent data and the (scientific) references therein, attending industry events and workshops
at universities, interacting with scientists and firms, and by conducting own R&D (Allen, 1977; Patel
and Pavitt, 1997). They can also derive clues on technological opportunities through inferential learning
by monitoring technology decisions and patenting behavior of other firms (Bandura, 1986; Breschi et
al., 2000; Huber, 1991; Katila and Chen, 2009). As technological opportunities become more visible,
firms build up knowledge on the distribution of returns to R&D in particular technology domains.
Klevorick et al. (1995) analogizes R&D to drawing balls from an urn, in which technological
opportunities describe the distribution of values of the balls in the urn. When technological
opportunities are high, the distribution of draws (i.e. R&D projects) has a higher mean and R&D is
more likely to result in valuable inventions. Hence, firms are likely to (re)allocate R&D resources to
technology search and development into opportunity-rich technology domains.
In sum, technological opportunities are to an important extent driven by advances in scientific
research, they become visible to firms in various ways (including reference patterns on patent data),
and provide powerful incentives to firms to enter a NTD. This suggests the following hypothesis:
Hypothesis 1: The greater the technological opportunities in a new technology domain, the greater the
likelihood that a firm enters into this technology domain.
9
Despite (widely) available means and ways to identify technological opportunities, firms are
likely to be positioned heterogeneously to identify, accurately evaluate, and act upon technological
opportunities in particular technology domains. We argue that the likelihood that firms recognize and
act upon technological opportunities is greater if firms possess knowledge and experience in related
technology domains.
New R&D projects are proposed by individuals and teams ingrained with technological
knowledge, capabilities and heuristics reflecting their past experiences and technological
specializations (Allen and Marquis, 1964; Dosi, 1982). Problem-definition and problem-selection
processes are influenced by prior R&D experiences of individuals and teams. (Fleck, 1935; Kuhn, 1962;
Lave, 1988). Results of past technology activities are taken as natural starting points for proposing and
initiating new technological activities (Stuart and Podolny, 1996). Domains with rich technological
opportunities may not be identified as such or may not be among the set of technologies considered for
new search if they are situated far beyond the technology repertoire that is already present within the
firm.
Prior experience of individuals and firms also affects internal selection processes (Nelson and
Winter, 1982). Firms’ R&D funds are allocated across R&D projects by management teams that have
limited information-gathering, attention and information-processing abilities (Simon, 1955 & 1979;
Cyert and March, 1963; Ocasio, 1997). Under these conditions of bounded rationality, managers cannot
attend equally to all available technological opportunities (Ocasio, 1997) and the direction of R&D
allocations and technological search is influenced by accumulated set of beliefs on the best performing
business models, future opportunities, and critical resources (Prahalad and Bettis, 1986; Christensen,
1997; Teece, 2007; Tripsas and Gavetti, 2000). Relatively stable beliefs and technological search
routines simplify decision making and filter how individuals and firms assess new technological
opportunities (Bercovitz et al., 1996; Grégoire and Shepherd, 2010; Tripsas, 2009; Gruber, Macmillan
& Thompson, 2012, 2013; Barreto, 2012). Routines and beliefs tend to limit the search space of firms
to opportunities located in the vicinity of existing (technological) resources (Christensen, 1997; Tripsas
and Gavetti, 2000; Coen and Maritan, 2011; Benner and Tripsas, 2012). Bounded search reduces the
10
probability that firms adequately assess the importance of technological opportunities situated beyond
the scope of prior conducted technology activities.
The above arguments suggest that firms’ technology exploration behavior is constrained by
cognitive limitations and experience of individuals and the organizations that they employ (Nelson and
Winter, 1982; Tripsas and Gavetti, 2000; Gruber, Macmillan & Thompson, 2012, 2013). These
limitations hinder the identification and enactment of opportunities that are distal to the firms existing
technology resources. Technological opportunities are more likely to lead to efforts to enter NTDs, the
more the technologies in these NTDs are proximate and related to the portfolio of technology resources
of the firm. This leads to the following hypothesis:
Hypothesis 2: The technological relatedness between a new technology domain and a firm’s existing
technology base positively moderates the effect of technological opportunities on the likelihood that a
firm enters into this technology domain.
Entry into NTDs is not only governed by differences in technological opportunities and firms’
existing technological resources but is also influenced by the behavior of rival firms – in particular, by
incumbent firms with existing technology positions. Firms that have carved out strong technology
positions enabling them to exploit their technology leadership have strong incentives to protect their
positions (Gilbert and Newbery, 1982; Gambardella et al., 2007). A strong position within a technology
domain can establish an at least temporary quasi-monopoly, allowing firms to extract higher rents from
exploiting their technology, in particular when they possess significant complementary downstream
assets (Arora and Fosfuri, 2003; Gambardella et al., 2007).
Incumbent firms can use different strategies to raise entry barriers and to reduce the
attractiveness of entry into a technology domain. A primary strategy to raise such entry barriers is patent
pre-emption (Cohen et al., 2002; Gilbert and Newbery, 1982; Granstrand, 1999; Gambardella et al.,
2007; Grimpe and Hussinger, 2014). Patent pre-emption occurs when incumbents expand their patent
portfolio scope by applying for patents on variants of existing technologies (e.g. Gilbert and Newbery,
1982; Schneider, 2008; Cohen et al., 2002; Ceccagnoli, 2009). Firms expand their patent portfolios
strategically in order to reduce the options for rival and entrant firms to patent technology variants.
11
Patent pre-emption entails the creation of ‘patent fences’ (Granstrand, 1999; Schneider, 2008; Reitzig,
2004) or ‘patent walls’ (Blind et al., 2006): i.e. broad groups of similar patents in a technology domain
owned by a single firm. These patent fences reduce the ‘space’ in a domain for patent applications by
new entrants. They hamper new entrants in technology development and successful patent applications
by forcing the entrants to ‘invent around’ existing patents.
Patent pre-emption strategies are most often employed by large firms with strong patent
portfolios (Cohen et al., 2002; Blind et al., 2006) and are found to have effective entry deterring effects
in industries in which incumbents employ them to safeguard existing leadership positions (Cockburn
and MacGarvie, 2006; Ceccagnoli, 2009). Hence, the greater the level of concentrated technology
ownership in the hands of a limited number of incumbent firms in a technology domain, the more likely
that these incumbent firms use their patent portfolios strategically to discourage entry. Potential entrants
into a NTD characterized by concentrated patent ownership will have to face such entry barriers and
will generally expect competition from incumbents aiming to protect their established position. This
will discourage entry into these technology domains. We hypothesize:
Hypothesis 3: The higher the level of (expected) technology competition from incumbents in a new
technology domain, the lower the likelihood that a firm enters into this domain.
Technological Performance in New Technology Domains
Firms are positioned heterogeneously to benefit from emerging technological opportunities.
We argue that the ability of firms to seize technological opportunities in NTDs depends on the
relatedness between NTDs and firms’ existing technology base. When firms recognize technological
opportunities in more distal domains, such opportunities are most likely to be approached from the
cognitive mindsets and organizational routines that build on the current expertise and technology base
(Bercovitz et al., 1996; Christensen, 1997). As existing routines and mindsets may be less effective in
the distal domains, entry into distal NTDs is less likely to be successful. The pursuit of distal
technological opportunities may also conflict with elements of a firm’s identity (Tripsas, 2009; Benner
& Tripsas, 2012) and create resistance from internal and external stakeholders (Gavetti, 2012).
12
The pursuit of distal technologies will render it less likely that a firm benefits from economies
of scope and knowledge sharing in technology search and knowledge creation, as existing and distal
new domains might have little synergetic potential (Henderson and Cockburn, 1996). Knowledge
creation is a cumulative, path-dependent process, influenced by capabilities already present at the
individual and organizational level (Dosi, 1982; Van de Ven et al., 1989; Cohen and Levinthal, 1990,
Teece et al., 1997). Individuals learn through a process in which new understandings build on
established concepts and ideas (Vygotsky, 1978). The ability to learn therefore increases when new
technology domains are close to what is already known (Cohen and Levinthal, 1990; Cassiman and
Veugelers, 2006; Bierly et al., 2009). An organization’s ability to learn in turn depends on the ability
of its individual members to learn, since organizational learning involves the joint contribution of
individual members to define and solve problems (e.g. Helfat, 1994).
Hence, although technological opportunities imply the promise of increased technological
performance, firms that have fewer possibilities to leverage existing technological knowledge into
NTDs will be less well positioned to exploit technological opportunities in NTDs. These considerations
lead to the following hypothesis:
Hypothesis 4: The technological relatedness between a new technology domain and a firm’s existing
technology base positively moderates the effect of technological opportunities on the firm’s
technological performance within the new technology domain.
The ability of firms to successfully build up a technology position in NTDs also depends on the
strategic behavior of the incumbent firms in the technology domain subsequent to entry. Firms that have
overcome initial entry hurdles and that have developed potentially promising technologies in a NTD
can still face important challenges stemming from incumbent firm behavior. If only a few incumbents
hold the “secrets” of a particular technology, they have strong incentives to thwart efforts of new
entrants to carve out a stronger patent position in the technology domain. Important means at their
disposal in response to entry are restrictive licensing strategies and stepping up patent fencing efforts
(Gilbert and Newbery, 1982; Gambardella et al., 2007).
13
In the case of defensive licensing, established firms refuse to license existing technologies to
new entrants. They choose to forego profits from licensing patented technologies in order to block
efforts by new entrants to establish a significant position in the technology domain (Arora and Fosfuri,
2003; Ziedonis, 2004). Defensive licensing can be an effective strategy to protect existing leadership
positions of incumbents since innovations are cumulative and build further on prior innovations
(Scotchmer, 1991; Shapiro, 2000; Grindley and Teece, 1997; Reitzig, 2004). Restricted access to
technologies protected in prior patents can impede effective participation in new technology
development by new entrants in the technology domain (Levin et al., 1987; Shapiro, 2000), reducing
the likelihood that entrants are able to expand their patent position.
Incumbents can also escalate patent fencing strategies in response to entry into their technology
domains (Cohen et al., 2002; Reitzig, 2004). If entrants are unable to ‘invent around’ the patent fences,
they will be forced to search for technical solutions in less attractive areas of a technology domain,
characterized by lower probabilities of successful innovation (Granstrand, 1999).
The above arguments suggest that firms entering into NTDs characterized by concentrated
technology ownership will face tough ‘post entry’ conditions and will therefore be less able to develop
a significant technological position in the NTD. This implies the following hypothesis:
Hypothesis 5: The higher the levels of technology competition from incumbents in a new technology
domain, the lower the technological performance of a firm in the new technology domain
Data and Sample
We collected longitudinal data (1995-2002) on the technological activities of 176 firms
operating in R&D intensive industries. The sample firms are Japanese, European and US firms with the
largest R&D budgets in five industries: pharmaceuticals and biotechnology, chemicals, IT hardware
(computers and communication equipment), electronics and electrical machinery, and non-electrical
machinery. The firms are drawn from the ‘2004 EU industrial R&D investment scoreboard’, which
provides listings of the 500 most R&D intensive European and the 500 most R&D intensive non-
European (mostly US and Japanese) firms.
14
Table I shows the number of sampled firms in each industry and region of origin. The firms are
roughly equally distributed across industries and regions. The US hosts the largest number of firms in
the pharmaceuticals & biotechnology and IT industries. Japan records the largest number of electronics
and electrical machinery firms. The sample of European firms is equally distributed over the five
sectors. Electronics and IT hardware firms are the largest, employing respectively 60,000 and 48,000
employees, on average. Chemical and non-electrical machinery firms are somewhat smaller and employ
on average around 25,000 people. The pharmaceutical and biotechnology firms rank the lowest with an
average number of 17,000 employees. Electronics and IT hardware firms have the largest average
patent stocks (840 and 560, respectively), followed by chemicals (461), pharmaceuticals and biotech
(250) and non-electrical machinery (160).
-------------------------------------------
INSERT TABLE I ABOUT HERE
-------------------------------------------
We use patent data to construct indicators of firms’ entry choices in NTDs and their
technological performance in those NTDs. Patent data have the advantage that they are publicly
available, cover long time series and contain detailed information on the technological content and
ownership of inventions. Patent data also have their shortcomings: patent propensities vary across
industries and firms, and patented inventions differ in technical and economic value (Griliches, 1990).
The first concern implies limiting analyses to industries with a high propensity to patent, such as our
sample industries (Arundel and Kabla, 1998). The second issue can be addressed by weighing patent
counts by the number of forward patent citations they receive (Trajtenberg, 1990; Hall et al., 2005).
Another potential disadvantage of using patents is that patents are a form of ‘intermediate output’ of
the R&D process rather than the ‘final output’ such as actual product or process innovations.
Although patent-based indicators have their limitations, patents are found to correlate strongly
with other indicators of technological activity such as expert rankings of companies’ technological
performance (Narin et al., 1987) and the number of new product announcements in trade and technical
journals (Narin and Noma, 1987; Hagedoorn and Cloodt, 2003). Patent based indicators are extensively
used in research on technological innovation (e.g. Ahuja and Lampert, 2001; Rosenkopf and Nerkar,
15
2001; Phene et al., 2006; Katila and Chen, 2009), and the literature has qualified patents as appropriate
indicators of firms’ technological activities.
We used patent filings with the European Patent Office (EPO) as the source of information on
entry into NTDs. EPO data was preferred to USPTO data because of the unavailability of information
in the USPTO on patent applications. The EPO publishes information on both patent applications and
granted patents since its foundation in 1978, but the USPTO only published information on granted
patents prior to 2001. Since patent applications provide the broadest available measure of firms’
technological search, indicators of firms’ technology exploration choices are preferably created from
data on patent applications rather than on the subset of granted patents.
An application for a patent in a specific technology domain, which may or may not
subsequently be granted, provides a clear indication that a firm is pursuing technology development in
the technology domain. Such technology development should be seen as having a minimum of
substance, as the costs associated with drafting and applying for patents is such that insignificant
inventions in the technology domain are unlikely to lead to patent filings (Van Pottelsberghe and
François, 2006). The patent application is a broader measure than a patent grant, as the former is a closer
indicator of technology development efforts, while the latter is closer to an indicator of success: a
granted patent establishes an invention that is novel and potentially exploitable.
We constructed patent datasets of firms at the consolidated level, i.e. all patents of the parent
firm and its consolidated (majority-owned) subsidiaries were collected. For this purpose, yearly lists of
consolidated subsidiaries included in corporate annual reports, 10-K reports filed with the SEC in the
US and, for Japanese firms, information on foreign subsidiaries published by Toyo Keizai in the yearly
‘Directories of Japanese Overseas Investments’, were used. The consolidation was conducted on an
annual basis to take into account changes in the group structure of firms over time. Using consolidated
patent data is important to get a complete view of firms’ entries in NTDs, since a considerable share of
firms’ patented inventions are developed in firms’ subsidiaries.
Measures and Methods
16
We constructed two dependent variables, ‘entry into a NTD’ and ‘technological performance
in a NTD’, from technology class information available from patent documents. The EPO classifies all
patents in at least one technology class, using the International Patent Classification System (IPC). Each
of the approximately 64,000 technology subclasses stands for a particular technical function or
application. Technology classes can be aggregated into 118 broader three-digit IPC classes, which we
use in our study. An overview of the 118 technology domains is provided in Table II. When a patent
contains multiple IPC three-digit technology codes, it is assigned to each of the technology domains.
Entry into New Technology Domains
We examine entries into new-to-the-firm technology domains by the 176 firms during the
period 1996-1999. A technology domain is defined as new-to-a-firm in year t, if the firm did not patent
in that technology domain during the prior five years. The assumption is that, a domain presents a new
technology to the firm if the firm has not been active in it for a considerable time. In technology-
intensive industries, the rate of technical change is fast. A firm’s technology stock in a technology
domain depreciates and becomes obsolete when a firm is inactive in the technology domain for an
extended period of time (Ahuja and Lampert, 2001). Prior research in technology-intensive industries
has often considered a five-year window as appropriate for assessing the ‘newness’ of technology
domains for firms (e.g. Ahuja and Lampert, 2001; Stuart and Podolny, 1996; Gilsing et al., 2008;
Belderbos et al., 2010).
Our panel dataset (1996-1999) consists of all firm-technology domain combinations that are
new to the 176 firms. The firms were active on average in 20 technologies in their 5-year patent
portfolios. Hence, close to 100 technology domains are, on average, yet to be explored by the sample
firms. This resulted in a panel dataset (1996-1999) with 17,305 new-to-the-firm technology domains
and potential entry decisions at the firm-technology domain level. Entry took place in 7.5 percent of the
cases: 1,301 entries in NTDs are observed by 166 firms. These entries encompass 117 of the 118
technology domains. The final dataset for analysis is restricted to 17,191 firm-technology combinations
and 1,288 entries after removing outliers situated in the domain of biochemistry (which we discuss
17
further below). The broad range of technology domains represented among the entries facilitates
identification of the influence of characteristics of technology domains on entry decisions.
The dependent variable ‘entry in a NTD’ takes the value ‘0’ if a firm remains inactive in a NTD,
and is coded ‘1’ if the firm starts to explore the NTD, as evidenced by a patent application. Once a firm
initiates activities in a NTD, the corresponding firm-technology domain observation is no longer
considered as a (potential) entry in subsequent years.
We note that most of the NTD entries are originating from internal R&D activities. Only in 3%
of the cases entry took place via acquisitions, as indicated by patent applications in a NTD by a
subsidiary that was acquired in the entry year. Empirical results are robust to the removal of the
acquisition-driven entry cases from the analyses. Inspection of our data demonstrates that the low
number of acquisition-driven entries is related to the fact that firms often first invest internally in a
technology domain before specialized target firms are acquired with specific expertise in that
technology domain.
Given the bivariate nature of the dependent variable (entry in a NTD) and the time dependence
of the entry process, we use a duration model to examine the determinants of firms’ entries in NTDs.
We opted for the semi-parametric Cox proportional hazard model (Cox, 1972) because this model
requires no upfront assumption concerning the distributional properties of the hazard rate of entry. The
Cox model allows the baseline hazard to be fitted from the data. Ex-post calculation of the baseline
hazard showed a declining function: as time elapses and firms do not enter a particular NTD, it becomes
less likely that they will enter the NTD later. This is a common feature of duration models and is (partly)
the result of stability in firm preferences over time. The Cox model specifies the hazard that a firm i
enters a NTD j as the product of a baseline hazard h0(t) and a firm-specific hazard, with the latter
modeled as an exponential function of the model parameters βx and regressors xij: h(t|xij) = h0(t).exp(xij.
βx).αi
The model is augmented with a stochastic (random) firm-level component αi that corrects for
possible unobserved firm-specific effects such as differences in internal R&D organization. The firm-
level component, or ‘frailty’ term, enters the hazard function in a multiplicative manner and has a mean
18
of 1 and a variance of θ. If the estimate of θ differs significantly from zero, then the null hypothesis of
no firm-level heterogeneity is rejected.
Technological Performance in New Technology Domains
We test the hypotheses on the technological performance of firms in NTDs by examining the
characteristics of the 1,288 entries in NTDs that occurred between 1996 and 1999. The dependent
variable ‘technological performance in a NTD’ is measured as the citation-weighted number of patent
applications of a firm in the NTD over a fixed period of three years subsequent to the entry year. In
about half of the cases (53%), entry in a NTD was unsuccessful and did not result in follow-up patents
in the first three years subsequent to entry. On average, our sample firms filed 1,4 follow-up patents in
the NTDs, with a wide variety across the entry cases, ranging between 0 and 41 patents. Since the
number of forward citations to any patent depends on the length of the citation window (Trajtenberg,
1990; Hall et al., 2005), we follow prior work by calculating the number of forward citations over a
fixed four-year time window (see Hall et al., 2007).
The dependent variable is a count variable. In this case, count data models are preferred to
linear regression models as they explicitly take into account the non-negativity and discreteness of the
dependent variable (Cameron and Trivedi, 1998). We employ Negative Binomial count data models
that control for over-dispersion in the dependent variable. Standard errors are clustered at the firm level
to control for correlations in error terms due to unobserved firm characteristics.
Technological Opportunities
Following prior work (e.g. Levin et al., 1985; Klevorick et al., 1995; Duguet and MacGarvie,
2005), we measure variations between technology domains in technological opportunities by
differences in the importance of science as a source of relevant knowledge in these technology domains.
More specifically, we approximate the level of technological opportunities in a technology domain at
time t by the average number of citations to scientific literature in patents filed in the technology domain
in t-1. As such, our indicator of technological opportunities is akin to the notion of ‘external enablers’
19
of opportunities, advanced by Davidsson (2015), as the more ‘exogenous’ constituent of the individual-
opportunity nexus.
The rationale for adopting this indicator is twofold. First, a considerable number of new
exploitable technological opportunities find their origin in new scientific discoveries and insights.
Indeed, empirical evidence has been provided that scientific activities – and scientific references in
patent documents – are indicative of subsequent technological and industrial development on a larger
scale (e.g. Van Looy et al., 2006; Schmoch, 2007). In this respect, the occurrence of scientific references
signals the relevance of scientific research for technology development in the domain and is likely to
precede and signal future growth. Second, the strongest technological opportunities are likely to be
present during the early phases of the development of technology domains. Such periods are
characterized by relatively lower levels of available technical prior art (i.e. prior patents). In order to
assess claims of novelty, examiners rely more often on other sources and on scientific references in
particular. Hence, the presence of scientific references on patent documents signals the ‘greenfield’
character of the technology domain – which is associated with ample future growth opportunities.ii
The indicator of technological opportunities is calculated using all EPO patents applied for
between 1995 and 2001. Patents cite a variety of non-patent literature – journals, books, newspapers,
company reports, industry-related documents etc., which not all refer to scientific sources (Harhoff et
al., 2003; Callaert et al., 2006). We identified the subset of scientific references exhaustively by
applying the machine-learning algorithm developed by Callaert et al. (2012). With this algorithm we
classified approximately half of the non-patent references as scientific. This number is comparable to
numbers reported in prior studies on the nature of non-patent references (Van Viaenen et al., 1990;
Harhoff et al., 2003; Callaert et al., 2006; Leten et al., 2014). The 623,615 EPO patents examined
include altogether 415,593 references to scientific literature.
The average number of citations to scientific literature varies importantly across technology
domains, as shown in Table II. The average science citation intensity across the 118 technology domains
is 0.29 (cites per patent). About 5 percent of the domains feature a citation intensity of more than 1
scientific reference per patent, while about half of the domains exhibit rather small science citation
intensities with averages of 1 citation per 10 or 100 patents, or no citations at all. The number of
20
citations to scientific literature is the highest in the technology domain biochemistry (including
microbiology and genetic engineering) with a citation rate of 5 on average. Other technology domains
scoring relatively high on citations to science are organic chemistry, agriculture, medical and veterinary
science, measuring and testing, and crystal growth. Technology domains that rank particularly low in
opportunities are saddlery and upholstery, sewing, hand or travelling articles, jewelry, and
opening/closing bottles.
Given the particularly high citation ratio measured for the biochemistry field – about 20 times
greater than the average value of opportunities across domains- we examined the robustness of our
analysis with respect to these potential outlier observations.iii We also explored the possibility of
curvilinear effects of technological opportunities in the entry and technological performance analyses,
by including a linear and a quadratic term in the analyses. The estimates suggest an inverted U-shaped
relationship, with the inflection point situated almost exactly at the opportunity value for biochemistry.
Once the approximately 1 percent of biochemistry observations were omitted, the inverted U-shape
disappeared. While science citations are a powerful indicator of opportunities across a wide variety of
technology domains, this suggests that the indicator also has its limitations. In the biochemistry field
characterized by an extremely high propensity to cite scientific literature, science may be constitutive
for technology development rather than a relatively rare event signaling novel opportunities emerging
from new scientific findings and insights. Our findings appear to suggest that for this – ‘extreme’ –
technology domain, higher levels of science intensity may actually signal more extended timeframes
and higher levels of uncertainty rather than immediately addressable opportunities. Considering this
evidence, we chose to omit all observations pertaining to the biochemistry field from the remaining
analyses.
--------------------------------------------
INSERT TABLE II ABOUT HERE
--------------------------------------------
We take the natural logarithm of the science citation ratio as our measure of technological
opportunities to reduce the skewness in the distribution of the measure. Since we observe the value zero
for a limited number of technology domains, we add the value one before applying the logarithmic
21
transformation. This has the advantage that fields with zero citation intensity obtain the value zero after
transformation.iv
Technology Competition
We measure entry barriers and the degree of expected post-entry competition from established
incumbents by the level of concentrated technology ownership in each technology domain. We obtain
a measure of ownership concentration in a technology domain at time t by using assignee name
harmonizing algorithms (Van Looy et al., 2006) to identify patents belonging to the same firms. This
method allows us to calculate the technology concentration indices on (partially) consolidated firm
patent portfolios.
The precise measure is constructed as follows. Let Ni be the number of patents that firm i owns
in a technology domain and N the total number of patents in the technology domain. The level of
technology concentration of a technology domain is defined as 1/Σi(Ni/N)2 : the 'number equivalent' (the
inverse) of the Herfindahl index of concentration, representing the number of firms over which patents
would have to be equally distributed in order to yield the same value of the index. The number
equivalent can take values in a range from 1 (all patents are owned by a single firm) to +∞ (fully
distributed ownership) and has better distributional properties than the Herfindahl index itself
(Lipzynski et al., 2001). We take the natural logarithm of this measure to reduce initial skewness in its
distribution. Since higher values correspond to less concentrated technology ownership, we
operationalize technology competition as minus the logarithmically transformed number equivalent.
Technological Relatedness
To calculate the level of technological relatedness of a NTD and the firm’s existing technology
portfolio, we start from a technology relatedness measure for each pair of technology domains. We
consider two technology domains as more related if the patents classified in these technology domains
cite each other more frequently. Such cross-citations are indicative of a shared knowledge base (Leten
et al., 2007) and the importance of a particular technology domain for technology development in the
other domain.
22
We use citation data for all granted EPO patents applied for between 1990 and 2003. The
technology-relatedness measure is calculated from 969,471 cited patents listed on 456,340 citing
patents. By comparing the observed and expected (random) number of citations between two
technology domains, symmetric pair-wise technology-relatedness measures can be calculated. Let Oij
be the observed number of cited patents of technology domain j listed on patents of technology domain
i, with Oi= ∑j Oij. A technology domain has a higher random probability of being cited the more patents
belong to the domain. Let Nj be the number of patents that are classified in technology domain j, with
the total number of citable patents T=∑j Nj. Without assumptions on the distribution of citations across
technology domains, this gives the following expression for the expected (random) number of cited
patents of technology domain j in citing patents of technology domain i: (Eij)= Oi*(Nj/T). The
relatedness of two technology domains i and j (Rij) is then calculated as the ratio between the actually
observed number of citations and the expected number of citations Eij.
The pairwise relatedness measures are subsequently used to calculate the average level of
technological relatedness between a NTD and the firm’s existing technology portfolio. The technology
portfolio of a firm in year t consists of all patent applications in the past five years. With Pj the total
number of patents in the portfolio (with a total size of P) that are classified in technology domain j, this
gives the following expression for the level of technology relatedness of a NTD i and a firm’s existing
technology base: ∑j (Pj/P) *Rij.
Control Variables
The analysis controls for a range of other factors that may affect firms’ choices to enter NTDs
and the subsequent technological performance of firms in these NTDs. First, we include an indicator
for the size of a firm’s existing patent portfolio, measured as the logarithm of the number of patents
applied by the firm over the past five years. Firms with large technology portfolios are more experienced
in innovation and may be better positioned to develop technological competences in NTDs.
Second, we control for differences in the size of firms’ R&D investments, measured as one-year
lagged R&D expenditures (expressed in billions of USD). Firms that marshal more R&D investments
23
are more likely to start, and sustain, the exploration of NTDs. R&D expenditure data is collected from
Compustat, Worldscope and firms’ annual reports.
Third, we include an indicator for firms’ economic performance: the profit margin measured
as the ratio of net profits to sales. Firms with a better (prior) economic performance may have deeper
pockets to (successfully) enter into NTDs; profitability may also reflect otherwise unmeasured firm
heterogeneity and managerial competences. Because we have no profit margin information for a small
number of observations (5 percent), we add an additional variable (no profit margin info) that takes the
value 1 for these observations (and -1 otherwise).
Fourth, we add an indicator for the level of technology diversification present in a firm’s
technology (patent) portfolio. A diversified technology base implies a broader set of knowledge
components that can be (re)combined to create new innovations (Schumpeter, 1934; Hargadon and
Sutton, 1997; Fleming, 2001). Technologically diversified firms may therefore be more likely to enter
into NTDs and achieve a higher technological performance in those NTDs. On the other hand, at the
highest diversification levels firms may be less likely to enter (the remaining) NTDs because they have
already entered the most attractive domains. To control for these influences, we include the variable
technology diversification, measured as the ‘spread’ of patents in a firm’s five-year patent portfolio over
the 118 technology domains. The diversification variable is measured as the inverse of the Herfindahl
index and takes higher values for diverse technology portfolios. To allow for a potentially more complex
influence of technology diversification on entry in NTDs we include both the linear and the quadratic
term in the entry analyses.
Fifth, we include an indicator of the level of product diversification of firms. Firms with a more
diverse product portfolio may be more inclined to build up competences in NTDs and may be more
persistent in their endeavors in NTDs, as more products may simultaneously benefit from new
technologies (Granstrand, 1998; Piscitello, 2004). The product diversification variable is measured as
one minus the Herfindahl of the spread of firms’ sales over the four-digit SIC industries in which a firm
has reported sales (source: Compustat and firms’ annual reports). Since we lack information for a small
number of observations (8%) on firms’ product diversification, we add an additional variable (no
product diversification info) that takes the value 1 for these observations (and -1 otherwise).
24
Finally, we include a set of variables to control for differences across the five sectors, home
regions (Europe, US and Japan) and years (1996-1999). Firms that belong to different sectors may have
different needs and incentives to enter into NTDs. The year variables capture changes over time in the
propensity of firms to enter into NTDs and patent inventions in those NTDs. The home region variables
control for possible differences in the propensity of European, US and Japanese firms to apply for EPO
patents. We use contrast codes rather than dummy coding to allow a more direct comparison of group
differences in the propensity to enter and perform in NTDs (Davis, 2010).
In the entry analysis, all explanatory variables are one-year lagged with respect to the year of
(potential) entry. In the technological performance analyses, average values over the three-year period
(‘entry year’ to ‘entry year + 2’) are taken for all explanatory variables. We mean-centered all
continuous variables prior to the analyses and prior to creating the interaction terms. The main effects
of the variables that are interacted (technological opportunities and technological relatedness) therefore
are representative of the effects at the mean of the interacting variable. Mean centering, together with
the use of contrast codes for all categorical variables, implies that the constant term in the performance
model represents performance for an ‘average’ firm with average values for the continuous variables
and zero values for the set of contrasts.
Descriptives
Tables 3 and 4 show the descriptive statistics and correlations for the dependent and explanatory
variables in both models. Technological opportunities are correlated positively with entry and
technological performance in NTDs, while technology competition correlates negatively with both. The
tables also show a higher value for technological opportunities, and a lower value of technology
competition, for the entered NTDs. These statistics provide some 'prima facie' evidence that firms are
more likely to enter NTDs characterized by abundant technological opportunities and less concentrated
technology ownership. None of the reported correlations between the independent variables is
excessively high. The highest correlation is found between R&D expenses and patent portfolio size.
-----------------------------------------------------------
INSERT TABLES III AND IV ABOUT HERE
25
-----------------------------------------------------------
Empirical Results
Entry into New Technology Domains
The results of the Cox proportional hazard models analyzing the antecedents of firms' decisions
to enter into NTDs are presented in Table V. The coefficients displayed are exponentiated to allow for
an interpretation of the coefficients as hazard ratios: they represent the proportional change in the
probability to enter into NTDs due to a unit change in an independent variable. A hazard ratio that is
larger (smaller) than one indicates an increase (decrease) in the probability to enter into NTDs. Model
1 only includes the control variables and Model 2 adds the two environmental characteristics.
Technology relatedness is added in Model 3 and interacted with technological opportunities in Model
4. All models are highly significant, and the log-likelihood ratio tests reveal that the hypotheses-testing
variables significantly increase the explanatory power of the models. The significant coefficients of the
firm-specific random effect (the 'frailty' term θ) show that there is unobserved firm-specific
heterogeneity in the process of entry in NTDs.
---------------------------------------------
INSERT TABLE V ABOUT HERE
---------------------------------------------
The coefficient estimates for the control variables show that firms with larger R&D budgets
(models 2-4) and patent stocks are more likely to enter into NTDs, while no effect is found for prior
profitability. There is weak evidence that firms with a diverse technology portfolio are more likely to
enter into NTDs (models 3 and 4). The positive coefficient for product diversification indicates that
firms active in multiple product markets have a greater propensity to explore NTDs. Entry into NTDs
is least likely, all other things equal, in the pharmaceutical industry, and most likely in the chemical
industry. The coefficients of the contrasts for the year variables suggest an upward sloping linear
relationship between the entry year and the probability to enter into NTDs.
26
The richness of technological opportunities in a technology domain is positively and
significantly related to entry decisions in NTDs in all hypotheses testing models, in support of
Hypothesis 1. The estimated hazard ratios indicate that the probability of a firm to enter into a NTD
rises by approximately 150 percent per unit increase in the measure of technological opportunities. This
result implies, for example, that firms are, ceteris paribus, one and a half times more likely to enter the
technology domain “medical and veterinary science” which is characterized by high levels of
technological opportunities (1.87, cf. Table II) than the technology domain “printing” which features
lower levels of opportunities (0.054, cf. Table II).v
The interaction term of technological opportunities and technological relatedness in Model 4
is estimated as smaller than one (0.849) but only weakly significant at the 10 percent level.vi Given that
the coefficients are exponentiated, a coefficient smaller than one implies that the effect of technological
opportunities on NTD entry is negatively, rather than positively, moderated by the level of technological
relatedness of a NTD and the firm’s existing technology resources. Hence, Hypothesis 2 has to be
rejected, as it predicted a positive moderation effect. The weakly significant negative moderation effect
reduces the positive effect of technological opportunities only mildly for NTDs that feature a higher
than average relatedness to the firm’s existing technology portfolio. Estimations show that the effect of
technological opportunities is reduced from a 150 percent increase in the probability of entry for average
related NTDs to a 113 percent increase in this probability for closely related NTDs – while the effect
rises to an 180 percent increase for an unrelated NTD.vii Relatedness itself has an appreciable effect on
entry: the estimated hazard ratio evaluated at the mean of technological opportunities implies that the
likelihood of entry into a moderately related domainviii is 75 percent larger than the hazard of entry into
a completely unrelated domain.
Hypothesis 3 is supported by the negative and significant effect of technology competition, as
indicated by a hazard ratio smaller than one. A unit increase in technology competition (which is slightly
more than a standard deviation change) in Model 4 reduces, ceteris paribus, the probability to enter into
a NTD by 52 percent.
Technological Performance in New Technology Domains
27
The results of the Negative Binomial regression models of the determinants of firms’
technological performance in NTDs after entry are reported in Table VI. The coefficients are
exponentiated to allow for an interpretation as incidence-rate ratios: they represent the proportional
change in the technological performance in a NTD due to a unit change in the independent variable.
Model 5 includes the control variables only, and the hypotheses-testing variables are added in Models
6-8. The models are strongly significant as indicated by the Chi-square test statistics. The inclusion of
the hypotheses-testing variables significantly increases the explanatory power of the model, as indicated
by the three Log-Likelihood ratio test statistics.
---------------------------------------------
INSERT TABLE VI ABOUT HERE
---------------------------------------------
The coefficient estimates of the control variables indicate that the technological performance
of firms in NTDs is higher when firms spend more resources on R&D. No significant differences in
technological performance in NTDs are found across firms active in different industries and originating
from different home regions. The coefficients of the contrasts for the year variables show both linear
and cubical elements in the pattern of technological performance in NTDs over time. Given that
continuous variables are mean centered and categorical variables contrast coded, the estimated
incidence ratio of the constant term (about 2.5) implies that an average firm under average
circumstances records about 2.5 post-entry citation-weighted patents.
Technological opportunities are associated with greater technological performance, with the
estimates suggesting a substantial 170-180 percent increase in patent performance due to a unit increase
in opportunities. This result implies that the technological performance in, for instance, the technology
domain “medical and veterinary science” which is characterized by high levels of technological
opportunities, is on average almost double the performance in the technology domain “printing” which
features low levels of opportunities.
In Model 8, the interaction effect between technological opportunities and technological
relatedness is positive - as indicated by an incidence-rate ratio larger than one – and significant. This
lends support to Hypothesis 4: the effect of technological opportunities on the technological
28
performance in NTDs is positively moderated by the technological relatedness between the NTD and
the firm’s existing technology portfolio. Further calculations show that for firms with a closely related
technology base, the effect of a unit increase in technological opportunities rises from 180 to 427
percent, while for unrelated fields the effect of opportunities is no longer significant. Relatedness itself
also enhances performance: the estimated incident rate ratio implies that patent performance is 67
percent higher in a domain with moderate relatedness than in an unrelated domain, given an average
level of technological opportunities.
Hypothesis 5 is supported by a significant incidence-rate ratio smaller than one for technology
competition. A unit increase in the technology competition variable in Model 8, a little more than a
standard deviation increase, reduces the technological performance of firms in a NTD, on average, by
22 percent.
Supplementary Analysis
We conducted a number of supplementary analyses to examine the robustness of our findings.
We examined the sensitivity of results in the performance analyses to the inclusion of firm fixed effects.
Firm fixed effects control for possible remaining firm level heterogeneity affecting the technological
performance in NTDs. Coefficient identification in a fixed-effect model is only possible in case there
are multiple-entries for the sample firms, reducing the sample to 1201 observations, and the inclusion
of fixed effects reduces residual variation in particular for firms with few entries in NTDs. Fixed-effect
analyses produced qualitatively similar results for the hypotheses testing variables. The main difference
was that the standard error of the interaction effect between technological relatedness and technological
opportunities increased, such that the coefficient fell just below conventional significance levels
(p=0.11).
We conducted additional analyses in which we substituted the two variables capturing the size
of firms’ technology activities in the model (R&D expenses and patent portfolio size) by firm size
(measured by the logarithm of the number of employees). Firm size had a positive and significant effect
in both the entry and technological performance models. The coefficients of the hypotheses-testing
variables were unaffected, while significance levels increased.
29
We also examined the robustness of findings in case of a stricter definition of ‘newness’ of
technology domains. We extended the time window during which firms should not have filed for patent
applications in a technology domain from 5 to 10 years. This reduced the number of firm-domain
combinations for the entry analysis to 15,800 and the number of entries into NTDs to 897. The empirical
results did not alter materially. The only more substantive difference was that the (non-hypothesized)
weak negative interaction effect between technological relatedness and technological opportunities in
the entry model became insignificant.
We conducted additional analysis to further explore the nature of the interaction effect of
technological opportunities and technological relatedness in entry analysis. One possibility is that the
lack of support for Hypothesis 2 is due to differences in the interplay between technological
opportunities and technological relatedness depending on the available R&D resources of firms. Large
firms with ample R&D resources may be less technologically constrained in the exploration of
technological opportunities. Since our sample primarily includes large R&D intensive firms, we divided
the sample based on R&D budgets at the bottom 25th percentile. Results indeed showed a negative
moderation effect for the large firms, contrasting with a positive moderation effect for firms with
smaller R&D budgets, but in both subsamples the estimated coefficients were insignificant.
Discussion
Building up competences in NTDs is essential to ensure the long-term viability of firms in
dynamic technology environments. It presents substantial managerial challenges because it involves
considerable resources, technical and commercial outcomes are uncertain, and failed attempts can
disturb existing operations. While this has inspired researchers to examine how internal processes and
resources can facilitate firms in developing competences in NTDs, the role of the external (technology)
environment has remained underexposed. In particular, extant research has not factored in the notion
that the success of firms’ innovation activities depends on the actions and innovation outcomes of
competitors (Katila and Chen, 2009; McGahan and Silverman, 2006).
30
The current study contributes to the literature on (technology) exploration by highlighting the
crucial role of environmental characteristics in determining the direction and success of technology
development. We suggest that a more complete understanding of firms’ entry and performance in NTDs
requires consideration of two key characteristics of the technology environment: technological
opportunities and technology competition. Competition from established firms in a technology domain
reduces both the probability of entry and the subsequent technological performance within the NTD.
The richness of technological opportunities in technology domains attracts firm entries, but only firms
possessing related technological resources are likely to capitalize on those emerging opportunities.
While internal characteristics constitute the breeding ground for new technology initiatives, successful
broadening of technological capabilities is shaped as well by the actions of competitors and by the
interaction of internal resources and opportunities in the environment.
The empirical results did not lend support to the hypothesis that the presence of related
technological resources determines firms’ ability to recognize and act on technological opportunities.
Hence, while firms are on average more likely to enter into NTDs situated in the vicinity of their existing
technology base - a finding consistent with prior studies suggesting the path-dependent nature of
technology search (Dosi, 1982; Cantwell and Fai, 1999; Helfat, 1994; Stuart and Podolny, 1996; Kim
and Kogut, 1996; Garud and Karnoe, 2001; Martin and Mitchell, 1998; Nelson and Winter, 1977;
Dowell and Swaminathan, 2006) - such technological relatedness does not seem to constrain the
responsiveness of firms to technological opportunities in NTDs.
This finding is intriguing and suggests that firms are equally attracted to technological
opportunities in distal and proximal technology domains. This finding may be specific to the setting of
our empirical research, however: R&D intensive firms with broad resources to conduct exploratory
R&D and to scan external developments in patenting. Firms with ample resources for R&D, a well-
developed sensing strategy consisting of activities such as patent scouting and venturing, will keep a
close watch on a broad spectrum of technological opportunities and patenting trends. However, our
results also show that many entries into unrelated NTDs that are rich in technological opportunities turn
out to be unsuccessful. Together, these findings suggest the need for further theorizing on the practice
of technology exploration in large R&D intensive firms.
31
Implications for research
Our study re-affirms the original propositions advanced by Nelson and Winter (1977; 1982).
Nelson and Winter depicted firm behavior as shaped simultaneously by ‘organizational genetics’
(available resources and competences, including technological ones) and the ‘selection’ environment,
which poses threats to firms but also provides opportunities, especially to firms that have the appropriate
profile to seize them. The complementary nature of the resource-based view on firms' behavior, with a
focus on internal resources and processes, and the industrial organization literature, which emphasizes
the importance of environmental (technological) characteristics for the effectiveness of firms’
technology strategies hence suggests the need to use integrative frameworks in future theory
development.
Our findings contribute to the recent debate whether distal or proximate search provide most
advantages to firms (Gavetti, 2012; Winter, 2012). Our results can be interpreted as indicating that for
R&D intensive firms, proximate search dominates, but distal search may occur in technology domains
rich in technological opportunities. At the same time, success is most assured in case of proximate
search. Hence, search behavior and success chances are heterogeneous and depend on the munificence
of the technology environment. Environments may often present themselves to firms as a trade-off
between stepwise proximal exploration with a higher probability of success, and distal exploration of a
potentially more promising trajectory but with a much lower rate of success. We note that our study
explored this trade-off by examining both the antecedents of entry and the drivers of subsequent
technological performance in NTDs, while prior studies have only looked at one of these dimensions
(e.g. Helfat, 1994). The suggestion for future research is to adopt a more encompassing perspective,
examining both entry and performance in (technology) exploration behavior.
Our study also has implications for the literature on (technological) opportunities (Teece et al.,
1997; Shane, 2001; Zahra, 2008). Teece et al. (1997) advanced the idea that (technological)
opportunities are firm-specific: “Not only do firms in the same industry face menus with different costs
associated with particular technological choices, they are also looking at menus containing different
choices” (Teece et al., 1997, p.524) and this notion is consistent with the view in the entrepreneurship
32
literature that (business) opportunities are ‘created’ (Davidsson, 2015). While our findings are generally
in agreement with this notion, they also provide a more nuanced view. On the one hand, the pattern of
related entry into NTDs suggests that firms are exploring different menus in technology domains
depending on their existing technology portfolios. On the other hand, recognition of relevant
technological opportunities is less constrained and more diverse in resource rich firms, where
technology exploration tends to have characteristics of a trial and error approach spanning also unrelated
but promising technology domains. Our study also suggests that opportunities of a technological nature
have an observable qualification, which is in agreement with the dominant view in the industrial
organization literature (Scherer, 196; Jaffe, 1986) and with views expressed in contributions to the
entrepreneurship literature (e.g. Zahra, 2008; Shane & Venkataraman, 2000).
Finally, our findings inform the broader strategic management literature on knowledge sourcing
and innovation through M&As and alliances. The theoretical rationale for some of the stylized facts
concerning the performance effects of technology based M&As has an interesting parallel with the
arguments in our paper. Ahuja & Katila (2001) and Cloodt et al. (2006) show that an acquirer is most
likely to benefit from M&As if the technology base of the target firms differs, but is not too distant,
from the technology base of the acquirer. Similarly, research on technology alliances has found that
while information inflows from strong ‘local’ ties are beneficial, alliances with new and distant partners
may be required to expose the firm to new innovative ideas (Hagedoorn et al., 2011, Uzzi, 1997;
Sampson, 2007; Letterie et al., 2001; Gilsing et al., 2008; Vanhaverbeke et al. 2015). Our study suggest
that the direction and performance effects of search for M&A targets or alliance partners will also be
governed by the technological opportunities embedded in the domains in which partners and target
firms are active – and not only by their proximity to the technology base of the focal firm. A promising
avenue for future research is the examination of the role of M&As and alliances in the identification
and successful exploration of opportunity rich NTDs.
Managerial implications
Our findings suggest that capitalizing on technological opportunities is conditional on a related
knowledge base to enact knowledge integration. If related resources are absent, technology
33
development efforts may be less effective and technology transition trajectories are more hazardous. At
the same time, large R&D intensive firms do experiment with technology entry in unrelated but
opportunity rich domains. A case of unsuccessful entry in NTDs may illustrate the importance of these
notions for managerial practice. In 2000, Royal Dutch Shell decided to diversify into various types of
renewable energy sources, each of which implied entering NTDs with ample (perceived) technological
opportunities: solar power, wind power, hydrogen energy and biofuels. Between 2004 and 2009, Shell
invested approximately 1.7 billion USD in the development of renewable energy technology. In 2009
however, Shell announced a withdrawal from wind, solar, and hydrogen energy. Only biofuels, where
the chemical capabilities of the firm could be leveraged, were retained in the technology and business
portfolio (The Guardian, 2009). This example illustrates how large firms can experiment with, and
invest substantial resources in, the development of unrelated technologies deemed rich in technological
and business opportunities – while the absence of related capabilities increases the risk of failure. This
suggests that firms should carefully balance the need to master a range of new technologies in
technology intensive industries (Pavitt and Patel, 1997; Granstrand, 1998) with the constraints due to
the characteristics of firms’ existing technological capabilities.
A second implication is the need to take into account rival firms’ strategies and technology
development efforts. If technological opportunities present themselves as observable to a variety of
R&D intensive firms with the resources to explore a wide range of NTDs, opportunity rich areas are
likely to become ‘crowded’ areas of technology development. This reduces the chances of success in
carving out a sustainable presence, in particular if firms lack the benefits of scope and cross-fertilization
in unrelated domains. These considerations are only strengthened if leadership positions become
entrenched in technology domains and incumbents raise entry barriers to defend their technology
leadership
Limitations
Our study is subject to a number of limitations, which highlight avenues for further research. A
first limitation is our focus on large R&D intensive firms. While this assures a rich pattern of entry in
NTDs, our results are less likely to be representative of small firms in high-tech industries. We suggest
34
that future research also takes these firms as a focus of attention to examine if entry into promising
NTDs is indeed more constrained to related technologies in contrast to the broader technology
exploration pattern that we observed in large R&D intensive firms.
Future work could also refine and further develop the operationalization of the concepts of
technological opportunities and technology competition. We used a specific measure of technological
opportunities: the relevance of scientific knowledge in the technology domain. While this indicator has
a strong prior in theory and empirical work (Levin et al., 1985; Klevorick et al., 1995) and has a robust
relationship with NTD entry and performance across technology domains, our analysis revealed that
this measure is less able to identify exploitable opportunities in the domain characterized by the highest
propensity to draw on scientific knowledge (biochemistry). In domains with an extreme reliance on
scientific prior art, higher levels of science intensity might actually signal more extended timeframes
and higher levels of uncertainty rather than immediately addressable opportunities. Future research
would benefit from a better understanding of the specific (life cycle) dynamics in domains characterized
by high levels of dependence on science, which in turn may result in more suitable indicators of
exploitable technological opportunities in those domains.
Future research could also explore the possibility of utilizing direct evidence of aggressive
patent strategies of incumbent firms. One way to identify such strategies is to examine the composition
of firms’ patent portfolios to see if their patents invalidate the ‘novelty’ of entrants’ patents (e.g. Grimpe
and Hussinger, 2014). Finally, in line with suggestions by O’Reilly and Tushman (2008) and Teece
(2007), future research may envisage to include variables that reflect organizational design choices and
practices that enable the development of capabilities in NTDs.
Conclusion
Firms' choices to enter into NTDs and their subsequent technological performance in these
NTDs are governed both by firm–level factors and environmental conditions. Perspectives that stress
the environment as a key determinant of technology entry and resource-oriented perspectives
emphasizing firm-level antecedents complement and interact to explain heterogeneous patterns of entry
and performance in NTDs. Our study reveals the roles of firm-level related technological resources, the

35
richness of technological opportunities, and technology competition by strong incumbents as key
antecedents of entry and success in NTDs. While the absence of a related technology base does not
discourage firms to enter domains that are rich in technological opportunities, firms do require related
technological expertise in order to successfully exploit technological opportunities post-entry.
Environmental munificence thus presents itself often to firms as a trade-off between proximal
exploration with higher probability of technological success, and distal exploration in potentially more
promising technology domains with reduced chances of success.
36
References
Abernathy, W. and Utterback, J. (1978). ‘Patterns of industrial innovation’. Technology Review, 80(7),
40-47.
Agarwal R. and Helfat, C. (2009). ‘Strategic renewal of organizations’. Organization Science, 20(2),
281-293.
Ahuja G., R. Katila (2001). ‘Technological acquisitions and the innovation performance of acquiring
firms: A longitudinal study’. Strategic Management Journal 22 197–220.
Ahuja, G. and Lampert, C.M. (2001). ‘Entrepreneurship in the large firm: a longitudinal study of how
established firms create breakthrough inventions’. Strategic Management Journal, 22 (6-7), 521-
543.
Allen, T. (1977). Managing the flow of technology. MIT Press: Cambridge, MA.
Allen, T. and Marquis, D. (1964). ‘Positive and negative biasing sets: the effects of prior experience on
research performance’. IEEE Transactions on Engineering Management, 11, 158-161.
Alvarez, S.A. and Barney, J.B. (2013). ‘Epistemology, opportunities, and entrepreneurship: Comments
on Venkatraman et al. (2012) and Shane (2012)’. Academy of Management Review, 38(1), 154-157.
Andersen, B. (1999). ‘The hunt for S-shaped growth paths in technological innovation: a patent study’.
Journal of Evolutionary Economics, 9, 487-526.
Arora, A. and Fosfuri, A. (2003). ‘Licensing the market for technology’. Journal of Economic Behavior
and Organization, 52, 277-295.
Arundel, A. and Kabla, I. (1998). ‘What percentage of innovations are patented? Empirical estimates
from European firms’. Research Policy, 27, 127-141.
Bain, J. (1956). Barriers to New Competition. Harvard University Press: Cambridge, MA.
Bandura, A. (1986). Social foundations of thought and action. Prentice-Hall: Englewood Cliffs, NJ.
Barney, J. (1991). ‘Firm resources and sustained competitive advantage’. Journal of Management, 17,
99-120.
Barreto, I. (2012). ‘ A behavioral theory of market expansion based on the opportunity prospects rule.‘
Organization Science, 23(4), 1008-1023.
37
Belderbos, R., Faems, D., Leten, B. and Van Looy, B. (2010). ‘Technological activities and their impact
on the financial performance of firms: Exploitation and exploration within and between firms’. The
Journal of Product Innovation Management, 27, 869-882
Belderbos, R., Fukao, K. and Iwasa, T. (2009). ‘Domestic and foreign R&D investment’. Economics of
Innovation and New Technologies, 18 (4), 369–380.
Belderbos, R. and Somers, D (2015). ‘Do technology leaders deter inward R&D investments?, Regional
Studies, 49 (11), 1805-1821, 2015.
Benner, M. and Tripsas, M. (2012). ‘The influence of prior industry affiliation on framing in nascent
industries: The evolution of digital cameras’. Strategic Management Journal, 33, 277-302.
Bercovitz, J., De Figueredo, J. and Teece, D. (1996). Firm capabilities and managerial decision
making: a theory of innovation biases. In Technological Innovation: oversights and foresights.
Edited by Garud R et al. Cambridge University Press.
Bierly, P., Damanpour, F. and Santoro, M. (2009). ‘The application of external knowledge:
Organizational conditions for exploration and exploitation’. Journal of Management Studies,
46(3), 481-509.
Blind, K., J. Edler, Frietsch, R. and Schmoch, U. (2006). ‘Motives to patent: Empirical evidence from
Germany’. Research Policy 35, 655-672.
Bowen, H. and Wiersema, M. (2009). ‘The Use of Limited Dependent Variable Techniques in Strategy
Research: Issues and Methods’. Strategic Management Journal, 30, 679-692.
Breschi, S., Lissoni, F. and Malerba, F. (2003). ‘Knowledge-relatedness in firm technological
diversification’. Research Policy, 32, 69-87.
Breschi, S., Malerba, F. and Orsenigo, L. (2000). ‘Technological regimes and Schumpeterian patterns
of innovation’. The Economic Journal, 110, 388-410.
Callaert, J., Van Looy, B., Verbeek, A., Debackere, K., Thijs, B. 2006. Traces of prior art: An
analysis of non-patent references found in patent documents. Scientometrics 69(1), 3-20.
Callaert, J., Grouwels, J., Van Looy, B., 2012. Delineating the scientific footprint in technology:
Identifying scientific publications within non-patent references. Scientometrics 91(2), 383-398.
38
Cameron, A. and Trivedi, P. (1998). Regression Analysis of Count Data. Cambridge University Press:
Cambridge.
Cantwell, J. and Fai, F. (1999). Firms as source of innovation and growth: the evolution of technological
competence. Journal of Evolutionary Economics, 9, 331-366.
Cassiman, B. and Veugelers, R. (2006). In search of complementarity in innovation strategy: internal
R&D and external knowledge acquisition. Management Science, 52(1), 68-82.
Ceccagnoli, M. (2009). Appropriability, preemption, and firm performance. Strategic Management
Journal, 30, 81-98.
Christensen, C. (1997). The innovator’s dilemma: when new technologies cause great firms to fail.
Harvard Business School Press: Boston, MA.
Cloodt, M., J. Hagedoorn, H. Van Kranenburg (2006). ‘Mergers and acquisitions: Their effects on the
innovative performance of companies in high-tech industries’. Research Policy 35(5) 642-654.
Cockburn, I. and MacGarvie, M. (2006). Entry, exit and patenting in the software industry. NBER
Working Paper No. 12 563. National Bureau of Economic Research: Cambridge, MA.
Coen, C. and Maritan, C. (2011). ‘Investing in capabilities: the dynamics of resource allocation’.
Organization Science, 22(11), 99-117.
Cohen, W. and Levinthal, D. (1990). ‘Absorptive capacity: a new perspective on learning and
innovation’. Administrative Science Quarterly, 35, 128-152.
Cohen, W., Goto, A., Nagata, A., Nelson, R. and Walsh, J. (2002). ‘R&D Spillovers, patents, and
incentives to innovate in Japan and the United States’. Research Policy, 31, 1349-1367.
Cooper, A. and Schendel, D. (1976). ‘Strategic responses to technological threats’. Business Horizons,
61-69.
Cox, D. (1972). ‘Regression models and life tables’. Journal of the Royal Statistical Society, 34, 187-
220.
Cyert, R.M. and March, J.G. (1963). A behavioral theory of the firm. Prentice-Hall: Englewood Cliffs
NJ.
Danneels, E. and Sethi, R. (2011). ‘New product exploration under environmental turbulence’.
Organization Science, 22(4), 1026-1039.
39
Davidsson, P. (2015). ‘Entrepreneurial opportunities and the entrepreneurship nexus: A re-
conceptualization’. Journal of Business Venturing, 30, 674-695.
Davis, M.J. (2010) Contrast Coding in Multiple Regression Analysis: Strengths, Weaknesses, and
Utility of Popular Coding Structures. Journal of Data Science, 8, 61-73.
Dosi, G. (1982). ‘Technological paradigms and technological trajectories’. Research Policy, 11, 147-
162.
Dowell, G. and Swaminathan, A. (2006). ‘Entry timing, exploration, and firm survival in the early U.S.
bicycle industry’. Strategic Management Journal, 27, 1159-1182.
Duguet, E. and MacGarvie, M. (2005). ‘How well do patent citations measure flows of technology?
Evidence from French innovation surveys’, Economics of Innovation and New Technology,
14(5), 375-393.
Eisenhardt, K. and Martin, J. (2000). ‘Dynamic capabilities: what are they?’. Strategic Management
Journal, 21(10-11), 1105-1121.
Fleck, L. (1935). Genesis and development of a scientific fact. University of Chicago Press.
Fleming, L. (2001). ‘Recombinant uncertainty in technological search’. Management Science, 47, 117-
132.
Fleming, L. and Sorenson O. (2004). ‘Science as a map in technological search’. Strategic Management
Journal, 25, 909-928.
Foss, K. and Foss, N.J. (2008). ‘Understanding opportunity discovery and sustainable advantage: the
role of transaction costs and property rights’. Strategic Entrepreneurship Journal, 2(3), 191-207.
Gambardella, A., Giuri, P. and Luzzi, A. (2007). ‘The markets for patents in Europe’. Research Policy,
36, 1163-1183.
Garud R. and Karnøe P. (eds.) (2001). Path Dependence and Creation. Lawrence Erlbaum Associates
Inc. Mahwah, N.J.
Gavetti, G. (2012). ‘Toward a behavioral theory of strategy’. Organization Science, 23(1), 267-285.
Gilbert, R. (2005). Looking for mister Schumpeter: where are we in the competition-innovation debate?
In: Innovation Policy and The Economy. Jaffe A, Lerner J, Stern S (Eds.). MIT Press.
40
Gilbert, R. and Newbery, D. (1982). ‘Preemptive patenting and the persistence of monopoly’. The
American Economic Review, 72(3), 514-526.
Gilsing, V., Nooteboom, B., Vanhaverbeke, W., Duysters, G. and Van den Oord, A. (2008). ‘Network
embeddedness and the exploration of novel technologies: technological distance, betweenness
centrality and density’. Research Policy, 37(10), 1717-1731.
Granstrand, O. (1998). ‘Towards a theory of the technology-based firm’. Research Policy, 27, 465-489.
Granstrand, O. (1999). The Economics and Management of Intellectual Property. Edward Elgar:
Cheltenham, UK.
Grant, R.A. (1996). ‘Towards a knowledge-based theory of the firm’. Strategic Management Journal,
17, 109-122.
Grégoire, D., Barr, P. and Shepherd, D. (2010). ‘Cognitive processes of opportunity recognition: the
role of structural alignment’. Organization Science, 21(2), 413-431.
Griliches, Z. (1990). ‘Patents statistics as economic indicators: a survey’. Journal of Economic
Literature, 28(4), 1661-1707.
Grimpe, C. and Hussinger, K. (2014). ‘Resource complementarity and value capture in firm
acquisitions: The role of intellectual property rights’. Strategic Management Journal, 35, 1762-
1780.
Grindley, P. and Teece, D. (1997). ‘Managing intellectual capital: Licensing and cross-licensing in
semiconductors and electronics’. California Management Review, 39(2), 8-41.
Gruber, M., Macmillan, I and Johnson J. (2012). ‘From minds to markets: How human capital
endowments shape market opportunity identification of technology start-ups’. Journal of
Management, 38(5), 1421-1449.
Gruber, M., Macmillan, I and Johnson J. (2013). ‘Escaping the prior knowledge corridor: What shapes
the number and variety of market opportunities identified before market entry of technology start-
ups? Organization Science, 24(1), 280-300.
Gupta, A., Smith, K. and Shalley, E. (2006). ‘The interplay between exploration and exploitation’. The
Academy of Management Journal, 49(4), 693-708.
41
Hagedoorn, J. and Cloodt, M. (2003). ‘Measuring innovative performance: is there an advantage in
using multiple indicators?’ Research Policy, 32, 1365-1379.
Hagedoorn, J., Letterie, W., Palm. F. (2011). ‘The information value of R&D alliances: The preference
for local or distant ties’, Strategic Organization, 9 (4), 283-309.
Hall, B., Jaffe, A. and Trajtenberg, M. (2005). ‘Market value and patent citations’. Rand Journal of
Economics, 36(1): 16-38.
Hall, B.H., Thoma, G. and Torrisi, S. (2007). The Market Value of Patents and R&D: Evidence from
European Firms. NBER Working Paper 13426, Cambridge, MA.
Hargadon, A. and Sutton, R. (1997). ‘Technology brokering and innovation in a product development
firm’. Administrative Science Quarterly, 42, 716-749.
Harhoff, D., Scherer, F., Vopel K., 2003. Citations, family size, opposition and the value of patent
rights. Research Policy 32, 1343-1363.
Helfat, C. (1994). ‘Evolutionary trajectories in petroleum firm R&D’. Management Science, 40(12),
1720-1747.
Helfat, C., Finkelstein, S., Mitchell, W., Peteraf, M., Singh, H., Teece, D. and Winter, S. (2007).
Dynamic Capabilities: Understanding Strategic Change in Organizations. Blackwell Publishing.
Henderson, R. and Cockburn, I. (1996). ‘Scale, scope and spillovers: the determinants of research
productivity in drug discovery’. Rand Journal of Economics, 27(1), 32-59.
Hitt, M.A., Hoskisson, R.E., Ireland, R.D., Harisson, J.S. (1991). ‘Effects of Acquisitions on R&D
Inputs and Outputs’, Academy of Management Journal, 34 (3), 693-706.
Hoetker, G. (2007). ‘The use of logit and probit models in strategic management literature: critical
issues’. Strategic Management Journal, 28, 331-343.
Huber, G. (1991). ‘Organizational learning: The contributing processes and the literatures’.
Organization Science, 2(1), 88-115.
Jaffe, A. (1986). ‘Technological opportunity and spillovers of R&D: Evidence from firms’ patents,
profits and market value’. American Economic Review, 76(5), 984-1001.
42
Jansen, J., van den Bosch, F. and Volberda, H. (2006). ‘Exploratory innovation, exploitative innovation
and performance: effects of organizational antecedents and environmental moderators’.
Management Science, 52(11), 1661-1674.
Katila, R and Chen, E. (2008). ‘Effects of search timing on product innovation: the value of not being
in sync’. Administrative Science Quarterly, 53(4), 593-625.
Katila, R. and Ahuja, G. (2002). ‘Something old, something new: a longitudinal study of search
behavior and new product introduction’. Academy of Management Journal, 45(6), 1183-1194.
Katila, R. and Mang, P.Y. (2003). ‘Exploiting technological opportunities: the timing of collaborations’.
Research Policy, 32, 317-332.
Katila, R., Rosenberger, J.D. and Eisenhardt, K. (2008). ‘Swimming with sharks: Technology ventures,
defense mechanisms and corporate relationships’. Administrative Science Quarterly, 53(2), 295-
332.
Kauffman, S., Lobo, J. and Macready, W. (2000). ‘Optimal search on a technology landscape’. Journal
of Economic Behavior and Organization, 43, 141-166.
Kim, D. and Kogut, B. (1996). ‘Technological platforms and diversification’. Organization Science,
7(3), 283-301.
Klein, P.G. (2008). ‘Opportunity discovery, entrepreneurial action, and economic organization’.
Strategic Entrepreneurship Journal, 2(3), 175-190.
Klevorick, A., Levin, R., Nelson, R. and Winter, S. (1995). ‘On the sources and significance of inter-
industry differences in technological opportunities’. Research Policy, 24, 185-205.
Kuhn, T.S. (1962). The structure of scientific revolutions. University of Chicago Press.
Lave, J. (1988). Cognition in Practice. Cambridge University Press.
Leten, B., Belderbos, R. and Van Looy, B. (2007). ‘Technological diversification, coherence and
performance of firms’. The Journal of Product Innovation Management, 24(6), 567-579.
Leten B., Landoni P., Van Looy B. (2014). Science or graduates: How do firms benefit from the
proximity of universities? Research Policy, 43(8), 1398-1412.
Levin, R., Klevorick, A., Nelson, R. and Winter, S. (1987). ‘Appropriating the returns from industrial
research and development’. Brookings Papers on Economic Activity, 3, 783-831.
43
Levin, R.C. and Reiss, P.C. (1984). ‘Tests of a Schumpeterian model of R&D and market structure’.
In: Griliches Z (editor). R&D, Patents and Productivity. The University of Chicago Press:
Chicago and London, 175-204.
Levin, R.C., Cohen, W.M. and Mowery, D. (1985). ‘R and D appropriability, opportunities and market
structure: New evidence on some Schumpeterian hypotheses’. American Economic Review,
75(2), 20-24.
Levinthal, D. and March, J. (1993). ‘The myopia of learning’. Strategic Management Journal, 14, 95-
112.
Levitt, B. and March, J. (1988). ‘Organizational learning’. Annual Review of Sociology, 14, 319-340.
Lipczynski, J., Wilson, J. and Goddard, J. (2001). Industrial Organization: Competition, Strategy and
Policy. Pearson Education Limited: Essex, England.
March, J. (1991). ‘Exploration and exploitation in organizational learning’. Organization Science, 2(1),
71-87.
Markides, C. and Williamson, P. (1994). ‘Related diversification, core competences and corporate
performance’. Strategic Management Journal, 15, 149-165.
Martin, X. and Mitchell, W. (1998). ‘The influence of local search and performance heuristics on new
design introduction in a new product market’. Research Policy, 26, 753-771.
McGahan, A.M. and Silverman, B.S. (2006). ‘Profiting from technological innovation by others: the
effect of competitor patenting on firm value’. Research Policy, 1222-1242.
McGrath, R. (2001). ‘Exploratory learning, innovative capacity and managerial oversight’. Academy of
Management Journal, 44(1), 118-131.
Mitchell, D. and Singh, K. (1993). ‘Death of the lethargic: Effects of expansion into new technical
subfields on performance in a firm’s base business’. Organization Science, 4(2), 152-180.
Mitchell, W. and Singh, K. (1992). ‘Incumbents’ use of pre-entry alliances before expansion into new
technological subfields of an industry’. Journal of Economic Behavior and Organization, 18(3),
347-372.
Narin, F. and Noma, E. (1987). ‘Patents as indicators of corporate technological strength’. Research
Policy, 16, 143-155.
44
Nelson, R. and Winter, S. (1977). ‘In search of useful theory of innovation’. Research Policy 6: 36-76.
Nelson, R. and Winter, S. (1982). An evolutionary theory of economic change. Harvard University
Press: Massachusetts and London, England.
Nesta, L. and Saviotti, P. (2005). ‘Coherence of the knowledge base and the firm’s innovative
performance: Evidence from the U.S. pharmaceutical industry’. The Journal of Industrial
Economics, 53(1), 123-142.
Ocasio, W. (1997). ‘Towards an attention-based view of the firm’. Strategic Management Journal,
18(summer special issue), 187-206.
O’Reilly, C. and Tushman, M. (2008). ‘Ambidexterity as a dynamic capability: resolving the
innovator’s dilemma’. Research in Organizational Behavior, 28, 185-206.
Patel, P. and Pavitt, K. (1997). ‘The technological competencies of the world’s largest firms: complex
and path-dependent, but not much variety’. Research Policy, 26, 141-156.
Penrose, E. (1959). The theory of the firm. Oxford Basil Blackwell.
Peteraf, M.A. (1993). ‘The cornerstones of competitive advantage: a resource-based view’. Strategic
Management Journal, 14(3), 179-191.
Phene, A., Fladmoe-Lindquist, K. and Marsh, L. (2006). ‘Breakthrough innovations in the U.S.
biotechnology industry: the effects of technological space and geographic origin’. Strategic
Management Journal, 27, 369-388.
Piscitello, L. (2004). ‘Corporate diversification, coherence and economic performance’. Industrial and
Corporate Change, 13(5), 757-787.
Prahalad, C.K. and Bettis, RA. (1986). ‘The dominant logic: A new linkage between diversity and
performance’. Strategic Management Journal, 7(6), 485-501.
Prahalad, C.K. and Hamel, G. (1990). ‘The core competence of the firm’. Harvard Business Review,
May/June, 79-91.
Reinganum, J. (1983). ‘Uncertain innovation and the persistence of monopoly’. American Economic
Review, 73, 741-748.
Reitzig, M. (2004). ‘The private values of ‘thickets’ and ‘fences’: towards an updated picture of the use
of patents across industries’. Economics of Innovation and New Technology, 13(5), 457-476.
45
Rosenberg, N. (1974). ‘Science, invention and economic growth’. The Economic Journal, March: 90-
108.
Rosenkopf, L. and Nerkar, A. (2001). ‘Beyond local search: Boundary-spanning, exploration, and
impact in the optical disk industry’. Strategic Management Journal, 22, 287-306.
Sampson, R. C. (2007). ‘R&D alliances and firm performance: The impact of technological diversity
and alliance organization on innovation’. Acad. of Management J. 50(2) 364–366.
Scherer, F.M. (1965). ‘Firm size, market structure, opportunity, and the output of patented inventions’.
American Economic Review, 55(5), 1097-1125.
Schmoch, U. (2007). ‘Double-boom cyclus and the comeback of science-push and market-pull’.
Research Policy, 36, 1000-1015.
Schneider, C. (2008). ‘Fences and competition in patent races’. International Journal of Industrial
Organization, 26, 1348-1364.
Schumpeter, J. (1934). Business Cycles. McGraw-Hill Book Company Inc: New York.
Scotchmer, S. (1991). ‘Standing of the shoulders of giants: Cumulative research and the patent law’.
The Journal of Economic Perspectives, 5(1), 29-42.
Shane S. and Venkataraman, S. (2000) ‘The promise of entrepreneurship as a field of research’.
Academy of Management Review, 25, 217-226.
Shane, S. (2001). ‘Technological Opportunities and New Firm Creation’, Management Science, 47 (2),
205-220.
Shapiro, C. (2000). ‘Navigating the patent thicket: Cross licenses, patent pools, and standard setting’.
In: Innovation Policy and The Economy. Jaffe A, Lerner J, Stern S. (Eds.). MIT Press.
Simon, H. (1955). ‘A behavioral model of rational choice’. Quarterly Journal of Economics, 69, 99-
118.
Simon, H. (1979). ‘Rational decision making behavior in business organizations’. The American
Economic Review, 69(4), 493-513.
Simsek, Z. (2009). ‘Organizational ambidexterity: Towards a multilevel understanding’. Journal of
Management Studies, 46(4), 597-624.
46
Spender, J.C. (1996). ‘Making knowledge the basis of a dynamic theory of the firm’. Strategic
Management Journal, 17, 45-62.
Stuart, T. and Podolny, J. (1996). ‘Local search and the evolution of technological capabilities’.
Strategic Management Journal, 17, 21-38.
Sutton, J. (1998). Technology and market structure. MIT Press: Cambridge.
Teece, D. (2000). Managing intellectual capital: organizational, strategic, and policy dimensions.
Oxford University Press: Oxford, UK.
Teece, D. (2007). ‘Explicating dynamic capabilities: the nature and microfoundations of sustainable
enterprise performance’. Strategic Management Journal, 28, 1319-1350.
Teece, D., Pisano, G. and Shuen, A. (1997). ‘Dynamic capabilities and strategic management’. Strategic
Management Journal, 18(7), 509-533.
Teece, D.J. (1980). ‘Economics of scope and the scope of the enterprise’. Journal of Economic Behavior
and Organization, 1, 223-247.
The Guardian. (2009). Shell dumps wind, solar and hydrogen power in favor of biofuels.
Tijssen, R.J.W., Buter, R.K., van Leeuwen Th.N., (2000). ‘Technological relevance of science: An
assessment of citation linkages between patents and research papers’. Scientometrics 47(2), 389-
412.
Trajtenberg, M. (1990). ‘A penny for your quotes: patent citation and the value of innovations.’ Rand
Journal of Economics, 21, 172-187.
Tripsas, M. (1997). ‘Unraveling the process of creative destruction: complementary assets and
incumbent survival in the typesetter industry’. Strategic Management Journal, 18, 119-142.
Tripsas, M. (2009). ‘Technology, identity and inertia through the lens of the “digital photography
company”’. Organization Science, 2, 441-460.
Tripsas, M., Gavetti, G. (2000). ‘Capabilities, cognition and inertia: evidence from digital imaging’.
Strategic Management Journal, 21, 1147-1161.
Turner, S., Mitchell, W. and Bettis, R. (2010). ‘Responding to rivals and complements: How market
concentration shapes generational product innovation strategy’. Organization Science, 21(4), 854-
872.
47
Tushman, M. and Anderson, P. (1986). ‘Technological discontinuities and organizational
environments’. Administrative Science Quarterly, 31, 439-465.
Tushman, M. and O’Reilly, C. (1996). ‘Ambidextrous organizations: managing evolutionary and
revolutionary change’. California Management Review, 38(4), 8-30.
Uotila, J., Maula, M., Keil, T. and Zahra, G. (2009). ‘Exploration, exploitation, and financial
performance: analysis of S&P 500 corporations’. Strategic Management Journal, 30, 221-231.
Uzzi, B. (1997) ‘The Social Structure and Competition in Interfirm Networks: The Paradox of
Embeddedness’, Administrative Science Quarterly 42: 35–67.
Van de Ven, A., Angle, H. and Poole, M.S. (1989). Research on the Management of Innovation: The
Minnesota Studies. Harper & Row Publishers.
Vanhaverbeke, W., Belderbos R., Duysters G. and Beerkens. B (2015), Technological performance and
alliances over the industry life cycle: Evidence from the ASIC industry, Journal of Product
Innovation Management 32(4), 556–573, 2015.
Van Looy, B., E. Zimmermann, R. Veugelers, J. Mello, A. Verbeek, and K. Debackere (2003), Do
science-technology interactions pay off when developing technology? An exploratory
investigation of 10 science-intensive technology domains, Scientometrics, 57, 355-367.
Van Looy, B., Du Plessis, M. and Magerman, T. (2006). ‘Data production methods for harmonized
patent indicators: assignee sector allocation.’ EUROSTAT Working Paper and Studies,
Luxemburg.
Van Looy, B., Martens, T. and Debackere, K. (2005). ‘Organizing for continuous innovation: on the
sustainability of ambidextrous organizations’. Journal of Creativity and Innovation Management,
14(3), 208-221.
Van Vianen, B., Moed, H., Van Raan, A., 1990. An exploration of the science base of recent
technology. Research Policy 19, 61-81.
Van Pottelsberghe de la Potterie B. and François D. (2006). ‘The cost factor in patent systems.’ EPO
working papers CEB 06-002.
48
Venkataraman, S., & Sarasvathy, S.D. (2001). ‘Strategy and entrepreneurship: Outlines of an untold
story.’ In M. Hitt, E. Freeman, & J. Harrison (Eds), Handbook of Strategic Management (pp. 650-
668). Oxford, UK: Blackwell Publishers.
Vygotsky, L. (1978). Mind in society: The development of higher psychological processes. Harvard
University Press.
Walrave, B., van Oorschot, K. and Romme, A. (2011). ‘Getting trapped in the suppression of
exploration: A simulation model’. Journal of Management Studies, 48(8), 1727-1751.
Wernerfelt, B. (1984). ‘A resource-based view of the firm’. Strategic Management Journal, 5(2), 171-
181.
Winter, S. (2012). ‘Purpose and progress in the theory of strategy: Comments on Gavetti’. Organization
Science, 23(1), 288-297.
Zahra, S. (2008). ‘The virtuous circle of discovery and creation of entrepreneurial opportunities’.
Strategic Entrepreneurship Journal, 2, 243-257.
Ziedonis, R.H. (2004). ‘Don’t fence me in: fragmented Markets for technology and the patent
acquisition strategies of firms’. Management Science, 50(6), 804-820.
49
Table I: Sample Composition
Sector Europe Japan US TotalChemicals 11 11 11 33Electronics and Electrical Machinery 11 14 7 32Non-Electrical Machinery 13 11 11 35IT Hardware 13 12 16 41Pharmaceuticals & Biotech 10 11 14 35Total 58 59 59 176
Region
50
Table II: Technological Opportunities By Technology Domain
Notes: The reported numbers for the technological opportunities measure are the average number of citations to scientific literature per EPO patent filed in the technology domain over the period 1995-2001.
IPC IPC
A Human Necessities C12 biochemistry 5.062A01 agriculture 2.126 C13 sugar 0.768A21 baking 0.486 C14 skins, leather 0.130A22 butchering 0.029 C21 metallurgy of iron 0.192A23 foods or foodstuffs 0.910 C22 metallurgy of (non-) ferrous alloys 0.333A24 tobacco 0.080 C23 coating metallic material 0.485A41 wearing apparel 0.015 C25 electrolytic/electrophoretic processes 0.227A42 headwear 0.007 C30 crystal growth 1.268A43 footwear 0.008 D Textiles, PaperA44 jewellery 0.006 D01 threads and fibres 0.136A45 hand or travelling articles 0.006 D02 yarns 0.025A46 brushware 0.010 D03 weaving 0.024A47 furniture 0.007 D04 braiding 0.036A61 medical, veterinary science 1.868 D05 sewing 0.000A62 life-saving, fire-fighting 0.166 D06 treatment of textiles 0.120A63 sports, games 0.048 D07 ropes 0.019B Performing Operations, Transporting D21 paper-making 0.124B01 physical/chemical processes in general 0.369 E Fixed ConstructionsB02 crushing, pulverising 0.039 E01 construction of roads 0.027B03 separation of solid materials 0.245 E02 hydraulic engineering 0.040B04 centrifugal apparatus 0.024 E03 water supply 0.018B05 spraying, atomising 0.105 E04 building 0.026B06 generating/transmitting vibrations 0.226 E05 locks, keys 0.010B07 separating solids from solids 0.071 E06 doors, windows, shutters 0.017B08 cleaning 0.061 E21 earth rock drilling 0.153B09 disposal of solid waste 0.390 F Mechanical Engineering, Lightning, HeatingB21 mechanical metal-working 0.069 F01 machines/engines in general 0.055B22 casting, powder metallurgy 0.164 F02 combustion engines 0.051B23 machine tools 0.074 F03 machines/engines for liquids 0.221B24 grinding, polishing 0.051 F04 positive-displacement machines 0.047B25 hand tools 0.112 F15 fluid-pressure actuators 0.124B26 hand cutting tools 0.016 F16 engineering elements or units 0.030B27 working/preserving wood 0.041 F17 storing/distributing gases/liquids 0.113B28 working cement 0.044 F21 lighting 0.047B29 working of plastics 0.080 F22 steam generation 0.100B30 presses 0.021 F23 combustion apparatus 0.054B31 making articles of paper 0.015 F24 heating 0.048B32 layered products 0.073 F25 refrigeration, cooling 0.085B41 printing 0.054 F26 drying 0.057B42 book binding 0.034 F27 furnaces 0.083B43 writing or drawing implements 0.010 F28 heat exchange in general 0.051B44 decorative arts 0.067 F41 weapons 0.079B60 vehicles in general 0.038 F42 ammunition 0.039B61 railways 0.070 G PhysicsB62 land vehicles 0.024 G01 measuring, testing 1.516B63 ships 0.080 G02 optics 0.614B64 aircraft, aviation 0.263 G03 photography 0.185B65 conveying, packing 0.012 G04 horology 0.104B66 hoisting, lifting 0.028 G05 controlling, regulating 0.319B67 opening/closing bottles 0.007 G06 computing 0.800B68 saddlery, upholstery 0.000 G07 checking-devices 0.117C Chemistry, Metallurgy G08 signalling 0.157C01 inorganic chemistry 0.569 G09 educating, cryptography 0.199C02 treatment of water 0.224 G10 musical instruments 0.899C03 glass 0.316 G11 information storage 0.245C04 cements, concrete 0.317 G12 instrument details 0.660C05 fertilizers 0.252 G21 nuclear physics 0.493C06 explosives, matches 0.337 H ElectricityC07 organic chemistry 2.973 H01 electric elements 0.451C08 organic macromolecular compounds 0.329 H02 generation/distribution electric power 0.177C09 dyes, paints 0.263 H03 electronic circuitry 0.579C10 petroleum, gas and coke 0.162 H04 electric communication technique 0.598C11 animal/vegetable oils 0.367 H05 electric techniques (others) 0.199
Technology Domain OpportunitiesTechnology Domain Opportunities
51
Table III: Descriptives and Correlations for the Entry into New Technology Domains Analysis
Notes: * indicates significance at 5% level.
Mean Std. Dev (1) (2) (3) (4) (5) (6) (7) (8)(1) Technology Entry 0.02 0.14(2) Technology Competition -3.95 0.82 -0.07*(3) Technological Opportunities 0.16 0.21 0.04* -0.06*(4) Technological Relatedness 0.48 0.59 0.09* 0.06* 0.08*(5) R&D Expenses 0.44 0.75 0.05* 0.06* -0.04* -0.12*(6) Patent Portfolio Size 4.79 1.53 0.06* 0.08* -0.06* -0.08* 0.60*(7) Profit Margin 0.05 0.50 0.01* 0.01* 0 0.01* 0.06* 0.10*(8) Technology Diversification 5.43 3.79 0.08* 0.08* -0.03* 0.13* 0.13* 0.32* 0.01*(9) Product Diversification 0.50 0.28 0.03* 0.03* -0.01* 0.06* 0.06* 0.13* 0.08* 0.28*
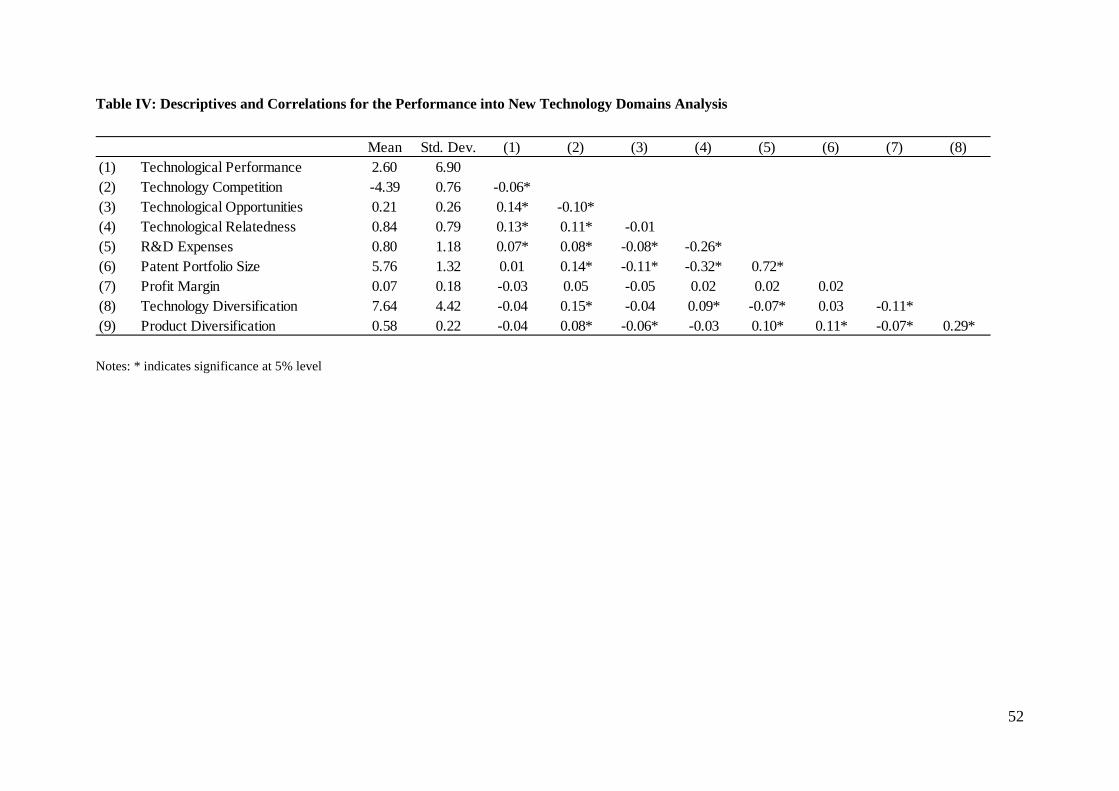
52
Table IV: Descriptives and Correlations for the Performance into New Technology Domains Analysis
Notes: * indicates significance at 5% level
Mean Std. Dev. (1) (2) (3) (4) (5) (6) (7) (8)(1) Technological Performance 2.60 6.90(2) Technology Competition -4.39 0.76 -0.06*(3) Technological Opportunities 0.21 0.26 0.14* -0.10*(4) Technological Relatedness 0.84 0.79 0.13* 0.11* -0.01(5) R&D Expenses 0.80 1.18 0.07* 0.08* -0.08* -0.26*(6) Patent Portfolio Size 5.76 1.32 0.01 0.14* -0.11* -0.32* 0.72*(7) Profit Margin 0.07 0.18 -0.03 0.05 -0.05 0.02 0.02 0.02(8) Technology Diversification 7.64 4.42 -0.04 0.15* -0.04 0.09* -0.07* 0.03 -0.11*(9) Product Diversification 0.58 0.22 -0.04 0.08* -0.06* -0.03 0.10* 0.11* -0.07* 0.29*
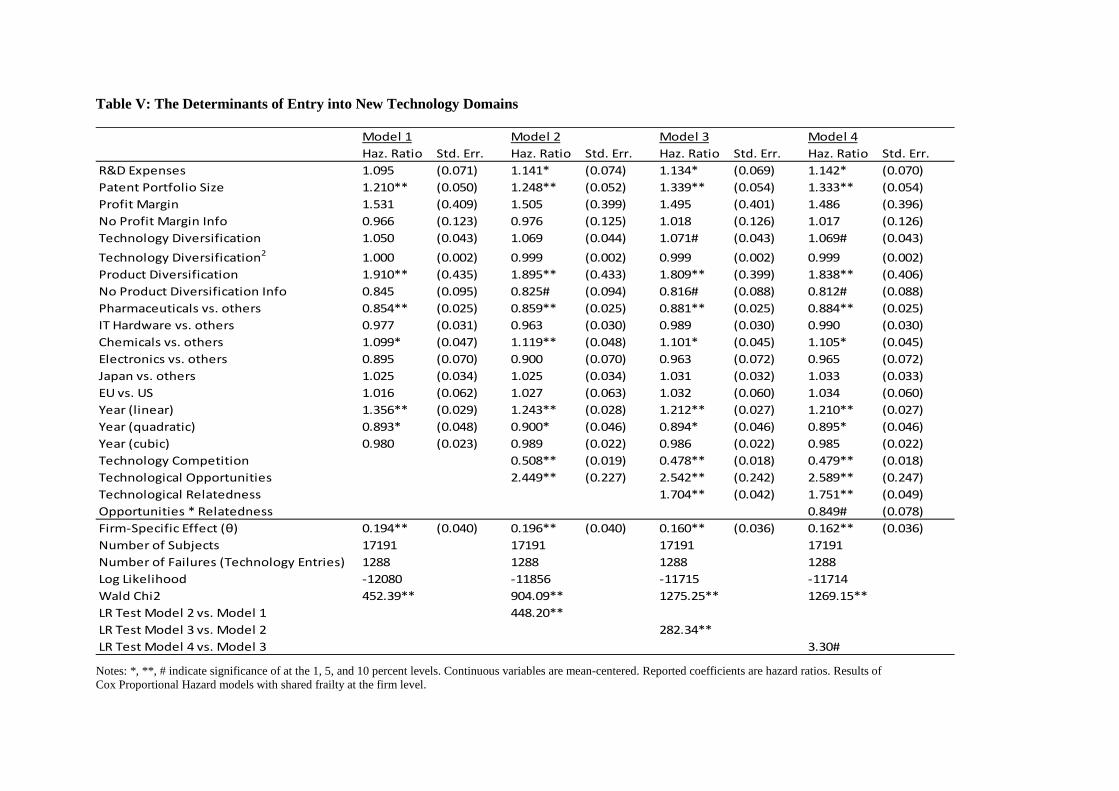
Table V: The Determinants of Entry into New Technology Domains
Notes: *, **, # indicate significance of at the 1, 5, and 10 percent levels. Continuous variables are mean-centered. Reported coefficients are hazard ratios. Results of Cox Proportional Hazard models with shared frailty at the firm level.
Haz. Ratio Std. Err. Haz. Ratio Std. Err. Haz. Ratio Std. Err. Haz. Ratio Std. Err.R&D Expenses 1.095 (0.071) 1.141* (0.074) 1.134* (0.069) 1.142* (0.070)Patent Portfolio Size 1.210** (0.050) 1.248** (0.052) 1.339** (0.054) 1.333** (0.054)Profit Margin 1.531 (0.409) 1.505 (0.399) 1.495 (0.401) 1.486 (0.396)No Profit Margin Info 0.966 (0.123) 0.976 (0.125) 1.018 (0.126) 1.017 (0.126)Technology Diversification 1.050 (0.043) 1.069 (0.044) 1.071# (0.043) 1.069# (0.043)Technology Diversification2 1.000 (0.002) 0.999 (0.002) 0.999 (0.002) 0.999 (0.002)Product Diversification 1.910** (0.435) 1.895** (0.433) 1.809** (0.399) 1.838** (0.406)No Product Diversification Info 0.845 (0.095) 0.825# (0.094) 0.816# (0.088) 0.812# (0.088)Pharmaceuticals vs. others 0.854** (0.025) 0.859** (0.025) 0.881** (0.025) 0.884** (0.025)IT Hardware vs. others 0.977 (0.031) 0.963 (0.030) 0.989 (0.030) 0.990 (0.030)Chemicals vs. others 1.099* (0.047) 1.119** (0.048) 1.101* (0.045) 1.105* (0.045)Electronics vs. others 0.895 (0.070) 0.900 (0.070) 0.963 (0.072) 0.965 (0.072)Japan vs. others 1.025 (0.034) 1.025 (0.034) 1.031 (0.032) 1.033 (0.033)EU vs. US 1.016 (0.062) 1.027 (0.063) 1.032 (0.060) 1.034 (0.060)Year (linear) 1.356** (0.029) 1.243** (0.028) 1.212** (0.027) 1.210** (0.027)Year (quadratic) 0.893* (0.048) 0.900* (0.046) 0.894* (0.046) 0.895* (0.046)Year (cubic) 0.980 (0.023) 0.989 (0.022) 0.986 (0.022) 0.985 (0.022)Technology Competition 0.508** (0.019) 0.478** (0.018) 0.479** (0.018)Technological Opportunities 2.449** (0.227) 2.542** (0.242) 2.589** (0.247)Technological Relatedness 1.704** (0.042) 1.751** (0.049)Opportunities * Relatedness 0.849# (0.078)Firm-Specific Effect (θ) 0.194** (0.040) 0.196** (0.040) 0.160** (0.036) 0.162** (0.036)Number of Subjects 17191 17191 17191 17191Number of Failures (Technology Entries) 1288 1288 1288 1288Log Likelihood -12080 -11856 -11715 -11714Wald Chi2 452.39** 904.09** 1275.25** 1269.15**LR Test Model 2 vs. Model 1 448.20**LR Test Model 3 vs. Model 2 282.34**LR Test Model 4 vs. Model 3 3.30#
Model 1 Model 2 Model 3 Model 4
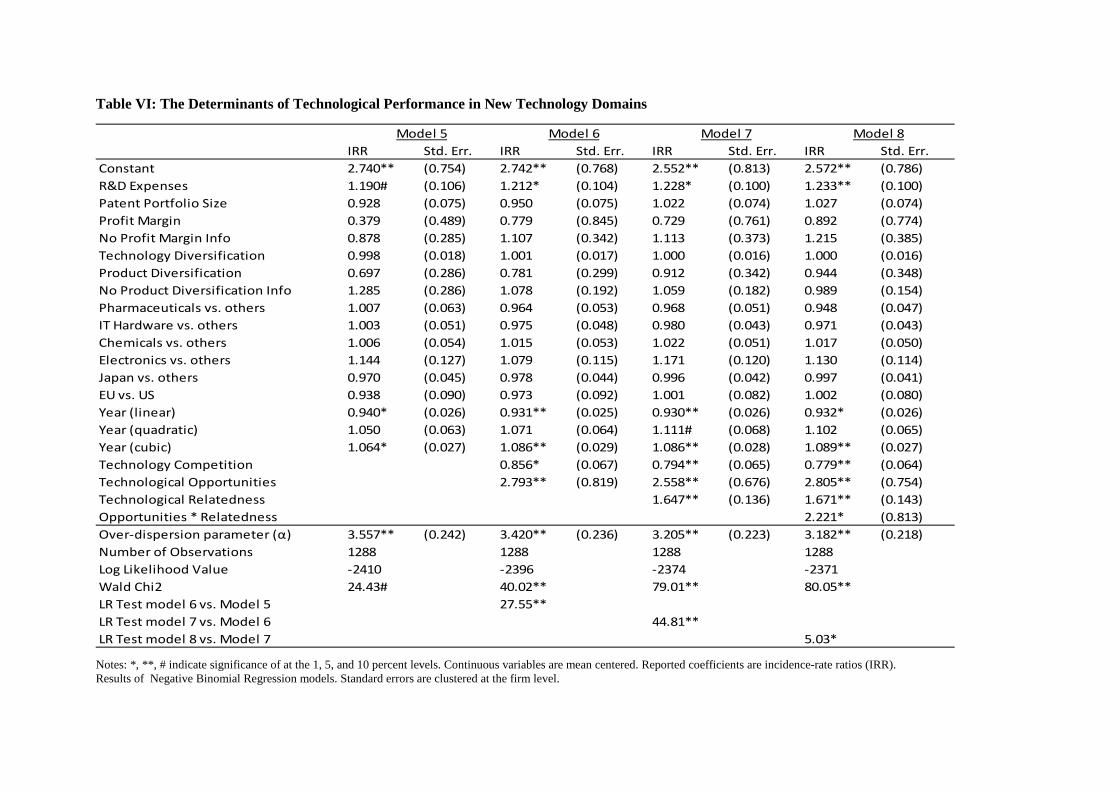
Table VI: The Determinants of Technological Performance in New Technology Domains
Notes: *, **, # indicate significance of at the 1, 5, and 10 percent levels. Continuous variables are mean centered. Reported coefficients are incidence-rate ratios (IRR). Results of Negative Binomial Regression models. Standard errors are clustered at the firm level.
IRR Std. Err. IRR Std. Err. IRR Std. Err. IRR Std. Err.Constant 2.740** (0.754) 2.742** (0.768) 2.552** (0.813) 2.572** (0.786)R&D Expenses 1.190# (0.106) 1.212* (0.104) 1.228* (0.100) 1.233** (0.100)Patent Portfolio Size 0.928 (0.075) 0.950 (0.075) 1.022 (0.074) 1.027 (0.074)Profit Margin 0.379 (0.489) 0.779 (0.845) 0.729 (0.761) 0.892 (0.774)No Profit Margin Info 0.878 (0.285) 1.107 (0.342) 1.113 (0.373) 1.215 (0.385)Technology Diversification 0.998 (0.018) 1.001 (0.017) 1.000 (0.016) 1.000 (0.016)Product Diversification 0.697 (0.286) 0.781 (0.299) 0.912 (0.342) 0.944 (0.348)No Product Diversification Info 1.285 (0.286) 1.078 (0.192) 1.059 (0.182) 0.989 (0.154)Pharmaceuticals vs. others 1.007 (0.063) 0.964 (0.053) 0.968 (0.051) 0.948 (0.047)IT Hardware vs. others 1.003 (0.051) 0.975 (0.048) 0.980 (0.043) 0.971 (0.043)Chemicals vs. others 1.006 (0.054) 1.015 (0.053) 1.022 (0.051) 1.017 (0.050)Electronics vs. others 1.144 (0.127) 1.079 (0.115) 1.171 (0.120) 1.130 (0.114)Japan vs. others 0.970 (0.045) 0.978 (0.044) 0.996 (0.042) 0.997 (0.041)EU vs. US 0.938 (0.090) 0.973 (0.092) 1.001 (0.082) 1.002 (0.080)Year (linear) 0.940* (0.026) 0.931** (0.025) 0.930** (0.026) 0.932* (0.026)Year (quadratic) 1.050 (0.063) 1.071 (0.064) 1.111# (0.068) 1.102 (0.065)Year (cubic) 1.064* (0.027) 1.086** (0.029) 1.086** (0.028) 1.089** (0.027)Technology Competition 0.856* (0.067) 0.794** (0.065) 0.779** (0.064)Technological Opportunities 2.793** (0.819) 2.558** (0.676) 2.805** (0.754)Technological Relatedness 1.647** (0.136) 1.671** (0.143)Opportunities * Relatedness 2.221* (0.813)Over-dispersion parameter (α) 3.557** (0.242) 3.420** (0.236) 3.205** (0.223) 3.182** (0.218)Number of Observations 1288 1288 1288 1288Log Likelihood Value -2410 -2396 -2374 -2371Wald Chi2 24.43# 40.02** 79.01** 80.05**LR Test model 6 vs. Model 5 27.55**LR Test model 7 vs. Model 6 44.81**LR Test model 8 vs. Model 7 5.03*
Model 5 Model 6 Model 7 Model 8
ENDNOTES
iThe precise nature of entrepreneurial opportunities has remained an issue of debate, i.e. whether opportunities
are there to be discovered or whether they are created through enactment by entrepreneurs (e.g. Venkataraman
& Sarasvathy, 2001; Foss & Foss, 2008; Klein, 2008; Alvarez and Barney 2013). For a more elaborate overview
on the notion of entrepreneurial opportunities and its constituents, we refer to Davidsson (2015) who advances a
distinction between external enablers, new venture ideas and opportunity confidence to characterize the
‘individual-opportunity’ nexus more accurately. As outlined by Davidsson (2015), actors exert influence on
enablers but for most actors, such changes are ‘exogenous’ and hence can be labeled as ‘environmental’.
ii We note that surveys of patent inventors (Tijssen, 2001; Fleming and Sorenson, 2004) have shown that inventors
are aware of a significant part of the scientific papers cited in their patents, such that scientific references are seen
as indicators of the ‘usage’ of scientific discoveries by firms in their technology activities (Fleming and Sorenson,
2004). The role of scientific information derived from citations to the scientific literature on patent documents as
an indicator of technological opportunities has been validated as strongly correlated with survey-based measures
of the importance of science for the innovation processes (e.g. Duguet and MacGarvie, 2005).
iii We are indebted to one of the reviewers for this suggestion.
iv Adding the minimum sample value instead of the value one creates large negative values after transformation.
Models with an alternative variable applying such a transformation give comparable results.
v Given the log transformation for technological opportunities, ln (1+1.87) - ln (1+0.054) ≈ 1.
vi This finding furthermore appeared less than robust in alternatively specified models, such as models with an
increased time window to establish domains that are new to the firm.
vii These calculations follow from estimating alternative models at different levels of centering. Unrelated NTDs
have a relatedness value of zero; closely related NTDs are taken as having a value of relatedness (1.6) equal to
the mean + 2 standard deviations of relatedness in the entry analysis.
viii Moderately related domains are defined as domains with a relatedness value of 1.

FACULTY OF ECONOMICS AND BUSINESS DEPARTMENT OF MANAGERIAL ECONOMICS, STRATEGY AND INNOVATION
Naamsestraat 69 bus 3500 3000 LEUVEN, BELGIË
tel. + 32 16 32 67 00 fax + 32 16 32 67 32
[email protected] www.econ.kuleuven.be/MSI