Embed Size (px)
Citation preview

ENVISION HOI Heart of Illinois Long Range Transportation Plan
LRTP BLUE RIBBON STEERING COMMITTEEMaureen Addis, IDOT District 4
Mayor Mark Allen, Village of Peoria Heights
Mayor Jim Ardis, City of Peoria
Mayor Laurie Barra, City of Pekin
Mayor Doug Crew, City of Chillicothe
Mayor Dana Dearborn, Village of Marquette Heights
Mayor Jeff DeGroot, Village of Germantown Hills
Mayor James Dillon, City of West Peoria
Mayor Jack Fennell, Village of Dunlap
Mayor Stephen Flowers, Village of North Pekin
Kensil Garnett, IDOT District 4
Stan Glasier, Woodford County Board Chair
Mayor Fred Lang, Village of Creve Coeur
Mayor Gary Manier, City of Washington
Sharon McBride, Greater Peoria Mass Transit District Board Chair
Mayor Dave Mingus, City of East Peoria
Tom O’Neill, Peoria County Board Chairman
Mayor Ronald Rainson, Village of Morton
Mayor Rhonda Wolfe, Village of Bartonville
Dave Zimmerman, Tazewell County Board Chair
LRTP TECHNICAL ADVISORY COMMITTEEJoe Alexander, CityLink
Marty Clinch, Woodford County
Aaron Coffeen, Bike Peoria
Michael Guerra, PPUATS Technical Committee
John Hamann, HSTP Committee
Sally Hanley, Economic Development Council for Central Illinois
Tom Kelso, IDOT
Denny Kief, Focus Forward Central Illinois
Gary Maden, Army Corps of Engineers, Rock Island
Gene Olson, Metropolitan Airport Authority of Peoria
Tom O’Neill, PPUATS Policy Committee
Marshall B. Plumley, Army Corps of Engineers, Rock Island
Mike Pula, Friends of the Rock Island Trail
Mayor Ron Rainson, PPUATS Policy Committee
Mike Rogers, City of Peoria Public Works
Connie Schiele, HSTP Committee
Josh Sender, PPUATS Technical Committee
Betsy Tracy, FHWA
Terrisa Worsfold, IDOT District 4
Mike Zerbonia, Army Corps of Engineers, Peoria
This plan was prepared by TCRPC staff in collaboration with its member agencies, partnership organizations, and local stakeholders.
PPUATS TECHNICAL COMMITTEEJoe Alexander, CityLink*
Ed Andrews, City of Washington
Amy Benecke-McLaren, Peoria County
Lindell Loy, Woodford County
Kenneth Coulter, City of Chillicothe
Craig Fink, Tazewell County
Jeff Gilles, Peoria County
Darin Girdler, City of Pekin*
Michael Guerra, City of Pekin
Alicia Hermann, Village of West Peoria* and Village of Creve Coeur
Craig Loudermilk, Village of Morton
Patrick Meyer, Village of Bartonville
Josh Moore, CityLink
Jon Oliphant, City of Washington*
Gene Olson, Metropolitan Airport Authority of Peoria
Dan Parr, Tazewell County
Scott Reeise, City of Peoria
Pete Saunders, Tri-County Regional Planning Commission
Rick Semonski, City of East Peoria
Josh Sender, Peoria County
Kyle Smith, Village of Peoria Heights
Nick Stoffer, City of Peoria
Henry Strube Jr., City of West Peoria
Frank Sturm, Village of Morton*
Terissa Worsfold, IDOT
PPUATS POLICY COMMITTEEMaureen Addis, IDOT
Mayor Mark Allen, Village of Peoria Heights
Mayor Jim Ardis, City of Peoria
Mayor Laurie Barra, City of Pekin
John Carlson, City of West Peoria*
Russ Crawford, Tazewell County
Mayor Doug Crew, City of Chillicothe
Mayor James Dillon, City of West Peoria
Steve Ferguson, City of East Peoria*
Matt Fick, Village of Peoria Heights*
Darin Girdler, City of Pekin*
Tim Gleason, City of Washington*
Tina Hart, Village of Bartonville*
Ginger Herman, Village of Morton*
Mayor Fred Lang, Village of Creve Coeur
Barry Logan, Woodford County
Tom Lucek, CityLink
Mayor Gary Manier, City of Washington
Sharon McBride, CityLink
Mayor Dave Mingus, City of East Peoria
Josh Moore, CityLink*
Stephen Morris, Peoria County
Tom O’Neill, Peoria County
Mayor Ron Rainson, Village of Morton
Mike Rogers, City of Peoria
Phil Salzar, Peoria County
Greg Sinn, Tazewell County
Mayor Rhonda Wolfe, Village of Bartonville* Alternate Board Chair
5 TABLE OF CONTENTS: Env i s ion HOI Long Range Transpor tat ion P lan
TRI-COUNTY REGIONAL PLANNING COMMISSION STAFFAdministration
Pete Saunders, Executive Director
Debbie Ulrich, Office Manager
Dave Shotick, Accountant
Planning Staff
Maggie Martino, Planning Program Manager
Nicholas Hayward, Planner III
Jill Goforth, Planner II*
David Smesrud, Planner II
Kathryn Shackelford, Planner I*
Ryan Harms, Planner I
GIS Staff
Eric Miller, GIS Program Manager
Greg Sachau, GIS Manager
Matt Junker, GIS Specialist III
*LRTP Project Manager
6 TABLE OF CONTENTS: Env i s ion HOI Long Range Transpor tat ion P lan
TABLE OF CONTENTS
11 INTRODUCTION 15 PUBLIC PARTICIPATION
23 DEMOGRAPHICS 31 LAND USE
39 ENVIRONMENT 47 PUBLIC HEALTH
51 ECONOMIC DEVELOPMENT 57 TRANSPORTATION
121 FUNDING ANALYSIS
141 TRAVEL DEMAND MODEL
109 GOALS
151 APPENDIX
7TABLE OF CONTENTS: Env i s ion HOI Long Range Transpor tat ion P lan TABLE OF CONTENTS: Env i s ion HOI Long Range Transpor tat ion P lan
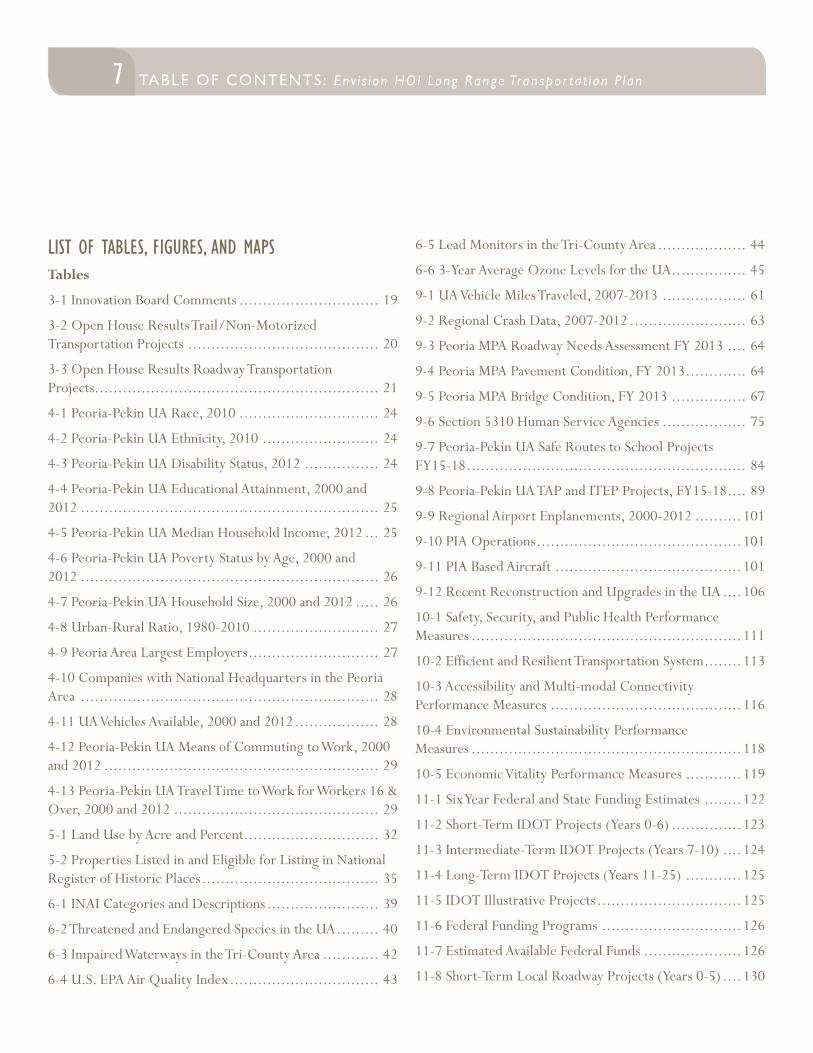
LIST OF TABLES, FIGURES, AND MAPSTables
3-1 Innovation Board Comments .............................. 19
3-2 Open House Results Trail/Non-Motorized Transportation Projects ......................................... 20
3-3 Open House Results Roadway Transportation Projects ............................................................. 21
4-1 Peoria-Pekin UA Race, 2010 .............................. 24
4-2 Peoria-Pekin UA Ethnicity, 2010 ......................... 24
4-3 Peoria-Pekin UA Disability Status, 2012 ................ 24
4-4 Peoria-Pekin UA Educational Attainment, 2000 and 2012 ................................................................ 25
4-5 Peoria-Pekin UA Median Household Income, 2012 ... 25
4-6 Peoria-Pekin UA Poverty Status by Age, 2000 and 2012 ................................................................ 26
4-7 Peoria-Pekin UA Household Size, 2000 and 2012 ..... 26
4-8 Urban-Rural Ratio, 1980-2010 ........................... 27
4-9 Peoria Area Largest Employers ............................ 27
4-10 Companies with National Headquarters in the Peoria Area ................................................................ 28
4-11 UA Vehicles Available, 2000 and 2012 .................. 28
4-12 Peoria-Pekin UA Means of Commuting to Work, 2000 and 2012 ........................................................... 29
4-13 Peoria-Pekin UA Travel Time to Work for Workers 16 & Over, 2000 and 2012 ............................................ 29
5-1 Land Use by Acre and Percent............................. 32
5-2 Properties Listed in and Eligible for Listing in National Register of Historic Places ...................................... 35
6-1 INAI Categories and Descriptions ........................ 39
6-2 Threatened and Endangered Species in the UA ......... 40
6-3 Impaired Waterways in the Tri-County Area ............ 42
6-4 U.S. EPA Air Quality Index ................................ 43
6-5 Lead Monitors in the Tri-County Area ................... 44
6-6 3-Year Average Ozone Levels for the UA ................ 45
9-1 UA Vehicle Miles Traveled, 2007-2013 .................. 61
9-2 Regional Crash Data, 2007-2012 ......................... 63
9-3 Peoria MPA Roadway Needs Assessment FY 2013 .... 64
9-4 Peoria MPA Pavement Condition, FY 2013 ............. 64
9-5 Peoria MPA Bridge Condition, FY 2013 ................ 67
9-6 Section 5310 Human Service Agencies .................. 75
9-7 Peoria-Pekin UA Safe Routes to School Projects FY15-18 ............................................................ 84
9-8 Peoria-Pekin UA TAP and ITEP Projects, FY15-18 .... 89
9-9 Regional Airport Enplanements, 2000-2012 ..........101
9-10 PIA Operations ............................................101
9-11 PIA Based Aircraft ........................................101
9-12 Recent Reconstruction and Upgrades in the UA ....106
10-1 Safety, Security, and Public Health Performance Measures ..........................................................111
10-2 Efficient and Resilient Transportation System ........113
10-3 Accessibility and Multi-modal Connectivity Performance Measures .........................................116
10-4 Environmental Sustainability Performance Measures ..........................................................118
10-5 Economic Vitality Performance Measures ............119
11-1 Six Year Federal and State Funding Estimates ........122
11-2 Short-Term IDOT Projects (Years 0-6) ...............123
11-3 Intermediate-Term IDOT Projects (Years 7-10) ....124
11-4 Long-Term IDOT Projects (Years 11-25) ............125
11-5 IDOT Illustrative Projects ...............................125
11-6 Federal Funding Programs ..............................126
11-7 Estimated Available Federal Funds .....................126
11-8 Short-Term Local Roadway Projects (Years 0-5) ....130
8 TABLE OF CONTENTS: Env i s ion HOI Long Range Transpor tat ion P lan
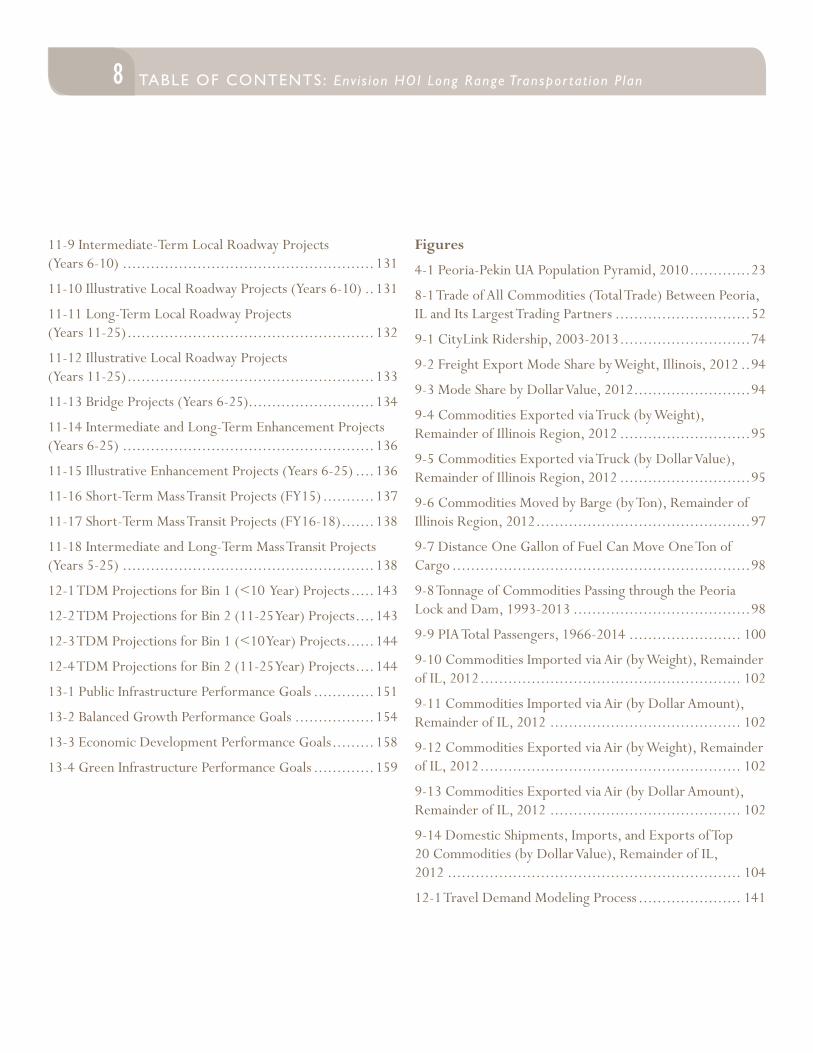
11-9 Intermediate-Term Local Roadway Projects (Years 6-10) ......................................................131
11-10 Illustrative Local Roadway Projects (Years 6-10) ..131
11-11 Long-Term Local Roadway Projects (Years 11-25) .....................................................132
11-12 Illustrative Local Roadway Projects (Years 11-25) .....................................................133
11-13 Bridge Projects (Years 6-25)...........................134
11-14 Intermediate and Long-Term Enhancement Projects (Years 6-25) ......................................................136
11-15 Illustrative Enhancement Projects (Years 6-25) ....136
11-16 Short-Term Mass Transit Projects (FY15) ...........137
11-17 Short-Term Mass Transit Projects (FY16-18) .......138
11-18 Intermediate and Long-Term Mass Transit Projects (Years 5-25) ......................................................138
12-1 TDM Projections for Bin 1 (<10 Year) Projects .....143
12-2 TDM Projections for Bin 2 (11-25 Year) Projects ....143
12-3 TDM Projections for Bin 1 (<10 Year) Projects ......144
12-4 TDM Projections for Bin 2 (11-25 Year) Projects ....144
13-1 Public Infrastructure Performance Goals .............151
13-2 Balanced Growth Performance Goals .................154
13-3 Economic Development Performance Goals .........158
13-4 Green Infrastructure Performance Goals .............159
Figures
4-1 Peoria-Pekin UA Population Pyramid, 2010 .............23
8-1 Trade of All Commodities (Total Trade) Between Peoria, IL and Its Largest Trading Partners .............................52
9-1 CityLink Ridership, 2003-2013 ............................74
9-2 Freight Export Mode Share by Weight, Illinois, 2012 ..94
9-3 Mode Share by Dollar Value, 2012 .........................94
9-4 Commodities Exported via Truck (by Weight), Remainder of Illinois Region, 2012 ............................95
9-5 Commodities Exported via Truck (by Dollar Value), Remainder of Illinois Region, 2012 ............................95
9-6 Commodities Moved by Barge (by Ton), Remainder of Illinois Region, 2012 ..............................................97
9-7 Distance One Gallon of Fuel Can Move One Ton of Cargo ................................................................98
9-8 Tonnage of Commodities Passing through the Peoria Lock and Dam, 1993-2013 ......................................98
9-9 PIA Total Passengers, 1966-2014 ........................ 100
9-10 Commodities Imported via Air (by Weight), Remainder of IL, 2012 ........................................................ 102
9-11 Commodities Imported via Air (by Dollar Amount), Remainder of IL, 2012 ......................................... 102
9-12 Commodities Exported via Air (by Weight), Remainder of IL, 2012 ........................................................ 102
9-13 Commodities Exported via Air (by Dollar Amount), Remainder of IL, 2012 ......................................... 102
9-14 Domestic Shipments, Imports, and Exports of Top 20 Commodities (by Dollar Value), Remainder of IL, 2012 ............................................................... 104
12-1 Travel Demand Modeling Process ...................... 141
9TABLE OF CONTENTS: Env i s ion HOI Long Range Transpor tat ion P lan TABLE OF CONTENTS: Env i s ion HOI Long Range Transpor tat ion P lan
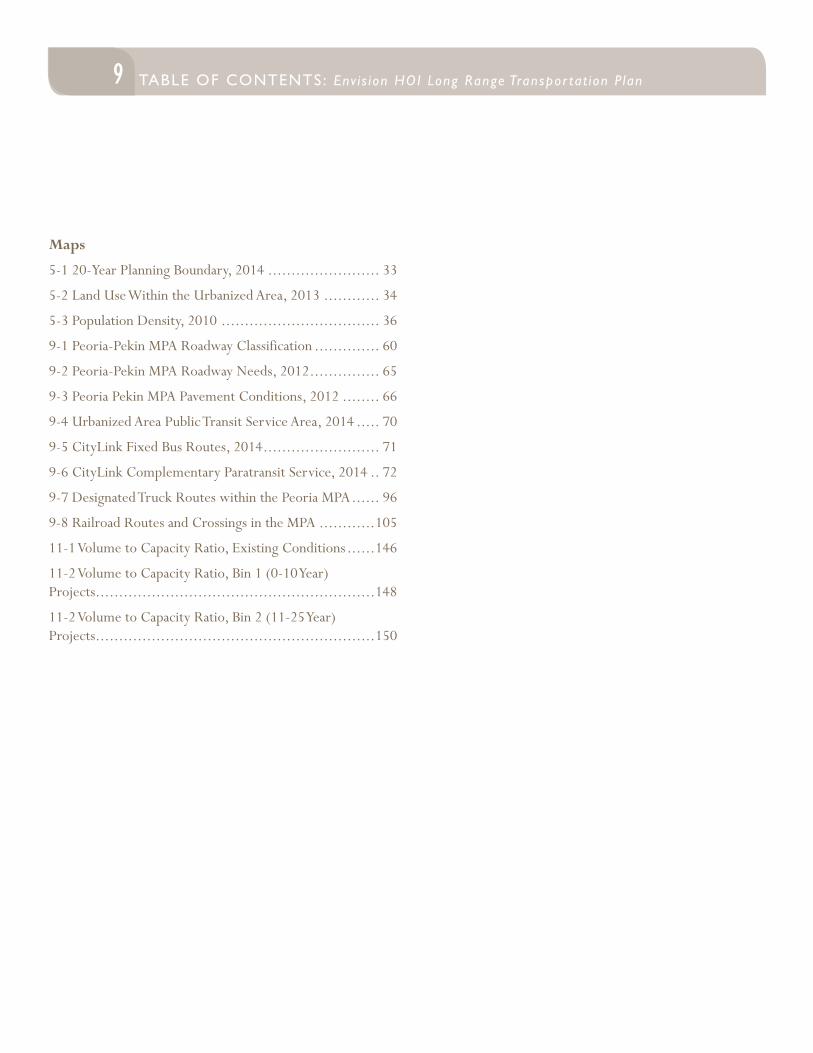
Maps
5-1 20-Year Planning Boundary, 2014 ........................ 33
5-2 Land Use Within the Urbanized Area, 2013 ............ 34
5-3 Population Density, 2010 .................................. 36
9-1 Peoria-Pekin MPA Roadway Classification .............. 60
9-2 Peoria-Pekin MPA Roadway Needs, 2012 ............... 65
9-3 Peoria Pekin MPA Pavement Conditions, 2012 ........ 66
9-4 Urbanized Area Public Transit Service Area, 2014 ..... 70
9-5 CityLink Fixed Bus Routes, 2014 ......................... 71
9-6 CityLink Complementary Paratransit Service, 2014 .. 72
9-7 Designated Truck Routes within the Peoria MPA ...... 96
9-8 Railroad Routes and Crossings in the MPA ............105
11-1 Volume to Capacity Ratio, Existing Conditions ......146
11-2 Volume to Capacity Ratio, Bin 1 (0-10 Year) Projects ............................................................148
11-2 Volume to Capacity Ratio, Bin 2 (11-25 Year) Projects ............................................................150

10 TABLE OF CONTENTS: Env i s ion HOI Long Range Transpor tat ion P lan
INTRODUCTION
11 INTRODUCTION: Env i s ion HOI Long Range Transpor tat ion P lanTABLE OF CONTENTS: Env i s ion HOI Long Range Transpor tat ion P lan
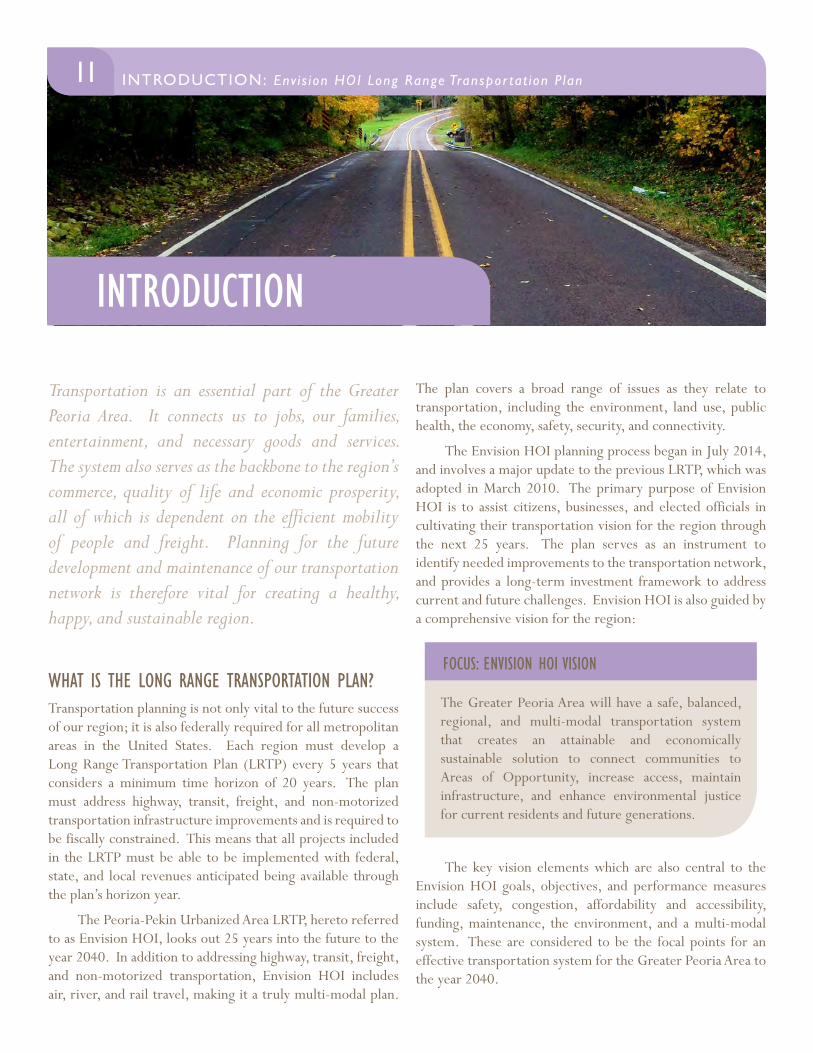
Transportation is an essential part of the Greater Peoria Area. It connects us to jobs, our families, entertainment, and necessary goods and services. The system also serves as the backbone to the region’s commerce, quality of life and economic prosperity, all of which is dependent on the efficient mobility of people and freight. Planning for the future development and maintenance of our transportation network is therefore vital for creating a healthy, happy, and sustainable region.
WHAT IS THE LONG RANGE TRANSPORTATION PLAN?Transportation planning is not only vital to the future success of our region; it is also federally required for all metropolitan areas in the United States. Each region must develop a Long Range Transportation Plan (LRTP) every 5 years that considers a minimum time horizon of 20 years. The plan must address highway, transit, freight, and non-motorized transportation infrastructure improvements and is required to be fiscally constrained. This means that all projects included in the LRTP must be able to be implemented with federal, state, and local revenues anticipated being available through the plan’s horizon year.
The Peoria-Pekin Urbanized Area LRTP, hereto referred to as Envision HOI, looks out 25 years into the future to the year 2040. In addition to addressing highway, transit, freight, and non-motorized transportation, Envision HOI includes air, river, and rail travel, making it a truly multi-modal plan.
The plan covers a broad range of issues as they relate to transportation, including the environment, land use, public health, the economy, safety, security, and connectivity.
The Envision HOI planning process began in July 2014, and involves a major update to the previous LRTP, which was adopted in March 2010. The primary purpose of Envision HOI is to assist citizens, businesses, and elected officials in cultivating their transportation vision for the region through the next 25 years. The plan serves as an instrument to identify needed improvements to the transportation network, and provides a long-term investment framework to address current and future challenges. Envision HOI is also guided by a comprehensive vision for the region:
The key vision elements which are also central to the Envision HOI goals, objectives, and performance measures include safety, congestion, affordability and accessibility, funding, maintenance, the environment, and a multi-modal system. These are considered to be the focal points for an effective transportation system for the Greater Peoria Area to the year 2040.
The Greater Peoria Area will have a safe, balanced, regional, and multi-modal transportation system that creates an attainable and economically sustainable solution to connect communities to Areas of Opportunity, increase access, maintain infrastructure, and enhance environmental justice for current residents and future generations.
FOCUS: ENVISION HOI VISION
12 INTRODUCTION: Env i s ion HOI Long Range Transpor tat ion P lan
WHO DEVELOPS THE LONG RANGE TRANSPORTATION PLAN?The Metropolitan Planning Organization (MPO) is responsible for maintaining and updating the LRTP. The MPO is a federally mandated transportation planning agency for metropolitan areas with populations greater than 50,000. In addition to developing the LRTP, the MPO is responsible for the following aspects of the transportation planning process:
• To give advice regarding development in the region;
• To review and advise on proposed changes in transportation planning concepts;
• To serve as a liaison between governmental units in the study area; and
• To obtain optimum cooperation of all governmental units in providing information and implementing various elements of the transportation plan.
In our region, the Tri-County Regional Planning Commission (TCRPC) has been designated as the MPO. TCRPC has delegated its duties to the Peoria-Pekin Urbanized Area Transportation Study (PPUATS), which serves as an advisory board to TCRPC on all transportation matters.
PPUATS is made up of a range of transportation professionals and elected officials who represent the diverse needs of our region. These individuals represent the General Wayne A. Downing Peoria International Airport, the Greater Peoria Mass Transit District, the Illinois Department of Transportation, the Federal Highway Administration, and the following local municipalities and counties:
• Peoria County
• Tazewell County
• Woodford County
• City of Chillicothe
• City of East Peoria
• City of Peoria
• City of Pekin
• City of Washington
• City of West Peoria
• Village of Bartonville
• Village of Creve Coeur
• Village of Peoria Heights
• Village of Morton
PPUATS is divided into two committees, a Policy Committee and a Technical Committee. The PPUATS Policy Committee consists of elected officials representing the jurisdictions and agencies listed above; it is responsible for determining transportation policy within the framework of the urban transportation planning process. Members of the PPUATS Technical Committee, on the other hand, are appointed by their respective PPUATS jurisdiction or agency and consist mostly of transportation professionals. As the MPO, TCRPC has review authority over PPUATS, and may request that both committees further consider and act upon controversial decisions.
While TCRPC staff oversees the LRTP planning process as a whole, PPUATS is responsible for providing data, giving recommendations and advice regarding the plan’s goals and objectives, developing a transportation project list, and selecting a finalized, fiscally constrained transportation project list.
WHAT GEOGRAPHICAL AREA DOES THE LONG RANGE TRANSPORTATION PLAN CONSIDER?The LRTP addresses transportation needs for an area of urban development known as the Metropolitan Planning Area (MPA). To understand what land area the MPA covers, it is necessary to explain two additional designated areas, the Urbanized Area and the Adjusted Urbanized Area.
The Urbanized Area (UZA) is defined by the Bureau of the Census as a geographic area with a population of 50,000 or more residents. In general, the UZA has a dense settlement pattern. The core of the UZA is typically comprised of census block groups with populations of at least 1,000 persons per square mile. Census block groups with a minimum of 500 persons per square mile may be added if they are within a defined proximity to the UZA’s core. For Envision HOI, population data from the 2010 Census was used.
13INTRODUCTION: Env i s ion HOI Long Range Transpor tat ion P lan INTRODUCTION: Env i s ion HOI Long Range Transpor tat ion P lan
For planning purposes, PPUATS adjusts the UZA, and is referred to as the Adjusted Urbanized Area. The Adjusted UZA includes the entire UZA, plus other small areas necessary to round-off the jagged or irregular boundaries of the UZA. Additionally, the Adjusted UZA includes lands that are likely to be developed within the next five years, and other abutting or nearby developed lands. The Adjusted UZA is used primarily to determine which roadways are eligible for federal urban and rural funding assistance. The most recent Adjusted UZA for PPUATS was adopted in May 2014.
The Metropolitan Planning Area is similarly determined by PPUATS. The MPA includes the Adjusted UZA, plus the area that is expected to be urbanized in the next 20-25 years. It can be as large as the metropolitan statistical area or consolidated metropolitan statistical area, as defined by the Bureau of the Census. Any use of federal funds for transportation purposes within the MPA must be identified in the LRTP. Map 5-1 on page 27 shows the boundaries of the UZA and the MPA.
The following jurisdictions are within the currently defined MPA:
Peoria County
Bartonville
Bellevue
Chillicothe
Dunlap
Edwards
Hanna City
Mapleton
Mossville
Norwood
Peoria
Peoria Heights
West Peoria
Tazewell County
Creve Coeur
East Peoria
Marquette Heights
Morton
North Pekin
Pekin
South Pekin
Tremont
Washington
Woodford County
Bayview Gardens
Germantown Hills
Metamora
Spring Bay
WHAT ARE THE FEDERAL REQUIREMENTS OF THE LONG RANGE TRANSPORTATION PLAN?The development and maintenance of a Long Range Transportation Plan is outlined as a requirement in Moving Ahead for Progress in the 21st Century (MAP-21), the most recent federal surface transportation authorization legislation that took effect on October 1, 2012. MAP-21 requirements for the LRTP are very similar to the previous transportation authorization, SAFETEA-LU. Each require the LRTP to address eight specified planning factors, evaluate future conditions on the transportation system, analyze air quality,
14 INTRODUCTION: Env i s ion HOI Long Range Transpor tat ion P lan
and develop a fiscally constrained financial plan. Promoting the MAP-21 planning factors (below) is a primary goal of Envision HOI.
• Support the economic vitality of the metropolitan area, especially by enabling global competitiveness, productivity, and efficiency.
• Increase the safety of the transportation system for motorized and non-motorized users.
• Increase the security of the transportation system for motorized and non-motorized users.
• Increase accessibility and mobility of people and freight.
• Protect and enhance the environment, promote energy conservation, improve the quality of life, and promote consistency between transportation improvements and State and local planned growth and economic development patterns.
• Enhance the integration and connectivity of the transportation system, across and between modes, for people and freight.
• Promote efficient system management and operation.
• Emphasize the preservation of the existing transportation system.
MAP-21 also requires MPOs to develop a performance-based approach to transportation decision-making to support the eight national goals of the federal aid highway program. These goals include:
• Safety;
• Infrastructure Condition;
• Congestion Reduction;
• System Reliability;
• Freight Movement and Economic Vitality;
• Environmental Sustainability; and
• Reduced Project Delivery Delays.
This performance-based approach to transportation planning involves establishing performance measures
and targets that track progress towards specific goals and objectives. In general, performance measures identify strengths and weaknesses in the transportation system by evaluating whether specific components of the system are getting better or worse over time.
The previous LRTP, PPUATS 2010-2035 LRTP, identified performance measures as a part of its planning process. Envision HOI will therefore assess progress on those measures, remove measures that are no longer relevant, improve upon measures that are too vague, and add measures that may have been previously overlooked and/or reflect the new vision and policy direction of Envision HOI.
PUBLIC ENGAGEMENT
15 PUBLIC ENGAGEMENT: Env i s ion HOI Long Range Transpor tat ion P lanINTRODUCTION: Env i s ion HOI Long Range Transpor tat ion P lan
Public participation is an important component of any planning process. A planning process should both communicate information about the process to the general public and enable the general public to provide input into the process. The constant exchange of information and ideas between planners and the general public helps save time and money by discovering and avoiding issues long before they become burdens on the tax base. Effective participation also builds trust and buy-in from the general public, resulting in not only a better plan, but a more easily executable plan that is more likely to be supported and embraced by the region.
The geographic scope of the long range transportation plan is the MPA, an area that consists of portions of Peoria, Tazewell, and Woodford Counties that encompass the densely developed areas of the region centered on the City of Peoria and land immediately surrounding the densely developed areas. Given the size and large population of this area, engaging residents in meaningful interaction is challenging.
In order to effectively engage the general public in this planning process, TCRPC used a variety of outreach methods in order to maximize the number and type of opportunities for residents to become involved in the process. From participating in special meetings to attending community events to offering input online, residents became involved in the planning process through all of the outreach opportunities
used during this process.
OUTREACH METHODS
LRTP TECHNICAL COMMITTEE
In addition to transportation planners and engineers, the technical committee that oversaw the LRTP process included individuals who represent a local bicycle advocacy group and a local advocacy group for individuals with disabilities. Including non-practitioners on the committee enabled direct input from system users into discussions pertaining to the management of this planning process. This committee structure also enabled a variety of perspectives to be shared when different transportation issues were being discussed.
MINDMIXER WEBSITE
A website was established with the sole intent of engaging residents in the LRTP process. The website was developed in cooperation with MindMixer, a company devoted to building stronger relationships between communities and residents through transparent, meaningful and productive interactions. TCRPC worked with MindMixer to establish an online platform through which residents could provide input into the LRTP process from their own homes and on their own schedules. The website URL was envisionhoi.mindmixer.com, and the website enabled residents to:
• Click on a map of the region to identify locations where a transportation issue or challenge exists;
• Select the project types for which a hypothetical $100 for transportation should be spent; and
• Submit ideas on innovative transportation improvements that the region should explore.
16 PUBLIC ENGAGEMENT: Env i s ion HOI Long Range Transpor tat ion P lan
A broad variety of input was gathered through the MindMixer website. More detailed information about the input that was gathered is provided later in this section.
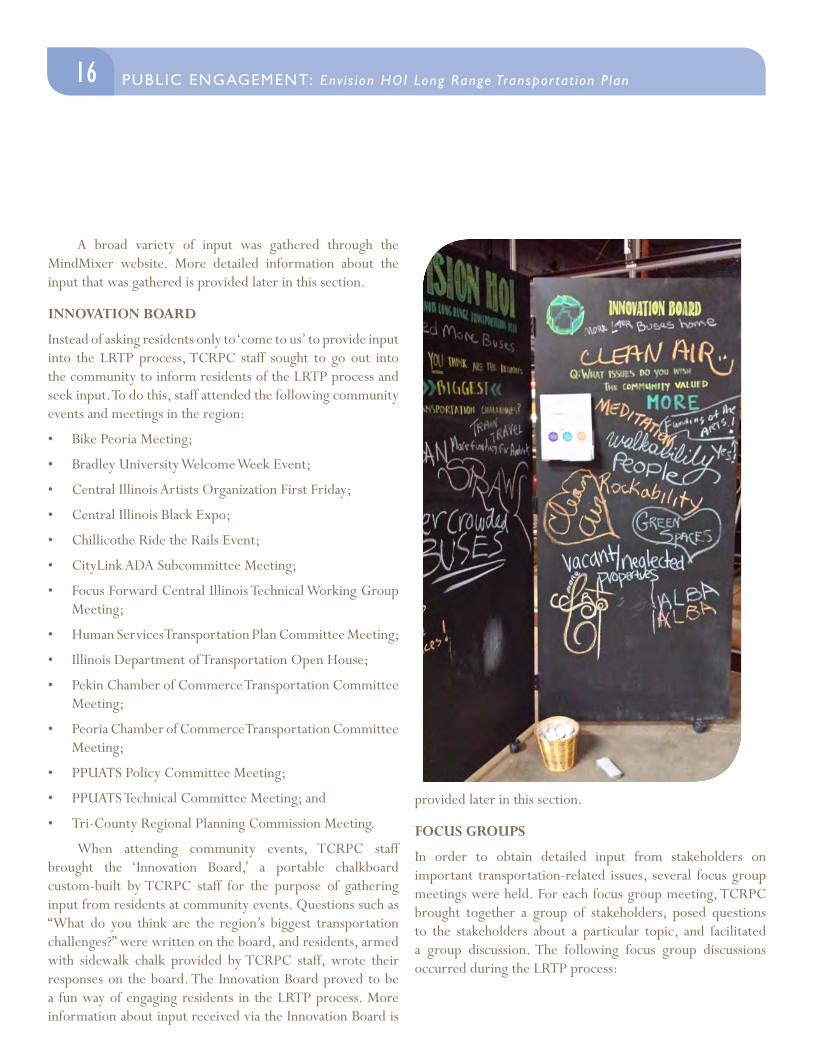
INNOVATION BOARD
Instead of asking residents only to ‘come to us’ to provide input into the LRTP process, TCRPC staff sought to go out into the community to inform residents of the LRTP process and seek input. To do this, staff attended the following community events and meetings in the region:
• Bike Peoria Meeting;
• Bradley University Welcome Week Event;
• Central Illinois Artists Organization First Friday;
• Central Illinois Black Expo;
• Chillicothe Ride the Rails Event;
• CityLink ADA Subcommittee Meeting;
• Focus Forward Central Illinois Technical Working Group Meeting;
• Human Services Transportation Plan Committee Meeting;
• Illinois Department of Transportation Open House;
• Pekin Chamber of Commerce Transportation Committee Meeting;
• Peoria Chamber of Commerce Transportation Committee Meeting;
• PPUATS Policy Committee Meeting;
• PPUATS Technical Committee Meeting; and
• Tri-County Regional Planning Commission Meeting.
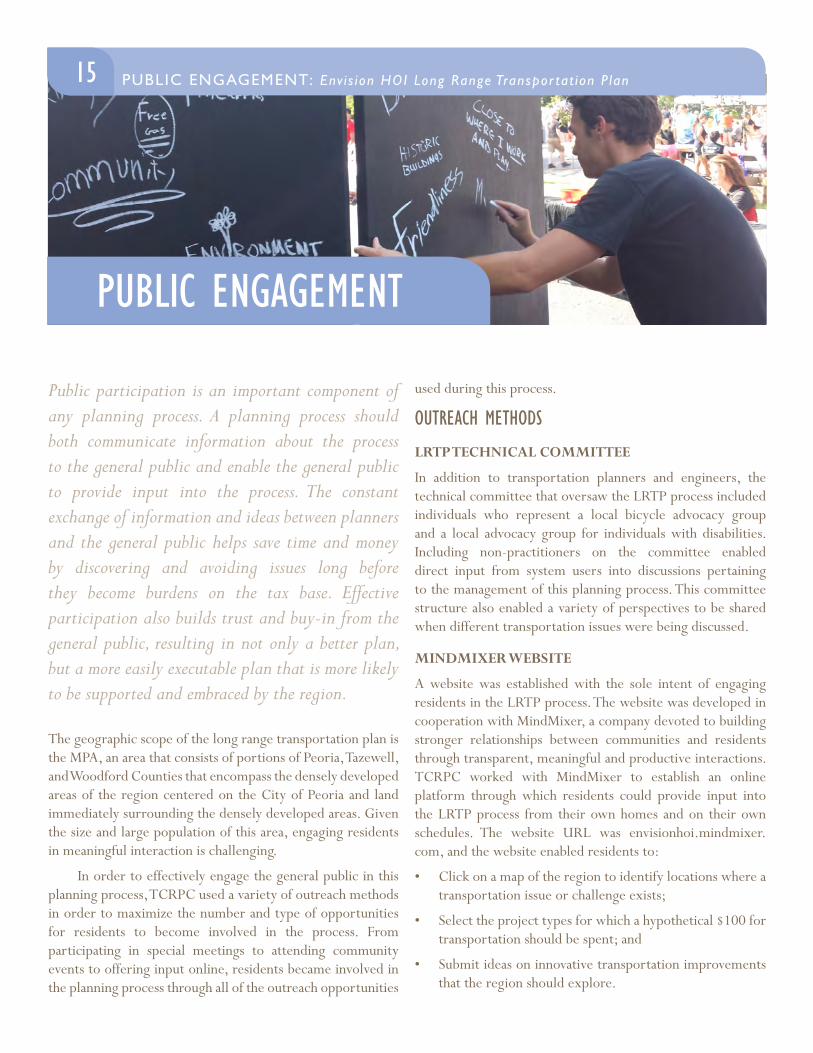
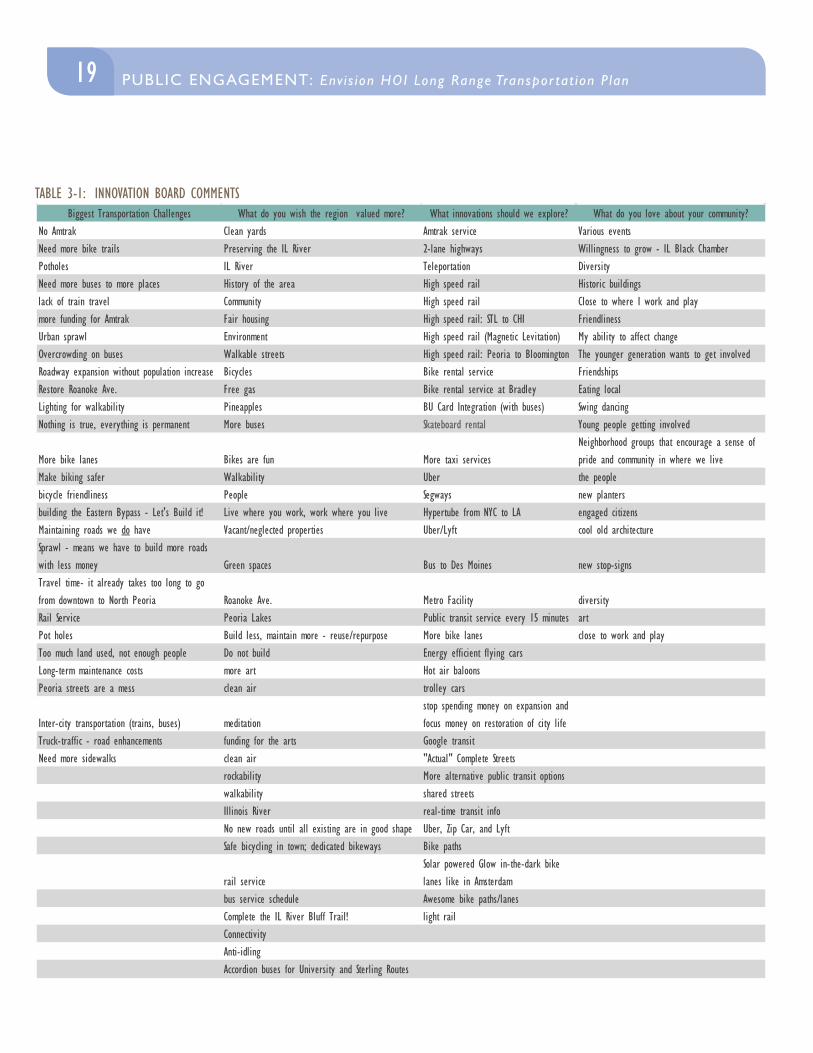
When attending community events, TCRPC staff brought the ‘Innovation Board,’ a portable chalkboard custom-built by TCRPC staff for the purpose of gathering input from residents at community events. Questions such as “What do you think are the region’s biggest transportation challenges?” were written on the board, and residents, armed with sidewalk chalk provided by TCRPC staff, wrote their responses on the board. The Innovation Board proved to be a fun way of engaging residents in the LRTP process. More information about input received via the Innovation Board is
provided later in this section.
FOCUS GROUPS
In order to obtain detailed input from stakeholders on important transportation-related issues, several focus group meetings were held. For each focus group meeting, TCRPC brought together a group of stakeholders, posed questions to the stakeholders about a particular topic, and facilitated a group discussion. The following focus group discussions occurred during the LRTP process:
17PUBLIC ENGAGEMENT: Env i s ion HOI Long Range Transpor tat ion P lan PUBLIC ENGAGEMENT: Env i s ion HOI Long Range Transpor tat ion P lan
Economic Development
A facilitated discussion occurred at a regular meeting of the Focus Forward Central Illinois Technical Working Group (TWG) on September 23. The TWG is a group consisting of local economic development and community development professionals that helps guide regional economic development.
Tri-County Regional Planning Commission
A facilitated discussion occurred at a regular meeting of the Tri-County Regional Planning Commission on September 25. The Commission – the governing board of the agency of the same name – primarily consists of county board members representing Peoria, Tazewell, and Woodford Counties.
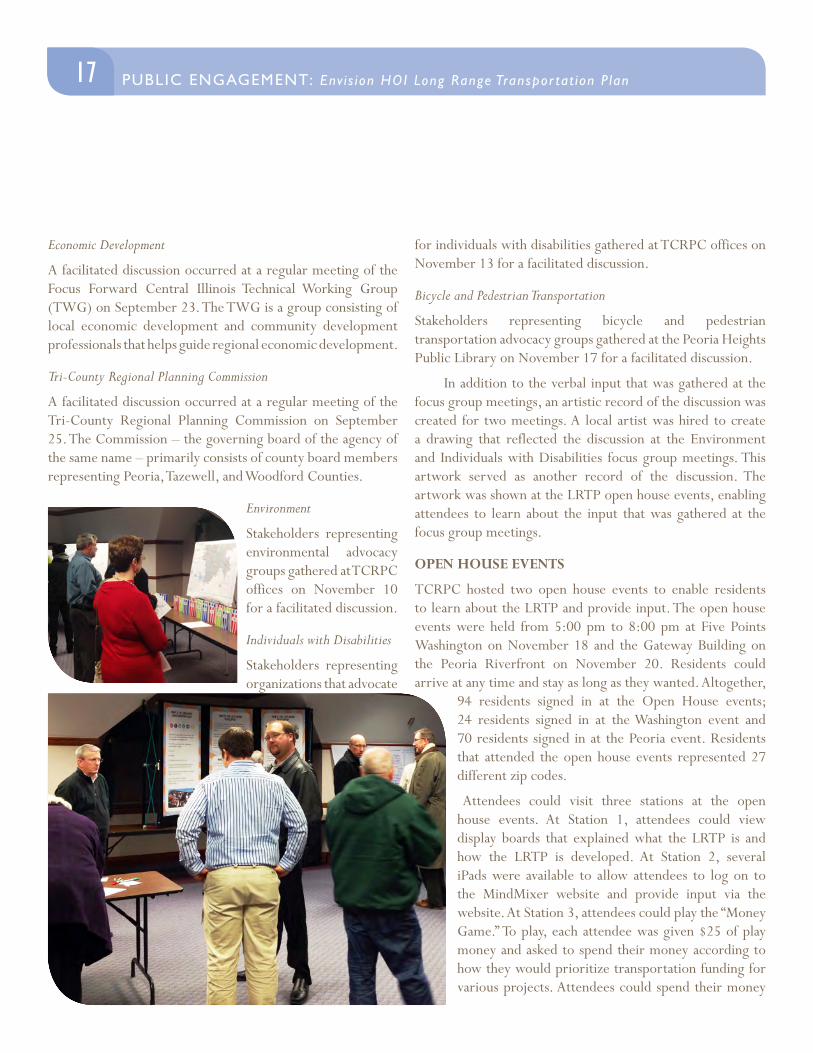
Environment
Stakeholders representing environmental advocacy groups gathered at TCRPC offices on November 10 for a facilitated discussion.
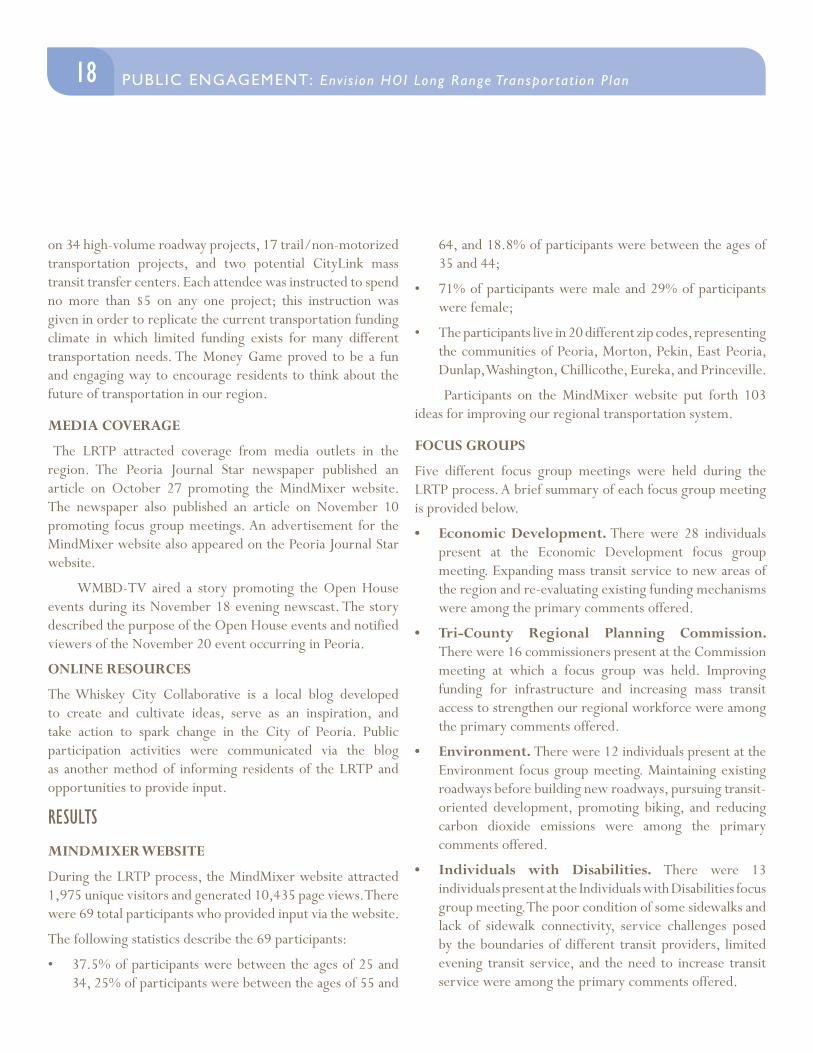
Individuals with Disabilities
Stakeholders representing organizations that advocate
for individuals with disabilities gathered at TCRPC offices on November 13 for a facilitated discussion.
Bicycle and Pedestrian Transportation
Stakeholders representing bicycle and pedestrian transportation advocacy groups gathered at the Peoria Heights Public Library on November 17 for a facilitated discussion.
In addition to the verbal input that was gathered at the focus group meetings, an artistic record of the discussion was created for two meetings. A local artist was hired to create a drawing that reflected the discussion at the Environment and Individuals with Disabilities focus group meetings. This artwork served as another record of the discussion. The artwork was shown at the LRTP open house events, enabling attendees to learn about the input that was gathered at the focus group meetings.
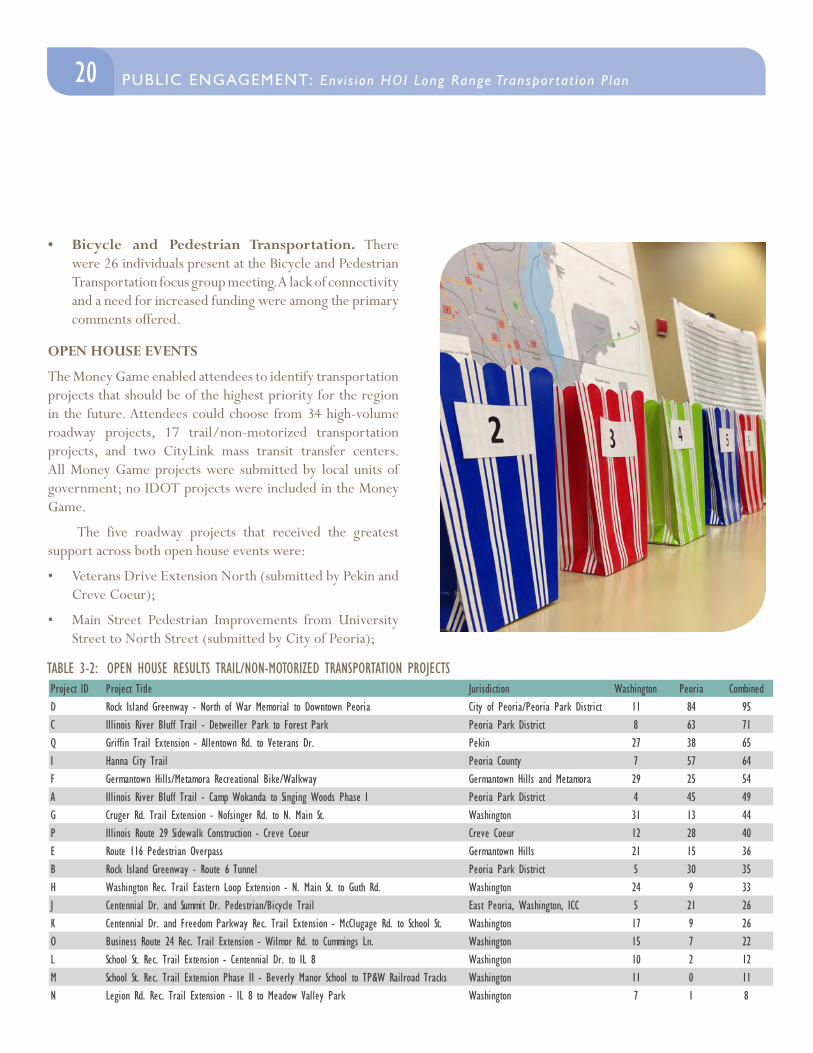
OPEN HOUSE EVENTS
TCRPC hosted two open house events to enable residents to learn about the LRTP and provide input. The open house events were held from 5:00 pm to 8:00 pm at Five Points Washington on November 18 and the Gateway Building on the Peoria Riverfront on November 20. Residents could arrive at any time and stay as long as they wanted. Altogether,
94 residents signed in at the Open House events; 24 residents signed in at the Washington event and 70 residents signed in at the Peoria event. Residents that attended the open house events represented 27 different zip codes.
Attendees could visit three stations at the open house events. At Station 1, attendees could view display boards that explained what the LRTP is and how the LRTP is developed. At Station 2, several iPads were available to allow attendees to log on to the MindMixer website and provide input via the website. At Station 3, attendees could play the “Money Game.” To play, each attendee was given $25 of play money and asked to spend their money according to how they would prioritize transportation funding for various projects. Attendees could spend their money
18 PUBLIC ENGAGEMENT: Env i s ion HOI Long Range Transpor tat ion P lan
on 34 high-volume roadway projects, 17 trail/non-motorized transportation projects, and two potential CityLink mass transit transfer centers. Each attendee was instructed to spend no more than $5 on any one project; this instruction was given in order to replicate the current transportation funding climate in which limited funding exists for many different transportation needs. The Money Game proved to be a fun and engaging way to encourage residents to think about the future of transportation in our region.
MEDIA COVERAGE
The LRTP attracted coverage from media outlets in the region. The Peoria Journal Star newspaper published an article on October 27 promoting the MindMixer website. The newspaper also published an article on November 10 promoting focus group meetings. An advertisement for the MindMixer website also appeared on the Peoria Journal Star website.
WMBD-TV aired a story promoting the Open House events during its November 18 evening newscast. The story described the purpose of the Open House events and notified viewers of the November 20 event occurring in Peoria.
ONLINE RESOURCES
The Whiskey City Collaborative is a local blog developed to create and cultivate ideas, serve as an inspiration, and take action to spark change in the City of Peoria. Public participation activities were communicated via the blog as another method of informing residents of the LRTP and opportunities to provide input.
RESULTS
MINDMIXER WEBSITE
During the LRTP process, the MindMixer website attracted 1,975 unique visitors and generated 10,435 page views. There were 69 total participants who provided input via the website.
The following statistics describe the 69 participants:
• 37.5% of participants were between the ages of 25 and 34, 25% of participants were between the ages of 55 and
64, and 18.8% of participants were between the ages of 35 and 44;
• 71% of participants were male and 29% of participants were female;
• The participants live in 20 different zip codes, representing the communities of Peoria, Morton, Pekin, East Peoria, Dunlap, Washington, Chillicothe, Eureka, and Princeville.
Participants on the MindMixer website put forth 103 ideas for improving our regional transportation system.
FOCUS GROUPS
Five different focus group meetings were held during the LRTP process. A brief summary of each focus group meeting is provided below.
• Economic Development. There were 28 individuals present at the Economic Development focus group meeting. Expanding mass transit service to new areas of the region and re-evaluating existing funding mechanisms were among the primary comments offered.
• Tri-County Regional Planning Commission. There were 16 commissioners present at the Commission meeting at which a focus group was held. Improving funding for infrastructure and increasing mass transit access to strengthen our regional workforce were among the primary comments offered.
• Environment. There were 12 individuals present at the Environment focus group meeting. Maintaining existing roadways before building new roadways, pursuing transit-oriented development, promoting biking, and reducing carbon dioxide emissions were among the primary comments offered.
• Individuals with Disabilities. There were 13 individuals present at the Individuals with Disabilities focus group meeting. The poor condition of some sidewalks and lack of sidewalk connectivity, service challenges posed by the boundaries of different transit providers, limited evening transit service, and the need to increase transit service were among the primary comments offered.
19PUBLIC ENGAGEMENT: Env i s ion HOI Long Range Transpor tat ion P lan PUBLIC ENGAGEMENT: Env i s ion HOI Long Range Transpor tat ion P lan
TABLE 3-1: INNOVATION BOARD COMMENTSBiggest Transportation Challenges What do you wish the region valued more? What innovations should we explore? What do you love about your community?
No Amtrak Clean yards Amtrak service Various eventsNeed more bike trails Preserving the IL River 2-lane highways Willingness to grow - IL Black ChamberPotholes IL River Teleportation DiversityNeed more buses to more places History of the area High speed rail Historic buildingslack of train travel Community High speed rail Close to where I work and playmore funding for Amtrak Fair housing High speed rail: STL to CHI FriendlinessUrban sprawl Environment High speed rail (Magnetic Levitation) My ability to affect changeOvercrowding on buses Walkable streets High speed rail: Peoria to Bloomington The younger generation wants to get involvedRoadway expansion without population increase Bicycles Bike rental service FriendshipsRestore Roanoke Ave. Free gas Bike rental service at Bradley Eating localLighting for walkability Pineapples BU Card Integration (with buses) Swing dancingNothing is true, everything is permanent More buses Skateboard rental Young people getting involved
More bike lanes Bikes are fun More taxi servicesNeighborhood groups that encourage a sense of pride and community in where we live
Make biking safer Walkability Uber the peoplebicycle friendliness People Segways new plantersbuilding the Eastern Bypass - Let's Build it! Live where you work, work where you live Hypertube from NYC to LA engaged citizensMaintaining roads we do have Vacant/neglected properties Uber/Lyft cool old architectureSprawl - means we have to build more roads with less money Green spaces Bus to Des Moines new stop-signsTravel time- it already takes too long to go from downtown to North Peoria Roanoke Ave. Metro Facility diversityRail Service Peoria Lakes Public transit service every 15 minutes artPot holes Build less, maintain more - reuse/repurpose More bike lanes close to work and playToo much land used, not enough people Do not build Energy efficient flying carsLong-term maintenance costs more art Hot air baloonsPeoria streets are a mess clean air trolley cars
Inter-city transportation (trains, buses) meditationstop spending money on expansion and focus money on restoration of city life
Truck-traffic - road enhancements funding for the arts Google transitNeed more sidewalks clean air "Actual" Complete Streets
rockability More alternative public transit optionswalkability shared streetsIllinois River real-time transit infoNo new roads until all existing are in good shape Uber, Zip Car, and LyftSafe bicycling in town; dedicated bikeways Bike paths
rail serviceSolar powered Glow in-the-dark bike lanes like in Amsterdam
bus service schedule Awesome bike paths/lanesComplete the IL River Bluff Trail! light railConnectivityAnti-idlingAccordion buses for University and Sterling Routes
20 PUBLIC ENGAGEMENT: Env i s ion HOI Long Range Transpor tat ion P lan
• Bicycle and Pedestrian Transportation. There were 26 individuals present at the Bicycle and Pedestrian Transportation focus group meeting. A lack of connectivity and a need for increased funding were among the primary comments offered.
OPEN HOUSE EVENTS
The Money Game enabled attendees to identify transportation projects that should be of the highest priority for the region in the future. Attendees could choose from 34 high-volume roadway projects, 17 trail/non-motorized transportation projects, and two CityLink mass transit transfer centers. All Money Game projects were submitted by local units of government; no IDOT projects were included in the Money Game.
The five roadway projects that received the greatest support across both open house events were:
• Veterans Drive Extension North (submitted by Pekin and Creve Coeur);
• Main Street Pedestrian Improvements from University Street to North Street (submitted by City of Peoria);
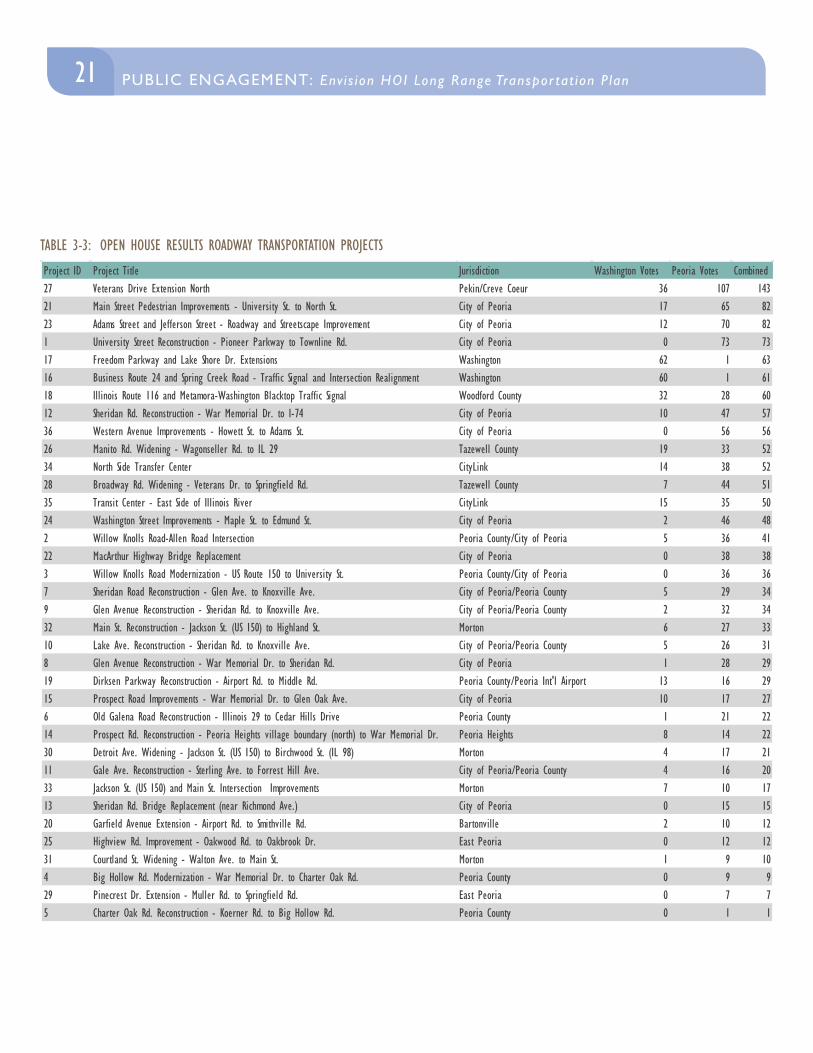
TABLE 3-2: OPEN HOUSE RESULTS TRAIL/NON-MOTORIZED TRANSPORTATION PROJECTSProject ID Project Title Jurisdiction Washington Peoria CombinedD Rock Island Greenway - North of War Memorial to Downtown Peoria City of Peoria/Peoria Park District 11 84 95C Illinois River Bluff Trail - Detweiller Park to Forest Park Peoria Park District 8 63 71Q Griffin Trail Extension - Allentown Rd. to Veterans Dr. Pekin 27 38 65I Hanna City Trail Peoria County 7 57 64F Germantown Hills/Metamora Recreational Bike/Walkway Germantown Hills and Metamora 29 25 54A Illinois River Bluff Trail - Camp Wokanda to Singing Woods Phase I Peoria Park District 4 45 49G Cruger Rd. Trail Extension - Nofsinger Rd. to N. Main St. Washington 31 13 44P Illinois Route 29 Sidewalk Construction - Creve Coeur Creve Coeur 12 28 40E Route 116 Pedestrian Overpass Germantown Hills 21 15 36B Rock Island Greenway - Route 6 Tunnel Peoria Park District 5 30 35H Washington Rec. Trail Eastern Loop Extension - N. Main St. to Guth Rd. Washington 24 9 33J Centennial Dr. and Summit Dr. Pedestrian/Bicycle Trail East Peoria, Washington, ICC 5 21 26K Centennial Dr. and Freedom Parkway Rec. Trail Extension - McClugage Rd. to School St. Washington 17 9 26O Business Route 24 Rec. Trail Extension - Wilmor Rd. to Cummings Ln. Washington 15 7 22L School St. Rec. Trail Extension - Centennial Dr. to IL 8 Washington 10 2 12M School St. Rec. Trail Extension Phase II - Beverly Manor School to TP&W Railroad Tracks Washington 11 0 11N Legion Rd. Rec. Trail Extension - IL 8 to Meadow Valley Park Washington 7 1 8
21PUBLIC ENGAGEMENT: Env i s ion HOI Long Range Transpor tat ion P lan PUBLIC ENGAGEMENT: Env i s ion HOI Long Range Transpor tat ion P lan
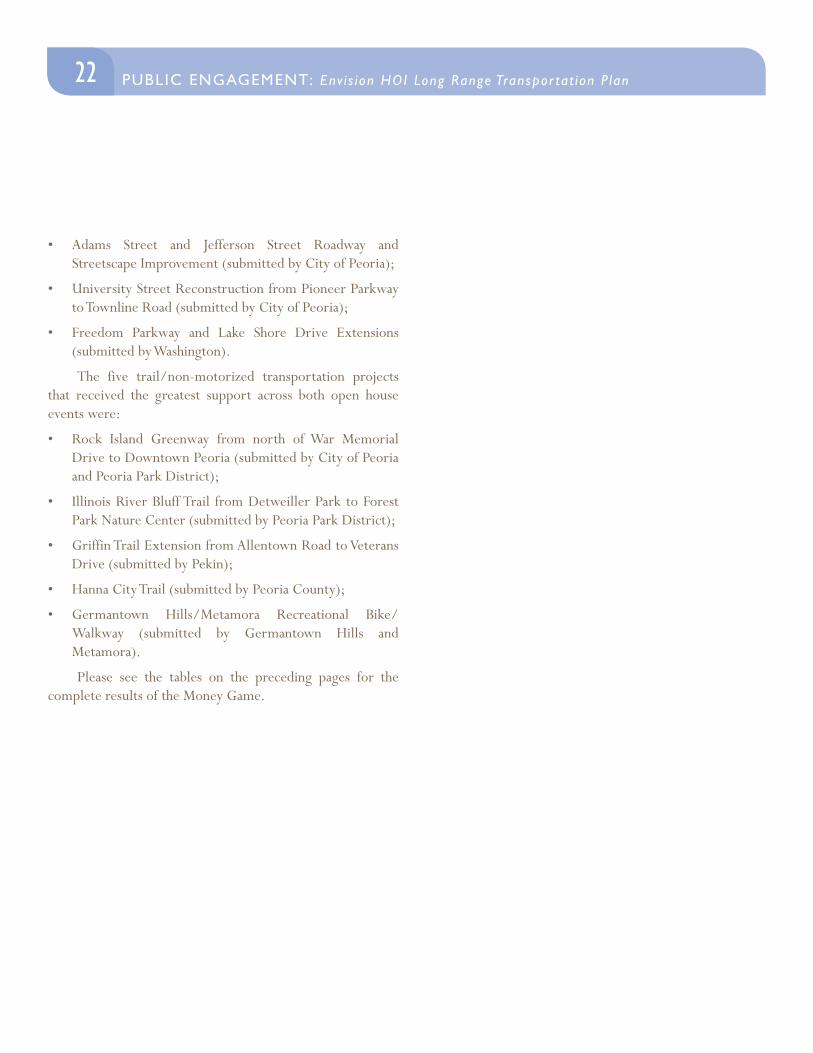
TABLE 3-3: OPEN HOUSE RESULTS ROADWAY TRANSPORTATION PROJECTS
Project ID Project Title Jurisdiction Washington Votes Peoria Votes Combined27 Veterans Drive Extension North Pekin/Creve Coeur 36 107 14321 Main Street Pedestrian Improvements - University St. to North St. City of Peoria 17 65 8223 Adams Street and Jefferson Street - Roadway and Streetscape Improvement City of Peoria 12 70 821 University Street Reconstruction - Pioneer Parkway to Townline Rd. City of Peoria 0 73 7317 Freedom Parkway and Lake Shore Dr. Extensions Washington 62 1 6316 Business Route 24 and Spring Creek Road - Traffic Signal and Intersection Realignment Washington 60 1 6118 Illinois Route 116 and Metamora-Washington Blacktop Traffic Signal Woodford County 32 28 6012 Sheridan Rd. Reconstruction - War Memorial Dr. to I-74 City of Peoria 10 47 5736 Western Avenue Improvements - Howett St. to Adams St. City of Peoria 0 56 5626 Manito Rd. Widening - Wagonseller Rd. to IL 29 Tazewell County 19 33 5234 North Side Transfer Center CityLink 14 38 5228 Broadway Rd. Widening - Veterans Dr. to Springfield Rd. Tazewell County 7 44 5135 Transit Center - East Side of Illinois River CityLink 15 35 5024 Washington Street Improvements - Maple St. to Edmund St. City of Peoria 2 46 482 Willow Knolls Road-Allen Road Intersection Peoria County/City of Peoria 5 36 4122 MacArthur Highway Bridge Replacement City of Peoria 0 38 383 Willow Knolls Road Modernization - US Route 150 to University St. Peoria County/City of Peoria 0 36 367 Sheridan Road Reconstruction - Glen Ave. to Knoxville Ave. City of Peoria/Peoria County 5 29 349 Glen Avenue Reconstruction - Sheridan Rd. to Knoxville Ave. City of Peoria/Peoria County 2 32 3432 Main St. Reconstruction - Jackson St. (US 150) to Highland St. Morton 6 27 3310 Lake Ave. Reconstruction - Sheridan Rd. to Knoxville Ave. City of Peoria/Peoria County 5 26 318 Glen Avenue Reconstruction - War Memorial Dr. to Sheridan Rd. City of Peoria 1 28 2919 Dirksen Parkway Reconstruction - Airport Rd. to Middle Rd. Peoria County/Peoria Int'l Airport 13 16 2915 Prospect Road Improvements - War Memorial Dr. to Glen Oak Ave. City of Peoria 10 17 276 Old Galena Road Reconstruction - Illinois 29 to Cedar Hills Drive Peoria County 1 21 2214 Prospect Rd. Reconstruction - Peoria Heights village boundary (north) to War Memorial Dr. Peoria Heights 8 14 2230 Detroit Ave. Widening - Jackson St. (US 150) to Birchwood St. (IL 98) Morton 4 17 2111 Gale Ave. Reconstruction - Sterling Ave. to Forrest Hill Ave. City of Peoria/Peoria County 4 16 2033 Jackson St. (US 150) and Main St. Intersection Improvements Morton 7 10 1713 Sheridan Rd. Bridge Replacement (near Richmond Ave.) City of Peoria 0 15 1520 Garfield Avenue Extension - Airport Rd. to Smithville Rd. Bartonville 2 10 1225 Highview Rd. Improvement - Oakwood Rd. to Oakbrook Dr. East Peoria 0 12 1231 Courtland St. Widening - Walton Ave. to Main St. Morton 1 9 104 Big Hollow Rd. Modernization - War Memorial Dr. to Charter Oak Rd. Peoria County 0 9 929 Pinecrest Dr. Extension - Muller Rd. to Springfield Rd. East Peoria 0 7 75 Charter Oak Rd. Reconstruction - Koerner Rd. to Big Hollow Rd. Peoria County 0 1 1
22 PUBLIC ENGAGEMENT: Env i s ion HOI Long Range Transpor tat ion P lan
• Adams Street and Jefferson Street Roadway and Streetscape Improvement (submitted by City of Peoria);
• University Street Reconstruction from Pioneer Parkway to Townline Road (submitted by City of Peoria);
• Freedom Parkway and Lake Shore Drive Extensions (submitted by Washington).
The five trail/non-motorized transportation projects that received the greatest support across both open house events were:
• Rock Island Greenway from north of War Memorial Drive to Downtown Peoria (submitted by City of Peoria and Peoria Park District);
• Illinois River Bluff Trail from Detweiller Park to Forest Park Nature Center (submitted by Peoria Park District);
• Griffin Trail Extension from Allentown Road to Veterans Drive (submitted by Pekin);
• Hanna City Trail (submitted by Peoria County);
• Germantown Hills/Metamora Recreational Bike/Walkway (submitted by Germantown Hills and Metamora).
Please see the tables on the preceding pages for the complete results of the Money Game.
DEMOGRAPHICS
23 DEMOGRAPHICS: Env i s ion HOI Long Range Transpor tat ion P lanPUBLIC ENGAGEMENT: Env i s ion HOI Long Range Transpor tat ion P lan
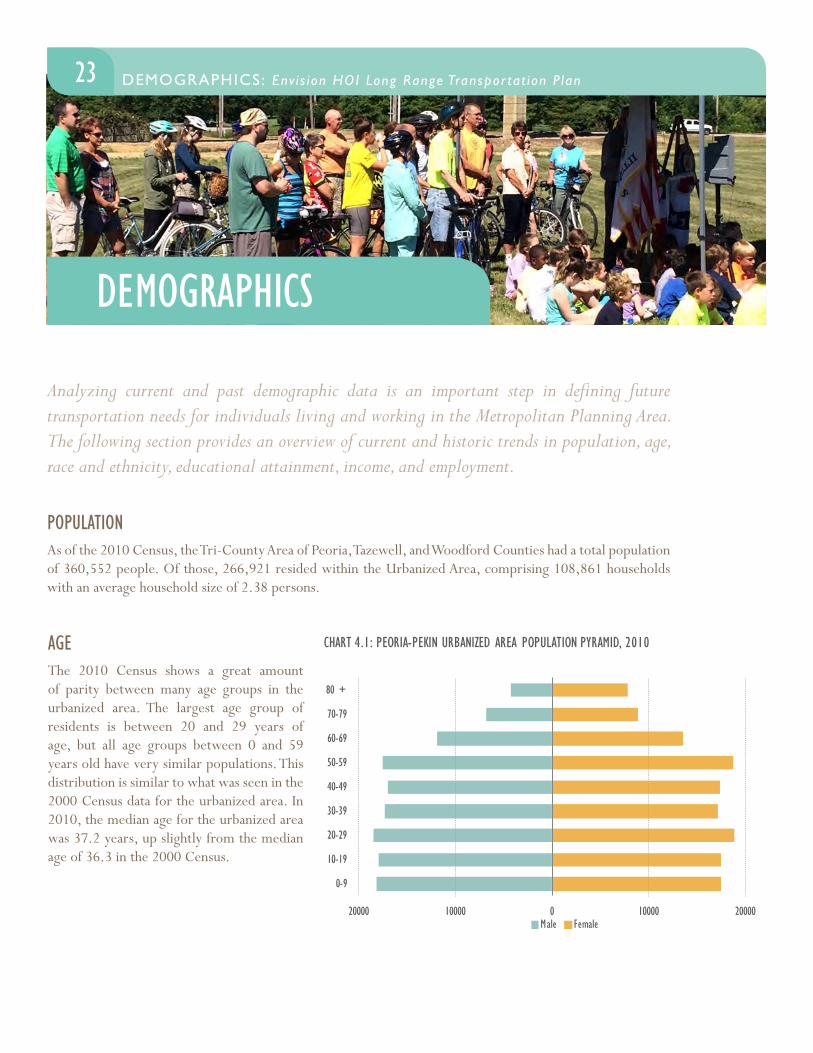
Analyzing current and past demographic data is an important step in defining future transportation needs for individuals living and working in the Metropolitan Planning Area. The following section provides an overview of current and historic trends in population, age, race and ethnicity, educational attainment, income, and employment.
POPULATIONAs of the 2010 Census, the Tri-County Area of Peoria, Tazewell, and Woodford Counties had a total population of 360,552 people. Of those, 266,921 resided within the Urbanized Area, comprising 108,861 households with an average household size of 2.38 persons.
AGEThe 2010 Census shows a great amount of parity between many age groups in the urbanized area. The largest age group of residents is between 20 and 29 years of age, but all age groups between 0 and 59 years old have very similar populations. This distribution is similar to what was seen in the 2000 Census data for the urbanized area. In 2010, the median age for the urbanized area was 37.2 years, up slightly from the median age of 36.3 in the 2000 Census.
20000 10000 0 10000 20000
0-9
10-19
20-29
30-39
40-49
50-59
60-69
70-79
80 +
CHART 4.1: PEORIA-PEKIN URBANIZED AREA POPULATION PYRAMID, 2010
Male Female
24 DEMOGRAPHICS: Env i s ion HOI Long Range Transpor tat ion P lan
HISPANIC OR LATINO ORIGIN 2000 2010Hispanic or Latino 1.8% 3.4%Not Hispanic or Latino 98.2% 96.6%
TABLE 4-2: PEORIA-PEKIN UA ETHNICITY, 2010
Source: U.S. Census
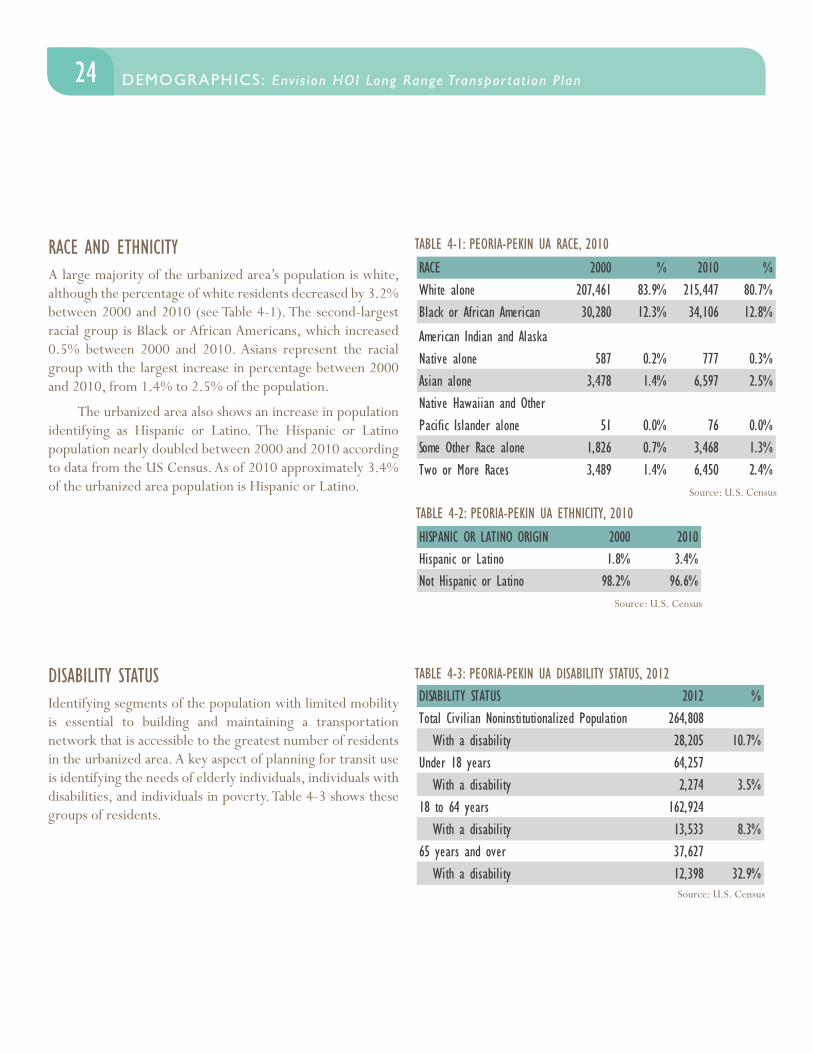
DISABILITY STATUSIdentifying segments of the population with limited mobility is essential to building and maintaining a transportation network that is accessible to the greatest number of residents in the urbanized area. A key aspect of planning for transit use is identifying the needs of elderly individuals, individuals with disabilities, and individuals in poverty. Table 4-3 shows these groups of residents.
RACE AND ETHNICITYA large majority of the urbanized area’s population is white, although the percentage of white residents decreased by 3.2% between 2000 and 2010 (see Table 4-1). The second-largest racial group is Black or African Americans, which increased 0.5% between 2000 and 2010. Asians represent the racial group with the largest increase in percentage between 2000 and 2010, from 1.4% to 2.5% of the population.
The urbanized area also shows an increase in population identifying as Hispanic or Latino. The Hispanic or Latino population nearly doubled between 2000 and 2010 according to data from the US Census. As of 2010 approximately 3.4% of the urbanized area population is Hispanic or Latino.
DISABILITY STATUS 2012 %Total Civilian Noninstitutionalized Population 264,808
With a disability 28,205 10.7%Under 18 years 64,257
With a disability 2,274 3.5%18 to 64 years 162,924
With a disability 13,533 8.3%65 years and over 37,627
With a disability 12,398 32.9%
TABLE 4-3: PEORIA-PEKIN UA DISABILITY STATUS, 2012
Source: U.S. Census
RACE 2000 % 2010 %207,461 83.9% 215,447 80.7%30,280 12.3% 34,106 12.8%
587 0.2% 777 0.3%3,478 1.4% 6,597 2.5%
51 0.0% 76 0.0%1,826 0.7% 3,468 1.3%3,489 1.4% 6,450 2.4%
White aloneBlack or African American
American Indian and Alaska Native aloneAsian aloneNative Hawaiian and Other Pacific Islander aloneSome Other Race aloneTwo or More Races
TABLE 4-1: PEORIA-PEKIN UA RACE, 2010
Source: U.S. Census
25DEMOGRAPHICS: Env i s ion HOI Long Range Transpor tat ion P lan DEMOGRAPHICS: Env i s ion HOI Long Range Transpor tat ion P lan
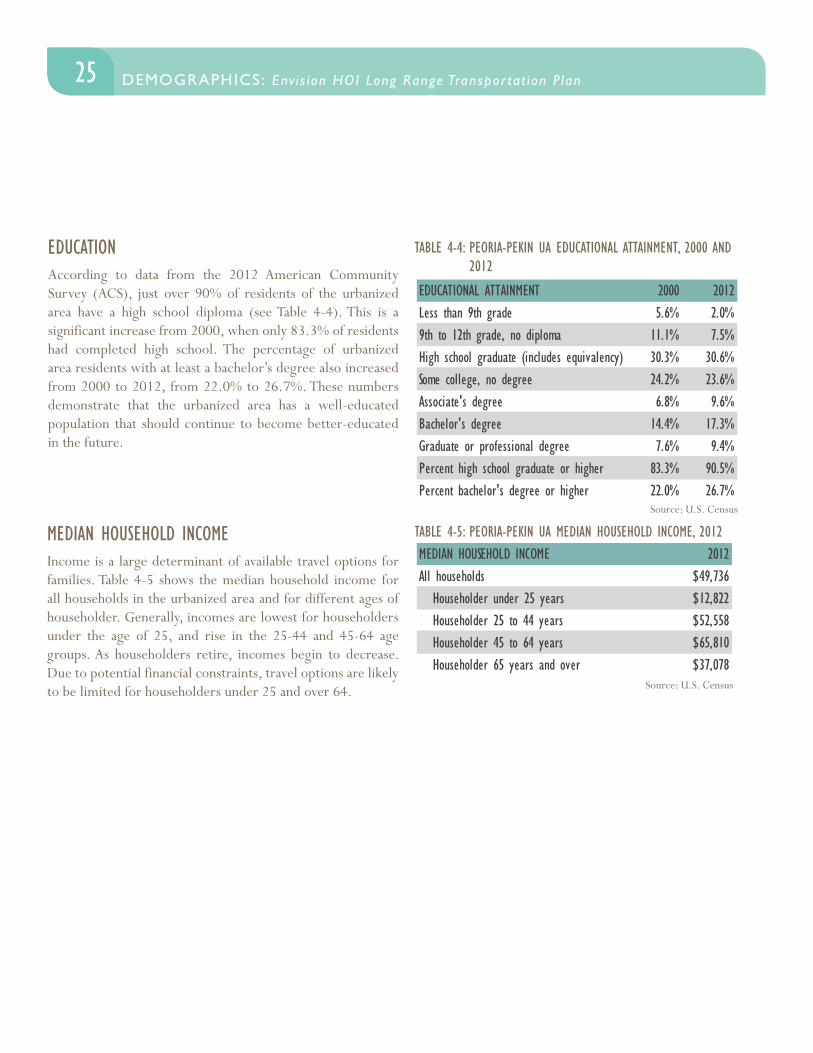
EDUCATIONAccording to data from the 2012 American Community Survey (ACS), just over 90% of residents of the urbanized area have a high school diploma (see Table 4-4). This is a significant increase from 2000, when only 83.3% of residents had completed high school. The percentage of urbanized area residents with at least a bachelor’s degree also increased from 2000 to 2012, from 22.0% to 26.7%. These numbers demonstrate that the urbanized area has a well-educated population that should continue to become better-educated in the future.
EDUCATIONAL ATTAINMENT 2000 2012Less than 9th grade 5.6% 2.0%9th to 12th grade, no diploma 11.1% 7.5%High school graduate (includes equivalency) 30.3% 30.6%Some college, no degree 24.2% 23.6%Associate's degree 6.8% 9.6%Bachelor's degree 14.4% 17.3%Graduate or professional degree 7.6% 9.4%Percent high school graduate or higher 83.3% 90.5%Percent bachelor's degree or higher 22.0% 26.7%
TABLE 4-4: PEORIA-PEKIN UA EDUCATIONAL ATTAINMENT, 2000 AND 2012
Source: U.S. Census
MEDIAN HOUSEHOLD INCOMEIncome is a large determinant of available travel options for families. Table 4-5 shows the median household income for all households in the urbanized area and for different ages of householder. Generally, incomes are lowest for householders under the age of 25, and rise in the 25-44 and 45-64 age groups. As householders retire, incomes begin to decrease. Due to potential financial constraints, travel options are likely to be limited for householders under 25 and over 64.
MEDIAN HOUSEHOLD INCOME 2012All households $49,736
Householder under 25 years $12,822Householder 25 to 44 years $52,558Householder 45 to 64 years $65,810Householder 65 years and over $37,078
TABLE 4-5: PEORIA-PEKIN UA MEDIAN HOUSEHOLD INCOME, 2012
Source: U.S. Census
26 DEMOGRAPHICS: Env i s ion HOI Long Range Transpor tat ion P lan
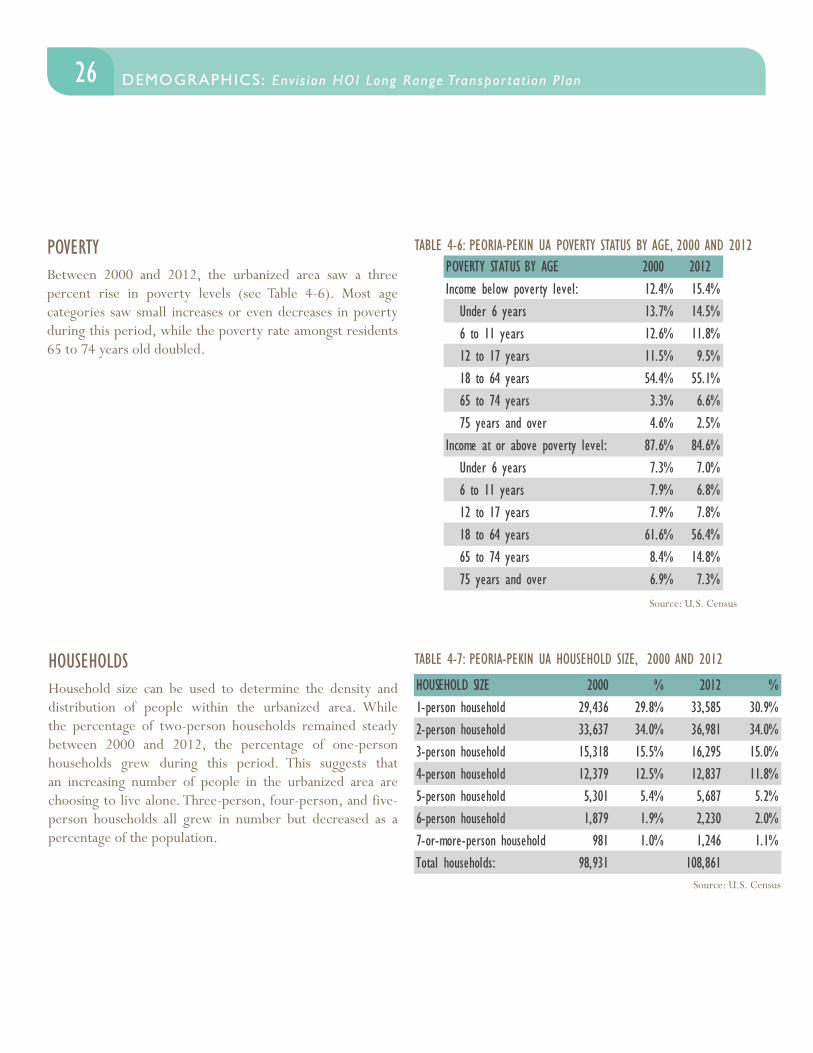
POVERTYBetween 2000 and 2012, the urbanized area saw a three percent rise in poverty levels (see Table 4-6). Most age categories saw small increases or even decreases in poverty during this period, while the poverty rate amongst residents 65 to 74 years old doubled.
TABLE 4-6: PEORIA-PEKIN UA POVERTY STATUS BY AGE, 2000 AND 2012
Source: U.S. Census
HOUSEHOLDSHousehold size can be used to determine the density and distribution of people within the urbanized area. While the percentage of two-person households remained steady between 2000 and 2012, the percentage of one-person households grew during this period. This suggests that an increasing number of people in the urbanized area are choosing to live alone. Three-person, four-person, and five-person households all grew in number but decreased as a percentage of the population.
HOUSEHOLD SIZE 2000 % 2012 %1-person household 29,436 29.8% 33,585 30.9%2-person household 33,637 34.0% 36,981 34.0%3-person household 15,318 15.5% 16,295 15.0%4-person household 12,379 12.5% 12,837 11.8%5-person household 5,301 5.4% 5,687 5.2%6-person household 1,879 1.9% 2,230 2.0%7-or-more-person household 981 1.0% 1,246 1.1%Total households: 98,931 108,861
TABLE 4-7: PEORIA-PEKIN UA HOUSEHOLD SIZE, 2000 AND 2012
Source: U.S. Census
POVERTY STATUS BY AGE 2000 201212.4% 15.4%
Under 6 years 13.7% 14.5%6 to 11 years 12.6% 11.8%12 to 17 years 11.5% 9.5%18 to 64 years 54.4% 55.1%65 to 74 years 3.3% 6.6%75 years and over 4.6% 2.5%
87.6% 84.6%Under 6 years 7.3% 7.0%6 to 11 years 7.9% 6.8%12 to 17 years 7.9% 7.8%18 to 64 years 61.6% 56.4%65 to 74 years 8.4% 14.8%75 years and over 6.9% 7.3%
Income below poverty level:
Income at or above poverty level:
27DEMOGRAPHICS: Env i s ion HOI Long Range Transpor tat ion P lan DEMOGRAPHICS: Env i s ion HOI Long Range Transpor tat ion P lan
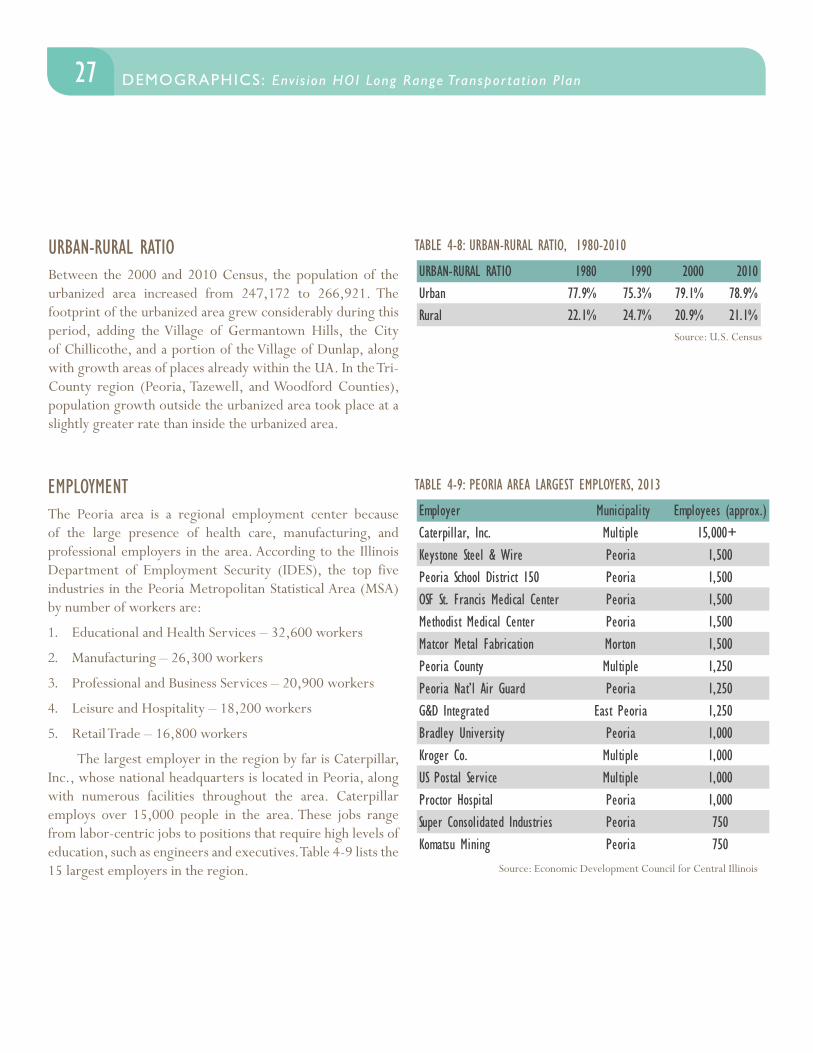
URBAN-RURAL RATIOBetween the 2000 and 2010 Census, the population of the urbanized area increased from 247,172 to 266,921. The footprint of the urbanized area grew considerably during this period, adding the Village of Germantown Hills, the City of Chillicothe, and a portion of the Village of Dunlap, along with growth areas of places already within the UA. In the Tri-County region (Peoria, Tazewell, and Woodford Counties), population growth outside the urbanized area took place at a slightly greater rate than inside the urbanized area.
URBAN-RURAL RATIO 1980 1990 2000 2010Urban 77.9% 75.3% 79.1% 78.9%Rural 22.1% 24.7% 20.9% 21.1%
TABLE 4-8: URBAN-RURAL RATIO, 1980-2010
Source: U.S. Census
EMPLOYMENTThe Peoria area is a regional employment center because of the large presence of health care, manufacturing, and professional employers in the area. According to the Illinois Department of Employment Security (IDES), the top five industries in the Peoria Metropolitan Statistical Area (MSA) by number of workers are:
1. Educational and Health Services – 32,600 workers
2. Manufacturing – 26,300 workers
3. Professional and Business Services – 20,900 workers
4. Leisure and Hospitality – 18,200 workers
5. Retail Trade – 16,800 workers
The largest employer in the region by far is Caterpillar, Inc., whose national headquarters is located in Peoria, along with numerous facilities throughout the area. Caterpillar employs over 15,000 people in the area. These jobs range from labor-centric jobs to positions that require high levels of education, such as engineers and executives. Table 4-9 lists the 15 largest employers in the region.
TABLE 4-9: PEORIA AREA LARGEST EMPLOYERS, 2013
Source: Economic Development Council for Central Illinois
Employer Municipality Employees (approx.)Caterpillar, Inc. Multiple 15,000+ Keystone Steel & Wire Peoria 1,500Peoria School District 150 Peoria 1,500OSF St. Francis Medical Center Peoria 1,500Methodist Medical Center Peoria 1,500Matcor Metal Fabrication Morton 1,500Peoria County Multiple 1,250Peoria Nat’l Air Guard Peoria 1,250G&D Integrated East Peoria 1,250Bradley University Peoria 1,000Kroger Co. Multiple 1,000US Postal Service Multiple 1,000Proctor Hospital Peoria 1,000Super Consolidated Industries Peoria 750Komatsu Mining Peoria 750
28 DEMOGRAPHICS: Env i s ion HOI Long Range Transpor tat ion P lan
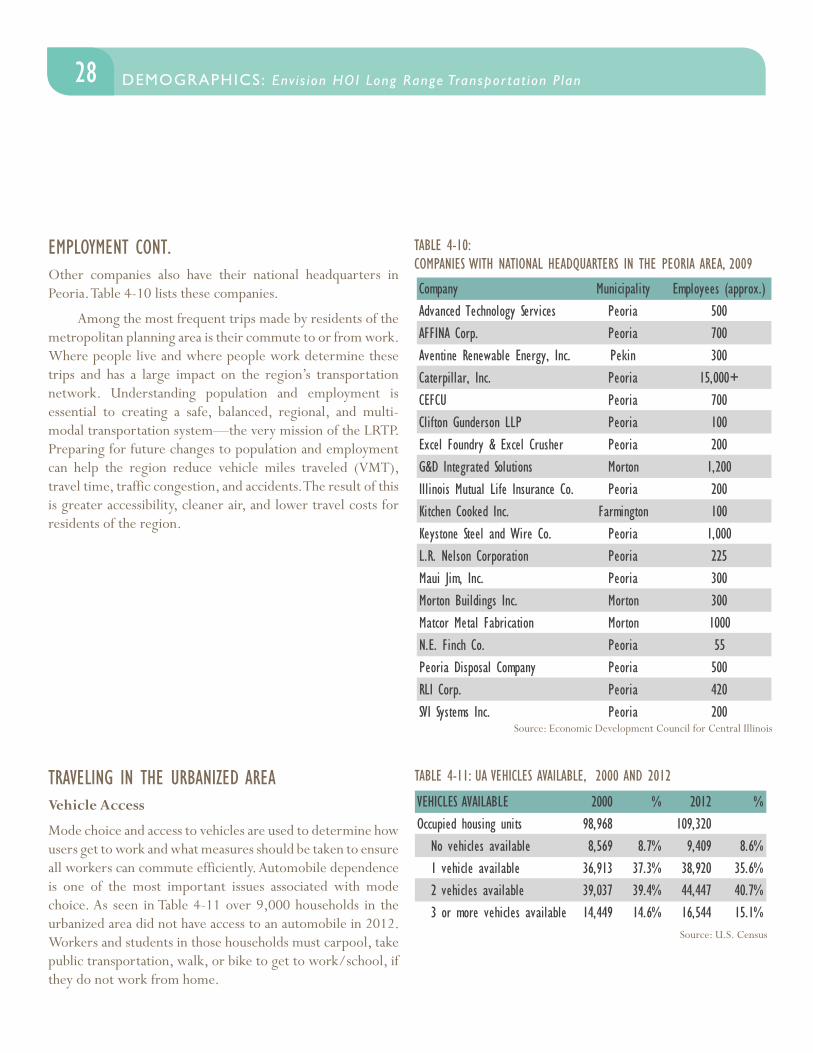
EMPLOYMENT CONT.Other companies also have their national headquarters in Peoria. Table 4-10 lists these companies.
Among the most frequent trips made by residents of the metropolitan planning area is their commute to or from work. Where people live and where people work determine these trips and has a large impact on the region’s transportation network. Understanding population and employment is essential to creating a safe, balanced, regional, and multi-modal transportation system—the very mission of the LRTP. Preparing for future changes to population and employment can help the region reduce vehicle miles traveled (VMT), travel time, traffic congestion, and accidents. The result of this is greater accessibility, cleaner air, and lower travel costs for residents of the region.
Company Municipality Employees (approx.)Advanced Technology Services Peoria 500AFFINA Corp. Peoria 700Aventine Renewable Energy, Inc. Pekin 300Caterpillar, Inc. Peoria 15,000+CEFCU Peoria 700Clifton Gunderson LLP Peoria 100Excel Foundry & Excel Crusher Peoria 200G&D Integrated Solutions Morton 1,200Illinois Mutual Life Insurance Co. Peoria 200Kitchen Cooked Inc. Farmington 100Keystone Steel and Wire Co. Peoria 1,000L.R. Nelson Corporation Peoria 225Maui Jim, Inc. Peoria 300Morton Buildings Inc. Morton 300Matcor Metal Fabrication Morton 1000N.E. Finch Co. Peoria 55Peoria Disposal Company Peoria 500RLI Corp. Peoria 420SVI Systems Inc. Peoria 200
TABLE 4-10:COMPANIES WITH NATIONAL HEADQUARTERS IN THE PEORIA AREA, 2009
TRAVELING IN THE URBANIZED AREAVehicle Access
Mode choice and access to vehicles are used to determine how users get to work and what measures should be taken to ensure all workers can commute efficiently. Automobile dependence is one of the most important issues associated with mode choice. As seen in Table 4-11 over 9,000 households in the urbanized area did not have access to an automobile in 2012. Workers and students in those households must carpool, take public transportation, walk, or bike to get to work/school, if they do not work from home.
VEHICLES AVAILABLE 2000 % 2012 %Occupied housing units 98,968 109,320
No vehicles available 8,569 8.7% 9,409 8.6%1 vehicle available 36,913 37.3% 38,920 35.6%2 vehicles available 39,037 39.4% 44,447 40.7%3 or more vehicles available 14,449 14.6% 16,544 15.1%
TABLE 4-11: UA VEHICLES AVAILABLE, 2000 AND 2012
Source: U.S. Census
Source: Economic Development Council for Central Illinois
29DEMOGRAPHICS: Env i s ion HOI Long Range Transpor tat ion P lan DEMOGRAPHICS: Env i s ion HOI Long Range Transpor tat ion P lan
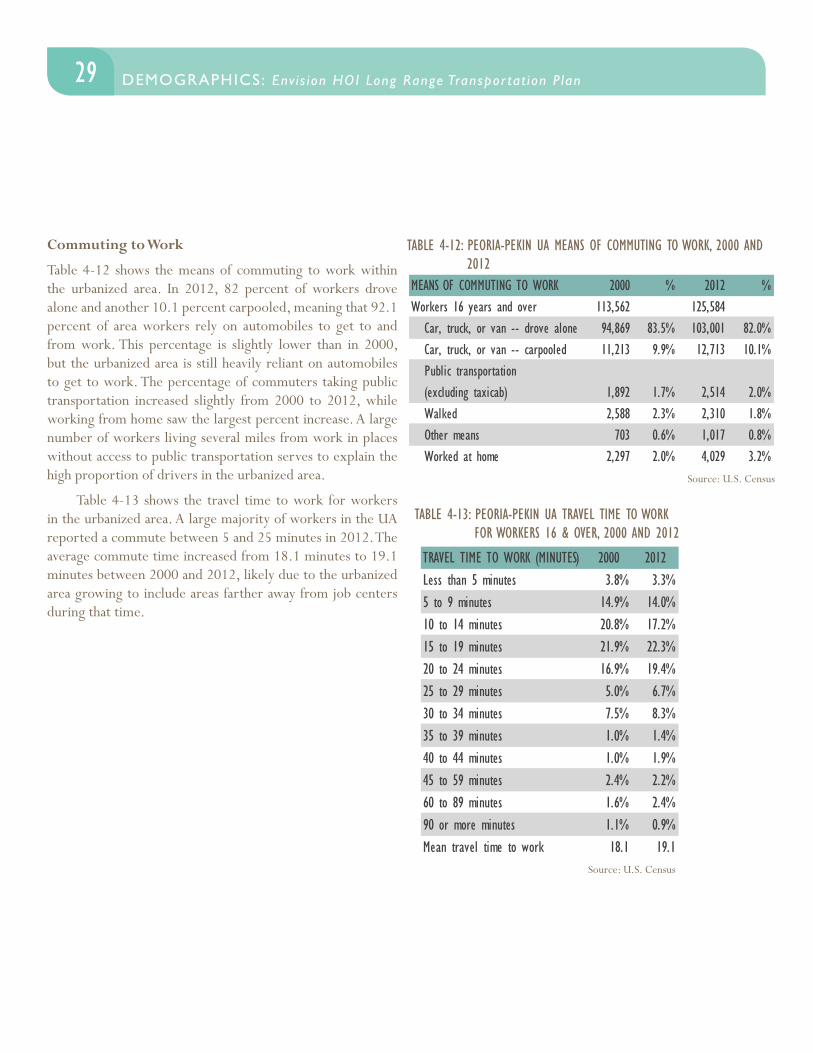
Commuting to Work
Table 4-12 shows the means of commuting to work within the urbanized area. In 2012, 82 percent of workers drove alone and another 10.1 percent carpooled, meaning that 92.1 percent of area workers rely on automobiles to get to and from work. This percentage is slightly lower than in 2000, but the urbanized area is still heavily reliant on automobiles to get to work. The percentage of commuters taking public transportation increased slightly from 2000 to 2012, while working from home saw the largest percent increase. A large number of workers living several miles from work in places without access to public transportation serves to explain the high proportion of drivers in the urbanized area.
Table 4-13 shows the travel time to work for workers in the urbanized area. A large majority of workers in the UA reported a commute between 5 and 25 minutes in 2012. The average commute time increased from 18.1 minutes to 19.1 minutes between 2000 and 2012, likely due to the urbanized area growing to include areas farther away from job centers during that time.
TABLE 4-12: PEORIA-PEKIN UA MEANS OF COMMUTING TO WORK, 2000 AND 2012
Source: U.S. Census
TRAVEL TIME TO WORK (MINUTES) 2000 2012Less than 5 minutes 3.8% 3.3%5 to 9 minutes 14.9% 14.0%10 to 14 minutes 20.8% 17.2%15 to 19 minutes 21.9% 22.3%20 to 24 minutes 16.9% 19.4%25 to 29 minutes 5.0% 6.7%30 to 34 minutes 7.5% 8.3%35 to 39 minutes 1.0% 1.4%40 to 44 minutes 1.0% 1.9%45 to 59 minutes 2.4% 2.2%60 to 89 minutes 1.6% 2.4%90 or more minutes 1.1% 0.9%Mean travel time to work 18.1 19.1
TABLE 4-13: PEORIA-PEKIN UA TRAVEL TIME TO WORK FOR WORKERS 16 & OVER, 2000 AND 2012
Source: U.S. Census
MEANS OF COMMUTING TO WORK 2000 % 2012 %Workers 16 years and over 113,562 125,584
Car, truck, or van -- drove alone 94,869 83.5% 103,001 82.0%Car, truck, or van -- carpooled 11,213 9.9% 12,713 10.1%Public transportation (excluding taxicab) 1,892 1.7% 2,514 2.0%Walked 2,588 2.3% 2,310 1.8%Other means 703 0.6% 1,017 0.8%Worked at home 2,297 2.0% 4,029 3.2%

30 DEMOGRAPHICS: Env i s ion HOI Long Range Transpor tat ion P lan
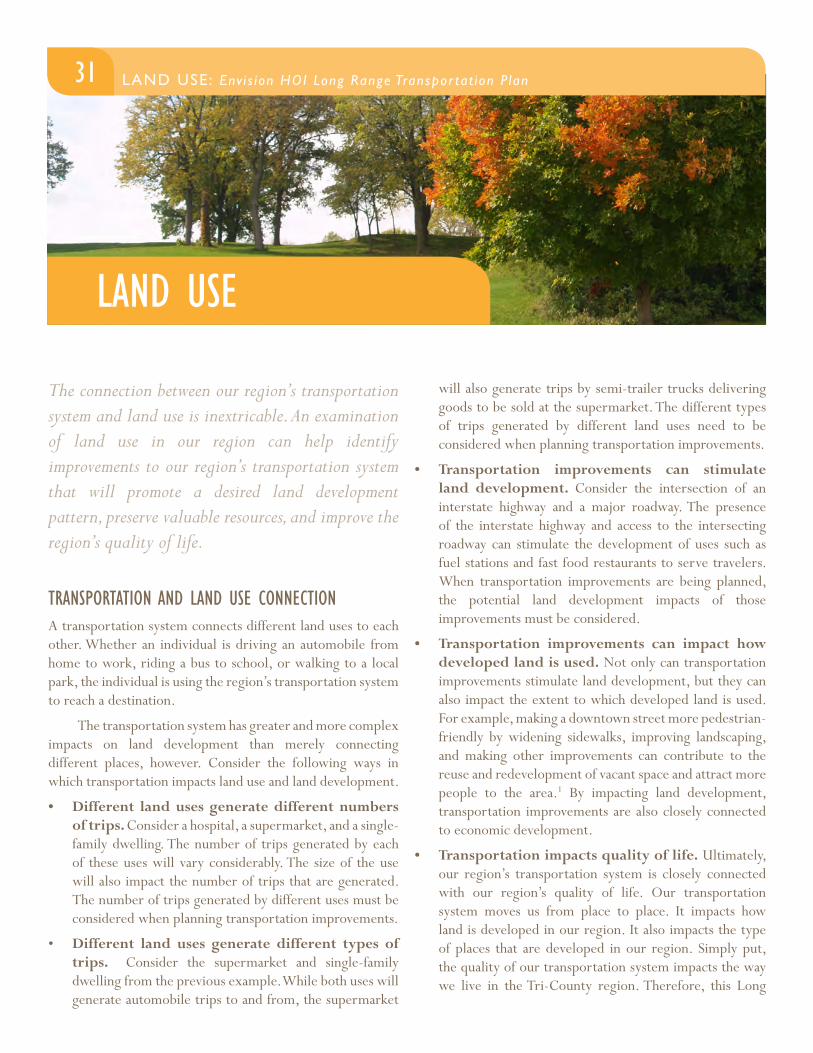
LAND USE
31 LAND USE: Env i s ion HOI Long Range Transpor tat ion P lanDEMOGRAPHICS: Env i s ion HOI Long Range Transpor tat ion P lan
The connection between our region’s transportation system and land use is inextricable. An examination of land use in our region can help identify improvements to our region’s transportation system that will promote a desired land development pattern, preserve valuable resources, and improve the region’s quality of life.
TRANSPORTATION AND LAND USE CONNECTIONA transportation system connects different land uses to each other. Whether an individual is driving an automobile from home to work, riding a bus to school, or walking to a local park, the individual is using the region’s transportation system to reach a destination.
The transportation system has greater and more complex impacts on land development than merely connecting different places, however. Consider the following ways in which transportation impacts land use and land development.
• Different land uses generate different numbers of trips. Consider a hospital, a supermarket, and a single-family dwelling. The number of trips generated by each of these uses will vary considerably. The size of the use will also impact the number of trips that are generated. The number of trips generated by different uses must be considered when planning transportation improvements.
• Different land uses generate different types of trips. Consider the supermarket and single-family dwelling from the previous example. While both uses will generate automobile trips to and from, the supermarket
will also generate trips by semi-trailer trucks delivering goods to be sold at the supermarket. The different types of trips generated by different land uses need to be considered when planning transportation improvements.
• Transportation improvements can stimulate land development. Consider the intersection of an interstate highway and a major roadway. The presence of the interstate highway and access to the intersecting roadway can stimulate the development of uses such as fuel stations and fast food restaurants to serve travelers. When transportation improvements are being planned, the potential land development impacts of those improvements must be considered.
• Transportation improvements can impact how developed land is used. Not only can transportation improvements stimulate land development, but they can also impact the extent to which developed land is used. For example, making a downtown street more pedestrian-friendly by widening sidewalks, improving landscaping, and making other improvements can contribute to the reuse and redevelopment of vacant space and attract more people to the area.1 By impacting land development, transportation improvements are also closely connected to economic development.
• Transportation impacts quality of life. Ultimately, our region’s transportation system is closely connected with our region’s quality of life. Our transportation system moves us from place to place. It impacts how land is developed in our region. It also impacts the type of places that are developed in our region. Simply put, the quality of our transportation system impacts the way we live in the Tri-County region. Therefore, this Long
32 LAND USE: Env i s ion HOI Long Range Transpor tat ion P lan
Range Transportation Plan process is an important step in planning for a bright future for the Tri-County region.
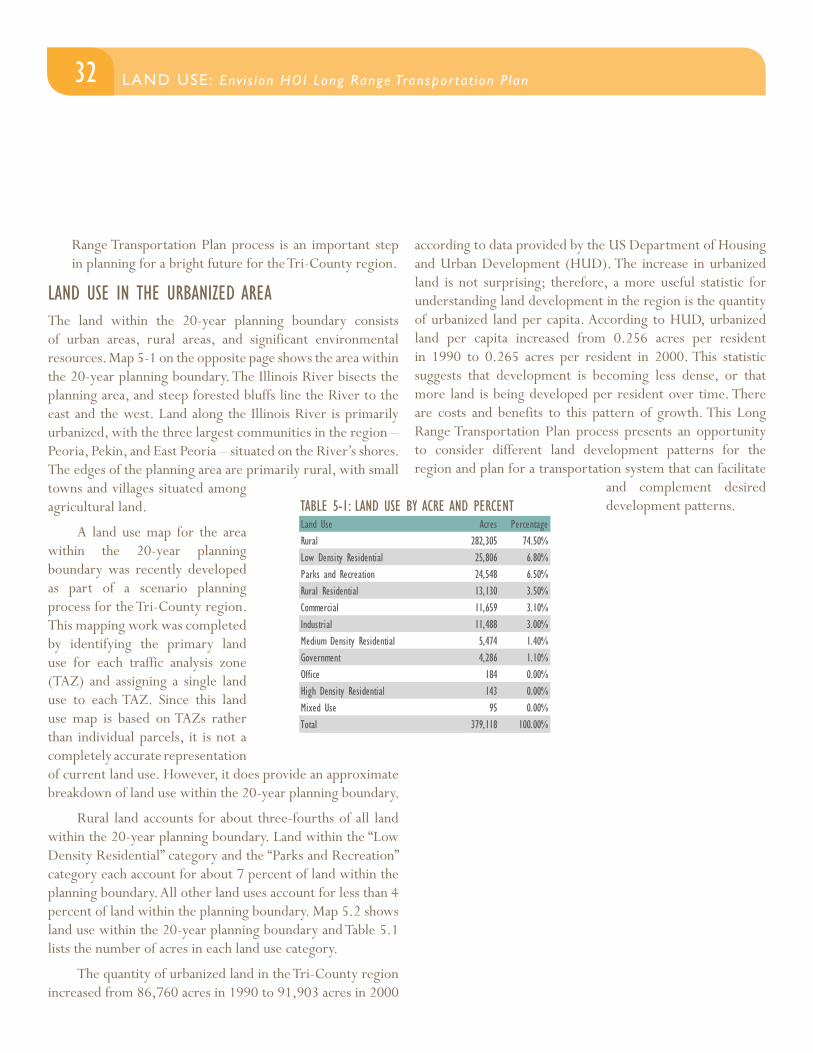
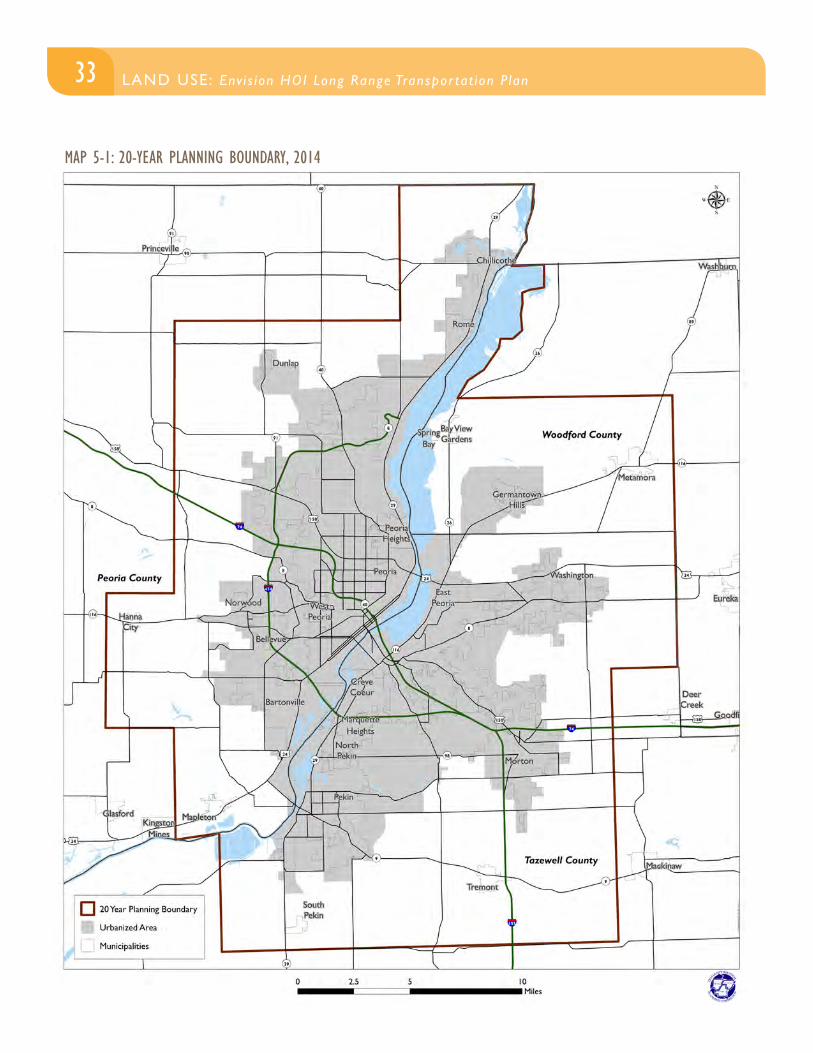
LAND USE IN THE URBANIZED AREAThe land within the 20-year planning boundary consists of urban areas, rural areas, and significant environmental resources. Map 5-1 on the opposite page shows the area within the 20-year planning boundary. The Illinois River bisects the planning area, and steep forested bluffs line the River to the east and the west. Land along the Illinois River is primarily urbanized, with the three largest communities in the region – Peoria, Pekin, and East Peoria – situated on the River’s shores. The edges of the planning area are primarily rural, with small towns and villages situated among agricultural land.
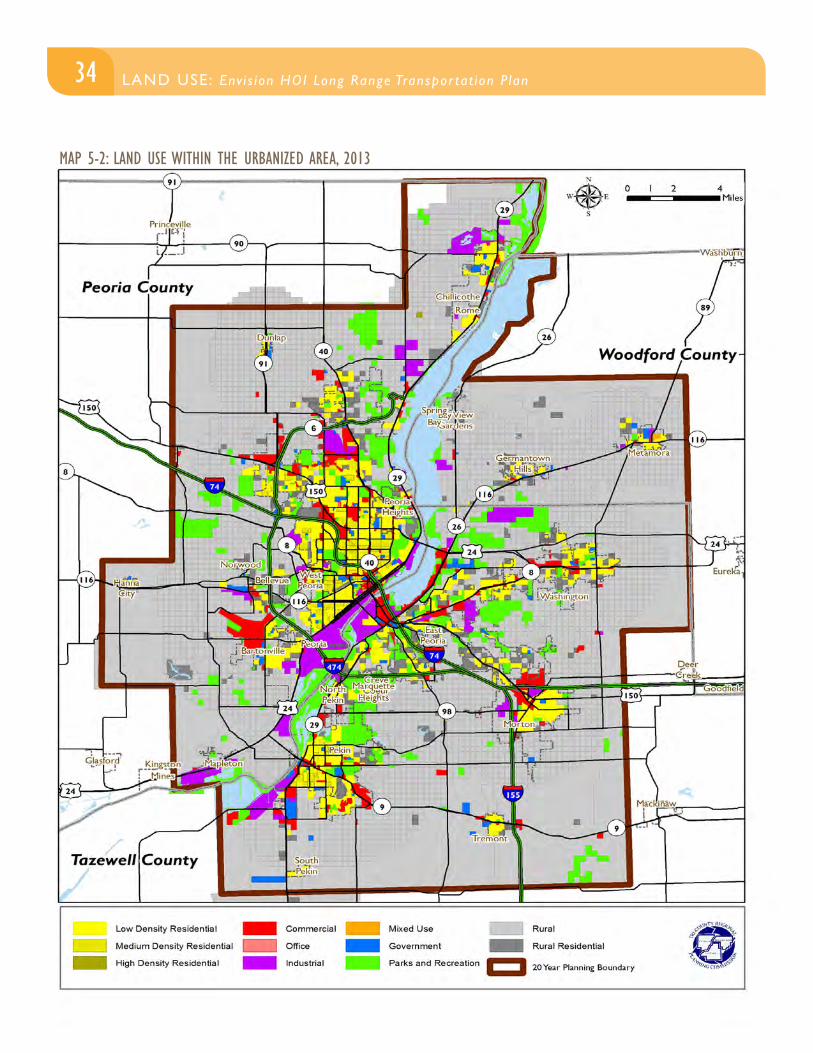
A land use map for the area within the 20-year planning boundary was recently developed as part of a scenario planning process for the Tri-County region. This mapping work was completed by identifying the primary land use for each traffic analysis zone (TAZ) and assigning a single land use to each TAZ. Since this land use map is based on TAZs rather than individual parcels, it is not a completely accurate representation of current land use. However, it does provide an approximate breakdown of land use within the 20-year planning boundary.
Rural land accounts for about three-fourths of all land within the 20-year planning boundary. Land within the “Low Density Residential” category and the “Parks and Recreation” category each account for about 7 percent of land within the planning boundary. All other land uses account for less than 4 percent of land within the planning boundary. Map 5.2 shows land use within the 20-year planning boundary and Table 5.1 lists the number of acres in each land use category.
The quantity of urbanized land in the Tri-County region increased from 86,760 acres in 1990 to 91,903 acres in 2000
according to data provided by the US Department of Housing and Urban Development (HUD). The increase in urbanized land is not surprising; therefore, a more useful statistic for understanding land development in the region is the quantity of urbanized land per capita. According to HUD, urbanized land per capita increased from 0.256 acres per resident in 1990 to 0.265 acres per resident in 2000. This statistic suggests that development is becoming less dense, or that more land is being developed per resident over time. There are costs and benefits to this pattern of growth. This Long Range Transportation Plan process presents an opportunity to consider different land development patterns for the region and plan for a transportation system that can facilitate
and complement desired development patterns.
Land Use Acres PercentageRural 282,305 74.50%Low Density Residential 25,806 6.80%Parks and Recreation 24,548 6.50%Rural Residential 13,130 3.50%Commercial 11,659 3.10%Industrial 11,488 3.00%Medium Density Residential 5,474 1.40%Government 4,286 1.10%Office 184 0.00%High Density Residential 143 0.00%Mixed Use 95 0.00%Total 379,118 100.00%
TABLE 5-1: LAND USE BY ACRE AND PERCENT
33LAND USE: Env i s ion HOI Long Range Transpor tat ion P lan LAND USE: Env i s ion HOI Long Range Transpor tat ion P lan
MAP 5-1: 20-YEAR PLANNING BOUNDARY, 2014
34 LAND USE: Env i s ion HOI Long Range Transpor tat ion P lan
MAP 5-2: LAND USE WITHIN THE URBANIZED AREA, 2013
35LAND USE: Env i s ion HOI Long Range Transpor tat ion P lan LAND USE: Env i s ion HOI Long Range Transpor tat ion P lan
POPULATION DENSITY
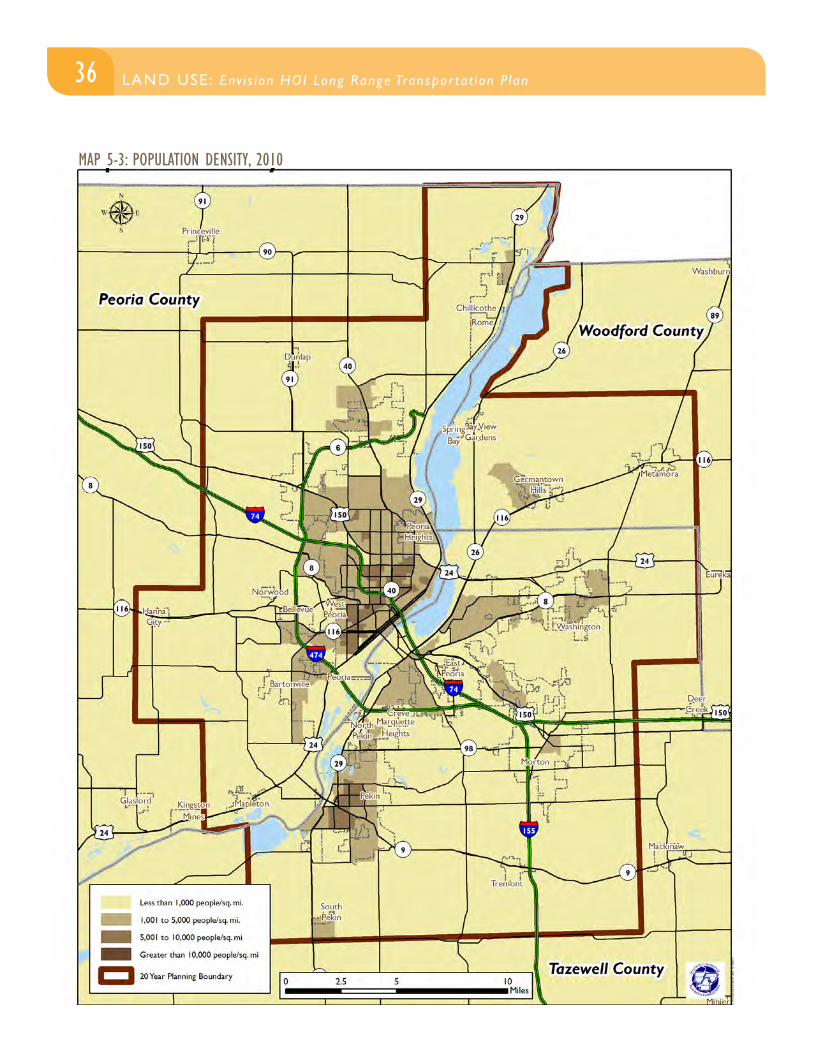
The population density of the 20-year planning area is presented in Map 5.3. The population density is shown by block group, which is a unit of geography defined by the United States Census Bureau for purposes of data collection and analysis. The population density data is from the 2010 United States Census conducted by the Census Bureau.
The most densely populated areas – block groups with a population density greater than 5,000 residents per square mile – are located within Peoria and Pekin, the region’s two largest communities. Areas with a population density of greater than 1,000 residents per square mile and less than or equal to 5,000 residents per square mile are located within Peoria, Pekin, and other communities such as East Peoria, Washington, Morton, Creve Coeur, and Germantown Hills. The majority of the planning area has a population density less than or equal to 1,000 residents per square mile. These areas are located outside of communities and are generally rural in nature.
The population density of any given area impacts the desirability of different transportation modes. For example, walking and bicycling are more prevalent in densely developed areas than in sparsely developed areas. Yet transportation improvements can also impact future population density. For example, pedestrian improvements in commercial cores can help spur retail business development and attract residents and shoppers to an area. Thus the existing population density and the preferred future population density of different areas should be considered as transportation improvements are proposed for the Tri-County region.
HISTORIC RESOURCES
The impact of transportation improvements on historic resources must be carefully considered. According to Section 4(f) of the Department of Transportation Act of 1966, any federally-assisted transportation projects may not use land from a historic site unless the following conditions are satisfied:
1. There is no feasible and prudent alternative to the use of land from the historic site.
2. The action includes all possible planning to minimize harm to the property resulting from use.
Historic sites include properties of national, state, or local significance. Section 4(f) applies to properties listed or eligible for listing in the National Register of Historic Places. In some cases, the law also applies to properties identified by state and local governments as historically significant.
The definition of “use” in this legislation is broadly applied and includes physical harm as well as detrimental impacts to the historic site. Therefore, this legislation applies not just to the proposed demolition of a historic site but to potential adverse impacts to the historic site such as noise and pollution.2
There are 55 properties in the Tri-County region listed in the National Register of Historic Places. These properties include buildings, objects, structures, sites, and historic districts. There are an additional 18 properties that have been determined to be eligible for listing in the National Register. Table 5-2 below provides a breakdown of historic properties listed in and eligible to be listed in the National Register by county.
There are other historic resources in the region that have been designated as local landmarks by local units of government that have a historic preservation ordinance. The City of Peoria, City of Washington, and Peoria Park District each have a historic preservation ordinance. A historic preservation ordinance asserts the importance of preserving historic resources for a unit of government and provides a mechanism by which historic properties can be preserved.
Source: Illinois Historic Preservation Agency; National Park Service
TABLE 5-2: PROPERTIES LISTED IN AND ELIGIBLE FOR LISTING IN NATIONAL REGISTER OF HISTORIC PLACES
County Listed Properties Eligible PropertiesPeoria 32 5Tazewell 15 8Woodford 8 5Total 55 18
36 LAND USE: Env i s ion HOI Long Range Transpor tat ion P lan
MAP 5-3: POPULATION DENSITY, 2010
37LAND USE: Env i s ion HOI Long Range Transpor tat ion P lan LAND USE: Env i s ion HOI Long Range Transpor tat ion P lan
The Tri-County region has a unique history, and the region’s historic resources can help contribute to the region’s sense of place, stimulate economic development and tourism, and contribute to a high quality of life. While federal transportation law provides protection for some historic resources when transportation improvements are being considered, a broader view of the region’s historic resources should be taken when changes to the transportation system are proposed. Broadly examining the region’s historic resources can help achieve the goals of providing a quality transportation system while preserving historic resources to promote a high quality of life.
REFERENCE NOTES
1 The Economic Benefits of Walkable Communities (Local Government Commission, 19 Sept. 2014 http://www.lgc.org/wordpress/docs/freepub/community_design/focus/walk_to_money.pdf).
2 “Section 4(f) of the Department of Transportation Act,” 22 Sept. 2014 <http://www.preservationnation.org/information-center/law-and-policy/legal-resources/preservation-law-101/federal-law/transportation-act.html>.
“Section 4(f) Program Overview,” 22 Sept. 2014 <http://www.environment.fhwa.dot.gov/4f/>.

38 LAND USE: Env i s ion HOI Long Range Transpor tat ion P lan
ENVIRONMENT
39 ENVIRONMENT: Env i s ion HOI Long Range Transpor tat ion P lanLAND USE: Env i s ion HOI Long Range Transpor tat ion P lan
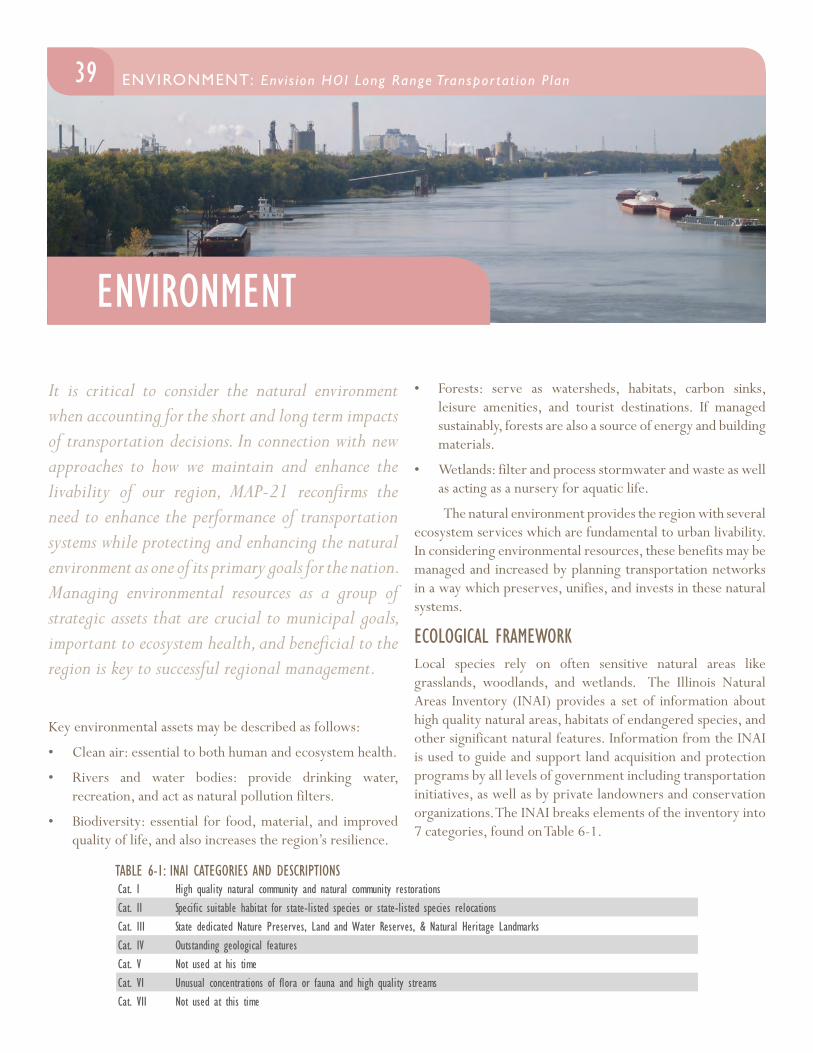
It is critical to consider the natural environment when accounting for the short and long term impacts of transportation decisions. In connection with new approaches to how we maintain and enhance the livability of our region, MAP-21 reconfirms the need to enhance the performance of transportation systems while protecting and enhancing the natural environment as one of its primary goals for the nation. Managing environmental resources as a group of strategic assets that are crucial to municipal goals, important to ecosystem health, and beneficial to the region is key to successful regional management.
Key environmental assets may be described as follows:
• Clean air: essential to both human and ecosystem health.
• Rivers and water bodies: provide drinking water, recreation, and act as natural pollution filters.
• Biodiversity: essential for food, material, and improved quality of life, and also increases the region’s resilience.
• Forests: serve as watersheds, habitats, carbon sinks, leisure amenities, and tourist destinations. If managed sustainably, forests are also a source of energy and building materials.
• Wetlands: filter and process stormwater and waste as well as acting as a nursery for aquatic life.
The natural environment provides the region with several ecosystem services which are fundamental to urban livability. In considering environmental resources, these benefits may be managed and increased by planning transportation networks in a way which preserves, unifies, and invests in these natural systems.
ECOLOGICAL FRAMEWORKLocal species rely on often sensitive natural areas like grasslands, woodlands, and wetlands. The Illinois Natural Areas Inventory (INAI) provides a set of information about high quality natural areas, habitats of endangered species, and other significant natural features. Information from the INAI is used to guide and support land acquisition and protection programs by all levels of government including transportation initiatives, as well as by private landowners and conservation organizations. The INAI breaks elements of the inventory into 7 categories, found on Table 6-1.
INAI Categories and Descriptions Cat. I High quality natural community and natural community restorationsCat. II Specific suitable habitat for state-listed species or state-listed species relocationsCat. III State dedicated Nature Preserves, Land and Water Reserves, & Natural Heritage LandmarksCat. IV Outstanding geological featuresCat. V Not used at his timeCat. VI Unusual concentrations of flora or fauna and high quality streamsCat. VII Not used at this time
TABLE 6-1: INAI CATEGORIES AND DESCRIPTIONS
40 ENVIRONMENT: Env i s ion HOI Long Range Transpor tat ion P lan
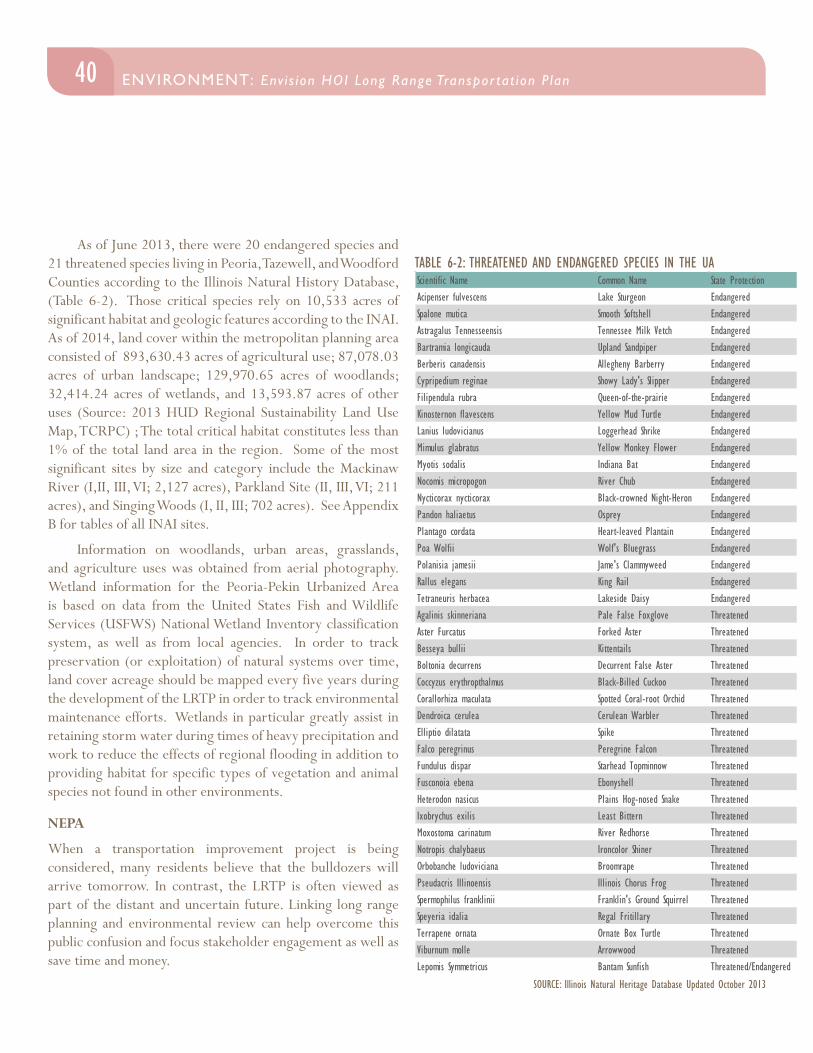
As of June 2013, there were 20 endangered species and 21 threatened species living in Peoria, Tazewell, and Woodford Counties according to the Illinois Natural History Database, (Table 6-2). Those critical species rely on 10,533 acres of significant habitat and geologic features according to the INAI. As of 2014, land cover within the metropolitan planning area consisted of 893,630.43 acres of agricultural use; 87,078.03 acres of urban landscape; 129,970.65 acres of woodlands; 32,414.24 acres of wetlands, and 13,593.87 acres of other uses (Source: 2013 HUD Regional Sustainability Land Use Map, TCRPC) ; The total critical habitat constitutes less than 1% of the total land area in the region. Some of the most significant sites by size and category include the Mackinaw River (I,II, III, VI; 2,127 acres), Parkland Site (II, III, VI; 211 acres), and Singing Woods (I, II, III; 702 acres). See Appendix B for tables of all INAI sites.
Information on woodlands, urban areas, grasslands, and agriculture uses was obtained from aerial photography. Wetland information for the Peoria-Pekin Urbanized Area is based on data from the United States Fish and Wildlife Services (USFWS) National Wetland Inventory classification system, as well as from local agencies. In order to track preservation (or exploitation) of natural systems over time, land cover acreage should be mapped every five years during the development of the LRTP in order to track environmental maintenance efforts. Wetlands in particular greatly assist in retaining storm water during times of heavy precipitation and work to reduce the effects of regional flooding in addition to providing habitat for specific types of vegetation and animal species not found in other environments.
NEPA
When a transportation improvement project is being considered, many residents believe that the bulldozers will arrive tomorrow. In contrast, the LRTP is often viewed as part of the distant and uncertain future. Linking long range planning and environmental review can help overcome this public confusion and focus stakeholder engagement as well as save time and money.
TABLE 6-2: THREATENED AND ENDANGERED SPECIES IN THE UA
SOURCE: Illinois Natural Heritage Database Updated October 2013
Scientific Name Common Name State ProtectionAcipenser fulvescens Lake Sturgeon EndangeredSpalone mutica Smooth Softshell EndangeredAstragalus Tennesseensis Tennessee Milk Vetch EndangeredBartramia longicauda Upland Sandpiper EndangeredBerberis canadensis Allegheny Barberry EndangeredCypripedium reginae Showy Lady's Slipper EndangeredFilipendula rubra Queen-of-the-prairie EndangeredKinosternon flavescens Yellow Mud Turtle EndangeredLanius ludovicianus Loggerhead Shrike EndangeredMimulus glabratus Yellow Monkey Flower EndangeredMyotis sodalis Indiana Bat EndangeredNocomis micropogon River Chub EndangeredNycticorax nycticorax Black-crowned Night-Heron EndangeredPandon haliaetus Osprey EndangeredPlantago cordata Heart-leaved Plantain EndangeredPoa Wolfii Wolf's Bluegrass EndangeredPolanisia jamesii Jame's Clammyweed EndangeredRallus elegans King Rail EndangeredTetraneuris herbacea Lakeside Daisy EndangeredAgalinis skinneriana Pale False Foxglove ThreatenedAster Furcatus Forked Aster ThreatenedBesseya bullii Kittentails ThreatenedBoltonia decurrens Decurrent False Aster ThreatenedCoccyzus erythropthalmus Black-Billed Cuckoo ThreatenedCorallorhiza maculata Spotted Coral-root Orchid ThreatenedDendroica cerulea Cerulean Warbler ThreatenedElliptio dilatata Spike ThreatenedFalco peregrinus Peregrine Falcon ThreatenedFundulus dispar Starhead Topminnow ThreatenedFusconoia ebena Ebonyshell ThreatenedHeterodon nasicus Plains Hog-nosed Snake ThreatenedIxobrychus exilis Least Bittern ThreatenedMoxostoma carinatum River Redhorse ThreatenedNotropis chalybaeus Ironcolor Shiner ThreatenedOrbobanche ludoviciana Broomrape ThreatenedPseudacris Illinoensis Illinois Chorus Frog ThreatenedSpermophilus franklinii Franklin's Ground Squirrel ThreatenedSpeyeria idalia Regal Fritillary ThreatenedTerrapene ornata Ornate Box Turtle ThreatenedViburnum molle Arrowwood ThreatenedLepomis Symmetricus Bantam Sunfish Threatened/Endangered
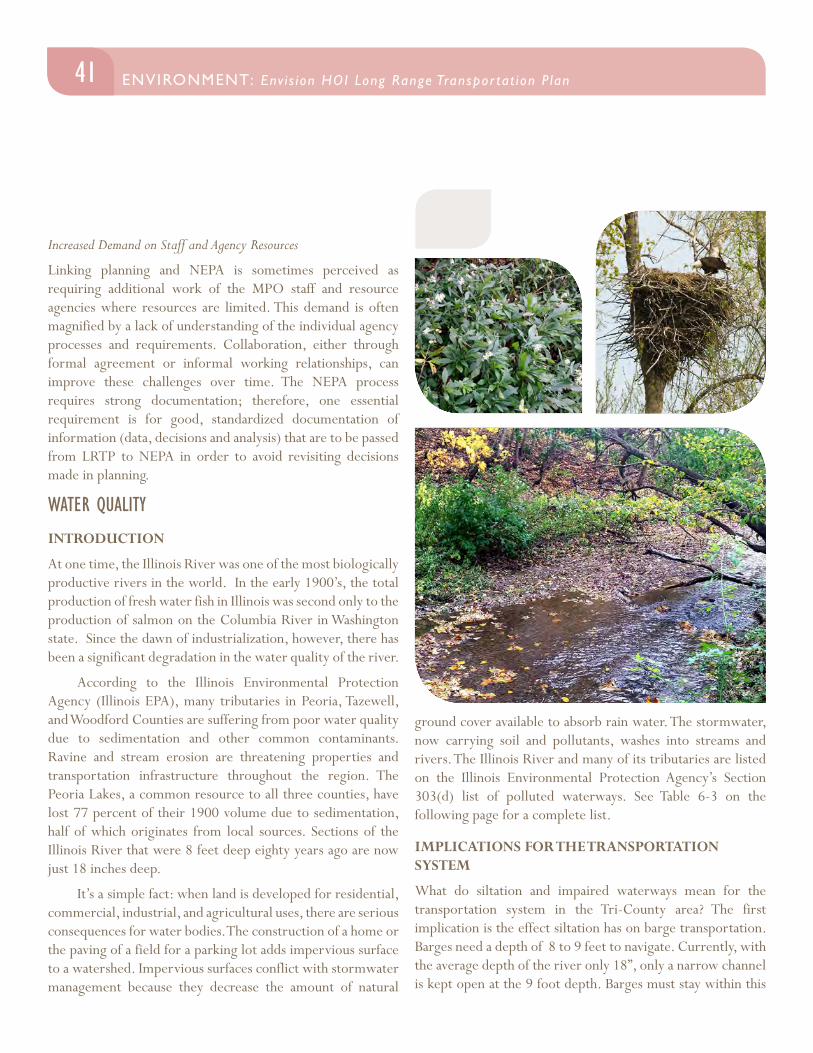
41ENVIRONMENT: Env i s ion HOI Long Range Transpor tat ion P lan ENVIRONMENT: Env i s ion HOI Long Range Transpor tat ion P lan
Increased Demand on Staff and Agency Resources
Linking planning and NEPA is sometimes perceived as requiring additional work of the MPO staff and resource agencies where resources are limited. This demand is often magnified by a lack of understanding of the individual agency processes and requirements. Collaboration, either through formal agreement or informal working relationships, can improve these challenges over time. The NEPA process requires strong documentation; therefore, one essential requirement is for good, standardized documentation of information (data, decisions and analysis) that are to be passed from LRTP to NEPA in order to avoid revisiting decisions made in planning.
WATER QUALITY
INTRODUCTION
At one time, the Illinois River was one of the most biologically productive rivers in the world. In the early 1900’s, the total production of fresh water fish in Illinois was second only to the production of salmon on the Columbia River in Washington state. Since the dawn of industrialization, however, there has been a significant degradation in the water quality of the river.
According to the Illinois Environmental Protection Agency (Illinois EPA), many tributaries in Peoria, Tazewell, and Woodford Counties are suffering from poor water quality due to sedimentation and other common contaminants. Ravine and stream erosion are threatening properties and transportation infrastructure throughout the region. The Peoria Lakes, a common resource to all three counties, have lost 77 percent of their 1900 volume due to sedimentation, half of which originates from local sources. Sections of the Illinois River that were 8 feet deep eighty years ago are now just 18 inches deep.
It’s a simple fact: when land is developed for residential, commercial, industrial, and agricultural uses, there are serious consequences for water bodies. The construction of a home or the paving of a field for a parking lot adds impervious surface to a watershed. Impervious surfaces conflict with stormwater management because they decrease the amount of natural
ground cover available to absorb rain water. The stormwater, now carrying soil and pollutants, washes into streams and rivers. The Illinois River and many of its tributaries are listed on the Illinois Environmental Protection Agency’s Section 303(d) list of polluted waterways. See Table 6-3 on the following page for a complete list.
IMPLICATIONS FOR THE TRANSPORTATION SYSTEM
What do siltation and impaired waterways mean for the transportation system in the Tri-County area? The first implication is the effect siltation has on barge transportation. Barges need a depth of 8 to 9 feet to navigate. Currently, with the average depth of the river only 18”, only a narrow channel is kept open at the 9 foot depth. Barges must stay within this
42 ENVIRONMENT: Env i s ion HOI Long Range Transpor tat ion P lan
channel or risk running aground. This means that when 2 barges going in opposite directions must pass, one barge must pull over. There are only certain places along the river where a barge can safely pull over to let another barge pass. This leads to delays in the river transport of freight.
Another implication is the impact on the design of the highway road network. Roadways add to the total amount of impervious surface in the region. Stormwater from roadways must be managed in an environmentally sensitive manner so that it does not pick up soil and pollutants that flow into streams and rivers.
One method of lessening the impact of stormwater is through green infrastructure. Green infrastructures are strategically planned and managed networks of natural lands, working landscapes and other open spaces that conserve ecosystem values and functions and provide associated benefits to human populations.
Using green infrastructure techniques in the transportation system has many benefits. For example, a road built through the heart of a historically wet area can experience flooding and can deplete the ability for that area to absorb and filter stormwater. However, when these systems are built in concert, a community can effectively build a transportation system while maintaining the vital roles that ecosystems play in community health and wellbeing.
TABLE 6-3: IMPAIRED WATERWAYS IN THE TRI-COUNTY AREA
Source: USEPA 303(d) List, 2014
Name Designated Use CauseE. Br. Panther Cr. Aquatic Life Dissolved OxygenEureka Lake Aesthetic Quality Phosphorus, Total Suspended SolidsFargo Run Aquatic Life Cause UnknownFarm Creek Aquatic Life Dissolved Oxygen
Illinois RiverFish Consumption, Recreation, Primary Contact
Mercury, PCBs, Fecal Coliform, Total Dissolved Solids
Kickapoo Creek Fish Consumption Mercury, PCSsLake of the Woods Fish Consumption Mercury, PCBs
Mackinaw RiverFish Consumption, Recreation, Primary Contact PCBs, Fecal Coliform
Tenmile Creek Aquatic Life Dissolved Oxygen, Manganese
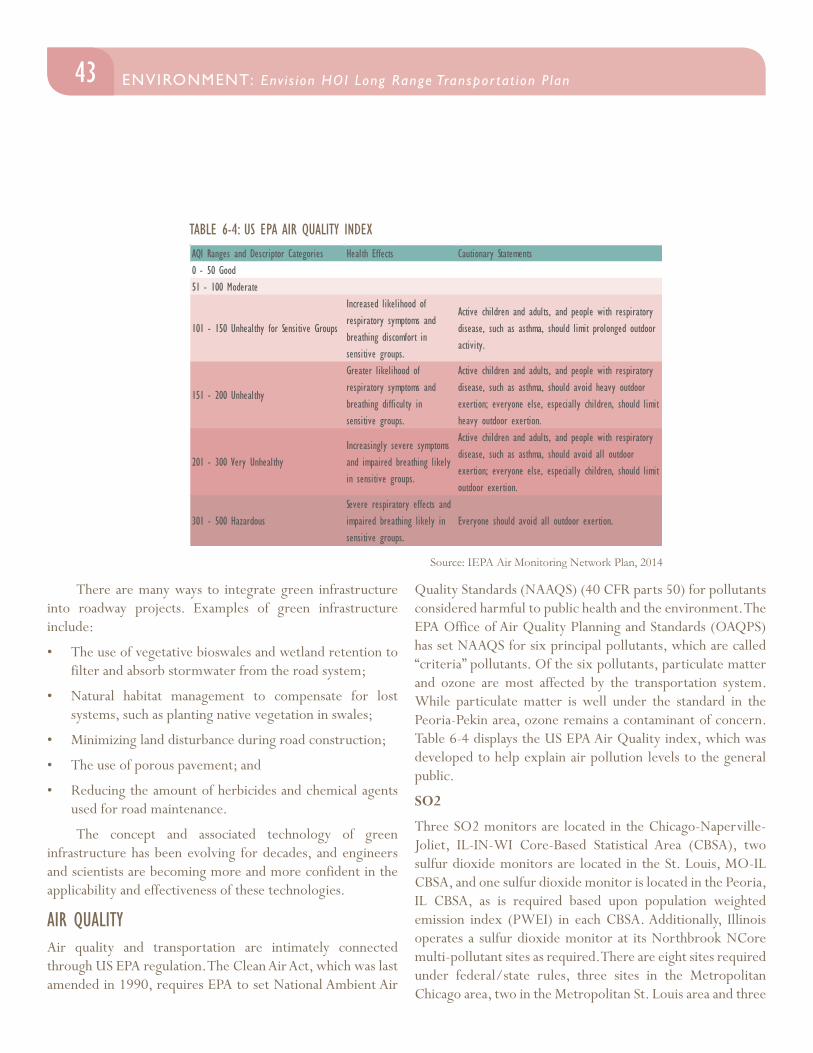
43ENVIRONMENT: Env i s ion HOI Long Range Transpor tat ion P lan ENVIRONMENT: Env i s ion HOI Long Range Transpor tat ion P lan
There are many ways to integrate green infrastructure into roadway projects. Examples of green infrastructure include:
• The use of vegetative bioswales and wetland retention to filter and absorb stormwater from the road system;
• Natural habitat management to compensate for lost systems, such as planting native vegetation in swales;
• Minimizing land disturbance during road construction;
• The use of porous pavement; and
• Reducing the amount of herbicides and chemical agents used for road maintenance.
The concept and associated technology of green infrastructure has been evolving for decades, and engineers and scientists are becoming more and more confident in the applicability and effectiveness of these technologies.
AIR QUALITYAir quality and transportation are intimately connected through US EPA regulation. The Clean Air Act, which was last amended in 1990, requires EPA to set National Ambient Air
Quality Standards (NAAQS) (40 CFR parts 50) for pollutants considered harmful to public health and the environment. The EPA Office of Air Quality Planning and Standards (OAQPS) has set NAAQS for six principal pollutants, which are called “criteria” pollutants. Of the six pollutants, particulate matter and ozone are most affected by the transportation system. While particulate matter is well under the standard in the Peoria-Pekin area, ozone remains a contaminant of concern. Table 6-4 displays the US EPA Air Quality index, which was developed to help explain air pollution levels to the general public.
SO2
Three SO2 monitors are located in the Chicago-Naperville-Joliet, IL-IN-WI Core-Based Statistical Area (CBSA), two sulfur dioxide monitors are located in the St. Louis, MO-IL CBSA, and one sulfur dioxide monitor is located in the Peoria, IL CBSA, as is required based upon population weighted emission index (PWEI) in each CBSA. Additionally, Illinois operates a sulfur dioxide monitor at its Northbrook NCore multi-pollutant sites as required. There are eight sites required under federal/state rules, three sites in the Metropolitan Chicago area, two in the Metropolitan St. Louis area and three
TABLE 6-4: US EPA AIR QUALITY INDEX
Source: IEPA Air Monitoring Network Plan, 2014
AQI Ranges and Descriptor Categories Health Effects Cautionary Statements0 - 50 Good51 - 100 Moderate
101 - 150 Unhealthy for Sensitive Groups
Increased likelihood of respiratory symptoms and breathing discomfort in sensitive groups.
Active children and adults, and people with respiratory disease, such as asthma, should limit prolonged outdoor activity.
151 - 200 Unhealthy
Greater likelihood of respiratory symptoms and breathing difficulty in sensitive groups.
Active children and adults, and people with respiratory disease, such as asthma, should avoid heavy outdoor exertion; everyone else, especially children, should limit heavy outdoor exertion.
201 - 300 Very UnhealthyIncreasingly severe symptoms and impaired breathing likely in sensitive groups.
Active children and adults, and people with respiratory disease, such as asthma, should avoid all outdoor exertion; everyone else, especially children, should limit outdoor exertion.
301 - 500 HazardousSevere respiratory effects and impaired breathing likely in sensitive groups.
Everyone should avoid all outdoor exertion.
44 ENVIRONMENT: Env i s ion HOI Long Range Transpor tat ion P lan
areas where concentrations were found to exceed the hourly sulfur dioxide air quality standard. A total of fourteen sites were operated in 2013; thirteen will be operated in 2014. Illinois seeks to discontinue the Decatur SO2 monitor.
In addition to the population required SO2 monitor in Peoria, a second monitor is located within the PPUATS area in Pekin, Illinois. This site was determined based upon its high concentration of SO2 far exceeding NAAQS of 75 ppb. The Pekin monitor, located at Pekin Fire Station #3, continues to be classified as non attainment. Efforts are being made with local factories to bring the site into compliance.
PARTICULATE MATTER
Both PM10 and PM2.5, refer to a measurement of air particle size – 10 micrometers and 2.5 micrometers, respectively. Contamination at these levels is typically the result of chemical reactions such as vehicular combustion, power generation, and certain industrial processes. Major components measured by the Illinois State EPA include: sulfur dioxide, carbon monoxide, and nitrogen dioxide. The exact chemistry is complex, and particle formation is dependent on other pollutants and atmospheric conditions.
In the context of the Peoria-Pekin Urbanized Area, it is important to note that ammonia from surrounding agricultural sources such as fertilizer and animal feed operations contribute to the formation of sulfurous and nitrogenous particulate matter that exists in the atmosphere such as ammonium sulfate and ammonium nitrate.1 IEPA maintains no PM10 and one PM2.5 in the Peoria Pekin Urbanized Area. The Peoria monitor maintains a one hour attainment standard of < 15 micrograms per cubic meter resulting in no required action.
LEAD
In CBSAs of 500,000 residents or more, one lead population based monitor is required. Illinois operates a population based lead monitor at the Northbrook location. An additional
1 The Particle Pollution Report: Current Understanding of Air Quality and Emissions through 2003. Neil Frank. 2006. The Chemical Composition of PM2.5 to support PM Implementation. AQAG/AQAD USEPA. Pomporn Chantara. 2012. PM10 and Its Chemical Composition. Chiang Mai University
population based lead monitor is required in the St. Louis, MO-IL MSA. Neither is located in the PPUATS area; however, Illinois is required to operate source oriented monitors near facilities emitting 0.5 tons/year of lead that also have maximum lead concentrations in ambient air in excess of 50 percent of the NAAQS. Thirteen lead sites were identified in the 2013 network plan, one of which is a special purpose monitor. The 2014 network plan proposes six sites, one of which is a special purpose monitor. Three of the proposed discontinuations meet EPA guidance for shutdown as defined in 40 CFR 58 Subpart B 58.14(c)(1). Illinois EPA will propose to discontinue four other lead monitors, two of which are located within the PPUATS area. These monitors each have three years of clean data, and are among the lowest design values recorded in Illinois EPA’s lead network, exceeding attainment of < 0.15 micrograms per cubic meter as shown in Table 6-5 below.
OZONE
Ozone is the combination of volatile organics, nitrogen oxides, carbon monoxide, and sunshine that result in harmful and powerful oxidants. There is a great deal of evidence that indicates high concentrations (ppm) of ozone created by high concentrations of pollution and daylight UV rays at the earth’s surface can harm lung function and irritate the respiratory system. Additional effects of the ozone on health can be found in the Public Health Section. Three majority contributors of ozone are transportation, individuals (lawnmowers, boats, etc), and industry.
As sunlight is a variable in the ozone equation, the weather greatly affects ozone levels. Potential for high levels occurs on hot days with lots of sunlight and low winds. Ozone season is April through November, when ozone levels are the highest. Ozone is measured at various sites throughout the nation. All sites are chosen based on EPA standards of site selection.
Design ValuesAQS Code Operator 2008 2009 2010 2011 2012 2010-201217-143-0110 IEPA - - 0.02 0.01 0.01 0.0217-143-0210 IEPA - - 0.01 0.02 0.01 0.02
Lead Three Month Rolling Averages
Source: IEPA Air Monitoring Network Plan, 2014
TABLE 6-5 LEAD MONITORS IN THE TRI-COUNTY AREA
45ENVIRONMENT: Env i s ion HOI Long Range Transpor tat ion P lan ENVIRONMENT: Env i s ion HOI Long Range Transpor tat ion P lan
Readings are taken every hour and are averaged over an 8-hour span. Annual Site readings are calculated by selecting the 4th highest 8-hour reading of the year and averaging this reading with readings from the previous two years. IEPA has placed two reading stations in the Peoria-Pekin area. One station is located in the City of Peoria and another in Peoria Heights. EPA calculated levels for the years 2012 – 2014 are in Table 6-6 below.
The EPA regulated ozone level is 0.075 ppm. The 3-year-average peak daytime concentrations for the Peoria and Peoria Heights ozone monitors reached 0.062 and 0.069 parts per million (ppm) respectively as of September 2014. This means that the local contributions of ozone can only increase .006 to .013 ppm (8% to 17%) for our community to remain in attainment.
In 2008, the US EPA ozone standard became more stringent, dropping from .08 ppm to .075 ppm attainment levels. In December 2014, the EPA published its proposed revision to the NAAQS for ozone. The EPA is proposing to revise the primary ozone standard to a level within the range of 0.065 to 0.070 ppm. EPA expects to finalize the ozone rule by October 2015.
A decrease of attainment levels would certainly put the PPUATS area at risk for being in non-attainment for ozone. If our region is in non-attainment, then actions to reduce air pollution become mandatory for transportation officials and industries. Transportation officials must design new construction projects to accomplish emissions reductions and must implement programs to reduce emissions from individual citizens. Industry will be subject to more stringent emission restrictions.
Year 2010-2012 2011-2013 2012-2014EPA Standard 0.075 0.075 0.075Peoria 0.063 0.063 0.062Peoria Heights 0.072 0.071 0.069
TABLE 6-6: 3- YEAR AVERAGE OZONE LEVELS FOR THE UA
Source: US EPA, 2014
PUBLIC INPUT
Throughout the public engagement process, several comments were brought up regarding environmental protection. In general, the comments fell into three categories: 1) The need to protect and preserve our existing environment; 2) The need to improve existing water and air quality; and 3) The need to reduce the consumption of land via sprawl. Many identified the natural environment, including the Illinois River, as a highly valued regional asset. In addition, many noted the threat of air and water pollution via mobile and point sources as major threats to the overall health, environmental quality, and quality of life in the region. Some suggested the positive effect of young activists as an opportunity to engage and empower citizens to take action towards protecting the regional environment. The following comments and suggestions were expressed regarding environmental protection (please note that this is not a comprehensive list):
• Reduce urban sprawl.
• Focus on system maintenance as opposed to expansion.
• Invest in alternative fuel systems for transportation modes.
• Create anti-idling policies.
• Protect green space and natural environment from pollution and development.

46 ENVIRONMENT: Env i s ion HOI Long Range Transpor tat ion P lan
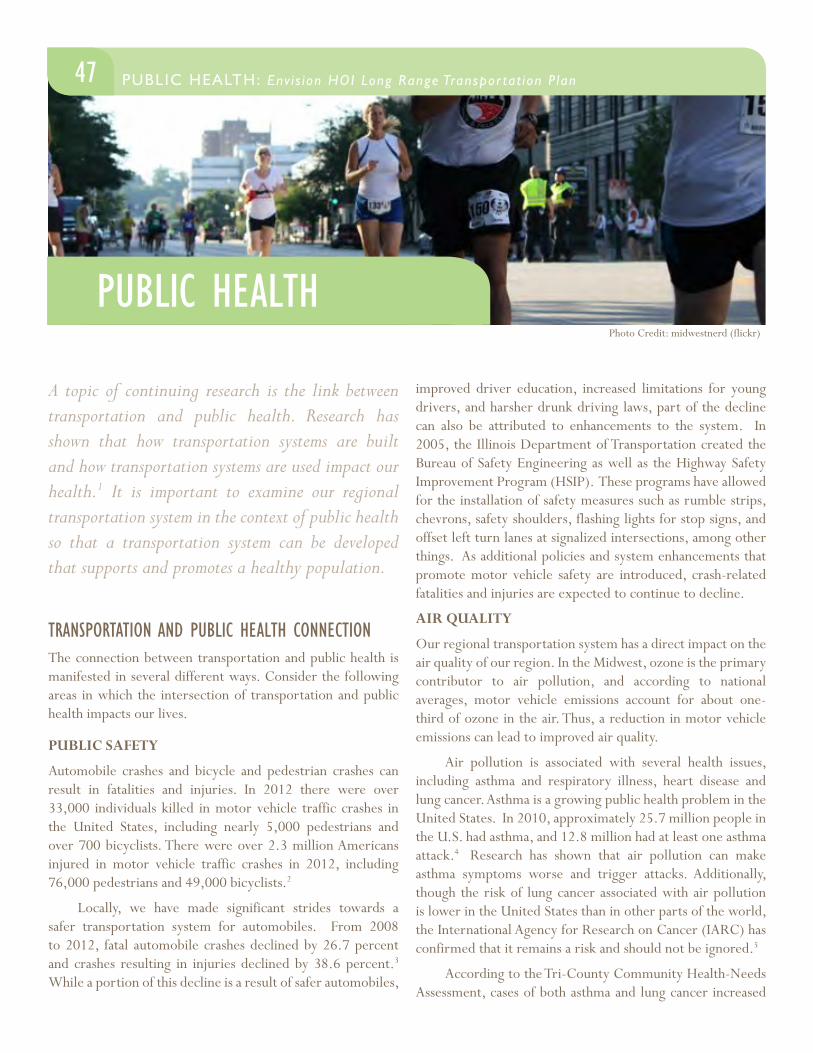
PUBLIC HEALTH
47 PUBLIC HEALTH: Env i s ion HOI Long Range Transpor tat ion P lanENVIRONMENT: Env i s ion HOI Long Range Transpor tat ion P lan
A topic of continuing research is the link between transportation and public health. Research has shown that how transportation systems are built and how transportation systems are used impact our health.1 It is important to examine our regional transportation system in the context of public health so that a transportation system can be developed that supports and promotes a healthy population.
TRANSPORTATION AND PUBLIC HEALTH CONNECTIONThe connection between transportation and public health is manifested in several different ways. Consider the following areas in which the intersection of transportation and public health impacts our lives.
PUBLIC SAFETY
Automobile crashes and bicycle and pedestrian crashes can result in fatalities and injuries. In 2012 there were over 33,000 individuals killed in motor vehicle traffic crashes in the United States, including nearly 5,000 pedestrians and over 700 bicyclists. There were over 2.3 million Americans injured in motor vehicle traffic crashes in 2012, including 76,000 pedestrians and 49,000 bicyclists.2
Locally, we have made significant strides towards a safer transportation system for automobiles. From 2008 to 2012, fatal automobile crashes declined by 26.7 percent and crashes resulting in injuries declined by 38.6 percent.3 While a portion of this decline is a result of safer automobiles,
improved driver education, increased limitations for young drivers, and harsher drunk driving laws, part of the decline can also be attributed to enhancements to the system. In 2005, the Illinois Department of Transportation created the Bureau of Safety Engineering as well as the Highway Safety Improvement Program (HSIP). These programs have allowed for the installation of safety measures such as rumble strips, chevrons, safety shoulders, flashing lights for stop signs, and offset left turn lanes at signalized intersections, among other things. As additional policies and system enhancements that promote motor vehicle safety are introduced, crash-related fatalities and injuries are expected to continue to decline.
AIR QUALITY
Our regional transportation system has a direct impact on the air quality of our region. In the Midwest, ozone is the primary contributor to air pollution, and according to national averages, motor vehicle emissions account for about one-third of ozone in the air. Thus, a reduction in motor vehicle emissions can lead to improved air quality.
Air pollution is associated with several health issues, including asthma and respiratory illness, heart disease and lung cancer. Asthma is a growing public health problem in the United States. In 2010, approximately 25.7 million people in the U.S. had asthma, and 12.8 million had at least one asthma attack.4 Research has shown that air pollution can make asthma symptoms worse and trigger attacks. Additionally, though the risk of lung cancer associated with air pollution is lower in the United States than in other parts of the world, the International Agency for Research on Cancer (IARC) has confirmed that it remains a risk and should not be ignored.5
According to the Tri-County Community Health-Needs Assessment, cases of both asthma and lung cancer increased
Photo Credit: midwestnerd (flickr)
48 PUBLIC HEALTH: Env i s ion HOI Long Range Transpor tat ion P lan
from 2008-2011 for inpatient admissions at Peoria-area hospitals. Of course, air pollution is just one of many factors that could be contributing to this increase; however, its effects should not be overlooked.
While individual actions and motor vehicle technology contribute to reducing ozone levels, so too can improvements to our regional transportation system. Developing a system that enables more users to walk, bike, or use mass transit can help reduce motor vehicle emissions, improve air quality and, subsequently, minimize the effects of air pollution on physical health issues.
PHYSICAL ACTIVITY AND OBESITY
Obesity is a growing public health concern in the United States. According to the Centers for Disease Control and Prevention (CDC), more than one-third of adults in the US are obese, and about 17 percent of US children and adolescents aged 2 to 19 are obese.6 In addition, research has shown a direct link between automobile-oriented communities and low rates of physical activity.7 These findings suggest that transportation systems in which physical activity (such as walking or biking) is difficult or discouraged could be a contributing factor to obesity in the United States.
According to the CDC, adults need at least 150 minutes of moderate-intensity aerobic activity every week, as well as full body muscle-strengthening activities at least twice per week.8 However, as reported by the Tri-County Community Health-Assessment, only 15 percent of the Tri-County population engages in exercise at least 5 times per week, and the percentage of people who are overweight or obese is slightly higher than the state average of 64 percent.9
This is particularly concerning, as Illinois has the 6th highest obesity rate in the United States. While poor diet choices contribute significantly to obesity, lack of physical activity also plays a part. A transportation system that enables the use of a variety of modes, including walking and biking, provides greater options for individuals to engage in physical activity and improve their physical health.
ACCESSIBILITY (FRESH FOODS, HEALTHCARE SERVICES)
In the U.S., millions of individuals are unable to transport themselves or purchase transportation due to physical and/or mental disabilities, income status, or age.10 These individuals, often referred to as “transportation disadvantaged,” must depend on others to obtain access to fresh foods, medical care, gainful employment, and educational opportunities. Difficulty accessing transportation can have major effects on both the physical and emotional health of these individuals.
According to the 2012 American Community Survey, in the Peoria-Pekin urbanized area, 16.9% of individuals are living below the poverty level, 10.7% of individuals are living with a disability, and 21.1% of individuals are too young to drive (under 16 years of age). While the region is making progress towards a more multi-modal system, there are gaps that remain that make it difficult for the transportation disadvantaged to access goods and services. For instance, local transit service is unavailable after midnight during the weekdays and has limited hours on the weekends. Furthermore, transit is limited to the cities of Peoria, Pekin, and East Peoria. Additionally, as referenced in the transportation section, the bicycle network lacks connectivity, making it difficult to use for transportation purposes.
A transportation system that provides multiple, affordable options can help alleviate some of the troubles the transportation disadvantaged face when attempting to access basic needs, including food, medical care, and employment.
CONCLUSIONA transportation system that provides a range of affordable, safe and efficient options for getting around will minimize negative public health impacts. The Greater Peoria Area, like most communities in the United States, has been designed and built to favor automobile use. This has led to a population that is very dependent on the automobile to access goods and services across the region. In fact, according to the 2012 American Community Survey, approximately 82% of workers in the Peoria-Pekin urbanized area drove alone to work, and 10.1% of workers carpooled. This statistic – though it doesn’t
49PUBLIC HEALTH: Env i s ion HOI Long Range Transpor tat ion P lan PUBLIC HEALTH: Env i s ion HOI Long Range Transpor tat ion P lan
include educational, medical, and shopping trips – provides a sense of how auto-dependent the region is. As referenced above, dependence on the automobile can lead to poor air quality, fewer opportunities to be active, and lack of options
for the transportation disadvantaged. By investing in transit, bicycle and pedestrian infrastructure, and introducing more policies and system enhancements that address transportation safety issues, our transportation system will be better able to support a healthy population.
REFERENCE NOTES
1. American Public Health Association. (April 2009). At the Intersection of Public Health and Transportation: Promoting Healthy Transportation Policy. Retrieved from http://www.apha.org/~/media/files/pdf/topics/transport/at_the_intersection.ashx [Accessed September 30, 2014].
2. U.S. Department of Transportation National Highway Traffic Safety Administration. (2012). Traffic Safety Facts 2012: A Compilation of Motor Vehicle Crash Data from the Fatality Analysis Reporting System and the General Estimates System. Retrieved from http://www-nrd.nhtsa.dot.gov/Pubs/812032.pdf [Accessed September 30, 2014].
3. Illinois Department of Transportation. (2014). Illinois Roadway Crash Data. Retrieved from http://www.idot.illinois.gov/transportation-system/safety/Illinois-Roadway-Crash-Data [Accessed September 30, 2014].
4. Centers for Disease Control and Prevention. (July 2012). Asthma and Air Pollution: A Tool Kit. Retrieved from http://ephtracking.cdc.gov/docs/CDC_Asthma_Final.pdf [Accessed October 7, 2014].
5. Simon, Stacy. (October 2013). World Health Organization: Outdoor Air Pollution Causes Cancer. Retrieved from http://www.cancer.org/cancer/news/world-health-organization-outdoor-air-pollution-causes-cancer [Accessed October 7, 2014].
6. Center for Disease Control and Prevention. (September 2014). Adult Obesity Facts. Retrieved from http://www.cdc.gov/obesity/data/adult.html [Accessed Sept. 30 2014].
Center for Disease Control and Prevention. (September 2014).
Childhood Obesity Facts. Retrieved from http://www.cdc.gov/obesity/data/childhood.html [Accessed Sept. 30 2014]
7. American Public Health Association. (April 2009). At the Intersection of Public Health and Transportation: Promoting Healthy Transportation Policy. Retrieved from http://www.apha.org/~/media/files/pdf/topics/transport/at_the_intersection.ashx [Accessed September 30, 2014].
8. Centers for Disease Control and Prevention. (March 2014). How Much Physical Activity do Adults Need?. Retrieved from http://www.cdc.gov/physicalactivity/everyone/guidelines/adults.html [Accessed February 3, 2015].
9. Michel, Eric J. and Dr. Laurence Weinzimmer. (2013). Tri-County Health Needs Assessment 2013. Retrieved from http://www.peoriacounty.org/download/?path=%2Fpcchd%2FPeoria-Area+CHNA+Summary.pdf [Accessed September 22, 2014].
10. United States Government Accountability Office. (June 2012). Transportation-Disadvantaged Populations: Federal Coordination Efforts Could be Further Strengthened. Retrieved from http://www.gao.gov/assets/600/591708.pdf [Accessed October 6, 2014].

50 PUBLIC HEALTH: Env i s ion HOI Long Range Transpor tat ion P lan
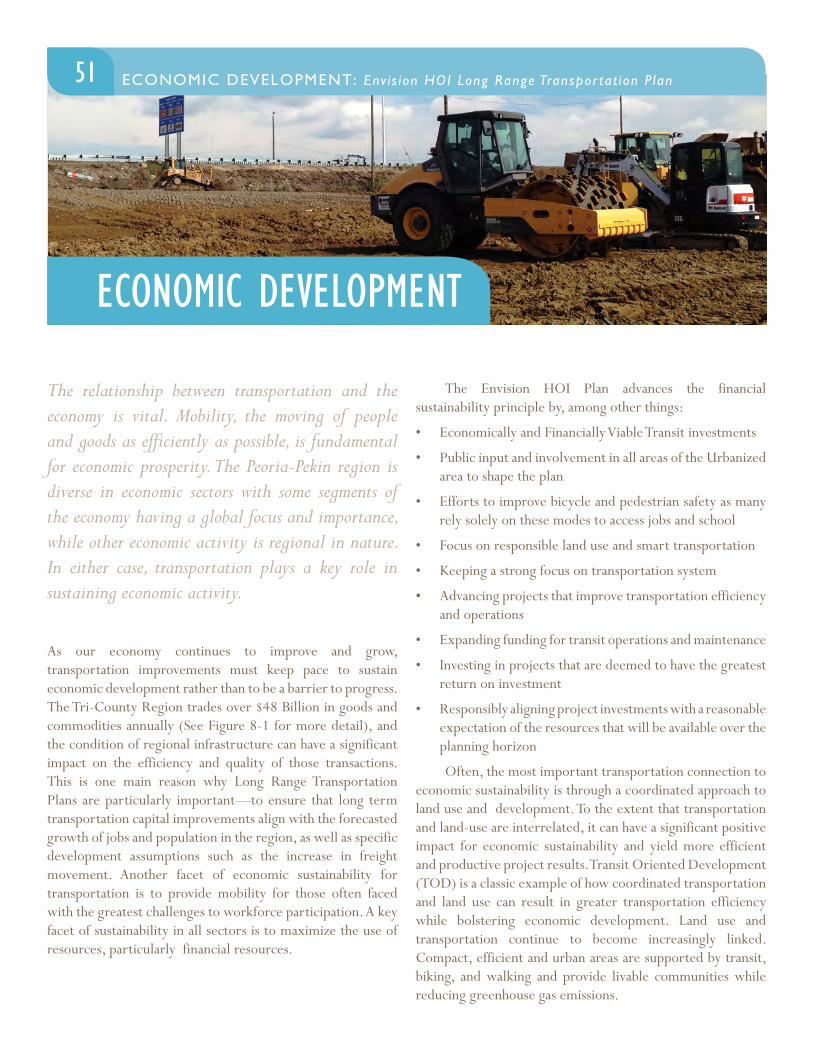
ECONOMIC DEVELOPMENT
51 ECONOMIC DEVELOPMENT: Env i s ion HOI Long Range Transpor tat ion P lanPUBLIC HEALTH: Env i s ion HOI Long Range Transpor tat ion P lan
The relationship between transportation and the economy is vital. Mobility, the moving of people and goods as efficiently as possible, is fundamental for economic prosperity. The Peoria-Pekin region is diverse in economic sectors with some segments of the economy having a global focus and importance, while other economic activity is regional in nature. In either case, transportation plays a key role in sustaining economic activity.
As our economy continues to improve and grow, transportation improvements must keep pace to sustain economic development rather than to be a barrier to progress. The Tri-County Region trades over $48 Billion in goods and commodities annually (See Figure 8-1 for more detail), and the condition of regional infrastructure can have a significant impact on the efficiency and quality of those transactions. This is one main reason why Long Range Transportation Plans are particularly important—to ensure that long term transportation capital improvements align with the forecasted growth of jobs and population in the region, as well as specific development assumptions such as the increase in freight movement. Another facet of economic sustainability for transportation is to provide mobility for those often faced with the greatest challenges to workforce participation. A key facet of sustainability in all sectors is to maximize the use of resources, particularly financial resources.
The Envision HOI Plan advances the financial sustainability principle by, among other things:
• Economically and Financially Viable Transit investments
• Public input and involvement in all areas of the Urbanized area to shape the plan
• Efforts to improve bicycle and pedestrian safety as many rely solely on these modes to access jobs and school
• Focus on responsible land use and smart transportation
• Keeping a strong focus on transportation system
• Advancing projects that improve transportation efficiency and operations
• Expanding funding for transit operations and maintenance
• Investing in projects that are deemed to have the greatest return on investment
• Responsibly aligning project investments with a reasonable expectation of the resources that will be available over the planning horizon
Often, the most important transportation connection to economic sustainability is through a coordinated approach to land use and development. To the extent that transportation and land-use are interrelated, it can have a significant positive impact for economic sustainability and yield more efficient and productive project results. Transit Oriented Development (TOD) is a classic example of how coordinated transportation and land use can result in greater transportation efficiency while bolstering economic development. Land use and transportation continue to become increasingly linked. Compact, efficient and urban areas are supported by transit, biking, and walking and provide livable communities while reducing greenhouse gas emissions.
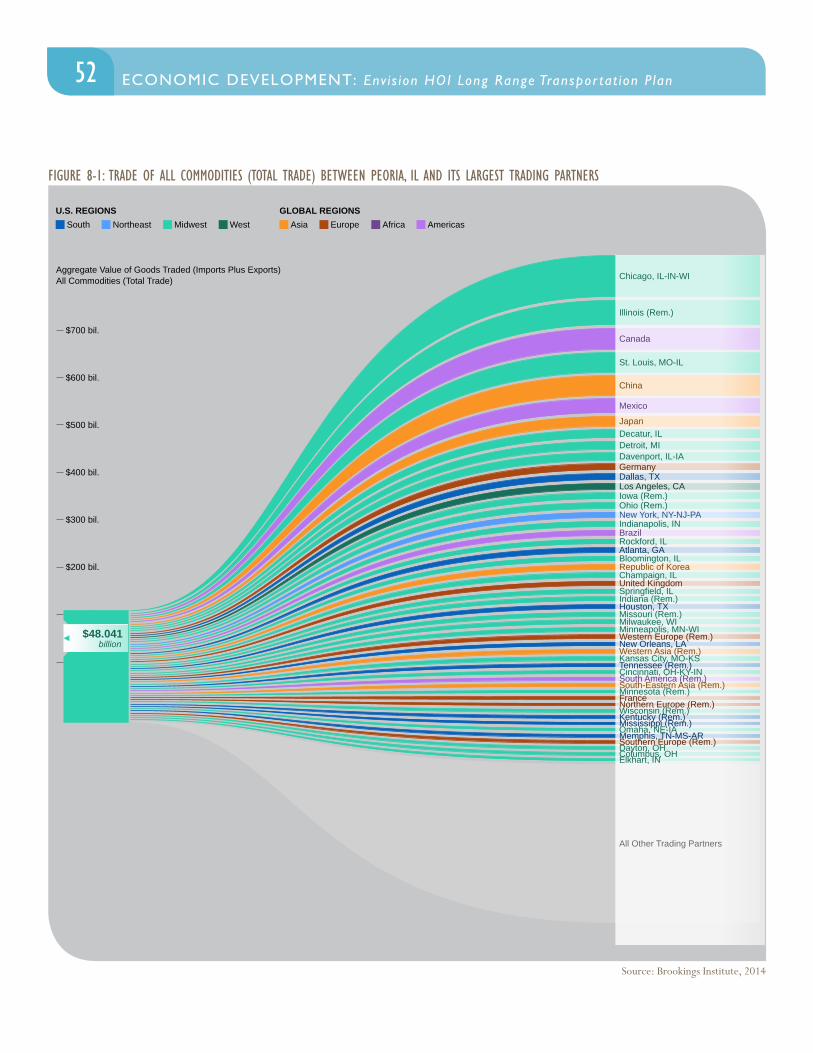
52 ECONOMIC DEVELOPMENT: Env i s ion HOI Long Range Transpor tat ion P lan
Aggregate Value of Goods Traded (Imports Plus Exports)All Commodities (Total Trade)
$0
$100 bil.
$200 bil.
$300 bil.
$400 bil.
$500 bil.
$600 bil.
$700 bil.
$48.041billion
Dallas, TX
Houston, TX
Canada
China
Mexico
Chicago, IL-IN-WI
Los Angeles, CA
New York, NY-NJ-PA
Western Asia (Rem.)
Japan
South America (Rem.)
Ohio (Rem.)
Cincinnati, OH-KY-IN
Detroit, MI
South-Eastern Asia (Rem.)
Indiana (Rem.)
Atlanta, GA
Minneapolis, MN-WI
Memphis, TN-MS-AR
St. Louis, MO-IL
Republic of Korea
Brazil
Germany
All Other Trading Partners
Illinois (Rem.)
Decatur, IL
Davenport, IL-IA
Iowa (Rem.)
Indianapolis, IN
Rockford, IL
Bloomington, IL
Champaign, ILUnited KingdomSpringfield, IL
Missouri (Rem.)Milwaukee, WIWestern Europe (Rem.)New Orleans, LAKansas City, MO-KSTennessee (Rem.)
Minnesota (Rem.)FranceNorthern Europe (Rem.)Wisconsin (Rem.)Kentucky (Rem.)Mississippi (Rem.)Omaha, NE-IASouthern Europe (Rem.)Dayton, OHColumbus, OHElkhart, IN
Trade of All Commodities (Total Trade) between Peoria, IL and its Largest Trading Partners
U.S. REGIONS GLOBAL REGIONSSouth Northeast Midwest West Asia Europe Africa Americas
Source: Brookings Institute, 2014
FIGURE 8-1: TRADE OF ALL COMMODITIES (TOTAL TRADE) BETWEEN PEORIA, IL AND ITS LARGEST TRADING PARTNERS
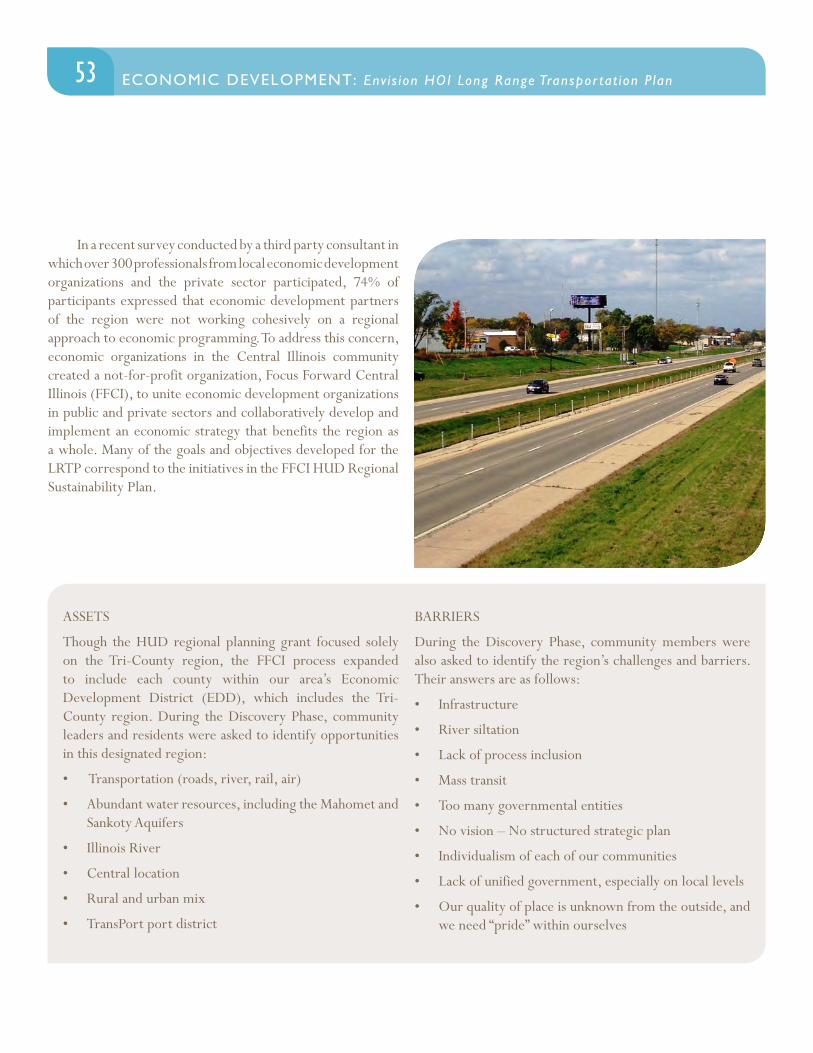
53ECONOMIC DEVELOPMENT: Env i s ion HOI Long Range Transpor tat ion P lan ECONOMIC DEVELOPMENT: Env i s ion HOI Long Range Transpor tat ion P lan
ASSETS
Though the HUD regional planning grant focused solely on the Tri-County region, the FFCI process expanded to include each county within our area’s Economic Development District (EDD), which includes the Tri-County region. During the Discovery Phase, community leaders and residents were asked to identify opportunities in this designated region:
• Transportation (roads, river, rail, air)
• Abundant water resources, including the Mahomet and Sankoty Aquifers
• Illinois River
• Central location
• Rural and urban mix
• TransPort port district
BARRIERS
During the Discovery Phase, community members were also asked to identify the region’s challenges and barriers. Their answers are as follows:
• Infrastructure
• River siltation
• Lack of process inclusion
• Mass transit
• Too many governmental entities
• No vision – No structured strategic plan
• Individualism of each of our communities
• Lack of unified government, especially on local levels
• Our quality of place is unknown from the outside, and we need “pride” within ourselves
In a recent survey conducted by a third party consultant in which over 300 professionals from local economic development organizations and the private sector participated, 74% of participants expressed that economic development partners of the region were not working cohesively on a regional approach to economic programming. To address this concern, economic organizations in the Central Illinois community created a not-for-profit organization, Focus Forward Central Illinois (FFCI), to unite economic development organizations in public and private sectors and collaboratively develop and implement an economic strategy that benefits the region as a whole. Many of the goals and objectives developed for the LRTP correspond to the initiatives in the FFCI HUD Regional Sustainability Plan.
54 ECONOMIC DEVELOPMENT: Env i s ion HOI Long Range Transpor tat ion P lan
OTHER ECONOMIC DEVELOPMENT CONSIDERATIONS
Greater Peoria Economic Development Council
The Greater Peoria Economic Development Council, “drives economic growth within the Greater Peoria Area in collaboration with our local economic development partners through targeted business assistance and attraction, workforce development, and regional marketing.” The council publishes data and information, which are used by industries and investors seeking to locate, expand or invest in the Peoria region. Among these publications are lists of sites actively being marketed for sale and/or development, as well as buildings available for lease or sale.
Comprehensive Development Strategy And Economic Development District (CEDS)
As its name implies, a CEDS lays out a regional strategy for economic development with the ultimate goal being a stronger, more diverse regional economy. While the CEDS’ most critical function is to provide a regional economic development framework, it also serves as a required vehicle through which some federal agencies (especially the EDA) evaluate requests for grant assistance. Without having a CEDS approved by the EDA, no one in the region is eligible to receive Economic Development Assistance Grants, including the Stimulus Funds for economic development. Having a CEDS in place has become more important than ever. The Central Illinois EDC is in the process of considering its CEDS document for update.
Economic Development District (EDD):
An Economic Development District is a federally-designated organization charged with the maintenance and implementation of the CEDS plan. Application for designation involves several steps including written support by the State
of Illinois, Peoria, Tazewell, Woodford, Logan, and Mason Counties, and a plan of operation as a nonprofit organization. Greater Peoria Economic Development Council has been designated the EDD for the Peoria MPA. Through this, the EDD is eligible for a 50% matching planning grant to fund the program and staff.
Relationship with Economic Development Administration
The Economic Development District of the Central Illinois is a multi-county non-profit organization. Serving as a bridge between the private and public sectors, the EDD networks with area leaders to bring forth more economic development projects potentially eligible for grant funding. This crucial service helps to match local dollars to state and federal dollars to bring more wealth and jobs to the Region, thus extending the economic development capabilities of Peoria, Tazewell, Woodford, Logan and Mason Counties. First, they help align economic development goals for the Region; second, they help identify new economic development projects potentially eligible for an EDA or other grant. In addition, the EDD serves as the point of contact for EDA staff when local projects are submitted for EDA grants. When local economic development projects arise that align with EDA funding priorities and the goals of the local CEDS document, staff also assists local government and non-profit organizations in submitting the grant proposals and ensuring all necessary preparations are taken before submittal. Finally, EDD staff coordinates the CEDS Strategy Committee, a group of local private and public sector leaders charged with the annual oversight of the CEDS plan. This includes the annual update of the data and projects within the plan. Other responsibilities of the EDD include:
• Maintain Comprehensive Economic Development Strategy (CEDS) for the Region.
• Submit funding request to the EDA for a 3-year planning grant of $191,000 for 2012-2015.
• Annually report on the goals, strategies, project prioritization, & completion of EDD scope of work.
• Hold open meetings at least once a year, publishing the date and agenda of such meetings enough in advance to
55ECONOMIC DEVELOPMENT: Env i s ion HOI Long Range Transpor tat ion P lan ECONOMIC DEVELOPMENT: Env i s ion HOI Long Range Transpor tat ion P lan
allow the public a reasonable time to prepare in order to participate effectively.
• Assist qualified eligible governments and nonprofits with EDA grant applications.
• Serve as the point of contact for the CEDS Strategy Committee as well as the EDA for agencies and organizations preparing to apply for funding.
• Provide ongoing technical assistance to area governments and nonprofits to align economic development goals and priorities and work on economic development initiatives from an intra-MSA area to the Tri-County Region.
• Grant/loan research, writing, and administration to both the EDA and other federal and non-federal funding sources.
• Provide a “request for assistance program” serving area agencies and organizations through the development of graphic materials and reports such as maps, fact sheets, and local government promotional and planning information.
• Run the Focus Forward Central Illinois program (regional sustainability metrics). Provide data tracking and reporting services including demographic and economic research and serve as a clearinghouse for the community for this information.
• Assist CEDS Strategy Committee to develop several key sub-committees they have expressed specific interest in, namely initially alternative energy, healthcare, and aerospace.
• Maintain ongoing relationships. Ongoing public and private relationships are crucial to the CEDS process.
PUBLIC INPUT
Throughout the public engagement process, several comments were brought up regarding regional economic development. In general, the comments fell into two categories: 1) The need to maintain and improve existing transportation systems without contributing to sprawl, and 2) The need to identify and increase funding strategies to support our regional infrastructure.
The need to maintain and support our existing regional infrastructure was one of the most common comments. The public wants to see the region “maintain the roads we do have” before investing in new construction. This includes reducing land consumption without population growth to support it, reinvesting in our urban core, and focusing on funding long-term maintenance before investing in large scale expansion projects. Many local leaders and elected officials expressed concern over current funding strategies, including the Highway Trust Fund and the Inland Waterways Trust Fund. They cited that the current funding levels will fall well short of maintaining the current systems and suggested that alternatives be explored in the near future.
CONCLUSION
Transportation investment is a major catalyst for economic development. In developing the LRTP, as well as the Transportation Improvement Plan (TIP), special emphasis should be given to determining the economic impacts of the proposed improvements. Given the constrained financial resources of state and federal transportation agencies, priority should be given to those projects capable of promoting economic development. Lower priority must be assigned to transportation projects whose benefits are slight or illusory, given the structure of the Peoria area economy.
The Tri-County MSA is a self-contained and balanced economic region, with a strong manufacturing base, an attractive environment, and a skilled labor market. The transportation projects that enhance these strengths should be considered by officials and stakeholders.

56 ECONOMIC DEVELOPMENT: Env i s ion HOI Long Range Transpor tat ion P lan
TRANSPORTATION
57 TRANSPORTATION: Env i s ion HOI Long Range Transpor tat ion P lanECONOMIC DEVELOPMENT: Env i s ion HOI Long Range Transpor tat ion P lan
Understanding how the transportation system currently works with regard to the quality of the infrastructure and frequency of use, planners can better assess how the system should evolve into the future. Furthermore, providing active transportation options and multi-modal access to different parts of the region is paramount to developing thriving communities, increasing economic competitiveness, and improving local health.
The Long Range Transportation Plan’s main purpose is to analyze and assess the existing and future transportation infrastructure for the urbanized area. Without an efficient and user-friendly transportation system, congestion, delay and additional crashes could occur. The metropolitan planning area’s transportation system can be characterized by interlocking grid patterns, transected by a major US Interstate (I-74), and partially circumvented by a major bypass (I-474) stretching over a land area of nearly 200 square miles.
The data in this section of Envision HOI was collected by the Tri-County Regional Planning Commission (TCRPC), Peoria-Pekin Urbanized Area Transportation Study (PPUATS), PPUATS member agencies, the Illinois Department of Transportation, and the U.S. Department of Transportation, and the U.S. Census Bureau.
The transportation system of the Peoria-Pekin Metropolitan Area includes these major infrastructure elements:
• Class I Trails: 35.6 miles
• Miles of Bicycle Infrastructure: 62
• Traffic Signals: 362
• CityLink Buses: 58
• CityLink Routes: 23
• Paratransit Buses: 33
• CityLink Bus Stops: 1,699
• Miles of Roadway: 4,910.9
• Passenger Rail Routes: 0
• Rail Freight Carriers: 10
• Commercial Airports: 1
• General Aviation Airports: 2
This section will detail infrastructure, safety, and ridership data for the following modes of transportation within the urbanized and metropolitan planning area:
• Roadways and Motor Vehicles
• Bus Transportation
• Transportation Access for Peoria with Disabilities
• Bicycles and Pedestrians
• Freight (Truck, River, Air, Rail)
• Air Travel
58 TRANSPORTATION: Env i s ion HOI Long Range Transpor tat ion P lan
TRANSPORTATION ASSETS
• The Tri-County Region has been largely unaffected by systemic congestion issues faced by many other metropolitan areas across the nation.
• The Cities of Peoria, East Peoria, and Pekin have access to quality bus service from CityLink, which provided a record 3.4 million rides in 2012.
• The Tri-County Region has two rural public transportation providers which provide access and mobility primarily for the disabled, elderly, and low-income populations.
• The region has over 60 miles of existing bicycle trails, with an additional 74 miles of trails proposed. Many of the proposed trails will connect existing trails in order to form a continuous, more comprehensive bicycling network.
• Quality access to railroad service for freight, including access to four Class I carriers (e.g. Union Pacific), three regional Class II carriers, and several short-line operators.
• The Peoria-Pekin Union Railroad, located in Creve Coeur and East Peoria, is the largest switching and classification yard in Central Illinois, having in excess of 100 miles of track with the capacity of 2500 cars.
• Tri-County regional leaders are committed to establishing a connection to the high speed rail network.
• Due to the significant channel depth of the Illinois River, barges can navigate the river year-round.
• The Illinois River provides a cheaper alternative for transporting freight. It is estimated that cargo can be moved by barge for one-third the cost of rail and one-fifth the cost of truck.
• The Peoria region has access to an international airport, which provides direct flights to Chicago, Atlanta, Detroit, Minneapolis, Las Vegas, Phoenix, Tampa/St. Petersburg, Dallas/Fort Worth, Orlando, and Punta Gorda.
TRANSPORTATION BARRIERS
• Several communities within the Peoria-Pekin urbanized area are not served by public transit.
• Though public transportation is gaining support – especially among younger generations – there continues to be a stigma surrounding bus as a form of transportation.
• Many bus stops within the community are not accessible – particularly to disabled individuals.
• Rural public transportation is not well understood by the general public, and has not been fully recognized as an essential component to the transportation network.
• For a variety of reasons, use of alternative transportation modes is lacking in the region.
• Retrofitting streets for bike lanes and acquiring land for bike trails can be expensive.
• The built environment does not encourage walking. Many stores cannot be accessed without traveling through a parking-lot.
• Many sidewalks are inaccessible to disabled individuals. Some are too narrow; some are blocked by light poles; and some have a severe slant towards the street.
• While the region enjoys great access to rail infrastructure, rail service is limited strictly to freight; the region currently does not have direct access to Amtrak passenger rail service.
• Significant delays occur in the lock and dam system along the Illinois River. Plans are underway to improve the locks, but construction is many years away.
• Sedimentation from eroding ravines within the Illinois River watershed is reducing the depth of the Illinois River, making it more difficult for barges to navigate through the channels.
• Airport strikes and the recession have caused inconsistency from airlines.
In 2014, TCRPC completed a three-year planning process for the HUD Regional Sustainability Grant, “Brilliant Bright Community”. The grant provided the opportunity for an in-depth review of transportation conditions in the Metropolitan Area. Through interviews, public outreach, surveys, and data collection, a regional transportation assessment was developed. The assets and barriers identified in that process are listed below.
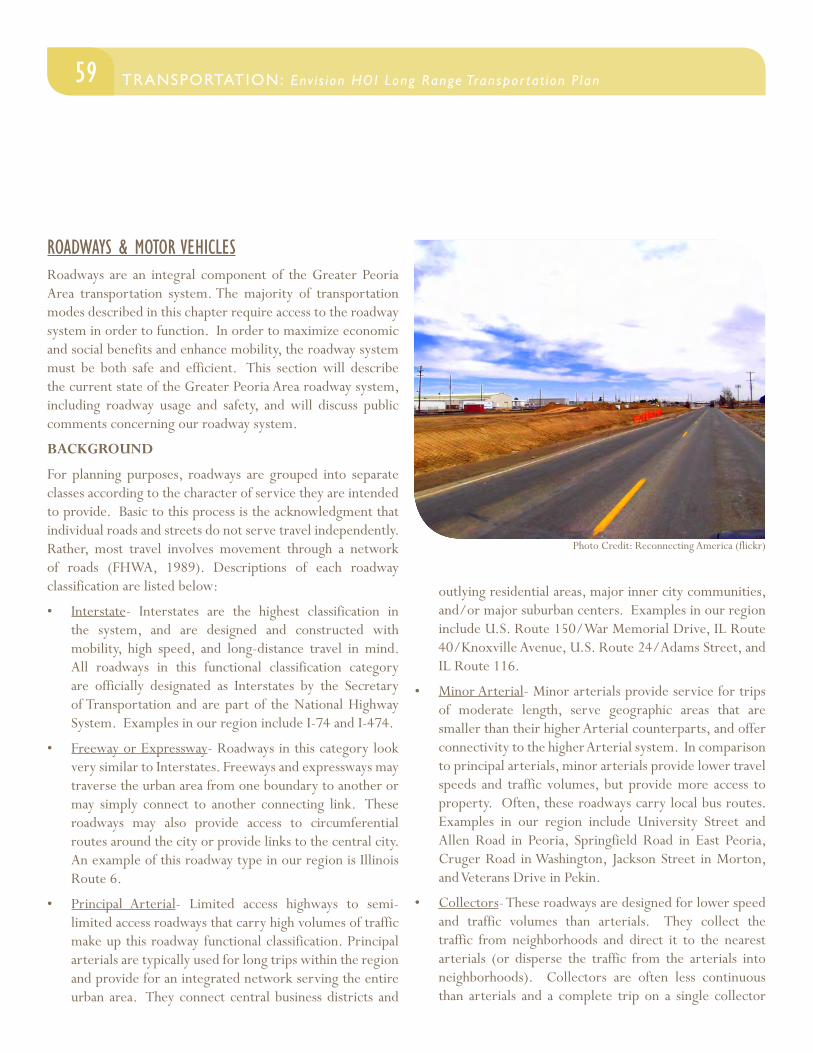
59TRANSPORTATION: Env i s ion HOI Long Range Transpor tat ion P lan TRANSPORTATION: Env i s ion HOI Long Range Transpor tat ion P lan
ROADWAYS & MOTOR VEHICLESRoadways are an integral component of the Greater Peoria Area transportation system. The majority of transportation modes described in this chapter require access to the roadway system in order to function. In order to maximize economic and social benefits and enhance mobility, the roadway system must be both safe and efficient. This section will describe the current state of the Greater Peoria Area roadway system, including roadway usage and safety, and will discuss public comments concerning our roadway system.
BACKGROUND
For planning purposes, roadways are grouped into separate classes according to the character of service they are intended to provide. Basic to this process is the acknowledgment that individual roads and streets do not serve travel independently. Rather, most travel involves movement through a network of roads (FHWA, 1989). Descriptions of each roadway classification are listed below:
• Interstate- Interstates are the highest classification in the system, and are designed and constructed with mobility, high speed, and long-distance travel in mind. All roadways in this functional classification category are officially designated as Interstates by the Secretary of Transportation and are part of the National Highway System. Examples in our region include I-74 and I-474.
• Freeway or Expressway- Roadways in this category look very similar to Interstates. Freeways and expressways may traverse the urban area from one boundary to another or may simply connect to another connecting link. These roadways may also provide access to circumferential routes around the city or provide links to the central city. An example of this roadway type in our region is Illinois Route 6.
• Principal Arterial- Limited access highways to semi-limited access roadways that carry high volumes of traffic make up this roadway functional classification. Principal arterials are typically used for long trips within the region and provide for an integrated network serving the entire urban area. They connect central business districts and
outlying residential areas, major inner city communities, and/or major suburban centers. Examples in our region include U.S. Route 150/War Memorial Drive, IL Route 40/Knoxville Avenue, U.S. Route 24/Adams Street, and IL Route 116.
• Minor Arterial- Minor arterials provide service for trips of moderate length, serve geographic areas that are smaller than their higher Arterial counterparts, and offer connectivity to the higher Arterial system. In comparison to principal arterials, minor arterials provide lower travel speeds and traffic volumes, but provide more access to property. Often, these roadways carry local bus routes. Examples in our region include University Street and Allen Road in Peoria, Springfield Road in East Peoria, Cruger Road in Washington, Jackson Street in Morton, and Veterans Drive in Pekin.
• Collectors- These roadways are designed for lower speed and traffic volumes than arterials. They collect the traffic from neighborhoods and direct it to the nearest arterials (or disperse the traffic from the arterials into neighborhoods). Collectors are often less continuous than arterials and a complete trip on a single collector
Photo Credit: Reconnecting America (flickr)
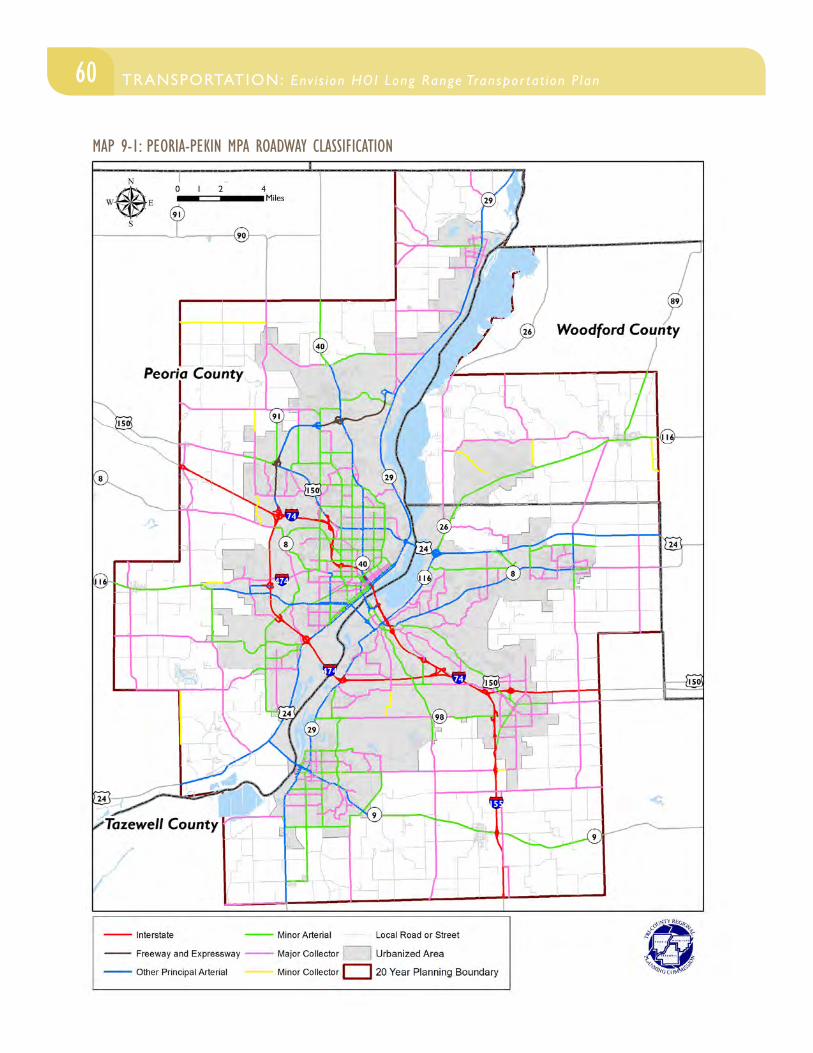
60 TRANSPORTATION: Env i s ion HOI Long Range Transpor tat ion P lan
MAP 9-1: PEORIA-PEKIN MPA ROADWAY CLASSIFICATION
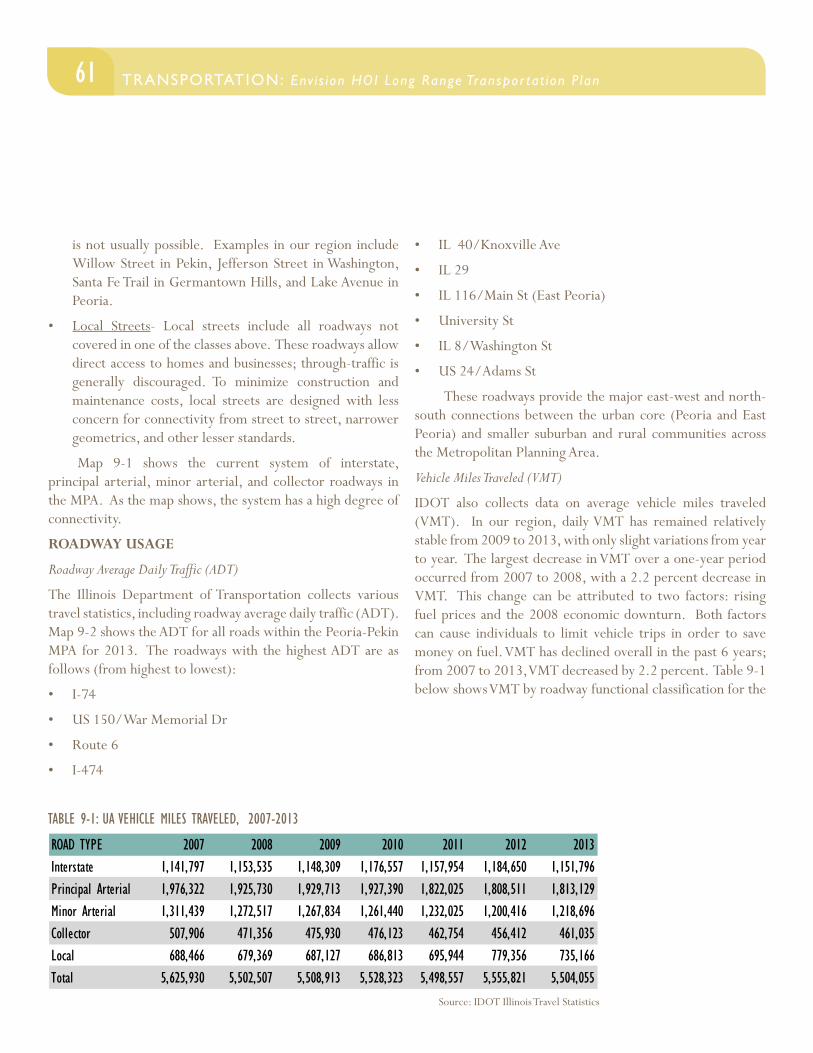
61TRANSPORTATION: Env i s ion HOI Long Range Transpor tat ion P lan TRANSPORTATION: Env i s ion HOI Long Range Transpor tat ion P lan
is not usually possible. Examples in our region include Willow Street in Pekin, Jefferson Street in Washington, Santa Fe Trail in Germantown Hills, and Lake Avenue in Peoria.
• Local Streets- Local streets include all roadways not covered in one of the classes above. These roadways allow direct access to homes and businesses; through-traffic is generally discouraged. To minimize construction and maintenance costs, local streets are designed with less concern for connectivity from street to street, narrower geometrics, and other lesser standards.
Map 9-1 shows the current system of interstate, principal arterial, minor arterial, and collector roadways in the MPA. As the map shows, the system has a high degree of connectivity.
ROADWAY USAGE
Roadway Average Daily Traffic (ADT)
The Illinois Department of Transportation collects various travel statistics, including roadway average daily traffic (ADT). Map 9-2 shows the ADT for all roads within the Peoria-Pekin MPA for 2013. The roadways with the highest ADT are as follows (from highest to lowest):
• I-74
• US 150/War Memorial Dr
• Route 6
• I-474
• IL 40/Knoxville Ave
• IL 29
• IL 116/Main St (East Peoria)
• University St
• IL 8/Washington St
• US 24/Adams St
These roadways provide the major east-west and north-south connections between the urban core (Peoria and East Peoria) and smaller suburban and rural communities across the Metropolitan Planning Area.
Vehicle Miles Traveled (VMT)
IDOT also collects data on average vehicle miles traveled (VMT). In our region, daily VMT has remained relatively stable from 2009 to 2013, with only slight variations from year to year. The largest decrease in VMT over a one-year period occurred from 2007 to 2008, with a 2.2 percent decrease in VMT. This change can be attributed to two factors: rising fuel prices and the 2008 economic downturn. Both factors can cause individuals to limit vehicle trips in order to save money on fuel. VMT has declined overall in the past 6 years; from 2007 to 2013, VMT decreased by 2.2 percent. Table 9-1 below shows VMT by roadway functional classification for the
TABLE 9-1: UA VEHICLE MILES TRAVELED, 2007-2013
Source: IDOT Illinois Travel Statistics
ROAD TYPE 2007 2008 2009 2010 2011 2012 2013Interstate 1,141,797 1,153,535 1,148,309 1,176,557 1,157,954 1,184,650 1,151,796Principal Arterial 1,976,322 1,925,730 1,929,713 1,927,390 1,822,025 1,808,511 1,813,129Minor Arterial 1,311,439 1,272,517 1,267,834 1,261,440 1,232,025 1,200,416 1,218,696Collector 507,906 471,356 475,930 476,123 462,754 456,412 461,035Local 688,466 679,369 687,127 686,813 695,944 779,356 735,166Total 5,625,930 5,502,507 5,508,913 5,528,323 5,498,557 5,555,821 5,504,055
62 TRANSPORTATION: Env i s ion HOI Long Range Transpor tat ion P lan
Peoria-Pekin Urbanized Area from 2007-2013.
Congestion Management
Because roadways are a primary component of our transportation system for bus, trucks and automobiles, they are bound to become congested in certain areas. In order to manage and plan for congestion and to comply with federal requirements, the region has adopted a Congestion Management Process (CMP). The CMP is intended to serve as an organized and transparent way for our planning area to identify and manage congestion, connect performance measures to support funding for projects, and evaluate recommended strategies to ensure the region is effectively addressing congestion. The plan recommends actions such as improving intersections and traffic signals, adding left turn lanes, implementing roundabouts where appropriate, upgrading signage, expanding and improving public transportation services, and encouraging the construction of sidewalks and bikeways.
Our Travel Demand Model is able to identify current and future congestion along the MPA roadways. To see where roadways are most likely to be congested in the future, visit the Travel Demand Model Section.
ROADWAY SAFETY
Maintaining a safe roadway system is essential to sustaining and enhancing the quality of life for regional residents. Deaths and injuries resulting from traffic crashes are a serious public health concern and substantially impact local communities with medical costs, lost wages, insurance costs, taxes, police, fire, and emergency medical services, legal and court costs, and property damage.
State Safety Plans and Initiatives
To address major roadway safety concerns, the Illinois Department of Transportation created the Bureau of Safety Engineering and completed a Statewide Comprehensive Highway Safety Plan (CHSP) in 2005. Since then, IDOT has implemented the Highway Safety Improvement Program (HSIP), began dedicating more money to safety projects, and started taking a system improvement approach versus a spot improvement only approach. This has included installing
safety measures such as rumble strips, chevrons, safety shoulders, flashing lights for stop signs, and offset left turn lanes at signalized intersections at various locations.
IDOT now publishes an annual Strategic Highway Safety Plan (SHSP). Similar to the 2005 CHSP, the SHSP emphasizes 11 focus areas:
• Alcohol and Other Impaired Driving;
• Automated Traffic Law Enforcement Systems;
• Driver Behavior and Awareness;
• Highway-Railroad Grade Crossings;
• Information Systems for Decision Making;
• Intersections;
• Large Trucks;
• Roadway Departure;
• Safety Belts/Occupant Protection;
• Vulnerable Users; and
• Work Zones.
The SHSP builds upon and improves data, data systems, safety analysis and evaluation, and is the overarching plan used to implement various safety programs and initiatives.
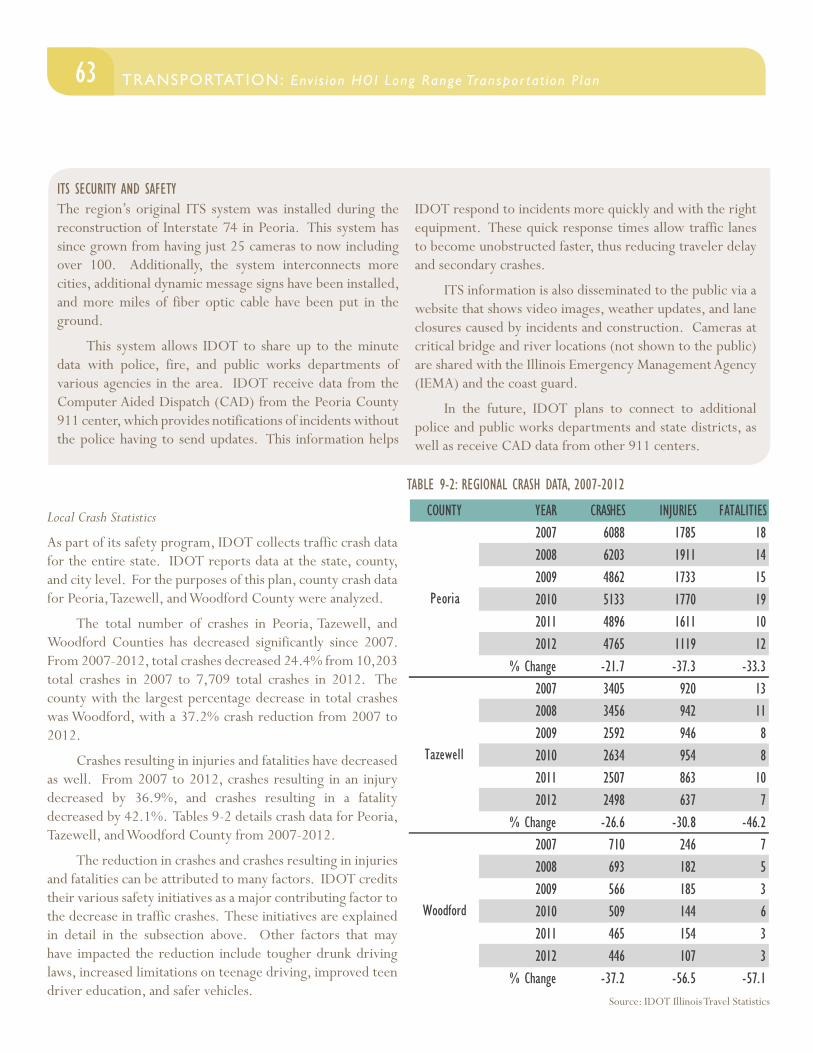
63TRANSPORTATION: Env i s ion HOI Long Range Transpor tat ion P lan TRANSPORTATION: Env i s ion HOI Long Range Transpor tat ion P lan
Local Crash Statistics
As part of its safety program, IDOT collects traffic crash data for the entire state. IDOT reports data at the state, county, and city level. For the purposes of this plan, county crash data for Peoria, Tazewell, and Woodford County were analyzed.
The total number of crashes in Peoria, Tazewell, and Woodford Counties has decreased significantly since 2007. From 2007-2012, total crashes decreased 24.4% from 10,203 total crashes in 2007 to 7,709 total crashes in 2012. The county with the largest percentage decrease in total crashes was Woodford, with a 37.2% crash reduction from 2007 to 2012.
Crashes resulting in injuries and fatalities have decreased as well. From 2007 to 2012, crashes resulting in an injury decreased by 36.9%, and crashes resulting in a fatality decreased by 42.1%. Tables 9-2 details crash data for Peoria, Tazewell, and Woodford County from 2007-2012.
The reduction in crashes and crashes resulting in injuries and fatalities can be attributed to many factors. IDOT credits their various safety initiatives as a major contributing factor to the decrease in traffic crashes. These initiatives are explained in detail in the subsection above. Other factors that may have impacted the reduction include tougher drunk driving laws, increased limitations on teenage driving, improved teen driver education, and safer vehicles.
TABLE 9-2: REGIONAL CRASH DATA, 2007-2012
Source: IDOT Illinois Travel Statistics
COUNTY YEAR CRASHES INJURIES FATALITIES2007 6088 1785 182008 6203 1911 142009 4862 1733 152010 5133 1770 192011 4896 1611 102012 4765 1119 12
% Change -21.7 -37.3 -33.32007 3405 920 132008 3456 942 112009 2592 946 82010 2634 954 82011 2507 863 102012 2498 637 7
% Change -26.6 -30.8 -46.22007 710 246 72008 693 182 52009 566 185 32010 509 144 62011 465 154 32012 446 107 3
% Change -37.2 -56.5 -57.1
Tazewell
Woodford
Peoria
The region’s original ITS system was installed during the reconstruction of Interstate 74 in Peoria. This system has since grown from having just 25 cameras to now including over 100. Additionally, the system interconnects more cities, additional dynamic message signs have been installed, and more miles of fiber optic cable have been put in the ground.
This system allows IDOT to share up to the minute data with police, fire, and public works departments of various agencies in the area. IDOT receive data from the Computer Aided Dispatch (CAD) from the Peoria County 911 center, which provides notifications of incidents without the police having to send updates. This information helps
IDOT respond to incidents more quickly and with the right equipment. These quick response times allow traffic lanes to become unobstructed faster, thus reducing traveler delay and secondary crashes.
ITS information is also disseminated to the public via a website that shows video images, weather updates, and lane closures caused by incidents and construction. Cameras at critical bridge and river locations (not shown to the public) are shared with the Illinois Emergency Management Agency (IEMA) and the coast guard.
In the future, IDOT plans to connect to additional police and public works departments and state districts, as well as receive CAD data from other 911 centers.
ITS SECURITY AND SAFETY
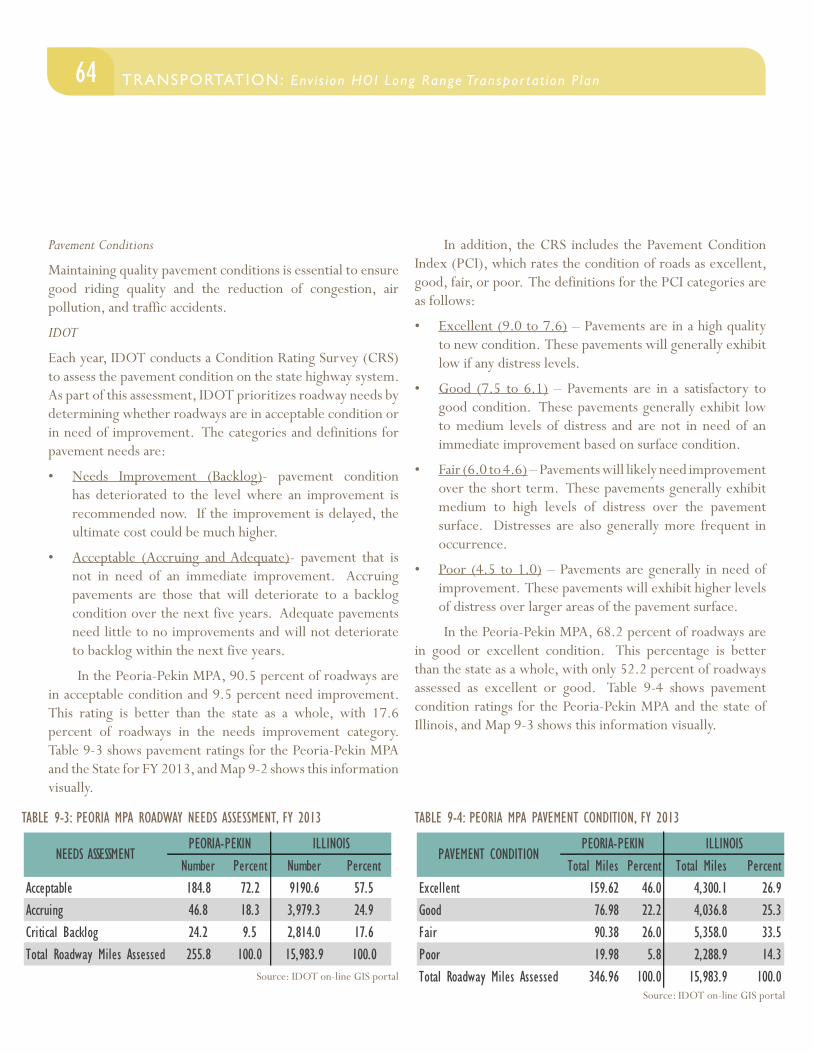
64 TRANSPORTATION: Env i s ion HOI Long Range Transpor tat ion P lan
Pavement Conditions
Maintaining quality pavement conditions is essential to ensure good riding quality and the reduction of congestion, air pollution, and traffic accidents.
IDOT
Each year, IDOT conducts a Condition Rating Survey (CRS) to assess the pavement condition on the state highway system. As part of this assessment, IDOT prioritizes roadway needs by determining whether roadways are in acceptable condition or in need of improvement. The categories and definitions for pavement needs are:
• Needs Improvement (Backlog)- pavement condition has deteriorated to the level where an improvement is recommended now. If the improvement is delayed, the ultimate cost could be much higher.
• Acceptable (Accruing and Adequate)- pavement that is not in need of an immediate improvement. Accruing pavements are those that will deteriorate to a backlog condition over the next five years. Adequate pavements need little to no improvements and will not deteriorate to backlog within the next five years.
In the Peoria-Pekin MPA, 90.5 percent of roadways are in acceptable condition and 9.5 percent need improvement. This rating is better than the state as a whole, with 17.6 percent of roadways in the needs improvement category. Table 9-3 shows pavement ratings for the Peoria-Pekin MPA and the State for FY 2013, and Map 9-2 shows this information visually.
In addition, the CRS includes the Pavement Condition Index (PCI), which rates the condition of roads as excellent, good, fair, or poor. The definitions for the PCI categories are as follows:
• Excellent (9.0 to 7.6) – Pavements are in a high quality to new condition. These pavements will generally exhibit low if any distress levels.
• Good (7.5 to 6.1) – Pavements are in a satisfactory to good condition. These pavements generally exhibit low to medium levels of distress and are not in need of an immediate improvement based on surface condition.
• Fair (6.0 to 4.6) – Pavements will likely need improvement over the short term. These pavements generally exhibit medium to high levels of distress over the pavement surface. Distresses are also generally more frequent in occurrence.
• Poor (4.5 to 1.0) – Pavements are generally in need of improvement. These pavements will exhibit higher levels of distress over larger areas of the pavement surface.
In the Peoria-Pekin MPA, 68.2 percent of roadways are in good or excellent condition. This percentage is better than the state as a whole, with only 52.2 percent of roadways assessed as excellent or good. Table 9-4 shows pavement condition ratings for the Peoria-Pekin MPA and the state of Illinois, and Map 9-3 shows this information visually.
TABLE 9-3: PEORIA MPA ROADWAY NEEDS ASSESSMENT, FY 2013
Source: IDOT on-line GIS portal
Number Percent Number PercentAcceptable 184.8 72.2 9190.6 57.5Accruing 46.8 18.3 3,979.3 24.9Critical Backlog 24.2 9.5 2,814.0 17.6Total Roadway Miles Assessed 255.8 100.0 15,983.9 100.0
PEORIA-PEKIN ILLINOISNEEDS ASSESSMENT
TABLE 9-4: PEORIA MPA PAVEMENT CONDITION, FY 2013
Source: IDOT on-line GIS portal
Total Miles Percent Total Miles PercentExcellent 159.62 46.0 4,300.1 26.9Good 76.98 22.2 4,036.8 25.3Fair 90.38 26.0 5,358.0 33.5Poor 19.98 5.8 2,288.9 14.3Total Roadway Miles Assessed 346.96 100.0 15,983.9 100.0
PEORIA-PEKIN ILLINOISPAVEMENT CONDITION
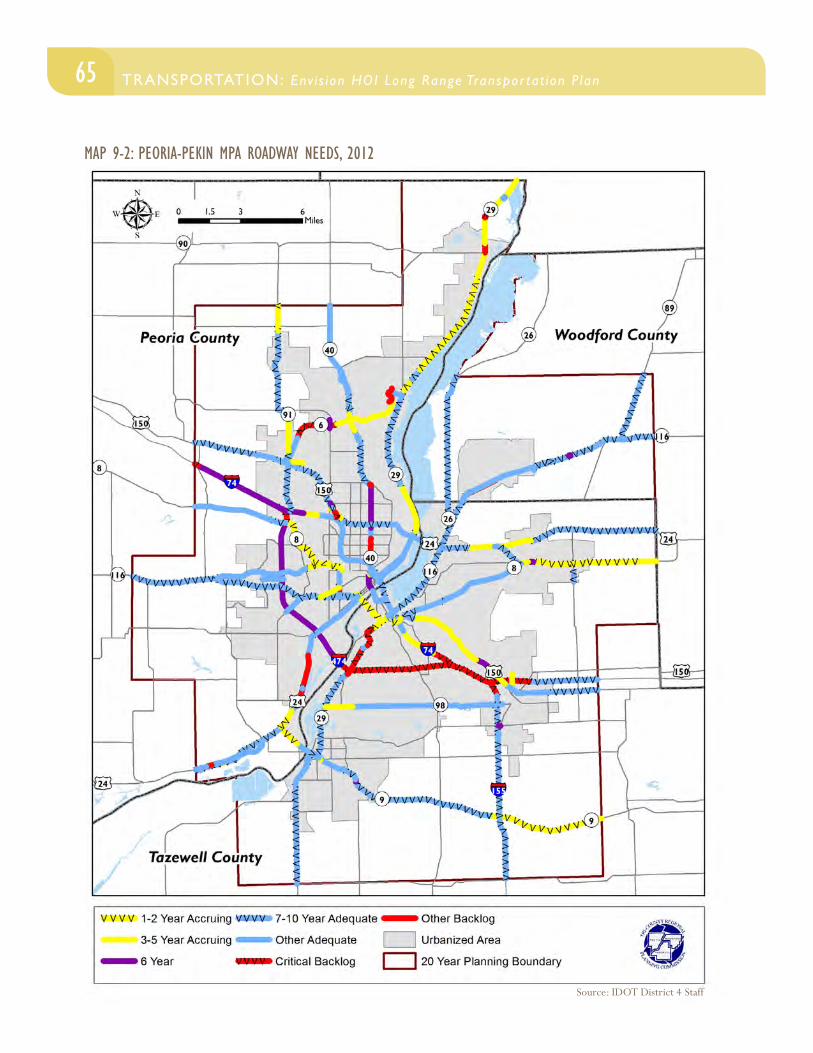
65TRANSPORTATION: Env i s ion HOI Long Range Transpor tat ion P lan TRANSPORTATION: Env i s ion HOI Long Range Transpor tat ion P lan
MAP 9-2: PEORIA-PEKIN MPA ROADWAY NEEDS, 2012
Source: IDOT District 4 Staff
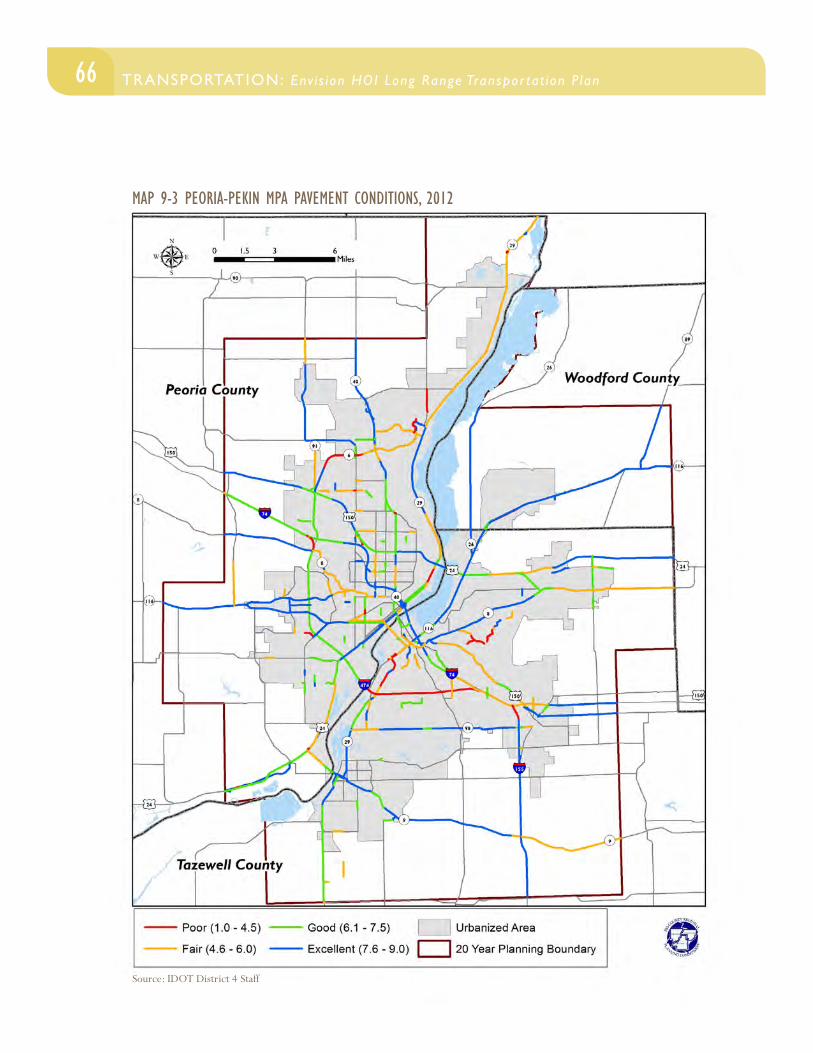
66 TRANSPORTATION: Env i s ion HOI Long Range Transpor tat ion P lan
MAP 9-3 PEORIA-PEKIN MPA PAVEMENT CONDITIONS, 2012
Source: IDOT District 4 Staff
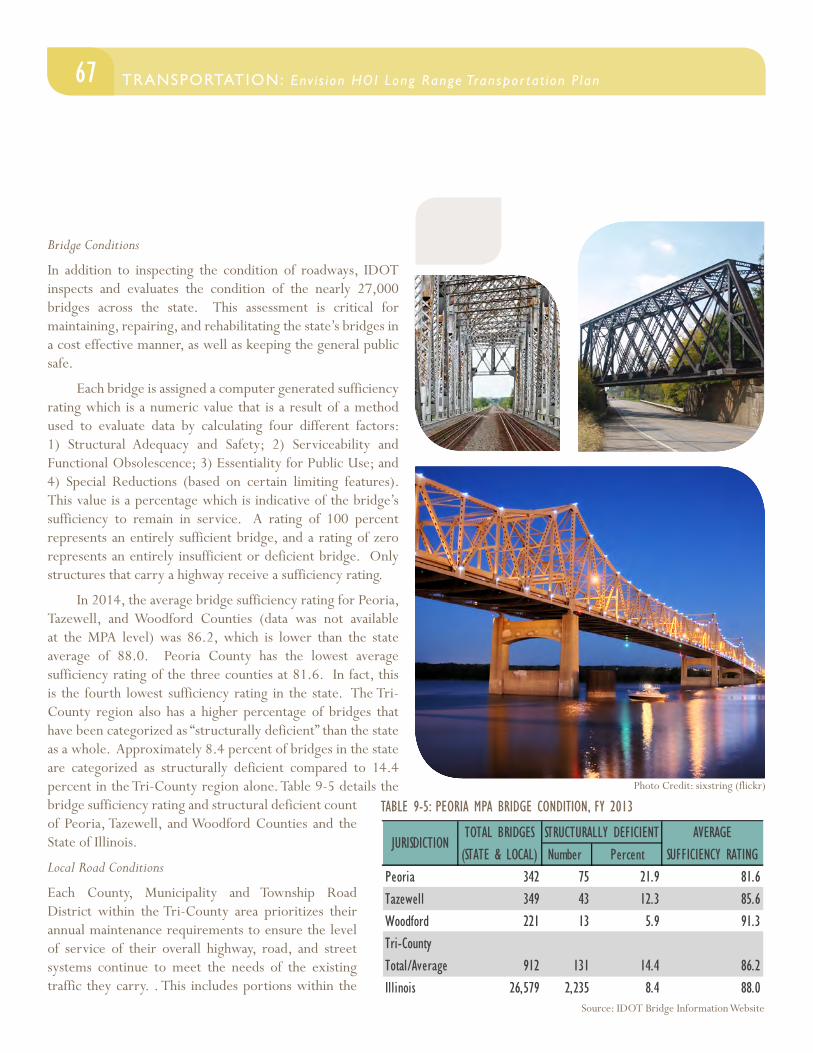
67TRANSPORTATION: Env i s ion HOI Long Range Transpor tat ion P lan TRANSPORTATION: Env i s ion HOI Long Range Transpor tat ion P lan
Bridge Conditions
In addition to inspecting the condition of roadways, IDOT inspects and evaluates the condition of the nearly 27,000 bridges across the state. This assessment is critical for maintaining, repairing, and rehabilitating the state’s bridges in a cost effective manner, as well as keeping the general public safe.
Each bridge is assigned a computer generated sufficiency rating which is a numeric value that is a result of a method used to evaluate data by calculating four different factors: 1) Structural Adequacy and Safety; 2) Serviceability and Functional Obsolescence; 3) Essentiality for Public Use; and 4) Special Reductions (based on certain limiting features). This value is a percentage which is indicative of the bridge’s sufficiency to remain in service. A rating of 100 percent represents an entirely sufficient bridge, and a rating of zero represents an entirely insufficient or deficient bridge. Only structures that carry a highway receive a sufficiency rating.
In 2014, the average bridge sufficiency rating for Peoria, Tazewell, and Woodford Counties (data was not available at the MPA level) was 86.2, which is lower than the state average of 88.0. Peoria County has the lowest average sufficiency rating of the three counties at 81.6. In fact, this is the fourth lowest sufficiency rating in the state. The Tri-County region also has a higher percentage of bridges that have been categorized as “structurally deficient” than the state as a whole. Approximately 8.4 percent of bridges in the state are categorized as structurally deficient compared to 14.4 percent in the Tri-County region alone. Table 9-5 details the bridge sufficiency rating and structural deficient count of Peoria, Tazewell, and Woodford Counties and the State of Illinois.
Local Road Conditions
Each County, Municipality and Township Road District within the Tri-County area prioritizes their annual maintenance requirements to ensure the level of service of their overall highway, road, and street systems continue to meet the needs of the existing traffic they carry. . This includes portions within the
TABLE 9-5: PEORIA MPA BRIDGE CONDITION, FY 2013
Number PercentPeoria 342 75 21.9 81.6Tazewell 349 43 12.3 85.6Woodford 221 13 5.9 91.3Tri-County Total/Average 912 131 14.4 86.2Illinois 26,579 2,235 8.4 88.0
TOTAL BRIDGES (STATE & LOCAL)
JURISDICTIONSTRUCTURALLY DEFICIENT AVERAGE
SUFFICIENCY RATING
Source: IDOT Bridge Information Website
Photo Credit: sixstring (flickr)
68 TRANSPORTATION: Env i s ion HOI Long Range Transpor tat ion P lan
urban area and 20-year planning boundary, Each year they report an increasing gap between the cost to preserve their systems and the available funding to address that fundamental need. Historic increases in costs within the past decade for the basic maintenance and preservation efforts necessary to maintain that level of service, combined with stagnant or declining federal and state funding essential to meet those basic needs, has resulted in a system that is in a state of decline. The shortfall is forcing the system to revert to a lower level of service; in effect, returning to conditions of an earlier time. It is against this system-wide deficit that improvements to individual locations within the system must be weighed.
ROADWAY INITIATIVES
Complete Streets
Complete Streets are avenues, boulevards, roads, and drives that include room for every traveler to safely and conveniently reach their destinations. These roadways are not limited to automobile use; they provide people of all ages and abilities the choice to walk, cycle, use public transit, or use other modes of travel.
In 2007, the State of Illinois adopted a Complete Streets policy in accordance with the Illinois Public Act 095-0665 (Illinois Complete Streets Law). This law provides the framework for Illinois municipalities, counties, and metropolitan areas to establish new policies and standards to incorporate transportation facilities for all types of users in their planning, programming, and implementation documents. In March 2010, US-DOT reinforced this position by stating that “every transportation agency, including DOT, has the responsibility to improve conditions and opportunities for walking and bicycling and to integrate walking and bicycling into their transportation systems.”
There is no one definition or example of a complete street. Depending on the particular needs and uses of a particular roadway, different features may be appropriate. Ultimately, the goal is to create a roadway environment that is usable and friendly to vehicular and non-vehicular traffic. Some features that a complete street may include are: sidewalks, bike lanes (or wide paved shoulders), special bus lanes, comfortable
and accessible public transportation stops, frequent and safe crossing opportunities, median islands, accessible pedestrian signals, curb extensions, narrower travel lanes, roundabouts, and others.
Though no community within the Peoria-Pekin MPA has officially adopted a Complete Streets policy, many are beginning to embrace its goals. In 2010, the City of Peoria received a grant to create a Complete Streets network in its Warehouse District. Additionally, the City of East Peoria has embraced Complete Streets concepts in the construction of the Levee District, a new downtown commercial center. In the coming years, transportation projects that include accommodations for bicyclists, pedestrians, and public transit users are likely to increase.
Public Input
Throughout the public engagement process, several comments were brought up regarding roadways and automobiles. In general, the comments fell into three categories: 1) Roadway maintenance and efficiency; 2) Integrating land use and transportation planning; and 3) Implementing Complete Streets concepts.
Maintaining our roadways was one of the greatest concerns of our community. Many expressed the need to focus on repairing our current roads network before building new roadways. In that same vein, the public would like to see
Photo Credit: Terra Engineering
The City of Peoria implemented Complete Streets features, including enhanced pedestrian accommodations at the intersection of Main Street and University Ave.
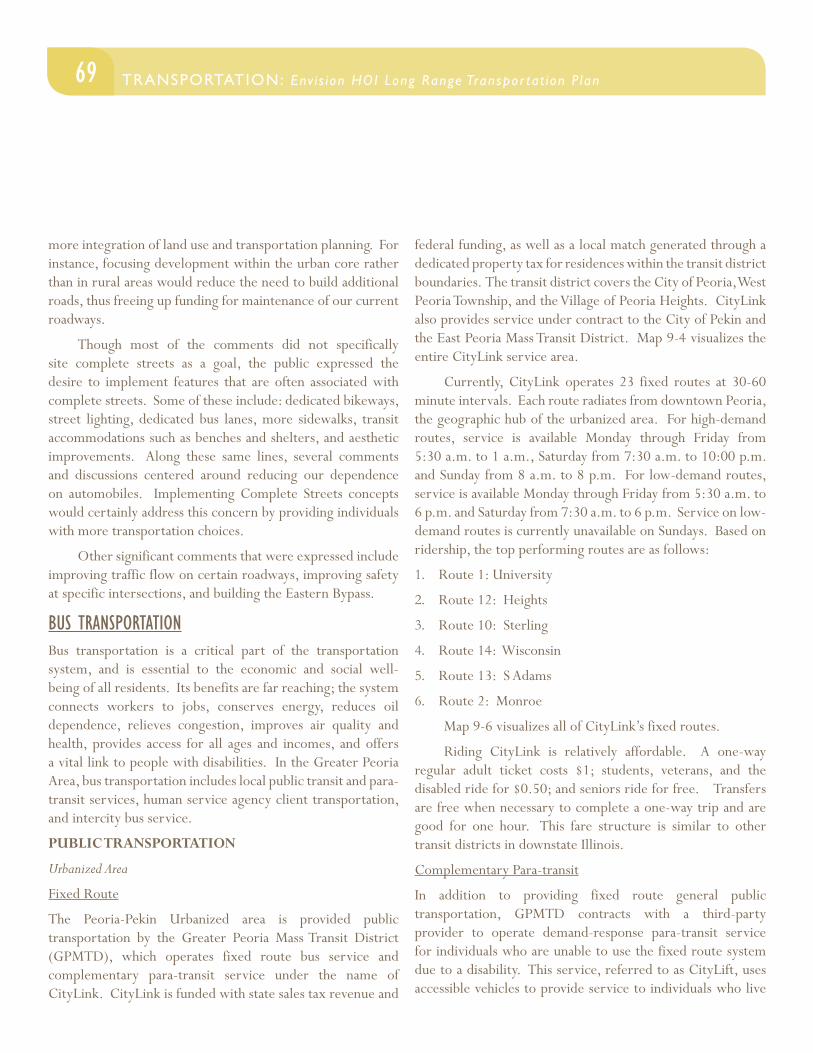
69TRANSPORTATION: Env i s ion HOI Long Range Transpor tat ion P lan TRANSPORTATION: Env i s ion HOI Long Range Transpor tat ion P lan
more integration of land use and transportation planning. For instance, focusing development within the urban core rather than in rural areas would reduce the need to build additional roads, thus freeing up funding for maintenance of our current roadways.
Though most of the comments did not specifically site complete streets as a goal, the public expressed the desire to implement features that are often associated with complete streets. Some of these include: dedicated bikeways, street lighting, dedicated bus lanes, more sidewalks, transit accommodations such as benches and shelters, and aesthetic improvements. Along these same lines, several comments and discussions centered around reducing our dependence on automobiles. Implementing Complete Streets concepts would certainly address this concern by providing individuals with more transportation choices.
Other significant comments that were expressed include improving traffic flow on certain roadways, improving safety at specific intersections, and building the Eastern Bypass.
BUS TRANSPORTATIONBus transportation is a critical part of the transportation system, and is essential to the economic and social well-being of all residents. Its benefits are far reaching; the system connects workers to jobs, conserves energy, reduces oil dependence, relieves congestion, improves air quality and health, provides access for all ages and incomes, and offers a vital link to people with disabilities. In the Greater Peoria Area, bus transportation includes local public transit and para-transit services, human service agency client transportation, and intercity bus service.
PUBLIC TRANSPORTATION
Urbanized Area
Fixed Route
The Peoria-Pekin Urbanized area is provided public transportation by the Greater Peoria Mass Transit District (GPMTD), which operates fixed route bus service and complementary para-transit service under the name of CityLink. CityLink is funded with state sales tax revenue and
federal funding, as well as a local match generated through a dedicated property tax for residences within the transit district boundaries. The transit district covers the City of Peoria, West Peoria Township, and the Village of Peoria Heights. CityLink also provides service under contract to the City of Pekin and the East Peoria Mass Transit District. Map 9-4 visualizes the entire CityLink service area.
Currently, CityLink operates 23 fixed routes at 30-60 minute intervals. Each route radiates from downtown Peoria, the geographic hub of the urbanized area. For high-demand routes, service is available Monday through Friday from 5:30 a.m. to 1 a.m., Saturday from 7:30 a.m. to 10:00 p.m. and Sunday from 8 a.m. to 8 p.m. For low-demand routes, service is available Monday through Friday from 5:30 a.m. to 6 p.m. and Saturday from 7:30 a.m. to 6 p.m. Service on low-demand routes is currently unavailable on Sundays. Based on ridership, the top performing routes are as follows:
1. Route 1: University
2. Route 12: Heights
3. Route 10: Sterling
4. Route 14: Wisconsin
5. Route 13: S Adams
6. Route 2: Monroe
Map 9-6 visualizes all of CityLink’s fixed routes.
Riding CityLink is relatively affordable. A one-way regular adult ticket costs $1; students, veterans, and the disabled ride for $0.50; and seniors ride for free. Transfers are free when necessary to complete a one-way trip and are good for one hour. This fare structure is similar to other transit districts in downstate Illinois.
Complementary Para-transit
In addition to providing fixed route general public transportation, GPMTD contracts with a third-party provider to operate demand-response para-transit service for individuals who are unable to use the fixed route system due to a disability. This service, referred to as CityLift, uses accessible vehicles to provide service to individuals who live
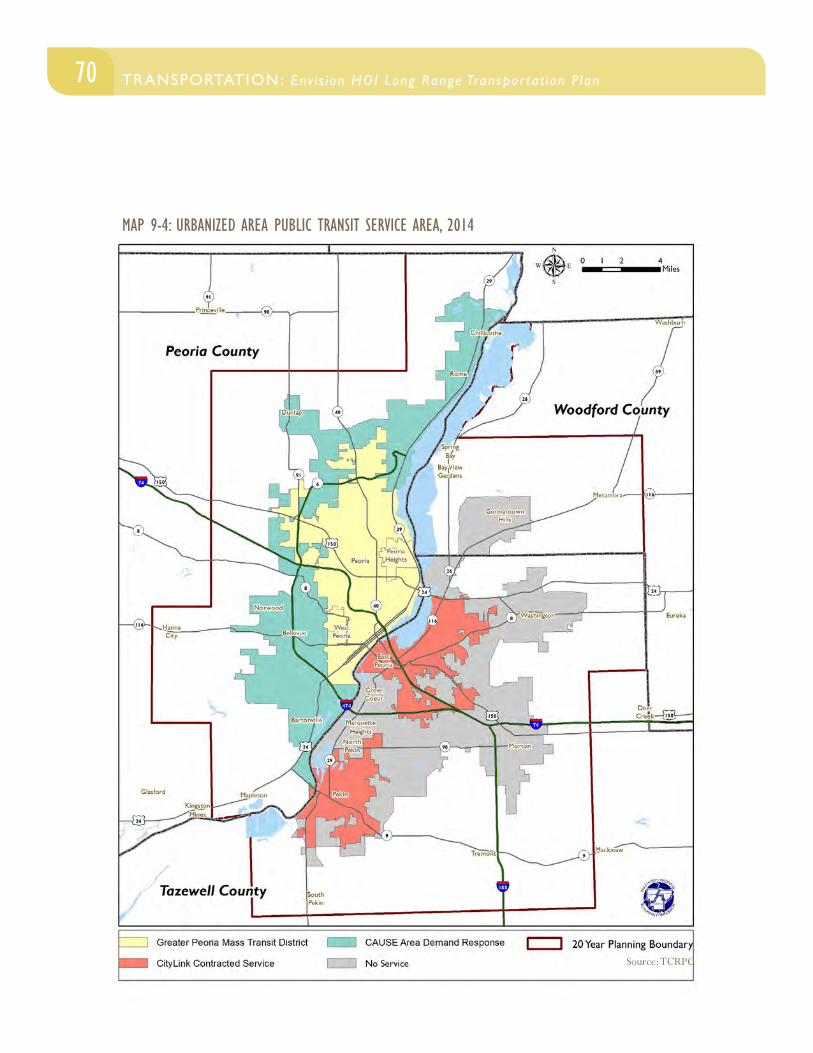
70 TRANSPORTATION: Env i s ion HOI Long Range Transpor tat ion P lan
MAP 9-4: URBANIZED AREA PUBLIC TRANSIT SERVICE AREA, 2014
Source: TCRPC
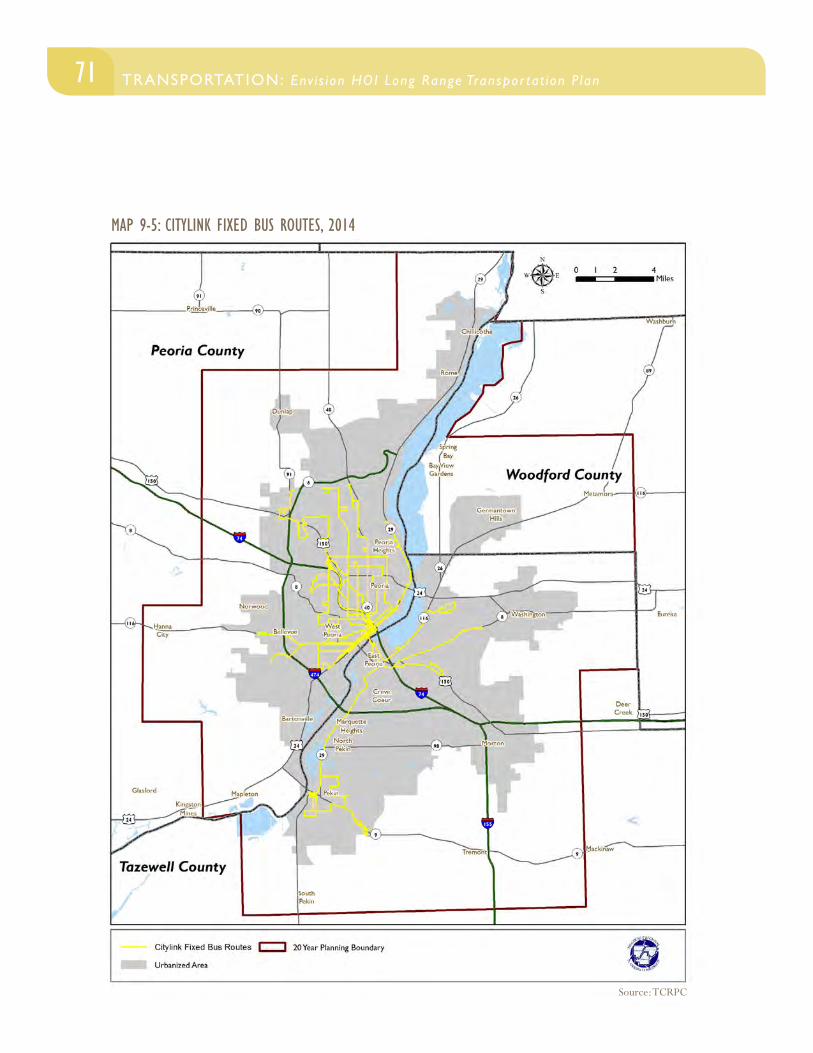
71TRANSPORTATION: Env i s ion HOI Long Range Transpor tat ion P lan TRANSPORTATION: Env i s ion HOI Long Range Transpor tat ion P lan
MAP 9-5: CITYLINK FIXED BUS ROUTES, 2014
Source: TCRPC
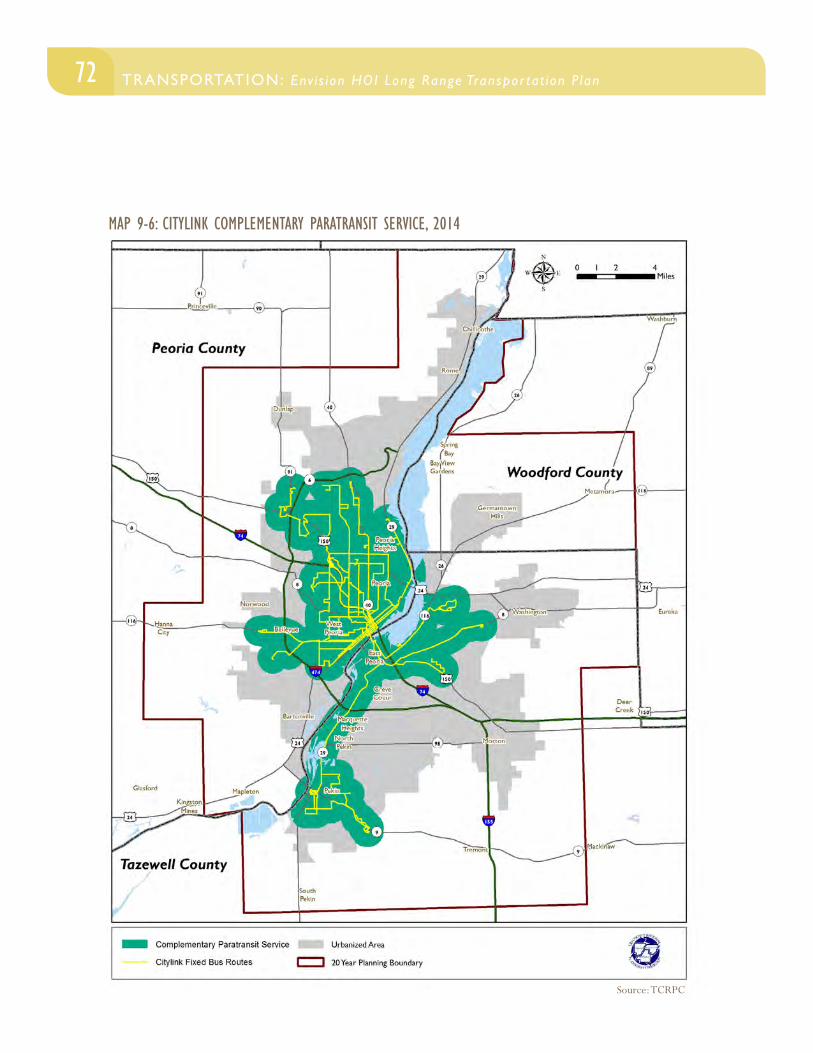
72 TRANSPORTATION: Env i s ion HOI Long Range Transpor tat ion P lan
MAP 9-6: CITYLINK COMPLEMENTARY PARATRANSIT SERVICE, 2014
Source: TCRPC
73TRANSPORTATION: Env i s ion HOI Long Range Transpor tat ion P lan TRANSPORTATION: Env i s ion HOI Long Range Transpor tat ion P lan
within three-quarters of a mile from the fixed route bus lines (Map 9-6). The provision of this complementary service is a federal requirement for all public entities operating fixed route transportation services for the general public.
CityLift paratransit service is limited to individuals who are eligible under the requirements of the Americans with Disability Act of 1990 (ADA). Eligibility is determined through an evaluation and certification process. Once deemed eligible, individuals can ride CityLift for a cost of $2 one-way, and are provided with “door-to-door” service. In door-to-door service, the vehicle driver offers assistance from the rider’s door to the vehicle, and provides comparable assistance at the destination. Individuals must make reservations for this service the day before the scheduled trip per federal guidelines.
Within the City of Peoria, Peoria Heights, West Peoria, and East Peoria, CityLift service is available Monday through Friday from 5:30 a.m. to 1:00 a.m., Saturday from 7:30 a.m. to 10:30 p.m., and Sunday from 7:30 a.m. to 7:30 p.m. Currently, Sunday service to East Peoria is unavailable. Within Pekin, service is available Monday through Friday from 6:45 a.m. to 5:40 p.m., and is unavailable on Saturday and Sunday.
C.A.U.S.E. Area Demand Response
The 2010 U.S. Census expanded the Peoria-Pekin Urbanized Area boundaries, which led to the addition of Chillicothe, Dunlap, and Germantown Hills to the urbanized area. Prior to this expansion, Chillicothe and Dunlap were serviced by Peoria County’s rural public transportation service, CountyLink; and Germantown Hills was serviced by Woodford County’s rural public transportation service, WeCare. Due to federal regulations, CountyLink and WeCare, as rural service providers, are unable to provide transportation service that both originates and terminates within an urban area. Therefore, Germantown Hills, Dunlap, and Chillicothe were left without public transportation service.
To temporarily resolve this issue, GPMTD has taken over transportation services within the expanded Urbanized Area. Currently, the service is only available in Peoria County. The service is being funded in part through two federal grant
programs, Section 5316 Job Access and Reverse Commute (JARC) and Section 5317 New Freedom. Acquired funding from these programs is anticipated to last through FY 2016.
The service, referred to as C.A.U.S.E. Area (CityLink Area Urban Service Expansion) demand response, is available to anyone living or working within the C.A.U.S.E. Area boundaries (See map Map 9-5). The service operates Monday through Saturday from 5:30 a.m. to 6 p.m. and is unavailable on Sundays. A one-way passenger fare is $6. Individuals are encouraged to schedule their rides at least 24 hours in advance; however, same day reservations are accepted.
While the C.A.U.S.E. Area demand response service partially resolves a major transportation gap, the current service is temporary. The JARC and New Freedom grant programs have been consolidated and restructured under MAP-21, the most recent transportation legislation. In order for this service to continue, alternative funding sources would need to be identified.
Ridership Trends
Though the private vehicle remains the predominant mode of transportation in the Peoria-Pekin Urbanized Area – in 2012, only 2% of commuters used public transit – transit ridership is gaining momentum. From 2003 to 2013, one-way passenger trips increased from 1.8 million to 3.4 million, an increase of 86.5%. Though this massive ridership increase is due in part to a variety of economic and environmental factors outside of CityLink’s immediate control, it is also due in part to various programs and efforts by CityLink to enhance and improve their service. Some of these efforts include:
• In 2000, GPMTD changed its public name from GP Transit to CityLink to aid in advertising and marketing. Additionally, buses and promotional materials were updated with a more modern color scheme.
• In 2003, GPMTD opened a $4.8 million modern transit center, which includes a covered canopy with eighteen bus-parking stalls. Inside the climate controlled center, public restrooms, a seating area, and vending machines are provided. As a convenience, individuals can also make payments to the local utility and water company at the
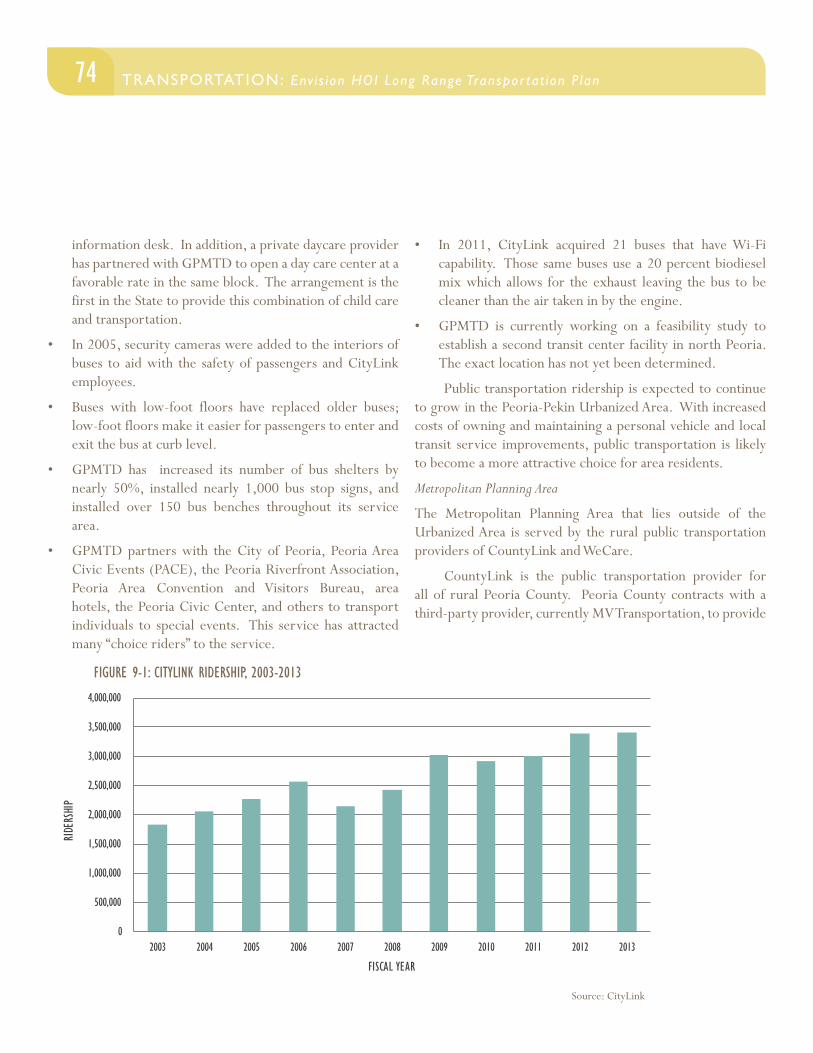
74 TRANSPORTATION: Env i s ion HOI Long Range Transpor tat ion P lan
information desk. In addition, a private daycare provider has partnered with GPMTD to open a day care center at a favorable rate in the same block. The arrangement is the first in the State to provide this combination of child care and transportation.
• In 2005, security cameras were added to the interiors of buses to aid with the safety of passengers and CityLink employees.
• Buses with low-foot floors have replaced older buses; low-foot floors make it easier for passengers to enter and exit the bus at curb level.
• GPMTD has increased its number of bus shelters by nearly 50%, installed nearly 1,000 bus stop signs, and installed over 150 bus benches throughout its service area.
• GPMTD partners with the City of Peoria, Peoria Area Civic Events (PACE), the Peoria Riverfront Association, Peoria Area Convention and Visitors Bureau, area hotels, the Peoria Civic Center, and others to transport individuals to special events. This service has attracted many “choice riders” to the service.
Source: CityLink
• In 2011, CityLink acquired 21 buses that have Wi-Fi capability. Those same buses use a 20 percent biodiesel mix which allows for the exhaust leaving the bus to be cleaner than the air taken in by the engine.
• GPMTD is currently working on a feasibility study to establish a second transit center facility in north Peoria. The exact location has not yet been determined.
Public transportation ridership is expected to continue to grow in the Peoria-Pekin Urbanized Area. With increased costs of owning and maintaining a personal vehicle and local transit service improvements, public transportation is likely to become a more attractive choice for area residents.
Metropolitan Planning Area
The Metropolitan Planning Area that lies outside of the Urbanized Area is served by the rural public transportation providers of CountyLink and WeCare.
CountyLink is the public transportation provider for all of rural Peoria County. Peoria County contracts with a third-party provider, currently MV Transportation, to provide
0
500,000
1,000,000
1,500,000
2,000,000
2,500,000
3,000,000
3,500,000
4,000,000
2003 2004 2005 2006 2007 2008 2009 2010 2011 2012 2013
RIDE
RSHIP
FISCAL YEAR
CHART X.X: CITYLINK RIDERSHIP, 2003 - 2013FIGURE 9-1: CITYLINK RIDERSHIP, 2003-2013
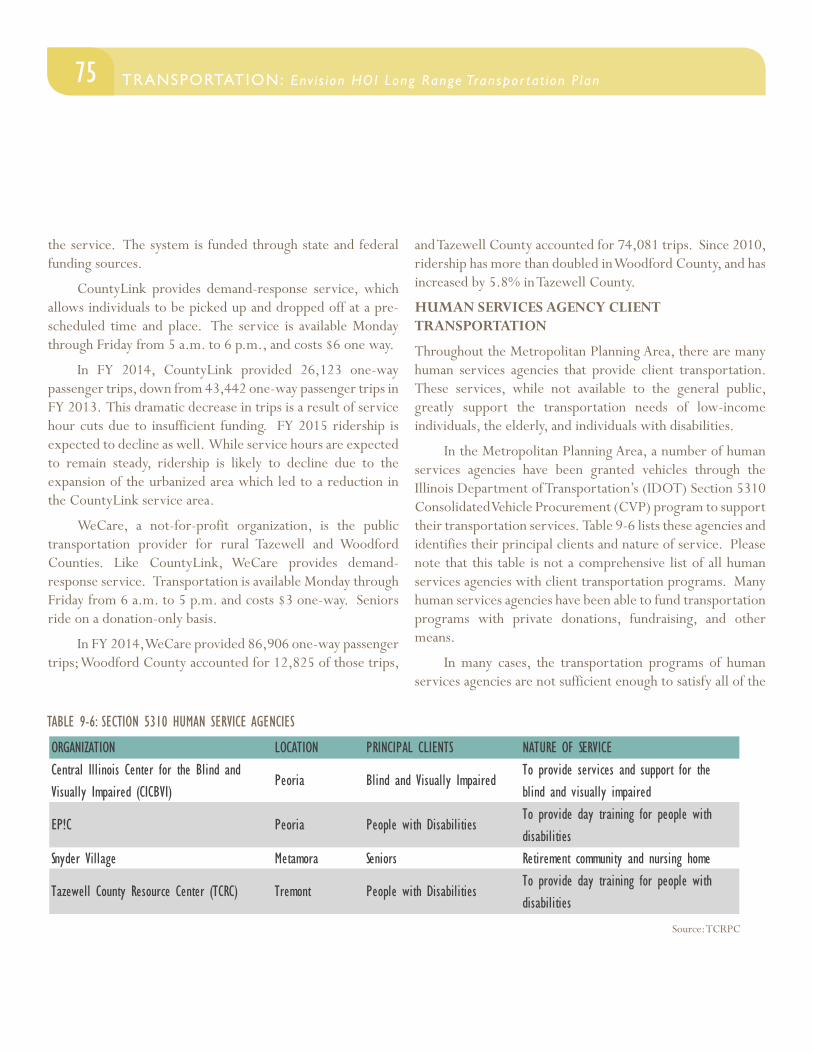
75TRANSPORTATION: Env i s ion HOI Long Range Transpor tat ion P lan TRANSPORTATION: Env i s ion HOI Long Range Transpor tat ion P lan
the service. The system is funded through state and federal funding sources.
CountyLink provides demand-response service, which allows individuals to be picked up and dropped off at a pre-scheduled time and place. The service is available Monday through Friday from 5 a.m. to 6 p.m., and costs $6 one way.
In FY 2014, CountyLink provided 26,123 one-way passenger trips, down from 43,442 one-way passenger trips in FY 2013. This dramatic decrease in trips is a result of service hour cuts due to insufficient funding. FY 2015 ridership is expected to decline as well. While service hours are expected to remain steady, ridership is likely to decline due to the expansion of the urbanized area which led to a reduction in the CountyLink service area.
WeCare, a not-for-profit organization, is the public transportation provider for rural Tazewell and Woodford Counties. Like CountyLink, WeCare provides demand-response service. Transportation is available Monday through Friday from 6 a.m. to 5 p.m. and costs $3 one-way. Seniors ride on a donation-only basis.
In FY 2014, WeCare provided 86,906 one-way passenger trips; Woodford County accounted for 12,825 of those trips,
and Tazewell County accounted for 74,081 trips. Since 2010, ridership has more than doubled in Woodford County, and has increased by 5.8% in Tazewell County.
HUMAN SERVICES AGENCY CLIENT TRANSPORTATION
Throughout the Metropolitan Planning Area, there are many human services agencies that provide client transportation. These services, while not available to the general public, greatly support the transportation needs of low-income individuals, the elderly, and individuals with disabilities.
In the Metropolitan Planning Area, a number of human services agencies have been granted vehicles through the Illinois Department of Transportation’s (IDOT) Section 5310 Consolidated Vehicle Procurement (CVP) program to support their transportation services. Table 9-6 lists these agencies and identifies their principal clients and nature of service. Please note that this table is not a comprehensive list of all human services agencies with client transportation programs. Many human services agencies have been able to fund transportation programs with private donations, fundraising, and other means.
In many cases, the transportation programs of human services agencies are not sufficient enough to satisfy all of the
TABLE 9-6: SECTION 5310 HUMAN SERVICE AGENCIES
Source: TCRPC
ORGANIZATION LOCATION PRINCIPAL CLIENTS NATURE OF SERVICECentral Illinois Center for the Blind and Visually Impaired (CICBVI)
Peoria Blind and Visually ImpairedTo provide services and support for the blind and visually impaired
EP!C Peoria People with DisabilitiesTo provide day training for people with disabilities
Snyder Village Metamora Seniors Retirement community and nursing home
Tazewell County Resource Center (TCRC) Tremont People with DisabilitiesTo provide day training for people with disabilities
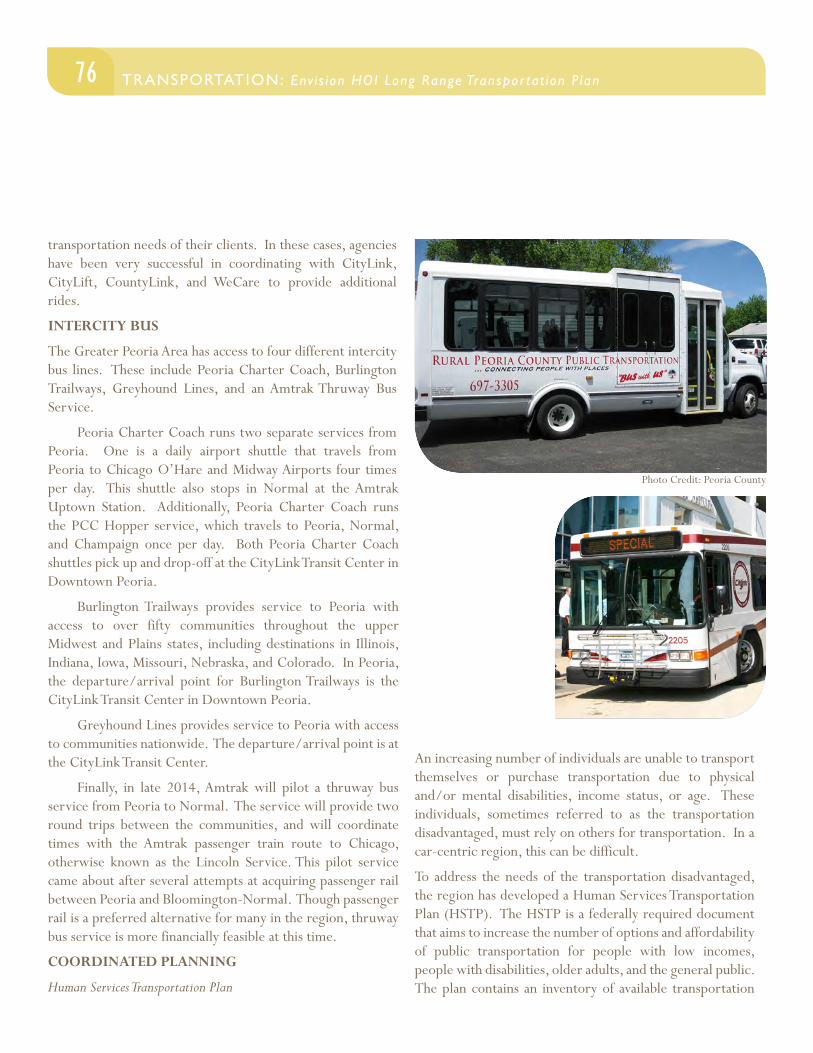
76 TRANSPORTATION: Env i s ion HOI Long Range Transpor tat ion P lan
transportation needs of their clients. In these cases, agencies have been very successful in coordinating with CityLink, CityLift, CountyLink, and WeCare to provide additional rides.
INTERCITY BUS
The Greater Peoria Area has access to four different intercity bus lines. These include Peoria Charter Coach, Burlington Trailways, Greyhound Lines, and an Amtrak Thruway Bus Service.
Peoria Charter Coach runs two separate services from Peoria. One is a daily airport shuttle that travels from Peoria to Chicago O’Hare and Midway Airports four times per day. This shuttle also stops in Normal at the Amtrak Uptown Station. Additionally, Peoria Charter Coach runs the PCC Hopper service, which travels to Peoria, Normal, and Champaign once per day. Both Peoria Charter Coach shuttles pick up and drop-off at the CityLink Transit Center in Downtown Peoria.
Burlington Trailways provides service to Peoria with access to over fifty communities throughout the upper Midwest and Plains states, including destinations in Illinois, Indiana, Iowa, Missouri, Nebraska, and Colorado. In Peoria, the departure/arrival point for Burlington Trailways is the CityLink Transit Center in Downtown Peoria.
Greyhound Lines provides service to Peoria with access to communities nationwide. The departure/arrival point is at the CityLink Transit Center.
Finally, in late 2014, Amtrak will pilot a thruway bus service from Peoria to Normal. The service will provide two round trips between the communities, and will coordinate times with the Amtrak passenger train route to Chicago, otherwise known as the Lincoln Service. This pilot service came about after several attempts at acquiring passenger rail between Peoria and Bloomington-Normal. Though passenger rail is a preferred alternative for many in the region, thruway bus service is more financially feasible at this time.
COORDINATED PLANNING
Human Services Transportation Plan
An increasing number of individuals are unable to transport themselves or purchase transportation due to physical and/or mental disabilities, income status, or age. These individuals, sometimes referred to as the transportation disadvantaged, must rely on others for transportation. In a car-centric region, this can be difficult.
To address the needs of the transportation disadvantaged, the region has developed a Human Services Transportation Plan (HSTP). The HSTP is a federally required document that aims to increase the number of options and affordability of public transportation for people with low incomes, people with disabilities, older adults, and the general public. The plan contains an inventory of available transportation
Photo Credit: Peoria County
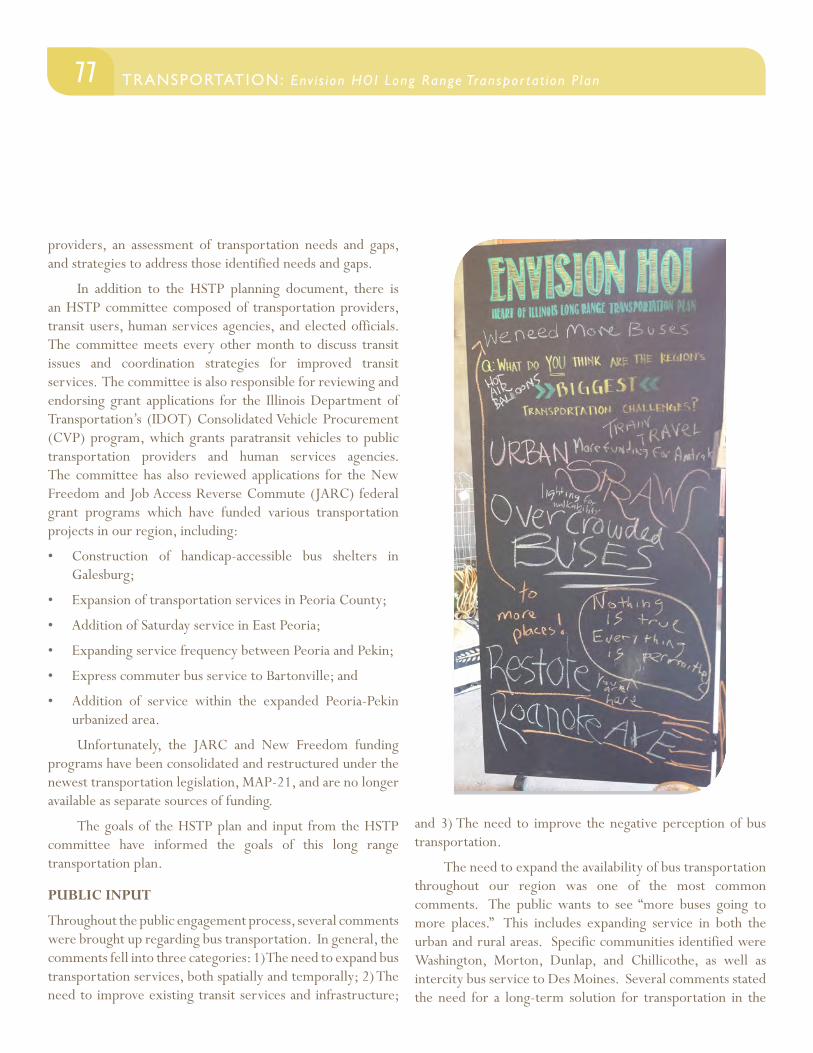
77TRANSPORTATION: Env i s ion HOI Long Range Transpor tat ion P lan TRANSPORTATION: Env i s ion HOI Long Range Transpor tat ion P lan
providers, an assessment of transportation needs and gaps, and strategies to address those identified needs and gaps.
In addition to the HSTP planning document, there is an HSTP committee composed of transportation providers, transit users, human services agencies, and elected officials. The committee meets every other month to discuss transit issues and coordination strategies for improved transit services. The committee is also responsible for reviewing and endorsing grant applications for the Illinois Department of Transportation’s (IDOT) Consolidated Vehicle Procurement (CVP) program, which grants paratransit vehicles to public transportation providers and human services agencies. The committee has also reviewed applications for the New Freedom and Job Access Reverse Commute (JARC) federal grant programs which have funded various transportation projects in our region, including:
• Construction of handicap-accessible bus shelters in Galesburg;
• Expansion of transportation services in Peoria County;
• Addition of Saturday service in East Peoria;
• Expanding service frequency between Peoria and Pekin;
• Express commuter bus service to Bartonville; and
• Addition of service within the expanded Peoria-Pekin urbanized area.
Unfortunately, the JARC and New Freedom funding programs have been consolidated and restructured under the newest transportation legislation, MAP-21, and are no longer available as separate sources of funding.
The goals of the HSTP plan and input from the HSTP committee have informed the goals of this long range transportation plan.
PUBLIC INPUT
Throughout the public engagement process, several comments were brought up regarding bus transportation. In general, the comments fell into three categories: 1) The need to expand bus transportation services, both spatially and temporally; 2) The need to improve existing transit services and infrastructure;
and 3) The need to improve the negative perception of bus transportation.
The need to expand the availability of bus transportation throughout our region was one of the most common comments. The public wants to see “more buses going to more places.” This includes expanding service in both the urban and rural areas. Specific communities identified were Washington, Morton, Dunlap, and Chillicothe, as well as intercity bus service to Des Moines. Several comments stated the need for a long-term solution for transportation in the
78 TRANSPORTATION: Env i s ion HOI Long Range Transpor tat ion P lan
expanded urbanized area as well. The public also expressed the need for transportation services in the early morning and late night hours. Some suggested having transit service available 24/7. It was noted that 24/7 transit service is vital to support our workforce.
A number of comments had to do with improving existing transportation services and infrastructure. Several individuals expressed that the current public transportation system is difficult to use, and that schedules need to be clearer and more accessible. Integrating bus schedule data onto Google Transit and making real-time data available to the public were two proposed solutions to this issue. Many comments articulated the need for more buses or larger buses to reduce over-crowding. Additionally, several individuals with disabilities articulated the need for improved bus shelters and pads, as well as improved sidewalk infrastructure – particularly at high-traffic bus stops. A number of individuals would also like to see reduced headway times for buses. Snow removal from sidewalks and driveway entrances was brought up in several different engagement groups. In one specific example, an individual with disabilities noted that snow plowed into the entrance of her driveway often results in CityLift being unable to access the driveway and therefore unable to pick her up.
Finally, there was discussion about the perceptions of public transportation during several focus group meetings. Participants noted that in order for public transportation to make huge improvements, the region will have to accept it as a viable transportation choice for all residents, rather than just for the transportation disadvantaged. Currently, there are communities and businesses in the region that are not favorable towards public transportation service.
Though the public expressed the need for many changes in our current bus transportation system, some comments did note that the system is improving. The CityLink Transit Center was identified as a great asset, and the expansion of transit services in the expanded urbanized area was acknowledged as a major triumph.
79TRANSPORTATION: Env i s ion HOI Long Range Transpor tat ion P lan TRANSPORTATION: Env i s ion HOI Long Range Transpor tat ion P lan
TRANSPORTATION ACCESS FOR PEOPLE WITH DISABILITIESTransportation and mobility play key roles in the struggle for equal opportunity in the disability community. Affordable and reliable transportation allows people with disabilities to access important opportunities in education, employment, health care, housing, and recreation. Because national, state, and local investments in transportation infrastructure have disproportionately favored cars and highways, those who cannot drive cars often lack viable transportation options.
According to the 2012 American Community Survey, approximately 10.7 percent of Peoria-Pekin Urbanized Area residents are living with a disability. The disability rate is expected to increase in the coming years due to an aging population and increases in chronic health conditions, among other causes.1It is therefore vital that the needs of this community are addressed.
NATIONAL POLICY
The Americans with Disabilities Act (ADA) was passed in 1990 to ensure that people with disabilities have equal opportunity to participate in society. The law required all new public transportation vehicles to be accessible. Additionally, transit operators had to begin providing paratransit services for those who cannot use the fixed route system. Other modes of transit that are covered include commuter transit, subway, and intercity rail systems. The law also addresses the accessibility of public places, including restaurants, hotels, theaters, doctor’s offices, grocery stores, entertainment venues, schools, and daycare facilities, among others. All new construction and modifications to existing public facilities must be made accessible, and existing facilities must try to remove as many barriers as possible. Though the ADA improved conditions for people with disabilities, transportation choices are still limited, as the law does not address private transportation such as taxis.
1 World Health Organization. (September 2013). Disability and Health, Fact Sheet No 352. Retrieved from http://www.who.int/mediacentre/factsheets/fs352/en/ [Accessed November 24, 2014].
LOCAL EFFORTS
Locally, several groups exist with the goal of promoting the interests and improving services for people with disabilities. These include the Human Services Transportation Plan Committee (discussed in detail in the Bus Transportation section), the Accessible Transportation Coalition Initiative, the CityLink ADA Committee, and the Peoria Mayor’s Advisory Committee for the Disabled.
The Accessible Transportation Coalition Initiative (ATCI) was established in August 2012 after the Greater Peoria Mass Transit District was awarded a technical assistance grant from Easter Seals Project Action. A representative from Easter Seals traveled to Peoria to host a two-day workshop with a group of disability and transportation representatives. During the workshop, specific goals and action items for the group to accomplish within the next year were identified. The ATCI group now meets every other month to work on the action items and discuss other accessibility issues. To date, the group has conducted a transportation needs assessment in the communities of Creve Coeur, Marquette Heights, and North Pekin; coordinated with a dialysis center to address clients not paying for CityLift service; and assessed the accessibility features of a number of bus stops within the transit district.
The CityLink ADA Committee meets every other month to discuss the CityLift para-transit service and issues facing individuals with disabilities. The group often meets with the ATCI committee in order to coordinate work on various goals.
The Peoria Mayor’s Advisory Committee has historically met once a month; however, the group has not had a meeting in some time. Members of the committee represent and promote the interest of citizens with disabilities by ensuring the following:
• Adequate public and private services for maintaining and improving the health and welfare of persons with disabilities;
• Adequate dissemination of information concerning the interest, problems, and affairs of persons with disabilities;
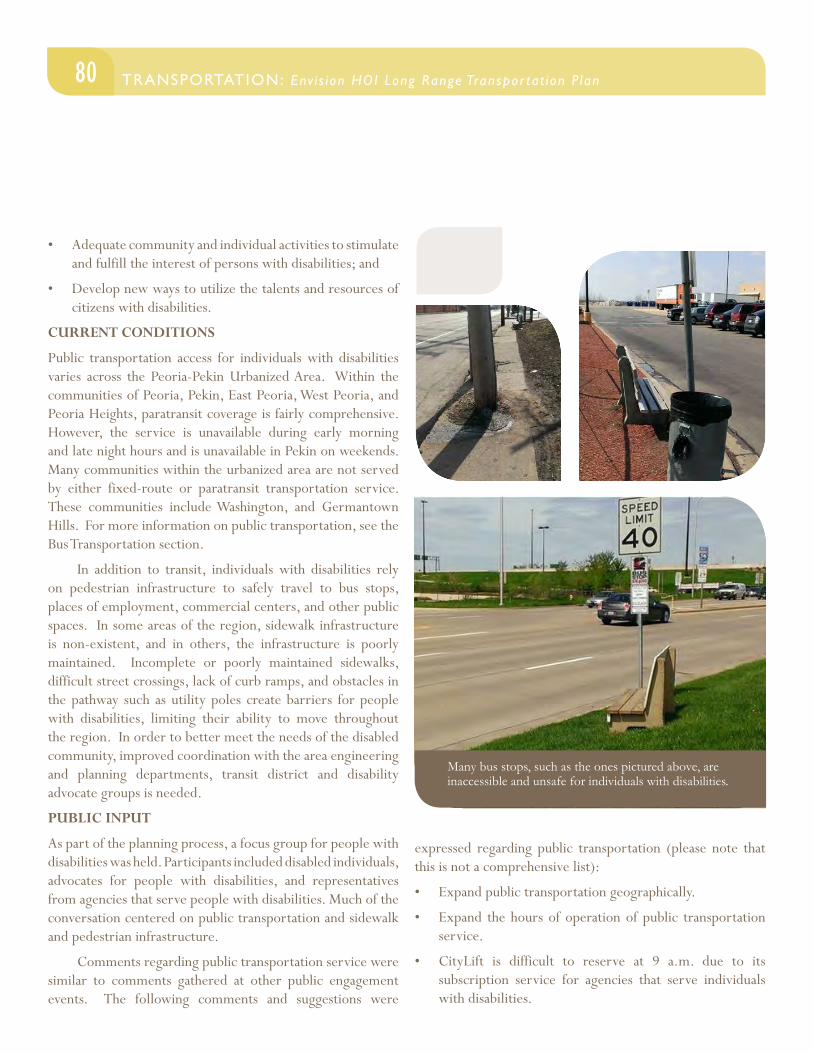
80 TRANSPORTATION: Env i s ion HOI Long Range Transpor tat ion P lan
• Adequate community and individual activities to stimulate and fulfill the interest of persons with disabilities; and
• Develop new ways to utilize the talents and resources of citizens with disabilities.
CURRENT CONDITIONS
Public transportation access for individuals with disabilities varies across the Peoria-Pekin Urbanized Area. Within the communities of Peoria, Pekin, East Peoria, West Peoria, and Peoria Heights, paratransit coverage is fairly comprehensive. However, the service is unavailable during early morning and late night hours and is unavailable in Pekin on weekends. Many communities within the urbanized area are not served by either fixed-route or paratransit transportation service. These communities include Washington, and Germantown Hills. For more information on public transportation, see the Bus Transportation section.
In addition to transit, individuals with disabilities rely on pedestrian infrastructure to safely travel to bus stops, places of employment, commercial centers, and other public spaces. In some areas of the region, sidewalk infrastructure is non-existent, and in others, the infrastructure is poorly maintained. Incomplete or poorly maintained sidewalks, difficult street crossings, lack of curb ramps, and obstacles in the pathway such as utility poles create barriers for people with disabilities, limiting their ability to move throughout the region. In order to better meet the needs of the disabled community, improved coordination with the area engineering and planning departments, transit district and disability advocate groups is needed.
PUBLIC INPUT
As part of the planning process, a focus group for people with disabilities was held. Participants included disabled individuals, advocates for people with disabilities, and representatives from agencies that serve people with disabilities. Much of the conversation centered on public transportation and sidewalk and pedestrian infrastructure.
Comments regarding public transportation service were similar to comments gathered at other public engagement events. The following comments and suggestions were
Many bus stops, such as the ones pictured above, are inaccessible and unsafe for individuals with disabilities.
expressed regarding public transportation (please note that this is not a comprehensive list):
• Expand public transportation geographically.
• Expand the hours of operation of public transportation service.
• CityLift is difficult to reserve at 9 a.m. due to its subscription service for agencies that serve individuals with disabilities.
81TRANSPORTATION: Env i s ion HOI Long Range Transpor tat ion P lan TRANSPORTATION: Env i s ion HOI Long Range Transpor tat ion P lan
• Cars and delivery vehicles often park in bus lanes/stops in Downtown Peoria, making it difficult for disabled individuals to board the bus.
• Transit staff awareness and sensitivity to people with disabilities has improved.
• In order to successfully use transit, you have to know a lot about how the system works. A transit hot line (#511) would be a helpful service for visitors and new riders.
• A universal rider card could be useful for individuals with disabilities who travel frequently. This would allow paratransit eligibility to transfer to systems throughout the state.
• Some private parking lots are built without transit in mind, making it difficult or impossible for paratransit vehicles to access building entry points.
• Some feel unsafe waiting for the bus at night.
• Investing in more buses should be a priority for enhancing public transportation for individuals with disabilities.
The following comments and suggestions were expressed regarding pedestrian infrastructure:
• Increase pedestrian signal crossing times to allow sufficient time for individuals with disabilities to safely cross the intersection.
• Create an ordinance for the removal of snow from sidewalks in area communities.
• Sidewalks are non-existent in some areas, and are in poor condition in others.
• Improving and expanding sidewalk infrastructure would have the largest impact in making the transportation system more accessible for people with disabilities.
• Some pathways and driveway entrances are unsafe due to poor visibility.
• The City of Peoria should coordinate with CityLink and the various disability advocacy groups for prioritizing where sidewalks should be added and/or improved. Sidewalks near high-traffic bus stops should be a priority.
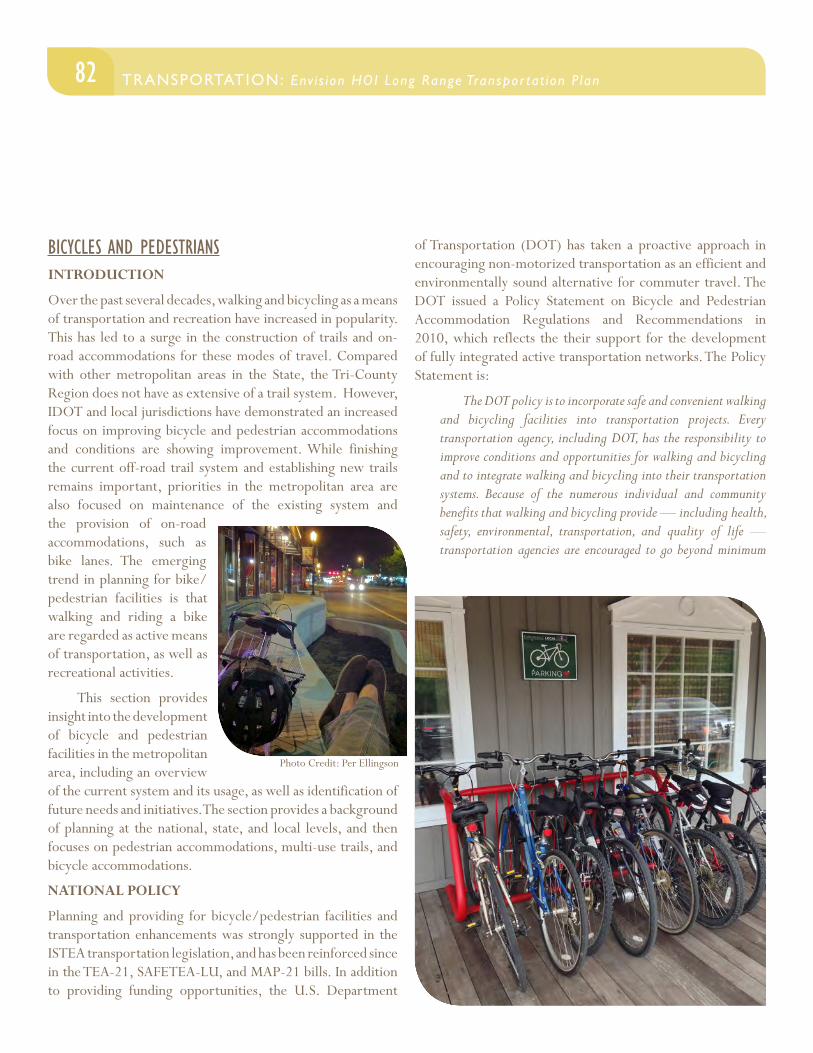
82 TRANSPORTATION: Env i s ion HOI Long Range Transpor tat ion P lan
BICYCLES AND PEDESTRIANSINTRODUCTION
Over the past several decades, walking and bicycling as a means of transportation and recreation have increased in popularity. This has led to a surge in the construction of trails and on-road accommodations for these modes of travel. Compared with other metropolitan areas in the State, the Tri-County Region does not have as extensive of a trail system. However, IDOT and local jurisdictions have demonstrated an increased focus on improving bicycle and pedestrian accommodations and conditions are showing improvement. While finishing the current off-road trail system and establishing new trails remains important, priorities in the metropolitan area are also focused on maintenance of the existing system and the provision of on-road accommodations, such as bike lanes. The emerging trend in planning for bike/pedestrian facilities is that walking and riding a bike are regarded as active means of transportation, as well as recreational activities.
This section provides insight into the development of bicycle and pedestrian facilities in the metropolitan area, including an overview of the current system and its usage, as well as identification of future needs and initiatives. The section provides a background of planning at the national, state, and local levels, and then focuses on pedestrian accommodations, multi-use trails, and bicycle accommodations.
NATIONAL POLICY
Planning and providing for bicycle/pedestrian facilities and transportation enhancements was strongly supported in the ISTEA transportation legislation, and has been reinforced since in the TEA-21, SAFETEA-LU, and MAP-21 bills. In addition to providing funding opportunities, the U.S. Department
of Transportation (DOT) has taken a proactive approach in encouraging non-motorized transportation as an efficient and environmentally sound alternative for commuter travel. The DOT issued a Policy Statement on Bicycle and Pedestrian Accommodation Regulations and Recommendations in 2010, which reflects the their support for the development of fully integrated active transportation networks. The Policy Statement is:
The DOT policy is to incorporate safe and convenient walking and bicycling facilities into transportation projects. Every transportation agency, including DOT, has the responsibility to improve conditions and opportunities for walking and bicycling and to integrate walking and bicycling into their transportation systems. Because of the numerous individual and community benefits that walking and bicycling provide — including health, safety, environmental, transportation, and quality of life — transportation agencies are encouraged to go beyond minimum
Photo Credit: Per Ellingson
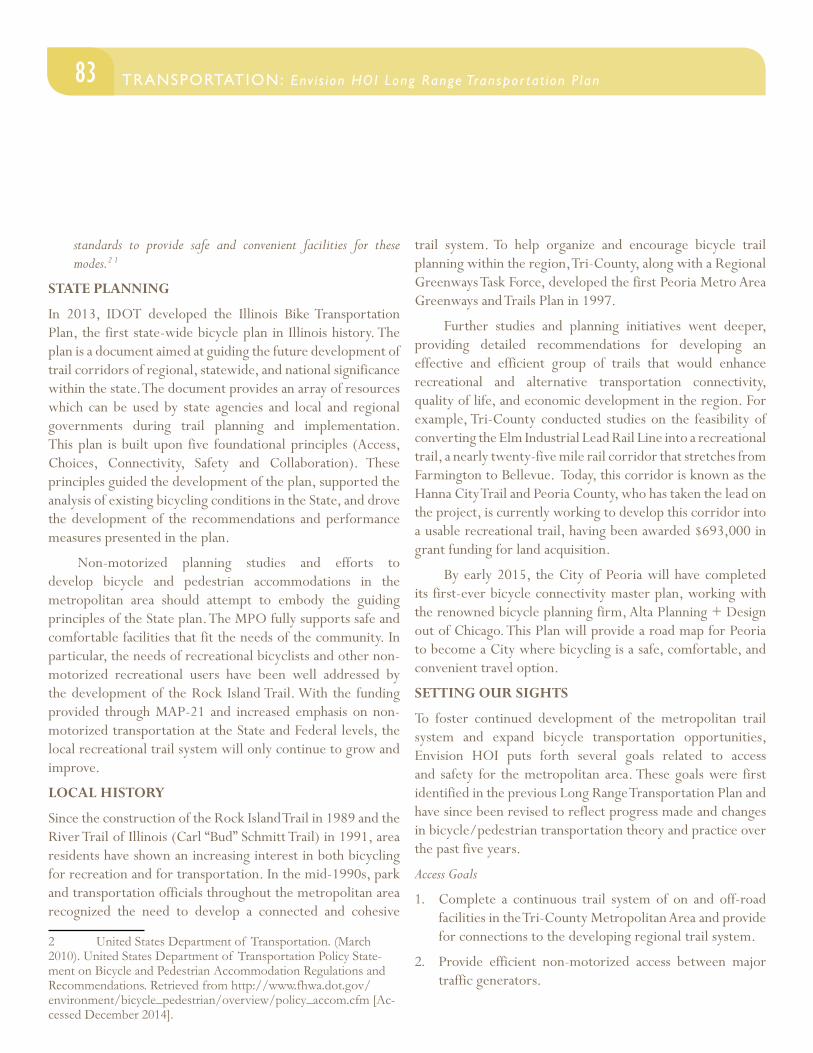
83TRANSPORTATION: Env i s ion HOI Long Range Transpor tat ion P lan TRANSPORTATION: Env i s ion HOI Long Range Transpor tat ion P lan
standards to provide safe and convenient facilities for these modes.2 1
STATE PLANNING
In 2013, IDOT developed the Illinois Bike Transportation Plan, the first state-wide bicycle plan in Illinois history. The plan is a document aimed at guiding the future development of trail corridors of regional, statewide, and national significance within the state. The document provides an array of resources which can be used by state agencies and local and regional governments during trail planning and implementation. This plan is built upon five foundational principles (Access, Choices, Connectivity, Safety and Collaboration). These principles guided the development of the plan, supported the analysis of existing bicycling conditions in the State, and drove the development of the recommendations and performance measures presented in the plan.
Non-motorized planning studies and efforts to develop bicycle and pedestrian accommodations in the metropolitan area should attempt to embody the guiding principles of the State plan. The MPO fully supports safe and comfortable facilities that fit the needs of the community. In particular, the needs of recreational bicyclists and other non-motorized recreational users have been well addressed by the development of the Rock Island Trail. With the funding provided through MAP-21 and increased emphasis on non-motorized transportation at the State and Federal levels, the local recreational trail system will only continue to grow and improve.
LOCAL HISTORY
Since the construction of the Rock Island Trail in 1989 and the River Trail of Illinois (Carl “Bud” Schmitt Trail) in 1991, area residents have shown an increasing interest in both bicycling for recreation and for transportation. In the mid-1990s, park and transportation officials throughout the metropolitan area recognized the need to develop a connected and cohesive
2 United States Department of Transportation. (March 2010). United States Department of Transportation Policy State-ment on Bicycle and Pedestrian Accommodation Regulations and Recommendations. Retrieved from http://www.fhwa.dot.gov/environment/bicycle_pedestrian/overview/policy_accom.cfm [Ac-cessed December 2014].
trail system. To help organize and encourage bicycle trail planning within the region, Tri-County, along with a Regional Greenways Task Force, developed the first Peoria Metro Area Greenways and Trails Plan in 1997.
Further studies and planning initiatives went deeper, providing detailed recommendations for developing an effective and efficient group of trails that would enhance recreational and alternative transportation connectivity, quality of life, and economic development in the region. For example, Tri-County conducted studies on the feasibility of converting the Elm Industrial Lead Rail Line into a recreational trail, a nearly twenty-five mile rail corridor that stretches from Farmington to Bellevue. Today, this corridor is known as the Hanna City Trail and Peoria County, who has taken the lead on the project, is currently working to develop this corridor into a usable recreational trail, having been awarded $693,000 in grant funding for land acquisition.
By early 2015, the City of Peoria will have completed its first-ever bicycle connectivity master plan, working with the renowned bicycle planning firm, Alta Planning + Design out of Chicago. This Plan will provide a road map for Peoria to become a City where bicycling is a safe, comfortable, and convenient travel option.
SETTING OUR SIGHTS
To foster continued development of the metropolitan trail system and expand bicycle transportation opportunities, Envision HOI puts forth several goals related to access and safety for the metropolitan area. These goals were first identified in the previous Long Range Transportation Plan and have since been revised to reflect progress made and changes in bicycle/pedestrian transportation theory and practice over the past five years.
Access Goals
1. Complete a continuous trail system of on and off-road facilities in the Tri-County Metropolitan Area and provide for connections to the developing regional trail system.
2. Provide efficient non-motorized access between major traffic generators.
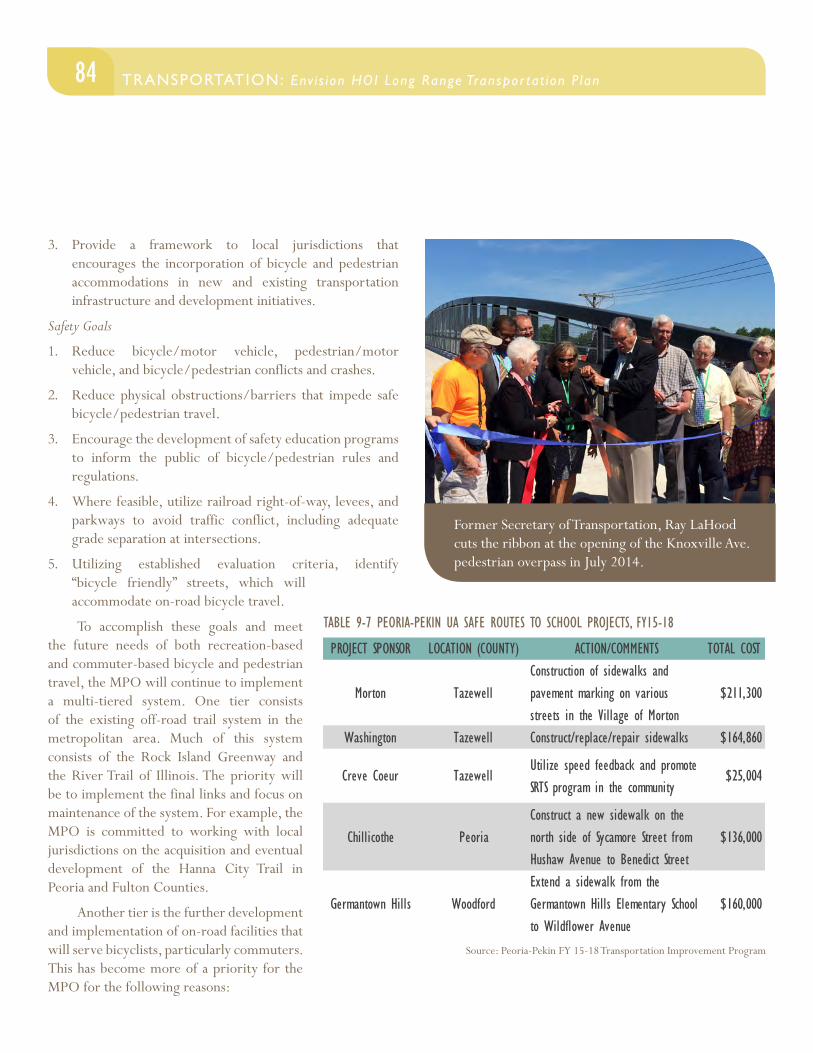
84 TRANSPORTATION: Env i s ion HOI Long Range Transpor tat ion P lan
3. Provide a framework to local jurisdictions that encourages the incorporation of bicycle and pedestrian accommodations in new and existing transportation infrastructure and development initiatives.
Safety Goals
1. Reduce bicycle/motor vehicle, pedestrian/motor vehicle, and bicycle/pedestrian conflicts and crashes.
2. Reduce physical obstructions/barriers that impede safe bicycle/pedestrian travel.
3. Encourage the development of safety education programs to inform the public of bicycle/pedestrian rules and regulations.
4. Where feasible, utilize railroad right-of-way, levees, and parkways to avoid traffic conflict, including adequate grade separation at intersections.
5. Utilizing established evaluation criteria, identify “bicycle friendly” streets, which will accommodate on-road bicycle travel.
To accomplish these goals and meet the future needs of both recreation-based and commuter-based bicycle and pedestrian travel, the MPO will continue to implement a multi-tiered system. One tier consists of the existing off-road trail system in the metropolitan area. Much of this system consists of the Rock Island Greenway and the River Trail of Illinois. The priority will be to implement the final links and focus on maintenance of the system. For example, the MPO is committed to working with local jurisdictions on the acquisition and eventual development of the Hanna City Trail in Peoria and Fulton Counties.
Another tier is the further development and implementation of on-road facilities that will serve bicyclists, particularly commuters. This has become more of a priority for the MPO for the following reasons:
PROJECT SPONSOR LOCATION (COUNTY) ACTION/COMMENTS TOTAL COST
Morton TazewellConstruction of sidewalks and pavement marking on various streets in the Village of Morton
$211,300
Washington Tazewell Construct/replace/repair sidewalks $164,860
Creve Coeur TazewellUtilize speed feedback and promote SRTS program in the community
$25,004
Chillicothe PeoriaConstruct a new sidewalk on the north side of Sycamore Street from Hushaw Avenue to Benedict Street
$136,000
Germantown Hills WoodfordExtend a sidewalk from the Germantown Hills Elementary School to Wildflower Avenue
$160,000
TABLE 9-7 PEORIA-PEKIN UA SAFE ROUTES TO SCHOOL PROJECTS, FY15-18
Source: Peoria-Pekin FY 15-18 Transportation Improvement Program
Former Secretary of Transportation, Ray LaHood cuts the ribbon at the opening of the Knoxville Ave. pedestrian overpass in July 2014.

85TRANSPORTATION: Env i s ion HOI Long Range Transpor tat ion P lan TRANSPORTATION: Env i s ion HOI Long Range Transpor tat ion P lan
1. Greater increase in transportation efficiency for bicycle commuters.
2. Better advances the goals of the Envision HOI plan.
3. More overall positive impact on the established MPO performance measures.
4. On-road facilities can be coupled with local road reconstruction projects.
5. Lower cost and ease of developing on-road facilities versus new recreational trails.
It is important to stress that the on and off-road systems envisioned must dovetail to provide seamless interaction between trails and on-road facilities. The MPO’s focus for pedestrians will be enhancing the walking environment by filling in sidewalk gaps, improving crossing safety, advocating for sidewalk snow removal laws, and linking neighborhoods with schools and destinations.
The existing trail system provides for non-motorized access to various recreation-based venues. While the primary use of the current trail system is for recreation, it does also have a role in providing connectivity to shopping, schools, and employment centers. Primary destinations considered in the overall development of the non-motorized system include intersections with existing local, regional, and statewide trails, parks and other outdoor recreation venues (which are largely already connected via trails), large retail/commercial areas, schools, colleges, large employment centers, and various public service facilities. The location of each destination will serve as a framework for the development of further bicycle and pedestrian accommodations.
PEDESTRIAN ACCOMMODATIONS
The provision of pedestrian accommodations has been an area of growing interest for the MPO. In the past, pedestrian accommodations were often seen as an issue for local jurisdictions, as stand-alone sidewalk projects were not eligible for federal aid. Also, jurisdictions have varying policies regarding the installation and maintenance of sidewalks. While walking has always been considered a viable and important mode of transportation, there has not been a great deal of MPO-level planning with regard to it previously.
Although not required by city ordinance, a Peoria resident clears the sidewalk after a recent snowfall. The MPO appeals to the public to keep this critical part of the transportation system accessible by clearing sidewalks, especially for children walking to/from school.
86 TRANSPORTATION: Env i s ion HOI Long Range Transpor tat ion P lan
The Safe, Accountable, Flexible, Efficient Transportation Equity Act: A Legacy for Users (SAFETEA-LU) brought about a renewed focus on pedestrian issues, primarily through the Safe Routes to School (SRTS) program, which was aimed at helping to increase the number of children walking and bicycling to school. Sidewalks, crossing improvements, and other projects involving pedestrians were common SRTS initiatives. SRTS has remained a popular initiative even though MAP-21 eliminated it as a specific, stand-alone program and placed it under the new Transportation Alternatives Program (TAP). There are still several active SRTS projects ongoing within the MPO, which are listed in the table 9-7.
TRAIL SYSTEM
The local trail system is one of the area’s best recreational amenities. In a way, trails bridge the gap between pedestrians and bicyclists, as they are a type of infrastructure that can be used by both. While the MPO is shifting away from the trail mindset specifically for bicyclists who ride for transportation, and not necessarily recreation, trails are still an important part of the MPO’s planning efforts. Recent road reconstruction projects have often included a separated trail rather than an on-road bicycle accommodation, likely because trails serve both pedestrian and bicyclists and are the type of accommodation that is familiar in the area. While this plan focuses more heavily on accommodating bicycles on roadways, it is still important to review the existing trail system and understand the recreation and transportation value it provides.
BICYCLE ACCOMMODATIONS
Residents of the MPA are fortunate to have access to the existing and expanding multi-use trail network available in the region, but there is an increased focus on providing more and better facilities. The planning process, funding, and dedication that have gone into constructing the current system have been extensive. The vision first set out decades ago to build the Rock Island Greenway and State Trail has largely been realized. While other trails remain to be constructed, the majority of the Rock Island Trail is now complete. Due to this, as well as an emphasis on providing the most appropriate accommodations for bicyclists and pedestrians on any given road, the MPO has shifted its focus from planning additional
trails to creating a Non-Motorized Transportation Plan, which lays out a vision of bicycle and pedestrian facilities throughout the MPA, including all jurisdictions – Peoria, East Peoria, Pekin, Washington, Morton, Peoria Heights, Chillicothe, West Peoria, Germantown Hills, Dunlap, Creve Coeur, N. Pekin, Marquette Heights, and portions of Peoria, Tazewell and Woodford Counties. While this vision will include off-road trails, it focuses more on creating a network of on-road bicycle facilities and shared lanes that would greatly enhance the bicycling environment of the MPA.
Bicyclist Skill Levels
An important consideration in the design and location of bicycle accommodations is the varying skill level of bicyclists. The metropolitan area’s system of bicycle and pedestrian facilities, including off-road trails and on-road accommodations, should continue to be designed for all users to the extent possible. The skill level and preferences of bicycle riders can vary greatly. Riders who use bicycles to commute to work are likely comfortable on the majority of roads, including those without designated bicycle facilities. However, the casual user may be uncomfortable on routes that do not include separate bicycle designations, and younger children are likely best suited for facilities that are separate from the road.
American Association of State Highway and Transportation Officials’ (AASHTO) 2012 Guide for the Development of Bicycle Facilities discusses types of bicyclists by dividing them into two main categories:
• Experienced/Confident Riders: Most are comfortable riding with vehicles on street, prefer a more direct route, avoid riding on sidewalks, may ride up to 25 mph, and may cycle longer distances.
• Casual/Less Confident Riders: Prefer on or off-road designated bicycle facilities, may avoid busier streets, may ride on sidewalks, may ride around 8-12 mph, and may cycle shorter distances.
Cyclists are often divided into categories based on their preferences and needs. There are four common types of cyclists: Strong & Fearless; Enthused & Confident; Interested but Concerned; and No Way No How. These groups are based
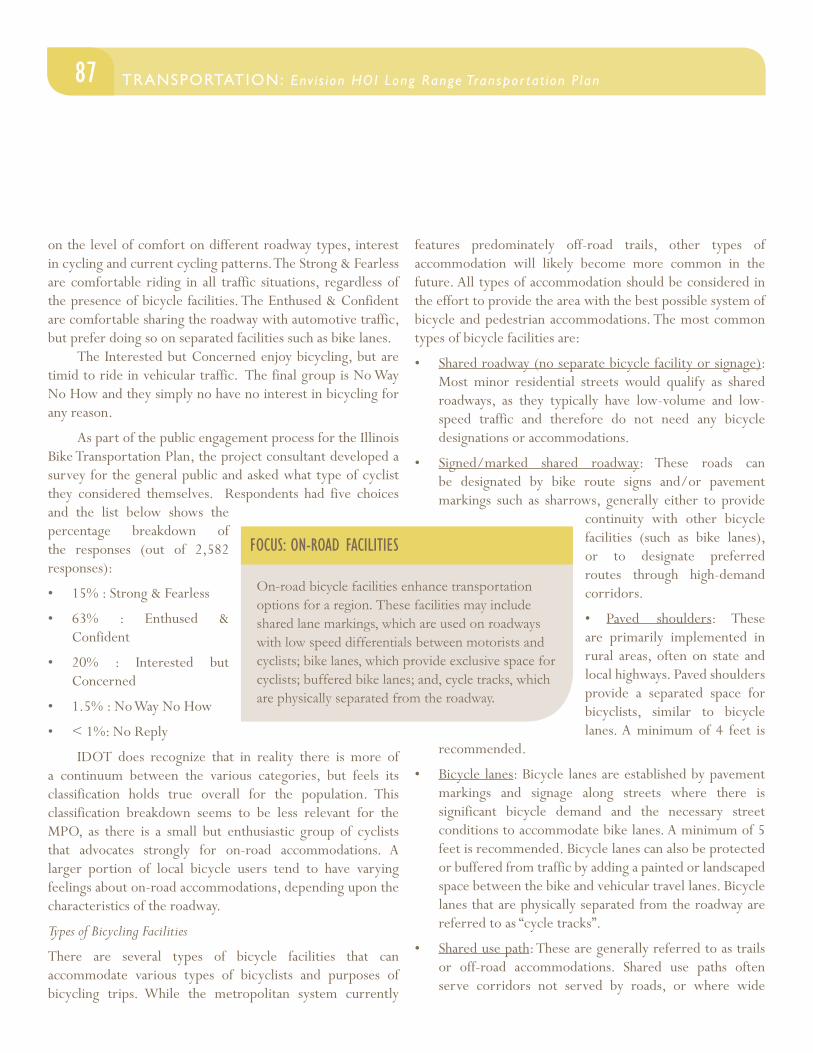
87TRANSPORTATION: Env i s ion HOI Long Range Transpor tat ion P lan TRANSPORTATION: Env i s ion HOI Long Range Transpor tat ion P lan
features predominately off-road trails, other types of accommodation will likely become more common in the future. All types of accommodation should be considered in the effort to provide the area with the best possible system of bicycle and pedestrian accommodations. The most common types of bicycle facilities are:
• Shared roadway (no separate bicycle facility or signage): Most minor residential streets would qualify as shared roadways, as they typically have low-volume and low-speed traffic and therefore do not need any bicycle designations or accommodations.
• Signed/marked shared roadway: These roads can be designated by bike route signs and/or pavement markings such as sharrows, generally either to provide
continuity with other bicycle facilities (such as bike lanes), or to designate preferred routes through high-demand corridors.
• Paved shoulders: These are primarily implemented in rural areas, often on state and local highways. Paved shoulders provide a separated space for bicyclists, similar to bicycle lanes. A minimum of 4 feet is
recommended.
• Bicycle lanes: Bicycle lanes are established by pavement markings and signage along streets where there is significant bicycle demand and the necessary street conditions to accommodate bike lanes. A minimum of 5 feet is recommended. Bicycle lanes can also be protected or buffered from traffic by adding a painted or landscaped space between the bike and vehicular travel lanes. Bicycle lanes that are physically separated from the roadway are referred to as “cycle tracks”.
• Shared use path: These are generally referred to as trails or off-road accommodations. Shared use paths often serve corridors not served by roads, or where wide
on the level of comfort on different roadway types, interest in cycling and current cycling patterns. The Strong & Fearless are comfortable riding in all traffic situations, regardless of the presence of bicycle facilities. The Enthused & Confident are comfortable sharing the roadway with automotive traffic, but prefer doing so on separated facilities such as bike lanes. The Interested but Concerned enjoy bicycling, but are timid to ride in vehicular traffic. The final group is No Way No How and they simply no have no interest in bicycling for any reason.
As part of the public engagement process for the Illinois Bike Transportation Plan, the project consultant developed a survey for the general public and asked what type of cyclist they considered themselves. Respondents had five choices and the list below shows the percentage breakdown of the responses (out of 2,582 responses):
• 15% : Strong & Fearless
• 63% : Enthused & Confident
• 20% : Interested but Concerned
• 1.5% : No Way No How
• < 1%: No Reply
IDOT does recognize that in reality there is more of a continuum between the various categories, but feels its classification holds true overall for the population. This classification breakdown seems to be less relevant for the MPO, as there is a small but enthusiastic group of cyclists that advocates strongly for on-road accommodations. A larger portion of local bicycle users tend to have varying feelings about on-road accommodations, depending upon the characteristics of the roadway.
Types of Bicycling Facilities
There are several types of bicycle facilities that can accommodate various types of bicyclists and purposes of bicycling trips. While the metropolitan system currently
On-road bicycle facilities enhance transportation options for a region. These facilities may include shared lane markings, which are used on roadways with low speed differentials between motorists and cyclists; bike lanes, which provide exclusive space for cyclists; buffered bike lanes; and, cycle tracks, which are physically separated from the roadway.
FOCUS: ON-ROAD FACILITIES
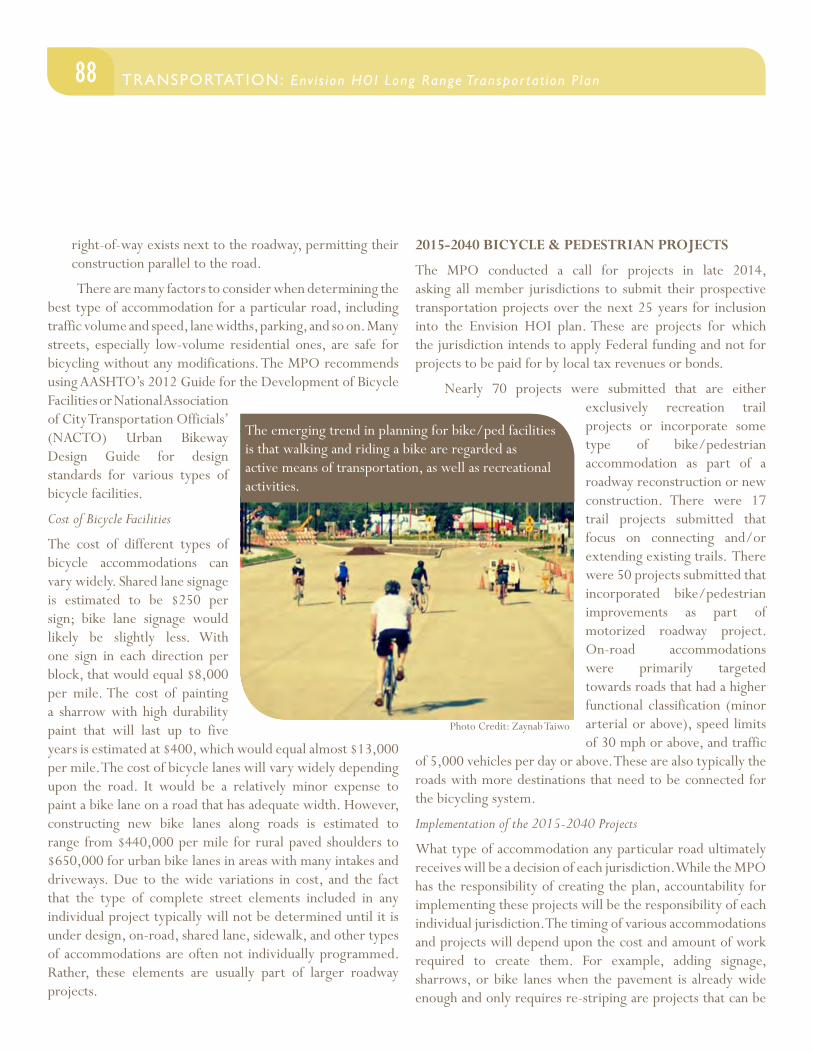
88 TRANSPORTATION: Env i s ion HOI Long Range Transpor tat ion P lan
right-of-way exists next to the roadway, permitting their construction parallel to the road.
There are many factors to consider when determining the best type of accommodation for a particular road, including traffic volume and speed, lane widths, parking, and so on. Many streets, especially low-volume residential ones, are safe for bicycling without any modifications. The MPO recommends using AASHTO’s 2012 Guide for the Development of Bicycle Facilities or National Association of City Transportation Officials’ (NACTO) Urban Bikeway Design Guide for design standards for various types of bicycle facilities.
Cost of Bicycle Facilities
The cost of different types of bicycle accommodations can vary widely. Shared lane signage is estimated to be $250 per sign; bike lane signage would likely be slightly less. With one sign in each direction per block, that would equal $8,000 per mile. The cost of painting a sharrow with high durability paint that will last up to five years is estimated at $400, which would equal almost $13,000 per mile. The cost of bicycle lanes will vary widely depending upon the road. It would be a relatively minor expense to paint a bike lane on a road that has adequate width. However, constructing new bike lanes along roads is estimated to range from $440,000 per mile for rural paved shoulders to $650,000 for urban bike lanes in areas with many intakes and driveways. Due to the wide variations in cost, and the fact that the type of complete street elements included in any individual project typically will not be determined until it is under design, on-road, shared lane, sidewalk, and other types of accommodations are often not individually programmed. Rather, these elements are usually part of larger roadway projects.
2015-2040 BICYCLE & PEDESTRIAN PROJECTS
The MPO conducted a call for projects in late 2014, asking all member jurisdictions to submit their prospective transportation projects over the next 25 years for inclusion into the Envision HOI plan. These are projects for which the jurisdiction intends to apply Federal funding and not for projects to be paid for by local tax revenues or bonds.
Nearly 70 projects were submitted that are either exclusively recreation trail projects or incorporate some type of bike/pedestrian accommodation as part of a roadway reconstruction or new construction. There were 17 trail projects submitted that focus on connecting and/or extending existing trails. There were 50 projects submitted that incorporated bike/pedestrian improvements as part of motorized roadway project. On-road accommodations were primarily targeted towards roads that had a higher functional classification (minor arterial or above), speed limits of 30 mph or above, and traffic
of 5,000 vehicles per day or above. These are also typically the roads with more destinations that need to be connected for the bicycling system.
Implementation of the 2015-2040 Projects
What type of accommodation any particular road ultimately receives will be a decision of each jurisdiction. While the MPO has the responsibility of creating the plan, accountability for implementing these projects will be the responsibility of each individual jurisdiction. The timing of various accommodations and projects will depend upon the cost and amount of work required to create them. For example, adding signage, sharrows, or bike lanes when the pavement is already wide enough and only requires re-striping are projects that can be
The emerging trend in planning for bike/ped facilities is that walking and riding a bike are regarded as active means of transportation, as well as recreational activities.
Photo Credit: Zaynab Taiwo
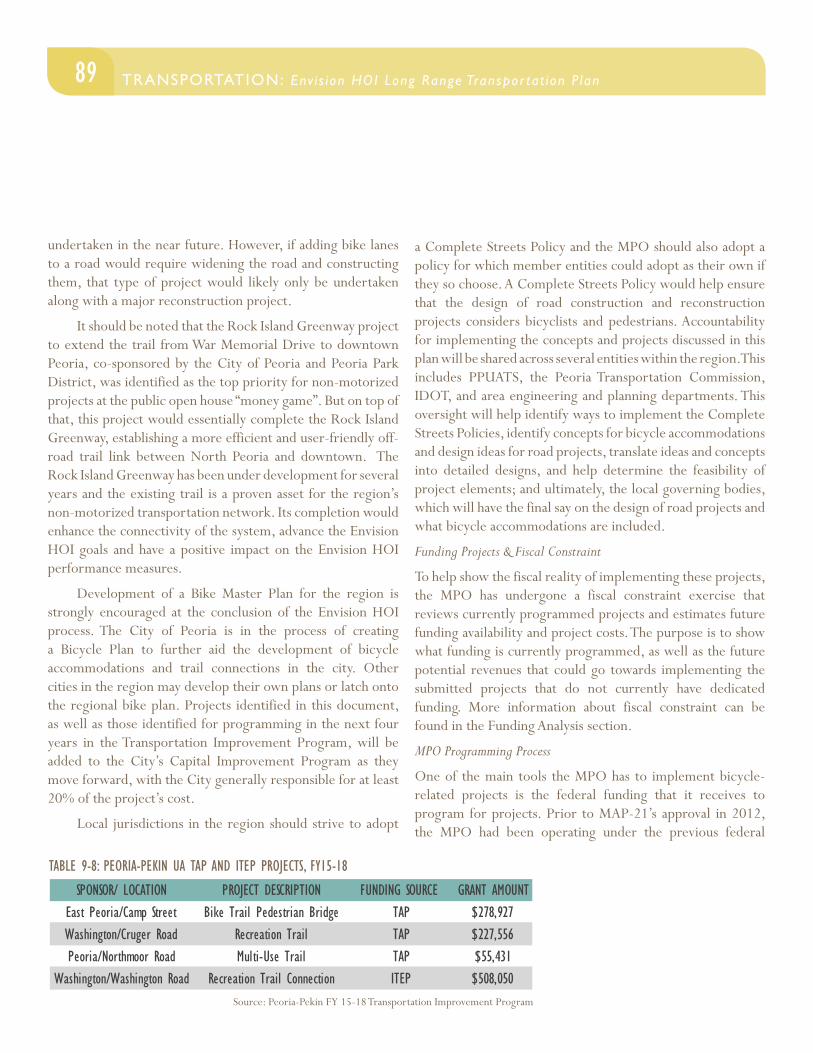
89TRANSPORTATION: Env i s ion HOI Long Range Transpor tat ion P lan TRANSPORTATION: Env i s ion HOI Long Range Transpor tat ion P lan
a Complete Streets Policy and the MPO should also adopt a policy for which member entities could adopt as their own if they so choose. A Complete Streets Policy would help ensure that the design of road construction and reconstruction projects considers bicyclists and pedestrians. Accountability for implementing the concepts and projects discussed in this plan will be shared across several entities within the region. This includes PPUATS, the Peoria Transportation Commission, IDOT, and area engineering and planning departments. This oversight will help identify ways to implement the Complete Streets Policies, identify concepts for bicycle accommodations and design ideas for road projects, translate ideas and concepts into detailed designs, and help determine the feasibility of project elements; and ultimately, the local governing bodies, which will have the final say on the design of road projects and what bicycle accommodations are included.
Funding Projects & Fiscal Constraint
To help show the fiscal reality of implementing these projects, the MPO has undergone a fiscal constraint exercise that reviews currently programmed projects and estimates future funding availability and project costs. The purpose is to show what funding is currently programmed, as well as the future potential revenues that could go towards implementing the submitted projects that do not currently have dedicated funding. More information about fiscal constraint can be found in the Funding Analysis section.
MPO Programming Process
One of the main tools the MPO has to implement bicycle-related projects is the federal funding that it receives to program for projects. Prior to MAP-21’s approval in 2012, the MPO had been operating under the previous federal
undertaken in the near future. However, if adding bike lanes to a road would require widening the road and constructing them, that type of project would likely only be undertaken along with a major reconstruction project.
It should be noted that the Rock Island Greenway project to extend the trail from War Memorial Drive to downtown Peoria, co-sponsored by the City of Peoria and Peoria Park District, was identified as the top priority for non-motorized projects at the public open house “money game”. But on top of that, this project would essentially complete the Rock Island Greenway, establishing a more efficient and user-friendly off-road trail link between North Peoria and downtown. The Rock Island Greenway has been under development for several years and the existing trail is a proven asset for the region’s non-motorized transportation network. Its completion would enhance the connectivity of the system, advance the Envision HOI goals and have a positive impact on the Envision HOI performance measures.
Development of a Bike Master Plan for the region is strongly encouraged at the conclusion of the Envision HOI process. The City of Peoria is in the process of creating a Bicycle Plan to further aid the development of bicycle accommodations and trail connections in the city. Other cities in the region may develop their own plans or latch onto the regional bike plan. Projects identified in this document, as well as those identified for programming in the next four years in the Transportation Improvement Program, will be added to the City’s Capital Improvement Program as they move forward, with the City generally responsible for at least 20% of the project’s cost.
Local jurisdictions in the region should strive to adopt
SPONSOR/ LOCATION PROJECT DESCRIPTION FUNDING SOURCE GRANT AMOUNTEast Peoria/Camp Street Bike Trail Pedestrian Bridge TAP $278,927 Washington/Cruger Road Recreation Trail TAP $227,556 Peoria/Northmoor Road Multi-Use Trail TAP $55,431
Washington/Washington Road Recreation Trail Connection ITEP $508,050
TABLE 9-8: PEORIA-PEKIN UA TAP AND ITEP PROJECTS, FY15-18
Source: Peoria-Pekin FY 15-18 Transportation Improvement Program
90 TRANSPORTATION: Env i s ion HOI Long Range Transpor tat ion P lan
transportation legislation, SAFETEA-LU. The approval of MAP-21 resulted in the consolidation and elimination of a number of federal aid programs, as well as an increased emphasis on asset management and performance measures.
At the MPO level, programming for the Surface Transportation Program - Urban (STU) remained relatively unchanged. However, the Transportation Enhancement Program, which had funded projects such as trails and scenic and historic transportation improvements, changed significantly. Funding for these types of projects is now available through the Transportation Alternatives Program (TAP). The State of Illinois operates a similar program called the Illinois Transportation Enhancement Program (ITEP).
Even though Enhancement changed to TAP, one of the more popular programs, Safe Routes to Schools (SRTS), was maintained under TAP. The Federal government continues to distribute SRTS funds as TAP funds to IDOT for programming. MPOs are not allowed to apply for or sponsor SRTS applications, but local SRTS projects must be listed in the TIP. The MPO also has a recent history of programming STU funds for trail and enhancement projects. While that may continue into the future, this plan does not make the assumption that it will. The PPUATS MPO is large enough in population to receive a separate allocation of TAP funds to program specifically for trail projects, which amounted to approximately $280,000 for FY 2013 - 2014.
Current road projects programmed in the TIP are also anticipated to include bicycle and/or pedestrian elements. The exact types of accommodations these projects include will be determined as they are under design. These projects include:
• New eastbound span of the McCluggage Bridge in FY 2018
• Northmoor Road from University to Hamilton in Peoria in FY 2017
• Northmoor Road from Hamilton to Allen in Peoria in FY 2018
• Dirksen Parkway from Airport to Middle in Peoria in FY 2019
• Detroit Avenue at US 150 in Morton in FY 2016
• Hanna City Trail corridor acquisition in Peoria County in FY 2018
TRACKING PROGRESS
Ways to measure the success of the implementation of bicycle accommodations include the measures listed below (and are described in more detail in the Performance Measures section). These will be tracked over time as data is available and as measures are applicable.
• Existing mileage of various accommodation types (multi-use trails, bike lanes, sharrows, signed bike routes, other) – measured utilizing our GIS capabilities
• Percent of the population within a half mile of each type of accommodation – measured utilizing our GIS capabilities
• For MPO funded projects, the amount that is spent on each type of accommodation – to be tracked by Tri-County RPC
• Crashes involving bicyclists – measured using IDOT crash data
• Percent of trips made via bicycling – measured with American Community Survey data and local surveys
• Usage of accommodations – measured with local counts
• Ancillary health indicators, such as BMI levels – measured as available/applicable
• Ancillary economic development indicators, such as retail activity and property values – measured as available/applicable
The MPO plans to track these measurements by taking an annual snapshot of the system and tracking progress year to year. Usage will be the hardest item to measure. The MPO will be discussing the feasibility of conducting trail counts in the future. Since counts are typically done manually, a future endeavor may be to invest in camera or sensor technology that could provide more accurate counts. Additionally, any time special counts are collected for road projects, the MPO will request that those counts also include pedestrians and bicyclists if possible.
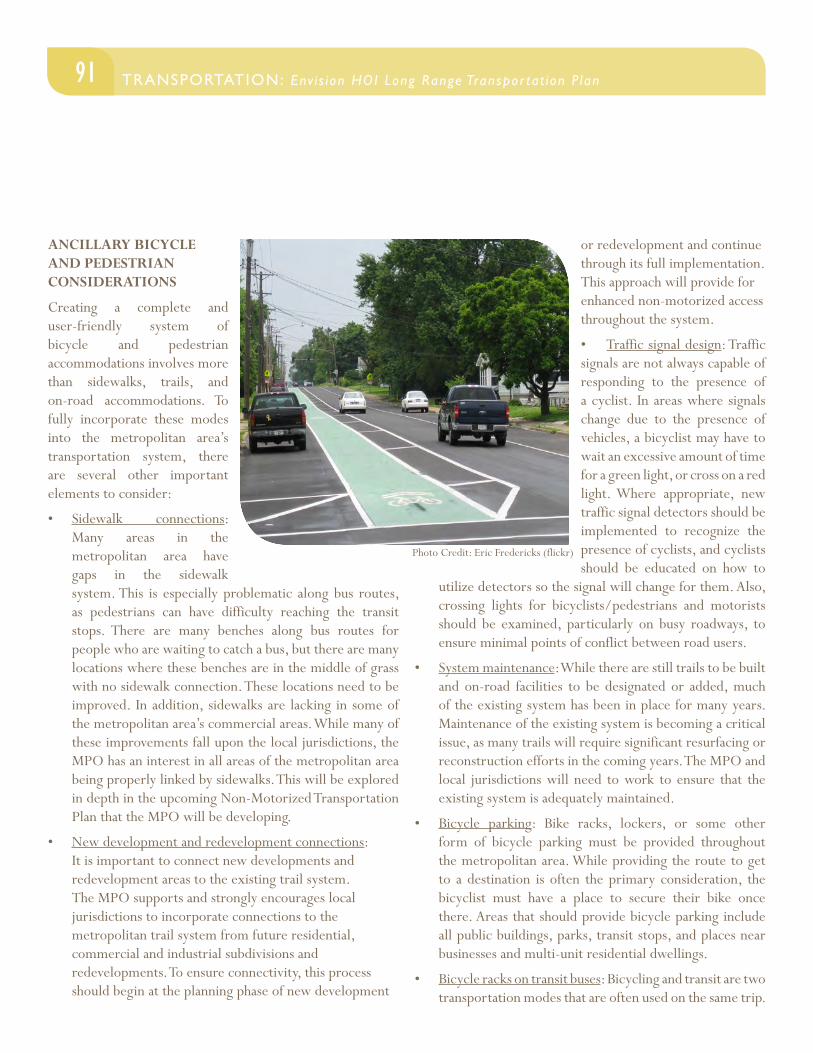
91TRANSPORTATION: Env i s ion HOI Long Range Transpor tat ion P lan TRANSPORTATION: Env i s ion HOI Long Range Transpor tat ion P lan
or redevelopment and continue through its full implementation. This approach will provide for enhanced non-motorized access throughout the system.
• Traffic signal design: Traffic signals are not always capable of responding to the presence of a cyclist. In areas where signals change due to the presence of vehicles, a bicyclist may have to wait an excessive amount of time for a green light, or cross on a red light. Where appropriate, new traffic signal detectors should be implemented to recognize the presence of cyclists, and cyclists should be educated on how to
utilize detectors so the signal will change for them. Also, crossing lights for bicyclists/pedestrians and motorists should be examined, particularly on busy roadways, to ensure minimal points of conflict between road users.
• System maintenance: While there are still trails to be built and on-road facilities to be designated or added, much of the existing system has been in place for many years. Maintenance of the existing system is becoming a critical issue, as many trails will require significant resurfacing or reconstruction efforts in the coming years. The MPO and local jurisdictions will need to work to ensure that the existing system is adequately maintained.
• Bicycle parking: Bike racks, lockers, or some other form of bicycle parking must be provided throughout the metropolitan area. While providing the route to get to a destination is often the primary consideration, the bicyclist must have a place to secure their bike once there. Areas that should provide bicycle parking include all public buildings, parks, transit stops, and places near businesses and multi-unit residential dwellings.
• Bicycle racks on transit buses: Bicycling and transit are two transportation modes that are often used on the same trip.
ANCILLARY BICYCLE AND PEDESTRIAN CONSIDERATIONS
Creating a complete and user-friendly system of bicycle and pedestrian accommodations involves more than sidewalks, trails, and on-road accommodations. To fully incorporate these modes into the metropolitan area’s transportation system, there are several other important elements to consider:
• Sidewalk connections: Many areas in the metropolitan area have gaps in the sidewalk system. This is especially problematic along bus routes, as pedestrians can have difficulty reaching the transit stops. There are many benches along bus routes for people who are waiting to catch a bus, but there are many locations where these benches are in the middle of grass with no sidewalk connection. These locations need to be improved. In addition, sidewalks are lacking in some of the metropolitan area’s commercial areas. While many of these improvements fall upon the local jurisdictions, the MPO has an interest in all areas of the metropolitan area being properly linked by sidewalks. This will be explored in depth in the upcoming Non-Motorized Transportation Plan that the MPO will be developing.
• New development and redevelopment connections: It is important to connect new developments and redevelopment areas to the existing trail system. The MPO supports and strongly encourages local jurisdictions to incorporate connections to the metropolitan trail system from future residential, commercial and industrial subdivisions and redevelopments. To ensure connectivity, this process should begin at the planning phase of new development
Photo Credit: Eric Fredericks (flickr)
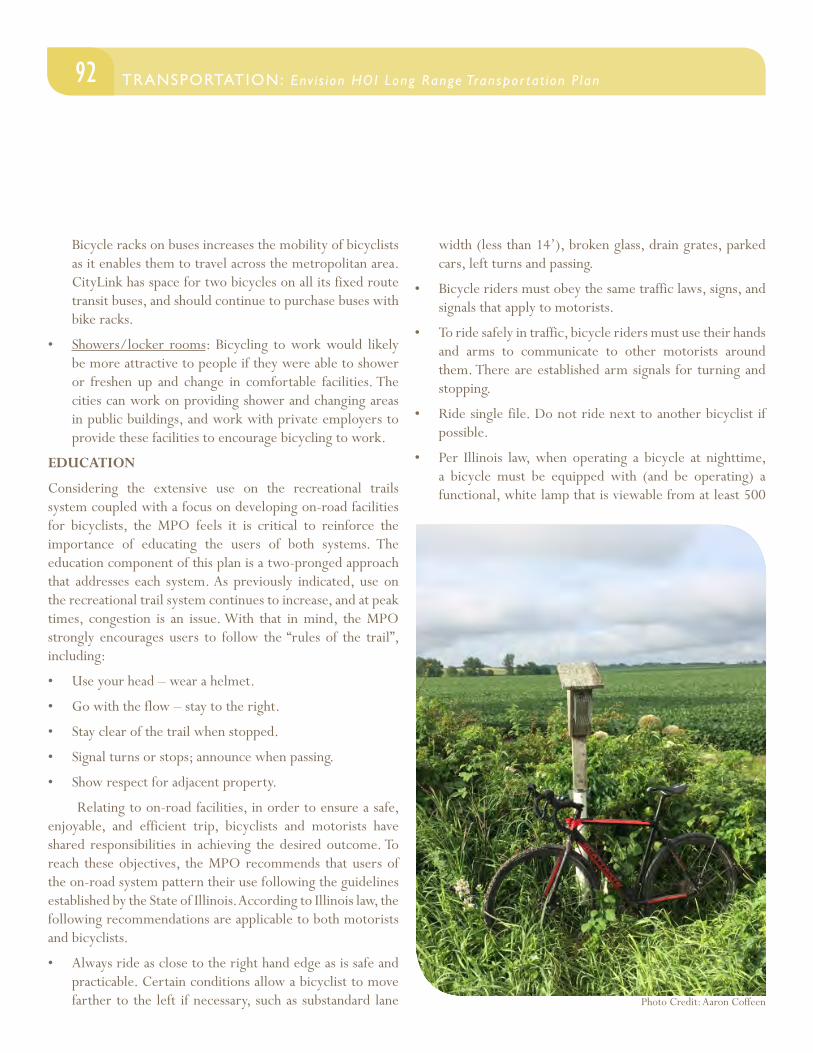
92 TRANSPORTATION: Env i s ion HOI Long Range Transpor tat ion P lan
Bicycle racks on buses increases the mobility of bicyclists as it enables them to travel across the metropolitan area. CityLink has space for two bicycles on all its fixed route transit buses, and should continue to purchase buses with bike racks.
• Showers/locker rooms: Bicycling to work would likely be more attractive to people if they were able to shower or freshen up and change in comfortable facilities. The cities can work on providing shower and changing areas in public buildings, and work with private employers to provide these facilities to encourage bicycling to work.
EDUCATION
Considering the extensive use on the recreational trails system coupled with a focus on developing on-road facilities for bicyclists, the MPO feels it is critical to reinforce the importance of educating the users of both systems. The education component of this plan is a two-pronged approach that addresses each system. As previously indicated, use on the recreational trail system continues to increase, and at peak times, congestion is an issue. With that in mind, the MPO strongly encourages users to follow the “rules of the trail”, including:
• Use your head – wear a helmet.
• Go with the flow – stay to the right.
• Stay clear of the trail when stopped.
• Signal turns or stops; announce when passing.
• Show respect for adjacent property.
Relating to on-road facilities, in order to ensure a safe, enjoyable, and efficient trip, bicyclists and motorists have shared responsibilities in achieving the desired outcome. To reach these objectives, the MPO recommends that users of the on-road system pattern their use following the guidelines established by the State of Illinois. According to Illinois law, the following recommendations are applicable to both motorists and bicyclists.
• Always ride as close to the right hand edge as is safe and practicable. Certain conditions allow a bicyclist to move farther to the left if necessary, such as substandard lane
width (less than 14’), broken glass, drain grates, parked cars, left turns and passing.
• Bicycle riders must obey the same traffic laws, signs, and signals that apply to motorists.
• To ride safely in traffic, bicycle riders must use their hands and arms to communicate to other motorists around them. There are established arm signals for turning and stopping.
• Ride single file. Do not ride next to another bicyclist if possible.
• Per Illinois law, when operating a bicycle at nighttime, a bicycle must be equipped with (and be operating) a functional, white lamp that is viewable from at least 500
Photo Credit: Aaron Coffeen
93TRANSPORTATION: Env i s ion HOI Long Range Transpor tat ion P lan TRANSPORTATION: Env i s ion HOI Long Range Transpor tat ion P lan
feet. In addition, the bicycle must be mounted with an Illinois Department of Transportation approved, red reflector visible from 100 – 600 ft.
Other education initiatives supported by the MPO include:
• Incorporating appropriate and safe bicycling techniques into the K-8 school curriculum.
• Discouraging the practice of bicycling on sidewalks as bicyclists mature in their riding capabilities.
• Supporting safe bicycling initiatives developed by the State of Illinois.
• Encouraging helmet use for all bicyclists.
• Encouraging law enforcement agencies to enforce traffic laws for bicyclists.
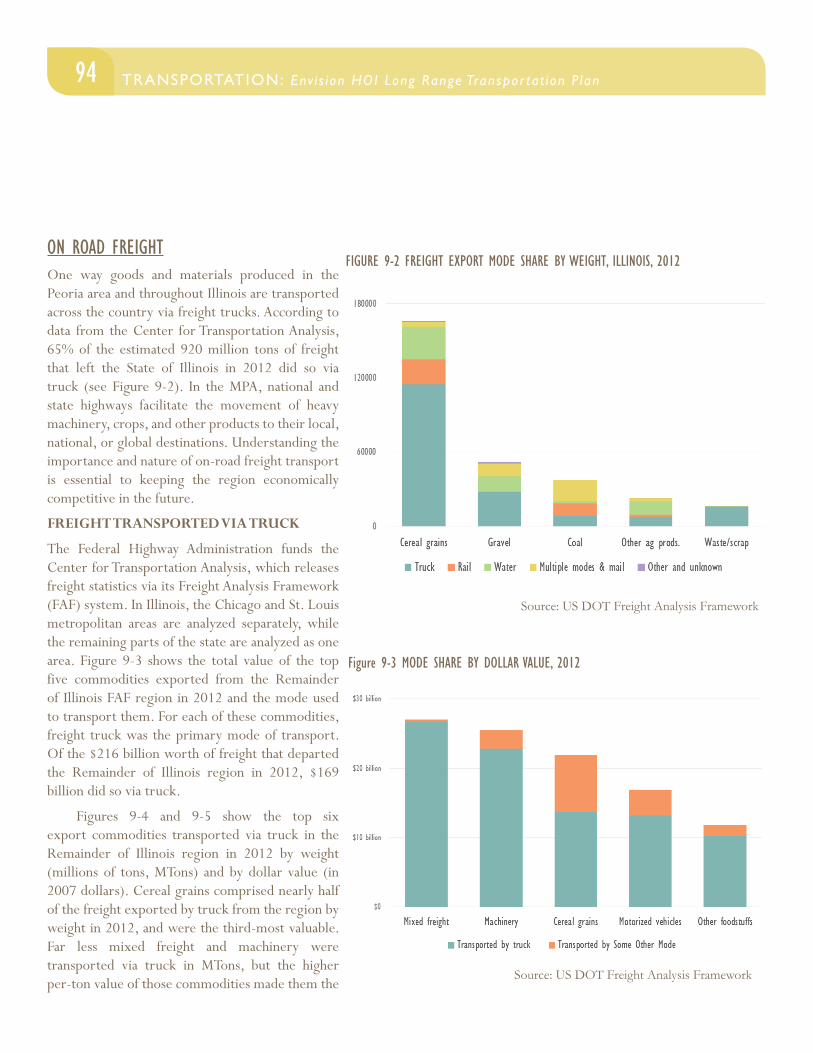
94 TRANSPORTATION: Env i s ion HOI Long Range Transpor tat ion P lan
ON ROAD FREIGHTOne way goods and materials produced in the Peoria area and throughout Illinois are transported across the country via freight trucks. According to data from the Center for Transportation Analysis, 65% of the estimated 920 million tons of freight that left the State of Illinois in 2012 did so via truck (see Figure 9-2). In the MPA, national and state highways facilitate the movement of heavy machinery, crops, and other products to their local, national, or global destinations. Understanding the importance and nature of on-road freight transport is essential to keeping the region economically competitive in the future.
FREIGHT TRANSPORTED VIA TRUCK
The Federal Highway Administration funds the Center for Transportation Analysis, which releases freight statistics via its Freight Analysis Framework (FAF) system. In Illinois, the Chicago and St. Louis metropolitan areas are analyzed separately, while the remaining parts of the state are analyzed as one area. Figure 9-3 shows the total value of the top five commodities exported from the Remainder of Illinois FAF region in 2012 and the mode used to transport them. For each of these commodities, freight truck was the primary mode of transport. Of the $216 billion worth of freight that departed the Remainder of Illinois region in 2012, $169 billion did so via truck.
Figures 9-4 and 9-5 show the top six export commodities transported via truck in the Remainder of Illinois region in 2012 by weight (millions of tons, MTons) and by dollar value (in 2007 dollars). Cereal grains comprised nearly half of the freight exported by truck from the region by weight in 2012, and were the third-most valuable. Far less mixed freight and machinery were transported via truck in MTons, but the higher per-ton value of those commodities made them the
FIGURE 9-2 FREIGHT EXPORT MODE SHARE BY WEIGHT, ILLINOIS, 2012
Figure 9-3 MODE SHARE BY DOLLAR VALUE, 2012
Source: US DOT Freight Analysis Framework
Source: US DOT Freight Analysis Framework
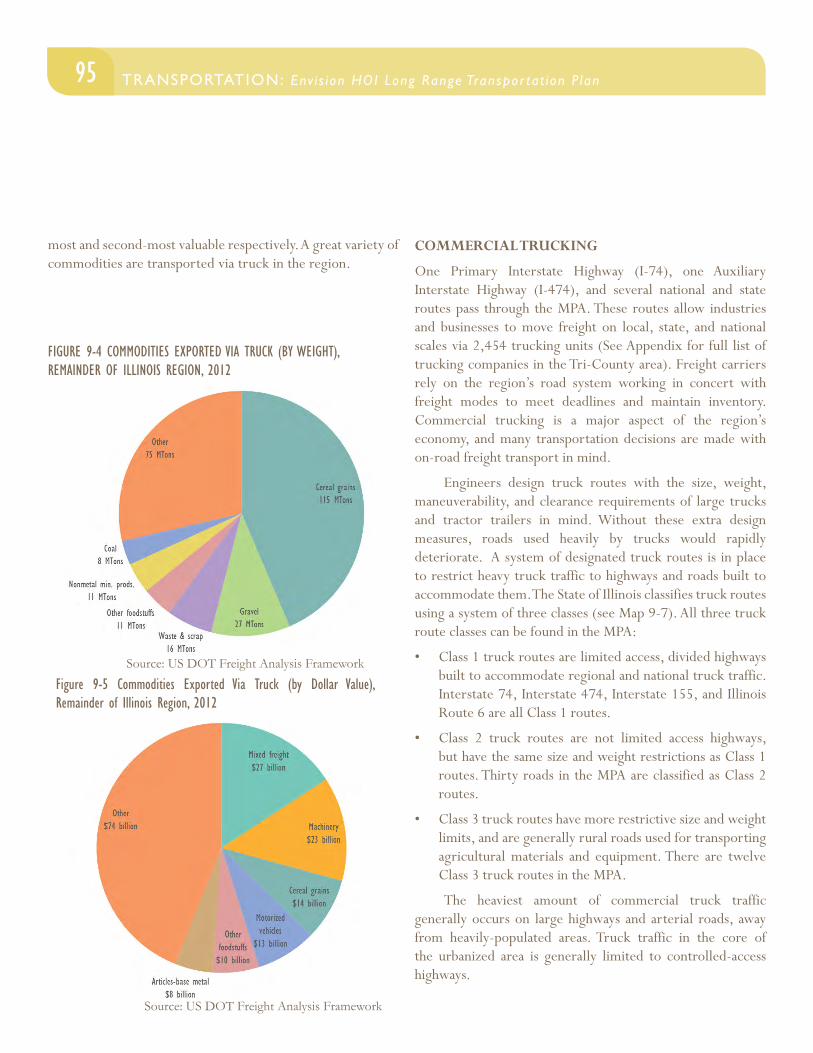
95TRANSPORTATION: Env i s ion HOI Long Range Transpor tat ion P lan TRANSPORTATION: Env i s ion HOI Long Range Transpor tat ion P lan
most and second-most valuable respectively. A great variety of commodities are transported via truck in the region.
COMMERCIAL TRUCKING
One Primary Interstate Highway (I-74), one Auxiliary Interstate Highway (I-474), and several national and state routes pass through the MPA. These routes allow industries and businesses to move freight on local, state, and national scales via 2,454 trucking units (See Appendix for full list of trucking companies in the Tri-County area). Freight carriers rely on the region’s road system working in concert with freight modes to meet deadlines and maintain inventory. Commercial trucking is a major aspect of the region’s economy, and many transportation decisions are made with on-road freight transport in mind.
Engineers design truck routes with the size, weight, maneuverability, and clearance requirements of large trucks and tractor trailers in mind. Without these extra design measures, roads used heavily by trucks would rapidly deteriorate. A system of designated truck routes is in place to restrict heavy truck traffic to highways and roads built to accommodate them. The State of Illinois classifies truck routes using a system of three classes (see Map 9-7). All three truck route classes can be found in the MPA:
• Class 1 truck routes are limited access, divided highways built to accommodate regional and national truck traffic. Interstate 74, Interstate 474, Interstate 155, and Illinois Route 6 are all Class 1 routes.
• Class 2 truck routes are not limited access highways, but have the same size and weight restrictions as Class 1 routes. Thirty roads in the MPA are classified as Class 2 routes.
• Class 3 truck routes have more restrictive size and weight limits, and are generally rural roads used for transporting agricultural materials and equipment. There are twelve Class 3 truck routes in the MPA.
The heaviest amount of commercial truck traffic generally occurs on large highways and arterial roads, away from heavily-populated areas. Truck traffic in the core of the urbanized area is generally limited to controlled-access highways.
FIGURE 9-4 COMMODITIES EXPORTED VIA TRUCK (BY WEIGHT), REMAINDER OF ILLINOIS REGION, 2012
Figure 9-5 Commodities Exported Via Truck (by Dollar Value), Remainder of Illinois Region, 2012
Source: US DOT Freight Analysis Framework
Source: US DOT Freight Analysis Framework
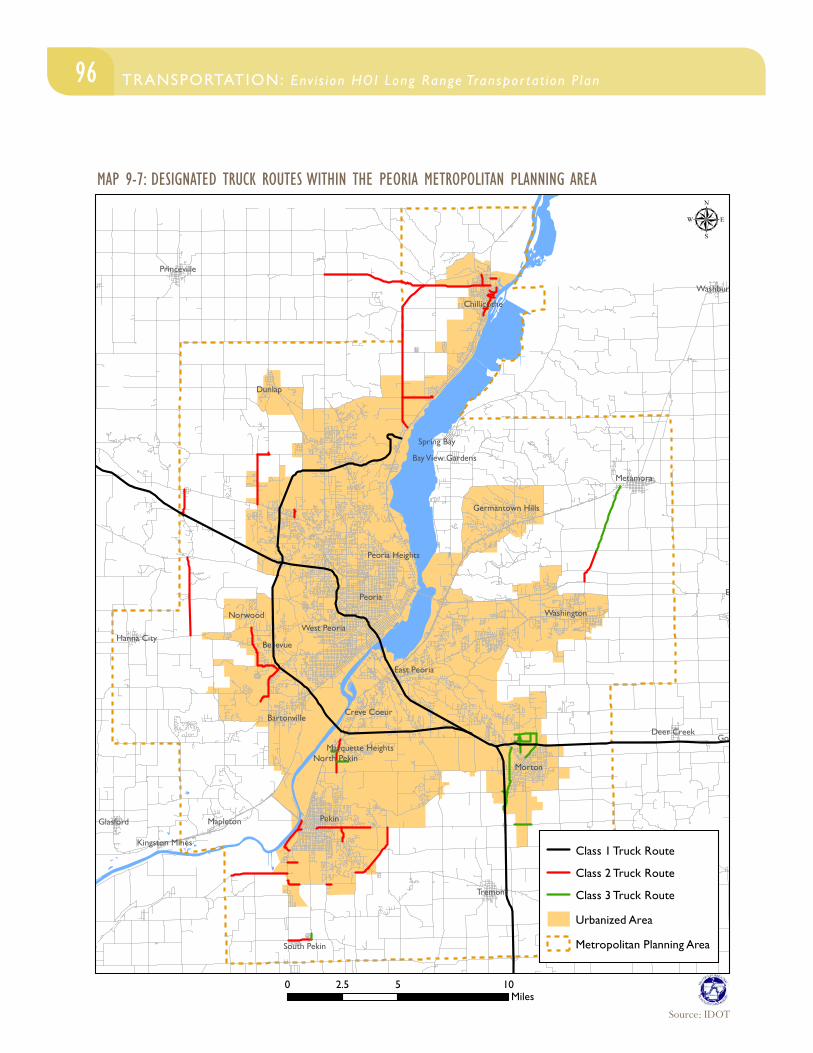
96 TRANSPORTATION: Env i s ion HOI Long Range Transpor tat ion P lan
Peoria
Pekin
East Peoria
Morton
Bartonville
Washington
Eureka
Chillicothe
Creve Coeur
Bellevue
Metamora
Princeville
Peoria Heights
North Pekin
Goodfield
Tremont
Mackinaw
West Peoria
Glasford
Dunlap
Spring Bay
Mapleton
Kingston Mines
Germantown Hills
Washburn
Marquette Heights
Bay View Gardens
Hanna City
Deer Creek
South Pekin
Norwood
Designated Truck Routes
Class 1 Truck Route
Class 2 Truck Route
Class 3 Truck Route
Urbanized Area
Metropolitan Planning Area
µ
0 5 102.5Miles
Within the Peoria Metropolitan Planning AreaMAP 9-7: DESIGNATED TRUCK ROUTES WITHIN THE PEORIA METROPOLITAN PLANNING AREA
Source: IDOT
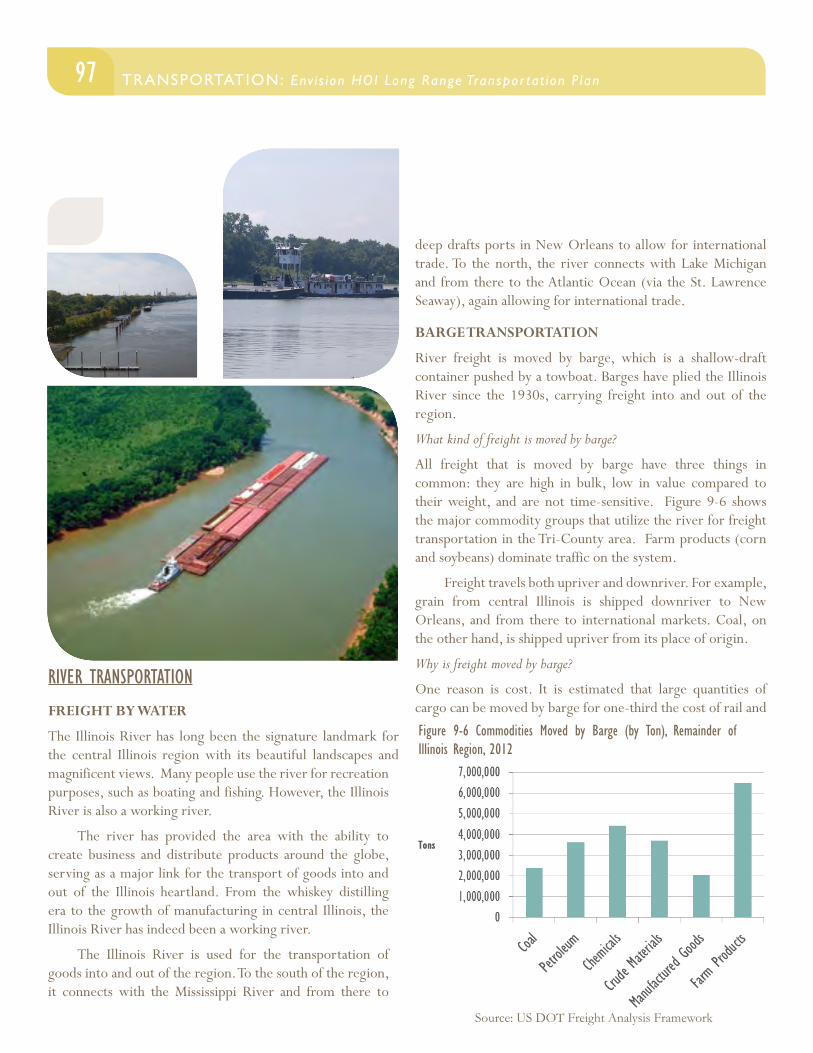
97TRANSPORTATION: Env i s ion HOI Long Range Transpor tat ion P lan TRANSPORTATION: Env i s ion HOI Long Range Transpor tat ion P lan
RIVER TRANSPORTATION
FREIGHT BY WATER
The Illinois River has long been the signature landmark for the central Illinois region with its beautiful landscapes and magnificent views. Many people use the river for recreation purposes, such as boating and fishing. However, the Illinois River is also a working river.
The river has provided the area with the ability to create business and distribute products around the globe, serving as a major link for the transport of goods into and out of the Illinois heartland. From the whiskey distilling era to the growth of manufacturing in central Illinois, the Illinois River has indeed been a working river.
The Illinois River is used for the transportation of goods into and out of the region. To the south of the region, it connects with the Mississippi River and from there to
deep drafts ports in New Orleans to allow for international trade. To the north, the river connects with Lake Michigan and from there to the Atlantic Ocean (via the St. Lawrence Seaway), again allowing for international trade.
BARGE TRANSPORTATION
River freight is moved by barge, which is a shallow-draft container pushed by a towboat. Barges have plied the Illinois River since the 1930s, carrying freight into and out of the region.
What kind of freight is moved by barge?
All freight that is moved by barge have three things in common: they are high in bulk, low in value compared to their weight, and are not time-sensitive. Figure 9-6 shows the major commodity groups that utilize the river for freight transportation in the Tri-County area. Farm products (corn and soybeans) dominate traffic on the system.
Freight travels both upriver and downriver. For example, grain from central Illinois is shipped downriver to New Orleans, and from there to international markets. Coal, on the other hand, is shipped upriver from its place of origin.
Why is freight moved by barge?
One reason is cost. It is estimated that large quantities of cargo can be moved by barge for one-third the cost of rail and
Figure 9-6 Commodities Moved by Barge (by Ton), Remainder of Illinois Region, 2012
Source: US DOT Freight Analysis Framework
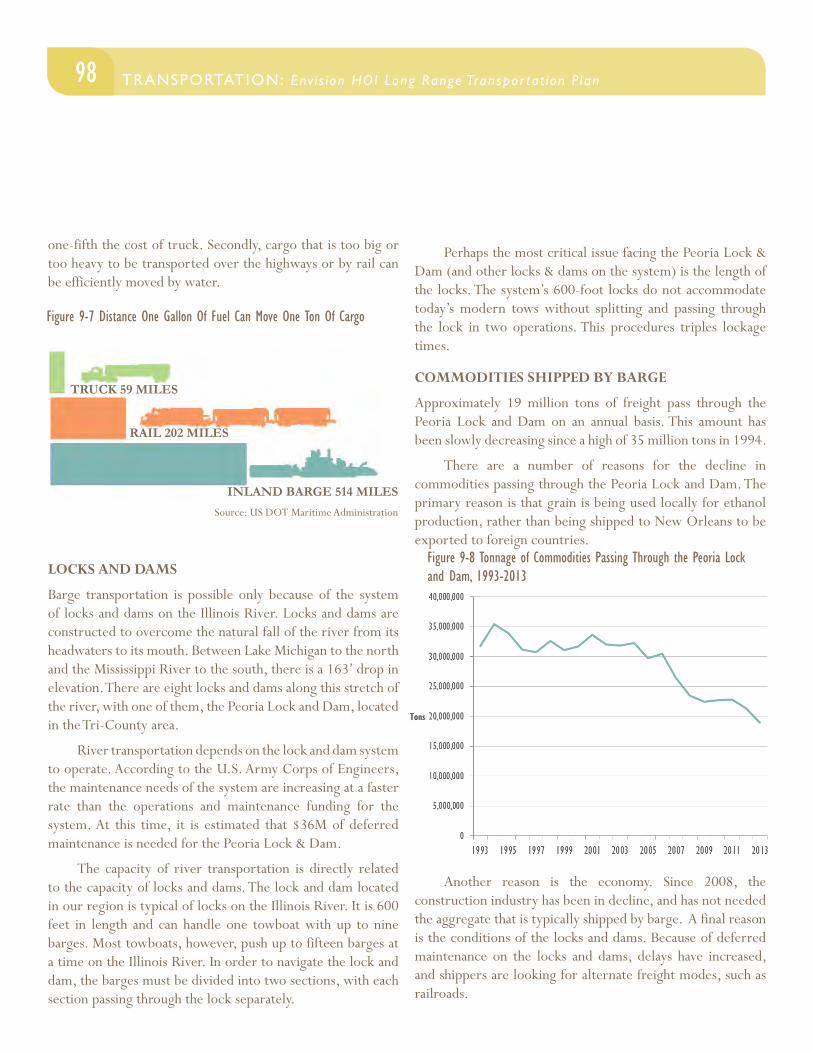
98 TRANSPORTATION: Env i s ion HOI Long Range Transpor tat ion P lan
one-fifth the cost of truck. Secondly, cargo that is too big or too heavy to be transported over the highways or by rail can be efficiently moved by water.
LOCKS AND DAMS
Barge transportation is possible only because of the system of locks and dams on the Illinois River. Locks and dams are constructed to overcome the natural fall of the river from its headwaters to its mouth. Between Lake Michigan to the north and the Mississippi River to the south, there is a 163’ drop in elevation. There are eight locks and dams along this stretch of the river, with one of them, the Peoria Lock and Dam, located in the Tri-County area.
River transportation depends on the lock and dam system to operate. According to the U.S. Army Corps of Engineers, the maintenance needs of the system are increasing at a faster rate than the operations and maintenance funding for the system. At this time, it is estimated that $36M of deferred maintenance is needed for the Peoria Lock & Dam.
The capacity of river transportation is directly related to the capacity of locks and dams. The lock and dam located in our region is typical of locks on the Illinois River. It is 600 feet in length and can handle one towboat with up to nine barges. Most towboats, however, push up to fifteen barges at a time on the Illinois River. In order to navigate the lock and dam, the barges must be divided into two sections, with each section passing through the lock separately.
Perhaps the most critical issue facing the Peoria Lock & Dam (and other locks & dams on the system) is the length of the locks. The system’s 600-foot locks do not accommodate today’s modern tows without splitting and passing through the lock in two operations. This procedures triples lockage times.
COMMODITIES SHIPPED BY BARGE
Approximately 19 million tons of freight pass through the Peoria Lock and Dam on an annual basis. This amount has been slowly decreasing since a high of 35 million tons in 1994.
There are a number of reasons for the decline in commodities passing through the Peoria Lock and Dam. The primary reason is that grain is being used locally for ethanol production, rather than being shipped to New Orleans to be exported to foreign countries.
Another reason is the economy. Since 2008, the construction industry has been in decline, and has not needed the aggregate that is typically shipped by barge. A final reason is the conditions of the locks and dams. Because of deferred maintenance on the locks and dams, delays have increased, and shippers are looking for alternate freight modes, such as railroads.
TRUCK 59 MILES
RAIL 202 MILES
INLAND BARGE 514 MILES
Figure 9-7 Distance One Gallon Of Fuel Can Move One Ton Of Cargo
Figure 9-8 Tonnage of Commodities Passing Through the Peoria Lock and Dam, 1993-2013
Source: US DOT Maritime Administration
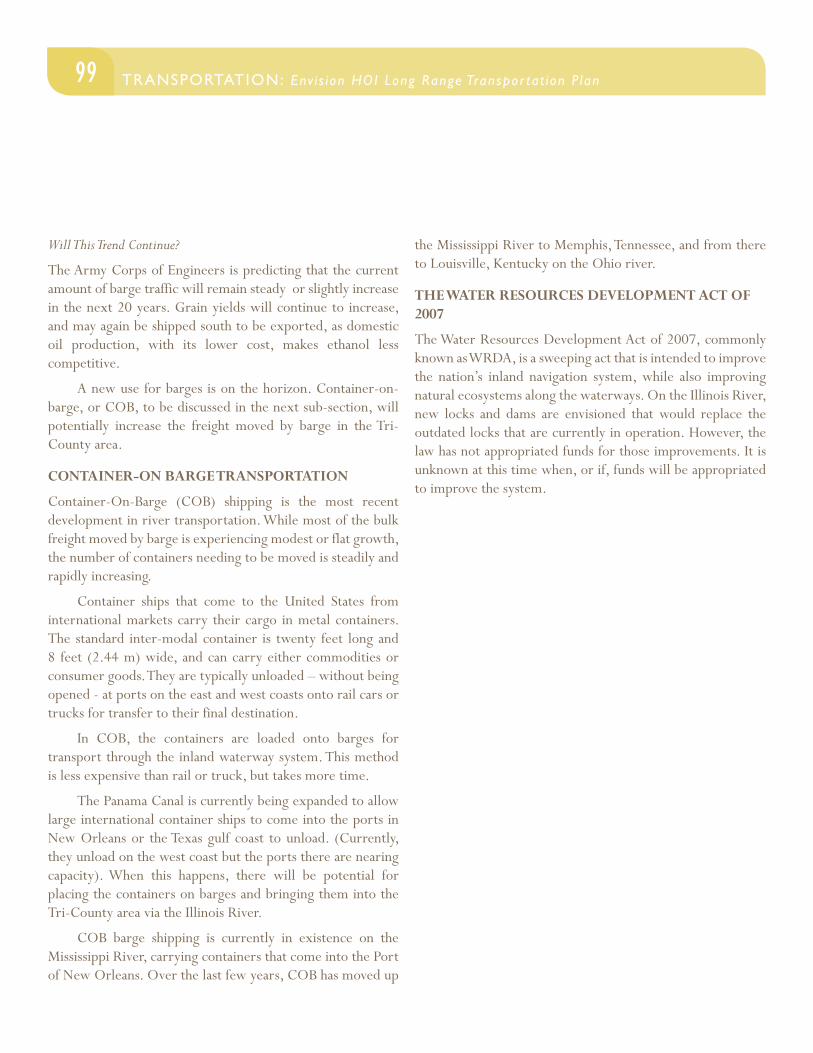
99TRANSPORTATION: Env i s ion HOI Long Range Transpor tat ion P lan TRANSPORTATION: Env i s ion HOI Long Range Transpor tat ion P lan
Will This Trend Continue?
The Army Corps of Engineers is predicting that the current amount of barge traffic will remain steady or slightly increase in the next 20 years. Grain yields will continue to increase, and may again be shipped south to be exported, as domestic oil production, with its lower cost, makes ethanol less competitive.
A new use for barges is on the horizon. Container-on-barge, or COB, to be discussed in the next sub-section, will potentially increase the freight moved by barge in the Tri-County area.
CONTAINER-ON BARGE TRANSPORTATION
Container-On-Barge (COB) shipping is the most recent development in river transportation. While most of the bulk freight moved by barge is experiencing modest or flat growth, the number of containers needing to be moved is steadily and rapidly increasing.
Container ships that come to the United States from international markets carry their cargo in metal containers. The standard inter-modal container is twenty feet long and 8 feet (2.44 m) wide, and can carry either commodities or consumer goods. They are typically unloaded – without being opened - at ports on the east and west coasts onto rail cars or trucks for transfer to their final destination.
In COB, the containers are loaded onto barges for transport through the inland waterway system. This method is less expensive than rail or truck, but takes more time.
The Panama Canal is currently being expanded to allow large international container ships to come into the ports in New Orleans or the Texas gulf coast to unload. (Currently, they unload on the west coast but the ports there are nearing capacity). When this happens, there will be potential for placing the containers on barges and bringing them into the Tri-County area via the Illinois River.
COB barge shipping is currently in existence on the Mississippi River, carrying containers that come into the Port of New Orleans. Over the last few years, COB has moved up
the Mississippi River to Memphis, Tennessee, and from there to Louisville, Kentucky on the Ohio river.
THE WATER RESOURCES DEVELOPMENT ACT OF 2007
The Water Resources Development Act of 2007, commonly known as WRDA, is a sweeping act that is intended to improve the nation’s inland navigation system, while also improving natural ecosystems along the waterways. On the Illinois River, new locks and dams are envisioned that would replace the outdated locks that are currently in operation. However, the law has not appropriated funds for those improvements. It is unknown at this time when, or if, funds will be appropriated to improve the system.
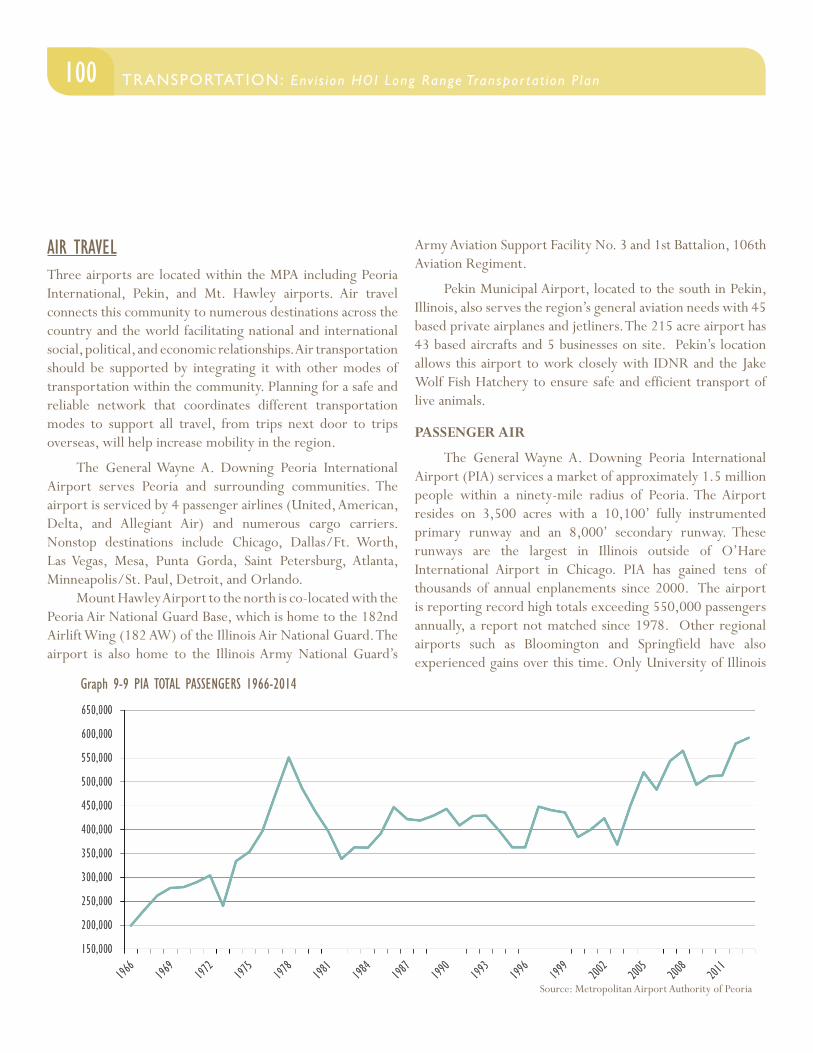
100 TRANSPORTATION: Env i s ion HOI Long Range Transpor tat ion P lan
AIR TRAVELThree airports are located within the MPA including Peoria International, Pekin, and Mt. Hawley airports. Air travel connects this community to numerous destinations across the country and the world facilitating national and international social, political, and economic relationships. Air transportation should be supported by integrating it with other modes of transportation within the community. Planning for a safe and reliable network that coordinates different transportation modes to support all travel, from trips next door to trips overseas, will help increase mobility in the region.
The General Wayne A. Downing Peoria International Airport serves Peoria and surrounding communities. The airport is serviced by 4 passenger airlines (United, American, Delta, and Allegiant Air) and numerous cargo carriers. Nonstop destinations include Chicago, Dallas/Ft. Worth, Las Vegas, Mesa, Punta Gorda, Saint Petersburg, Atlanta, Minneapolis/St. Paul, Detroit, and Orlando. Mount Hawley Airport to the north is co-located with the Peoria Air National Guard Base, which is home to the 182nd Airlift Wing (182 AW) of the Illinois Air National Guard. The airport is also home to the Illinois Army National Guard’s
Army Aviation Support Facility No. 3 and 1st Battalion, 106th Aviation Regiment.
Pekin Municipal Airport, located to the south in Pekin, Illinois, also serves the region’s general aviation needs with 45 based private airplanes and jetliners. The 215 acre airport has 43 based aircrafts and 5 businesses on site. Pekin’s location allows this airport to work closely with IDNR and the Jake Wolf Fish Hatchery to ensure safe and efficient transport of live animals.
PASSENGER AIR
The General Wayne A. Downing Peoria International Airport (PIA) services a market of approximately 1.5 million people within a ninety-mile radius of Peoria. The Airport resides on 3,500 acres with a 10,100’ fully instrumented primary runway and an 8,000’ secondary runway. These runways are the largest in Illinois outside of O’Hare International Airport in Chicago. PIA has gained tens of thousands of annual enplanements since 2000. The airport is reporting record high totals exceeding 550,000 passengers annually, a report not matched since 1978. Other regional airports such as Bloomington and Springfield have also experienced gains over this time. Only University of Illinois
Graph 9-9 PIA TOTAL PASSENGERS 1966-2014
Source: Metropolitan Airport Authority of Peoria
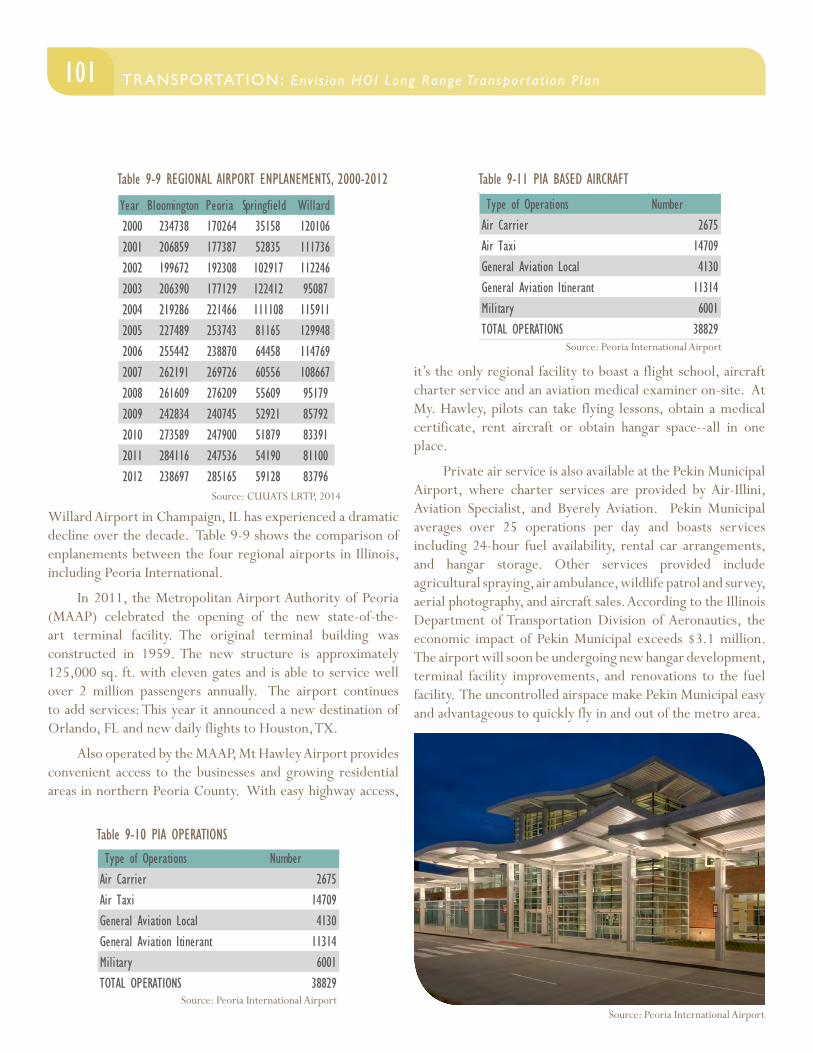
101TRANSPORTATION: Env i s ion HOI Long Range Transpor tat ion P lan TRANSPORTATION: Env i s ion HOI Long Range Transpor tat ion P lan
Willard Airport in Champaign, IL has experienced a dramatic decline over the decade. Table 9-9 shows the comparison of enplanements between the four regional airports in Illinois, including Peoria International.
In 2011, the Metropolitan Airport Authority of Peoria (MAAP) celebrated the opening of the new state-of-the-art terminal facility. The original terminal building was constructed in 1959. The new structure is approximately 125,000 sq. ft. with eleven gates and is able to service well over 2 million passengers annually. The airport continues to add services: This year it announced a new destination of Orlando, FL and new daily flights to Houston, TX.
Also operated by the MAAP, Mt Hawley Airport provides convenient access to the businesses and growing residential areas in northern Peoria County. With easy highway access,
it’s the only regional facility to boast a flight school, aircraft charter service and an aviation medical examiner on-site. At My. Hawley, pilots can take flying lessons, obtain a medical certificate, rent aircraft or obtain hangar space--all in one place.
Private air service is also available at the Pekin Municipal Airport, where charter services are provided by Air-Illini, Aviation Specialist, and Byerely Aviation. Pekin Municipal averages over 25 operations per day and boasts services including 24-hour fuel availability, rental car arrangements, and hangar storage. Other services provided include agricultural spraying, air ambulance, wildlife patrol and survey, aerial photography, and aircraft sales. According to the Illinois Department of Transportation Division of Aeronautics, the economic impact of Pekin Municipal exceeds $3.1 million. The airport will soon be undergoing new hangar development, terminal facility improvements, and renovations to the fuel facility. The uncontrolled airspace make Pekin Municipal easy and advantageous to quickly fly in and out of the metro area.
Year Bloomington Peoria Springfield Willard2000 234738 170264 35158 1201062001 206859 177387 52835 1117362002 199672 192308 102917 1122462003 206390 177129 122412 950872004 219286 221466 111108 1159112005 227489 253743 81165 1299482006 255442 238870 64458 1147692007 262191 269726 60556 1086672008 261609 276209 55609 951792009 242834 240745 52921 857922010 273589 247900 51879 833912011 284116 247536 54190 811002012 238697 285165 59128 83796
Table 9-9 REGIONAL AIRPORT ENPLANEMENTS, 2000-2012
Type of Operations NumberAir Carrier 2675Air Taxi 14709General Aviation Local 4130General Aviation Itinerant 11314Military 6001TOTAL OPERATIONS 38829
Type of Operations NumberAir Carrier 2675Air Taxi 14709General Aviation Local 4130General Aviation Itinerant 11314Military 6001TOTAL OPERATIONS 38829
Table 9-10 PIA OPERATIONS
Table 9-11 PIA BASED AIRCRAFT
Source: Peoria International Airport
Source: Peoria International Airport
Source: CUUATS LRTP, 2014
Source: Peoria International Airport
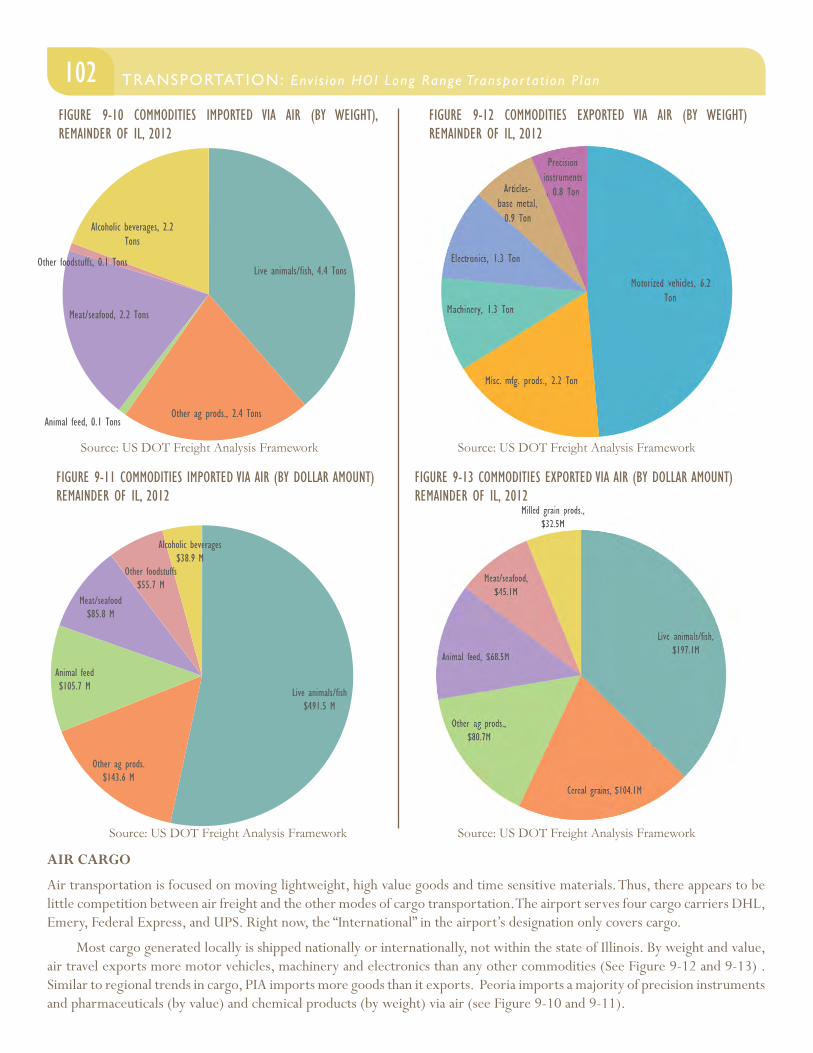
102 TRANSPORTATION: Env i s ion HOI Long Range Transpor tat ion P lan
AIR CARGO
Air transportation is focused on moving lightweight, high value goods and time sensitive materials. Thus, there appears to be little competition between air freight and the other modes of cargo transportation. The airport serves four cargo carriers DHL, Emery, Federal Express, and UPS. Right now, the “International” in the airport’s designation only covers cargo.
Most cargo generated locally is shipped nationally or internationally, not within the state of Illinois. By weight and value, air travel exports more motor vehicles, machinery and electronics than any other commodities (See Figure 9-12 and 9-13) . Similar to regional trends in cargo, PIA imports more goods than it exports. Peoria imports a majority of precision instruments and pharmaceuticals (by value) and chemical products (by weight) via air (see Figure 9-10 and 9-11).
Source: US DOT Freight Analysis Framework
Source: US DOT Freight Analysis Framework
FIGURE 9-10 COMMODITIES IMPORTED VIA AIR (BY WEIGHT), REMAINDER OF IL, 2012
FIGURE 9-11 COMMODITIES IMPORTED VIA AIR (BY DOLLAR AMOUNT) REMAINDER OF IL, 2012
Source: US DOT Freight Analysis Framework
FIGURE 9-13 COMMODITIES EXPORTED VIA AIR (BY DOLLAR AMOUNT) REMAINDER OF IL, 2012
Source: US DOT Freight Analysis Framework
FIGURE 9-12 COMMODITIES EXPORTED VIA AIR (BY WEIGHT) REMAINDER OF IL, 2012
Live animals/fish, 4.4 Tons
Other ag prods., 2.4 TonsAnimal feed, 0.1 Tons
Meat/seafood, 2.2 Tons
Other foodstuffs, 0.1 Tons
Alcoholic beverages, 2.2 Tons
Live animals/fish$491.5 M
Other ag prods.$143.6 M
Animal feed$105.7 M
Meat/seafood$85.8 M
Other foodstuffs$55.7 M
Alcoholic beverages$38.9 M
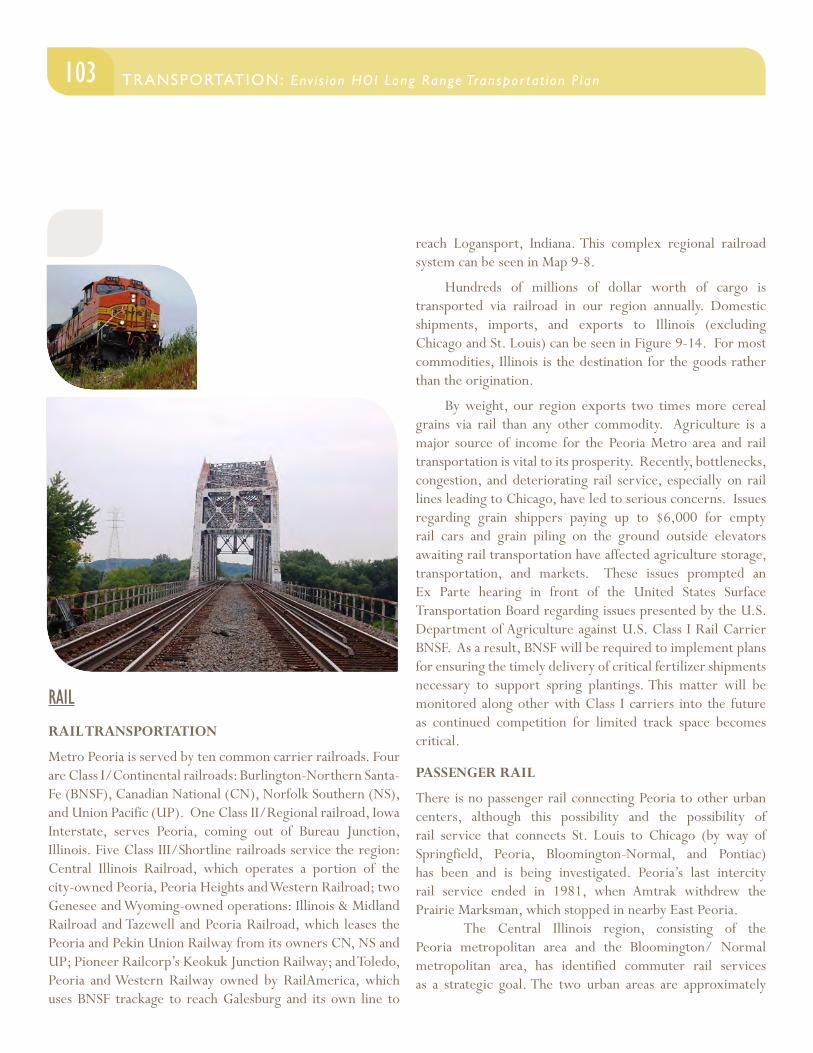
103TRANSPORTATION: Env i s ion HOI Long Range Transpor tat ion P lan TRANSPORTATION: Env i s ion HOI Long Range Transpor tat ion P lan
reach Logansport, Indiana. This complex regional railroad system can be seen in Map 9-8.
Hundreds of millions of dollar worth of cargo is transported via railroad in our region annually. Domestic shipments, imports, and exports to Illinois (excluding Chicago and St. Louis) can be seen in Figure 9-14. For most commodities, Illinois is the destination for the goods rather than the origination.
By weight, our region exports two times more cereal grains via rail than any other commodity. Agriculture is a major source of income for the Peoria Metro area and rail transportation is vital to its prosperity. Recently, bottlenecks, congestion, and deteriorating rail service, especially on rail lines leading to Chicago, have led to serious concerns. Issues regarding grain shippers paying up to $6,000 for empty rail cars and grain piling on the ground outside elevators awaiting rail transportation have affected agriculture storage, transportation, and markets. These issues prompted an Ex Parte hearing in front of the United States Surface Transportation Board regarding issues presented by the U.S. Department of Agriculture against U.S. Class I Rail Carrier BNSF. As a result, BNSF will be required to implement plans for ensuring the timely delivery of critical fertilizer shipments necessary to support spring plantings. This matter will be monitored along other with Class I carriers into the future as continued competition for limited track space becomes critical.
PASSENGER RAIL
There is no passenger rail connecting Peoria to other urban centers, although this possibility and the possibility of rail service that connects St. Louis to Chicago (by way of Springfield, Peoria, Bloomington-Normal, and Pontiac) has been and is being investigated. Peoria’s last intercity rail service ended in 1981, when Amtrak withdrew the Prairie Marksman, which stopped in nearby East Peoria. The Central Illinois region, consisting of the Peoria metropolitan area and the Bloomington/ Normal metropolitan area, has identified commuter rail services as a strategic goal. The two urban areas are approximately
RAIL
RAIL TRANSPORTATION
Metro Peoria is served by ten common carrier railroads. Four are Class I/Continental railroads: Burlington-Northern Santa-Fe (BNSF), Canadian National (CN), Norfolk Southern (NS), and Union Pacific (UP). One Class II/Regional railroad, Iowa Interstate, serves Peoria, coming out of Bureau Junction, Illinois. Five Class III/Shortline railroads service the region: Central Illinois Railroad, which operates a portion of the city-owned Peoria, Peoria Heights and Western Railroad; two Genesee and Wyoming-owned operations: Illinois & Midland Railroad and Tazewell and Peoria Railroad, which leases the Peoria and Pekin Union Railway from its owners CN, NS and UP; Pioneer Railcorp’s Keokuk Junction Railway; and Toledo, Peoria and Western Railway owned by RailAmerica, which uses BNSF trackage to reach Galesburg and its own line to
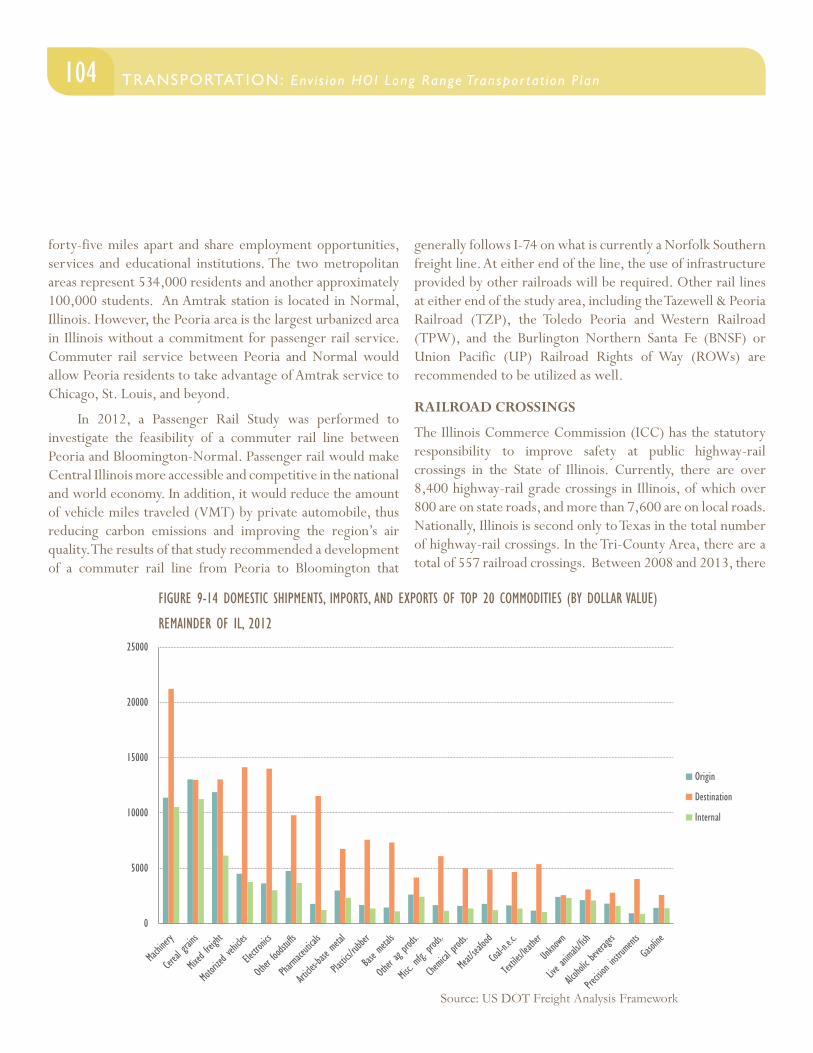
104 TRANSPORTATION: Env i s ion HOI Long Range Transpor tat ion P lan
0
5000
10000
15000
20000
25000
Origin
Destination
Internal
forty-five miles apart and share employment opportunities, services and educational institutions. The two metropolitan areas represent 534,000 residents and another approximately 100,000 students. An Amtrak station is located in Normal, Illinois. However, the Peoria area is the largest urbanized area in Illinois without a commitment for passenger rail service. Commuter rail service between Peoria and Normal would allow Peoria residents to take advantage of Amtrak service to Chicago, St. Louis, and beyond.
In 2012, a Passenger Rail Study was performed to investigate the feasibility of a commuter rail line between Peoria and Bloomington-Normal. Passenger rail would make Central Illinois more accessible and competitive in the national and world economy. In addition, it would reduce the amount of vehicle miles traveled (VMT) by private automobile, thus reducing carbon emissions and improving the region’s air quality. The results of that study recommended a development of a commuter rail line from Peoria to Bloomington that
generally follows I-74 on what is currently a Norfolk Southern freight line. At either end of the line, the use of infrastructure provided by other railroads will be required. Other rail lines at either end of the study area, including the Tazewell & Peoria Railroad (TZP), the Toledo Peoria and Western Railroad (TPW), and the Burlington Northern Santa Fe (BNSF) or Union Pacific (UP) Railroad Rights of Way (ROWs) are recommended to be utilized as well.
RAILROAD CROSSINGS
The Illinois Commerce Commission (ICC) has the statutory responsibility to improve safety at public highway-rail crossings in the State of Illinois. Currently, there are over 8,400 highway-rail grade crossings in Illinois, of which over 800 are on state roads, and more than 7,600 are on local roads. Nationally, Illinois is second only to Texas in the total number of highway-rail crossings. In the Tri-County Area, there are a total of 557 railroad crossings. Between 2008 and 2013, there
FIGURE 9-14 DOMESTIC SHIPMENTS, IMPORTS, AND EXPORTS OF TOP 20 COMMODITIES (BY DOLLAR VALUE)
REMAINDER OF IL, 2012
Source: US DOT Freight Analysis Framework
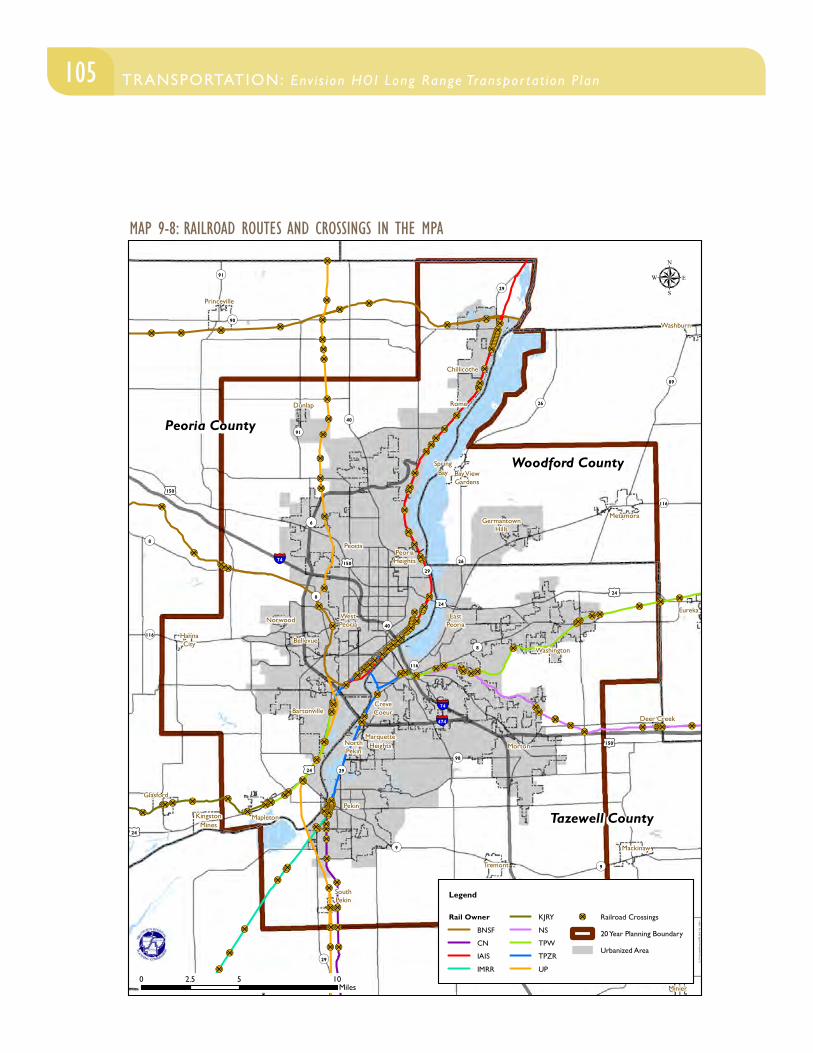
105TRANSPORTATION: Env i s ion HOI Long Range Transpor tat ion P lan TRANSPORTATION: Env i s ion HOI Long Range Transpor tat ion P lan
¹º»¼¹º»¼
¹º»¼
¹º»¼
¹º»¼
¹º»¼¹º»¼
¹º»¼¹º»¼
¹º»¼
¹º»¼
¹º»¼
¹º»¼
¹º»¼
¹º»¼
¹º»¼
¹º»¼
¹º»¼
¹º»¼
¹º»¼
¹º»¼
¹º»¼
¹º»¼¹º»¼
¹º»¼
¹º»¼¹º»¼¹º»¼¹º»¼
¹º»¼
¹º»¼
¹º»¼
¹º»¼
¹º»¼
¹º»¼
¹º»¼
¹º»¼
¹º»¼
¹º»¼
¹º»¼
¹º»¼
¹º»¼
¹º»¼
¹º»¼
¹º»¼
¹º»¼
¹º»¼
¹º»¼
¹º»¼
¹º»¼
¹º»¼
¹º»¼
¹º»¼
¹º»¼
¹º»¼
¹º»¼
¹º»¼
¹º»¼
¹º»¼
¹º»¼¹º»¼¹º»¼¹º»¼
¹º»¼¹º»¼ ¹º»¼¹º»¼
¹º»¼¹º»¼
¹º»¼¹º»¼
¹º»¼¹º»¼ ¹º»¼¹º»¼¹º»¼ ¹º»¼ ¹º»¼
¹º»¼¹º»¼¹º»¼¹º»¼
¹º»¼
¹º»¼¹º»¼
¹º»¼
¹º»¼¹º»¼¹º»¼¹º»¼¹º»¼¹º»¼¹º»¼¹º»¼¹º»¼¹º»¼¹º»¼¹º»¼¹º»¼
¹º»¼
¹º»¼
¹º»¼
¹º»¼
¹º»¼
¹º»¼
¹º»¼¹º»¼¹º»¼¹º»¼¹º»¼¹º»¼¹º»¼¹º»¼¹º»¼
¹º»¼¹º»¼¹º»¼¹º»¼
¹º»¼¹º»¼¹º»¼¹º»¼¹º»¼
¹º»¼¹º»¼¹º»¼
¹º»¼
¹º»¼¹º»¼
¹º»¼
¹º»¼¹º»¼
¹º»¼
¹º»¼¹º»¼
¹º»¼
¹º»¼
¹º»¼
¹º»¼
¹º»¼
¹º»¼
¹º»¼
¹º»¼
¹º»¼¹º»¼
¹º»¼
¹º»¼
¹º»¼
¹º»¼
¹º»¼
¹º»¼
¹º»¼
¹º»¼
¹º»¼
¹º»¼
¹º»¼
¹º»¼
¹º»¼
¹º»¼
¹º»¼
¹º»¼¹º»¼¹º»¼
¹º»¼
¹º»¼
¹º»¼¹º»¼¹º»¼¹º»¼
¹º»¼
¹º»¼
¹º»¼¹º»¼¹º»¼¹º»¼¹º»¼¹º»¼¹º»¼¹º»¼¹º»¼
¹º»¼
¹º»¼
¹º»¼
¹º»¼¹º»¼
¹º»¼
¹º»¼¹º»¼
¹º»¼¹º»¼¹º»¼¹º»¼¹º»¼¹º»¼¹º»¼¹º»¼
¹º»¼
¹º»¼¹º»¼
CreveCoeur
Deer Creek
EastPeoria
Mackinaw
MarquetteHeights
Minier
MortonNorthPekin
Pekin
PeoriaHeights
SouthPekin
Tremont
Washington
Bay ViewGardens
Eureka
GermantownHills
Metamora
SpringBay
Washburn
Bartonville
Bellevue
Chillicothe
Dunlap
Glasford
HannaCity
KingstonMines
Mapleton
Norwood
Peoria
Princeville
Rome
WestPeoria
¬«91
¬«90
¬«8
¬«29
¬«29
¬«116
¬«40
¬«91
¬«8
¬«9
¬«40
¬«8
¬«122
¬«98
¬«29
¬«116
¬«29
¬«9
¬«26
¬«116
¬«89
¬«26
§̈¦155
§̈¦474
§̈¦74
§̈¦74
£¤24
£¤24
£¤150
£¤150
£¤150
£¤24
£¤24
¬«6
Tri-County Railroads and Railroad Crossings
µ
Woodford County
Peoria County
Tazewell County
Legend
Rail Owner
BNSF
CN
IAIS
IMRR
KJRY
NS
TPW
TPZR
UP
¹º»¼ Railroad Crossings
20 Year Planning Boundary
Urbanized Area
0 5 102.5Miles
S:\_
Tri C
ount
ies\
Proj
ects
\LRT
P_20
15 M
J 11
/201
4
MAP 9-8: RAILROAD ROUTES AND CROSSINGS IN THE MPA
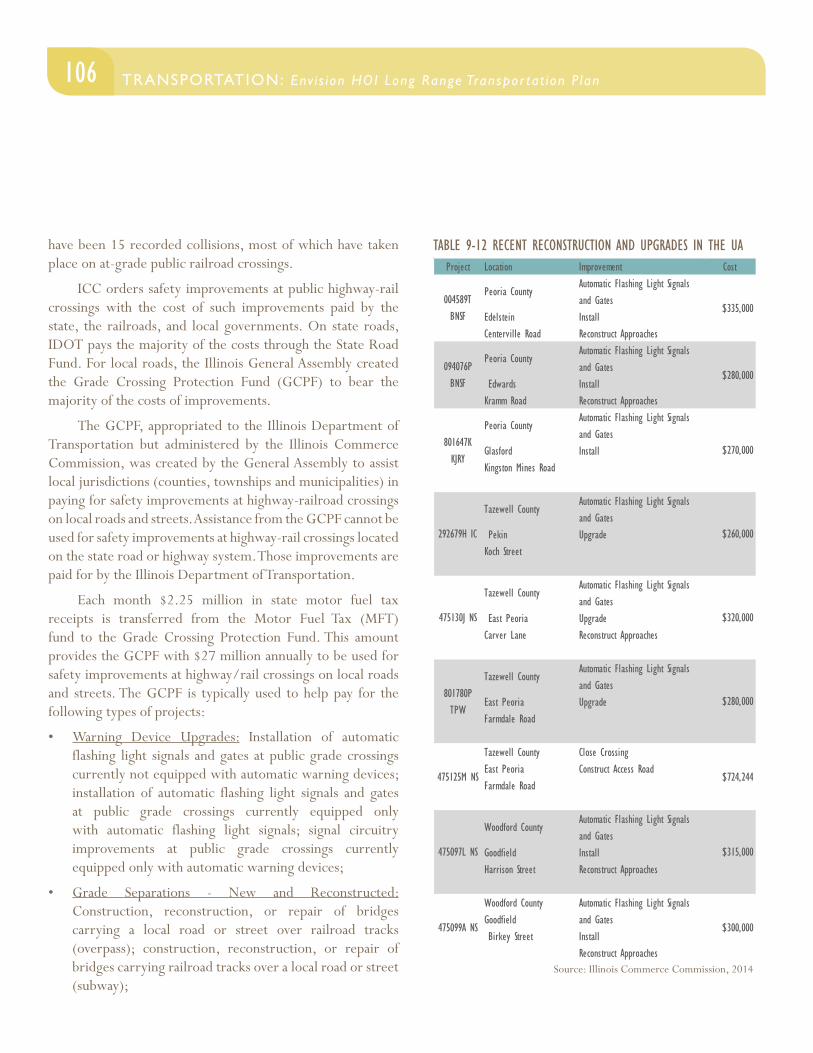
106 TRANSPORTATION: Env i s ion HOI Long Range Transpor tat ion P lan
have been 15 recorded collisions, most of which have taken place on at-grade public railroad crossings.
ICC orders safety improvements at public highway-rail crossings with the cost of such improvements paid by the state, the railroads, and local governments. On state roads, IDOT pays the majority of the costs through the State Road Fund. For local roads, the Illinois General Assembly created the Grade Crossing Protection Fund (GCPF) to bear the majority of the costs of improvements.
The GCPF, appropriated to the Illinois Department of Transportation but administered by the Illinois Commerce Commission, was created by the General Assembly to assist local jurisdictions (counties, townships and municipalities) in paying for safety improvements at highway-railroad crossings on local roads and streets. Assistance from the GCPF cannot be used for safety improvements at highway-rail crossings located on the state road or highway system. Those improvements are paid for by the Illinois Department of Transportation.
Each month $2.25 million in state motor fuel tax receipts is transferred from the Motor Fuel Tax (MFT) fund to the Grade Crossing Protection Fund. This amount provides the GCPF with $27 million annually to be used for safety improvements at highway/rail crossings on local roads and streets. The GCPF is typically used to help pay for the following types of projects:
• Warning Device Upgrades: Installation of automatic flashing light signals and gates at public grade crossings currently not equipped with automatic warning devices; installation of automatic flashing light signals and gates at public grade crossings currently equipped only with automatic flashing light signals; signal circuitry improvements at public grade crossings currently equipped only with automatic warning devices;
• Grade Separations - New and Reconstructed: Construction, reconstruction, or repair of bridges carrying a local road or street over railroad tracks (overpass); construction, reconstruction, or repair of bridges carrying railroad tracks over a local road or street (subway);
TABLE 9-12 RECENT RECONSTRUCTION AND UPGRADES IN THE UA
Source: Illinois Commerce Commission, 2014
Project Location Improvement Cost
Peoria CountyAutomatic Flashing Light Signals and Gates
Edelstein InstallCenterville Road Reconstruct Approaches
Peoria CountyAutomatic Flashing Light Signals and Gates
Edwards InstallKramm Road Reconstruct Approaches
Peoria CountyAutomatic Flashing Light Signals and Gates
Glasford InstallKingston Mines Road
Tazewell CountyAutomatic Flashing Light Signals and Gates
Pekin UpgradeKoch Street
Tazewell CountyAutomatic Flashing Light Signals and Gates
East Peoria UpgradeCarver Lane Reconstruct Approaches
Tazewell CountyAutomatic Flashing Light Signals and Gates
East Peoria UpgradeFarmdale Road
Tazewell County Close CrossingEast Peoria Construct Access RoadFarmdale Road
Woodford CountyAutomatic Flashing Light Signals and Gates
Goodfield InstallHarrison Street Reconstruct Approaches
Woodford County Goodfield
Automatic Flashing Light Signals and Gates
Birkey Street InstallReconstruct Approaches
004589T BNSF
$335,000
094076P BNSF
$280,000
801647K KJRY
$270,000
292679H IC $260,000
475130J NS $320,000
801780P TPW
$280,000
475125M NS $724,244
475097L NS $315,000
475099A NS $300,000
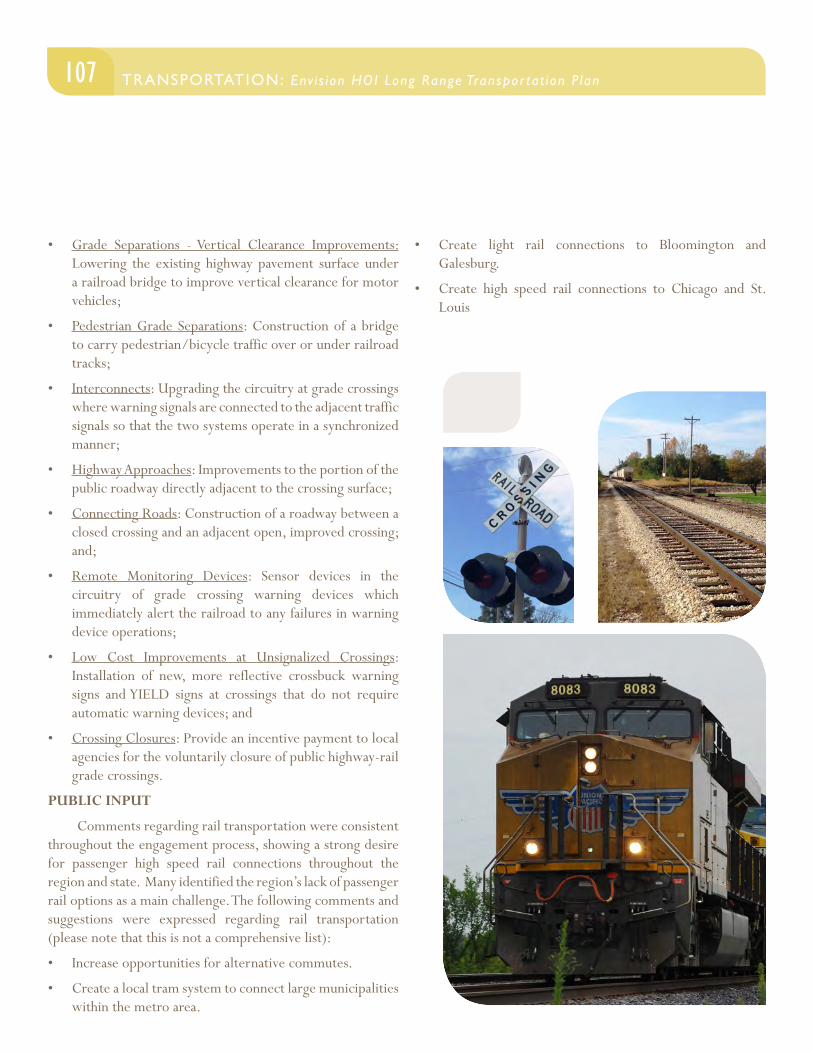
107TRANSPORTATION: Env i s ion HOI Long Range Transpor tat ion P lan TRANSPORTATION: Env i s ion HOI Long Range Transpor tat ion P lan
• Grade Separations - Vertical Clearance Improvements: Lowering the existing highway pavement surface under a railroad bridge to improve vertical clearance for motor vehicles;
• Pedestrian Grade Separations: Construction of a bridge to carry pedestrian/bicycle traffic over or under railroad tracks;
• Interconnects: Upgrading the circuitry at grade crossings where warning signals are connected to the adjacent traffic signals so that the two systems operate in a synchronized manner;
• Highway Approaches: Improvements to the portion of the public roadway directly adjacent to the crossing surface;
• Connecting Roads: Construction of a roadway between a closed crossing and an adjacent open, improved crossing; and;
• Remote Monitoring Devices: Sensor devices in the circuitry of grade crossing warning devices which immediately alert the railroad to any failures in warning device operations;
• Low Cost Improvements at Unsignalized Crossings: Installation of new, more reflective crossbuck warning signs and YIELD signs at crossings that do not require automatic warning devices; and
• Crossing Closures: Provide an incentive payment to local agencies for the voluntarily closure of public highway-rail grade crossings.
PUBLIC INPUT
Comments regarding rail transportation were consistent throughout the engagement process, showing a strong desire for passenger high speed rail connections throughout the region and state. Many identified the region’s lack of passenger rail options as a main challenge. The following comments and suggestions were expressed regarding rail transportation (please note that this is not a comprehensive list):
• Increase opportunities for alternative commutes.
• Create a local tram system to connect large municipalities within the metro area.
• Create light rail connections to Bloomington and Galesburg.
• Create high speed rail connections to Chicago and St. Louis

108 TRANSPORTATION: Env i s ion HOI Long Range Transpor tat ion P lan
TRANSPORTATION: Env i s ion HOI Long Range Transpor tat ion P lan
GOALS
109 GOALS: Env i s ion HOI Long Range Transpor tat ion P lan
Identifying goals and strategies is an important step in determining what direction planning efforts should take, independent of time frame and individual projects. A goal is defined as a broad statement that identifies a desired end result. A strategy is more specific, and identifies a course of action to achieve a specific goal. Envision HOI also includes performance measures, which help individuals and agencies track progress toward the completion of each goal and strategy over time. All performance measures have a base year of 2015.
METHODOLOGYGoals, strategies, and performance measures were developed by TCRPC staff, in conjunction with the LRTP Technical Advisory Committee. Each was informed by the following factors:
• Map-21 priorities;
• Envision HOI vision statement;
• Public input received through our various outreach methods;
• Data analysis;
• Local knowledge;
• Current planning efforts;
• 2010 LRTP; and
• Relevant plans, including the Human Services Transportation Plan and the Congestion Management Plan.
Envision HOI goals, strategies, and performance measures are divided into five themes:
• Safety, Security, and Public Health;
• Efficient and Resilient Transportation System;
• Accessibility and Multi-modal Connectivity;
• Environmental Sustainability; and
• Economic Vitality.
110 GOALS: Env i s ion HOI Long Range Transpor tat ion P lan
GOAL
Improve safety for all transportation system users.
STRATEGIES
• Improve visibility through improved lighting, striping, signage, visibility triangles, and access control.
• Encourage the development of safety education programs to inform the public of bicycle/pedestrian rules and regulations.
• Reduce physical obstructions/barriers that impede safe bicycle/pedestrian travel.
• Increase pedestrian signal crossing time.
• Where feasible, utilize railroad right-of-way, levees, and parkways for alternative transportation routes to avoid traffic conflict, including adequate grade separation at intersections.
• Utilizing established evaluation criteria, identify “bicycle friendly” streets that will accommodate on-road bicycle travel.
• Increase the number of railroad crossing signals.
• Improve driver training relative to safe practices for approaching and traversing railroad crossings.
• Continue to prepare applications for Highway Safety Improvement Program (HSIP) funds.
• Increase enforcement in priority safety areas (e.g. Click It or Ticket).
SAFETY, SECURITY, AND PUBLIC HEALTHMAP-21 Planning Principles:
1. Increase the safety of the transportation system for motorized and non-motorized users.
2. Increase the security of the transportation system for motorized and non-motorized users.
• Provide improved public transit stop locations for pedestrian safety and security (e.g. lighting, sheltered benches).
• Increase enforcement of driver adherence to crosswalk rules in urbanized areas and school zones.
• Support expanded local Safe Routes to School programs.
GOAL
Improve transportation security for all users of the transportation system.
STRATEGIES
• Map regional commodity flows in order to begin tracking the number of hazardous materials and potential exposure to incidents.
• Coordinate with agencies in charge of emergency vehicle access and evacuation plans.
• Perform periodic emergency evacuation drills at different agencies including local school districts.
• Develop and maintain up to date information on the metropolitan planning area’s public and specialized transportation rolling stock capital assets.
• Develop incident-management plans.
• Maintain partnerships between both states and among regional enforcement entities and other security stakeholders.
GOAL
Facilitate active, healthy living.
STRATEGIES
• Encourage non-motorized travel.
• Integrate expanded and improved bicycle and pedestrian facilities into new and existing developments.
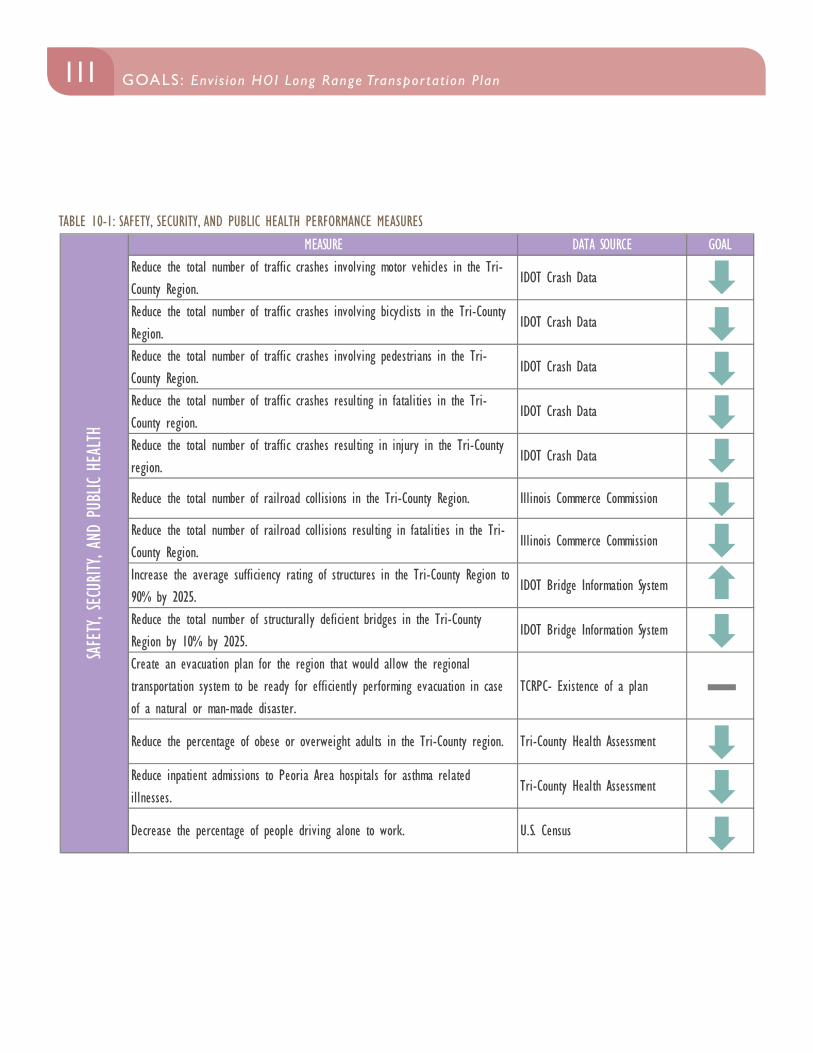
111GOALS: Env i s ion HOI Long Range Transpor tat ion P lan GOALS: Env i s ion HOI Long Range Transpor tat ion P lan
TABLE 10-1: SAFETY, SECURITY, AND PUBLIC HEALTH PERFORMANCE MEASURESMEASURE DATA SOURCE GOAL
Reduce the total number of traffic crashes involving motor vehicles in the Tri-County Region.
IDOT Crash Data
Reduce the total number of traffic crashes involving bicyclists in the Tri-County Region.
IDOT Crash Data
Reduce the total number of traffic crashes involving pedestrians in the Tri-County Region.
IDOT Crash Data
Reduce the total number of traffic crashes resulting in fatalities in the Tri-County region.
IDOT Crash Data
Reduce the total number of traffic crashes resulting in injury in the Tri-County region.
IDOT Crash Data
Reduce the total number of railroad collisions in the Tri-County Region. Illinois Commerce Commission
Reduce the total number of railroad collisions resulting in fatalities in the Tri-County Region.
Illinois Commerce Commission
Increase the average sufficiency rating of structures in the Tri-County Region to 90% by 2025.
IDOT Bridge Information System
Reduce the total number of structurally deficient bridges in the Tri-County Region by 10% by 2025.
IDOT Bridge Information System
Create an evacuation plan for the region that would allow the regional transportation system to be ready for efficiently performing evacuation in case of a natural or man-made disaster.
TCRPC- Existence of a plan
Reduce the percentage of obese or overweight adults in the Tri-County region. Tri-County Health Assessment
Reduce inpatient admissions to Peoria Area hospitals for asthma related illnesses.
Tri-County Health Assessment
Decrease the percentage of people driving alone to work. U.S. Census
SAFE
TY, S
ECUR
ITY, A
ND P
UBLIC
HEA
LTH
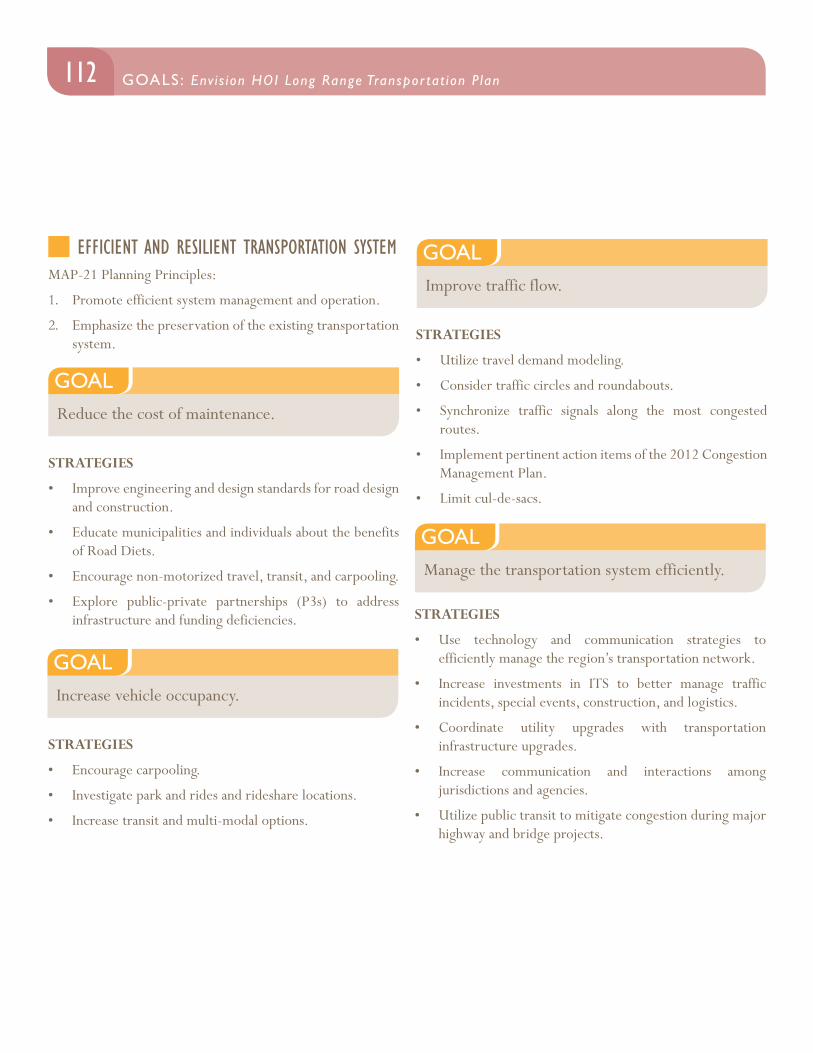
112 GOALS: Env i s ion HOI Long Range Transpor tat ion P lan
GOAL Reduce the cost of maintenance.
EFFICIENT AND RESILIENT TRANSPORTATION SYSTEMMAP-21 Planning Principles:
1. Promote efficient system management and operation.
2. Emphasize the preservation of the existing transportation system.
STRATEGIES
• Improve engineering and design standards for road design and construction.
• Educate municipalities and individuals about the benefits of Road Diets.
• Encourage non-motorized travel, transit, and carpooling.
• Explore public-private partnerships (P3s) to address infrastructure and funding deficiencies.
GOAL Increase vehicle occupancy.
STRATEGIES
• Encourage carpooling.
• Investigate park and rides and rideshare locations.
• Increase transit and multi-modal options.
GOAL Improve traffic flow.
STRATEGIES
• Utilize travel demand modeling.
• Consider traffic circles and roundabouts.
• Synchronize traffic signals along the most congested routes.
• Implement pertinent action items of the 2012 Congestion Management Plan.
• Limit cul-de-sacs.
GOAL Manage the transportation system efficiently.
STRATEGIES
• Use technology and communication strategies to efficiently manage the region’s transportation network.
• Increase investments in ITS to better manage traffic incidents, special events, construction, and logistics.
• Coordinate utility upgrades with transportation infrastructure upgrades.
• Increase communication and interactions among jurisdictions and agencies.
• Utilize public transit to mitigate congestion during major highway and bridge projects.
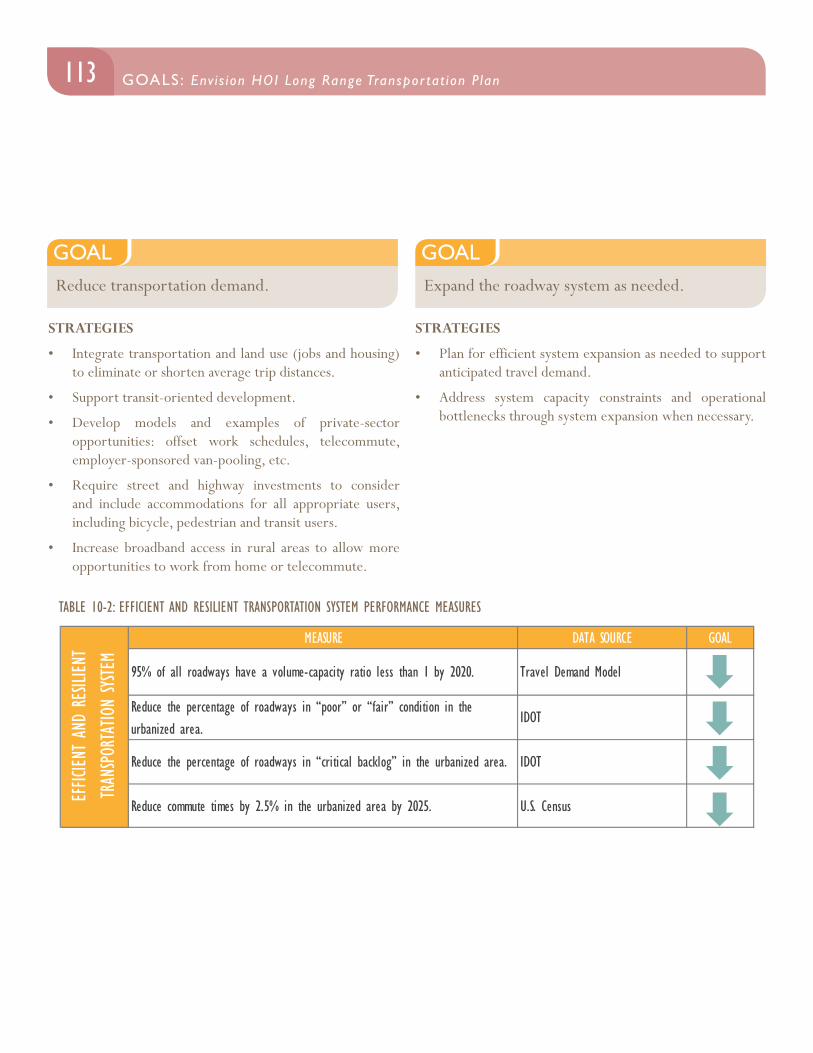
113GOALS: Env i s ion HOI Long Range Transpor tat ion P lan GOALS: Env i s ion HOI Long Range Transpor tat ion P lan
MEASURE DATA SOURCE GOAL
95% of all roadways have a volume-capacity ratio less than 1 by 2020. Travel Demand Model
Reduce the percentage of roadways in “poor” or “fair” condition in the urbanized area.
IDOT
Reduce the percentage of roadways in “critical backlog” in the urbanized area. IDOT
Reduce commute times by 2.5% in the urbanized area by 2025. U.S. Census
EFFIC
IENT AN
D RE
SILIEN
T TR
ANSPOR
TATIO
N SYS
TEM
TABLE 10-2: EFFICIENT AND RESILIENT TRANSPORTATION SYSTEM PERFORMANCE MEASURES
GOAL Reduce transportation demand.
STRATEGIES
• Integrate transportation and land use (jobs and housing) to eliminate or shorten average trip distances.
• Support transit-oriented development.
• Develop models and examples of private-sector opportunities: offset work schedules, telecommute, employer-sponsored van-pooling, etc.
• Require street and highway investments to consider and include accommodations for all appropriate users, including bicycle, pedestrian and transit users.
• Increase broadband access in rural areas to allow more opportunities to work from home or telecommute.
GOAL Expand the roadway system as needed.
STRATEGIES
• Plan for efficient system expansion as needed to support anticipated travel demand.
• Address system capacity constraints and operational bottlenecks through system expansion when necessary.
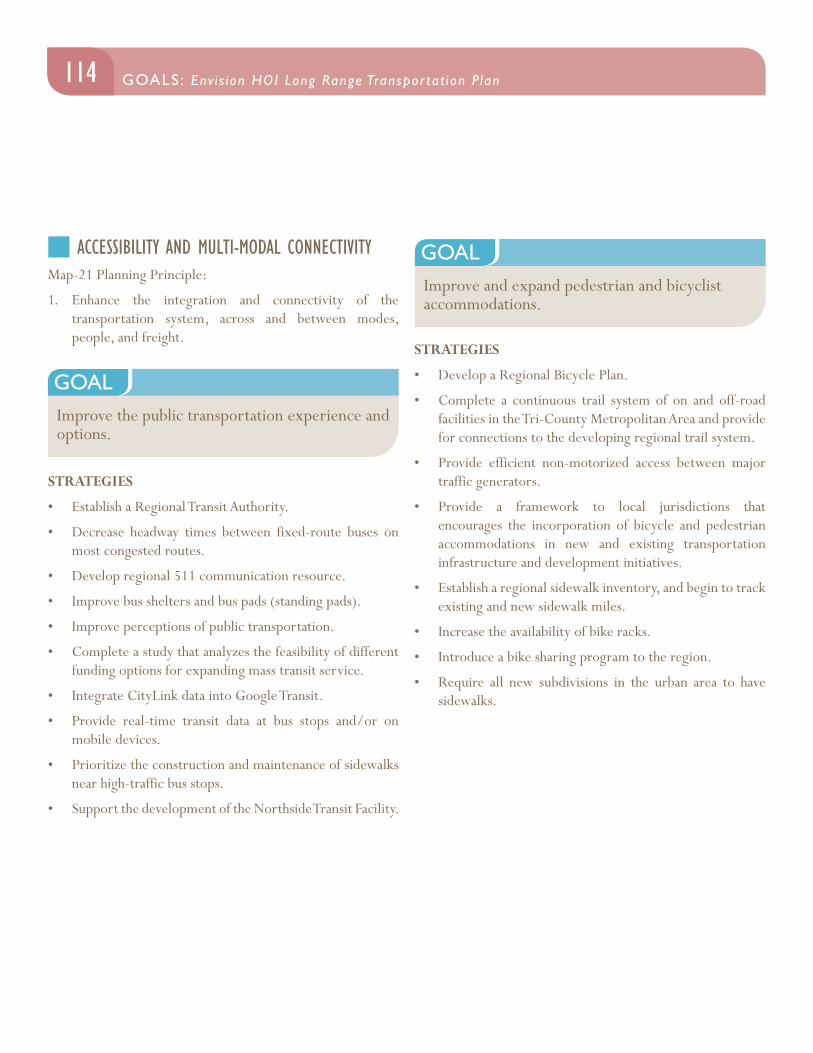
114 GOALS: Env i s ion HOI Long Range Transpor tat ion P lan
GOAL Improve the public transportation experience and options.
ACCESSIBILITY AND MULTI-MODAL CONNECTIVITYMap-21 Planning Principle:
1. Enhance the integration and connectivity of the transportation system, across and between modes, people, and freight.
STRATEGIES
• Establish a Regional Transit Authority.
• Decrease headway times between fixed-route buses on most congested routes.
• Develop regional 511 communication resource.
• Improve bus shelters and bus pads (standing pads).
• Improve perceptions of public transportation.
• Complete a study that analyzes the feasibility of different funding options for expanding mass transit service.
• Integrate CityLink data into Google Transit.
• Provide real-time transit data at bus stops and/or on mobile devices.
• Prioritize the construction and maintenance of sidewalks near high-traffic bus stops.
• Support the development of the Northside Transit Facility.
GOAL Improve and expand pedestrian and bicyclist accommodations.
STRATEGIES
• Develop a Regional Bicycle Plan.
• Complete a continuous trail system of on and off-road facilities in the Tri-County Metropolitan Area and provide for connections to the developing regional trail system.
• Provide efficient non-motorized access between major traffic generators.
• Provide a framework to local jurisdictions that encourages the incorporation of bicycle and pedestrian accommodations in new and existing transportation infrastructure and development initiatives.
• Establish a regional sidewalk inventory, and begin to track existing and new sidewalk miles.
• Increase the availability of bike racks.
• Introduce a bike sharing program to the region.
• Require all new subdivisions in the urban area to have sidewalks.
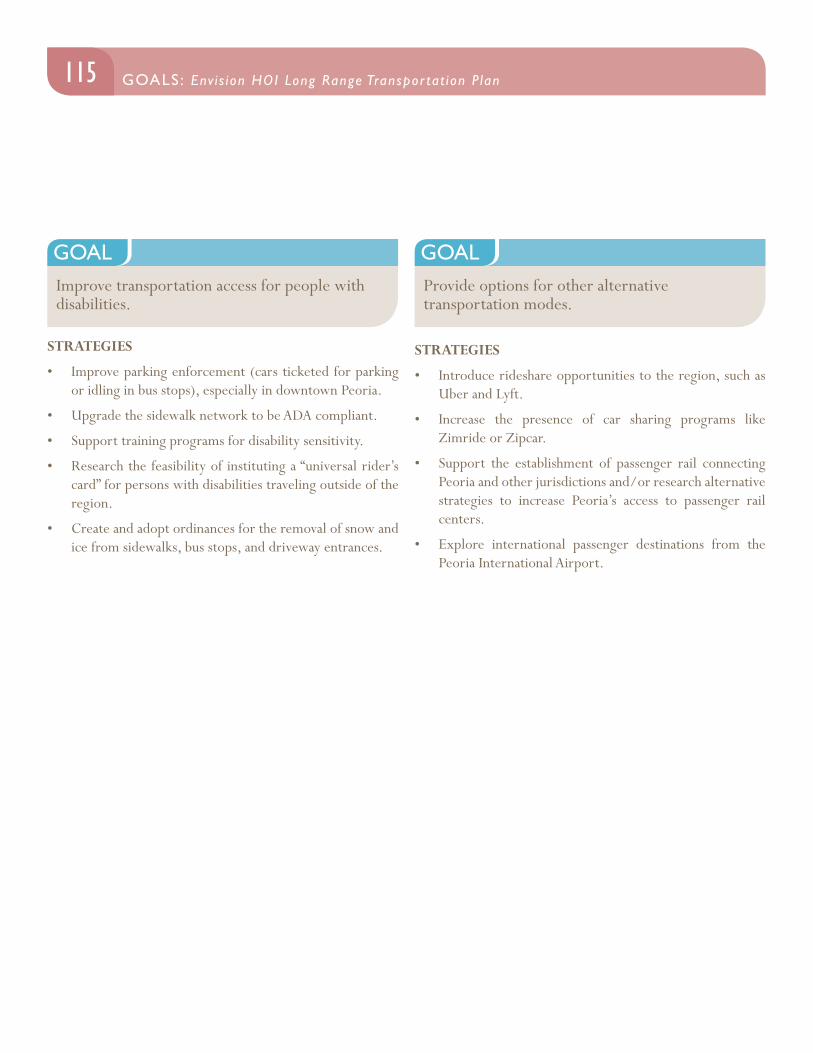
115GOALS: Env i s ion HOI Long Range Transpor tat ion P lan GOALS: Env i s ion HOI Long Range Transpor tat ion P lan
GOAL Improve transportation access for people with disabilities.
STRATEGIES
• Improve parking enforcement (cars ticketed for parking or idling in bus stops), especially in downtown Peoria.
• Upgrade the sidewalk network to be ADA compliant.
• Support training programs for disability sensitivity.
• Research the feasibility of instituting a “universal rider’s card” for persons with disabilities traveling outside of the region.
• Create and adopt ordinances for the removal of snow and ice from sidewalks, bus stops, and driveway entrances.
GOAL Provide options for other alternative transportation modes.
STRATEGIES
• Introduce rideshare opportunities to the region, such as Uber and Lyft.
• Increase the presence of car sharing programs like Zimride or Zipcar.
• Support the establishment of passenger rail connecting Peoria and other jurisdictions and/or research alternative strategies to increase Peoria’s access to passenger rail centers.
• Explore international passenger destinations from the Peoria International Airport.
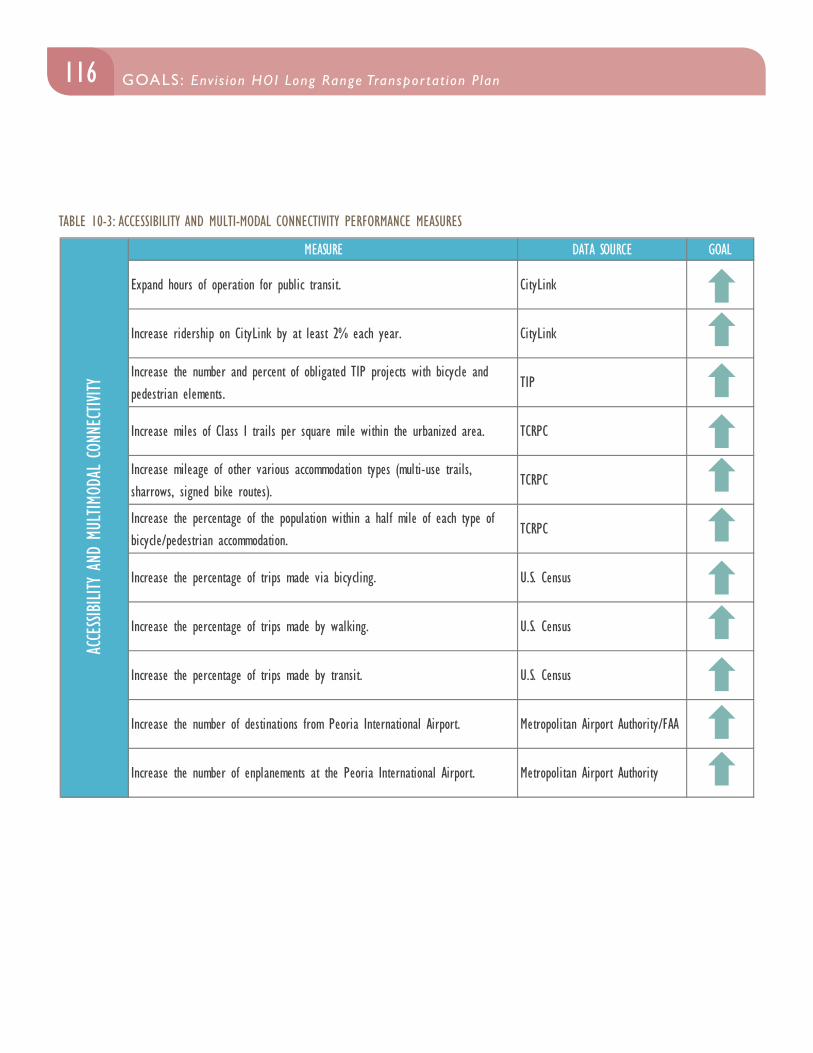
116 GOALS: Env i s ion HOI Long Range Transpor tat ion P lan
TABLE 10-3: ACCESSIBILITY AND MULTI-MODAL CONNECTIVITY PERFORMANCE MEASURES
MEASURE DATA SOURCE GOAL
Expand hours of operation for public transit. CityLink
Increase ridership on CityLink by at least 2% each year. CityLink
Increase the number and percent of obligated TIP projects with bicycle and pedestrian elements.
TIP
Increase miles of Class I trails per square mile within the urbanized area. TCRPC
Increase mileage of other various accommodation types (multi-use trails, sharrows, signed bike routes).
TCRPC
Increase the percentage of the population within a half mile of each type of bicycle/pedestrian accommodation.
TCRPC
Increase the percentage of trips made via bicycling. U.S. Census
Increase the percentage of trips made by walking. U.S. Census
Increase the percentage of trips made by transit. U.S. Census
Increase the number of destinations from Peoria International Airport. Metropolitan Airport Authority/FAA
Increase the number of enplanements at the Peoria International Airport. Metropolitan Airport Authority
ACCE
SSIBIL
ITY A
ND M
ULTIM
ODAL
CON
NECTIVI
TY
117GOALS: Env i s ion HOI Long Range Transpor tat ion P lan GOALS: Env i s ion HOI Long Range Transpor tat ion P lan
ENVIRONMENTAL SUSTAINABILITYMAP-21 Planning Principle:
1. Protect and enhance the environment, promote energy conservation, improve the quality of life, and promote consistency between transportation improvements and State and local planned growth and economic development patterns.
GOAL Improve air quality.
STRATEGIES
• Reduce emissions from city, municipal, and state operated vehicles.
• Reduce emissions from sanitation vehicles (garbage trucks and sanitary sewer fleet) by using ultra-low sulfur diesel (ULSD) fuels.
• Reduce emissions from non-road vehicles such as construction equipment by upgrading to ultra-low sulfur diesel (ULSD) vehicles.
• Create an inventory of municipal owned fleets and construction equipment to track progress.
• Encourage improved engine efficiency in rolling stock, airplanes, and water freight vehicles.
GOAL Preserve existing green infrastructure.
STRATEGIES
• Avoid future impacts of new roadway construction on environmental corridors.
• Encourage local jurisdictions to adopt environmental protection ordinances such as the model ravine overlay protection or the stream buffer ordinance.
• Address agricultural preservation.
GOAL Utilize green infrastructure for future projects.
STRATEGIES
• Identify green infrastructure improvement opportunities in existing transportation project plans.
• Integrate new storm water management technologies into the construction of all new roadways.
• Utilize green infrastructure watershed best management practices such as vegetated bioswales and wetland retention basins to filter and absorb stormwater from the roadway system.
GOAL Contribute to and support the protection of the Illinois River.
STRATEGIES
• Minimize land disturbance during construction, particularly on steep slopes.
• Reduce the water quality impacts of herbicide and other chemical agents used for road maintenance.
• Aim for zero run-off from road projects by utilizing best management practices (BMP’s).
GOAL Reduce vehicle miles traveled (VMT).
STRATEGIES
• Support and promote public transportation.
• Introduce ridesharing and/or carpooling programs.
• Build mixed-use, compact development.
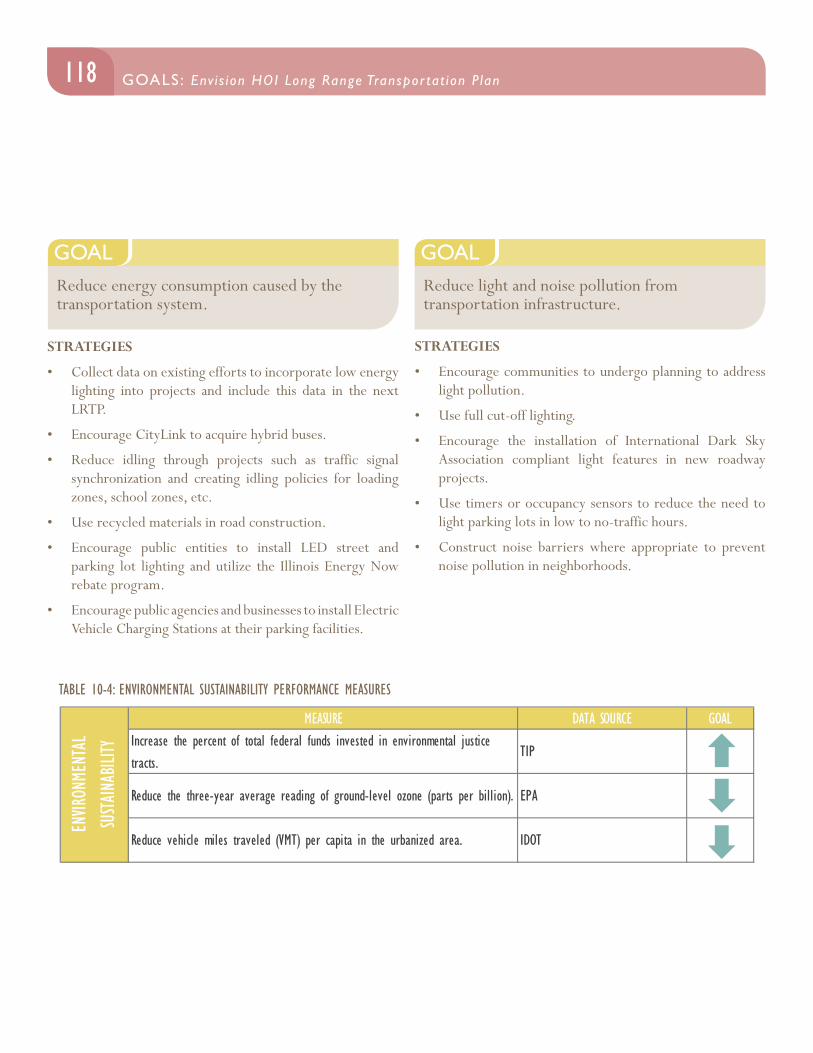
118 GOALS: Env i s ion HOI Long Range Transpor tat ion P lan
GOAL Reduce energy consumption caused by the transportation system.
STRATEGIES
• Collect data on existing efforts to incorporate low energy lighting into projects and include this data in the next LRTP.
• Encourage CityLink to acquire hybrid buses.
• Reduce idling through projects such as traffic signal synchronization and creating idling policies for loading zones, school zones, etc.
• Use recycled materials in road construction.
• Encourage public entities to install LED street and parking lot lighting and utilize the Illinois Energy Now rebate program.
• Encourage public agencies and businesses to install Electric Vehicle Charging Stations at their parking facilities.
GOAL Reduce light and noise pollution from transportation infrastructure.
STRATEGIES
• Encourage communities to undergo planning to address light pollution.
• Use full cut-off lighting.
• Encourage the installation of International Dark Sky Association compliant light features in new roadway projects.
• Use timers or occupancy sensors to reduce the need to light parking lots in low to no-traffic hours.
• Construct noise barriers where appropriate to prevent noise pollution in neighborhoods.
MEASURE DATA SOURCE GOALIncrease the percent of total federal funds invested in environmental justice tracts.
TIP
Reduce the three-year average reading of ground-level ozone (parts per billion). EPA
Reduce vehicle miles traveled (VMT) per capita in the urbanized area. IDOT
ENVIR
ONME
NTAL
SU
STAINAB
ILITY
TABLE 10-4: ENVIRONMENTAL SUSTAINABILITY PERFORMANCE MEASURES
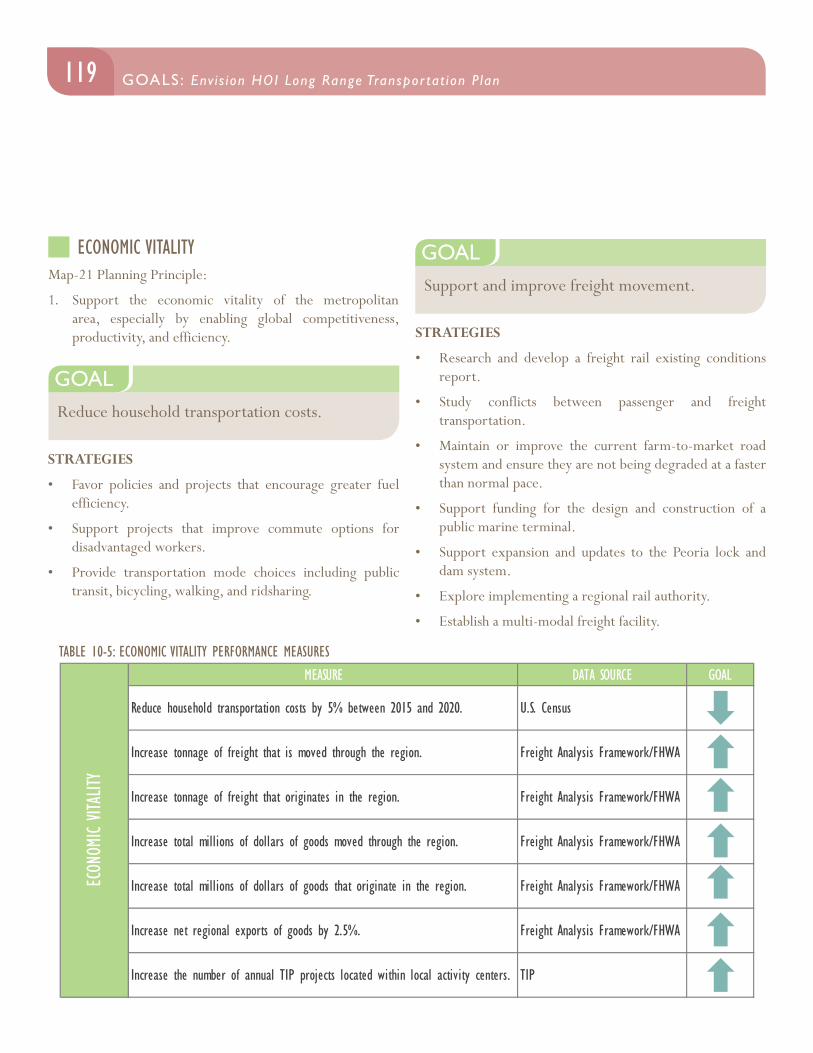
119GOALS: Env i s ion HOI Long Range Transpor tat ion P lan GOALS: Env i s ion HOI Long Range Transpor tat ion P lan
ECONOMIC VITALITYMap-21 Planning Principle:
1. Support the economic vitality of the metropolitan area, especially by enabling global competitiveness, productivity, and efficiency.
GOAL Support and improve freight movement.
STRATEGIES
• Research and develop a freight rail existing conditions report.
• Study conflicts between passenger and freight transportation.
• Maintain or improve the current farm-to-market road system and ensure they are not being degraded at a faster than normal pace.
• Support funding for the design and construction of a public marine terminal.
• Support expansion and updates to the Peoria lock and dam system.
• Explore implementing a regional rail authority.
• Establish a multi-modal freight facility.
GOAL Reduce household transportation costs.
STRATEGIES
• Favor policies and projects that encourage greater fuel efficiency.
• Support projects that improve commute options for disadvantaged workers.
• Provide transportation mode choices including public transit, bicycling, walking, and ridsharing.
TABLE 10-5: ECONOMIC VITALITY PERFORMANCE MEASURESMEASURE DATA SOURCE GOAL
Reduce household transportation costs by 5% between 2015 and 2020. U.S. Census
Increase tonnage of freight that is moved through the region. Freight Analysis Framework/FHWA
Increase tonnage of freight that originates in the region. Freight Analysis Framework/FHWA
Increase total millions of dollars of goods moved through the region. Freight Analysis Framework/FHWA
Increase total millions of dollars of goods that originate in the region. Freight Analysis Framework/FHWA
Increase net regional exports of goods by 2.5%. Freight Analysis Framework/FHWA
Increase the number of annual TIP projects located within local activity centers. TIP
ECON
OMIC
VITAL
ITY

120 GOALS: Env i s ion HOI Long Range Transpor tat ion P lan
FUNDING ANALYSIS
121 FUNDING ANALYSIS : Env i s ion HOI Long Range Transpor tat ion P lanGOALS: Env i s ion HOI Long Range Transpor tat ion P lan
By Federal law, the LRTP must be fiscally constrained. This means that transportation projects included in the plan must have reasonably guaranteed funding sources for them to be included.
INTRODUCTIONThis chapter will discuss revenue sources and estimate the amount of federal funding that will be available for transportation projects over the next twenty-five years in the Peoria-Pekin Metropolitan Planning Area. The purpose of this analysis is to determine whether or not the region has adequate resources to operate and maintain the existing transportation system, while also having the resources to build future capacity into the transportation system. There are many types of transportation addressed in this analysis, including highways and bridges, mass transit, and non-motorized transportation, such as bicycle trails and pedestrian accommodations.
There are many sources of funds that the Illinois Department of Transportation (IDOT), counties, and municipalities use to maintain and expand their transportation systems. They include federal, state, and local sources. This document will focus only on the federal sources of funds.
The primary source of federal funds for transportation projects is Moving Ahead for Progress in the 21st Century, commonly known as MAP-21. MAP-21 was originally set to expire on September 30, 2014. Congress has extended that deadline to May 31, 2015.
IDOT relies primarily on federal funds to build and maintain roads and bridges on the state and federal system.
IDOT also relies on the State of Illinois to provide the matching funds needed for these projects, as most federal transportation programs require a 20% match. The State uses funds received from the Motor Fuel Tax to provide the match.
There are a number of federal funds that IDOT can use. Some funds, such as the Major Bridge Fund, can be used only for bridges, while other funds are unrestricted. Certain funds, such as STP-Urban (STU), can be used only in the urbanized area. Other funds, such as STP-Rural (STR), must be used outside the urbanized area, but can also be used within the 20-Year Planning Boundary.
Counties also receive dedicated federal funds. Peoria, Tazewell, and Woodford Counties receive an annual allotment of federal bridge funds known as HBP (Highway Bridge Program). Each county’s allotment is based on the total need of deficient local bridges in the county as compared to that which exists statewide. These funds are limited to use on existing local structures within the county which meet eligibility criteria based solely on their deficient need and only when authorized by counties in coordination with IDOT regardless of whether or not they are within the urbanized area or the 20- Year Planning Boundary. Counties also receive an allocation of federal STR (STP-Rural) funds which may only be used to address needs on county highways or other rural federal-aid eligible routes throughout the county that are outside of the urbanized area and only when authorized by counties in coordination with IDOT. Counties may compete for other statewide transportation funds such as Major Bridge funds. They are also eligible to apply for STU (STP-Urban) funds that are programmed by the MPO and must be used within the 20-Year Planning Boundary.
Photo Credit: stantoncady(flickr)
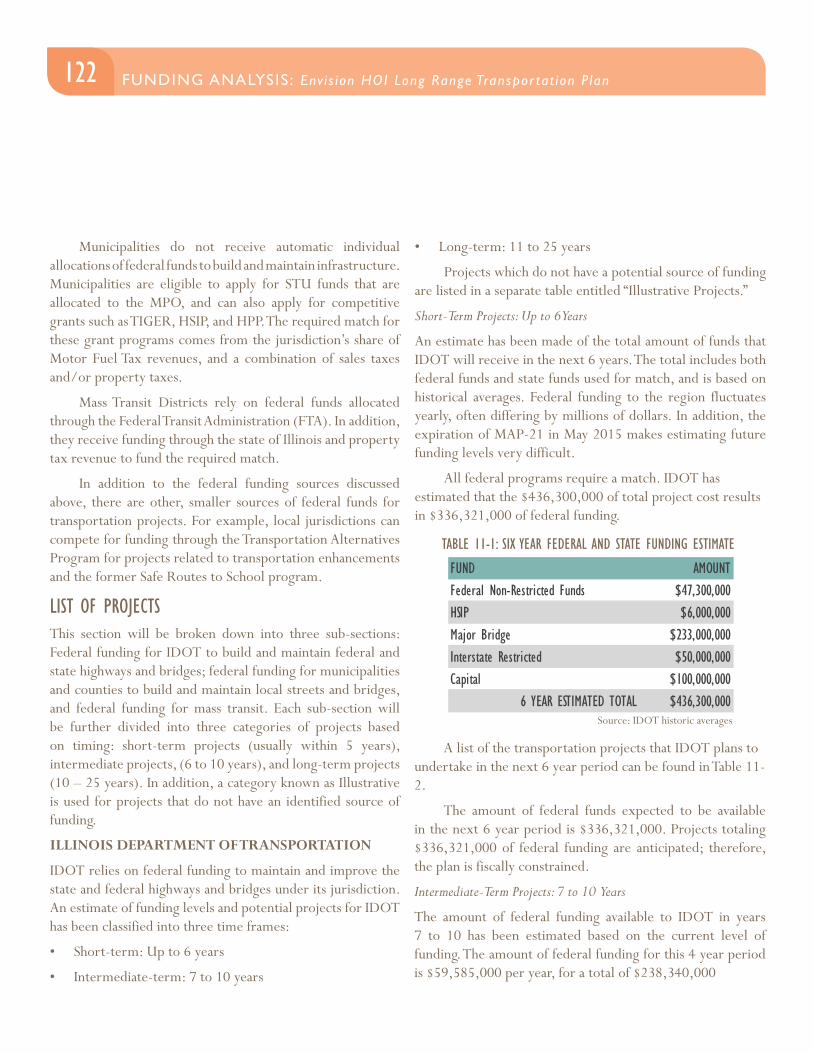
122 FUNDING ANALYSIS : Env i s ion HOI Long Range Transpor tat ion P lan
Municipalities do not receive automatic individual allocations of federal funds to build and maintain infrastructure. Municipalities are eligible to apply for STU funds that are allocated to the MPO, and can also apply for competitive grants such as TIGER, HSIP, and HPP. The required match for these grant programs comes from the jurisdiction’s share of Motor Fuel Tax revenues, and a combination of sales taxes and/or property taxes.
Mass Transit Districts rely on federal funds allocated through the Federal Transit Administration (FTA). In addition, they receive funding through the state of Illinois and property tax revenue to fund the required match.
In addition to the federal funding sources discussed above, there are other, smaller sources of federal funds for transportation projects. For example, local jurisdictions can compete for funding through the Transportation Alternatives Program for projects related to transportation enhancements and the former Safe Routes to School program.
LIST OF PROJECTSThis section will be broken down into three sub-sections: Federal funding for IDOT to build and maintain federal and state highways and bridges; federal funding for municipalities and counties to build and maintain local streets and bridges, and federal funding for mass transit. Each sub-section will be further divided into three categories of projects based on timing: short-term projects (usually within 5 years), intermediate projects, (6 to 10 years), and long-term projects (10 – 25 years). In addition, a category known as Illustrative is used for projects that do not have an identified source of funding.
ILLINOIS DEPARTMENT OF TRANSPORTATION
IDOT relies on federal funding to maintain and improve the state and federal highways and bridges under its jurisdiction. An estimate of funding levels and potential projects for IDOT has been classified into three time frames:
• Short-term: Up to 6 years
• Intermediate-term: 7 to 10 years
• Long-term: 11 to 25 years
Projects which do not have a potential source of funding are listed in a separate table entitled “Illustrative Projects.”
Short-Term Projects: Up to 6 Years
An estimate has been made of the total amount of funds that IDOT will receive in the next 6 years. The total includes both federal funds and state funds used for match, and is based on historical averages. Federal funding to the region fluctuates yearly, often differing by millions of dollars. In addition, the expiration of MAP-21 in May 2015 makes estimating future funding levels very difficult.
All federal programs require a match. IDOT has estimated that the $436,300,000 of total project cost results in $336,321,000 of federal funding.
FUND AMOUNTFederal Non-Restricted Funds $47,300,000 HSIP $6,000,000 Major Bridge $233,000,000 Interstate Restricted $50,000,000 Capital $100,000,000
6 YEAR ESTIMATED TOTAL $436,300,000
TABLE 11-1: SIX YEAR FEDERAL AND STATE FUNDING ESTIMATE
Source: IDOT historic averages
A list of the transportation projects that IDOT plans to undertake in the next 6 year period can be found in Table 11-2.
The amount of federal funds expected to be available in the next 6 year period is $336,321,000. Projects totaling $336,321,000 of federal funding are anticipated; therefore, the plan is fiscally constrained.
Intermediate-Term Projects: 7 to 10 Years
The amount of federal funding available to IDOT in years 7 to 10 has been estimated based on the current level of funding. The amount of federal funding for this 4 year period is $59,585,000 per year, for a total of $238,340,000
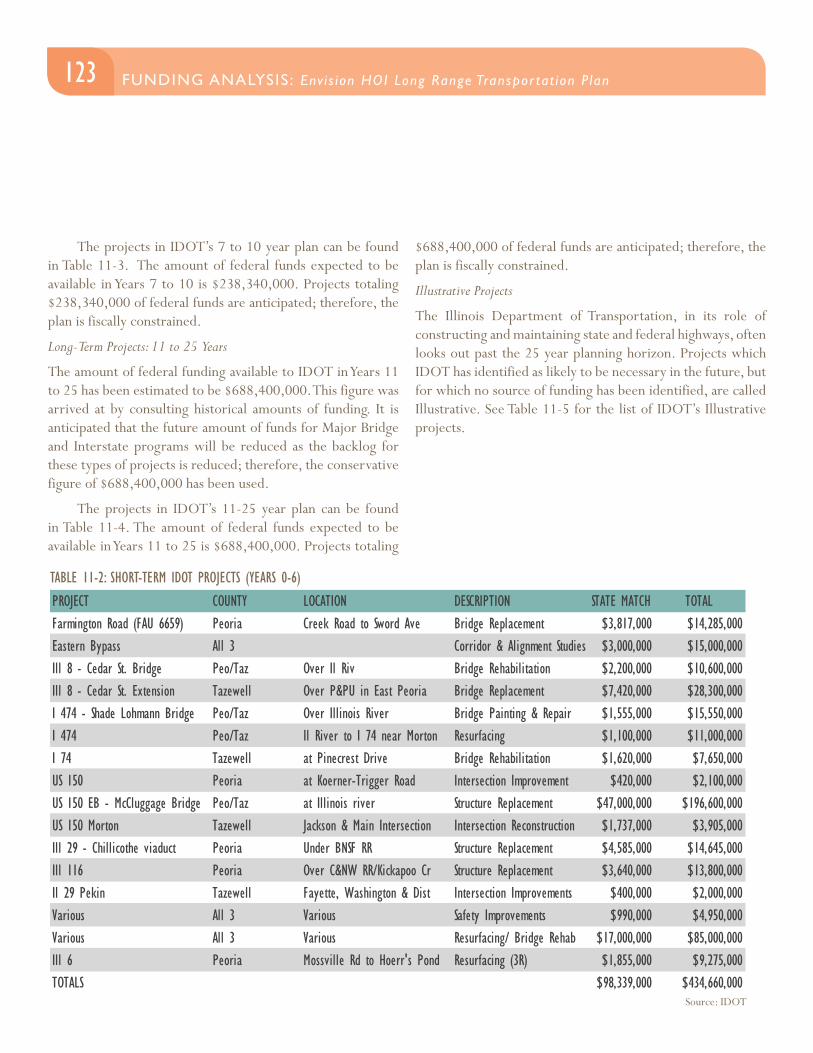
123FUNDING ANALYSIS : Env i s ion HOI Long Range Transpor tat ion P lan FUNDING ANALYSIS : Env i s ion HOI Long Range Transpor tat ion P lan
The projects in IDOT’s 7 to 10 year plan can be found in Table 11-3. The amount of federal funds expected to be available in Years 7 to 10 is $238,340,000. Projects totaling $238,340,000 of federal funds are anticipated; therefore, the plan is fiscally constrained.
Long-Term Projects: 11 to 25 Years
The amount of federal funding available to IDOT in Years 11 to 25 has been estimated to be $688,400,000. This figure was arrived at by consulting historical amounts of funding. It is anticipated that the future amount of funds for Major Bridge and Interstate programs will be reduced as the backlog for these types of projects is reduced; therefore, the conservative figure of $688,400,000 has been used.
The projects in IDOT’s 11-25 year plan can be found in Table 11-4. The amount of federal funds expected to be available in Years 11 to 25 is $688,400,000. Projects totaling
$688,400,000 of federal funds are anticipated; therefore, the plan is fiscally constrained.
Illustrative Projects
The Illinois Department of Transportation, in its role of constructing and maintaining state and federal highways, often looks out past the 25 year planning horizon. Projects which IDOT has identified as likely to be necessary in the future, but for which no source of funding has been identified, are called Illustrative. See Table 11-5 for the list of IDOT’s Illustrative projects.
TABLE 11-2: SHORT-TERM IDOT PROJECTS (YEARS 0-6)
Source: IDOT
PROJECT COUNTY LOCATION DESCRIPTION STATE MATCH TOTAL Farmington Road (FAU 6659) Peoria Creek Road to Sword Ave Bridge Replacement $3,817,000 $14,285,000Eastern Bypass All 3 Corridor & Alignment Studies $3,000,000 $15,000,000Ill 8 - Cedar St. Bridge Peo/Taz Over Il Riv Bridge Rehabilitation $2,200,000 $10,600,000Ill 8 - Cedar St. Extension Tazewell Over P&PU in East Peoria Bridge Replacement $7,420,000 $28,300,000I 474 - Shade Lohmann Bridge Peo/Taz Over Illinois River Bridge Painting & Repair $1,555,000 $15,550,000I 474 Peo/Taz Il River to I 74 near Morton Resurfacing $1,100,000 $11,000,000I 74 Tazewell at Pinecrest Drive Bridge Rehabilitation $1,620,000 $7,650,000US 150 Peoria at Koerner-Trigger Road Intersection Improvement $420,000 $2,100,000US 150 EB - McCluggage Bridge Peo/Taz at Illinois river Structure Replacement $47,000,000 $196,600,000US 150 Morton Tazewell Jackson & Main Intersection Intersection Reconstruction $1,737,000 $3,905,000Ill 29 - Chillicothe viaduct Peoria Under BNSF RR Structure Replacement $4,585,000 $14,645,000Ill 116 Peoria Over C&NW RR/Kickapoo Cr Structure Replacement $3,640,000 $13,800,000Il 29 Pekin Tazewell Fayette, Washington & Dist Intersection Improvements $400,000 $2,000,000Various All 3 Various Safety Improvements $990,000 $4,950,000Various All 3 Various Resurfacing/ Bridge Rehab $17,000,000 $85,000,000Ill 6 Peoria Mossville Rd to Hoerr's Pond Resurfacing (3R) $1,855,000 $9,275,000TOTALS $98,339,000 $434,660,000
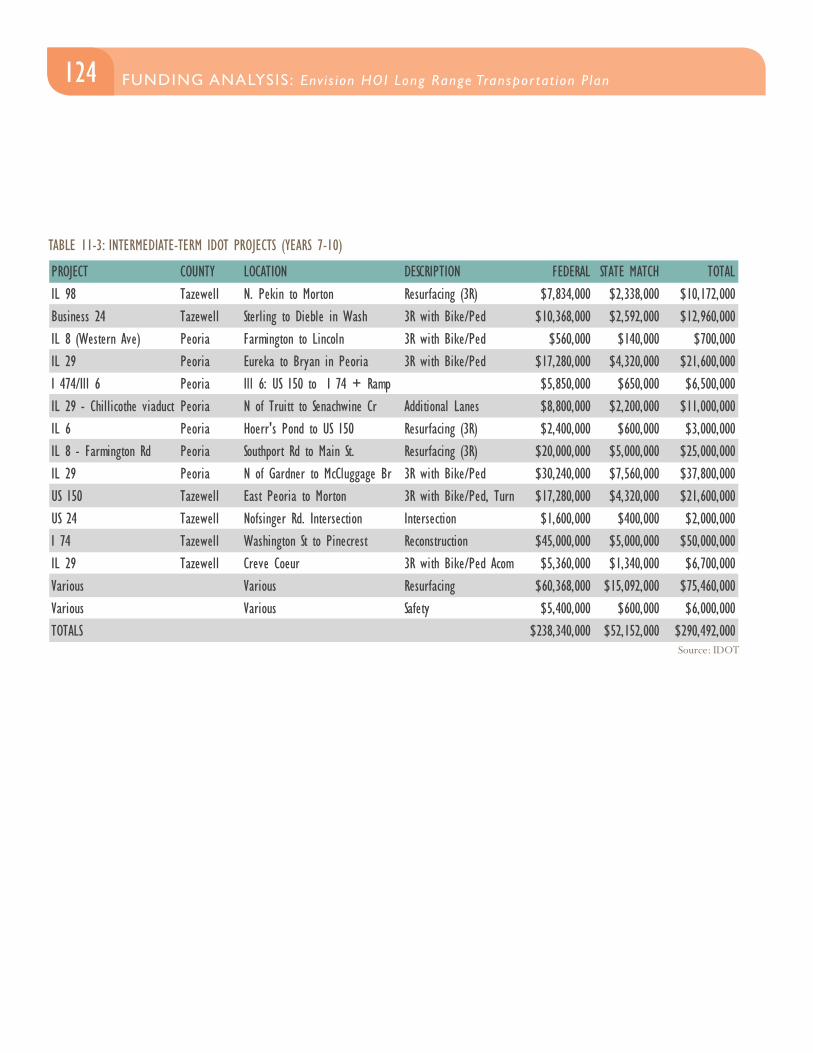
124 FUNDING ANALYSIS : Env i s ion HOI Long Range Transpor tat ion P lan
TABLE 11-3: INTERMEDIATE-TERM IDOT PROJECTS (YEARS 7-10)
Source: IDOT
PROJECT COUNTY LOCATION DESCRIPTION FEDERAL STATE MATCH TOTAL IL 98 Tazewell N. Pekin to Morton Resurfacing (3R) $7,834,000 $2,338,000 $10,172,000Business 24 Tazewell Sterling to Dieble in Wash 3R with Bike/Ped $10,368,000 $2,592,000 $12,960,000IL 8 (Western Ave) Peoria Farmington to Lincoln 3R with Bike/Ped $560,000 $140,000 $700,000IL 29 Peoria Eureka to Bryan in Peoria 3R with Bike/Ped $17,280,000 $4,320,000 $21,600,000I 474/Ill 6 Peoria Ill 6: US 150 to I 74 + Ramp $5,850,000 $650,000 $6,500,000IL 29 - Chillicothe viaduct Peoria N of Truitt to Senachwine Cr Additional Lanes $8,800,000 $2,200,000 $11,000,000IL 6 Peoria Hoerr's Pond to US 150 Resurfacing (3R) $2,400,000 $600,000 $3,000,000IL 8 - Farmington Rd Peoria Southport Rd to Main St. Resurfacing (3R) $20,000,000 $5,000,000 $25,000,000IL 29 Peoria N of Gardner to McCluggage Br 3R with Bike/Ped $30,240,000 $7,560,000 $37,800,000US 150 Tazewell East Peoria to Morton 3R with Bike/Ped, Turn $17,280,000 $4,320,000 $21,600,000US 24 Tazewell Nofsinger Rd. Intersection Intersection $1,600,000 $400,000 $2,000,000I 74 Tazewell Washington St to Pinecrest Reconstruction $45,000,000 $5,000,000 $50,000,000IL 29 Tazewell Creve Coeur 3R with Bike/Ped Acom $5,360,000 $1,340,000 $6,700,000Various Various Resurfacing $60,368,000 $15,092,000 $75,460,000Various Various Safety $5,400,000 $600,000 $6,000,000TOTALS $238,340,000 $52,152,000 $290,492,000
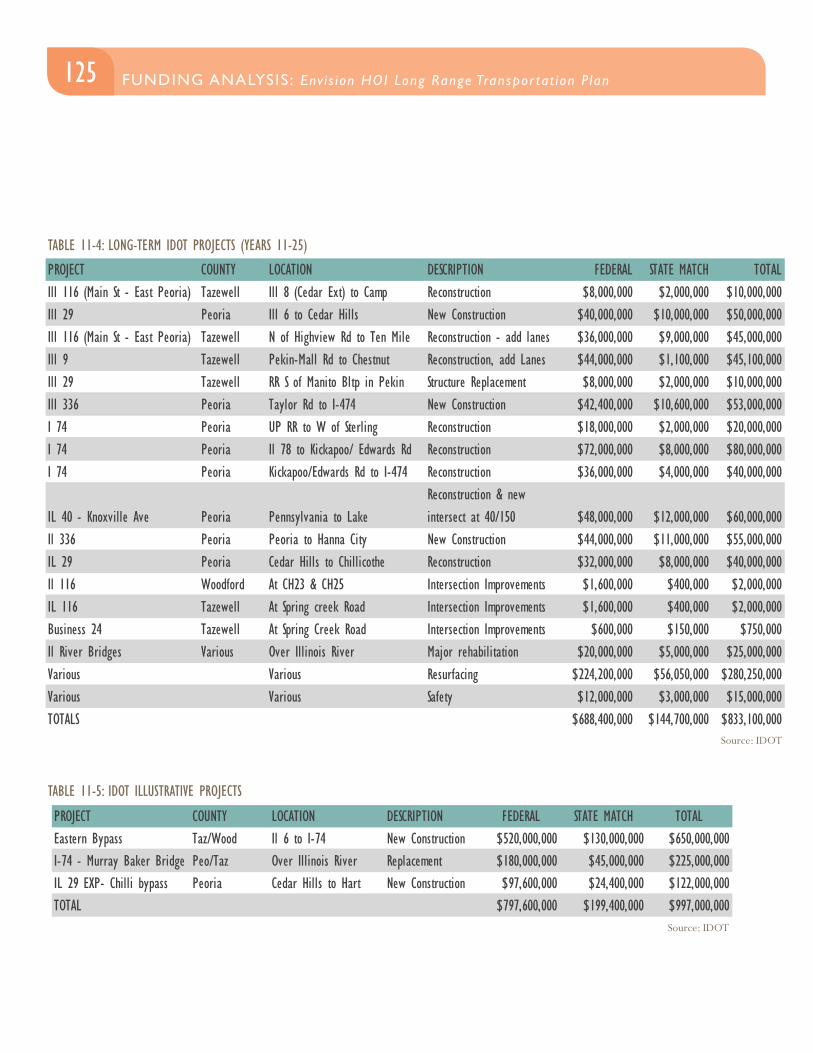
125FUNDING ANALYSIS : Env i s ion HOI Long Range Transpor tat ion P lan FUNDING ANALYSIS : Env i s ion HOI Long Range Transpor tat ion P lan
TABLE 11-5: IDOT ILLUSTRATIVE PROJECTS
Source: IDOT
PROJECT COUNTY LOCATION DESCRIPTION FEDERAL STATE MATCH TOTALEastern Bypass Taz/Wood Il 6 to I-74 New Construction $520,000,000 $130,000,000 $650,000,000I-74 - Murray Baker Bridge Peo/Taz Over Illinois River Replacement $180,000,000 $45,000,000 $225,000,000IL 29 EXP- Chilli bypass Peoria Cedar Hills to Hart New Construction $97,600,000 $24,400,000 $122,000,000TOTAL $797,600,000 $199,400,000 $997,000,000
TABLE 11-4: LONG-TERM IDOT PROJECTS (YEARS 11-25)
Source: IDOT
PROJECT COUNTY LOCATION DESCRIPTION FEDERAL STATE MATCH TOTAL Ill 116 (Main St - East Peoria) Tazewell Ill 8 (Cedar Ext) to Camp Reconstruction $8,000,000 $2,000,000 $10,000,000Ill 29 Peoria Ill 6 to Cedar Hills New Construction $40,000,000 $10,000,000 $50,000,000Ill 116 (Main St - East Peoria) Tazewell N of Highview Rd to Ten Mile Reconstruction - add lanes $36,000,000 $9,000,000 $45,000,000Ill 9 Tazewell Pekin-Mall Rd to Chestnut Reconstruction, add Lanes $44,000,000 $1,100,000 $45,100,000Ill 29 Tazewell RR S of Manito Bltp in Pekin Structure Replacement $8,000,000 $2,000,000 $10,000,000Ill 336 Peoria Taylor Rd to I-474 New Construction $42,400,000 $10,600,000 $53,000,000I 74 Peoria UP RR to W of Sterling Reconstruction $18,000,000 $2,000,000 $20,000,000I 74 Peoria Il 78 to Kickapoo/ Edwards Rd Reconstruction $72,000,000 $8,000,000 $80,000,000I 74 Peoria Kickapoo/Edwards Rd to I-474 Reconstruction $36,000,000 $4,000,000 $40,000,000
IL 40 - Knoxville Ave Peoria Pennsylvania to LakeReconstruction & new intersect at 40/150 $48,000,000 $12,000,000 $60,000,000
Il 336 Peoria Peoria to Hanna City New Construction $44,000,000 $11,000,000 $55,000,000IL 29 Peoria Cedar Hills to Chillicothe Reconstruction $32,000,000 $8,000,000 $40,000,000Il 116 Woodford At CH23 & CH25 Intersection Improvements $1,600,000 $400,000 $2,000,000IL 116 Tazewell At Spring creek Road Intersection Improvements $1,600,000 $400,000 $2,000,000Business 24 Tazewell At Spring Creek Road Intersection Improvements $600,000 $150,000 $750,000Il River Bridges Various Over Illinois River Major rehabilitation $20,000,000 $5,000,000 $25,000,000Various Various Resurfacing $224,200,000 $56,050,000 $280,250,000Various Various Safety $12,000,000 $3,000,000 $15,000,000TOTALS $688,400,000 $144,700,000 $833,100,000
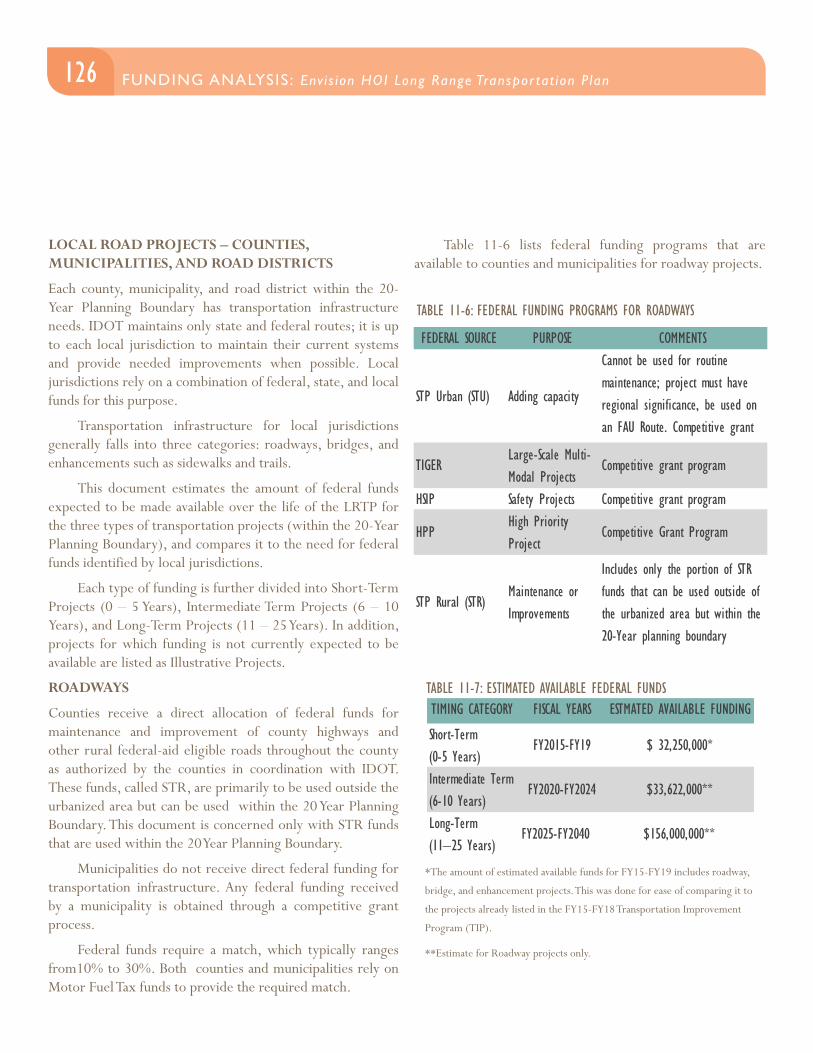
126 FUNDING ANALYSIS : Env i s ion HOI Long Range Transpor tat ion P lan
LOCAL ROAD PROJECTS – COUNTIES, MUNICIPALITIES, AND ROAD DISTRICTS
Each county, municipality, and road district within the 20-Year Planning Boundary has transportation infrastructure needs. IDOT maintains only state and federal routes; it is up to each local jurisdiction to maintain their current systems and provide needed improvements when possible. Local jurisdictions rely on a combination of federal, state, and local funds for this purpose.
Transportation infrastructure for local jurisdictions generally falls into three categories: roadways, bridges, and enhancements such as sidewalks and trails.
This document estimates the amount of federal funds expected to be made available over the life of the LRTP for the three types of transportation projects (within the 20-Year Planning Boundary), and compares it to the need for federal funds identified by local jurisdictions.
Each type of funding is further divided into Short-Term Projects (0 – 5 Years), Intermediate Term Projects (6 – 10 Years), and Long-Term Projects (11 – 25 Years). In addition, projects for which funding is not currently expected to be available are listed as Illustrative Projects.
ROADWAYS
Counties receive a direct allocation of federal funds for maintenance and improvement of county highways and other rural federal-aid eligible roads throughout the county as authorized by the counties in coordination with IDOT. These funds, called STR, are primarily to be used outside the urbanized area but can be used within the 20 Year Planning Boundary. This document is concerned only with STR funds that are used within the 20 Year Planning Boundary.
Municipalities do not receive direct federal funding for transportation infrastructure. Any federal funding received by a municipality is obtained through a competitive grant process.
Federal funds require a match, which typically ranges from10% to 30%. Both counties and municipalities rely on Motor Fuel Tax funds to provide the required match.
Table 11-6 lists federal funding programs that are available to counties and municipalities for roadway projects.
TABLE 11-6: FEDERAL FUNDING PROGRAMS FOR ROADWAYS
FEDERAL SOURCE PURPOSE COMMENTS
STP Urban (STU) Adding capacity
Cannot be used for routine maintenance; project must have regional significance, be used on an FAU Route. Competitive grant program
TIGERLarge-Scale Multi-Modal Projects
Competitive grant program
HSIP Safety Projects Competitive grant program
HPPHigh Priority Project
Competitive Grant Program
STP Rural (STR)Maintenance or Improvements
Includes only the portion of STR funds that can be used outside of the urbanized area but within the 20-Year planning boundary
*The amount of estimated available funds for FY15-FY19 includes roadway,
bridge, and enhancement projects. This was done for ease of comparing it to
the projects already listed in the FY15-FY18 Transportation Improvement
Program (TIP).
**Estimate for Roadway projects only.
TABLE 11-7: ESTIMATED AVAILABLE FEDERAL FUNDSTIMING CATEGORY FISCAL YEARS ESTMATED AVAILABLE FUNDING
Short-Term (0-5 Years)
FY2015-FY19 $ 32,250,000*
Intermediate Term (6-10 Years)
FY2020-FY2024 $33,622,000**
Long-Term (11–25 Years)
FY2025-FY2040 $156,000,000**
127FUNDING ANALYSIS : Env i s ion HOI Long Range Transpor tat ion P lan FUNDING ANALYSIS : Env i s ion HOI Long Range Transpor tat ion P lan
An estimate has been made of the amount of federal funds that will be available in the following time periods for counties and municipalities. The estimates are calculated based on historical figures with a 2% inflation factor added in later years, and can be seen in Table 11-7.
Short-Term Roadway Projects (0 – 5 Years)
Table 11-8 shows the projects for the 0 - 5 Year Category. Most of these projects are included in the FY15-FY18 Transportation Improvement Program and have an identified source of federal funding.
The amount of federal funds expected to be available in Years 0 - 5 is $32,250,000. Projects totaling $26,415,557 are anticipated; therefore, the plan is fiscally constrained.
Intermediate-Term Roadway Projects (6– 10 Years)
The estimate for federal funds anticipated to be available for Intermediate Term Projects (Years 6-10) was determined using historical data. A 2% inflation factor was added to the average annual amount available in Years 0-5. The federal amount expected to be available for roadway projects is $33,622,000.
As part of the LRTP process, counties and municipalities were asked to identify local projects to be funded with federal funds. Twenty-seven projects were identified for Years 6 - 10, for a total of $253,720,000. If the federal funding source contributes 75%1 of the project cost, $190,290,000 of federal funding would be required.
There is a huge need for funding for transportation infrastructure projects; however, the amount of federal funding is limited and this plan must be fiscally constrained.
1 Federal funding sources require a match by the local jurisdiction. The funding sources available to local jurisdictions have varying match requirements, usually 20% to 30%. Therefore, a 25% match has been assumed.
In order to make the list of projects fiscally constrained, the list of 27 projects was reduced to correspond to the amount of federal funds expected to be available. A number of factors were used to reduce the amount of projects in order to make the plan fiscally constrained. The following factors were used:
• The regional significance of the project;
• Regional equity (ensuring that projects in each county were selected);
• Results of the Travel Demand Model, including the environmental impact of projects; and
• Results of public input.
In addition, larger projects were divided into phases so that no one project was allocated a disproportionate amount of funding. Since the primary source of federal funds for local projects is the STU program, each phase was allocated an amount of money that could reasonably be available through that program. However, it is important to note that the dollar amounts associated with these phases are only estimates; jurisdictions can still apply for other grants in order to fund the project in its entirety. If a project was divided into phases, the second phase was automatically included in the Long-Term Projects (11-25 Year) list. If the project was not fully funded even after being split into phases, its remaining estimated project cost was placed in the illustrative project list. All projects not selected for any funding are also listed as Illustrative Projects.
The amount of federal funding estimated to be available for roadway projects in Years 6-10 is $33,622,000. Projects totaling $33,555,000 in federal funds are anticipated; therefore, the plan is fiscally constrained.
It is important to note that the intermediate-term, long-term, and illustrative project lists presented in this section are conceptual in nature and are intended to be used only as a guide. There are countless variables that may affect the projected timeline and cost of a project, as well as its importance to the region. It is for these reasons that the LRTP is updated often to re-evaluate our transportation needs.
FOCUS: PROJECT LISTS
128 FUNDING ANALYSIS : Env i s ion HOI Long Range Transpor tat ion P lan
Long-Term Roadway Projects (11 – 25 Years)
The estimate for federal funds anticipated to be available for Long-Term Roadway Projects (Years 11-25) was determined using historical data. A 2% inflation factor was added to the average annual amount available in Years 6-10. The federal amount expected to be available for roadway projects is $118,750,000.
The projects slated for years 11 – 25 total $316,875,000. Assuming a federal contribution of 75%, $237,650,000 of federal funding would be needed to complete all projects. In order to make the list of projects fiscally constrained, the list of projects was reduced to correspond to the amount of federal funds expected to be available. As with the Intermediate-Term projects, a number of factors were used to reduce the amount of projects in order to make the plan fiscally constrained. Again, larger projects were divided into phases so that no one project was allocated a disproportionate amount of funding.
Table 11-11 shows that roadway projects with federal funding in the amount of $118,406,250 are anticipated for Years 11-25. As $118,750,000 is expected to be available, the plan is fiscally constrained. All roadway projects not selected for Years 11-25 are listed as Illustrative Projects in Table 11-12.
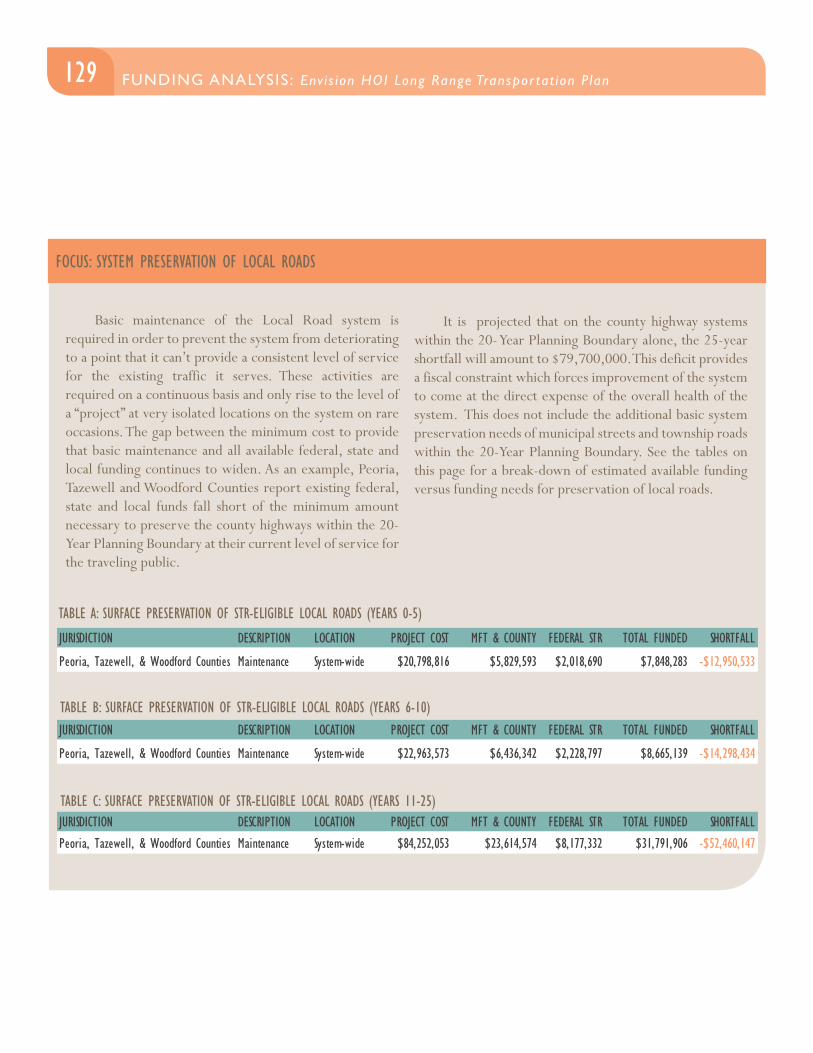
129FUNDING ANALYSIS : Env i s ion HOI Long Range Transpor tat ion P lan FUNDING ANALYSIS : Env i s ion HOI Long Range Transpor tat ion P lan
FOCUS: SYSTEM PRESERVATION OF LOCAL ROADS
Basic maintenance of the Local Road system is required in order to prevent the system from deteriorating to a point that it can’t provide a consistent level of service for the existing traffic it serves. These activities are required on a continuous basis and only rise to the level of a “project” at very isolated locations on the system on rare occasions. The gap between the minimum cost to provide that basic maintenance and all available federal, state and local funding continues to widen. As an example, Peoria, Tazewell and Woodford Counties report existing federal, state and local funds fall short of the minimum amount necessary to preserve the county highways within the 20-Year Planning Boundary at their current level of service for the traveling public.
TABLE A: SURFACE PRESERVATION OF STR-ELIGIBLE LOCAL ROADS (YEARS 0-5)
It is projected that on the county highway systems within the 20- Year Planning Boundary alone, the 25-year shortfall will amount to $79,700,000. This deficit provides a fiscal constraint which forces improvement of the system to come at the direct expense of the overall health of the system. This does not include the additional basic system preservation needs of municipal streets and township roads within the 20-Year Planning Boundary. See the tables on this page for a break-down of estimated available funding versus funding needs for preservation of local roads.
TABLE B: SURFACE PRESERVATION OF STR-ELIGIBLE LOCAL ROADS (YEARS 6-10)
TABLE C: SURFACE PRESERVATION OF STR-ELIGIBLE LOCAL ROADS (YEARS 11-25)
JURISDICTION DESCRIPTION LOCATION PROJECT COST MFT & COUNTY FEDERAL STR TOTAL FUNDED SHORTFALL
Peoria, Tazewell, & Woodford Counties Maintenance System-wide $20,798,816 $5,829,593 $2,018,690 $7,848,283 -$12,950,533
JURISDICTION DESCRIPTION LOCATION PROJECT COST MFT & COUNTY FEDERAL STR TOTAL FUNDED SHORTFALL
Peoria, Tazewell, & Woodford Counties Maintenance System-wide $22,963,573 $6,436,342 $2,228,797 $8,665,139 -$14,298,434
JURISDICTION DESCRIPTION LOCATION PROJECT COST MFT & COUNTY FEDERAL STR TOTAL FUNDED SHORTFALLPeoria, Tazewell, & Woodford Counties Maintenance System-wide $84,252,053 $23,614,574 $8,177,332 $31,791,906 -$52,460,147
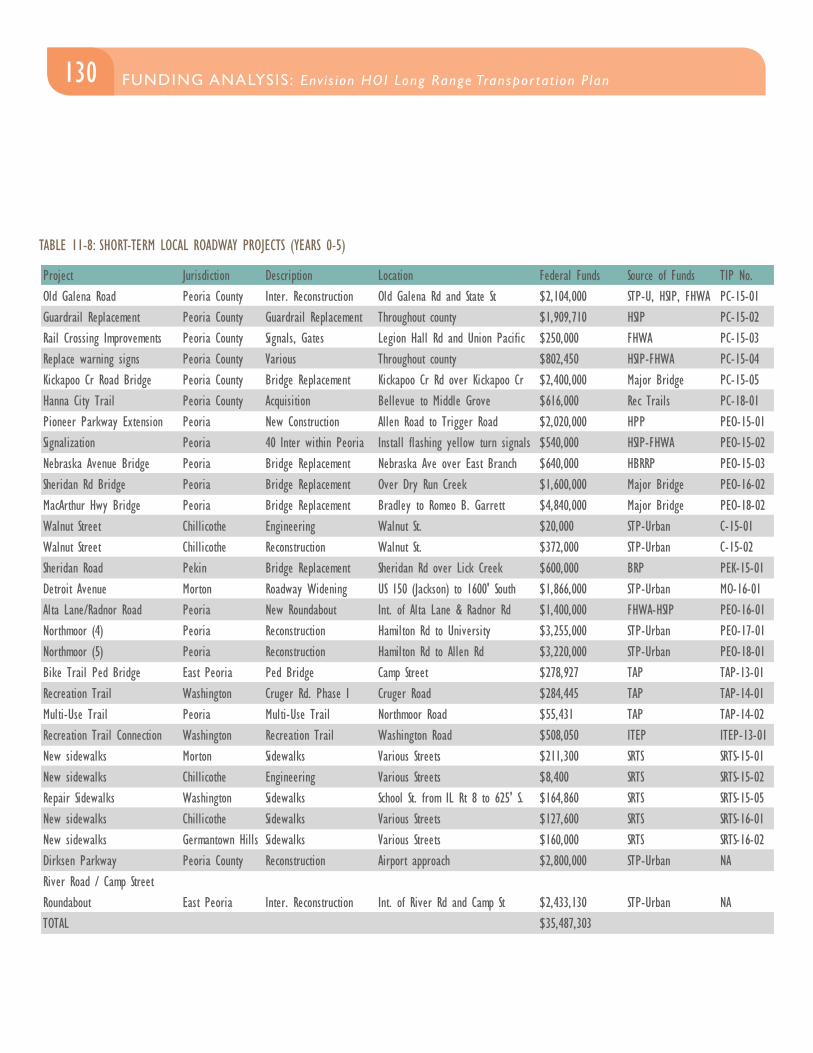
130 FUNDING ANALYSIS : Env i s ion HOI Long Range Transpor tat ion P lan
TABLE 11-8: SHORT-TERM LOCAL ROADWAY PROJECTS (YEARS 0-5)
Project Jurisdiction Description Location Federal Funds Source of Funds TIP No.Old Galena Road Peoria County Inter. Reconstruction Old Galena Rd and State St $2,104,000 STP-U, HSIP, FHWA PC-15-01Guardrail Replacement Peoria County Guardrail Replacement Throughout county $1,909,710 HSIP PC-15-02Rail Crossing Improvements Peoria County Signals, Gates Legion Hall Rd and Union Pacific $250,000 FHWA PC-15-03Replace warning signs Peoria County Various Throughout county $802,450 HSIP-FHWA PC-15-04Kickapoo Cr Road Bridge Peoria County Bridge Replacement Kickapoo Cr Rd over Kickapoo Cr $2,400,000 Major Bridge PC-15-05Hanna City Trail Peoria County Acquisition Bellevue to Middle Grove $616,000 Rec Trails PC-18-01Pioneer Parkway Extension Peoria New Construction Allen Road to Trigger Road $2,020,000 HPP PEO-15-01Signalization Peoria 40 Inter within Peoria Install flashing yellow turn signals $540,000 HSIP-FHWA PEO-15-02Nebraska Avenue Bridge Peoria Bridge Replacement Nebraska Ave over East Branch $640,000 HBRRP PEO-15-03Sheridan Rd Bridge Peoria Bridge Replacement Over Dry Run Creek $1,600,000 Major Bridge PEO-16-02MacArthur Hwy Bridge Peoria Bridge Replacement Bradley to Romeo B. Garrett $4,840,000 Major Bridge PEO-18-02Walnut Street Chillicothe Engineering Walnut St. $20,000 STP-Urban C-15-01Walnut Street Chillicothe Reconstruction Walnut St. $372,000 STP-Urban C-15-02Sheridan Road Pekin Bridge Replacement Sheridan Rd over Lick Creek $600,000 BRP PEK-15-01Detroit Avenue Morton Roadway Widening US 150 (Jackson) to 1600' South $1,866,000 STP-Urban MO-16-01Alta Lane/Radnor Road Peoria New Roundabout Int. of Alta Lane & Radnor Rd $1,400,000 FHWA-HSIP PEO-16-01Northmoor (4) Peoria Reconstruction Hamilton Rd to University $3,255,000 STP-Urban PEO-17-01Northmoor (5) Peoria Reconstruction Hamilton Rd to Allen Rd $3,220,000 STP-Urban PEO-18-01Bike Trail Ped Bridge East Peoria Ped Bridge Camp Street $278,927 TAP TAP-13-01Recreation Trail Washington Cruger Rd. Phase I Cruger Road $284,445 TAP TAP-14-01Multi-Use Trail Peoria Multi-Use Trail Northmoor Road $55,431 TAP TAP-14-02Recreation Trail Connection Washington Recreation Trail Washington Road $508,050 ITEP ITEP-13-01New sidewalks Morton Sidewalks Various Streets $211,300 SRTS SRTS-15-01New sidewalks Chillicothe Engineering Various Streets $8,400 SRTS SRTS-15-02Repair Sidewalks Washington Sidewalks School St. from IL Rt 8 to 625' S. $164,860 SRTS SRTS-15-05New sidewalks Chillicothe Sidewalks Various Streets $127,600 SRTS SRTS-16-01New sidewalks Germantown Hills Sidewalks Various Streets $160,000 SRTS SRTS-16-02Dirksen Parkway Peoria County Reconstruction Airport approach $2,800,000 STP-Urban NARiver Road / Camp Street Roundabout East Peoria Inter. Reconstruction Int. of River Rd and Camp St $2,433,130 STP-Urban NATOTAL $35,487,303
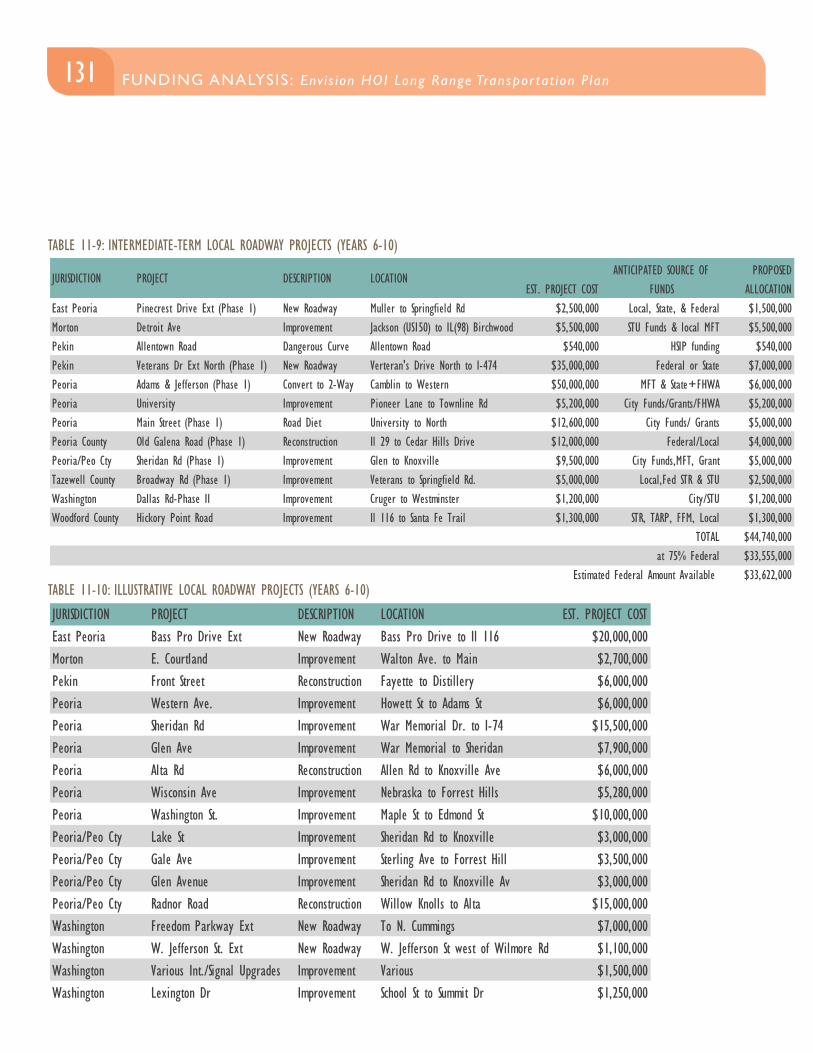
131FUNDING ANALYSIS : Env i s ion HOI Long Range Transpor tat ion P lan FUNDING ANALYSIS : Env i s ion HOI Long Range Transpor tat ion P lan
TABLE 11-9: INTERMEDIATE-TERM LOCAL ROADWAY PROJECTS (YEARS 6-10)
JURISDICTION PROJECT DESCRIPTION LOCATIONEST. PROJECT COST
ANTICIPATED SOURCE OF FUNDS
PROPOSED ALLOCATION
East Peoria Pinecrest Drive Ext (Phase 1) New Roadway Muller to Springfield Rd $2,500,000 Local, State, & Federal $1,500,000Morton Detroit Ave Improvement Jackson (US150) to IL(98) Birchwood $5,500,000 STU Funds & local MFT $5,500,000Pekin Allentown Road Dangerous Curve Allentown Road $540,000 HSIP funding $540,000Pekin Veterans Dr Ext North (Phase 1) New Roadway Verteran's Drive North to I-474 $35,000,000 Federal or State $7,000,000Peoria Adams & Jefferson (Phase 1) Convert to 2-Way Camblin to Western $50,000,000 MFT & State+FHWA $6,000,000Peoria University Improvement Pioneer Lane to Townline Rd $5,200,000 City Funds/Grants/FHWA $5,200,000Peoria Main Street (Phase 1) Road Diet University to North $12,600,000 City Funds/ Grants $5,000,000Peoria County Old Galena Road (Phase 1) Reconstruction Il 29 to Cedar Hills Drive $12,000,000 Federal/Local $4,000,000Peoria/Peo Cty Sheridan Rd (Phase 1) Improvement Glen to Knoxville $9,500,000 City Funds,MFT, Grant $5,000,000Tazewell County Broadway Rd (Phase 1) Improvement Veterans to Springfield Rd. $5,000,000 Local,Fed STR & STU $2,500,000Washington Dallas Rd-Phase II Improvement Cruger to Westminster $1,200,000 City/STU $1,200,000Woodford County Hickory Point Road Improvement Il 116 to Santa Fe Trail $1,300,000 STR, TARP, FFM, Local $1,300,000
TOTAL $44,740,000at 75% Federal $33,555,000
$33,622,000Estimated Federal Amount Available TABLE 11-10: ILLUSTRATIVE LOCAL ROADWAY PROJECTS (YEARS 6-10)
JURISDICTION PROJECT DESCRIPTION LOCATION EST. PROJECT COSTEast Peoria Bass Pro Drive Ext New Roadway Bass Pro Drive to Il 116 $20,000,000Morton E. Courtland Improvement Walton Ave. to Main $2,700,000Pekin Front Street Reconstruction Fayette to Distillery $6,000,000Peoria Western Ave. Improvement Howett St to Adams St $6,000,000Peoria Sheridan Rd Improvement War Memorial Dr. to I-74 $15,500,000Peoria Glen Ave Improvement War Memorial to Sheridan $7,900,000Peoria Alta Rd Reconstruction Allen Rd to Knoxville Ave $6,000,000Peoria Wisconsin Ave Improvement Nebraska to Forrest Hills $5,280,000Peoria Washington St. Improvement Maple St to Edmond St $10,000,000Peoria/Peo Cty Lake St Improvement Sheridan Rd to Knoxville $3,000,000Peoria/Peo Cty Gale Ave Improvement Sterling Ave to Forrest Hill $3,500,000Peoria/Peo Cty Glen Avenue Improvement Sheridan Rd to Knoxville Av $3,000,000Peoria/Peo Cty Radnor Road Reconstruction Willow Knolls to Alta $15,000,000Washington Freedom Parkway Ext New Roadway To N. Cummings $7,000,000Washington W. Jefferson St. Ext New Roadway W. Jefferson St west of Wilmore Rd $1,100,000Washington Various Int./Signal Upgrades Improvement Various $1,500,000Washington Lexington Dr Improvement School St to Summit Dr $1,250,000
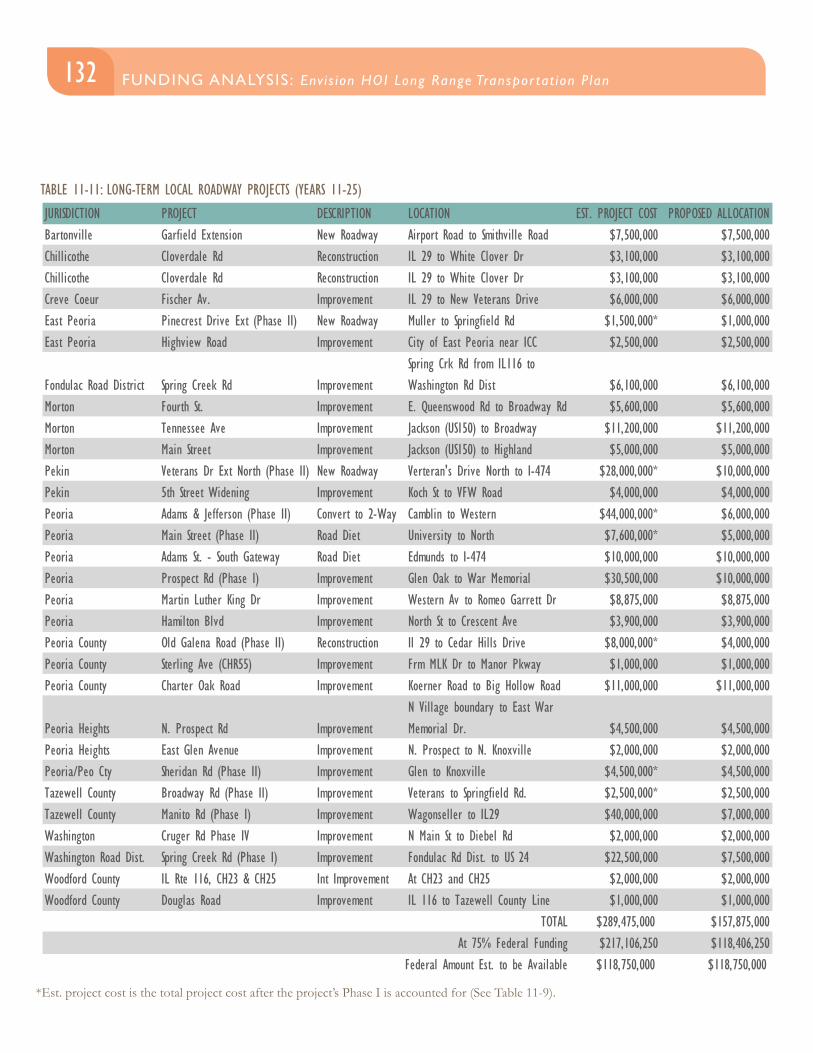
132 FUNDING ANALYSIS : Env i s ion HOI Long Range Transpor tat ion P lan
TABLE 11-11: LONG-TERM LOCAL ROADWAY PROJECTS (YEARS 11-25)
*Est. project cost is the total project cost after the project’s Phase I is accounted for (See Table 11-9).
JURISDICTION PROJECT DESCRIPTION LOCATION EST. PROJECT COST PROPOSED ALLOCATIONBartonville Garfield Extension New Roadway Airport Road to Smithville Road $7,500,000 $7,500,000Chillicothe Cloverdale Rd Reconstruction IL 29 to White Clover Dr $3,100,000 $3,100,000Chillicothe Cloverdale Rd Reconstruction IL 29 to White Clover Dr $3,100,000 $3,100,000Creve Coeur Fischer Av. Improvement IL 29 to New Veterans Drive $6,000,000 $6,000,000East Peoria Pinecrest Drive Ext (Phase II) New Roadway Muller to Springfield Rd $1,500,000* $1,000,000East Peoria Highview Road Improvement City of East Peoria near ICC $2,500,000 $2,500,000
Fondulac Road District Spring Creek Rd ImprovementSpring Crk Rd from IL116 to Washington Rd Dist $6,100,000 $6,100,000
Morton Fourth St. Improvement E. Queenswood Rd to Broadway Rd $5,600,000 $5,600,000Morton Tennessee Ave Improvement Jackson (US150) to Broadway $11,200,000 $11,200,000Morton Main Street Improvement Jackson (US150) to Highland $5,000,000 $5,000,000Pekin Veterans Dr Ext North (Phase II) New Roadway Verteran's Drive North to I-474 $28,000,000* $10,000,000Pekin 5th Street Widening Improvement Koch St to VFW Road $4,000,000 $4,000,000Peoria Adams & Jefferson (Phase II) Convert to 2-Way Camblin to Western $44,000,000* $6,000,000Peoria Main Street (Phase II) Road Diet University to North $7,600,000* $5,000,000Peoria Adams St. - South Gateway Road Diet Edmunds to I-474 $10,000,000 $10,000,000Peoria Prospect Rd (Phase I) Improvement Glen Oak to War Memorial $30,500,000 $10,000,000Peoria Martin Luther King Dr Improvement Western Av to Romeo Garrett Dr $8,875,000 $8,875,000Peoria Hamilton Blvd Improvement North St to Crescent Ave $3,900,000 $3,900,000Peoria County Old Galena Road (Phase II) Reconstruction Il 29 to Cedar Hills Drive $8,000,000* $4,000,000Peoria County Sterling Ave (CHR55) Improvement Frm MLK Dr to Manor Pkway $1,000,000 $1,000,000Peoria County Charter Oak Road Improvement Koerner Road to Big Hollow Road $11,000,000 $11,000,000
Peoria Heights N. Prospect Rd ImprovementN Village boundary to East War Memorial Dr. $4,500,000 $4,500,000
Peoria Heights East Glen Avenue Improvement N. Prospect to N. Knoxville $2,000,000 $2,000,000Peoria/Peo Cty Sheridan Rd (Phase II) Improvement Glen to Knoxville $4,500,000* $4,500,000Tazewell County Broadway Rd (Phase II) Improvement Veterans to Springfield Rd. $2,500,000* $2,500,000Tazewell County Manito Rd (Phase I) Improvement Wagonseller to IL29 $40,000,000 $7,000,000Washington Cruger Rd Phase IV Improvement N Main St to Diebel Rd $2,000,000 $2,000,000Washington Road Dist. Spring Creek Rd (Phase I) Improvement Fondulac Rd Dist. to US 24 $22,500,000 $7,500,000Woodford County IL Rte 116, CH23 & CH25 Int Improvement At CH23 and CH25 $2,000,000 $2,000,000Woodford County Douglas Road Improvement IL 116 to Tazewell County Line $1,000,000 $1,000,000
TOTAL $289,475,000 $157,875,000At 75% Federal Funding $217,106,250 $118,406,250
Federal Amount Est. to be Available $118,750,000 $118,750,000
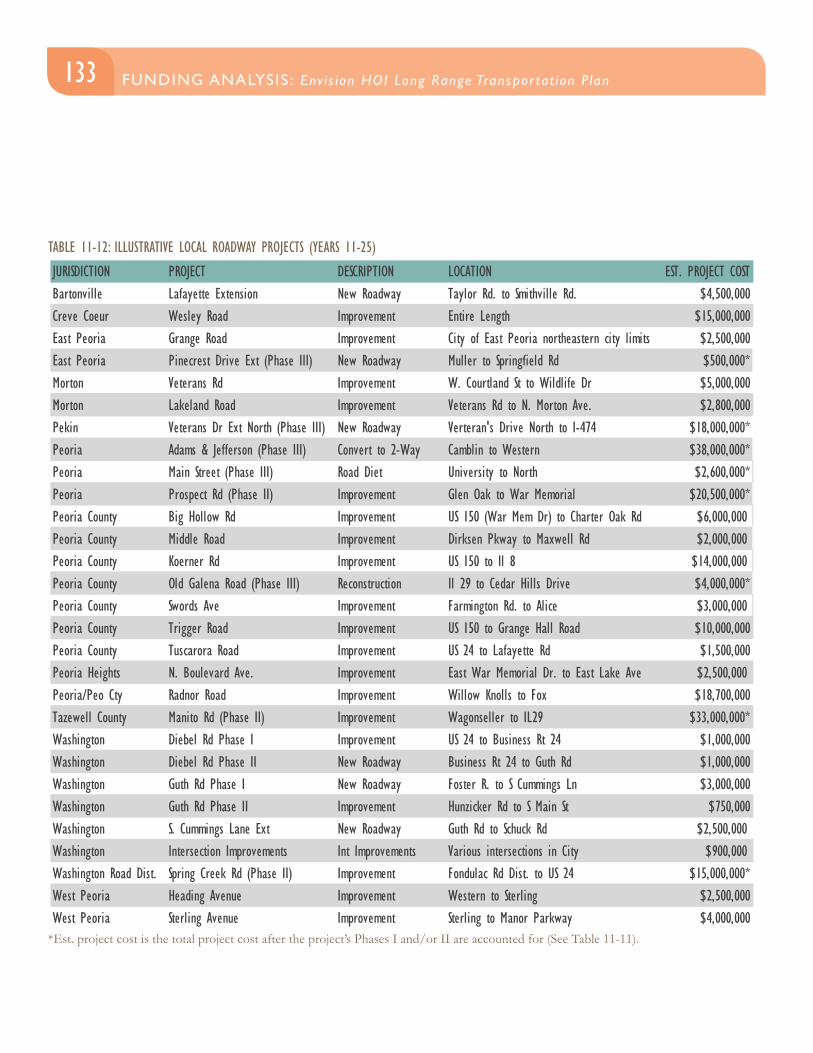
133FUNDING ANALYSIS : Env i s ion HOI Long Range Transpor tat ion P lan FUNDING ANALYSIS : Env i s ion HOI Long Range Transpor tat ion P lan
TABLE 11-12: ILLUSTRATIVE LOCAL ROADWAY PROJECTS (YEARS 11-25)
*Est. project cost is the total project cost after the project’s Phases I and/or II are accounted for (See Table 11-11).
JURISDICTION PROJECT DESCRIPTION LOCATION EST. PROJECT COSTBartonville Lafayette Extension New Roadway Taylor Rd. to Smithville Rd. $4,500,000Creve Coeur Wesley Road Improvement Entire Length $15,000,000East Peoria Grange Road Improvement City of East Peoria northeastern city limits $2,500,000East Peoria Pinecrest Drive Ext (Phase III) New Roadway Muller to Springfield Rd $500,000*Morton Veterans Rd Improvement W. Courtland St to Wildlife Dr $5,000,000Morton Lakeland Road Improvement Veterans Rd to N. Morton Ave. $2,800,000Pekin Veterans Dr Ext North (Phase III) New Roadway Verteran's Drive North to I-474 $18,000,000*Peoria Adams & Jefferson (Phase III) Convert to 2-Way Camblin to Western $38,000,000*Peoria Main Street (Phase III) Road Diet University to North $2,600,000*Peoria Prospect Rd (Phase II) Improvement Glen Oak to War Memorial $20,500,000*Peoria County Big Hollow Rd Improvement US 150 (War Mem Dr) to Charter Oak Rd $6,000,000Peoria County Middle Road Improvement Dirksen Pkway to Maxwell Rd $2,000,000Peoria County Koerner Rd Improvement US 150 to Il 8 $14,000,000Peoria County Old Galena Road (Phase III) Reconstruction Il 29 to Cedar Hills Drive $4,000,000*Peoria County Swords Ave Improvement Farmington Rd. to Alice $3,000,000Peoria County Trigger Road Improvement US 150 to Grange Hall Road $10,000,000Peoria County Tuscarora Road Improvement US 24 to Lafayette Rd $1,500,000Peoria Heights N. Boulevard Ave. Improvement East War Memorial Dr. to East Lake Ave $2,500,000Peoria/Peo Cty Radnor Road Improvement Willow Knolls to Fox $18,700,000Tazewell County Manito Rd (Phase II) Improvement Wagonseller to IL29 $33,000,000*Washington Diebel Rd Phase I Improvement US 24 to Business Rt 24 $1,000,000Washington Diebel Rd Phase II New Roadway Business Rt 24 to Guth Rd $1,000,000Washington Guth Rd Phase I New Roadway Foster R. to S Cummings Ln $3,000,000Washington Guth Rd Phase II Improvement Hunzicker Rd to S Main St $750,000Washington S. Cummings Lane Ext New Roadway Guth Rd to Schuck Rd $2,500,000Washington Intersection Improvements Int Improvements Various intersections in City $900,000Washington Road Dist. Spring Creek Rd (Phase II) Improvement Fondulac Rd Dist. to US 24 $15,000,000*West Peoria Heading Avenue Improvement Western to Sterling $2,500,000West Peoria Sterling Avenue Improvement Sterling to Manor Parkway $4,000,000
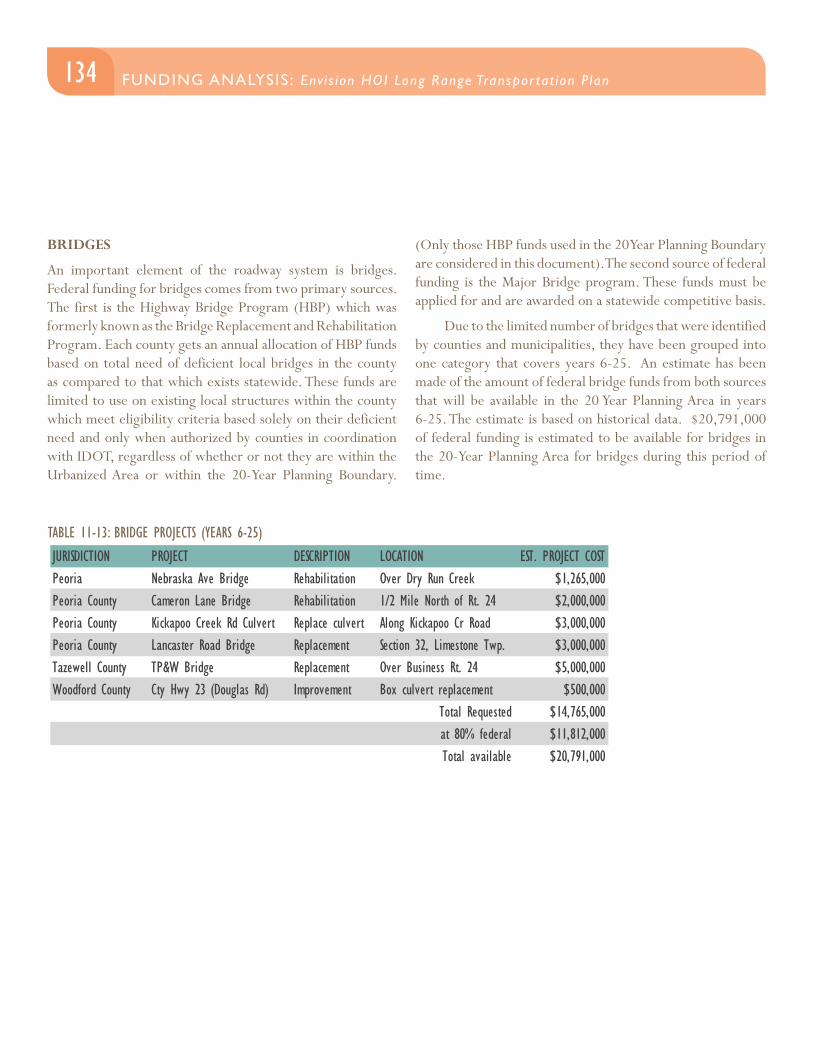
134 FUNDING ANALYSIS : Env i s ion HOI Long Range Transpor tat ion P lan
BRIDGES
An important element of the roadway system is bridges. Federal funding for bridges comes from two primary sources. The first is the Highway Bridge Program (HBP) which was formerly known as the Bridge Replacement and Rehabilitation Program. Each county gets an annual allocation of HBP funds based on total need of deficient local bridges in the county as compared to that which exists statewide. These funds are limited to use on existing local structures within the county which meet eligibility criteria based solely on their deficient need and only when authorized by counties in coordination with IDOT, regardless of whether or not they are within the Urbanized Area or within the 20-Year Planning Boundary.
TABLE 11-13: BRIDGE PROJECTS (YEARS 6-25)JURISDICTION PROJECT DESCRIPTION LOCATION EST. PROJECT COSTPeoria Nebraska Ave Bridge Rehabilitation Over Dry Run Creek $1,265,000Peoria County Cameron Lane Bridge Rehabilitation 1/2 Mile North of Rt. 24 $2,000,000Peoria County Kickapoo Creek Rd Culvert Replace culvert Along Kickapoo Cr Road $3,000,000Peoria County Lancaster Road Bridge Replacement Section 32, Limestone Twp. $3,000,000Tazewell County TP&W Bridge Replacement Over Business Rt. 24 $5,000,000Woodford County Cty Hwy 23 (Douglas Rd) Improvement Box culvert replacement $500,000
Total Requested $14,765,000at 80% federal $11,812,000Total available $20,791,000
(Only those HBP funds used in the 20 Year Planning Boundary are considered in this document). The second source of federal funding is the Major Bridge program. These funds must be applied for and are awarded on a statewide competitive basis.
Due to the limited number of bridges that were identified by counties and municipalities, they have been grouped into one category that covers years 6-25. An estimate has been made of the amount of federal bridge funds from both sources that will be available in the 20 Year Planning Area in years 6-25. The estimate is based on historical data. $20,791,000 of federal funding is estimated to be available for bridges in the 20-Year Planning Area for bridges during this period of time.
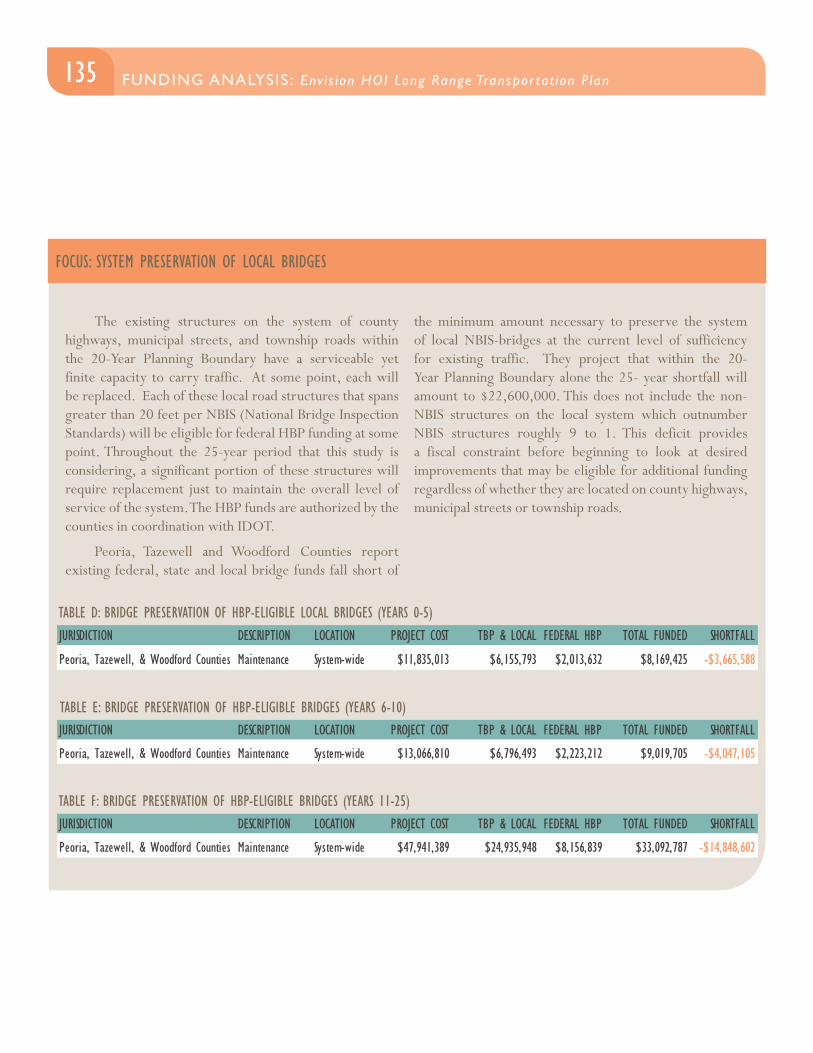
135FUNDING ANALYSIS : Env i s ion HOI Long Range Transpor tat ion P lan FUNDING ANALYSIS : Env i s ion HOI Long Range Transpor tat ion P lan
FOCUS: SYSTEM PRESERVATION OF LOCAL BRIDGES
The existing structures on the system of county highways, municipal streets, and township roads within the 20-Year Planning Boundary have a serviceable yet finite capacity to carry traffic. At some point, each will be replaced. Each of these local road structures that spans greater than 20 feet per NBIS (National Bridge Inspection Standards) will be eligible for federal HBP funding at some point. Throughout the 25-year period that this study is considering, a significant portion of these structures will require replacement just to maintain the overall level of service of the system. The HBP funds are authorized by the counties in coordination with IDOT.
Peoria, Tazewell and Woodford Counties report existing federal, state and local bridge funds fall short of
TABLE D: BRIDGE PRESERVATION OF HBP-ELIGIBLE LOCAL BRIDGES (YEARS 0-5)
the minimum amount necessary to preserve the system of local NBIS-bridges at the current level of sufficiency for existing traffic. They project that within the 20-Year Planning Boundary alone the 25- year shortfall will amount to $22,600,000. This does not include the non-NBIS structures on the local system which outnumber NBIS structures roughly 9 to 1. This deficit provides a fiscal constraint before beginning to look at desired improvements that may be eligible for additional funding regardless of whether they are located on county highways, municipal streets or township roads.
TABLE E: BRIDGE PRESERVATION OF HBP-ELIGIBLE BRIDGES (YEARS 6-10)
TABLE F: BRIDGE PRESERVATION OF HBP-ELIGIBLE BRIDGES (YEARS 11-25)
JURISDICTION DESCRIPTION LOCATION PROJECT COST TBP & LOCAL FEDERAL HBP TOTAL FUNDED SHORTFALL
Peoria, Tazewell, & Woodford Counties Maintenance System-wide $11,835,013 $6,155,793 $2,013,632 $8,169,425 -$3,665,588
JURISDICTION DESCRIPTION LOCATION PROJECT COST TBP & LOCAL FEDERAL HBP TOTAL FUNDED SHORTFALL
Peoria, Tazewell, & Woodford Counties Maintenance System-wide $13,066,810 $6,796,493 $2,223,212 $9,019,705 -$4,047,105
JURISDICTION DESCRIPTION LOCATION PROJECT COST TBP & LOCAL FEDERAL HBP TOTAL FUNDED SHORTFALL
Peoria, Tazewell, & Woodford Counties Maintenance System-wide $47,941,389 $24,935,948 $8,156,839 $33,092,787 -$14,848,602
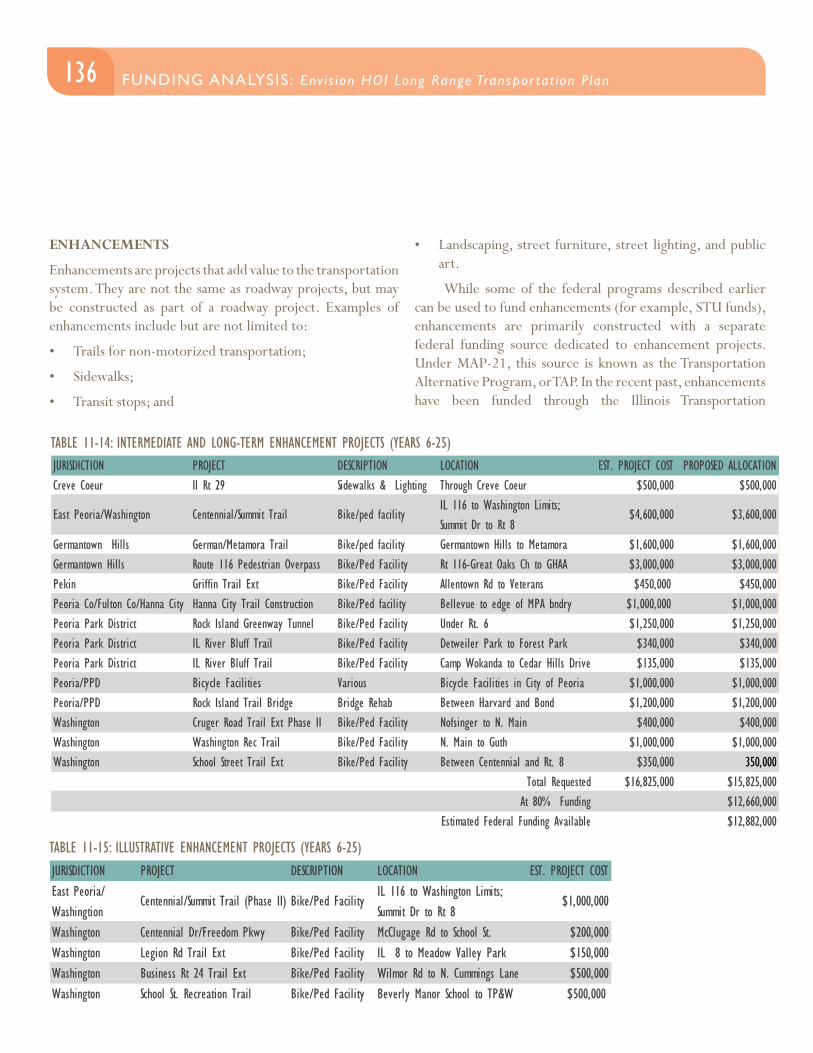
136 FUNDING ANALYSIS : Env i s ion HOI Long Range Transpor tat ion P lan
TABLE 11-14: INTERMEDIATE AND LONG-TERM ENHANCEMENT PROJECTS (YEARS 6-25)
TABLE 11-15: ILLUSTRATIVE ENHANCEMENT PROJECTS (YEARS 6-25)
ENHANCEMENTS
Enhancements are projects that add value to the transportation system. They are not the same as roadway projects, but may be constructed as part of a roadway project. Examples of enhancements include but are not limited to:
• Trails for non-motorized transportation;
• Sidewalks;
• Transit stops; and
JURISDICTION PROJECT DESCRIPTION LOCATION EST. PROJECT COSTEast Peoria/ Washingtion
Centennial/Summit Trail (Phase II) Bike/Ped FacilityIL 116 to Washington Limits; Summit Dr to Rt 8
$1,000,000
Washington Centennial Dr/Freedom Pkwy Bike/Ped Facility McClugage Rd to School St. $200,000Washington Legion Rd Trail Ext Bike/Ped Facility IL 8 to Meadow Valley Park $150,000Washington Business Rt 24 Trail Ext Bike/Ped Facility Wilmor Rd to N. Cummings Lane $500,000Washington School St. Recreation Trail Bike/Ped Facility Beverly Manor School to TP&W $500,000
JURISDICTION PROJECT DESCRIPTION LOCATION EST. PROJECT COST PROPOSED ALLOCATIONCreve Coeur Il Rt 29 Sidewalks & Lighting Through Creve Coeur $500,000 $500,000
East Peoria/Washington Centennial/Summit Trail Bike/ped facilityIL 116 to Washington Limits; Summit Dr to Rt 8
$4,600,000 $3,600,000
Germantown Hills German/Metamora Trail Bike/ped facility Germantown Hills to Metamora $1,600,000 $1,600,000Germantown Hills Route 116 Pedestrian Overpass Bike/Ped Facility Rt 116-Great Oaks Ch to GHAA $3,000,000 $3,000,000Pekin Griffin Trail Ext Bike/Ped Facility Allentown Rd to Veterans $450,000 $450,000Peoria Co/Fulton Co/Hanna City Hanna City Trail Construction Bike/Ped facility Bellevue to edge of MPA bndry $1,000,000 $1,000,000Peoria Park District Rock Island Greenway Tunnel Bike/Ped Facility Under Rt. 6 $1,250,000 $1,250,000Peoria Park District IL River Bluff Trail Bike/Ped Facility Detweiler Park to Forest Park $340,000 $340,000Peoria Park District IL River Bluff Trail Bike/Ped Facility Camp Wokanda to Cedar Hills Drive $135,000 $135,000Peoria/PPD Bicycle Facilities Various Bicycle Facilities in City of Peoria $1,000,000 $1,000,000Peoria/PPD Rock Island Trail Bridge Bridge Rehab Between Harvard and Bond $1,200,000 $1,200,000Washington Cruger Road Trail Ext Phase II Bike/Ped Facility Nofsinger to N. Main $400,000 $400,000Washington Washington Rec Trail Bike/Ped Facility N. Main to Guth $1,000,000 $1,000,000Washington School Street Trail Ext Bike/Ped Facility Between Centennial and Rt. 8 $350,000 350,000
Total Requested $16,825,000 $15,825,000At 80% Funding $12,660,000
Estimated Federal Funding Available $12,882,000
• Landscaping, street furniture, street lighting, and public art.
While some of the federal programs described earlier can be used to fund enhancements (for example, STU funds), enhancements are primarily constructed with a separate federal funding source dedicated to enhancement projects. Under MAP-21, this source is known as the Transportation Alternative Program, or TAP. In the recent past, enhancements have been funded through the Illinois Transportation
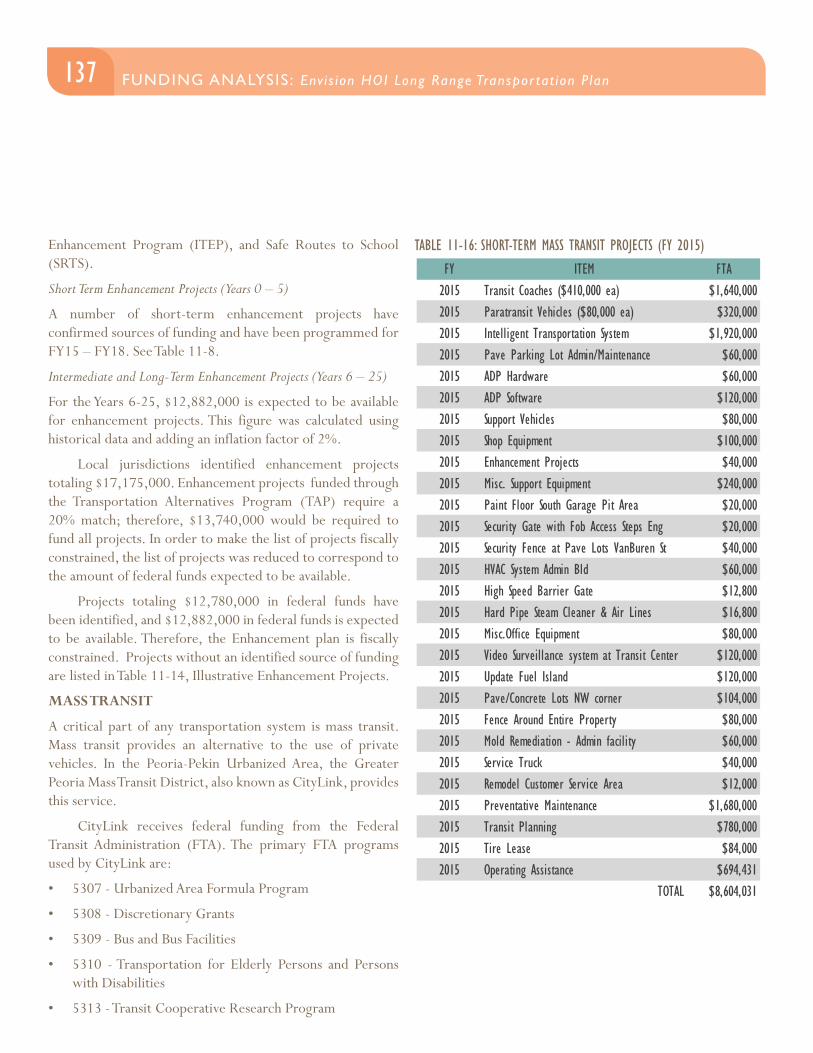
137FUNDING ANALYSIS : Env i s ion HOI Long Range Transpor tat ion P lan FUNDING ANALYSIS : Env i s ion HOI Long Range Transpor tat ion P lan
Enhancement Program (ITEP), and Safe Routes to School (SRTS).
Short Term Enhancement Projects (Years 0 – 5)
A number of short-term enhancement projects have confirmed sources of funding and have been programmed for FY15 – FY18. See Table 11-8.
Intermediate and Long-Term Enhancement Projects (Years 6 – 25)
For the Years 6-25, $12,882,000 is expected to be available for enhancement projects. This figure was calculated using historical data and adding an inflation factor of 2%.
Local jurisdictions identified enhancement projects totaling $17,175,000. Enhancement projects funded through the Transportation Alternatives Program (TAP) require a 20% match; therefore, $13,740,000 would be required to fund all projects. In order to make the list of projects fiscally constrained, the list of projects was reduced to correspond to the amount of federal funds expected to be available.
Projects totaling $12,780,000 in federal funds have been identified, and $12,882,000 in federal funds is expected to be available. Therefore, the Enhancement plan is fiscally constrained. Projects without an identified source of funding are listed in Table 11-14, Illustrative Enhancement Projects.
MASS TRANSIT
A critical part of any transportation system is mass transit. Mass transit provides an alternative to the use of private vehicles. In the Peoria-Pekin Urbanized Area, the Greater Peoria Mass Transit District, also known as CityLink, provides this service.
CityLink receives federal funding from the Federal Transit Administration (FTA). The primary FTA programs used by CityLink are:
• 5307 - Urbanized Area Formula Program
• 5308 - Discretionary Grants
• 5309 - Bus and Bus Facilities
• 5310 - Transportation for Elderly Persons and Persons with Disabilities
• 5313 - Transit Cooperative Research Program
TABLE 11-16: SHORT-TERM MASS TRANSIT PROJECTS (FY 2015)FY ITEM FTA2015 Transit Coaches ($410,000 ea) $1,640,0002015 Paratransit Vehicles ($80,000 ea) $320,0002015 Intelligent Transportation System $1,920,0002015 Pave Parking Lot Admin/Maintenance $60,0002015 ADP Hardware $60,0002015 ADP Software $120,0002015 Support Vehicles $80,0002015 Shop Equipment $100,0002015 Enhancement Projects $40,0002015 Misc. Support Equipment $240,0002015 Paint Floor South Garage Pit Area $20,0002015 Security Gate with Fob Access Steps Eng $20,0002015 Security Fence at Pave Lots VanBuren St $40,0002015 HVAC System Admin Bld $60,0002015 High Speed Barrier Gate $12,8002015 Hard Pipe Steam Cleaner & Air Lines $16,8002015 Misc.Office Equipment $80,0002015 Video Surveillance system at Transit Center $120,0002015 Update Fuel Island $120,0002015 Pave/Concrete Lots NW corner $104,0002015 Fence Around Entire Property $80,0002015 Mold Remediation - Admin facility $60,0002015 Service Truck $40,0002015 Remodel Customer Service Area $12,0002015 Preventative Maintenance $1,680,0002015 Transit Planning $780,0002015 Tire Lease $84,0002015 Operating Assistance $694,431
TOTAL $8,604,031
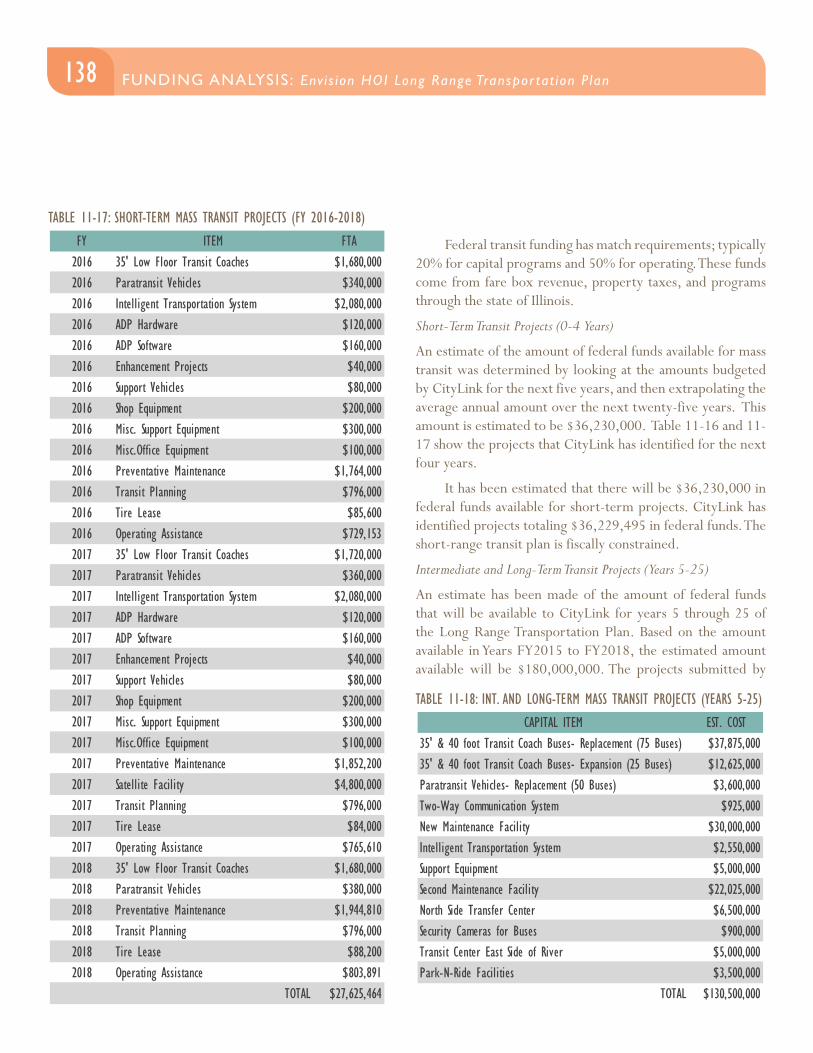
138 FUNDING ANALYSIS : Env i s ion HOI Long Range Transpor tat ion P lan
FY ITEM FTA2016 35' Low Floor Transit Coaches $1,680,0002016 Paratransit Vehicles $340,0002016 Intelligent Transportation System $2,080,0002016 ADP Hardware $120,0002016 ADP Software $160,0002016 Enhancement Projects $40,0002016 Support Vehicles $80,0002016 Shop Equipment $200,0002016 Misc. Support Equipment $300,0002016 Misc.Office Equipment $100,0002016 Preventative Maintenance $1,764,0002016 Transit Planning $796,0002016 Tire Lease $85,6002016 Operating Assistance $729,1532017 35' Low Floor Transit Coaches $1,720,0002017 Paratransit Vehicles $360,0002017 Intelligent Transportation System $2,080,0002017 ADP Hardware $120,0002017 ADP Software $160,0002017 Enhancement Projects $40,0002017 Support Vehicles $80,0002017 Shop Equipment $200,0002017 Misc. Support Equipment $300,0002017 Misc.Office Equipment $100,0002017 Preventative Maintenance $1,852,2002017 Satellite Facility $4,800,0002017 Transit Planning $796,0002017 Tire Lease $84,0002017 Operating Assistance $765,6102018 35' Low Floor Transit Coaches $1,680,0002018 Paratransit Vehicles $380,0002018 Preventative Maintenance $1,944,8102018 Transit Planning $796,0002018 Tire Lease $88,2002018 Operating Assistance $803,891
TOTAL $27,625,464
TABLE 11-17: SHORT-TERM MASS TRANSIT PROJECTS (FY 2016-2018)
Federal transit funding has match requirements; typically 20% for capital programs and 50% for operating. These funds come from fare box revenue, property taxes, and programs through the state of Illinois.
Short-Term Transit Projects (0-4 Years)
An estimate of the amount of federal funds available for mass transit was determined by looking at the amounts budgeted by CityLink for the next five years, and then extrapolating the average annual amount over the next twenty-five years. This amount is estimated to be $36,230,000. Table 11-16 and 11-17 show the projects that CityLink has identified for the next four years.
It has been estimated that there will be $36,230,000 in federal funds available for short-term projects. CityLink has identified projects totaling $36,229,495 in federal funds. The short-range transit plan is fiscally constrained.
Intermediate and Long-Term Transit Projects (Years 5-25)
An estimate has been made of the amount of federal funds that will be available to CityLink for years 5 through 25 of the Long Range Transportation Plan. Based on the amount available in Years FY2015 to FY2018, the estimated amount available will be $180,000,000. The projects submitted by
TABLE 11-18: INT. AND LONG-TERM MASS TRANSIT PROJECTS (YEARS 5-25)CAPITAL ITEM EST. COST
35' & 40 foot Transit Coach Buses- Replacement (75 Buses) $37,875,00035' & 40 foot Transit Coach Buses- Expansion (25 Buses) $12,625,000Paratransit Vehicles- Replacement (50 Buses) $3,600,000Two-Way Communication System $925,000New Maintenance Facility $30,000,000Intelligent Transportation System $2,550,000Support Equipment $5,000,000Second Maintenance Facility $22,025,000North Side Transfer Center $6,500,000Security Cameras for Buses $900,000Transit Center East Side of River $5,000,000Park-N-Ride Facilities $3,500,000
TOTAL $130,500,000
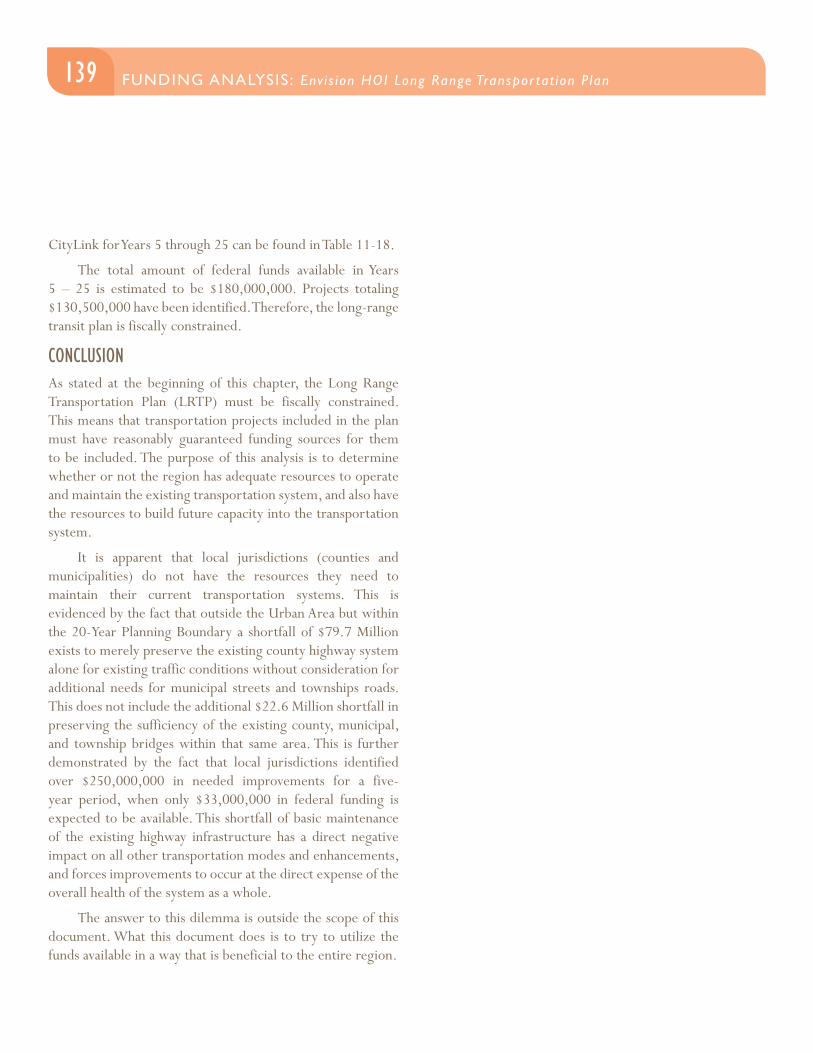
139FUNDING ANALYSIS : Env i s ion HOI Long Range Transpor tat ion P lan FUNDING ANALYSIS : Env i s ion HOI Long Range Transpor tat ion P lan
CityLink for Years 5 through 25 can be found in Table 11-18.
The total amount of federal funds available in Years 5 – 25 is estimated to be $180,000,000. Projects totaling $130,500,000 have been identified. Therefore, the long-range transit plan is fiscally constrained.
CONCLUSIONAs stated at the beginning of this chapter, the Long Range Transportation Plan (LRTP) must be fiscally constrained. This means that transportation projects included in the plan must have reasonably guaranteed funding sources for them to be included. The purpose of this analysis is to determine whether or not the region has adequate resources to operate and maintain the existing transportation system, and also have the resources to build future capacity into the transportation system.
It is apparent that local jurisdictions (counties and municipalities) do not have the resources they need to maintain their current transportation systems. This is evidenced by the fact that outside the Urban Area but within the 20-Year Planning Boundary a shortfall of $79.7 Million exists to merely preserve the existing county highway system alone for existing traffic conditions without consideration for additional needs for municipal streets and townships roads. This does not include the additional $22.6 Million shortfall in preserving the sufficiency of the existing county, municipal, and township bridges within that same area. This is further demonstrated by the fact that local jurisdictions identified over $250,000,000 in needed improvements for a five-year period, when only $33,000,000 in federal funding is expected to be available. This shortfall of basic maintenance of the existing highway infrastructure has a direct negative impact on all other transportation modes and enhancements, and forces improvements to occur at the direct expense of the overall health of the system as a whole.
The answer to this dilemma is outside the scope of this document. What this document does is to try to utilize the funds available in a way that is beneficial to the entire region.

140 FUNDING ANALYSIS : Env i s ion HOI Long Range Transpor tat ion P lan
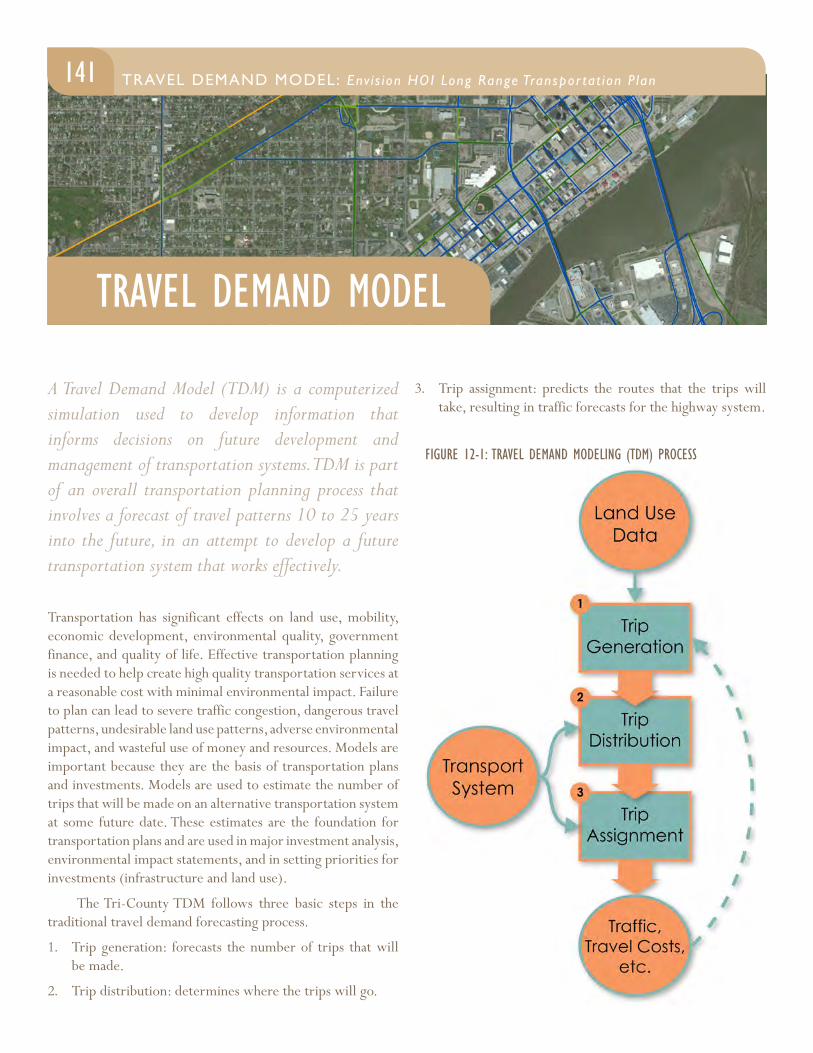
TRAVEL DEMAND MODEL
141 TRAVEL DEMAND MODEL: Env i s ion HOI Long Range Transpor tat ion P lanFUNDING ANALYSIS : Env i s ion HOI Long Range Transpor tat ion P lan
A Travel Demand Model (TDM) is a computerized simulation used to develop information that informs decisions on future development and management of transportation systems. TDM is part of an overall transportation planning process that involves a forecast of travel patterns 10 to 25 years into the future, in an attempt to develop a future transportation system that works effectively.
Transportation has significant effects on land use, mobility, economic development, environmental quality, government finance, and quality of life. Effective transportation planning is needed to help create high quality transportation services at a reasonable cost with minimal environmental impact. Failure to plan can lead to severe traffic congestion, dangerous travel patterns, undesirable land use patterns, adverse environmental impact, and wasteful use of money and resources. Models are important because they are the basis of transportation plans and investments. Models are used to estimate the number of trips that will be made on an alternative transportation system at some future date. These estimates are the foundation for transportation plans and are used in major investment analysis, environmental impact statements, and in setting priorities for investments (infrastructure and land use).
The Tri-County TDM follows three basic steps in the traditional travel demand forecasting process.
1. Trip generation: forecasts the number of trips that will be made.
2. Trip distribution: determines where the trips will go.
3. Trip assignment: predicts the routes that the trips will take, resulting in traffic forecasts for the highway system.
FIGURE 12-1: TRAVEL DEMAND MODELING (TDM) PROCESS
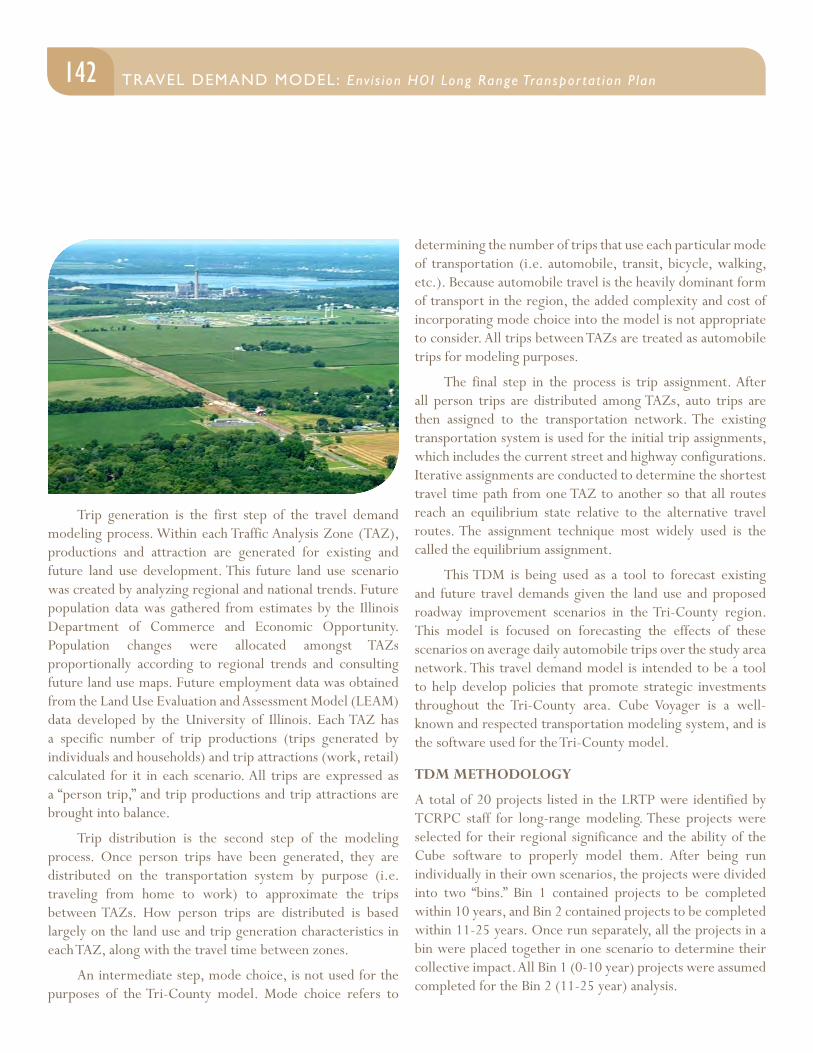
142 TRAVEL DEMAND MODEL: Env i s ion HOI Long Range Transpor tat ion P lan
Trip generation is the first step of the travel demand modeling process. Within each Traffic Analysis Zone (TAZ), productions and attraction are generated for existing and future land use development. This future land use scenario was created by analyzing regional and national trends. Future population data was gathered from estimates by the Illinois Department of Commerce and Economic Opportunity. Population changes were allocated amongst TAZs proportionally according to regional trends and consulting future land use maps. Future employment data was obtained from the Land Use Evaluation and Assessment Model (LEAM) data developed by the University of Illinois. Each TAZ has a specific number of trip productions (trips generated by individuals and households) and trip attractions (work, retail) calculated for it in each scenario. All trips are expressed as a “person trip,” and trip productions and trip attractions are brought into balance.
Trip distribution is the second step of the modeling process. Once person trips have been generated, they are distributed on the transportation system by purpose (i.e. traveling from home to work) to approximate the trips between TAZs. How person trips are distributed is based largely on the land use and trip generation characteristics in each TAZ, along with the travel time between zones.
An intermediate step, mode choice, is not used for the purposes of the Tri-County model. Mode choice refers to
determining the number of trips that use each particular mode of transportation (i.e. automobile, transit, bicycle, walking, etc.). Because automobile travel is the heavily dominant form of transport in the region, the added complexity and cost of incorporating mode choice into the model is not appropriate to consider. All trips between TAZs are treated as automobile trips for modeling purposes.
The final step in the process is trip assignment. After all person trips are distributed among TAZs, auto trips are then assigned to the transportation network. The existing transportation system is used for the initial trip assignments, which includes the current street and highway configurations. Iterative assignments are conducted to determine the shortest travel time path from one TAZ to another so that all routes reach an equilibrium state relative to the alternative travel routes. The assignment technique most widely used is the called the equilibrium assignment.
This TDM is being used as a tool to forecast existing and future travel demands given the land use and proposed roadway improvement scenarios in the Tri-County region. This model is focused on forecasting the effects of these scenarios on average daily automobile trips over the study area network. This travel demand model is intended to be a tool to help develop policies that promote strategic investments throughout the Tri-County area. Cube Voyager is a well-known and respected transportation modeling system, and is the software used for the Tri-County model.
TDM METHODOLOGY
A total of 20 projects listed in the LRTP were identified by TCRPC staff for long-range modeling. These projects were selected for their regional significance and the ability of the Cube software to properly model them. After being run individually in their own scenarios, the projects were divided into two “bins.” Bin 1 contained projects to be completed within 10 years, and Bin 2 contained projects to be completed within 11-25 years. Once run separately, all the projects in a bin were placed together in one scenario to determine their collective impact. All Bin 1 (0-10 year) projects were assumed completed for the Bin 2 (11-25 year) analysis.
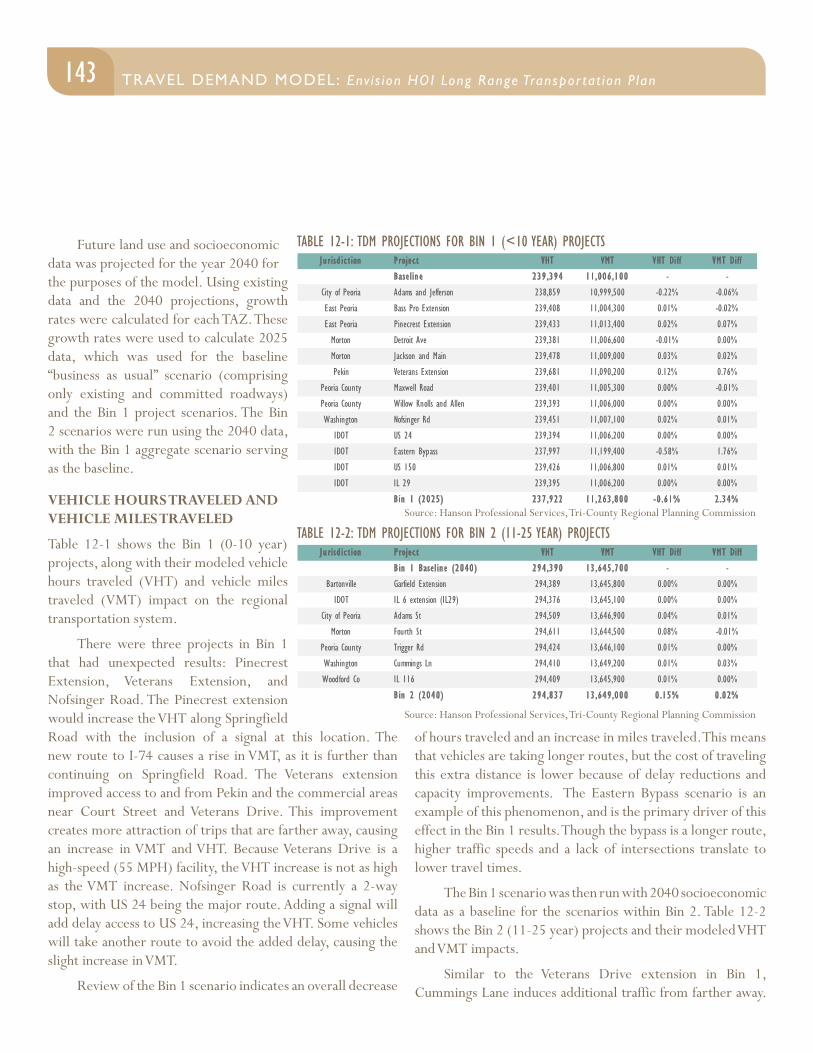
143TRAVEL DEMAND MODEL: Env i s ion HOI Long Range Transpor tat ion P lan TRAVEL DEMAND MODEL: Env i s ion HOI Long Range Transpor tat ion P lan
Future land use and socioeconomic data was projected for the year 2040 for the purposes of the model. Using existing data and the 2040 projections, growth rates were calculated for each TAZ. These growth rates were used to calculate 2025 data, which was used for the baseline “business as usual” scenario (comprising only existing and committed roadways) and the Bin 1 project scenarios. The Bin 2 scenarios were run using the 2040 data, with the Bin 1 aggregate scenario serving as the baseline.
VEHICLE HOURS TRAVELED AND VEHICLE MILES TRAVELED
Table 12-1 shows the Bin 1 (0-10 year) projects, along with their modeled vehicle hours traveled (VHT) and vehicle miles traveled (VMT) impact on the regional transportation system.
There were three projects in Bin 1 that had unexpected results: Pinecrest Extension, Veterans Extension, and Nofsinger Road. The Pinecrest extension would increase the VHT along Springfield Road with the inclusion of a signal at this location. The new route to I-74 causes a rise in VMT, as it is further than continuing on Springfield Road. The Veterans extension improved access to and from Pekin and the commercial areas near Court Street and Veterans Drive. This improvement creates more attraction of trips that are farther away, causing an increase in VMT and VHT. Because Veterans Drive is a high-speed (55 MPH) facility, the VHT increase is not as high as the VMT increase. Nofsinger Road is currently a 2-way stop, with US 24 being the major route. Adding a signal will add delay access to US 24, increasing the VHT. Some vehicles will take another route to avoid the added delay, causing the slight increase in VMT.
Review of the Bin 1 scenario indicates an overall decrease
of hours traveled and an increase in miles traveled. This means that vehicles are taking longer routes, but the cost of traveling this extra distance is lower because of delay reductions and capacity improvements. The Eastern Bypass scenario is an example of this phenomenon, and is the primary driver of this effect in the Bin 1 results. Though the bypass is a longer route, higher traffic speeds and a lack of intersections translate to lower travel times.
The Bin 1 scenario was then run with 2040 socioeconomic data as a baseline for the scenarios within Bin 2. Table 12-2 shows the Bin 2 (11-25 year) projects and their modeled VHT and VMT impacts.
Similar to the Veterans Drive extension in Bin 1, Cummings Lane induces additional traffic from farther away.
J u risd ic t ion Projec t VHT VMT VHT Diff VMT Diff
Base l in e 239 ,394 11 ,006 ,100 - -
City of Peoria Adams and Jefferson 238,859 10,999,500 -0.22% -0.06%
East Peoria Bass Pro Extension 239,408 11,004,300 0.01% -0.02%
East Peoria Pinecrest Extension 239,433 11,013,400 0.02% 0.07%
Morton Detroit Ave 239,381 11,006,600 -0.01% 0.00%
Morton Jackson and Main 239,478 11,009,000 0.03% 0.02%
Pekin Veterans Extension 239,681 11,090,200 0.12% 0.76%
Peoria County Maxwell Road 239,401 11,005,300 0.00% -0.01%
Peoria County Willow Knolls and Allen 239,393 11,006,000 0.00% 0.00%
Washington Nofsinger Rd 239,451 11,007,100 0.02% 0.01%
IDOT US 24 239,394 11,006,200 0.00% 0.00%
IDOT Eastern Bypass 237,997 11,199,400 -0.58% 1.76%
IDOT US 150 239,426 11,006,800 0.01% 0.01%
IDOT IL 29 239,395 11,006,200 0.00% 0.00%
Bin 1 (2025 ) 237 ,922 11 ,263 ,800 -0 .61% 2 .34%
Ju risd ic t ion Projec t VHT VMT VHT Diff VMT Diff
B in 1 Base l in e (2040 ) 294 ,390 13 ,645 ,700 - -
Bartonville Garfield Extension 294,389 13,645,800 0.00% 0.00%
IDOT IL 6 extension (IL29) 294,376 13,645,100 0.00% 0.00%
City of Peoria Adams St 294,509 13,646,900 0.04% 0.01%
Morton Fourth St 294,611 13,644,500 0.08% -0.01%
Peoria County Trigger Rd 294,424 13,646,100 0.01% 0.00%
Washington Cummings Ln 294,410 13,649,200 0.01% 0.03%
Woodford Co IL 116 294,409 13,645,900 0.01% 0.00%
Bin 2 (2040 ) 294 ,837 13 ,649 ,000 0 .15% 0 .02%
TABLE 12-1: TDM PROJECTIONS FOR BIN 1 (<10 YEAR) PROJECTS
TABLE 12-2: TDM PROJECTIONS FOR BIN 2 (11-25 YEAR) PROJECTSSource: Hanson Professional Services, Tri-County Regional Planning Commission
Source: Hanson Professional Services, Tri-County Regional Planning Commission
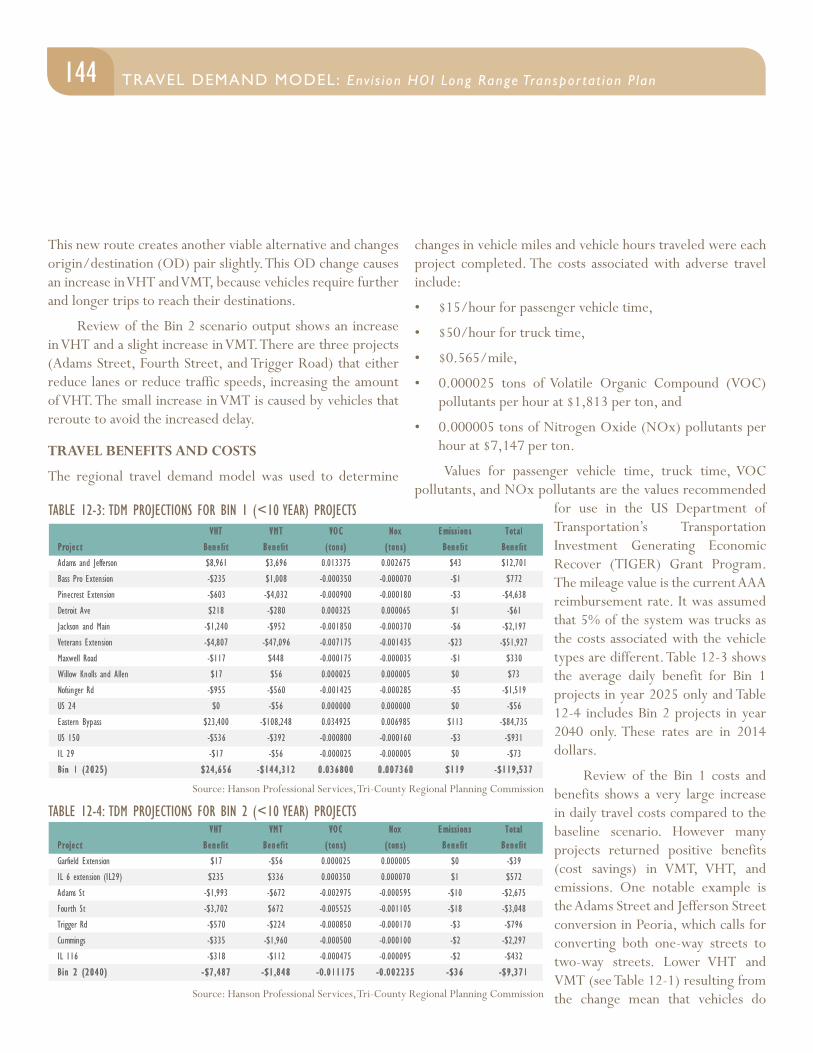
144 TRAVEL DEMAND MODEL: Env i s ion HOI Long Range Transpor tat ion P lan
This new route creates another viable alternative and changes origin/destination (OD) pair slightly. This OD change causes an increase in VHT and VMT, because vehicles require further and longer trips to reach their destinations.
Review of the Bin 2 scenario output shows an increase in VHT and a slight increase in VMT. There are three projects (Adams Street, Fourth Street, and Trigger Road) that either reduce lanes or reduce traffic speeds, increasing the amount of VHT. The small increase in VMT is caused by vehicles that reroute to avoid the increased delay.
TRAVEL BENEFITS AND COSTS
The regional travel demand model was used to determine
changes in vehicle miles and vehicle hours traveled were each project completed. The costs associated with adverse travel include:
• $15/hour for passenger vehicle time,
• $50/hour for truck time,
• $0.565/mile,
• 0.000025 tons of Volatile Organic Compound (VOC) pollutants per hour at $1,813 per ton, and
• 0.000005 tons of Nitrogen Oxide (NOx) pollutants per hour at $7,147 per ton.
Values for passenger vehicle time, truck time, VOC pollutants, and NOx pollutants are the values recommended
for use in the US Department of Transportation’s Transportation Investment Generating Economic Recover (TIGER) Grant Program. The mileage value is the current AAA reimbursement rate. It was assumed that 5% of the system was trucks as the costs associated with the vehicle types are different. Table 12-3 shows the average daily benefit for Bin 1 projects in year 2025 only and Table 12-4 includes Bin 2 projects in year 2040 only. These rates are in 2014 dollars.
Review of the Bin 1 costs and benefits shows a very large increase in daily travel costs compared to the baseline scenario. However many projects returned positive benefits (cost savings) in VMT, VHT, and emissions. One notable example is the Adams Street and Jefferson Street conversion in Peoria, which calls for converting both one-way streets to two-way streets. Lower VHT and VMT (see Table 12-1) resulting from the change mean that vehicles do
VHT VMT VO C Nox Emission s Total
P rojec t Ben efit Ben efit ( ton s) ( ton s) Ben efit Ben efit
Garfield Extension $17 -$56 0.000025 0.000005 $0 -$39
IL 6 extension (IL29) $235 $336 0.000350 0.000070 $1 $572
Adams St -$1,993 -$672 -0.002975 -0.000595 -$10 -$2,675
Fourth St -$3,702 $672 -0.005525 -0.001105 -$18 -$3,048
Trigger Rd -$570 -$224 -0.000850 -0.000170 -$3 -$796
Cummings -$335 -$1,960 -0.000500 -0.000100 -$2 -$2,297
IL 116 -$318 -$112 -0.000475 -0.000095 -$2 -$432
Bin 2 (2040 ) -$7 ,487 -$1 ,848 -0 .011175 -0 .002235 -$36 -$9 ,371
VHT VMT VO C Nox Emission s Total
P rojec t Ben efit Ben efit ( ton s) ( ton s) Ben efit Ben efit
Adams and Jefferson $8,961 $3,696 0.013375 0.002675 $43 $12,701
Bass Pro Extension -$235 $1,008 -0.000350 -0.000070 -$1 $772
Pinecrest Extension -$603 -$4,032 -0.000900 -0.000180 -$3 -$4,638
Detroit Ave $218 -$280 0.000325 0.000065 $1 -$61
Jackson and Main -$1,240 -$952 -0.001850 -0.000370 -$6 -$2,197
Veterans Extension -$4,807 -$47,096 -0.007175 -0.001435 -$23 -$51,927
Maxwell Road -$117 $448 -0.000175 -0.000035 -$1 $330
Willow Knolls and Allen $17 $56 0.000025 0.000005 $0 $73
Nofsinger Rd -$955 -$560 -0.001425 -0.000285 -$5 -$1,519
US 24 $0 -$56 0.000000 0.000000 $0 -$56
Eastern Bypass $23,400 -$108,248 0.034925 0.006985 $113 -$84,735
US 150 -$536 -$392 -0.000800 -0.000160 -$3 -$931
IL 29 -$17 -$56 -0.000025 -0.000005 $0 -$73
Bin 1 (2025 ) $24 ,656 -$144 ,312 0 .036800 0 .007360 $119 -$119 ,537
TABLE 12-4: TDM PROJECTIONS FOR BIN 2 (<10 YEAR) PROJECTS
TABLE 12-3: TDM PROJECTIONS FOR BIN 1 (<10 YEAR) PROJECTS
Source: Hanson Professional Services, Tri-County Regional Planning Commission
Source: Hanson Professional Services, Tri-County Regional Planning Commission
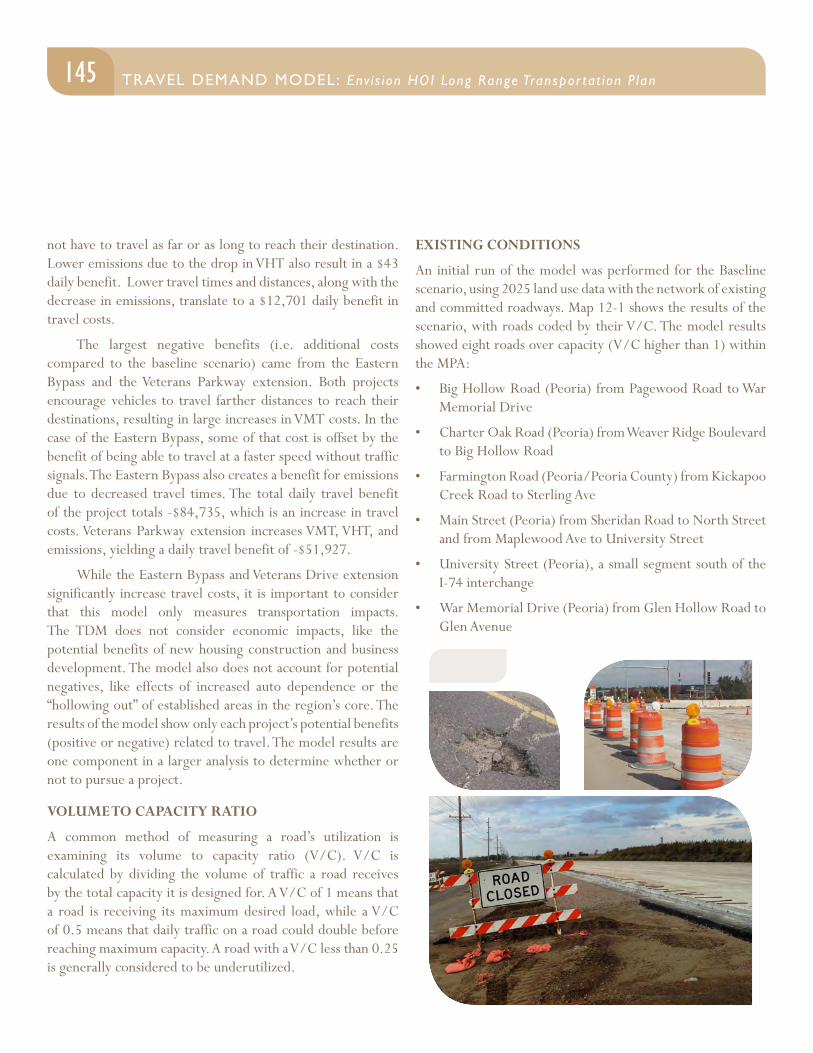
145TRAVEL DEMAND MODEL: Env i s ion HOI Long Range Transpor tat ion P lan TRAVEL DEMAND MODEL: Env i s ion HOI Long Range Transpor tat ion P lan
not have to travel as far or as long to reach their destination. Lower emissions due to the drop in VHT also result in a $43 daily benefit. Lower travel times and distances, along with the decrease in emissions, translate to a $12,701 daily benefit in travel costs.
The largest negative benefits (i.e. additional costs compared to the baseline scenario) came from the Eastern Bypass and the Veterans Parkway extension. Both projects encourage vehicles to travel farther distances to reach their destinations, resulting in large increases in VMT costs. In the case of the Eastern Bypass, some of that cost is offset by the benefit of being able to travel at a faster speed without traffic signals. The Eastern Bypass also creates a benefit for emissions due to decreased travel times. The total daily travel benefit of the project totals -$84,735, which is an increase in travel costs. Veterans Parkway extension increases VMT, VHT, and emissions, yielding a daily travel benefit of -$51,927.
While the Eastern Bypass and Veterans Drive extension significantly increase travel costs, it is important to consider that this model only measures transportation impacts. The TDM does not consider economic impacts, like the potential benefits of new housing construction and business development. The model also does not account for potential negatives, like effects of increased auto dependence or the “hollowing out” of established areas in the region’s core. The results of the model show only each project’s potential benefits (positive or negative) related to travel. The model results are one component in a larger analysis to determine whether or not to pursue a project.
VOLUME TO CAPACITY RATIO
A common method of measuring a road’s utilization is examining its volume to capacity ratio (V/C). V/C is calculated by dividing the volume of traffic a road receives by the total capacity it is designed for. A V/C of 1 means that a road is receiving its maximum desired load, while a V/C of 0.5 means that daily traffic on a road could double before reaching maximum capacity. A road with a V/C less than 0.25 is generally considered to be underutilized.
EXISTING CONDITIONS
An initial run of the model was performed for the Baseline scenario, using 2025 land use data with the network of existing and committed roadways. Map 12-1 shows the results of the scenario, with roads coded by their V/C. The model results showed eight roads over capacity (V/C higher than 1) within the MPA:
• Big Hollow Road (Peoria) from Pagewood Road to War Memorial Drive
• Charter Oak Road (Peoria) from Weaver Ridge Boulevard to Big Hollow Road
• Farmington Road (Peoria/Peoria County) from Kickapoo Creek Road to Sterling Ave
• Main Street (Peoria) from Sheridan Road to North Street and from Maplewood Ave to University Street
• University Street (Peoria), a small segment south of the I-74 interchange
• War Memorial Drive (Peoria) from Glen Hollow Road to Glen Avenue
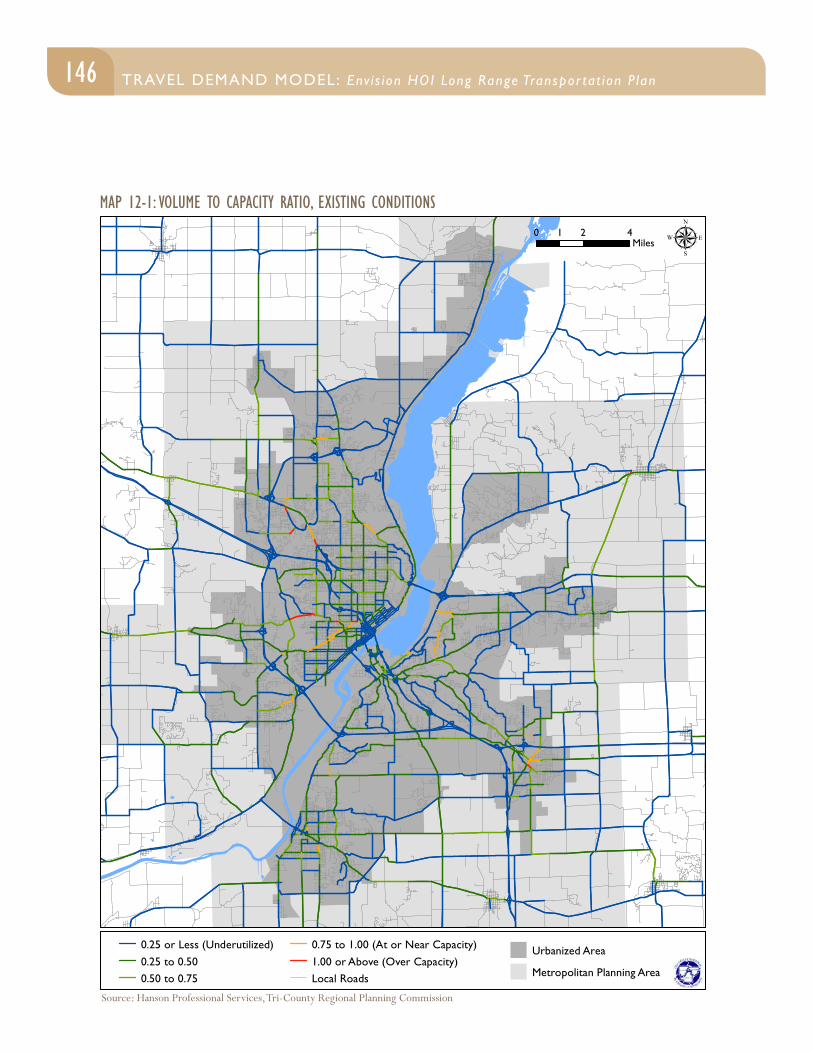
146 TRAVEL DEMAND MODEL: Env i s ion HOI Long Range Transpor tat ion P lan
Volume to Capacity Ratio Existing Conditions
µ0 2 41Miles
0.25 or Less (Underutilized)0.25 to 0.500.50 to 0.75
0.75 to 1.00 (At or Near Capacity)1.00 or Above (Over Capacity)Local Roads
Urbanized Area
Metropolitan Planning Area
Hanson Professional ServicesTri-County Regional Planning Commission
Sources:MAP 12-1: VOLUME TO CAPACITY RATIO, EXISTING CONDITIONS
Source: Hanson Professional Services, Tri-County Regional Planning Commission
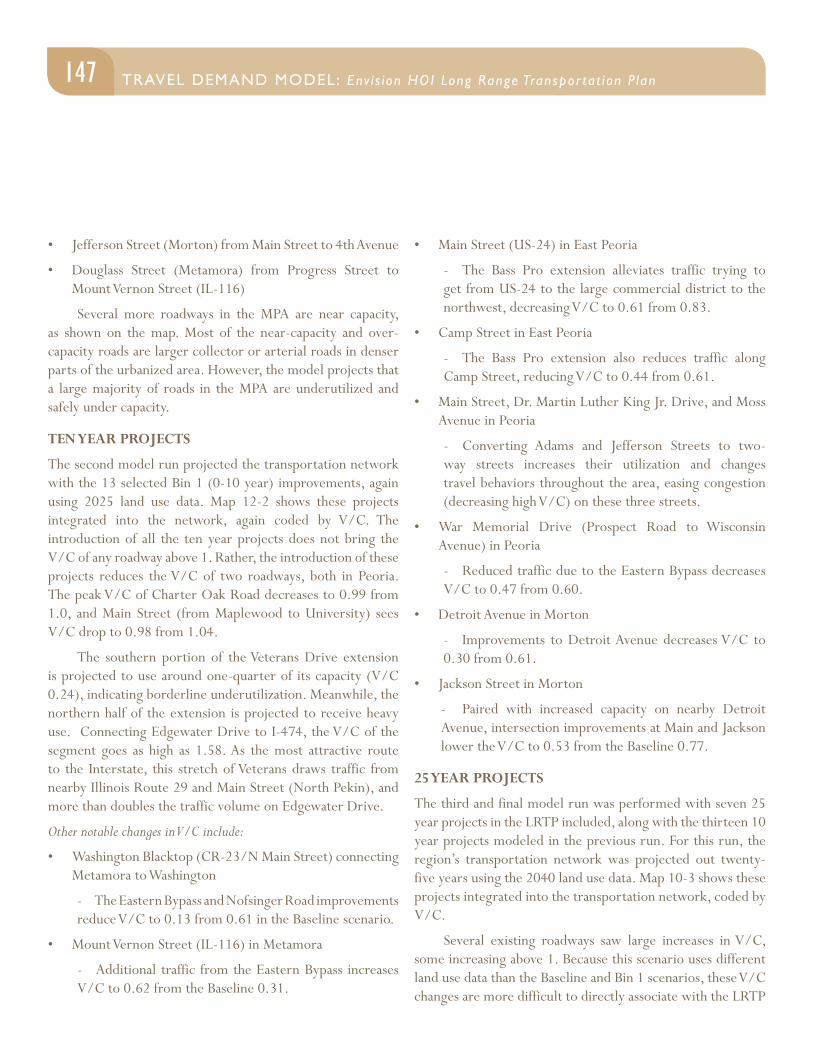
147TRAVEL DEMAND MODEL: Env i s ion HOI Long Range Transpor tat ion P lan TRAVEL DEMAND MODEL: Env i s ion HOI Long Range Transpor tat ion P lan
• Jefferson Street (Morton) from Main Street to 4th Avenue
• Douglass Street (Metamora) from Progress Street to Mount Vernon Street (IL-116)
Several more roadways in the MPA are near capacity, as shown on the map. Most of the near-capacity and over-capacity roads are larger collector or arterial roads in denser parts of the urbanized area. However, the model projects that a large majority of roads in the MPA are underutilized and safely under capacity.
TEN YEAR PROJECTS
The second model run projected the transportation network with the 13 selected Bin 1 (0-10 year) improvements, again using 2025 land use data. Map 12-2 shows these projects integrated into the network, again coded by V/C. The introduction of all the ten year projects does not bring the V/C of any roadway above 1. Rather, the introduction of these projects reduces the V/C of two roadways, both in Peoria. The peak V/C of Charter Oak Road decreases to 0.99 from 1.0, and Main Street (from Maplewood to University) sees V/C drop to 0.98 from 1.04.
The southern portion of the Veterans Drive extension is projected to use around one-quarter of its capacity (V/C 0.24), indicating borderline underutilization. Meanwhile, the northern half of the extension is projected to receive heavy use. Connecting Edgewater Drive to I-474, the V/C of the segment goes as high as 1.58. As the most attractive route to the Interstate, this stretch of Veterans draws traffic from nearby Illinois Route 29 and Main Street (North Pekin), and more than doubles the traffic volume on Edgewater Drive.
Other notable changes in V/C include:
• Washington Blacktop (CR-23/N Main Street) connecting Metamora to Washington
- The Eastern Bypass and Nofsinger Road improvements reduce V/C to 0.13 from 0.61 in the Baseline scenario.
• Mount Vernon Street (IL-116) in Metamora
- Additional traffic from the Eastern Bypass increases V/C to 0.62 from the Baseline 0.31.
• Main Street (US-24) in East Peoria
- The Bass Pro extension alleviates traffic trying to get from US-24 to the large commercial district to the northwest, decreasing V/C to 0.61 from 0.83.
• Camp Street in East Peoria
- The Bass Pro extension also reduces traffic along Camp Street, reducing V/C to 0.44 from 0.61.
• Main Street, Dr. Martin Luther King Jr. Drive, and Moss Avenue in Peoria
- Converting Adams and Jefferson Streets to two-way streets increases their utilization and changes travel behaviors throughout the area, easing congestion (decreasing high V/C) on these three streets.
• War Memorial Drive (Prospect Road to Wisconsin Avenue) in Peoria
- Reduced traffic due to the Eastern Bypass decreases V/C to 0.47 from 0.60.
• Detroit Avenue in Morton
- Improvements to Detroit Avenue decreases V/C to 0.30 from 0.61.
• Jackson Street in Morton
- Paired with increased capacity on nearby Detroit Avenue, intersection improvements at Main and Jackson lower the V/C to 0.53 from the Baseline 0.77.
25 YEAR PROJECTS
The third and final model run was performed with seven 25 year projects in the LRTP included, along with the thirteen 10 year projects modeled in the previous run. For this run, the region’s transportation network was projected out twenty-five years using the 2040 land use data. Map 10-3 shows these projects integrated into the transportation network, coded by V/C.
Several existing roadways saw large increases in V/C, some increasing above 1. Because this scenario uses different land use data than the Baseline and Bin 1 scenarios, these V/C changes are more difficult to directly associate with the LRTP
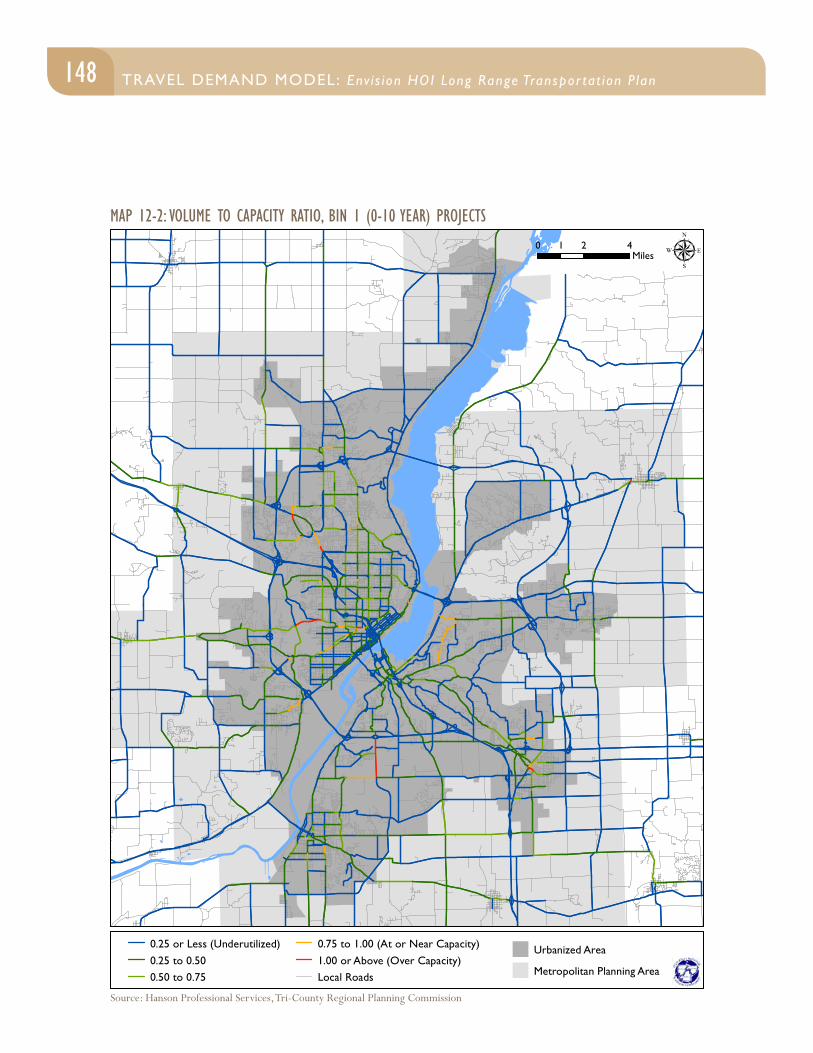
148 TRAVEL DEMAND MODEL: Env i s ion HOI Long Range Transpor tat ion P lan
Volume to Capacity Ratio Bin 1 (0-10 Year) Projects
µ0 2 41Miles
0.25 or Less (Underutilized)0.25 to 0.500.50 to 0.75
0.75 to 1.00 (At or Near Capacity)1.00 or Above (Over Capacity)Local Roads
Urbanized Area
Metropolitan Planning Area
Hanson Professional ServicesTri-County Regional Planning Commission
Sources:MAP 12-2: VOLUME TO CAPACITY RATIO, BIN 1 (0-10 YEAR) PROJECTS
Source: Hanson Professional Services, Tri-County Regional Planning Commission
149TRAVEL DEMAND MODEL: Env i s ion HOI Long Range Transpor tat ion P lan TRAVEL DEMAND MODEL: Env i s ion HOI Long Range Transpor tat ion P lan
projects introduced for this run. For this reason, a direct comparison is not appropriate. However, this analysis shows how the LRTP projects will be utilized in the future, and highlights existing roadways possibly in need of investment moving forward.
Of the seven projects introduced in this run, three are roadway extensions, two are roadway widenings, one is a road diet, and one is a roadway signalization. Of the three extensions, none see a V/C above 0.1, indicating that they are congestion-free but underutilized in the 2040 scenario. The widening of 4th Avenue in Morton leaves its V/C below 0.18, but may create congestion problems for nearby roads use them to access 4th. After being widened, Trigger Road in Peoria only sees a V/C of 0.05, as new travelers in the area appear more attracted to IL-91 and Orange Prairie Road.
The Adams Street road diet in Peoria has a small impact on congestion. V/C does not eclipse 0.6 throughout most of the stretch proposed to be dieted, indicating approximately 60% capacity. One quarter-mile section of Adams, between Krause Avenue and Western Avenue, has a V/C of 1.06. Signalization of Mount Vernon Street (IL-116) and CR-23 in Metamora does not appear to dissuade travelers from passing through the intersection, as traffic through the area remains concentrated on the highway.
CONCLUSION
Most of the transportation system in the MPA currently operates far below its capacity, and is expected to do so in the future. However, problem areas do exist. The stated purpose of the travel demand model is to inform transportation decisions based on existing conditions and proposed changes. The introduction of these projects addresses a number of the transport system’s problems and does not exacerbate others. While the model results show some potential issues with projects as proposed, these issues are minor and can be managed with proper planning. As a whole, these projects serve to maintain the integrity and efficiency of the transportation network into the future.
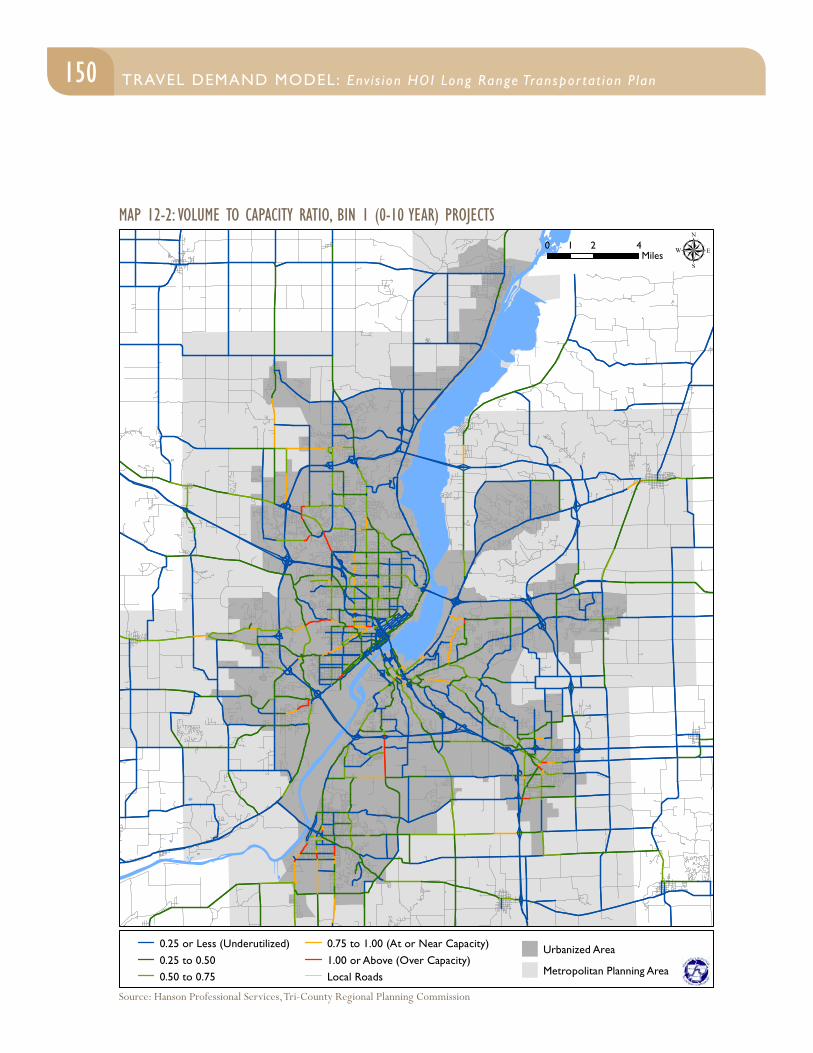
150 TRAVEL DEMAND MODEL: Env i s ion HOI Long Range Transpor tat ion P lan
Volume to Capacity Ratio Bin 2 (11-25 Year) Projects
µ0 2 41Miles
0.25 or Less (Underutilized)0.25 to 0.500.50 to 0.75
0.75 to 1.00 (At or Near Capacity)1.00 or Above (Over Capacity)Local Roads
Urbanized Area
Metropolitan Planning Area
Hanson Professional ServicesTri-County Regional Planning Commission
Sources:MAP 12-2: VOLUME TO CAPACITY RATIO, BIN 1 (0-10 YEAR) PROJECTS
Source: Hanson Professional Services, Tri-County Regional Planning Commission
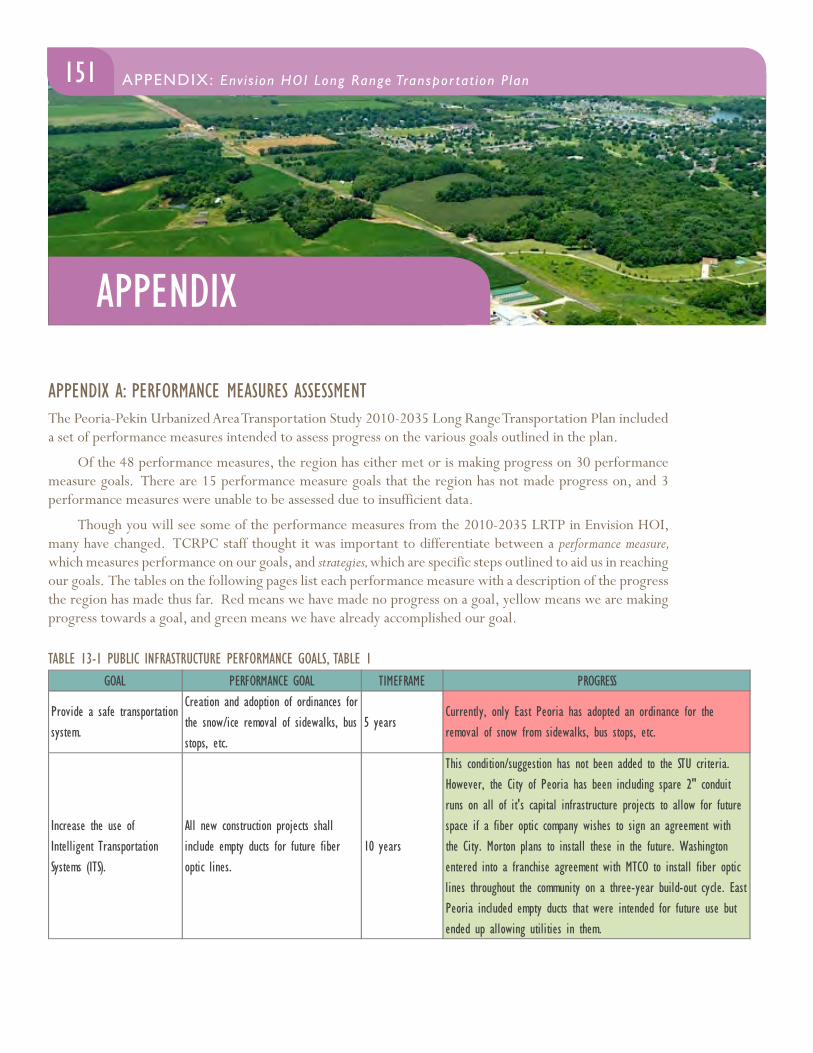
APPENDIX
151 APPENDIX: Env i s ion HOI Long Range Transpor tat ion P lanTRAVEL DEMAND MODEL: Env i s ion HOI Long Range Transpor tat ion P lan
APPENDIX A: PERFORMANCE MEASURES ASSESSMENTThe Peoria-Pekin Urbanized Area Transportation Study 2010-2035 Long Range Transportation Plan included a set of performance measures intended to assess progress on the various goals outlined in the plan.
Of the 48 performance measures, the region has either met or is making progress on 30 performance measure goals. There are 15 performance measure goals that the region has not made progress on, and 3 performance measures were unable to be assessed due to insufficient data.
Though you will see some of the performance measures from the 2010-2035 LRTP in Envision HOI, many have changed. TCRPC staff thought it was important to differentiate between a performance measure, which measures performance on our goals, and strategies, which are specific steps outlined to aid us in reaching our goals. The tables on the following pages list each performance measure with a description of the progress the region has made thus far. Red means we have made no progress on a goal, yellow means we are making progress towards a goal, and green means we have already accomplished our goal.
TABLE 13-1 PUBLIC INFRASTRUCTURE PERFORMANCE GOALS, TABLE 1GOAL PERFORMANCE GOAL TIMEFRAME PROGRESS
Provide a safe transportation system.
Creation and adoption of ordinances for the snow/ice removal of sidewalks, bus stops, etc.
5 yearsCurrently, only East Peoria has adopted an ordinance for the removal of snow from sidewalks, bus stops, etc.
Increase the use of Intelligent Transportation Systems (ITS).
All new construction projects shall include empty ducts for future fiber optic lines.
10 years
This condition/suggestion has not been added to the STU criteria. However, the City of Peoria has been including spare 2" conduit runs on all of it's capital infrastructure projects to allow for future space if a fiber optic company wishes to sign an agreement with the City. Morton plans to install these in the future. Washington entered into a franchise agreement with MTCO to install fiber optic lines throughout the community on a three-year build-out cycle. East Peoria included empty ducts that were intended for future use but ended up allowing utilities in them.
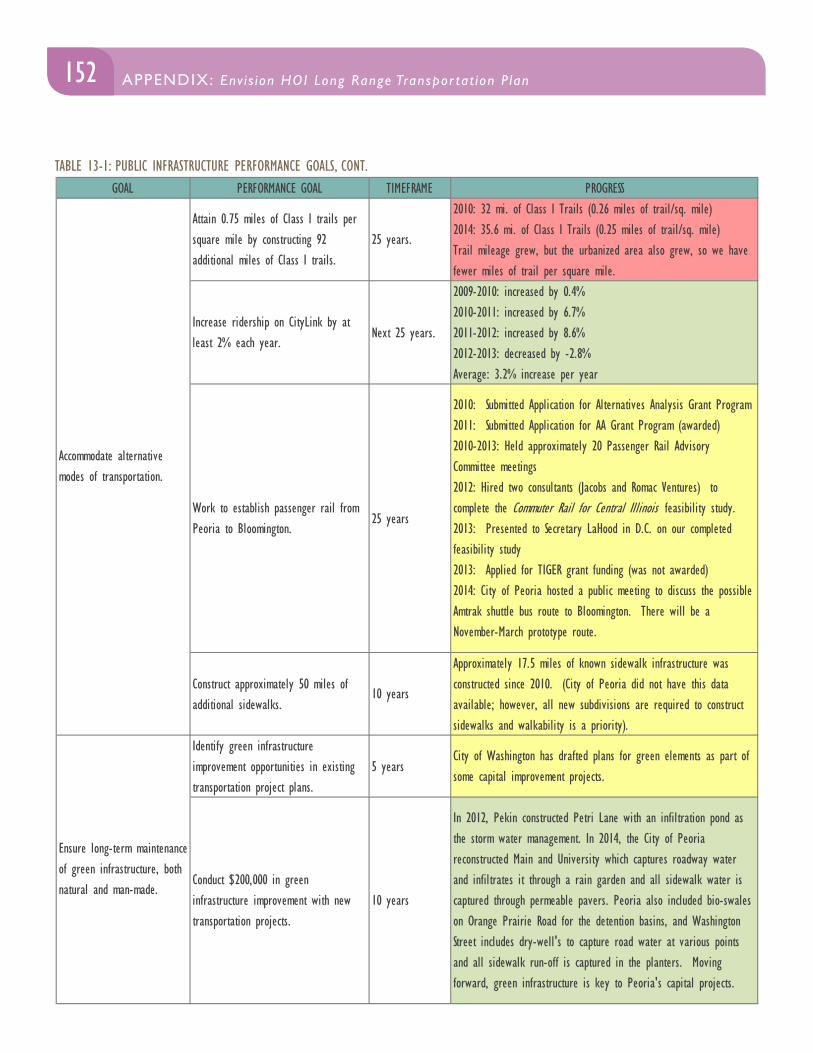
152 APPENDIX: Env i s ion HOI Long Range Transpor tat ion P lan
TABLE 13-1: PUBLIC INFRASTRUCTURE PERFORMANCE GOALS, CONT.GOAL PERFORMANCE GOAL TIMEFRAME PROGRESS
Attain 0.75 miles of Class I trails per square mile by constructing 92 additional miles of Class I trails.
25 years.
2010: 32 mi. of Class I Trails (0.26 miles of trail/sq. mile)2014: 35.6 mi. of Class I Trails (0.25 miles of trail/sq. mile)Trail mileage grew, but the urbanized area also grew, so we have fewer miles of trail per square mile.
Increase ridership on CityLink by at least 2% each year.
Next 25 years.
2009-2010: increased by 0.4% 2010-2011: increased by 6.7% 2011-2012: increased by 8.6% 2012-2013: decreased by -2.8% Average: 3.2% increase per year
Work to establish passenger rail from Peoria to Bloomington.
25 years
2010: Submitted Application for Alternatives Analysis Grant Program2011: Submitted Application for AA Grant Program (awarded)2010-2013: Held approximately 20 Passenger Rail Advisory Committee meetings2012: Hired two consultants (Jacobs and Romac Ventures) to complete the Commuter Rail for Central Illinois feasibility study. 2013: Presented to Secretary LaHood in D.C. on our completed feasibility study2013: Applied for TIGER grant funding (was not awarded)2014: City of Peoria hosted a public meeting to discuss the possible Amtrak shuttle bus route to Bloomington. There will be a November-March prototype route.
Construct approximately 50 miles of additional sidewalks.
10 years
Approximately 17.5 miles of known sidewalk infrastructure was constructed since 2010. (City of Peoria did not have this data available; however, all new subdivisions are required to construct sidewalks and walkability is a priority).
Identify green infrastructure improvement opportunities in existing transportation project plans.
5 yearsCity of Washington has drafted plans for green elements as part of some capital improvement projects.
Conduct $200,000 in green infrastructure improvement with new transportation projects.
10 years
In 2012, Pekin constructed Petri Lane with an infiltration pond as the storm water management. In 2014, the City of Peoria reconstructed Main and University which captures roadway water and infiltrates it through a rain garden and all sidewalk water is captured through permeable pavers. Peoria also included bio-swales on Orange Prairie Road for the detention basins, and Washington Street includes dry-well's to capture road water at various points and all sidewalk run-off is captured in the planters. Moving forward, green infrastructure is key to Peoria's capital projects.
Ensure long-term maintenance of green infrastructure, both natural and man-made.
Accommodate alternative modes of transportation.
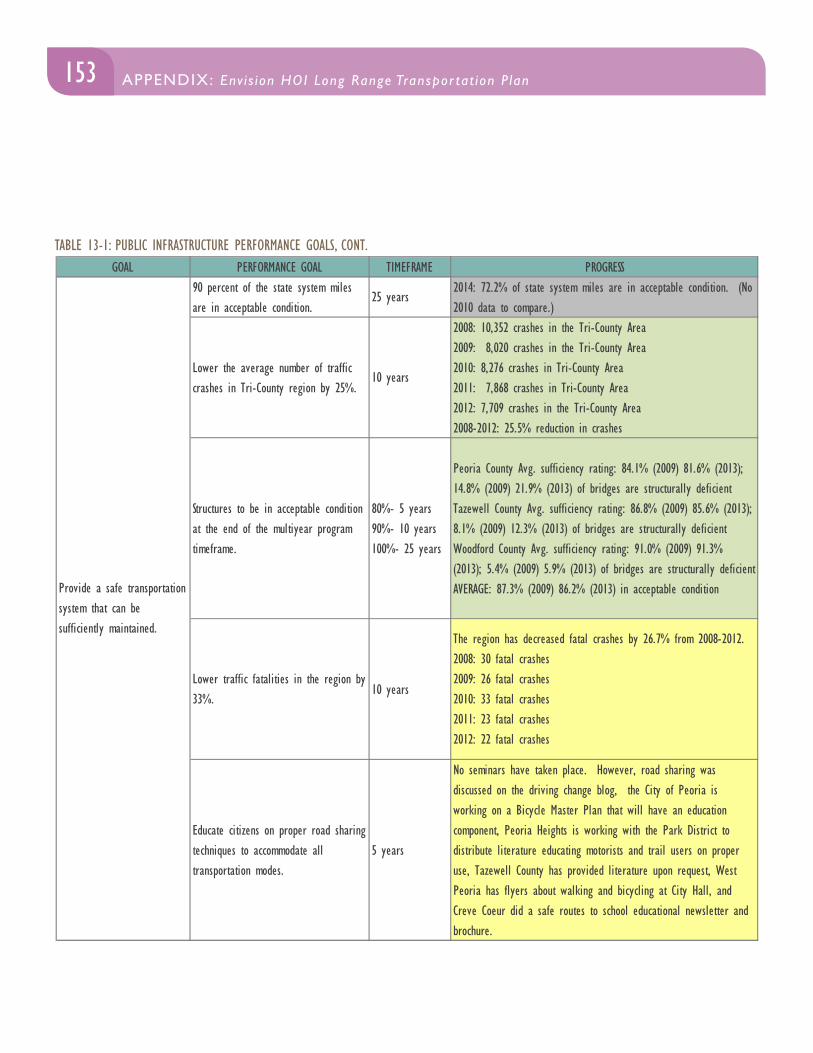
153APPENDIX: Env i s ion HOI Long Range Transpor tat ion P lan APPENDIX: Env i s ion HOI Long Range Transpor tat ion P lan
TABLE 13-1: PUBLIC INFRASTRUCTURE PERFORMANCE GOALS, CONT.GOAL PERFORMANCE GOAL TIMEFRAME PROGRESS
90 percent of the state system miles are in acceptable condition.
25 years2014: 72.2% of state system miles are in acceptable condition. (No 2010 data to compare.)
Lower the average number of traffic crashes in Tri-County region by 25%.
10 years
2008: 10,352 crashes in the Tri-County Area2009: 8,020 crashes in the Tri-County Area2010: 8,276 crashes in Tri-County Area2011: 7,868 crashes in Tri-County Area2012: 7,709 crashes in the Tri-County Area2008-2012: 25.5% reduction in crashes
Structures to be in acceptable condition at the end of the multiyear program timeframe.
80%- 5 years 90%- 10 years 100%- 25 years
Peoria County Avg. sufficiency rating: 84.1% (2009) 81.6% (2013); 14.8% (2009) 21.9% (2013) of bridges are structurally deficientTazewell County Avg. sufficiency rating: 86.8% (2009) 85.6% (2013); 8.1% (2009) 12.3% (2013) of bridges are structurally deficientWoodford County Avg. sufficiency rating: 91.0% (2009) 91.3% (2013); 5.4% (2009) 5.9% (2013) of bridges are structurally deficientAVERAGE: 87.3% (2009) 86.2% (2013) in acceptable condition
Lower traffic fatalities in the region by 33%.
10 years
The region has decreased fatal crashes by 26.7% from 2008-2012.2008: 30 fatal crashes2009: 26 fatal crashes2010: 33 fatal crashes2011: 23 fatal crashes2012: 22 fatal crashes
Educate citizens on proper road sharing techniques to accommodate all transportation modes.
5 years
No seminars have taken place. However, road sharing was discussed on the driving change blog, the City of Peoria is working on a Bicycle Master Plan that will have an education component, Peoria Heights is working with the Park District to distribute literature educating motorists and trail users on proper use, Tazewell County has provided literature upon request, West Peoria has flyers about walking and bicycling at City Hall, and Creve Coeur did a safe routes to school educational newsletter and brochure.
Provide a safe transportation system that can be sufficiently maintained.
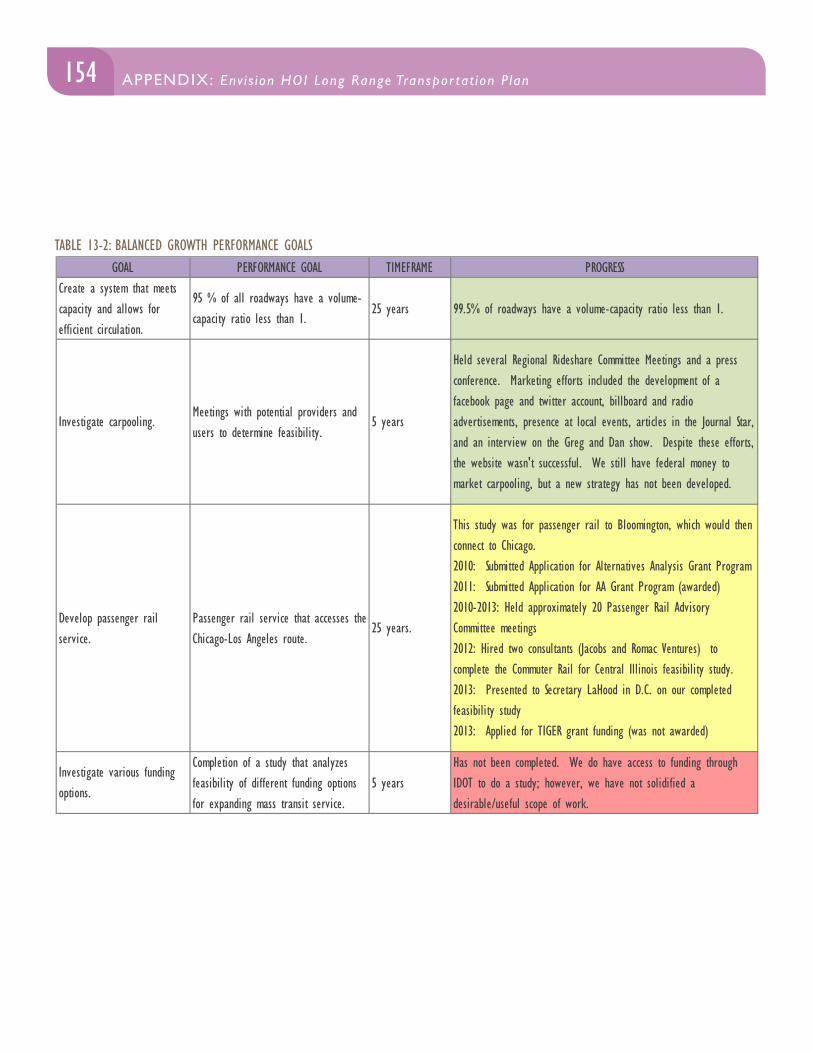
154 APPENDIX: Env i s ion HOI Long Range Transpor tat ion P lan
TABLE 13-2: BALANCED GROWTH PERFORMANCE GOALSGOAL PERFORMANCE GOAL TIMEFRAME PROGRESS
Create a system that meets capacity and allows for efficient circulation.
95 % of all roadways have a volume-capacity ratio less than 1.
25 years 99.5% of roadways have a volume-capacity ratio less than 1.
Investigate carpooling. Meetings with potential providers and users to determine feasibility.
5 years
Held several Regional Rideshare Committee Meetings and a press conference. Marketing efforts included the development of a facebook page and twitter account, billboard and radio advertisements, presence at local events, articles in the Journal Star, and an interview on the Greg and Dan show. Despite these efforts, the website wasn't successful. We still have federal money to market carpooling, but a new strategy has not been developed.
Develop passenger rail service.
Passenger rail service that accesses the Chicago-Los Angeles route.
25 years.
This study was for passenger rail to Bloomington, which would then connect to Chicago.2010: Submitted Application for Alternatives Analysis Grant Program2011: Submitted Application for AA Grant Program (awarded)2010-2013: Held approximately 20 Passenger Rail Advisory Committee meetings2012: Hired two consultants (Jacobs and Romac Ventures) to complete the Commuter Rail for Central Illinois feasibility study. 2013: Presented to Secretary LaHood in D.C. on our completed feasibility study2013: Applied for TIGER grant funding (was not awarded)
Investigate various funding options.
Completion of a study that analyzes feasibility of different funding options for expanding mass transit service.
5 yearsHas not been completed. We do have access to funding through IDOT to do a study; however, we have not solidified a desirable/useful scope of work.
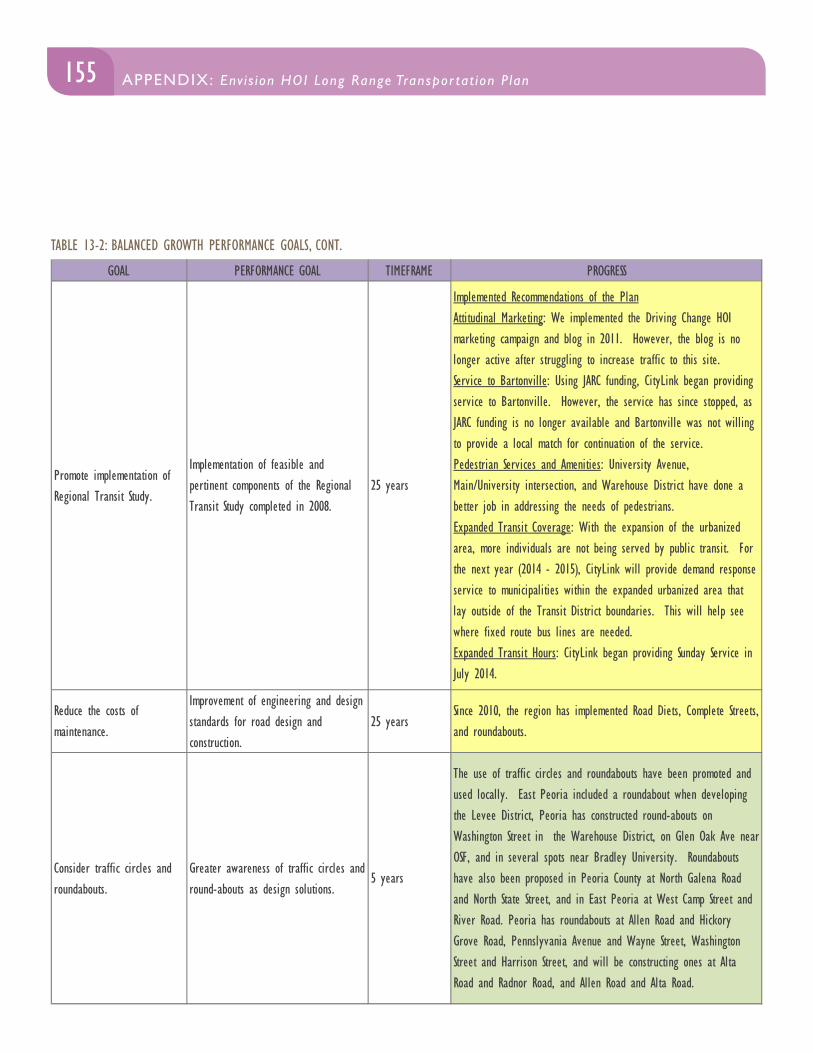
155APPENDIX: Env i s ion HOI Long Range Transpor tat ion P lan APPENDIX: Env i s ion HOI Long Range Transpor tat ion P lan
TABLE 13-2: BALANCED GROWTH PERFORMANCE GOALS, CONT.
GOAL PERFORMANCE GOAL TIMEFRAME PROGRESS
Promote implementation of Regional Transit Study.
Implementation of feasible and pertinent components of the Regional Transit Study completed in 2008.
25 years
Implemented Recommendations of the PlanAttitudinal Marketing: We implemented the Driving Change HOI marketing campaign and blog in 2011. However, the blog is no longer active after struggling to increase traffic to this site.Service to Bartonville: Using JARC funding, CityLink began providing service to Bartonville. However, the service has since stopped, as JARC funding is no longer available and Bartonville was not willing to provide a local match for continuation of the service.Pedestrian Services and Amenities: University Avenue, Main/University intersection, and Warehouse District have done a better job in addressing the needs of pedestrians.Expanded Transit Coverage: With the expansion of the urbanized area, more individuals are not being served by public transit. For the next year (2014 - 2015), CityLink will provide demand response service to municipalities within the expanded urbanized area that lay outside of the Transit District boundaries. This will help see where fixed route bus lines are needed.Expanded Transit Hours: CityLink began providing Sunday Service in July 2014.
Reduce the costs of maintenance.
Improvement of engineering and design standards for road design and construction.
25 yearsSince 2010, the region has implemented Road Diets, Complete Streets, and roundabouts.
Consider traffic circles and roundabouts.
Greater awareness of traffic circles and round-abouts as design solutions.
5 years
The use of traffic circles and roundabouts have been promoted and used locally. East Peoria included a roundabout when developing the Levee District, Peoria has constructed round-abouts on Washington Street in the Warehouse District, on Glen Oak Ave near OSF, and in several spots near Bradley University. Roundabouts have also been proposed in Peoria County at North Galena Road and North State Street, and in East Peoria at West Camp Street and River Road. Peoria has roundabouts at Allen Road and Hickory Grove Road, Pennslyvania Avenue and Wayne Street, Washington Street and Harrison Street, and will be constructing ones at Alta Road and Radnor Road, and Allen Road and Alta Road.
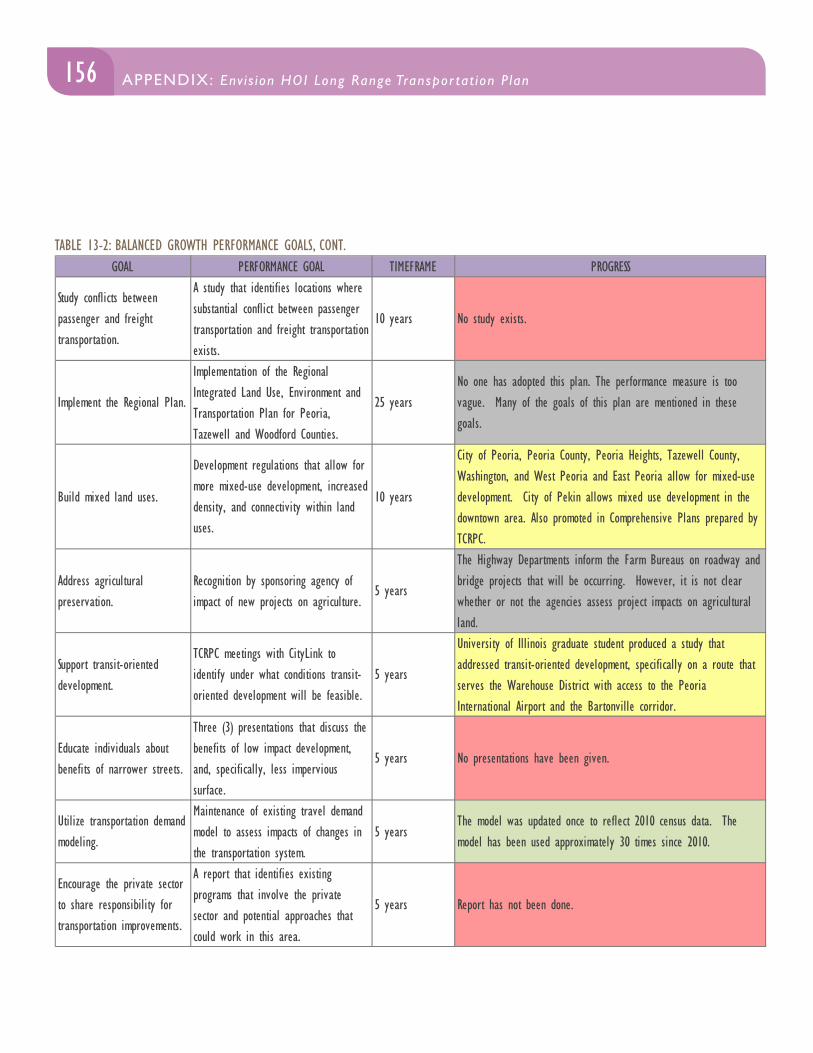
156 APPENDIX: Env i s ion HOI Long Range Transpor tat ion P lan
TABLE 13-2: BALANCED GROWTH PERFORMANCE GOALS, CONT.GOAL PERFORMANCE GOAL TIMEFRAME PROGRESS
Study conflicts between passenger and freight transportation.
A study that identifies locations where substantial conflict between passenger transportation and freight transportation exists.
10 years No study exists.
Implement the Regional Plan.
Implementation of the Regional Integrated Land Use, Environment and Transportation Plan for Peoria, Tazewell and Woodford Counties.
25 yearsNo one has adopted this plan. The performance measure is too vague. Many of the goals of this plan are mentioned in these goals.
Build mixed land uses.
Development regulations that allow for more mixed-use development, increased density, and connectivity within land uses.
10 years
City of Peoria, Peoria County, Peoria Heights, Tazewell County, Washington, and West Peoria and East Peoria allow for mixed-use development. City of Pekin allows mixed use development in the downtown area. Also promoted in Comprehensive Plans prepared by TCRPC.
Address agricultural preservation.
Recognition by sponsoring agency of impact of new projects on agriculture.
5 years
The Highway Departments inform the Farm Bureaus on roadway and bridge projects that will be occurring. However, it is not clear whether or not the agencies assess project impacts on agricultural land.
Support transit-oriented development.
TCRPC meetings with CityLink to identify under what conditions transit-oriented development will be feasible.
5 years
University of Illinois graduate student produced a study that addressed transit-oriented development, specifically on a route that serves the Warehouse District with access to the Peoria International Airport and the Bartonville corridor.
Educate individuals about benefits of narrower streets.
Three (3) presentations that discuss the benefits of low impact development, and, specifically, less impervious surface.
5 years No presentations have been given.
Utilize transportation demand modeling.
Maintenance of existing travel demand model to assess impacts of changes in the transportation system.
5 yearsThe model was updated once to reflect 2010 census data. The model has been used approximately 30 times since 2010.
Encourage the private sector to share responsibility for transportation improvements.
A report that identifies existing programs that involve the private sector and potential approaches that could work in this area.
5 years Report has not been done.
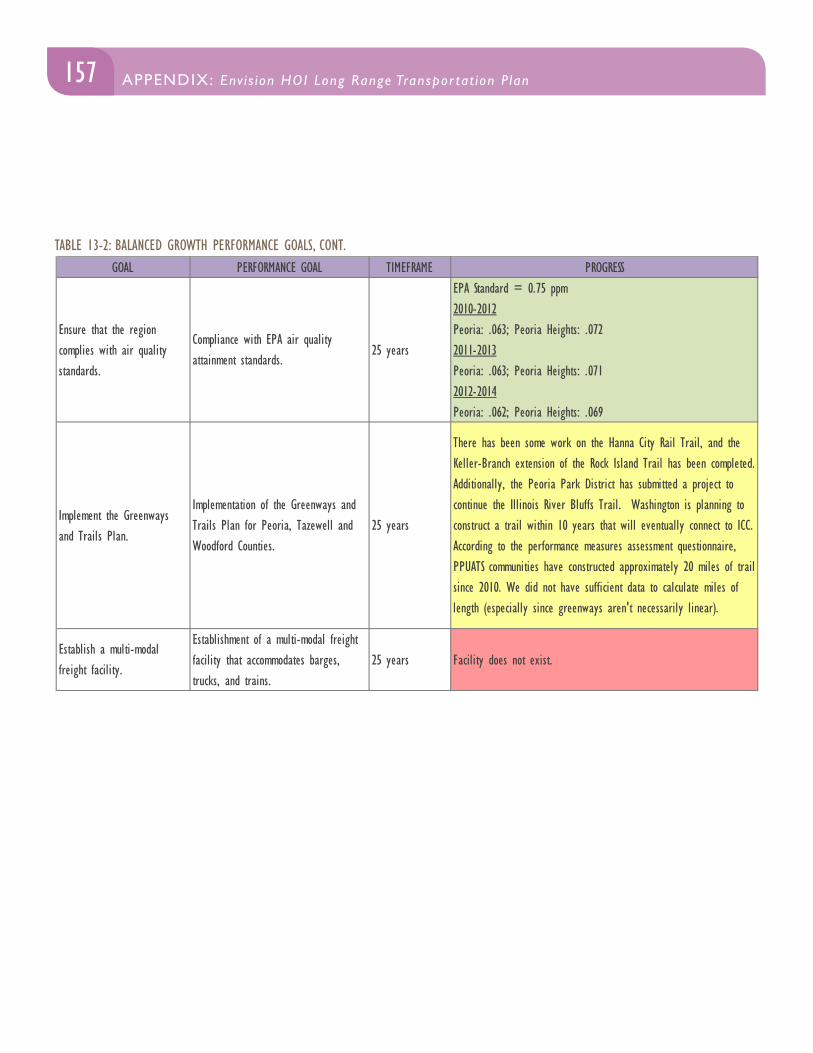
157APPENDIX: Env i s ion HOI Long Range Transpor tat ion P lan APPENDIX: Env i s ion HOI Long Range Transpor tat ion P lan
TABLE 13-2: BALANCED GROWTH PERFORMANCE GOALS, CONT.GOAL PERFORMANCE GOAL TIMEFRAME PROGRESS
Ensure that the region complies with air quality standards.
Compliance with EPA air quality attainment standards.
25 years
EPA Standard = 0.75 ppm2010-2012Peoria: .063; Peoria Heights: .0722011-2013Peoria: .063; Peoria Heights: .0712012-2014Peoria: .062; Peoria Heights: .069
Implement the Greenways and Trails Plan.
Implementation of the Greenways and Trails Plan for Peoria, Tazewell and Woodford Counties.
25 years
There has been some work on the Hanna City Rail Trail, and the Keller-Branch extension of the Rock Island Trail has been completed. Additionally, the Peoria Park District has submitted a project to continue the Illinois River Bluffs Trail. Washington is planning to construct a trail within 10 years that will eventually connect to ICC. According to the performance measures assessment questionnaire, PPUATS communities have constructed approximately 20 miles of trail since 2010. We did not have sufficient data to calculate miles of length (especially since greenways aren't necessarily linear).
Establish a multi-modal freight facility.
Establishment of a multi-modal freight facility that accommodates barges, trucks, and trains.
25 years Facility does not exist.
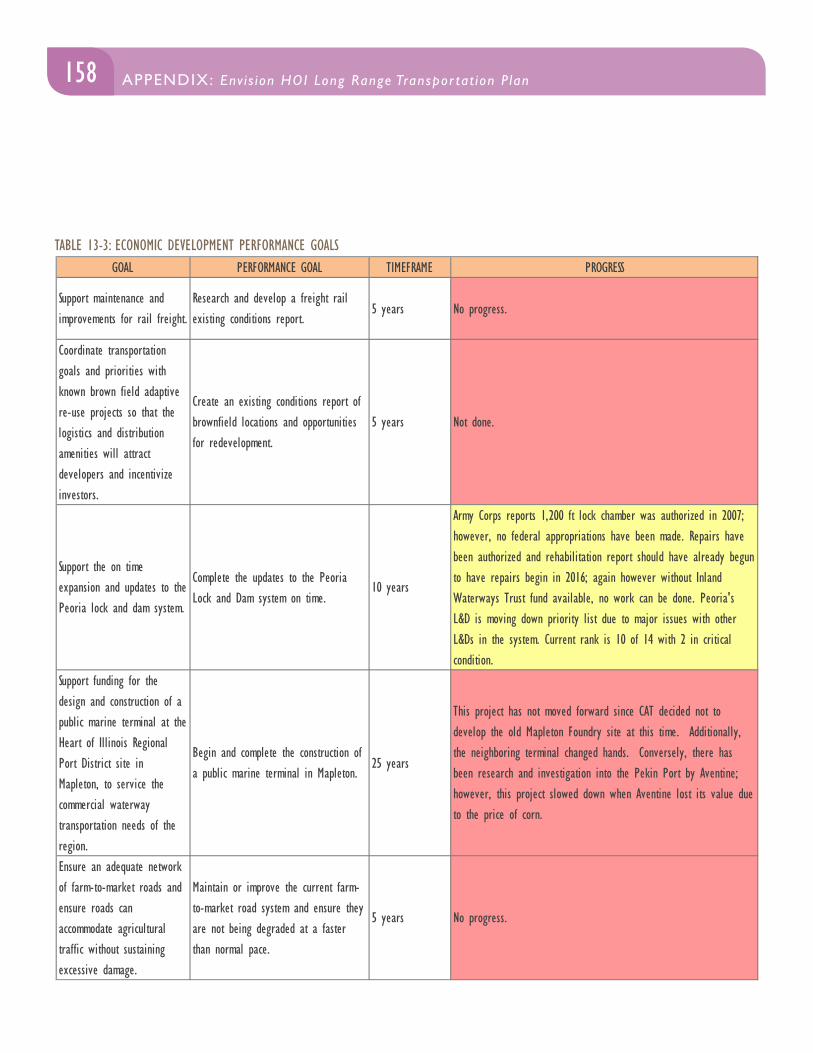
158 APPENDIX: Env i s ion HOI Long Range Transpor tat ion P lan
TABLE 13-3: ECONOMIC DEVELOPMENT PERFORMANCE GOALSGOAL PERFORMANCE GOAL TIMEFRAME PROGRESS
Support maintenance and improvements for rail freight.
Research and develop a freight rail existing conditions report.
5 years No progress.
Coordinate transportation goals and priorities with known brown field adaptive re-use projects so that the logistics and distribution amenities will attract developers and incentivize investors.
Create an existing conditions report of brownfield locations and opportunities for redevelopment.
5 years Not done.
Support the on time expansion and updates to the Peoria lock and dam system.
Complete the updates to the Peoria Lock and Dam system on time.
10 years
Army Corps reports 1,200 ft lock chamber was authorized in 2007; however, no federal appropriations have been made. Repairs have been authorized and rehabilitation report should have already begun to have repairs begin in 2016; again however without Inland Waterways Trust fund available, no work can be done. Peoria's L&D is moving down priority list due to major issues with other L&Ds in the system. Current rank is 10 of 14 with 2 in critical condition.
Support funding for the design and construction of a public marine terminal at the Heart of Illinois Regional Port District site in Mapleton, to service the commercial waterway transportation needs of the region.
Begin and complete the construction of a public marine terminal in Mapleton.
25 years
This project has not moved forward since CAT decided not to develop the old Mapleton Foundry site at this time. Additionally, the neighboring terminal changed hands. Conversely, there has been research and investigation into the Pekin Port by Aventine; however, this project slowed down when Aventine lost its value due to the price of corn.
Ensure an adequate network of farm-to-market roads and ensure roads can accommodate agricultural traffic without sustaining excessive damage.
Maintain or improve the current farm-to-market road system and ensure they are not being degraded at a faster than normal pace.
5 years No progress.
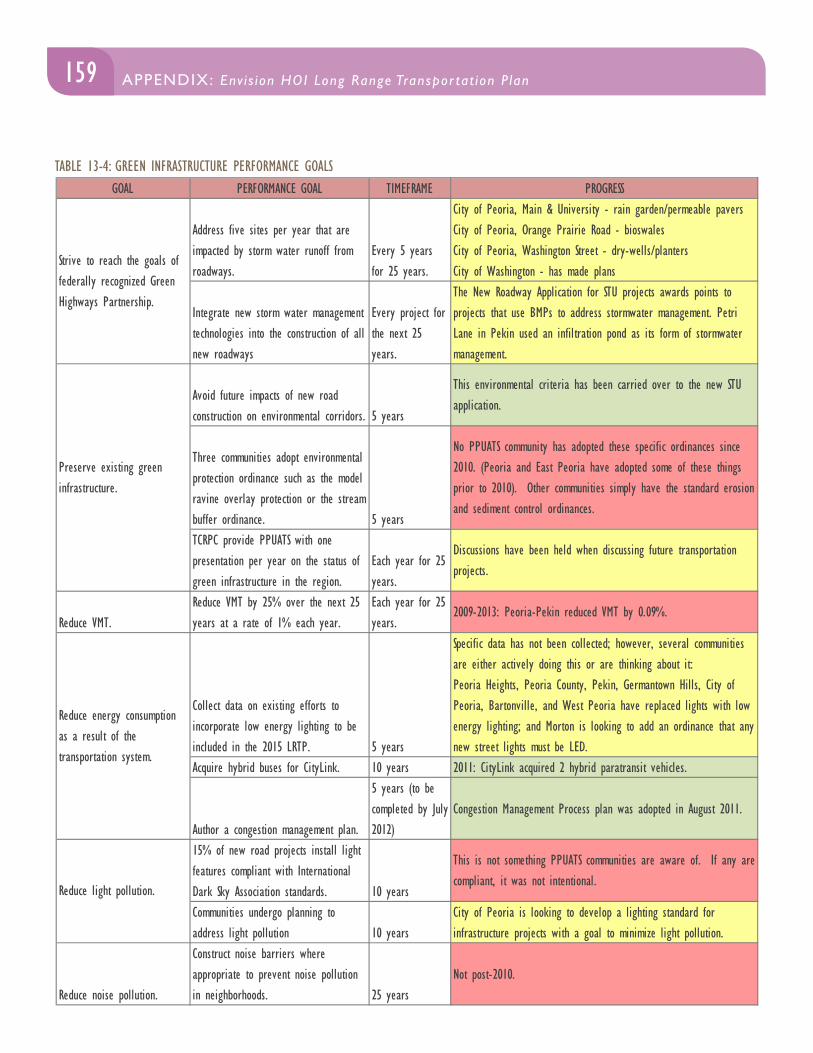
159APPENDIX: Env i s ion HOI Long Range Transpor tat ion P lan APPENDIX: Env i s ion HOI Long Range Transpor tat ion P lan
TABLE 13-4: GREEN INFRASTRUCTURE PERFORMANCE GOALSGOAL PERFORMANCE GOAL TIMEFRAME PROGRESS
Address five sites per year that are impacted by storm water runoff from roadways.
Every 5 years for 25 years.
City of Peoria, Main & University - rain garden/permeable paversCity of Peoria, Orange Prairie Road - bioswalesCity of Peoria, Washington Street - dry-wells/plantersCity of Washington - has made plans
Integrate new storm water management technologies into the construction of all new roadways
Every project for the next 25 years.
The New Roadway Application for STU projects awards points to projects that use BMPs to address stormwater management. Petri Lane in Pekin used an infiltration pond as its form of stormwater management.
Avoid future impacts of new road construction on environmental corridors. 5 years
This environmental criteria has been carried over to the new STU application.
Three communities adopt environmental protection ordinance such as the model ravine overlay protection or the stream buffer ordinance. 5 years
No PPUATS community has adopted these specific ordinances since 2010. (Peoria and East Peoria have adopted some of these things prior to 2010). Other communities simply have the standard erosion and sediment control ordinances.
TCRPC provide PPUATS with one presentation per year on the status of green infrastructure in the region.
Each year for 25 years.
Discussions have been held when discussing future transportation projects.
Reduce VMT.Reduce VMT by 25% over the next 25 years at a rate of 1% each year.
Each year for 25 years.
2009-2013: Peoria-Pekin reduced VMT by 0.09%.
Collect data on existing efforts to incorporate low energy lighting to be included in the 2015 LRTP. 5 years
Specific data has not been collected; however, several communities are either actively doing this or are thinking about it:Peoria Heights, Peoria County, Pekin, Germantown Hills, City of Peoria, Bartonville, and West Peoria have replaced lights with low energy lighting; and Morton is looking to add an ordinance that any new street lights must be LED.
Acquire hybrid buses for CityLink. 10 years 2011: CityLink acquired 2 hybrid paratransit vehicles.
Author a congestion management plan.
5 years (to be completed by July 2012)
Congestion Management Process plan was adopted in August 2011.
15% of new road projects install light features compliant with International Dark Sky Association standards. 10 years
This is not something PPUATS communities are aware of. If any are compliant, it was not intentional.
Communities undergo planning to address light pollution 10 years
City of Peoria is looking to develop a lighting standard for infrastructure projects with a goal to minimize light pollution.
Reduce noise pollution.
Construct noise barriers where appropriate to prevent noise pollution in neighborhoods. 25 years
Not post-2010.
Reduce energy consumption as a result of the transportation system.
Reduce light pollution.
Strive to reach the goals of federally recognized Green Highways Partnership.
Preserve existing green infrastructure.
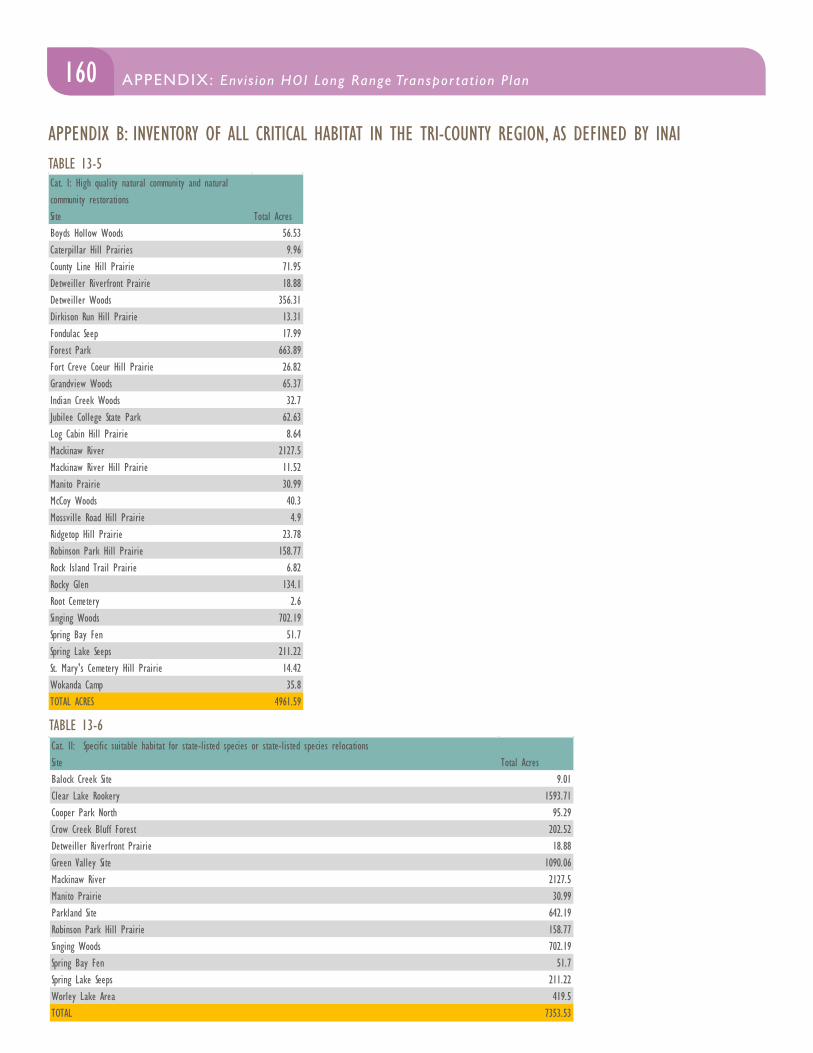
160 APPENDIX: Env i s ion HOI Long Range Transpor tat ion P lan
APPENDIX B: INVENTORY OF ALL CRITICAL HABITAT IN THE TRI-COUNTY REGION, AS DEFINED BY INAI
TABLE 13-6
TABLE 13-5
Cat. II: Specific suitable habitat for state-listed species or state-listed species relocationsSite Total AcresBalock Creek Site 9.01Clear Lake Rookery 1593.71Cooper Park North 95.29Crow Creek Bluff Forest 202.52Detweiller Riverfront Prairie 18.88Green Valley Site 1090.06Mackinaw River 2127.5Manito Prairie 30.99Parkland Site 642.19Robinson Park Hill Prairie 158.77Singing Woods 702.19Spring Bay Fen 51.7Spring Lake Seeps 211.22Worley Lake Area 419.5TOTAL 7353.53
Cat. I: High quality natural community and natural community restorationsSite Total AcresBoyds Hollow Woods 56.53Caterpillar Hill Prairies 9.96County Line Hill Prairie 71.95Detweiller Riverfront Prairie 18.88Detweiller Woods 356.31Dirkison Run Hill Prairie 13.31Fondulac Seep 17.99Forest Park 663.89Fort Creve Coeur Hill Prairie 26.82Grandview Woods 65.37Indian Creek Woods 32.7Jubilee College State Park 62.63Log Cabin Hill Prairie 8.64Mackinaw River 2127.5Mackinaw River Hill Prairie 11.52Manito Prairie 30.99McCoy Woods 40.3Mossville Road Hill Prairie 4.9Ridgetop Hill Prairie 23.78Robinson Park Hill Prairie 158.77Rock Island Trail Prairie 6.82Rocky Glen 134.1Root Cemetery 2.6Singing Woods 702.19Spring Bay Fen 51.7Spring Lake Seeps 211.22St. Mary's Cemetery Hill Prairie 14.42Wokanda Camp 35.8TOTAL ACRES 4961.59
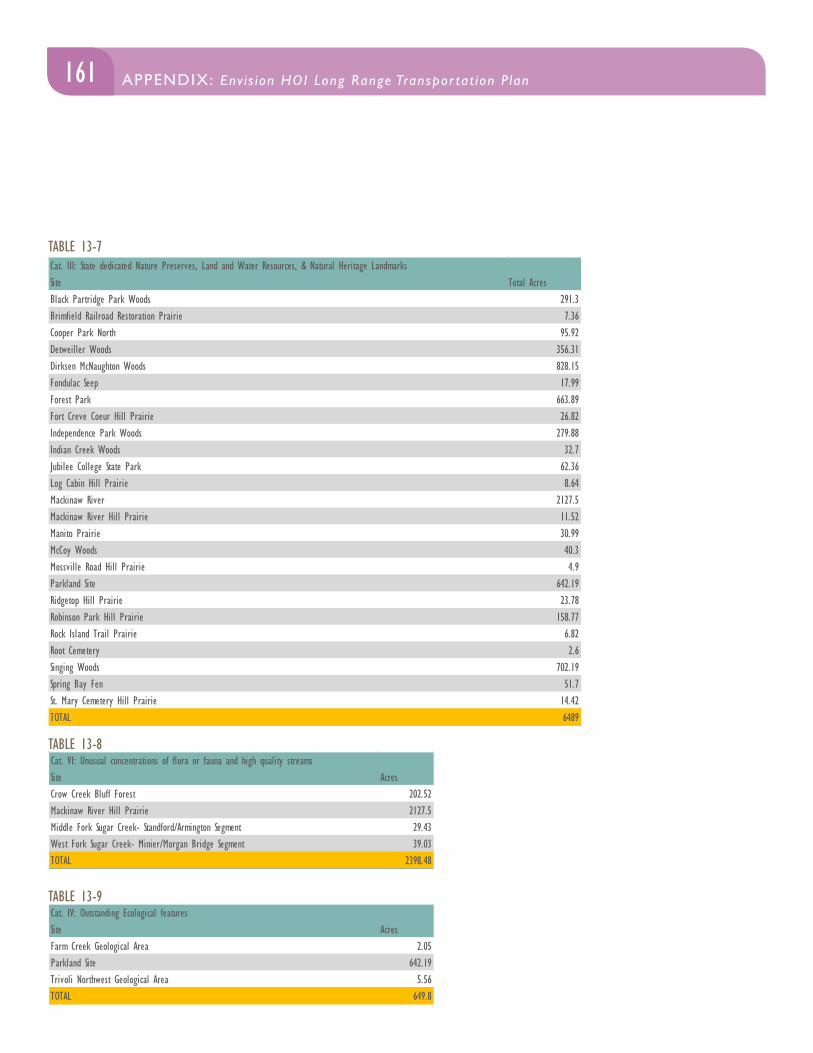
161APPENDIX: Env i s ion HOI Long Range Transpor tat ion P lan APPENDIX: Env i s ion HOI Long Range Transpor tat ion P lan
TABLE 13-7
TABLE 13-8
TABLE 13-9
Cat. III: State dedicated Nature Preserves, Land and Water Resources, & Natural Heritage LandmarksSite Total AcresBlack Partridge Park Woods 291.3Brimfield Railroad Restoration Prairie 7.36Cooper Park North 95.92Detweiller Woods 356.31Dirksen McNaughton Woods 828.15Fondulac Seep 17.99Forest Park 663.89Fort Creve Coeur Hill Prairie 26.82Independence Park Woods 279.88Indian Creek Woods 32.7Jubilee College State Park 62.36Log Cabin Hill Prairie 8.64Mackinaw River 2127.5Mackinaw River Hill Prairie 11.52Manito Prairie 30.99McCoy Woods 40.3Mossville Road Hill Prairie 4.9Parkland Site 642.19Ridgetop Hill Prairie 23.78Robinson Park Hill Prairie 158.77Rock Island Trail Prairie 6.82Root Cemetery 2.6Singing Woods 702.19Spring Bay Fen 51.7St. Mary Cemetery Hill Prairie 14.42TOTAL 6489
Cat. IV: Outstanding Ecological featuresSite AcresFarm Creek Geological Area 2.05Parkland Site 642.19Trivoli Northwest Geological Area 5.56TOTAL 649.8
Cat. VI: Unusual concentrations of flora or fauna and high quality streamsSite AcresCrow Creek Bluff Forest 202.52Mackinaw River Hill Prairie 2127.5Middle Fork Sugar Creek- Standford/Armington Segment 29.43West Fork Sugar Creek- Minier/Morgan Bridge Segment 39.03TOTAL 2398.48
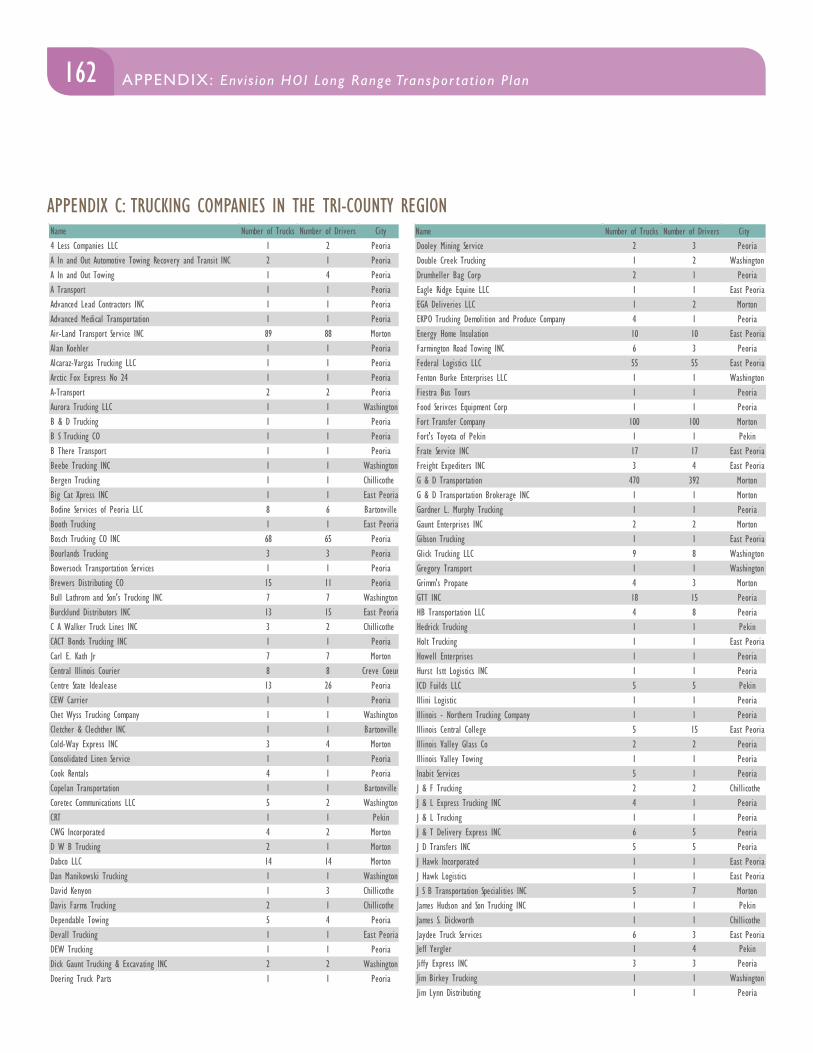
162 APPENDIX: Env i s ion HOI Long Range Transpor tat ion P lan
Name Number of Trucks Number of Drivers City4 Less Companies LLC 1 2 PeoriaA In and Out Automotive Towing Recovery and Transit INC 2 1 PeoriaA In and Out Towing 1 4 PeoriaA Transport 1 1 PeoriaAdvanced Lead Contractors INC 1 1 PeoriaAdvanced Medical Transportation 1 1 PeoriaAir-Land Transport Service INC 89 88 MortonAlan Koehler 1 1 PeoriaAlcaraz-Vargas Trucking LLC 1 1 PeoriaArctic Fox Express No 24 1 1 PeoriaA-Transport 2 2 PeoriaAurora Trucking LLC 1 1 WashingtonB & D Trucking 1 1 PeoriaB S Trucking CO 1 1 PeoriaB There Transport 1 1 PeoriaBeebe Trucking INC 1 1 WashingtonBergen Trucking 1 1 Chillicothe Big Cat Xpress INC 1 1 East PeoriaBodine Services of Peoria LLC 8 6 BartonvilleBooth Trucking 1 1 East PeoriaBosch Trucking CO INC 68 65 PeoriaBourlands Trucking 3 3 PeoriaBowersock Transportation Services 1 1 PeoriaBrewers Distributing CO 15 11 PeoriaBull Lathrom and Son's Trucking INC 7 7 WashingtonBurcklund Distributors INC 13 15 East PeoriaC A Walker Truck Lines INC 3 2 Chillicothe CACT Bonds Trucking INC 1 1 PeoriaCarl E. Kath Jr 7 7 MortonCentral Illinois Courier 8 8 Creve CoeurCentre State Idealease 13 26 PeoriaCEW Carrier 1 1 PeoriaChet Wyss Trucking Company 1 1 WashingtonCletcher & Clechther INC 1 1 BartonvilleCold-Way Express INC 3 4 MortonConsolidated Linen Service 1 1 PeoriaCook Rentals 4 1 PeoriaCopelan Transportation 1 1 BartonvilleCoretec Communications LLC 5 2 WashingtonCRT 1 1 PekinCWG Incorporated 4 2 MortonD W B Trucking 2 1 MortonDabco LLC 14 14 MortonDan Manikowski Trucking 1 1 WashingtonDavid Kenyon 1 3 Chillicothe Davis Farms Trucking 2 1 Chillicothe Dependable Towing 5 4 PeoriaDevall Trucking 1 1 East PeoriaDEW Trucking 1 1 PeoriaDick Gaunt Trucking & Excavating INC 2 2 WashingtonDoering Truck Parts 1 1 PeoriaDooley Mining Service 2 3 PeoriaDouble Creek Trucking 1 2 WashingtonDrumheller Bag Corp 2 1 PeoriaEagle Ridge Equine LLC 1 1 East PeoriaEGA Deliveries LLC 1 2 MortonEKPO Trucking Demolition and Produce Company 4 1 PeoriaEnergy Home Insulation 10 10 East PeoriaFarmington Road Towing INC 6 3 PeoriaFederal Logistics LLC 55 55 East PeoriaFenton Burke Enterprises LLC 1 1 WashingtonFiestra Bus Tours 1 1 PeoriaFood Serivces Equipment Corp 1 1 PeoriaFort Transfer Company 100 100 MortonFort's Toyota of Pekin 1 1 PekinFrate Service INC 17 17 East PeoriaFreight Expediters INC 3 4 East PeoriaG & D Transportation 470 392 MortonG & D Transportation Brokerage INC 1 1 MortonGardner L. Murphy Trucking 1 1 PeoriaGaunt Enterprises INC 2 2 MortonGibson Trucking 1 1 East PeoriaGlick Trucking LLC 9 8 WashingtonGregory Transport 1 1 WashingtonGrimm's Propane 4 3 MortonGTT INC 18 15 PeoriaHB Transportation LLC 4 8 PeoriaHedrick Trucking 1 1 PekinHolt Trucking 1 1 East PeoriaHowell Enterprises 1 1 PeoriaHurst 1stt Logistics INC 1 1 PeoriaICD Fuilds LLC 5 5 PekinIllini Logistic 1 1 PeoriaIllinois - Northern Trucking Company 1 1 PeoriaIllinois Central College 5 15 East PeoriaIllinois Valley Glass Co 2 2 PeoriaIllinois Valley Towing 1 1 PeoriaInabit Services 5 1 PeoriaJ & F Trucking 2 2 Chillicothe J & L Express Trucking INC 4 1 PeoriaJ & L Trucking 1 1 PeoriaJ & T Delivery Express INC 6 5 PeoriaJ D Transfers INC 5 5 PeoriaJ Hawk Incorporated 1 1 East PeoriaJ Hawk Logistics 1 1 East PeoriaJ S B Transportation Specialities INC 5 7 MortonJames Hudson and Son Trucking INC 1 1 PekinJames S. Dickworth 1 1 Chillicothe Jaydee Truck Services 6 3 East PeoriaJeff Yergler 1 4 PekinJiffy Express INC 3 3 PeoriaJim Birkey Trucking 1 1 WashingtonJim Lynn Distributing 1 1 PeoriaJoe Hoskins Trucking 1 1 Chillicothe Joshua Campbell 1 1 East PeoriaJRBR Trucking 3 2 WashingtonK & M Express INC 1 1 PekinK2 Industrial Services INC 19 25 PekinKDF Trucking 1 1 Chillicothe Kemper Express 5 17 PeoriaKen Andrews Trucking 1 1 WashingtonKenway Transportation INC 1 1 East PeoriaLighthouse Automotive 1 6 MortonLogistic Freight Services LLC 1 1 PeoriaLvn Enterprises 1 1 PeoriaM & D Farms INC 1 3 Chillicothe M & W Construction Leasing 7 7 Creve CoeurM J Hamilton INC 2 2 MortonMaui Jim USA INC 3 3 PeoriaMay Trucking 1 1 PeoriaMetro Moving & Delivery Service INC 11 10 East PeoriaMidwest Bio Fuels 1 1 PekinMidwest Construction Services of Peoria 6 2 BartonvilleMike Eddy and Son Trucking 1 1 PeoriaMike Lauderback Trucking 1 1 WashingtonMike Yordy and Sons INC 1 5 MortonMike's Mobile Home Repair INC 1 1 East PeoriaMistri Logistrics 1 1 PeoriaMobile Techs 1 4 Chillicothe Mooberry LTD 2 2 East PeoriaMordue Moving and Storage INC 23 19 PeoriaMorton Auto Auction INC 1 1 MortonMr. Tow ITS Wrecker Services 1 1 BartonvilleN E Finch Co 7 6 PeoriaNational Mehl Tours INC 1 1 PeoriaNew Concepts Trucking INC 1 1 PeoriaNewlun Transport Service Clarence E. Newlun 1 1 PekinOil Waste Services INC 10 8 PeoriaO'Neil Brothers Transfer and Storage 36 26 PeoriaPEDL LTD 1 1 East PeoriaPeoria Disposal Company 67 57 PeoriaPHD Services LLC 3 10 PeoriaPierson Trucking INC 3 1 PeoriaPioneer Transit LLC 1 1 PekinPony Express 1 1 PeoriaPortable Moving and Storage of Central Illinois INC Pods 6 6 PeoriaPremium Trucking INC 1 1 PeoriaProcare Home Heath Services 7 5 PekinProgressive Innovations LTD 1 1 PekinProvincial Transport Services INC 1 1 East PeoriaR & M Tansport of Peoria INC 1 1 PeoriaR Douglas Emlen 1 1 WashingtonR P & Sons 1 1 PeoriaRea Rea Transportation INC 1 1 PeoriaRhodes Trucking 1 1 PekinRichard L Breeding 1 1 PeoriaRickey Enterprises INC 1 4 WashingtonRiley's Trucking 5 4 PeoriaRingenberg Logistics LLC 1 1 PeoriaRisinger Bros Transfer INC 230 236 MortonRiver City Carriers 1 1 WashingtonRoberson Trucking 1 1 PeoriaRoecker Cabinets and Millwork 1 1 MortonRoger L. Mulvaney 5 4 PeoriaRoger L. Mulvaney INC 3 3 PeoriaRogun Services INC 1 2 PeoriaRRR Transportaion INC 1 1 PeoriaRTC 1 1 PeoriaSam Leman I LLC 1 1 PeoriaSavannah Hilton Had Portable Moving and Storage INC 2 2 PeoriaSC2 INC 8 6 PeoriaScales Service and Supply INC 3 3 East PeoriaSCCI LLC 4 4 PeoriaSchefftech Productions LLC 1 1 PeoriaScheuer Trucking 1 1 PeoriaSchumm Transit 1 1 MortonScott Weaver and Sons Trucking and Excavating 2 1 WashingtonSeays Delivery Services Air Freight INC 5 3 PeoriaSherwood Trucking 1 1 PeoriaSonshine Trucking INC 2 3 MortonSpecialized Transport 3 2 Creve CoeurStallings Delivery Express INC 7 7 BartonvilleStar Transport INC 673 691 MortonStrube Trucking LLC 1 1 PekinT R Worrick Trucking 1 1 Chillicothe Tanbem Dump Truck Halling 1 1 PekinTC Cliffs Tank Lines LLC 4 4 PeoriaTCF Industries INC 5 8 PeoriaTerm Brokers INC 1 1 BartonvilleThe Elephant and Tiger Encounter 1 1 PeoriaThe H3 Group LLC 1 1 PeoriaThree R Transport INC 2 2 PeoriaThrift Trucking 23 35 BartonvilleTitan Industries INC 1 1 East PeoriaTobin Brothers INC 1 1 PeoriaTower Logistics LLC 1 1 PeoriaTraffic Tom INC 7 7 BartonvilleTransquip Resources INC 1 1 PekinTrapper Trucking Lines INC 2 2 MortonTri County Water Treatment LLC 2 2 PeoriaTrotter Trucking 1 1 PekinTurf Solutions Group LLC 1 1 PeoriaUnzicker Equipment INC 1 1 MortonVarnes Transport 1 1 PeoriaW H Trucking 1 1 MortonWaid Enterprises 1 1 BartonvilleWaid Transport INC 38 38 BartonvilleWalters Brothers Harley Davidson INC 2 2 PeoriaWelch Gaming LLC 1 3 PeoriaWelch Trucking INC 1 2 East PeoriaWildermuth Farms 1 1 PekinWilliam Lasley II 1 1 PekinWilliams & Russell Trucking CO 1 1 BartonvilleWinkler Meats Inc 2 2 PeoriaWKP Transfer 35 40 PeoriaXavier Trucking INC 1 1 PeoriaYo-Mac Transport INC 1 1 PeoriaZeal Optics 1 2 PeoriaTotal 2454 2422
Name Number of Trucks Number of Drivers City4 Less Companies LLC 1 2 PeoriaA In and Out Automotive Towing Recovery and Transit INC 2 1 PeoriaA In and Out Towing 1 4 PeoriaA Transport 1 1 PeoriaAdvanced Lead Contractors INC 1 1 PeoriaAdvanced Medical Transportation 1 1 PeoriaAir-Land Transport Service INC 89 88 MortonAlan Koehler 1 1 PeoriaAlcaraz-Vargas Trucking LLC 1 1 PeoriaArctic Fox Express No 24 1 1 PeoriaA-Transport 2 2 PeoriaAurora Trucking LLC 1 1 WashingtonB & D Trucking 1 1 PeoriaB S Trucking CO 1 1 PeoriaB There Transport 1 1 PeoriaBeebe Trucking INC 1 1 WashingtonBergen Trucking 1 1 Chillicothe Big Cat Xpress INC 1 1 East PeoriaBodine Services of Peoria LLC 8 6 BartonvilleBooth Trucking 1 1 East PeoriaBosch Trucking CO INC 68 65 PeoriaBourlands Trucking 3 3 PeoriaBowersock Transportation Services 1 1 PeoriaBrewers Distributing CO 15 11 PeoriaBull Lathrom and Son's Trucking INC 7 7 WashingtonBurcklund Distributors INC 13 15 East PeoriaC A Walker Truck Lines INC 3 2 Chillicothe CACT Bonds Trucking INC 1 1 PeoriaCarl E. Kath Jr 7 7 MortonCentral Illinois Courier 8 8 Creve CoeurCentre State Idealease 13 26 PeoriaCEW Carrier 1 1 PeoriaChet Wyss Trucking Company 1 1 WashingtonCletcher & Clechther INC 1 1 BartonvilleCold-Way Express INC 3 4 MortonConsolidated Linen Service 1 1 PeoriaCook Rentals 4 1 PeoriaCopelan Transportation 1 1 BartonvilleCoretec Communications LLC 5 2 WashingtonCRT 1 1 PekinCWG Incorporated 4 2 MortonD W B Trucking 2 1 MortonDabco LLC 14 14 MortonDan Manikowski Trucking 1 1 WashingtonDavid Kenyon 1 3 Chillicothe Davis Farms Trucking 2 1 Chillicothe Dependable Towing 5 4 PeoriaDevall Trucking 1 1 East PeoriaDEW Trucking 1 1 PeoriaDick Gaunt Trucking & Excavating INC 2 2 WashingtonDoering Truck Parts 1 1 PeoriaDooley Mining Service 2 3 PeoriaDouble Creek Trucking 1 2 WashingtonDrumheller Bag Corp 2 1 PeoriaEagle Ridge Equine LLC 1 1 East PeoriaEGA Deliveries LLC 1 2 MortonEKPO Trucking Demolition and Produce Company 4 1 PeoriaEnergy Home Insulation 10 10 East PeoriaFarmington Road Towing INC 6 3 PeoriaFederal Logistics LLC 55 55 East PeoriaFenton Burke Enterprises LLC 1 1 WashingtonFiestra Bus Tours 1 1 PeoriaFood Serivces Equipment Corp 1 1 PeoriaFort Transfer Company 100 100 MortonFort's Toyota of Pekin 1 1 PekinFrate Service INC 17 17 East PeoriaFreight Expediters INC 3 4 East PeoriaG & D Transportation 470 392 MortonG & D Transportation Brokerage INC 1 1 MortonGardner L. Murphy Trucking 1 1 PeoriaGaunt Enterprises INC 2 2 MortonGibson Trucking 1 1 East PeoriaGlick Trucking LLC 9 8 WashingtonGregory Transport 1 1 WashingtonGrimm's Propane 4 3 MortonGTT INC 18 15 PeoriaHB Transportation LLC 4 8 PeoriaHedrick Trucking 1 1 PekinHolt Trucking 1 1 East PeoriaHowell Enterprises 1 1 PeoriaHurst 1stt Logistics INC 1 1 PeoriaICD Fuilds LLC 5 5 PekinIllini Logistic 1 1 PeoriaIllinois - Northern Trucking Company 1 1 PeoriaIllinois Central College 5 15 East PeoriaIllinois Valley Glass Co 2 2 PeoriaIllinois Valley Towing 1 1 PeoriaInabit Services 5 1 PeoriaJ & F Trucking 2 2 Chillicothe J & L Express Trucking INC 4 1 PeoriaJ & L Trucking 1 1 PeoriaJ & T Delivery Express INC 6 5 PeoriaJ D Transfers INC 5 5 PeoriaJ Hawk Incorporated 1 1 East PeoriaJ Hawk Logistics 1 1 East PeoriaJ S B Transportation Specialities INC 5 7 MortonJames Hudson and Son Trucking INC 1 1 PekinJames S. Dickworth 1 1 Chillicothe Jaydee Truck Services 6 3 East PeoriaJeff Yergler 1 4 PekinJiffy Express INC 3 3 PeoriaJim Birkey Trucking 1 1 WashingtonJim Lynn Distributing 1 1 PeoriaJoe Hoskins Trucking 1 1 Chillicothe Joshua Campbell 1 1 East PeoriaJRBR Trucking 3 2 WashingtonK & M Express INC 1 1 PekinK2 Industrial Services INC 19 25 PekinKDF Trucking 1 1 Chillicothe Kemper Express 5 17 PeoriaKen Andrews Trucking 1 1 WashingtonKenway Transportation INC 1 1 East PeoriaLighthouse Automotive 1 6 MortonLogistic Freight Services LLC 1 1 PeoriaLvn Enterprises 1 1 PeoriaM & D Farms INC 1 3 Chillicothe M & W Construction Leasing 7 7 Creve CoeurM J Hamilton INC 2 2 MortonMaui Jim USA INC 3 3 PeoriaMay Trucking 1 1 PeoriaMetro Moving & Delivery Service INC 11 10 East PeoriaMidwest Bio Fuels 1 1 PekinMidwest Construction Services of Peoria 6 2 BartonvilleMike Eddy and Son Trucking 1 1 PeoriaMike Lauderback Trucking 1 1 WashingtonMike Yordy and Sons INC 1 5 MortonMike's Mobile Home Repair INC 1 1 East PeoriaMistri Logistrics 1 1 PeoriaMobile Techs 1 4 Chillicothe Mooberry LTD 2 2 East PeoriaMordue Moving and Storage INC 23 19 PeoriaMorton Auto Auction INC 1 1 MortonMr. Tow ITS Wrecker Services 1 1 BartonvilleN E Finch Co 7 6 PeoriaNational Mehl Tours INC 1 1 PeoriaNew Concepts Trucking INC 1 1 PeoriaNewlun Transport Service Clarence E. Newlun 1 1 PekinOil Waste Services INC 10 8 PeoriaO'Neil Brothers Transfer and Storage 36 26 PeoriaPEDL LTD 1 1 East PeoriaPeoria Disposal Company 67 57 PeoriaPHD Services LLC 3 10 PeoriaPierson Trucking INC 3 1 PeoriaPioneer Transit LLC 1 1 PekinPony Express 1 1 PeoriaPortable Moving and Storage of Central Illinois INC Pods 6 6 PeoriaPremium Trucking INC 1 1 PeoriaProcare Home Heath Services 7 5 PekinProgressive Innovations LTD 1 1 PekinProvincial Transport Services INC 1 1 East PeoriaR & M Tansport of Peoria INC 1 1 PeoriaR Douglas Emlen 1 1 WashingtonR P & Sons 1 1 PeoriaRea Rea Transportation INC 1 1 PeoriaRhodes Trucking 1 1 PekinRichard L Breeding 1 1 PeoriaRickey Enterprises INC 1 4 WashingtonRiley's Trucking 5 4 PeoriaRingenberg Logistics LLC 1 1 PeoriaRisinger Bros Transfer INC 230 236 MortonRiver City Carriers 1 1 WashingtonRoberson Trucking 1 1 PeoriaRoecker Cabinets and Millwork 1 1 MortonRoger L. Mulvaney 5 4 PeoriaRoger L. Mulvaney INC 3 3 PeoriaRogun Services INC 1 2 PeoriaRRR Transportaion INC 1 1 PeoriaRTC 1 1 PeoriaSam Leman I LLC 1 1 PeoriaSavannah Hilton Had Portable Moving and Storage INC 2 2 PeoriaSC2 INC 8 6 PeoriaScales Service and Supply INC 3 3 East PeoriaSCCI LLC 4 4 PeoriaSchefftech Productions LLC 1 1 PeoriaScheuer Trucking 1 1 PeoriaSchumm Transit 1 1 MortonScott Weaver and Sons Trucking and Excavating 2 1 WashingtonSeays Delivery Services Air Freight INC 5 3 PeoriaSherwood Trucking 1 1 PeoriaSonshine Trucking INC 2 3 MortonSpecialized Transport 3 2 Creve CoeurStallings Delivery Express INC 7 7 BartonvilleStar Transport INC 673 691 MortonStrube Trucking LLC 1 1 PekinT R Worrick Trucking 1 1 Chillicothe Tanbem Dump Truck Halling 1 1 PekinTC Cliffs Tank Lines LLC 4 4 PeoriaTCF Industries INC 5 8 PeoriaTerm Brokers INC 1 1 BartonvilleThe Elephant and Tiger Encounter 1 1 PeoriaThe H3 Group LLC 1 1 PeoriaThree R Transport INC 2 2 PeoriaThrift Trucking 23 35 BartonvilleTitan Industries INC 1 1 East PeoriaTobin Brothers INC 1 1 PeoriaTower Logistics LLC 1 1 PeoriaTraffic Tom INC 7 7 BartonvilleTransquip Resources INC 1 1 PekinTrapper Trucking Lines INC 2 2 MortonTri County Water Treatment LLC 2 2 PeoriaTrotter Trucking 1 1 PekinTurf Solutions Group LLC 1 1 PeoriaUnzicker Equipment INC 1 1 MortonVarnes Transport 1 1 PeoriaW H Trucking 1 1 MortonWaid Enterprises 1 1 BartonvilleWaid Transport INC 38 38 BartonvilleWalters Brothers Harley Davidson INC 2 2 PeoriaWelch Gaming LLC 1 3 PeoriaWelch Trucking INC 1 2 East PeoriaWildermuth Farms 1 1 PekinWilliam Lasley II 1 1 PekinWilliams & Russell Trucking CO 1 1 BartonvilleWinkler Meats Inc 2 2 PeoriaWKP Transfer 35 40 PeoriaXavier Trucking INC 1 1 PeoriaYo-Mac Transport INC 1 1 PeoriaZeal Optics 1 2 PeoriaTotal 2454 2422
Name Number of Trucks Number of Drivers City
APPENDIX C: TRUCKING COMPANIES IN THE TRI-COUNTY REGION
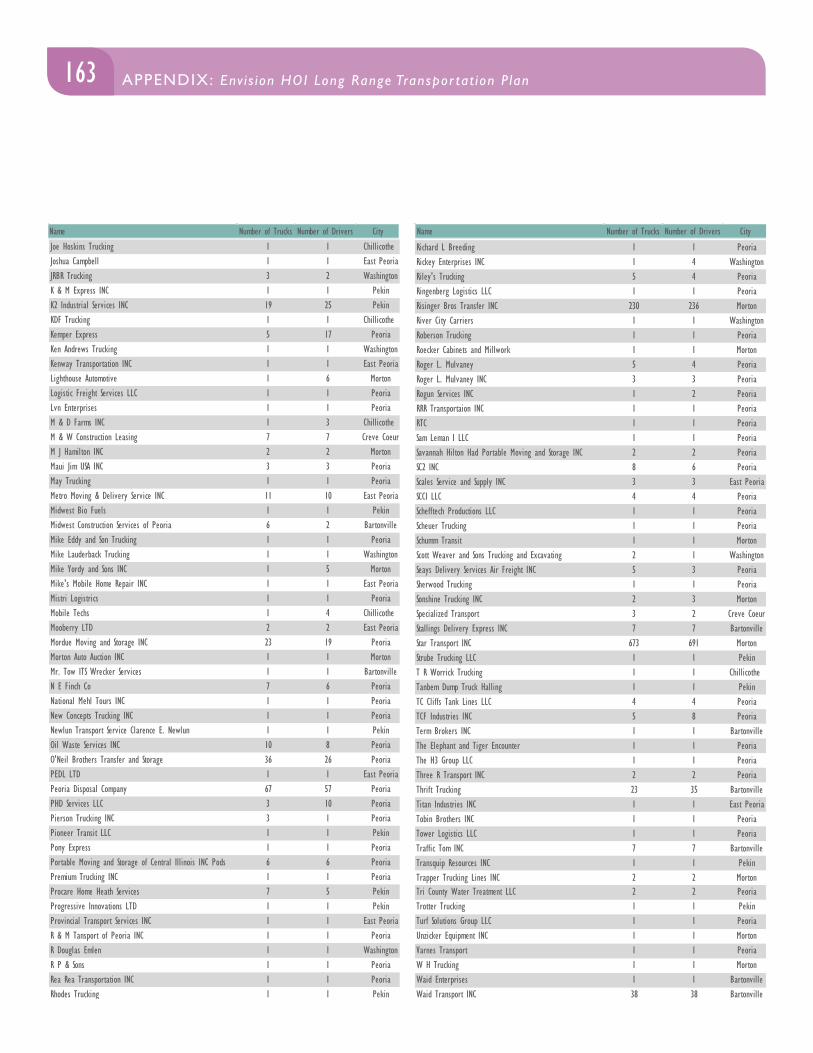
163APPENDIX: Env i s ion HOI Long Range Transpor tat ion P lan APPENDIX: Env i s ion HOI Long Range Transpor tat ion P lan
Name Number of Trucks Number of Drivers City4 Less Companies LLC 1 2 PeoriaA In and Out Automotive Towing Recovery and Transit INC 2 1 PeoriaA In and Out Towing 1 4 PeoriaA Transport 1 1 PeoriaAdvanced Lead Contractors INC 1 1 PeoriaAdvanced Medical Transportation 1 1 PeoriaAir-Land Transport Service INC 89 88 MortonAlan Koehler 1 1 PeoriaAlcaraz-Vargas Trucking LLC 1 1 PeoriaArctic Fox Express No 24 1 1 PeoriaA-Transport 2 2 PeoriaAurora Trucking LLC 1 1 WashingtonB & D Trucking 1 1 PeoriaB S Trucking CO 1 1 PeoriaB There Transport 1 1 PeoriaBeebe Trucking INC 1 1 WashingtonBergen Trucking 1 1 Chillicothe Big Cat Xpress INC 1 1 East PeoriaBodine Services of Peoria LLC 8 6 BartonvilleBooth Trucking 1 1 East PeoriaBosch Trucking CO INC 68 65 PeoriaBourlands Trucking 3 3 PeoriaBowersock Transportation Services 1 1 PeoriaBrewers Distributing CO 15 11 PeoriaBull Lathrom and Son's Trucking INC 7 7 WashingtonBurcklund Distributors INC 13 15 East PeoriaC A Walker Truck Lines INC 3 2 Chillicothe CACT Bonds Trucking INC 1 1 PeoriaCarl E. Kath Jr 7 7 MortonCentral Illinois Courier 8 8 Creve CoeurCentre State Idealease 13 26 PeoriaCEW Carrier 1 1 PeoriaChet Wyss Trucking Company 1 1 WashingtonCletcher & Clechther INC 1 1 BartonvilleCold-Way Express INC 3 4 MortonConsolidated Linen Service 1 1 PeoriaCook Rentals 4 1 PeoriaCopelan Transportation 1 1 BartonvilleCoretec Communications LLC 5 2 WashingtonCRT 1 1 PekinCWG Incorporated 4 2 MortonD W B Trucking 2 1 MortonDabco LLC 14 14 MortonDan Manikowski Trucking 1 1 WashingtonDavid Kenyon 1 3 Chillicothe Davis Farms Trucking 2 1 Chillicothe Dependable Towing 5 4 PeoriaDevall Trucking 1 1 East PeoriaDEW Trucking 1 1 PeoriaDick Gaunt Trucking & Excavating INC 2 2 WashingtonDoering Truck Parts 1 1 PeoriaDooley Mining Service 2 3 PeoriaDouble Creek Trucking 1 2 WashingtonDrumheller Bag Corp 2 1 PeoriaEagle Ridge Equine LLC 1 1 East PeoriaEGA Deliveries LLC 1 2 MortonEKPO Trucking Demolition and Produce Company 4 1 PeoriaEnergy Home Insulation 10 10 East PeoriaFarmington Road Towing INC 6 3 PeoriaFederal Logistics LLC 55 55 East PeoriaFenton Burke Enterprises LLC 1 1 WashingtonFiestra Bus Tours 1 1 PeoriaFood Serivces Equipment Corp 1 1 PeoriaFort Transfer Company 100 100 MortonFort's Toyota of Pekin 1 1 PekinFrate Service INC 17 17 East PeoriaFreight Expediters INC 3 4 East PeoriaG & D Transportation 470 392 MortonG & D Transportation Brokerage INC 1 1 MortonGardner L. Murphy Trucking 1 1 PeoriaGaunt Enterprises INC 2 2 MortonGibson Trucking 1 1 East PeoriaGlick Trucking LLC 9 8 WashingtonGregory Transport 1 1 WashingtonGrimm's Propane 4 3 MortonGTT INC 18 15 PeoriaHB Transportation LLC 4 8 PeoriaHedrick Trucking 1 1 PekinHolt Trucking 1 1 East PeoriaHowell Enterprises 1 1 PeoriaHurst 1stt Logistics INC 1 1 PeoriaICD Fuilds LLC 5 5 PekinIllini Logistic 1 1 PeoriaIllinois - Northern Trucking Company 1 1 PeoriaIllinois Central College 5 15 East PeoriaIllinois Valley Glass Co 2 2 PeoriaIllinois Valley Towing 1 1 PeoriaInabit Services 5 1 PeoriaJ & F Trucking 2 2 Chillicothe J & L Express Trucking INC 4 1 PeoriaJ & L Trucking 1 1 PeoriaJ & T Delivery Express INC 6 5 PeoriaJ D Transfers INC 5 5 PeoriaJ Hawk Incorporated 1 1 East PeoriaJ Hawk Logistics 1 1 East PeoriaJ S B Transportation Specialities INC 5 7 MortonJames Hudson and Son Trucking INC 1 1 PekinJames S. Dickworth 1 1 Chillicothe Jaydee Truck Services 6 3 East PeoriaJeff Yergler 1 4 PekinJiffy Express INC 3 3 PeoriaJim Birkey Trucking 1 1 WashingtonJim Lynn Distributing 1 1 PeoriaJoe Hoskins Trucking 1 1 Chillicothe Joshua Campbell 1 1 East PeoriaJRBR Trucking 3 2 WashingtonK & M Express INC 1 1 PekinK2 Industrial Services INC 19 25 PekinKDF Trucking 1 1 Chillicothe Kemper Express 5 17 PeoriaKen Andrews Trucking 1 1 WashingtonKenway Transportation INC 1 1 East PeoriaLighthouse Automotive 1 6 MortonLogistic Freight Services LLC 1 1 PeoriaLvn Enterprises 1 1 PeoriaM & D Farms INC 1 3 Chillicothe M & W Construction Leasing 7 7 Creve CoeurM J Hamilton INC 2 2 MortonMaui Jim USA INC 3 3 PeoriaMay Trucking 1 1 PeoriaMetro Moving & Delivery Service INC 11 10 East PeoriaMidwest Bio Fuels 1 1 PekinMidwest Construction Services of Peoria 6 2 BartonvilleMike Eddy and Son Trucking 1 1 PeoriaMike Lauderback Trucking 1 1 WashingtonMike Yordy and Sons INC 1 5 MortonMike's Mobile Home Repair INC 1 1 East PeoriaMistri Logistrics 1 1 PeoriaMobile Techs 1 4 Chillicothe Mooberry LTD 2 2 East PeoriaMordue Moving and Storage INC 23 19 PeoriaMorton Auto Auction INC 1 1 MortonMr. Tow ITS Wrecker Services 1 1 BartonvilleN E Finch Co 7 6 PeoriaNational Mehl Tours INC 1 1 PeoriaNew Concepts Trucking INC 1 1 PeoriaNewlun Transport Service Clarence E. Newlun 1 1 PekinOil Waste Services INC 10 8 PeoriaO'Neil Brothers Transfer and Storage 36 26 PeoriaPEDL LTD 1 1 East PeoriaPeoria Disposal Company 67 57 PeoriaPHD Services LLC 3 10 PeoriaPierson Trucking INC 3 1 PeoriaPioneer Transit LLC 1 1 PekinPony Express 1 1 PeoriaPortable Moving and Storage of Central Illinois INC Pods 6 6 PeoriaPremium Trucking INC 1 1 PeoriaProcare Home Heath Services 7 5 PekinProgressive Innovations LTD 1 1 PekinProvincial Transport Services INC 1 1 East PeoriaR & M Tansport of Peoria INC 1 1 PeoriaR Douglas Emlen 1 1 WashingtonR P & Sons 1 1 PeoriaRea Rea Transportation INC 1 1 PeoriaRhodes Trucking 1 1 PekinRichard L Breeding 1 1 PeoriaRickey Enterprises INC 1 4 WashingtonRiley's Trucking 5 4 PeoriaRingenberg Logistics LLC 1 1 PeoriaRisinger Bros Transfer INC 230 236 MortonRiver City Carriers 1 1 WashingtonRoberson Trucking 1 1 PeoriaRoecker Cabinets and Millwork 1 1 MortonRoger L. Mulvaney 5 4 PeoriaRoger L. Mulvaney INC 3 3 PeoriaRogun Services INC 1 2 PeoriaRRR Transportaion INC 1 1 PeoriaRTC 1 1 PeoriaSam Leman I LLC 1 1 PeoriaSavannah Hilton Had Portable Moving and Storage INC 2 2 PeoriaSC2 INC 8 6 PeoriaScales Service and Supply INC 3 3 East PeoriaSCCI LLC 4 4 PeoriaSchefftech Productions LLC 1 1 PeoriaScheuer Trucking 1 1 PeoriaSchumm Transit 1 1 MortonScott Weaver and Sons Trucking and Excavating 2 1 WashingtonSeays Delivery Services Air Freight INC 5 3 PeoriaSherwood Trucking 1 1 PeoriaSonshine Trucking INC 2 3 MortonSpecialized Transport 3 2 Creve CoeurStallings Delivery Express INC 7 7 BartonvilleStar Transport INC 673 691 MortonStrube Trucking LLC 1 1 PekinT R Worrick Trucking 1 1 Chillicothe Tanbem Dump Truck Halling 1 1 PekinTC Cliffs Tank Lines LLC 4 4 PeoriaTCF Industries INC 5 8 PeoriaTerm Brokers INC 1 1 BartonvilleThe Elephant and Tiger Encounter 1 1 PeoriaThe H3 Group LLC 1 1 PeoriaThree R Transport INC 2 2 PeoriaThrift Trucking 23 35 BartonvilleTitan Industries INC 1 1 East PeoriaTobin Brothers INC 1 1 PeoriaTower Logistics LLC 1 1 PeoriaTraffic Tom INC 7 7 BartonvilleTransquip Resources INC 1 1 PekinTrapper Trucking Lines INC 2 2 MortonTri County Water Treatment LLC 2 2 PeoriaTrotter Trucking 1 1 PekinTurf Solutions Group LLC 1 1 PeoriaUnzicker Equipment INC 1 1 MortonVarnes Transport 1 1 PeoriaW H Trucking 1 1 MortonWaid Enterprises 1 1 BartonvilleWaid Transport INC 38 38 BartonvilleWalters Brothers Harley Davidson INC 2 2 PeoriaWelch Gaming LLC 1 3 PeoriaWelch Trucking INC 1 2 East PeoriaWildermuth Farms 1 1 PekinWilliam Lasley II 1 1 PekinWilliams & Russell Trucking CO 1 1 BartonvilleWinkler Meats Inc 2 2 PeoriaWKP Transfer 35 40 PeoriaXavier Trucking INC 1 1 PeoriaYo-Mac Transport INC 1 1 PeoriaZeal Optics 1 2 PeoriaTotal 2454 2422
Name Number of Trucks Number of Drivers City4 Less Companies LLC 1 2 PeoriaA In and Out Automotive Towing Recovery and Transit INC 2 1 PeoriaA In and Out Towing 1 4 PeoriaA Transport 1 1 PeoriaAdvanced Lead Contractors INC 1 1 PeoriaAdvanced Medical Transportation 1 1 PeoriaAir-Land Transport Service INC 89 88 MortonAlan Koehler 1 1 PeoriaAlcaraz-Vargas Trucking LLC 1 1 PeoriaArctic Fox Express No 24 1 1 PeoriaA-Transport 2 2 PeoriaAurora Trucking LLC 1 1 WashingtonB & D Trucking 1 1 PeoriaB S Trucking CO 1 1 PeoriaB There Transport 1 1 PeoriaBeebe Trucking INC 1 1 WashingtonBergen Trucking 1 1 Chillicothe Big Cat Xpress INC 1 1 East PeoriaBodine Services of Peoria LLC 8 6 BartonvilleBooth Trucking 1 1 East PeoriaBosch Trucking CO INC 68 65 PeoriaBourlands Trucking 3 3 PeoriaBowersock Transportation Services 1 1 PeoriaBrewers Distributing CO 15 11 PeoriaBull Lathrom and Son's Trucking INC 7 7 WashingtonBurcklund Distributors INC 13 15 East PeoriaC A Walker Truck Lines INC 3 2 Chillicothe CACT Bonds Trucking INC 1 1 PeoriaCarl E. Kath Jr 7 7 MortonCentral Illinois Courier 8 8 Creve CoeurCentre State Idealease 13 26 PeoriaCEW Carrier 1 1 PeoriaChet Wyss Trucking Company 1 1 WashingtonCletcher & Clechther INC 1 1 BartonvilleCold-Way Express INC 3 4 MortonConsolidated Linen Service 1 1 PeoriaCook Rentals 4 1 PeoriaCopelan Transportation 1 1 BartonvilleCoretec Communications LLC 5 2 WashingtonCRT 1 1 PekinCWG Incorporated 4 2 MortonD W B Trucking 2 1 MortonDabco LLC 14 14 MortonDan Manikowski Trucking 1 1 WashingtonDavid Kenyon 1 3 Chillicothe Davis Farms Trucking 2 1 Chillicothe Dependable Towing 5 4 PeoriaDevall Trucking 1 1 East PeoriaDEW Trucking 1 1 PeoriaDick Gaunt Trucking & Excavating INC 2 2 WashingtonDoering Truck Parts 1 1 PeoriaDooley Mining Service 2 3 PeoriaDouble Creek Trucking 1 2 WashingtonDrumheller Bag Corp 2 1 PeoriaEagle Ridge Equine LLC 1 1 East PeoriaEGA Deliveries LLC 1 2 MortonEKPO Trucking Demolition and Produce Company 4 1 PeoriaEnergy Home Insulation 10 10 East PeoriaFarmington Road Towing INC 6 3 PeoriaFederal Logistics LLC 55 55 East PeoriaFenton Burke Enterprises LLC 1 1 WashingtonFiestra Bus Tours 1 1 PeoriaFood Serivces Equipment Corp 1 1 PeoriaFort Transfer Company 100 100 MortonFort's Toyota of Pekin 1 1 PekinFrate Service INC 17 17 East PeoriaFreight Expediters INC 3 4 East PeoriaG & D Transportation 470 392 MortonG & D Transportation Brokerage INC 1 1 MortonGardner L. Murphy Trucking 1 1 PeoriaGaunt Enterprises INC 2 2 MortonGibson Trucking 1 1 East PeoriaGlick Trucking LLC 9 8 WashingtonGregory Transport 1 1 WashingtonGrimm's Propane 4 3 MortonGTT INC 18 15 PeoriaHB Transportation LLC 4 8 PeoriaHedrick Trucking 1 1 PekinHolt Trucking 1 1 East PeoriaHowell Enterprises 1 1 PeoriaHurst 1stt Logistics INC 1 1 PeoriaICD Fuilds LLC 5 5 PekinIllini Logistic 1 1 PeoriaIllinois - Northern Trucking Company 1 1 PeoriaIllinois Central College 5 15 East PeoriaIllinois Valley Glass Co 2 2 PeoriaIllinois Valley Towing 1 1 PeoriaInabit Services 5 1 PeoriaJ & F Trucking 2 2 Chillicothe J & L Express Trucking INC 4 1 PeoriaJ & L Trucking 1 1 PeoriaJ & T Delivery Express INC 6 5 PeoriaJ D Transfers INC 5 5 PeoriaJ Hawk Incorporated 1 1 East PeoriaJ Hawk Logistics 1 1 East PeoriaJ S B Transportation Specialities INC 5 7 MortonJames Hudson and Son Trucking INC 1 1 PekinJames S. Dickworth 1 1 Chillicothe Jaydee Truck Services 6 3 East PeoriaJeff Yergler 1 4 PekinJiffy Express INC 3 3 PeoriaJim Birkey Trucking 1 1 WashingtonJim Lynn Distributing 1 1 PeoriaJoe Hoskins Trucking 1 1 Chillicothe Joshua Campbell 1 1 East PeoriaJRBR Trucking 3 2 WashingtonK & M Express INC 1 1 PekinK2 Industrial Services INC 19 25 PekinKDF Trucking 1 1 Chillicothe Kemper Express 5 17 PeoriaKen Andrews Trucking 1 1 WashingtonKenway Transportation INC 1 1 East PeoriaLighthouse Automotive 1 6 MortonLogistic Freight Services LLC 1 1 PeoriaLvn Enterprises 1 1 PeoriaM & D Farms INC 1 3 Chillicothe M & W Construction Leasing 7 7 Creve CoeurM J Hamilton INC 2 2 MortonMaui Jim USA INC 3 3 PeoriaMay Trucking 1 1 PeoriaMetro Moving & Delivery Service INC 11 10 East PeoriaMidwest Bio Fuels 1 1 PekinMidwest Construction Services of Peoria 6 2 BartonvilleMike Eddy and Son Trucking 1 1 PeoriaMike Lauderback Trucking 1 1 WashingtonMike Yordy and Sons INC 1 5 MortonMike's Mobile Home Repair INC 1 1 East PeoriaMistri Logistrics 1 1 PeoriaMobile Techs 1 4 Chillicothe Mooberry LTD 2 2 East PeoriaMordue Moving and Storage INC 23 19 PeoriaMorton Auto Auction INC 1 1 MortonMr. Tow ITS Wrecker Services 1 1 BartonvilleN E Finch Co 7 6 PeoriaNational Mehl Tours INC 1 1 PeoriaNew Concepts Trucking INC 1 1 PeoriaNewlun Transport Service Clarence E. Newlun 1 1 PekinOil Waste Services INC 10 8 PeoriaO'Neil Brothers Transfer and Storage 36 26 PeoriaPEDL LTD 1 1 East PeoriaPeoria Disposal Company 67 57 PeoriaPHD Services LLC 3 10 PeoriaPierson Trucking INC 3 1 PeoriaPioneer Transit LLC 1 1 PekinPony Express 1 1 PeoriaPortable Moving and Storage of Central Illinois INC Pods 6 6 PeoriaPremium Trucking INC 1 1 PeoriaProcare Home Heath Services 7 5 PekinProgressive Innovations LTD 1 1 PekinProvincial Transport Services INC 1 1 East PeoriaR & M Tansport of Peoria INC 1 1 PeoriaR Douglas Emlen 1 1 WashingtonR P & Sons 1 1 PeoriaRea Rea Transportation INC 1 1 PeoriaRhodes Trucking 1 1 PekinRichard L Breeding 1 1 PeoriaRickey Enterprises INC 1 4 WashingtonRiley's Trucking 5 4 PeoriaRingenberg Logistics LLC 1 1 PeoriaRisinger Bros Transfer INC 230 236 MortonRiver City Carriers 1 1 WashingtonRoberson Trucking 1 1 PeoriaRoecker Cabinets and Millwork 1 1 MortonRoger L. Mulvaney 5 4 PeoriaRoger L. Mulvaney INC 3 3 PeoriaRogun Services INC 1 2 PeoriaRRR Transportaion INC 1 1 PeoriaRTC 1 1 PeoriaSam Leman I LLC 1 1 PeoriaSavannah Hilton Had Portable Moving and Storage INC 2 2 PeoriaSC2 INC 8 6 PeoriaScales Service and Supply INC 3 3 East PeoriaSCCI LLC 4 4 PeoriaSchefftech Productions LLC 1 1 PeoriaScheuer Trucking 1 1 PeoriaSchumm Transit 1 1 MortonScott Weaver and Sons Trucking and Excavating 2 1 WashingtonSeays Delivery Services Air Freight INC 5 3 PeoriaSherwood Trucking 1 1 PeoriaSonshine Trucking INC 2 3 MortonSpecialized Transport 3 2 Creve CoeurStallings Delivery Express INC 7 7 BartonvilleStar Transport INC 673 691 MortonStrube Trucking LLC 1 1 PekinT R Worrick Trucking 1 1 Chillicothe Tanbem Dump Truck Halling 1 1 PekinTC Cliffs Tank Lines LLC 4 4 PeoriaTCF Industries INC 5 8 PeoriaTerm Brokers INC 1 1 BartonvilleThe Elephant and Tiger Encounter 1 1 PeoriaThe H3 Group LLC 1 1 PeoriaThree R Transport INC 2 2 PeoriaThrift Trucking 23 35 BartonvilleTitan Industries INC 1 1 East PeoriaTobin Brothers INC 1 1 PeoriaTower Logistics LLC 1 1 PeoriaTraffic Tom INC 7 7 BartonvilleTransquip Resources INC 1 1 PekinTrapper Trucking Lines INC 2 2 MortonTri County Water Treatment LLC 2 2 PeoriaTrotter Trucking 1 1 PekinTurf Solutions Group LLC 1 1 PeoriaUnzicker Equipment INC 1 1 MortonVarnes Transport 1 1 PeoriaW H Trucking 1 1 MortonWaid Enterprises 1 1 BartonvilleWaid Transport INC 38 38 BartonvilleWalters Brothers Harley Davidson INC 2 2 PeoriaWelch Gaming LLC 1 3 PeoriaWelch Trucking INC 1 2 East PeoriaWildermuth Farms 1 1 PekinWilliam Lasley II 1 1 PekinWilliams & Russell Trucking CO 1 1 BartonvilleWinkler Meats Inc 2 2 PeoriaWKP Transfer 35 40 PeoriaXavier Trucking INC 1 1 PeoriaYo-Mac Transport INC 1 1 PeoriaZeal Optics 1 2 PeoriaTotal 2454 2422
Name Number of Trucks Number of Drivers City Name Number of Trucks Number of Drivers City
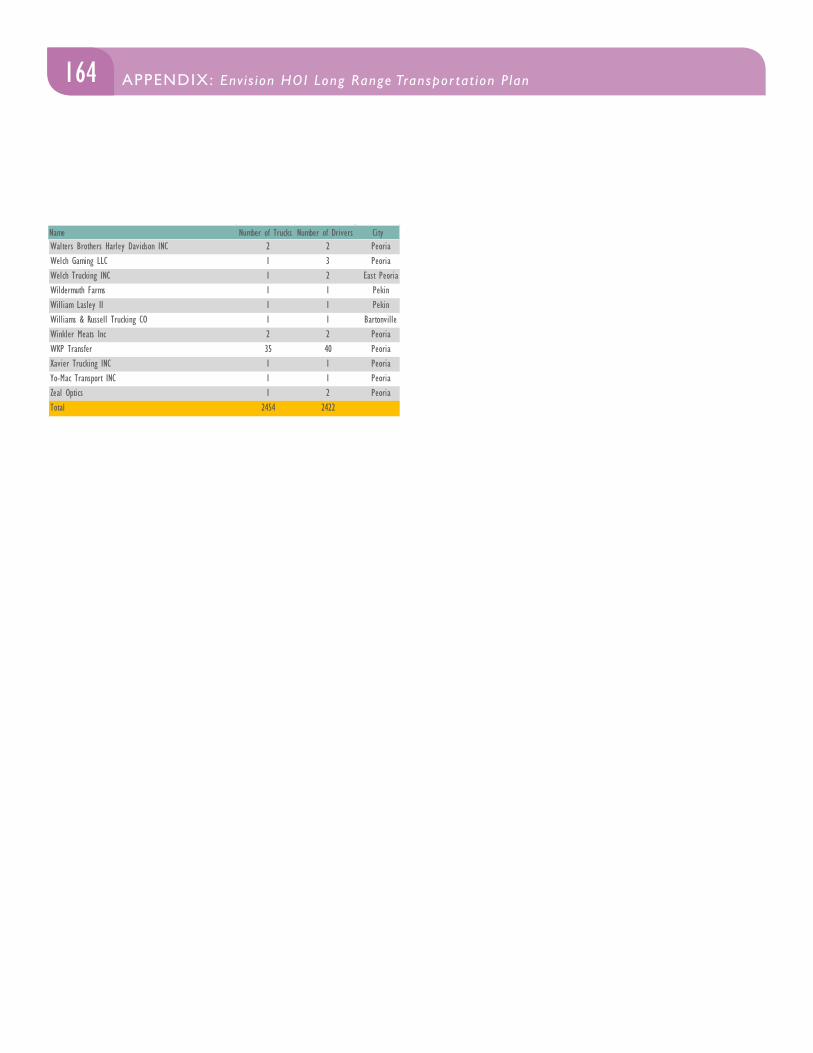
164 APPENDIX: Env i s ion HOI Long Range Transpor tat ion P lan
Name Number of Trucks Number of Drivers City4 Less Companies LLC 1 2 PeoriaA In and Out Automotive Towing Recovery and Transit INC 2 1 PeoriaA In and Out Towing 1 4 PeoriaA Transport 1 1 PeoriaAdvanced Lead Contractors INC 1 1 PeoriaAdvanced Medical Transportation 1 1 PeoriaAir-Land Transport Service INC 89 88 MortonAlan Koehler 1 1 PeoriaAlcaraz-Vargas Trucking LLC 1 1 PeoriaArctic Fox Express No 24 1 1 PeoriaA-Transport 2 2 PeoriaAurora Trucking LLC 1 1 WashingtonB & D Trucking 1 1 PeoriaB S Trucking CO 1 1 PeoriaB There Transport 1 1 PeoriaBeebe Trucking INC 1 1 WashingtonBergen Trucking 1 1 Chillicothe Big Cat Xpress INC 1 1 East PeoriaBodine Services of Peoria LLC 8 6 BartonvilleBooth Trucking 1 1 East PeoriaBosch Trucking CO INC 68 65 PeoriaBourlands Trucking 3 3 PeoriaBowersock Transportation Services 1 1 PeoriaBrewers Distributing CO 15 11 PeoriaBull Lathrom and Son's Trucking INC 7 7 WashingtonBurcklund Distributors INC 13 15 East PeoriaC A Walker Truck Lines INC 3 2 Chillicothe CACT Bonds Trucking INC 1 1 PeoriaCarl E. Kath Jr 7 7 MortonCentral Illinois Courier 8 8 Creve CoeurCentre State Idealease 13 26 PeoriaCEW Carrier 1 1 PeoriaChet Wyss Trucking Company 1 1 WashingtonCletcher & Clechther INC 1 1 BartonvilleCold-Way Express INC 3 4 MortonConsolidated Linen Service 1 1 PeoriaCook Rentals 4 1 PeoriaCopelan Transportation 1 1 BartonvilleCoretec Communications LLC 5 2 WashingtonCRT 1 1 PekinCWG Incorporated 4 2 MortonD W B Trucking 2 1 MortonDabco LLC 14 14 MortonDan Manikowski Trucking 1 1 WashingtonDavid Kenyon 1 3 Chillicothe Davis Farms Trucking 2 1 Chillicothe Dependable Towing 5 4 PeoriaDevall Trucking 1 1 East PeoriaDEW Trucking 1 1 PeoriaDick Gaunt Trucking & Excavating INC 2 2 WashingtonDoering Truck Parts 1 1 PeoriaDooley Mining Service 2 3 PeoriaDouble Creek Trucking 1 2 WashingtonDrumheller Bag Corp 2 1 PeoriaEagle Ridge Equine LLC 1 1 East PeoriaEGA Deliveries LLC 1 2 MortonEKPO Trucking Demolition and Produce Company 4 1 PeoriaEnergy Home Insulation 10 10 East PeoriaFarmington Road Towing INC 6 3 PeoriaFederal Logistics LLC 55 55 East PeoriaFenton Burke Enterprises LLC 1 1 WashingtonFiestra Bus Tours 1 1 PeoriaFood Serivces Equipment Corp 1 1 PeoriaFort Transfer Company 100 100 MortonFort's Toyota of Pekin 1 1 PekinFrate Service INC 17 17 East PeoriaFreight Expediters INC 3 4 East PeoriaG & D Transportation 470 392 MortonG & D Transportation Brokerage INC 1 1 MortonGardner L. Murphy Trucking 1 1 PeoriaGaunt Enterprises INC 2 2 MortonGibson Trucking 1 1 East PeoriaGlick Trucking LLC 9 8 WashingtonGregory Transport 1 1 WashingtonGrimm's Propane 4 3 MortonGTT INC 18 15 PeoriaHB Transportation LLC 4 8 PeoriaHedrick Trucking 1 1 PekinHolt Trucking 1 1 East PeoriaHowell Enterprises 1 1 PeoriaHurst 1stt Logistics INC 1 1 PeoriaICD Fuilds LLC 5 5 PekinIllini Logistic 1 1 PeoriaIllinois - Northern Trucking Company 1 1 PeoriaIllinois Central College 5 15 East PeoriaIllinois Valley Glass Co 2 2 PeoriaIllinois Valley Towing 1 1 PeoriaInabit Services 5 1 PeoriaJ & F Trucking 2 2 Chillicothe J & L Express Trucking INC 4 1 PeoriaJ & L Trucking 1 1 PeoriaJ & T Delivery Express INC 6 5 PeoriaJ D Transfers INC 5 5 PeoriaJ Hawk Incorporated 1 1 East PeoriaJ Hawk Logistics 1 1 East PeoriaJ S B Transportation Specialities INC 5 7 MortonJames Hudson and Son Trucking INC 1 1 PekinJames S. Dickworth 1 1 Chillicothe Jaydee Truck Services 6 3 East PeoriaJeff Yergler 1 4 PekinJiffy Express INC 3 3 PeoriaJim Birkey Trucking 1 1 WashingtonJim Lynn Distributing 1 1 PeoriaJoe Hoskins Trucking 1 1 Chillicothe Joshua Campbell 1 1 East PeoriaJRBR Trucking 3 2 WashingtonK & M Express INC 1 1 PekinK2 Industrial Services INC 19 25 PekinKDF Trucking 1 1 Chillicothe Kemper Express 5 17 PeoriaKen Andrews Trucking 1 1 WashingtonKenway Transportation INC 1 1 East PeoriaLighthouse Automotive 1 6 MortonLogistic Freight Services LLC 1 1 PeoriaLvn Enterprises 1 1 PeoriaM & D Farms INC 1 3 Chillicothe M & W Construction Leasing 7 7 Creve CoeurM J Hamilton INC 2 2 MortonMaui Jim USA INC 3 3 PeoriaMay Trucking 1 1 PeoriaMetro Moving & Delivery Service INC 11 10 East PeoriaMidwest Bio Fuels 1 1 PekinMidwest Construction Services of Peoria 6 2 BartonvilleMike Eddy and Son Trucking 1 1 PeoriaMike Lauderback Trucking 1 1 WashingtonMike Yordy and Sons INC 1 5 MortonMike's Mobile Home Repair INC 1 1 East PeoriaMistri Logistrics 1 1 PeoriaMobile Techs 1 4 Chillicothe Mooberry LTD 2 2 East PeoriaMordue Moving and Storage INC 23 19 PeoriaMorton Auto Auction INC 1 1 MortonMr. Tow ITS Wrecker Services 1 1 BartonvilleN E Finch Co 7 6 PeoriaNational Mehl Tours INC 1 1 PeoriaNew Concepts Trucking INC 1 1 PeoriaNewlun Transport Service Clarence E. Newlun 1 1 PekinOil Waste Services INC 10 8 PeoriaO'Neil Brothers Transfer and Storage 36 26 PeoriaPEDL LTD 1 1 East PeoriaPeoria Disposal Company 67 57 PeoriaPHD Services LLC 3 10 PeoriaPierson Trucking INC 3 1 PeoriaPioneer Transit LLC 1 1 PekinPony Express 1 1 PeoriaPortable Moving and Storage of Central Illinois INC Pods 6 6 PeoriaPremium Trucking INC 1 1 PeoriaProcare Home Heath Services 7 5 PekinProgressive Innovations LTD 1 1 PekinProvincial Transport Services INC 1 1 East PeoriaR & M Tansport of Peoria INC 1 1 PeoriaR Douglas Emlen 1 1 WashingtonR P & Sons 1 1 PeoriaRea Rea Transportation INC 1 1 PeoriaRhodes Trucking 1 1 PekinRichard L Breeding 1 1 PeoriaRickey Enterprises INC 1 4 WashingtonRiley's Trucking 5 4 PeoriaRingenberg Logistics LLC 1 1 PeoriaRisinger Bros Transfer INC 230 236 MortonRiver City Carriers 1 1 WashingtonRoberson Trucking 1 1 PeoriaRoecker Cabinets and Millwork 1 1 MortonRoger L. Mulvaney 5 4 PeoriaRoger L. Mulvaney INC 3 3 PeoriaRogun Services INC 1 2 PeoriaRRR Transportaion INC 1 1 PeoriaRTC 1 1 PeoriaSam Leman I LLC 1 1 PeoriaSavannah Hilton Had Portable Moving and Storage INC 2 2 PeoriaSC2 INC 8 6 PeoriaScales Service and Supply INC 3 3 East PeoriaSCCI LLC 4 4 PeoriaSchefftech Productions LLC 1 1 PeoriaScheuer Trucking 1 1 PeoriaSchumm Transit 1 1 MortonScott Weaver and Sons Trucking and Excavating 2 1 WashingtonSeays Delivery Services Air Freight INC 5 3 PeoriaSherwood Trucking 1 1 PeoriaSonshine Trucking INC 2 3 MortonSpecialized Transport 3 2 Creve CoeurStallings Delivery Express INC 7 7 BartonvilleStar Transport INC 673 691 MortonStrube Trucking LLC 1 1 PekinT R Worrick Trucking 1 1 Chillicothe Tanbem Dump Truck Halling 1 1 PekinTC Cliffs Tank Lines LLC 4 4 PeoriaTCF Industries INC 5 8 PeoriaTerm Brokers INC 1 1 BartonvilleThe Elephant and Tiger Encounter 1 1 PeoriaThe H3 Group LLC 1 1 PeoriaThree R Transport INC 2 2 PeoriaThrift Trucking 23 35 BartonvilleTitan Industries INC 1 1 East PeoriaTobin Brothers INC 1 1 PeoriaTower Logistics LLC 1 1 PeoriaTraffic Tom INC 7 7 BartonvilleTransquip Resources INC 1 1 PekinTrapper Trucking Lines INC 2 2 MortonTri County Water Treatment LLC 2 2 PeoriaTrotter Trucking 1 1 PekinTurf Solutions Group LLC 1 1 PeoriaUnzicker Equipment INC 1 1 MortonVarnes Transport 1 1 PeoriaW H Trucking 1 1 MortonWaid Enterprises 1 1 BartonvilleWaid Transport INC 38 38 BartonvilleWalters Brothers Harley Davidson INC 2 2 PeoriaWelch Gaming LLC 1 3 PeoriaWelch Trucking INC 1 2 East PeoriaWildermuth Farms 1 1 PekinWilliam Lasley II 1 1 PekinWilliams & Russell Trucking CO 1 1 BartonvilleWinkler Meats Inc 2 2 PeoriaWKP Transfer 35 40 PeoriaXavier Trucking INC 1 1 PeoriaYo-Mac Transport INC 1 1 PeoriaZeal Optics 1 2 PeoriaTotal 2454 2422
Name Number of Trucks Number of Drivers City