Embed Size (px)
Citation preview

EPA ENERGY STAR Climate Controls
Stakeholder working meeting
RCCS Field Savings Metric
Agenda
• Quick run through algorithm, clarifying questions
• Feedback on algorithm and method, discussion
• Capture new ideas
• Next steps working together
• Parking lot
1
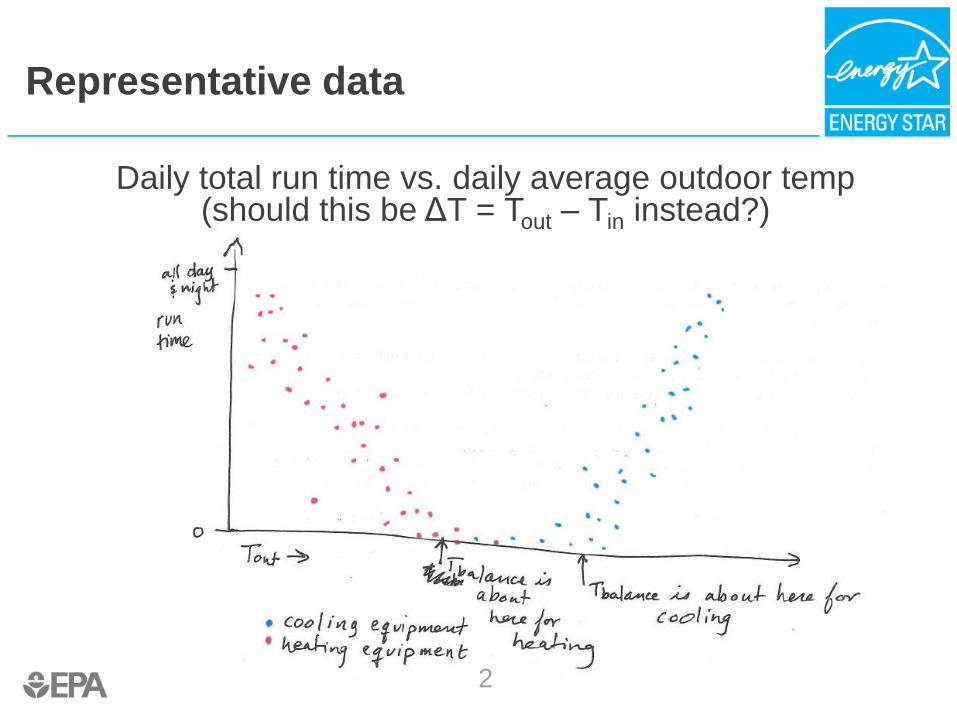
Representative data
Daily total run time vs. daily average outdoor temp (should this be ΔT = Tout – Tin instead?)
2
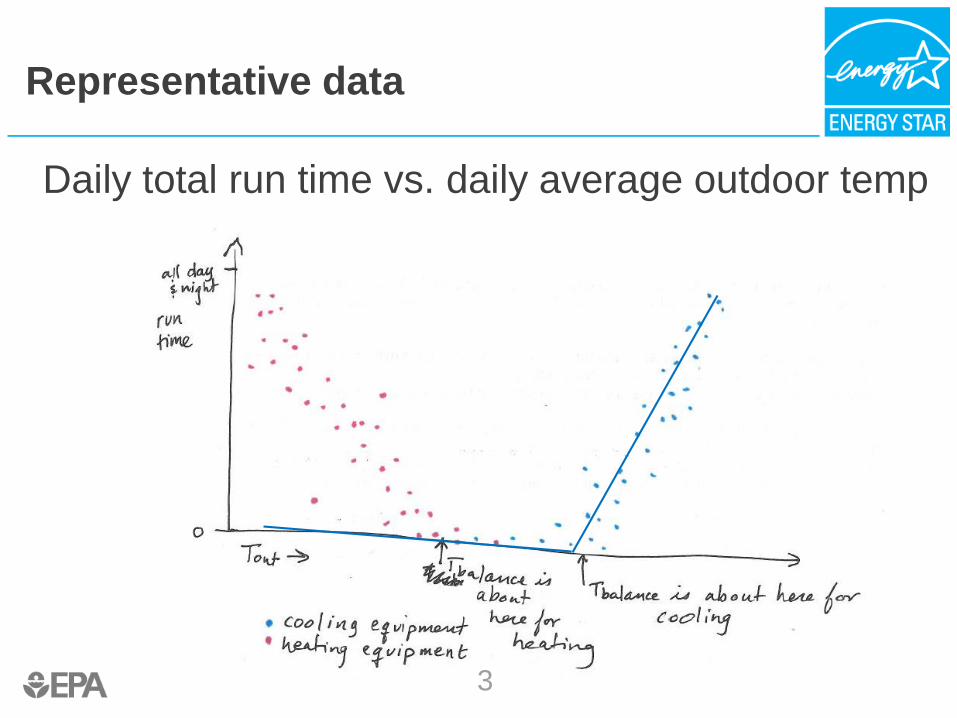
Representative data
Daily total run time vs. daily average outdoor temp
3
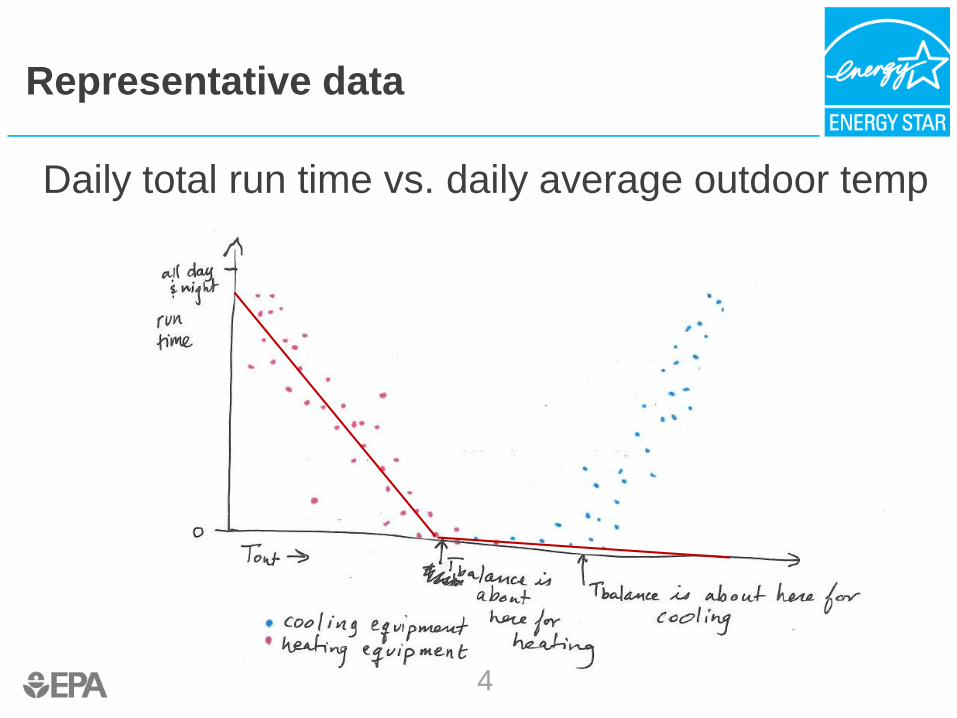
Representative data
Daily total run time vs. daily average outdoor temp
4
Curve and scatter affected by
• Temperature settings in home
• Equipment capacity
• Home characteristics (insulation, sealing, etc.)
• Day/night temperature differences (climate)
• Level and type of activity in the home
• Schedule of activity in the home
• Solar gain
• Other heating sources
5
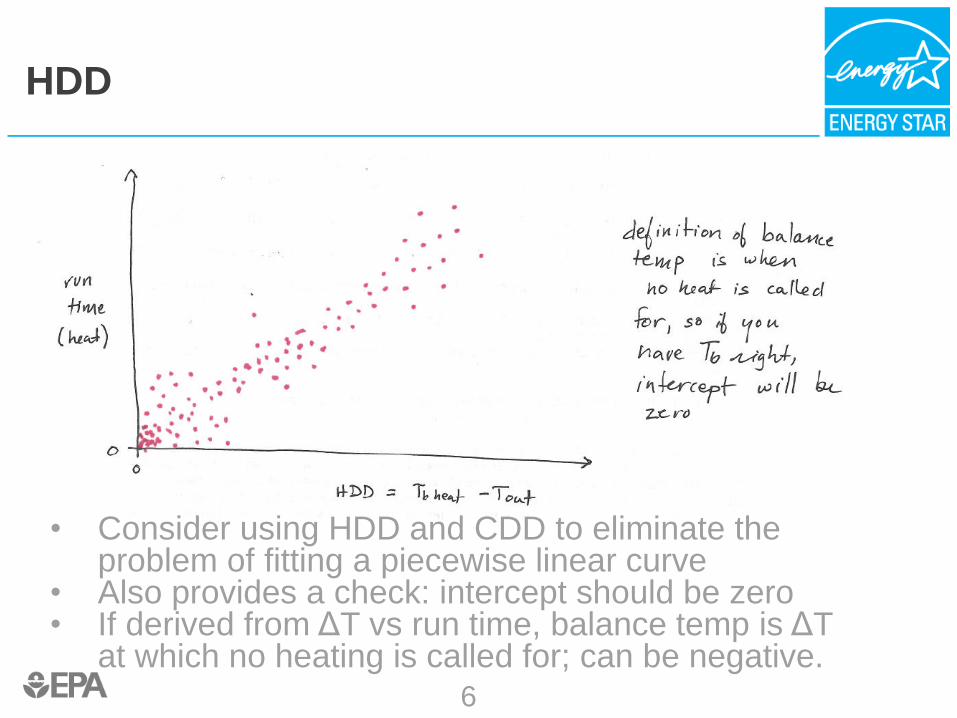
HDD
• Consider using HDD and CDD to eliminate the problem of fitting a piecewise linear curve
• Also provides a check: intercept should be zero• If derived from ΔT vs run time, balance temp is ΔT
at which no heating is called for; can be negative.
6
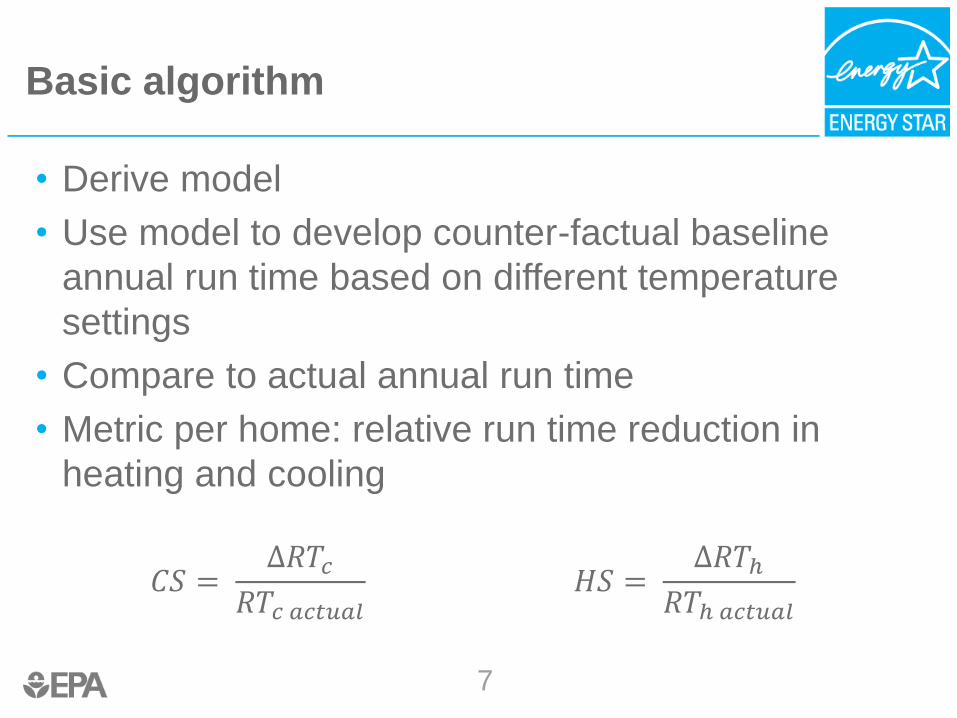
Basic algorithm
• Derive model
• Use model to develop counter-factual baseline
annual run time based on different temperature
settings
• Compare to actual annual run time
• Metric per home: relative run time reduction in
heating and cooling
𝐶𝑆 =∆𝑅𝑇𝑐
𝑅𝑇𝑐 𝑎𝑐𝑡𝑢𝑎𝑙𝐻𝑆 =
∆𝑅𝑇ℎ𝑅𝑇ℎ 𝑎𝑐𝑡𝑢𝑎𝑙
7
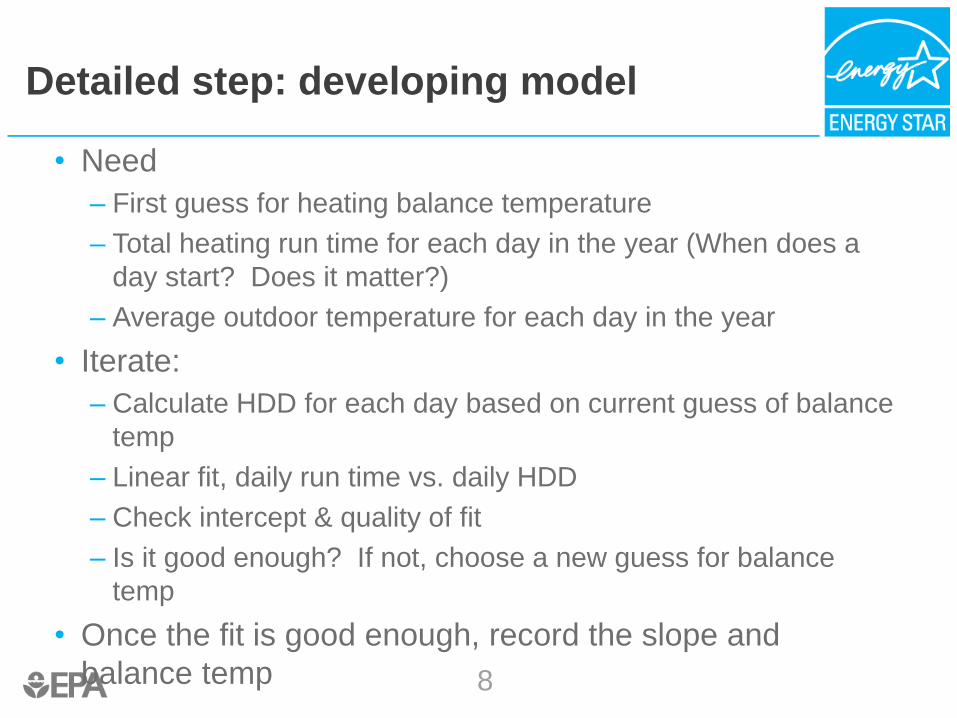
Detailed step: developing model
• Need
– First guess for heating balance temperature
– Total heating run time for each day in the year (When does a
day start? Does it matter?)
– Average outdoor temperature for each day in the year
• Iterate:
– Calculate HDD for each day based on current guess of balance
temp
– Linear fit, daily run time vs. daily HDD
– Check intercept & quality of fit
– Is it good enough? If not, choose a new guess for balance
temp
• Once the fit is good enough, record the slope and
balance temp 8
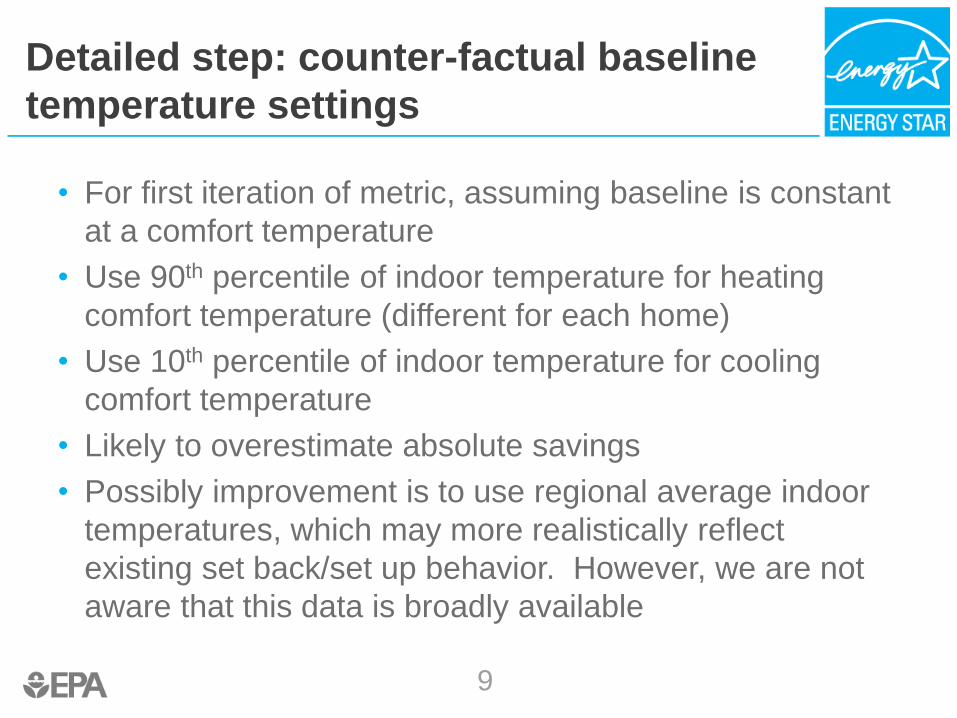
• For first iteration of metric, assuming baseline is constant
at a comfort temperature
• Use 90th percentile of indoor temperature for heating
comfort temperature (different for each home)
• Use 10th percentile of indoor temperature for cooling
comfort temperature
• Likely to overestimate absolute savings
• Possibly improvement is to use regional average indoor
temperatures, which may more realistically reflect
existing set back/set up behavior. However, we are not
aware that this data is broadly available
Detailed step: counter-factual baseline
temperature settings
9
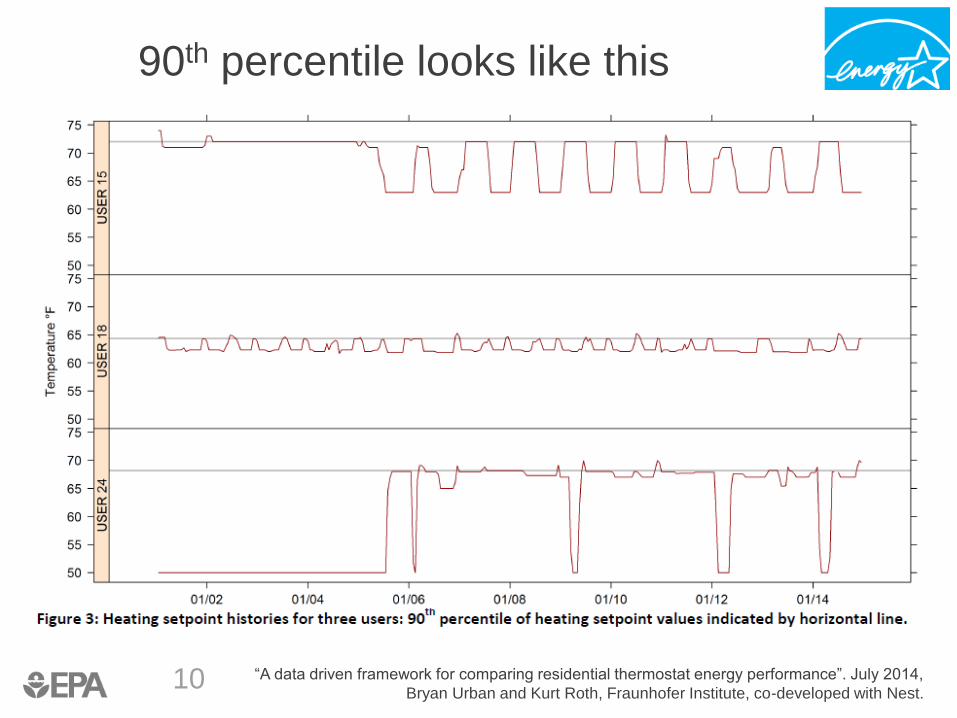
“A data driven framework for comparing residential thermostat energy performance”. July 2014,
Bryan Urban and Kurt Roth, Fraunhofer Institute, co-developed with Nest.
90th percentile looks like this
10
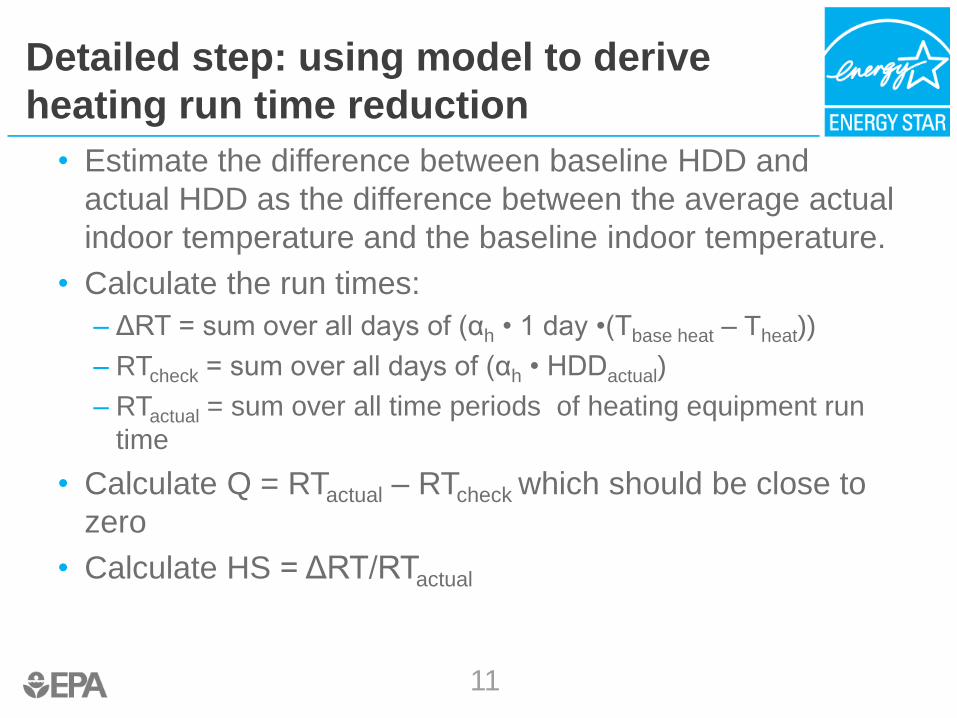
Detailed step: using model to derive
heating run time reduction
• Estimate the difference between baseline HDD and
actual HDD as the difference between the average actual
indoor temperature and the baseline indoor temperature.
• Calculate the run times:
– ΔRT = sum over all days of (αh • 1 day •(Tbase heat – Theat))
– RTcheck = sum over all days of (αh • HDDactual)
– RTactual = sum over all time periods of heating equipment run
time
• Calculate Q = RTactual – RTcheck which should be close to
zero
• Calculate HS = ΔRT/RTactual
11
Intended process moving forward
• EPA will release code open source code for
calculating our current idea for a metric
• Providers will run the code on the data that they
have available
• Providers will report results to EPA (or ICF)
• EPA will publish all results together anonymously
so that all stakeholders can see where they stack
up according to the metric
12
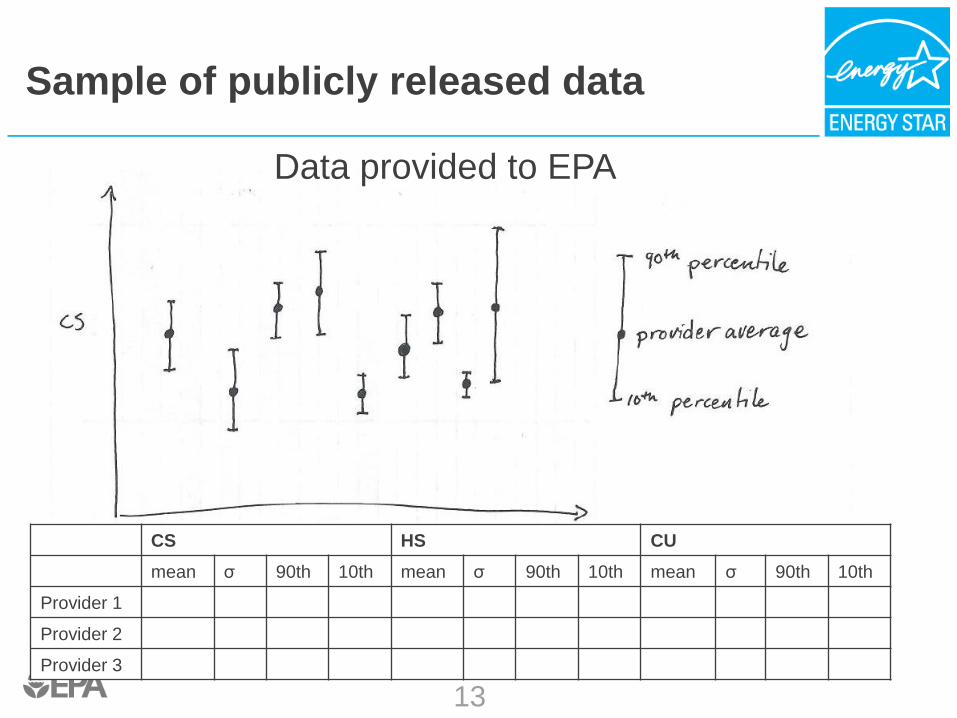
Sample of publicly released data
Data provided to EPA
CS HS CU
mean σ 90th 10th mean σ 90th 10th mean σ 90th 10th
Provider 1
Provider 2
Provider 3
13
Discussion
• Ratio estimator instead of linear fit
– Average y over average x and divide – forces slope through
zero, calculate mean square error. Weights the days with
higher degree days more heavily, because the intercept is
forced towards zero
– Use average daily temps to get DD, or use sum of hourly
readings?
• ΔT model might be better than HDD?
– Start the HDD calculation with ∆T rather than with absolute
outside T, the run a ratio estimator
– ∆T vs run time is a linear fit
14
Discussion
• Baseline – pros and cons of the 90th percentile
– To be addressed in detail on 1/30/15
• How to handle heat pumps
– Also not addressed in detail
14
Agreed upon actions
• EPA will capture the various options to calculate the
model of run time for each home, and send around to
stakeholders as a meeting report.
• EPA will post slides and meeting report to climate
controls development web page. Stakeholders may also
request to have it sent to them.
• Stakeholders with data will run algorithms on it, and be
ready to talk about results and issues on 2/13/15.
• Discussion two weeks from today will focus on baselines;
stakeholders are invited to come prepared with thoughts
and/or references.
15
Parking lot
• Will providers use this method to make savings claims?
• Verification and gaming the system?
• Modulating system thermostats not eligible – market
disadvantage?
• Does the customer base bias the metric results, aside
from the qualities of the products?
16
Contact Information
Abigail Daken
EPA ENERGY STAR Program
202-343-9375
Doug Frazee
ICF International
443-333-9267