Embed Size (px)
Citation preview
Epidemiological and clinical studies of viral pneumonia in
young children in Bhaktapur, Nepal.
Maria Mathisen
Dissertation for the degree philosophiae doctor (PhD)
at the University of Bergen
2010
Dissertation date: November 12, 2010

Maria Mathisen
2
Viral pneumonia in children
3
Contents
���������� ������������������������������������������������������������������������������������������������������������������������������������������ ��
��������� ���� ��������������������������������������������������������������������������������������������������������������������������������������������������� ��
��� ����������� ���� �������������������������������������������������������������������������������������������������������������������������������������������
������� ���� �����������������������������������������������������������������������������������������������������������������������������������������������������
��� ��� �����������������������������������������������������������������������������������������������������������������������������������������������������������������
��� �� ���� ��� ��������������������������������������������������������������������������������������������������������������������������������������������� �
!"������������������� ������� ��#����� ��� �������������������������������������������������������������������������������������� � �
$ ������������� ������"��"����������� ������������������������������������������������������������������������������������������������� � �
%������� #���������� ��#����������� ���� ���������������������������������������������������������������������������������������������������� &'�
����������������������������� ����������� ��#����������� ����������������������������������������������������� &��
��� ��������������� �������������������������������������������������������������������������������������������������������������������������������������������� &(�
)������������������������������������������������������������������������������������������������������������������������������������������������������������ &��
) �������� "� �����#������������ �������������������������������������������������������������������������������������������������������� &*�
+�������� "� "��� ��������������������������������������������������������������������������������������������������������������������������������������������������� &,�
&�� -�.� ��� ��������������������������������������������������������������������������������������������������������������������������������������������������'�
��� / "����������������������������������������������������������������������������������������������������������������������������������������������������������
0����������"��� ����������������������������������������������������������������������������������������������������������������������������������������������� ���
% �#�������������� ��� ����������������������������������������������������������������������������������������������������������������������������������� ���
+������ �������������������������������������������������������������������������������������������������������������������������������������������������������������������� ���
% � �� ���������#�� �������������������������������������������������������������������������������������������������������������������������������������������������� (&�
$ "������������������������������������������������������������������������������������������������������������������������������������������������������������������������ (��
(�� 1��� ���������������������������������������������������������������������������������������������������������������������������������������������������������(��
%��.� ��"���� ��� ��� ������������������������������������������������������������������������������������������������������������������������������������������� (*�
2���������#�������������������������������������������������������������������������������������������������������������������������������������������������������������� ( �
��� )��������� ������������������������������������������������������������������������������������������������������������������������������������������������� �
+�3���#���������� ��#����������� ���������������������������������������������������������������������������������������������������������� � �
%������� #���������� ��#����������� ���� ���������������������������������������������������������������������������������������������������� *��
������� ����� ��� �����#������������������������ ������������ ������������������������������������� *(�
������� ����� ��������� ��#����������� ���������������� ���������������������������������������������������� *��
Maria Mathisen
4
������������������ ����������������������������������������������������������������������������������������������������������������������������������������������
��� ����� ��� ��������������������������������������������������������������������������������������������������������������������������������������������� ���
��� ����������������� ���������������������������������������������������������������������������������������������������������������������������� ���
�������� �������������������������������������������������������������������������������������������������������������������������������������������������������� ���
��������������������
������
�
Viral pneumonia in children
5
Acknowledgements
I wish to express my sincere gratitude to a lot of people who have contributed to this thesis
in various ways. Most importantly, this work would not have been possible without the
cooperation of all the children and their families in Bhaktapur who participated in the
studies, for which I am truly grateful.
I first off all want to thank my supervisor Tor Strand for giving me the opportunity to join
the research project in Nepal and for introducing me to the field of clinical research. His
advice, trust and encouragement throughout this process have been invaluable to me. I feel
very privileged to have been able to work with interesting and important research questions
under his inspiring and qualified guidance.
I am also very grateful to my co-supervisor Halvor Sommerfelt for his enthusiasm and
support, for patiently sharing his skills in epidemiology and for his invaluable feedback on
important aspects of study design, methodological issues and manuscript writing.
I wish to thank my Nepalese colleagues in Kathmandu at the Child Health Department,
Institute of Medicine, Tribhuvan University, Professor Prakash S. Shrestha, Associate
Professor Sudha Basnet and Professor Ramesh K. Adhikari for their dedicated efforts in the
implementation of the project and support of my work. I also thank Dr. Ram Krishna
Chandyo, Dr. Manjeswori Ulak, and Dr. Meeru Gurung for their continuous efforts in the
field clinic and for their support and friendship.
I also want to thank my colleague Dr. Palle Valentiner-Branth and his family for their
hospitality and generosity during the two years we shared in Nepal during the project period.
Thanks to Palle for sharing his experience with me, for the constructive discussions we had
during the field trial, and for his input towards the manuscripts.
My thanks go to Shyam Dhaubhadel and his family for giving us the opportunity to conduct
the research project at Siddhi Memorial Hospital in Bhaktapur. The support and efforts of
the hospital staff throughout the project period is also most appreciated.
I thank Biswa Nath Sharma for his dedicated efforts and responsibility in running the PCR
laboratory and Govinda Gurung for his diligent work in the laboratory and for administering
the samples. Their extraordinary work with the PCR analyses was essential for the success
Maria Mathisen
6
of this study. I also thank Subash Sherchan for excellent work with the PCR analyses. The
Department of Microbiology at Tribhuvan University Teaching Hospital provided the
laboratory facility at the university campus and thus made it possible for us to establish our
virus PCR laboratory. Thanks to Professor Nhuchhe Ratna Tuladhar, Professor Bharat Mani
Pokharel and Professor Jeevan Sherchand for their support in this process. I also thank all
members of the Child Health Research Advisory Committee, including Professor Pushpa Raj
Sharma, Professor Arun Syami, and Dr. Ratendra Nath Shrestha.
I am grateful to Dag Hvidsten, Håkon Haaheim, Ann Helen Helmersen, Maria Frost and
Tore Jarl Gutteberg at the Department of Microbiology and Infection Control at the
University Hospital of North Norway. Thanks to Tore and Dag for supporting our project
and providing training in Tromsø for our Nepalese laboratory staff. Thanks to Dag also for
the valuable discussions and his contribution to writing the manuscripts. Håkon and Ann
Helen travelled to Nepal to provide technical assistance in the establishment and running of
the PCR analyses. This was essential for the implementation of the project and their
contribution is highly appreciated. Thanks to Ann Helen and Maria for the quality control
analyses done in Tromsø.
I thank Professor Shobha Broor at the Department of Microbiology at All India Institute of
Medical Sciences, New Delhi, and her PhD student Preeti Bharaj for the training in PCR
methods they provided for the Nepalese laboratory team and myself. I also thank Dr. Nita
Bhandari at Society of Applied Studies, New Delhi, for her valuable input on design and
conduct of the pneumonia study in Bhaktapur.
I thank Andy Shrago, Karen Harrington and others at Prodesse for facilitating the transfer of
the Hexaplex Plus assay to our laboratory in Nepal and for the training Håkon and I received
in the premises of Prodesse in Waukesha, as well as technical support during the initiation of
the project in Nepal.
I also thank others who have contributed to my academic progress or this thesis, especially
Håkon Gjessing, Bjørn Bolann, Philippe Chevalier and Dorthe Jeppesen.
This PhD emerges from the Centre for International Health at the University of Bergen. I
would like to thank the leadership and all my colleagues at CiH for creating a positive and
inspiring work environment. Although nearly four years of my PhD-period was spent in
Viral pneumonia in children
7
Nepal, CiH has served as an important base in between stays abroad and in the last phase of
analyzing and writing.
And of course I wish to thank my parents Randi and Carl, my brother Henrik, and my
husband Chijioke, for their love and support always, and all my friends who have
encouraged me and cared for me.
I also wish to thank the many people who in various ways have contributed to my research
work or made a positive impact on my life as a PhD student in Norway or outside Norway.
Some were employed in the Child Health Research Project in Nepal as fieldworkers,
supervisors, computer staff, administrative staff, doctors, or driver. Others have carried
equipment to Nepal, advised me, helped me with practicalities, taught me Nepali, provided
accommodation, invited me for dinner, served me dal bhat or chia, gone trekking with me,
brewed coffee, or simply kept me company:
Dipendra Adhikari, Chantelle Allen, Sheldon Allen, Peter Andersen, Hans Arneberg, Shova
Bista, Sama Bhandari, Chandrawati Chitrakar, Ashok Dangal, Krishneswori Datheputhe,
Harald Eikeland, Helen Eikeland, Ingunn Engebretsen, Jan Fadnes, Ruth Foster, Punita
Gauchan, Elisabeth Gullbrå, Kjartan Gullbrå, Magnus Hatlebakk, Anja Hem, Elin Hestvik,
Solfrid Hornell, William Howlett, Marte Jürgensen, Bishnu Maya Kadel, Bimala
Karmacharya, Bidhya Karmacharya, Sahilendra Karmacharya, Samir K.C., Lathaa
Khadka, Nim Raj Khyaju, Padma Khayargoli, Ram Krishna Kuikel, Sukramani Kuikel, Unni
Kvernhusvik, Allison Kwessel, Sudan Lama, Borgny Lavik, Inge Løvåsen, Mari Skar
Manger, Devi Maharjan, Sushila Maharjan, Subhadra Malla, Alemnesh Mirkuzie, Mercy
Njeru, Babu Ram Neupane, Kalpana Neupane, Nazik Nurelhuda, Annelies Ollieuz, Bjørg
Evjen Olsen, Vegard Pedersen, Torunn Perstølen, Keshav Prasad Poudal, Shiva Poudel,
Sunaina Poudel, Shova Pradhan, Pramila and Protima, Samjhana Premi, Ratna Rajthala,
Ram Pyari Rana, Pashupati Bhakta Raya, Uma Regmi, Borghild Rønning, Shanti Sachin,
Ingvild Fossgård Sandøy, Anne-Sylvie Saulnier, Bhim and Jharana Shahi, Bandhu Shrestha,
Shyam Shrestha, Umesh Tami Shrestha, Tom Solberg, Nils Gunnar Songstad, Hans
Steinsland, Bina Suwal, Indira Suwal, Dorjee Tamang, Shanta Tamang, Indira Twati, Sarah
Webster, and Rachael Woloszyn.

Maria Mathisen
8
Viral pneumonia in children
9
Collaborations
This study emerged from Centre for International Health, Faculty of Medicine and Dentistry,
University of Bergen. The existing collaboration with Child Health Department, Institute of
Medicine, Tribhuvan University, Kathmandu, Nepal, provided the institutional framework
for the research environment of this study. The research presented was part of the clinical
trial: Community- and Health Facility-Based Intervention With Zinc as Adjuvant Therapy
for Childhood Pneumonia (http://clinicaltrials.gov/ct2/show/NCT00148733). The research
consortium for the trial included several additional institutions: Department of Epidemiology
Research, Statens Serum Institut (SSI), Copenhagen, Denmark; Department of Pediatrics,
All India Institute of Medical Sciences (AIIMS), New Delhi, India; Epidemiology,
Prevention Research Unit, the Institute of Research for Development (IRD), Montpellier,
France; and Society for Applied Studies (SAS), Calcutta, India; and Department of
Microbiology and Infection Control, University Hospital of North Norway, Tromsø,
Norway.
Funding for the study was provided by the Norwegian Council of Universities’ Committee
for Development Research and Education (NUFU project numbers 36/2002 and
2007/10177), the European Commission (EU-INCO-DC contract number INCO-FP6-
003740), and the Research Council of Norway (RCN project number 151054 and 172226) as
well as by a grant from the Danish Council of Developmental Research (91128).

Maria Mathisen
10
Viral pneumonia in children
11
List of publications
Paper I
Mathisen M, Strand TA, Sharma BN, Chandyo RK, Valentiner-Branth P, Basnet S, Adhikari
RK, Hvidsten D, Shrestha PS, Sommerfelt H: RNA viruses in community-acquired
childhood pneumonia in semi-urban Nepal; a cross-sectional study. BMC Medicine.
2009;7(35).
Paper II
Mathisen M, Strand TA, Sharma BN, Chandyo RK, Valentiner-Branth P, Basnet S, Adhikari
RK, Hvidsten D, Shrestha PS, Sommerfelt H: Clinical presentation and severity of viral
community-acquired pneumonia in young Nepalese children. Pediatr Infect Dis J.
2010;29(1):e1-6.
Paper III
Mathisen M, Strand TA, Valentiner-Branth P, Chandyo RK, Basnet S, Sharma BN, Adhikari
RK, Hvidsten D, Shrestha PS, Sommerfelt H: Respiratory viruses in Nepalese children with
and without pneumonia; a case-control study. Pediatr Infect Dis J. 2010;29:731-735.
Reprints were made with permissions from Wolters Kluwer Health.

Maria Mathisen
12
Viral pneumonia in children
13
Abbreviations
ALRI acute lower respiratory tract infection
ARI acute respiratory infection
BCG Bacille Calmette-Guérin
CRP C-reactive protein
DTP Combined vaccine against diphtheria, tetanus and pertussis
EHA enzyme hybridization assay
ELISA enzyme-linked immunosorbent assay
EPI Expanded Program on Immunization
GAPP Global Action Plan for Pneumonia
GAVI Global Alliance for Vaccines and Immunization
GPS global positioning system
hBoV human bocavirus
Hib Haemophilus Influenzae type b
hMPV human metapneumovirus
IF immunofluorescence
IMCI Integrated Management of Childhood Illness
LCI lower chest wall indrawing
LMICs low-and-middle-income countries
MOR matched odds ratio
NA nucleic acid
NPA nasopharyngeal aspirate
OR odds ratio
PCR polymerase chain reaction
PIV parainfluenza virus
RNA ribonucleic acid
RR respiratory rate
RSV respiratory syncytial virus
SpO2 oxygen saturation
under-5s children under five years of age
UNICEF United Nations Children’s Fund
UNN University Hospital of North Norway
URI upper respiratory tract infection
UTM Universal transport medium
VDC village development committee
WHO World Health Organization

Maria Mathisen
14
Viral pneumonia in children
15
Abstract
Pneumonia remains the leading cause of illness and death in children less than 5 years of age
in low-and-middle-income countries. Both bacteria and viruses are major causes of
pneumonia in children. The disease burden attributed to the different respiratory pathogens
varies with season and between regions. Knowledge of the relative importance of each agent
is essential for adequate case management as well as prevention strategies, such as
development of vaccines. This thesis focuses on respiratory viruses as causes of pneumonia.
The basis for the present thesis is: 1) a cross-sectional study of 2,219 children with
community-acquired pneumonia as defined under the Integrated Management of Childhood
Illness (IMCI) program in the World Health Organization and 2) a case-control study of 680
pneumonia cases and 680 matched controls. Study subjects were included at a field clinic in
Bhaktapur, Nepal. A nasopharyngeal aspirate was collected from each child at inclusion and
examined for seven respiratory viruses using a commercial multiplex reverse transcription
polymerase chain reaction (PCR) assay. The aim of the large cross-sectional study was to
obtain information on the frequency of these seven common respiratory viruses and their
seasonal distribution over a three-year period. Moreover, the study was designed to obtain
information on clinical characteristics and outcomes of the pneumonia episodes and how the
individual respiratory viruses were associated with these factors. The case-control study was
undertaken to measure the degree to which the individual viruses were associated with IMCI
defined pneumonia.
We identified at least one virus in a large proportion (40%) of the children with pneumonia.
Respiratory syncytial virus (RSV), influenza A, and parainfluenza virus (PIV) type 3 were
most frequently detected among the seven viruses in the three-year study. The epidemics of
infection with individual respiratory viruses contributed substantially to the observed
pneumonia epidemics. RSV occurred in yearly epidemics in relation to the rainy season or
during the winter. We also found that RSV infection was associated with signs of severe
illness; the children infected with RSV more frequently had severe pneumonia and, among
infants, low oxygen saturation, compared to children who were RSV negative. Among cases
with non-severe pneumonia, the children with RSV infection had longer time to recovery
and increased risk of treatment failure compared to the other children. The case-control
study revealed that all the seven viruses were associated with pneumonia but that the
Maria Mathisen
16
strength of this association varied. RSV, PIV type 3 and influenza A were most strongly
associated with pneumonia.
Our findings indicate that these viruses are important causes of pneumonia in young children
in Bhaktapur. Although influenza A and PIV type 3, like RSV, were among the most
common viruses and were strongly associated with pneumonia, RSV was by far the most
frequently detected virus over the three-year period and children infected with RSV had the
most severe clinical presentations and outcomes. This supports the notion that development
of a safe and effective RSV vaccine should be a priority for prevention of pneumonia in
young children in low-and-middle-income countries.
Viral pneumonia in children
17
1. Introduction
The global burden of acute respiratory infection
Acute respiratory infection (ARI) is one of the leading causes of illness and death in children
under five years of age (under-5s). According to World Health Organization (WHO)
estimates, nearly 2 million under-5s die from ARI every year, corresponding to about 19%
of all deaths in this age group (1). Pneumonia and bronchiolitis are considered to be leading
contributors to the global burden of ARI in young children and responsible for the greater
part of these deaths, of which the vast majority occurs in the developing world. The WHO
algorithm for classification of ARI identifies children with acute lower respiratory tract
infection (ALRI) as being in need of antibiotic treatment, acknowledging that a substantial
part of the infections are actually viral. In this thesis, I use the term pneumonia as defined
under WHO’s Integrated Management of Childhood Illness (IMCI) program, which captures
the clinical entities of both pneumonia and bronchiolitis and is sometimes referred to as
“clinical pneumonia” (2). Aspects related to the challenges inherent in this classification of
pneumonia are discussed in further detail below (“Diagnosing pneumonia”). Hereafter the
terms pneumonia and ALRI will be used interchangeably.
The incidence of pneumonia in under-5s in industrialized countries is estimated at 0.05
episodes per child-year. In contrast, the incidence in low-and-middle-income countries
(LMICs) is approximately 0.3 episodes per child-year, which translates into more than 150
million new episodes annually (3). The regions with the highest incidence are South-East
Asia and sub-Saharan Africa. The incidence varies with the prevalence of several risk
factors; including malnutrition, low birth weight, non-exclusive breastfeeding, indoor air
pollution, and crowding (4). Incidence also varies with age and is higher in infants than in
toddlers, i.e. young children �12 months old (3).
Etiological agents in childhood pneumonia
A variety of infectious agents cause pneumonia, but Streptococcus pneumoniae
(pneumococcus), Haemophilus influenzae, Staphylococcus aureus and respiratory syncytial
Maria Mathisen
18
virus (RSV) are considered to be the most important respiratory pathogens in areas without
adequate pneumococcal and H. influenza type b (Hib) vaccine coverage, i.e. in most of the
developing world. Other important respiratory viruses are influenza A and B, parainfluenza
virus (PIV) type 1-3, human metapneumovirus (hMPV) and adenovirus. Until recent
increases in measles vaccine coverage, measles still accounted for a substantial number of
pneumonia deaths in children (5). In general, the true burden of the various organisms
causing pneumonia is inadequately documented in LMICs due to lack of surveillance
systems and diagnostic facilities (6).
Bacterial etiology
Etiology studies in the 1980s and 90s found pneumococcus to be the most common cause of
severe pneumonia in LMICs, followed by H. influenzae and S. aureus (7-11). These studies
were based on lung or pleural puncture combined with blood culture and included only a
small number of children. Vaccine probe studies (12-17) have more recently been used to
estimate disease burden attributable to pneumococcus and Hib (18, 19). It is estimated that
nearly 14 million episodes of pneumococcal pneumonia and 8 million episodes of Hib
pneumonia occur in under-5s annually, and pneumococcus alone cause around 700,000
deaths from pneumonia in this age group (18, 19). Estimates based on the proportion of
radiographically confirmed pneumonia prevented in vaccine probe studies and supported by
lung aspiration studies indicate that pneumococcus cause 17% to 37% of pneumonia cases
among under-5s (20). The corresponding proportion for Hib is estimated at 0-31% (20).
Other important bacterial organisms with varying occurrence are Staphylococcus aureus,
which may cause severe, necrotizing pneumonia with complicated effusion and rapid
progression, non-type-b H. influenzae, and Klebsiella pneumoniae (3, 20, 21). Non-typhoid
Salmonella species have been associated with non-severe pneumonia in malaria-endemic
tropical regions of Africa, but its etiological role in pneumonia is still controversial (3).
Several other gram-negative bacteria as well as atypical organisms such as Mycoplasma
pneumoniae and Chlamydophila pneumoniae also cause pneumonia, but are not believed to
be among the most common causes in the under-5 age group (21). Additionally,
Mycobacterium tuberculosis has been identified in a proportion of acute pneumonia (7) and
still continues to be an important cause of severe illness and death in children (6), especially
Viral pneumonia in children
19
in areas with high HIV infection prevalence (22-25). Pneumonia due to opportunistic fungal
infections with Pneumocystis jirovecii is also frequent in HIV endemic areas (26).
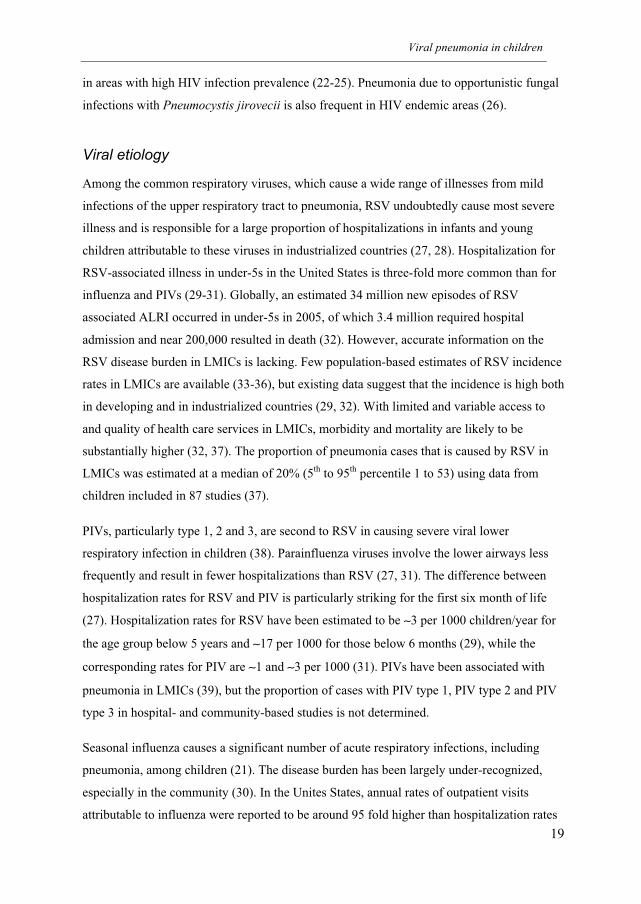
Viral etiology
Among the common respiratory viruses, which cause a wide range of illnesses from mild
infections of the upper respiratory tract to pneumonia, RSV undoubtedly cause most severe
illness and is responsible for a large proportion of hospitalizations in infants and young
children attributable to these viruses in industrialized countries (27, 28). Hospitalization for
RSV-associated illness in under-5s in the United States is three-fold more common than for
influenza and PIVs (29-31). Globally, an estimated 34 million new episodes of RSV
associated ALRI occurred in under-5s in 2005, of which 3.4 million required hospital
admission and near 200,000 resulted in death (32). However, accurate information on the
RSV disease burden in LMICs is lacking. Few population-based estimates of RSV incidence
rates in LMICs are available (33-36), but existing data suggest that the incidence is high both
in developing and in industrialized countries (29, 32). With limited and variable access to
and quality of health care services in LMICs, morbidity and mortality are likely to be
substantially higher (32, 37). The proportion of pneumonia cases that is caused by RSV in
LMICs was estimated at a median of 20% (5th
to 95th
percentile 1 to 53) using data from
children included in 87 studies (37).
PIVs, particularly type 1, 2 and 3, are second to RSV in causing severe viral lower
respiratory infection in children (38). Parainfluenza viruses involve the lower airways less
frequently and result in fewer hospitalizations than RSV (27, 31). The difference between
hospitalization rates for RSV and PIV is particularly striking for the first six month of life
(27). Hospitalization rates for RSV have been estimated to be �3 per 1000 children/year for
the age group below 5 years and �17 per 1000 for those below 6 months (29), while the
corresponding rates for PIV are �1 and �3 per 1000 (31). PIVs have been associated with
pneumonia in LMICs (39), but the proportion of cases with PIV type 1, PIV type 2 and PIV
type 3 in hospital- and community-based studies is not determined.
Seasonal influenza causes a significant number of acute respiratory infections, including
pneumonia, among children (21). The disease burden has been largely under-recognized,
especially in the community (30). In the Unites States, annual rates of outpatient visits
attributable to influenza were reported to be around 95 fold higher than hospitalization rates
Maria Mathisen
20
for children under 5 years, while the highest rates of hospitalization (4.5 per 1000 children)
were reported for those below 6 months of age (30), similar to for RSV and parainfluenza
(29, 31). The role of influenza in contributing to pneumonia has been uncertain, particularly
in LMICs, but recent data from Bangladesh indicate that it could be substantial (40). In
Hong Kong (41), population-based estimated hospitalization rates for influenza exceeded
those reported in the United States (30). Respiratory viruses also play an important role in
the pathogenesis of pneumonia by predisposing to bacterial infections, a feature especially
associated with influenza virus (42).
In 2001, hMPV was detected in the Netherlands and is together with RSV a member of the
subfamily Pneumovirinae within the Paramyxoviridae family (43). The virus is now
recognized as an important causative agent of ARI in children, both in the community and in
hospitalized cases (44). It seems to have a worldwide distribution, being detected in a large
number of locations (45). The rate of hospitalization for hMPV infection has been found to
be lower than for RSV infections but higher than that observed for influenza and
parainfluenza viruses (46, 47). High incidence rates for hMPV-ALRI hospitalization are
reported in South Africa and Hong Kong (48, 49). Available data show that hMPV account
for approximately 5-8% of ARI hospitalizations (44, 50-52) and 2-6% of community cases
of ARI in children below 5 years of age in industrialized countries (44, 50, 53). Hospital-
based studies of children �5 years in LMICs have shown similar occurrence (54-57), but
very few studies report on hMPV pneumonia in the community (58).
Seasonality of respiratory viral infections
Infections with these respiratory viruses exhibit distinct seasonal patterns in most temperate
regions. Typically, RSV and influenza cause annual recurrent well-defined epidemics during
the cold months (37, 59, 60). The activity of hMPV has been shown to be greatest in winter
and spring in the northern hemisphere (44) and autumn through spring in the southern
hemisphere (48, 53, 61), but data are still somewhat limited as year-round surveillance has
not been extensively undertaken. In initial reports, the hMPV incidence varied substantially
from year to year (62). There are now reports suggesting a biennial epidemic pattern of early
and late hMPV occurrence in several European countries (59, 63, 64). PIV type 3 infections
occur year round with outbreaks usually occurring in spring, while type 1 and 2 demonstrate
Viral pneumonia in children
21
a biennial pattern with epidemics in the fall or early winter, sometimes in alternate years (65-
67).
Although the seasonal variations of RSV and influenza infections have been extensively
studied in various LMICs, especially for RSV, it is difficult to outline a clear pattern. A
review by Weber and coworkers (39) revealed that RSV infections peaked during the cold
months in temperate regions in the southern hemisphere, seemingly independent of rainfall.
In sub-tropical and tropical locations with seasonal rainfall, RSV tended to occur in relation
to the rainy season, however, in locations closer to the equator with perennial rainfall, RSV
activity was almost continuous and peaks of infection varied (39). Influenza is also reported
to be detectable throughout the year in tropical and sub-tropical regions with less predictable
timing of outbreaks, although there are reports of a biannual pattern of outbreaks with
considerable activity between epidemic periods (60). The peak hMPV season is reported to
be during late winter to spring in Bangladesh (58) and India (54), while outbreaks have been
observed in spring and autumn in South Korea (68) and in spring and summer in Hong Kong
(49), but observation periods for these studies have only been 1-2 years. In a three-year
study in South Africa, hMPV was seen in yearly epidemics, peaking during autumn and
winter (48). There are few comprehensive reports on seasonality of PIVs from developing
regions. Most studies have a short observation time and many studies did not distinguish
between the different PIV types (69, 70). Seasonal observations in Singapore and Taiwan
were largely similar to those in temperate regions described above (71, 72).
Clinical and epidemiological aspects of respiratory viral infections
RSV causes a wide spectrum of respiratory infections from rhinitis and otitis media to severe
infections of the lower respiratory tract. The virus is the major cause of bronchiolitis in
infancy and a significant cause of pneumonia during the first few years of life (73). Between
25 to 33% of primary RSV infections involve the lower airways (74), but this proportion is
lower in reinfections and with increasing age (75). Infants are at highest risk of developing
severe manifestations of the infection, especially before 6 months of age (75). Severe disease
typically presents with fever, cough, expiratory wheeze, dyspnea and cyanosis (74). Spread
of RSV from contaminated nasal secretions occurs via large respiratory droplets (76), which
requires close person-to-person contact or contact with contaminated surface for
Maria Mathisen
22
transmission. The virus persists on environmental surfaces for hours and is thus a frequent
cause of nosocomial infections, especially in pediatric wards (6, 76). Primary infection is
rarely asymptomatic and reinfections are frequent. In a prospective study in the United
States, around two-thirds of children were infected during their first year of life, and by the
age of two, nearly all children had experienced one infection and nearly half had been
infected twice (75). Reinfections occur in all ages as immunity to RSV infection is
incomplete and short-lived (77), but disease severity wanes with age (67). However, RSV
may cause severe infections in immunocompromized adults and elderly people (78).
Hospitalization for RSV bronchiolitis has been associated with subsequent asthma and
wheezing in children (79, 80), but atopy and wheezing have also been shown to be risk
factors for RSV hospitalization in young children (81). The majority of children who get
severe RSV disease are otherwise healthy, but premature infants, infants with congenital
heart disease, cystic fibrosis, bronchopulmonary dysplasia, or immunodeficiency are at
particular high risk of severe illness (28, 82-84). Several other important risk factors for
severe RSV illness related to the environment and the host have been identified, including
male sex, age <6 months, birth in the first half of the RSV season, crowded living
conditions, siblings, lack of breastfeeding, and day care exposure (85). Level of passively
acquired maternal antibody to RSV could be an underlying factor in age of acquisition (86).
A recent study of RSV burden in the United States found that only prematurity and young
age were independent risk factors for hospitalization (29).
Influenza infection in children mainly manifests as febrile illness with respiratory symptoms,
but can also cause severe respiratory illness, particularly in individuals with underlying
cardiopulmonary conditions (6). High fever, rhinitis and cough are common features of
influenza illness in children (40, 87-90), while adults frequently experience general malaise,
headache, and myalgia as well. In young children influenza resembles other severe
respiratory tract infections causing pneumonia, bronchiolitis, croup, otitis media, and, more
rarely, febrile convulsions (74). Virus is transmitted via aerosols and droplets from
respiratory secretions generated through coughing and sneezing, or by contaminated hands
(6). Children experience the highest attack rates during seasonal epidemics (91), as they
typically shed high amounts of viruses during infection and thus have an important role in
the transmission in the community (92), while individuals aged 65 years and older
experience most serious illness, complications and death from influenza (93). Among
children, those younger than 2 years of age are most susceptible to severe consequences of
Viral pneumonia in children
23
influenza infection (88, 90, 91) and estimates of hospitalization rates due to influenza are
similar to those of adults at high risk (94, 95). Studies report no difference in clinical
symptoms or signs between illness episodes caused by type A and B, but some have found
children hospitalized with influenza A infection to be younger (89, 90, 96).
Like RSV, parainfluenza viruses cause infections restricted to the respiratory tract (74).
While PIV type 1, 2 and 3 are the principal causes of croup, type 3 is also known to cause
pneumonia and bronchiolitis in young children, typically in infants (67). The subglottal
swelling in croup results in a barking cough, tachypena, tachycardia and suprasternal
retraction (74). PIVs usually cause mild cold-like upper respiratory infection (URI) or
pharyngitis, but approximately 15-25% of infections spread to the lower respiratory tract
(66, 74). PIV type 3 is considered second to RSV in causing severe infections in infants,
both with peak incidence of hospitalization before 6 months of age (29, 31). The virus is
transmitted by respiratory droplets and person-to-person contact (74). Most children are
infected with PIV type 3 by two years of age and with types 1 and 2 by five (67). Like for
RSV, reinfections occur throughout life, as acquired immunity is short-lived (97). There are
indications that croup is relatively less frequent in LMICs (38). Caucasian children have for
instance been found to have higher incidence of croup compared to African-American (98).
The clinical manifestations of hMPV are similar to those of RSV (44, 99) and sometimes
those of influenza (45). However, a number of studies report hMPV to cause less severe
illness, more frequently manifest as pneumonia than bronchiolitis and infect slightly older
children than those infected with RSV (100-107). Infections with hMPV have also been
found to cause respiratory disease of similar severity as RSV infections (47). Seroprevalence
surveys have shown that virtually all children are infected with hMPV by the age of 5 (43).
The virus cause infection in all age groups, but has its greatest effect in children; those <2
years have the highest incidence and are at the highest risk of serious infections (44, 108).
Pre-term infants also seem prone to severe disease (99). Adults usually suffer from relatively
mild common cold-like respiratory symptoms (109), but like RSV and influenza virus
infections, hMPV infections may also cause severe illness in the elderly and in patients with
underlying disease (44, 109, 110). Several studies suggest that hMPV, like RSV, may be
associated with episodes of acute wheezing and asthma exacerbations in children (44). Risk
factors for severe hMPV disease and frequency of reinfections have not been extensively
studied (111-114).
Maria Mathisen
24
Control of pneumonia
Interventions targeting risk factors for pneumonia are required for primary prevention,
whereas case management aims at reducing disease severity and case fatality. Both strategies
are needed to reduce pneumonia mortality. The WHO ARI standard case management
approach developed in the 1980s focuses on early detection and treatment with appropriate
antibiotics (115) and has been the cornerstone of pneumonia control in low-income
countries. The program was later incorporated into the Integrated Management of Childhood
Illness (IMCI) guidelines (116). Community-based implementation of this case management
strategy has greatly reduced overall and pneumonia mortality in young children (117), but
implementation is lagging behind in many high-incidence countries and therefore has
substantial potential for improvement (118). However, increasing antimicrobial resistance of
pathogens causing pneumonia (25, 119) demonstrates the need for additional strategies.
There are also areas for improvement in facility-based treatment. Hypoxia is associated with
increased risk of mortality from pneumonia (120) and proper assessment and treatment of
hypoxia has been shown to substantially reduce case fatality (121). The use of pulse
oximetry is far more accurate than clinical signs in detecting hypoxia (122). Unfortunately,
oximetry and oxygen therapy are unavailable in many developing country settings.
Vaccination against the important respiratory pathogens is effective in the prevention of
childhood pneumonia and leads to a reduction in mortality; immunization against pertussis,
measles, and pneumococcal infection being striking examples (5). While Hib and
pneumococcal conjugate vaccines are licensed and recommended by WHO for inclusion in
national programs (123, 124), LMICs can ill afford them. Special initiatives by the Global
Alliance for Vaccines and Immunization (GAVI) may increase coverage (5). Vaccines
against RSV and PIV type 3 are currently being developed (5), despite earlier setbacks,
especially for RSV vaccines (38).
Malnutrition is an underlying factor in more than half of all under-5 deaths (4) and is
strongly associated with an increased risk of dying from pneumonia (125). In fact, about a
quarter of pneumonia deaths in LMICs are attributable to underweight or stunting alone
(126). Promotion of exclusive breastfeeding, especially in the first month of life, and
improving zinc nutriture are other potentially effective interventions in the prevention of
pneumonia (126).
Viral pneumonia in children
25
In 2007, WHO and UNICEF initiated a Global Action Plan for Pneumonia (GAPP) to
increase awareness of pneumonia as a major killer of children and to develop a unified and
equitable approach towards pneumonia control (127). In order to increase child survival,
countries should focus on four areas that offer the best prospects for pneumonia control,
namely vaccines, case management, nutrition and environment (128). Vaccines against
measles, pertussis, pneumococcus and Hib, effective case management at both community
and health facility levels, improvement of nutrition through promotion of exclusive
breastfeeding and improving zinc nutriture, and reducing the prevalence of low birth weight
are identified as key strategies for pneumonia control with the potential to substantially
reduce pneumonia illness and death in under-5s (129). Environmental interventions, such as
improvement of indoor air quality through cleaner fuels and better stoves, may prevent
pneumonia and should be encouraged (129). In addition, prevention and management of
HIV infection is also perceived as a major area that needs to be addressed to prevent
pneumonia (129).
Diagnosing pneumonia
The diagnosis of true bacterial pneumonia in children remains a challenge, despite the
frequency and severity of this condition. The reference standard for diagnosing pneumonia is
an aspirate from the lower respiratory tract obtained by lung puncture or bronchoscopy
(130). As a non-invasive proxy, radiography is considered a pragmatic reference standard for
the diagnosis of pneumonia, but due to variability in interpretations by radiologists, this
method also has its clear limitations (131). To improve the agreement of radiological
categorization of pneumonia with alveolar consolidations in children, WHO established
standardized criteria for interpretation of chest radiographs (132). This approach is limited
by the fact that the classical radiologic feature of alveolar consolidation is not produced by
all bacterial pneumonia episodes and may also be caused by non-bacterial pathogens (133).
Moreover, chest x-ray may be negative in the early course of pneumonia and radiographic
changes brought about by pneumonia may persist for weeks after recovery. Auscultatory
findings, such as crepitations and bronchial breath sounds, used by doctors in the clinical
assessment are largely subjective and have proven difficult to standardize (130).
Maria Mathisen
26
Identifying cases of bacterial pneumonia is crucial to better target antibiotic treatment. This
is especially a challenge in LMICs where limited resources imply that comprehensive
individual investigation may not be feasible. The WHO ARI case management approach
aims to facilitate and standardize clinical decision-making in resource-limited settings (134)
and classifies pneumonia in order to inform case management. In contrast to the
conventional diagnosis of pneumonia that uses a combination of clinical signs, chest x-ray or
laboratory investigations, the WHO algorithm for classification of ARI is based on simple
clinical signs only. These signs, which trained health workers can recognize accurately, have
been validated and found to be sensitive and specific indicators of pneumonia (135). Thus,
WHO defines pneumonia as an acute episode with fast breathing or lower chest indrawing in
children with cough or difficult breathing. This approach identifies most children that
potentially suffer from pneumonia and thereby require antibiotics, but in fact also
encompasses those with bronchiolitis and a number of those suffering from reactive airways
disease with superimposed respiratory infection (134). Global estimates of morbidity and
mortality for clinical pneumonia are largely based on this definition (2).
Determining the etiology of pneumonia
Important rationale for pneumonia etiology research in LMICs is to establish evidence-based
treatment guidelines (136) and direct the development of preventive strategies. Determining
the etiology of childhood pneumonia has been attempted for decades, but has been hampered
by the lack of sufficiently sensitive and specific tests. Most importantly, representative
specimen from the lower respiratory tract is difficult to obtain. Children do not easily
produce expectorate for examination, which even in adults is of questionable relevance for
identifying the causative agents of pneumonia due to possible contamination by upper
respiratory flora (137). Lung puncture is an invasive procedure and limited to those with a
distinct area of consolidation on chest x-ray, thus, studies in LMICs based on such data are
limited (138). Isolation of bacteria from blood of a child with signs of lung infection is
highly specific for bacterial pneumonia but carries low sensitivity because the majority of
cases are not bacteremic (139). The value of serology is often dependent on the availability
of paired serum samples to assess any antibody titer increase, as well as the time of serum
collection in relation to the onset of illness (140, 141). Some pathogens are difficult to
culture and require advanced laboratory facilities that are not available in many hospitals.
Viral pneumonia in children
27
Moreover, many widely employed methods for detection of pathogens causing pneumonia
are flawed, leaving no adequate gold standard for testing performance of new diagnostic
methods, such as nucleic acid detection. Rapid tests of bacterial etiology by antigen
detection in urine are not able to differentiate between colonization and infection with
bacteria (142). Since children in LMICs frequently are carriers of pneumococcus and Hib
(143-145) (146), the tests have low specificity in children. It is not possible to clinically
distinguish between bacterial and viral pneumonia in young children, and biomarkers, such
as serum concentrations of acute phase proteins e.g. C-reactive protein (CRP) and
procalcitonin, add little to the diagnostic accuracy (147-149). Vaccine probe studies are
perhaps the best available means to determine the proportion of pneumonia attributable to a
specific pathogen, but notably only estimate the role of the vaccine-type strains of a
pathogen on a population level (150). There is also a possibility of serotype-replacement
disease, as seen among Alaska native children (151).
The ability of the common epidemic respiratory viruses to cause lower respiratory tract
infection is well established, also for the relatively recently discovered hMPV. As opposed
to several bacteria, respiratory viruses do not colonize the upper respiratory tract, but rather
replicates in mucosal epithelial cells in the upper airways (152). Virus isolation by tissue
culture of nasopharyngeal specimens depends on the presence of viable virus and has
traditionally been considered the gold standard for diagnosing respiratory viral infection
(153). It has generally been assumed that a viral pathogen detected in upper respiratory tract
secretions during ALRI is the cause of the illness (154). There are however, some problems
inherent in this view. All the major viruses that cause pneumonia may cause a spectrum of
clinical illness from inapparent infection of the upper airways to severe infection of the
lower respiratory tract. In fact, acute respiratory infections initiate in the upper respiratory
tract epithelium and in some cases descend to the lower respiratory tract. In general,
infection is much more common in the upper than in the lower respiratory tract and on
average, young children typically experience 5 episodes of URI yearly (155). A virus may be
detected before the onset of symptoms and sometimes for a period after recovery, which
means that a child may test positive for a respiratory virus for several weeks of the year.
Thus, a virus present in a specimen from upper respiratory tract during pneumonia could be
either causal or incidental, questioning its causal role in individual cases and making
epidemiological estimates of causality across individuals prone to exaggeration.
Maria Mathisen
28
The wide application of molecular methods in routine diagnostics of ARI has improved
sensitivity compared to conventional methods, such as tissue culture and direct fluorescent
antibody assays (153, 156-158). Moreover, molecular diagnostics have facilitated
simultaneous detection of multiple pathogens in a single specimen and reduced analysis
time. Polymerase chain reaction (PCR) assays have been developed for detection of
rhinovirus and for newly discovered viruses such as hMPV, human bocavirus (hBoV) and
subtypes of coronavirus. Combined with the use of comprehensive diagnostic testing
protocols including a wide array of pathogens, this has resulted in an increase in the
proportion of specimen from patients that test positive for any respiratory pathogen.
However, there is a penalty to this increased sensitivity. An increase in the proportion of test
positive specimen also from asymptomatic individuals (159), especially in young children
(160) and the frequent detection of multiple pathogens in single specimens, particularly in
studies utilizing multiple diagnostic methods including sensitive PCR assays to detect
respiratory agents (59, 161, 162) have complicated the interpretation of positive PCR results.
These issues have raised concern regarding the clinical relevance of detecting certain viral
pathogens in upper airways secretion and highlight the problem of ascribing the cause to
individual agents. Consequently, it is essential to determine the proportion of virus positive
nasopharyngeal specimens in a control group before making assumptions about causality.
Most studies of viral etiology have failed to do so.
Focus of the thesis
Data on etiology and clinical presentation of childhood pneumonia are important for
planning and assessment of pneumonia control strategies (163). In addition, data on etiology
enable more accurate evaluation of the impact of new interventions, such as the introduction
of vaccines (152). Such data are lacking for many LMICs, including Nepal. The focus of this
thesis is to examine the epidemiological and clinical importance, in terms of frequency,
seasonality and severity, of 7 respiratory RNA viruses in young Nepalese children with
pneumonia in a community-based setting. The viruses were identified in nasopharyngeal
aspirates (NPAs) using a validated (158, 164-166) commercial multiplex reverse
transcription PCR assay. Using data from a cross-sectional study and a case-control study
embedded therein, we measured the proportion of pneumonias with and calculated
pathogenicity odds ratios (ORs) for these 7 viruses. These ORs measure the degree to which
Viral pneumonia in children
29
the viruses are associated with pneumonia. Because we do not believe reverse causality is a
relevant problem in this context, this is likely to be the best available measure of causality.
Maria Mathisen
30
2. Objectives
Overall objective
To assess the role of RNA viruses in community-acquired pneumonia in young Nepalese
children.
Specific objectives
In young Nepalese children;
1. Identify common viral pathogens in community-acquired pneumonia over a three-
year period (Paper I);
2. Describe the seasonality of common viral pathogens in community-acquired
pneumonia over a three-year period (Paper I);
3. Describe the clinical presentation, severity and course of viral community-acquired
pneumonia (Paper II);
4. Measure the association between the presence of respiratory viruses in
nasopharyngeal aspirates and pneumonia (Paper III).
Viral pneumonia in children
31
3. Methods
Nepal demographics
Nepal is a landlocked country in South Asia bordered by China and India. It is commonly
divided into three major areas that run east-west: the arid Mountain Region with the
Himalayan Range in the north, the central Hill Region that includes the Kathmandu Valley,
and the Terai Region, which refers to the southern fertile and densely populated lowland
plains. The climatic zones corresponds to the altitude and range from tropical to arctic. The
proximity to the Bay of Bengal makes Nepal influenced by the Indian monsoon in the
summer.
The population exceeded 25 millions in 2006 (167). Nearly one quarter of the population
lives below the poverty line (1 USD per day) (168). Labor migration to the Gulf, India and
Malaysia is widespread. The overall adult literacy rate is 56.5% (169), but there are great
disparities between genders and across regions (167). In 2001, only 14% of the population
lived in urban areas (170), but this may have increased during the ten-year long Maoist led
violent insurgency that ended in 2006. The infant mortality rate (per 1000 live births) has
declined the last 15 years from 79 (1991-1995) to 48 (2001-2005) (167) and life expectancy
at birth is around 66 years (169). Undernutrition is common, especially among children.
About half of the children below 5 years were stunted and nearly 40% were under-weight in
2006 (167). The Expanded Program on Immunization (EPI) began in 1979 and official
figures indicate that overall coverage for all basic vaccines (BCG, measles, and three doses
each of DPT and polio vaccine) had reached 83% in 2006 (167).
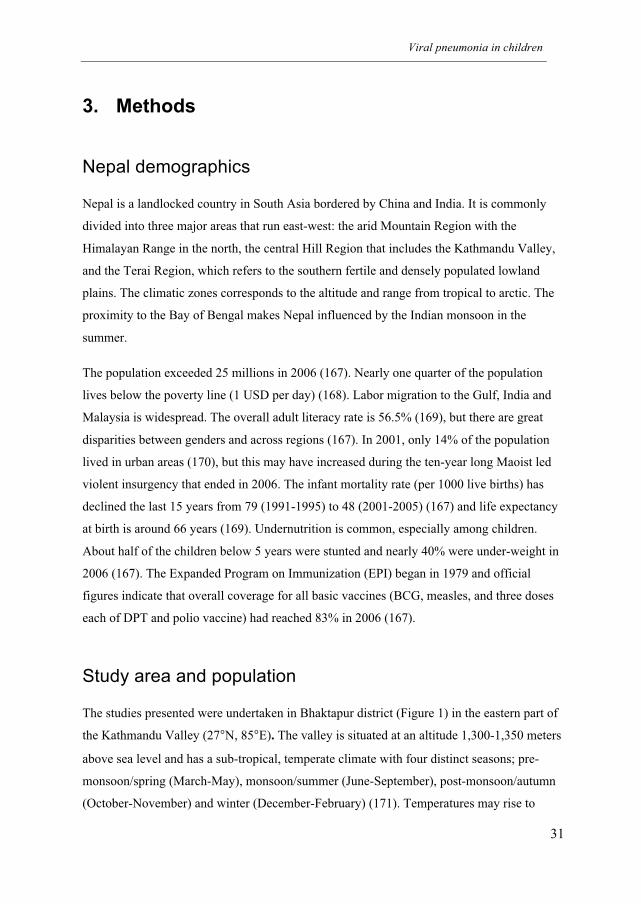
Study area and population
The studies presented were undertaken in Bhaktapur district (Figure 1) in the eastern part of
the Kathmandu Valley (27°N, 85°E). The valley is situated at an altitude 1,300-1,350 meters
above sea level and has a sub-tropical, temperate climate with four distinct seasons; pre-
monsoon/spring (March-May), monsoon/summer (June-September), post-monsoon/autumn
(October-November) and winter (December-February) (171). Temperatures may rise to
Maria Mathisen
32
35°C in summer, while minimum temperatures can fall to 0°C in winter. The valley is the
most densely populated area in the country.
Bhaktapur town is the district headquarters with a population of about 80,000. The
municipality is divided into 17 administrative ‘wadas’ or neighborhoods. The Newars form
the major ethnic group in the area and a large proportion is involved in subsistence farming.
Migrant minority groups, such as the Lama and the Tamang, are more frequently engaged
working in numerous carpet or brick factories, which makes them more dependent on
purchasing food items and hence vulnerable to fluctuations of the prices in the market.
Undernutrition, mainly manifest as stunting, and anemia, is common among children below
5 years of age (172). The vaccine coverage is >90% for all vaccines included in the national
EPI (173).
Figure 1. Map of Nepal with details of Bhaktapur district with municipality boundaries and surrounding
village development committees (VDCs).
Prior to study start, we undertook a baseline census of children below three years of age
living in households in the 17 wadas in Bhaktapur municipality. This census, which covered
Viral pneumonia in children
33
8,398 households, showed that 41% of families with young children owned some
agricultural land, while 22% owned domestic animals. Most of the households had access to
piped drinking water (97%) and toilet with central drainage (88%). About half of the
families owned their own accommodation (52%), while 46% lived in only one room.
Although winters are cold and houses not isolated, heating of rooms is not common.
Cooking is mainly done indoors and kerosene was used by 51%.
Fieldwork
One cross-sectional study and one case-control study form the basis of this thesis. A display
of the field studies and methods in relation to the papers is given below (Table 1).
Table 1. Study design, period, topic and main analyses of the field studies presented in the respective
papers.
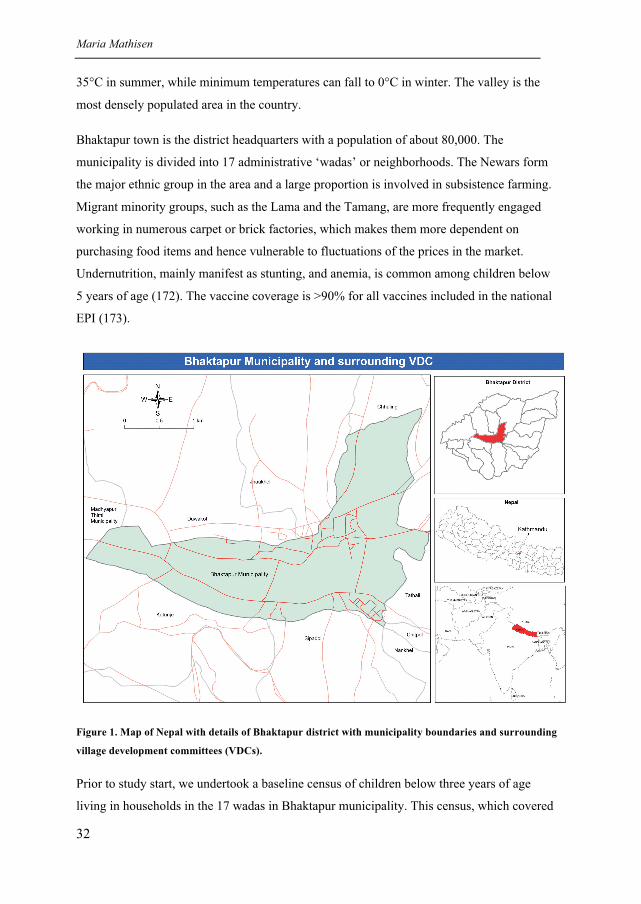
Recruitment area and strategy
The baseline census formed the basis for the surveillance system that was set up and
maintained throughout the study period (Figure 2). We generated a list of all children below
three years of age using the data from the census and regularly updated the list by identifying
newborn babies and excluding children who had completed 36 months of age, moved away
from the area or left the cohort for other reasons. The children in this open cohort were
subject to monthly active surveillance and received a card that entitled them to free basic
Paper Study type Study period Topic Main analyses
I Cross-sectional study 29 June 2004 to 30 June 2007 Identification of common 1) Descriptive statistics
of children with WHO- respiratory viruses and
defined pneumonia their seasonality
(n=2,219)
II Cross-sectional study 29 June 2004 to 30 June 2007 Clinical presentation, 1) Logistic regression
of children with WHO- severity and outcome of 2) Cox regression
defined pneumonia pneumonia episode
(n=2,219)
III Matched case-control 25 March 2006 to 9 July 2007 Comparison of virus 1) Conditional logistic
study of children with frequency in children with regression
and without WHO- and without pneumonia
defined pneumonia
(n=1360)
Maria Mathisen
34
health services at the project facility. At first encounter, the fieldworker collected detailed
information about the household and the individual child. At the monthly visits, he or she
obtained information, mainly from the mother, on symptoms of respiratory and diarrheal
illness during the last seven days and referred children with symptoms of illness to the study
clinic. In the area outside the municipality, no regular surveillance was undertaken and
household information was obtained only when a child was included in the study.
Figure 2. Time points for initiation and ending of the baseline census, the surveillance of children <3
years of age, and the clinical trial with inclusion periods for cases and controls in the virus studies. The
virus studies that form the basis for the current thesis were embedded in the clinical trial.
For the cross-sectional study (paper I and II), the participants were recruited mainly from the
municipality of Bhaktapur, i.e. from the open cohort of children that were under active
surveillance. However, we also included eligible children with pneumonia from the
surrounding district if brought to the study clinic. A total of 1,899 (85.6%) of the 2,219 cases
were recruited from within the municipality, while the remaining came from the adjacent
village development committees in the district. In the case-control study (paper III), both
cases and controls were recruited solely from within the municipality of Bhaktapur.
The project staffed an outpatient department at Siddhi Memorial Hospital in the outskirts of
Bhaktapur and families could bring their children for free treatment at our clinic for common
childhood illnesses. In addition, the project ran a 10-bed pediatric ward with 24-hour service
where mainly children with severe pneumonia were admitted.
1 2 3 4 1 2 3 4 1 2 3 4 1 2 3 4 1 2 3 4
2007
Census
Surveillance of children <3 years of age in Bhaktapur municipality
Inclusion of pneumonia cases for viral testing
Clinical trial assessing the effect of zinc for pneumonia
Inclusion of controls
2003 2004 2005 2006
Viral pneumonia in children
35
Recruitment of cases, case definition and exclusion criteria
Children aged 2-35 months who came to our study clinic were screened for fast breathing or
lower chest wall indrawing (LCI) and classified according to the standard WHO algorithm
for ARI (174). Pneumonia was defined as cough or difficult breathing combined with fast
breathing, i.e. �50 breaths/min for children 2-11 months old, and �40 breaths/min for
children �12 months old. Severe pneumonia was defined as cough or difficult breathing
combined with LCI. Children with auscultatory wheeze were given 2 doses of 2.5 mg
nebulized salbutamol administered 15 minutes apart followed by reassessment after 30
minutes. A child was included only if he or she had fast breathing or LCI at reassessment.
Cases with very severe pneumonia/disease, i.e. cough or difficult breathing with stridor
when calm or any general danger signs (inability to drink/breastfeed, persistent vomiting,
convulsions, lethargy or unconsciousness) were not included, but instead referred to a
tertiary level hospital after initial treatment. Cases with other severe illness, documented
tuberculosis, congenital heart disease, dysentery, severe anemia (defined as hemoglobin <7
mg/L), or severe malnutrition (defined as <70% National Health Care Surveys median
weight for height) were not included in the study. Those with a history of cough for more
than 14 days or who had received antibiotics within the last 48 hours were excluded.
Children could not participate in the cross-sectional study again (paper I and II) until after 6
months because of restrictions imposed by the clinical trial protocol (175). Children included
in the case-control study (paper III) could be enrolled as a case or as a control in the study
again only after 2 months. The exclusion criteria for cases also applied to the controls,
except that hemoglobin was not routinely measured in control children.
Paper I and II
We included 2,230 cases of pneumonia among 1,909 children from June 29, 2004 to June
30, 2007. Only for five days in September 2004 were we not able to include children due to
lack of NPA collection equipment. The children were, after obtaining informed parental
consent, enrolled in a clinical trial assessing the effect of zinc as adjuvant therapy in children
with pneumonia (175). All included children were randomized to receive either zinc (10 mg
for children aged 2–11 mo, 20 mg for children aged �12 mo) or placebo daily for 14 days
adjuvant to antibiotics.
Maria Mathisen
36
Paper III
We included children in the case-control study from March 25, 2006 in parallel with the
undertaking of the zinc supplementation trial. The last case was included on June 30 and the
last control on July 9, 2007. Among the 680 cases in the case-control study, 570 were also
included in the zinc-pneumonia trial, while 110 cases were not because less than 6 months
had lapsed from the previous enrolment in the trial. Hence, not all the laboratory
investigations, such as CRP, were available at baseline for the cases that did not enroll in the
zinc trial. A “grace period” of two months was set to ensure that cases were not included
twice for the same episode.
Selection of controls (paper III)
Controls were matched by age (in months) of the case. One control was randomly selected
for each case from the list of children under surveillance that was updated monthly. After
inclusion of a case, a fieldworker visited the home of a potential control child on the same or
the following day. If parents consented to the child’s participation, he or she was referred to
the study clinic to be examined for eligibility as a control. If the child did not come to the
clinic after two home visits, or was not found or not eligible for other reasons, another
randomly selected age-matched child was approached.
Case management
Children with non-severe pneumonia received oral antibiotic treatment with cotrimoxazole
for five days according to the WHO’s standard case management guidelines for pneumonia
(12) and were examined daily by a fieldworker until recovery. The day of recovery was
defined as the first of two consecutive days with a normal respiratory rate for age as assessed
by the fieldworker. The fieldworker referred the child to the clinic if he or she still had fast
breathing at 72 hours after inclusion. If the study physician confirmed pneumonia, treatment
was changed to amoxycillin for 5 days. Treatment failure was defined as a change of
antibiotic or hospitalization for pneumonia within the first three days after inclusion. Cases
of severe pneumonia were hospitalized and received parenteral benzylpenicillin as first line
treatment. Children with oxygen saturation (SpO2) <90% received oxygen treatment.
Viral pneumonia in children
37
Data collection
The fieldworkers involved in data collection were trained in standard case management
according to the IMCI strategy (176) for one week, facilitated by Nepalese pediatricians and
investigators from the study group in Nepal, who also trained and supervised doctors in
study procedures.
The child’s respiratory rate (RR) was assessed according to WHO guidelines (177), counting
twice for one minute using a UNICEF timer. If only one of the counts were in the fast
breathing range, counting was repeated and the two counts that were in the same category
were recorded. The lower of the two counts was used in the analyses. We attempted to count
the RR in children that were either awake and quiet or sleeping, as breastfeeding may
increase the RR in some children and make assessment of LCI difficult. The majority of
children were assessed while awake and quiet (96%), a small number while sleeping (3%),
and very few while breastfeeding (<1%).
Arterial SpO2 was measured either on a finger or a toe with a pulse oxymeter (Siemens
MicrO2, Siemens Medical Systems Inc, Danvers, MA, USA) using a pediatric sensor
(Nellcor, Pleasanton, CA, USA). It was recorded twice one minute apart after stabilization of
the reading for one minute. The higher of the two measurements was used in the analyses.
To determine the normal values for SpO2 in children living in Kathmandu (at approximately
1,350 meters above sea level), we conducted a reference study among 425 healthy children
aged 2 to 35 months attending the vaccination clinic in Kanti Children’s Hospital in
Kathmandu. SpO2 was measured twice as described above. According to Duke and
coworkers (121), the lowest value for normal oxygen saturation in children can be defined as
the mean SpO2 minus 2 standard deviations (SD). In our group of healthy children, the mean
(SD) was 95.9% (1.50), which gives a lower limit of SpO2 of 93% among normal children.
Based on these data, we used SpO2 <93% for defining hypoxia in the three papers, but we
also present the proportions of children with SpO2 <90%; this is the WHO threshold for
oxygen administration (178).
We registered the location of the children’s residence in Bhaktapur, i.e. children under
surveillance (including the controls) as well as all included pneumonia cases, using handheld
global positioning system (GPS) devises (eTrex�, Garmin Ltd., Olathe, KS, USA). The
geographical location of the houses was visualized using a GPS-based computerized plot
Maria Mathisen
38
(Google Earth Pro) and was utilized to map the distribution of viral infections in the
community over time.
Collection, processing and storage of nasopharyngeal aspirates
NPA specimens were obtained using a sterile, disposable suction catheter (Pennine
Healthcare Ltd., Derbyshire, UK) with a suction trap (trachea suction set,
Unomedical a/s, Birkerød, Denmark) connected to a foot pump (Ambu® Uni-Suction
Pump, Ambu A/S, Ballerup, Denmark). The catheter was inserted through the child’s
nostril to a distance equivalent of that from the nostril to the earlobe [21]. Suction
was applied for minimum of ten seconds with maximum negative pressure of 200
mm Hg. Secretion remaining in the catheter after suction was recovered by rinsing 2-
3 ml virus transport medium (DiagnoStick®, Department of Microbiology,
University Hospital of North Norway, Tromsø, Norway) through the catheter into the
suction trap. The trap was then disconnected and sealed. In March 2006, we changed
transport medium to Universal Transport Medium (UTM) System (Copan
Diagnostics Inc., Corona, CA) because the in-house product DiagnoStick® was no
longer available. The new transport medium had the advantage of tolerating storage
temperatures from 2-30°C before use, while the DiagnoStick® had to be kept frozen
before use when stored for longer periods of time.
The specimens were refrigerated at 2-8°C following collection at the field clinic and
transported on ice every working day to the main laboratory in Kathmandu, where
they were vortexed and divided in three equal aliquots in sterile vials (CryoTubes™,
Nunc AS, Roskilde, Denmark). The aliquots analyzed in Nepal were either frozen at
–70°C or kept refrigerated at 2-8°C before analysis (paper I and II). Two aliquots
were immediately frozen at –70°C and transported to Norway on dry ice and again
stored at –70°C for quality control purpose. The specimens for the case-control study
(paper III) were all refrigerated at 2-8°C before analysis (mean number of days of
storage was approximately 10 days (range 0-37), median 6 days [IQR 3-12]). The
storage conditions were identical for case and control specimens.
Viral pneumonia in children
39
Comparative study of different storage temperatures
There is concern regarding degradation of viral RNA by storing specimens at temperatures
of 2-8°C as compared to -70°C. We therefore undertook a separate study comparing results
between samples refrigerated at 2-8°C for up to four months (i.e. 125 days) and samples
frozen at -70°C immediately after processing. Assuming the frozen storage as gold standard,
this comparative study showed that the sensitivity for samples refrigerated for up to four
months was 93%. Moreover, the sensitivity did not differ substantially between samples
refrigerated for periods of 2 months, 3 months and 4 months (data not shown). The
specificity was 96% in the refrigerated samples compared to the frozen samples. It is not
likely that specificity, as opposed to sensitivity, would be affected by prolonged storage at 2-
8°C.
Setting up and running the virus laboratory in Kathmandu
The project hired a bus to shuttle fieldworkers from Kathmandu to Bhaktapur in the morning
and back again in the evening five days a week. This bus also carried the NPA specimens
from the field clinic to the project office in Kathmandu. Samples were received, processed
and frozen by one of the project laboratory staff. Initially we used a -70°C freezer that was
available in the research laboratory to store our samples, but to increase the freezer capacity
we purchased a -86°C ultra-low temperature freezer that was shipped from Norway to Nepal.
This freezer broke down within the first year and had to be replaced by a second freezer also
shipped from Norway because there were no possibilities for repairing the broken freezer in
Nepal. Despite these challenges, none of the specimens suffered accidental thawing.
The dry ice for transportation of NPA aliquots to Norway had to be ordered from New
Delhi, India, through a local dealer in Nepal and was shipped to Kathmandu by air. We had a
special bag made in Nepal for shipment purpose for transportation to Norway. There were
always substantial amounts of dry ice remaining at arrival, indicating that temperatures
during transport had been below -40°C.
The Department of Microbiology at Tribhuvan University Teaching Hospital provided the 3-
room facility that we needed to set up a PCR laboratory. A lot of laboratory equipment and
consumables were hand-carried from Norway to Nepal. The reagents for the PCR assays
were imported directly from USA. This was divided into three major shipments over the
Maria Mathisen
40
three-year period due to limited shelf life of the reagents. We also ordered pipette tips in
bulk from France. Nepal charges a high tax on imported goods. This motivated an
application for import tax exemption for our research material, which was a rather lengthy
process that had to be repeated for every shipment. The body at the university that dealt with
these applications was not operational for a longer period of time during the political unrest
in the spring of 2006 when King Gyanendra was forced by the democracy movement to
renounce his sovereign power. This delayed import of essential reagents for the laboratory
for several months. Due to a general shortage of electricity in Nepal, the power supply is not
continuous in Kathmandu at certain times of the year. The authorities scheduled local “load
shedding”, and the power could be discontinued for up to ~30 hours a week. To avoid
interrupted power supply in our laboratory, we installed a back-up battery that would last for
the required number of hours of the scheduled power cut, which rarely exceeded 4 hours.
However, this battery was too small to serve as a back up for the freezers, which
occasionally were without power. Therefore, we monitored the freezer temperature, which
was never recorded to be above -40°C at any time.
Competence/capacity building
The Department of Microbiology and Infection Control at the University Hospital of North
Norway (UNN) in Tromsø supported us in the planning and set up of the laboratory. Håkon
Haaheim, a UNN staff, and myself (MM) went for a one-week training in the facilities of
Prodesse in Waukeshaw, WI, USA in September 2004. Unfortunately, the two main
Nepalese laboratory staffs, Biswa Nath Sharma and Govinda Gurung, were not granted a US
visa for this trip. They received training in PCR analyses at the virus laboratory in the
Department of Microbiology at All India Institute of Medical Sciences (AIIMS) under
supervision of Professor Shobha Broor for ten days in April 2005 together with me. Håkon
Haaheim travelled to Nepal in August 2005 to assist us in setting up the lab and to start the
PCR analyses. The following year Ann Helen Helmersen from UNN visited Nepal for two
weeks to provide assistance in making analysis procedures more efficient. This, and the
introduction of multi-channel pipettes and PCR strips instead of individual PCR vials,
resulted in a 3-fold increase in analysis capacity. In 2006 two of the Nepalese laboratory
staff had a one-week stay at the Department of Microbiology and Infection Control at UNN
for additional training.
Viral pneumonia in children
41
Virus identification
One aliquot of each specimen was tested at our research laboratory in Nepal for RSV,
influenza A and B, PIV type 1, 2 and 3, and hMPV using a commercially available multiplex
reverse transcription PCR assay (Hexaplex Plus�, Prodesse Inc., Waukeshaw, WI) with
minor modifications of the manufacturer’s instructions (179) and previous descriptions
(166). In brief, nucleic acids were extracted from 360 �l of NPA using a nucleic acid (NA)
extraction kit (Roche High Pure Viral Nucleic Acid Kit, F. Hoffman-La Roche Ltd., Basel,
Switzerland) according to the manufacturer’s instructions. Each run of the assay included a
positive RNA control and a negative control (virus transport medium), starting at NA
isolation. Specimens and negative controls were individually spiked with 40 �l of internal
control during NA isolation to identify any inhibition. Reverse transcription with random
hexamers and multiplex PCR were performed according to the Hexaplex Plus protocol using
GeneAmp®
PCR System 2700 (ABI, Applied Biosystems, Foster City, CA, USA). The PCR
supermix contained seven pairs of forward and backward primers flanking unique sequences
of the seven viruses (the hemagglutinin neuraminidase gene of PIV type 1, 2 and 3, the
matrix protein gene of influenza A, the NS1 and NS2 genes of influenza B, the NS1 and
NS2 genes of RSV and the nucleocapsid gene of hMPV). After amplification, the PCR
products were purified using Qiagen QIAquick PCR Purification Kit (QIAGEN Inc.,
Valencia, CA, USA) and analyzed by enzyme hybridization assay (EHA) (166), measuring
the optical density at 450 nm (OD450) using a micro-plate reader (Stat Fax®
2100, Awareness
Technology Inc., Palm City, FL, USA). The EHA was mainly run directly with individual
probes discriminating between the different types of PIV and influenza. However, the EHA
was during some periods run with pooled probes for PIV and influenza and then
discriminated in a second EHA if the pooled probe yielded a positive result. Definitions of
cut-off values and interpretation of PCR results were as described in paper III.
Three hundred and twenty-four NPA aliquots were stored beyond 3 months at 2-8°C before
analysis in Nepal. Of these, we reanalyzed the 133 that yielded a negative result, now using
the aliquot that had been frozen at –70°C and transported on dry ice to Norway. This was
done at the Department of Microbiology and Infection Control, UNN, Tromsø, Norway,
using the Hexaplex Plus assay and an automated extraction platform (NucliSens®
easyMAG, bioMérieux, Durham, NC). Nucleic acids were extracted from 400 �l of sample,
Maria Mathisen
42
negative and positive processing controls and amplification control using the extraction
principle with magnetic particles of this platform.
Statistical analyses
Statistical analyses were performed using Stata/MP version 10.1 for Macintosh (Stata
corporation, College Station, TX, USA). Anthropometric measures were expressed as Z-
scores, which were generated using the WHO Child Growth Standards 2005 (180).
Statistical significance was defined as a P-value <0.05.
In paper I and II, the 95% confidence intervals (CI) for proportions were calculated with
binominal exact confidence interval using the “ci” command. Relative proportions were
calculated using the “binreg” command. We used Cox proportional hazard models to
estimate the association between viral status and duration of the non-severe pneumonia
episodes. The odds ratio for treatment failure in non-severe cases was calculated using
logistic regression. In the multiple regression models where each virus was used as the
exposure variable we included age, breastfeeding status, whether the child belonged to the
zinc or placebo arm of the trial, as well as presence of the seven different viruses. We also
performed these analyses using high CRP (as an indirect marker of bacterial infection) as the
exposure variable. In these latter analyses we included viral status (positive or negative) in
the model instead of each of the seven viruses. Of the children included in these analysis,
274 were enrolled twice and 18 thrice. We used the “cluster” option in Stata to adjust the P-
values and the confidence intervals of our estimates for repeated enrollments and thus
allowed for possible dependence of observations in a child that was included more than
once.
Meteorological data for the Kathmandu airport weather station (located approximately 10
km from Bhaktapur) were obtained from Department of Hydrology and Meteorology,
Ministry of Environment, Science and Technology, Kathmandu, Nepal. Mean daily values
for relative humidity and temperature were calculated as the average of two daily
measurements (relative humidity at 8.45 AM and 5.45 PM, and maximum and minimum
temperature). We estimated the Spearman rank order correlation coefficient to describe the
association between the monthly number of infections with each virus and meteorological
factors.
Viral pneumonia in children
43
Proportions in the baseline table of paper III were compared using logistic regression. In an
unmatched design, the pathogenicity odds ratio (OR) for each virus is the odds of detecting a
pathogen-positive specimen from a child with pneumonia divided by the odds of detecting a
pathogen-positive specimen from a control child. To take the matching into account, we
estimated the pathogenicity using conditional logistic regression to calculate the matched
OR (MOR). Because we sampled each control concurrently, i.e. shortly after the
corresponding case had been identified, this OR is a direct estimate rather than a biased
approximation of the incidence rate ratio for the given pathogen (181). These analyses
included 1,360 specimens from 1,059 children of whom 808 were enrolled once, 210 twice,
33 three times, 7 four times, and one child five times. We used the “cluster” option in Stata
to take repeated enrollments and thus possible dependence of observations in children that
were included more than once into account when calculating the confidence intervals and P-
values of these pathogenicity estimates. This adjustment only marginally affected the
precision of the presented estimates. We sought to identify possible confounders, such as the
presence of other viruses, sex, breastfeeding status, stunting, wasting, and whether the child
had been delivered in a hospital, using unconditional logistic regression including age
categories as factors. We also explored whether the MORs were different in children below
and above 6 months of age for the two most common viruses. The P-values for such possible
interactions were obtained from the unconditional models.
Ethical issues
The protocol for the study descried in paper I and II had ethical clearance from the Research
Ethics Committee of the Institute of Medicine at Tribhuvan University in Kathmandu, Nepal
as well as from the Regional Committee for Medical and Health Research Ethics (REK) of
Western Norway (REK project no. 129.03). The protocol for the case-control study in paper
III was approved by the Research Ethics Committee at Tribhuvan University, Nepal. Ethical
approval was not sought in Norway, which was according to the Norwegian national
guidelines at the time of application (2005). The storage of NPA specimens in Norway have
been registered and approved by the Norwegian National Biobank Register, Norwegian
Institute of Public Health (research biobank no 1832).
Informed consent for participation was obtained from the guardian of the child, usually one
of the parents. A witnessed verbal informed consent was obtained from those who were
Maria Mathisen
44
illiterate and a register of witnesses was kept at the field site. Children below three years of
age received treatment for common childhood illnesses free of charge and this was not
limited to study participants. Participants were informed that withdrawal of consent did not
affect health care services offered by the project.
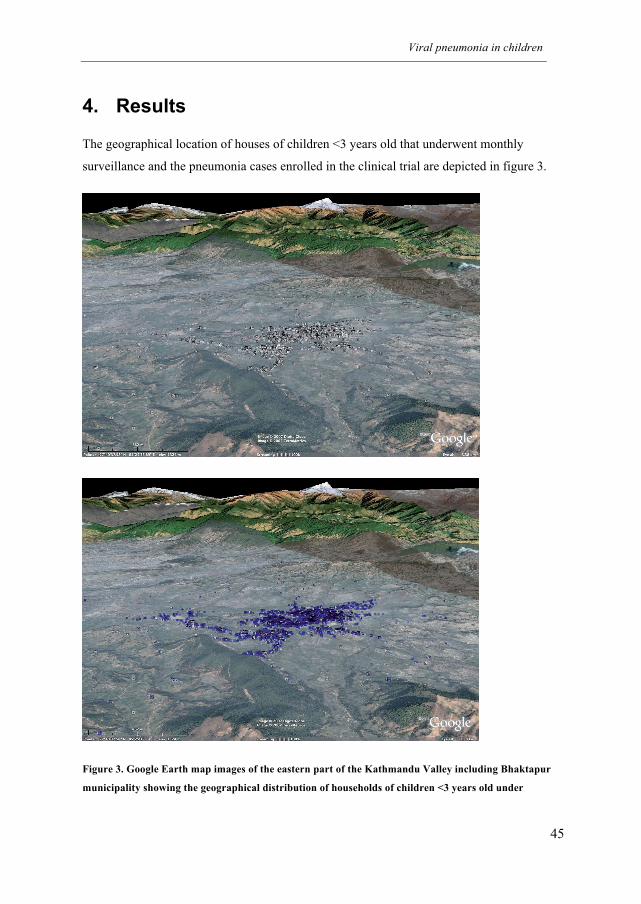
Viral pneumonia in children
45
4. Results
The geographical location of houses of children <3 years old that underwent monthly
surveillance and the pneumonia cases enrolled in the clinical trial are depicted in figure 3.
Figure 3. Google Earth map images of the eastern part of the Kathmandu Valley including Bhaktapur
municipality showing the geographical distribution of households of children <3 years old under
Maria Mathisen
46
monthly surveillance (white squares) and children with pneumonia (blue squares) enrolled in the clinical
trial.
Subject characteristics
Cross-sectional study (paper I & II)
For this three-year study, we included 2,230 pneumonia cases. We excluded 11 cases from
the analyses because of inhibition of the PCR. Of the remaining 2,219 cases, 56.9% were
boys and 45.8% were infants (i.e. 2 to 11 months). The overall mean (SD) age of the study
children was 13.4 (8.3) months but this was substantially lower among the children with
severe pneumonia (8.6 [7.4] months). There were also more (62.6%) boys in the group with
severe pneumonia. The majority (87.7%) of children were still breastfed at the time of
inclusion in the study. Mean birth weight was 2,86 kg in the 1,585 children where this
information was available, and 224 (14%) had low birth weight (<2,5 kg). Hospital delivery
was reported in 1,718 (77.5%). Wasting was more frequently seen among cases with severe
pneumonia than among non-severe cases (6.1% vs 3.6%), while the proportions of stunting
were very similar (22% vs 24%). About a quarter of mothers reported not being able to read
or write, while this was much less common among fathers (5%). Sixty-six percent of
mothers did not work outside their home and almost half of the fathers (48.6%) were daily
wage earners (i.e. work contracted on a day-to-day basis).
Case-control study (paper III)
The background characteristics of the cases in the case-control study did not differ from the
larger population of cases described above with regard to age, sex, breastfeeding, birth
weight, anthropometrical measures, or socio-economic variables. The controls were more
often born in hospital than the cases (89% vs 81%), but their birth weights were nearly
identical. A larger proportion of the cases were wasted and stunted compared to controls, but
the differences were not substantial and the total numbers of children with wasting and
stunting were small. There were a slightly higher proportion of controls that came from
families owning agricultural land, belonged to the Newar caste, or lived in an extended
family as compared to the cases (Table 1 in paper III). Other background characteristics
were evenly distributed between the two groups.
Viral pneumonia in children
47
Virus analyses
An overview of the main findings are shown in table 2.
Frequency of respiratory viral infections (paper I)
We detected at least one virus in 887 (40%) of the 2,219 pneumonia cases from June 2004 to
July 2007. More than one virus was detected in only 29 (3.3%) of the positive specimens.
RSV was the most common of the seven viruses being identified in 334 (15.1%) cases.
Influenza A was second in frequency (164 or 7.4%) followed by PIV type 3 (129 or 5.8%)
(Table 2).
Seasonality of respiratory viral infections (paper I)
We observed the largest epidemics of pneumonia during the end of the monsoon season and
in winter, and most epidemic peaks coincided with epidemics, individual or compiled, of
RSV, hMPV, influenza A and B, and PIV type 3. PIV type 1 occurred in an endemic pattern
throughout the year with no major peaks. We only identified 17 cases with PIV type 2
infection during the entire study and these were sporadic. An annual RSV epidemic peaked
either in September (2004 and 2006) or in December (2005). We observed a single hMPV
epidemic, which occurred in December to January the first year, while the only substantial
PIV type 3 outbreak peaked in June 2006. Influenza epidemics were predominantly observed
during winter months and outbreaks of type A and B infections more or less overlapped. The
spatial-temporal distribution of the individual viruses is shown online in the following
website: http://folk.uib.no/mihtr/CHRP/Virus.html.
Respiratory viral infections and climatic parameters (paper I)
In the Spearman correlation analyses RSV and hMPV were positively associated with
relative humidity (r=0.40; P=0.015 and 0.55; P 0.0005, respectively) but not with
temperature or rainfall. In contrast, PIV type 3 was positively associated with temperature
(r=0.65; P<0.0001) and rainfall (r=0.68; P<0.0001) but not with humidity. Influenza A did
not correlate with any of the tree meteorological parameters, while influenza B exhibited
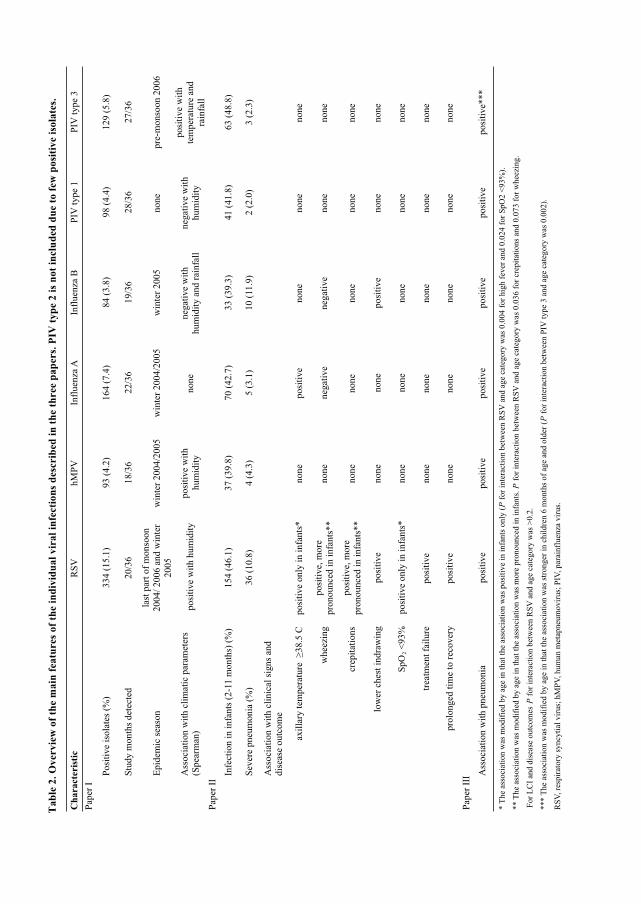
Ta
ble
2.
Ov
erv
iew
of
the m
ain
fea
tures
of
the i
nd
ivid
ua
l v
ira
l in
fecti
on
s d
esc
rib
ed
in
th
e t
hree p
ap
ers.
PIV
ty
pe 2
is
no
t in
clu
ded
du
e t
o f
ew
po
siti
ve i
sola
tes.
Ch
ara
cter
isti
cR
SV
hM
PV
Infl
uen
za A
Infl
uen
za B
PIV
type
1P
IV t
ype
3
Pap
er I
Posi
tive
isola
tes
(%)
334 (
15.1
)93 (
4.2
)164 (
7.4
)84 (
3.8
)98 (
4.4
)129 (
5.8
)
Stu
dy m
onth
s det
ecte
d20/3
618/3
622/3
619/3
628/3
627/3
6
Epid
emic
sea
son
last
par
t of
monso
on
2004/
2006 a
nd w
inte
r
2005
win
ter
2004/2
005
win
ter
2004/2
005
win
ter
2005
none
pre
-monso
on 2
006
Ass
oci
atio
n w
ith c
lim
atic
par
amet
ers
(Spea
rman
) p
osi
tive
wit
h h
um
idit
yposi
tive
wit
h
hum
idit
ynone
neg
ativ
e w
ith
hum
idit
y a
nd r
ainfa
ll
neg
ativ
e w
ith
hum
idit
y
posi
tive
wit
h
tem
per
ature
and
rain
fall
Pap
er I
I
Infe
ctio
n i
n i
nfa
nts
(2-1
1 m
onth
s) (
%)
154 (
46.1
)37 (
39.8
)70 (
42.7
)33 (
39.3
)41 (
41.8
)63 (
48.8
)
Sev
ere
pneu
monia
(%
)36 (
10.8
)4 (
4.3
)5 (
3.1
)10 (
11.9
)2 (
2.0
)3 (
2.3
)
Ass
oci
atio
n w
ith c
linic
al s
igns
and
dis
ease
outc
om
e
axil
lary
tem
per
ature
�
38.5
Cposi
tive
only
in i
nfa
nts
*none
posi
tive
none
none
none
whee
zing
posi
tive,
more
pro
nounce
d i
n i
nfa
nts
**
none
neg
ativ
eneg
ativ
enone
none
crep
itat
ions
posi
tive,
more
pro
nounce
d i
n i
nfa
nts
**
none
none
none
none
none
low
er c
hes
t in
dra
win
gposi
tive
none
none
posi
tive
none
none
SpO
2 <
93%
posi
tive
only
in i
nfa
nts
*none
none
none
none
none
trea
tmen
t fa
ilure
posi
tive
none
none
none
none
none
pro
longed
tim
e to
rec
over
yposi
tive
none
none
none
none
none
Pap
er I
II
Ass
oci
atio
n w
ith p
neu
monia
posi
tive
posi
tive
posi
tive
posi
tive
posi
tive
posi
tive*
**
* T
he
asso
ciat
ion w
as m
odif
ied b
y a
ge
in t
hat
the
asso
ciat
ion w
as p
osi
tive
in i
nfa
nts
only
(P
for
inte
ract
ion b
etw
een R
SV
and a
ge
cate
gory
was
0.0
04 f
or
hig
h f
ever
and 0
.024 f
or
SpO
2 <
93%
).
** T
he
asso
ciat
ion w
as m
odif
ied b
y a
ge
in t
hat
the
asso
ciat
ion w
as m
ore
pro
nounce
d i
n i
nfa
nts
. P
for
inte
ract
ion b
etw
een R
SV
and a
ge
cate
gory
was
0.0
36 f
or
crep
itat
ions
and 0
.073 f
or
whee
zing.
For
LC
I an
d d
isea
se o
utc
om
es P
for
inte
ract
ion b
etw
een R
SV
and a
ge
cate
gory
was
>0.2
.
*** T
he
asso
ciat
ion w
as m
odif
ied b
y a
ge
in t
hat
the
asso
ciat
ion w
as s
tronger
in c
hil
dre
n 6
month
s of
age
and o
lder
(P
for
inte
ract
ion b
etw
een P
IV t
ype
3 a
nd a
ge
cate
gory
was
0.0
02).
RS
V, re
spir
atory
syncy
tial
vir
us;
hM
PV
, hum
an m
etap
neu
movir
us;
PIV
, par
ainfl
uen
za v
irus.
Viral pneumonia in children
49
moderate negative correlation with all three (-0.31 to -0.39, P<0.066). As RSV infections
peaked towards the end of the monsoon in the first and third year of the study but showed no
correlation with rainfall, we further explored if there was an association with preceding
rainfall. By introducing a 2-month lag after peak precipitation, we did indeed observe such
an association (r=0.49; P=0.003).
Clinical features and outcomes of respiratory viral infections (paper II)
RSV was identified in 298 (14.3%) of the 2,088 cases with non-severe pneumonia, 36
(27.5%) of the 131 cases with severe pneumonia, and in 154 (15.2%) of the 1,016 infants 2-
11 months of age. Mean age did not differ much between children infected with the different
viruses (13.4 to 15.1 months) (Table 2), but was higher in those with non-severe compared
to those with severe illness (13.7 vs 8.6 months). Half (53%) of the severe cases occurred in
infants 2-5 months old and nearly one third of these were infected by RSV. Among those
infected with PIV type 3 and RSV, nearly half were 2-11 months old (48.8% and 46.1%,
respectively).
High fever (axillary temperature >38.5° C) was more common in those infected with
influenza A compared to those who were not (OR 2.79; CI 1.89, 4.11). This tendency, albeit
less pronounced, was also seen for Influenza B (1.45; CI 0.80, 2.62). A similar association
between high fever and RSV infection was observed, but only in infants (Table 2 and 3).
Being infected with RSV was also associated with LCI (i.e. severe pneumonia), hypoxia
(SpO2<93%), wheezing, and crepitations. The associations between RSV infection and these
clinical signs were more pronounced in children below 1 year of age (Table 2-4), but only
for crepitations and hypoxia was there a significant age interaction with RSV (Table 2 and
4).
Among the 2,088 non-severe pneumonia cases, children infected with RSV had a higher risk
of treatment failure and delayed time to recovery compared to children without RSV. RSV
positive cases experienced treatment failure twice as often as the other children and had on
average 18% longer duration of illness (Table 5). None of the total 2,219 cases of
pneumonia died as a result of their disease.
Maria Mathisen
50
CRP as exposure variable
We also analyzed the data using high CRP as a proxy for bacterial pneumonia. We used two
different cut-offs (>40 mg/L and >80 mg/L) to define high CRP. CRP >40 mg/L was
associated with high fever, crepitations, and LCI (Table 3 and 4). We found that the
associations were even more pronounced using 80 mg/L as the cut-off. Neither CRP >40
mg/L nor CRP >80 mg/L were significantly associated with SpO2 <93%. However, using
SpO2 <90% as the cut-off for hypoxia, having CRP >40mg/L and >80 mg/L were both
substantially and statistically significantly associated with hypoxia, the OR being 4.0 (CI
2.1, 7.6) and 6.0 (CI 2.4, 15.0), respectively. Similar to what was observed for RSV, the
association between CRP and crepitations was stronger for infants than for older children.
Wheezing was highly associated with CRP >80 mg/L, but for this outcome we observed a
qualitative interaction; wheezing was more common in infants with high CRP than in those
with lower CRP (OR 1.8), while the opposite was found in older children (OR 0.50). For the
remaining clinical signs and disease outcomes there were no other significant interactions;
the lowest P-value for interaction with LCI being 0.11 for CRP >80 mg/L in infants (OR
4.3) versus in older children (OR 0.72) (Table 3 and 4).
Among the non-severe pneumonia cases, CRP >40 mg/L was associated with longer episode
duration (HR 0.88; CI 0.80, 0.97; P=0.009). High CRP was also associated with increased
risk of treatment failure. This association was significant both for CRP >40 (OR 1.4; CI 1.1,
1.9; P=0.012) and CRP >80 (OR 2.1; CI 2.3, 3.6; P=0.005). These associations were not
confounded by the presence of virus.
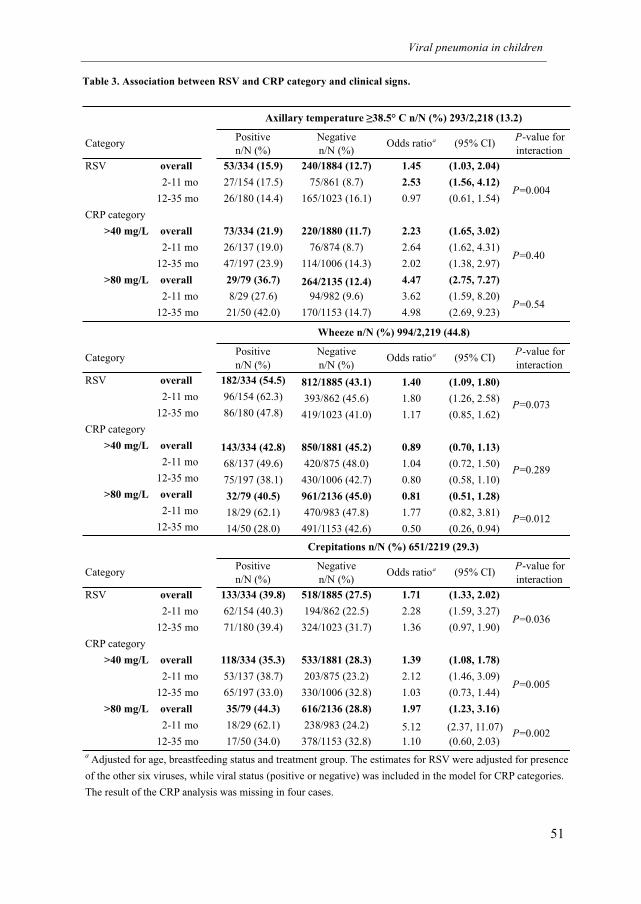
Viral pneumonia in children
51
Table 3. Association between RSV and CRP category and clinical signs.
Category
Positive
n/N (%)
Negative
n/N (%)Odds ratioa (95% CI)
P-value for
interaction
RSV overall 53/334 (15.9) 240/1884 (12.7) 1.45 (1.03, 2.04)
2-11 mo 27/154 (17.5) 75/861 (8.7) 2.53 (1.56, 4.12)
12-35 mo 26/180 (14.4) 165/1023 (16.1) 0.97 (0.61, 1.54)
CRP category
>40 mg/L overall 73/334 (21.9) 220/1880 (11.7) 2.23 (1.65, 3.02)
2-11 mo 26/137 (19.0) 76/874 (8.7) 2.64 (1.62, 4.31)
12-35 mo 47/197 (23.9) 114/1006 (14.3) 2.02 (1.38, 2.97)
>80 mg/L overall 29/79 (36.7) 264/2135 (12.4) 4.47 (2.75, 7.27)
2-11 mo 8/29 (27.6) 94/982 (9.6) 3.62 (1.59, 8.20)
12-35 mo 21/50 (42.0) 170/1153 (14.7) 4.98 (2.69, 9.23)
CategoryPositive
n/N (%)
Negative
n/N (%)Odds ratioa (95% CI)
P-value for
interaction
RSV overall 182/334 (54.5) 812/1885 (43.1) 1.40 (1.09, 1.80)
2-11 mo 96/154 (62.3) 393/862 (45.6) 1.80 (1.26, 2.58)
12-35 mo 86/180 (47.8) 419/1023 (41.0) 1.17 (0.85, 1.62)
CRP category
>40 mg/L overall 143/334 (42.8) 850/1881 (45.2) 0.89 (0.70, 1.13)
2-11 mo 68/137 (49.6) 420/875 (48.0) 1.04 (0.72, 1.50)
12-35 mo 75/197 (38.1) 430/1006 (42.7) 0.80 (0.58, 1.10)
>80 mg/L overall 32/79 (40.5) 961/2136 (45.0) 0.81 (0.51, 1.28)
2-11 mo 18/29 (62.1) 470/983 (47.8) 1.77 (0.82, 3.81)
12-35 mo 14/50 (28.0) 491/1153 (42.6) 0.50 (0.26, 0.94)
CategoryPositive
n/N (%)
Negative
n/N (%)Odds ratioa (95% CI)
P-value for
interaction
RSV overall 133/334 (39.8) 518/1885 (27.5) 1.71 (1.33, 2.02)
2-11 mo 62/154 (40.3) 194/862 (22.5) 2.28 (1.59, 3.27)
12-35 mo 71/180 (39.4) 324/1023 (31.7) 1.36 (0.97, 1.90)
CRP category
>40 mg/L overall 118/334 (35.3) 533/1881 (28.3) 1.39 (1.08, 1.78)
2-11 mo 53/137 (38.7) 203/875 (23.2) 2.12 (1.46, 3.09)
12-35 mo 65/197 (33.0) 330/1006 (32.8) 1.03 (0.73, 1.44)
>80 mg/L overall 35/79 (44.3) 616/2136 (28.8) 1.97 (1.23, 3.16)
2-11 mo 18/29 (62.1) 238/983 (24.2) 5.12 (2.37, 11.07)
12-35 mo 17/50 (34.0) 378/1153 (32.8) 1.10 (0.60, 2.03)
a Adjusted for age, breastfeeding status and treatment group. The estimates for RSV were adjusted for presence
of the other six viruses, while viral status (positive or negative) was included in the model for CRP categories.
The result of the CRP analysis was missing in four cases.
Wheeze n/N (%) 994/2,219 (44.8)
P=0.073
P=0.289
P=0.012
P=0.54
Crepitations n/N (%) 651/2219 (29.3)
P=0.036
P=0.005
P=0.002
Axillary temperature �38.5° C n/N (%) 293/2,218 (13.2)
P=0.004
P=0.40
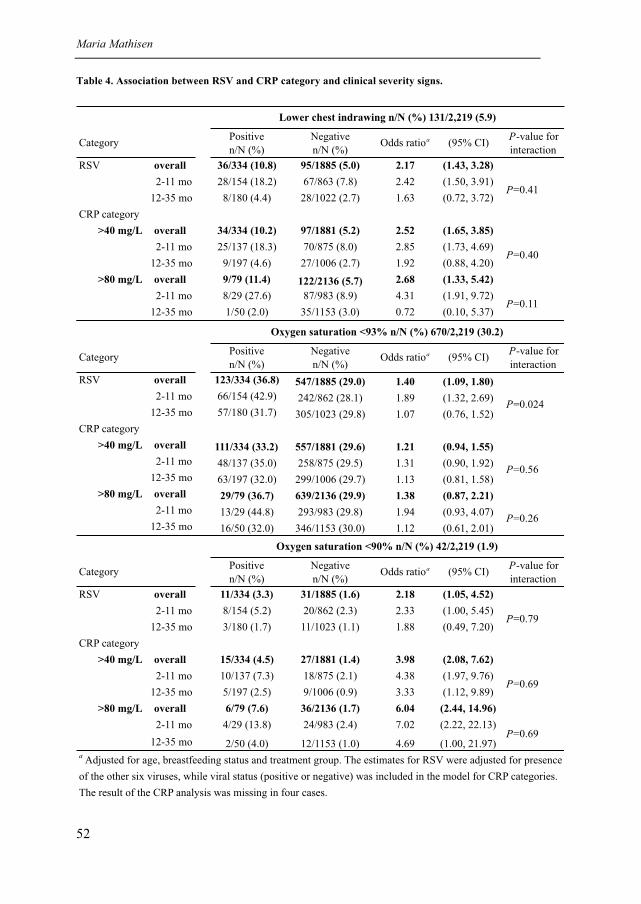
Maria Mathisen
52
Table 4. Association between RSV and CRP category and clinical severity signs.
Category
Positive
n/N (%)
Negative
n/N (%)Odds ratioa (95% CI)
P-value for
interaction
RSV overall 36/334 (10.8) 95/1885 (5.0) 2.17 (1.43, 3.28)
2-11 mo 28/154 (18.2) 67/863 (7.8) 2.42 (1.50, 3.91)
12-35 mo 8/180 (4.4) 28/1022 (2.7) 1.63 (0.72, 3.72)
CRP category
>40 mg/L overall 34/334 (10.2) 97/1881 (5.2) 2.52 (1.65, 3.85)
2-11 mo 25/137 (18.3) 70/875 (8.0) 2.85 (1.73, 4.69)
12-35 mo 9/197 (4.6) 27/1006 (2.7) 1.92 (0.88, 4.20)
>80 mg/L overall 9/79 (11.4) 122/2136 (5.7) 2.68 (1.33, 5.42)
2-11 mo 8/29 (27.6) 87/983 (8.9) 4.31 (1.91, 9.72)
12-35 mo 1/50 (2.0) 35/1153 (3.0) 0.72 (0.10, 5.37)P=0.11
Lower chest indrawing n/N (%) 131/2,219 (5.9)
P=0.41
P=0.40
CategoryPositive
n/N (%)
Negative
n/N (%)Odds ratioa (95% CI)
P-value for
interaction
RSV overall 123/334 (36.8) 547/1885 (29.0) 1.40 (1.09, 1.80)
2-11 mo 66/154 (42.9) 242/862 (28.1) 1.89 (1.32, 2.69)
12-35 mo 57/180 (31.7) 305/1023 (29.8) 1.07 (0.76, 1.52)
CRP category
>40 mg/L overall 111/334 (33.2) 557/1881 (29.6) 1.21 (0.94, 1.55)
2-11 mo 48/137 (35.0) 258/875 (29.5) 1.31 (0.90, 1.92)
12-35 mo 63/197 (32.0) 299/1006 (29.7) 1.13 (0.81, 1.58)
>80 mg/L overall 29/79 (36.7) 639/2136 (29.9) 1.38 (0.87, 2.21)
2-11 mo 13/29 (44.8) 293/983 (29.8) 1.94 (0.93, 4.07)
12-35 mo 16/50 (32.0) 346/1153 (30.0) 1.12 (0.61, 2.01)
CategoryPositive
n/N (%)
Negative
n/N (%)Odds ratioa (95% CI)
P-value for
interaction
RSV overall 11/334 (3.3) 31/1885 (1.6) 2.18 (1.05, 4.52)
2-11 mo 8/154 (5.2) 20/862 (2.3) 2.33 (1.00, 5.45)
12-35 mo 3/180 (1.7) 11/1023 (1.1) 1.88 (0.49, 7.20)
CRP category
>40 mg/L overall 15/334 (4.5) 27/1881 (1.4) 3.98 (2.08, 7.62)
2-11 mo 10/137 (7.3) 18/875 (2.1) 4.38 (1.97, 9.76)
12-35 mo 5/197 (2.5) 9/1006 (0.9) 3.33 (1.12, 9.89)
>80 mg/L overall 6/79 (7.6) 36/2136 (1.7) 6.04 (2.44, 14.96)
2-11 mo 4/29 (13.8) 24/983 (2.4) 7.02 (2.22, 22.13)
12-35 mo 2/50 (4.0) 12/1153 (1.0) 4.69 (1.00, 21.97)a Adjusted for age, breastfeeding status and treatment group. The estimates for RSV were adjusted for presence
of the other six viruses, while viral status (positive or negative) was included in the model for CRP categories.
The result of the CRP analysis was missing in four cases.
P=0.79
P=0.69
P=0.69
Oxygen saturation <93% n/N (%) 670/2,219 (30.2)
P=0.024
P=0.56
P=0.26
Oxygen saturation <90% n/N (%) 42/2,219 (1.9)
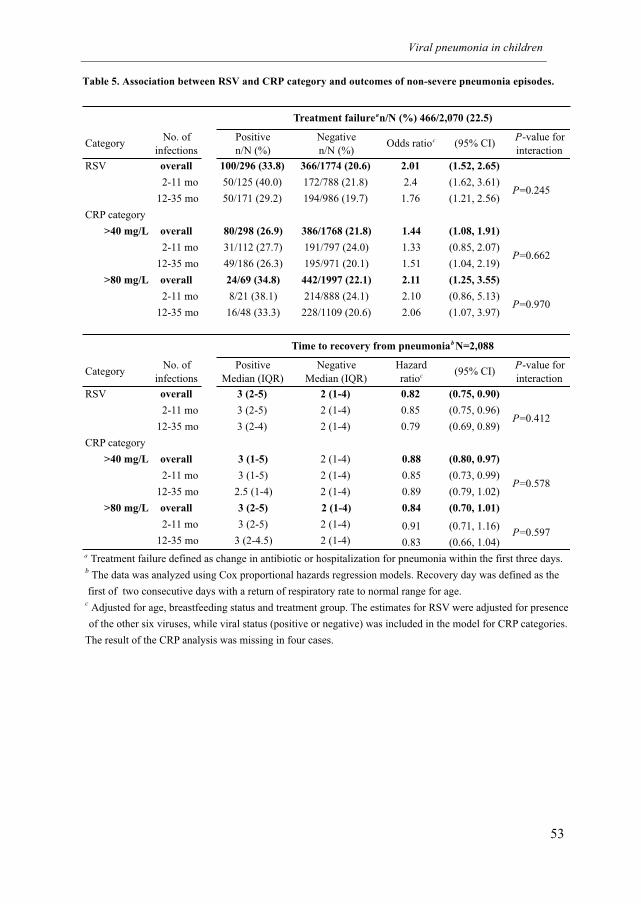
Viral pneumonia in children
53
Table 5. Association between RSV and CRP category and outcomes of non-severe pneumonia episodes.
No. of
infections
Positive
n/N (%)
Negative
n/N (%)Odds ratioc (95% CI)
P-value for
interaction
RSV overall 100/296 (33.8) 366/1774 (20.6) 2.01 (1.52, 2.65)
2-11 mo 50/125 (40.0) 172/788 (21.8) 2.4 (1.62, 3.61)
12-35 mo 50/171 (29.2) 194/986 (19.7) 1.76 (1.21, 2.56)
CRP category
>40 mg/L overall 80/298 (26.9) 386/1768 (21.8) 1.44 (1.08, 1.91)
2-11 mo 31/112 (27.7) 191/797 (24.0) 1.33 (0.85, 2.07)
12-35 mo 49/186 (26.3) 195/971 (20.1) 1.51 (1.04, 2.19)
>80 mg/L overall 24/69 (34.8) 442/1997 (22.1) 2.11 (1.25, 3.55)
2-11 mo 8/21 (38.1) 214/888 (24.1) 2.10 (0.86, 5.13)
12-35 mo 16/48 (33.3) 228/1109 (20.6) 2.06 (1.07, 3.97)
No. of
infections
Positive
Median (IQR)
Negative
Median (IQR)
Hazard
ratioc (95% CI)P-value for
interaction
RSV overall 3 (2-5) 2 (1-4) 0.82 (0.75, 0.90)
2-11 mo 3 (2-5) 2 (1-4) 0.85 (0.75, 0.96)
12-35 mo 3 (2-4) 2 (1-4) 0.79 (0.69, 0.89)
CRP category
>40 mg/L overall 3 (1-5) 2 (1-4) 0.88 (0.80, 0.97)
2-11 mo 3 (1-5) 2 (1-4) 0.85 (0.73, 0.99)
12-35 mo 2.5 (1-4) 2 (1-4) 0.89 (0.79, 1.02)
>80 mg/L overall 3 (2-5) 2 (1-4) 0.84 (0.70, 1.01)
2-11 mo 3 (2-5) 2 (1-4) 0.91 (0.71, 1.16)
12-35 mo 3 (2-4.5) 2 (1-4) 0.83 (0.66, 1.04)a Treatment failure defined as change in antibiotic or hospitalization for pneumonia within the first three days.b The data was analyzed using Cox proportional hazards regression models. Recovery day was defined as the
first of two consecutive days with a return of respiratory rate to normal range for age.c Adjusted for age, breastfeeding status and treatment group. The estimates for RSV were adjusted for presence
The result of the CRP analysis was missing in four cases.
of the other six viruses, while viral status (positive or negative) was included in the model for CRP categories.
Treatment failurean/N (%) 466/2,070 (22.5)
Category
P=0.245
P=0.662
P=0.970
P=0.597
Time to recovery from pneumoniab N=2,088
Category
P=0.412
P=0.578
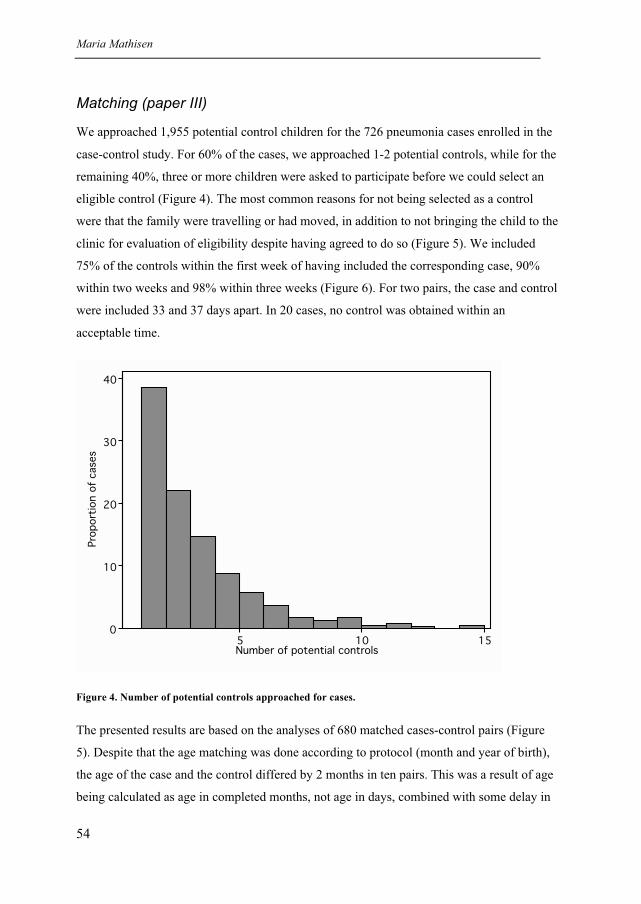
Maria Mathisen
54
Matching (paper III)
We approached 1,955 potential control children for the 726 pneumonia cases enrolled in the
case-control study. For 60% of the cases, we approached 1-2 potential controls, while for the
remaining 40%, three or more children were asked to participate before we could select an
eligible control (Figure 4). The most common reasons for not being selected as a control
were that the family were travelling or had moved, in addition to not bringing the child to the
clinic for evaluation of eligibility despite having agreed to do so (Figure 5). We included
75% of the controls within the first week of having included the corresponding case, 90%
within two weeks and 98% within three weeks (Figure 6). For two pairs, the case and control
were included 33 and 37 days apart. In 20 cases, no control was obtained within an
acceptable time.
0
10
20
30
40
Pro
port
ion o
f cases
5 10 15Number of potential controls
Figure 4. Number of potential controls approached for cases.
The presented results are based on the analyses of 680 matched cases-control pairs (Figure
5). Despite that the age matching was done according to protocol (month and year of birth),
the age of the case and the control differed by 2 months in ten pairs. This was a result of age
being calculated as age in completed months, not age in days, combined with some delay in
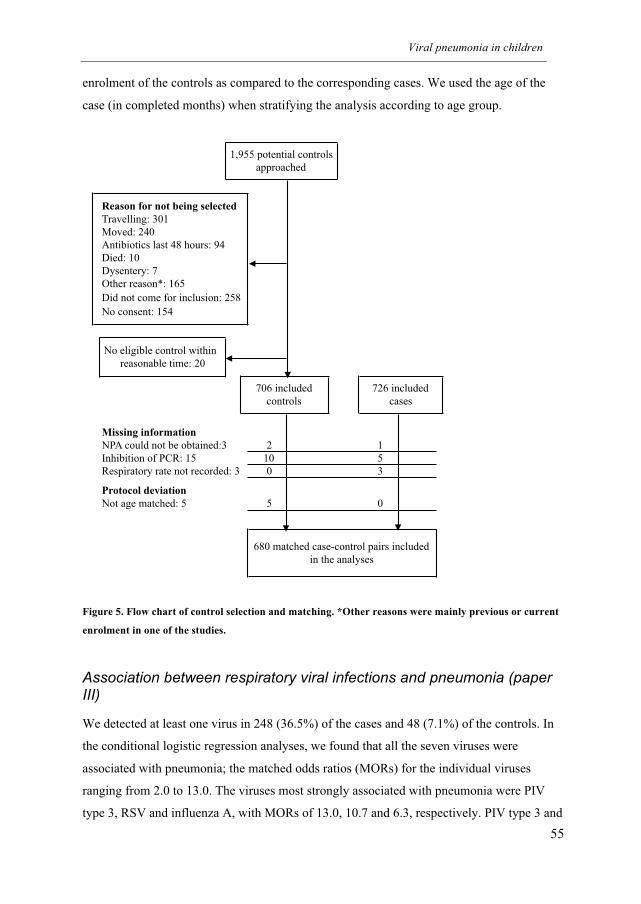
Viral pneumonia in children
55
enrolment of the controls as compared to the corresponding cases. We used the age of the
case (in completed months) when stratifying the analysis according to age group.
Figure 5. Flow chart of control selection and matching. *Other reasons were mainly previous or current
enrolment in one of the studies.
Association between respiratory viral infections and pneumonia (paper III)
We detected at least one virus in 248 (36.5%) of the cases and 48 (7.1%) of the controls. In
the conditional logistic regression analyses, we found that all the seven viruses were
associated with pneumonia; the matched odds ratios (MORs) for the individual viruses
ranging from 2.0 to 13.0. The viruses most strongly associated with pneumonia were PIV
type 3, RSV and influenza A, with MORs of 13.0, 10.7 and 6.3, respectively. PIV type 3 and
Travelling: 301
Moved: 240
Antibiotics last 48 hours: 94
Died: 10
Dysentery: 7
Other reason*: 165
Did not come for inclusion: 258
No consent: 154
Missing information
NPA could not be obtained:3 2 1
Inhibition of PCR: 15 10 5
Respiratory rate not recorded: 3 0 3
Protocol deviation
Not age matched: 5 5 0
1,955 potential controls
approached
Reason for not being selected
706 included
controls
680 matched case-control pairs included
in the analyses
726 included
cases
No eligible control within
reasonable time: 20
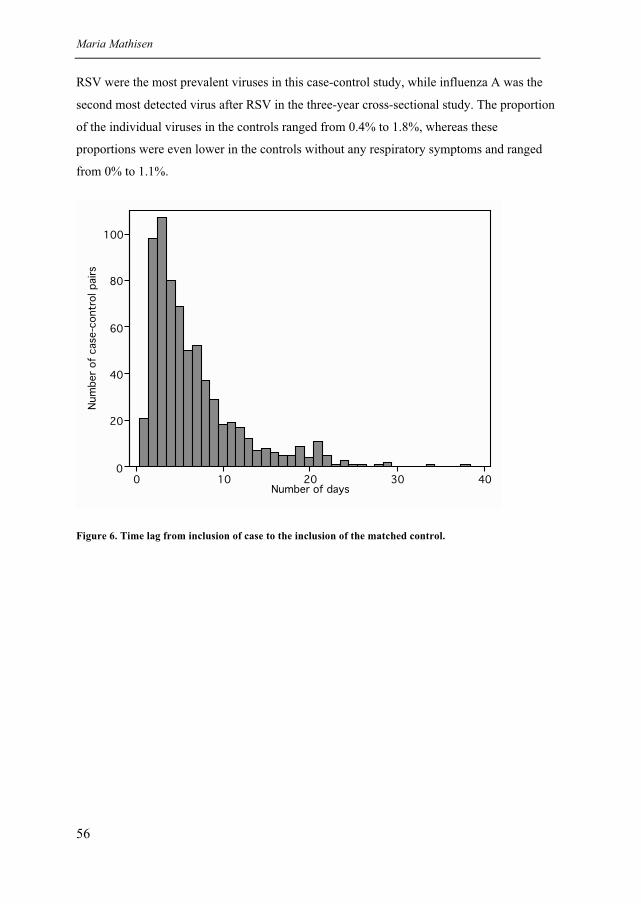
Maria Mathisen
56
RSV were the most prevalent viruses in this case-control study, while influenza A was the
second most detected virus after RSV in the three-year cross-sectional study. The proportion
of the individual viruses in the controls ranged from 0.4% to 1.8%, whereas these
proportions were even lower in the controls without any respiratory symptoms and ranged
from 0% to 1.1%.
0
20
40
60
80
100
Num
ber
of
case-c
ontr
ol pairs
0 10 20 30 40Number of days
Figure 6. Time lag from inclusion of case to the inclusion of the matched control.
Viral pneumonia in children
57
5. Discussion
Frequency of respiratory viral infections
The etiology of viral childhood pneumonias have been studied extensively during the last 3-
4 decades and there is a large body of research contributing to this field both in
industrialized countries as well as in LMICs. Comparing studies is difficult because
pneumonia case definitions, study settings and method of case ascertainment, as well as age
group of the study populations differ. Many hospital-based studies have had limited
observation time, and some were performed during one or only a few seasons (105, 182-
184). Hospital-based studies will tend to include cases with more severe illness compared
with longitudinal community-based studies. In addition, various clinical specimens and
diagnostic assays with different sensitivity and specificity have been used in order to identify
a varying number of viral agents (185-189). Finally, a number of newly identified viruses
have recently emerged as pathogens with the potential to cause pneumonia (161, 162, 190-
192). This has contributed to great variations in the reported overall frequency of viruses
detected in children with pneumonia.
We identified at least one respiratory RNA virus in 40% of the pneumonia cases. Studies of
viral etiology of ALRI in tropical and developing countries published up to 1996 identified
virus in 9% to 64% of hospital-based studies and 11% to 36% of community-based studies
(39). Notably, measles played a major role in some of the studies undertaken up to the mid
1980s. Importantly, studies before 1980 mainly depended on classical diagnostic techniques
such as culture and serology for viral identification. Rapid antigen tests, such as
immunofluorescence (IF) and enzyme-linked immunosorbent assay (ELISA), were more
widely used in later studies, IF often in combination with culture (39). The rapid antigen
tests were more sensitive than culture for RSV (193, 194) but less sensitive for some of the
other common respiratory viruses, in particular adenovirus (195, 196).
The epidemiological setting of our study could be compared to two rather large studies in
Pakistan and Thailand that included both ambulant and admitted under-5s with ALRI, albeit
over a period of only 17 and 12 months, respectively. The study in Pakistan detected virus in
37% of cases using viral culture and IF, while the study in Thailand identified virus in 45%
Maria Mathisen
58
using the same methods in addition to serology (188, 189). In addition to the viruses we
detected, these studies also identified adenovirus, and the study in Thailand identified
another four additional respiratory viruses. Two recently published community-based studies
reported comparable results; a cohort study of children followed till 24 months of age in
Bangladesh detected virus in 45% of ALRI cases (197), while a study in India that followed
children up till 42 months of age identified virus in 26% of ALRI cases (35). Both studies
identified adenovirus in addition to the viruses included in our assay using antigen detection
and the latter also performed rapid culture assay for RSV.
There are few comprehensive studies of common respiratory viruses from LMICs that have
employed sensitive molecular methods for virus identification (55). A study in Brazil
detected a virus in 60% of hospitalized under-5s with radiologically diagnosed pneumonia
using PCR for rhinovirus and serology and antigen tests for 7 other common respiratory
viruses (187). A study of hospitalized under-5s conducted over 14 months in Vietnam
detected viruses using multiplex PCR for 13 organisms in 70% of ALRI cases, notably with
a high proportion of rhinovirus (55). A similar 5-year study in Korea, which is a
industrialized country in Asia, reported identification of virus in 60% of ALRI cases (191).
Frequency of RSV
RSV has been the predominating virus in the great majority of etiology studies in LMICs
(39). We identified RSV in 15.1% (CI 13.6%, 16.6%) of all pneumonia cases (14% [CI
12.8% to 15.8%] of non-severe cases and 27% [CI 20% to 36%] of severe cases) over three
years and three RSV epidemics. In comparison, a community-based study that followed 635
Kenyan children from birth until all had experienced three RSV epidemics identified RSV
using IF in 13% of those with ALRI, 19% of severe ALRI cases and 5 % of hospitalized
ALRI cases (36).
However, the proportion of RSV positive specimens in children with ALRI varies greatly
between studies (39). Even studies of under-5s in four LMICs based on a standardized WHO
protocol using antigen detection (ELISA) found the proportions of ALRI and severe ALRI
with RSV to be 18% to 35% and 7% to 45%, respectively (34). In a comprehensive review,
Stensballe and co-workers estimated the proportion of RSV positive tests in children with
ALRI at a median of 20% (5th
to 95th
percentile 1 to 53) in LMICs and 25% (5th
to 95th
percentile 1 to 75) in industrialized countries (37). They reported the proportion of RSV
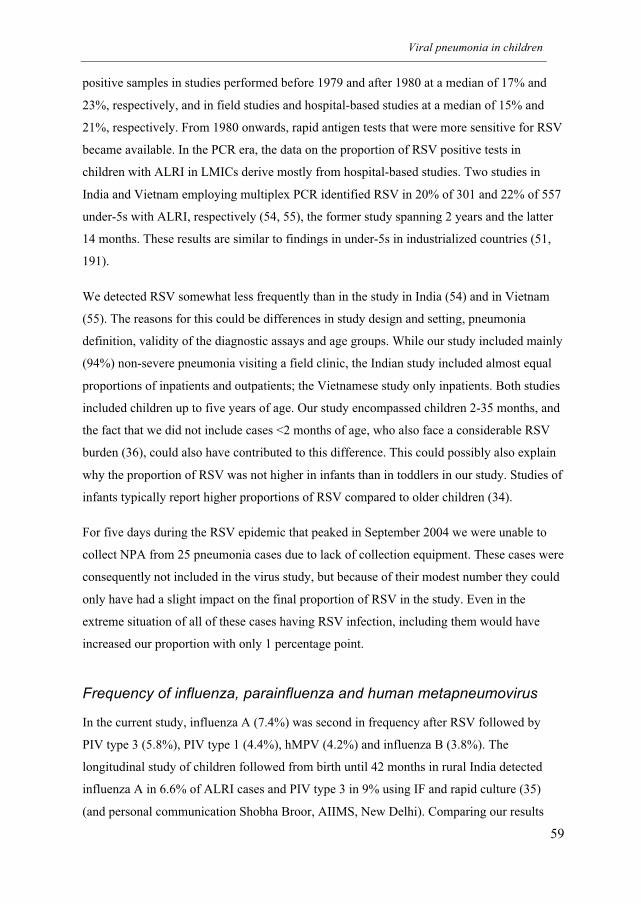
Viral pneumonia in children
59
positive samples in studies performed before 1979 and after 1980 at a median of 17% and
23%, respectively, and in field studies and hospital-based studies at a median of 15% and
21%, respectively. From 1980 onwards, rapid antigen tests that were more sensitive for RSV
became available. In the PCR era, the data on the proportion of RSV positive tests in
children with ALRI in LMICs derive mostly from hospital-based studies. Two studies in
India and Vietnam employing multiplex PCR identified RSV in 20% of 301 and 22% of 557
under-5s with ALRI, respectively (54, 55), the former study spanning 2 years and the latter
14 months. These results are similar to findings in under-5s in industrialized countries (51,
191).
We detected RSV somewhat less frequently than in the study in India (54) and in Vietnam
(55). The reasons for this could be differences in study design and setting, pneumonia
definition, validity of the diagnostic assays and age groups. While our study included mainly
(94%) non-severe pneumonia visiting a field clinic, the Indian study included almost equal
proportions of inpatients and outpatients; the Vietnamese study only inpatients. Both studies
included children up to five years of age. Our study encompassed children 2-35 months, and
the fact that we did not include cases <2 months of age, who also face a considerable RSV
burden (36), could also have contributed to this difference. This could possibly also explain
why the proportion of RSV was not higher in infants than in toddlers in our study. Studies of
infants typically report higher proportions of RSV compared to older children (34).
For five days during the RSV epidemic that peaked in September 2004 we were unable to
collect NPA from 25 pneumonia cases due to lack of collection equipment. These cases were
consequently not included in the virus study, but because of their modest number they could
only have had a slight impact on the final proportion of RSV in the study. Even in the
extreme situation of all of these cases having RSV infection, including them would have
increased our proportion with only 1 percentage point.
Frequency of influenza, parainfluenza and human metapneumovirus
In the current study, influenza A (7.4%) was second in frequency after RSV followed by
PIV type 3 (5.8%), PIV type 1 (4.4%), hMPV (4.2%) and influenza B (3.8%). The
longitudinal study of children followed from birth until 42 months in rural India detected
influenza A in 6.6% of ALRI cases and PIV type 3 in 9% using IF and rapid culture (35)
(and personal communication Shobha Broor, AIIMS, New Delhi). Comparing our results
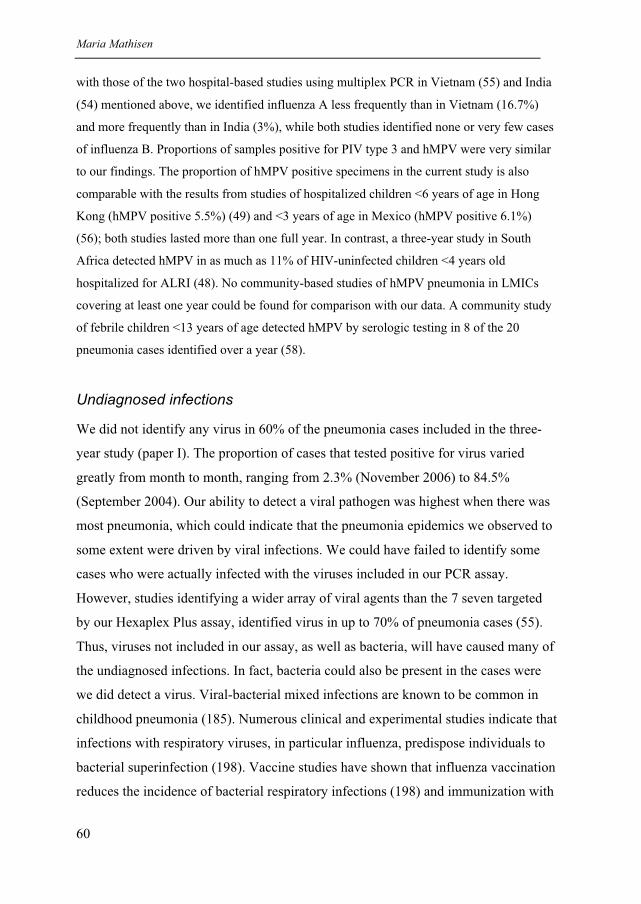
Maria Mathisen
60
with those of the two hospital-based studies using multiplex PCR in Vietnam (55) and India
(54) mentioned above, we identified influenza A less frequently than in Vietnam (16.7%)
and more frequently than in India (3%), while both studies identified none or very few cases
of influenza B. Proportions of samples positive for PIV type 3 and hMPV were very similar
to our findings. The proportion of hMPV positive specimens in the current study is also
comparable with the results from studies of hospitalized children <6 years of age in Hong
Kong (hMPV positive 5.5%) (49) and <3 years of age in Mexico (hMPV positive 6.1%)
(56); both studies lasted more than one full year. In contrast, a three-year study in South
Africa detected hMPV in as much as 11% of HIV-uninfected children <4 years old
hospitalized for ALRI (48). No community-based studies of hMPV pneumonia in LMICs
covering at least one year could be found for comparison with our data. A community study
of febrile children <13 years of age detected hMPV by serologic testing in 8 of the 20
pneumonia cases identified over a year (58).
Undiagnosed infections
We did not identify any virus in 60% of the pneumonia cases included in the three-
year study (paper I). The proportion of cases that tested positive for virus varied
greatly from month to month, ranging from 2.3% (November 2006) to 84.5%
(September 2004). Our ability to detect a viral pathogen was highest when there was
most pneumonia, which could indicate that the pneumonia epidemics we observed to
some extent were driven by viral infections. We could have failed to identify some
cases who were actually infected with the viruses included in our PCR assay.
However, studies identifying a wider array of viral agents than the 7 seven targeted
by our Hexaplex Plus assay, identified virus in up to 70% of pneumonia cases (55).
Thus, viruses not included in our assay, as well as bacteria, will have caused many of
the undiagnosed infections. In fact, bacteria could also be present in the cases were
we did detect a virus. Viral-bacterial mixed infections are known to be common in
childhood pneumonia (185). Numerous clinical and experimental studies indicate that
infections with respiratory viruses, in particular influenza, predispose individuals to
bacterial superinfection (198). Vaccine studies have shown that influenza vaccination
reduces the incidence of bacterial respiratory infections (198) and immunization with
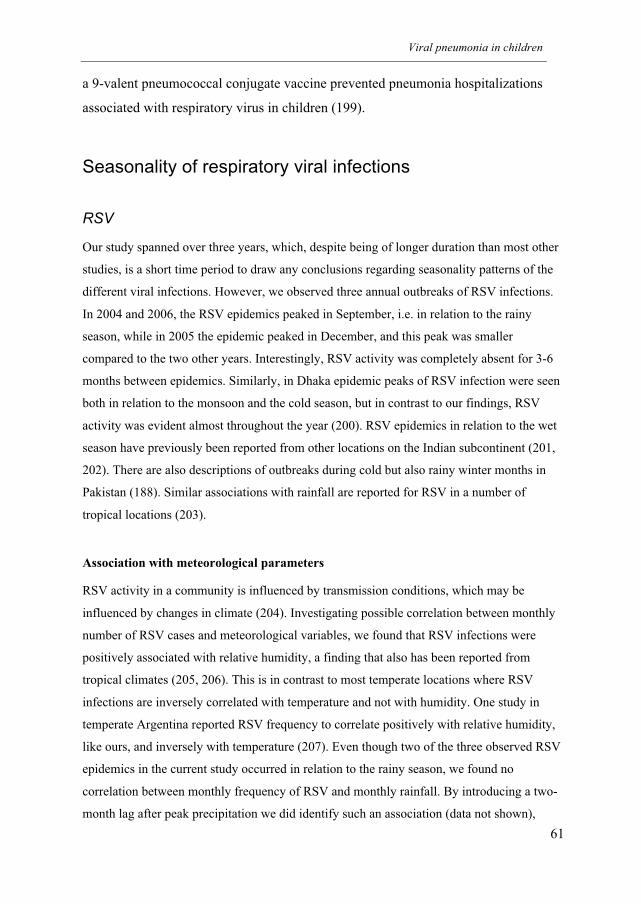
Viral pneumonia in children
61
a 9-valent pneumococcal conjugate vaccine prevented pneumonia hospitalizations
associated with respiratory virus in children (199).
Seasonality of respiratory viral infections
RSV
Our study spanned over three years, which, despite being of longer duration than most other
studies, is a short time period to draw any conclusions regarding seasonality patterns of the
different viral infections. However, we observed three annual outbreaks of RSV infections.
In 2004 and 2006, the RSV epidemics peaked in September, i.e. in relation to the rainy
season, while in 2005 the epidemic peaked in December, and this peak was smaller
compared to the two other years. Interestingly, RSV activity was completely absent for 3-6
months between epidemics. Similarly, in Dhaka epidemic peaks of RSV infection were seen
both in relation to the monsoon and the cold season, but in contrast to our findings, RSV
activity was evident almost throughout the year (200). RSV epidemics in relation to the wet
season have previously been reported from other locations on the Indian subcontinent (201,
202). There are also descriptions of outbreaks during cold but also rainy winter months in
Pakistan (188). Similar associations with rainfall are reported for RSV in a number of
tropical locations (203).
Association with meteorological parameters
RSV activity in a community is influenced by transmission conditions, which may be
influenced by changes in climate (204). Investigating possible correlation between monthly
number of RSV cases and meteorological variables, we found that RSV infections were
positively associated with relative humidity, a finding that also has been reported from
tropical climates (205, 206). This is in contrast to most temperate locations where RSV
infections are inversely correlated with temperature and not with humidity. One study in
temperate Argentina reported RSV frequency to correlate positively with relative humidity,
like ours, and inversely with temperature (207). Even though two of the three observed RSV
epidemics in the current study occurred in relation to the rainy season, we found no
correlation between monthly frequency of RSV and monthly rainfall. By introducing a two-
month lag after peak precipitation we did identify such an association (data not shown),
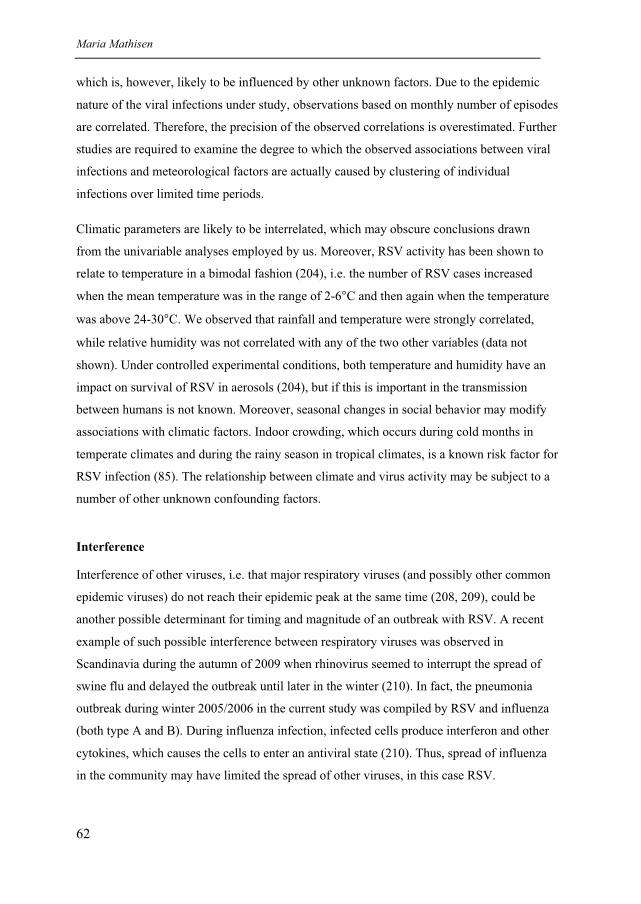
Maria Mathisen
62
which is, however, likely to be influenced by other unknown factors. Due to the epidemic
nature of the viral infections under study, observations based on monthly number of episodes
are correlated. Therefore, the precision of the observed correlations is overestimated. Further
studies are required to examine the degree to which the observed associations between viral
infections and meteorological factors are actually caused by clustering of individual
infections over limited time periods.
Climatic parameters are likely to be interrelated, which may obscure conclusions drawn
from the univariable analyses employed by us. Moreover, RSV activity has been shown to
relate to temperature in a bimodal fashion (204), i.e. the number of RSV cases increased
when the mean temperature was in the range of 2-6°C and then again when the temperature
was above 24-30°C. We observed that rainfall and temperature were strongly correlated,
while relative humidity was not correlated with any of the two other variables (data not
shown). Under controlled experimental conditions, both temperature and humidity have an
impact on survival of RSV in aerosols (204), but if this is important in the transmission
between humans is not known. Moreover, seasonal changes in social behavior may modify
associations with climatic factors. Indoor crowding, which occurs during cold months in
temperate climates and during the rainy season in tropical climates, is a known risk factor for
RSV infection (85). The relationship between climate and virus activity may be subject to a
number of other unknown confounding factors.
Interference
Interference of other viruses, i.e. that major respiratory viruses (and possibly other common
epidemic viruses) do not reach their epidemic peak at the same time (208, 209), could be
another possible determinant for timing and magnitude of an outbreak with RSV. A recent
example of such possible interference between respiratory viruses was observed in
Scandinavia during the autumn of 2009 when rhinovirus seemed to interrupt the spread of
swine flu and delayed the outbreak until later in the winter (210). In fact, the pneumonia
outbreak during winter 2005/2006 in the current study was compiled by RSV and influenza
(both type A and B). During influenza infection, infected cells produce interferon and other
cytokines, which causes the cells to enter an antiviral state (210). Thus, spread of influenza
in the community may have limited the spread of other viruses, in this case RSV.
Viral pneumonia in children
63
Biennial epidemic pattern
Although the most typical pattern of RSV infections in temperate locations is regular annual
epidemics during the cold season, there are also reports of alternating cycles of large and
small annual epidemics with different timing of the peak activity in several European
countries (59, 211-213). The reasons for such dual rhythm of biennially alternating large
winter peaks and smaller spring peaks are unknown, but climatic factors, alternating
dominating subtypes and interference of other viruses have been suggested (59, 212, 213).
We have too short observation time to determine if the observed RSV epidemics fit into a
similar biennial pattern.
Parainfluenza virus
PIV type 1 activity was endemic with no major peaks throughout the study period, which
deviates from the pattern of biennial autumn epidemics frequently described elsewhere (66,
71). We observed only a single, not yearly, outbreak of PIV type 3, but the timing/season of
the epidemic was in line with what has been reported in temperate (66) and subtropical
regions (72). The PIV type 3 epidemic occurred in spring 2006 after the termination of the
influenza epidemic, a phenomenon also observed over 6 consecutive years in the US (97).
We also saw clusters of PIV type 3 infection at the same time of the year during the previous
and the following year that did not reach epidemic proportions. PIV type 3 predominated
during the wet and warm summer months in the current study. In tropical locations, such as
Singapore and Papua New Guinea, PIV type 3 infections have also been described as
endemic with annual epidemics occurring during the first half of the year and occasionally in
autumn (71, 214).
Influenza virus
We found that peaks of influenza infections were greatest during winter months with
overlapping activity of type A and B. We detected influenza in 25 of the 36 months of the
study, and our findings are in line with those from tropical and sub-tropical locations where
influenza is diagnosed greater parts of the year (215, 216). There are several reports from
tropical areas of influenza epidemics occurring during the rainy season (203). We, however,
only observed moderate activity during the months of rain. A summer outbreak of influenza
Maria Mathisen
64
has been described in the plains of southern Nepal (217), where the climate is different from
that in the hill region.
Human metapneumovirus
The single hMPV winter epidemic seen in the current study peaked in January 2005 after a
major RSV epidemic. A winter outbreak of hMPV is consistent with observations in Europe
(44) and South Africa (48). In India (54) and Bangladesh (58) hMPV peaks occurred in
March and April, which is the dry but warm pre-monsoon season. The incidence of hMPV
has previously been reported to vary substantially from year to year (62). There is a lack of
studies with surveillance of several years’ duration in LMICs. Studies with longer
observation time, primarily in Europe, have reported a biennial pattern of alternating early
and late occurrence of epidemics (59, 63, 64, 218); similar to what has been reported for
RSV. Moreover, in these studies hMPV epidemics occurred anti-cyclical to RSV, i.e. small
hMPV epidemics occurred in years with large RSV epidemics, and vice versa, an
observation that supports the concept of interference by competing pathogens.
Association between etiology and clinical signs and outcomes of infection
Children with RSV infection were twice as likely to present with severe pneumonia (i.e.
LCI) or SpO2 <90% compared to the other children. Apart from influenza B that also was
associated with LCI, none of the other viruses were associated with any of these severity
signs. It is known that RSV involves the lower airways more frequently than other common
respiratory viruses (67). Among children with RSV infection, we also noted that several
clinical signs were more common or only observed in infants.
Similar to RSV, high CRP (used as an indirect marker of suspected bacterial pneumonia)
was associated with LCI, crepitations), high fever and SpO2 <90%. The associations were
most pronounced using a cut-off for CRP of 80 mg/L and for infants, but the age interaction
for these clinical signs was only significant for crepitations and high fever. These findings
are plausible, as severe presentation of pneumonia is more common in infancy. Although
CRP has generally low sensitivity and specificity in differentiating between bacterial and
Viral pneumonia in children
65
viral pneumonia, a CRP concentration >80 mg/L has been shown to predict bacterial
pneumonia well (specificity 0.90) in children <2 years of age (133).
Among the 2,088 non-severe cases, longer duration of illness and increased risk of treatment
failure was observed for cases with RSV and for cases with high CRP. A high CRP would
usually indicate a more severe infection that could take longer than three days to resolve
despite effective antibiotic treatment. Moreover, antimicrobial resistance to cotrimoxazole
(the first line antibiotic used) is common in Nepal (138). The antibiotic treatment would
have no impact on a viral infection unless there is a concomitant bacterial infection. The
observation that RSV was associated with treatment failure probably reflects that RSV
infections took longer to resolve than the other infections, which may have tended to resolve
spontaneously within 3 days of treatment.
Although the assumed bacterial pneumonia cases more frequently presented with a higher
degree of hypoxia (SpO2<90%) compared with the RSV cases, our findings suggest that the
presentation and outcome of RSV infections was on the whole similar to that of assumed
bacterial infection, underscoring the paramount position of RSV among the respiratory
pathogens. Although we cannot rule out the possibility of a concomitant bacterial infection,
adjusting for high CRP in the analyses did not change the estimates for RSV or the other
viruses (data not shown). Most previous studies demonstrating the severity of RSV
infections with regard to clinical presentation and outcome are from hospitalized children
(83, 186, 219). The current findings indicate that a sizable proportion of children with RSV
infections exhibit signs of severe illness also in a community setting with predominantly
ambulant patients. In the United States, the outpatient load of RSV infection is 10-25 times
higher than the inpatient load for children <5 years (29). If this is the case also in Nepal and
other LMICs, the burden of ALRI caused by RSV is high.
Association between respiratory viral infections and pneumonia
PIV type 3, RSV, Influenza A, PIV type 1, hMPV and Influenza B were all significantly
associated with pneumonia, with matched odds ratios ranging from 13.0 to 2.2. We detected
PIV type 3, RSV, and Influenza A in 14%, 10% and 3% of cases, while the corresponding
proportions in the controls were 1.8%, 1.2% and 0.6%, respectively. According to a recent
Maria Mathisen
66
review, RSV positive specimens have been identified using PCR in 0% to 5% of
asymptomatic children (159). For other common viruses such as PIV, influenza and hMPV,
proportions have ranged from 0% to 2% (51, 159). Similar results have been reported from
previous studies in LMICs using culture, IF or serology (10, 214). These viruses are not
frequently present in control children, which is an indicator of their causal role in pneumonia
when detected from the upper airways during illness. PIV type 2 had a matched odds ratio of
2.0, and was the most infrequent of the viruses with only 9 infections during the entire case-
control study. Accordingly, the corresponding precision was lower than for the other viruses;
its 95% confidence interval spanning 0.5 to 8.0. Our findings are in line with those reported
for Australian children during the first year of life (220). We were not able to identify
reports on such associations from other LMICs.
The viruses most strongly associated with pneumonia in the case-control study (paper III)
were also the most prevalent viruses detected in pneumonia cases in this community during
the three-year cross-sectional study (paper I). Because the studies were clinic-based, these
two observations will necessarily be closely related. It is likely that the most pathogenic
viruses give disease that prompts visits to a health facility. A cohort study with frequent
sampling of children in the homes may have given somewhat different estimates for the
viruses. However, our estimates are consistent with those obtained in such a longitudinal
study (220).
We identified at least one virus in 7.1% of controls. As for cases, the overall proportion of
viruses detected in controls will depend upon the number and kind of agents tested for. Viral
pathogens or atypical bacteria have been found in up to 68% of control subjects less than 5
years in Netherlands, but the study employed a broader diagnostic panel than ours and the
major agents detected (for all age groups) were rhinovirus, coronavirus and Chlamydophila
species (160). The availability of PCR for rhinovirus has increased the proportion of positive
findings in asymptomatic subjects (159). In the Netherlands, rhinovirus has been detected in
22% of children aged up to 7 years by biweekly sampling (221) and 20% of asymptomatic
children aged up to two years (222). Studies on some newly identified viruses such as hBoV
and hMPV are mainly based on PCR detection. In Israeli children, hMPV was identified in
2.2% of season-matched controls (51), while hBoV was detected in 8.6% of asymptomatic
infants in a Danish birth cohort followed for 1 year with monthly sampling (223), but none
of 68 healthy children <5 years of age in France (224, 225). Studies including PCR assays
Viral pneumonia in children
67
for rhinovirus and hBoV tend to report higher proportions of overall virus positive
specimens in sick children (55, 161, 162, 185, 191, 221), but these viruses are also among
the viruses detected as frequently in asymptomatic controls as in cases (221, 223).
Quantization of viral load has been suggested in the assessment of their role in lower
respiratory tract infection (161, 226, 227). There are no reports so far from LMICs on
frequency of detection in controls using PCR for these viruses.
We found a higher association between PIV type 3 and pneumonia for children six months
and older compared with 2-5 months old children. A similar, albeit statistically non-
significant, age-dependent difference was also found for RSV. The explanation for this
difference between infants and older children is uncertain, but could partly be due to
maternal antibodies protecting the infants during the first 6 months of life (228-230).
Limitations of the study
As we did not know the exact number of children in the target age group in this population,
we were not able to estimate true incidence rates of pneumonia and consequently not disease
burden in the community. Our clinic was not the sole health facility in Bhaktapur, and we
conducted an active monthly surveillance of an open cohort of children below three years of
age and have reasons to believe that the majority of pneumonia cases were brought to our
clinic. The proportion of severe cases (5.9%, CI 5% to 7%) was only slightly lower than the
estimated average of 8.7% (IQR 7% to 13%) (3). Some children with severe illness were
probably transported directly to a tertiary level hospital in the capital and thereby bypassed
our clinic. Moreover, we excluded cases of pneumonia that had received antibiotics within
the last 48 hours prior to inclusion. This would lead to a bias toward inclusion of milder
cases. In fact, among those that met our inclusion criteria we found that cases with severe
pneumonia were more likely to have received antibiotic treatment in the previous 48 hours
compared with non-severe cases (19% vs 8%, respectively), which would result in
underestimation of viruses that cause severe pneumonia.
Although fieldworkers referred children with respiratory symptoms, the inclusion of cases
for the studies relied on parents actually bringing their child to the project clinic. The
baseline census and the subsequent active surveillance of children below three years of age
in all the neighborhoods of Bhaktapur municipality made the project well known and the
Maria Mathisen
68
free treatment offered by our study clinic for common childhood illnesses encouraged
parents to use this facility. One could argue that this could motivate the poorer part of the
population to utilize our services and bias the study population towards a lower socio-
economic level. However, the socio-economic features of the study population did not differ
from those of the surveilled population (data not shown). We therefore have no reason to
believe that there was any substantial selection bias in the inclusion of cases for the studies.
The controls in paper III were randomly selected from a list of children under surveillance.
Children from migrant families could in theory be underrepresented on this list and any
difference in socioeconomic status between migrant families and the indigenous population
could have introduced a bias in our pathogenicity odds ratio estimates. We observed a
difference in anthropometric measures between the cases and the controls, as well as in the
proportion of children who were delivered in hospital. Adjusting for these factors in the
unconditional logistic regression analyses did not, however, substantially alter the estimates
(data not shown), making such selection an unlikely source of bias.
The political instability during the democracy movement in the spring of 2006 led to several
days of nationwide general strike in the beginning of April. Due to the demonstrations in
Kathmandu the government imposed daytime curfew, which failed to curb the protests. In
the following days crowds of several hundred thousands participated in the demonstrations
against King Gyanendra and his government and violent clashes with armed police took
place in the streets. This culminated on April 21, when the king announced that he would
step down from power and called for general elections. Bhaktapur was less affected by the
emergency measures and our field activities were not interrupted despite that public
transportation in the valley came to a halt during these weeks. Our field clinic was within
walking distance from most parts of the municipality and disruption of public transport
should not have had a major impact on people’s ability to access the clinic. Yet the general
political situation and emergency measures in April 2006 may have impeded parents from
seeking medical treatment for their sick children. Notably, the inclusion of cases during
April that year was the lowest during the whole study period and approximately half of the
inclusions for April the other two years. If this can be attributed to the political situation or
to a period of genuinely low pneumonia incidence is uncertain.
The aim of the WHO pneumonia definition has been to ensure high sensitivity and
simultaneously attempting to maintain adequate specificity in order to avoid failing to treat
Viral pneumonia in children
69
bacterial pneumonia and minimize the number of children with non-bacterial pneumonia
receiving unnecessary antibiotics. Prior to revision in 2008 (176), the WHO ARI algorithm
detected about 80% of the children that required antibiotic treatment (231, 232). However,
20-30% of children who met the criteria were unnecessarily treated with antibiotics, and
many of these children presented with wheeze (232). Most children with non-recurrent
wheeze are likely to have a viral infection and hence will not benefit from the use of
antibiotics (232). Thus, to improve the specificity of the criteria, revised guidelines
recommended a trial of rapid acting bronchodilator in children with wheeze and fast
breathing and/or lower chest indrawing before being classified as pneumonia (176). In the
current study, we treated all wheezing children with salbutamol, which is according to the
revised 2008 guidelines, and excluded the child if he or she no longer fulfilled the criteria for
pneumonia at reassessment. However, despite of the relatively low specificity of the WHO
definition of pneumonia and that we allowed controls to have respiratory symptoms, we did
demonstrate a very strong association between the presence of virus in NPA and WHO
defined pneumonia. Any lack of specificity in diagnostic criteria for measuring study
outcomes tends to bias the odds ratio towards 1 (233), thus, our estimates of association are
rather under- than overestimated.
We used a commercially available multiplex PCR kit for our analyses undertaken in Nepal.
This assay detects the most common viruses causing pneumonia in children and has proven
highly sensitive and specific for this purpose (166) compared to conventional methods (157,
158). Drawbacks of the assay are that it is both costly and relatively labor intensive. We
estimated the reagent cost per sample to approximately 50 USD and this makes it not
feasible for routine diagnostics in a low-income country. Development of new or
establishment of existing in-house PCR assays could increase sustainability in a LMIC
setting, if adequate training and infrastructure is ensured. Efforts in laboratory diagnostics of
respiratory viruses should perhaps focus on epidemiologic surveillance rather than clinical
routine analysis, as a positive PCR test has limited implications for the individual patient, i.e.
it does not rule out the presence of bacterial agents.
Sensitivity of PCR analyses
Even though we primarily included new cases of pneumonia and most cases presented early
in the course of illness (95% within 7 days of illness), some specimen collected from cases
Maria Mathisen
70
will not contain detectable viral RNA. This could be due to timing of specimen collection in
relation to onset of symptoms, inadequate collection procedures, or loss or degradation of
RNA during transport, processing or storage. Using a multiplex PCR implies some loss in
sensitivity compared to PCR assays for single agents, but an advantage is the possibility of
co-detections in a single specimen. However, the detection of more than one virus was
relatively low, at 3.3%, in our study.
Three-hundred-and-twenty four of the 2,219 NPAs were stored for up to 16 months at 2-8°C.
The samples refrigerated beyond three months that yielded a negative result (n=133) were
reanalyzed in the laboratory at the University Hospital of North Norway in Tromsø using the
aliquot that was frozen at -70°C immediately after processing in Nepal, while positive
samples (n=191) were not. Thus, we were probably unable to identify some co-detections
among the positive samples that were not reanalyzed. Assuming a proportion of viral co-
infections similar to what we observed in the rest of the study, the estimated co-detection
would have been 4.1% instead of the currently reported 3.3%. Moreover, the comparative
study described under the “Methods” section showed that refrigeration at 2-8°C for up to
three months resulted in a 7% loss in sensitivity compared to storage at -70°C. However, this
concerned approximately 10% (243/2,219) of our samples only, but indicates that the
proportion of children that tested positive for any virus could be slightly underestimated in
the current study.
Other pathogens
The detection of other respiratory pathogens, notably S. pneumonia, H. influenzae and S.
aureus, would also have been of great interest, but was not feasible within our project
setting. In particular in the case-control study, detection of rhinovirus, adenovirus, hBoV,
coronavirus, and enterovirus, viruses that are also frequently identified in healthy children
(159), would have enabled us to estimate individual pathogenicity odds ratios for each virus
and thereby better define their role in childhood pneumonia.
Viral pneumonia in children
71
6. Conclusions
The studies presented in this thesis show the importance of RSV, PIV type 3, and influenza
virus in childhood pneumonia in this Nepalese community. The cross-sectional study
contributed information on seasonal patterns and clinical features of the different viral
infections. The observed pneumonia epidemics were to a considerable extent driven by viral
epidemics. RSV was found to be the most common among the seven viruses identified over
the period of three years. Annual epidemics with RSV occurred in relation to the rainy
season or during the cold months. The newly identified virus, hMPV, was shown to circulate
in the community and an outbreak with hMPV occurred one of the winter seasons. RSV
infection was associated with the most severe clinical presentation and outcome among all
the viral infections we identified. The high pathogenicity estimates for the commonly
occurring PIV type 3, RSV and influenza viruses make them important targets for preventive
measures, such as vaccination.
Maria Mathisen
72
7. Research challenges
The important role of RSV in community-acquired pneumonia both with regards to
frequency and severity in young children underscore the need for continued effort to develop
of a safe and effective RSV vaccine, as this could substantially reduce the burden of
pneumonia in children of LMICs.
Population-based studies should be undertaken in order to define the proportion of
pneumonia cases attributable to each virus and to estimate the disease burden of the most
important viral agents.
Efforts should be made to gain better regional data on the viral and bacterial causes of
childhood pneumonia. New viral respiratory pathogens have emerged and their exact causal
role in pneumonia needs further investigation.
Local epidemiologic surveillance of respiratory viruses causing pneumonia in children
should be undertaken to enable prediction of outbreaks and for planning of preventive and
therapeutic control measures.
Viral pneumonia in children
73
References
1. Black RE, Cousens S, Johnson HL, et al. Global, regional, and national causes of
child mortality in 2008: a systematic analysis. Lancet. 2010;375:1969-1987.
2. Rudan I, Tomaskovic L, Boschi-Pinto C, Campbell H, WHO Child Health
Epidemiology Reference Group. Global estimate of the incidence of clinical
pneumonia among children under five years of age. Bull World Health Organ.
2004;82:895-903.
3. Rudan I, Borchi-Pinto C, Biloglav Z, Mulholland K, Campbell H. Epidemiology and
etiology of childhood pneumonia. Bull World Health Organ. 2008;86:408-416.
4. WHO, UNICEF. Pneumonia. The forgotten killer of children. Geneva: World Health
Organization; 2006.
5. Madhi SA, Levine OS, Hajjeh R, Mansoor OD, Cherian T. Vaccines to prevent
pneumonia and improve child survival. Bull World Health Organ. 2008;86:365-372.
6. WHO. Acute Respiratory Infections (Update September 2009) 2009. Available at:
www.who.int/vaccine_research/diseases/ari/en/print.html.
7. Adegbola RA, Falade AG, Sam BE, et al. The etiology of pneumonia in
malnourished and well-nourished Gambian children. Pediatr Infect Dis J.
1994;13:975-982.
8. Falade AG, Mulholland EK, Adegbola RA, Greenwood BM. Bacterial isolates from
blood and lung aspirate cultures in Gambian children with lobar pneumonia. Ann
Trop Paediatr. 1997;17:315-319.
9. Forgie IM, O'Neill KP, Lloyd-Evans N, et al. Etiology of acute lower respiratory
tract infections in Gambian children: II. Acute lower respiratory tract infection in
children ages one to nine years presenting at the hospital. Pediatr Infect Dis J.
1991;10:42-47.
10. Forgie IM, O'Neill KP, Lloyd-Evans N, et al. Etiology of acute lower respiratory
tract infections in Gambian children: I. Acute lower respiratory tract infections in
infants presenting at the hospital. Pediatr Infect Dis J. 1991;10:33-41.
11. Shann F, Gratten M, Germer S, et al. Aetiology of pneumonia in children in Goroka
Hospital, Papua New Guinea. Lancet. 1984;2:537-541.
12. Cutts FT, Zaman SMA, Enwere G, et al. Efficacy of nine-valent pneumococcal
conjugate vaccine against pneumonia and invasive pneumococcal disease in The
Gambia: randomised, double-blind, placebo-controlled trial. Lancet. 2005;365:1139-
1146.
13. Klugman KP, Madhi SA, Huebner RE, et al. A trial of a 9-valent pneumococcal
conjugate vaccine in children with and those without HIV infection. N Engl J Med.
2003;349:1341-1348.
14. Madhi SA, Kuwanda L, Cutland C, Klugman KP. The impact of a 9-valent
pneumococcal conjugate vaccine on the public health burden of pneumonia in HIV-
infected and -uninfected children. Clin Infect Dis. 2005;40:1511-1518.
15. Mulholland K, Hilton S, Adegbola R, et al. Randomised trial of Haemophilus
influenzae type-b tetanus protein conjugate vaccine [corrected] for prevention of
pneumonia and meningitis in Gambian infants. Lancet. 1997;349:1191-1197.
16. de Andrade ALSS, de Andrade JG, Martelli CMT, et al. Effectiveness of
Haemophilus influenzae b conjugate vaccine on childhood pneumonia: a case-control
study in Brazil. Int J Epidemiol. 2004;33:173-181.
Maria Mathisen
74
17. Levine OS, Lagos R, Muñoz A, et al. Defining the burden of pneumonia in children
preventable by vaccination against Haemophilus influenzae type b. Pediatr Infect Dis
J. 1999;18:1060-1064.
18. O'Brien KL, Wolfson LJ, Watt JP, et al. Burden of disease caused by Streptococcus
pneumoniae in children younger than 5 years: global estimates. Lancet.
2009;374:893-902.
19. Watt JP, Wolfson LJ, O'Brien KL, et al. Burden of disease caused by Haemophilus
influenzae type b in children younger than 5 years: global estimates. Lancet.
2009;374:903-911.
20. Grant GB, Campbell H, Dowell SF, et al. Recommendations for treatment of
childhood non-severe pneumonia. Lancet Infect Dis. 2009;9:185-196.
21. McIntosh K. Community-acquired pneumonia in children. N Engl J Med.
2002;346:429-437.
22. Zar HJ, Madhi SA. Childhood pneumonia--progress and challenges. S Afr Med J.
2006;96:890-900.
23. McNally LM, Jeena PM, Gajee K, et al. Effect of age, polymicrobial disease, and
maternal HIV status on treatment response and cause of severe pneumonia in South
African children: a prospective descriptive study. Lancet. 2007;369:1440-1451.
24. Chintu C, Mudenda V, Lucas S, et al. Lung diseases at necropsy in African children
dying from respiratory illnesses: a descriptive necropsy study. Lancet. 2002;360:985-
990.
25. Madhi SA, Petersen K, Madhi A, Khoosal M, Klugman KP. Increased disease
burden and antibiotic resistance of bacteria causing severe community-acquired
lower respiratory tract infections in human immunodeficiency virus type 1-infected
children. Clin Infect Dis. 2000;31:170-176.
26. Ruffini DD, Madhi SA. The high burden of Pneumocystis carinii pneumonia in
African HIV-1-infected children hospitalized for severe pneumonia. AIDS.
2002;16:105-112.
27. Iwane MK, Edwards KM, Szilagyi PG, et al. Population-based surveillance for
hospitalizations associated with respiratory syncytial virus, influenza virus, and
parainfluenza viruses among young children. Pediatrics. 2004;113:1758-1764.
28. Berner R, Schwoerer F, Schumacher RF, Meder M, Forster J. Community and
nosocomially acquired respiratory syncytial virus infection in a German paediatric
hospital from 1988 to 1999. Eur J Pediatr. 2001;160:541-547.
29. Hall CB, Weinberg GA, Iwane MK, et al. The Burden of Respiratory Syncytial Virus
Infection in Young Children. New Engl J Med. 2009;360:588-598.
30. Poehling KA, Edwards KM, Weinberg GA, et al. The underrecognized burden of
influenza in young children. N Engl J Med. 2006;355:31-40.
31. Weinberg GA, Hall CB, Iwane MK, et al. Parainfluenza virus infection of young
children: estimates of the population-based burden of hospitalization. J Pediatr.
2009;154:694-699.
32. Nair H, Nokes DJ, Gessner BD, et al. Global burden of acute lower respiratory
infections due to respiratory syncytial virus in young children: a systematic review
and meta-analysis. Lancet. 2010;375:1545-1555.
33. Weber MW, Milligan P, Sanneh M, et al. An epidemiological study of RSV infection
in the Gambia. Bull World Health Organ. 2002;80:562-568.
34. Robertson SE, Roca A, Alonso P, et al. Respiratory syncytial virus infection:
denominator-based studies in Indonesia, Mozambique, Nigeria and South Africa.
Bull World Health Organ. 2004;82:914-922.
Viral pneumonia in children
75
35. Broor S, Parveen S, Bharaj P, et al. A prospective three-year cohort study of the
epidemiology and virology of acute respiratory infections of children in rural India.
PLoS ONE. 2007;2:e491.
36. Nokes DJ, Okiro EA, Ngama M, et al. Respiratory syncytial virus infection and
disease in infants and young children observed from birth in Kilifi District, Kenya.
Clin Infect Dis. 2008;46:50-57.
37. Stensballe LG, Devasundaram JK, Simoes EA. Respiratory syncytial virus
epidemics: the ups and downs of a seasonal virus. Pediatr Infect Dis J. 2003;22:S21-
32.
38. Girard MP, Cherian T, Pervikov Y, Kieny MP. A review of vaccine research and
development: human acute respiratory infections. Vaccine. 2005;23:5708-5724.
39. Weber MW, Mulholland EK, Greenwood BM. Respiratory syncytial virus infection
in tropical and developing countries. Trop Med Int Health. 1998;3:268-280.
40. Brooks W, Goswami D, Rahman M, et al. Influenza is a major contributor to
childhood pneumonia in a tropical developing country. Pediatr Infect Dis J.
2010;29;216-221.
41. Chiu SS, Lau YL, Chan KH, Wong WH, Peiris JS. Influenza-related hospitalizations
among children in Hong Kong. N Engl J Med. 2002;347:2097-2103.
42. McCullers JA. Insights into the interaction between influenza virus and
pneumococcus. Clin Microbiol Rev. 2006;19:571-582.
43. van den Hoogen BG, de Jong JC, Groen J, et al. A newly discovered human
pneumovirus isolated from young children with respiratory tract disease. Nat Med.
2001;7:719-724.
44. van den Hoogen BG, Osterhaus DM, Fouchier RA. Clinical impact and diagnosis of
human metapneumovirus infection. Pediatr Infect Dis J. 2004;23:S25-32.
45. Principi N, Bosis S, Esposito S. Human metapneumovirus in paediatric patients. Clin
Microbiol Infect. 2006;12:301-308.
46. Cilla G, Oñate E, Perez-Yarza EG, et al. Hospitalization rates for human
metapneumovirus infection among 0- to 3-year-olds in Gipuzkoa (Basque Country),
Spain. Epidemiol Infect. 2009;137:66-72.
47. Mullins JA, Erdman DD, Weinberg GA, et al. Human metapneumovirus infection
among children hospitalized with acute respiratory illness. Emerging Infect Dis.
2004;10:700-705.
48. Madhi SA, Ludewick H, Kuwanda L, et al. Seasonality, incidence, and repeat human
metapneumovirus lower respiratory tract infections in an area with a high prevalence
of human immunodeficiency virus type-1 infection. Pediatr Infect Dis J.
2007;26:693-699.
49. Peiris JS, Tang WH, Chan KH, et al. Children with respiratory disease associated
with metapneumovirus in Hong Kong. Emerging Infect Dis. 2003;9:628-633.
50. Montejano-Elías L, Alpuche-Solís AG, Zárate-Chávez V, et al. Human
metapneumovirus and other respiratory viral infections in children attending a day
care center. Pediatr Infect Dis J. 2009;28:1024-1026.
51. Wolf DG, Greenberg D, Shemer-Avni Y, et al. Association of human
metapneumovirus with radiologically diagnosed community-acquired alveolar
pneumonia in young children. J Pediatr. 2010;156:115-120.
52. Foulongne V, Guyon G, Rodière M, Segondy M. Human metapneumovirus infection
in young children hospitalized with respiratory tract disease. Pediatr Infect Dis J.
2006;25:354-359.
53. Lambert SB, Allen KM, Druce JD, et al. Community epidemiology of human
metapneumovirus, human coronavirus NL63, and other respiratory viruses in healthy
Maria Mathisen
76
preschool-aged children using parent-collected specimens. Pediatrics.
2007;120:e929-937.
54. Bharaj P, Sullender WM, Kabra SK, et al. Respiratory viral infections detected by
multiplex PCR among pediatric patients with lower respiratory tract infections seen
at an urban hospital in Delhi from 2005 to 2007. Virol J. 2009;6:89.
55. Yoshida LM, Suzuki M, Yamamoto T, et al. Viral pathogens associated with acute
respiratory infections in central vietnamese children. Pediatr Infect Dis J.
2010;29:75-77.
56. Noyola D. Human metapneumovirus infections in Mexico: epidemiological and
clinical characteristics. J Med Microbiol. 2005;54:969-974.
57. IJpma FF, Beekhuis D, Cotton MF, et al. Human metapneumovirus infection in
hospital referred South African children. J Med Virol. 2004;73:486-493.
58. Brooks WA, Erdman D, Terebuh P. Human metapneumovirus infection among
children, Bangladesh. Emerging Infect Dis. 2007;13:1611-1613.
59. Weigl JAI, Puppe W, Meyer CU, et al. Ten years' experience with year-round active
surveillance of up to 19 respiratory pathogens in children. Eur J Pediatr.
2007;166:957-966.
60. Simonsen L. The global impact of influenza on morbidity and mortality. Vaccine.
1999;17 Suppl 1:S3-10.
61. Sloots TP, Mackay IM, Bialasiewicz S, et al. Human metapneumovirus, Australia,
2001-2004. Emerging Infect Dis. 2006;12:1263-1266.
62. Maggi F, Pifferi M, Vatteroni M, et al. Human metapneumovirus associated with
respiratory tract infections in a 3-year study of nasal swabs from infants in Italy. J
Clin Microbiol. 2003;41:2987-2991.
63. Aberle SW, Aberle JH, Sandhofer M, Pracher E, Popow-Kraupp T. Biennial Spring
Activity of Human Metapneumovirus in Austria. Pediatr Infect Dis J. 2008;27:1065-
1068.
64. Rafiefard F, Yun Z, Orvell C. Epidemiologic characteristics and seasonal distribution
of human metapneumovirus infections in five epidemic seasons in Stockholm,
Sweden, 2002-2006. J Med Virol. 2008;80:1631-1638.
65. Henrickson KJ. Parainfluenza viruses. Clin Microbiol Rev. 2003;16:242-264.
66. Reed G, Jewett PH, Thompson J, Tollefson SJ, Wright PF. Epidemiology and
clinical impact of parainfluenza virus infections in otherwise healthy infants and
young children <5 years old. J Infect Dis. 1997;175:807-813.
67. Hall CB. Respiratory Syncytial Virus and Parainfluenza Virus. N Engl J med.
2001;344:1917-1928.
68. Chung JY, Han TH, Kim SW, Hwang ES. Genotype variability of human
metapneumovirus, South Korea. J Med Virol. 2008;80:902-905.
69. Souza LS, Ramos EA, Carvalho FM, et al. Viral respiratory infections in young
children attending day care in urban Northeast Brazil. Pediatr Pulmonol.
2003;35:184-191.
70. Maitreyi RS, Broor S, Kabra SK, et al. Rapid detection of respiratory viruses by
centrifugation enhanced cultures from children with acute lower respiratory tract
infections. J Clin Virol. 2000;16:41-47.
71. Chew F, Doraisingham S, Ling AE, Kumarasinghe G, Lee B. Seasonal trends of viral
respiratory tract infections in the tropics. Epidemiol Infect. 1998;121:121-128.
72. Yang TY, Lu CY, Kao CL, et al. Clinical manifestations of parainfluenza infection in
children. J Microbiol Immunol Infect. 2003;36:270-274.
Viral pneumonia in children
77
73. McIntosh K. Respiratory Syncytial Virus. In: Evans A, Kaslow R, eds. Viral
Infections in Humans. 4th ed. New York: Plenum Publishing Corporation; 1997:691-
711.
74. Murray PR, Rosenthal KS, Kobayashi GS, Pfaller MA. Virology. Medical
Microbiology. 4th ed. St. Louis: Mosby, Inc.; 2002:523-542.
75. Glezen WP, Taber LH, Frank AL, Kasel JA. Risk of primary infection and
reinfection with respiratory syncytial virus. Am J Dis Child. 1986;140:543-546.
76. Hall CB. Nosocomial respiratory syncytial virus infections: the "Cold War" has not
ended. Clin Infect Dis. 2000;31:590-596.
77. Hall CB, Walsh EE, Long CE, Schnabel KC. Immunity to and frequency of
reinfection with respiratory syncytial virus. J Infect Dis. 1991;163:693-698.
78. Falsey AR, Hennessey PA, Formica MA, Cox C, Walsh EE. Respiratory syncytial
virus infection in elderly and high-risk adults. N Engl J Med. 2005;352:1749-1759.
79. Henderson J, Hilliard TN, Sherriff A, et al. Hospitalization for RSV bronchiolitis
before 12 months of age and subsequent asthma, atopy and wheeze: a longitudinal
birth cohort study. Pediatr Allergy Immunol. 2005;16:386-392.
80. Stein RT, Sherrill D, Morgan WJ, et al. Respiratory syncytial virus in early life and
risk of wheeze and allergy by age 13 years. Lancet. 1999;354:541-545.
81. Stensballe LG, Kristensen K, Simoes EAF, Jensen H, al. e. Atopic disposition,
wheezing, and subsequent respiratory syncytial virus hospitalization in danish
children younger than 18 months: A nested case-control study. Pediatrics.
2006;118:e1360-e1368.
82. Welliver RC. Review of epidemiology and clinical risk factors for severe respiratory
syncytial virus (RSV) infection. J Pediatr. 2003;143:S112-117.
83. Eriksson M, Bennet R, Rotzén-Ostlund M, von Sydow M, Wirgart BZ. Population-
based rates of severe respiratory syncytial virus infection in children with and
without risk factors, and outcome in a tertiary care setting. Acta Paediatr.
2002;91:593-598.
84. Simoes EA. Respiratory syncytial virus infection. Lancet. 1999;354:847-852.
85. Simoes EA. Environmental and demographic risk factors for respiratory syncytial
virus lower respiratory tract disease. J Pediatr. 2003;143:S118-126.
86. Glezen WP, Paredes A, Allison JE, Taber LH, Frank AL. Risk of respiratory
syncytial virus infection for infants from low-income families in relationship to age,
sex, ethnic group, and maternal antibody level. J Pediatr. 1981;98:708-715.
87. Laundy M, Ajayi-Obe E, Hawrami K, et al. Influenza A community-acquired
pneumonia in East London infants and young children. Pediatr Infect Dis J.
2003;22:S223-227.
88. Neuzil KM, Zhu Y, Griffin MR, et al. Burden of interpandemic influenza in children
younger than 5 years: a 25-year prospective study. J Infect Dis. 2002;185:147-152.
89. Peltola V, Ziegler T, Ruuskanen O. Influenza A and B virus infections in children.
Clin Infect Dis. 2003;36:299-305.
90. Silvennoinen H, Peltola V, Lehtinen P, Vainionpää R, Heikkinen T. Clinical
presentation of influenza in unselected children treated as outpatients. Pediatr Infect
Dis J. 2009;28:372-375.
91. Glezen WP, Taber LH, Frank AL, Gruber WC, Piedra PA. Influenza virus infections
in infants. Pediatr Infect Dis J. 1997;16:1065-1068.
92. Reichert TA, Sugaya N, Fedson DS, et al. The Japanese experience with vaccinating
schoolchildren against influenza. N Engl J Med. 2001;344:889-896.
93. Thompson WW, Shay DK, Weintraub E, et al. Mortality associated with influenza
and respiratory syncytial virus in the United States. JAMA. 2003;289:179-186.
Maria Mathisen
78
94. Neuzil KM, Mellen BG, Wright PF, Mitchel EF, Griffin MR. The effect of influenza
on hospitalizations, outpatient visits, and courses of antibiotics in children. N Engl J
Med. 2000;342:225-231.
95. American Academy of Pediatrics Committee on Infectious Diseases.
Recommendations for influenza immunization of children. Pediatrics.
2004;113:1441-1447.
96. Daley AJ, Nallusamy R, Isaacs D. Comparison of influenza A and influenza B virus
infection in hospitalized children. J Paediatr Child Health. 2000;36:332-335.
97. Glezen WP, Frank AL, Taber LH, Kasel JA. Parainfluenza virus type 3: seasonality
and risk of infection and reinfection in young children. J Infect Dis. 1984;150:851-
857.
98. Henrickson KJ, Kuhn SM, Savatski LL. Epidemiology and cost of infection with
human parainfluenza virus types 1 and 2 in young children. Clin Infect Dis.
1994;18:770-779.
99. Mejías A, Chávez-Bueno S, Ramilo O. Human metapneumovirus: a not so new virus.
Pediatr Infect Dis J. 2004;23:1-7.
100. Wolf DG, Greenberg D, Kalkstein D, et al. Comparison of human metapneumovirus,
respiratory syncytial virus and influenza A virus lower respiratory tract infections in
hospitalized young children. Pediatr Infect Dis J. 2006;25:320-324.
101. Klein MI, Coviello S, Bauer G, et al. The impact of infection with human
metapneumovirus and other respiratory viruses in young infants and children at high
risk for severe pulmonary disease. J Infect Dis. 2006;193:1544-1551.
102. Al-Sonboli N, Hart CA, Al-Aeryani A, et al. Respiratory syncytial virus and human
metapneumovirus in children with acute respiratory infections in Yemen. Pediatr
Infect Dis J. 2005;24:734-736.
103. Sarasini A, Percivalle E, Rovida F, et al. Detection and pathogenicity of human
metapneumovirus respiratory infection in pediatric Italian patients during a winter-
spring season. J Clin Virol. 2006;35:59-68.
104. Bosis S, Esposito S, Niesters HG, et al. Impact of human metapneumovirus in
childhood: comparison with respiratory syncytial virus and influenza viruses. J Med
Virol. 2005;75:101-104.
105. Døllner H, Risnes K, Radtke A, Nordbø SA. Outbreak of human metapneumovirus
infection in Norwegian children. Pediatr Infect Dis J. 2004;23:436-440.
106. Boivin G, de Serres G, Côté S, et al. Human metapneumovirus infections in
hospitalized children. Emerging Infect Dis. 2003;9:634-640.
107. von Linstow ML, Larsen HH, Eugen-Olsen J, et al. Human metapneumovirus and
respiratory syncytial virus in hospitalized danish children with acute respiratory tract
infection. Scand J Infect Dis. 2004;36:578-584.
108. Heikkinen T, Osterback R, Peltola V, Jartti T, Vainionpää R. Human
metapneumovirus infections in children. Emerging Infect Dis. 2008;14:101-106.
109. Falsey AR, Erdman D, Anderson LJ, Walsh EE. Human metapneumovirus infections
in young and elderly adults. J Infect Dis. 2003;187:785-790.
110. Boivin G, Abed Y, Pelletier G, et al. Virological features and clinical manifestations
associated with human metapneumovirus: a new paramyxovirus responsible for acute
respiratory-tract infections in all age groups. J Infect Dis. 2002;186:1330-1334.
111. Robinson JL, Lee BE, Bastien N, Li Y. Seasonality and clinical features of human
metapneumovirus infection in children in Northern Alberta. J Med Virol.
2005;76:98-105.
Viral pneumonia in children
79
112. von Linstow ML, Høgh M, Nordbø SA, et al. A community study of clinical traits
and risk factors for human metapneumovirus and respiratory syncytial virus infection
during the first year of life. Eur J Pediatr. 2008;167:1125-1133.
113. Ebihara T, Endo R, Kikuta H, et al. Human metapneumovirus infection in Japanese
children. J Clin Microbiol. 2004;42:126-132.
114. Williams JV, Wang CK, Yang CF, et al. The role of human metapneumovirus in
upper respiratory tract infections in children: a 20-year experience. J Infect Dis.
2006;193:387-395.
115. WHO. Clinical management of acute respiratory infections in children: a WHO
memorandum. Bull World Health Organ. 1981;59:707-716.
116. WHO. Integrated management of the sick child. Bull World Health Organ.
1995;73:735-740.
117. Sazawal S, Black RE, Group PCMT. Effect of pneumonia case management on
mortality in neonates, infants, and preschool children: a meta-analysis of community-
based trials. Lancet Infect Dis. 2003;3:547-556.
118. Marsh DR, Gilroy KE, Van de Weerdt R, Wansi E, Qazi S. Community case
management of pneumonia: at a tipping point? Bull World Health Organ.
2008;86:381-389.
119. Felmingham D, Feldman C, Hryniewicz W, et al. Surveillance of resistance in
bacteria causing community-acquired respiratory tract infections. Clin Microbiol
Infect. 2002;8 Suppl 2:12-42.
120. Lozano JM. Epidemiology of hypoxaemia in children with acute lower respiratory
infection. Int J Tuberc Lung Dis. 2001;5:496-504.
121. Duke T, Mgone J, Frank D. Hypoxaemia in children with severe pneumonia in Papua
New Guinea. Int J Tuberc Lung Dis. 2001;5:511-519.
122. Ayieko P, English M. In children aged 2-59 months with pneumonia, which clinical
signs best predict hypoxaemia? J Trop Pediatr. 2006;52:307-310.
123. WHO. WHO Position Paper on Haemophilus influenzae type b conjugate vaccines.
Weekly epidemiological record; 2006:445-452.
124. WHO. Pneumococcal conjugate vaccine for childhood immunization - WHO
position paper. Weekly epidemiological record; 2007:93-104.
125. Rice AL, Sacco L, Hyder A, Black RE. Malnutrition as an underlying cause of
childhood deaths associated with infectious diseases in developing countries. Bull
World Health Organ. 2000;78:1207-1221.
126. Roth DE, Caulfield L, Ezzati M, Black RE. Acute lower respiratory infections in
childhood: opportunities for reducing the global burden through nutritional
interventions. Bull World Health Organ. 2008;86:356-364.
127. Greenwood BM, Weber MW, Mulholland K. Childhood pneumonia--preventing the
worlds biggest killer of children. Bull World Health Organ. 2007;85:502-503.
128. Greenwood B. A global action plan for the prevention and control of pneumonia.
Bull World Health Organ. 2008;86:322-322A.
129. WHO, UNICEF. Global Action Plan for Prevention and Control of Pneumonia
(GAPP). Geneva; 2009:1-23.
130. Margolis P, Gadomski A. The rational clinical examination. Does this infant have
pneumonia? JAMA. 1998;279:308-313.
131. Cherian T, Mulholland EK, Carlin JB, et al. Standardized interpretation of paediatric
chest radiographs for the diagnosis of pneumonia in epidemiological studies. Bull
World Health Organ. 2005;83:353-359.
Maria Mathisen
80
132. WHO, Pneumonia Vaccine Trial Investigators Group. Standardization of
interpretation of chest radiographs for the diagnosis of pneumonia in children.
WHO/V&B/01.35. World Health Organization; Geneva; 2001:1-39.
133. Virkki R, Juven T, Rikalainen H, et al. Differentiation of bacterial and viral
pneumonia in children. Thorax. 2002;57:438-441.
134. Graham SM, English M, Hazir T, Enarson P, Duke T. Challenges to improving case
management of childhood pneumonia at health facilities in resource-limited settings.
Bull World Health Organ. 2008;86:349-355.
135. Cherian T, John TJ, Simoes EAF, Steinhoff MC, John M. Evaluation of simple
clinical signs for the diagnosis of acute lower respiratory tract infection. Lancet.
1988;2:125-128.
136. Scott JAG, Brooks WA, Peiris JSM, Holtzman D, Mulhollan EK. Pneumonia
research to reduce childhood mortality in the developing world. J Clin Invest.
2008;118:1291-1300.
137. Buttery J, Moxon ER. Capsulate bacteria and the lung. Br Med Bull. 2002;61:63-80.
138. Vuori-Holopainen E, Peltola H. Reappraisal of lung tap: review of an old method for
better etiologic diagnosis of childhood pneumonia. Clin Infect Dis. 2001;32:715-726.
139. Cherian T. Describing the epidemiology and aetiology of bacterial pneumonia in
children: an unresolved problem. J Health Popul Nutr. 2005;23:1-5.
140. Hvidsten D, Halvorsen DS, Berdal BP, Gutteberg TJ. Chlamydophila pneumoniae
diagnostics: importance of methodology in relation to timing of sampling. Clin
Microbiol Infect. 2009;15:42-49.
141. Nohynek H, Eskola J, Kleemola M, et al. Bacterial antibody assays in the diagnosis
of acute lower respiratory tract infection in children. Pediatr Infect Dis J.
1995;14:478-484.
142. Dowell SF, Garman RL, Liu G, Levine OS, Yang YH. Evaluation of Binax NOW, an
assay for the detection of pneumococcal antigen in urine samples, performed among
pediatric patients. Clin Infect Dis. 2001;32:824-825.
143. Coles CL, Sherchand JB, Khatry SK, et al. Nasopharyngeal carriage of S.
pneumoniae among young children in rural Nepal. Trop Med Int Health.
2009;14:1025-1033.
144. Abdullahi O, Nyiro J, Lewa P, Slack M, Scott JAG. The descriptive epidemiology of
Streptococcus pneumoniae and Haemophilus influenzae nasopharyngeal carriage in
children and adults in Kilifi district, Kenya. Pediatr Infect Dis J. 2008;27:59-64.
145. Hill PC, Akisanya A, Sankareh K, et al. Nasopharyngeal carriage of Streptococcus
pneumoniae in Gambian villagers. Clin Infect Dis. 2006;43:673-679.
146. Factor SH, LaClaire L, Bronsdon M, et al. Streptococcus pneumoniae and
Haemophilus influenzae type B carriage, Central Asia. Emerging Infect Dis.
2005;11:1476-1479.
147. Korppi M. Non-specific host response markers in the differentiation between
pneumococcal and viral pneumonia: What is the most accurate combination? Pediatr
Int. 2004;46:545-550.
148. Simon L, Gauvin F, Amre DK, Saint-Louis P, Lacroix J. Serum procalcitonin and C-
reactive protein levels as markers of bacterial infection: a systematic review and
meta-analysis. Clin Infect Dis. 2004;39:206-217.
149. van der Meer V, Neven AK, van den Broek PJ, Assendelft WJ. Diagnostic value of C
reactive protein in infections of the lower respiratory tract: systematic review. BMJ.
2005;331:26.
150. Mulholland EK. Use of vaccine trials to estimate burden of disease. J Health Popul
Nutr. 2004;22:257-267.
Viral pneumonia in children
81
151. Singleton RJ, Hennessy TW, Bulkow LR, et al. Invasive pneumococcal disease
caused by nonvaccine serotypes among Alaska native children with high levels of 7-
valent pneumococcal conjugate vaccine coverage. JAMA. 2007;297:1784-1792.
152. Murdoch DR, O'Brien KL, Scott JAG, et al. Breathing new life into pneumonia
diagnostics. J Clin Microbiol. 2009;47:3405-3408.
153. Henrickson KJ. Advances in the laboratory diagnosis of viral respiratory disease.
Pediatr Infect Dis J. 2004;23:S6-10.
154. Loda FA, Clyde WA, Glezen WP, et al. Studies on the role of viruses, bacteria, and
M. pneumoniae as causes of lower respiratory tract infections in children. J Pediatr.
1968;72:161-176.
155. Zaman K, Baqui AH, Yunus M, et al. Acute respiratory infections in children: a
community-based longitudinal study in rural Bangladesh. J Trop Pediatr.
1997;43:133-137.
156. Syrmis MW, Whiley DM, Thomas M, et al. A sensitive, specific, and cost-effective
multiplex reverse transcriptase-PCR assay for the detection of seven common
respiratory viruses in respiratory samples. J Mol Diagn. 2004;6:125-131.
157. Weinberg GA, Erdman DD, Edwards KM, et al. Superiority of reverse-transcription
polymerase chain reaction to conventional viral culture in the diagnosis of acute
respiratory tract infections in children. J Infect Dis. 2004;189:706-710.
158. Liolios L, Jenney A, Spelman D, et al. Comparison of a multiplex reverse
transcription-PCR-enzyme hybridization assay with conventional viral culture and
immunofluorescence techniques for the detection of seven viral respiratory
pathogens. J Clin Microbiol. 2001;39:2779-2783.
159. Jartti T, Jartti L, Peltola V, Waris M, Ruuskanen O. Identification of respiratory
viruses in asymptomatic subjects. Pediatr Infect Dis J. 2008;27:1103-1107.
160. van Gageldonk-Lafeber AB, Heijnen ML, Bartelds AI, et al. A case-control study of
acute respiratory tract infection in general practice patients in The Netherlands. Clin
Infect Dis. 2005;41:490-497.
161. Christensen A, Nordbø SA, Krokstad S, Rognlien AG, Døllner H. Human bocavirus
commonly involved in multiple viral airway infections. J Clin Virol. 2008;41:34-37.
162. Arden KE, McErlean P, Nissen MD, Sloots TP, Mackay IM. Frequent detection of
human rhinoviruses, paramyxoviruses, coronaviruses, and bocavirus during acute
respiratory tract infections. J Med Virol. 2006;78:1232-1240.
163. Nacul LC, Kirkwood BR, Carneiro AC, et al. Aetiology and clinical presentation of
pneumonia in hospitalized and outpatient children in Northeast Brazil and risk
factors for severity. J Health Popul Nutr. 2005;23:6-15.
164. Fan J, Henrickson KJ, Savatski LL. Rapid simultaneous diagnosis of infections with
respiratory syncytial viruses A and B, influenza viruses A and B, and human
parainfluenza virus types 1, 2, and 3 by multiplex quantitative reverse transcription-
polymerase chain reaction-enzyme hybridization assay (Hexaplex). Clin Infect Dis.
1998;26:1397-1402.
165. Hindiyeh M, Hillyard DR, Carroll KC. Evaluation of the Prodesse Hexaplex
multiplex PCR assay for direct detection of seven respiratory viruses in clinical
specimens. Am J Clin Pathol. 2001;116:218-224.
166. Kehl SC, Henrickson KJ, Hua W, Fan J. Evaluation of the Hexaplex assay for
detection of respiratory viruses in children. J Clin Microbiol. 2001;39:1696-1701.
167. Ministry of Health and Population (MOHP) [Nepal], New ERA, and Macro
International Inc. Nepal Demographic and Health Survey 2006. Kathmandu, Nepal;
2007.
168. World Bank. World Development Report 2007. Washington, DC.; 2007.
Maria Mathisen
82
169. United Nations Development Programme. Human Development Report 2009. New
York; 2009.
170. Nepal Central Bureau of Statistics. Population Census 2001: National Report.
Kathmandu; 2001.
171. Giri D, Krishna Murthy V, Adhikary PR. The influence of meteorological conditions
on PM10 concentrations in Kathmandu Valley. Int J Environ Res. 2008;2:49-60.
172. Strand TA, Chandyo RK, Bahl R, et al. Effectiveness and efficacy of zinc for the
treatment of acute diarrhea in young children. Pediatrics. 2002;109:898-903.
173. District Public Health Office. Half yearly report on EPI coverage in Bhaktapur
district. Bhaktapur, Nepal 2008.
174. World Health Organization, UNICEF. Integrated Management of Childhood Illness;
chart booklet. Geneva: Division of Child and Adolescent Health and Development,
WHO; 2002.
175. Valentiner-Branth P, Shrestha PS, Chandyo RK, et al. A randomized controlled trial
of the effect of zinc as adjuvant therapy in children 2-35 mo of age with severe or
nonsevere pneumonia in Bhaktapur, Nepal. Am J Clin Nutr. 2010;91:1667-1674.
176. World Health Organization, UNICEF. Integrated Management of Childhood Illness;
chart booklet. Geneva: Department of Child and Adolescent Health and
Development, WHO; 2008.
177. World Health Organization, UNICEF. Model IMCI handbook: Integrated
management of childhood illness. WHO/FCH/CAH/00.12. Geneva: Division of
Child and Adolescent Health and Development, World Health Organization; 2005.
178. World Health Organization. Pocket Book of Hospital Care for Children: Guidelines
for the Management of Common Illnesses with Limited Resources. Geneva: WHO;
2005.
179. Prodesse. Hexaplex Plus Kit. For detection of Human Parainfluenza 1, 2 and 3,
Influenza A and B, Respiratory Syncytial Virus and human Metapneumovirus.
Revision 4.2a July 2007 2007. Available at: http://www.prodesse.com.
180. WHO Multicentre Growth Reference Study Group. WHO Child Growth Standards:
Length/height-for-age, weight-for-age, weight-for-length, weight-for-height and body
mass index-for-age: Methods and development. Geneva: World Health Organization;
2006.
181. Rothman KJ, Greenland S, Lash TL. Modern Epidemiology. 3rd ed. Philadelphia:
Lippincott Williams & Wilkins; 2008.
182. Forgie IM, Campbell H, Lloyd-Evans N, et al. Etiology of acute lower respiratory
tract infections in children in a rural community in The Gambia. Pediatr Infect Dis J.
1992;11:466-473.
183. Noyola DE, Rodríguez-Moreno G, Sánchez-Alvarado J, Martínez-Wagner R, Ochoa-
Zavala JR. Viral etiology of lower respiratory tract infections in hospitalized children
in Mexico. Pediatr Infect Dis J. 2004;23:118-123.
184. Ruutu P, Halonen P, Meurman O, et al. Viral lower respiratory tract infections in
Filipino children. J Infect Dis. 1990;161:175-179.
185. Juvén T, Mertsola J, Waris M, et al. Etiology of community-acquired pneumonia in
254 hospitalized children. Pediatr Infect Dis J. 2000;19:293-298.
186. Michelow IC, Olsen K, Lozano J, et al. Epidemiology and clinical characteristics of
community-acquired pneumonia in hospitalized children. Pediatrics. 2004;113:701-
707.
187. Nascimento-Carvalho CM, Ribeiro CT, Cardoso MRA, et al. The role of respiratory
viral infections among children hospitalized for community-acquired pneumonia in a
developing country. Pediatr Infect Dis J. 2008;27:939-941.
Viral pneumonia in children
83
188. Ghafoor A, Nomani NK, Ishaq Z, et al. Diagnoses of acute lower respiratory tract
infections in children in Rawalpindi and Islamabad, Pakistan. Rev Infect Dis.
1990;12:S907-914.
189. Suwanjutha S, Chantarojanasiri T, Watthana-kasetr S, et al. A study of nonbacterial
agents of acute lower respiratory tract infection in Thai children. Rev Infect Dis.
1990;12:S923-928.
190. Arnold J, Singh K, Spector S, Sawyer M. Undiagnosed Respiratory Viruses in
Children. Pediatrics. 2008;121:e631.
191. Choi EH, Lee HJ, Kim SJ, et al. The association of newly identified respiratory
viruses with lower respiratory tract infections in Korean children, 2000-2005. Clin
Infect Dis. 2006;43:585-592.
192. Jennings LC, Anderson TP, Werno AM, Beynon KA, Murdoch DR. Viral etiology of
acute respiratory tract infections in children presenting to hospital: role of
polymerase chain reaction and demonstration of multiple infections. Pediatr Infect
Dis J. 2004;23:1003-1007.
193. Freymuth F, Quibriac M, Petitjean J, et al. Comparison of two new tests for rapid
diagnosis of respiratory syncytial virus infections by enzyme-linked immunosorbent
assay and immunofluorescence techniques. J Clin Microbiol. 1986;24:1013-1016.
194. Johnston SL, Siegel CS. Evaluation of direct immunofluorescence, enzyme
immunoassay, centrifugation culture, and conventional culture for the detection of
respiratory syncytial virus. J Clin Microbiol. 1990;28:2394-2397.
195. Rocholl C, Gerber K, Daly J, Pavia AT, Byington CL. Adenoviral infections in
children: the impact of rapid diagnosis. Pediatrics. 2004;113:e51-56.
196. Shetty AK, Treynor E, Hill DW, et al. Comparison of conventional viral cultures
with direct fluorescent antibody stains for diagnosis of community-acquired
respiratory virus infections in hospitalized children. Pediatr Infect Dis J.
2003;22:789-794.
197. Hasan K, Jolly P, Marquis G, et al. Viral etiology of pneumonia in a cohort of
newborns till 24 months of age in Rural Mirzapur, Bangladesh. Scand J Infect Dis.
2006;38:690-695.
198. Peltola VT, McCullers JA. Respiratory viruses predisposing to bacterial infections:
role of neuraminidase. Pediatr Infect Dis J. 2004;23:S87-97.
199. Madhi SA, Klugman KP, The Vaccine Trialist Group. A role for Streptococcus
pneumoniae in virus-associated pneumonia. Nat Med. 2004;10:811-813.
200. Huq F, Rahman M, Nahar N, et al. Acute lower respiratory tract infection due to
virus among hospitalized children in Dhaka, Bangladesh. Rev Infect Dis. 1990;12
Suppl 8:S982-987.
201. Agarwal SC, Bardoloi JN, Mehta S. Respiratory syncytial virus infection in infancy
and childhood in a community in Chandigarh. Indian J Med Res. 1971;59:19-25.
202. John TJ, Cherian T, Steinhoff MC, Simoes EA, John M. Etiology of acute respiratory
infections in children in tropical southern India. Rev Infect Dis. 1991;13 Suppl
6:S463-469.
203. Shek LP, Lee BW. Epidemiology and seasonality of respiratory tract virus infections
in the tropics. Paediatr Respir Rev. 2003;4:105-111.
204. Yusuf S, Piedimonte G, Auais A, et al. The relationship of meteorological conditions
to the epidemic activity of respiratory syncytial virus. Epidemiol Infect.
2007;135:1077-1090.
205. Chan PK, Sung RY, Fung KS, et al. Epidemiology of respiratory syncytial virus
infection among paediatric patients in Hong Kong: seasonality and disease impact.
Epidemiol Infect. 1999;123:257-262.
Maria Mathisen
84
206. Omer SB, Sutanto A, Sarwo H, et al. Climatic, temporal, and geographic
characteristics of respiratory syncytial virus disease in a tropical island population.
Epidemiol Infect. 2008;136:1319-1327.
207. Viegas M, Barrero PR, Maffey AF, Mistchenko AS. Respiratory viruses seasonality
in children under five years of age in Buenos Aires, Argentina: a five-year analysis. J
Infect. 2004;49:222-228.
208. Ånestad G. Surveillance of respiratory viral infections by rapid immunofluorescence
diagnosis, with emphasis on virus interference. Epidemiol Infect. 1987;99:523-531.
209. Ånestad G, Vainio K, Hungnes O. Interference between outbreaks of epidemic
viruses. Scand J Infect Dis. 2007;39:653-654.
210. Linde A, Rotzén-Ostlund M, Zweygberg-Wirgart B, Rubinova S, Brytting M. Does
viral interference affect spread of influenza? Euro Surveill. 2009;14.
211. Mullins JA, Lamonte AC, Bresee JS, Anderson LJ. Substantial variability in
community respiratory syncytial virus season timing. Pediatr Infect Dis J.
2003;22:857-862.
212. Waris M. Pattern of respiratory syncytial virus epidemics in Finland: two-year cycles
with alternating prevalence of groups A and B. J Infect Dis. 1991;163:464-469.
213. Mlinaric-Galinovic G, Vojnovic G, Cepin-Bogovic J, et al. Does the viral subtype
influence the biennial cycle of respiratory syncytial virus? Virol J. 2009;6:133.
214. Phillips PA, Lehmann D, Spooner V, et al. Viruses associated with acute lower
respiratory tract infections in children from the eastern highlands of Papua New
Guinea (1983-1985). Southeast Asian J Trop Med Public Health. 1990;21:373-382.
215. Alonso WJ, Viboud C, Simonsen L, et al. Seasonality of influenza in Brazil: a
traveling wave from the Amazon to the subtropics. Am J Epidemiol. 2007;165:1434-
1442.
216. Jian J, Chen G, Lai C, et al. Genetic and epidemiological analysis of influenza virus
epidemics in Taiwan during 2003 to 2006. J Clin Microbiol. 2008;46:1426-1434.
217. Daum LT, Shaw MW, Klimov AI, et al. Influenza A (H3N2) outbreak, Nepal.
Emerging Infect Dis. 2005;11:1186-1191.
218. Heininger U, Kruker AT, Bonhoeffer J, Schaad UB. Human metapneumovirus
infections-biannual epidemics and clinical findings in children in the region of Basel,
Switzerland. Eur J Pediatr. 2009;168:1455-1460.
219. Midulla F, Scagnolari C, Bonci E, et al. Respiratory syncytial virus, human bocavirus
and rhinovirus bronchiolitis in infants. Arch Dis Child. 2010;95:35-41.
220. Kusel MM, de Klerk NH, Holt PG, et al. Role of respiratory viruses in acute upper
and lower respiratory tract illness in the first year of life: a birth cohort study. Pediatr
Infect Dis J. 2006;25:680-686.
221. van der Zalm MM, van Ewijk BE, Wilbrink B, et al. Respiratory pathogens in
children with and without respiratory symptoms. J Pediatr. 2008.
222. van Benten I, Koopman L, Niesters B, et al. Predominance of rhinovirus in the nose
of symptomatic and asymptomatic infants. Pediatr Allergy Immunol. 2003;14:363-
370.
223. von Linstow M-L, Høgh M, Høgh B. Clinical and epidemiologic characteristics of
human bocavirus in Danish infants: results from a prospective birth cohort study.
Pediatr Infect Dis J. 2008;27:897-902.
224. Brieu N, Guyon G, Rodière M, Segondy M, Foulongne V. Human bocavirus
infection in children with respiratory tract disease. Pediatr Infect Dis J. 2008;27:969-
973.
Viral pneumonia in children
85
225. García-García ML, Calvo C, Pozo F, et al. Human bocavirus detection in
nasopharyngeal aspirates of children without clinical symptoms of respiratory
infection. Pediatr Infect Dis J. 2008;27:358-360.
226. Allander T, Jartti T, Gupta S, et al. Human bocavirus and acute wheezing in children.
Clin Infect Dis. 2007;44:904-910.
227. Gerna G, Piralla A, Rovida F, et al. Correlation of rhinovirus load in the respiratory
tract and clinical symptoms in hospitalized immunocompetent and
immunocompromised patients. J Med Virol. 2009;81:1498-1507.
228. Piedra PA, Jewell AM, Cron SG, Atmar RL, Glezen WP. Correlates of immunity to
respiratory syncytial virus (RSV) associated-hospitalization: establishment of
minimum protective threshold levels of serum neutralizing antibodies. Vaccine.
2003;21:3479-3482.
229. Roca A, Abacassamo F, Loscertales MP, et al. Prevalence of respiratory syncytial
virus IgG antibodies in infants living in a rural area of Mozambique. J Med Virol.
2002;67:616-623.
230. Stensballe LG, Ravn H, Kristensen K, et al. Seasonal variation of maternally derived
respiratory syncytial virus antibodies and association with infant hospitalizations for
respiratory syncytial virus. J Pediatr. 2009;154:296-298.
231. World Health Organization. Technical bases for the WHO recommendations on the
management of pneumonia in children at first-level health facilities.
WHO/ARI/91.20. Geneva: WHO, Programme for the control of acute respiratory
infections; 1991.
232. WHO. Consultative meeting to review evidence and research priorities in the
managenment of acute respiratory infections (ARI). WHO/FCH/CAH/04.2. Geneva:
World Health Organization; 2004:1-30.
233. Smith PG, Morrow RH. Field trials of health interventions in developing countries:
A toolbox. 2nd ed. London: Macmillan Education; 1996.

Maria Mathisen
86


![[JR] Incidence of Viral Infection Detected by PCR in Childhood Pneumonia - MOD 3](https://img.pdfslide.net/doc/110x75/577c7ad41a28abe054964d21/jr-incidence-of-viral-infection-detected-by-pcr-in-childhood-pneumonia-.jpg)