Embed Size (px)
Citation preview
NATIONAL INSTITUTE OF MENTAL HEALTH AND NEUROSCIENCES,BANGALORE - 560 029
TRAUMATIC BRAIN INJURY
THE TEAM
Gururaj Ga, Kolluri S.V.R.b , Chandramouli B.Ab,
Subbakrishna D.Kc & Kraus JFd
Research Officersa
Suryanarayana S. P and Rajashree Narasimhan
Ananda, Balachandra, H.C.S.C.R Reddy
Data Managera
Vijendra S. Kargudri
Departments of Epidemiologya, Neurosurgeryb &
Biostatisticsc
NATIONAL INSTITUTE OF MENTAL HEALTH &
NEUROSCIENCES BANGALORE, India
and
Southern California Injury Prevention Research
Centred,
UCLA School of Public Health, Los Angeles, USAd
Address for Correspondence
G. Gururaj
Professor & Head
Department of Epidemiology
WHO Collaborating Centre for Injury Prevention and
Safety Promotion
National Institute of Mental Health & Neuro Sciences
Bangalore-560029, India. e-mail: [email protected]
Suggested Citation
Gururaj G, Kolluri S.V.R, Chandramouli B.A,
Subbakrishna D.K and Kraus JF, "Traumatic Brain Injury",
National Institute of Mental Health & Neuro Sciences,
Publication no. 61, Bangalore - 560029, India. 2005
TraumaticBrainInjury
Page Nos.
Executive Summary
1. Introduction 1
2. Neurotrauma registry: Role and purpose 3
3. The City of Bangalore 5
4. The study centre: NIMHANS 6
4.1 Objectives of Neurotrauma Registry 7
5. Methodology 7
5.1 Phase - I Study 7
5.2 Phase - II Study 9
5.3 Phase - III Study 10
6. Results 11
6.1 Socio-demographic characteristics 12
6.2 Alcohol and TBIs 13
6.3 Causes of TBIs 14
6.4. Road traffic injuries and TBIs 14
6.5. Falls and acquired brain injuries 21
6.6. Violence and Neurotrauma 25
6.7. Prehospital and emergency care 27
6.8. Severity and nature of brain injuries 30
6.9. Management details 30
6.10. Economic aspects of TBIs 33
6.11. Disabilities and Quality of Life (Phase - II study) 33
6.12. Disabilities and Quality of Life (Phase - III Study) 37
7. Implications and emerging Issues 39
8. Epilogue 41
9. Recommendations 42
10. Inputs from project into policies and programmes 48
11. Presentation in National and International meetings 48
12. References 49
13. Annexure
1. Questionnaire 1
2. Questionnaire 2
CONTENTS
T raumatic Brain Injuries (TBIs) are a major public health problem in India, resulting in deaths,
injuries and disabilities of young and productive people of our society. The economic losses to
India are phenomenal, though unmeasured. As India progresses to greater growth and development in
terms of motorization, urbanization, TBIs will increase in India. The recent World Report on Road
Traffic Injury Prevention and The World Report on Violence and Health by World Health Organization
clearly highlight the growing enormity of the problem of injuries across the world and the urgent need
for well designed and evaluated programmes in prevention, management and rehabilitation. Countries
like India have not placed much greater emphasis on prevention.
Any growth, development and progress in every society has to be balanced with appropriate safety
policies and programmes in all areas. The failure to implement several proven countermeasures and
neglect of people’s safety has only resulted in increase of TBIs. Technological advancements in recent
years have clearly reduced the case fatality rates from Injuries and TBIs, especially in Urban India.
However, the problem continues to be high in rural and peripheral areas due to lack of adequate
trauma care. Rehabilitation services are still to reach the vast parts of the country due to lack of
facilities and skilled human resources. Thus, many injured continue to live with disabilities resulting
in increasing socioeconomic burden and poor quality of life. Importance should be given to all three
aspects of brain injuries, namely: prevention, management and rehabilitation, integrated through well-
coordinated activities in a systematic approach. As India has resource limitations in all areas, more
markedly in health care, policy makers and professionals need to identify cost effective means of
developing integrated programmes.
The need for good quality scientific information for policy and programme development needs no
overemphasis. The lack of research and good quality data in India is often a major barrier, as we tend
to undermine the importance of the problem, even though it is a major public health issue. In order to
bridge this gap, the Departments of Epidemiology, Neurosurgery and Biostatistics in collaboration
with The Southern California Injury Prevention Research Center undertook this project over a period of
three and a half years in Bangalore. This first extensive and in-depth study has documented several
epidemiological dimensions of TBIs in India, revealing the enormity of the problem. This understanding
should lead to more research and influence policies across India from several other centers. The efforts
of the research team will be amply rewarded if more focus is laid on strengthening research to place
injuries and TBIs on the public health agenda of our governments. I hope that the coming years will
witness a decline in TBIs in the Indian region.
Dr. D. Nagaraja
Director/Vice-Chancellor
National Institute of Mental Health and Neuro Sciences
Bangalore-560 029, India. March 05, 2005
FOREWORD
C omprehensive research in India in the area of Traumatic Brain Injuries (TBIs) is extremely limited.
Scientific information in this area is vital and a basic prerequisite to understand the enormity of
the problem and its various determinants and various dimensions to formulate, implement and evaluate
programs for reduction of morbidity, mortality, disability and socioeconomic losses in every country.
Earlier research in India has been extremely limited and has been from isolated settings based on
personal areas of interest by individual researchers.
Injuries are a major public health problem today. Injuries and TBIs in India have been increasing
significantly due to rapid motorization, industrialization, migration and changing value systems of
Indian society. The consequences on health are tremendous and have been underestimated due to
absence of research. Apart from instantaneous deaths, the suffering and poor quality of life among
survivors is a living testimony to the impact of TBIs.
Earlier research at NIMHANS has focused on examining epidemiological burden, disabilities and
causation in a limited manner through small-scale independent studies. The need for a well-designed
comprehensive study was felt by the team and also expressed by professionals on several platforms.
The present study was thus conceived and carried out to examine in depth all aspects of TBIs registered
at NIMHANS. The study has adopted well-defined scientific methodologies for measurement and
quantification in several areas. This report summarizes the salient findings from this study to track
events and changes from the time of injury occurrence till 2 years after hospital discharge. The contents
focus on the characteristics of the injured persons, where did it occur? How did it occur?, Why did it
occur ?, nature of prehospital and emergency care, course during hospital stay and nature – impact after
discharge. As hospital based follow-ups were not adequate in terms of coverage, domiciliary interviews
were conducted for in-depth interviews of patients and family members. Broadly, the findings of the
study cover important issues related to prevention, management and rehabilitation along with identifying
new areas for research. The various recommendations placed at the end of the report needs immediate
attention of political leaders, policy makers and professionals.
This publication is also intended to stimulate and encourage research in the area of TBIs in India and
other developing countries. “Accidents are no more accidents”; Unraveling the factors - causes, situations,
circumstances, is crucial to initiate action in a scientific way. This understanding is also crucial to
move from present pessimistic attitudes to more optimistic thinking in the area of prevention and
rehabilitation. We hope that our efforts will be amply rewarded if readers consider promoting and
conducting research in this area along with placing injuries and TBIs on the public health agenda of
their respective communities.
Study team
NIMHANS March 05, 2005
PREFACE
We sincerely acknowledge the support and encouragement from Dr. D. Nagaraja, Director/
Vice-Chancellor, NIMHANS and Dr. M. Gourie-Devi (former Director/Vice-Chancellor,
NIMHANS) in conducting this study. We are highly thankful to Prof. Jess F. Kraus, Director, Southern
California Injury Research Centre and Professor of Epidemiology, UCLA School of Public Health, Los
Angeles, USA, for facilitating this study by providing guidance and financial support for conducting
this study. Our sincere thanks to all the faculty members and residents of the Neurosurgery Department,
Casualty Medical Officers and nursing staff of NIMHANS for extending all cooperation towards this
study. We are deeply indebted to Mr. Joseph and Ms.Maria and their team from the medical records
department of NIMHANS for helping with records on a day to day basis. We also are thankful to
Dr. Suryanarayana SP, Dr. Rajashree Narasimhan, Mr. Ananda, Mr. H.C.S.C.R Reddy and
Mr. Balachandra, Research Officers in the project for diligent and meticulous data collection and data
entry in the entire project. Our thanks go to Mr. Vijendra S. Kargudri for efficient data management in
the study. Thanks to Ms. Beereshwari for contribution towards manuscript development. Thanks are
also to Mr. Ravindranath for language editing of the final report. Finally, we are extremely grateful to
all patients and their family members for cooperation in this study, amidst their pain and suffering.
ACKNOWLEDGMENTS
THANKS
TO
NATIONAL INSTITUTE OF MENTAL HEALTH & NEURO SCIENCES,
BANGALORE, INDIA
and
SOUTHERN CALIFORNIA INJURY PREVENTION RESEARCH CENTRE,
UNIVERSITY OF CALIFORNIA, LOS ANGELES, USA
FOR
FINANCIAL SUPPORT TOWARDS THIS PROJECT
India is facing the triple burden of communicable diseases, non-communicable diseases and injuries.
The number of deaths, hospitalization, disabilities due to injuries has been increasing due to socio-
demographic and epidemiological transition. The unprecedented motorization, urbanization, rapid
industrialization, increasing media penetration across society, changing lifestyles and values of people
along with absence of safety policies and programmes has added further to this Scenario. It is estimated
that nearly 4,50,000 people died due to injuries during 2001 as per official report. As per a recent
report entitled “First India Injury Report: Problem – Solutions”, it is estimated that during 2004 nearly
8,50,000 persons died and 16.5 million were hospitalized due to injuries in India. Among various
injuries, traumatic brain injuries (TBIs) are a leading cause of morbidity, mortality, disability, socio-
economic losses and poor quality of life among survivors. It is estimated that nearly 1 million persons
are injured, 200,000 people die and nearly 1 million require rehabilitation services every year in India.
In the city of Bangalore alone, nearly 10,000 individuals sustain brain injury and more than 1,000 die
every year. The related epidemiological information required for developing programmes in prevention,
management and rehabilitation are not available in India due to lack of systematic research efforts.
The present study undertaken at NIMHANS (National Institute of Mental Health & Neuro Science)
during 2000-03 aimed at bridging this gap by comprehensively examining all major aspects of
Neurotrauma. NIMHANS provides care for nearly 60 - 70% of brain-injured persons in Bangalore city.
7,164 persons were enrolled into a Neurotrauma Registry during the year 2000 at NIMHANS. Trained
research officers undertook data collection from emergency service department of NIMHANS round the
clock using standard and validated instruments. Reliable methodological measures were used for
measuring socioeconomic variables, injury causes (International Classification of Diseases -10th Revision
and International Classification of External Causes of Injuries), severity (Glasgow Coma Scale), outcome
(Glasgow Outcome Scale), disabilities (Modified Barthel’s Index and Glasgow Outcome Scale - Extended
Version) and Quality of Life (WHO Quality Of Life – BREF Version). While Phase–1 study focused on
identifying and measuring all epidemiological correlates in a hospital setting, phases–II and III focused
on identifying disability patterns, extent of socio-economic burden and measuring quality of life. Thus,
all major issues with regard to preventive, managerial, rehabilitative and economic aspects have been
addressed in this study from Bangalore. The scenario is likely to be similar for other Indian cities and
in some of the other developing countries.
The present descriptive summary report provides salient data from the study and future reports will
discuss individual aspects in detail. On an average, 20 - 25 patients are registered every day with a head
injury at NIMHANS and TBIs constituted 39% of total registration during 2000.
� Individuals in the age group of 21 - 35 years were represented to the extent of 40% with children
(< 15 years) and elderly accounting for 20% and 5%, respectively with a male to female ratio of
4:1.
EXECUTIVE SUMMARY
� The majority of those injured were with less than collegiate levels of education, employed in
skilled and unskilled jobs, married and with income levels of < Rs. 3,000 per month.
� Road Traffic Injuries (RTIs) (59%), Falls (25%) and Violence (10%) were the major causes of
neurotrauma.
� RTIs occurred predominantly in the age group of 15 - 40 years, among men and during evenings
and nights (66%). Pedestrians (26%), two-wheeler riders (31%) and pillions (12%) and bicyclists
(8%) were represented in higher numbers. The majority of the RTIs took place in midblocks of
roads (70%). Not wearing helmets, driving under influence of alcohol, over speeding and overtaking,
crossing in the middle of the road were the major behavioural factors. Poor visibility of vehicles
and or roads and mechanical problems of vehicles were responsible for one-third of injuries, road
design and structural issues were responsible for another 30% of TBIs.
� Falls were the second-leading cause (25%), with the majority occurring in children and elderly.
Amongst them domestic falls (57%) were the leading cause followed by falls in public places
(15%). Accidental falls at home (26%), falls from stairs/steps (22%) and fall from building
(14%) were the common pattern of fall injuries.
� Violence/assault (10%) were the third-leading cause, more frequent among men and associated
with use of blunt physical objects.
� Prehospital and emergency care was poor in the areas of - availability of First Aid Services (even
though many had contacted a health care provider, recognition and management of brain injuries
was poor), high referrals from local hospitals (even for injuries which could have been managed
at peripheral levels), safer transportation (ambulances were used only in 25%) and longer interval
between injury and reaching definitive hospital (only 13% within one hour and 40% in one to
three hours).
� In total, 71% of TBIs were mild, 15% moderate and 13% severe in nature based on Glasgow
Coma Scale. Concussions (36%), contusion (32%), skull fractures (12%) and brain haemorrhages
(13%) were the injury patterns. Severe polytrauma was noticed in 22% of total injuries.
� Measurement of outcome based on GOS at hospital discharge time revealed that 5.5% died in
hospital and 4% were discharged in a persistent vegetative state. Severe and moderate disabilities
were observed in 15% and 37%, respectively.
� Various types of disabilities affecting activities of daily living, memory, communication, social
interaction and ability to work were seen in 52% of the patients at hospital discharge time.
� Phase II and III study of the present project (community based follow-up study) focused on
measuring disability patterns, socioeconomic burden and quality of life at 1 and 2 years after
discharge. Nearly 35% had problems in health, social, economic dimensions of life at 1-year
follow-up, while more than 50% of them continued to have problems in similar areas at second
year follow up also. The study has brought out a clear need for well planned and cost effective
rehabilitation services in the city.
� The sudden occurrence of TBIs had placed a major economic burden on individuals and families
to meet costs of hospitalization and rehabilitation. The affected families had to spend resources
(their own or borrowed from external source) to reach definitive hospitals, to take care of injured
person during hospital stay and after discharge. This however excludes expenditure met by the
hospital to provide care as these costs are subsidized in public hospitals. The indirect costs due to
loss of work and income are substantial and are not routinely included in costing exercises. Thus,
the total costs are huge and phenomenal for developing societies.
� The quality of life was poor in nearly 30% of brain-injured persons at two years post discharge.
The study after comprehensively examining all major aspects of neurotrauma has placed several
recommendations for prevention, management and rehabilitation of brain injuries. These
recommendations are based on findings from study, perspectives of professionals and reactions of
survivors and families. Information from project has been freely shared with policymakers, professionals
and public (through press) for bringing in well-organized service and prevention programmes. The
Government of Karnataka should urgently consider implementing the following major interventions
through its member departments with the broader aim of reducing the burden of TBIs. These include:
i) Implementing helmet legislation by immediate notification and strict enforcement;
ii) Reducing drinking and driving by strict enforcement;
iii) Speed control mechanisms within and outside city by engineering and enforcement measures;
iv) Improving pedestrian facilities by engineering solutions;
v) Increasing visibility of vehicles and roads;
vi) Better organization of emergency and prehospital care facilities;
vii) Introducing trauma audits in hospitals;
viii) Strengthening training of doctors and allied personnel in early recognition and management of
brain injured persons;
ix) Improving facilities in taluks and district hospitals (making them as integrated trauma care centres);
and
x) Organization and delivery of rehabilitation services.
Description of these recommendations along with important details can be found at the end of the
report. Needless to say, increasing awareness across society for various measures should be inbuilt into
respective programmes. A greater level of awareness on safety on roads, homes, workplace is very much
required at all levels with development and implementation of safety policies and programmes. This
requires integration and better coordination along with implementation and evaluation of programmes
at all levels. Undoubtedly, this man-made tragedy can be effectively controlled and needs a vision and
mission to act.
1
1Introduction
The demographic, epidemiological and economic transition in India has changed thehealth scenario in a significant way during the last two decades. This shift in health problemsand priorities has brought the entire spectrum of non-communicable diseases and injuries tothe forefront of health care delivery system. Among these emerging problems, man-madeand behavior-linked injuries occupy a significant place. The rapid urbanization,industrialization, motorization and changing lifestyles of individuals have given rise to aplethora of problems, among which injuries top the list. A number of social factorsaccompanying this change like increasing migration, large-scale housing and constructionactivities, economic reforms, increasing import of technology without safety criteria, lack ofsafety measures on road at home and in work and play sites, emerging problem of alcoholand drugs, increasing violence and crime rates and the general absence and disregard tosafety practices at all places has contributed to an alarming increase of injuries. The gradualdecline of communicable diseases and advances in health care technology has also been oneof the factors for the emergence of injuries as a major public health problem. A steep increasein vehicle and human population traversing the adverse road situations has made road trafficinjuries a serious condition. Meagre prehospital care with added delay in emergency carehas only added further to rising mortality and disability rates. The phenomenal increase inmorbidity, mortality, disability and socio-economic impact from injuries, and brain injuriesin particular, during the past decade has been a matter of increasing concern amongprofessionals and policy makers.
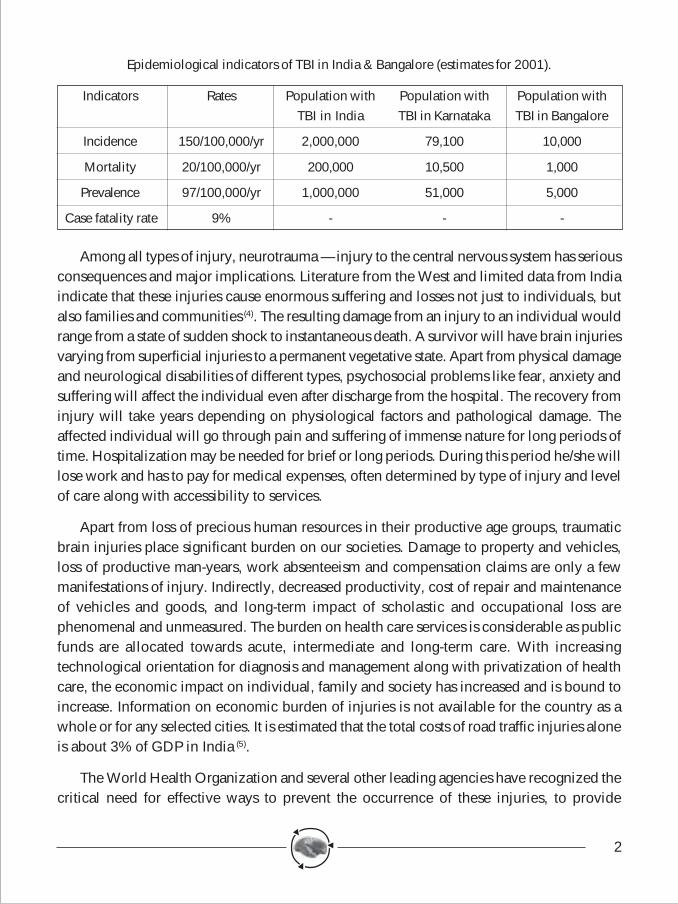
At the global level, it is estimated that the annual incidence and mortality from AcquiredBrain Injury (ABIs) or Traumatic Brain Injuries (TBIs) is 200 and 20 per 1,00,000 per year,respectively (1). National level data in India is not available for traumatic brain injuries as inmany developed countries. The only epidemiological study undertaken in Bangalore by theauthors has revealed that the incidence, mortality and case fatality rates were 150/1,00,000,20/1,00,000 and 10%, respectively(2, 3). At the national level, nearly two million people sustainbrain injuries, 0.2 million loose their lives and nearly a million need rehabilitation servicesevery year. Nearly 10,000 people sustain brain injury every year in the city of Bangalore withmore than 1,000 deaths. The data also showed that the majority of these individuals aremales, in their early years (5 - 44 years) and often involved in road traffic injuries. The survivorsof injuries had various problems in day-to-day life affecting almost every sphere of life. Thestudy also highlighted the lack of comprehensive, integrated, preventive and rehabilitativeprogrammes in the city of Bangalore as noticed in the rest of the country.
2
Epidemiological indicators of TBI in India & Bangalore (estimates for 2001).
Indicators Rates Population with Population with Population withTBI in India TBI in Karnataka TBI in Bangalore
Incidence 150/100,000/yr 2,000,000 79,100 10,000
Mortality 20/100,000/yr 200,000 10,500 1,000
Prevalence 97/100,000/yr 1,000,000 51,000 5,000
Case fatality rate 9% - - -
Among all types of injury, neurotrauma — injury to the central nervous system has seriousconsequences and major implications. Literature from the West and limited data from Indiaindicate that these injuries cause enormous suffering and losses not just to individuals, butalso families and communities (4). The resulting damage from an injury to an individual wouldrange from a state of sudden shock to instantaneous death. A survivor will have brain injuriesvarying from superficial injuries to a permanent vegetative state. Apart from physical damageand neurological disabilities of different types, psychosocial problems like fear, anxiety andsuffering will affect the individual even after discharge from the hospital. The recovery frominjury will take years depending on physiological factors and pathological damage. Theaffected individual will go through pain and suffering of immense nature for long periods oftime. Hospitalization may be needed for brief or long periods. During this period he/she willlose work and has to pay for medical expenses, often determined by type of injury and levelof care along with accessibility to services.
Apart from loss of precious human resources in their productive age groups, traumaticbrain injuries place significant burden on our societies. Damage to property and vehicles,loss of productive man-years, work absenteeism and compensation claims are only a fewmanifestations of injury. Indirectly, decreased productivity, cost of repair and maintenanceof vehicles and goods, and long-term impact of scholastic and occupational loss arephenomenal and unmeasured. The burden on health care services is considerable as publicfunds are allocated towards acute, intermediate and long-term care. With increasingtechnological orientation for diagnosis and management along with privatization of healthcare, the economic impact on individual, family and society has increased and is bound toincrease. Information on economic burden of injuries is not available for the country as awhole or for any selected cities. It is estimated that the total costs of road traffic injuries aloneis about 3% of GDP in India (5).
The World Health Organization and several other leading agencies have recognized thecritical need for effective ways to prevent the occurrence of these injuries, to provide
3
appropriate care for those injured and for rehabilitation of survivors. In order to effectivelyorganize and implement these programmes in an acceptable, cost-effective and sustainablemanner reliable information is required in every country. This is crucial to influencepolicymakers and public health administrators. These programmes require good informationbased on well-designed and scientific epidemiological studies. Information is required onthe number of persons affected, persons at increased risk of injury, nature of external causes,severity of injuries, outcome and impact of traumatic brain injuries for designing andimplementing interventions.
Epidemiology, defined as “the study of distribution and determinants of health and relatedevents in population” and the application of this information for improving health ofcommunities. A major purpose of epidemiologic studies and surveillance is to provideinformation necessary for primary prevention (avoiding the occurrence of injury), secondaryprevention (early diagnosis and treatment) and tertiary prevention (mitigating the sequelae ofinjury and reducing consequent disability). To assess the public health importance of injuriesand to design and implement effective injury prevention programmes, it is necessary to describethe (1) magnitude of the problem (e.g., total number of persons with neurotrauma in terms ofincidence and mortality rates and prevalence of resulting impairments), (2) population athighest risk of injury (varied subgroups in population), (3) causes (external causes andcircumstances of injury) and, (4) severity and outcome (e.g., type of injury, case fatality ratio,patient disposition, resulting disability, cost of care and impact of injuries). Any interventionsdeveloped and implemented in society needs to be evaluated in a scientific way. Thus,descriptive, analytical or interventional studies help in defining the problem and bringing theissue on the public health agenda of individual societies and communities. However, carefulattention has to be paid for case definition, case identification methods, inclusion and exclusioncriteria, and classification methods in any type of study. Epidemiology also has to movebeyond ‘counting heads’ to organizing affordable, cost-effective and sustainable injuryprevention policies and programmes in developing countries.
Neurotrauma epidemiological research is the scientific study of distribution (problem) oftraumatic brain injuries in a given population, their causes and risk factors with the purposeof identifying mechanisms and approaches to prevent (reduce) the occurrence of injuries,reduce severity and to organize need-based rehabilitation services. Establishing neurotraumaregistries in different areas helps in comparing the various dimensions of the problem,developing interventional strategies and to learn success and failures for future remedialmeasures.
4
2Neurotrauma registry: Role and purpose
The use of disease-specific registries in epidemiological research needs no special emphasis.Several registries established in different areas have shown that population based and hospital-based registries are widely accepted and have been of tremendous scope for descriptive,analytical and interventional research, thus contributing for the development of services. Thehospital-based and population-based Cancer Registries in India are classic examples ofregistries and their contribution to cancer prevention and control are well known. To register,means: 'to set down formally in writing, to enter or record in a precise manner'. Brooke in1974 described a registry as availability of uniform information, about individual persons,collected in a systematic manner to serve a predetermined purpose (6). Several uses of aregistry are: (1) Identification of individuals; (2) Immediate protection of an individual; (3)Surveillance purposes, (4) Treatment evaluation and (5) Service evaluation (7).
A Neurotrauma Registry provides detailed description on various components ofneurotrauma. Two major issues to be kept in mind are systematic data collection activitiesbased on uniform set of data from all registered cases, and keeping the registry sensitive (notto miss out subjects with TBI) and specific (to exclude non TBI subjects). This would ensureenrolling all TBI subjects in a given hospital. Thus, a neurotrauma register provides detaileddescription of all individuals sustaining a TBI during a given period (beginning with a date) ina defined population, the major demographic features of which are known and representativeof the selected population.
The criteria of a neurotrauma registry are:-
1) Uniform definition
2) Inclusion of all subjects with a TBI in a defined area
3) Case identification from multiple sources
4) Case evaluation by a trained team
5) Consistency in diagnosis
6) Established classification methods.
Employing these criteria will help in strengthening data-collection procedures and bringuniformity across centres or even within one centre. These issues will be elaborated furtherin subsequent sections of this report. This essentially amounts to adopting objective diagnosticcriteria, objective diagnostic evaluation, uniformity in information gathering by all personsinvolved and data pooling on a prospective basis. It is essential to note that case definition;
5
methods of case ascertainment and procedures of classification remain uniform throughoutthe operation of a registry. If changes are made, special care should be taken in documentingthese changes and appropriate provisions are made in analysis and interpretation of data.
A neurotrauma registry serves different purposes. Some of the important uses are listedbelow:
a) If established in a defined geographical area and all subjects with TBI are included,The registry reveal vital data on morbidity, mortality and disability rates (Incidence,fatality and disability rates).
b) The registry can identify major causes, pattern and mode of injury occurrence in sub-categories of injured persons, thus identifying "Population at risk".
c) It improves diagnostic accuracy as all subjects are weighed in comparison with goldstandard.
d) Registry helps in identifying and establishing association of number of health conditionsassociated with neurotrauma, specially in establishing cause-effect associations overa period of time (e.g.: Epilepsy and TBI's).
e) The registry is continued over a period of time, will reveal temporal changes inoccurrence and pattern of neurotrauma.
f) Since much of the information will be gathered in a registry, it can serve as a basicground tool for clinical and intervention trials. It would highlight how much changehas been brought about by an intervention.
g) The registry brings out problems in diagnostic classification with every chance ofimproving the same in future.
h) The registry helps in developing and understanding prognosis in neurotraumamanagement and in anticipating future risks.
i) Information from a neurotrauma registry will ultimately reveal the socioeconomicburden and health needs of a community. Once again, this will help in creatingawareness among policy makers and public to place neurotrauma prevention highon the public health agenda.
For a neurotrauma registry to be effective, "Quality Control" is the key word. Qualitycontrol process must be inbuilt and must be known and followed by all members of theteam. There should also be some hidden checks to test internal validity. An "OperationalManual" must be developed at the beginning of study for uniformity of procedures. This
6
manual should highlight case definition, inclusion and exclusion criteria, definition of variousterms, ways of collecting information, checking for information from other sources, codingprocedures and other aspects. This manual should be used for training of all personnel in aregistry. It should also highlight computerization process and data management along withsteps in data analysis and report development. While this will ensure reliability and uniformityin data collection and computerization, it will also improve timeliness of work components,reliability of reports, smooth running of a registry and greater utilization of data; thus bringingincreasing participation and satisfaction among all team members. The contents of the manualshould lay down a 'step-by-step approach' of various mechanisms, variable definition codingand entry of proformas in a registry. The manual should be piloted and updated as and whenchanges and revisions are made in the study. Apart from adhering to the instructions in themanual, "monitoring and supervising" by other members of the team is crucial for the successof a registry. The supervisory staff should look for whether all cases of TBI and Spinal CordInjury (SCI) have been included, whether training imparted is adequate? whether interviewsin emergency services, wards, and rehabilitation units are satisfactory? whether proformaentries are correct? whether coding has been done as per specifications? Check whether anyblank columns have been encountered? etc.,
A neurotrauma registry assumes that all individuals with a traumatic brain injury will becovered from a defined geographical area. But in many countries and in cities, there will bemultiple caregivers. It is essential, therefore, to include all centres. Nevertheless, registriescan be developed in individual institutions. As per our earlier study (2), it was established thatnearly 70% of brain injured persons receive care from National Institute of Mental HealthAnd Neuro Sciences (NIMHANS) in the city of Bangalore. Hence, it was decided to set upthe registry at NIMHANS. A registry by covering a defined geographical area will berepresentative of the population it is covering and data must be used for all activities in thatarea.
3The City of Bangalore
In recent years, the city of Bangalore has been acclaimed as one of the 10 new high-techcities in the world as per many media surveys. The city of Bangalore with a population of 5.8million, spread over 451 km2., is an emerging hub of social, economic and technologicalrevolution in India. The city has been recording an unprecedented increase of population,industrialization, urbanization, and migration of families from rural areas to city along withthe ongoing socio-demographic and epidemiological transition. An accompanying effect of
7
these changes has been an increase of social, economic and health problems in the city. Inthis changing scenario, injuries and traumatic brain injuries have emerged as a leading publichealth problem in Bangalore and Karnataka. Not a single day passes in the life of peoplewithout reading or hearing about these injuries.
Bangalore urban district had a decennial growth rate of 21% during 1991-01(8). The cityhas a population density of 2204/sq.km. (average for Karnataka state - 234/sq.km.). The maleto female ratio as per the latest census was 960 females per 1000 males. The literacy level ofthe population was 66% (males 72% and females 60%).
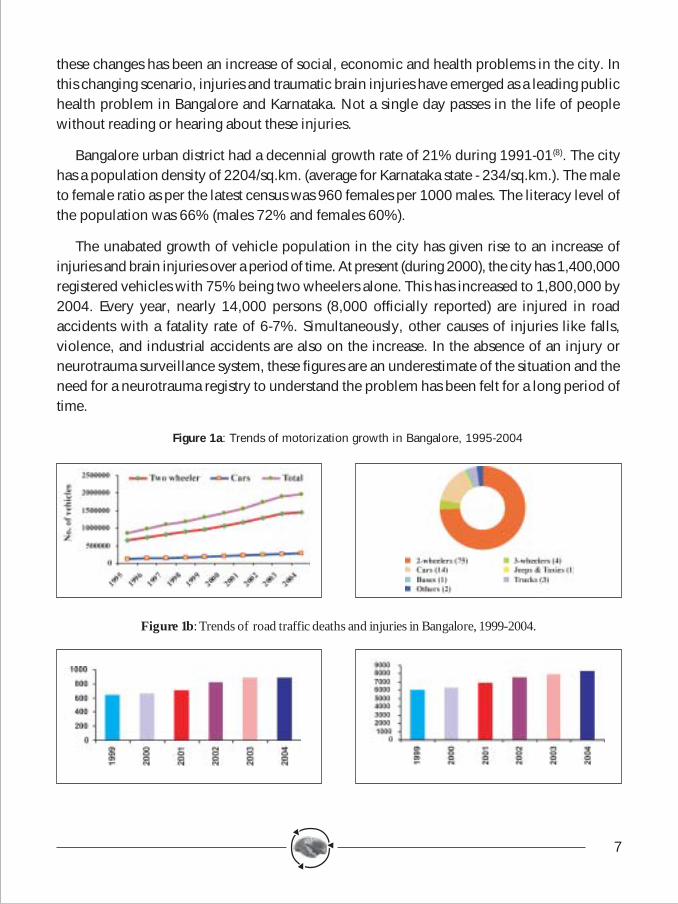
The unabated growth of vehicle population in the city has given rise to an increase ofinjuries and brain injuries over a period of time. At present (during 2000), the city has 1,400,000registered vehicles with 75% being two wheelers alone. This has increased to 1,800,000 by2004. Every year, nearly 14,000 persons (8,000 officially reported) are injured in roadaccidents with a fatality rate of 6-7%. Simultaneously, other causes of injuries like falls,violence, and industrial accidents are also on the increase. In the absence of an injury orneurotrauma surveillance system, these figures are an underestimate of the situation and theneed for a neurotrauma registry to understand the problem has been felt for a long period oftime.
Figure 1a: Trends of motorization growth in Bangalore, 1995-2004
Figure 1b: Trends of road traffic deaths and injuries in Bangalore, 1999-2004.
8
4The study centre: NIMHANS
NIMHANS is a premier institution in India and South East Asia, recognized for itscontributions in service, training and research in the area of mental health and neuro sciences,and also traumatic brain injuries. Since 1994, the institute has been working as a deemeduniversity even though it is 50 years old in its existence. A multidisciplinary integrated approachis the mainstay of this institute. The institute provides services for a large number of patientsfrom within and outside the state of Karnataka. A large number of trainees also come fromoutside the state and India as part of the training programmes sponsored by various agencies.Research projects with support from various bodies of the Government of India, WHO,UNICEF and other agencies on a number of topics are under progress.
Services for neurotrauma patients are provided on various fronts. A well equipped andhygienic casualty department, modern radiological and laboratory facilities, state-of-the-artoperating theatres, short-stay and long-stay admission facilities, regularly run outpatientservices, a post-trauma clinic on every Tuesday, rehabilitation services along with committedstaff are the hallmarks of patient care features. The Neurosurgical Department providescontinuous care for trauma patients on a 24-hour basis with supportive inputs from casualtystaff in the Emergency Service Department. Patients from Bangalore, other parts of Karnatakaand India are the regular beneficiaries of these services.
Research in the area of neurotrauma has continued on focused clinical questions and alsoon major public health issues. The Departments of Epidemiology and Neurosurgery haveundertaken various studies in focused areas of TBIs. Some of these studies have paved theway for formulation of policies and programmes, increasing public awareness, developingnew action plans and for placing neurotrauma on the public health agenda. However, previousstudies have been of a shorter duration and on a limited number of subjects. Hence, it wasdecided to establish a "Neurotrauma Registry" at NIMHANS to examine the problem of TBIin a comprehensive manner from all angles. The registry has helped in bridging the gap inour understanding of neurotrauma and to develop data required for prevention, managementand rehabilitation. The findings will also be used to make inputs for various policies andprogrammes in the long run. Further, information generated at NIMHANS will also be areflection of the situation in other cities of India and other developing countries as well.
4.1 Objectives of Neurotrauma Registry
The aim of developing neurotrauma registry at NIMHANS was to collect comprehensiveand vital information from all subjects with TBI seeking help from NIMHANS. The specific
9
objectives were to identify the
1. Proportional morbidity, mortality and case fatality rates for TBIs at NIMHANS.
2. Magnitude and role of various external causes and risk factors in the occurrenceof TBIs.
3. Pattern and pathways of prehospital and emergency care.
4. Nature of interventions among hospital registered and admitted subjects.
5. Various disabilities among subjects with TBI at the time of hospital discharge and atfollow-up periods of one year and two years.
6. Economic impact of TBI from a sample of total patients.
5Methodology
5.1 Phase-I Study
The current project was undertaken at NIMHANS during the period March 2000 to March2003, over a period of three years. The research team was led by an epidemiologist, 2Neurosurgeons and a Biostatistician. The entire Department of Neurosurgery including allclinical staff and those from the associated departments of radiology, neurology and otherdepartments participated in the study. An operation manual was developed at the beginningof the study, which was adopted during the entire study period to maintain uniformity in datacollection procedures(9) (available on request)
During the study period, a total of 7,164 head injury patients were registered at NIMHANS.The Emergency Service Division was covered round-the-clock by a team of three trainedresearch officers. The research officers were trained at the beginning of the study on all studycomponents in a detailed manner. The focus of training was on theoretical aspects, importanceof conducting research, concept of neurotrauma registry, detailed description of variables inthe proforma and scope of the study. The physiological aspects of brain functioning and itsimportance, various causes of brain injury in the community, mechanisms of brain injury,methods of presentation of brain-injured persons, precautions to be taken at the time of datacollection, data entry, data coding and cross verification techniques were explained. A seriesof practical training sessions were undertaken in the beginning to familiarize the investigatorsin the art and science of data collection. Inter and Intra-observer variations were kept to aminimum and the entire data collection methodology was standardized at the beginning ofthe study. Information was collected from patients/family members/ relatives/police during
10
their time of hospital stay depending on the status of the patient and availability of anaccompanying person.
Informed consent was obtained from patients and their families for participating in thestudy after explaining the nature of the study. Those unwilling to participate, uncooperativeand not being able to answer were not included in the study. Preference was given tomanagement of patients and data collection was undertaken subsequentto patient care. All information was kept confidential and not disclosed to any persons.
A case of traumatic brain injury for the purpose of this study (10) was defined as "Anoccurrence of injury to the head (arising from blunt or penetrating trauma or from acceleration-deceleration forces) by an external agent with at least one of the following:
a) Observed or self-reported alteration of consciousness or amnesia due to headtrauma, and/or,
b) Neurological or neuropsychological changes (determined from neurologic andneuropsychological examinations) or diagnosis of skull fracture or intracranial lesions(determined from radiological examination or other neuro-diagnostic procedures) that couldbe attributed to head trauma and/or,
c) Occurrence of death resulting from trauma with head injury or traumatic brain injurylisted on the Death Certificate, Autopsy Report, or Medical Examiner's Report in thesequence of conditions that resulted in death."
The clinical definition of TBI excludes (1) lacerations, avulsions or concussion of face,eye, ear, scalp or forehead without the other criteria listed above; 2) fractures of facial boneswithout the other criteria listed above; 3) birth trauma; 4) cerebral anoxia that is not acomplication of brain trauma; 5) inflammatory infarction, toxic or metabolic encephalopathythat are not complications of brain trauma; 6) neoplasm; 7) brain infarction (stroke) or intra-cranial hemorrhage without associated trauma.
A case of spinal cord injury was defined as acute traumatic lesion of neural elements inthe spinal canal (spinal cord and cauda equina) resulting in temporary or permanent sensorydeficit, or autonomic dysfunctions. These deficits or dysfunctions may be incomplete orcomplete.
Specially designed, pre-tested and pre-coded proforma was developed for the study. Thisinstrument was validated at the beginning of the study and changes were made prior to thebeginning of the study. The areas of information gathering were identification and socio-demographic characteristics; risk factors specially history of alcohol consumption, cause of
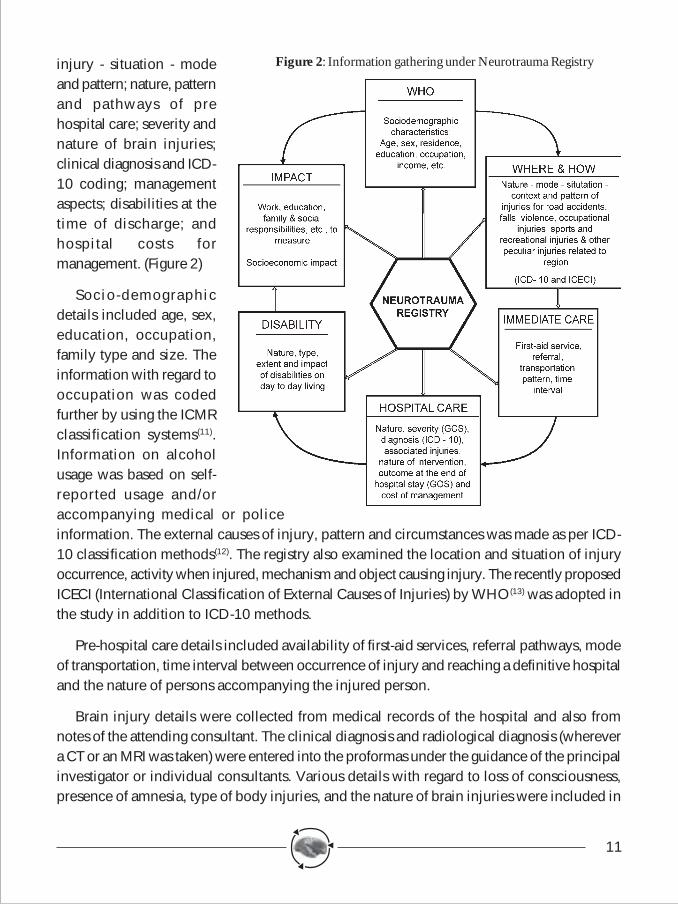
11
injury - situation - modeand pattern; nature, patternand pathways of prehospital care; severity andnature of brain injuries;clinical diagnosis and ICD-10 coding; managementaspects; disabilities at thetime of discharge; andhospital costs formanagement. (Figure 2)
Socio-demographicdetails included age, sex,education, occupation,family type and size. Theinformation with regard tooccupation was codedfurther by using the ICMRclassification systems(11).Information on alcoholusage was based on self-reported usage and/oraccompanying medical or policeinformation. The external causes of injury, pattern and circumstances was made as per ICD-10 classification methods(12). The registry also examined the location and situation of injuryoccurrence, activity when injured, mechanism and object causing injury. The recently proposedICECI (International Classification of External Causes of Injuries) by WHO(13) was adopted inthe study in addition to ICD-10 methods.
Pre-hospital care details included availability of first-aid services, referral pathways, modeof transportation, time interval between occurrence of injury and reaching a definitive hospitaland the nature of persons accompanying the injured person.
Brain injury details were collected from medical records of the hospital and also fromnotes of the attending consultant. The clinical diagnosis and radiological diagnosis (wherevera CT or an MRI was taken) were entered into the proformas under the guidance of the principalinvestigator or individual consultants. Various details with regard to loss of consciousness,presence of amnesia, type of body injuries, and the nature of brain injuries were included in
Figure 2: Information gathering under Neurotrauma Registry
12
data collection systems. The clinical diagnosis was made based on ICD-10 classificationsystems. The severity of brain injury was assessed based on Glasgow Coma Scale (14).Abbreviated Injury Scale (15) was used to classify all injuries. The Injury Severity Scale foreach subject was developed based on the AIS.
Management details with regard to emergency care, medical or surgical care wasdocumented for each patient based on the intervention followed at NIMHANS. The durationof hospital stay was also taken from hospital records.
The economic aspects (the cost of managing a head injury patient in emergency medicalservices of NIMHANS) were calculated in a systematic way by including direct and indirecthospital costs.
All subjects were evaluated at hospital discharge time with Glasgow Outcome Scale(16).The disability assessment was undertaken for all severe, moderate and mild brain injurysubjects with the help of modified Barthel's Index (17).
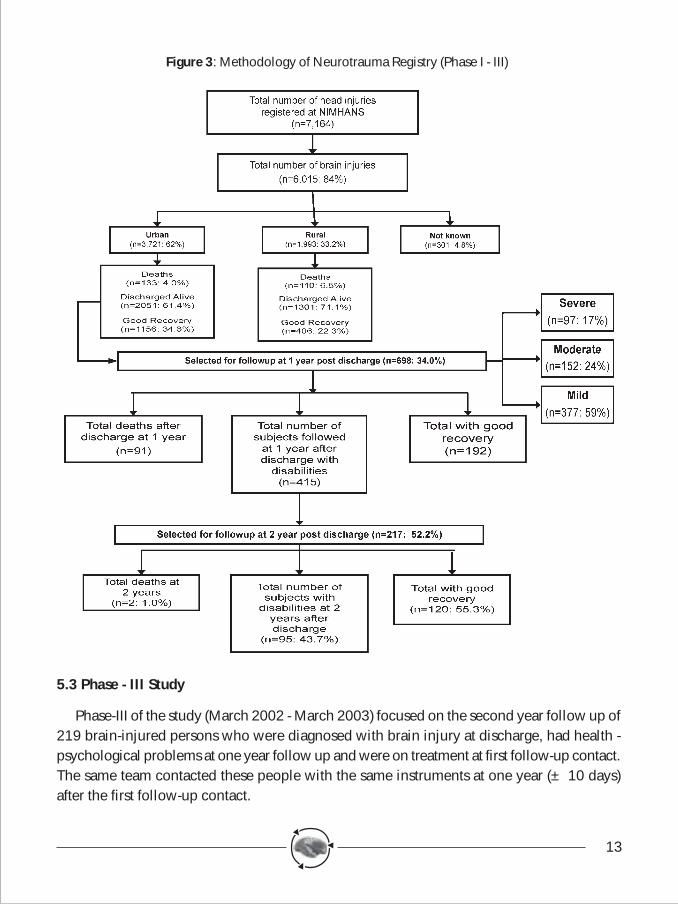
Thus during the period March 2000 - March 2001, a total of 7,164 patients were registeredand were enrolled into the Neurotrauma Registry at NIMHANS.
5.2 Phase-II Study
The Phase-II Study (March 2001 - March 2002) focused on measuring disabilities, identifyingsocio-economic burden and specifying the quality of life among brain injured persons. Thesubjects were identified based on the criteria of (i) discharged alive with a diagnosis of braininjury and (ii) resident of the city of Bangalore. All subjects with a diagnosis of serious braininjury (GCS < 8), 50% of those with a moderate brain injury (GCS 9-12) and 10% of mildbrain injuries (GCS>13) were recruited for the second phase of study.
A total of 698 patients qualifying under these criteria were contacted one-year (± 10days) post discharge. Letters were mailed and telephone contacts were established at thebeginning and were requested to come to NIMHANS. Since the response was not satisfactory(only 13%), it was decided to undertake domiciliary visits by the team of trained researchofficers. The disability and impact of TBIs were evaluated with the modified version of GOS- extended version(18). The socioeconomic burden was assessed with the scale developed byPai and Kapur at NIMHANS. The impact of brain injury on the individual and family wasassessed in the areas of activity in daily living, communication, social interaction, familyburden, family responsibility and economic impact. World Health Organization - Quality ofLife (BREF Version) was used to assess quality of life(19). (Figure 3)
13
5.3 Phase - III Study
Phase-III of the study (March 2002 - March 2003) focused on the second year follow up of219 brain-injured persons who were diagnosed with brain injury at discharge, had health -psychological problems at one year follow up and were on treatment at first follow-up contact.The same team contacted these people with the same instruments at one year (± 10 days)after the first follow-up contact.
Figure 3: Methodology of Neurotrauma Registry (Phase I - III)
14
The economic impact was assessed by both direct and indirect methods. The cost ofmanaging head injury patients at NIMHANS was a comprehensive method by focusing onexpenditure incurred towards manpower, equipment, basic infrastructure and maintenancecosts. From the families, expenditure incurred till reaching the hospital, during the course ofhospital stay and during follow-up periods after discharge from the hospital was collectedsystematically.
The entire data collection at different stages of the project was monitored on a day-to-daybasis by the principal investigator. Mechanisms were set up for daily, weekly and monthlyreview of the progress of activities by the entire team. All data collected from a total of 7164patients was checked for completeness, accuracy and coding. Data analysis was undertakenusing the EPI-INFO Version 6(21).
The present report is descriptive in nature highlighting salient findings from the study onvital aspects of major importance. The available data would be analyzed in depth in a stratifiedmanner on various aspects of traumatic brain injuries in a rapidly developing city of India indue course of time.
6Results
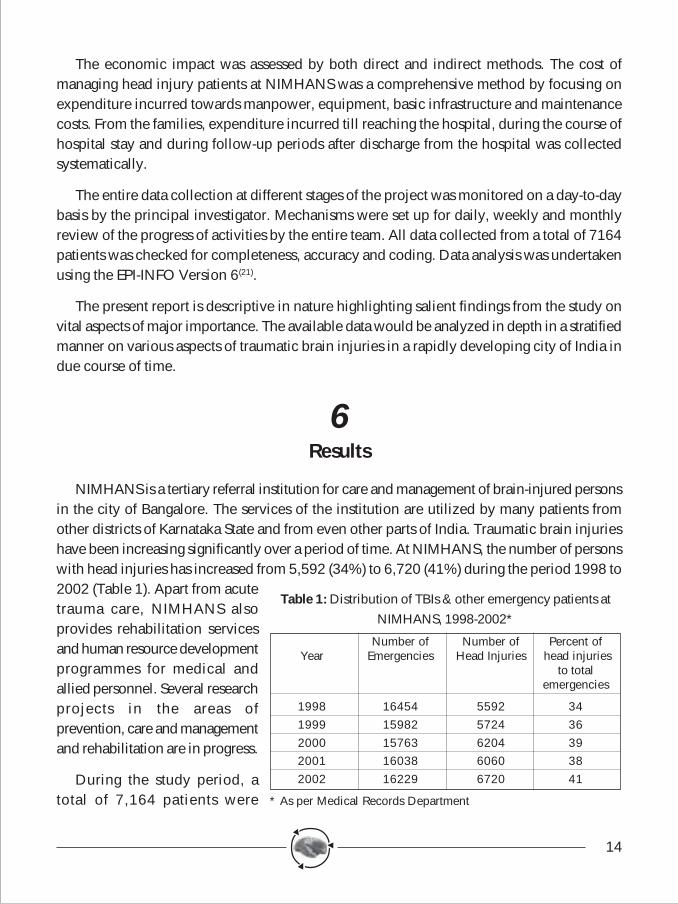
NIMHANS is a tertiary referral institution for care and management of brain-injured personsin the city of Bangalore. The services of the institution are utilized by many patients fromother districts of Karnataka State and from even other parts of India. Traumatic brain injurieshave been increasing significantly over a period of time. At NIMHANS, the number of personswith head injuries has increased from 5,592 (34%) to 6,720 (41%) during the period 1998 to2002 (Table 1). Apart from acutetrauma care, NIMHANS alsoprovides rehabilitation servicesand human resource developmentprogrammes for medical andallied personnel. Several researchprojects in the areas ofprevention, care and managementand rehabilitation are in progress.
During the study period, atotal of 7,164 patients were
Number of Number of Percent ofYear Emergencies Head Injuries head injuries
to totalemergencies
1998 16454 5592 341999 15982 5724 362000 15763 6204 392001 16038 6060 382002 16229 6720 41
* As per Medical Records Department
Table 1: Distribution of TBIs & other emergency patients atNIMHANS, 1998-2002*
15
registered in the emergency and casualty divisions ofNIMHANS. As mentioned under methodology, informationwas collected from all patients seen in the institution. However,in some instances, information was not available due tounconscious status of patients, attendants not being available,immediate referral of patients to other hospitals, immediatereferral of patients for investigations like CT, MRI and others,patients brought by police in hit-and-run injuries and non-cooperation of the patients.
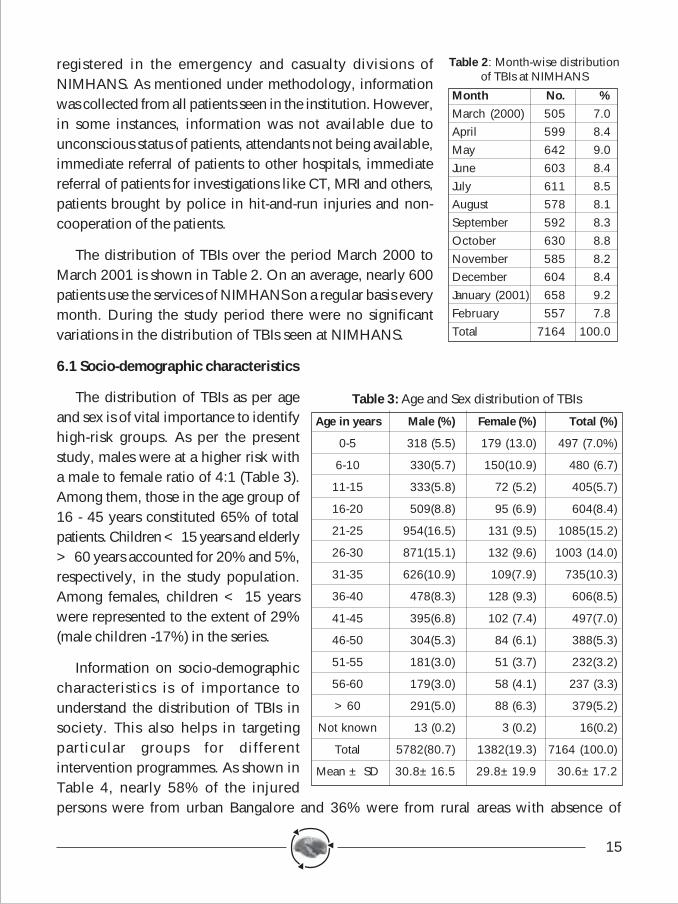
The distribution of TBIs over the period March 2000 toMarch 2001 is shown in Table 2. On an average, nearly 600patients use the services of NIMHANS on a regular basis everymonth. During the study period there were no significantvariations in the distribution of TBIs seen at NIMHANS.
6.1 Socio-demographic characteristics
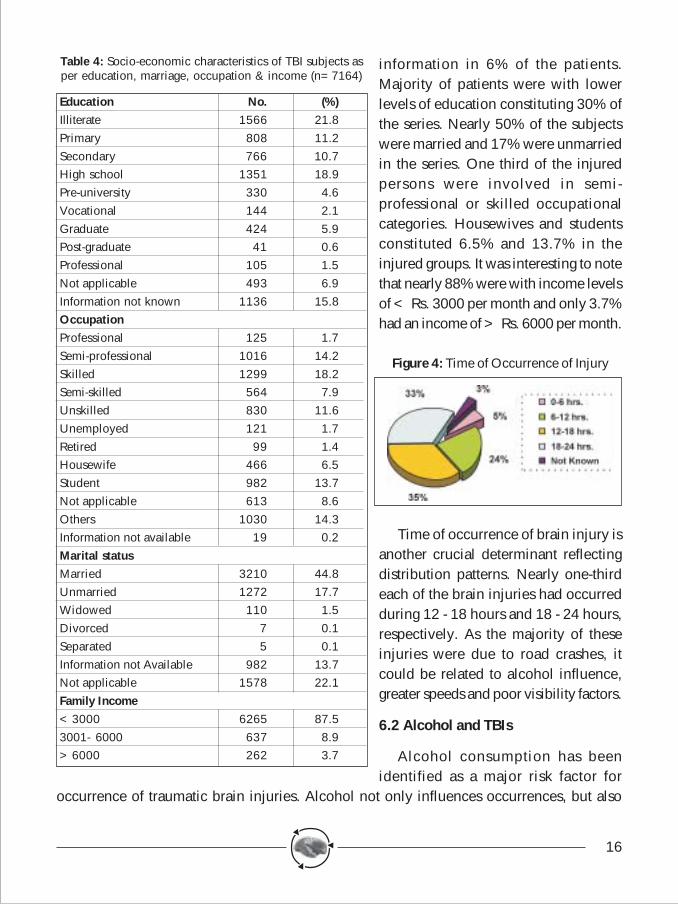
The distribution of TBIs as per ageand sex is of vital importance to identifyhigh-risk groups. As per the presentstudy, males were at a higher risk witha male to female ratio of 4:1 (Table 3).Among them, those in the age group of16 - 45 years constituted 65% of totalpatients. Children < 15 years and elderly> 60 years accounted for 20% and 5%,respectively, in the study population.Among females, children < 15 yearswere represented to the extent of 29%(male children -17%) in the series.
Information on socio-demographiccharacteristics is of importance tounderstand the distribution of TBIs insociety. This also helps in targetingparticular groups for differentintervention programmes. As shown inTable 4, nearly 58% of the injuredpersons were from urban Bangalore and 36% were from rural areas with absence of
Table 2: Month-wise distributionof TBIs at NIMHANS
Month No. %March (2000) 505 7.0April 599 8.4May 642 9.0June 603 8.4July 611 8.5August 578 8.1September 592 8.3October 630 8.8November 585 8.2December 604 8.4January (2001) 658 9.2February 557 7.8Total 7164 100.0
Table 3: Age and Sex distribution of TBIs
Age in years Male (%) Female (%) Total (%)
0-5 318 (5.5) 179 (13.0) 497 (7.0%)
6-10 330(5.7) 150(10.9) 480 (6.7)
11-15 333(5.8) 72 (5.2) 405(5.7)
16-20 509(8.8) 95 (6.9) 604(8.4)
21-25 954(16.5) 131 (9.5) 1085(15.2)
26-30 871(15.1) 132 (9.6) 1003 (14.0)
31-35 626(10.9) 109(7.9) 735(10.3)
36-40 478(8.3) 128 (9.3) 606(8.5)
41-45 395(6.8) 102 (7.4) 497(7.0)
46-50 304(5.3) 84 (6.1) 388(5.3)
51-55 181(3.0) 51 (3.7) 232(3.2)
56-60 179(3.0) 58 (4.1) 237 (3.3)
>60 291(5.0) 88 (6.3) 379(5.2)
Not known 13 (0.2) 3 (0.2) 16(0.2)
Total 5782(80.7) 1382(19.3) 7164 (100.0)
Mean ± SD 30.8±16.5 29.8±19.9 30.6±17.2
16
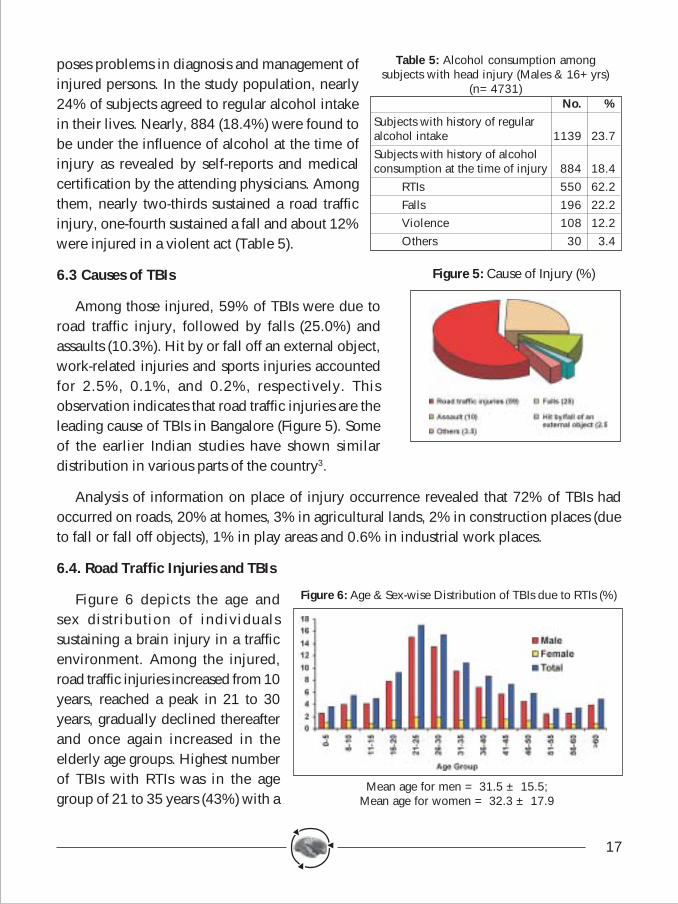
information in 6% of the patients.Majority of patients were with lowerlevels of education constituting 30% ofthe series. Nearly 50% of the subjectswere married and 17% were unmarriedin the series. One third of the injuredpersons were involved in semi-professional or skilled occupationalcategories. Housewives and studentsconstituted 6.5% and 13.7% in theinjured groups. It was interesting to notethat nearly 88% were with income levelsof < Rs. 3000 per month and only 3.7%had an income of > Rs. 6000 per month.
Time of occurrence of brain injury isanother crucial determinant reflectingdistribution patterns. Nearly one-thirdeach of the brain injuries had occurredduring 12 - 18 hours and 18 - 24 hours,respectively. As the majority of theseinjuries were due to road crashes, itcould be related to alcohol influence,greater speeds and poor visibility factors.
6.2 Alcohol and TBIs
Alcohol consumption has beenidentified as a major risk factor for
occurrence of traumatic brain injuries. Alcohol not only influences occurrences, but also
Table 4: Socio-economic characteristics of TBI subjects asper education, marriage, occupation & income (n=7164)
Education No. (%)Illiterate 1566 21.8Primary 808 11.2Secondary 766 10.7High school 1351 18.9Pre-university 330 4.6Vocational 144 2.1Graduate 424 5.9Post-graduate 41 0.6Professional 105 1.5Not applicable 493 6.9Information not known 1136 15.8OccupationProfessional 125 1.7Semi-professional 1016 14.2Skilled 1299 18.2Semi-skilled 564 7.9Unskilled 830 11.6Unemployed 121 1.7Retired 99 1.4Housewife 466 6.5Student 982 13.7Not applicable 613 8.6Others 1030 14.3Information not available 19 0.2Marital statusMarried 3210 44.8Unmarried 1272 17.7Widowed 110 1.5Divorced 7 0.1Separated 5 0.1Information not Available 982 13.7Not applicable 1578 22.1Family Income<3000 6265 87.53001- 6000 637 8.9>6000 262 3.7
Figure 4: Time of Occurrence of Injury
17
poses problems in diagnosis and management ofinjured persons. In the study population, nearly24% of subjects agreed to regular alcohol intakein their lives. Nearly, 884 (18.4%) were found tobe under the influence of alcohol at the time ofinjury as revealed by self-reports and medicalcertification by the attending physicians. Amongthem, nearly two-thirds sustained a road trafficinjury, one-fourth sustained a fall and about 12%were injured in a violent act (Table 5).
6.3 Causes of TBIs
Among those injured, 59% of TBIs were due toroad traffic injury, followed by falls (25.0%) andassaults (10.3%). Hit by or fall off an external object,work-related injuries and sports injuries accountedfor 2.5%, 0.1%, and 0.2%, respectively. Thisobservation indicates that road traffic injuries are theleading cause of TBIs in Bangalore (Figure 5). Someof the earlier Indian studies have shown similardistribution in various parts of the country3.
Analysis of information on place of injury occurrence revealed that 72% of TBIs hadoccurred on roads, 20% at homes, 3% in agricultural lands, 2% in construction places (dueto fall or fall off objects), 1% in play areas and 0.6% in industrial work places.
6.4. Road Traffic Injuries and TBIs
Figure 6 depicts the age andsex distribution of individualssustaining a brain injury in a trafficenvironment. Among the injured,road traffic injuries increased from 10years, reached a peak in 21 to 30years, gradually declined thereafterand once again increased in theelderly age groups. Highest numberof TBIs with RTIs was in the agegroup of 21 to 35 years (43%) with a
Table 5: Alcohol consumption amongsubjects with head injury (Males & 16+yrs)
(n=4731)No. %
Subjects with history of regularalcohol intake 1139 23.7Subjects with history of alcoholconsumption at the time of injury 884 18.4
RTIs 550 62.2Falls 196 22.2Violence 108 12.2Others 30 3.4
Figure 5: Cause of Injury (%)
Figure 6: Age & Sex-wise Distribution of TBIs due to RTIs (%)
Mean age for men = 31.5 ± 15.5;Mean age for women = 32.3 ± 17.9
18
Table 6: Socio-demographic characteristics of RTIsubjects as per occupational, educational,
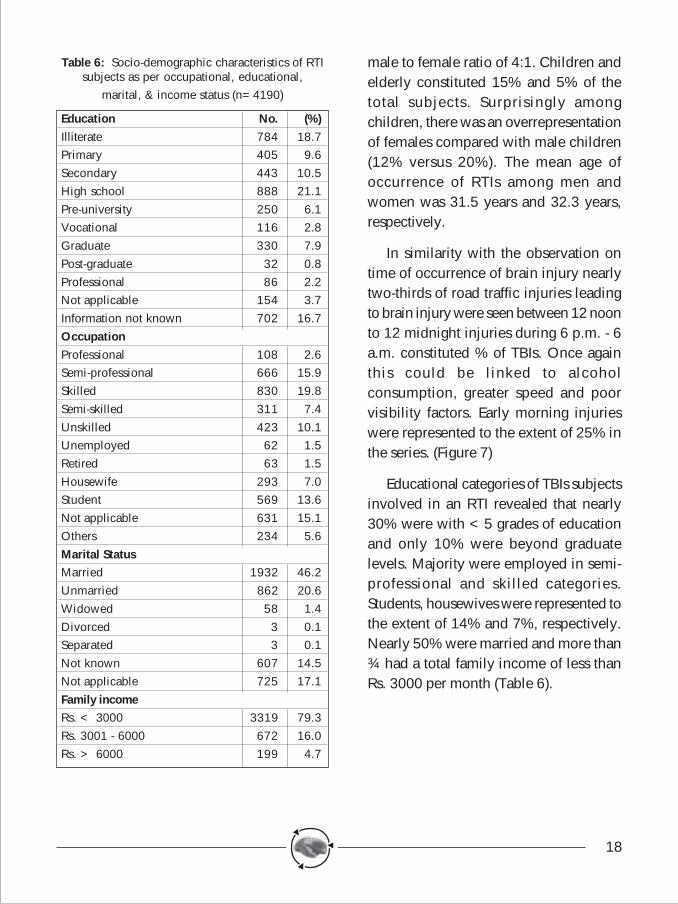
marital, & income status (n=4190)
Education No. (%)Illiterate 784 18.7Primary 405 9.6Secondary 443 10.5High school 888 21.1Pre-university 250 6.1Vocational 116 2.8Graduate 330 7.9Post-graduate 32 0.8Professional 86 2.2Not applicable 154 3.7Information not known 702 16.7OccupationProfessional 108 2.6Semi-professional 666 15.9Skilled 830 19.8Semi-skilled 311 7.4Unskilled 423 10.1Unemployed 62 1.5Retired 63 1.5Housewife 293 7.0Student 569 13.6Not applicable 631 15.1Others 234 5.6Marital StatusMarried 1932 46.2Unmarried 862 20.6Widowed 58 1.4Divorced 3 0.1Separated 3 0.1Not known 607 14.5Not applicable 725 17.1Family incomeRs. < 3000 3319 79.3Rs. 3001 - 6000 672 16.0Rs. > 6000 199 4.7
male to female ratio of 4:1. Children andelderly constituted 15% and 5% of thetotal subjects. Surprisingly amongchildren, there was an overrepresentationof females compared with male children(12% versus 20%). The mean age ofoccurrence of RTIs among men andwomen was 31.5 years and 32.3 years,respectively.
In similarity with the observation ontime of occurrence of brain injury nearlytwo-thirds of road traffic injuries leadingto brain injury were seen between 12 noonto 12 midnight injuries during 6 p.m. - 6a.m. constituted % of TBIs. Once againthis could be linked to alcoholconsumption, greater speed and poorvisibility factors. Early morning injurieswere represented to the extent of 25% inthe series. (Figure 7)
Educational categories of TBIs subjectsinvolved in an RTI revealed that nearly30% were with <5 grades of educationand only 10% were beyond graduatelevels. Majority were employed in semi-professional and skilled categories.Students, housewives were represented tothe extent of 14% and 7%, respectively.Nearly 50% were married and more than¾ had a total family income of less thanRs. 3000 per month (Table 6).
19
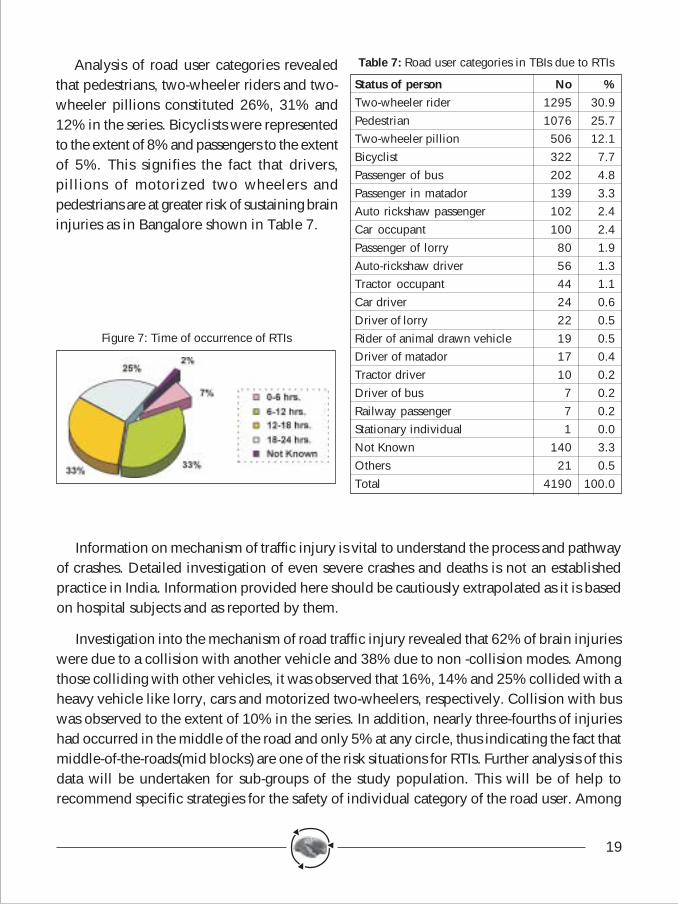
Table 7: Road user categories in TBIs due to RTIs
Status of person No %Two-wheeler rider 1295 30.9Pedestrian 1076 25.7Two-wheeler pillion 506 12.1Bicyclist 322 7.7Passenger of bus 202 4.8Passenger in matador 139 3.3Auto rickshaw passenger 102 2.4Car occupant 100 2.4Passenger of lorry 80 1.9Auto-rickshaw driver 56 1.3Tractor occupant 44 1.1Car driver 24 0.6Driver of lorry 22 0.5Rider of animal drawn vehicle 19 0.5Driver of matador 17 0.4Tractor driver 10 0.2Driver of bus 7 0.2Railway passenger 7 0.2Stationary individual 1 0.0Not Known 140 3.3Others 21 0.5Total 4190 100.0
Analysis of road user categories revealedthat pedestrians, two-wheeler riders and two-wheeler pillions constituted 26%, 31% and12% in the series. Bicyclists were representedto the extent of 8% and passengers to the extentof 5%. This signifies the fact that drivers,pillions of motorized two wheelers andpedestrians are at greater risk of sustaining braininjuries as in Bangalore shown in Table 7.
Figure 7: Time of occurrence of RTIs
Information on mechanism of traffic injury is vital to understand the process and pathwayof crashes. Detailed investigation of even severe crashes and deaths is not an establishedpractice in India. Information provided here should be cautiously extrapolated as it is basedon hospital subjects and as reported by them.
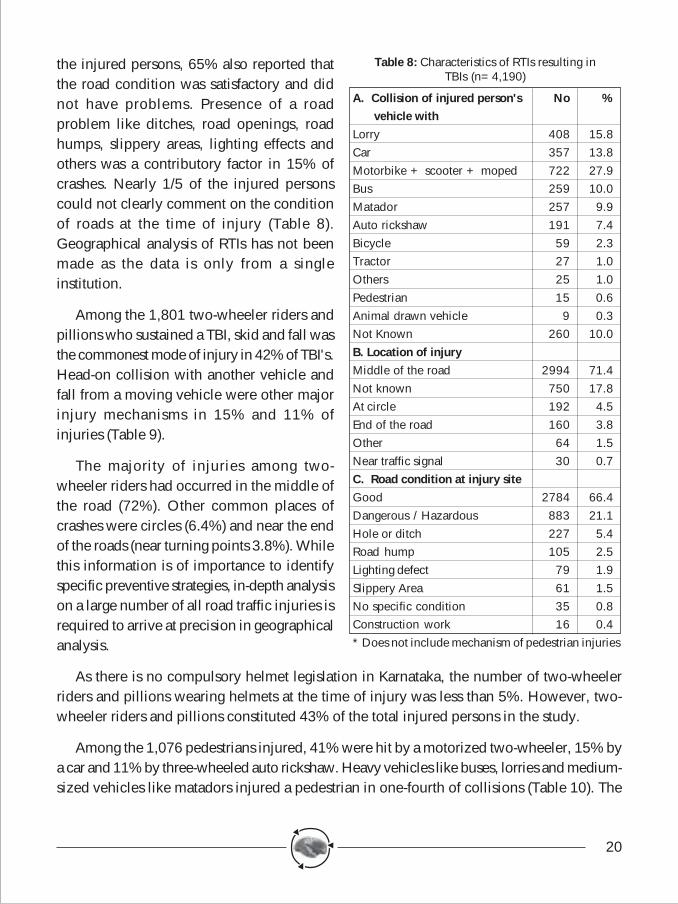
Investigation into the mechanism of road traffic injury revealed that 62% of brain injurieswere due to a collision with another vehicle and 38% due to non -collision modes. Amongthose colliding with other vehicles, it was observed that 16%, 14% and 25% collided with aheavy vehicle like lorry, cars and motorized two-wheelers, respectively. Collision with buswas observed to the extent of 10% in the series. In addition, nearly three-fourths of injurieshad occurred in the middle of the road and only 5% at any circle, thus indicating the fact thatmiddle-of-the-roads(mid blocks) are one of the risk situations for RTIs. Further analysis of thisdata will be undertaken for sub-groups of the study population. This will be of help torecommend specific strategies for the safety of individual category of the road user. Among
20
the injured persons, 65% also reported thatthe road condition was satisfactory and didnot have problems. Presence of a roadproblem like ditches, road openings, roadhumps, slippery areas, lighting effects andothers was a contributory factor in 15% ofcrashes. Nearly 1/5 of the injured personscould not clearly comment on the conditionof roads at the time of injury (Table 8).Geographical analysis of RTIs has not beenmade as the data is only from a singleinstitution.
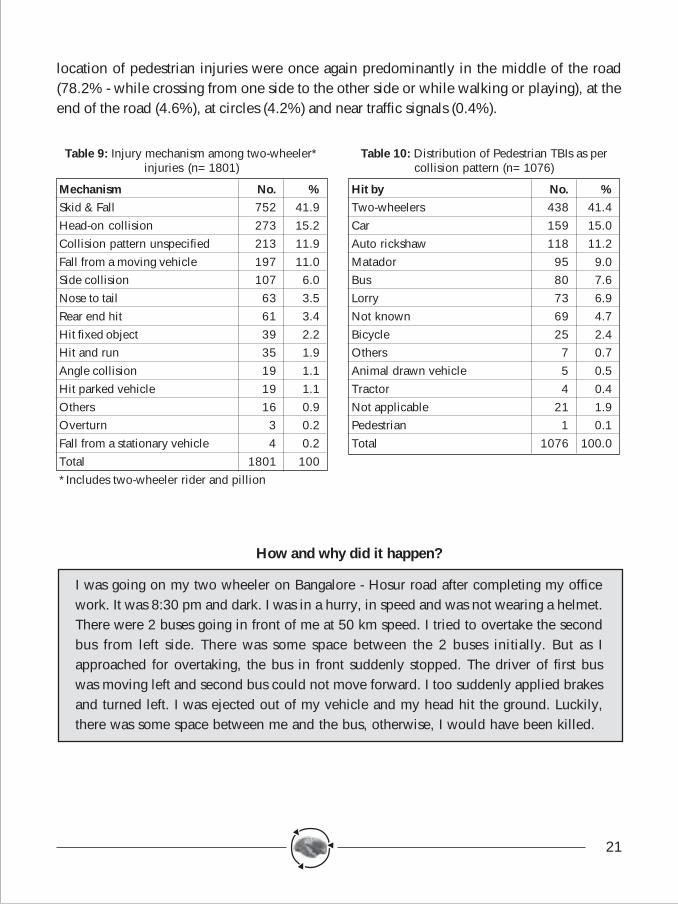
Among the 1,801 two-wheeler riders andpillions who sustained a TBI, skid and fall wasthe commonest mode of injury in 42% of TBI's.Head-on collision with another vehicle andfall from a moving vehicle were other majorinjury mechanisms in 15% and 11% ofinjuries (Table 9).
The majority of injuries among two-wheeler riders had occurred in the middle ofthe road (72%). Other common places ofcrashes were circles (6.4%) and near the endof the roads (near turning points 3.8%). Whilethis information is of importance to identifyspecific preventive strategies, in-depth analysison a large number of all road traffic injuries isrequired to arrive at precision in geographicalanalysis.
As there is no compulsory helmet legislation in Karnataka, the number of two-wheelerriders and pillions wearing helmets at the time of injury was less than 5%. However, two-wheeler riders and pillions constituted 43% of the total injured persons in the study.
Among the 1,076 pedestrians injured, 41% were hit by a motorized two-wheeler, 15% bya car and 11% by three-wheeled auto rickshaw. Heavy vehicles like buses, lorries and medium-sized vehicles like matadors injured a pedestrian in one-fourth of collisions (Table 10). The
Table 8: Characteristics of RTIs resulting inTBIs (n=4,190)
A. Collision of injured person's No % vehicle withLorry 408 15.8Car 357 13.8Motorbike + scooter + moped 722 27.9Bus 259 10.0Matador 257 9.9Auto rickshaw 191 7.4Bicycle 59 2.3Tractor 27 1.0Others 25 1.0Pedestrian 15 0.6Animal drawn vehicle 9 0.3Not Known 260 10.0B. Location of injuryMiddle of the road 2994 71.4Not known 750 17.8At circle 192 4.5End of the road 160 3.8Other 64 1.5Near traffic signal 30 0.7C. Road condition at injury siteGood 2784 66.4Dangerous / Hazardous 883 21.1Hole or ditch 227 5.4Road hump 105 2.5Lighting defect 79 1.9Slippery Area 61 1.5No specific condition 35 0.8Construction work 16 0.4* Does not include mechanism of pedestrian injuries
21
location of pedestrian injuries were once again predominantly in the middle of the road(78.2% - while crossing from one side to the other side or while walking or playing), at theend of the road (4.6%), at circles (4.2%) and near traffic signals (0.4%).
How and why did it happen?
I was going on my two wheeler on Bangalore - Hosur road after completing my officework. It was 8:30 pm and dark. I was in a hurry, in speed and was not wearing a helmet.There were 2 buses going in front of me at 50 km speed. I tried to overtake the secondbus from left side. There was some space between the 2 buses initially. But as Iapproached for overtaking, the bus in front suddenly stopped. The driver of first buswas moving left and second bus could not move forward. I too suddenly applied brakesand turned left. I was ejected out of my vehicle and my head hit the ground. Luckily,there was some space between me and the bus, otherwise, I would have been killed.
Table 10: Distribution of Pedestrian TBIs as percollision pattern (n=1076)
Hit by No. %Two-wheelers 438 41.4Car 159 15.0Auto rickshaw 118 11.2Matador 95 9.0Bus 80 7.6Lorry 73 6.9Not known 69 4.7Bicycle 25 2.4Others 7 0.7Animal drawn vehicle 5 0.5Tractor 4 0.4Not applicable 21 1.9Pedestrian 1 0.1Total 1076 100.0
Table 9: Injury mechanism among two-wheeler*injuries (n=1801)
Mechanism No. %Skid & Fall 752 41.9Head-on collision 273 15.2Collision pattern unspecified 213 11.9Fall from a moving vehicle 197 11.0Side collision 107 6.0Nose to tail 63 3.5Rear end hit 61 3.4Hit fixed object 39 2.2Hit and run 35 1.9Angle collision 19 1.1Hit parked vehicle 19 1.1Others 16 0.9Overturn 3 0.2Fall from a stationary vehicle 4 0.2Total 1801 100*Includes two-wheeler rider and pillion
22
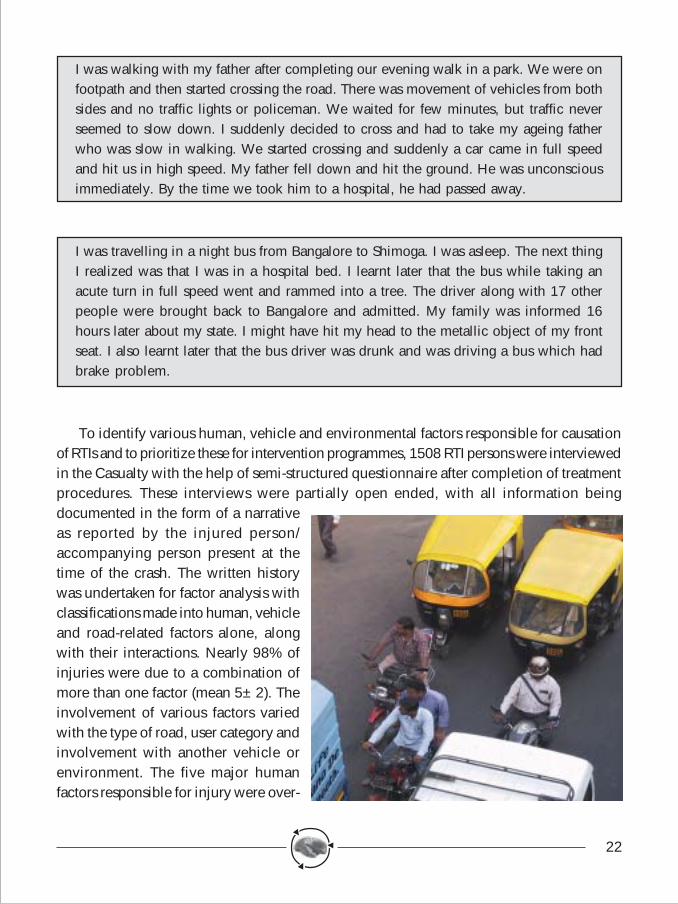
I was walking with my father after completing our evening walk in a park. We were onfootpath and then started crossing the road. There was movement of vehicles from bothsides and no traffic lights or policeman. We waited for few minutes, but traffic neverseemed to slow down. I suddenly decided to cross and had to take my ageing fatherwho was slow in walking. We started crossing and suddenly a car came in full speedand hit us in high speed. My father fell down and hit the ground. He was unconsciousimmediately. By the time we took him to a hospital, he had passed away.
I was travelling in a night bus from Bangalore to Shimoga. I was asleep. The next thingI realized was that I was in a hospital bed. I learnt later that the bus while taking anacute turn in full speed went and rammed into a tree. The driver along with 17 otherpeople were brought back to Bangalore and admitted. My family was informed 16hours later about my state. I might have hit my head to the metallic object of my frontseat. I also learnt later that the bus driver was drunk and was driving a bus which hadbrake problem.
To identify various human, vehicle and environmental factors responsible for causationof RTIs and to prioritize these for intervention programmes, 1508 RTI persons were interviewedin the Casualty with the help of semi-structured questionnaire after completion of treatmentprocedures. These interviews were partially open ended, with all information beingdocumented in the form of a narrativeas reported by the injured person/accompanying person present at thetime of the crash. The written historywas undertaken for factor analysis withclassifications made into human, vehicleand road-related factors alone, alongwith their interactions. Nearly 98% ofinjuries were due to a combination ofmore than one factor (mean 5±2). Theinvolvement of various factors variedwith the type of road, user category andinvolvement with another vehicle orenvironment. The five major humanfactors responsible for injury were over-
23
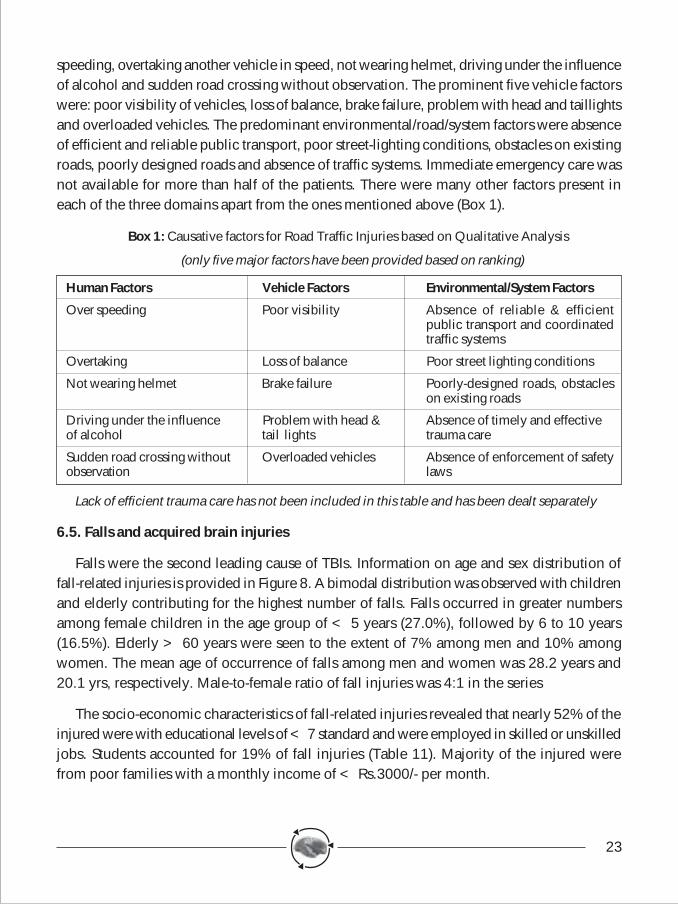
speeding, overtaking another vehicle in speed, not wearing helmet, driving under the influenceof alcohol and sudden road crossing without observation. The prominent five vehicle factorswere: poor visibility of vehicles, loss of balance, brake failure, problem with head and taillightsand overloaded vehicles. The predominant environmental/road/system factors were absenceof efficient and reliable public transport, poor street-lighting conditions, obstacles on existingroads, poorly designed roads and absence of traffic systems. Immediate emergency care wasnot available for more than half of the patients. There were many other factors present ineach of the three domains apart from the ones mentioned above (Box 1).
Box 1: Causative factors for Road Traffic Injuries based on Qualitative Analysis
(only five major factors have been provided based on ranking)
Human Factors Vehicle Factors Environmental/System Factors
Over speeding Poor visibility Absence of reliable & efficientpublic transport and coordinatedtraffic systems
Overtaking Loss of balance Poor street lighting conditions
Not wearing helmet Brake failure Poorly-designed roads, obstacleson existing roads
Driving under the influence Problem with head & Absence of timely and effectiveof alcohol tail lights trauma care
Sudden road crossing without Overloaded vehicles Absence of enforcement of safetyobservation laws
Lack of efficient trauma care has not been included in this table and has been dealt separately
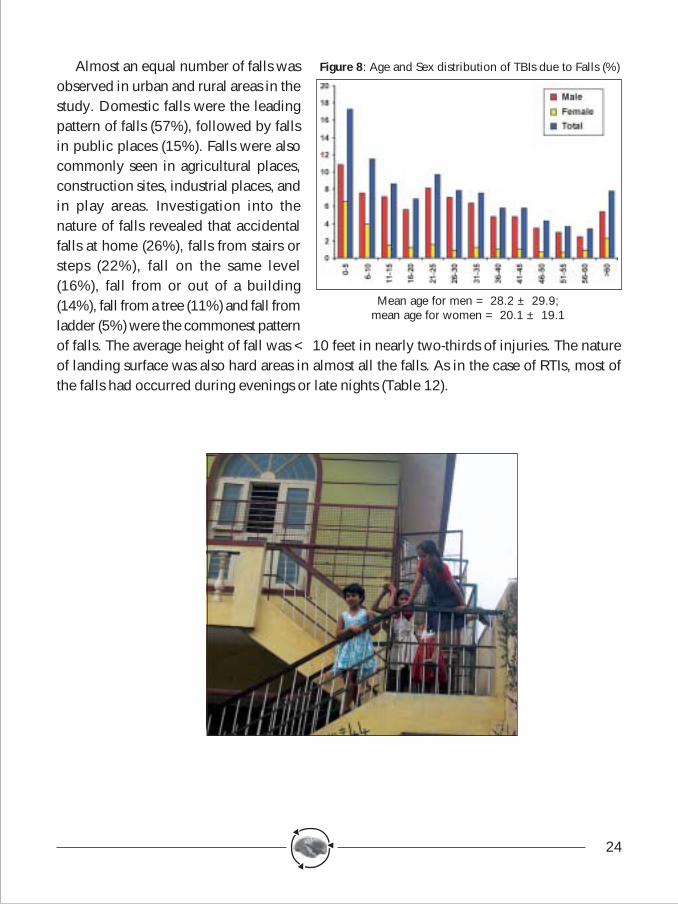
6.5. Falls and acquired brain injuries
Falls were the second leading cause of TBIs. Information on age and sex distribution offall-related injuries is provided in Figure 8. A bimodal distribution was observed with childrenand elderly contributing for the highest number of falls. Falls occurred in greater numbersamong female children in the age group of < 5 years (27.0%), followed by 6 to 10 years(16.5%). Elderly > 60 years were seen to the extent of 7% among men and 10% amongwomen. The mean age of occurrence of falls among men and women was 28.2 years and20.1 yrs, respectively. Male-to-female ratio of fall injuries was 4:1 in the series
The socio-economic characteristics of fall-related injuries revealed that nearly 52% of theinjured were with educational levels of < 7 standard and were employed in skilled or unskilledjobs. Students accounted for 19% of fall injuries (Table 11). Majority of the injured werefrom poor families with a monthly income of < Rs.3000/- per month.
24
Almost an equal number of falls wasobserved in urban and rural areas in thestudy. Domestic falls were the leadingpattern of falls (57%), followed by fallsin public places (15%). Falls were alsocommonly seen in agricultural places,construction sites, industrial places, andin play areas. Investigation into thenature of falls revealed that accidentalfalls at home (26%), falls from stairs orsteps (22%), fall on the same level(16%), fall from or out of a building(14%), fall from a tree (11%) and fall fromladder (5%) were the commonest patternof falls. The average height of fall was < 10 feet in nearly two-thirds of injuries. The natureof landing surface was also hard areas in almost all the falls. As in the case of RTIs, most ofthe falls had occurred during evenings or late nights (Table 12).
Figure 8: Age and Sex distribution of TBIs due to Falls (%)
Mean age for men = 28.2 ± 29.9;mean age for women = 20.1 ± 19.1
25
Table 11: Socio-demographic characteristics of fallssubjects as per occupational, educational, marital,
& income status (n=1795)
Occupation No. %Professional 4 0.2Semi-professional 161 9.0Skilled 247 13.7Semi-skilled 135 7.4Unskilled 229 12.7Unemployed 38 2.1Retired 33 1.8Housewife 122 6.8Student 324 18.4Not applicable 169 9.4Others 330 18.4Not known 3 0.1EducationIlliterate 455 25.4Primary 296 16.5Secondary 194 10.8High school 262 14.6Pre-university 37 2.1Vocational 14 0.8Graduate 42 2.3Post-graduate 5 0.3Professional 12 0.7Not applicable 302 16.9Not known 175 9.6Marital StatusMarried 687 38.3Unmarried 216 12.0Widowed 43 2.4Divorced 2 0.1Separated 137 7.6Not known 2 0.1Not applicable 708 39.5Family Income< 3000 1545 86.13000 - 6000 209 11.6> 6000 41 2.3
Table 12: Characteristics of falls as per place,nature, height and landing surface.
Place of Residence No. %Urban 1147 63.9Rural 598 33.3Information not available 50 2.8Total 1795 100.0Place of FallDomestic 1019 56.7Public places 275 15.3Agricultural 165 9.1Construction site 111 6.1Not known 67 3.7Industrial 64 3.5Others 47 2.6Play site 30 1.6School 17 0.9Nature of FallAccidental fall 464 25.9Fall from stairs or steps 387 21.6Fall on same level 283 15.8Fall from or out of building 249 13.9Fall from a tree 200 11.1Fall from ladder 76 4.2Fall into hole or otheropening in surface 35 2.0Fall from same level due topushing/collision 32 1.8Fall due to specific medical condition 27 1.5Not known 23 1.2Fall due to effect of drugs 19 1.1Average Height of Fall (in feet)0 - 5 568 38.56 - 10 518 35.211 - 15 234 15.916 - 20 95 6.421 - 25 23 1.626 - 30 22 1.5> 30 12 0.9Nature of Landing SurfaceHard 1581 88.2Not known 68 3.8Soft or mild 65 3.6Building material 65 3.6Others 16 0.8
26
It was holiday time and I had taken my son along with his friends to a fun park. Theywere all playing and got onto a merry go round. I was scared and he was scared too.But, his friends pulled him into the merry go round. I told the operator not to operate itfast and to stop after two rounds. After they got in and wheel started moving in fullspeed and they were all screaming. After 7-8 rounds, suddenly there was a loud noiseand the wheel chain had snapped. All children fell down and some were thrown in theair. My son and all others got injured and luckily no one died. I got him admitted to ahospital and we were referred to 2 other hospitals due to lack of doctors and facilities.He survived, but has difficulties in learning and memory.
6.6. Violence and Neurotrauma
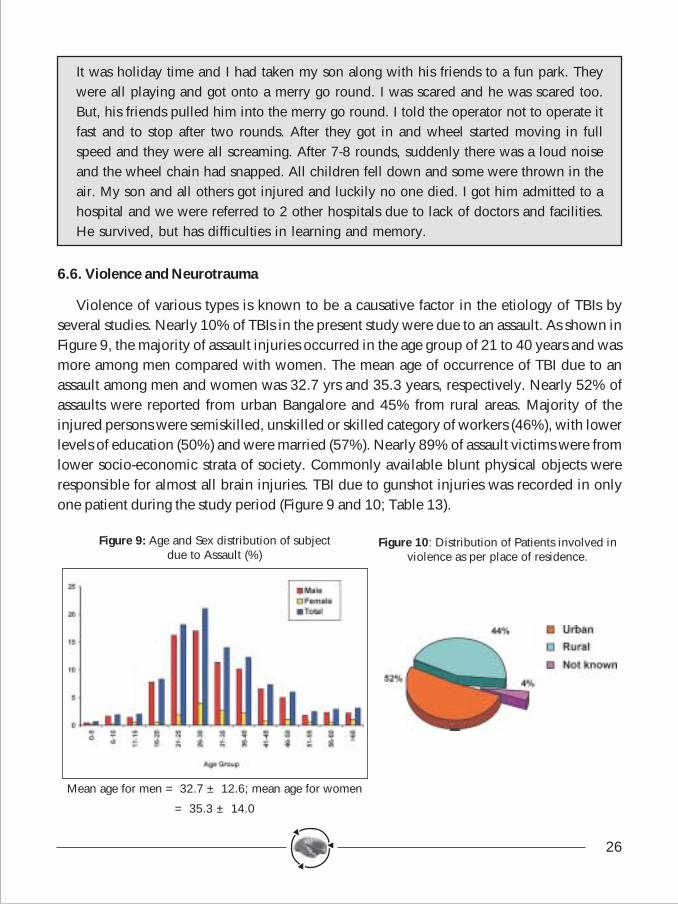
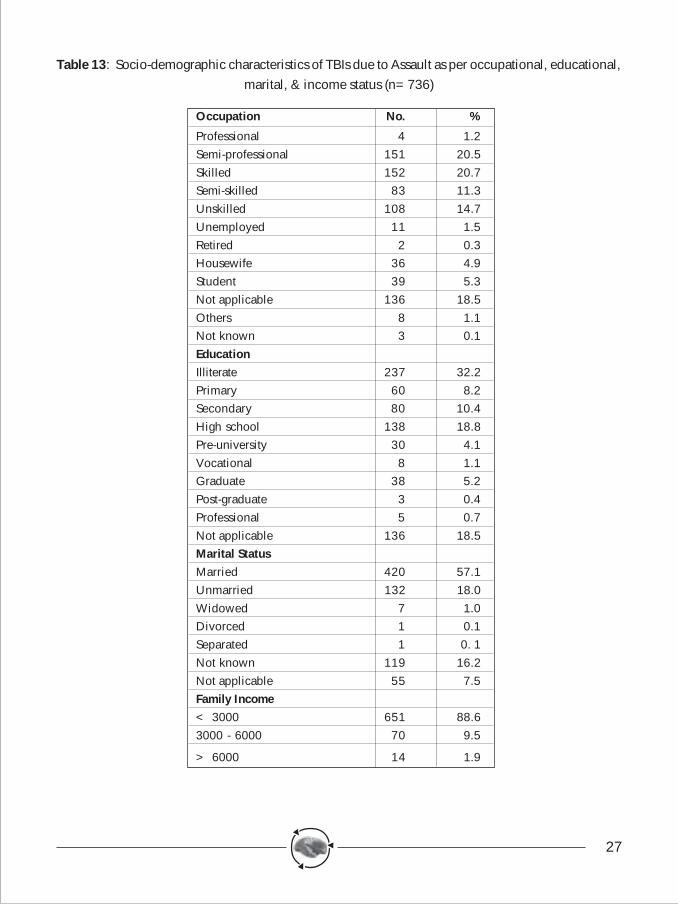
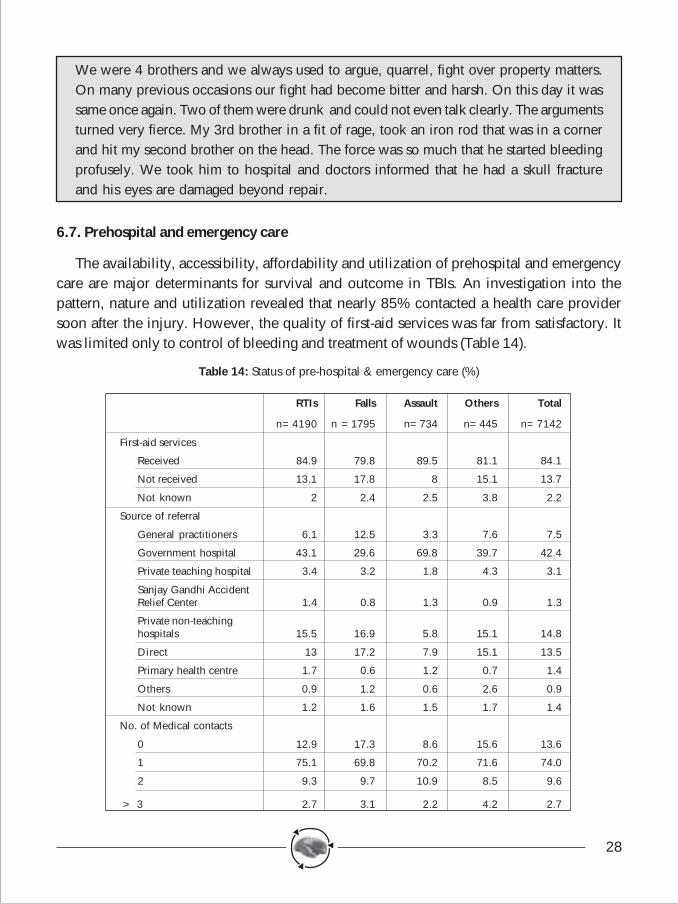
Violence of various types is known to be a causative factor in the etiology of TBIs byseveral studies. Nearly 10% of TBIs in the present study were due to an assault. As shown inFigure 9, the majority of assault injuries occurred in the age group of 21 to 40 years and wasmore among men compared with women. The mean age of occurrence of TBI due to anassault among men and women was 32.7 yrs and 35.3 years, respectively. Nearly 52% ofassaults were reported from urban Bangalore and 45% from rural areas. Majority of theinjured persons were semiskilled, unskilled or skilled category of workers (46%), with lowerlevels of education (50%) and were married (57%). Nearly 89% of assault victims were fromlower socio-economic strata of society. Commonly available blunt physical objects wereresponsible for almost all brain injuries. TBI due to gunshot injuries was recorded in onlyone patient during the study period (Figure 9 and 10; Table 13).
Figure 9: Age and Sex distribution of subjectdue to Assault (%)
Mean age for men = 32.7 ± 12.6; mean age for women
= 35.3 ± 14.0
Figure 10: Distribution of Patients involved inviolence as per place of residence.
27
Table 13: Socio-demographic characteristics of TBIs due to Assault as per occupational, educational,marital, & income status (n=736)
Occupation No. %
Professional 4 1.2Semi-professional 151 20.5Skilled 152 20.7Semi-skilled 83 11.3Unskilled 108 14.7Unemployed 11 1.5Retired 2 0.3Housewife 36 4.9Student 39 5.3Not applicable 136 18.5Others 8 1.1Not known 3 0.1EducationIlliterate 237 32.2Primary 60 8.2Secondary 80 10.4High school 138 18.8Pre-university 30 4.1Vocational 8 1.1Graduate 38 5.2Post-graduate 3 0.4Professional 5 0.7Not applicable 136 18.5Marital StatusMarried 420 57.1Unmarried 132 18.0Widowed 7 1.0Divorced 1 0.1Separated 1 0. 1Not known 119 16.2Not applicable 55 7.5Family Income< 3000 651 88.63000 - 6000 70 9.5
> 6000 14 1.9
28
We were 4 brothers and we always used to argue, quarrel, fight over property matters.On many previous occasions our fight had become bitter and harsh. On this day it wassame once again. Two of them were drunk and could not even talk clearly. The argumentsturned very fierce. My 3rd brother in a fit of rage, took an iron rod that was in a cornerand hit my second brother on the head. The force was so much that he started bleedingprofusely. We took him to hospital and doctors informed that he had a skull fractureand his eyes are damaged beyond repair.
6.7. Prehospital and emergency care
The availability, accessibility, affordability and utilization of prehospital and emergencycare are major determinants for survival and outcome in TBIs. An investigation into thepattern, nature and utilization revealed that nearly 85% contacted a health care providersoon after the injury. However, the quality of first-aid services was far from satisfactory. Itwas limited only to control of bleeding and treatment of wounds (Table 14).
Table 14: Status of pre-hospital & emergency care (%)
RTIs Falls Assault Others Total
n=4190 n =1795 n=734 n=445 n=7142
First-aid services
Received 84.9 79.8 89.5 81.1 84.1
Not received 13.1 17.8 8 15.1 13.7
Not known 2 2.4 2.5 3.8 2.2
Source of referral
General practitioners 6.1 12.5 3.3 7.6 7.5
Government hospital 43.1 29.6 69.8 39.7 42.4
Private teaching hospital 3.4 3.2 1.8 4.3 3.1
Sanjay Gandhi AccidentRelief Center 1.4 0.8 1.3 0.9 1.3
Private non-teachinghospitals 15.5 16.9 5.8 15.1 14.8
Direct 13 17.2 7.9 15.1 13.5
Primary health centre 1.7 0.6 1.2 0.7 1.4
Others 0.9 1.2 0.6 2.6 0.9
Not known 1.2 1.6 1.5 1.7 1.4
No. of Medical contacts
0 12.9 17.3 8.6 15.6 13.6
1 75.1 69.8 70.2 71.6 74.0
2 9.3 9.7 10.9 8.5 9.6
> 3 2.7 3.1 2.2 4.2 2.7
29
The source of referral revealed that neighbouring government hospitals were the majorsource of referral in 42% of injuries. The private non -teaching hospitals and private teachinghospitals within the city had referred 18% of the cases. Only 14% of injured persons hadreached the hospital directly on their own. There were no significant differences with regardto various injury causes in the source of referral. In three-fourths of the injuries, the patientshad made at least one medical contact with another hospital before reaching NIMHANS(Table 14). In all, 10% of the brain-injured persons had contacted more than two hospitalsbefore reaching NIMHANS.
Table 15: Transportation pattern and time interval among subjects with TBI (%)
Mode of transportation
RTIs Falls Assault Others Total
Auto rickshaw 26.6 40.6 28.9 23.4 30.6
Private vehicle 24.2 23.3 18.5 26.0 23.3
Ambulance 25.5 14.5 20.0 16.1 22.0
Public vehicle 2.3 5.5 6.8 5.9 3.7
Own vehicle 0.5 1.1 0.4 0.5 0.7
Hoysala/Police 5.7 1.4 9.4 9.7 5.0
Others 0.7 1.1 0.5 1.2 0.8
Not known 14.4 12.4 15.4 17.3 14.0
Time interval between injury & reaching a definitive hospital
< 1 hr 13.2 11.7 5.9 12.1 12.0
1 - 3 32.6 26.9 24.4 22.2 29.7
3 - 6 23.2 19.7 22.5 24.1 22.3
6 - 12 13.4 10.9 17.7 13.2 13.2
12 - 18 4.1 5.3 6.4 3.8 4.6
18 - 24 2.6 5.1 4.1 3.1 3.4
> 24 7.6 16.5 14.3 11.3 10.8
Not known 3.2 3.9 4.8 10.2 3.9
The mode of transportation was predominantly private vehicles and locally available three-wheeled auto rickshaws in 23% and 31%, respectively. An ambulance was used fortransportation in 22% of the injured patients. In more than half of the injuries, a familymember or a different person had accompanied the injured person to NIMHANS. This wasslightly high among fall-related injuries as compared to other injury causes.
Availability of early and appropriate care after an injury is a major determinant in avoidingsecondary injuries and death. Even though, the majority had received some first-aid soon
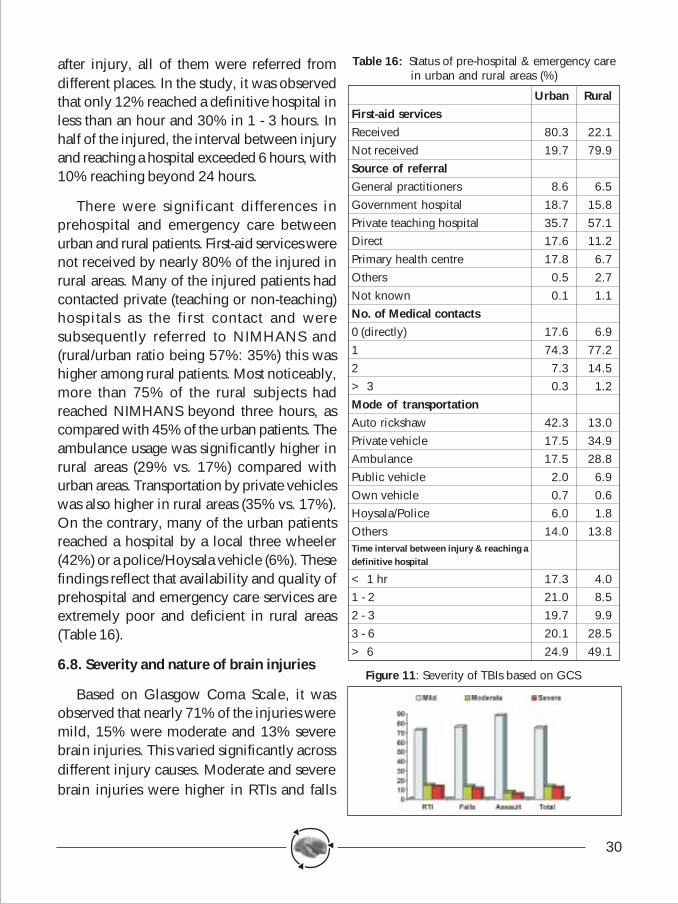
30
after injury, all of them were referred fromdifferent places. In the study, it was observedthat only 12% reached a definitive hospital inless than an hour and 30% in 1 - 3 hours. Inhalf of the injured, the interval between injuryand reaching a hospital exceeded 6 hours, with10% reaching beyond 24 hours.
There were significant differences inprehospital and emergency care betweenurban and rural patients. First-aid services werenot received by nearly 80% of the injured inrural areas. Many of the injured patients hadcontacted private (teaching or non-teaching)hospitals as the first contact and weresubsequently referred to NIMHANS and(rural/urban ratio being 57%: 35%) this washigher among rural patients. Most noticeably,more than 75% of the rural subjects hadreached NIMHANS beyond three hours, ascompared with 45% of the urban patients. Theambulance usage was significantly higher inrural areas (29% vs. 17%) compared withurban areas. Transportation by private vehicleswas also higher in rural areas (35% vs. 17%).On the contrary, many of the urban patientsreached a hospital by a local three wheeler(42%) or a police/Hoysala vehicle (6%). Thesefindings reflect that availability and quality ofprehospital and emergency care services areextremely poor and deficient in rural areas(Table 16).
6.8. Severity and nature of brain injuries
Based on Glasgow Coma Scale, it wasobserved that nearly 71% of the injuries weremild, 15% were moderate and 13% severebrain injuries. This varied significantly acrossdifferent injury causes. Moderate and severebrain injuries were higher in RTIs and falls
Table 16: Status of pre-hospital & emergency carein urban and rural areas (%)
Urban RuralFirst-aid servicesReceived 80.3 22.1Not received 19.7 79.9Source of referralGeneral practitioners 8.6 6.5Government hospital 18.7 15.8Private teaching hospital 35.7 57.1Direct 17.6 11.2Primary health centre 17.8 6.7Others 0.5 2.7Not known 0.1 1.1No. of Medical contacts0 (directly) 17.6 6.91 74.3 77.22 7.3 14.5> 3 0.3 1.2Mode of transportationAuto rickshaw 42.3 13.0Private vehicle 17.5 34.9Ambulance 17.5 28.8Public vehicle 2.0 6.9Own vehicle 0.7 0.6Hoysala/Police 6.0 1.8Others 14.0 13.8Time interval between injury & reaching adefinitive hospital
< 1 hr 17.3 4.01 - 2 21.0 8.52 - 3 19.7 9.93 - 6 20.1 28.5> 6 24.9 49.1
Figure 11: Severity of TBIs based on GCS
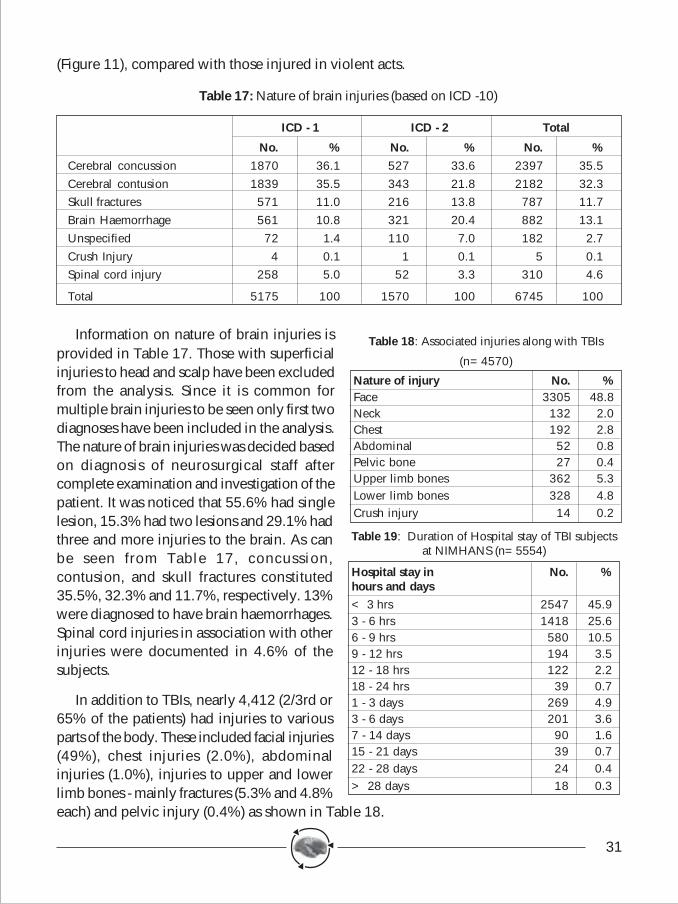
31
(Figure 11), compared with those injured in violent acts.
Table 17: Nature of brain injuries (based on ICD -10)
ICD - 1 ICD - 2 Total
No. % No. % No. %Cerebral concussion 1870 36.1 527 33.6 2397 35.5Cerebral contusion 1839 35.5 343 21.8 2182 32.3Skull fractures 571 11.0 216 13.8 787 11.7Brain Haemorrhage 561 10.8 321 20.4 882 13.1Unspecified 72 1.4 110 7.0 182 2.7Crush Injury 4 0.1 1 0.1 5 0.1Spinal cord injury 258 5.0 52 3.3 310 4.6
Total 5175 100 1570 100 6745 100
Information on nature of brain injuries isprovided in Table 17. Those with superficialinjuries to head and scalp have been excludedfrom the analysis. Since it is common formultiple brain injuries to be seen only first twodiagnoses have been included in the analysis.The nature of brain injuries was decided basedon diagnosis of neurosurgical staff aftercomplete examination and investigation of thepatient. It was noticed that 55.6% had singlelesion, 15.3% had two lesions and 29.1% hadthree and more injuries to the brain. As canbe seen from Table 17, concussion,contusion, and skull fractures constituted35.5%, 32.3% and 11.7%, respectively. 13%were diagnosed to have brain haemorrhages.Spinal cord injuries in association with otherinjuries were documented in 4.6% of thesubjects.
In addition to TBIs, nearly 4,412 (2/3rd or65% of the patients) had injuries to variousparts of the body. These included facial injuries(49%), chest injuries (2.0%), abdominalinjuries (1.0%), injuries to upper and lowerlimb bones - mainly fractures (5.3% and 4.8%each) and pelvic injury (0.4%) as shown in Table 18.
Table 18: Associated injuries along with TBIs
(n=4570)
Nature of injury No. %Face 3305 48.8Neck 132 2.0Chest 192 2.8Abdominal 52 0.8Pelvic bone 27 0.4Upper limb bones 362 5.3Lower limb bones 328 4.8Crush injury 14 0.2
Table 19: Duration of Hospital stay of TBI subjectsat NIMHANS (n=5554)
Hospital stay in No. %hours and days< 3 hrs 2547 45.93 - 6 hrs 1418 25.66 - 9 hrs 580 10.59 - 12 hrs 194 3.512 - 18 hrs 122 2.218 - 24 hrs 39 0.71 - 3 days 269 4.93 - 6 days 201 3.67 - 14 days 90 1.615 - 21 days 39 0.722 - 28 days 24 0.4> 28 days 18 0.3
32
6.9. Management details
The mode of management revealed that either nearly 45% were provided treatment in theemergency room and referred to other hospitals, 48% were admitted for short- or long-termobservation for investigations and medical management. Surgical intervention was undertakenin 6% of the total brain injured persons.
Information on duration of hospital stay was available for 5554 (82%) of the subjects.Duration of hospital stay revealed that nearly 45% of the patients stayed in the hospital forapproximately three hours. Among the remaining patients, 26%, 14% and 3% stayed forthree to six hours, six to 12 hours and 12 to 24 hours, respectively. Nearly 641 (11%) patientsstayed in the hospital for more than a day. The mean duration of stay for short-term and long-term stay patients was approximately fourhours and seven days, respectively (Table 19).
The outcome of traumatic brain injuriesbased on Glasgow Outcome Scale revealedthat 6% died in the course of hospital stay,4% were in a persistent vegetative state, 15%were severely disabled, 47% were moderatelydisabled and 29% had recovered at the end ofthe hospital stay (Table 20).
Table 21: Pattern of disabilities among TBI cases at hospital discharge (n=2994)
Severe - Moderate - Mild -
GCS <=8 (n=417) GCS=9 to12 (n=500) GCS >13 (n=2077) Disability assessment Not Yes but Yes, can do Not Yes but Yes, can do Not Yes but Yes, can do
possible needs without possible needs without possible needs withouthelp help help help help help
Bathing by self 61.4 31.7 7.0 35.0 53.8 11.2 8.3 37.1 54.6Dressing by self 60.4 31.2 8.4 34.2 51.0 14.8 8.2 32.1 59.7Grooming by self 60.9 27.6 11.5 33.4 46.4 20.2 8.0 27.0 65.0Eating by self 59.7 28.5 11.8 32.6 46.4 21.0 7.1 27.4 65.5Sitting/standing by self 59.7 30.9 9.4 32.8 48.0 19.2 8.0 30.3 61.6Walking about 15 metersby self 64.0 29.5 6.5 39.2 50.2 10.6 10.3 37.1 52.6Having control overbladder/bowel 59.0 24.5 16.5 33.2 41.4 25.4 7.4 25.0 67.7Hearing abilities 47.2 16.3 36.5 19.6 27.4 53.0 1.9 6.5 91.7Normal memory/thinking ability 52.0 25.4 22.5 26.4 39.4 34.2 3.3 15.1 81.6Communicating needs 56.6 27.3 16.1 34.0 41.4 24.6 5.9 21.8 72.4Social interaction 64.7 25.7 9.6 44.0 45.0 11.0 12.5 30.5 57.0
Family responsibilities 81.8 15.6 2.6 69.8 26.8 3.4 33.4 40.1 26.5
Able to work as before 87.1 10.3 2.6 78.3 19.3 2.4 42.3 37.7 20.0
Table 20: Outcome of TBI based on GlasgowOutcome Sscale
Outcome based on GCS No. %Death 308 5.5Persistent vegetative state 206 3.7Severe disability 850 15.3Moderate disability 2597 46.8Good recovery 1593 28.7Total 5554 100
33
Table 21 provides detailed description of disability pattern and status after a brain injuryamong hospital-registered subjects at the time of hospital discharge. Disability assessmentwas done using Modified Barthel's Index Among severely brain injured, nearly all subjectscould not perform any activities of daily living like bathing, dressing, grooming, eating, sitting-standing and others, either on their own or even with support. Even hearing abilities weredisrupted significantly in two-third of the subjects. Memory and thinking abilities were alteredin approximately three-fourth of the patients. Social interactions, undertaking familyresponsibilities and ability to work at pre-injury levels were totally lost among all severelybrain-injured persons. In the group with moderate brain injuries nearly one-third had totalloss of regular activities of daily living with another 40 - 50% requiring support to performthe same. Once again the three domains of social interaction, carrying out family responsibilitiesand work ability were significantly affected in 90% of the injured persons. Even among thosewith mild brain injury, around 10% had difficulties and one-third required external help forperforming daily living activities. The data will be analyzed in greater detail for different agegroups, sexes, associated injuries and other confounders in our subsequent reports.
6.10. Economic aspects of TBIs
One of the objectives of the study was to identify the economic cost of managing a braininjury patient at NIMHANS. Considerable difficulties were experienced in arriving at thesefigures, and complete attempts were made to obtain data from all sources. It can be seenfrom Table 22 that the cost of managing one patient per day (in the EMS Department only) isestimated at Rs. 2,152. This is the lowest possible estimate and in actual values could bemuch higher (detailed report available separately). Also, this does not include medical/surgical/ICU costs of inpatients, which constitute nearly one-third of the head injury patients.
Table 22: Apportioned costs of managing TBIs in the EMS Department of NIMHANS (in Indian rupees).
Particular INR per month
Apportioned human resources costs 315400.00
Apportioned infrastructure costs (building) 34000.00
Apportioned furniture costs and related 6773.00
Apportioned costs for supportive services, essential services and related 339509.00
Apportioned costs for radiological services 224415.00
Apportioned costs for ambulance services 34333.00
Total apportioned cost for care to head injury patients per month 954431.00
Total costs for care for head injury patients per month including miscellaneouscosts @ 15% = Rs.1,43,164.59 1097595.00
Total apportioned costs for care for head injury patients per day 36587.00
Total apportioned costs for care of one head injury patient per day 2152.00
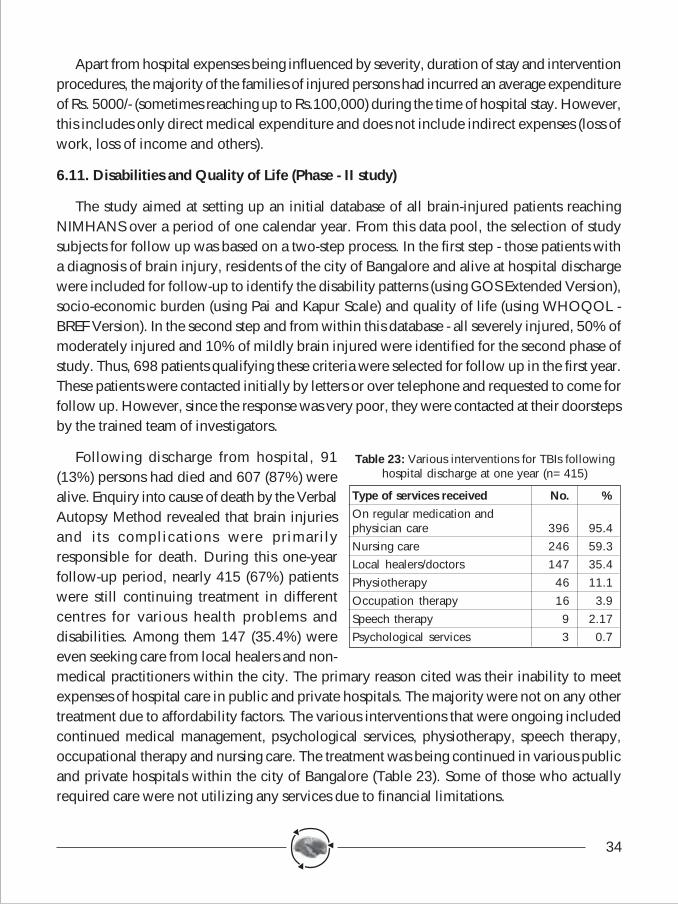
34
Apart from hospital expenses being influenced by severity, duration of stay and interventionprocedures, the majority of the families of injured persons had incurred an average expenditureof Rs. 5000/- (sometimes reaching up to Rs.100,000) during the time of hospital stay. However,this includes only direct medical expenditure and does not include indirect expenses (loss ofwork, loss of income and others).
6.11. Disabilities and Quality of Life (Phase - II study)
The study aimed at setting up an initial database of all brain-injured patients reachingNIMHANS over a period of one calendar year. From this data pool, the selection of studysubjects for follow up was based on a two-step process. In the first step - those patients witha diagnosis of brain injury, residents of the city of Bangalore and alive at hospital dischargewere included for follow-up to identify the disability patterns (using GOS Extended Version),socio-economic burden (using Pai and Kapur Scale) and quality of life (using WHOQOL -BREF Version). In the second step and from within this database - all severely injured, 50% ofmoderately injured and 10% of mildly brain injured were identified for the second phase ofstudy. Thus, 698 patients qualifying these criteria were selected for follow up in the first year.These patients were contacted initially by letters or over telephone and requested to come forfollow up. However, since the response was very poor, they were contacted at their doorstepsby the trained team of investigators.
Following discharge from hospital, 91(13%) persons had died and 607 (87%) werealive. Enquiry into cause of death by the VerbalAutopsy Method revealed that brain injuriesand its complications were primarilyresponsible for death. During this one-yearfollow-up period, nearly 415 (67%) patientswere still continuing treatment in differentcentres for various health problems anddisabilities. Among them 147 (35.4%) wereeven seeking care from local healers and non-medical practitioners within the city. The primary reason cited was their inability to meetexpenses of hospital care in public and private hospitals. The majority were not on any othertreatment due to affordability factors. The various interventions that were ongoing includedcontinued medical management, psychological services, physiotherapy, speech therapy,occupational therapy and nursing care. The treatment was being continued in various publicand private hospitals within the city of Bangalore (Table 23). Some of those who actuallyrequired care were not utilizing any services due to financial limitations.
Table 23: Various interventions for TBIs followinghospital discharge at one year (n=415)
Type of services received No. %On regular medication andphysician care 396 95.4Nursing care 246 59.3Local healers/doctors 147 35.4Physiotherapy 46 11.1Occupation therapy 16 3.9Speech therapy 9 2.17Psychological services 3 0.7
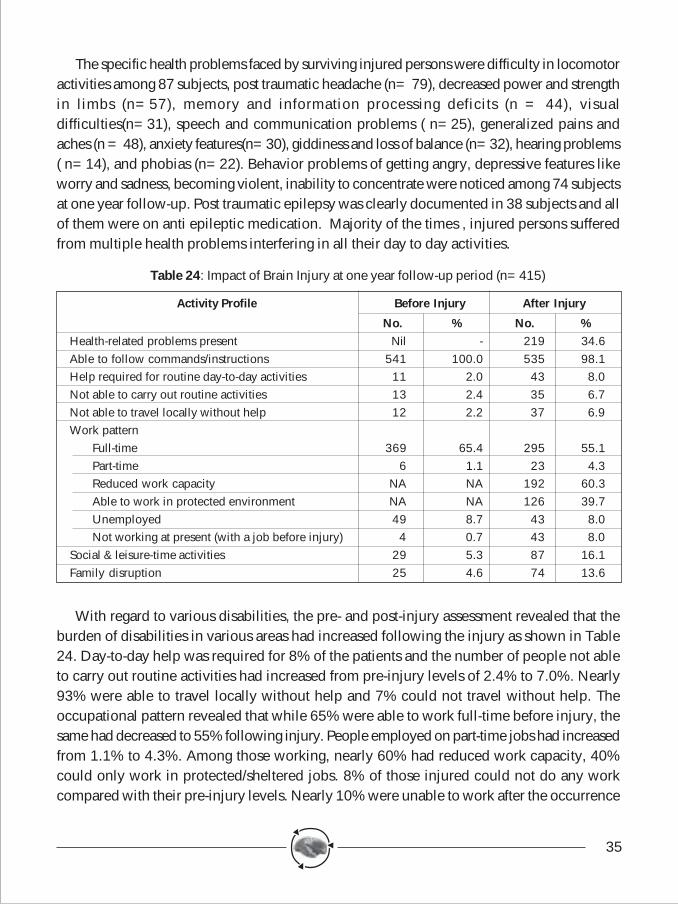
35
The specific health problems faced by surviving injured persons were difficulty in locomotoractivities among 87 subjects, post traumatic headache (n= 79), decreased power and strengthin limbs (n=57), memory and information processing deficits (n = 44), visualdifficulties(n=31), speech and communication problems ( n=25), generalized pains andaches (n = 48), anxiety features(n=30), giddiness and loss of balance (n=32), hearing problems( n=14), and phobias (n=22). Behavior problems of getting angry, depressive features likeworry and sadness, becoming violent, inability to concentrate were noticed among 74 subjectsat one year follow-up. Post traumatic epilepsy was clearly documented in 38 subjects and allof them were on anti epileptic medication. Majority of the times , injured persons sufferedfrom multiple health problems interfering in all their day to day activities.
Table 24: Impact of Brain Injury at one year follow-up period (n=415)
Activity Profile Before Injury After Injury
No. % No. %Health-related problems present Nil - 219 34.6Able to follow commands/instructions 541 100.0 535 98.1Help required for routine day-to-day activities 11 2.0 43 8.0Not able to carry out routine activities 13 2.4 35 6.7Not able to travel locally without help 12 2.2 37 6.9Work pattern
Full-time 369 65.4 295 55.1Part-time 6 1.1 23 4.3Reduced work capacity NA NA 192 60.3Able to work in protected environment NA NA 126 39.7Unemployed 49 8.7 43 8.0Not working at present (with a job before injury) 4 0.7 43 8.0
Social & leisure-time activities 29 5.3 87 16.1Family disruption 25 4.6 74 13.6
With regard to various disabilities, the pre- and post-injury assessment revealed that theburden of disabilities in various areas had increased following the injury as shown in Table24. Day-to-day help was required for 8% of the patients and the number of people not ableto carry out routine activities had increased from pre-injury levels of 2.4% to 7.0%. Nearly93% were able to travel locally without help and 7% could not travel without help. Theoccupational pattern revealed that while 65% were able to work full-time before injury, thesame had decreased to 55% following injury. People employed on part-time jobs had increasedfrom 1.1% to 4.3%. Among those working, nearly 60% had reduced work capacity, 40%could only work in protected/sheltered jobs. 8% of those injured could not do any workcompared with their pre-injury levels. Nearly 10% were unable to work after the occurrence
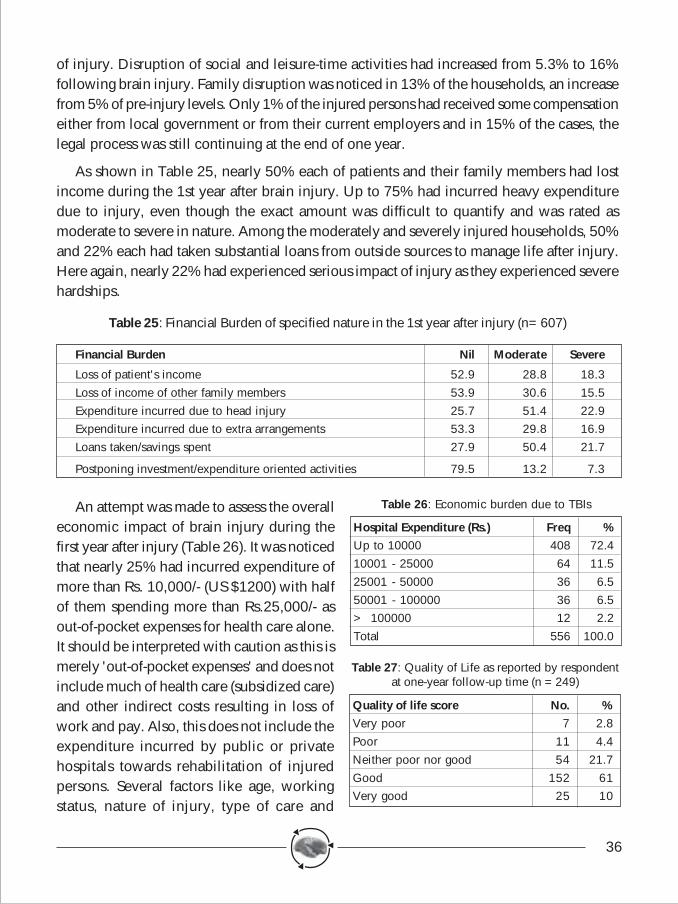
36
of injury. Disruption of social and leisure-time activities had increased from 5.3% to 16%following brain injury. Family disruption was noticed in 13% of the households, an increasefrom 5% of pre-injury levels. Only 1% of the injured persons had received some compensationeither from local government or from their current employers and in 15% of the cases, thelegal process was still continuing at the end of one year.
As shown in Table 25, nearly 50% each of patients and their family members had lostincome during the 1st year after brain injury. Up to 75% had incurred heavy expendituredue to injury, even though the exact amount was difficult to quantify and was rated asmoderate to severe in nature. Among the moderately and severely injured households, 50%and 22% each had taken substantial loans from outside sources to manage life after injury.Here again, nearly 22% had experienced serious impact of injury as they experienced severehardships.
Table 25: Financial Burden of specified nature in the 1st year after injury (n=607)
Financial Burden Nil Moderate Severe
Loss of patient's income 52.9 28.8 18.3Loss of income of other family members 53.9 30.6 15.5Expenditure incurred due to head injury 25.7 51.4 22.9Expenditure incurred due to extra arrangements 53.3 29.8 16.9Loans taken/savings spent 27.9 50.4 21.7
Postponing investment/expenditure oriented activities 79.5 13.2 7.3
An attempt was made to assess the overalleconomic impact of brain injury during thefirst year after injury (Table 26). It was noticedthat nearly 25% had incurred expenditure ofmore than Rs. 10,000/- (US $1200) with halfof them spending more than Rs.25,000/- asout-of-pocket expenses for health care alone.It should be interpreted with caution as this ismerely 'out-of-pocket expenses' and does notinclude much of health care (subsidized care)and other indirect costs resulting in loss ofwork and pay. Also, this does not include theexpenditure incurred by public or privatehospitals towards rehabilitation of injuredpersons. Several factors like age, workingstatus, nature of injury, type of care and
Table 26: Economic burden due to TBIs
Hospital Expenditure (Rs.) Freq %Up to 10000 408 72.410001 - 25000 64 11.525001 - 50000 36 6.550001 - 100000 36 6.5> 100000 12 2.2Total 556 100.0
Table 27: Quality of Life as reported by respondentat one-year follow-up time (n =249)
Quality of life score No. %Very poor 7 2.8Poor 11 4.4Neither poor nor good 54 21.7Good 152 61Very good 25 10
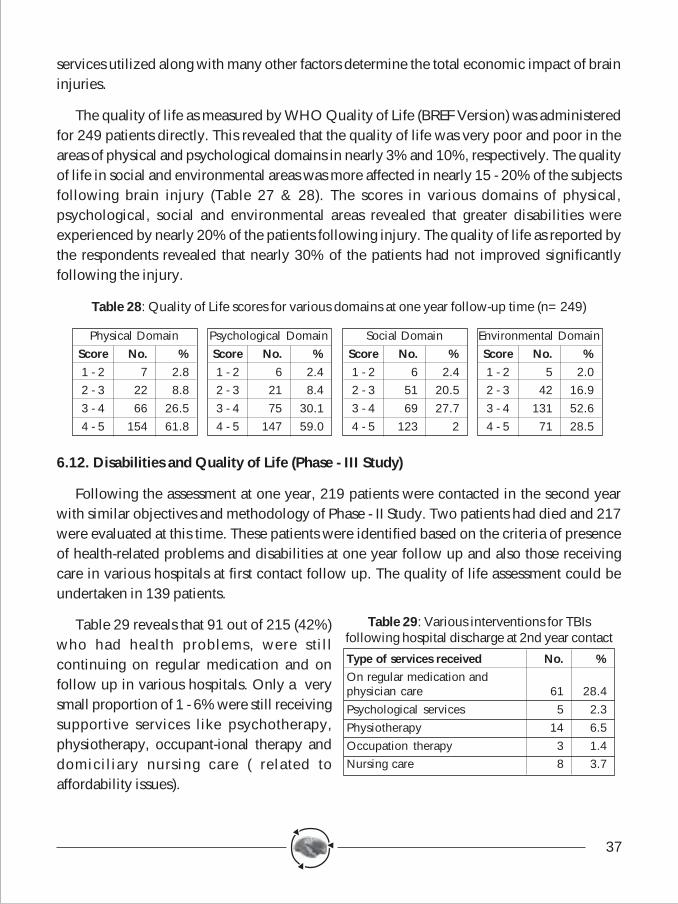
37
services utilized along with many other factors determine the total economic impact of braininjuries.
The quality of life as measured by WHO Quality of Life (BREF Version) was administeredfor 249 patients directly. This revealed that the quality of life was very poor and poor in theareas of physical and psychological domains in nearly 3% and 10%, respectively. The qualityof life in social and environmental areas was more affected in nearly 15 - 20% of the subjectsfollowing brain injury (Table 27 & 28). The scores in various domains of physical,psychological, social and environmental areas revealed that greater disabilities wereexperienced by nearly 20% of the patients following injury. The quality of life as reported bythe respondents revealed that nearly 30% of the patients had not improved significantlyfollowing the injury.
Table 28: Quality of Life scores for various domains at one year follow-up time (n=249)
6.12. Disabilities and Quality of Life (Phase - III Study)
Following the assessment at one year, 219 patients were contacted in the second yearwith similar objectives and methodology of Phase - II Study. Two patients had died and 217were evaluated at this time. These patients were identified based on the criteria of presenceof health-related problems and disabilities at one year follow up and also those receivingcare in various hospitals at first contact follow up. The quality of life assessment could beundertaken in 139 patients.
Table 29 reveals that 91 out of 215 (42%)who had health problems, were stillcontinuing on regular medication and onfollow up in various hospitals. Only a verysmall proportion of 1 - 6% were still receivingsupportive services like psychotherapy,physiotherapy, occupant-ional therapy anddomiciliary nursing care ( related toaffordability issues).
Physical DomainScore No. %1 - 2 7 2.82 - 3 22 8.83 - 4 66 26.54 - 5 154 61.8
Psychological DomainScore No. %1 - 2 6 2.42 - 3 21 8.43 - 4 75 30.14 - 5 147 59.0
Social DomainScore No. %1 - 2 6 2.42 - 3 51 20.53 - 4 69 27.74 - 5 123 2
Environmental DomainScore No. %1 - 2 5 2.02 - 3 42 16.93 - 4 131 52.64 - 5 71 28.5
Table 29: Various interventions for TBIsfollowing hospital discharge at 2nd year contact
Type of services received No. %On regular medication andphysician care 61 28.4Psychological services 5 2.3Physiotherapy 14 6.5Occupation therapy 3 1.4Nursing care 8 3.7
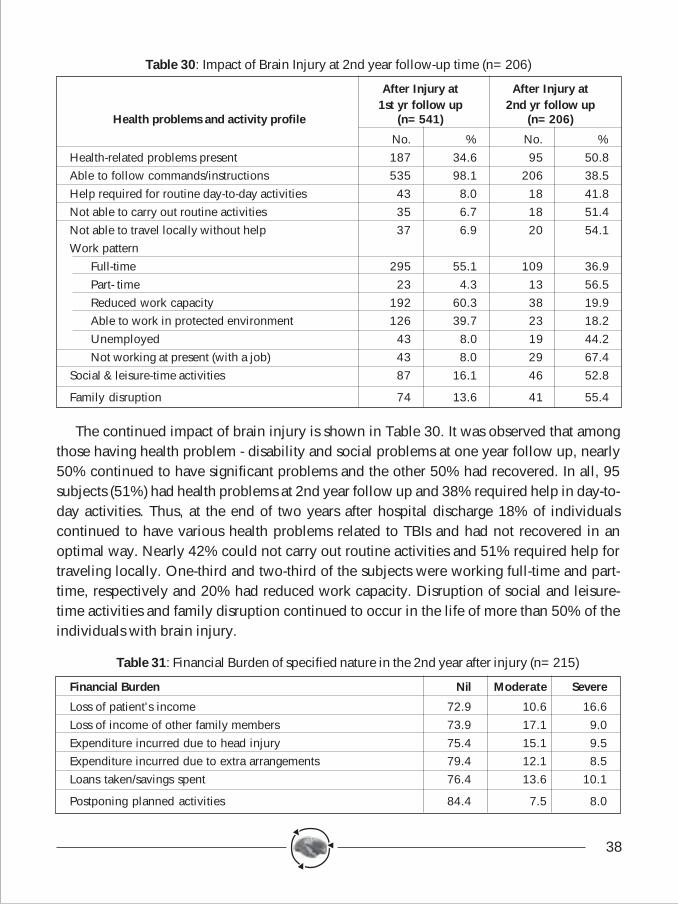
38
Table 30: Impact of Brain Injury at 2nd year follow-up time (n=206)
After Injury at After Injury at1st yr follow up 2nd yr follow up
Health problems and activity profile (n=541) (n=206)
No. % No. %Health-related problems present 187 34.6 95 50.8Able to follow commands/instructions 535 98.1 206 38.5Help required for routine day-to-day activities 43 8.0 18 41.8Not able to carry out routine activities 35 6.7 18 51.4Not able to travel locally without help 37 6.9 20 54.1Work pattern
Full-time 295 55.1 109 36.9Part- time 23 4.3 13 56.5Reduced work capacity 192 60.3 38 19.9Able to work in protected environment 126 39.7 23 18.2Unemployed 43 8.0 19 44.2Not working at present (with a job) 43 8.0 29 67.4
Social & leisure-time activities 87 16.1 46 52.8
Family disruption 74 13.6 41 55.4
The continued impact of brain injury is shown in Table 30. It was observed that amongthose having health problem - disability and social problems at one year follow up, nearly50% continued to have significant problems and the other 50% had recovered. In all, 95subjects (51%) had health problems at 2nd year follow up and 38% required help in day-to-day activities. Thus, at the end of two years after hospital discharge 18% of individualscontinued to have various health problems related to TBIs and had not recovered in anoptimal way. Nearly 42% could not carry out routine activities and 51% required help fortraveling locally. One-third and two-third of the subjects were working full-time and part-time, respectively and 20% had reduced work capacity. Disruption of social and leisure-time activities and family disruption continued to occur in the life of more than 50% of theindividuals with brain injury.
Table 31: Financial Burden of specified nature in the 2nd year after injury (n=215)
Financial Burden Nil Moderate Severe
Loss of patient's income 72.9 10.6 16.6Loss of income of other family members 73.9 17.1 9.0Expenditure incurred due to head injury 75.4 15.1 9.5Expenditure incurred due to extra arrangements 79.4 12.1 8.5Loans taken/savings spent 76.4 13.6 10.1
Postponing planned activities 84.4 7.5 8.0
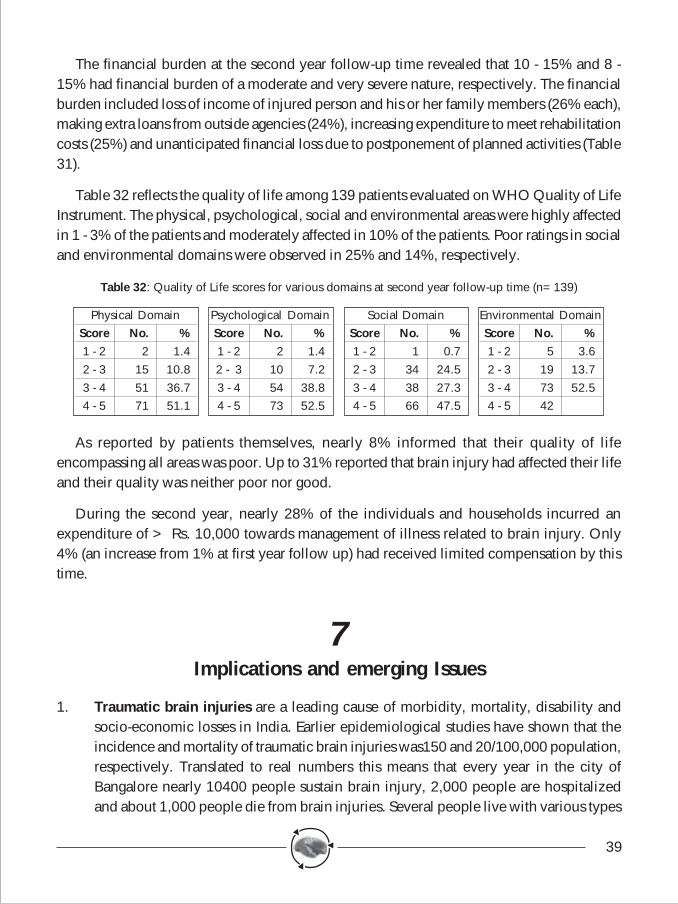
39
The financial burden at the second year follow-up time revealed that 10 - 15% and 8 -15% had financial burden of a moderate and very severe nature, respectively. The financialburden included loss of income of injured person and his or her family members (26% each),making extra loans from outside agencies (24%), increasing expenditure to meet rehabilitationcosts (25%) and unanticipated financial loss due to postponement of planned activities (Table31).
Table 32 reflects the quality of life among 139 patients evaluated on WHO Quality of LifeInstrument. The physical, psychological, social and environmental areas were highly affectedin 1 - 3% of the patients and moderately affected in 10% of the patients. Poor ratings in socialand environmental domains were observed in 25% and 14%, respectively.
Table 32: Quality of Life scores for various domains at second year follow-up time (n=139)
As reported by patients themselves, nearly 8% informed that their quality of lifeencompassing all areas was poor. Up to 31% reported that brain injury had affected their lifeand their quality was neither poor nor good.
During the second year, nearly 28% of the individuals and households incurred anexpenditure of > Rs. 10,000 towards management of illness related to brain injury. Only4% (an increase from 1% at first year follow up) had received limited compensation by thistime.
7Implications and emerging Issues
1. Traumatic brain injuries are a leading cause of morbidity, mortality, disability andsocio-economic losses in India. Earlier epidemiological studies have shown that theincidence and mortality of traumatic brain injuries was150 and 20/100,000 population,respectively. Translated to real numbers this means that every year in the city ofBangalore nearly 10400 people sustain brain injury, 2,000 people are hospitalizedand about 1,000 people die from brain injuries. Several people live with various types
Physical DomainScore No. %1 - 2 2 1.42 - 3 15 10.83 - 4 51 36.74 - 5 71 51.1
Psychological DomainScore No. %1 - 2 2 1.42 - 3 10 7.23 - 4 54 38.84 - 5 73 52.5
Social DomainScore No. %1 - 2 1 0.72 - 3 34 24.53 - 4 38 27.34 - 5 66 47.5
Environmental DomainScore No. %1 - 2 5 3.62 - 3 19 13.73 - 4 73 52.54 - 5 42
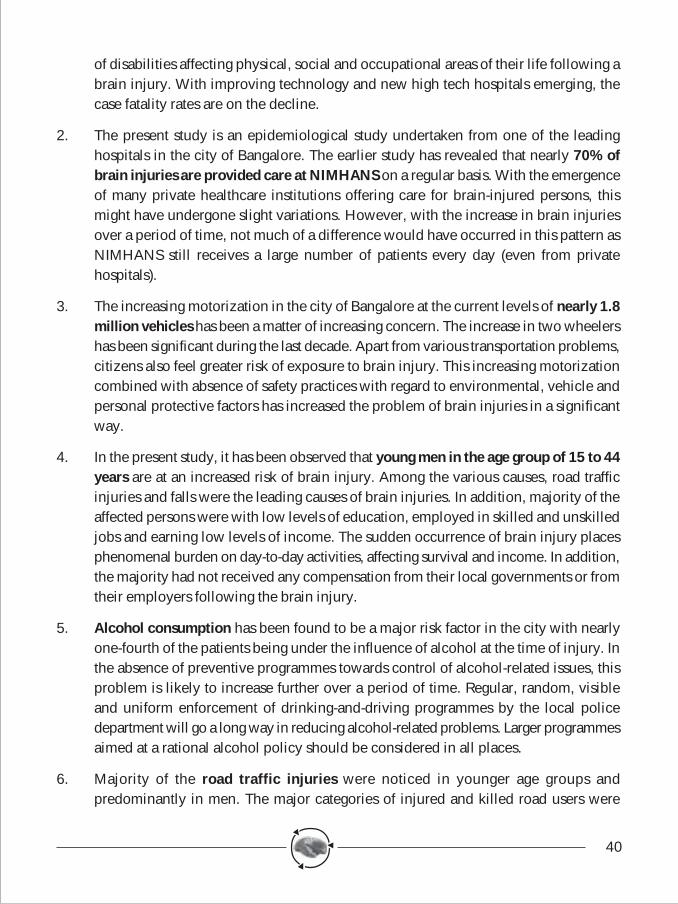
40
of disabilities affecting physical, social and occupational areas of their life following abrain injury. With improving technology and new high tech hospitals emerging, thecase fatality rates are on the decline.
2. The present study is an epidemiological study undertaken from one of the leadinghospitals in the city of Bangalore. The earlier study has revealed that nearly 70% ofbrain injuries are provided care at NIMHANS on a regular basis. With the emergenceof many private healthcare institutions offering care for brain-injured persons, thismight have undergone slight variations. However, with the increase in brain injuriesover a period of time, not much of a difference would have occurred in this pattern asNIMHANS still receives a large number of patients every day (even from privatehospitals).
3. The increasing motorization in the city of Bangalore at the current levels of nearly 1.8million vehicles has been a matter of increasing concern. The increase in two wheelershas been significant during the last decade. Apart from various transportation problems,citizens also feel greater risk of exposure to brain injury. This increasing motorizationcombined with absence of safety practices with regard to environmental, vehicle andpersonal protective factors has increased the problem of brain injuries in a significantway.
4. In the present study, it has been observed that young men in the age group of 15 to 44years are at an increased risk of brain injury. Among the various causes, road trafficinjuries and falls were the leading causes of brain injuries. In addition, majority of theaffected persons were with low levels of education, employed in skilled and unskilledjobs and earning low levels of income. The sudden occurrence of brain injury placesphenomenal burden on day-to-day activities, affecting survival and income. In addition,the majority had not received any compensation from their local governments or fromtheir employers following the brain injury.
5. Alcohol consumption has been found to be a major risk factor in the city with nearlyone-fourth of the patients being under the influence of alcohol at the time of injury. Inthe absence of preventive programmes towards control of alcohol-related issues, thisproblem is likely to increase further over a period of time. Regular, random, visibleand uniform enforcement of drinking-and-driving programmes by the local policedepartment will go a long way in reducing alcohol-related problems. Larger programmesaimed at a rational alcohol policy should be considered in all places.
6. Majority of the road traffic injuries were noticed in younger age groups andpredominantly in men. The major categories of injured and killed road users were
41
motorized two wheeler occupants, pedestrians and bicyclists. Collision of heavy vehicleswith these categories of road users resulted in greater number of deaths and seriousinjuries. Undoubtedly, safety of these Vulnerable road users should be of importanceto save lives and prevent disabilities.
7. With nearly 1.8 million vehicles and 75% of them being two wheelers alone, safetyand protection of two-wheeler occupants should occupy an important place. It wasobserved that only less than 5% of the injured were wearing a helmet at the time ofinjury. Despite the enormous scientific evidence on protective nature of helmets, thegovernment has still not introduced mandatory helmet legislation. Compulsory helmetlegislation, speed control and better traffic management will go a long way in reducingtwo-wheeler injuries. Safer pedestrian crossing places will be of importance to reducepedestrian exposure to the occurrence of brain injuries.
8. Falls were the second leading cause of traumatic brain injuries in the study with majoritybeing children or elderly people and predominantly women. The majority of the fallshad occurred in homes or in public places and the nature of the falls was primarilyaccidental or fall from stairs or steps. Further, the majority of the falls had occurred atan average height of less than 15 feet and on a hard surface. This emphasizes theimportance of domestic safety, play safety and work safety towards prevention of braininjuries.
9. Violence was the third leading cause of traumatic brain injuries in the study withnearly 10% of the brain injuries due to violence. Much of the violence was due tousage of commonly available blunt physical objects due to interpersonal rivalry, propertydisputes, communal riots, disharmony between the family and other reasons. Theperpetrator was always a known person to the injured person.
10. Prehospital and emergency care was found to be totally inadequate and unscientific.In the given scenario, many of the brain injuries being mild injuries, local doctorscould have provided care in local hospitals. However, referring such patients to atertiary apex central institution added only to time delays and increasing brain injuryseverity. In addition, many of the patients were transported in private vehicles andambulances were used in one-fourth of the brain injuries. Appropriate organization ofemergency and prehospital care is the need of the hour.
11. The majority of the brain injuries were mild brain injuries and concussive head injuries.Contusions, haemorrhages and skull fractures accounted for one-third of brain injuries.Nearly 25% of the registered patients were admitted in the hospital and providedmedical and surgical care. The duration of hospital stay varied from a few hours to a
42
few days with nearly 10% staying for longer periods. The case fatality rate of braininjuries has been on the decline for the last few years at NIMHANS due to improvedfacilities, greater manpower and early interventions.
12. Nearly one-third of the patients continued to experience various disabilities havingan impact on their day-to-day activities. Nearly 10% could not continue in their previouswork and had reported restricted work abilities. In all, 8% reported themselves to beunfit for any work following a brain injury. Injury had also affected their social andleisure-time activities causing family disruption at various levels. This indicates theneed for reorganizing and strengthening brain-injury rehabilitation within the city. Thestudy could not identify disability patterns and the burden among rural people whererehabilitation services are far from satisfactory. To use rehabilitation services, thesepeople need to travel longer distances to nearby district headquarters or to the cities.
13. Less than 1% of patients had received some compensation following the injury within1 year. This indicates the absence of supportive mechanisms for maintenance andrehabilitation of brain-injured persons in the city. Absence of income from their previousjobs combined with lack of compensation places additional burden on individualsand their families. This had necessitated people to sell their existing property, makeadditional debts at higher rates of interest and had forced other family members to takeup employment to compensate for loss of income of the injured person.
14. Interestingly, nearly 25% of patients had incurred a total expenditure of more thanRs.20,000 towards injury care. This included only the expenditure incurred by individualhouseholds and their family members as out-of-pocket expenses. Since much of thehealth care in public institutions is subsidized, the cost incurred by institutions has notbeen taken into account. From a collateral study in this project it was identified thatRs.2,152 is incurred towards management of one patient for a day’s stay at NIMHANScasually. If the subsidized expenditure and the family expenditure are combinedtogether, it indicates the phenomenal economical losses by brain injuries in a rapidlydeveloping city.
15. From a state of normal life to a state of disabled life, the quality of life of the injuredperson is a gradual decline over a period of time. In the study, it was noticed thatnearly one-third of brain-injured persons have long-term disabilities affecting variousspheres of life, thus bringing a decline in their quality of life at 1 year with half of themhaving disabilities at 2nd year. This resulted in the emergence of new psychosocialproblems likely to be present for the rest of an individual's life.
43
8Epilogue
Traumatic brain injuries are a leading cause of injuries, deaths and disabilities in India.Due to lack of research, the various dimensions of TBIs are underreported and underestimated.The present study undertaken over a three-year period (2000-2003) at NIMHANS has unraveledthe socio-demographic characteristics, causative patterns, risk factors, status of pre-hospitaland emergency care, injury patterns in terms of severity and nature and outcome in a seriesof 7164 head injury - 5630 brain-injured persons. The first and second year follow up revealedthat one-third of the patients will have health problems, disabilities, socio-economic burdenand a poor quality of life at the end of hospital stay. These people who were normal beforeinjury pass through a phase of hospitalization due to an injury like RTI, falls, violence andothers with a significant burden and a poor quality of life affecting all dimensions of their life.Hospital and families incur huge expenditure due to an injury after forcing individuals togenerate resources by other methods. In all, 409 persons died with a case fatality rate of7.1% (308 in hospital and 93 after discharge). At one-year and two-year follow-up time itwas observed that one-third (35%) and one-fifth (20%), with half of them seen at one yearfollow up, respectively, confirmed to have problems, disabilities and increased burden afterinjury.
Unless systematic efforts are made in India towards prevention, management andrehabilitation, many more individuals, children and middle-aged adults will continue to dieand this will be an unbearable loss to Indian society.
9Recommendations
The following recommendations are placed herewith for reducing morbidity, mortalityand disability from traumatic brain injury. The recommendations have been developed basedon study results, opinion of medical professionals, views expressed by participating subjectsand their families. The recommendations are also based on the current understanding ofinterventions ongoing in the field of traumatic brain injury prevention, management andrehabilitation. We sincerely hope that these recommendations will be considered seriouslyby policymakers, programme managers, professionals and the media for bringing in safetymechanisms and consciousness among the citizens of Bangalore and in other parts of country.Undoubtedly, similar efforts are required across several states and cities of the country to
44
reduce the growing burden of traumatic brain injuries. The suggested recommendations includeboth short-term and long-term measures.
1. Scientific understanding of the problem of traumatic brain injuries in its various dimensionsis very crucial to organize services in the areas of acute care, rehabilitation and towardsprevention. Information on the precise magnitude of the problem, risk factors, causes,mechanism, clinical manifestations and outcome from traumatic brain injury is very crucialin understanding the problem to identify remedial measures. The present study has beenconducted in one major hospital in the city of Bangalore, with a focus on pre-injury topost-injury status over a period of three years. The study has brought a wealth of informationwith regard to various issues of acquired traumatic brain injuries.
♦ It is important that a long-term surveillance system focusing on the problem and itsdeterminants and consequences is developed for the city of Bangalore by inclusionof information from all major hospitals in the city on a uniform basis based onstandardized methodologies. Record linkage system with police data will be highlyuseful. This would help in tracking the epidemic, identifying changes in causationand also the various risk factors. In addition, it would also help in measuring theimpact of interventions over a period of time.
2. Since a large number of people, predominantly men in the younger age groups, are injured,killed and disabled in brain injuries, it is appropriate to focus on several preventivestrategies. Experience of developed countries has revealed that traumatic brain injuriesare predictable and preventable. Several interventions, combined with one another andimplemented on a scientific basis have resulted in a gradual decline of brain injuries inmany high-income countries. Areas of road safety, home safety, work safety and playsafety have to be given major importance and interventions have to be developed on ascientific basis for implementation. It is important that we move from pessimisticapproaches to a more optimistic vision with a commitment to reduce injuries and traumaticbrain injuries with increased focus on safety at all levels.
♦ Awareness and sensitization programmes should be undertaken by healthprofessionals in collaboration with media personnel to increase safety consciousnessin society among political leaders, policymakers, product/vehicle manufacturers,professionals and the community.
3. At present, there are no systematic programs that are developed, implemented andevaluated based on scientific policies and programmes. There is an immediate need toformulate a national injury prevention policy and programme based on analysis of availabledata with inputs from different sectors.
45
♦ A national injury prevention policy with defined programmes in the areas of roadsafety, home safety and work safety should be formulated with clearly- defined goalsand objectives. A time-bound action plan with short-term and long-term activitiesshould be clearly specified in this process. The National Road safety Policy is currentlyunder development .
♦ At the city and state level, programmes aimed at prevention of road traffic injuriesshould receive highest importance as nearly 60 percent of traumatic brain injuriesare due to road traffic injuries. Activities that can be implemented with minimal orless additional resources - and those demonstrated to have scientific evidence shouldbe taken up on a priority basis for prevention programmes.
♦ To effectively implement these activities, a coordinating body with sufficient funds,status and authority to formulate, guide, and supervise activities at the state levelneeds to be formed. This body could be independent of any ministries with aresponsible senior nodal officer to coordinate all activities.
4. Considering the importance of pedestrians, motorized two-wheeler occupants andbicyclists being involved in greater numbers in traumatic brain injuries, preventive effortsshould be focused on making these groups safer in the longer run. Known and scientificallyproven interventions should be considered on a priority basis in Bangalore and otherplaces. In this direction, the following activities should be undertaken on a priority basis:
♦ Mandatory helmet legislation should be introduced in Karnataka and should be totallyenforced by the Department of Police. Sufficient global and national evidence existsin this regard and a large number of brain injuries among two-wheeler occupantscan be reduced with this measure. The enforcement should be visible, uniform andrandom with stiff penalties. Community awareness programmes should be combinedwith enforcement strategies for better compliance with the law. No confusion shouldbe created amongst public and once the law is introduced, it should not be repealedfor any simple reasons.
♦ The existing laws with regard to seatbelt usage by car occupants should be widelypublicized and enforced by the police. It should also be ensured that all cars arefitted with seatbelts and necessary awareness among vehicle manufacturers and publicshould be promoted.
♦ The existing laws and enforcement with regard to reduction of drinking-and-drivingshould be strengthened and enforced in a visible, uniform, random manner with stiffpenalties by the police. To achieve this, dedicated enforcement teams should beconstituted and supplied with breathalyzers and other requirements of transport and
46
supply items. The required training should be provided to all involved policepersonnel in this regard. In addition, all hospitals in the city must introduce breathalcohol testing with the help of breathalyzers.
♦ The city council needs to formulate effective speed-control laws with clearly- definedspeed limits within the city, on highways and in arterial roads. The formulation ofspeed control laws should be based on scientific studies and must be clearlycommunicated to the public on a regular basis. Necessary enforcement should beundertaken by the police and the transport departments in all places, both withinand outside the city with new technologies that are currently available. In addition,low cost engineering scientific solutions of traffic calming, speed breakers and roaddesign features should be systematically introduced all over the city and state. Highwayroad design should consider regulation of speed at safer levels on scientific methods.
♦ The existing traffic regulations need to be efficiently communicated to the public andtraffic violators should be fined appropriately to control violation of traffic laws. Theexisting sections of the Indian Motor Vehicles Act must be clearly enforced in thisregard.
♦ Safer pedestrian crossing and walking places must be provided on all possible routesin the city of Bangalore. Wherever possible, pedestrians mixing with traffic shouldbe avoided and engineering solutions for safe travel of pedestrians should bepromoted.
♦ Bicycle travel is an important mode of non-motorized transport within the city.Wherever possible, bicycle routes must be earmarked for travel of bicyclists withinthe city. The visibility of bicycles should be improved with use of bright-reflectorizedcolors. Community awareness programmes towards safe travel by bicycles shouldalso be promoted through media channels.
♦ Implementing safe, reliable and efficient public transportation systems is undoubtedlythe need for the whole city and also across many other places. This would increasemobility in a safe mode while decreasing individual risk of exposure associated withpersonal and unsafe modes of transport. An investment in this policy will reduceinjuries, deaths and disabilities and also address associated problems of trafficcongestion, air pollution and other hazards.
5. Road design, development, expansion and maintenance should be given top importancein the city of Bangalore and other places. The design of the roads should be scientifickeeping in view the increasing motorization and transportation within the city. Road-
47
related issues should be considered in local area planning, and appropriate strategies forurban travel should be based on local area networks.
♦ Roads should be cleared from ditches, potholes, openings, manholes and otherobstacles. This has to be taken on a war footing on all roads in the city, throughoutthe total geographical area.
♦ Based on scientific analysis of information, more use of engineering principles insafer design and operation of roads with traffic-calming techniques, separation ofheavy vehicle - fast moving traffic from pedestrians and slow-moving heavy vehiclesshould be developed.
♦ All hard, rigid and immobile objects should be removed from the roads. Whereverrequired soft and non-rigid flexible materials should be used on the roads.
♦ Since 30 to 40 percent of road crashes occur on national and state highways, theseroads should be designed and developed on a scientific basis keeping in view thelocal travel and transportation patterns. Some prominent interventions related topromoting helmet usage, reducing drinking and driving, reducing and regulating speed,strict prohibition of overtaking from wrong side, increasing visibility, separation oftraffic, and strengthening prehospital and hospital care require immediate attention.Road design features should be incorporated in road construction and maintenanceand vehicle crashworthiness and stability to be significantly improved for reductionof severe crashes.
6. Poor visibility of human beings, vehicles and risk situations and dangers on the road hasbeen found to be a major contributing factor for occurrence of road traffic injuries andtraumatic brain injuries. In this regard, it is important
♦ That vehicle manufacturers use brighter and reflective colours;
♦ Reflectorisation of vehicles, specially heavy vehicles, two-wheelers and bicyclesshould be strongly encouraged;
♦ All roads with ongoing maintenance and repair works should display signboardscautioning drivers to be careful at these places;
♦ All edges of the roads should be marked in clear and reflective paints indicating thewidth of the road;
♦ All pedestrian and bicycle movement places should be clearly demarcated andprominently shown in bright reflective colors;
48
♦ Street lighting has to be improved with better use of technologies ( solar lightingoptions could be considered) in all possible places;
♦ Daytime usage of headlights by vehicle drivers should be increased slowly andgradually as scientific research has clearly demonstrated reduction of crashes withthe use of this method.
7. The present study and several other studies in the Indian region have revealed that nearlyone-fourth of the injuries occur at home and domestic falls are one of the major causesfor traumatic brain injuries. The mechanism of injury reveals that falls, especially amongchildren and the elderly and in women, are significantly high. More research is requiredto identify specific details where interventions are likely to succeed. However, somestrategies likely to yield positive results are: -
♦ Avoidance of slippery floors and encouraging more use of antiskid floor materials;
♦ Usage of soft and energy-absorbing materials in homes;
♦ Education of parents and family members to increase supervision of children;
♦ Better illumination of the interior of homes to increase visibility of the surroundings.
8. Violence with blunt objects is a common mechanism for occurrence of acquired braininjuries. Once again, more research is required to identify the precise mechanism and todevelop intervention mechanisms. Some promising interventions in this area are:
♦ Promotion of life skills education in colleges and workplaces for better conflictresolution management;
♦ Limiting accessibility to weapons specially among youth;
♦ Mechanisms to restrict alcohol consumption;
♦ Supportive and counseling services for individuals suffering from alcohol, drugs andother personality problems.
9. Prehospital and emergency care should be given top most importance to save lives evenafter the occurrence of injury.
♦ First responders training for police, drivers, teachers and for all categories of thepersonnel on basic life-saving measures should be undertaken by institutions basedon uniform and consensus-driven methodology on fundamental interventions thatcan be effectively undertaken. These programs should be continuous with periodicrefresher courses.
49
♦ Ambulance systems within the city need to be reorganized to see that immediatetransportation of the injured persons is undertaken in an effective manner.
♦ Several emergency care systems are already working within the city. The systemsneed to be effectively organized and coordinated based on geographical mappingsystems with common access numbers.
♦ All hospitals in the city irrespective of the levels and facilities must mandatorilyprovide basic and essential care towards stabilization of the patients' condition,irrespective of the ability of the injured persons to pay. The existing legal provisionsshould be widely communicated to society and to the health care institutions by allmedia channels.
♦ Early transportation of patients to definitive hospitals is very vital for immediateinterventions to prevent deaths and subsequent disabilities. It is vital that informationon the availability of definitive services in various hospitals is widely communicatedto the public and treatment is provided on arrival of patients.
♦ Even though it is clearly mentioned that the public would not be subjected tounnecessary legal procedures for accompanying patients to hospitals after injury, itis still substantially unclear in the minds of the public. The legal provisions in thisregard must be widely communicated to the public through various media channels.
♦ All doctors, nurses and other paramedical personnel in different (public and private)health care institutions must be trained in basic life-support systems through trainingprogrammes. These personnel should be specially trained in the recognition of braininjury at the early stage and to refer cases depending on the extent of severity basedon triage principles to avoid unnecessary referrals.
♦ The emergency care services in the casualty departments of various hospitals needsto be studied in great detail to identify various lacunae that exists in coordinationand delivery of emergency care. The physical and human resources with basic facilitiesfor investigation and management should be upgraded in all hospitals for provisionof care.
10. All hospitals on national highways and at district headquarters should be upgraded asintegrated trauma care centers to manage mild and moderate brain injury and those witha lesser degree of polytrauma. The required investigating and management support systemsin terms of physical resources should be strengthened in all these hospitals with trainingand operation of facilities.
50
11. Training of medical officers in taluk and district hospitals and local government hospitalsmust be undertaken for early recognition and better management of persons with a braininjury. These programmes should highlight recognition of brain injury, management atlocal level and referral-based triage.
12. Trauma audits must be introduced in every hospital to identify critical lapses in managementof patients. This would help in a systematic way to identify critical areas of improvementfor reducing mortality and disability rates.
13. Compensation systems for injured persons must be strengthened to provide timely supportfor individuals and families. In the study it was noticed that less than 5% of the patientsreceived some support and in nearly one-fourth of the instances, the legal process wasstill continuing even after two years after the occurrence of injury. This places enormousburden on individuals and families and forces them to generate resources for managementof the injured person. The legal hurdles must be removed to provide timely compensationfor injured persons and their families.
14. The rehabilitation process is an important component to restore the optimal functioningcapacity of the injured person. However problems have been experienced with regard toavailability of services in urban and rural areas. It is important that patients are educatedat the end of hospital stay towards appropriate rehabilitation services that need to beavailed of in due course of time to restore functioning of the individual. In addition,services should be made available by both the public and the private sectors in urban aswell as rural areas, towards timely rehabilitation of the brain-injured persons. In thisdirection, services should be strengthened in government district hospitals with manpowerand additional facilities for rural patients. In urban Bangalore, patient and family educationat the end of hospital stay towards the type of rehabilitation services that need to becontinued should be informed to the patients during their course of hospital stay.
15. Any program, not driven by evidence and science is unlikely to yield positive results. Asystematic injury surveillance program should be established in Bangalore and othercities/states to track the evolving change and trends, identify causation and to measurethe impact of interventions. A simple and effective reporting system within police andhealth sectors should be developed with a focus on capturing information on those factorswhich can be potentially modified. Implementation of these interventions should lead toreduction of RTIs and other injuries. This data should be analyzed in a continuous mannerby technical teams ( police, health and engineering)and should be used for interventionprograms. Technical teams should undertake multidisciplinary crash investigations. Thereis also need to establish trauma registries at medical college levels across the state. Thus,there is need for creating these mechanisms in Bangalore and all other places for
51
scientific understanding and developing interventions.
16. National Neurotrauma Prevention Programme under a broader national injury preventionpolicy with all components of education, engineering, enforcement and emergency caremust be developed for the Indian region by involved ministries in partnership with variousprofessional bodies with involvement of all related governmental and non-governmentalorganizations.
10Inputs from project into policies and programmes
The information from the project has been of extreme value in the comprehensiveunderstanding of neurotrauma issues in prevention, management, rehabilitation, socio-economic burden and current initiatives. The data has helped in reorganizing and augmentingservices within NIMHANS by redistribution of resources. Simultaneously, the data has beenprovided to concerned departments in the city of Bangalore and the state of Karnataka fordeveloping safety measures. Inputs for reintroduction of helmet legislation, reducing drinking-and-driving, strengthening emergency services and pedestrian safety issues has been significant.Media professionals have quoted the information on several occasions to increase awarenessamong the public on road and home safety issues. Rehabilitation of the brain-injured personshas also received a major boost within the institute and resources/facilities have beenstrengthened during the last three years.
11Presentation in National and International meetings
(till September 2004)
Information developed from the project has been shared with professionals and policymakers on several occasions in the past three years.
11.1 Gururaj G, Sastry Kolluri VR, Chandramouli BA and Subbakrishna DK. NeurotraumaRegistry in NIMHANS. First National Neuroscience Conference, Bangalore, September10 - 12, 2004.
11.2 Gururaj G: Human Resource Development for injury prevention and control in
52
developing countries. Seventh World Conference on Injury Prevention and Control,Vienna, June 6 - 9, 2004.
11.3 Gururaj G and Kraus JF: Epidemiological determinants of road traffic injuries in India.Seventh World Conference on Injury Prevention and Control, Vienna, June 6 - 9,2004.
11.4 Gururaj G: Challenges in measuring intentional injuries. TASC and UNICEF RegionalConference on Childhood Injuries, Bangkok April 19 - 21, 2004.
11.5 Gururaj G: Methodological issues in violence and injury prevention research indeveloping countries. Forum Seven Meeting, Geneva, December 2 - 5, 2003
11.6 Gururaj G: Current status of prehospital care in India. WHO Inter-country ConsultativeMeeting on Strategies for Prehospital and Emergency Care in South East Asia,Ahmedabad, June 2 - 5, 2003.
11.7 Gururaj G. Road traffic injuries in India and South East Asia. An EpidemiologicalPerspective: Forum 6 meeting of Global Forum for Health Research, Arusha, Tanzania,November 12 - 15, 2002.
11.8 Gururaj G, Sastry KVR, Chandramouli BA and Subbakrishna DK. Disabilities & impactafter Traumatic Brain Injury. Results of one year outcome study from Bangalore, India.Seventh European Multidisciplinary Neurotraumatologica, New Castle, Upon Tyne,June 27 - 29, 2002.
11.9 Gururaj G, Sastry KVR, Chandramouli BA and Subbakrishna DK. Alcoholconsumption, road accidents and acquired brain injuries. Sixth World Conference on"Injury Prevention and Control", Montreal, 12 - 15 May, 2002.
11.10 Gururaj G, Sastry KVR, Chandramouli BA and Subbakrishna DK. The pattern andimpact of prehospital care on traumatic brain injury. Seventh European MultidisciplinaryNeurotraumatologica, New Castle, Upon Tyne, June 27 - 29, 2002.
53
References
1. Romer CJ, Zitnay G, Gururaj G et al: Prevention, critical care and rehabilitation ofNeurotrauma, WHO Collaborating Centre for Neurotrauma, 1995.
2. Gururaj G: An Epidemiological approach to Prevention, Prehospital care andRehabilitation in Neurotrauma, Neurology, India, 43(3), 1995, 95 106.
3. Gururaj G. Epidemiology of Traumatic Brain Injuries: Indian Scenario, NeurologicalResearch, 24, 1 - 5, 2002.
4. Gururaj G and Sastry KVR. Problem and determinants of traumatic brain injuries inIndia. NIMHANS Journal, 17(4), 1999, 407 - 422.
5. Planning Commission Report of the working group on prevention of road accidentsand injuries, Government of India, 2002.
6. Brooke E.M: The Current and future use of Registers in Health Information Systems.World Health Organization, 1974.
7. Goldberg J, Gelfand M and Levy PS; Registry evaluation methods: A review and casestudy. Epidemiologic reviews, 232 - 241, 1980.
8. Directorate of Census Operation, Karnataka Census of India, 2001.
9. Gururaj G, Sastry KVR, Chandramouli BA and Subbakrishna DK. Training Manual forNeurotrauma Registry in NIMHANS, 2000.
10. Centre for Disease Control and World Health Organization. Standards for Surveillancein Neurotrauma, 2000 (unpublished document).
11. Gourie-Devi M, Gururaj G and Satishchandra P: Neuroepidemiology in developingcountries - A manual for descriptive studies. Second edition, Prism Books Pvt. Ltd.,1997.
12. World Health Organization. International classification of diseases 10th revision, 1996.
13. World Health Organization. International Classification for External Causes of Injuries(ICECI). Guidelines for counting and classifying external causes of injuries for preventionand control, 1998.
14. Teasdale G and Jennet B. Assessment of coma and Impaired Consciousness. Lancet,2, 1974, 81 - 4.
54
15. Association for Advancement of Automotive Medicine. Abbreviated Injury Scale.
16. Anderson SI, Housley AM, Jones PA, Slattery J, and Miller JD (1993). Glasgow OutcomeScale: an inter-rater reliability study. Brain Injury, 7, 309 - 317.
17. Dobkin BH. Neurologic Rehabilitation. FA Davis Philadelphia 1996: 107.
18. Wilson JTL, Pettigrew LE and Teasdale GM. Structured interviews for the GlasgowOutcome Scale and the Extended Glasgow Scale: Guidelines for their use. Journal ofNeurotrauma, 15(8), 1998, 573 - 85.
19. World Health Organization. WHOQOL - BREF. Introduction, Administration, Scalingand Generic version of the assessment.
20. Epi-Info version 6.04d, Epidemiology Program Office, Division of Public HealthSurveillance and Informatics, Centers for Disease Control and Prevention, 1600 CliftonRd, Atlanta, GA 30333, U.S.A
55
Annexure - I
NEUROTRAUMA REGISTRY – Phase - IStudy by the Department of Epidemiology and Neurosurgery,
National Institute of Mental Health & Neuro Sciences, Bangalore, Indiaand
Southern California Injury Prevention Research Centre, Los Angeles, USA.
A. IDENTIFICATION INFORMATION
1. Sl. No. ________________________ 2. Neuro No. _________________________________
3. ECR No. _______________________ 4. Date & Time of Interview: _____________________
B. SOCIODEMOGRAPHIC DETAILS
5. Name: _____________________________________________________________________________
6. Age: 7. Sex: 8. Place of residence:
9. Address: __________________________________________________________________________
__________________________________________________________________________
__________________________________________________________________________
__________________________________________________________________________
Landmarks for house identification: __________________________________________________
Telephone No.: _____________________________________________________________________
10.Education: ___________ 11. Marital Status: ____________ 12. Occupation: _______________
13.Approximate family income (per month): _____________________________________________
C. RISK FACTOR INFORMATION
14.H/O alcohol consumption14.1 Time interval (hr : mm) : 14.2 H/o regular alcohol intake:
15.Past history of epilepsy
15.1 Duration (years/months) / 15.2 Treatment status:
D. INJURY DETAILS
16.Date & Time of occurrence of brain injury ____________________________________________
17.Place of injury occurrence:
56
If others, specify: ______________________________________________________________________
18.Location of injury occurrence: __________________________________________________________(code as per A - Z map)
19.Cause of brain injury:(skip to appropriate sections)
20.Road Traffic Accidents:a. Road condition: _______ b. Status of person: _______ c. Hit by: _______
d. Location: _______ e. Nature of Collision: ______
f. Pedestrian maneuver: ______ g. Any protection equipment: ______
h. Wearing of helmet: _________________ If yes, name of helmet: _________________________
Strapping: ______________ i. Wearing of seat belt: ______________
21.Falls:a. Nature of falls: __________ b. Height of fall (in feet): ____________
c. Nature of landing surface: ____________________________________
22.Assault:a. Injury Intentional/Unintentional/Unknown
b. Reason for injury ____________________________________________________
_______________________________________________________
c. Assault by (person) _____________________________________________________
d. Assault by (nature of instrument) ________________________________________
23.Nature of falling object:
Others, specify: ___________________________________________________________
24.Industrial accident:
Specify ___________________________________________________________________
25.Sports Injuries
Nature of sports (Name) ___________________________________________________Protective equipment to head
26.Other type of injuries, specify ______________________________________________
57
E. PREHOSPITALISATION CARE DETAILS
27.First-aid services(Describe the type of interventions)
If yes, where: _____________________________________________________________
28.Source of referral:If others, specify: _________________________________________________________
29.No. of medical contact till reaching NIMHANS.
30.Brought by: _______________________________________________________________
31.Pathways of careTime interval
Place of injury occurrence - 1st Medical contact ( ).
1st Medical contact ( ) - 2nd Medical contact ( ).
2nd Medical contact ( ) - 3rd Medical contact ( ).
3rd Medical contact ( ) - 4th Medical contact ( ).
4th Medical contact ( ) - 5th Medical contact ( ).
Total time interval
32.Mode of transportation:
If others, specify: _________________________________________________________
F. CLINICAL DETAILS
33.Status on arrival:
34.a. Presence of amnesia b. Type: ___________________________________________
58
35.Glasgow Coma Scale on admission:
a. Visual response (E): ___ b. Motor Response (M): ___ c. Verbal Response (V): ___
Total Coma Score (E+M+V) = 3 to 15
36.Glasgow Coma Scale after 3 hours:
a. Visual response (E): ___ b. Motor Response (M): ___ c. Verbal Response (V): ___
Total Coma Score (E+M+V) = 3 to 15
37.Associated injuries: (1-Present, 2-Absent)
a. Neck injury: _____ b. Chest injury: _____ c. Abdominal injury: _____
e. Injury to pelvic bones: _____ f. Injury to long bones UL: _____
g. Injury to long bones LL: _____ h. Crush injury: _____
38.Details of injuries AIS
39.Diagnosis:a. Diagnosis on arrival:b. Diagnosis by neurosurgical staff:c. Diagnosis by CT Scan/MRI/X-ray:d. Postoperative diagnosis:e. Discharge diagnosis:f. Autopsy diagnosis:
ICD Code:
ICD Code:
G. MANAGEMENT DETAILS
40.Mode of management: _________________________________________________________________
59
41.Details of specific interventions
_______________________________________________________________________________________
_______________________________________________________________________________________
_______________________________________________________________________________________
_______________________________________________________________________________________
42.Medical management42.1 ICP monitoring: ______________________________________________________________
42.2 ICU management: ______________________________________________________________
42.3 Ventilator usage: ______________________________________________________________
43.If operated, time interval between admission and surgical intervention: _____________________
44.Reason for any delay in surgical intervention:
_______________________________________________________________________________________
_______________________________________________________________________________________
45.Course during hospital stay:
46.Duration of hospital stay:
a. In days: b. In hours: :
47.Discharge disposition: _________________________________________________________________
48.Outcome (based on Glasgow Outcome Scale):
49.a. Hospital costs (in Rupees)
b. Expenditure incurred by patients/family memberstill hospital discharge time
c. Total Cost
50.Advised to follow up at NIMHANS/Other Hospitals
50.1 Advised date and time of follow up _______________________________________________
H. DISABILITY ASSESSMENT
51.TOTAL DISABILITY SCORE :
60
a. Is the patient able to bathe by self :(1) No (2) Yes but needs help (3) Yes
b. Is the patient able to dress by self :(1) No (2) Partially and needs help (3) Yes
c. Is the patient able to groom by self :(1) No (2) Needs help (3) Yes
d. Is the patient able to eat by self :(1) No (2) Needs help (3) Yes
e. Is the patient able to sit/stand by self :(1) No (2) Needs help (3) Yes
f. Is the patient able to walk about 15 metres by self :(1) No (2) Needs help (3) Yes
g. Is the patient having control over bladder/bowel :(1) No (2) Partial help (3) Yes
h. Is the patient able to see well (with glasses if required) :(1) No (2) Yes
i. Is the patient able to hear well :(1) No (2) Yes but needs aids (3) Yes
j. Is the patient having normal memory/thinking ability :(1) No (2) Impaired (3) Yes
k. Is the patient able to communicate needs :(1) No (2) Partially (3) Yes
l. How is the patient’s social interaction compared prior to illness :(1) Nil (2) Less than before (3) Normal
m. Is the patient able to undertake family responsibilities as earlier :(1) No (2) Yes but less than before (3) Yes
n. Is the patient able to go for work as before :(1) No (2) Less than before (3) Yes
I. AUTOPSY DETAILS
51.Cause of death:i) Immediate cause of death ___________________________________________________________
ii) Antecedent causes of death _______________________________________________________
iii) Other associated conditions _______________________________________________________
52.Autopsy diagnosis ____________________________________________________________________
____________________________________________________________________
61
Annexure - II
NEUROTRAUMA REGISTRY – Phase - IIStudy supported by NIMHANS, Bangalore, India &
SCIPRC (WHO Collaborating Centre, Los Angeles, USA)
1. Sl. No.: __________________ 2. ECR No.: _______________ 3. Neuro No.:______________
4.1 Name: _________________________________________________________________________________
4.2 Date of interview at NIMHANS 5.1 Follow-up status: Regular follow up - 1/Telephone - 2/Letter - 3/House visit - 4.
5.2 Date of interview for Phase - II:
6. Post-Injury Interval 7. Respondent
8. Who is taking care of you now (in months): Parents - 1/Spouse - 2/In-laws - 3/Relatives - 4/Friends - 5/Others - 6, specify.
9. Who was taking care of you before injury:Parents -1/Spouse - 2/In-laws - 3/ Relatives - 4/Friends- 5/Others - 6, specify.
9.1 Disability score at hospital discharge ................................................................................
9.2 Disability pattern
a. Is the patient able to bathe by self :(1) No (2) Yes but needs help (3) Yes
b. Is the patient able to dress by self :(1) No (2) Partially and needs help (3) Yes
c. Is the patient able to groom by self :(1) No (2) Needs help (3) Yes
d. Is the patient able to eat by self :(1) No (2) Needs help (3) Yes
e. Is the patient able to sit/stand by self :(1) No (2) Needs help (3) Yes
f. Is the patient able to walk about 15 metres by self :(1) No (2) Needs help (3) Yes
g. Is the patient having control over bladder/bowel :(1) No (2) Partial help (3) Yes
h. Is the patient able to see well (with glasses if required) :(1) No (2) Yes
i. Is the patient able to hear well :(1) No (2) Yes but needs aids (3) Yes
62
j. Is the patient having normal memory/thinking ability :(1) No (2) Impaired (3) Yes
k. Is the patient able to communicate needs :(1) No (2) Partially (3) Yes
l. How is the patient’s social interaction compared prior to illness :(1) Nil (2) Less than before (3) Normal
m. Is the patient able to undertake family responsibilities as earlier :(1) No (2) Yes but less than before (3) Yes
n. Does the patient go for work as before :(1) No (2) Less than before (3) Yes or has changed job
9.3 Follow-up Diagnosis _____________________________________________________________________
10. How do you feel you are coping with changes in your life style since having head injury?
No problem - 1/some, able to handle on my own - 2/some, could use help frequently – 3/ bad,need help always - 4.
11. Post injury Rehabilitation measures:
A. During the last one year, after your hospital contactwith NIMHANS, have you been receiving care atNIMHANS or in any other place? Yes/No
B. If yes, were you hospitalised in other hospitals?
Specify name/duration _________________________________________________
C. If yes, what type of services have you been receiving/received?
1. On regular medication & physician care Yes/No2. Psychological services Yes/No3. Physiotherapy Yes/No4. Speech therapy Yes/No5. Occupational therapy Yes/No6. Nursing care Yes/No7. Local healers/doctors Yes/No
D. For how long, did you/are you receiving theseServices? Duration (in months /days). ____ / ____
Section - I. Post-Injury Disability Assessment : (1 - No; 2 - Yes)
1. Ability to follow commands, words, instructions or respond to instructions No - 1/Yes - 22.1 Assistance required at home every day for some activities of day-to-day living No - 1/Yes - 2
63
2.2 Frequent help or someone to be around for most of the time No - 1/Yes - 22.3 Assistance prior to injury No - 1/Yes - 23.1 Able to carry out routine activities (e.g., local shopping) outside home without
assistance No - 1/Yes - 23.2 Ability to carry out activities without assistance prior to injury No - 1/Yes - 24.1 Able to travel locally without assistance No - 1/Yes - 24.2 Able to travel locally without assistance prior to injury No - 1/Yes – 25. Work-related details.
A. Occupation prior to injury...................................................................................
B. Before injury, what was your pattern of work? 1 - Full-time/2 - Part-time/3 - House wife/4 - Student/5 - Retired/6 - Unemployed/7 - Unfit for work/not working
then
C. After injury, what is your pattern of work? 1 - Full-time/2 - Part-time/3 - House wife/4 - Student/5 - Retired/6 - Unemployed/7 - Unfit for work/not working
now
D. How do you rate your future job prospects after this injury? 1 - Not going to be affected/2 - Affected, but slightly/3 - Affected, very severely/4 - Will be worse/bad
E. Did you receive any compensation/in the processof receiving after the injury? No - 1/Yes - 2/Under
investigation - 3
If yes, how much?: _____________________________
5.1 Ability to work to previous capacity No - 1/Yes - 2
5.2 Restriction in work Reduced work capacity - 1/ Ableto work in a protected/supervisedenvironment or currently unableto work - 2
5.3 Work status prior to injury No - 1/Yes - 26.1 Resumption of regular social & leisure activities outside home No - 1/Yes - 2
6.2 Extent of restriction of social and leisure activities Participating slightly less thanbefore - 1/
Much less - 2/Unable to participate - 3
6.3 Social & leisure activity prior to injury No - 1/Yes - 2
7.1 Psychological problems resulting in family disruption or disruption in friendships No - 1/Yes -2
64
7.2 Extent of disruption Occasional -1/frequent - 2/constant - 3
7.3 Family disruption prior to injury No - 1/Yes - 2
8.1. Current problems affecting daily life No - 1/Yes - 2
8.2. Problems prior to injury No - 1/Yes - 2
9. Epilepsy No - 1/Yes - 2
Has the person had any epileptic fits? No - 1/Yes - 2
Has the person been informed that he is at risk ofdeveloping epilepsy? No - 1/Yes - 2
10. Vital factor in outcome Effects of head injury alone – 1/Injury to other parts of the body – 2/
Combination of both – 3.
Total Scoring:
11. Disability from spinal injury:
11.1 Bladder management No problem-1/Need help sometimes-2/Need help always- 3/NA - 4.
11.2 Bowel management No problem-1/Need help sometimes-2/Need help always- 3/NA - 4.
11.3 Mobility status No problem-1/Need help sometimes-2/Need help always- 3/NA - 4.
11.4 ADL status No problem-1/Need help sometimes-2/Need help always- 3/NA - 4.
11.5 Medical complications No problem-1/Need help sometimes-2/Need help always- 3/NA - 4.
65
Section 2 Specific Burden and Impact on family(Score 0-2 for each general and specific items)
12.1 Financial burden:1. Loss of Patient’s income Nil - 0/Moderate - 1/Severe - 2
2. Loss of income of other family members Nil - 0/Moderate - 1/Severe - 2
3. Expenditure incurred due to head injury Nil - 0/Moderate - 1/Severe - 2
4. Expenditure incurred due to extra arrangement Nil - 0/Moderate - 1/Severe - 2
5. Loans taken/savings spent Nil - 0/Moderate - 1/Severe - 2
6. Postponing planned activities Nil - 0/Moderate - 1/Severe - 2
12.2 Disruption of family routine activities:
1. Absence from paid work/school/household activities Nil - 0/Moderate - 1/Severe - 2
2. Inability to participate in household work Nil - 0/Moderate - 1/Severe - 2
3. Disruption of activity of other members Nil - 0/Moderate - 1/Severe - 2
4. Person’s behavior disrupting activities Nil - 0/Moderate - 1/Severe - 2
5. Neglect of family due to person’s illness Nil - 0/Moderate - 1/Severe - 2
12.3 Disruption of family leisure activities:
1. Stopping of normal recreational activities Nil - 0/Moderate - 1/Severe - 2
2. Person’s illness occupying other person’s time Nil - 0/Moderate - 1/Severe - 2
3. Lack of attention to other family members Nil - 0/Moderate - 1/Severe - 2
4. Postponing leisure activities Nil - 0/Moderate - 1/Severe - 2
12.4 Family Interaction:
1. General atmosphere in the house Nil - 0/Moderate - 1/Severe - 2
2. Increasing arguments over illness Nil - 0/Moderate - 1/Severe - 2
3. Relatives/friends stopping visiting family Nil - 0/Moderate - 1/Severe - 2
4. Seclusion of the family Nil - 0/Moderate - 1/Severe - 2
5. Other untoward/hostile affects Nil - 0/Moderate - 1/Severe - 2
12.5 Physical health of others:
1. Health of other family members Nil - 0/Moderate - 1/Severe - 2
2. Other adverse affects Nil - 0/Moderate - 1/Severe - 2
12.6 Mental health of others:
1. Mental health of other family members Nil - 0/Moderate - 1/Severe - 2
2. Other adverse affects Nil - 0/Moderate - 1/Severe - 2
66
12.7 Any other burden? How much would you sayyou have suffered owing to the patient’s illness? Nil - 1/Moderate - 2/Severe - 3/ NA - 4
13. Social support networks:
13.1 Who is providing you all the help after your injury? Family - 1/Friends – 2 /Neighbours - 3/Others – 4, (specify)
13.2 What support have you received from these people?
1) Sharing my problems and talking to me.
2) Helping me in day-to-day activities.
3) Financial help.
4) Helping me by visiting hospital
5) Others (specify)
13.3 What support have you received from government agencies?_______________________________
13.4 What support have you received from NGOs? ____________________________________________
14. Economic burden on family:
14.1 What are the areas in which you have been incurring expenditure due to the injury in the lastone month/year?
One month For the whole duration since injury
Medicines
Doctor’s/hospital fees
Other service-related expenditure
Transport expenses
Legal expenses
Loss of other member’s income
Religious/spiritual activities
Damage to vehicles/property
Others
14.2 What has been your expenditure since the time of injury?
1) Pre-hospital expenditure
2) Hospital expenditure
3) Post-hospital expenditure
Total in the past one year: _________________
67
Section 3: Status of information: Quality of life:
15.1 (G1) : How would you rate your quality of life? Very poor - 1/Poor - 2/Neither poor norgood - 3/Good - 4/Very good - 5.
15.2 (G4) : How satisfied are you with your health? Very dissatisfied - 1/Dissatisfied – 2/Neither satisfied nor dissatisfied – 3/Satisfied – 4/Very satisfied – 5.
15.3 (F1.4) : To what extent do you feel that (physical) painprevents you from doing what you need to do? Not at all – 1/A little – 2/A moderate
amount – 3/Very much – 4/An extreme amount – 5.
15.4 (F11.3) : How much do you need any medical treatment tofunction in your daily life? Not at all – 1/A little – 2/A moderate
amount – 3/Very much – 4/An extreme amount – 5.
15.5 (F4.1) : How much do you enjoy life? Not at all – 1/A little – 2/A moderateamount – 3/Very much – 4/An extreme amount – 5.
15.6 (F24.2) : To what extent do you feel your life tobe meaningful? Not at all – 1/A little – 2/A moderate
amount – 3/Very much – 4/An extreme amount – 5.
15.7 (F5.3) : How well are you able to concentrate? Not at all – 1/A little – 2/A moderateamount – 3/Very much – 4/Extremely – 5.
15.8 (F16.1) : How safe do you feel in your daily life? Not at all – 1/A little – 2/A moderateamount – 3/Very much – 4/Extremely – 5.
15.9 (F22.1) : How healthy is your physical environment? Not at all – 1/A little – 2/A moderateamount – 3/Very much – 4/Extremely – 5.
15.10 (F2.1) : Do you have enough energy for every- day life? Not at all – 1/A little – 2/A moderately – 3/ Mostly – 4/Completely – 5.
15.11 (F7.1) : Are you able to accept your bodily appearance? Not at all – 1/A little – 2/A moderateamount – 3/Very much – 4/Extremely – 5.
15.12 (F18.1) : Have you enough money to meet your needs? Not at all – 1/A little – 2/Moderately– 3/Very much – 4/Extremely – 5.
15.13 (F20.1) : How available to you is the informationthat you need in your day-to-day life? Not at all – 1/A little – 2/ Moderately
– 3/Very much – 4/ Extremely – 5.
68
15.14 (F21.1) : To what extent do you have theopportunity for leisure activities? Not at all – 1/A little – 2/Moderately
– 3/Very much – 4/ Extremely – 5.
15.15 (F9.1) : How well are you able to get around? Very poor - 1/Poor - 2/Neither poornor good - 3/Good - 4/Very good - 5.
15.16 (F3.3) : How satisfied are you with your sleep? Very dissatisfied - 1/Dissatisfied – 2/Neither satisfied nor dissatisfied – 3/Satisfied – 4/Very satisfied – 5.
15.17 (F10.3) : How satisfied are you with your ability to performyour daily living activities? Very dissatisfied - 1/Dissatisfied – 2/
Neither satisfied nor dissatisfied – 3/Satisfied – 4/Very satisfied – 5.
15.18 (F12.4) : How satisfied are you with your capacity for work? Very dissatisfied - 1/Dissatisfied – 2/Neither satisfied nor dissatisfied – 3/Satisfied – 4/Very satisfied – 5.
15.19 (F6.3) : How satisfied are you with yourself? Very dissatisfied - 1/Dissatisfied – 2/Neither satisfied nor dissatisfied – 3/Satisfied – 4/Very satisfied – 5.
15.20(F13.3) : How satisfied are you with yourpersonal relationships? Very dissatisfied - 1/Dissatisfied – 2/
Neither satisfied nor dissatisfied – 3/Satisfied – 4/Very satisfied – 5.
15.21 (F15.3) : How satisfied are you with your sex life? Very dissatisfied - 1/Dissatisfied – 2/Neither satisfied nor dissatisfied – 3/Satisfied – 4/Very satisfied – 5.
15.22 (F14.4) : How satisfied are you with the support youget from your friends? Very dissatisfied - 1/Dissatisfied – 2/
Neither satisfied nor dissatisfied – 3/Satisfied – 4/Very satisfied – 5.
15.23 (F17.3) : How satisfied are your with the conditions ofyour living place? Very dissatisfied - 1/Dissatisfied – 2/
Neither satisfied nor dissatisfied – 3/Satisfied – 4/Very satisfied – 5.
15.24 (F19.3) : How satisfied are you with your access tohealth services? Very dissatisfied - 1/Dissatisfied – 2/
Neither satisfied nor dissatisfied – 3/Satisfied – 4/Very satisfied – 5.
15.25 (F23.3) : How satisfied are you with your transport? Very dissatisfied - 1/Dissatisfied – 2/Neither satisfied nor dissatisfied – 3/Satisfied – 4/Very satisfied – 5.
69
15.26 (F8.1) : How often do you have negative feelings suchas blue mood, despair, anxiety, depression? Never-1/Seldom-2/Quite often-3/
Very often - 4/Always - 5.
16. Status of information: Directly from patient or family members - 1/from friends - incomplete information - 2 /Not possible to collect any information - 3.
Specify, reasons _______________________________________________________________
Investigator’s Code & Signature
70
Srilatha, 32 years ….
It was a Sunday morning. Since it was a holiday for my husband and children,
everything was going in a relaxed manner since morning. Being a free day, my
husband decided that we will have breakfast in a restaurant as I was in no mood to
do any cooking. Nitesh (my husband), Rajiv and Rachita (my children aged 7 and 3
years) and myself decided to go out. Since, my husband did not want to drive his
car, we decided to go on my brother’s motorbike . It was so difficult to accommodate
4 people in one bike, but still we managed. A special Sunday breakfast has to be in
a special hotel. As we were going, children were generally talking to me and my
husband. My husband was not wearing his helmet also. Since the roads were free
on a Sunday morning, Nitesh was driving in high speed. As we approached a
circle, my husband did not slow down. Adding to this, was the absence of traffic
policeman in circle. As we were taking a right turn, a car from our right side tried
to overtake us. My husband moved fast and turned right. At that point, he lost
control and had a skid. Since he was in speed, all of us were thrown helter –
swelter and went everywhere. I was the one to get up first and could not speak.
I had some bruises everywhere and was in searing pain. My daughter was lying a
few feet away and was screaming. Both my son and husband were lying nearby
without any movement. My husband was in a pool of blood. All roadside people
had gathered immediately and somebody stopped 2 auto rickshaws. One person
wanted to call an ambulance, but we thought we would move on our own as we
thought it is not good to wait. Two other people came along with us in the auto
and reached a nursing home. The doctors started treatment. They informed that my
son and husband have to be shifted to a bigger hospital for investigations. They
also said that both would require surgery. Both my daughter and me were treated
Contd........
71
and X-ray was done for me. Luckily, there were no fractures. My daughter escaped
with minor injuries with no damage to life. After about 2 hours, we shifted my
husband and son to another hospital. The hospital authorities asked us to deposit
Rs. 20,000. By that time, my brother and other relatives had joined and they took
care of these issues. After tests, we were informed that both my husband and son
should undergo surgery and we agreed. My husband was taken in for surgery
and was operated over 6 hours and later shifted to Intensive care unit. My son
also underwent surgery for 3 hours & was shifted to post operative ward. We
were all in pain, shock and unexplainable misery. Whatever, we want to call it,
my husband did not recover after surgery and started deteriorating. This caused
such a major shock to everyone. By Monday evening, my husband was slipping
and we were in panic. At 7.30 pm, doctors expressed their inability to do anything
further and he was declared dead. My son was still recovering and could not
understand what was going on.The sudden turn of events in my life is something
I am not able to understand, think and comprehend. The death of my husband
has thrown my family out of gear and I am still living with my brother’s family.
All unexpected things have started happening. Financial problems, social
problems, fear of future, children’s future, where will I live?, how do I survive ?
have all started coming up and I don’t have any answers. My son after 2 months
of discharge becomes angry and has difficulty in talking. Every time, I talk to him,
he struggles for words. I don’t know what he will do when he goes to school.
I am taking him to doctor regularly. Doctors say, we will train him and bring him
back. I am not sure what we will do from now on………...
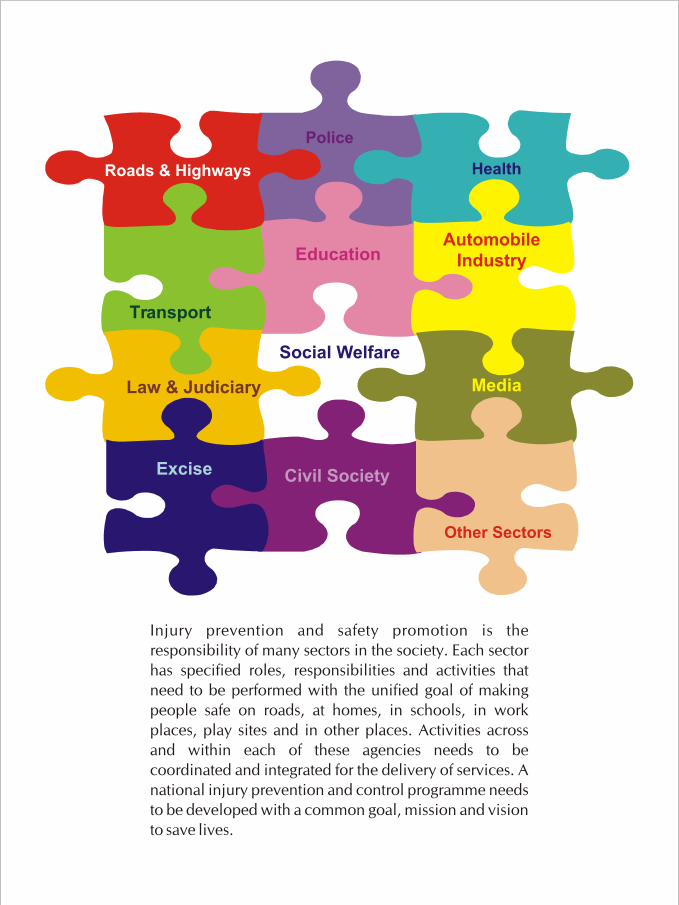
Health
Roads & Highways
Transport
Education
Excise
Police
Automobile Industry
Law & Judiciary
Social Welfare
Civil Society
Other Sectors
Media
Injury prevention and safety promotion is the responsibility of many sectors in the society. Each sector has specified roles, responsibilities and activities that need to be performed with the unified goal of making people safe on roads, at homes, in schools, in work places, play sites and in other places. Activities across and within each of these agencies needs to be coordinated and integrated for the delivery of services. A national injury prevention and control programme needs to be developed with a common goal, mission and vision to save lives.