Embed Size (px)
Citation preview
Epidemiology of
Colorectal Cancer and
Overview of Screening Modalities
Ala Sharara, M.D., FACG, AGAFProfessor & Head, Division of Gastroenterology
American University of Beirut Medical Center, Lebanon
Which of the following is best suited for population-based screening for CRC?
1. Colonoscopy
2. CT colonography
3. Videocapsule colonoscopy
4. Stool guaiac test
5. Fecal DNA test
6. Fecal immunochemical test (FIT)
Question
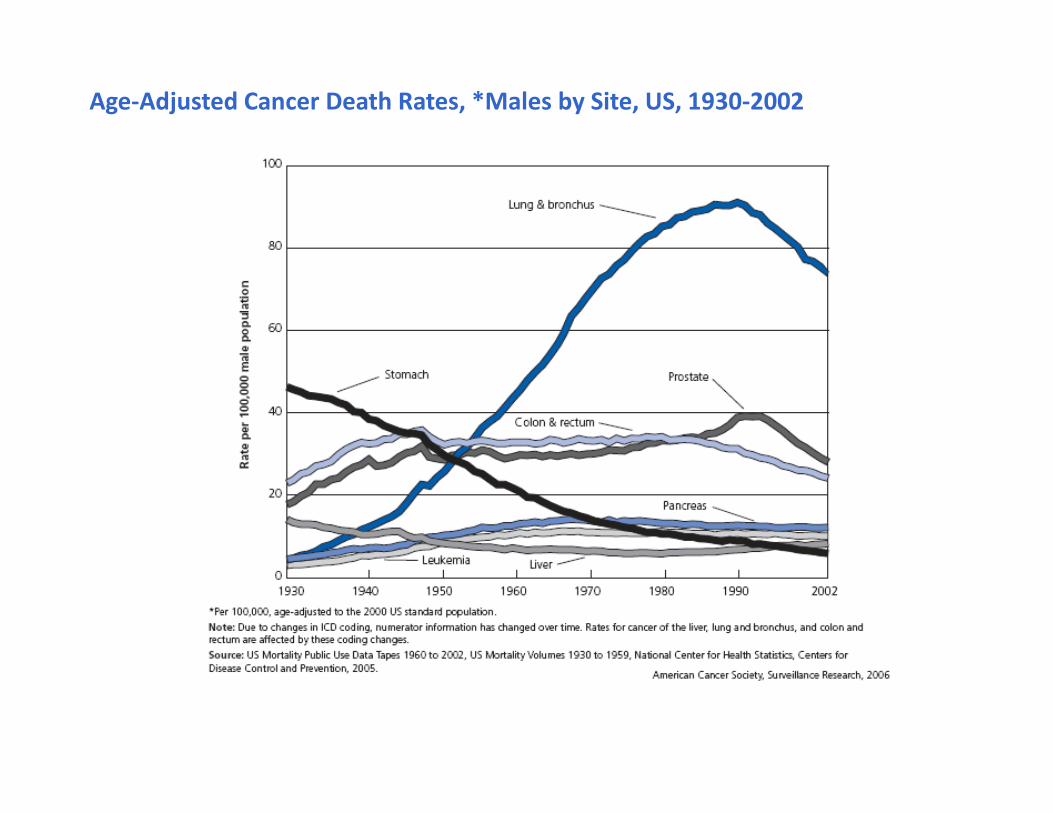
Age-Adjusted Cancer Death Rates, *Males by Site, US, 1930-2002
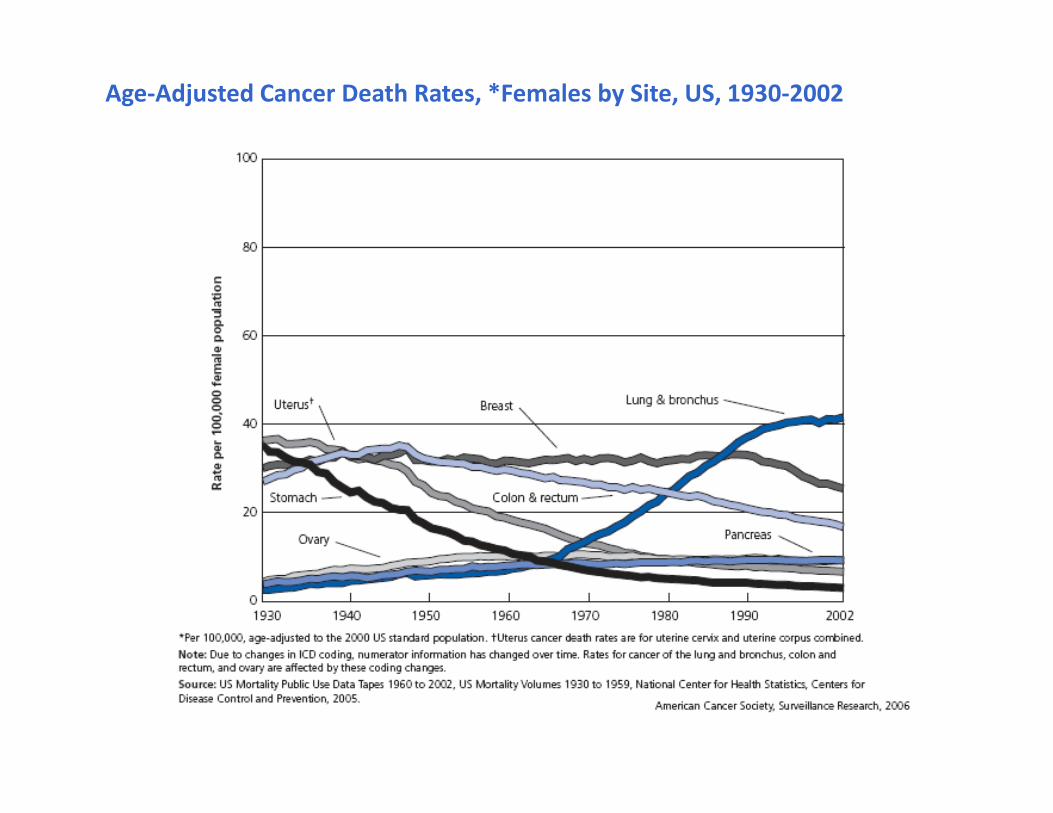
Age-Adjusted Cancer Death Rates, *Females by Site, US, 1930-2002
0
Age
Ra
te p
er
10
0,0
00
20-24 30-34 40-44 50-54 60-64 70-74 80-84
100
200
300
400
500
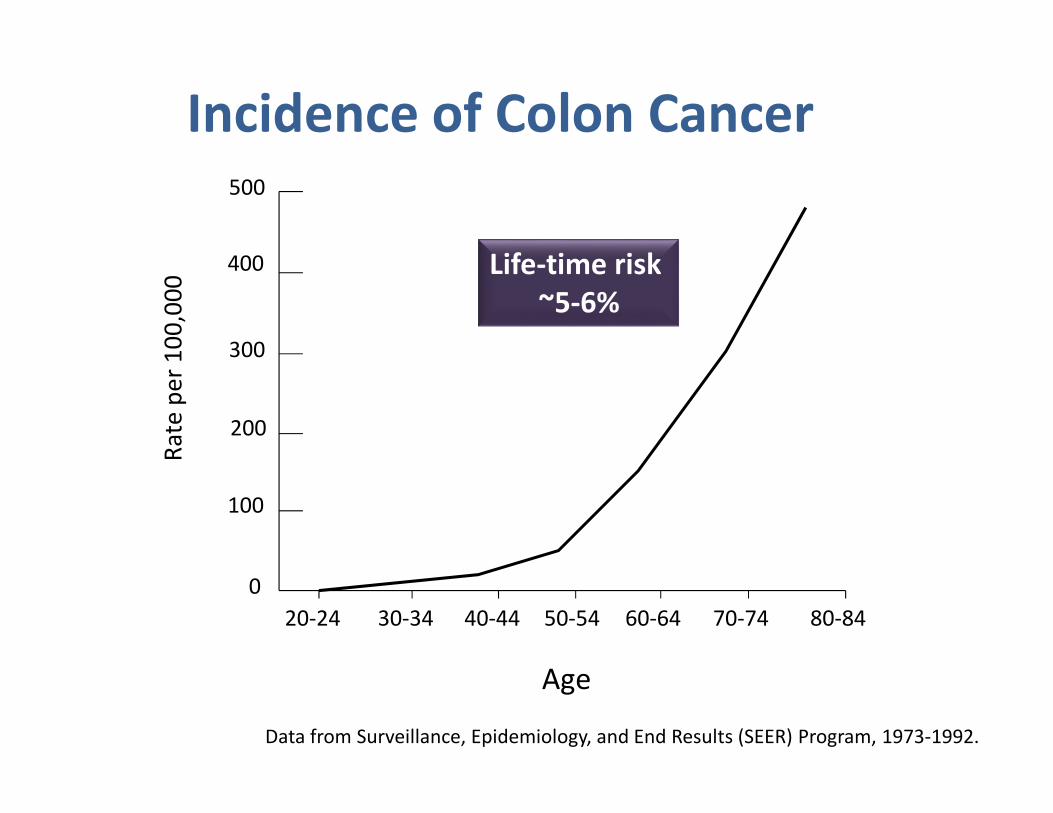
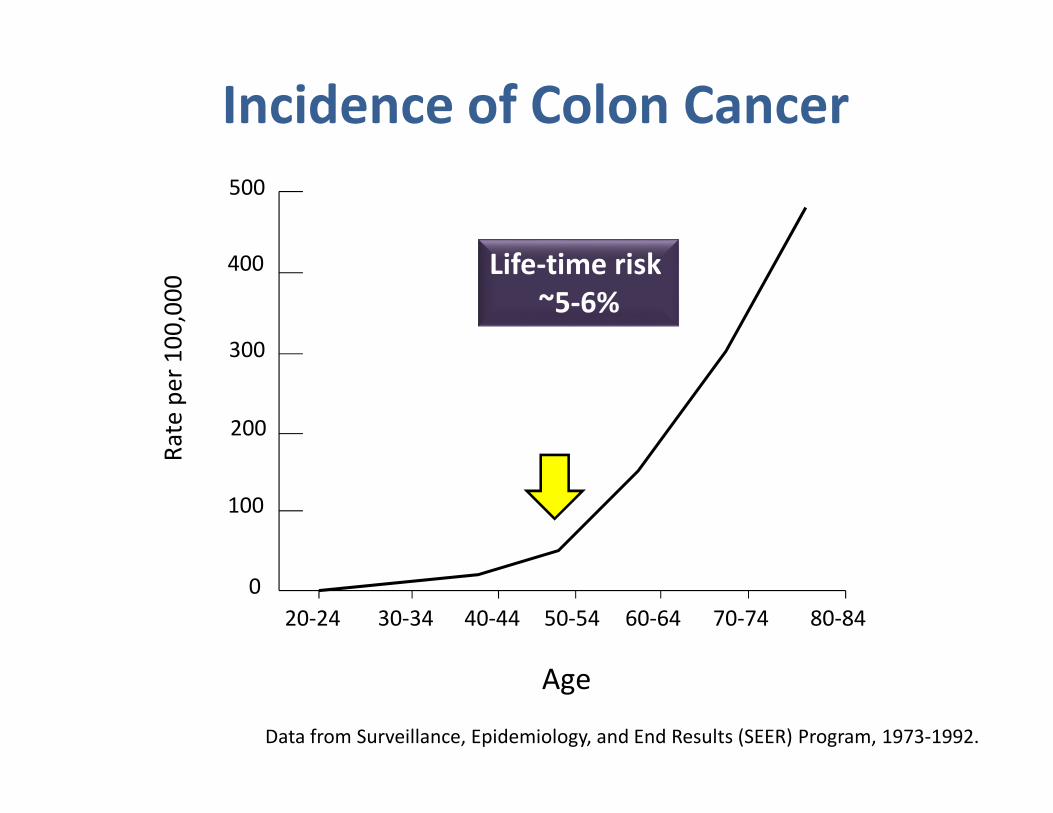
Incidence of Colon Cancer
Data from Surveillance, Epidemiology, and End Results (SEER) Program, 1973-1992.
Life-time risk
~5-6%
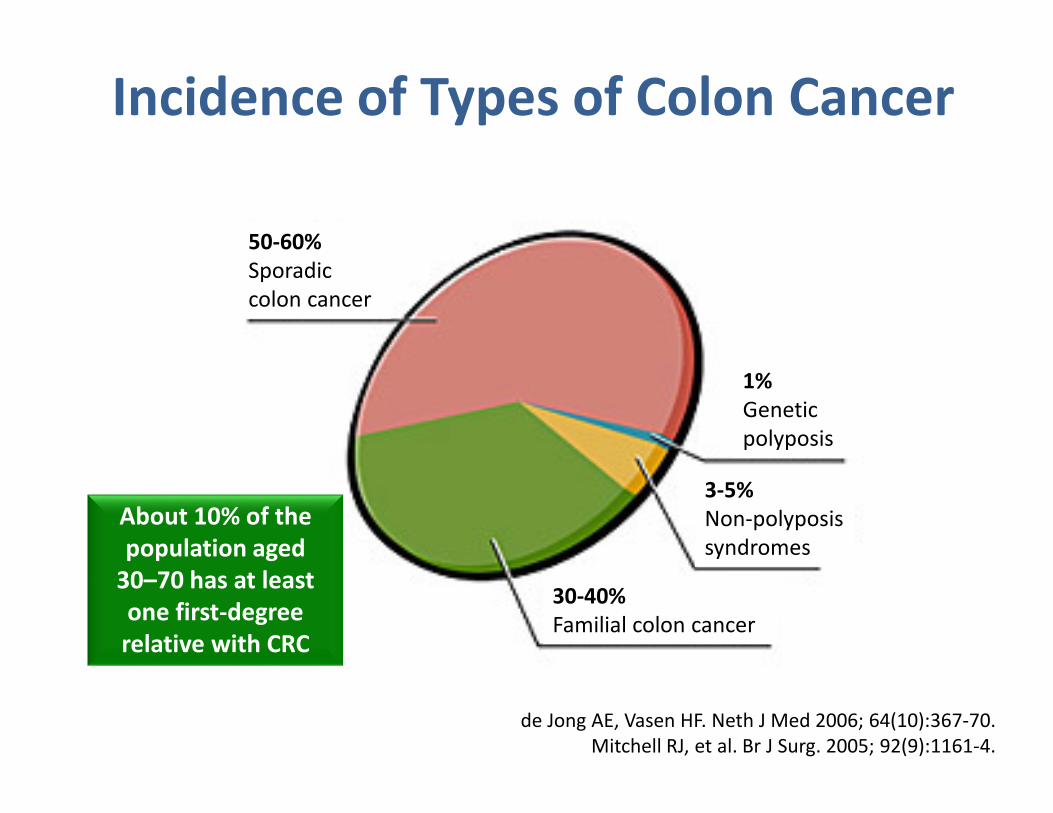
50-60%
Sporadic
colon cancer
1%
Genetic
polyposis
3-5%
Non-polyposis
syndromes
30-40%
Familial colon cancer
Incidence of Types of Colon Cancer
About 10% of the
population aged
30–70 has at least
one first-degree
relative with CRC
de Jong AE, Vasen HF. Neth J Med 2006; 64(10):367-70.
Mitchell RJ, et al. Br J Surg. 2005; 92(9):1161-4.
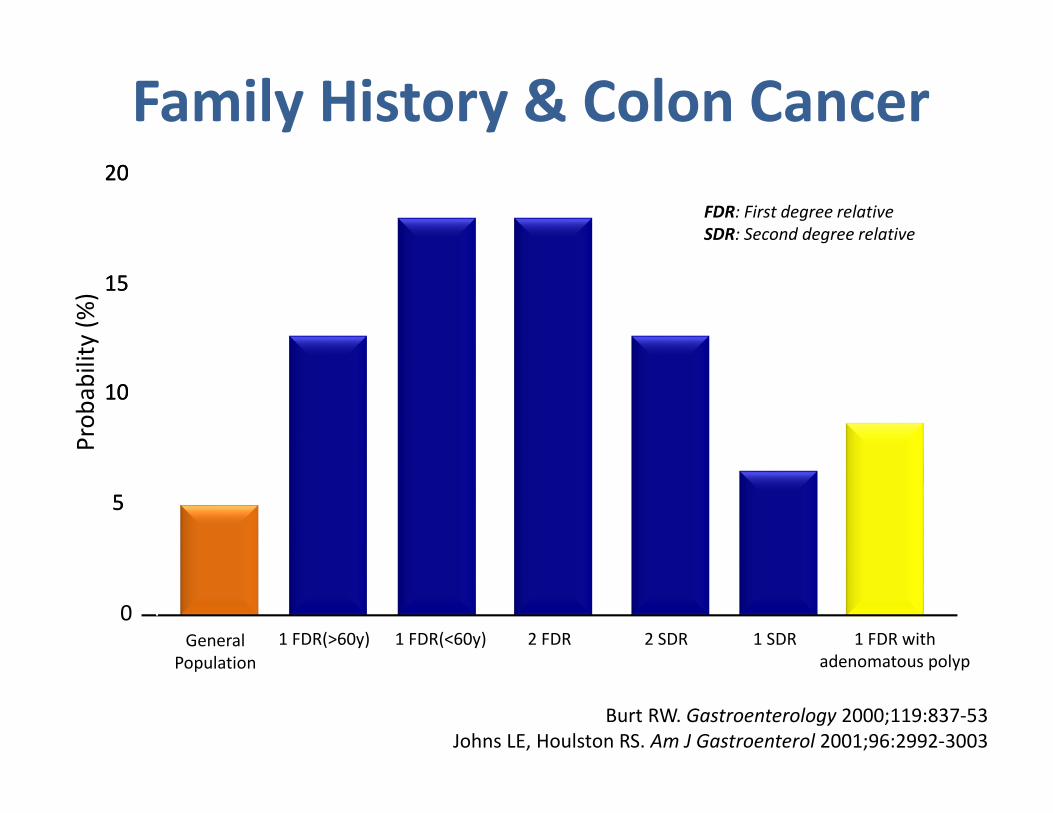
General
Population
1 FDR(>60y) 1 FDR(<60y) 2 FDR 2 SDR 1 SDR 1 FDR with
adenomatous polyp
0
55
1010
1515
2020
Pro
ba
bili
ty (
%)
FDR: First degree relative
SDR: Second degree relative
Family History & Colon Cancer
Burt RW. Gastroenterology 2000;119:837-53
Johns LE, Houlston RS. Am J Gastroenterol 2001;96:2992-3003
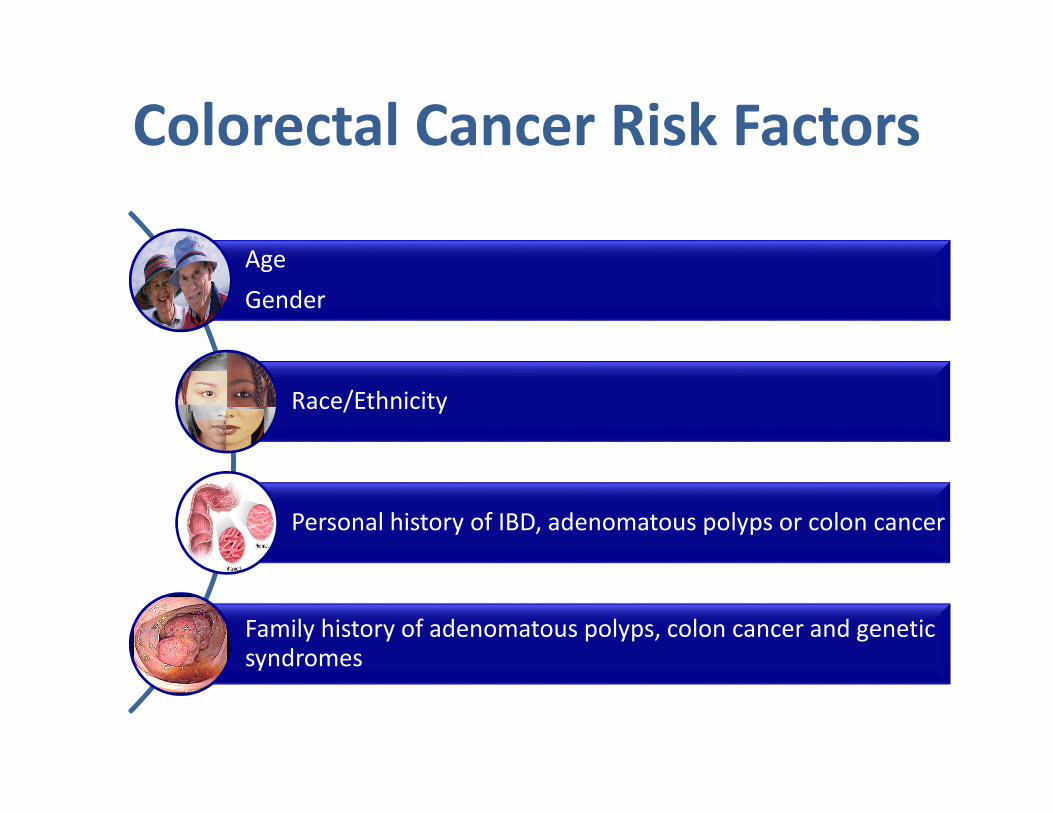
Colorectal Cancer Risk Factors
Age
Gender
Race/Ethnicity
Personal history of IBD, adenomatous polyps or colon cancer
Family history of adenomatous polyps, colon cancer and genetic syndromes
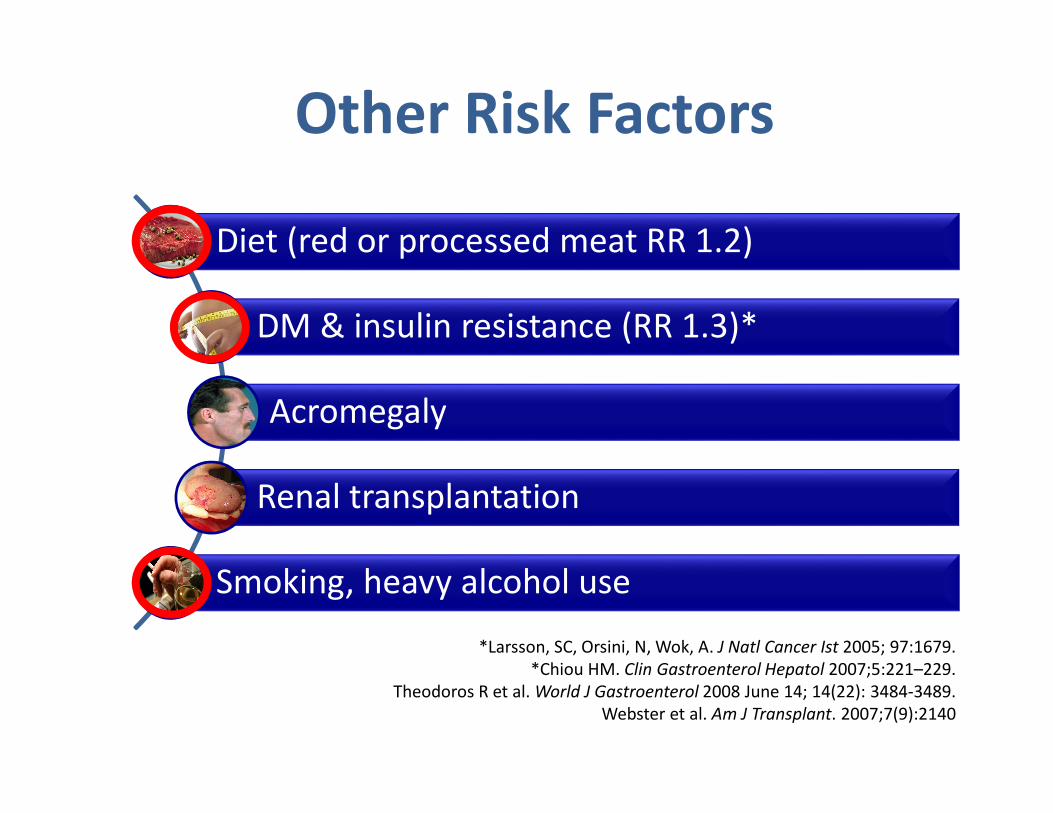
Other Risk Factors
Diet (red or processed meat RR 1.2)
DM & insulin resistance (RR 1.3)*
Acromegaly
Renal transplantation
Smoking, heavy alcohol use
*Larsson, SC, Orsini, N, Wok, A. J Natl Cancer Ist 2005; 97:1679.
*Chiou HM. Clin Gastroenterol Hepatol 2007;5:221–229.
Theodoros R et al. World J Gastroenterol 2008 June 14; 14(22): 3484-3489.
Webster et al. Am J Transplant. 2007;7(9):2140
0
Age
Ra
te p
er
10
0,0
00
20-24 30-34 40-44 50-54 60-64 70-74 80-84
100
200
300
400
500
Incidence of Colon Cancer
Data from Surveillance, Epidemiology, and End Results (SEER) Program, 1973-1992.
Life-time risk
~5-6%
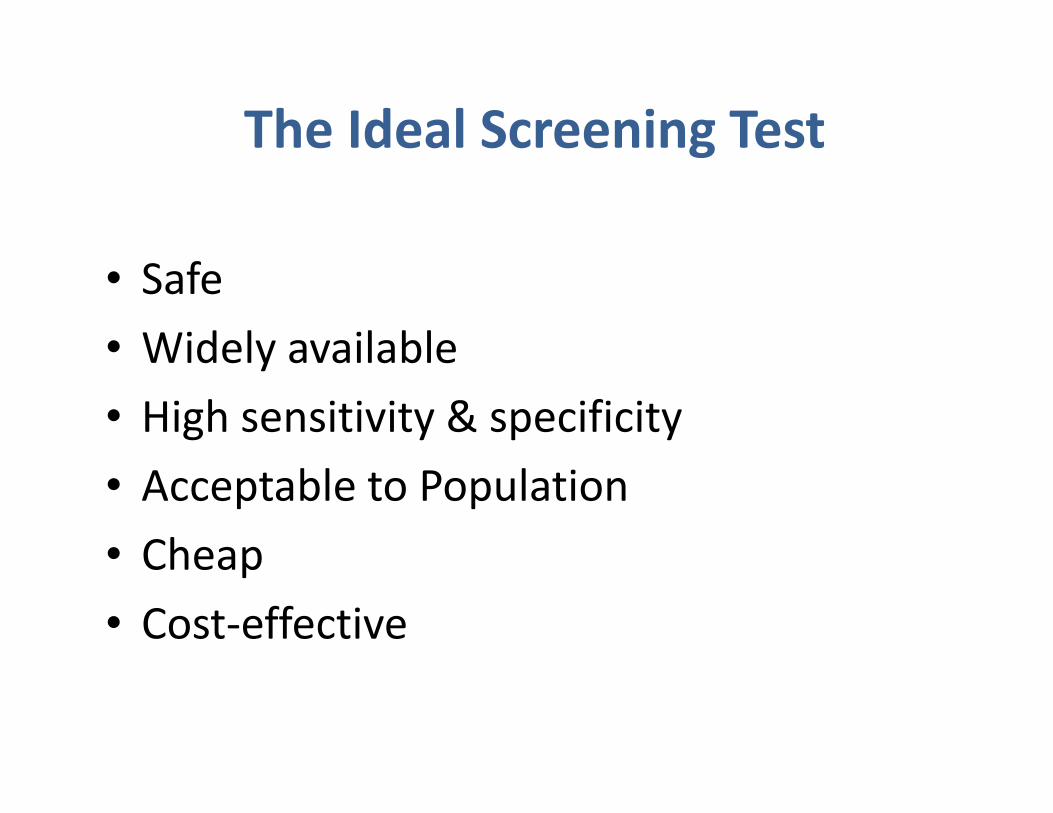
The Ideal Screening Test
• Safe
• Widely available
• High sensitivity & specificity
• Acceptable to Population
• Cheap
• Cost-effective
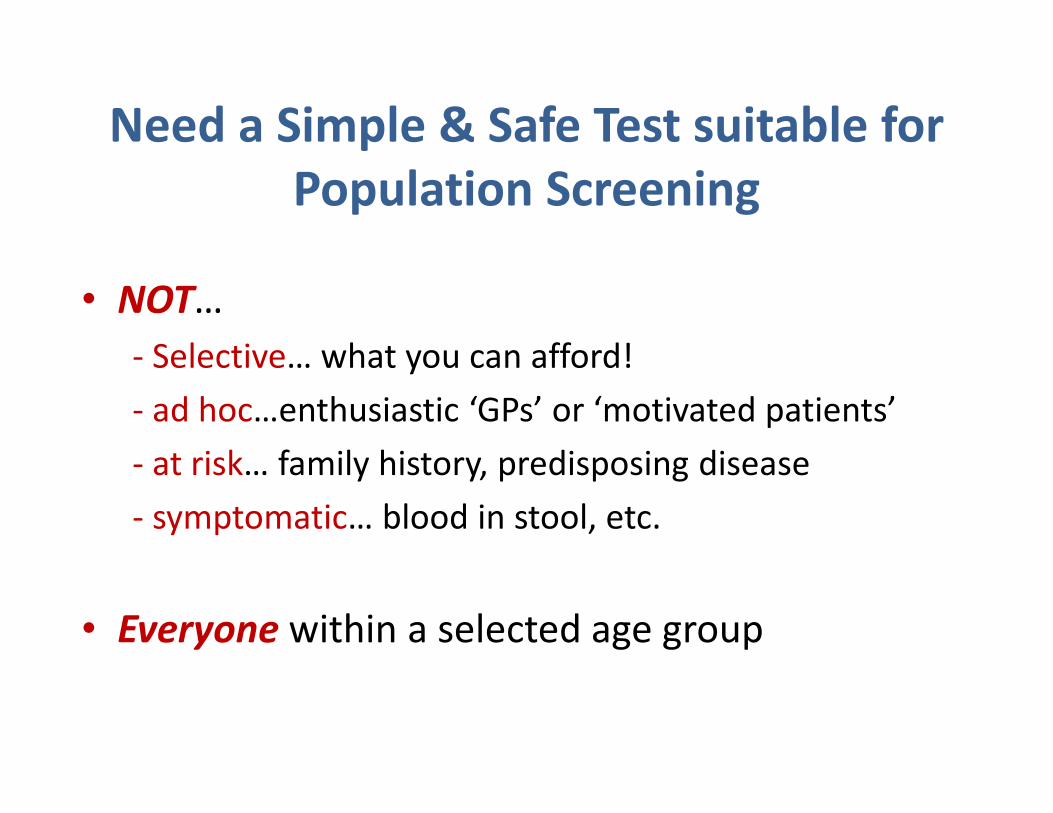
Need a Simple & Safe Test suitable for
Population Screening
• NOT…
- Selective… what you can afford!
- ad hoc…enthusiastic ‘GPs’ or ‘motivated patients’
- at risk… family history, predisposing disease
- symptomatic… blood in stool, etc.
• Everyone within a selected age group
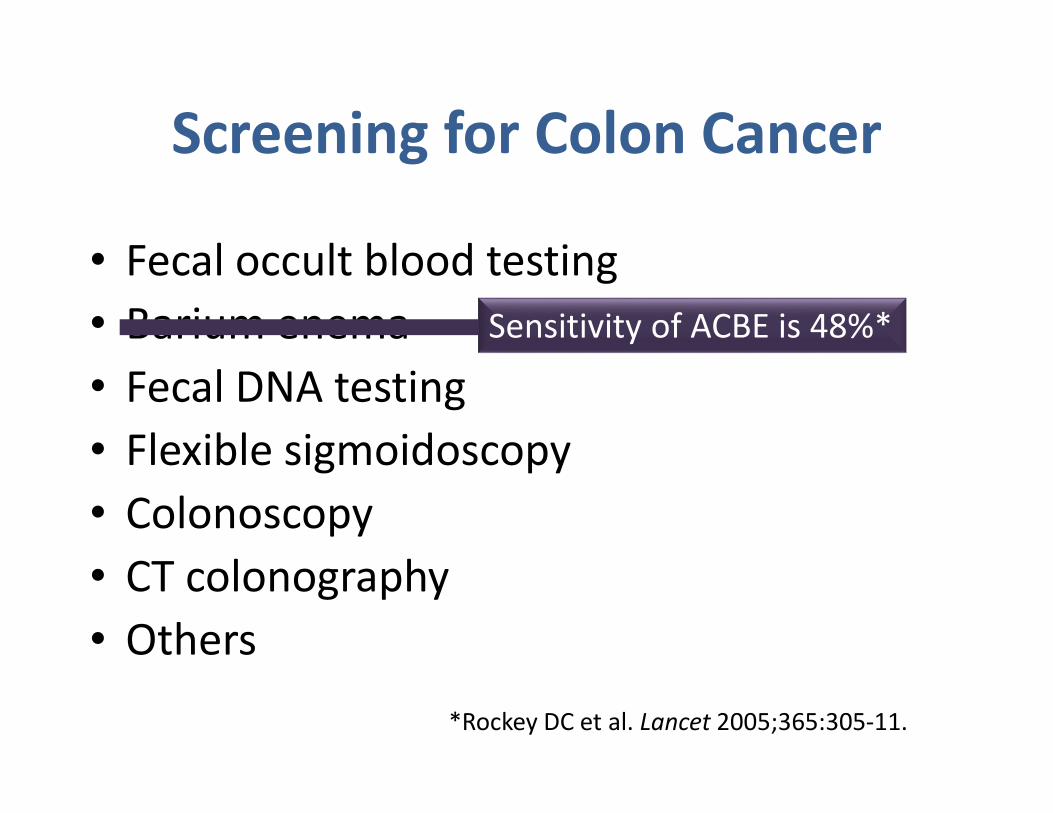
Screening for Colon Cancer
• Fecal occult blood testing
• Barium enema
• Fecal DNA testing
• Flexible sigmoidoscopy
• Colonoscopy
• CT colonography
• Others
Sensitivity of ACBE is 48%*
*Rockey DC et al. Lancet 2005;365:305-11.
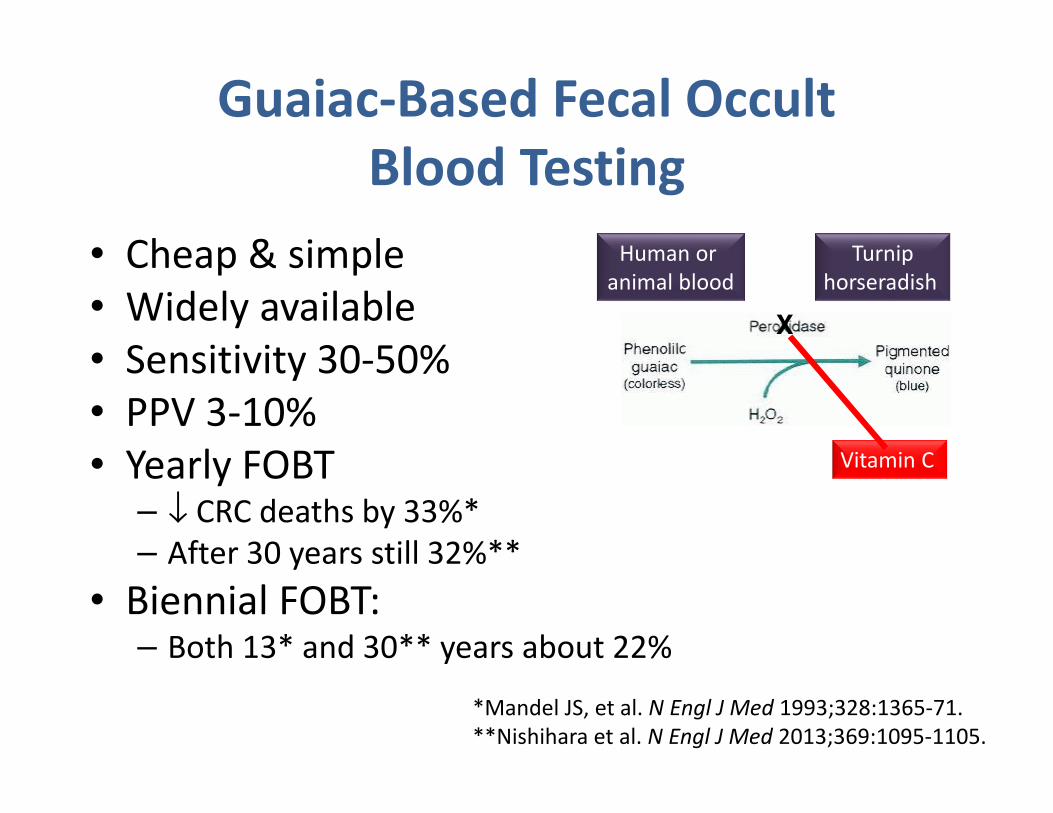
Guaiac-Based Fecal Occult
Blood Testing
• Cheap & simple
• Widely available
• Sensitivity 30-50%
• PPV 3-10%
• Yearly FOBT – ↓ CRC deaths by 33%*
– After 30 years still 32%**
• Biennial FOBT:– Both 13* and 30** years about 22%
Turnip
horseradish
Human or
animal blood
Vitamin C
X
*Mandel JS, et al. N Engl J Med 1993;328:1365-71.
**Nishihara et al. N Engl J Med 2013;369:1095-1105.
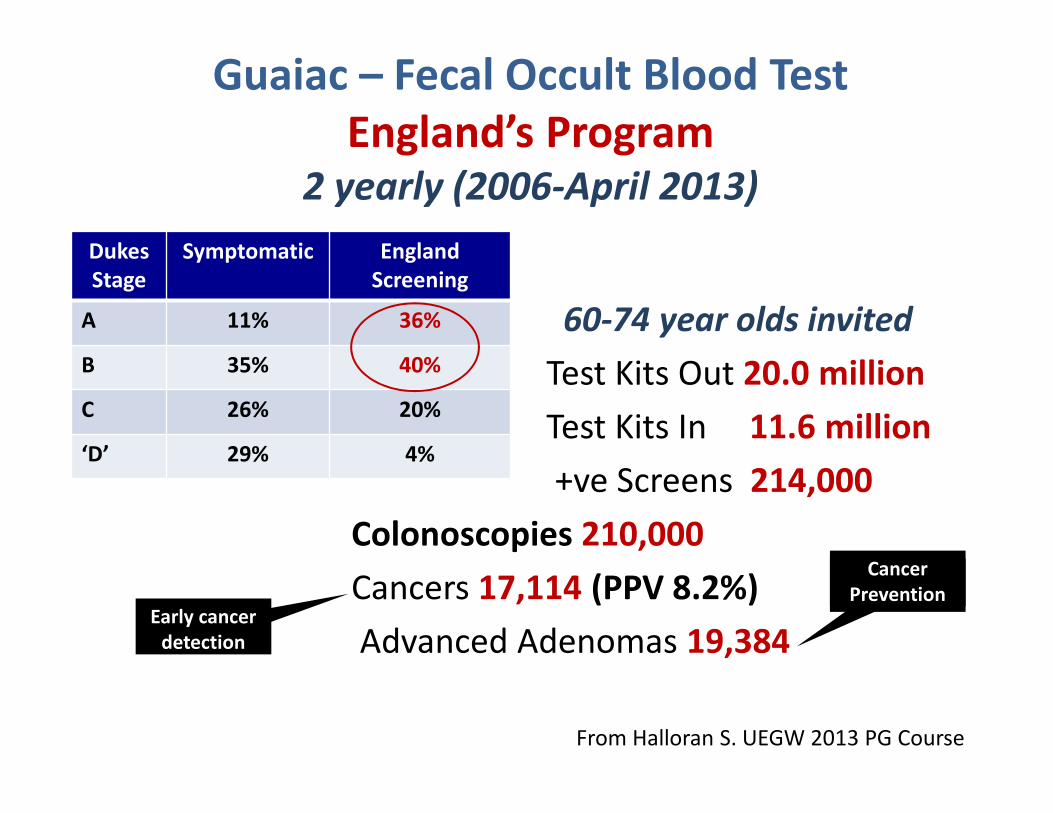
Guaiac – Fecal Occult Blood Test
England’s Program 2 yearly (2006-April 2013)
60-74 year olds invited
Test Kits Out 20.0 million
Test Kits In 11.6 million
+ve Screens 214,000
Colonoscopies 210,000
Cancers 17,114 (PPV 8.2%)
Advanced Adenomas 19,384Early cancer
detection
Cancer
Prevention
Dukes
Stage
Symptomatic England
Screening
A 11% 36%
B 35% 40%
C 26% 20%
‘D’ 29% 4%
From Halloran S. UEGW 2013 PG Course
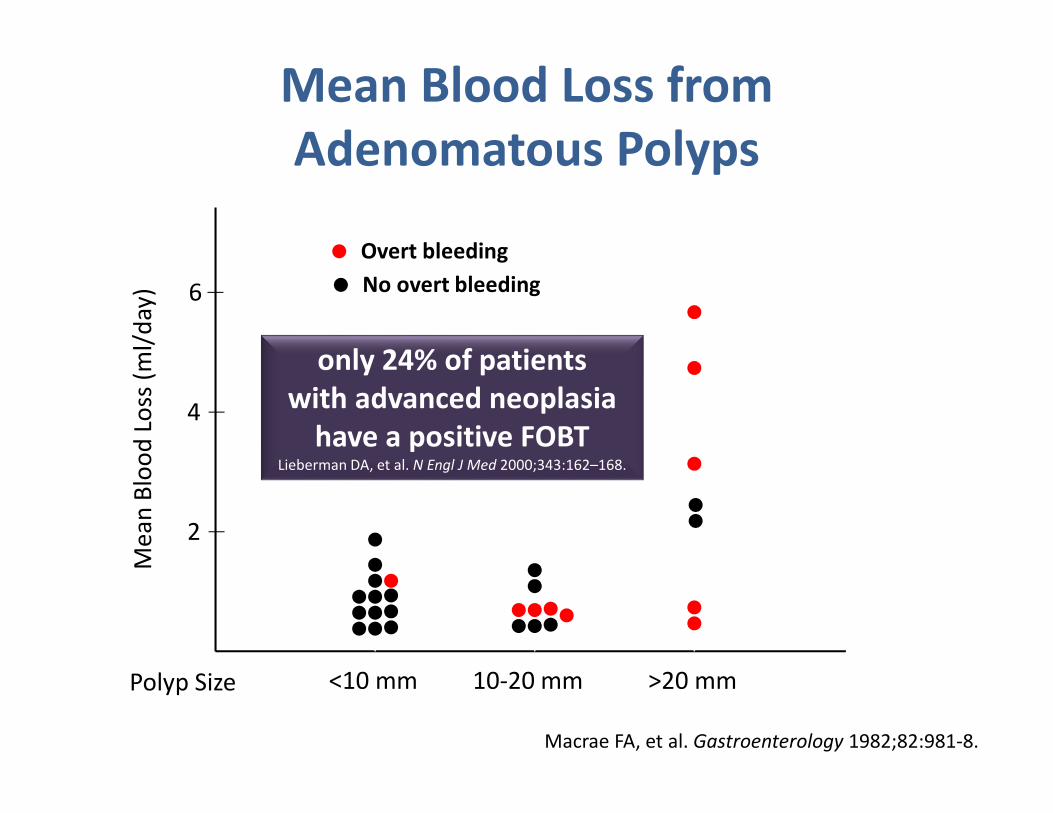
2
4
6
Me
an
Blo
od
Lo
ss (
ml/
da
y)
Polyp Size <10 mm 10-20 mm >20 mm
Overt bleeding
No overt bleeding
Mean Blood Loss from
Adenomatous Polyps
Macrae FA, et al. Gastroenterology 1982;82:981-8.
only 24% of patients
with advanced neoplasia
have a positive FOBTLieberman DA, et al. N Engl J Med 2000;343:162–168.
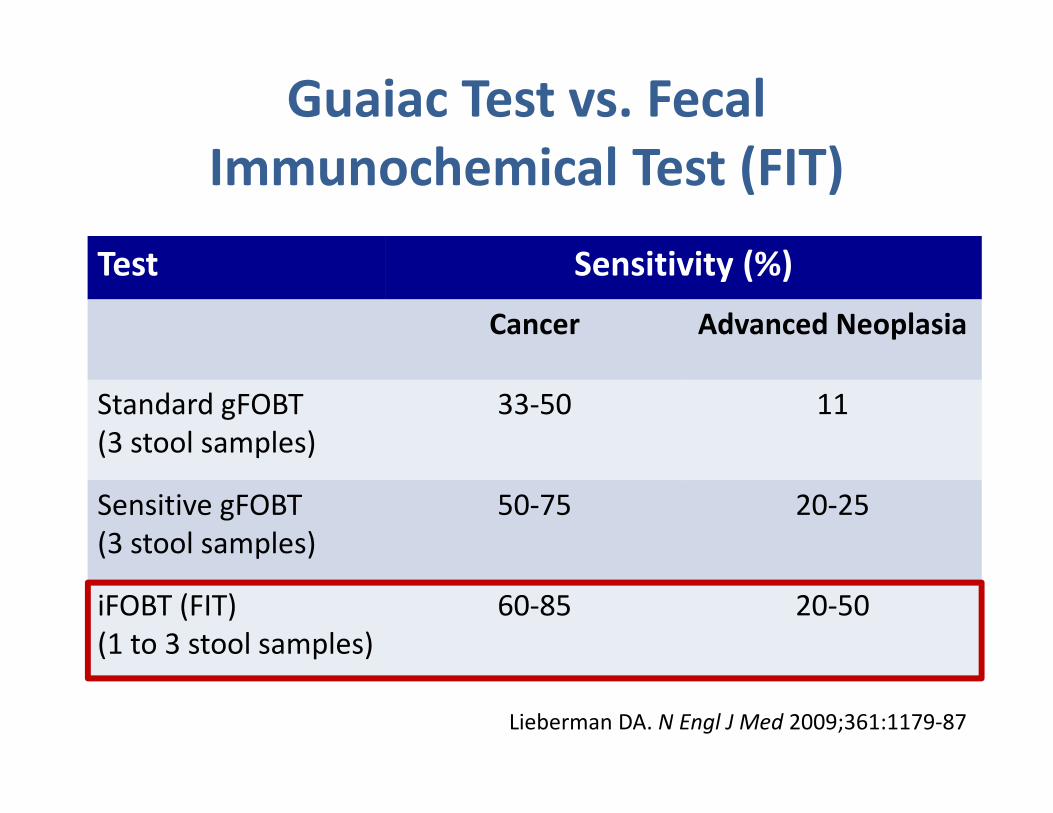
Guaiac Test vs. Fecal
Immunochemical Test (FIT)
Test Sensitivity (%)
Cancer Advanced Neoplasia
Standard gFOBT
(3 stool samples)
33-50 11
Sensitive gFOBT
(3 stool samples)
50-75 20-25
iFOBT (FIT)
(1 to 3 stool samples)
60-85 20-50
Lieberman DA. N Engl J Med 2009;361:1179-87
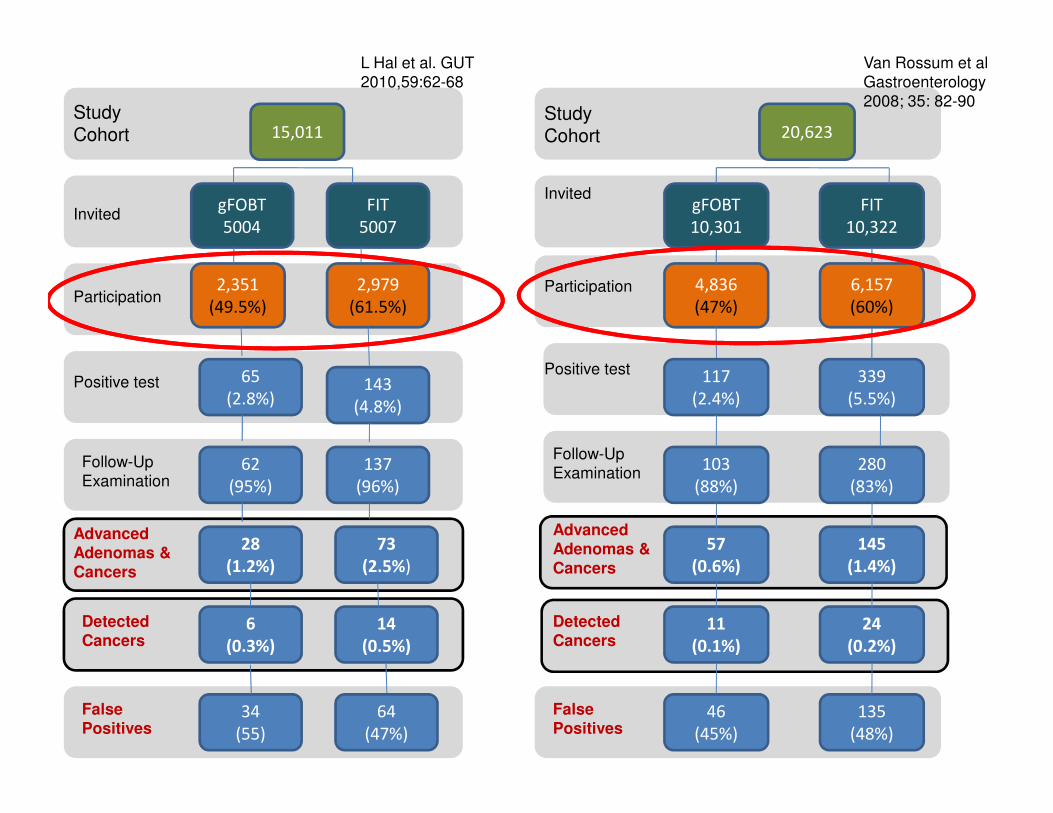
Study Cohort
Invited gFOBT
5004
FIT
5007
15,011
2,351
(49.5%)
2,979
(61.5%)Participation
65
(2.8%)
14
(0.5%)
6
(0.3%)
64
(47%)
34
(55)
143
(4.8%)
62
(95%)
137
(96%)
28
(1.2%)
73
(2.5%)
Positive test
Follow-Up
Examination
Advanced
Adenomas &
Cancers
Detected
Cancers
False
Positives
Study Cohort
Invited
Participation
Positive test
Follow-Up
Examination
Advanced
Adenomas &
Cancers
Detected
Cancers
False
Positives
20,623
gFOBT
10,301
FIT
10,322
6,157
(60%)
4,836
(47%)
339
(5.5%)
117
(2.4%)
103
(88%)
280
(83%)
57
(0.6%)
145
(1.4%)
24
(0.2%)
11
(0.1%)
135
(48%)
46
(45%)
L Hal et al. GUT
2010,59:62-68
Van Rossum et al
Gastroenterology
2008; 35: 82-90
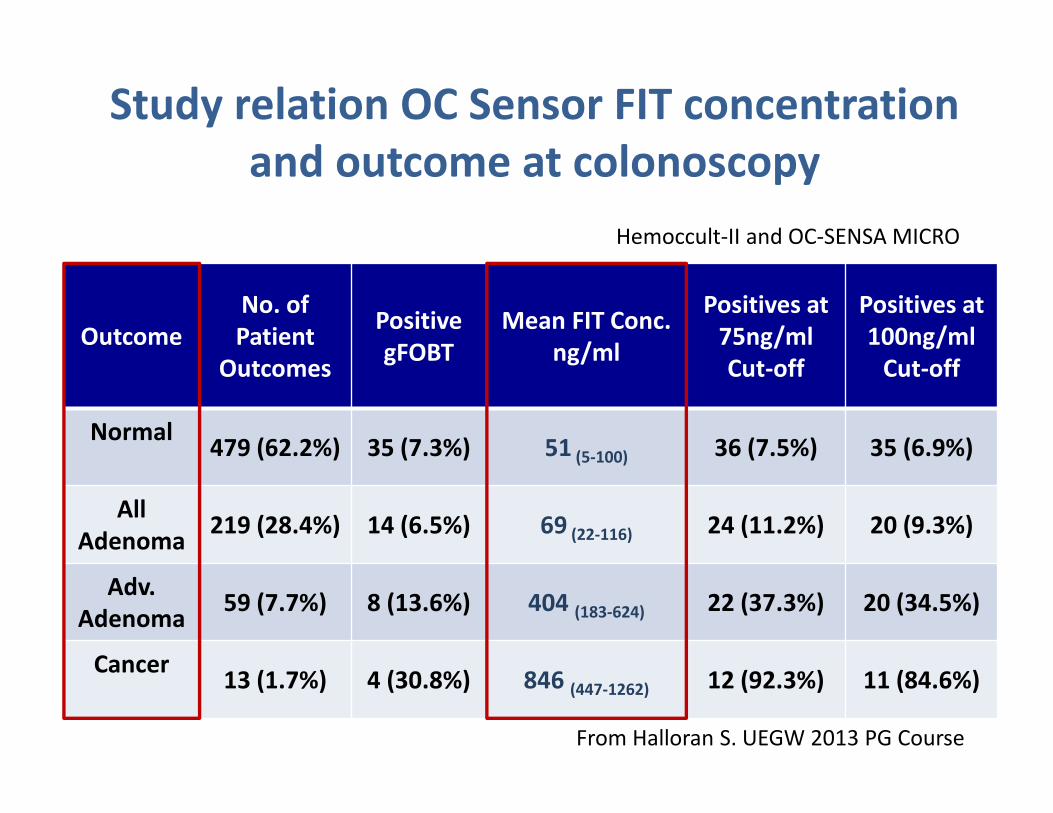
Study relation OC Sensor FIT concentration
and outcome at colonoscopy
Outcome
No. of
Patient
Outcomes
Positive
gFOBT
Mean FIT Conc.
ng/ml
Positives at
75ng/ml
Cut-off
Positives at
100ng/ml
Cut-off
Normal 479 (62.2%) 35 (7.3%) 51 (5-100) 36 (7.5%) 35 (6.9%)
All
Adenoma219 (28.4%) 14 (6.5%) 69 (22-116) 24 (11.2%) 20 (9.3%)
Adv.
Adenoma 59 (7.7%) 8 (13.6%) 404 (183-624) 22 (37.3%) 20 (34.5%)
Cancer 13 (1.7%) 4 (30.8%) 846 (447-1262) 12 (92.3%) 11 (84.6%)
Hemoccult-II and OC-SENSA MICRO
From Halloran S. UEGW 2013 PG Course
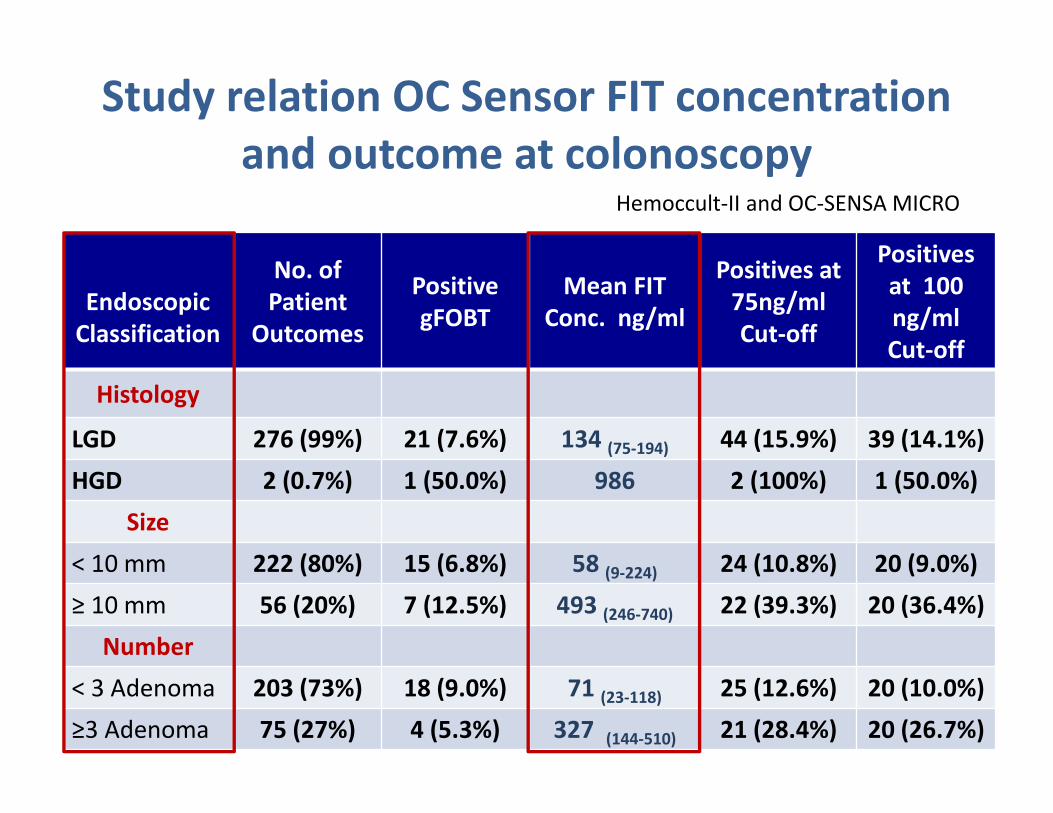
Study relation OC Sensor FIT concentration
and outcome at colonoscopy
Endoscopic
Classification
No. of
Patient
Outcomes
Positive
gFOBT
Mean FIT
Conc. ng/ml
Positives at
75ng/ml
Cut-off
Positives
at 100
ng/ml
Cut-off
Histology
LGD 276 (99%) 21 (7.6%) 134 (75-194) 44 (15.9%) 39 (14.1%)
HGD 2 (0.7%) 1 (50.0%) 986 2 (100%) 1 (50.0%)
Size
< 10 mm 222 (80%) 15 (6.8%) 58 (9-224) 24 (10.8%) 20 (9.0%)
≥ 10 mm 56 (20%) 7 (12.5%) 493 (246-740) 22 (39.3%) 20 (36.4%)
Number
< 3 Adenoma 203 (73%) 18 (9.0%) 71 (23-118) 25 (12.6%) 20 (10.0%)
≥3 Adenoma 75 (27%) 4 (5.3%) 327 (144-510) 21 (28.4%) 20 (26.7%)
Hemoccult-II and OC-SENSA MICRO
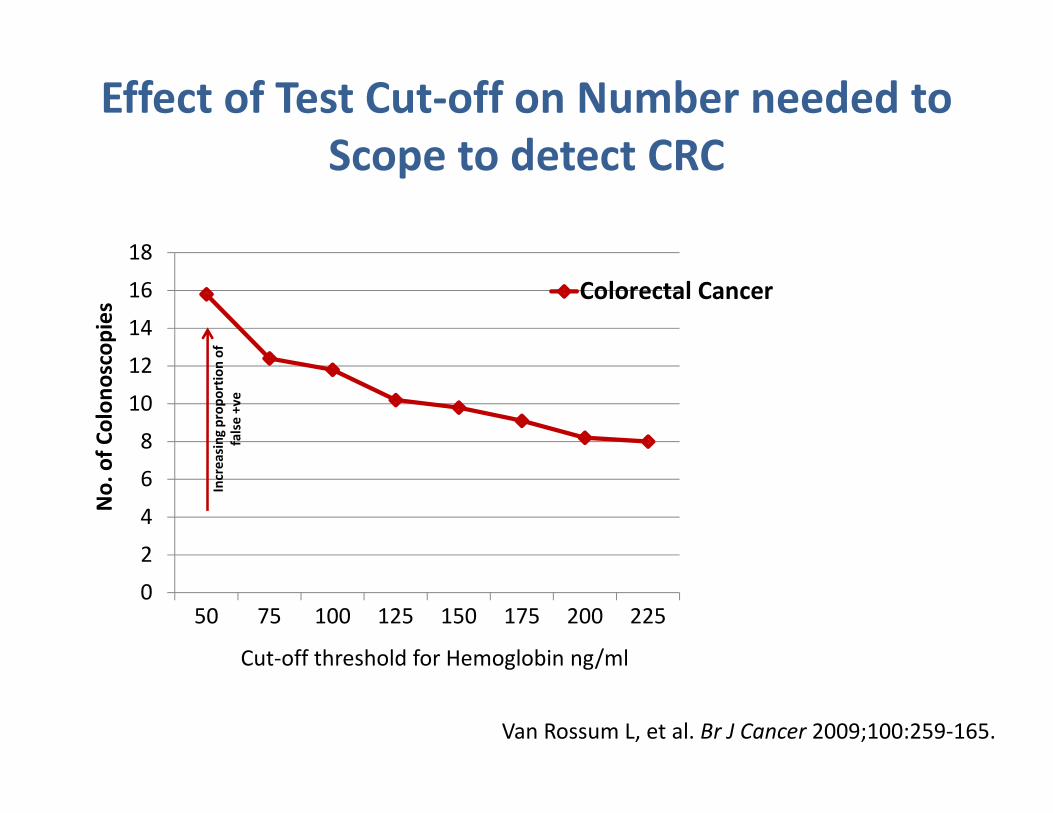
Effect of Test Cut-off on Number needed to
Scope to detect CRC
0
2
4
6
8
10
12
14
16
18
50 75 100 125 150 175 200 225
Colorectal Cancer
Incr
ea
sin
g p
rop
ort
ion
of
fals
e +
ve
Cut-off threshold for Hemoglobin ng/ml
No
. o
f C
olo
no
sco
pie
s
Van Rossum L, et al. Br J Cancer 2009;100:259-165.
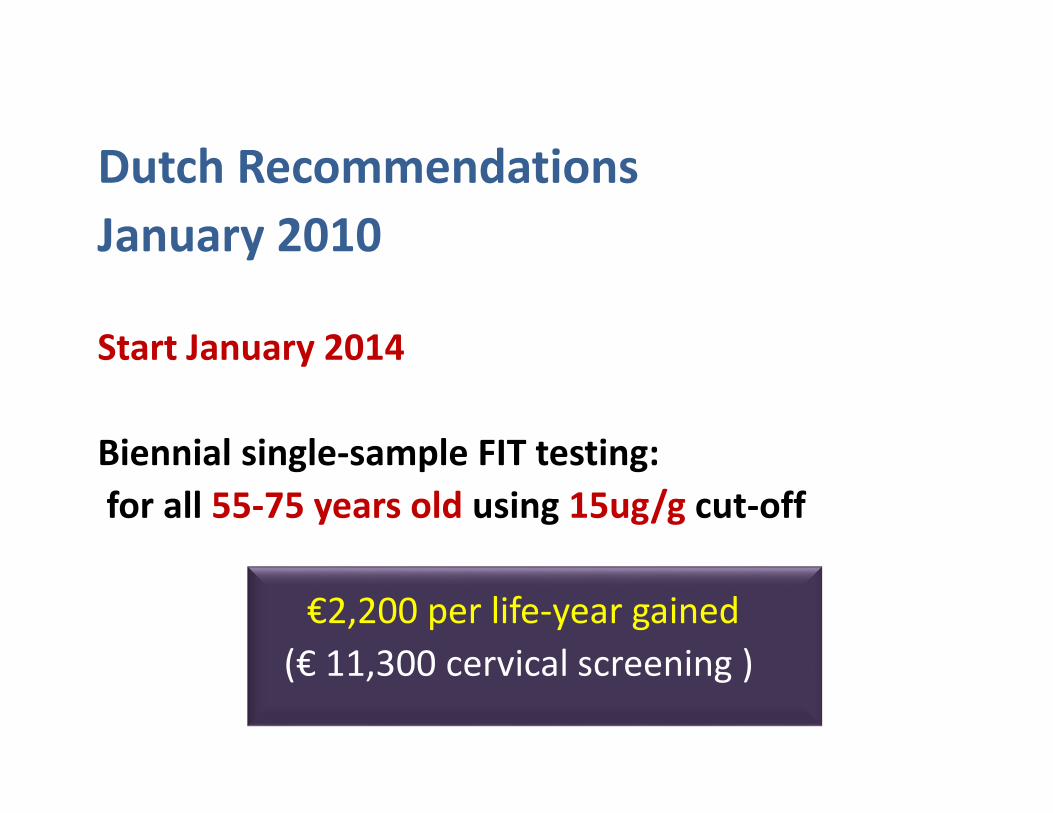
Dutch Recommendations
January 2010
Start January 2014
Biennial single-sample FIT testing:
for all 55-75 years old using 15ug/g cut-off
€2,200 per life-year gained
(€ 11,300 cervical screening )
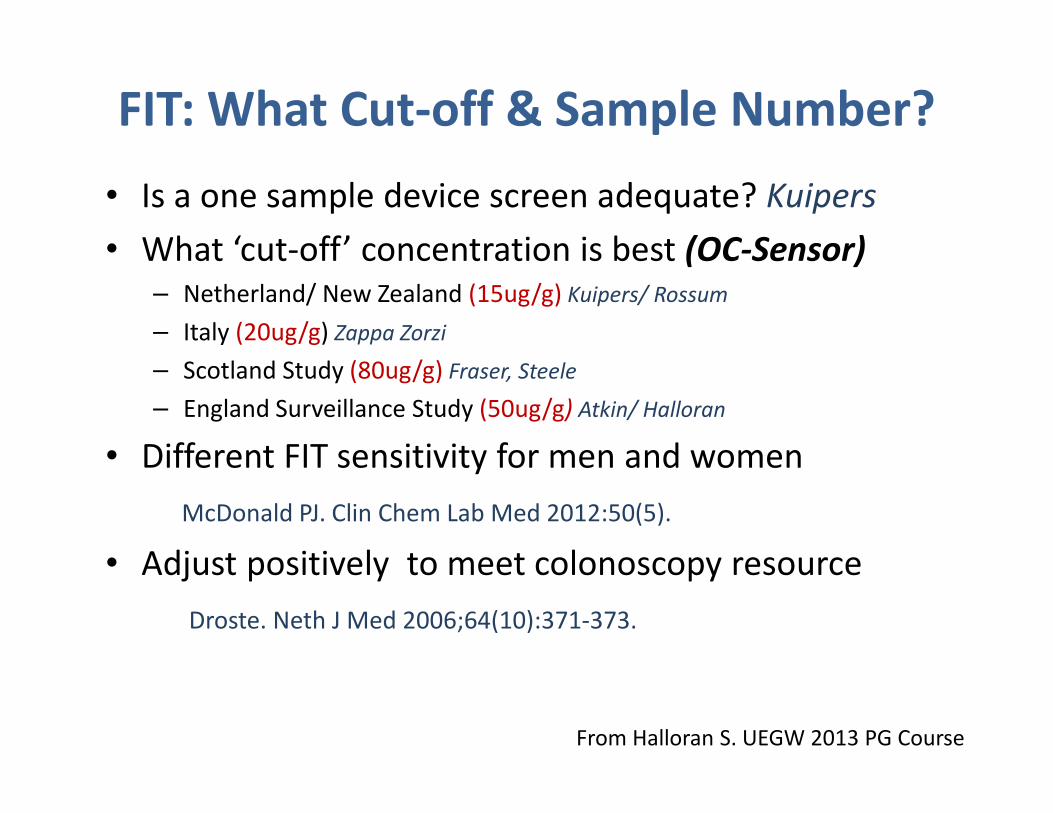
FIT: What Cut-off & Sample Number?
• Is a one sample device screen adequate? Kuipers
• What ‘cut-off’ concentration is best (OC-Sensor)
– Netherland/ New Zealand (15ug/g) Kuipers/ Rossum
– Italy (20ug/g) Zappa Zorzi
– Scotland Study (80ug/g) Fraser, Steele
– England Surveillance Study (50ug/g) Atkin/ Halloran
• Different FIT sensitivity for men and women
McDonald PJ. Clin Chem Lab Med 2012:50(5).
• Adjust positively to meet colonoscopy resource
Droste. Neth J Med 2006;64(10):371-373.
From Halloran S. UEGW 2013 PG Course
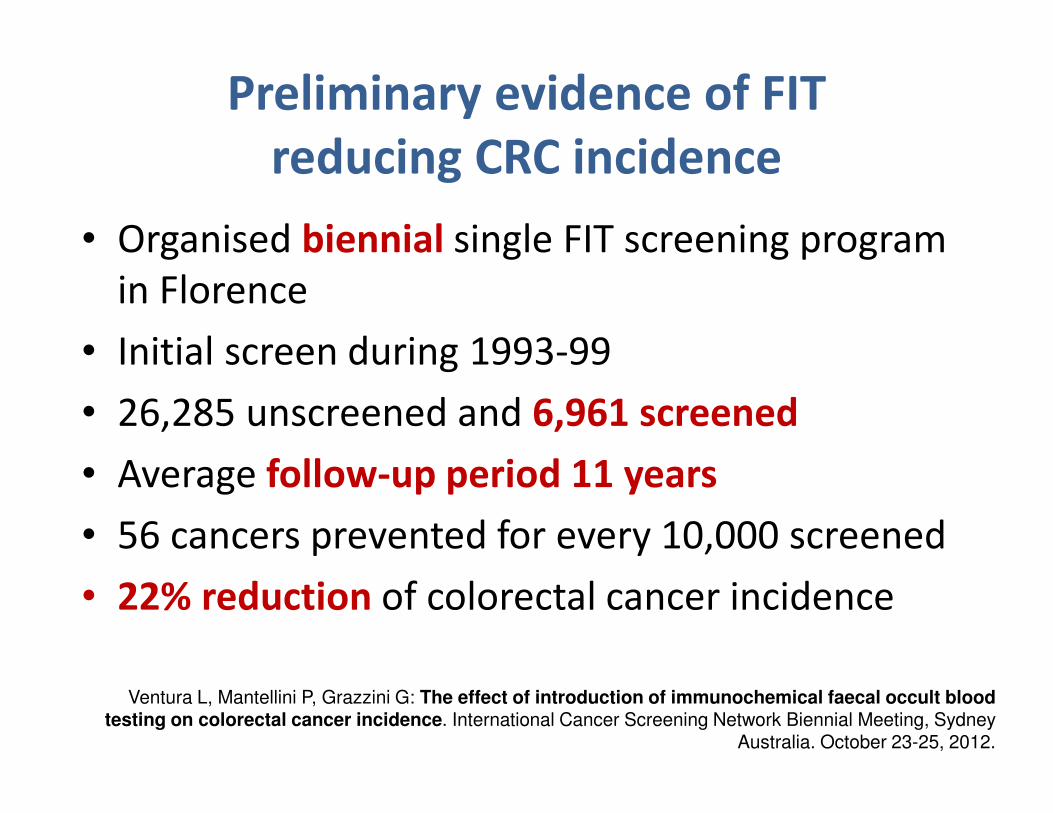
Preliminary evidence of FIT
reducing CRC incidence
• Organised biennial single FIT screening program
in Florence
• Initial screen during 1993-99
• 26,285 unscreened and 6,961 screened
• Average follow-up period 11 years
• 56 cancers prevented for every 10,000 screened
• 22% reduction of colorectal cancer incidence
Ventura L, Mantellini P, Grazzini G: The effect of introduction of immunochemical faecal occult blood testing on colorectal cancer incidence. International Cancer Screening Network Biennial Meeting, Sydney
Australia. October 23-25, 2012.
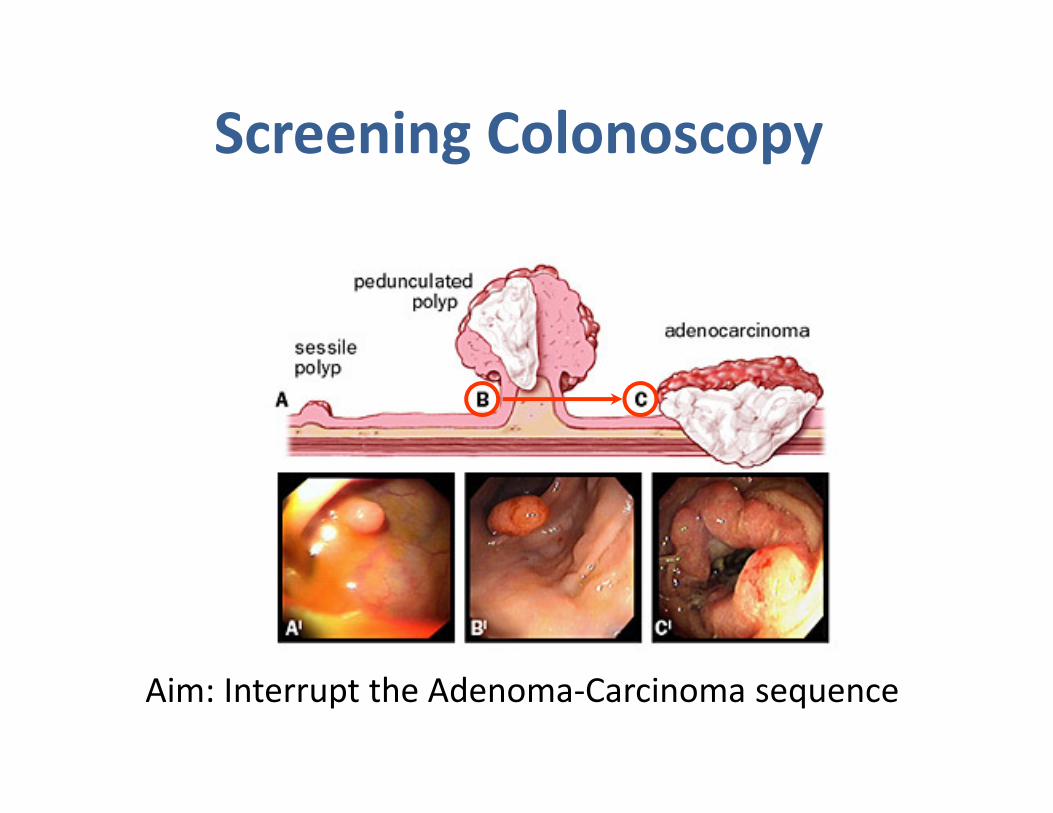
Screening Colonoscopy
Aim: Interrupt the Adenoma-Carcinoma sequence
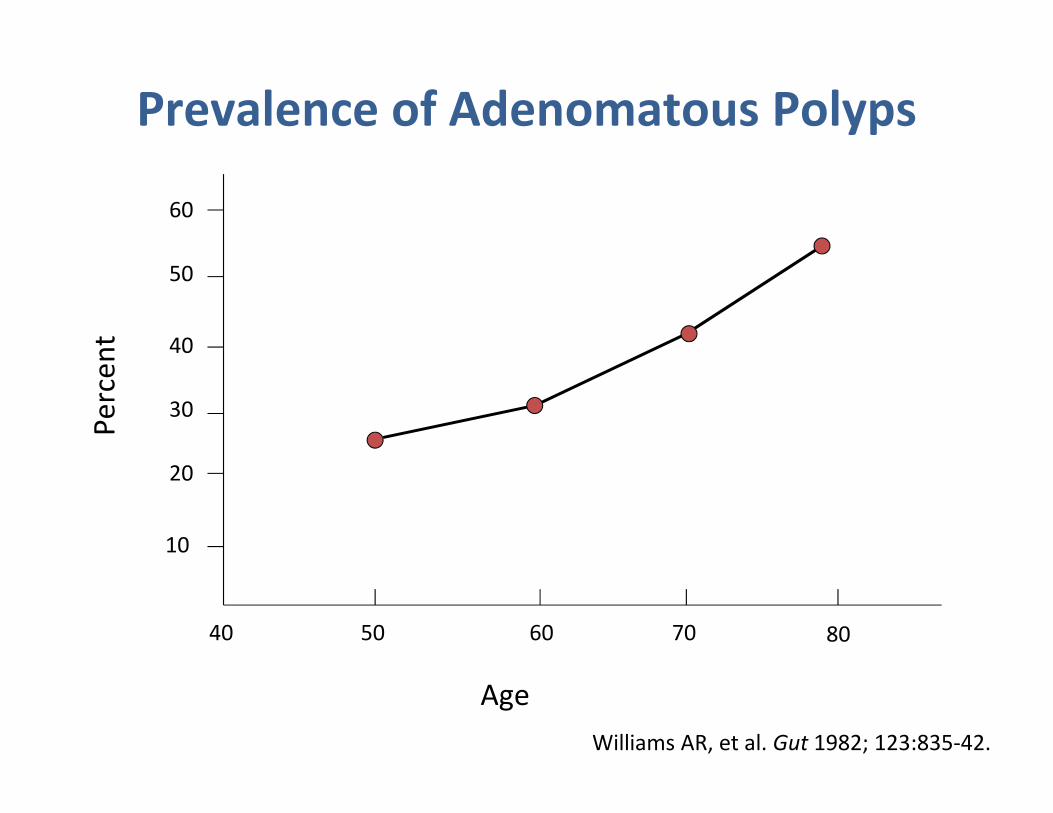
40 50 60 70 80
10
20
30
40
50
60
Age
Pe
rce
nt
Prevalence of Adenomatous Polyps
Williams AR, et al. Gut 1982; 123:835-42.
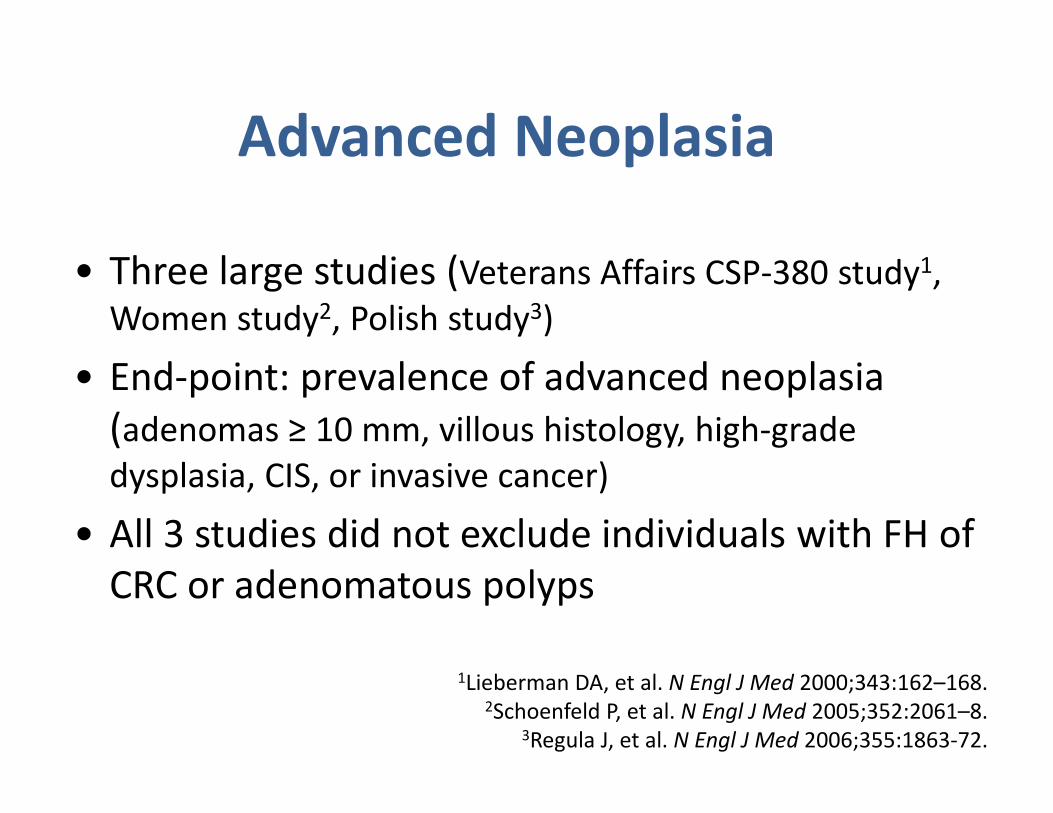
• Three large studies (Veterans Affairs CSP-380 study1,
Women study2, Polish study3)
• End-point: prevalence of advanced neoplasia
(adenomas ≥ 10 mm, villous histology, high-grade
dysplasia, CIS, or invasive cancer)
• All 3 studies did not exclude individuals with FH of
CRC or adenomatous polyps
1Lieberman DA, et al. N Engl J Med 2000;343:162–168.2Schoenfeld P, et al. N Engl J Med 2005;352:2061–8.
3Regula J, et al. N Engl J Med 2006;355:1863-72.
Advanced Neoplasia
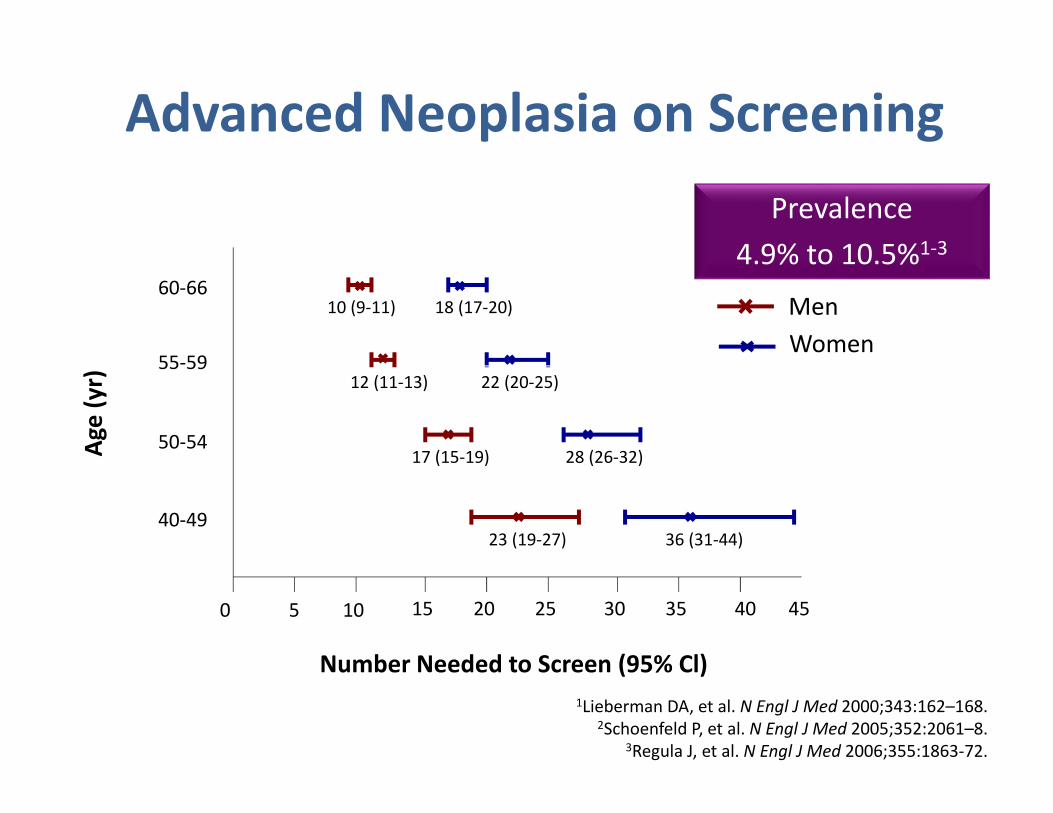
Prevalence
4.9% to 10.5%1-3
1Lieberman DA, et al. N Engl J Med 2000;343:162–168.2Schoenfeld P, et al. N Engl J Med 2005;352:2061–8.
3Regula J, et al. N Engl J Med 2006;355:1863-72.
0
40-49
50-54
55-59
60-66
Ag
e (
yr)
Number Needed to Screen (95% Cl)
5 10 15 20 25 30 35 40 45
10 (9-11) 18 (17-20)
12 (11-13) 22 (20-25)
17 (15-19)
23 (19-27)
28 (26-32)
36 (31-44)
Men
Women
Advanced Neoplasia on Screening
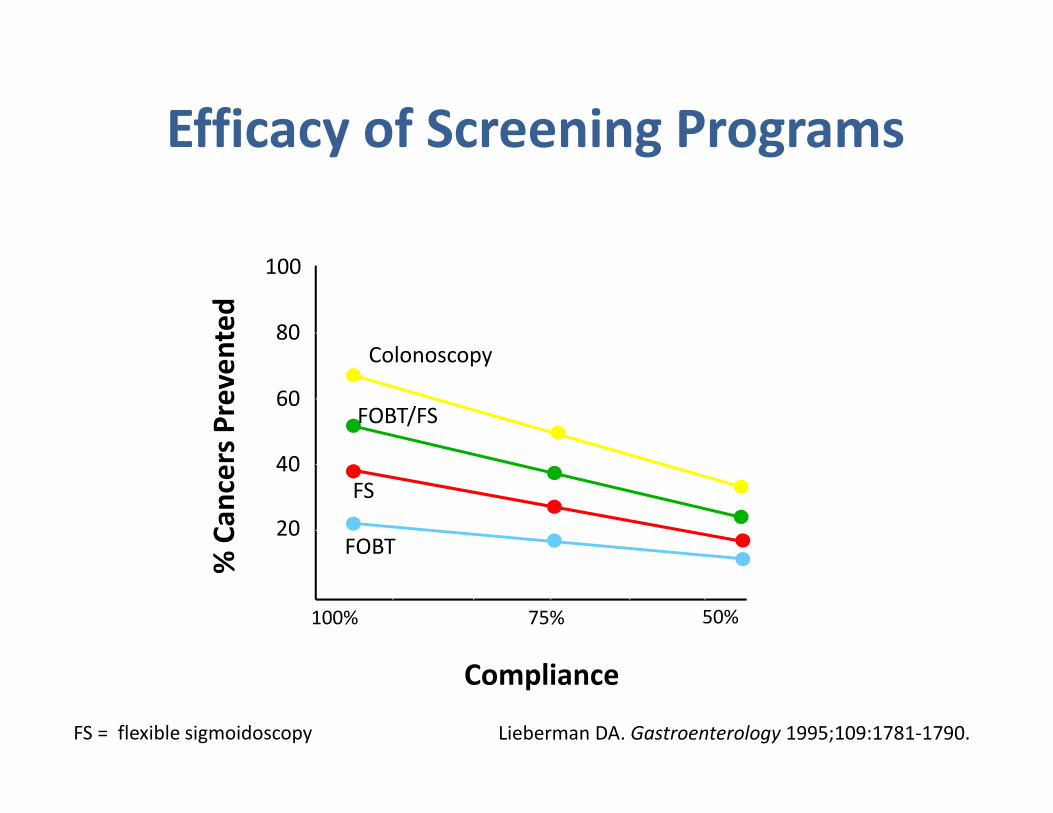
Compliance
% C
an
cers
Pre
ve
nte
d
75%100% 50%
20
40
60
80
100
Lieberman DA. Gastroenterology 1995;109:1781-1790.
Efficacy of Screening Programs
FOBT
FS
FOBT/FS
Colonoscopy
FS = flexible sigmoidoscopy
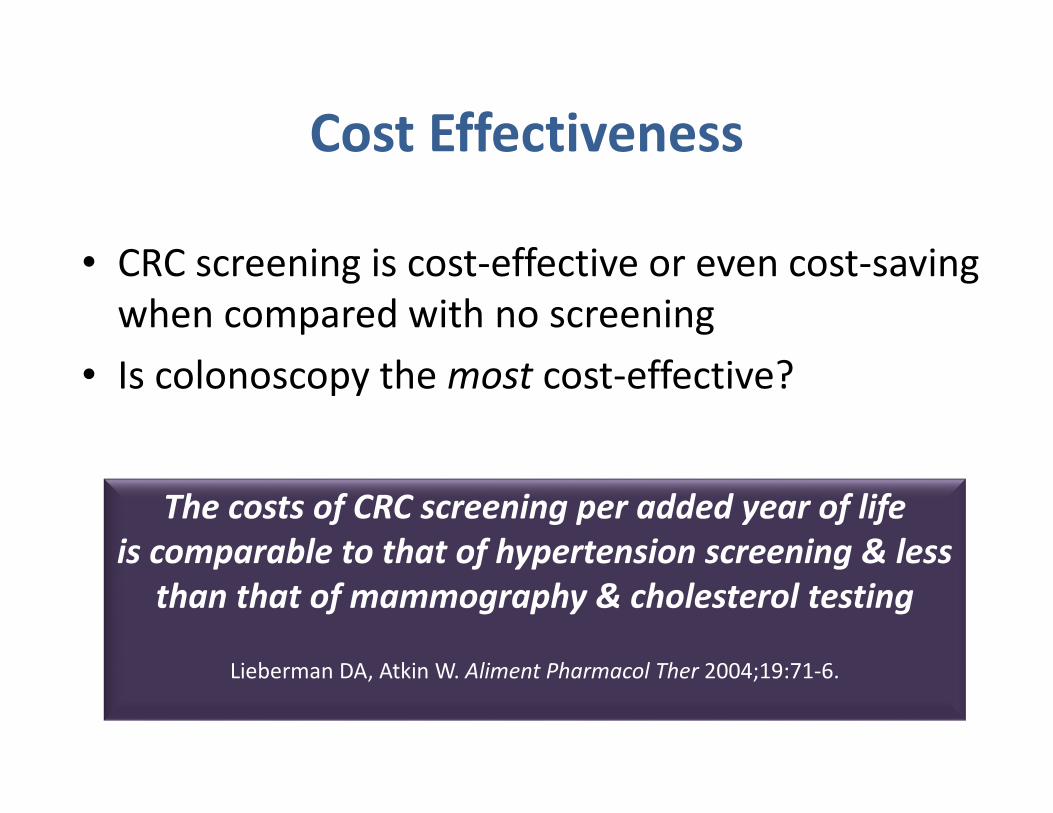
Cost Effectiveness
• CRC screening is cost-effective or even cost-saving
when compared with no screening
• Is colonoscopy the most cost-effective?
The costs of CRC screening per added year of life
is comparable to that of hypertension screening & less
than that of mammography & cholesterol testing
Lieberman DA, Atkin W. Aliment Pharmacol Ther 2004;19:71-6.
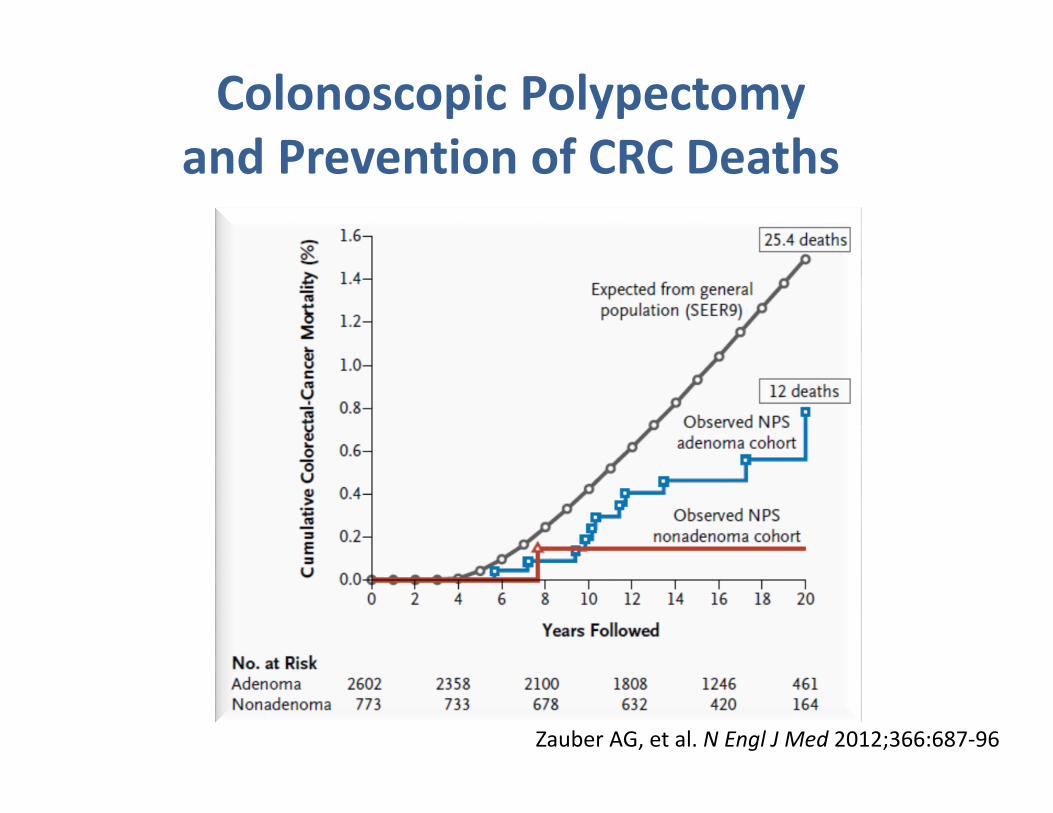
Colonoscopic Polypectomy
and Prevention of CRC Deaths
Zauber AG, et al. N Engl J Med 2012;366:687-96
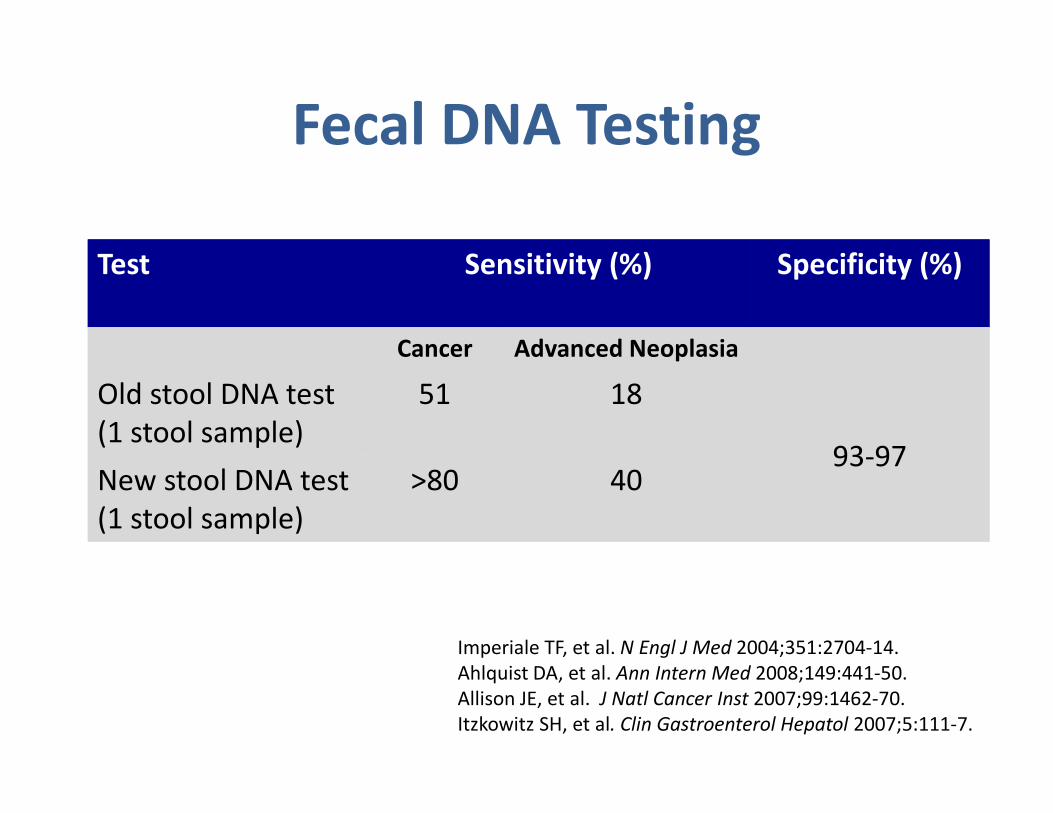
Test Sensitivity (%) Specificity (%)
Cancer Advanced Neoplasia
Old stool DNA test
(1 stool sample)
51 18
93-97New stool DNA test
(1 stool sample)
>80 40
Imperiale TF, et al. N Engl J Med 2004;351:2704-14.
Ahlquist DA, et al. Ann Intern Med 2008;149:441-50.
Allison JE, et al. J Natl Cancer Inst 2007;99:1462-70.
Itzkowitz SH, et al. Clin Gastroenterol Hepatol 2007;5:111-7.
Fecal DNA Testing
Meta-analysis: summary sensitivities
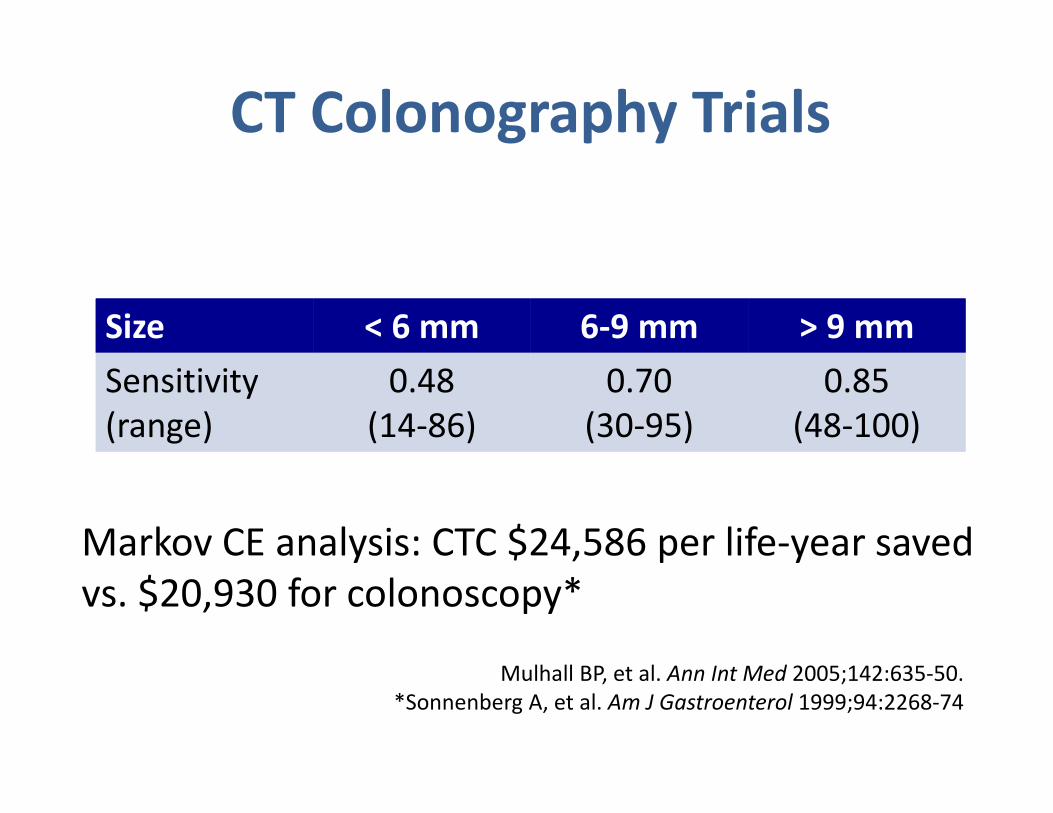
Mulhall BP, et al. Ann Int Med 2005;142:635-50.
*Sonnenberg A, et al. Am J Gastroenterol 1999;94:2268-74
CT Colonography Trials
Markov CE analysis: CTC $24,586 per life-year saved
vs. $20,930 for colonoscopy*
Size < 6 mm 6-9 mm > 9 mm
Sensitivity
(range)
0.48
(14-86)
0.70
(30-95)
0.85
(48-100)
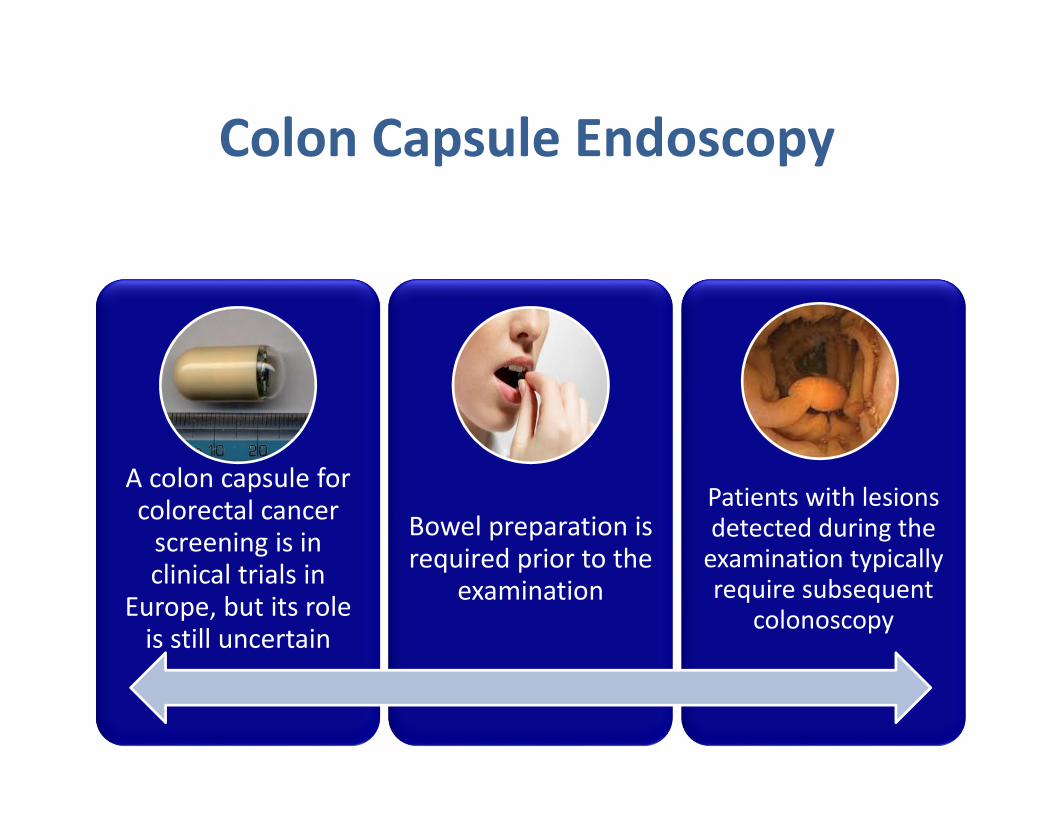
Colon Capsule Endoscopy
A colon capsule for colorectal cancer
screening is in clinical trials in
Europe, but its role is still uncertain
Bowel preparation is required prior to the
examination
Patients with lesions detected during the
examination typically require subsequent
colonoscopy
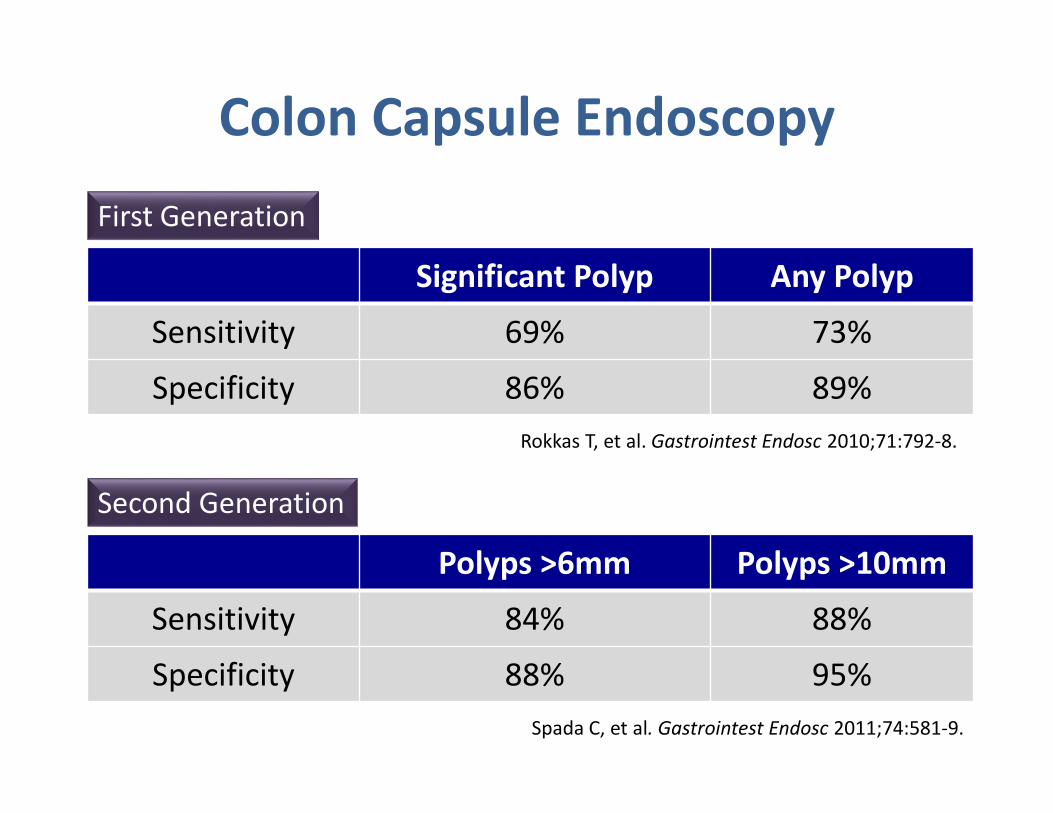
Significant Polyp Any Polyp
Sensitivity 69% 73%
Specificity 86% 89%
Rokkas T, et al. Gastrointest Endosc 2010;71:792-8.
Polyps >6mm Polyps >10mm
Sensitivity 84% 88%
Specificity 88% 95%
Colon Capsule Endoscopy
First Generation
Second Generation
Spada C, et al. Gastrointest Endosc 2011;74:581-9.
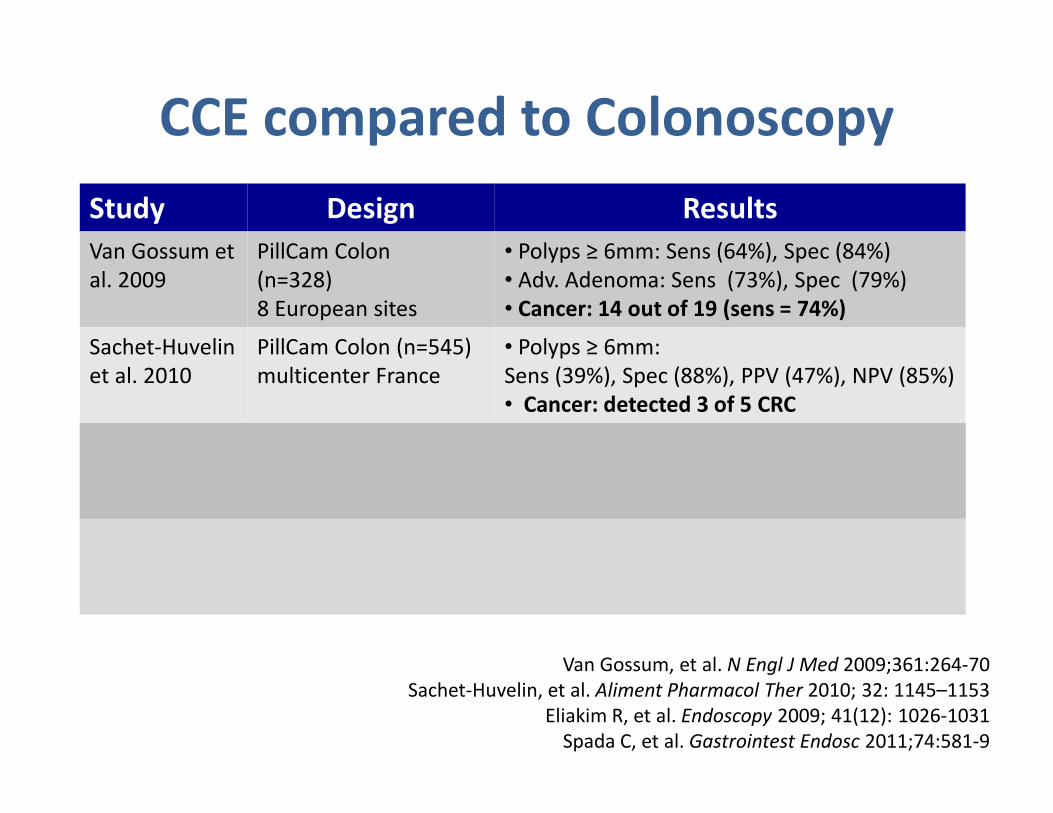
Study Design Results
Van Gossum et
al. 2009
PillCam Colon
(n=328)
8 European sites
• Polyps ≥ 6mm: Sens (64%), Spec (84%)
• Adv. Adenoma: Sens (73%), Spec (79%)
• Cancer: 14 out of 19 (sens = 74%)
Sachet-Huvelin
et al. 2010
PillCam Colon (n=545)
multicenter France
• Polyps ≥ 6mm:
Sens (39%), Spec (88%), PPV (47%), NPV (85%)
• Cancer: detected 3 of 5 CRC
Eliakim et al.
2009
PillCam Colon 2 (n=98) Polyps ≥ 6mm:
Sensitivity=89%
Specificity=76%
Polyps ≥ 10mm:
Sensitivity=88%
Specificity=89%
Spada et al.
2011
PillCam Colon 2
(n=117)
8 European sites
Polyps ≥ 6mm:
Sens = 84%
Spec = 64%
Polyps ≥ 10mm:
Sens = 88%
Spec = 95%
CCE compared to Colonoscopy
Van Gossum, et al. N Engl J Med 2009;361:264-70
Sachet-Huvelin, et al. Aliment Pharmacol Ther 2010; 32: 1145–1153
Eliakim R, et al. Endoscopy 2009; 41(12): 1026-1031
Spada C, et al. Gastrointest Endosc 2011;74:581-9

Epidemiology of Colorectal
Cancer in Lebanon
Colorectal Cancer in Lebanon
• CRC is the second most commonly reported
cancer in females and the fourth most
commonly reported cancer in males in
Lebanon in 2012
• CRC is diagnosed in an average of 630
individuals annually in Lebanon
• No vital statistics or information about burden
of disease in terms of morbidity & mortality
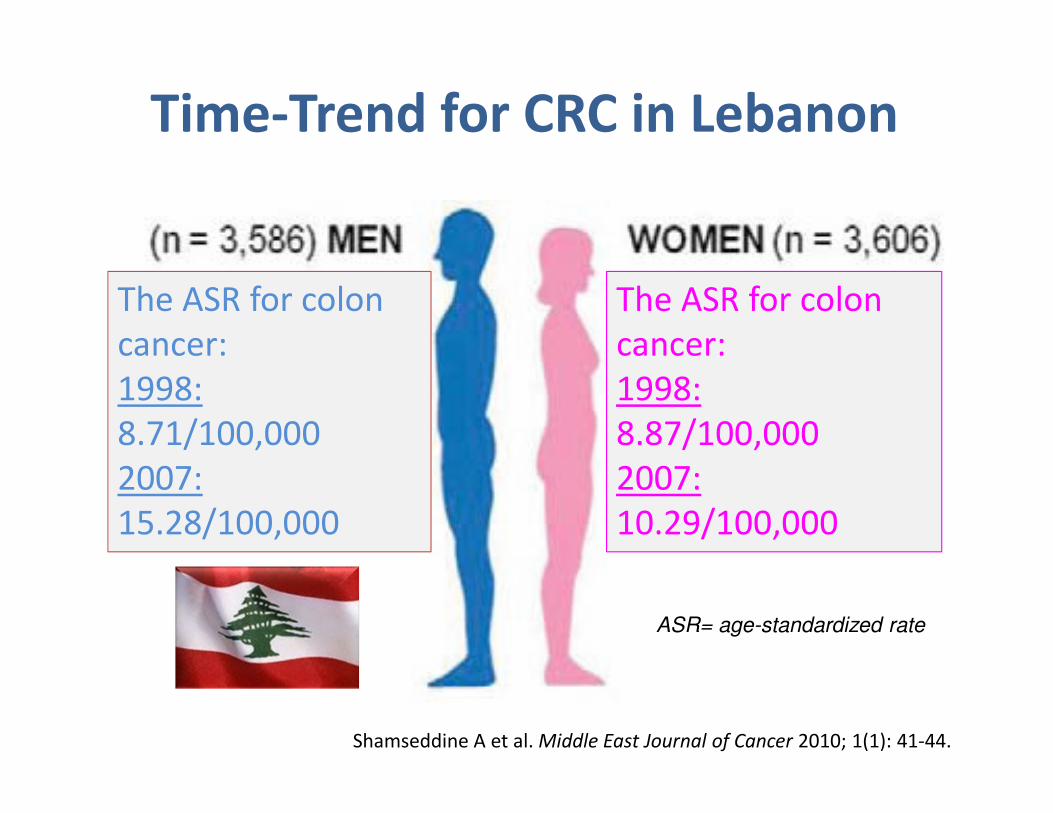
Shamseddine A et al. Middle East Journal of Cancer 2010; 1(1): 41-44.
The ASR for colon
cancer:
1998:
8.71/100,000
2007:
15.28/100,000
The ASR for colon
cancer:
1998:
8.87/100,000
2007:
10.29/100,000
Time-Trend for CRC in Lebanon
ASR= age-standardized rate
Colorectal Cancer in Lebanon
• There is no national CRC screening strategy or
education awareness program
• Screening with fecal occult blood testing is
rarely practiced
• Gastroenterologists recommend and perform
screening colonoscopy on an erratic and
opportunistic basis
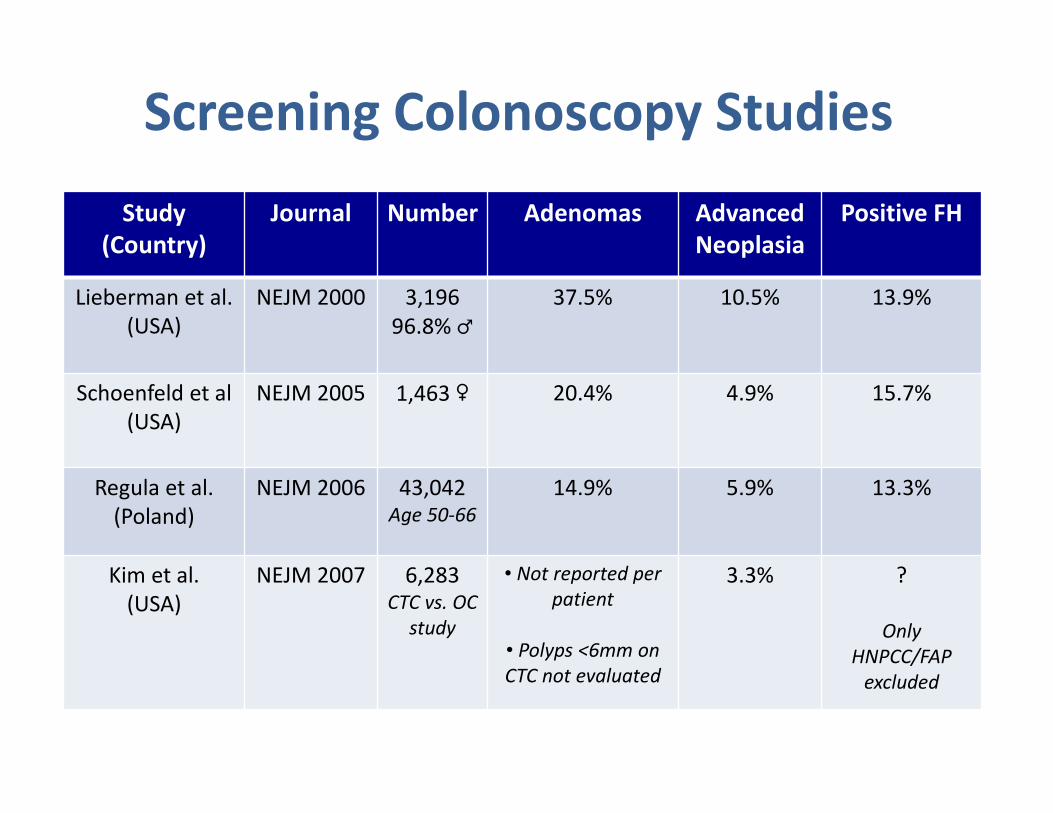
Screening Colonoscopy Studies
Study
(Country)
Journal Number Adenomas Advanced
Neoplasia
Positive FH
Lieberman et al.
(USA)
NEJM 2000 3,196
96.8% ♂
37.5% 10.5% 13.9%
Schoenfeld et al
(USA)
NEJM 2005 1,463 ♀ 20.4% 4.9% 15.7%
Regula et al.
(Poland)
NEJM 2006 43,042Age 50-66
14.9% 5.9% 13.3%
Kim et al.
(USA)
NEJM 2007 6,283CTC vs. OC
study
• Not reported per
patient
• Polyps <6mm on
CTC not evaluated
3.3% ?
Only
HNPCC/FAP
excluded
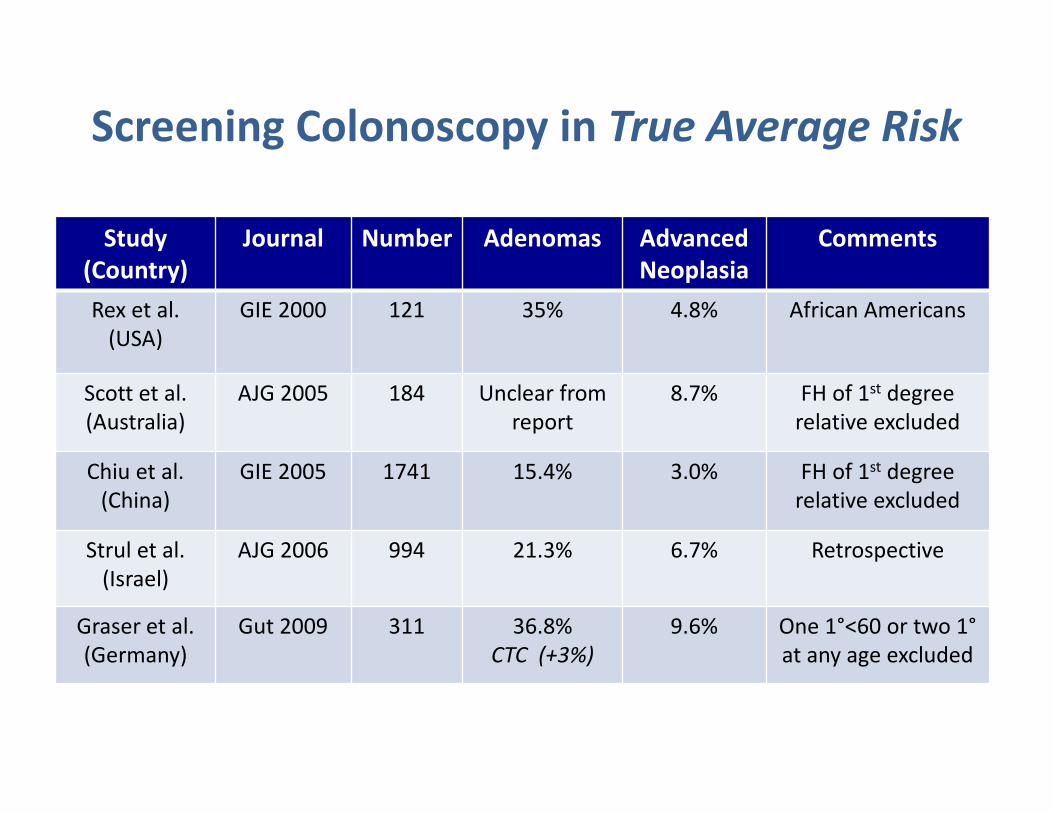
Study
(Country)
Journal Number Adenomas Advanced
Neoplasia
Comments
Rex et al.
(USA)
GIE 2000 121 35% 4.8% African Americans
Scott et al.
(Australia)
AJG 2005 184 Unclear from
report
8.7% FH of 1st degree
relative excluded
Chiu et al.
(China)
GIE 2005 1741 15.4% 3.0% FH of 1st degree
relative excluded
Strul et al.
(Israel)
AJG 2006 994 21.3% 6.7% Retrospective
Graser et al.
(Germany)
Gut 2009 311 36.8%
CTC (+3%)
9.6% One 1°<60 or two 1°
at any age excluded
Screening Colonoscopy in True Average Risk
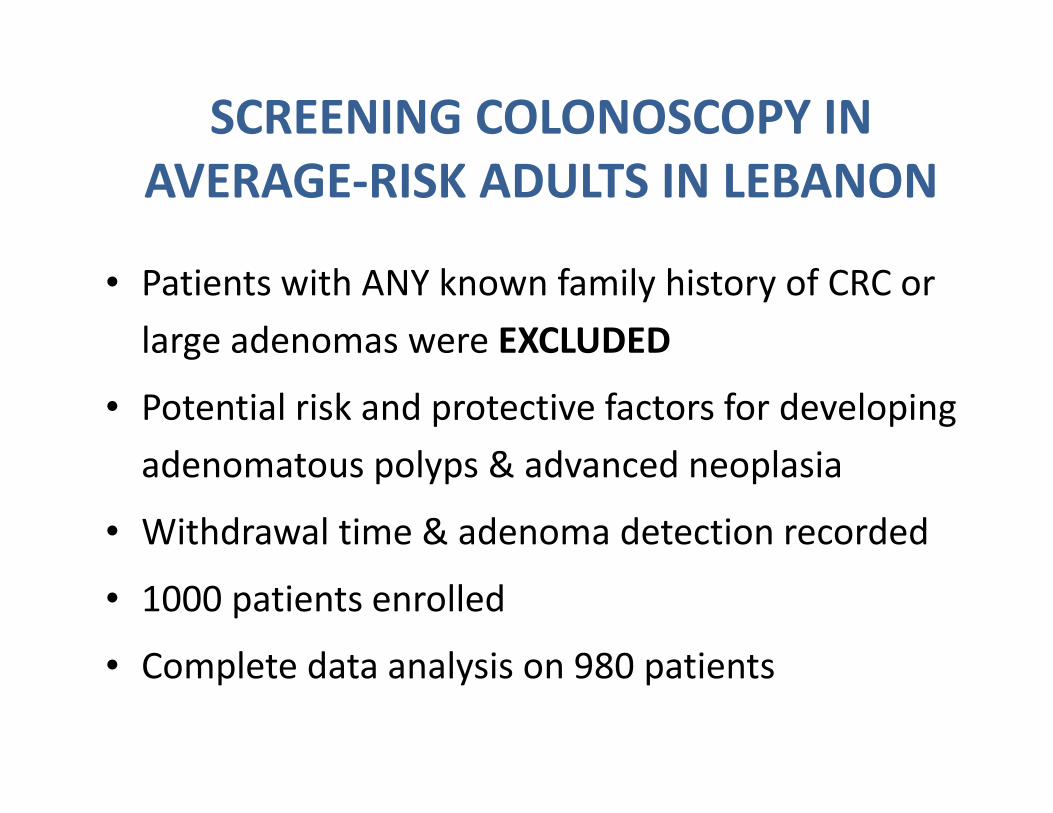
SCREENING COLONOSCOPY IN
AVERAGE-RISK ADULTS IN LEBANON
• Patients with ANY known family history of CRC or
large adenomas were EXCLUDED
• Potential risk and protective factors for developing
adenomatous polyps & advanced neoplasia
• Withdrawal time & adenoma detection recorded
• 1000 patients enrolled
• Complete data analysis on 980 patients
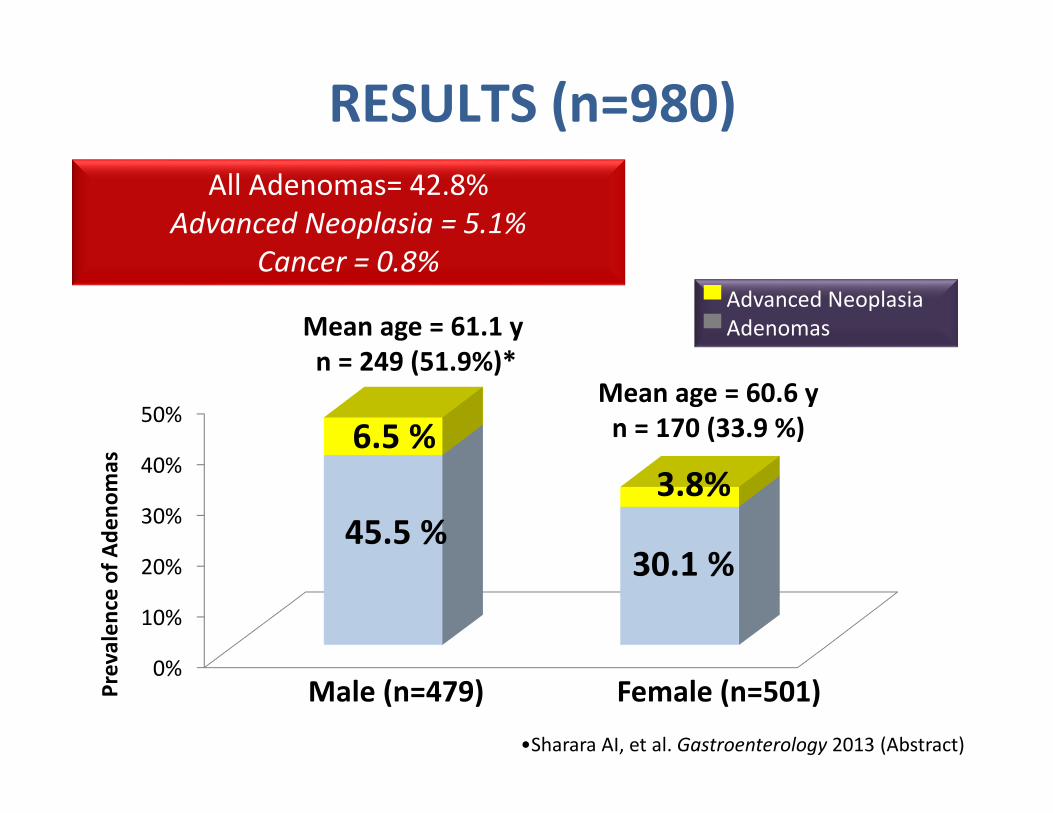
All Adenomas= 42.8%
Advanced Neoplasia = 5.1%
Cancer = 0.8%
0%
10%
20%
30%
40%
50%6.5 %
3.8%
45.5 %30.1 %
RESULTS (n=980)
Mean age = 61.1 y
n = 249 (51.9%)*Mean age = 60.6 y
n = 170 (33.9 %)
Pre
va
len
ce o
f A
de
no
ma
s
Male (n=479) Female (n=501)
▀ Advanced Neoplasia
▀ Adenomas
•Sharara AI, et al. Gastroenterology 2013 (Abstract)
0
10
20
30
40
50
60
70
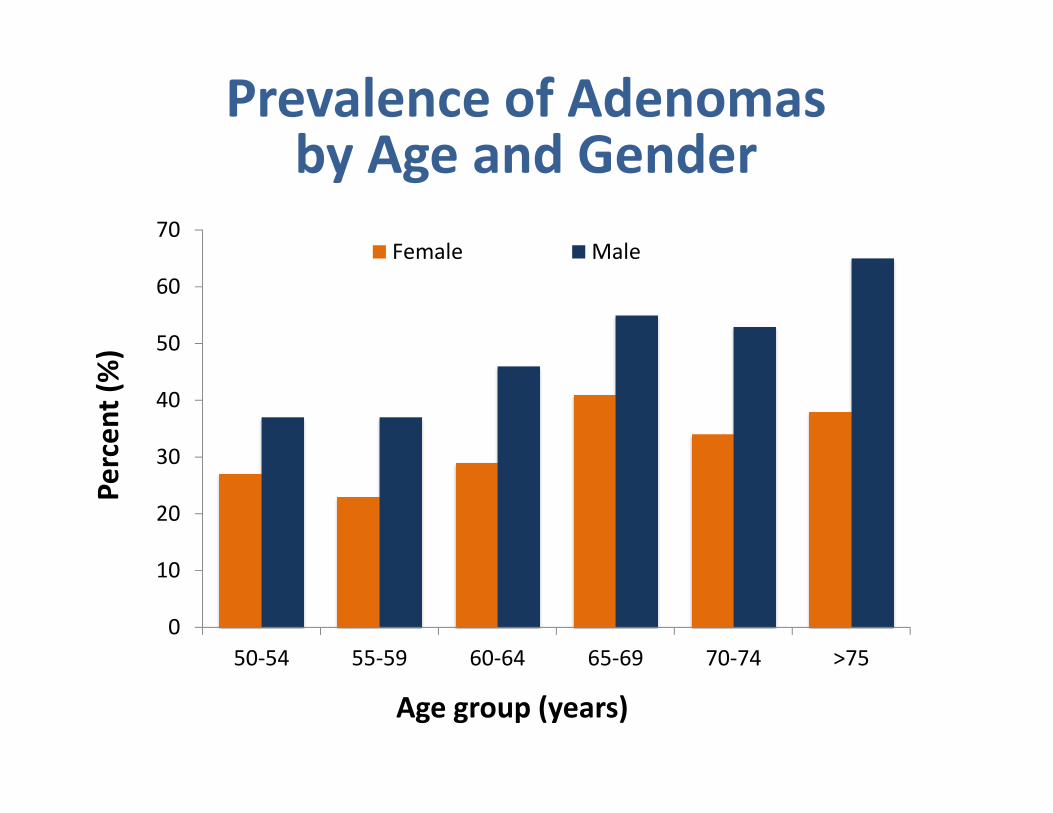
50-54 55-59 60-64 65-69 70-74 >75
Female Male
Pe
rce
nt
(%)
Age group (years)
Prevalence of Adenomasby Age and Gender
0
2
4
6
8
10
12
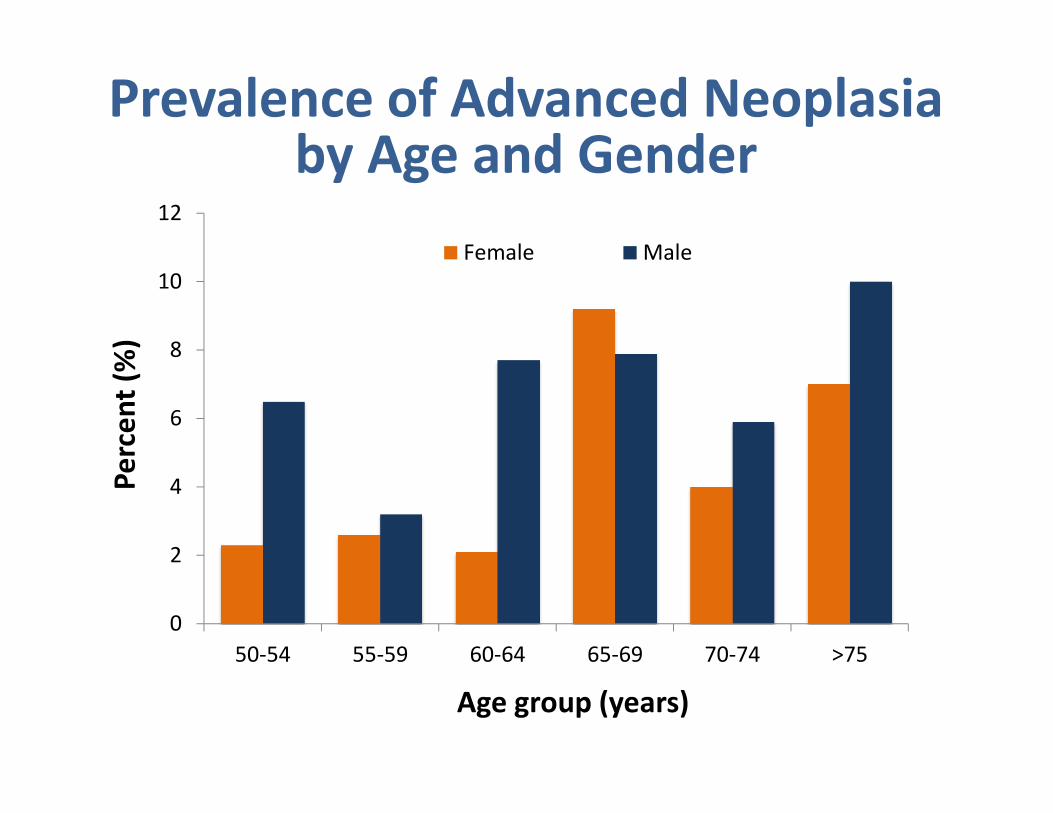
50-54 55-59 60-64 65-69 70-74 >75
Female Male
Pe
rce
nt
(%)
Age group (years)
Prevalence of Advanced Neoplasiaby Age and Gender
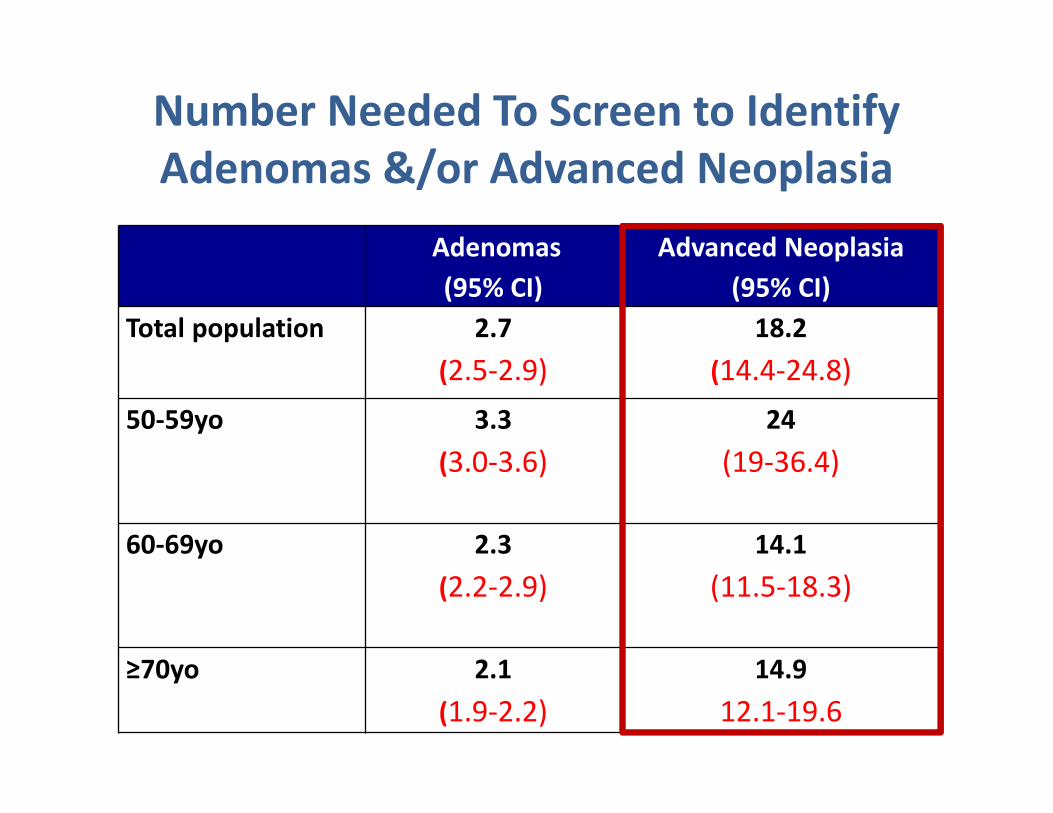
Number Needed To Screen to Identify
Adenomas &/or Advanced Neoplasia
Adenomas
(95% CI)
Advanced Neoplasia
(95% CI)
Total population 2.7
(2.5-2.9)
18.2
(14.4-24.8)
50-59yo 3.3
(3.0-3.6)
24
(19-36.4)
60-69yo 2.3
(2.2-2.9)
14.1
(11.5-18.3)
≥70yo 2.1
(1.9-2.2)
14.9
12.1-19.6
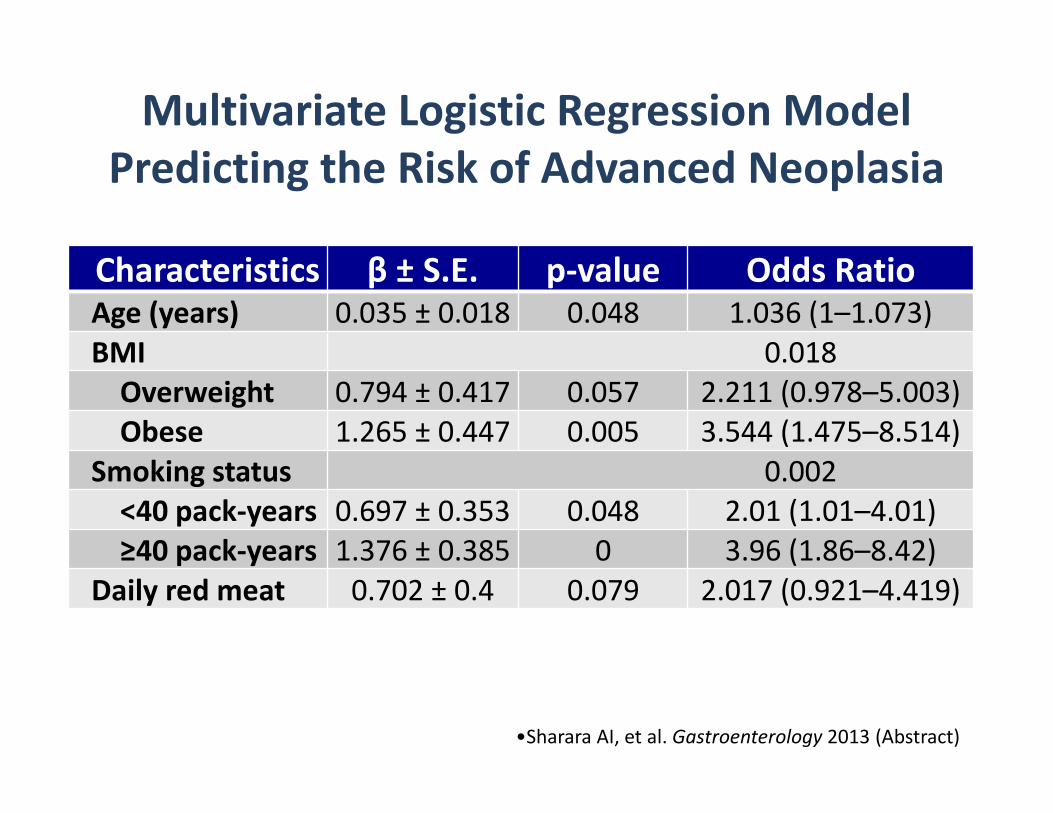
Characteristics β ± S.E. p-value Odds RatioAge (years) 0.035 ± 0.018 0.048 1.036 (1–1.073)
BMI 0.018
Overweight 0.794 ± 0.417 0.057 2.211 (0.978–5.003)
Obese 1.265 ± 0.447 0.005 3.544 (1.475–8.514)
Smoking status 0.002
<40 pack-years 0.697 ± 0.353 0.048 2.01 (1.01–4.01)
≥40 pack-years 1.376 ± 0.385 0 3.96 (1.86–8.42)
Daily red meat 0.702 ± 0.4 0.079 2.017 (0.921–4.419)
Multivariate Logistic Regression Model
Predicting the Risk of Advanced Neoplasia
•Sharara AI, et al. Gastroenterology 2013 (Abstract)
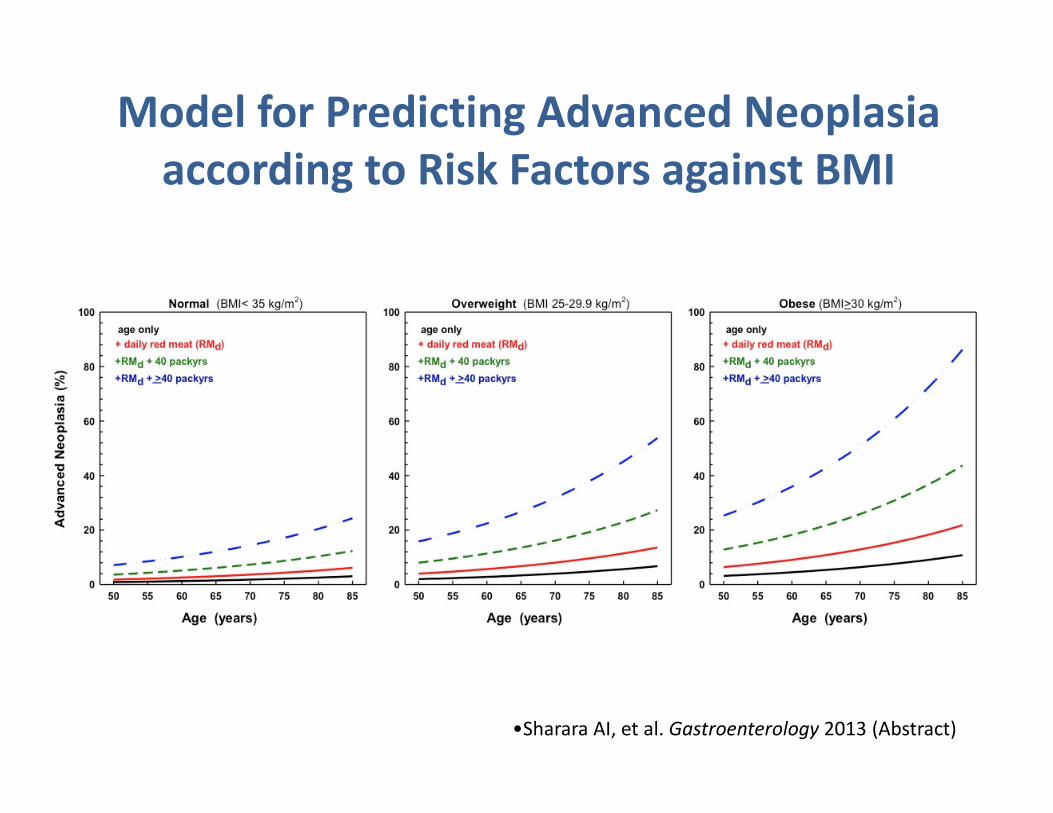
Model for Predicting Advanced Neoplasia
according to Risk Factors against BMI
•Sharara AI, et al. Gastroenterology 2013 (Abstract)

65
68 170
0
0
x
2.0
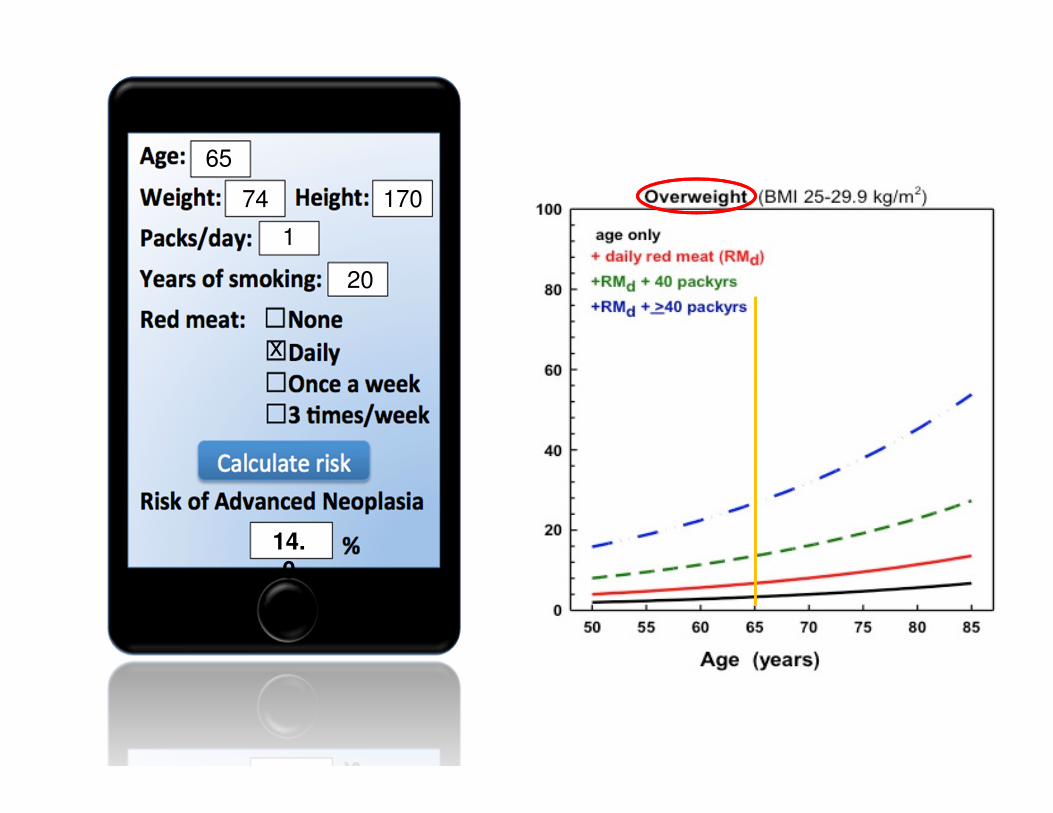
65
74 170
1
20
x
14.
0
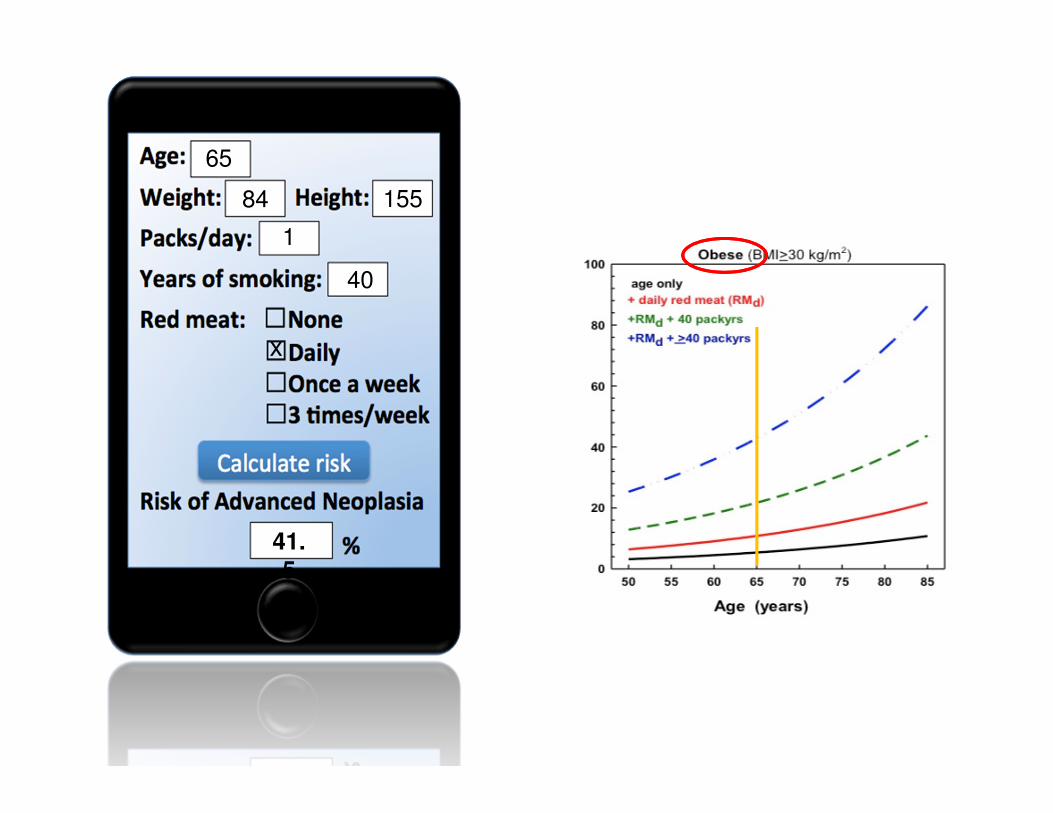
65
84 155
1
40
x
41.
5
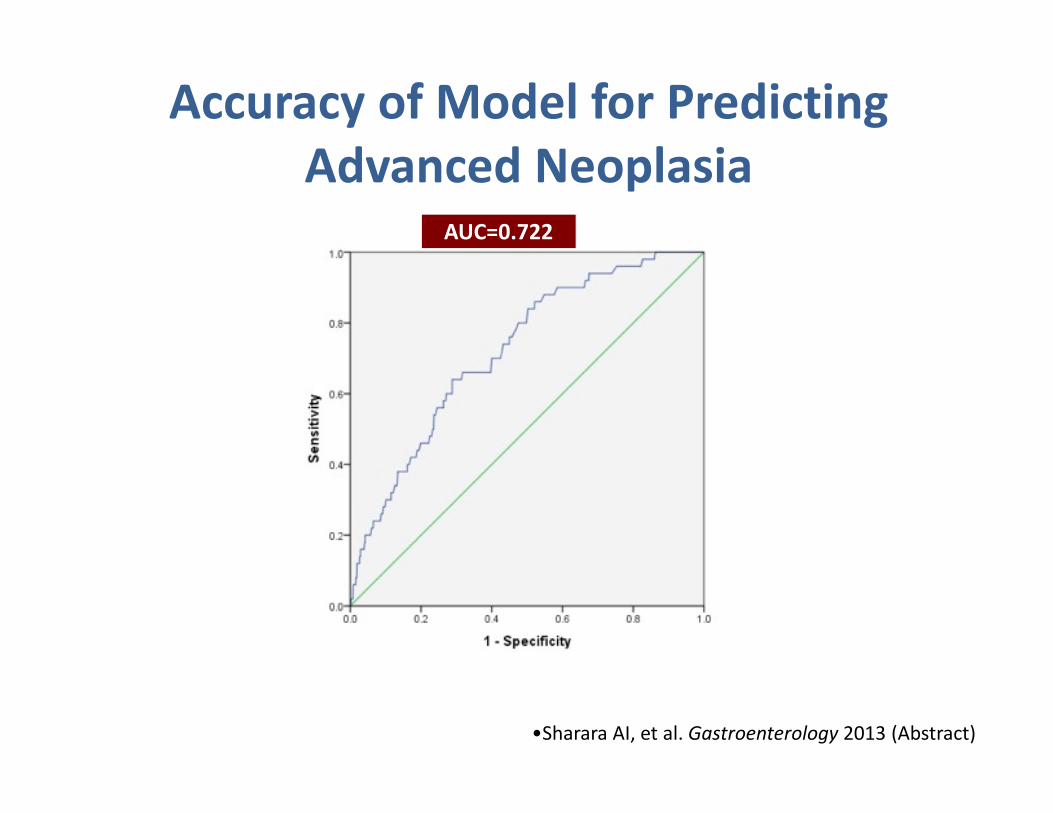
AUC=0.722
Accuracy of Model for Predicting
Advanced Neoplasia
•Sharara AI, et al. Gastroenterology 2013 (Abstract)
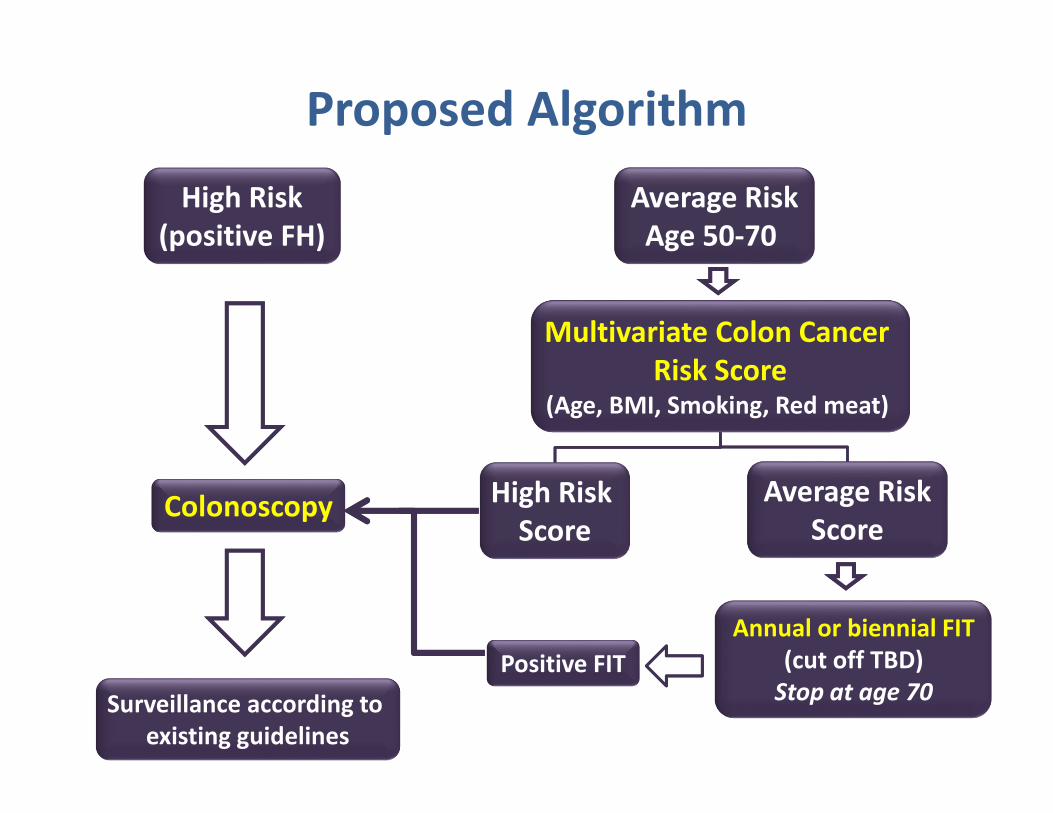
Average Risk
Age 50-70
Average Risk
Score
Multivariate Colon Cancer
Risk Score(Age, BMI, Smoking, Red meat)
High Risk
Score
Annual or biennial FIT
(cut off TBD)
Stop at age 70Positive FIT
Colonoscopy
Surveillance according to
existing guidelines
High Risk
(positive FH)
Proposed Algorithm
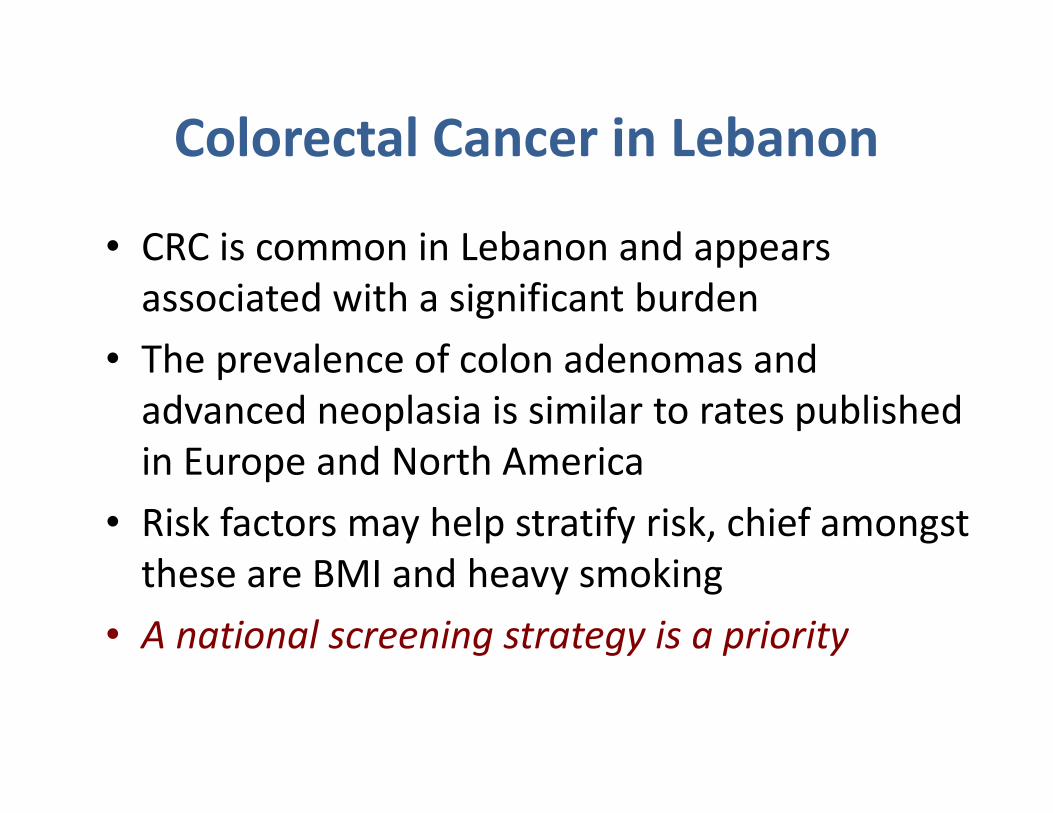
Colorectal Cancer in Lebanon
• CRC is common in Lebanon and appears
associated with a significant burden
• The prevalence of colon adenomas and
advanced neoplasia is similar to rates published
in Europe and North America
• Risk factors may help stratify risk, chief amongst
these are BMI and heavy smoking
• A national screening strategy is a priority


No National Program for Colorectal
Cancer Screening