Embed Size (px)
Citation preview
Article
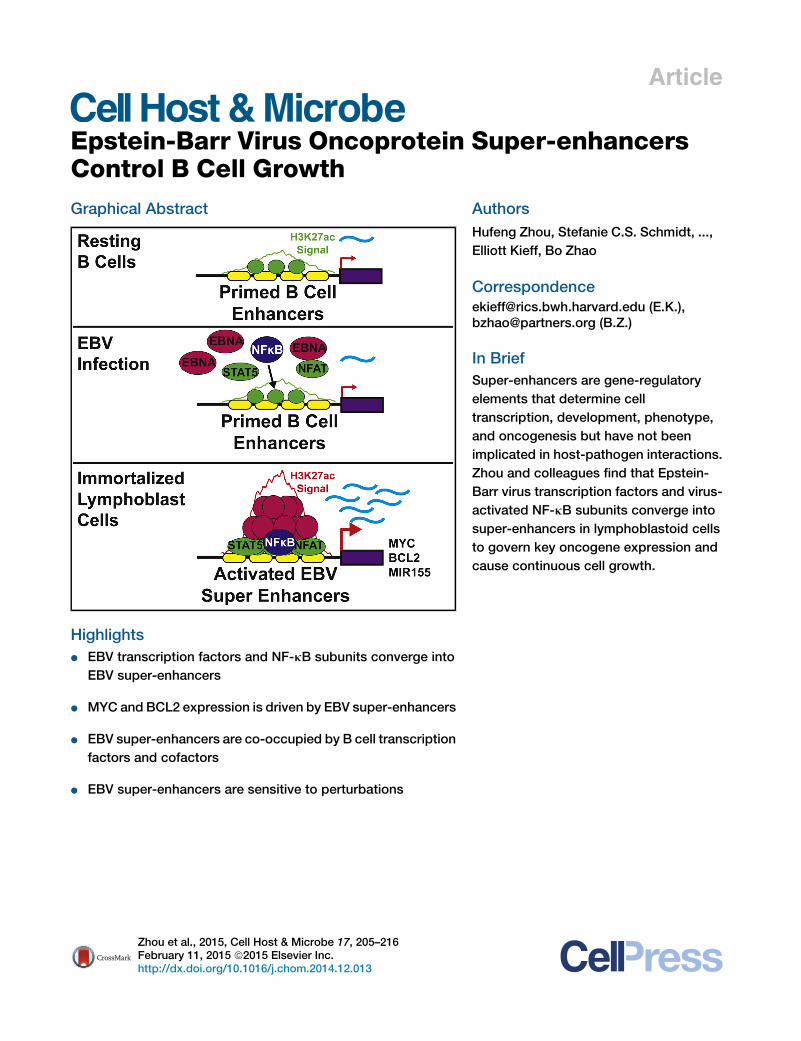
Epstein-Barr Virus Oncoprotein Super-enhancers
Control B Cell GrowthGraphical Abstract
Highlights
d EBV transcription factors and NF-kB subunits converge into
EBV super-enhancers
d MYC and BCL2 expression is driven by EBV super-enhancers
d EBV super-enhancers are co-occupied by B cell transcription
factors and cofactors
d EBV super-enhancers are sensitive to perturbations
Zhou et al., 2015, Cell Host & Microbe 17, 205–216February 11, 2015 ª2015 Elsevier Inc.http://dx.doi.org/10.1016/j.chom.2014.12.013
Authors
Hufeng Zhou, Stefanie C.S. Schmidt, ...,
Elliott Kieff, Bo Zhao
[email protected] (E.K.),[email protected] (B.Z.)
In Brief
Super-enhancers are gene-regulatory
elements that determine cell
transcription, development, phenotype,
and oncogenesis but have not been
implicated in host-pathogen interactions.
Zhou and colleagues find that Epstein-
Barr virus transcription factors and virus-
activated NF-kB subunits converge into
super-enhancers in lymphoblastoid cells
to govern key oncogene expression and
cause continuous cell growth.
Cell Host & Microbe
Article
Epstein-Barr Virus OncoproteinSuper-enhancers Control B Cell GrowthHufeng Zhou,1,2,5 Stefanie C.S. Schmidt,1,2,5 Sizun Jiang,1,2,5 Bradford Willox,1 Katharina Bernhardt,1,2 Jun Liang,1,2
Eric C. Johannsen,3 Peter Kharchenko,4 Benjamin E. Gewurz,1,2,6 Elliott Kieff,1,2,6,* and Bo Zhao1,2,6,*1Department of Medicine, Brigham and Women’s Hospital, Boston, MA 02115, USA2Department of Microbiology and Immunobiology, Harvard Medical School, Boston, MA 02115, USA3Department of Medicine and McArdle Laboratory for Cancer Research, University of Wisconsin-Madison, Madison, WI 53706, USA4Center for Biomedical Informatics, Harvard Medical School and Division of Hematology, Children’s Hospital, Boston, MA 02115, USA5Co-first author6Co-senior author*Correspondence: [email protected] (E.K.), [email protected] (B.Z.)
http://dx.doi.org/10.1016/j.chom.2014.12.013
SUMMARY
Super-enhancers are clusters of gene-regulatorysites bound by multiple transcription factors thatgovern cell transcription, development, phenotype,and oncogenesis. By examining Epstein-Barr virus(EBV)-transformed lymphoblastoid cell lines (LCLs),we identified four EBV oncoproteins and five EBV-activated NF-kB subunits co-occupying �1,800enhancer sites. Of these, 187 had markedly higherand broader histone H3K27ac signals, characteristicof super-enhancers, and were designated ‘‘EBVsuper-enhancers.’’ EBV super-enhancer-associatedgenes included the MYC and BCL2 oncogenes,which enable LCL proliferation and survival. EBV su-per-enhancers were enriched for B cell transcriptionfactor motifs and had high co-occupancy of STAT5and NFAT transcription factors (TFs). EBV super-enhancer-associated genes were more highly ex-pressed than other LCL genes. Disrupting EBVsuper-enhancers by the bromodomain inhibitor JQ1or conditionally inactivating an EBV oncoprotein orNF-kB decreased MYC or BCL2 expression and ar-rested LCL growth. These findings provide insightinto mechanisms of EBV-induced lymphoprolifera-tion and identify potential therapeutic interventions.
INTRODUCTION
Epstein-Barr virus (EBV), the first human tumor virus, discovered
50 years ago in African Burkitt’s lymphoma cells (Epstein et al.,
1964), is causally associated with infectious mononucleosis,
Burkitt’s lymphoma, Hodgkin’s lymphoma, HIV-related lym-
phomas, posttransplant lymphoproliferative diseases (PTLDs),
nasopharyngeal carcinoma, and some gastric cancers (Long-
necker et al., 2013; Young and Rickinson, 2004). In primary
EBV infection, virus transits across the oropharyngeal epithelium
to reach the B cell compartment. EBV converts primary B cells
into activated blasts, which enable EBV to colonize the B cell
compartment. Indeed, EBV-transformed lymphoblasts can be
Cell Host &
seen transiently in patients with infectiousmononucleosis, which
is caused by primary EBV infection (Kurth et al., 2000). Although
T- and NK-cell surveillance eventually contains lymphoblast pro-
liferation, EBV latently infected B cells are the reservoir from
which the virus establishes lifelong infection. With HIV infection,
organ transplantation, or primary immunodeficiency, impaired
control of EBV latently infected B cells leads to fatal lymphopro-
liferative diseases and lymphomas. In vitro, EBV transforms pri-
mary resting B lymphocytes (RBLs) to continuously proliferating
lymphoblastoid cell lines (LCLs). LCLs express the same viral
genes as some EBV lymphomas. These viral genes include six
Epstein-Barr virus nuclear antigens (EBNAs), three latent mem-
brane proteins (LMPs), and multiple microRNAs (Longnecker
et al., 2013; Young and Rickinson, 2004). LCLs are therefore a
useful model for studying EBV mediated B-lymphoid oncogen-
esis (Longnecker et al., 2013).
Reverse genetic studies indicate that viral oncoproteins
EBNA2, EBNALP, EBNA3A, EBNA3C, and LMP1 are each
required for LCL growth and survival (Longnecker et al., 2013).
EBNAs bind to virus and cell DNA through their interactions
with cell DNA binding proteins. EBNA2 and EBNALP are the first
EBV genes expressed after B cell infection (Alfieri et al., 1991).
EBNA2 mostly binds to DNA through the cell DNA binding
protein RBPJ, and activates cell gene transcription, including
MYC, the EBV cell surface receptor CD21, andCD23 (Grossman
et al., 1994; Henkel et al., 1994; Kaiser et al., 1999; Wang et al.,
1987; Zhao et al., 2011b). EBNA2 binds to B cell enhancer
sites �428 kb and 525 kb upstream of MYC and loops to the
MYC TSS to activate MYC transcription (Zhao et al., 2011b).
The EBNA2 C-terminal acidic activation domain recruits basal
and activation-related TFs, including Pol II, p300/CBP, TFIID,
and TFIIH (Tong et al., 1995; Wang et al., 2000). EBNALP coac-
tivates with EBNA2 and derepresses transcription by removing
NCoR and associated repressors from promoter DNA (Harada
and Kieff, 1997; Portal et al., 2006, 2011, 2013). EBNA3A and
EBNA3C repress p16INK4A and p14ARF expression, thereby pre-
venting senescence and enabling continuous LCL growth
(Maruo et al., 2011; Skalska et al., 2013). EBNA3A and EBNA3C
also affect the expression ofmany host genes (Hertle et al., 2009;
Zhao et al., 2011a). However, the growth-inhibiting effects of
EBNA3A or EBNA3C deficiency can only be rescued by restoring
EBNA3A or EBNA3C expression (Maruo et al., 2005, 2006),
indicating that they both have unique nonredundant functions.
Microbe 17, 205–216, February 11, 2015 ª2015 Elsevier Inc. 205
LMP1 constitutively activates NF-kB to promote growth and
survival. NF-kBs are dimeric TFs assembled from the RelA,
RelB, cRel, p50, and p52 subunits. In resting B cells, NF-kB is
tethered in the cytosol by IkBa. In LCLs, LMP1 signaling triggers
IkBa degradation and NF-kB homo- or heterodimer nuclear
translocation. Inducible overexpression of a nondegradable
IkBa blocks NF-kB activity and causes LCL apoptosis (Cahir-
McFarland et al., 2000, 2004). Conditional inactivation of
EBNA2, EBNA3A, EBNA3C, or NF-kB identified cell genes
regulated by these EBV oncoproteins. However, only a limited
repertoire of cell genes are coregulated by EBNAs or NF-kB
(Cahir-McFarland et al., 2004; Hertle et al., 2009; Zhao et al.,
2006, 2011a).
Super-enhancers are recently discovered enhancers with
extraordinarily high and broad ChIP-seq signals for activation-
related TFs, H3K27ac modification, bromodomain binding
protein, BRD4, or mediator Med1 (Chapuy et al., 2013; Hnisz
et al., 2013; Loven et al., 2013; Parker et al., 2013; Whyte
et al., 2013). Super-enhancers are principle determinants of
cell identity and oncogenesis, although a super-enhancer role
in host-pathogen interactions has not yet been reported. Su-
per-enhancers are associated with genes critical for cell func-
tion, are co-occupied by multiple TFs in dense clusters, and
are more sensitive to perturbation than typical enhancers (Cha-
puy et al., 2013; Hnisz et al., 2013; Loven et al., 2013; Whyte
et al., 2013). Super-enhancer formation can also be rapidly
induced de novo upon cytokine stimulation accompanied by
the decommission of parental cell super-enhancers (Brown
et al., 2014). BRD4 inhibition by bromodomain inhibitor JQ1
has significantly larger effects on super-enhancer-associated
gene expression than on typical enhancer-associated gene
expression (Hnisz et al., 2013; Loven et al., 2013). In multiple
myeloma (Loven et al., 2013) and diffuse large B cell lymphomas
(DLBCLs) (Chapuy et al., 2013), theMYC oncogene is controlled
by super-enhancers.
We have now used EBNA2; EBNALP; EBNA3A; EBNA3C; NF-
kB subunits RelA, RelB, cRel, p50, and p52; and ENCODE
GM12878 LCL TF ChIP-seq data for integrated analyses of
EBV super-enhancer effects on LCL growth. We were surprised
to find all four oncogenic EBNAs and all five NF-kB subunits
co-occupying 187 sites that had extraordinarily high H3K27ac
signals, indicative of super-enhancers. As characteristic of su-
per-enhancers, EBV super-enhancers regulated key B cell
growth and survival genes, and super-enhancer disruption by
the BRD4 inhibitor JQ1, or by EBNA2 or NF-kB inactivation, in-
hibited EBV super-enhancer-associated gene expression and
LCL growth.
RESULTS
EBNA2 Super-enhancersMarkedly elevated ChIP-seq signals of the B cell master TF SPI1/
PU.1 distinguish B cell super-enhancers from typical enhancers
(Whyte et al., 2013). Interestingly, we previously found that
LCL EBNA2 sites were enriched for the SPI1 motif, and were
frequently co-occupied by SPI1, suggesting possible EBNA2
incorporation into super-enhancers (Zhao et al., 2011b).
EBNA2 ChIP-Seq signals were therefore tested for hallmarks
of super-enhancer formation (Whyte et al., 2013). Model-based
206 Cell Host & Microbe 17, 205–216, February 11, 2015 ª2015 Else
analysis of ChIP-Seq (MACS) identified 42,251 EBNA2 sites
with p < 10�5 (Zhang et al., 2008). Many EBNA2 sites were in
broad clusters, characteristic of super-enhancers. EBNA2 sites
within 12.5 kb windows were then merged into 16,133 EBNA2
clusters (Whyte et al., 2013) and ranked by their EBNA2 ChIP-
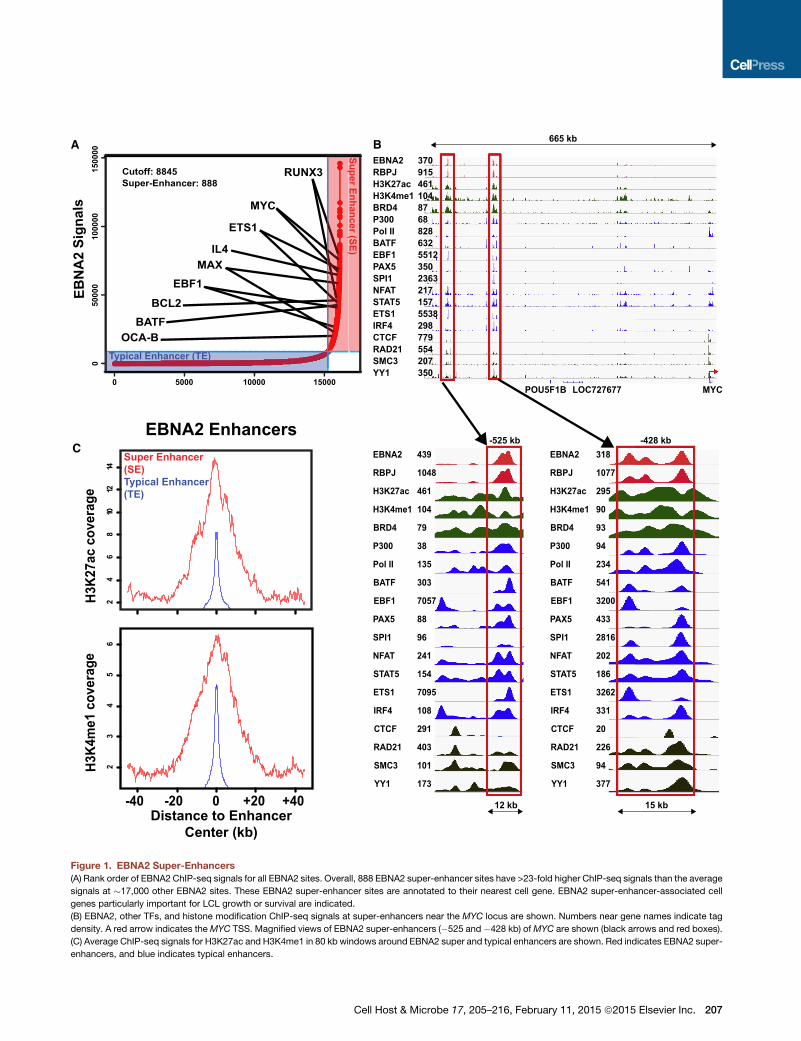
Seq signal. Interestingly, 888 (5.5%) of the EBNA2 sites had
ChIP-seq signals 23 times higher than typical EBNA2 sites and
were >4 kbwide (see Table S1 available online; Figure 1A). These
sites were therefore subsequently referred to as EBNA2 super-
enhancers.
As expected, most EBNA2 super-enhancers were not near
transcription start sites (TSSs) (Zhao et al., 2011b). We first as-
signed EBNA2 super-enhancers to their nearest genes (Whyte
et al., 2013). Chromatin conformation capture (3C) followed
by deep sequencing (Hi-C) captures long-range enhancer-pro-
moter interactions and defines genome topological association
domains (TADs) (Lieberman-Aiden et al., 2009). We tested our
EBNA2 super-enhancer-associated gene assignments using
high-resolution GM12878 LCL Hi-C data (Selvaraj et al., 2013).
Approximately 86%of EBNA2super-enhancers and their associ-
atedgenepairs occurredwithin the sameHi-CTAD, in agreement
with super-enhancers and their targeted genes frequently co-
occurring within CTCF/Cohesin domains (Dowen et al., 2014).
EBNA2 super-enhancers frequently localized near genes en-
coding relevant B cell TFs, including MYC, MAX, EBF, RUNX3,
ETS1, and BATF, as well as the B cell-specific coactivator
OCAB (Figure 1A). Many other cell TFs, including BATF, EBF,
ETS1, IRF4, SPI1, NFAT, STAT5, and PAX5, co-occupied
EBNA2 super-enhancer sites. RBPJ also had significant signals
at these sites. Cell TFs involved in chromatin looping, such as
CTCF, SMC3, and RAD21, were at adjacent sites (Figure 1B).
EBNA2 upregulation of MYC is essential for LCL growth (Fau-
mont et al., 2009). EBNA2 super-enhancers at ��525 kb and
�428 kb of the MYC TSS likely induce MYC expression (Alfieri
et al., 1991; Kaiser et al., 1999; Zhao et al., 2011b) (Figure 1B).
The �428 kb EBNA2 super-enhancer site loops to the MYC
TSS in an EBNA2-dependent manner by fluorescence in situ
hybridization (FISH) and 3C-qPCR (Zhao et al., 2011b). MYC
heterodimerizes with MAX to activate Cyclin D2 expression,
promote cell cycle entry, and enable LCL DNA replication. Two
EBNA2 super-enhancer sites also localized near MAX and likely
affect MAX expression (Figure 1A). EBNA2 also upregulates
RUNX3 expression and represses RUNX1 expression (Spender
et al., 1999).
The 888 EBNA2 super-enhancer sites (SE in Figure 1C) had
much higher H3K27ac andH3K4me1 signals than EBNA2 typical
enhancer (TE) sites, indicative of a higher transcription activation
state (Figure 1C).
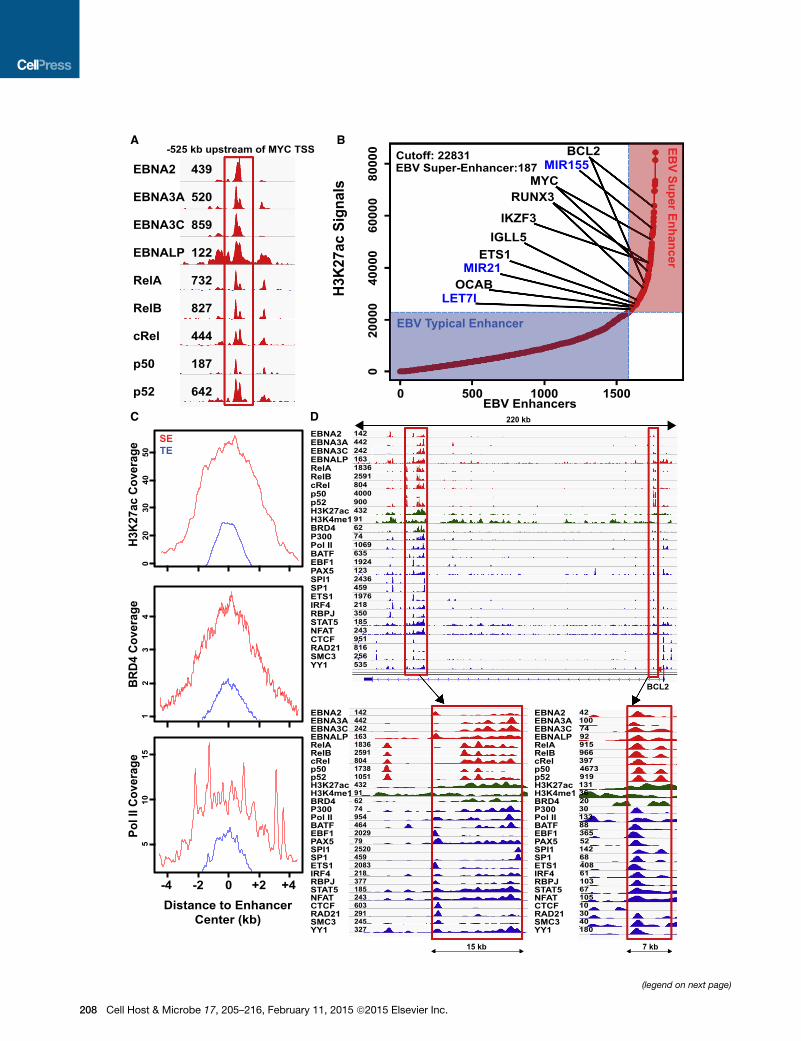
EBV Super-enhancersEBNA2 and EBNA3C colocalize at MYC enhancers, with RelA
and EBNALP (Jiang et al., 2014; Portal et al., 2013; Zhao et al.,
2011b, 2014). EBNA3A, RelB, cREL, p50, and p52 binding at
EBNA2 MYC super-enhancers was evaluated. Surprisingly, all
oncogenic EBNAs and NF-kB subunits were at the MYC
enhancer site (Figure 2A). We therefore searched for genome-
wide co-occurrences of all EBNAs and NF-kB subunits. In total,
1,771 sites had significant signals for all EBNAs and NF-kB sub-
units, and were therefore designated as EBV enhancers.
vier Inc.
EBNA2 Enhancers
EBNA2RBPJH3K27acH3K4me1BRD4P300Pol IIBATFEBF1PAX5SPI1NFATSTAT5ETS1IRF4CTCFRAD21SMC3YY1
3709154611048768828632551235023632171575538298779554207350
MYCPOU5F1B
-525 kb -428 kb
LOC727677
665 kbA B
C
24
68
1012
14
H3K2
7ac
cove
rage
23
45
6
H3K4
me1
cov
erag
e
RUNX3
MYC
ETS1
IL4MAX
EBF1
BCL2BATF
OCA-B
Cutoff: 8845Super-Enhancer: 888
EBN
A2
Sign
als
5000
010
0000
1500
000
0 5000 10000 15000
Super Enhancer (SE)Typical Enhancer(TE)
-40 -20 0 +20 +40Distance to Enhancer
Center (kb)
EBNA2
RBPJ
H3K27ac
H3K4me1
BRD4
P300
Pol II
BATF
EBF1
PAX5
SPI1
NFAT
STAT5
ETS1
IRF4
CTCF
RAD21
SMC3
YY1
439
1048
461
104
79
38
135
303
7057
88
96
241
154
7095
108
291
403
101
173
318
1077
295
90
93
94
234
541
3200
433
2816
202
186
3262
331
20
226
94
377
EBNA2
RBPJ
H3K27ac
H3K4me1
BRD4
P300
Pol II
BATF
EBF1
PAX5
SPI1
NFAT
STAT5
ETS1
IRF4
CTCF
RAD21
SMC3
YY1
12 kb 15 kb
Super Enhancer (SE)
Typical Enhancer (TE)
Figure 1. EBNA2 Super-Enhancers
(A) Rank order of EBNA2 ChIP-seq signals for all EBNA2 sites. Overall, 888 EBNA2 super-enhancer sites have >23-fold higher ChIP-seq signals than the average
signals at �17,000 other EBNA2 sites. These EBNA2 super-enhancer sites are annotated to their nearest cell gene. EBNA2 super-enhancer-associated cell
genes particularly important for LCL growth or survival are indicated.
(B) EBNA2, other TFs, and histone modification ChIP-seq signals at super-enhancers near the MYC locus are shown. Numbers near gene names indicate tag
density. A red arrow indicates theMYC TSS. Magnified views of EBNA2 super-enhancers (�525 and �428 kb) ofMYC are shown (black arrows and red boxes).
(C) Average ChIP-seq signals for H3K27ac and H3K4me1 in 80 kb windows around EBNA2 super and typical enhancers are shown. Red indicates EBNA2 super-
enhancers, and blue indicates typical enhancers.
Cell Host & Microbe 17, 205–216, February 11, 2015 ª2015 Elsevier Inc. 207
EBNA2-525 kb upstream of MYC TSS
EBNA3A
EBNA3C
EBNALP
RelA
RelB
cRel
p50
p52
439
520
859
122
732
827
444
187
642
BCL2MIR155
MYCRUNX3
IKZF3IGLL5
ETS1MIR21
OCABLET7I
Cutoff: 22831EBV Super-Enhancer:187
slangiSca72K3H
A B
42100749291596639746739191313620301338836552142684086110367105103040180
142442242163183625918041738105143291627495446420297925204592083218377185243603291245327
EBNA2EBNA3AEBNA3CEBNALPRelARelBcRelp50p52H3K27acH3K4me1BRD4P300Pol IIBATFEBF1PAX5SPI1
NFATSTAT5
ETS1IRF4
CTCFRAD21SMC3YY1
RBPJ
SP1
1424422421631836259180440009004329162741069635192412324364591976218350185243951816256535
BCL2
C D
2000
040
000
6000
080
000
0
0 500 1000 1500EBV Enhancers
egarevoCca72K3H
egar evoC4DRB
egar evoC II l oP50
4030
200
SETE
43
21
510
15
Distance to Enhancer Center (kb)
0 +2 +4-2-4
EBNA2EBNA3AEBNA3CEBNALPRelARelBcRelp50p52H3K27acH3K4me1BRD4P300Pol IIBATFEBF1PAX5SPI1
NFATSTAT5
ETS1IRF4
CTCFRAD21SMC3YY1
RBPJ
SP1
EBNA2EBNA3AEBNA3CEBNALPRelARelBcRelp50p52H3K27acH3K4me1BRD4P300Pol IIBATFEBF1PAX5SPI1
NFATSTAT5
ETS1IRF4
CTCFRAD21SMC3YY1
RBPJ
SP1
15 kb
220 kb
7 kb
EBV Typical Enhancer
EBV Super Enhancer
(legend on next page)
208 Cell Host & Microbe 17, 205–216, February 11, 2015 ª2015 Elsevier Inc.
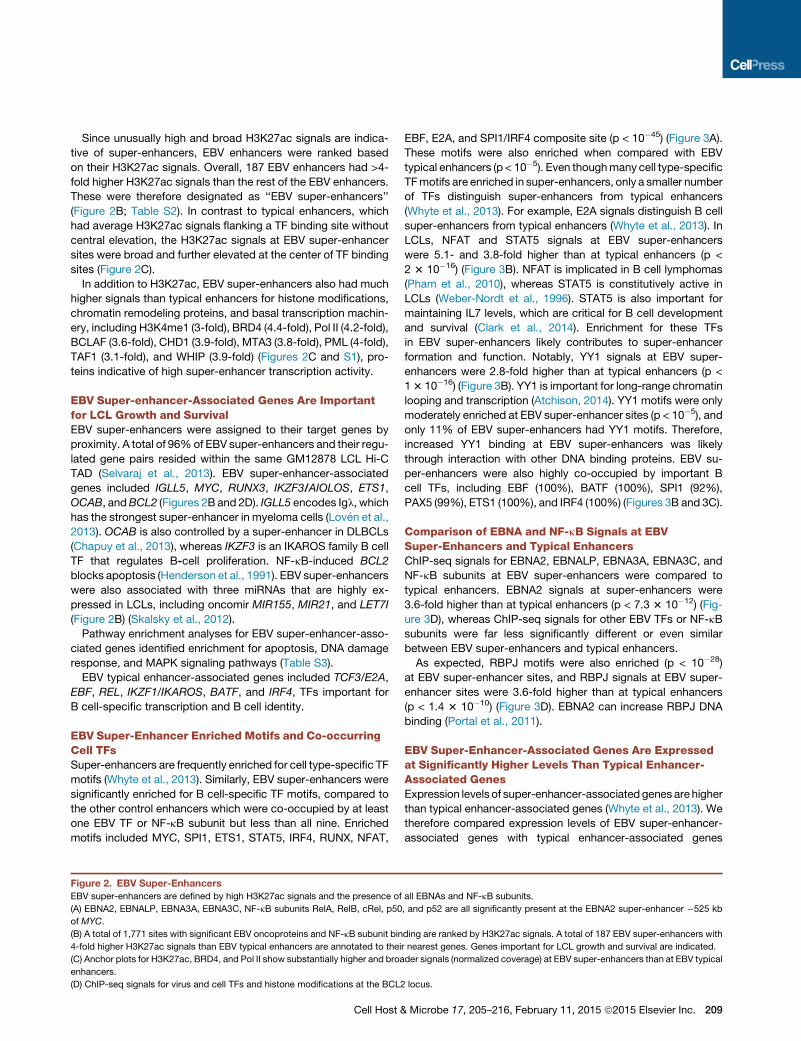
Since unusually high and broad H3K27ac signals are indica-
tive of super-enhancers, EBV enhancers were ranked based
on their H3K27ac signals. Overall, 187 EBV enhancers had >4-
fold higher H3K27ac signals than the rest of the EBV enhancers.
These were therefore designated as ‘‘EBV super-enhancers’’
(Figure 2B; Table S2). In contrast to typical enhancers, which
had average H3K27ac signals flanking a TF binding site without
central elevation, the H3K27ac signals at EBV super-enhancer
sites were broad and further elevated at the center of TF binding
sites (Figure 2C).
In addition to H3K27ac, EBV super-enhancers also had much
higher signals than typical enhancers for histone modifications,
chromatin remodeling proteins, and basal transcription machin-
ery, including H3K4me1 (3-fold), BRD4 (4.4-fold), Pol II (4.2-fold),
BCLAF (3.6-fold), CHD1 (3.9-fold), MTA3 (3.8-fold), PML (4-fold),
TAF1 (3.1-fold), and WHIP (3.9-fold) (Figures 2C and S1), pro-
teins indicative of high super-enhancer transcription activity.
EBV Super-enhancer-Associated Genes Are Importantfor LCL Growth and SurvivalEBV super-enhancers were assigned to their target genes by
proximity. A total of 96%of EBV super-enhancers and their regu-
lated gene pairs resided within the same GM12878 LCL Hi-C
TAD (Selvaraj et al., 2013). EBV super-enhancer-associated
genes included IGLL5, MYC, RUNX3, IKZF3/AIOLOS, ETS1,
OCAB, andBCL2 (Figures 2B and 2D). IGLL5 encodes Igl, which
has the strongest super-enhancer in myeloma cells (Loven et al.,
2013). OCAB is also controlled by a super-enhancer in DLBCLs
(Chapuy et al., 2013), whereas IKZF3 is an IKAROS family B cell
TF that regulates B-cell proliferation. NF-kB-induced BCL2
blocks apoptosis (Henderson et al., 1991). EBV super-enhancers
were also associated with three miRNAs that are highly ex-
pressed in LCLs, including oncomir MIR155, MIR21, and LET7I
(Figure 2B) (Skalsky et al., 2012).
Pathway enrichment analyses for EBV super-enhancer-asso-
ciated genes identified enrichment for apoptosis, DNA damage
response, and MAPK signaling pathways (Table S3).
EBV typical enhancer-associated genes included TCF3/E2A,
EBF, REL, IKZF1/IKAROS, BATF, and IRF4, TFs important for
B cell-specific transcription and B cell identity.
EBV Super-Enhancer Enriched Motifs and Co-occurringCell TFsSuper-enhancers are frequently enriched for cell type-specific TF
motifs (Whyte et al., 2013). Similarly, EBV super-enhancers were
significantly enriched for B cell-specific TF motifs, compared to
the other control enhancers which were co-occupied by at least
one EBV TF or NF-kB subunit but less than all nine. Enriched
motifs included MYC, SPI1, ETS1, STAT5, IRF4, RUNX, NFAT,
Figure 2. EBV Super-Enhancers
EBV super-enhancers are defined by high H3K27ac signals and the presence of
(A) EBNA2, EBNALP, EBNA3A, EBNA3C, NF-kB subunits RelA, RelB, cRel, p50
of MYC.
(B) A total of 1,771 sites with significant EBV oncoproteins and NF-kB subunit bin
4-fold higher H3K27ac signals than EBV typical enhancers are annotated to thei
(C) Anchor plots for H3K27ac, BRD4, and Pol II show substantially higher and broa
enhancers.
(D) ChIP-seq signals for virus and cell TFs and histone modifications at the BCL2
Cell Host &
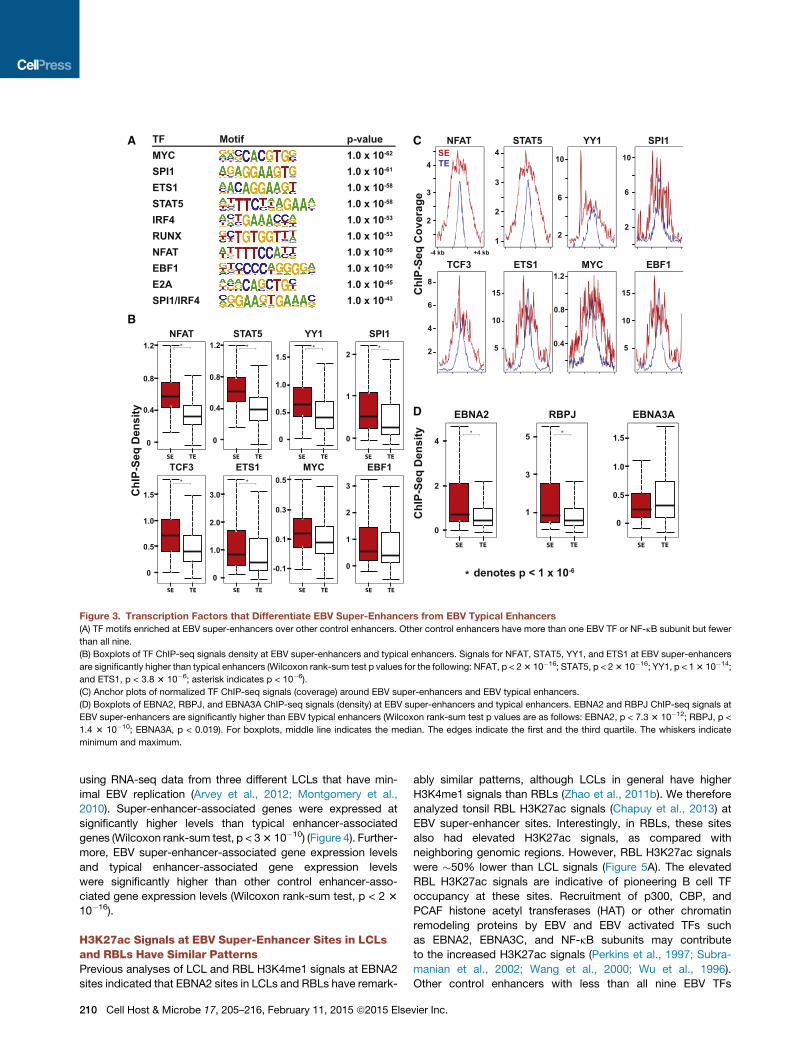
EBF, E2A, and SPI1/IRF4 composite site (p < 10�45) (Figure 3A).
These motifs were also enriched when compared with EBV
typical enhancers (p < 10�5). Even thoughmany cell type-specific
TFmotifs are enriched in super-enhancers, only a smaller number
of TFs distinguish super-enhancers from typical enhancers
(Whyte et al., 2013). For example, E2A signals distinguish B cell
super-enhancers from typical enhancers (Whyte et al., 2013). In
LCLs, NFAT and STAT5 signals at EBV super-enhancers
were 5.1- and 3.8-fold higher than at typical enhancers (p <
2 3 10�16) (Figure 3B). NFAT is implicated in B cell lymphomas
(Pham et al., 2010), whereas STAT5 is constitutively active in
LCLs (Weber-Nordt et al., 1996). STAT5 is also important for
maintaining IL7 levels, which are critical for B cell development
and survival (Clark et al., 2014). Enrichment for these TFs
in EBV super-enhancers likely contributes to super-enhancer
formation and function. Notably, YY1 signals at EBV super-
enhancers were 2.8-fold higher than at typical enhancers (p <
13 10�16) (Figure 3B). YY1 is important for long-range chromatin
looping and transcription (Atchison, 2014). YY1 motifs were only
moderately enriched at EBV super-enhancer sites (p < 10�5), and
only 11% of EBV super-enhancers had YY1 motifs. Therefore,
increased YY1 binding at EBV super-enhancers was likely
through interaction with other DNA binding proteins. EBV su-
per-enhancers were also highly co-occupied by important B
cell TFs, including EBF (100%), BATF (100%), SPI1 (92%),
PAX5 (99%), ETS1 (100%), and IRF4 (100%) (Figures 3B and 3C).
Comparison of EBNA and NF-kB Signals at EBVSuper-Enhancers and Typical EnhancersChIP-seq signals for EBNA2, EBNALP, EBNA3A, EBNA3C, and
NF-kB subunits at EBV super-enhancers were compared to
typical enhancers. EBNA2 signals at super-enhancers were
3.6-fold higher than at typical enhancers (p < 7.3 3 10�12) (Fig-
ure 3D), whereas ChIP-seq signals for other EBV TFs or NF-kB
subunits were far less significantly different or even similar
between EBV super-enhancers and typical enhancers.
As expected, RBPJ motifs were also enriched (p < 10�28)
at EBV super-enhancer sites, and RBPJ signals at EBV super-
enhancer sites were 3.6-fold higher than at typical enhancers
(p < 1.4 3 10�10) (Figure 3D). EBNA2 can increase RBPJ DNA
binding (Portal et al., 2011).
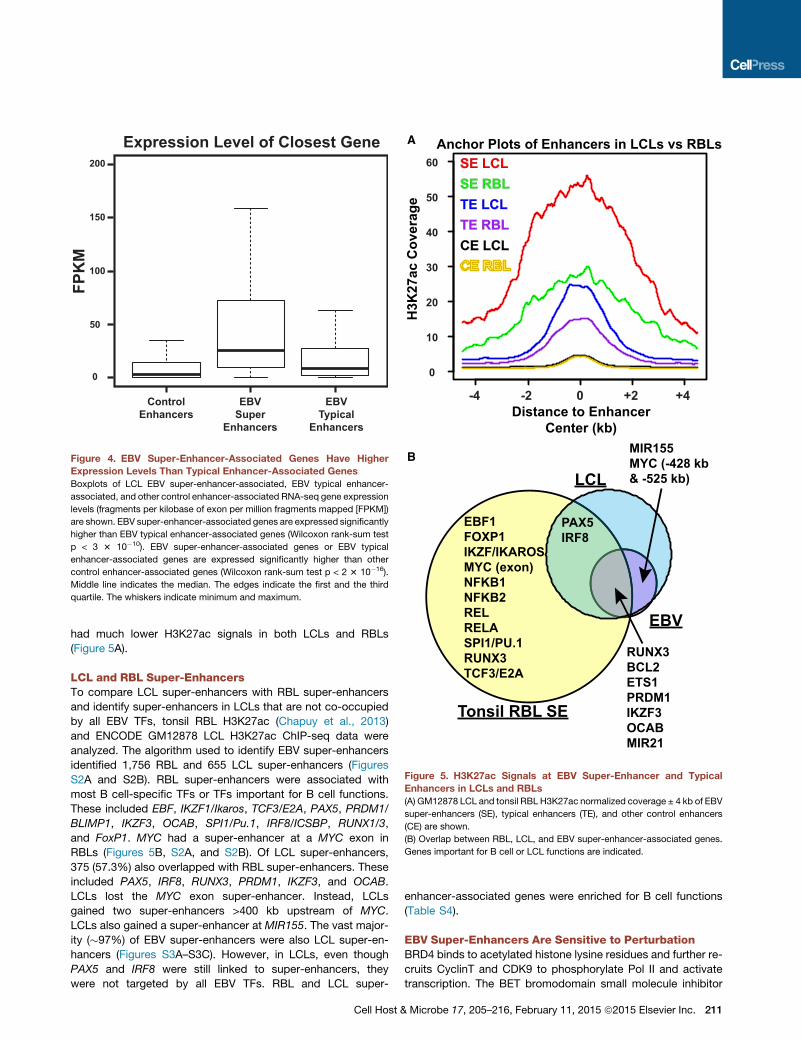
EBV Super-Enhancer-Associated Genes Are Expressedat Significantly Higher Levels Than Typical Enhancer-Associated GenesExpression levels of super-enhancer-associatedgenes arehigher
than typical enhancer-associated genes (Whyte et al., 2013). We
therefore compared expression levels of EBV super-enhancer-
associated genes with typical enhancer-associated genes
all EBNAs and NF-kB subunits.
, and p52 are all significantly present at the EBNA2 super-enhancer �525 kb
ding are ranked by H3K27ac signals. A total of 187 EBV super-enhancers with
r nearest genes. Genes important for LCL growth and survival are indicated.
der signals (normalized coverage) at EBV super-enhancers than at EBV typical
locus.
Microbe 17, 205–216, February 11, 2015 ª2015 Elsevier Inc. 209
NFAT STAT5 YY1 SPI1
TCF3 ETS1 MYC EBF1
1.2
0.8
0.4
0
1.2
0.8
0.4
0 0
0.5
1.0
1.5
0
1
2
0
0.5
1.0
0
1.0
2.0
-0.1 0
1
2
3
0.1
0.3
0.5
3.01.5
NFAT STAT5 YY1 SPI1
TCF3 ETS1 MYC EBF1
4
3
2
4
3
2
12
6
10
2
6
10
2
4
6
815
10
5 0.4 5
10
15
0.8
1.2
SETE
TF Motif p-valueMYCSPI1ETS1STAT5IRF4RUNXNFATEBF1E2ASPI1/IRF4
1.0 x 10-62
1.0 x 10-61
1.0 x 10-58
1.0 x 10-58
1.0 x 10-53
1.0 x 10-53
1.0 x 10-50
1.0 x 10-50
1.0 x 10-45
1.0 x 10-43
-4 kb +4 kb
EBNA2
4
2
0
RBPJ
5
3
1
EBNA3A
1.5
1.0
0
0.5
D
C
B
AC
hIP-
Seq
Den
sity
ChI
P-Se
q C
over
age
ChI
P-Se
q D
ensi
ty
*
*
* *
*
*
* * *
denotes p < 1 x 10⁻⁶
Figure 3. Transcription Factors that Differentiate EBV Super-Enhancers from EBV Typical Enhancers
(A) TF motifs enriched at EBV super-enhancers over other control enhancers. Other control enhancers have more than one EBV TF or NF-kB subunit but fewer
than all nine.
(B) Boxplots of TF ChIP-seq signals density at EBV super-enhancers and typical enhancers. Signals for NFAT, STAT5, YY1, and ETS1 at EBV super-enhancers
are significantly higher than typical enhancers (Wilcoxon rank-sum test p values for the following: NFAT, p < 23 10�16; STAT5, p < 23 10�16; YY1, p < 13 10�14;
and ETS1, p < 3.8 3 10�6; asterisk indicates p < 10�6).
(C) Anchor plots of normalized TF ChIP-seq signals (coverage) around EBV super-enhancers and EBV typical enhancers.
(D) Boxplots of EBNA2, RBPJ, and EBNA3A ChIP-seq signals (density) at EBV super-enhancers and typical enhancers. EBNA2 and RBPJ ChIP-seq signals at
EBV super-enhancers are significantly higher than EBV typical enhancers (Wilcoxon rank-sum test p values are as follows: EBNA2, p < 7.3 3 10�12; RBPJ, p <
1.4 3 10�10; EBNA3A, p < 0.019). For boxplots, middle line indicates the median. The edges indicate the first and the third quartile. The whiskers indicate
minimum and maximum.
using RNA-seq data from three different LCLs that have min-
imal EBV replication (Arvey et al., 2012; Montgomery et al.,
2010). Super-enhancer-associated genes were expressed at
significantly higher levels than typical enhancer-associated
genes (Wilcoxon rank-sum test, p < 33 10�10) (Figure 4). Further-
more, EBV super-enhancer-associated gene expression levels
and typical enhancer-associated gene expression levels
were significantly higher than other control enhancer-asso-
ciated gene expression levels (Wilcoxon rank-sum test, p < 2 3
10�16).
H3K27ac Signals at EBV Super-Enhancer Sites in LCLsand RBLs Have Similar PatternsPrevious analyses of LCL and RBL H3K4me1 signals at EBNA2
sites indicated that EBNA2 sites in LCLs and RBLs have remark-
210 Cell Host & Microbe 17, 205–216, February 11, 2015 ª2015 Else
ably similar patterns, although LCLs in general have higher
H3K4me1 signals than RBLs (Zhao et al., 2011b). We therefore
analyzed tonsil RBL H3K27ac signals (Chapuy et al., 2013) at
EBV super-enhancer sites. Interestingly, in RBLs, these sites
also had elevated H3K27ac signals, as compared with
neighboring genomic regions. However, RBL H3K27ac signals
were �50% lower than LCL signals (Figure 5A). The elevated
RBL H3K27ac signals are indicative of pioneering B cell TF
occupancy at these sites. Recruitment of p300, CBP, and
PCAF histone acetyl transferases (HAT) or other chromatin
remodeling proteins by EBV and EBV activated TFs such
as EBNA2, EBNA3C, and NF-kB subunits may contribute
to the increased H3K27ac signals (Perkins et al., 1997; Subra-
manian et al., 2002; Wang et al., 2000; Wu et al., 1996).
Other control enhancers with less than all nine EBV TFs
vier Inc.
0
50
100
150
200
FPK
M
ControlEnhancers
EBVSuper
Enhancers
EBVTypical
Enhancers
Expression Level of Closest Gene
Figure 4. EBV Super-Enhancer-Associated Genes Have Higher
Expression Levels Than Typical Enhancer-Associated Genes
Boxplots of LCL EBV super-enhancer-associated, EBV typical enhancer-
associated, and other control enhancer-associated RNA-seq gene expression
levels (fragments per kilobase of exon per million fragments mapped [FPKM])
are shown. EBV super-enhancer-associated genes are expressed significantly
higher than EBV typical enhancer-associated genes (Wilcoxon rank-sum test
p < 3 3 10�10). EBV super-enhancer-associated genes or EBV typical
enhancer-associated genes are expressed significantly higher than other
control enhancer-associated genes (Wilcoxon rank-sum test p < 2 3 10�16).
Middle line indicates the median. The edges indicate the first and the third
quartile. The whiskers indicate minimum and maximum.
Anchor Plots of Enhancers in LCLs vs RBLs
Tonsil RBL SE
EBV
LCL
PAX5IRF8
EBF1FOXP1IKZF/IKAROSMYC (exon)NFKB1NFKB2RELRELASPI1/PU.1RUNX3TCF3/E2A
MIR155MYC (-428 kb & -525 kb)
RUNX3BCL2ETS1PRDM1IKZF3OCABMIR21
H3K
27ac
Cov
erag
e 50
60
40
30
20
10
0
Distance to Enhancer Center (kb)
0 +2 +4-2-4
SE LCLSE RBLTE LCLTE RBLCE LCL
A
B
Figure 5. H3K27ac Signals at EBV Super-Enhancer and Typical
Enhancers in LCLs and RBLs
(A) GM12878 LCL and tonsil RBL H3K27ac normalized coverage ± 4 kb of EBV
super-enhancers (SE), typical enhancers (TE), and other control enhancers
(CE) are shown.
(B) Overlap between RBL, LCL, and EBV super-enhancer-associated genes.
Genes important for B cell or LCL functions are indicated.
had much lower H3K27ac signals in both LCLs and RBLs
(Figure 5A).
LCL and RBL Super-EnhancersTo compare LCL super-enhancers with RBL super-enhancers
and identify super-enhancers in LCLs that are not co-occupied
by all EBV TFs, tonsil RBL H3K27ac (Chapuy et al., 2013)
and ENCODE GM12878 LCL H3K27ac ChIP-seq data were
analyzed. The algorithm used to identify EBV super-enhancers
identified 1,756 RBL and 655 LCL super-enhancers (Figures
S2A and S2B). RBL super-enhancers were associated with
most B cell-specific TFs or TFs important for B cell functions.
These included EBF, IKZF1/Ikaros, TCF3/E2A, PAX5, PRDM1/
BLIMP1, IKZF3, OCAB, SPI1/Pu.1, IRF8/ICSBP, RUNX1/3,
and FoxP1. MYC had a super-enhancer at a MYC exon in
RBLs (Figures 5B, S2A, and S2B). Of LCL super-enhancers,
375 (57.3%) also overlapped with RBL super-enhancers. These
included PAX5, IRF8, RUNX3, PRDM1, IKZF3, and OCAB.
LCLs lost the MYC exon super-enhancer. Instead, LCLs
gained two super-enhancers >400 kb upstream of MYC.
LCLs also gained a super-enhancer at MIR155. The vast major-
ity (�97%) of EBV super-enhancers were also LCL super-en-
hancers (Figures S3A–S3C). However, in LCLs, even though
PAX5 and IRF8 were still linked to super-enhancers, they
were not targeted by all EBV TFs. RBL and LCL super-
Cell Host &
enhancer-associated genes were enriched for B cell functions
(Table S4).
EBV Super-Enhancers Are Sensitive to PerturbationBRD4 binds to acetylated histone lysine residues and further re-
cruits CyclinT and CDK9 to phosphorylate Pol II and activate
transcription. The BET bromodomain small molecule inhibitor
Microbe 17, 205–216, February 11, 2015 ª2015 Elsevier Inc. 211
mR
NA
1
0DMSO JQ1
MYC
mR
NA
1
0
H3K
27ac
1
0
mR
NA
1
0E2+ E2-
MYC
κBhi
BCL2κBlo κBhi κBhiκBlo κBlo
RUNX MIR155
A B
C
D
DMSO D1
DMSO D3
JQ1 D1
JQ1 D3
EBNA2EBNA3AEBNA3CEBNALPRelARelBcRelp50p52H3K27acH3K4me1BRD4P300Pol IIBATFEBF1PAX5SPI1
NFATSTAT5
ETS1IRF4
CTCFRAD21SMC3YY1
RBPJ
SP1
35211588210564126163220089632713911519893794943811827952824415223706176134429261139317
H3K
27ac
1
0
108 kb 25 kb 20 kb
CFSE Staining
κBhi
BCL2κBlo κBhi κBhiκBlo κBlo
RUNX MIR155
E2+ E2-MIR21
E2+ E2-MYC
E2+ E2-MIR21
1154761292751875375911229820262587088556218456569411914916319911339310
253632901404174744652737712473140265771215606733307462667861146214220814373387
MIR21RUNX3 MIR155
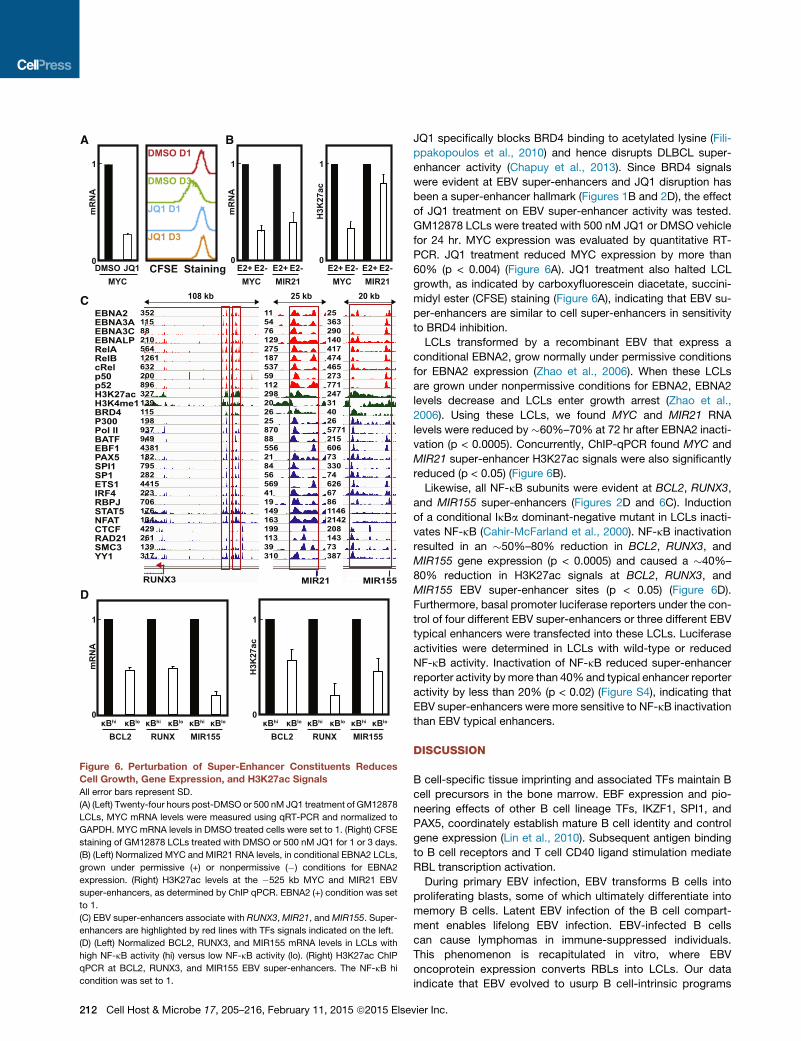
Figure 6. Perturbation of Super-Enhancer Constituents Reduces
Cell Growth, Gene Expression, and H3K27ac Signals
All error bars represent SD.
(A) (Left) Twenty-four hours post-DMSO or 500 nM JQ1 treatment of GM12878
LCLs, MYC mRNA levels were measured using qRT-PCR and normalized to
GAPDH. MYC mRNA levels in DMSO treated cells were set to 1. (Right) CFSE
staining of GM12878 LCLs treated with DMSO or 500 nM JQ1 for 1 or 3 days.
(B) (Left) Normalized MYC and MIR21 RNA levels, in conditional EBNA2 LCLs,
grown under permissive (+) or nonpermissive (�) conditions for EBNA2
expression. (Right) H3K27ac levels at the �525 kb MYC and MIR21 EBV
super-enhancers, as determined by ChIP qPCR. EBNA2 (+) condition was set
to 1.
(C) EBV super-enhancers associate with RUNX3,MIR21, andMIR155. Super-
enhancers are highlighted by red lines with TFs signals indicated on the left.
(D) (Left) Normalized BCL2, RUNX3, and MIR155 mRNA levels in LCLs with
high NF-kB activity (hi) versus low NF-kB activity (lo). (Right) H3K27ac ChIP
qPCR at BCL2, RUNX3, and MIR155 EBV super-enhancers. The NF-kB hi
condition was set to 1.
212 Cell Host & Microbe 17, 205–216, February 11, 2015 ª2015 Else
JQ1 specifically blocks BRD4 binding to acetylated lysine (Fili-
ppakopoulos et al., 2010) and hence disrupts DLBCL super-
enhancer activity (Chapuy et al., 2013). Since BRD4 signals
were evident at EBV super-enhancers and JQ1 disruption has
been a super-enhancer hallmark (Figures 1B and 2D), the effect
of JQ1 treatment on EBV super-enhancer activity was tested.
GM12878 LCLs were treated with 500 nM JQ1 or DMSO vehicle
for 24 hr. MYC expression was evaluated by quantitative RT-
PCR. JQ1 treatment reduced MYC expression by more than
60% (p < 0.004) (Figure 6A). JQ1 treatment also halted LCL
growth, as indicated by carboxyfluorescein diacetate, succini-
midyl ester (CFSE) staining (Figure 6A), indicating that EBV su-
per-enhancers are similar to cell super-enhancers in sensitivity
to BRD4 inhibition.
LCLs transformed by a recombinant EBV that express a
conditional EBNA2, grow normally under permissive conditions
for EBNA2 expression (Zhao et al., 2006). When these LCLs
are grown under nonpermissive conditions for EBNA2, EBNA2
levels decrease and LCLs enter growth arrest (Zhao et al.,
2006). Using these LCLs, we found MYC and MIR21 RNA
levels were reduced by �60%–70% at 72 hr after EBNA2 inacti-
vation (p < 0.0005). Concurrently, ChIP-qPCR found MYC and
MIR21 super-enhancer H3K27ac signals were also significantly
reduced (p < 0.05) (Figure 6B).
Likewise, all NF-kB subunits were evident at BCL2, RUNX3,
and MIR155 super-enhancers (Figures 2D and 6C). Induction
of a conditional IkBa dominant-negative mutant in LCLs inacti-
vates NF-kB (Cahir-McFarland et al., 2000). NF-kB inactivation
resulted in an �50%–80% reduction in BCL2, RUNX3, and
MIR155 gene expression (p < 0.0005) and caused a �40%–
80% reduction in H3K27ac signals at BCL2, RUNX3, and
MIR155 EBV super-enhancer sites (p < 0.05) (Figure 6D).
Furthermore, basal promoter luciferase reporters under the con-
trol of four different EBV super-enhancers or three different EBV
typical enhancers were transfected into these LCLs. Luciferase
activities were determined in LCLs with wild-type or reduced
NF-kB activity. Inactivation of NF-kB reduced super-enhancer
reporter activity bymore than 40%and typical enhancer reporter
activity by less than 20% (p < 0.02) (Figure S4), indicating that
EBV super-enhancers were more sensitive to NF-kB inactivation
than EBV typical enhancers.
DISCUSSION
B cell-specific tissue imprinting and associated TFs maintain B
cell precursors in the bone marrow. EBF expression and pio-
neering effects of other B cell lineage TFs, IKZF1, SPI1, and
PAX5, coordinately establish mature B cell identity and control
gene expression (Lin et al., 2010). Subsequent antigen binding
to B cell receptors and T cell CD40 ligand stimulation mediate
RBL transcription activation.
During primary EBV infection, EBV transforms B cells into
proliferating blasts, some of which ultimately differentiate into
memory B cells. Latent EBV infection of the B cell compart-
ment enables lifelong EBV infection. EBV-infected B cells
can cause lymphomas in immune-suppressed individuals.
This phenomenon is recapitulated in vitro, where EBV
oncoprotein expression converts RBLs into LCLs. Our data
indicate that EBV evolved to usurp B cell-intrinsic programs
vier Inc.
H3K27acSignal
Activated EBV Super Enhancers
H3K27acSignal
Primed B CellEnhancers
Primed B CellEnhancers
H3K27acSignal
EBV TF
Enhancer Element
EBV Virus
EBV Episome
Cell TF
Resting B Cells
Lymphoblastoid Cells
EBV Infection &
Immortalization
mRNA
NFATSTAT5NFκB
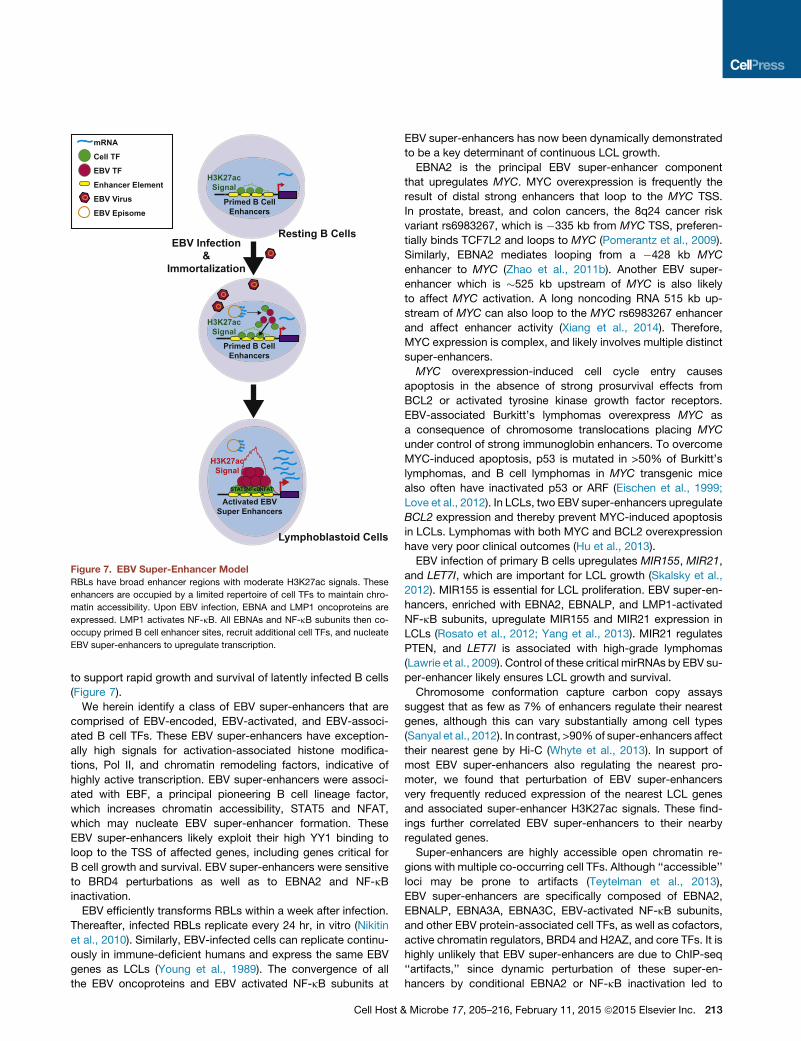
Figure 7. EBV Super-Enhancer Model
RBLs have broad enhancer regions with moderate H3K27ac signals. These
enhancers are occupied by a limited repertoire of cell TFs to maintain chro-
matin accessibility. Upon EBV infection, EBNA and LMP1 oncoproteins are
expressed. LMP1 activates NF-kB. All EBNAs and NF-kB subunits then co-
occupy primed B cell enhancer sites, recruit additional cell TFs, and nucleate
EBV super-enhancers to upregulate transcription.
to support rapid growth and survival of latently infected B cells
(Figure 7).
We herein identify a class of EBV super-enhancers that are
comprised of EBV-encoded, EBV-activated, and EBV-associ-
ated B cell TFs. These EBV super-enhancers have exception-
ally high signals for activation-associated histone modifica-
tions, Pol II, and chromatin remodeling factors, indicative of
highly active transcription. EBV super-enhancers were associ-
ated with EBF, a principal pioneering B cell lineage factor,
which increases chromatin accessibility, STAT5 and NFAT,
which may nucleate EBV super-enhancer formation. These
EBV super-enhancers likely exploit their high YY1 binding to
loop to the TSS of affected genes, including genes critical for
B cell growth and survival. EBV super-enhancers were sensitive
to BRD4 perturbations as well as to EBNA2 and NF-kB
inactivation.
EBV efficiently transforms RBLs within a week after infection.
Thereafter, infected RBLs replicate every 24 hr, in vitro (Nikitin
et al., 2010). Similarly, EBV-infected cells can replicate continu-
ously in immune-deficient humans and express the same EBV
genes as LCLs (Young et al., 1989). The convergence of all
the EBV oncoproteins and EBV activated NF-kB subunits at
Cell Host &
EBV super-enhancers has now been dynamically demonstrated
to be a key determinant of continuous LCL growth.
EBNA2 is the principal EBV super-enhancer component
that upregulates MYC. MYC overexpression is frequently the
result of distal strong enhancers that loop to the MYC TSS.
In prostate, breast, and colon cancers, the 8q24 cancer risk
variant rs6983267, which is �335 kb from MYC TSS, preferen-
tially binds TCF7L2 and loops to MYC (Pomerantz et al., 2009).
Similarly, EBNA2 mediates looping from a �428 kb MYC
enhancer to MYC (Zhao et al., 2011b). Another EBV super-
enhancer which is �525 kb upstream of MYC is also likely
to affect MYC activation. A long noncoding RNA 515 kb up-
stream of MYC can also loop to the MYC rs6983267 enhancer
and affect enhancer activity (Xiang et al., 2014). Therefore,
MYC expression is complex, and likely involves multiple distinct
super-enhancers.
MYC overexpression-induced cell cycle entry causes
apoptosis in the absence of strong prosurvival effects from
BCL2 or activated tyrosine kinase growth factor receptors.
EBV-associated Burkitt’s lymphomas overexpress MYC as
a consequence of chromosome translocations placing MYC
under control of strong immunoglobin enhancers. To overcome
MYC-induced apoptosis, p53 is mutated in >50% of Burkitt’s
lymphomas, and B cell lymphomas in MYC transgenic mice
also often have inactivated p53 or ARF (Eischen et al., 1999;
Love et al., 2012). In LCLs, two EBV super-enhancers upregulate
BCL2 expression and thereby prevent MYC-induced apoptosis
in LCLs. Lymphomas with both MYC and BCL2 overexpression
have very poor clinical outcomes (Hu et al., 2013).
EBV infection of primary B cells upregulates MIR155, MIR21,
and LET7I, which are important for LCL growth (Skalsky et al.,
2012). MIR155 is essential for LCL proliferation. EBV super-en-
hancers, enriched with EBNA2, EBNALP, and LMP1-activated
NF-kB subunits, upregulate MIR155 and MIR21 expression in
LCLs (Rosato et al., 2012; Yang et al., 2013). MIR21 regulates
PTEN, and LET7I is associated with high-grade lymphomas
(Lawrie et al., 2009). Control of these critical mirRNAs by EBV su-
per-enhancer likely ensures LCL growth and survival.
Chromosome conformation capture carbon copy assays
suggest that as few as 7% of enhancers regulate their nearest
genes, although this can vary substantially among cell types
(Sanyal et al., 2012). In contrast, >90%of super-enhancers affect
their nearest gene by Hi-C (Whyte et al., 2013). In support of
most EBV super-enhancers also regulating the nearest pro-
moter, we found that perturbation of EBV super-enhancers
very frequently reduced expression of the nearest LCL genes
and associated super-enhancer H3K27ac signals. These find-
ings further correlated EBV super-enhancers to their nearby
regulated genes.
Super-enhancers are highly accessible open chromatin re-
gions with multiple co-occurring cell TFs. Although ‘‘accessible’’
loci may be prone to artifacts (Teytelman et al., 2013),
EBV super-enhancers are specifically composed of EBNA2,
EBNALP, EBNA3A, EBNA3C, EBV-activated NF-kB subunits,
and other EBV protein-associated cell TFs, as well as cofactors,
active chromatin regulators, BRD4 and H2AZ, and core TFs. It is
highly unlikely that EBV super-enhancers are due to ChIP-seq
‘‘artifacts,’’ since dynamic perturbation of these super-en-
hancers by conditional EBNA2 or NF-kB inactivation led to
Microbe 17, 205–216, February 11, 2015 ª2015 Elsevier Inc. 213
downregulation of EBV super-enhancer-associated genes and
cessation of cell growth. Furthermore, EBV super-enhancers
are functionally relevant to LCL biology.
EBNA2 inactivation substantially decreased MYC expression,
but had surprisingly little effect on BCL2 expression, whereas
NF-kB inactivation had a dramatic effect on BCL2 expression
and small effect on MYC expression, confirming that MYC and
BCL2 are differentially affected by EBNA2 and NF-kB, respec-
tively. Increased activities from other EBV super-enhancer con-
stituents are likely to compensate for the deficiency. Thus, the
co-occurrence of other EBV TFs and NF-kB subunits at MYC
and BCL2 may be indicative of an underlying, fail-safe transcrip-
tion mechanism that assures proliferation and survival.
Like other super-enhancers (Loven et al., 2013), EBV super-
enhancers were sensitive to perturbations. JQ1 inhibition
decreased super-enhancer-associated transcription more than
typical enhancer-associated transcription (Chapuy et al., 2013;
Loven et al., 2013). As reflected in BRD4 inhibition and EBNA2
and NF-kB inactivation, EBV super-enhancers were sensitive
to perturbation. These data indicate that EBV super-enhancer
disruption may be effective in controlling EBV-transformed cell
growth.
EXPERIMENTAL PROCEDURES
Sequencing Data Alignment
All ChIP-Seq reads were mapped to hg19 using Bowtie (version 0.12.9). Align-
ments were done with parameters: -S -t -p 1 -k 1 -m 1.
Identifying ChIP-Seq-Enriched Regions
MACS (1.4.2) was used to identify ChIP-seq TF binding sites. Default param-
eters were used with the exception of ‘‘to-large,’’ which was set due to low
sequencing depth of older ChIP-seq data sets.
Motif Enrichment
HOMER (4.4) ‘‘findMotifsGenome.pl’’ was used to identify enriched motifs
(Heinz et al., 2010) with ‘‘other control enhancers’’ set as background.
Identification of Overlapping Binding Sites
HOMER ‘‘MergePeak’’ was used to identify the co-occurrence of binding sites
(default parameters). If there was an overlap between the start and end coor-
dinates of both enhancer regions, these enhancers were considered
‘‘overlapping.’’
Definition of EBV Enhancers
EBV enhancers were defined by the colocalization of four EBNAs and five NF-
kB subunits. Binding sites of these transcription factors were identified by
MACS. ‘‘Other control enhancers’’ were defined by the presence of at least
one, but less than all nine, TFs.
Identifying EBV Super-Enhancers and EBNA2 Super-Enhancers
To identify EBV super-enhancers, all EBV enhancers were ranked according to
their total background-subtracted H3K27ac ChIP-seq signal. EBV enhancers
were sorted and plotted based on H3K27ac signals in ascending order. The
x axis shows H3K27ac ChIP-seq signals’ rank order; the y axis shows normal-
ized H3K27ac signals. A line was drawn from the first enhancer with lowest
signal to the last enhancerwith the highest signal to determine adiagonal slope.
A point on the ranked plot with a tangent line identical to the diagonal slopewas
identified. This x axis point was set as the cutoff to distinguish EBV super-en-
hancers fromEBV typical enhancers. TheEBVenhancerswithH3K27acsignals
higher than this point were assigned as EBV super-enhancers.
EBNA2 super-enhancers were identified as described above using EBNA2
ChIP-seq signals. EBNA2 binding sites within 12.5 kb were stitched together
as previously described (Whyte et al., 2013).
214 Cell Host & Microbe 17, 205–216, February 11, 2015 ª2015 Else
Hi-C Validation of Super-Enhancer, and Associated Gene
Assignment
GM12878 LCL Hi-C topological association domains (generated by Bing Ren
Lab) (Selvaraj et al., 2013) were used to validate the assignment of super-
enhancer and associated gene pairs. Correct assignments were scored based
on the co-occurrence of a super-enhancer and its associated gene within the
same TAD.
Anchor Plots
Anchor plots show the distribution of TFs and histone modification ChIP-
Seq signals at various binding sites, as previously described (Portal et al.,
2013).
Gene Expression Analysis
EBV super-enhancer-, EBV typical enhancer-, and EBV other control
enhancer-associated gene expression was determined using LCL RNA-seq
data. The average gene expression level (FPKM) was calculated with three
LCLs (NA06985, NA07000, and NA07347). RNA-seq data from these three
LCLs were chosen because they had the least amount of EBV late gene
expression. Boxplots were drawn using R, and the statistical significance of
the difference between each two pairs of the three groups was determined
using the Wilcoxon signed-rank test.
Pathway Enrichment Analysis
The enriched pathways of super-enhancer-associated genes were identified
using the ‘‘Identify Pathways’’ function of the IntPath database (Zhou et al.,
2012) and DAVID database (Huang et al., 2008).
Reporter Assays
Four EBV super-enhancer and three typical enhancer sequences were
PCR amplified and cloned into pGL3 promoter luciferase reporter vectors
(Promega). A total of 20 mg of control or enhancer luciferase vectors,
together with 2 mg of Renilla expression vector, was electroporated
(Gene Pulser II, Bio-Rad), into 7 3 106 LCLs containing an inducible
IkBa mutant. Electroporated cells were split into permissive or nonpermis-
sive conditions for mutant IkBa expression and grown for 48 hr. Dual lucif-
erase/Renilla assays were done following the manufacturer’s directions
(Promega).
ACCESSION NUMBERS
BRD4 ChIP-seq data have been deposited to the Gene Expression Omnibus
under accession number GSE62912.
SUPPLEMENTAL INFORMATION
Supplemental Information includes four figures and four tables and can be
found with this article at http://dx.doi.org/10.1016/j.chom.2014.12.013.
AUTHOR CONTRIBUTIONS
B.Z. and E.K. designed the study; B.Z. and E.K. supervised research; B.Z.,
S.C.S.S., S.J., B.W., K.B., B.E.G., and J.L. performed experiments; E.C.J.
and P.K., provided new reagents; H.Z. performed the computational analysis;
H.Z. and S.J. prepared figures and tables; and B.Z., H.Z., S.C.S.S., S.J.,
B.E.G., and E.K. wrote the manuscript.
ACKNOWLEDGMENTS
We thank Brian J. Abraham, Ellen Cahir-McFarland, Hongfang Wang, Shirley
Liu, and Tao Liu for helpful discussions. We thank Bing Ren and Anthony
Schmitt for the GM12878 Hi-C TAD data set. We thank Jay Bradner for the
JQ1 compound. We thank Amy Holthaus and Amy Zheng for technical
assistance. E.K. was supported by R01CA047006, R01CA170023, and
R01CA085180 from the National Cancer Institute. B.E.G. was supported by
a Burroughs Wellcome Medical Scientist career award and K08CA140780.
E.C.J. was supported by R01DE023939 from NIDCR.
vier Inc.
Received: June 11, 2014
Revised: October 16, 2014
Accepted: November 15, 2014
Published: January 29, 2015
REFERENCES
Alfieri, C., Birkenbach, M., and Kieff, E. (1991). Early events in Epstein-Barr vi-
rus infection of human B lymphocytes. Virology 181, 595–608.
Arvey, A., Tempera, I., Tsai, K., Chen, H.S., Tikhmyanova, N., Klichinsky, M.,
Leslie, C., and Lieberman, P.M. (2012). An atlas of the Epstein-Barr virus tran-
scriptome and epigenome reveals host-virus regulatory interactions. Cell Host
Microbe 12, 233–245.
Atchison, M.L. (2014). Function of YY1 in long-distance DNA interactions.
Front. Immunol. 5, 45.
Brown, J.D., Lin, C.Y., Duan, Q., Griffin, G., Federation, A.J., Paranal, R.M.,
Bair, S., Newton, G., Lichtman, A.H., Kung, A.L., et al. (2014). NF-kB directs
dynamic super enhancer formation in inflammation and atherogenesis. Mol.
Cell 56, 219–231.
Cahir-McFarland, E.D., Davidson, D.M., Schauer, S.L., Duong, J., and Kieff, E.
(2000). NF-kappa B inhibition causes spontaneous apoptosis in Epstein-Barr
virus-transformed lymphoblastoid cells. Proc. Natl. Acad. Sci. USA 97,
6055–6060.
Cahir-McFarland, E.D., Carter, K., Rosenwald, A., Giltnane, J.M., Henrickson,
S.E., Staudt, L.M., and Kieff, E. (2004). Role of NF-kappa B in cell survival and
transcription of latent membrane protein 1-expressing or Epstein-Barr virus la-
tency III-infected cells. J. Virol. 78, 4108–4119.
Chapuy, B., McKeown, M.R., Lin, C.Y., Monti, S., Roemer, M.G., Qi, J., Rahl,
P.B., Sun, H.H., Yeda, K.T., Doench, J.G., et al. (2013). Discovery and charac-
terization of super-enhancer-associated dependencies in diffuse large B cell
lymphoma. Cancer Cell 24, 777–790.
Clark, M.R., Mandal, M., Ochiai, K., and Singh, H. (2014). Orchestrating B cell
lymphopoiesis through interplay of IL-7 receptor and pre-B cell receptor sig-
nalling. Nat. Rev. Immunol. 14, 69–80.
Dowen, J.M., Fan, Z.P., Hnisz, D., Ren, G., Abraham, B.J., Zhang, L.N.,
Weintraub, A.S., Schuijers, J., Lee, T.I., Zhao, K., and Young, R.A. (2014).
Control of cell identity genes occurs in insulated neighborhoods in mammalian
chromosomes. Cell 159, 374–387.
Eischen, C.M., Weber, J.D., Roussel, M.F., Sherr, C.J., and Cleveland, J.L.
(1999). Disruption of the ARF-Mdm2-p53 tumor suppressor pathway in Myc-
induced lymphomagenesis. Genes Dev. 13, 2658–2669.
Epstein, M.A., Achong, B.G., and Barr, Y.M. (1964). Virus particles in cultured
lymphoblasts from Burkitt’s lymphoma. Lancet 1, 702–703.
Faumont, N., Durand-Panteix, S., Schlee, M., Gromminger, S., Schuhmacher,
M., Holzel, M., Laux, G., Mailhammer, R., Rosenwald, A., Staudt, L.M., et al.
(2009). c-Myc and Rel/NF-kappaB are the two master transcriptional systems
activated in the latency III program of Epstein-Barr virus-immortalized B cells.
J. Virol. 83, 5014–5027.
Filippakopoulos, P., Qi, J., Picaud, S., Shen, Y., Smith, W.B., Fedorov, O.,
Morse, E.M., Keates, T., Hickman, T.T., Felletar, I., et al. (2010). Selective inhi-
bition of BET bromodomains. Nature 468, 1067–1073.
Grossman, S.R., Johannsen, E., Tong, X., Yalamanchili, R., and Kieff, E. (1994).
The Epstein-Barr virus nuclear antigen 2 transactivator is directed to response
elements by the J kappa recombination signal binding protein. Proc. Natl.
Acad. Sci. USA 91, 7568–7572.
Harada, S., and Kieff, E. (1997). Epstein-Barr virus nuclear protein LP stimu-
lates EBNA-2 acidic domain-mediated transcriptional activation. J. Virol. 71,
6611–6618.
Heinz, S., Benner, C., Spann, N., Bertolino, E., Lin, Y.C., Laslo, P., Cheng, J.X.,
Murre, C., Singh, H., and Glass, C.K. (2010). Simple combinations of lineage-
determining transcription factors prime cis-regulatory elements required for
macrophage and B cell identities. Mol. Cell 38, 576–589.
Henderson, S., Rowe, M., Gregory, C., Croom-Carter, D., Wang, F.,
Longnecker, R., Kieff, E., and Rickinson, A. (1991). Induction of bcl-2
Cell Host &
expression by Epstein-Barr virus latent membrane protein 1 protects infected
B cells from programmed cell death. Cell 65, 1107–1115.
Henkel, T., Ling, P.D., Hayward, S.D., and Peterson, M.G. (1994). Mediation of
Epstein-Barr virus EBNA2 transactivation by recombination signal-binding
protein J kappa. Science 265, 92–95.
Hertle, M.L., Popp, C., Petermann, S., Maier, S., Kremmer, E., Lang, R.,
Mages, J., and Kempkes, B. (2009). Differential gene expression patterns of
EBV infected EBNA-3A positive and negative human B lymphocytes. PLoS
Pathog. 5, e1000506.
Hnisz, D., Abraham, B.J., Lee, T.I., Lau, A., Saint-Andre, V., Sigova, A.A., Hoke,
H.A., and Young, R.A. (2013). Super-enhancers in the control of cell identity
and disease. Cell 155, 934–947.
Hu, S., Xu-Monette, Z.Y., Tzankov, A., Green, T., Wu, L., Balasubramanyam,
A., Liu, W.M., Visco, C., Li, Y., Miranda, R.N., et al. (2013). MYC/BCL2 protein
coexpression contributes to the inferior survival of activated B-cell subtype of
diffuse large B-cell lymphoma and demonstrates high-risk gene expression
signatures: a report from The International DLBCL Rituximab-CHOP
Consortium Program. Blood 121, 4021–4031, quiz 4250.
Huang, W., Sherman, B.T., Stephens, R., Baseler, M.W., Lane, H.C., and
Lempicki, R.A. (2008). DAVID gene ID conversion tool. Bioinformation 2,
428–430.
Jiang, S., Willox, B., Zhou, H., Holthaus, A.M., Wang, A., Shi, T.T., Maruo, S.,
Kharchenko, P.V., Johannsen, E.C., Kieff, E., and Zhao, B. (2014). Epstein-Barr
virus nuclear antigen 3C binds to BATF/IRF4 or SPI1/IRF4 composite sites and
recruits Sin3A to repress CDKN2A. Proc. Natl. Acad. Sci. USA 111, 421–426.
Kaiser, C., Laux, G., Eick, D., Jochner, N., Bornkamm, G.W., and Kempkes, B.
(1999). The proto-oncogene c-myc is a direct target gene of Epstein-Barr virus
nuclear antigen 2. J. Virol. 73, 4481–4484.
Kurth, J., Spieker, T., Wustrow, J., Strickler, G.J., Hansmann, L.M., Rajewsky,
K., and Kuppers, R. (2000). EBV-infected B cells in infectious mononucleosis:
viral strategies for spreading in the B cell compartment and establishing la-
tency. Immunity 13, 485–495.
Lawrie, C.H., Chi, J., Taylor, S., Tramonti, D., Ballabio, E., Palazzo, S.,
Saunders, N.J., Pezzella, F., Boultwood, J., Wainscoat, J.S., and Hatton,
C.S. (2009). Expression of microRNAs in diffuse large B cell lymphoma is asso-
ciated with immunophenotype, survival and transformation from follicular lym-
phoma. J. Cell. Mol. Med. 13, 1248–1260.
Lieberman-Aiden, E., van Berkum, N.L., Williams, L., Imakaev, M., Ragoczy,
T., Telling, A., Amit, I., Lajoie, B.R., Sabo, P.J., Dorschner, M.O., et al.
(2009). Comprehensive mapping of long-range interactions reveals folding
principles of the human genome. Science 326, 289–293.
Lin, Y.C., Jhunjhunwala, S., Benner, C., Heinz, S., Welinder, E., Mansson, R.,
Sigvardsson, M., Hagman, J., Espinoza, C.A., Dutkowski, J., et al. (2010). A
global network of transcription factors, involving E2A, EBF1 and Foxo1, that
orchestrates B cell fate. Nat. Immunol. 11, 635–643.
Longnecker, R., Kieff, E., and Cohen, J.I. (2013). Epstein-Barr virus. In Fields,
Virology, D.M. Knipe, and P.M. Howley, eds. (Philadelphia: Lippincott,Williams
and Wilkins), pp. 1898–1959.
Love, C., Sun, Z., Jima, D., Li, G., Zhang, J., Miles, R., Richards, K.L., Dunphy,
C.H., Choi, W.W., Srivastava, G., et al. (2012). The genetic landscape of muta-
tions in Burkitt lymphoma. Nat. Genet. 44, 1321–1325.
Loven, J., Hoke, H.A., Lin, C.Y., Lau, A., Orlando, D.A., Vakoc, C.R., Bradner,
J.E., Lee, T.I., and Young, R.A. (2013). Selective inhibition of tumor oncogenes
by disruption of super-enhancers. Cell 153, 320–334.
Maruo, S., Johannsen, E., Illanes, D., Cooper, A., Zhao, B., and Kieff, E. (2005).
Epstein-Barr virus nuclear protein 3A domains essential for growth of lympho-
blasts: transcriptional regulation through RBP-Jkappa/CBF1 is critical. J. Virol.
79, 10171–10179.
Maruo, S., Wu, Y., Ishikawa, S., Kanda, T., Iwakiri, D., and Takada, K. (2006).
Epstein-Barr virus nuclear protein EBNA3C is required for cell cycle progres-
sion and growth maintenance of lymphoblastoid cells. Proc. Natl. Acad. Sci.
USA 103, 19500–19505.
Maruo, S., Zhao, B., Johannsen, E., Kieff, E., Zou, J., and Takada, K. (2011).
Epstein-Barr virus nuclear antigens 3C and 3A maintain lymphoblastoid cell
Microbe 17, 205–216, February 11, 2015 ª2015 Elsevier Inc. 215
growth by repressing p16INK4A and p14ARF expression. Proc. Natl. Acad.
Sci. USA 108, 1919–1924.
Montgomery, S.B., Sammeth, M., Gutierrez-Arcelus, M., Lach, R.P., Ingle, C.,
Nisbett, J., Guigo, R., and Dermitzakis, E.T. (2010). Transcriptome genetics us-
ing second generation sequencing in a Caucasian population. Nature 464,
773–777.
Nikitin, P.A., Yan, C.M., Forte, E., Bocedi, A., Tourigny, J.P., White, R.E.,
Allday, M.J., Patel, A., Dave, S.S., Kim, W., et al. (2010). An ATM/Chk2-medi-
ated DNA damage-responsive signaling pathway suppresses Epstein-Barr vi-
rus transformation of primary human B cells. Cell Host Microbe 8, 510–522.
Parker, S.C., Stitzel, M.L., Taylor, D.L., Orozco, J.M., Erdos, M.R., Akiyama,
J.A., van Bueren, K.L., Chines, P.S., Narisu, N., Black, B.L., et al.; NISC
Comparative Sequencing Program; National Institutes of Health Intramural
Sequencing Center Comparative Sequencing Program Authors; NISC
Comparative Sequencing Program Authors (2013). Chromatin stretch
enhancer states drive cell-specific gene regulation and harbor human disease
risk variants. Proc. Natl. Acad. Sci. USA 110, 17921–17926.
Perkins, N.D., Felzien, L.K., Betts, J.C., Leung, K., Beach, D.H., and Nabel,
G.J. (1997). Regulation of NF-kappaB by cyclin-dependent kinases associated
with the p300 coactivator. Science 275, 523–527.
Pham, L.V., Tamayo, A.T., Li, C., Bueso-Ramos, C., and Ford, R.J. (2010). An
epigenetic chromatin remodeling role for NFATc1 in transcriptional regulation
of growth and survival genes in diffuse large B-cell lymphomas. Blood 116,
3899–3906.
Pomerantz, M.M., Ahmadiyeh, N., Jia, L., Herman, P., Verzi, M.P.,
Doddapaneni, H., Beckwith, C.A., Chan, J.A., Hills, A., Davis, M., et al.
(2009). The 8q24 cancer risk variant rs6983267 shows long-range interaction
with MYC in colorectal cancer. Nat. Genet. 41, 882–884.
Portal, D., Rosendorff, A., and Kieff, E. (2006). Epstein-Barr nuclear antigen
leader protein coactivates transcription through interaction with histone de-
acetylase 4. Proc. Natl. Acad. Sci. USA 103, 19278–19283.
Portal, D., Zhao, B., Calderwood, M.A., Sommermann, T., Johannsen, E., and
Kieff, E. (2011). EBV nuclear antigen EBNALP dismisses transcription repres-
sors NCoR and RBPJ from enhancers and EBNA2 increases NCoR-deficient
RBPJ DNA binding. Proc. Natl. Acad. Sci. USA 108, 7808–7813.
Portal, D., Zhou, H., Zhao, B., Kharchenko, P.V., Lowry, E., Wong, L.,
Quackenbush, J., Holloway, D., Jiang, S., Lu, Y., and Kieff, E. (2013).
Epstein-Barr virus nuclear antigen leader protein localizes to promoters and
enhancers with cell transcription factors and EBNA2. Proc. Natl. Acad. Sci.
USA 110, 18537–18542.
Rosato, P., Anastasiadou, E., Garg, N., Lenze, D., Boccellato, F., Vincenti, S.,
Severa, M., Coccia, E.M., Bigi, R., Cirone, M., et al. (2012). Differential regula-
tion of miR-21 and miR-146a by Epstein-Barr virus-encoded EBNA2.
Leukemia 26, 2343–2352.
Sanyal, A., Lajoie, B.R., Jain, G., and Dekker, J. (2012). The long-range inter-
action landscape of gene promoters. Nature 489, 109–113.
Selvaraj, S., R Dixon, J., Bansal, V., and Ren, B. (2013). Whole-genome haplo-
type reconstruction using proximity-ligation and shotgun sequencing. Nat.
Biotechnol. 31, 1111–1118.
Skalska, L., White, R.E., Parker, G.A., Turro, E., Sinclair, A.J., Paschos, K., and
Allday, M.J. (2013). Induction of p16(INK4a) is the major barrier to proliferation
when Epstein-Barr virus (EBV) transforms primary B cells into lymphoblastoid
cell lines. PLoS Pathog. 9, e1003187.
Skalsky, R.L., Corcoran, D.L., Gottwein, E., Frank, C.L., Kang, D., Hafner, M.,
Nusbaum, J.D., Feederle, R., Delecluse, H.J., Luftig, M.A., et al. (2012). The
viral and cellular microRNA targetome in lymphoblastoid cell lines. PLoS
Pathog. 8, e1002484.
Spender, L.C., Cannell, E.J., Hollyoake, M., Wensing, B., Gawn, J.M.,
Brimmell, M., Packham, G., and Farrell, P.J. (1999). Control of cell cycle entry
and apoptosis in B lymphocytes infected by Epstein-Barr virus. J. Virol. 73,
4678–4688.
Subramanian, C., Hasan, S., Rowe, M., Hottiger, M., Orre, R., and Robertson,
E.S. (2002). Epstein-Barr virus nuclear antigen 3C and prothymosin alpha
216 Cell Host & Microbe 17, 205–216, February 11, 2015 ª2015 Else
interact with the p300 transcriptional coactivator at the CH1 and CH3/HAT
domains and cooperate in regulation of transcription and histone acetylation.
J. Virol. 76, 4699–4708.
Teytelman, L., Thurtle, D.M., Rine, J., and van Oudenaarden, A. (2013). Highly
expressed loci are vulnerable to misleading ChIP localization of multiple unre-
lated proteins. Proc. Natl. Acad. Sci. USA 110, 18602–18607.
Tong, X., Drapkin, R., Reinberg, D., and Kieff, E. (1995). The 62- and 80-kDa
subunits of transcription factor IIH mediate the interaction with Epstein-Barr
virus nuclear protein 2. Proc. Natl. Acad. Sci. USA 92, 3259–3263.
Wang, F., Gregory, C.D., Rowe,M., Rickinson, A.B.,Wang, D., Birkenbach, M.,
Kikutani, H., Kishimoto, T., and Kieff, E. (1987). Epstein-Barr virus nuclear an-
tigen 2 specifically induces expression of the B-cell activation antigen CD23.
Proc. Natl. Acad. Sci. USA 84, 3452–3456.
Wang, L., Grossman, S.R., and Kieff, E. (2000). Epstein-Barr virus nuclear pro-
tein 2 interacts with p300, CBP, and PCAF histone acetyltransferases in acti-
vation of the LMP1 promoter. Proc. Natl. Acad. Sci. USA 97, 430–435.
Weber-Nordt, R.M., Egen, C., Wehinger, J., Ludwig, W., Gouilleux-Gruart, V.,
Mertelsmann, R., and Finke, J. (1996). Constitutive activation of STAT proteins
in primary lymphoid and myeloid leukemia cells and in Epstein-Barr virus
(EBV)-related lymphoma cell lines. Blood 88, 809–816.
Whyte, W.A., Orlando, D.A., Hnisz, D., Abraham, B.J., Lin, C.Y., Kagey, M.H.,
Rahl, P.B., Lee, T.I., and Young, R.A. (2013). Master transcription factors and
mediator establish super-enhancers at key cell identity genes. Cell 153,
307–319.
Wu, D.Y., Kalpana, G.V., Goff, S.P., and Schubach, W.H. (1996). Epstein-Barr
virus nuclear protein 2 (EBNA2) binds to a component of the human SNF-SWI
complex, hSNF5/Ini1. J. Virol. 70, 6020–6028.
Xiang, J.F., Yin, Q.F., Chen, T., Zhang, Y., Zhang, X.O., Wu, Z., Zhang, S.,
Wang, H.B., Ge, J., Lu, X., et al. (2014). Human colorectal cancer-specific
CCAT1-L lncRNA regulates long-range chromatin interactions at the MYC
locus. Cell Res. 24, 513–531.
Yang, G.-D., Huang, T.-J., Peng, L.-X., Yang, C.-F., Liu, R.-Y., Huang, H.-B.,
Chu, Q.-Q., Yang, H.-J., Huang, J.-L., Zhu, Z.-Y., et al. (2013). Epstein-Barr
Virus_Encoded LMP1 upregulates microRNA-21 to promote the resistance
of nasopharyngeal carcinoma cells to cisplatin-induced Apoptosis by sup-
pressing PDCD4 and Fas-L. PLoS ONE 8, e78355.
Young, L.S., and Rickinson, A.B. (2004). Epstein-Barr virus: 40 years on. Nat.
Rev. Cancer 4, 757–768.
Young, L., Alfieri, C., Hennessy, K., Evans, H., O’Hara, C., Anderson, K.C., Ritz,
J., Shapiro, R.S., Rickinson, A., Kieff, E., et al. (1989). Expression of Epstein-
Barr virus transformation-associated genes in tissues of patients with EBV
lymphoproliferative disease. N. Engl. J. Med. 321, 1080–1085.
Zhang, Y., Liu, T., Meyer, C.A., Eeckhoute, J., Johnson, D.S., Bernstein, B.E.,
Nusbaum, C., Myers, R.M., Brown, M., Li, W., and Liu, X.S. (2008). Model-
based analysis of ChIP-Seq (MACS). Genome Biol. 9, R137.
Zhao, B., Maruo, S., Cooper, A., R Chase, M., Johannsen, E., Kieff, E., and
Cahir-McFarland, E. (2006). RNAs induced by Epstein-Barr virus nuclear anti-
gen 2 in lymphoblastoid cell lines. Proc. Natl. Acad. Sci. USA 103, 1900–1905.
Zhao, B., Mar, J.C., Maruo, S., Lee, S., Gewurz, B.E., Johannsen, E., Holton,
K., Rubio, R., Takada, K., Quackenbush, J., and Kieff, E. (2011a). Epstein-
Barr virus nuclear antigen 3C regulated genes in lymphoblastoid cell lines.
Proc. Natl. Acad. Sci. USA 108, 337–342.
Zhao, B., Zou, J., Wang, H., Johannsen, E., Peng, C.W., Quackenbush, J.,
Mar, J.C., Morton, C.C., Freedman, M.L., Blacklow, S.C., et al. (2011b).
Epstein-Barr virus exploits intrinsic B-lymphocyte transcription programs to
achieve immortal cell growth. Proc. Natl. Acad. Sci. USA 108, 14902–14907.
Zhao, B., Barrera, L.A., Ersing, I., Willox, B., Schmidt, S.C., Greenfeld, H.,
Zhou, H., Mollo, S.B., Shi, T.T., Takasaki, K., et al. (2014). The NF-kappaB
genomic landscape in lymphoblastoid B cells. Cell Rep. 8, 1595–1606.
Zhou, H., Jin, J., Zhang, H., Yi, B., Wozniak, M., andWong, L. (2012). IntPath—
an integrated pathway gene relationship database for model organisms and
important pathogens. BMC Syst. Biol. 6 (Suppl 2 ), S2.
vier Inc.