Embed Size (px)
Citation preview
© 2016 Equirus. All rights reserved.
1QFY17 Earnings Preview
Auto Parts
Eicher Motors is expected to deliver 44%/53% EBITDA/PAT growth driven by
38%/34% yoy volume growth in RE/VECV
Bajaj is expected to deliver 10% EBITDA growth while Hero 20% due to
margin expansion driven by lower RM prices yoy
Exide is expected to deliver 12%/18% EBITDA/PAT growth driven by
improvement in EBITDAM and higher other income on increased cash. Amara
is expected to deliver 11%/9% EBITDA/PA\T growth
In tyre space, Balkrishna is expected to post 7% EBIDTA growth while Apollo
is expected to post 4% EBITDA decline due to margin compression
Capital Goods
We think that cap goods companies would continue to report results in
1QFY17 which would not reflect much change in the stressful conditions as
such. The cap goods and industrials space is struggling because of lack of
ordering activity and except for some select names in a few sub-sectors;
most other companies are finding it difficult to generate enough order flows
and seeing a decline in book to bill ratios. There are a few other things
which happen as a result, a) pressure on profitability, b) deterioration in
working capital cycle, and, c) unwillingness to undertake new investment in
building capacity. It is also important to note that Index of Industrial
Production (IIP) numbers which have been reported are bad (for the month
of April, after March which also reported flat IIP). Three key takeaways from
IIP data, 1) A sharp 3% dip in manufacturing was a clear sentiment dampener
we think, 2) The IIP data has been poor over last few months and this is
certainly not a good sign for recovery, and, 3) even a bad number this
month was possible because of a massive 15% yoy increase in Electricity.
Consumer Goods
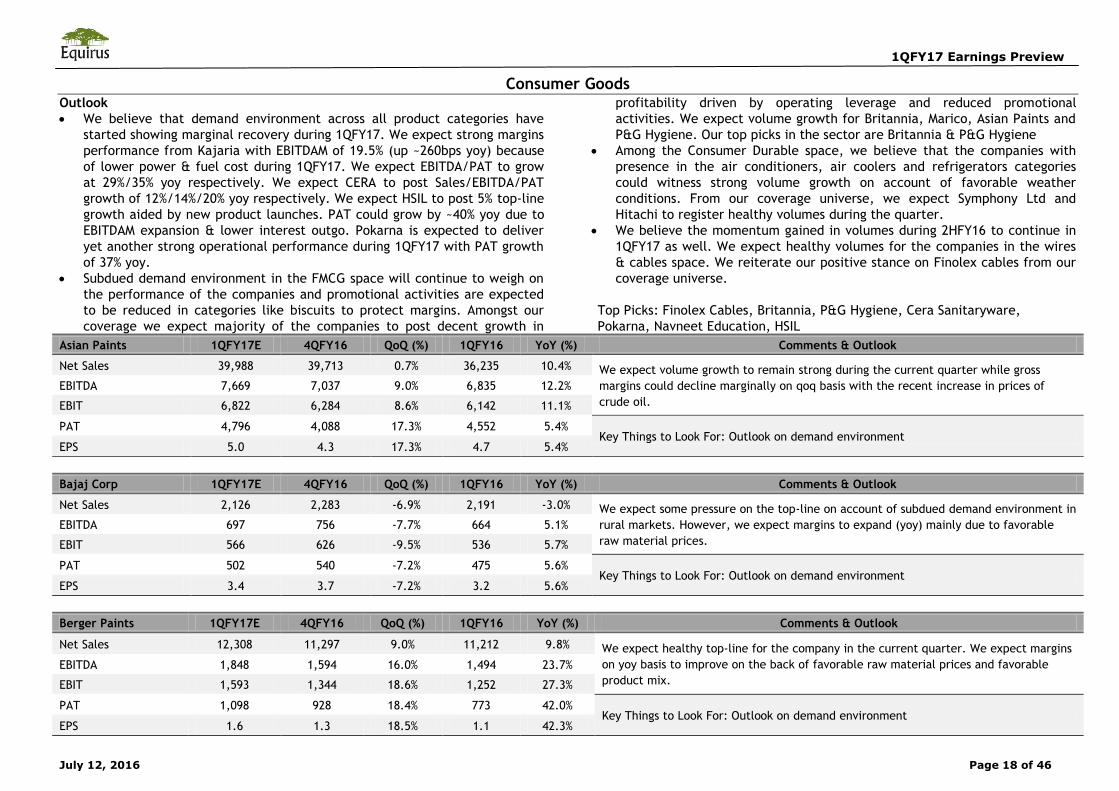
We believe that demand environment across all product categories have
started showing marginal recovery during 1QFY17. We expect strong margins
performance from Kajaria with EBITDAM of 19.5% (up ~260bps yoy) because
of lower power & fuel cost during 1QFY17. We expect EBITDA/PAT to grow
at 29%/35% yoy respectively. We expect CERA to post Sales/EBITDA/PAT
growth of 12%/14%/20% yoy respectively. We expect HSIL to post 5% top-line
growth aided by new product launches. PAT could grow by ~40% yoy due to
EBITDAM expansion & lower interest outgo. Pokarna is expected to deliver
yet another strong operational performance during 1QFY17 with PAT growth
of 37% yoy.
Subdued demand environment in the FMCG space will continue to weigh on
the performance of the companies and promotional activities are expected
to be reduced in categories like biscuits to protect margins. Amongst our
coverage we expect majority of the companies to post decent growth in
profitability driven by operating leverage and reduced promotional
activities. We expect volume growth for Britannia, Marico, Asian Paints and
P&G Hygiene. Our top picks in the sector are Britannia & P&G Hygiene
Among the Consumer Durable space, we believe that the companies with
presence in the air conditioners, air coolers and refrigerators categories
could witness strong volume growth on account of favorable weather
conditions. From our coverage universe, we expect Symphony Ltd and
Hitachi to register healthy volumes during the quarter.
We believe the momentum gained in volumes during 2HFY16 to continue in
1QFY17 as well. We expect healthy volumes for the companies in the wires
& cables space. We reiterate our positive stance on Finolex cables in our
coverage universe.
Metals and Mining
In our coverage, GMDC is expected to post 8% yoy EBITDA growth, except
which all other companies are expected to report decline due to company
related issues
Hindustan Zinc’s mined metal volumes are expected to decline 40% yoy as
deepening of RA open cast mine will lead to lower ore production in 1HFY17
Oil & Gas
Volume for transmission companies is expected to remain marginally higher
on account of RasGas contract becoming affordable and lower spot LNG
prices. IGL/GGAS to report good volume growth with margin expansion on
account of lower APM gas price effective from Apr'16. Refining margin to
remain marginally weaker on qoq basis and petchem spread is expected to
expand. PLNG likely to report qoq improvement in volume driven by regas
and spot volume.
1QFY17 Earnings Preview
July 12, 2016 Page 2 of 46
Pharmaceuticals
1QFY17 will be a mixed quarter. Quarter will be highlighted by 1)
Contribution from products launched under 180 days exclusivity, 2) Full
quarter integration of acquisitions, 3) Increase in R&D spend and 4) Pressure
due to discontinuation of high value Venezuela business, new NLEM impact
& FDC impact and erosion of high value products that existed in the last
quarters, 5) Dearth of new approvals. Quarter will be supposedly unique
because majority of the large caps will be posting robust growth as
compared to mid-caps, mainly due to 180 day exclusive launch. While
Midcaps will be under pressure due to increase R&D expenditure.
Utilities
India has a total installed capacity of 303,118 MW as of Jun’16
compared to 275,512 MW as of Jun’15. The challenges with regards to fuel
availability are receding and outlook is improving on this front. Going ahead,
demand pick up and long term bids will be the key factors to watch out for.
Several positives like RasGas renegotiation, improvement in Gas based PLFs,
UDAY scheme, lower LNG and international coal prices etc have also played
out over the last 12 months. Overall, we expect the capital utilization
and asset sweating to improve going ahead. We continue to believe in
strong balance sheets with efficient assets.
Construction
Government has awarded projects covering ~13,000kms since it took office
in May’14. For FY17, total award target has been set at 25,000kms. NHAI has
awarded projects covering 4,171kms in FY16 vs. 3,060kms in FY15 &
1,437kms in FY14. NHAI is targeting to construct 8,000kms for FY17 while
MORTH+NHIDCL are targeting 7,000kms. Total target for construction is
15,000kms vs. 6,000kms in FY16. Additionally more than 1,000 projects
covering 32,000kms are being planned for improvement & construction.
NHAI, MORTH and NHIDCL order pipelines continue to remain buoyant with
most of the upcoming projects being in the EPC mode while the BOT space is
seeing a smaller project pipeline. Hybrid Annuity project pipeline remains
robust with ~27 projects worth Rs. 347bn covering 1,815 kms being already
lined up for next 6 months. State projects in UP, Chhattisgarh and Bihar are
expected to come up in next 12 months. Most of the players continue to
stick their core competency of doing EPC business in order to repair their
stretched balance sheets but this has resulted in over-crowding in the EPC
space. We expect competition to continue in the EPC & Hybrid segment but
believe that the pie is large enough for all the players to win enough orders
for the coming 24 months. The BOT space is not going to see that much
competitive intensity for next 12/18 months and would see bidding from 5-6
players only (case to case basis). In this space we are bullish on Ashoka
Buildcon, Sadbhav Engineering, PNC Infratech and Sadbhav Infra.
IT Services
1QFY17 is expected to be seasonally strong quarter but this should include
moderate cross currency tailwinds too. However, 1Q has pressures in terms
of wage hikes and visa costs that could negatively impact margins.
Management commentaries on lower visa applications, impact of Brexit and
insights on spending across verticals should be interesting. We expect qoq $
Sales growth to be broadly in 1%-4% range and margin impact of upto
~150bps due to seasonality. Other key things to look include deal wins and
hiring trends.
1QFY17 Earnings Preview
July 12, 2016 Page 3 of 46
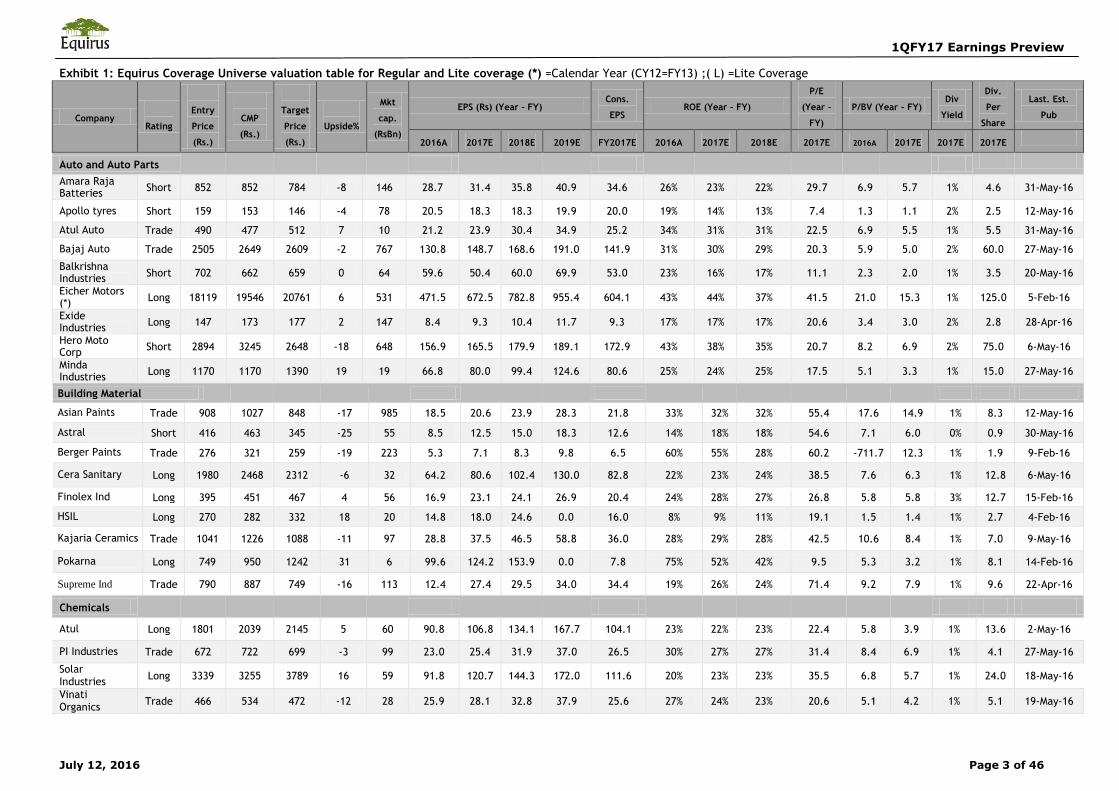
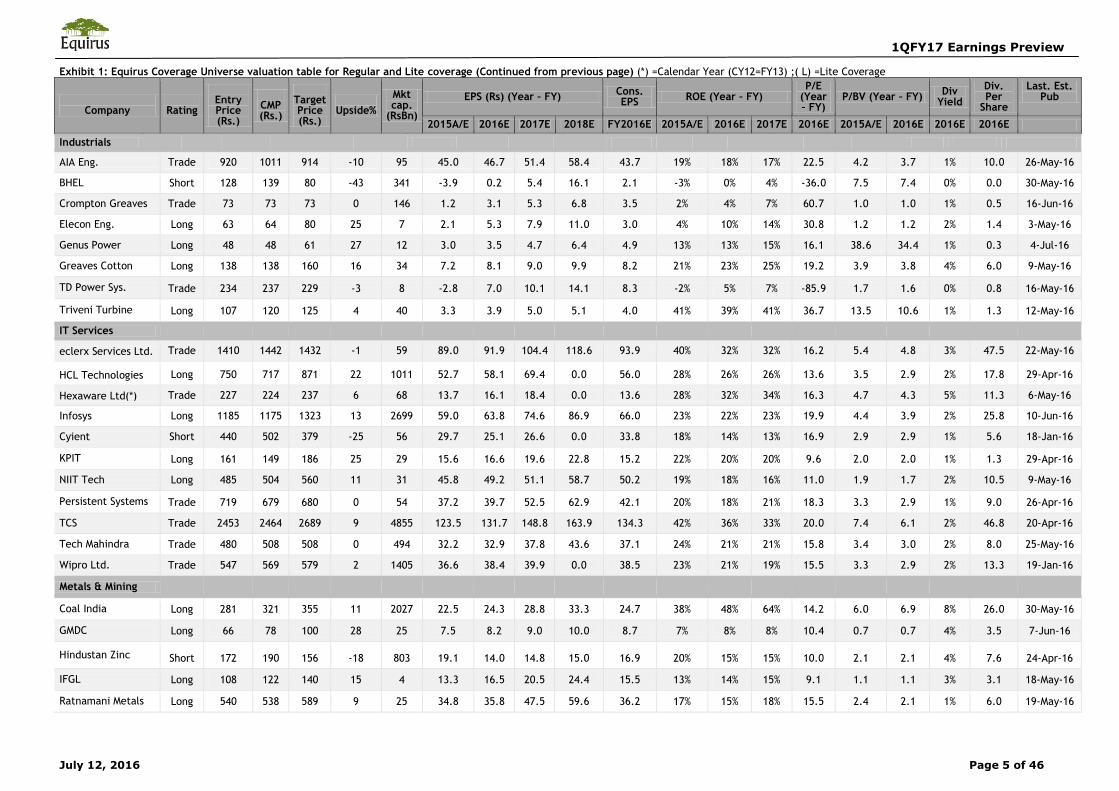
Exhibit 1: Equirus Coverage Universe valuation table for Regular and Lite coverage (*) =Calendar Year (CY12=FY13) ;( L) =Lite Coverage
Company
Rating
Entry
Price
(Rs.)
CMP
(Rs.)
Target
Price
(Rs.)
Upside%
Mkt
cap.
(RsBn)
EPS (Rs) (Year – FY) Cons.
EPS ROE (Year – FY)
P/E
(Year –
FY)
P/BV (Year – FY) Div
Yield
Div.
Per
Share
Last. Est.
Pub
2016A 2017E 2018E 2019E FY2017E 2016A 2017E 2018E 2017E 2016A 2017E 2017E 2017E
Auto and Auto Parts
Amara Raja Batteries
Short 852 852 784 -8 146 28.7 31.4 35.8 40.9 34.6 26% 23% 22% 29.7 6.9 5.7 1% 4.6 31-May-16
Apollo tyres Short 159 153 146 -4 78 20.5 18.3 18.3 19.9 20.0 19% 14% 13% 7.4 1.3 1.1 2% 2.5 12-May-16
Atul Auto Trade 490 477 512 7 10 21.2 23.9 30.4 34.9 25.2 34% 31% 31% 22.5 6.9 5.5 1% 5.5 31-May-16
Bajaj Auto Trade 2505 2649 2609 -2 767 130.8 148.7 168.6 191.0 141.9 31% 30% 29% 20.3 5.9 5.0 2% 60.0 27-May-16
Balkrishna Industries
Short 702 662 659 0 64 59.6 50.4 60.0 69.9 53.0 23% 16% 17% 11.1 2.3 2.0 1% 3.5 20-May-16
Eicher Motors (*)
Long 18119 19546 20761 6 531 471.5 672.5 782.8 955.4 604.1 43% 44% 37% 41.5 21.0 15.3 1% 125.0 5-Feb-16
Exide Industries
Long 147 173 177 2 147 8.4 9.3 10.4 11.7 9.3 17% 17% 17% 20.6 3.4 3.0 2% 2.8 28-Apr-16
Hero Moto Corp
Short 2894 3245 2648 -18 648 156.9 165.5 179.9 189.1 172.9 43% 38% 35% 20.7 8.2 6.9 2% 75.0 6-May-16
Minda Industries
Long 1170 1170 1390 19 19 66.8 80.0 99.4 124.6 80.6 25% 24% 25% 17.5 5.1 3.3 1% 15.0 27-May-16
Building Material
Asian Paints Trade 908 1027 848 -17 985 18.5 20.6 23.9 28.3 21.8 33% 32% 32% 55.4 17.6 14.9 1% 8.3 12-May-16
Astral Short 416 463 345 -25 55 8.5 12.5 15.0 18.3 12.6 14% 18% 18% 54.6 7.1 6.0 0% 0.9 30-May-16
Berger Paints Trade 276 321 259 -19 223 5.3 7.1 8.3 9.8 6.5 60% 55% 28% 60.2 -711.7 12.3 1% 1.9 9-Feb-16
Cera Sanitary Long 1980 2468 2312 -6 32 64.2 80.6 102.4 130.0 82.8 22% 23% 24% 38.5 7.6 6.3 1% 12.8 6-May-16
Finolex Ind Long 395 451 467 4 56 16.9 23.1 24.1 26.9 20.4 24% 28% 27% 26.8 5.8 5.8 3% 12.7 15-Feb-16
HSIL Long 270 282 332 18 20 14.8 18.0 24.6 0.0 16.0 8% 9% 11% 19.1 1.5 1.4 1% 2.7 4-Feb-16
Kajaria Ceramics Trade 1041 1226 1088 -11 97 28.8 37.5 46.5 58.8 36.0 28% 29% 28% 42.5 10.6 8.4 1% 7.0 9-May-16
Pokarna Long 749 950 1242 31 6 99.6 124.2 153.9 0.0 7.8 75% 52% 42% 9.5 5.3 3.2 1% 8.1 14-Feb-16
Supreme Ind Trade 790 887 749 -16 113 12.4 27.4 29.5 34.0 34.4 19% 26% 24% 71.4 9.2 7.9 1% 9.6 22-Apr-16
Chemicals
Atul Long 1801 2039 2145 5 60 90.8 106.8 134.1 167.7 104.1 23% 22% 23% 22.4 5.8 3.9 1% 13.6 2-May-16
PI Industries Trade 672 722 699 -3 99 23.0 25.4 31.9 37.0 26.5 30% 27% 27% 31.4 8.4 6.9 1% 4.1 27-May-16
Solar Industries
Long 3339 3255 3789 16 59 91.8 120.7 144.3 172.0 111.6 20% 23% 23% 35.5 6.8 5.7 1% 24.0 18-May-16
Vinati Organics
Trade 466 534 472 -12 28 25.9 28.1 32.8 37.9 25.6 27% 24% 23% 20.6 5.1 4.2 1% 5.1 19-May-16
1QFY17 Earnings Preview
July 12, 2016 Page 4 of 46
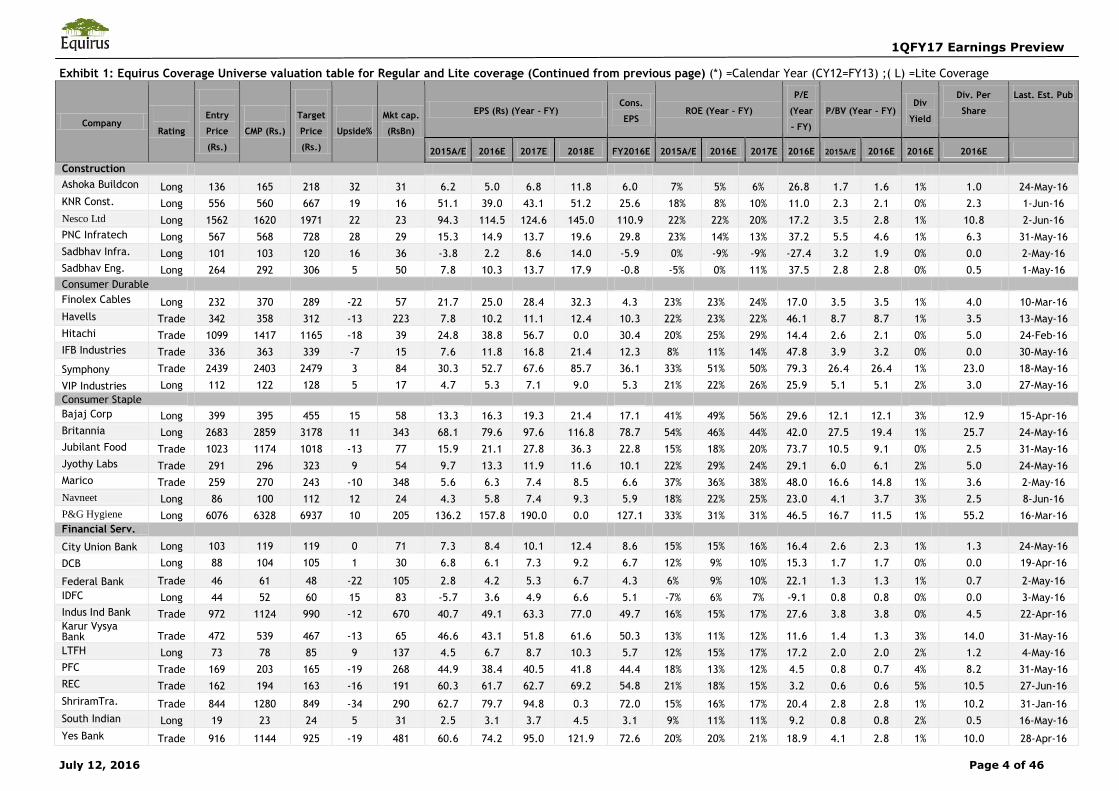
Exhibit 1: Equirus Coverage Universe valuation table for Regular and Lite coverage (Continued from previous page) (*) =Calendar Year (CY12=FY13) ;( L) =Lite Coverage
Company
Rating
Entry
Price
(Rs.)
CMP (Rs.)
Target
Price
(Rs.)
Upside%
Mkt cap.
(RsBn)
EPS (Rs) (Year – FY) Cons.
EPS ROE (Year – FY)
P/E
(Year
– FY)
P/BV (Year – FY) Div
Yield
Div. Per
Share
Last. Est. Pub
2015A/E 2016E 2017E 2018E FY2016E 2015A/E 2016E 2017E 2016E 2015A/E 2016E 2016E 2016E
Construction
Ashoka Buildcon Long 136 165 218 32 31 6.2 5.0 6.8 11.8 6.0 7% 5% 6% 26.8 1.7 1.6 1% 1.0 24-May-16
KNR Const. Long 556 560 667 19 16 51.1 39.0 43.1 51.2 25.6 18% 8% 10% 11.0 2.3 2.1 0% 2.3 1-Jun-16
Nesco Ltd Long 1562 1620 1971 22 23 94.3 114.5 124.6 145.0 110.9 22% 22% 20% 17.2 3.5 2.8 1% 10.8 2-Jun-16
PNC Infratech Long 567 568 728 28 29 15.3 14.9 13.7 19.6 29.8 23% 14% 13% 37.2 5.5 4.6 1% 6.3 31-May-16
Sadbhav Infra. Long 101 103 120 16 36 -3.8 2.2 8.6 14.0 -5.9 0% -9% -9% -27.4 3.2 1.9 0% 0.0 2-May-16
Sadbhav Eng. Long 264 292 306 5 50 7.8 10.3 13.7 17.9 -0.8 -5% 0% 11% 37.5 2.8 2.8 0% 0.5 1-May-16
Consumer Durable
Finolex Cables Long 232 370 289 -22 57 21.7 25.0 28.4 32.3 4.3 23% 23% 24% 17.0 3.5 3.5 1% 4.0 10-Mar-16
Havells Trade 342 358 312 -13 223 7.8 10.2 11.1 12.4 10.3 22% 23% 22% 46.1 8.7 8.7 1% 3.5 13-May-16
Hitachi Trade 1099 1417 1165 -18 39 24.8 38.8 56.7 0.0 30.4 20% 25% 29% 14.4 2.6 2.1 0% 5.0 24-Feb-16
IFB Industries Trade 336 363 339 -7 15 7.6 11.8 16.8 21.4 12.3 8% 11% 14% 47.8 3.9 3.2 0% 0.0 30-May-16
Symphony Trade 2439 2403 2479 3 84 30.3 52.7 67.6 85.7 36.1 33% 51% 50% 79.3 26.4 26.4 1% 23.0 18-May-16
VIP Industries Long 112 122 128 5 17 4.7 5.3 7.1 9.0 5.3 21% 22% 26% 25.9 5.1 5.1 2% 3.0 27-May-16
Consumer Staple
Bajaj Corp Long 399 395 455 15 58 13.3 16.3 19.3 21.4 17.1 41% 49% 56% 29.6 12.1 12.1 3% 12.9 15-Apr-16
Britannia Long 2683 2859 3178 11 343 68.1 79.6 97.6 116.8 78.7 54% 46% 44% 42.0 27.5 19.4 1% 25.7 24-May-16
Jubilant Food Trade 1023 1174 1018 -13 77 15.9 21.1 27.8 36.3 22.8 15% 18% 20% 73.7 10.5 9.1 0% 2.5 31-May-16
Jyothy Labs Trade 291 296 323 9 54 9.7 13.3 11.9 11.6 10.1 22% 29% 24% 29.1 6.0 6.1 2% 5.0 24-May-16
Marico Trade 259 270 243 -10 348 5.6 6.3 7.4 8.5 6.6 37% 36% 38% 48.0 16.6 14.8 1% 3.6 2-May-16
Navneet Long 86 100 112 12 24 4.3 5.8 7.4 9.3 5.9 18% 22% 25% 23.0 4.1 3.7 3% 2.5 8-Jun-16
P&G Hygiene Long 6076 6328 6937 10 205 136.2 157.8 190.0 0.0 127.1 33% 31% 31% 46.5 16.7 11.5 1% 55.2 16-Mar-16
Financial Serv.
City Union Bank Long 103 119 119 0 71 7.3 8.4 10.1 12.4 8.6 15% 15% 16% 16.4 2.6 2.3 1% 1.3 24-May-16
DCB Long 88 104 105 1 30 6.8 6.1 7.3 9.2 6.7 12% 9% 10% 15.3 1.7 1.7 0% 0.0 19-Apr-16
Federal Bank Trade 46 61 48 -22 105 2.8 4.2 5.3 6.7 4.3 6% 9% 10% 22.1 1.3 1.3 1% 0.7 2-May-16
IDFC Long 44 52 60 15 83 -5.7 3.6 4.9 6.6 5.1 -7% 6% 7% -9.1 0.8 0.8 0% 0.0 3-May-16
Indus Ind Bank Trade 972 1124 990 -12 670 40.7 49.1 63.3 77.0 49.7 16% 15% 17% 27.6 3.8 3.8 0% 4.5 22-Apr-16 Karur Vysya Bank Trade 472 539 467 -13 65 46.6 43.1 51.8 61.6 50.3 13% 11% 12% 11.6 1.4 1.3 3% 14.0 31-May-16
LTFH Long 73 78 85 9 137 4.5 6.7 8.7 10.3 5.7 12% 15% 17% 17.2 2.0 2.0 2% 1.2 4-May-16
PFC Trade 169 203 165 -19 268 44.9 38.4 40.5 41.8 44.4 18% 13% 12% 4.5 0.8 0.7 4% 8.2 31-May-16
REC Trade 162 194 163 -16 191 60.3 61.7 62.7 69.2 54.8 21% 18% 15% 3.2 0.6 0.6 5% 10.5 27-Jun-16
ShriramTra. Trade 844 1280 849 -34 290 62.7 79.7 94.8 0.3 72.0 15% 16% 17% 20.4 2.8 2.8 1% 10.2 31-Jan-16
South Indian Long 19 23 24 5 31 2.5 3.1 3.7 4.5 3.1 9% 11% 11% 9.2 0.8 0.8 2% 0.5 16-May-16
Yes Bank Trade 916 1144 925 -19 481 60.6 74.2 95.0 121.9 72.6 20% 20% 21% 18.9 4.1 2.8 1% 10.0 28-Apr-16
1QFY17 Earnings Preview
July 12, 2016 Page 5 of 46
Exhibit 1: Equirus Coverage Universe valuation table for Regular and Lite coverage (Continued from previous page) (*) =Calendar Year (CY12=FY13) ;( L) =Lite Coverage
Company
Rating
Entry Price (Rs.)
CMP (Rs.)
Target Price (Rs.)
Upside%
Mkt cap.
(RsBn)
EPS (Rs) (Year – FY) Cons. EPS
ROE (Year – FY) P/E
(Year – FY)
P/BV (Year – FY) Div
Yield
Div. Per
Share
Last. Est. Pub
2015A/E 2016E 2017E 2018E FY2016E 2015A/E 2016E 2017E 2016E 2015A/E 2016E 2016E 2016E
Industrials
AIA Eng. Trade 920 1011 914 -10 95 45.0 46.7 51.4 58.4 43.7 19% 18% 17% 22.5 4.2 3.7 1% 10.0 26-May-16
BHEL Short 128 139 80 -43 341 -3.9 0.2 5.4 16.1 2.1 -3% 0% 4% -36.0 7.5 7.4 0% 0.0 30-May-16
Crompton Greaves Trade 73 73 73 0 146 1.2 3.1 5.3 6.8 3.5 2% 4% 7% 60.7 1.0 1.0 1% 0.5 16-Jun-16
Elecon Eng. Long 63 64 80 25 7 2.1 5.3 7.9 11.0 3.0 4% 10% 14% 30.8 1.2 1.2 2% 1.4 3-May-16
Genus Power Long 48 48 61 27 12 3.0 3.5 4.7 6.4 4.9 13% 13% 15% 16.1 38.6 34.4 1% 0.3 4-Jul-16
Greaves Cotton Long 138 138 160 16 34 7.2 8.1 9.0 9.9 8.2 21% 23% 25% 19.2 3.9 3.8 4% 6.0 9-May-16
TD Power Sys. Trade 234 237 229 -3 8 -2.8 7.0 10.1 14.1 8.3 -2% 5% 7% -85.9 1.7 1.6 0% 0.8 16-May-16
Triveni Turbine Long 107 120 125 4 40 3.3 3.9 5.0 5.1 4.0 41% 39% 41% 36.7 13.5 10.6 1% 1.3 12-May-16
IT Services
eclerx Services Ltd. Trade 1410 1442 1432 -1 59 89.0 91.9 104.4 118.6 93.9 40% 32% 32% 16.2 5.4 4.8 3% 47.5 22-May-16
HCL Technologies Long 750 717 871 22 1011 52.7 58.1 69.4 0.0 56.0 28% 26% 26% 13.6 3.5 2.9 2% 17.8 29-Apr-16
Hexaware Ltd(*) Trade 227 224 237 6 68 13.7 16.1 18.4 0.0 13.6 28% 32% 34% 16.3 4.7 4.3 5% 11.3 6-May-16
Infosys Long 1185 1175 1323 13 2699 59.0 63.8 74.6 86.9 66.0 23% 22% 23% 19.9 4.4 3.9 2% 25.8 10-Jun-16
Cyient Short 440 502 379 -25 56 29.7 25.1 26.6 0.0 33.8 18% 14% 13% 16.9 2.9 2.9 1% 5.6 18-Jan-16
KPIT Long 161 149 186 25 29 15.6 16.6 19.6 22.8 15.2 22% 20% 20% 9.6 2.0 2.0 1% 1.3 29-Apr-16
NIIT Tech Long 485 504 560 11 31 45.8 49.2 51.1 58.7 50.2 19% 18% 16% 11.0 1.9 1.7 2% 10.5 9-May-16
Persistent Systems Trade 719 679 680 0 54 37.2 39.7 52.5 62.9 42.1 20% 18% 21% 18.3 3.3 2.9 1% 9.0 26-Apr-16
TCS Trade 2453 2464 2689 9 4855 123.5 131.7 148.8 163.9 134.3 42% 36% 33% 20.0 7.4 6.1 2% 46.8 20-Apr-16
Tech Mahindra Trade 480 508 508 0 494 32.2 32.9 37.8 43.6 37.1 24% 21% 21% 15.8 3.4 3.0 2% 8.0 25-May-16
Wipro Ltd. Trade 547 569 579 2 1405 36.6 38.4 39.9 0.0 38.5 23% 21% 19% 15.5 3.3 2.9 2% 13.3 19-Jan-16
Metals & Mining
Coal India Long 281 321 355 11 2027 22.5 24.3 28.8 33.3 24.7 38% 48% 64% 14.2 6.0 6.9 8% 26.0 30-May-16
GMDC Long 66 78 100 28 25 7.5 8.2 9.0 10.0 8.7 7% 8% 8% 10.4 0.7 0.7 4% 3.5 7-Jun-16
Hindustan Zinc Short 172 190 156 -18 803 19.1 14.0 14.8 15.0 16.9 20% 15% 15% 10.0 2.1 2.1 4% 7.6 24-Apr-16
IFGL Long 108 122 140 15 4 13.3 16.5 20.5 24.4 15.5 13% 14% 15% 9.1 1.1 1.1 3% 3.1 18-May-16
Ratnamani Metals Long 540 538 589 9 25 34.8 35.8 47.5 59.6 36.2 17% 15% 18% 15.5 2.4 2.1 1% 6.0 19-May-16
1QFY17 Earnings Preview
July 12, 2016 Page 6 of 46
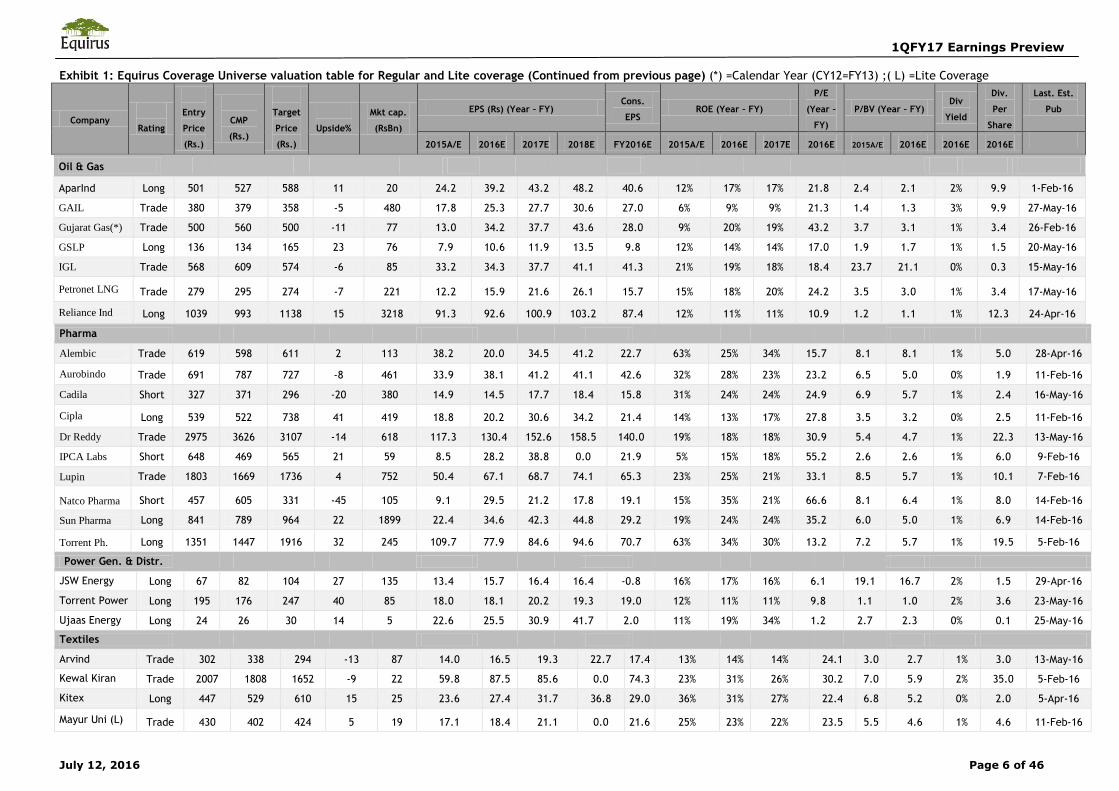
Exhibit 1: Equirus Coverage Universe valuation table for Regular and Lite coverage (Continued from previous page) (*) =Calendar Year (CY12=FY13) ;( L) =Lite Coverage
Company
Rating
Entry
Price
(Rs.)
CMP
(Rs.)
Target
Price
(Rs.)
Upside%
Mkt cap.
(RsBn)
EPS (Rs) (Year – FY) Cons.
EPS ROE (Year – FY)
P/E
(Year –
FY)
P/BV (Year – FY) Div
Yield
Div.
Per
Share
Last. Est.
Pub
2015A/E 2016E 2017E 2018E FY2016E 2015A/E 2016E 2017E 2016E 2015A/E 2016E 2016E 2016E
Oil & Gas
AparInd Long 501 527 588 11 20 24.2 39.2 43.2 48.2 40.6 12% 17% 17% 21.8 2.4 2.1 2% 9.9 1-Feb-16
GAIL Trade 380 379 358 -5 480 17.8 25.3 27.7 30.6 27.0 6% 9% 9% 21.3 1.4 1.3 3% 9.9 27-May-16
Gujarat Gas(*) Trade 500 560 500 -11 77 13.0 34.2 37.7 43.6 28.0 9% 20% 19% 43.2 3.7 3.1 1% 3.4 26-Feb-16
GSLP Long 136 134 165 23 76 7.9 10.6 11.9 13.5 9.8 12% 14% 14% 17.0 1.9 1.7 1% 1.5 20-May-16
IGL Trade 568 609 574 -6 85 33.2 34.3 37.7 41.1 41.3 21% 19% 18% 18.4 23.7 21.1 0% 0.3 15-May-16
Petronet LNG Trade 279 295 274 -7 221 12.2 15.9 21.6 26.1 15.7 15% 18% 20% 24.2 3.5 3.0 1% 3.4 17-May-16
Reliance Ind Long 1039 993 1138 15 3218 91.3 92.6 100.9 103.2 87.4 12% 11% 11% 10.9 1.2 1.1 1% 12.3 24-Apr-16
Pharma
Alembic Trade 619 598 611 2 113 38.2 20.0 34.5 41.2 22.7 63% 25% 34% 15.7 8.1 8.1 1% 5.0 28-Apr-16
Aurobindo Trade 691 787 727 -8 461 33.9 38.1 41.2 41.1 42.6 32% 28% 23% 23.2 6.5 5.0 0% 1.9 11-Feb-16
Cadila Short 327 371 296 -20 380 14.9 14.5 17.7 18.4 15.8 31% 24% 24% 24.9 6.9 5.7 1% 2.4 16-May-16
Cipla Long 539 522 738 41 419 18.8 20.2 30.6 34.2 21.4 14% 13% 17% 27.8 3.5 3.2 0% 2.5 11-Feb-16
Dr Reddy Trade 2975 3626 3107 -14 618 117.3 130.4 152.6 158.5 140.0 19% 18% 18% 30.9 5.4 4.7 1% 22.3 13-May-16
IPCA Labs Short 648 469 565 21 59 8.5 28.2 38.8 0.0 21.9 5% 15% 18% 55.2 2.6 2.6 1% 6.0 9-Feb-16
Lupin Trade 1803 1669 1736 4 752 50.4 67.1 68.7 74.1 65.3 23% 25% 21% 33.1 8.5 5.7 1% 10.1 7-Feb-16
Natco Pharma Short 457 605 331 -45 105 9.1 29.5 21.2 17.8 19.1 15% 35% 21% 66.6 8.1 6.4 1% 8.0 14-Feb-16
Sun Pharma Long 841 789 964 22 1899 22.4 34.6 42.3 44.8 29.2 19% 24% 24% 35.2 6.0 5.0 1% 6.9 14-Feb-16
Torrent Ph. Long 1351 1447 1916 32 245 109.7 77.9 84.6 94.6 70.7 63% 34% 30% 13.2 7.2 5.7 1% 19.5 5-Feb-16
Power Gen. & Distr.
JSW Energy Long 67 82 104 27 135 13.4 15.7 16.4 16.4 -0.8 16% 17% 16% 6.1 19.1 16.7 2% 1.5 29-Apr-16
Torrent Power Long 195 176 247 40 85 18.0 18.1 20.2 19.3 19.0 12% 11% 11% 9.8 1.1 1.0 2% 3.6 23-May-16
Ujaas Energy Long 24 26 30 14 5 22.6 25.5 30.9 41.7 2.0 11% 19% 34% 1.2 2.7 2.3 0% 0.1 25-May-16
Textiles
Arvind Trade 302 338 294 -13 87 14.0 16.5 19.3 22.7 17.4 13% 14% 14% 24.1 3.0 2.7 1% 3.0 13-May-16
Kewal Kiran Trade 2007 1808 1652 -9 22 59.8 87.5 85.6 0.0 74.3 23% 31% 26% 30.2 7.0 5.9 2% 35.0 5-Feb-16
Kitex Long 447 529 610 15 25 23.6 27.4 31.7 36.8 29.0 36% 31% 27% 22.4 6.8 5.2 0% 2.0 5-Apr-16
Mayur Uni (L) Trade 430 402 424 5 19 17.1 18.4 21.1 0.0 21.6 25% 23% 22% 23.5 5.5 4.6 1% 4.6 11-Feb-16
1QFY17 Earnings Preview
July 12, 2016 Page 7 of 46
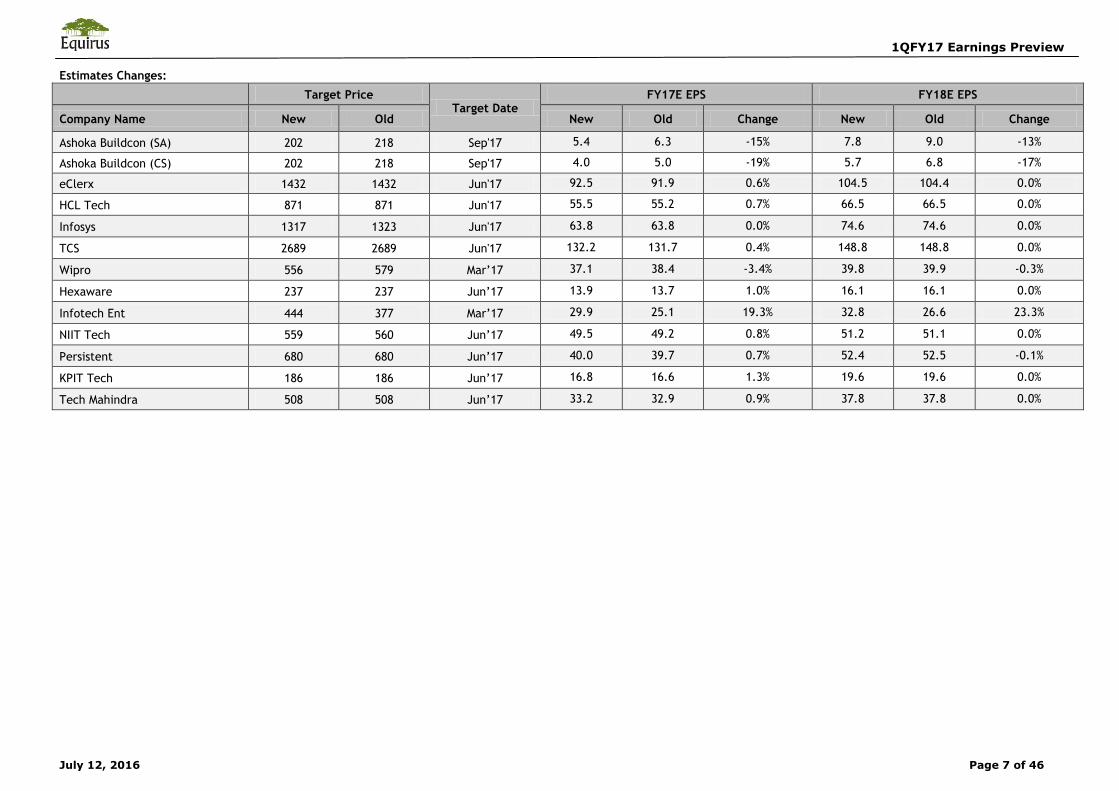
Estimates Changes:
Target Price
Target Date FY17E EPS FY18E EPS
Company Name New Old New Old Change New Old Change
Ashoka Buildcon (SA) 202 218 Sep'17 5.4 6.3 -15% 7.8 9.0 -13%
Ashoka Buildcon (CS) 202 218 Sep'17 4.0 5.0 -19% 5.7 6.8 -17%
eClerx 1432 1432 Jun'17 92.5 91.9 0.6% 104.5 104.4 0.0%
HCL Tech 871 871 Jun'17 55.5 55.2 0.7% 66.5 66.5 0.0%
Infosys 1317 1323 Jun'17 63.8 63.8 0.0% 74.6 74.6 0.0%
TCS 2689 2689 Jun'17 132.2 131.7 0.4% 148.8 148.8 0.0%
Wipro 556 579 Mar’17 37.1 38.4 -3.4% 39.8 39.9 -0.3%
Hexaware 237 237 Jun’17 13.9 13.7 1.0% 16.1 16.1 0.0%
Infotech Ent 444 377 Mar’17 29.9 25.1 19.3% 32.8 26.6 23.3%
NIIT Tech 559 560 Jun’17 49.5 49.2 0.8% 51.2 51.1 0.0%
Persistent 680 680 Jun’17 40.0 39.7 0.7% 52.4 52.5 -0.1%
KPIT Tech 186 186 Jun’17 16.8 16.6 1.3% 19.6 19.6 0.0%
Tech Mahindra 508 508 Jun’17 33.2 32.9 0.9% 37.8 37.8 0.0%
1QFY17 Earnings Preview
July 12, 2016 Page 8 of 46
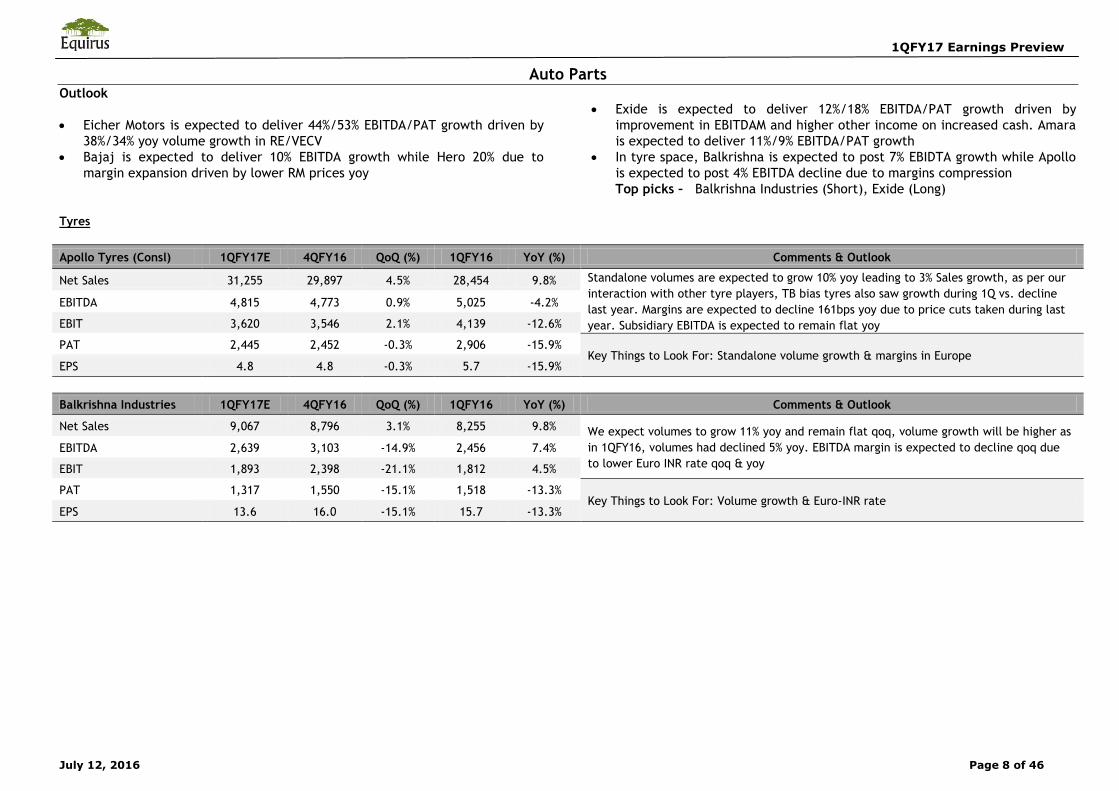
Auto PartsOutlook
Eicher Motors is expected to deliver 44%/53% EBITDA/PAT growth driven by
38%/34% yoy volume growth in RE/VECV
Bajaj is expected to deliver 10% EBITDA growth while Hero 20% due to
margin expansion driven by lower RM prices yoy
Exide is expected to deliver 12%/18% EBITDA/PAT growth driven by
improvement in EBITDAM and higher other income on increased cash. Amara
is expected to deliver 11%/9% EBITDA/PAT growth
In tyre space, Balkrishna is expected to post 7% EBIDTA growth while Apollo
is expected to post 4% EBITDA decline due to margins compression
Top picks – Balkrishna Industries (Short), Exide (Long)
Tyres
Apollo Tyres (Consl) 1QFY17E 4QFY16 QoQ (%) 1QFY16 YoY (%) Comments & Outlook
Net Sales 31,255 29,897 4.5% 28,454 9.8% Standalone volumes are expected to grow 10% yoy leading to 3% Sales growth, as per our
interaction with other tyre players, TB bias tyres also saw growth during 1Q vs. decline
last year. Margins are expected to decline 161bps yoy due to price cuts taken during last
year. Subsidiary EBITDA is expected to remain flat yoy
EBITDA 4,815 4,773 0.9% 5,025 -4.2%
EBIT 3,620 3,546 2.1% 4,139 -12.6%
PAT 2,445 2,452 -0.3% 2,906 -15.9% Key Things to Look For: Standalone volume growth & margins in Europe
EPS 4.8 4.8 -0.3% 5.7 -15.9%
Balkrishna Industries 1QFY17E 4QFY16 QoQ (%) 1QFY16 YoY (%) Comments & Outlook
Net Sales 9,067 8,796 3.1% 8,255 9.8% We expect volumes to grow 11% yoy and remain flat qoq, volume growth will be higher as
in 1QFY16, volumes had declined 5% yoy. EBITDA margin is expected to decline qoq due
to lower Euro INR rate qoq & yoy EBITDA 2,639 3,103 -14.9% 2,456 7.4%
EBIT 1,893 2,398 -21.1% 1,812 4.5%
PAT 1,317 1,550 -15.1% 1,518 -13.3% Key Things to Look For: Volume growth & Euro-INR rate
EPS 13.6 16.0 -15.1% 15.7 -13.3%
1QFY17 Earnings Preview
July 12, 2016 Page 9 of 46
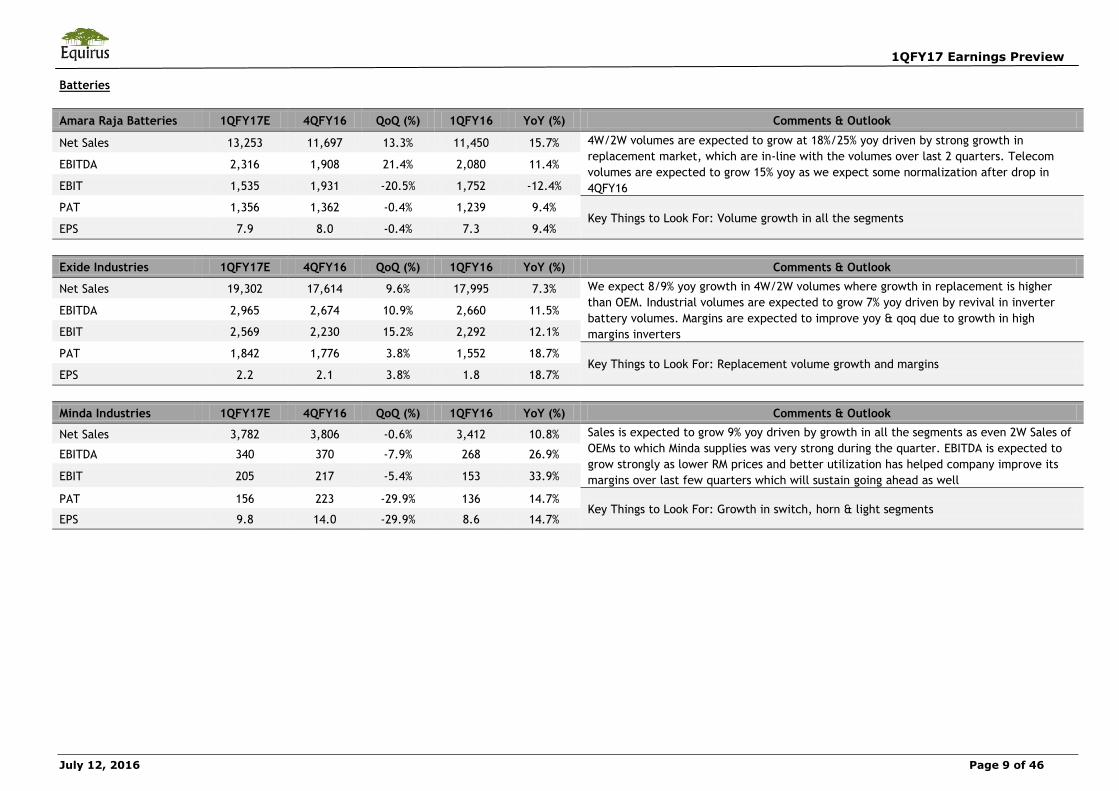
Batteries
Amara Raja Batteries 1QFY17E 4QFY16 QoQ (%) 1QFY16 YoY (%) Comments & Outlook
Net Sales 13,253 11,697 13.3% 11,450 15.7% 4W/2W volumes are expected to grow at 18%/25% yoy driven by strong growth in
replacement market, which are in-line with the volumes over last 2 quarters. Telecom
volumes are expected to grow 15% yoy as we expect some normalization after drop in
4QFY16
EBITDA 2,316 1,908 21.4% 2,080 11.4%
EBIT 1,535 1,931 -20.5% 1,752 -12.4%
PAT 1,356 1,362 -0.4% 1,239 9.4% Key Things to Look For: Volume growth in all the segments
EPS 7.9 8.0 -0.4% 7.3 9.4%
Exide Industries 1QFY17E 4QFY16 QoQ (%) 1QFY16 YoY (%) Comments & Outlook
Net Sales 19,302 17,614 9.6% 17,995 7.3% We expect 8/9% yoy growth in 4W/2W volumes where growth in replacement is higher
than OEM. Industrial volumes are expected to grow 7% yoy driven by revival in inverter
battery volumes. Margins are expected to improve yoy & qoq due to growth in high
margins inverters
EBITDA 2,965 2,674 10.9% 2,660 11.5%
EBIT 2,569 2,230 15.2% 2,292 12.1%
PAT 1,842 1,776 3.8% 1,552 18.7% Key Things to Look For: Replacement volume growth and margins
EPS 2.2 2.1 3.8% 1.8 18.7%
Minda Industries 1QFY17E 4QFY16 QoQ (%) 1QFY16 YoY (%) Comments & Outlook
Net Sales 3,782 3,806 -0.6% 3,412 10.8% Sales is expected to grow 9% yoy driven by growth in all the segments as even 2W Sales of
OEMs to which Minda supplies was very strong during the quarter. EBITDA is expected to
grow strongly as lower RM prices and better utilization has helped company improve its
margins over last few quarters which will sustain going ahead as well
EBITDA 340 370 -7.9% 268 26.9%
EBIT 205 217 -5.4% 153 33.9%
PAT 156 223 -29.9% 136 14.7% Key Things to Look For: Growth in switch, horn & light segments
EPS 9.8 14.0 -29.9% 8.6 14.7%

1QFY17 Earnings Preview
July 12, 2016 Page 10 of 46
Automobiles
Atul Auto 1QFY17E 4QFY16 QoQ (%) 1QFY16 YoY (%) Comments & Outlook
Net Sales 930 1,297 -28.3% 1,068 -12.9% Volumes have declined 14% yoy due to VAT issues in its largest market during the month
of April and demand weakness in Gujarat and Northern markets where Atul is stronger.
This will lead to Sales as well as PAT decline yoy EBITDA 106 173 -38.8% 119 -10.8%
EBIT 91 160 -43.2% 106 -13.8%
PAT 62 109 -42.6% 71 -12.3% Key Things to Look For: Gross margins
EPS 2.8 4.8 -42.6% 3.2 -14.1%
Bajaj Auto 1QFY17E 4QFY16 QoQ (%) 1QFY16 YoY (%) Comments & Outlook
Net Sales 59,480 54,114 9.9% 56,135 6.0% Domestic 2W/3W volumes improved 13%/48% but export 2W/3W volumes declined
17%/46% due to demand and currency availability issues in Africa. Export is expected to
contribute 36% of total Sales vs. 47% last year. We expect EBITDAM to contract 28bps qoq
due to poor mix
EBITDA 12,491 11,515 8.5% 11,397 9.6%
EBIT 11,706 10,754 8.8% 10,612 10.3%
PAT 9,588 8,031 19.4% 10,148 -5.5% Key Things to Look For: Margins
EPS 33.1 27.8 19.4% 35.1 -5.5%
Eicher Consol 1QFY17E 5QFY16 QoQ (%) 2QFY16 YoY (%) Comments & Outlook
Net Sales 37,093 37,649 -1.5% 29,167 27.2% RE volumes have grown 38% yoy, we expect EBITDAM to expand 278bps yoy due to RM
benefits and operating leverage. VECV volumes have grown 34% yoy led by growth in HD
and LMD segments, we expect subsidiary EBITDAM to improve 29bps yoy due to benefits of
operating leverage
EBITDA 6,211 6,399 -2.9% 4,316 43.9%
EBIT 5,123 5,313 -3.6% 3,522 45.5%
PAT 3,396 3,345 1.5% 2,218 53.1% Key Things to Look For: EBITDA Margins
EPS 125.3 123.4 1.5% 81.9 53.1%
Hero Motocorp 1QFY17E 4QFY16 QoQ (%) 1QFY16 YoY (%) Comments & Outlook
Net Sales 76,345 75,122 1.6% 69,553 9.8% Volumes have grown 6% yoy due to strong volume growth during the month of led driven
by demand revival in rural pockets. Margins are expected to improve 140bps yoy due to
gross margin expansion, margins will also likely improve 81bps qoq as marketing and other
expenses are lower in 1Q
EBITDA 12,567 11,758 6.9% 10,479 19.9%
EBIT 11,388 10,604 7.4% 9,449 20.5%
PAT 8,728 8,142 7.2% 7,503 16.3% Key Things to Look For: Margins
EPS 43.7 40.8 7.2% 37.6 16.3%
1QFY17 Earnings Preview
July 12, 2016 Page 11 of 46
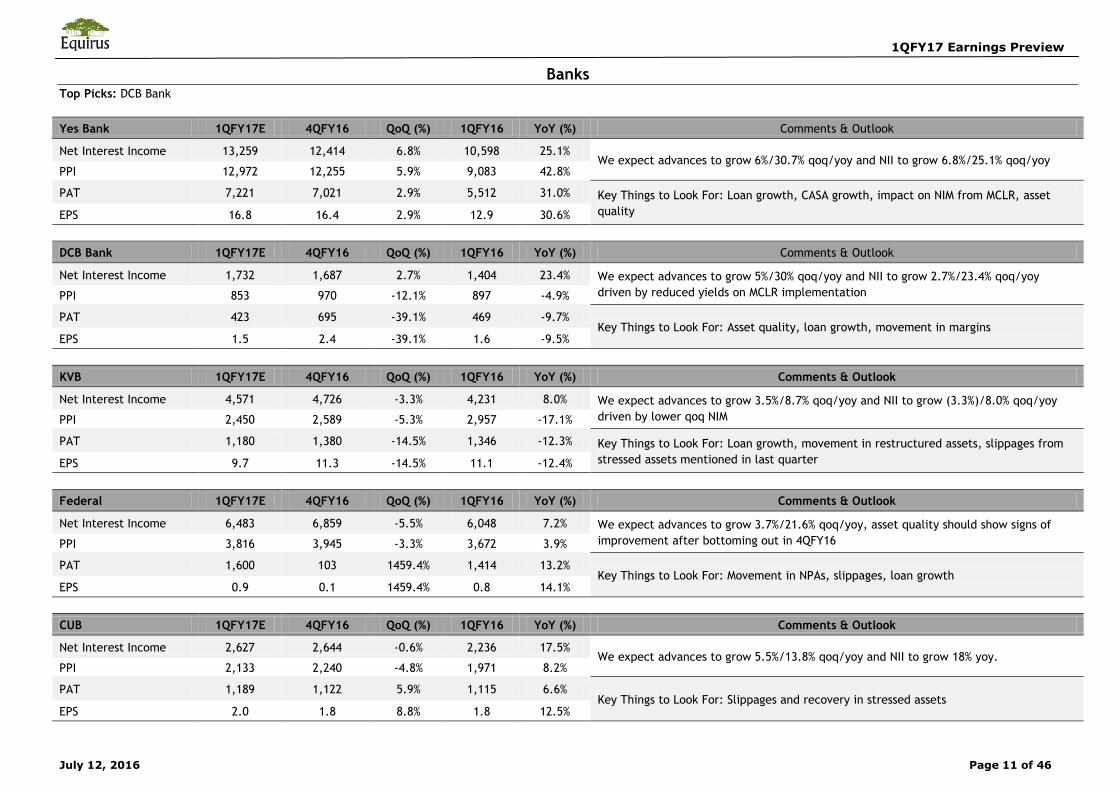
Banks
Top Picks: DCB Bank
Yes Bank 1QFY17E 4QFY16 QoQ (%) 1QFY16 YoY (%) Comments & Outlook
Net Interest Income 13,259 12,414 6.8% 10,598 25.1% We expect advances to grow 6%/30.7% qoq/yoy and NII to grow 6.8%/25.1% qoq/yoy
PPI 12,972 12,255 5.9% 9,083 42.8%
PAT 7,221 7,021 2.9% 5,512 31.0% Key Things to Look For: Loan growth, CASA growth, impact on NIM from MCLR, asset
quality EPS 16.8 16.4 2.9% 12.9 30.6%
DCB Bank 1QFY17E 4QFY16 QoQ (%) 1QFY16 YoY (%) Comments & Outlook
Net Interest Income 1,732 1,687 2.7% 1,404 23.4% We expect advances to grow 5%/30% qoq/yoy and NII to grow 2.7%/23.4% qoq/yoy
driven by reduced yields on MCLR implementation PPI 853 970 -12.1% 897 -4.9%
PAT 423 695 -39.1% 469 -9.7% Key Things to Look For: Asset quality, loan growth, movement in margins
EPS 1.5 2.4 -39.1% 1.6 -9.5%
KVB 1QFY17E 4QFY16 QoQ (%) 1QFY16 YoY (%) Comments & Outlook
Net Interest Income 4,571 4,726 -3.3% 4,231 8.0% We expect advances to grow 3.5%/8.7% qoq/yoy and NII to grow (3.3%)/8.0% qoq/yoy
driven by lower qoq NIM PPI 2,450 2,589 -5.3% 2,957 -17.1%
PAT 1,180 1,380 -14.5% 1,346 -12.3% Key Things to Look For: Loan growth, movement in restructured assets, slippages from
stressed assets mentioned in last quarter EPS 9.7 11.3 -14.5% 11.1 -12.4%
Federal 1QFY17E 4QFY16 QoQ (%) 1QFY16 YoY (%) Comments & Outlook
Net Interest Income 6,483 6,859 -5.5% 6,048 7.2% We expect advances to grow 3.7%/21.6% qoq/yoy, asset quality should show signs of
improvement after bottoming out in 4QFY16 PPI 3,816 3,945 -3.3% 3,672 3.9%
PAT 1,600 103 1459.4% 1,414 13.2% Key Things to Look For: Movement in NPAs, slippages, loan growth
EPS 0.9 0.1 1459.4% 0.8 14.1%
CUB 1QFY17E 4QFY16 QoQ (%) 1QFY16 YoY (%) Comments & Outlook
Net Interest Income 2,627 2,644 -0.6% 2,236 17.5% We expect advances to grow 5.5%/13.8% qoq/yoy and NII to grow 18% yoy.
PPI 2,133 2,240 -4.8% 1,971 8.2%
PAT 1,189 1,122 5.9% 1,115 6.6% Key Things to Look For: Slippages and recovery in stressed assets
EPS 2.0 1.8 8.8% 1.8 12.5%
1QFY17 Earnings Preview
July 12, 2016 Page 12 of 46
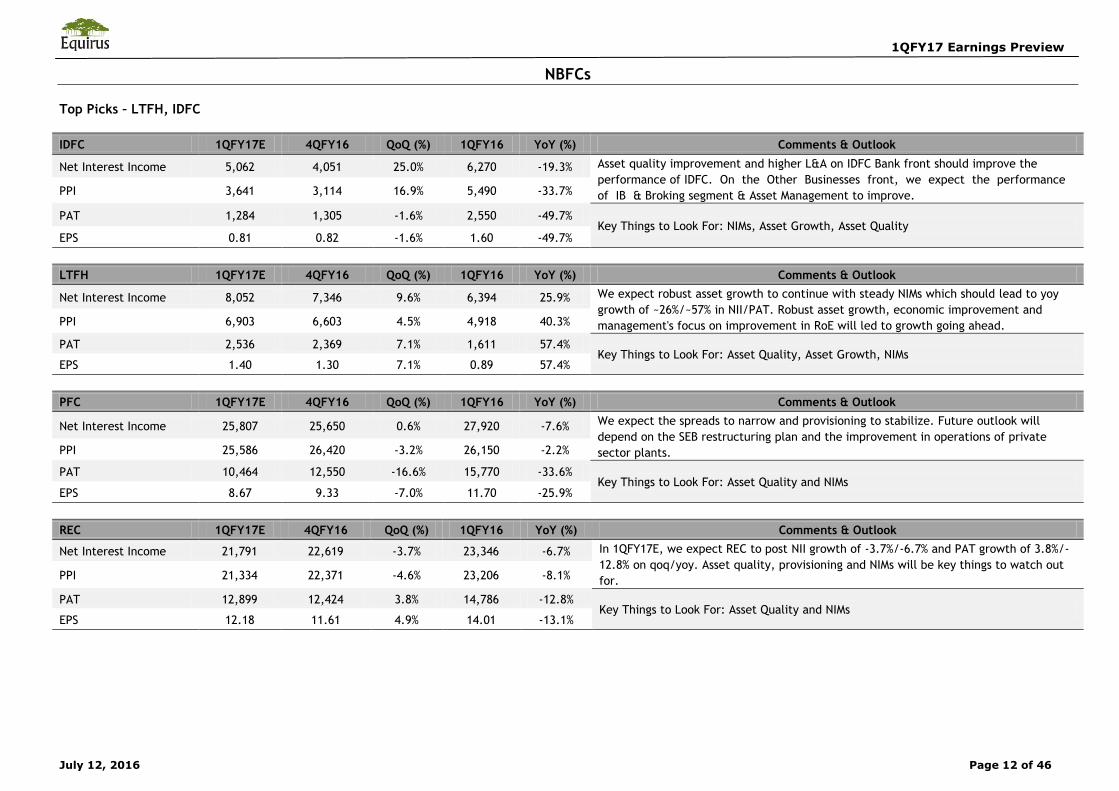
NBFCs
Top Picks – LTFH, IDFC
IDFC 1QFY17E 4QFY16 QoQ (%) 1QFY16 YoY (%) Comments & Outlook
Net Interest Income 5,062 4,051 25.0% 6,270 -19.3% Asset quality improvement and higher L&A on IDFC Bank front should improve the
performance of IDFC. On the Other Businesses front, we expect the performance
of IB & Broking segment & Asset Management to improve. PPI 3,641 3,114 16.9% 5,490 -33.7%
PAT 1,284 1,305 -1.6% 2,550 -49.7% Key Things to Look For: NIMs, Asset Growth, Asset Quality
EPS 0.81 0.82 -1.6% 1.60 -49.7%
LTFH 1QFY17E 4QFY16 QoQ (%) 1QFY16 YoY (%) Comments & Outlook
Net Interest Income 8,052 7,346 9.6% 6,394 25.9% We expect robust asset growth to continue with steady NIMs which should lead to yoy
growth of ~26%/~57% in NII/PAT. Robust asset growth, economic improvement and
management's focus on improvement in RoE will led to growth going ahead. PPI 6,903 6,603 4.5% 4,918 40.3%
PAT 2,536 2,369 7.1% 1,611 57.4% Key Things to Look For: Asset Quality, Asset Growth, NIMs
EPS 1.40 1.30 7.1% 0.89 57.4%
PFC 1QFY17E 4QFY16 QoQ (%) 1QFY16 YoY (%) Comments & Outlook
Net Interest Income 25,807 25,650 0.6% 27,920 -7.6% We expect the spreads to narrow and provisioning to stabilize. Future outlook will
depend on the SEB restructuring plan and the improvement in operations of private
sector plants. PPI 25,586 26,420 -3.2% 26,150 -2.2%
PAT 10,464 12,550 -16.6% 15,770 -33.6% Key Things to Look For: Asset Quality and NIMs
EPS 8.67 9.33 -7.0% 11.70 -25.9%
REC 1QFY17E 4QFY16 QoQ (%) 1QFY16 YoY (%) Comments & Outlook
Net Interest Income 21,791 22,619 -3.7% 23,346 -6.7% In 1QFY17E, we expect REC to post NII growth of -3.7%/-6.7% and PAT growth of 3.8%/-
12.8% on qoq/yoy. Asset quality, provisioning and NIMs will be key things to watch out
for. PPI 21,334 22,371 -4.6% 23,206 -8.1%
PAT 12,899 12,424 3.8% 14,786 -12.8% Key Things to Look For: Asset Quality and NIMs
EPS 12.18 11.61 4.9% 14.01 -13.1%
1QFY17 Earnings Preview
July 12, 2016 Page 13 of 46
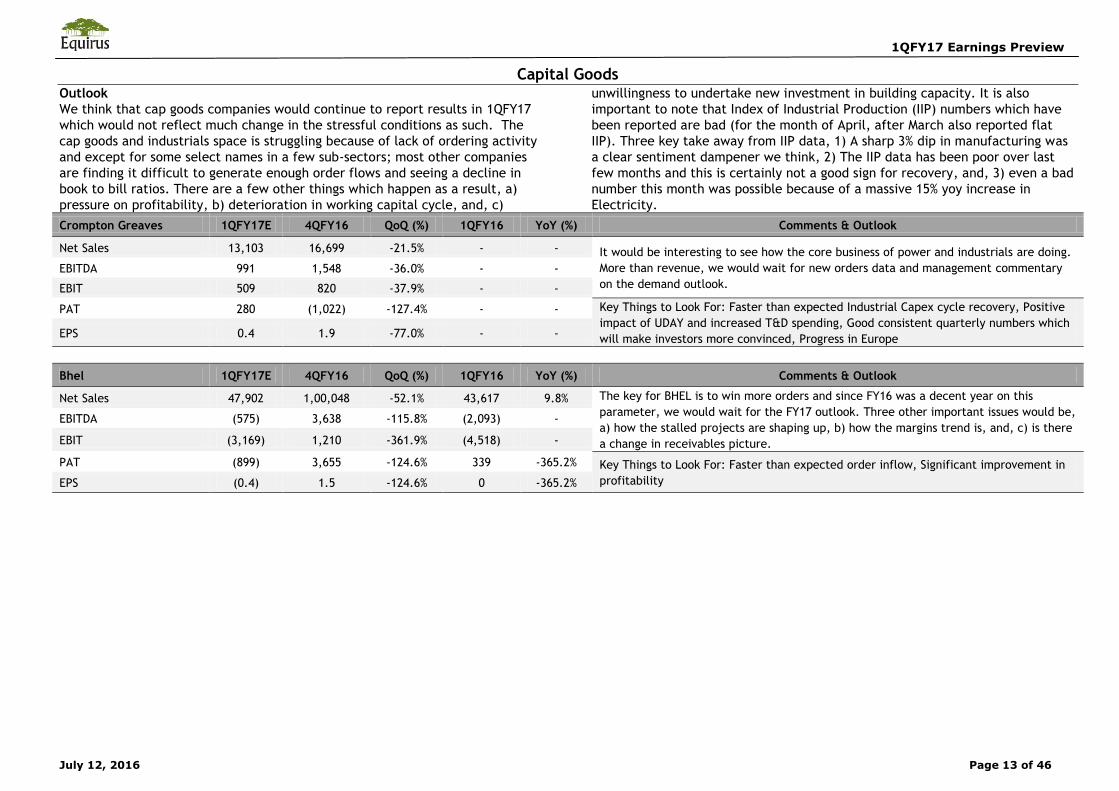
Capital GoodsOutlook
We think that cap goods companies would continue to report results in 1QFY17
which would not reflect much change in the stressful conditions as such. The
cap goods and industrials space is struggling because of lack of ordering activity
and except for some select names in a few sub-sectors; most other companies
are finding it difficult to generate enough order flows and seeing a decline in
book to bill ratios. There are a few other things which happen as a result, a)
pressure on profitability, b) deterioration in working capital cycle, and, c)
unwillingness to undertake new investment in building capacity. It is also
important to note that Index of Industrial Production (IIP) numbers which have
been reported are bad (for the month of April, after March also reported flat
IIP). Three key take away from IIP data, 1) A sharp 3% dip in manufacturing was
a clear sentiment dampener we think, 2) The IIP data has been poor over last
few months and this is certainly not a good sign for recovery, and, 3) even a bad
number this month was possible because of a massive 15% yoy increase in
Electricity.
Crompton Greaves 1QFY17E 4QFY16 QoQ (%) 1QFY16 YoY (%) Comments & Outlook
Net Sales 13,103 16,699 -21.5% - - It would be interesting to see how the core business of power and industrials are doing.
More than revenue, we would wait for new orders data and management commentary
on the demand outlook. EBITDA 991 1,548 -36.0% - -
EBIT 509 820 -37.9% - -
PAT 280 (1,022) -127.4% - - Key Things to Look For: Faster than expected Industrial Capex cycle recovery, Positive
impact of UDAY and increased T&D spending, Good consistent quarterly numbers which
will make investors more convinced, Progress in Europe EPS 0.4 1.9 -77.0% - -
Bhel 1QFY17E 4QFY16 QoQ (%) 1QFY16 YoY (%) Comments & Outlook
Net Sales 47,902 1,00,048 -52.1% 43,617 9.8% The key for BHEL is to win more orders and since FY16 was a decent year on this
parameter, we would wait for the FY17 outlook. Three other important issues would be,
a) how the stalled projects are shaping up, b) how the margins trend is, and, c) is there
a change in receivables picture.
EBITDA (575) 3,638 -115.8% (2,093) -
EBIT (3,169) 1,210 -361.9% (4,518) -
PAT (899) 3,655 -124.6% 339 -365.2% Key Things to Look For: Faster than expected order inflow, Significant improvement in
profitability EPS (0.4) 1.5 -124.6% 0 -365.2%
1QFY17 Earnings Preview
July 12, 2016 Page 14 of 46
ConstructionOutlook
Government has awarded projects covering ~13,000kms since it took office in
May’14. For FY17, total award target has been set at 25,000kms. NHAI has
awarded projects covering 4,171kms in FY16 vs. 3,060kms in FY15 & 1,437kms in
FY14. NHAI is targeting to construct 8,000kms for FY17 while MORTH+NHIDCL are
targeting 7,000kms. Total target for construction is 15,000kms vs. 6,000kms in
FY16. Additionally more than 1,000 projects covering 32,000kms are being
planned for improvement & construction. NHAI, MORTH and NHIDCL order
pipelines continue to remain buoyant with most of the upcoming projects being
in the EPC mode while the BOT space is seeing a smaller project pipeline.
Hybrid Annuity project pipeline remains robust with ~27 projects worth Rs.
347bn covering 1,815 kms being already lined up for next 6 months. State
projects in UP, Chhattisgarh and Bihar are expected to come up in next 12
months. Most of the players continue to stick their core competency of doing
EPC business in order to repair their stretched balance sheets but this has
resulted in over-crowding in the EPC space. We expect competition to continue
in the EPC & Hybrid segment but believe that the pie is large enough for all the
players to win enough orders for the coming 24 months. The BOT space is not
going to see that much competitive intensity for next 12/18 months and would
see bidding from 5-6 players only (case to case basis). In this space we are
bullish on Ashoka Buildcon, Sadbhav Engineering, PNC Infratech and Sadbhav
Infra
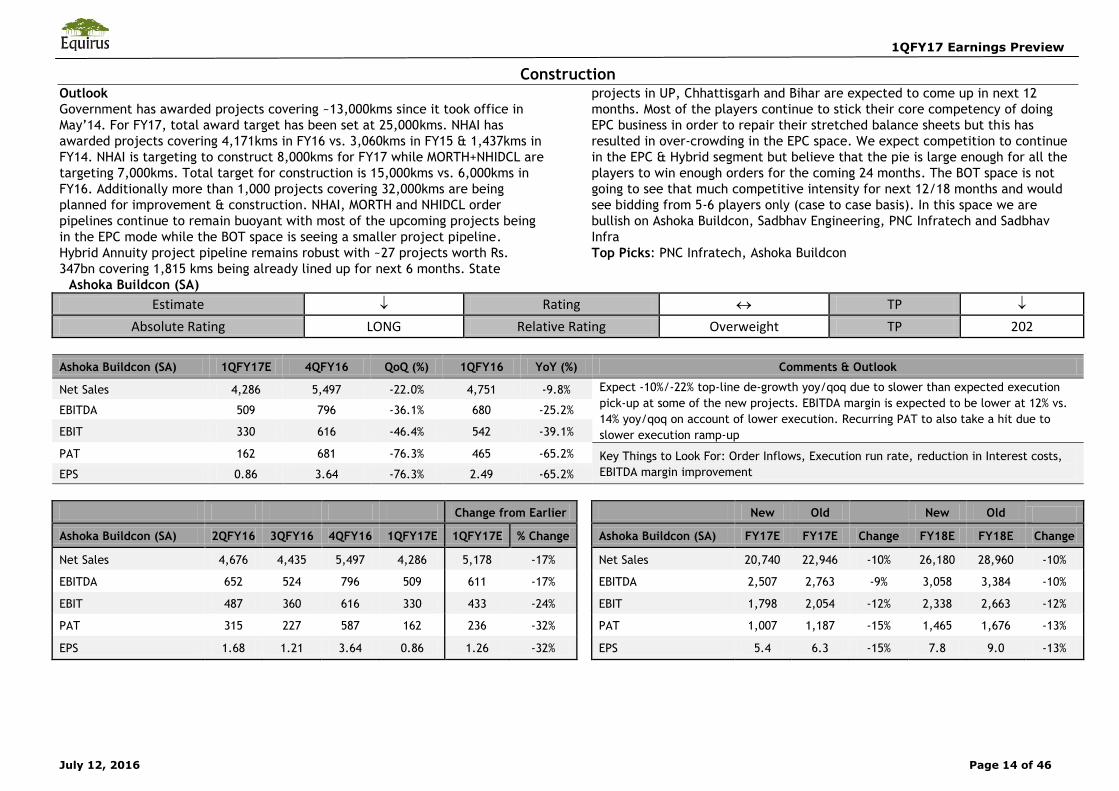
Top Picks: PNC Infratech, Ashoka Buildcon
Ashoka Buildcon (SA)
Estimate Rating TP
Absolute Rating LONG Relative Rating Overweight TP 202
Ashoka Buildcon (SA) 1QFY17E 4QFY16 QoQ (%) 1QFY16 YoY (%) Comments & Outlook
Net Sales 4,286 5,497 -22.0% 4,751 -9.8% Expect -10%/-22% top-line de-growth yoy/qoq due to slower than expected execution
pick-up at some of the new projects. EBITDA margin is expected to be lower at 12% vs.
14% yoy/qoq on account of lower execution. Recurring PAT to also take a hit due to
slower execution ramp-up
EBITDA 509 796 -36.1% 680 -25.2%
EBIT 330 616 -46.4% 542 -39.1%
PAT 162 681 -76.3% 465 -65.2% Key Things to Look For: Order Inflows, Execution run rate, reduction in Interest costs,
EBITDA margin improvement EPS 0.86 3.64 -76.3% 2.49 -65.2%
Change from Earlier
New Old
New Old
Ashoka Buildcon (SA) 2QFY16 3QFY16 4QFY16 1QFY17E 1QFY17E % Change
Ashoka Buildcon (SA) FY17E FY17E Change FY18E FY18E Change
Net Sales 4,676 4,435 5,497 4,286 5,178 -17%
Net Sales 20,740 22,946 -10% 26,180 28,960 -10%
EBITDA 652 524 796 509 611 -17%
EBITDA 2,507 2,763 -9% 3,058 3,384 -10%
EBIT 487 360 616 330 433 -24%
EBIT 1,798 2,054 -12% 2,338 2,663 -12%
PAT 315 227 587 162 236 -32%
PAT 1,007 1,187 -15% 1,465 1,676 -13%
EPS 1.68 1.21 3.64 0.86 1.26 -32%
EPS 5.4 6.3 -15% 7.8 9.0 -13%
1QFY17 Earnings Preview
July 12, 2016 Page 15 of 46
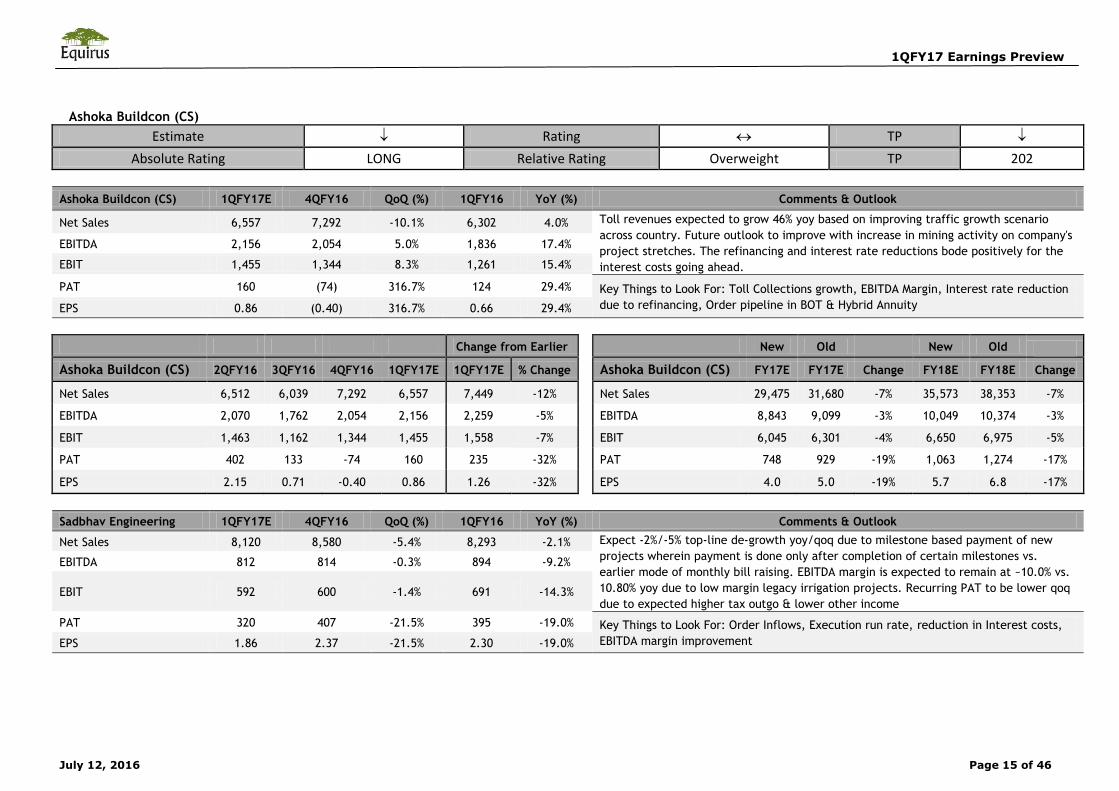
Ashoka Buildcon (CS)
Estimate Rating TP
Absolute Rating LONG Relative Rating Overweight TP 202
Ashoka Buildcon (CS) 1QFY17E 4QFY16 QoQ (%) 1QFY16 YoY (%) Comments & Outlook
Net Sales 6,557 7,292 -10.1% 6,302 4.0% Toll revenues expected to grow 46% yoy based on improving traffic growth scenario
across country. Future outlook to improve with increase in mining activity on company's
project stretches. The refinancing and interest rate reductions bode positively for the
interest costs going ahead.
EBITDA 2,156 2,054 5.0% 1,836 17.4%
EBIT 1,455 1,344 8.3% 1,261 15.4%
PAT 160 (74) 316.7% 124 29.4% Key Things to Look For: Toll Collections growth, EBITDA Margin, Interest rate reduction
due to refinancing, Order pipeline in BOT & Hybrid Annuity EPS 0.86 (0.40) 316.7% 0.66 29.4%
Change from Earlier
New Old
New Old
Ashoka Buildcon (CS) 2QFY16 3QFY16 4QFY16 1QFY17E 1QFY17E % Change
Ashoka Buildcon (CS) FY17E FY17E Change FY18E FY18E Change
Net Sales 6,512 6,039 7,292 6,557 7,449 -12%
Net Sales 29,475 31,680 -7% 35,573 38,353 -7%
EBITDA 2,070 1,762 2,054 2,156 2,259 -5%
EBITDA 8,843 9,099 -3% 10,049 10,374 -3%
EBIT 1,463 1,162 1,344 1,455 1,558 -7%
EBIT 6,045 6,301 -4% 6,650 6,975 -5%
PAT 402 133 -74 160 235 -32%
PAT 748 929 -19% 1,063 1,274 -17%
EPS 2.15 0.71 -0.40 0.86 1.26 -32%
EPS 4.0 5.0 -19% 5.7 6.8 -17%
Sadbhav Engineering 1QFY17E 4QFY16 QoQ (%) 1QFY16 YoY (%) Comments & Outlook
Net Sales 8,120 8,580 -5.4% 8,293 -2.1% Expect -2%/-5% top-line de-growth yoy/qoq due to milestone based payment of new
projects wherein payment is done only after completion of certain milestones vs.
earlier mode of monthly bill raising. EBITDA margin is expected to remain at ~10.0% vs.
10.80% yoy due to low margin legacy irrigation projects. Recurring PAT to be lower qoq
due to expected higher tax outgo & lower other income
EBITDA 812 814 -0.3% 894 -9.2%
EBIT 592 600 -1.4% 691 -14.3%
PAT 320 407 -21.5% 395 -19.0% Key Things to Look For: Order Inflows, Execution run rate, reduction in Interest costs,
EBITDA margin improvement EPS 1.86 2.37 -21.5% 2.30 -19.0%
1QFY17 Earnings Preview
July 12, 2016 Page 16 of 46
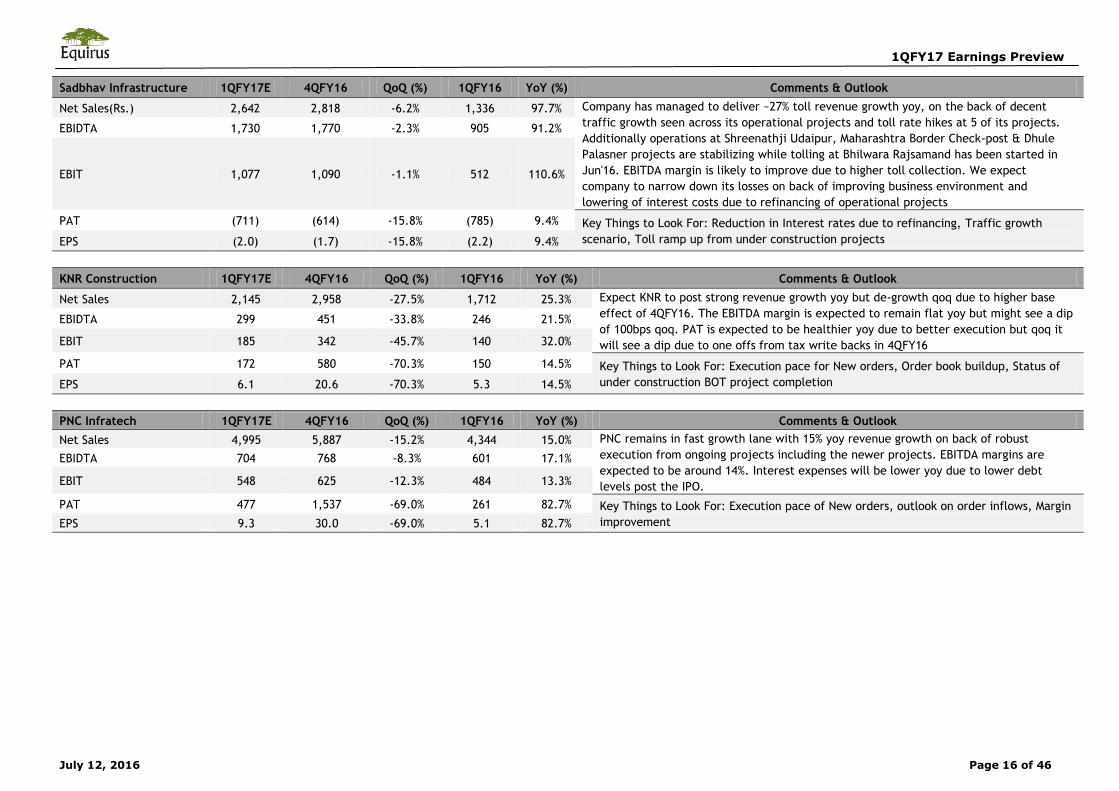
Sadbhav Infrastructure 1QFY17E 4QFY16 QoQ (%) 1QFY16 YoY (%) Comments & Outlook
Net Sales(Rs.) 2,642 2,818 -6.2% 1,336 97.7% Company has managed to deliver ~27% toll revenue growth yoy, on the back of decent
traffic growth seen across its operational projects and toll rate hikes at 5 of its projects.
Additionally operations at Shreenathji Udaipur, Maharashtra Border Check-post & Dhule
Palasner projects are stabilizing while tolling at Bhilwara Rajsamand has been started in
Jun'16. EBITDA margin is likely to improve due to higher toll collection. We expect
company to narrow down its losses on back of improving business environment and
lowering of interest costs due to refinancing of operational projects
EBIDTA 1,730 1,770 -2.3% 905 91.2%
EBIT 1,077 1,090 -1.1% 512 110.6%
PAT (711) (614) -15.8% (785) 9.4% Key Things to Look For: Reduction in Interest rates due to refinancing, Traffic growth
scenario, Toll ramp up from under construction projects EPS (2.0) (1.7) -15.8% (2.2) 9.4% KNR Construction 1QFY17E 4QFY16 QoQ (%) 1QFY16 YoY (%) Comments & Outlook
Net Sales 2,145 2,958 -27.5% 1,712 25.3% Expect KNR to post strong revenue growth yoy but de-growth qoq due to higher base
effect of 4QFY16. The EBITDA margin is expected to remain flat yoy but might see a dip
of 100bps qoq. PAT is expected to be healthier yoy due to better execution but qoq it
will see a dip due to one offs from tax write backs in 4QFY16
EBIDTA 299 451 -33.8% 246 21.5%
EBIT 185 342 -45.7% 140 32.0%
PAT 172 580 -70.3% 150 14.5% Key Things to Look For: Execution pace for New orders, Order book buildup, Status of
under construction BOT project completion EPS 6.1 20.6 -70.3% 5.3 14.5% PNC Infratech 1QFY17E 4QFY16 QoQ (%) 1QFY16 YoY (%) Comments & Outlook
Net Sales 4,995 5,887 -15.2% 4,344 15.0% PNC remains in fast growth lane with 15% yoy revenue growth on back of robust
execution from ongoing projects including the newer projects. EBITDA margins are
expected to be around 14%. Interest expenses will be lower yoy due to lower debt
levels post the IPO.
EBIDTA 704 768 -8.3% 601 17.1%
EBIT 548 625 -12.3% 484 13.3%
PAT 477 1,537 -69.0% 261 82.7% Key Things to Look For: Execution pace of New orders, outlook on order inflows, Margin
improvement EPS 9.3 30.0 -69.0% 5.1 82.7%
1QFY17 Earnings Preview
July 12, 2016 Page 17 of 46
Chemicals & Diversified Manufacturing
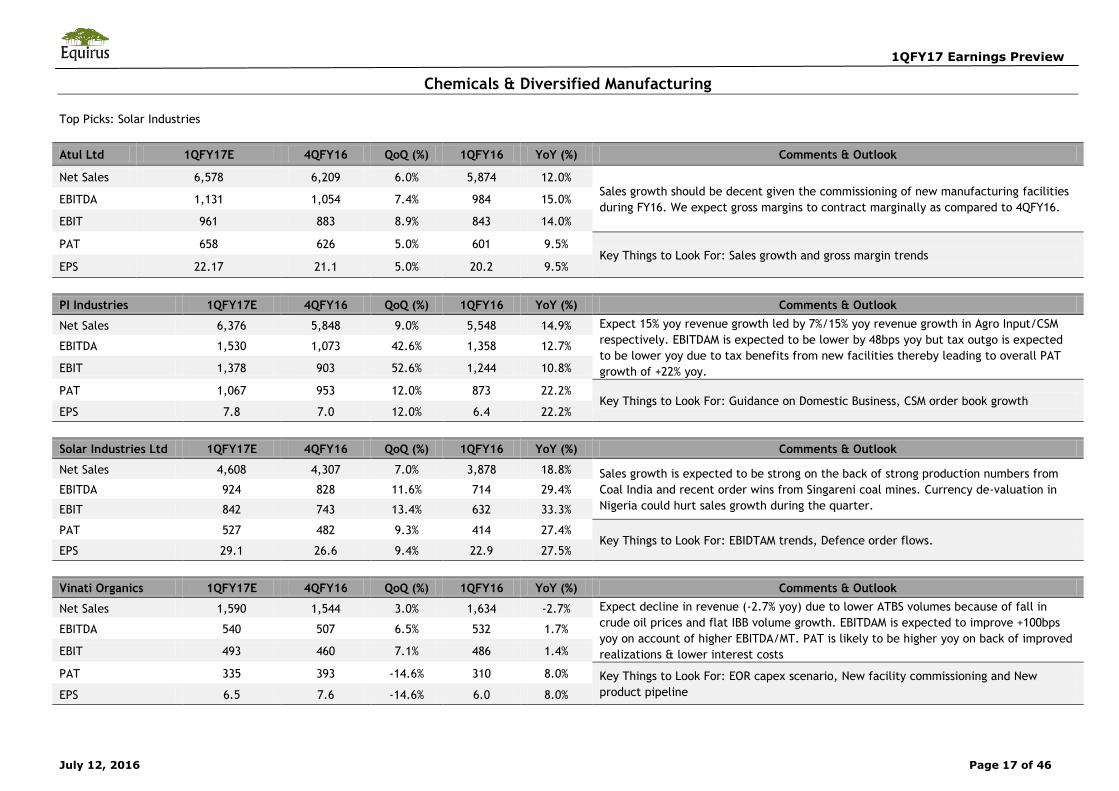
Top Picks: Solar Industries
Atul Ltd 1QFY17E 4QFY16 QoQ (%) 1QFY16 YoY (%) Comments & Outlook
Net Sales 6,578 6,209 6.0% 5,874 12.0% Sales growth should be decent given the commissioning of new manufacturing facilities
during FY16. We expect gross margins to contract marginally as compared to 4QFY16. EBITDA 1,131 1,054 7.4% 984 15.0%
EBIT 961 883 8.9% 843 14.0%
PAT 658 626 5.0% 601 9.5% Key Things to Look For: Sales growth and gross margin trends
EPS 22.17 21.1 5.0% 20.2 9.5%
PI Industries 1QFY17E 4QFY16 QoQ (%) 1QFY16 YoY (%) Comments & Outlook
Net Sales 6,376 5,848 9.0% 5,548 14.9% Expect 15% yoy revenue growth led by 7%/15% yoy revenue growth in Agro Input/CSM
respectively. EBITDAM is expected to be lower by 48bps yoy but tax outgo is expected
to be lower yoy due to tax benefits from new facilities thereby leading to overall PAT
growth of +22% yoy.
EBITDA 1,530 1,073 42.6% 1,358 12.7%
EBIT 1,378 903 52.6% 1,244 10.8%
PAT 1,067 953 12.0% 873 22.2% Key Things to Look For: Guidance on Domestic Business, CSM order book growth
EPS 7.8 7.0 12.0% 6.4 22.2%
Solar Industries Ltd 1QFY17E 4QFY16 QoQ (%) 1QFY16 YoY (%) Comments & Outlook
Net Sales 4,608 4,307 7.0% 3,878 18.8% Sales growth is expected to be strong on the back of strong production numbers from
Coal India and recent order wins from Singareni coal mines. Currency de-valuation in
Nigeria could hurt sales growth during the quarter. EBITDA 924 828 11.6% 714 29.4%
EBIT 842 743 13.4% 632 33.3%
PAT 527 482 9.3% 414 27.4% Key Things to Look For: EBIDTAM trends, Defence order flows.
EPS 29.1 26.6 9.4% 22.9 27.5%
Vinati Organics 1QFY17E 4QFY16 QoQ (%) 1QFY16 YoY (%) Comments & Outlook
Net Sales 1,590 1,544 3.0% 1,634 -2.7% Expect decline in revenue (-2.7% yoy) due to lower ATBS volumes because of fall in
crude oil prices and flat IBB volume growth. EBITDAM is expected to improve +100bps
yoy on account of higher EBITDA/MT. PAT is likely to be higher yoy on back of improved
realizations & lower interest costs
EBITDA 540 507 6.5% 532 1.7%
EBIT 493 460 7.1% 486 1.4%
PAT 335 393 -14.6% 310 8.0% Key Things to Look For: EOR capex scenario, New facility commissioning and New
product pipeline EPS 6.5 7.6 -14.6% 6.0 8.0%
1QFY17 Earnings Preview
July 12, 2016 Page 18 of 46
Consumer Goods Outlook
We believe that demand environment across all product categories have
started showing marginal recovery during 1QFY17. We expect strong margins
performance from Kajaria with EBITDAM of 19.5% (up ~260bps yoy) because
of lower power & fuel cost during 1QFY17. We expect EBITDA/PAT to grow
at 29%/35% yoy respectively. We expect CERA to post Sales/EBITDA/PAT
growth of 12%/14%/20% yoy respectively. We expect HSIL to post 5% top-line
growth aided by new product launches. PAT could grow by ~40% yoy due to
EBITDAM expansion & lower interest outgo. Pokarna is expected to deliver
yet another strong operational performance during 1QFY17 with PAT growth
of 37% yoy.
Subdued demand environment in the FMCG space will continue to weigh on
the performance of the companies and promotional activities are expected
to be reduced in categories like biscuits to protect margins. Amongst our
coverage we expect majority of the companies to post decent growth in
profitability driven by operating leverage and reduced promotional
activities. We expect volume growth for Britannia, Marico, Asian Paints and
P&G Hygiene. Our top picks in the sector are Britannia & P&G Hygiene
Among the Consumer Durable space, we believe that the companies with
presence in the air conditioners, air coolers and refrigerators categories
could witness strong volume growth on account of favorable weather
conditions. From our coverage universe, we expect Symphony Ltd and
Hitachi to register healthy volumes during the quarter.
We believe the momentum gained in volumes during 2HFY16 to continue in
1QFY17 as well. We expect healthy volumes for the companies in the wires
& cables space. We reiterate our positive stance on Finolex cables from our
coverage universe.
Top Picks: Finolex Cables, Britannia, P&G Hygiene, Cera Sanitaryware,
Pokarna, Navneet Education, HSIL
Asian Paints 1QFY17E 4QFY16 QoQ (%) 1QFY16 YoY (%) Comments & Outlook
Net Sales 39,988 39,713 0.7% 36,235 10.4% We expect volume growth to remain strong during the current quarter while gross
margins could decline marginally on qoq basis with the recent increase in prices of
crude oil. EBITDA 7,669 7,037 9.0% 6,835 12.2%
EBIT 6,822 6,284 8.6% 6,142 11.1%
PAT 4,796 4,088 17.3% 4,552 5.4% Key Things to Look For: Outlook on demand environment
EPS 5.0 4.3 17.3% 4.7 5.4%
Bajaj Corp 1QFY17E 4QFY16 QoQ (%) 1QFY16 YoY (%) Comments & Outlook
Net Sales 2,126 2,283 -6.9% 2,191 -3.0% We expect some pressure on the top-line on account of subdued demand environment in
rural markets. However, we expect margins to expand (yoy) mainly due to favorable
raw material prices. EBITDA 697 756 -7.7% 664 5.1%
EBIT 566 626 -9.5% 536 5.7%
PAT 502 540 -7.2% 475 5.6% Key Things to Look For: Outlook on demand environment
EPS 3.4 3.7 -7.2% 3.2 5.6%
Berger Paints 1QFY17E 4QFY16 QoQ (%) 1QFY16 YoY (%) Comments & Outlook
Net Sales 12,308 11,297 9.0% 11,212 9.8% We expect healthy top-line for the company in the current quarter. We expect margins
on yoy basis to improve on the back of favorable raw material prices and favorable
product mix. EBITDA 1,848 1,594 16.0% 1,494 23.7%
EBIT 1,593 1,344 18.6% 1,252 27.3%
PAT 1,098 928 18.4% 773 42.0% Key Things to Look For: Outlook on demand environment
EPS 1.6 1.3 18.5% 1.1 42.3%
1QFY17 Earnings Preview
July 12, 2016 Page 19 of 46
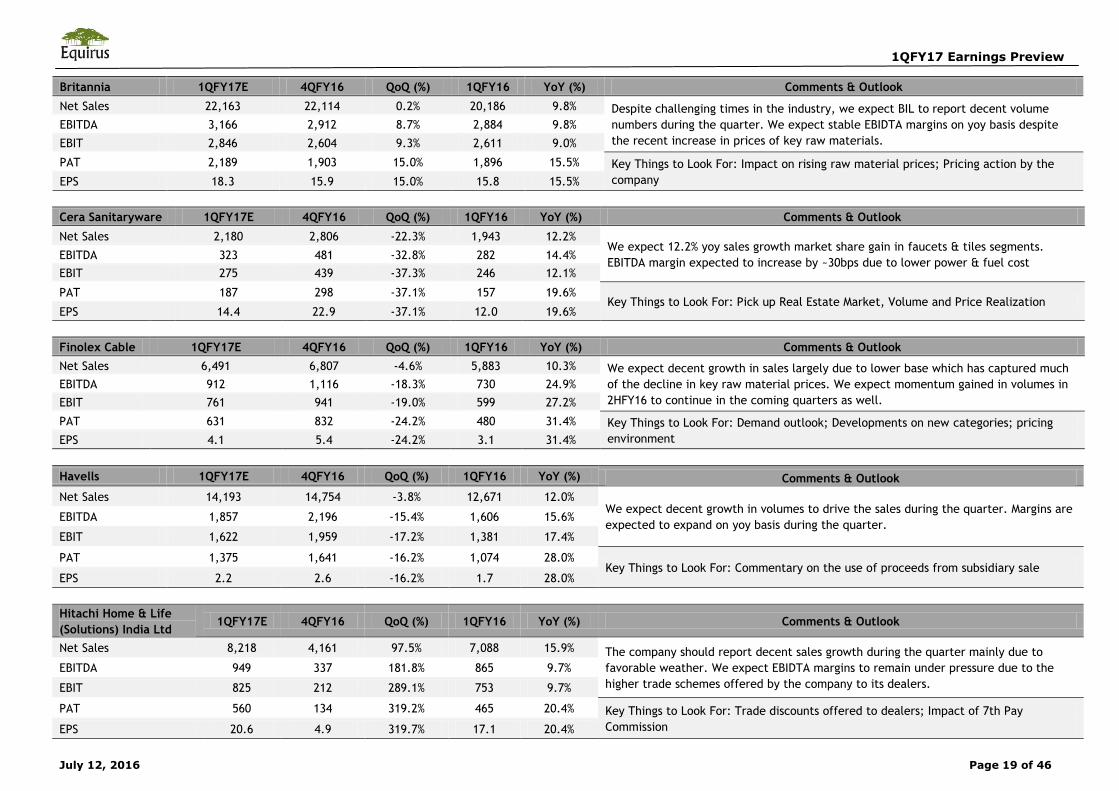
Britannia 1QFY17E 4QFY16 QoQ (%) 1QFY16 YoY (%) Comments & Outlook
Net Sales 22,163 22,114 0.2% 20,186 9.8% Despite challenging times in the industry, we expect BIL to report decent volume
numbers during the quarter. We expect stable EBIDTA margins on yoy basis despite
the recent increase in prices of key raw materials. EBITDA 3,166 2,912 8.7% 2,884 9.8% EBIT 2,846 2,604 9.3% 2,611 9.0%
PAT 2,189 1,903 15.0% 1,896 15.5% Key Things to Look For: Impact on rising raw material prices; Pricing action by the
company EPS 18.3 15.9 15.0% 15.8 15.5%
Cera Sanitaryware 1QFY17E 4QFY16 QoQ (%) 1QFY16 YoY (%) Comments & Outlook
Net Sales 2,180 2,806 -22.3% 1,943 12.2% We expect 12.2% yoy sales growth market share gain in faucets & tiles segments.
EBITDA margin expected to increase by ~30bps due to lower power & fuel cost EBITDA 323 481 -32.8% 282 14.4% EBIT 275 439 -37.3% 246 12.1%
PAT 187 298 -37.1% 157 19.6% Key Things to Look For: Pick up Real Estate Market, Volume and Price Realization
EPS 14.4 22.9 -37.1% 12.0 19.6% Finolex Cable 1QFY17E 4QFY16 QoQ (%) 1QFY16 YoY (%) Comments & Outlook
Net Sales 6,491 6,807 -4.6% 5,883 10.3% We expect decent growth in sales largely due to lower base which has captured much
of the decline in key raw material prices. We expect momentum gained in volumes in
2HFY16 to continue in the coming quarters as well. EBITDA 912 1,116 -18.3% 730 24.9% EBIT 761 941 -19.0% 599 27.2%
PAT 631 832 -24.2% 480 31.4% Key Things to Look For: Demand outlook; Developments on new categories; pricing
environment EPS 4.1 5.4 -24.2% 3.1 31.4%
Havells 1QFY17E 4QFY16 QoQ (%) 1QFY16 YoY (%) Comments & Outlook Net Sales 14,193 14,754 -3.8% 12,671 12.0%
We expect decent growth in volumes to drive the sales during the quarter. Margins are
expected to expand on yoy basis during the quarter. EBITDA 1,857 2,196 -15.4% 1,606 15.6%
EBIT 1,622 1,959 -17.2% 1,381 17.4%
PAT 1,375 1,641 -16.2% 1,074 28.0% Key Things to Look For: Commentary on the use of proceeds from subsidiary sale
EPS 2.2 2.6 -16.2% 1.7 28.0%
Hitachi Home & Life
(Solutions) India Ltd 1QFY17E 4QFY16 QoQ (%) 1QFY16 YoY (%) Comments & Outlook
Net Sales 8,218 4,161 97.5% 7,088 15.9% The company should report decent sales growth during the quarter mainly due to
favorable weather. We expect EBIDTA margins to remain under pressure due to the
higher trade schemes offered by the company to its dealers. EBITDA 949 337 181.8% 865 9.7%
EBIT 825 212 289.1% 753 9.7%
PAT 560 134 319.2% 465 20.4% Key Things to Look For: Trade discounts offered to dealers; Impact of 7th Pay
Commission EPS 20.6 4.9 319.7% 17.1 20.4%
1QFY17 Earnings Preview
July 12, 2016 Page 20 of 46
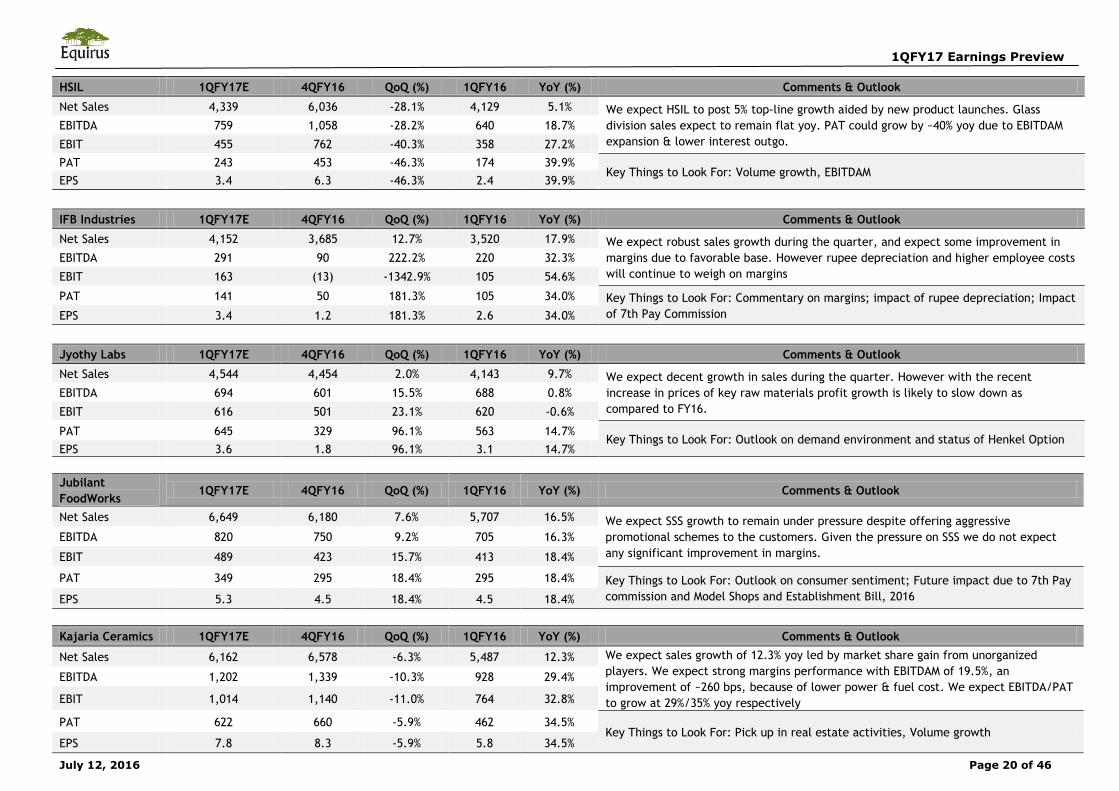
HSIL 1QFY17E 4QFY16 QoQ (%) 1QFY16 YoY (%) Comments & Outlook
Net Sales 4,339 6,036 -28.1% 4,129 5.1% We expect HSIL to post 5% top-line growth aided by new product launches. Glass
division sales expect to remain flat yoy. PAT could grow by ~40% yoy due to EBITDAM
expansion & lower interest outgo. EBITDA 759 1,058 -28.2% 640 18.7%
EBIT 455 762 -40.3% 358 27.2% PAT 243 453 -46.3% 174 39.9%
Key Things to Look For: Volume growth, EBITDAM EPS 3.4 6.3 -46.3% 2.4 39.9%
IFB Industries 1QFY17E 4QFY16 QoQ (%) 1QFY16 YoY (%) Comments & Outlook
Net Sales 4,152 3,685 12.7% 3,520 17.9% We expect robust sales growth during the quarter, and expect some improvement in
margins due to favorable base. However rupee depreciation and higher employee costs
will continue to weigh on margins EBITDA 291 90 222.2% 220 32.3%
EBIT 163 (13) -1342.9% 105 54.6%
PAT 141 50 181.3% 105 34.0% Key Things to Look For: Commentary on margins; impact of rupee depreciation; Impact
of 7th Pay Commission EPS 3.4 1.2 181.3% 2.6 34.0%
Jyothy Labs 1QFY17E 4QFY16 QoQ (%) 1QFY16 YoY (%) Comments & Outlook
Net Sales 4,544 4,454 2.0% 4,143 9.7% We expect decent growth in sales during the quarter. However with the recent
increase in prices of key raw materials profit growth is likely to slow down as
compared to FY16. EBITDA 694 601 15.5% 688 0.8%
EBIT 616 501 23.1% 620 -0.6%
PAT 645 329 96.1% 563 14.7% Key Things to Look For: Outlook on demand environment and status of Henkel Option
EPS 3.6 1.8 96.1% 3.1 14.7%
Jubilant
FoodWorks 1QFY17E 4QFY16 QoQ (%) 1QFY16 YoY (%) Comments & Outlook
Net Sales 6,649 6,180 7.6% 5,707 16.5% We expect SSS growth to remain under pressure despite offering aggressive
promotional schemes to the customers. Given the pressure on SSS we do not expect
any significant improvement in margins. EBITDA 820 750 9.2% 705 16.3%
EBIT 489 423 15.7% 413 18.4%
PAT 349 295 18.4% 295 18.4% Key Things to Look For: Outlook on consumer sentiment; Future impact due to 7th Pay
commission and Model Shops and Establishment Bill, 2016 EPS 5.3 4.5 18.4% 4.5 18.4%
Kajaria Ceramics 1QFY17E 4QFY16 QoQ (%) 1QFY16 YoY (%) Comments & Outlook
Net Sales 6,162 6,578 -6.3% 5,487 12.3% We expect sales growth of 12.3% yoy led by market share gain from unorganized
players. We expect strong margins performance with EBITDAM of 19.5%, an
improvement of ~260 bps, because of lower power & fuel cost. We expect EBITDA/PAT
to grow at 29%/35% yoy respectively
EBITDA 1,202 1,339 -10.3% 928 29.4%
EBIT 1,014 1,140 -11.0% 764 32.8%
PAT 622 660 -5.9% 462 34.5% Key Things to Look For: Pick up in real estate activities, Volume growth
EPS 7.8 8.3 -5.9% 5.8 34.5%
1QFY17 Earnings Preview
July 12, 2016 Page 21 of 46
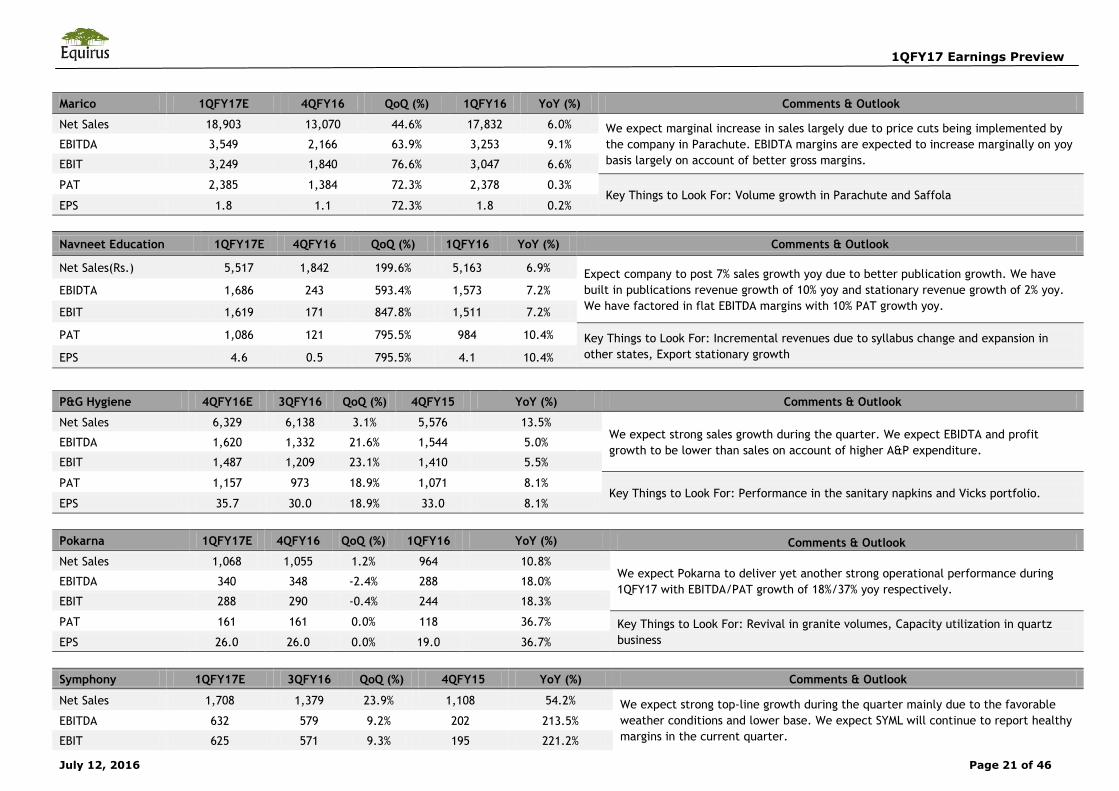
Marico 1QFY17E 4QFY16 QoQ (%) 1QFY16 YoY (%) Comments & Outlook
Net Sales 18,903 13,070 44.6% 17,832 6.0% We expect marginal increase in sales largely due to price cuts being implemented by
the company in Parachute. EBIDTA margins are expected to increase marginally on yoy
basis largely on account of better gross margins. EBITDA 3,549 2,166 63.9% 3,253 9.1%
EBIT 3,249 1,840 76.6% 3,047 6.6%
PAT 2,385 1,384 72.3% 2,378 0.3% Key Things to Look For: Volume growth in Parachute and Saffola
EPS 1.8 1.1 72.3% 1.8 0.2%
Navneet Education 1QFY17E 4QFY16 QoQ (%) 1QFY16 YoY (%) Comments & Outlook
Net Sales(Rs.) 5,517 1,842 199.6% 5,163 6.9% Expect company to post 7% sales growth yoy due to better publication growth. We have
built in publications revenue growth of 10% yoy and stationary revenue growth of 2% yoy.
We have factored in flat EBITDA margins with 10% PAT growth yoy. EBIDTA 1,686 243 593.4% 1,573 7.2%
EBIT 1,619 171 847.8% 1,511 7.2%
PAT 1,086 121 795.5% 984 10.4% Key Things to Look For: Incremental revenues due to syllabus change and expansion in
other states, Export stationary growth EPS 4.6 0.5 795.5% 4.1 10.4%
P&G Hygiene 4QFY16E 3QFY16 QoQ (%) 4QFY15 YoY (%) Comments & Outlook
Net Sales 6,329 6,138 3.1% 5,576 13.5% We expect strong sales growth during the quarter. We expect EBIDTA and profit
growth to be lower than sales on account of higher A&P expenditure. EBITDA 1,620 1,332 21.6% 1,544 5.0%
EBIT 1,487 1,209 23.1% 1,410 5.5%
PAT 1,157 973 18.9% 1,071 8.1% Key Things to Look For: Performance in the sanitary napkins and Vicks portfolio.
EPS 35.7 30.0 18.9% 33.0 8.1%
Pokarna 1QFY17E 4QFY16 QoQ (%) 1QFY16 YoY (%) Comments & Outlook Net Sales 1,068 1,055 1.2% 964 10.8%
We expect Pokarna to deliver yet another strong operational performance during
1QFY17 with EBITDA/PAT growth of 18%/37% yoy respectively. EBITDA 340 348 -2.4% 288 18.0%
EBIT 288 290 -0.4% 244 18.3%
PAT 161 161 0.0% 118 36.7% Key Things to Look For: Revival in granite volumes, Capacity utilization in quartz
business EPS 26.0 26.0 0.0% 19.0 36.7%
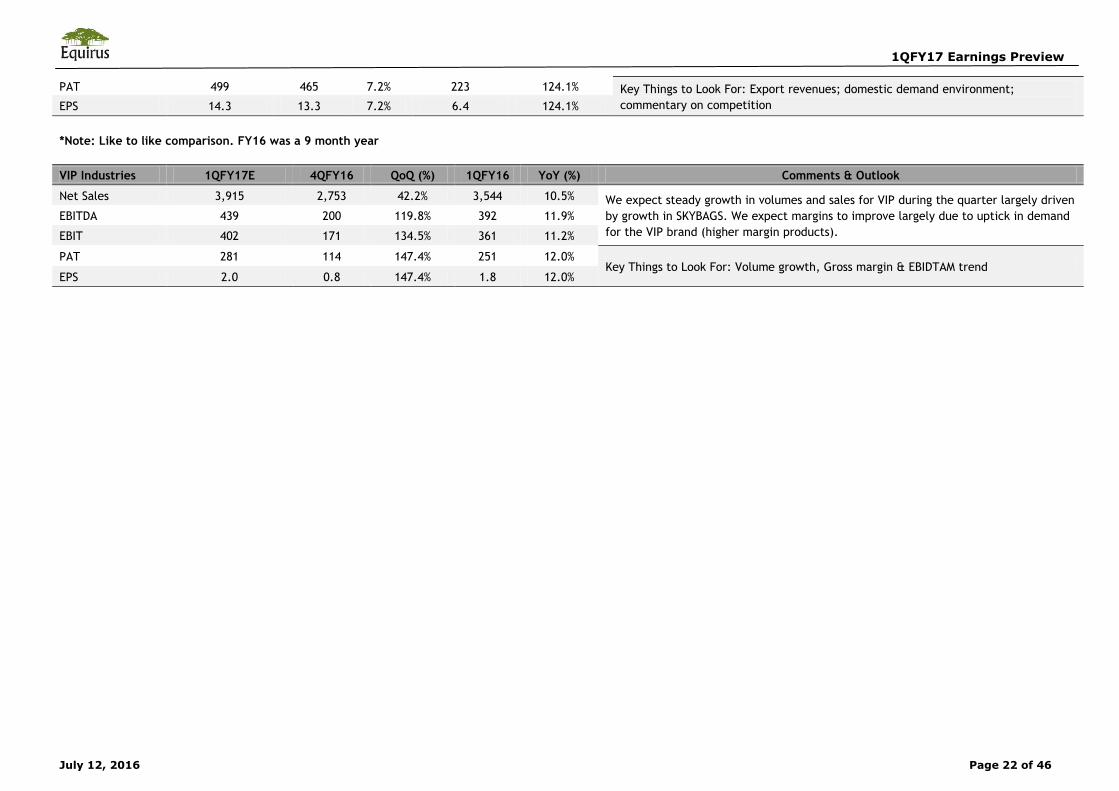
Symphony 1QFY17E 3QFY16 QoQ (%) 4QFY15 YoY (%) Comments & Outlook
Net Sales 1,708 1,379 23.9% 1,108 54.2% We expect strong top-line growth during the quarter mainly due to the favorable
weather conditions and lower base. We expect SYML will continue to report healthy
margins in the current quarter. EBITDA 632 579 9.2% 202 213.5%
EBIT 625 571 9.3% 195 221.2%
1QFY17 Earnings Preview
July 12, 2016 Page 22 of 46
PAT 499 465 7.2% 223 124.1% Key Things to Look For: Export revenues; domestic demand environment;
commentary on competition EPS 14.3 13.3 7.2% 6.4 124.1%
*Note: Like to like comparison. FY16 was a 9 month year
VIP Industries 1QFY17E 4QFY16 QoQ (%) 1QFY16 YoY (%) Comments & Outlook
Net Sales 3,915 2,753 42.2% 3,544 10.5% We expect steady growth in volumes and sales for VIP during the quarter largely driven
by growth in SKYBAGS. We expect margins to improve largely due to uptick in demand
for the VIP brand (higher margin products). EBITDA 439 200 119.8% 392 11.9%
EBIT 402 171 134.5% 361 11.2%
PAT 281 114 147.4% 251 12.0% Key Things to Look For: Volume growth, Gross margin & EBIDTAM trend
EPS 2.0 0.8 147.4% 1.8 12.0%
1QFY17 Earnings Preview
July 12, 2016 Page 23 of 46
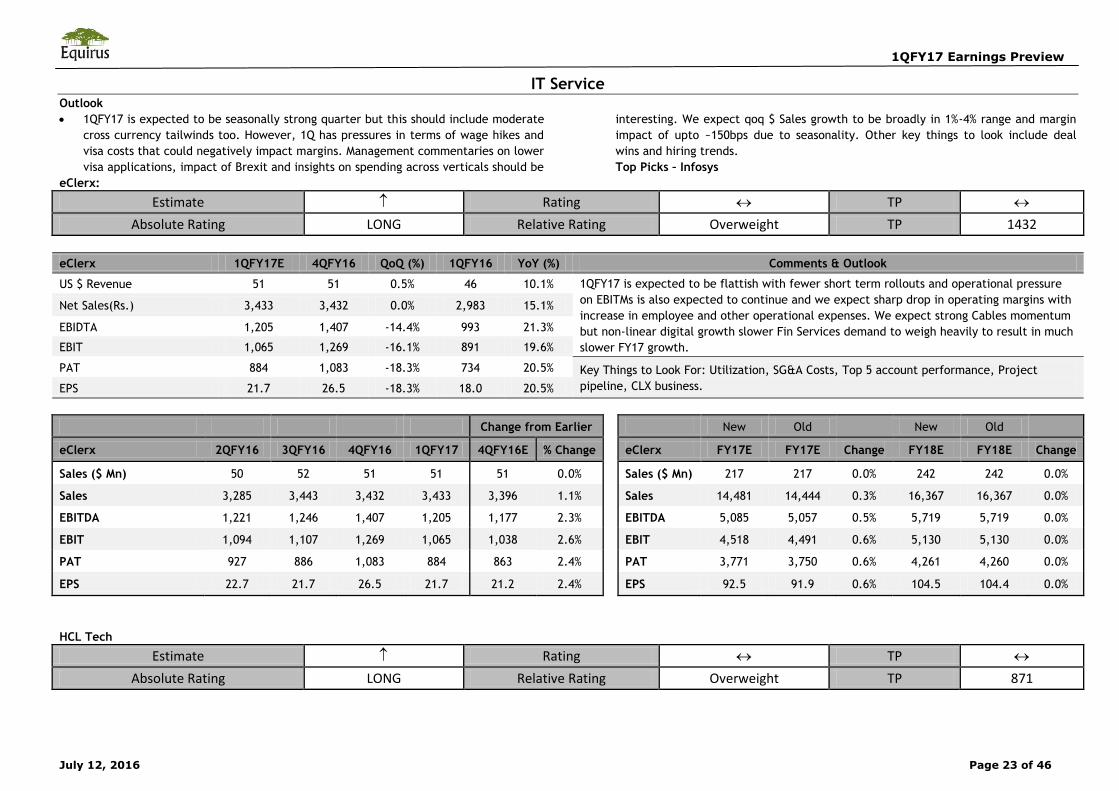
IT ServiceOutlook
1QFY17 is expected to be seasonally strong quarter but this should include moderate
cross currency tailwinds too. However, 1Q has pressures in terms of wage hikes and
visa costs that could negatively impact margins. Management commentaries on lower
visa applications, impact of Brexit and insights on spending across verticals should be
interesting. We expect qoq $ Sales growth to be broadly in 1%-4% range and margin
impact of upto ~150bps due to seasonality. Other key things to look include deal
wins and hiring trends.
Top Picks – Infosys
eClerx:
Estimate Rating TP
Absolute Rating LONG Relative Rating Overweight TP 1432
eClerx 1QFY17E 4QFY16 QoQ (%) 1QFY16 YoY (%) Comments & Outlook
US $ Revenue 51 51 0.5% 46 10.1% 1QFY17 is expected to be flattish with fewer short term rollouts and operational pressure
on EBITMs is also expected to continue and we expect sharp drop in operating margins with
increase in employee and other operational expenses. We expect strong Cables momentum
but non-linear digital growth slower Fin Services demand to weigh heavily to result in much
slower FY17 growth.
Net Sales(Rs.) 3,433 3,432 0.0% 2,983 15.1%
EBIDTA 1,205 1,407 -14.4% 993 21.3%
EBIT 1,065 1,269 -16.1% 891 19.6%
PAT 884 1,083 -18.3% 734 20.5% Key Things to Look For: Utilization, SG&A Costs, Top 5 account performance, Project
pipeline, CLX business. EPS 21.7 26.5 -18.3% 18.0 20.5%
Change from Earlier
New Old
New Old
eClerx 2QFY16 3QFY16 4QFY16 1QFY17 4QFY16E % Change
eClerx FY17E FY17E Change FY18E FY18E Change
Sales ($ Mn) 50 52 51 51 51 0.0%
Sales ($ Mn) 217 217 0.0% 242 242 0.0%
Sales 3,285 3,443 3,432 3,433 3,396 1.1%
Sales 14,481 14,444 0.3% 16,367 16,367 0.0%
EBITDA 1,221 1,246 1,407 1,205 1,177 2.3%
EBITDA 5,085 5,057 0.5% 5,719 5,719 0.0%
EBIT 1,094 1,107 1,269 1,065 1,038 2.6%
EBIT 4,518 4,491 0.6% 5,130 5,130 0.0%
PAT 927 886 1,083 884 863 2.4%
PAT 3,771 3,750 0.6% 4,261 4,260 0.0%
EPS 22.7 21.7 26.5 21.7 21.2 2.4%
EPS 92.5 91.9 0.6% 104.5 104.4 0.0%
HCL Tech
Estimate Rating TP
Absolute Rating LONG Relative Rating Overweight TP 871
1QFY17 Earnings Preview
July 12, 2016 Page 24 of 46
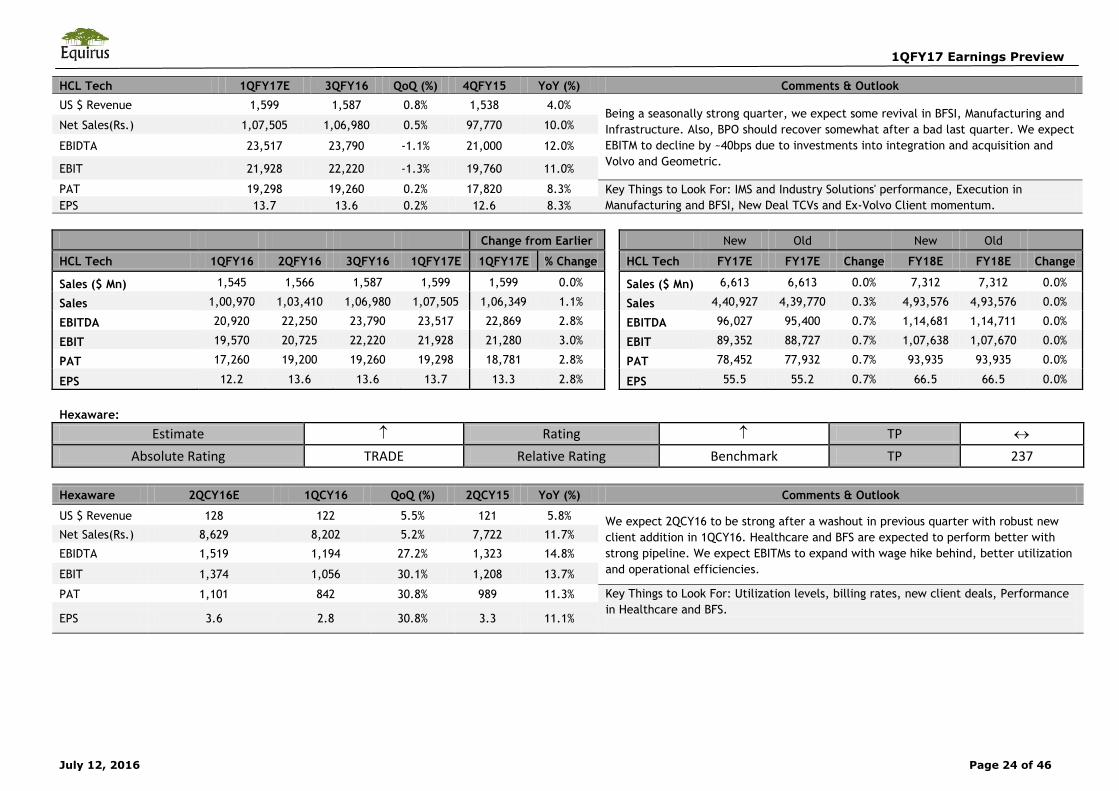
HCL Tech 1QFY17E 3QFY16 QoQ (%) 4QFY15 YoY (%) Comments & Outlook
US $ Revenue 1,599 1,587 0.8% 1,538 4.0% Being a seasonally strong quarter, we expect some revival in BFSI, Manufacturing and
Infrastructure. Also, BPO should recover somewhat after a bad last quarter. We expect
EBITM to decline by ~40bps due to investments into integration and acquisition and
Volvo and Geometric.
Net Sales(Rs.) 1,07,505 1,06,980 0.5% 97,770 10.0%
EBIDTA 23,517 23,790 -1.1% 21,000 12.0%
EBIT 21,928 22,220 -1.3% 19,760 11.0%
PAT 19,298 19,260 0.2% 17,820 8.3% Key Things to Look For: IMS and Industry Solutions' performance, Execution in
Manufacturing and BFSI, New Deal TCVs and Ex-Volvo Client momentum. EPS 13.7 13.6 0.2% 12.6 8.3%
Change from Earlier
New Old
New Old
HCL Tech 1QFY16 2QFY16 3QFY16 1QFY17E 1QFY17E % Change
HCL Tech FY17E FY17E Change FY18E FY18E Change
Sales ($ Mn) 1,545 1,566 1,587 1,599 1,599 0.0%
Sales ($ Mn) 6,613 6,613 0.0% 7,312 7,312 0.0%
Sales 1,00,970 1,03,410 1,06,980 1,07,505 1,06,349 1.1%
Sales 4,40,927 4,39,770 0.3% 4,93,576 4,93,576 0.0%
EBITDA 20,920 22,250 23,790 23,517 22,869 2.8%
EBITDA 96,027 95,400 0.7% 1,14,681 1,14,711 0.0%
EBIT 19,570 20,725 22,220 21,928 21,280 3.0%
EBIT 89,352 88,727 0.7% 1,07,638 1,07,670 0.0%
PAT 17,260 19,200 19,260 19,298 18,781 2.8%
PAT 78,452 77,932 0.7% 93,935 93,935 0.0%
EPS 12.2 13.6 13.6 13.7 13.3 2.8%
EPS 55.5 55.2 0.7% 66.5 66.5 0.0%
Hexaware:
Estimate Rating TP
Absolute Rating TRADE Relative Rating Benchmark TP 237
Hexaware 2QCY16E 1QCY16 QoQ (%) 2QCY15 YoY (%) Comments & Outlook
US $ Revenue 128 122 5.5% 121 5.8% We expect 2QCY16 to be strong after a washout in previous quarter with robust new
client addition in 1QCY16. Healthcare and BFS are expected to perform better with
strong pipeline. We expect EBITMs to expand with wage hike behind, better utilization
and operational efficiencies.
Net Sales(Rs.) 8,629 8,202 5.2% 7,722 11.7%
EBIDTA 1,519 1,194 27.2% 1,323 14.8%
EBIT 1,374 1,056 30.1% 1,208 13.7%
PAT 1,101 842 30.8% 989 11.3% Key Things to Look For: Utilization levels, billing rates, new client deals, Performance
in Healthcare and BFS.
EPS 3.6 2.8 30.8% 3.3 11.1%
1QFY17 Earnings Preview
July 12, 2016 Page 25 of 46
Change from Earlier
New Old
New Old
Hexaware 3QCY15 4QCY15 1QCY16 2QCY16 2QCY16E Change %
Hexaware CY16E CY16E Change CY17E CY17E Change
Sales ($ Mn) 125 124 122 128 128 0.0%
Sales ($ Mn) 521 521 0.0% 584 584 0.0%
Sales 8,184 8,195 8,202 8,629 8,536 1.1%
Sales 34,851 34,758 0.3% 39,298 39,298 0.0%
EBITDA 1,461 1,302 1,194 1,519 1,467 3.5%
EBITDA 5,843 5,792 0.9% 6,808 6,809 0.0%
EBIT 1,340 1,171 1,056 1,374 1,322 3.9%
EBIT 5,242 5,191 1.0% 6,115 6,117 0.0%
PAT 1,116 994 842 1,101 1,061 3.8%
PAT 4,186 4,147 1.0% 4,871 4,872 0.0%
EPS 3.7 3.3 2.8 3.6 3.5 3.8%
EPS 13.9 13.7 1.0% 16.1 16.1 0.0%
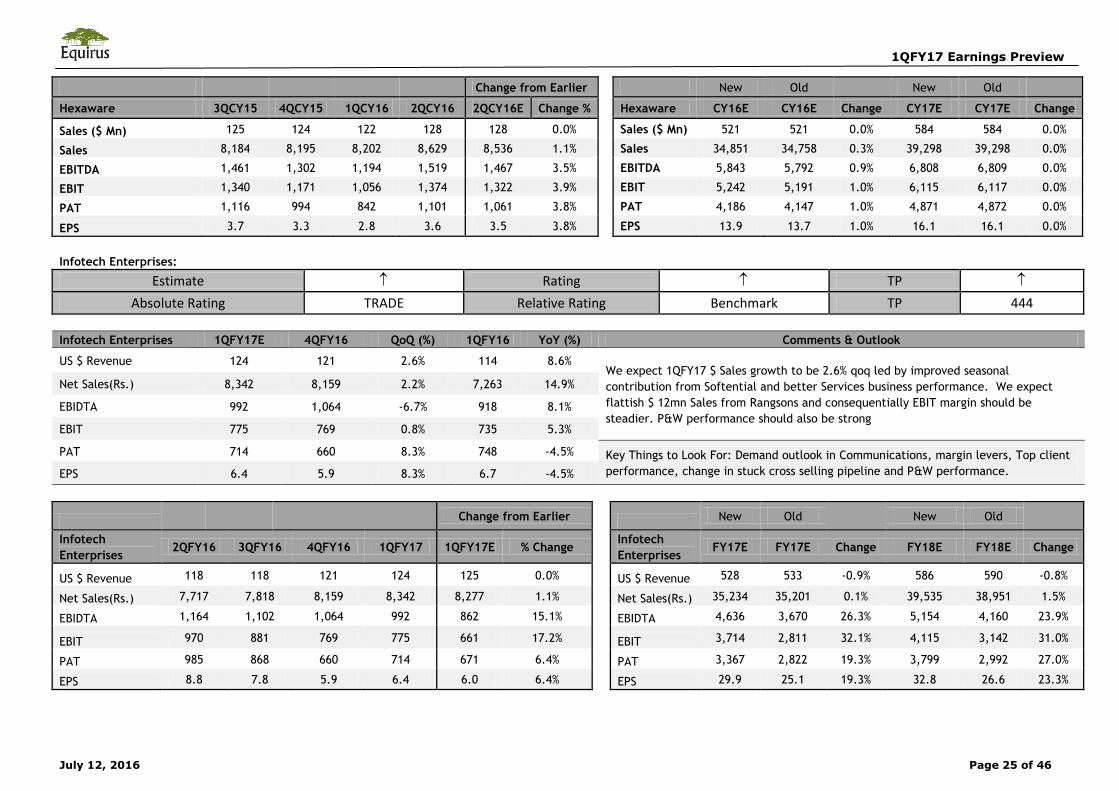
Infotech Enterprises:
Estimate Rating TP
Absolute Rating TRADE Relative Rating Benchmark TP 444
Infotech Enterprises 1QFY17E 4QFY16 QoQ (%) 1QFY16 YoY (%) Comments & Outlook
US $ Revenue 124 121 2.6% 114 8.6% We expect 1QFY17 $ Sales growth to be 2.6% qoq led by improved seasonal
contribution from Softential and better Services business performance. We expect
flattish $ 12mn Sales from Rangsons and consequentially EBIT margin should be
steadier. P&W performance should also be strong
Net Sales(Rs.) 8,342 8,159 2.2% 7,263 14.9%
EBIDTA 992 1,064 -6.7% 918 8.1%
EBIT 775 769 0.8% 735 5.3%
PAT 714 660 8.3% 748 -4.5% Key Things to Look For: Demand outlook in Communications, margin levers, Top client
performance, change in stuck cross selling pipeline and P&W performance. EPS 6.4 5.9 8.3% 6.7 -4.5%
Change from Earlier
New Old
New Old
Infotech
Enterprises 2QFY16 3QFY16 4QFY16 1QFY17 1QFY17E % Change
Infotech
Enterprises FY17E FY17E Change FY18E FY18E Change
US $ Revenue 118 118 121 124 125 0.0%
US $ Revenue 528 533 -0.9% 586 590 -0.8%
Net Sales(Rs.) 7,717 7,818 8,159 8,342 8,277 1.1%
Net Sales(Rs.) 35,234 35,201 0.1% 39,535 38,951 1.5%
EBIDTA 1,164 1,102 1,064 992 862 15.1%
EBIDTA 4,636 3,670 26.3% 5,154 4,160 23.9%
EBIT 970 881 769 775 661 17.2%
EBIT 3,714 2,811 32.1% 4,115 3,142 31.0%
PAT 985 868 660 714 671 6.4%
PAT 3,367 2,822 19.3% 3,799 2,992 27.0%
EPS 8.8 7.8 5.9 6.4 6.0 6.4%
EPS 29.9 25.1 19.3% 32.8 26.6 23.3%
1QFY17 Earnings Preview
July 12, 2016 Page 26 of 46
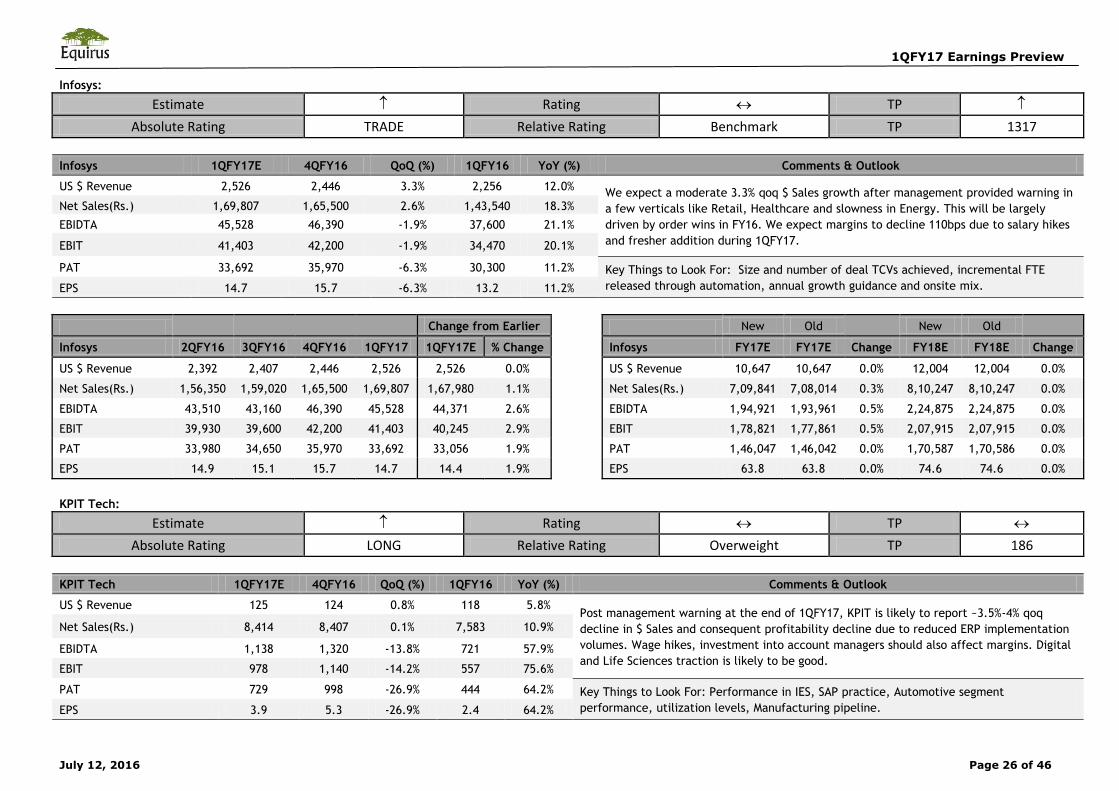
Infosys:
Estimate Rating TP
Absolute Rating TRADE Relative Rating Benchmark TP 1317
Infosys 1QFY17E 4QFY16 QoQ (%) 1QFY16 YoY (%) Comments & Outlook
US $ Revenue 2,526 2,446 3.3% 2,256 12.0% We expect a moderate 3.3% qoq $ Sales growth after management provided warning in
a few verticals like Retail, Healthcare and slowness in Energy. This will be largely
driven by order wins in FY16. We expect margins to decline 110bps due to salary hikes
and fresher addition during 1QFY17.
Net Sales(Rs.) 1,69,807 1,65,500 2.6% 1,43,540 18.3% EBIDTA 45,528 46,390 -1.9% 37,600 21.1%
EBIT 41,403 42,200 -1.9% 34,470 20.1%
PAT 33,692 35,970 -6.3% 30,300 11.2% Key Things to Look For: Size and number of deal TCVs achieved, incremental FTE
released through automation, annual growth guidance and onsite mix. EPS 14.7 15.7 -6.3% 13.2 11.2%
Change from Earlier
New Old
New Old
Infosys 2QFY16 3QFY16 4QFY16 1QFY17 1QFY17E % Change
Infosys FY17E FY17E Change FY18E FY18E Change
US $ Revenue 2,392 2,407 2,446 2,526 2,526 0.0%
US $ Revenue 10,647 10,647 0.0% 12,004 12,004 0.0%
Net Sales(Rs.) 1,56,350 1,59,020 1,65,500 1,69,807 1,67,980 1.1%
Net Sales(Rs.) 7,09,841 7,08,014 0.3% 8,10,247 8,10,247 0.0%
EBIDTA 43,510 43,160 46,390 45,528 44,371 2.6%
EBIDTA 1,94,921 1,93,961 0.5% 2,24,875 2,24,875 0.0%
EBIT 39,930 39,600 42,200 41,403 40,245 2.9%
EBIT 1,78,821 1,77,861 0.5% 2,07,915 2,07,915 0.0%
PAT 33,980 34,650 35,970 33,692 33,056 1.9%
PAT 1,46,047 1,46,042 0.0% 1,70,587 1,70,586 0.0%
EPS 14.9 15.1 15.7 14.7 14.4 1.9%
EPS 63.8 63.8 0.0% 74.6 74.6 0.0%
KPIT Tech:
Estimate Rating TP
Absolute Rating LONG Relative Rating Overweight TP 186
KPIT Tech 1QFY17E 4QFY16 QoQ (%) 1QFY16 YoY (%) Comments & Outlook
US $ Revenue 125 124 0.8% 118 5.8% Post management warning at the end of 1QFY17, KPIT is likely to report ~3.5%-4% qoq
decline in $ Sales and consequent profitability decline due to reduced ERP implementation
volumes. Wage hikes, investment into account managers should also affect margins. Digital
and Life Sciences traction is likely to be good.
Net Sales(Rs.) 8,414 8,407 0.1% 7,583 10.9%
EBIDTA 1,138 1,320 -13.8% 721 57.9%
EBIT 978 1,140 -14.2% 557 75.6%
PAT 729 998 -26.9% 444 64.2% Key Things to Look For: Performance in IES, SAP practice, Automotive segment
performance, utilization levels, Manufacturing pipeline. EPS 3.9 5.3 -26.9% 2.4 64.2%
1QFY17 Earnings Preview
July 12, 2016 Page 27 of 46
Change from Earlier
New Old
New Old
KPIT Tech 2QFY16 3QFY16 4QFY16 1QFY17 1QFY17E % Change
KPIT Tech FY17E FY17E Change FY18E FY18E Change
US $ Revenue 125 123 124 125 125 0.0%
US $ Revenue 513 513 0.0% 550 550 0.0%
Net Sales(Rs.) 8,123 8,130 8,407 8,414 8,323 1.1%
Net Sales(Rs.) 34,186 34,095 0.3% 37,138 37,138 0.0%
EBIDTA 1,132 1,180 1,320 1,138 1,072 6.2%
EBIDTA 4,832 4,765 1.4% 5,539 5,539 0.0%
EBIT 965 1,000 1,140 978 911 7.3%
EBIT 4,173 4,107 1.6% 4,861 4,861 0.0%
PAT 751 735 998 729 685 6.5%
PAT 3,152 3,112 1.3% 3,685 3,684 0.0%
EPS 4.0 3.9 5.3 3.9 3.6 6.5%
EPS 16.8 16.6 1.3% 19.6 19.6 0.0%
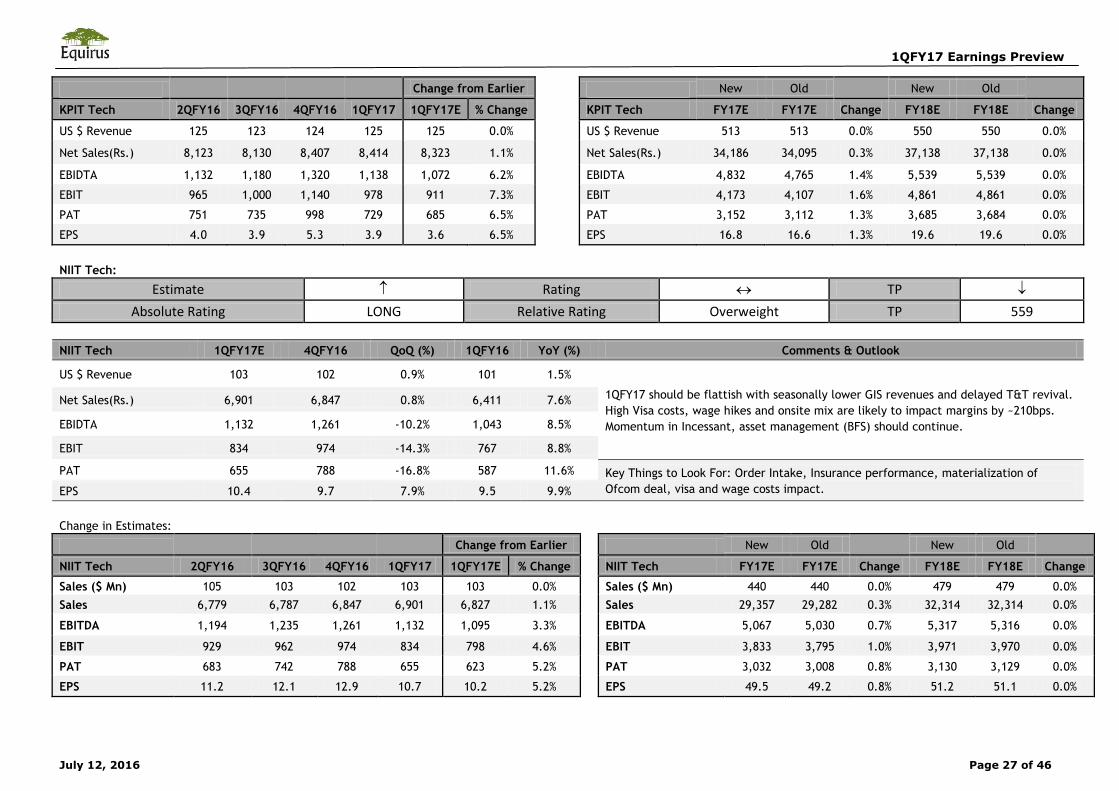
NIIT Tech:
Estimate Rating TP
Absolute Rating LONG Relative Rating Overweight TP 559
NIIT Tech 1QFY17E 4QFY16 QoQ (%) 1QFY16 YoY (%) Comments & Outlook
US $ Revenue 103 102 0.9% 101 1.5%
1QFY17 should be flattish with seasonally lower GIS revenues and delayed T&T revival.
High Visa costs, wage hikes and onsite mix are likely to impact margins by ~210bps.
Momentum in Incessant, asset management (BFS) should continue.
Net Sales(Rs.) 6,901 6,847 0.8% 6,411 7.6%
EBIDTA 1,132 1,261 -10.2% 1,043 8.5%
EBIT 834 974 -14.3% 767 8.8%
PAT 655 788 -16.8% 587 11.6% Key Things to Look For: Order Intake, Insurance performance, materialization of
Ofcom deal, visa and wage costs impact. EPS 10.4 9.7 7.9% 9.5 9.9%
Change in Estimates:
Change from Earlier
New Old
New Old
NIIT Tech 2QFY16 3QFY16 4QFY16 1QFY17 1QFY17E % Change
NIIT Tech FY17E FY17E Change FY18E FY18E Change
Sales ($ Mn) 105 103 102 103 103 0.0%
Sales ($ Mn) 440 440 0.0% 479 479 0.0% Sales 6,779 6,787 6,847 6,901 6,827 1.1%
Sales 29,357 29,282 0.3% 32,314 32,314 0.0%
EBITDA 1,194 1,235 1,261 1,132 1,095 3.3%
EBITDA 5,067 5,030 0.7% 5,317 5,316 0.0%
EBIT 929 962 974 834 798 4.6%
EBIT 3,833 3,795 1.0% 3,971 3,970 0.0%
PAT 683 742 788 655 623 5.2%
PAT 3,032 3,008 0.8% 3,130 3,129 0.0%
EPS 11.2 12.1 12.9 10.7 10.2 5.2%
EPS 49.5 49.2 0.8% 51.2 51.1 0.0%
1QFY17 Earnings Preview
July 12, 2016 Page 28 of 46
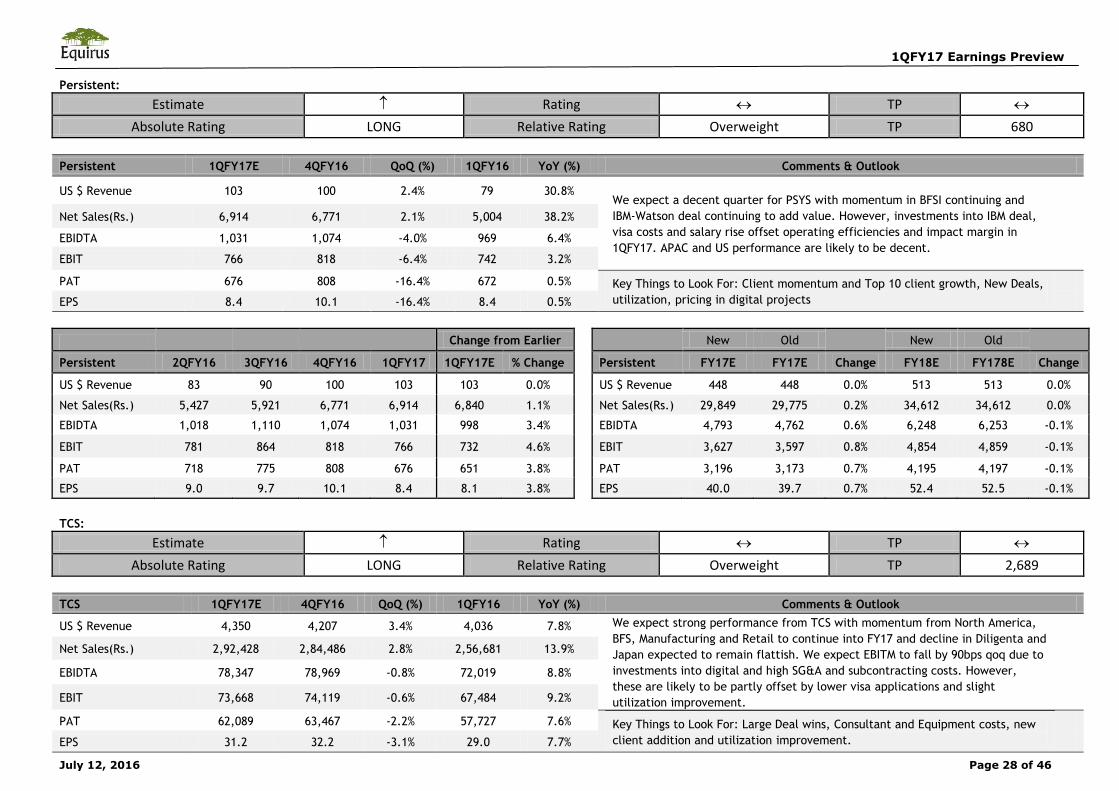
Persistent:
Estimate Rating TP
Absolute Rating LONG Relative Rating Overweight TP 680
Persistent 1QFY17E 4QFY16 QoQ (%) 1QFY16 YoY (%) Comments & Outlook
US $ Revenue 103 100 2.4% 79 30.8% We expect a decent quarter for PSYS with momentum in BFSI continuing and
IBM-Watson deal continuing to add value. However, investments into IBM deal,
visa costs and salary rise offset operating efficiencies and impact margin in
1QFY17. APAC and US performance are likely to be decent.
Net Sales(Rs.) 6,914 6,771 2.1% 5,004 38.2%
EBIDTA 1,031 1,074 -4.0% 969 6.4%
EBIT 766 818 -6.4% 742 3.2%
PAT 676 808 -16.4% 672 0.5% Key Things to Look For: Client momentum and Top 10 client growth, New Deals,
utilization, pricing in digital projects
EPS 8.4 10.1 -16.4% 8.4 0.5%
Change from Earlier
New Old
New Old
Persistent 2QFY16 3QFY16 4QFY16 1QFY17 1QFY17E % Change
Persistent FY17E FY17E Change FY18E FY178E Change
US $ Revenue 83 90 100 103 103 0.0%
US $ Revenue 448 448 0.0% 513 513 0.0%
Net Sales(Rs.) 5,427 5,921 6,771 6,914 6,840 1.1%
Net Sales(Rs.) 29,849 29,775 0.2% 34,612 34,612 0.0%
EBIDTA 1,018 1,110 1,074 1,031 998 3.4%
EBIDTA 4,793 4,762 0.6% 6,248 6,253 -0.1%
EBIT 781 864 818 766 732 4.6%
EBIT 3,627 3,597 0.8% 4,854 4,859 -0.1%
PAT 718 775 808 676 651 3.8%
PAT 3,196 3,173 0.7% 4,195 4,197 -0.1%
EPS 9.0 9.7 10.1 8.4 8.1 3.8%
EPS 40.0 39.7 0.7% 52.4 52.5 -0.1%
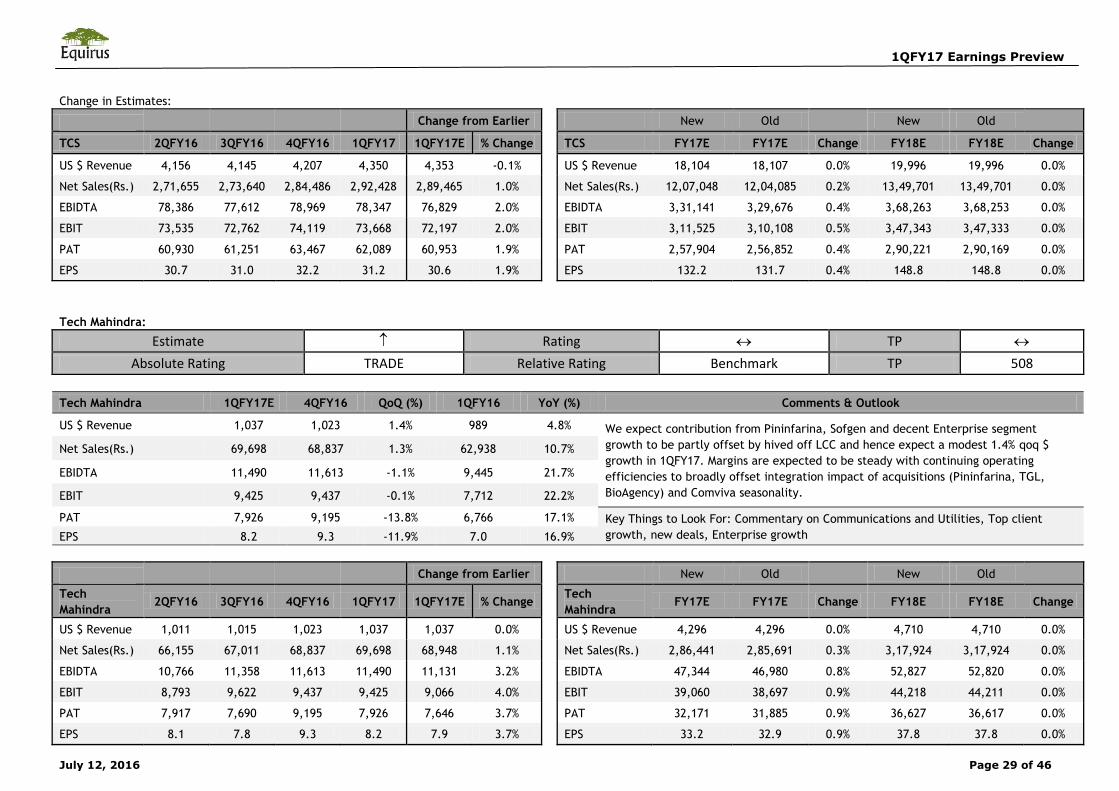
TCS:
Estimate Rating TP
Absolute Rating LONG Relative Rating Overweight TP 2,689
TCS 1QFY17E 4QFY16 QoQ (%) 1QFY16 YoY (%) Comments & Outlook
US $ Revenue 4,350 4,207 3.4% 4,036 7.8% We expect strong performance from TCS with momentum from North America,
BFS, Manufacturing and Retail to continue into FY17 and decline in Diligenta and
Japan expected to remain flattish. We expect EBITM to fall by 90bps qoq due to
investments into digital and high SG&A and subcontracting costs. However,
these are likely to be partly offset by lower visa applications and slight
utilization improvement.
Net Sales(Rs.) 2,92,428 2,84,486 2.8% 2,56,681 13.9%
EBIDTA 78,347 78,969 -0.8% 72,019 8.8%
EBIT 73,668 74,119 -0.6% 67,484 9.2%
PAT 62,089 63,467 -2.2% 57,727 7.6% Key Things to Look For: Large Deal wins, Consultant and Equipment costs, new
client addition and utilization improvement.
EPS 31.2 32.2 -3.1% 29.0 7.7%
1QFY17 Earnings Preview
July 12, 2016 Page 29 of 46
Change in Estimates:
Change from Earlier
New Old
New Old
TCS 2QFY16 3QFY16 4QFY16 1QFY17 1QFY17E % Change
TCS FY17E FY17E Change FY18E FY18E Change
US $ Revenue 4,156 4,145 4,207 4,350 4,353 -0.1%
US $ Revenue 18,104 18,107 0.0% 19,996 19,996 0.0%
Net Sales(Rs.) 2,71,655 2,73,640 2,84,486 2,92,428 2,89,465 1.0%
Net Sales(Rs.) 12,07,048 12,04,085 0.2% 13,49,701 13,49,701 0.0%
EBIDTA 78,386 77,612 78,969 78,347 76,829 2.0%
EBIDTA 3,31,141 3,29,676 0.4% 3,68,263 3,68,253 0.0%
EBIT 73,535 72,762 74,119 73,668 72,197 2.0%
EBIT 3,11,525 3,10,108 0.5% 3,47,343 3,47,333 0.0%
PAT 60,930 61,251 63,467 62,089 60,953 1.9%
PAT 2,57,904 2,56,852 0.4% 2,90,221 2,90,169 0.0%
EPS 30.7 31.0 32.2 31.2 30.6 1.9%
EPS 132.2 131.7 0.4% 148.8 148.8 0.0%
Tech Mahindra:
Estimate Rating TP
Absolute Rating TRADE Relative Rating Benchmark TP 508
Tech Mahindra 1QFY17E 4QFY16 QoQ (%) 1QFY16 YoY (%) Comments & Outlook
US $ Revenue 1,037 1,023 1.4% 989 4.8% We expect contribution from Pininfarina, Sofgen and decent Enterprise segment
growth to be partly offset by hived off LCC and hence expect a modest 1.4% qoq $
growth in 1QFY17. Margins are expected to be steady with continuing operating
efficiencies to broadly offset integration impact of acquisitions (Pininfarina, TGL,
BioAgency) and Comviva seasonality.
Net Sales(Rs.) 69,698 68,837 1.3% 62,938 10.7%
EBIDTA 11,490 11,613 -1.1% 9,445 21.7%
EBIT 9,425 9,437 -0.1% 7,712 22.2%
PAT 7,926 9,195 -13.8% 6,766 17.1% Key Things to Look For: Commentary on Communications and Utilities, Top client
growth, new deals, Enterprise growth EPS 8.2 9.3 -11.9% 7.0 16.9%
Change from Earlier
New Old
New Old
Tech
Mahindra 2QFY16 3QFY16 4QFY16 1QFY17 1QFY17E % Change
Tech
Mahindra FY17E FY17E Change FY18E FY18E Change
US $ Revenue 1,011 1,015 1,023 1,037 1,037 0.0%
US $ Revenue 4,296 4,296 0.0% 4,710 4,710 0.0%
Net Sales(Rs.) 66,155 67,011 68,837 69,698 68,948 1.1%
Net Sales(Rs.) 2,86,441 2,85,691 0.3% 3,17,924 3,17,924 0.0%
EBIDTA 10,766 11,358 11,613 11,490 11,131 3.2%
EBIDTA 47,344 46,980 0.8% 52,827 52,820 0.0%
EBIT 8,793 9,622 9,437 9,425 9,066 4.0%
EBIT 39,060 38,697 0.9% 44,218 44,211 0.0%
PAT 7,917 7,690 9,195 7,926 7,646 3.7%
PAT 32,171 31,885 0.9% 36,627 36,617 0.0%
EPS 8.1 7.8 9.3 8.2 7.9 3.7%
EPS 33.2 32.9 0.9% 37.8 37.8 0.0%
1QFY17 Earnings Preview
July 12, 2016 Page 30 of 46
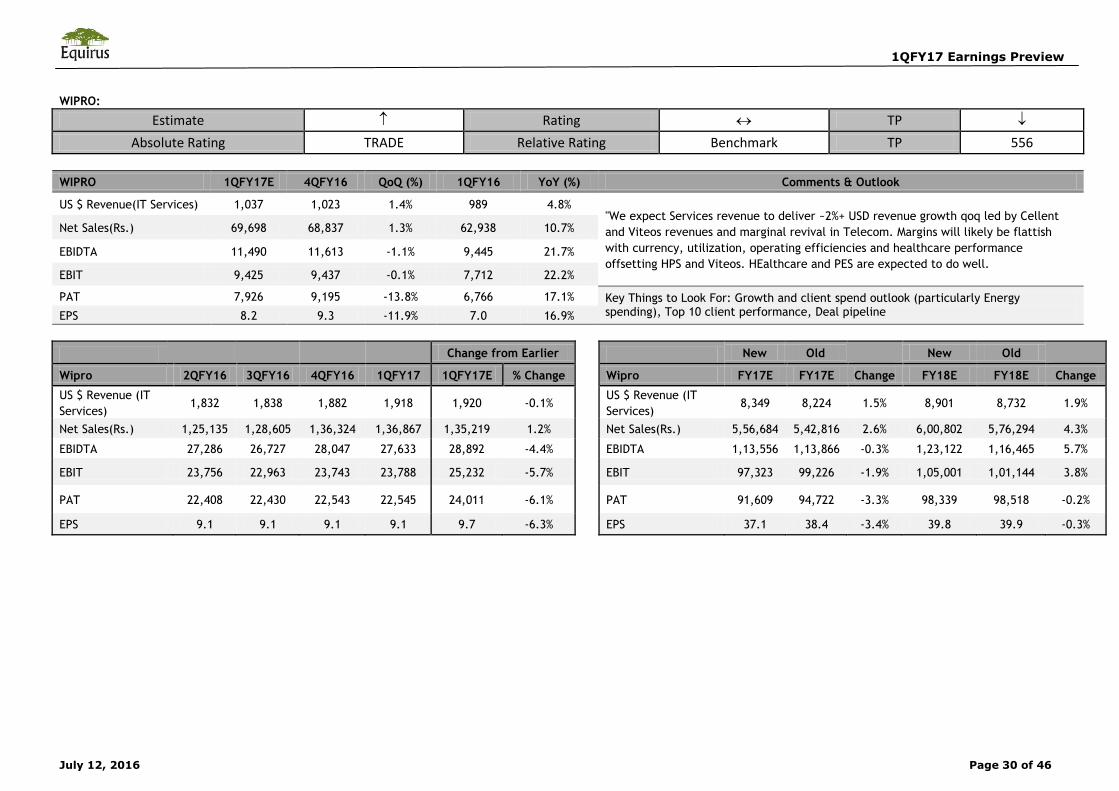
WIPRO:
Estimate Rating TP
Absolute Rating TRADE Relative Rating Benchmark TP 556
WIPRO 1QFY17E 4QFY16 QoQ (%) 1QFY16 YoY (%) Comments & Outlook
US $ Revenue(IT Services) 1,037 1,023 1.4% 989 4.8% "We expect Services revenue to deliver ~2%+ USD revenue growth qoq led by Cellent
and Viteos revenues and marginal revival in Telecom. Margins will likely be flattish
with currency, utilization, operating efficiencies and healthcare performance
offsetting HPS and Viteos. HEalthcare and PES are expected to do well.
Net Sales(Rs.) 69,698 68,837 1.3% 62,938 10.7%
EBIDTA 11,490 11,613 -1.1% 9,445 21.7%
EBIT 9,425 9,437 -0.1% 7,712 22.2%
PAT 7,926 9,195 -13.8% 6,766 17.1% Key Things to Look For: Growth and client spend outlook (particularly Energy spending), Top 10 client performance, Deal pipeline EPS 8.2 9.3 -11.9% 7.0 16.9%
Change from Earlier
New Old
New Old
Wipro 2QFY16 3QFY16 4QFY16 1QFY17 1QFY17E % Change
Wipro FY17E FY17E Change FY18E FY18E Change
US $ Revenue (IT
Services) 1,832 1,838 1,882 1,918 1,920 -0.1%
US $ Revenue (IT
Services) 8,349 8,224 1.5% 8,901 8,732 1.9%
Net Sales(Rs.) 1,25,135 1,28,605 1,36,324 1,36,867 1,35,219 1.2%
Net Sales(Rs.) 5,56,684 5,42,816 2.6% 6,00,802 5,76,294 4.3%
EBIDTA 27,286 26,727 28,047 27,633 28,892 -4.4%
EBIDTA 1,13,556 1,13,866 -0.3% 1,23,122 1,16,465 5.7%
EBIT 23,756 22,963 23,743 23,788 25,232 -5.7%
EBIT 97,323 99,226 -1.9% 1,05,001 1,01,144 3.8%
PAT 22,408 22,430 22,543 22,545 24,011 -6.1%
PAT 91,609 94,722 -3.3% 98,339 98,518 -0.2%
EPS 9.1 9.1 9.1 9.1 9.7 -6.3%
EPS 37.1 38.4 -3.4% 39.8 39.9 -0.3%
1QFY17 Earnings Preview
July 12, 2016 Page 31 of 46
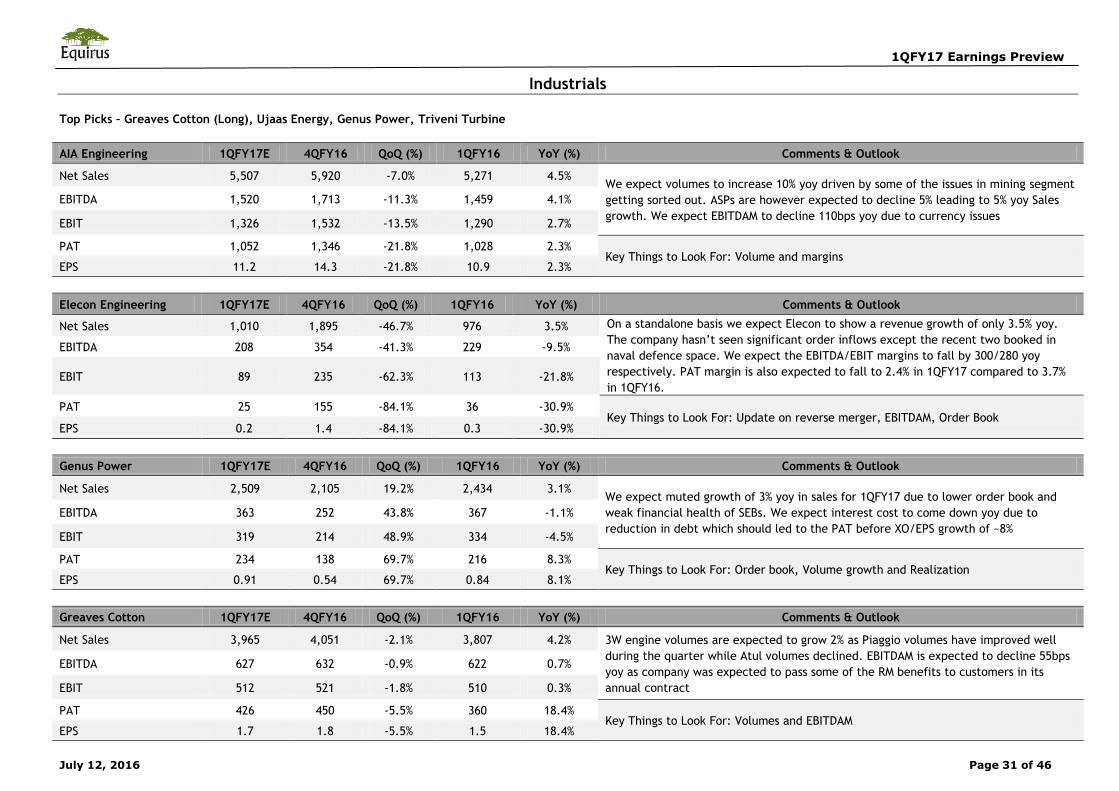
Industrials
Top Picks – Greaves Cotton (Long), Ujaas Energy, Genus Power, Triveni Turbine
AIA Engineering 1QFY17E 4QFY16 QoQ (%) 1QFY16 YoY (%) Comments & Outlook
Net Sales 5,507 5,920 -7.0% 5,271 4.5% We expect volumes to increase 10% yoy driven by some of the issues in mining segment
getting sorted out. ASPs are however expected to decline 5% leading to 5% yoy Sales
growth. We expect EBITDAM to decline 110bps yoy due to currency issues EBITDA 1,520 1,713 -11.3% 1,459 4.1%
EBIT 1,326 1,532 -13.5% 1,290 2.7%
PAT 1,052 1,346 -21.8% 1,028 2.3% Key Things to Look For: Volume and margins
EPS 11.2 14.3 -21.8% 10.9 2.3%
Elecon Engineering 1QFY17E 4QFY16 QoQ (%) 1QFY16 YoY (%) Comments & Outlook
Net Sales 1,010 1,895 -46.7% 976 3.5% On a standalone basis we expect Elecon to show a revenue growth of only 3.5% yoy.
The company hasn’t seen significant order inflows except the recent two booked in
naval defence space. We expect the EBITDA/EBIT margins to fall by 300/280 yoy
respectively. PAT margin is also expected to fall to 2.4% in 1QFY17 compared to 3.7%
in 1QFY16.
EBITDA 208 354 -41.3% 229 -9.5%
EBIT 89 235 -62.3% 113 -21.8%
PAT 25 155 -84.1% 36 -30.9% Key Things to Look For: Update on reverse merger, EBITDAM, Order Book
EPS 0.2 1.4 -84.1% 0.3 -30.9%
Genus Power 1QFY17E 4QFY16 QoQ (%) 1QFY16 YoY (%) Comments & Outlook
Net Sales 2,509 2,105 19.2% 2,434 3.1% We expect muted growth of 3% yoy in sales for 1QFY17 due to lower order book and
weak financial health of SEBs. We expect interest cost to come down yoy due to
reduction in debt which should led to the PAT before XO/EPS growth of ~8% EBITDA 363 252 43.8% 367 -1.1%
EBIT 319 214 48.9% 334 -4.5%
PAT 234 138 69.7% 216 8.3% Key Things to Look For: Order book, Volume growth and Realization
EPS 0.91 0.54 69.7% 0.84 8.1%
Greaves Cotton 1QFY17E 4QFY16 QoQ (%) 1QFY16 YoY (%) Comments & Outlook
Net Sales 3,965 4,051 -2.1% 3,807 4.2% 3W engine volumes are expected to grow 2% as Piaggio volumes have improved well
during the quarter while Atul volumes declined. EBITDAM is expected to decline 55bps
yoy as company was expected to pass some of the RM benefits to customers in its
annual contract
EBITDA 627 632 -0.9% 622 0.7%
EBIT 512 521 -1.8% 510 0.3%
PAT 426 450 -5.5% 360 18.4% Key Things to Look For: Volumes and EBITDAM
EPS 1.7 1.8 -5.5% 1.5 18.4%
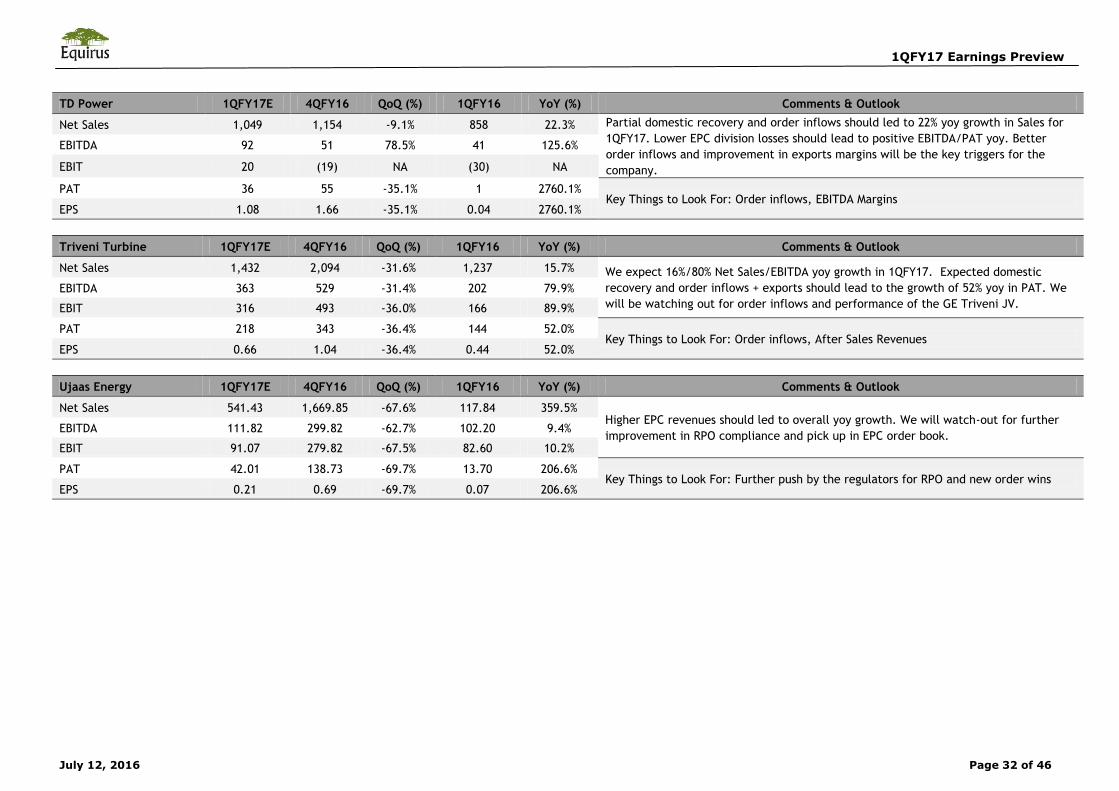
1QFY17 Earnings Preview
July 12, 2016 Page 32 of 46
TD Power 1QFY17E 4QFY16 QoQ (%) 1QFY16 YoY (%) Comments & Outlook
Net Sales 1,049 1,154 -9.1% 858 22.3% Partial domestic recovery and order inflows should led to 22% yoy growth in Sales for
1QFY17. Lower EPC division losses should lead to positive EBITDA/PAT yoy. Better
order inflows and improvement in exports margins will be the key triggers for the
company.
EBITDA 92 51 78.5% 41 125.6%
EBIT 20 (19) NA (30) NA
PAT 36 55 -35.1% 1 2760.1% Key Things to Look For: Order inflows, EBITDA Margins
EPS 1.08 1.66 -35.1% 0.04 2760.1%
Triveni Turbine 1QFY17E 4QFY16 QoQ (%) 1QFY16 YoY (%) Comments & Outlook
Net Sales 1,432 2,094 -31.6% 1,237 15.7% We expect 16%/80% Net Sales/EBITDA yoy growth in 1QFY17. Expected domestic
recovery and order inflows + exports should lead to the growth of 52% yoy in PAT. We
will be watching out for order inflows and performance of the GE Triveni JV. EBITDA 363 529 -31.4% 202 79.9%
EBIT 316 493 -36.0% 166 89.9%
PAT 218 343 -36.4% 144 52.0% Key Things to Look For: Order inflows, After Sales Revenues
EPS 0.66 1.04 -36.4% 0.44 52.0%
Ujaas Energy 1QFY17E 4QFY16 QoQ (%) 1QFY16 YoY (%) Comments & Outlook
Net Sales 541.43 1,669.85 -67.6% 117.84 359.5% Higher EPC revenues should led to overall yoy growth. We will watch-out for further
improvement in RPO compliance and pick up in EPC order book. EBITDA 111.82 299.82 -62.7% 102.20 9.4%
EBIT 91.07 279.82 -67.5% 82.60 10.2%
PAT 42.01 138.73 -69.7% 13.70 206.6% Key Things to Look For: Further push by the regulators for RPO and new order wins
EPS 0.21 0.69 -69.7% 0.07 206.6%
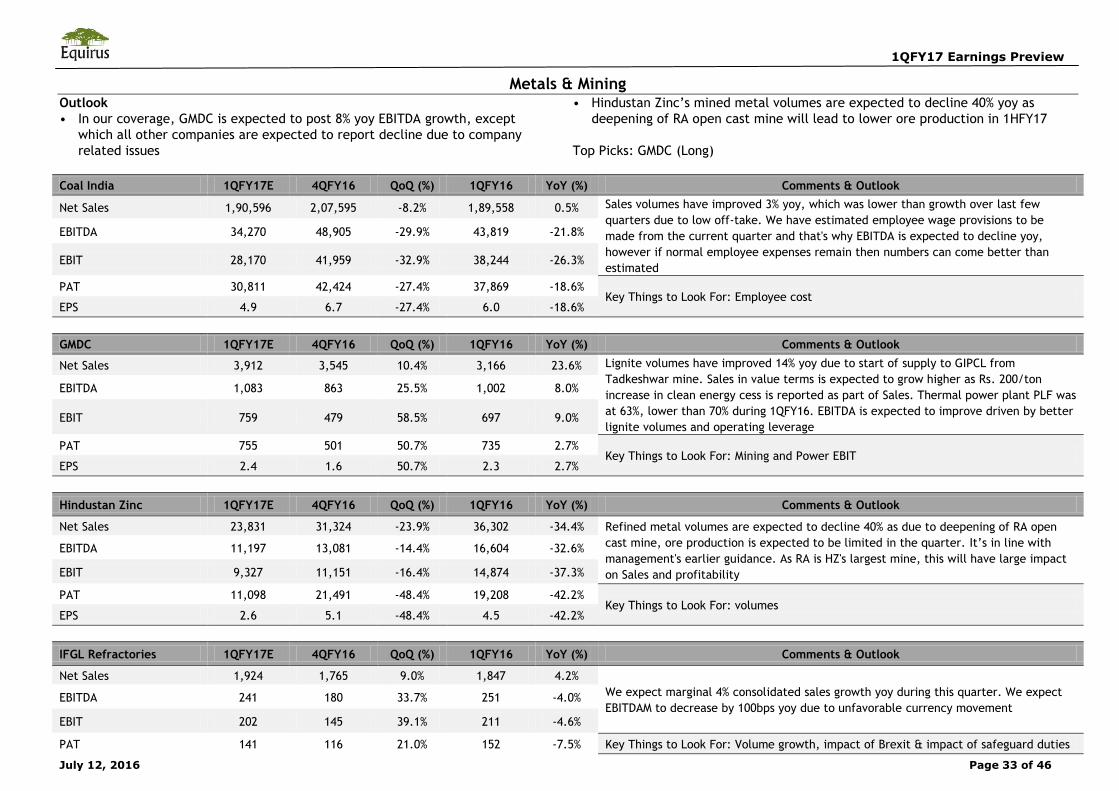
1QFY17 Earnings Preview
July 12, 2016 Page 33 of 46
Metals & Mining Outlook
• In our coverage, GMDC is expected to post 8% yoy EBITDA growth, except
which all other companies are expected to report decline due to company
related issues
• Hindustan Zinc’s mined metal volumes are expected to decline 40% yoy as
deepening of RA open cast mine will lead to lower ore production in 1HFY17
Top Picks: GMDC (Long)
Coal India 1QFY17E 4QFY16 QoQ (%) 1QFY16 YoY (%) Comments & Outlook
Net Sales 1,90,596 2,07,595 -8.2% 1,89,558 0.5% Sales volumes have improved 3% yoy, which was lower than growth over last few
quarters due to low off-take. We have estimated employee wage provisions to be
made from the current quarter and that's why EBITDA is expected to decline yoy,
however if normal employee expenses remain then numbers can come better than
estimated
EBITDA 34,270 48,905 -29.9% 43,819 -21.8%
EBIT 28,170 41,959 -32.9% 38,244 -26.3%
PAT 30,811 42,424 -27.4% 37,869 -18.6% Key Things to Look For: Employee cost
EPS 4.9 6.7 -27.4% 6.0 -18.6%
GMDC 1QFY17E 4QFY16 QoQ (%) 1QFY16 YoY (%) Comments & Outlook
Net Sales 3,912 3,545 10.4% 3,166 23.6% Lignite volumes have improved 14% yoy due to start of supply to GIPCL from
Tadkeshwar mine. Sales in value terms is expected to grow higher as Rs. 200/ton
increase in clean energy cess is reported as part of Sales. Thermal power plant PLF was
at 63%, lower than 70% during 1QFY16. EBITDA is expected to improve driven by better
lignite volumes and operating leverage
EBITDA 1,083 863 25.5% 1,002 8.0%
EBIT 759 479 58.5% 697 9.0%
PAT 755 501 50.7% 735 2.7% Key Things to Look For: Mining and Power EBIT
EPS 2.4 1.6 50.7% 2.3 2.7%
Hindustan Zinc 1QFY17E 4QFY16 QoQ (%) 1QFY16 YoY (%) Comments & Outlook
Net Sales 23,831 31,324 -23.9% 36,302 -34.4% Refined metal volumes are expected to decline 40% as due to deepening of RA open
cast mine, ore production is expected to be limited in the quarter. It’s in line with
management's earlier guidance. As RA is HZ's largest mine, this will have large impact
on Sales and profitability
EBITDA 11,197 13,081 -14.4% 16,604 -32.6%
EBIT 9,327 11,151 -16.4% 14,874 -37.3%
PAT 11,098 21,491 -48.4% 19,208 -42.2% Key Things to Look For: volumes
EPS 2.6 5.1 -48.4% 4.5 -42.2%
IFGL Refractories 1QFY17E 4QFY16 QoQ (%) 1QFY16 YoY (%) Comments & Outlook
Net Sales 1,924 1,765 9.0% 1,847 4.2% We expect marginal 4% consolidated sales growth yoy during this quarter. We expect
EBITDAM to decrease by 100bps yoy due to unfavorable currency movement EBITDA 241 180 33.7% 251 -4.0%
EBIT 202 145 39.1% 211 -4.6%
PAT 141 116 21.0% 152 -7.5% Key Things to Look For: Volume growth, impact of Brexit & impact of safeguard duties
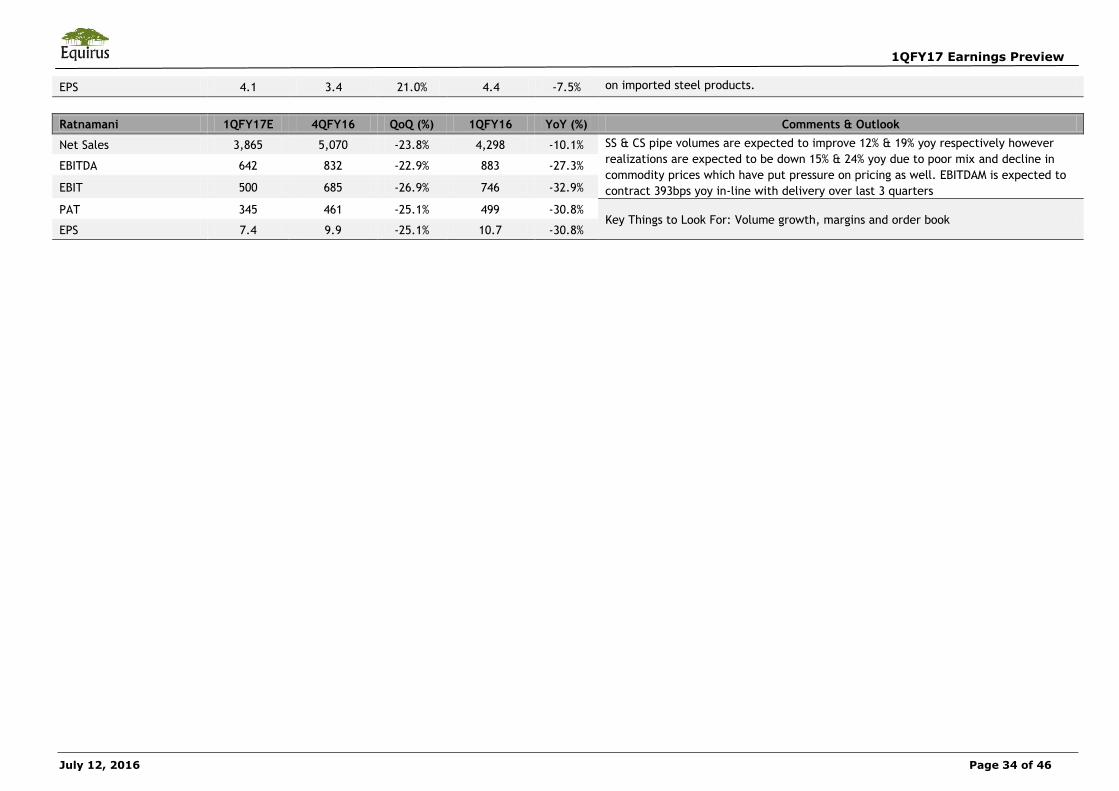
1QFY17 Earnings Preview
July 12, 2016 Page 34 of 46
EPS 4.1 3.4 21.0% 4.4 -7.5% on imported steel products.
Ratnamani 1QFY17E 4QFY16 QoQ (%) 1QFY16 YoY (%) Comments & Outlook
Net Sales 3,865 5,070 -23.8% 4,298 -10.1% SS & CS pipe volumes are expected to improve 12% & 19% yoy respectively however
realizations are expected to be down 15% & 24% yoy due to poor mix and decline in
commodity prices which have put pressure on pricing as well. EBITDAM is expected to
contract 393bps yoy in-line with delivery over last 3 quarters
EBITDA 642 832 -22.9% 883 -27.3%
EBIT 500 685 -26.9% 746 -32.9%
PAT 345 461 -25.1% 499 -30.8% Key Things to Look For: Volume growth, margins and order book
EPS 7.4 9.9 -25.1% 10.7 -30.8%
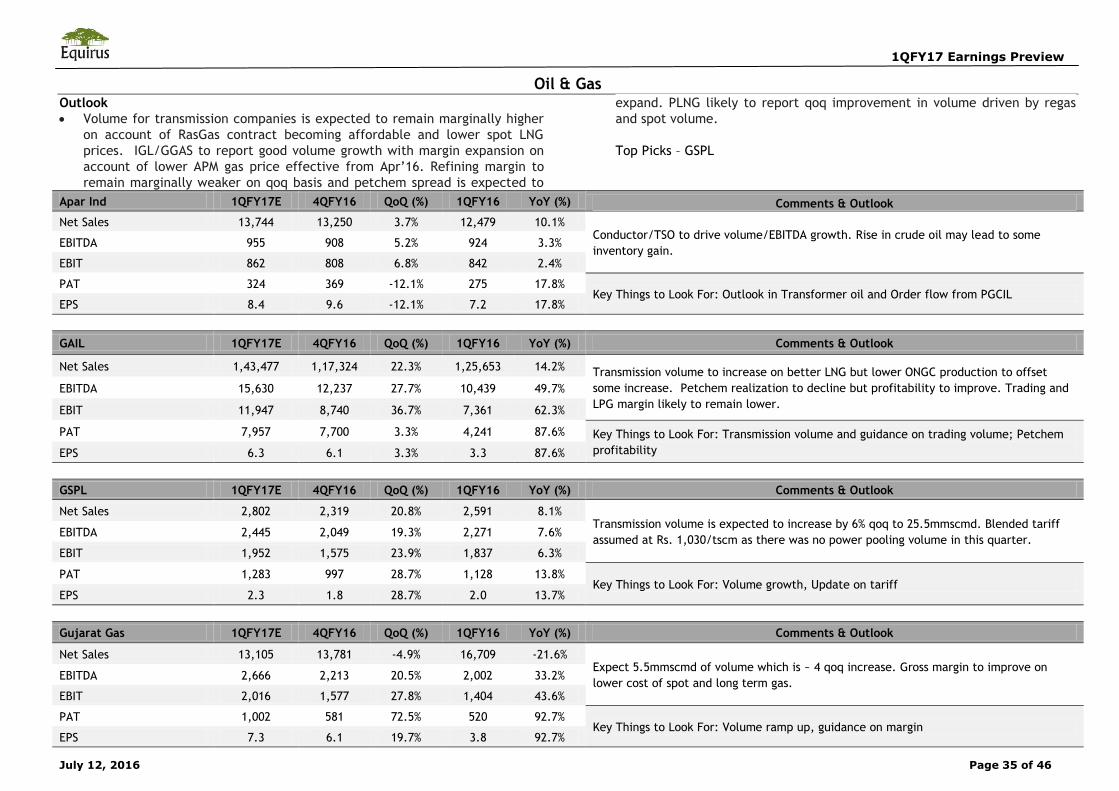
1QFY17 Earnings Preview
July 12, 2016 Page 35 of 46
Oil & GasOutlook
Volume for transmission companies is expected to remain marginally higher
on account of RasGas contract becoming affordable and lower spot LNG
prices. IGL/GGAS to report good volume growth with margin expansion on
account of lower APM gas price effective from Apr’16. Refining margin to
remain marginally weaker on qoq basis and petchem spread is expected to
expand. PLNG likely to report qoq improvement in volume driven by regas
and spot volume.
Top Picks – GSPL
Apar Ind 1QFY17E 4QFY16 QoQ (%) 1QFY16 YoY (%) Comments & Outlook Net Sales 13,744 13,250 3.7% 12,479 10.1%
Conductor/TSO to drive volume/EBITDA growth. Rise in crude oil may lead to some
inventory gain. EBITDA 955 908 5.2% 924 3.3%
EBIT 862 808 6.8% 842 2.4%
PAT 324 369 -12.1% 275 17.8% Key Things to Look For: Outlook in Transformer oil and Order flow from PGCIL
EPS 8.4 9.6 -12.1% 7.2 17.8%
GAIL 1QFY17E 4QFY16 QoQ (%) 1QFY16 YoY (%) Comments & Outlook
Net Sales 1,43,477 1,17,324 22.3% 1,25,653 14.2% Transmission volume to increase on better LNG but lower ONGC production to offset
some increase. Petchem realization to decline but profitability to improve. Trading and
LPG margin likely to remain lower. EBITDA 15,630 12,237 27.7% 10,439 49.7%
EBIT 11,947 8,740 36.7% 7,361 62.3%
PAT 7,957 7,700 3.3% 4,241 87.6% Key Things to Look For: Transmission volume and guidance on trading volume; Petchem
profitability EPS 6.3 6.1 3.3% 3.3 87.6%
GSPL 1QFY17E 4QFY16 QoQ (%) 1QFY16 YoY (%) Comments & Outlook
Net Sales 2,802 2,319 20.8% 2,591 8.1% Transmission volume is expected to increase by 6% qoq to 25.5mmscmd. Blended tariff
assumed at Rs. 1,030/tscm as there was no power pooling volume in this quarter. EBITDA 2,445 2,049 19.3% 2,271 7.6%
EBIT 1,952 1,575 23.9% 1,837 6.3%
PAT 1,283 997 28.7% 1,128 13.8% Key Things to Look For: Volume growth, Update on tariff
EPS 2.3 1.8 28.7% 2.0 13.7%
Gujarat Gas 1QFY17E 4QFY16 QoQ (%) 1QFY16 YoY (%) Comments & Outlook
Net Sales 13,105 13,781 -4.9% 16,709 -21.6% Expect 5.5mmscmd of volume which is ~ 4 qoq increase. Gross margin to improve on
lower cost of spot and long term gas. EBITDA 2,666 2,213 20.5% 2,002 33.2%
EBIT 2,016 1,577 27.8% 1,404 43.6%
PAT 1,002 581 72.5% 520 92.7% Key Things to Look For: Volume ramp up, guidance on margin
EPS 7.3 6.1 19.7% 3.8 92.7%
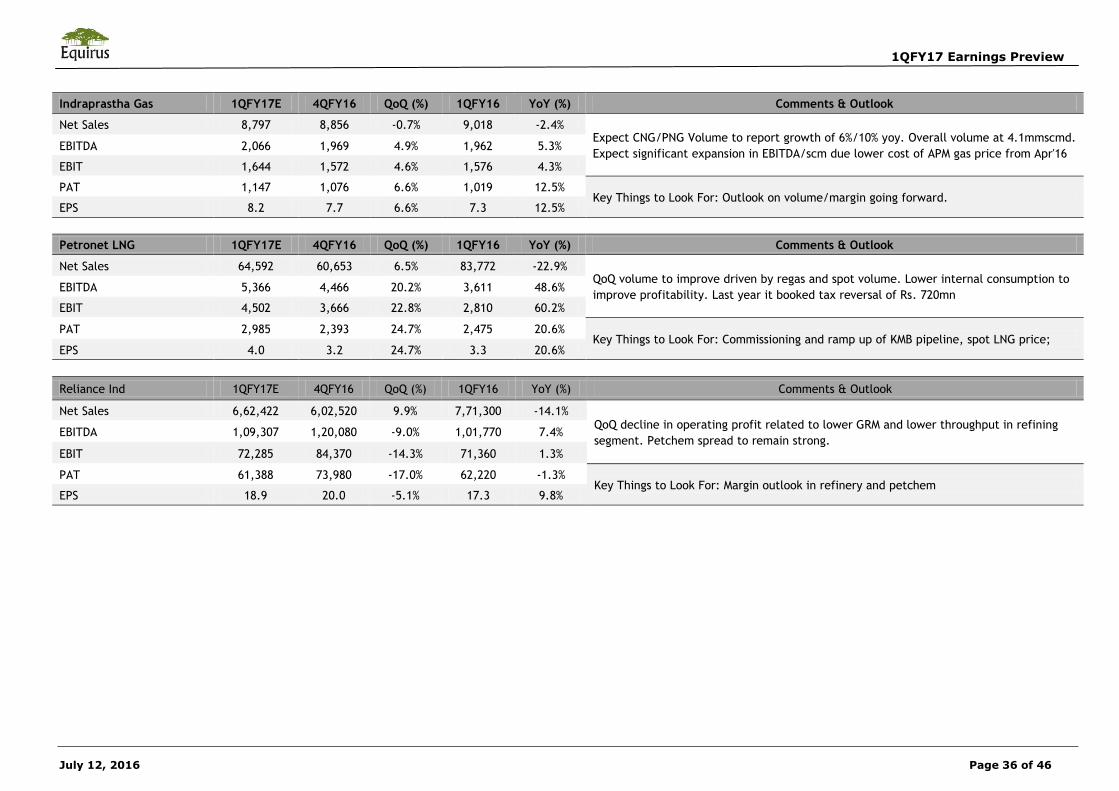
1QFY17 Earnings Preview
July 12, 2016 Page 36 of 46
Indraprastha Gas 1QFY17E 4QFY16 QoQ (%) 1QFY16 YoY (%) Comments & Outlook
Net Sales 8,797 8,856 -0.7% 9,018 -2.4% Expect CNG/PNG Volume to report growth of 6%/10% yoy. Overall volume at 4.1mmscmd.
Expect significant expansion in EBITDA/scm due lower cost of APM gas price from Apr'16 EBITDA 2,066 1,969 4.9% 1,962 5.3%
EBIT 1,644 1,572 4.6% 1,576 4.3%
PAT 1,147 1,076 6.6% 1,019 12.5% Key Things to Look For: Outlook on volume/margin going forward.
EPS 8.2 7.7 6.6% 7.3 12.5%
Petronet LNG 1QFY17E 4QFY16 QoQ (%) 1QFY16 YoY (%) Comments & Outlook
Net Sales 64,592 60,653 6.5% 83,772 -22.9% QoQ volume to improve driven by regas and spot volume. Lower internal consumption to
improve profitability. Last year it booked tax reversal of Rs. 720mn EBITDA 5,366 4,466 20.2% 3,611 48.6%
EBIT 4,502 3,666 22.8% 2,810 60.2%
PAT 2,985 2,393 24.7% 2,475 20.6% Key Things to Look For: Commissioning and ramp up of KMB pipeline, spot LNG price;
EPS 4.0 3.2 24.7% 3.3 20.6%
Reliance Ind 1QFY17E 4QFY16 QoQ (%) 1QFY16 YoY (%) Comments & Outlook
Net Sales 6,62,422 6,02,520 9.9% 7,71,300 -14.1% QoQ decline in operating profit related to lower GRM and lower throughput in refining
segment. Petchem spread to remain strong. EBITDA 1,09,307 1,20,080 -9.0% 1,01,770 7.4%
EBIT 72,285 84,370 -14.3% 71,360 1.3%
PAT 61,388 73,980 -17.0% 62,220 -1.3% Key Things to Look For: Margin outlook in refinery and petchem
EPS 18.9 20.0 -5.1% 17.3 9.8%
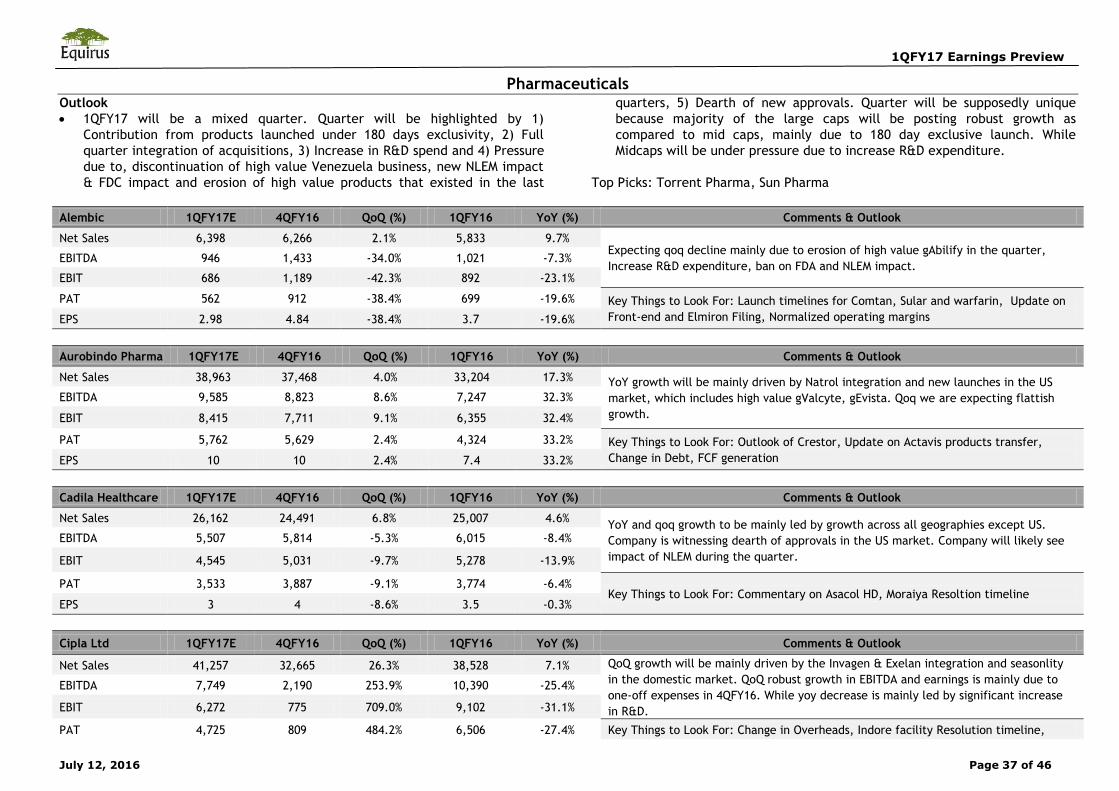
1QFY17 Earnings Preview
July 12, 2016 Page 37 of 46
Pharmaceuticals Outlook
1QFY17 will be a mixed quarter. Quarter will be highlighted by 1)
Contribution from products launched under 180 days exclusivity, 2) Full
quarter integration of acquisitions, 3) Increase in R&D spend and 4) Pressure
due to, discontinuation of high value Venezuela business, new NLEM impact
& FDC impact and erosion of high value products that existed in the last
quarters, 5) Dearth of new approvals. Quarter will be supposedly unique
because majority of the large caps will be posting robust growth as
compared to mid caps, mainly due to 180 day exclusive launch. While
Midcaps will be under pressure due to increase R&D expenditure.
Top Picks: Torrent Pharma, Sun Pharma
Alembic 1QFY17E 4QFY16 QoQ (%) 1QFY16 YoY (%) Comments & Outlook
Net Sales 6,398 6,266 2.1% 5,833 9.7% Expecting qoq decline mainly due to erosion of high value gAbilify in the quarter,
Increase R&D expenditure, ban on FDA and NLEM impact. EBITDA 946 1,433 -34.0% 1,021 -7.3%
EBIT 686 1,189 -42.3% 892 -23.1%
PAT 562 912 -38.4% 699 -19.6% Key Things to Look For: Launch timelines for Comtan, Sular and warfarin, Update on
Front-end and Elmiron Filing, Normalized operating margins EPS 2.98 4.84 -38.4% 3.7 -19.6%
Aurobindo Pharma 1QFY17E 4QFY16 QoQ (%) 1QFY16 YoY (%) Comments & Outlook
Net Sales 38,963 37,468 4.0% 33,204 17.3% YoY growth will be mainly driven by Natrol integration and new launches in the US
market, which includes high value gValcyte, gEvista. Qoq we are expecting flattish
growth. EBITDA 9,585 8,823 8.6% 7,247 32.3%
EBIT 8,415 7,711 9.1% 6,355 32.4%
PAT 5,762 5,629 2.4% 4,324 33.2% Key Things to Look For: Outlook of Crestor, Update on Actavis products transfer,
Change in Debt, FCF generation EPS 10 10 2.4% 7.4 33.2%
Cadila Healthcare 1QFY17E 4QFY16 QoQ (%) 1QFY16 YoY (%) Comments & Outlook
Net Sales 26,162 24,491 6.8% 25,007 4.6% YoY and qoq growth to be mainly led by growth across all geographies except US.
Company is witnessing dearth of approvals in the US market. Company will likely see
impact of NLEM during the quarter. EBITDA 5,507 5,814 -5.3% 6,015 -8.4%
EBIT 4,545 5,031 -9.7% 5,278 -13.9%
PAT 3,533 3,887 -9.1% 3,774 -6.4% Key Things to Look For: Commentary on Asacol HD, Moraiya Resoltion timeline
EPS 3 4 -8.6% 3.5 -0.3%
Cipla Ltd 1QFY17E 4QFY16 QoQ (%) 1QFY16 YoY (%) Comments & Outlook
Net Sales 41,257 32,665 26.3% 38,528 7.1% QoQ growth will be mainly driven by the Invagen & Exelan integration and seasonlity
in the domestic market. QoQ robust growth in EBITDA and earnings is mainly due to
one-off expenses in 4QFY16. While yoy decrease is mainly led by significant increase
in R&D.
EBITDA 7,749 2,190 253.9% 10,390 -25.4%
EBIT 6,272 775 709.0% 9,102 -31.1%
PAT 4,725 809 484.2% 6,506 -27.4% Key Things to Look For: Change in Overheads, Indore facility Resolution timeline,

1QFY17 Earnings Preview
July 12, 2016 Page 38 of 46
EPS 5.88 1.01 484.5% 8.1 -27.4% Advair launch in UK and US filing timelines.
Ipca Labs 1QFY17E 4QFY16 QoQ (%) 1QFY16 YoY (%) Comments & Outlook
Net Sales 7,932 6,246 27.0% 7,580 4.7% QoQ we're expecting growth across all the business segments except for Institutional
and US business. Growth will be mainly led by domestic market seasonality. EBITDA 1,130 635 78.1% 822 37.6%
EBIT 643 243 164.7% 401 60.5%
PAT 514 377 36.3% 189 171.9% Key Things to Look For: Outlook of Institutional business, Update on resolution of
USFDA import alerts on facilities, Any uptick in HCQs sales. EPS 4.1 3.0 36.3% 1.5 171.9%
Lupin 1QFY17E 4QFY16 QoQ (%) 1QFY16 YoY (%) Comments & Outlook
Net Sales 46,661 41,812 11.6% 31,502 48.1% We're expecting robust growth yoy on the back of gGlumetza launch under 180 days
exclusivity and qoq growth on the back of full quarter integration of Gavis. EBITDA 14,118 13,674 3.2% 8,166 72.9%
EBIT 12,485 12,228 2.1% 7,159 74.4%
PAT 8,676 8,071 7.5% 5,248 65.3% Key Things to Look For: Gavis Intergation, Clarity on Goa remediation, Appoval
timeline for Renagel, Welchol, Detrol La and Renvela approval. EPS 19.27 17.93 7.5% 11.7 65.1%
Natco 1QFY17E 4QFY16 QoQ (%) 1QFY16 YoY (%) Comments & Outlook
Net Sales 3,208 4,070 -21.2% 2,237 43.4% Expecting qoq decline mainly because, 1) 4QFY16 included Venezuela sale, which are
not expected to be repeated this quarter, 2) Decline in their B2B Hep-c portfolio sales
as 2 customers have started manufacturing their own. EBITDA 683 925 -26.2% 575 18.8%
EBIT 545 802 -32.0% 448 21.6%
PAT 440 602 -27.0% 282 55.7% Key Things to Look For: Sales from Hep-c Portfolio, Venezuela sales, Approval
timelines for gCopaxone. EPS 2.52 3.46 -27.0% 1.6 55.7%
Sun Pharma 1QFY17E 4QFY16 QoQ (%) 1QFY16 YoY (%) Comments & Outlook
Net Sales 82,800 76,342 8.5% 67,577 22.5% Expecting robust qoq top-line growth on the back of high value Gleevec which is
launched under 180 days exclusivity. Meantime, Ranbaxy synergy will drive EBITDA
and PAT. EBITDA 31,428 25,203 24.7% 18,498 69.9%
EBIT 28,557 22,560 26.6% 16,097 77.4%
PAT 21,927 17,137 28.0% 11,642 88.3% Key Things to Look For: Gleevec outlook post exclusivity, Commentary of Halol re-
inspection timeline and sales normalization. EPS 9.1 7.1 28.0% 4.8 88.3%
Dr Reddy's Labs 1QFY17E 4QFY16 QoQ (%) 1QFY16 YoY (%) Comments & Outlook
Net Sales 37,406 37,562 -0.4% 37,578 -0.5% Expecting flattish qoq and yoy growth mainly due to dearth of approvals and
discontinuation of Venezuela sales. EBITDA 7,490 7,797 -3.9% 9,855 -24.0%
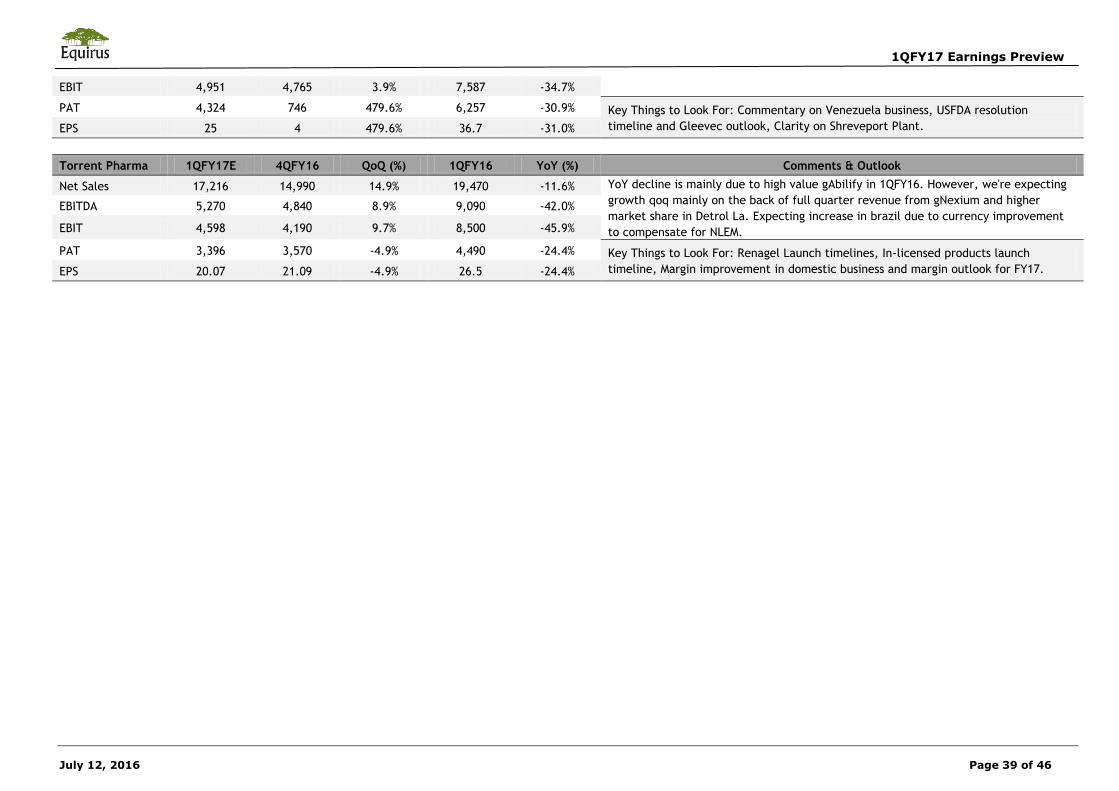
1QFY17 Earnings Preview
July 12, 2016 Page 39 of 46
EBIT 4,951 4,765 3.9% 7,587 -34.7%
PAT 4,324 746 479.6% 6,257 -30.9% Key Things to Look For: Commentary on Venezuela business, USFDA resolution
timeline and Gleevec outlook, Clarity on Shreveport Plant. EPS 25 4 479.6% 36.7 -31.0%
Torrent Pharma 1QFY17E 4QFY16 QoQ (%) 1QFY16 YoY (%) Comments & Outlook
Net Sales 17,216 14,990 14.9% 19,470 -11.6% YoY decline is mainly due to high value gAbilify in 1QFY16. However, we're expecting
growth qoq mainly on the back of full quarter revenue from gNexium and higher
market share in Detrol La. Expecting increase in brazil due to currency improvement
to compensate for NLEM.
EBITDA 5,270 4,840 8.9% 9,090 -42.0%
EBIT 4,598 4,190 9.7% 8,500 -45.9%
PAT 3,396 3,570 -4.9% 4,490 -24.4% Key Things to Look For: Renagel Launch timelines, In-licensed products launch
timeline, Margin improvement in domestic business and margin outlook for FY17. EPS 20.07 21.09 -4.9% 26.5 -24.4%
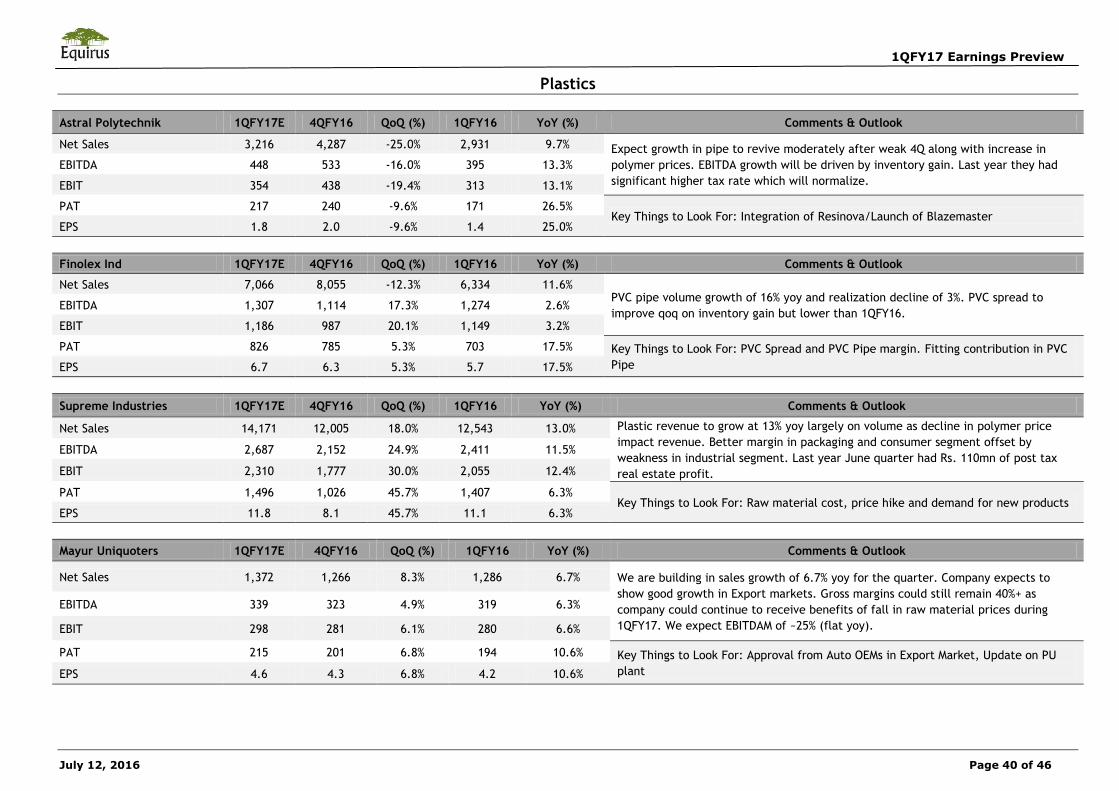
1QFY17 Earnings Preview
July 12, 2016 Page 40 of 46
Plastics
Astral Polytechnik 1QFY17E 4QFY16 QoQ (%) 1QFY16 YoY (%) Comments & Outlook
Net Sales 3,216 4,287 -25.0% 2,931 9.7% Expect growth in pipe to revive moderately after weak 4Q along with increase in
polymer prices. EBITDA growth will be driven by inventory gain. Last year they had
significant higher tax rate which will normalize. EBITDA 448 533 -16.0% 395 13.3%
EBIT 354 438 -19.4% 313 13.1%
PAT 217 240 -9.6% 171 26.5% Key Things to Look For: Integration of Resinova/Launch of Blazemaster
EPS 1.8 2.0 -9.6% 1.4 25.0%
Finolex Ind 1QFY17E 4QFY16 QoQ (%) 1QFY16 YoY (%) Comments & Outlook
Net Sales 7,066 8,055 -12.3% 6,334 11.6% PVC pipe volume growth of 16% yoy and realization decline of 3%. PVC spread to
improve qoq on inventory gain but lower than 1QFY16. EBITDA 1,307 1,114 17.3% 1,274 2.6%
EBIT 1,186 987 20.1% 1,149 3.2%
PAT 826 785 5.3% 703 17.5% Key Things to Look For: PVC Spread and PVC Pipe margin. Fitting contribution in PVC
Pipe EPS 6.7 6.3 5.3% 5.7 17.5%
Supreme Industries 1QFY17E 4QFY16 QoQ (%) 1QFY16 YoY (%) Comments & Outlook
Net Sales 14,171 12,005 18.0% 12,543 13.0% Plastic revenue to grow at 13% yoy largely on volume as decline in polymer price
impact revenue. Better margin in packaging and consumer segment offset by
weakness in industrial segment. Last year June quarter had Rs. 110mn of post tax
real estate profit.
EBITDA 2,687 2,152 24.9% 2,411 11.5%
EBIT 2,310 1,777 30.0% 2,055 12.4%
PAT 1,496 1,026 45.7% 1,407 6.3% Key Things to Look For: Raw material cost, price hike and demand for new products
EPS 11.8 8.1 45.7% 11.1 6.3%
Mayur Uniquoters 1QFY17E 4QFY16 QoQ (%) 1QFY16 YoY (%) Comments & Outlook
Net Sales 1,372 1,266 8.3% 1,286 6.7% We are building in sales growth of 6.7% yoy for the quarter. Company expects to
show good growth in Export markets. Gross margins could still remain 40%+ as
company could continue to receive benefits of fall in raw material prices during
1QFY17. We expect EBITDAM of ~25% (flat yoy).
EBITDA 339 323 4.9% 319 6.3%
EBIT 298 281 6.1% 280 6.6%
PAT 215 201 6.8% 194 10.6% Key Things to Look For: Approval from Auto OEMs in Export Market, Update on PU
plant EPS 4.6 4.3 6.8% 4.2 10.6%
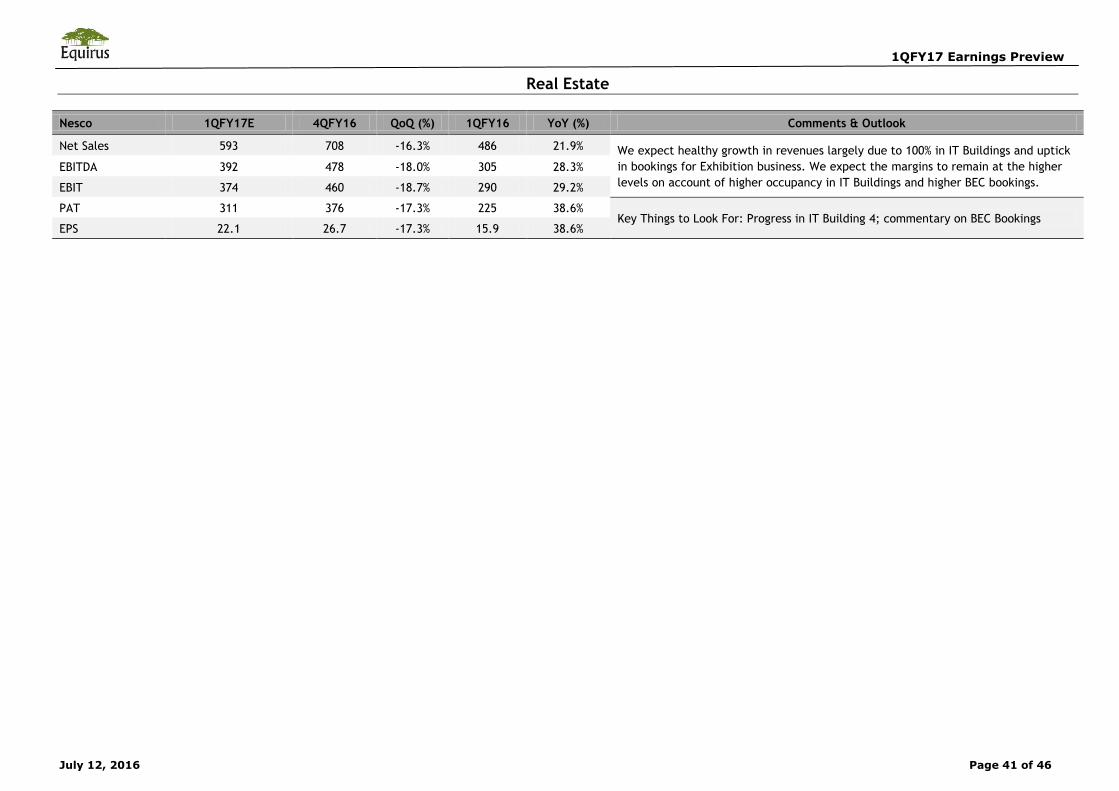
1QFY17 Earnings Preview
July 12, 2016 Page 41 of 46
Real Estate
Nesco 1QFY17E 4QFY16 QoQ (%) 1QFY16 YoY (%) Comments & Outlook
Net Sales 593 708 -16.3% 486 21.9% We expect healthy growth in revenues largely due to 100% in IT Buildings and uptick
in bookings for Exhibition business. We expect the margins to remain at the higher
levels on account of higher occupancy in IT Buildings and higher BEC bookings. EBITDA 392 478 -18.0% 305 28.3%
EBIT 374 460 -18.7% 290 29.2%
PAT 311 376 -17.3% 225 38.6% Key Things to Look For: Progress in IT Building 4; commentary on BEC Bookings
EPS 22.1 26.7 -17.3% 15.9 38.6%
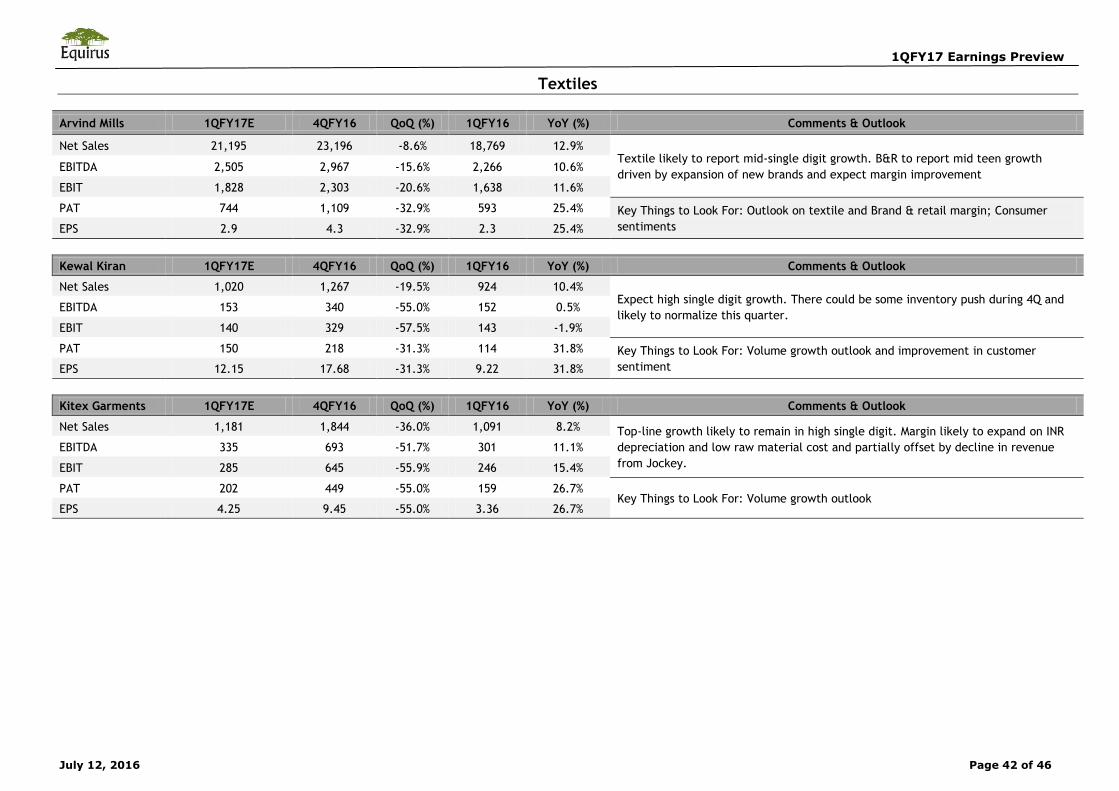
1QFY17 Earnings Preview
July 12, 2016 Page 42 of 46
Textiles
Arvind Mills 1QFY17E 4QFY16 QoQ (%) 1QFY16 YoY (%) Comments & Outlook
Net Sales 21,195 23,196 -8.6% 18,769 12.9% Textile likely to report mid-single digit growth. B&R to report mid teen growth
driven by expansion of new brands and expect margin improvement EBITDA 2,505 2,967 -15.6% 2,266 10.6%
EBIT 1,828 2,303 -20.6% 1,638 11.6%
PAT 744 1,109 -32.9% 593 25.4% Key Things to Look For: Outlook on textile and Brand & retail margin; Consumer
sentiments EPS 2.9 4.3 -32.9% 2.3 25.4%
Kewal Kiran 1QFY17E 4QFY16 QoQ (%) 1QFY16 YoY (%) Comments & Outlook
Net Sales 1,020 1,267 -19.5% 924 10.4% Expect high single digit growth. There could be some inventory push during 4Q and
likely to normalize this quarter. EBITDA 153 340 -55.0% 152 0.5%
EBIT 140 329 -57.5% 143 -1.9%
PAT 150 218 -31.3% 114 31.8% Key Things to Look For: Volume growth outlook and improvement in customer
sentiment EPS 12.15 17.68 -31.3% 9.22 31.8%
Kitex Garments 1QFY17E 4QFY16 QoQ (%) 1QFY16 YoY (%) Comments & Outlook
Net Sales 1,181 1,844 -36.0% 1,091 8.2% Top-line growth likely to remain in high single digit. Margin likely to expand on INR
depreciation and low raw material cost and partially offset by decline in revenue
from Jockey. EBITDA 335 693 -51.7% 301 11.1%
EBIT 285 645 -55.9% 246 15.4%
PAT 202 449 -55.0% 159 26.7% Key Things to Look For: Volume growth outlook
EPS 4.25 9.45 -55.0% 3.36 26.7%
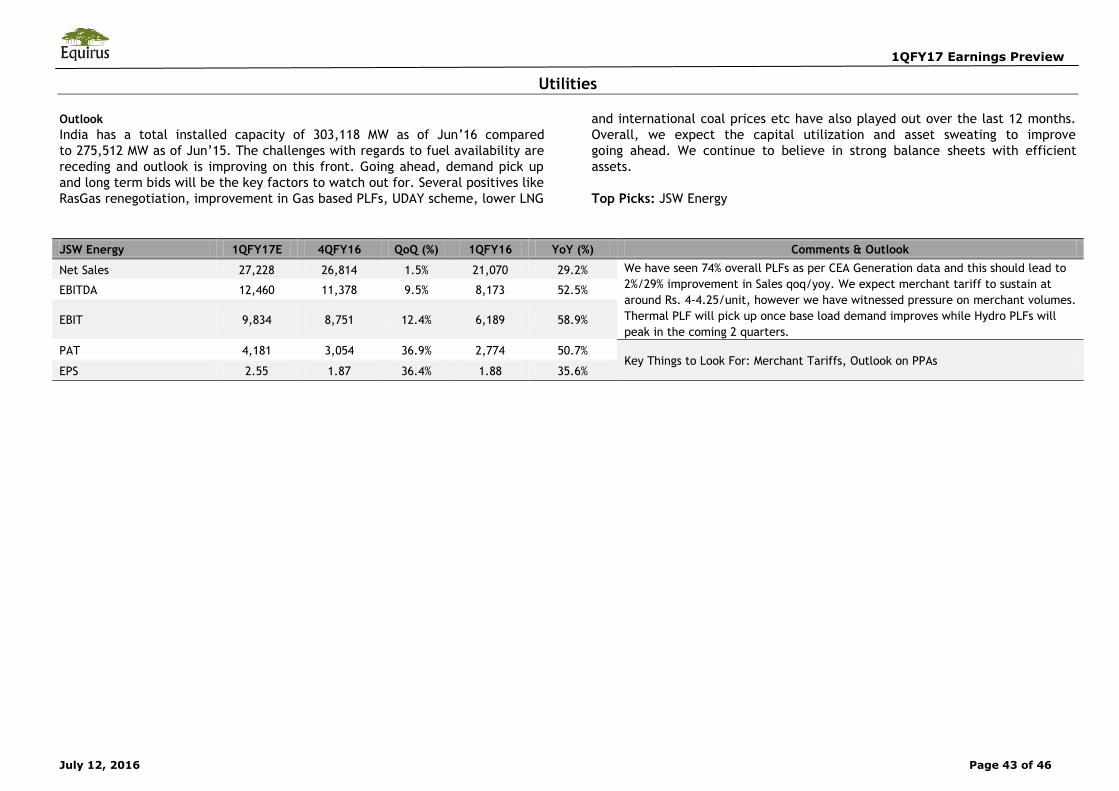
1QFY17 Earnings Preview
July 12, 2016 Page 43 of 46
Utilities
Outlook
India has a total installed capacity of 303,118 MW as of Jun’16 compared
to 275,512 MW as of Jun’15. The challenges with regards to fuel availability are
receding and outlook is improving on this front. Going ahead, demand pick up
and long term bids will be the key factors to watch out for. Several positives like
RasGas renegotiation, improvement in Gas based PLFs, UDAY scheme, lower LNG
and international coal prices etc have also played out over the last 12 months.
Overall, we expect the capital utilization and asset sweating to improve
going ahead. We continue to believe in strong balance sheets with efficient
assets.
Top Picks: JSW Energy
JSW Energy 1QFY17E 4QFY16 QoQ (%) 1QFY16 YoY (%) Comments & Outlook
Net Sales 27,228 26,814 1.5% 21,070 29.2% We have seen 74% overall PLFs as per CEA Generation data and this should lead to
2%/29% improvement in Sales qoq/yoy. We expect merchant tariff to sustain at
around Rs. 4-4.25/unit, however we have witnessed pressure on merchant volumes.
Thermal PLF will pick up once base load demand improves while Hydro PLFs will
peak in the coming 2 quarters.
EBITDA 12,460 11,378 9.5% 8,173 52.5%
EBIT 9,834 8,751 12.4% 6,189 58.9%
PAT 4,181 3,054 36.9% 2,774 50.7% Key Things to Look For: Merchant Tariffs, Outlook on PPAs
EPS 2.55 1.87 36.4% 1.88 35.6%
1QFY17 Earnings Preview
July 12, 2016
Equirus Securities
Pankaj Sharma Executive Director [email protected] 91-79-61909540/41
Research Analysts Sector/Industry Email Equity Sales E-mail
Anirvan Sarkar Banking & Financial Services [email protected] 91-79-61909526 Vishad Turakhia [email protected] 91-22-43320633
Ashutosh Tiwari Auto, Metals & Mining [email protected] 91-79-61909517 Vibhor Rastogi [email protected] 91-22-43320635
Devam Modi Power & Infrastructure [email protected] 91-79-61909516 Subham Sinha [email protected] 91-22-43320631
Dhaval Dama FMCG, Mid-Caps [email protected] 91-79-61909518 Sweta Sheth [email protected] 91-22-43320634
Maulik Patel Oil and Gas [email protected] 91-79-61909519 Dealing Room E-mail
Nimish Mehta Pharma [email protected] 91-79-61909550 Ashish Shah [email protected] 91-79-61909504
Umesh Raut Industrials [email protected] 91-79-61909529 Ilesh Savla [email protected] 91-79-61909505
Associates
Jigar Chokshi [email protected] 91-79-61909506
Ankit Choudhary [email protected] 91-79-61909550 Manoj Kejriwal [email protected] 91-79-61909508
Manoj Gori
[email protected] 91-79-61909523 Sandip Amrutiya [email protected] 91-79-61909503
Meet Chande [email protected] 91-79-61909513 Compliance Officer E-mail
Parva Soni [email protected] 91-79-61909541 Smita Sharma [email protected] 91-79-61909509
Pranav Mehta [email protected] 91-79-61909514
Raj Kantawala [email protected] 91-79-61909532
Ram Varun [email protected] 91-79-61909530
Saylee Warade [email protected] 91-79-61909527
Vikas Jain [email protected] 91-79-61909531
Rating & Coverage Definitions: Absolute Rating • LONG : Over the investment horizon, ATR >= Ke for companies with Free Float market cap > Rs 5 billion and ATR >= 20% for rest of the companies • SHORT: ATR <= negative 5% over investment horizon • TRADE: Stocks that do not meet the criteria for either LONG or SHORT Relative Rating • OVERWEIGHT: Likely to outperform the benchmark by at least 5% over investment horizon • BENCHMARK: likely to perform in line with the benchmark • UNDERWEIGHT: likely to under-perform the benchmark by at least 5% over investment horizon Target Price and Investment Horizon Target Price is a point value for stocks with Absolute rating of LONG or SHORT and a range value for stocks rated TRADE. Investment Horizon is set at a minimum 3 months to maximum 15 months with target date falling on last day of a calendar quarter. Lite vs. Regular Coverage vs. Spot Coverage We aim to keep our rating and estimates updated at least once a quarter for Regular Coverage stocks. Generally, we would have access to the company and we would maintain detailed financial model for Regular coverage companies. We intend to publish updates on Lite coverage stocks only an opportunistic basis and subject to our ability to contact the management. Our rating and estimates for Lite coverage stocks may not be current. Spot coverage is meant for one-off coverage of a specific company and in such cases, earnings forecast and target price are optional. Spot coverage is meant to stimulate discussion rather than provide a research opinion.
Registered Office:
Equirus Securities Private Limited
Unit No. 1201, 12th Floor, C Wing, Marathon Futurex,
N M Joshi Marg, Lower Parel,
Mumbai-400013.
Tel. No: +91 – (0)22 – 4332 0600
Fax No: +91- (0)22 – 4332 0601
Corporate Office:
3rd floor, House No. 9,
Magnet Corporate Park, Near Zydus Hospital, B/H Intas Sola Bridge,
S.G. Highway Ahmedabad-380054, Gujarat
Tel. No: +91 (0)79 - 6190 9550
Fax No: +91 (0)79 – 6190 9560
1QFY17 Earnings Preview
July 12, 2016
© 2016 Equirus Securities Private Limited. All rights reserved. For Private Circulation only. This report or any portion hereof may not be reprinted, sold or redistributed without the written consent of Equirus Securities Private Limited Analyst Certification The views expressed in this research report accurately reflect the personal views of the concerned analyst(s) about the subject securities or sector and no part of the compensation of the research analyst(s) was, is, or will be directly or indirectly related to the specific recommendations and views expressed by research analyst(s) in this report.
Disclaimers Equirus Securities Private Limited (ESPL) having Corporate Identification Number U65993MH2007PTC176044 is registered in India with Securities and Exchange Board of India (SEBI) as a trading member on the Capital Market (Reg. No. INB231301731), Futures & Options Segment (Reg. No. INF231301731) of the National Stock Exchange of India Ltd. (NSE) and on Cash Segment (Reg. No. INB011301737) of Bombay Stock Exchange Limited (BSE). We are under the process of seeking registration under SEBI (Research Analyst) Regulations, 2014. There are no disciplinary actions that have been taken by any regulatory authority. ESPL is a subsidiary of Equirus Capital Pvt. Ltd. (ECPL) which is registered with SEBI as Category I Merchant Banker. ESPL/its affiliates provide investment banking services including but not limited to Private Equity, Mergers & Acquisitions, Structured Finance and Institutional Equities.
ESPL/its affiliates may have, managed or co-managed public offering of securities of the subject company or have received a mandate from the subject company or may have received compensation from the subject company for investment banking or brokerage services in the past twelve months. ESPL & its affiliates, their directors and employees may from time to time have positions or options in the company and buy or sell the securities of the company (ies) mentioned herein. Research Analyst may have served as an officer, director or employee of the subject company. This document is not directed or intended for distribution to, or use by, any person or entity who is a citizen or resident of or located in any locality, state, country or other jurisdiction, where such distribution, publication, availability or use would be contrary to law, regulation or which would subject ESPL and affiliates to any registration or licensing requirement within such jurisdiction. The securities described herein may or may not be eligible for sale in all jurisdictions or to a certain category of investors. Persons in whose possession this document may come are required to inform them of, and to observe, such applicable restrictions. Please delete this document if you are not authorized to view the same. By reading this document you represent and warrant that you have full authority and all rights necessary to view and read this document.
This document has been prepared solely for information purpose and does not constitute a solicitation to any person to buy, sell or subscribe a security. ESPL is not soliciting any action based on this report. The information contained herein is from publicly available data or other sources believed to be reliable but ESPL provides no guarantee as to its accuracy or completeness. The information contained herein stand on date, which are subject to change or modification. Any such changes could impact our interpretation of relevant information contained herein. While we would endeavour to update the information herein on reasonable basis. ESPL, its affiliates, their directors and employees are under no obligation to update or keep the information current. Also there may be regulatory, compliance, or other reasons that may prevent ESPL and its group companies from doing so. This document is prepared for assistance only and is not intended to be and must not alone be taken as the basis for an investment decision. Each recipient of this document should make such investigations as it deems necessary to arrive at an independent evaluation of an investment in the securities of companies referred to in this document including the merits and risks involved. This document is intended for general circulation and does not take into account the specific investment objectives, financial situation or particular needs of any particular person. ESPL and its group companies, employees, directors and agents accept no liability, and disclaim all responsibility, for the consequences of you or anyone else acting, or refraining to act, in reliance on the information contained in this publication or for any decision based on it. ESPL/its affiliates do and seek to do business with companies covered in its research report. Thus, investors should be aware that the firm may have conflict of interest.
Additional Disclaimer for U.S. Persons ESPL/its affiliates are not a registered broker – dealer under the U.S. Securities Exchange Act of 1934, as amended (the“1934 act”) and under applicable state laws in the United States. In addition Equirus is not a
registered investment adviser under the U.S. Investment Advisers Act of 1940, as amended (the "Advisers Act" and together with the 1934 Act, the "Acts), and under applicable state laws in the United States.
Accordingly, in the absence of specific exemption under the Acts, any brokerage and investment services provided by Equirus, including the products and services described herein are not available to or intended
for U.S. persons. The information contained in this Report is not intended for any person who is a resident of the United States of America or a resident of any jurisdiction, the laws of which imposes prohibition on
soliciting the securities business in that jurisdiction without going through the registration requirements and/or prohibit the use of any information contained in this website. This Report and its respective
contents does not constitute an offer or invitation to purchase or subscribe for any securities or solicitation of any investments or investment services and/or shall not be considered as an advertisement tool. "U.S.
Persons" are generally defined as a natural person, residing in the United States or any entity organized or incorporated under the laws of the United States. US Citizens living abroad may also be deemed "US
Persons" under certain rules.
1QFY17 Earnings Preview
July 12, 2016
Disclosures
Disclosure of Interest statement for the subject Company Yes/No If Yes, nature of such interest
Analyst/ESPL/Associate/Relatives’ financial interest No
Analyst/ESPL/Associate/Relatives’ actual/beneficial ownership of 1% or more No
Analyst/ESPL/Associate/Relatives’ material conflict of interest No
Whether ECPL managed any public offering in past 12 months No
* Associate means individual who assist Analyst