Embed Size (px)
Citation preview
Third quarter report 2006 October 19, 2006
Ericsson reports continued solid financial performance
• Net sales SEK 40.8 (36.2) b. in the quarter, SEK 124.1 (106.2) b. first nine months • Operating income SEK 8.8 (7.8) b. in the quarter, SEK 23.6 (22.7) b. first nine months • Operating margin 21.5% (21.6%) in the quarter, supported by strong Sony Ericsson performance • Net income SEK 6.2 (5.3) b. in the quarter, SEK 16.5 (15.8) b. first nine months1) • Earnings per share SEK 0.39 (0.34) in the quarter, SEK 1.04 (1.00), first nine months1) • Restructuring charges in the quarter of SEK 2.9 b., divestiture capital gain of SEK 3.0 b.
CEO COMMENTS “We see continued positive business momentum and accelerating focus on broadband,” says Carl-Henric Svanberg, President and CEO of Ericsson (NASDAQ:ERIC). “For billions of people mobile broadband will be the way to reach high-speed connectivity and access to the internet. This will cause a significant increase in voice and data traffic in the world’s networks. Traffic in mobile networks is expected to quadruple in the next five years and there is even stronger growth expected in fixed broadband.
Mobile broadband enables high-speed downloads of music, mobile TV, mobile office and other multimedia applications. The rollout of mobile broadband, HSPA, is happening all over the world, and we have announced eight new contracts during the quarter. We have a unique capability to combine leading mobile and fixed broadband solutions, meeting operators’ increasing demand for new consumer and enterprise applications.
Our leading services business continues to show strong growth. We offer operators the opportunity to increase their customer focus and realize considerable savings. Our strategy has to date resulted in more than 100 announced managed services contracts across the world.
With key contract wins, we have strengthened our market position further, and through continued focus on operational excellence, including already announced ongoing cost cutting activities, and the very strong performance by Sony Ericsson, our profitability shows a healthy development,” concludes Carl-Henric Svanberg.
FINANCIAL HIGHLIGHTS Income statement and cash flow
Third quarter Second quarter Nine-month period
SEK b. 20062) 20063) 2005 Change4) 2006 Change 20063) 2005 Change
Net sales 40.8 40.8 36.2 12% 44.2 -8% 124.1 106.2 17%
Gross margin 41.8% 37.6% 45.2% - 42.0% - 41.0% 46.4% -
Operating income 8.7 8.8 7.8 11% 8.3 6% 23.6 22.7 4%
Operating margin 21.4% 21.5% 21.6% - 18.7% - 19.1% 21.4% -
Income after financial items 8.8 8.9 8.0 - 8.3 - 23.8 23.3 -Net income1) 6.23) 6.2 5.3 - 5.7 - 16.5 15.8 -Cash flow before financial investing activities 6.63) 6.6 -1.1 - -2.0 - -11.5 -2.2 -Earnings per share, SEK1) 0.393) 0.39 0.34 - 0.36 - 1.04 1.00 -
1)Attributable to stockholders of the parent company, excluding minority interest. 2)Excluding restructuring charges of SEK 2.9 b. and capital gain of SEK 3.0 b. 3)Including restructuring charges of SEK 2.9 b. and capital gain of SEK 3.0 b. 4)Q3 2006, excluding restructuring charges and capital gain, compared with Q3 2005.
Sales in the quarter were up 12% year-over-year, with growth in all areas and with professional services being especially strong. Gross margin, excluding restructuring charges, decreased slightly sequentially from 42.0% to 41.8% (45.2%).
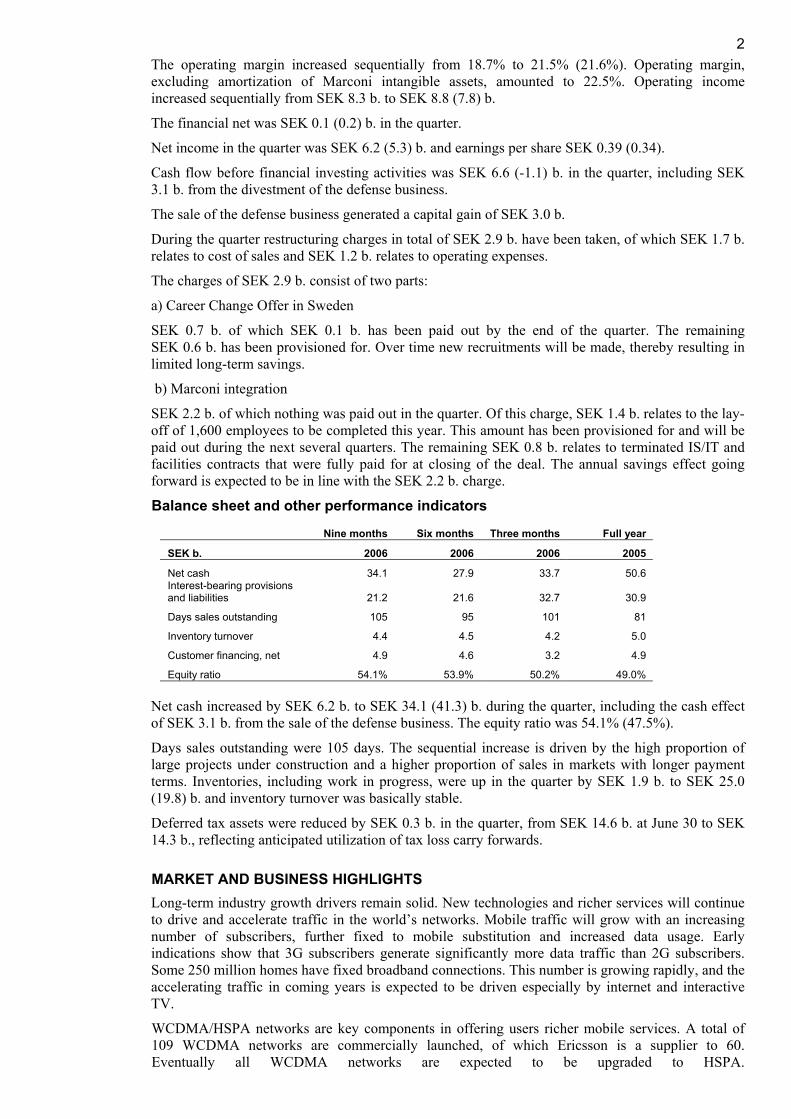
2The operating margin increased sequentially from 18.7% to 21.5% (21.6%). Operating margin, excluding amortization of Marconi intangible assets, amounted to 22.5%. Operating income increased sequentially from SEK 8.3 b. to SEK 8.8 (7.8) b.
The financial net was SEK 0.1 (0.2) b. in the quarter.
Net income in the quarter was SEK 6.2 (5.3) b. and earnings per share SEK 0.39 (0.34).
Cash flow before financial investing activities was SEK 6.6 (-1.1) b. in the quarter, including SEK 3.1 b. from the divestment of the defense business.
The sale of the defense business generated a capital gain of SEK 3.0 b.
During the quarter restructuring charges in total of SEK 2.9 b. have been taken, of which SEK 1.7 b. relates to cost of sales and SEK 1.2 b. relates to operating expenses.
The charges of SEK 2.9 b. consist of two parts:
a) Career Change Offer in Sweden
SEK 0.7 b. of which SEK 0.1 b. has been paid out by the end of the quarter. The remaining SEK 0.6 b. has been provisioned for. Over time new recruitments will be made, thereby resulting in limited long-term savings.
b) Marconi integration
SEK 2.2 b. of which nothing was paid out in the quarter. Of this charge, SEK 1.4 b. relates to the lay-off of 1,600 employees to be completed this year. This amount has been provisioned for and will be paid out during the next several quarters. The remaining SEK 0.8 b. relates to terminated IS/IT and facilities contracts that were fully paid for at closing of the deal. The annual savings effect going forward is expected to be in line with the SEK 2.2 b. charge.
Balance sheet and other performance indicators
Nine months Six months Three months Full year
SEK b. 2006 2006 2006 2005
Net cash 34.1 27.9 33.7 50.6 Interest-bearing provisions and liabilities 21.2 21.6 32.7 30.9
Days sales outstanding 105 95 101 81
Inventory turnover 4.4 4.5 4.2 5.0
Customer financing, net 4.9 4.6 3.2 4.9
Equity ratio 54.1% 53.9% 50.2% 49.0%
Net cash increased by SEK 6.2 b. to SEK 34.1 (41.3) b. during the quarter, including the cash effect of SEK 3.1 b. from the sale of the defense business. The equity ratio was 54.1% (47.5%).
Days sales outstanding were 105 days. The sequential increase is driven by the high proportion of large projects under construction and a higher proportion of sales in markets with longer payment terms. Inventories, including work in progress, were up in the quarter by SEK 1.9 b. to SEK 25.0 (19.8) b. and inventory turnover was basically stable.
Deferred tax assets were reduced by SEK 0.3 b. in the quarter, from SEK 14.6 b. at June 30 to SEK 14.3 b., reflecting anticipated utilization of tax loss carry forwards.
MARKET AND BUSINESS HIGHLIGHTS Long-term industry growth drivers remain solid. New technologies and richer services will continue to drive and accelerate traffic in the world’s networks. Mobile traffic will grow with an increasing number of subscribers, further fixed to mobile substitution and increased data usage. Early indications show that 3G subscribers generate significantly more data traffic than 2G subscribers. Some 250 million homes have fixed broadband connections. This number is growing rapidly, and the accelerating traffic in coming years is expected to be driven especially by internet and interactive TV.
WCDMA/HSPA networks are key components in offering users richer mobile services. A total of 109 WCDMA networks are commercially launched, of which Ericsson is a supplier to 60. Eventually all WCDMA networks are expected to be upgraded to HSPA.
3Ericsson is currently powering 30 commercially launched HSPA networks. The number of WCDMA subscriptions grew by approximately 13 million to more than 80 million during the quarter.
Through convergence and increased broadband capabilities, the mobility driven telecom world and the PC-centric world will gradually merge and internet will become available to billions. This will accelerate the market for new IP-based multimedia services such as interactive TV, broadcasting, gaming, music and office applications.
The market potential for mobile broadband services is growing quickly also in such high growth markets where mobile coverage and penetration have come far and where basic data services such as SMS already play a vital role. Mobile broadband is often the only way to access broadband services and internet in markets with limited fixed-line alternatives. Consequently, focus on high-speed mobile networks is increasing among operators also in these markets.
More complex networks, increasing focus on business development, and a strive for cost efficiency are driving operators’ demand for professional services. We have clear market leadership through our early start, and we presently provide advanced support services, around-the-clock, to networks with more than 725 million subscribers as well as manage networks with more than 80 million subscribers. Our strong growth is based on our technology leadership, scale advantages and local presence.
Regional overview Western Europe sales were up by 19% compared to the same quarter last year. Growth is primarily driven by strong services sales and high demand for transmission and fixed broadband access. Mobile systems sales were flat, however, mobile broadband, HSPA, is gaining traction.
Central and Eastern Europe, Middle East and Africa sales grew by 24% compared to the same quarter last year. Countries in Africa and the Middle East are showing strong growth. The growth is primarily in GSM, driven by the need for cost efficient coverage. But there is also a growing demand for mobile broadband.
Asia Pacific sales grew by 38% compared to the same quarter last year. Australia, Bangladesh, China, India, Indonesia and Japan were particularly strong although China was down sequentially. After the end of the quarter, Telstra in Australia launched their nationwide HSPA network after a record rollout time of only 10 months.
North America sales were down 36% year-over-year. The Cingular HSPA build-out continues according to plan. The 2G build-out also continues, however, Cingular’s continued reductions of excess inventory have, as expected, affected our sales. The US spectrum auctions have been completed and will open up new business opportunities. T-Mobile has already announced their intention to roll out WCDMA/HSPA in the new spectrum.
Latin America sales declined by 18% compared to the same quarter last year. Sales increased 10% sequentially, mainly driven by Central America and South Latin America. Many markets have a continued need for investments in quality and coverage. In parallel, tender processes for 3G networks are ongoing, including a further migration from CDMA to GSM/WCDMA.
Subscriber growth
The growth of net mobile subscriptions continued with some 100 million new subscriptions in the quarter. At the end of the quarter, worldwide subscription penetration reached 40% with more than 2.5 billion subscriptions in total, of which more than 2.1 billion are GSM/WCDMA. The global number of subscriptions is expected to pass three billion during 2007.
OUTLOOK All estimates are measured in USD and refer to market growth compared to previous year.
The traffic growth in the world’s mobile networks is expected to continue as a result of both new services and new subscribers.
For 2006 we continue to believe that the GSM/WCDMA track within the global mobile systems market, measured in USD, will show moderate growth compared to 2005.
4We continue to believe that the addressable market for professional services will show good growth in 2006.
For 2007 our early estimate is that the GSM/WCDMA track within the global mobile systems market, measured in USD, will show moderate growth similar to 2006.
The addressable market for professional services is expected to show good growth in 2007.
With our technology leadership and global presence we are well positioned to take advantage of these market opportunities.
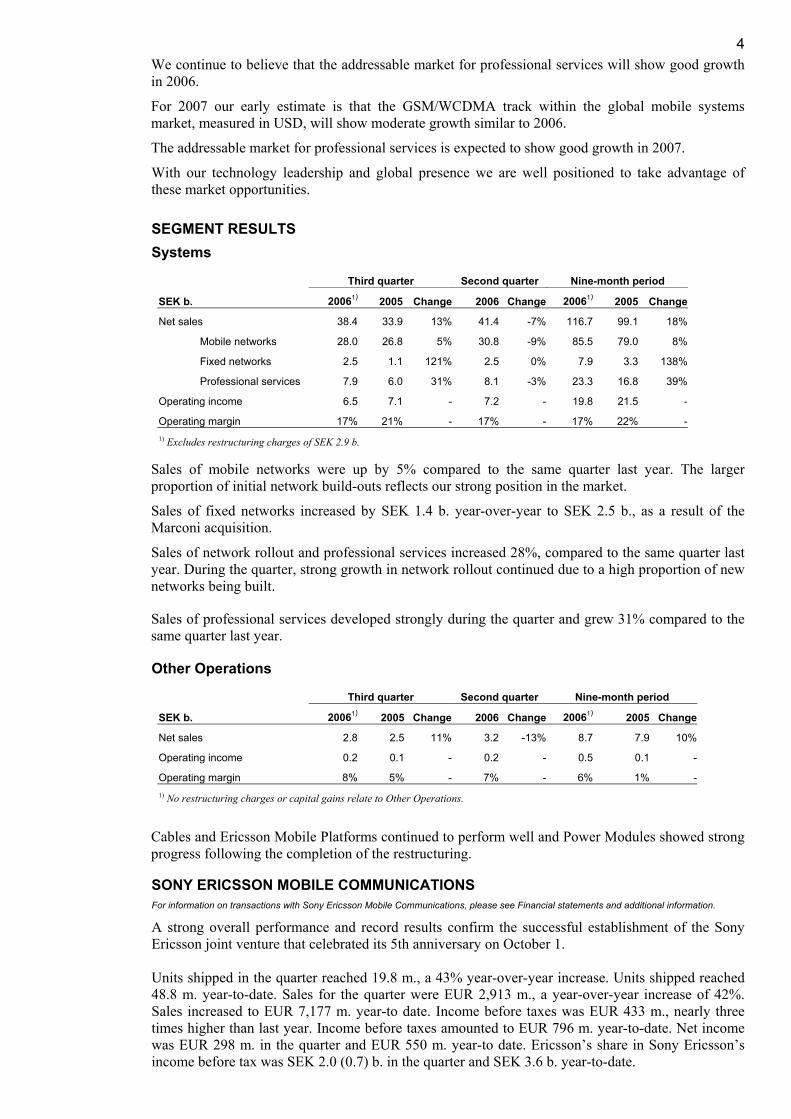
SEGMENT RESULTS Systems
Third quarter Second quarter Nine-month period
SEK b. 20061) 2005 Change 2006 Change 20061) 2005 Change
Net sales 38.4 33.9 13% 41.4 -7% 116.7 99.1 18%
Mobile networks 28.0 26.8 5% 30.8 -9% 85.5 79.0 8%
Fixed networks 2.5 1.1 121% 2.5 0% 7.9 3.3 138%
Professional services 7.9 6.0 31% 8.1 -3% 23.3 16.8 39%
Operating income 6.5 7.1 - 7.2 - 19.8 21.5 -
Operating margin 17% 21% - 17% - 17% 22% -
1) Excludes restructuring charges of SEK 2.9 b.
Sales of mobile networks were up by 5% compared to the same quarter last year. The larger proportion of initial network build-outs reflects our strong position in the market.
Sales of fixed networks increased by SEK 1.4 b. year-over-year to SEK 2.5 b., as a result of the Marconi acquisition.
Sales of network rollout and professional services increased 28%, compared to the same quarter last year. During the quarter, strong growth in network rollout continued due to a high proportion of new networks being built.
Sales of professional services developed strongly during the quarter and grew 31% compared to the same quarter last year.
Other Operations
Third quarter Second quarter Nine-month period
SEK b. 20061) 2005 Change 2006 Change 20061) 2005 Change
Net sales 2.8 2.5 11% 3.2 -13% 8.7 7.9 10%
Operating income 0.2 0.1 - 0.2 - 0.5 0.1 -
Operating margin 8% 5% - 7% - 6% 1% -
1) No restructuring charges or capital gains relate to Other Operations. Cables and Ericsson Mobile Platforms continued to perform well and Power Modules showed strong progress following the completion of the restructuring.
SONY ERICSSON MOBILE COMMUNICATIONS For information on transactions with Sony Ericsson Mobile Communications, please see Financial statements and additional information.
A strong overall performance and record results confirm the successful establishment of the Sony Ericsson joint venture that celebrated its 5th anniversary on October 1. Units shipped in the quarter reached 19.8 m., a 43% year-over-year increase. Units shipped reached 48.8 m. year-to-date. Sales for the quarter were EUR 2,913 m., a year-over-year increase of 42%. Sales increased to EUR 7,177 m. year-to date. Income before taxes was EUR 433 m., nearly three times higher than last year. Income before taxes amounted to EUR 796 m. year-to-date. Net income was EUR 298 m. in the quarter and EUR 550 m. year-to date. Ericsson’s share in Sony Ericsson’s income before tax was SEK 2.0 (0.7) b. in the quarter and SEK 3.6 b. year-to-date.
5The quarter was particularly strong as a result of successful launches across the product portfolio, including the K800 Cyber-shot™ phone and several Walkman® phones. The strategy of using flagship products to give Sony Ericsson a lead position within product categories such as imaging or music is successful and also builds demand for lower-end models in the same categories.
PARENT COMPANY INFORMATION Net sales for the nine months period amounted to SEK 0.4 (0.9) b. and income after financial items was SEK 12.5 (6.6) b. Net profits from disposals of shares, including sale of the defense business, have affected income by SEK 3.5 b. Major changes in the parent company’s financial position for the nine months period include decreased current and non-current receivables from subsidiaries of SEK 15.9 b. and decreased cash and short-term cash investments of SEK 26.4 b. Current and non-current liabilities to subsidiaries decreased by SEK 32.5 b. and current maturities of long-term borrowings decreased by SEK 9.7 b. At the end of the quarter, cash and short-term cash investments amounted to SEK 48.6 (75.0) b. In accordance with the conditions of the stock purchase plans and option plans for Ericsson employees, 4,075,368 shares from treasury stock were sold or distributed to employees during the third quarter. The holding of treasury stock at September 30, 2006, was 258,158,984 class B shares.
OTHER INFORMATION Marconi integration Marconi developed well and the operating income run rate passed breakeven in the quarter, excluding amortization of intangible assets. It should however be noted that product portfolios have been merged and it is not possible to separately track Marconi numbers with full accuracy. The restructuring will lead to annual savings of SEK 2.2 b. from fourth quarter 2006. The demand for our combined transmission offering is high and a doubling of the production capacity is presently under way.
New organization As announced on September 15, 2006, Ericsson will implement a more customer-oriented organization with three business units, Networks, Global Services and Multimedia, each optimized for its specific market segment. The new organization will be in effect as of January 1, 2007. Networks will include radio access, core, transport and fixed networks, presently reported under segment Systems. Networks will also include Cables and Power Modules, presently reported under segment Other Operations. Multimedia will include Multimedia Systems, presently reported under segment Systems, plus Ericsson Mobile Platforms and Enterprise, presently reported under segment Other Operations. Global Services remains unchanged.
Sale of defense business On September 1, 2006, Ericsson completed the sales of its defense business, Ericsson Microwave Systems AB, and its 40% holding in Saab Ericsson Space, to Saab AB. The purchase price was SEK 3.8 b. in cash and the agreement involved transfer of approximately 1,250 employees. Cash flow effect in the quarter was SEK 3.1 b. from the divestment and the capital gain SEK 3.0 b.
Completed offer in Netwise On August 4, 2006, Ericsson completed its recommended cash offer of SEK 60 per share to the shareholders and holders of warrants in Netwise AB to transfer all shares in and all warrants issued by Netwise to Ericsson. Netwise B-shares are listed on Nya Marknaden in Sweden. The total value of the offer amounted to SEK 300 m.
Stockholm, October 19, 2006 Carl-Henric Svanberg President and CEO Date for next report: February 2, 2007
6REVIEW REPORT We have reviewed the interim report for the period January 1 to September 30, 2006, for Telefonaktiebolaget LM Ericsson (publ). Management is responsible for the preparation and presentation of this interim financial information in accordance with IAS 34 and the Annual Accounts Act. Our responsibility is to express a conclusion on this interim financial information based on our review.
We conducted our review in accordance with the Standard on Review Engagements SÖG 2410, Review of Interim Financial Information Performed by the Independent Auditor of the Entity, issued by FAR. A review consists of making inquiries, primarily of persons responsible for financial and accounting matters, and applying analytical and other review procedures. A review is substantially less in scope than an audit conducted in accordance with Standards on Auditing in Sweden, RS, and other generally accepted auditing practices. The procedures performed in a review do not enable us to obtain a level of assurance that would make us aware of all significant matters that might be identified in an audit. Therefore, the conclusion expressed based on a review does not give the same level of assurance as a conclusion expressed based on an audit.
Based on our review, nothing has come to our attention that causes us to believe that the accompanying interim financial information is not, in all material respects, in accordance with IAS 34 and the Annual Accounts Act.
Stockholm, October 19, 2006
Bo Hjalmarsson Peter Clemedtson Thomas Thiel Authorized Public Accountant Authorized Public Accountant Authorized Public Accountant PricewaterhouseCoopers AB PricewaterhouseCoopers AB
EDITOR’S NOTE To read the complete report with tables, please go to: www.ericsson.com/investors/financial_reports/2006/9month06-en.pdf
Ericsson invites media, investors and analysts to a press conference at the Ericsson headquarters, Torshamnsgatan 23, Stockholm, at 09.00 (CET), October 19.
An analyst and media conference call will begin at 16.00 (CET).
Live audio webcasts of the press conference and conference call as well as supporting slides will be available at www.ericsson.com/press and www.ericsson.com/investors FOR FURTHER INFORMATION, PLEASE CONTACT Henry Sténson, Senior Vice President, Communications Phone: +46 8 719 4044 E-mail: [email protected] or [email protected] Investors Gary Pinkham, Vice President, Investor Relations Phone: +46 8 719 0000 E-mail: [email protected] Susanne Andersson, Investor Relations Phone: +46 8 719 4631 E-mail: [email protected]
Glenn Sapadin, Investor Relations, North America Phone: +1 212 843 8435; E-mail: [email protected] Media Åse Lindskog, Director, Head of Media Relations Phone: +46 8 719 9725, +46 730 244 872; E-mail: [email protected] Ola Rembe, Director, Media Relations Phone: +46 8 719 9727, +46 730 244 873; E-mail:[email protected]
Telefonaktiebolaget LM Ericsson (publ)
Org. number: 556016-0680 Torshamnsgatan 23
SE-164 83 Stockholm Phone: +46 8 719 00 00
www.ericsson.com
7
Safe Harbor Statement of Ericsson under the Private Securities Litigation Reform Act of 1995;
All statements made or incorporated by reference in this release, other than statements or characterizations of historical facts, are forward-looking statements. These forward-looking statements are based on our current expectations, estimates and projections about our industry, management’s beliefs and certain assumptions made by us. Forward-looking statements can often be identified by words such as “anticipates”, “expects”, “intends”, “plans”, “predicts”, “believes”, “seeks”, “estimates”, “may”, “will”, “should”, “would”, “potential”, “continue”, and variations or negatives of these words, and include, among others, statements regarding: (i) strategies, outlook and growth prospects; (ii) positioning to deliver future plans and to realize potential for future growth; (iii) liquidity and capital resources and expenditure, and our credit ratings; (iv) growth in demand for our products and services; (v) our joint venture activities; (vi) economic outlook and industry trends; (vii) developments of our markets; (viii) the impact of regulatory initiatives; (ix) research and development expenditures; (x) the strength of our competitors; (xi) future cost savings; and (xii) plans to launch new products and services.
In addition, any statements that refer to expectations, projections or other characterizations of future events or circumstances, including any underlying assumptions, are forward-looking statements. These forward-looking statements speak only as of the date hereof and are based upon the information available to us at this time. Such information is subject to change, and we will not necessarily inform you of such changes. These statements are not guarantees of future performance and are subject to risks, uncertainties and assumptions that are difficult to predict. Therefore, our actual results could differ materially and adversely from those expressed in any forward-looking statements as a result of various factors. Important factors that may cause such a difference for Ericsson include, but are not limited to: (i) material adverse changes in the markets in which we operate or in global economic conditions; (ii) increased product and price competition; (iii) further reductions in capital expenditure by network operators; (iv) the cost of technological innovation and increased expenditure to improve quality of service; (v) significant changes in market share for our principal products and services; (vi) foreign exchange rate fluctuations; and (vii) the successful implementation of our business and operational initiatives.
FINANCIAL STATEMENTS AND ADDITIONAL INFORMATION Financial statements Page Consolidated income statement 8 Consolidated balance sheet 9 Consolidated statement of cash flows 10 Consolidated statement of recognized income and expense 11 Consolidated income statement - isolated quarters 12 Additional information Page Accounting policies 13 Net sales by segment by quarter 15 Operating income, operating margin and employees by segment by quarter 16 Net sales by market area by quarter 17 External net sales by market area by segment 18 Top ten markets in sales 19 Customer financing risk exposure 19 Transactions with Sony Ericsson Mobile Communications 19 Other information 20
8
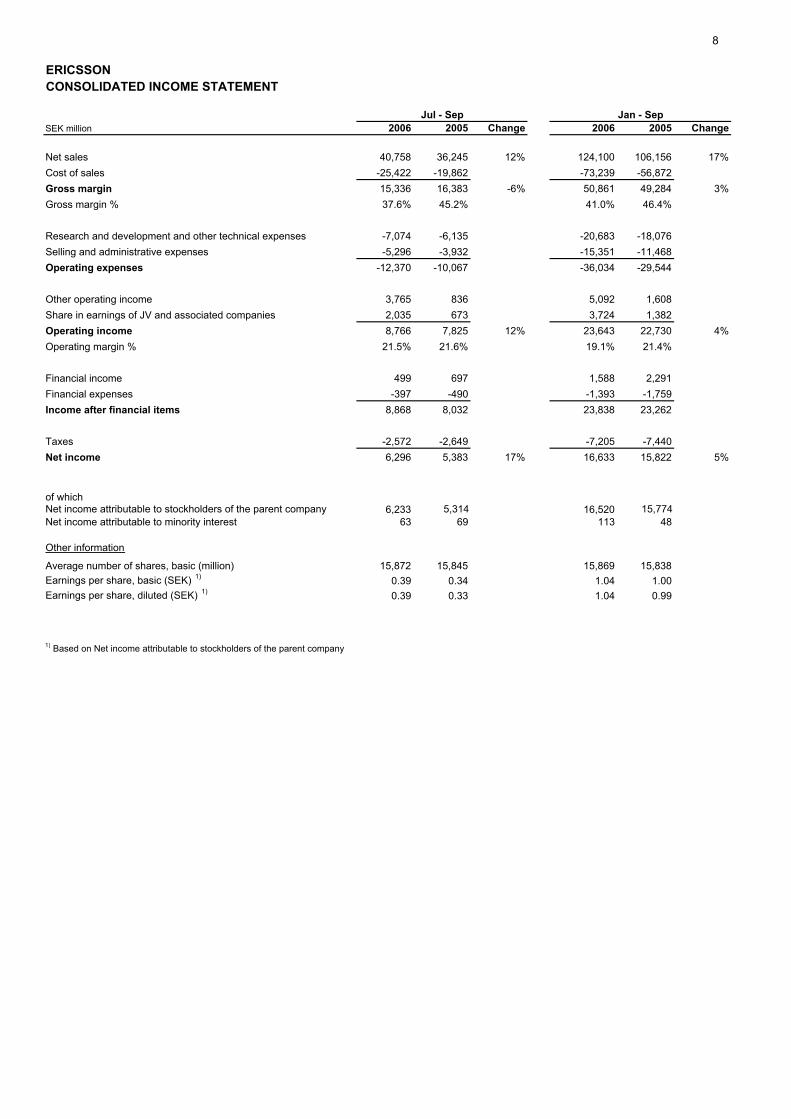
ERICSSONCONSOLIDATED INCOME STATEMENT
SEK million 2006 2005 Change 2006 2005 Change
Net sales 40,758 36,245 12% 124,100 106,156 17%Cost of sales -25,422 -19,862 -73,239 -56,872Gross margin 15,336 16,383 -6% 50,861 49,284 3%Gross margin % 37.6% 45.2% 41.0% 46.4%
Research and development and other technical expenses -7,074 -6,135 -20,683 -18,076Selling and administrative expenses -5,296 -3,932 -15,351 -11,468Operating expenses -12,370 -10,067 -36,034 -29,544
Other operating income 3,765 836 5,092 1,608Share in earnings of JV and associated companies 2,035 673 3,724 1,382Operating income 8,766 7,825 12% 23,643 22,730 4%Operating margin % 21.5% 21.6% 19.1% 21.4%
Financial income 499 697 1,588 2,291Financial expenses -397 -490 -1,393 -1,759Income after financial items 8,868 8,032 23,838 23,262
Taxes -2,572 -2,649 -7,205 -7,440Net income 6,296 5,383 17% 16,633 15,822 5%
of whichNet income attributable to stockholders of the parent company 6,233 5,314 16,520 15,774Net income attributable to minority interest 63 69 113 48
Other information
Average number of shares, basic (million) 15,872 15,845 15,869 15,838Earnings per share, basic (SEK) 1) 0.39 0.34 1.04 1.00Earnings per share, diluted (SEK) 1) 0.39 0.33 1.04 0.99
1) Based on Net income attributable to stockholders of the parent company
Jul - Sep Jan - Sep
9
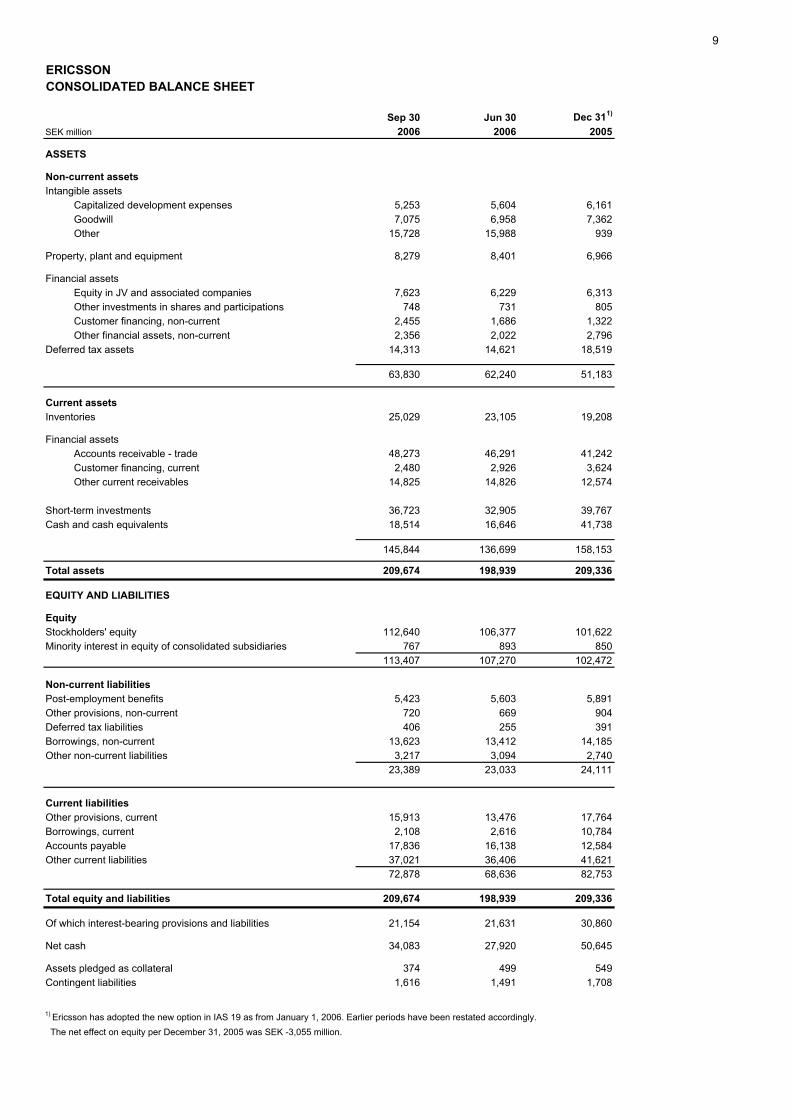
ERICSSONCONSOLIDATED BALANCE SHEET
Sep 30 Jun 30 Dec 311)
SEK million 2006 2006 2005
ASSETS
Non-current assets Intangible assets Capitalized development expenses 5,253 5,604 6,161 Goodwill 7,075 6,958 7,362 Other 15,728 15,988 939
Property, plant and equipment 8,279 8,401 6,966
Financial assets Equity in JV and associated companies 7,623 6,229 6,313 Other investments in shares and participations 748 731 805 Customer financing, non-current 2,455 1,686 1,322 Other financial assets, non-current 2,356 2,022 2,796Deferred tax assets 14,313 14,621 18,519
63,830 62,240 51,183
Current assets Inventories 25,029 23,105 19,208
Financial assets Accounts receivable - trade 48,273 46,291 41,242 Customer financing, current 2,480 2,926 3,624 Other current receivables 14,825 14,826 12,574
Short-term investments 36,723 32,905 39,767Cash and cash equivalents 18,514 16,646 41,738
145,844 136,699 158,153
Total assets 209,674 198,939 209,336
EQUITY AND LIABILITIES
EquityStockholders' equity 112,640 106,377 101,622Minority interest in equity of consolidated subsidiaries 767 893 850
113,407 107,270 102,472
Non-current liabilities Post-employment benefits 5,423 5,603 5,891Other provisions, non-current 720 669 904Deferred tax liabilities 406 255 391Borrowings, non-current 13,623 13,412 14,185Other non-current liabilities 3,217 3,094 2,740
23,389 23,033 24,111
Current liabilitiesOther provisions, current 15,913 13,476 17,764Borrowings, current 2,108 2,616 10,784Accounts payable 17,836 16,138 12,584Other current liabilities 37,021 36,406 41,621
72,878 68,636 82,753
Total equity and liabilities 209,674 198,939 209,336
Of which interest-bearing provisions and liabilities 21,154 21,631 30,860
Net cash 34,083 27,920 50,645
Assets pledged as collateral 374 499 549Contingent liabilities 1,616 1,491 1,708
1) Ericsson has adopted the new option in IAS 19 as from January 1, 2006. Earlier periods have been restated accordingly. The net effect on equity per December 31, 2005 was SEK -3,055 million.
10
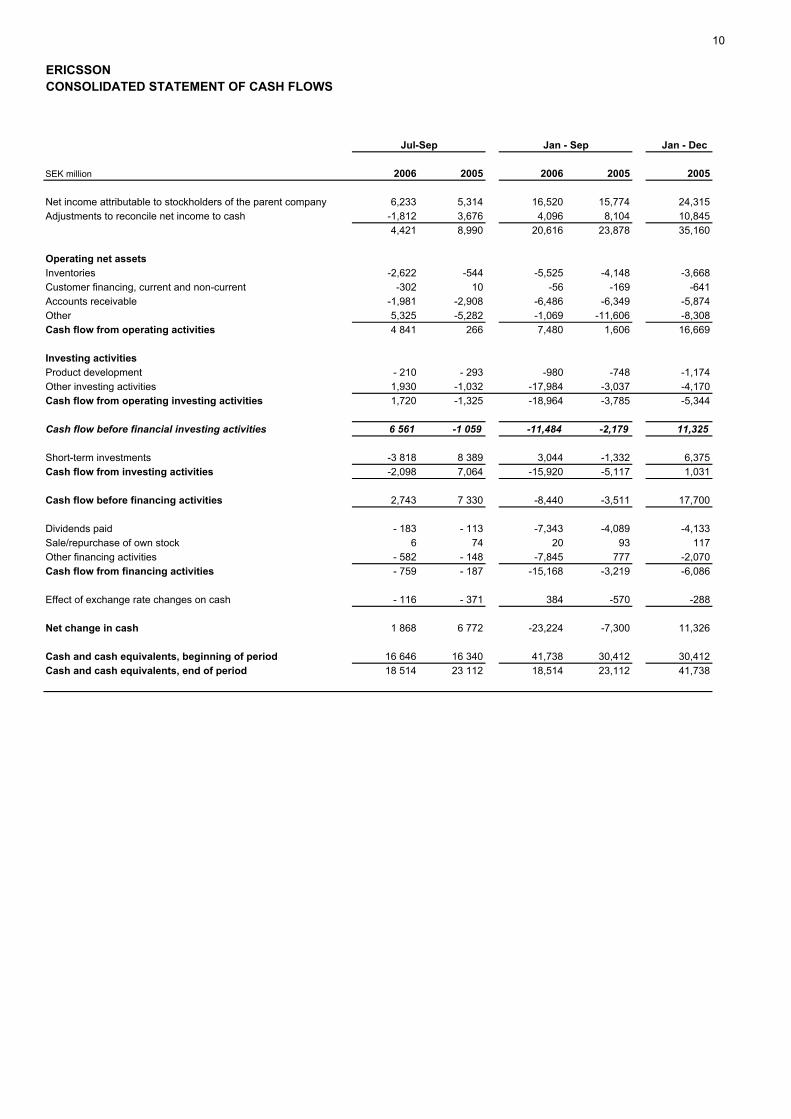
ERICSSONCONSOLIDATED STATEMENT OF CASH FLOWS
Jan - Dec
SEK million 2006 2005 2006 2005 2005
Net income attributable to stockholders of the parent company 6,233 5,314 16,520 15,774 24,315Adjustments to reconcile net income to cash -1,812 3,676 4,096 8,104 10,845
4,421 8,990 20,616 23,878 35,160
Operating net assetsInventories -2,622 -544 -5,525 -4,148 -3,668Customer financing, current and non-current -302 10 -56 -169 -641Accounts receivable -1,981 -2,908 -6,486 -6,349 -5,874Other 5,325 -5,282 -1,069 -11,606 -8,308Cash flow from operating activities 4 841 266 7,480 1,606 16,669
Investing activitiesProduct development - 210 - 293 -980 -748 -1,174Other investing activities 1,930 -1,032 -17,984 -3,037 -4,170Cash flow from operating investing activities 1,720 -1,325 -18,964 -3,785 -5,344
Cash flow before financial investing activities 6 561 -1 059 -11,484 -2,179 11,325
Short-term investments -3 818 8 389 3,044 -1,332 6,375Cash flow from investing activities -2,098 7,064 -15,920 -5,117 1,031
Cash flow before financing activities 2,743 7 330 -8,440 -3,511 17,700
Dividends paid - 183 - 113 -7,343 -4,089 -4,133Sale/repurchase of own stock 6 74 20 93 117Other financing activities - 582 - 148 -7,845 777 -2,070Cash flow from financing activities - 759 - 187 -15,168 -3,219 -6,086
Effect of exchange rate changes on cash - 116 - 371 384 -570 -288
Net change in cash 1 868 6 772 -23,224 -7,300 11,326
Cash and cash equivalents, beginning of period 16 646 16 340 41,738 30,412 30,412Cash and cash equivalents, end of period 18 514 23 112 18,514 23,112 41,738
Jan - SepJul-Sep
11
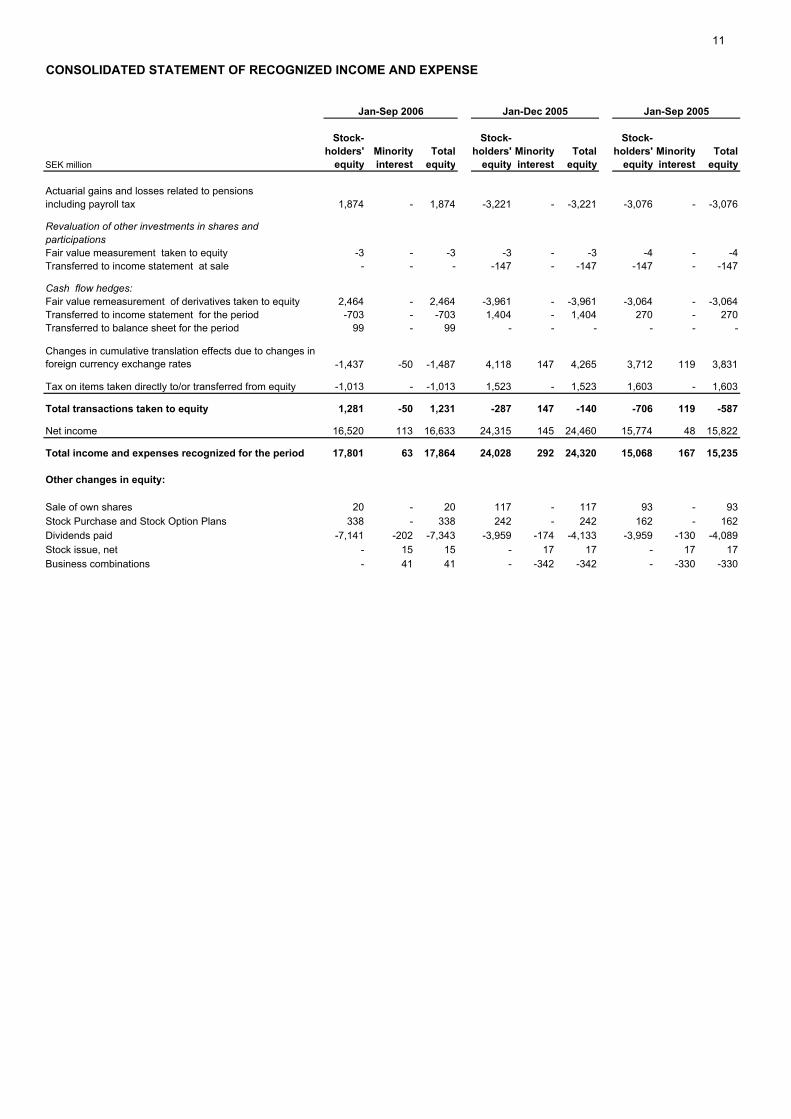
CONSOLIDATED STATEMENT OF RECOGNIZED INCOME AND EXPENSE
Stock- Stock- Stock-holders' Minority Total holders' Minority Total holders' Minority Total
SEK million equity interest equity equity interest equity equity interest equity
Actuarial gains and losses related to pensionsincluding payroll tax 1,874 - 1,874 -3,221 - -3,221 -3,076 - -3,076
Revaluation of other investments in shares and participationsFair value measurement taken to equity -3 - -3 -3 - -3 -4 - -4Transferred to income statement at sale - - - -147 - -147 -147 - -147
Cash flow hedges: Fair value remeasurement of derivatives taken to equity 2,464 - 2,464 -3,961 - -3,961 -3,064 - -3,064Transferred to income statement for the period -703 - -703 1,404 - 1,404 270 - 270Transferred to balance sheet for the period 99 - 99 - - - - - -
Changes in cumulative translation effects due to changes in foreign currency exchange rates -1,437 -50 -1,487 4,118 147 4,265 3,712 119 3,831
Tax on items taken directly to/or transferred from equity -1,013 - -1,013 1,523 - 1,523 1,603 - 1,603
Total transactions taken to equity 1,281 -50 1,231 -287 147 -140 -706 119 -587
Net income 16,520 113 16,633 24,315 145 24,460 15,774 48 15,822
Total income and expenses recognized for the period 17,801 63 17,864 24,028 292 24,320 15,068 167 15,235
Other changes in equity:
Sale of own shares 20 - 20 117 - 117 93 - 93Stock Purchase and Stock Option Plans 338 - 338 242 - 242 162 - 162Dividends paid -7,141 -202 -7,343 -3,959 -174 -4,133 -3,959 -130 -4,089Stock issue, net - 15 15 - 17 17 - 17 17Business combinations - 41 41 - -342 -342 - -330 -330
Jan-Sep 2006 Jan-Dec 2005 Jan-Sep 2005
12
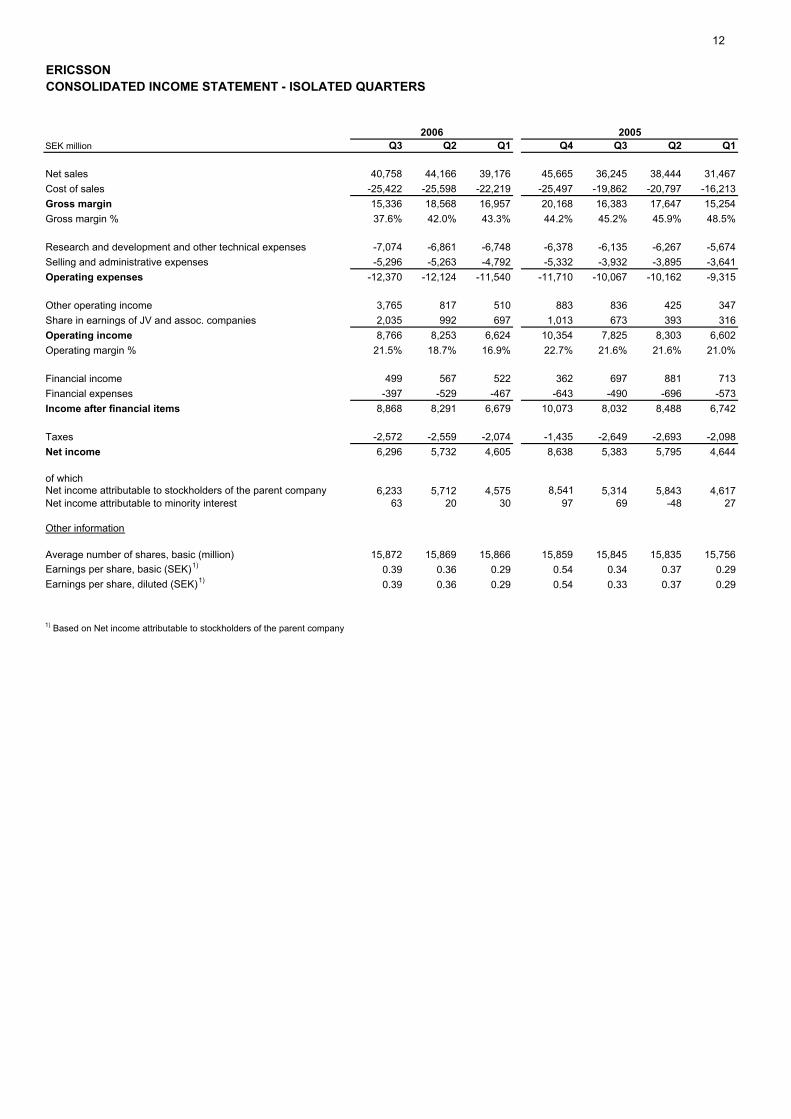
ERICSSONCONSOLIDATED INCOME STATEMENT - ISOLATED QUARTERS
SEK million Q3 Q2 Q1 Q4 Q3 Q2 Q1
Net sales 40,758 44,166 39,176 45,665 36,245 38,444 31,467Cost of sales -25,422 -25,598 -22,219 -25,497 -19,862 -20,797 -16,213Gross margin 15,336 18,568 16,957 20,168 16,383 17,647 15,254Gross margin % 37.6% 42.0% 43.3% 44.2% 45.2% 45.9% 48.5%
Research and development and other technical expenses -7,074 -6,861 -6,748 -6,378 -6,135 -6,267 -5,674Selling and administrative expenses -5,296 -5,263 -4,792 -5,332 -3,932 -3,895 -3,641Operating expenses -12,370 -12,124 -11,540 -11,710 -10,067 -10,162 -9,315
Other operating income 3,765 817 510 883 836 425 347Share in earnings of JV and assoc. companies 2,035 992 697 1,013 673 393 316Operating income 8,766 8,253 6,624 10,354 7,825 8,303 6,602Operating margin % 21.5% 18.7% 16.9% 22.7% 21.6% 21.6% 21.0%
Financial income 499 567 522 362 697 881 713Financial expenses -397 -529 -467 -643 -490 -696 -573Income after financial items 8,868 8,291 6,679 10,073 8,032 8,488 6,742
Taxes -2,572 -2,559 -2,074 -1,435 -2,649 -2,693 -2,098Net income 6,296 5,732 4,605 8,638 5,383 5,795 4,644
of whichNet income attributable to stockholders of the parent company 6,233 5,712 4,575 8,541 5,314 5,843 4,617Net income attributable to minority interest 63 20 30 97 69 -48 27
Other information
Average number of shares, basic (million) 15,872 15,869 15,866 15,859 15,845 15,835 15,756Earnings per share, basic (SEK)1) 0.39 0.36 0.29 0.54 0.34 0.37 0.29Earnings per share, diluted (SEK)1) 0.39 0.36 0.29 0.54 0.33 0.37 0.29
1) Based on Net income attributable to stockholders of the parent company
20052006
13
Accounting policies
This interim report is prepared in accordance with IAS 34. The term IFRS used in this document refers to the application of IAS and IFRS as well as interpretations of these standards as issued by IASB’s Standards Interpretation Committee (SIC) and International Financial Reporting Interpretations Committee (IFRIC). In this interim report we have adopted the following amendments and interpretations effective as from January 1, 2006. These amendments and interpretations have been endorsed by the EU, except for one amendment to IAS 21. That amendment is commented below under IAS 21.
IAS 19 Employee Benefits
As from January 1, 2006, Ericsson has adopted the new allowed alternative in IAS 19, Employee Benefits, on how to recognize actuarial gains and losses. The previous method to recognize actuarial gains and losses – to the extent that they fell outside the 10 percent corridor – was that they were amortized over the average remaining service time of plan participants. Instead, as from January 1, 2006, all actuarial gains and losses are recognized directly in equity, net of deferred tax, in the period they occur. Earlier reporting periods have been restated accordingly. The adoption of this new alternative has increased the provision for post-employment benefits with SEK 3.5 billion, accruals for social security with SEK 0.8 billion and has affected equity by SEK 3.1 billion net of tax as per January 1, 2006. The impact on reported equity as per January 1, 2005, is SEK 0,7 billion. IAS 39 Financial instruments: Recognition and Measurement Three amendments have been issued by the IASB, effective as from January 1, 2006, with earlier application encouraged. The amendments relate to: • Cash Flow Hedges of Forecast Intra group Transactions that permits the foreign currency risk of a highly probable intra group forecast transaction to qualify as the hedged item in a cash flow hedge. Ericsson adopted his amendment 2005. • Fair Value Option that restricts the use of the option to designate any financial asset or any financial liability to be measured at fair value through profit and loss. The company carries loans and receivables, deposits and borrowing at amortized cost, except for specific issued bonds where the carrying value is adjusted as a result of the application of fair value hedge accounting. This amendment has therefore not had a any impact on the financial position or result for 2005 and is not expected to have any impact for 2006. • Financial guarantee contracts that requires financial guarantee contracts to be recognized, initially at fair value and subsequently at the higher of (i) the amount determined in accordance with IAS 37 Provisions, Contingent Liabilities and Contingent Assets and (ii) the amount initially recognized less any cumulative amortization. This amendment has not had a significant impact on the financial position or result. IAS 21The Effects of Changes in Foreign Exchange Rates IAS 21 has been amended in relation to the accounting treatment of Net Investments in a Foreign Operation. A monetary item that forms part of a company investment in a foreign operation should not be dependent on the currency of the monetary item. Also, the accounting should not depend on which entity within the group that conducts a transaction with the foreign operation. It is only the second amendment that is endorsed by the EU as of March 31, 2006. These amendments have not had a significant impact on the financial position or result. IFRIC 4 Determining whether an Arrangement contains a Lease This interpretation has not had a significant impact on the financial position and result.
14IFRIC 6 Liabilities arising from Participating in a Specific Market – Waste of Electric and Electronic Equipment This amendment has not had a significant impact on the financial position or result.
Parent Company information
The Parent Company reports according to RR 32 “Reporting in separate financial statements“. RR 32 requires the Parent Company to use similar accounting principles as for the Group, i.e. IFRS to the extent allowed by RR 32.
15
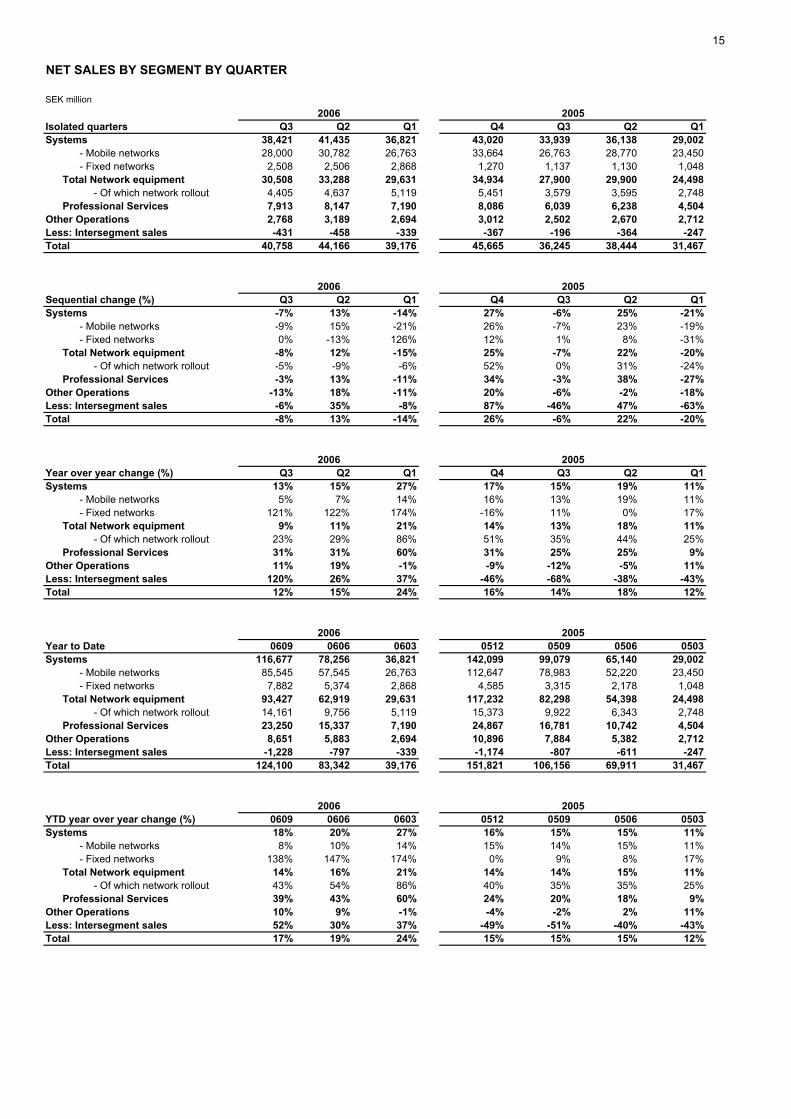
NET SALES BY SEGMENT BY QUARTER
SEK million
Isolated quarters Q3 Q2 Q1 Q4 Q3 Q2 Q1Systems 38,421 41,435 36,821 43,020 33,939 36,138 29,002 - Mobile networks 28,000 30,782 26,763 33,664 26,763 28,770 23,450 - Fixed networks 2,508 2,506 2,868 1,270 1,137 1,130 1,048 Total Network equipment 30,508 33,288 29,631 34,934 27,900 29,900 24,498 - Of which network rollout 4,405 4,637 5,119 5,451 3,579 3,595 2,748 Professional Services 7,913 8,147 7,190 8,086 6,039 6,238 4,504Other Operations 2,768 3,189 2,694 3,012 2,502 2,670 2,712Less: Intersegment sales -431 -458 -339 -367 -196 -364 -247Total 40,758 44,166 39,176 45,665 36,245 38,444 31,467
Sequential change (%) Q3 Q2 Q1 Q4 Q3 Q2 Q1Systems -7% 13% -14% 27% -6% 25% -21% - Mobile networks -9% 15% -21% 26% -7% 23% -19% - Fixed networks 0% -13% 126% 12% 1% 8% -31% Total Network equipment -8% 12% -15% 25% -7% 22% -20% - Of which network rollout -5% -9% -6% 52% 0% 31% -24% Professional Services -3% 13% -11% 34% -3% 38% -27%Other Operations -13% 18% -11% 20% -6% -2% -18%Less: Intersegment sales -6% 35% -8% 87% -46% 47% -63%Total -8% 13% -14% 26% -6% 22% -20%
Year over year change (%) Q3 Q2 Q1 Q4 Q3 Q2 Q1Systems 13% 15% 27% 17% 15% 19% 11% - Mobile networks 5% 7% 14% 16% 13% 19% 11% - Fixed networks 121% 122% 174% -16% 11% 0% 17% Total Network equipment 9% 11% 21% 14% 13% 18% 11% - Of which network rollout 23% 29% 86% 51% 35% 44% 25% Professional Services 31% 31% 60% 31% 25% 25% 9%Other Operations 11% 19% -1% -9% -12% -5% 11%Less: Intersegment sales 120% 26% 37% -46% -68% -38% -43%Total 12% 15% 24% 16% 14% 18% 12%
Year to Date 0609 0606 0603 0512 0509 0506 0503Systems 116,677 78,256 36,821 142,099 99,079 65,140 29,002 - Mobile networks 85,545 57,545 26,763 112,647 78,983 52,220 23,450 - Fixed networks 7,882 5,374 2,868 4,585 3,315 2,178 1,048 Total Network equipment 93,427 62,919 29,631 117,232 82,298 54,398 24,498 - Of which network rollout 14,161 9,756 5,119 15,373 9,922 6,343 2,748 Professional Services 23,250 15,337 7,190 24,867 16,781 10,742 4,504Other Operations 8,651 5,883 2,694 10,896 7,884 5,382 2,712Less: Intersegment sales -1,228 -797 -339 -1,174 -807 -611 -247Total 124,100 83,342 39,176 151,821 106,156 69,911 31,467
YTD year over year change (%) 0609 0606 0603 0512 0509 0506 0503Systems 18% 20% 27% 16% 15% 15% 11% - Mobile networks 8% 10% 14% 15% 14% 15% 11% - Fixed networks 138% 147% 174% 0% 9% 8% 17% Total Network equipment 14% 16% 21% 14% 14% 15% 11% - Of which network rollout 43% 54% 86% 40% 35% 35% 25% Professional Services 39% 43% 60% 24% 20% 18% 9%Other Operations 10% 9% -1% -4% -2% 2% 11%Less: Intersegment sales 52% 30% 37% -49% -51% -40% -43%Total 17% 19% 24% 15% 15% 15% 12%
2006
2006
2006
2006
2005
2005
2005
2005
2005
2006
16
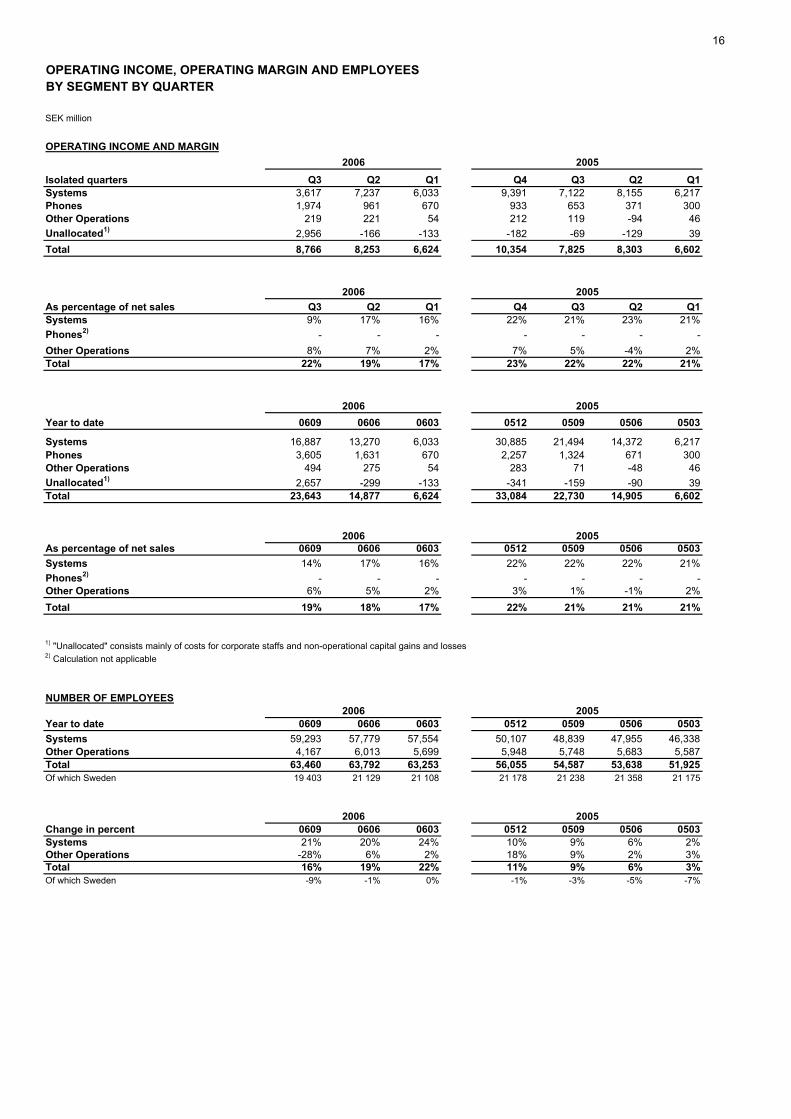
OPERATING INCOME, OPERATING MARGIN AND EMPLOYEES BY SEGMENT BY QUARTER
SEK million
OPERATING INCOME AND MARGIN
Isolated quarters Q3 Q2 Q1 Q4 Q3 Q2 Q1Systems 3,617 7,237 6,033 9,391 7,122 8,155 6,217Phones 1,974 961 670 933 653 371 300Other Operations 219 221 54 212 119 -94 46Unallocated1) 2,956 -166 -133 -182 -69 -129 39Total 8,766 8,253 6,624 10,354 7,825 8,303 6,602
As percentage of net sales Q3 Q2 Q1 Q4 Q3 Q2 Q1Systems 9% 17% 16% 22% 21% 23% 21%Phones2) - - - - - - -Other Operations 8% 7% 2% 7% 5% -4% 2%Total 22% 19% 17% 23% 22% 22% 21%
Year to date 0609 0606 0603 0512 0509 0506 0503
Systems 16,887 13,270 6,033 30,885 21,494 14,372 6,217Phones 3,605 1,631 670 2,257 1,324 671 300Other Operations 494 275 54 283 71 -48 46Unallocated1) 2,657 -299 -133 -341 -159 -90 39Total 23,643 14,877 6,624 33,084 22,730 14,905 6,602
As percentage of net sales 0609 0606 0603 0512 0509 0506 0503Systems 14% 17% 16% 22% 22% 22% 21%Phones2) - - - - - - -Other Operations 6% 5% 2% 3% 1% -1% 2%Total 19% 18% 17% 22% 21% 21% 21%
1) "Unallocated" consists mainly of costs for corporate staffs and non-operational capital gains and losses2) Calculation not applicable
NUMBER OF EMPLOYEES
Year to date 0609 0606 0603 0512 0509 0506 0503Systems 59,293 57,779 57,554 50,107 48,839 47,955 46,338Other Operations 4,167 6,013 5,699 5,948 5,748 5,683 5,587Total 63,460 63,792 63,253 56,055 54,587 53,638 51,925Of which Sweden 19 403 21 129 21 108 21 178 21 238 21 358 21 175
2006Change in percent 0609 0606 0603 0512 0509 0506 0503Systems 21% 20% 24% 10% 9% 6% 2%Other Operations -28% 6% 2% 18% 9% 2% 3%Total 16% 19% 22% 11% 9% 6% 3%Of which Sweden -9% -1% 0% -1% -3% -5% -7%
2006
2006
2006
2005
2005
2005
2005
20052006
20052006
17
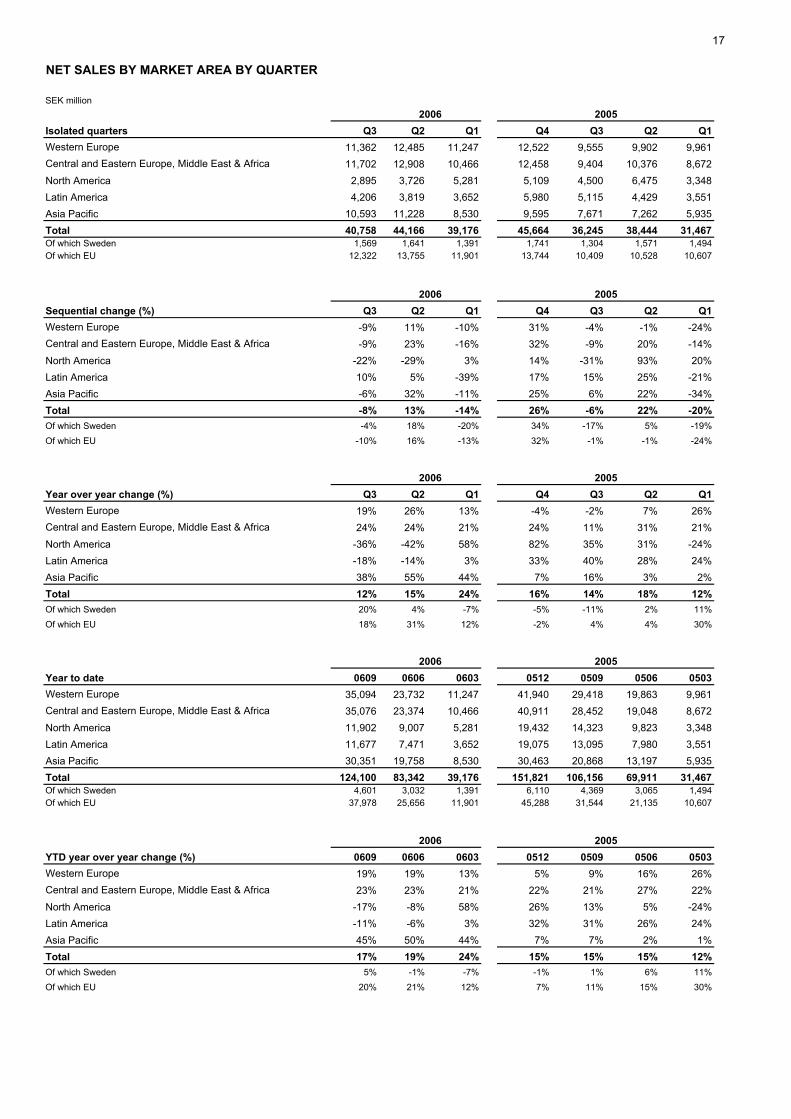
NET SALES BY MARKET AREA BY QUARTER
SEK million
Isolated quarters Q3 Q2 Q1 Q4 Q3 Q2 Q1Western Europe 11,362 12,485 11,247 12,522 9,555 9,902 9,961Central and Eastern Europe, Middle East & Africa 11,702 12,908 10,466 12,458 9,404 10,376 8,672North America 2,895 3,726 5,281 5,109 4,500 6,475 3,348Latin America 4,206 3,819 3,652 5,980 5,115 4,429 3,551Asia Pacific 10,593 11,228 8,530 9,595 7,671 7,262 5,935Total 40,758 44,166 39,176 45,664 36,245 38,444 31,467Of which Sweden 1,569 1,641 1,391 1,741 1,304 1,571 1,494Of which EU 12,322 13,755 11,901 13,744 10,409 10,528 10,607
Sequential change (%) Q3 Q2 Q1 Q4 Q3 Q2 Q1Western Europe -9% 11% -10% 31% -4% -1% -24%Central and Eastern Europe, Middle East & Africa -9% 23% -16% 32% -9% 20% -14%North America -22% -29% 3% 14% -31% 93% 20%Latin America 10% 5% -39% 17% 15% 25% -21%Asia Pacific -6% 32% -11% 25% 6% 22% -34%Total -8% 13% -14% 26% -6% 22% -20%Of which Sweden -4% 18% -20% 34% -17% 5% -19%Of which EU -10% 16% -13% 32% -1% -1% -24%
Year over year change (%) Q3 Q2 Q1 Q4 Q3 Q2 Q1Western Europe 19% 26% 13% -4% -2% 7% 26%Central and Eastern Europe, Middle East & Africa 24% 24% 21% 24% 11% 31% 21%North America -36% -42% 58% 82% 35% 31% -24%Latin America -18% -14% 3% 33% 40% 28% 24%Asia Pacific 38% 55% 44% 7% 16% 3% 2%Total 12% 15% 24% 16% 14% 18% 12%Of which Sweden 20% 4% -7% -5% -11% 2% 11%Of which EU 18% 31% 12% -2% 4% 4% 30%
Year to date 0609 0606 0603 0512 0509 0506 0503Western Europe 35,094 23,732 11,247 41,940 29,418 19,863 9,961Central and Eastern Europe, Middle East & Africa 35,076 23,374 10,466 40,911 28,452 19,048 8,672North America 11,902 9,007 5,281 19,432 14,323 9,823 3,348Latin America 11,677 7,471 3,652 19,075 13,095 7,980 3,551Asia Pacific 30,351 19,758 8,530 30,463 20,868 13,197 5,935Total 124,100 83,342 39,176 151,821 106,156 69,911 31,467Of which Sweden 4,601 3,032 1,391 6,110 4,369 3,065 1,494Of which EU 37,978 25,656 11,901 45,288 31,544 21,135 10,607
YTD year over year change (%) 0609 0606 0603 0512 0509 0506 0503Western Europe 19% 19% 13% 5% 9% 16% 26%Central and Eastern Europe, Middle East & Africa 23% 23% 21% 22% 21% 27% 22%North America -17% -8% 58% 26% 13% 5% -24%Latin America -11% -6% 3% 32% 31% 26% 24%Asia Pacific 45% 50% 44% 7% 7% 2% 1%Total 17% 19% 24% 15% 15% 15% 12%Of which Sweden 5% -1% -7% -1% 1% 6% 11%Of which EU 20% 21% 12% 7% 11% 15% 30%
2006
2006
2006
2006
2006
2005
2005
2005
2005
2005
18
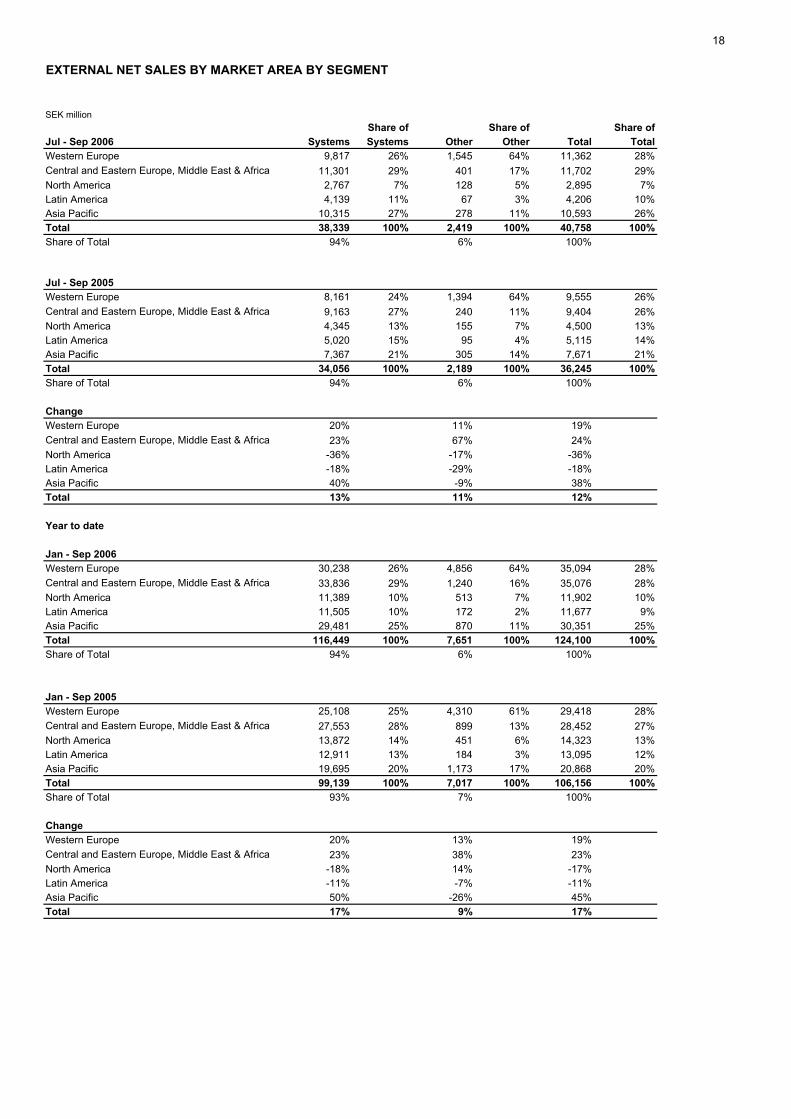
EXTERNAL NET SALES BY MARKET AREA BY SEGMENT
SEK millionShare of Share of Share of
Jul - Sep 2006 Systems Systems Other Other Total TotalWestern Europe 9,817 26% 1,545 64% 11,362 28%Central and Eastern Europe, Middle East & Africa 11,301 29% 401 17% 11,702 29%North America 2,767 7% 128 5% 2,895 7%Latin America 4,139 11% 67 3% 4,206 10%Asia Pacific 10,315 27% 278 11% 10,593 26%Total 38,339 100% 2,419 100% 40,758 100%Share of Total 94% 6% 100%
Jul - Sep 2005Western Europe 8,161 24% 1,394 64% 9,555 26%Central and Eastern Europe, Middle East & Africa 9,163 27% 240 11% 9,404 26%North America 4,345 13% 155 7% 4,500 13%Latin America 5,020 15% 95 4% 5,115 14%Asia Pacific 7,367 21% 305 14% 7,671 21%Total 34,056 100% 2,189 100% 36,245 100%Share of Total 94% 6% 100%
ChangeWestern Europe 20% 11% 19%Central and Eastern Europe, Middle East & Africa 23% 67% 24%North America -36% -17% -36%Latin America -18% -29% -18%Asia Pacific 40% -9% 38%Total 13% 11% 12%
Year to date
Jan - Sep 2006Western Europe 30,238 26% 4,856 64% 35,094 28%Central and Eastern Europe, Middle East & Africa 33,836 29% 1,240 16% 35,076 28%North America 11,389 10% 513 7% 11,902 10%Latin America 11,505 10% 172 2% 11,677 9%Asia Pacific 29,481 25% 870 11% 30,351 25%Total 116,449 100% 7,651 100% 124,100 100%Share of Total 94% 6% 100%
Jan - Sep 2005Western Europe 25,108 25% 4,310 61% 29,418 28%Central and Eastern Europe, Middle East & Africa 27,553 28% 899 13% 28,452 27%North America 13,872 14% 451 6% 14,323 13%Latin America 12,911 13% 184 3% 13,095 12%Asia Pacific 19,695 20% 1,173 17% 20,868 20%Total 99,139 100% 7,017 100% 106,156 100%Share of Total 93% 7% 100%
ChangeWestern Europe 20% 13% 19%Central and Eastern Europe, Middle East & Africa 23% 38% 23%North America -18% 14% -17%Latin America -11% -7% -11%Asia Pacific 50% -26% 45%Total 17% 9% 17%
19
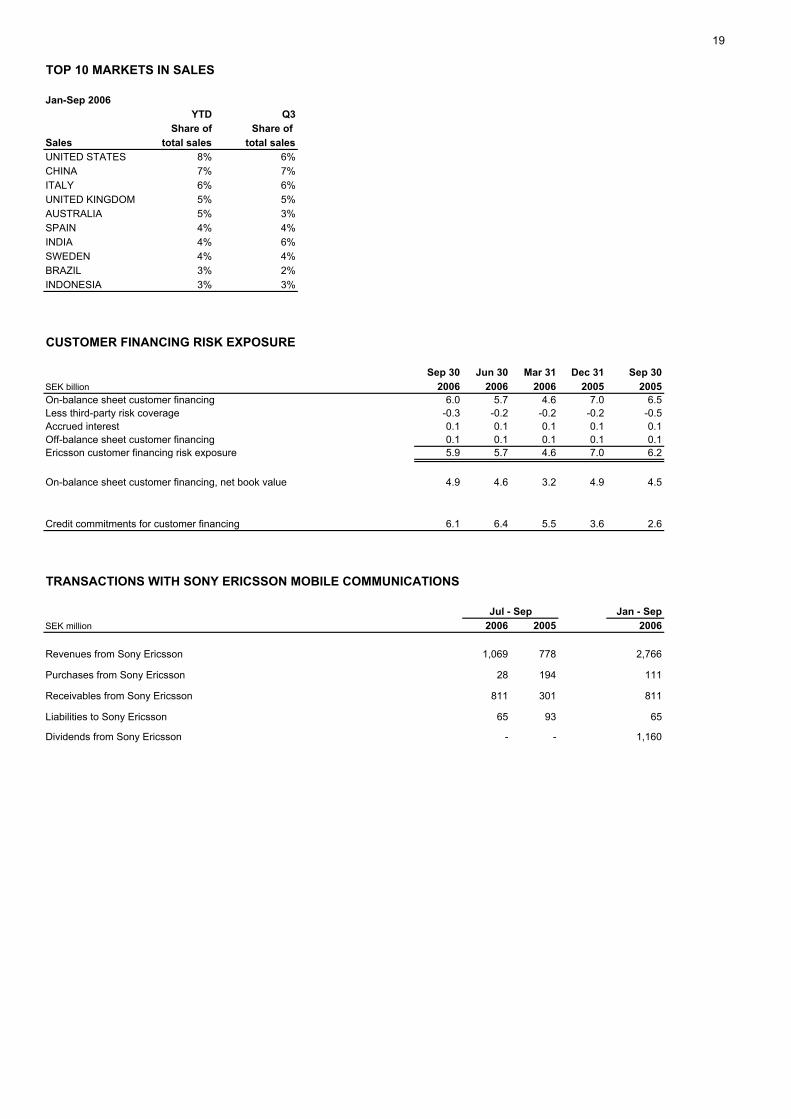
TOP 10 MARKETS IN SALES
Jan-Sep 2006YTD Q3
Share of Share of Sales total sales total salesUNITED STATES 8% 6%CHINA 7% 7%ITALY 6% 6%UNITED KINGDOM 5% 5%AUSTRALIA 5% 3%SPAIN 4% 4%INDIA 4% 6%SWEDEN 4% 4%BRAZIL 3% 2%INDONESIA 3% 3%
CUSTOMER FINANCING RISK EXPOSURE
Sep 30 Jun 30 Mar 31 Dec 31 Sep 30SEK billion 2006 2006 2006 2005 2005On-balance sheet customer financing 6.0 5.7 4.6 7.0 6.5Less third-party risk coverage -0.3 -0.2 -0.2 -0.2 -0.5Accrued interest 0.1 0.1 0.1 0.1 0.1Off-balance sheet customer financing 0.1 0.1 0.1 0.1 0.1Ericsson customer financing risk exposure 5.9 5.7 4.6 7.0 6.2
On-balance sheet customer financing, net book value 4.9 4.6 3.2 4.9 4.5
Credit commitments for customer financing 6.1 6.4 5.5 3.6 2.6
TRANSACTIONS WITH SONY ERICSSON MOBILE COMMUNICATIONS
Jan - SepSEK million 2006 2005 2006
Revenues from Sony Ericsson 1,069 778 2,766
Purchases from Sony Ericsson 28 194 111
Receivables from Sony Ericsson 811 301 811
Liabilities to Sony Ericsson 65 93 65
Dividends from Sony Ericsson - - 1,160
Jul - Sep
20
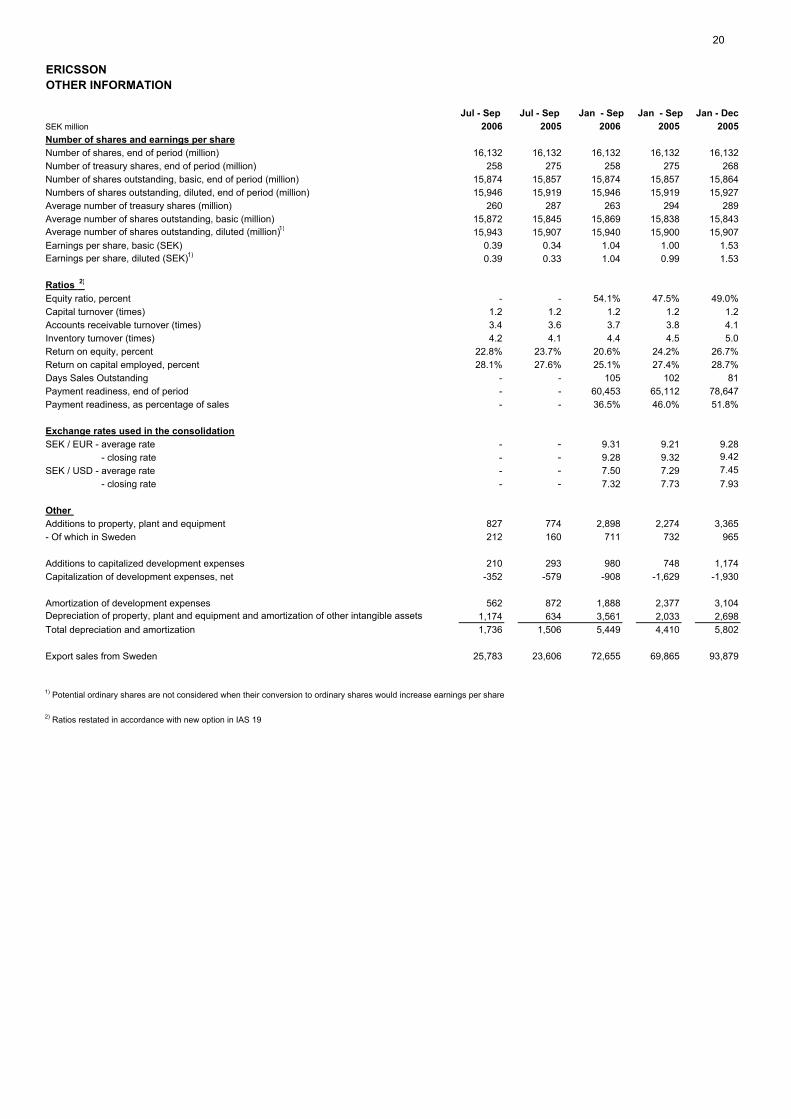
ERICSSONOTHER INFORMATION
Jul - Sep Jul - Sep Jan - Sep Jan - Sep Jan - DecSEK million 2006 2005 2006 2005 2005Number of shares and earnings per shareNumber of shares, end of period (million) 16,132 16,132 16,132 16,132 16,132Number of treasury shares, end of period (million) 258 275 258 275 268Number of shares outstanding, basic, end of period (million) 15,874 15,857 15,874 15,857 15,864Numbers of shares outstanding, diluted, end of period (million) 15,946 15,919 15,946 15,919 15,927Average number of treasury shares (million) 260 287 263 294 289Average number of shares outstanding, basic (million) 15,872 15,845 15,869 15,838 15,843Average number of shares outstanding, diluted (million)1) 15,943 15,907 15,940 15,900 15,907Earnings per share, basic (SEK) 0.39 0.34 1.04 1.00 1.53Earnings per share, diluted (SEK)1) 0.39 0.33 1.04 0.99 1.53
Ratios 2)
Equity ratio, percent - - 54.1% 47.5% 49.0%Capital turnover (times) 1.2 1.2 1.2 1.2 1.2Accounts receivable turnover (times) 3.4 3.6 3.7 3.8 4.1Inventory turnover (times) 4.2 4.1 4.4 4.5 5.0Return on equity, percent 22.8% 23.7% 20.6% 24.2% 26.7%Return on capital employed, percent 28.1% 27.6% 25.1% 27.4% 28.7%Days Sales Outstanding - - 105 102 81Payment readiness, end of period - - 60,453 65,112 78,647Payment readiness, as percentage of sales - - 36.5% 46.0% 51.8%
Exchange rates used in the consolidationSEK / EUR - average rate - - 9.31 9.21 9.28 - closing rate - - 9.28 9.32 9.42SEK / USD - average rate - - 7.50 7.29 7.45 - closing rate - - 7.32 7.73 7.93
Other Additions to property, plant and equipment 827 774 2,898 2,274 3,365- Of which in Sweden 212 160 711 732 965
Additions to capitalized development expenses 210 293 980 748 1,174Capitalization of development expenses, net -352 -579 -908 -1,629 -1,930
Amortization of development expenses 562 872 1,888 2,377 3,104Depreciation of property, plant and equipment and amortization of other intangible assets 1,174 634 3,561 2,033 2,698Total depreciation and amortization 1,736 1,506 5,449 4,410 5,802
Export sales from Sweden 25,783 23,606 72,655 69,865 93,879
1) Potential ordinary shares are not considered when their conversion to ordinary shares would increase earnings per share
2) Ratios restated in accordance with new option in IAS 19