Embed Size (px)
Citation preview
This article was downloaded by: [Eindhoven Technical University]On: 19 October 2014, At: 07:01Publisher: Taylor & FrancisInforma Ltd Registered in England and Wales Registered Number: 1072954Registered office: Mortimer House, 37-41 Mortimer Street, London W1T 3JH,UK
International Journal ofRemote SensingPublication details, including instructions for authorsand subscription information:http://www.tandfonline.com/loi/tres20
Error assessment of validationtechniques for estimatingsuspended particulate matterconcentration from airbornemultispectral imageryA. M. Matthews a , A. G. Duncan a & R. G. Davison aa National Centre for Environmental DataPublished online: 25 Nov 2010.
To cite this article: A. M. Matthews , A. G. Duncan & R. G. Davison (2001) Errorassessment of validation techniques for estimating suspended particulate matterconcentration from airborne multispectral imagery, International Journal of RemoteSensing, 22:2-3, 449-469, DOI: 10.1080/014311601450031
To link to this article: http://dx.doi.org/10.1080/014311601450031
PLEASE SCROLL DOWN FOR ARTICLE
Taylor & Francis makes every effort to ensure the accuracy of all theinformation (the “Content”) contained in the publications on our platform.However, Taylor & Francis, our agents, and our licensors make norepresentations or warranties whatsoever as to the accuracy, completeness,or suitability for any purpose of the Content. Any opinions and viewsexpressed in this publication are the opinions and views of the authors, andare not the views of or endorsed by Taylor & Francis. The accuracy of theContent should not be relied upon and should be independently verified withprimary sources of information. Taylor and Francis shall not be liable for anylosses, actions, claims, proceedings, demands, costs, expenses, damages,and other liabilities whatsoever or howsoever caused arising directly or

indirectly in connection with, in relation to or arising out of the use of theContent.
This article may be used for research, teaching, and private study purposes.Any substantial or systematic reproduction, redistribution, reselling, loan,sub-licensing, systematic supply, or distribution in any form to anyone isexpressly forbidden. Terms & Conditions of access and use can be found athttp://www.tandfonline.com/page/terms-and-conditions
Dow
nloa
ded
by [
Ein
dhov
en T
echn
ical
Uni
vers
ity]
at 0
7:01
19
Oct
ober
201
4
int. j. remote sensing, 2001, vol. 22, no. 2 & 3, 449–469
Error assessment of validation techniques for estimating suspendedparticulate matter concentration from airborne multispectral imagery
A. M. MATTHEWS, A. G. DUNCAN and R. G. DAVISON
Environment Agency, National Centre for Environmental Data andSurveillance, Rivers House, Lower Bristol Road, Bath BA2 9ES, England, UK
(Received 9 November 1998; in � nal form 14 September 1999)
Abstract. Signi� cant errors have been reported when transporting algorithmsfor converting aerial imagery to suspended particulate matter concentration todata collected at diŒerent times in diŒerent geographical sites. This raises thepossibility that the relationships developed are coincidental rather than causal.Determination of the portability of the relationships will allow an assessment ofthe degree of causality of such algorithms. This paper describes the developmentof algorithms for two sites in UK coastal waters and the assessment of the errorsincurred when porting these algorithms to datasets collected at diŒerent seasonsand from varying geographical sites. The errors incurred when using algorithmsat sites having diŒering morphologies are considered to be too large for opera-tional use. The high accuracy of transfer to data from the same site at a diŒerentseason indicates the causality of the relationship derived and allows therecommendation of a way forward for algorithm development.
1. IntroductionThis paper assesses the use of aerial imagery for estimating the spatial distribution
of suspended particulate matter (SPM) in coastal waters. The measurement of thisparameter in the coastal environment is essential for studies of erosion and deposition.It is also vital to the understanding of pollutant transport in the particulate phaseand the deposition and resuspension of such pollutants within estuaries and thecoastal zone. New legislation under the Environment Act (1995) has placed aresponsibility on the Environment Agency to ‘form an opinion on the state ofpollution of the environment’. This has resulted in a heightened need to developsuitable assessment methods for integrated monitoring of coastal water quality.Accurate spatial measurement of the dynamics and characteristics of SPM mayprovide essential information to determine the fate of pollutants and suggest howproblems associated with their build-up may be managed.
Aerial remote sensing provides the only realistic method of estimating SPMconcentrations over the entire coastal zone (Curran et al. 1987, Boxall et al. 1993 ).Measurements of SPM concentration from vessels, whilst highly accurate, are repres-entative of only a small geographical area in a highly variable system. Aerial imageryallows the capture of a synoptic measurement of concentration over a wide spatialscale, with the ability to collect data at diŒering tidal states and simultaneous withvessel surveys.
Internationa l Journal of Remote SensingISSN 0143-1161 print/ISSN 1366-5901 online © 2001 Taylor & Francis Ltd
http://www.tandf.co.uk/journals
Dow
nloa
ded
by [
Ein
dhov
en T
echn
ical
Uni
vers
ity]
at 0
7:01
19
Oct
ober
201
4
A. M. Matthews et al.450
Over the past two decades the problem of accurately estimating SPM concentra-tion from remote sensing techniques has been intensively investigated (Mitchelsonet al. 1986, Rimmer et al. 1987, Brown and Simpson 1990, Weeks and Simpson1991). The majority of estimates of SPM from satellite sensors have been made withthe Landsat Multispectral Scanner (MSS). For example, Klemas et al. (1973) founda correlation between SPM concentration and re� ectance at 600–700 nm. Mundayand Alfoldi (1979) found that the Landsat radiance correlated best with the logarithmof SPM concentration. Ritchie et al. (1990) found that Landsat Thematic Mapper(TM) was as good, though no better for the estimation of SPM, but had a � nerspatial resolution. Stumpf and Pennock (1989) used the red and near-infrared chan-nels of the Advanced Very High Resolution Radiometer (AVHRR) to estimate thesuspended solids loading of estuaries.
In coastal waters, phenomena are often of such a scale as to preclude measurementby satellite sensors. Features tend to be smaller than the typical 1 km pixel size ofthe AVHRR and Coastal Zone Color Scanner (CZCS) sensors. The � ner resolutionof the Landsat MSS and TM makes these instruments more suitable for coastalscale processes, but the repeat time of overpasses means that when combined withthe cloudy conditions often experienced in the UK, only a very few overpasses areavailable over any particular scene. Collection of data from aircraft systems over-comes many of these problems. Aircraft sensors may be � own at low altitude allowingcollection of data at a � ner spatial resolution. Moreover, these platforms are tempor-ally more � exible, with the ability to collect data at speci� c tidal sites, and at timesof good weather conditions.
Algorithms such as those used for satellite sensors have been applied to datafrom aircraft. Collins and Pattiaratchi (1984) used multiple regression techniques tocalibrate Daedalus Airborne Thematic Mapper (ATM) data of the Bristol Channel.Rimmer et al. (1987) used both linear and multiple regression techniques to estimatesuspended solids from ATM data in the same region. In their work concerning theIrish Sea, Mitchelson et al. (1986) established the need for two algorithms thatshould be changed depending on the suspended solids concentration.
These studies have shown that, whilst absolute concentrations can be obtainedfor speci� c geographical locations and times, signi� cant errors are incurred in portingthese algorithms to other sites. These limitations have eŒectively precluded thedevelopment of a general empirical algorithm. For example, Curran et al. (1987 )indicated the di� culty in inverting empirically derived relationships to apply towider datasets. This raises the possibility that any correlation between spectral dataand SPM concentration may be coincidental rather than a causal � t, or that thereis a causal relationship but the algorithms are not able to exclude spurious interfer-ence eŒects, for example due to atmospheric interference. The quantitative portabilityof such algorithms has not yet been established. There is thus a need to determinethe validity and robustness of presently available correlation techniques by character-izing the extent of predictive errors when porting relationships to spatially andtemporally diŒerent datasets. This may only be undertaken using an intensive coord-inated data collection exercise which allows collection of simultaneous remote sensingand in situ data. This is the fundamental problem tackled in this paper.
An intensive study carried out by the Environment Agency’s National Centre forEnvironmental Data and Surveillance is described here. This data collectioncampaign consisted of three key parts.
E Water samples for gravimetric laboratory analysis of SPM concentration were
Dow
nloa
ded
by [
Ein
dhov
en T
echn
ical
Uni
vers
ity]
at 0
7:01
19
Oct
ober
201
4
Algal blooms detection, monitoring and prediction 451
collected from 1 m depth by a coastal survey vessel at 5 km intervals withinthe study area. Samples were analysed for total suspended matter by heatingto 105 ß C, before being heated to 500 ß C to determine the inorganic fractionusing the procedures described by the Standing Committee of Analysts andpublished by the Environment Agency. Sampling locations were at varyingdistances from the shore to encompass the oŒshore variability in SPMconcentration.
E In situ measurements of transmission or turbidity were gathered using a con-tinuous monitoring system towed behind the vessel which traversed bothoŒshore and alongshore within the study area.
E Synchronous over� ights were made with a light aircraft mounted with aCompact Airborne Spectrographic Imager (CASI), a visible wavelengthprogrammable imaging spectrometer.
Unlike previous studies, the campaign allowed the collection of near-synchronousin situ and remotely sensed data. This is essential for coastal zone research due tothe spatial and temporal dynamics of the system, even though many previous studieshave been limited to the development of algorithms using laboratory simulations ofthe marine environment (Novo et al. 1989 a, b, 1991, Bhargava and Mariam 1992,Chen et al. 1992, Han and Rundquist 1994, Matthews 1994). The data collected hereenabled direct development of algorithms to validate conversions of aerial imageryto synchronous in situ data, thereby removing any problems associated with portingalgorithms developed in the laboratory to aerial imagery. Once developed the errorsincurred in the use of these techniques could, for the � rst time, be rigorouslyexamined, both for speci� c sites and when algorithms are ported between diŒerentsites.
The aims of this paper are thus as follows.
1. To produce a quantitative assessment of the errors incurred when relatingremotely sensed data to in situ SPM concentrations.
2. To determine whether it is possible to produce a suite of empirically derivedgeneral algorithms to convert airborne (CASI) imagery to suspended solidsconcentration in UK coastal waters.
2. Data collectionTo meet the research needs identi� ed above, integrated aerial and shipborne
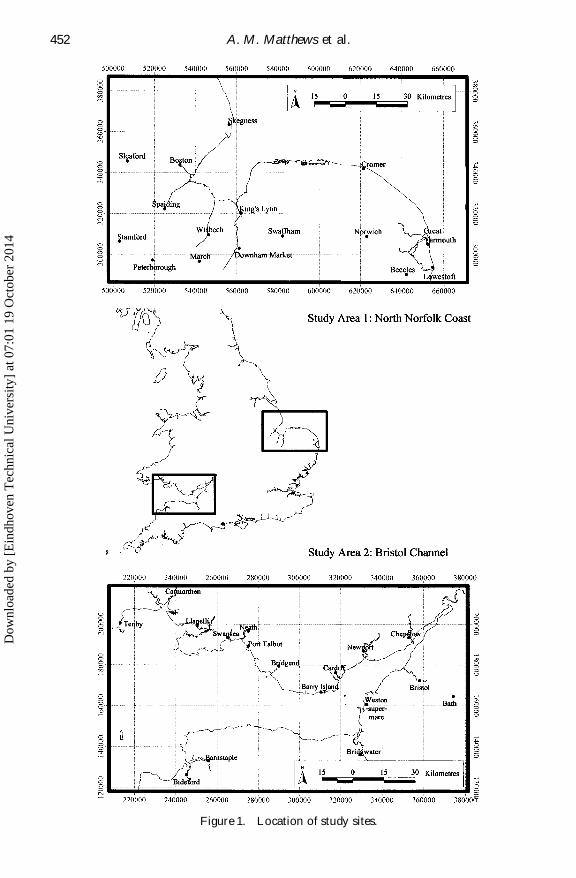
campaigns were mounted throughout the period May to September 1996. Althoughthis period does not encompass the full range of suspended solids concentrations(which would be considerably higher in winter) these months proved most reliablefor collection of high-quality aerial imagery. Study sites which had distinct morpholo-gical characteristics were selected to allow a thorough testing of the portability ofalgorithms developed, diŒering morphologies having been shown to aŒect the per-formance of algorithms in previous studies (Novo et al. 1989 a, Hewitson, Personalcommunication, 1992). Moreover, a wide range of SPM concentration was requiredto allow the development of statistically robust algorithms. Figure 1 shows thelocation of the two study sites selected, the Bristol Channel and the north Norfolkcoast. These sites are of diŒering morphologies; the Bristol Channel site is dominatedby inorganic red sediment and the Norfolk coast site has a higher organic content.Previous data collected by the Environment Agency from the Bristol Channel showed
Dow
nloa
ded
by [
Ein
dhov
en T
echn
ical
Uni
vers
ity]
at 0
7:01
19
Oct
ober
201
4
A. M. Matthews et al.452
Figure 1. Location of study sites.
Dow
nloa
ded
by [
Ein
dhov
en T
echn
ical
Uni
vers
ity]
at 0
7:01
19
Oct
ober
201
4
Algal blooms detection, monitoring and prediction 453
a steep gradient in SPM away from the River Severn, with a distinct front betweenestuarine and coastal water noted around Minehead (Environment Agency 1996 a).The Norfolk coast site not only exhibits high concentrations of SPM, but also hasbeen shown to have high variability in the distribution of sediment in previousstudies (Environment Agency 1996 b). The collection of data at diŒerent seasonsallowed variation in atmospheric eŒects to be considered, thus establishing thetemporal portability of the algorithms.
The airborne campaign consisted of over� ights with the Environment Agency’sCASI sensor operating in enhanced spectral mode. This was set to record 72 spectralchannels of approximately 8 nm bandwidth, extending from 400 nm–920 nm. Theswath width of 402 pixels resulted in a spatial resolution of 20 m at 3000 m altitude.This CASI was operated with a wide angle lens, with a � eld of view of 80 ß . Thesurvey design incorporated � ightlines both parallel and perpendicular to the coastlineto encompass the full variability in SPM concentration.
Simultaneous with the CASI over� ights, a research vessel traversed the areabeneath the � ightlines. The vessel followed a path both parallel and perpendicularto the coast encompassing the full range of SPM concentration within the studyarea. The area covered by the vessel during an aircraft over� ight was small incomparison to the � ightline coverage due to the diŒerence in speed of the twoplatforms, which may reduce the correlation between the two sampling techniquesin the dynamic coastal environment. Care was therefore taken to coincide the twoinstruments whenever possible. One litre water samples were collected from a depthof 1 m, representative of surface water, for laboratory analysis of SPM concentration.Both total and inorganic SPM concentrations were determined using gravimetricanalysis. In addition, samples were analysed for chlorophyll-a concentration in orderto establish if the presence of varying degrees of organic load would alter the actionof the algorithms.
In order to provide spatially dense SPM data for validation purposes, continuousmeasurements of either percentage transmission or turbidity units were recordedfrom a towed body, recording a measurement every ten seconds. The continuoussystem was towed at approximately 4 m depth, at a distance behind the vessel toobviate the in� uence of the vessel’s wake. The diŒering depths of the two samplingsystems may introduce calibration di� culties where strati� cation occurs. The CASIprovides an integrated measurement of surface water SPM concentration, the depthfrom which the suspended solids concentration is recorded being dependent on theconcentration itself. The two study areas have been investigated previously to identifyany regions of strati� cation using vertical pro� le data: no evidence of verticalstructure was found (Environment Agency 1997).
From the eight campaigns conducted, only datasets ful� lling strict criteria for algo-rithm development were taken forward into the analysis procedure. These are shown intable 1. Data from only four campaigns satis� ed the above criteria; details are shownin table 2. In order to test the algorithms on independent datasets rigorously, onecampaign was selected from each site for the production of algorithms and the secondwas used for algorithm validation. These test datasets were gathered at diŒerent timesto allow seasonal variability to be investigated . Additionally, the datasets themselveswere analysed as a split sample to investigate variability within the dataset.
3. Data analysisData analysis followed a hierarchical approach in which the laboratory data
were used to calibrate the continuous track transmissometer data, which in turn
Dow
nloa
ded
by [
Ein
dhov
en T
echn
ical
Uni
vers
ity]
at 0
7:01
19
Oct
ober
201
4
A. M. Matthews et al.454
Table 1. Quality criteria for data inclusion in algorithm development.
Requirement Quality criteria
SPM concentration range A range of > 12 mg l Õ 1 across 20 km ofstudy area
Spatio-temporal coincidence of in situ data At least ten transmission or turbidityand laboratory samples readings must be recorded within a 250 m
radius of each laboratory sample sitelocation, recorded within 30 minutes of thelaboratory sample being taken
Spatial coincidence of in situ data and CASI At least 15 km of continuous track transmisdata sion or turbidity readings must lie
geographically within the area of theairborne CASI data
Quality assured laboratory samples Water samples analysed for SPMconcentration in the laboratory must bequality assured; extreme values (e.g.> 80 mg l Õ 1 SPM) must be checked withlaboratory
Quality assured in situ continuous Continuous transmission or turbiditymeasurements measurements must be geographically
located; data must be free of noise andspurious peaks and troughs
CASI data quality CASI data must be geo-corrected; date andtime must be known; edge brightening andglint must be minimal; image must be freeof clouds, sunglint and cloud shadow
Table 2. Data collection exercises used in algorithm development.
Range of chlorophyll- Range of SPM ina in laboratory laboratory samples
Site Date samples (mgl Õ 1 ) (mg l Õ 1 )
Norfolk 30 May 1996 4.9–16.08 < 2–24Norfolk 11 August 1996 0.94–14.5 < 1.5–22Bristol Channel 24 June 1996 1.87–5.36 < 1.5–24Bristol Channel 12 September 1996 0.58–2.37 < 1.5–90
were used to calibrate the coincident CASI imagery. A linear correlation techniquewas used for the laboratory data to turbidity conversion, with an exponentialcorrelation used to relate the laboratory data to transmission. The convertedtransmission data were correlated to the ratio of each of the 72 channels of CASI-enhanced spectral data, using both linear and exponential methods. The best correla-tions were used to produce algorithms for the estimation of SPM concentrationfrom CASI imagery. The development of each type of algorithm is described below.
The accuracy of the algorithms developed from the best correlations was assessedin two ways. Firstly, within the developmental dataset, data points were divided into‘odd’ and ‘even’ sets, one set being used to calibrate and the other set to validatethe calibration. Secondly the algorithms were applied to diŒerent validation datasets
Dow
nloa
ded
by [
Ein
dhov
en T
echn
ical
Uni
vers
ity]
at 0
7:01
19
Oct
ober
201
4
Algal blooms detection, monitoring and prediction 455
and results compared against both laboratory and continuous track data. This isdescribed in §4.
3.1. L aboratory to continuous transmission/turbidity data correlationThe � rst stage of the validation procedure was to use the laboratory water
samples to convert the continuous transmission and turbidity values to SPM concen-tration. A number of theoretical assumptions were made prior to the calibration. Itwas assumed that laboratory samples for SPM (measured in mg l Õ 1 ) were reliableand representative of the body of water around the sample site. Continuous transmis-sion measurements were reported in units of percentage transmission, and continuousturbidity measurements in nephelometric turbidity units (NTUs).
In order for the relationship between laboratory samples and spatio-temporall yassociated continuous transmission measurements to be statistically modelled, theymust show a signi� cant negative correlation (the relationship between laboratorysamples and spatio-temporall y continuous turbidity must show a signi� cant positivecorrelation) . The algorithm development to model the relationship between laborat-ory samples and continuous track transmission or turbidity was carried out usingeither linear or nonlinear regressions.
The relationship between transmission and SPM is nonlinear due to saturationof transmission at concentrations above approximately 50 mg l Õ 1 . Although a lineartrend is commonly used to approximate the relationship, a logarithmic equation wasfound to be more appropriate in this study due to the wide range of SPM concentra-tion encountered within the test sites. This emphasizes the need for careful qualitycontrol of data in order to complete this research test. The relationship betweencontinuous turbidity data and laboratory samples was best represented by a linearequation.
Collection of continuous measurements allowed geographical buŒers to beselected around the position at which the laboratory sample was taken in order todetermine the optimum buŒer size for correlating between SPM and transmissionor turbidity. Although a signi� cant correlation was found between the laboratorysamples and the continuous track data for a large range of scales, including directlycoincident points, the best correlations tended to occur with continuous track datalying within a 100 m spatial (approximately equating to a 30 minute temporal) buŒerof the laboratory samples. This may be explained by the highly dynamic nature ofthe coastal system, which results in a number of continuous track measurementsbeing recorded in the time taken to collect a water sample for laboratory analysis.
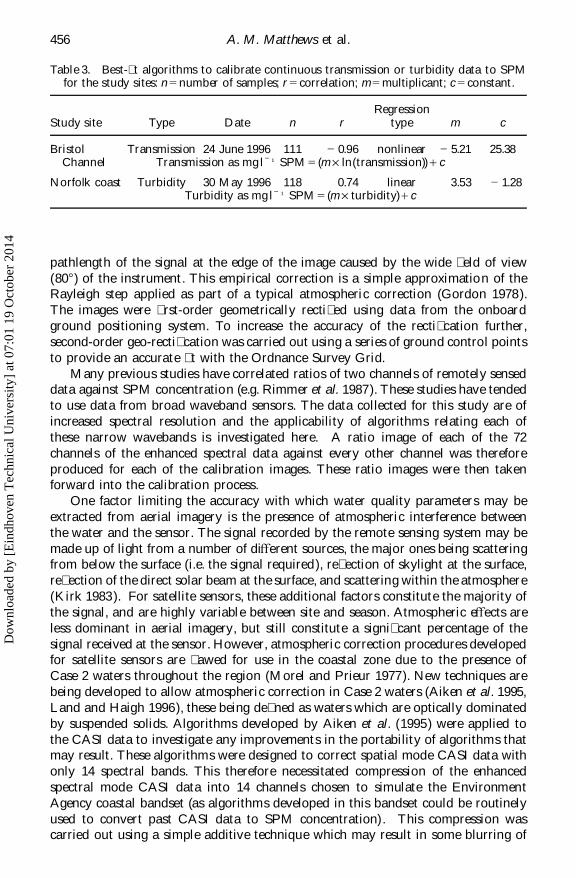
Best-� t regression equations for the calibration of continuous transmission orturbidity data to laboratory SPM (at 105 ß C) equivalence have been calculated forthe study sites (table 3).
3.2. Continuous data to image data regressionFor imagery to be validated for SPM concentration, there must be a signi� cant
relationship between the image data surface and the continuous track data convertedto SPM, the image surface being some combination of the 72 channels of enhancedspectral data. The relationship between the imagery and the calibrated continuousSPM data can then be modelled using either linear or nonlinear regression.
To achieve this, CASI imagery was radiometrically converted to spectral radianceunits. An empirical correction was then applied to account for the enhancedbrightening of the imagery at the edge. This brightening results from the increased
Dow
nloa
ded
by [
Ein
dhov
en T
echn
ical
Uni
vers
ity]
at 0
7:01
19
Oct
ober
201
4
A. M. Matthews et al.456
Table 3. Best-� t algorithms to calibrate continuous transmission or turbidity data to SPMfor the study sites: n 5 number of samples; r 5 correlation; m 5 multiplicant; c 5 constant.
RegressionStudy site Type Date n r type m c
Bristol Transmission 24 June 1996 111 Õ 0.96 nonlinear Õ 5.21 25.38Channel Transmission as mg l Õ 1 SPM 5 (m Ö ln(transmission)) 1 c
Norfolk coast Turbidity 30 May 1996 118 0.74 linear 3.53 Õ 1.28Turbidity as mg l Õ 1 SPM 5 (m Ö turbidity) 1 c
pathlength of the signal at the edge of the image caused by the wide � eld of view(80 ß ) of the instrument. This empirical correction is a simple approximation of theRayleigh step applied as part of a typical atmospheric correction (Gordon 1978).The images were � rst-order geometrically recti� ed using data from the onboardground positioning system. To increase the accuracy of the recti� cation further,second-order geo-recti� cation was carried out using a series of ground control pointsto provide an accurate � t with the Ordnance Survey Grid.
Many previous studies have correlated ratios of two channels of remotely senseddata against SPM concentration (e.g. Rimmer et al. 1987). These studies have tendedto use data from broad waveband sensors. The data collected for this study are ofincreased spectral resolution and the applicability of algorithms relating each ofthese narrow wavebands is investigated here. A ratio image of each of the 72channels of the enhanced spectral data against every other channel was thereforeproduced for each of the calibration images. These ratio images were then takenforward into the calibration process.
One factor limiting the accuracy with which water quality parameters may beextracted from aerial imagery is the presence of atmospheric interference betweenthe water and the sensor. The signal recorded by the remote sensing system may bemade up of light from a number of diŒerent sources, the major ones being scatteringfrom below the surface (i.e. the signal required), re� ection of skylight at the surface,re� ection of the direct solar beam at the surface, and scattering within the atmosphere(Kirk 1983). For satellite sensors, these additional factors constitute the majority ofthe signal, and are highly variable between site and season. Atmospheric eŒects areless dominant in aerial imagery, but still constitute a signi� cant percentage of thesignal received at the sensor. However, atmospheric correction procedures developedfor satellite sensors are � awed for use in the coastal zone due to the presence ofCase 2 waters throughout the region (Morel and Prieur 1977). New techniques arebeing developed to allow atmospheric correction in Case 2 waters (Aiken et al. 1995,Land and Haigh 1996), these being de� ned as waters which are optically dominatedby suspended solids. Algorithms developed by Aiken et al. (1995) were applied tothe CASI data to investigate any improvements in the portability of algorithms thatmay result. These algorithms were designed to correct spatial mode CASI data withonly 14 spectral bands. This therefore necessitated compression of the enhancedspectral mode CASI data into 14 channels chosen to simulate the EnvironmentAgency coastal bandset (as algorithms developed in this bandset could be routinelyused to convert past CASI data to SPM concentration) . This compression wascarried out using a simple additive technique which may result in some blurring of
Dow
nloa
ded
by [
Ein
dhov
en T
echn
ical
Uni
vers
ity]
at 0
7:01
19
Oct
ober
201
4
Algal blooms detection, monitoring and prediction 457
information in individual spectral bands. Once compressed these data were atmo-spherically corrected before ratios were calculated between each of the 14 spectralchannels to allow correlation with ground truth data.
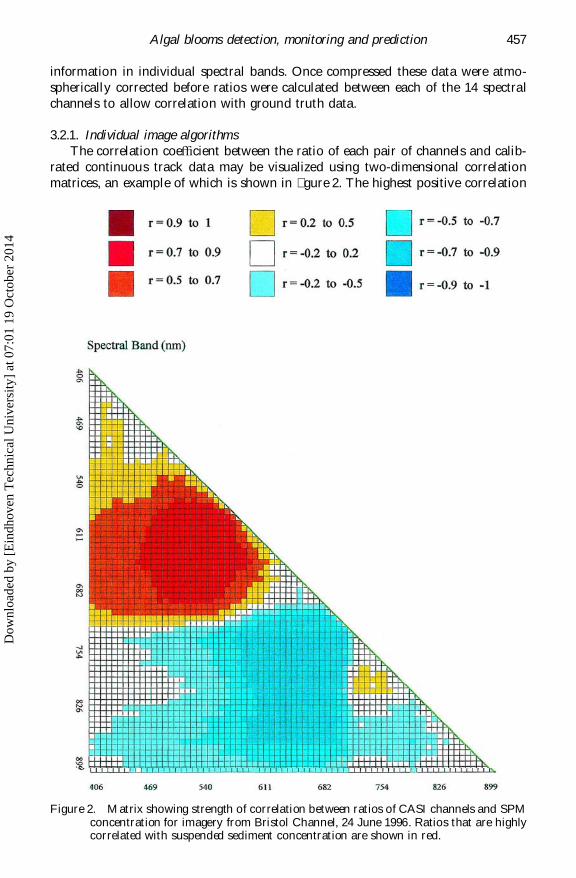
3.2.1. Individual image algorithmsThe correlation coe� cient between the ratio of each pair of channels and calib-
rated continuous track data may be visualized using two-dimensional correlationmatrices, an example of which is shown in � gure 2. The highest positive correlation
Figure 2. Matrix showing strength of correlation between ratios of CASI channels and SPMconcentration for imagery from Bristol Channel, 24 June 1996. Ratios that are highlycorrelated with suspended sediment concentration are shown in red.
Dow
nloa
ded
by [
Ein
dhov
en T
echn
ical
Uni
vers
ity]
at 0
7:01
19
Oct
ober
201
4
A. M. Matthews et al.458
between an individual channel ratio and the calibrated transmissometer or turbiditydata is shown as red in each matrix. Comparison of the quantitative values ofmatrices of diŒerent images has allowed the identi� cation of channel ratios thatshow a consistent correlation with SPM concentration. A consistent correlationbetween images would suggest a ratio suitable for the calibration of a set of imagesfrom a particular site. The correlation matrix for each image shows a similar spatialpattern, although with diŒering strength, with two predominantly positively correl-ated areas at approximately red against near-infrared and at red against blue. Theseareas have corresponding negative correlations where the reverse ratios occur. Thehigh correlation with ratios containing a red wavelength channel is explained by thefact that red light has the lowest energy within the visible spectrum and is thus mosthighly scattered.
3.2.2. Site-speci� c (local) algorithmsIn order to calculate an algorithm for the two sites using the training datasets,
coe� cients from the correlation matrices of the individual images covering this areawere averaged for each ratio. The relationships between various red and near-infraredratios are highlighted as being strongly correlated. The Pearson correlation coe� -cient, r, is a comparison between two independent variables. The value of r that isstatistically signi� cant varies depending on the sample size and may be calculatedusing a standard t-test. All ratios showing a statistically signi� cant correlation wereinvestigated.
Two screening techniques were used to ensure that the � nal selection of predictivealgorithms would be as robust (i.e. portable) as possible. Firstly, selection was madenot only on the strength of the correlation (as measured by r), but also on thestrength of adjacent wavelength correlations. This was to minimize the possibilityof spurious relationships with a statistical outlier. Secondly, equations with largeconstants and low-wavelength multiplicants were rejected as not realistic for spanninga range of applications because they would represent an overall radiance rather thana spectral signature correlation.
Accordingly, the Bristol Channel site-speci� c algorithm was
SPM 5 A3.39 Ö(radiance@661 nm)
(radiance@754 nm)B Õ 2.6 (1)
and the Norfolk coast site-speci� c algorithm was:
SPM 5 A44.22 Ö(radiance@661 nm)
(radiance@754 nm)B Õ 84.7 (2)
where SPM 5 suspended particulate matter in mg l Õ 1 .
3.2.3. Algorithms for atmospherically corrected imageryCorrelation matrices were also produced for the 14-channel atmospherically
corrected imagery. For each wavelength, the correlation between calibrated SPMand the band ratio was lower than that found prior to the removal of atmosphericeŒects. Moreover, the strong correlation between SPM and the red to near-infraredband ratio was no longer apparent. The highest correlations were noted betweenSPM and the red to blue/green band ratio.
The low correlation coe� cients found meant that the further development ofsite-speci� c and global algorithms has not been undertaken with atmospherically
Dow
nloa
ded
by [
Ein
dhov
en T
echn
ical
Uni
vers
ity]
at 0
7:01
19
Oct
ober
201
4
Algal blooms detection, monitoring and prediction 459
corrected imagery. Similarly, nonlinear exponential algorithms were developed withthe non-atmosphericall y corrected dataset.
3.2.4. An exponential equationVisual examination of the scatter plots of channel ratio against SPM concentra-
tion showed that the linear regression may not provide the optimum � t to the data.Various other curves were therefore � tted to the datasets in order to best representthe scatter, with an exponential curve providing the best � t.
Exponential algorithms were developed for the two individual images whichshowed the best linear correlation, one from the Bristol Channel and one from theNorfolk coast, and additionally for a mosaic of three images from the Norfolkcoast. This image mosaic was produced for a parallel case study to investigate thedevelopment of algorithms for chlorophyll-a (Environment Agency 1997). Thecorrelation coe� cient for this mosaic was found to be much greater than that forthe individual images.
Exponential equations provided highly accurate � ts to the calibration datasets.The Bristol Channel site recorded the best correlation between the ratio618 nm/754 nm and SPM concentration, with an r value of 0.814. The best correlationfor the Norfolk coast site is between the ratio 575 nm/747 nm and SPM concentration,with a slight increase in the correlation coe� cient when all images are included inthe mosaic. The algorithms are as follows.
Bristol Channel exponential algorithm:
SPM 5 expA Õ 0.793 1 A0.929 Ö(radiance@618 nm)
(radiance@754 nm)BB (3)
Norfolk coast (individual image) exponential algorithm:
SPM 5 expA Õ 5.356 1 A3.426 Ö(radiance@575 nm)
(radiance@747 nm)BB (4)
Norfolk coast (image mosaic) exponential algorithm:
SPM 5 expA Õ 5.920 1 A3.607 Ö(radiance@618 nm)
(radiance@754 nm)BB (5)
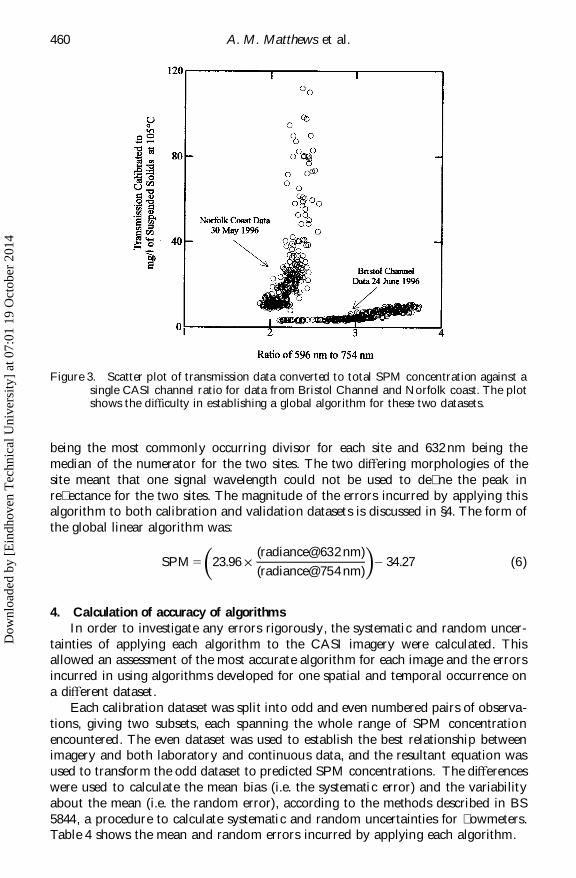
3.2.5. A global linear algorithmFigure 3 shows data from the Bristol Channel and Norfolk coast study sites
plotted on one graph. The channel ratio selected is that which shows the commonlybest correlation in both datasets. It is immediately apparent that there are twopopulations within the graph. This means that the development of a global algorithmis highly unlikely to succeed using the empirical algorithm development approachfor CASI imagery. However, an attempt was made to establish such an algorithmso that the errors incurred could be accurately assessed. This development wascarried out using a linear algorithm as this was computationally simpler andpotentially more portable.
In order to calculate the global calibration algorithm, coe� cients from the localsites’ correlation matrices were averaged for each ratio. The relationship betweenred and near-infrared ratios was again highlighted as being the most strongly correl-ated to the sea truth SPM data. The global algorithm for calibrating CASI enhancedspectral data to mg l Õ 1 of SPM was selected as the ratio of 632 nm/754 nm, 754 nm
Dow
nloa
ded
by [
Ein
dhov
en T
echn
ical
Uni
vers
ity]
at 0
7:01
19
Oct
ober
201
4
A. M. Matthews et al.460
Figure 3. Scatter plot of transmission data converted to total SPM concentration against asingle CASI channel ratio for data from Bristol Channel and Norfolk coast. The plotshows the di� culty in establishing a global algorithm for these two datasets.
being the most commonly occurring divisor for each site and 632 nm being themedian of the numerator for the two sites. The two diŒering morphologies of thesite meant that one signal wavelength could not be used to de� ne the peak inre� ectance for the two sites. The magnitude of the errors incurred by applying thisalgorithm to both calibration and validation datasets is discussed in §4. The form ofthe global linear algorithm was:
SPM 5 A23.96 Ö(radiance@632 nm)
(radiance@754 nm)B Õ 34.27 (6)
4. Calculation of accuracy of algorithmsIn order to investigate any errors rigorously, the systematic and random uncer-
tainties of applying each algorithm to the CASI imagery were calculated. Thisallowed an assessment of the most accurate algorithm for each image and the errorsincurred in using algorithms developed for one spatial and temporal occurrence ona diŒerent dataset.
Each calibration dataset was split into odd and even numbered pairs of observa-tions, giving two subsets, each spanning the whole range of SPM concentrationencountered. The even dataset was used to establish the best relationship betweenimagery and both laboratory and continuous data, and the resultant equation wasused to transform the odd dataset to predicted SPM concentrations. The diŒerenceswere used to calculate the mean bias (i.e. the systematic error) and the variabilityabout the mean (i.e. the random error), according to the methods described in BS5844, a procedure to calculate systematic and random uncertainties for � owmeters.Table 4 shows the mean and random errors incurred by applying each algorithm.
Dow
nloa
ded
by [
Ein
dhov
en T
echn
ical
Uni
vers
ity]
at 0
7:01
19
Oct
ober
201
4
Algal blooms detection, monitoring and prediction 461
The accuracies found from the algorithms were compared against those found intraditional laboratory gravimetric analysis. The mean error for the determinationof SPM concentration in laboratory analysis is 10% of the SPM concentration, witha random error of 12% (Gardner 1989). Thus, for an average SPM concentrationof 10 mg l Õ 1 the mean error, or bias, would be 1 mg l Õ 1 and the random error wouldbe 1.2 mg l Õ 1 , with random errors of up to 11 mg l Õ 1 for the maximum SPMconcentrations encountered in this study.
4.1. Bristol Channel datasets—24 June 1996 and 12 September 1996SPM concentrations measured by laboratory analysis of water samples were in
the range 0–24 mg l Õ 1 for the calibration dataset and between 0 and 90 mg l Õ 1 forthe validation dataset.
Both the image-speci� c and site-speci� c linear algorithms gave a good � t for thiscalibration dataset, with mean errors of 0.77 mg l Õ 1 and 1.2 mg l Õ 1 when comparedwith calibrated transmission values. The random errors of 1.1 mg l Õ 1 and 2.4 mg l Õ 1
compared well with the average laboratory errors of 1.2 mg l Õ 1 and were much betterthan the errors for high concentrations in laboratory measurements. Correlation ofCASI imagery directly against laboratory samples was less convincing, with a randomerror of 2.99 mg l Õ 1 or 3.83 mg l Õ 1 depending on the algorithm used.
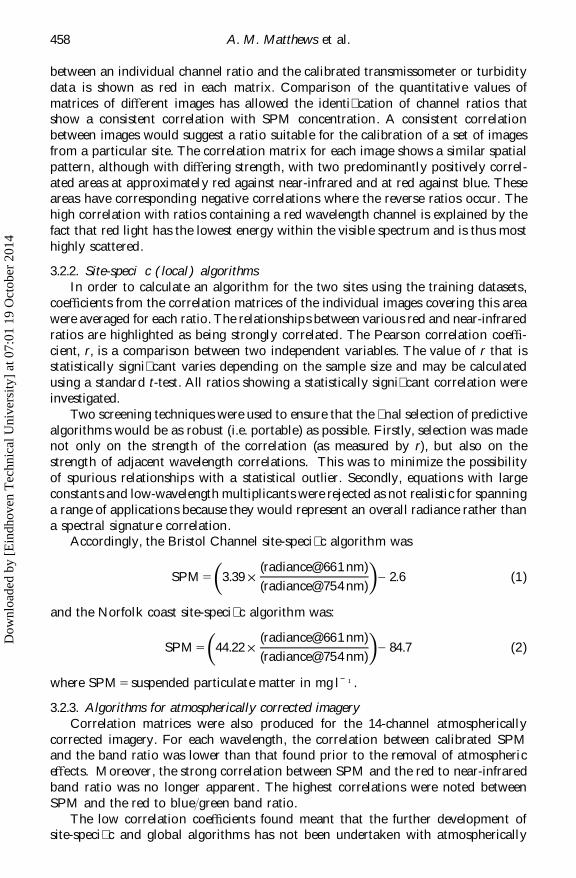
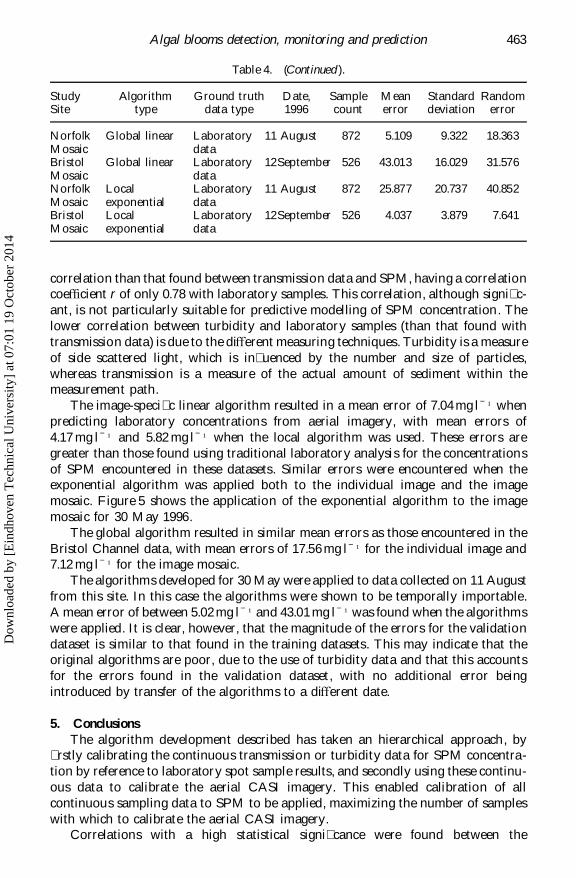
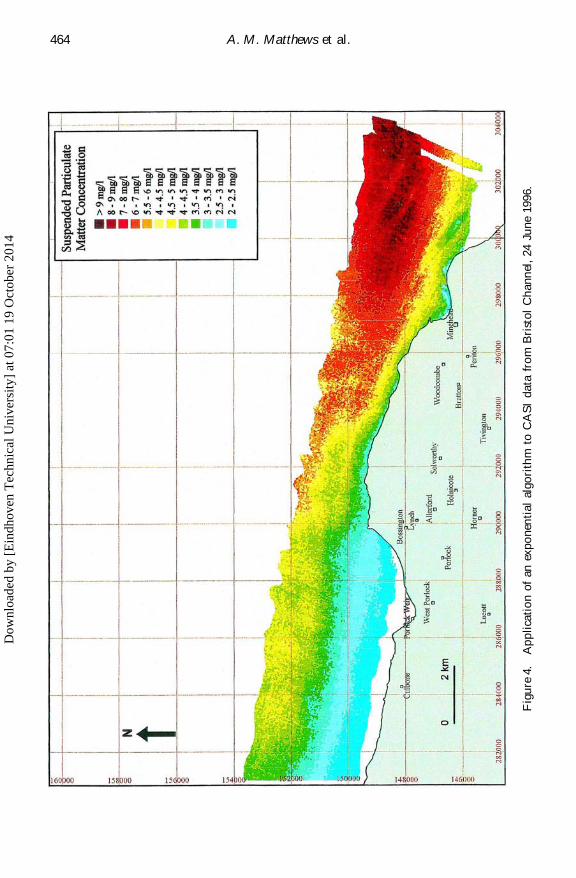
The image-speci� c exponential algorithm gave a slightly improved � t over theimage-speci� c linear algorithm, with a mean error of 0.75 mg l Õ 1 and a random errorof 1.12 mg l Õ 1 . Again the correlation with laboratory samples was lower than thatwith calibrated transmission data. Application of this algorithm to data from 24 Juneis illustrated in � gure 4. This shows the decrease in SPM concentration both oŒshoreand away from Bridgwater Bay (see � gure 1).
The global linear algorithm developed with data from the Bristol Channel andthe Norfolk coast gave a poor correlation when applied to the Bristol Channelcalibration dataset, with a mean error of 25.23 mg l Õ 1 and a random error of20.54 mg l Õ 1 . These errors exceed those found in gravimetric analysis, even forexceptionally high concentrations of SPM.
The above analysis determines the absolute accuracy of the algorithms. In orderto assess the portability, the algorithms developed for data on 24 June 1996 wereapplied to data collected from the same area on 12 September 1996. The errorsincurred in this transfer were small, with the highest accuracy of application foundwith the local linear equation, having a mean error of 2.28 mg l Õ 1 and a randomerror of 2.26 mg l Õ 1 . This compares extremely well with the laboratory accuraciesand demonstrates the portability of this algorithm between diŒerent data collectionexercises at the Bristol Channel site. The image-speci� c exponential algorithm alsogave an acceptable correlation, although the mean error of 4.04 mg l Õ 1 and therandom error of 7.64 mg l Õ 1 exceed the laboratory accuracies for low SPM concentra-tions. Application of the global algorithm resulted in poor results, with a mean errorof 43.01 mg l Õ 1 and a random error of 31.58 mg l Õ 1 .
4.2. Norfolk coast datasets—30 May 1996 and 11 August 1996The range of SPM concentration within the calibration dataset for the Norfolk
coast was 0–24 mg l Õ 1 , with a range of 0–22 mg l Õ 1 in the validation dataset.The mean and random errors resulting from calibration of images from the
Norfolk coast were higher than those encountered in the Bristol Channel. Thesealgorithms were developed using the calibrated turbidity data, which had a lower
Dow
nloa
ded
by [
Ein
dhov
en T
echn
ical
Uni
vers
ity]
at 0
7:01
19
Oct
ober
201
4
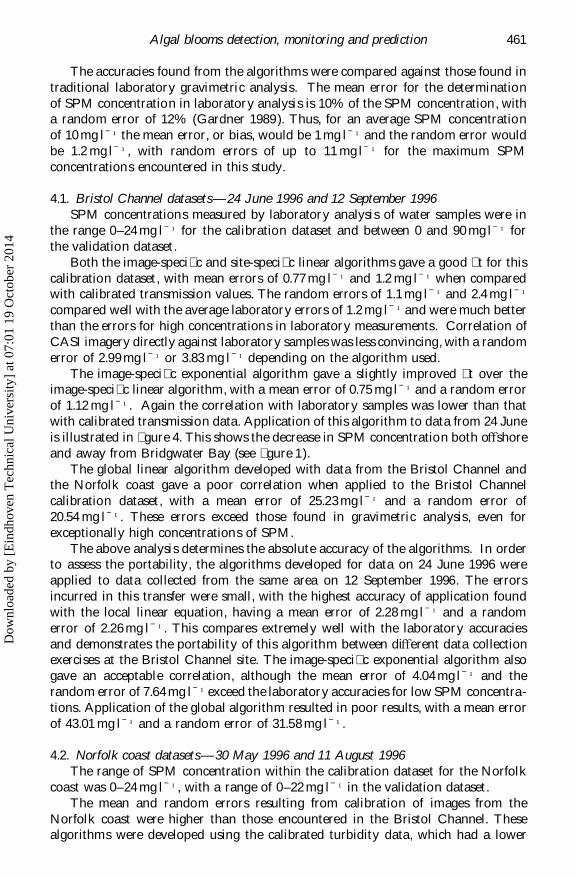
A. M. Matthews et al.462
Table 4. Errors incurred in the conversion of CASI imagery to suspended solidsconcentration.
Study Algorithm Ground truth Date, Sample Mean Standard RandomSite type data type 1996 count error deviation error
Norfolk Image-speci� c Calibrated 30 May 579 11.638 11.325 22.310linear turbidity
Norfolk Image-speci� c Laboratory 30 May 138 7.042 4.944 9.739linear data
Bristol Image-speci� c Calibrated 24 June 239 0.770 0.558 1.099linear transmission
Bristol Image-speci� c Laboratory 24 June 324 2.259 1.518 2.991linear data
Norfolk Local linear Calibrated 30 May 579 12.077 18.347 36.144turbidity
Norfolk Local linear Laboratory 30 May 138 4.171 2.530 4.984data
Bristol Local linear Calibrated 24 June 239 1.196 1.220 2.403transmission
Bristol Local linear Laboratory 24 June 324 2.558 1.946 3.833data
Norfolk Local linear Calibrated 30 May 2193 5.818 10.976 21.623Mosaic turbidityNorfolk Local linear Laboratory 30 May 464 3.749 2.274 4.479Mosaic dataNorfolk Global linear Calibrated 30 May 579 17.560 21.709 42.766
turbidityNorfolk Global linear Laboratory 30 May 138 4.989 3.821 7.527
dataBristol Global linear Calibrated 24 June 239 25.234 10.427 20.541
transmissionBristol Global linear Laboratory 24 June 324 16.624 8.518 16.780
dataNorfolk Global linear Calibrated 30 May 2193 7.118 13.363 26.325Mosaic turbidityNorfolk Global linear Laboratory 30 May 464 4.112 2.707 5.333Mosaic dataNorfolk Image-speci� c Calibrated 30 May 579 9.920 11.927 23.496
exponential turbidityNorfolk Image-speci� c Laboratory 30 May 138 5.338 3.966 7.813
exponential dataBristol Image-speci� c Calibrated 24 June 239 0.751 0.567 1.117
exponential transmissionBristol Image-speci� c Laboratory 24 June 324 2.229 1.497 2.949
exponential dataNorfolk Local Calibrated 30 May 579 9.246 12.207 24.048
exponential turbidityNorfolk Local Laboratory 30 May 138 4.309 3.053 6.014
exponential dataNorfolk Local Calibrated 30 May 2193 5.128 8.323 16.396Mosaic exponential turbidityNorfolk Local Laboratory 30 May 464 2.832 2.347 4.678Mosaic exponential dataNorfolk Local linear Laboratory 11 August 872 7.368 7.527 14.829Mosaic dataBristol Local linear Laboratory 12September 526 2.282 1.149 2.264Mosaic data
Dow
nloa
ded
by [
Ein
dhov
en T
echn
ical
Uni
vers
ity]
at 0
7:01
19
Oct
ober
201
4
Algal blooms detection, monitoring and prediction 463
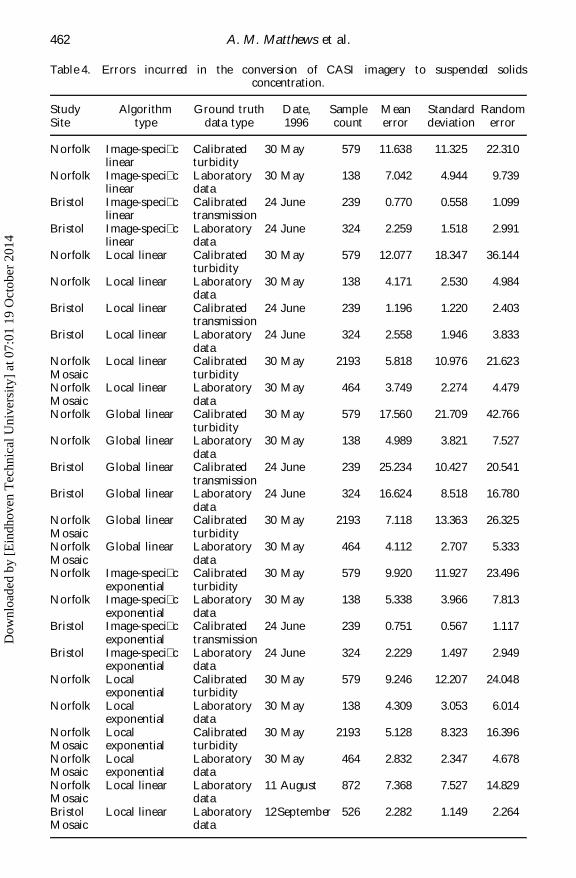
Table 4. (Continued ).
Study Algorithm Ground truth Date, Sample Mean Standard RandomSite type data type 1996 count error deviation error
Norfolk Global linear Laboratory 11 August 872 5.109 9.322 18.363Mosaic dataBristol Global linear Laboratory 12September 526 43.013 16.029 31.576Mosaic dataNorfolk Local Laboratory 11 August 872 25.877 20.737 40.852Mosaic exponential dataBristol Local Laboratory 12September 526 4.037 3.879 7.641Mosaic exponential data
correlation than that found between transmission data and SPM, having a correlationcoe� cient r of only 0.78 with laboratory samples. This correlation, although signi� c-ant, is not particularly suitable for predictive modelling of SPM concentration. Thelower correlation between turbidity and laboratory samples (than that found withtransmission data) is due to the diŒerent measuring techniques. Turbidity is a measureof side scattered light, which is in� uenced by the number and size of particles,whereas transmission is a measure of the actual amount of sediment within themeasurement path.
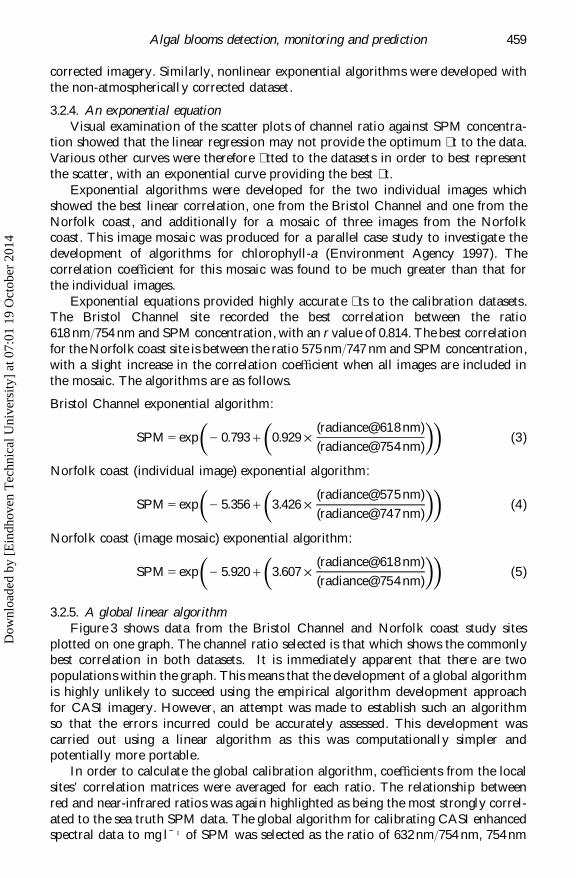
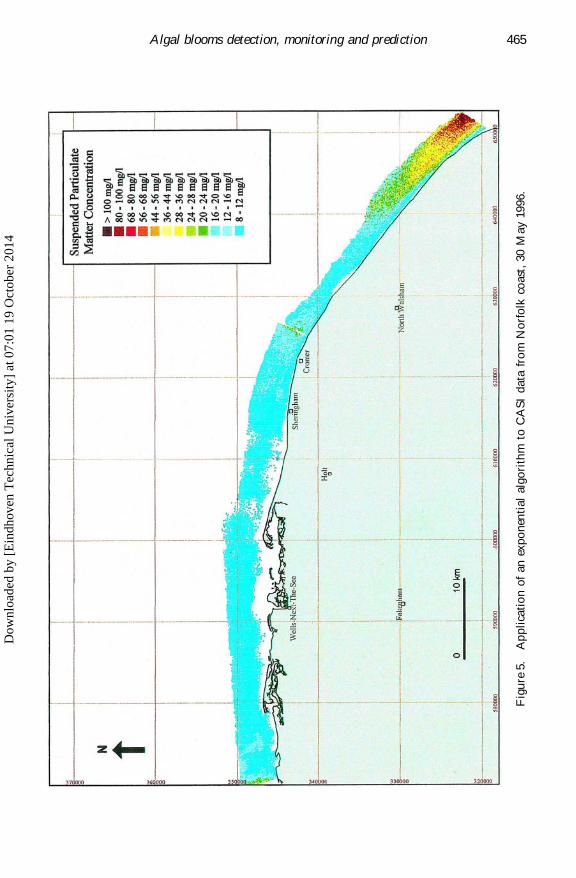
The image-speci� c linear algorithm resulted in a mean error of 7.04 mg l Õ 1 whenpredicting laboratory concentrations from aerial imagery, with mean errors of4.17 mg l Õ 1 and 5.82 mg l Õ 1 when the local algorithm was used. These errors aregreater than those found using traditional laboratory analysis for the concentrationsof SPM encountered in these datasets. Similar errors were encountered when theexponential algorithm was applied both to the individual image and the imagemosaic. Figure 5 shows the application of the exponential algorithm to the imagemosaic for 30 May 1996.
The global algorithm resulted in similar mean errors as those encountered in theBristol Channel data, with mean errors of 17.56 mg l Õ 1 for the individual image and7.12 mg l Õ 1 for the image mosaic.
The algorithms developed for 30 May were applied to data collected on 11 Augustfrom this site. In this case the algorithms were shown to be temporally importable.A mean error of between 5.02 mg l Õ 1 and 43.01 mg l Õ 1 was found when the algorithmswere applied. It is clear, however, that the magnitude of the errors for the validationdataset is similar to that found in the training datasets. This may indicate that theoriginal algorithms are poor, due to the use of turbidity data and that this accountsfor the errors found in the validation dataset, with no additional error beingintroduced by transfer of the algorithms to a diŒerent date.
5. ConclusionsThe algorithm development described has taken an hierarchical approach, by
� rstly calibrating the continuous transmission or turbidity data for SPM concentra-tion by reference to laboratory spot sample results, and secondly using these continu-ous data to calibrate the aerial CASI imagery. This enabled calibration of allcontinuous sampling data to SPM to be applied, maximizing the number of sampleswith which to calibrate the aerial CASI imagery.
Correlations with a high statistical signi� cance were found between the
Dow
nloa
ded
by [
Ein
dhov
en T
echn
ical
Uni
vers
ity]
at 0
7:01
19
Oct
ober
201
4
A. M. Matthews et al.464
Fig
ure
4.A
pp
lica
tio
nof
anex
po
nen
tial
algo
rith
mto
CA
SI
data
fro
mB
rist
ol
Ch
ann
el,
24Ju
ne
1996.
Dow
nloa
ded
by [
Ein
dhov
en T
echn
ical
Uni
vers
ity]
at 0
7:01
19
Oct
ober
201
4
Algal blooms detection, monitoring and prediction 465
Fig
ure
5.A
pp
lica
tio
nof
anex
po
nen
tial
algo
rith
mto
CA
SI
data
fro
mN
orf
olk
coas
t,30
May
1996.
Dow
nloa
ded
by [
Ein
dhov
en T
echn
ical
Uni
vers
ity]
at 0
7:01
19
Oct
ober
201
4
A. M. Matthews et al.466
continuous data and the laboratory samples of SPM for each of the case study sites,with a negative nonlinear correlation between transmission and SPM and a positivelinear correlation between turbidity and SPM. The correlation between laboratorysamples and turbidity was not found to be high enough to allow accurate predictivemodelling of SPM concentration, with transmission being selected as the best variablewith which to build a predictive relationship for SPM. Additionally, the magnitudeof the correlation between laboratory water samples and transmission found in theBristol Channel dataset may be due to the dominance of mineral SPM comparedwith organic solids in this region. In areas where there are high levels of organicmatter, calibration of percentage transmission is less reliable.
A thorough investigation was carried out into the linear relationship between allratio combinations of any two of the 72 CASI bands and the concentration of SPM.For each image a number of statistically signi� cant correlations were found whichallowed progression to the development of an algorithm for each study site. Thehighest correlation was found between SPM and the red to near-infrared band ratio,which is due to the physical properties of sediment-laden water. Clear water absorbsall sunlight in the near-infrared, whereas the presence of sediment within the watercolumn results in enhanced scattering at these wavelengths. Laboratory studies haveshown that the re� ectance recorded at near-infrared wavelengths varies only withconcentration of suspended sediment independent of sediment type, thus providinga baseline against which to compare the peak in re� ectance at red wavelengths(Hudson et al. 1994 ).
The scatter plots of SPM concentration against channel ratio clearly showedthat a curve would provide a better � t to the data than the linear equation. Anumber of curves were � tted to the data, with an exponential curve found to providethe statistically best � t. Application of these algorithms resulted in increased accuracyof prediction for both validation and calibration datasets.
The eŒects of atmospheric interference have previously been considered to be sogreat that their removal is considered essential for the utilization of remotely senseddata (Aiken et al. 1995). Algorithms developed by these workers were applied to theCASI images collected from the case study sites. Although there was generally astatistically signi� cant correlation between the ratio of channels in atmosphericallycorrected images and SPM, the value of this correlation was found to be substantiallylower than that with the imagery which had only had edge eŒects removed.
The accuracy with which each algorithm could predict the SPM concentrationwas assessed by splitting the dataset into two and using half to develop a calibrationand the other half as a test dataset. The results of this procedure showed that boththe linear and the exponential algorithms for the Bristol Channel dataset showedmean and random errors comparable to those found by traditional laboratorytechniques when the image data were correlated with the calibrated transmissiondata. The algorithms developed to calibrate CASI imagery for SPM concentrationhave therefore shown highly signi� cant correlations between the imagery and in situmeasurements. Moreover, the aerial techniques can allow estimation of SPM withaccuracy comparable to traditional laboratory techniques. These techniques allowthe visualization of SPM concentration gradients over a wide spatial scale.
Algorithms developed for the Bristol Channel site proved to be temporallyportable, giving accurate estimations of SPM concentration when applied to datacollected from the same site later in the year. Low mean and random errors werefound when the linear algorithms developed for the Bristol Channel site on 24 June
Dow
nloa
ded
by [
Ein
dhov
en T
echn
ical
Uni
vers
ity]
at 0
7:01
19
Oct
ober
201
4
Algal blooms detection, monitoring and prediction 467
1996 were applied to data collected from the same site on 12 September 1996. Theexponential algorithm proved to be less portable between data collection exercisesat the same site. This is considered to be due to the number of variables within theequation, which is designed to provide an accurate � t with a speci� c dataset. Thehigh accuracy of the linear algorithm shows the clear potential for establishing alocal algorithm for this site for routine calibration of CASI imagery. The temporalportability is considered to be due to the dominance of inorganic SPM in this region.
The algorithms did not produce the same level of accuracy when applied in thesame way to the Norfolk datasets. Again, major errors occurred when moving fromgravimetric to optical methods, but the degree of correlation was worse with theseturbidity data than with the transmission data used in the Bristol Channel study.This may be due to the diŒerent measuring techniques used by the two systems, withturbidity being a measure of scattered light (which is in� uenced by the number andsize of particles present) and transmission being a measure of the light attenuatedby sediment within the measurement path. The use of currently available atmosphericcorrection procedures was not able to improve the accuracy of the individualalgorithms or the portability of these between data collection exercises.
Site-speci� c algorithms for the calibration of CASI imagery to SPM concentrationhave been developed with statistically high correlations against calibrated transmis-sion data. These algorithms show some portability between diŒerent surveillanceevents at the same site. However, the development of a global algorithm for theroutine calibration of CASI imagery proved unsuccessful, with currently availableatmospheric correction actually decreasing the portability. Scatter plots of channelratios against SPM concentration showed that the Bristol Channel and Norfolkcoast optical datasets were clearly diŒerent and could not be reconciled in onecommon relationship. However, the portability of algorithms to data from a diŒerentdate but similar location means that a suite of algorithms could be developed fordiŒerent sections of the coastline, thus reducing the requirement for costly in situdata. This portability also implies that the measurement principle is valid and causal.
Despite the failure of presently accepted image processing techniques to increasethe spatial and temporal portability of the algorithms, particularly for the Norfolkcoast datasets, the diŒerences in the accuracy with which the linear and exponentialequations � t the datasets show that there is room for improvement in the algorithmaccuracy. This suggests that more innovative procedures, such as full spectral analysisusing chemometric techniques which derive a relationship based on more than twospectral channels, may improve the correlations found.
The accuracy of using aerial imagery to estimate SPM concentration has thereforebeen established. Empirical techniques have been shown to provide highly accuratepredictive algorithms for calibration of the CASI imagery, providing that in situ boatdata are collected synchronously. This clearly allows the spatial estimation of SPMconcentration across a wide area. This study shows that, in order to allow conversionof imagery to SPM to the accuracy described above, it is necessary to have at least15 in situ water samples, with a range of at least 12 mg l Õ 1 over a study area of20 km and continuous sampling of transmission between the sample sites. Furtherresearch is, however, required to develop general rules concerning algorithmdevelopment.
Furthermore, this study has also shown that the complexity of the relationshipbetween in situ SPM concentration and aerial imagery is too great to allow the useof two-channel ratio techniques for the development of a globally applicable SPM
Dow
nloa
ded
by [
Ein
dhov
en T
echn
ical
Uni
vers
ity]
at 0
7:01
19
Oct
ober
201
4
A. M. Matthews et al.468
algorithm. Further developments in analytical techniques should be made before thesearch for a global algorithm continues.
References
Aiken, J., Hudson, S., Moore, G., and Bottrell, H., 1995, Further development of airborneremote sensing techniques. A preliminary report to the National Rivers Authority.Plymouth Marine Laboratory, Plymouth, UK, April 1995.
Bhargava, D. S., and Mariam, D. W., 1992, Cumulative eŒects of salinity and sedimentconcentration on re� ectance measurement. International Journal of Remote Sensing,13, 2151–2159.
Boxall, S. R., Chaddock, S. E., Matthews, A. M., and Holden, N., 1993, Airborne RemoteSensing of Coastal Waters. National Rivers Authority, Bristol, UK, 1993.
Brown, J., and Simpson, J. H., 1990, The radiometric determination of total pigment andseston and its potential use in shelf seas. Estuarine, Coastal and Shelf Science, 31, 1–9.
Chen, Z., Curran, P. J., and Hansom, J. D., 1992, Derivative re� ectance spectrometry toestimate suspended sediment concentration. Remote Sensing Environment, 40, 67–77.
Collins, M., and Pattiaratchi, C., 1984, Identi� cation of suspended sediment in coastalwaters using Airborne Thematic Mapper data. International Journal of Remote Sensing,5, 635–657.
Curran, P. J., Hansom, J. D., Plummer, S. E., and Pedley, M. I., 1987, Multispectral remotesensing of nearshore suspended sediments: a pilot study. International Journal ofRemote Sensing, 8, 103–122.
Environment Agency, 1996 a, National Marine Baseline Survey, 1995. Littoral Cell 7: LandsEnd to the Severn Estuary NC/MAR/016/9. Environment Agency, National Centrefor Environmental Monitoring and Surveillance, Bath, UK.
Environment Agency, 1996 b, National Marine Baseline Survey, 1995. Littoral Cell 2:Flamborough Head to The Wash NC/MAR/016/4. Environment Agency, NationalCentre for Environmental Monitoring and Surveillance, Bath, UK.
Environment Agency, 1997, Calibration of CASI imagery for high concentrations of chloro-phyll-a in turbid waters. Environment Agency, National Centre for EnvironmentalData and Surveillance, Bath, UK.
Gardner, M. J., 1989, A Manual on Analytical Quality Control for the Water Industry, editedby R. V. Cheeseman and A. L. Wilson, WRc publication NS30, Swindon, UK.
Gordon, H. R., 1978, Removal of atmospheric eŒects from satellite imagery of the oceans.Applied Optics, 17, 1631–1636.
Han, L., and Rundquist, D. C., 1994, The response of both surface re� ectance and theunderwater light � eld to various levels of suspended sediments: preliminary results.Photogrammetric Engineering and Remote Sensing, 60, 1463–1471.
Hudson, S. J., Moore, G. F., Bale, A. J., Dyer, K. R., and Aiken, J., 1994, An operationalapproach to determining suspended sediment distributions in the Humber Estuary byairborne multi-spectral imagery. Proceedings of the First International Conference onAirborne Remote Sensing, Strasbourg, France, 12– 15 September 1994.
Kirk, J. T. O., 1983, L ight and Photosynthesis in Aquatic Ecosystems, First edition (Cambridge:Cambridge University Press), pp. 401.
Klemas, V., Borchardt, J .F., and Treasure, W. M., 1973, Suspended sediments observationsfrom ERTS-1. Remote Sensing of Environment, 2, 205–221.
Land, P. E., and Haigh, J. D., 1996, Atmospheric correction over case 2 waters using aniterative � tting algorithm. Applied Optics, 35, 5443–5451.
Matthews, A. M., 1994, High resolution spectral remote sensing of phytoplankton in thecoastal zone. Ph.D. Thesis, University of Southampton, Faculty of Science, Departmentof Oceanography.
Mitchelson, E. G., Jacob, N. J., and Simpson, J. H., 1986, Ocean colour algorithms from theCase 2 waters of the Irish Sea in comparison to algorithms from case 1 waters.Continental Shelf Research, 5, 403–415.
Morel, A. Y., and Prieur, L., 1977, Analysis of variations in ocean colour. L imnology andOceanography, 22, 709–722.
Dow
nloa
ded
by [
Ein
dhov
en T
echn
ical
Uni
vers
ity]
at 0
7:01
19
Oct
ober
201
4
Algal blooms detection, monitoring and prediction 469
Munday, J. C., and Alfoldi, T. T., 1979, Landsat test of diŒuse re� ectance models for aquaticsuspended solids measurement. Remote Sensing of Environment, 8, 169–183.
Novo, E. M. M., Hansom, J. D., and Curran, P. J., 1989 a, The eŒect of sediment type onthe relationship between re� ectance and suspended sediment concentration.International Journal of Remote Sensing, 10, 1283–1289.
Novo, E. M. M., Hansom, J. D., and Curran, P. J., 1989 b, The eŒect of viewing geometryand wavelength on the relationship between re� ectance and suspended sedimentconcentration. International Journal of Remote Sensing, 10, 1357–1372.
Novo, E. M. M., Steffen, C. A., and Bragga, C. A., 1991, Results of a laboratory experimenton relating spectral re� ectance to total suspended solids. Remote Sensing ofEnvironment, 36, 67–72.
Rimmer, J. C., Collins, M. B., and Pattiaratchi, C., 1987, Mapping of water quality incoastal waters using Airborne Thematic Mapper data. International Journal of RemoteSensing, 8, 85–102.
Ritchie, J. C., Cooper, C. M., and Scheibe, F. R., 1990, The relationship of MSS and TMdigital data with suspended sediments, chlorophyll and temperature in Moon Lake,Mississippi. Remote Sensing of Environment, 33, 137–148.
Stumpf, R. P., and Pennock, J. R., 1989, Calibration of a general optical equation for remotesensing of suspended sediments in a moderately turbid estuary. Journal of GeophysicalResearch, 94, 14363–14371.
Weeks, A., and Simpson, J. H., 1991, The measurement of suspended particulate concentrationsfrom remotely sensed data. International Journal of Remote Sensing, 12, 725–737.
Dow
nloa
ded
by [
Ein
dhov
en T
echn
ical
Uni
vers
ity]
at 0
7:01
19
Oct
ober
201
4