Embed Size (px)
Citation preview
ERSC-SPP Minimizing Bulk Power Costs Study
E5439 May 3, 2012
ABB Inc. Power Systems Division Grid Systems Consulting 940 Main Campus Drive, Suite 300 Raleigh, NC 27606
Rev No. Revision Description Date Authored by Reviewed by Approved by
0 ABB Team
Pillutla, S Prabhakara, F.S W. Wong
1 SPP review April 27, 2012 SPP Team
LEGAL NOTICE
This document, prepared by ABB Inc., is an account of work sponsored by ERSC and SPP. Neither ERSC, SPP nor ABB Inc., nor any person or persons acting on behalf of either party: (i) makes any warranty or representation, expressed or implied, with respect to the use of any information contained in this report, or that the use of any information, apparatus, method, or process disclosed in this report may not infringe privately owned rights, or (ii) assumes any liabilities with respect to the use of or for damages resulting from the use of any information, apparatus, method, or process disclosed in this document.
Prepared for: SPP, ERSC Report No.: E5439 Date: 27 April 2012 Revised: ABB Study Team: Ashish Jain Maria Moore Alkesh Patel Sri Pillutla F.S Prabhakara Gang Shen Seshadri Subramanian Lan Trinh Jinxiang Zhu Report Reviewed by: F.S Prabhakara Report Approved by: Willie Wong
ii ABB Power Systems Consulting ERSC-SPP
Acknowledgments ABB and SPP wish to express gratitude to all individuals and organizations that have participated in any way in this study. Significant support has been given from many parties in collecting data and providing input for the study. Special thanks are given to the following individuals for the time and effort they have spent in supporting this study, answering questions and providing guidance during the many discussions on important topics. Their efforts have been critical to this vast and complex study.
Philip Movish Kirk Patterson
Benjamin Roubique
Eric Burkey Antoine Lucas
Harvey Scribner
ERSC WG
E-5439
iii MBPC Study – Summary Report
Contents List of Figures ............................................................................................................................. v
List of Tables ............................................................................................................................. vi
1 Background ...................................................................................................................... 7
2 Reliability Must Run (RMR) designation ........................................................................... 8
3 Study Approach ...............................................................................................................10
4 Study Cases Formulation ................................................................................................13
5 Study Assumptions ..........................................................................................................20 5.1 PRODUCTION COST MODELING ASSUMPTIONS .................................................................20 5.2 TRANSMISSION MODELING ASSUMPTIONS .......................................................................23
6 Development of Reference Cases ...................................................................................25
7 WOTAB Load Pocket ......................................................................................................29 7.1 WOTAB 2013 RESULTS ................................................................................................30
7.1.1 Production Cost Calculation ...................................................................................30
7.1.2 Power Flow Analysis ..............................................................................................30 7.2 WOTAB 2022 RESULTS ................................................................................................32
7.2.1 Production Cost Calculation ...................................................................................32
7.2.2 Power Flow Analysis ..............................................................................................33 7.3 WOTAB REGION SUMMARY ...........................................................................................35
8 Western Region Analysis ................................................................................................36 8.1 YEAR 2013 CONDITION ..................................................................................................37
8.1.1 Production Costing Calculation ..............................................................................37
8.1.2 Power Flow Analysis ..............................................................................................37 8.2 YEAR 2022 CONDITION ..................................................................................................38
8.2.1 Production Costing Calculation ..............................................................................38
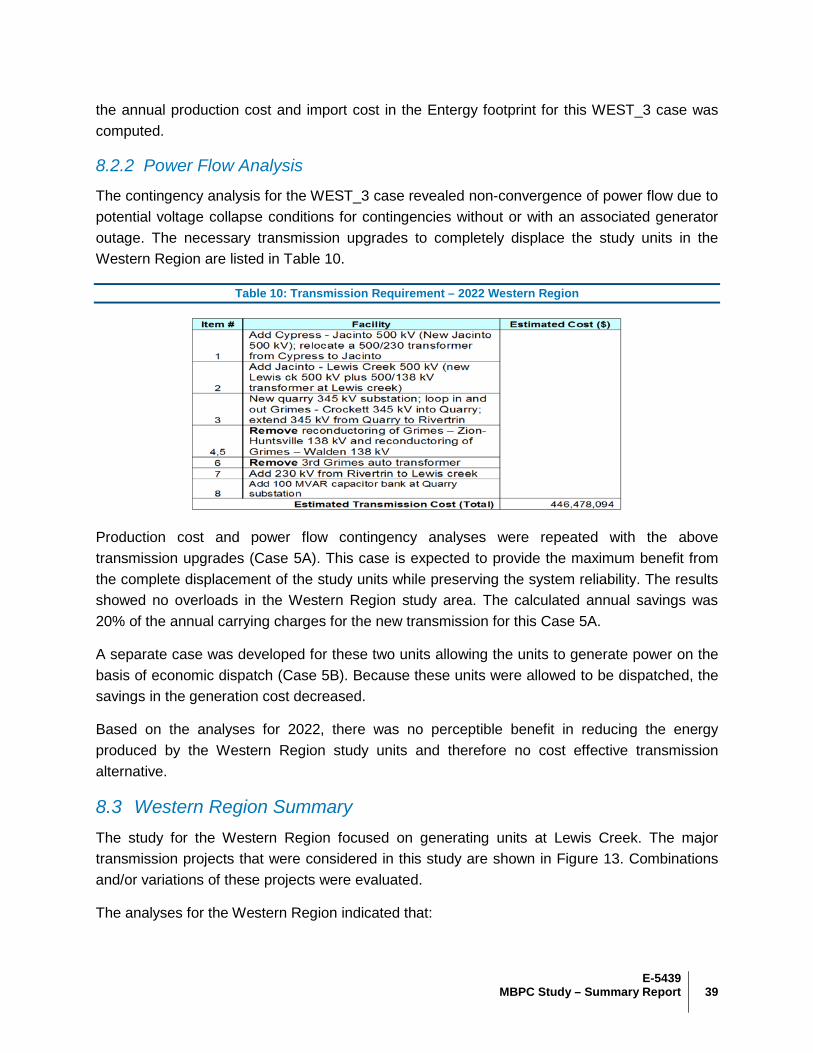
8.2.2 Power Flow Analysis ..............................................................................................39 8.3 WESTERN REGION SUMMARY .........................................................................................39
9 Amite South Region Analysis ..........................................................................................41 9.1 YEAR 2013 CONDITION ..................................................................................................42
9.1.1 Production Costing Calculation ..............................................................................42
9.1.2 Power Flow Analysis ..............................................................................................43 9.2 YEAR 2022 CONDITION ..................................................................................................45
9.2.1 Production Costing Calculation ..............................................................................45
9.2.2 Power Flow Analysis ..............................................................................................45 9.3 AMITE SOUTH REGION SUMMARY ...................................................................................48
10 DSG Region Analysis ......................................................................................................49 10.1 YEAR 2013 CONDITION ...............................................................................................49
iv ABB Power Systems Consulting ERSC-SPP
10.1.1 Production Cost Calculation................................................................................49
10.1.2 Power Flow Analysis ..........................................................................................50 10.2 YEAR 2022 CONDITION ...............................................................................................52
10.2.1 Production Costing Calculation ...........................................................................52
10.2.2 Power Flow Analysis ..........................................................................................52 10.3 DSG REGION SUMMARY .............................................................................................53
11 Rex Brown Analysis ........................................................................................................55 11.1 YEAR 2013 CONDITION ...............................................................................................55
11.1.1 Production Cost Simulations ...............................................................................55 11.2 YEAR 2022 CONDITION ...............................................................................................56
11.2.1 Production Cost Calculation................................................................................56
11.2.2 Power Flow Analysis ..........................................................................................56 11.3 REX BROWN SUMMARY ...............................................................................................57
12 Sensitivity Analyses .........................................................................................................58 12.1 GAS PRICE SENSITIVITY ..............................................................................................58 12.2 QF SENSITIVITY ..........................................................................................................58 12.3 RFP RESOURCE SENSITIVITY ......................................................................................59
13 Conclusions .....................................................................................................................59
E-5439
v MBPC Study – Summary Report
List of Figures Figure 1 : General Study Approach ...........................................................................................11
Figure 2: Conceptual View of Economic Comparison ................................................................12
Figure 3: Cases Flow Chart.......................................................................................................15
Figure 4: Heuristic Optimization Flow Chart ..............................................................................19
Figure 5: Main Features of GridView .........................................................................................20
Figure 6: Bubble Diagram illustration for 2013 Reference Case ................................................27
Figure 7: Bubble Diagram illustration for 2022 Reference Case ................................................28
Figure 8: WOTAB Region Transmission System .......................................................................29
Figure 9: Benefit-to-cost Curves – 2013 WOTAB ......................................................................32
Figure 10: Benefit-to-cost Curves – 2022 WOTAB ....................................................................34
Figure 11: Major Transmission Upgrades Considered for WOTAB Region ..............................35
Figure 12: Western Region Transmission System .....................................................................36
Figure 15: Major Transmission Upgrades Considered for the Western Region .........................40
Figure 16: Amite South Transmission System ...........................................................................41
Figure 17: Benefit-to-cost Curves – 2013 Amite South ..............................................................44
Figure 18: Benefit-to-cost Curves – 2022 Amite South ..............................................................47
Figure 19: Major Transmission Upgrades Considered for Amite South .....................................48
Figure 20: DSG Region Transmission System ..........................................................................49
Figure 21: Benefit-to-cost Curves –2013 DSG ..........................................................................51
Figure 22: Benefit-to-cost Curves – 2022 DSG .........................................................................53
Figure 23: Major Transmission Upgrades Considered for DSG Region .....................................54
Figure 24: Rex Brown Region Transmission System.................................................................55
Figure 25: Major Transmission Upgrades Considered for Rex Brown Region ...........................57
vi ABB Power Systems Consulting ERSC-SPP
List of Tables Table 1: Case Description .........................................................................................................15
Table 2: WOTAB Cases Description .........................................................................................30
Table 3: WOTAB 2013 Change in Annual Production, Compared to Reference Case ..............30
Table 4: Transmission Requirement – 2013 WOTAB ................................................................31
Table 5: WOTAB 2022 Change in Annual Production, Compared to Reference Case ..............32
Table 6: Transmission Requirement – 2022 WOTAB ................................................................34
Table 7: WEST Case Description ..............................................................................................36
Table 8: Western 2013 Change in Annual Production, Compared to Reference Case ..............37
Table 9: Transmission Requirement – 2013 Western Region ....................................................38
Table 10: Transmission Requirement – 2022 Western Region ..................................................39
Table 11: Amite South Case Description ...................................................................................42
Table 12: Amite South 2013 Change in Annual Production, Compared to Reference Case ......42
Table 13: Transmission Requirement – 2013 Amite South ........................................................44
Table 14: Amite South 2022 Change in Annual Production, Compared to Reference Case ......45
Table 15: Transmission Requirement – 2022 Amite South ........................................................46
Table 16: DSG 2013 Change in Annual Production, Compared to Reference Case ..................50
Table 17: DSG Case Description ..............................................................................................50
Table 18: Transmission Requirement – 2013 DSG ...................................................................51
Table 19: Transmission Requirement –2022 DSG ....................................................................53
E-5439
7 MBPC Study – Summary Report
ERSC-SPP
MINIMIZE BULK POWER COSTS STUDY
SUMMARY REPORT
1 Background
This study was developed from a strongly held hypothesis on the part of the ERSC that “if transmission were to be built into various Entergy load pockets then certain high heat rate/low efficiency generating units could be run at lower levels with the result being that the net operating cost would be less than without the transmission.” In essence, if the difference between the initial annual production cost of the Entergy footprint and that of the test case with transmission built in appropriate places was greater than the annualized cost of ownership of that transmission, then those transmission projects so identified would be eligible for additional refined studies and possibly ultimate construction.
This study pertains to the Entergy Transmission System, which spans multiple states including Louisiana and parts of Mississippi, Arkansas, and Texas. In addition to Entergy owned generation resources (mostly legacy plants with higher heat rates), there are more recently built merchant generation plants within the footprint which may have generally lower heat rates and hence could produce lower cost energy. In addition, there are a few load pockets within Entergy’s Transmission System that have, by definition, transmission and reactive power constraints. Certain of the older, less efficient generating units/plants, designated as Reliability Must-Run (RMR), are dispatched (historically) within these load pockets in order to mitigate the transmission and reactive power constraints. The amount of generation (MW) and duration (hours) varies by the specific load pocket, load variation within the load pocket, and the transmission limitations and reactive power requirements. The historical (based on the information for 2006 thru’ 2008) use of such plants, denoted by their respective capacity factors, ranges from 5% to 48%.
In principle, if there were no transmission limitations into or requirements for reactive power within these load pockets, then there would not be any need for RMR designation of the plants/units within a load pocket to mitigate such limitations. It is possible though that the units in the load pockets are providing reactive power support under certain loading conditions and in those cases additional transmission may not eliminate the need for the RMR rules on the units. The construction of new transmission designed for the elimination of RMR rules relating to constrained transmission feeding a load pocket a new Security Constrained Unit Commitment (SCUC) and Security Constrained Economic Dispatch (SCED) could utilize the lower cost generation resources outside the load pocket(s) to a greater extent; thereby tending to minimize the ultimate cost of energy to the consumer, assuming that the annualized cost of the transmission additions did not exceed the reductions in productions costs
8 ABB Power Systems Consulting ERSC-SPP
However, creating transmission system additions with truly no bottlenecks or limitations into a load pocket is an expensive proposition and it may not make economic sense to eliminate all the transmission limitations. Thus, it is imperative to balance the production cost savings that can be realized from a more economic dispatch of all available generation resources versus the annualized cost of transmission improvements (additions, reconfiguration, upgrades etc.).
The Entergy Regional State Committee (ERSC) and Southwest Power Pool (SPP) commissioned this Minimizing Bulk Power Costs (MBPC) Study for identifying the most cost effective transmission project(s) specifically for minimizing generation from the high cost units in nine different Entergy load pockets/generation plants.
This summary report describes in general terms the overall study process and conclusions. Much of the work and information resulting from this study are considered critical infrastructure and market sensitive information and not included here in order to maintain the required confidentiality. However, more complete details have been provided to the ERSC-SPP Study Team through the complete final report.
2 Reliability Must Run (RMR) designation
The historical development and geographical features of the Entergy transmission system have resulted in a system that broadly consists of an EHV backbone connecting several load-serving sub-regions. In many locations throughout the country, the amount of power that can be brought into a sub-region and transferred between sub-regions is limited by the transmission system. In these sub-regions, the load contained within that region relies on generators that are local to that region to serve a portion of the regional load. To ensure load is reliably served in each sub-region, Entergy Transmission makes certain that sufficient generation is online locally; while taking into account the amount of transmission capability that is available to move energy into the sub-region.
This coordination is achieved through analytical studies that determine, for each affected sub-region, the regional load levels at which various local generators within a region need to be committed to ensure that adequate generation capacity is available. These studies result in operational guidelines that effectively act as a “backstop” to ensure that adequate local generation capacity is available in the event that such generation would not have been committed for other economic or operational reasons. In most instances, these guidelines specify the commitment of some of these local units when the load in a region is expected to exceed a certain level. These local generators are then identified as Reliability Must Run (RMR) units in the guideline since they need to be committed when certain conditions (i.e., load levels increasing beyond a certain point) are met in order to serve the regional load requirements while maintaining the reliability of the transmission system.
E-5439
9 MBPC Study – Summary Report
Determination of RMR Guidelines
The RMR guidelines that influence the commitment of local generation in a region tend to group the generators by electrical proximity. This means that a group of generators that have a comparable effect on a transmission constraint tend to be governed by the same RMR guideline and might be grouped in a manner that allows the commitment of any one of the units electrically similar to the commitment of any of the others from the point of view of the RMR rule to satisfy the reliability requirement.
Entergy Transmission employs a standard utility methodology to determine RMR guidelines. Analytical studies are undertaken in two steps. The first step of the study identifies any thermal overloads or under-voltage conditions that may result in the event the system experiences the loss of one or more critical transmission elements or generating units at the same time a local generator(s) is not committed to run. Typically, for a given region, the RMR studies initially assume load to be equal to the maximum level that is forecasted to be present in that region; usually the summer peak hour. Local generator(s) or groups of generators are then de-committed sequentially and the post-contingent thermal overloads or under-voltage conditions that result from each commitment pattern are identified. The second step of the study identifies the load levels at which a generator or group of generators must be committed to avoid the thermal overloads or under-voltage conditions identified in the first step. The load level in a region is decreased until the thermal or voltage conditions meet the reliability requirements for the region even with local generator(s) de-committed.
In practice, the RMR study process usually begins with the de-commitment of a generator, followed by the determination of the most-limiting constraint which, in turn, is followed by a reduction in scalable load until the most-limiting constraint is alleviated. The reduced load level is the maximum load serving capability of the region that can be supported by that particular generation commitment pattern. This procedure is repeated sequentially for each local generator in the region until the load serving capabilities under various generation commitment combinations in a region have been determined. The result is an RMR rule that tabulates the load serving capabilities that can be supported by varying the generation commitment combinations.
RMR Designations and their Effect on Unit Commitment Decisions
RMR guidelines are just one of a number of factors that can influence unit commitment decisions. First, a unit may be committed for economic reasons even before any reliability or operational considerations are taken into account. Examples of other operational considerations that can influence unit commitment decisions for units that have not been committed for economic reasons include the following: system demand requirements, system reserve requirements, system flexibility requirements, load following capability, unit
10 ABB Power Systems Consulting ERSC-SPP
characteristics, local area reserve requirements, and fuel constraints. In summary, a generator that has been identified in an RMR guideline may be committed for other reasons, without regard to the RMR guideline. Conversely, if the RMR guidelines for a unit are relaxed due to a transmission upgrade, that unit may still be committed just as frequently due to the other factors listed above.
3 Study Approach
The two main considerations in this study are:
1. Most economic utilization of all available generation resources within the Entergy footprint spanning four states (production cost calculations for 8,760 hours), and
2. Cost effective transmission solutions that eliminate the need for the RMR designations in the load pockets under study (transmission analyses1)
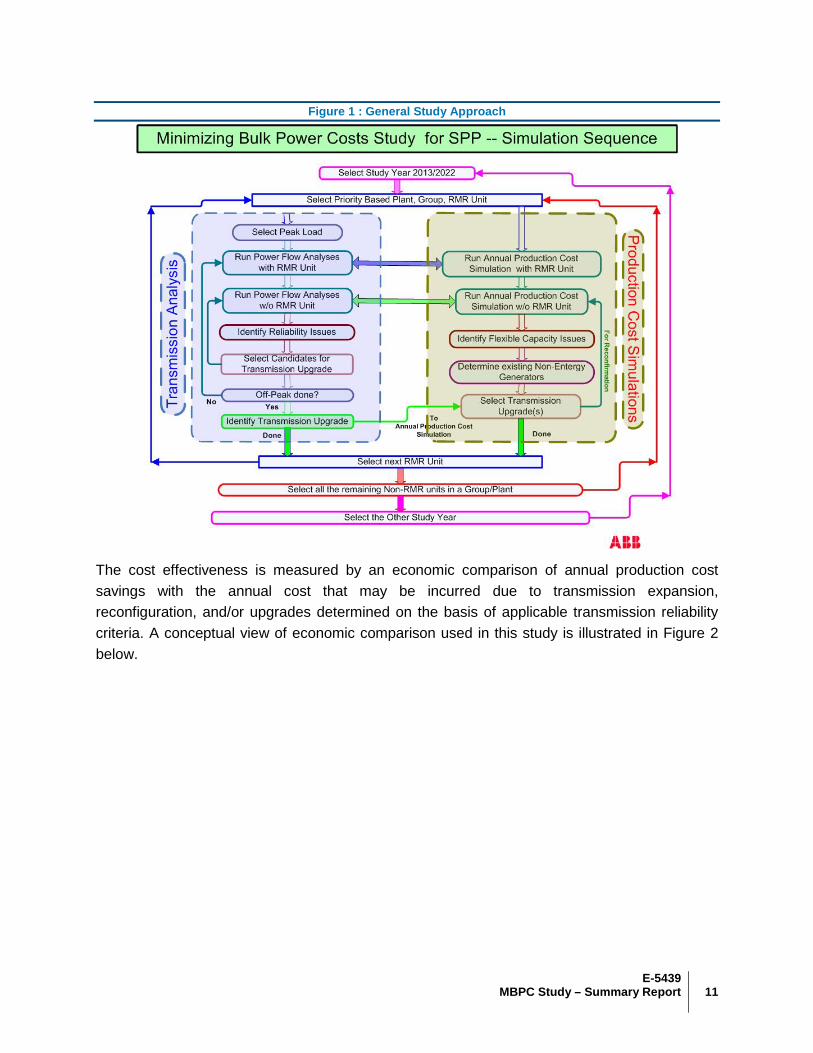
This required a parallel and iterative process between production cost simulations for quantifying possible savings from more economical generation and transmission analyses for identifying the cost of transmission improvements to fully meet the transmission reliability requirements. A conceptual overview of the main simulation steps involved in this parallel process is illustrated in Figure 1.
1 Only Steady State Power Flow Simulations and Analyses were performed as a part of this Study. Further analyses such as Dynamic Stability and Short-Circuit Calculations may be needed.
E-5439
11 MBPC Study – Summary Report
Figure 1 : General Study Approach
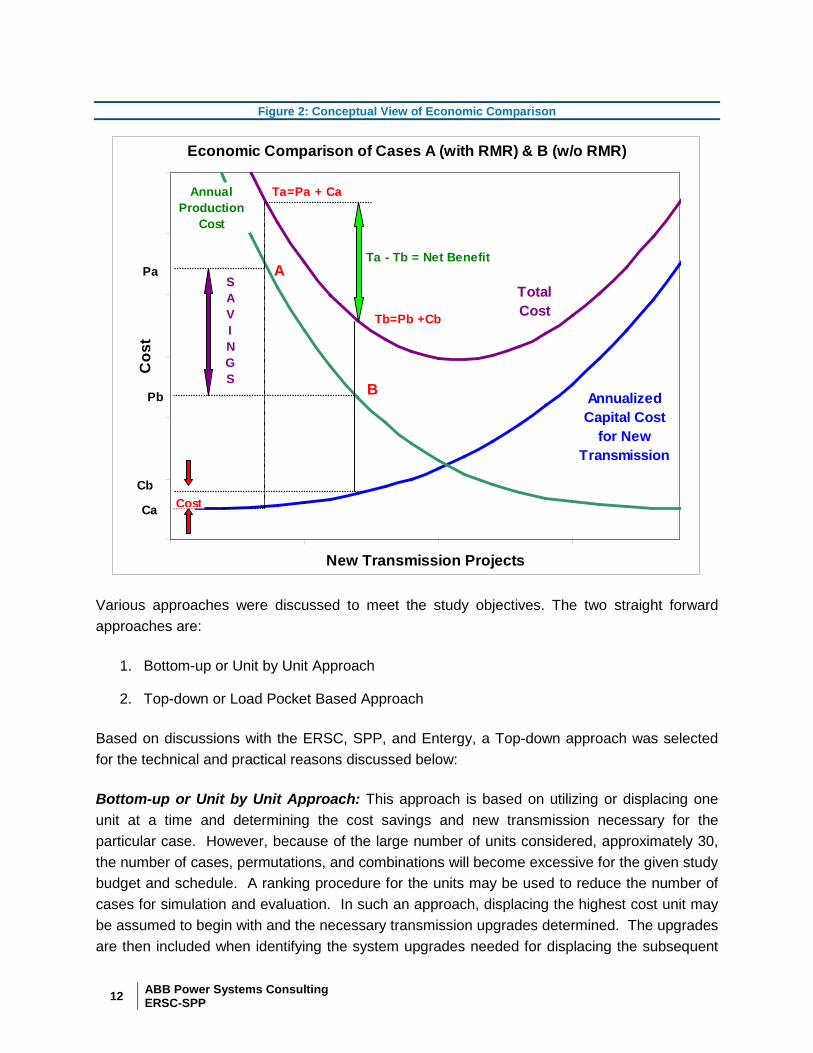
The cost effectiveness is measured by an economic comparison of annual production cost savings with the annual cost that may be incurred due to transmission expansion, reconfiguration, and/or upgrades determined on the basis of applicable transmission reliability criteria. A conceptual view of economic comparison used in this study is illustrated in Figure 2 below.
12 ABB Power Systems Consulting ERSC-SPP
Figure 2: Conceptual View of Economic Comparison
Various approaches were discussed to meet the study objectives. The two straight forward approaches are:
1. Bottom-up or Unit by Unit Approach
2. Top-down or Load Pocket Based Approach
Based on discussions with the ERSC, SPP, and Entergy, a Top-down approach was selected for the technical and practical reasons discussed below:
Bottom-up or Unit by Unit Approach: This approach is based on utilizing or displacing one unit at a time and determining the cost savings and new transmission necessary for the particular case. However, because of the large number of units considered, approximately 30, the number of cases, permutations, and combinations will become excessive for the given study budget and schedule. A ranking procedure for the units may be used to reduce the number of cases for simulation and evaluation. In such an approach, displacing the highest cost unit may be assumed to begin with and the necessary transmission upgrades determined. The upgrades are then included when identifying the system upgrades needed for displacing the subsequent
Economic Comparison of Cases A (with RMR) & B (w/o RMR)
1000
3000
5000
7000
9000
11000
13000
1 6 11 16New Transmission Projects
Cos
t
AnnualizedCapital Cost
for NewTransmission
Pa A
Pb B
Ca
TotalCost
Cb
Ta=Pa + Ca
Tb=Pb +Cb
SAVINGS
Cost
Ta - Tb = Net Benefit
Annual Production
Cost
E-5439
13 MBPC Study – Summary Report
unit(s). In this incremental and sequential manner, the system upgrades needed to displace all the high cost units may be determined.
The disadvantage of using this ranking method is the cost of a transmission upgrade(s) for a lower cost unit or a partial displacement of a higher cost unit may be small as compared to that of a higher cost unit, thereby yielding a higher benefit/cost ratio. However, due to sequential steps, the transmission required for displacing a high cost unit would have already been determined in the previous steps and included for the subsequent unit displacement cases. The lower transmission options will be totally masked. Since the ranking of units to reduce the number of cases to a manageable set was not considered to be useful, this Unit by Unit Approach was not considered to be appropriate.
Top-down or Load Pocket Based Approach: To begin this approach, the transmission solution to resolve the entire RMR restriction or dispatch of high cost units in each load pocket is determined. This is consistent with the focus of this study, i.e. what is driving the RMR requirement and what are the transmission limitations and how to mitigate these transmission issues.
However, the least cost transmission solution comes in blocks and some of these in large blocks; mostly due to economy of scale, rights-of way, and other routing problems as well reactive compensation equipment ratings. If the resolution of the entire load pocket problem is uneconomic, staging and/or down-sizing of the pre-determined transmission solution for the particular load pocket may be performed in order to obtain the necessary granularity of the solution under the assumption that the high cost units would be available for dispatch without the RMR status. Further, if an evaluation of a combination of the load pockets becomes necessary or desired, new cases may be created for further evaluation by combining the transmission solutions for the individual load pockets. The Top-down Approach was used in this study.
4 Study Cases Formulation
As shown earlier, in Figure 1, there are two main simulations:
1. Production costing simulations for the entire year (8760 hours), and
2. Power flow analyses for base case and contingencies for the peak2 load condition.
2 System peak load condition was chosen because it was deemed to be the most-limiting from a steady-state (thermal loading and voltage) perspective
14 ABB Power Systems Consulting ERSC-SPP
In general, the production cost simulation is performed first and the power flow base case is then prepared by importing the generation dispatch for the peak load hour. Completing each case requires a minimum of two simulations; a production cost run and a power flow run under system intact conditions and applicable contingency case conditions.
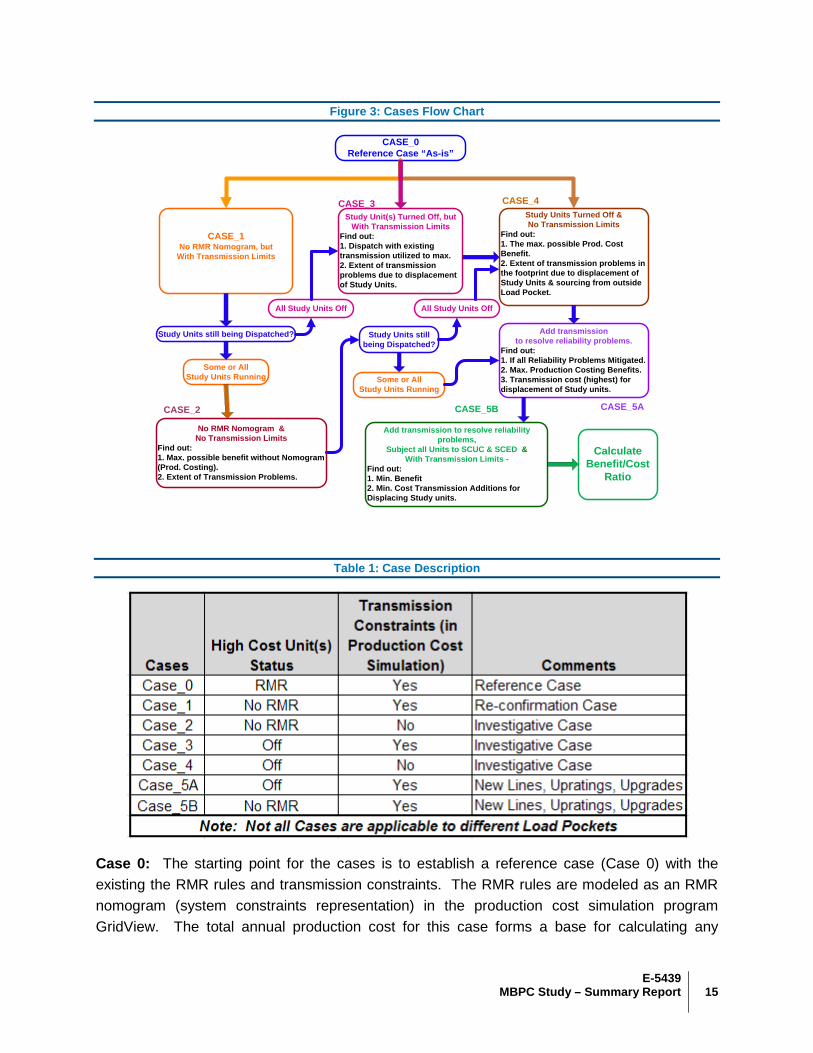
The process of minimizing bulk power system costs requires an understanding of the nature of transmission limitations that force the high cost units to run in the individual load pockets. The benefits from changing the designation or reducing the utilization of the study units can then be calculated by two production cost runs: i) with study units, and ii) without study units but with transmission upgrades. Transmission constraints in production cost simulations impact the commitment and dispatch3 of generating units. Mitigation of reliability concerns in power flow simulations through transmission additions also impacts unit commitment and dispatch. It may be possible to redispatch the system more economically by utilizing the added transmission in lieu of high cost units. It is necessary to decouple these two intertwined aspects for determining the transmission solutions that would either eliminate or reduce the utilization of high cost units within each load pocket. This decoupling was achieved by formulating a number of different intermediate cases. The cases formulated are shown in Figure 3 (relationship to each other) and Table 1 (case description).
3 Security Constrained Unit Commitment (SCUC) and Security Constrained Economic Dispatch (SCED).
E-5439
15 MBPC Study – Summary Report
Figure 3: Cases Flow Chart
CASE_0Reference Case “As-is”
CASE_1No RMR Nomogram, but
With Transmission Limits
Study Unit(s) Turned Off, butWith Transmission Limits
Find out:1. Dispatch with existing transmission utilized to max.2. Extent of transmission problems due to displacement of Study Units.
Add transmissionto resolve reliability problems.
Find out:1. If all Reliability Problems Mitigated.2. Max. Production Costing Benefits.3. Transmission cost (highest) for displacement of Study units.
All Study Units Off
Some or All Study Units Running
No RMR Nomogram &No Transmission Limits
Find out:1. Max. possible benefit without Nomogram (Prod. Costing).2. Extent of Transmission Problems.
Study Units Turned Off &No Transmission Limits
Find out:1. The max. possible Prod. Cost Benefit.2. Extent of transmission problems in the footprint due to displacement of Study Units & sourcing from outside Load Pocket.
Add transmission to resolve reliability problems,
Subject all Units to SCUC & SCED &With Transmission Limits -
Find out:1. Min. Benefit2. Min. Cost Transmission Additions for Displacing Study units.
CASE_3 CASE_4
CASE_5ACASE_5B
Study Units still being Dispatched?
NoCalculate
Benefit/Cost Ratio
CASE_2
Study Units still being Dispatched?
Some or All Study Units Running
All Study Units Off
Table 1: Case Description
Case 0: The starting point for the cases is to establish a reference case (Case 0) with the existing the RMR rules and transmission constraints. The RMR rules are modeled as an RMR nomogram (system constraints representation) in the production cost simulation program GridView. The total annual production cost for this case forms a base for calculating any
16 ABB Power Systems Consulting ERSC-SPP
savings for the other cases. Transmission overloads and voltage violations form a pre-existing basis so that only the cost of new changes is calculated.
Case 1: This case is same as the reference case, except that the existing RMR nomograms for the study units are not enforced during the production cost simulation. The main purpose of running Case 1 is to determine whether the study units are committed and dispatched without the RMR rules. If the units are not dispatched, then the need for the RMR rules can be further examined and the need to run additional cases can also be determined. The annual production cost for Case 1, as compared to the reference case, also provides any savings or additional cost due to not enforcing the RMR rules. Transmission analyses using the peak hour generation dispatch from the production cost run for this case will document any additional transmission overloads.
Case 2: As shown in Figure 3, the next case is in the production cost run for Case 1. In this case, some or all of the study units may have been dispatched at some time during the 8,760 hours. The reason for the dispatch of these higher cost units could be either due to i) the transmission constraints, or ii) economic dispatch itself. Note that the high cost units may be economical at certain hours; irrespective of the RMR rules or no other generation resource being available. Case 2 is formulated where both the RMR rules and transmission constraints are not enforced. This case is an intermediate case and meant for investigative purposes only. From the results of the production cost simulation, maximum possible annual benefits may be estimated by comparing Case 2 with the previous cases. A subsequent power flow simulation using the corresponding peak hour dispatch and contingency analysis may be used to determine the extent of transmission overloads and voltage violations for the most economical generation dispatch. This is an important part of the results from this case. It is necessary to know the extent of transmission problems before appropriate transmission upgrades or changes can be proposed for further evaluation.
Case 3: This case is formulated directly from the reference case. In Case 3, the study units are assumed to be unavailable for commitment or dispatch in the production cost simulation while all the transmission constraints are enforced. The study units are intentionally turned off4 to estimate possible benefits and impacts on transmission reliability. This case simulates the optimal utilization of the existing transmission to provide access to lower cost generation while enforcing reliability criteria. The production cost simulation may show i) load shedding within the load pocket due to non-availability of generation resource or ii) a new dispatch with a different annual production cost. If load shedding is indicated, the turning off of the study units
4 The intentional turning-off of study units should not be construed, in any shape or form, to be same as retirement of these units.
E-5439
17 MBPC Study – Summary Report
with existing transmission is not feasible. Consequently, it is not necessary to follow-up with power flow simulations for this condition. The same is true if a higher production cost is shown for this case. If the production cost is shown to be lower than the reference case, follow-up power flow and contingency analysis are performed to determine the extent of new transmission problems due to the new generation dispatch for the peak hour obtained from the production cost simulation for this case.
Case 4: This case is also an intermediate investigative case. This case could be run directly after running the reference case, if it is certain the possible outcomes from the other earlier cases (1, 2, and 3) are inconsequential.
Even though the study units were assumed to be turned off in the previous case, Case 3, the transmission constraints were left in place. If additional transmission can be provided, the savings from generation may be higher. To explore this possibility further, transmission limits are ignored in the production cost simulation along with the study units being turned off. From a production cost perspective, this will provide an estimate of maximum possible benefit from not running the high cost study unit. However, from a power flow perspective, it can be expected that not running the study units will result in steady-state violations; thermal and/or voltage. The ensuing power flow and contingency analysis, using the peak hour generation dispatch from the production cost simulation, will establish the extent of transmission overloads and voltage problems.
Case 5A: In Figure 3, two paths to this case are shown. The first path is through Cases 1 and 2, where the RMR nomograms for the study units were not enforced but some or all of the study units were dispatched during the 8,760 hours in the production cost simulation. Transmission problems in Case 2, preliminarily based on the latest dispatch from for the peak hour, are also identified that require mitigation.
Another path to this case is through Case 4 where transmission problems, based on the latest dispatch from the production cost simulation for the peak hour, are identified that require mitigation. In this case, specific transmission additions are made to resolve the previously identified transmission problems. This case essentially determines an estimate of the maximum production cost savings potential that also has the maximum cost for all the transmission additions. The benefit/cost ratio could be greater than or less than 1.0. Because the generation dispatch for each load pocket is very much dependent upon the transmission capability, further refinement for finding a most suitable and acceptable combination of generation dispatch and transmission additions may be necessary.
Case 5B: As mentioned in the previous paragraph, this is a case for further refinement between the production cost simulation and transmission system reliability analyses for the both the purposes of consistency between generation dispatch and transmission constraints in the
18 ABB Power Systems Consulting ERSC-SPP
production cost runs as well as maximizing the benefit/cost ratio. In this case, the study units are available for commitment and dispatch by the production cost program. In theory, this is a concluding case because the “benefit” from dispatching the higher cost units on an economic basis is compared with the “cost” of new transmission for maintaining the minimum reliability requirements. In practice however, that might not be the case, because:
1. Even though the calculated benefit/cost ratio from the Case 5A scenario is less than 1, increasing the dispatch of the higher cost units, including just one or a few more units, may reduce the need for one of the large cost transmission additions, thereby making a case for economic attractiveness of the transmission solution.
2. Another outcome is that the benefit/cost ratio from the Case 5A scenario is greater than 1. It may be possible to further improve it by dispatching one additional higher cost unit or a few more units which may reduce one of the large cost transmission additions, thereby increasing the benefit and reducing the transmission cost.
In order to arrive at meaningful results, additional sensitivity cases may need to be performed. Such additional evaluations were carried out for the study regions as needed.
Maximizing Benefit/Cost Ratio
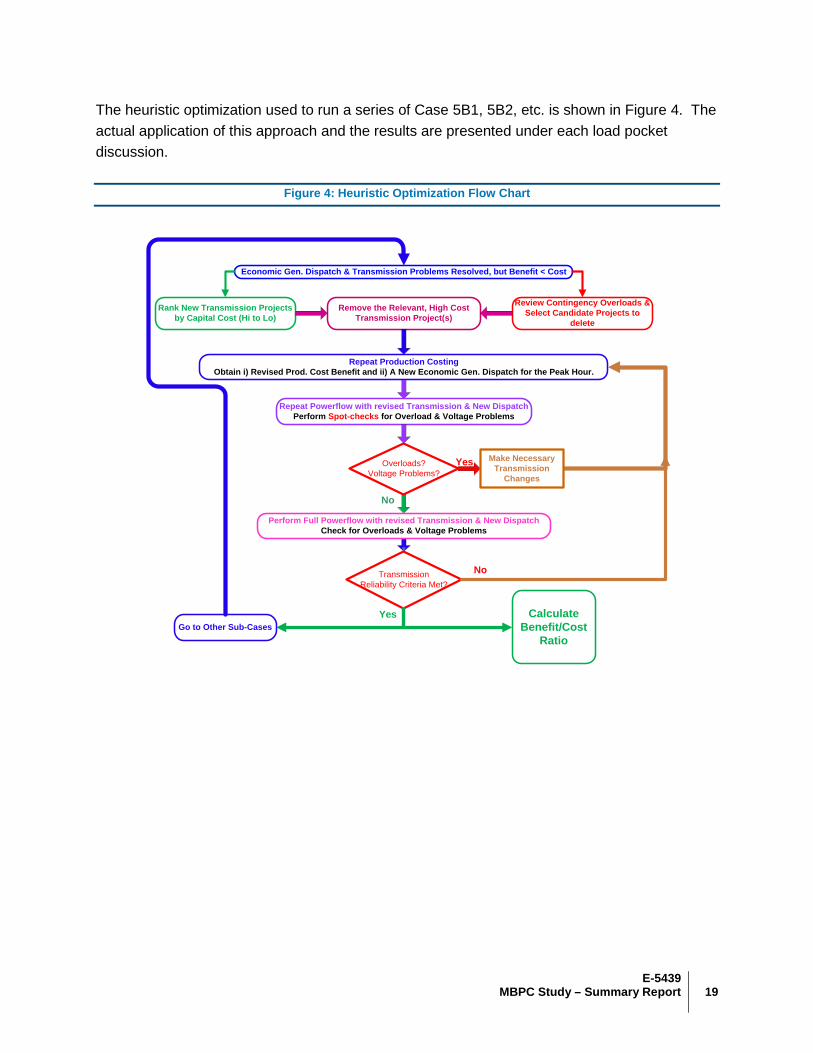
Maximizing the benefit/cost ratio means increasing the production cost savings as much as possible by replacing the study units needed to preserve reliability with cost effective transmission solutions without compromising system reliability. Performing simulations for all combinations of multiple high cost units and determining transmission solutions to each of these combinations is a monumental task. It is possible to take a heuristic optimization approach to examine the possibility for improving the benefit/cost ratio in Case 5B.
The way to improve the benefit/cost ratio is by increasing the benefit and decreasing the cost. The cases corresponding to maximum generation savings with no transmission constraints have been completed and those cases (Cases 2 and 4) were the starting point for Case 5A. See Figure 3. Starting from Case 5A or Case 5B, the benefit will only increase. Further improvement in the benefit/cost ratio involves a larger reduction in the new transmission additions as compared to a decrease in generation savings or an increase in generation cost.
Because the transmission addition capability is in large blocks, ranking the transmission projects by cost and eliminating the high cost transmission additions, one-by-one, is a sensible approach. The high cost additions may be the proper solution to eliminate the severe contingency-based overloads that would be seen otherwise. It is important to keep in mind the transmission contingency results from the earlier Cases 5A, 5B, etc. Any revised transmission determines the economic dispatch of the units as well. Thus, the rerun of production cost simulations become necessary.
E-5439
19 MBPC Study – Summary Report
The heuristic optimization used to run a series of Case 5B1, 5B2, etc. is shown in Figure 4. The actual application of this approach and the results are presented under each load pocket discussion.
Figure 4: Heuristic Optimization Flow Chart
Economic Gen. Dispatch & Transmission Problems Resolved, but Benefit < Cost
Rank New Transmission Projectsby Capital Cost (Hi to Lo)
Remove the Relevant, High Cost Transmission Project(s)
Repeat Production CostingObtain i) Revised Prod. Cost Benefit and ii) A New Economic Gen. Dispatch for the Peak Hour.
Go to Other Sub-CasesCalculate
Benefit/Cost Ratio
No
Review Contingency Overloads & Select Candidate Projects to
delete
Repeat Powerflow with revised Transmission & New DispatchPerform Spot-checks for Overload & Voltage Problems
Overloads? Voltage Problems?
Make Necessary Transmission
Changes
Perform Full Powerflow with revised Transmission & New DispatchCheck for Overloads & Voltage Problems
Yes
TransmissionReliability Criteria Met?
Yes
No
20 ABB Power Systems Consulting ERSC-SPP
5 Study Assumptions
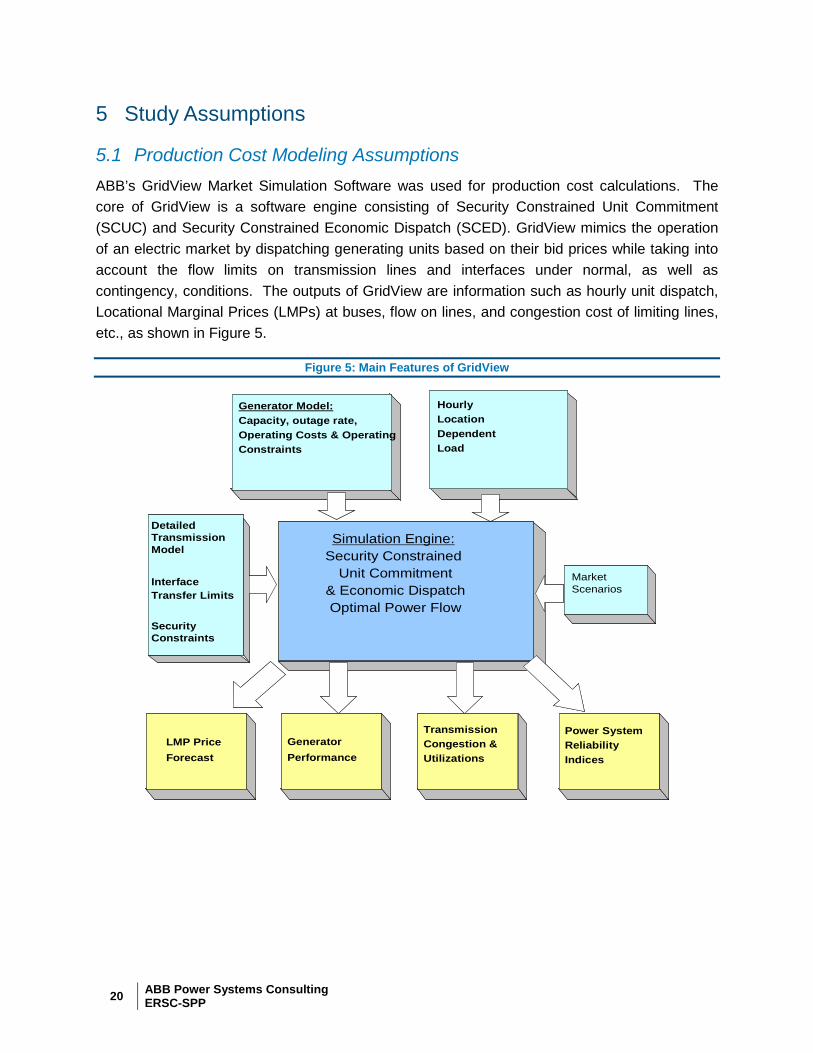
5.1 Production Cost Modeling Assumptions ABB’s GridView Market Simulation Software was used for production cost calculations. The core of GridView is a software engine consisting of Security Constrained Unit Commitment (SCUC) and Security Constrained Economic Dispatch (SCED). GridView mimics the operation of an electric market by dispatching generating units based on their bid prices while taking into account the flow limits on transmission lines and interfaces under normal, as well as contingency, conditions. The outputs of GridView are information such as hourly unit dispatch, Locational Marginal Prices (LMPs) at buses, flow on lines, and congestion cost of limiting lines, etc., as shown in Figure 5.
Figure 5: Main Features of GridView
Generator Model:Capacity, outage rate,Operating Costs & Operating Constraints
Simulation Engine:Security Constrained
Unit Commitment& Economic Dispatch Optimal Power Flow
Market Scenarios
LMP Price Forecast
Hourly Location Dependent Load
DetailedTransmissionModel
Interface Transfer Limits
Security Constraints
GeneratorPerformance
TransmissionCongestion &Utilizations
Power SystemReliabilityIndices
E-5439
21 MBPC Study – Summary Report
The primary output of interest from the GridView simulations is the total annual energy cost5. The emphasis is on the differential between the total annual energy cost between the reference case and other cases.
Data Sources: This production costing database represented the SPP power system with detailed models of generators, loads, and the transmission network within the entire SPP footprint, Entergy, and nearby areas including TVA, SOCO, and AECI. The GridView database was created from publicly available sources like EPA, EIA, GADS (Generator Availability Data System), FERC Form, and SPP. The database was reviewed by SPP and Entergy. All costs used in this study are expressed in real 2009 US dollars, unless otherwise noted.
Load Level: For SPP areas, the load forecast for 2013 was extracted from the 2010 SPP EIA-411 report. For 2022, the load forecast was extrapolated from the 2010-2019 load data. Entergy provided load forecasts and load curves for its seven sub-regions6. The non-SPP areas of AECI, SOCO and TVA load forecasts, peak and annual energy for years 2013 and 2022 were also collected from FERC Form 714.
The loads were represented with chronological 8760 hours curves for each area. For SPP areas, load curves were provided by SPP. For non-SPP areas, load shapes were from 2006 historical load curves, published in FERC Form 714.
Generation: Thermal unit is represented in GridView in details, including: unit type, fuel type, heat rate blocks, summer and winter capacities, variable O and M, start-up fuel usage, minimum up and down, forced outage, maintenance schedule, emission rate, ramping rate, quick-start, and spinning reserve capabilities.
Generation data was collected from various sources including EPA and EIA public sources. IPP units within the Entergy footprint were also included. The heat rates of IPP units were adjusted to be the same as Perryville CCGTs with a 10% adder. Variable O and M of those units were also matched to Perryville CCGTs.
The scheduled maintenance and forced outage rate with durations were estimated based on unit size and type as reported by the GADS database. Where unit-specific data is not available, like-new planned units, typical values based on unit type, fuel, and size were used. Maintenance schedules of many Entergy units were provided by Entergy.
5 Total annual production cost within the Entergy footprint plus cost of any exports/imports. 6 Entergy APL, Entergy Gulf States, Entergy LPL North, Entergy LPL South, Entergy MPL, Entergy NOPSI and Entergy Texas.
22 ABB Power Systems Consulting ERSC-SPP
In addition to known retirement units, several units were made unavailable based on information provided by SPP and Entergy. Plum Point 2 and Bell Font 2 (TVA) commissioning dates were moved beyond study year 2022. Duke Hot Springs 2 and Washington Parish CC were not included as well. The Acadia 2 plant was moved to a new Entergy network bus.
Hydro/Wind Representation: Hydro generators were dispatched for peak shaving with the constraint that the total cumulative monthly generation did not exceed the monthly energy allocation as provided by Entergy.
A total of 4 GW of wind capacity was added to the SPP region for 2013 and 7 GW for 2022. The wind units were modeled as hourly resources with given hourly generation curves. The hourly wind production curves for the units in the SPP region were provided by SPP. The hourly resource is represented at zero cost and becomes must-take energy with a provision for curtailment as necessary.
Qualified Facilities (QF): QF puts were modeled as non-firm energy purchases; Network Resources were committed based on “no QF put” but dispatched with historical put value. Entergy provided hourly production curve for all QF put units. Along with producing energy for sale, QF units also produce energy for their own self-serve loads. This part of the QF unit’s production was modeled as an hourly resource with a fixed/flat production curve. Some of the QF put units may have curtailment/energy spillage in the reference case. If included in the study cases and the amount of energy spillage is noticeably different, the hourly production curve of the particular QF unit was adjusted to match the output in the reference case as closely as possible.
Operating Reserve Requirements: For the Entergy footprint and Tier 1 regions, a reserve margin of 5% was enforced. Furthermore, specific reserve requirements of fixed 550 MW for Entergy Gulf States and load plus the largest committed unit capacity minus import of 3,200 MW for both areas of Entergy LPL South and Entergy NOPSI were included in the model. The reserve requirement for these last two areas was modeled with a nomogram7.
Unit emission rate for NOX, SO2, and CO2, collected from EPA sources as well as emission allowance price forecast8 were added to the GridView database.
Wheeling Charge: A commitment hurdle rate of $10/MWh for the interfaces across different entities within the Entergy footprint was applied. Exports and/or imports to/from areas outside the Entergy footprint were penalized by a commitment hurdle rate of $1000/MWh. In addition, a
7 Plants included in the reserve commitment nomogram: Little Gypsy, Michoud, Ninemile Point, Waterford and OXY CCGT 500MW.
8 Price in $/Short Ton for 2013 and 2022, respectively: NOx $1,347 and $1,770; SO2 $323 and $351; Zero for CO2.
E-5439
23 MBPC Study – Summary Report
dispatch wheeling charge ranging from $3/MWh to $6/MWh was applied to the interfaces across different entities within the Entergy footprint and $8/MWh for interfaces with outside areas.
Fuel Price: The forecasted fuel prices in $/MMBtu (2009 real dollars) for study years 2013 and 2022 were provided by SPP. The projected gas prices were segregated by the month of the year, as well as by different states. The forecasted price range for natural gas for 2013 was from a low of $5.22/MMBtu to a high of $6.81/MMBtu and, correspondingly, from a low of $6.37/MMBtu to a high of $8.14/MMBtu for 2022. The forecasted price range for oil (FO2) for 2013 was from a low of $16.99/MMBtu to a high of $19.23/MMBtu and, correspondingly, from a low of $22.27/MMBtu to a high of $25.18/MMBtu for 2022. The forecasted price range for oil (FO6) for 2013 was from a low of $7.70/MMBtu to a high of $10.47/MMBtu and, correspondingly, from a low of $10.17/MMBtu to a high of $13.82/MMBtu for 2022. The coal forecasted price was provided by SPP for the individual plants. The coal price range was a low of $1.26/MMBtu (Nebraska) to a high of $2.79/MMBtu (Louisiana).
Even though the fuel price is a main determinant of the total annual production cost, the fuel price differential between the units within a load pocket and outside the load pocket is of interest. The difference in the total annual production cost between the reference case and the other cases is used for the economic comparison of transmission alternatives. The latest available fuel price forecast was considered to be sufficient for the purpose of this study. Two production cost sensitivity cases, a lower fuel price (-30%) and a higher fuel price (+20%), were simulated for all the load pockets for both study years.
Transmission Representation: The transmission system was modeled exactly as in the PSS/E power flow case with explicit representation of all transmission facilities including lines, transformers, phase shifters, and DC ties. For the purposes of production costing simulation, flowgates/interfaces with their limits and selected N-1 contingencies were modeled9. The thermal limits of all transmission lines of 115 kV and above within the Entergy footprint and 345 kV and above for the rest of system and lines, related to the RMR guideline, are included. A Transmission Reliability Margin (TRM) of 3% was used in the GridView model.
5.2 Transmission Modeling Assumptions SPP provided the power flow cases for study years 2013 and 2022. These cases represent Entergy and SPP transmission system as well as the rest of the Eastern Interconnection. The total demand within the Entergy footprint10 in the 2013 summer peak case is 33,874 MW. The
9 Flowgates/interfaces and contingencies definitions were provided by SPP and Entergy. 10 Areas in the power flow model are, PLUM, OMLP, BCA, LAGN, WESTMEMP, CONWAY, BUBA, PUPP, DERS, DENL, EES, CELE, LAFA and LEPA
24 ABB Power Systems Consulting ERSC-SPP
corresponding demand for 2022 summer peak conditions is 37,972 MW. The power flow simulations were performed using PSS/E software.
Contingencies: Transmission line outages and transformer outages within the Entergy footprint are based on “automatic” N-1 contingency specification and included branches connected between buses with a base voltage of 100 kV and above. For evaluations within the individual load pockets, Entergy includes simultaneous outage of a transmission element and a generating unit (N-1_G-1) as a part of its transmission reliability evaluation. Entergy provided the respective N-1_G-1 contingency descriptions. In addition, selected N-2 contingencies were also performed.
Transmission Reliability Criteria: Transmission facilities rated 69 kV and above within Entergy and other embedded areas and tie-lines out of Entergy and facilities rated 345 kV and above in the Tier 1 areas11 were monitored.
For thermal overloads, electrical flows above the applicable branch rating of normal continuous rating (Rate A) under system intact conditions and long-term emergency rating (Rate B) for contingency conditions are flagged.
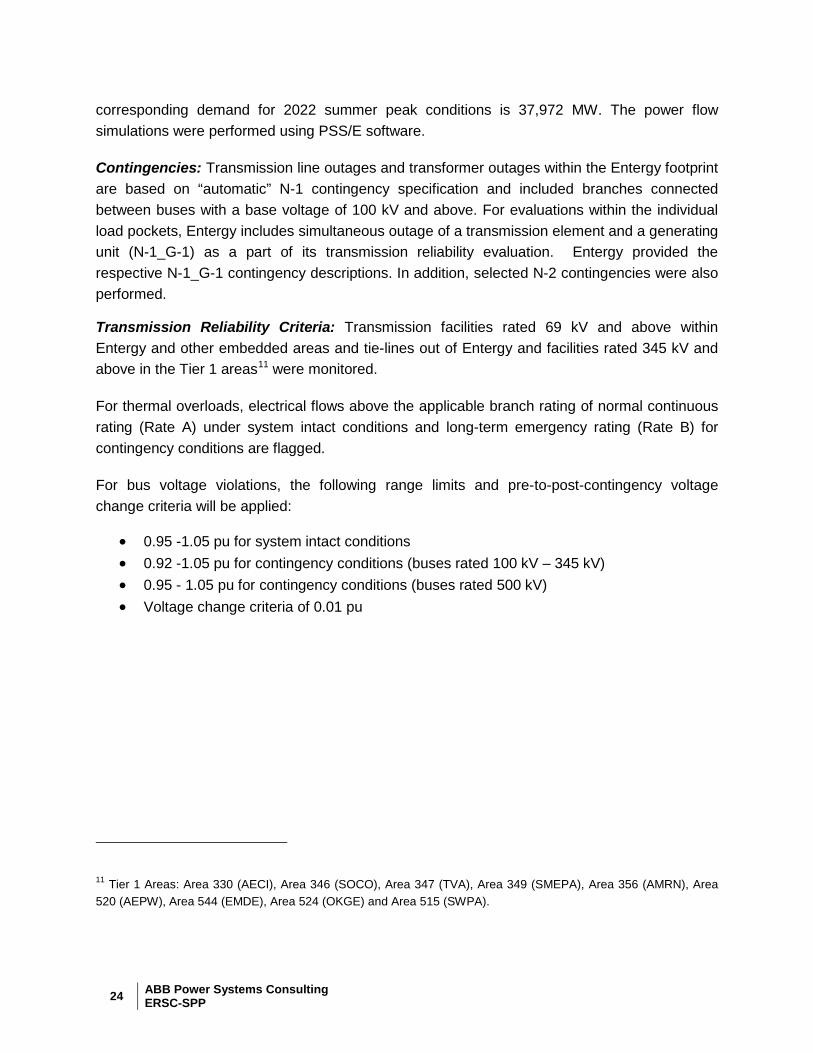
For bus voltage violations, the following range limits and pre-to-post-contingency voltage change criteria will be applied:
• 0.95 -1.05 pu for system intact conditions • 0.92 -1.05 pu for contingency conditions (buses rated 100 kV – 345 kV) • 0.95 - 1.05 pu for contingency conditions (buses rated 500 kV) • Voltage change criteria of 0.01 pu
11 Tier 1 Areas: Area 330 (AECI), Area 346 (SOCO), Area 347 (TVA), Area 349 (SMEPA), Area 356 (AMRN), Area 520 (AEPW), Area 544 (EMDE), Area 524 (OKGE) and Area 515 (SWPA).
E-5439
25 MBPC Study – Summary Report
6 Development of Reference Cases
Two different reference cases for the two study years were developed with 2013 representing near-term and 2022 for a ten year horizon. The reference cases were created for both a production cost model in GridView and a power flow model in PSS/E. The development of these cases followed a rigorous procedure of compiling data/information from SPP, Entergy, and its member companies as well as the IPPs. The models and the sample results were reviewed by representatives of Entergy, SPP, and the ESRC WG.
The GridView database was validated against the historical years’ generation statistics, namely, the average generation for different generation types (Nuclear, Coal, and Gas), the annual total energy generation from most of the large generation units, and the annual service hours for these units. Necessary changes for individual items within the GridView database were made to make the production cost model mimic the actual operation to the extent possible.
A reference power flow case is necessary to establish a base line reliability performance of the as-is transmission system. Two power flow cases were developed with one representing 2013 and one representing 2022. SPP provided the starting power flow cases.
The production cost simulation is based on 8,760 hours; hour by hour for the entire year. The transmission system reliability performance is evaluated for a pre-selected single hour; usually for the peak load hour when the lines and transformers are loaded to the highest. The understanding here is that from a thermal loading and voltage perspective, the majority of the problems occur during peak load conditions.
In this study, proper synchronization of peak hour dispatch in the production cost simulation and the power flow case is necessary. Because of multiple generation entities and interconnections both internal and external to Entergy footprint, synchronization is more involved than just importing a new dispatch; it involves the matching of various flows as well. This synchronization is achieved through repeated use of the following steps until a reasonable correspondence of generation dispatch and flows between production cost and power flow cases are obtained.
1. Run production cost simulations for 8,760 hours and identify the Entergy system peak load hour. Simulations show that the Entergy system peaks on August 26, 2013 at 1500 hours.
2. Compare the Entergy footprint area loads as obtained from the power flow case against corresponding loads at the Entergy system peak load hour.
3. If discrepancies are found in the Entergy footprint loads between GridView and PSS/E, adjust the one hour loads in GridView to match the PSS/E loads and rerun the production cost simulations to obtain the generation dispatch for that hour.
26 ABB Power Systems Consulting ERSC-SPP
4. Import the Entergy footprint generation dispatch at the peak load hour from GridView into PSS/E. The GridView dispatch for the Tier 1 areas12 is not imported in to PSS/E. The interchanges in the PSS/E model between the Entergy footprint and Tier 1 are matched with GridView as closely as possible by adjusting the Tier 1 generation.
5. Confirm whether the power flow model is synchronized with the GridView database by comparing the following between the GridView and PSS/E models:
a. Interface flows between the Entergy footprint and Tier 1 areas.
b. Flows on selected branches in the Entergy footprint.
If necessary, adjust the power flow model to match the PSS/E flows as closely as possible with the GridView flows. The resulting power flow model is then the corresponding power flow case.
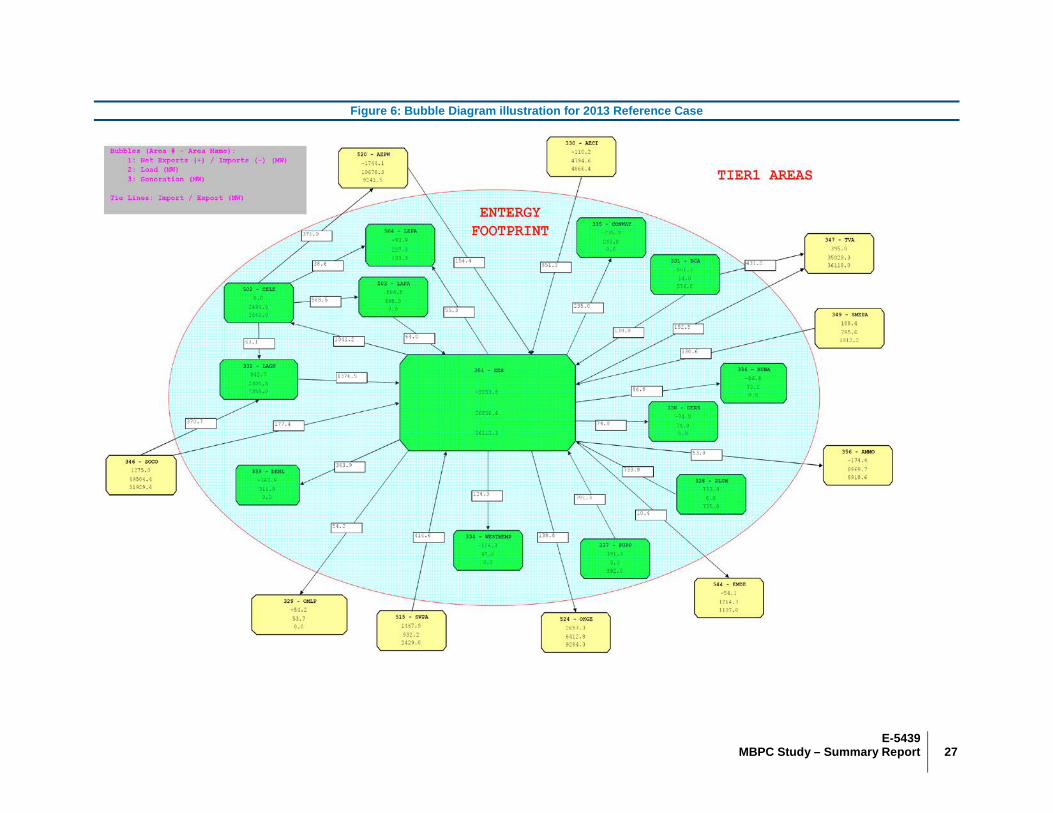
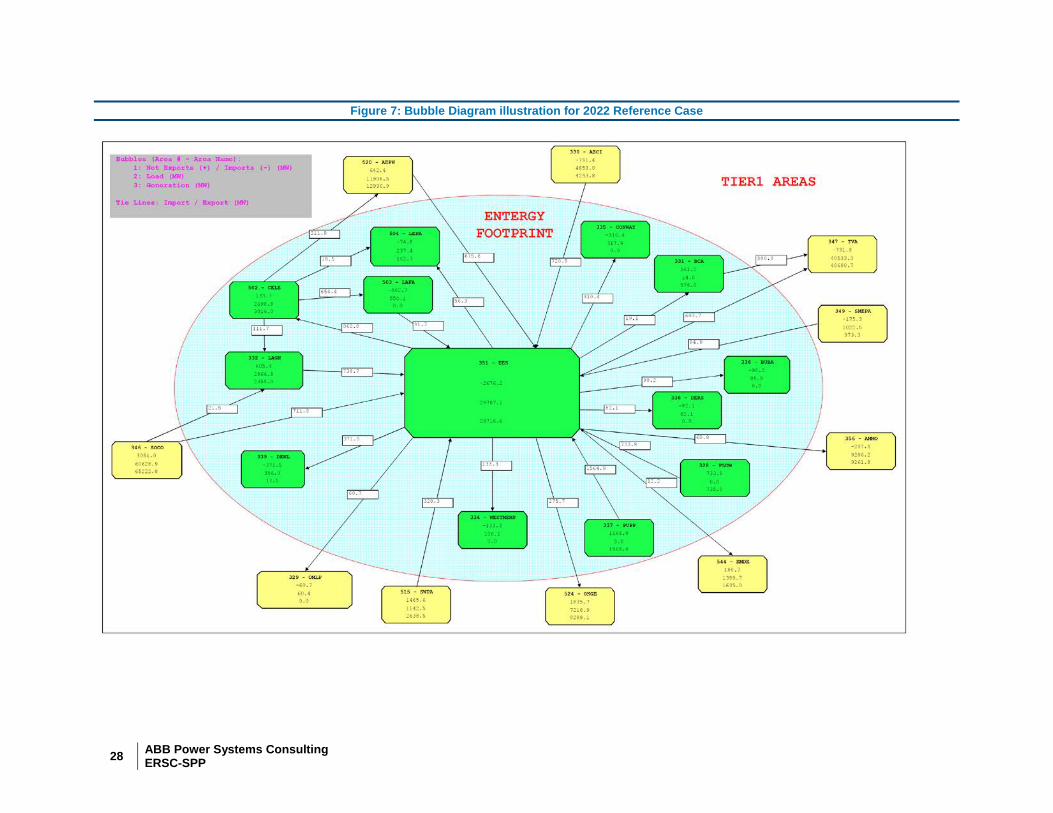
The above described synchronization step was performed for all the cases in this study. The two reference case results for years 2013 and 2022 are shown in Figures 6 and 7.
12 AECI, AEPW, AMMO, EMDE, OKGE, OMLP, SMEPA, SWPA, SOCO and TVA.
E-5439
27 MBPC Study – Summary Report
Figure 6: Bubble Diagram illustration for 2013 Reference Case
28 ABB Power Systems Consulting ERSC-SPP
Figure 7: Bubble Diagram illustration for 2022 Reference Case
E-5439
29 MBPC Study – Summary Report
7 WOTAB Load Pocket
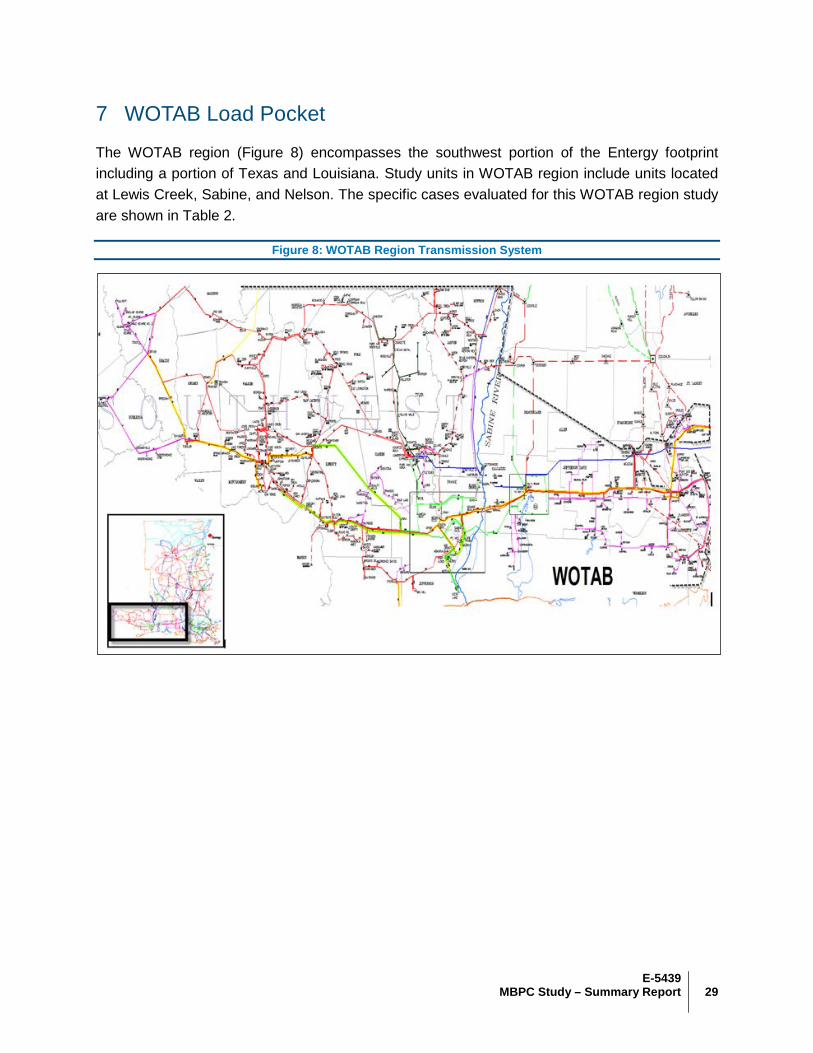
The WOTAB region (Figure 8) encompasses the southwest portion of the Entergy footprint including a portion of Texas and Louisiana. Study units in WOTAB region include units located at Lewis Creek, Sabine, and Nelson. The specific cases evaluated for this WOTAB region study are shown in Table 2.
Figure 8: WOTAB Region Transmission System
30 ABB Power Systems Consulting ERSC-SPP
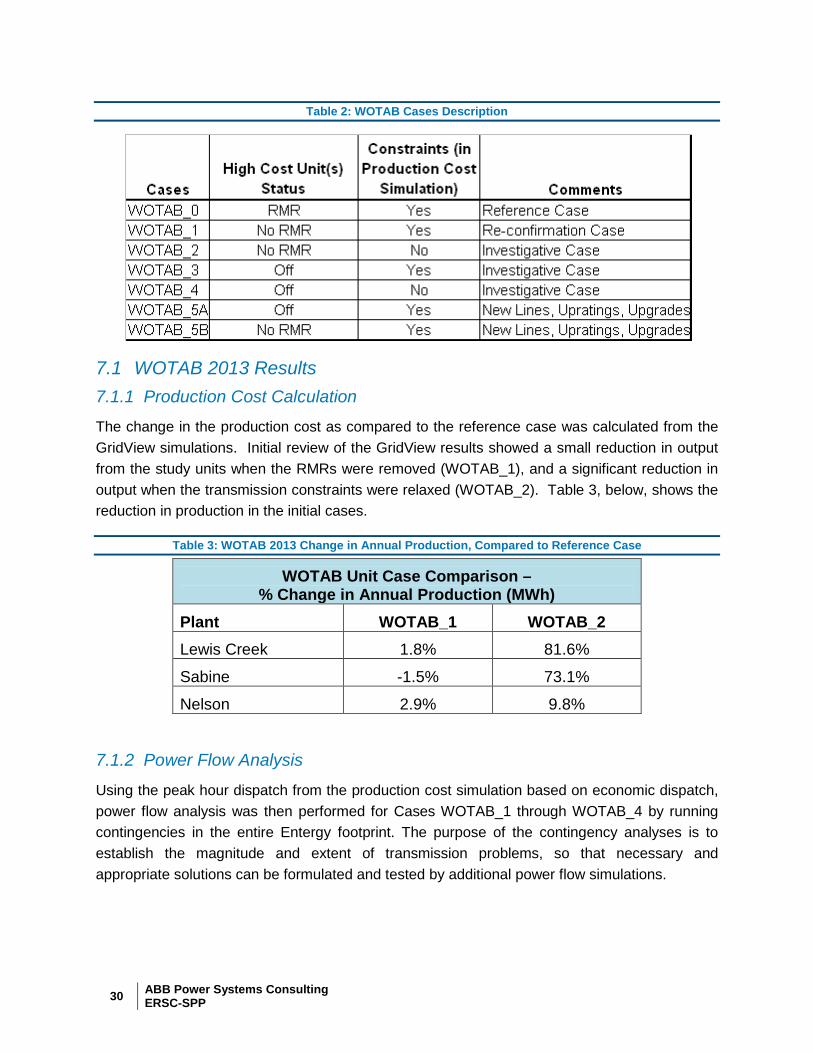
Table 2: WOTAB Cases Description
7.1 WOTAB 2013 Results 7.1.1 Production Cost Calculation
The change in the production cost as compared to the reference case was calculated from the GridView simulations. Initial review of the GridView results showed a small reduction in output from the study units when the RMRs were removed (WOTAB_1), and a significant reduction in output when the transmission constraints were relaxed (WOTAB_2). Table 3, below, shows the reduction in production in the initial cases.
Table 3: WOTAB 2013 Change in Annual Production, Compared to Reference Case
WOTAB Unit Case Comparison – % Change in Annual Production (MWh)
Plant WOTAB_1 WOTAB_2 Lewis Creek 1.8% 81.6%
Sabine -1.5% 73.1%
Nelson 2.9% 9.8%
7.1.2 Power Flow Analysis
Using the peak hour dispatch from the production cost simulation based on economic dispatch, power flow analysis was then performed for Cases WOTAB_1 through WOTAB_4 by running contingencies in the entire Entergy footprint. The purpose of the contingency analyses is to establish the magnitude and extent of transmission problems, so that necessary and appropriate solutions can be formulated and tested by additional power flow simulations.
E-5439
31 MBPC Study – Summary Report
Results of the power flow analysis showed several post-contingent thermal overloads in the Western13 Region and WOTAB. Moreover, several contingencies led to non-convergence of power flow, most likely due to voltage problems. The extent of the thermal and voltage problems varies from case to case.
At first, thermal overloads were addressed and then voltage problems were identified and mitigated. However, during the actual study process, iteration between these two steps becomes necessary. Identified contingencies that did not provide a solution in the AC analysis and showed large overloads may be considered major contingencies.
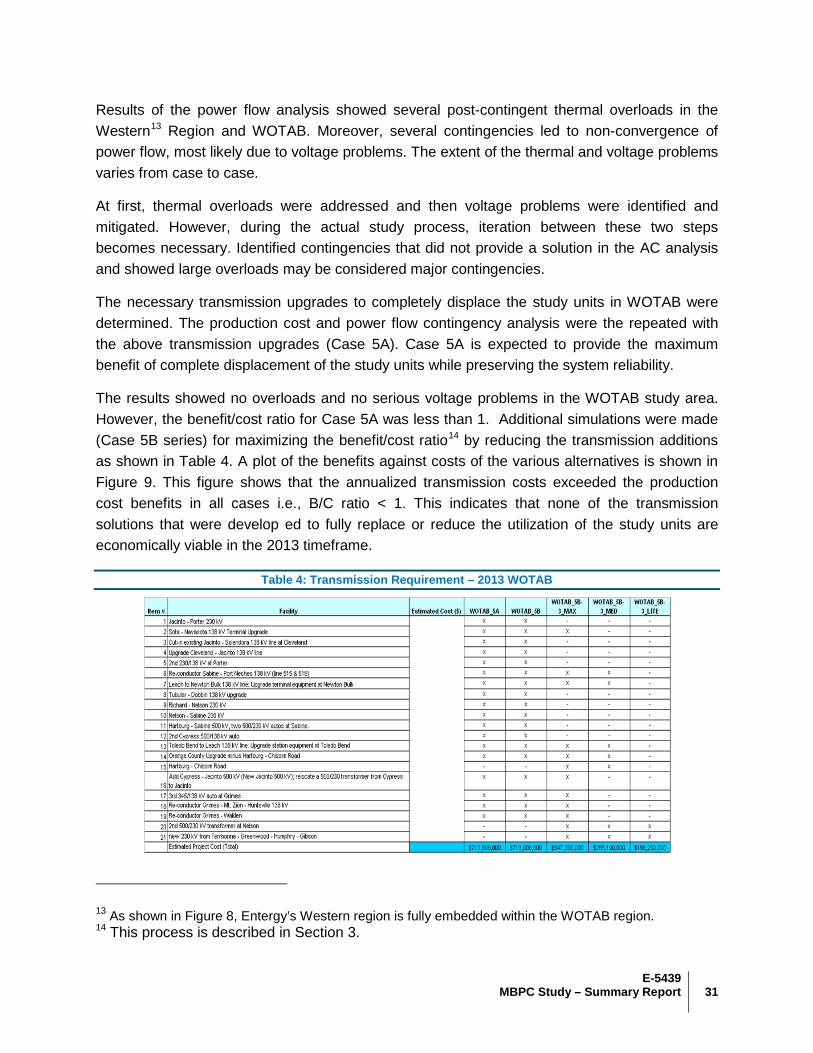
The necessary transmission upgrades to completely displace the study units in WOTAB were determined. The production cost and power flow contingency analysis were the repeated with the above transmission upgrades (Case 5A). Case 5A is expected to provide the maximum benefit of complete displacement of the study units while preserving the system reliability.
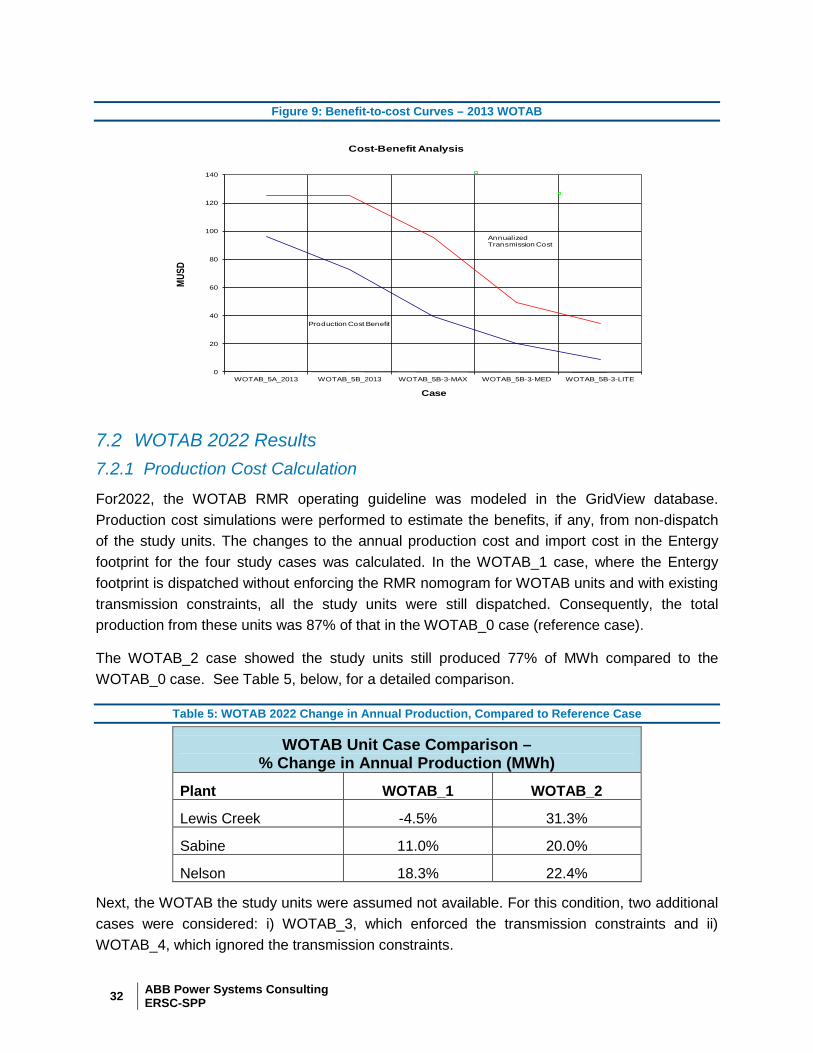
The results showed no overloads and no serious voltage problems in the WOTAB study area. However, the benefit/cost ratio for Case 5A was less than 1. Additional simulations were made (Case 5B series) for maximizing the benefit/cost ratio14 by reducing the transmission additions as shown in Table 4. A plot of the benefits against costs of the various alternatives is shown in Figure 9. This figure shows that the annualized transmission costs exceeded the production cost benefits in all cases i.e., B/C ratio < 1. This indicates that none of the transmission solutions that were develop ed to fully replace or reduce the utilization of the study units are economically viable in the 2013 timeframe.
Table 4: Transmission Requirement – 2013 WOTAB
13 As shown in Figure 8, Entergy’s Western region is fully embedded within the WOTAB region. 14 This process is described in Section 3.
32 ABB Power Systems Consulting ERSC-SPP
Figure 9: Benefit-to-cost Curves – 2013 WOTAB
7.2 WOTAB 2022 Results 7.2.1 Production Cost Calculation
For2022, the WOTAB RMR operating guideline was modeled in the GridView database. Production cost simulations were performed to estimate the benefits, if any, from non-dispatch of the study units. The changes to the annual production cost and import cost in the Entergy footprint for the four study cases was calculated. In the WOTAB_1 case, where the Entergy footprint is dispatched without enforcing the RMR nomogram for WOTAB units and with existing transmission constraints, all the study units were still dispatched. Consequently, the total production from these units was 87% of that in the WOTAB_0 case (reference case).
The WOTAB_2 case showed the study units still produced 77% of MWh compared to the WOTAB_0 case. See Table 5, below, for a detailed comparison.
Table 5: WOTAB 2022 Change in Annual Production, Compared to Reference Case
WOTAB Unit Case Comparison – % Change in Annual Production (MWh)
Plant WOTAB_1 WOTAB_2 Lewis Creek -4.5% 31.3%
Sabine 11.0% 20.0%
Nelson 18.3% 22.4%
Next, the WOTAB the study units were assumed not available. For this condition, two additional cases were considered: i) WOTAB_3, which enforced the transmission constraints and ii) WOTAB_4, which ignored the transmission constraints.
0
20
40
60
80
100
120
140
WOTAB_5A_2013 WOTAB_5B_2013 WOTAB_5B-3-MAX WOTAB_5B-3-MED WOTAB_5B-3-LITE
MUSD
Case
Cost-Benefit Analysis
Production Cost Benefit
Annualized Transmission Cost
E-5439
33 MBPC Study – Summary Report
7.2.2 Power Flow Analysis
Power flow analysis was performed on Cases WOTAB_1 through WOTAB_4 by running contingencies in the entire Entergy footprint. The contingency analysis revealed non-convergence of power flow due to potential voltage collapse conditions for contingencies without or with an associated generator outage.
Several contingencies led to non-convergence of power flow which were most likely due to voltage problems. The production cost and power flow contingency analysis were repeated with transmission upgrades (Case 5A). This case is expected to provide the maximum benefit of complete displacement of the study units while preserving the system reliability. The results showed no overloads in the WOTAB study area and no serious voltage problems. The benefit/cost ratio for this Case 5A was less than 11.
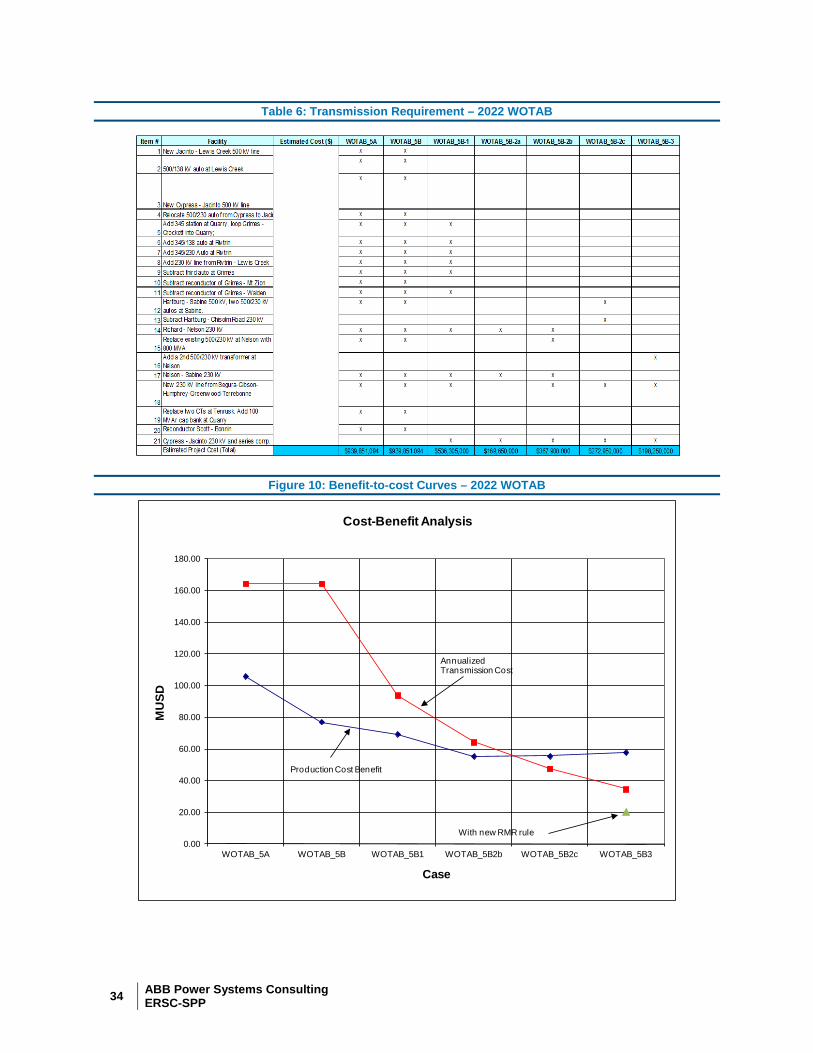
Additional simulations were made (Case 5B series) for maximizing the benefit/cost ratio15 by reducing the transmission additions as shown in Table 6.
A simultaneous production cost analysis and power flow verification was performed on the above cases. The power flow evaluation performed for the peak load hour did not show any incremental deterioration in reliability. The cost-benefit analysis is shown graphically in Figure 10. As can be seen from this figure, there was at least one transmission alternative where the benefit/cost ratio was greater than 11.
15 This process is described in Section 3.
34 ABB Power Systems Consulting ERSC-SPP
Table 6: Transmission Requirement – 2022 WOTAB
Figure 10: Benefit-to-cost Curves – 2022 WOTAB
0.00
20.00
40.00
60.00
80.00
100.00
120.00
140.00
160.00
180.00
WOTAB_5A WOTAB_5B WOTAB_5B1 WOTAB_5B2b WOTAB_5B2c WOTAB_5B3
MU
SD
Case
Cost-Benefit Analysis
Production Cost Benefit
Annualized Transmission Cost
With new RMR rule
E-5439
35 MBPC Study – Summary Report
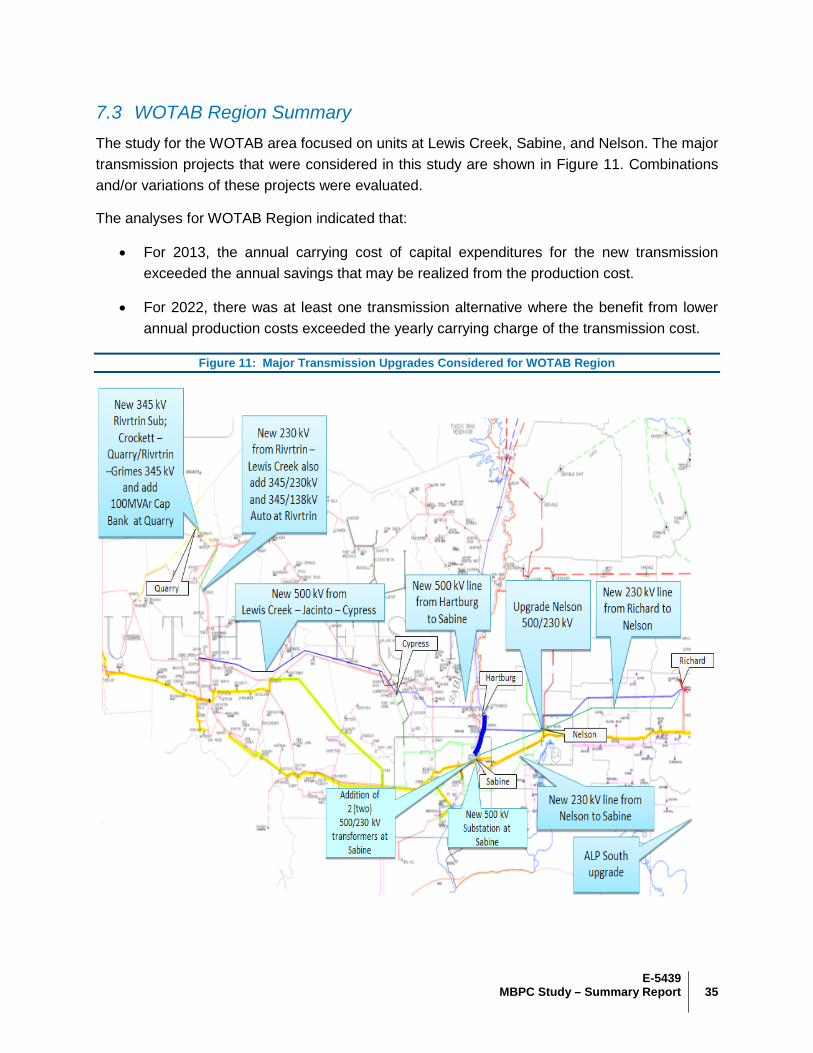
7.3 WOTAB Region Summary The study for the WOTAB area focused on units at Lewis Creek, Sabine, and Nelson. The major transmission projects that were considered in this study are shown in Figure 11. Combinations and/or variations of these projects were evaluated.
The analyses for WOTAB Region indicated that:
• For 2013, the annual carrying cost of capital expenditures for the new transmission exceeded the annual savings that may be realized from the production cost.
• For 2022, there was at least one transmission alternative where the benefit from lower annual production costs exceeded the yearly carrying charge of the transmission cost.
Figure 11: Major Transmission Upgrades Considered for WOTAB Region
36 ABB Power Systems Consulting ERSC-SPP
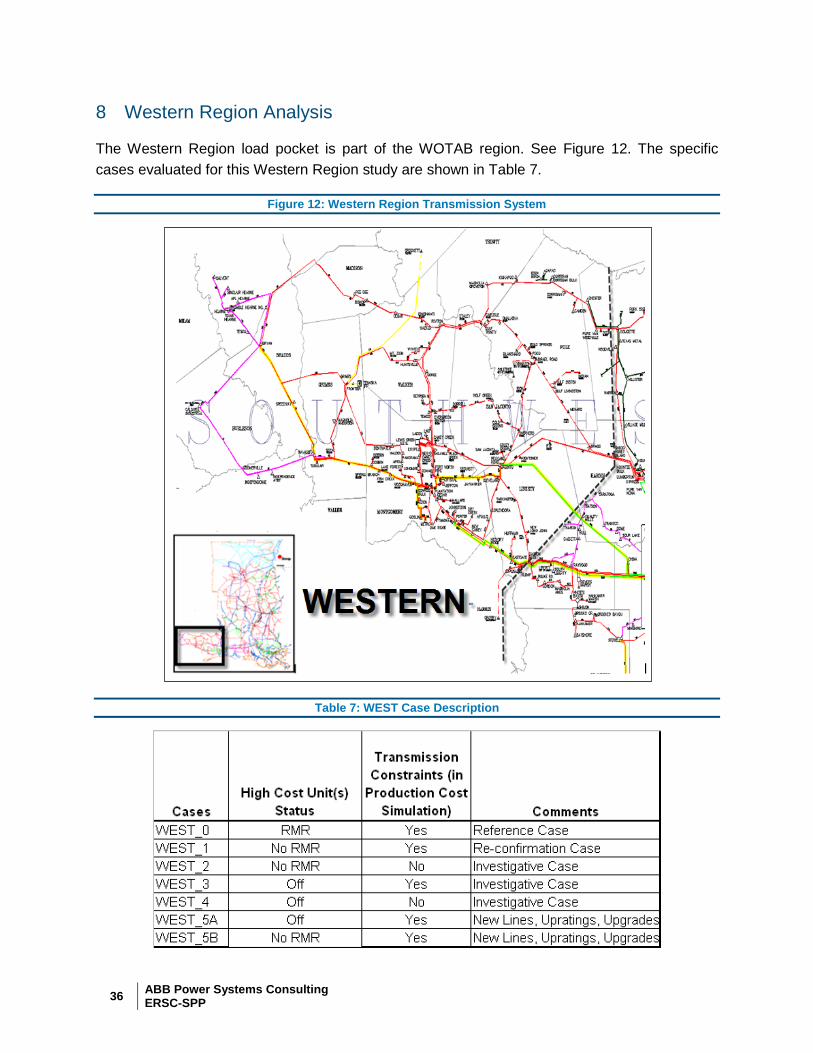
8 Western Region Analysis
The Western Region load pocket is part of the WOTAB region. See Figure 12. The specific cases evaluated for this Western Region study are shown in Table 7.
Figure 12: Western Region Transmission System
Table 7: WEST Case Description
E-5439
37 MBPC Study – Summary Report
8.1 Year 2013 Condition 8.1.1 Production Costing Calculation
For Entergy’s Western Region, the RMR operating guideline was modeled in the GridView database with a nomogram. Production cost simulations were performed to compute the benefits, if any, from the removal of the RMR designation with or without transmission limits/constraints in the Western Region. As an investigative case with the non-dispatch of the study units were also evaluated. The changes to the annual production cost and import cost in the Entergy footprint for the first four study cases were calculated.
The first case, WEST_0, is the reference case and therefore has a zero value assigned to the production cost differential. In the WEST_1 case, where the Entergy footprint is dispatched without enforcing the RMR nomogram for Western Region units, it was observed that all study units were dispatched with no noticeable reduction in production from the reference case.
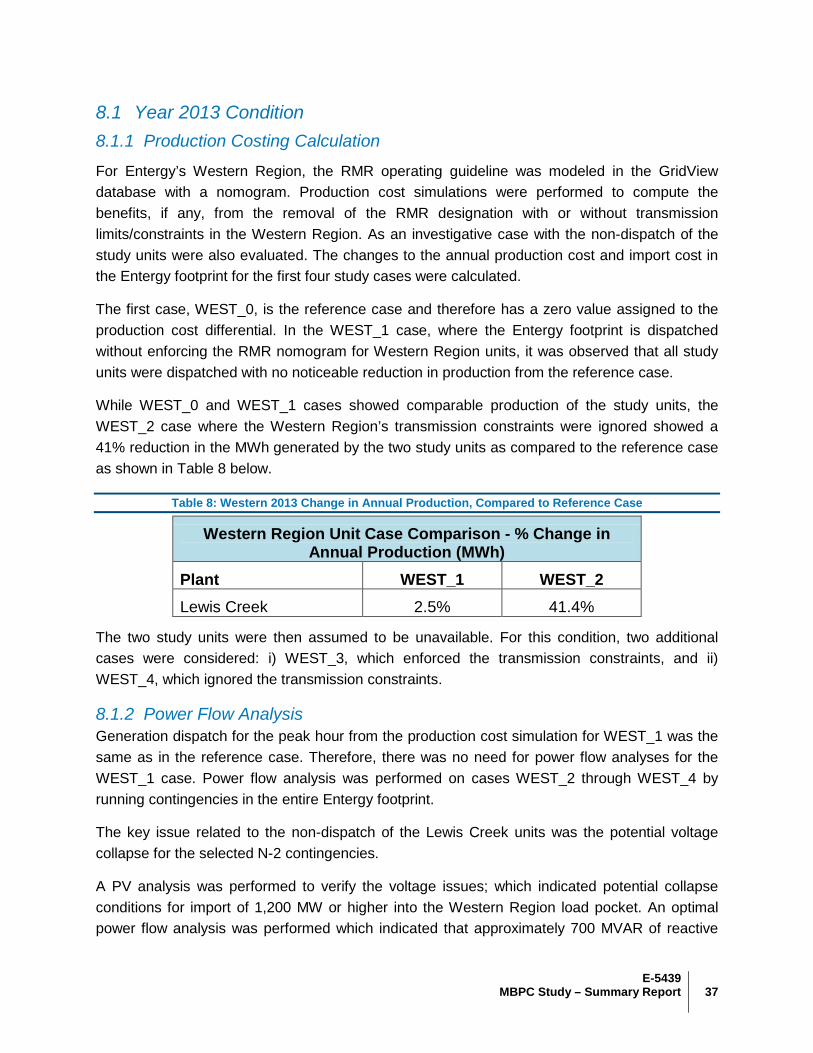
While WEST_0 and WEST_1 cases showed comparable production of the study units, the WEST_2 case where the Western Region’s transmission constraints were ignored showed a 41% reduction in the MWh generated by the two study units as compared to the reference case as shown in Table 8 below.
Table 8: Western 2013 Change in Annual Production, Compared to Reference Case
Western Region Unit Case Comparison - % Change in Annual Production (MWh)
Plant WEST_1 WEST_2 Lewis Creek 2.5% 41.4%
The two study units were then assumed to be unavailable. For this condition, two additional cases were considered: i) WEST_3, which enforced the transmission constraints, and ii) WEST_4, which ignored the transmission constraints.
8.1.2 Power Flow Analysis Generation dispatch for the peak hour from the production cost simulation for WEST_1 was the same as in the reference case. Therefore, there was no need for power flow analyses for the WEST_1 case. Power flow analysis was performed on cases WEST_2 through WEST_4 by running contingencies in the entire Entergy footprint.
The key issue related to the non-dispatch of the Lewis Creek units was the potential voltage collapse for the selected N-2 contingencies.
A PV analysis was performed to verify the voltage issues; which indicated potential collapse conditions for import of 1,200 MW or higher into the Western Region load pocket. An optimal power flow analysis was performed which indicated that approximately 700 MVAR of reactive
38 ABB Power Systems Consulting ERSC-SPP
power support within Western Region is necessary to displace the Lewis Creek units’ generation with imports from outside the Western area. Large overloads were noted on the 138 kV lines that made up the Western–WOTAB interface and elsewhere inside Western Region even with the additional reactive power support.
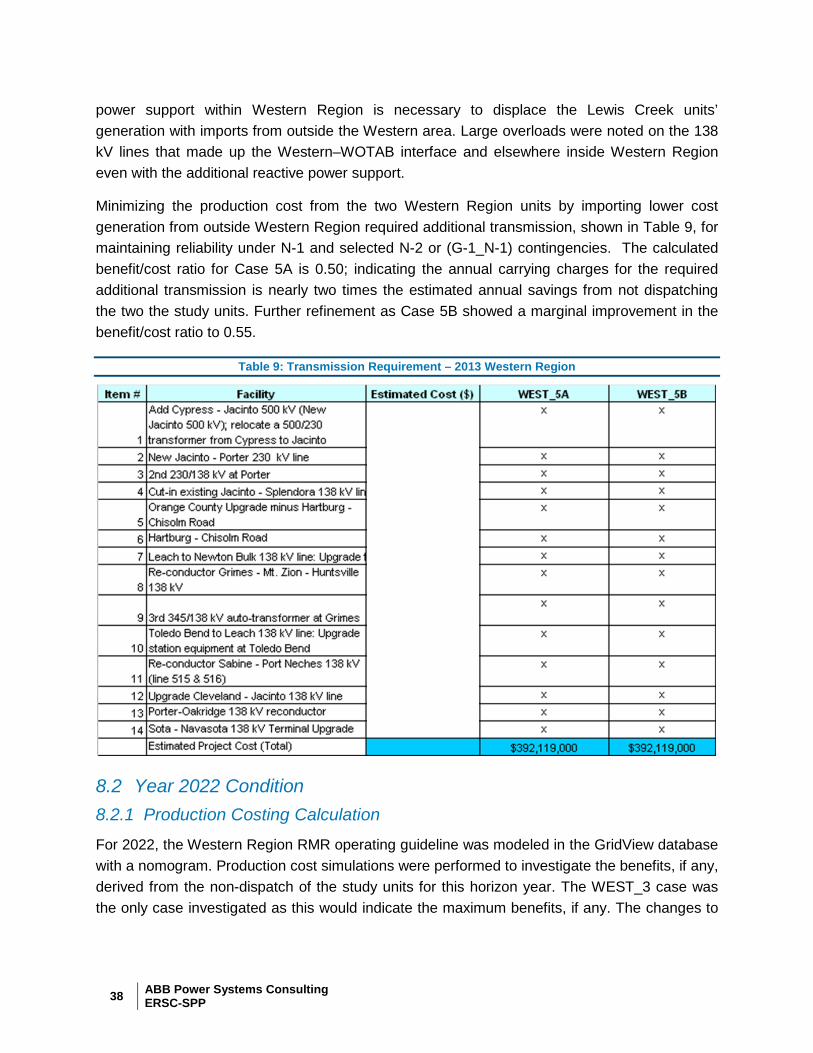
Minimizing the production cost from the two Western Region units by importing lower cost generation from outside Western Region required additional transmission, shown in Table 9, for maintaining reliability under N-1 and selected N-2 or (G-1_N-1) contingencies. The calculated benefit/cost ratio for Case 5A is 0.50; indicating the annual carrying charges for the required additional transmission is nearly two times the estimated annual savings from not dispatching the two the study units. Further refinement as Case 5B showed a marginal improvement in the benefit/cost ratio to 0.55.
Table 9: Transmission Requirement – 2013 Western Region
8.2 Year 2022 Condition 8.2.1 Production Costing Calculation
For 2022, the Western Region RMR operating guideline was modeled in the GridView database with a nomogram. Production cost simulations were performed to investigate the benefits, if any, derived from the non-dispatch of the study units for this horizon year. The WEST_3 case was the only case investigated as this would indicate the maximum benefits, if any. The changes to
E-5439
39 MBPC Study – Summary Report
the annual production cost and import cost in the Entergy footprint for this WEST_3 case was computed.
8.2.2 Power Flow Analysis
The contingency analysis for the WEST_3 case revealed non-convergence of power flow due to potential voltage collapse conditions for contingencies without or with an associated generator outage. The necessary transmission upgrades to completely displace the study units in the Western Region are listed in Table 10.
Table 10: Transmission Requirement – 2022 Western Region
Production cost and power flow contingency analyses were repeated with the above transmission upgrades (Case 5A). This case is expected to provide the maximum benefit from the complete displacement of the study units while preserving the system reliability. The results showed no overloads in the Western Region study area. The calculated annual savings was 20% of the annual carrying charges for the new transmission for this Case 5A.
A separate case was developed for these two units allowing the units to generate power on the basis of economic dispatch (Case 5B). Because these units were allowed to be dispatched, the savings in the generation cost decreased.
Based on the analyses for 2022, there was no perceptible benefit in reducing the energy produced by the Western Region study units and therefore no cost effective transmission alternative.
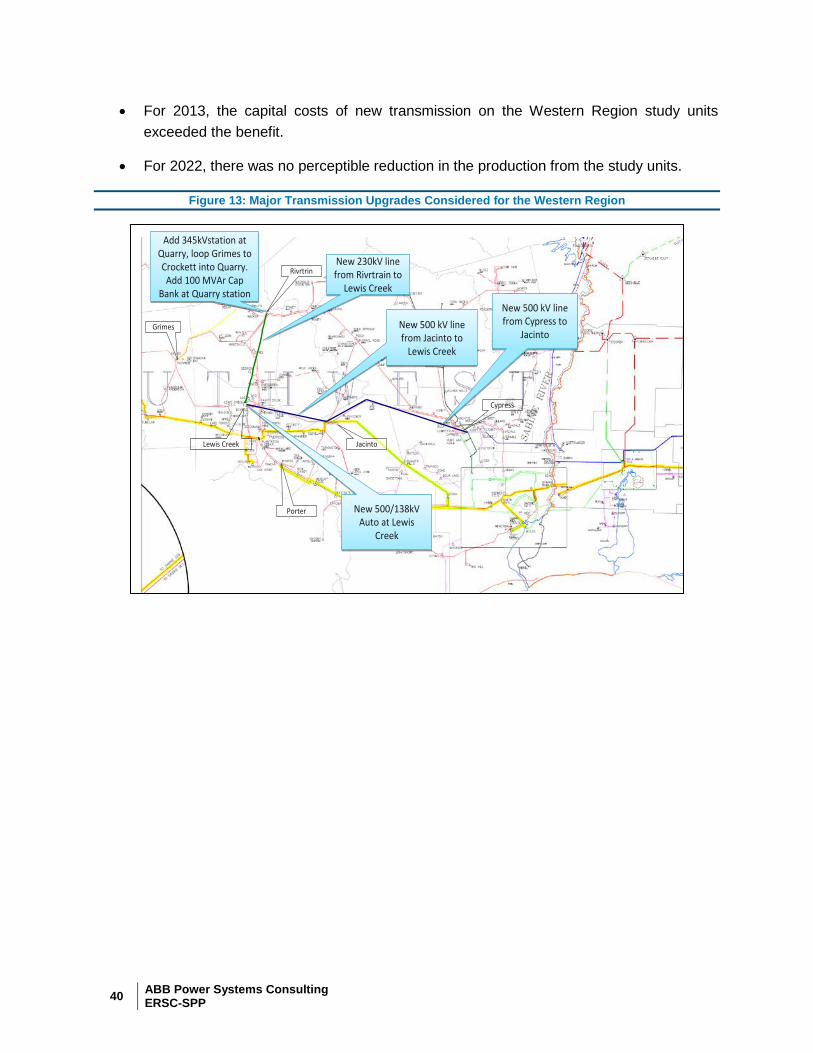
8.3 Western Region Summary The study for the Western Region focused on generating units at Lewis Creek. The major transmission projects that were considered in this study are shown in Figure 13. Combinations and/or variations of these projects were evaluated.
The analyses for the Western Region indicated that:
40 ABB Power Systems Consulting ERSC-SPP
• For 2013, the capital costs of new transmission on the Western Region study units exceeded the benefit.
• For 2022, there was no perceptible reduction in the production from the study units.
Figure 13: Major Transmission Upgrades Considered for the Western Region
Porter
New 500 kV line from Jacinto to
Lewis Creek
New 500 kV line from Jacinto to
Lewis Creek
New 230kV line from Rivrtrain to
Lewis Creek
New 230kV line from Rivrtrain to
Lewis Creek
Add 345kVstation at Quarry, loop Grimes to Crockett into Quarry. Add 100 MVAr Cap
Bank at Quarry station
Add 345kVstation at Quarry, loop Grimes to Crockett into Quarry. Add 100 MVAr Cap
Bank at Quarry station
Grimes
Lewis Creek Jacinto
Cypress
New 500 kV line from Cypress to
Jacinto
New 500 kV line from Cypress to
Jacinto
New 500/138kV Auto at Lewis
Creek
New 500/138kV Auto at Lewis
Creek
Rivrtrin
E-5439
41 MBPC Study – Summary Report
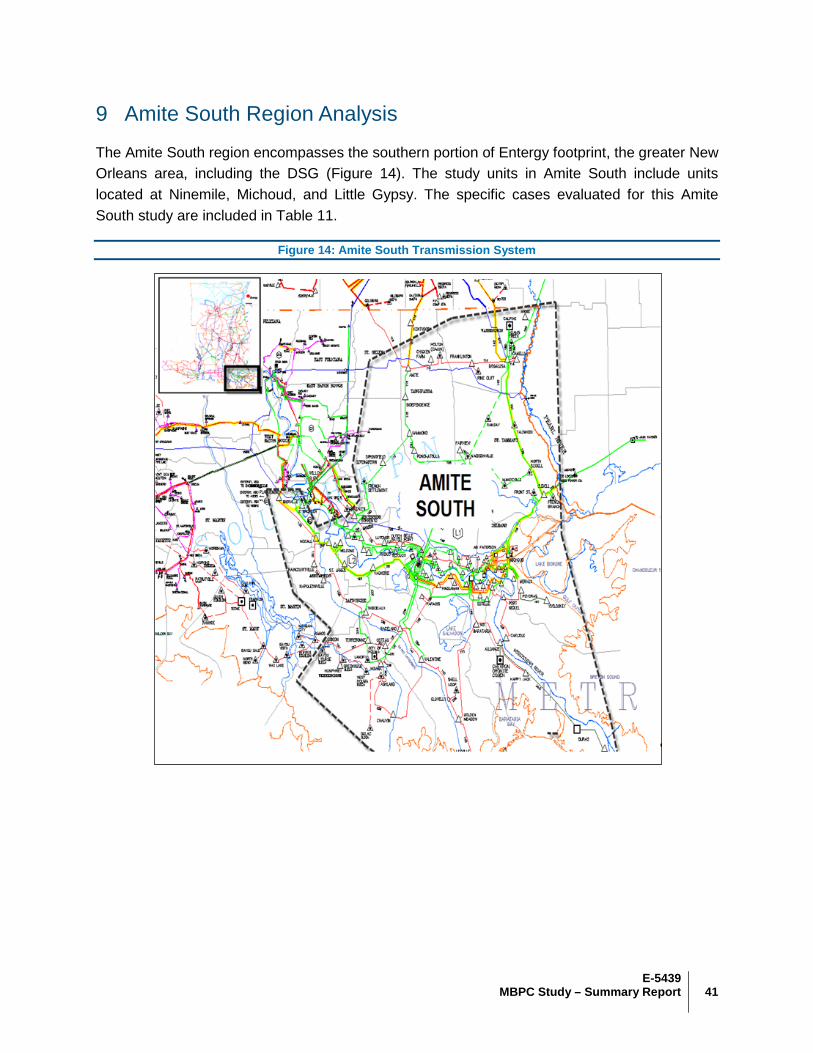
9 Amite South Region Analysis
The Amite South region encompasses the southern portion of Entergy footprint, the greater New Orleans area, including the DSG (Figure 14). The study units in Amite South include units located at Ninemile, Michoud, and Little Gypsy. The specific cases evaluated for this Amite South study are included in Table 11.
Figure 14: Amite South Transmission System
42 ABB Power Systems Consulting ERSC-SPP
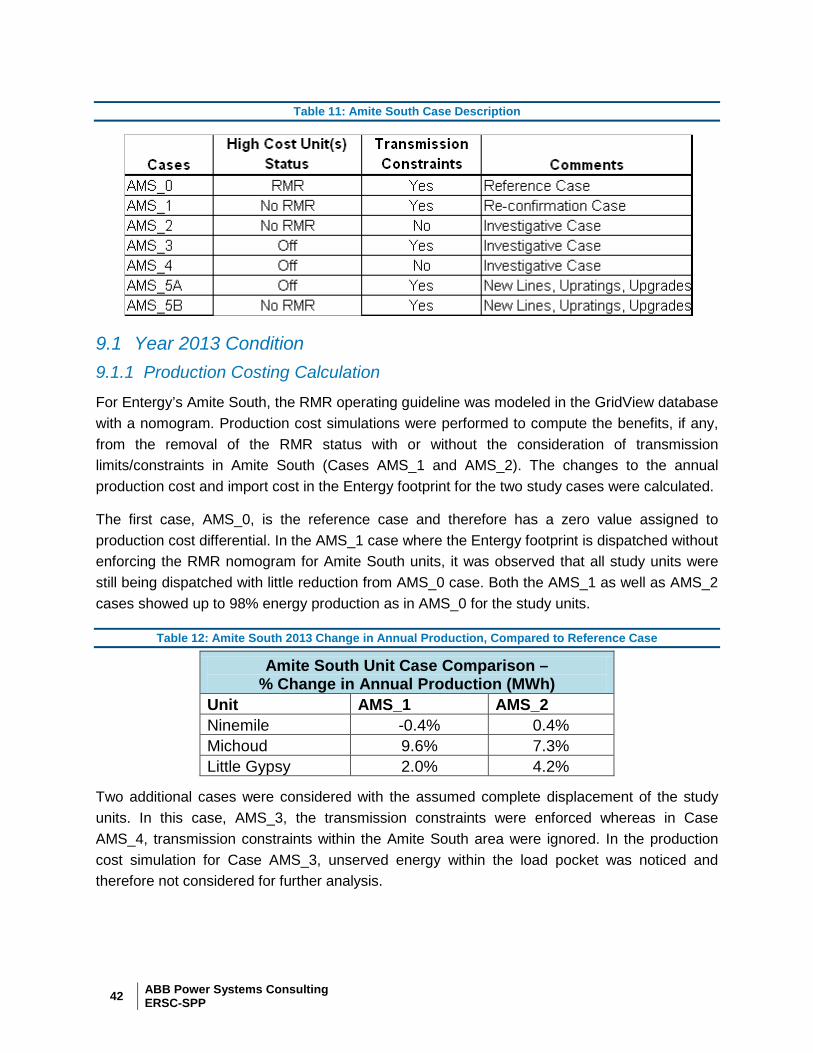
Table 11: Amite South Case Description
9.1 Year 2013 Condition 9.1.1 Production Costing Calculation
For Entergy’s Amite South, the RMR operating guideline was modeled in the GridView database with a nomogram. Production cost simulations were performed to compute the benefits, if any, from the removal of the RMR status with or without the consideration of transmission limits/constraints in Amite South (Cases AMS_1 and AMS_2). The changes to the annual production cost and import cost in the Entergy footprint for the two study cases were calculated.
The first case, AMS_0, is the reference case and therefore has a zero value assigned to production cost differential. In the AMS_1 case where the Entergy footprint is dispatched without enforcing the RMR nomogram for Amite South units, it was observed that all study units were still being dispatched with little reduction from AMS_0 case. Both the AMS_1 as well as AMS_2 cases showed up to 98% energy production as in AMS_0 for the study units.
Table 12: Amite South 2013 Change in Annual Production, Compared to Reference Case
Amite South Unit Case Comparison – % Change in Annual Production (MWh)
Unit AMS_1 AMS_2 Ninemile -0.4% 0.4% Michoud 9.6% 7.3% Little Gypsy 2.0% 4.2%
Two additional cases were considered with the assumed complete displacement of the study units. In this case, AMS_3, the transmission constraints were enforced whereas in Case AMS_4, transmission constraints within the Amite South area were ignored. In the production cost simulation for Case AMS_3, unserved energy within the load pocket was noticed and therefore not considered for further analysis.
E-5439
43 MBPC Study – Summary Report
9.1.2 Power Flow Analysis Power flow analysis was performed on Cases AMS_1, AMS_2, and AMS_4, for the peak load hour considering the generation dispatch from the production costing analysis. Since the production costing run for AMS_3 resulted in unserved energy, no power flow analysis was performed for this case.
Under system intact conditions, two transmission facilities were overloaded in the AMS_4 case. In addition, certain contingencies did not provide a power flow solution due to potential voltage collapse conditions. The outage of contingent lines in combination with other generator outages in the region also resulted in power flow non-convergence.
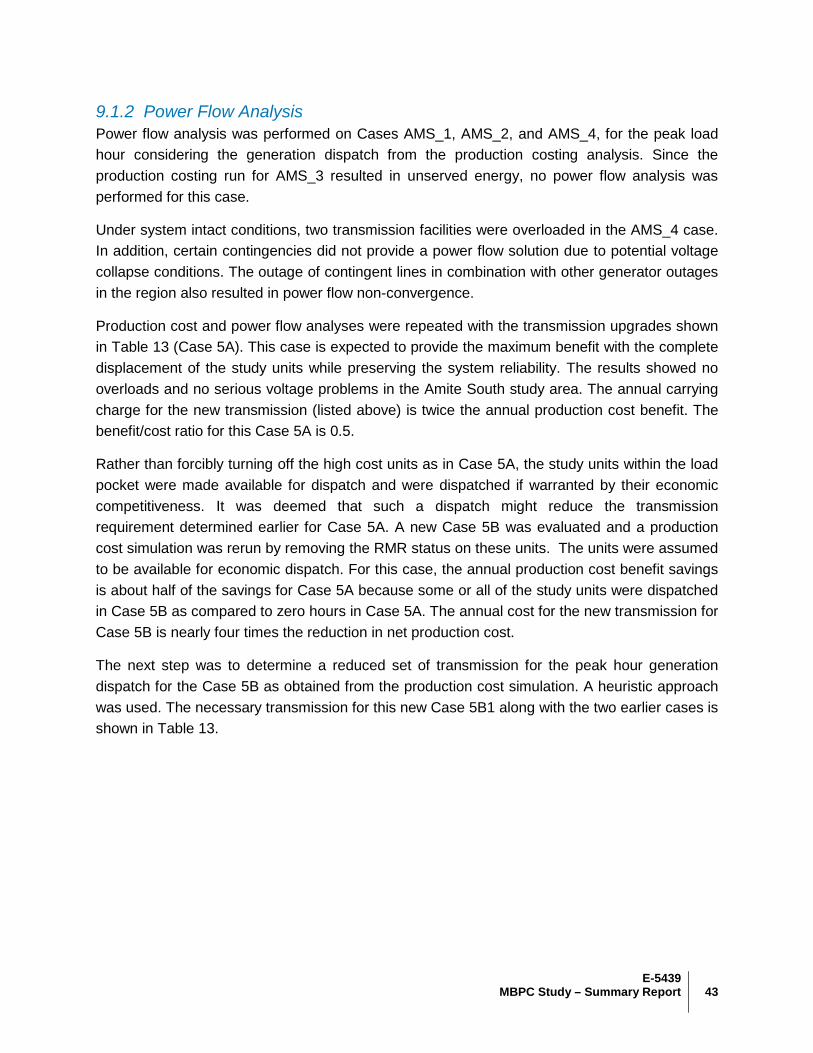
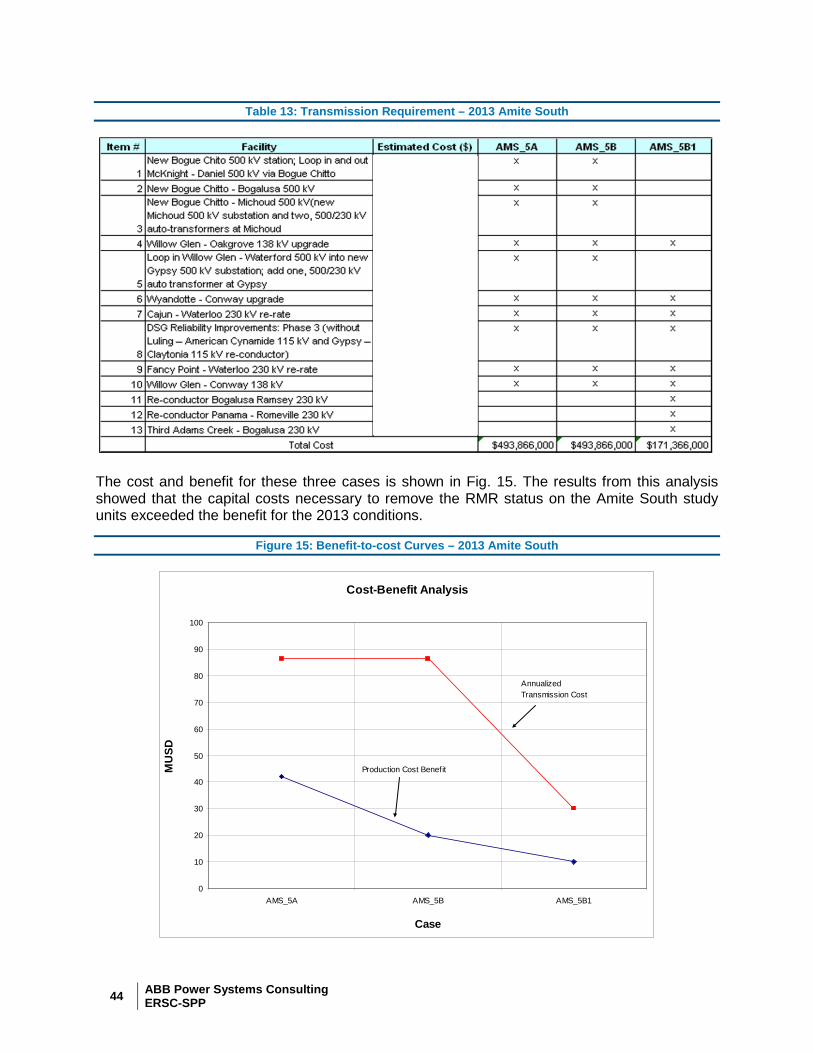
Production cost and power flow analyses were repeated with the transmission upgrades shown in Table 13 (Case 5A). This case is expected to provide the maximum benefit with the complete displacement of the study units while preserving the system reliability. The results showed no overloads and no serious voltage problems in the Amite South study area. The annual carrying charge for the new transmission (listed above) is twice the annual production cost benefit. The benefit/cost ratio for this Case 5A is 0.5.
Rather than forcibly turning off the high cost units as in Case 5A, the study units within the load pocket were made available for dispatch and were dispatched if warranted by their economic competitiveness. It was deemed that such a dispatch might reduce the transmission requirement determined earlier for Case 5A. A new Case 5B was evaluated and a production cost simulation was rerun by removing the RMR status on these units. The units were assumed to be available for economic dispatch. For this case, the annual production cost benefit savings is about half of the savings for Case 5A because some or all of the study units were dispatched in Case 5B as compared to zero hours in Case 5A. The annual cost for the new transmission for Case 5B is nearly four times the reduction in net production cost.
The next step was to determine a reduced set of transmission for the peak hour generation dispatch for the Case 5B as obtained from the production cost simulation. A heuristic approach was used. The necessary transmission for this new Case 5B1 along with the two earlier cases is shown in Table 13.
44 ABB Power Systems Consulting ERSC-SPP
Table 13: Transmission Requirement – 2013 Amite South
The cost and benefit for these three cases is shown in Fig. 15. The results from this analysis showed that the capital costs necessary to remove the RMR status on the Amite South study units exceeded the benefit for the 2013 conditions.
Figure 15: Benefit-to-cost Curves – 2013 Amite South
Cost-Benefit Analysis
0
10
20
30
40
50
60
70
80
90
100
AMS_5A AMS_5B AMS_5B1
Case
MU
SD
Production Cost Benefit
Annualized Transmission Cost
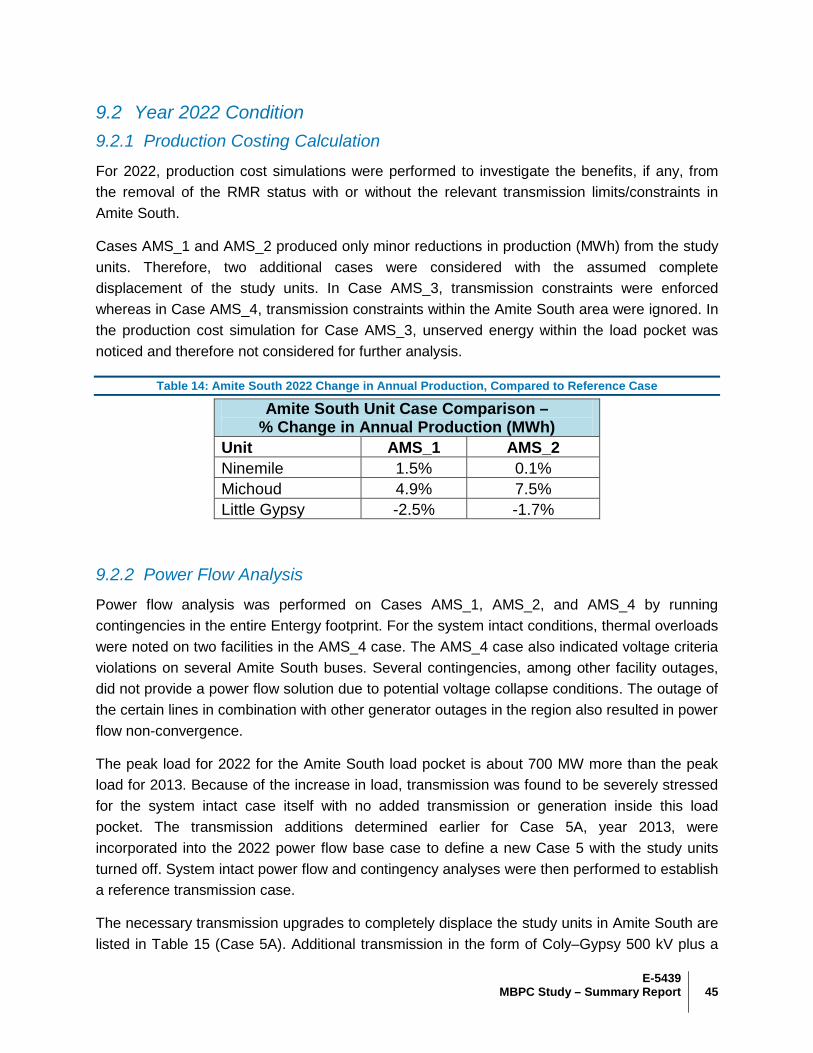
E-5439
45 MBPC Study – Summary Report
9.2 Year 2022 Condition 9.2.1 Production Costing Calculation
For 2022, production cost simulations were performed to investigate the benefits, if any, from the removal of the RMR status with or without the relevant transmission limits/constraints in Amite South.
Cases AMS_1 and AMS_2 produced only minor reductions in production (MWh) from the study units. Therefore, two additional cases were considered with the assumed complete displacement of the study units. In Case AMS_3, transmission constraints were enforced whereas in Case AMS_4, transmission constraints within the Amite South area were ignored. In the production cost simulation for Case AMS_3, unserved energy within the load pocket was noticed and therefore not considered for further analysis.
Table 14: Amite South 2022 Change in Annual Production, Compared to Reference Case
Amite South Unit Case Comparison – % Change in Annual Production (MWh)
Unit AMS_1 AMS_2 Ninemile 1.5% 0.1% Michoud 4.9% 7.5% Little Gypsy -2.5% -1.7%
9.2.2 Power Flow Analysis
Power flow analysis was performed on Cases AMS_1, AMS_2, and AMS_4 by running contingencies in the entire Entergy footprint. For the system intact conditions, thermal overloads were noted on two facilities in the AMS_4 case. The AMS_4 case also indicated voltage criteria violations on several Amite South buses. Several contingencies, among other facility outages, did not provide a power flow solution due to potential voltage collapse conditions. The outage of the certain lines in combination with other generator outages in the region also resulted in power flow non-convergence.
The peak load for 2022 for the Amite South load pocket is about 700 MW more than the peak load for 2013. Because of the increase in load, transmission was found to be severely stressed for the system intact case itself with no added transmission or generation inside this load pocket. The transmission additions determined earlier for Case 5A, year 2013, were incorporated into the 2022 power flow base case to define a new Case 5 with the study units turned off. System intact power flow and contingency analyses were then performed to establish a reference transmission case.
The necessary transmission upgrades to completely displace the study units in Amite South are listed in Table 15 (Case 5A). Additional transmission in the form of Coly–Gypsy 500 kV plus a
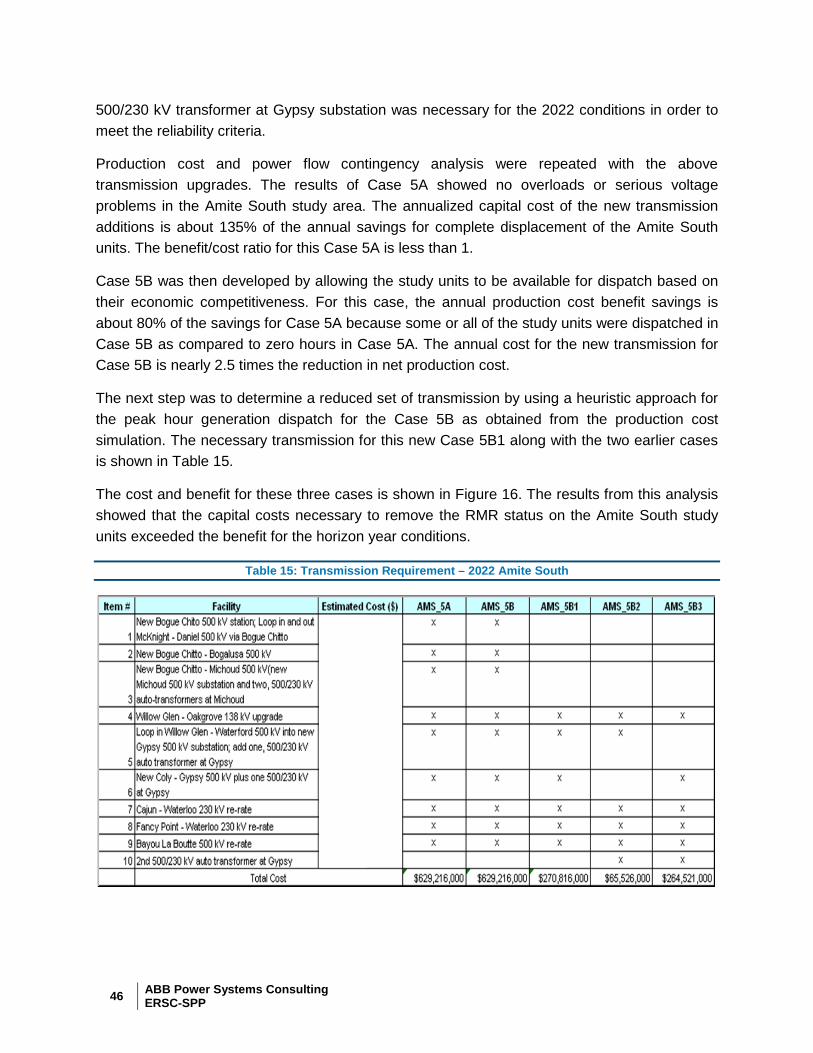
46 ABB Power Systems Consulting ERSC-SPP
500/230 kV transformer at Gypsy substation was necessary for the 2022 conditions in order to meet the reliability criteria.
Production cost and power flow contingency analysis were repeated with the above transmission upgrades. The results of Case 5A showed no overloads or serious voltage problems in the Amite South study area. The annualized capital cost of the new transmission additions is about 135% of the annual savings for complete displacement of the Amite South units. The benefit/cost ratio for this Case 5A is less than 1.
Case 5B was then developed by allowing the study units to be available for dispatch based on their economic competitiveness. For this case, the annual production cost benefit savings is about 80% of the savings for Case 5A because some or all of the study units were dispatched in Case 5B as compared to zero hours in Case 5A. The annual cost for the new transmission for Case 5B is nearly 2.5 times the reduction in net production cost.
The next step was to determine a reduced set of transmission by using a heuristic approach for the peak hour generation dispatch for the Case 5B as obtained from the production cost simulation. The necessary transmission for this new Case 5B1 along with the two earlier cases is shown in Table 15.
The cost and benefit for these three cases is shown in Figure 16. The results from this analysis showed that the capital costs necessary to remove the RMR status on the Amite South study units exceeded the benefit for the horizon year conditions.
Table 15: Transmission Requirement – 2022 Amite South
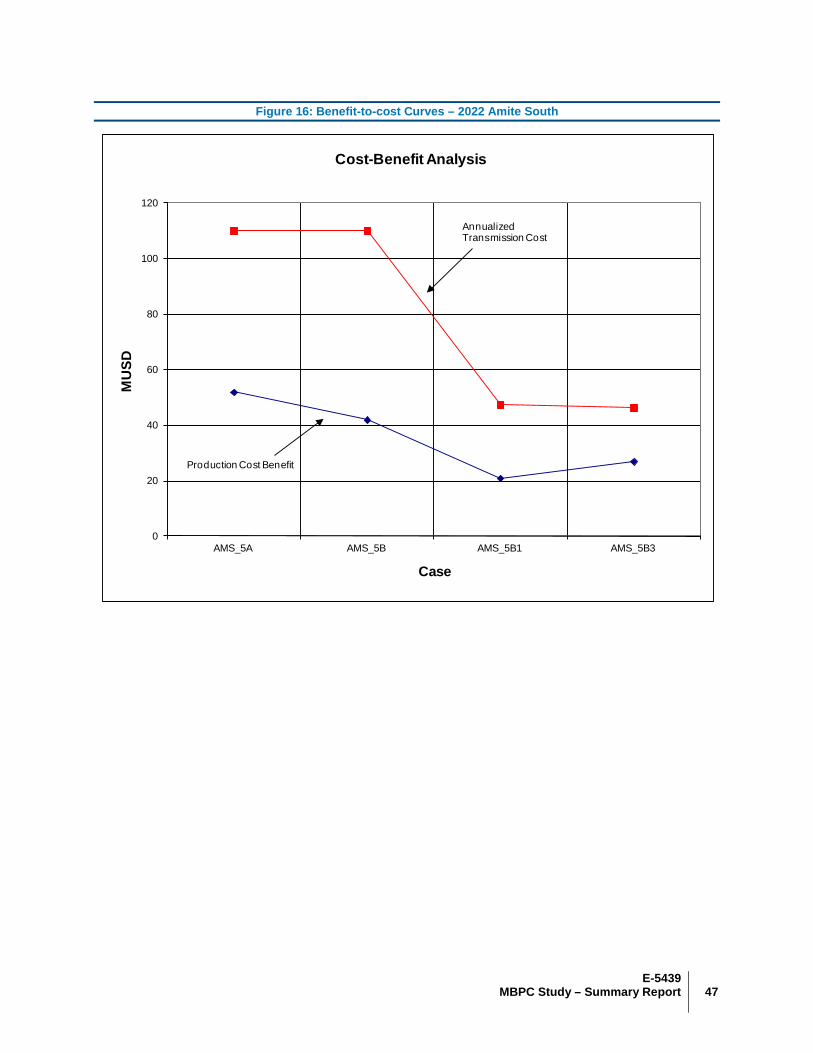
E-5439
47 MBPC Study – Summary Report
Figure 16: Benefit-to-cost Curves – 2022 Amite South
0
20
40
60
80
100
120
AMS_5A AMS_5B AMS_5B1 AMS_5B3
MU
SD
Case
Cost-Benefit Analysis
Production Cost Benefit
Annualized Transmission Cost
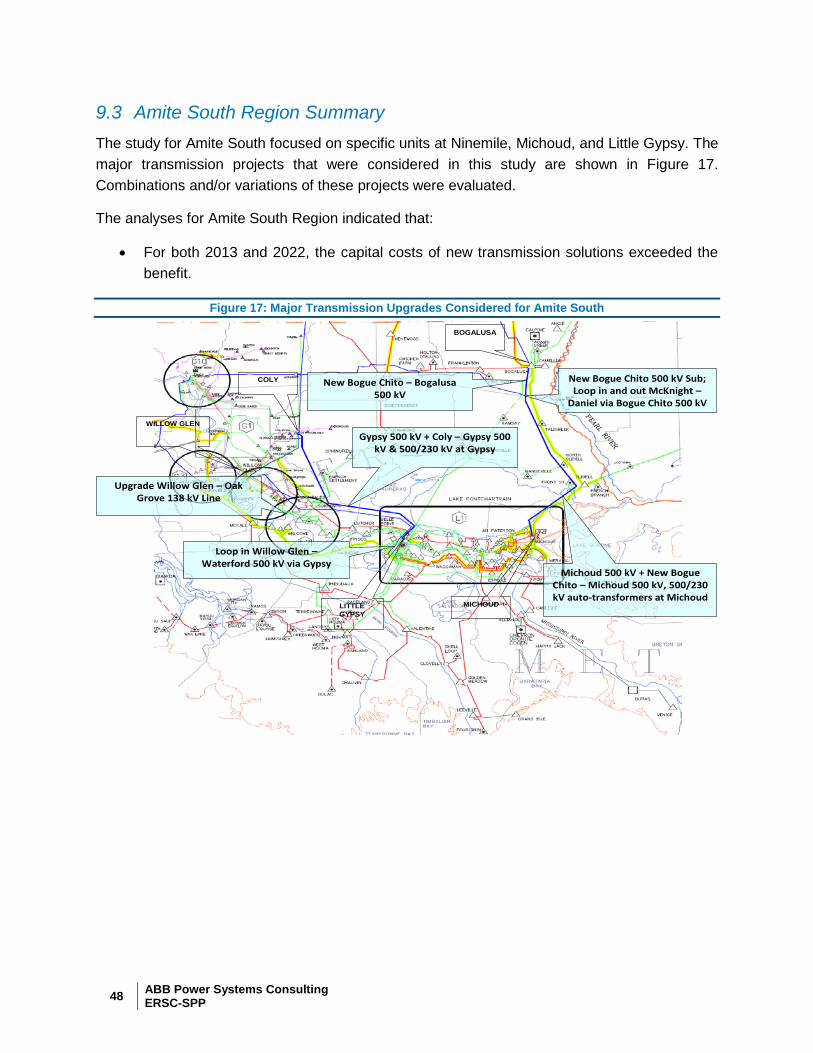
48 ABB Power Systems Consulting ERSC-SPP
9.3 Amite South Region Summary The study for Amite South focused on specific units at Ninemile, Michoud, and Little Gypsy. The major transmission projects that were considered in this study are shown in Figure 17. Combinations and/or variations of these projects were evaluated.
The analyses for Amite South Region indicated that:
• For both 2013 and 2022, the capital costs of new transmission solutions exceeded the benefit.
Figure 17: Major Transmission Upgrades Considered for Amite South
Gypsy 500 kV + Coly – Gypsy 500 kV & 500/230 kV at Gypsy
New Bogue Chito 500 kV Sub; Loop in and out McKnight –
Daniel via Bogue Chito 500 kV
New Bogue Chito – Bogalusa 500 kV
Michoud 500 kV + New BogueChito – Michoud 500 kV, 500/230 kV auto-transformers at Michoud
Loop in Willow Glen –Waterford 500 kV via Gypsy
Upgrade Willow Glen – Oak Grove 138 kV Line
MICHOUD
BOGALUSA
WILLOW GLEN
COLY
LITTLE GYPSY
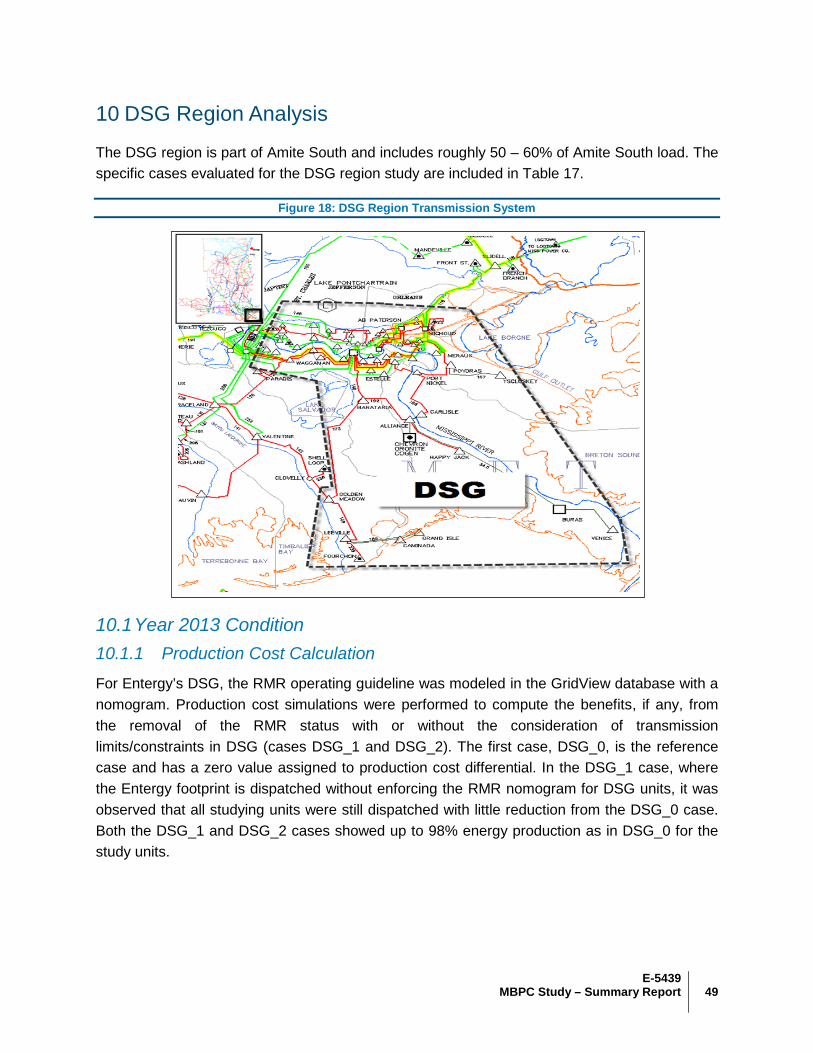
E-5439
49 MBPC Study – Summary Report
10 DSG Region Analysis
The DSG region is part of Amite South and includes roughly 50 – 60% of Amite South load. The specific cases evaluated for the DSG region study are included in Table 17.
Figure 18: DSG Region Transmission System
10.1 Year 2013 Condition 10.1.1 Production Cost Calculation
For Entergy’s DSG, the RMR operating guideline was modeled in the GridView database with a nomogram. Production cost simulations were performed to compute the benefits, if any, from the removal of the RMR status with or without the consideration of transmission limits/constraints in DSG (cases DSG_1 and DSG_2). The first case, DSG_0, is the reference case and has a zero value assigned to production cost differential. In the DSG_1 case, where the Entergy footprint is dispatched without enforcing the RMR nomogram for DSG units, it was observed that all studying units were still dispatched with little reduction from the DSG_0 case. Both the DSG_1 and DSG_2 cases showed up to 98% energy production as in DSG_0 for the study units.
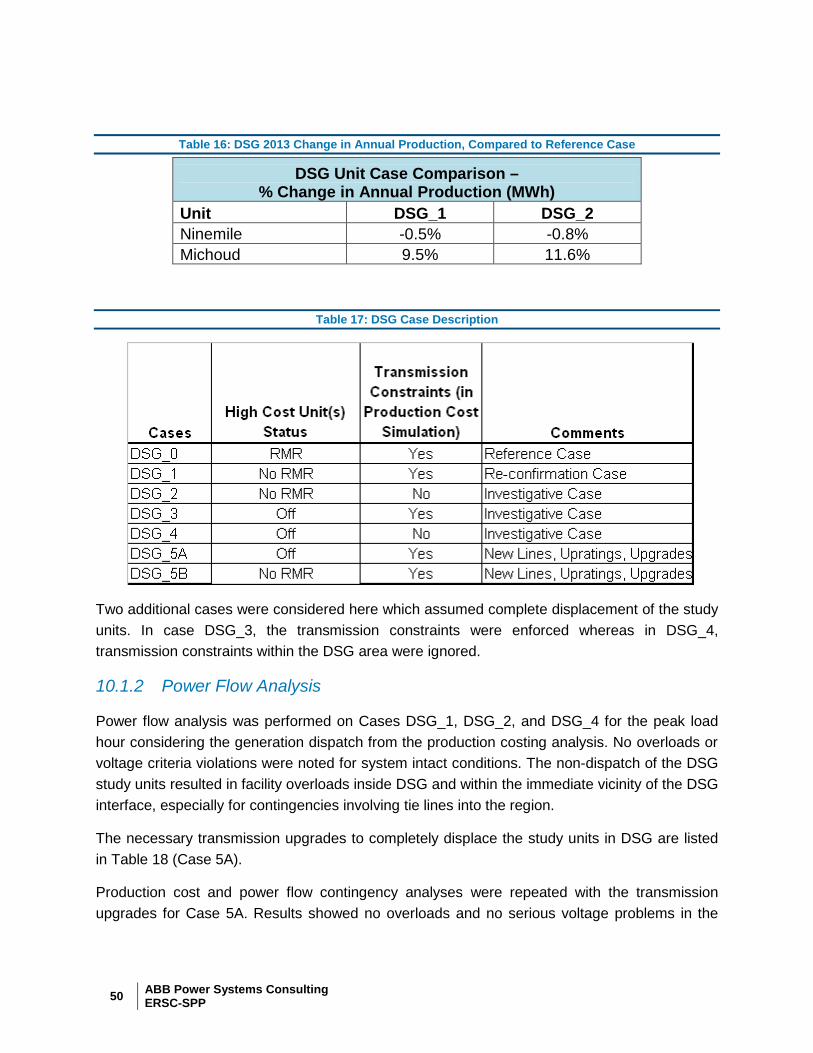
50 ABB Power Systems Consulting ERSC-SPP
Table 16: DSG 2013 Change in Annual Production, Compared to Reference Case
DSG Unit Case Comparison – % Change in Annual Production (MWh)
Unit DSG_1 DSG_2 Ninemile -0.5% -0.8% Michoud 9.5% 11.6%
Table 17: DSG Case Description
Two additional cases were considered here which assumed complete displacement of the study units. In case DSG_3, the transmission constraints were enforced whereas in DSG_4, transmission constraints within the DSG area were ignored.
10.1.2 Power Flow Analysis
Power flow analysis was performed on Cases DSG_1, DSG_2, and DSG_4 for the peak load hour considering the generation dispatch from the production costing analysis. No overloads or voltage criteria violations were noted for system intact conditions. The non-dispatch of the DSG study units resulted in facility overloads inside DSG and within the immediate vicinity of the DSG interface, especially for contingencies involving tie lines into the region.
The necessary transmission upgrades to completely displace the study units in DSG are listed in Table 18 (Case 5A).
Production cost and power flow contingency analyses were repeated with the transmission upgrades for Case 5A. Results showed no overloads and no serious voltage problems in the
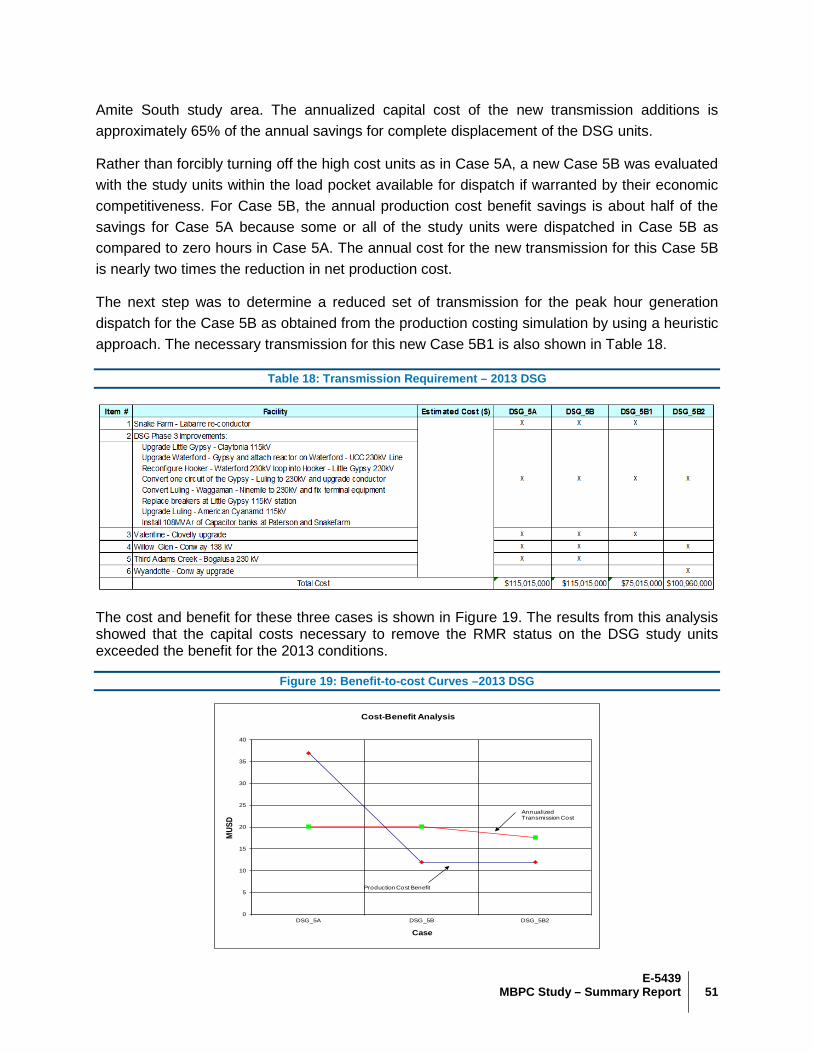
E-5439
51 MBPC Study – Summary Report
Amite South study area. The annualized capital cost of the new transmission additions is approximately 65% of the annual savings for complete displacement of the DSG units.
Rather than forcibly turning off the high cost units as in Case 5A, a new Case 5B was evaluated with the study units within the load pocket available for dispatch if warranted by their economic competitiveness. For Case 5B, the annual production cost benefit savings is about half of the savings for Case 5A because some or all of the study units were dispatched in Case 5B as compared to zero hours in Case 5A. The annual cost for the new transmission for this Case 5B is nearly two times the reduction in net production cost.
The next step was to determine a reduced set of transmission for the peak hour generation dispatch for the Case 5B as obtained from the production costing simulation by using a heuristic approach. The necessary transmission for this new Case 5B1 is also shown in Table 18.
Table 18: Transmission Requirement – 2013 DSG
The cost and benefit for these three cases is shown in Figure 19. The results from this analysis showed that the capital costs necessary to remove the RMR status on the DSG study units exceeded the benefit for the 2013 conditions.
Figure 19: Benefit-to-cost Curves –2013 DSG
0
5
10
15
20
25
30
35
40
DSG_5A DSG_5B DSG_5B2
MUS
D
Case
Cost-Benefit Analysis
Production Cost Benefit
Annualized Transmission Cost
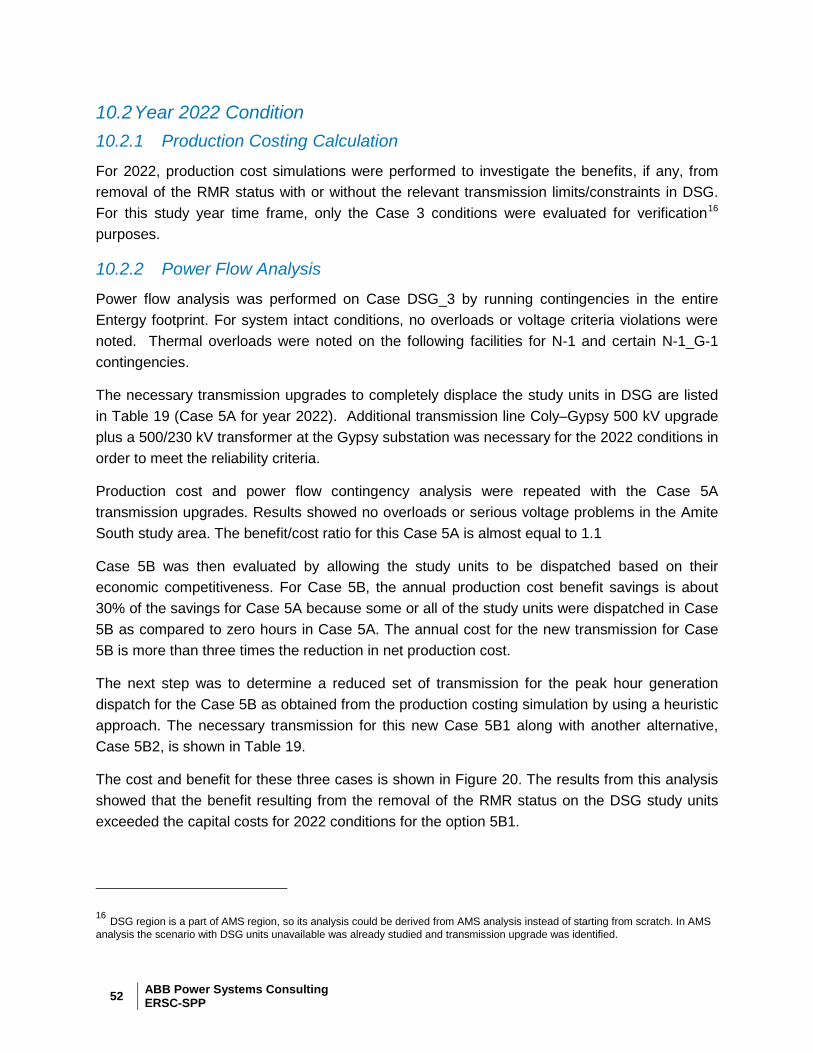
52 ABB Power Systems Consulting ERSC-SPP
10.2 Year 2022 Condition 10.2.1 Production Costing Calculation
For 2022, production cost simulations were performed to investigate the benefits, if any, from removal of the RMR status with or without the relevant transmission limits/constraints in DSG. For this study year time frame, only the Case 3 conditions were evaluated for verification16 purposes.
10.2.2 Power Flow Analysis
Power flow analysis was performed on Case DSG_3 by running contingencies in the entire Entergy footprint. For system intact conditions, no overloads or voltage criteria violations were noted. Thermal overloads were noted on the following facilities for N-1 and certain N-1_G-1 contingencies.
The necessary transmission upgrades to completely displace the study units in DSG are listed in Table 19 (Case 5A for year 2022). Additional transmission line Coly–Gypsy 500 kV upgrade plus a 500/230 kV transformer at the Gypsy substation was necessary for the 2022 conditions in order to meet the reliability criteria.
Production cost and power flow contingency analysis were repeated with the Case 5A transmission upgrades. Results showed no overloads or serious voltage problems in the Amite South study area. The benefit/cost ratio for this Case 5A is almost equal to 1.1
Case 5B was then evaluated by allowing the study units to be dispatched based on their economic competitiveness. For Case 5B, the annual production cost benefit savings is about 30% of the savings for Case 5A because some or all of the study units were dispatched in Case 5B as compared to zero hours in Case 5A. The annual cost for the new transmission for Case 5B is more than three times the reduction in net production cost.
The next step was to determine a reduced set of transmission for the peak hour generation dispatch for the Case 5B as obtained from the production costing simulation by using a heuristic approach. The necessary transmission for this new Case 5B1 along with another alternative, Case 5B2, is shown in Table 19.
The cost and benefit for these three cases is shown in Figure 20. The results from this analysis showed that the benefit resulting from the removal of the RMR status on the DSG study units exceeded the capital costs for 2022 conditions for the option 5B1.
16 DSG region is a part of AMS region, so its analysis could be derived from AMS analysis instead of starting from scratch. In AMS analysis the scenario with DSG units unavailable was already studied and transmission upgrade was identified.
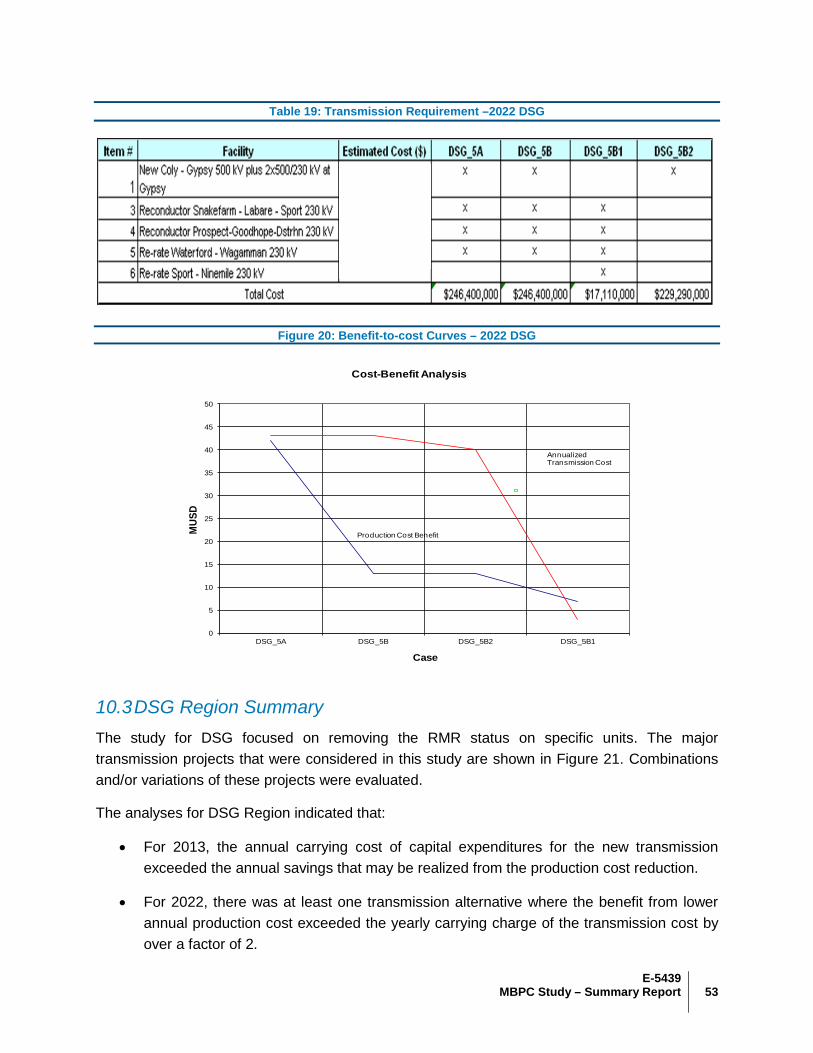
E-5439
53 MBPC Study – Summary Report
Table 19: Transmission Requirement –2022 DSG
Figure 20: Benefit-to-cost Curves – 2022 DSG
10.3 DSG Region Summary The study for DSG focused on removing the RMR status on specific units. The major transmission projects that were considered in this study are shown in Figure 21. Combinations and/or variations of these projects were evaluated.
The analyses for DSG Region indicated that:
• For 2013, the annual carrying cost of capital expenditures for the new transmission exceeded the annual savings that may be realized from the production cost reduction.
• For 2022, there was at least one transmission alternative where the benefit from lower annual production cost exceeded the yearly carrying charge of the transmission cost by over a factor of 2.
0
5
10
15
20
25
30
35
40
45
50
DSG_5A DSG_5B DSG_5B2 DSG_5B1
MUS
D
Case
Cost-Benefit Analysis
Production Cost Benefit
Annualized Transmission Cost
54 ABB Power Systems Consulting ERSC-SPP
Figure 21: Major Transmission Upgrades Considered for DSG Region
Gypsy 500 kV + Coly – Gypsy 500 kV & 500/230 kV at Gypsy
Re-conductor Snake Farm –Labarre – S. Port 230 kV Line
Increase rating of Waterford –Wagamman 230 kV Line to 1031 MVA (same as Wagamman – 9Mile section)
Re-conductor Prospect –GoodHope – Dstrhn 230 kV Line
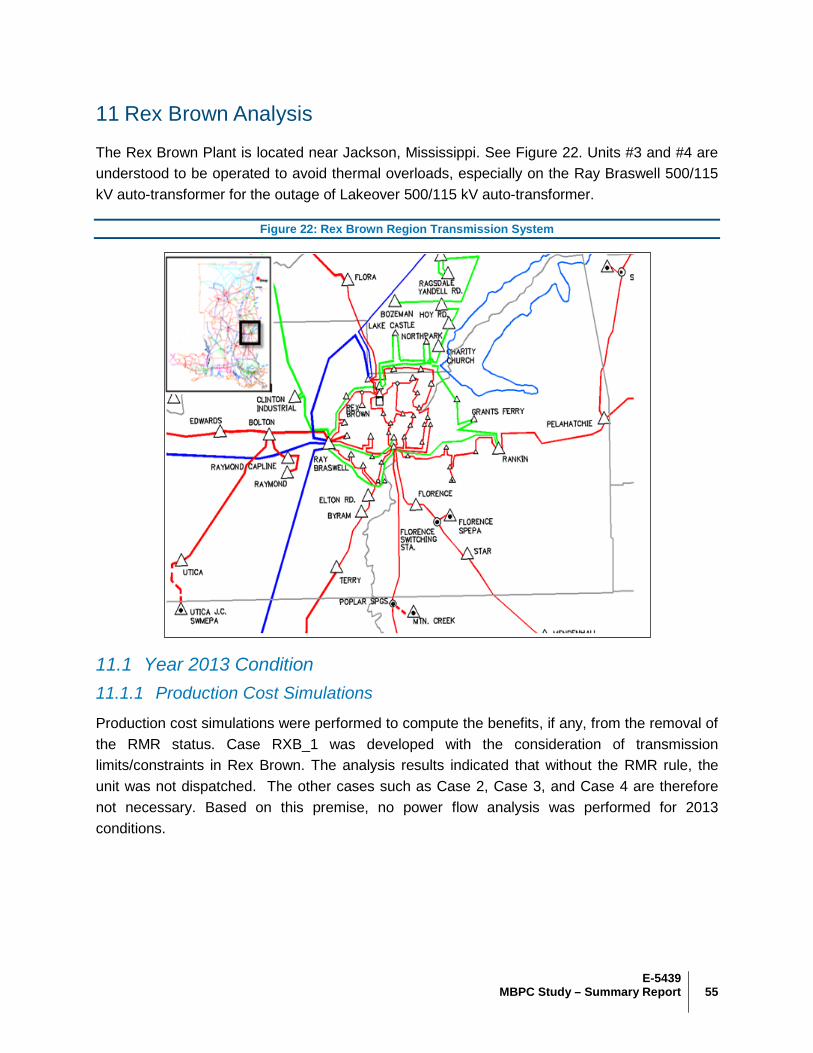
E-5439
55 MBPC Study – Summary Report
11 Rex Brown Analysis
The Rex Brown Plant is located near Jackson, Mississippi. See Figure 22. Units #3 and #4 are understood to be operated to avoid thermal overloads, especially on the Ray Braswell 500/115 kV auto-transformer for the outage of Lakeover 500/115 kV auto-transformer.
Figure 22: Rex Brown Region Transmission System
11.1 Year 2013 Condition 11.1.1 Production Cost Simulations
Production cost simulations were performed to compute the benefits, if any, from the removal of the RMR status. Case RXB_1 was developed with the consideration of transmission limits/constraints in Rex Brown. The analysis results indicated that without the RMR rule, the unit was not dispatched. The other cases such as Case 2, Case 3, and Case 4 are therefore not necessary. Based on this premise, no power flow analysis was performed for 2013 conditions.
56 ABB Power Systems Consulting ERSC-SPP
11.2 Year 2022 Condition 11.2.1 Production Cost Calculation
For 2022, production cost simulations were performed to investigate the benefits, if any, from removal of the RMR status with or without the relevant transmission limits/constraints in the Rex Brown vicinity.
Production cost simulations were performed to compute the benefits, if any, from the removal of the RMR status. Case RXB_1 was developed with the consideration of transmission limits/constraints in Rex Brown. The analysis results indicated that without the RMR rule, the unit was not dispatched. The other cases such as Case 2, Case 3, and Case 4 are therefore not necessary.
11.2.2 Power Flow Analysis
A power flow analysis, system intact and contingency, was performed to verify the reliability concerns, if any, by not dispatching the Rex Brown study unit generation.
The results from the power flow analysis indicated the following overloads when the Rex Brown study unit was not dispatched:
• Ray Braswell-Jackson West 115 kV: 105% loading (based on 143 MVA rating) for the outage of 230/115 kV transformer at Jackson - Jackson South. This facility was loaded to 96% in the reference case.
• Jackson East-Jackson South 115 kV: 107% loading (based on 161 MVA rating) for the outage of JX-MON – JX-FON 115 kV circuit. The above facility was loaded to 101% in the reference case for the same contingency.
No voltage related problems were indicated.
Based on discussions with SPP and Entergy, the mitigation of the above loading problems included:
• Reconductor of Ray Braswell-West Jackson 115 kV line (~6.4 miles); increasing the thermal rating to 262 MVA
• Reconductor of Jackson South-Jackson East 115kV (~1.8 miles) to increase its capacity to 221 MVA
The above mitigation measure resolved the reliability concerns due to the non-dispatch of the Rex Brown study unit. The production cost and power flow contingency analysis were repeated with the above transmission upgrades and without the RMR nomogram (Case 5B). The results showed no overloads or serious voltage problems in the Amite South study area. The benefit/cost ratio for this Case 5B is almost equal to one.
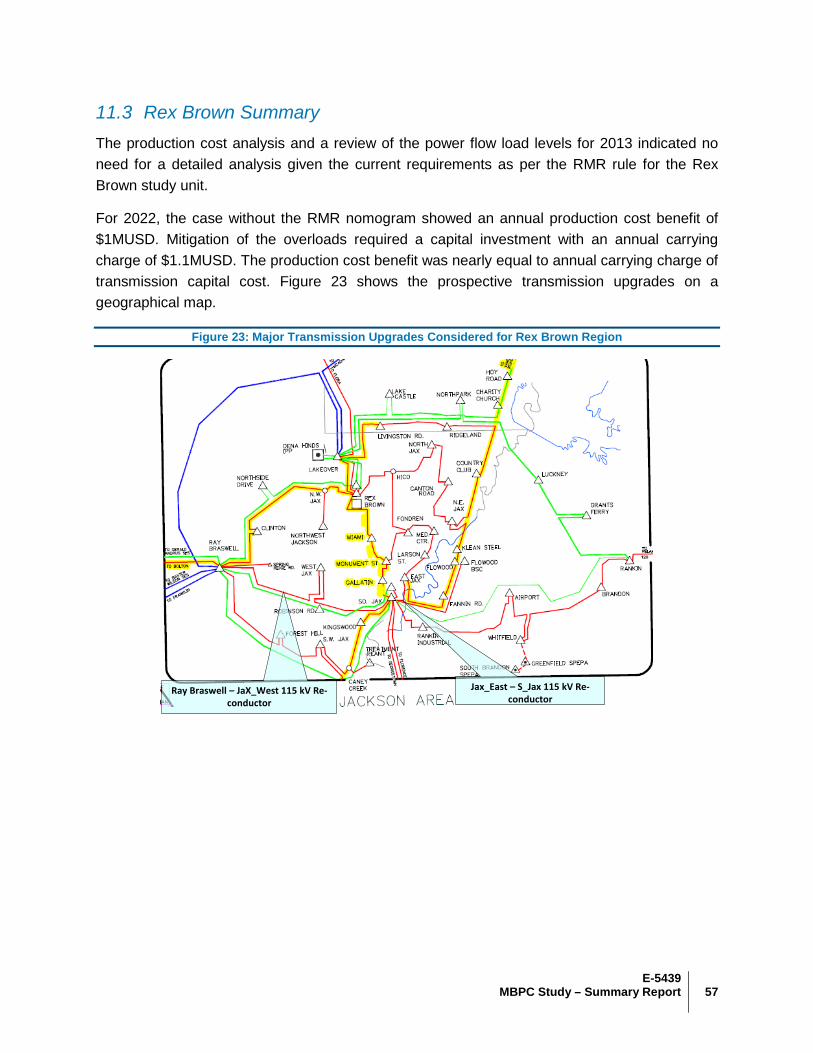
E-5439
57 MBPC Study – Summary Report
11.3 Rex Brown Summary The production cost analysis and a review of the power flow load levels for 2013 indicated no need for a detailed analysis given the current requirements as per the RMR rule for the Rex Brown study unit.
For 2022, the case without the RMR nomogram showed an annual production cost benefit of $1MUSD. Mitigation of the overloads required a capital investment with an annual carrying charge of $1.1MUSD. The production cost benefit was nearly equal to annual carrying charge of transmission capital cost. Figure 23 shows the prospective transmission upgrades on a geographical map.
Figure 23: Major Transmission Upgrades Considered for Rex Brown Region
Ray Braswell – JaX_West 115 kV Re-conductor
Jax_East – S_Jax 115 kV Re-conductor
58 ABB Power Systems Consulting ERSC-SPP
12 Sensitivity Analyses
The benefit-to-cost analyses for the different study units and regions in sections 6 through 10 were performed based on certain deterministic parameters such as forecasted fuel price, currently installed generating units, the resulting economic dispatch etc. In view of possible changes on the ground conditions in the future, the following sensitivity analyses were performed:
1. Gas Price Elasticity
2. QF Sensitivity
3. RFP Sensitivity
12.1 Gas Price Sensitivity Gas price is one of the major parameters in the production cost simulations. Impact on the calculated benefits from the production cost simulations due to different gas price assumptions was evaluated through two sensitivity cases. A -30% reduction of gas price and a +20% increase from the base values was used. This evaluation was done for both the study time frames of 2013 and 2022 but limited to the 5B case with the highest benefit/cost ratio. The transmission upgrades associated with the relevant cases was not changed.
In general, a higher gas price will result in larger production cost reduction with a transmission solution resulting in a higher benefit. Similarly, the lower the gas price, the lower the benefit of a transmission solution. Due to complexity of network congestions, which causes QF unit curtailments, the benefit result could be counter-intuitive in some scenarios.
12.2 QF Sensitivity During the course of this study, it was noted that a co-generation plant which is also a qualified facility was not dispatched during the whole year as expected; most probably due to the outlet constraints on the Addis–Tiger 230 kV line. The curtailment of this unit is expected to impact the production cost results for both WOTAB as well as Amite South cases.
For both the WOTAB and Amite South load pockets, the production cost calculations were rerun with the Addis–Tiger upgrade for the 5B cases only. With this upgrade, the QF facility in question dispatched according to the expectations.
In general, these sensitivity case results showed the complexity of QF unit dispatch with a given historical hourly production curve. The shape of the hourly curve and the amount of energy have impacts on the solution benefit but the relationships are non-linear and counter-intuitive.
E-5439
59 MBPC Study – Summary Report
12.3 RFP Resource Sensitivity A newly proposed generation resource is being planned for commissioning in the 2015 time frame at Ninemile. A sensitivity analysis was performed for DSG and Amite South regions for 2022 conditions.
This analysis considered the following system upgrades that are also planned:
• Upgrade of Ninemile – Southport 230kV
• Update of reserve nomogram for Entergy_LPL_South and NOPSI
• Updated the DSG target levels.
The cases with the inclusion of new RFP resource showed a small decrease in production cost savings.
13 Conclusions The Entergy Regional State Committee (ERSC) and Southwest Power Pool (SPP)
commissioned the Minimizing Bulk Power Costs (MBPC) Study for identifying the most cost
effective transmission project(s) specifically for minimizing generation from the high cost units in
nine different Entergy generation plants. These generation plants are located within three main
regions: WOTAB, Amite South, and Mississippi regions and in two nested sub-regions: Western
Region within WOTAB and DSG within Amite South. Due to transmission constraints or
reliability concerns, many of the generation units within these regions are committed out of
economic order when load in the region reaches certain levels.
In this study, the cost of generation was determined by using a Security Constrained Unit
Commitment (SCUC) and Security Constrained Economic Dispatch (SCED) approach so that
the most economic utilization of all available generation resources within the Entergy footprint
for various cases is ensured. Production cost calculations were for 8,760 hours. The total cost
of generation for each case was computed as the total cost of production (fuel + VOM) plus the
cost of imports and less the cost of exports.
The transmission requirement was determined by performing a rigorous reliability evaluation of
the transmission network through the use of power flow and contingency analyses. From these
analyses, the annual carrying charge for the new transmission was calculated.
60 ABB Power Systems Consulting ERSC-SPP
A parallel and iterative process between production cost simulations for quantifying possible
savings from more economical generation and transmission analyses for identifying the cost of
transmission improvements to fully meet the transmission reliability requirements were
necessary to determine cost effective transmission solutions. For each of the five load pockets,
several cases encompassing a wide range of possibilities were formulated and analyzed. The
study covered two specific years; year 2013 (near-term) and year 2022 (horizon).
To begin, a reference case (Case 0) including the RMR rules and transmission constraints was
established. The total annual production cost for this case formed a basis for calculating any
savings from other cases. Any transmission overload or voltage violation that was the result of
the economic dispatch was considered a pre-existing condition for the study analysis.
In the first study case (Case 1), the RMR nomograms for the study units were not enforced
during the production cost simulation and no new transmission topology was included. The
existing RMR units were dispatched at a slightly lower level even though RMR rules were not
enforced. The decrease in the total generation cost for the all load pockets ranged from $0 to
$33M. This case confirmed that the main reason for the nine high cost plants being committed
and dispatched in the actual operation is transmission limitations.
In the second study case (Case 2), both the RMR rules and transmission constraints were not
enforced. From this case, a hypothetical reduction in generation cost was estimated. The
decrease in the total generation cost for the all load pockets ranged from $3M to $74M. This
case is meant for investigative purposes only because of unlimited transmission capacity
assumption.
The third study case (Case 3) was another hypothetical case where the RMR units were
intentionally turned off while transmission constraints were enforced. In all the production cost
simulations, there was load shedding in all the load pockets; thereby reconfirming that the need
to run these RMR units is based on transmission limitations.
The fourth study case (Case 4; a combination of previous two cases) was an extreme example
where the RMR units are intentionally turned off and transmission constraints were not
enforced. This case provides a theoretical maximum for generation savings and a very high
requirement for transmission yet to be determined. The range of generation cost reduction was
from $4M to $95M with unlimited transmission.
In the subsequent cases (Cases 5A and 5B1, 5B2….), the transmission necessary for reducing
the use of generation from RMR units was determined.
E-5439
61 MBPC Study – Summary Report
In 2013, the annual carrying cost of capital expenditures for the new transmission to remove the
RMR status on the study units exceeded the annual savings that may be realized from the
production cost reductions for all the load pockets.
For 2022, a few transmission additions in the WOTAB region show some promise of decreasing
the total generation cost. The two new transmission upgrades are i) a new 230 kV line from
Segura to Gibson along with the rebuilding of the existing Gibson-Humphrey-Greenwood-
Terrebonne from 115 kV line to 230 kV and ii) a second 500/230 kV transformer at Nelson. The
calculated benefit/cost ratios are greater than 1.
For the DSG region in 2022, there was at least one transmission alternative where the benefit
from lower annual production cost due to removal of RMR status on the study units exceeded
the yearly carrying charge of the transmission cost. Even though the generation savings is not
very significant, the benefit/cost ratio is about 2 because of the modest transmission additions; i)
Snakefarm-Labarre-Southport 230 kV line re-conductor, ii) Prospect-Good Hope-Destrehan 230
kV line re-conductor and iii) Waterford-Waggaman 230 kV line re-rate.
The sensitivity analysis showed that higher gas prices will increase the benefit of the
transmission solution and lower gas prices will reduce it. With constant capital cost, the
benefit/cost ratio will increase with higher gas prices and reduce with lower gas prices. With a
30% gas price reduction, the above mentioned transmission solution for WOTAB was still cost
effective.
The specific transmission alternatives identified for the WOTAB and DSG regions that show
positive results may require further study, e.g. stability analysis, prior to committing to
construction of these projects.
Also, upon evaluation of the individual load pockets, it was found that there are some
transmission upgrades that may be common to different load pockets, such as the Segura-
Gibson-Humphrey-Greenwood-Terrebonne 230 kV line. This upgrade was found to benefit both
the WOTAB and Amite South load pockets. As next a step, a sensitivity study combining all the
load pockets may be performed in order to quantify the overall potential benefit over the shared
upgrade cost.