Embed Size (px)
Citation preview
ESR study of Mn doped II±VI and III±V DMS
H. Nojiri a,*, M. Motokawa a, S. Takeyama b, F. Matsukura c, H. Ohno c
a Institute for Material Research, Tohoku University, Sendai 980-8577, Japanb Department of Physics, Himeji Institute of Technology, Ako-gun, Hyogo 678-1297, Japan
c Research Institute of Electrical Communication, Tohoku University, Sendai 980-8577, Japan
Abstract
We have measured the submillimeter wave ESR of II±VI and III±V semiconductors doped with Mn ions to study
their electronic states. In Cd0:65Mn0:35Te, a crossover from the broadened ESR absorption to an ordinal easy-plane type
antiferromagnetic resonance has been observed around 13 T. This crossover ®eld gives the measure of the distribution
of the exchange ®elds in the spinglass state. On the other hand, a ferromagnetic resonance has been observed in
Ga1ÿxMnxAs(x� 0.029, 0.034). The g-value has been determined as g� 2.0 which corresponds to the Mn2� ions.
The saturation magnetization has also been estimated and considerable reduction was found. Ó 1998 Elsevier Science
B.V. All rights reserved.
Keywords: Cd1)xMnxTe; Ga1)xMnxAs; ESR; Diluted magnetic semiconductor
1. Introduction
Recent discovery of ferromagnetism in Mndoped III±V diluted magnetic semiconductors(DMS) has attracted much interests from the viewpoint of using the spin degrees of freedom in semi-conductor devices [1±3]. Since this ferromagnetismappears in highly hole doped samples, it has beenconsidered that the ferromagnetic interaction iscaused presumably by the moving carriers. How-ever, the charge state of Mn ions and their cou-pling with doped holes have been still unclear. Incontrast to III±V DMS, antiferromagnetic super-exchange interaction is dominant in II±VI DMSsuch as Cd1-xMnxTe. It gives rise to a spinglass or-dering which may have some similarity with III±VIDMS with very low hole concentrations. As is well
known, ESR is a useful probe to study the magnet-ic ions doped in semiconductor. But in the magnet-ically ordered semiconductor, the line width ofESR shows the considerable broadening due tothe exchange couplings and it is essential to usethe submillimeter wave ESR to observe the signalsin the ordered states. In the following, we will re-port the results of the submillimeter wave ESR ex-periments on both Cd1ÿxMnxTe and Ga1ÿxMnxAsand discuss the electronic states of Mn ions and ex-change interactions.
2. Experimental
A submillimeter wave ESR system with thefrequency range of 0.03±7 THz has been used forexperiments. A far-infrared (FIR) laser, backwardtraveling wave tubes, and Gunn oscillators areemployed as the radiation sources. Pulsed magnet-ic ®elds up to 40 T is generated and a simple
Physica B 256±258 (1998) 569±572
* Corresponding author. Tel.: +81-22-215-2019; fax: +81-22-
215-2016; e-mail: [email protected]
0921-4526/98/$ ± see front matter Ó 1998 Elsevier Science B.V. All rights reserved.
PII: S 0 9 2 1 - 4 5 2 6 ( 9 8 ) 0 0 5 0 4 - 3
transmission method is used with a InSb detector.A bulk sample of non-doped Cd0:65Mn0:35Te hasbeen used for experiments. A ®lm of Ga1ÿxMnxAsof 2000 nm thickness grown by MBE technique onsemi-insulating GaAs substrate has been used. Ithas been con®rmed that this GaAs substrate itselfshows no ESR signal caused by an impurity.
3. ESR of Cd0:65Mn0:35Te
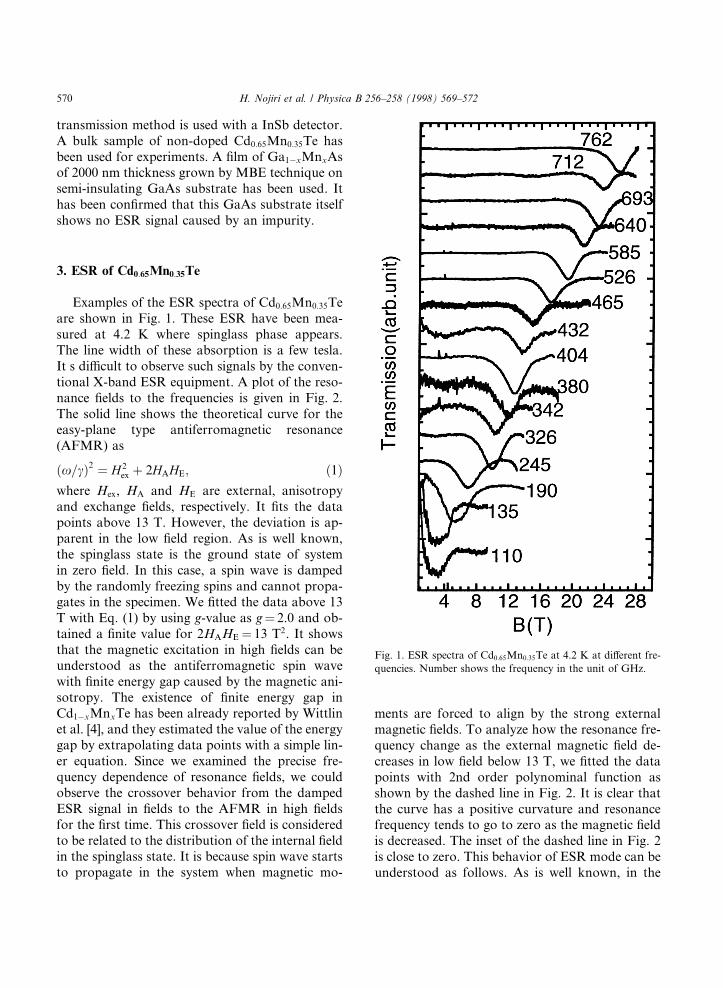
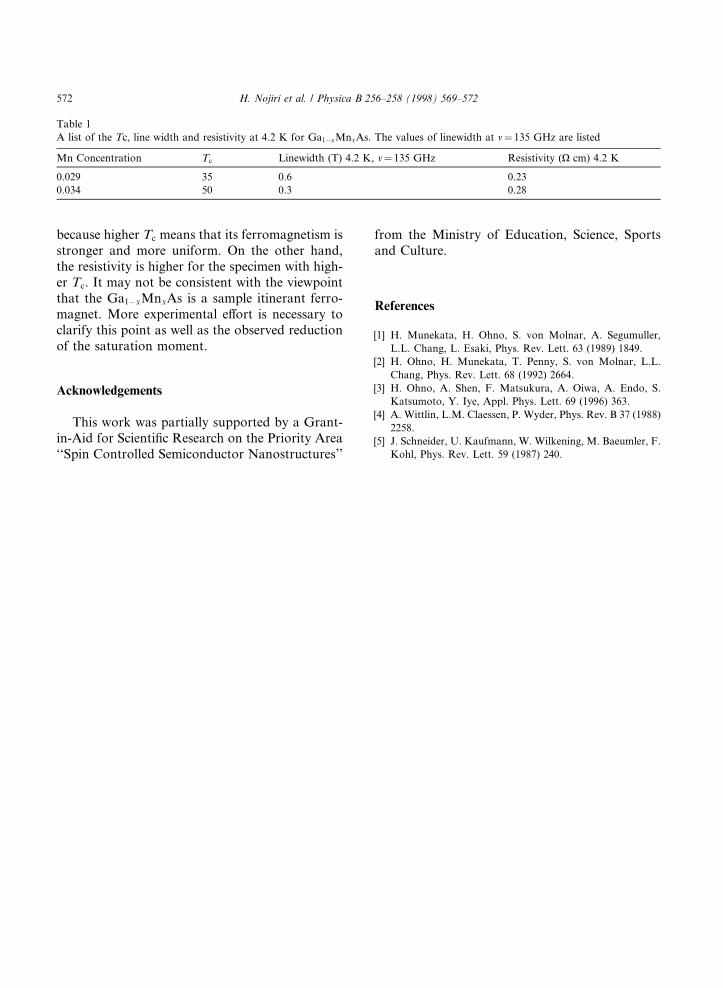
Examples of the ESR spectra of Cd0:65Mn0:35Teare shown in Fig. 1. These ESR have been mea-sured at 4.2 K where spinglass phase appears.The line width of these absorption is a few tesla.It s di�cult to observe such signals by the conven-tional X-band ESR equipment. A plot of the reso-nance ®elds to the frequencies is given in Fig. 2.The solid line shows the theoretical curve for theeasy-plane type antiferromagnetic resonance(AFMR) as
�x=c�2 � H 2ex � 2HAHE; �1�
where Hex, HA and HE are external, anisotropyand exchange ®elds, respectively. It ®ts the datapoints above 13 T. However, the deviation is ap-parent in the low ®eld region. As is well known,the spinglass state is the ground state of systemin zero ®eld. In this case, a spin wave is dampedby the randomly freezing spins and cannot propa-gates in the specimen. We ®tted the data above 13T with Eq. (1) by using g-value as g� 2.0 and ob-tained a ®nite value for 2HAHE� 13 T2. It showsthat the magnetic excitation in high ®elds can beunderstood as the antiferromagnetic spin wavewith ®nite energy gap caused by the magnetic ani-sotropy. The existence of ®nite energy gap inCd1ÿxMnxTe has been already reported by Wittlinet al. [4], and they estimated the value of the energygap by extrapolating data points with a simple lin-er equation. Since we examined the precise fre-quency dependence of resonance ®elds, we couldobserve the crossover behavior from the dampedESR signal in ®elds to the AFMR in high ®eldsfor the ®rst time. This crossover ®eld is consideredto be related to the distribution of the internal ®eldin the spinglass state. It is because spin wave startsto propagate in the system when magnetic mo-
ments are forced to align by the strong externalmagnetic ®elds. To analyze how the resonance fre-quency change as the external magnetic ®eld de-creases in low ®eld below 13 T, we ®tted the datapoints with 2nd order polynominal function asshown by the dashed line in Fig. 2. It is clear thatthe curve has a positive curvature and resonancefrequency tends to go to zero as the magnetic ®eldis decreased. The inset of the dashed line in Fig. 2is close to zero. This behavior of ESR mode can beunderstood as follows. As is well known, in the
Fig. 1. ESR spectra of Cd0:65Mn0:35Te at 4.2 K at di�erent fre-
quencies. Number shows the frequency in the unit of GHz.
570 H. Nojiri et al. / Physica B 256±258 (1998) 569±572
spin glass system, the spatial average of the inter-nal ®elds around magnetic ions is expected to bezero. It means that there is no uniform modewhich causes the uniform Larmor precession ofthe magnetic moments in the zero ®eld limit.
4. Ferromagnetic resonance of Ga1ÿxMnxAs
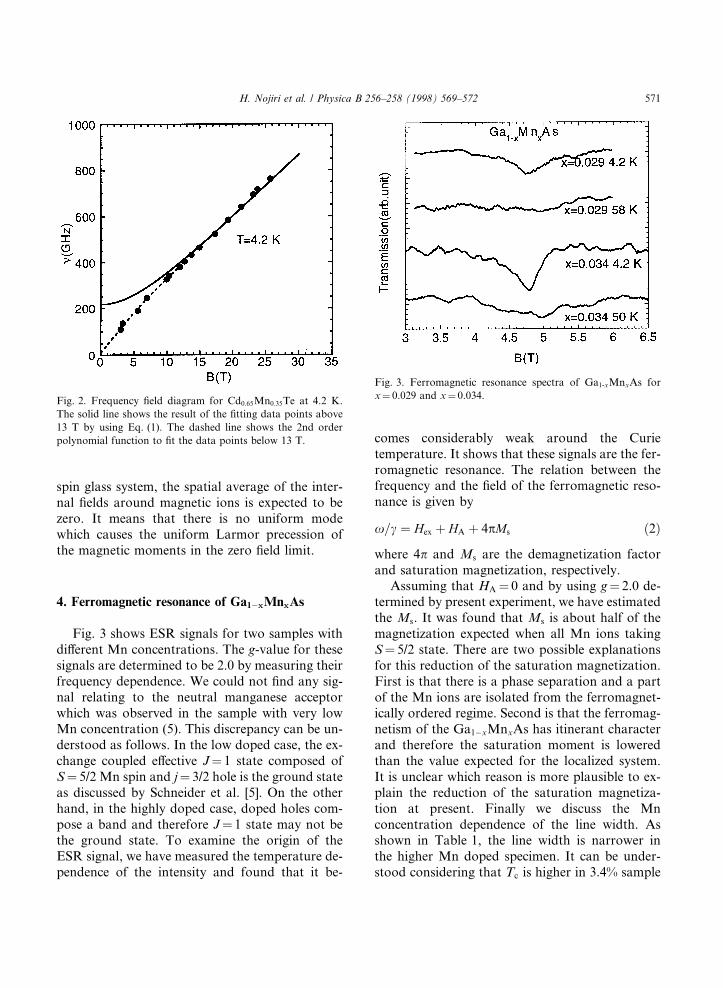
Fig. 3 shows ESR signals for two samples withdi�erent Mn concentrations. The g-value for thesesignals are determined to be 2.0 by measuring theirfrequency dependence. We could not ®nd any sig-nal relating to the neutral manganese acceptorwhich was observed in the sample with very lowMn concentration (5). This discrepancy can be un-derstood as follows. In the low doped case, the ex-change coupled e�ective J� 1 state composed ofS� 5/2 Mn spin and j� 3/2 hole is the ground stateas discussed by Schneider et al. [5]. On the otherhand, in the highly doped case, doped holes com-pose a band and therefore J� 1 state may not bethe ground state. To examine the origin of theESR signal, we have measured the temperature de-pendence of the intensity and found that it be-
comes considerably weak around the Curietemperature. It shows that these signals are the fer-romagnetic resonance. The relation between thefrequency and the ®eld of the ferromagnetic reso-nance is given by
x=c � Hex � HA � 4pMs �2�where 4p and Ms are the demagnetization factorand saturation magnetization, respectively.
Assuming that HA� 0 and by using g� 2.0 de-termined by present experiment, we have estimatedthe Ms. It was found that Ms is about half of themagnetization expected when all Mn ions takingS� 5/2 state. There are two possible explanationsfor this reduction of the saturation magnetization.First is that there is a phase separation and a partof the Mn ions are isolated from the ferromagnet-ically ordered regime. Second is that the ferromag-netism of the Ga1ÿxMnxAs has itinerant characterand therefore the saturation moment is loweredthan the value expected for the localized system.It is unclear which reason is more plausible to ex-plain the reduction of the saturation magnetiza-tion at present. Finally we discuss the Mnconcentration dependence of the line width. Asshown in Table 1, the line width is narrower inthe higher Mn doped specimen. It can be under-stood considering that Tc is higher in 3.4% sample
Fig. 3. Ferromagnetic resonance spectra of Ga1-xMnxAs for
x� 0.029 and x� 0.034.Fig. 2. Frequency ®eld diagram for Cd0:65Mn0:35Te at 4.2 K.
The solid line shows the result of the ®tting data points above
13 T by using Eq. (1). The dashed line shows the 2nd order
polynomial function to ®t the data points below 13 T.
H. Nojiri et al. / Physica B 256±258 (1998) 569±572 571
because higher Tc means that its ferromagnetism isstronger and more uniform. On the other hand,the resistivity is higher for the specimen with high-er Tc. It may not be consistent with the viewpointthat the Ga1ÿxMnxAs is a sample itinerant ferro-magnet. More experimental e�ort is necessary toclarify this point as well as the observed reductionof the saturation moment.
Acknowledgements
This work was partially supported by a Grant-in-Aid for Scienti®c Research on the Priority Area``Spin Controlled Semiconductor Nanostructures''
from the Ministry of Education, Science, Sportsand Culture.
References
[1] H. Munekata, H. Ohno, S. von Molnar, A. Segumuller,
L.L. Chang, L. Esaki, Phys. Rev. Lett. 63 (1989) 1849.
[2] H. Ohno, H. Munekata, T. Penny, S. von Molnar, L.L.
Chang, Phys. Rev. Lett. 68 (1992) 2664.
[3] H. Ohno, A. Shen, F. Matsukura, A. Oiwa, A. Endo, S.
Katsumoto, Y. Iye, Appl. Phys. Lett. 69 (1996) 363.
[4] A. Wittlin, L.M. Claessen, P. Wyder, Phys. Rev. B 37 (1988)
2258.
[5] J. Schneider, U. Kaufmann, W. Wilkening, M. Baeumler, F.
Kohl, Phys. Rev. Lett. 59 (1987) 240.
Table 1
A list of the Tc, line width and resistivity at 4.2 K for Ga1ÿxMnxAs. The values of linewidth at m� 135 GHz are listed
Mn Concentration Tc Linewidth (T) 4.2 K, m� 135 GHz Resistivity (X cm) 4.2 K
0.029 35 0.6 0.23
0.034 50 0.3 0.28
572 H. Nojiri et al. / Physica B 256±258 (1998) 569±572