Embed Size (px)
Citation preview
BioMed CentralCarbon Balance and Management
ss
Open AcceResearchEstimates of CO2 from fires in the United States: implications for carbon managementChristine Wiedinmyer*1 and Jason C Neff2Address: 1Atmospheric Chemistry Division/The Institute for Integrative and Multidisciplinary Earth Studies, National Center for Atmospheric Research, Boulder, CO, USA and 2Geological Sciences Department and Environmental Studies Program, University of Colorado, Boulder, CO, USA
Email: Christine Wiedinmyer* - [email protected]; Jason C Neff - [email protected]
* Corresponding author
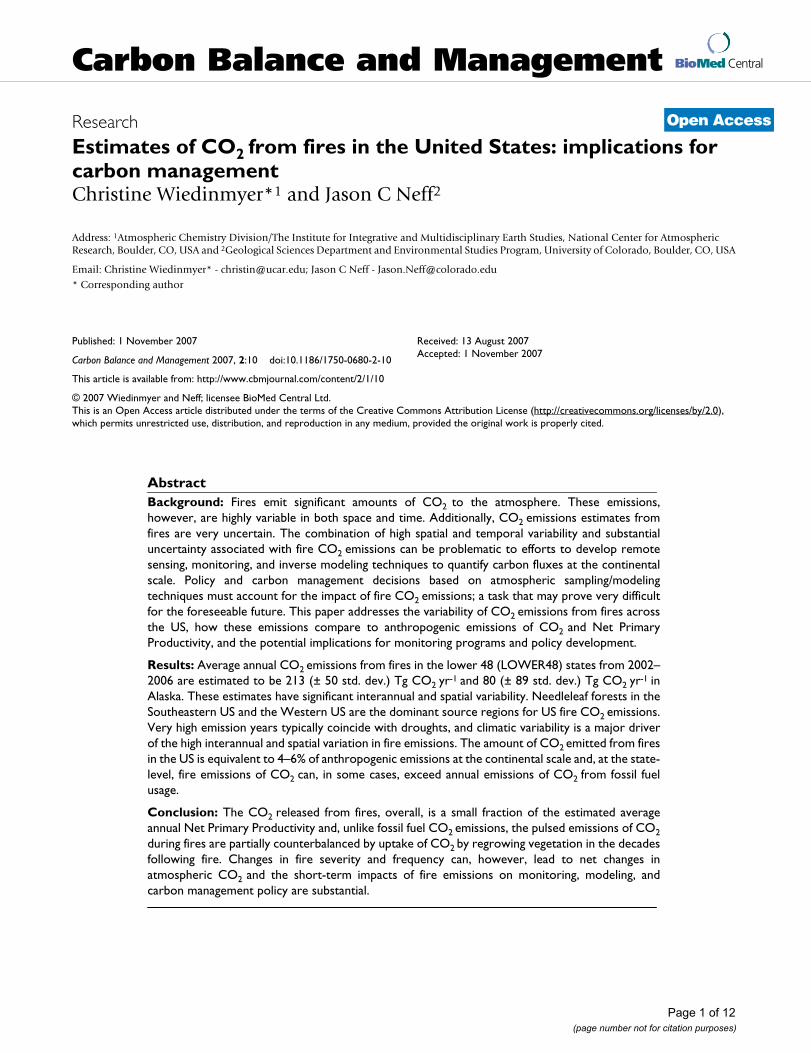
AbstractBackground: Fires emit significant amounts of CO2 to the atmosphere. These emissions,however, are highly variable in both space and time. Additionally, CO2 emissions estimates fromfires are very uncertain. The combination of high spatial and temporal variability and substantialuncertainty associated with fire CO2 emissions can be problematic to efforts to develop remotesensing, monitoring, and inverse modeling techniques to quantify carbon fluxes at the continentalscale. Policy and carbon management decisions based on atmospheric sampling/modelingtechniques must account for the impact of fire CO2 emissions; a task that may prove very difficultfor the foreseeable future. This paper addresses the variability of CO2 emissions from fires acrossthe US, how these emissions compare to anthropogenic emissions of CO2 and Net PrimaryProductivity, and the potential implications for monitoring programs and policy development.
Results: Average annual CO2 emissions from fires in the lower 48 (LOWER48) states from 2002–2006 are estimated to be 213 (± 50 std. dev.) Tg CO2 yr-1 and 80 (± 89 std. dev.) Tg CO2 yr-1 inAlaska. These estimates have significant interannual and spatial variability. Needleleaf forests in theSoutheastern US and the Western US are the dominant source regions for US fire CO2 emissions.Very high emission years typically coincide with droughts, and climatic variability is a major driverof the high interannual and spatial variation in fire emissions. The amount of CO2 emitted from firesin the US is equivalent to 4–6% of anthropogenic emissions at the continental scale and, at the state-level, fire emissions of CO2 can, in some cases, exceed annual emissions of CO2 from fossil fuelusage.
Conclusion: The CO2 released from fires, overall, is a small fraction of the estimated averageannual Net Primary Productivity and, unlike fossil fuel CO2 emissions, the pulsed emissions of CO2during fires are partially counterbalanced by uptake of CO2 by regrowing vegetation in the decadesfollowing fire. Changes in fire severity and frequency can, however, lead to net changes inatmospheric CO2 and the short-term impacts of fire emissions on monitoring, modeling, andcarbon management policy are substantial.
Published: 1 November 2007
Carbon Balance and Management 2007, 2:10 doi:10.1186/1750-0680-2-10
Received: 13 August 2007Accepted: 1 November 2007
This article is available from: http://www.cbmjournal.com/content/2/1/10
© 2007 Wiedinmyer and Neff; licensee BioMed Central Ltd. This is an Open Access article distributed under the terms of the Creative Commons Attribution License (http://creativecommons.org/licenses/by/2.0), which permits unrestricted use, distribution, and reproduction in any medium, provided the original work is properly cited.
Page 1 of 12(page number not for citation purposes)
Carbon Balance and Management 2007, 2:10 http://www.cbmjournal.com/content/2/1/10
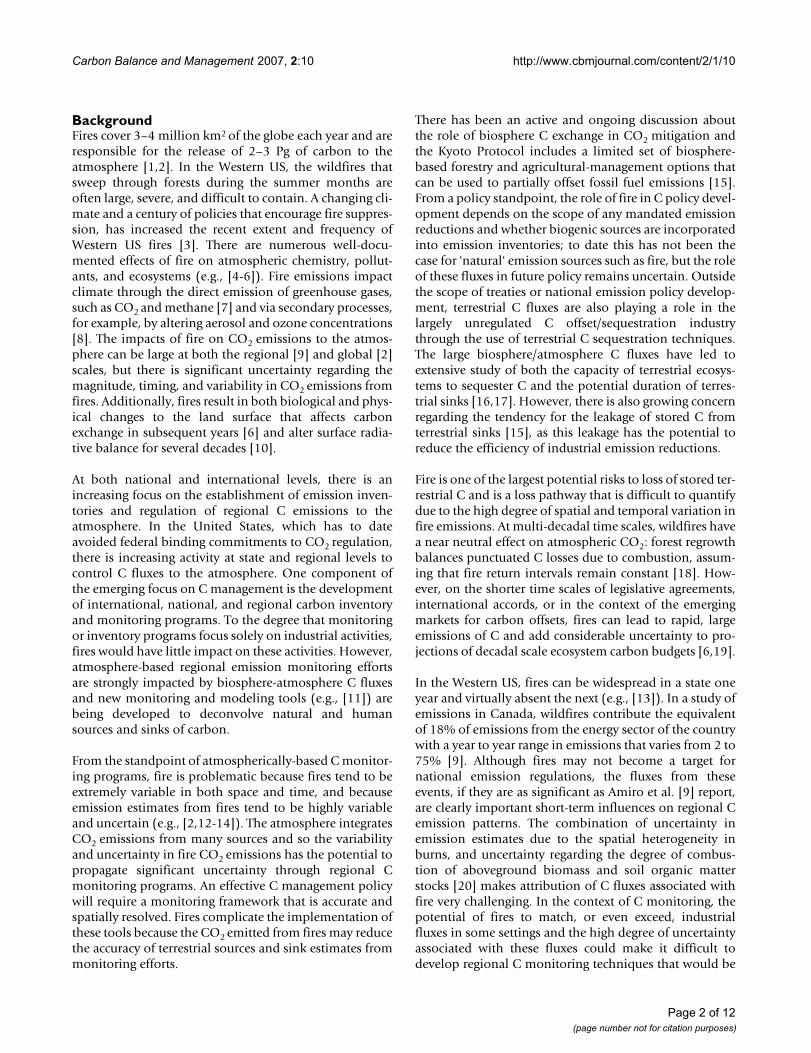
BackgroundFires cover 3–4 million km2 of the globe each year and areresponsible for the release of 2–3 Pg of carbon to theatmosphere [1,2]. In the Western US, the wildfires thatsweep through forests during the summer months areoften large, severe, and difficult to contain. A changing cli-mate and a century of policies that encourage fire suppres-sion, has increased the recent extent and frequency ofWestern US fires [3]. There are numerous well-docu-mented effects of fire on atmospheric chemistry, pollut-ants, and ecosystems (e.g., [4-6]). Fire emissions impactclimate through the direct emission of greenhouse gases,such as CO2 and methane [7] and via secondary processes,for example, by altering aerosol and ozone concentrations[8]. The impacts of fire on CO2 emissions to the atmos-phere can be large at both the regional [9] and global [2]scales, but there is significant uncertainty regarding themagnitude, timing, and variability in CO2 emissions fromfires. Additionally, fires result in both biological and phys-ical changes to the land surface that affects carbonexchange in subsequent years [6] and alter surface radia-tive balance for several decades [10].
At both national and international levels, there is anincreasing focus on the establishment of emission inven-tories and regulation of regional C emissions to theatmosphere. In the United States, which has to dateavoided federal binding commitments to CO2 regulation,there is increasing activity at state and regional levels tocontrol C fluxes to the atmosphere. One component ofthe emerging focus on C management is the developmentof international, national, and regional carbon inventoryand monitoring programs. To the degree that monitoringor inventory programs focus solely on industrial activities,fires would have little impact on these activities. However,atmosphere-based regional emission monitoring effortsare strongly impacted by biosphere-atmosphere C fluxesand new monitoring and modeling tools (e.g., [11]) arebeing developed to deconvolve natural and humansources and sinks of carbon.
From the standpoint of atmospherically-based C monitor-ing programs, fire is problematic because fires tend to beextremely variable in both space and time, and becauseemission estimates from fires tend to be highly variableand uncertain (e.g., [2,12-14]). The atmosphere integratesCO2 emissions from many sources and so the variabilityand uncertainty in fire CO2 emissions has the potential topropagate significant uncertainty through regional Cmonitoring programs. An effective C management policywill require a monitoring framework that is accurate andspatially resolved. Fires complicate the implementation ofthese tools because the CO2 emitted from fires may reducethe accuracy of terrestrial sources and sink estimates frommonitoring efforts.
There has been an active and ongoing discussion aboutthe role of biosphere C exchange in CO2 mitigation andthe Kyoto Protocol includes a limited set of biosphere-based forestry and agricultural-management options thatcan be used to partially offset fossil fuel emissions [15].From a policy standpoint, the role of fire in C policy devel-opment depends on the scope of any mandated emissionreductions and whether biogenic sources are incorporatedinto emission inventories; to date this has not been thecase for 'natural' emission sources such as fire, but the roleof these fluxes in future policy remains uncertain. Outsidethe scope of treaties or national emission policy develop-ment, terrestrial C fluxes are also playing a role in thelargely unregulated C offset/sequestration industrythrough the use of terrestrial C sequestration techniques.The large biosphere/atmosphere C fluxes have led toextensive study of both the capacity of terrestrial ecosys-tems to sequester C and the potential duration of terres-trial sinks [16,17]. However, there is also growing concernregarding the tendency for the leakage of stored C fromterrestrial sinks [15], as this leakage has the potential toreduce the efficiency of industrial emission reductions.
Fire is one of the largest potential risks to loss of stored ter-restrial C and is a loss pathway that is difficult to quantifydue to the high degree of spatial and temporal variation infire emissions. At multi-decadal time scales, wildfires havea near neutral effect on atmospheric CO2: forest regrowthbalances punctuated C losses due to combustion, assum-ing that fire return intervals remain constant [18]. How-ever, on the shorter time scales of legislative agreements,international accords, or in the context of the emergingmarkets for carbon offsets, fires can lead to rapid, largeemissions of C and add considerable uncertainty to pro-jections of decadal scale ecosystem carbon budgets [6,19].
In the Western US, fires can be widespread in a state oneyear and virtually absent the next (e.g., [13]). In a study ofemissions in Canada, wildfires contribute the equivalentof 18% of emissions from the energy sector of the countrywith a year to year range in emissions that varies from 2 to75% [9]. Although fires may not become a target fornational emission regulations, the fluxes from theseevents, if they are as significant as Amiro et al. [9] report,are clearly important short-term influences on regional Cemission patterns. The combination of uncertainty inemission estimates due to the spatial heterogeneity inburns, and uncertainty regarding the degree of combus-tion of aboveground biomass and soil organic matterstocks [20] makes attribution of C fluxes associated withfire very challenging. In the context of C monitoring, thepotential of fires to match, or even exceed, industrialfluxes in some settings and the high degree of uncertaintyassociated with these fluxes could make it difficult todevelop regional C monitoring techniques that would be
Page 2 of 12(page number not for citation purposes)
Carbon Balance and Management 2007, 2:10 http://www.cbmjournal.com/content/2/1/10
capable of providing sufficient source/sink informationfor policy development or implementation.
Fire return intervals in forested US ecosystems vary, butrange from decades in semi-arid interior forests to centu-ries for coastal ecosystems [21]. There has been muchdebate over the role of historical land management prac-tices, such as fire suppression, in contemporary fire andforest growth patterns and a growing discussion of howwildfires will respond to climate change (e.g., [3,22,23]).The long duration of forest regrowth between fire eventsand the variability in the magnitude of C emission duringfire highlights the uncertainty of this aspect of terrestrial Ccycling. In the Kyoto protocol, the complex nature of ter-restrial sources and sinks led to a relatively narrow defini-tion of the types of terrestrial C sequestration activitiesthat could be used to meet treaty objectives [24]. Thesesequestration activities thus far have been largely con-strained to agricultural management and reforestationprojects, although there has been a vigorous and ongoingdebate about the appropriate scope of terrestrial C seques-tration activities [25]. At regional and national levels, ter-restrial sinks driven by historic land use change, such asreforestation efforts, can be sizeable [26] and may repre-sent an attractive target in future C mitigation negotia-tions. Similarly, fire mitigation programs such as forestthinning may reduce the severity or extent of fires, butmay also have uncertain impacts on sequestered carbon(depending on the fate of C removed from forests). Fromthis standpoint, the potential for C losses from fire repre-sents a risk to C sequestration potential and a factor thatneeds to be considered in discussions regarding appropri-ate credit for terrestrial sinks in atmospheric C mitigation.
In this study, we evaluate the role that fire plays in carbonemissions from a number of states throughout the US.The motivation, following Amiro et al., [9], is, in part, toassess the degree to which fire can influence regional car-bon budgets and the year to year and state to state varia-bility of the potential impacts. This is the first study ofwhich we are aware that includes the spatial and temporalresolution of fire CO2 emissions for the US, and assessesthe importance of these emissions compared to fossil fuelburning CO2 emissions. We also focus on the role that firemay play in longer-term ecosystem C budgets by compar-ing fire emissions to Net Primary Productivity (NPP) in arange of ecosystems at a regional level. Through thesecomparisons, our goal is to more clearly delineate the rolethat fire is playing in regional C budgets with the hope ofproviding some insight into the impact that fire may haveon both C monitoring and management plans in thefuture.
Results and discussionCO2 emissions from firesDaily CO2 emissions from fires in North America wereestimated for 2002 through 2006 using the methodsdescribed by Wiedinmyer et. al. [13]. Annually, the aver-age CO2 emitted from fires in the lower 48 (LOWER48)states from 2002–2006 is estimated to be 213 (± 50 std.dev.) Tg CO2 yr-1 and 80 (± 89 std. dev.) Tg CO2 yr-1 inAlaska. There is substantial variation in the overall magni-tude of annual emissions from states in the US, rangingfrom the average of 80 Tg of CO2 in Alaska to < 0.01 TgCO2 in Rhode Island and Vermont. Emissions from theNortheastern and Midwestern US states tend to be verysmall; the annual emissions from the US are dominatedby the Western and Southeastern US states. For manyWestern and Southeastern US States, there are largeannual fire emissions of CO2 averaging ~10 Tg CO2 (withan average coefficient of variance of more than 50%). TheNortheastern states have the least amount of emissionsper area: Vermont, Rhode Island, Maine, and New Hamp-shire all have an average annual fire emission of <1 metricton CO2 km-2. The Southeastern and Western states havethe largest amount of CO2 from fires: Alabama, Florida,Georgia, Louisiana, and Washington all have an averageannual fire emission > 75 metric ton CO2 km-2.
The interannual variability in the annual emission esti-mates is substantial. In the LOWER48, the annual emis-sions from year to year vary as much as a factor of 1.8, andin Alaska, the annual CO2 estimates vary by over an orderof magnitude. Overall, the interannual variance of fireemissions in the Southeastern US is lower than in theWestern US. This interannual variability could arise fromseveral causes, including changes in meteorology and cli-mate (e.g., drought) and land management practices thatdeal with agricultural and prescribed burning.
Fires occur within the US for a number of reasons, includ-ing wildfires started from both natural and anthropogeniccauses, prescribed burning, and burning for agriculturalpurposes. An analysis of the fire emission estimates pre-sented here shows that the majority of the emissions fromfires in the US are from needleleaf forests. For 2006,needleleaf forests are estimated to emit 78% of the CO2emissions from continental US fires. This suggests that,although important, natural and prescribed burning ingrasslands and burning in croplands for agricultural pur-poses does not contribute significantly to the overallannual US CO2 fire emissions inventory. CO2 emissionsfrom grasslands account for 5% of the 2006 estimated fireemissions inventory, and emissions from croplands con-tribute <3%. In both the Western and the SoutheasternUS, 86% of the estimated 2006 CO2 emissions come fromneedleleaf forests.
Page 3 of 12(page number not for citation purposes)
Carbon Balance and Management 2007, 2:10 http://www.cbmjournal.com/content/2/1/10
The amount of area burned for management practices(prescribed burns) varies by region. In the SoutheasternUS, the majority of acreage burned is via prescribed burns.According to the National Interagency Fire Center (NIFC;[27]) less than one third of the reported area burned in2006 in the Southeastern states was due to wildfires; twothirds of the area burned was the result of prescribedburns. In Alabama, 94% of the 2006 reported burn areawas attributed to prescribed burns. Since prescribed burnsin the Southeastern US tend to occur between Novemberand April [28] and the majority of emissions in this regioncome from needleleaf forests, we assume that much of theemissions through the spring and fall months (discussedbelow) can be primarily attributed to prescribed burns inforested areas.
In the Western US, fire-related CO2 emissions are domi-nantly related to wildfire activity. A report for the WesternRegional Air Partnership [29] estimates that 57% of theacreage burned in 2002 in the Western US States was dueto wildfires, 23% for agricultural purposes, and theremainder for land management practices. Although thepercentage of agricultural burned area was significant, theamount of biomass burned, and therefore the emissions,were relatively small in the overall inventory.
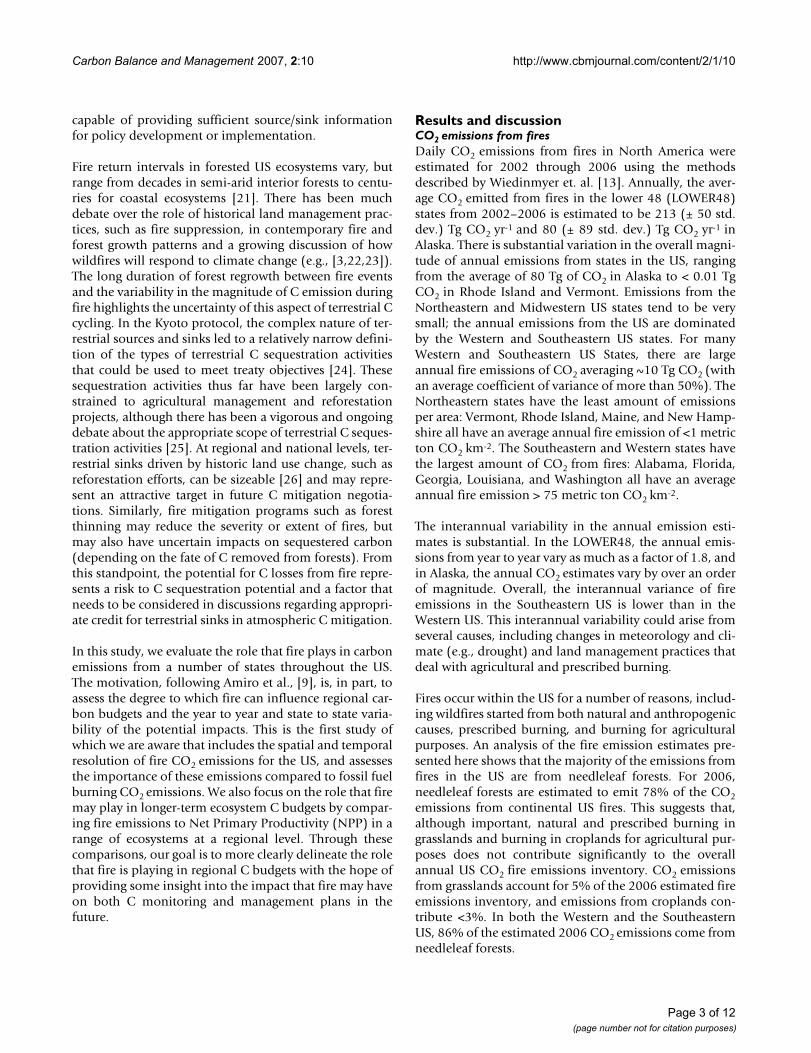
Seasonal variation in fire CO2 emissionsThere is strong seasonal variation in fire CO2 emissions,with regional differences in the peak emissions across theUS. Generally, the monthly emissions of CO2 from fires inthe LOWER48 have two peaks: a small peak during thespring months (March and April) and a larger peak duringthe summer months (Figure 1). These two peaks are
Annual emissions of CO2 from firesFigure 1Annual emissions of CO2 from fires. Monthly emissions of CO2 from fires for the LOWER48, averaged for 2002–2006. The error bars represent the standard deviation of the monthly emissions for the 5 years.
Page 4 of 12(page number not for citation purposes)
Carbon Balance and Management 2007, 2:10 http://www.cbmjournal.com/content/2/1/10
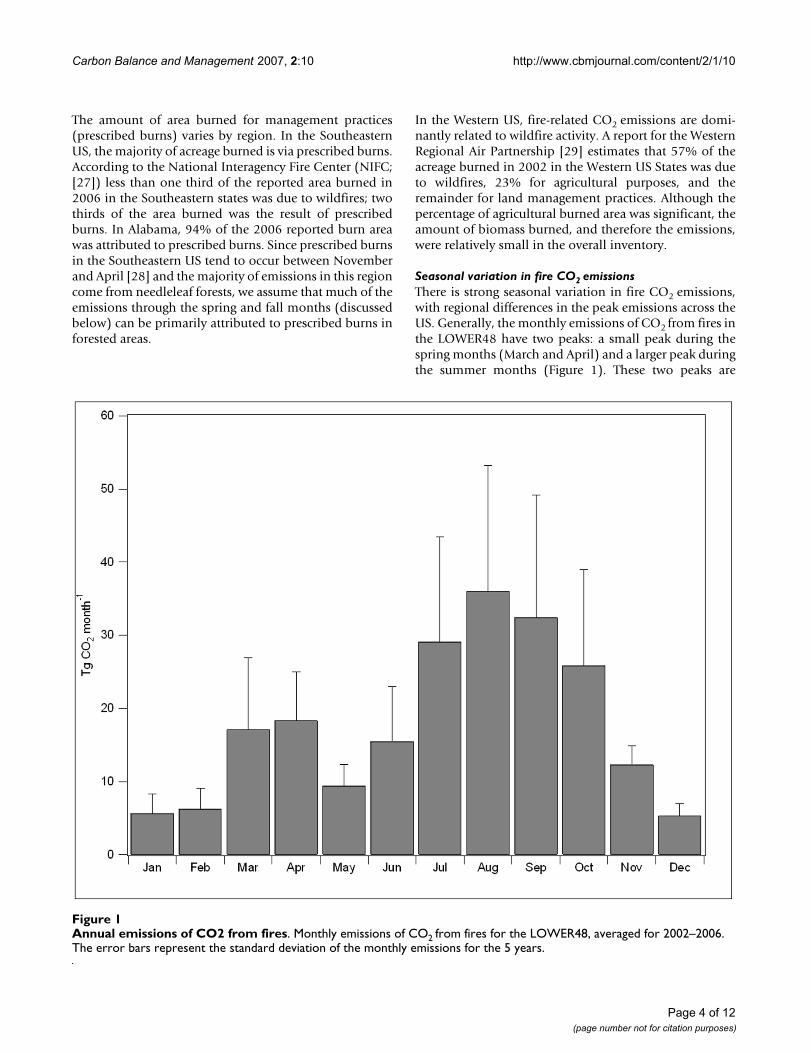
driven by the timing of fires in two distinct portions of theUS, with spring fire emissions dominated by fires in theSoutheastern and Central US, and summer fire emissionsdriven by emissions for the Western US (Figure 2).
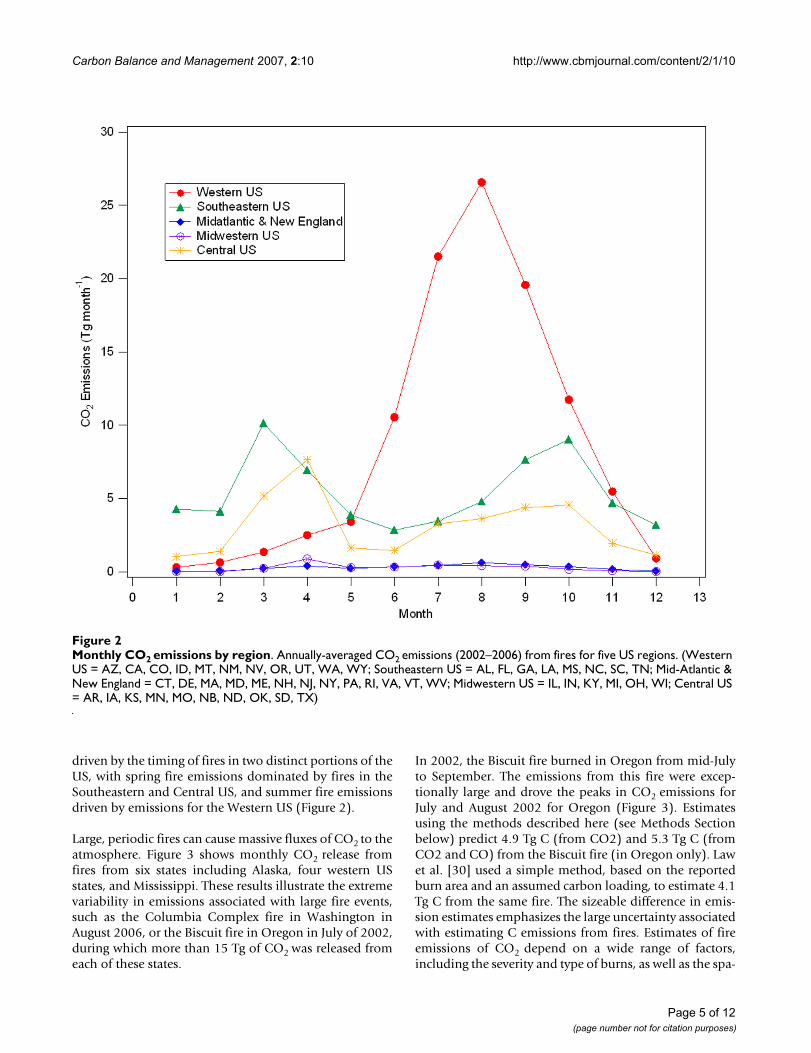
Large, periodic fires can cause massive fluxes of CO2 to theatmosphere. Figure 3 shows monthly CO2 release fromfires from six states including Alaska, four western USstates, and Mississippi. These results illustrate the extremevariability in emissions associated with large fire events,such as the Columbia Complex fire in Washington inAugust 2006, or the Biscuit fire in Oregon in July of 2002,during which more than 15 Tg of CO2 was released fromeach of these states.
In 2002, the Biscuit fire burned in Oregon from mid-Julyto September. The emissions from this fire were excep-tionally large and drove the peaks in CO2 emissions forJuly and August 2002 for Oregon (Figure 3). Estimatesusing the methods described here (see Methods Sectionbelow) predict 4.9 Tg C (from CO2) and 5.3 Tg C (fromCO2 and CO) from the Biscuit fire (in Oregon only). Lawet al. [30] used a simple method, based on the reportedburn area and an assumed carbon loading, to estimate 4.1Tg C from the same fire. The sizeable difference in emis-sion estimates emphasizes the large uncertainty associatedwith estimating C emissions from fires. Estimates of fireemissions of CO2 depend on a wide range of factors,including the severity and type of burns, as well as the spa-
Monthly CO2 emissions by regionFigure 2Monthly CO2 emissions by region. Annually-averaged CO2 emissions (2002–2006) from fires for five US regions. (Western US = AZ, CA, CO, ID, MT, NM, NV, OR, UT, WA, WY; Southeastern US = AL, FL, GA, LA, MS, NC, SC, TN; Mid-Atlantic & New England = CT, DE, MA, MD, ME, NH, NJ, NY, PA, RI, VA, VT, WV; Midwestern US = IL, IN, KY, MI, OH, WI; Central US = AR, IA, KS, MN, MO, NB, ND, OK, SD, TX)
Page 5 of 12(page number not for citation purposes)
Carbon Balance and Management 2007, 2:10 http://www.cbmjournal.com/content/2/1/10
tial heterogeneity of vegetation and fire intensity [2,6].Combined, these factors make it exceptionally difficult toaccurately measure C emissions from field-based tech-niques, regardless of methods used. Unfortunately,remote sensing-based methods also result in highly uncer-tain C flux estimates for fire, and there is currently no clear
method available to reduce these uncertainties [19].Given these complexities, the flux estimates for the Biscuitfire made by this study and the Law et. al. [30] study areprobably about as similar as can be expected. Law et. al.[30] applied a reported burn area, while the methodemployed in this study applied a burn area based on
Monthly state CO2 emissionsFigure 3Monthly state CO2 emissions. Monthly emissions of CO2 from fires for selected states.
Page 6 of 12(page number not for citation purposes)
Carbon Balance and Management 2007, 2:10 http://www.cbmjournal.com/content/2/1/10
remote sensing observations. Both methods used differentfuel loading estimates and emission factors. The impact ofinherent uncertainty in emission estimates is that the highdegree of variability (e.g., >25% of the flux) in fire emis-sion estimates is not likely to be reduced soon and hasimplications for both our understanding of fires in theglobal carbon cycle and our ability to monitor and assessthe causes of biosphere-atmosphere fluxes at a regionalscale.
Fires and regional CO2 emissionsA striking implication of very large wildfires is that asevere fire season lasting only one or two months canrelease as much carbon as the annual emissions from theentire transportation or energy sector of an individualstate. While the long-term atmospheric implications ofwildfire and fossil-fuel C release can be strikingly differ-ent, the pulsed emission releases from wildfire events canmatch or even exceed monthly or annual industrial emis-sions on a regional basis. To examine the role of wildfirein the context of industrial emissions, we comparenational and state level emissions of CO2 from fossil fuelcombustion to our estimated fire emissions of CO2.
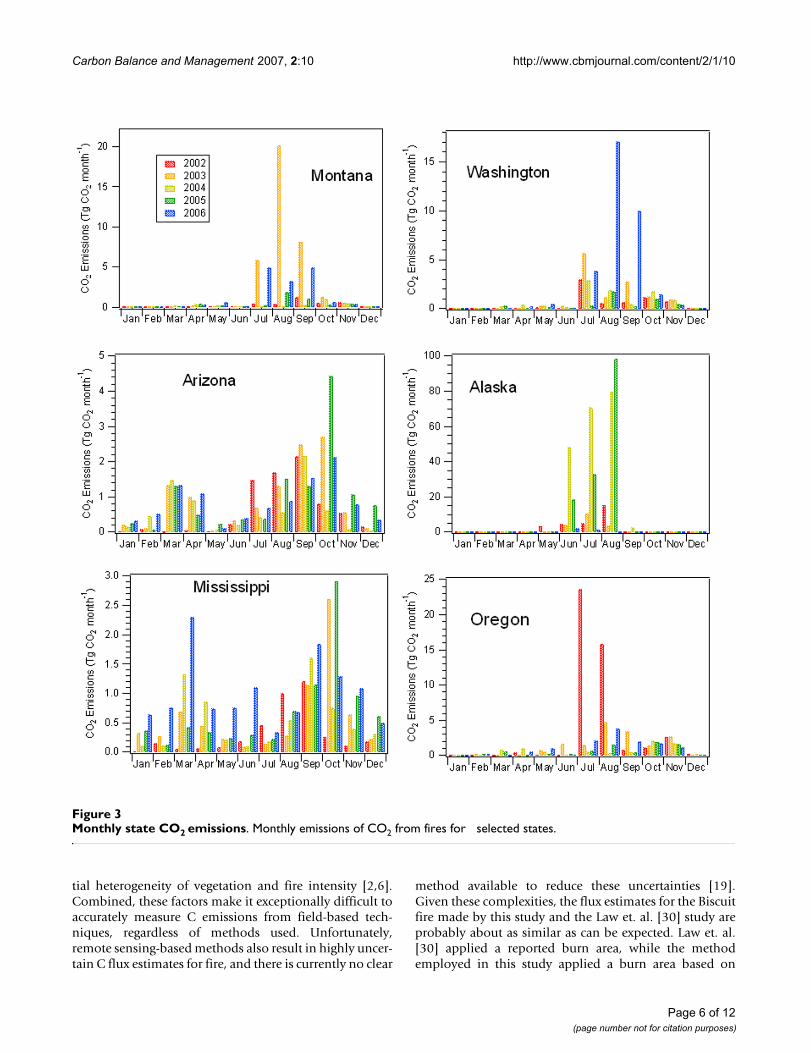
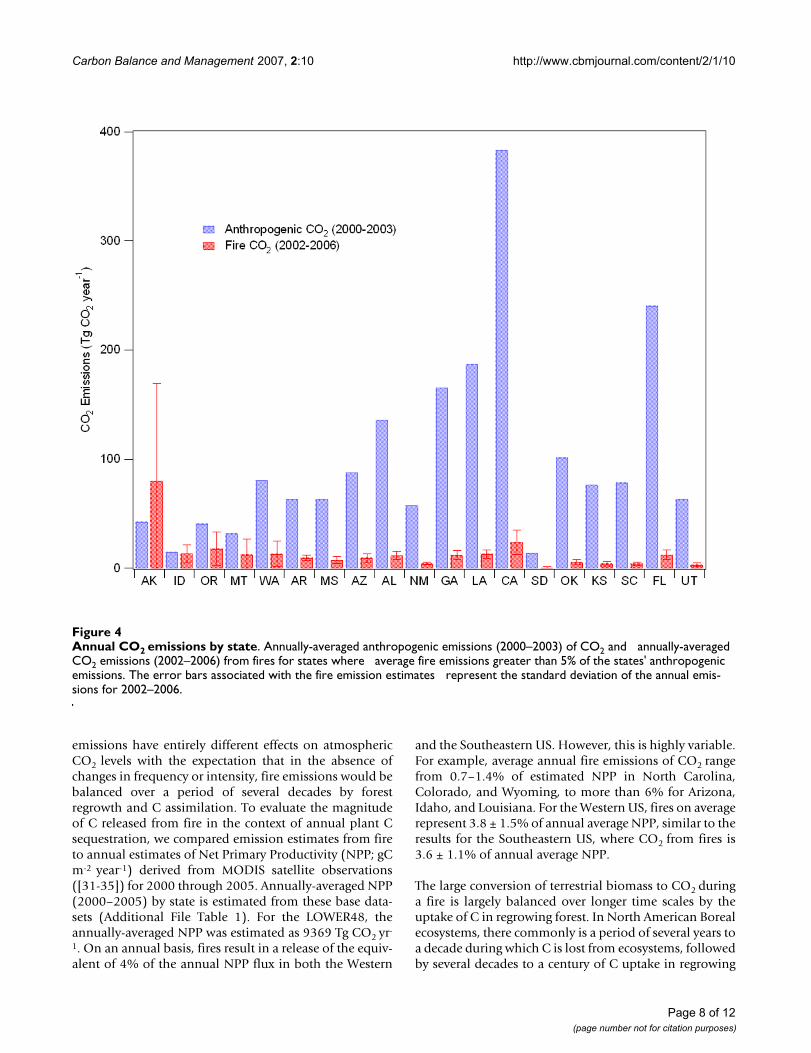
Annually, for the continental US (not including Washing-ton D.C.), the average CO2 emissions from all fossil fuelburning (FFB) sources from 2000 – 2003 were 5738 TgCO2 [31]. Annual average CO2 emissions for 2002 – 2006from fires in the continental US was 293 Tg CO2, corre-sponding to the equivalent of 5.1% of the annual FFBemissions from 2000–2003 (and 5.4% of the averagefrom 1990–2003). Depending on the year, emissionsfrom fires for the entire Continental US were equivalent toas little as 4% of the FFB emissions, and as much as 6%.However, tHowhis is for the entire U.S; on a state-level,the importance of fire emissions of CO2 relative to FFBemissions is much different. There are eight states (Alaska,Idaho, Oregon, Montana, Washington, Arkansas, Missis-sippi, and Arizona) where the annually-averaged (2002–2006) fire emissions are equal to more than 10% of thestate-level FFB CO2 emissions, and eleven other stateswhose fire emissions equal more than 5% of the state-level CO2 emissions (Figure 4, Additional Table 1). In thecase of Alaska, annually-averaged fire emissions of CO2(2002–2006) are consistently greater than the annuallyaveraged (2000–2003) emissions from FFB (Figure 4). Forthe states located in the Western and Southeastern US,average annual fire emissions of CO2 range from theequivalent of 2–4% of FFB emissions in North Carolina,Colorado, and Wyoming, to 89% of emissions in Idaho.(It should be noted, however, that Idaho does not haveany coal-fire power plants, which emit large amounts ofCO2). For the Western US States, fire CO2 emissions onaverage are equivalent to 11 ± 4% of annual FFB CO2emissions, and for the Southeastern US fire CO2 emis-
sions are equivalent to 6 ± 2% of annual FFB CO2 emis-sions.
The relative importance of CO2 emissions from fires toregional C emissions varies seasonally and annually. Forexample, during particularly intense fire years, such as2006 in Idaho, the emissions of CO2 from fires in Idahowere 1.6 times higher than all of the annually-averaged(2000–2003) FFB emissions from that state, and nearlydouble the mean annual fire CO2 emissions for the statefor 2002–2006. Similarly, in 2006, Montana and Wash-ington experienced CO2 emissions from fires during theyear that were equivalent to ~47 and 42% of the totalannual state-level FFB CO2 emissions, respectively. Inaddition to significant interannual variation, regionalfires are typically active for just a few months of the year.The monthly emissions of CO2 from fires for 2002through 2006 for six selected states are shown in Figure 3.Alaska, Montana, Washington, and Oregon all show largesummer peaks in wildfire CO2emissions that are of thesame magnitude or greater than the CO2 from FFB sourcesduring those months.
In California, the annual FFB emissions inventory of CO2is the largest in the country behind Texas (362 Tg CO2 yr-
1 averaged from 1990–2003). Even so, the annual aver-aged emissions of CO2 from fires are significant (24 TgCO2 yr-1; equivalent to 6% of the FFB emission esti-mates). Although the ratio of annual state-level CO2 emis-sions from fires to FFB sources is fairly low, and Californiadoes not have significant coal-fire power plant CO2 emis-sions, this ratio is also subject to substantial variation. Bythe end of October 2003, wildfires burned more than750,000 acres, producing the equivalent of 49% of themonthly CO2 emitted by FFB sources for state. Thisoccurred in more than one year that we investigated. Themajor wildfires in September 2006, including the Day Firein Southern California, produced an estimated 16 Tg CO2for that month, equivalent to approximately 50% of esti-mated total monthly FFB emissions for the entire state.Thus, even in highly industrialized regions of the countrywith significant FFB CO2 emissions, fires can contributesignificant amounts of CO2 to the atmosphere. These firesnot only impact regional CO2 fluxes, but can also impactvisibility and air quality. Phuleria et. al. [5] shows how theemissions from the October 2003 Californian firesincreased air pollutant concentrations, most notably par-ticulate matter with diameters less than 10 μm (PM10),throughout the Los Angeles Basin.
Multi-decadal implications of fire C releaseFires represent a potentially large short-term release of car-bon that is largely offset over longer time scales (decades)by the uptake of atmospheric carbon associated with for-est regrowth. From this standpoint, fires and fossil fuel
Page 7 of 12(page number not for citation purposes)
Carbon Balance and Management 2007, 2:10 http://www.cbmjournal.com/content/2/1/10
emissions have entirely different effects on atmosphericCO2 levels with the expectation that in the absence ofchanges in frequency or intensity, fire emissions would bebalanced over a period of several decades by forestregrowth and C assimilation. To evaluate the magnitudeof C released from fire in the context of annual plant Csequestration, we compared emission estimates from fireto annual estimates of Net Primary Productivity (NPP; gCm-2 year-1) derived from MODIS satellite observations([31-35]) for 2000 through 2005. Annually-averaged NPP(2000–2005) by state is estimated from these base data-sets (Additional File Table 1). For the LOWER48, theannually-averaged NPP was estimated as 9369 Tg CO2 yr-
1. On an annual basis, fires result in a release of the equiv-alent of 4% of the annual NPP flux in both the Western
and the Southeastern US. However, this is highly variable.For example, average annual fire emissions of CO2 rangefrom 0.7–1.4% of estimated NPP in North Carolina,Colorado, and Wyoming, to more than 6% for Arizona,Idaho, and Louisiana. For the Western US, fires on averagerepresent 3.8 ± 1.5% of annual average NPP, similar to theresults for the Southeastern US, where CO2 from fires is3.6 ± 1.1% of annual average NPP.
The large conversion of terrestrial biomass to CO2 duringa fire is largely balanced over longer time scales by theuptake of C in regrowing forest. In North American Borealecosystems, there commonly is a period of several years toa decade during which C is lost from ecosystems, followedby several decades to a century of C uptake in regrowing
Annual CO2 emissions by stateFigure 4Annual CO2 emissions by state. Annually-averaged anthropogenic emissions (2000–2003) of CO2 and annually-averaged CO2 emissions (2002–2006) from fires for states where average fire emissions greater than 5% of the states' anthropogenic emissions. The error bars associated with the fire emission estimates represent the standard deviation of the annual emis-sions for 2002–2006.
Page 8 of 12(page number not for citation purposes)
Carbon Balance and Management 2007, 2:10 http://www.cbmjournal.com/content/2/1/10
forests [6,36]. However, fire regimes and intensity arechanging for at least some portions of the US [3,21], andfollowing European settlement of the Western US, the firefrequency in some forests was reduced [37] leading to anaccumulation of C in terrestrial systems. The relativelylarge fraction of NPP that is currently lost to fire in anumber of Western US ecosystems represents, in part, thereturn of some of this historically accumulated C to theatmosphere, and sets the stage for future C uptake in theseforested ecosystems. The historic and future impact of fireemissions on atmospheric CO2 also depends on the fre-quency and intensity of fires in the 21st century. A shorten-ing of fire return intervals, increases in area burned, and/or increases in fire severity can lead to net emissions ofCO2, even on a multi-decadal times scale [6,10,38]. Withchanging climate and projected increases in burned areain the US [39,40], there is a significant potential for addi-tional net release of C from the forests of the United Statesdue to changing fire dynamics in the coming decades.
ConclusionFires represent a large and highly variable component ofthe US carbon budget. This study illustrates the highdegree of spatial variability in fire CO2 emissions withexceptionally large fluxes of CO2 due to wildfire in theWestern US and large emissions from controlled burnsand forest management activities in the Southeastern US.In some Western US states, such as Alaska and Idaho, theannual emission of CO2 from wildfire in some yearsequals or exceeds the emissions from fossil fuel combus-tion. Even in states with large FFB CO2 sources, such asCalifornia, fires can be a significant annual and highly sig-nificant seasonal component to the regional C budget.
The long-term impacts of CO2 emissions from fire are con-siderably different than from fossil fuel burning emissionsbecause fire emissions are at least partially balanced overdecades by forest regrowth and terrestrial C sequestration.Changing climate and fire regimes, however may lead tofire emissions that increasingly diverge from historicalmeans. Over shorter time periods fires, with their inher-ently uncertain emission estimates, represent a major hur-dle to the establishment of accurate C source and sinkaccounting based on atmospheric CO2 observations.
While isotopic and tracer techniques could certainly aid inthe reduction of uncertainty in regional C inverse mode-ling, fires represent a level of complexity in terrestrial Cdynamics that deserve increased attention.
MethodsFire emission estimatesA simple modeling approach, described by Wiedinmyeret. al. [13], was used to calculate the daily fire emissionsof carbon dioxide (ECO2) in North America from 2002through 2006. ECO2 was calculated as:
ECO2 = A(x,t) * B(x,t) * EFCO2 (1)
where A(x,t) is the area burned at location x and time t,B(x,t) is the biomass burned at location x and time t, andEFCO2 is an emission factor, or the mass of CO2 that isemitted per mass of biomass burned.
With this method, fire location and timing is determinedwith the MODIS Active Fire product. The MODIS instru-ments aboard the NASA Terra and Aqua satellites eachprovide approximately twice-daily passes over NorthAmerica. These daily fire detections were processed by theUS Forest Service Remote Sensing Applications Center for2002 through 2006 using the MODIS Active Fire datadeveloped by the UMD Rapid Response team [41].
The fuel loading at each fire was determined using a com-bination of satellite products. The Global Land Cover2000 (GLC2000) dataset is used to characterize the eco-system type for each identified fire. The GLC2000 identi-fies 29 different land cover classes in North and CentralAmerica at a 1 km2 resolution [42]. For each land coverclass, a total fuel loading has been assigned using a com-bination of values found in the literature [13]. The frac-tion of woody and herbaceous fuels associated with eachclass was determined using information from the FuelsCharacterization Classification System (FCCS; [43,44]).The fraction of forest, herbaceous cover, and bare groundat each fire was determined using the Vegetation Contin-uous Fields (VCF) MODIS product, scaled to 1 km2
[45,46]. The amount of biomass burned was assumed tobe a function of forest cover (where > 60% tree cover is
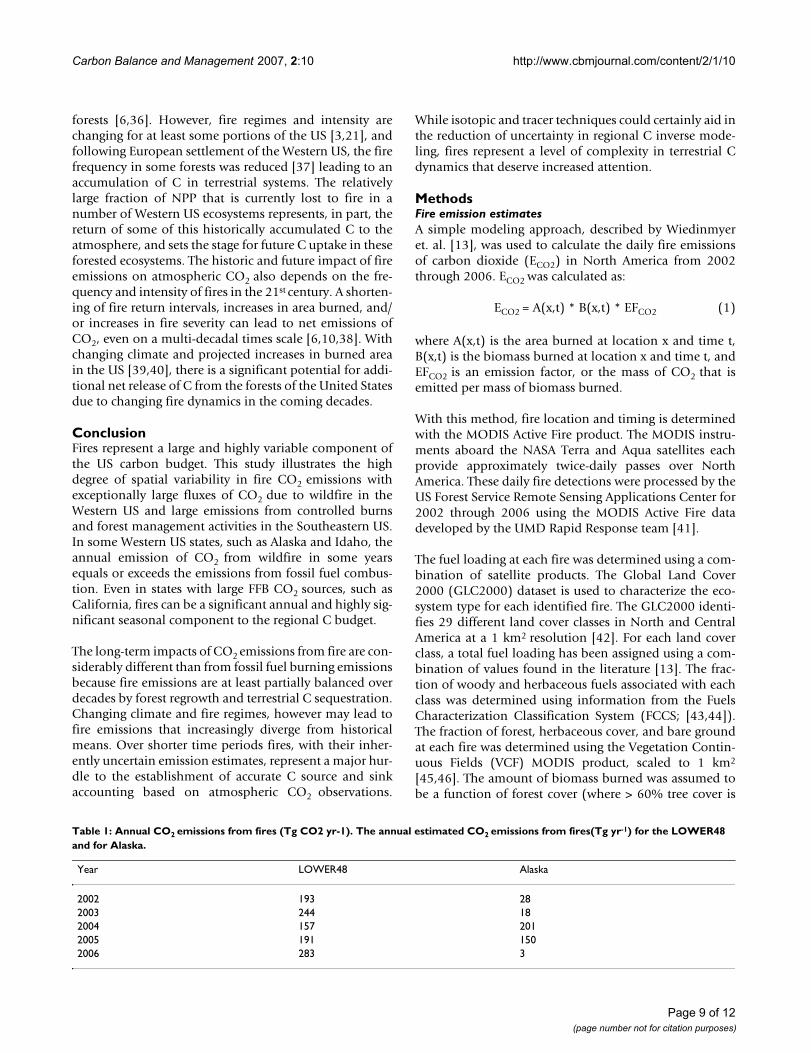
Table 1: Annual CO2 emissions from fires (Tg CO2 yr-1). The annual estimated CO2 emissions from fires(Tg yr-1) for the LOWER48 and for Alaska.
Year LOWER48 Alaska
2002 193 282003 244 182004 157 2012005 191 1502006 283 3
Page 9 of 12(page number not for citation purposes)
Carbon Balance and Management 2007, 2:10 http://www.cbmjournal.com/content/2/1/10
considered forest, 40–60% tree cover is considered Wood-lands, and <40% tree cover is considered Grasslands), fol-lowing the methods applied by Ito and Penner [47].
For the results shown here, each detected fire was treatedas an individual fire. Based on the nominal resolution ofthe MODIS instruments, the total possible area burned foreach fire pixel was assumed to be 1 km2. For each firedetection, the 1 km2 was scaled to the amount of barecover assigned at that spot by the VCF product. For exam-ple, if the bare cover was 20% at a fire point, the areaburned was estimated to be 0.8 km2. Using this method-ology, daily fire emissions of CO2 were estimated for 2002through 2006. Only emissions from the US are presentedin this paper.
Fire emission estimate uncertaintyThe emissions of CO2 from fires are highly uncertain dueto the combined errors and uncertainties in the modelframework and inputs. Uncertainties in the fire emissionestimates may arise from the satellite detections of thefires, the assumptions made in the fuel loading andamount of fuel burned, the estimated area burned, andthe assigned emission factors. The Active Fire satelliteproduct produces daily fire detections. This product is notscreened for missing data, and does not flag those areasobstructed by clouds. The timing of the satellite detectionsand the inability to detect fire through clouds can lead tomissed detections and an underestimation of fire detec-tions [41,48]. The area burned assigned to each pixel (1km2) is considered an upper estimate. The fuel loadingsassociated with each general land cover classification aretaken from few studies, and in reality are highly variable.
Wiedinmyer et. al. [13] were unable to assign a quantita-tive assessment of uncertainty on the emission estimatesusing the described modeling technique. However, theypredict that the uncertainties can be over a factor of two.
When compared to other estimates of CO2 emissionsfrom fires, these estimates are within this uncertainty. Forthe Conterminous US, the Global Fire Emissions Data-base, version 2 (GFEDv2, [2]) predict emissions of CO2that are approximately two to five times lower than thoseestimates here. Other models used to predict emissionsfrom fires are much closer to the values predicted here. Amore comprehensive intercomparison of emission esti-mates of CO from fire emissions models for the US isdescribed by Al-Saadi et. al. [12]. In general, the emissionsfrom the methodology used here are higher than thosepredicted by the GFEDv2, but lower than those predictedby a NOAA product [12]. To consider the uncertaintyassociated with the emission estimates, we assign a factorof at least 2 to the estimates.
The validation of fire emission estimates is difficult, sincethe emissions from fire to fire are highly variable, anddirect flux measurements from fires are extremely diffi-cult. Inverse modeling of fire emissions using in situ meas-urements or satellite observations provides a means toconstrain fire emission estimates: however, these methodscan not provide a direct quantification of emissions fromfires. The uncertainty in the fire emission estimates, alongwith the variability in the spatial and temporal allocationof these emissions, adds further complications for effortsto constrain C fluxes with monitoring and modeling tech-niques. Future work is needed not only to better quantifyemissions from fires, but to better constrain the uncertain-ties associated with the estimates.
Net Primary ProductivityThe Net Primary Productivity (NPP) is defined as the rateat which biomass grows in an ecosystem. It is often usedas a measure of carbon uptake by vegetation, or carbonstored in vegetation. For this study, the annual NPP valuesdetermined from the MODIS Satellite instruments wereused [31-35]. This product provided annual NPP values
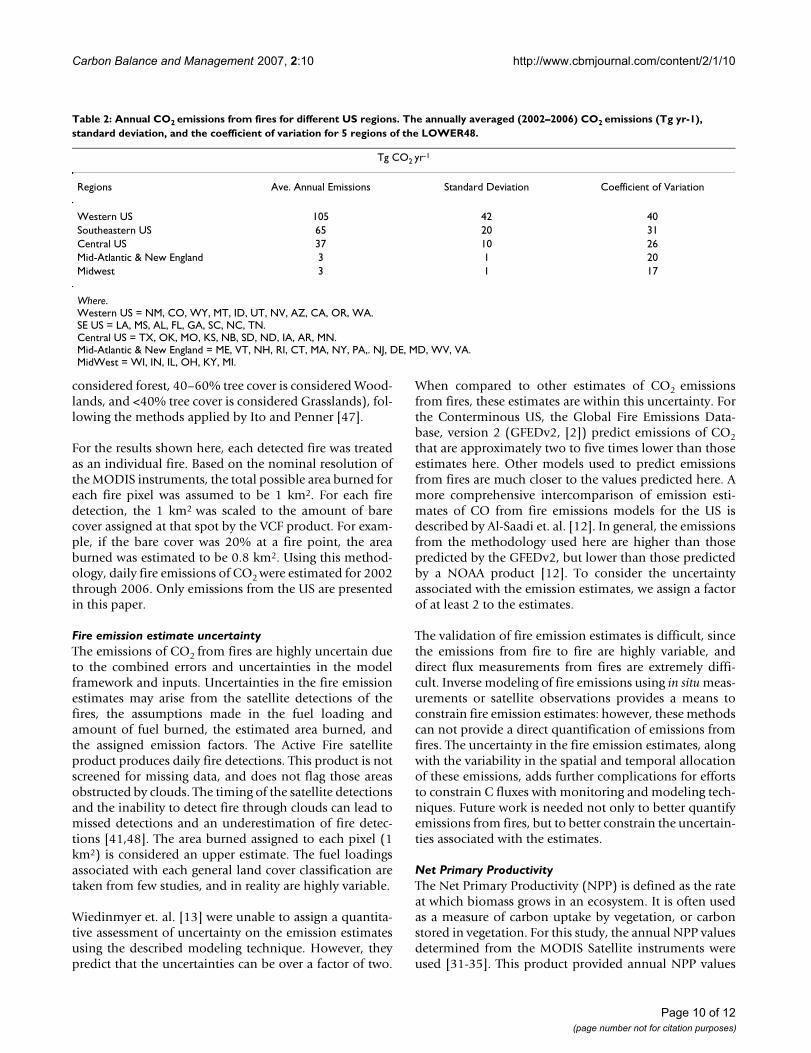
Table 2: Annual CO2 emissions from fires for different US regions. The annually averaged (2002–2006) CO2 emissions (Tg yr-1), standard deviation, and the coefficient of variation for 5 regions of the LOWER48.
Tg CO2 yr-1
Regions Ave. Annual Emissions Standard Deviation Coefficient of Variation
Western US 105 42 40Southeastern US 65 20 31Central US 37 10 26Mid-Atlantic & New England 3 1 20Midwest 3 1 17
Where.Western US = NM, CO, WY, MT, ID, UT, NV, AZ, CA, OR, WA.SE US = LA, MS, AL, FL, GA, SC, NC, TN.Central US = TX, OK, MO, KS, NB, SD, ND, IA, AR, MN.Mid-Atlantic & New England = ME, VT, NH, RI, CT, MA, NY, PA,. NJ, DE, MD, WV, VA.MidWest = WI, IN, IL, OH, KY, MI.
Page 10 of 12(page number not for citation purposes)
Carbon Balance and Management 2007, 2:10 http://www.cbmjournal.com/content/2/1/10
(gC m-2 year-1) with a spatial resolution of 1 km2 for thecontinuous US Annual NPP values (TgCO2 yr-1) for eachof the 6 years (2000–2005) were averaged for each state inthe continuous US.
Fossil fuel burning emissions of CO2To evaluate the importance of biomass burning emissionsrelative to those from fossil fuel burning, the US Depart-ment of Energy report of annual CO2 emissions from fos-sil fuel combustion for the country [31] is used. Theannual total CO2 emissions by state from 1990 to 2003,was published in April 2007 [49]. This inventory does notinclude all industrial sources, but is the most completeinventory of which we are aware.
Competing interestsThe author(s) declare that they have no competing inter-ests.
Authors' contributionsCW performed the fire emission estimates and processedthe DOE FFB emissions and the NPP data. CW and JNboth analyzed the results and contributed equally to themanuscript. Both authors have read and approved thefinal manuscript.
Additional material
AcknowledgementsThe authors would like to thank Jana Milford, Peter Thornton, and five anonymous reviewers for their useful comments on the manuscript. The authors also thank Maosheng Zhao for assistance with the NPP data, Brad Quayle for providing the MODIS fire counts, and David Schimel for helpful discussions. The National Center for Atmospheric Research is operated by the University Corporation for Atmospheric Research under the spon-sorship of the National Science Foundation.
References1. Giglio L, van der Werf GR, Randerson JT, Collatz GJ, Kasibhatla P:
Global estimation of burned area using MODIS active fireobservations. Atmospheric Chemistry and Physics 2006, 6:957-974.
2. van der Werf GR, Randerson JT, Giglio L, Collatz GJ, Kasibhatla PS,Arellano AF: Interannual variability in global biomass burningemissions from 1997 to 2004. Atmospheric Chemistry and Physics2006, 6:3423-3441.
3. Westerling AL, Hidalgo HG, Cayan DR, Swetnam TW: Warmingand earlier spring increase western US forest wildfire activ-ity. Science 2006, 313:940-943.
4. Wotawa G, Trainer M: The influence of Canadian forest fires onpollutant concentrations in the United States. Science 2000,288(5464):324-328.
5. Phuleria HC, Fine PM, Zhu Y, Sioutas C: Air quality impacts of theOctober 2003 Southern California wildfires. J Geophys Res2005, 110:D07S20. doi:10.1029/2004JD004626
6. Harden JW, Trumbore SE, Stocks BJ, Hirsch A, Gower ST, O'NeillKP, Kasischke ES: The role of fire in the boreal carbon budget.Global Change Biology 2000, 6:174-184.
7. Simpson IJ, Rowland FS, Meinardi S, Blake DR: Influence of biomassburning during recent fluctuations in the slow growth of glo-bal tropospheric methane. Geophys Res Lett 2006, 33:L22808.doi:10.1029/2006GL027330
8. Naik V, Mauzerall DL, Horowitz LW, Schwarzkopf MD, RamaswamyV, Oppenheimer M: On the sensitivity of radiative forcing frombiomass burning aerosols and ozone to emission location.Geophys Res Lett 2007, 34:L03818. doi:10.1029/2006GL028149
9. Amiro BD, Todd JB, Wotton BM, Logan KA, Flannigan MD, Stocks BJ,Mason JA, Martell DL, Hirsch KG: Direct carbon emissions fromCanadian forest fires, 1959–1999. Canadian Journal of ForestResearch-Revue Canadienne De Recherche Forestiere 2001, 31:512-525.
10. Randerson JT, Liu H, Flanner MG, Chambers SD, Jin Y, Hess PG,Pfister G, Mack MC, Treseder KK, Welp LR, Chapin FS, Harden JW,Goulden ML, Lyons E, Neff JC, Schuur EAG, Zender CS: The impactof boreal forest fire on climate warming. Science 2006,314:1130-1132.
11. Carbon Tracker [http://www.esrl.noaa.gov/gmd/ccgg/carbontracker/]
12. Al-Saadi J, Soja AA, Pierce B, Kittaka C, Emmons L, Kondragunta S,Zhang X, Wiedinmyer C, Schaack T, Szykman J: Global Near-Real-Time Estimates of Biomass Burning Emissions using Satel-lite Active Fire Detections. presented at 16th International EmissionInventory Conference, Raleigh, NC, May 14 – 17, 2007 [http://www.epa.gov/ttn/chief/conference/ei16/].
13. Wiedinmyer C, Quayle B, Geron C, Belote A, McKenzie D, Zhang X,O'Neill S, Wynne KK: Estimating emissions from fires in NorthAmerica for Air Quality Modeling. Atmospheric Environment2006, 40:3419-3432.
14. Jain AK: Global estimation of CO emissions using three setsof satellite data for burned area. Atmospheric Environment 2007,41:6931-6940.
15. Kennett SA: National policies for biosphere greenhouse gasmanagement: Issues and opportunities. Environmental Manage-ment 2002, 30:595-608.
16. Cannell MGR: Carbon sequestration and biomass energy off-set: theoretical, potential and achievable capacities globally,in Europe and the UK. Biomass & Bioenergy 2003, 24:97-116.
17. Yamasaki A: An overview of CO2 mitigation options for globalwarming – Emphasizing CO2 sequestration options. Journal ofChemical Engineering of Japan 2003, 36:361-375.
18. Kurz WA, Apps MJ: Contribution of Northern Forests to theGlobal C Cycle – Canada as a Case-Study. Water Air and Soil Pol-lution 1993, 70:163-176.
19. French NHF, Goovaerts P, Kasischke ES: Uncertainty in estimat-ing carbon emissions from boreal forest fires. Journal of Geo-physical Research-Atmospheres 2004, 109(D14):Art No. D14S08.
20. Neff JC, Harden JW, Gleixner G: Fire effects on soil organic mat-ter content, composition, and nutrients in boreal interiorAlaska. Canadian Journal of Forest Research-Revue Canadienne DeRecherche Forestiere 2005, 35:2178-2187.
21. Noss RF, Franklin JF, Baker WL, Schoennagel T, Moyle PB: Managingfire-prone forests in the western United States. Frontiers inEcology and the Environment 2006, 4:481-487.
22. Bodin P, Wiman BLB: The usefulness of stability concepts in for-est management when coping with increasing climate uncer-tainties. Forest Ecology and Management 2000, 242(2–3):541-52.
23. Girod CM, Hurtt GC, Frolking S, Aber JD, King AW: The tensionbetween fire risk and carbon storage: evaluating US carbonand fire management strategies through ecosystem models.Earth Interactions 2007, 11:33.
24. Subak S: Agricultural soil carbon accumulation in NorthAmerica: considerations for climate policy. Global Environmen-tal Change-Human and Policy Dimensions 2000, 10:185-195.
25. Martin PH, Nabuurs GJ, Aubinet M, Karjalainen T, Vine EL, KinsmanJ, Heath LS: Carbon sinks in temperate forests. Annual Review ofEnergy and the Environment 2001, 26:435-465.
Additional file 1Emissions of CO2 from FFB and NPP for each state. The monthly and annual averaged CO2 emissions from each state are provided. Addition-ally, the FFB emissions and the annual estimated NPP are also given for each state.Click here for file[http://www.biomedcentral.com/content/supplementary/1750-0680-2-10-S1.doc]
Page 11 of 12(page number not for citation purposes)
Carbon Balance and Management 2007, 2:10 http://www.cbmjournal.com/content/2/1/10
Publish with BioMed Central and every scientist can read your work free of charge
"BioMed Central will be the most significant development for disseminating the results of biomedical research in our lifetime."
Sir Paul Nurse, Cancer Research UK
Your research papers will be:
available free of charge to the entire biomedical community
peer reviewed and published immediately upon acceptance
cited in PubMed and archived on PubMed Central
yours — you keep the copyright
Submit your manuscript here:http://www.biomedcentral.com/info/publishing_adv.asp
BioMedcentral
26. Pacala SW, Hurtt GC, Baker D, Peylin P, Houghton RA, Birdsey RA,Heath L, Sundquist ET, Stallard RF, Ciais P, Moorcroft P, CaspersenJP, Shevliakova E, Moore B, Kohlmaier G, Holland E, Gloor M, Har-mon ME, Fan SM, Sarmiento JL, Goodale CL, Schimel D, Field CB:Consistent land- and atmosphere-based US carbon sink esti-mates. Science 2001, 292:2316-2320.
27. National Interagency Fire Center [http://www.nifc.gov/nicc/predictive/intelligence/intelligence.htm]
28. Haines TK, Busby RL, Cleaves DA: Prescribed burning in theSouth: trends, purpose, and barriers. Southern Journal of AppliedForestry 2001, 25:149-153.
29. Western Regional Air Partnership (WRAP): 2002 Fire EmissionInventory for the WRAP Region – Phase II, Project No. 178-6. [http://www.wrapair.org/forums/fejf/tasks/FEJFtask7PhaseII.html].July 22, 2005
30. Law BE, Turner D, Campbell J, Sun OJ, Van Tuyl S, Ritts WD, CohenWB: Disturbance and climate effects on carbon stocks andfluxes across Western Oregon USA. Global Change Biology 2004,10:1429-1444.
31. U.S. Department of Energy [http://www.eia.doe.gov/environment.html]
32. Running SW, Nemani RR, Heinsch FA, Zhao M, Reeves M, HashimotoH: A continuous satellite-derived measure of global terres-trial primary productivity: Future science and applications.Bioscience 2004, 56(6):547-560.
33. Zhao M, Heinsch FA, Nemani RR, Running SW: Improvements ofthe MODIS terrestrial gross and net primary production glo-bal dataset. Remote Sensing of Environment 2005, 95:164-176.
34. Zhao M, Running SW, Nemani RR: Sensitivity of Moderate Reso-lution Imaging Spectroradiometer (MODIS) terrestrial pri-mary production to the accuracy of meteorologicalreanalyses. Journal of Geophysical Research 2006, 111:G01002.doi:10.1029/2004JG000004
35. Heinsch FA, Zhao M, Running SW, et al.: Evaluation of remotesensing based terrestrial productivity from MODIS usingregional tower eddy flux network observations. IEEE Transac-tions on Geoscience and Remote Sensing 2006, 44(7):1908-1925.
36. Hicke JA, Asner GP, Kasischke ES, French NHF, Randerson JT, Col-latz GJ, Stocks BJ, Tucker CJ, Los SO, Field CB: Postfire responseof North American boreal forest net primary productivityanalyzed with satellite observations. Global Change Biology 2003,9:1145-1157.
37. Savage M, Swetnam TW: Early 19th-Century Fire Decline Fol-lowing Sheep Pasturing in a Navajo Ponderosa Pine Forest.Ecology 1990, 71:2374-2378.
38. Kashian DM, Romme WH, Tinker DB, et al.: Carbon storage onlandscapes with stand-replacing fires. Bioscience 2006,56(7):598-606.
39. Neilson RP, Drapek RJ: Potentially complex biosphereresponses to transient global warming. Global Change Biology1998, 4(5):505-521.
40. Dale VH, Joyce LA, McNulty S, et al.: Climate change and forestdisturbances. Bioscience 2001, 51(9):723-734.
41. Giglio L, Descloitres J, Justice CO, Kaufman YJ: An Enhanced Con-textual Fire Detection Algorithm for MODIS. Remote Sensingof Environment 2003, 87(2–3):273-282.
42. Latifovic R, Zhu Z, Cihlar J, Beaubien J, Fraser R: The Land CoverMap for North America in the Year 2000. GLC2000 database,European Commission Joint Research Centre 2003 [http://www-gvm.jrc.it/glc2000/].
43. Fuels Characterization Classification System (FCCS) [http://www.fs.fed.us/pnw/fera/fccs/]
44. Ottmar RD, Sandberg DV, Prichard SJ, Riccardi CL: An Overview ofthe Fuel Characteristic Classification System – Quantifying,Classifying, and Creating Fuelbeds for Resource Planning.Canadian Journal of Forest Research 2007 in press.
45. Hansen M, DeFries R, Townshend JR, Carroll M, Dimiceli C, SohlbergR: Vegetation Continuous Fields MOD44B, 2001 PercentTree Cover, Collection 3. University of Maryland, College Park,Maryland; 2003.
46. Hansen M, DeFries RS, Townshend JRG, Carroll M, Dimiceli C, Sohl-berg RA: Global Percent Tree Cover at a Spatial Resolutionof 500 Meters: First Results of the MODIS Vegetation Con-tinuous Fields Algorithm. Earth Interactions 2003, 7(10):1-15.
47. Ito A, Penner JE: Global estimates of biomass burning emis-sions based on satellite imagery for the year 2000. J GeophysRes 2004, 109:D14S05. doi:10.1029/2003JD004423
48. NASA/University of Maryland. MODIS Hotspot/Active FireDetections. Data set. MODIS Rapid Response Project,NASA/GSFC [producer], University of Maryland, Fire Infor-mation for Resource Management System [distributors]2002 [http://maps.geog.umd.edu].
49. US Department of Energy [http://www.eia.doe.gov/oiaf/1605/ggrpt/excel/tbl_statetotal.xls]
Page 12 of 12(page number not for citation purposes)