Embed Size (px)
Citation preview
ESTIMATING THE CASH FLOW AND MANAGERIAL BENEFITS OF COMPLYING WITH THE VALUE ADDED TAX REQUIREMENTS: THE CASE OF
SMALL AND MEDIUM ENTERPRISES IN BOTSWANA _______________________________________________________________
TSHEPISO MAKARA (corresponding author) Dr Tshepiso Makara is a Finance lecturer in the Department of Business Management and
Entrepreneurship, Botswana International University of Science and Technology, Plot 10071 Palapye, Botswana. Email: [email protected].
NTHATI RAMETSE Dr Nthati Rametse, is a Senior Lecturer in the College of Business, School of Management,
RMIT University, GPO Box 2476V, Melbourne, 3001, Australia. Email: [email protected].
___________________________________________________________________________ Businesses in many countries are required to comply with Value Added Tax (VAT) requirements. In Botswana, the VAT legislation was introduced in July 2002. While the compliance costs that come with the efforts to adhere to stringent VAT regulations are known to be regressive, businesses also gain in the form of cash flow enhancement and managerial improvement. This paper presents the estimates of the cash flow and managerial benefits of VAT compliance for Small and Medium Enterprises (SMEs) in Botswana for the years 2009/10 and 2010/11. Emphasis is placed on small businesses because they have a significant influence on employment creation and sustainable development of the country. This study employed questionnaire surveys to collect data on VAT compliance benefits from the SMEs in Botswana. Cash flow benefits are estimated at P59 million and P67 million, in aggregate, for the years 2009/10 and 2010/11, respectively. Aggregate managerial benefits are estimated at P79 million for 2009/10 and P94 million for 2010/11. Cash flow benefits represent around 0.6 per cent of the Gross Domestic Product (GDP) and 1.5 per cent of VAT revenue for both years. Managerial benefit estimates represent roughly 0.8 per cent of the GDP and 2 per cent of the VAT revenue for both years. The findings in this study indicate that SMEs in Botswana gain significantly from complying with the country’s VAT legislation requirements. ___________________________________________________________________________
2
1.0 INTRODUCTION Background Tax has become a significant source of government revenue for most countries, especially developing ones. While taxation is vital to ensure the provision of infrastructure and public services, compliance with its requirements often leads to additional costs over and above the tax amount, known as tax compliance costs.1 However, tax requirements may not always lead to an outward flow of cash from the businesses. Benefits, known as tax compliance benefits may accrue to businesses as they comply with the tax system. The objective of this paper is to discuss the findings of the benefits that Small and Medium-sized Enterprises (SMEs) in Botswana derived as a result of complying with the Value Added Tax (VAT), which was introduced on 1 July, 2002. Pope asserts that it is important for researchers, small business owners, lobby groups and policy makers to recognise the benefits of complying with the Goods and Services Tax (GST).2 Recognising the benefits of VAT in Botswana and elsewhere is an incentive for SMEs to comply with the VAT requirements. Sandford et al3 had earlier expressed that clearly there are continuing and not inconsiderable managerial benefits from the better record-keeping which is necessary to comply with VAT requirements. Taxpayers who comply with taxation requirements may gain Cash Flow Benefits (CFB), managerial benefits4 and tax deductibility benefits. CFB comprise of the collection period and the grace period, which is the time that the business is holding the tax collected before it is remitted to the tax authorities. Managerial benefits may arise from the use of technology acquired for VAT purposes and stringent record keeping for VAT substantiation. Managerial benefits, due to their elusive nature, appear to be the most difficult to estimate when compared to other benefits.5 As a result, managerial benefits are rarely investigated in tax compliance costs except by a few major studies.6 Tax deductibility benefits arise from businesses claiming back from the tax authorities legitimate business expenses (acquisition of new plant or new software/upgrades).
1 C Sandford, M Godwin and P Hardwick Administrative and Compliance Costs of Taxation, (Fiscal Publication, Bath, 1989) at 14. The compliance costs of VAT for businesses in Botswana have already been estimated and published in an earlier study. See Tshepiso Makara and Jeff Pope “Estimates of the Compliance Costs of Value Added Tax in Botswana” (2013) 19(3) New Zealand Journal of Taxation Law and Policy 183 at 197-202. 2 Pope “Estimating and alleviating the goods and services tax compliance cost burden upon small business” (2001) 11(1) Revenue Law Journal 6 at 14. 3 Sandford, Godwin and Hardwick, above n 1 at 118. 4 It must be noted that managerial benefits are less relevant for large businesses as they generally have sophisticated accounting systems used in their daily business affairs, with or without tax. 5 C Sandford, M Godwin, P Hardwick and I Butterworth Costs and benefits of VAT (Heinemann Educational books, London, 1981) at 96. 6 Sandford, Godwin, Hardwick and Butterworth, above n 5; Sandford, Godwin and Hardwick, above n 1; C Sandford, and J Hasseldine The Compliance Costs of Business Taxes in New Zealand (Institute of Policy Studies, Wellington, 1992); National Audit Office HM Customs and Excise: Cost to Business of Complying with VAT Requirements (HMSO, London, 1994); B Tran-Nam and J Glover “Tax Reform in Australia: Impacts of Tax Compliance Costs on Small Business”, (2002) 5(3) Journal of Australian Taxation 338; N Rametse “Small Business Managerial benefits Derived from the Implementation of the Australian Tax Reform” in A Sawyer (ed.) Proceedings of 2009 Australian Tax Teachers Association Conference, New Zealand, 19-21 January 2009, 1-35; P Lignier Identification and Evaluation of the Managerial Benefits derived by Small Businesses as a result of Complying with the Australian Tax System (thesis presented for the Degree of Doctor of Philosophy of the University of New South Wales, 2008); Tshepiso Makara “The Compliance Costs of Value Added Tax for Businesses in Botswana” (thesis submitted to the Faculty of Business of Curtin University of Technology in fulfilment of the requirements for the degree of Doctor of Philosophy, 2014).
3
This research did not estimate tax deductibility, however, it is worth noting that some studies, for example Evans et al and Tran-Nam et al have investigated this benefit.7 Evans et al note that tax deductibility has very little impact in terms of improving small businesses relative to larger businesses. In their review of Pope’s research, which did not consider tax deductibility in estimating compliance costs of major taxes in Australia, Evans et al argue that had Pope’s study considered tax deductibility, compliance costs would have been reduced by 25 per cent. The VAT in Botswana was introduced in July 2002, at a rate of 10 per cent. This rate has since been increased to 12 per cent.8 This study estimates the cash flow and managerial benefits gained by SMEs in Botswana while complying with the requirements of the VAT system. The authors have estimated SMEs managerial benefits because are important to the economy of Botswana, as they provide employment and output. Additionally, it is well known that SMEs have high compliance costs. The rest of the paper is organised as follows. Section 2 provides a snapshot of the importance of SMEs in Botswana and the Botswana tax system. Section 3 reviews the literature. Section 4 discusses the methodology employed in this research. Sections 5 and 6 discuss the estimation and the results of CFB and managerial benefits respectively. Sections 7 and 8 provide the estimation and the results of the aggregate and net compliance costs of VAT considering CFB and managerial benefits respectively. Section 9 concludes the paper highlighting policy implications for SMEs in Botswana. 2.0 BOTSWANA SMALL AND MEDIUM SIZED ENTERPRISES AND THE TAX
SYSTEM SMEs in Botswana The Botswana business market is very small and populated by Small, Micro and Medium Enterprises (SMMEs). The distinction of businesses by size is often based on the number of employees, turnover or a combination of the two. Small businesses in Botswana employ between 5 and 25 people with an annual turnover of around P60,000 - P1,500,000.9 Medium sized businesses hire between 26 and 100 people and have an annual turnover of between P1,500,000 and P5 million. A large enterprise is characterised by a turnover that exceeds P5 million and has an employee pool of over 100 people.10 The Botswana Unified Revenue Service (BURS) classifies the VAT registered businesses into three groups namely A, B and C. Groups A and B comprise businesses with a turnover below P12 million whereas Group C encompasses businesses that have an annual turnover exceeding P12 million. These groups are also distinguished by the manner in which they file the VAT returns. Group C firms file VAT returns monthly while groups A and B file VAT returns
7 C Evans, K Ritchie, B Tran-Nam, and M Walpole, A Report into Taxpayer Costs of Compliance (Australian Government Publishing Service, Canberra, 1997) at 83; J Pope “Compliance Costs of Taxation: Policy Implications” (1994) 11(1) Australian Tax Forum 85; B Tran-Nam, C Evans and P Lignier “Personal Taxpayer Compliance Costs: Recent Evidence from Australia” (2014) 29 Australian Tax Forum 137. 8 The increase took effect on the 1st April 2010. See International Monetary Fund Botswana: 2009 Article IV Consultation—Staff Report; Public Information Notice on the Executive Board Discussion; and Statement by the Executive Director for Botswana (IMF Country Report 10/172, 2010) at 18. 9 P1 = 0.10 USD as at 5th January 2018. <www.xe.com>. 10 Botswana Institute for Development Policy Analysis, The new Policy on Small, Medium and Micro Enterprises, (Gaborone, 2004), p 1, see also http://www.bidpa.bw/docs/bidpa_briefing/SPECIAL%20BRIEFING%20-%20SME%20POLICY.PDF (as at 27 October 2009).
4
bimonthly on alternate months. Table 1 shows the number of VAT registered businesses in each of the BURS classification groups. This study follows BURS’s taxpayer classification to distinguish between business sizes and to estimate aggregate VAT compliance benefits. Table 1: Value Added Tax Registered Businesses by Botswana Unified Revenue Service Classification
2009/10 2010/11 Groups a Annual Turnover N Percentage N Percentage A B C
Less than P12 million Less than P12 million P12 million and over
7,831 7,894 215
49 50 1
11,582 11,705 644
48 49 3
Overall 15,940 100 23,931 100 a There is no difference between groups A and B. These businesses are the same with regard to size. Botswana Unified
Revenue Service has segregated these businesses into two groups (filing on alternate months) mainly to ease congestion at the VAT office during the filing period.
Source: The data was obtained by personal enquiry of the researchers to BURS management in 2010 and 2011.
Overview of Botswana’s Tax System The tax system in Botswana is regarded as robust and non-distortionary11 and taxation constitutes a significant portion of total government revenue. The main contributors to the tax system in Botswana are the income tax, VAT, and the customs and excise duties. In terms of the taxation climate, Botswana’s tax system is prudent and may be commended for the country’s increased private sector investments. In addition, the tax environment in Botswana is favourable compared with other countries. When compared with the average tax on profit for Sub-Saharan Africa (SSA) and the Organisation for Economic Cooperation and Development (OECD) at 68 per cent and 43 per cent, respectively, Botswana ranks lower at 19.5 per cent.12 The International Finance Cooperation (IFC) reported that, globally, Botswana stood at 22 in the ranking of 183 economies on the ease of paying taxes for the year 2011.13 The total tax collections made by BURS from the year 2005/06 to 2011/12 are displayed in Table 2. The biggest contributor to the Botswana government’s tax revenue is the Income tax, followed by Customs Union Receipts (CUR) and lastly, VAT. Tax revenue data shows that from the financial year 2005/06 to the year 2011/12, the tax revenue doubled. The largest increase over the years came from income taxes. Table 2: Botswana Tax Revenue Collection by Tax Type (P Million)
Tax type 2005/06 2006/07 2007/08 2008/09 2009/10 2010/11 2011/12 VAT Income Tax CUR
1,988 5,898 3,936
2,221 6,875 6,693
2,899 7,221 7,839
3,544 7,900 7,753
3,845 8,229 7,933
4,648 9,208 6,207
4,633 11,308 8,424
Overall 11,822 15,814 17,959 9,197 20,007 20,065 24,336 Sources: Derived from Botswana Unified Revenue Service (2006; 2007; 2008; 2009; 2010; 2011; 2012).
11 African Economic Outlook, Botswana Country Note, (African Development Bank Group, 2012), at 6, see also http://www.africaneconomicoutlook.org/fileadmin/uploads/aeo/PDF/Bostwana%20Full%20PDF%20Country%20Note.pdf. 12 Ibid, at. 9. 13 International Finance Corporation, Doing Business 2012, Botswana: Doing Business in a More Transparent World, (Washington D. C.: Report No. 65237, 2012).
5
Value Added Tax Filing Large businesses, with a turnover of P12 million (US$1.2 million)14 and above, are required to file VAT returns every month while enterprises with a turnover below P12 million have to file every two months.15 The frequency of VAT filing for SMEs in Botswana poses a question of the complexity of the country’s VAT system and the burden of VAT upon these businesses. However, these costs are mitigated by the benefits that accrue to businesses in the form of cash flow and improved managerial skills. 3.0 REVIEW OF VALUE ADDED TAX COMPLIANCE BENEFITS STUDIES Studies of Value Added Tax Cash Flow Benefits Studies that have investigated cash flow benefits over and above compliance costs are sparse. The majority of these studies, summarised below, have been conducted in the UK. Overall, the findings, with the exception of Isle, Freudenberg and Copp, suggest that substantial cash flow benefits accrue to businesses.16 The findings of the research by Isle et al suggest that minimal or no cash flow benefits accrue to small business in Australia.17 Sandford, Godwin, Hardwick and Butterworth estimated aggregate cash flow benefits for UK businesses at £73 million. The smallest businesses gained £0.3 million while the largest ones gained £59 million. A follow-up study by Sandford, Godwin and Hardwick estimated the value of cash flow benefits for UK businesses at £580 million. Still in the UK, the National Audit Office conducted a study which reported the cash flow benefits to be estimated at £600 million. In New Zealand, Sandford and Hasseldine estimated the value of cash flow benefits at NZ$176 million. The study by Allers reported the aggregated cash flow benefits for businesses in the Netherlands to be Gld360 million. Contrary to the studies above, the research by Isle, Freudenberg and Copp found that the goods and services taxpayers in Australia recognized minimal or no cash flow benefit from holding the GST liability before it is remitted to the government. Studies of Value Added Tax Managerial Benefits The review of the literature reveals that there has been quite a few studies that have been conducted on managerial benefits. However, only two of them (the National Audit Office study in the UK in 1994 and the 2009 study by Rametse in Australia) have attempted to value managerial benefits. Largely, the studies,18 succinctly reviewed below, confirm that businesses,
14 See n 9. 15 Government of Botswana, A Guide to Botswana's Value Added Tax, (Botswana Government: Gaborone, 2001), at 26. 16 Sandford, Godwin and Hardwick, above n 1; Sandford and Hasseldine, above n 6; Maarten Adriaan Allers Administrative and Compliance Costs of Taxation and Public Transfers in the Netherlands (Woltersgroep Groningen, 1994); National Audit Office, above n 6; Melisa B Isle, Brett Freudenberg and Richard Copp “Cash Flow Benefit from GST: Is it Realised by Small Businesses in Australia?” (2014) 29 Australian Tax Forum 417. 17 Isle, Freudenberg and Copp, above n 16 at 443. 18 Sandford, Godwin, Hardwick and Butterworth, above n 5; Sandford, Godwin and Hardwick, above n 1; Sandford and Hasseldine, above n 6; National Audit Office, above n 6; B Tran-Nam and J Glover “Tax Reform in Australia: Impacts of Tax Compliance Costs on Small Business” (2002) 5(3) Journal of Australian Taxation 338 at 365; Rametse, above n 6, at 8; P Lignier “Identification and Evaluation of the Managerial Benefits Derived by Small Businesses as a result of Complying with the Australian Tax System” (thesis submitted to the Faculty of Law of the University of New South Wales in fulfilment of the requirements for the degree of Doctor of Philosophy, 2008) at 257-259; Isle, Freudenberg and Copp, above n 16, at 439; Sharon Smulders, Medeleing Stinglingh, Riel Franzsen and Lizelle Flecher “Tax Compliance Costs for the Small Business Sector in South Africa – establishing a baseline” (2012) 10(2) eJournal of Tax Research at 184-226.
6
especially small ones, gain some managerial benefits from record keeping for VAT/GST purposes. It is important to note that within the African context, as noted by Smulders et al, for the first time in South Africa, the small business sector also confirmed the existence of managerial benefits. The UK study by Sandford, Godwin, Hardwick and Butterworth reports that 32 per cent and 26 per cent of the respondents indicated that their purchase records and sales records, respectively, were better kept. Twenty five per cent of the respondents agreed that they saved money by doing their own accounts. Other managerial benefits such as improved stock control, frequent claim of discounts and a reduction of losses from bad debts were reported. An extension of this study by Sandford, Godwin and Hardwick reports that 30 per cent of the respondents agreed that record-keeping for VAT gives them benefits. Still in the UK, the National Audit Office estimated managerial benefits at £150 million. The benefits ranged from £4 million for the smallest firms to £49 million for the largest ones. The New Zealand study by Sandford and Hasseldine found that 47 per cent and 40 per cent of the respondents claimed that their purchase records and sales records, respectively, were better kept since the introduction of the GST. Forty per cent of the respondents indicated that they saved money by doing their accounts. Similarly, some businesses reported that their stock was better controlled. In addition, they claimed discounts frequently and losses from bad debts were reduced. In Australia, small businesses cited additional reporting for GST purposes as a source of fiscal discipline or new information for the conduct of their business. Greater managerial benefits seemed to be experienced by the businesses that were not computerized when the tax reforms were introduced. Another Australian study estimated average managerial benefits at AUD4,639 per small business. Rametse maintains that managerial benefits increase with the size of the firm due to the extensive amount of resources expended by the larger firms. Additionally, the study notes that the activities of the small businesses improved from the acquisition of computers for GST purposes. Small businesses recognized improvement in record-keeping. Still in Australia, Lignier reports that a larger portion of the respondents benefited from improvements to their accounting information system. Improvements to credit management were associated with the presence of tax compliance requirements. Lignier found that small businesses gained savings on accountancy costs. Isle, Freudenberg and Copp report that more than half of the participants confirmed that they realized benefits in the form of improvements in record-keeping and assistance with other tax obligations. 4.0 METHODOLOGY Overview Questionnaires were used to collect data form the businesses in Botswana. Many international VAT/GST compliance costs studies have used postal questionnaire surveys to collect data from respondents. A detailed analysis of the advantages and disadvantages of the methodologies is provided by Sandford, Godwin and Hardwick.19 Arguments for and against the use of mail
19 See Sandford, Godwin and Hardwick above n 1, at 52-53.
7
surveys as opposed to electronic surveys particularly in tackling non-response bias are provided by Michaelidou and Dibb.20 It must be noted that most of the research techniques that are used to collect data in developing countries have been adopted from developed countries. However, Bulmer and Warwick21 caution that “the social survey is a western product which cannot be straightforwardly exported to the developing world.” While the survey techniques are successful in developed countries, they may be futile in emerging countries due to differences in culture, language and the state of infrastructure. Thus, the differences in culture and infrastructure were considered when designing the questionnaires used in this study. Furthermore, the procedure of questionnaire delivery that is commonly employed in developed countries was modified to accommodate the inadequate infrastructure in Botswana. Sample and Representativeness In this study, due to the unreliability of the postal system in Botswana, the questionnaires were hand-delivered to and collected from randomly selected businesses. Representativeness of a sample entails whether the sample is an accurate reflection of the whole population from which it is taken or not. Furthermore, can the results be generalised outside the sample of the survey? An Australian study, Wallschutzky and Gibson surveyed only twelve small businesses to estimate the extent of their tax compliance costs, and as such, the results cannot be generalised outside the sample of the survey.22 Thus, where a stratified sample cannot be obtained, it is important to use a large sample, as compliance costs vary across industries, the size of the firm and business structure. In the Botswana situation, where respondents’ return of questionnaire surveys is poor, a sample size of 600 businesses was considered acceptable to address an issue of representativeness. Measurement/Instrument and Statistical Procedure In devising the questionnaire, the overall objective of the study was considered. The main objective is to estimate the cash flow and managerial benefits of complying with the VAT system in Botswana, as well as resultant net compliance costs. The survey questionnaires (Appendices A and B) were divided into three main sections. Section A, requested general information, which included the legal structure, the length of business in operation, the main business activity (industry), the year of business registration for VAT, the main place of registration, the business’ financial year and the business’ turnover. This information enabled the computation of cross tabulations. The analysis of responses was performed using the Statistical Package for Social Sciences (SPSS) to compute descriptive statements, cross tabulations and other statistics. Section B solicited the information that enabled the estimation of VAT compliance costs, which included time costs and monetary costs, both internal and external to their businesses. Questions 18 and 15, respectively, requested the data that related to the estimation of the cash flow benefits.
20 Nina Michaelidou and Sally Dibb “Using Email Questionnaires for Research: Good Practice in Tackling Non-Response” (2005) 14(4) Journal of Targeting, Measurement and Analysis for Marketing 289, at 289-296. 21 Martin Bulmer and Donald P Warwick Social Research in Developing Countries: Surveys and Censuses in the Third World (UCL Press, Taylor and Francis Group, London, 1993) at 32. 22 Wallschutzky and Gibson “Small Business Cost of Compliance” (1993) 10(4) Australian Tax Forum at 527.
8
Question 18 reads: Excluding debts, approximately what percentage of your 2009/2010 sales and purchases (by value) was settled within each of the following periods after invoicing: For cash, within one week, between one week and one month, between the 1st and 2nd month, and more than two months after invoicing? Question 15 reads: Excluding debts, approximately what percentage of your 2010/11 sales and purchases (by value) was settled within each of the following periods after invoicing: For cash, within one week, between one week and one month, between the 1st and 2nd month, and more than two months after invoicing? Question 21a and 21b mainly focused on managerial benefits. The respondents were requested to state if record keeping for VAT purposes benefited their business. If they responded “yes”, they were asked to estimate the value of the benefit. Section C elicited information from the respondents using a 5-point Likert Scale, on perceptions and opinions, in order to measure and summarise certain situations relevant to VAT compliance. Five major statements were summed up to determine enterprises’ perceptions to VAT compliance costs in Botswana. Respondents were asked to indicate with a tick whether they ‘strongly agree’, ‘agree’, ‘neutral’, ‘disagree’, or ‘strongly disagree’. Question 23(e) was also on managerial benefit and requested respondents to state if VAT helps to improve their business management. Question 23(i) also requested respondents to state if VAT helps to improve their business record keeping. In ascertaining the validity and reliability of the questionnaire for this investigation, a pilot study was conducted. This was particularly aimed at identifying the areas where the respondents had difficulties or required more explanation. In compliance costs research, this issue is particularly important, as most respondents are usually unfamiliar with the concept. The pilot questionnaire was sent to ten businesses in Botswana. The results of the pilot study were summarised through content analysis and this provided additional information to be included in the final questionnaire. The questionnaire was revised and structured questions were used in developing a new instrument. Procedure The questionnaire was hand distributed to 600 businesses in the city of Gaborone23 and surrounding towns and villages in the financial year 2009/10. In the financial year 2010/11, 100 questionnaires were hand distributed to businesses in the City of Gaborone and neighbouring towns. Due to financial and time constraints, villages were excluded from the 2010/11 survey. Response rates of 23 per cent and 50 per cent were obtained for the financial years 2009/10 and 2010/11 respectively after allowing for unusable responses, as outlined in Table 3. 23 Gaborone is the Capital City of Botswana. Its population in 2011 was 231,592. See Central Statistics Office, Botswana Population and Housing Census: Alphabetical Index of Districts, (Government of Botswana, Gaborone, 2011) at 1.
9
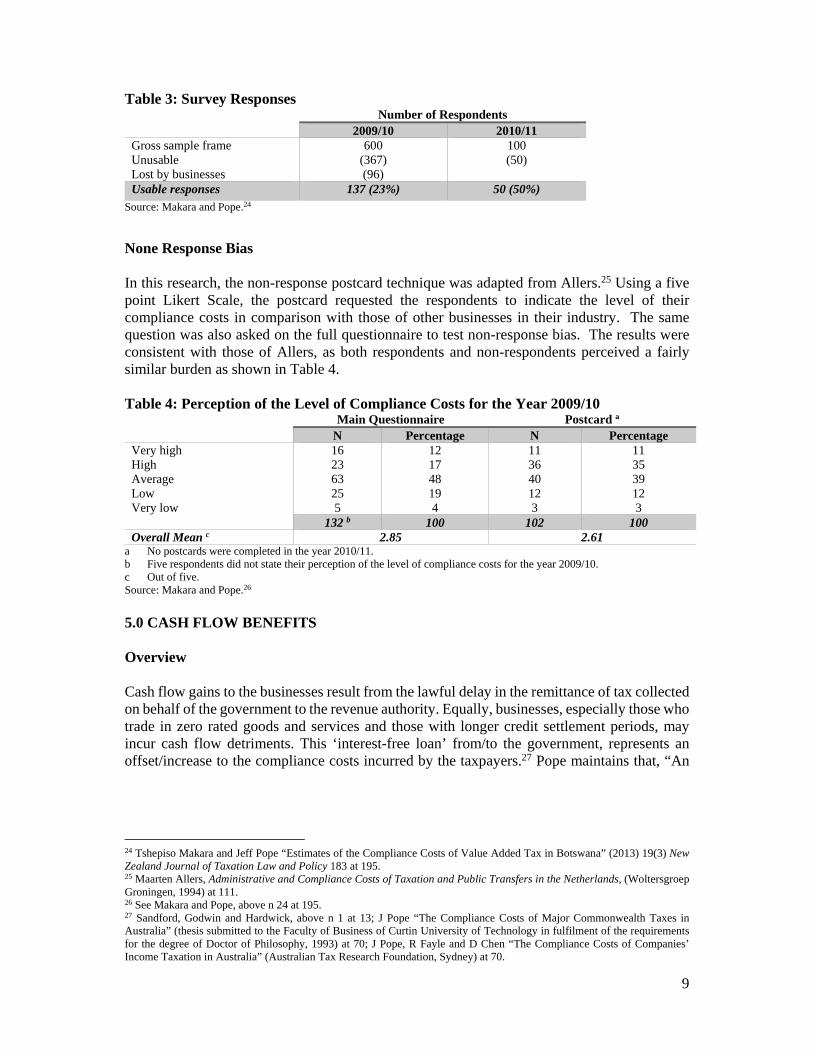
Table 3: Survey Responses Number of Respondents
2009/10 2010/11 Gross sample frame Unusable Lost by businesses
600 (367) (96)
100 (50)
Usable responses 137 (23%) 50 (50%)
Source: Makara and Pope.24
None Response Bias In this research, the non-response postcard technique was adapted from Allers.25 Using a five point Likert Scale, the postcard requested the respondents to indicate the level of their compliance costs in comparison with those of other businesses in their industry. The same question was also asked on the full questionnaire to test non-response bias. The results were consistent with those of Allers, as both respondents and non-respondents perceived a fairly similar burden as shown in Table 4. Table 4: Perception of the Level of Compliance Costs for the Year 2009/10
Main Questionnaire Postcard a
N Percentage N Percentage Very high High Average Low Very low
16 23 63 25 5
12 17 48 19 4
11 36 40 12 3
11 35 39 12 3
132 b 100 102 100 Overall Mean c 2.85 2.61
a No postcards were completed in the year 2010/11. b Five respondents did not state their perception of the level of compliance costs for the year 2009/10. c Out of five. Source: Makara and Pope.26
5.0 CASH FLOW BENEFITS Overview Cash flow gains to the businesses result from the lawful delay in the remittance of tax collected on behalf of the government to the revenue authority. Equally, businesses, especially those who trade in zero rated goods and services and those with longer credit settlement periods, may incur cash flow detriments. This ‘interest-free loan’ from/to the government, represents an offset/increase to the compliance costs incurred by the taxpayers.27 Pope maintains that, “An
24 Tshepiso Makara and Jeff Pope “Estimates of the Compliance Costs of Value Added Tax in Botswana” (2013) 19(3) New Zealand Journal of Taxation Law and Policy 183 at 195. 25 Maarten Allers, Administrative and Compliance Costs of Taxation and Public Transfers in the Netherlands, (Woltersgroep Groningen, 1994) at 111. 26 See Makara and Pope, above n 24 at 195. 27 Sandford, Godwin and Hardwick, above n 1 at 13; J Pope “The Compliance Costs of Major Commonwealth Taxes in Australia” (thesis submitted to the Faculty of Business of Curtin University of Technology in fulfilment of the requirements for the degree of Doctor of Philosophy, 1993) at 70; J Pope, R Fayle and D Chen “The Compliance Costs of Companies’ Income Taxation in Australia” (Australian Tax Research Foundation, Sydney) at 70.
10
assessment of the compliance costs of taxation upon business must consider, in particular, the effect of the value of cash flow benefits arising from the timing of tax payments.”28 The cash flow benefits and costs constitute ‘a zero sum game’ in that when the economy is taken as a whole, the gains and losses resulting from the leads and lags in tax payment cancel out.29 Hence cash flow benefits are redistributive in nature and do not provide savings to the economy as a whole.30 Nevertheless, to those who gain and those who lose, the benefits and costs are real and may significantly affect the financial position of the taxpayers, particularly during economic downturns.31 Furthermore, the values of the cash flow benefits and cash flow costs may not completely cancel out because governments and taxpayers borrow and lend on different terms.32 The cash flow benefit estimates should be treated cautiously due to their sensitivity to the level of interest rates. While cash flow benefits reduce the compliance costs borne by the taxpayers, they do nothing to reduce the regressiveness of tax compliance costs. If anything, cash flow benefits widen the disproportionate gap in the distribution of tax compliance costs between smaller and larger businesses. Cash flow benefits may lead to negative compliance costs for larger businesses, while those of smaller firms remain positive and substantial. The existence of cash flow benefits actually increases the regressive impact of compliance costs.33 This finding also corroborates with Evans et al who estimated the cash flow benefits for the major Commonwealth taxes for 1994/95 at around AUD 1,781 million. Evans et al found that SME taxpayers enjoyed relatively lower cash flow benefits (AUD 216 million and AUD 537 million, respectively) than those enjoyed by large business taxpayers.34 Estimation of Cash Flow Benefits The issue of the value of the cash flow benefits for business is complex. This value varies from one company to the other and depends on factors such as the size of the business, the industry it operates in, its competitive position and its credit arrangements with suppliers and customers. Thus, the estimates of the value of cash flow benefits are exactly that, and depend on the assumptions made. Nevertheless, these estimates provide a good indication of the order of the magnitude of cash flow benefits to businesses which should be offset against gross compliance costs.35 The estimation of the value of cash flow benefits incorporates a number of factors such as the amount of tax payable by the taxpayer, the time lag between the receipt of income and the payment of tax, the use of cash flow benefits and the bank’s average business indicator rate36 or the published base lending rate.37 It must be noted that to date, all compliance costs studies have valued cash flow benefits at an aggregate level rather than at firm level.
28 Jeff Pope “Tax Compliance Costs: The Value of Cash Flow Benefits to Business and the Effect of Pay As You Go and the GST” in Michael Walpole and Chris Evans (eds.) Tax administration in the 21st century (Prospect Media, Sydney, 2001) at 304. 29 Sandford and Hasseldine, above n 6, at 7; Pope, above n 27, at 70. 30 Pope, above n 28, at 304; Pope, Fayle and Chen “The Compliance Cost of Wholesale Sales Tax in Australia” (Australian Tax Research Foundation, Sydney, 1993) at 51. 31 Pope, above n 27, at 71. 32 Sandford, Godwin and Hardwick, above n 1, at 23. 33 Ibid at 200 34 Evans, Ritchie, Tran-Nam, and Walpole, above n 7, at 42-50. 35 Pope, above n 28, at 309. 36 Evans, Ritchie, Tran-Nam, and Walpole, above n 7, at 14. 37 Sandford and Hasseldine, above n 6, at 11.
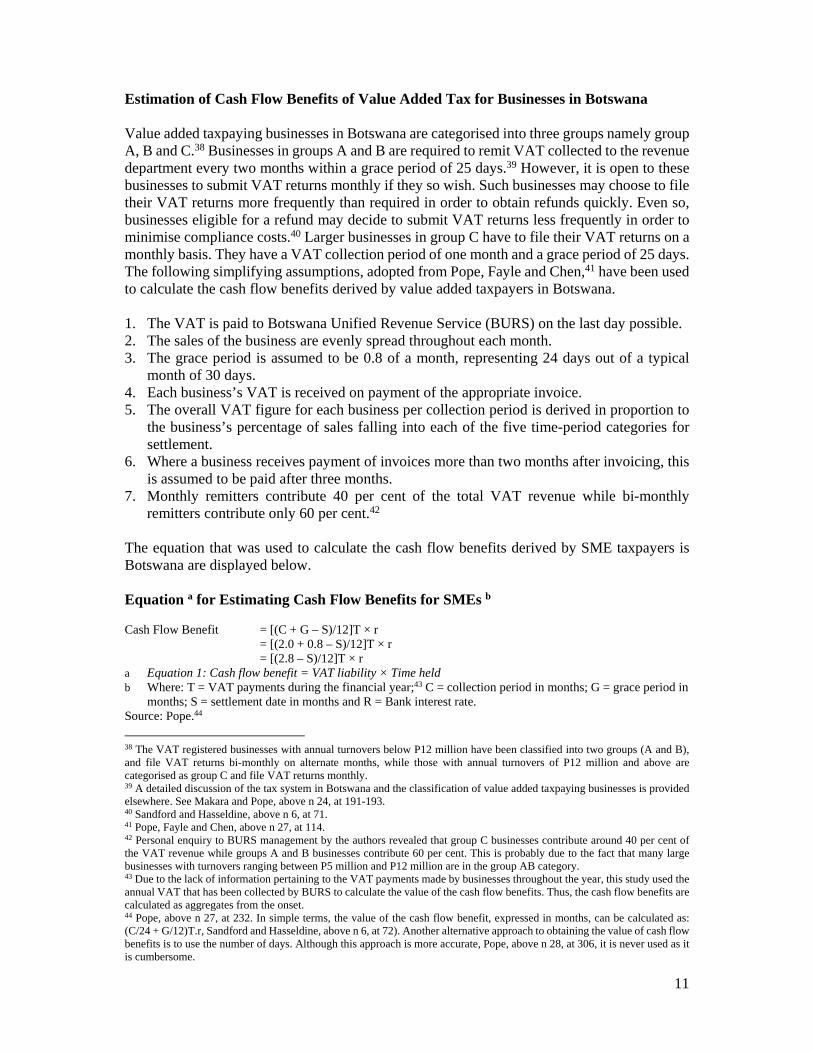
11
Estimation of Cash Flow Benefits of Value Added Tax for Businesses in Botswana Value added taxpaying businesses in Botswana are categorised into three groups namely group A, B and C.38 Businesses in groups A and B are required to remit VAT collected to the revenue department every two months within a grace period of 25 days.39 However, it is open to these businesses to submit VAT returns monthly if they so wish. Such businesses may choose to file their VAT returns more frequently than required in order to obtain refunds quickly. Even so, businesses eligible for a refund may decide to submit VAT returns less frequently in order to minimise compliance costs.40 Larger businesses in group C have to file their VAT returns on a monthly basis. They have a VAT collection period of one month and a grace period of 25 days. The following simplifying assumptions, adopted from Pope, Fayle and Chen,41 have been used to calculate the cash flow benefits derived by value added taxpayers in Botswana. 1. The VAT is paid to Botswana Unified Revenue Service (BURS) on the last day possible. 2. The sales of the business are evenly spread throughout each month. 3. The grace period is assumed to be 0.8 of a month, representing 24 days out of a typical
month of 30 days. 4. Each business’s VAT is received on payment of the appropriate invoice. 5. The overall VAT figure for each business per collection period is derived in proportion to
the business’s percentage of sales falling into each of the five time-period categories for settlement.
6. Where a business receives payment of invoices more than two months after invoicing, this is assumed to be paid after three months.
7. Monthly remitters contribute 40 per cent of the total VAT revenue while bi-monthly remitters contribute only 60 per cent.42
The equation that was used to calculate the cash flow benefits derived by SME taxpayers is Botswana are displayed below. Equation a for Estimating Cash Flow Benefits for SMEs b Cash Flow Benefit = [(C + G – S)/12]T × r
= [(2.0 + 0.8 – S)/12]T × r = [(2.8 – S)/12]T × r
a Equation 1: Cash flow benefit = VAT liability × Time held b Where: T = VAT payments during the financial year;43 C = collection period in months; G = grace period in
months; S = settlement date in months and R = Bank interest rate. Source: Pope.44
38 The VAT registered businesses with annual turnovers below P12 million have been classified into two groups (A and B), and file VAT returns bi-monthly on alternate months, while those with annual turnovers of P12 million and above are categorised as group C and file VAT returns monthly. 39 A detailed discussion of the tax system in Botswana and the classification of value added taxpaying businesses is provided elsewhere. See Makara and Pope, above n 24, at 191-193. 40 Sandford and Hasseldine, above n 6, at 71. 41 Pope, Fayle and Chen, above n 27, at 114. 42 Personal enquiry to BURS management by the authors revealed that group C businesses contribute around 40 per cent of the VAT revenue while groups A and B businesses contribute 60 per cent. This is probably due to the fact that many large businesses with turnovers ranging between P5 million and P12 million are in the group AB category. 43 Due to the lack of information pertaining to the VAT payments made by businesses throughout the year, this study used the annual VAT that has been collected by BURS to calculate the value of the cash flow benefits. Thus, the cash flow benefits are calculated as aggregates from the onset. 44 Pope, above n 27, at 232. In simple terms, the value of the cash flow benefit, expressed in months, can be calculated as: (C/24 + G/12)T.r, Sandford and Hasseldine, above n 6, at 72). Another alternative approach to obtaining the value of cash flow benefits is to use the number of days. Although this approach is more accurate, Pope, above n 28, at 306, it is never used as it is cumbersome.
12
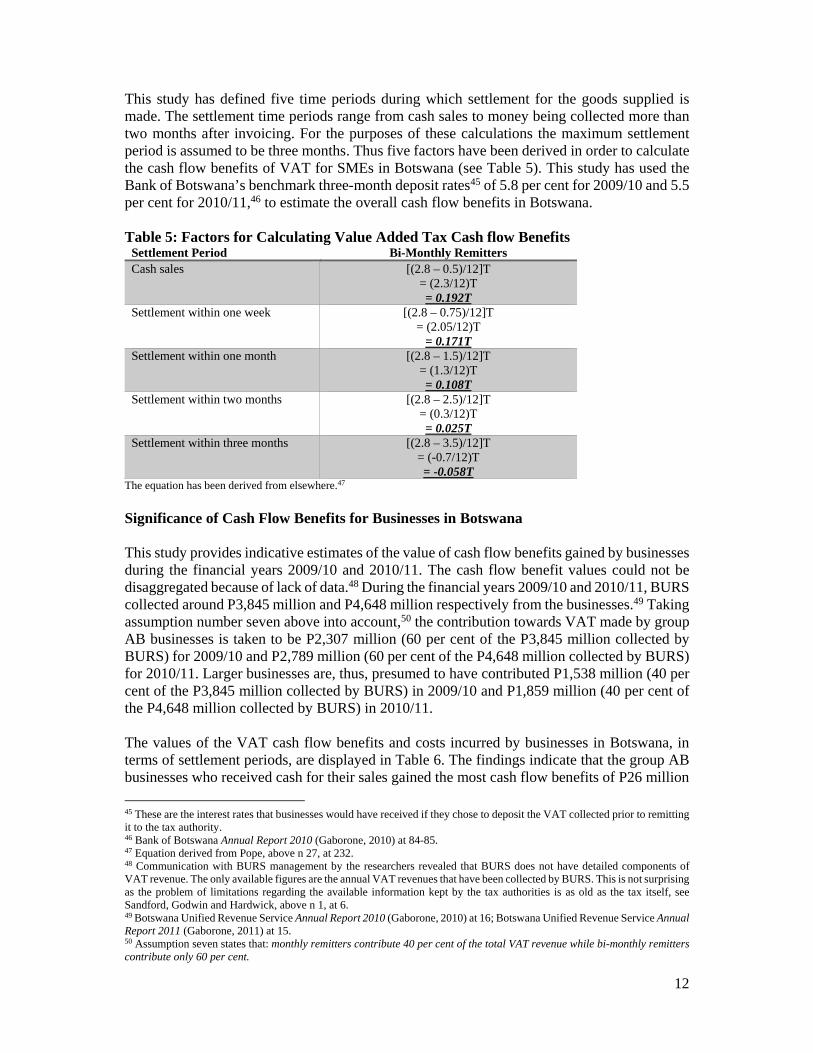
This study has defined five time periods during which settlement for the goods supplied is made. The settlement time periods range from cash sales to money being collected more than two months after invoicing. For the purposes of these calculations the maximum settlement period is assumed to be three months. Thus five factors have been derived in order to calculate the cash flow benefits of VAT for SMEs in Botswana (see Table 5). This study has used the Bank of Botswana’s benchmark three-month deposit rates45 of 5.8 per cent for 2009/10 and 5.5 per cent for 2010/11,46 to estimate the overall cash flow benefits in Botswana. Table 5: Factors for Calculating Value Added Tax Cash flow Benefits
Settlement Period Bi-Monthly Remitters Cash sales
[(2.8 – 0.5)/12]T = (2.3/12)T = 0.192T
Settlement within one week
[(2.8 – 0.75)/12]T = (2.05/12)T
= 0.171T Settlement within one month
[(2.8 – 1.5)/12]T = (1.3/12)T = 0.108T
Settlement within two months [(2.8 – 2.5)/12]T = (0.3/12)T = 0.025T
Settlement within three months [(2.8 – 3.5)/12]T = (-0.7/12)T = -0.058T
The equation has been derived from elsewhere.47 Significance of Cash Flow Benefits for Businesses in Botswana This study provides indicative estimates of the value of cash flow benefits gained by businesses during the financial years 2009/10 and 2010/11. The cash flow benefit values could not be disaggregated because of lack of data.48 During the financial years 2009/10 and 2010/11, BURS collected around P3,845 million and P4,648 million respectively from the businesses.49 Taking assumption number seven above into account,50 the contribution towards VAT made by group AB businesses is taken to be P2,307 million (60 per cent of the P3,845 million collected by BURS) for 2009/10 and P2,789 million (60 per cent of the P4,648 million collected by BURS) for 2010/11. Larger businesses are, thus, presumed to have contributed P1,538 million (40 per cent of the P3,845 million collected by BURS) in 2009/10 and P1,859 million (40 per cent of the P4,648 million collected by BURS) in 2010/11. The values of the VAT cash flow benefits and costs incurred by businesses in Botswana, in terms of settlement periods, are displayed in Table 6. The findings indicate that the group AB businesses who received cash for their sales gained the most cash flow benefits of P26 million
45 These are the interest rates that businesses would have received if they chose to deposit the VAT collected prior to remitting it to the tax authority. 46 Bank of Botswana Annual Report 2010 (Gaborone, 2010) at 84-85. 47 Equation derived from Pope, above n 27, at 232. 48 Communication with BURS management by the researchers revealed that BURS does not have detailed components of VAT revenue. The only available figures are the annual VAT revenues that have been collected by BURS. This is not surprising as the problem of limitations regarding the available information kept by the tax authorities is as old as the tax itself, see Sandford, Godwin and Hardwick, above n 1, at 6. 49 Botswana Unified Revenue Service Annual Report 2010 (Gaborone, 2010) at 16; Botswana Unified Revenue Service Annual Report 2011 (Gaborone, 2011) at 15. 50 Assumption seven states that: monthly remitters contribute 40 per cent of the total VAT revenue while bi-monthly remitters contribute only 60 per cent.
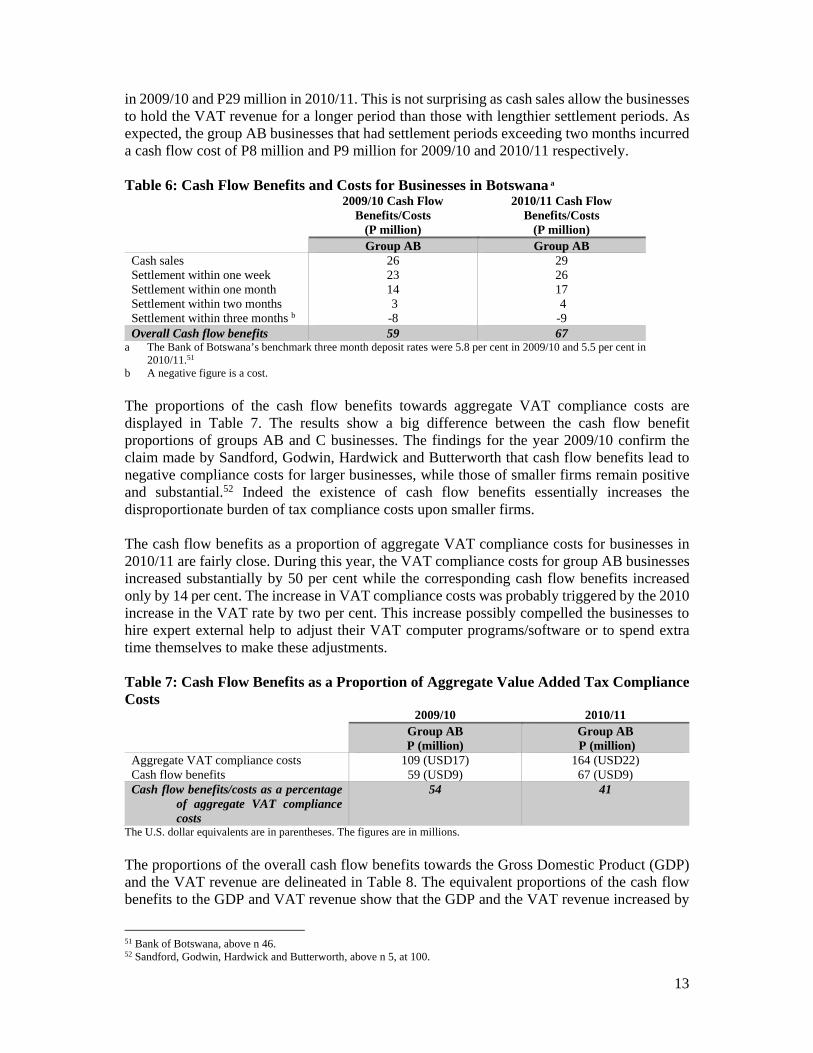
13
in 2009/10 and P29 million in 2010/11. This is not surprising as cash sales allow the businesses to hold the VAT revenue for a longer period than those with lengthier settlement periods. As expected, the group AB businesses that had settlement periods exceeding two months incurred a cash flow cost of P8 million and P9 million for 2009/10 and 2010/11 respectively. Table 6: Cash Flow Benefits and Costs for Businesses in Botswana a
2009/10 Cash Flow Benefits/Costs
(P million)
2010/11 Cash Flow Benefits/Costs
(P million) Group AB Group AB
Cash sales Settlement within one week Settlement within one month Settlement within two months Settlement within three months b
26 23 14 3 -8
29 26 17 4 -9
Overall Cash flow benefits 59 67 a The Bank of Botswana’s benchmark three month deposit rates were 5.8 per cent in 2009/10 and 5.5 per cent in
2010/11.51 b A negative figure is a cost.
The proportions of the cash flow benefits towards aggregate VAT compliance costs are displayed in Table 7. The results show a big difference between the cash flow benefit proportions of groups AB and C businesses. The findings for the year 2009/10 confirm the claim made by Sandford, Godwin, Hardwick and Butterworth that cash flow benefits lead to negative compliance costs for larger businesses, while those of smaller firms remain positive and substantial.52 Indeed the existence of cash flow benefits essentially increases the disproportionate burden of tax compliance costs upon smaller firms. The cash flow benefits as a proportion of aggregate VAT compliance costs for businesses in 2010/11 are fairly close. During this year, the VAT compliance costs for group AB businesses increased substantially by 50 per cent while the corresponding cash flow benefits increased only by 14 per cent. The increase in VAT compliance costs was probably triggered by the 2010 increase in the VAT rate by two per cent. This increase possibly compelled the businesses to hire expert external help to adjust their VAT computer programs/software or to spend extra time themselves to make these adjustments. Table 7: Cash Flow Benefits as a Proportion of Aggregate Value Added Tax Compliance Costs
2009/10 2010/11 Group AB P (million)
Group AB P (million)
Aggregate VAT compliance costs Cash flow benefits
109 (USD17) 59 (USD9)
164 (USD22) 67 (USD9)
Cash flow benefits/costs as a percentage of aggregate VAT compliance costs
54 41
The U.S. dollar equivalents are in parentheses. The figures are in millions.
The proportions of the overall cash flow benefits towards the Gross Domestic Product (GDP) and the VAT revenue are delineated in Table 8. The equivalent proportions of the cash flow benefits to the GDP and VAT revenue show that the GDP and the VAT revenue increased by
51 Bank of Botswana, above n 46. 52 Sandford, Godwin, Hardwick and Butterworth, above n 5, at 100.
14
similar magnitudes over a 12 month period. A key finding is that the cash flow benefits proportions towards GDP and VAT revenue are stable. Table 8: Cash Flow Benefits as a Proportion of Gross Domestic Product and Value Added Tax Revenue
2009/10 2010/11 P
(million) USD
(million) P
(million) USD
(million) Cash Flow Benefits 59 8.7 67 8.7 GDP 101,258 15,695 120,541 16,152 VAT Revenue 3,845 596 4,648 623 Percentage Cash Flow Benefits as a Percentage of GDP 0.6 0.6 Cash Flow Benefits as a Percentage of VAT Revenue 1.5 1.4
6.0 MANAGERIAL BENEFITS Overview The record keeping requirements imposed by the tax system may result in managerial benefits for the businesses. Compliance costs studies suggest that managerial benefits are important and exist, particularly for small businesses. These gains are generally resource savers53 and provide a basis for improved business or individual decision making.54 Managerial benefits have long been recognised and discussed extensively from a theoretical point of view in the tax compliance costs literature, however, their empirical evidence remains sparse. The main reason why many tax compliance costs researchers have shied away from estimating managerial benefits is because these gains are difficult to measure. Sandford, Godwin and Hardwick maintain that managerial benefits are significant in offsetting tax compliance costs, but cautioned that it is impossible to get an accurate value of such gains.55 It has also been suggested that while these benefits theoretically exist, they are normally excluded from tax compliance costs studies due to the difficulty in their estimation.56 The difficulty of measuring managerial benefits arises from the accounting-taxation overlap issues in tax compliance costs. The problem of distinguishing between accounting induced and tax induced managerial benefits mirrors the tricky issue of separating accounting costs and tax compliance costs. Another concern relates to the fact that the magnitude of managerial benefits depends on how small businesses value managerial information. Tran-Nam notes that as small businesses tend to value managerial information less than large businesses, the aggregate value of GST induced managerial benefits to business taxpayers may not be too high.57 Perceived Managerial Benefits This section of the paper outlines the estimates of managerial benefits gained by SMEs in Botswana. The respondents were asked to indicate if they received any benefits from record
53 Sandford and Hasseldine, above n 6, at 76. 54 B Tran-Nam, C Evans, M Walpole and K Ritchie “Tax Compliance Costs: Research Methodology and Empirical Evidence from Australia” (2000) 53(2) National Tax Journal 229, at 232. 55 Sandford, Godwin and Hardwick, above n 1, at 118. 56 Tran-Nam, Evans, Walpole and Ritchie, above n 54, at 232. 57 B Tran-Nam “Tax Compliance Costs Methodology—A Research Agenda for the Future” in C Evans, J. Pope and J. Hasseldine (eds.), Tax ComplianceCcosts: A Festschrift for Cedric Sandford (Prospect Media, Sydney, 2001) at 55.
15
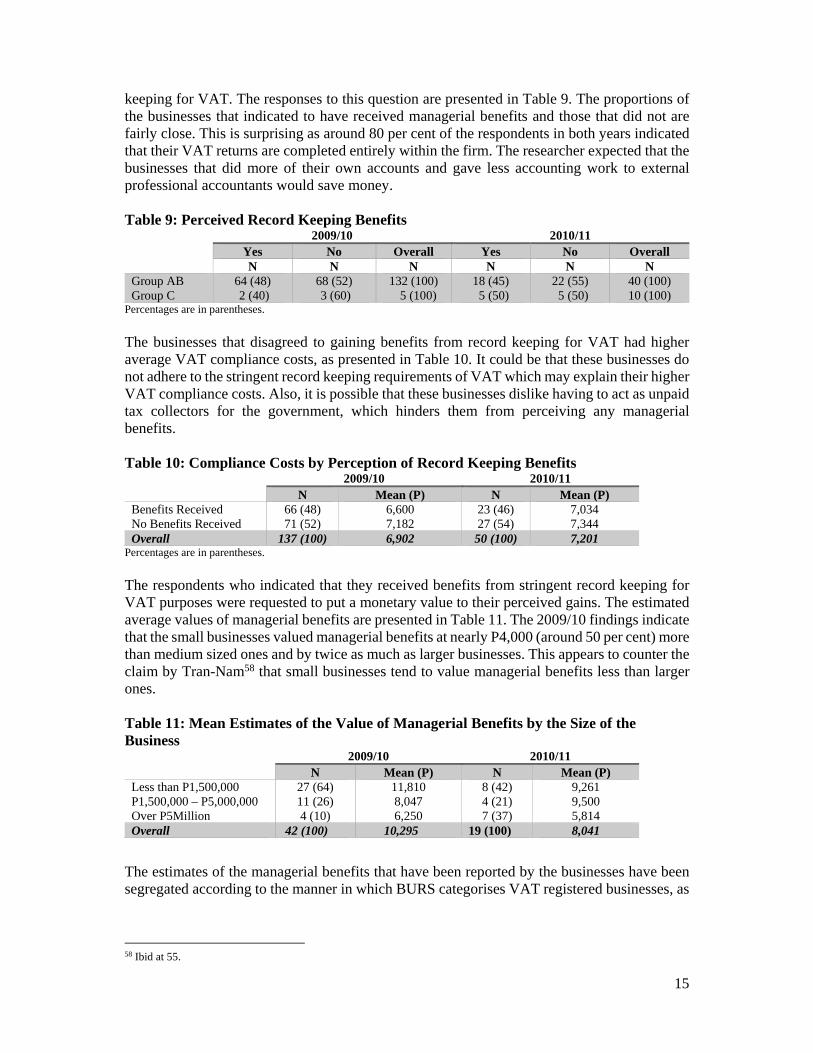
keeping for VAT. The responses to this question are presented in Table 9. The proportions of the businesses that indicated to have received managerial benefits and those that did not are fairly close. This is surprising as around 80 per cent of the respondents in both years indicated that their VAT returns are completed entirely within the firm. The researcher expected that the businesses that did more of their own accounts and gave less accounting work to external professional accountants would save money. Table 9: Perceived Record Keeping Benefits
2009/10 2010/11 Yes No Overall Yes No Overall N N N N N N
Group AB Group C
64 (48) 2 (40)
68 (52) 3 (60)
132 (100) 5 (100)
18 (45) 5 (50)
22 (55) 5 (50)
40 (100) 10 (100)
Percentages are in parentheses. The businesses that disagreed to gaining benefits from record keeping for VAT had higher average VAT compliance costs, as presented in Table 10. It could be that these businesses do not adhere to the stringent record keeping requirements of VAT which may explain their higher VAT compliance costs. Also, it is possible that these businesses dislike having to act as unpaid tax collectors for the government, which hinders them from perceiving any managerial benefits. Table 10: Compliance Costs by Perception of Record Keeping Benefits
2009/10 2010/11 N Mean (P) N Mean (P)
Benefits Received No Benefits Received
66 (48) 71 (52)
6,600 7,182
23 (46) 27 (54)
7,034 7,344
Overall 137 (100) 6,902 50 (100) 7,201 Percentages are in parentheses.
The respondents who indicated that they received benefits from stringent record keeping for VAT purposes were requested to put a monetary value to their perceived gains. The estimated average values of managerial benefits are presented in Table 11. The 2009/10 findings indicate that the small businesses valued managerial benefits at nearly P4,000 (around 50 per cent) more than medium sized ones and by twice as much as larger businesses. This appears to counter the claim by Tran-Nam58 that small businesses tend to value managerial benefits less than larger ones. Table 11: Mean Estimates of the Value of Managerial Benefits by the Size of the Business
2009/10 2010/11 N Mean (P) N Mean (P)
Less than P1,500,000 P1,500,000 – P5,000,000 Over P5Million
27 (64) 11 (26) 4 (10)
11,810 8,047 6,250
8 (42) 4 (21) 7 (37)
9,261 9,500 5,814
Overall 42 (100) 10,295 19 (100) 8,041
The estimates of the managerial benefits that have been reported by the businesses have been segregated according to the manner in which BURS categorises VAT registered businesses, as
58 Ibid at 55.
16
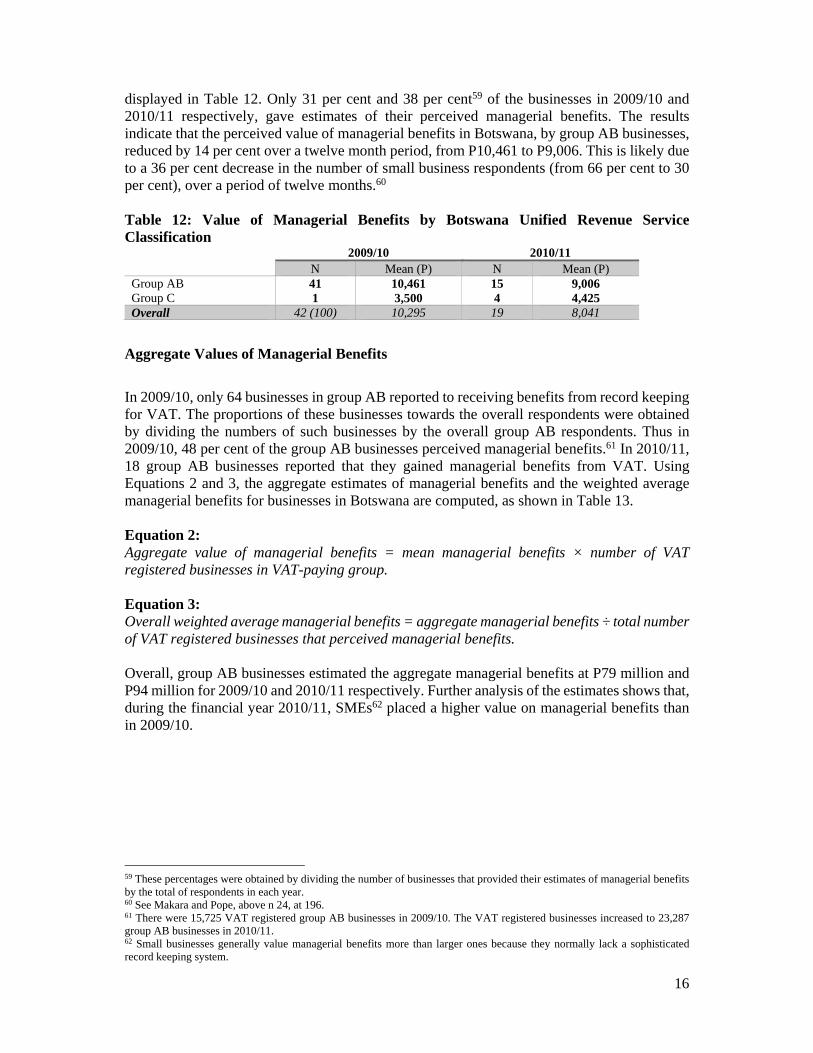
displayed in Table 12. Only 31 per cent and 38 per cent59 of the businesses in 2009/10 and 2010/11 respectively, gave estimates of their perceived managerial benefits. The results indicate that the perceived value of managerial benefits in Botswana, by group AB businesses, reduced by 14 per cent over a twelve month period, from P10,461 to P9,006. This is likely due to a 36 per cent decrease in the number of small business respondents (from 66 per cent to 30 per cent), over a period of twelve months.60 Table 12: Value of Managerial Benefits by Botswana Unified Revenue Service Classification
2009/10 2010/11 N Mean (P) N Mean (P)
Group AB Group C
41 1
10,461 3,500
15 4
9,006 4,425
Overall 42 (100) 10,295 19 8,041
Aggregate Values of Managerial Benefits
In 2009/10, only 64 businesses in group AB reported to receiving benefits from record keeping for VAT. The proportions of these businesses towards the overall respondents were obtained by dividing the numbers of such businesses by the overall group AB respondents. Thus in 2009/10, 48 per cent of the group AB businesses perceived managerial benefits.61 In 2010/11, 18 group AB businesses reported that they gained managerial benefits from VAT. Using Equations 2 and 3, the aggregate estimates of managerial benefits and the weighted average managerial benefits for businesses in Botswana are computed, as shown in Table 13. Equation 2: Aggregate value of managerial benefits = mean managerial benefits × number of VAT registered businesses in VAT-paying group. Equation 3: Overall weighted average managerial benefits = aggregate managerial benefits ÷ total number of VAT registered businesses that perceived managerial benefits. Overall, group AB businesses estimated the aggregate managerial benefits at P79 million and P94 million for 2009/10 and 2010/11 respectively. Further analysis of the estimates shows that, during the financial year 2010/11, SMEs62 placed a higher value on managerial benefits than in 2009/10. 59 These percentages were obtained by dividing the number of businesses that provided their estimates of managerial benefits by the total of respondents in each year. 60 See Makara and Pope, above n 24, at 196. 61 There were 15,725 VAT registered group AB businesses in 2009/10. The VAT registered businesses increased to 23,287 group AB businesses in 2010/11. 62 Small businesses generally value managerial benefits more than larger ones because they normally lack a sophisticated record keeping system.
17
Table 13: Aggregate Values of Managerial Benefits for Businesses in Botswana 2009/10 2010/11
N Mean (P)
Weighted Managerial Benefits
N Mean (P)
Weighted Managerial Benefits
P (million)
USD (million)
P (million)
USD (million)
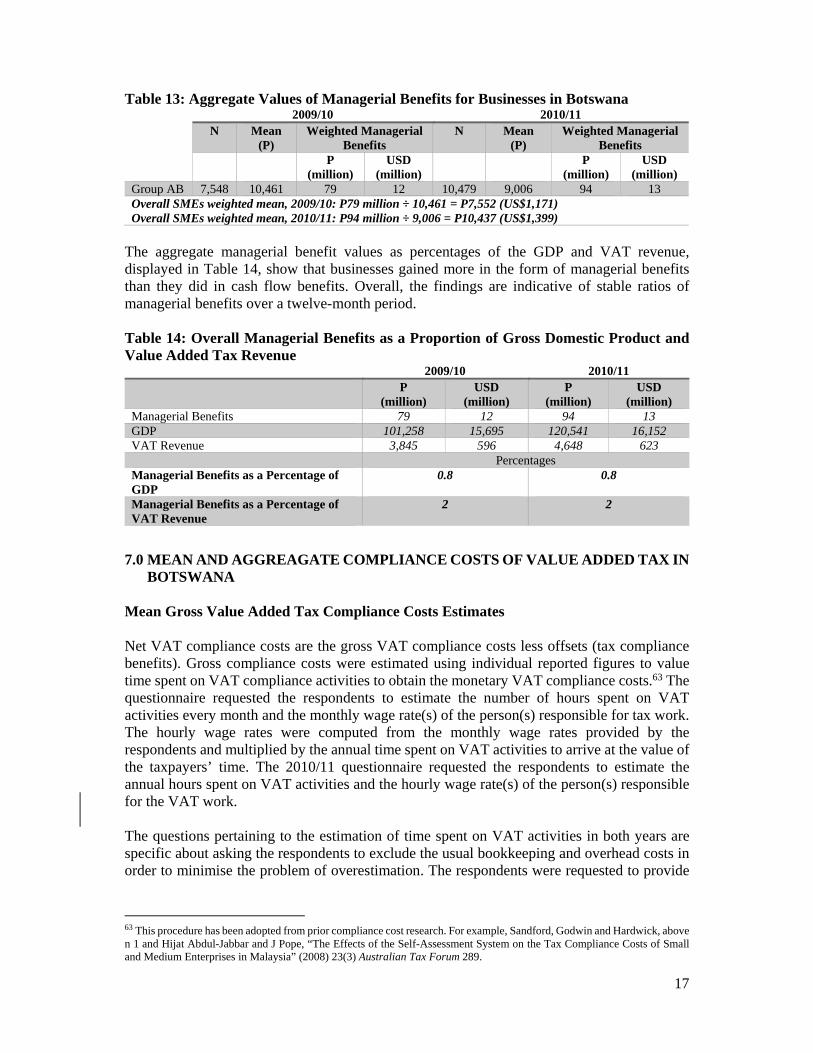
Group AB 7,548 10,461 79 12 10,479 9,006 94 13 Overall SMEs weighted mean, 2009/10: P79 million ÷ 10,461 = P7,552 (US$1,171) Overall SMEs weighted mean, 2010/11: P94 million ÷ 9,006 = P10,437 (US$1,399)
The aggregate managerial benefit values as percentages of the GDP and VAT revenue, displayed in Table 14, show that businesses gained more in the form of managerial benefits than they did in cash flow benefits. Overall, the findings are indicative of stable ratios of managerial benefits over a twelve-month period. Table 14: Overall Managerial Benefits as a Proportion of Gross Domestic Product and Value Added Tax Revenue
2009/10 2010/11 P
(million) USD
(million) P
(million) USD
(million) Managerial Benefits 79 12 94 13 GDP 101,258 15,695 120,541 16,152 VAT Revenue 3,845 596 4,648 623 Percentages Managerial Benefits as a Percentage of GDP
0.8 0.8
Managerial Benefits as a Percentage of VAT Revenue
2 2
7.0 MEAN AND AGGREAGATE COMPLIANCE COSTS OF VALUE ADDED TAX IN
BOTSWANA
Mean Gross Value Added Tax Compliance Costs Estimates Net VAT compliance costs are the gross VAT compliance costs less offsets (tax compliance benefits). Gross compliance costs were estimated using individual reported figures to value time spent on VAT compliance activities to obtain the monetary VAT compliance costs.63 The questionnaire requested the respondents to estimate the number of hours spent on VAT activities every month and the monthly wage rate(s) of the person(s) responsible for tax work. The hourly wage rates were computed from the monthly wage rates provided by the respondents and multiplied by the annual time spent on VAT activities to arrive at the value of the taxpayers’ time. The 2010/11 questionnaire requested the respondents to estimate the annual hours spent on VAT activities and the hourly wage rate(s) of the person(s) responsible for the VAT work. The questions pertaining to the estimation of time spent on VAT activities in both years are specific about asking the respondents to exclude the usual bookkeeping and overhead costs in order to minimise the problem of overestimation. The respondents were requested to provide
63 This procedure has been adopted from prior compliance cost research. For example, Sandford, Godwin and Hardwick, above n 1 and Hijat Abdul-Jabbar and J Pope, “The Effects of the Self-Assessment System on the Tax Compliance Costs of Small and Medium Enterprises in Malaysia” (2008) 23(3) Australian Tax Forum 289.
18
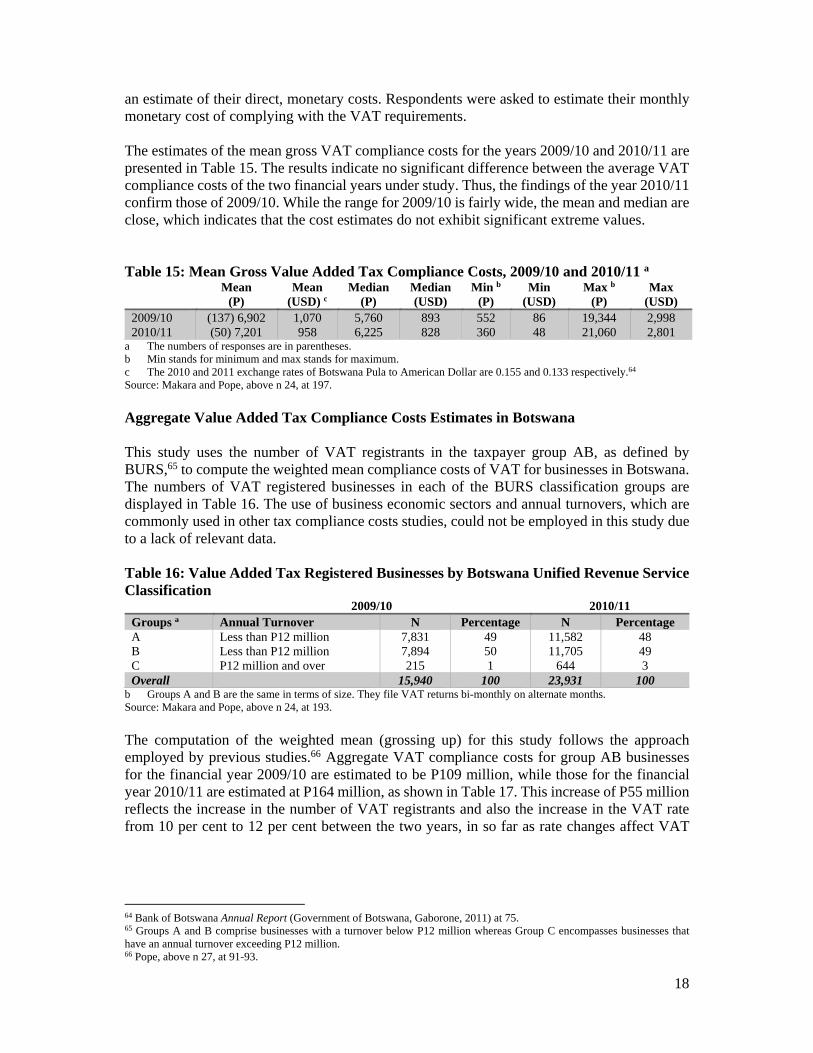
an estimate of their direct, monetary costs. Respondents were asked to estimate their monthly monetary cost of complying with the VAT requirements. The estimates of the mean gross VAT compliance costs for the years 2009/10 and 2010/11 are presented in Table 15. The results indicate no significant difference between the average VAT compliance costs of the two financial years under study. Thus, the findings of the year 2010/11 confirm those of 2009/10. While the range for 2009/10 is fairly wide, the mean and median are close, which indicates that the cost estimates do not exhibit significant extreme values. Table 15: Mean Gross Value Added Tax Compliance Costs, 2009/10 and 2010/11 a
Mean (P)
Mean (USD) c
Median
(P) Median (USD)
Min b
(P) Min
(USD) Max b
(P) Max
(USD) 2009/10 2010/11
(137) 6,902 (50) 7,201
1,070 958
5,760 6,225
893 828
552 360
86 48
19,344 21,060
2,998 2,801
a The numbers of responses are in parentheses. b Min stands for minimum and max stands for maximum. c The 2010 and 2011 exchange rates of Botswana Pula to American Dollar are 0.155 and 0.133 respectively.64 Source: Makara and Pope, above n 24, at 197. Aggregate Value Added Tax Compliance Costs Estimates in Botswana This study uses the number of VAT registrants in the taxpayer group AB, as defined by BURS,65 to compute the weighted mean compliance costs of VAT for businesses in Botswana. The numbers of VAT registered businesses in each of the BURS classification groups are displayed in Table 16. The use of business economic sectors and annual turnovers, which are commonly used in other tax compliance costs studies, could not be employed in this study due to a lack of relevant data. Table 16: Value Added Tax Registered Businesses by Botswana Unified Revenue Service Classification
2009/10 2010/11 Groups a Annual Turnover N Percentage N Percentage A B C
Less than P12 million Less than P12 million P12 million and over
7,831 7,894 215
49 50 1
11,582 11,705
644
48 49 3
Overall 15,940 100 23,931 100 b Groups A and B are the same in terms of size. They file VAT returns bi-monthly on alternate months. Source: Makara and Pope, above n 24, at 193.
The computation of the weighted mean (grossing up) for this study follows the approach employed by previous studies.66 Aggregate VAT compliance costs for group AB businesses for the financial year 2009/10 are estimated to be P109 million, while those for the financial year 2010/11 are estimated at P164 million, as shown in Table 17. This increase of P55 million reflects the increase in the number of VAT registrants and also the increase in the VAT rate from 10 per cent to 12 per cent between the two years, in so far as rate changes affect VAT
64 Bank of Botswana Annual Report (Government of Botswana, Gaborone, 2011) at 75. 65 Groups A and B comprise businesses with a turnover below P12 million whereas Group C encompasses businesses that have an annual turnover exceeding P12 million. 66 Pope, above n 27, at 91-93.
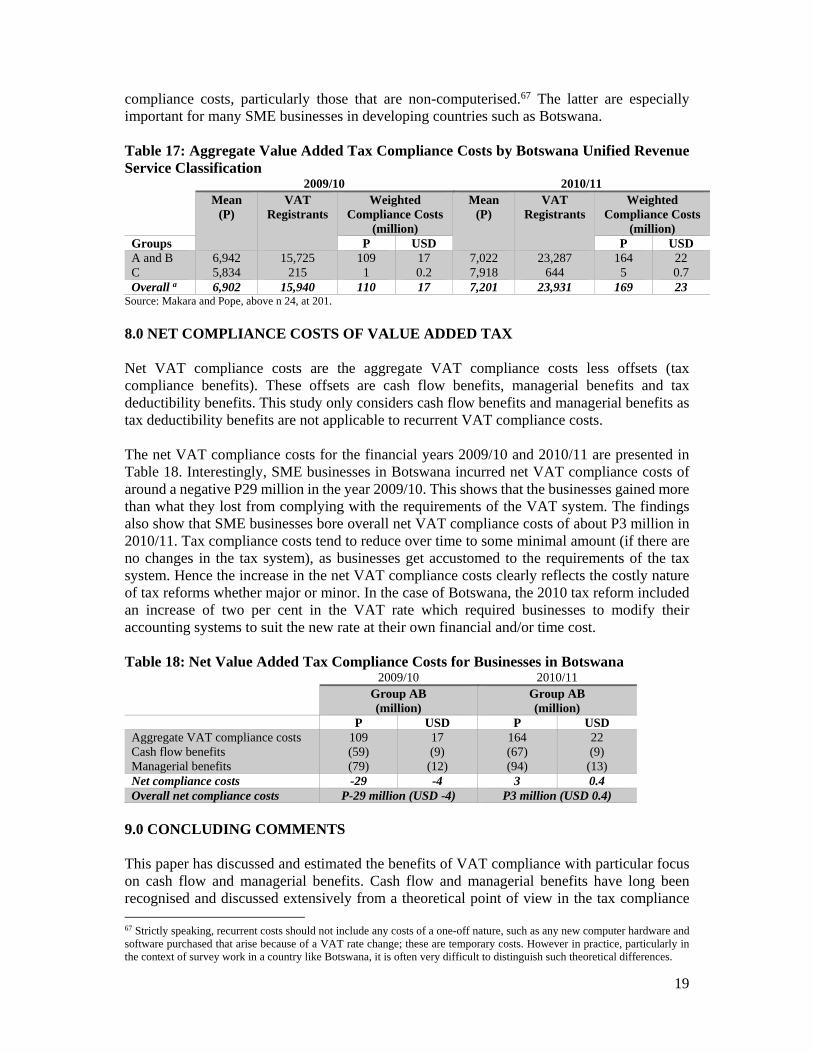
19
compliance costs, particularly those that are non-computerised.67 The latter are especially important for many SME businesses in developing countries such as Botswana. Table 17: Aggregate Value Added Tax Compliance Costs by Botswana Unified Revenue Service Classification
2009/10 2010/11 Mean
(P) VAT
Registrants Weighted
Compliance Costs (million)
Mean (P)
VAT Registrants
Weighted Compliance Costs
(million) Groups P USD P USD A and B C
6,942 5,834
15,725 215
109 1
17 0.2
7,022 7,918
23,287 644
164 5
22 0.7
Overall a 6,902 15,940 110 17 7,201 23,931 169 23 Source: Makara and Pope, above n 24, at 201.
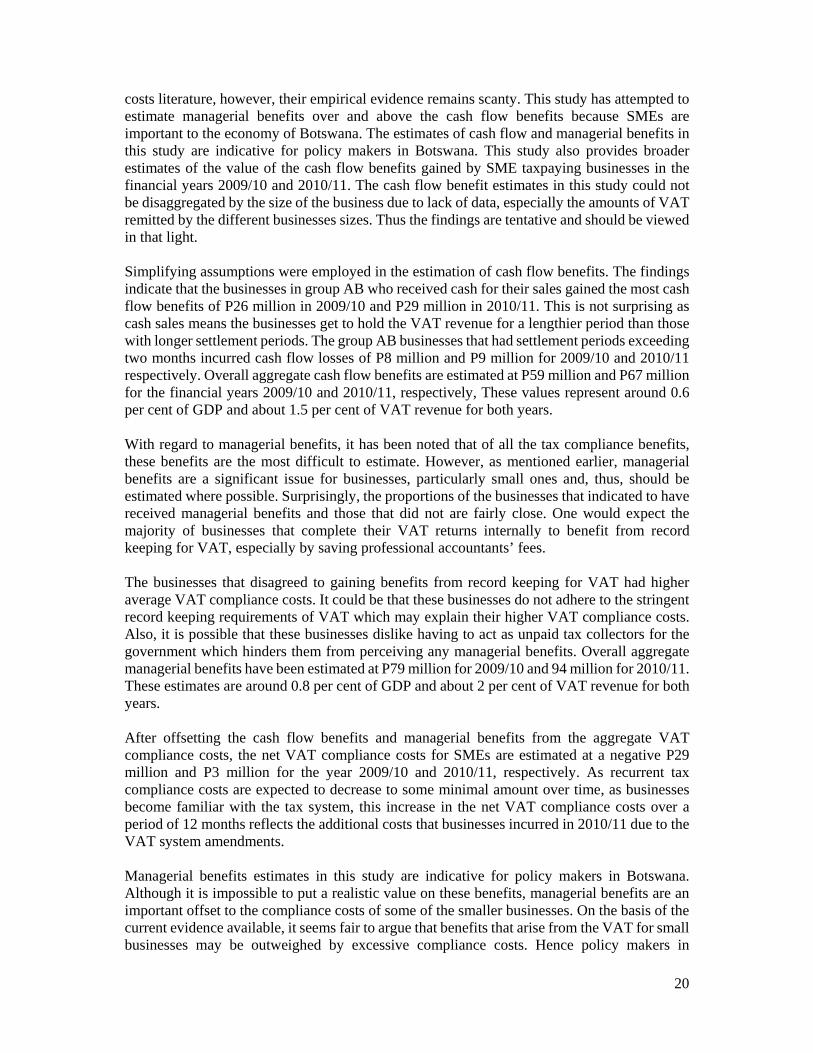
8.0 NET COMPLIANCE COSTS OF VALUE ADDED TAX Net VAT compliance costs are the aggregate VAT compliance costs less offsets (tax compliance benefits). These offsets are cash flow benefits, managerial benefits and tax deductibility benefits. This study only considers cash flow benefits and managerial benefits as tax deductibility benefits are not applicable to recurrent VAT compliance costs. The net VAT compliance costs for the financial years 2009/10 and 2010/11 are presented in Table 18. Interestingly, SME businesses in Botswana incurred net VAT compliance costs of around a negative P29 million in the year 2009/10. This shows that the businesses gained more than what they lost from complying with the requirements of the VAT system. The findings also show that SME businesses bore overall net VAT compliance costs of about P3 million in 2010/11. Tax compliance costs tend to reduce over time to some minimal amount (if there are no changes in the tax system), as businesses get accustomed to the requirements of the tax system. Hence the increase in the net VAT compliance costs clearly reflects the costly nature of tax reforms whether major or minor. In the case of Botswana, the 2010 tax reform included an increase of two per cent in the VAT rate which required businesses to modify their accounting systems to suit the new rate at their own financial and/or time cost. Table 18: Net Value Added Tax Compliance Costs for Businesses in Botswana
2009/10 2010/11 Group AB (million)
Group AB (million)
P USD P USD Aggregate VAT compliance costs Cash flow benefits Managerial benefits
109 (59) (79)
17 (9) (12)
164 (67) (94)
22 (9)
(13) Net compliance costs -29 -4 3 0.4 Overall net compliance costs P-29 million (USD -4) P3 million (USD 0.4)
9.0 CONCLUDING COMMENTS This paper has discussed and estimated the benefits of VAT compliance with particular focus on cash flow and managerial benefits. Cash flow and managerial benefits have long been recognised and discussed extensively from a theoretical point of view in the tax compliance 67 Strictly speaking, recurrent costs should not include any costs of a one-off nature, such as any new computer hardware and software purchased that arise because of a VAT rate change; these are temporary costs. However in practice, particularly in the context of survey work in a country like Botswana, it is often very difficult to distinguish such theoretical differences.
20
costs literature, however, their empirical evidence remains scanty. This study has attempted to estimate managerial benefits over and above the cash flow benefits because SMEs are important to the economy of Botswana. The estimates of cash flow and managerial benefits in this study are indicative for policy makers in Botswana. This study also provides broader estimates of the value of the cash flow benefits gained by SME taxpaying businesses in the financial years 2009/10 and 2010/11. The cash flow benefit estimates in this study could not be disaggregated by the size of the business due to lack of data, especially the amounts of VAT remitted by the different businesses sizes. Thus the findings are tentative and should be viewed in that light. Simplifying assumptions were employed in the estimation of cash flow benefits. The findings indicate that the businesses in group AB who received cash for their sales gained the most cash flow benefits of P26 million in 2009/10 and P29 million in 2010/11. This is not surprising as cash sales means the businesses get to hold the VAT revenue for a lengthier period than those with longer settlement periods. The group AB businesses that had settlement periods exceeding two months incurred cash flow losses of P8 million and P9 million for 2009/10 and 2010/11 respectively. Overall aggregate cash flow benefits are estimated at P59 million and P67 million for the financial years 2009/10 and 2010/11, respectively, These values represent around 0.6 per cent of GDP and about 1.5 per cent of VAT revenue for both years. With regard to managerial benefits, it has been noted that of all the tax compliance benefits, these benefits are the most difficult to estimate. However, as mentioned earlier, managerial benefits are a significant issue for businesses, particularly small ones and, thus, should be estimated where possible. Surprisingly, the proportions of the businesses that indicated to have received managerial benefits and those that did not are fairly close. One would expect the majority of businesses that complete their VAT returns internally to benefit from record keeping for VAT, especially by saving professional accountants’ fees. The businesses that disagreed to gaining benefits from record keeping for VAT had higher average VAT compliance costs. It could be that these businesses do not adhere to the stringent record keeping requirements of VAT which may explain their higher VAT compliance costs. Also, it is possible that these businesses dislike having to act as unpaid tax collectors for the government which hinders them from perceiving any managerial benefits. Overall aggregate managerial benefits have been estimated at P79 million for 2009/10 and 94 million for 2010/11. These estimates are around 0.8 per cent of GDP and about 2 per cent of VAT revenue for both years. After offsetting the cash flow benefits and managerial benefits from the aggregate VAT compliance costs, the net VAT compliance costs for SMEs are estimated at a negative P29 million and P3 million for the year 2009/10 and 2010/11, respectively. As recurrent tax compliance costs are expected to decrease to some minimal amount over time, as businesses become familiar with the tax system, this increase in the net VAT compliance costs over a period of 12 months reflects the additional costs that businesses incurred in 2010/11 due to the VAT system amendments. Managerial benefits estimates in this study are indicative for policy makers in Botswana. Although it is impossible to put a realistic value on these benefits, managerial benefits are an important offset to the compliance costs of some of the smaller businesses. On the basis of the current evidence available, it seems fair to argue that benefits that arise from the VAT for small businesses may be outweighed by excessive compliance costs. Hence policy makers in
21
Botswana should recognise the regressivity of the VAT, provide financial support for small businesses and encourage small businesses to acquire and use technology, particularly in the electronic lodgment and monetary transfers of tax. The government should encourage stringent record keeping for VAT substantiation for the small business community, as it has the capacity to lower their accounting fees and the overall compliance costs. More work is needed in this area in order to fully understand the nature and magnitude of cash flow and managerial benefits of VAT compliance in Botswana and other countries. To this date, empirical research in this area remains sparse. The limitation is that the data is more than five years old which may make its relevancy doubtful. However, the current compliance costs studies were reviewed and augmented in this research in order to strengthen this paper68 and substantiate the view that managerial benefits for SMEs do exist, particularly within the African context.69
68 Ranjana Gupta and Adrian J Sawyer “The Costs of Compliance and Associated Benefits for Small and Medium Enterprises in New Zealand: Some Recent Findings” (2015) 30 Australian Tax Forum 135 at 154. 69 Smulders et al, above n 18.