Embed Size (px)
Citation preview
ESTIMATION OF IMPROVEMENT IN ROSACEA USING IMAGE PROCESSING
Pulkit Agrawal
Indian Inst. of Technology KanpurDept. of Electrical Engg.
India
Jonathan H. Manton
The University of MelbourneDept. of Electrical Engg.
Australia
Weng-Hung Chung
Chang Gung Memorial HospitalDept. of Dermatology
Taipei
ABSTRACT
This paper addresses a need by dermatologists of being ableto assess quantitatively the change in severity of the skin dis-ease rosacea. Traditionally, the efficacy of a treatment couldonly be assessed subjectively, such as by a dermatologist atweekly intervals giving a patient under treatment a score re-lated to the degree of severity of the rosacea, with say a scoreof 5 meaning “severe” and a score of 1 “mild”. The methodproposed in this paper is the first to offer an objective mea-sure of the change in severity of rosacea; the basic idea is touse image processing techniques to find, assess and comparethe sizes and degrees of redness of skin in photographs of apatient’s face taken over a period of time. Challenges includethe need to take into account the different lighting conditionsand orientations of the photographs.
Index Terms— Biomedical image processing, Biomedi-cal Signal Processing, Skin, Diseases
1. INTRODUCTION
Image processing techniques are steadily gaining popularityin medical and dermatological applications. In the past, de-tection of Melanoma[1], multispectral imaging for identifica-tion and characterization of different types of acne in acnepatients [2] are among some of the uses.It is often simpler and much more convenient for a doctorto obtain and work with digital photographs clicked with acommercial digital camera as compared to other techniquessuch as multispectral imaging. We propose a technique whichwould objectively and quantitatively assess the changes inseverity of affected areas in digital photographs of patient’sface taken over a period of time. An objective criterion al-lows for direct comparison of efficacy of different treatmentprocedures and also allows for reproduction of analysis.The major challenges include identification and developmentof robust and relevant parameters for characterization. Fur-thermore, the effect of changes in lightning condition andvariability in size of affected patches, due to different orien-tation of faces in different photographs also needs to be con-sidered.
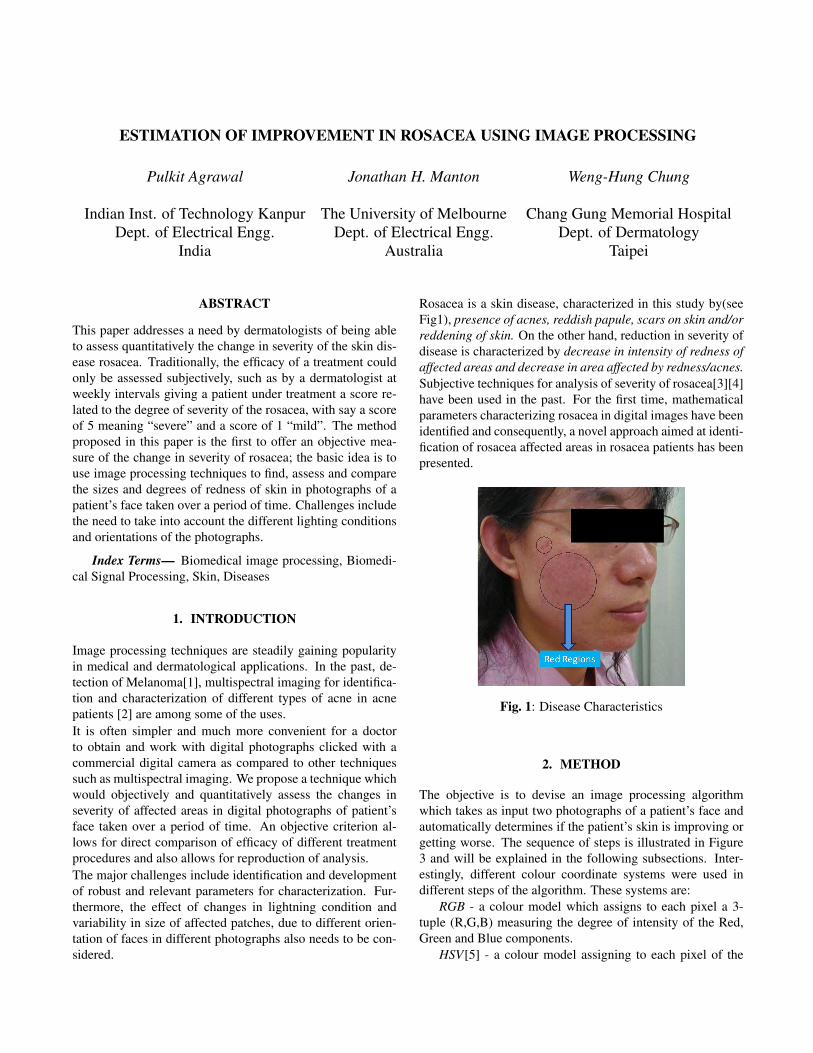
Rosacea is a skin disease, characterized in this study by(seeFig1), presence of acnes, reddish papule, scars on skin and/orreddening of skin. On the other hand, reduction in severity ofdisease is characterized by decrease in intensity of redness ofaffected areas and decrease in area affected by redness/acnes.Subjective techniques for analysis of severity of rosacea[3][4]have been used in the past. For the first time, mathematicalparameters characterizing rosacea in digital images have beenidentified and consequently, a novel approach aimed at identi-fication of rosacea affected areas in rosacea patients has beenpresented.
Fig. 1: Disease Characteristics
2. METHOD
The objective is to devise an image processing algorithmwhich takes as input two photographs of a patient’s face andautomatically determines if the patient’s skin is improving orgetting worse. The sequence of steps is illustrated in Figure3 and will be explained in the following subsections. Inter-estingly, different colour coordinate systems were used indifferent steps of the algorithm. These systems are:
RGB - a colour model which assigns to each pixel a 3-tuple (R,G,B) measuring the degree of intensity of the Red,Green and Blue components.
HSV[5] - a colour model assigning to each pixel of the
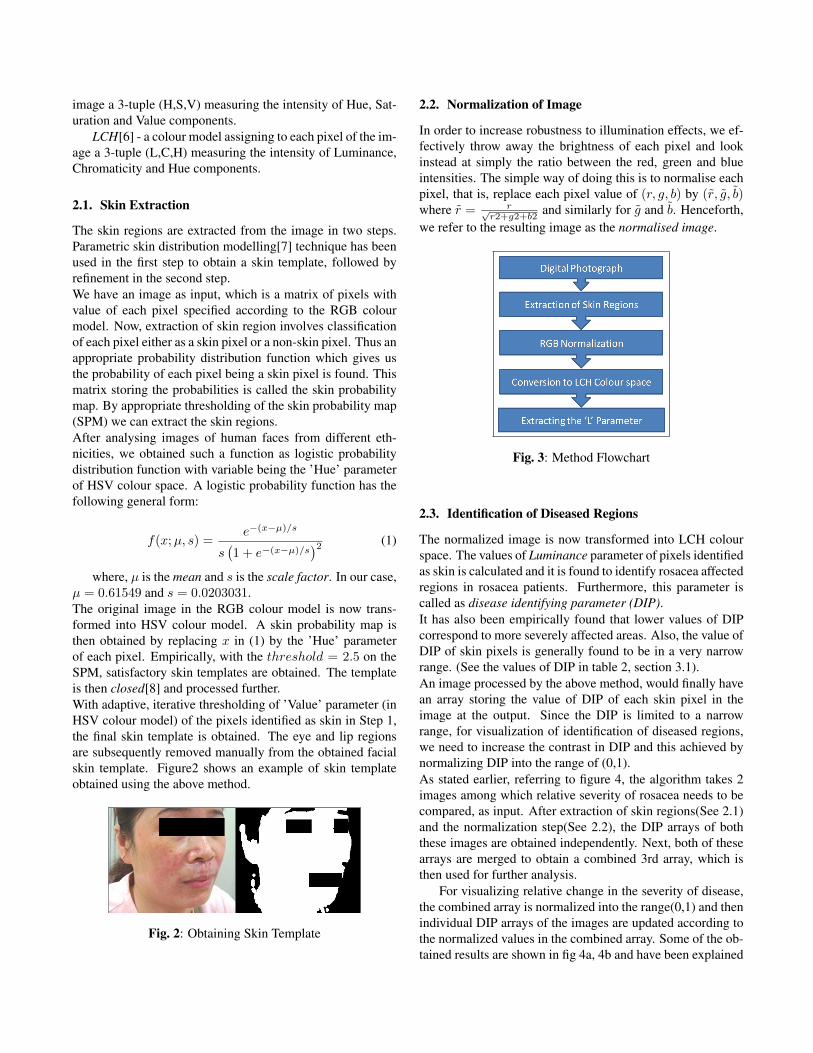
image a 3-tuple (H,S,V) measuring the intensity of Hue, Sat-uration and Value components.
LCH[6] - a colour model assigning to each pixel of the im-age a 3-tuple (L,C,H) measuring the intensity of Luminance,Chromaticity and Hue components.
2.1. Skin Extraction
The skin regions are extracted from the image in two steps.Parametric skin distribution modelling[7] technique has beenused in the first step to obtain a skin template, followed byrefinement in the second step.We have an image as input, which is a matrix of pixels withvalue of each pixel specified according to the RGB colourmodel. Now, extraction of skin region involves classificationof each pixel either as a skin pixel or a non-skin pixel. Thus anappropriate probability distribution function which gives usthe probability of each pixel being a skin pixel is found. Thismatrix storing the probabilities is called the skin probabilitymap. By appropriate thresholding of the skin probability map(SPM) we can extract the skin regions.After analysing images of human faces from different eth-nicities, we obtained such a function as logistic probabilitydistribution function with variable being the ’Hue’ parameterof HSV colour space. A logistic probability function has thefollowing general form:
f(x;µ, s) =e−(x−µ)/s
s(1 + e−(x−µ)/s
)2 (1)
where, µ is the mean and s is the scale factor. In our case,µ = 0.61549 and s = 0.0203031.The original image in the RGB colour model is now trans-formed into HSV colour model. A skin probability map isthen obtained by replacing x in (1) by the ’Hue’ parameterof each pixel. Empirically, with the threshold = 2.5 on theSPM, satisfactory skin templates are obtained. The templateis then closed[8] and processed further.With adaptive, iterative thresholding of ’Value’ parameter (inHSV colour model) of the pixels identified as skin in Step 1,the final skin template is obtained. The eye and lip regionsare subsequently removed manually from the obtained facialskin template. Figure2 shows an example of skin templateobtained using the above method.
Fig. 2: Obtaining Skin Template
2.2. Normalization of Image
In order to increase robustness to illumination effects, we ef-fectively throw away the brightness of each pixel and lookinstead at simply the ratio between the red, green and blueintensities. The simple way of doing this is to normalise eachpixel, that is, replace each pixel value of (r, g, b) by (r̃, g̃, b̃)where r̃ = r√
r2+g2+b2and similarly for g̃ and b̃. Henceforth,
we refer to the resulting image as the normalised image.
Fig. 3: Method Flowchart
2.3. Identification of Diseased Regions
The normalized image is now transformed into LCH colourspace. The values of Luminance parameter of pixels identifiedas skin is calculated and it is found to identify rosacea affectedregions in rosacea patients. Furthermore, this parameter iscalled as disease identifying parameter (DIP).It has also been empirically found that lower values of DIPcorrespond to more severely affected areas. Also, the value ofDIP of skin pixels is generally found to be in a very narrowrange. (See the values of DIP in table 2, section 3.1).An image processed by the above method, would finally havean array storing the value of DIP of each skin pixel in theimage at the output. Since the DIP is limited to a narrowrange, for visualization of identification of diseased regions,we need to increase the contrast in DIP and this achieved bynormalizing DIP into the range of (0,1).As stated earlier, referring to figure 4, the algorithm takes 2images among which relative severity of rosacea needs to becompared, as input. After extraction of skin regions(See 2.1)and the normalization step(See 2.2), the DIP arrays of boththese images are obtained independently. Next, both of thesearrays are merged to obtain a combined 3rd array, which isthen used for further analysis.
For visualizing relative change in the severity of disease,the combined array is normalized into the range(0,1) and thenindividual DIP arrays of the images are updated according tothe normalized values in the combined array. Some of the ob-tained results are shown in fig 4a, 4b and have been explained
(a) Sample 1 (b) Sample 2
(c) Sample 3 (d) Legend
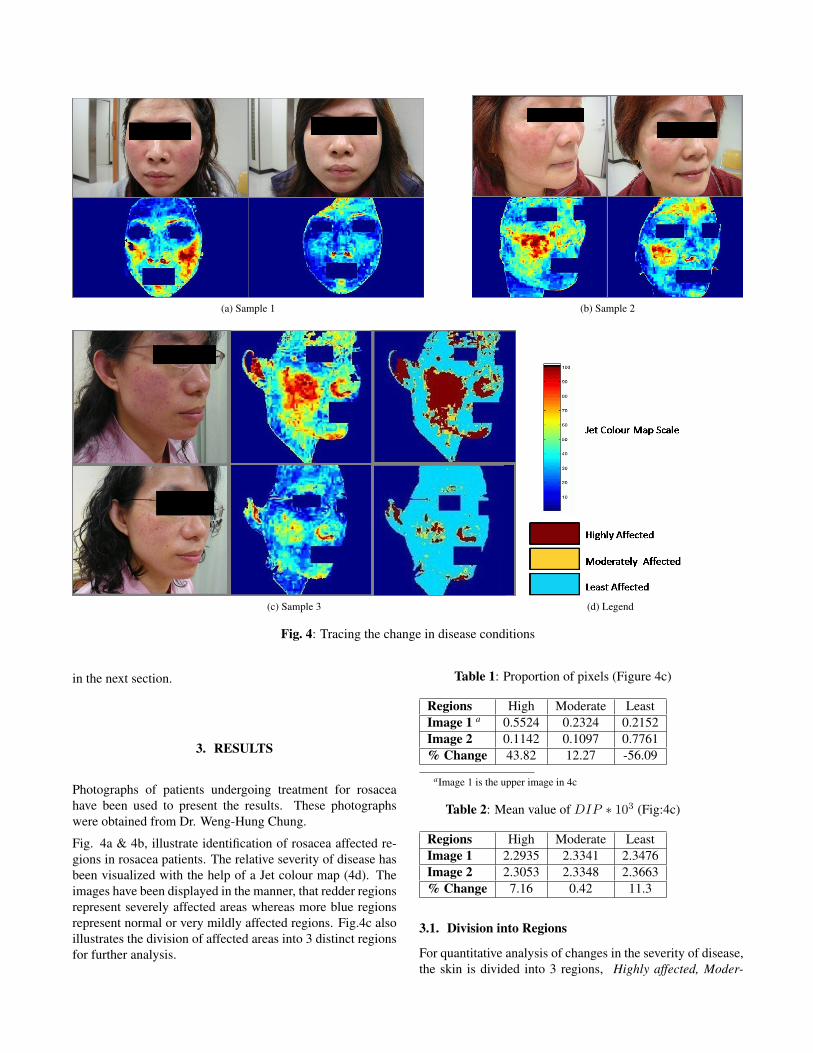
Fig. 4: Tracing the change in disease conditions
in the next section.
3. RESULTS
Photographs of patients undergoing treatment for rosaceahave been used to present the results. These photographswere obtained from Dr. Weng-Hung Chung.
Fig. 4a & 4b, illustrate identification of rosacea affected re-gions in rosacea patients. The relative severity of disease hasbeen visualized with the help of a Jet colour map (4d). Theimages have been displayed in the manner, that redder regionsrepresent severely affected areas whereas more blue regionsrepresent normal or very mildly affected regions. Fig.4c alsoillustrates the division of affected areas into 3 distinct regionsfor further analysis.
Table 1: Proportion of pixels (Figure 4c)
Regions High Moderate LeastImage 1 a 0.5524 0.2324 0.2152Image 2 0.1142 0.1097 0.7761% Change 43.82 12.27 -56.09
aImage 1 is the upper image in 4c
Table 2: Mean value of DIP ∗ 103 (Fig:4c)
Regions High Moderate LeastImage 1 2.2935 2.3341 2.3476Image 2 2.3053 2.3348 2.3663% Change 7.16 0.42 11.3
3.1. Division into Regions
For quantitative analysis of changes in the severity of disease,the skin is divided into 3 regions, Highly affected, Moder-
ately Affected, Least Affected, based on the value of diseaseidentifying parameter. Let the combined DIP array (Sec. 2.3)of both the images be known as Array1. The elements of Ar-ray1 are now sorted. Let the total number of elements in thisarray be N. Now we obtain 2 thresholds,
th1 = Array1[N/3] (2)
th2 = Array1[2N/3] (3)
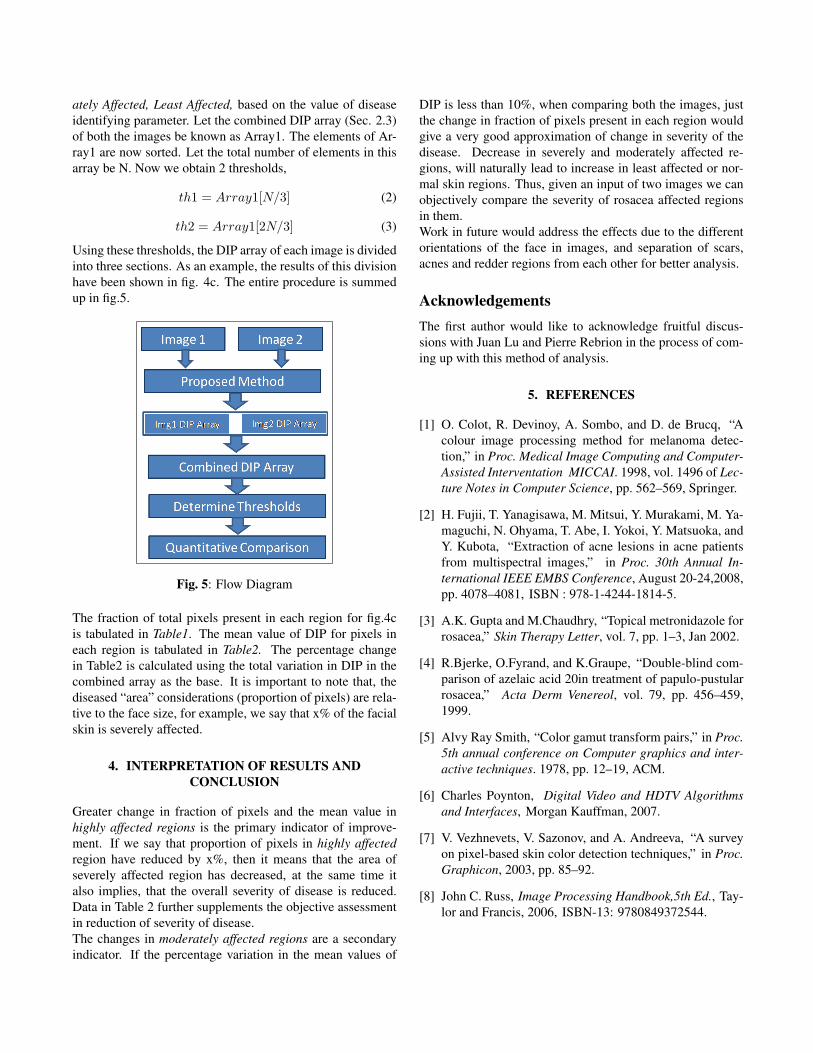
Using these thresholds, the DIP array of each image is dividedinto three sections. As an example, the results of this divisionhave been shown in fig. 4c. The entire procedure is summedup in fig.5.
Fig. 5: Flow Diagram
The fraction of total pixels present in each region for fig.4cis tabulated in Table1. The mean value of DIP for pixels ineach region is tabulated in Table2. The percentage changein Table2 is calculated using the total variation in DIP in thecombined array as the base. It is important to note that, thediseased “area” considerations (proportion of pixels) are rela-tive to the face size, for example, we say that x% of the facialskin is severely affected.
4. INTERPRETATION OF RESULTS ANDCONCLUSION
Greater change in fraction of pixels and the mean value inhighly affected regions is the primary indicator of improve-ment. If we say that proportion of pixels in highly affectedregion have reduced by x%, then it means that the area ofseverely affected region has decreased, at the same time italso implies, that the overall severity of disease is reduced.Data in Table 2 further supplements the objective assessmentin reduction of severity of disease.The changes in moderately affected regions are a secondaryindicator. If the percentage variation in the mean values of
DIP is less than 10%, when comparing both the images, justthe change in fraction of pixels present in each region wouldgive a very good approximation of change in severity of thedisease. Decrease in severely and moderately affected re-gions, will naturally lead to increase in least affected or nor-mal skin regions. Thus, given an input of two images we canobjectively compare the severity of rosacea affected regionsin them.Work in future would address the effects due to the differentorientations of the face in images, and separation of scars,acnes and redder regions from each other for better analysis.
AcknowledgementsThe first author would like to acknowledge fruitful discus-sions with Juan Lu and Pierre Rebrion in the process of com-ing up with this method of analysis.
5. REFERENCES
[1] O. Colot, R. Devinoy, A. Sombo, and D. de Brucq, “Acolour image processing method for melanoma detec-tion,” in Proc. Medical Image Computing and Computer-Assisted Interventation MICCAI. 1998, vol. 1496 of Lec-ture Notes in Computer Science, pp. 562–569, Springer.
[2] H. Fujii, T. Yanagisawa, M. Mitsui, Y. Murakami, M. Ya-maguchi, N. Ohyama, T. Abe, I. Yokoi, Y. Matsuoka, andY. Kubota, “Extraction of acne lesions in acne patientsfrom multispectral images,” in Proc. 30th Annual In-ternational IEEE EMBS Conference, August 20-24,2008,pp. 4078–4081, ISBN : 978-1-4244-1814-5.
[3] A.K. Gupta and M.Chaudhry, “Topical metronidazole forrosacea,” Skin Therapy Letter, vol. 7, pp. 1–3, Jan 2002.
[4] R.Bjerke, O.Fyrand, and K.Graupe, “Double-blind com-parison of azelaic acid 20in treatment of papulo-pustularrosacea,” Acta Derm Venereol, vol. 79, pp. 456–459,1999.
[5] Alvy Ray Smith, “Color gamut transform pairs,” in Proc.5th annual conference on Computer graphics and inter-active techniques. 1978, pp. 12–19, ACM.
[6] Charles Poynton, Digital Video and HDTV Algorithmsand Interfaces, Morgan Kauffman, 2007.
[7] V. Vezhnevets, V. Sazonov, and A. Andreeva, “A surveyon pixel-based skin color detection techniques,” in Proc.Graphicon, 2003, pp. 85–92.
[8] John C. Russ, Image Processing Handbook,5th Ed., Tay-lor and Francis, 2006, ISBN-13: 9780849372544.