Embed Size (px)
Citation preview
HUMAN HEALTH • ENVIRONMENTAL HEALTH
© 2015 PerkinElmer
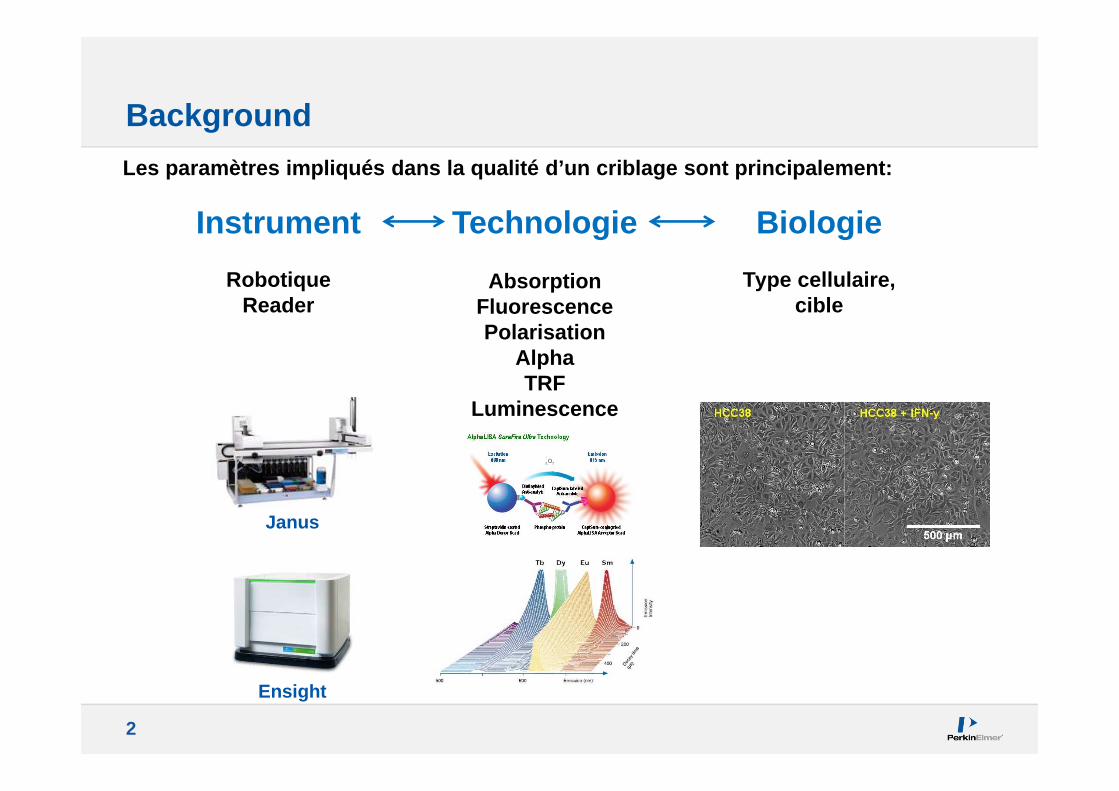
ETC (CRCM) – Marseille, 2018-10-03Reynald HURTEAUX – Field Application Specialist
2
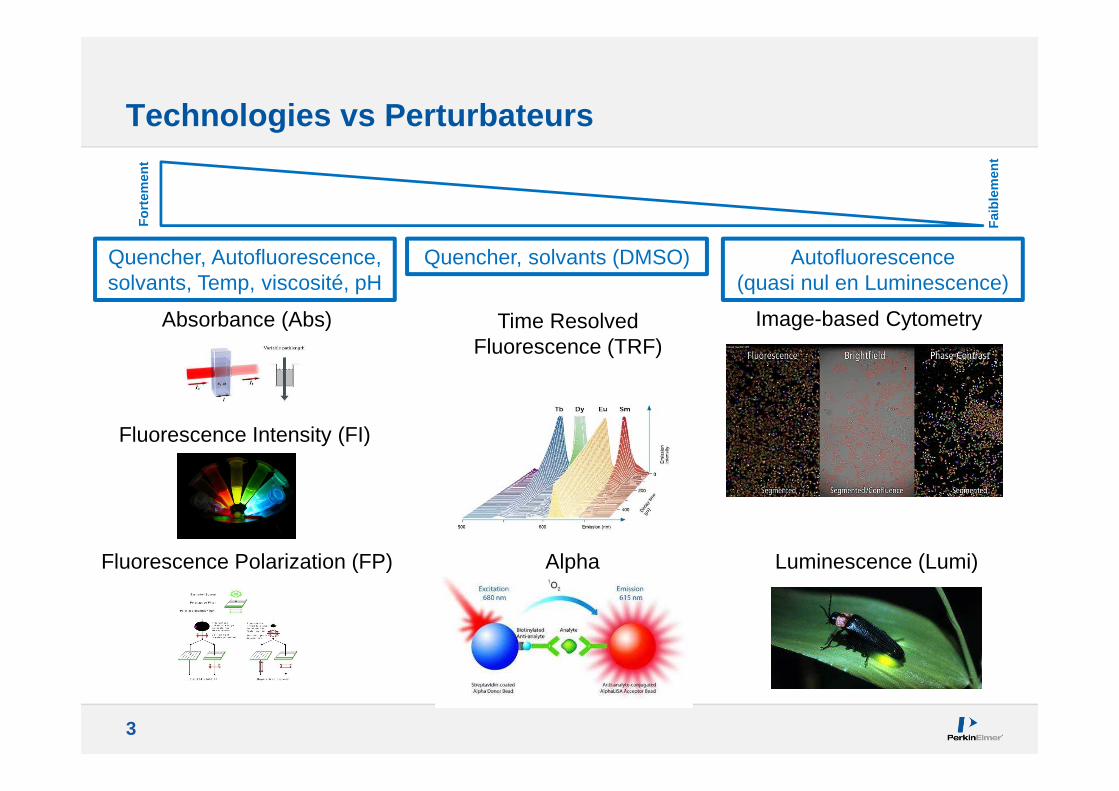
Background
Les paramètres impliqués dans la qualité d’un cribl age sont principalement:
BiologieTechnologieInstrument
RobotiqueReader
AbsorptionFluorescencePolarisation
AlphaTRF
Luminescence
Type cellulaire, cible
Janus
Ensight
3
Technologies vs Perturbateurs
Luminescence (Lumi)
Fluorescence Intensity (FI)
Fluorescence Polarization (FP) Alpha
Time Resolved Fluorescence (TRF)
Absorbance (Abs) Image-based Cytometry
For
tem
ent
Quencher, Autofluorescence, solvants, Temp, viscosité, pH
Quencher, solvants (DMSO) Autofluorescence(quasi nul en Luminescence)
Fai
blem
ent
4
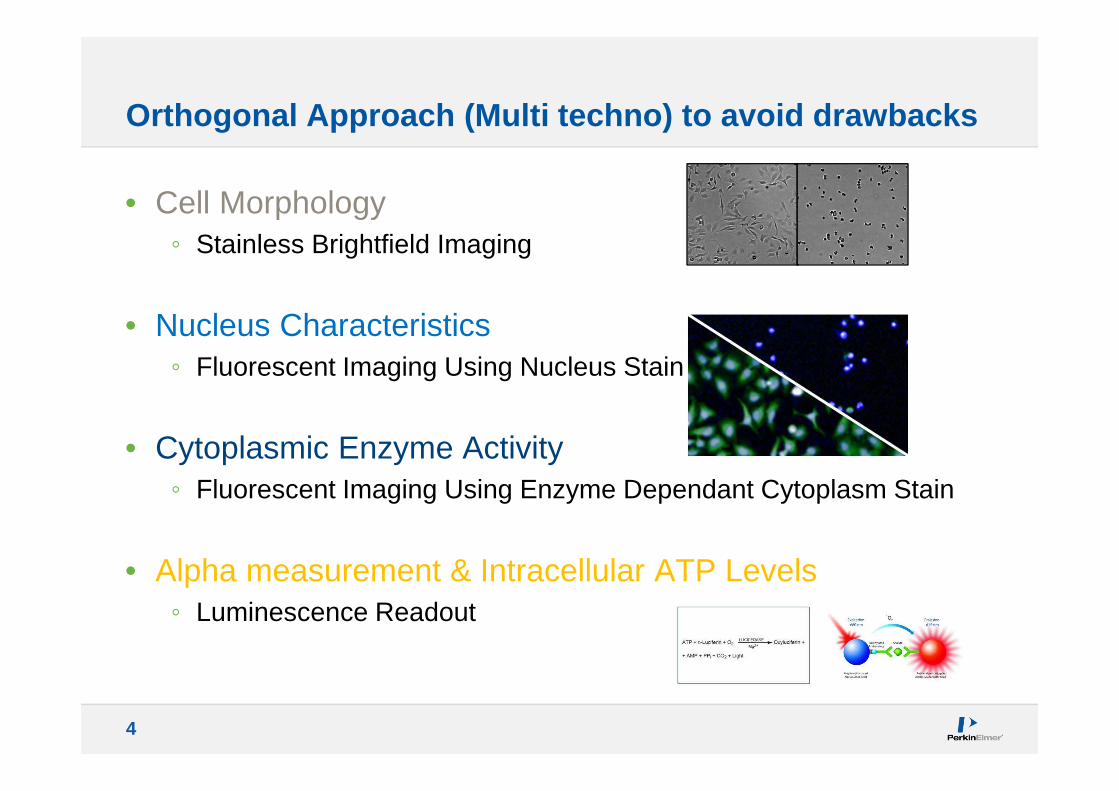
Orthogonal Approach (Multi techno) to avoid drawbacks
• Cell Morphology◦ Stainless Brightfield Imaging
• Nucleus Characteristics◦ Fluorescent Imaging Using Nucleus Stain
• Cytoplasmic Enzyme Activity◦ Fluorescent Imaging Using Enzyme Dependant Cytoplasm Stain
• Alpha measurement & Intracellular ATP Levels◦ Luminescence Readout
5
Absorbance
Fluorescence Intensity
Luminescence
Time-Resolved
Fluorescence
Alpha Technology
Cellular Imaging
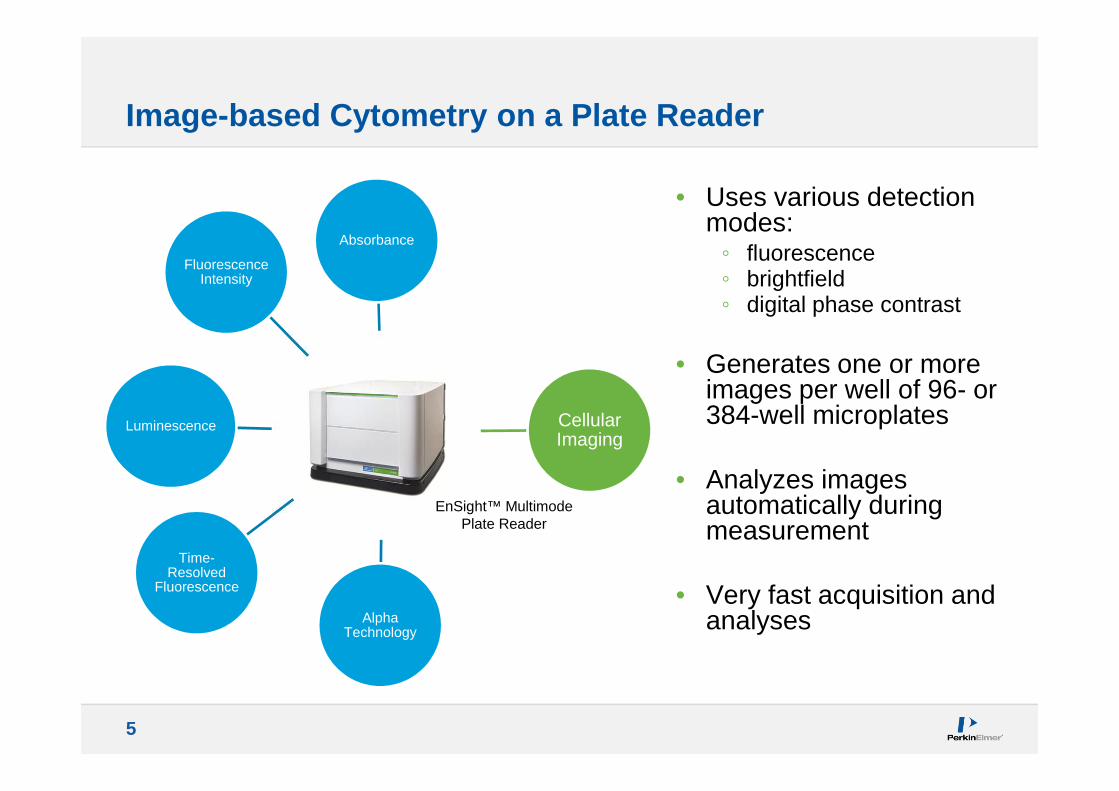
Image-based Cytometry on a Plate Reader
• Uses various detection modes: ◦ fluorescence ◦ brightfield◦ digital phase contrast
• Generates one or more images per well of 96- or 384-well microplates
• Analyzes images automatically during measurement
• Very fast acquisition and analyses
EnSight™ Multimode Plate Reader
6
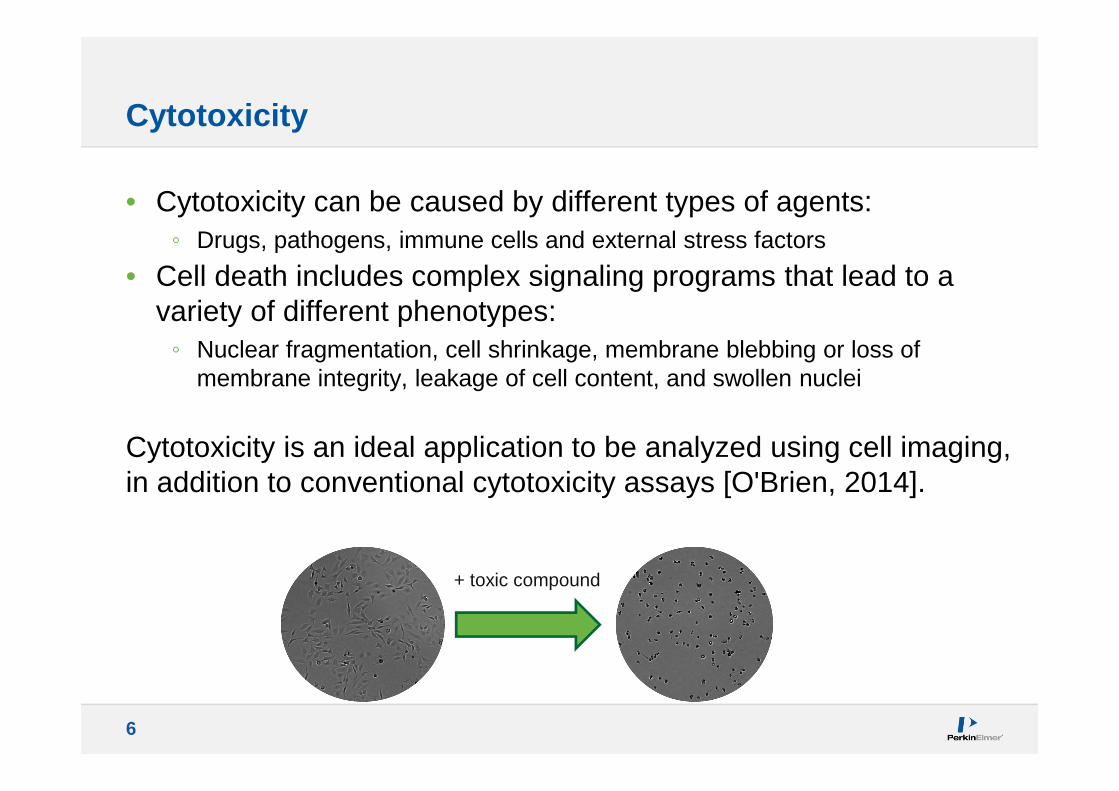
Cytotoxicity
• Cytotoxicity can be caused by different types of agents: ◦ Drugs, pathogens, immune cells and external stress factors
• Cell death includes complex signaling programs that lead to a variety of different phenotypes: ◦ Nuclear fragmentation, cell shrinkage, membrane blebbing or loss of
membrane integrity, leakage of cell content, and swollen nuclei
Cytotoxicity is an ideal application to be analyzed using cell imaging, in addition to conventional cytotoxicity assays [O'Brien, 2014].
+ toxic compound
7
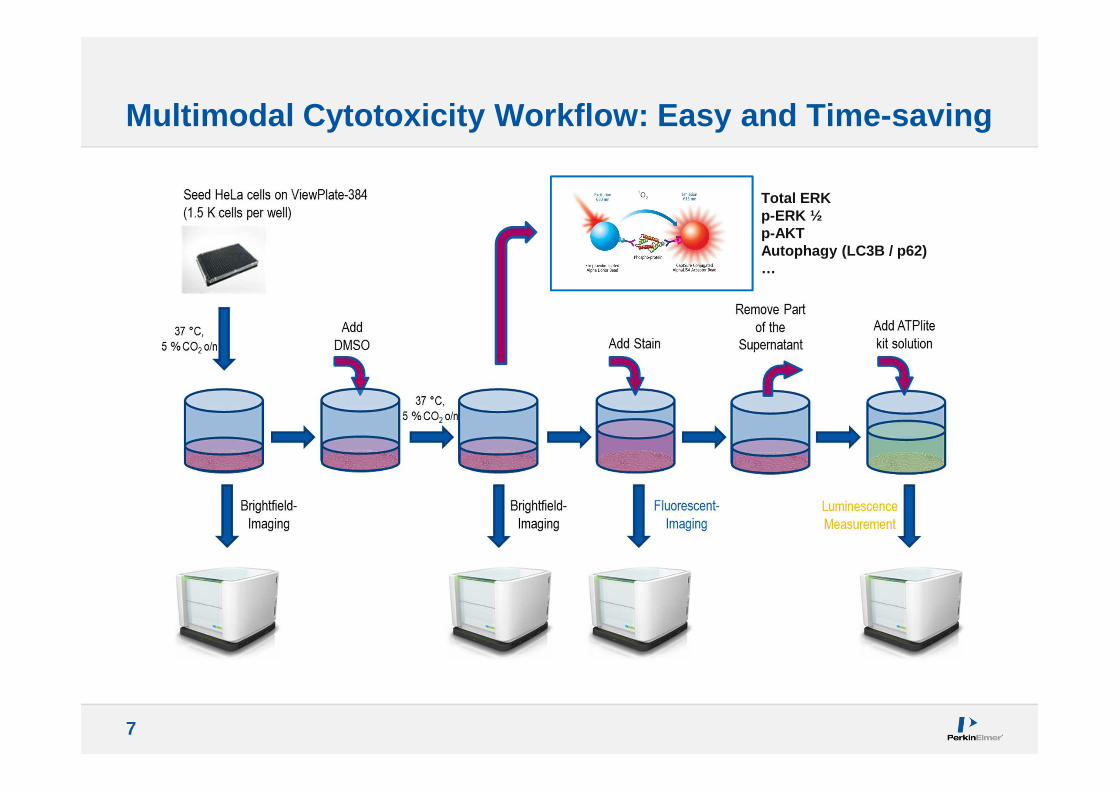
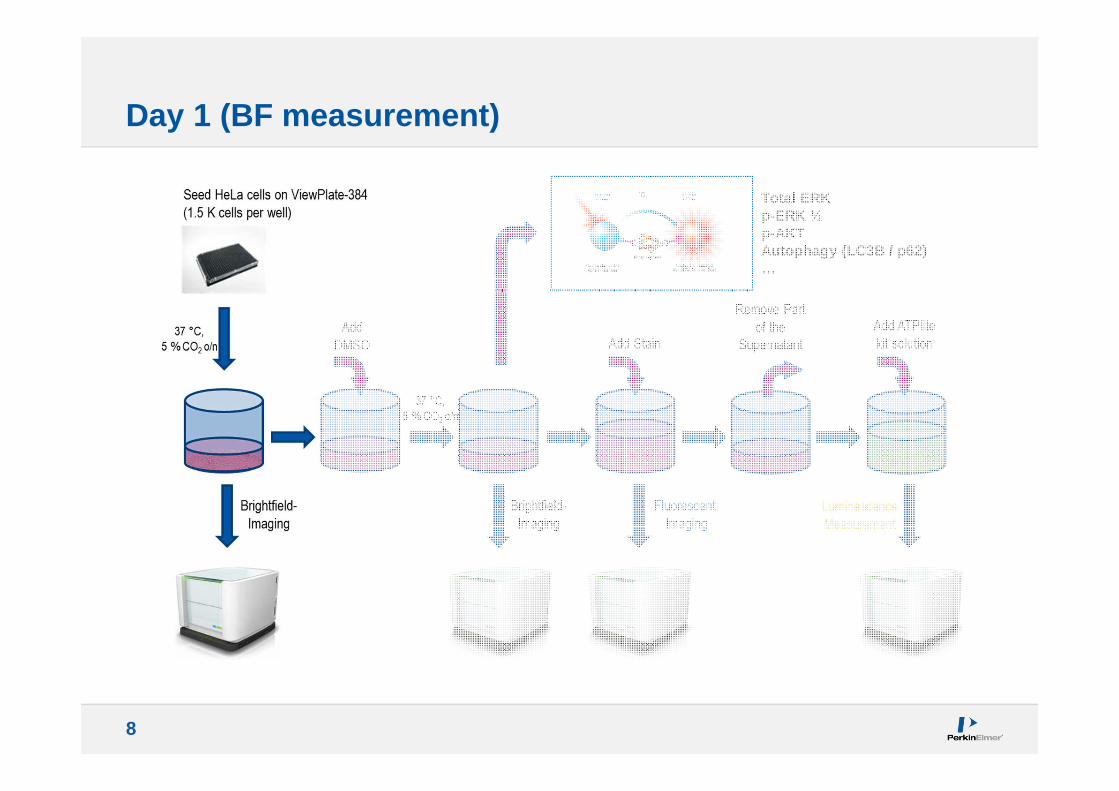
Multimodal Cytotoxicity Workflow: Easy and Time-sav ing
Total ERKp-ERK ½p-AKTAutophagy (LC3B / p62)…
8
Day 1 (BF measurement)
Total ERKp-ERK ½p-AKTAutophagy (LC3B / p62)…
9
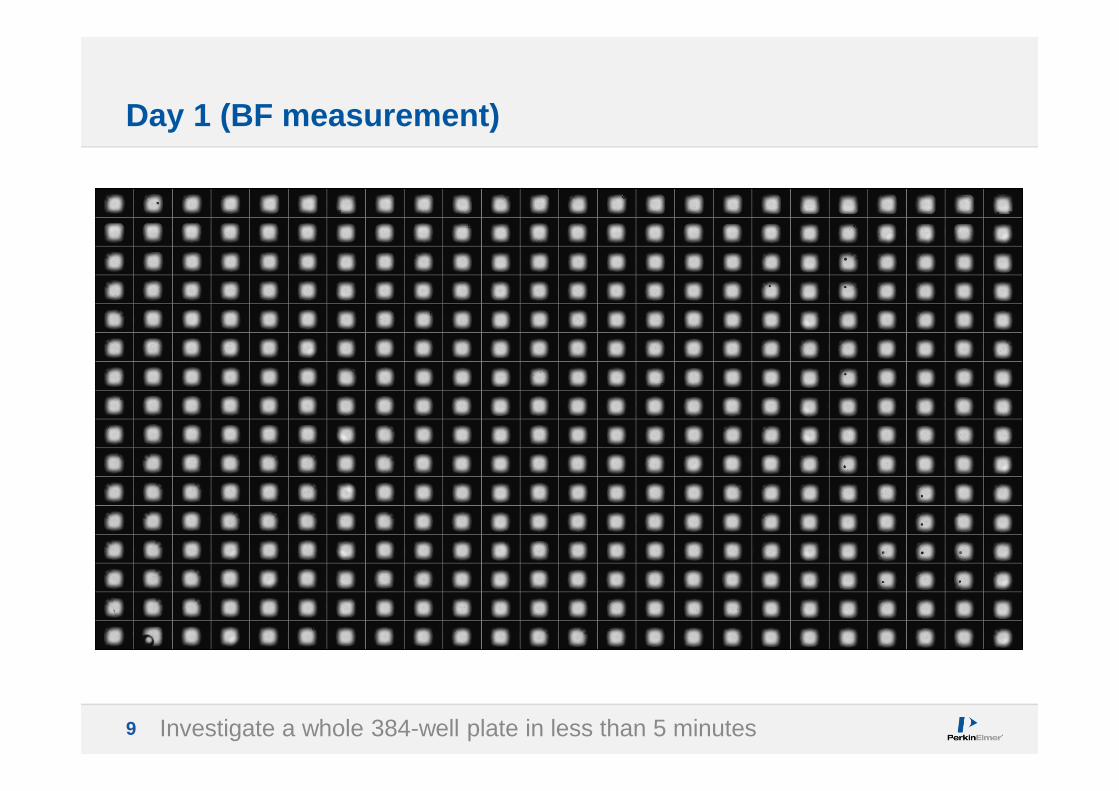
Day 1 (BF measurement)
Investigate a whole 384-well plate in less than 5 minutes
10
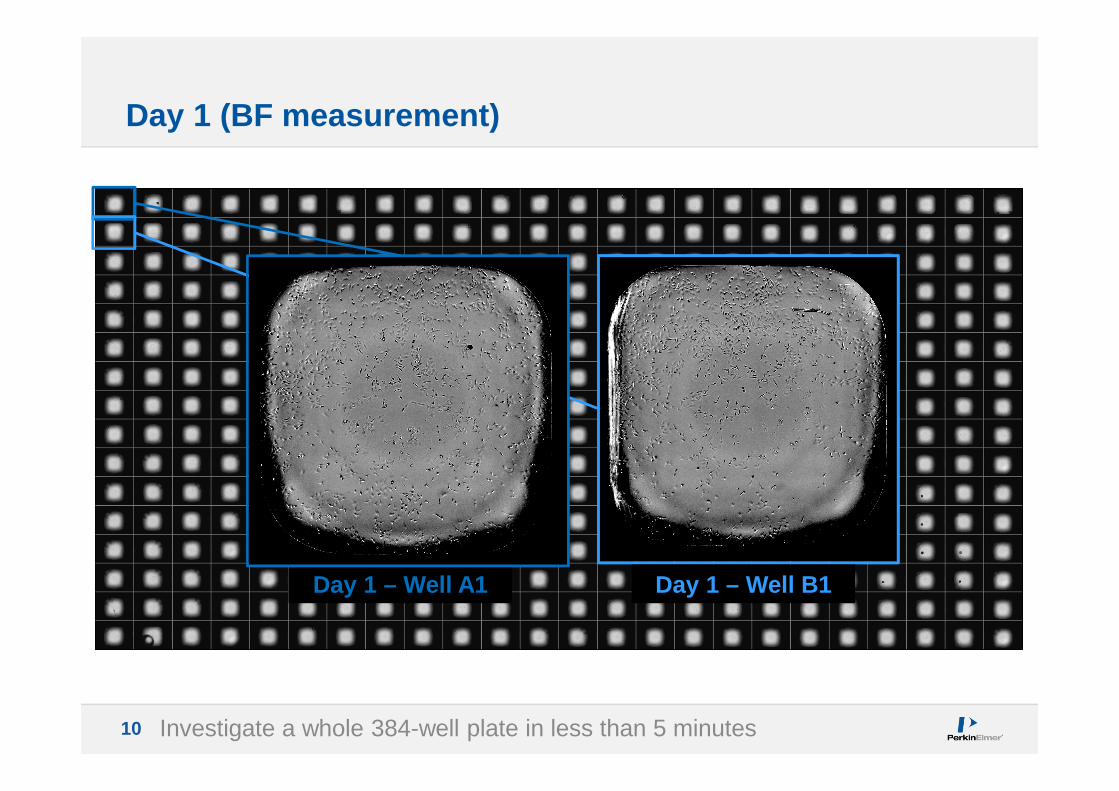
Day 1 (BF measurement)
Investigate a whole 384-well plate in less than 5 minutes
Day 1 – Well A1 Day 1 – Well B1
11
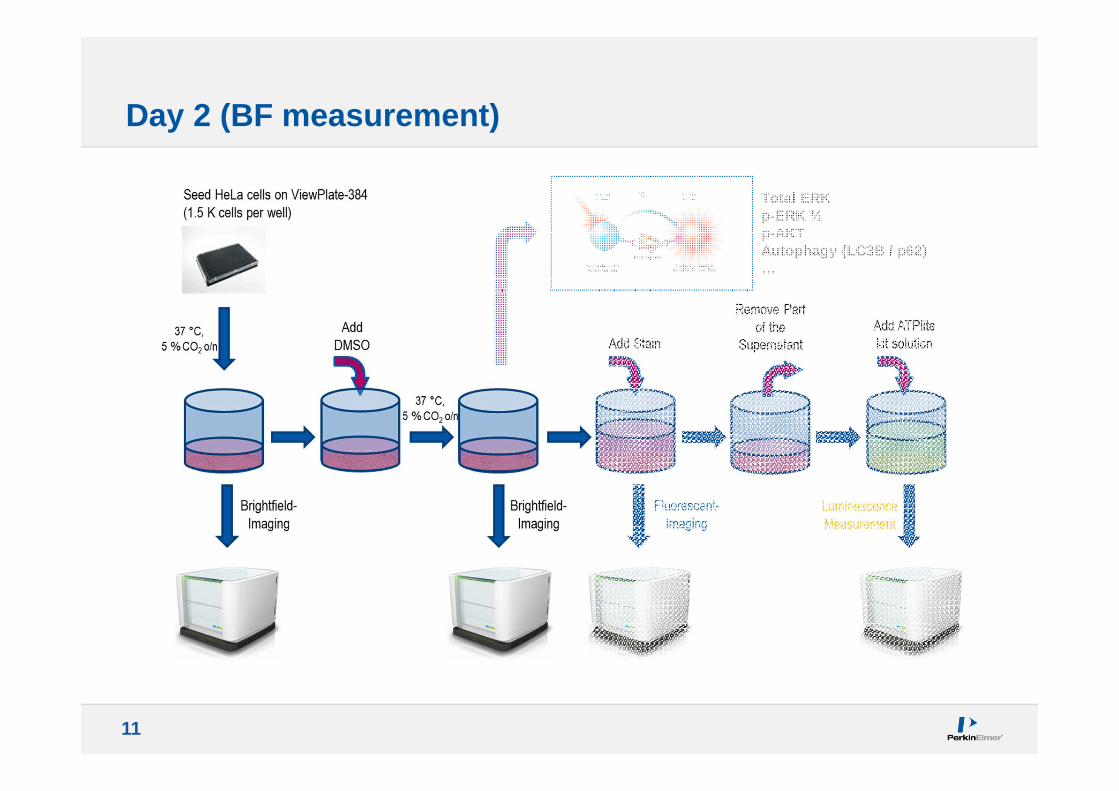
Day 2 (BF measurement)
Total ERKp-ERK ½p-AKTAutophagy (LC3B / p62)…
12
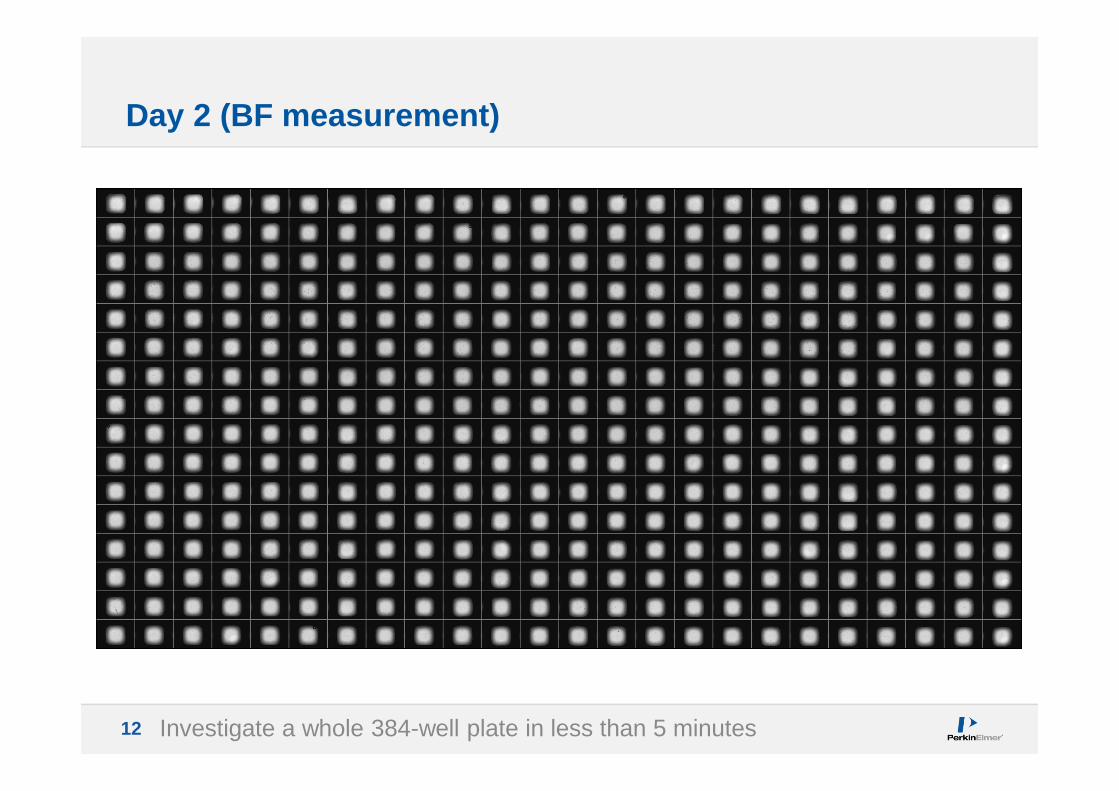
Day 2 (BF measurement)
Investigate a whole 384-well plate in less than 5 minutes
13
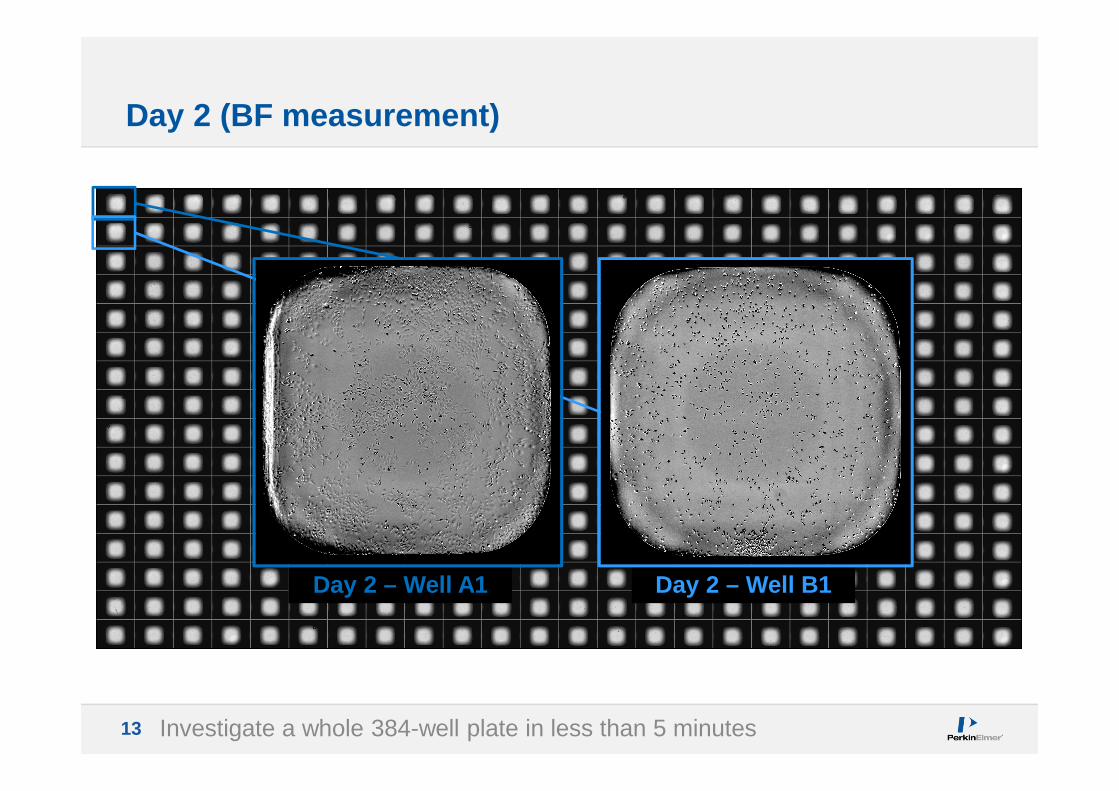
Day 2 (BF measurement)
Investigate a whole 384-well plate in less than 5 minutes
Day 2 – Well A1 Day 2 – Well B1
14
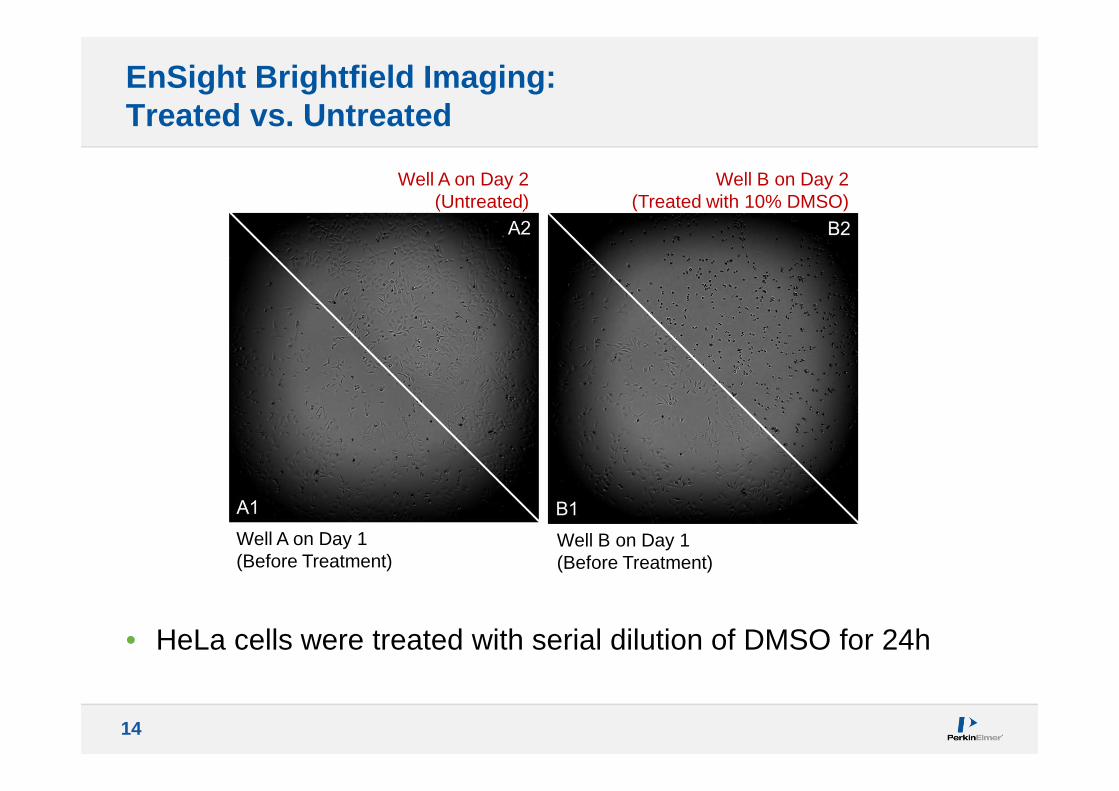
EnSight Brightfield Imaging: Treated vs. Untreated
Well B on Day 1 (Before Treatment)
Well B on Day 2 (Treated with 10% DMSO)
Well A on Day 2 (Untreated)
Well A on Day 1 (Before Treatment)
• HeLa cells were treated with serial dilution of DMSO for 24h
15
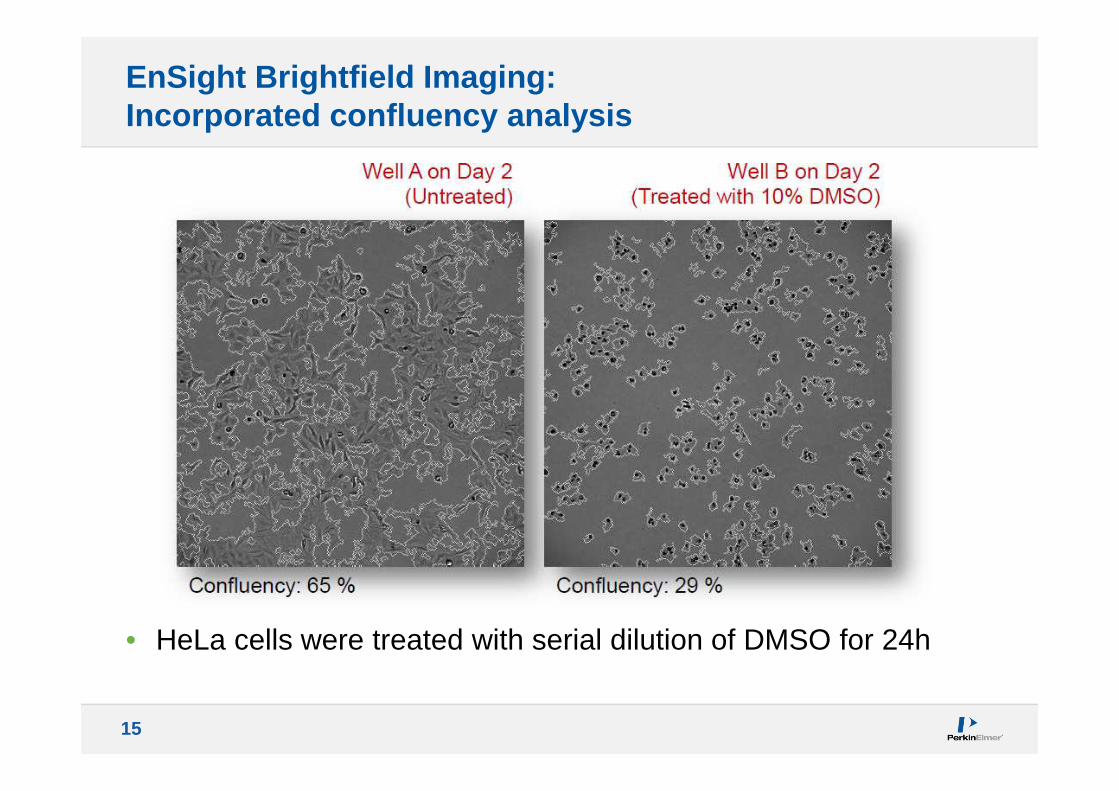
EnSight Brightfield Imaging: Incorporated confluency analysis
• HeLa cells were treated with serial dilution of DMSO for 24h
16
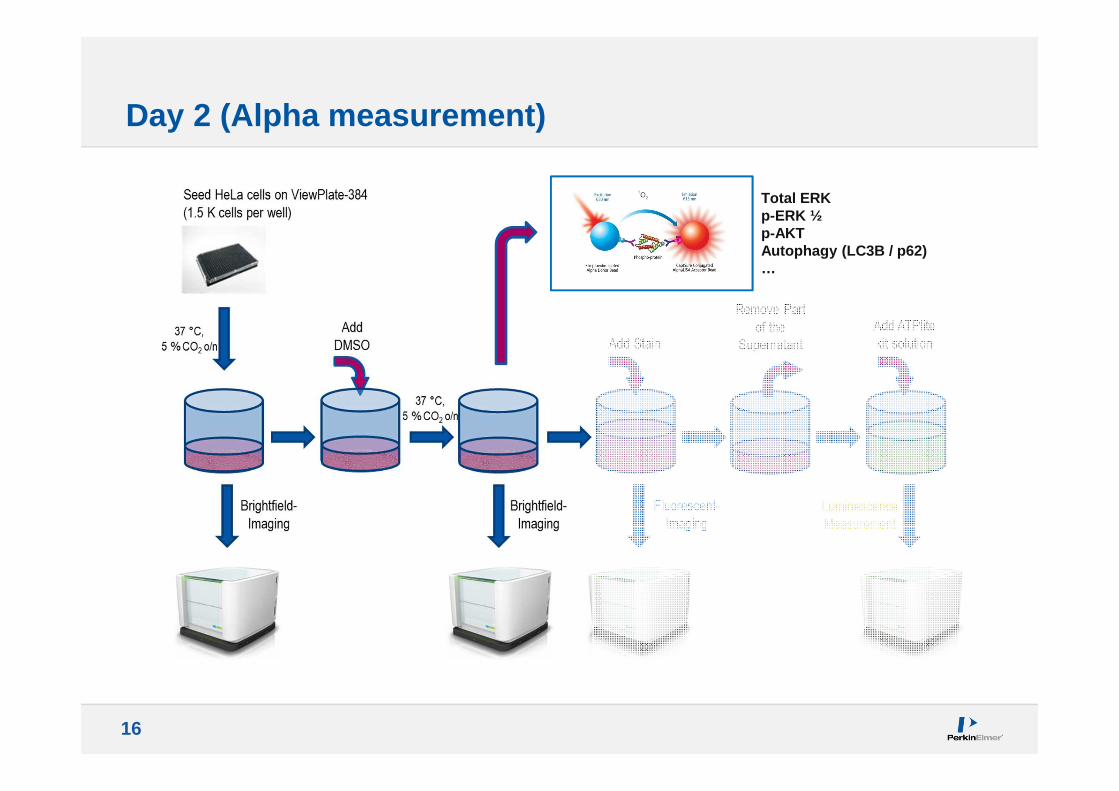
Day 2 (Alpha measurement)
Total ERKp-ERK ½p-AKTAutophagy (LC3B / p62)…
17
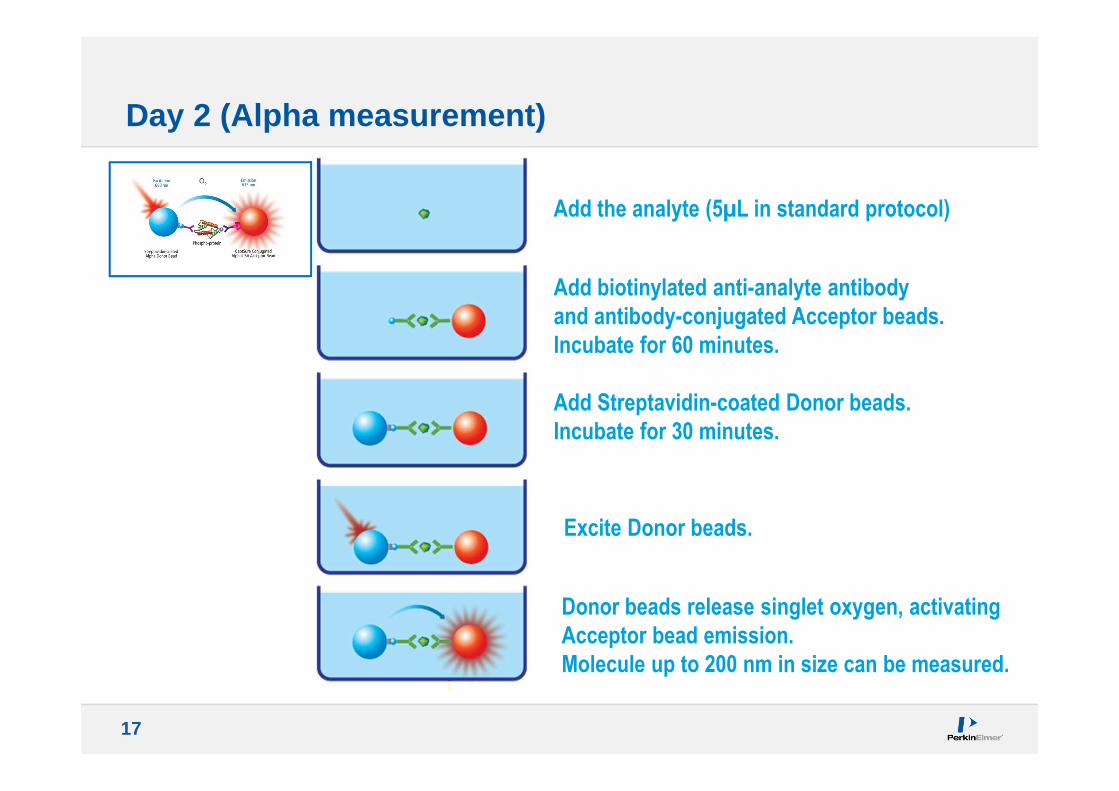
Day 2 (Alpha measurement)
Add the analyte (5µL in standard protocol)
Add biotinylated anti-analyte antibody
and antibody-conjugated Acceptor beads.
Incubate for 60 minutes.
Excite Donor beads.
Add Streptavidin-coated Donor beads.
Incubate for 30 minutes.
Donor beads release singlet oxygen, activating
Acceptor bead emission.
Molecule up to 200 nm in size can be measured.
18
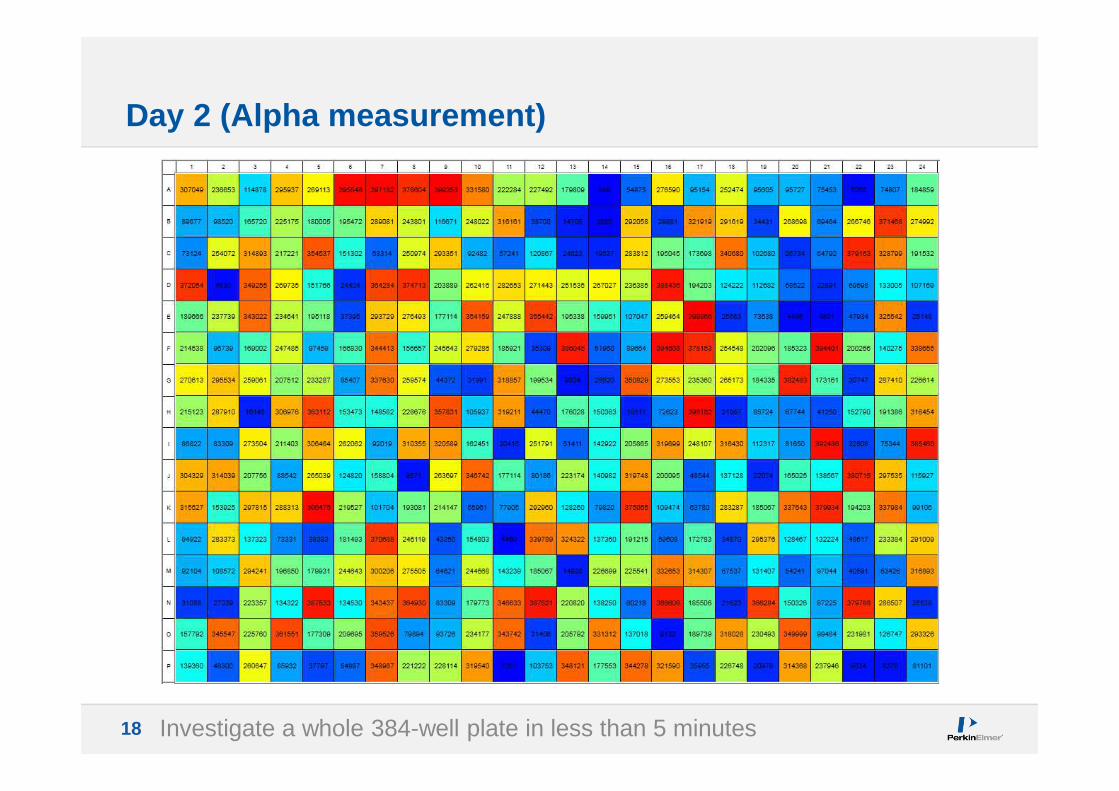
Day 2 (Alpha measurement)
Investigate a whole 384-well plate in less than 5 minutes
19
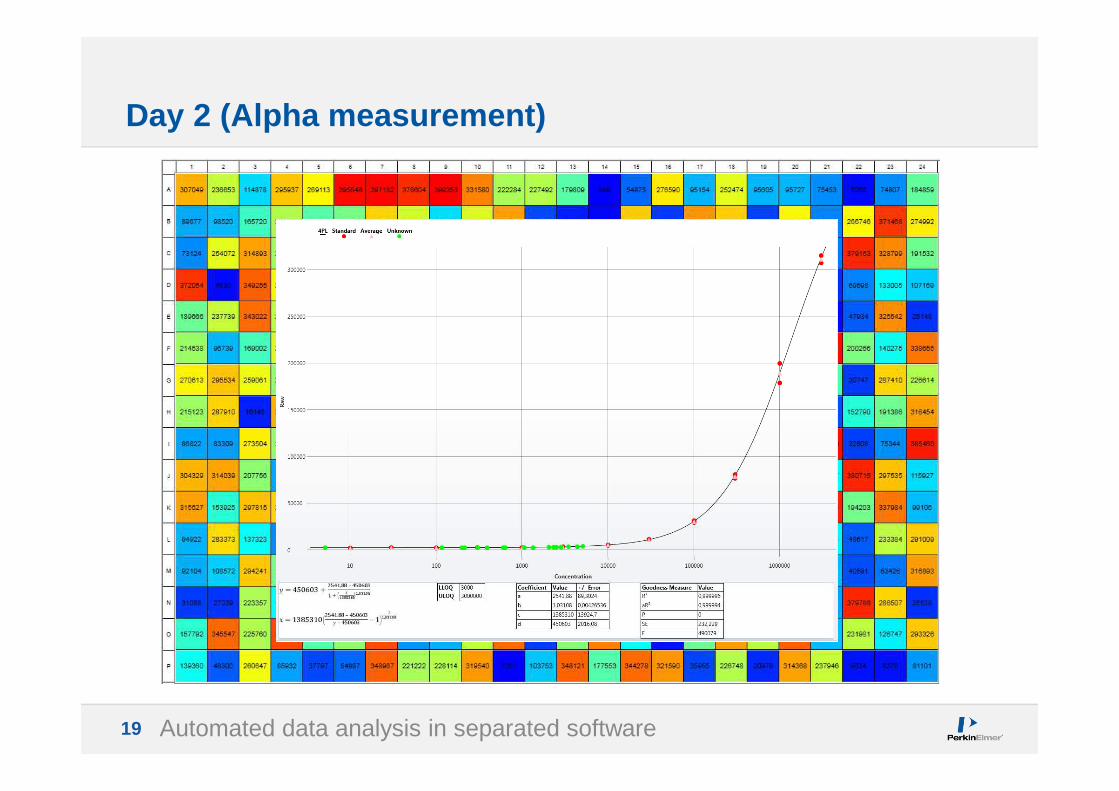
Day 2 (Alpha measurement)
Automated data analysis in separated software
20
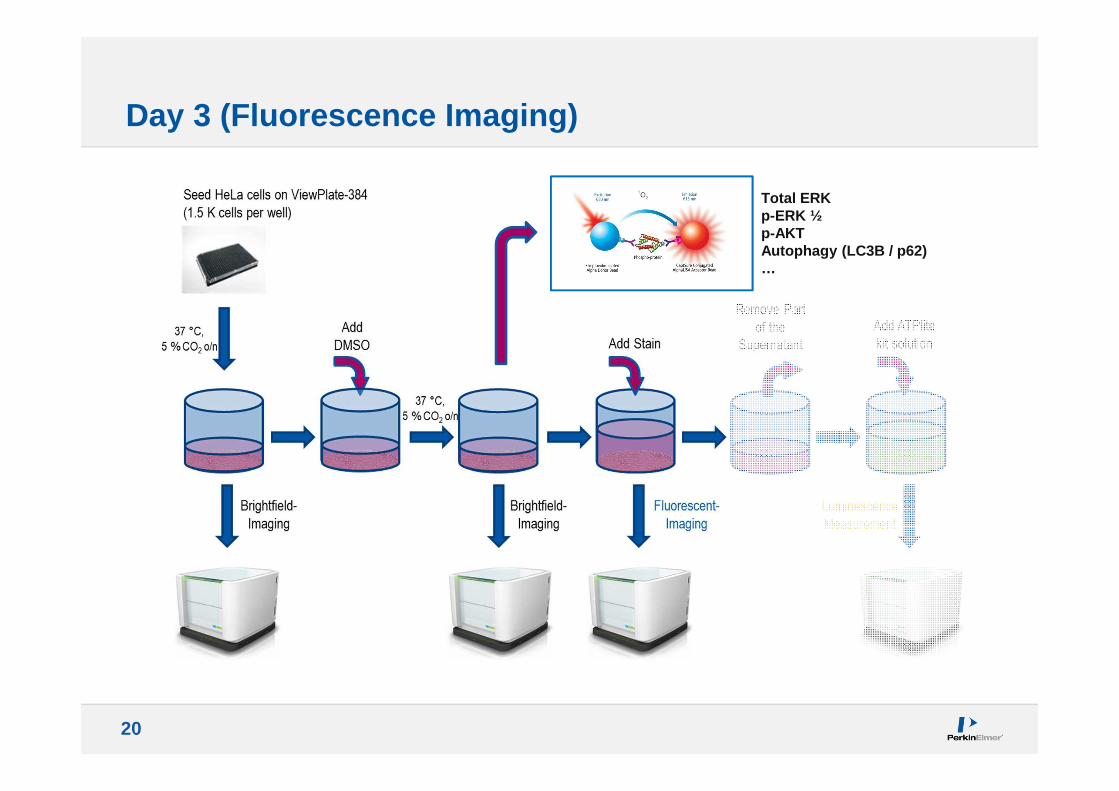
Day 3 (Fluorescence Imaging)
Total ERKp-ERK ½p-AKTAutophagy (LC3B / p62)…
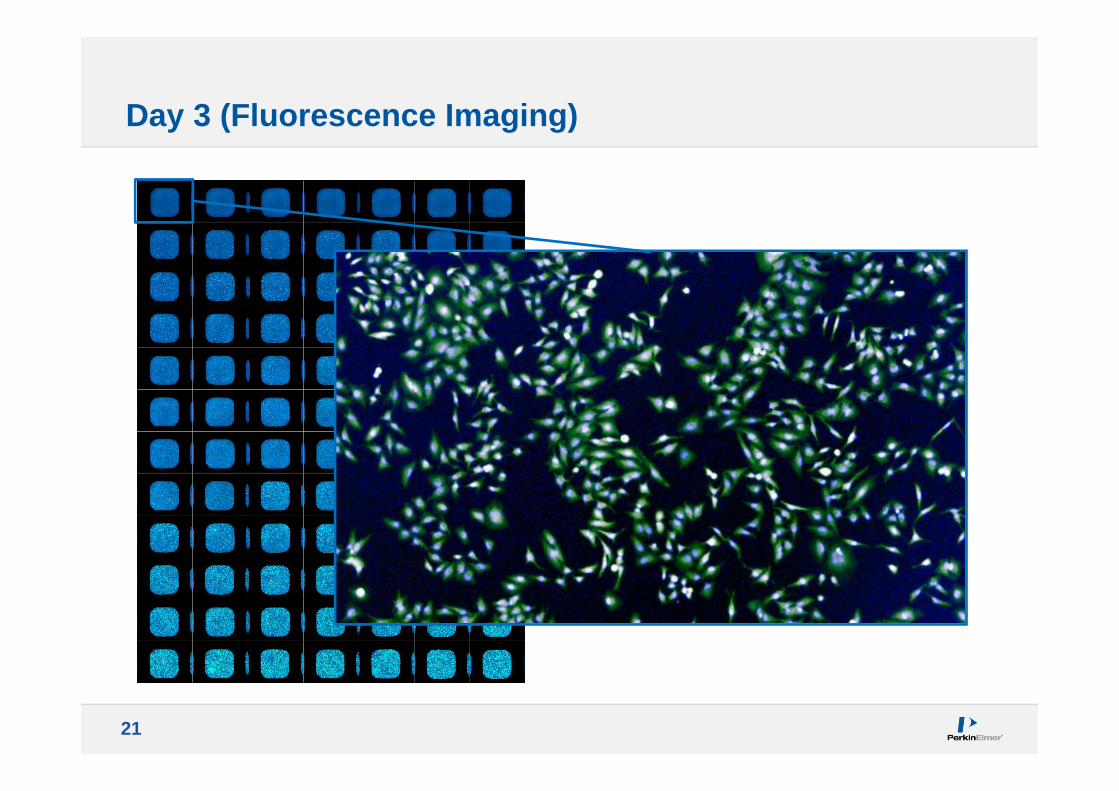
21
Day 3 (Fluorescence Imaging)
22
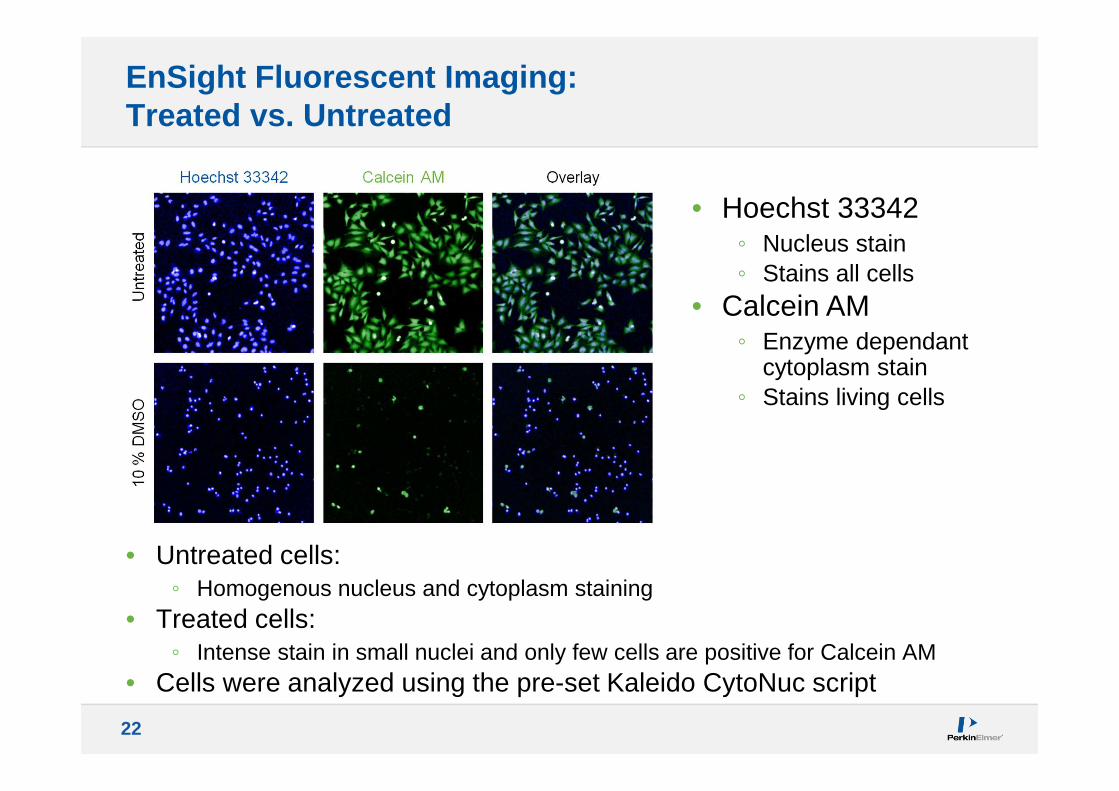
EnSight Fluorescent Imaging: Treated vs. Untreated
• Untreated cells: ◦ Homogenous nucleus and cytoplasm staining
• Treated cells: ◦ Intense stain in small nuclei and only few cells are positive for Calcein AM
• Cells were analyzed using the pre-set Kaleido CytoNuc script
• Hoechst 33342◦ Nucleus stain◦ Stains all cells
• Calcein AM ◦ Enzyme dependant
cytoplasm stain◦ Stains living cells
23
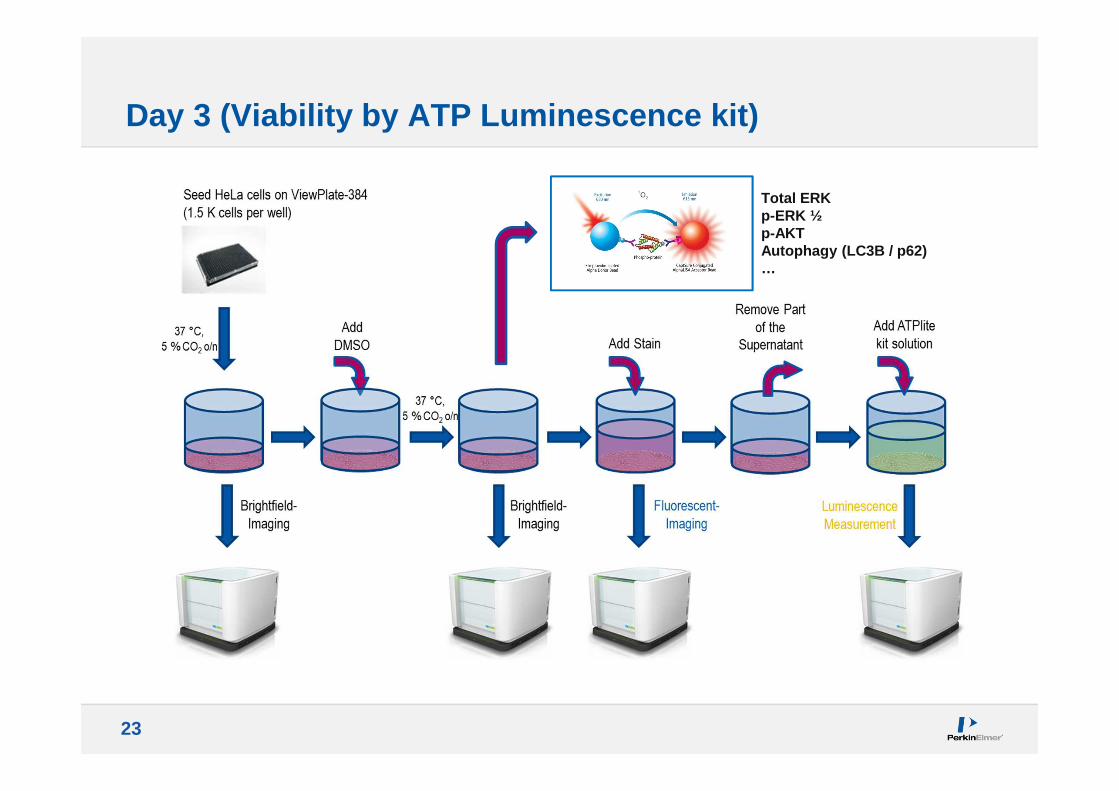
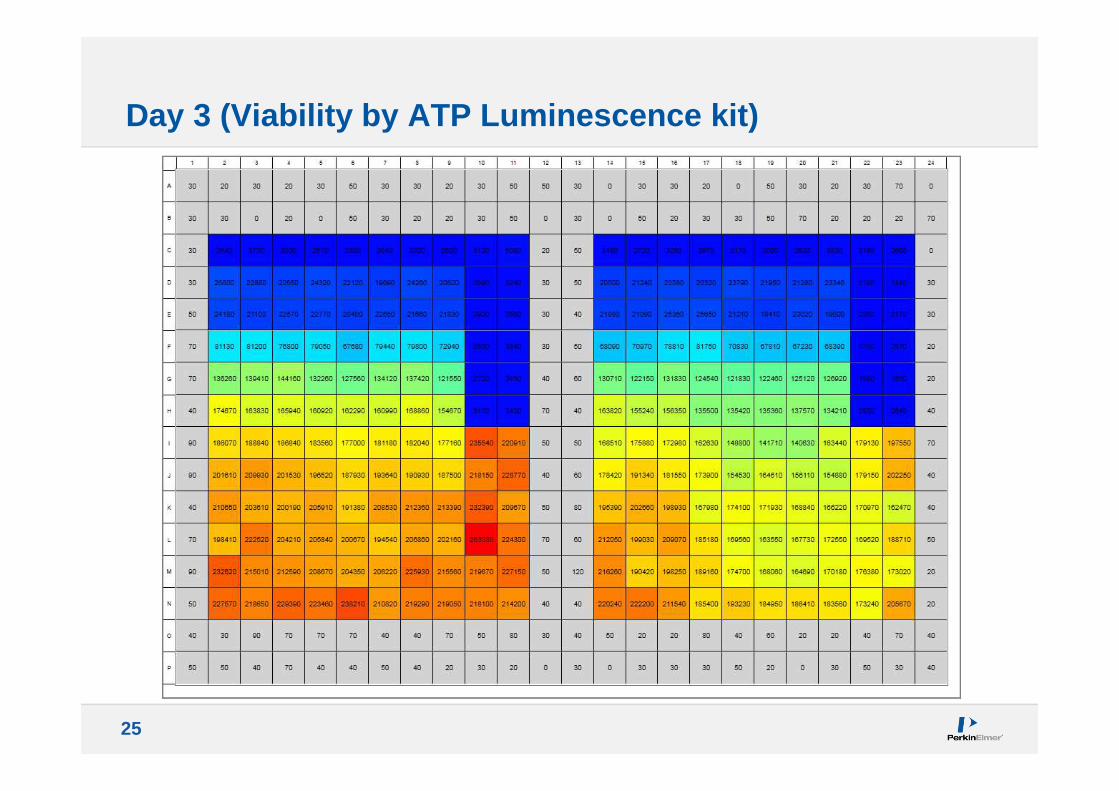
Day 3 (Viability by ATP Luminescence kit)
Total ERKp-ERK ½p-AKTAutophagy (LC3B / p62)…
24
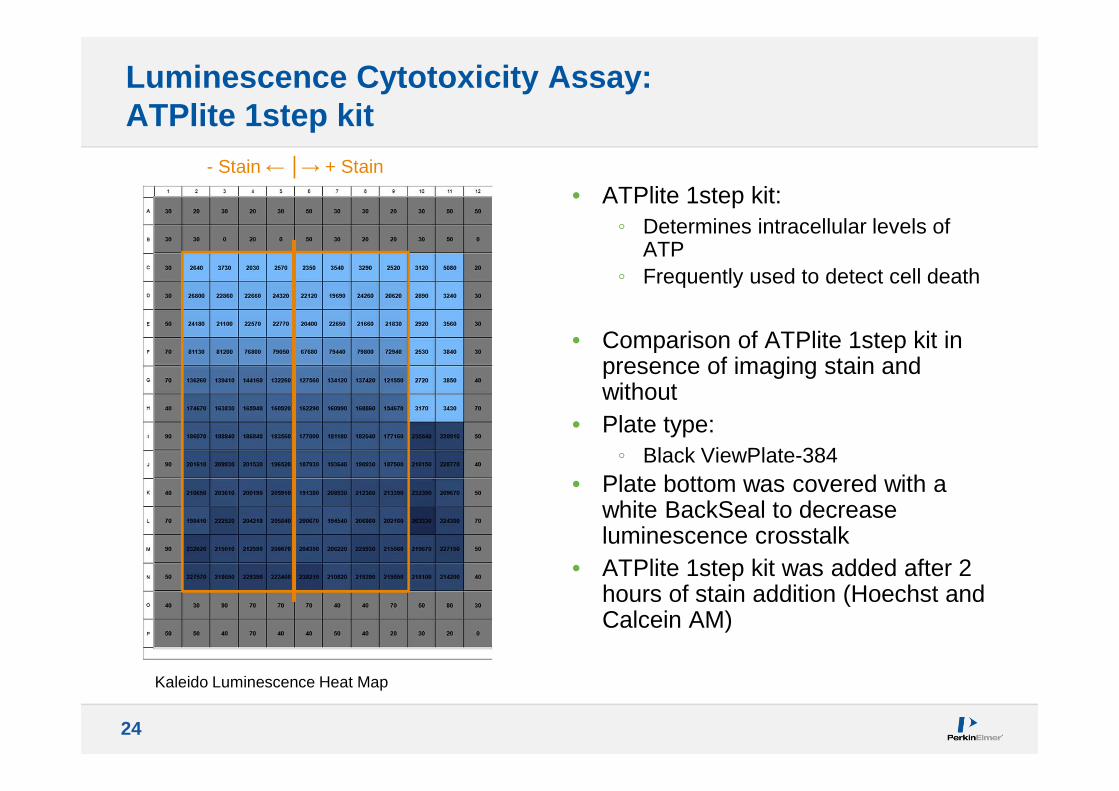
Luminescence Cytotoxicity Assay: ATPlite 1step kit
• ATPlite 1step kit: ◦ Determines intracellular levels of
ATP◦ Frequently used to detect cell death
• Comparison of ATPlite 1step kit in presence of imaging stain and without
• Plate type: ◦ Black ViewPlate-384
• Plate bottom was covered with a white BackSeal to decrease luminescence crosstalk
• ATPlite 1step kit was added after 2 hours of stain addition (Hoechst and Calcein AM)
Kaleido Luminescence Heat Map
- Stain ← │→ + Stain
25
Day 3 (Viability by ATP Luminescence kit)
26
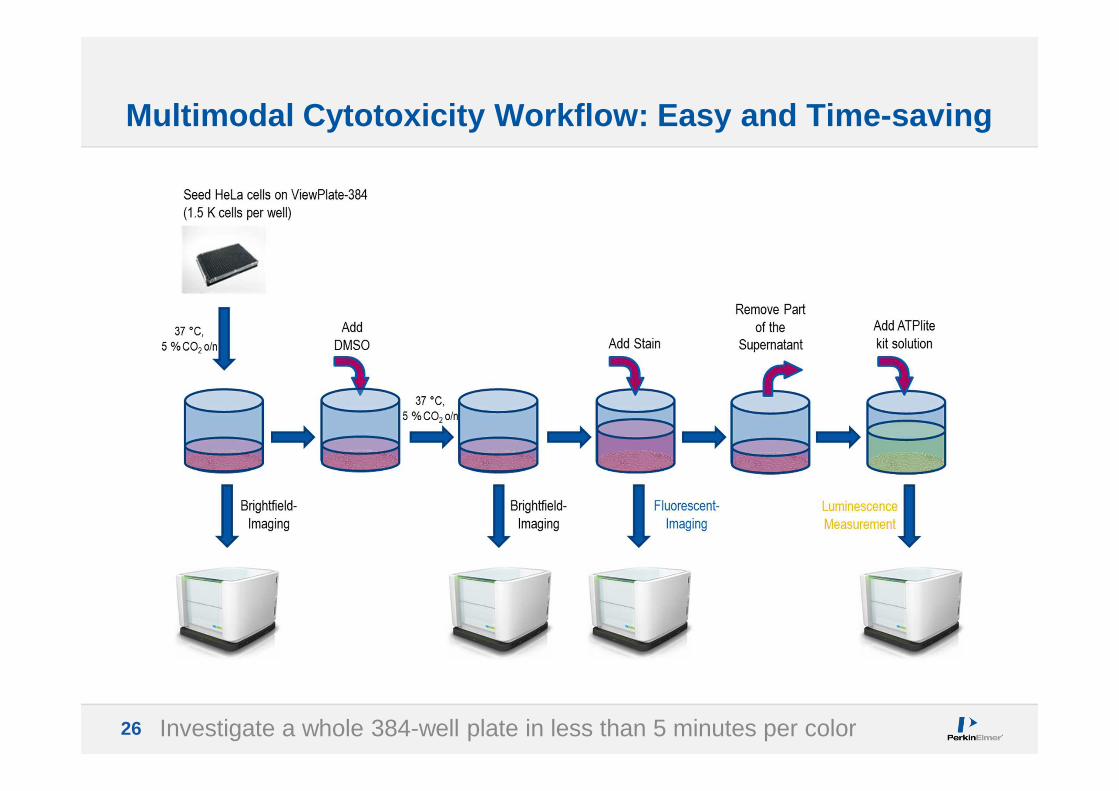
Multimodal Cytotoxicity Workflow: Easy and Time-sav ing
Investigate a whole 384-well plate in less than 5 minutes per color
27
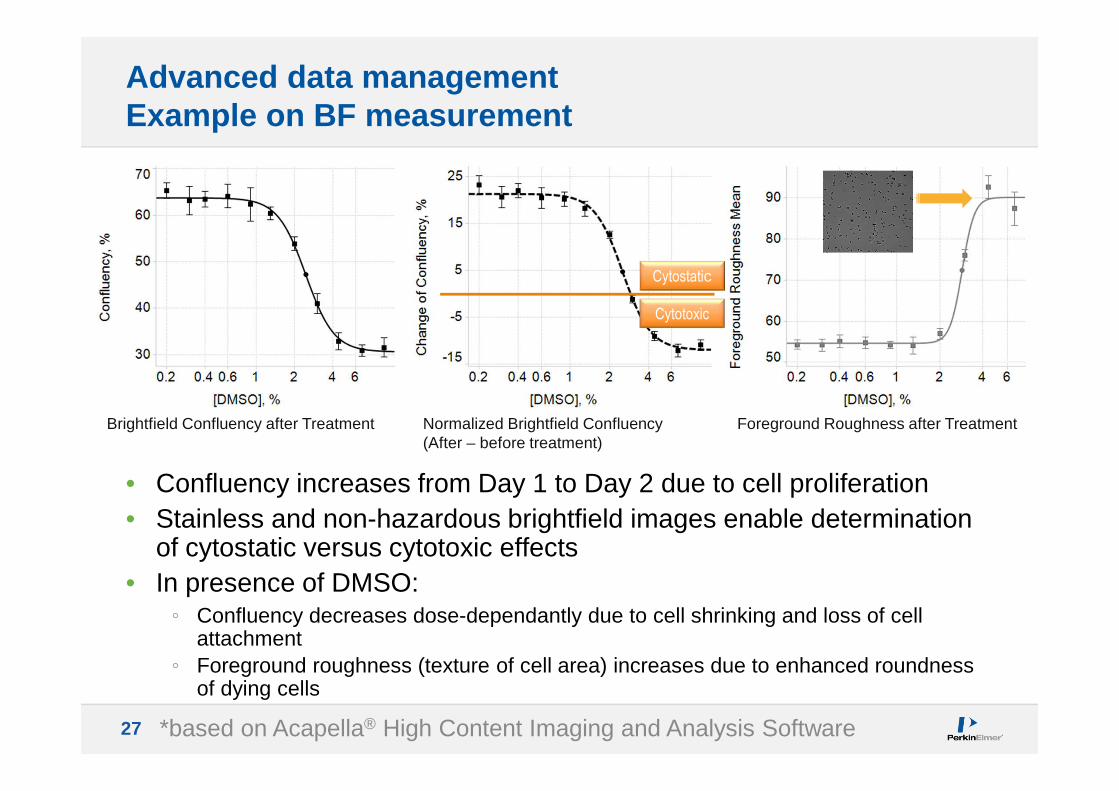
Advanced data managementExample on BF measurement
• Confluency increases from Day 1 to Day 2 due to cell proliferation• Stainless and non-hazardous brightfield images enable determination
of cytostatic versus cytotoxic effects • In presence of DMSO:
◦ Confluency decreases dose-dependantly due to cell shrinking and loss of cell attachment
◦ Foreground roughness (texture of cell area) increases due to enhanced roundness of dying cells
Brightfield Confluency after Treatment Normalized Brightfield Confluency (After – before treatment)
Foreground Roughness after Treatment
Cytostatic
Cytotoxic
*based on Acapella® High Content Imaging and Analysis Software
28
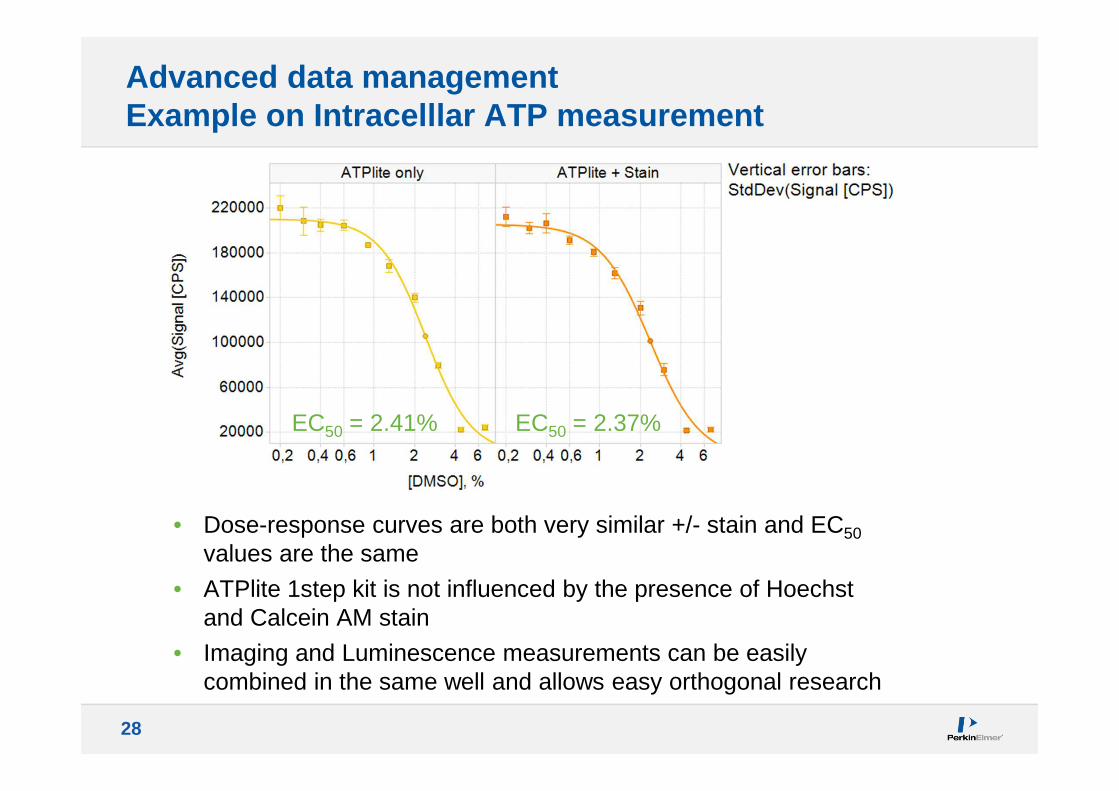
• Dose-response curves are both very similar +/- stain and EC50values are the same
• ATPlite 1step kit is not influenced by the presence of Hoechst and Calcein AM stain
• Imaging and Luminescence measurements can be easily combined in the same well and allows easy orthogonal research
EC50 = 2.41% EC50 = 2.37%
Advanced data managementExample on Intracelllar ATP measurement
29
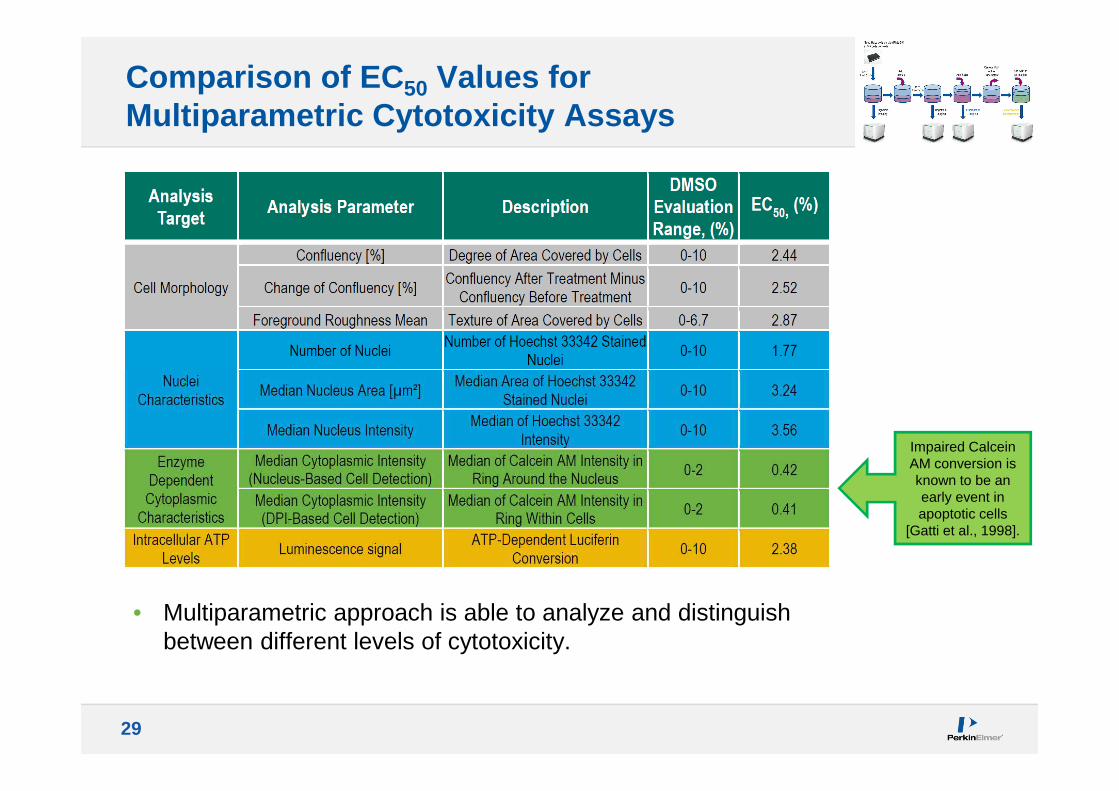
Comparison of EC 50 Values for Multiparametric Cytotoxicity Assays
• Multiparametric approach is able to analyze and distinguish between different levels of cytotoxicity.
Impaired Calcein AM conversion is known to be an early event in apoptotic cells
[Gatti et al., 1998].
30
Conclusion
• Gain more data & findings faster out of your sample to confirm your results
• Check cell morphology, cell nucleus & cytoplasm characteristics as well as intracellular ATP levels◦ Get the complete picture of cytotoxicity on different levels
• Watch cell proliferation and compound effects by using stainless brightfield confluency analysis◦ Robust & easy to apply◦ Non-invasive, live cell assay◦ Distinguish between cell static vs. cell toxic effects
• Utilize the power of image segmentation by fluorescent image analysis◦ Distinguishes between nucleus and cytoplasm ◦ Allows for more detailed analysis of different effects of cytotoxicity
• Get confidence in your results by intracellular ATP measurements using Luminescence ◦ Orthogonal: Confirms the well-imaging based results
Orthogonal approachAnalysis of Cytotoxicity

3131
FOR THEBETTER