Embed Size (px)
Citation preview
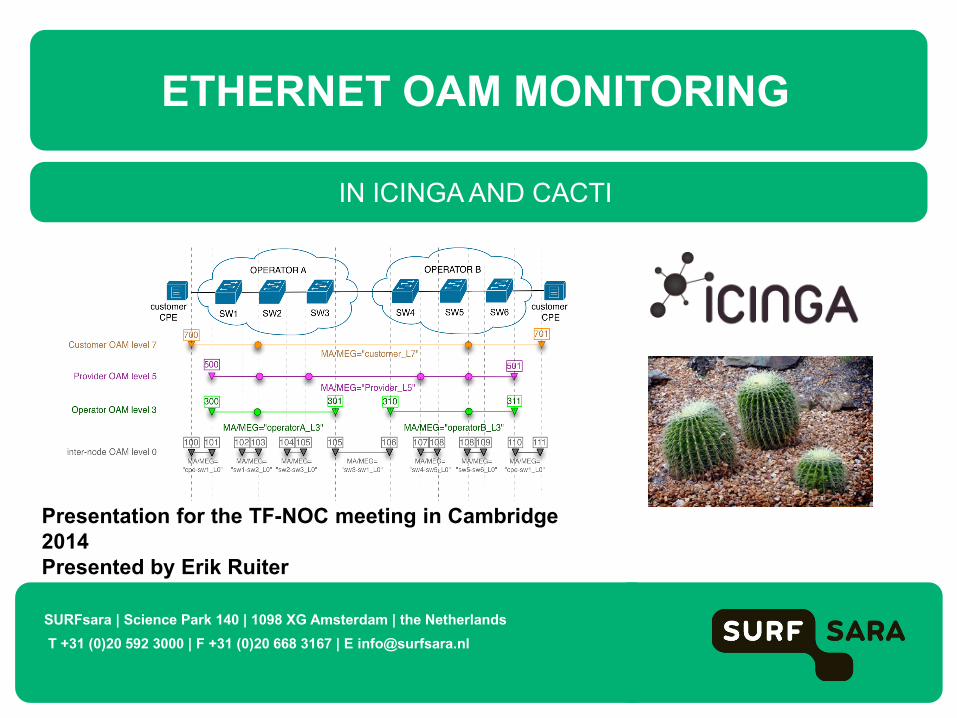
IN ICINGA AND CACTI
ETHERNET OAM MONITORING
SURFsara | Science Park 140 | 1098 XG Amsterdam | the Netherlands T +31 (0)20 592 3000 | F +31 (0)20 668 3167 | E [email protected]
Presentation for the TF-NOC meeting in Cambridge 2014 Presented by Erik Ruiter
Ethernet OAM Monitoring
Presentation overview - Background - Ethernet OAM overview - Icinga plugins - Cacti templates - Issues and experiences during testing / developing
2 TF-NOC meeting Cambridge 2014 – Monitoring Ethernet OAM in Icinga and Cacti
TF-NOC meeting Cambridge 2014 – Monitoring Ethernet OAM in Icinga and Cacti
About SURFsara
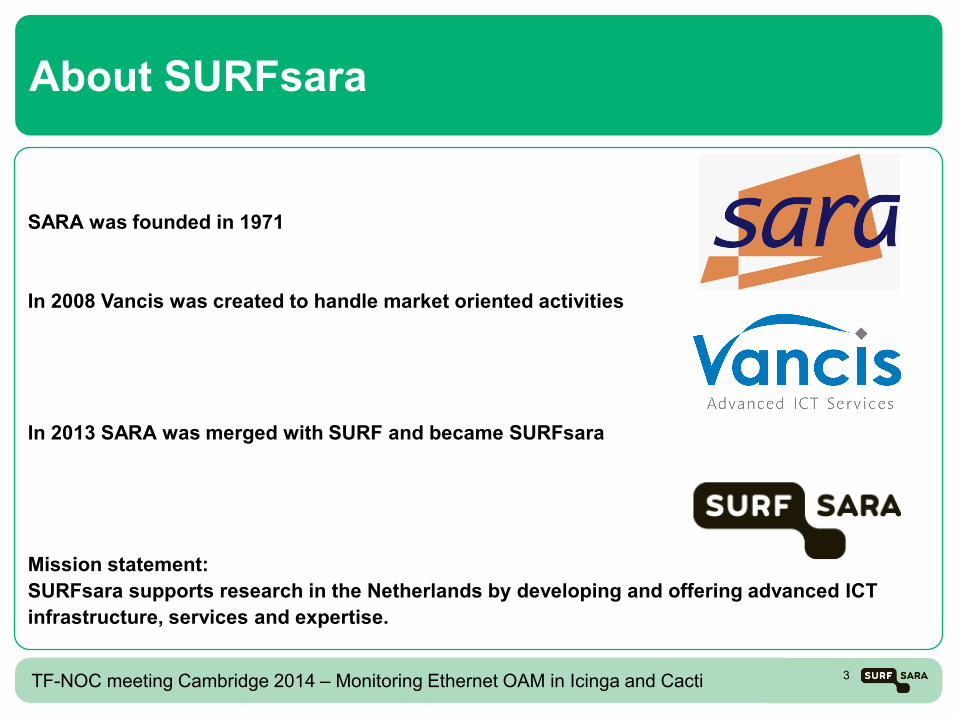
SARA was founded in 1971 In 2008 Vancis was created to handle market oriented activities In 2013 SARA was merged with SURF and became SURFsara Mission statement: SURFsara supports research in the Netherlands by developing and offering advanced ICT infrastructure, services and expertise.
3
TF-NOC meeting Cambridge 2014 – Monitoring Ethernet OAM in Icinga and Cacti
Services
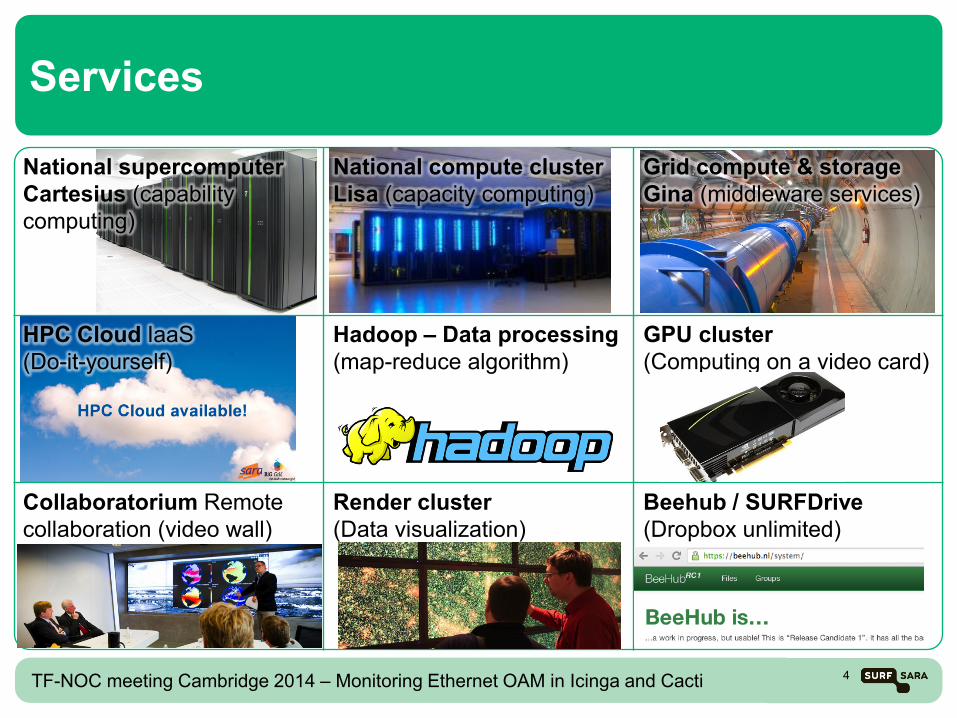
National supercomputer Cartesius (capability computing)
National compute cluster Lisa (capacity computing)
Grid compute & storage Gina (middleware services)
HPC Cloud IaaS (Do-it-yourself)
Hadoop – Data processing (map-reduce algorithm)
GPU cluster (Computing on a video card)
Collaboratorium Remote collaboration (video wall)
Render cluster (Data visualization)
Beehub / SURFDrive (Dropbox unlimited)
4

TF-NOC meeting Cambridge 2014 – Monitoring Ethernet OAM in Icinga and Cacti
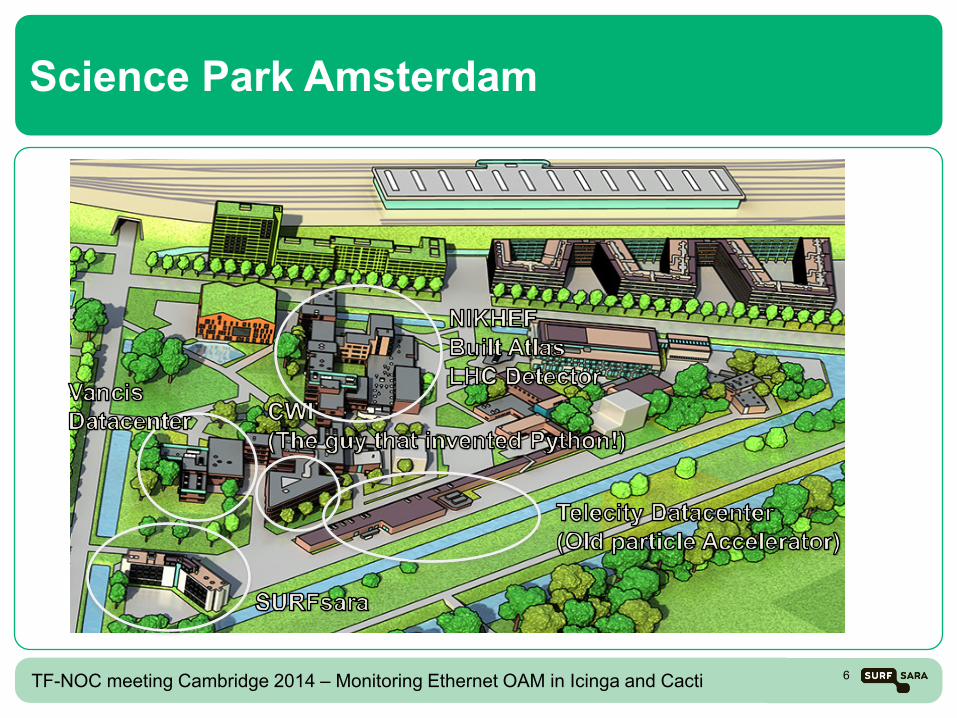
Science Park Amsterdam
5
TF-NOC meeting Cambridge 2014 – Monitoring Ethernet OAM in Icinga and Cacti
Science Park Amsterdam
6
Background
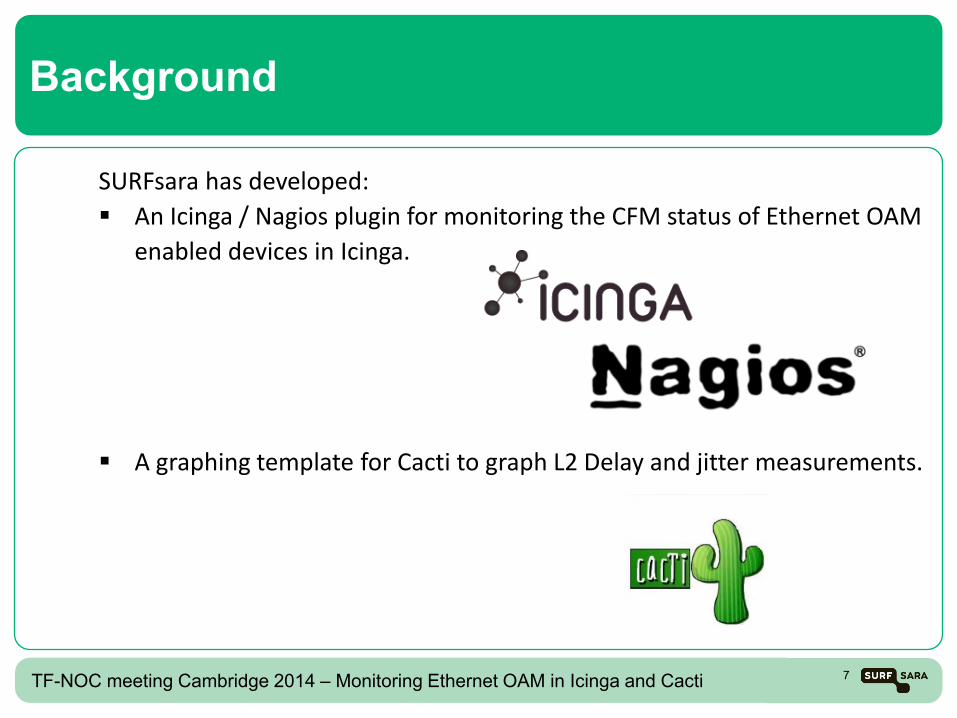
SURFsara has developed: An Icinga / Nagios plugin for monitoring the CFM status of Ethernet OAM
enabled devices in Icinga.
A graphing template for Cacti to graph L2 Delay and jitter measurements.
7 TF-NOC meeting Cambridge 2014 – Monitoring Ethernet OAM in Icinga and Cacti
Why?
We wanted to demonstrate that it is possible to implement simple OAM
monitoring without spending too much resources.
We wanted to have this available in our existing OSS environment, so that we did not have to invest in additional software.
No additional software required for L2 monitoring, this saves time and resources when implementing Ethernet OAM.
8 TF-NOC meeting Cambridge 2014 – Monitoring Ethernet OAM in Icinga and Cacti
What is Ethernet OAM
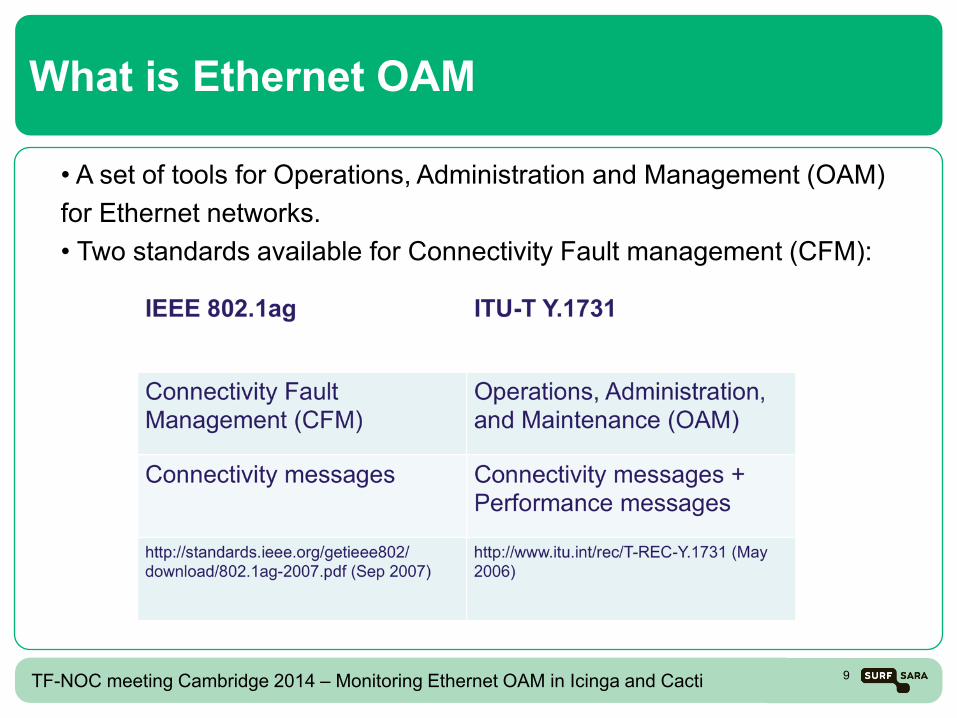
• A set of tools for Operations, Administration and Management (OAM) for Ethernet networks. • Two standards available for Connectivity Fault management (CFM):
9 TF-NOC meeting Cambridge 2014 – Monitoring Ethernet OAM in Icinga and Cacti
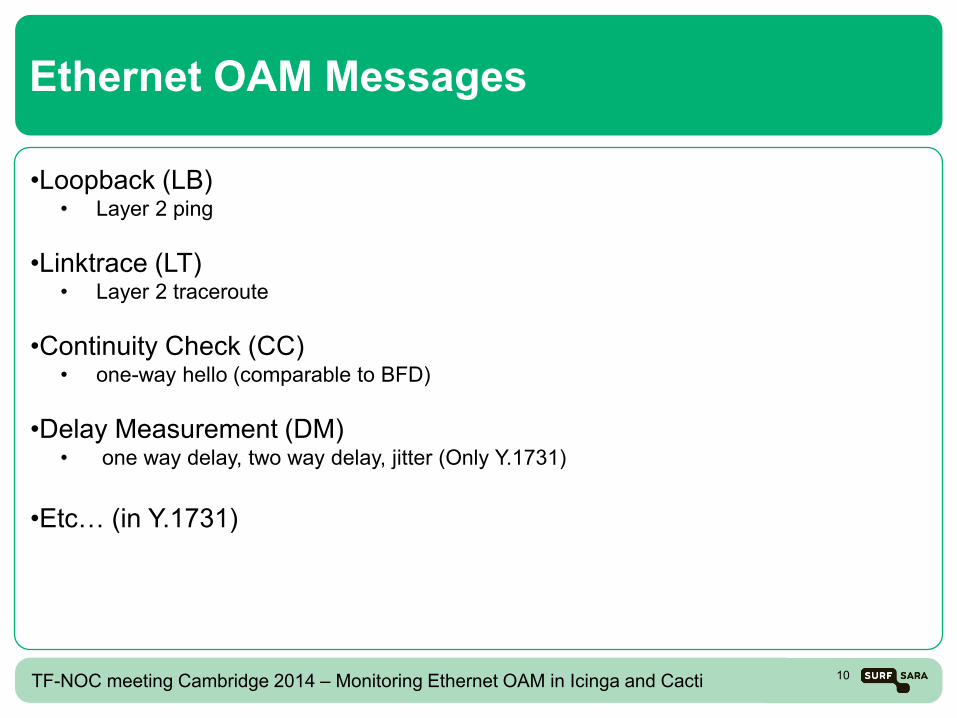
Ethernet OAM Messages
•Loopback (LB) • Layer 2 ping
•Linktrace (LT)
• Layer 2 traceroute
•Continuity Check (CC) • one-way hello (comparable to BFD)
•Delay Measurement (DM)
• one way delay, two way delay, jitter (Only Y.1731) •Etc… (in Y.1731)
10 TF-NOC meeting Cambridge 2014 – Monitoring Ethernet OAM in Icinga and Cacti
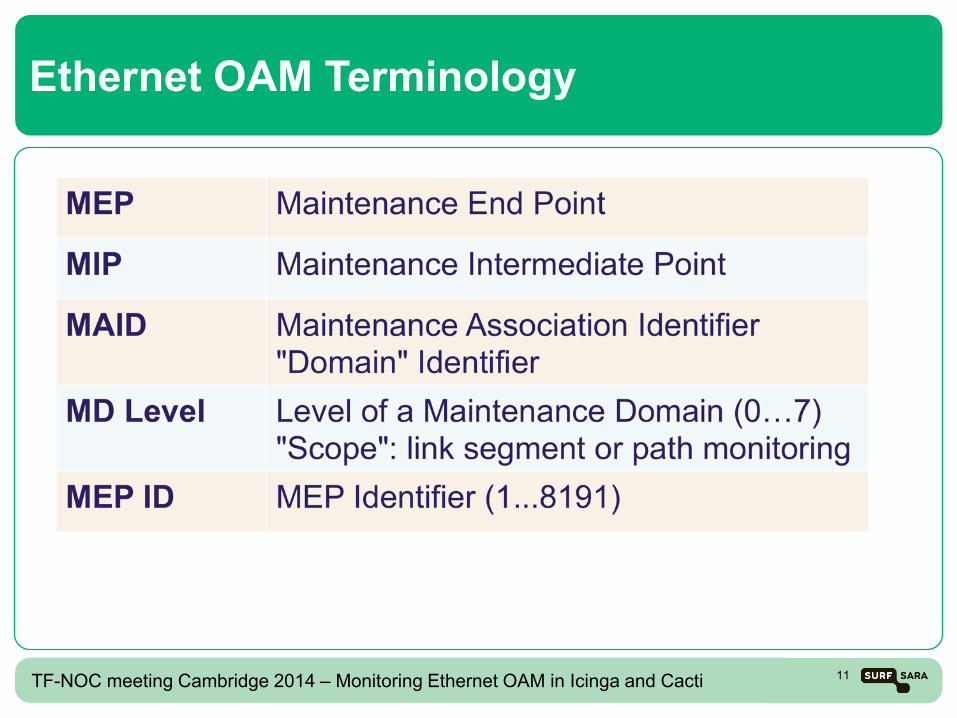
Ethernet OAM Terminology
11 TF-NOC meeting Cambridge 2014 – Monitoring Ethernet OAM in Icinga and Cacti
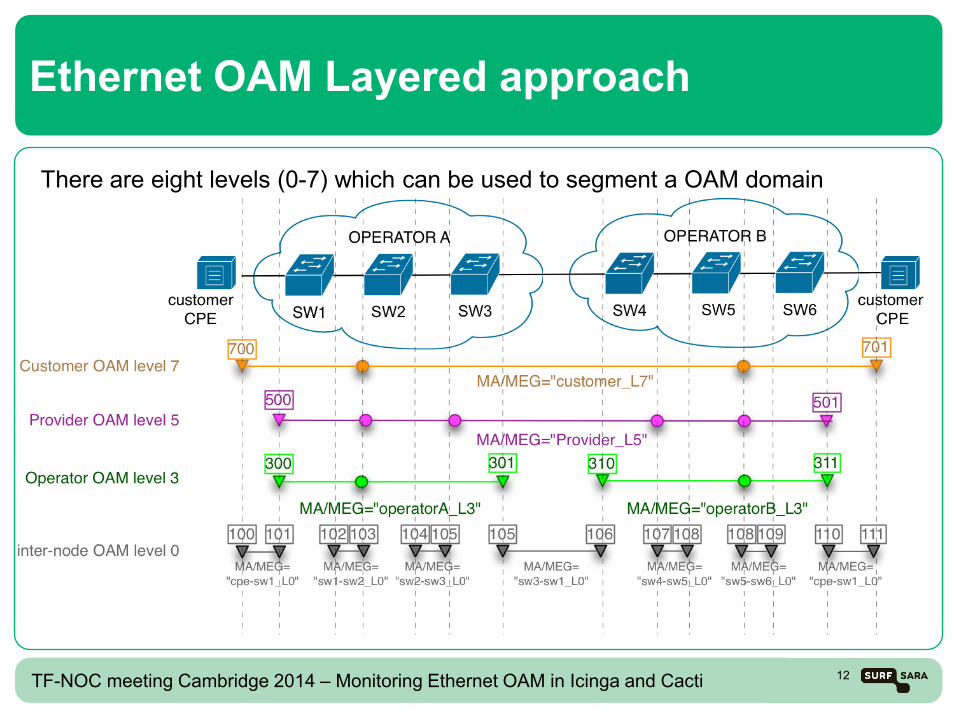
Ethernet OAM Layered approach
12 TF-NOC meeting Cambridge 2014 – Monitoring Ethernet OAM in Icinga and Cacti
There are eight levels (0-7) which can be used to segment a OAM domain
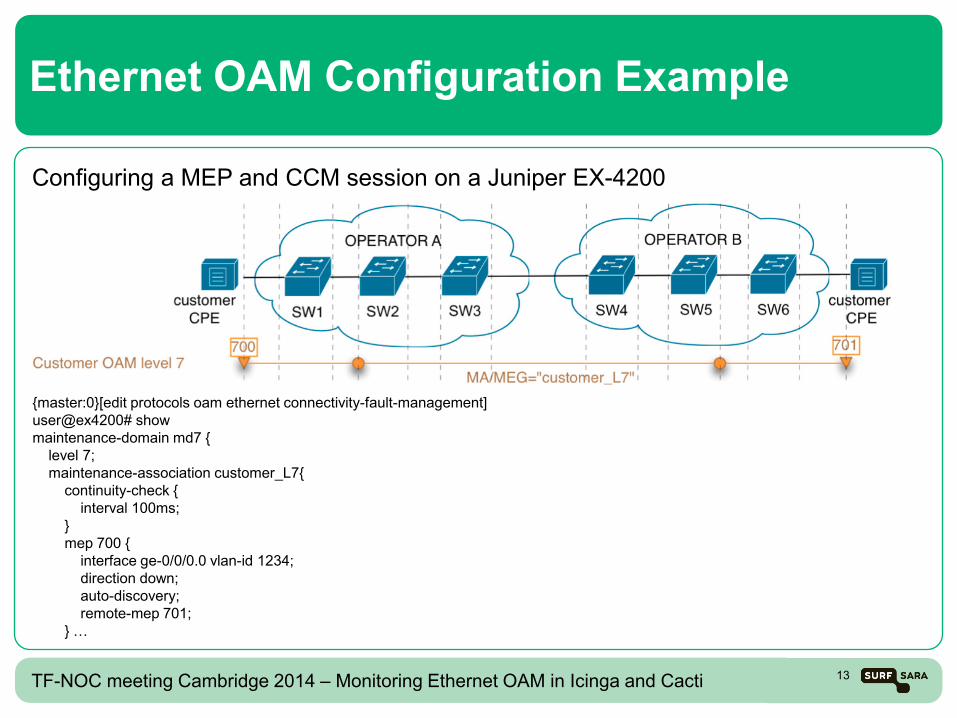
Ethernet OAM Configuration Example
{master:0}[edit protocols oam ethernet connectivity-fault-management] user@ex4200# show maintenance-domain md7 { level 7; maintenance-association customer_L7{ continuity-check { interval 100ms; } mep 700 { interface ge-0/0/0.0 vlan-id 1234; direction down; auto-discovery; remote-mep 701; } …
Configuring a MEP and CCM session on a Juniper EX-4200
13 TF-NOC meeting Cambridge 2014 – Monitoring Ethernet OAM in Icinga and Cacti
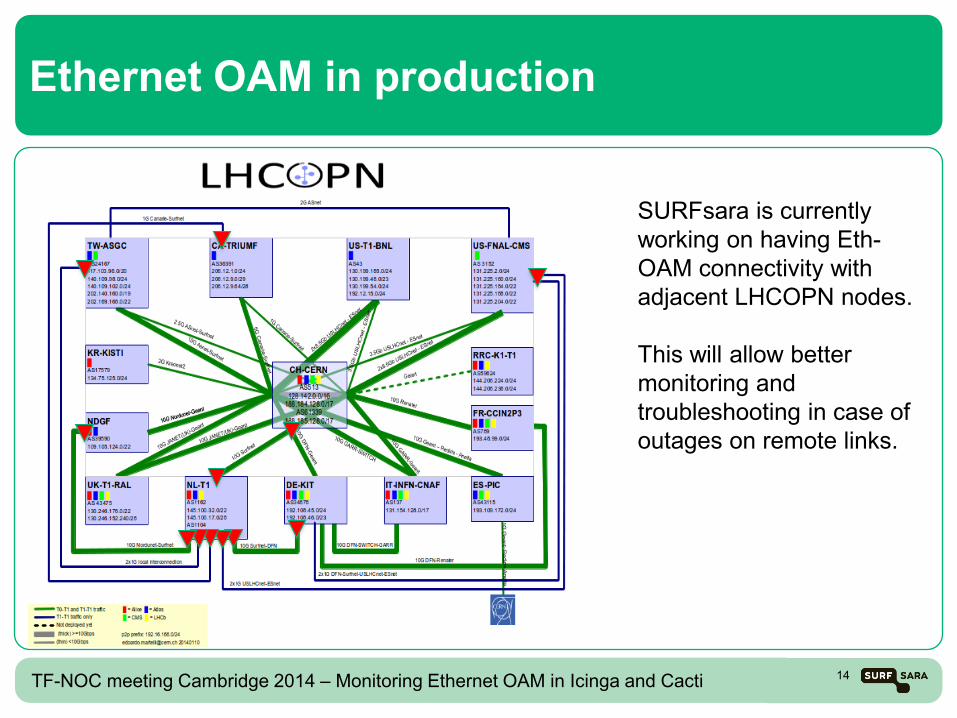
Ethernet OAM in production
SURFsara is currently working on having Eth-OAM connectivity with adjacent LHCOPN nodes. This will allow better monitoring and troubleshooting in case of outages on remote links.
14 TF-NOC meeting Cambridge 2014 – Monitoring Ethernet OAM in Icinga and Cacti
Ethernet OAM Icinga plugins
The following plugins are available for Icinga - check_ethping - check_ethtrace - check_cfm_state Usage and examples are explained on the following slides
15 TF-NOC meeting Cambridge 2014 – Monitoring Ethernet OAM in Icinga and Cacti
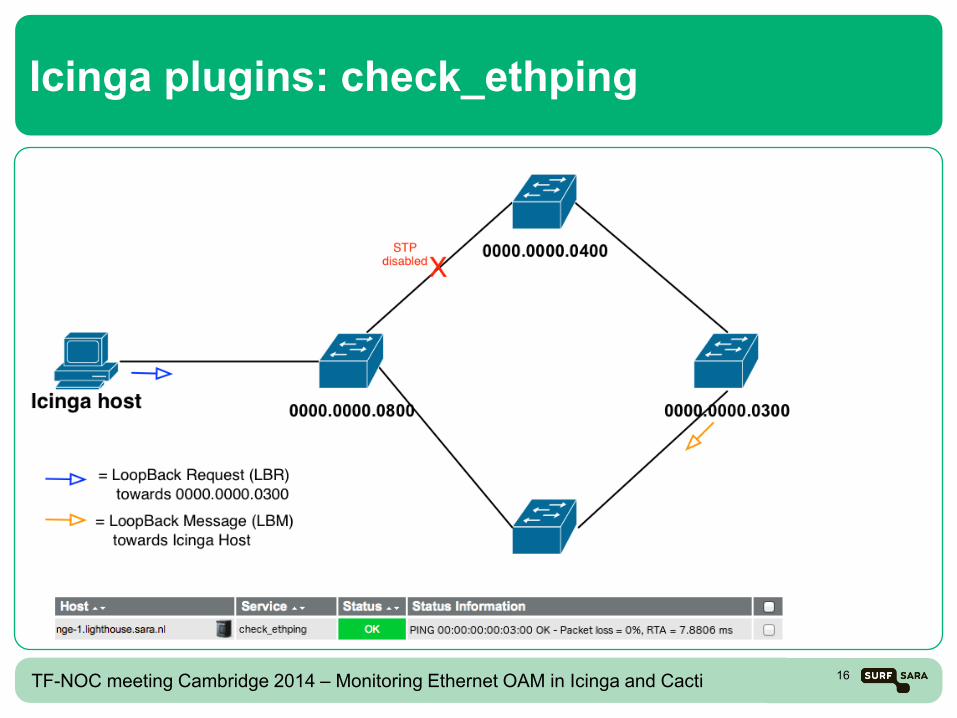
Icinga plugins: check_ethping
16 TF-NOC meeting Cambridge 2014 – Monitoring Ethernet OAM in Icinga and Cacti
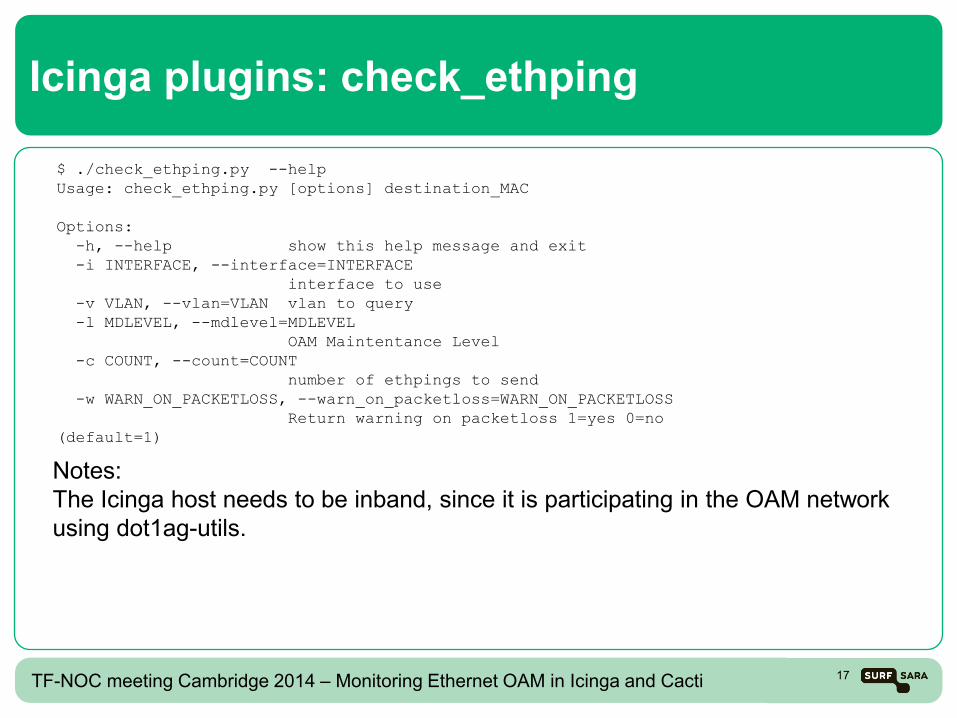
Icinga plugins: check_ethping
$ ./check_ethping.py --help Usage: check_ethping.py [options] destination_MAC Options: -h, --help show this help message and exit -i INTERFACE, --interface=INTERFACE interface to use -v VLAN, --vlan=VLAN vlan to query -l MDLEVEL, --mdlevel=MDLEVEL OAM Maintentance Level -c COUNT, --count=COUNT number of ethpings to send -w WARN_ON_PACKETLOSS, --warn_on_packetloss=WARN_ON_PACKETLOSS Return warning on packetloss 1=yes 0=no (default=1)
Notes: The Icinga host needs to be inband, since it is participating in the OAM network using dot1ag-utils.
17 TF-NOC meeting Cambridge 2014 – Monitoring Ethernet OAM in Icinga and Cacti
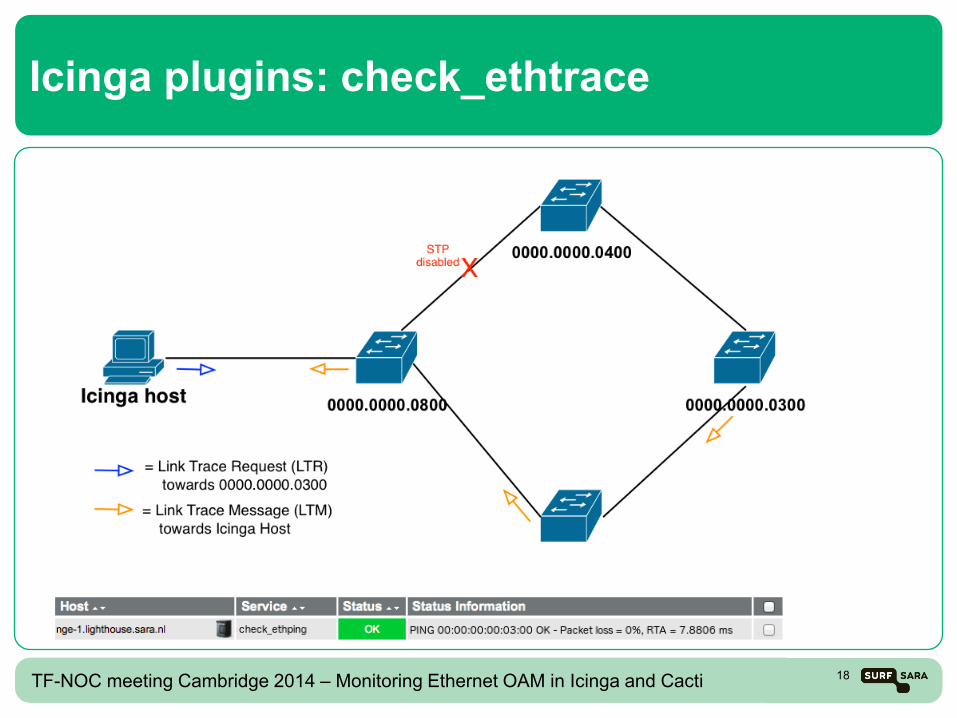
Icinga plugins: check_ethtrace
18 TF-NOC meeting Cambridge 2014 – Monitoring Ethernet OAM in Icinga and Cacti
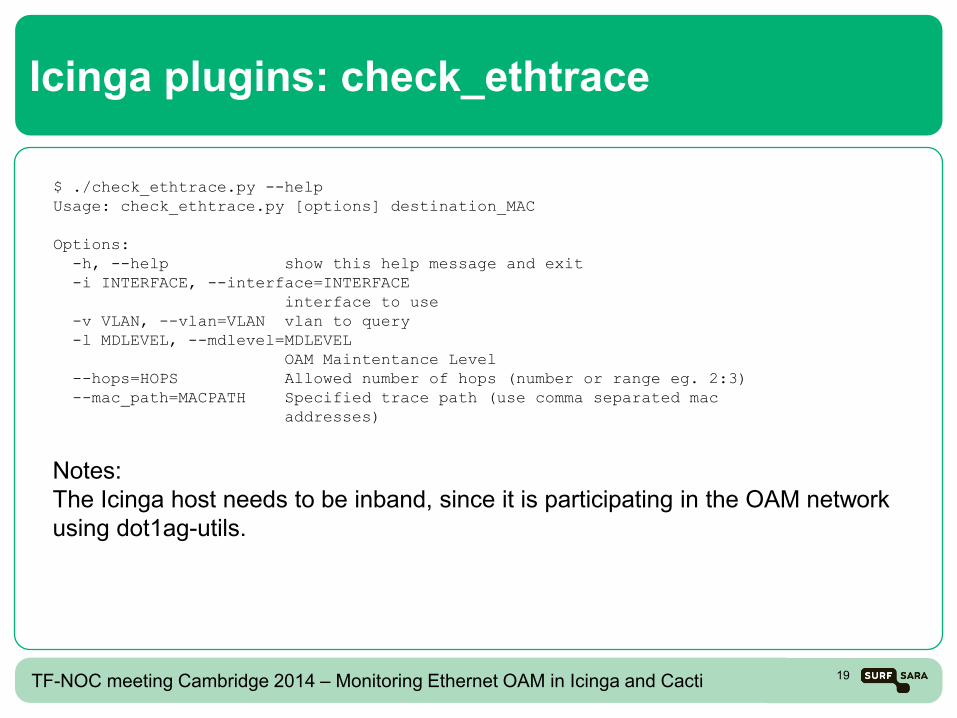
Icinga plugins: check_ethtrace
$ ./check_ethtrace.py --help Usage: check_ethtrace.py [options] destination_MAC Options: -h, --help show this help message and exit -i INTERFACE, --interface=INTERFACE interface to use -v VLAN, --vlan=VLAN vlan to query -l MDLEVEL, --mdlevel=MDLEVEL OAM Maintentance Level --hops=HOPS Allowed number of hops (number or range eg. 2:3) --mac_path=MACPATH Specified trace path (use comma separated mac addresses)
Notes: The Icinga host needs to be inband, since it is participating in the OAM network using dot1ag-utils.
19 TF-NOC meeting Cambridge 2014 – Monitoring Ethernet OAM in Icinga and Cacti
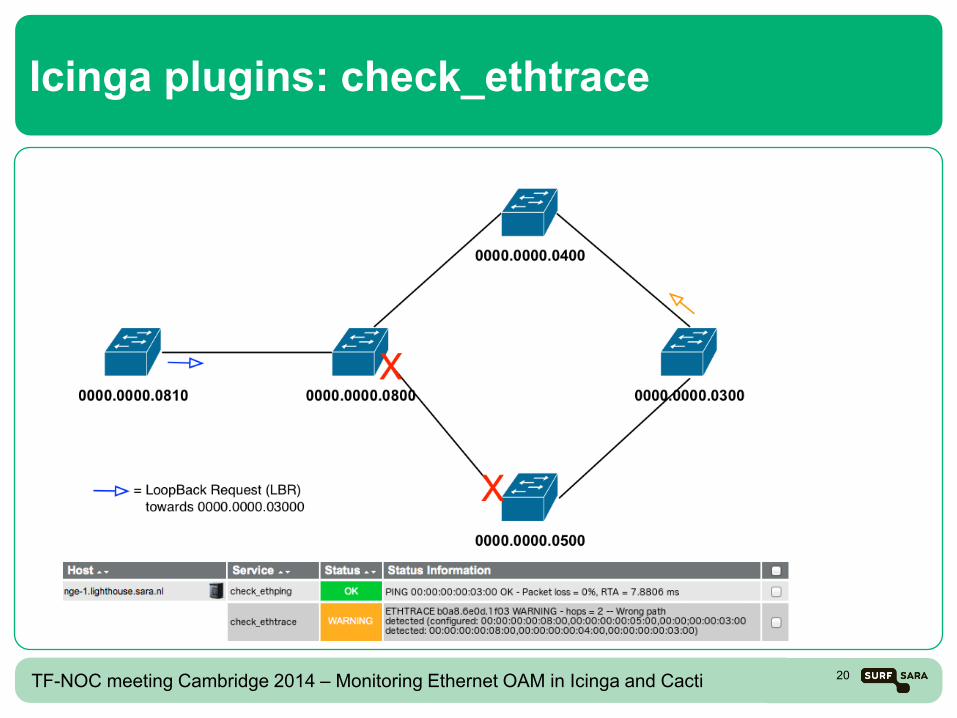
Icinga plugins: check_ethtrace
20 TF-NOC meeting Cambridge 2014 – Monitoring Ethernet OAM in Icinga and Cacti
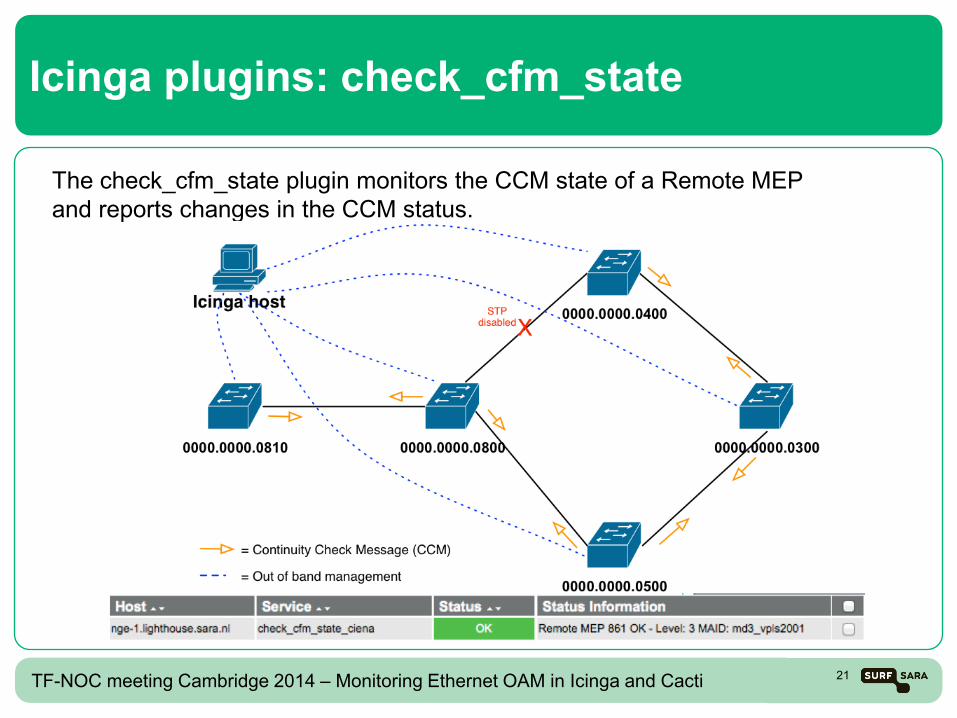
Icinga plugins: check_cfm_state
The check_cfm_state plugin monitors the CCM state of a Remote MEP and reports changes in the CCM status.
21 TF-NOC meeting Cambridge 2014 – Monitoring Ethernet OAM in Icinga and Cacti
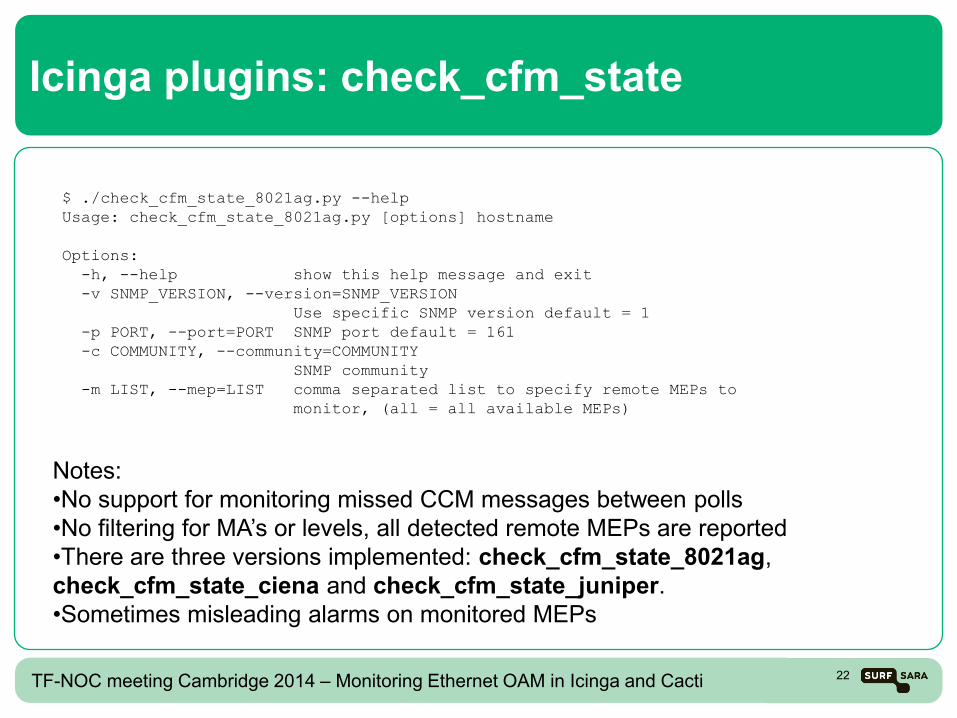
Icinga plugins: check_cfm_state
$ ./check_cfm_state_8021ag.py --help Usage: check_cfm_state_8021ag.py [options] hostname Options: -h, --help show this help message and exit -v SNMP_VERSION, --version=SNMP_VERSION Use specific SNMP version default = 1 -p PORT, --port=PORT SNMP port default = 161 -c COMMUNITY, --community=COMMUNITY SNMP community -m LIST, --mep=LIST comma separated list to specify remote MEPs to monitor, (all = all available MEPs)
Notes: •No support for monitoring missed CCM messages between polls •No filtering for MA’s or levels, all detected remote MEPs are reported •There are three versions implemented: check_cfm_state_8021ag, check_cfm_state_ciena and check_cfm_state_juniper. •Sometimes misleading alarms on monitored MEPs
22 TF-NOC meeting Cambridge 2014 – Monitoring Ethernet OAM in Icinga and Cacti
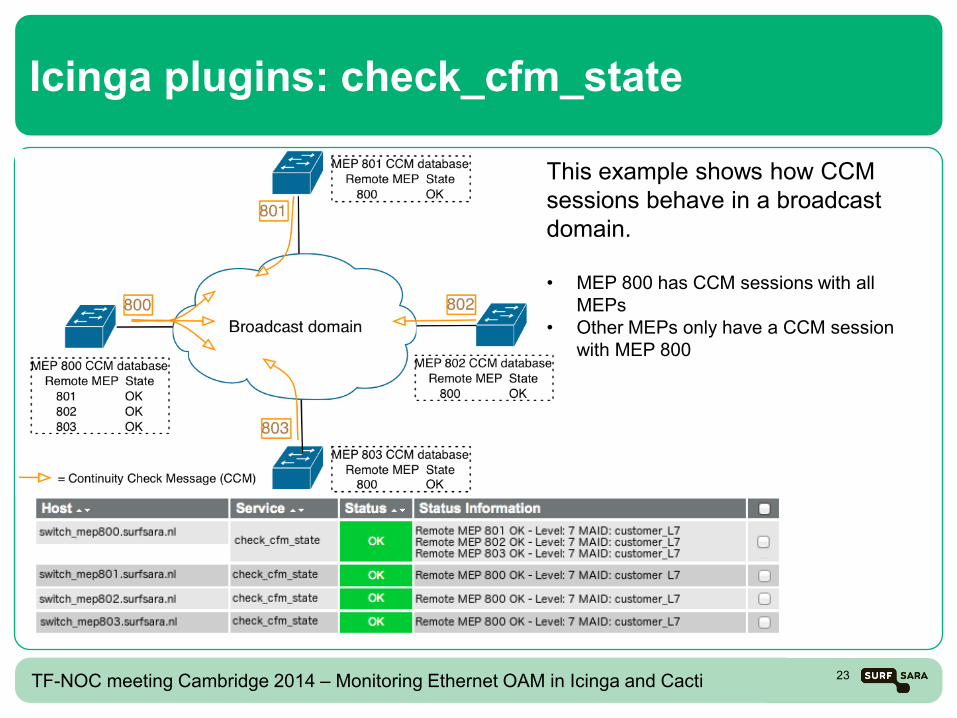
Icinga plugins: check_cfm_state
This example shows how CCM sessions behave in a broadcast domain. • MEP 800 has CCM sessions with all
MEPs • Other MEPs only have a CCM session
with MEP 800
23 TF-NOC meeting Cambridge 2014 – Monitoring Ethernet OAM in Icinga and Cacti
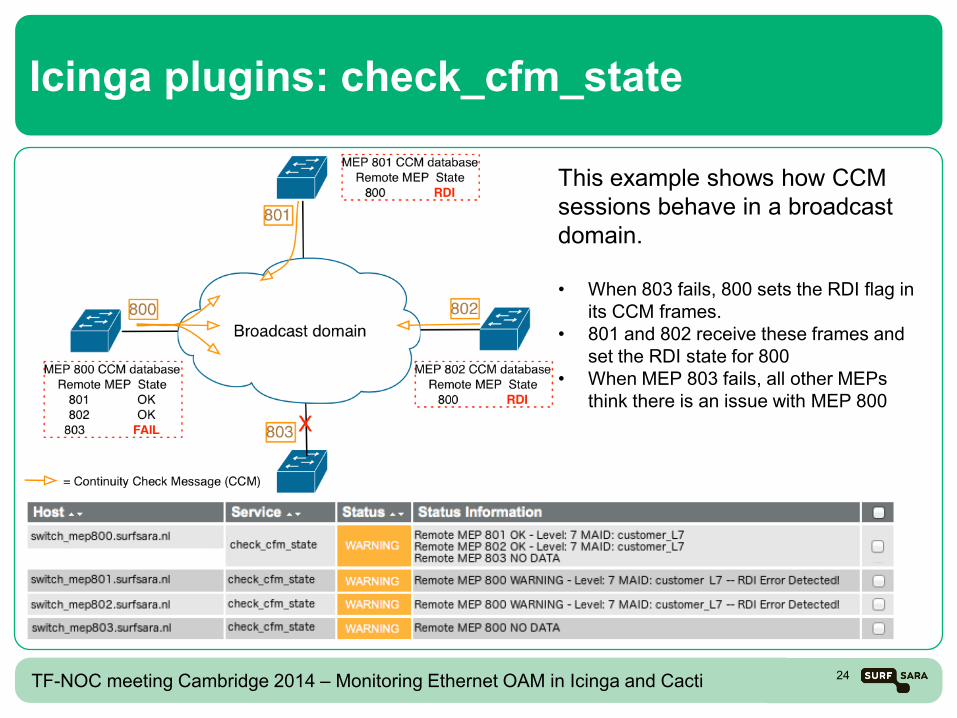
Icinga plugins: check_cfm_state
This example shows how CCM sessions behave in a broadcast domain. • When 803 fails, 800 sets the RDI flag in
its CCM frames. • 801 and 802 receive these frames and
set the RDI state for 800 • When MEP 803 fails, all other MEPs
think there is an issue with MEP 800
24 TF-NOC meeting Cambridge 2014 – Monitoring Ethernet OAM in Icinga and Cacti
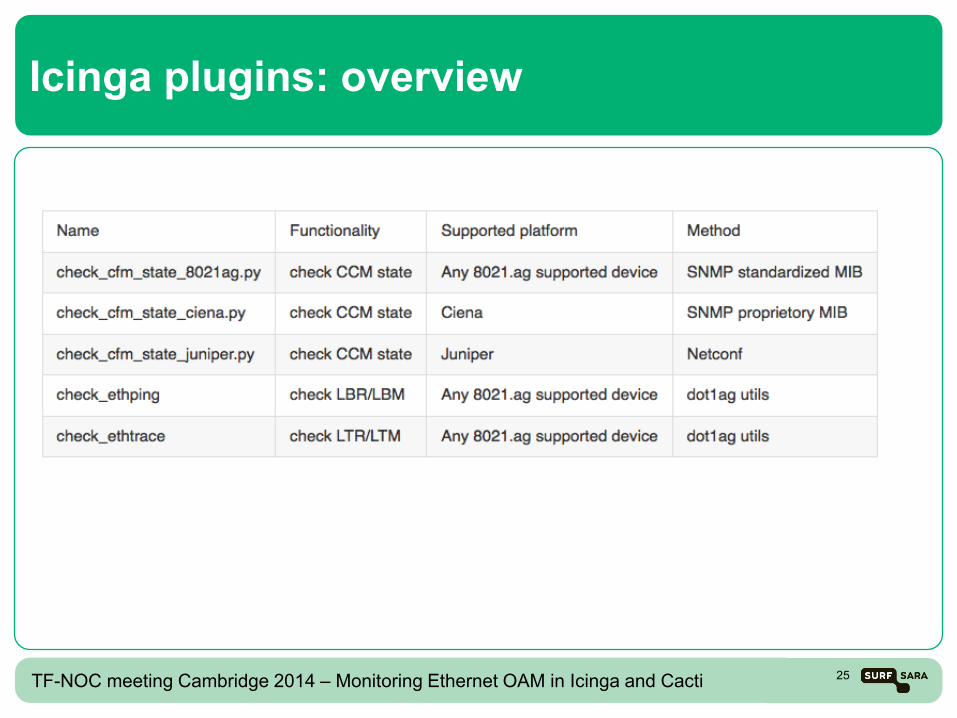
Icinga plugins: overview
25 TF-NOC meeting Cambridge 2014 – Monitoring Ethernet OAM in Icinga and Cacti
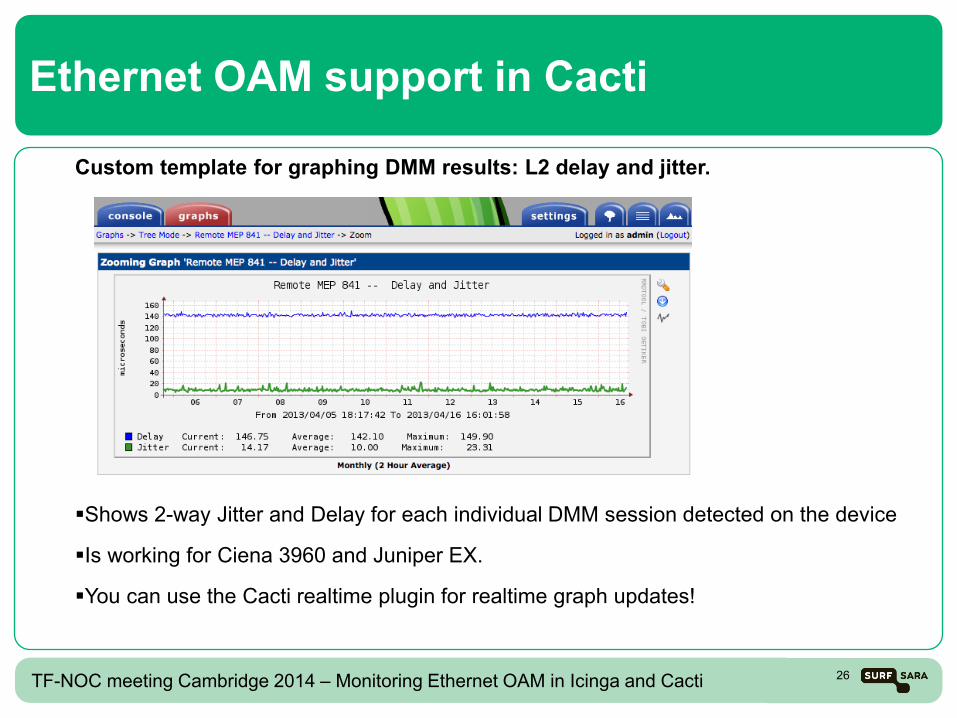
Ethernet OAM support in Cacti Custom template for graphing DMM results: L2 delay and jitter. Shows 2-way Jitter and Delay for each individual DMM session detected on the device Is working for Ciena 3960 and Juniper EX. You can use the Cacti realtime plugin for realtime graph updates!
26 TF-NOC meeting Cambridge 2014 – Monitoring Ethernet OAM in Icinga and Cacti
Building a custom Cacti template
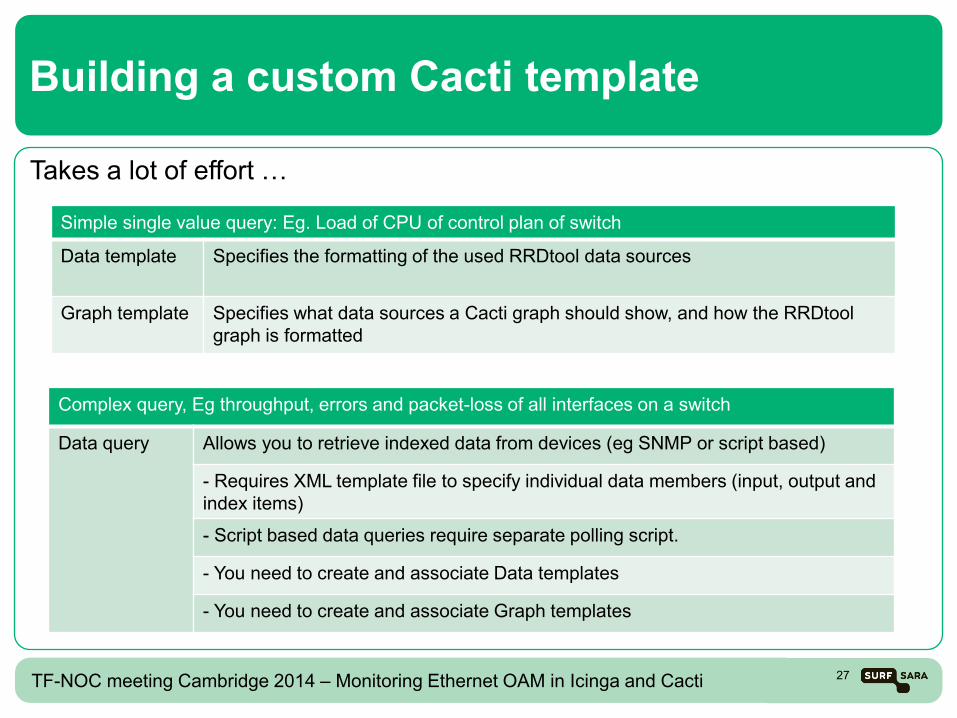
Takes a lot of effort …
27 TF-NOC meeting Cambridge 2014 – Monitoring Ethernet OAM in Icinga and Cacti
Simple single value query: Eg. Load of CPU of control plan of switch
Data template Specifies the formatting of the used RRDtool data sources
Graph template Specifies what data sources a Cacti graph should show, and how the RRDtool graph is formatted
Complex query, Eg throughput, errors and packet-loss of all interfaces on a switch
Data query
Allows you to retrieve indexed data from devices (eg SNMP or script based)
- Requires XML template file to specify individual data members (input, output and index items)
- Script based data queries require separate polling script.
- You need to create and associate Data templates
- You need to create and associate Graph templates
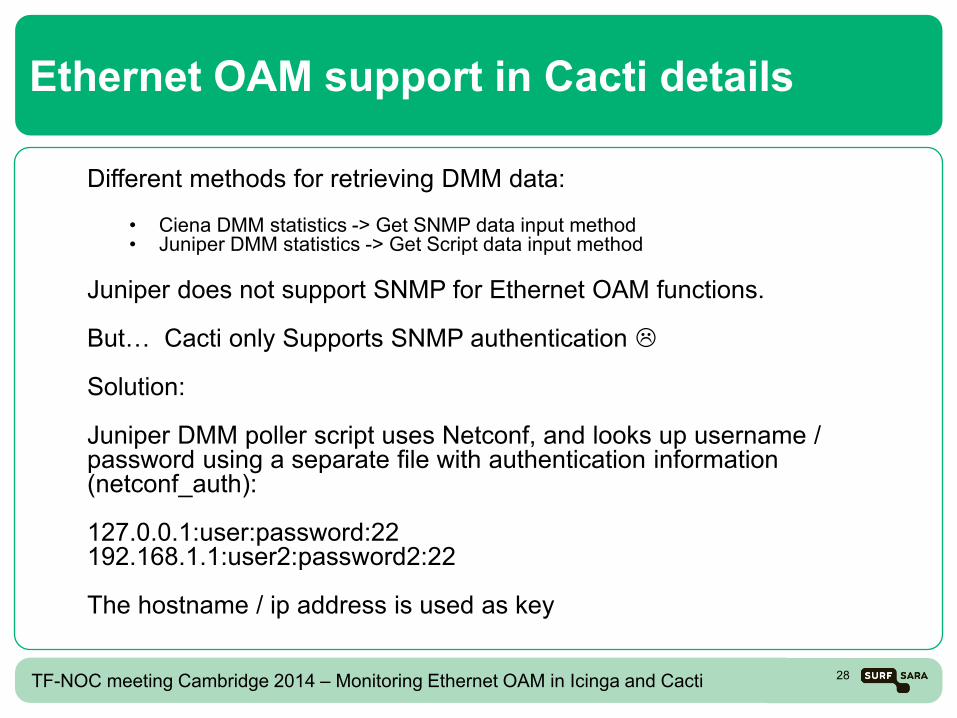
Ethernet OAM support in Cacti details Different methods for retrieving DMM data:
• Ciena DMM statistics -> Get SNMP data input method • Juniper DMM statistics -> Get Script data input method
Juniper does not support SNMP for Ethernet OAM functions. But… Cacti only Supports SNMP authentication Solution: Juniper DMM poller script uses Netconf, and looks up username / password using a separate file with authentication information (netconf_auth): 127.0.0.1:user:password:22 192.168.1.1:user2:password2:22 The hostname / ip address is used as key
28 TF-NOC meeting Cambridge 2014 – Monitoring Ethernet OAM in Icinga and Cacti
Used tools: Python dependancies
Used libraries / tools Net-SNMP and Python Net-SNMP bindings: • General SNMP toolset, with an extension to build python scripts. Ncc-client: • Is a Netconf client API in Python. Is required for querying Eth-OAM settings
/ results in Juniper Systems. • There are a number of forks existing, from which the Juniper fork was
used.
29 TF-NOC meeting Cambridge 2014 – Monitoring Ethernet OAM in Icinga and Cacti
Used tools: dot1ag-utils
Dot1ag-utils: • A software implementation of 802.1ag • Allows you to enable ETH OAM on a Linux system, or an open Linux based
switching platform (eg. Arista EOS).
• Provides L2 ping, L2 trace and CCM functionality
• Was developed inhouse at SARA by a former collegea. (Ronald van der Pol, now works at SURFnet)
30 TF-NOC meeting Cambridge 2014 – Monitoring Ethernet OAM in Icinga and Cacti
TF-NOC meeting Cambridge 2014 – Monitoring Ethernet OAM in Icinga and Cacti
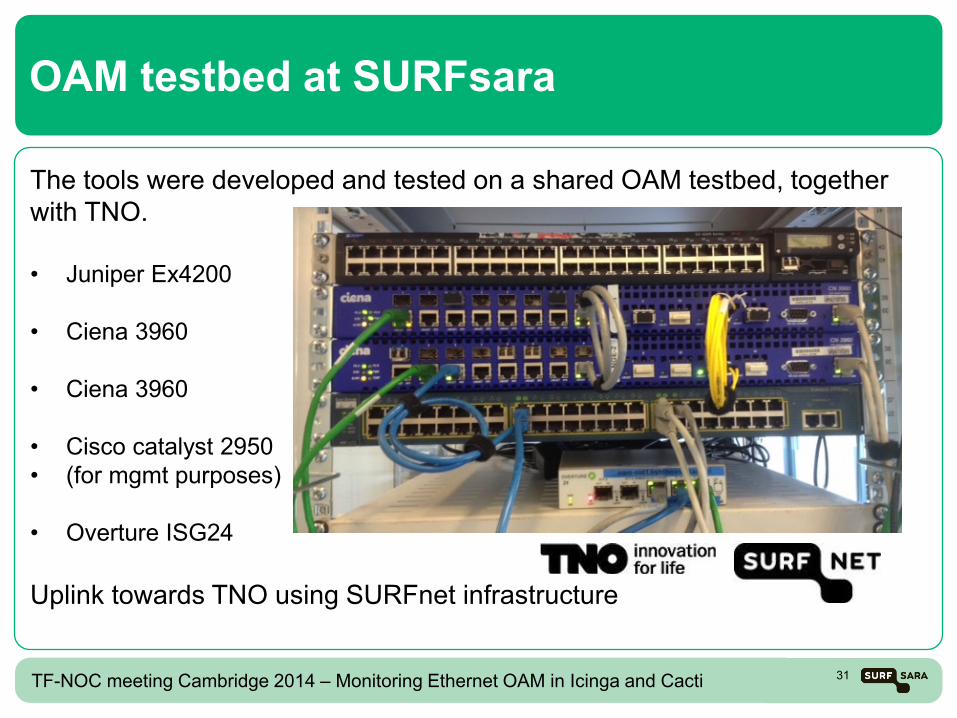
OAM testbed at SURFsara
The tools were developed and tested on a shared OAM testbed, together with TNO. • Juniper Ex4200
• Ciena 3960
• Ciena 3960
• Cisco catalyst 2950 • (for mgmt purposes)
• Overture ISG24 Uplink towards TNO using SURFnet infrastructure
31
Notes and Issues
Vendor support is growing, but not complete: •Juniper provides dot1ag and Y.1731 support on MX an EX platform, but only on CLI and Netconf, no SNMP (Planned in Roadmap for 2014) •Cisco has Ethernet Support on 3400 ME models, but not on mainstream C3750 or smaller datacenter switches.
Tested devices: •Juniper MX 960 •Juniper EX4200 •Ciena 3960 •Overture 24 •MRV OptiSwitch 904 •Fijitsu FDX2400M We sometimes encounter issues in the OAM implementation of devices. •Bugs in device firmware. •Errors in MIB files
32 TF-NOC meeting Cambridge 2014 – Monitoring Ethernet OAM in Icinga and Cacti
Ethernet OAM Monitoring
Want to know more? https://github.com/sara-nl/eth-oam
Thank you!
33 TF-NOC meeting Cambridge 2014 – Monitoring Ethernet OAM in Icinga and Cacti