Embed Size (px)
Citation preview
FISCAL STUDIES, vol. 27, no. 1, pp. 17–46 (2006) 0143-5671
© 2006 The Authors Journal compilation © Institute for Fiscal Studies, 2006. Published by Blackwell Publishing Ltd, 9600 Garsington Road, Oxford, OX4 2DQ, UK and 350 Main Street, Malden, MA 02148, USA
Ethnic Differences in Birth Outcomes in England*
LORRAINE DEARDEN,† ALICE MESNARD‡ and JONATHAN SHAW§
†Institute for Fiscal Studies; Institute of Education, University of London ([email protected]) ‡Institute for Fiscal Studies ([email protected]) §Institute for Fiscal Studies ([email protected])
Abstract
This paper uses the Millennium Cohort Study to look at ethnic differences in birth outcomes for a cohort of English children born in 2000 and 2001. There is an increasingly large literature showing that longer gestation and higher birthweight are positively associated with cognitive and non-cognitive outcomes later in life, so understanding sources of ethnic differences in these outcomes and identifying factors that may influence birth outcomes has a lot of potential policy interest. This paper shows that even after controlling for background characteristics in a number of ways, there still remain unexplained differences in both gestation and birthweight outcomes across broad ethnic groups. It also suggests, however, that there may be potential policy levers that could be used to narrow this ethnic gap in birth outcomes, such as reducing the proportion of underweight Asian mothers and overweight Black mothers and increasing ethnic minority attendance at antenatal classes.
*The authors would like to thank Alissa Goodman for her comments and support and the Department for Education and Skills and HM Treasury which funded this research. The usual disclaimer applies.
JEL classification numbers: O15, I12.
18 Fiscal Studies
© 2006 The Authors Journal compilation © Institute for Fiscal Studies, 2006
I. Introduction
There is a growing literature on the sources of ethnic inequalities in a variety of outcomes including health, education, earnings and retirement in the UK. Most of this work, however, focuses on adult outcomes (see, for example, Nazroo (2003) and Dustmann and Fabbri (2005)).1 This is in no small part due to data availability. In this paper, we use the new Millennium Cohort Study (MCS) to look at ethnic differences in outcomes of children at birth. This paper is the first part of a wider research agenda that will document sources of ethnic inequalities in early childhood outcomes using the MCS.2
There is also an increasing body of research that shows that increased birthweight and length of gestation are positively associated with cognitive and health outcomes later in life, independent of other socio-economic factors (see, for example, Behrman and Rosenzweig (2004), Richards et al. (2002), Record, McKeown and Edwards (1969), Almond, Chay and Lee (2005) or the survey by Pojda and Kelley (2000) on the determinants and effects of low birthweight). This begs the question, ‘What factors are associated with differences in duration of gestation and birthweight and do these vary by ethnicity?’. There is epidemiological evidence that length of gestation and birthweight vary by ethnicity. This appears to hold even after differences in socio-economic factors have been controlled for, and a recent paper presents evidence that this may be in part due to earlier maturation of Black and Asian foetuses (Patel et al., 2004). Despite this evidence, a recent survey article by Savitz (2004) argues that these studies fall far short of showing that these differences are purely genetic and also argues that the ‘possibility of a modifiable social or behavioural explanation for these patterns remains highly plausible, but largely untested’. In this paper, we hope to look at this issue in regard to gestational age at birth and birthweight to see what may be driving ethnic differences in birth outcomes.
We will focus on length of gestation in days and birthweight and look at whether these birth outcomes vary by ethnicity in the MCS sample and how much of any variation is due to differences in background characteristics and maternal behaviour before and during pregnancy. Clearly, an important determinant of birthweight will be length of gestation, and another interesting question is to determine whether there are factors that impact on both gestation and birthweight (controlling for gestation), or only on
1See as well Prime Minister’s Strategy Unit (2003). 2In earlier work, we also looked at sources of ethnic inequality in child outcomes at 9 months. It turns
out that two of the most important determinants of all parent-assessed outcomes at 9 months are gestational age at delivery and birthweight. Because of this, we thought that it was important to document in detail ethnic differences in these two outcomes as a starting point for our research in this area.
Ethnic differences in birth outcomes in England 19
© 2006 The Authors
Journal compilation © Institute for Fiscal Studies, 2006
gestation, or only on birthweight, and the importance of this for different ethnic groups.
To study the determinants of length of gestation and birthweight, we will mostly use simple linear models assuming that background factors operate in the same way across the distribution of outcomes. However, this might be an oversimplifying assumption. Moreover, we cannot exclude that crossing the low-birthweight and preterm thresholds matters more than birthweight and length of gestation for subsequent development. In particular, a large part of the epidemiological literature has focused on the associations between low birthweight and adult health, with possible effects through adult health on adult productivity (see, for example, Barker (1992 and 1998)), or on the consequences of being born preterm for later development outcomes. For all these reasons, we will also check the robustness of our results by studying the determinants of having low-weight and preterm babies and by measuring the ethnic gaps in birth outcomes using different methods, including non-parametric ones.
This paper studies differences in birth outcomes across ethnic groups as a starting point for future research that will look at the impact of background factors, including birthweight and duration of gestation, on cognitive and health outcomes at 9 months, 3 years and beyond. The paper is largely descriptive and describes raw differences in these birth outcomes and then differences after background characteristics have been controlled for. It shows which background characteristics are important in explaining birth outcomes and how these characteristics vary by ethnic group. The paper concentrates on the following characteristics:
• maternal behaviour before the birth, such as smoking behaviour, drinking behaviour, pre-pregnancy body mass index (BMI)3 and weight, attending antenatal classes and job attendance during pregnancy;
• family composition and status variables, such as number of previous children, single-parent status and age of having child;
• longer-term socio-economic background factors, measured by parents’ qualifications, income and work patterns;4
• other characteristics of parents, such as parental height, mother’s long-term health condition and whether they have twins or triplets.
The first set of characteristics, which we have described as ‘maternal behaviour’, are factors that potentially could be influenced by better
3The body mass index is measured as weight in kilograms divided by squared height in metres. It is
used in this paper to classify people as underweight (BMI less than 18.5), normal (BMI in the range 18.5 to 24.9), overweight (BMI in the range 25 to 29.9) and obese (BMI 30 and above).
4Our income data relate to family income when the child is 9 months old – not during pregnancy.
20 Fiscal Studies
© 2006 The Authors Journal compilation © Institute for Fiscal Studies, 2006
information and resources before and during pregnancy. The second set of characteristics, termed ‘family characteristics’, cannot be altered easily by policy, but again parents’ fertility decisions may be influenced by understanding what effect the size of family, timing of pregnancy and family circumstances may have on their child’s early outcomes. The third set of characteristics we have labelled ‘socio-economic background factors’ and in this paper we proxy these using parental qualifications, income and labour market status. Whilst socio-economic status can be influenced by policy in the longer term, it is much more difficult to change it in the short term. The last set of characteristics is a group of factors that will be important determinants of birth outcomes but over which policymakers can have little influence, such as being a twin or triplet, parents’ heights and the long-term health condition of the mother.5
What it is important to understand is that all of these potential explanatory factors tend to vary by ethnicity, and it is important to see how much differences in ethnic outcomes are reduced or increased once these factors are controlled for. This is what the paper attempts to do. Moreover, we cannot assume that these factors affect birth outcomes in a similar way across ethnic groups. Understanding these relationships may help inform policymakers about the best forms of interventions for different ethnic groups in improving birth outcomes that are known to have a crucial role in determining later health and cognitive outcomes. In Section II, we describe the data we use in the analysis and look at how our background characteristics vary by ethnicity. Section III presents our results that look at sources of ethnic inequality in outcomes at birth. In Section IV, we check the robustness of our results by measuring the ethnic gaps in birth outcomes using different methods. Our conclusions in Section V emphasise the policy implications of our findings and outline the topics that need to be considered in future research.
II. The MCS data, ethnicity and child outcomes
1. The Millennium Cohort Study
In this paper, we use the first sweep of the Millennium Cohort Study, a survey of the parents of almost 19,000 children born in the UK in 2000–01. The survey was carried out when the babies were around 9 months old and collected retrospective information on the pregnancy, birth and first 9 months of the child’s life.
5Of course, this is not quite true in the case of being a twin or triplet as a consequence of fertility
treatment. For instance, policymakers have placed restrictions on the number of embryos that may be implanted when having IVF treatment.
Ethnic differences in birth outcomes in England 21
© 2006 The Authors
Journal compilation © Institute for Fiscal Studies, 2006
One of the huge advantages of the MCS compared with earlier birth cohort studies is that it has a large sample of non-White babies, particularly in England where just over 26 per cent of the babies in the sample are non-White. There has, however, been deliberate oversampling of ethnic minority and other disadvantaged groups, which represent just over 14 per cent of non-White babies born in England at the time of the first sweep of the MCS.6 Because most of the ethnic oversampling is concentrated in England, this paper only considers outcomes for children who were living in England at age 9 months.
2. Ethnic groups
We define four different ethnic groups.7 Whilst a more detailed ethnic breakdown is available from the survey, the methodology we employ requires us to have quite large sample sizes. The groups we define are
• White; • Black including Black Caribbean and Black African; • Asian including Indian, Pakistani and Bangladeshi; • Other including Mixed ethnic origin.
3. Length of gestation and birthweight
We consider four child outcomes at birth – length of gestation in days, birthweight, low birthweight and being preterm. The MCS provides data on birthweight in kilograms and a derived measure of gestation in days8 and it adopts the World Health Organisation (WHO) definitions of low birthweight (below 2,500 grams) and preterm birth (less than 259 days or 37 completed weeks of gestation).9 We also tested the robustness of our results by adopting different categories, such as very low-weight babies (defined by the WHO as below 1,500 grams) or very preterm babies (less than 32 weeks of gestation). Our main results did not change.
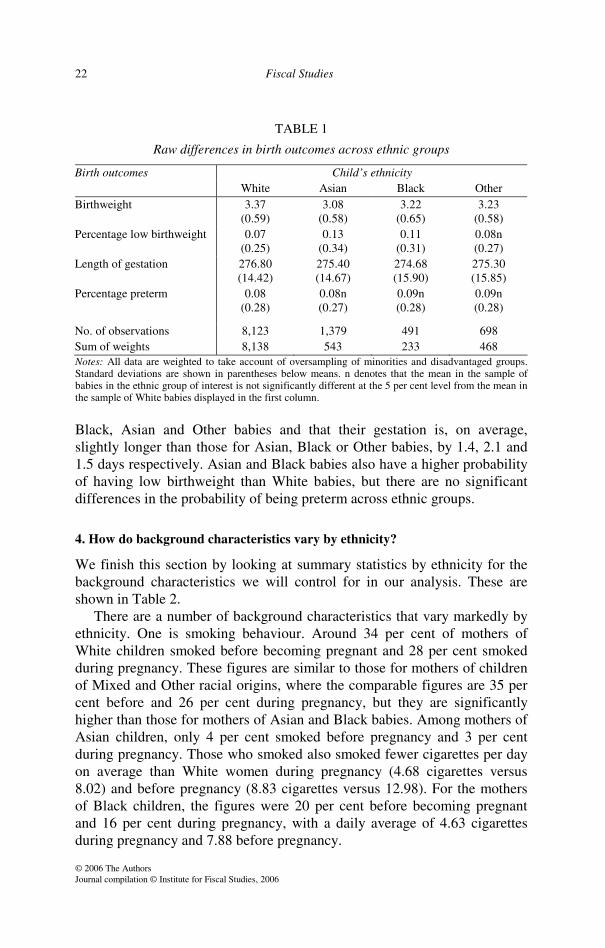
The raw average differences in the outcomes at birth across ethnic groups presented in Table 1 show that White babies are, on average, bigger than
6In all work presented below, we reweight the data to take account of this oversampling. 7The MCS defines eight main ethnic groups: White, Mixed, Indian, Pakistani, Bangladeshi, Black
Caribbean, Black African and Other. 8In the near future, we will be able to check the accuracy of self-reported gestation length and
birthweight by using birth register and/or hospital maternity data that also have information on expected date of delivery and birthweight which will be linked to the MCS with the consent of mothers at the first interview.
9The definitions adopted by the Health Assembly appear in volume 1, pages 1233–8 of International Classification of Diseases, Revision 10.
22 Fiscal Studies
© 2006 The Authors Journal compilation © Institute for Fiscal Studies, 2006
TABLE 1
Raw differences in birth outcomes across ethnic groups
Birth outcomes Child’s ethnicity White Asian Black Other Birthweight 3.37
(0.59) 3.08
(0.58) 3.22
(0.65) 3.23
(0.58) Percentage low birthweight 0.07
(0.25) 0.13
(0.34) 0.11
(0.31) 0.08n (0.27)
Length of gestation 276.80 (14.42)
275.40 (14.67)
274.68 (15.90)
275.30 (15.85)
Percentage preterm 0.08 (0.28)
0.08n (0.27)
0.09n (0.28)
0.09n (0.28)
No. of observations 8,123 1,379 491 698 Sum of weights 8,138 543 233 468 Notes: All data are weighted to take account of oversampling of minorities and disadvantaged groups. Standard deviations are shown in parentheses below means. n denotes that the mean in the sample of babies in the ethnic group of interest is not significantly different at the 5 per cent level from the mean in the sample of White babies displayed in the first column.
Black, Asian and Other babies and that their gestation is, on average, slightly longer than those for Asian, Black or Other babies, by 1.4, 2.1 and 1.5 days respectively. Asian and Black babies also have a higher probability of having low birthweight than White babies, but there are no significant differences in the probability of being preterm across ethnic groups.
4. How do background characteristics vary by ethnicity?
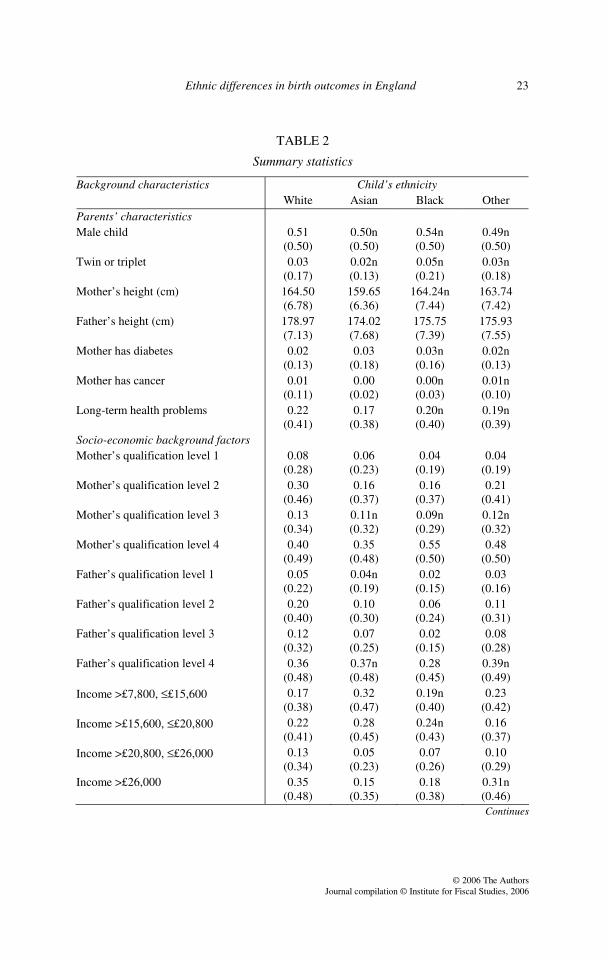
We finish this section by looking at summary statistics by ethnicity for the background characteristics we will control for in our analysis. These are shown in Table 2.
There are a number of background characteristics that vary markedly by ethnicity. One is smoking behaviour. Around 34 per cent of mothers of White children smoked before becoming pregnant and 28 per cent smoked during pregnancy. These figures are similar to those for mothers of children of Mixed and Other racial origins, where the comparable figures are 35 per cent before and 26 per cent during pregnancy, but they are significantly higher than those for mothers of Asian and Black babies. Among mothers of Asian children, only 4 per cent smoked before pregnancy and 3 per cent during pregnancy. Those who smoked also smoked fewer cigarettes per day on average than White women during pregnancy (4.68 cigarettes versus 8.02) and before pregnancy (8.83 cigarettes versus 12.98). For the mothers of Black children, the figures were 20 per cent before becoming pregnant and 16 per cent during pregnancy, with a daily average of 4.63 cigarettes during pregnancy and 7.88 before pregnancy.
Ethnic differences in birth outcomes in England 23
© 2006 The Authors
Journal compilation © Institute for Fiscal Studies, 2006
TABLE 2
Summary statistics
Background characteristics Child’s ethnicity White Asian Black Other Parents’ characteristics Male child 0.51
(0.50) 0.50n (0.50)
0.54n (0.50)
0.49n (0.50)
Twin or triplet 0.03 (0.17)
0.02n (0.13)
0.05n (0.21)
0.03n (0.18)
Mother’s height (cm) 164.50 (6.78)
159.65 (6.36)
164.24n (7.44)
163.74 (7.42)
Father’s height (cm) 178.97 (7.13)
174.02 (7.68)
175.75 (7.39)
175.93 (7.55)
Mother has diabetes 0.02 (0.13)
0.03 (0.18)
0.03n (0.16)
0.02n (0.13)
Mother has cancer 0.01 (0.11)
0.00 (0.02)
0.00n (0.03)
0.01n (0.10)
Long-term health problems 0.22 (0.41)
0.17 (0.38)
0.20n (0.40)
0.19n (0.39)
Socio-economic background factors Mother’s qualification level 1 0.08
(0.28) 0.06
(0.23) 0.04
(0.19) 0.04
(0.19) Mother’s qualification level 2 0.30
(0.46) 0.16
(0.37) 0.16
(0.37) 0.21
(0.41) Mother’s qualification level 3 0.13
(0.34) 0.11n (0.32)
0.09n (0.29)
0.12n (0.32)
Mother’s qualification level 4 0.40 (0.49)
0.35 (0.48)
0.55 (0.50)
0.48 (0.50)
Father’s qualification level 1 0.05 (0.22)
0.04n (0.19)
0.02 (0.15)
0.03 (0.16)
Father’s qualification level 2 0.20 (0.40)
0.10 (0.30)
0.06 (0.24)
0.11 (0.31)
Father’s qualification level 3 0.12 (0.32)
0.07 (0.25)
0.02 (0.15)
0.08 (0.28)
Father’s qualification level 4 0.36 (0.48)
0.37n (0.48)
0.28 (0.45)
0.39n (0.49)
Income >£7,800, ££15,600 0.17 (0.38)
0.32 (0.47)
0.19n (0.40)
0.23 (0.42)
Income >£15,600, ££20,800 0.22 (0.41)
0.28 (0.45)
0.24n (0.43)
0.16 (0.37)
Income >£20,800, ££26,000 0.13 (0.34)
0.05 (0.23)
0.07 (0.26)
0.10 (0.29)
Income >£26,000 0.35 (0.48)
0.15 (0.35)
0.18 (0.38)
0.31n (0.46) Continues
24 Fiscal Studies
© 2006 The Authors Journal compilation © Institute for Fiscal Studies, 2006
TABLE 2 continued
Background characteristics Child’s ethnicity White Asian Black Other Family characteristics Age of mother at birth 29.11
(5.76) 27.25 (5.22)
30.42 (6.11)
29.25n (5.95)
Number of older children 0.83 (0.95)
1.22 (1.25)
1.09 (1.11)
0.85n (1.02)
Lone parent 0.13 (0.34)
0.06 (0.24)
0.47 (0.50)
0.26 (0.44)
Maternal behaviour Smoked before pregnancy 0.34
(0.48) 0.04
(0.20) 0.20
(0.40) 0.35n (0.48)
No. of cigarettes per day before pregnancy (conditional on smoking)
12.98 (7.70)
8.83 (7.91)
7.88 (6.63)
10.44n (7.50)
Smoked during pregnancy 0.28 (0.45)
0.03 (0.18)
0.16 (0.04)
0.26n (0.44)
No. of cigarettes per day during pregnancy (conditional on smoking)
8.02 (7.03)
4.68 (4.33)
4.63 (5.57)
6.79n (7.19)
Drank alcohol during pregnancy 0.37 (0.48)
0.02 (0.16)
0.20 (0.40)
0.29 (0.46)
Weekly units of alcohol 0.59 (2.01)
0.02 (0.20)
0.17 (0.89)
0.42n (1.59)
Weight before pregnancy 64.26 (12.63)
58.38 (11.23)
67.62 (14.03)
62.24 (12.59)
BMI – underweight 0.05 (0.21)
0.11 (0.31)
0.05n (0.21)
0.09 (0.29)
BMI – overweight 0.19 (0.39)
0.19n (0.39)
0.27 (0.44)
0.20n (0.40)
BMI – obese 0.09 (0.29)
0.07n (0.26)
0.15 (0.36)
0.07n (0.26)
Worked during pregnancy 0.72 (0.45)
0.33 (0.47)
0.66n (0.47)
0.58 (0.49)
Mother has ever worked 0.96 (0.18)
0.65 (0.48)
0.84 (0.37)
0.87 (0.34)
Attended antenatal classes 0.40 (0.49)
0.22 (0.41)
0.30 (0.46)
0.33 (0.47)
Dummy for non-answer to question on antenatal class attendance
0.02 (0.14)
0.08 (0.28)
0.04n (0.19)
0.05 (0.21)
Week of first antenatal visit 11.24 (3.68)
11.19n (4.02)
12.30 (4.71)
11.95 (4.27)
No. of observations 8,123 1,379 491 698 Sum of weights 8,138 543 233 468 Notes: All data are weighted to take account of oversampling of minorities and disadvantaged groups. Standard deviations are shown in parentheses. All variables show means for non-missing data. n denotes that the mean in the sample of babies in the ethnic group of interest is not significantly different at the 5 per cent level from the mean in the sample of White babies displayed in the first column.
Ethnic differences in birth outcomes in England 25
© 2006 The Authors
Journal compilation © Institute for Fiscal Studies, 2006
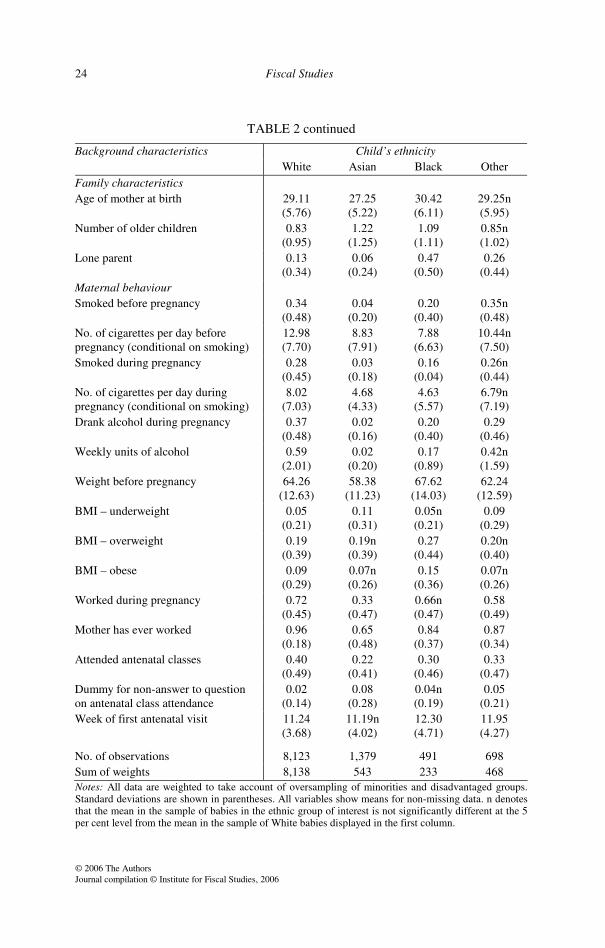
Another big ethnic difference in mothers’ behaviour concerns drinking during pregnancy: 37 per cent of mothers of White children drank alcohol during their pregnancy, compared with only 2 per cent of mothers of Asian children, 20 per cent of mothers of Black children and 29 per cent of mothers of children from Other ethnic origin.
Moreover, women from different ethnic groups differ in their work participation during pregnancy:10 72 per cent of mothers of White children work during pregnancy, which is not significantly different from the incidence of work among mothers of Black children (66 per cent) but is higher than for women with children of other backgrounds; the figures are 58 per cent for Other ethnic background and only 33 per cent for Asian. These differences partly reflect more fundamental differences in work participation across ethnic groups, as 96 per cent of mothers of White children have worked at some time in their life compared with 65 per cent of those with Asian children, 84 per cent of those with Black children and 87 per cent of those with children of Other ethnic background.
The physical characteristics of the parents of children from different ethnic backgrounds also differ. In our paper, we control for parents’ heights, mother’s weight, mother’s health and a categorical measure of the mother’s pre-pregnancy body mass index where the base group is those with normal BMI.11 We see from Table 2 that mothers of Asian children are, on average, around 4 centimetres shorter than mothers of children of Other ethnic background and 5 centimetres shorter than mothers of White or Black children. Fathers of White children are, on average, at least 3 centimetres taller than fathers of children of other racial origins. The table also shows that mothers of Black children have a higher average weight and much more dispersion around this mean (as indicated by the standard deviation) than mothers of children from other ethnic groups. The mothers of Asian children have the lowest average weight before pregnancy and the lowest dispersion. We can also see that 11 per cent of the mothers of Asian children and 9 per cent of mothers of children of Mixed or Other racial origin are underweight for their height, compared with 5 per cent of mothers of White or Black children. On the other side, 42 per cent of mothers of Black children are either overweight or obese compared with around 26–28 per cent of mothers of children from other ethnic backgrounds. Moreover, mothers of White babies are significantly more likely to have cancer and long-term health
10The working status of the mother is represented by two dummy variables, one indicating whether or
not the mother worked during pregnancy and the other indicating whether or not the mother has ever worked (either at the time of the survey – when the child is 9 months old – or in the past).
11Mothers with a normal BMI are taken to be those women whose pre-pregnancy BMI fell in the range 18.5 to 24.9; see footnote 3.
26 Fiscal Studies
© 2006 The Authors Journal compilation © Institute for Fiscal Studies, 2006
problems than mothers of Asian babies, who are significantly more affected by diabetes.
There is very little difference in when women of children from different racial origins make their first antenatal visit. There is, however, a big difference across ethnicities in attendance at antenatal classes, with 40 per cent of mothers of White children attending compared with 22 per cent of mothers of Asian children, 30 per cent of mothers of Black children and 33 per cent of mothers of children of Mixed or Other ethnic origins. These differences are quite large and could point to an important factor that might affect birth outcomes. The variable, however, is highly endogenous to birth outcomes as, by definition, the mothers of children born prematurely are much less likely to be able to attend antenatal classes. We therefore reluctantly exclude this variable in most of our analysis but we will consider it for the sample of children who were not premature (i.e. not born before 37 weeks’ gestation) to look at the potential influence of attendance at antenatal classes.
The average age of mothers at birth varies across ethnic groups, ranging from 27.25 years for mothers of Asian children to 30.42 years for mothers of Black children. The average size of the family also varies significantly across ethnic groups, with the mothers of Asian children having an average of 1.22 older children compared with 1.09 for mothers of Black children, 0.83 for mothers of White children and 0.85 for mothers of children from Mixed or Other ethnic backgrounds. The proportion of lone parents varies markedly for different ethnic groups too, with 47 per cent of mothers of Black children, 26 per cent of mothers of children from Mixed or Other ethnic backgrounds, 13 per cent of mothers of White children and 6 per cent of mothers of Asian children being lone parents.
The qualifications and income of parents also vary markedly across ethnic groups;12 the relative social disadvantage of ethnic minorities in these respects has already been well documented. Parents of White children are, on average, better educated and have higher income than other parents, and the parents of Asian children are, on average, the least well off and worst educated in our data.
Finally, we control for the gender of the baby and for being a twin or triplet; being a twin or triplet is slightly more common among Black children and less common among Asian children in our sample, but the differences are not significant.
12The qualification/education levels of the parents are represented by dummy variables: ‘level 1’
indicates ‘GCSEs D–G’ or ‘nvq/svq/gsvq level 1’; ‘level 2’ indicates ‘GCSEs A–C’, ‘nvq/svq/gsvq level 2’ or ‘trade apprenticeships’; ‘level 3’ indicates ‘A/AS/S levels’ or ‘nvq/svq/gsvq level 3’; ‘level 4’ indicates ‘HE diploma’, ‘first degree’, ‘higher degree’, ‘other academic qualification’, ‘nursing/other medical’, ‘prof at degree 1’ or ‘other vocational qualification’; and ‘level 0’ indicates ‘none of these’.
Ethnic differences in birth outcomes in England 27
© 2006 The Authors
Journal compilation © Institute for Fiscal Studies, 2006
III. How much of the difference in birth outcomes between ethnic groups is explained by ethnicity and how much by other background characteristics?
There is quite a large literature looking at the determinants of birthweight and the impact of factors such as smoking during pregnancy.13 There is less of a literature on the determinants of length of gestation and, given the clear link between gestation and birthweight, we feel it is important from a policy perspective to try to disentangle the impact of background factors on both these outcomes at birth. Therefore we estimate the determinants of length of gestation and birthweight separately. When looking at the determinants of birthweight, we first consider a model where we ignore length of gestation. We then move on to consider whether there are factors that explain differences in birthweight given the length of gestation. We believe that both questions are of policy interest.
1. Methodological approach
In our analysis, we begin by showing the distribution of outcomes across ethnic groups. We then use simple regression models to show the raw differences in birth outcomes across ethnic groups (specification 1), the differences when we control for height of both parents, mother’s health and being a twin or triplet (specification 2), the differences when we also control for socio-economic background factors (specification 3) and finally the differences when we control for factors that depend on maternal behaviour before and during the pregnancy (specifications 4 and 5). We also checked the robustness of our results by including a rich set of local area characteristics, including population size, proportion of lone parents and proportions of employed males and females (all from Census data) as well as several indices to measure deprivation in the local area (from the Office of the Deputy Prime Minister’s Index of Deprivation Measures).14 We will not, however, present the effects associated with these variables because studying neighbourhood effects is beyond the scope of this paper, but we did check that our results remained unchanged when these additional control variables were included.
Of course, one problem with all our models is that there are likely to be unobservable characteristics of the mother that determine both our outcome variables and some of our controls – that is, a number of our explanatory variables are potentially endogenous. This endogeneity could bias our
13See, for example, Goldstein (1977). 14These characteristics are matched to the MCS data at the ‘super output area’ level using families’
postcodes.
28 Fiscal Studies
© 2006 The Authors Journal compilation © Institute for Fiscal Studies, 2006
estimates of the impact of these factors. For example, in our final model, it is highly likely that there are unobserved determinants of both length of gestation and birthweight that will potentially bias our estimates of the impact of gestation length on birthweight. However, the rich set of variables we use to control for family and area background as well as for the behaviour of the parents before and during pregnancy gives us some hope of overcoming a large part of these problems. Moreover, in order to test the robustness of our results, we keep the results from regressions using potential endogenous variables among the regressors (as in specifications 4 and 5) separate from those using a restricted number of controls that are a priori clearly exogenous to birth outcomes. The results and their limitations are discussed further in Section V.
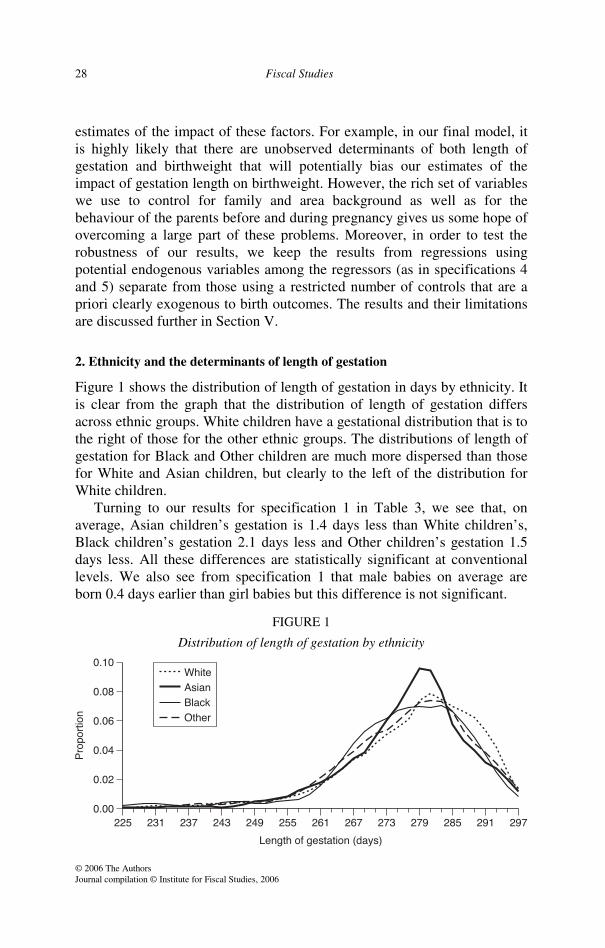
2. Ethnicity and the determinants of length of gestation
Figure 1 shows the distribution of length of gestation in days by ethnicity. It is clear from the graph that the distribution of length of gestation differs across ethnic groups. White children have a gestational distribution that is to the right of those for the other ethnic groups. The distributions of length of gestation for Black and Other children are much more dispersed than those for White and Asian children, but clearly to the left of the distribution for White children.
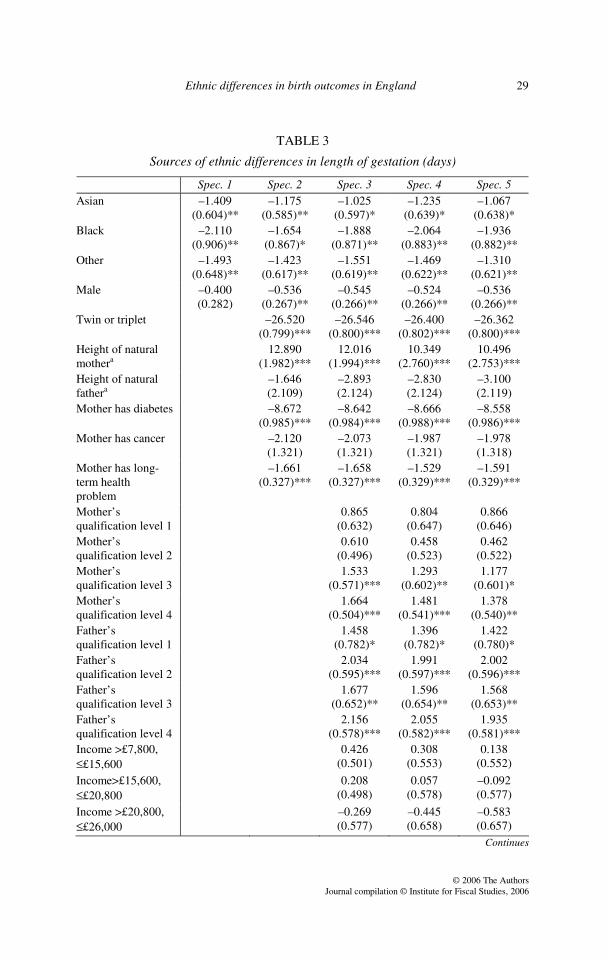
Turning to our results for specification 1 in Table 3, we see that, on average, Asian children’s gestation is 1.4 days less than White children’s, Black children’s gestation 2.1 days less and Other children’s gestation 1.5 days less. All these differences are statistically significant at conventional levels. We also see from specification 1 that male babies on average are born 0.4 days earlier than girl babies but this difference is not significant.
FIGURE 1
Distribution of length of gestation by ethnicity
Ethnic differences in birth outcomes in England 29
© 2006 The Authors
Journal compilation © Institute for Fiscal Studies, 2006
TABLE 3
Sources of ethnic differences in length of gestation (days)
Spec. 1 Spec. 2 Spec. 3 Spec. 4 Spec. 5 Asian –1.409
(0.604)** –1.175
(0.585)** –1.025
(0.597)* –1.235
(0.639)* –1.067
(0.638)* Black –2.110
(0.906)** –1.654
(0.867)* –1.888
(0.871)** –2.064
(0.883)** –1.936
(0.882)** Other –1.493
(0.648)** –1.423
(0.617)** –1.551
(0.619)** –1.469
(0.622)** –1.310
(0.621)** Male –0.400
(0.282) –0.536
(0.267)** –0.545
(0.266)** –0.524
(0.266)** –0.536
(0.266)** Twin or triplet –26.520
(0.799)*** –26.546
(0.800)*** –26.400
(0.802)*** –26.362
(0.800)*** Height of natural mothera
12.890 (1.982)***
12.016 (1.994)***
10.349 (2.760)***
10.496 (2.753)***
Height of natural fathera
–1.646 (2.109)
–2.893 (2.124)
–2.830 (2.124)
–3.100 (2.119)
Mother has diabetes –8.672 (0.985)***
–8.642 (0.984)***
–8.666 (0.988)***
–8.558 (0.986)***
Mother has cancer –2.120 (1.321)
–2.073 (1.321)
–1.987 (1.321)
–1.978 (1.318)
Mother has long-term health problem
–1.661 (0.327)***
–1.658 (0.327)***
–1.529 (0.329)***
–1.591 (0.329)***
Mother’s qualification level 1
0.865 (0.632)
0.804 (0.647)
0.866 (0.646)
Mother’s qualification level 2
0.610 (0.496)
0.458 (0.523)
0.462 (0.522)
Mother’s qualification level 3
1.533 (0.571)***
1.293 (0.602)**
1.177 (0.601)*
Mother’s qualification level 4
1.664 (0.504)***
1.481 (0.541)***
1.378 (0.540)**
Father’s qualification level 1
1.458 (0.782)*
1.396 (0.782)*
1.422 (0.780)*
Father’s qualification level 2
2.034 (0.595)***
1.991 (0.597)***
2.002 (0.596)***
Father’s qualification level 3
1.677 (0.652)**
1.596 (0.654)**
1.568 (0.653)**
Father’s qualification level 4
2.156 (0.578)***
2.055 (0.582)***
1.935 (0.581)***
Income >£7,800, ££15,600
0.426 (0.501)
0.308 (0.553)
0.138 (0.552)
Income>£15,600, ££20,800
0.208 (0.498)
0.057 (0.578)
–0.092 (0.577)
Income >£20,800, ££26,000
–0.269 (0.577)
–0.445 (0.658)
–0.583 (0.657)
Continues
30 Fiscal Studies
© 2006 The Authors Journal compilation © Institute for Fiscal Studies, 2006
TABLE 3 continued
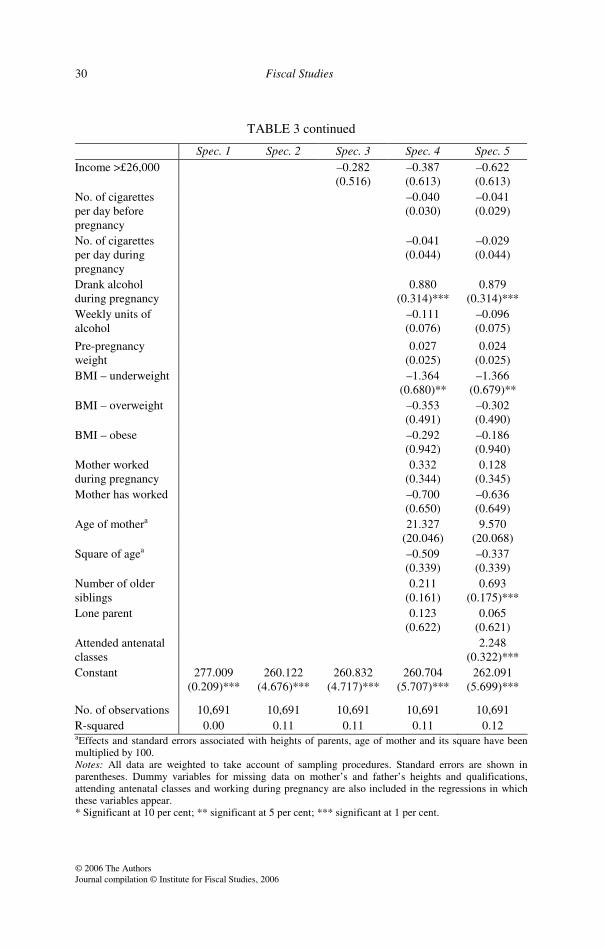
Spec. 1 Spec. 2 Spec. 3 Spec. 4 Spec. 5 Income >£26,000 –0.282
(0.516) –0.387 (0.613)
–0.622 (0.613)
No. of cigarettes per day before pregnancy
–0.040 (0.030)
–0.041 (0.029)
No. of cigarettes per day during pregnancy
–0.041 (0.044)
–0.029 (0.044)
Drank alcohol during pregnancy
0.880 (0.314)***
0.879 (0.314)***
Weekly units of alcohol
–0.111 (0.076)
–0.096 (0.075)
Pre-pregnancy weight
0.027 (0.025)
0.024 (0.025)
BMI – underweight –1.364 (0.680)**
–1.366 (0.679)**
BMI – overweight –0.353 (0.491)
–0.302 (0.490)
BMI – obese –0.292 (0.942)
–0.186 (0.940)
Mother worked during pregnancy
0.332 (0.344)
0.128 (0.345)
Mother has worked –0.700 (0.650)
–0.636 (0.649)
Age of mothera 21.327 (20.046)
9.570 (20.068)
Square of agea –0.509 (0.339)
–0.337 (0.339)
Number of older siblings
0.211 (0.161)
0.693 (0.175)***
Lone parent 0.123 (0.622)
0.065 (0.621)
Attended antenatal classes
2.248 (0.322)***
Constant 277.009 (0.209)***
260.122 (4.676)***
260.832 (4.717)***
260.704 (5.707)***
262.091 (5.699)***
No. of observations 10,691 10,691 10,691 10,691 10,691 R-squared 0.00 0.11 0.11 0.11 0.12 aEffects and standard errors associated with heights of parents, age of mother and its square have been multiplied by 100. Notes: All data are weighted to take account of sampling procedures. Standard errors are shown in parentheses. Dummy variables for missing data on mother’s and father’s heights and qualifications, attending antenatal classes and working during pregnancy are also included in the regressions in which these variables appear. * Significant at 10 per cent; ** significant at 5 per cent; *** significant at 1 per cent.
Ethnic differences in birth outcomes in England 31
© 2006 The Authors
Journal compilation © Institute for Fiscal Studies, 2006
These raw ethnic differences are reduced once we control for parental height, being a twin or triplet and mother’s long-term health condition (specification 2). Mother’s height (but not father’s) has a significant impact on length of gestation, with each additional centimetre increasing gestation by 0.13 days. The difference in the average height of the mothers of White and of Asian children (around 5 centimetres) explains half of the observed difference in gestation length between White and Asian babies (1.4 days). Poor long-term health of the mother, such as having diabetes, has a strong effect, reducing gestation by 8.7 days.
When we control for socio-economic factors, in specification 3, the differences are further reduced for Asian babies but not for Black babies. Mother’s and father’s qualifications are also important, but income is not.15
Moving to specification 4, interestingly smoking behaviour before and during pregnancy appears not to affect length of gestation.16 However, we have to be very careful when interpreting this result, as we are not sure about the quality of reporting on smoking behaviour. Note, though, that under-reporting problems, which are likely to be more important concerning smoking during pregnancy, would tend to overestimate the magnitude of these effects. This suggests that the well-documented detrimental effect of smoking on birthweight operates independently of gestation length. We will look at this issue in more detail in the next subsection.
Women who drink during pregnancy have a gestation that is, on average, almost a day longer. As we saw in Section II, the largest groups doing this are mothers of White and Other children. Pre-pregnancy weight has no effect on length of gestation, but being underweight for your height reduces gestation by 1.4 days. As we saw from Table 2, around 10 per cent of mothers of Asian and Other children were underweight before becoming pregnant. Moreover, twins and triplets have significantly shorter gestations, by, on average, 26 days, whereas mother’s age and lone-parent status have no impact on gestational outcomes.
Importantly, we test for whether working during pregnancy has any impact on length of gestation, conditional on whether the mother has ever worked. The two dummy variables capturing work status of the mother before and during pregnancy turn out to be not significant.
As shown by specification 5, attending antenatal classes increases gestation by 2.2 days, which is a large impact. We included a dummy variable to control for the fact that many women did not respond to this
15It must be remembered that our income measure is family income when the child was 9 months old.
The results do not change significantly if we exclude income from our analysis. 16In our original specification, we controlled for incidence of smoking before and during pregnancy
and for number of cigarettes. The incidence measures were always insignificant when both measures were included; for this reason, we only include number of cigarettes rather than incidence.
32 Fiscal Studies
© 2006 The Authors Journal compilation © Institute for Fiscal Studies, 2006
question. As we were worried about possible endogeneity problems, we also looked at the impact of attendance at antenatal classes on babies who made it to 37 weeks’ gestation and whose births therefore would not have precluded their mothers from attending such classes, which tend to start between 28 and 34 weeks’ gestation. We found that attending an antenatal class still increased gestation for this group of full-term babies by 1.2 days and this effect was significant at the 1 per cent level. We also took the sample of first-born babies, as mothers are less likely to attend antenatal classes for second births. For this smaller sample, we found a larger effect of attending antenatal classes, increasing gestation by 4.6 days. Finally, we checked that the timing of a woman’s first antenatal visit does not have any significant impact on length of gestation, which motivated why we do not control for this in our final specifications.
In Table 2, we saw that there were big differences across ethnic groups in attendance at antenatal classes, and now we see that this may be a potential policy focus to increase length of gestation for ethnic minority groups.
We also studied the determinants of the probability of giving birth to preterm babies, as it may be that it is crossing the preterm threshold rather than length of gestation that matters for children’s subsequent development. Our results showed that there are no significant differences across ethnic groups in the incidence of preterm babies, either before or after controlling for other characteristics, and that other determinants are very similar to the ones discussed above for the length of gestation.17
3. Ethnicity and the determinants of birthweight
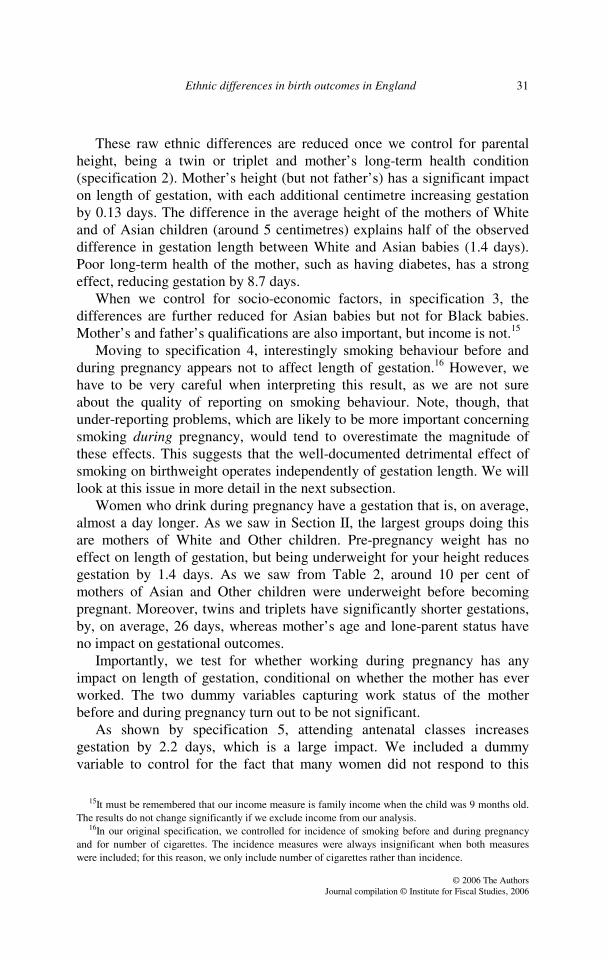
Figure 2 shows the distribution of birthweights by ethnicity of the child. We see that the distribution of birthweights for White babies is to the right, and the distribution for Asian babies is to the left, of those for all other ethnic groups. The distributions for Black and Other children are virtually on top of each other, but there is much wider dispersion in the Black birthweight distribution – similar to what we saw for length of gestation.
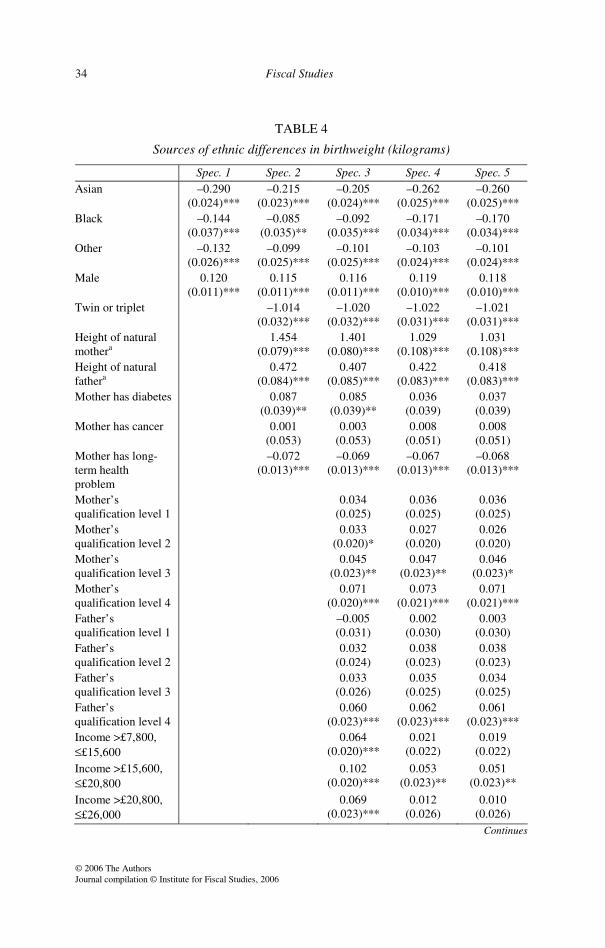
Turning to Table 4, we see from specification 1 that, compared with White babies, Asian babies are on average around 290 grams lighter, Black babies around 144 grams lighter and Other babies around 132 grams lighter. Male babies are around 120 grams heavier than female babies. Once we control for parents’ heights, mother’s health condition, being a twin or triplet and parents’ qualifications and income (as in specifications 2 and 3), the gap becomes significantly narrower for Asian babies.
17Therefore we do not tabulate these results.
Ethnic differences in birth outcomes in England 33
© 2006 The Authors
Journal compilation © Institute for Fiscal Studies, 2006
FIGURE 2
Distribution of birthweight by ethnicity
So what are the important determinants of birthweight ignoring length of
gestation? We see from Table 4 that mother’s and father’s heights are important determinants of birthweight, whereas only mother’s height was important for length of gestation. We also find that mothers with diabetes have bigger children. However, this may indicate worse health conditions of these babies through transmission of the mother’s diabetes. Other long-term health problems of mothers have a negative impact on birthweight.
Parents’ qualifications are important, as they were with length of gestation, but now income also plays an important role that was not observed with length of gestation.
Both smoking during and smoking before pregnancy have significant and negative effects on the child’s birthweight. In our sample, 82 per cent of women who smoked before becoming pregnant also smoked during pregnancy. The average number of cigarettes smoked per day by those women who smoked before pregnancy was 12.5 whereas the average for those who smoked during pregnancy was 7.7. This means that a woman who smoked these amounts before and during pregnancy would have a baby that was on average around 144 grams lighter and that the impact on birthweight of the smoking before pregnancy would be similar to the impact of the smoking during pregnancy. However, we have to mention again that women might be more likely to admit to smoking before pregnancy than to smoking during pregnancy, so what we are picking up about smoking before pregnancy might be part of the effect of smoking during pregnancy.
34 Fiscal Studies
© 2006 The Authors Journal compilation © Institute for Fiscal Studies, 2006
TABLE 4
Sources of ethnic differences in birthweight (kilograms)
Spec. 1 Spec. 2 Spec. 3 Spec. 4 Spec. 5 Asian –0.290
(0.024)*** –0.215
(0.023)*** –0.205
(0.024)*** –0.262
(0.025)*** –0.260
(0.025)*** Black –0.144
(0.037)*** –0.085
(0.035)** –0.092
(0.035)*** –0.171
(0.034)*** –0.170
(0.034)*** Other –0.132
(0.026)*** –0.099
(0.025)*** –0.101
(0.025)*** –0.103
(0.024)*** –0.101
(0.024)*** Male 0.120
(0.011)*** 0.115
(0.011)*** 0.116
(0.011)*** 0.119
(0.010)*** 0.118
(0.010)*** Twin or triplet –1.014
(0.032)*** –1.020
(0.032)*** –1.022
(0.031)*** –1.021
(0.031)*** Height of natural mothera
1.454 (0.079)***
1.401 (0.080)***
1.029 (0.108)***
1.031 (0.108)***
Height of natural fathera
0.472 (0.084)***
0.407 (0.085)***
0.422 (0.083)***
0.418 (0.083)***
Mother has diabetes 0.087 (0.039)**
0.085 (0.039)**
0.036 (0.039)
0.037 (0.039)
Mother has cancer 0.001 (0.053)
0.003 (0.053)
0.008 (0.051)
0.008 (0.051)
Mother has long-term health problem
–0.072 (0.013)***
–0.069 (0.013)***
–0.067 (0.013)***
–0.068 (0.013)***
Mother’s qualification level 1
0.034 (0.025)
0.036 (0.025)
0.036 (0.025)
Mother’s qualification level 2
0.033 (0.020)*
0.027 (0.020)
0.026 (0.020)
Mother’s qualification level 3
0.045 (0.023)**
0.047 (0.023)**
0.046 (0.023)*
Mother’s qualification level 4
0.071 (0.020)***
0.073 (0.021)***
0.071 (0.021)***
Father’s qualification level 1
–0.005 (0.031)
0.002 (0.030)
0.003 (0.030)
Father’s qualification level 2
0.032 (0.024)
0.038 (0.023)
0.038 (0.023)
Father’s qualification level 3
0.033 (0.026)
0.035 (0.025)
0.034 (0.025)
Father’s qualification level 4
0.060 (0.023)***
0.062 (0.023)***
0.061 (0.023)***
Income >£7,800, ££15,600
0.064 (0.020)***
0.021 (0.022)
0.019 (0.022)
Income >£15,600, ££20,800
0.102 (0.020)***
0.053 (0.023)**
0.051 (0.023)**
Income >£20,800, ££26,000
0.069 (0.023)***
0.012 (0.026)
0.010 (0.026)
Continues
Ethnic differences in birth outcomes in England 35
© 2006 The Authors
Journal compilation © Institute for Fiscal Studies, 2006
Spec. 1 Spec. 2 Spec. 3 Spec. 4 Spec. 5 Income >£26,000 0.080
(0.021)*** 0.036
(0.024) 0.033
(0.024) No. of cigarettes per day before pregnancy
–0.006 (0.001)***
–0.006 (0.001)***
No. of cigarettes per day during pregnancy
–0.009 (0.002)***
–0.009 (0.002)***
Drank alcohol during pregnancy
0.017 (0.012)
0.017 (0.012)
Weekly units of alcohol
–0.006 (0.003)**
–0.006 (0.003)**
Pre-pregnancy weight
0.007 (0.001)***
0.007 (0.001)***
BMI – underweight –0.077 (0.027)***
–0.077 (0.027)***
BMI – overweight 0.000 (0.019)
0.001 (0.019)
BMI – obese –0.062 (0.037)*
–0.061 (0.037)*
Mother worked during pregnancy
–0.006 (0.013)
–0.008 (0.013)
Mother has worked –0.004 (0.025)
–0.003 (0.025)
Age of mothera –1.426 (0.781)*
–1.558 (0.784)**
Square of agea 0.016 (0.013)
0.018 (0.013)
Number of older siblings
0.075 (0.006)***
0.080 (0.007)***
Lone parent 0.014 (0.024)
0.013 (0.024)
Attended antenatal classes
0.024 (0.013)*
Constant 3.309 (0.008)***
0.138 (0.187)
0.175 (0.188)
0.630 (0.222)***
0.647 (0.223)***
No. of observations 10,691 10,691 10,691 10,691 10,691 R-squared 0.03 0.14 0.15 0.20 0.20 aEffects and standard errors associated with heights of parents, age of mother and its square have been multiplied by 100. Notes: All data are weighted to take account of sampling procedures. Standard errors are shown in parentheses. Dummy variables for missing data on mother’s and father’s heights and qualifications, attending antenatal classes and working during pregnancy are also included in the regressions in which these variables appear. * Significant at 10 per cent; ** significant at 5 per cent; *** significant at 1 per cent.
36 Fiscal Studies
© 2006 The Authors Journal compilation © Institute for Fiscal Studies, 2006
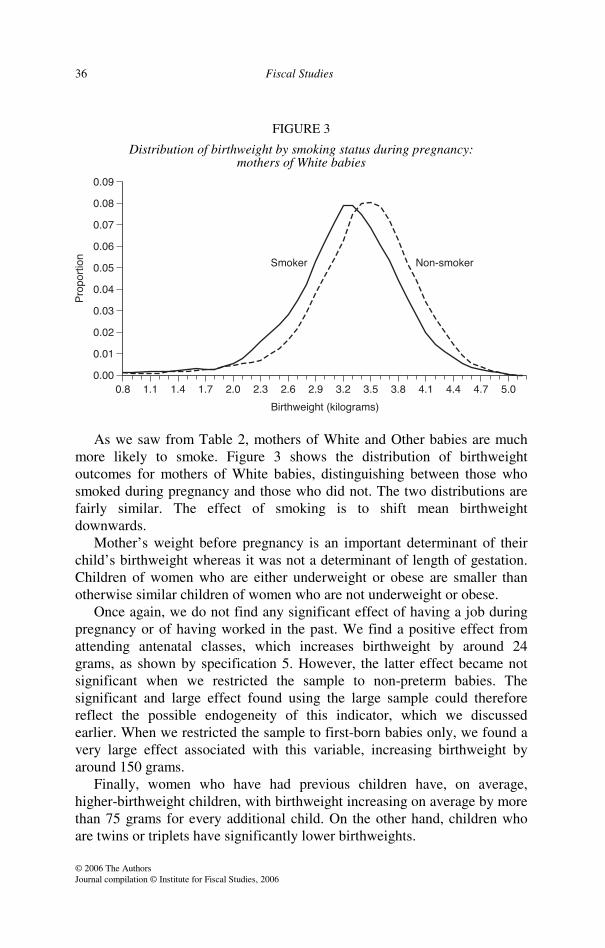
FIGURE 3
Distribution of birthweight by smoking status during pregnancy: mothers of White babies
As we saw from Table 2, mothers of White and Other babies are much
more likely to smoke. Figure 3 shows the distribution of birthweight outcomes for mothers of White babies, distinguishing between those who smoked during pregnancy and those who did not. The two distributions are fairly similar. The effect of smoking is to shift mean birthweight downwards.
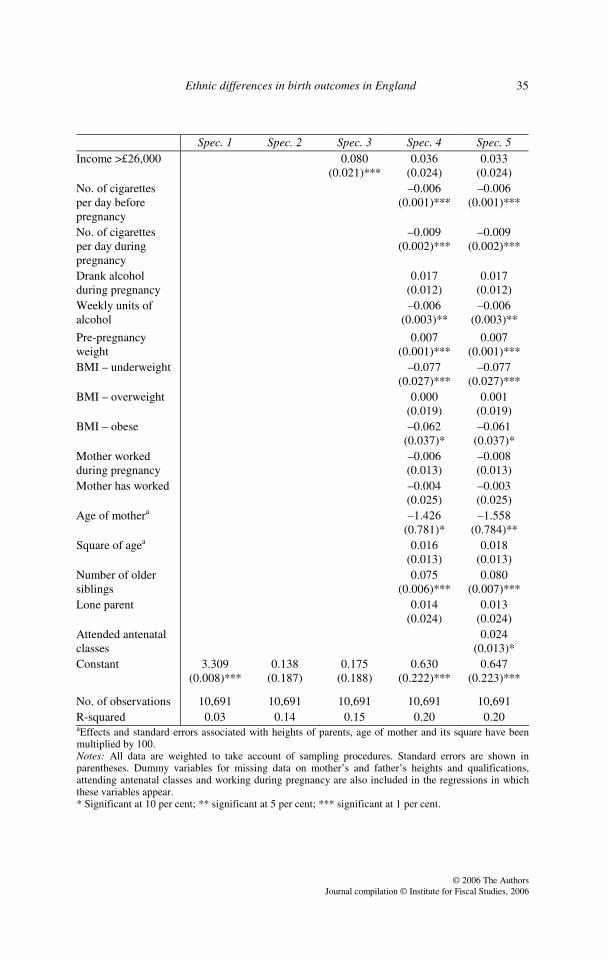
Mother’s weight before pregnancy is an important determinant of their child’s birthweight whereas it was not a determinant of length of gestation. Children of women who are either underweight or obese are smaller than otherwise similar children of women who are not underweight or obese.
Once again, we do not find any significant effect of having a job during pregnancy or of having worked in the past. We find a positive effect from attending antenatal classes, which increases birthweight by around 24 grams, as shown by specification 5. However, the latter effect became not significant when we restricted the sample to non-preterm babies. The significant and large effect found using the large sample could therefore reflect the possible endogeneity of this indicator, which we discussed earlier. When we restricted the sample to first-born babies only, we found a very large effect associated with this variable, increasing birthweight by around 150 grams.
Finally, women who have had previous children have, on average, higher-birthweight children, with birthweight increasing on average by more than 75 grams for every additional child. On the other hand, children who are twins or triplets have significantly lower birthweights.
Ethnic differences in birth outcomes in England 37
© 2006 The Authors
Journal compilation © Institute for Fiscal Studies, 2006
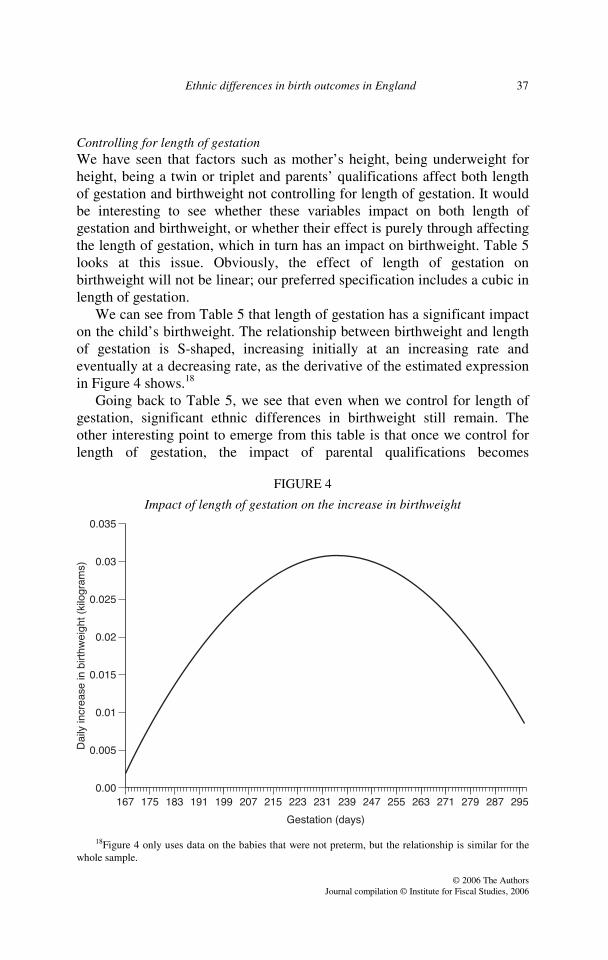
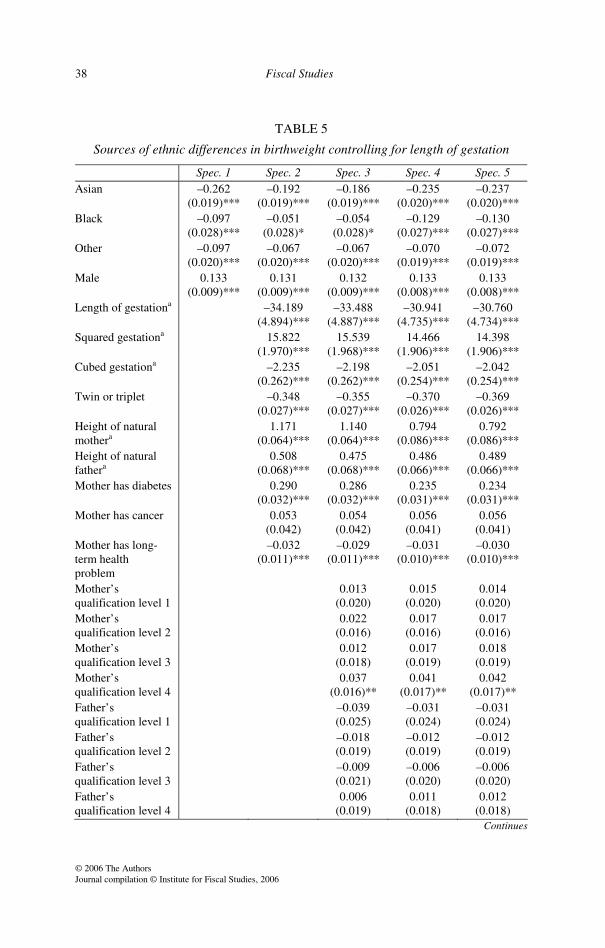
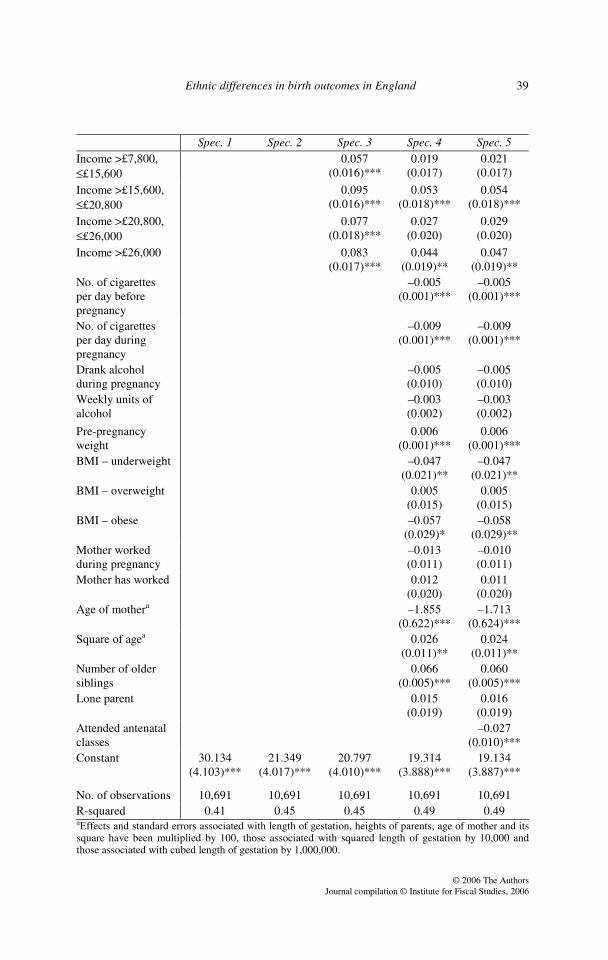
Controlling for length of gestation We have seen that factors such as mother’s height, being underweight for height, being a twin or triplet and parents’ qualifications affect both length of gestation and birthweight not controlling for length of gestation. It would be interesting to see whether these variables impact on both length of gestation and birthweight, or whether their effect is purely through affecting the length of gestation, which in turn has an impact on birthweight. Table 5 looks at this issue. Obviously, the effect of length of gestation on birthweight will not be linear; our preferred specification includes a cubic in length of gestation.
We can see from Table 5 that length of gestation has a significant impact on the child’s birthweight. The relationship between birthweight and length of gestation is S-shaped, increasing initially at an increasing rate and eventually at a decreasing rate, as the derivative of the estimated expression in Figure 4 shows.18
Going back to Table 5, we see that even when we control for length of gestation, significant ethnic differences in birthweight still remain. The other interesting point to emerge from this table is that once we control for length of gestation, the impact of parental qualifications becomes
FIGURE 4
Impact of length of gestation on the increase in birthweight
18Figure 4 only uses data on the babies that were not preterm, but the relationship is similar for the whole sample.
38 Fiscal Studies
© 2006 The Authors Journal compilation © Institute for Fiscal Studies, 2006
TABLE 5
Sources of ethnic differences in birthweight controlling for length of gestation
Spec. 1 Spec. 2 Spec. 3 Spec. 4 Spec. 5 Asian –0.262
(0.019)*** –0.192
(0.019)*** –0.186
(0.019)*** –0.235
(0.020)*** –0.237
(0.020)*** Black –0.097
(0.028)*** –0.051
(0.028)* –0.054
(0.028)* –0.129
(0.027)*** –0.130
(0.027)*** Other –0.097
(0.020)*** –0.067
(0.020)*** –0.067
(0.020)*** –0.070
(0.019)*** –0.072
(0.019)*** Male 0.133
(0.009)*** 0.131
(0.009)*** 0.132
(0.009)*** 0.133
(0.008)*** 0.133
(0.008)*** Length of gestationa –34.189
(4.894)*** –33.488
(4.887)*** –30.941
(4.735)*** –30.760
(4.734)*** Squared gestationa 15.822
(1.970)*** 15.539
(1.968)*** 14.466
(1.906)*** 14.398
(1.906)*** Cubed gestationa –2.235
(0.262)*** –2.198
(0.262)*** –2.051
(0.254)*** –2.042
(0.254)*** Twin or triplet –0.348
(0.027)*** –0.355
(0.027)*** –0.370
(0.026)*** –0.369
(0.026)*** Height of natural mothera
1.171 (0.064)***
1.140 (0.064)***
0.794 (0.086)***
0.792 (0.086)***
Height of natural fathera
0.508 (0.068)***
0.475 (0.068)***
0.486 (0.066)***
0.489 (0.066)***
Mother has diabetes 0.290 (0.032)***
0.286 (0.032)***
0.235 (0.031)***
0.234 (0.031)***
Mother has cancer 0.053 (0.042)
0.054 (0.042)
0.056 (0.041)
0.056 (0.041)
Mother has long-term health problem
–0.032 (0.011)***
–0.029 (0.011)***
–0.031 (0.010)***
–0.030 (0.010)***
Mother’s qualification level 1
0.013 (0.020)
0.015 (0.020)
0.014 (0.020)
Mother’s qualification level 2
0.022 (0.016)
0.017 (0.016)
0.017 (0.016)
Mother’s qualification level 3
0.012 (0.018)
0.017 (0.019)
0.018 (0.019)
Mother’s qualification level 4
0.037 (0.016)**
0.041 (0.017)**
0.042 (0.017)**
Father’s qualification level 1
–0.039 (0.025)
–0.031 (0.024)
–0.031 (0.024)
Father’s qualification level 2
–0.018 (0.019)
–0.012 (0.019)
–0.012 (0.019)
Father’s qualification level 3
–0.009 (0.021)
–0.006 (0.020)
–0.006 (0.020)
Father’s qualification level 4
0.006 (0.019)
0.011 (0.018)
0.012 (0.018)
Continues
Ethnic differences in birth outcomes in England 39
© 2006 The Authors
Journal compilation © Institute for Fiscal Studies, 2006
Spec. 1 Spec. 2 Spec. 3 Spec. 4 Spec. 5 Income >£7,800, ££15,600
0.057 (0.016)***
0.019 (0.017)
0.021 (0.017)
Income >£15,600, ££20,800
0.095 (0.016)***
0.053 (0.018)***
0.054 (0.018)***
Income >£20,800, ££26,000
0.077 (0.018)***
0.027 (0.020)
0.029 (0.020)
Income >£26,000 0.083 (0.017)***
0.044 (0.019)**
0.047 (0.019)**
No. of cigarettes per day before pregnancy
–0.005 (0.001)***
–0.005 (0.001)***
No. of cigarettes per day during pregnancy
–0.009 (0.001)***
–0.009 (0.001)***
Drank alcohol during pregnancy
–0.005 (0.010)
–0.005 (0.010)
Weekly units of alcohol
–0.003 (0.002)
–0.003 (0.002)
Pre-pregnancy weight
0.006 (0.001)***
0.006 (0.001)***
BMI – underweight –0.047 (0.021)**
–0.047 (0.021)**
BMI – overweight 0.005 (0.015)
0.005 (0.015)
BMI – obese –0.057 (0.029)*
–0.058 (0.029)**
Mother worked during pregnancy
–0.013 (0.011)
–0.010 (0.011)
Mother has worked 0.012 (0.020)
0.011 (0.020)
Age of mothera –1.855 (0.622)***
–1.713 (0.624)***
Square of agea 0.026 (0.011)**
0.024 (0.011)**
Number of older siblings
0.066 (0.005)***
0.060 (0.005)***
Lone parent 0.015 (0.019)
0.016 (0.019)
Attended antenatal classes
–0.027 (0.010)***
Constant 30.134 (4.103)***
21.349 (4.017)***
20.797 (4.010)***
19.314 (3.888)***
19.134 (3.887)***
No. of observations 10,691 10,691 10,691 10,691 10,691 R-squared 0.41 0.45 0.45 0.49 0.49 aEffects and standard errors associated with length of gestation, heights of parents, age of mother and its square have been multiplied by 100, those associated with squared length of gestation by 10,000 and those associated with cubed length of gestation by 1,000,000.
40 Fiscal Studies
© 2006 The Authors Journal compilation © Institute for Fiscal Studies, 2006
Notes to Table 5: All data are weighted to take account of sampling procedures. Standard errors are shown in parentheses. Dummy variables for missing data on mother’s and father’s heights and qualifications, attending antenatal classes and working during pregnancy are also included in the regressions in which these variables appear. * Significant at 10 per cent; ** significant at 5 per cent; *** significant at 1 per cent.
insignificant except for women with level 4 qualifications. This suggests that parents’ qualification levels being higher has a much more significant effect in extending gestation and, through this, increasing birthweight, rather than directly affecting birthweight. Smoking, on the other hand, has no impact on length of gestation (recall Table 3), yet has a significant negative impact on birthweight. Factors such as mother’s height and health affect both length of gestation and birthweight controlling for length of gestation.
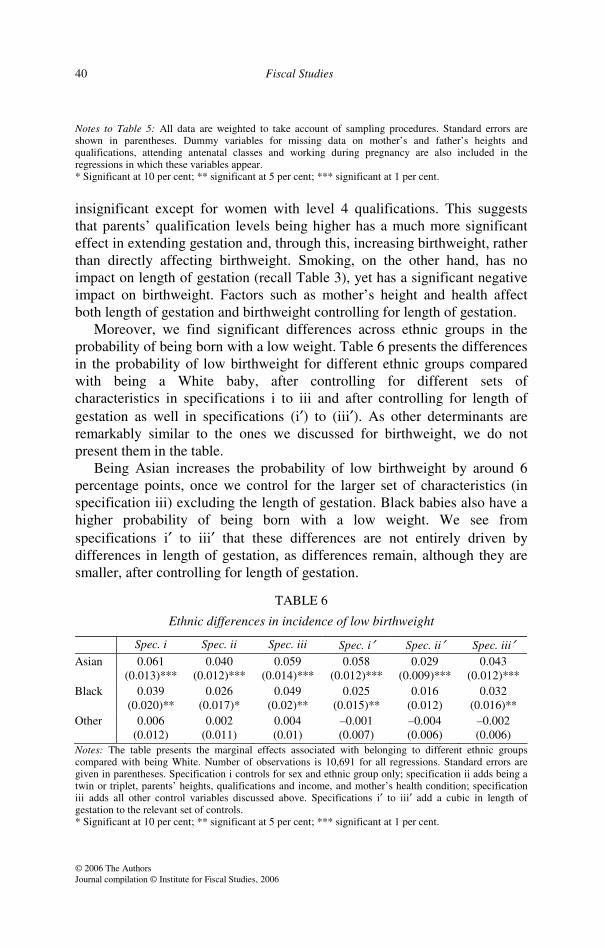
Moreover, we find significant differences across ethnic groups in the probability of being born with a low weight. Table 6 presents the differences in the probability of low birthweight for different ethnic groups compared with being a White baby, after controlling for different sets of characteristics in specifications i to iii and after controlling for length of gestation as well in specifications (i′) to (iii′). As other determinants are remarkably similar to the ones we discussed for birthweight, we do not present them in the table.
Being Asian increases the probability of low birthweight by around 6 percentage points, once we control for the larger set of characteristics (in specification iii) excluding the length of gestation. Black babies also have a higher probability of being born with a low weight. We see from specifications i′ to iii′ that these differences are not entirely driven by differences in length of gestation, as differences remain, although they are smaller, after controlling for length of gestation.
TABLE 6
Ethnic differences in incidence of low birthweight
Spec. i Spec. ii Spec. iii Spec. i′ Spec. ii′ Spec. iii′ Asian 0.061
(0.013)*** 0.040
(0.012)*** 0.059
(0.014)*** 0.058
(0.012)*** 0.029
(0.009)*** 0.043
(0.012)*** Black 0.039
(0.020)** 0.026
(0.017)* 0.049
(0.02)** 0.025
(0.015)** 0.016
(0.012) 0.032
(0.016)** Other 0.006
(0.012) 0.002
(0.011) 0.004 (0.01)
–0.001 (0.007)
–0.004 (0.006)
–0.002 (0.006)
Notes: The table presents the marginal effects associated with belonging to different ethnic groups compared with being White. Number of observations is 10,691 for all regressions. Standard errors are given in parentheses. Specification i controls for sex and ethnic group only; specification ii adds being a twin or triplet, parents’ heights, qualifications and income, and mother’s health condition; specification iii adds all other control variables discussed above. Specifications i′ to iii′ add a cubic in length of gestation to the relevant set of controls. * Significant at 10 per cent; ** significant at 5 per cent; *** significant at 1 per cent.
Ethnic differences in birth outcomes in England 41
© 2006 The Authors
Journal compilation © Institute for Fiscal Studies, 2006
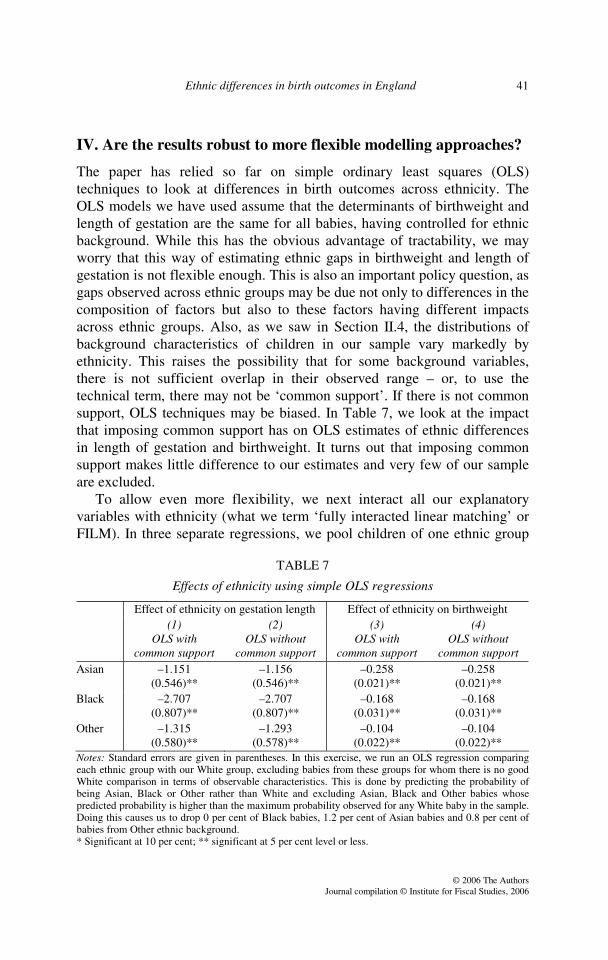
IV. Are the results robust to more flexible modelling approaches?
The paper has relied so far on simple ordinary least squares (OLS) techniques to look at differences in birth outcomes across ethnicity. The OLS models we have used assume that the determinants of birthweight and length of gestation are the same for all babies, having controlled for ethnic background. While this has the obvious advantage of tractability, we may worry that this way of estimating ethnic gaps in birthweight and length of gestation is not flexible enough. This is also an important policy question, as gaps observed across ethnic groups may be due not only to differences in the composition of factors but also to these factors having different impacts across ethnic groups. Also, as we saw in Section II.4, the distributions of background characteristics of children in our sample vary markedly by ethnicity. This raises the possibility that for some background variables, there is not sufficient overlap in their observed range – or, to use the technical term, there may not be ‘common support’. If there is not common support, OLS techniques may be biased. In Table 7, we look at the impact that imposing common support has on OLS estimates of ethnic differences in length of gestation and birthweight. It turns out that imposing common support makes little difference to our estimates and very few of our sample are excluded.
To allow even more flexibility, we next interact all our explanatory variables with ethnicity (what we term ‘fully interacted linear matching’ or FILM). In three separate regressions, we pool children of one ethnic group
TABLE 7
Effects of ethnicity using simple OLS regressions
Effect of ethnicity on gestation length Effect of ethnicity on birthweight (1)
OLS with common support
(2) OLS without
common support
(3) OLS with
common support
(4) OLS without
common support Asian –1.151
(0.546)** –1.156
(0.546)** –0.258
(0.021)** –0.258
(0.021)** Black –2.707
(0.807)** –2.707
(0.807)** –0.168
(0.031)** –0.168
(0.031)** Other –1.315
(0.580)** –1.293
(0.578)** –0.104
(0.022)** –0.104
(0.022)** Notes: Standard errors are given in parentheses. In this exercise, we run an OLS regression comparing each ethnic group with our White group, excluding babies from these groups for whom there is no good White comparison in terms of observable characteristics. This is done by predicting the probability of being Asian, Black or Other rather than White and excluding Asian, Black and Other babies whose predicted probability is higher than the maximum probability observed for any White baby in the sample. Doing this causes us to drop 0 per cent of Black babies, 1.2 per cent of Asian babies and 0.8 per cent of babies from Other ethnic background. * Significant at 10 per cent; ** significant at 5 per cent level or less.
42 Fiscal Studies
© 2006 The Authors Journal compilation © Institute for Fiscal Studies, 2006
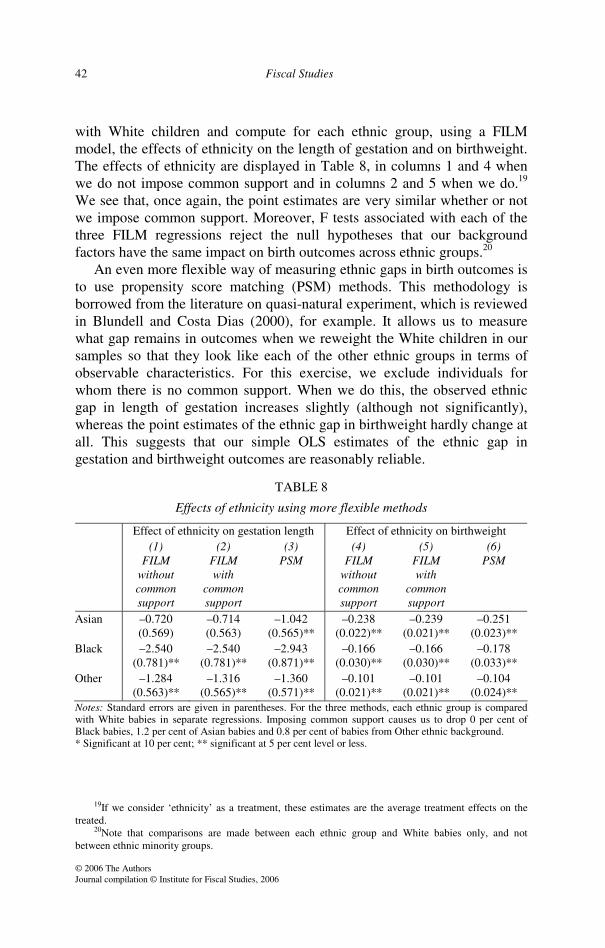
with White children and compute for each ethnic group, using a FILM model, the effects of ethnicity on the length of gestation and on birthweight. The effects of ethnicity are displayed in Table 8, in columns 1 and 4 when we do not impose common support and in columns 2 and 5 when we do.19 We see that, once again, the point estimates are very similar whether or not we impose common support. Moreover, F tests associated with each of the three FILM regressions reject the null hypotheses that our background factors have the same impact on birth outcomes across ethnic groups.20
An even more flexible way of measuring ethnic gaps in birth outcomes is to use propensity score matching (PSM) methods. This methodology is borrowed from the literature on quasi-natural experiment, which is reviewed in Blundell and Costa Dias (2000), for example. It allows us to measure what gap remains in outcomes when we reweight the White children in our samples so that they look like each of the other ethnic groups in terms of observable characteristics. For this exercise, we exclude individuals for whom there is no common support. When we do this, the observed ethnic gap in length of gestation increases slightly (although not significantly), whereas the point estimates of the ethnic gap in birthweight hardly change at all. This suggests that our simple OLS estimates of the ethnic gap in gestation and birthweight outcomes are reasonably reliable.
TABLE 8
Effects of ethnicity using more flexible methods
Effect of ethnicity on gestation length Effect of ethnicity on birthweight (1)
FILM without common support
(2) FILM with
common support
(3) PSM
(4) FILM
without common support
(5) FILM with
common support
(6) PSM
Asian –0.720 (0.569)
–0.714 (0.563)
–1.042 (0.565)**
–0.238 (0.022)**
–0.239 (0.021)**
–0.251 (0.023)**
Black –2.540 (0.781)**
–2.540 (0.781)**
–2.943 (0.871)**
–0.166 (0.030)**
–0.166 (0.030)**
–0.178 (0.033)**
Other –1.284 (0.563)**
–1.316 (0.565)**
–1.360 (0.571)**
–0.101 (0.021)**
–0.101 (0.021)**
–0.104 (0.024)**
Notes: Standard errors are given in parentheses. For the three methods, each ethnic group is compared with White babies in separate regressions. Imposing common support causes us to drop 0 per cent of Black babies, 1.2 per cent of Asian babies and 0.8 per cent of babies from Other ethnic background. * Significant at 10 per cent; ** significant at 5 per cent level or less.
19If we consider ‘ethnicity’ as a treatment, these estimates are the average treatment effects on the
treated. 20Note that comparisons are made between each ethnic group and White babies only, and not
between ethnic minority groups.
Ethnic differences in birth outcomes in England 43
© 2006 The Authors
Journal compilation © Institute for Fiscal Studies, 2006
Thus it appears that controlling for covariates in a simple way, such as with OLS, gives a good approximation of the effects of ethnicity on birthweight and length of gestation, even though the PSM methods offer the most flexible way of estimating such ethnic gaps.
V. Conclusions
There is clear evidence that increased birthweight and length of gestation are positively associated with cognitive and health outcomes later in life, independent of other socio-economic factors. There is also clear evidence that these two outcomes vary by ethnicity. Are there factors that explain differences in duration of gestation and birthweight, and do these vary by ethnicity?
In this paper, we have seen that the following factors have a positive impact on length of gestation and a negative impact on the probability of giving birth preterm:
• mother’s height and good health condition; • mother consuming alcohol during pregnancy; • mother not being underweight for her height; • not being a twin or triplet; • mother attending antenatal classes.
We also found that the mother or father having higher qualifications has a positive impact on length of gestation, while income has no significant impact.
Many of these factors vary by ethnicity, and policies that attempt to increase attendance at antenatal classes and to educate women about the dangers of being underweight when commencing a pregnancy could help reduce some of these ethnic inequalities in gestational outcomes.
Another outcome that varies significantly across ethnicity is birthweight. We found that Asian babies are around 6 percentage points more likely to be of low birthweight than White babies, and that Black babies are around 5 percentage points more likely to be of low birthweight than White babies, once we control for socio-economic factors and the behaviour of the parents. The following factors have a positive impact on a child’s birthweight and a negative impact on the incidence of low-weight babies:
• mother’s and father’s heights and good long-term health condition of the mother;
• mother not smoking before or during pregnancy; • mother not being underweight or obese;
44 Fiscal Studies
© 2006 The Authors Journal compilation © Institute for Fiscal Studies, 2006
• not being a twin or triplet; • income; • mother or father having higher qualifications; • mother being younger; • having older siblings.
Some but not all of these factors are also determinants of the length of gestation, and in the case of higher parental qualifications, most of their positive effect on birthweight operates through their effect on length of gestation. Factors such as mother’s height affect both length of gestation and birthweight controlling for length of gestation. Other factors, such as income, father’s height and smoking, only affect birthweight.
Again, this has important policy implications. First, it appears that smoking before becoming pregnant or during pregnancy impacts on a child’s birthweight. This actually reduces the birthweight gap between White babies and Asian and Black babies, whose mothers smoke significantly less. Smoking is an area that could be influenced by education initiatives. We have to be somewhat cautious, however, in interpreting these effects, as the smoked-during-pregnancy variable may particularly suffer from under-reporting problems and the effect of smoking before pregnancy may simply be capturing the effect of smoking during pregnancy, if mothers are more likely to admit to smoking before pregnancy than to smoking during pregnancy. Second, the importance of not being underweight or obese when starting a pregnancy could also be addressed through education initiatives. Mothers of Asian and Other children are much more likely to be underweight and mothers of Black children much more likely to be overweight, and so policies that educate women about the risks of being underweight or obese may help reduce ethnic differences in birthweights. But one of the most important things to ensure a good birthweight is increasing the length of gestation. We found that attending antenatal classes increases the length of gestation significantly, so promoting these could have a positive indirect effect on birthweights.
One limitation of this work is that some of the factors we studied are likely to be endogenous to birth outcomes. In particular, the behaviour of mothers, such as smoking, drinking, attending antenatal classes, working during pregnancy and weight, may be explained by unobserved factors that we are unable to control for in our regressions and which also affect birth outcomes.21 In future work, we will look for credible instruments for such behaviours, using natural experiments such as the Sure Start programmes or
21For evidence on endogeneity of inputs in health production functions, see, for example, Rosenzweig and Schultz (1983), Rosenzweig and Wolpin (1991), Grossman and Joyce (1990) or Currie and Cole (1993).
Ethnic differences in birth outcomes in England 45
© 2006 The Authors
Journal compilation © Institute for Fiscal Studies, 2006
other policy measures, which are likely to have changed the behaviour of mothers and have been implemented in some areas but not everywhere.
We have also measured the ethnic gaps in birth outcomes using more flexible methods than simple OLS methods, such as FILM or propensity score matching, and found very comparable estimates of ethnic gaps in length of gestation and birthweight. All these methods highlight that a large part of the differences in birthweight and length of gestation persist, even after controlling for the large sets of characteristics we have discussed in this paper: Asian children are the lightest babies at birth, with birthweight lower than that of White babies by around 250 grams, and have shorter gestations by around 1 day on average. Black babies and babies from Mixed and Other ethnic background also have lower birthweights and shorter gestations than White babies, by respectively around 170 grams and more than 2.5 days for Black children and around 100 grams and 1.3 days for children from Mixed and Other ethnic background.
References
Almond, D., Chay, K. Y. and Lee, D. S. (2005), ‘The costs of low birth weight’, Quarterly Journal of Economics, vol. 120, pp. 1031–83.
Barker, D. J. P. (1992), Fetal and Infant Origins of Adult Disease, papers written by the Medical Research Council Environmental Epidemiology Unit, University of Southampton; London: British Medical Journal.
— (1998), Mothers, Babies and Health in Later Life, second edition, Churchill Livingstone. Behrman, J. R. and Rosenzweig, M. (2004), ‘Returns to birthweight’, Review of Economics
and Statistics, vol. 86, pp. 586–601. Blundell, R. and Costa Dias, M. (2000), ‘Evaluation methods for non-experimental data’,
Fiscal Studies, vol. 21, pp. 427–68. Currie, J. and Cole, N. (1993), ‘Welfare and child health: the link between AFDC
participation and birth weight’, American Economic Review, vol. 83, pp. 971–85. Dustmann, C. and Fabbri, F. (2005), ‘Immigrants in the British labour market’, Fiscal
Studies, vol. 26, pp. 423–70. Goldstein, H. (1977), ‘Smoking in pregnancy: some notes on the statistical controversy’,
British Journal of Preventive and Social Medicine, vol. 31, pp. 13–17. Grossman, M. and Joyce, T. (1990), ‘Unobservables, pregnancy resolutions, and birth weight
production functions in New York City’, Journal of Political Economy, vol. 98, pp. 983–1007.
Nazroo, J. (2003), ‘The structuring of ethnic inequalities in health: economic position, racial discrimination and racism’, American Journal of Public Health, vol. 93, pp. 277–84.
Patel, R. R., Steer, P., Doyle, P., Little, M. and Elliott, P. (2004), ‘Does gestation vary by ethnic group? A London based study of over 122 000 pregnancies with spontaneous onset of labour’, International Journal of Epidemiology, vol. 33, pp. 107–13.
Pojda, J. and Kelley, L. (2000), ‘Low birthweight’, ACC/SCN (Administrative Committee on Coordination / Sub-Committee on Nutrition), Nutrition Policy Paper no. 18.
Prime Minister’s Strategy Unit (2003), Ethnic Minorities and the Labour Market, London: Cabinet Office.

46 Fiscal Studies
© 2006 The Authors Journal compilation © Institute for Fiscal Studies, 2006
Record, R. G., McKeown, T. and Edwards, J. H. (1969), ‘The relation of measured intelligence to birth weight and duration of gestation’, Annals of Human Genetics, vol. 33, pp. 71–9.
Richards, M., Hardy, R., Kuh, D. and Wadsworth, M. E. J. (2002), ‘Birthweight, postnatal growth and cognitive function in a national UK birth cohort’, International Journal of Epidemiology, vol. 31, pp. 342–8.
Rosenzweig, M. and Schultz, T. P. (1983), ‘Estimating a household production function: heterogeneity, the demand for health inputs, and their effects on birth weight’, Journal of Political Economy, vol. 91, pp. 723–46.
— and Wolpin, K. I. (1991), ‘Inequality at birth: the scope for policy intervention’, Journal of Econometrics, vol. 50, pp. 205–28.
Savitz, D. (2004), ‘Commentary: ethnic differences in gestational age exist: but are they “normal”?’, International Journal of Epidemiology, vol. 33, pp. 114–15.