Embed Size (px)
Citation preview
FINAL REPORT
DGVII – TRANSPORT
European Railways Optimisation PlanningEnvironment -
Transportation Railways Integrated Planning
T R I P
Contract RA-97-AM-1165
June 2000
Version 1.0
EuROPE-TRIP Final Report
Contract RA-97-AM-1165 Final Report – Ver. 1.0 (June 2000)
Final Report
Public
EuROPE - TRIP
Contract n° RA-97-AM-1165
Project Co-ordinator: Ferrovie dello Stato SpA – Divisione Infrastruttura
Piazza della Croce Rossa, n.1 – 00161 Roma
Partners:
Steer Davies and Gleave Ltd
Centrum for Transport och Samhallsforskning
AEA Technology
Scanrail
CEMAT SpA
SINTEF
Università degli Studi di Roma – DISP
Università degli Studi di Genova – DIMA
Universidad de Santiago de Compostela - USC
Tilburg University – KUB
Project Duration: 1st June 1997 - 31st May 1999
Final Report: June 2000
Version: 1.0
PROJECT FUNDED BY THE EUROPEAN
COMMISSION UNDER THE TRANSPORT
RTD PROGRAMME OF THE
4th EU FRAMEWORK PROGRAMME
EuROPE-TRIP Final Report
Contract RA-97-AM-1165 Final Report – Ver. 1.0 (June 2000) Page 1
Volume Contents
EXECUTIVE SUMMARY ................................................................................................ 5
Introduction...................................................................................................................................................5
Objectives......................................................................................................................................................5
System Model Specifications and Business Model Demonstrator................................................................6
Market Algorithms .......................................................................................................................................6
Market Game Model ....................................................................................................................................7
Line capacity analysis ...................................................................................................................................7
Cost methods .................................................................................................................................................8
Conclusions....................................................................................................................................................8
OBJECTIVES OF THE PROJECT ............................................................................... 10
1. SCENARIO AND SYSTEM MODEL SPECIFICATIONS ....................................... 13
1.1.Introduction ..........................................................................................................................................13
1.2.The directives........................................................................................................................................131.2.1. Directive 91/440 ............................................................................................................................131.2.2. Directive 95/19 ..............................................................................................................................131.2.3. New directive proposals .................................................................................................................141.2.4. The structure of the European rail industry ....................................................................................141.2.5. The players....................................................................................................................................151.2.6. Relationships between the players..................................................................................................161.2.7. Business planning..........................................................................................................................17
1.3.Key concepts and their representation.................................................................................................181.3.1. Representation of line capacity and timetables ...............................................................................181.3.2. Costs of using infrastructure ..........................................................................................................191.3.3. Representation of access rights ......................................................................................................201.3.4. Representation of access to infrastructure.......................................................................................201.3.5. Performance criteria ......................................................................................................................201.3.6. TRIP and the “infrastructure package”...........................................................................................21
2. THE RAILWAY LINE CAPACITY.......................................................................... 22
2.1.Introduction ..........................................................................................................................................22
2.2.A framework of analysis .......................................................................................................................22
2.3.The 3-level framework..........................................................................................................................24
2.4.General time-tabling considerations ....................................................................................................27
EuROPE-TRIP Final Report
Contract RA-97-AM-1165 Final Report – Ver. 1.0 (June 2000) Page 2
2.4.1. ‘Limit’ or bottleneck section ..........................................................................................................272.4.2. Maintenance..................................................................................................................................272.4.3. Slow-downs - Regularity margins ..................................................................................................272.4.4. Diagramming techniques...............................................................................................................27
2.5.Congestion.............................................................................................................................................28
2.6.The TRIPLIB proposed methodology ..................................................................................................29
2.7.Analytic Methods ..................................................................................................................................30
2.8.Scheduling Algorithms..........................................................................................................................312.8.1. Introduction...................................................................................................................................312.8.2. The FLOU Algorithm....................................................................................................................322.8.3. Test case........................................................................................................................................322.8.4. The TCM Algorithm .....................................................................................................................34
2.9.Simulation Analysis...............................................................................................................................38
2.10. Conclusions .......................................................................................................................................41
2.11. Bibliography.....................................................................................................................................43
3. COST OF USING INFRASTRUCTURE................................................................. 44
3.1.Study Overview.....................................................................................................................................44
3.2.Models and applications of rail infrastructure costs............................................................................443.2.1. Historical backgrounds ..................................................................................................................443.2.2. The nature of infrastructure costs...................................................................................................453.2.3. The UIC contribution.....................................................................................................................493.2.4. External costs ................................................................................................................................513.2.5. Cost methods analysis....................................................................................................................513.2.6. Cost allocation methods.................................................................................................................52
3.3.The LIBERAIL-TRIP Case Study .......................................................................................................54
3.4.CORINNE (COst Railway INfrastructure NEtwork)..........................................................................58
3.5.DEA (Data Envelopment Analysis) ......................................................................................................59
3.6.Cost of using Intermodal Terminals .....................................................................................................62
3.7.Infrastructure costs in the future..........................................................................................................63
3.8.Conclusions and recommendations.......................................................................................................66
3.9.Bibliography .........................................................................................................................................67
4. HOW TO SHARE RAIL INFRASTRUCTURE COSTS .......................................... 68
4.1.Introduction ..........................................................................................................................................68
4.2.Method overview...................................................................................................................................68
EuROPE-TRIP Final Report
Contract RA-97-AM-1165 Final Report – Ver. 1.0 (June 2000) Page 3
4.3.How to apply the concepts ....................................................................................................................70
4.4.Generalised Airport Game - Maintenance and Infrastructure cost games.........................................71
4.5.Conclusions and applications................................................................................................................72
4.6.Bibliography .........................................................................................................................................74
5. ACCESS TO INFRASTRUCTURE: THE INTEGRATED MODEL ........................ 75
5.1.Introduction ..........................................................................................................................................75
5.2.The model..............................................................................................................................................77
5.3.Case study .............................................................................................................................................80
5.4.Conclusions............................................................................................................................................82
5.5.Bibliography .........................................................................................................................................83
6. ACCESS TO INFRASTRUCTURE: THE AUCTION MODEL ............................... 85
6.1.Introduction ..........................................................................................................................................85
6.2.Overriding objectives in capacity allocation ........................................................................................85
6.3.Economic aspects on infrastructure use and congestion ......................................................................87
6.4.The Problem of Allocating Track Capacity .........................................................................................886.4.1. General features of the sector’s capacity allocation problem...........................................................886.4.2. Demand and supply characteristics of track capacity allocation......................................................89
6.5.An efficiency-enhancing model for track capacity allocation..............................................................896.5.1. The two analytical sub-problems....................................................................................................896.5.2. The auction and the time-tabling process .......................................................................................90
6.6.Additional aspects of the allocation process .........................................................................................956.6.1. The micro-design of the process.....................................................................................................956.6.2. Objectives other than efficiency .....................................................................................................956.6.3. Complementarities.........................................................................................................................96
6.7.Conclusions............................................................................................................................................97
6.8.Bibliography .........................................................................................................................................98
7. THE BUSINESS PLANNING MODEL................................................................... 99
7.1.Introduction ..........................................................................................................................................99
7.2.Model Description.................................................................................................................................99
7.3.Model structure...................................................................................................................................101
7.4.Demonstrator outline ..........................................................................................................................103
EuROPE-TRIP Final Report
Contract RA-97-AM-1165 Final Report – Ver. 1.0 (June 2000) Page 4
7.4.1. Setting up a model simulation......................................................................................................1037.4.2. Resource decisions.......................................................................................................................1047.4.3. Running the model ......................................................................................................................1067.4.4. Testing policies for infrastructure management............................................................................107
7.5.Conclusions..........................................................................................................................................110
7.6.Bibliography .......................................................................................................................................111
8. TRIP AND THE PROPOSED EUROPEAN DIRECTIVE ON RAILINFRASTRUCTURE ACCESS AND CHARGING ...................................................... 112
8.1.The principles of the EU proposal......................................................................................................112
8.2.Infrastructure charges ........................................................................................................................1148.2.1. Establishing, determining and collecting charges (Art. 4) ............................................................1148.2.2. Infrastructure costs and accounts (Art.6)......................................................................................1148.2.3. Principles of Charging (Art. 8) ....................................................................................................1158.2.4. Exceptions to charging principles (Art. 9)....................................................................................115
8.3.Capacity allocation .............................................................................................................................1158.3.1. Co-ordinated and Capacity-constrained infrastructure (Art.2) ......................................................1158.3.2. The network statement (Art.3) .....................................................................................................1168.3.3. Principles of charging (Art.8) ......................................................................................................1178.3.4. Performance scheme (Art.12) ......................................................................................................1188.3.5. Reservation charges (Art.13) .......................................................................................................1188.3.6. Capacity rights (Art. 14) ..............................................................................................................1188.3.7. Network statement – capacity allocation (Art.17).........................................................................1188.3.8. Principles of allocation (Art 18)...................................................................................................1198.3.9. Framework agreements (Art.20) ..................................................................................................1198.3.10...........................................................................................................................Scheduling (Art.23).
1208.3.11............................................................................................................ Coordination process (Art.24)
1208.3.12............................................................................................................... Scarcity of capacity (Art.25)
1208.3.13.............................................................................................................Short-notice requests (Art.26)
1218.3.14......................................................................................................Specialised infrastructure (Art.27)
1228.3.15.................................................................................................................. Capacity analysis (Art.28)
1228.3.16.................................................................................................. Capacity enhancement plan (Art.29)
1238.3.17.................................................................................Infrastructure capacity for maintenance (Art.31)
123
8.4.Conclusions..........................................................................................................................................125
9. CONCLUSIONS OF THE REPORT .................................................................... 126
APPENDIX.................................................................................................................. 128
EuROPE-TRIP Final Report
Contract RA-97-AM-1165 Final Report – Ver. 1.0 (June 2000) Page 5
Executive summary
Introduction
This document is the final report of the EuROPE-TRIP project, undertaken within the 4th EU-RDFramework under contract DGVII-Transport RA-97-AM-1165. The TRIP project addressed there-organisation process that is reshaping the railway sector in Europe, i.e. the separation betweeninfrastructure management and transport service provision. Its general overall purpose was toassist in evaluating a range of strategies, which could be set by policy makers and followed byinfrastructure managers in the context of European Directive 91/440. The latter expresses a needfor increased competition within the rail transport sector, with the expectation that this wouldresult in both improved commercial attitudes and increased quality in the provision of railservices. TRIP provides a framework to study the process for putting the policy principlesrequired by the Directive into practice, in particular the principle of open access.The TRIP project was part of a larger RDT initiative - i.e. EuROPE (European RailwaysOptimisation Planning Environment) - where two other projects were developed for supportingrailways in the timetable and related planning activities, i.e. TRIS (Teleconferencing RailwaysInformation System) and TRIO (Transportation Railways Innovative Optimisation).
In addition there has been a specific co-operation between TRIP and LIBERAIL (another projectwithin the same RDT Transport Programme). A case study with regard to analysing infrastructureusage costs and allocation methods and the assessment of capacity of railway lines, with particularreference to a European corridor, was undertaken jointly.
Objectives
More specifically the aim of the TRIP project was to assist the management of rail infrastructure,by providing models, which support short and medium to long term planning by taking intoaccount the evolution of the European market and transportation policies derived from EUdirectives 91/440 and 95/19. The idea behind the project was to build a reference frameworkdesigned to help the Infrastructure Management (IM) in resource and planning issues focusing onbusiness strategy, access to infrastructure rulings and market behaviour, methods for defining thecost of using infrastructure and assessing the capacity of rail lines.
The final aim was to accomplish and demonstrate prototype software tools encompassing thetasks undertaken as part of the project, i.e.:• The analysis of infrastructure usage costs and allocation methods;• The capacity of railway lines;• The definition of a system dynamics model to represent different planning scenarios with
regard to infrastructure management;• The study of market mechanisms between infrastructure operators and transport companies,
EuROPE-TRIP Final Report
Contract RA-97-AM-1165 Final Report – Ver. 1.0 (June 2000) Page 6
with particular reference to issues concerning access to rail infrastructure.
These tasks were undertaken in the following workpackages:• System Model Specifications• Market Game Model• Market Algorithms• Cost Methods• Line Capacity• Business Model Demonstrator.
which are summarised in this report.
System Model Specifications and Business Model Demonstrator
This work has specified the structure and rationale of a simulation model, able to represent aplanning scenario for the railway system. Its main use and focus would be to secure access forcurrent and future demand to European rail corridors and assess economic impacts ofinfrastructure management policies. Following the specification and general design of a businessplanning model, based on the systems dynamics method, a software implementation anddemonstrator was set up.
The model focuses on the role of the infrastructure manager (IM) - i.e. the “supply” side of themarket - in the context of the new railway industry and the associated relationships among theinfrastructure manager, the regulatory authorities and the train operators.
Modern System Dynamic software, such as used in this study, is designed to allow construction of‘microworld’ (i.e. business sectors) simulations which can be easily operated by the user. Theintention is to capture the most important structural features of the system in a long rangeframework (e.g. 10 years +), and to experiment with different strategies to understand how thesystem behaves and learn how to get the best performance from it.
Market Algorithms
The aim of this work was to evaluate how theoretical results in transport modelling and economicliterature can be put at profit in access to infrastructure, where two main problems arise:• Firstly, how should the infrastructure manager allocate track capacity among the various
operators; and• Secondly, how should the infrastructure manager allocate the building and the maintenance
costs among the operators through a fair fee system.
Both problems were approached from a game theory point of view, in a context characterised byoligopolistic interdependence. Game theory, in fact, is the study of multiperson decision problems,for predicting outcomes of a group of interacting agents, where an action of a single agentdirectly affects the payoffs (welfare or profits) of other participating agents. Thus, game theory
EuROPE-TRIP Final Report
Contract RA-97-AM-1165 Final Report – Ver. 1.0 (June 2000) Page 7
studies the choices of rational agents in a strategic interaction context. This means thatconsequences of an action for an agent are dependent not only on his own choice, but also on theactions of the other agents. A game is said to be cooperative when the players can communicateand establish constraining agreements before the beginning of the game. In a non-cooperativegame the players do not have such an opportunity and the agents choose their strategiesindependently from each other.
In TRIP these concepts have been applied recognising the close relationship with the open accessto infrastructure principles.To this aim:- an integrated model has been developed to study the economic equilibrium conditions for
setting access charges and customer transport pricing;
- cost allocation methods are used to indicate how to share rail infrastructure costs among thetrain operators.
Market Game Model
The purpose of this work was:• to describe the logical structure of the “open” access to infrastructure• to specify a mechanism that generates efficient timetables within an organizational structure
where train operations have been separated from infrastructure control; and• to test this for a simplified but real time-tabling problem.
The task of the IM is to establish a procedure, which can be used to solve the track capacityallocation problem. The suggestion here is to shape a computer based architecture with thefollowing key components:• the process should be decentralised, operators compiling their demand for track access using
their own computers and submitting demand specifications over the Internet;• formal, mathematical optimization software must be used in order to identify the value-
maximising timetable, given this demand; and• an auction procedure will be applied in order to provide non-biased information about the
operators’ value-of-access.
The concept has been tested and the prototype set up with contribution from previous researchcarried out in Sweden.
Line capacity analysis
The aim of this workpackage was to define standard methods for determining the capacity ofrailway lines, with particular reference to European corridors.
EuROPE-TRIP Final Report
Contract RA-97-AM-1165 Final Report – Ver. 1.0 (June 2000) Page 8
A survey of methods currently in use or proposed for computing line capacity is discussed, withthe objective of defining a general methodology.The capacity of lines is what the management of infrastructure has to sell as its final product. Tothis aim, the definition of line capacities on trans-European corridors and the evaluation andrecognition of standard and robust methods were addressed. To do this, a number of issues wereaddressed, such as the level of detail in the specifications at which rail capacity should bedetermined, the set of hypothesis on which it must be computed and the identification ofbottlenecks on trans-European line sections.A general, “multi-layer” approach was introduced, outlining a progressive method to estimate linecapacity from aggregate to detail analysis, including:
- analytical methods,
- scheduling models, and
- simulation.
A case study was selected where relevant data was collected about a specific European railcorridor. The purpose of this was to conduct experimental testing and analyse the results usingappropriate tools.The study highlights the potential of the state-of-the-art scheduling models, one of which wasoriginally developed in TRIP.
Cost methods
The aim of this workpackage was to define a standard method for analysing the costs of usinginfrastructure in the context of a European railway system. A framework of definitions and rulesfor analysis was outlined to create common understanding and with the purpose to agree on acommon reference model in future. Further objectives were to provide a supporting case studywhich proceeded to data collection for a EU corridor (France-Italy) and a Danish main line.The cost of using infrastructure is composed of various elements, and driving sectors like traincontrol, maintenance and others. Moreover rail infrastructure costs should be regarded on a life-cycle basis. A common reference framework is deemed necessary as basis for setting up a fairaccess charging and taking benefit from some benchmarking among European IMs.
In addition the study:- presents a method to compare efficiency among organisational units managing the
infrastructure.- outlines the costs of using intermodal inland terminals.
Conclusions
TRIP has realised several products in order to deepen the knowledge for infrastructuremanagement. Some of the models and approaches were presented for the first time in this projectand are directly linked to issues addressed in EU railway directives. In particular problems relatingto track allocation and access charges can benefit from the methodological hints and resultsprovided in the project. Finally this follows the requirement stressed in the proposal for a newdirective to “adopt any innovative management techniques”.
EuROPE-TRIP Final Report
Contract RA-97-AM-1165 Final Report – Ver. 1.0 (June 2000) Page 9
________________________________________
Acknowledgements
TRIP was the result of several contributors and cultural experiences, i.e. rail infrastructuremanagers, transport consultants and academic researchers.In particular we should acknowledge the contribution by:Ferrovie dello Stato (FS) – Divisione Infrastruttura, for supporting the co-ordination role andproviding data useful for various workpackages; for this we particularly mention: VincenzoAutiero, Vito Sante Achille, Vito Chinnici, Valter Colarieti. This team also leaded the work aboutLine Capacity and Cost Methods. For the latter also deserves mentioning the graduate thesis byElisabetta Firenze. In addition Giuseppe Sacco helped the project co-ordinator Pier Luigi Guidato develop and implement the proposed algorithms .CTS was responsible of the Market Game Model for which Jen-Eric Nilsson was undoubtedly theinitiator for testing auction methods for railway open access, in collaboration with JoakimFredriksson and Gunnar Isacsson.SDG provided the general system model specifications and developed the business planningdemonstrator: Fred Beltrandi, John Swanson and Maarten Kroes were involved in this work.SINTEF - Erik Nordboe - compiled the section about the analytic methods for line capacity andproduced the software package to implement them.AEAT carried out the line simulations exercises: Chris Gurney and Rob Taylor.The more academic modelling was made by DISP: Alberto Nastasi and Anna Bassanini; DIMA:Fioravante Patrone, Vito Fragnelli, C.Viale; KUB: Maurice Koster, Henk Norde, Stef Tijs. andUSC: Ignacio Garcia-Jurado, L. Carpente; moreover DISP was assisted by Ettore Savoino.ScanRail – Hans H. Nielsen - collected infrastructure cost data for the case study in their country.CEMAT - Aldo Panada and Francesco Martenini - provided the section about the cost of usingintermodal inland terminals. Finally we should acknowledge SYSTRA and SNCF for contributingto the joint case studies between TRIP and LIBERAIL (M. Genete) and providing useful data forcompleting the common corridor exercise in collaboration with the French railways (J. P.Estival).In addition TRIS (Transport Telematics Sector) project should be acknowledged for providingthe TCM (Traffic Capacity Management) algorithm, implemented by P. Toth, M. Fischetti, A.Caprara and others.To sum up in TRIP flourished the contribution by dedicated persons and organisations from atleast 7 European countries.
EuROPE-TRIP Final Report
Contract RA-97-AM-1165 Final Report – Ver. 1.0 (June 2000) Page 10
Objectives of the Project
EuROPE-TRIP is aimed to assist the Infrastructure Managers and policy makers following the re-organisation of the rail transport services.
The work covered by the project was grouped around a number of themes, as follows:
Line Capacity
• The work on Line Capacity was aimed at providing an assessment of methods to analyse thecapacity of railway lines with cases studies, and propose a methodology particularly in view oflong distance European corridors.
Costs of using infrastructure
This work focused on:• Analysing the costs of using the rail infrastructure; a European corridor was used as a case
study for a data collection and assessment;• Providing methods for comparative and efficiency analysis of infrastructure management units;• Evaluating the costs of using inland intermodal terminals.
Access to infrastructure modelling
The purpose of this work was to:• Describe the access to infrastructure by rational and quantitative modelling, through the
application of economic concepts from theory of games and auction methods, in order tostudy the competitive structure of the market and behaviour of the players (infrastructuremanager, train operators) in open access conditions;
• Describe the principles of cost allocation for policy rulings how to share infrastructure costsamong several users (train operators).
Infrastructure business model
The purpose of this work was to develop a simulation model to represent the infrastructuremanagement business and use the “system dynamics” method as basis for implementing a businessplanning tool for the infrastructure manager.
EuROPE-TRIP Final Report
Contract RA-97-AM-1165 Final Report – Ver. 1.0 (June 2000) Page 11
Project architecture and contents of the Final Report
To these aims the project was structured into six workpackages:
• System model and Specifications• Line Capacity• Cost methods• Market Algorithms• Market Game Model• Business Demonstrator.
These have each originated a deliverable whose results are provided in the present final report.
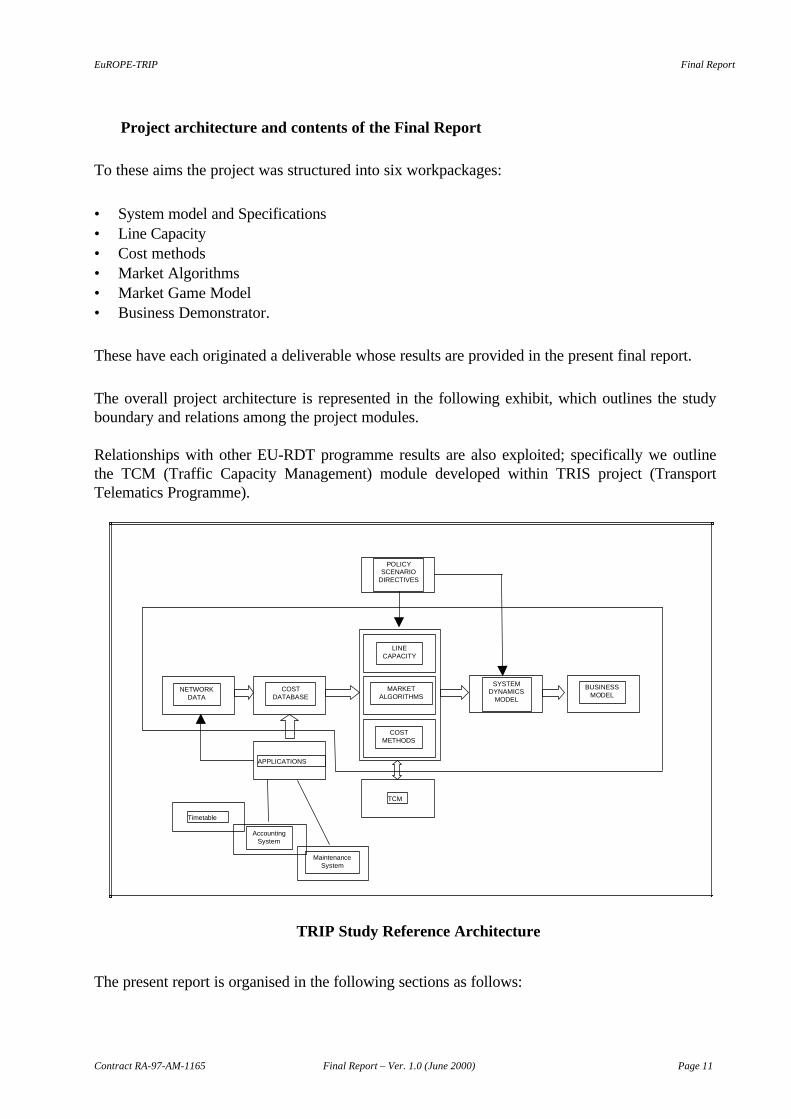
The overall project architecture is represented in the following exhibit, which outlines the studyboundary and relations among the project modules.
Relationships with other EU-RDT programme results are also exploited; specifically we outlinethe TCM (Traffic Capacity Management) module developed within TRIS project (TransportTelematics Programme).
TRIP Study Reference Architecture
The present report is organised in the following sections as follows:
Timetable
COSTDATABASE
LINECAPACITY
MARKETALGORITHMS
COSTMETHODS
POLICYSCENARIO
DIRECTIVES
NETWORKDATA
APPLICATIONS
TCM
SYSTEMDYNAMICS
MODEL
BUSINESSMODEL
AccountingSystem
MaintenanceSystem
EuROPE-TRIP Final Report
Contract RA-97-AM-1165 Final Report – Ver. 1.0 (June 2000) Page 12
Section 1 - Scenario and System Model Specifications
Section 2 - Railway Line Capacity
Section 3 – Costs of using infrastructure
Section 4 – How to share infrastructure costs
Section 5 – Access to infrastructure: the analytic model
Section 6 – Access to infrastructure: the auction model
Section 7 – The Business Planning Model
Section 8 – TRIP and proposal for a European Directive
Conclusions of the report
Bibliographic references are given at the end of each section.
The report concludes with the list of articles and presentations to conferences (Appendix).
EuROPE-TRIP Final Report
Contract RA-97-AM-1165 Final Report – Ver. 1.0 (June 2000) Page 13
1. Scenario and System Model Specifications
1.1. Introduction
This section provides a general overview of the business environment of the European Unionrailways and covers the main issues that are important in relation to the work undertaken forTRIP. It also introduces several topics which were the subject of further analysis and quantitativemodelling undertaken in the various workpackages.
In particular it focuses on issues that relate to the specification of a business planning model. Thiswork was undertaken as part of the System Model Specifications workpackage. This focused onthe management of infrastructure in the context of the new railways organisation and theassociated relationships between the Infrastructure Manager, the Regulatory Authorities andTrain Operators. It addressed the role of the infrastructure manager (IM) - i.e. the “supply” sideof the market - in the new institutional environment driven by the EU directives - 91/440, 95/19 -and the proposals for their amendments, COM(1998) 480.
1.2. The directives
1.2.1. Directive 91/440
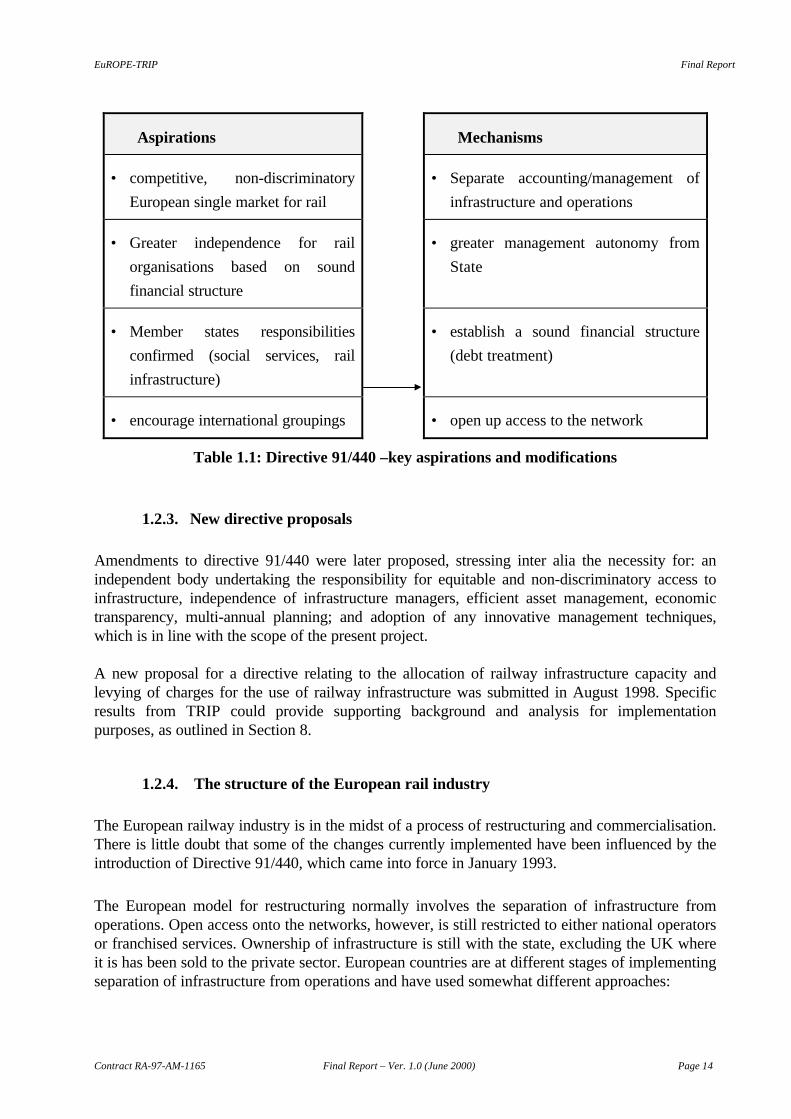
Directive 91/440 was designed inter alia to liberalise the market for providing rail services, at leastin specific areas where the EU would see a particular need (between member states/internationaltraffic) as a means of improving rail’s competitive position. The Directive expresses a need forincreased competition within the rail transport sector, with the expectation that this would resultin both improved commercial attitudes and increased quality in the provision of rail services.Table 1 below shows the key aspirations of the Directive against the mechanisms that it requireseach member state to implement.
1.2.2. Directive 95/19
Directive 95/19 was designed to set down operational principles for implementing the access-to-infrastructure procedure, i.e. the process of Train Operators requesting the InfrastructureManager the right to use certain paths, in view of international corridors (i.e. crossing moreEuropean rail networks). It also indicated the time window at which notice ought to be given(two months) allowing the IMs to process the demand and respond to the request.The directive, though accepted in national regulations, in general is not yet endorsed in practice incurrent railway operations.
EuROPE-TRIP Final Report
Contract RA-97-AM-1165 Final Report – Ver. 1.0 (June 2000) Page 14
Aspirations Mechanisms
• competitive, non-discriminatory
European single market for rail
• Separate accounting/management of
infrastructure and operations
• Greater independence for rail
organisations based on sound
financial structure
• greater management autonomy from
State
• Member states responsibilities
confirmed (social services, rail
infrastructure)
• establish a sound financial structure
(debt treatment)
• encourage international groupings • open up access to the network
Table 1.1: Directive 91/440 –key aspirations and modifications
1.2.3. New directive proposals
Amendments to directive 91/440 were later proposed, stressing inter alia the necessity for: anindependent body undertaking the responsibility for equitable and non-discriminatory access toinfrastructure, independence of infrastructure managers, efficient asset management, economictransparency, multi-annual planning; and adoption of any innovative management techniques,which is in line with the scope of the present project.
A new proposal for a directive relating to the allocation of railway infrastructure capacity andlevying of charges for the use of railway infrastructure was submitted in August 1998. Specificresults from TRIP could provide supporting background and analysis for implementationpurposes, as outlined in Section 8.
1.2.4. The structure of the European rail industry
The European railway industry is in the midst of a process of restructuring and commercialisation.There is little doubt that some of the changes currently implemented have been influenced by theintroduction of Directive 91/440, which came into force in January 1993.
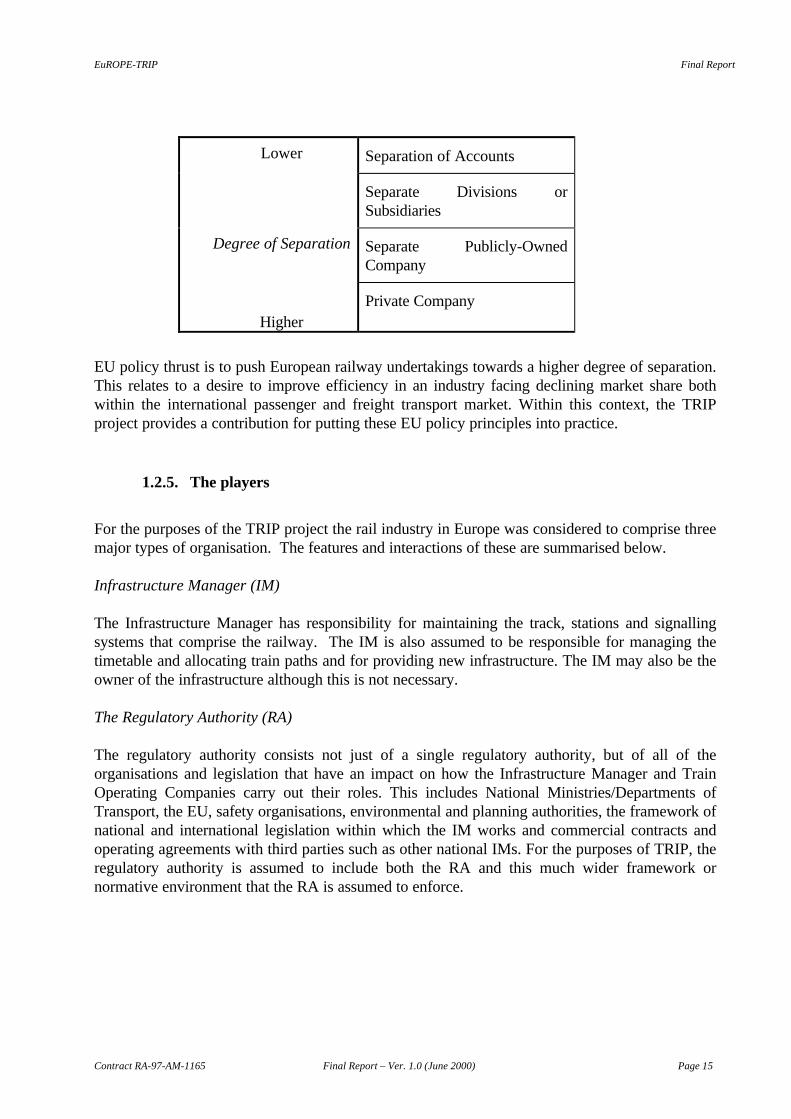
The European model for restructuring normally involves the separation of infrastructure fromoperations. Open access onto the networks, however, is still restricted to either national operatorsor franchised services. Ownership of infrastructure is still with the state, excluding the UK whereit is has been sold to the private sector. European countries are at different stages of implementingseparation of infrastructure from operations and have used somewhat different approaches:
EuROPE-TRIP Final Report
Contract RA-97-AM-1165 Final Report – Ver. 1.0 (June 2000) Page 15
Lower Separation of Accounts
Separate Divisions orSubsidiaries
Degree of Separation Separate Publicly-OwnedCompany
HigherPrivate Company
EU policy thrust is to push European railway undertakings towards a higher degree of separation.This relates to a desire to improve efficiency in an industry facing declining market share bothwithin the international passenger and freight transport market. Within this context, the TRIPproject provides a contribution for putting these EU policy principles into practice.
1.2.5. The players
For the purposes of the TRIP project the rail industry in Europe was considered to comprise threemajor types of organisation. The features and interactions of these are summarised below.
Infrastructure Manager (IM)
The Infrastructure Manager has responsibility for maintaining the track, stations and signallingsystems that comprise the railway. The IM is also assumed to be responsible for managing thetimetable and allocating train paths and for providing new infrastructure. The IM may also be theowner of the infrastructure although this is not necessary.
The Regulatory Authority (RA)
The regulatory authority consists not just of a single regulatory authority, but of all of theorganisations and legislation that have an impact on how the Infrastructure Manager and TrainOperating Companies carry out their roles. This includes National Ministries/Departments ofTransport, the EU, safety organisations, environmental and planning authorities, the framework ofnational and international legislation within which the IM works and commercial contracts andoperating agreements with third parties such as other national IMs. For the purposes of TRIP, theregulatory authority is assumed to include both the RA and this much wider framework ornormative environment that the RA is assumed to enforce.
EuROPE-TRIP Final Report
Contract RA-97-AM-1165 Final Report – Ver. 1.0 (June 2000) Page 16
Train Operating Companies (TOC)
Train operating companies (also briefly ‘operators’) are companies that use the rail infrastructureto run train services. They contract with the IM to run timetable services - that is to use the trackat various times and in various locations. The service operators have an existing timetable ofservices that they run and have constraints on how they can vary these. The constraints take formof both regulatory and contractual constraints from the RA and contractual and financialconstraints based on relationships with the IM.
1.2.6. Relationships between the players
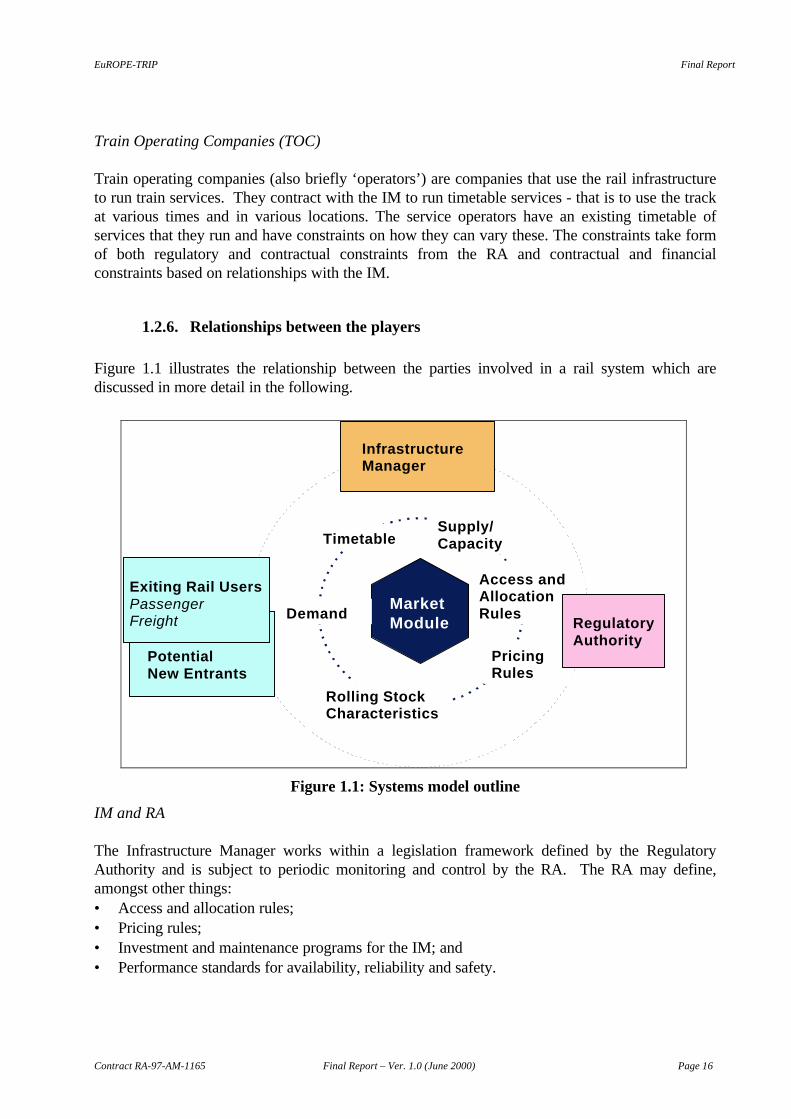
Figure 1.1 illustrates the relationship between the parties involved in a rail system which arediscussed in more detail in the following.
Exiting Rail UsersPassengerFreight
PotentialNew Entrants
InfrastructureManager
MarketModule
Rolling StockCharacteristics
Demand
Access andAllocationRules
Supply/CapacityTimetable
PricingRules
RegulatoryAuthority
Figure 1.1: Systems model outline
IM and RA
The Infrastructure Manager works within a legislation framework defined by the RegulatoryAuthority and is subject to periodic monitoring and control by the RA. The RA may define,amongst other things:• Access and allocation rules;• Pricing rules;• Investment and maintenance programs for the IM; and• Performance standards for availability, reliability and safety.
EuROPE-TRIP Final Report
Contract RA-97-AM-1165 Final Report – Ver. 1.0 (June 2000) Page 17
The RA may also fulfil an arbitration role for disputes between the RA and the TOCs. The RAmay also be the route by which certain subsidies and other payments reach the IM.
IM and TOC
The IM enters into contracts with TOCs to provide access to certain sections of track, stationsand other infrastructure at certain times. The IM also contracts to provide power and otherservices such as facilities management. The contracts provide certain guarantees as to the level ofservice provision (maintenance standards and timing, safety, power levels etc.) and impose on theTOC certain duties related to the running performance of trains and the type of rail vehicles thatuse the slots. These contracts are supported and enforced by penalty regimes on either party forfailure to honour the defined conditions.
TOC and RA
The TOCs are governed by the rules established by the RA, with regard to their relationships withthe IM and with regard to their relationships with each other, with the users of their servicesand/or client organisations. Relationships with the IM have been described above, the other areasof regulation include:• Inter-operator usage rules;• Timetabling and protection of “network” benefits;• Subsidies for socially necessary services; and• Access rights, constraints and priorities.
1.2.7. Business planning
In a purely commercial environment “Business Planning” is usually considered to consist of thedevelopment of a set of strategies to maximise profits (or other definition of shareholder value)within the constraints of the business environment and the actions of competitors. In the case ofrail infrastructure managers, financial targets are not necessarily the only objective to be attainedand competitors may not exist. In fact the IM has to meet a range of objectives, some of themfinancial and some of them imposed by the RA.
The approach adopted in this study has been to develop among others a model that demonstratesthe linkage between policy decisions and a range of performance and output measures. The modelcan therefore be used to explore how business decisions affect a mix of outputs; the preferred oroptimal mix of outputs is not determined by the model but would be a matter for the IM tochoose in any instance.
The process of business planning for the Infrastructure Manager has two distinct classes ofoperation, which reflect the time frame being considered:
Strategic - typically with a 10-15 year time horizon - where major changes to the rail system arebeing considered. Such changes may encompass new infrastructure, the introduction of new
EuROPE-TRIP Final Report
Contract RA-97-AM-1165 Final Report – Ver. 1.0 (June 2000) Page 18
technology or major legislative change, each of which may require a major re-evaluation of all ofthe services offered. The IM will seek to maximise the total value of its utility, within the boundsof regulatory constraints.
Tactical - with a much shorter time frame of 1-2 years - where proposals for service modificationor introduction of a new service needs to be considered. This (1 year) is usually the timetableperiod. In such cases the existing service patterns and infrastructure characteristics dominate inconsidering the ability of the network to accommodate change. The incremental costs ofaccommodating the new service must be less than the incremental utility gain obtained by the IM.
The TRIP models address both the strategic and tactical. The strategic view deals with the widerframework - legislative, financial, infrastructure - within which the railway operates, but theoperational characteristics at any time is the accumulation of many shorter-term tactical decisionstaken over the years. The business-planning model aims to test the relationships between differentstyles of tactical decision making and the long-term strategic operating framework.
1.3. Key concepts and their representation
In developing the specifications of the TRIP business-planning model a number of key conceptswere identified. Each of these is described below.
1.3.1. Representation of line capacity and timetables
Track capacity is a complex issue and its definition must recognise the range of factors that have amaterial effect on it, as discussed in the aftermath.
For the purposes of the system model, some new planning oriented methods can be used, whichare more simplified than traditional timetable tools, yet can provide workable representation of thephenomenon. The Train Capacity Management (TCM) software1 was used to find thecombinations of trains under which the corridor operates at capacity. Given a requested timetable,it generates potential train paths and traces and solves conflicts between these potential train pathsin a timetable. As such it contains essential data on infrastructure and rolling stock standardrunning times.
Using TCM an exercise was undertaken to determine the combinations of train paths (high speed,regional and freight) where the rail corridor (used in the sytems model) would reach capacity.With this production function incorporated into the system model, it is possible to assess for anyproposed train combination of paths whether or not the corridor would operate under at or abovecapacity and what the utilisation of the infrastructure is.
1 This was developed within EuROPE-TRIS project, 4th EU-RDT Transport Telematics Programme.
EuROPE-TRIP Final Report
Contract RA-97-AM-1165 Final Report – Ver. 1.0 (June 2000) Page 19
The system model does not contain within it detailed descriptions of timetables, but instead usessummary information about path numbers, representing number of trains (by type) operating in arail corridor within a certain time frame. A distinction is made between services that are part ofthe core timetable, and other services or requests for services that arise as the service operatorsrecognise new commercial opportunities.
1.3.2. Costs of using infrastructure
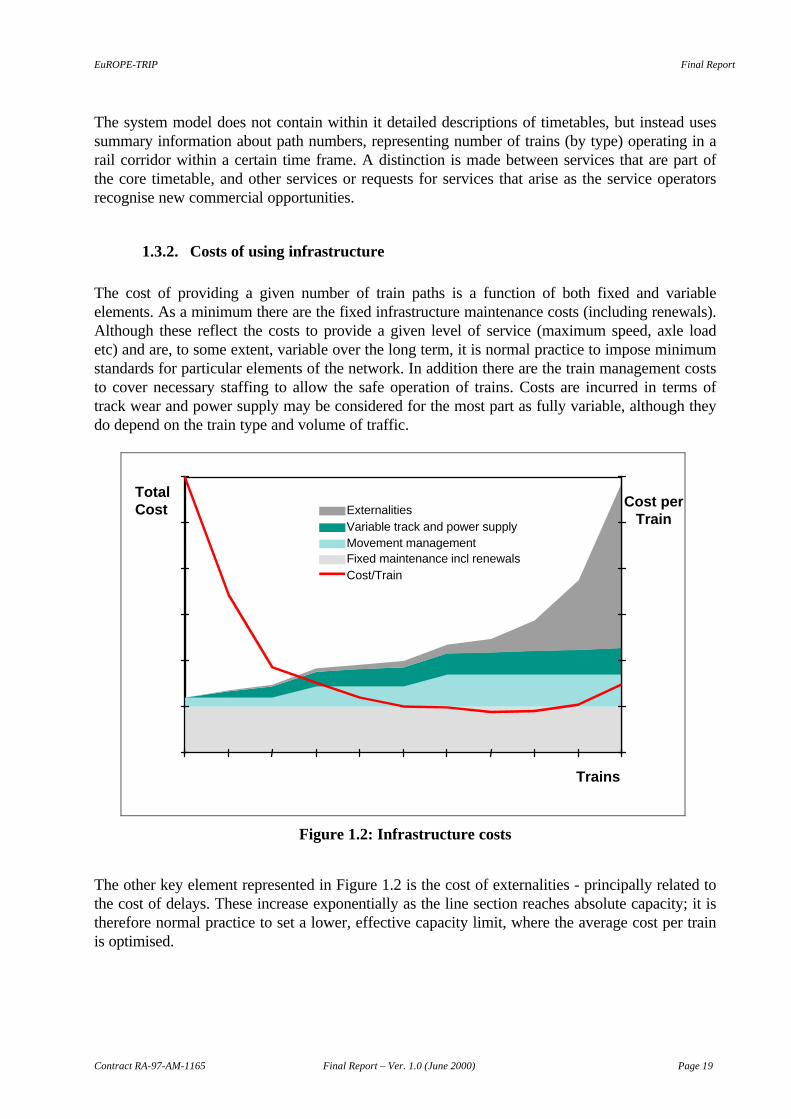
The cost of providing a given number of train paths is a function of both fixed and variableelements. As a minimum there are the fixed infrastructure maintenance costs (including renewals).Although these reflect the costs to provide a given level of service (maximum speed, axle loadetc) and are, to some extent, variable over the long term, it is normal practice to impose minimumstandards for particular elements of the network. In addition there are the train management coststo cover necessary staffing to allow the safe operation of trains. Costs are incurred in terms oftrack wear and power supply may be considered for the most part as fully variable, although theydo depend on the train type and volume of traffic.
0
50
100
150
200
250
300
0 1 2 3 4 5 6 7 8 9 10Trains
TotalCost
0
20
40
60
80
100
120
ExternalitiesVariable track and power supplyMovement managementFixed maintenance incl renewalsCost/Train
Cost perTrain
Figure 1.2: Infrastructure costs
The other key element represented in Figure 1.2 is the cost of externalities - principally related tothe cost of delays. These increase exponentially as the line section reaches absolute capacity; it istherefore normal practice to set a lower, effective capacity limit, where the average cost per trainis optimised.
EuROPE-TRIP Final Report
Contract RA-97-AM-1165 Final Report – Ver. 1.0 (June 2000) Page 20
Costs of using infrastructure and rational methods how to allocate them among operators arediscussed analysed in Sections 3 and 4 of this report, while a separate paragraph is devoted to thecosts of using inland intermodal terminals, as they are increasingly important in the developmentof freight access to rail infrastructure.
1.3.3. Representation of access rights
It is likely that even under open access rules different operators will have different rights of accessto rail infrastructure. Existing state operators using government subsidy to provide sociallydesirable services, may well have certain parts of their operating capacity guaranteed (for exampleurban commuter services to major cities or for direct/connecting services to rural communities).Such rights may take the form of fixed slots, with limited capacity for variation, or involvingsignificant financial penalties for the allocation of the slots to other operators. Other users willhave existing or historic access rights guaranteed by law or contract, which may be difficult tochange in the short and medium term. They may be completely open to renegotiations at a fixeddate in the future (for example TOC franchisees in the UK have certain track access slotsguaranteed by contract with the IM).
Finally, some access rights will be negotiated on fully commercial contracts and may even be one-off or subject to short term variation at the request of the IM or the TOC.
1.3.4. Representation of access to infrastructure
Before setting up rules for access to infrastructure, it is desirable to test from a theoretical and/orlaboratory point of view the market behaviour and make assessment of the various workingmodels that can provide better guide to regulatory authorities and policy makers. In this regardthree approaches are followed in the study to highlight the various system perspectives.First a analytical model is developed in order to represent an integrated view of access toinfrastructure, starting from market demand and modelling the mechanism of transport pricing(economic equilibrium between final customers and transport operators) and infrastructurecharging mechanism (access fees to infrastructure manager by transport operators).
Second an auction model is set up and experiments carried out in order to represent the marketaccess in the more competitive way. This also follows an approach based on experimentaleconomics. Finally a simulation model is developed through the system dynamics method whichaims to demonstrate a business planning model of the infrastructure management.
These approaches are further discussed in Sections 5, 6 and 7 of this report.
1.3.5. Performance criteria
The model is concerned with evaluating the performance of the Infrastructure Manager andconditions for providing access to rail network in a sustainable way. In practice the IM will have
EuROPE-TRIP Final Report
Contract RA-97-AM-1165 Final Report – Ver. 1.0 (June 2000) Page 21
several targets and criteria by which performance is evaluated, and to reflect this it is helpful togenerate distinct performance indicators in order to provide a multivariate evaluation framework,which will include the following criteria:
• Financial (costs and revenues);• Quality of service delivery;• Regulatory business targets;• Business targets.
These will be included in the Business Planning Model described in Section 7.
The model currently does not include social costs and benefits, but if they were to be included itwould be necessary to identify the scope of anticipated impacts. These might include the impacton the wider community including road decongestion, safety, the environment and local orregional economic activity and employment. Road decongestion benefits and disbenefits wouldarise from reductions/increases in car traffic associated with the introduction of new rail servicesor alterations to times of existing trains. The levels of attraction from car/road freight and theirassociated value would be linked to the locality: urban areas, inter-urban or rural services.
Benefit rates would incorporate time-savings to remaining road users, vehicle operating costs andaccident rates. The major environmental benefit or disbenefit would be changes in the volume ofvehicle emissions. It will be clear that assessments of this type will require spatially disaggregatedforecasts of passenger demand by market sector. This was beyond the scope of this work and themodel does not therefore produce estimates of external benefits.
We hope to extend the model structure in further research to include this and other impactsrelevant to infrastructure strategic planning.
1.3.6. TRIP and the “infrastructure package”
During this project development a new series of directives amendments have been proposed forthe railway sector. It was beyond the scope of the original TRIP contract to give full answer tothe requirements of the complex and evolving scenario. Nevertheless the project can provide auseful contribution in the context of the new “infrastructure package”. In the Section 9 of thereport the more relevant hints are given how the results of this work can assist the decisionmakers and managers to exploit the criteria and methods provided in the policy issues related toinfrastructure access and charging.
EuROPE-TRIP Final Report
Contract RA-97-AM-1165 Final Report – Ver. 1.0 (June 2000) Page 22
2. THE RAILWAY LINE CAPACITY
2.1. Introduction
This chapter summarises the work undertaken within the Line Capacity workpackage . The workfocused on studying methods to define the capacity of railway lines and issues that are related tothis. This work resulted in the definition of a new methodology for carrying out capacity studies.This methodology puts together various approaches into a unified “three layers” framework,made of:• Analytic methods,• Scheduling methods, and• Simulation methods.
Numerical applications are discussed for different models and the results of a study jointly carriedout with LIBERAIL project, within the same EU-RDT Transport Programme, are reported. Thiswork has particularly regarded a proposed methodology for European rail corridors and somecase studies are presented.
2.2. A framework of analysis
Topological and technological characteristics of the line, traffic mix and quality of service (i.e.regularity margins and timetable reliability) are major issues for defining line capacity.Furthermore service rulings (e.g. train priority and other planning considerations) also have agreat impact. In the framework addressed in this study line capacity is closely related to timetableplanning process, which should be put in its proper context.
Timetable planning process
Line capacity determination is input to the timetable planning process, for which some definitionscan be found in Bussieck and Al. [2]; the overall process can be outlined in the following phases:
- Demand and marketing plans
- Line planning
- Commercial Train scheduling.
- Technical Train scheduling.
The first three phases belong to the Transport Companies or Train Operators (TO), the Technicalphase to the Infrastructure Management.From estimates about origin-destination (O-D) traffic flows (passenger or freight), congruent withother marketing policies, the TO sets up the line planning, which embraces a network and choosesa set of “operating lines” and their frequency in order to accommodate the traffic demand andoptimise other economic and service (e.g. connections quality) objectives.
EuROPE-TRIP Final Report
Contract RA-97-AM-1165 Final Report – Ver. 1.0 (June 2000) Page 23
The commercial train scheduling can be regarded as the preliminary timetable construction,provided by the Train Operators, which request Infrastructure Manager track allocation.Finally the IM has to produce technical train scheduling or pathing construction, to the level ofdetail required for train movement.The commercial (TO) and technical (IM) views have therefore different prospective, such as:
- scope of the analysis, that is network or line/station focus
- level of details
- horizontal (i.e. one-business) vs. vertical co-ordination (i.e. multi-business integration on the
same infrastructure)
- different and specific constraints (e.g. infrastructure maintenance) for the IM
- integration with resource planning (e.g. vehicles, crew) for the TOs.
Theoretical and practical capacity
It is of major importance to distinguish between theoretical and practical capacity.The former is measured by the number of trains able to run over the network per unit of time,with the trains permanently and ideally running at minimum headway (i.e. time distance betweentwo travelling trains).The latter is measured under more realistic assumptions, related to the level of expected operatingquality and system reliability, which affect both IM and Train Operators, besides major disruptionsand external events.
The art of time-tabling has to take account for that.
Timetables are usually represented by train graphs, time-distance or string diagrams. For eachtrain following another a minimum “clear” distance or headway must be provided, taking intoaccount safety and regularity factors.Minimum safety distance is guaranteed on the field signalling system and other operatingprocedures. This represents however only a minimum requirement for spacing trains (i.e. brakingdistance plus some safety margins).In addition a regularity margin is usually needed for absorbing irregularities and to guarantee atrain flow as smooth as possible.
These margins represent a design factor that can be very critical for assuring the timetable successand are increasingly becoming important in setting down the contractual rulings between IM andTOs for standards to be provided in access to infrastructure.
In the following the several factors that can be considered when addressing railway line capacityare also summarised:
• New or existing lines (design vs. current exploitation)• Infrastructure characteristics (e.g. track weight, signalling and block systems)• Single/Double or more tracks• Stations or loops pacing (for train meets or crosses)
EuROPE-TRIP Final Report
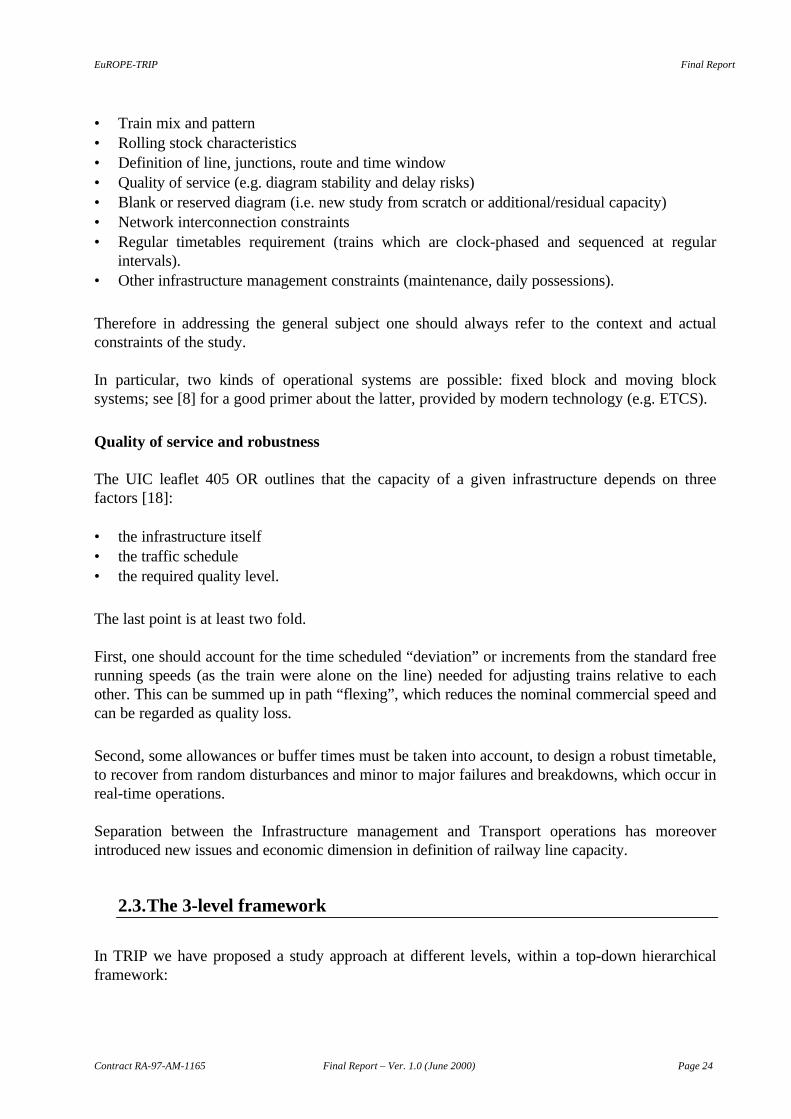
Contract RA-97-AM-1165 Final Report – Ver. 1.0 (June 2000) Page 24
• Train mix and pattern• Rolling stock characteristics• Definition of line, junctions, route and time window• Quality of service (e.g. diagram stability and delay risks)• Blank or reserved diagram (i.e. new study from scratch or additional/residual capacity)• Network interconnection constraints• Regular timetables requirement (trains which are clock-phased and sequenced at regular
intervals).• Other infrastructure management constraints (maintenance, daily possessions).
Therefore in addressing the general subject one should always refer to the context and actualconstraints of the study.
In particular, two kinds of operational systems are possible: fixed block and moving blocksystems; see [8] for a good primer about the latter, provided by modern technology (e.g. ETCS).
Quality of service and robustness
The UIC leaflet 405 OR outlines that the capacity of a given infrastructure depends on threefactors [18]:
• the infrastructure itself• the traffic schedule• the required quality level.
The last point is at least two fold.
First, one should account for the time scheduled “deviation” or increments from the standard freerunning speeds (as the train were alone on the line) needed for adjusting trains relative to eachother. This can be summed up in path “flexing”, which reduces the nominal commercial speed andcan be regarded as quality loss.
Second, some allowances or buffer times must be taken into account, to design a robust timetable,to recover from random disturbances and minor to major failures and breakdowns, which occur inreal-time operations.
Separation between the Infrastructure management and Transport operations has moreoverintroduced new issues and economic dimension in definition of railway line capacity.
2.3. The 3-level framework
In TRIP we have proposed a study approach at different levels, within a top-down hierarchicalframework:
EuROPE-TRIP Final Report
Contract RA-97-AM-1165 Final Report – Ver. 1.0 (June 2000) Page 25
1. analytical and deterministic formulas
2. probabilistic methods
3. mathematical programming ( scheduling or optimisation methods )
4. simulation and hybrid models.
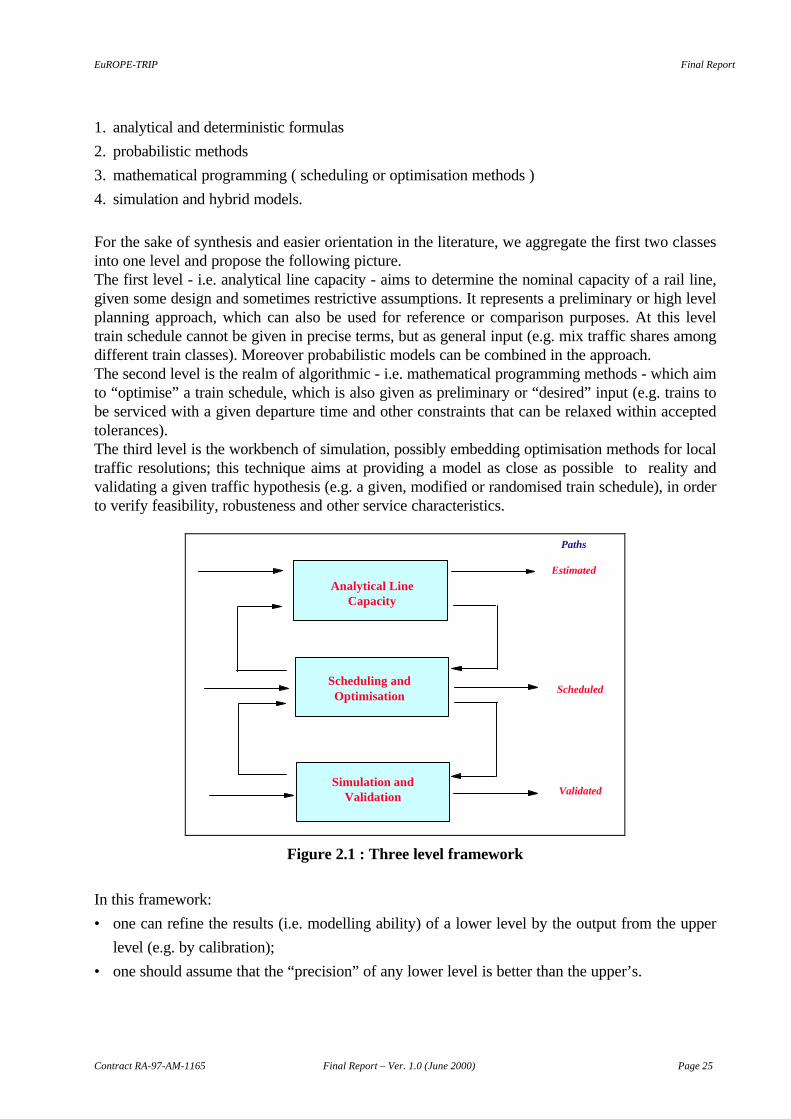
For the sake of synthesis and easier orientation in the literature, we aggregate the first two classesinto one level and propose the following picture.The first level - i.e. analytical line capacity - aims to determine the nominal capacity of a rail line,given some design and sometimes restrictive assumptions. It represents a preliminary or high levelplanning approach, which can also be used for reference or comparison purposes. At this leveltrain schedule cannot be given in precise terms, but as general input (e.g. mix traffic shares amongdifferent train classes). Moreover probabilistic models can be combined in the approach.The second level is the realm of algorithmic - i.e. mathematical programming methods - which aimto “optimise” a train schedule, which is also given as preliminary or “desired” input (e.g. trains tobe serviced with a given departure time and other constraints that can be relaxed within acceptedtolerances).The third level is the workbench of simulation, possibly embedding optimisation methods for localtraffic resolutions; this technique aims at providing a model as close as possible to reality andvalidating a given traffic hypothesis (e.g. a given, modified or randomised train schedule), in orderto verify feasibility, robusteness and other service characteristics.
Analytical LineCapacity
Simulation andValidation
Scheduling andOptimisation
Paths
Estimated
Scheduled
Validated
Figure 2.1 : Three level framework
In this framework:
• one can refine the results (i.e. modelling ability) of a lower level by the output from the upper
level (e.g. by calibration);
• one should assume that the “precision” of any lower level is better than the upper’s.
EuROPE-TRIP Final Report
Contract RA-97-AM-1165 Final Report – Ver. 1.0 (June 2000) Page 26
For instance typical target tolerances of the methods, respectively in terms of train number andtheir time or modelling error, might be suggested as follows:
Modelling “error” No. of Trains Timing
1st Level 10-15% 15-30 minutes
2nd Level 1-3% 5 minutes or less
3rd Level 0-1% 15 seconds or less
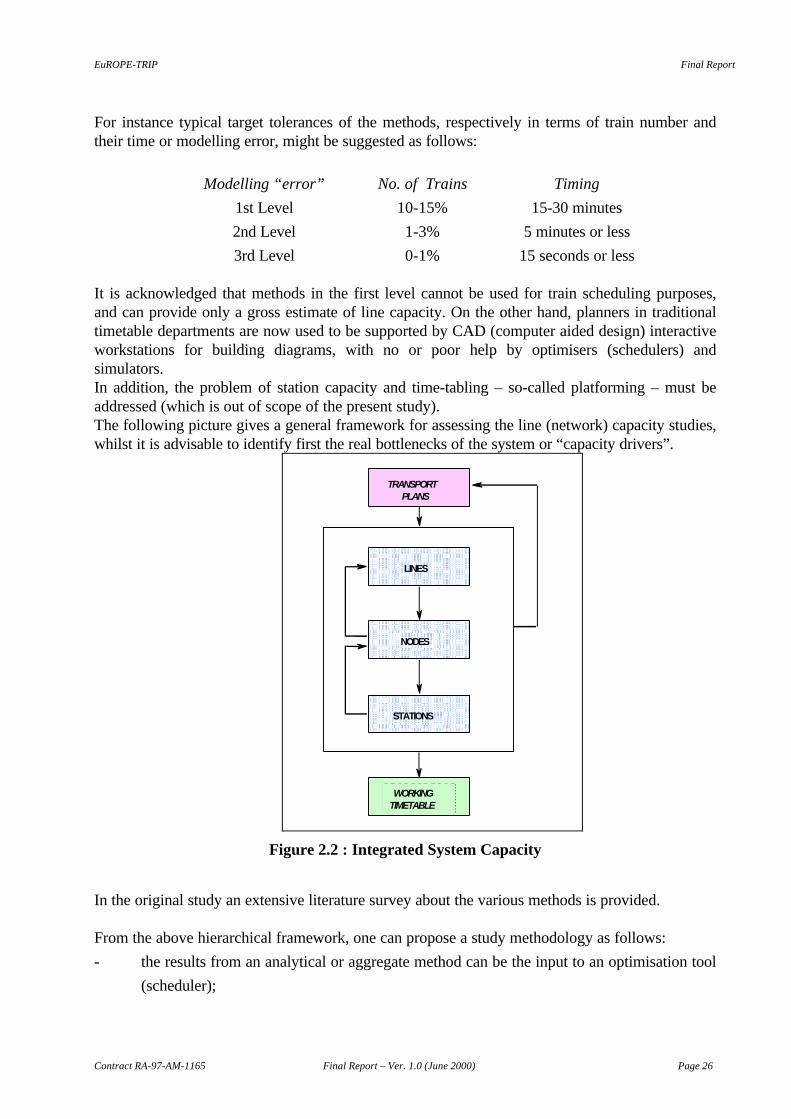
It is acknowledged that methods in the first level cannot be used for train scheduling purposes,and can provide only a gross estimate of line capacity. On the other hand, planners in traditionaltimetable departments are now used to be supported by CAD (computer aided design) interactiveworkstations for building diagrams, with no or poor help by optimisers (schedulers) andsimulators.In addition, the problem of station capacity and time-tabling – so-called platforming – must beaddressed (which is out of scope of the present study).The following picture gives a general framework for assessing the line (network) capacity studies,whilst it is advisable to identify first the real bottlenecks of the system or “capacity drivers”.
TRANSPORTPLANS
LINES
NODES
STATIONS
WORKINGTIMETABLE
Figure 2.2 : Integrated System Capacity
In the original study an extensive literature survey about the various methods is provided.
From the above hierarchical framework, one can propose a study methodology as follows:
- the results from an analytical or aggregate method can be the input to an optimisation tool
(scheduler);
EuROPE-TRIP Final Report
Contract RA-97-AM-1165 Final Report – Ver. 1.0 (June 2000) Page 27
- the scheduler should find pathing solution(s) at high level of precision, and
- drive a simulator for making final validation and providing other details.
2.4. General time-tabling considerations
Some further considerations can be done when considering how line capacity or timetables aremanaged in practice.
2.4.1. ‘Limit’ or bottleneck sectionRailway engineers are traditionally keen on the concept of the “limit” line section which is thedimensioning part or practical bottleneck of the whole traffic flowing on a railway line. This canbe caused by physical constraints, block section length etc…
2.4.2. MaintenanceTime windows or intervals (possessions) are to be reserved for infrastructure maintenance; e.g. a3 hours or longer intervals needed every day for each line section for classical lines; longerintervals are needed for high speed lines. Day light possessions can be shorter than night ones, atthe same level of works efficiency. Other policies are to concentrate maintenance on days wheretraffic is lower, making alternate day and night possessions, or closing lines on week-ends.
2.4.3. Slow-downs - Regularity marginsSlow-downs - i.e. speed reductions on certain line segments due to works and otherscontingencies - must be taken into account. Moreover regularity margins are commonly added byplanners to the nominal train running time, expressed as number of minutes every given linedistance (e.g. 2-4 minutes every 100 km). One can also refer to standards proposed by UIC. Co-ordination of works on long-distance and European corridors may be necessary.
2.4.4. Diagramming techniquesIn order to improve capacity and optimise rail utilisation, train patterns should be designedgrouping trains into “flights” i.e. trains having the same speed (‘parallel strings’); these aresometimes flexed to lower speed trains.Another technique is “compacting” current timetable in order to find new slots.
EuROPE-TRIP Final Report
Contract RA-97-AM-1165 Final Report – Ver. 1.0 (June 2000) Page. 28
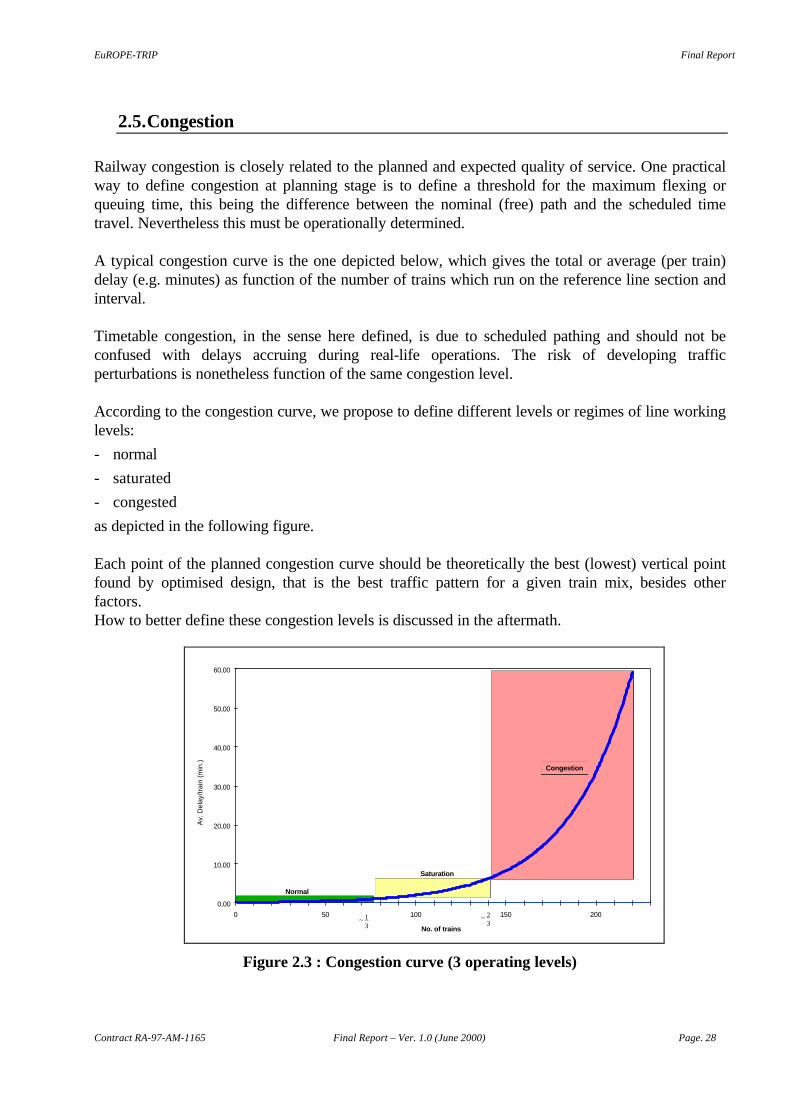
2.5. Congestion
Railway congestion is closely related to the planned and expected quality of service. One practicalway to define congestion at planning stage is to define a threshold for the maximum flexing orqueuing time, this being the difference between the nominal (free) path and the scheduled timetravel. Nevertheless this must be operationally determined.
A typical congestion curve is the one depicted below, which gives the total or average (per train)delay (e.g. minutes) as function of the number of trains which run on the reference line section andinterval.
Timetable congestion, in the sense here defined, is due to scheduled pathing and should not beconfused with delays accruing during real-life operations. The risk of developing trafficperturbations is nonetheless function of the same congestion level.
According to the congestion curve, we propose to define different levels or regimes of line workinglevels:
- normal
- saturated
- congested
as depicted in the following figure.
Each point of the planned congestion curve should be theoretically the best (lowest) vertical pointfound by optimised design, that is the best traffic pattern for a given train mix, besides otherfactors.How to better define these congestion levels is discussed in the aftermath.
0,00
10,00
20,00
30,00
40,00
50,00
60,00
0 50 100 150 200
No. of trains
Av.
Del
ay/tr
ain
(min
.)
13
~23
~
Saturation
Normal
Congestion
Figure 2.3 : Congestion curve (3 operating levels)
EuROPE-TRIP Final Report
Contract RA-97-AM-1165 Final Report – Ver. 1.0 (June 2000) Page 29
2.6. The TRIPLIB proposed methodology
Following the methodological survey, the study has applied the “3-level” exercise on a given line orcorridor - e.g. Rome-Milan-Paris-London – chosen as case study in the LIBERAIL-TRIPconcertation. This has addressed only specific corridor sections for deeper investigation, asdescribed in following test cases.The so-called TRIPLIB methodology is proposed as general result of the study, as follows:
1. Use the ‘best’ analytical formula available to identify the more constraining or bottlenecksections; these could be parts of the line ca.50-100 km long.
2. Estimate on these sections the ‘free’ or residual capacity, for given traffic type(s); for instancefreight trains, which can be particularly related to specific Freightways exploitation. Thisanalysis can be carried out by some appropriate algorithm (e.g. FLOU, see following section).
3. Make the same exercise, as step above, with the remaining corridor sections, identifying all theeligible paths that can be linked to the ones found in step 2.
4. Assemble available paths in steps 2 and 3.(This can already give a preliminary solution to theproblem).
5. Refine results in Step 4 by applying a more sophisticated schedule builder (e.g. TRIS-TCMAlgorithm). This can take into account other constraints and may be able to produce a bettersolution; this may also decrease the number of paths, as more constraints are added.
6. Identify the more congested sections that so remain and make these subject to a simulationexercise to verify the expected solution. At this point any state-of-the-art simulator can beapplied, according to availability and national preferences.
7. Using the simulator, make robustness assessment of the timetable so created, according to someappropriate methodology or regularity standards.
8. If the latter requirements are not satisfied, return to Step 2, Else OK; that is a new feasible pathschedule is found.
In practice the procedure allows for recycling, in order to find better or alternate solutions that canbe subject to other considerations.Step 1 can be facultative - peak loaded sections are usually known in advance- though it may beinteresting to verify analytical formulas with practical experience.Step 2 through 4 can be unified in just one module, if the algorithm can simultaneously process thewhole corridor (say 2000 km or more).It should be also necessary to analyse, within the considered period or working timetable, weeklytraffic variations to uncover days having more slot potential.
EuROPE-TRIP Final Report
Contract RA-97-AM-1165 Final Report – Ver. 1.0 (June 2000) Page 30
2.7. Analytic Methods
In the study various analytical methods to assess the line capacity have been analysed and practicalsoftware implementations and tests have been conducted.For the test cases we have chosen the three following methods, acknowledged as:
• UIC
• German Rails
• Malaspina & Reitiani.
UIC's method [19] calculates for maximum one stop in the considered line section and takesaccount of the order of trains. A buffer time is inserted to achieve an acceptable quality of service;the implementation handles maximum 4 train classes.German Rail's uses a simplified method classifying trains in two train classes (fast and slow trains).To design acceptable quality of service, the theoretical capacity is reduced by a utilisation factor.Malaspina and Reitiani's method [12] accounts for possible delays and probabilistic prioritycoefficients are introduced for all combinations of train classes.A computer package has been provided for carrying out the tests.
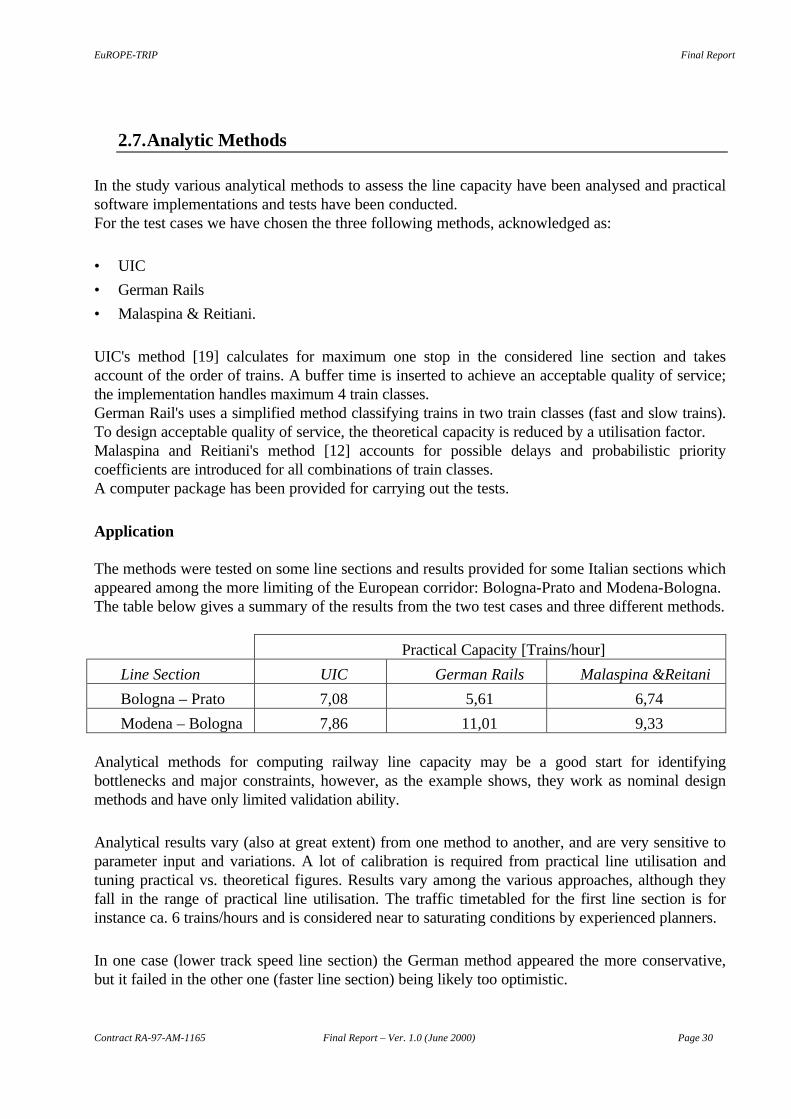
Application
The methods were tested on some line sections and results provided for some Italian sections whichappeared among the more limiting of the European corridor: Bologna-Prato and Modena-Bologna.The table below gives a summary of the results from the two test cases and three different methods.
Practical Capacity [Trains/hour]
Line Section UIC German Rails Malaspina &Reitani
Bologna – Prato 7,08 5,61 6,74
Modena – Bologna 7,86 11,01 9,33
Analytical methods for computing railway line capacity may be a good start for identifyingbottlenecks and major constraints, however, as the example shows, they work as nominal designmethods and have only limited validation ability.
Analytical results vary (also at great extent) from one method to another, and are very sensitive toparameter input and variations. A lot of calibration is required from practical line utilisation andtuning practical vs. theoretical figures. Results vary among the various approaches, although theyfall in the range of practical line utilisation. The traffic timetabled for the first line section is forinstance ca. 6 trains/hours and is considered near to saturating conditions by experienced planners.
In one case (lower track speed line section) the German method appeared the more conservative,but it failed in the other one (faster line section) being likely too optimistic.
EuROPE-TRIP Final Report
Contract RA-97-AM-1165 Final Report – Ver. 1.0 (June 2000) Page 31
Though being the oldest and outdated, the classical UIC method [19] still appears the most robustto input variations and changing conditions. It is likely the easiest to be calibrated in order toreplicate the practical conditions for operating the line at the current levels; moreover, in thisapplication, it fits very well (yet a bit more conservative) with the results given by moresophisticated scheduling method (see following Section).However it is not recognised any more as an official UIC leaflet, having been superseded by a newone [18], that provides no more formulas but only general principles about line capacity.
The Malaspina&Reitaini method looks like to improve very much the modelling theory and takeaccount of scheduled “delay” for pathing effect of trains; but still requires more validation andcalibration work than we were able to carry out in this application.
It is also curious that in this (albeit limited) application the various methods failed to agree aboutthe dimensioning part or bottleneck for each line section considered.
2.8. Scheduling Algorithms
2.8.1. Introduction
Scheduling algorithms are a more recent and promising approach, very useful for “second level”analysis, that is providing much better solution than pure analytical formulae, and yet notoverlapping with the field of simulation. They usually resort to so called optimisation andmathematical programming techniques, in the realm of combinatorial operations research.The output from schedulers can better drive simulators, which otherwise would be too ‘blind’ toolsand would not be able to start with good feasible plans to be validated.
In TRIP we have:
• conceived a new yet simplified algorithm oriented to determine the residual capacity of a line,
which is defined FLOU (Flow Line Optimal Utilisation)
• carried out tests with a more sophisticated scheduling algorithm developed within the TRIS
project, i.e. TCM (Traffic Capacity Management).
In the following part of the section we report about these experiences.
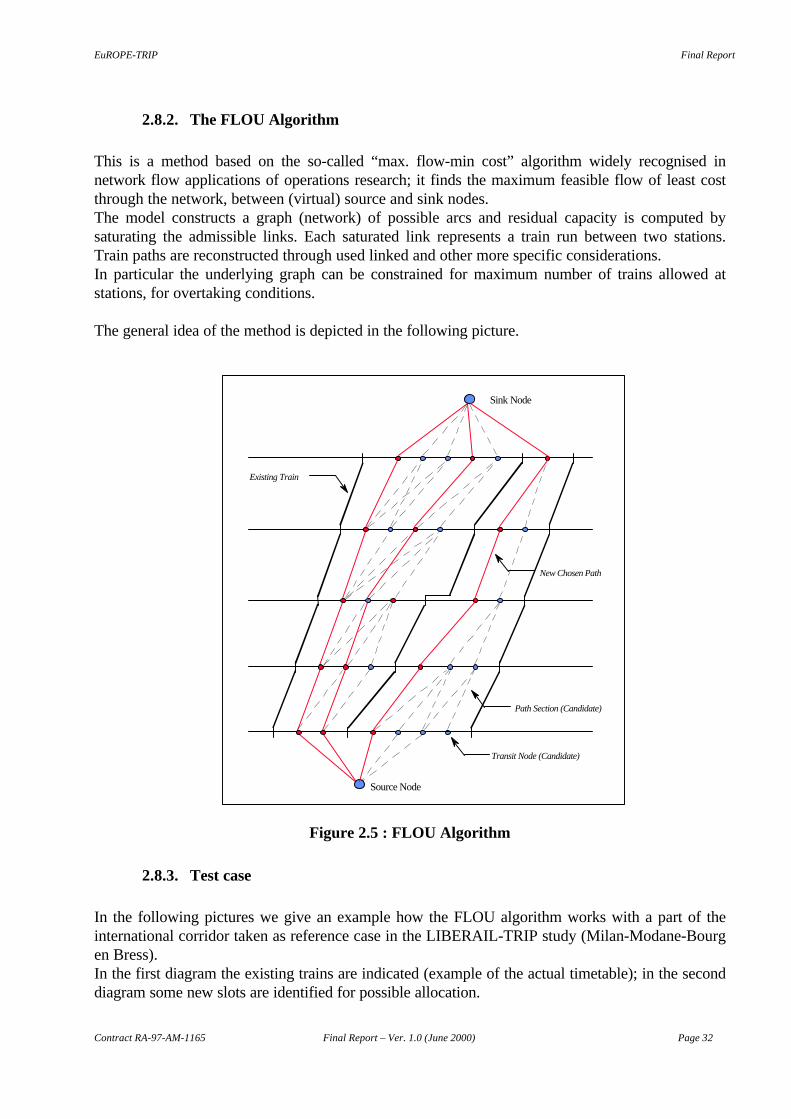
EuROPE-TRIP Final Report
Contract RA-97-AM-1165 Final Report – Ver. 1.0 (June 2000) Page 32
2.8.2. The FLOU Algorithm
This is a method based on the so-called “max. flow-min cost” algorithm widely recognised innetwork flow applications of operations research; it finds the maximum feasible flow of least costthrough the network, between (virtual) source and sink nodes.The model constructs a graph (network) of possible arcs and residual capacity is computed bysaturating the admissible links. Each saturated link represents a train run between two stations.Train paths are reconstructed through used linked and other more specific considerations.In particular the underlying graph can be constrained for maximum number of trains allowed atstations, for overtaking conditions.
The general idea of the method is depicted in the following picture.
Sink Node
Source Node
Transit Node (Candidate)
New Chosen Path
Existing Train
Path Section (Candidate)
Figure 2.5 : FLOU Algorithm
2.8.3. Test case
In the following pictures we give an example how the FLOU algorithm works with a part of theinternational corridor taken as reference case in the LIBERAIL-TRIP study (Milan-Modane-Bourgen Bress).In the first diagram the existing trains are indicated (example of the actual timetable); in the seconddiagram some new slots are identified for possible allocation.
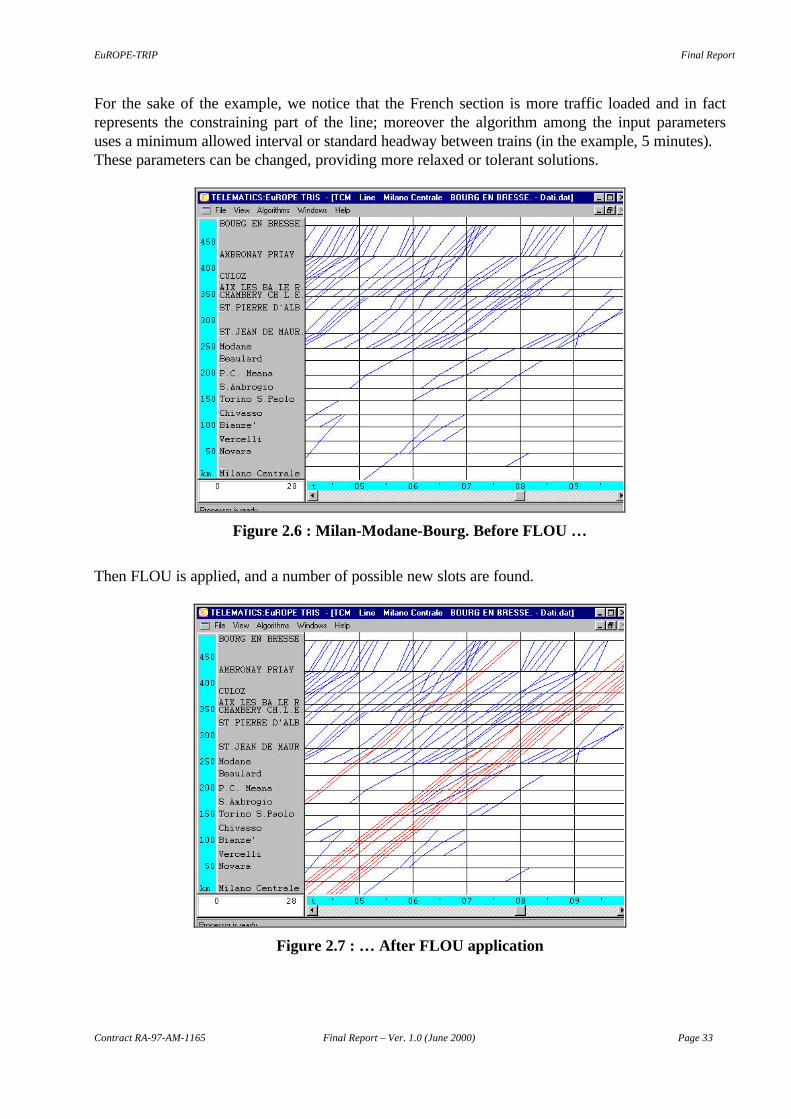
EuROPE-TRIP Final Report
Contract RA-97-AM-1165 Final Report – Ver. 1.0 (June 2000) Page 33
For the sake of the example, we notice that the French section is more traffic loaded and in factrepresents the constraining part of the line; moreover the algorithm among the input parametersuses a minimum allowed interval or standard headway between trains (in the example, 5 minutes).These parameters can be changed, providing more relaxed or tolerant solutions.
Figure 2.6 : Milan-Modane-Bourg. Before FLOU …
Then FLOU is applied, and a number of possible new slots are found.
Figure 2.7 : … After FLOU application
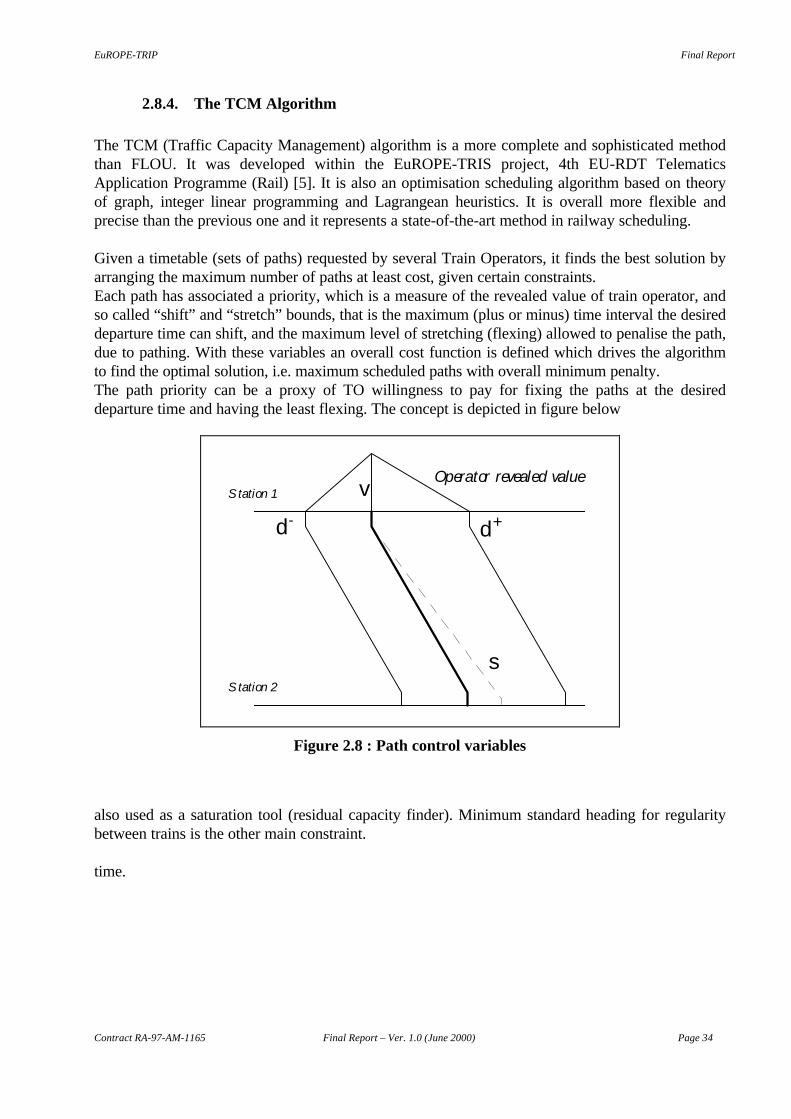
EuROPE-TRIP Final Report
Contract RA-97-AM-1165 Final Report – Ver. 1.0 (June 2000) Page 34
2.8.4. The TCM Algorithm
The TCM (Traffic Capacity Management) algorithm is a more complete and sophisticated methodthan FLOU. It was developed within the EuROPE-TRIS project, 4th EU-RDT TelematicsApplication Programme (Rail) [5]. It is also an optimisation scheduling algorithm based on theoryof graph, integer linear programming and Lagrangean heuristics. It is overall more flexible andprecise than the previous one and it represents a state-of-the-art method in railway scheduling.
Given a timetable (sets of paths) requested by several Train Operators, it finds the best solution byarranging the maximum number of paths at least cost, given certain constraints.Each path has associated a priority, which is a measure of the revealed value of train operator, andso called “shift” and “stretch” bounds, that is the maximum (plus or minus) time interval the desireddeparture time can shift, and the maximum level of stretching (flexing) allowed to penalise the path,due to pathing. With these variables an overall cost function is defined which drives the algorithmto find the optimal solution, i.e. maximum scheduled paths with overall minimum penalty.The path priority can be a proxy of TO willingness to pay for fixing the paths at the desireddeparture time and having the least flexing. The concept is depicted in figure below
v
d- d+
s
S tation 1
S tation 2
Operator revealed value
Figure 2.8 : Path control variables
also used as a saturation tool (residual capacity finder). Minimum standard heading for regularitybetween trains is the other main constraint.
time.
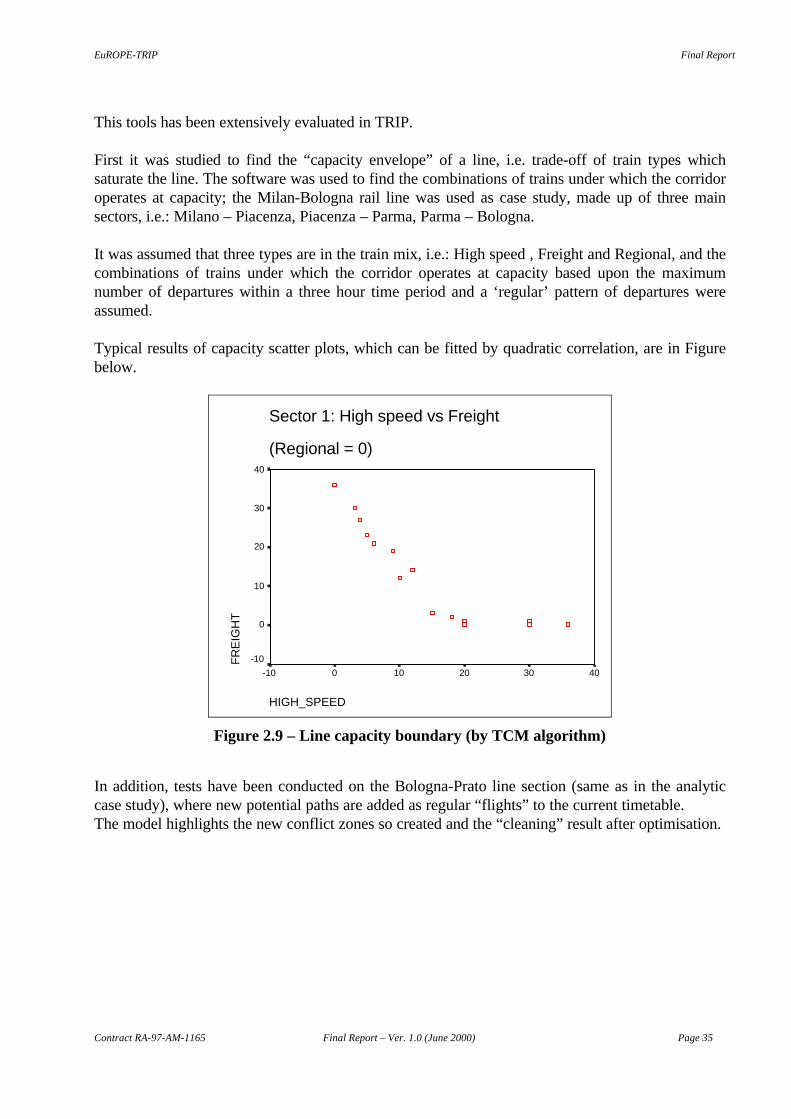
EuROPE-TRIP Final Report
Contract RA-97-AM-1165 Final Report – Ver. 1.0 (June 2000) Page 35
This tools has been extensively evaluated in TRIP.
First it was studied to find the “capacity envelope” of a line, i.e. trade-off of train types whichsaturate the line. The software was used to find the combinations of trains under which the corridoroperates at capacity; the Milan-Bologna rail line was used as case study, made up of three mainsectors, i.e.: Milano – Piacenza, Piacenza – Parma, Parma – Bologna.
It was assumed that three types are in the train mix, i.e.: High speed , Freight and Regional, and thecombinations of trains under which the corridor operates at capacity based upon the maximumnumber of departures within a three hour time period and a ‘regular’ pattern of departures wereassumed.
Typical results of capacity scatter plots, which can be fitted by quadratic correlation, are in Figurebelow.
Sector 1: High speed vs Freight
(Regional = 0)
HIGH_SPEED
403020100-10
FR
EIG
HT
40
30
20
10
0
-10
Figure 2.9 – Line capacity boundary (by TCM algorithm)
In addition, tests have been conducted on the Bologna-Prato line section (same as in the analyticcase study), where new potential paths are added as regular “flights” to the current timetable.The model highlights the new conflict zones so created and the “cleaning” result after optimisation.
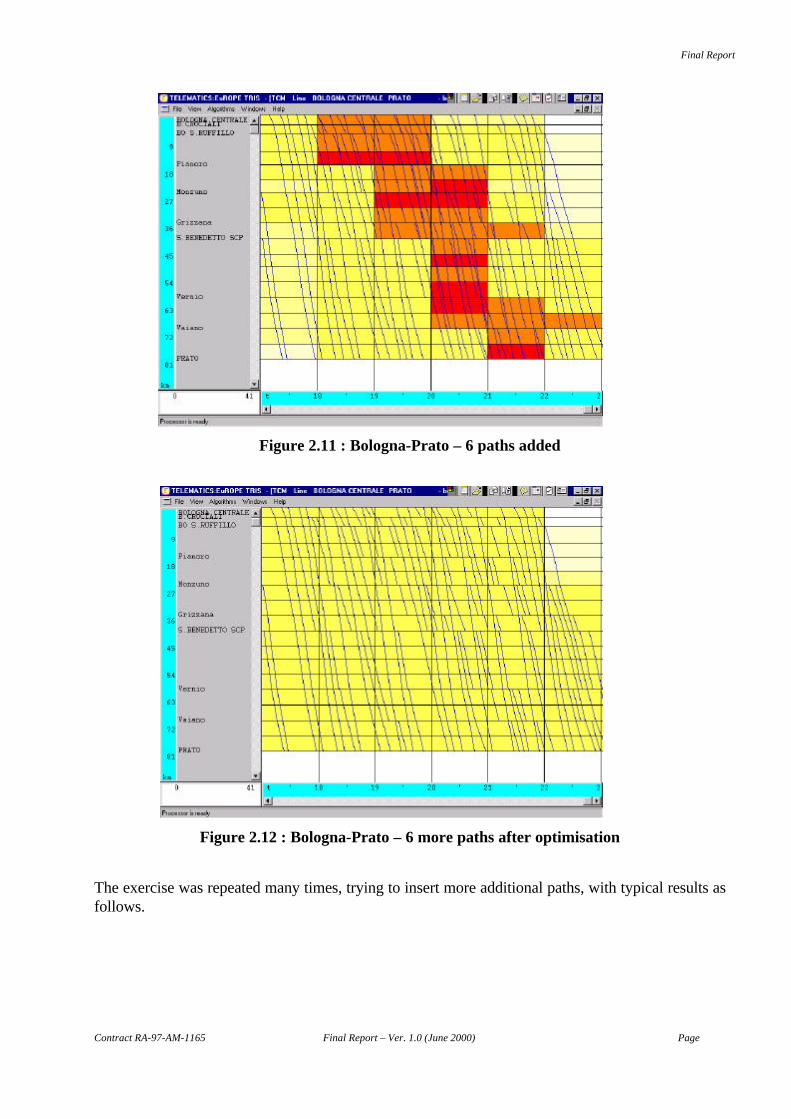
Final Report
Contract RA-97-AM-1165 Final Report – Ver. 1.0 (June 2000) Page
Figure 2.11 : Bologna-Prato – 6 paths added
Figure 2.12 : Bologna-Prato – 6 more paths after optimisation
The exercise was repeated many times, trying to insert more additional paths, with typical results asfollows.
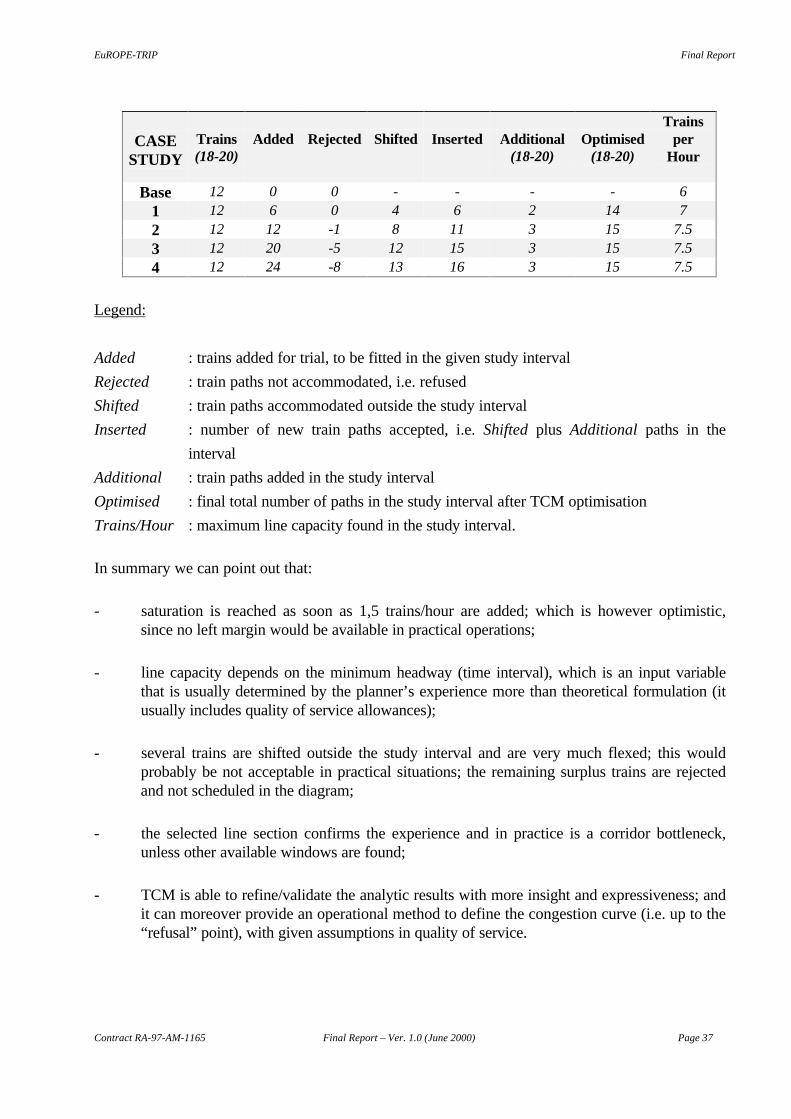
EuROPE-TRIP Final Report
Contract RA-97-AM-1165 Final Report – Ver. 1.0 (June 2000) Page 37
CASESTUDY
Trains(18-20)
Added Rejected Shifted Inserted Additional(18-20)
Optimised(18-20)
Trainsper
Hour
Base 12 0 0 - - - - 61 12 6 0 4 6 2 14 72 12 12 -1 8 11 3 15 7.53 12 20 -5 12 15 3 15 7.54 12 24 -8 13 16 3 15 7.5
Legend:
Added : trains added for trial, to be fitted in the given study interval
Rejected : train paths not accommodated, i.e. refused
Shifted : train paths accommodated outside the study interval
Inserted : number of new train paths accepted, i.e. Shifted plus Additional paths in the
interval
Additional : train paths added in the study interval
Optimised : final total number of paths in the study interval after TCM optimisation
Trains/Hour : maximum line capacity found in the study interval.
In summary we can point out that:
- saturation is reached as soon as 1,5 trains/hour are added; which is however optimistic,since no left margin would be available in practical operations;
- line capacity depends on the minimum headway (time interval), which is an input variablethat is usually determined by the planner’s experience more than theoretical formulation (itusually includes quality of service allowances);
- several trains are shifted outside the study interval and are very much flexed; this wouldprobably be not acceptable in practical situations; the remaining surplus trains are rejectedand not scheduled in the diagram;
- the selected line section confirms the experience and in practice is a corridor bottleneck,unless other available windows are found;
- TCM is able to refine/validate the analytic results with more insight and expressiveness; andit can moreover provide an operational method to define the congestion curve (i.e. up to the“refusal” point), with given assumptions in quality of service.
EuROPE-TRIP Final Report
Contract RA-97-AM-1165 Final Report – Ver. 1.0 (June 2000) Page 38
2.9. Simulation Analysis
The purpose of this investigation was to see if:
• Simulation can give a realistic answer for the maximum capacity of a line (i.e. an answer
demonstrable by observing the simulation or graphical output);
• Simulation can give an economical means of assessing capacity;
• The effects of individual factors on line capacity can be assessed using this technique.
A requirement of this project was a state-of-the-art simulator like VISION (Visualisation andInteractive Simulation of Infrastructure and Operations on rail Networks) be used to estimate thecapacity of European corridors, by addressing the analysis on specific line sections. These would beselected among the parts of the corridor that, following a higher level assessment, i.e. analytic orscheduling based method, should be considered the most constraining sections of the corridor.These lines were chosen to be:
• Waterloo to Channel Tunnel (in Great Britain),
• Bologna to Prato (in Italy), and the so-called
• Paris Freight Belt (in France).
The focus of this analysis was about the Unused Capacity. This refers to the capacity available forthe introduction of additional trains into an existing timetable. The question then arises as to whenthe maximum unused capacity is reached; is it when introducing extra trains just does “not” disruptthe existing timetabled trains, or can some delay be permitted to the existing trains? Opinionsamong the project partners differed here; one railway representative wished for zero delay toexisting trains, whereas others wished to explore how the delays increased with extra trains.
All estimates of line capacity are heavily dependant on the mix of traffic using the line section.Altering the proportions and sequences of different types of trains changes the capacity drastically.In such situations, as already said capacity is maximised by the well known technique of arrangingtrains of the same type together in “flights”.
It should be noted that the capacity of a line section is often determined by the difficulties ofrunning the trains through a key bottleneck. This may either impose a restriction on traffic flowingthrough the bottleneck, or may represent a section of line where the demand is high following aconverging junction.
The capacity of a line section can be increased by providing loops or refuges at carefully selectedplaces. Slower trains may then be diverted into the refuges to permit faster trains to overtake,albeit with the effect of delaying the train in the refuge.
In general, it can be concluded that there is no absolute value of capacity - capacity can only becalculated for a given situation, given hypotheses and commercial policy.
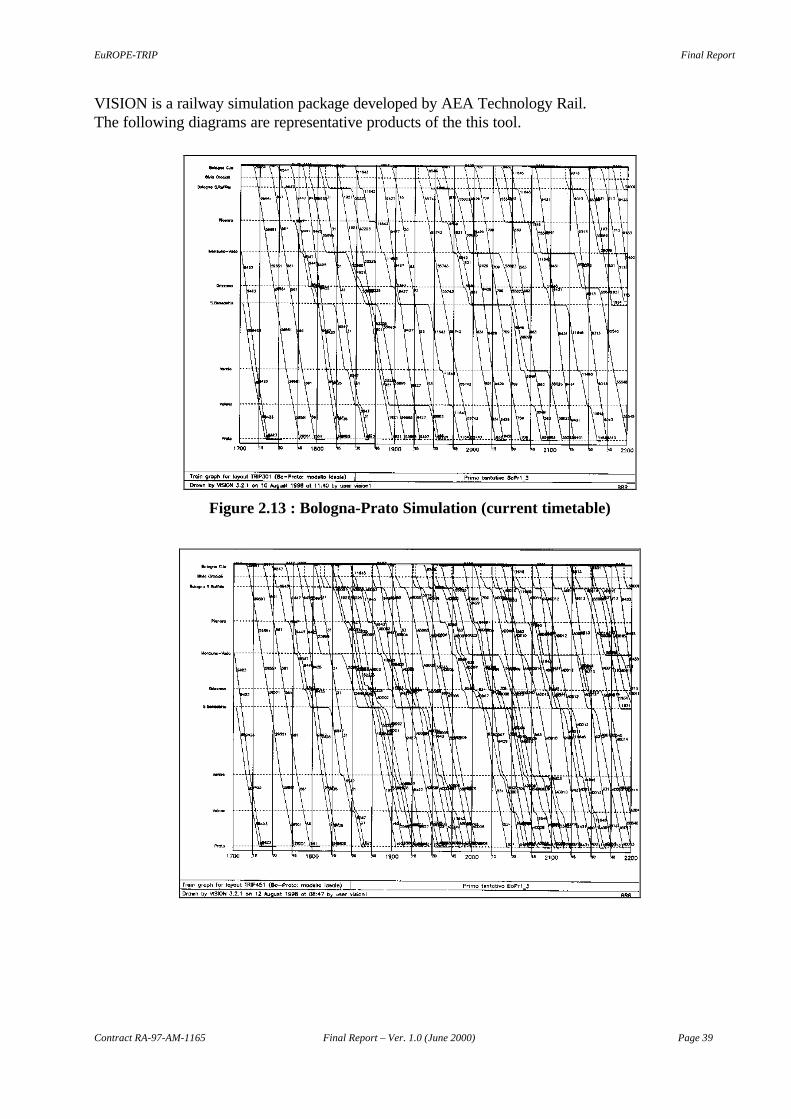
EuROPE-TRIP Final Report
Contract RA-97-AM-1165 Final Report – Ver. 1.0 (June 2000) Page 39
VISION is a railway simulation package developed by AEA Technology Rail.The following diagrams are representative products of the this tool.
Figure 2.13 : Bologna-Prato Simulation (current timetable)
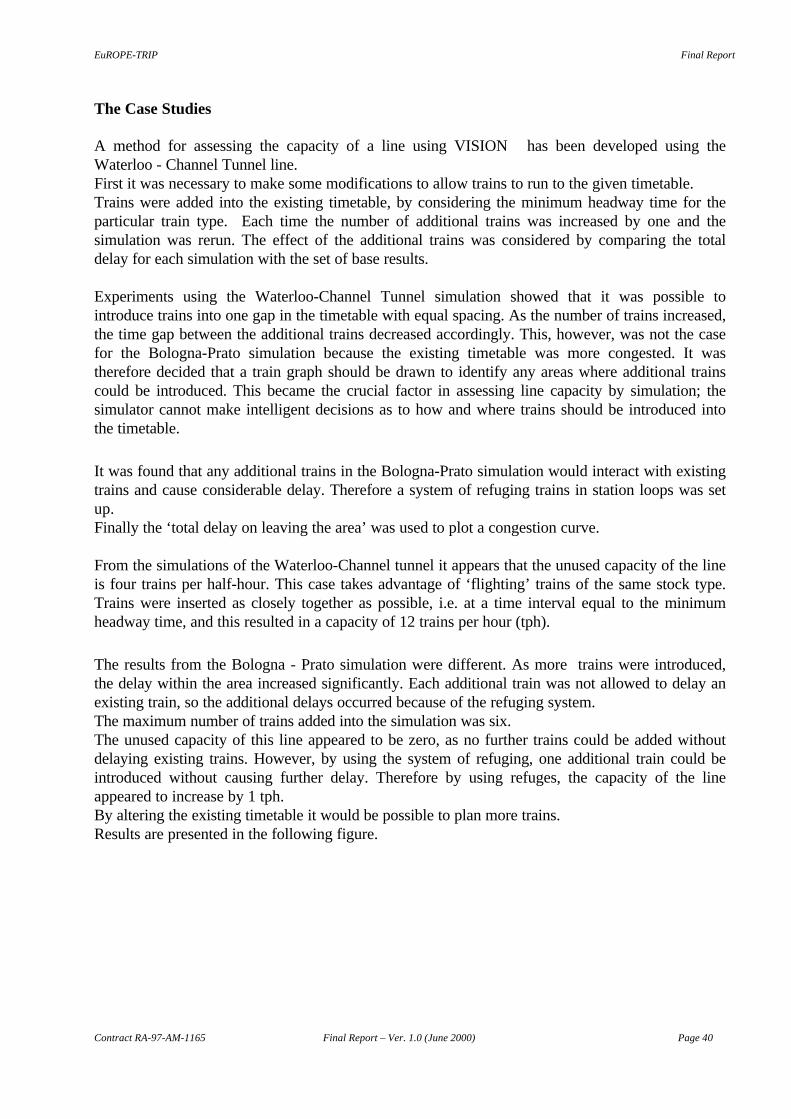
EuROPE-TRIP Final Report
Contract RA-97-AM-1165 Final Report – Ver. 1.0 (June 2000) Page 40
The Case Studies
A method for assessing the capacity of a line using VISION has been developed using theWaterloo - Channel Tunnel line.First it was necessary to make some modifications to allow trains to run to the given timetable.Trains were added into the existing timetable, by considering the minimum headway time for theparticular train type. Each time the number of additional trains was increased by one and thesimulation was rerun. The effect of the additional trains was considered by comparing the totaldelay for each simulation with the set of base results.
Experiments using the Waterloo-Channel Tunnel simulation showed that it was possible tointroduce trains into one gap in the timetable with equal spacing. As the number of trains increased,the time gap between the additional trains decreased accordingly. This, however, was not the casefor the Bologna-Prato simulation because the existing timetable was more congested. It wastherefore decided that a train graph should be drawn to identify any areas where additional trainscould be introduced. This became the crucial factor in assessing line capacity by simulation; thesimulator cannot make intelligent decisions as to how and where trains should be introduced intothe timetable.
It was found that any additional trains in the Bologna-Prato simulation would interact with existingtrains and cause considerable delay. Therefore a system of refuging trains in station loops was setup.Finally the ‘total delay on leaving the area’ was used to plot a congestion curve.
From the simulations of the Waterloo-Channel tunnel it appears that the unused capacity of the lineis four trains per half-hour. This case takes advantage of ‘flighting’ trains of the same stock type.Trains were inserted as closely together as possible, i.e. at a time interval equal to the minimumheadway time, and this resulted in a capacity of 12 trains per hour (tph).
The results from the Bologna - Prato simulation were different. As more trains were introduced,the delay within the area increased significantly. Each additional train was not allowed to delay anexisting train, so the additional delays occurred because of the refuging system.The maximum number of trains added into the simulation was six.The unused capacity of this line appeared to be zero, as no further trains could be added withoutdelaying existing trains. However, by using the system of refuging, one additional train could beintroduced without causing further delay. Therefore by using refuges, the capacity of the lineappeared to increase by 1 tph.By altering the existing timetable it would be possible to plan more trains.Results are presented in the following figure.
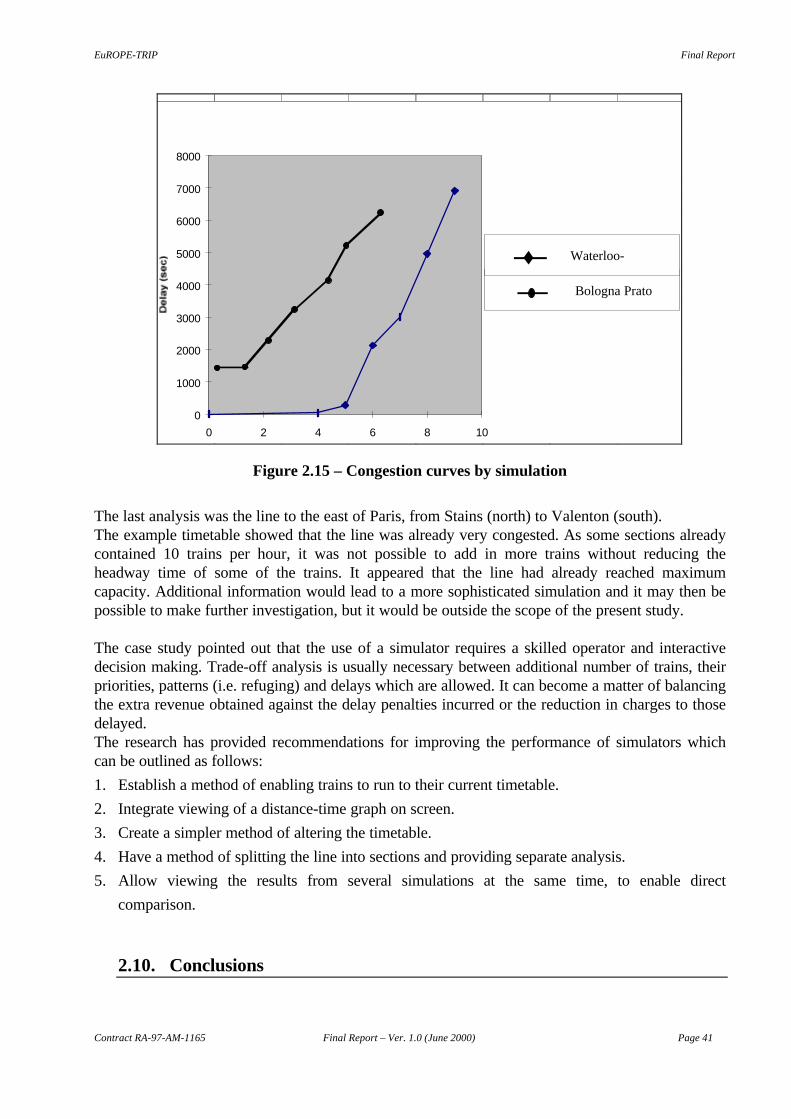
EuROPE-TRIP Final Report
Contract RA-97-AM-1165 Final Report – Ver. 1.0 (June 2000) Page 41
0
1000
2000
3000
4000
5000
6000
7000
8000
0 2 4 6 8 10
Figure 2.15 – Congestion curves by simulation
The last analysis was the line to the east of Paris, from Stains (north) to Valenton (south).The example timetable showed that the line was already very congested. As some sections alreadycontained 10 trains per hour, it was not possible to add in more trains without reducing theheadway time of some of the trains. It appeared that the line had already reached maximumcapacity. Additional information would lead to a more sophisticated simulation and it may then bepossible to make further investigation, but it would be outside the scope of the present study.
The case study pointed out that the use of a simulator requires a skilled operator and interactivedecision making. Trade-off analysis is usually necessary between additional number of trains, theirpriorities, patterns (i.e. refuging) and delays which are allowed. It can become a matter of balancingthe extra revenue obtained against the delay penalties incurred or the reduction in charges to thosedelayed.The research has provided recommendations for improving the performance of simulators whichcan be outlined as follows:
1. Establish a method of enabling trains to run to their current timetable.
2. Integrate viewing of a distance-time graph on screen.
3. Create a simpler method of altering the timetable.
4. Have a method of splitting the line into sections and providing separate analysis.
5. Allow viewing the results from several simulations at the same time, to enable direct
comparison.
2.10. Conclusions
Bologna Prato
Waterloo-
EuROPE-TRIP Final Report
Contract RA-97-AM-1165 Final Report – Ver. 1.0 (June 2000) Page 42
The problem of railway line capacity is increasingly becoming a major issue for:
• driving policies to allocate tracks to train operators,
• defining access charging systems, and
• exploiting European rail corridors.
New state of the art algorithms are available for provided rational support to define railwaycapacity under various assumptions, and in particular to help Infrastructure Managers to exploitresidual capacity on European corridors such as Freightways.When trying to answer the question, one should moreover consider performance allowances andintroduce new standards, e.g. based on congestion levels, for the more loaded sections of thenetwork.
Further data and involvement by the interested parties (i.e. European Infrastructure Managers)would be required in order to carry out deeper analysis and arrive at more comparative and agreedstandards.
The study demonstrates that it is feasible to propose an integrated methodology which can makeuse of various techniques, particularly scheduling and simulation tools.
Recent progress in operational research and optimisation based algorithms can provide outstandingmethods to the line capacity problem, and make intelligent input to simulators for final validation.
EuROPE-TRIP Final Report
Contract RA-97-AM-1165 Final Report – Ver. 1.0 (June 2000) Page 43
2.11. Bibliography
1. Brannlund U., Lindberg P., Nilsson J., Nou A. - Allocation of Scarce Track Capacity usingLagrangian Relaxation - Royal Institute of Technology , Nov. 1993
2. Bussieck M., Winter T., Zimmermann U. - Discrete Optimisation in Public Rail Transport -Mathematical Programming, Vol.79, Nos.1-3, 1997
3. Cai X., Goh C. - A Fast Heuristic for the Train Scheduling Problem - Computers Ops. Res.,Vol.21, No.5, 1994
4. Canciani G. - Criteri Progettuali di rinnovo e potenziamento delle linee ferroviariarie:modello di calcolo e di verifica della potenzialità di circolazione - PhD Thesis (in Italian),1991
5. Caprara A. et Al. - Models and Algorithms for the Train Scheduling Problem - EuROPE-TRISInternal Report
6. Carey M., Lockwood D. - A Model, Algortithms and Strategy for Train Pathing - Journ. Oper.Res. Soc., Vol.46, 1995
7. Higgins A., Kozan E., Ferreira L. - Optimal Scheduling of Trains on a Single Line Track -Transp. Res.-B Vol.30 No.2 1996
8. Holgate, D., Lawrence, P., The Relative Performance Benefits of Fixed and Moving Block, BRResearch, Derby, GB
9. Jovanovic D., Harker P. - Tactical Scheduling of Rail Operations: the SCAN I System -Transpn. Sc., Vol.25, No.1, 1991
10. Kaas, A., H., Strategic Capacity Analysis of Networks: Developing and practical use ofcapacity model for railway networks, ScanRail Consult, Technical University of Denmark
11. Kraay D., Harker P., Chen B. - Optimal Pacing of Trains in Freight Railroads: ModelFormulation and Solution - Oper. Res., Vol.39, No.1, 1991
12. Malaspina, R., Reitani, G. - Un criterio di calcolo della potenzialita di circolazione ferroviariasu linee a doppio binario - Ingegneria Ferroviaria, 1995 (CIFI review, Italian RailwayEngineers Association)
13. Petersen E., Merchant R. - Scheduling of Trains in a Linear Railway System - INFOR Vol.19,No.3, 1981
14. Petersen E., Taylor A. - A Structured Model for Rail Line Simulation and Optimization -Trans. Sci., 16, 1982
15. Quinchon C. - L’Utilisation des Capacités de l’Infrastructure L’attribution des Sillons - RevueGenerale des Chemins de Fer, Gennaio 1996
16. Schwanhausser, W. - Can operations be separated from the network in the provision ofrailroad products - European Conference of Ministers of Transport, Economic ResearchCentre, 1996
17. Szpigel B. - Optimal Train Scheduling on a Single Track Railway - OR’7218. UIC Leaflet 405 OR, Links between railway infrastructure capacity and the quality of
operations, International Union of Railways, 199619. UIC Leaflet 405-1- Method to be used for the determination of the capacity of lines - 1983
(superseded by new Leaflet in 1996, Ref.18)20. Zwaneveld P., Kroon L., Romelin H., Salomon M. - Routing Trains trough Railway Stations:
Model Formulation and Algorithms - Transpn. Sc., Vol.30, No.3, 1996
EuROPE-TRIP Final Report
Contract RA-97-AM-1165 Final Report – Ver. 1.0 (June 2000) Page 44
3. COST OF USING INFRASTRUCTURE
3.1. Study Overview
This Section summarises the work undertaken within the Cost Methods workpackage. The generalaim of this work was to come up with a standard methodology for the definition of cost elementswithin European rail infrastructure systems. It’s usefulness would be to inspire common ways toimplement the directives (related to charging systems), improving cost reference models, and takingaccount of benchmarking analysis among various railways.
The work focused on a general survey of the rail infrastructure literature and main cost drivers. Inthe present study the infrastructure is assumed as it is and the analysis is addressed to existingcapacity. A software package was designed to support data collection and analysis. A DEA (DataEnvelopment Analysis) methodology for comparing the efficiency among several infrastructuremanaging units was presented and an application discussed. A case study for a EU corridor(France-Italy) was undertaken, based on a joint work between TRIP and LIBERAIL and the resultswere reported and compared with the case of a main line in Denmark.
This chapter also summarises a study of costs of using inland intermodal terminals by transportoperators, due to the increasing importance of these infrastructures in the intermodal trafficdevelopment.
3.2. Models and applications of rail infrastructure costs
3.2.1. Historical backgrounds
The railway infrastructure costs have apparently had limited interests in the past in transportmanagement and academic circles. Before the ‘90s railway costs were more generally considered asan “aggregate” phenomenon, due to the traditional (i.e. pre-Directive 91/440) railway system, thatused to include both track and transport costs. In the past several contributions in this context haveappeared in the literature, most addressing the econometric analysis of railway production functionsand comparisons among different companies and countries [e.g.3]. These original studies alsoregarded the US and to a less extent the European organisations. The major focus concerned issueslike productivity and scale or density economies of the national systems [6]; some more interestregarded the cost allocation and regulation problems [12, 16].
In the same period UK is among the first European countries where problems about railinfrastructure costing are analysed (Select Committee on Nationalised Industries, 1960) and theproblem of relating fixed costs to different services is indicated. Besides recognising that a fairlyhigh portion of “fixed costs” represents a characteristic of this transport sector, “while certain costs(for example, those of earthworks) are invariant with traffic, it is often possible to allocate trackand signalling costs to particular services according to causation” [4]. Joy (1964) shows how thesecosts can vary according to quality of service with an example. If an express Category A service on
EuROPE-TRIP Final Report
Contract RA-97-AM-1165 Final Report – Ver. 1.0 (June 2000) Page 45
double track costs 100 per km per annum in track costs2, a less frequent Cat. B service costs 88,heavily used non-express Cat. C service 76, and slow Cat. D service 42 [adapted from 4].
It is possible with poorer quality services to have more basic signalling and lower trackmaintenance standards. Further there are quite significant differences associated with the costs oftrack used exclusively for passenger services and that used only for freight.
The Beeching Report (British Railway Board, 1963) found a single track line costed 75% per kmper annum more to maintain to passenger standards than to conform only to freight.The improvement in costing in UK came about in part because of the 1968 Transport Act and theintroduction of social service subsidies for specific routes - the system required ‘identification andcosting of those services and facilities whose cost should properly be borne or aided by thecommunity’. The common costs were allocated according to the ‘Cooper Brothers’ formula whichendorsed the idea of allocating track costs on the basis of gross ton miles, and signalling costs onthe basis of train miles. With homogeneous traffic flows evenly spread this is reasonable but withmixed traffic and peaks in use the allocation technique is unlikely to match causation with costs.The problems of allocating costs common to several services is, therefore, seen to be a difficult one[4]. This issue has been also addressed in TRIP project, following renewed interests in the lastdecade through modern applications of cost allocation based on co-operative game theoryapproaches, as outline in Section 4 of this report.
3.2.2. The nature of infrastructure costs
The total annual operational costs (i.e. excluding depreciation) of three major EuropeanInfrastructure Management (FS, SNCF, DB AG) in the most recent years can be estimated, fromvarious sources, at some billions of ECU, which correspond to ratio between ca. 100 and 150kECU per main line route kilometre.Although the infrastructure is not the complete picture of the railway industry, it certainly is amajor part of costing of the rail transport mode. Market, governments and competition are thethree forces pushing for overall improving of infrastructure management productivity and costefficiency, with so different cases (i.e. from high-speed and commercial lines to very poor regionalor social branches).
In addition some structural constraints remain, as regards the cost breakdown figures of a typicalIM, where labour can be 60% of operating costs.
Another traditional claim is the high percentage of fixed (unavoidable) costs, that contribute tokeep the system inflexible and difficult to manage.
A typical IM infrastructure cost breakdown is depicted in the following figure.
Difficulties about precisely identifying infrastructure costs have been already pointed in [22] andneeds for harmonising their reporting methods fully acknowledged. Briefly these costs can beseparated into four main categories:
2 At the time monetary units, only reference costing levels.
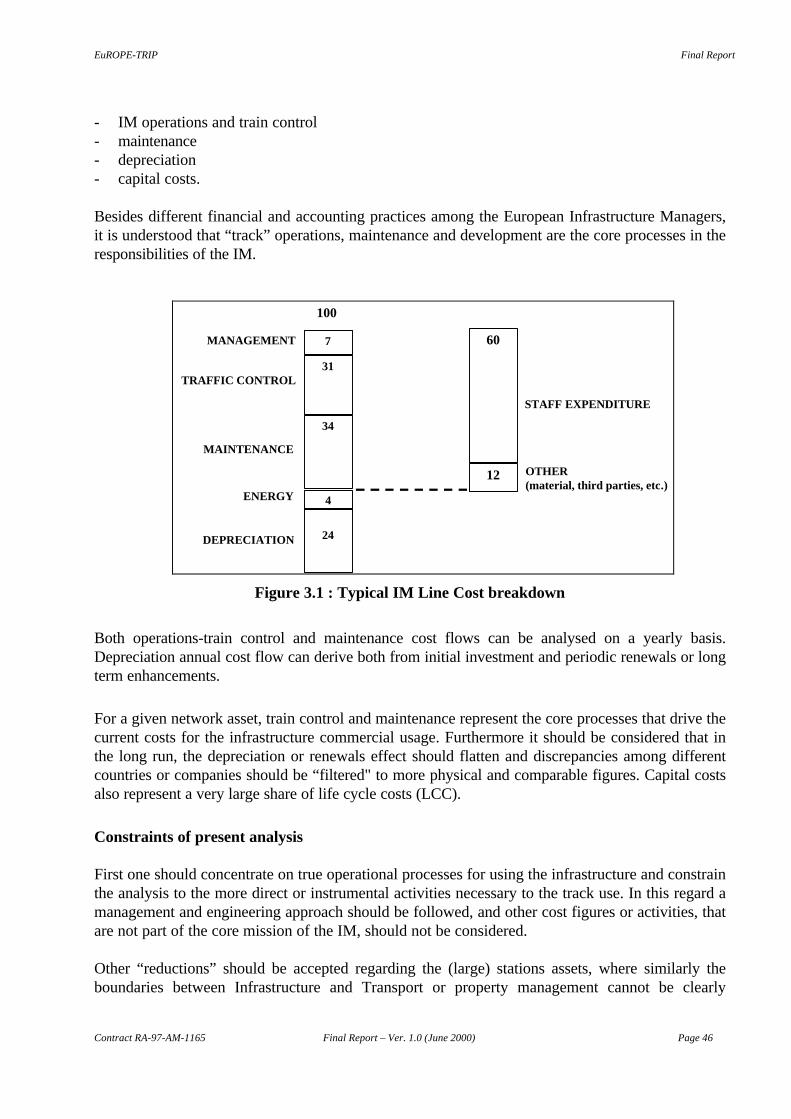
EuROPE-TRIP Final Report
Contract RA-97-AM-1165 Final Report – Ver. 1.0 (June 2000) Page 46
- IM operations and train control- maintenance- depreciation- capital costs.
Besides different financial and accounting practices among the European Infrastructure Managers,it is understood that “track” operations, maintenance and development are the core processes in theresponsibilities of the IM.
100
7
31
34
4
24
MANAGEMENT
TRAFFIC CONTROL
MAINTENANCE
ENERGY
DEPRECIATION
60
12
STAFF EXPENDITURE
OTHER(material, third parties, etc.)
Figure 3.1 : Typical IM Line Cost breakdown
Both operations-train control and maintenance cost flows can be analysed on a yearly basis.Depreciation annual cost flow can derive both from initial investment and periodic renewals or longterm enhancements.
For a given network asset, train control and maintenance represent the core processes that drive thecurrent costs for the infrastructure commercial usage. Furthermore it should be considered that inthe long run, the depreciation or renewals effect should flatten and discrepancies among differentcountries or companies should be “filtered" to more physical and comparable figures. Capital costsalso represent a very large share of life cycle costs (LCC).
Constraints of present analysis
First one should concentrate on true operational processes for using the infrastructure and constrainthe analysis to the more direct or instrumental activities necessary to the track use. In this regard amanagement and engineering approach should be followed, and other cost figures or activities, thatare not part of the core mission of the IM, should not be considered.
Other “reductions” should be accepted regarding the (large) stations assets, where similarly theboundaries between Infrastructure and Transport or property management cannot be clearly
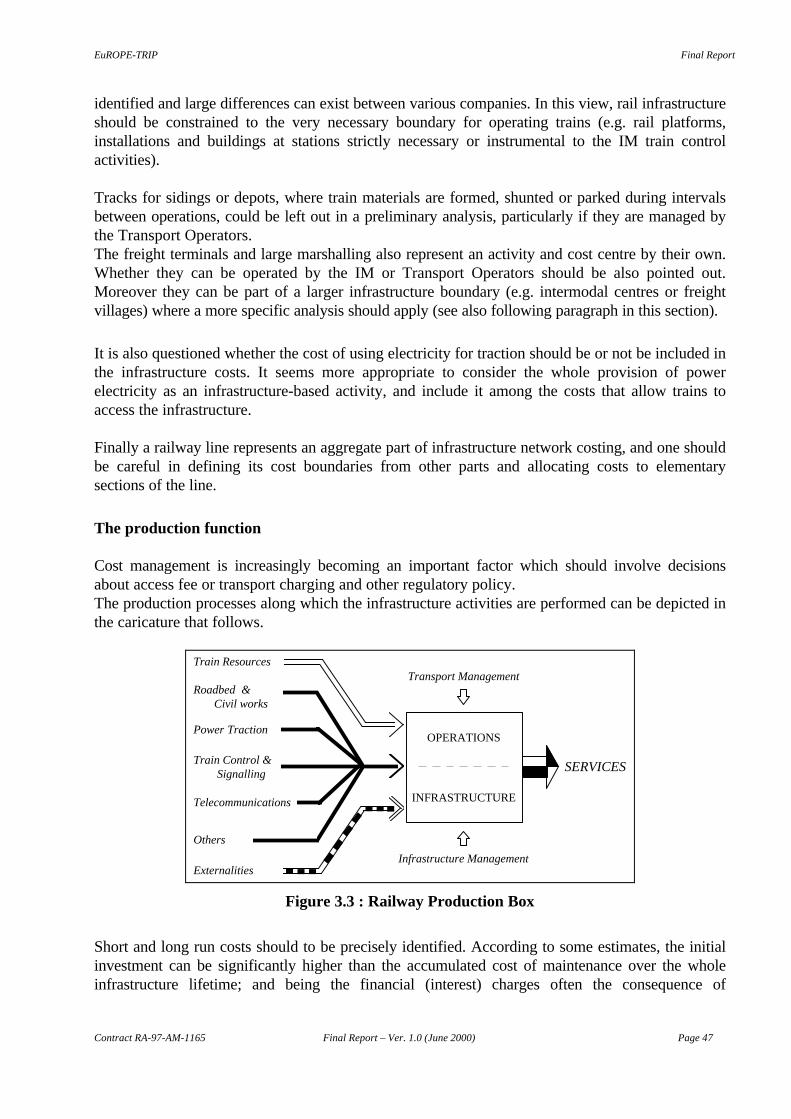
EuROPE-TRIP Final Report
Contract RA-97-AM-1165 Final Report – Ver. 1.0 (June 2000) Page 47
identified and large differences can exist between various companies. In this view, rail infrastructureshould be constrained to the very necessary boundary for operating trains (e.g. rail platforms,installations and buildings at stations strictly necessary or instrumental to the IM train controlactivities).
Tracks for sidings or depots, where train materials are formed, shunted or parked during intervalsbetween operations, could be left out in a preliminary analysis, particularly if they are managed bythe Transport Operators.The freight terminals and large marshalling also represent an activity and cost centre by their own.Whether they can be operated by the IM or Transport Operators should be also pointed out.Moreover they can be part of a larger infrastructure boundary (e.g. intermodal centres or freightvillages) where a more specific analysis should apply (see also following paragraph in this section).
It is also questioned whether the cost of using electricity for traction should be or not be included inthe infrastructure costs. It seems more appropriate to consider the whole provision of powerelectricity as an infrastructure-based activity, and include it among the costs that allow trains toaccess the infrastructure.
Finally a railway line represents an aggregate part of infrastructure network costing, and one shouldbe careful in defining its cost boundaries from other parts and allocating costs to elementarysections of the line.
The production function
Cost management is increasingly becoming an important factor which should involve decisionsabout access fee or transport charging and other regulatory policy.The production processes along which the infrastructure activities are performed can be depicted inthe caricature that follows.
Train Resources
Roadbed & Civil works
Power Traction
Train Control & Signalling
Telecommunications
Others
Externalities
OPERATIONS
INFRASTRUCTURE
SERVICES
Transport Management
Infrastructure Management
Figure 3.3 : Railway Production Box
Short and long run costs should to be precisely identified. According to some estimates, the initialinvestment can be significantly higher than the accumulated cost of maintenance over the wholeinfrastructure lifetime; and being the financial (interest) charges often the consequence of
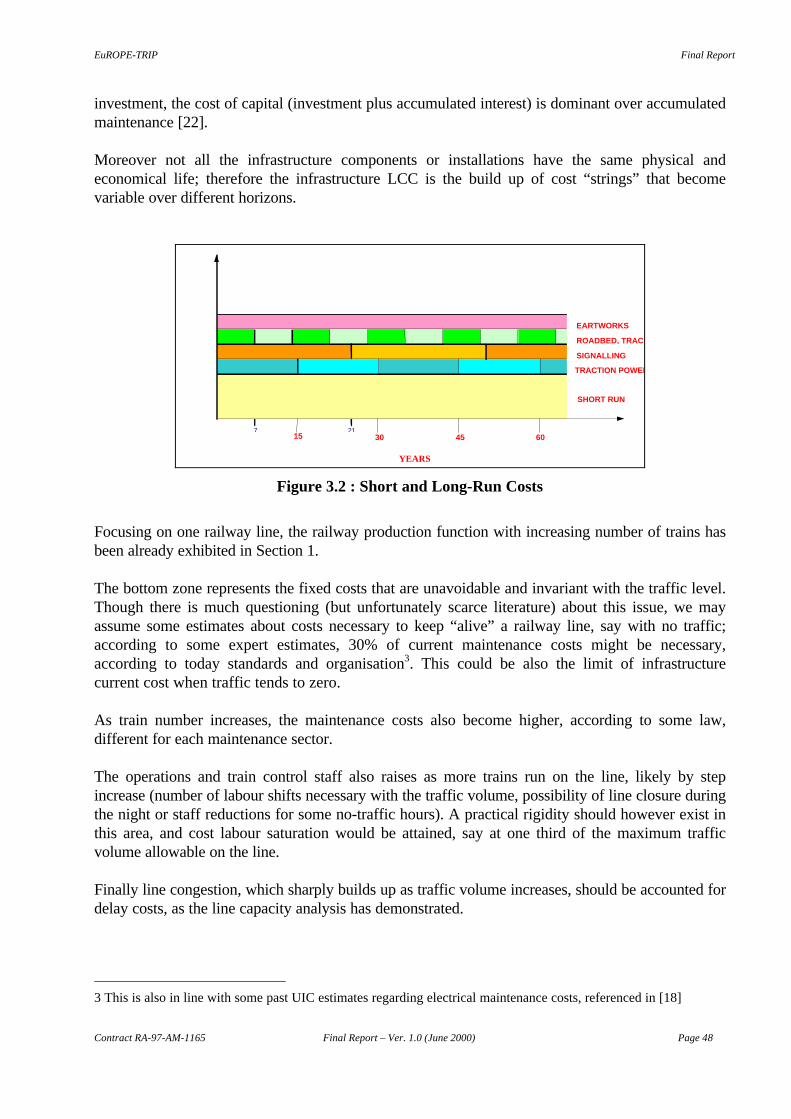
EuROPE-TRIP Final Report
Contract RA-97-AM-1165 Final Report – Ver. 1.0 (June 2000) Page 48
investment, the cost of capital (investment plus accumulated interest) is dominant over accumulatedmaintenance [22].
Moreover not all the infrastructure components or installations have the same physical andeconomical life; therefore the infrastructure LCC is the build up of cost “strings” that becomevariable over different horizons.
EARTWORKS
ROADBED, TRACK
SIGNALLING
TRACTION POWER
SHORT RUN
15 30 45 607 21
YEARS
Figure 3.2 : Short and Long-Run Costs
Focusing on one railway line, the railway production function with increasing number of trains hasbeen already exhibited in Section 1.
The bottom zone represents the fixed costs that are unavoidable and invariant with the traffic level.Though there is much questioning (but unfortunately scarce literature) about this issue, we mayassume some estimates about costs necessary to keep “alive” a railway line, say with no traffic;according to some expert estimates, 30% of current maintenance costs might be necessary,according to today standards and organisation3. This could be also the limit of infrastructurecurrent cost when traffic tends to zero.
As train number increases, the maintenance costs also become higher, according to some law,different for each maintenance sector.
The operations and train control staff also raises as more trains run on the line, likely by stepincrease (number of labour shifts necessary with the traffic volume, possibility of line closure duringthe night or staff reductions for some no-traffic hours). A practical rigidity should however exist inthis area, and cost labour saturation would be attained, say at one third of the maximum trafficvolume allowable on the line.
Finally line congestion, which sharply builds up as traffic volume increases, should be accounted fordelay costs, as the line capacity analysis has demonstrated.
3 This is also in line with some past UIC estimates regarding electrical maintenance costs, referenced in [18]
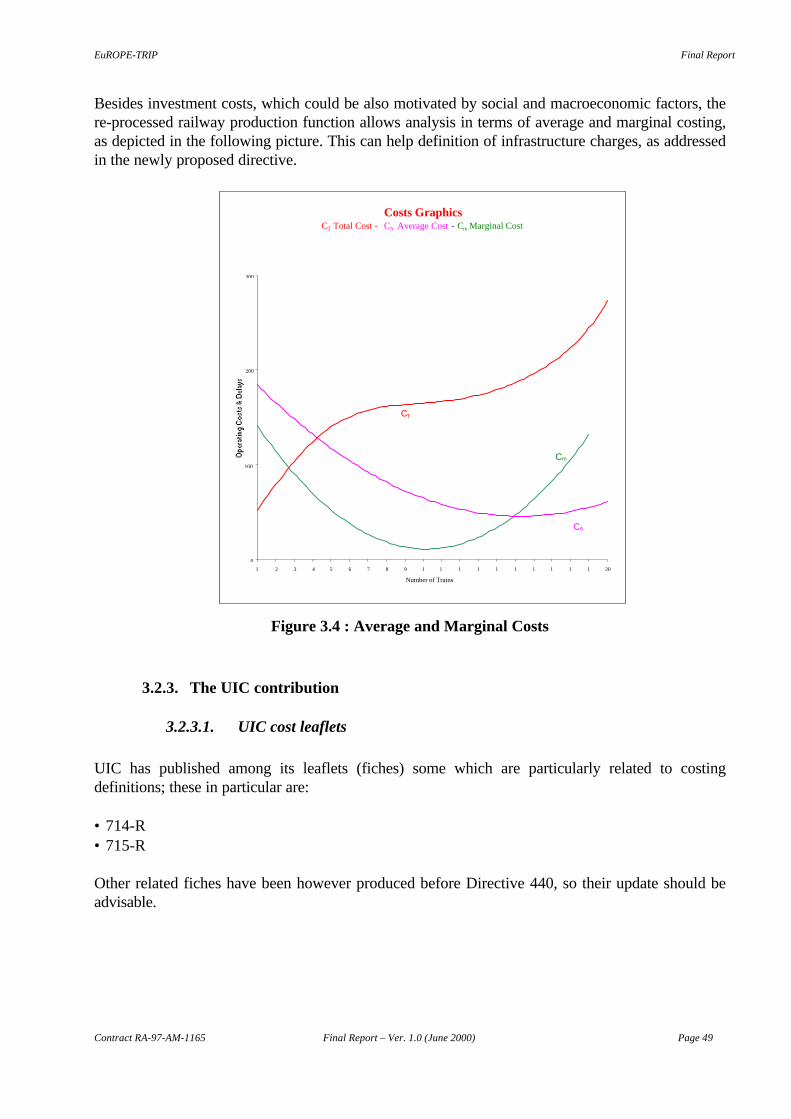
EuROPE-TRIP Final Report
Contract RA-97-AM-1165 Final Report – Ver. 1.0 (June 2000) Page 49
Besides investment costs, which could be also motivated by social and macroeconomic factors, there-processed railway production function allows analysis in terms of average and marginal costing,as depicted in the following picture. This can help definition of infrastructure charges, as addressedin the newly proposed directive.
Costs GraphicsCT Total Cost - CA Average Cost - Cm Marginal Cost
0
100
200
300
1 2 3 4 5 6 7 8 9 1 1 1 1 1 1 1 1 1 1 20
Number of Trains
CT
Cm
CA
Figure 3.4 : Average and Marginal Costs
3.2.3. The UIC contribution
3.2.3.1. UIC cost leaflets
UIC has published among its leaflets (fiches) some which are particularly related to costingdefinitions; these in particular are:
• 714-R• 715-R
Other related fiches have been however produced before Directive 440, so their update should beadvisable.
EuROPE-TRIP Final Report
Contract RA-97-AM-1165 Final Report – Ver. 1.0 (June 2000) Page 50
3.2.3.2. UIC cost report
Some more recent studies, edited under the sponsorship of UIC (Infrastructure Commission), haveprovided some useful hints. One of these reports analysed the data provided by seven Railways;major findings and recommendations drawn from this report can be summarised as follows.
- It is generally recognised that railway managers have the need to improve their current level ofinformation about maintenance costs. Cost mechanisms are only partially known.
- It is difficult to collect data on longer periods in systematic way (i.e. in order to study cost leveldynamics and improve knowledge between fixed and variable costs).
- There are appreciable differences in the renewal budgets and understanding; the ratio betweenmaintenance and renewals is very much variable among the companies. (The report suggests tobase comparisons on the sum of maintenance costs plus renewal expenditures, on long-runaveraging periods).
- Methods for harmonising data collection and analysis should be set up and agreed among therailways (the study has not considered financial and fiscal costs).
Renewals are recognised to include some new investment effect (capacity increase) but this LCCsystematic distortion may be common to various railways.
- Costs in the United States, being the comparison limited to the freight case, remain apparentlylower than in Europe, even taking into account corrective factors for the latter’s electrification.
- Average maintenance cost breakdown for major infrastructure components are as follows:• roadbed, track, tunnels, bridges :57%• train control, signalling :17%• power supply, overhead line :10%• rest :16%.
- Maintenance costs increase with track utilisation (gross ton/km per main track km); in particular alinear regression seems to fit well with the UIC-class number; considering for instance somerailways in the upper zone, an increase of ca. 7200 ECU/track-km per unit of UIC-class increase isrevealed (i.e. ca. 65.000 ECU/km for UIC class-1 lines).
- In the life cycle cost analysis of some railways, for the upper levels (1,2) UIC class lines, therenewal importance covers almost all the costs, and current maintenance is fading; however thesubstituted components are re-utilised on lower class lines.
- The statistical analysis points out that the ratio of single-track to double-track cost maintenanceper track is ca. 1,45.
Furthermore the report suggests a regression formula to compute new infrastructure investments,calibrated over thirty cases, with a spread +/- 30% .
EuROPE-TRIP Final Report
Contract RA-97-AM-1165 Final Report – Ver. 1.0 (June 2000) Page 51
After harmonising standard maintenance costs among countries, the UIC study (1996) reveals anaverage of 35,5 kECU/main track-km, which however does not include train control and operationspersonnel costs, and flattens the complexity and variations with line classes.
It should be observed that this study has focused on maintenance data about the whole networks ofthe involved companies. More in-depth analysis and benchmarking could be obtained addressingsimilar studies about particular railway lines. Nevertheless this report represents one of the few andinvaluable basis that have been made available in the last decades about this subject4.
3.2.4. External costs
This subject has been discussed in [26]. It should be outlined that the railways externalities are notcompletely separable between the infrastructure and the train effects. Among the issues:
- an electrified line contributes (more or less directly) to reducing the pollution, by improving theinvestment attractiveness of electric trains;
- the infrastructure retains direct responsibility of the environmental impact, particularly regardingvisual and landscape conservation (see for instance [5]). Noise shielding and protections must bealso provided in sensitive areas;
- safety is also directly affected by the Infrastructure Management, as regards signalling, othertechnologies and rulings which have direct impact on the risk levels of the system;
- finally the congestion levels should be considered in the overall cost accounting of IM and providebasis for improved exploitation of the infrastructure. Congestion can be supposed to occur whenmore than 2/3 of the design capacity is taken by the traffic flow (e.g. trains per hour)5.
From the foregoing, it should be estimated that Infrastructure accounts for the major portion of therailways external costs.
3.2.5. Cost methods analysis
Analytical and other methods to model the relatively complex problem of infrastructure costing canbe conceived. These can help different users get better insight of the phenomenon, improve thedecision making process and stimulate further analysis.
Various approaches can be shortly outlined as follows:- parametric design cost methods- econometric models- field data collection- other statistical and mathematical modelling (e.g. frontier analysis, DEA, i.e. Data Envelopment
Analysis).
4 At the moment of this writing, another UIC project is underway on the subject of infrastructure costs.5 See Section about Line Capacity in this report.
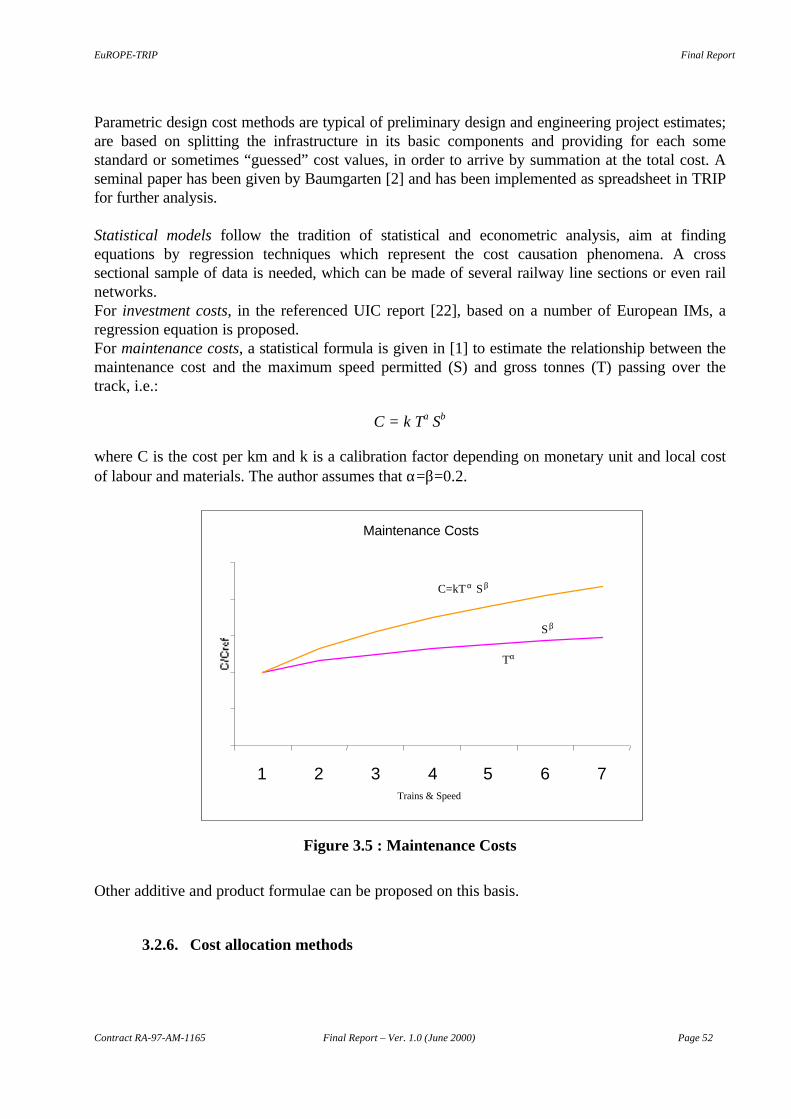
EuROPE-TRIP Final Report
Contract RA-97-AM-1165 Final Report – Ver. 1.0 (June 2000) Page 52
Parametric design cost methods are typical of preliminary design and engineering project estimates;are based on splitting the infrastructure in its basic components and providing for each somestandard or sometimes “guessed” cost values, in order to arrive by summation at the total cost. Aseminal paper has been given by Baumgarten [2] and has been implemented as spreadsheet in TRIPfor further analysis.
Statistical models follow the tradition of statistical and econometric analysis, aim at findingequations by regression techniques which represent the cost causation phenomena. A crosssectional sample of data is needed, which can be made of several railway line sections or even railnetworks.For investment costs, in the referenced UIC report [22], based on a number of European IMs, aregression equation is proposed.For maintenance costs, a statistical formula is given in [1] to estimate the relationship between themaintenance cost and the maximum speed permitted (S) and gross tonnes (T) passing over thetrack, i.e.:
C = k Tα Sβ
where C is the cost per km and k is a calibration factor depending on monetary unit and local costof labour and materials. The author assumes that α=β=0.2.
Maintenance Costs
1 2 3 4 5 6 7Trains & Speed
C=kT α Sβ
Sβ
Tα
Figure 3.5 : Maintenance Costs
Other additive and product formulae can be proposed on this basis.
3.2.6. Cost allocation methods
EuROPE-TRIP Final Report
Contract RA-97-AM-1165 Final Report – Ver. 1.0 (June 2000) Page 53
The problem how to rationally allocate rail infrastructure costs has historical references (seeintroductory paragraph ). This is not yet “pricing” but analysis about the cost drivers and basis thecommercial planning of a railway line. The cost allocation problem is therefore borderline betweenfully explaining cost causation and devising pricing or charging policies.From the engineer’s point of view, the analysis of material consumption, man-hours and tear andwear effects can help in determining the variable or marginal component of infrastructure costing.In particular this appears the case of the Banverket assumptions to define the variable charges oftrack fees, based on marginal wear and tear of different vehicles and speeds.The minimum fixed and short-run cost to “keep the track alive” is more subtle and economical innature, but can also depend on the design parameters of the line. Whom has the railway line beendesigned for ?
One of the general principle, already cited in [4], is that the better quality of service, the more onehas to pay allocated costs. “Economic principles advocate the notion of seeking avoidable costsassociated with specific users and then allocating these accordingly. The problem is defining thebase from which to begin the series of allocations - in the case of roads, are they mainly designedfor cars, with lorries imposing additional costs, or are they to provide a quality of service with thefaster car traffic necessitating higher engineering problems”? [4]. The problem is much similar inthe case of railways, where axle load, track design speed and signalling can be related to types oftrains. Therefore lighter and slower (e.g. regional) trains running on a high-speed line should bepaying for only the infrastructure that would be designed for them. In this case these trains can bealso marginally allocated in terms of infrastructure capital costs. Unfortunately slower trains arealso more track consuming and impose greater economic constraints to the faster trains, that can bepenalised. Slower train can thus lose their design cost advantage.
In this regard two concepts have been also introduced; the “prime user” and the “sole user” costallocation [7].
The prime user consider the responsibility for infrastructure cost on the basis of which traffic wasmost important in determining the characteristics of the line; avoidable cost techniques are thenapplied to secondary users.
For the sole user, the question is “what facilities would this traffic require if it were the only user onthe line with a brand new infrastructure?”. The prime user requirements are so determined from‘scratch’ and any other requirements of secondary users are then added and the cost (e.g. for extraplatforms at stations, slow parallel tracks) are allocated to the secondary user.
Having surplus capacity, from these concepts a slower train could get even more benefits in termsof marginal costs. Moreover, due to various situations of network, one can change the prime orsole user according to sections and time windows, allowing for flexible cost allocation.
Finally modern methods of cost allocation, which are refinements of the above concepts, can beconceived which are based on so-called co-operative game principles, from which some formulasare derived to rationally allocate costs among the players (e.g. types of traffics). For this line ofresearch line see following Section in this report.
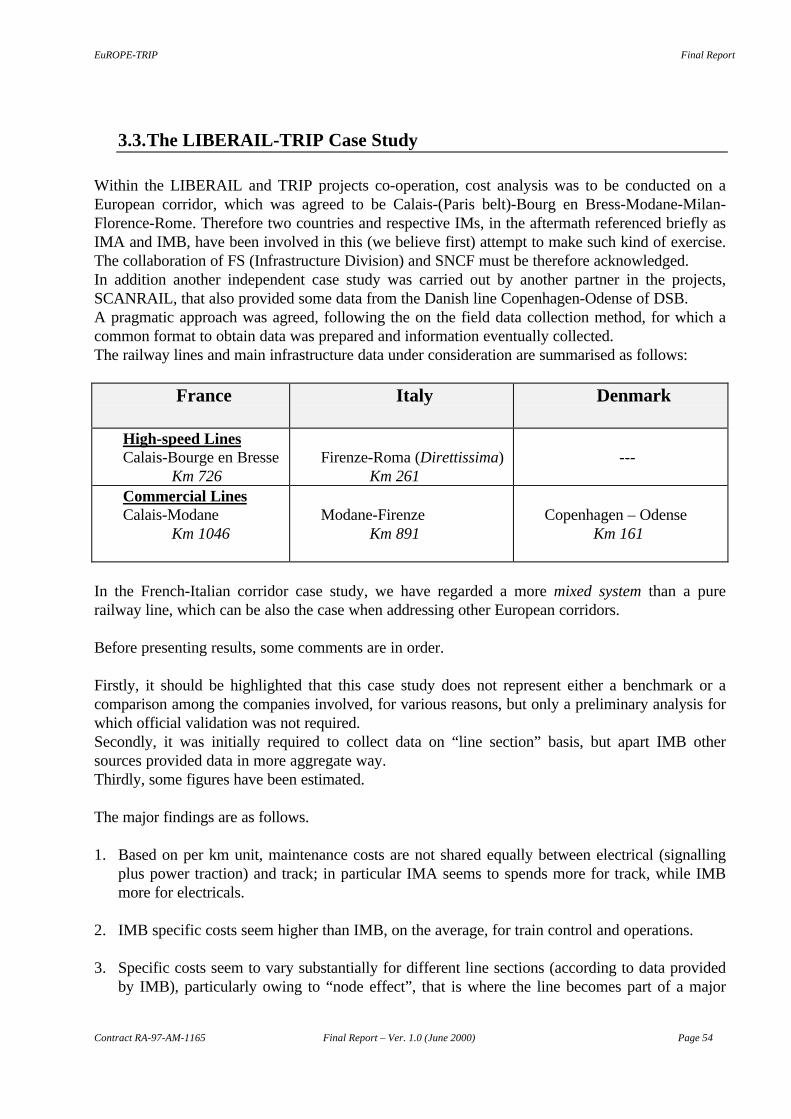
EuROPE-TRIP Final Report
Contract RA-97-AM-1165 Final Report – Ver. 1.0 (June 2000) Page 54
3.3. The LIBERAIL-TRIP Case Study
Within the LIBERAIL and TRIP projects co-operation, cost analysis was to be conducted on aEuropean corridor, which was agreed to be Calais-(Paris belt)-Bourg en Bress-Modane-Milan-Florence-Rome. Therefore two countries and respective IMs, in the aftermath referenced briefly asIMA and IMB, have been involved in this (we believe first) attempt to make such kind of exercise.The collaboration of FS (Infrastructure Division) and SNCF must be therefore acknowledged.In addition another independent case study was carried out by another partner in the projects,SCANRAIL, that also provided some data from the Danish line Copenhagen-Odense of DSB.A pragmatic approach was agreed, following the on the field data collection method, for which acommon format to obtain data was prepared and information eventually collected.The railway lines and main infrastructure data under consideration are summarised as follows:
France Italy Denmark
High-speed LinesCalais-Bourge en Bresse
Km 726Firenze-Roma (Direttissima)
Km 261 ---
Commercial LinesCalais-Modane
Km 1046Modane-Firenze
Km 891Copenhagen – Odense
Km 161
In the French-Italian corridor case study, we have regarded a more mixed system than a purerailway line, which can be also the case when addressing other European corridors.
Before presenting results, some comments are in order.
Firstly, it should be highlighted that this case study does not represent either a benchmark or acomparison among the companies involved, for various reasons, but only a preliminary analysis forwhich official validation was not required.Secondly, it was initially required to collect data on “line section” basis, but apart IMB othersources provided data in more aggregate way.Thirdly, some figures have been estimated.
The major findings are as follows.
1. Based on per km unit, maintenance costs are not shared equally between electrical (signallingplus power traction) and track; in particular IMA seems to spends more for track, while IMBmore for electricals.
2. IMB specific costs seem higher than IMB, on the average, for train control and operations.
3. Specific costs seem to vary substantially for different line sections (according to data providedby IMB), particularly owing to “node effect”, that is where the line becomes part of a major
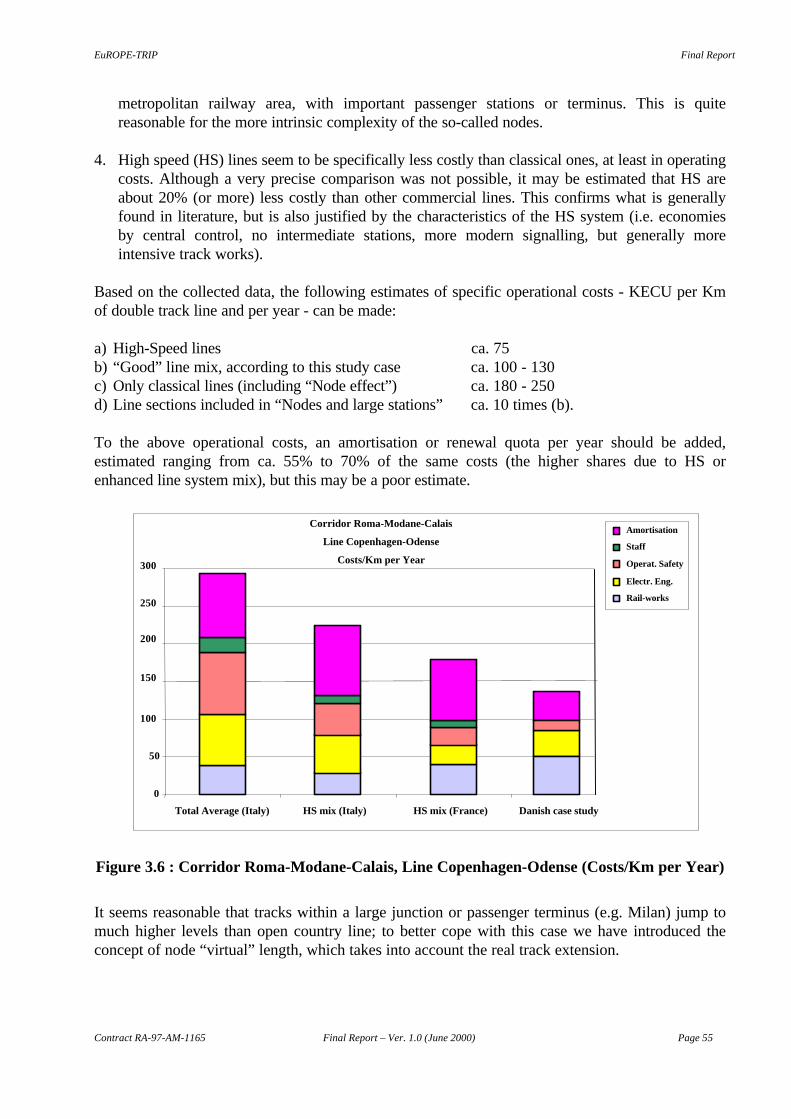
EuROPE-TRIP Final Report
Contract RA-97-AM-1165 Final Report – Ver. 1.0 (June 2000) Page 55
metropolitan railway area, with important passenger stations or terminus. This is quitereasonable for the more intrinsic complexity of the so-called nodes.
4. High speed (HS) lines seem to be specifically less costly than classical ones, at least in operatingcosts. Although a very precise comparison was not possible, it may be estimated that HS areabout 20% (or more) less costly than other commercial lines. This confirms what is generallyfound in literature, but is also justified by the characteristics of the HS system (i.e. economiesby central control, no intermediate stations, more modern signalling, but generally moreintensive track works).
Based on the collected data, the following estimates of specific operational costs - KECU per Kmof double track line and per year - can be made:
a) High-Speed lines ca. 75b) “Good” line mix, according to this study case ca. 100 - 130c) Only classical lines (including “Node effect”) ca. 180 - 250d) Line sections included in “Nodes and large stations” ca. 10 times (b).
To the above operational costs, an amortisation or renewal quota per year should be added,estimated ranging from ca. 55% to 70% of the same costs (the higher shares due to HS orenhanced line system mix), but this may be a poor estimate.
Figure 3.6 : Corridor Roma-Modane-Calais, Line Copenhagen-Odense (Costs/Km per Year)
It seems reasonable that tracks within a large junction or passenger terminus (e.g. Milan) jump tomuch higher levels than open country line; to better cope with this case we have introduced theconcept of node “virtual” length, which takes into account the real track extension.
Corridor Roma-Modane-Calais
Line Copenhagen-Odense
Costs/Km per Year
Amortisation
Staff
Operat. Safety
Electr. Eng.
Rail-works
Total Average (Italy) HS mix (Italy) HS mix (France) Danish case study
0
50
100
150
200
250
300
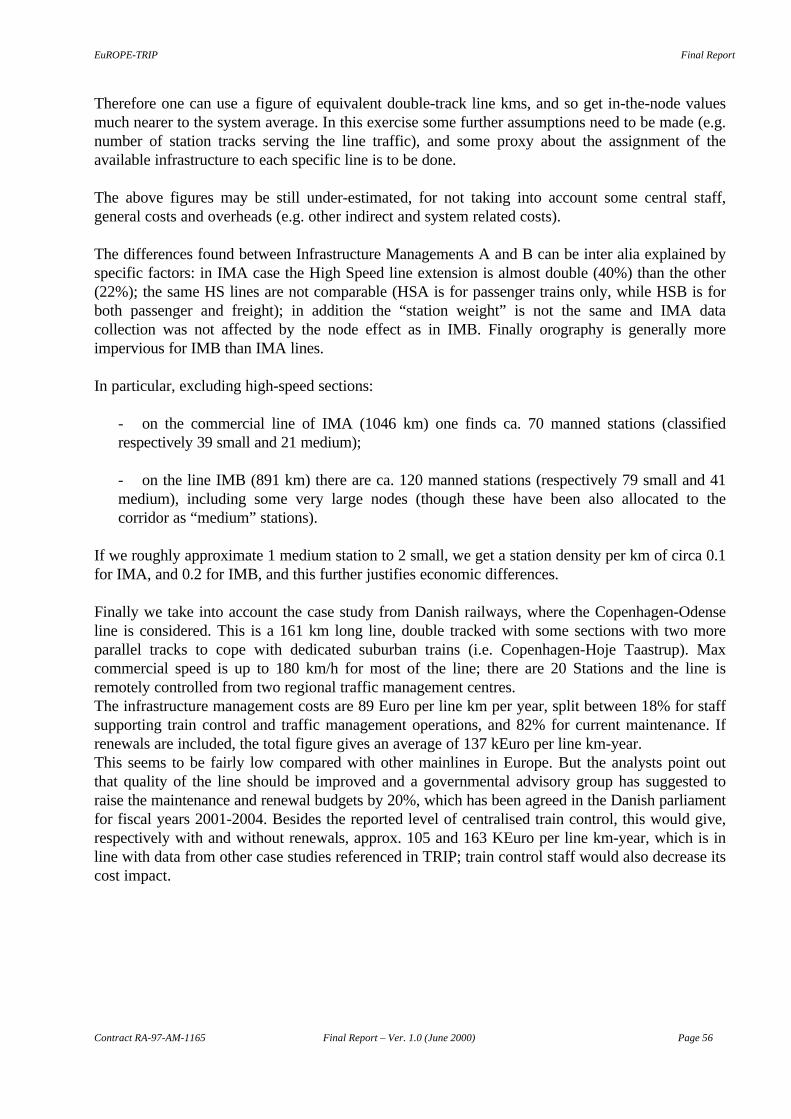
EuROPE-TRIP Final Report
Contract RA-97-AM-1165 Final Report – Ver. 1.0 (June 2000) Page 56
Therefore one can use a figure of equivalent double-track line kms, and so get in-the-node valuesmuch nearer to the system average. In this exercise some further assumptions need to be made (e.g.number of station tracks serving the line traffic), and some proxy about the assignment of theavailable infrastructure to each specific line is to be done.
The above figures may be still under-estimated, for not taking into account some central staff,general costs and overheads (e.g. other indirect and system related costs).
The differences found between Infrastructure Managements A and B can be inter alia explained byspecific factors: in IMA case the High Speed line extension is almost double (40%) than the other(22%); the same HS lines are not comparable (HSA is for passenger trains only, while HSB is forboth passenger and freight); in addition the “station weight” is not the same and IMA datacollection was not affected by the node effect as in IMB. Finally orography is generally moreimpervious for IMB than IMA lines.
In particular, excluding high-speed sections:
- on the commercial line of IMA (1046 km) one finds ca. 70 manned stations (classifiedrespectively 39 small and 21 medium);
- on the line IMB (891 km) there are ca. 120 manned stations (respectively 79 small and 41medium), including some very large nodes (though these have been also allocated to thecorridor as “medium” stations).
If we roughly approximate 1 medium station to 2 small, we get a station density per km of circa 0.1for IMA, and 0.2 for IMB, and this further justifies economic differences.
Finally we take into account the case study from Danish railways, where the Copenhagen-Odenseline is considered. This is a 161 km long line, double tracked with some sections with two moreparallel tracks to cope with dedicated suburban trains (i.e. Copenhagen-Hoje Taastrup). Maxcommercial speed is up to 180 km/h for most of the line; there are 20 Stations and the line isremotely controlled from two regional traffic management centres.The infrastructure management costs are 89 Euro per line km per year, split between 18% for staffsupporting train control and traffic management operations, and 82% for current maintenance. Ifrenewals are included, the total figure gives an average of 137 kEuro per line km-year.This seems to be fairly low compared with other mainlines in Europe. But the analysts point outthat quality of the line should be improved and a governmental advisory group has suggested toraise the maintenance and renewal budgets by 20%, which has been agreed in the Danish parliamentfor fiscal years 2001-2004. Besides the reported level of centralised train control, this would give,respectively with and without renewals, approx. 105 and 163 KEuro per line km-year, which is inline with data from other case studies referenced in TRIP; train control staff would also decrease itscost impact.
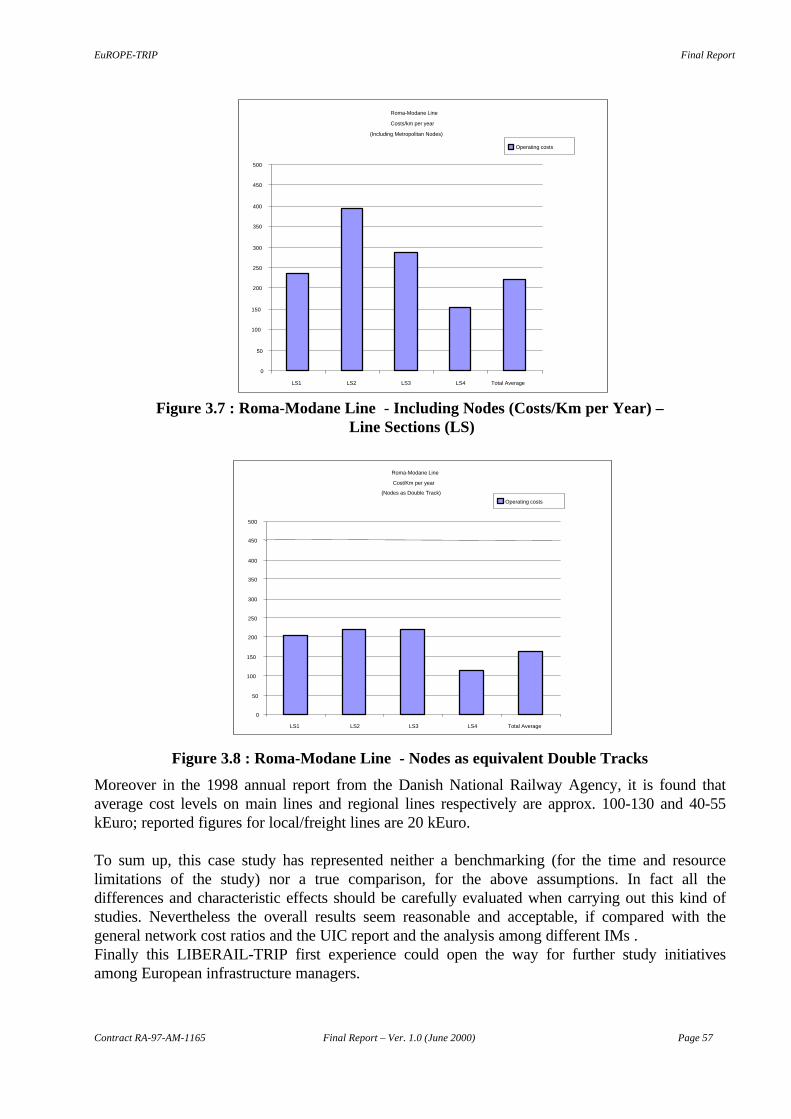
EuROPE-TRIP Final Report
Contract RA-97-AM-1165 Final Report – Ver. 1.0 (June 2000) Page 57
Roma-Modane Line
Costs/km per year
(Including Metropolitan Nodes)
0
50
100
150
200
250
300
350
400
450
500
LS1 LS2 LS3 LS4 Total Average
Operating costs
Figure 3.7 : Roma-Modane Line - Including Nodes (Costs/Km per Year) – Line Sections (LS)
Roma-Modane Line
Cost/Km per year
(Nodes as Double Track)
0
50
100
150
200
250
300
350
400
450
500
LS1 LS2 LS3 LS4 Total Average
Operating costs
Figure 3.8 : Roma-Modane Line - Nodes as equivalent Double Tracks
Moreover in the 1998 annual report from the Danish National Railway Agency, it is found thataverage cost levels on main lines and regional lines respectively are approx. 100-130 and 40-55kEuro; reported figures for local/freight lines are 20 kEuro.
To sum up, this case study has represented neither a benchmarking (for the time and resourcelimitations of the study) nor a true comparison, for the above assumptions. In fact all thedifferences and characteristic effects should be carefully evaluated when carrying out this kind ofstudies. Nevertheless the overall results seem reasonable and acceptable, if compared with thegeneral network cost ratios and the UIC report and the analysis among different IMs .Finally this LIBERAIL-TRIP first experience could open the way for further study initiativesamong European infrastructure managers.
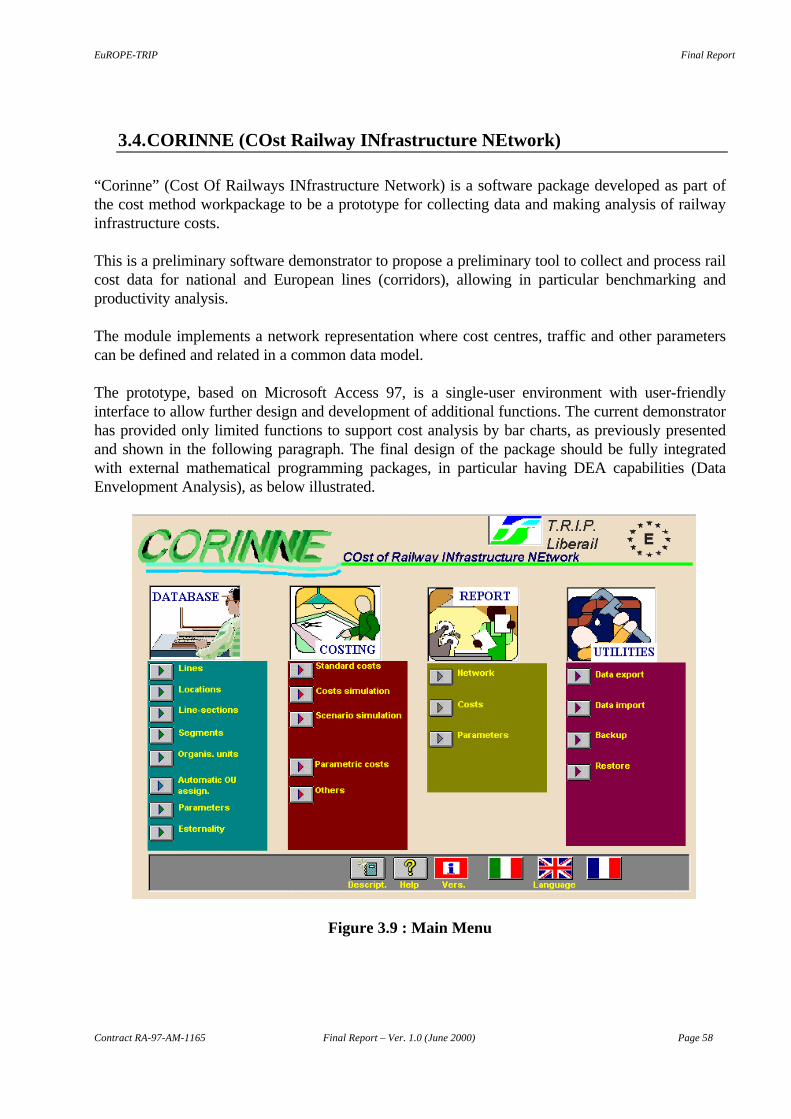
EuROPE-TRIP Final Report
Contract RA-97-AM-1165 Final Report – Ver. 1.0 (June 2000) Page 58
3.4. CORINNE (COst Railway INfrastructure NEtwork)
“Corinne” (Cost Of Railways INfrastructure Network) is a software package developed as part ofthe cost method workpackage to be a prototype for collecting data and making analysis of railwayinfrastructure costs.
This is a preliminary software demonstrator to propose a preliminary tool to collect and process railcost data for national and European lines (corridors), allowing in particular benchmarking andproductivity analysis.
The module implements a network representation where cost centres, traffic and other parameterscan be defined and related in a common data model.
The prototype, based on Microsoft Access 97, is a single-user environment with user-friendlyinterface to allow further design and development of additional functions. The current demonstratorhas provided only limited functions to support cost analysis by bar charts, as previously presentedand shown in the following paragraph. The final design of the package should be fully integratedwith external mathematical programming packages, in particular having DEA capabilities (DataEnvelopment Analysis), as below illustrated.
Figure 3.9 : Main Menu
EuROPE-TRIP Final Report
Contract RA-97-AM-1165 Final Report – Ver. 1.0 (June 2000) Page 59
3.5. DEA (Data Envelopment Analysis)
DEA (Data Envelopment Analysis) is a method based on mathematical programming which aims tomeasure relative efficiency among different so-called DMU (Decision Management Units). DEAwas originally conceived by Charnes, Cooper and Rhodes [24] to measure efficiency of multi-output multi-input systems, by defining a ratio of several weighted outputs to inputs. It finds itsorigins in the economic frontier analysis and represents an extension of the classical definition ofengineering efficiency, where the output/input ratio is usually less than unity and, varying from oneengineering field to another, gives a non dimensional measure of the system performance.The same concept is applied here to industrial or service providing units, aiming to identify the onesthat are the best in the group (i.e. efficiency = 1) and to compute relative performance measure forthe others. In the aftermath we confine ourselves to the so called Technical Efficiency (TE).
Given a set of DMUs as the study sample, the method, which is implemented via specific softwarepackages that provide an extension of linear programming models, is able to:- find the DMUs which are most efficient (i.e. by definition TE=1), i.e. ‘on the frontier’- provide an overall relative efficiency measure for the others (0 < TE < 1)- give an indication of “how much” the less efficient DMUs are far from the best ones, in
terms of resource utilisation; that is how much is the over-usage of each input resource, forthe given output.
Within the method structure and modelling approach, DEA can therefore be a powerful techniqueto analyse productivity issues before more detailed investigations can be carried out. Furthermore itrepresents a technique through which companies or public utilities can make preliminarybenchmarking and get orientation about management policies.In addition the basic method provides various kinds of models, according to the study context andproblem characteristics, e.g. so-called constant or variable returns to scale (CRS - VRS)productions.
In this study we conduct a preliminary demonstration how DEA can analyse the relativeproductivity of several organisational units which provide production (Infrastructure Management)for a railway line6.
We assumed that each railway DMU is responsible for a section of the railway line, where itprovides services in terms of:- Staff personnel (management and central office)- Safety (train control operations)- Railworks (track and railbed maintenance)- Electric equipment (signalling and overhead line maintenance)which also represent the input resources.
The output is given by the trains-km on the same line.For the case study 16 DMUs are considered (covering about 700 km double track main line) andinput resource values are given as operating cost figures.
6 This is essentially the same of the TRIP-LIBERAIL case study, limited to the Italian part of the corridor.
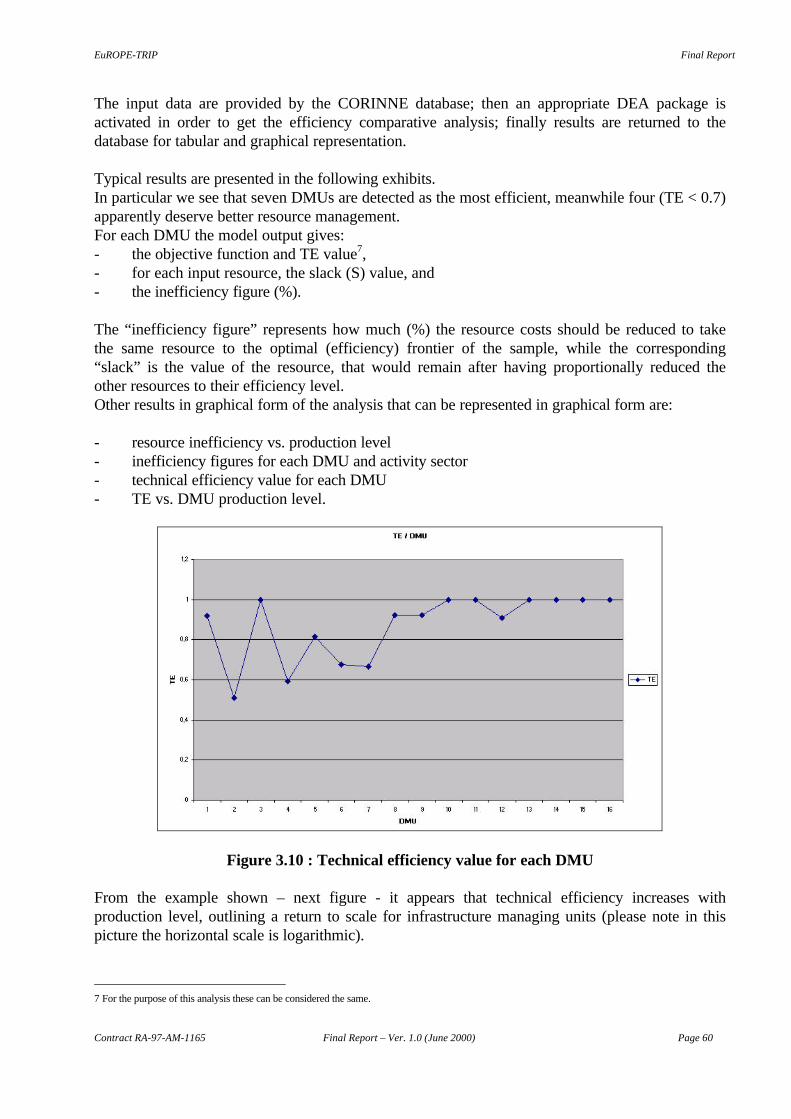
EuROPE-TRIP Final Report
Contract RA-97-AM-1165 Final Report – Ver. 1.0 (June 2000) Page 60
The input data are provided by the CORINNE database; then an appropriate DEA package isactivated in order to get the efficiency comparative analysis; finally results are returned to thedatabase for tabular and graphical representation.
Typical results are presented in the following exhibits.In particular we see that seven DMUs are detected as the most efficient, meanwhile four (TE < 0.7)apparently deserve better resource management.For each DMU the model output gives:- the objective function and TE value7,- for each input resource, the slack (S) value, and- the inefficiency figure (%).
The “inefficiency figure” represents how much (%) the resource costs should be reduced to takethe same resource to the optimal (efficiency) frontier of the sample, while the corresponding“slack” is the value of the resource, that would remain after having proportionally reduced theother resources to their efficiency level.Other results in graphical form of the analysis that can be represented in graphical form are:
- resource inefficiency vs. production level- inefficiency figures for each DMU and activity sector- technical efficiency value for each DMU- TE vs. DMU production level.
Figure 3.10 : Technical efficiency value for each DMU
From the example shown – next figure - it appears that technical efficiency increases withproduction level, outlining a return to scale for infrastructure managing units (please note in thispicture the horizontal scale is logarithmic).
7 For the purpose of this analysis these can be considered the same.
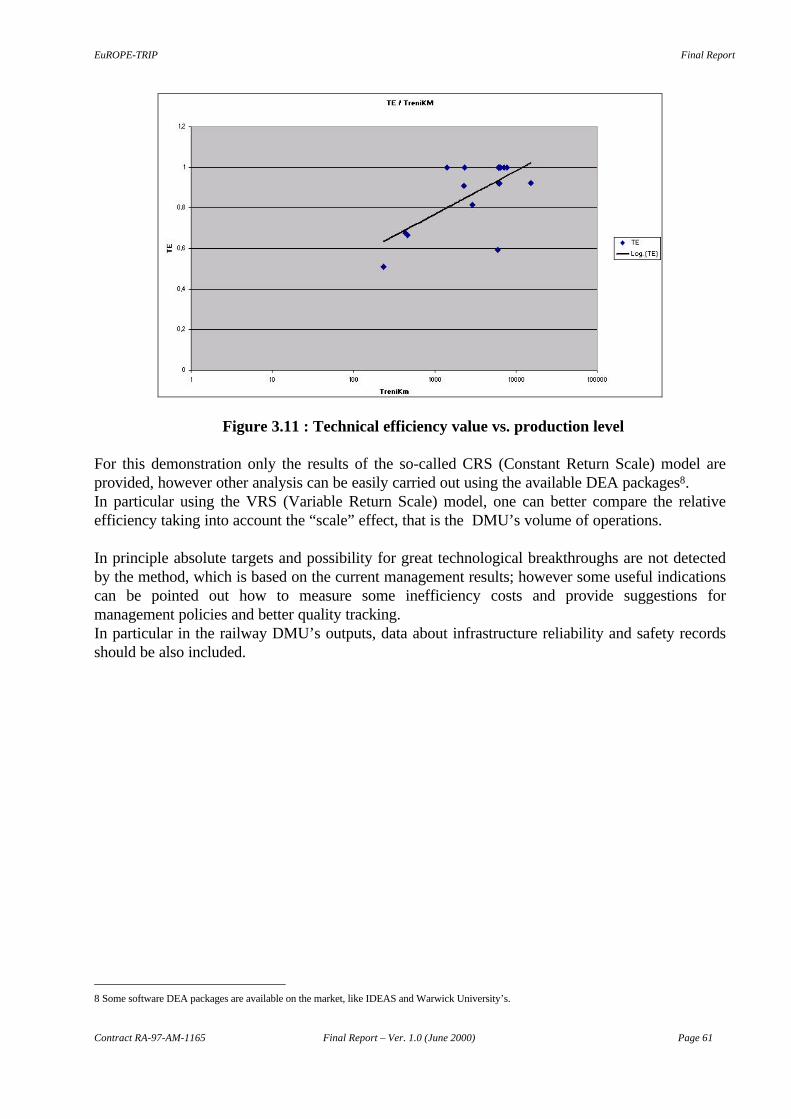
EuROPE-TRIP Final Report
Contract RA-97-AM-1165 Final Report – Ver. 1.0 (June 2000) Page 61
Figure 3.11 : Technical efficiency value vs. production level
For this demonstration only the results of the so-called CRS (Constant Return Scale) model areprovided, however other analysis can be easily carried out using the available DEA packages8.In particular using the VRS (Variable Return Scale) model, one can better compare the relativeefficiency taking into account the “scale” effect, that is the DMU’s volume of operations.
In principle absolute targets and possibility for great technological breakthroughs are not detectedby the method, which is based on the current management results; however some useful indicationscan be pointed out how to measure some inefficiency costs and provide suggestions formanagement policies and better quality tracking.In particular in the railway DMU’s outputs, data about infrastructure reliability and safety recordsshould be also included.
8 Some software DEA packages are available on the market, like IDEAS and Warwick University’s.
EuROPE-TRIP Final Report
Contract RA-97-AM-1165 Final Report – Ver. 1.0 (June 2000) Page 62
3.6. Cost of using Intermodal Terminals
Intermodal transport is recognised as an essential market for the railway development (andsurvival) in the freight logistic chain. Therefore a specific part of the TRIP study addressed thissubject in order to provide a more complete view about the major bottlenecks and costs facing theaccess-to-infrastructure from a combined transport operator’s point of view.
It should be noted that the railway facilities of the so called “intermodal inland terminals” weretraditionally provided by the vertically organised railways, as an internal part of their infrastructure,whilst the framework is now changing or has already adapted to the general industry re-organisation. Today these infrastructure are usually not managed any longer by the infrastructuremanager.This kind of analysis was therefore provided to TRIP by an intermodal transport operator as moreindependent and complementary assessment of the rail infrastructure usage and its economicviability.
The study has specifically addressed the definition of various terminal size-types, identifyingappropriate design indexes for the terminal dimensions, the crane activities and correspondingrequirements for movement capacity and related economic break-even analysis. This has quantifiedthe items that make up fixed and variable costs for an inland terminal, which moves container andunit loads between road vehicles and trains. In particular the number of crane hauls, depending onthe facility types (i.e. frontal cranes on wheels or straddle carrier on pre-disposed rails) andstandard traffic movements, are assumed as the cost drivers of the terminal. Moreover, to definethe terminal railway capacity, a reference train of the standard European type of the future isassumed (i.e. maximum length 700 m and 1600 tons gross weight at locomotive connection).
It is pointed out that the low growth in new terminal infrastructure is intensifying the utilisation ofthe existing facilities while operations methods need to be adapted; in particular in piggybacktransport, there has been a shift from the original “static management” of tracks to the new“dynamic management”. In the former, trains arrived in the morning were left on the operatingtracks until afternoon, when unit loads were loaded ready for evening departure; in the lattermodel, in the morning the trains to be unloaded are lined up on the operating tracks, from whichthey are removed one by one as they are unloaded and placed on dedicated tracks, subsequently thereverse operation of loading is carried out in the afternoon on the departing trains. This alsofollows the desiderata of the clientele but should not incur into limitations due to shortage ofwaiting tracks; at the same time timely and efficient manoeuvring organisation is needed.
As far as new infrastructures, it can be outlined that the creation of a terminal takes place when thetraffic demands is sufficient to cover the cost of the active crane haul to market prices, unlessspecial situations are taken into account. According to the study this cost is in the range of 17-25Euro.
As regards investment in new terminals construction, the study outlines the difficulty for these costsbe overturned in the form of interest calculations on management costs as it would take the activecrane haul price out of the market. There is, at present, a European price settled from first land
EuROPE-TRIP Final Report
Contract RA-97-AM-1165 Final Report – Ver. 1.0 (June 2000) Page 63
intermodal development (‘60s and ‘70s) where the terminals were set on traditional ready-madeinfrastructure railway facilities, some road connections were available, and terminal concessioncosts were kept to a minimum. Nevertheless land intermodal service made it possible for therailways to re-enter, albeit indirectly, door-to-door transport.
The study reports that the only quota of construction cost amortisation at best equals if not exceedsthe actual management costs; therefore more general cost-benefit analysis and state funding aregenerally required to justify a new terminal construction.
Moreover it is pointed out that should railway shunting activities be separated from access chargesand its cost change from train management to terminal management, an increase in the current pricefor terminal services can be expected.
Finally the ecological issues of an inland terminal are outlined, which appear to increase the localroad externality around the terminal location but should be considered in view of the wider scalebenefits. On the other hand specific types of traffic (e.g. harmful and dangerous goods) whichrequire high control level can be more easily channelled through these infrastructures.
3.7. Infrastructure costs in the future
What is in the future of rail infrastructure costs?
The IM should lower its current cost levels, in order to make the infrastructure increasingly moreproductive, less costly and more appealing for the transport market.
There is no question that the more efficient the IM production, the more productive the TransportOperators, with decreasing final transportation fares. It is also argued that the IM productivity isresponsible of the competitive nature of the rail system vs. other transport modes, while railTransport Operators would be left to compete (or co-operate with) each others at rail “intra-system” level. Furthermore higher efficiency levels of the IM can result in higher TO productivity,e.g. via more automated operations and increased flexibility, being the latter’s production functionmore sensitive to variable and operations related costs.
It is generally believed that significant margin of savings still exist and should be exploited asnecessary. It can be estimated that in about the next 15 years the IM has the opportunity todecrease its operating costs by 50% (some are even more optimistic), using at the best the availabletechnologies. Many of these should already exist and are only to be engineered and tested on thefield. The two major processes of the IM business- train control and maintenance - can in factresort to more automated technology and working methods. In fact for both sectors there areprevailing trends for substitution of manpower by technological systems and tools.In UK the policy towards more productivity has been formalised by the Office Rail Regulator(ORR) who has set cost reduction targets for Railtrack of minus 2% per annum [17]. Similar orless explicit programmes exist in other countries.
Train and route management can make use of centralised train control centres, which practicallyreduce to nihil the need of traditionally manned stations and signalmen on the line. This technologyhas been traditionally introduced on many lines and railway areas by CTC (Centralised Traffic
EuROPE-TRIP Final Report
Contract RA-97-AM-1165 Final Report – Ver. 1.0 (June 2000) Page 64
Control); a more massive strategy in this direction is now apparent in some countries of the Union(Italy, Sweden, UK), whose IMs have made public plans to concentrate all the networkmanagement in a limited number of TMS (Train Management Systems) centres; an evolutionarystage which also includes the new ERTMS programme. Each centre, supported by so-called ICRs(Intelligent Control Rooms), can be for instance responsible of a railway line or network of ca.1000 km or more; some front runners of this architecture have been already set up in Europe.Signalling can extensively introduce digital technology, opening the substitution market for old,electromechanical and relay based inter-lockings.Technology of diagnostic devices, for electrical (signalling, overhead line) and rail engineering, cannotably introduce dramatic savings in maintenance personnel and procedures. This also representsthe field where infrastructure should produce its most efforts in cost reduction programmes.Inclusion of diagnostics is obviously less costly and intrusive in digital apparatus at design stagethan adds-on to traditional ones.
The roadbed is another area where traditional rail engineering needs to develop new concepts tolower its current LCC levels. The high speed lines experience is already available to predict muchlonger track lives, up to several decades and committed to much longer operational life than in thepast (e.g. accumulated gross tons in the order of 750 millions).
Cost economics are however an intriguing issue. Global system economics should be alsoconsidered when conceiving cost reduction programs. For instance it is observed that “while heavyaxle loading will result in increased way maintenance costs, these costs can be more than offset byreduction in train operating costs and equipment ownership and maintenance costs” [21]. Axleloads increases up to 35 tonnes are evaluated. According to this kind of analysis, involving freighttraffic, one can find the best mix of values of number of wagons and axle load for which annualisedcosts are minimum; transport related savings about 5% are reported. This can also represent asubject where the IM can better investigate its variable costs causation.
Research and development programmes carried out at international levels are providing interestingresults. ECOTRACK - an abbreviation of Economical Track - is the system recently developed byERRI, the European Railway Research Institute, targeting track maintenance resources as costeffectively as possible. “The aim is to reduce costs by 20 to 40% at the minimum. Permanent waycosts are high, but savings are thought possible. The system, which is sponsored by 26 Europeanrailways and based on PC hardware and software, is claimed to “bring better, more objectivedecision-making in the maintenance sector and help to limit track life-cycle costs” [8].Another initiative to introduce new ideas and technology into railway maintenance is the REMAINproject (Modular System for Reliability and Maintainability in European rail transport), funded bythe European Union. Among others here the focus is on life cycle costs and condition monitoringsystems (CMS), with trial sites installed to test the concepts. With several sensors checking thestatus of the infrastructure (e.g. turnouts, track circuits etc...), maintenance policies can beconceived ensuring that the wear and tear of the equipment will be soon discovered and actionstaken that will increase reliability and shorten inspection times. Investment in sensing equipment isbecoming higher but operational maintenance is expected to be dramatically reduced; as result theLCC turnout costs with RCM can decrease by 60%. In addition costs of hazards and train delayscan be also limited very much; according to some estimates they would be today of the samemagnitude of direct costs [15]. Internalising the delay penalties should also become one of themajor cost problems of the Infrastructure Management, in face of contracts with the TrainOperators.
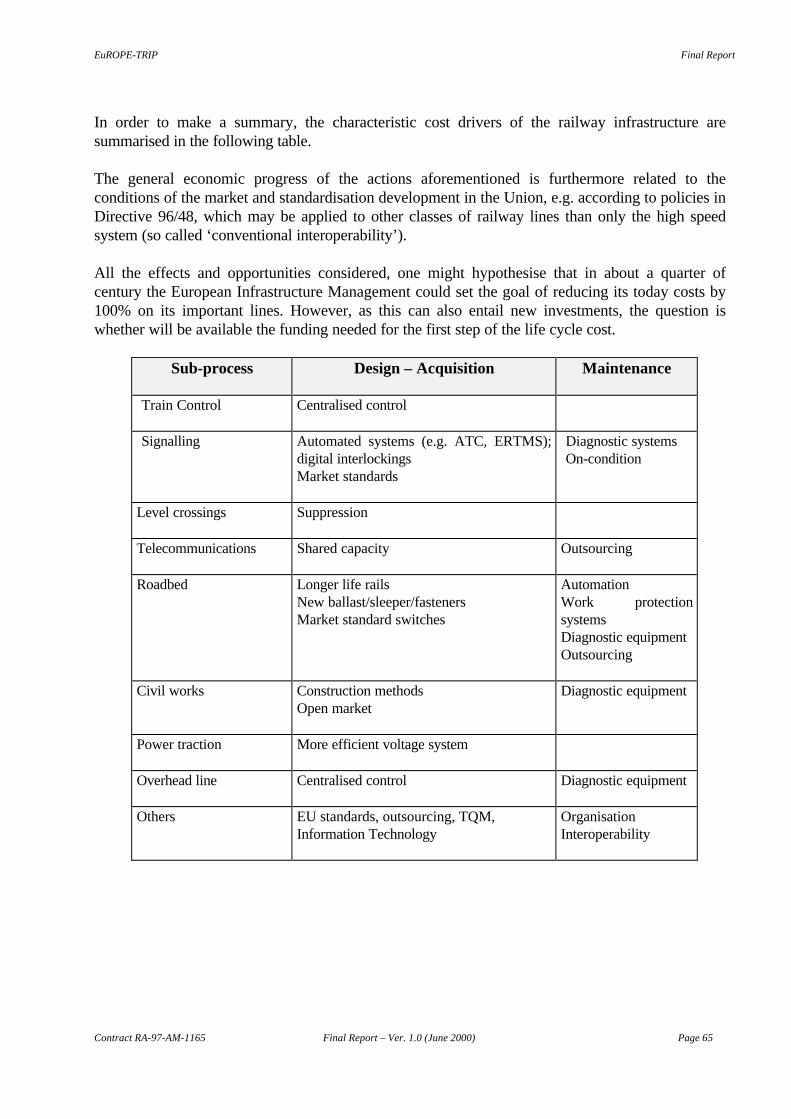
EuROPE-TRIP Final Report
Contract RA-97-AM-1165 Final Report – Ver. 1.0 (June 2000) Page 65
In order to make a summary, the characteristic cost drivers of the railway infrastructure aresummarised in the following table.
The general economic progress of the actions aforementioned is furthermore related to theconditions of the market and standardisation development in the Union, e.g. according to policies inDirective 96/48, which may be applied to other classes of railway lines than only the high speedsystem (so called ‘conventional interoperability’).
All the effects and opportunities considered, one might hypothesise that in about a quarter ofcentury the European Infrastructure Management could set the goal of reducing its today costs by100% on its important lines. However, as this can also entail new investments, the question iswhether will be available the funding needed for the first step of the life cycle cost.
Sub-process Design – Acquisition Maintenance
Train Control Centralised control
Signalling Automated systems (e.g. ATC, ERTMS);digital interlockingsMarket standards
Diagnostic systemsOn-condition
Level crossings Suppression
Telecommunications Shared capacity Outsourcing
Roadbed Longer life railsNew ballast/sleeper/fastenersMarket standard switches
AutomationWork protectionsystemsDiagnostic equipmentOutsourcing
Civil works Construction methodsOpen market
Diagnostic equipment
Power traction More efficient voltage system
Overhead line Centralised control Diagnostic equipment
Others EU standards, outsourcing, TQM,Information Technology
OrganisationInteroperability
EuROPE-TRIP Final Report
Contract RA-97-AM-1165 Final Report – Ver. 1.0 (June 2000) Page 66
3.8. Conclusions and recommendations
It should be recognised that railway managers are required to improve their current level ofinformation about maintenance costs and to better analyse cost causation.The engineering analysis about cost mechanisms and activity costing seems necessary for settingcost reduction programmes and overall better infrastructure managing.
The life cycle cost concept should become more widely accepted, as well better identification ofhidden costs (e.g. congestion and other externalities).
Cost harmonisation of rail infrastructure and regular reporting in the Union are required in order toaid infrastructure development and improve its efficiency standards.Benchmarking among Infrastructure Management and other sectors should be favoured, inparticular regarding the European Corridors; for instance the European IMs could identify somerailway lines as regular case studies and best practices “laboratories”.
Opportunities for dramatic cost reductions exist in the core missions of the InfrastructureManagement. For centralised Train Control, technology is already available; for Maintenance, moreapplied research, field testing and developments are needed and diagnostics opportunities exploited.
In addition to technical progress, design and maintenance standards definition can impact qualityand cost reducing programmes. Major difference behaviours and cost sensitive areas need to beidentified by concerted actions.
A balance sheet of common format for the European Infrastructure Management is to berecommended.The current IM cost related references - e.g. EC rulings and UIC leaflets – should be adjourned,following the re-organisation of the Union railways.
A specialistic Conference and other dissemination actions about cost assessment and improvementsfor Infrastructure Management in the EU could be regularly organised.
EuROPE-TRIP Final Report
Contract RA-97-AM-1165 Final Report – Ver. 1.0 (June 2000) Page 67
3.9. Bibliography
1. Amos P.F. - Computerised Costing Methods for Rail Business Planning - Travers MorganPTY, 1986
2. Baumbgartner J-P. – Ordres de grandeur de quelques couts dans les chemins de fer - EPFL-CFF
3. Borts G. - The Estimation of Rail Cost Functions - Econometrica, p.108, 19604. Button K. J. - Transport Economics - Edward Elgar, 19935. Carpenter T.G. - The Environmental Impact of Railways - Wiley, 19946. Caves D., Christensen L.R. - Productivity Growth, Scale Economies and Capacity Utilization
in US Railroads – American. Economic Review, p.994, 19817. Cole S. - Applied Transport Economics - Kogan Page, 19958. Cordner K. - ECOTRACK aims for economical track maintenance - European Railway
Review, September 19989. ECMT - Interurban Transport Costs - Round Table 98 (OECD), Paris 199510. Friedlander A. - The Social Cost of Regulating the Railroads – Am. Econ. Review, p.226,
197111. Griliches Z. - Cost Allocation in Railroad Regulation - Bell Journal of Economics, p.26, 197212. Hansson L., Nilsson J-E. - A New Swedish Railroad Policy: Separation of Infrastructure and
Traffic Production – Trans. Res., Vol.25A, No.4, 199113. Harris R. - Economies of Traffic Density in the Rail Freight Industry - Bell Journal of
Economics, p.556, 197714. Keeler T. - Railroad Costs, Returns to Scale and Excess Capacity - Review of Economics and
Statistics, 1974. p.20115. Mihm P. E. - Reducing costs by introducing modern technology in Railway maintenance -
European Railway Review, March 199816. Nash C.A., Preston J. - The Policy Debate in Great Britain - ECMT, Round Table 90,
(OECD) Paris 198317. ORR - Publications18. Stampacchia P - La Gestione delle Linee Ferroviarie – CSST Centro Studi sui Sistemi di
Trasporto, Aprile 199019. Transystem - Sistemi di trasporto - Procedura per l’Analisi dei Costi di Investimento e di
Gestione - Contratto CNR - PFT, 198520. Young HP (1994) - Cost Allocation. In Aumann RJ, Hart S (eds) Handbook of Game Theory
(Vol 2), North Holland, Amsterdam21. Zarembski A.M. - The Economics of Increasing Axle Loads – Eur. Railway Rev. June 199822. UIC - Les Couts de l’Infrastructure Ferroviaire. Investissements et Maintenance. (Rapport a
la Commission Infrastructure) - Paris, Sept. 199623. UIC Leaflets 714-R, 715-R24. Charnes A., Cooper W.W., Rhodes E. – Measuring the Efficiency of Decision Making Units
European Journal of Operational Research 2 (1978)25. Charnes A., Cooper W.W. – Preface to Topics in Data Envelopment Analysis – Annals of
Operations Research 2(1985)26. EC – Towards Fair and Efficient Pricing in Transport (Green Paper), 1995
EuROPE-TRIP Final Report
Contract RA-97-AM-1165 Final Report – Ver. 1.0 (June 2000) Page 68
4. HOW TO SHARE RAIL INFRASTRUCTURE COSTS
4.1. Introduction
This chapter summarises the work undertaken on Co-operative Game Models, which was part ofthe Cost methods Workpackage .
The work focused on the problem of how to share (i.e. allocate) rail infrastructure costs amongst anumber of operators using the same infrastructure and to propose methods for doing so in arational way.The so-called "cooperative methods" find their origin in modern economic literature of gametheory, where the players share information and reach binding agreements how the game payoff hasto be divided. This is also the rationale behind the cost allocation problem.
Within TRIP, researchers at the Universities of Genoa (Italy), Santiago de Compostela (Spain) andTilburg (The Netherlands) made joint effort and addressed the problem to:
• translate the results of this economic theory into the real of rail infrastructure, and
• study how the infrastructure management should allocate costs among the train operators,
through a fair fee system.
We believe this work can be considered the first in rail management, though seminal applicationshave already appeared in air transportation, i.e. sharing the cost for using runways at airports.
4.2. Method overview
It is appropriate to say a few words to indicate briefly what is a “game model”. Game theory is afield of applied economics which deals with decision situations in which different agents (players)are involved. This means that the final result depends on the actions of different decision makers. Itis usually assumed that the agents involved are intelligent (so that they organise their availableactions under appropriate strategies), and rational (as usually understood in economics, that is: theyhave well defined goals or preferences). When such a real situation is represented using themethods and instruments of this theory we have a game model.It should be clear that Game Theory is a natural tool to analyse situations in which strategicinteraction is crucial, as in the reorganisation of the European Railway sector. With the end ofmonopoly, Railway Transport cannot be reasonably depicted as a situation of "perfectcompetition": regulatory aspects remain, due to the peculiarity of the service involved. Moreover, itis easy to predict that the active subjects in this area will be a limited number (at least for a nonshort initial period of time), so, when transport operators make their decisions, they should takeinto account the position of the other agents. That is, interactive decision making, which ischaracteristic of game models, is crucial.
EuROPE-TRIP Final Report
Contract RA-97-AM-1165 Final Report – Ver. 1.0 (June 2000) Page 69
Since we shall deal with "cooperative game models", we have to make clear a terminological point.In game theory, it is not always assumed that the agents must have conflicting interests. It mayhappen that they could be interested in cooperating in order to achieve better results. Moreover thisshould be transferred into the language specific of the economic theory. Here "cooperative game"does not mean "converging interests of the players": it means that the institutional setting of theinteractive situation is such that they can make binding agreements. This condition also traces thefrontier between cooperative and non-cooperative games: in cooperative games players cansubscribe binding agreement, according to certain rulings, while in non-cooperative they cannot.How similar or conflicting are the interests of the different players has nothing to do with thisdivision.
One of the most usual application of cooperative game theory is the cost allocation problem. In thiscase the players share a common resource and have to decide how much each of them as to pay forits use: this has been our field of investigation. In fact we studied the situation in which differenttransport operators (the players) have to share a common railway infrastructure (the resource). Thecorresponding cost allocation may be viewed as an access fee derived from a cost sharing rule.It should be also clear that this cooperative approach is of special relevance from the “normative”point of view, the main point being how to define and incorporate fairness conditions into theenvisaged solution. But the solutions can take also into account many more conditions, like: thedifferent possibilities for the players of forming "coalitions"; efficiency considerations; presence orabsence of incentives to collaborate; existence or not of subsidies among the players; etc…Coming to the specific work done in TRIP, the contributions of the three Universities wereessentially at two levels.
The first one could be qualified as "scientific dissemination". We provided a survey of costallocation methods, devolving particular attention to the allocation of costs due to the use ofrailway infrastructure. This originated the survey "Cost Allocation and Cooperative Games: anIntroduction", by M. Koster (1999).The second level has been to develop a specific model of "cooperative game" that in our opiniondescribes in an adequate way the specific problem to divide among different transport operators thecosts deriving from the use of the railway infrastructure. This resulted in a couple of scientificpapers [5,9].
Due to the characteristics of these contributions, we shall give now a brief verbal description oftheir contents, to make hopefully easier the approach for the interested reader who is not aspecialist.
From the point of view of cost allocation, when infrastructure management and transportoperations are separated, two main problems arise.One is to allocate the track capacity among the various operators. This issue has been treated, forinstance, in Nilsson (1995), Brewer and Plott (1996) and Bassanini and Nastasi (1997).The second problem is to study how the infrastructure manager must allocate the building and themaintenance costs among the operators through a fair fee system. This can have a directcontribution to the normative aspect of levying access charges.The approach that we have used is standard in game theory; apart the survey quoted above, theinterested reader may also refer to the ‘general purpose’ survey of Young (1994).Coming to the point, consider a railway track that is used by different (e.g. by weight, length etc…)types of trains, and consider the problem of dividing among these trains the infrastructure costs.
EuROPE-TRIP Final Report
Contract RA-97-AM-1165 Final Report – Ver. 1.0 (June 2000) Page 70
Clearly it is a problem of joint cost allocation. To settle the question, one can see the infrastructureas a "sum" of different "facilities" (track, signalling system, stations, etc.). Trains of differentgroups need these facilities at different levels: fast trains need a more sophisticated track andsignalling system, compared with local trains, for which instead station services may be moreimportant (in particular "small" stations).
Furthermore, infrastructure costs for each facility can be seen as the sum of two components:"building" costs and of "maintenance" costs. If we consider only building costs, we are facing aproblem similar to the so-called "airport game". This terminology comes from some scientificworks (Littlechild and Owen, 1973 and Dubey, 1982), that studied a model in which the players(i.e. the airplanes ) share the cost of a facility (the landing strip) that they need at different levels(length), with the important characteristic that the cost for a coalition (a group of airplanes) issimply the cost of the player (aircraft) requiring the facility at the highest level (length) among thegroup.
For what concerns the maintenance costs, it can be assumed that they have a "fixed" component(i.e.: independent of the number of trains that use it), which can be incorporated into the investmentcosts, and a variable component, that as a first approximation can be assumed to be proportional tothe number of trains that use the facility.Similar considerations extend to other related problems: for example the costs for a bridge, to beused by small and big cars. There are building costs, that are different in the case of a bridge forsmall or big cars, and maintenance costs, a part of whom fixed (think of painting), and a part whichcan be assumed to be proportional to the number of vehicles and to the kind of bridge that wasbuilt.
Another related problem arises when some community has to buy a set of glasses: the "building"cost depends on the kind of glasses that will be selected (more or less expensive), while themaintenance cost can be considered as proportional to the number of glasses (the proportionalitycoefficient could be related with the probability of breaking a glass during some given unit of time).Actually, this last example was the "model problem" we had in mind to approach the railwayproblem: from this model problem was coming the name "glass game", referred to in our reports.
4.3. How to apply the concepts
We analysed these game models from the point of view of the so-called Shapley value and the“core”.The Shapley value is a recognised method to give solution to a problem how to allocate the payoff(cost) among the players’ coalitions, which satisfies certain rationality properties.The core is a concept largely used in economics. It means the whole payoff is shared among theplayers such that (1) for any coalition, the sum of individual shares is not less than total share theplayers would get if they act as one coalition, and (2) the sum of all individual shares is equal to thecoalition’s payoff made of “all” the players.The core is in some sense a way to guarantee the economic stability of the agents.It should be noticed that while the Shapley formula is a unique “point” valued solution, the core cancontain more than one point, that is a “set” valued solutions. Unluckily the core of a game may beempty.
EuROPE-TRIP Final Report
Contract RA-97-AM-1165 Final Report – Ver. 1.0 (June 2000) Page 71
However another property comes to play – “balancedeness”- which will be not defined herefurthermore: suffice to say that a game has non empty core if and only if is balanced (Bondareva-Shapley theorem).This would explain at least partially the titles of the scientific papers mentioned in references.Finally, exploiting the structure of the rail infrastructure games, we get a nice formula to computethe Shapley value and a class of minimal conditions that are equivalent to having a non empty core.Therefore these results can have practical applications.
Assume that we are given n different players (not necessarily physical persons: in our case, trains).We have a cooperative cost game in coalitional form if we can attribute to each group of subjectstheir joint costs. For example, we need to assess the costs (building, maintenance, or both,according to what we are interested in) for every set of trains.Then we can look for a reasonable cost allocation that satisfies fair properties. By cost allocationwe mean a division of the total cost that is due to all of the players. Game Theory provides manyways to do this (depending on the conditions that one wants or must fulfil). As above said, thereare two different types of solutions: set valued solutions and point valued solutions.
For what concerns set valued solutions, the idea is the following: we can be interested in finding allof the allocations satisfying some kind of property and search all of the cost allocations that satisfya stability criterion: there should be no group of players that, summing all of the costs that areallocated to all of its players, has to pay more than its overall joint costs (stand alone principle).This principle coincides with the no subsidising principle: each group of players should pay at leasttheir marginal cost (that is, the difference between the total cost and the cost without this group ofplayers). More precisely, the coincidence between these two principles is given whenever one looks(as usual) for cost allocations that divide among the players exactly all of the total costs.
In the class of point valued solutions, the Shapley value is the most known and used criterion forallocation of costs. However it is however not the unique criterion used in Game Theory: we canmention also the so-called nucleolus, the constrained egalitarian solution, the ACA (Alternate CostAvoided) method, the tau-value and others, which are described in the literature [e.g. 6].
All these criteria have in common basic concepts as efficiency and fairness, to which add otherproperties. So, there are many different ways to single out an allocation of the costs among thevarious subjects engaged in the game. This fact should not be surprising: depending on theconditions that we want to be satisfied by the normative criterion, we are driven to differentsolutions of our cost allocation problem. The above mentioned reference of Young (1994) is agood source on this point.Nevertheless in some practical applications these solutions may not differ a lot from each other.Finally some more details about the results of the above mentioned research can be outlined.
4.4. Generalised Airport Game - Maintenance and Infrastructure cost games
Our models involve airport games and generalised airport games (a new class of games which isproved to be closely related to our class of problems).Airport games, as said, are cost models for the building of one facility (in the original example,from which the name comes, it was a landing strip) where the wishes of the coalitions are linearly
EuROPE-TRIP Final Report
Contract RA-97-AM-1165 Final Report – Ver. 1.0 (June 2000) Page 72
ordered. Coalitions (i.e. same airplane types) desiring a more sophisticated facility (a larger landingstrip) have to pay at least as much as coalitions desiring a less sophisticated facility (a smallerlanding strip). If we drop this monotonicity condition we get the class of generalised airport games.The main difference between airport game and generalised airport game is that in the latter therequirements on the level of the resource are not necessarily increasing.The idea is to classify the players (trains) into groups, according to the cost of the original facility(investment) they require. Briefly we characterise the set of core allocations that equally treat theplayers of each group for generalised airport games and prove that they have non empty core.Which is a result of practical interest for assuring the existence of solutions, as above said.
Now we introduce maintenance games. Here we have provided an easy formula for the Shapleyvalue of a maintenance game. In the report by Fragnelli et al. is also included a simple example ofapplication to the allocation of costs for the use of the facility "track".This kind of solution, thanks to its additivity property, allows us to treat easily much more complex(and realistic) situations, in which one has to take into account many different facilities at the sametime (track, signalling, overhead equipment, etc.).
Finally we have studied the infrastructure cost games.An infrastructure cost game is the sum of an airport game plus a maintenance cost game, i.e. a costgame in which both the building and maintenance costs are taken into account.According to our technical results, we can have games obtained "summing" infrastructure costgames corresponding to different railway facilities.Here we present two simple formulas that allow to compute two core allocations which correspondto known solution concepts: the nucleolus and the Constrained Egalitarian Solution.Briefly the nucleolus is the allocation that minimises the "unhappyness" of the coalitions, i.e. thedifference between the joint costs of the players and the cost they have to pay according to theallocation.The Constrained Egalitarian Solution tries to assign the same charge to each player taking intoaccount the no subsidising principle.
4.5. Conclusions and applications
We can resume in the following scheme our work:
1. Our main interest is to design a fair fee system to allocate the building and maintenance costs ofthe railway infrastructure among the several operators using it.
2. We provide a formula to compute the fees in the case that the Shapley value of the cost game isassumed as a reasonable solution.
3. We give conditions under which it is possible to find a fee system that is stable and avoidssubsidisation and provides simple formulas for two possible fees that are related to a couple ofoutstanding solutions in the core (the nucleolus and the Egalitarian Constrained Allocation).
In order to offer an easily manageable support to people interested in analysing the data or costsusing the approach here proposed, we have translated the above results into ScRInC, a software
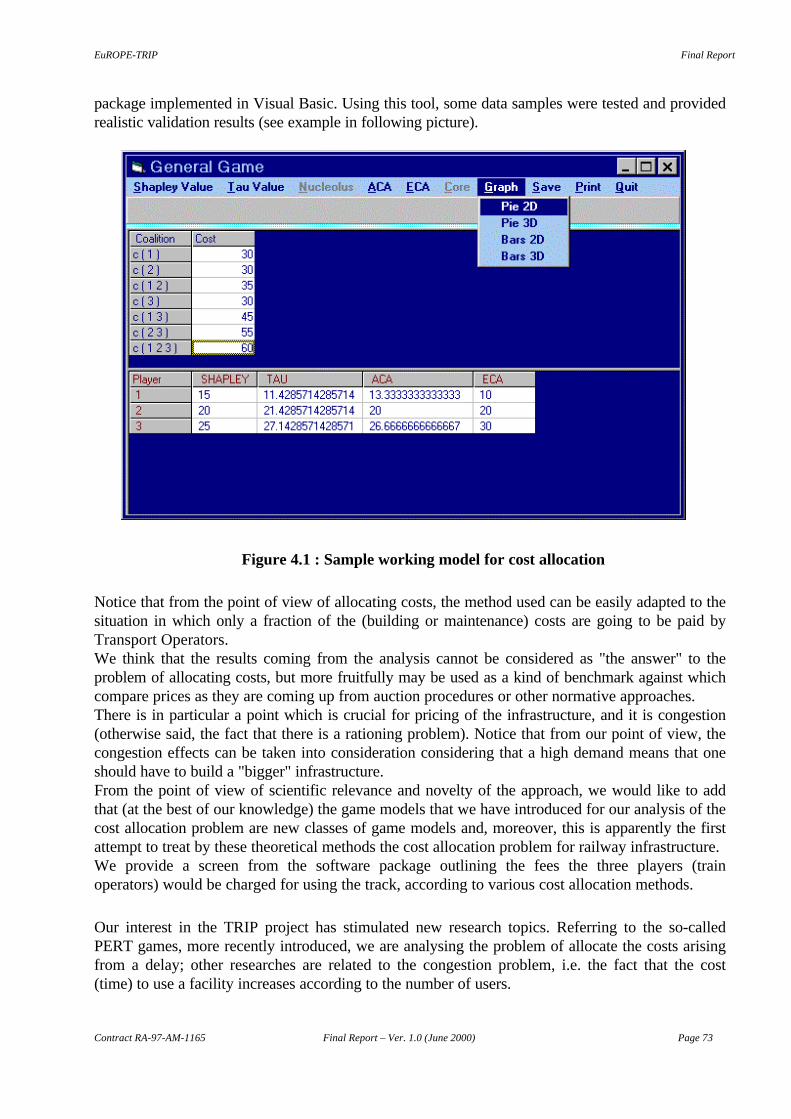
EuROPE-TRIP Final Report
Contract RA-97-AM-1165 Final Report – Ver. 1.0 (June 2000) Page 73
package implemented in Visual Basic. Using this tool, some data samples were tested and providedrealistic validation results (see example in following picture).
Figure 4.1 : Sample working model for cost allocation
Notice that from the point of view of allocating costs, the method used can be easily adapted to thesituation in which only a fraction of the (building or maintenance) costs are going to be paid byTransport Operators.We think that the results coming from the analysis cannot be considered as "the answer" to theproblem of allocating costs, but more fruitfully may be used as a kind of benchmark against whichcompare prices as they are coming up from auction procedures or other normative approaches.There is in particular a point which is crucial for pricing of the infrastructure, and it is congestion(otherwise said, the fact that there is a rationing problem). Notice that from our point of view, thecongestion effects can be taken into consideration considering that a high demand means that oneshould have to build a "bigger" infrastructure.From the point of view of scientific relevance and novelty of the approach, we would like to addthat (at the best of our knowledge) the game models that we have introduced for our analysis of thecost allocation problem are new classes of game models and, moreover, this is apparently the firstattempt to treat by these theoretical methods the cost allocation problem for railway infrastructure.We provide a screen from the software package outlining the fees the three players (trainoperators) would be charged for using the track, according to various cost allocation methods.
Our interest in the TRIP project has stimulated new research topics. Referring to the so-calledPERT games, more recently introduced, we are analysing the problem of allocate the costs arisingfrom a delay; other researches are related to the congestion problem, i.e. the fact that the cost(time) to use a facility increases according to the number of users.
EuROPE-TRIP Final Report
Contract RA-97-AM-1165 Final Report – Ver. 1.0 (June 2000) Page 74
4.6. Bibliography
1. Bassanini A, Nastasi A (1997) A Market Based Model for Railroad Capacity Allocation.Research Report RR-97.08, Dipartimento di Informatica, Sistemi e Produzione. Universitàdegli Studi di Roma Tor Vergata
2. Baumgartner J. P. - Ordine di grandezza di alcuni costi nelle ferrovie - Ingegneria Ferroviaria7/1977.
3. Brewer PJ, Plott CR (1996) A Binary Conflict Ascending Price (BICAP) Mechanism for theDecentralized Allocation of the Right to Use Railroad Tracks. International Journal ofIndustrial Organization 14:857-886
4. Dubey P (1982) The Shapley Value as Aircraft Landing Fees Revisited. Management Science28:869-874
5. Fragnelli V., García-Jurado I., Norde H., Patrone F. and Tijs S. (1999). How to share railwaysinfrastructure costs? To appear in “Game Practice”, F. Patrone, I. García-Jurado and S. Tijs(eds.) Kluwer Academic Publishers.
6. Koster M. (1999). Cost allocation and cooperative games: an introduction. Preprint.7. Littlechild S, Owen G (1973) A Simple Expression for the Shapley Value in a Special Case.
Management Science 20:370-3728. Nilsson JE (1995) Allocation of Track Capacity. CTS Working Paper 1995:1, Centre for
Research in Transportation and Society, Dalarna University College, Sweden9. Norde H., Fragnelli V., García-Jurado I., Patrone F. and Tijs S. (1999). Balancedness of
infrastructure cost games. Preprint.10. Young HP (1994) Cost Allocation. In Aumann RJ, Hart S (eds) Handbook of Game Theory
(Vol 2), North Holland, Amsterdam pp 1193-1235
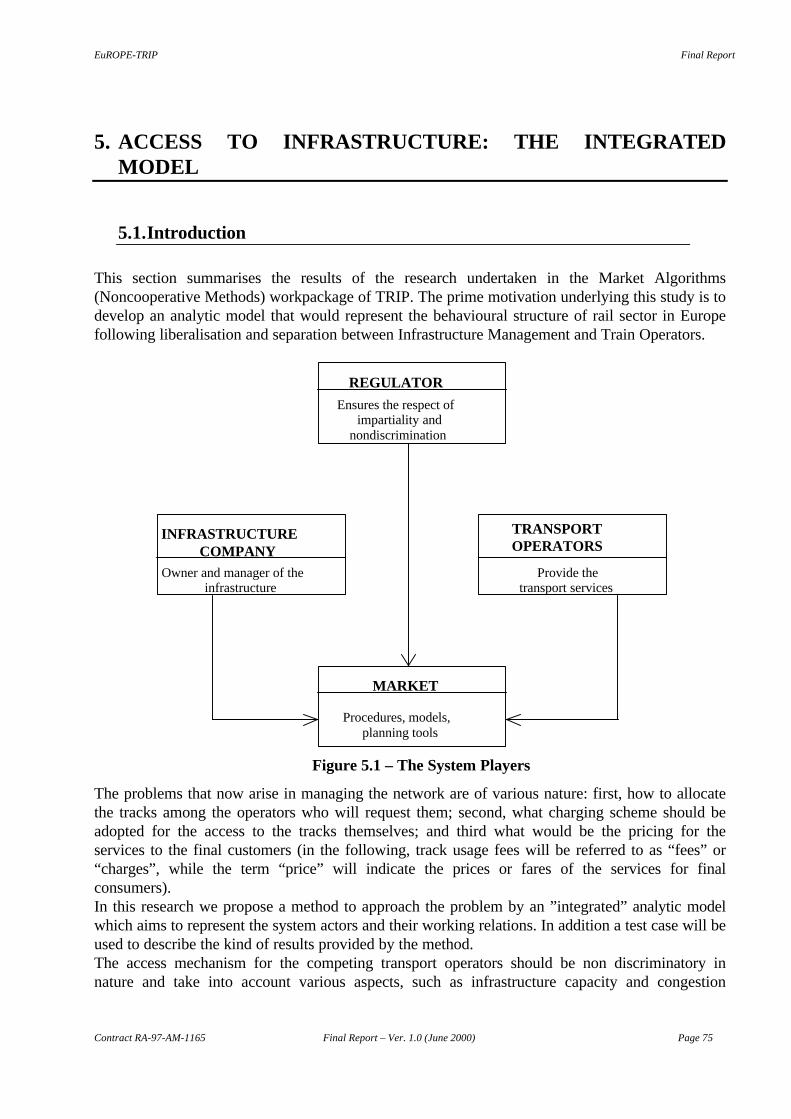
EuROPE-TRIP Final Report
Contract RA-97-AM-1165 Final Report – Ver. 1.0 (June 2000) Page 75
5. ACCESS TO INFRASTRUCTURE: THE INTEGRATEDMODEL
5.1. Introduction
This section summarises the results of the research undertaken in the Market Algorithms(Noncooperative Methods) workpackage of TRIP. The prime motivation underlying this study is todevelop an analytic model that would represent the behavioural structure of rail sector in Europefollowing liberalisation and separation between Infrastructure Management and Train Operators.
REGULATOR
INFRASTRUCTURECOMPANY
TRANSPORTOPERATORS
MARKET
Ensures the respect ofimpartiality and
nondiscrimination
Owner and manager of theinfrastructure
Provide thetransport services
Procedures, models,planning tools
Figure 5.1 – The System Players
The problems that now arise in managing the network are of various nature: first, how to allocatethe tracks among the operators who will request them; second, what charging scheme should beadopted for the access to the tracks themselves; and third what would be the pricing for theservices to the final customers (in the following, track usage fees will be referred to as “fees” or“charges”, while the term “price” will indicate the prices or fares of the services for finalconsumers).In this research we propose a method to approach the problem by an ”integrated” analytic modelwhich aims to represent the system actors and their working relations. In addition a test case will beused to describe the kind of results provided by the method.The access mechanism for the competing transport operators should be non discriminatory innature and take into account various aspects, such as infrastructure capacity and congestion
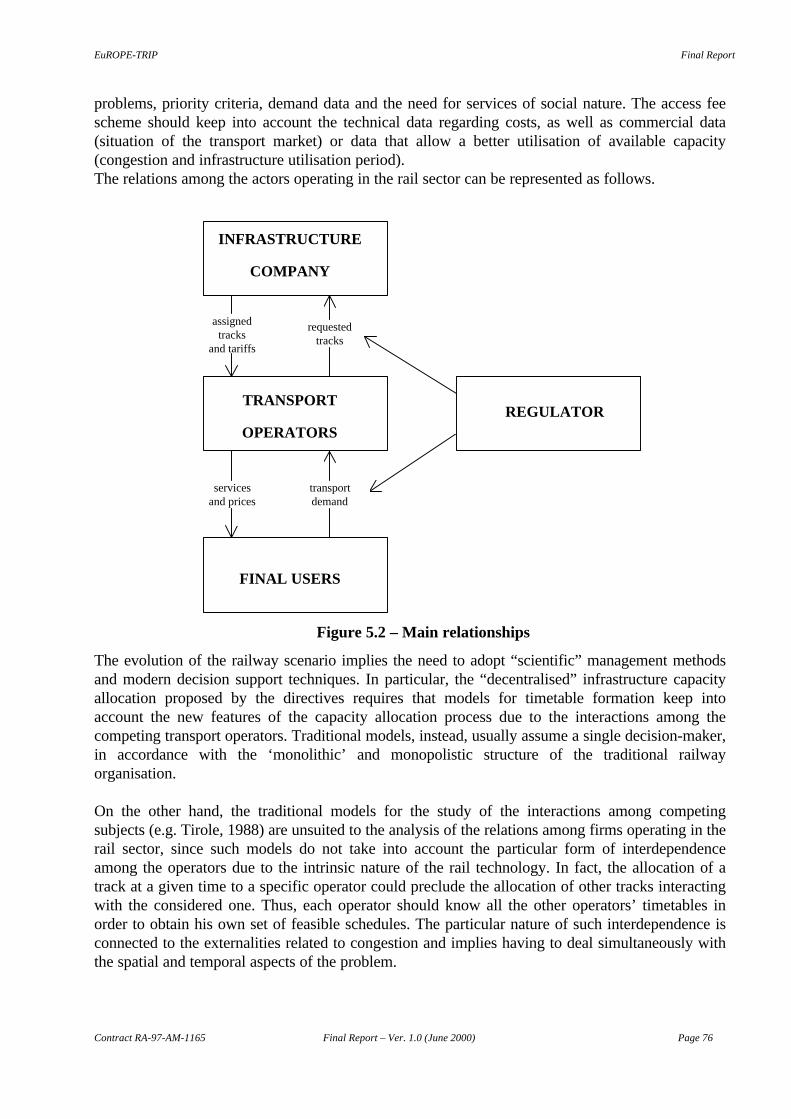
EuROPE-TRIP Final Report
Contract RA-97-AM-1165 Final Report – Ver. 1.0 (June 2000) Page 76
problems, priority criteria, demand data and the need for services of social nature. The access feescheme should keep into account the technical data regarding costs, as well as commercial data(situation of the transport market) or data that allow a better utilisation of available capacity(congestion and infrastructure utilisation period).The relations among the actors operating in the rail sector can be represented as follows.
INFRASTRUCTURE
COMPANY
TRANSPORT
OPERATORSREGULATOR
FINAL USERS
assignedtracks
and tariffs
requestedtracks
servicesand prices
transportdemand
Figure 5.2 – Main relationships
The evolution of the railway scenario implies the need to adopt “scientific” management methodsand modern decision support techniques. In particular, the “decentralised” infrastructure capacityallocation proposed by the directives requires that models for timetable formation keep intoaccount the new features of the capacity allocation process due to the interactions among thecompeting transport operators. Traditional models, instead, usually assume a single decision-maker,in accordance with the ‘monolithic’ and monopolistic structure of the traditional railwayorganisation.
On the other hand, the traditional models for the study of the interactions among competingsubjects (e.g. Tirole, 1988) are unsuited to the analysis of the relations among firms operating in therail sector, since such models do not take into account the particular form of interdependenceamong the operators due to the intrinsic nature of the rail technology. In fact, the allocation of atrack at a given time to a specific operator could preclude the allocation of other tracks interactingwith the considered one. Thus, each operator should know all the other operators’ timetables inorder to obtain his own set of feasible schedules. The particular nature of such interdependence isconnected to the externalities related to congestion and implies having to deal simultaneously withthe spatial and temporal aspects of the problem.
EuROPE-TRIP Final Report
Contract RA-97-AM-1165 Final Report – Ver. 1.0 (June 2000) Page 77
5.2. The model
We have proposed a three-stage model, based on game theory, that describes the competitionamong the transport operators (TOs) and the interactions between the latter and the infrastructuremanager (IM). The competing TOs request tracks to the IM based on passenger demand data, andset prices for the transport services they provide to the final users with the aim of maximising theirown profit. The IM elaborates a mechanism for the allocation of infrastructure capacity among theTOs on the basis of their requests, ensuring the respect of the line’s capacity constraints.
This mechanism is non-discriminatory, since the IM tries to fulfil the desiderata of each TOcompatibly with the requests of all the other operators; the regulator, therefore, is not explicitlyrepresented in the model. The IM maximises the value of the effective (finally diagrammed)schedule of each TO, by minimising the weighted deviation from the requested timetable for eachof the desired paths, enforcing the respect of the capacity constraints on the line. The weights arethe values the TOs attribute to the deviation from the requested schedules at each station, and theyare also used to give the priority level attributed to the considered train on each line segment in theconstruction of the effective final timetable, which is thus a function of the requested schedules andthe associated weights.
The allocation mechanism is analytically equivalent to a game whose set of players is composed ofthe competing TOs. In order to keep into account the particular form of interdependence amongthe operators, we have formulated the allocation mechanism using a generalisation of the modelsgenerally used to represent interactions among multiple subjects. We have also incorporated in themechanism the elements and the hypotheses of a line model in order to provide a representation ofcongestion effects in railway operations.
The mechanism is inherently non-discriminatory, and computes access fees that express thecongestion degree imposed by each train on the system as a whole.We therefore propose a market-based model for the allocation of railway capacity wherecongestion plays a crucial role in the determination of the infrastructure access tariffs. Furthermore,the model enables the IM to choose among multiple equilibrium solutions according to overallpolicy criteria.
The overall 3-stage model can be represented as in following Figure.
In the first stage, each TO submits to the IM his path requests in terms of the desired departure andarrival times in each station. Each TO behaves in a non-cooperative way and wants to obtaineffective schedules as close as possible to the requested ones. Together with the requestedtimetable, each TO submits to the IM the monetary value attributed to the deviation of one unit oftime from the requested schedule at each station for all the desired paths.
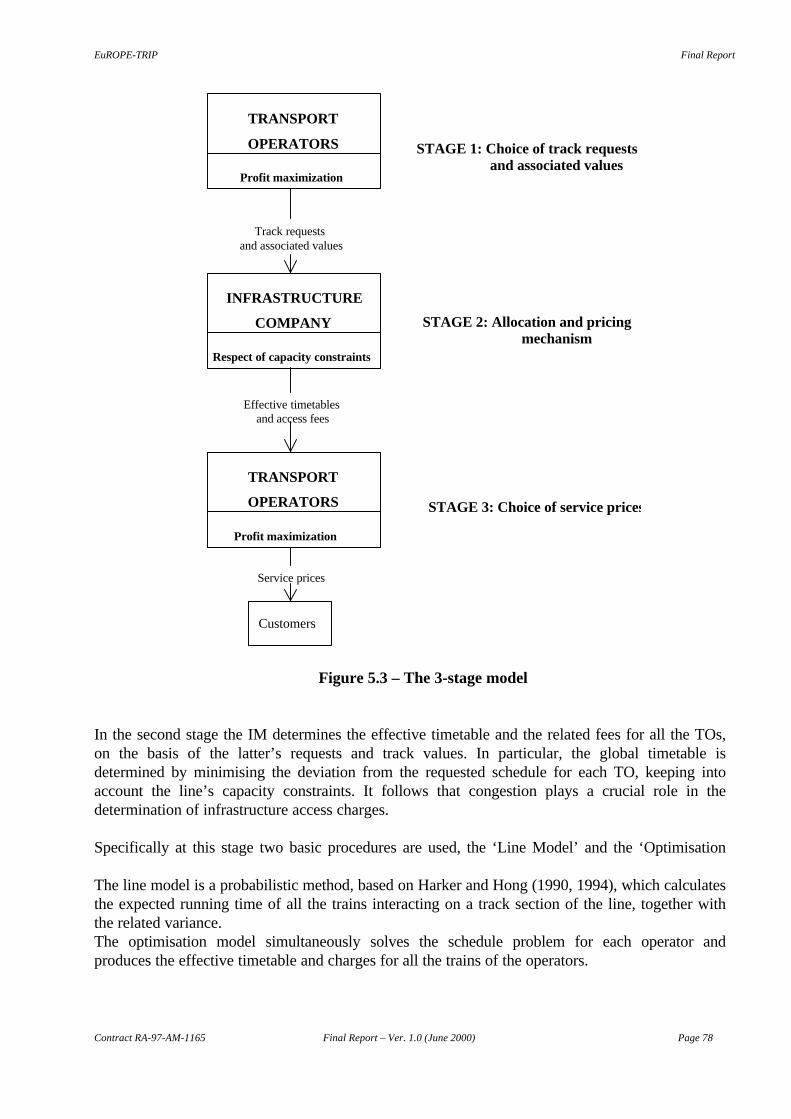
EuROPE-TRIP Final Report
Contract RA-97-AM-1165 Final Report – Ver. 1.0 (June 2000) Page 78
TRANSPORT
OPERATORS
Profit maximization
INFRASTRUCTURE
COMPANY
Respect of capacity constraints
TRANSPORT
OPERATORS
Profit maximization
Track requestsand associated values
Effective timetablesand access fees
Service prices
STAGE 1: Choice of track requests and associated values
STAGE 2: Allocation and pricing mechanism
STAGE 3: Choice of service prices
Figure 5.3 – The 3-stage model
In the second stage the IM determines the effective timetable and the related fees for all the TOs,on the basis of the latter’s requests and track values. In particular, the global timetable isdetermined by minimising the deviation from the requested schedule for each TO, keeping intoaccount the line’s capacity constraints. It follows that congestion plays a crucial role in thedetermination of infrastructure access charges.
Specifically at this stage two basic procedures are used, the ‘Line Model’ and the ‘Optimisation
The line model is a probabilistic method, based on Harker and Hong (1990, 1994), which calculatesthe expected running time of all the trains interacting on a track section of the line, together withthe related variance.The optimisation model simultaneously solves the schedule problem for each operator andproduces the effective timetable and charges for all the trains of the operators.
Customers
EuROPE-TRIP Final Report
Contract RA-97-AM-1165 Final Report – Ver. 1.0 (June 2000) Page 79
In the third stage the TOs set the prices of the services for the final users, on the basis of thetimetable and the access fees computed by the IM. Each TO maximises his profit with respect toprices while considering consumer choice, i.e. demand for trains as a function of prices must bedetermined in order to solve the maximisation problem. At this stage modal split between railwaysand other transport modes can be introduced.The passenger demand for each train depends on the train’s own schedule as well as on thetimetable of the other trains in the system (availability of alternative trains); it will also depend onthe prices the TOs impose on users (availability of cheaper trains).
We define all the 3-stage method an “integrated” model because it attempts to represent by analyticrelations the various aspects of rail transport sectors in a common framework. (See Appendix forfurther details).
For the purpose of this case study we assume that there is only one class of customers; thishypothesis is only made in order to simplify the analysis by reducing the complexity of the problem.In fact, if two classes of passengers were to be considered, two different prices would have to becalculated for each train. This would double the number of price variables and increase a lotcomputational time, but not change the model formulation or the solution methodology.
The consideration at the basis of the proposed economic model is that the delay of trains imposes atime cost that constitutes a large part of the total cost of the system. Even if each train weredelayed by a small amount, the impedance imposed over the traffic in the whole network would bemuch larger and grow with the density of traffic. Thus, a train with a higher priority level wouldgenerally experience less delay and will pay higher fees, unless the track demand on theinfrastructure portion it exploits is low. This consideration does not exclude the applicability of theproposed charging system to unprofitable tracks, as long as TOs are allowed to receive adequatesubsidies. In fact, as access charges are related to the congestion degree imposed by the train on thenetwork, they could be very high for some types of service. This could lower the profits of theseservices and call for State subsidies to ensure their viability. The level of profits finally achieved bythe operators in the third stage could indicate the need for subsidies (and their amount).
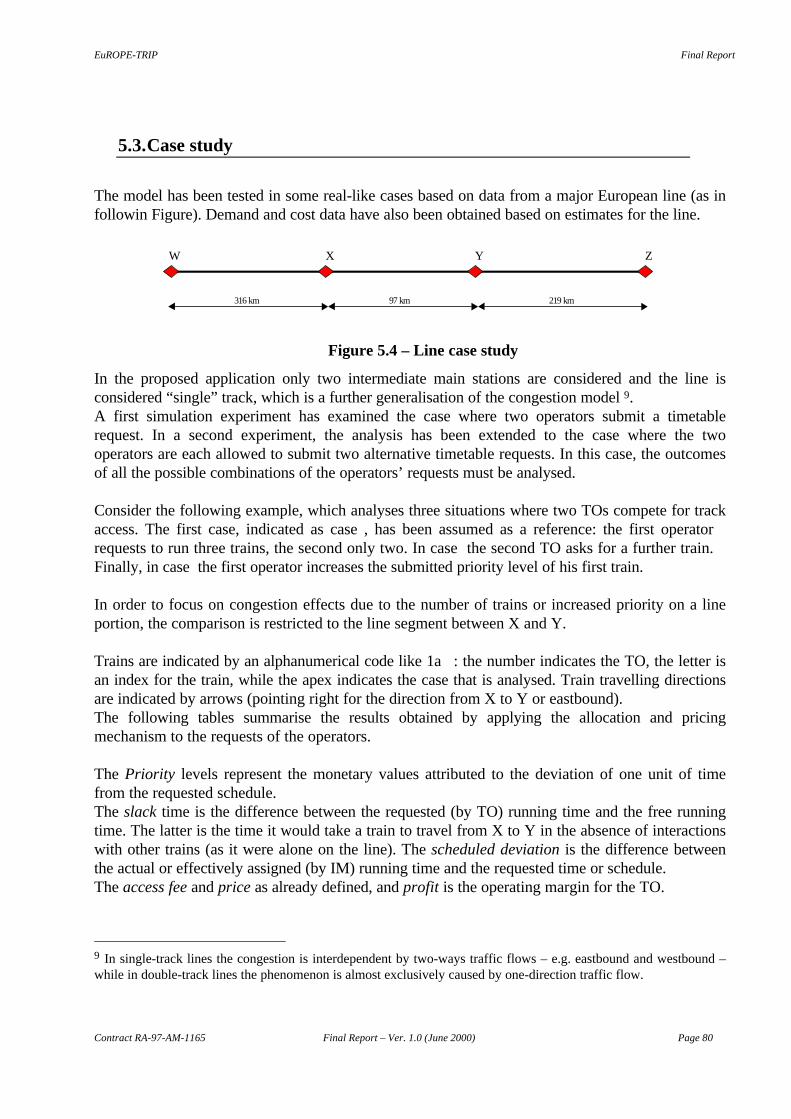
EuROPE-TRIP Final Report
Contract RA-97-AM-1165 Final Report – Ver. 1.0 (June 2000) Page 80
5.3. Case study
The model has been tested in some real-like cases based on data from a major European line (as infollowin Figure). Demand and cost data have also been obtained based on estimates for the line.
W X Y Z
316 km 97 km 219 km
Figure 5.4 – Line case study
In the proposed application only two intermediate main stations are considered and the line isconsidered “single” track, which is a further generalisation of the congestion model 9.A first simulation experiment has examined the case where two operators submit a timetablerequest. In a second experiment, the analysis has been extended to the case where the twooperators are each allowed to submit two alternative timetable requests. In this case, the outcomesof all the possible combinations of the operators’ requests must be analysed.
Consider the following example, which analyses three situations where two TOs compete for trackaccess. The first case, indicated as case �, has been assumed as a reference: the first operatorrequests to run three trains, the second only two. In case � the second TO asks for a further train.Finally, in case � the first operator increases the submitted priority level of his first train.
In order to focus on congestion effects due to the number of trains or increased priority on a lineportion, the comparison is restricted to the line segment between X and Y.
Trains are indicated by an alphanumerical code like 1a� : the number indicates the TO, the letter isan index for the train, while the apex indicates the case that is analysed. Train travelling directionsare indicated by arrows (pointing right for the direction from X to Y or eastbound).The following tables summarise the results obtained by applying the allocation and pricingmechanism to the requests of the operators.
The Priority levels represent the monetary values attributed to the deviation of one unit of timefrom the requested schedule.The slack time is the difference between the requested (by TO) running time and the free runningtime. The latter is the time it would take a train to travel from X to Y in the absence of interactionswith other trains (as it were alone on the line). The scheduled deviation is the difference betweenthe actual or effectively assigned (by IM) running time and the requested time or schedule.The access fee and price as already defined, and profit is the operating margin for the TO.
9 In single-track lines the congestion is interdependent by two-ways traffic flows – e.g. eastbound and westbound –while in double-track lines the phenomenon is almost exclusively caused by one-direction traffic flow.
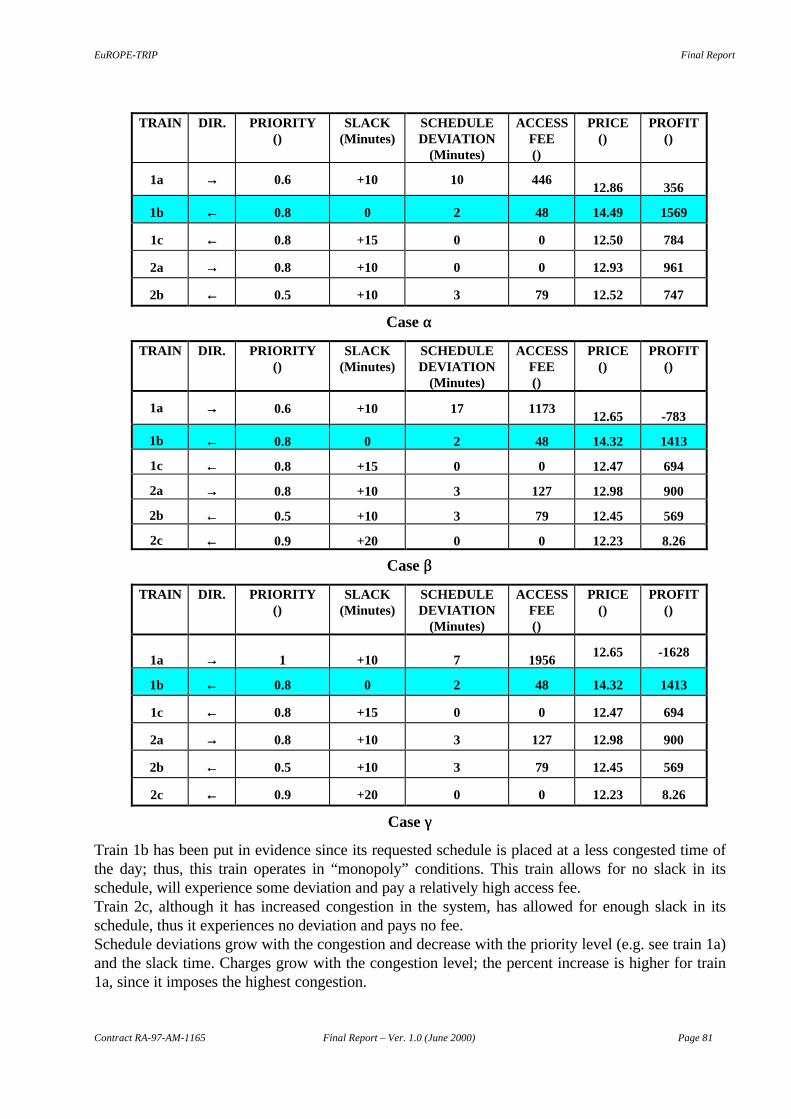
EuROPE-TRIP Final Report
Contract RA-97-AM-1165 Final Report – Ver. 1.0 (June 2000) Page 81
TRAIN DIR. PRIORITY(�)
SLACK(Minutes)
SCHEDULEDEVIATION
(Minutes)
ACCESSFEE(�)
PRICE(�)
PROFIT(�)
1a� →→ 0.6 +10 10 44612.86 356
1b� ←← 0.8 0 2 48 14.49 1569
1c� ←← 0.8 +15 0 0 12.50 784
2a� →→ 0.8 +10 0 0 12.93 961
2b� ←← 0.5 +10 3 79 12.52 747
Case αα
TRAIN DIR. PRIORITY(�)
SLACK(Minutes)
SCHEDULEDEVIATION
(Minutes)
ACCESSFEE(�)
PRICE(�)
PROFIT(�)
1a� →→ 0.6 +10 17 117312.65 -783
1b� ←← 0.8 0 2 48 14.32 1413
1c� ←← 0.8 +15 0 0 12.47 694
2a� →→ 0.8 +10 3 127 12.98 900
2b� ←← 0.5 +10 3 79 12.45 569
2c� ←← 0.9 +20 0 0 12.23 8.26
Case ββ
TRAIN DIR. PRIORITY(�)
SLACK(Minutes)
SCHEDULEDEVIATION
(Minutes)
ACCESSFEE(�)
PRICE(�)
PROFIT(�)
1a� →→ 1 +10 7 195612.65 -1628
1b� ←← 0.8 0 2 48 14.32 1413
1c� ←← 0.8 +15 0 0 12.47 694
2a� →→ 0.8 +10 3 127 12.98 900
2b� ←← 0.5 +10 3 79 12.45 569
2c� ←← 0.9 +20 0 0 12.23 8.26
Case γγ
Train 1b has been put in evidence since its requested schedule is placed at a less congested time ofthe day; thus, this train operates in “monopoly” conditions. This train allows for no slack in itsschedule, will experience some deviation and pay a relatively high access fee.Train 2c, although it has increased congestion in the system, has allowed for enough slack in itsschedule, thus it experiences no deviation and pays no fee.Schedule deviations grow with the congestion and decrease with the priority level (e.g. see train 1a)and the slack time. Charges grow with the congestion level; the percent increase is higher for train1a, since it imposes the highest congestion.
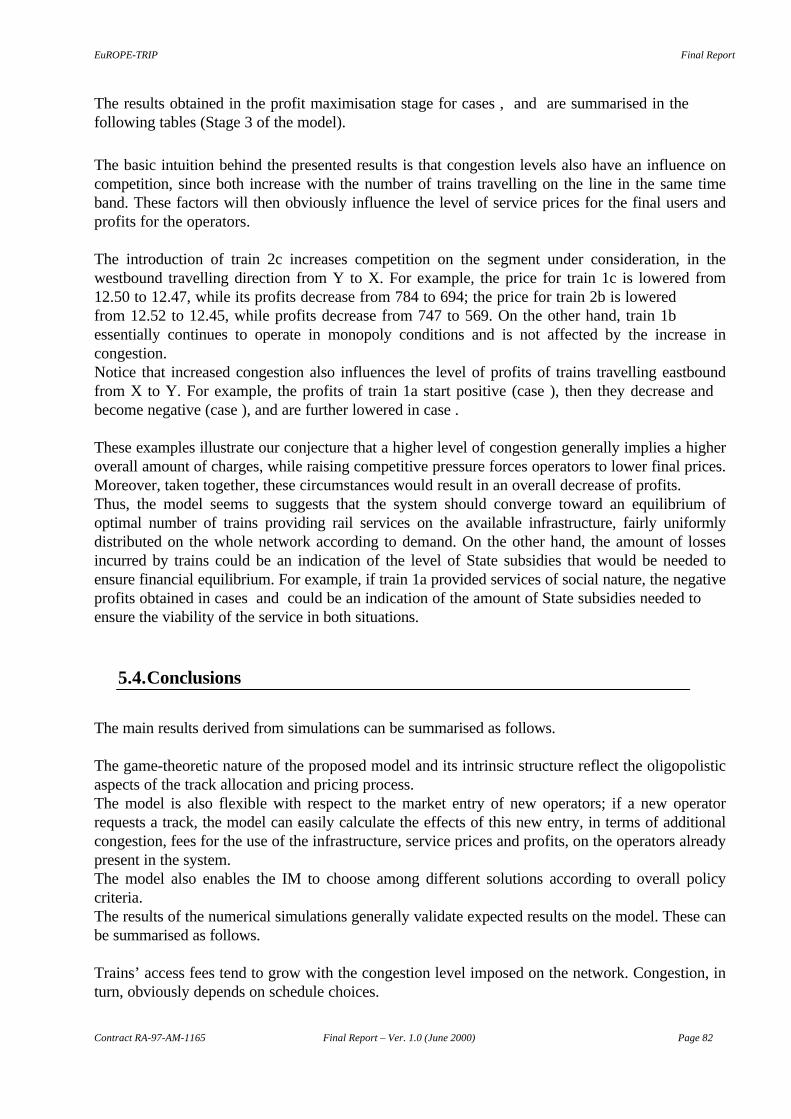
EuROPE-TRIP Final Report
Contract RA-97-AM-1165 Final Report – Ver. 1.0 (June 2000) Page 82
The results obtained in the profit maximisation stage for cases �, � and � are summarised in thefollowing tables (Stage 3 of the model).
The basic intuition behind the presented results is that congestion levels also have an influence oncompetition, since both increase with the number of trains travelling on the line in the same timeband. These factors will then obviously influence the level of service prices for the final users andprofits for the operators.
The introduction of train 2c increases competition on the segment under consideration, in thewestbound travelling direction from Y to X. For example, the price for train 1c is lowered from12.50� to 12.47�, while its profits decrease from 784� to 694�; the price for train 2b is loweredfrom 12.52� to 12.45�, while profits decrease from 747� to 569�. On the other hand, train 1bessentially continues to operate in monopoly conditions and is not affected by the increase incongestion.Notice that increased congestion also influences the level of profits of trains travelling eastboundfrom X to Y. For example, the profits of train 1a start positive (case �), then they decrease andbecome negative (case �), and are further lowered in case �.
These examples illustrate our conjecture that a higher level of congestion generally implies a higheroverall amount of charges, while raising competitive pressure forces operators to lower final prices.Moreover, taken together, these circumstances would result in an overall decrease of profits.Thus, the model seems to suggests that the system should converge toward an equilibrium ofoptimal number of trains providing rail services on the available infrastructure, fairly uniformlydistributed on the whole network according to demand. On the other hand, the amount of lossesincurred by trains could be an indication of the level of State subsidies that would be needed toensure financial equilibrium. For example, if train 1a provided services of social nature, the negativeprofits obtained in cases � and � could be an indication of the amount of State subsidies needed toensure the viability of the service in both situations.
5.4. Conclusions
The main results derived from simulations can be summarised as follows.
The game-theoretic nature of the proposed model and its intrinsic structure reflect the oligopolisticaspects of the track allocation and pricing process.The model is also flexible with respect to the market entry of new operators; if a new operatorrequests a track, the model can easily calculate the effects of this new entry, in terms of additionalcongestion, fees for the use of the infrastructure, service prices and profits, on the operators alreadypresent in the system.The model also enables the IM to choose among different solutions according to overall policycriteria.The results of the numerical simulations generally validate expected results on the model. These canbe summarised as follows.
Trains’ access fees tend to grow with the congestion level imposed on the network. Congestion, inturn, obviously depends on schedule choices.
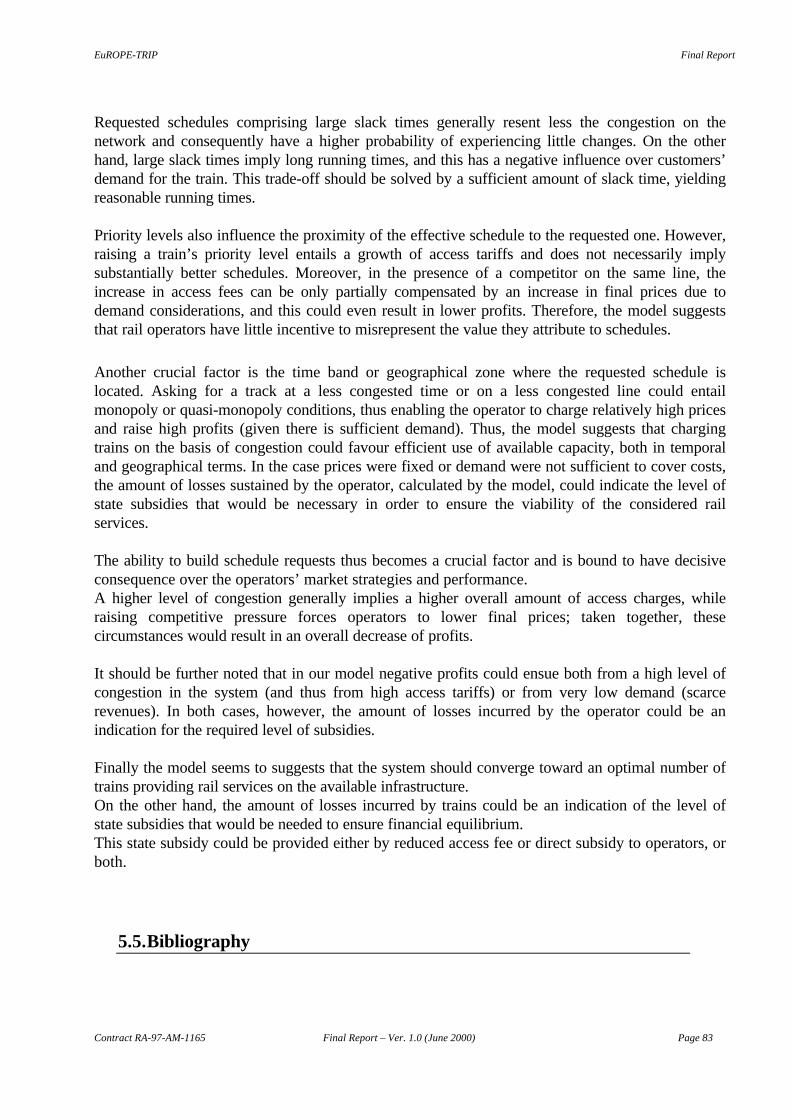
EuROPE-TRIP Final Report
Contract RA-97-AM-1165 Final Report – Ver. 1.0 (June 2000) Page 83
Requested schedules comprising large slack times generally resent less the congestion on thenetwork and consequently have a higher probability of experiencing little changes. On the otherhand, large slack times imply long running times, and this has a negative influence over customers’demand for the train. This trade-off should be solved by a sufficient amount of slack time, yieldingreasonable running times.
Priority levels also influence the proximity of the effective schedule to the requested one. However,raising a train’s priority level entails a growth of access tariffs and does not necessarily implysubstantially better schedules. Moreover, in the presence of a competitor on the same line, theincrease in access fees can be only partially compensated by an increase in final prices due todemand considerations, and this could even result in lower profits. Therefore, the model suggeststhat rail operators have little incentive to misrepresent the value they attribute to schedules.
Another crucial factor is the time band or geographical zone where the requested schedule islocated. Asking for a track at a less congested time or on a less congested line could entailmonopoly or quasi-monopoly conditions, thus enabling the operator to charge relatively high pricesand raise high profits (given there is sufficient demand). Thus, the model suggests that chargingtrains on the basis of congestion could favour efficient use of available capacity, both in temporaland geographical terms. In the case prices were fixed or demand were not sufficient to cover costs,the amount of losses sustained by the operator, calculated by the model, could indicate the level ofstate subsidies that would be necessary in order to ensure the viability of the considered railservices.
The ability to build schedule requests thus becomes a crucial factor and is bound to have decisiveconsequence over the operators’ market strategies and performance.A higher level of congestion generally implies a higher overall amount of access charges, whileraising competitive pressure forces operators to lower final prices; taken together, thesecircumstances would result in an overall decrease of profits.
It should be further noted that in our model negative profits could ensue both from a high level ofcongestion in the system (and thus from high access tariffs) or from very low demand (scarcerevenues). In both cases, however, the amount of losses incurred by the operator could be anindication for the required level of subsidies.
Finally the model seems to suggests that the system should converge toward an optimal number oftrains providing rail services on the available infrastructure.On the other hand, the amount of losses incurred by trains could be an indication of the level ofstate subsidies that would be needed to ensure financial equilibrium.This state subsidy could be provided either by reduced access fee or direct subsidy to operators, orboth.
5.5. Bibliography
EuROPE-TRIP Final Report
Contract RA-97-AM-1165 Final Report – Ver. 1.0 (June 2000) Page 84
1. Brewer, P.J. and C.R. Plott (1996): "A Binary Conflict Ascending Price (BICAP) Mechanismfor the Decentralized Allocation of the Right to Use Railroad Tracks". International Journal ofIndustrial Organization, 14, pp. 857-886.
2. Chen, B. and P.T. Harker (1990): "Two Moments Estimation of the Delay on a Single-TrackRail Line with Scheduled Traffic". Transportation Science, 24, pp. 261-275.
3. Crew, M.A. and P.R. Kleindorfer (1987): The Economics of Public Utility Regulation. TheMIT Press, Cambridge, MA.
4. De Vany, A. and T.R. Saving (1980): "Competition and Highway Pricing for StochasticTraffic". Journal of Business, 53, pp. 45-60.
5. Dobson G., Lederer J. (1993): “Airline Scheduling and Routing in a Hub-and-Spoke System”.Transportation Science 27, pp.281-297
6. Gabay, D. and H. Moulin (1980): "On the Uniqueness and Stability of Nash Equilibria inNoncooperative Games". In: A. Bensoussan, P. Kleindorfer and C.S. Tapiero (eds.), AppliedStochastic Control in Econometrics and Management Science, North Holland, Amstedam, pp.271-293.
7. Harker, P.T. (1991): "Generalized Nash Games and Quasi-Variational Inequalities".European Journal of Operation Research, 54, pp. 81-94.
8. Harker, P.T. and S. Hong (1990): "Two Moments Estimation of the Delay on a PartiallyDouble-Track Rail Line with Scheduled Traffic". Journal of Transportation Research Forum,31, pp. 38-49.
9. Harker, P.T. and S. Hong (1994): "Pricing of Track Time in Railroad Operations: an InternalMarket Approach". Transportation Research, 28B, pp. 197-212.
10. Kinderlehrer, D. and G. Stampacchia (1980): An Introduction to Variational Inequalities andtheir Applications. Academic Press, New York.
11. Levin, R.C. (1981): "Railroad Rates, Profitability, and Welfare under Deregulation". BellJournal of Economics, 12, pp. 1-26.
12. Morrison, S.A. (1983): "Prices and Investment Level for Airport Runways". In T.E. Keeler(ed.) Research in Transportation Economics, pp. 103-130.
13. Nash, C. (1993): "Rail Privatisation in Britain". Journal of Transport Economics and Policy,27, pp. 317-322.
14. Nilsson, J.E. (1995): "Allocation of Track Capacity". CTS Working paper 1995:1.15. Panzar, J.C. (1976): "A Neoclassical Approach to Peak Load Pricing". Bell Journal of
Economics, 7, pp. 521-530.16. Pigou, A.C. (1920): The Economics of Welfare. Macmillan, London.17. Selten, R. (1965): "Spieltheoretische Behandlung eines Oligopolmodells mit
Nachfrageträgheit". Zeitschrift für die gesamte Staatswissenschaft, 12, pp. 301-324.18. Selten, R. (1975): "Re-Examination of the Perfectness Concept for Equilibrium Points in
Extensive Games". International Journal of Game Theory, 4, pp. 25-55.19. Tirole, J. (1988): The Theory of Industrial Organization. The MIT Press, Cambridge, MA.20. Vickrey, W. (1969): "Congestion Theory and Transportation Investment". American Economic
Review, 59, pp. 251-260.
EuROPE-TRIP Final Report
Contract RA-97-AM-1165 Final Report – Ver. 1.0 (June 2000) Page. 85
6. ACCESS TO INFRASTRUCTURE: THE AUCTION MODEL
6.1. Introduction
This section summarises the work undertaken as part of the Market Game Model workpackage.The main aim was to describe the access to infrastructure in a competitive environment and tospecify a mechanism, i.e. a decision rule, which generates efficient timetables where train operatorsbid for path allocation. The suggested approach is different from the analytical modelling describedin previous section and is based on experimental economics, where the players can interact with theallocation mechanism through an auction system.
This part of the project outlines the principles, the results of laboratory tests and issues to do withthe proposed architecture which can fit into the framework of open access.The model is particularly apt to describe the situation where the demand for railway infrastructure,exceeds the supply , i.e. congested cases.The task of the IM is to establish a procedure, which can be used to solve the track capacityallocation problem. The suggestion here is to create a process, which is :- decentralised and computer-based, operators can compile their path demand by their owncomputers and submit demand specifications over the Internet;- supported by formal, mathematical optimisation software, in order to identify the value-maximising timetable, given the demand;- based on an auction procedure in order to provide non-biased information about the operators’value-of-access.
The model is also able to provide infrastructure values and infrastructure management principleseven in case of public service and other priority rulings for track allocation.
6.2. Overriding objectives in capacity allocation
The purpose of this report is therefore to describe how the network provider’s managementprocess is related to track capacity allocation, and the process’ dual - a price for the right tooperate trains - can be arranged and derived, respectively. Throughout the presentation these twoaspects are considered to be organically related to each other.The following Figure provides an overview of the relation between the parties of this process. TheInfrastructure Manager gives more Operators the right to run services over its infrastructure. Inreturn, each Operator pays fees according to a pre-specified charging structure. While tariffs couldcomprise both fixed and variable components, we are here only concerned with one of its variablecomponents, i.e. that part of the charge which is related to capacity allocation; in reality, this is acongestion charge.Besides track capacity allocation, the IM also has to resolve the issues about (capacity) investmentpriorities and daily dispatching. We take the view that the means used to allocate scarce trackcapacity provides a hub around which the managerial process also for the two complementary taskscan be related in important ways.
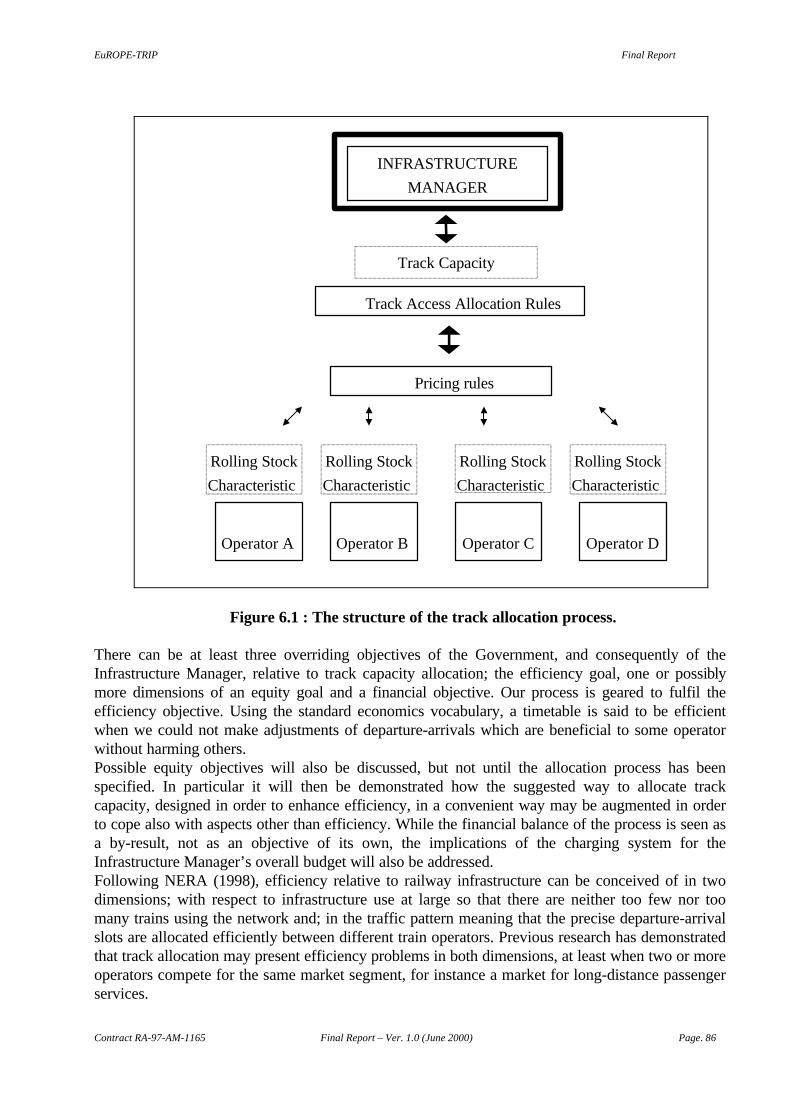
EuROPE-TRIP Final Report
Contract RA-97-AM-1165 Final Report – Ver. 1.0 (June 2000) Page. 86
Figure 6.1 : The structure of the track allocation process.
There can be at least three overriding objectives of the Government, and consequently of theInfrastructure Manager, relative to track capacity allocation; the efficiency goal, one or possiblymore dimensions of an equity goal and a financial objective. Our process is geared to fulfil theefficiency objective. Using the standard economics vocabulary, a timetable is said to be efficientwhen we could not make adjustments of departure-arrivals which are beneficial to some operatorwithout harming others.Possible equity objectives will also be discussed, but not until the allocation process has beenspecified. In particular it will then be demonstrated how the suggested way to allocate trackcapacity, designed in order to enhance efficiency, in a convenient way may be augmented in orderto cope also with aspects other than efficiency. While the financial balance of the process is seen asa by-result, not as an objective of its own, the implications of the charging system for theInfrastructure Manager’s overall budget will also be addressed.Following NERA (1998), efficiency relative to railway infrastructure can be conceived of in twodimensions; with respect to infrastructure use at large so that there are neither too few nor toomany trains using the network and; in the traffic pattern meaning that the precise departure-arrivalslots are allocated efficiently between different train operators. Previous research has demonstratedthat track allocation may present efficiency problems in both dimensions, at least when two or moreoperators compete for the same market segment, for instance a market for long-distance passengerservices.
INFRASTRUCTURE
MANAGER
Operator B Operator C Operator D
Pricing rules
Track Access Allocation Rules
Track Capacity
Rolling Stock
Characteristic
Rolling Stock
Characteristic
Rolling Stock
Characteristic
Rolling Stock
Characteristic
Operator A
EuROPE-TRIP Final Report
Contract RA-97-AM-1165 Final Report – Ver. 1.0 (June 2000) Page. 87
Another question is if a competitive market would generate an efficient number of departures takenover a day. It has been demonstrated that from a social perspective there are reasons to believe thattoo many (profit maximising) firms would be operating, resulting in excessive quality with respectto frequency.10
Moreover, we do not see a need for the IM or some regulatory body to preclude entry by one ormore operators into a certain market. There may, indeed, be several firms which want to try theirfortune on what is believed to be profitable segments, in particular during the first phases of aderegulation process. The belief is that the long-run outcome of having multiple bidders will be agradual elimination process. There is no need for the IM to interfere in this. We will return brieflyto this issue below.In this it should be noted that an efficient use of the network not necessarily means that it is used tocapacity. In situations where operators demand high-quality routes, i.e. trains with low probabilityfor delays, it may be efficient to admit a lower number of trains than would be physically feasiblesince slack enhances flexibility.The choice of means for capacity allocation may also have implications for other parts of the railindustry, in particular for the train operators’ way to organise their activities. This is so sincedifferent means to deal with track scarcity may provide operators with different incentives withrespect to composition of the rolling stock, i.e. choice of axle weight, number of units, speedcharacteristics etc. While possibly an important implication of the choice, it will not be further dealtwith in this paper.
6.3. Economic aspects on infrastructure use and congestion
An elaborate process for allocation of track capacity is necessary when we are dealing with aproblem of congested infrastructure.It has been common wisdom among economists that a congestion charge is a welfare enhancingmeans to ration access to roads with insufficient capacity relative to demand. Queues are sociallycostly, both in that they inflict costs on those sitting in the queue and since they provide poorincentives to give priority to those that most urgently need access to lanes. Although politicianshave not yet adopted this prescription, economists, and increasingly also public-sector officials,seem to become more and more confident of that there are no other efficient means to clear upclogged city streets and many inter-city arteries. The EU-commission’s Green Book on transportcharging (European Commission 1995) and the recent draft directive (European Commission 1998)bears witness of this.Airport runways and terminals are examples of other infrastructure facilities where demand foraccess often exceeds available capacity. In an influential report dating back to the late 1970s butpublished 10 years later, Grether et al. (1989) suggest a specific type of take-off and landing fee forcongested airports. Rather than one or a set of posted prices such as in the road congestion case,the recommendation is to settle fees by way of an auctioning procedure, with airlines bidding fordeparture and/or arrival time-slots. In a complementary paper, Rassenti et al. (1982) suggest howthis procedure could be applied in cases where there is airport congestion both at a flight’s take-offand landing.
10 Tirole (1992) provides a textbook presentation of these results.
EuROPE-TRIP Final Report
Contract RA-97-AM-1165 Final Report – Ver. 1.0 (June 2000) Page. 88
No auctioning procedure of this sort has been implemented. But four of the major US airports haveimplemented a ‘second-hand market’ for airport slots, meaning that provision is made for resale ofunder-utilised slots. Incumbents are also required to sell a certain share of their slots annually inorder to facilitate entry by newcomers; cf. e.g. Starkie (1994) for a review.11
In spite of extensive congestion in Europe, both on the ground and in the air corridors, there are noindications of that novel techniques for airport capacity allocation is high on the EU’s agenda. Thisis all the more disquieting since difficulties to acquire slots on congested airports may be oneimportant reason for that open-skies policies seem to result in oligopolistic rather than incompetitive market structures. It moreover testifies about that (the absence of) appropriateallocation techniques may have a profound impact on the way that the market that makes use of theinfrastructure - in this case air transport - works; cf. also Morrison & Winston (1989) on this.The US however has other experiences from capacity allocation. We think of the sale of radiofrequencies by way of sophisticated auctioning procedures. Radio frequencies are similar to railwaytracks in so far as different users want access to a limited supply of capacity. Another similarity isthat from the perspective of a user - a broadcasting firm or a train service operator - the value ofaccess to one part of the radio spectrum/the tracks may depend on whether or not the firm isallocated a complementary part of the spectrum/the tracks. Much in the same way, value-of-accessmay be (negatively) related to whether or not competing firms can buy frequencies/routes ‘close’ tothat of the firm.
6.4. The Problem of Allocating Track Capacity
6.4.1. General features of the sector’s capacity allocation problem
The need to establish the track allocation long in beforehand makes it feasible to apply moresophisticated methods than pre-specified tariff schemes in order to resolve the railway industry’ssupply-demand imbalance.So it is the train scheduling process which produces decisions about who is given access tocommon infrastructure facilities. Practical tools to facilitate scheduling in a deregulatedenvironment are therefore required in order to establish a (socially) efficient use of way-and-structures. Such tools are, moreover, also a prerequisite to support a deregulated and verticallyseparated industry’s supply of competitive services, i.e. railway operations which are able tocontest the road industry’s dominance over many transport relations.A conjecture is, in fact, that - seen in retrospect - technical problems to establish efficient time-tables under a vertically separated railway industry may have been an underlying reason for that theintegrated structure was chosen in the first place. Perhaps early-day railway industrialists realisedthat the conflicts which would arise between different operators using common tracks would be sosevere, and the chances to establish rules for access that maximised profits so poor, so that aunified structure was chosen. This puts the challenge of designing new allocation tools in aperspective, and it also provides the background for suggesting that an auction-based schedulingprocess, run long before traffic actually is operated, is applied as the prime means to allocate scarcetrack capacity. Before presenting the specific qualities of this process, we will, however, first give amore precise characterisation of the track allocation problem.
11 Bruzelius (1996) gives a coherent review of organisational issues related to the management of airports in general.
EuROPE-TRIP Final Report
Contract RA-97-AM-1165 Final Report – Ver. 1.0 (June 2000) Page. 89
6.4.2. Demand and supply characteristics of track capacity allocation
A timetable sets out who is given the right to operate trains over the network and when each trainwill run. Given the Infrastructure Manager’s objective, the process leading to that a time-table isestablished should be designed so that it generates the maximum social benefit from using availableinfrastructure. Economic theory related to most private goods demonstrates that the efficiencyobjective is well met by private firms with a financial goal. For this reason, the objective of the IMis taken to be to allocate available track capacity in a way which maximises the revenue from usingit, taking maintenance costs etc. of the IM for given. We conjecture that the financial objective iswell fit to support the overriding efficiency objective, at least as a first approximation.
These demand and supply aspects must be taken into account when we seek to establish an efficientmeans to handle the time-tabling problem. It is, in fact, the combination of these features occurringin a large and often physically complex network which gives the problem its immense combinatorialcomplexity.
6.5. An efficiency-enhancing model for track capacity allocation
Over the years, railways have resolved conflicts of interest between different classes of trains duringthe time-tabling process by using administrative procedures. Priorities seem to be based on somecommonly acknowledged pecking-order principle. Each category of train is given its priority, withhigher-priority trains typically given a first go on attractive routes. Internal committees, or indeedthe chief executive officer, are used to resolve conflicts remaining at the end of the process. Itshould, in addition, be borne in mind that we talk about a scheduling process which still by the endof the 20th century basically is manual; while first-generation soft-ware to draw string time-tables isnow available, paper, pencil and ruler are still commonly used to re-draft preliminary proposals.It is not bold to hypothesise that time-tables established using these procedures may generateinferior, non profit-maximising allocations. Although the personnel involved in the process is highlyregarded for its skills, the mere complexity of the task is sufficient to make it difficult to analyse, oreven realise the existence of, radical solutions to recurrent conflicts. Moreover, the system providespoor incentives for the division managers and indeed competing operators to willingly give upattractive routes to others, although this would cause minor harm only; it may even be difficult torecognise that such alternatives exist. Committees moreover have a bad reputation for creatingsolutions based on the concerns of the people on top at each moment.
6.5.1. The two analytical sub-problems
Analytically, the creation of a value- or revenue-maximising timetable - i.e. a schedule which getsthe maximum (social) net benefits out of existing infrastructure - can be conceived of as twoseparate but strongly related challenges. The 1) optimisation problem is concerned with themathematical aspects inherent in building the schedule diagram. In order to solve this the IM mustalso have access to relevant information about the value of the different services. For instance, tostrike the value-maximising balance between trains, knowledge about each party’s value of accessmust be available. If these facts are not known, it may be technically feasible to establish solutions,but the actual value of the trade-off which has (implicitly) been made could be way off the value-maximising resolution of the conflict.
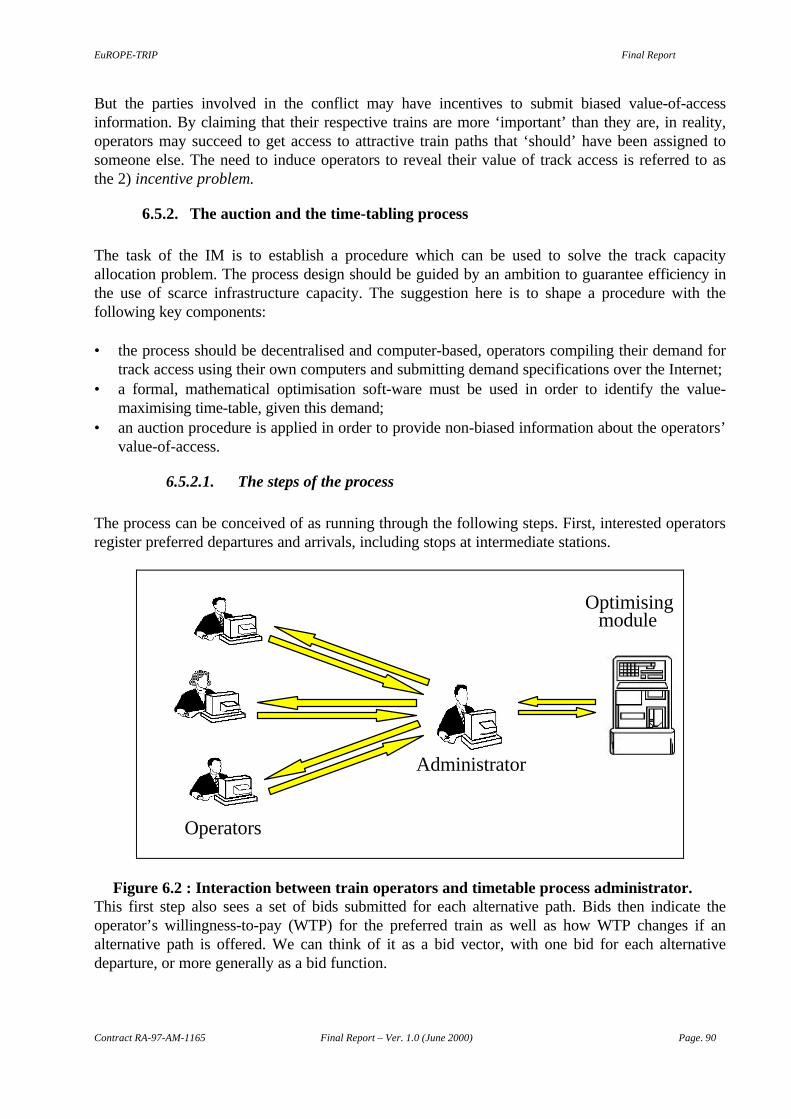
EuROPE-TRIP Final Report
Contract RA-97-AM-1165 Final Report – Ver. 1.0 (June 2000) Page. 90
But the parties involved in the conflict may have incentives to submit biased value-of-accessinformation. By claiming that their respective trains are more ‘important’ than they are, in reality,operators may succeed to get access to attractive train paths that ‘should’ have been assigned tosomeone else. The need to induce operators to reveal their value of track access is referred to asthe 2) incentive problem.
6.5.2. The auction and the time-tabling process
The task of the IM is to establish a procedure which can be used to solve the track capacityallocation problem. The process design should be guided by an ambition to guarantee efficiency inthe use of scarce infrastructure capacity. The suggestion here is to shape a procedure with thefollowing key components:
• the process should be decentralised and computer-based, operators compiling their demand fortrack access using their own computers and submitting demand specifications over the Internet;
• a formal, mathematical optimisation soft-ware must be used in order to identify the value-maximising time-table, given this demand;
• an auction procedure is applied in order to provide non-biased information about the operators’value-of-access.
6.5.2.1. The steps of the process
The process can be conceived of as running through the following steps. First, interested operatorsregister preferred departures and arrivals, including stops at intermediate stations.
Operators
Optimisingmodule
Administrator
Figure 6.2 : Interaction between train operators and timetable process administrator.This first step also sees a set of bids submitted for each alternative path. Bids then indicate theoperator’s willingness-to-pay (WTP) for the preferred train as well as how WTP changes if analternative path is offered. We can think of it as a bid vector, with one bid for each alternativedeparture, or more generally as a bid function.
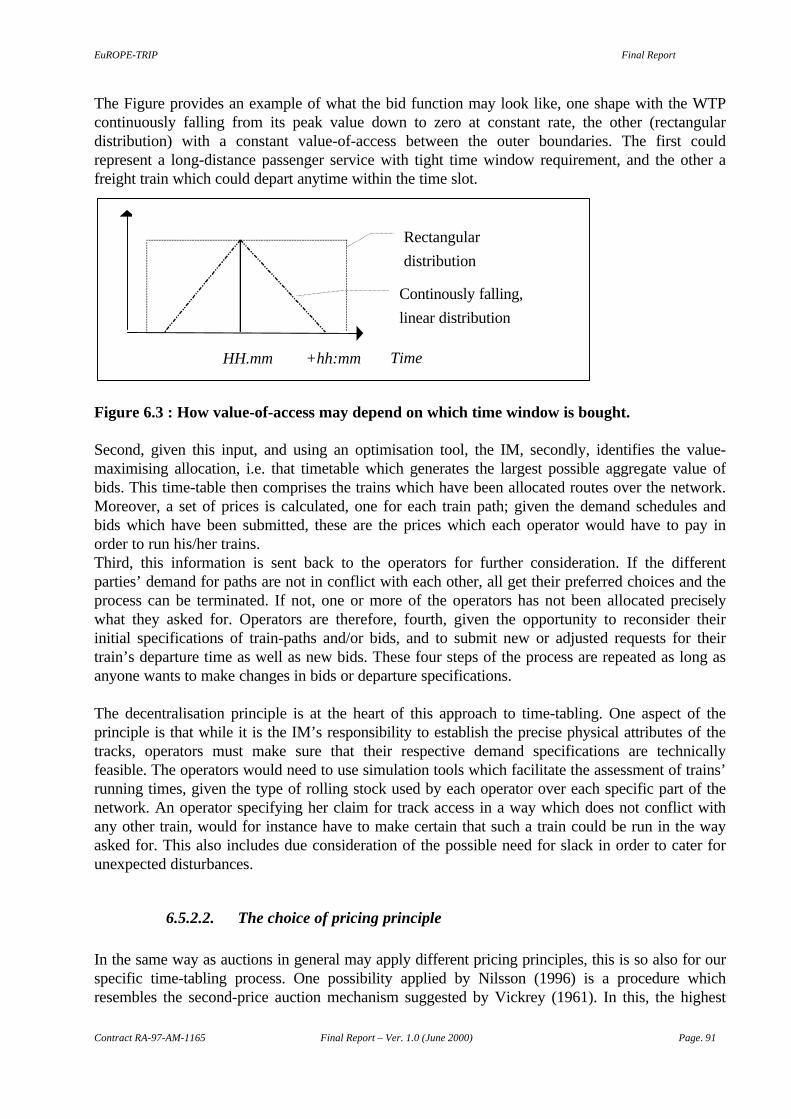
EuROPE-TRIP Final Report
Contract RA-97-AM-1165 Final Report – Ver. 1.0 (June 2000) Page. 91
The Figure provides an example of what the bid function may look like, one shape with the WTPcontinuously falling from its peak value down to zero at constant rate, the other (rectangulardistribution) with a constant value-of-access between the outer boundaries. The first couldrepresent a long-distance passenger service with tight time window requirement, and the other afreight train which could depart anytime within the time slot.
Figure 6.3 : How value-of-access may depend on which time window is bought.
Second, given this input, and using an optimisation tool, the IM, secondly, identifies the value-maximising allocation, i.e. that timetable which generates the largest possible aggregate value ofbids. This time-table then comprises the trains which have been allocated routes over the network.Moreover, a set of prices is calculated, one for each train path; given the demand schedules andbids which have been submitted, these are the prices which each operator would have to pay inorder to run his/her trains.Third, this information is sent back to the operators for further consideration. If the differentparties’ demand for paths are not in conflict with each other, all get their preferred choices and theprocess can be terminated. If not, one or more of the operators has not been allocated preciselywhat they asked for. Operators are therefore, fourth, given the opportunity to reconsider theirinitial specifications of train-paths and/or bids, and to submit new or adjusted requests for theirtrain’s departure time as well as new bids. These four steps of the process are repeated as long asanyone wants to make changes in bids or departure specifications.
The decentralisation principle is at the heart of this approach to time-tabling. One aspect of theprinciple is that while it is the IM’s responsibility to establish the precise physical attributes of thetracks, operators must make sure that their respective demand specifications are technicallyfeasible. The operators would need to use simulation tools which facilitate the assessment of trains’running times, given the type of rolling stock used by each operator over each specific part of thenetwork. An operator specifying her claim for track access in a way which does not conflict withany other train, would for instance have to make certain that such a train could be run in the wayasked for. This also includes due consideration of the possible need for slack in order to cater forunexpected disturbances.
6.5.2.2. The choice of pricing principle
In the same way as auctions in general may apply different pricing principles, this is so also for ourspecific time-tabling process. One possibility applied by Nilsson (1996) is a procedure whichresembles the second-price auction mechanism suggested by Vickrey (1961). In this, the highest
Rectangular
distribution
Continously falling,
linear distribution
Time
Value
HH.mm-hh:mm +hh:mm
EuROPE-TRIP Final Report
Contract RA-97-AM-1165 Final Report – Ver. 1.0 (June 2000) Page. 92
bidder wins a path after an open, iterative bidding process where bids may be increased while notreduced. The price is however not equal to the winning bid, but an amount corresponding to thebids made by operators crowded out by this allocation.This means, first, that if a path does not conflict with other paths and if only one operator bids forit, its price is zero. Second, with two or more bids for the same path, the price equals the second-highest bid for this path. The same principle applies if one path has to be deleted in order to givepriority to another, i.e. the price is the bid made by the party whose conflicting path was deleted.And, third, if a conflict can be solved by adjusting the departure time of one or more trains, the loss(or value reduction) of the other parties is the price to be paid.Brewer & Plott (1996) instead use the more traditional English auction, meaning that after that theiterative process has come to an end, the bidder with the highest bid pays a price equal to thewinning bid. Isacsson & Nilsson (1996) makes a coherent comparison of these, and another twopricing principles. A slightly different version of the first-price auction is tested by Cox et al.(1998).So what we have is an idea of using an auction mechanism to allocate track capacity. Severaldifferent designs of the pricing rule are conceivable. Furthermore, experiences from FCC’s (FederalCommunication Commission) sale of radio frequencies in USA illustrates that an on-line auctioningapproach clearly is a feasible way of selling strategic infrastructure capacity. Ex post assessments ofthe US process provide several indications of that the auction has delivered an enhanced efficiencyin resource use.
The background to this research is that economic theory has demonstrated that auctions in manysituations hold promise of delivering efficient allocations of goods and services. Different types ofauctions may, however, function differently depending on the precise nature of the goods beingsold. The question is therefore whether this overall efficiency conclusion bears over to the complexcircumstances of the track-allocation problem, and in particular how general principles can beadapted to the specificity of railways.What, then, is an economic experiment? The concept as such is simple: First, the detailed nature ofthe problem under analysis is described, here meaning that a precise statement of a time-tablingprocess is formulated; this is the story told in the previous section. Second, this basic structure isused to formulate a stylised set of experiment rules, i.e. rules that can be told to a group ofindividuals that do not know anything about the (track allocation) problem per se. Third, a group ofexperiment subjects, often students, are recruited.These are, fourth, asked to play a ‘game’ based on the experiment rules, and they are given realmonetary rewards for their participation in the game; the ‘better’ they perform, the more they earn.In this way, the subjects are given the same incentives as participants in a ‘real’ application of thetime-tabling process. Fifth, since the experiment leader controls the information given to subjects,he or she also knows what the outcome of the game ‘should’ be in order to establish an efficientallocation. The purpose of the experiment is to analyse whether the particular auctioningmechanism actually works in this way or not, or in other words to compare experimental with idealallocations.
The present research has generated many important insights about the ways in which the auctionworks. The most important are the following:
Efficiencies are high, in the 90 to 100% range. This means that during the experiments we are ableto generate solutions - allocations of routes to individuals/firms - which are almost identical to the
EuROPE-TRIP Final Report
Contract RA-97-AM-1165 Final Report – Ver. 1.0 (June 2000) Page. 93
value-maximising solutions to each problem. There is a tendency to slightly reduced efficiencies(towards the 90% level) when the number of participants is reduced from eight to six and four.It is difficult to establish significant differences between the pricing principles. While the first-pricerule is easier to understand, the second-price rule is slightly better to deal with public good types ofconflicts, in particular when the number of participants shrinks. This is also in accordance withtheoretical expectations.
6.5.2.3. Price implications of the mechanisms
Using an auction to allocate capacity means that operators have to pay an access or congestioncharge. Charges will differ according to how crowded the track is, with lower prices during off-peak periods and high charges during peaks. As a consequence, operators are given reason to (re-)consider the necessity of using tracks during periods with high load. Much in the same way as isdiscussed for congestion pricing in the road-sector, the presence of prices may induce a significantchange of traffic pattern for services which are not dependant on access to specific time windows.Another implication of the charging system is that operators may have to pay different amounts forphysically identical services, which run during different periods of the day. While this may have direfinancial consequences for some operations and be cheap to others, it is not an example of operatordiscrimination. Rather, it is a consequence of the chosen method to allocate capacity and that thehigh-price trains need access to tracks in a way which means that others have to be reshuffled inorder to provide for access.
6.5.2.4. The process, the optimisation tool and a user interface
The present work has taken the previous research one step further by combining the optimisationtool with a workable user interface; furthermore, we discuss the work on this topic which hassubsequently been initiated.
6.5.2.5. The user interface
The paper by Brännlund et al. (1998) suggests a specific optimisation approach and also presents acase study where the method is tested. We have made use of this case study in order to build aprototype user interface applicable for demonstration purposes. The user interface is built with theexplicit purpose to show how the auctioning process is meant to work, and it is available on aportable PC for some simple applications. The case study comprises a section of the Swedishrailway network, a 160 km single-track line with 17 meeting stations, i.e. 16 blocks.
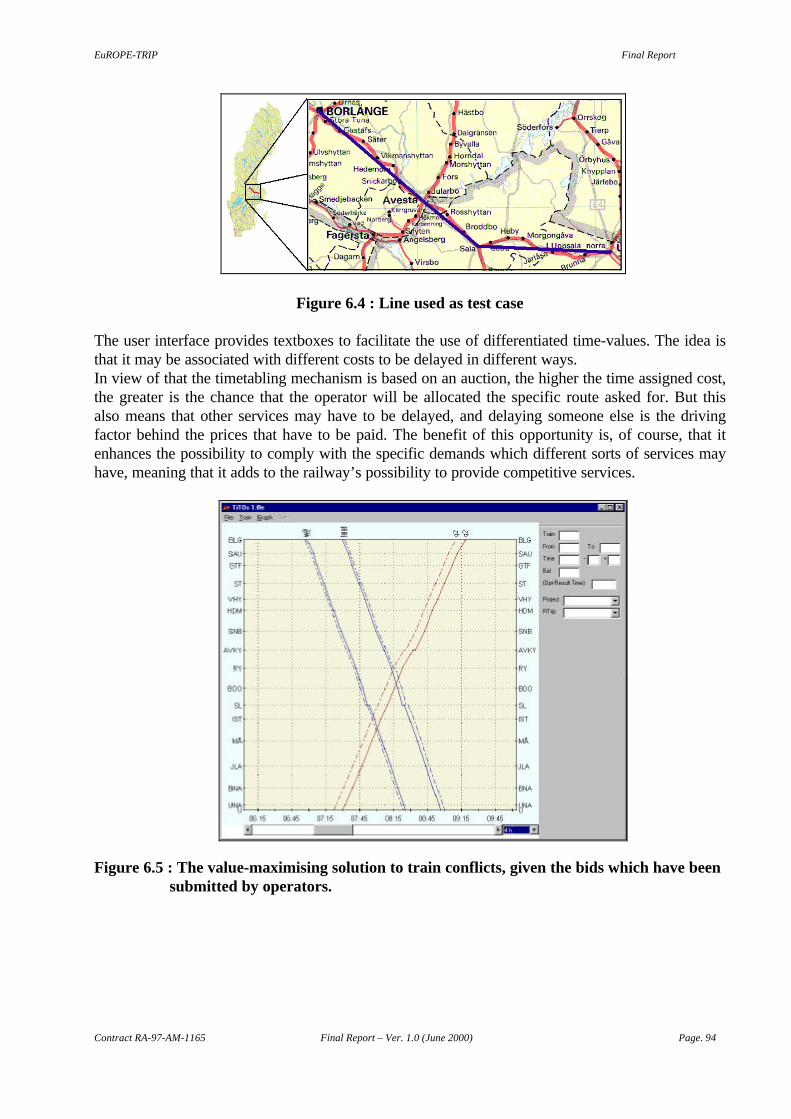
EuROPE-TRIP Final Report
Contract RA-97-AM-1165 Final Report – Ver. 1.0 (June 2000) Page. 94
Figure 6.4 : Line used as test case
The user interface provides textboxes to facilitate the use of differentiated time-values. The idea isthat it may be associated with different costs to be delayed in different ways.In view of that the timetabling mechanism is based on an auction, the higher the time assigned cost,the greater is the chance that the operator will be allocated the specific route asked for. But thisalso means that other services may have to be delayed, and delaying someone else is the drivingfactor behind the prices that have to be paid. The benefit of this opportunity is, of course, that itenhances the possibility to comply with the specific demands which different sorts of services mayhave, meaning that it adds to the railway’s possibility to provide competitive services.
Figure 6.5 : The value-maximising solution to train conflicts, given the bids which have beensubmitted by operators.
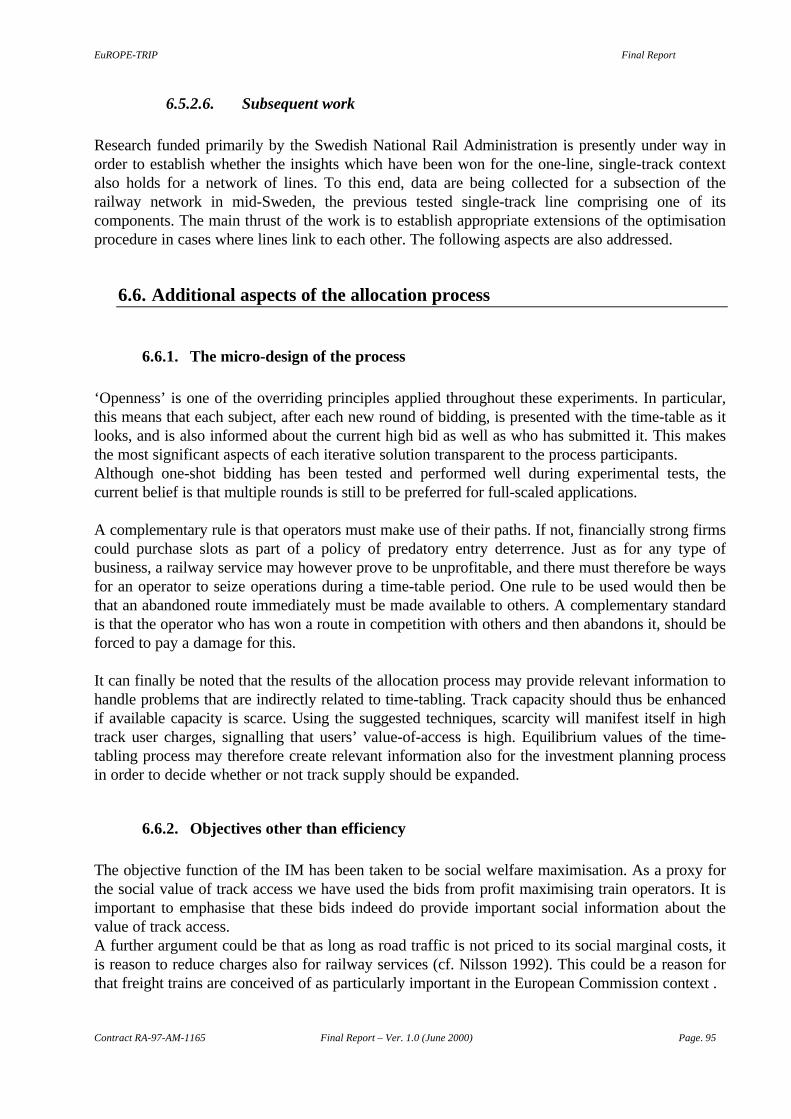
EuROPE-TRIP Final Report
Contract RA-97-AM-1165 Final Report – Ver. 1.0 (June 2000) Page. 95
6.5.2.6. Subsequent work
Research funded primarily by the Swedish National Rail Administration is presently under way inorder to establish whether the insights which have been won for the one-line, single-track contextalso holds for a network of lines. To this end, data are being collected for a subsection of therailway network in mid-Sweden, the previous tested single-track line comprising one of itscomponents. The main thrust of the work is to establish appropriate extensions of the optimisationprocedure in cases where lines link to each other. The following aspects are also addressed.
6.6. Additional aspects of the allocation process
6.6.1. The micro-design of the process
‘Openness’ is one of the overriding principles applied throughout these experiments. In particular,this means that each subject, after each new round of bidding, is presented with the time-table as itlooks, and is also informed about the current high bid as well as who has submitted it. This makesthe most significant aspects of each iterative solution transparent to the process participants.Although one-shot bidding has been tested and performed well during experimental tests, thecurrent belief is that multiple rounds is still to be preferred for full-scaled applications.
A complementary rule is that operators must make use of their paths. If not, financially strong firmscould purchase slots as part of a policy of predatory entry deterrence. Just as for any type ofbusiness, a railway service may however prove to be unprofitable, and there must therefore be waysfor an operator to seize operations during a time-table period. One rule to be used would then bethat an abandoned route immediately must be made available to others. A complementary standardis that the operator who has won a route in competition with others and then abandons it, should beforced to pay a damage for this.
It can finally be noted that the results of the allocation process may provide relevant information tohandle problems that are indirectly related to time-tabling. Track capacity should thus be enhancedif available capacity is scarce. Using the suggested techniques, scarcity will manifest itself in hightrack user charges, signalling that users’ value-of-access is high. Equilibrium values of the time-tabling process may therefore create relevant information also for the investment planning processin order to decide whether or not track supply should be expanded.
6.6.2. Objectives other than efficiency
The objective function of the IM has been taken to be social welfare maximisation. As a proxy forthe social value of track access we have used the bids from profit maximising train operators. It isimportant to emphasise that these bids indeed do provide important social information about thevalue of track access.A further argument could be that as long as road traffic is not priced to its social marginal costs, itis reason to reduce charges also for railway services (cf. Nilsson 1992). This could be a reason forthat freight trains are conceived of as particularly important in the European Commission context .
EuROPE-TRIP Final Report
Contract RA-97-AM-1165 Final Report – Ver. 1.0 (June 2000) Page. 96
Our purpose here is, however, not to establish which complementary objectives that should beheeded in the track allocation process; this is indeed a political prerogative. Rather, we want toprovide an instrument to handle such objectives, should they be considered relevant.
The time-tabling process can make use of the same approach. The Government would then have tospecify who should be counted as bidders to be given preferential treatment in this environment andalso lay down the degree of positive discrimination. Each bid from parties belonging to this groupcan be automatically multiplied with this factor before it is entered into the optimisationprogramme.
6.6.3. Complementarities
So far, the discussion about the allocation process has proceeded as if operators’ value of beingallocated specific slots/routes is not related to whether the same firm is given the right to run alsoother trains. This may be an overly simplistic proposition.
There may be important complementarities in the demand for track access. Getting a path at a giventime could be valuable only if it is possible to get elsewhere connecting services. Therefore theprocess should be designed in a way which makes it feasible for operators to co-ordinate (differentlegs of) their services. Moreover, different operators may wish to co-ordinate their services (e.g. toexchange passengers at some node in the network).Services of different operators may, on the other hand, also be each others’ substitutes. Two firmsrunning the same type of train over a section of the network may value track access differentlydepending on how close to each other the respective routes over the network are laid. As explainedbefore, this case is not considered to be compatible with a long-run equilibrium.Another type of negative interaction between different services relates to the quality of allocatedroutes. Routes A and B may be designed in a technically feasible way, meaning that there are noproblems in running the respective trains according to the nominal schedule. But the operator ofhigh-value route A may however believe that route B is ‘too close’ in the sense that if train B islate, there is a considerable risk that train A is also affected. For this reason the operator of train Amay legitimately have an interest in the routes of other operators and in particular how close toeach other that they should be allowed to be. There may be reason to provide scope for also thisaspect in the allocation process. It should at the same time be acknowledged that this would giveoperators predation opportunities. This is so since operators are given scope for tampering with thecompetitiveness of the market by way of ‘crowding out’ competitors in the name of a safetymargins.
We have therefore investigated a preliminary attempt to handle other aspects of the issue, includinga couple of economic experiments to assess its qualities.
The point that we want to make here is not related to the precise level of time-values; this is indeeda matter for the operators to define. Rather, emphasis is on setting up a process which providesscope for versatility when operators define their demand, including the use of different weights orvalues-of-time for the different classes of demand adjustments. The greater the possibility foroperators to specify their demand for access in a flexible way, the more flexible will the system beand the more likely is it that efficient time-tables could be established. In particular, by presentingoperators with this range of alternatives it is possible that the type of complementarities that weconcentrate on can be dealt with in an efficiency-enhancing manner.
EuROPE-TRIP Final Report
Contract RA-97-AM-1165 Final Report – Ver. 1.0 (June 2000) Page. 97
6.7. Conclusions
The European Commission has suggested a structure for infrastructure charging and capacityallocation. Basic principles include marginal cost pricing and allocation of track capacity in order tosupport efficiency in resource use.Research reported in the present paper suggests a practical tool for implementation of thesepropositions. The recommendation is to use an auction mechanism in order to strike the balancebetween conflicting demand in situations with insufficient infrastructure capacity. The auction isseen as an inherent part of the overall scheduling process which generates two outputs; a timetableand a set of (congestion) charges.The same mechanism will provide the infrastructure manager with information about the relativevalue of single departures, and ability to establish more efficient time-tables. Since operators haveto pay a price which is strongly related to the degree of scarcity, they will be forced to optimisefirst their requests. In many cases there may be significant flexibility in the demand in that a numberof departure times may be each others’ close substitutes. By defining demand in a flexible way, theprice may go down, for instance since capacity which otherwise would be unused can now beallocated. In the absence of prices, operators have poor reason to think twice over the congestionimplications of their demand. As a consequence, capacity shortages may - at least for a period oftime - be reduced.
There are two important challenges which must be met by any track allocation process. The first isrelated to the demand for conditions which are stable in a long-term perspective. An operator maybe deterred from investing in new rolling stock if the conditions for track access can not beestablished in beforehand; why spend money if it can not be ascertained that access will bepermitted or that the price for getting access is high? The problem derives from the different time-horizons of time-tabling and rolling stock life expectancy.The other problem is created by the short-sighted nature of much freight traffic. From the roadsector, the final customers are used to getting trucks for their shipments on short notice, often afew days only. This generates a demand for a similar competence from rail freight services torespond to demand on short notice. The concomitant necessity would then be to arrange for newallocations relative to time-tables to be taken with high frequency.The two issues lead to opposite conclusions, i.e. a need for long contracts on the one hand and anecessity to establish contracts for short periods on the other. This is, of course, a basic trade-offinherent in the process to establish time-tables. In particular, it is not related to the specific methodwhich is used in order to allocate capacity. The auctioning approach to time-tabling is in fact openfor any frequency of time-table establishment.
The overall conclusion of our work is that it is technically feasible to auction track capacity. Morethan being technically practicable, the procedure also holds promise to allocate track capacity in anefficient way. The next obvious step in the further development of the approach is to try it out in areal while yet small-scale pilot study where participants are required to submit binding bids for theirrespective services.
EuROPE-TRIP Final Report
Contract RA-97-AM-1165 Final Report – Ver. 1.0 (June 2000) Page. 98
6.8. Bibliography
1. Brewer, P.J., C.R. Plott (1996). A Binary Conflict Ascending Price (BICAP) Mechanism forthe Decentralized Allocation of the Right to Use Railroad Tracks. International Journal ofIndustrial Organization, Vol. 14, No. 6, pp 857-886.
2. Brännlund, U., P.O. Lindberg, J-E Nilsson, A. Nöu (1998). Railway Timetabling usingLagrangian Relaxation. Transportation Science, Vol. 32, No.4, November 1998.
3. Cox, J.C., T. Offerman, M.A. Olson and A. Schram (1998). Competition for vs. on the Rails: ALaboratory Experiment. Working Paper, CREED, University of Amsterdam.
4. European Commission (1995). Green Paper. Towards Fair and Efficient Pricing in Transport.COM (95) 691
5. European Commission (1996). White Paper. A Strategy for Revitalising the Community’sRailways. COM (96) 421, final.
6. European Commission (1998). Proposal for a Council Directive relating to the allocation ofrailway infrastructure capacity and the levying of charges for the use of railway infrastructureand safety certification, COM(98) 480 final.
7. Grether, D., M. Isaac, C. Plott (1989). The Allocation of Scarce Resources. ExperimentalEconomics and the Problem of Allocating Airport Slots. Westview Press.
8. Isacsson, G., J-E Nilsson (1996). An Experimental Comparison of First- And Second-PriceAuctions - the Case of Track Capacity Allocation. Working Paper, CTS, Dalarna University.
9. Kopicki, R. & L.S Thompson (1995). Best Methods of Railway Restructuring andPrivatisation. CFS Discussion Paper, World Bank.
10. McAffee, R.P. & J. McMillan (1996). Analyzing the Airwaves Auction. Journal of EconomicPerspectives, Vol. 10, No. 1, p 159-175.
11. McMillan, J. (1994). Selling Spectrum Rights. Journal of Economic Perspectives, Vol. 8, No.3, p 145-162.
12. Morrison, S., C. Winston (1989). Enhancing the Performance of the Deregulated AirTransport System. Brookings Papers on Economic Activity: Microeconomics. 1:1989, p. 61-112.
13. Nilsson, J-E (1992). Railway Infrastructure Pricing and Investment. Journal of TransportEconomics and Policy, November, pp. 245 - 259
14. Nilsson, J-E (1996). Allocation of Track Capacity. Experimental Evidence on the Use ofPriority Auctioning in the Railway Industry. Forthcoming in International Journal of IndustrialOrganization.
15. NERA (1998). An Examination of Rail Infrastructure Charges. Draft Final Report for theEuropean Commission, DG VII, London May 1988.
16. Rassenti, S.J., Smith, V.L., R.L. Bulfin (1982). A Combinatorial Auction Mechanism forAirport Time Slot Allocation. Bell Journal of Economics, Vol. 13, pp. 402-417.
17. Starkie, D. (1994). The US Market in Airport Slots. Journal of Transport Economics andPolicy. Vol. XXVIII, pp. 325-329.
18. Tirole, J. (1992). The Theory of Industrial Organisation. The MIT Press19. Vickrey, W. (1961). Counter-Speculation, Auctions and Competitive Sealed Tenders. Journal
of Finance Vol. 16; p. 8-37.
EuROPE-TRIP Final Report
Contract RA-97-AM-1165 Final Report – Ver. 1.0 (June 2000) Page. 99
7. THE BUSINESS PLANNING MODEL
7.1. Introduction
This Section describes the Business Model Demonstrator, which was developed withinworkpackages 1 and 6 of TRIP. The purpose of this simulation model is to evaluate a range ofstrategies, which could be set by policy makers and followed by infrastructure managers in thecontext of the European Directive 91/440 and following. This study has provided a framework tostudy the process for putting the policy principles required by the Directive into practice, inparticular the open access, and the business demonstrator aims to build a tool for making asynthesis of this process.The model focuses on the role of the Infrastructure Manager, i.e. the supply side of the market, andcan be used as a strategic (long term) business planning tool.This chapter describes the model structure and provides an overview of the demonstrator’sfunctionality as well as the user interfaces. The model has been designed and built using the SystemDynamics methodology and was implemented using the software package ITHINK.The purpose of the research was to demonstrate the feasibility of the approach, developing astrategic business modelling and planning tool for the rail Infrastructure Manager, which howevercould be extended to incorporate also the behaviour of the “transport” side of the rail market.
7.2. Model Description
The model is a business planning game which is designed to simulate IM’s business operation overa period of 10 years (more or less). The approach here is therefore strategic and is complementaryto the tactical view which is typical of the annual timetable or short-term track allocation. Thesimulation is based around the management of a rail corridor with a mix of train types operatingwith capacity constraints. The Milan to Bologna rail corridor in Italy is such a corridor and is usedas a case study in the TRIP model. This is a busy corridor of just under 300 kilometres, whichcurrently sees a varied mix of high speed trains, interregional trains, regional and freight trainsoperating.The model simulates how the business evolves through time, allowing the user to intervene to makedecisions about access charging, use of resources and so forth. As it runs it provides continuallyupdated information about:
• the number of paths operating and track utilisation
• the revenues from track access charges, for high speed, local and freight services
• responses from train companies to invitations to bid
• the condition of the infrastructure
• operating costs and maintenance expenditure
• penalty charges to train operators
The user can intervene to set inter alia:
EuROPE-TRIP Final Report
Contract RA-97-AM-1165 Final Report – Ver. 1.0 (June 2000) Page. 100
• the access charges
• target numbers of high speed, local & freight paths
• a target utilisation level
• maintenance expenditure.
Although the business is simulated over a time period of ten years, the structures within the modelare based around a daily operating period of three hours, representing the peak hours in thecorridor in one direction. There were two reasons for basing the model structure upon the peakperiod:
• The peak period is the most critical in terms of supply of and competition for capacity. In realitykey decisions about capacity enhancements would be based upon the period of the day whenthere are serious time and capacity constraints; and
• It was reasoned that the results for the peak hour simulation can be easily extended to cover themanagement of a corridor for a period including the interpeak.
In reality a wide variety of trains would operate in a rail corridor. Within TRIP it was decided tosimplify and reduce the number of possibilities in the model. Three types of train paths are used assuitable representatives of the paths operating in the corridor. These path types are:
• High speed;
• Regional; and
• Freight.
It is assumed that high-speed and freight trains cover the whole length of the corridor, whereasregional trains only operate in parts of the corridor. The line is treated as being divided into threeoperational zones. High speed and freight trains operate through the whole length of the line, butregional services only operate within the zones.In particular the Train Capacity Management (TCM) software is used to find the combinations oftrains under which the corridor operates at capacity (see Section 2).When the model is run the simulation is paused each year and IM can review its businessperformance and the condition of its assets. Resource decisions can be made or changed and thesimulation resumes. While the model is operating as an interactive simulation, information isprovided, as it would normally be seen by the IM. This may mean that information is not availableinstantaneously if there are delays in collecting it.The model provides an interactive and appealing interface. This interface has different views andallows IM to monitor its activities. Many graphs are provided showing the behaviour of modelvariables over time.Running a simulation involves undertaking a sequence of actions, which are described in theremainder of this chapter. They are:
• Simulation set up;
• Implementation of resource decisions; and
• Model running (including review of decisions).
EuROPE-TRIP Final Report
Contract RA-97-AM-1165 Final Report – Ver. 1.0 (June 2000) Page. 101
The first step, the simulation set up, involves setting values for variables that represent startingconditions in the rail corridor. The second step is to implement resource decisions, for exampledetermining maintenance expenditure levels. Finally the model is run interactively.
7.3. Model structure
The model architecture comprises several modules, each of which deals with one aspect of theInfrastructure Manager’s business, and is linked to the others according to its logical structure.
Model implementation
The implementation of the model is based on the System Dynamics method [Forrester 1961, Coyle1996] which is a time-step simulation based on a typical representation of the real world.Implementation can be made by specific software packages. ITHINK is the one used in thisapplication [4].
Contracts management
This module handles the issuing of contracts to operate train paths. The IM declares targets for thenumber of paths he wishes to see operate, for each of the three path types handled (local, inter-cityand freight). Applications are received from the train companies in response, which are thenprocessed. If applications exceed the target some will be turned down. Those that are acceptedbecome operational contracts after a preparation period, and remain in operation for a fixedcontract period after which they expire. This section also handles contracts, which are not rununder competitive commercial conditions.The control output provides information about the number of paths currently operating, the trackutilisation and the response of the train companies to invitations to tender or to changed tenderconditions.
Path pricing
Access charges are not determined by the model, but are set by the user. They are two partcharges, with fixed and variable components. The variable component is based on a rate per train-kilometer.
Infrastructure management
This section handles maintenance and upgrades of the infrastructure. The model recognises threeclasses of infrastructure: track, signalling and overhead power lines. These age through time, andmust be maintained to prevent deterioration. The model tells the user what maintenanceexpenditure is required, but the user decides what actually takes place. Periodic failures occur, andtheir rate increases as the excess age of the infrastructure increases (i.e. if maintenance is notadequate). Ageing infrastructure not only fails more frequently, but leads to capacity reductions asspeed restrictions are introduced.
EuROPE-TRIP Final Report
Contract RA-97-AM-1165 Final Report – Ver. 1.0 (June 2000) Page. 102
The infrastructure can be upgraded, and upgrades may be phased in over time. The main effectsare temporary disruptions during the upgrade period; reduced unit maintenance costs; and highercapacity.
Capacity and Utilization
This section monitors the number of paths operating and calculates the track utilisation. This isdone in a way that reflects the mix of path types operating. It also calculates the target utilisation,which is the utilisation that would occur if the IM’s declared target number of paths were tooperate.Capacity will be reduced if the infrastructure is not properly maintained, and is increased followingupgrades.
Costs and Revenues
This section calculates the revenue accruing to the IM from access charges, and costs arising from:maintenance, operating costs and penalty charges paid to operators in compensation for servicedisruptions attributable to the IM.
Train Companies
Train companies bid to operate train paths offered by the IM. The IM specifies the target numberof paths and the price, but the train company’s response will depend on their own assessment of themarket and the quality of the service they are receiving from the IM. The model assumes that theytake into account their own current and potential market size to form a view on the marginal valueof a path to them, and adjust this to reflect improvements or degrades to service speeds andreliability.The model does not recognise separate companies - they are treated as a single pool - but it doesrecognise that they may, in total, be capacity constrained, and that it will take time to alter the sizeof the rolling stock fleet available.
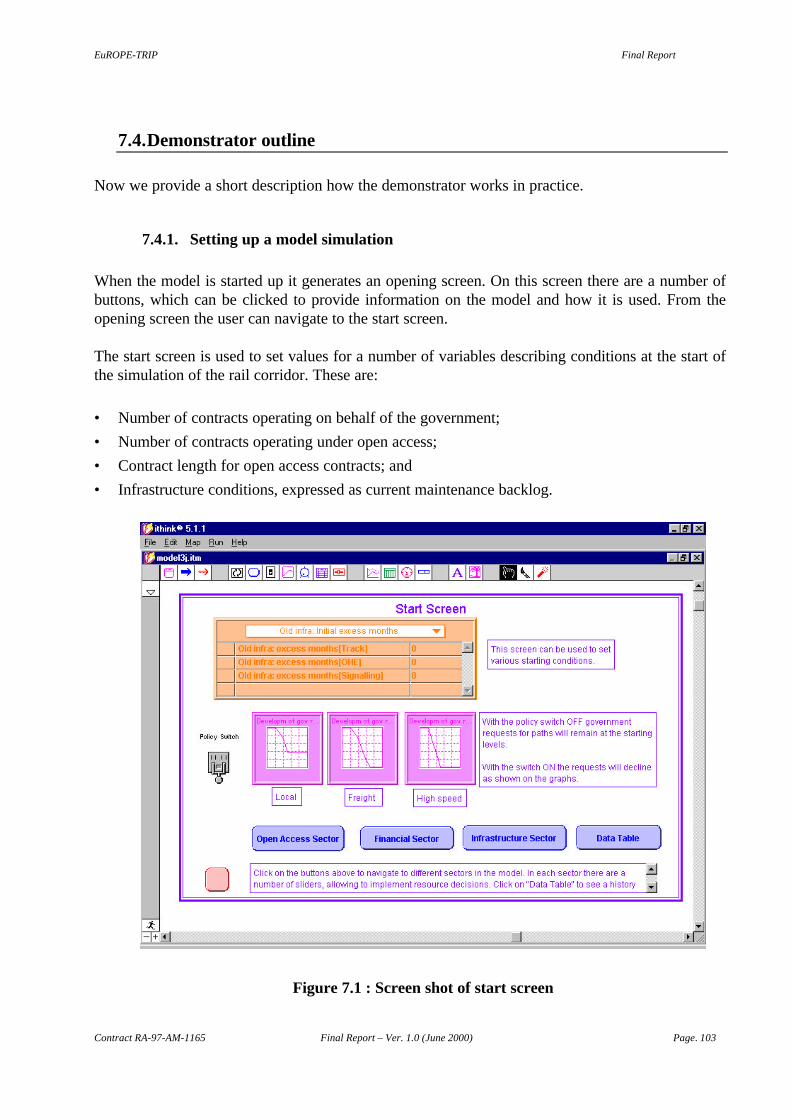
EuROPE-TRIP Final Report
Contract RA-97-AM-1165 Final Report – Ver. 1.0 (June 2000) Page. 103
7.4. Demonstrator outline
Now we provide a short description how the demonstrator works in practice.
7.4.1. Setting up a model simulation
When the model is started up it generates an opening screen. On this screen there are a number ofbuttons, which can be clicked to provide information on the model and how it is used. From theopening screen the user can navigate to the start screen.
The start screen is used to set values for a number of variables describing conditions at the start ofthe simulation of the rail corridor. These are:
• Number of contracts operating on behalf of the government;
• Number of contracts operating under open access;
• Contract length for open access contracts; and
• Infrastructure conditions, expressed as current maintenance backlog.
Figure 7.1 : Screen shot of start screen
EuROPE-TRIP Final Report
Contract RA-97-AM-1165 Final Report – Ver. 1.0 (June 2000) Page. 104
Figure above provides a screen shot of the start screen. The buttons at the bottom are used tonavigate between the control screens in the model. From the start screen there are navigations to:
• infrastructure management sector
• business strategy sector
• financial sector.
The use of these screen is outlined in following paragraph.
In the centre of the control screen are three graphs that can be used to specify the rate at whichcontracts operated on behalf of the government are withdrawn. By double clicking on one of thesegraph pads, the shape of the graph can be changed and paths can be phased out quicker or slowerthan initially specified. When the shape of a graph is changed a ’u’ appears on the graph pad. Bypressing this button the changes made to the graph are disregarded and the graph reverts to itsoriginal shape. The withdrawal process is activated by the policy switch to the left.
7.4.2. Resource decisions
Resource decisions within the model reflect the decisions the IM has to make in the operationalmanagement of a rail corridor. Decisions involve setting targets for open access contracts, settingmaintenance strategies and prices for contracts. Resource decisions are made before the model isrun or when the model is in ’pause’ mode. Resource decisions are input using sliders or switches.Resource decisions are briefly summarised in the following.For the sake of example, we give below one picture to exhibit how the control screen for oneresource decision looks like in the implementation.
7.4.2.1. Infrastructure management
This handles maintenance and upgrades of the infrastructure. The model recognises three types ofinfrastructure: Track, Signalling and Overhead Equipment. These age through time and must bemaintained to prevent deterioration. The model tells the user what maintenance expenditure isrequired, but the user decides what actually takes place. The infrastructure can be upgraded, andupgrades may be phased in over time. The main effects are temporary disruptions during theupgrade period, reduced unit maintenance costs and higher capacity.Graphs are provided showing:
• Old infrastructure: Maintenance expenditure and maintenance backlog;
• Upgraded infrastructure: Maintenance expenditure and maintenance backlog; and
• Required maintenance expenditure vs. actual maintenance expenditure.
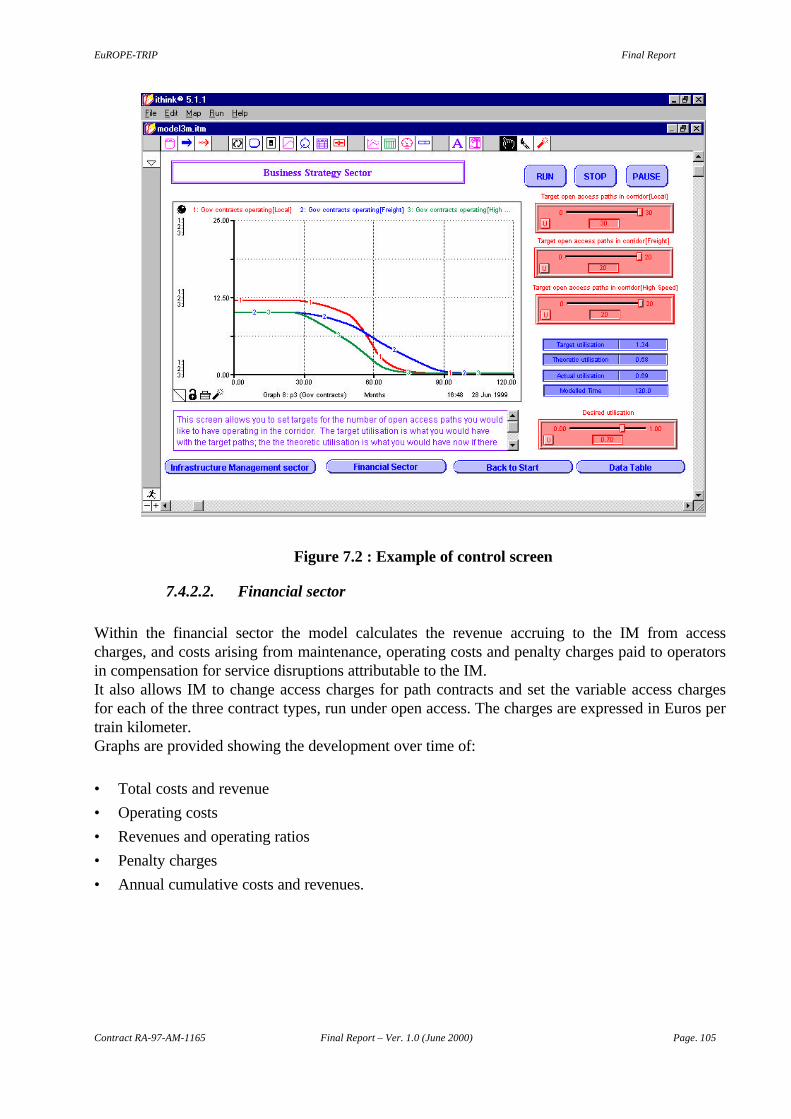
EuROPE-TRIP Final Report
Contract RA-97-AM-1165 Final Report – Ver. 1.0 (June 2000) Page. 105
Figure 7.2 : Example of control screen
7.4.2.2. Financial sector
Within the financial sector the model calculates the revenue accruing to the IM from accesscharges, and costs arising from maintenance, operating costs and penalty charges paid to operatorsin compensation for service disruptions attributable to the IM.It also allows IM to change access charges for path contracts and set the variable access chargesfor each of the three contract types, run under open access. The charges are expressed in Euros pertrain kilometer.Graphs are provided showing the development over time of:
• Total costs and revenue
• Operating costs
• Revenues and operating ratios
• Penalty charges
• Annual cumulative costs and revenues.
EuROPE-TRIP Final Report
Contract RA-97-AM-1165 Final Report – Ver. 1.0 (June 2000) Page. 106
7.4.2.3. Business strategy sector
This section handles the issuing of contracts to operate train paths. The IM declares targets for thenumber of paths he wishes to see operate, for each of the three path types handled (local, inter-cityand freight). Applications are received from the train companies in response, which are thenprocessed. If applications exceed the target some will be turned down. Those that are acceptedbecome operational after a preparation period, and remain in operation for a fixed contract periodafter which they expire.The user can set targets for each of the three contract types; the IM is also able to set an overalldesired line utilisation. One can for instance limit the acceptance of new contracts in order not toexceed corridor capacity.There are graphs providing information on:
• Utilisation
• Open access contracts operating
• Open access applications
• Contracts operating on behalf of government
• Rejection rate for open access contracts
• Acceptance rates for open access contracts
• Proportion of target contracts sold
• Request index
The proportion of target contracts sold indicates how far off the business is from reaching targetpath numbers. The ‘request index’ provides a measure of how well the train companies areresponding to the IM’s declared targets. If it is equal to one, then the application rate from theTOCs is sufficient to reach the target; if greater than one then the application rate exceeds thatrequired to meet the target, (and perhaps prices could be raised); if less than one then the target willnot be reached.
7.4.3. Running the model
The model is interactive. For instance one can :
• Run - to begin a new run or resume a paused run;
• Pause - to pause the simulation; and
• Stop – to stop the simulation.
This means that IMs business is simulated for one year after which the model will be paused. Whenthe model is paused IM is able to change his resource decisions although will be unable to changeconditions on the start screen.
EuROPE-TRIP Final Report
Contract RA-97-AM-1165 Final Report – Ver. 1.0 (June 2000) Page. 107
After the simulation has been completed sensitivity tests might be undertaken assuming differentstarting conditions or using different resource decisions. The procedure to do so is to go back tothe start screen and change initial conditions and than re-run the model.Finally a navigation to so-called “data table” is provided. This table provides an overview innumerical terms for some of the variables listed above for each time-step in the model simulation.
7.4.4. Testing policies for infrastructure management
Several simulation tests have been undertaken with the demonstrator, to validate the workability ofthe Infrastructure Business Planning Model, and to show how the model behaves and how it can beused for policy analysis.The target – we recall - is to analyse the dynamics occurring in the management of a rail corridor,although we do not claim that the prototype provides an accurate representation of the real world.To offer the reader some hints about the tests, we run some instances like the following.In one test case, which will be used here as reference, services operated for the government are allphased out and replaced by open access (OA) contracts. The base markets for all three types oftraffic are high and exceed the available capacity. The IM targets for path numbers have also beenset high, but with a desired utilisation of 70%.The effect is that demand exceeds the available capacity, and the IM in effect leaves it entirely tothe market to determine the eventual mix of traffic using the corridor, subject to the constraints thatutilisation should not be allowed to exceed the figure above. This is, admittedly, a somewhatunrealistic scenario, but has been chosen to demonstrate the dynamics of the model in a simplecase. The Figure, which was above exhibited and refers to this business case, shows the phasing outof the government contracts.Initially there are no open access contracts operational in the rail corridor. Because the TOC’sestimate of the potential market is high, they start to apply for contracts, and some becomeoperational. Their number is limited in the early months because of the government contracts. Asthese contracts are phased out more room becomes available for open access contracts and theacceptance rate for open access contracts increased.Figure below shows the development of open access contracts operating. At the end of thesimulation there are 15 local, 10 freight and 10 high speed contracts operational. This is higher thanthe initial number of paths operating and therefore the end utilisation is slightly higher than at thestart. Utilisation is also plotted in the same figure.
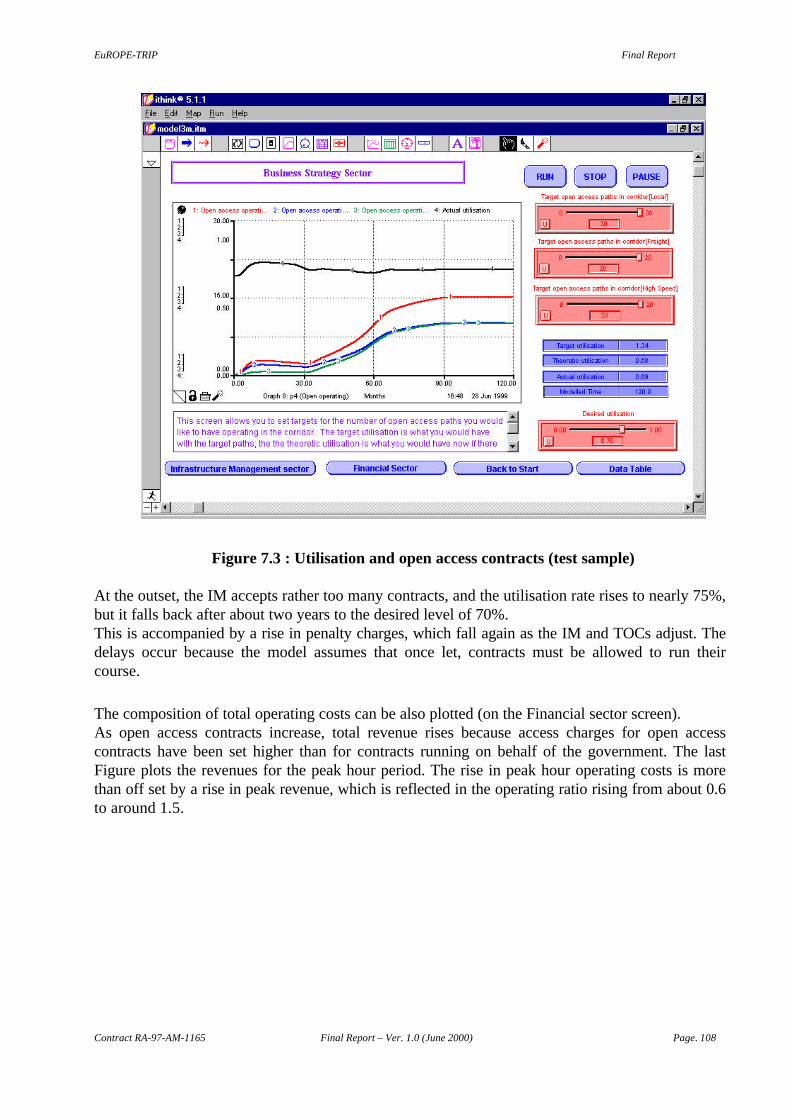
EuROPE-TRIP Final Report
Contract RA-97-AM-1165 Final Report – Ver. 1.0 (June 2000) Page. 108
Figure 7.3 : Utilisation and open access contracts (test sample)
At the outset, the IM accepts rather too many contracts, and the utilisation rate rises to nearly 75%,but it falls back after about two years to the desired level of 70%.This is accompanied by a rise in penalty charges, which fall again as the IM and TOCs adjust. Thedelays occur because the model assumes that once let, contracts must be allowed to run theircourse.
The composition of total operating costs can be also plotted (on the Financial sector screen).As open access contracts increase, total revenue rises because access charges for open accesscontracts have been set higher than for contracts running on behalf of the government. The lastFigure plots the revenues for the peak hour period. The rise in peak hour operating costs is morethan off set by a rise in peak revenue, which is reflected in the operating ratio rising from about 0.6to around 1.5.
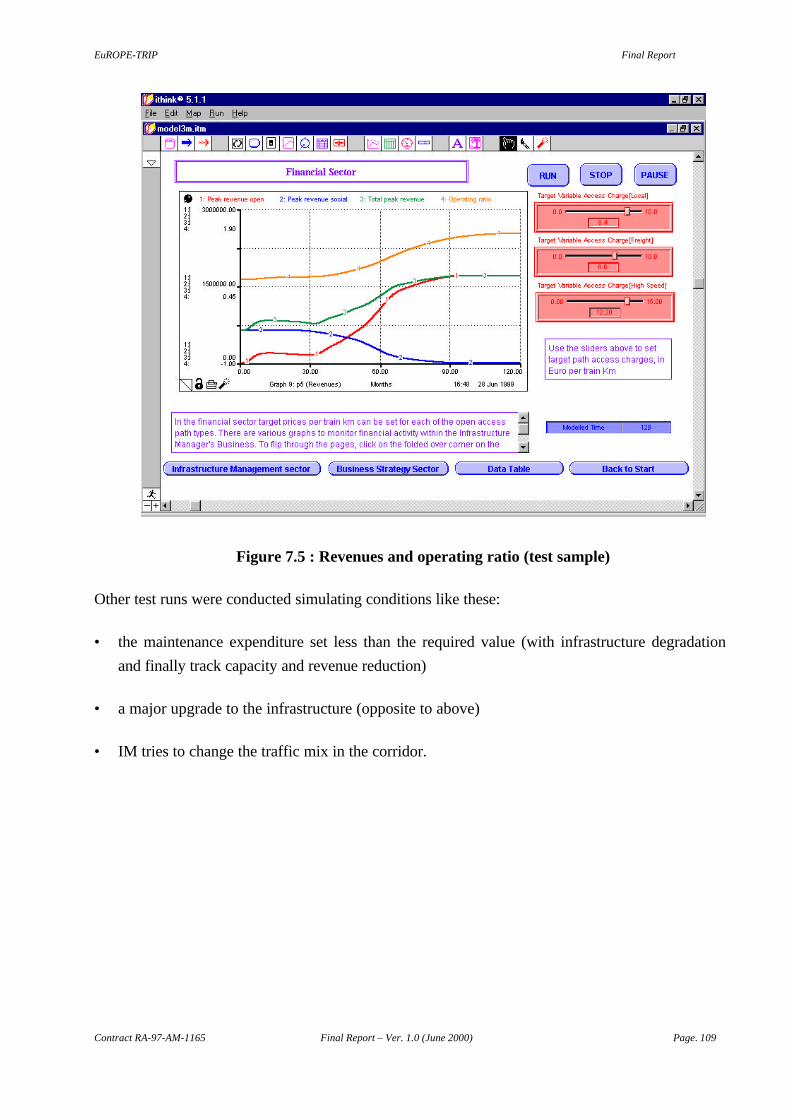
EuROPE-TRIP Final Report
Contract RA-97-AM-1165 Final Report – Ver. 1.0 (June 2000) Page. 109
Figure 7.5 : Revenues and operating ratio (test sample)
Other test runs were conducted simulating conditions like these:
• the maintenance expenditure set less than the required value (with infrastructure degradation
and finally track capacity and revenue reduction)
• a major upgrade to the infrastructure (opposite to above)
• IM tries to change the traffic mix in the corridor.
EuROPE-TRIP Final Report
Contract RA-97-AM-1165 Final Report – Ver. 1.0 (June 2000) Page. 110
7.5. Conclusions
This research has presented a prototype model designed to serve as a business planning tool for arail Infrastructure Manager. The purpose of the study was to test the feasibility and validity of thisobjective, and to produce a working prototype, that could be further implemented and exploited.We believe that this objective has been achieved.
Some comments are needed on what the model is and is not. It was designed to simulate whatmight actually happen within the IM’s business under Open Access, and to permit experimentationwith different policies to see how business performance might be improved. It is an attempt tosimulate what might really happen, not necessarily what should, and consequently it is not anoptimisation model. This is why access charges and target path mixes are inputs to the model, notoutputs. The model does not address the economic question of whether access charges should bebased on marginal costs or average costs, for example, but it does provide a means of testing theconsequences of these alternatives. That said, it is has become clear that there is scope for someoptimisation to be incorporated in subsequent versions of the model. For instance it would not behard to provide guidance on the target mix of path types that would maximise revenues within thecapacity constraints.
Where this model is, we believe, unique, is that it attempts to address the full scope of the IM’sbusiness, and his relationship with the train operators. It is an attempt to set out precisely how thisbusiness might operate, and demonstrate how it will behave dynamically. To achieve this it hasbeen necessary to reduce the detail in some areas, but selectivity is a key feature of successfulmodelling and we would argue that we have always aimed to simplify without damaging theessential structures and behavioural dynamics. The representation of capacity is particularlyinnovative and seems to offer a method capable of much wider application.
Although we have used realistic data where possible, such as by using the TRIS-TCM model tocalibrate the capacity module, we do not claim that the model is an accurate representation of theMilan to Bologna corridor. Some of the unit costs and infrastructure failure rates have been takenfrom UK publications for example, while some relationships, such as the rate at which failuresincrease with infrastructure age, have been hypothesised. All data values used in the model arefully documented but the model has never been viewed as something to be used ‘out of the box.’Any real application would require careful data collection and calibration work.
The real test of the model’s usefulness will be whether it can indeed be applied in real case studies.Some of the data needed are relatively standard, though not necessarily easy to obtain, such as unitoperating and maintenance costs, or failure rates. The rates at which these change with the age ofinfrastructure or with upgrades will be more difficult to establish, and some engineering judgementmay be called for. Some data are harder still for they deal with softer issues such as the rate atwhich TOCs alter their valuation of train paths as the quality of service changes. Many of theserelationships have been set up by us based on judgement, and it will probably be felt that in practicethey should be calibrated as closely as possible using real data. In practice this will not always bepossible, but it should be remembered that the model has been designed to simulate what managersactually do, and what they certainly do in many instances is to use judgement. Many of the
EuROPE-TRIP Final Report
Contract RA-97-AM-1165 Final Report – Ver. 1.0 (June 2000) Page. 111
graphical functions are designed to represent that judgement process, and might therefore bedetermined within acceptable limits by interviews with managers themselves. This is certainly withinthe spirit of system dynamics modelling as introduced by its father [Forrester, 1961].
Equally, the model represents a particular view of how the IM business might operate, yet in anygiven case it may be that the business is structured quite differently. In such cases some redesign ofthe model would be needed. This is not necessarily a problem, for the modelling software in whichthe TRIP prototype has been built is flexible and designed to facilitate redesign and editing. It doesmean however that the application of TRIP is not simply a matter of calibrating a model: it involvesmore careful analysis of how a business actually operates, and the skills to express this analytically.
Finally the model can fit within the aims foreseen in the EC directive proposal (1998) forsupporting business plans, analysing the capacity allocation on longer than annual periods and makeassessment of the so-called framework agreements between IM and train operators.
In summary, we do claim that the exercise has been successful, to the point where it justifies furtherdevelopment to bring it to the level of being a commercially viable consultancy tool.
7.6. Bibliography
1. Coyle, R.G. 1996. System Dynamics Modelling: A Practical Approach. Chapman and Hall:London.
2. Forrester, J.W. 1961. Industrial Dynamics. Portland, OR: Productivity Press.3. Gottschalk P. 1982. A system dynamics model for long range planning in a railroad. European
Journal of Operational research. (14) 1982: 156-162.4. High Performance Systems Inc.,1996.Technical Documentation ITHINK Analyst. Hanover.
EuROPE-TRIP Final Report
Contract RA-97-AM-1165 Final Report – Ver. 1.0 (June 2000) Page. 112
8. TRIP AND THE PROPOSED EUROPEAN DIRECTIVE ONRAIL INFRASTRUCTURE ACCESS AND CHARGING
Prior to the completion of the TRIP project, the European Commission presented a proposal for anew directive regarding the allocation of railway infrastructure capacity and the levying of chargesfor the use of railway infrastructure and safety certification, COM(1998) 480 final –98/0267(SYN).This section contains a review of the pertinent issues and comments on the relationship betweenthis document content and the TRIP study.First we give an overview of the proposal’s principles, then we provide more specific comments foreach interested Article and links to TRIP; this is organised in two sub-sections: InfrastructureCharges and Capacity Allocation.
8.1. The principles of the EU proposal
The proposal underlines the importance of correct line capacity determination for setting upappropriate capacity-allocation and charging schemes in consideration of the:- the various levels of current and foreseen utilisation of railway lines;- the impact of the line utilisation and related charging regime on the more general economical
issues of access-to-infrastructure.In particular the proposal states in advance among others that:
1. the capacity allocation schemes should encourage railway infrastructure manager (IM) tooptimise use of their infrastructure for society as a whole;
2. railway undertakings12 should receive clear and consistent signals from capacity-allocationschemes which lead to make rational decisions; furthermore railway undertakings should haveaccess to information about the constraints within the system to seek to optimise their capacityrequests;
3. capacity-allocation and charging schemes may need to take account of different original designcharacteristics and preferred users;
4. increasing the speed differential between freight and passenger rolling stock can exacerbate theconflict between these two types of traffic; moreover different users and types of users can havedifferent impact on capacity;
5. capacity-allocation and charging schemes must take account of increasing saturation;
6. different time-frames for planning traffic should be considered, in particular ensuring thatrequests of capacity made at short-notice can be satisfied;
12 This definition is equivalent to Transport Operators (TOC) or Train Operating Companies (TOC) adopted elsewhere.
EuROPE-TRIP Final Report
Contract RA-97-AM-1165 Final Report – Ver. 1.0 (June 2000) Page. 113
7. use of information technology is considered necessary to enhance the speed and responsivenessof the allocation process;
8. examination of the available capacity and methods of enhancing it are required;
9. one should allow flexibility for infrastructure managers to encourage more efficient use of thenetwork, e.g. ability to vary train paths;
10. negotiations for individual train paths could reflect the market value of the access and thecharging scheme should take into account additional and external costs imposed on society.
The aforementioned represent important objectives for addressing the methodological andnormative issues in question.A rapid survey reveals that the TRIP study can give direct contribution to specific points like: 1, 3,4, (mostly) 5, 6 and 8. In particular the methods presented in the project show that:
- the line capacity determination is not an “absolute” solution but is strongly dependent upon thetypes of traffics using the line;
- line capacity optimisation is not a clear cut concept, but is highly dependent upon theinfrastructure manager (or regulator’s) policy and quality of service to be provided;
- the saturation or congestion problem is a factor which can have high impact on line capacityand any reference design point should be also expressed in terms of saturation level;
- quantitative methods must in any case be validated and chosen as rational baseline forsupporting the capacity allocation schemes and providing impartial and transparent informationbetween infrastructure managers and train operators;
- the capacity definition problem implies more service and time-framed “solutions”, e.g. actualand residual capacity, which in turn are related to saturation and expected quality of service.
The main results of TRIP approach are to: consider line as not having “one-point” solution, ratherdifferent answers (according to policy or major optimisation criteria), introduce saturation as animportant analysis factor, and propose quantitative methods to address the problem.It should be recalled that in the companion project TRIS, complementary studies and algorithmshave been developed in the area of access-to-infrastructure, which more specifically focus on someof the above premises, particularly points 2, 7, 9 and (to some extent) 10.
Other extensive TRIP results have been provided (i.e. Market Game Model and Algorithms) formanaging efficiently the charging and access to infrastructure.In particular the questions raised by point 10 are answered by the definition and impact ofsaturation, which can be a direct measure of the market value of the network, or some of its linesections; it was moreover shown how additional (delay) costs increase, which must be included inthe charging mechanism.
EuROPE-TRIP Final Report
Contract RA-97-AM-1165 Final Report – Ver. 1.0 (June 2000) Page. 114
In the following paragraphs we aim to give some more detailed analysis of how the contents of theproposed directive are “paralleled” and can be provided with some methodological solution by theresults of this project. We first address the infrastructure charges and then the capacity allocation.In the following we put in italics the original text of the EC proposal, and point out comments andanswers suggested by our study, with reference to the articles of interest.
8.2. Infrastructure charges
8.2.1. Establishing, determining and collecting charges (Art. 4)
It is in general required that infrastructure managers shall ensure that the charging system is appliedin a way which results in ‘objective, equivalent and non-discriminatory’ charges for differentrailway undertakings that perform services of equivalent nature in a similar part of the market.This formulation allows for the use of congestion charges which will require operators ofsimilar/identical services, running their trains over a certain part of the infrastructure, to paydifferent prices. The reason is that price differentiation would be explained by differences of trafficload relative to capacity over the day and geographical zone (line sections) of the networks.The Line Capacity study of TRIP helps to define the congestion levels, as outlined in the aftermathtoo.
It is also stated that the IM shall respect ‘the commercial confidentiality of information providedto it by authorised applicants.’ The auction process proposed in TRIP would require that thestanding high bid(s) and bidder(s) is/are revealed. It is not clear whether this would be in conflictwith the above statement.However, if true market value principles are to be applied, one possible answer would be that, oncethe preliminary allocation work has been carried out (e.g. first timetable draft and “gross” pathvalues determined), one could make public the access requests to the all (or interested) trainoperators, in order to reach some further agreement about the timetable and make some chargingrefinements. In particular the interested parties may be the operators whose path requests interferewith each other.
8.2.2. Infrastructure costs and accounts (Art.6)
The infrastructure manager shall (…) at least balance income from infrastructure charges on onehand (…) and expenditures on the other.
It is therefore clear the importance to relate costs of using infrastructure, as illustrated in this study,to the charging levels. Besides congestion, different line sections can have different costs, aspointed out in our case studies, and this should be taken into account.Cost analysis per line section should also point out the technological differences, for which the IMshould be given incentive to reduce the costs and make enhancements. This can be also importantfor assessing all the European through corridor standards and pinpoint local improvements.
The ‘node’ or large station charging requires a separate analysis and specific assessment of jointcost allocation.
EuROPE-TRIP Final Report
Contract RA-97-AM-1165 Final Report – Ver. 1.0 (June 2000) Page. 115
Cost reporting would require to follow standard principles and methods. In addition charging levelsshould be harmonised throughout Europe, particularly for operators undertaking internationalservices, in order to guarantee efficiency and avoid economic diversities or cross servicesubsidisation (e.g. in-house savings and predatory practices in foreign networks).
8.2.3. Principles of Charging (Art. 8)
A basic proposition is that the infrastructure charge for the use of railway infrastructure shall be setat the cost that is directly incurred as a result of the operation of the train, what typically is referredto as the marginal cost of track use.The IM shall also include in the infrastructure charge a sum which reflects the scarcity ofcapacity. This charge shall only be levied on identifiable segments of the infrastructure which aresubject to capacity constraints.These principles are completely in line with the results provided in TRIP. See for instance the unitcost trend with increasing number of trains running on the line, and again the congestion theoreticaland experimental curves.
It can be noted that standard economic theory holds scarcity charges to be an inherent part of anysystem which shall work in order to further economic efficiency (see also Art.18).The methods proposed in our study about rational cost allocation can be also very supportive inthis case.
8.2.4. Exceptions to charging principles (Art. 9)
It is said that Member States should seek to ensure that any service which is able to pay at least thecost which it gives rise to is not prevented by the charging regime from utilising infrastructurecapacity. This is, in a new version, a confirmation of the commitment to marginal cost pricing inorder to enhance efficiency.It is also remarked that charges may be increased and modulated through negotiation in relationto the elasticity of demand for different services or types of services.This is also taken into account in the economic methods proposed in our study.
Please notice that the document makes also reference to the network element “length” which is notcompletely defined, i.e. does this imply “track” or “route” length ?
8.3. Capacity allocation
8.3.1. Co-ordinated and Capacity-constrained infrastructure (Art.2)
According to the proposal:
EuROPE-TRIP Final Report
Contract RA-97-AM-1165 Final Report – Ver. 1.0 (June 2000) Page. 116
‘Capacity-constrained’ infrastructure means a section of infrastructure for which demand forcapacity cannot be fully satisfied even after coordination of the different request for capacity.
‘Coordination’ means the process through which the allocation body and authorised applicantswill attempt to resolve situations in which there are conflicting applications for infrastructurecapacity.
TRIP attempts to define these two different levels of infrastructure usage, by providing a classicalcongestion curve and defining three utilisation level of capacity - i.e. normal, saturated, congested– according to the number of trains running on the line and the average flexing of their paths;that is how much a train path is “flexed” (reducing its average commercial speed) owing to trainconflict resolution.
One can work out even more this concept, and arrive at an operational yet simple definition ofcapacity-constrained and co-ordinated infrastructure. Nevertheless one should also define therelative train priorities when designing or making simulations of the congestion curve.
In TRIP we have also (implicitly) defined a co-ordinated infrastructure as ‘the one for which ascheduling algorithm achieves the maximum capacity, subject to given timetable planningstandards’. These standards are defined as maximum values allowed for:- shift: departure deviations (minutes) from the applicant’ requested time;- stretch (same as flexing): decrease average path speed in respect to nominal or theoretical speed
(as if the train was alone on the line).These concept were first introduced in TRIS project and implemented in TCM (Traffic CapacityManagement).
8.3.2. The network statement (Art.3)
The infrastructure manager (…) shall publish a network statement. (This) shall set out theinfrastructure which is available to railway undertakings (…with) a section setting out capacityallocation criteria and rules.
The network statement could contain a section stating the theoretical capacity of the railway linesunder the assumed conditions, i.e. types of traffic and their mix. The methodology for determiningthe line capacity could be outlined as purely indicative (not contractual) information and some trainpathing standards could be provided. These can be generally used by the infrastructure manager tomake preliminary design; one standard may impose for instance that “a time interval of no less than‘x’ minutes shall elapse between two trains departures”.This can be used for instance to allow overtaking at a station. In addition one might indicate themethod used for drafting preliminary allocation of the railway line, like using simulators orscheduling techniques implemented by state-of-the-art algorithms.
Based on historical traffic, e.g. last year working timetable, the network statement might indicatethe residual capacity, e.g. for some kind of traffic, which is available by section and time window.
EuROPE-TRIP Final Report
Contract RA-97-AM-1165 Final Report – Ver. 1.0 (June 2000) Page. 117
This could give the ‘authorised applicants’ some indication of preliminary network availability asguideline for making their own planning before submitting formal requests; this could also provideindication about the charging scheme and access fee levels.
It is questionable whether the infrastructure manager is ready to disseminate this kind ofinformation (like “timetable standards”) which is part of his planning expertise. Neverthelessinformation about the saturation level of the line should be given, i.e. ‘capacity-constrained’ or
Moreover the Network statement might contain the timetable parameters or tolerances (i.e. shiftand stretch) as defined in the above paragraph.
8.3.3. Principles of charging (Art.8)
The infrastructure manager shall include in the infrastructure charge a sum which reflects thescarcity of capacity.
The infrastructure charge may be modified by a charge to take account of the cost of the externaleffects arising from the operation of the train.
In the absence of any comparable level of charging of external costs in other competing modes oftransport, any such charge shall result in no overall change in revenue to the infrastructuremanager.
This charging scheme is based on congestion pricing principles: it can be put in practice accordingto the values taken by the capacity saturation curve introduced in the TRIP study and obtained bysimulation tests.
The charging scheme could take into account the effect of the additional (marginal) train added tothe schedule, which causes flexing to other trains. This could be considered as an incremental timepenalty and hence be translated into cost differential for charging the additional train access.However, since all path requests are received at the same time and should be treated equally, ifthere are no other priorities, the congestion charging should be treated as an incremental averageaccess fee.Moreover, if traffic types are sensibly different (i.e. freight and passenger, low and high speedtrains), the congestion charging could be also different according to train class and take intoaccount specific priorities. These could also be justified by the different characteristics (speed) ofthe rolling stocks and the impact they have on the growth of the congestion curve.
Finally the ‘no overall extra-revenue principle’ can take advantage from the uneven spreading oftraffic and congestion levels over the railway line, in different zones and time windows. That is themore capacity constrained zones should be charged more, and less the “empty” zones, in order toattract trains and unload the more congested infrastructure.This pricing scheme can be paralleled to some kind of yield management for the railwayinfrastructure.
EuROPE-TRIP Final Report
Contract RA-97-AM-1165 Final Report – Ver. 1.0 (June 2000) Page. 118
8.3.4. Performance scheme (Art.12)
Infrastructure charging scheme should encourage railway undertakings and the infrastructuremanager to minimise disruption and improve the performance of the railway network.
As pointed out in the proposal, this should provide for a penalty/reward scheme according to theinfrastructure or transport operator performance.
However one should consider that the more congested zones, the more liable to disruptions andoperational delays. Therefore the performance scheme should also take into account the disruptionrisk and be different according to capacity utilisation.This principle could be accepted among the network statement rulings.
8.3.5. Reservation charges (Art.13)
Where all requests for capacity can be satisfied without coordination, the charge shall, as amaximum, be no greater than the costs of providing the path.
Where coordination is required, the charge shall, as a maximum, reflect the value of the capacityrequested.This essentially complements the above principles of charging. Nevertheless, in order to providesome further incentive for efficient use of capacity, we propose that some flexible mechanismscould be considered for managing reservation charges, according to ‘dynamic concepts’. That isprovide a time limit within which a reserved path should be confirmed or cancelled, and in the lattercase made available for open short-notice or spot market scheduling.
8.3.6. Capacity rights (Art. 14)
It establishes that, once allocated to an applicant, capacity may not be transferred to anotherundertaking or service. This prevents a second-hand type of market for ‘slots’ of the type used atfour major US airports (cf. Starkie 1994). This article may impede efficiency in allocation ofcapacity.
Except for the efficiency objective, the IM is, amongst other things, to consider the followingfactors when allocation principles are determined: promotion of competitiveness and allowing forlong range planning to the train operators.This means that additional allocation mechanisms should be proposed, like the one referred to inthe previous point (path re-allocability by the IM) or long-term preliminary auctions.
8.3.7. Network statement – capacity allocation (Art.17)
EuROPE-TRIP Final Report
Contract RA-97-AM-1165 Final Report – Ver. 1.0 (June 2000) Page. 119
This (network) statement shall set out the general capacity characteristics of the infrastructurewhich is available to railway undertakings and any restrictions relating to its use, including likelycapacity requirements for maintenance.The statement shall specify (…) the procedures which shall be followed and criteria used whereinfrastructure is capacity constrained.
This complements the comments given for Art.3. The infrastructure manager can indicate thetechnical solutions and other rulings where cases of capacity constraints arise. These usuallyinclude:- unloading the more peak traffic zones by shifting trains (that is to postpone or anticipate train
departures to less saturated intervals);- flexing trains, i.e. imposing the same (reduced) speed in order to create regular train “flights”
(this usually sacrifices higher speed trains);- forbidding train passing which cannot achieve a threshold speed;- accept more delay risks and lower than quality standards operations (that is “relaxed” standards
for the benefit of more trains allocated).
8.3.8. Principles of allocation (Art 18)
This establishes that the IM indeed shall seek to allocate capacity in order to enhance efficiency and
maximisation of the flexibility available to the infrastructure managers.
It is obvious that these parts of the EC draft fit well with the research approaches proposalpresented here.It could even be hypothesised that the ‘only’ way to enhance efficiency in capacity constrainedsituations is by way of sophisticated charging systems. One minor problem may be that it is difficultto establish, before the timetabling process is initiated precisely, which sections are to be congestedwhen all demand has been submitted to the IM. This will, however, be made obvious as soon as theauctioning process has started. In particular, no bidder could claim that capacity shortages emergeas a surprise, considering the (probable) length of the process.
Please note also how well fits also the ‘flexibility’ requirement, i.e. making track allocation withinthe agreed tolerances, for adjusting the paths in the global diagram, by means of concepts likeshifting and stretching (flexing), e.g. according to TCM and FLOU algorithms.
8.3.9. Framework agreements (Art.20)
The framework agreement shall not specify a train path in detail.
The proposal allows for the infrastructure manager to enter an allocation agreement with atransport operator over a longer period than one timetable (year). The principle of not specifying atrain path in detail allows for a more general concept for infrastructure capacity management,
EuROPE-TRIP Final Report
Contract RA-97-AM-1165 Final Report – Ver. 1.0 (June 2000) Page. 120
which includes long term planning. To assess this process higher scheduling methods rather thandetail timetable design tools are required, as those outlined in TRIP and TRIS projects.
While the agreement should not specify a train path in detail, it should seek to meet the legitimatecommercial needs of the applicant.Methods for allocating capacity ‘ at large’ could therefore be used by the sample principles of the‘one year’ timetable, but in more relaxed or preliminary form.
This paragraph obviously opens up for the possibility of some loose form of long-term contracts.An extension of the auction approach would be to think of it in terms of option contracts. The ideawould then be to provide operators with some reasonable certainty before making extensiveinvestment in rolling stock with life-times much longer than the one-year contracts, and for whichsecond-hand markets are underdeveloped. The draft does, however, not provide further substancewith respect to the precise design of the contracts: In which way could, for instance, an operator beascertained a stable future access to tracks without pre-empting the whole allocation process offuture years? Would it be possible to make the operator pay a (small) price today which wouldprovide an un-proportionate extra weight in future allocation processes?Moreover framework agreements should not allow the ‘incumbents’ to acquire all the networkcapacity and some slots should be left for new entrants.
8.3.10. Scheduling (Art.23).
Considering the on-line, open-for-all bidding process that we have suggested, interested parties willin reality get more than the information made compulsory by the draft. They will, in fact, becomean ‘integral part’ of the scheduling process.This also means better management links between the supply and demand sides of the schedulingprocess, carried out by information technology.A computer architecture similar to the one tested in TRIP was developed in TRIS-TCM.
8.3.11. Coordination process (Art.24)
When a situation requiring coordination arises, the infrastructure manager shall have the right,within reasonable limits, to propose capacity that differs from that which was required.The principles governing the coordination process shall be defined in the network statement.
Actions on how to modify the capacity allocation in order to fit the more number of requestedpaths have been already outlined. These can be supported by appropriate algorithms. See alsocomments for Articles 3 and 17 above.
8.3.12. Scarcity of capacity (Art.25)
EuROPE-TRIP Final Report
Contract RA-97-AM-1165 Final Report – Ver. 1.0 (June 2000) Page. 121
When an infrastructure element is declared capacity constrained…) the infrastructure managershall carry out a capacity analysis (…) the infrastructure manager may in addition employpriority criteria to allocate capacity.
Actions already defined for Article 17 can be applied. In addition specific services can be givenallocation priority and others excluded. In fact the proposal makes reference to services being moreimportant to society.This for instance can happen where only regional trains are allocated in metropolitan nodes andpeak commuting hours.This simply means to increase the priority (value) of the given paths in our scheduling algorithmsand obtain rapid solution to the problem.
8.3.13. Short-notice requests (Art.26)
Infrastructure managers shall where necessary undertake an evaluation of the need for sparecapacity
The directive draft has addressed this very important issue of railway capacity, stressing therequirement for managing short-notice requests and evaluating spare capacity.TRIP has particularly focused on this subject and a specific algorithm has been implemented, e.g.FLOU (Flow Line Optimal Utilisation).
This can also apply to co-ordinated infrastructure; however, in case of “capacity constrained”infrastructure, less realistic seems the requirement for the IM to keep available spare capacitywithin the final scheduled timetable to enable response to short-notice requests.
The article also targets the issue of what to do if, after co-ordination of the requested paths andconsultation with applicants, it is not possible to adequately satisfy requests for capacity. Theinfrastructure manager must then immediately declare that element of infrastructure on which thishas occurred to be capacity constrained. The IM must then carry out a capacity analysis (cf. Article28 below) and, in these situations, the IM may employ additional priority criteria to allocatecapacity, inter alia taking into account the importance of a service to society. Again, the auctionmodel and scheduling mechanisms are nothing but a precise structure for how this can be handled,in reality.
The IM shall ensure that at any time it is able to respond to short notice requests for individual trainpaths, in no more than a few days, with an average response time less than 2 days (Article 26,‘Short notice requests’). To this end, the IM shall where necessary undertake an evaluation of theneed for spare capacity to be kept available within the final scheduled timetable to enable them torapidly respond to foreseeable short notice requests for capacity. Information on spare capacityshall be made available in the Network statement and to all authorised applicants who may wish touse this capacity.
There is no problem, for the same aforementioned mechanism, to meet this requirement. Indeed, allparticipants in the scheduling process are made aware of what spare capacity exists. A problem is,
EuROPE-TRIP Final Report
Contract RA-97-AM-1165 Final Report – Ver. 1.0 (June 2000) Page. 122
however, the concept per se. Is it, for instance, sufficient to leave empty room for one train perday?, two trains?, more? For congested parts of the network, should these empty slots be designedfor (high speed) passenger services or for (which type of) freight train? Should spare capacity,when sold, be cheaper or more expensive than capacity booked according to the ‘standard’procedure? If there is unused capacity, except for spare capacity corridors under peak hours,should the two be priced equally? While one could think of possible answers, the text leaves muchto the implementation phase, which may create a problem if IMs from different countries applydifferent rules.
8.3.14. Specialised infrastructure (Art.27)
Where there are suitable alternative routes the infrastructure manager may (…) designateparticular infrastructure for use by specified types of traffic.
This also means that priority traffic can be allocated to specialised infrastructure (namely high speedlines).According to this one should regard the capacity issue as a “network” more than a “line” problem.To this aim, routing algorithms, in addition to only scheduling models, should be used. Thecapacity of a network model was however out of scope of the present study and can be part offuture exploitation of TRIP (e.g. based on extension of FLOU algorithm).In addition the case of specialised infrastructure can be pointed out in railway metropolitan nodeswhere some parallel lines or routing alternatives are available and specialised traffic can be fedthrough (e.g. either high-speed or freight trains).
8.3.15. Capacity analysis (Art.28)
The objective of a capacity analysis (…) is to propose methods of enabling additional requests tobe satisfied.
The argument has been already addressed in previous paragraphs. See e.g. comments for Art. 3 and17.The methods surveyed and developed in TRIP can also be used for this kind of analysis, e.g.
- scheduling algorithms, like TCM, FLOU;
- simulation.Traditional analytic methods are less appropriate to reach the level of detail needed for this kind ofanalysis.The capacity analysis (cf. also what is said for Article 25 above) shall determine the restrictions oncapacity which prevent requests for capacity from being adequately met. The reasons for theconstraints, and what measures that might be taken in the short and medium term to ease them shallbe established. The analysis will consider the infrastructure, operating procedures, nature of thedifferent services operating and combined effect of all these factors on the capacity. The types ofmeasures which might be proposed could include e.g. re-routing of services, re-timing services,speed alterations and infrastructure improvements.
EuROPE-TRIP Final Report
Contract RA-97-AM-1165 Final Report – Ver. 1.0 (June 2000) Page. 123
Our processes include the measures enumerated in the last sentence as an integral part of thescheduling procedure.For capacity constrained infrastructure as defined above, the IM is in Article 30 (‘Use of trainpaths’) required the surrender of a train path which, over a period of at least one month, has beenused on less than 75% of the occasions for which it has been booked. This seems to be a clever wayof delimiting the risks of predatory behaviour of major actors.
Furthermore, in order to follow the efficiency and flexibility principles, the ‘operational’ (say day-to-day) access to infrastructure could allow for practical mechanisms to help the IM to bettermanage the network and allocate paths.
We have supposed for instance a ruling for ‘short-notice confirmation’ of paths which can be partof a general (annual) contract. According to this, if the path would not be confirmed within anagreed time-window, the IM would be free to assign it to other operators. This time window couldbe the same as the one proposed for short notice scheduling.
This would also allow for better short-notice requests (Art.26) and contingency management (e.g.trains delayed on long-distance corridors); particularly in case of constrained infrastructure.
We propose that this type of allocation, subject to short-notice path confirmation, should also beconsidered for evaluation and inclusion in a final amendment of the EC draft. The operator whogives the path back to IM might/should incur in loss of reservation fee.
8.3.16. Capacity enhancement plan (Art.29)
The document requires a capacity enhancement plan be developed in case of relevant capacityconstrained infrastructure.
This study can be supported among others by tools like the business plan demonstrator researchedin TRIP.
8.3.17. Infrastructure capacity for maintenance (Art.31)
The proposal takes account of the requirements for maintenance in the path allocation process. Thisregards “free traffic” corridors (possessions) which cannot be allocated or reduced traffic cases,where for instance a double track line can be only “half possessed” (one track available).
In some fortunate situations, where other lines are present, alternative routes or re-routings arepossible.
EuROPE-TRIP Final Report
Contract RA-97-AM-1165 Final Report – Ver. 1.0 (June 2000) Page. 124
Furthermore, in order to plan maintenance works at higher efficiency levels, possession hoursshould be held as long as possible. This may suggest to plan different traffic volumes over the weekand reserve some days (nights) in the week for maintenance purposes.The maintenance planning over a network is also a complex exercise that has to take into accountmulti-year periods and various contingencies.The presence of maintenance possessions over a long distance (e.g. international) corridorintroduces another difficulty for assessing the line capacity and taking parallel account of this majorconstraint. Scheduling algorithms like TCM and FLOU can take also account of this question, byreducing the available infrastructure by the given amount of capacity cut. However some alternativestudies should be carried out in order to simulate the effect of varying the time windows allocatedto possession.
In case of trans-European lines, one should verify that situations of overlapping maintenance arenot bottlenecks for the overall corridor and compute the spare capacity given this added constraint.Finally, in case of trans-border lines, closer coordination is generally required for maintenanceplanning.
Maintenance can also impact on standard capacity by imposing trains certain slow-downs on linesections where works are underway. If not well co-ordinated, these scheduled delays in one point(country) of the corridor can flex the path of some trains so that they cannot respect any more thescheduled time (e.g. meet with another possession already started). Therefore infrastructurecapacity should be accurately verified over one or more networks both for train running operationsand maintenance constraints.In any case the document stresses that “infrastructure managers shall collaborate to achieve theefficient operation of train services which cross more than one network” (Art.4).
EuROPE-TRIP Final Report
Contract RA-97-AM-1165 Final Report – Ver. 1.0 (June 2000) Page. 125
8.4. Conclusions
Several points of contact are found between the principles and policy objectives set down in thementioned proposal for directive and the results of the study carried out in TRIP.The project has identified specific methods and tools (some originally developed) which can beimplemented and further exploited to support the requirements set forth in the proposal, namely thenetwork statement and other questions regarding the rail infrastructure capacity.
It has been outlined how the residual capacity and short-notice capacity management are twointerrelated problems; and these can be addressed by appropriate methods.Furthermore, the link between the charging principles and capacity utilisation have been analysed,essentially based on marginal and peak-load pricing.In addition, the concept of saturation levels introduced in the project is directly linked to thedefinition of co-ordination and capacity constrained infrastructure found in the proposal.
Other principles and procedural behaviours for capacity allocation in the Union can be implementedusing demonstrators already developed with the EU-RDT programmes, based on information andtelematic technology; these particularly are the pilots described in TRIP deliverable “MarketAlgorithms” and the Traffic Capacity Management (TCM) model developed within TRIS(Teleconferencing Railaways Information System).
Finally, it is evident from the considerations above outlined that “infrastructure managers shallcollaborate to achieve the efficient operation of train services which cross more than oneinfrastructure network”.
EuROPE-TRIP Final Report
Contract RA-97-AM-1165 Final Report – Ver. 1.0 (June 2000) Page. 126
9. CONCLUSIONS OF THE REPORT
TRIP has addressed several issues which can put in a rational framework the policies required forinfrastructure management and provide recommendations for decision making in the rail sector.The amplitude of subjects treated in TRIP is likely representing one of the more supporting studiesin quantitative modelling and analysis on the subjects like:
- line capacity analysis
- cost of using rail infrastructure
- access to infrastructure, and
- business planning for infrastructure management.
For line capacity a unified methodology has been proposed, including analytic models, schedulingand simulation methods. In particular:- the potentials of state-of-the-art optimisers have been outlined for assessing line capacity on
long distance corridors and giving good start points to simulators for final validation;- the importance of congestion has been introduced as regulating factor for access to
infrastructure in various line conditions, and- feasibility to determine operational levels of quality of service has been suggested using the
same aforementioned scheduling tools.These results can support the normative definitions of line accessibility put forward in the proposalof a new directive, which for instance introduces the concept of “co-ordinated” and “capacity
Cost of using rail infrastructure has been put in practical perspective through a real case study of aEuropean corridor. The order of magnitude of these costs has been determined, and differencesamong several line sections have been pointed out, which should be taken into consideration whendetermining the current charging systems and setting up incentives for the infrastructure managersto improve their efficiency, and therefore final prices for the rail transport.Practical methods to understand how the marginal costing develops have been presented, which arealso related to the congestion levels. Moreover the requirement for setting up a common Europeanmethodology and implementing some benchmarking analysis has been stressed.
In addition a relatively modern technique for studying the production frontier and the comparativeefficiency of several infrastructure managing units – the so-called Data Envelopment Analysis(DEA) - has been presented.
Methods of making use of the results from economic literature about game theory have beendescribed to address the problems of how to allocate infrastructure costs among different operators(i.e. type of trains) according to their physical characteristics. Nevertheless, more in-depth analysisand calibration is needed, from the engineering point of view, to understand the impacts of differenttrains about the investments and maintenance costs of a commonly used infrastructure.
Within the costs of using infrastructure a study module has focused on the inland intermodalterminals, for their increasing importance in the railway transport chain management. Even in this
EuROPE-TRIP Final Report
Contract RA-97-AM-1165 Final Report – Ver. 1.0 (June 2000) Page. 127
case high capital investments in the infrastructure are required, recommending a more general cost-benefit analysis in providing access to rail transport with fair conditions, which should alsointernalise the external costs of alternative solutions (i.e. by road).
The problem how to rationally represent the structure of access-to-infrastructure, following the EUdirectives, has been given extensive account. Specifically two approaches have been illustrated: ananalytic model and an auction method. The former aims to represent the competitive behaviour ofagents making access to infrastructure, using theoretical modelling, whilst the latter finds its originsin experimental economics. Following some years of research, this novel (in railways) approach hasbeen also demonstrated in laboratory testing.
Finally a business planning model has been developed, aiming to simulate the strategies of theinfrastructure manager and alternatives about access to infrastructure policies.The purpose of this study was therefore to test the feasibility of representing the various micro-worlds of IM and his relations with TOCs, e.g. access to infrastructure with priority trafficsegments, financial ratios and other business trends with a long term perspective (e.g. 10 years).This management model could support the requirement stated by the EC that “business plans shallbe drawn up for infrastructure managers, including their investment and financing programmes”.This model is based on the so-called “System Dynamics”, which is a simulation method well knownin management science and can be easily understood and implemented.Nevertheless, it should be pointed that this work also needs more development and calibration tobecome a real product, while the general structure has been already developed.
Almost all the results from these methods can be related to the capacity allocation and chargingprinciples advocated in the more recently proposed directive (1998).
It can be pointed out that the most of the above studies have been synthesised and collected for thefirst time in one railway oriented project, in view of the new liberalised structure of the rail sector.Moreover all TRIP contents have been paralleled wherever possible with numerical test cases andsoftware implementations, up to demonstrator stage, as usually required in EU-RDT programmes.
Therefore various exploitation possibilities exist which can put at profit the results of the project.However, much co-ordination and willingness to participate in common ventures should beregarded as necessary from the Infrastructure Managers, who should be also ready to identifythemselves as one European network system.
We should also recall that a lot of effort has been devoted in TRIP to become a true Europe-wideinitiative. In particular a co-operation has been undertaken with LIBERAIL, another project in thesame Transport programme, in order to carry out the case studies in different countries. The resultsfrom another project, TRIS, within the Transport Telematics programme, have been specifically putat work (Traffic Capacity Management).
Eventually the TRIP effort should be considered a contribution to develop new “soft” technologiesand, as said in the aforementioned directive proposal, to “adopt any innovative management
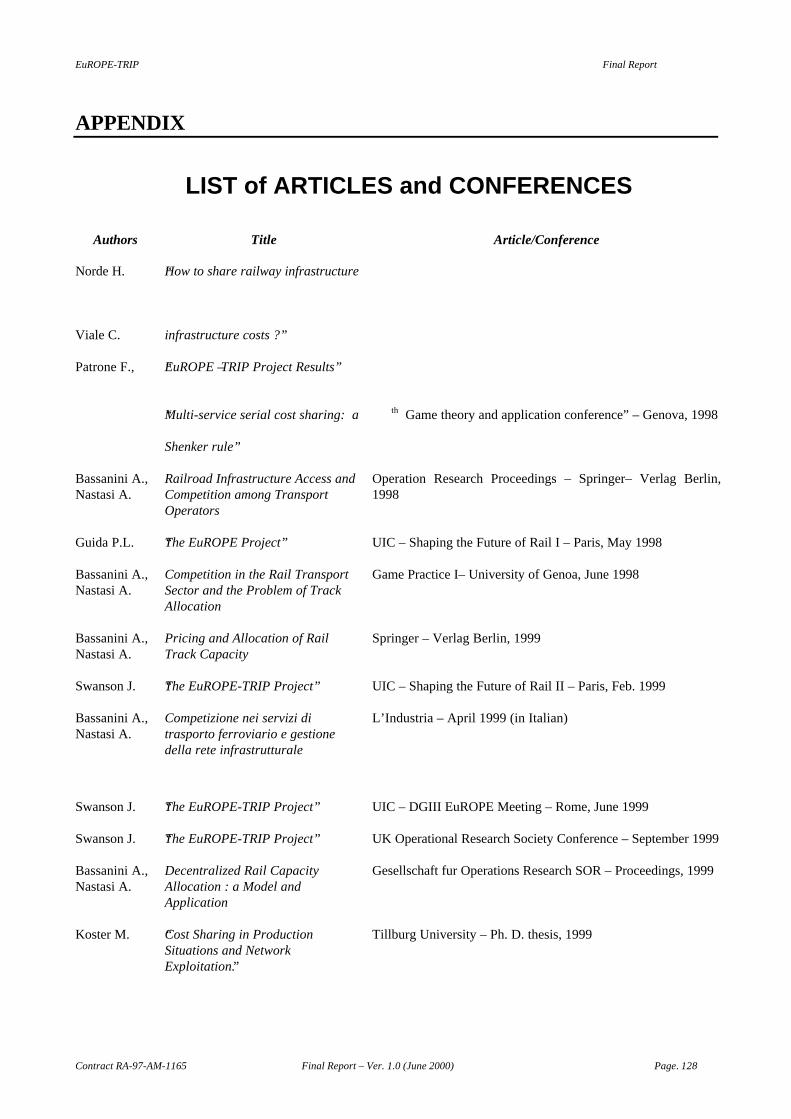
EuROPE-TRIP Final Report
Contract RA-97-AM-1165 Final Report – Ver. 1.0 (June 2000) Page. 128
APPENDIX
LIST of ARTICLES and CONFERENCES
Authors Title Article/Conference
Norde H. “How to share railway infrastructure
Viale C. infrastructure costs ?”
Patrone F., “EuROPE – TRIP Project Results”
“Multi-service serial cost sharing: a
Shenker rule”
th Game theory and application conference” – Genova, 1998
Bassanini A.,Nastasi A.
Railroad Infrastructure Access andCompetition among TransportOperators
Operation Research Proceedings – Springer– Verlag Berlin,1998
Guida P.L. “The EuROPE Project” UIC – Shaping the Future of Rail I – Paris, May 1998
Bassanini A.,Nastasi A.
Competition in the Rail TransportSector and the Problem of TrackAllocation
Game Practice I– University of Genoa, June 1998
Bassanini A.,Nastasi A.
Pricing and Allocation of RailTrack Capacity
Springer – Verlag Berlin, 1999
Swanson J. “The EuROPE-TRIP Project” UIC – Shaping the Future of Rail II – Paris, Feb. 1999
Bassanini A.,Nastasi A.
Competizione nei servizi ditrasporto ferroviario e gestionedella rete infrastrutturale
L’Industria – April 1999 (in Italian)
Swanson J. “The EuROPE-TRIP Project” UIC – DGIII EuROPE Meeting – Rome, June 1999
Swanson J. “The EuROPE-TRIP Project” UK Operational Research Society Conference – September 1999
Bassanini A.,Nastasi A.
Decentralized Rail CapacityAllocation : a Model andApplication
Gesellschaft fur Operations Research SOR – Proceedings, 1999
Koster M. “Cost Sharing in ProductionSituations and NetworkExploitation”.
Tillburg University – Ph. D. thesis, 1999
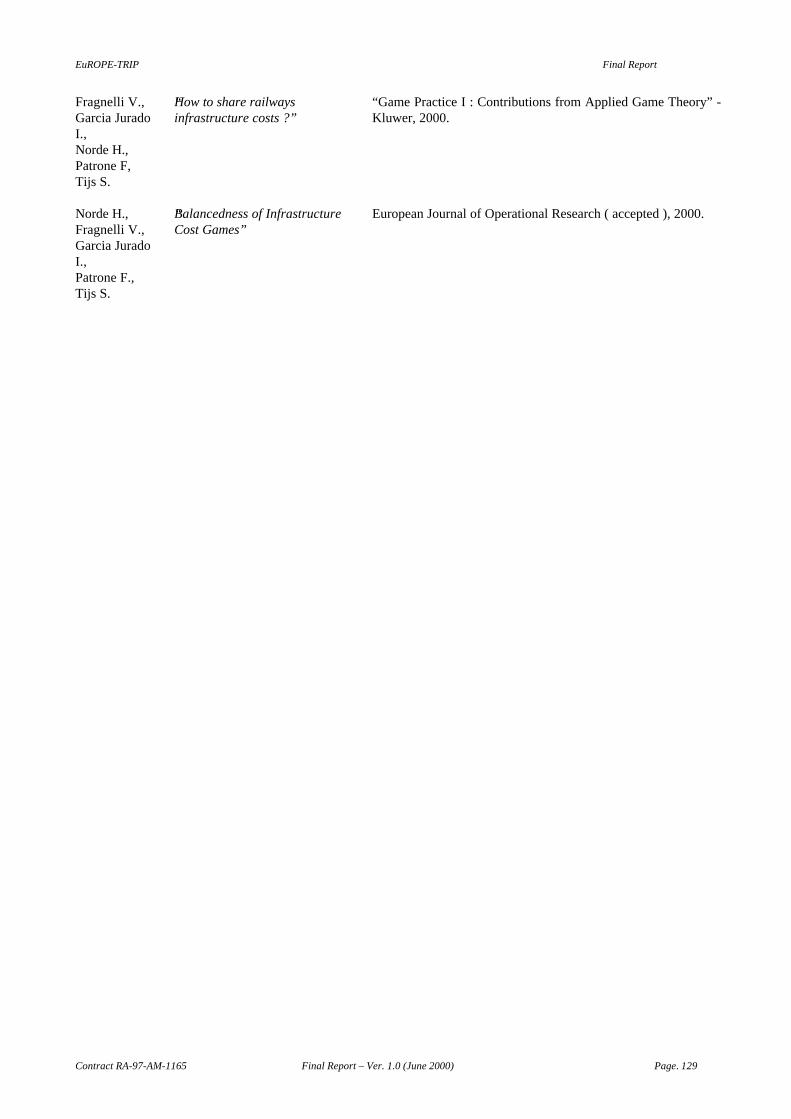
EuROPE-TRIP Final Report
Contract RA-97-AM-1165 Final Report – Ver. 1.0 (June 2000) Page. 129
Fragnelli V.,Garcia JuradoI.,Norde H.,Patrone F,Tijs S.
“How to share railwaysinfrastructure costs ?”
“Game Practice I : Contributions from Applied Game Theory” -Kluwer, 2000.
Norde H.,Fragnelli V.,Garcia JuradoI.,Patrone F.,Tijs S.
“Balancedness of InfrastructureCost Games”
European Journal of Operational Research ( accepted ), 2000.