Embed Size (px)
Citation preview
EUROPEAN VEHICLE MARKET STATISTICS Pocketbook 2016/17
International Council on Clean Transportation EuropeNeue Promenade 610178 Berlin+49 (30) [email protected]
ICC
TE
urop
ean
Veh
icle
Mar
ket
Stat
isti
cs 2
016
/17
1 Introduction 2
2 Number of Vehicles 14
3 Fuel Consumption & CO2 26
4 Technologies 42
5 Key Technical Parameters 52
6 Other Emissions & On-road 68
Annex Remarks on Data Sources 72 List of Figures and Tables 74 References 78 Abbreviations 80 Tables 81
Table of Contents
An electronic version of this Pocketbook including more detailed statistical data is available online: http://eupocketbook.theicct.org
2 3
EUROPEAN VEHICLE MARKET STATISTICS 2016/17
1 INTRODUCTION
The 2016/17 edition of European Vehicle Market Statistics offers a statistical portrait of passenger car, light commercial and heavy-duty vehicle fleets in the European Union (EU) from 2001 to 2015. As in previous editions, the emphasis is on vehicle techno logies, fuel consumption, and emissions of greenhouse gases and other air pollutants.
The following pages give a concise overview of data in subsequent chapters and also summarize the latest regulatory developments in the EU. More comprehensive tables are included in the annex, along with information on sources.
Number of vehiclesAfter declining for several years, new passenger
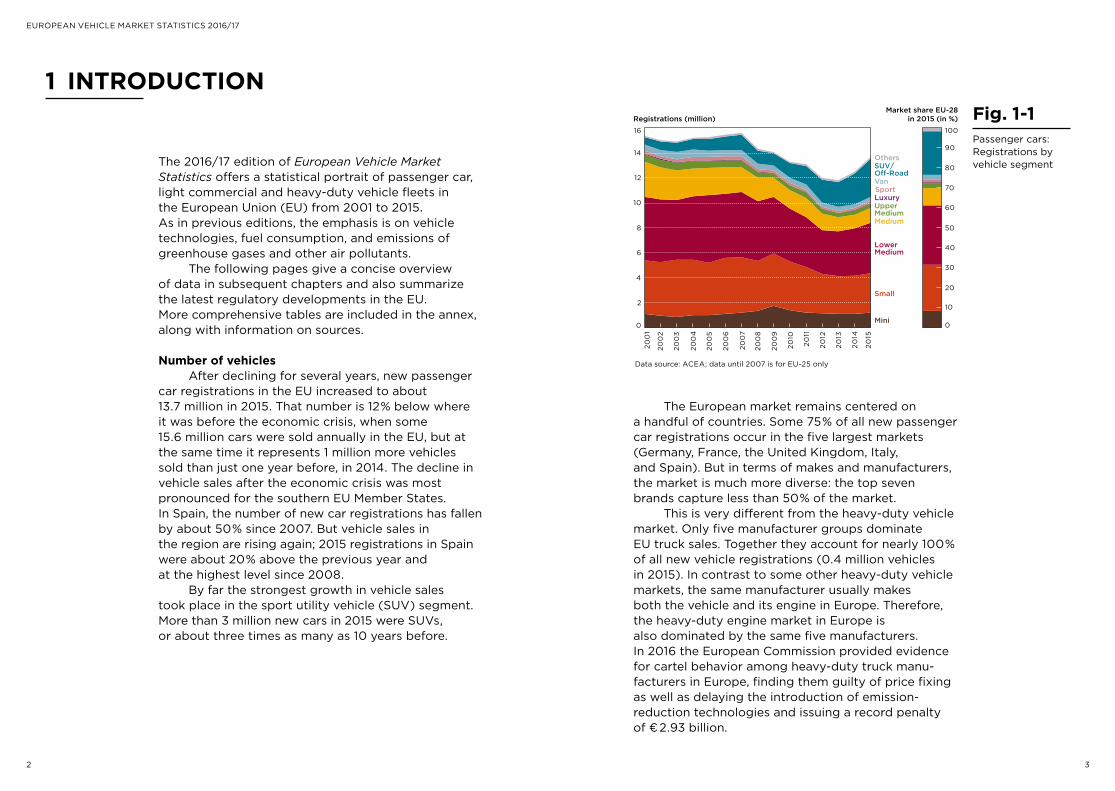
car registrations in the EU increased to about 13.7 million in 2015. That number is 12"% below where it was before the economic crisis, when some 15.6 million cars were sold annually in the EU, but at the same time it represents 1 million more vehicles sold than just one year before, in 2014. The decline in vehicle sales after the economic crisis was most pronounced for the southern EU Member States. In Spain, the number of new car registrations has fallen by about 50"% since 2007. But vehicle sales in the region are rising again; 2015 regis trations in Spain were about 20"% above the previous year and at the highest level since 2008.
By far the strongest growth in vehicle sales took place in the sport utility vehicle (SUV) segment. More than 3 million new cars in 2015 were SUVs, or about three times as many as 10 years before.
Data source: ACEA; data until 2007 is for EU-25 only
Fig. 1-1Passenger cars: Registrations by vehicle segment
The European market remains centered on a handful of countries. Some 75"% of all new passenger car registrations occur in the five largest markets (Germany, France, the United Kingdom, Italy, and Spain). But in terms of makes and manufacturers, the market is much more diverse: the top seven brands capture less than 50"% of the market.
This is very different from the heavy-duty vehicle market. Only five manufacturer groups dominate EU truck sales. Together they account for nearly 100"% of all new vehicle registrations (0.4 million vehicles in 2015). In contrast to some other heavy-duty vehicle markets, the same manufacturer usually makes both the vehicle and its engine in Europe. Therefore, the heavy-duty engine market in Europe is also dominated by the same five manufacturers. In 2016 the European Commission provided evidence for cartel behavior among heavy-duty truck manu-facturers in Europe, finding them guilty of price fixing as well as delaying the introduction of emission- reduction technologies and issuing a record penalty of €$2.93 billion.
0
2
4
6
8
10
12
14
16
Registrations (million) Market share EU-28
in 2015 (in %)
0
10
20
30
40
50
60
70
80
90
100
OthersSUV/Off-Road Van Sport Luxury Upper Medium Medium
Lower Medium
Small
Mini
200
1
200
2
200
3
200
4
200
5
200
6
200
7
200
8
200
9
2010
2011
20
15
2014
2013
2012
4 5
EUROPEAN VEHICLE MARKET STATISTICS 2016/17 1 Introduction
Internationally, total vehicle sales (passenger cars and commercial vehicles) increased at a somewhat slower pace than in 2014. While Turkey, Mexico, South Korea, the EU, India, the United States, and China saw robust growth, sales were flat or declined in Australia, Canada, Malaysia, Japan, Thailand, Indonesia, Brazil, and Russia. Total vehicle sales in Turkey increased by 25"%, while vehicle sales in Russia dropped by 35"% in 2015. Over the past five years much of the growth was concentrated in just two countries, China and the United States, which together accounted for 50"% of global vehicle sales. Growth outside the top 15 markets accelerated: car and truck sales in those smaller markets increased by 3"%, while the average vehicle sales growth rate in the top 15 markets was closer to 2"%. Emerging market economies with very high growth in the past few years – Brazil, Russia, and Thailand – continued to experience declines in sales in 2015.
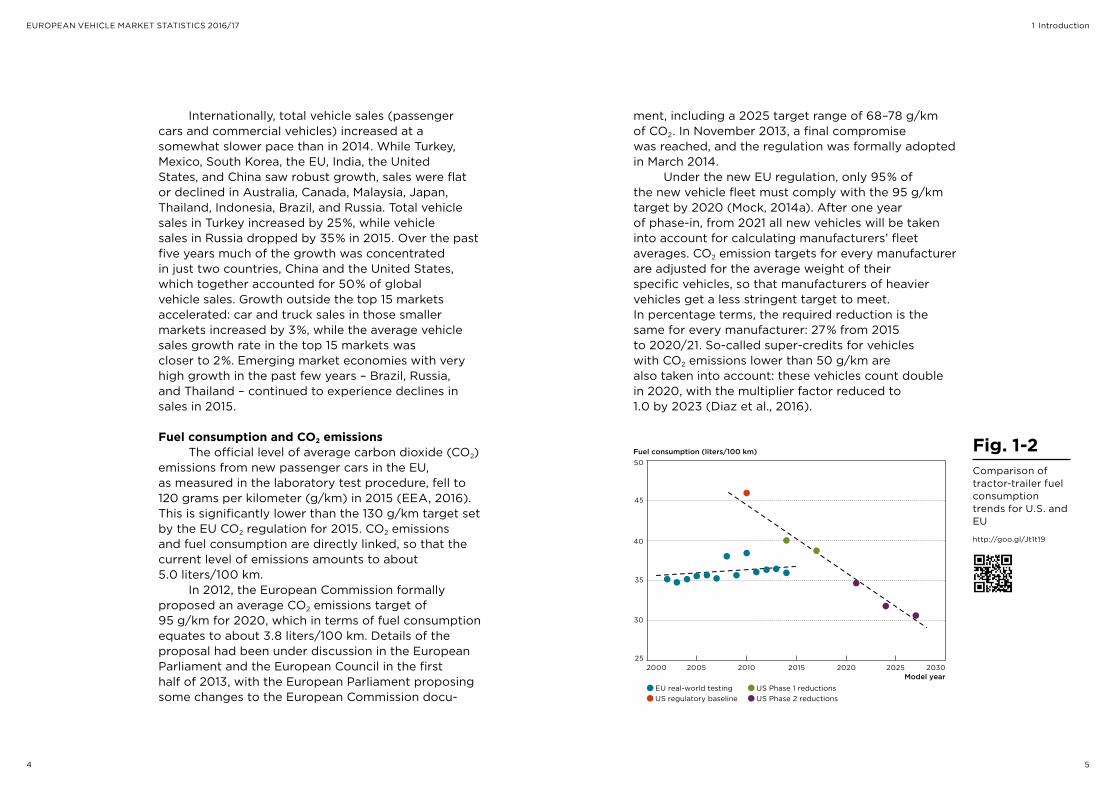
Fuel consumption and CO2 emissionsThe official level of average carbon dioxide (CO2)
emissions from new passenger cars in the EU, as measured in the laboratory test procedure, fell to 120 grams per kilometer (g/km) in 2015 (EEA, 2016). This is significantly lower than the 130 g/km target set by the EU CO2 regulation for 2015. CO2 emissions and fuel consumption are directly linked, so that the current level of emissions amounts to about 5.0 liters/100 km.
In 2012, the European Commission formally proposed an average CO2 emissions target of 95 g/km for 2020, which in terms of fuel consumption equates to about 3.8 liters/100 km. Details of the proposal had been under discussion in the European Parliament and the European Council in the first half of 2013, with the European Parliament proposing some changes to the European Commission docu-
ment, including a 2025 target range of 68–78 g/km of CO2. In November 2013, a final compromise was reached, and the regulation was formally adopted in March 2014.
Under the new EU regulation, only 95"% of the new vehicle fleet must comply with the 95 g/km target by 2020 (Mock, 2014a). After one year of phase-in, from 2021 all new vehicles will be taken into account for calculating manufacturers’ fleet averages. CO2 emission targets for every manufacturer are adjusted for the average weight of their specific vehicles, so that manufacturers of heavier vehicles get a less stringent target to meet. In percentage terms, the required reduction is the same for every manufacturer: 27"% from 2015 to 2020/21. So-called super-credits for vehicles with CO2 emissions lower than 50 g/km are also taken into account: these vehicles count double in 2020, with the multiplier factor reduced to 1.0 by 2023 (Diaz et al., 2016).
Fig. 1-2Comparison of tractor-trailer fuel consumption trends for U.S. and EU
http://goo.gl/Jt1t19
Model year2000 2005 2010 2015 2020 2025 2030
25
30
35
40
45
50Fuel consumption (liters/100 km)
US regulatory baseline US Phase 2 reductions US Phase 1 reductions EU real-world testing
6 7
EUROPEAN VEHICLE MARKET STATISTICS 2016/17 1 Introduction
Light commercial vehicles (i."e., commercial vehicles below 3.5 metric tons gross vehicle weight) have their own CO2 emission standard. The 2017 target requires an average fleet emission level of 175 g/km – a level that was reached in 2013. A new regulation setting a 2020 target of 147 g/km was adopted in February 2014. As for passenger cars, vehicle weight is taken into account when calculating manufacturer-specific CO2 targets.
For heavy-duty vehicles, the on-road fuel consumption (and thereby also CO2 emission) level of new tractor-trailer trucks in the EU has re mained fairly constant since the early 2000s (Muncrief and Sharpe, 2015). Over the last few years, the Euro-pean Commission has developed VECTO, a com puter simulation tool to determine CO2 emission levels of new heavy-duty vehicles. The Commission expects that this new tool will provide greater transparency and better comparability for CO2 emis-sion performance and fuel consumption of trucks and buses. The EU is the only major truck market in the world without a CO2 emission regulation (Muncrief, 2014). However, as part of its communi ca-tion on de-carbonizing the road vehicle sector, the European Commission announced in July 2016 to work towards the introduction of mandatory efficiency standards for new heavy-duty vehicles, with the objective of “curbing emissions well before 2030” (EC, 2016).
TechnologiesThe vast majority of Europe’s new cars remain
powered by gasoline or diesel motors. Diesel cars account for 52"% of all new registrations in 2015. This is despite the recent “Dieselgate” scandal and differs notably from other major car markets. The U.S., Chinese, and Japanese markets are all dominated by gasoline-powered cars, with diesels playing almost no role. One market of note that has embraced diesel technology, however, is India, where the diesel share was around 50"% in 2015.
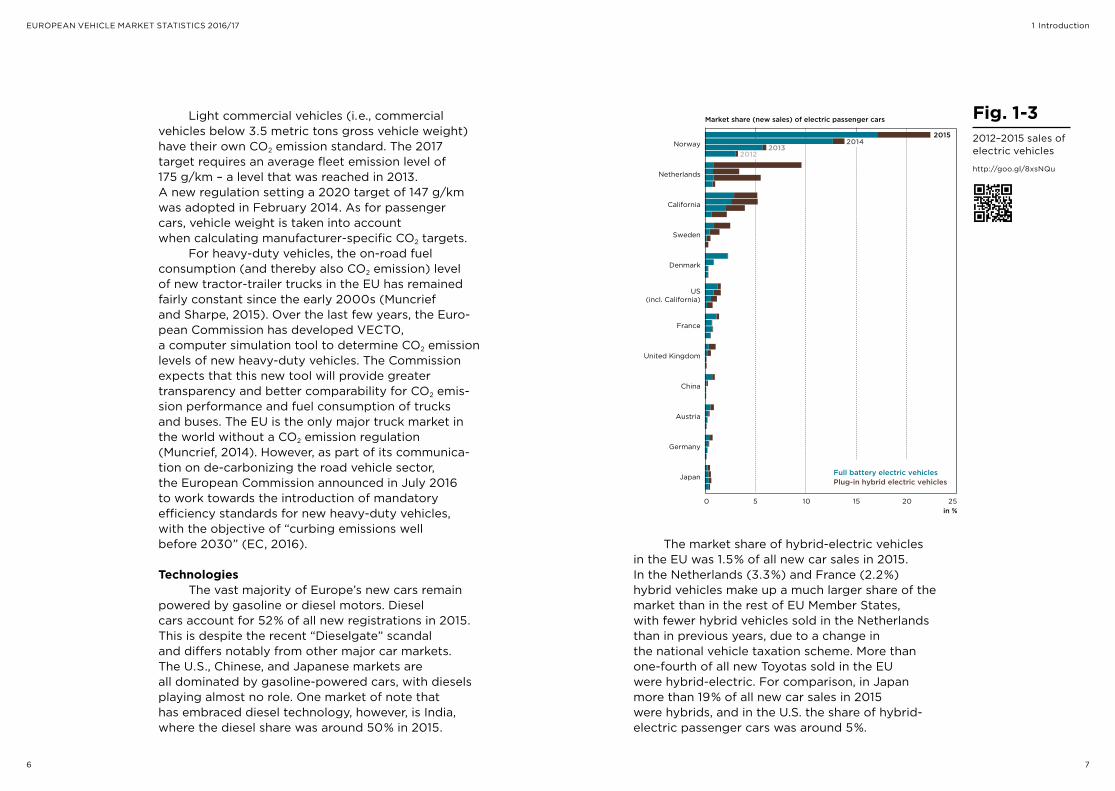
The market share of hybrid-electric vehicles in the EU was 1.5"% of all new car sales in 2015. In the Netherlands (3.3"%) and France (2.2"%) hybrid vehicles make up a much larger share of the market than in the rest of EU Member States, with fewer hybrid vehicles sold in the Netherlands than in previous years, due to a change in the national vehicle taxation scheme. More than one-fourth of all new Toyotas sold in the EU were hybrid-electric. For comparison, in Japan more than 19"% of all new car sales in 2015 were hybrids, and in the U.S. the share of hybrid- electric passenger cars was around 5"%.
Fig. 1-32012–2015 sales of electric vehicles
http://goo.gl/8xsNQu
Full battery electric vehicles Plug-in hybrid electric vehicles
20152014
20132012
Japan
Germany
Austria
China
United Kingdom
France
US(incl. California)
Denmark
Sweden
California
Netherlands
Norway
0 5 10 15 20 25in %
Market share (new sales) of electric passenger cars
8 9
EUROPEAN VEHICLE MARKET STATISTICS 2016/17 1 Introduction
Plug-in hybrid (PHEV) and battery-electric vehicles (BEV) make up about 1.1"% of vehicle registra-tions in the EU, with notable differences among the Member States. In the Netherlands, 8.8"% of all new sales were PHEVs in 2015, and another 0.9"% BEVs. This is more than twice as many electric vehicles as in the previous year. One underlying reason for the relatively high sales is the Netherlands’ CO2-based vehicle taxation scheme, which features generous rebates for vehicles that emit less than 50 g/km of CO2. Although they are not members of the EU, we also include data on Norway, Switzerland and Turkey in the EU Pocketbook. Particularly for electric vehicles, Norway is of great interest. PHEVs and BEVs accounted for more than 22"% of all new car sales in Norway in 2015, and in the first half of 2016 their market share further increased to 26"%. This makes Norway the world’s leading market for electric vehicles (in terms of market share, not absolute number of vehicles). Underlying reasons are, again, fiscal incentives provided by the Norwegian government.
Key technical parametersThe average mass of new cars in the EU
decreased slightly, to 1,385 kg in 2015. Ten years earlier, the average weight was around 1,340 kg. As in previous years, both the German and Swedish new car fleets were significantly above the EU average, at 1,460 and 1,567 kg respectively. In contrast, French, Italian, and Dutch consumers opted for significantly lighter cars (1,316, 1,302, and 1,335 kg respectively).
Average vehicle engine power, engine displacement, and average number of cylinders of new vehicles remained about constant in 2015.
Other emissions and on-roadIn September 2014, the Euro 6 emission standard
entered into force for newly type-approved vehicle models. In September 2015 it took effect for all new vehicles in the EU. In 2015, about 59"% of all new car sales were Euro 6 vehicles.
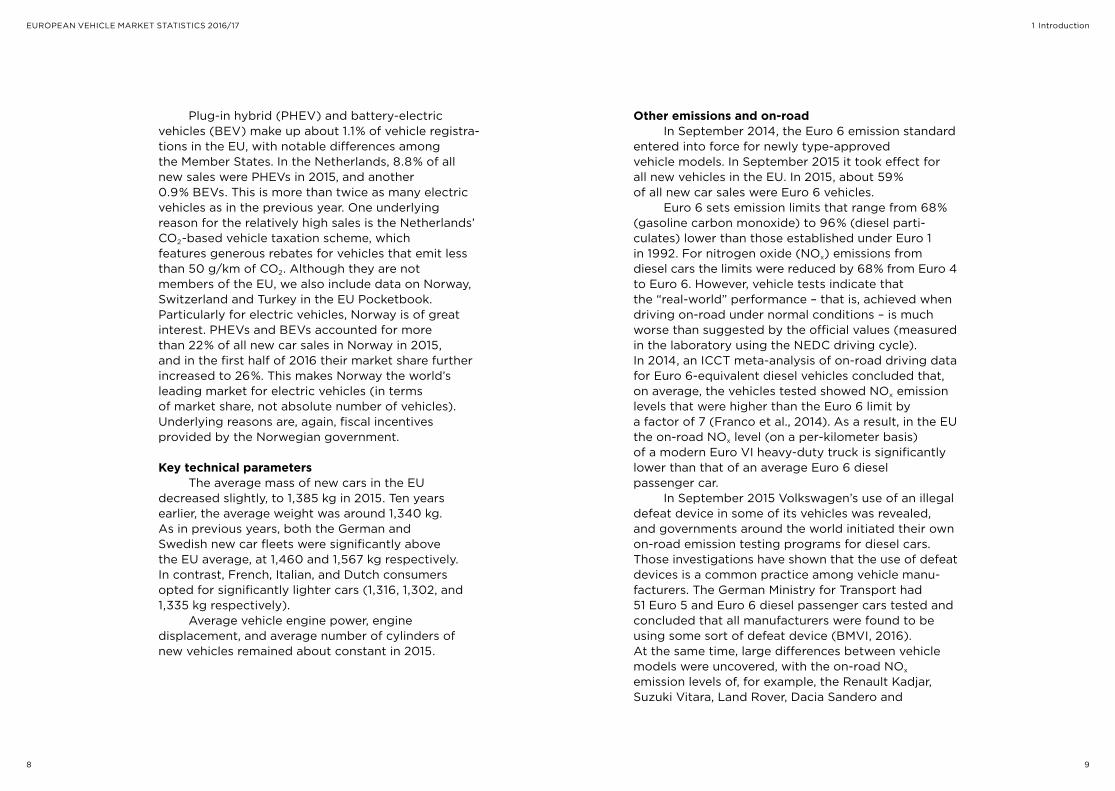
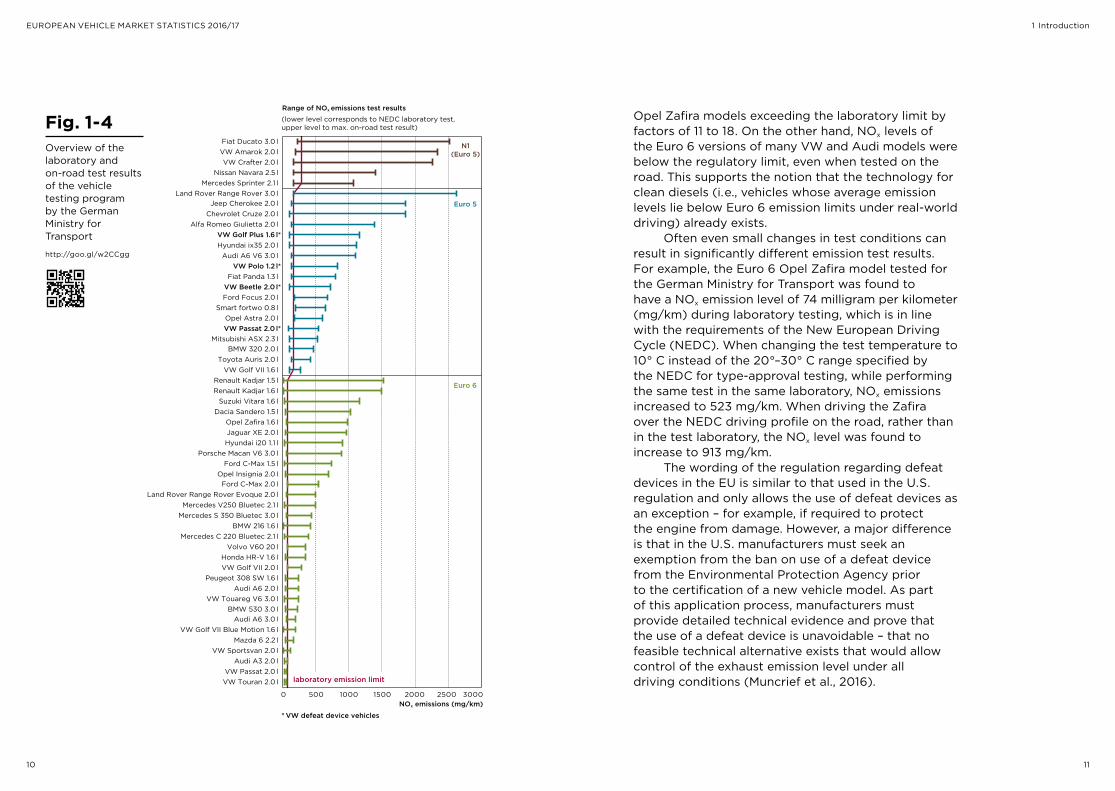
Euro 6 sets emission limits that range from 68"% (gasoline carbon monoxide) to 96"% (diesel parti - culates) lower than those established under Euro 1 in 1992. For nitrogen oxide (NOx) emissions from diesel cars the limits were reduced by 68"% from Euro 4 to Euro 6. However, vehicle tests indicate that the “real-world” performance – that is, achieved when driving on-road under normal conditions – is much worse than suggested by the official values (measured in the laboratory using the NEDC driving cycle). In 2014, an ICCT meta-analysis of on-road driving data for Euro 6-equivalent diesel vehicles concluded that, on average, the vehicles tested showed NOx emission levels that were higher than the Euro 6 limit by a factor of 7 (Franco et al., 2014). As a result, in the EU the on-road NOx level (on a per-kilometer basis) of a modern Euro VI heavy-duty truck is significantly lower than that of an average Euro 6 diesel passenger car.
In September 2015 Volkswagen’s use of an illegal defeat device in some of its vehicles was revealed, and governments around the world initiated their own on-road emission testing programs for diesel cars. Those investigations have shown that the use of defeat devices is a common practice among vehicle manu- facturers. The German Ministry for Transport had 51 Euro 5 and Euro 6 diesel passenger cars tested and concluded that all manufacturers were found to be using some sort of defeat device (BMVI, 2016). At the same time, large differences between vehicle models were uncovered, with the on-road NOx emission levels of, for example, the Renault Kadjar, Suzuki Vitara, Land Rover, Dacia Sandero and
10 11
EUROPEAN VEHICLE MARKET STATISTICS 2016/17 1 Introduction
Opel Zafira models exceeding the laboratory limit by factors of 11 to 18. On the other hand, NOx levels of the Euro 6 versions of many VW and Audi models were below the regulatory limit, even when tested on the road. This supports the notion that the technology for clean diesels (i."e., vehicles whose average emission levels lie below Euro 6 emission limits under real-world driving) already exists.
Often even small changes in test conditions can result in significantly different emission test results. For example, the Euro 6 Opel Zafira model tested for the German Ministry for Transport was found to have a NOx emission level of 74 milligram per kilometer (mg/km) during laboratory testing, which is in line with the requirements of the New European Driving Cycle (NEDC). When changing the test tem perature to 10° C instead of the 20°–30° C range specified by the NEDC for type-approval testing, while performing the same test in the same laboratory, NOx emissions increased to 523 mg/km. When driving the Zafira over the NEDC driving profile on the road, rather than in the test laboratory, the NOx level was found to increase to 913 mg/km.
The wording of the regulation regarding defeat devices in the EU is similar to that used in the U.S. regulation and only allows the use of defeat devices as an exception – for example, if required to protect the engine from damage. However, a major difference is that in the U.S. manufacturers must seek an exemption from the ban on use of a defeat device from the Environmental Protection Agency prior to the certification of a new vehicle model. As part of this application process, manufacturers must provide detailed technical evidence and prove that the use of a defeat device is unavoidable – that no feasible technical alternative exists that would allow control of the exhaust emission level under all driving conditions (Muncrief et al., 2016).
Fig. 1-4Overview of the laboratory and on-road test results of the vehicle testing program by the German Ministry for Transport
http://goo.gl/w2CCgg
0 500 1000 1500 2000 2500 3000NOx emissions (mg/km)
Range of NOx emissions test results(lower level corresponds to NEDC laboratory test, upper level to max. on-road test result)
Fiat Ducato 3.0 l N1(Euro 5)
Euro 5
Euro 6
VW Amarok 2.0 lVW Crafter 2.0 l
Nissan Navara 2.5 lMercedes Sprinter 2.1 l
Land Rover Range Rover 3.0 lJeep Cherokee 2.0 l
Chevrolet Cruze 2.0 lAlfa Romeo Giulietta 2.0 l
VW Golf Plus 1.6 l*Hyundai ix35 2.0 l
Audi A6 V6 3.0 lVW Polo 1.2 l*
Fiat Panda 1.3 lVW Beetle 2.0 l*Ford Focus 2.0 l
Smart fortwo 0.8 lOpel Astra 2.0 lVW Passat 2.0 l*
Mitsubishi ASX 2.3 lBMW 320 2.0 l
Toyota Auris 2.0 lVW Golf VII 1.6 l
Renault Kadjar 1.5 lRenault Kadjar 1.6 l
Suzuki Vitara 1.6 lDacia Sandero 1.5 l
Opel Zafira 1.6 lJaguar XE 2.0 lHyundai i20 1.1 l
Porsche Macan V6 3.0 lFord C-Max 1.5 l
Opel Insignia 2.0 lFord C-Max 2.0 l
Land Rover Range Rover Evoque 2.0 lMercedes V250 Bluetec 2.1 l
Mercedes S 350 Bluetec 3.0 lBMW 216 1.6 l
Mercedes C 220 Bluetec 2.1 lVolvo V60 20 l
Honda HR-V 1.6 lVW Golf VII 2.0 l
Peugeot 308 SW 1.6 lAudi A6 2.0 l
VW Touareg V6 3.0 lBMW 530 3.0 l
Audi A6 3.0 lVW Golf VII Blue Motion 1.6 l
Mazda 6 2.2 lVW Sportsvan 2.0 l
Audi A3 2.0 lVW Passat 2.0 lVW Touran 2.0 l
* VW defeat device vehicles
laboratory emission limit
12 13
EUROPEAN VEHICLE MARKET STATISTICS 2016/17 1 Introduction
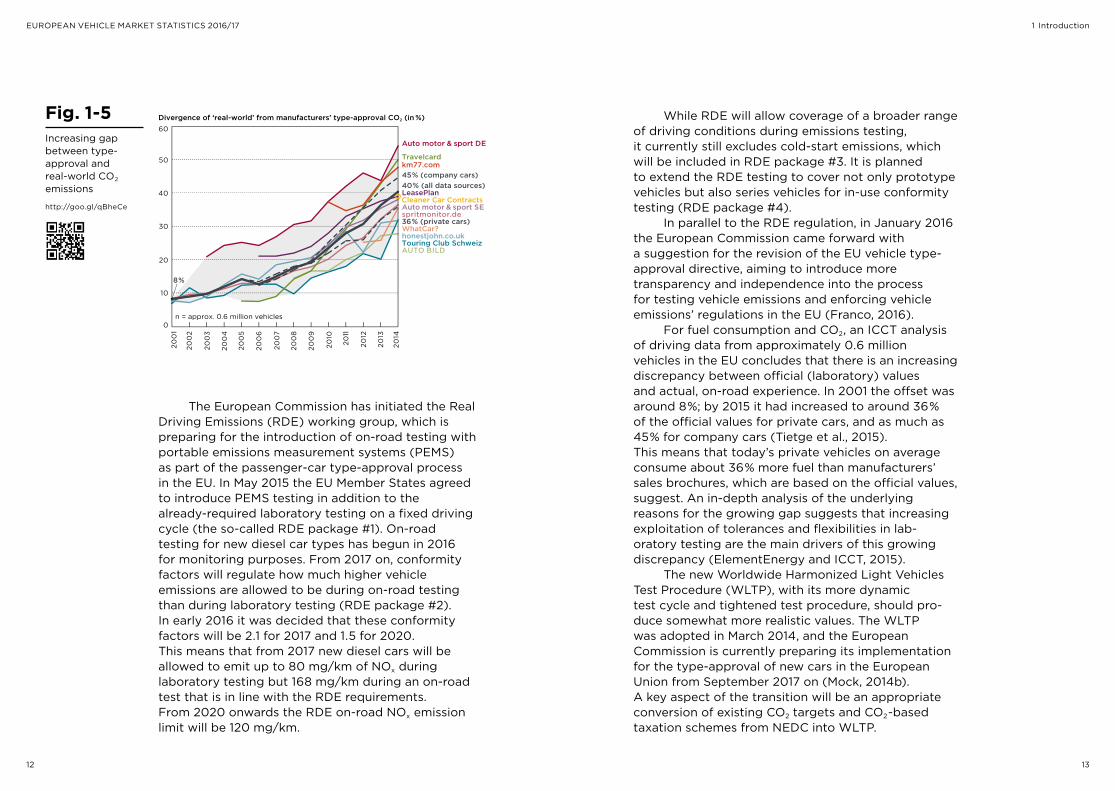
The European Commission has initiated the Real Driving Emissions (RDE) working group, which is preparing for the introduction of on-road testing with portable emissions measurement systems (PEMS) as part of the passenger-car type-approval process in the EU. In May 2015 the EU Member States agreed to introduce PEMS testing in addition to the already-required laboratory testing on a fixed driving cycle (the so-called RDE package #1). On-road testing for new diesel car types has begun in 2016 for monitoring purposes. From 2017 on, conformity factors will regulate how much higher vehicle emissions are allowed to be during on-road testing than during laboratory testing (RDE package #2). In early 2016 it was decided that these conformity factors will be 2.1 for 2017 and 1.5 for 2020. This means that from 2017 new diesel cars will be allowed to emit up to 80 mg/km of NOx during laboratory testing but 168 mg/km during an on-road test that is in line with the RDE requirements. From 2020 onwards the RDE on-road NOx emission limit will be 120 mg/km.
Fig. 1-5Increasing gap between type-approval and real-world CO2 emissions
http://goo.gl/qBheCe
0
10
20
30
40
50
60
200
1
200
2
200
3
200
4
200
5
200
6
200
7
2 00
8
200
9
2010
2011
2012
2014
2013
Touring Club Schweiz
WhatCar?
AUTO BILD
spritmonitor.de
45% (company cars)
Auto motor & sport DE
Auto motor & sport SE
Travelcard
40% (all data sources)
36% (private cars)
honestjohn.co.uk
LeasePlan Cleaner Car Contracts
km77.com
8%
Divergence of ‘real-world’ from manufacturers’ type-approval CO2 (in %)
n = approx. 0.6 million vehicles
While RDE will allow coverage of a broader range of driving conditions during emissions testing, it currently still excludes cold-start emissions, which will be included in RDE package #3. It is planned to extend the RDE testing to cover not only prototype vehicles but also series vehicles for in-use conformity testing (RDE package #4).
In parallel to the RDE regulation, in January 2016 the European Commission came forward with a suggestion for the revision of the EU vehicle type-approval directive, aiming to introduce more transparency and independence into the process for testing vehicle emissions and enforcing vehicle emissions’ regulations in the EU (Franco, 2016).
For fuel consumption and CO2, an ICCT analysis of driving data from approximately 0.6 million vehicles in the EU concludes that there is an increasing discrepancy between official (laboratory) values and actual, on-road experience. In 2001 the offset was around 8"%; by 2015 it had increased to around 36"% of the official values for private cars, and as much as 45"% for company cars (Tietge et al., 2015). This means that today’s private vehicles on average consume about 36"% more fuel than manufacturers’ sales brochures, which are based on the official values, suggest. An in-depth analysis of the underlying reasons for the growing gap suggests that increasing exploitation of tolerances and flexibilities in lab - ora tory testing are the main drivers of this growing discrepancy (ElementEnergy and ICCT, 2015).
The new Worldwide Harmonized Light Vehicles Test Procedure (WLTP), with its more dynamic test cycle and tightened test procedure, should pro- duce somewhat more realistic values. The WLTP was adopted in March 2014, and the European Commission is currently preparing its implementation for the type-approval of new cars in the European Union from September 2017 on (Mock, 2014b). A key aspect of the transition will be an appropriate conversion of existing CO2 targets and CO2-based taxation schemes from NEDC into WLTP.
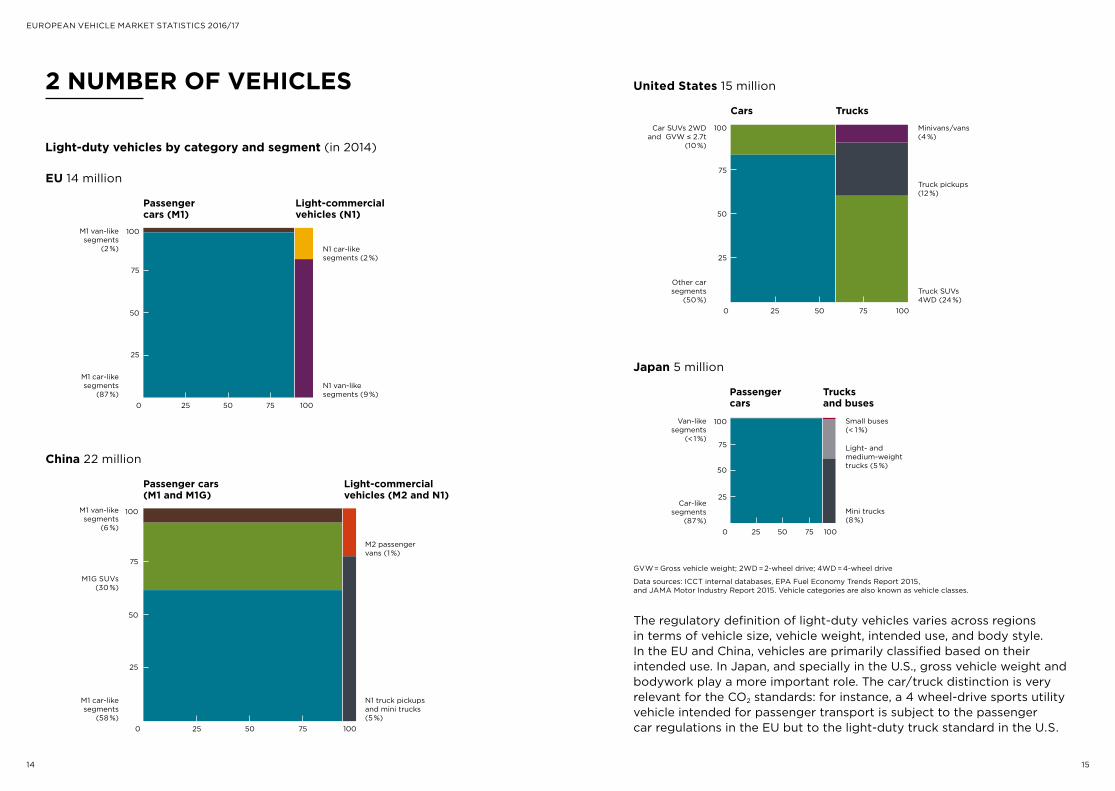
Light-duty vehicles by category and segment (in 2014)
EU 14 million
China 22 million
M1 car-like segments
(58$%)
M1G SUVs (30$%)
M2 passenger vans (1$%)
N1 truck pickups and mini trucks (5$%)
25
25
50
50
75
75
100$
100$
0
M1 van-like segments
(6$%)
Passenger cars (M1 and M1G)
Light-commercial vehicles (M2 and N1)
M1 car-like segments
(87$%)25
25
50
50
75
75
100$
100$
0
Passenger cars (M1)
Light-commercial vehicles (N1)
N1 van-like segments (9$%)
N1 car-like segments (2$%)
M1 van-like segments
(2$%)
United States 15 million
Japan 5 million
25
25
50
50
75
75
100$
100$
0
Cars Trucks
Other car segments
(50$%)Truck SUVs 4WD (24$%)
Truck pickups (12$%)
Minivans/vans (4$%)
Car SUVs 2WD and GVW ≤ 2.7t
(10$%)
7550250
75
50
25
100$
100$
Van-like segments
(<$1$%)
Small buses (< $1$%)
Light- and medium-weight trucks (5$%)
Mini trucks(8$%)
Car-like segments
(87$%)
Passenger cars
Trucks and buses
14 15
EUROPEAN VEHICLE MARKET STATISTICS 2016/17
2 NUMBER OF VEHICLES
The regulatory definition of light-duty vehicles varies across regions in terms of vehicle size, vehicle weight, intended use, and body style. In the EU and China, vehicles are primarily classified based on their intended use. In Japan, and specially in the U.S., gross vehicle weight and bodywork play a more important role. The car/truck distinction is very relevant for the CO2 standards: for instance, a 4 wheel-drive sports utility vehicle intended for passenger transport is subject to the passenger car regulations in the EU but to the light-duty truck standard in the U.S.
GVW$=$Gross vehicle weight; 2WD$=$2-wheel drive; 4WD$=$4-wheel drive
Data sources: ICCT internal databases, EPA Fuel Economy Trends Report 2015, and JAMA Motor Industry Report 2015. Vehicle categories are also known as vehicle classes.
16 17
EUROPEAN VEHICLE MARKET STATISTICS 2016/17
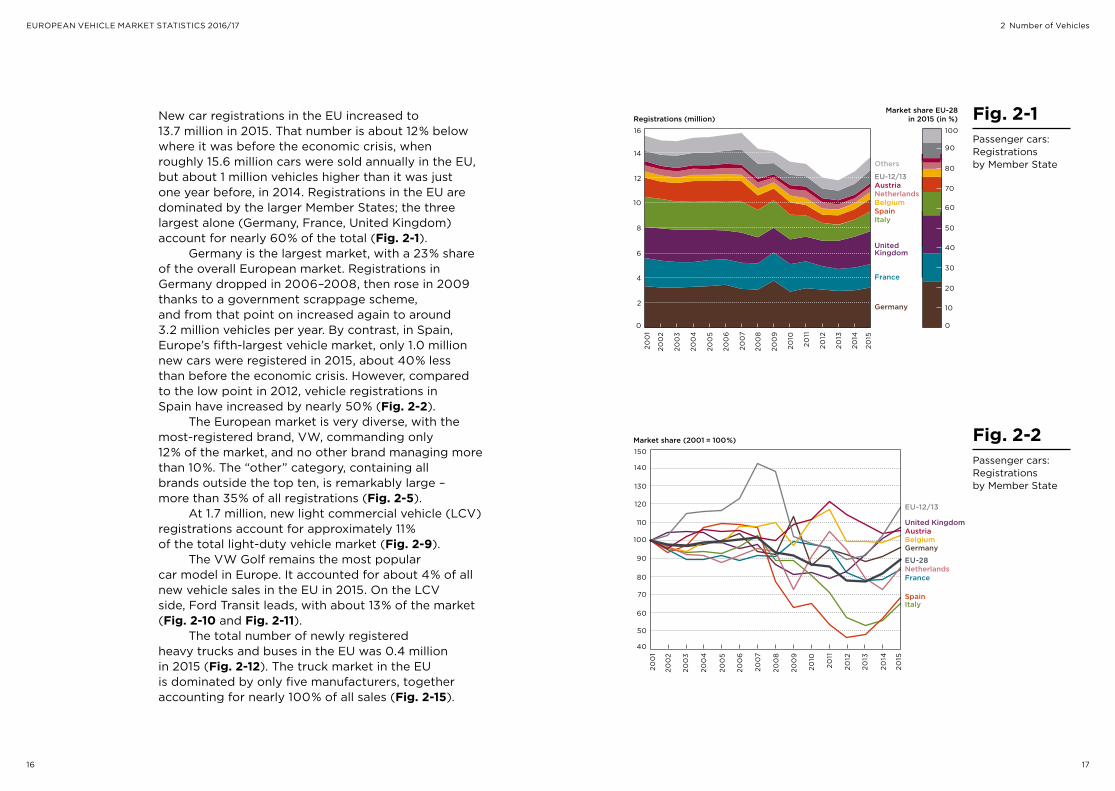
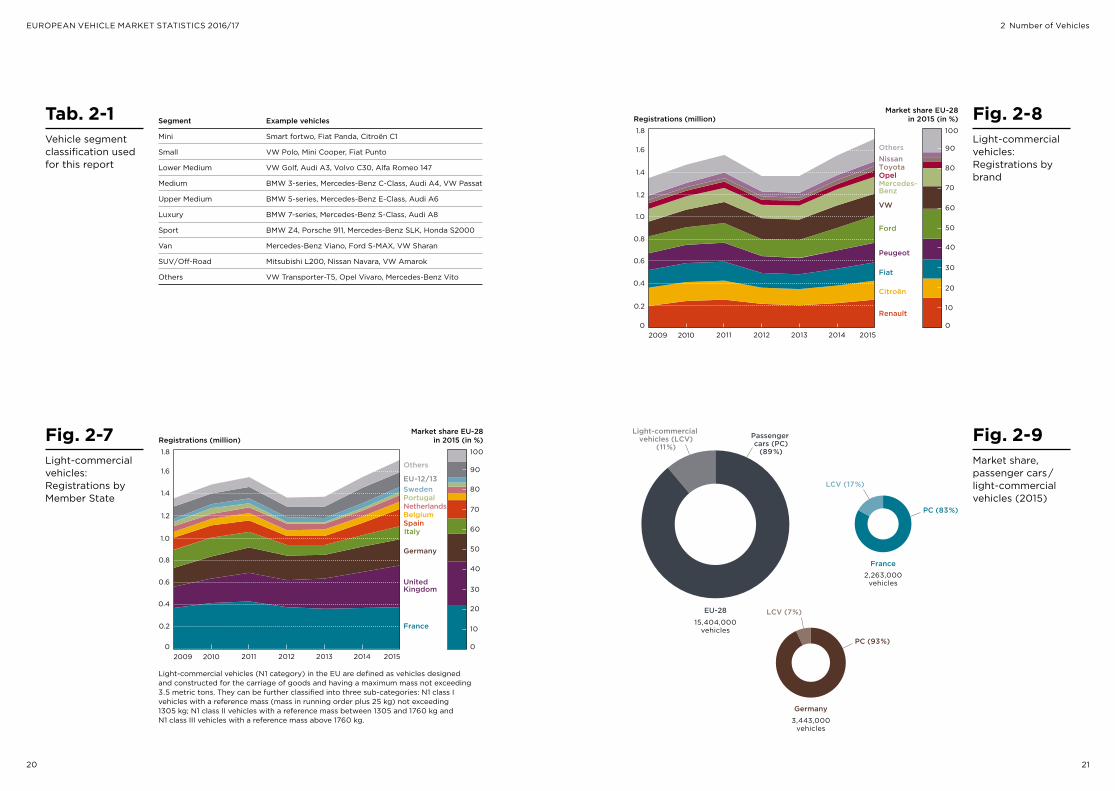
Fig. 2-1Passenger cars: Registrations by Member State
New car registrations in the EU increased to 13.7 million in 2015. That number is about 12"% below where it was before the economic crisis, when roughly 15.6 million cars were sold annually in the EU, but about 1 million vehicles higher than it was just one year before, in 2014. Registrations in the EU are dominated by the larger Member States; the three largest alone (Germany, France, United Kingdom) account for nearly 60"% of the total (Fig. 2-1).
Germany is the largest market, with a 23"% share of the overall European market. Registrations in Germany dropped in 2006–2008, then rose in 2009 thanks to a government scrappage scheme, and from that point on increased again to around 3.2 million vehicles per year. By contrast, in Spain, Europe’s fifth-largest vehicle market, only 1.0 million new cars were registered in 2015, about 40"% less than before the economic crisis. However, compared to the low point in 2012, vehicle registrations in Spain have increased by nearly 50"% (Fig. 2-2).
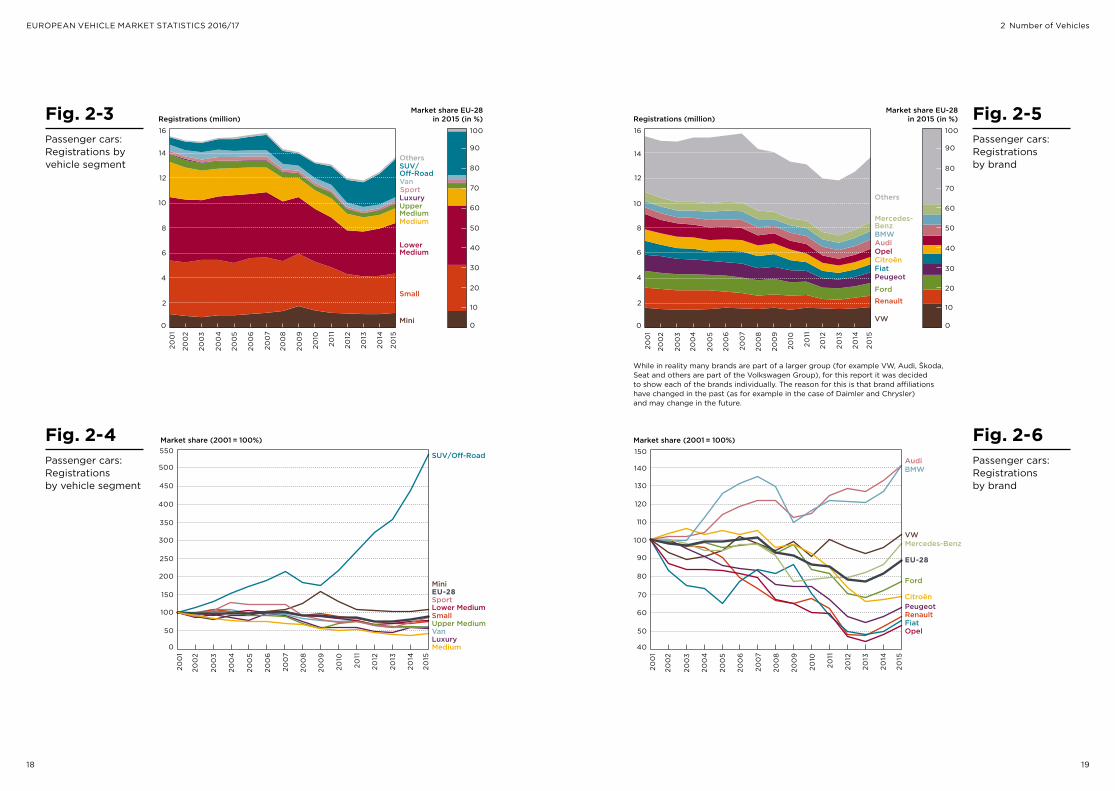
The European market is very diverse, with the most-registered brand, VW, commanding only 12"% of the market, and no other brand managing more than 10"%. The “other” category, containing all brands outside the top ten, is remarkably large – more than 35"% of all registrations (Fig. 2-5).
At 1.7 million, new light commercial vehicle (LCV) registrations account for approximately 11"% of the total light-duty vehicle market (Fig. 2-9).
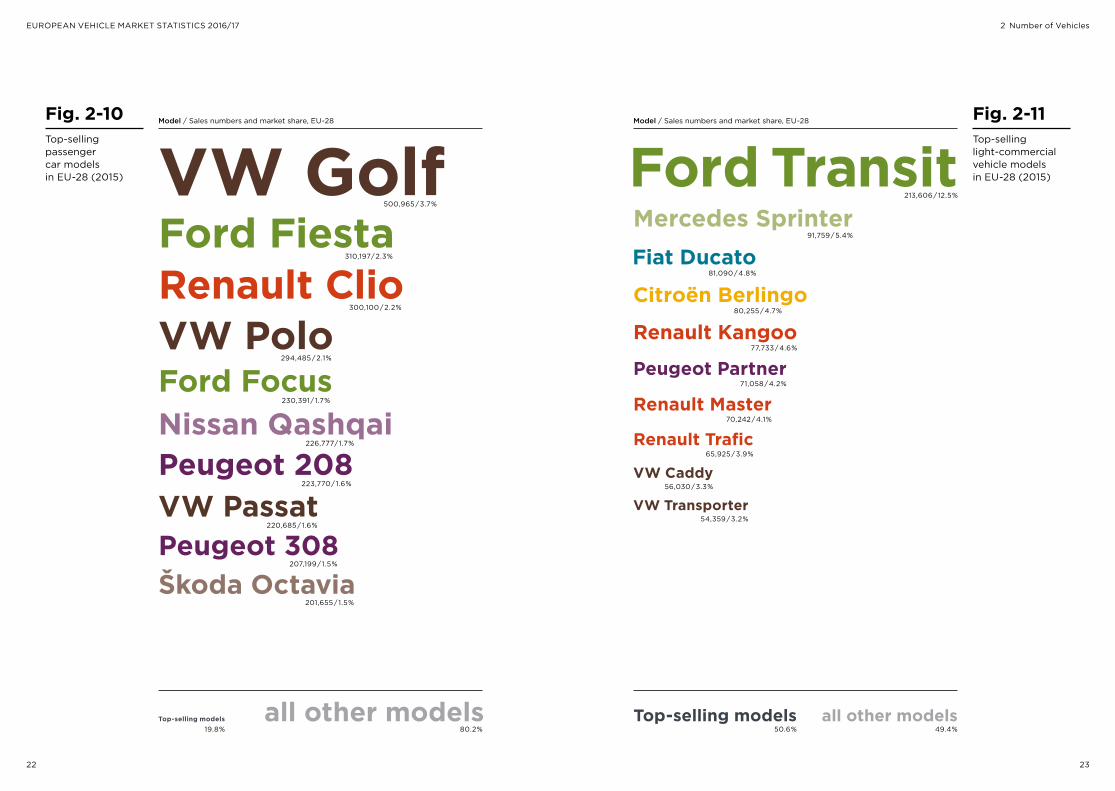
The VW Golf remains the most popular car model in Europe. It accounted for about 4"% of all new vehicle sales in the EU in 2015. On the LCV side, Ford Transit leads, with about 13"% of the market (Fig. 2-10 and Fig. 2-11).
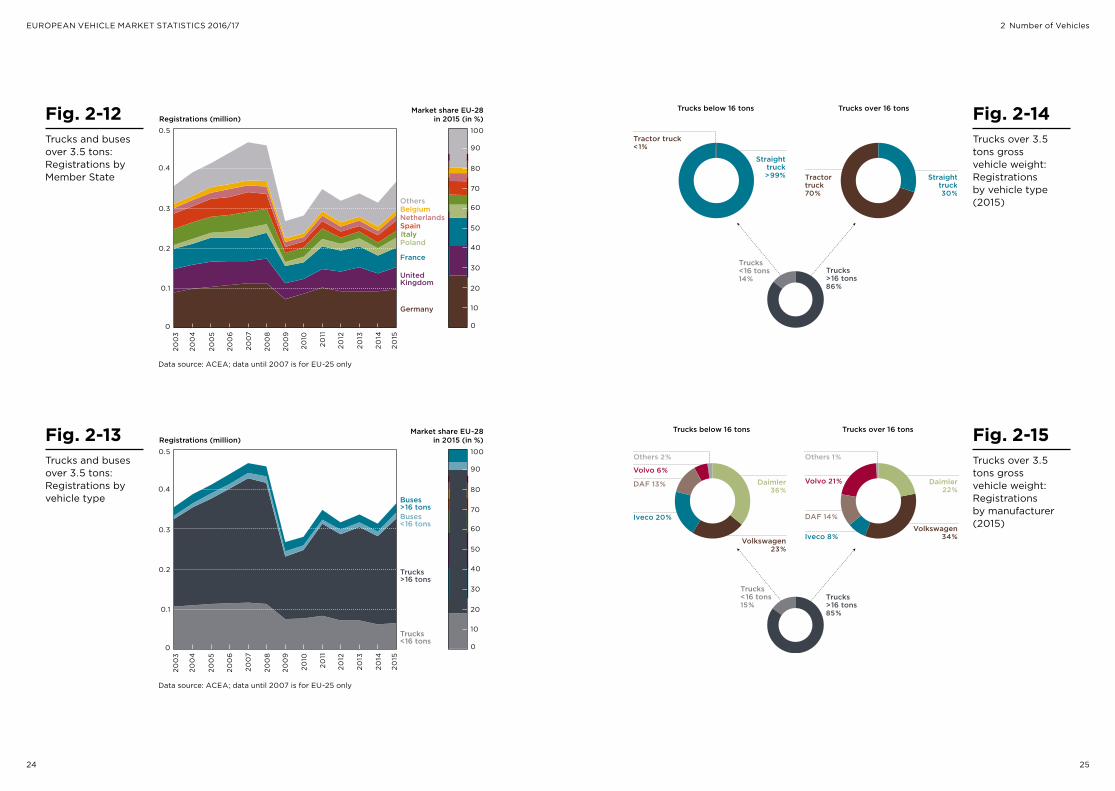
The total number of newly registered heavy trucks and buses in the EU was 0.4 million in 2015 (Fig. 2-12). The truck market in the EU is dominated by only five manufacturers, together accounting for nearly 100"% of all sales (Fig. 2-15).
2 Number of Vehicles
Fig. 2-2Passenger cars: Registrations by Member State
200
1
200
2
200
3
200
4
200
5
200
6
200
7
200
8
200
9
2010
2011
2013
2012
Registrations (million)
EU-12/13
Others
Austria NetherlandsBelgium Spain Italy
United Kingdom
France
Germany
0
10
20
30
40
50
60
70
80
90
100
Market share EU-28 in 2015 (in %)
0
2
4
6
8
10
12
14
16
2015
2014
Market share (2001 = 100%)
40
50
60
70
80
90
100
110
120
130
140
150
EU-28
EU-12/13
Austria
Netherlands
Belgium
Spain Italy
United Kingdom
France
Germany
200
1
200
2
200
3
200
4
200
5
200
6
200
7
200
8
200
9
2010
2011
2014
20
15
2013
2012
18 19
EUROPEAN VEHICLE MARKET STATISTICS 2016/17
Fig. 2-5Passenger cars: Registrations by brand
Fig. 2-6Passenger cars: Registrations by brand
While in reality many brands are part of a larger group (for example VW, Audi, Škoda, Seat and others are part of the Volkswagen Group), for this report it was decided to show each of the brands individually. The reason for this is that brand affiliations have changed in the past (as for example in the case of Daimler and Chrysler) and may change in the future.
Fig. 2-3Passenger cars: Registrations by vehicle segment
Fig. 2-4Passenger cars: Registrationsby vehicle segment
0
2
4
6
8
10
12
14
16
Registrations (million) Market share EU-28
in 2015 (in %)
0
10
20
30
40
50
60
70
80
90
100
OthersSUV/Off-Road Van Sport Luxury Upper Medium Medium
Lower Medium
Small
Mini
200
1
200
2
200
3
200
4
200
5
200
6
200
7
200
8
200
9
2010
2011
20
15
2014
2013
2012
2 Number of Vehicles
Market share (2001 = 100%)
200
1
200
2
200
3
200
4
200
5
200
6
200
7
200
8
200
9
2010
2011
2013
20
15
2014
2012
SUV/Off-Road
EU-28
Van
Sport
Luxury
Upper Medium
Medium
Lower Medium Small
Mini
0
50
100
150
200
250
300
350
400
450
500
550
Market share EU-28in 2015 (in %)
Mercedes-Benz
Others
BMW Audi Opel Citroën Fiat Peugeot
Ford Renault
VW
200
1
200
2
200
3
200
4
200
5
200
6
200
7
200
8
200
9
2010
2013
20
15
20
14
20
12
20
11
Registrations (million)
0
10
20
30
40
50
60
70
80
90
100
0
2
4
6
8
10
12
14
16
Market share (2001 = 100%)
200
1
200
2
200
3
200
4
200
5
200
6
200
7
200
8
200
9
2010
2011
2012
20
15
2014
2013
EU-28
40
50
60
70
80
90
100
110
120
130
150
140
Mercedes-Benz
BMW Audi
Opel
Citroën
Fiat
Peugeot
Ford
Renault
VW
20 21
EUROPEAN VEHICLE MARKET STATISTICS 2016/17
Fig. 2-8Light-commercial vehicles: Registrations by brand
Fig. 2-9Market share, passenger cars$/$ light-commercial vehicles (2015)
Fig. 2-7Light-commercial vehicles: Registrations by Member State
Light-commercial vehicles (N1 category) in the EU are defined as vehicles designed and constructed for the carriage of goods and having a maximum mass not exceeding 3.5 metric tons. They can be further classified into three sub-categories: N1 class I vehicles with a reference mass (mass in running order plus 25 kg) not exceeding 1305 kg; N1 class II vehicles with a reference mass between 1305 and 1760 kg and N1 class III vehicles with a reference mass above 1760 kg.
Tab. 2-1Vehicle segment classification used for this report
Segment Example vehicles
Mini Smart fortwo, Fiat Panda, Citroën C1
Small VW Polo, Mini Cooper, Fiat Punto
Lower Medium VW Golf, Audi A3, Volvo C30, Alfa Romeo 147
Medium BMW 3-series, Mercedes-Benz C-Class, Audi A4, VW Passat
Upper Medium BMW 5-series, Mercedes-Benz E-Class, Audi A6
Luxury BMW 7-series, Mercedes-Benz S-Class, Audi A8
Sport BMW Z4, Porsche 911, Mercedes-Benz SLK, Honda S2000
Van Mercedes-Benz Viano, Ford S-MAX, VW Sharan
SUV/Off-Road Mitsubishi L200, Nissan Navara, VW Amarok
Others VW Transporter-T5, Opel Vivaro, Mercedes-Benz Vito
2 Number of Vehicles
0
0.2
0.4
0.6
0.8
1.2
1.0
1.4
1.8
1.6
2009 2010 20152014201320122011
Market share EU-28in 2015 (in %)
0
10
20
30
40
50
60
70
80
90
100
Registrations (million)
EU-12/13 SwedenPortugal
Others
NetherlandsBelgium Spain Italy
United Kingdom
France
Germany
0
0.2
0.4
0.6
0.8
1.2
1.0
1.4
1.8
1.6
2009 2010 201520142013 2012 2011
Market share EU-28in 2015 (in %)
0
10
20
30
40
50
60
70
80
90
100
Registrations (million)
Others Nissan ToyotaOpel Mercedes-Benz
VW
Ford
Peugeot
Fiat
Citroën
Renault
Passenger cars (PC)
(89%)
Light-commercial vehicles (LCV)
(11%)
Germany3,443,000
vehicles
France2,263,000
vehicles
EU-2815,404,000
vehicles
PC (83%)
PC (93%)
LCV (17%)
LCV (7%)
22 23
EUROPEAN VEHICLE MARKET STATISTICS 2016/17
Fig. 2-10Top-selling passenger car models in EU-28 (2015)
Fig. 2-11Top-selling light-commercial vehicle models in EU-28 (2015)
Model / Sales numbers and market share, EU-28
VW Golf500,965$/$3.7%
207,199$/$1.5%Peugeot 308
201,655$/$1.5%Škoda Octavia
230,391$/$1.7%Ford Focus
300,100$/$2.2%Renault Clio
310,197$/$2.3%Ford Fiesta
294,485$/$2.1%VW Polo
19.8%Top-selling models
50.6%Top-selling models
80.2%all other models
49.4%all other models
Model / Sales numbers and market share, EU-28
Ford Transit213,606$/$12.5%
65,925$/$3.9%Renault Trafic
71,058$/$4.2%Peugeot Partner
223,770$/$1.6%Peugeot 208
70,242$/$4.1%Renault Master
81,090$/$4.8%Fiat Ducato
56,030$/$3.3%VW Caddy
54,359$/$3.2%VW Transporter
80,255$/$4.7%Citroën Berlingo
77,733$/$4.6%Renault Kangoo
91,759$/$5.4%Mercedes Sprinter
2 Number of Vehicles
226,777$/$1.7%Nissan Qashqai
220,685$/$1.6%VW Passat
24 25
EUROPEAN VEHICLE MARKET STATISTICS 2016/17
Fig. 2-12Trucks and buses over 3.5 tons: Registrations by Member State
Fig. 2-14Trucks over 3.5 tons gross vehicle weight: Registrations by vehicle type (2015)
Fig. 2-13Trucks and buses over 3.5 tons: Registrations by vehicle type
Fig. 2-15Trucks over 3.5 tons gross vehicle weight: Registrations by manufacturer (2015)
2 Number of Vehicles
Data source: ACEA; data until 2007 is for EU-25 only
Data source: ACEA; data until 2007 is for EU-25 only
200
3
200
4
200
5
200
6
200
7
200
8
200
9
2010
2011
20
15
2014
2013
2012
Registrations (million)
Others
NetherlandsBelgium
Spain Italy
United Kingdom
France
Poland
Germany
0
10
20
30
40
50
60
70
80
90
100
Market share EU-28 in 2015 (in %)
0
0.1
0.2
0.3
0.4
0.5
200
3
200
4
200
5
200
6
200
7
200
8
200
9
2010
2011
20
15
2014
2013
2012
Registrations (million)
0
10
20
30
40
50
60
70
80
90
100
Market share EU-28 in 2015 (in %)
0
0.1
0.2
0.3
0.4
0.5
Buses >16 tons Buses <16 tons
Trucks >16 tons
Trucks <16 tons
Trucks below 16 tons
Straighttruck>99%
Tractor truck<1%
Trucks <16 tons 14%
Trucks>16 tons86%
Trucks over 16 tons
Straighttruck30%
Tractortruck70%
Trucks below 16 tons
Iveco 20%
Iveco 8%
DAF 13%
DAF 14%
Volkswagen23%
Volkswagen34%
Volvo 6%Volvo 21%
Others 2%
Trucks over 16 tons
Daimler36%
Daimler22%
Others 1%
Trucks <16 tons 15%
Trucks>16 tons85%
Light-duty vehiclesHeavy-duty vehiclesCumulative CO2 reduction
26 27
EUROPEAN VEHICLE MARKET STATISTICS 2016/17
3 FUEL CONSUMPTION#& #CO2
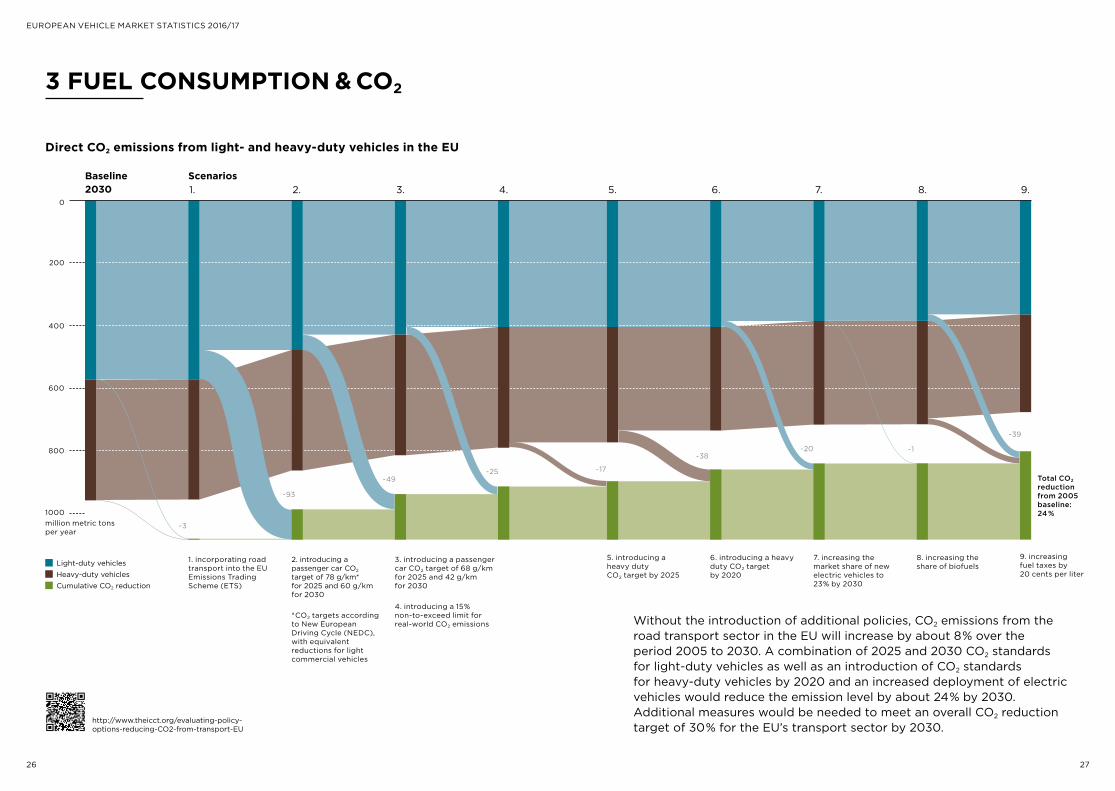
Direct CO2 emissions from light- and heavy-duty vehicles in the EU
Baseline Scenarios2030 1. 2. 3. 4. 5. 6. 7. 8. 9.
Without the introduction of additional policies, CO2 emissions from the road transport sector in the EU will increase by about 8"% over the period 2005 to 2030. A combination of 2025 and 2030 CO2 standards for light-duty vehicles as well as an introduction of CO2 standards for heavy-duty vehicles by 2020 and an increased deployment of electric vehicles would reduce the emission level by about 24"% by 2030. Additional measures would be needed to meet an overall CO2 reduction target of 30"% for the EU’s transport sector by 2030.
0
200
400
600
800
1000
-3
-93
-49-25 -17
-38-20 -1
-39
million metric tons per year
1. incorporating road transport into the EU Emissions Trading Scheme (ETS)
2. introducing a passenger car CO2 target of 78 g/km* for 2025 and 60 g/km for 2030
*$CO2 targets according to New European Driving Cycle (NEDC), with equivalent reductions for light commercial vehicles
3. introducing a passenger car CO2 target of 68 g/km for 2025 and 42 g/km for 2030
4. introducing a 15"% non-to-exceed limit for real-world CO2 emissions
6. introducing a heavy duty CO2 target by 2020
5. introducing a heavy duty CO2 target by 2025
7. increasing the market share of new electric vehicles to 23"% by 2030
8. increasing the share of biofuels
9. increasing fuel taxes by 20 cents per liter
Total CO2 reduction from 2005 baseline: 24!%
http://www.theicct.org/evaluating-policy-options-reducing-CO2-from-transport-EU
28 29
EUROPEAN VEHICLE MARKET STATISTICS 2016/17
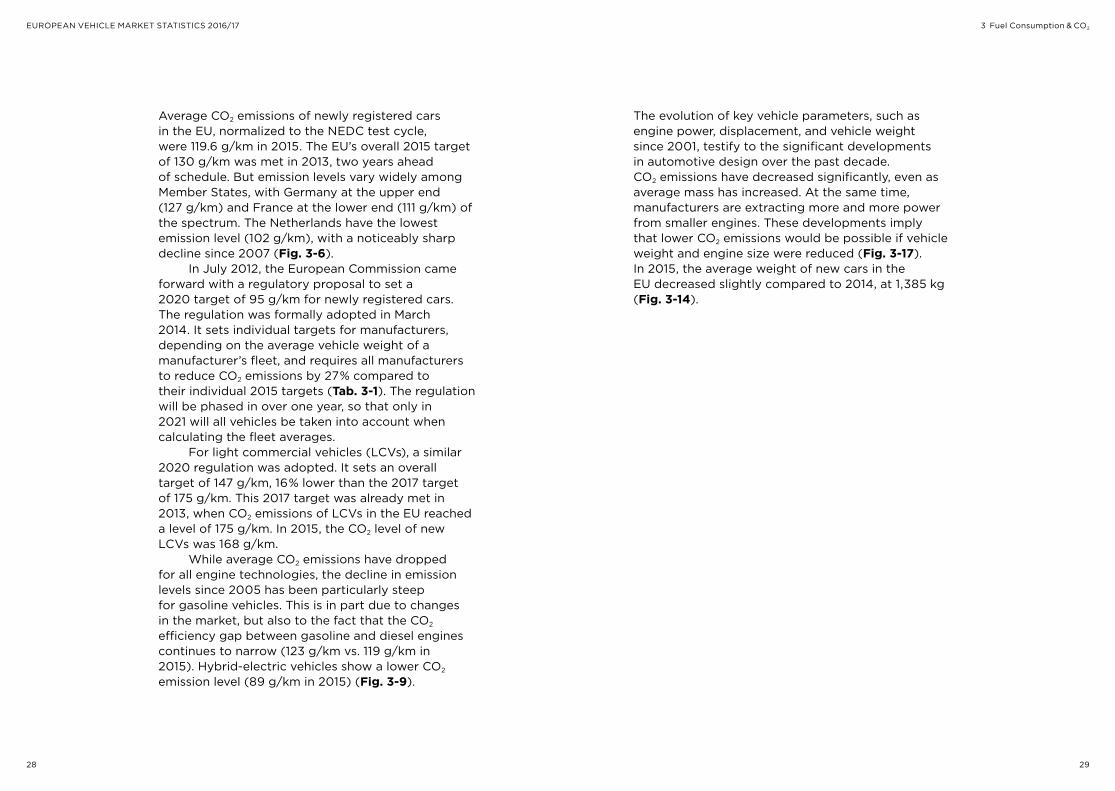
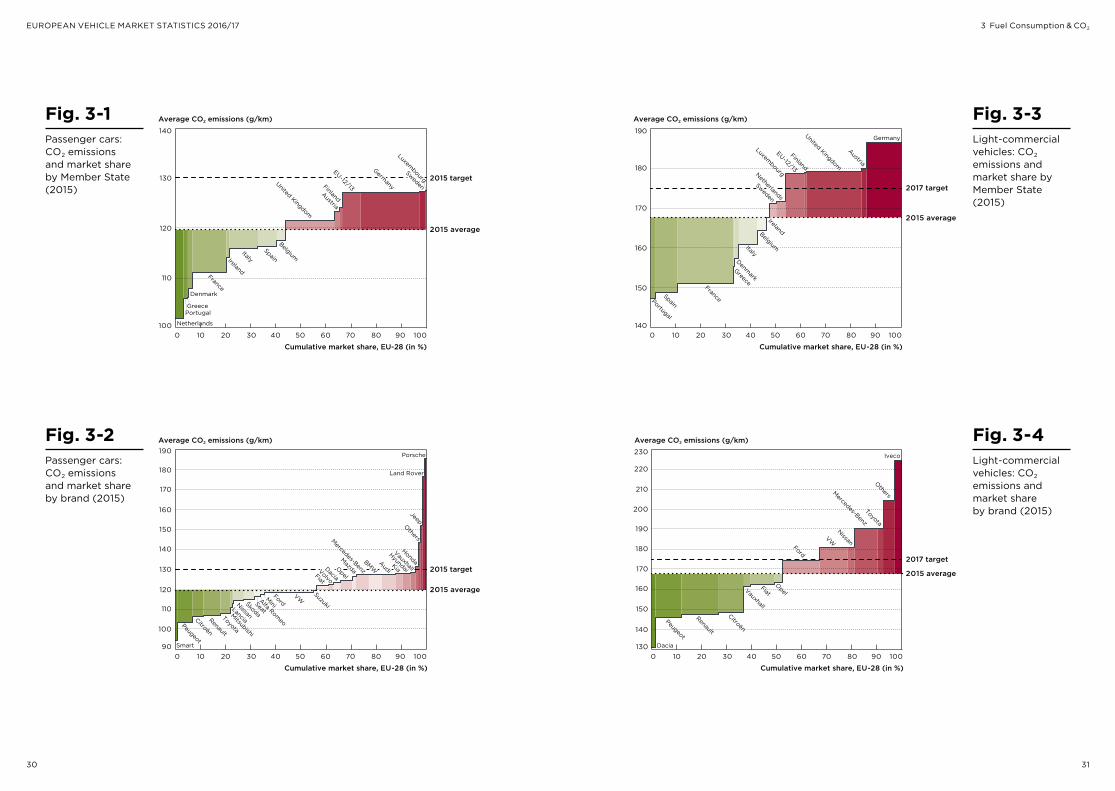
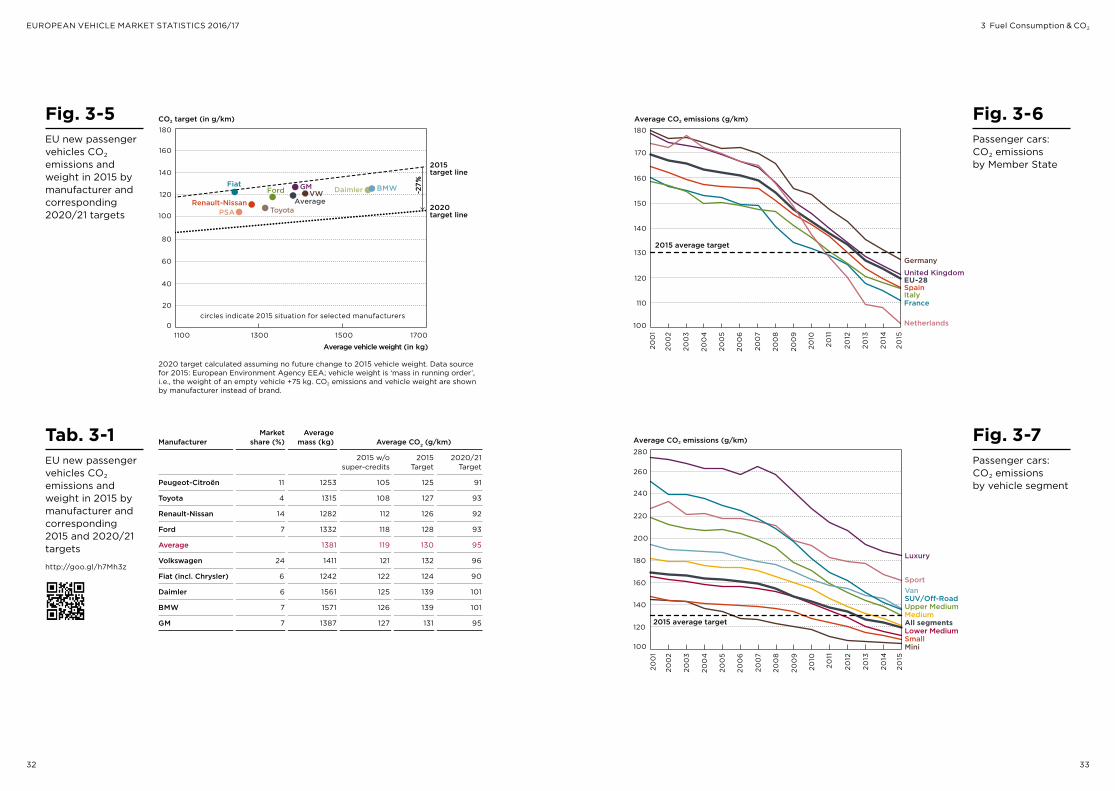
Average CO2 emissions of newly registered cars in the EU, normalized to the NEDC test cycle, were 119.6 g/km in 2015. The EU’s overall 2015 target of 130 g/km was met in 2013, two years ahead of schedule. But emission levels vary widely among Member States, with Germany at the upper end (127 g/km) and France at the lower end (111 g/km) of the spectrum. The Netherlands have the lowest emission level (102 g/km), with a noticeably sharp decline since 2007 (Fig. 3-6).
In July 2012, the European Commission came forward with a regulatory proposal to set a 2020 target of 95 g/km for newly registered cars. The regulation was formally adopted in March 2014. It sets individual targets for manufacturers, depending on the average vehicle weight of a manufacturer’s fleet, and requires all manufacturers to reduce CO2 emissions by 27"% compared to their individual 2015 targets (Tab. 3-1). The regulation will be phased in over one year, so that only in 2021 will all vehicles be taken into account when calculating the fleet averages.
For light commercial vehicles (LCVs), a similar 2020 regulation was adopted. It sets an overall target of 147 g/km, 16"% lower than the 2017 target of 175 g/km. This 2017 target was already met in 2013, when CO2 emissions of LCVs in the EU reached a level of 175 g/km. In 2015, the CO2 level of new LCVs was 168 g/km.
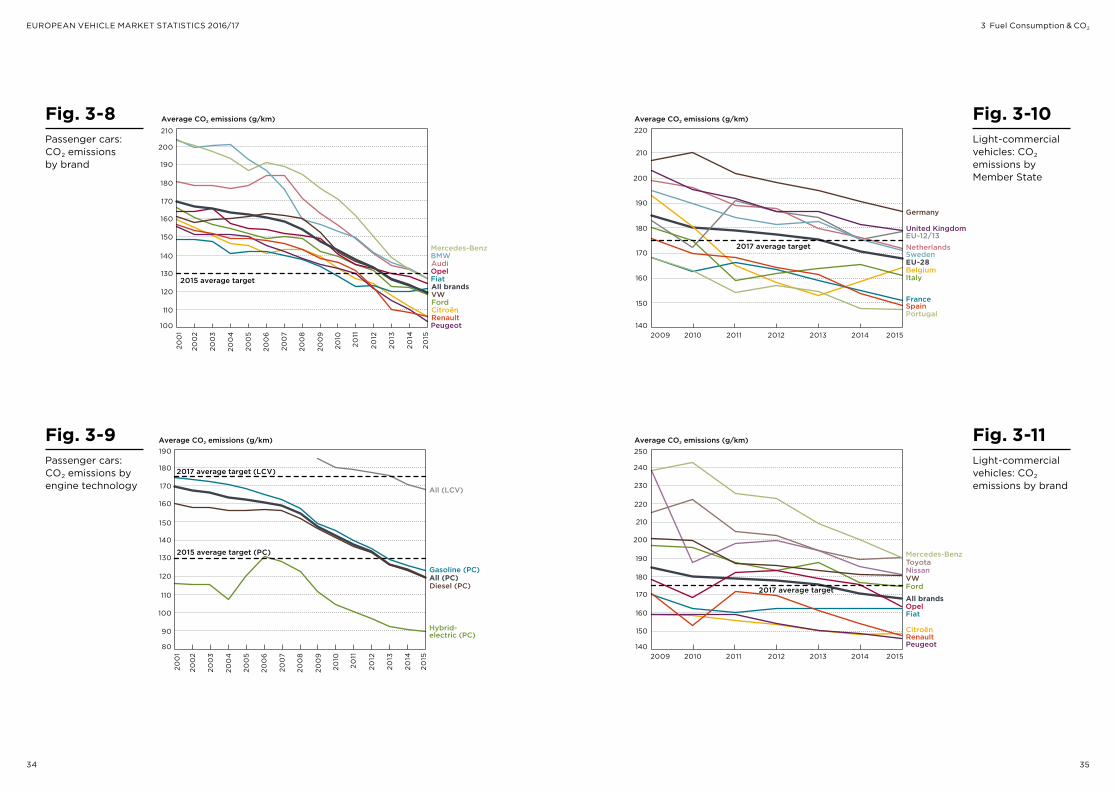
While average CO2 emissions have dropped for all engine technologies, the decline in emission levels since 2005 has been particularly steep for gasoline vehicles. This is in part due to changes in the market, but also to the fact that the CO2 efficiency gap between gasoline and diesel engines continues to narrow (123 g/km vs. 119 g/km in 2015). Hybrid-electric vehicles show a lower CO2 emission level (89 g/km in 2015) (Fig. 3-9).
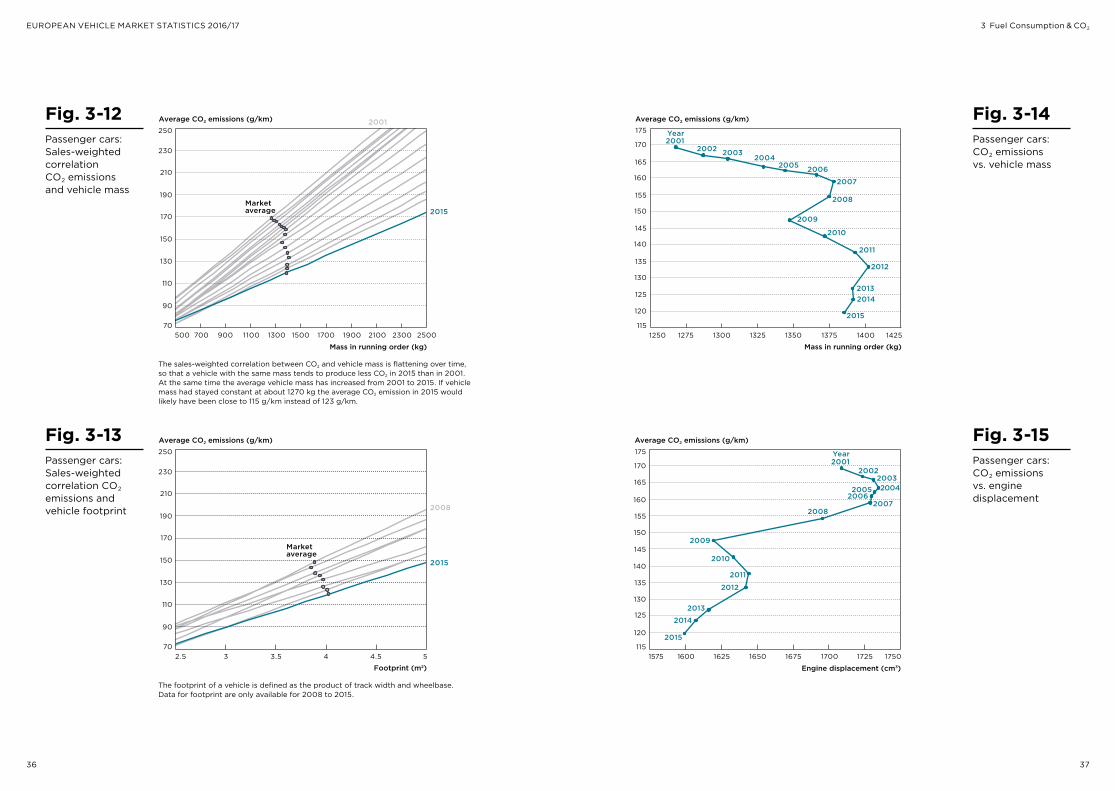
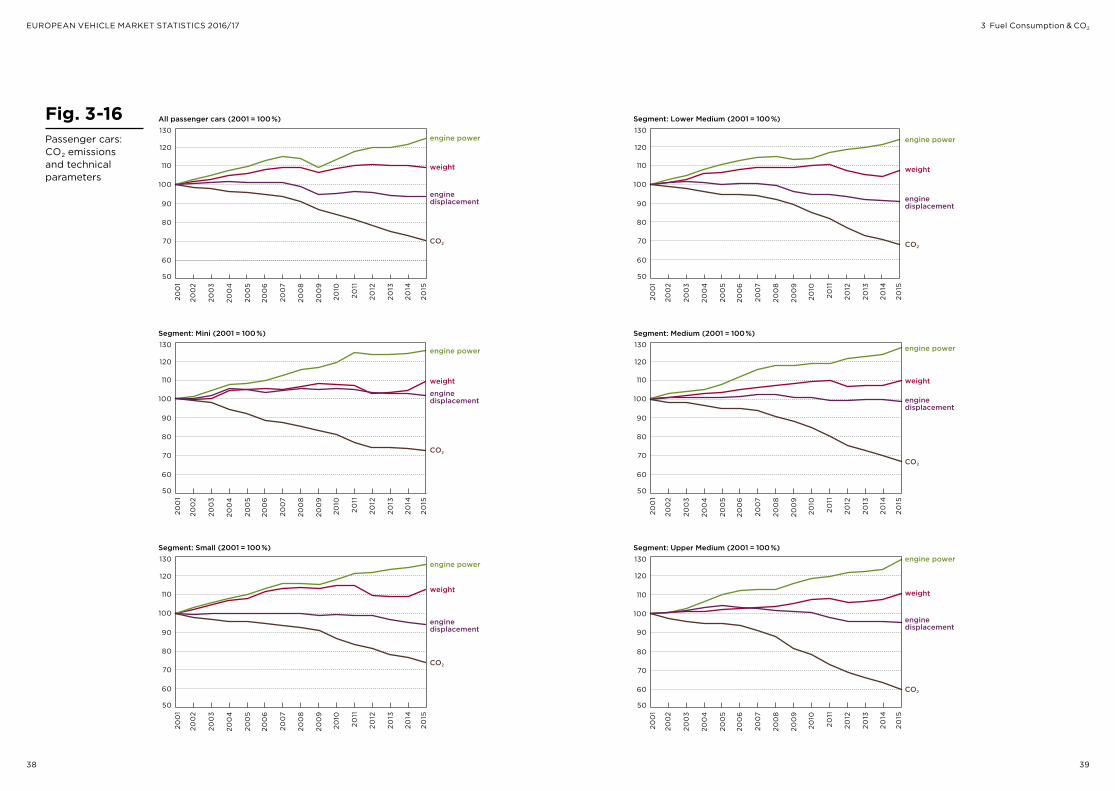
The evolution of key vehicle parameters, such as engine power, displacement, and vehicle weight since 2001, testify to the significant developments in automotive design over the past decade. CO2 emissions have decreased significantly, even as average mass has increased. At the same time, manufacturers are extracting more and more power from smaller engines. These developments imply that lower CO2 emissions would be possible if vehicle weight and engine size were reduced (Fig. 3-17). In 2015, the average weight of new cars in the EU decreased slightly compared to 2014, at 1,385 kg (Fig. 3-14).
3 Fuel Consumption & CO2
30 31
EUROPEAN VEHICLE MARKET STATISTICS 2016/17
Fig. 3-3Light-commercial vehicles: CO2 emissions and market share by Member State (2015)
Fig. 3-4Light-commercial vehicles: CO2 emissions and market share by brand (2015)
2017 target
2015 average
Average CO2 emissions (g/km)
0 10 20 30 40 50 60 70 80 90 100
Cumulative market share, EU-28 (in %)
150
140
160
170
180
190
Spain
Greece
Denmark
Ireland
Italy
United Kingdom
France Portugal
Belgium
EU-12/13
Sweden
FinlandNetherlands
Austria
Luxembourg
Germany
2017 target
2015 average
Average CO2 emissions (g/km)
0 10 20 30 40 50 60 70 80 90 100
Cumulative market share, EU-28 (in %)
Citroën
Dacia
Fiat
Peugeot
Renault
Mercedes-Benz
Iveco
Opel
Ford
Others
Nissan
Toyota
VW
Vauxhall
130
140
150
160
170
180
190
200
210
220
230
Fig. 3-2Passenger cars: CO2 emissions and market share by brand (2015)
2015 target
2015 average
Average CO2 emissions (g/km)
0 10 20 30 40 50 60 70 80 90 100
Cumulative market share, EU-28 (in %)
Smart
Lancia
Fiat
SeatToyota
Citroën
Alfa Romeo
Mini
Peugeot
FordŠkoda
NissanMitsubishi
HyundaiOpel
Kia
VauxhallDacia
Honda
Others
Jeep
MazdaAudi
BMWVolvo
Mercedes-Benz
Land Rover
Porsche
90
100
110
120
130
140
150
160
170
180
190
Suzuki
VW
Renault
Fig. 3-1Passenger cars: CO2 emissions and market share by Member State (2015) Finland
Austria
Netherlands
Belgium
Greece
Spain Italy Ireland
United Kingdom
Denmark
Portugal
France
Average CO2 emissions (g/km)
0 10 20 30 40 50 60 70 80 90 100
Cumulative market share, EU-28 (in %)
2015 target
2015 average
100
110
120
130
140
EU-12/13
Sweden
Luxembourg
Germany
3 Fuel Consumption & CO2
32 33
EUROPEAN VEHICLE MARKET STATISTICS 2016/17
Fig. 3-6Passenger cars: CO2 emissions by Member State
Fig. 3-7Passenger cars: CO2 emissions by vehicle segment
Spain Italy
United Kingdom
France
200
1
200
2
200
3
200
4
200
5
200
6
200
7
200
8
200
9
2010
20
15
20
14
2013
20
12
20
11
Average CO2 emissions (g/km)
Netherlands
EU-28
2015 average target
Germany
100
110
120
130
140
150
160
170
180
Average CO2 emissions (g/km)
100
120
140
160
180
200
220
240
260
280
SUV/Off-Road
All segments 2015 average target
Van Sport
Luxury
Upper Medium Medium
Lower Medium Small Mini
200
1
200
2
200
3
200
4
200
5
200
6
200
7
200
8
200
9
2010
20
15
20
14
2013
20
12
20
11
Tab. 3-1EU new passenger vehicles CO2 emissions and weight in 2015 by manufacturer and corresponding 2015 and 2020/21 targets
Fig. 3-5EU new passenger vehicles CO2 emissions and weight in 2015 by manufacturer and corresponding 2020/21 targets
Average
BMW Daimler VWRenault-Nissan
Ford
Toyota
CO2 target (in g/km)
1100 1300 1500 1700
Average vehicle weight (in kg)
2015target line
-27
%
2020target line
circles indicate 2015 situation for selected manufacturers0
20
40
60
80
100
120
140
160
180
GM
-27
%
PSA
Fiat
2020 target calculated assuming no future change to 2015 vehicle weight. Data source for 2015: European Environment Agency EEA; vehicle weight is ‘mass in running order’, i.e., the weight of an empty vehicle +75 kg. CO2 emissions and vehicle weight are shown by manufacturer instead of brand.
http://goo.gl/h7Mh3z
3 Fuel Consumption & CO2
Market AverageManufacturer share (%) mass (kg) Average CO2 (g/km)
2015 w/o 2015 2020/21 super-credits Target Target
Peugeot-Citroën 11 1253 105 125 91
Toyota 4 1315 108 127 93
Renault-Nissan 14 1282 112 126 92
Ford 7 1332 118 128 93
Average 1381 119 130 95
Volkswagen 24 1411 121 132 96
Fiat (incl. Chrysler) 6 1242 122 124 90
Daimler 6 1561 125 139 101
BMW 7 1571 126 139 101
GM 7 1387 127 131 95
34 35
EUROPEAN VEHICLE MARKET STATISTICS 2016/17
Fig. 3-9Passenger cars: CO2 emissions by engine technology
200
1
200
2
200
3
200
4
200
5
200
6
200
7
200
8
200
9
2010
20
15
20
14
2013
20
12
20
11
Average CO2 emissions (g/km)
Diesel (PC)
Hybrid-electric (PC)
Gasoline (PC)All (PC)
2015 average target (PC)
All (LCV)
2017 average target (LCV)
80
90
100
110
120
130
140
150
160
180
170
190
Fig. 3-8Passenger cars: CO2 emissions by brand
Average CO2 emissions (g/km)
All brands 2015 average target
Mercedes-Benz BMW Audi Opel
Citroën
Fiat
Peugeot
Ford
Renault
VW
100
110
120
130
140
150
160
170
180
190
200
210
200
1
200
2
200
3
200
4
200
5
200
6
200
7
200
8
200
9
2010
20
15
20
14
2013
20
12
20
11
3 Fuel Consumption & CO2
Fig. 3-10Light-commercial vehicles: CO2 emissions by Member State
Fig. 3-11Light-commercial vehicles: CO2 emissions by brand
2009 2010 20152014201320122011
Average CO2 emissions (g/km)
France
United Kingdom
Italy
Spain
Belgium
Netherlands
EU-28
Germany
Portugal
2017 average target Sweden
EU-12/13
140
150
160
170
180
190
200
210
220
Average CO2 emissions (g/km)
All brands
Mercedes-Benz
Opel
Citroën
Fiat
Peugeot
Ford
Renault
VW
Toyota Nissan
2017 average target
2009 2010 2015201420132012 2011 140
150
160
170
180
190
200
220
210
240
230
250
36 37
EUROPEAN VEHICLE MARKET STATISTICS 2016/17
Fig. 3-13Passenger cars: Sales-weighted correlation CO2 emissions and vehicle footprint
Fig. 3-14Passenger cars: CO2 emissions vs. vehicle mass
Fig. 3-15Passenger cars: CO2 emissions vs. engine displacement
Average CO2 emissions (g/km)
Mass in running order (kg)
2001Year
2011
2012
20132014
2015
2009
2008
2007
2006
2002
2010
20052004
2003
1250 1275 1300 1325 1350 1375 1400 1425
120
115
130
135
125
140
150
145
160
155
170
165
175
Average CO2 emissions (g/km)
1575 1600 1625 1650 1675 1700 1725 1750
Engine displacement (cm3)
2011
2012
2014
2015
2013
2009
20082007
2001Year
20052003
2010
20062004
2002
115
120
130
140
150
160
170
175
165
155
145
135
125
The footprint of a vehicle is defined as the product of track width and wheelbase. Data for footprint are only available for 2008 to 2015.
Fig. 3-12Passenger cars: Sales-weighted correlation CO2 emissions and vehicle mass
The sales-weighted correlation between CO2 and vehicle mass is flattening over time, so that a vehicle with the same mass tends to produce less CO2 in 2015 than in 2001. At the same time the average vehicle mass has increased from 2001 to 2015. If vehicle mass had stayed constant at about 1270 kg the average CO2 emission in 2015 would likely have been close to 115 g/km instead of 123 g/km.
3 Fuel Consumption & CO2
Average CO2 emissions (g/km)
70
90
110
130
150
170
190
210
230
250
Market average
2.5 3 3.5 4 4.5 5
Footprint (m2)
2008
2015
Average CO2 emissions (g/km)
70
90
110
130
150
170
190
210
230
250
500 700 900 1100 1300 1500 1700 1900 2100 2300 2500
Mass in running order (kg)
2001
2015Market average
38 39
EUROPEAN VEHICLE MARKET STATISTICS 2016/17
Fig. 3-16Passenger cars: CO2 emissions and technical parameters
All passenger cars (2001 = 100%)
CO2
weight
engine power
engine displacement
70
50
60
80
90
100
110
120
130
200
1
200
2
200
3
200
4
200
5
200
6
200
7
200
8
200
9
2010
20
15
20
14
2013
20
12
20
11
Segment: Mini (2001 = 100%)
CO2
weight
engine power
engine displacement
70
50
60
80
90
100
110
120
130
200
1
200
2
200
3
200
4
200
5
200
6
200
7
200
8
200
9
2010
20
15
20
14
2013
20
12
20
11
Segment: Small (2001 = 100%)
CO2
weight
engine power
engine displacement
70
50
60
80
90
100
110
120
130
200
1
200
2
200
3
200
4
200
5
200
6
200
7
200
8
200
9
2010
20
15
20
14
2013
20
12
20
11
Segment: Lower Medium (2001 = 100%)
CO2
weight
engine power
engine displacement
70
50
60
80
90
100
110
120
130
200
1
200
2
200
3
200
4
200
5
200
6
200
7
200
8
200
9
2010
20
15
20
14
2013
20
12
20
11
Segment: Medium (2001 = 100%)
CO2
weight
engine power
engine displacement
70
50
60
80
90
100
110
120
130
200
1
200
2
200
3
200
4
200
5
200
6
200
7
200
8
200
9
2010
20
15
20
14
2013
20
12
20
11
Segment: Upper Medium (2001 = 100%)
CO2
weight
engine power
engine displacement
60
50
70
80
90
100
110
120
130
200
1
200
2
200
3
200
4
200
5
200
6
200
7
200
8
200
9
2010
20
15
20
14
2013
20
12
20
11
3 Fuel Consumption & CO2
CO2 emissions (g/km)180
150
120
90
30
60
0500 1000vehicle weight (kg)
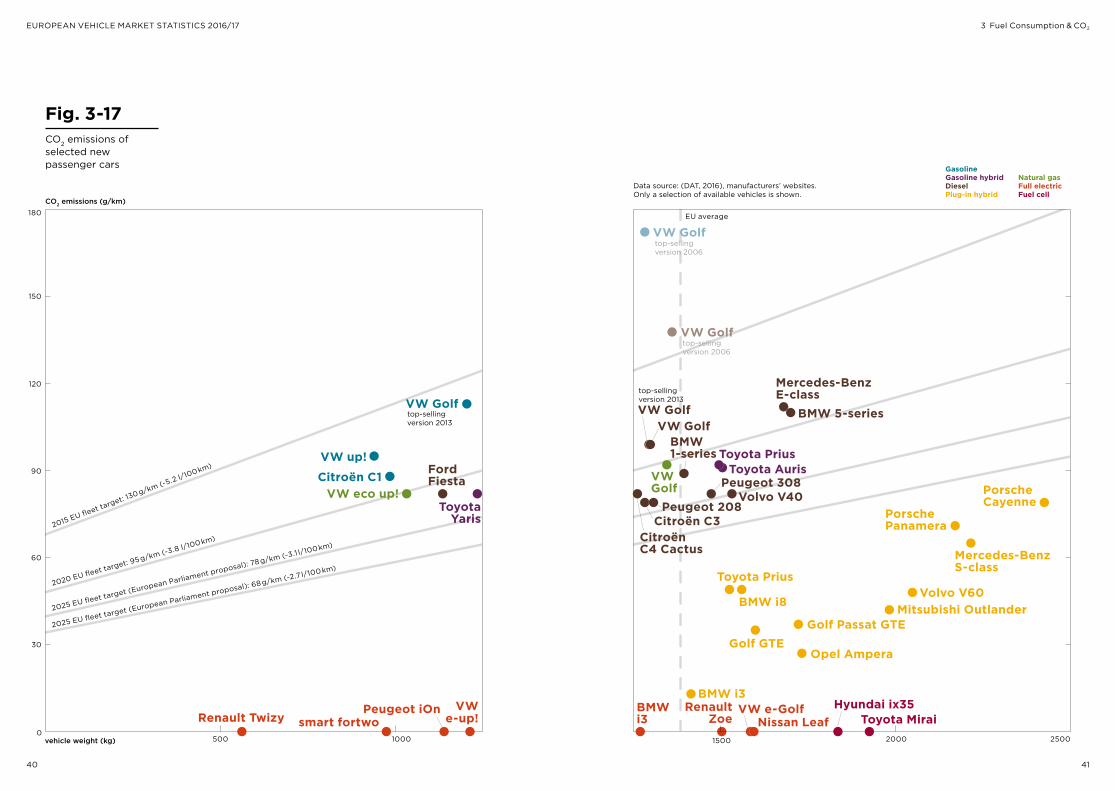
2015 EU fleet target: 130$g/km (~5.2 l/100$km)
2020 EU fleet target: 95$g/km (~3.8 l/100$km)
2025 EU fleet target (European Parliament proposal): 78$g/km (~3.1$l/100$km)
2025 EU fleet target (European Parliament proposal): 68$g/km (~2.7$l/100$km)
VW Golftop-selling version 2013
Ford Fiesta
VW up!
Toyota Yaris
VW eco up!Citroën C1
smart fortwoPeugeot iOn
Renault TwizyVW
e-up!
1500 2000 2500
VW Golftop-selling version 2006
VW Golftop-selling version 2006
top-selling version 2013
VW GolfVW Golf
Toyota Auris
Opel Ampera
Volvo V60
Porsche Cayenne
Porsche Panamera
Toyota Prius
Toyota Prius
BMW i3
Mercedes-Benz E-class
Mercedes-Benz S-class
BMW 5-series
BMW 1-series
Citroën C3Citroën C4 Cactus
BMW i3
Mitsubishi OutlanderBMW i8
Golf GTEGolf Passat GTE
Volvo V40Peugeot 208
Peugeot 308
EU average
VW Golf
Renault Zoe Nissan Leaf Toyota Mirai
Hyundai ix35VW e-Golf
Data source: (DAT, 2016), manufacturers’ websites. Only a selection of available vehicles is shown.
GasolineGasoline hybridDieselPlug-in hybrid Fuel cell
Natural gasFull electric
40 41
EUROPEAN VEHICLE MARKET STATISTICS 2016/17 3 Fuel Consumption & CO2
Fig. 3-17CO2 emissions of selected new passenger cars
42 43
EUROPEAN VEHICLE MARKET STATISTICS 2016/17
4 TECHNOLOGIES
Annual global electric vehicle sales
100,000
200,000
300,000
400,000
500,000
Surface areas are displayed proportional to electric vehicles’ sales data
Renault-Nissan
ZhidouToyotaHyundaiVolvo
JACSAICCheryMercedesGeneral Motors
Ford
Fiat
ZotyeKandiMitsubishi
TeslaVolkswagenBYD
BAIC
BMW
Highest-selling electric vehicle manufacturers and regions where electric vehicles were sold (2015)
Total:72,000
6,000
http://www.theicct.org/electric-vehicles
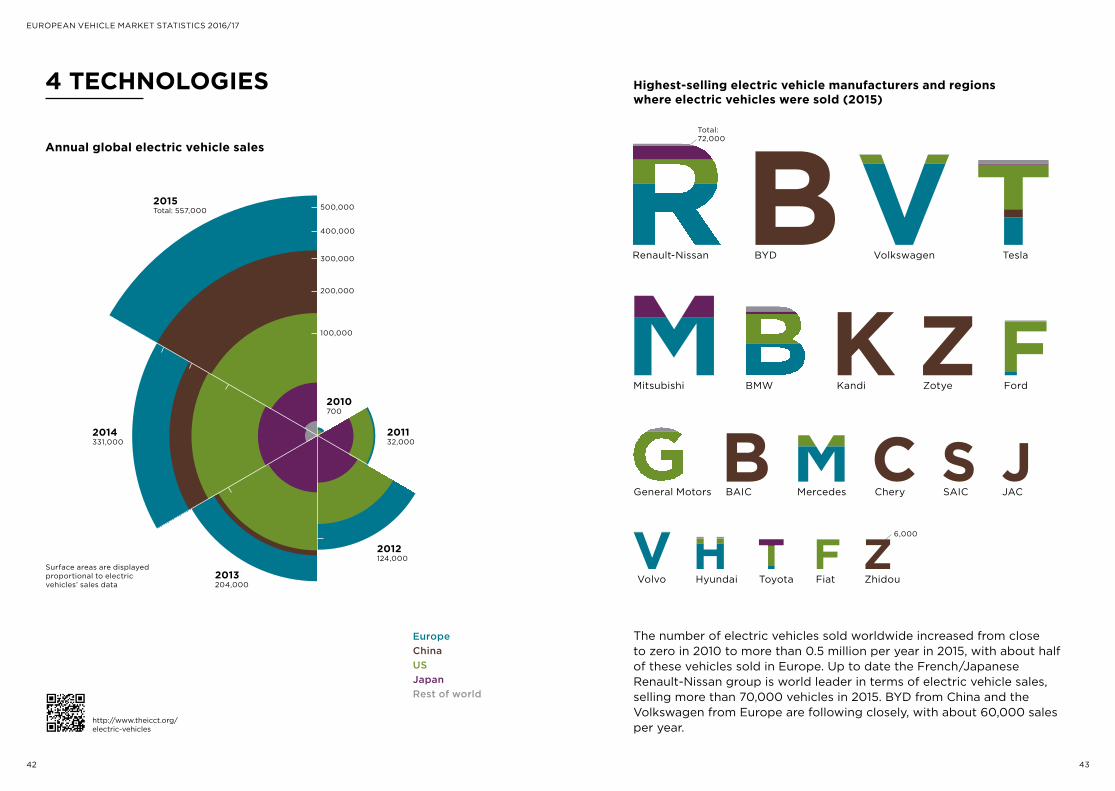
The number of electric vehicles sold worldwide increased from close to zero in 2010 to more than 0.5 million per year in 2015, with about half of these vehicles sold in Europe. Up to date the French/Japanese Renault-Nissan group is world leader in terms of electric vehicle sales, selling more than 70,000 vehicles in 2015. BYD from China and the Volkswagen from Europe are following closely, with about 60,000 sales per year.
EuropeChinaUSJapanRest of world
2015Total: 557,000
2014331,000
2013204,000
2012124,000
201132,000
2010700
44 45
EUROPEAN VEHICLE MARKET STATISTICS 2016/17
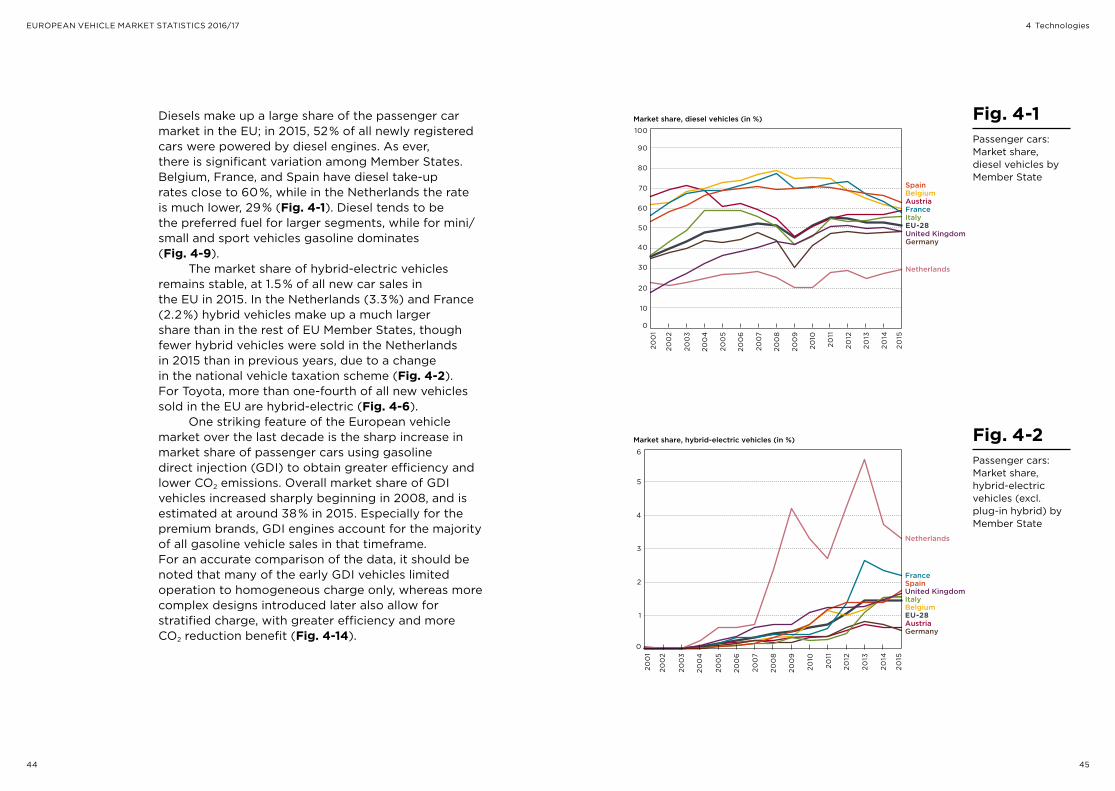
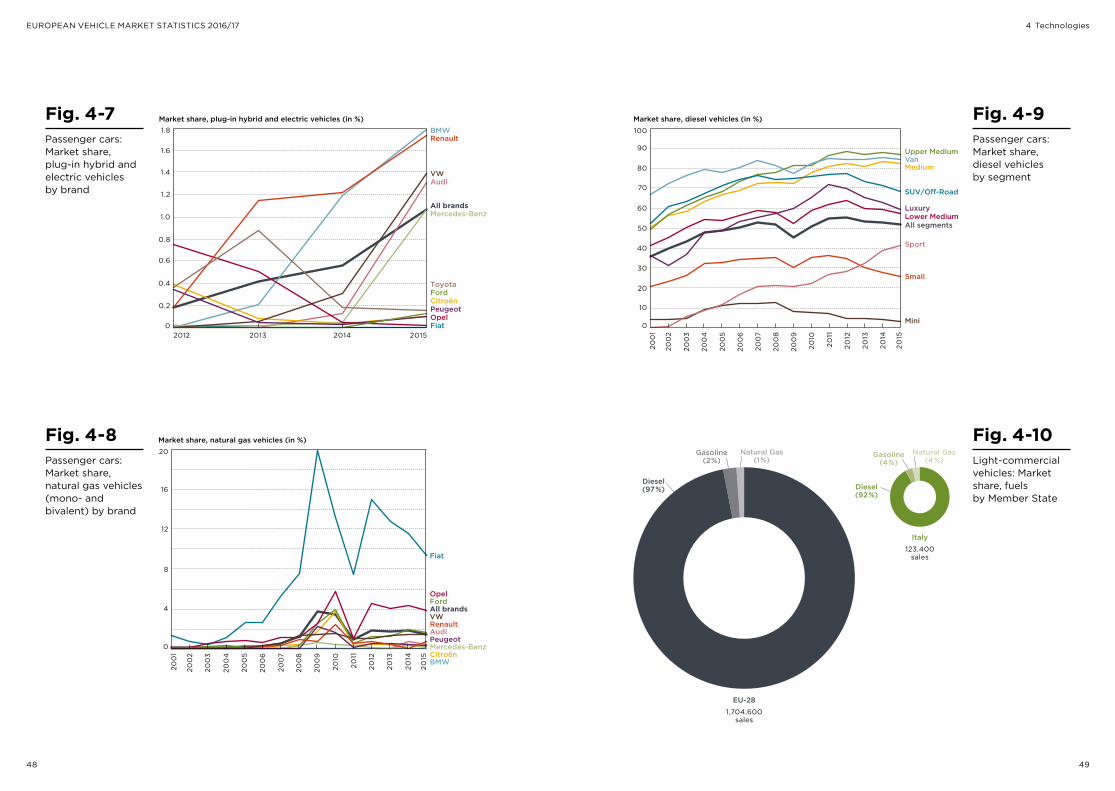
Diesels make up a large share of the passenger car market in the EU; in 2015, 52"% of all newly registered cars were powered by diesel engines. As ever, there is significant variation among Member States. Belgium, France, and Spain have diesel take-up rates close to 60"%, while in the Netherlands the rate is much lower, 29"% (Fig. 4-1). Diesel tends to be the preferred fuel for larger segments, while for mini/small and sport vehicles gasoline dominates (Fig. 4-9).
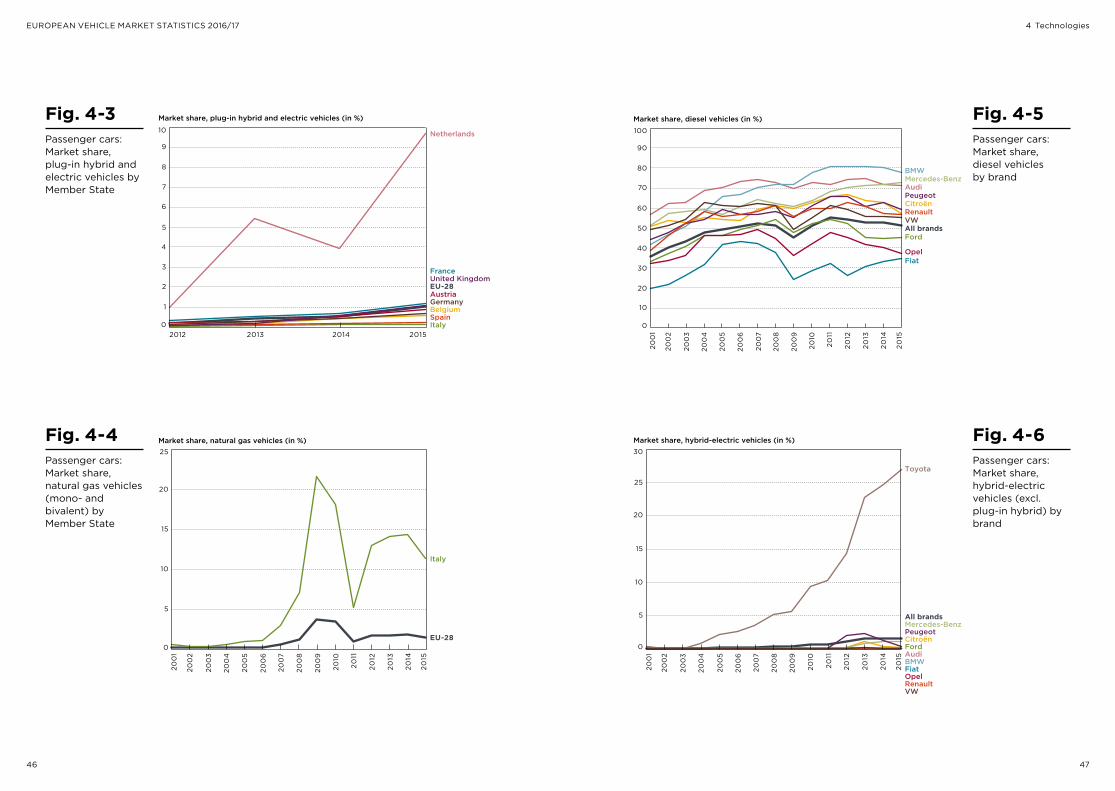
The market share of hybrid-electric vehicles remains stable, at 1.5"% of all new car sales in the EU in 2015. In the Netherlands (3.3"%) and France (2.2"%) hybrid vehicles make up a much larger share than in the rest of EU Member States, though fewer hybrid vehicles were sold in the Netherlands in 2015 than in previous years, due to a change in the national vehicle taxation scheme (Fig. 4-2). For Toyota, more than one-fourth of all new vehicles sold in the EU are hybrid-electric (Fig. 4-6).
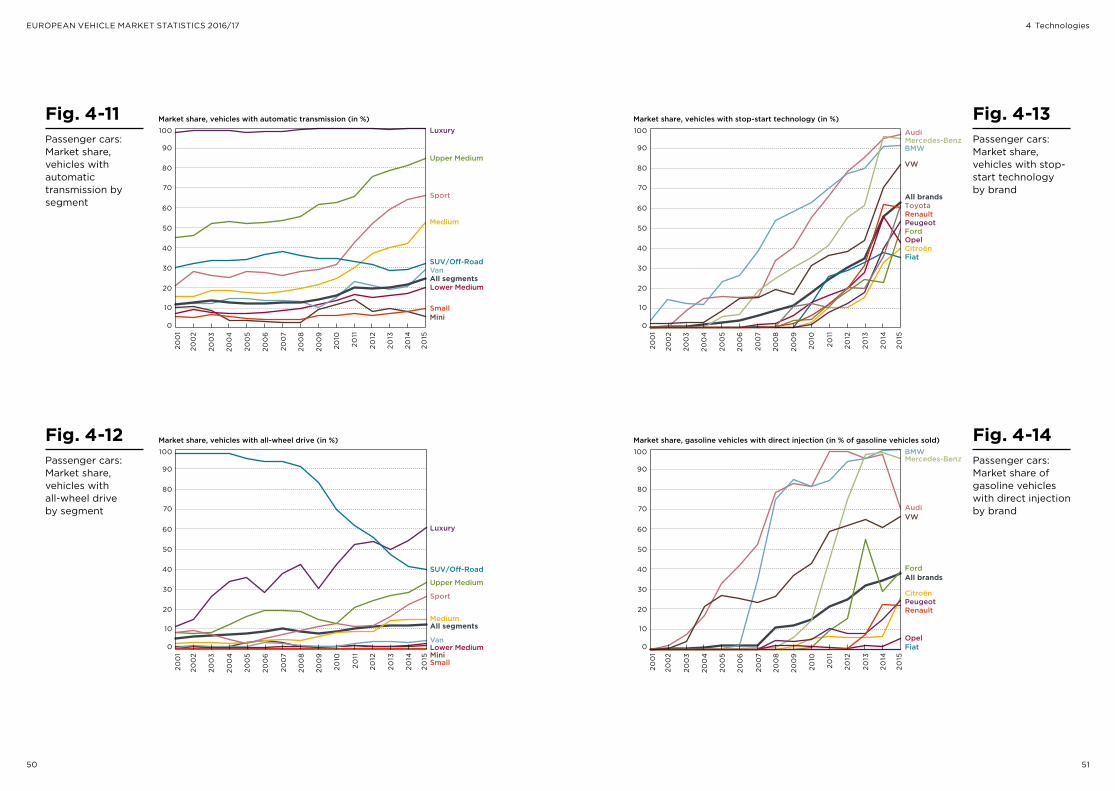
One striking feature of the European vehicle market over the last decade is the sharp increase in market share of passenger cars using gasoline direct injection (GDI) to obtain greater efficiency and lower CO2 emissions. Overall market share of GDI vehicles increased sharply beginning in 2008, and is estimated at around 38"% in 2015. Especially for the premium brands, GDI engines account for the majority of all gasoline vehicle sales in that timeframe. For an accurate comparison of the data, it should be noted that many of the early GDI vehicles limited operation to homogeneous charge only, whereas more complex designs introduced later also allow for stratified charge, with greater efficiency and more CO2 reduction benefit (Fig. 4-14).
Fig. 4-1Passenger cars: Market share, diesel vehicles by Member State
Fig. 4-2Passenger cars: Market share, hybrid-electric vehicles (excl. plug-in hybrid) by Member State
EU-28
Austria
Netherlands
Belgium Spain
Italy
United Kingdom
France
Germany
0
10
20
30
40
50
60
70
80
90
100
Market share, diesel vehicles (in %)
200
1
200
2
200
3
200
4
200
5
200
6
200
7
200
8
200
9
2010
20
15
20
14
2013
20
12
20
11
EU-28
Netherlands
Belgium
Spain
Italy United Kingdom
France
AustriaGermany
Market share, hybrid-electric vehicles (in %)
200
1
20
15
20
14
2013
20
12
0
1
2
3
4
5
6
200
2
200
3
200
4
200
5
200
6
200
7
200
8
200
9
2010
20
11
4 Technologies
46 47
EUROPEAN VEHICLE MARKET STATISTICS 2016/17
Fig. 4-3Passenger cars: Market share, plug-in hybrid and electric vehicles by Member State
4 Technologies
Fig. 4-6Passenger cars: Market share, hybrid-electric vehicles (excl. plug-in hybrid) by brand
Mercedes-Benz
BMW Audi
Opel
Citroën
Fiat
Peugeot
Ford
Renault VW
Toyota
All brands
Market share, hybrid-electric vehicles (in %)
200
1
200
2
200
3
200
4
200
5
200
6
200
7
200
8
200
9
2010
20
15
20
14
2013
20
12
20
11 0
5
10
15
20
30
25
Fig. 4-5Passenger cars: Market share, diesel vehicles by brand
0
10
20
30
40
50
60
70
80
90
100
Market share, diesel vehicles (in %)
Mercedes-Benz BMW
Audi
Opel
Citroën
Fiat
Peugeot
Ford
Renault VW All brands
200
1
200
2
200
3
200
4
200
5
200
6
200
7
200
8
200
9
2010
20
15
20
14
2013
20
12
20
11
Fig. 4-4Passenger cars: Market share, natural gas vehicles (mono- and bivalent) by Member State
EU-28
Italy
0
5
10
15
20
25 Market share, natural gas vehicles (in %)
200
1
200
2
200
3
200
4
200
5
200
6
200
7
200
8
200
9
2010
20
15
20
14
2013
20
12
20
11
EU-28
Netherlands
Belgium Spain Italy
United Kingdom France
AustriaGermany
Market share, plug-in hybrid and electric vehicles (in %)
2012 2015201420130
1
2
3
4
5
10
9
8
7
6
48 49
EUROPEAN VEHICLE MARKET STATISTICS 2016/17
Fig. 4-8Passenger cars: Market share, natural gas vehicles (mono- and bivalent) by brand
Mercedes-Benz
BMW
Audi
Opel
Citroën
Fiat
Peugeot
Ford
Renault VW All brands
0
4
8
12
16
20
Market share, natural gas vehicles (in %)
200
1
200
2
200
3
200
4
200
5
200
6
200
7
200
8
200
9
2010
20
15
20
14
2013
20
12
20
11
Fig. 4-7Passenger cars: Market share, plug-in hybrid and electric vehicles by brand
4 Technologies
Fig. 4-9Passenger cars: Market share, diesel vehicles by segment
Market share, diesel vehicles (in %)
0
10
20
30
40
50
60
70
80
90
100
SUV/Off-Road
Van
Sport
Luxury
Upper Medium
Medium
Lower Medium All segments
Small
Mini
200
1
200
2
200
3
200
4
200
5
200
6
200
7
200
8
200
9
2010
20
15
20
14
20
12
2013
20
11
Fig. 4-10Light-commercial vehicles: Market share, fuels by Member State
Market share, plug-in hybrid and electric vehicles (in %)
Mercedes-Benz
BMW
Audi
Opel
Citroën
Fiat
Peugeot
Ford
Renault
VW
Toyota
All brands
0
0.2
0.4
0.6
0.8
1.0
1.2
1.8
1.4
1.6
2012 201520142013
Diesel(97%) Diesel
(92%)
Gasoline(2%)
Gasoline(4%)
Natural Gas(1%)
Natural Gas(4%)
EU-281,704,600
sales
Italy123,400
sales
50 51
EUROPEAN VEHICLE MARKET STATISTICS 2016/17
Fig. 4-11Passenger cars: Market share, vehicles with automatic transmission by segment
Market share, vehicles with automatic transmission (in %)
0
10
20
30
40
50
60
70
80
90
100
SUV/Off-Road Van
Sport
Luxury
Upper Medium
Medium
Lower Medium All segments
Small Mini
200
1
200
2
200
3
200
4
200
5
200
6
200
7
200
8
200
9
2010
20
15
20
14
2013
20
12
20
11
Fig. 4-13Passenger cars: Market share, vehicles with stop- start technology by brand
4 Technologies
Fig. 4-14Passenger cars: Market share of gasoline vehicles with direct injection by brand
Mercedes-Benz BMW
Audi
Citroën Peugeot
Ford
Opel Fiat
Renault
VW
All brands
Market share, gasoline vehicles with direct injection (in % of gasoline vehicles sold)
0
10
20
30
40
50
60
70
80
90
100
200
1
200
2
200
3
200
4
200
5
200
6
200
7
200
8
200
9
2010
20
15
20
14
2013
20
12
20
11
Fig. 4-12Passenger cars: Market share, vehicles with all-wheel drive by segment
0
10
20
30
40
50
60
70
80
90
100
Van
Sport
SUV/Off-Road
Luxury
Upper Medium
Medium
Lower Medium
All segments
Small Mini
Market share, vehicles with all-wheel drive (in %)
200
1
200
2
200
3
200
4
200
5
200
6
200
7
200
8
200
9
2010
20
15
20
14
2013
20
12
20
11
0
10
20
30
40
50
60
70
80
90
100
Market share, vehicles with stop-start technology (in %)
Mercedes-Benz BMW
Audi
Opel Citroën Fiat
Peugeot Ford
ToyotaRenault
VW
All brands
200
1
200
2
200
3
200
4
200
5
200
6
200
7
200
8
200
9
2010
20
15
20
14
2013
20
12
20
11
1.81310
103143
Australia Toyota Corolla (Gasoline)
1221
81
1.6
99
EU28 Volkswagen Golf (Diesel)
1180
63
1.2
164
China Wuling Hong Guang (Gasoline)
CO2 (g/km)221
Vehicle mass (kg)1837
Engine power (kW)242
Engine displacement (l)2.7
USA Ford F150 (Gasoline)
Brazil Chevrolet Onix (Gasoline; ethanol flex-fuel)
919
72
1.4
163
Mexico Chevrolet Aveo (Gasoline)
CO2 (g/km)141
Vehicle mass (kg)1125
Engine power (kW)77
Engine displacement (l)1.6
970
54
1.5
60
Japan Toyota Aqua (Gasoline; hybrid-electric)
India Maruti Alto (Gasoline)
565
35
0.8
103
52 53
EUROPEAN VEHICLE MARKET STATISTICS 2016/17
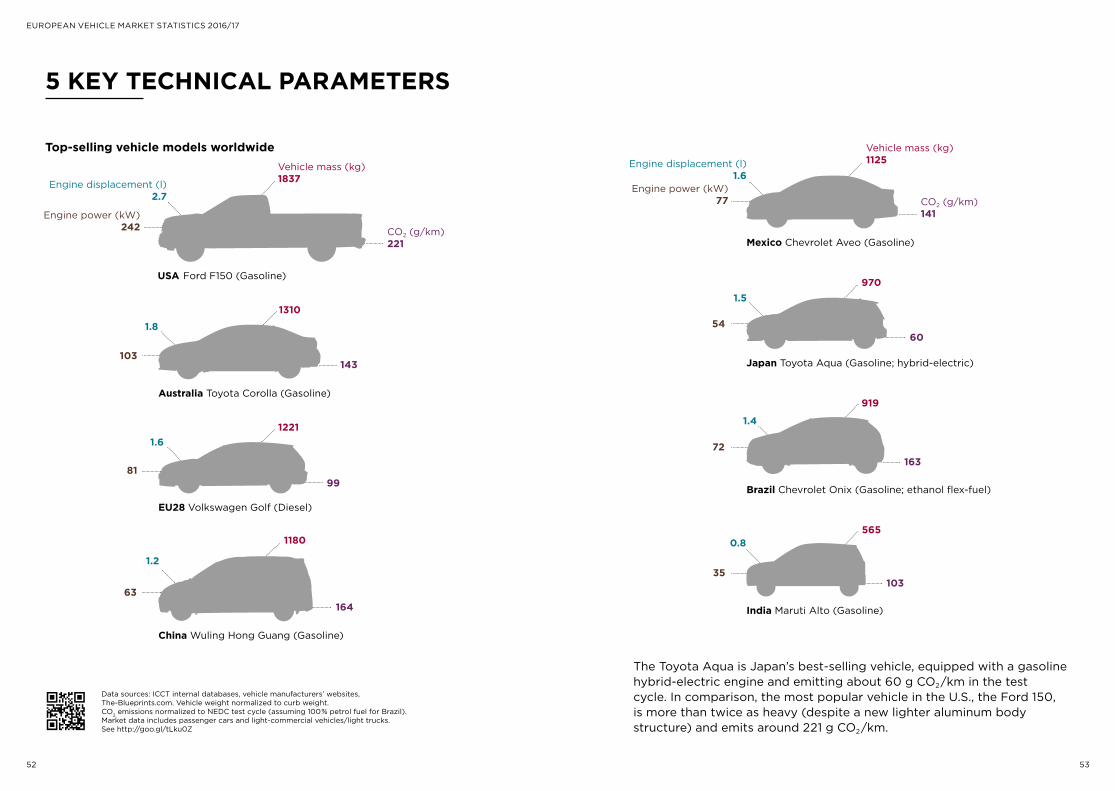
Data sources: ICCT internal databases, vehicle manufacturers’ websites, The-Blueprints.com. Vehicle weight normalized to curb weight. CO2 emissions normalized to NEDC test cycle (assuming 100"% petrol fuel for Brazil). Market data includes passenger cars and light-commercial vehicles/light trucks.See http://goo.gl/tLku0Z
The Toyota Aqua is Japan’s best-selling vehicle, equipped with a gasoline hybrid-electric engine and emitting about 60 g CO2/km in the test cycle. In comparison, the most popular vehicle in the U.S., the Ford 150, is more than twice as heavy (despite a new lighter aluminum body structure) and emits around 221 g CO2/km.
Top-selling vehicle models worldwide
5 KEY TECHNICAL PARAMETERS
54 55
EUROPEAN VEHICLE MARKET STATISTICS 2016/17
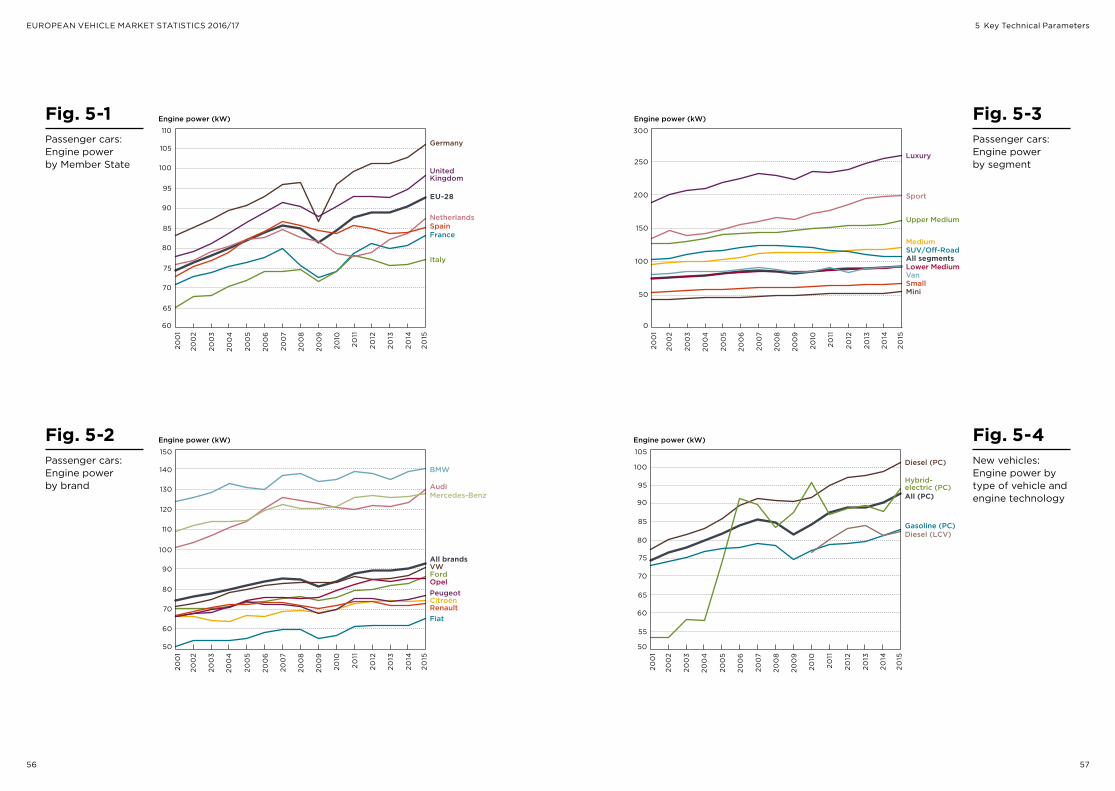
Average engine power for new passenger cars in the EU increased to 93 kW, over 30"% more than the average 10 years before.
Statistics on vehicle mass and CO2 emissions show that those countries and brands with bigger, heavier fleets also have the most powerful fleets, and vice versa. Germany’s fleet is signifi - cantly more powerful than the EU average (106 kW vs. 93 kW), while BMW, Mercedes-Benz, and Audi produce cars even more above the average, at 140 kW, 128 kW, and 130 kW respectively. At the other end of the scale, the French, Italian, and Dutch fleets all come in around or below 80 kW, while Fiat’s average barely exceeds 60 kW. The power figures also display the effects of the economic crisis, with almost all countries’ average power dipping significantly between 2008 and 2010 (Fig. 5-1 and Fig. 5-2).
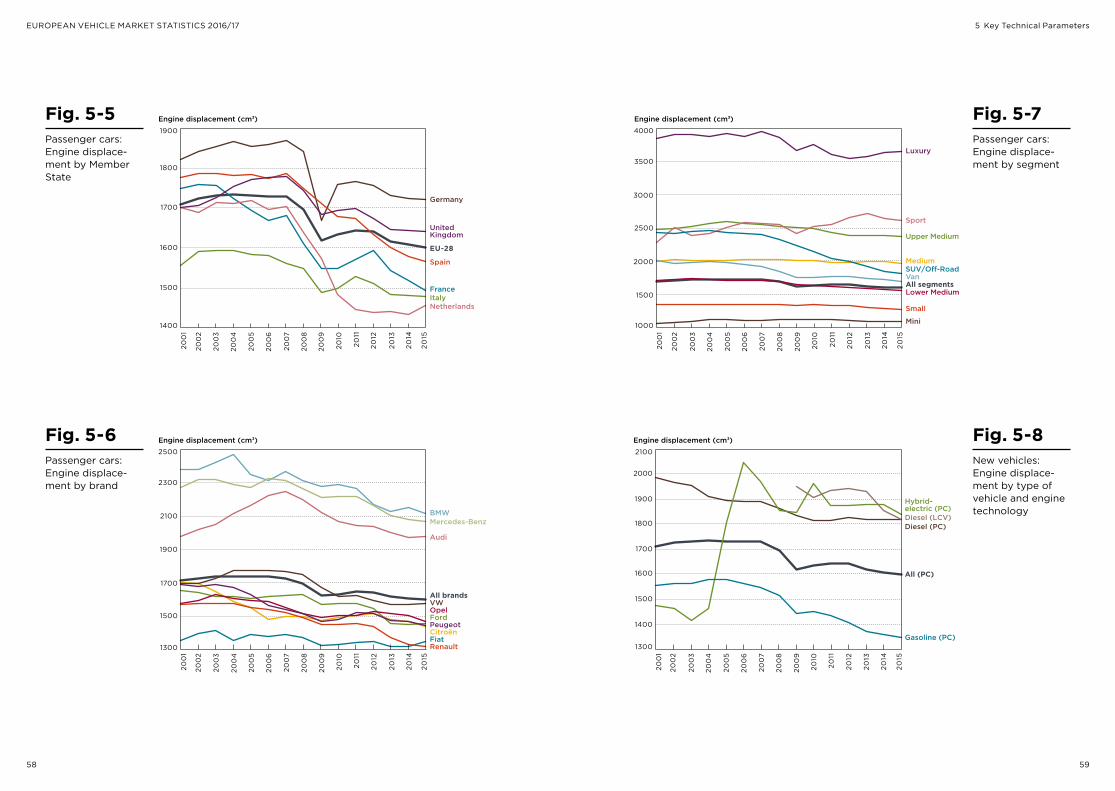
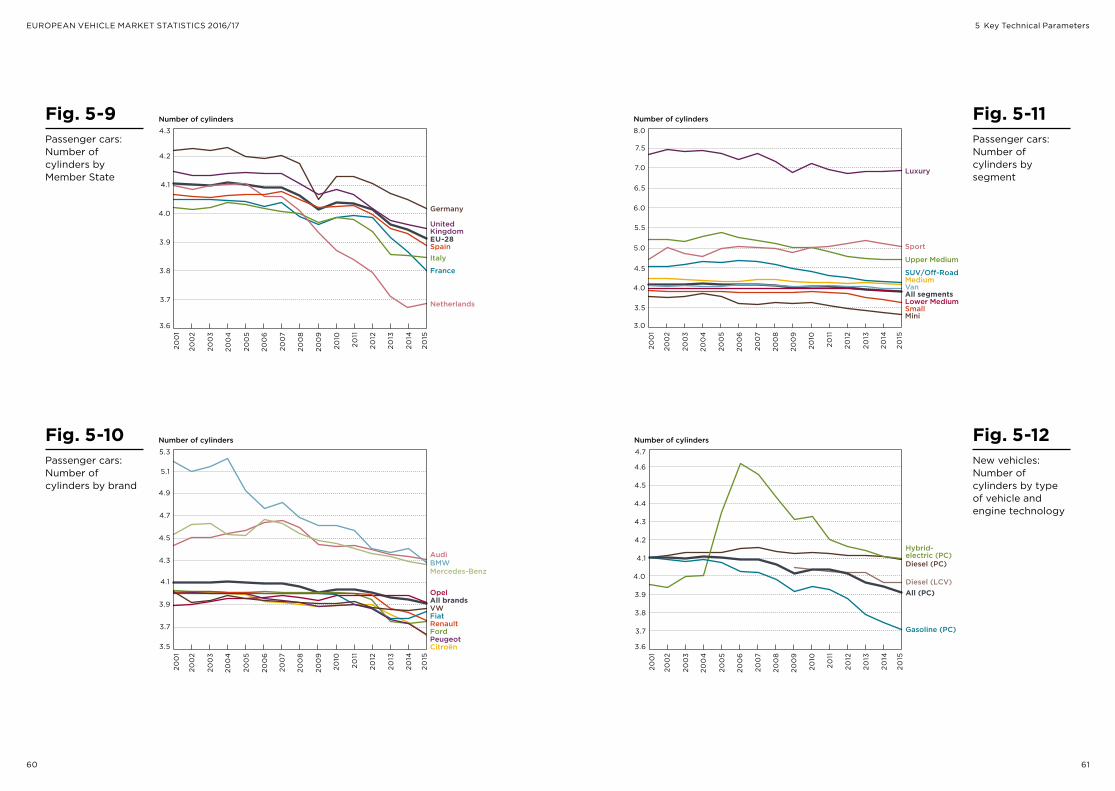
Both engine displacement and average number of cylinders are decreasing, especially since 2007. This is, in part, another effect of the economic crisis, but it also signals an underlying technological trend: improved combustion processes and turbo-charging allow manufacturers to extract more power from smaller engines. Thus, manufacturers are able to substitute a 6-cylinder engine for a 4-cylinder, and to generally reduce engine displacement (Fig. 5-5 to Fig. 5-12).
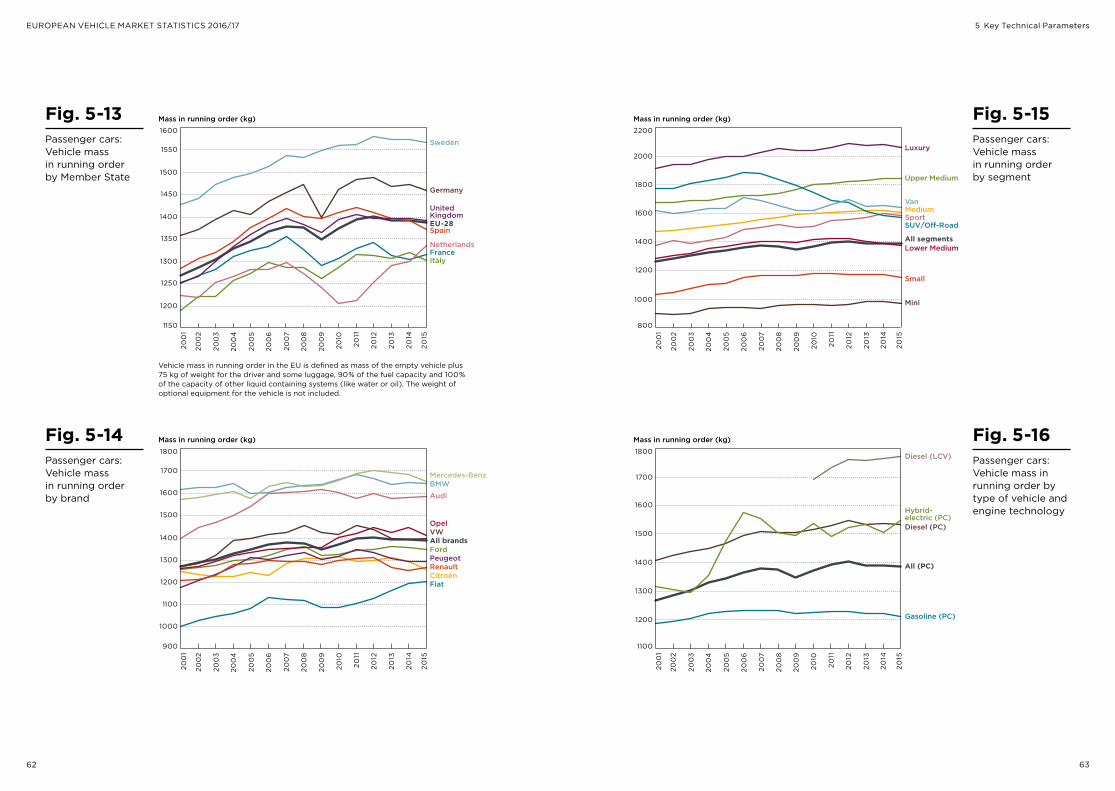
The average mass of new passenger cars in the EU decreased slightly to a level of 1,385 kg. Sweden (1,567 kg in 2015) and Germany (1,460 kg) have, on average, the heaviest cars in the EU; the Netherlands (1,335 kg) has the lightest (Fig. 5-13). The average size of the new fleet increased slightly, to a footprint of about 4.02 m2 (Fig. 5-19).
5 Key Technical Parameters
56 57
EUROPEAN VEHICLE MARKET STATISTICS 2016/17
Fig. 5-1Passenger cars: Engine power by Member State
Fig. 5-3Passenger cars: Engine power by segment
Fig. 5-4New vehicles: Engine power by type of vehicle and engine technology
Fig. 5-2Passenger cars: Engine power by brand
Mercedes-Benz
BMW
Audi
Opel
Citroën
Fiat
Peugeot
Ford
Renault
VW All brands
Engine power (kW)
50
60
70
80
90
100
110
120
130
140
150
200
1
200
2
200
3
200
4
200
5
200
6
200
7
200
8
200
9
2010
20
15
20
14
2013
20
12
20
11
Engine power (kW)
SUV/Off-Road
Van
Sport
Luxury
Upper Medium
Medium
Lower Medium All segments
Small Mini
0
50
100
150
200
250
300
200
1
200
2
200
3
200
4
200
5
200
6
200
7
200
8
200
9
2010
20
15
20
14
2013
20
12
20
11
Diesel (PC)
Hybrid-electric (PC)
Gasoline (PC)
All (PC)
Diesel (LCV)
Engine power (kW)
50
55
60
65
70
75
80
85
90
95
105
100
200
1
200
2
200
3
200
4
200
5
200
6
200
7
200
8
200
9
2010
20
15
20
14
2013
20
12
20
11
5 Key Technical Parameters
Engine power (kW)
EU-28
NetherlandsSpain
Italy
United Kingdom
France
Germany
60
65
70
75
80
85
90
95
100
110
105
200
1
200
2
200
3
200
4
200
5
200
6
200
7
200
8
200
9
2010
20
15
20
14
2013
20
12
20
11
58 59
EUROPEAN VEHICLE MARKET STATISTICS 2016/17
Fig. 5-5Passenger cars: Engine displace-ment by Member State
Fig. 5-6Passenger cars: Engine displace-ment by brand
Fig. 5-7Passenger cars: Engine displace-ment by segment
Fig. 5-8New vehicles: Engine displace-ment by type of vehicle and engine technology
EU-28
Netherlands
Spain
Italy
United Kingdom
France
Germany
1400
1500
1600
1700
1800
1900
Engine displacement (cm3)
200
1
200
2
200
3
200
4
200
5
200
6
200
7
200
8
200
9
2010
20
15
20
14
2013
20
12
20
11
1300
1500
1700
1900
2100
2300
2500
Mercedes-Benz BMW
Audi
Opel
Citroën Fiat
Peugeot Ford
Renault
VW All brands
Engine displacement (cm3)
200
1
200
2
200
3
200
4
200
5
200
6
200
7
200
8
200
9
2010
20
15
20
14
2013
20
12
20
11
1000
1500
2000
2500
3000
3500
4000
SUV/Off-Road Van
Sport
Luxury
Upper Medium
Medium
Lower Medium All segments
Small
Mini
Engine displacement (cm3)
200
1
200
2
200
3
200
4
200
5
200
6
200
7
200
8
200
9
2010
20
15
20
14
2013
20
12
20
11
5 Key Technical Parameters
1300
1400
1500
1600
1700
1800
1900
2000
2100
Diesel (PC)
Hybrid-electric (PC)
Gasoline (PC)
All (PC)
Diesel (LCV)
Engine displacement (cm3)
200
1
200
2
200
3
200
4
200
5
200
6
200
7
200
8
200
9
2010
20
15
20
14
2013
20
12
20
11
60 61
EUROPEAN VEHICLE MARKET STATISTICS 2016/17
Fig. 5-9Passenger cars: Number of cylinders by Member State
Fig. 5-11Passenger cars: Number of cylinders by segment
Fig. 5-10Passenger cars: Number of cylinders by brand
Fig. 5-12New vehicles: Number of cylinders by type of vehicle and engine technology
Number of cylinders
EU-28
Netherlands
Spain Italy
United Kingdom
France
Germany
3.6
3.7
3.8
3.9
4.0
4.1
4.2
4.3
200
1
200
2
200
3
200
4
200
5
200
6
200
7
200
8
200
9
2010
20
15
20
14
2013
20
12
20
11
Number of cylinders
3.0
3.5
4.0
4.5
5.0
5.5
6.0
6.5
7.0
7.5
8.0
SUV/Off-Road
Van
Sport
Luxury
Upper Medium
Medium
Lower Medium All segments
Small Mini
200
1
200
2
200
3
200
4
200
5
200
6
200
7
200
8
200
9
2010
20
15
20
14
2013
20
12
20
11
5 Key Technical Parameters
Number of cylinders
3.5
3.7
3.9
4.1
4.3
4.5
4.7
4.9
5.1
5.3
Mercedes-Benz BMW Audi
Opel
Citroën
Fiat
Peugeot Ford Renault
VW All brands
200
1
200
2
200
3
200
4
200
5
200
6
200
7
200
8
200
9
2010
20
15
20
14
2013
20
12
20
11
Number of cylinders
Diesel (PC)
Hybrid-electric (PC)
Gasoline (PC)
All (PC)Diesel (LCV)
3.6
3.7
3.8
3.9
4.0
4.1
4.2
4.3
4.4
4.5
4.6
4.7
200
1
200
2
200
3
200
4
200
5
200
6
200
7
200
8
200
9
2010
20
15
20
14
2013
20
12
20
11
62 63
EUROPEAN VEHICLE MARKET STATISTICS 2016/17
Fig. 5-13Passenger cars: Vehicle mass in running order by Member State
Fig. 5-15Passenger cars: Vehicle mass in running order by segment
Fig. 5-14Passenger cars: Vehicle mass in running order by brand
Fig. 5-16Passenger cars: Vehicle mass in running order by type of vehicle and engine technology
Vehicle mass in running order in the EU is defined as mass of the empty vehicle plus 75 kg of weight for the driver and some luggage, 90% of the fuel capacity and 100% of the capacity of other liquid containing systems (like water or oil). The weight of optional equipment for the vehicle is not included.
5 Key Technical Parameters
1150
1200
1250
1300
1350
1400
1450
1500
1550
1600
Mass in running order (kg)
EU-28
Netherlands
Spain
Italy
United Kingdom
France
Sweden
Germany 20
01
200
2
200
3
200
4
200
5
200
6
200
7
200
8
200
9
2010
20
15
20
14
2013
20
12
20
11
Mass in running order (kg)
800
1000
1200
1400
1600
1800
2000
2200
SUV/Off-Road
Van
Sport
Luxury
Upper Medium
Medium
Lower Medium All segments
Small
Mini
200
1
200
2
200
3
200
4
200
5
200
6
200
7
200
8
200
9
2010
20
15
20
14
2013
20
12
20
11
Mass in running order (kg)
1100
1200
1300
1400
1500
1600
1700
1800
Diesel (PC)
Hybrid-electric (PC)
Gasoline (PC)
All (PC)
Diesel (LCV)
200
1
200
2
200
3
200
4
200
5
200
6
200
7
200
8
200
9
2010
20
15
20
14
2013
20
12
20
11
Mass in running order (kg)
900
1000
1100
1200
1300
1400
1500
1600
1800
1700 Mercedes-Benz BMW Audi
Opel
Citroën Fiat
Peugeot Ford
Renault
VW All brands
200
1
200
2
200
3
200
4
200
5
200
6
200
7
200
8
200
9
2010
20
15
20
14
2013
20
12
20
11
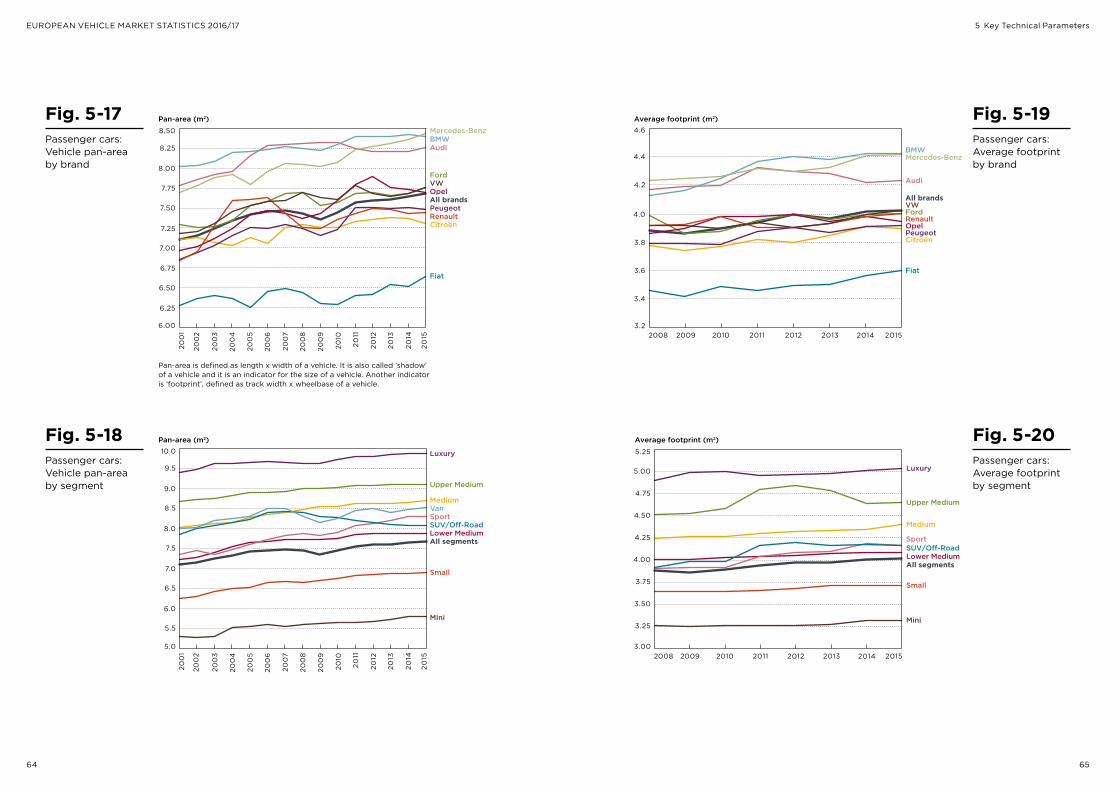
64 65
EUROPEAN VEHICLE MARKET STATISTICS 2016/17
Fig. 5-17Passenger cars: Vehicle pan-area by brand
Fig. 5-18Passenger cars: Vehicle pan-area by segment
6.00
6.25
6.50
6.75
7.00
7.25
7.50
7.75
8.00
8.25
8.50
Pan-area (m2) Mercedes-Benz BMW Audi
Opel
Citroën
Fiat
Peugeot
Ford
Renault
VW
All brands
200
1
200
2
200
3
200
4
200
5
200
6
200
7
200
8
200
9
2010
20
15
20
14
2013
20
12
20
11
Pan-area is defined as length x width of a vehicle. It is also called ‘shadow’ of a vehicle and it is an indicator for the size of a vehicle. Another indicator is ‘footprint’, defined as track width x wheelbase of a vehicle.
Fig. 5-19Passenger cars: Average footprint by brand
Fig. 5-20Passenger cars: Average footprint by segment
Average footprint (m2)
Mercedes-Benz BMW
Audi
Opel
Citroën
Fiat
Peugeot
Ford Renault
VW All brands
3.2
3.4
3.6
3.8
4.0
4.2
4.4
4.6
2008 2009 2010 20152014201320122011
Average footprint (m2)
SUV/Off-Road Sport
Luxury
Upper Medium
Medium
Lower Medium All segments
Small
Mini
3.00
3.25
3.50
3.75
4.00
4.25
4.50
4.75
5.00
5.25
2008 2009 2010 20152014201320122011
5 Key Technical Parameters
Pan-area (m2)
5.0
5.5
6.0
6.5
7.0
7.5
8.0
8.5
9.0
9.5
10.0
SUV/Off-Road
Van Sport
Luxury
Upper Medium
Medium
Lower Medium All segments
Small
Mini
200
1
200
2
200
3
200
4
200
5
200
6
200
7
2 00
8
200
9
2010
20
15
20
14
2013
20
12
20
11
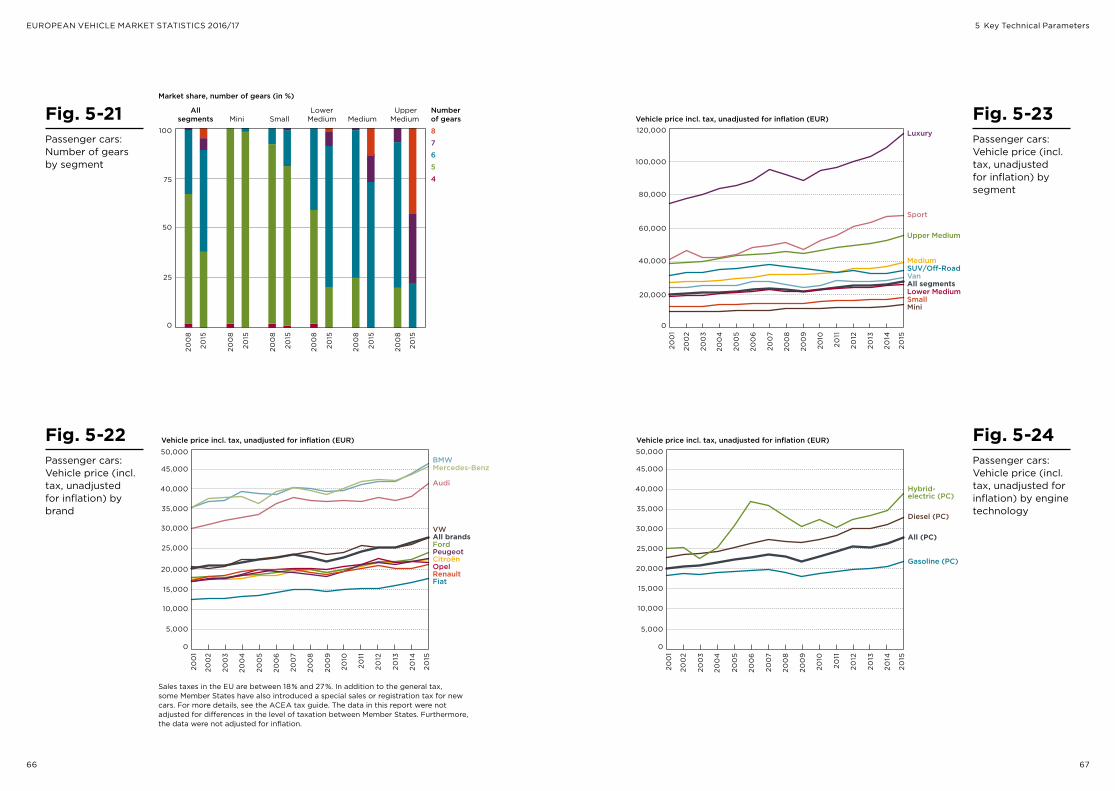
66 67
EUROPEAN VEHICLE MARKET STATISTICS 2016/17
Fig. 5-21Passenger cars: Number of gears by segment
5 Key Technical Parameters
Fig. 5-24Passenger cars: Vehicle price (incl. tax, unadjusted for inflation) by engine technology
Fig. 5-23Passenger cars: Vehicle price (incl. tax, unadjusted for inflation) by segment
Vehicle price incl. tax, unadjusted for inflation (EUR)
0
20,000
40,000
60,000
80,000
100,000
120,000
SUV/Off-Road Van
Sport
Luxury
Upper Medium
Medium
Lower Medium All segments
Small Mini
200
1
200
2
200
3
200
4
200
5
200
6
200
7
200
8
200
9
2010
20
15
20
14
2013
20
12
20
11
Fig. 5-22Passenger cars: Vehicle price (incl. tax, unadjusted for inflation) by brand
0
5,000
10,000
15,000
20,000
25,000
30,000
35,000
40,000
50,000
45,000
Vehicle price incl. tax, unadjusted for inflation (EUR)
Mercedes-Benz BMW
Audi
Opel Citroën
Fiat
Peugeot Ford
Renault
VW All brands
200
1
200
2
200
3
200
4
200
5
200
6
200
7
2 00
8
200
9
2010
20
15
20
14
2013
20
12
20
11
Sales taxes in the EU are between 18"% and 27"%. In addition to the general tax, some Member States have also introduced a special sales or registration tax for new cars. For more details, see the ACEA tax guide. The data in this report were not adjusted for differences in the level of taxation between Member States. Furthermore, the data were not adjusted for inflation.
Market share, number of gears (in %)
25
0
50
75
100
200
8
2015
200
8
2015
200
8
2015
200
8
2015
200
8
2015
200
8
2015
All segments Mini Small
Lower Medium Medium
UpperMedium
Number of gears8 7 6 5 4
0
5,000
10,000
15,000
20,000
25,000
30,000
35,000
45,000
40,000
50,000
Vehicle price incl. tax, unadjusted for inflation (EUR)
Diesel (PC)
Hybrid-electric (PC)
Gasoline (PC)
All (PC)
200
1
200
2
200
3
200
4
200
5
200
6
200
7
200
8
200
9
2010
20
15
20
14
2013
20
12
20
11
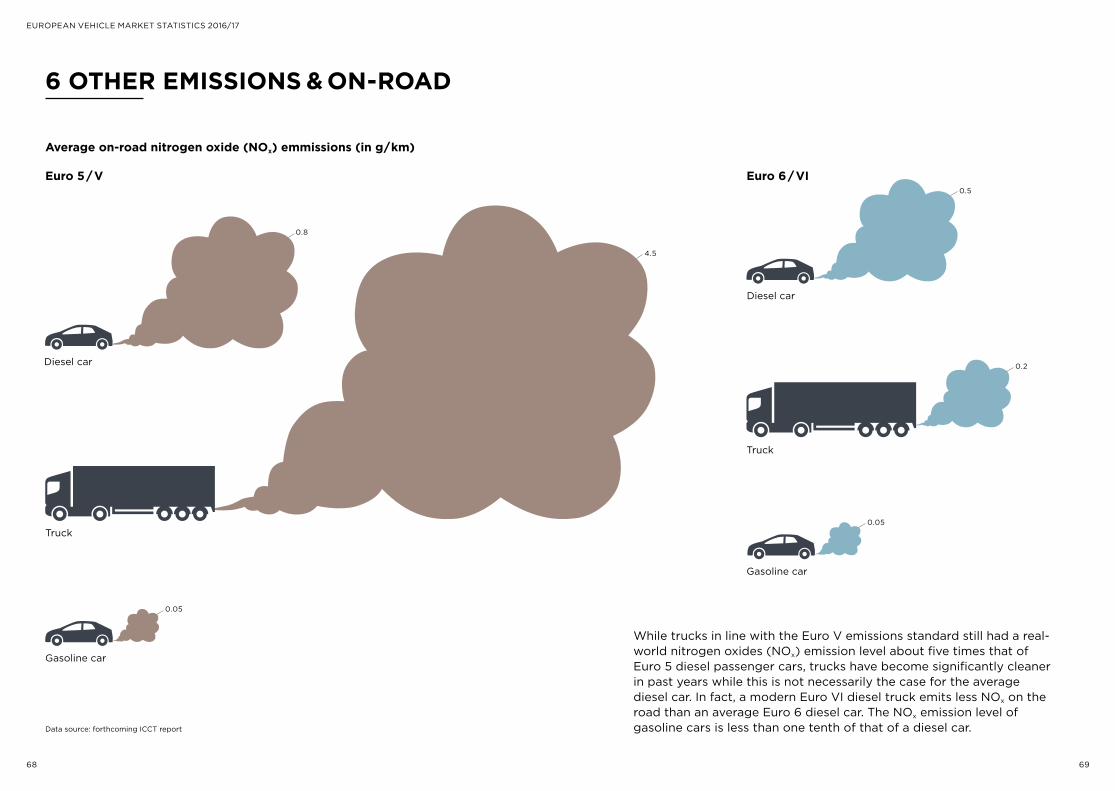
Truck
Truck
Diesel car
Diesel car
Gasoline car
Gasoline car
0.8
0.5
4.5
0.2
0.05
0.05
68 69
EUROPEAN VEHICLE MARKET STATISTICS 2016/17
6 OTHER EMISSIONS#&#ON-ROAD
While trucks in line with the Euro V emissions standard still had a real-world nitrogen oxides (NOx) emission level about five times that of Euro 5 diesel passenger cars, trucks have become significantly cleaner in past years while this is not necessarily the case for the average diesel car. In fact, a modern Euro VI diesel truck emits less NOx on the road than an average Euro 6 diesel car. The NOx emission level of gasoline cars is less than one tenth of that of a diesel car.
Average on-road nitrogen oxide (NOx) emmissions (in g/km)
Euro 5#/#V Euro 6#/#VI
Data source: forthcoming ICCT report
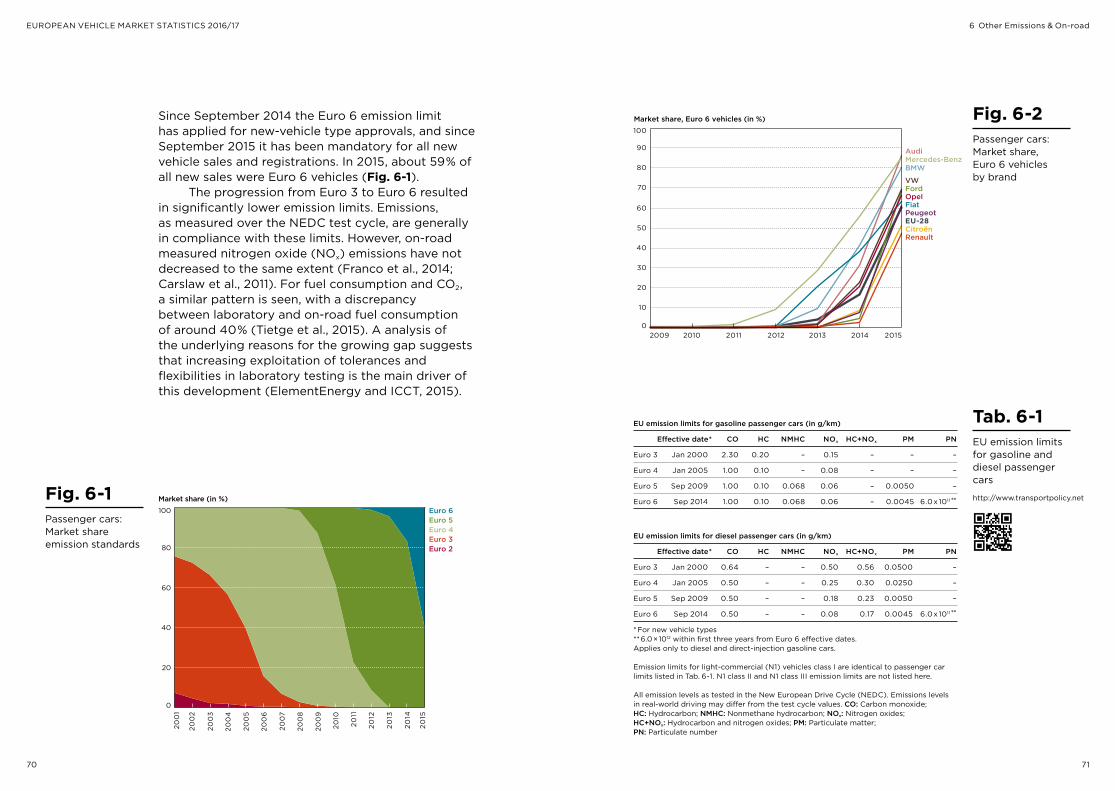
70 71
EUROPEAN VEHICLE MARKET STATISTICS 2016/17
Since September 2014 the Euro 6 emission limit has applied for new-vehicle type approvals, and since September 2015 it has been mandatory for all new vehicle sales and registrations. In 2015, about 59"% of all new sales were Euro 6 vehicles (Fig. 6-1).
The progression from Euro 3 to Euro 6 resulted in significantly lower emission limits. Emissions, as measured over the NEDC test cycle, are generally in compliance with these limits. However, on-road measured nitrogen oxide (NOx) emissions have not decreased to the same extent (Franco et al., 2014; Carslaw et al., 2011). For fuel consumption and CO2, a similar pattern is seen, with a discrepancy between laboratory and on-road fuel consumption of around 40"% (Tietge et al., 2015). A analysis of the underlying reasons for the growing gap suggests that increasing exploitation of tolerances and flexibilities in laboratory testing is the main driver of this development (ElementEnergy and ICCT, 2015).
6 Other Emissions & On-road
Tab. 6-1EU emission limits for gasoline and diesel passenger cars
EU emission limits for gasoline passenger cars (in g/km)
Effective date* CO HC NMHC NOx HC+NOx PM PN
Euro 3 Jan 2000 2.30 0.20 – 0.15 – – –
Euro 4 Jan 2005 1.00 0.10 – 0.08 – – –
Euro 5 Sep 2009 1.00 0.10 0.068 0.06 – 0.0050 –
Euro 6 Sep 2014 1.00 0.10 0.068 0.06 – 0.0045 6.0$x$1011**
EU emission limits for diesel passenger cars (in g/km)
Effective date* CO HC NMHC NOx HC+NOx PM PN
Euro 3 Jan 2000 0.64 – – 0.50 0.56 0.0500 –
Euro 4 Jan 2005 0.50 – – 0.25 0.30 0.0250 –
Euro 5 Sep 2009 0.50 – – 0.18 0.23 0.0050 –
Euro 6 Sep 2014 0.50 – – 0.08 0.17 0.0045 6.0$x$1011**
*$For new vehicle types**$6.0$×$1012 within first three years from Euro 6 effective dates. Applies only to diesel and direct-injection gasoline cars.
Emission limits for light-commercial (N1) vehicles class I are identical to passenger car limits listed in Tab. 6-1. N1 class II and N1 class III emission limits are not listed here.
All emission levels as tested in the New European Drive Cycle (NEDC). Emissions levels in real-world driving may differ from the test cycle values. CO: Carbon monoxide; HC: Hydrocarbon; NMHC: Nonmethane hydrocarbon; NOx: Nitrogen oxides; HC+NOx: Hydrocarbon and nitrogen oxides; PM: Particulate matter; PN: Particulate number
http://www.transportpolicy.netMarket share (in %)
0
20
40
60
80
100 Euro 6 Euro 5 Euro 4 Euro 3 Euro 2
200
1
200
2
200
3
200
4
200
5
200
6
200
7
200
8
200
9
2010
20
15
20
14
2013
20
12
20
11
Fig. 6-1Passenger cars: Market share emission standards
Fig. 6-2Passenger cars: Market share, Euro 6 vehicles by brand
Market share, Euro 6 vehicles (in %)
Mercedes-Benz BMW
Audi
Opel
Citroën
Fiat Peugeot
Ford
Renault
VW
EU-28
2009 2010 20152014201320122011 0
10
20
30
40
50
100
90
60
70
80
72 73
EUROPEAN VEHICLE MARKET STATISTICS 2016/17
Remarks on Data Sources
With the adoption of the EU regulation setting CO2 emission performance standards for new passenger cars (Regulation (EC) No. 443/2009) and light- commercial vehicles (Regulation (EC) No. 510/2011) Member States are required to report certain details for each new vehicle registered in their territory. The information is then compiled and published by the European Environmental Agency (EEA) on behalf of the European Commission. The first statistical report for passenger cars was published in 2011, and the first report for light-commercial vehicles in 2013. Before the adoption of Regulation (EC) No. 443/2009, Decision No. 1753/2000/EC was in place, which established the scheme for monitoring the average specific CO2 emissions from new passenger cars. Therefore, official EU CO2 monitoring data for new passenger cars is available from the year 2000 onwards. While these data collections are an important step forward in making trans parent and detailed vehicle market statistics for Europe available to the general public, the amount of infor mation included is limited to a few parameters, such as number of registrations, manufacturer, fuel type, CO2 emission, and vehicle mass.
The basis for the statistics shown in this report is a database compiled by the ICCT. It includes technical information, emission levels, and registration vol umes at a car variant level. Sources of information include data obtained by IHS-Polk from various registration authorities, as well as car manufacturers’ and importers’ associations, data from the Euro pean Environmental Agency, the United Kingdom Vehicle Certification Agency (VCA), the German Kraft fahrtbundesamt (KBA), Auto mobil Revue, km77.com, ADAC and information provided directly by manu facturers and suppliers. Data included in this report are aggregated to a great extent and are only intended to illustrate high-level trends. It is not to be considered official data and does not provide the same level of precision as the EC CO2 monitoring data.
For light-commercial vehicles only 2009 to 2015 data are available.
For the United States, the Environmental Protection Agency (US EPA) is in charge of releasing a similar annual publication that includes trends on vehicle technologies, CO2 emissions and fuel economy from 1975 onward (EPA, 2016). For China, a similar statistical overview was prepared by ICCT for the 2010 car fleet (He and Tu, 2012).
Annex
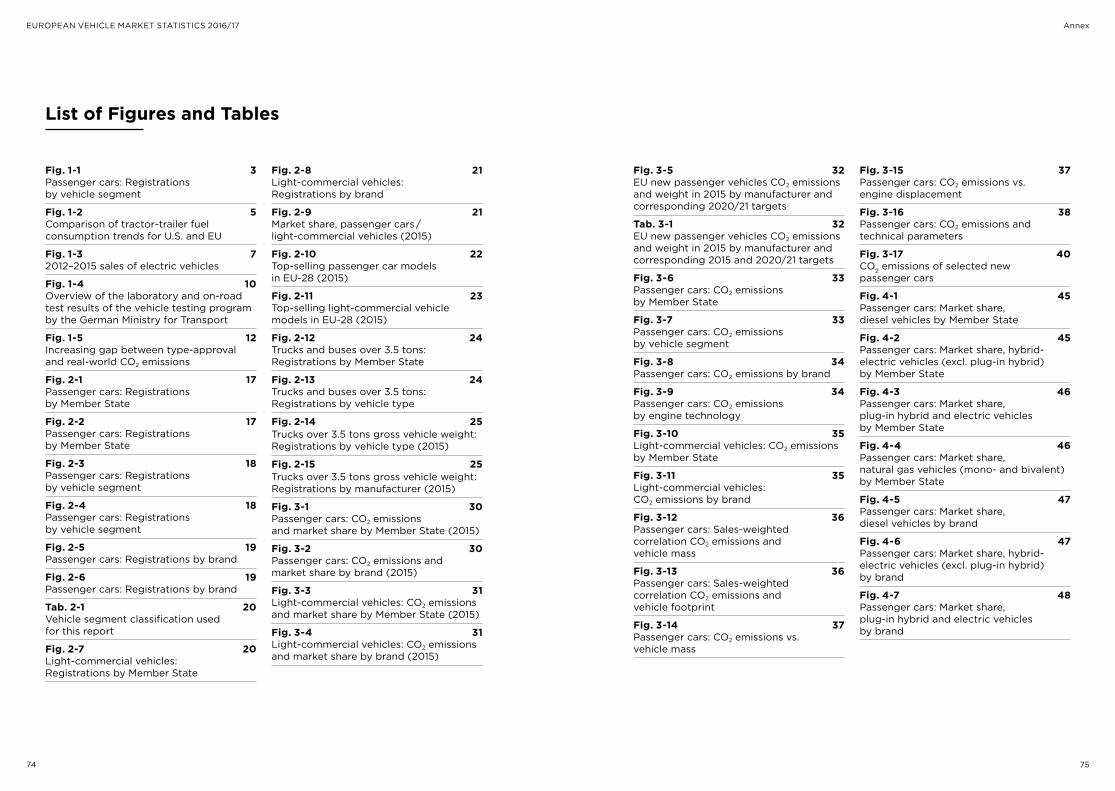
74 75
EUROPEAN VEHICLE MARKET STATISTICS 2016/17 Annex
List of Figures and Tables
Fig. 1-1 3Passenger cars: Registrations by vehicle segment
Fig. 1-2 5Comparison of tractor-trailer fuel consumption trends for U.S. and EU
Fig. 1-3 72012–2015 sales of electric vehicles
Fig. 1-4 10Overview of the laboratory and on-road test results of the vehicle testing program by the German Ministry for Transport
Fig. 1-5 12Increasing gap between type-approval and real-world CO2 emissions
Fig. 2-1 17Passenger cars: Registrations by Member State
Fig. 2-2 17Passenger cars: Registrations by Member State
Fig. 2-3 18Passenger cars: Registrations by vehicle segment
Fig. 2-4 18Passenger cars: Registrationsby vehicle segment
Fig. 2-5 19Passenger cars: Registrations by brand
Fig. 2-6 19Passenger cars: Registrations by brand
Tab. 2-1 20Vehicle segment classification used for this report
Fig. 2-7 20Light-commercial vehicles: Registrations by Member State
Fig. 2-8 21Light-commercial vehicles: Registrations by brand
Fig. 2-9 21Market share, passenger cars$/$ light-commercial vehicles (2015)
Fig. 2-10 22Top-selling passenger car models in EU-28 (2015)
Fig. 2-11 23Top-selling light-commercial vehicle models in EU-28 (2015)
Fig. 2-12 24Trucks and buses over 3.5 tons: Registrations by Member State
Fig. 2-13 24Trucks and buses over 3.5 tons: Registrations by vehicle type
Fig. 2-14 25Trucks over 3.5 tons gross vehicle weight: Registrations by vehicle type (2015)
Fig. 2-15 25Trucks over 3.5 tons gross vehicle weight: Registrations by manufacturer (2015)
Fig. 3-1 30Passenger cars: CO2 emissions and market share by Member State (2015)
Fig. 3-2 30Passenger cars: CO2 emissions and market share by brand (2015)
Fig. 3-3 31Light-commercial vehicles: CO2 emissions and market share by Member State (2015)
Fig. 3-4 31Light-commercial vehicles: CO2 emissions and market share by brand (2015)
Fig. 3-5 32EU new passenger vehicles CO2 emissions and weight in 2015 by manufacturer and corresponding 2020/21 targets
Tab. 3-1 32EU new passenger vehicles CO2 emissions and weight in 2015 by manufacturer and corresponding 2015 and 2020/21 targets
Fig. 3-6 33Passenger cars: CO2 emissions by Member State
Fig. 3-7 33Passenger cars: CO2 emissions by vehicle segment
Fig. 3-8 34Passenger cars: CO2 emissions by brand
Fig. 3-9 34Passenger cars: CO2 emissions by engine technology
Fig. 3-10 35Light-commercial vehicles: CO2 emissions by Member State
Fig. 3-11 35Light-commercial vehicles: CO2 emissions by brand
Fig. 3-12 36Passenger cars: Sales-weighted correlation CO2 emissions and vehicle mass
Fig. 3-13 36Passenger cars: Sales-weighted correlation CO2 emissions and vehicle footprint
Fig. 3-14 37Passenger cars: CO2 emissions vs. vehicle mass
Fig. 3-15 37Passenger cars: CO2 emissions vs. engine displacement
Fig. 3-16 38Passenger cars: CO2 emissions and technical parameters
Fig. 3-17 40CO2 emissions of selected new passenger cars
Fig. 4-1 45Passenger cars: Market share, diesel vehicles by Member State
Fig. 4-2 45Passenger cars: Market share, hybrid- electric vehicles (excl. plug-in hybrid) by Member State
Fig. 4-3 46Passenger cars: Market share, plug-in hybrid and electric vehicles by Member State
Fig. 4-4 46Passenger cars: Market share, natural gas vehicles (mono- and bivalent) by Member State
Fig. 4-5 47Passenger cars: Market share, diesel vehicles by brand
Fig. 4-6 47Passenger cars: Market share, hybrid- electric vehicles (excl. plug-in hybrid) by brand
Fig. 4-7 48Passenger cars: Market share, plug-in hybrid and electric vehicles by brand
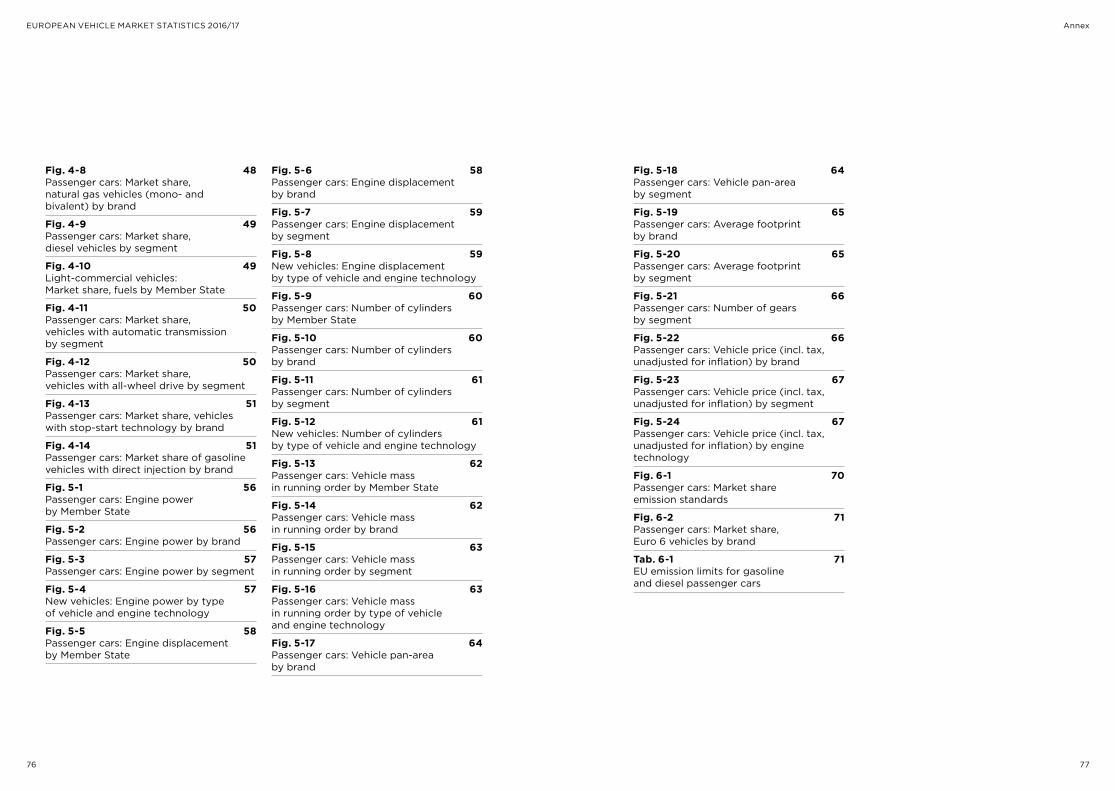
76 77
EUROPEAN VEHICLE MARKET STATISTICS 2016/17 Annex
Fig. 4-8 48Passenger cars: Market share, natural gas vehicles (mono- and bivalent) by brand
Fig. 4-9 49Passenger cars: Market share, diesel vehicles by segment
Fig. 4-10 49Light-commercial vehicles: Market share, fuels by Member State
Fig. 4-11 50Passenger cars: Market share, vehicles with automatic transmission by segment
Fig. 4-12 50Passenger cars: Market share, vehicles with all-wheel drive by segment
Fig. 4-13 51Passenger cars: Market share, vehicles with stop-start technology by brand
Fig. 4-14 51Passenger cars: Market share of gasoline vehicles with direct injection by brand
Fig. 5-1 56Passenger cars: Engine power by Member State
Fig. 5-2 56Passenger cars: Engine power by brand
Fig. 5-3 57Passenger cars: Engine power by segment
Fig. 5-4 57New vehicles: Engine power by type of vehicle and engine technology
Fig. 5-5 58Passenger cars: Engine displacement by Member State
Fig. 5-6 58Passenger cars: Engine displacement by brand
Fig. 5-7 59Passenger cars: Engine displacement by segment
Fig. 5-8 59New vehicles: Engine displacement by type of vehicle and engine technology
Fig. 5-9 60Passenger cars: Number of cylinders by Member State
Fig. 5-10 60Passenger cars: Number of cylinders by brand
Fig. 5-11 61Passenger cars: Number of cylinders by segment
Fig. 5-12 61New vehicles: Number of cylinders by type of vehicle and engine technology
Fig. 5-13 62Passenger cars: Vehicle mass in running order by Member State
Fig. 5-14 62Passenger cars: Vehicle mass in running order by brand
Fig. 5-15 63Passenger cars: Vehicle mass in running order by segment
Fig. 5-16 63Passenger cars: Vehicle mass in running order by type of vehicle and engine technology
Fig. 5-17 64Passenger cars: Vehicle pan-area by brand
Fig. 5-18 64Passenger cars: Vehicle pan-area by segment
Fig. 5-19 65Passenger cars: Average footprint by brand
Fig. 5-20 65Passenger cars: Average footprint by segment
Fig. 5-21 66Passenger cars: Number of gears by segment
Fig. 5-22 66Passenger cars: Vehicle price (incl. tax, unadjusted for inflation) by brand
Fig. 5-23 67Passenger cars: Vehicle price (incl. tax, unadjusted for inflation) by segment
Fig. 5-24 67Passenger cars: Vehicle price (incl. tax, unadjusted for inflation) by engine technology
Fig. 6-1 70Passenger cars: Market share emission standards
Fig. 6-2 71Passenger cars: Market share, Euro 6 vehicles by brand
Tab. 6-1 71EU emission limits for gasoline and diesel passenger cars
78 79
EUROPEAN VEHICLE MARKET STATISTICS 2016/17
BMVI (2016). Bericht der Untersuchungskommission “Volkswagen” – Untersuchungen und verwaltungsrechtliche Maßnahmen zu Volkswagen, Ergebnisse der Feld-untersuchung des Kraftfahrt-Bundesamtes zu unzulässigen Abschalteinrichtungen bei Dieselfahrzeugen und Schlussfolgerungen. Retrieved from http://www.bmvi.de/SharedDocs/DE/Publikationen/LA/bericht-untersuchungskommission-volkswagen
Carslaw et al. (2011). Recent evidence concerning higher NOx emissions from passenger cars and light duty vehicles. Journal of Atmospheric Environment 45 (2011) 7053–7063.
Diaz, S., Tietge, U., Mock, P. (2016). CO2 emissions from new passenger cars in the EU: Car manufacturers’ performance in 2015. International Council on Clean Transportation (ICCT). Retrieved from http://www.theicct.org/co2-from-new-cars-eu-2015
Deutsche Automobil Treuhand GmbH (DAT) (2016). Leitfaden über den Kraftstoff-verbrauch, die CO2-Emissionen und den Stromverbrauch aller neuen Personen - kraft wagenmodelle, die in Deutschland zum Verkauf angeboten werden. Ausgabe 2016, 3. Quartal.
European Commission (EC) (2016). A European Strategy for low-emission mobility. Retrieved from http://ec.europa.eu/transport/themes/strategies/news/2016-07-20-decarbonisation_en.htm
ElementEnergy and ICCT (2015). Impact of real-world driving on emissions from UK cars and vans. Retrieved from http://www.theccc.org.uk/publication/impact-of- real-world-driving-emissions
European Environmental Agency (EEA) (2016). Reported CO2 emissions from new cars continue to fall. Retrieved from http://www.eea.europa.eu/highlights/reported-co2-emissions-from-new
Franco, V., Posada, F., German, J., Mock, P. (2014). Real-world exhaust emissions from modern diesel cars. International Council on Clean Transportation (ICCT). Retrieved from http://www.theicct.org/real-world-exhaust-emissions-modern-diesel-cars
Franco, V. (2016). Proposed new type-approval system for motor vehicles in the European Union. International Council on Clean Transportation (ICCT). Retrieved from http://www.theicct.org/proposed-new-type-approval-framework- eu-policy-update
He, H., Tu, J. (2012). The New Passenger Car Fleet in China, 2010 – Technology Assessment and International Comparisons. International Council on Clean Transportation (ICCT). Retrieved from http://www.theicct.org/new-passenger-car- fleet-china-2010
References
Annex
International Council on Clean Transportation (ICCT) (2013). Global transportation roadmap. Retrieved from http://www.theicct.org/global-transportation-roadmap-model
Miller, J. (2016). Reducing CO2 emissions from road transport in the European Union: An evaluation of policy options. International Council on Clean Transportation (ICCT). Retrieved from http://www.theicct.org/evaluating-policy-options-reducing-CO2- from-transport-EU
Mock, P. (2014a). EU CO2 standards for passenger cars and light commercial vehicles. International Council on Clean Transportation (ICCT). Retrieved from http://theicct.org/eu-co2-standards-passenger-cars-and-lcvs
Mock, P. (2014b). World-Harmonized Light-Duty Vehicles Test Procedure. International Council on Clean Transportation (ICCT). Retrieved from http://www.theicct.org/wltp-november2013-update
Muncrief, R. (2014). Europe’s global leadership on vehicle emission standards at risk in the truck sector. International Council on Clean Transportation (ICCT). Retrieved from http://www.theicct.org/blogs/staff/europes-global-leadership- vehicle-emission-standards-at-risk-truck-sector
Muncrief, R., Sharpe, B. (2015). Overview of the heavy-duty vehicle market and CO2 emissions in the European Union. International Council on Clean Transportation (ICCT). Retrieved from http://www.theicct.org/overview-heavy-duty-vehicle-market-and- co2-emissions-european-union
Muncrief, R., German, J., Schultz, J. (2016). Defeat devices under the U.S. and EU passenger vehicle emissions testing regulations. International Council on Clean Transportation (ICCT). Retrieved from http://www.theicct.org/briefing-defeat-devices-us-eu-vehicle-emissions-regulations
Tietge, U., Zacharof, N., Mock, P., Franco, V., German, J., Bandivadekar, A., Ligterink, N., Lambrecht, U. (2015). From laboratory to road: A 2015 update of official and “real-world” fuel consumption and CO2 values for passenger cars in Europe. International Council on Clean Transportation (ICCT). Retrieved from http://www.theicct.org/laboratory-road-2015-update
United States Environmental Protection Agency (U.S. EPA) (2016). Light-Duty Automotive Technology, Carbon Dioxide Emissions, and Fuel Economy Trends: 1975 through 2015. Retrieved from http://www.epa.gov/otaq/fetrends.htm
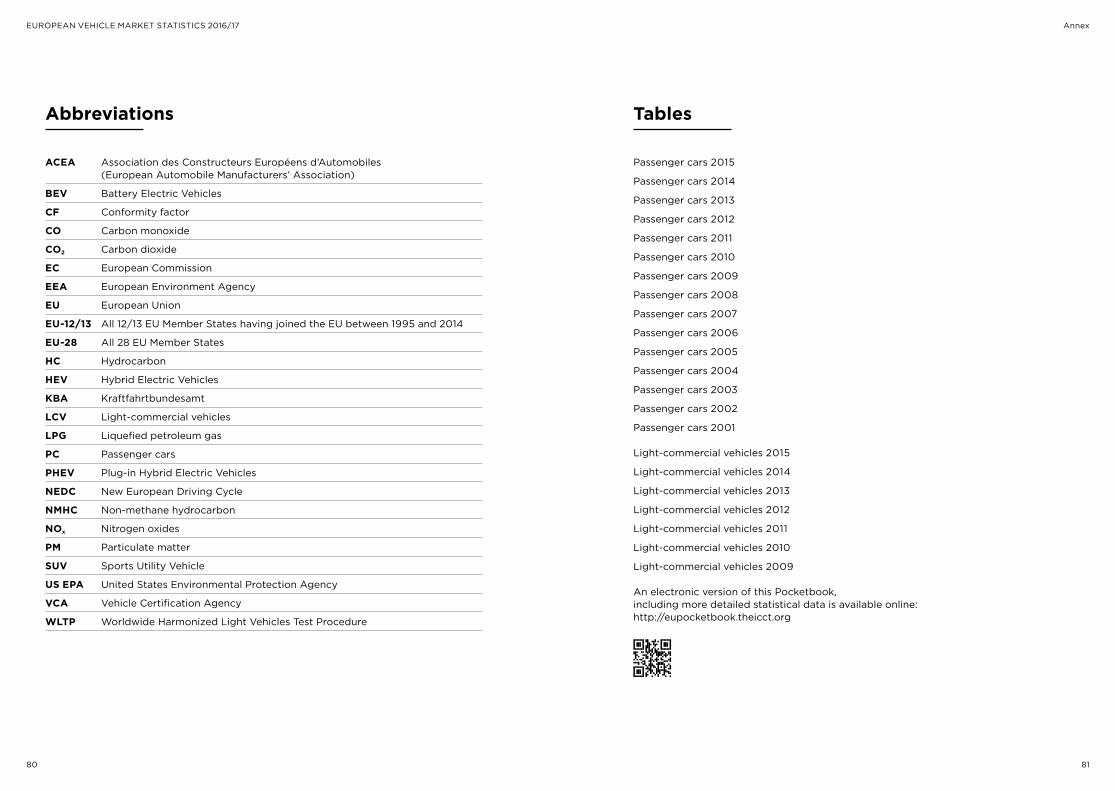
80 81
EUROPEAN VEHICLE MARKET STATISTICS 2016/17
Passenger cars 2015
Passenger cars 2014
Passenger cars 2013
Passenger cars 2012
Passenger cars 2011
Passenger cars 2010
Passenger cars 2009
Passenger cars 2008
Passenger cars 2007
Passenger cars 2006
Passenger cars 2005
Passenger cars 2004
Passenger cars 2003
Passenger cars 2002
Passenger cars 2001
Light-commercial vehicles 2015
Light-commercial vehicles 2014
Light-commercial vehicles 2013
Light-commercial vehicles 2012
Light-commercial vehicles 2011
Light-commercial vehicles 2010
Light-commercial vehicles 2009
An electronic version of this Pocketbook, including more detailed statistical data is available online: http://eupocketbook.theicct.org
Tables
Annex
ACEA Association des Constructeurs Européens d’Automobiles (European Automobile Manufacturers’ Association)
BEV Battery Electric Vehicles
CF Conformity factor
CO Carbon monoxide
CO2 Carbon dioxide
EC European Commission
EEA European Environment Agency
EU European Union
EU-12/13 All 12/13 EU Member States having joined the EU between 1995 and 2014
EU-28 All 28 EU Member States
HC Hydrocarbon
HEV Hybrid Electric Vehicles
KBA Kraftfahrtbundesamt
LCV Light-commercial vehicles
LPG Liquefied petroleum gas
PC Passenger cars
PHEV Plug-in Hybrid Electric Vehicles
NEDC New European Driving Cycle
NMHC Non-methane hydrocarbon
NOx Nitrogen oxides
PM Particulate matter
SUV Sports Utility Vehicle
US EPA United States Environmental Protection Agency
VCA Vehicle Certification Agency
WLTP Worldwide Harmonized Light Vehicles Test Procedure
Abbreviations
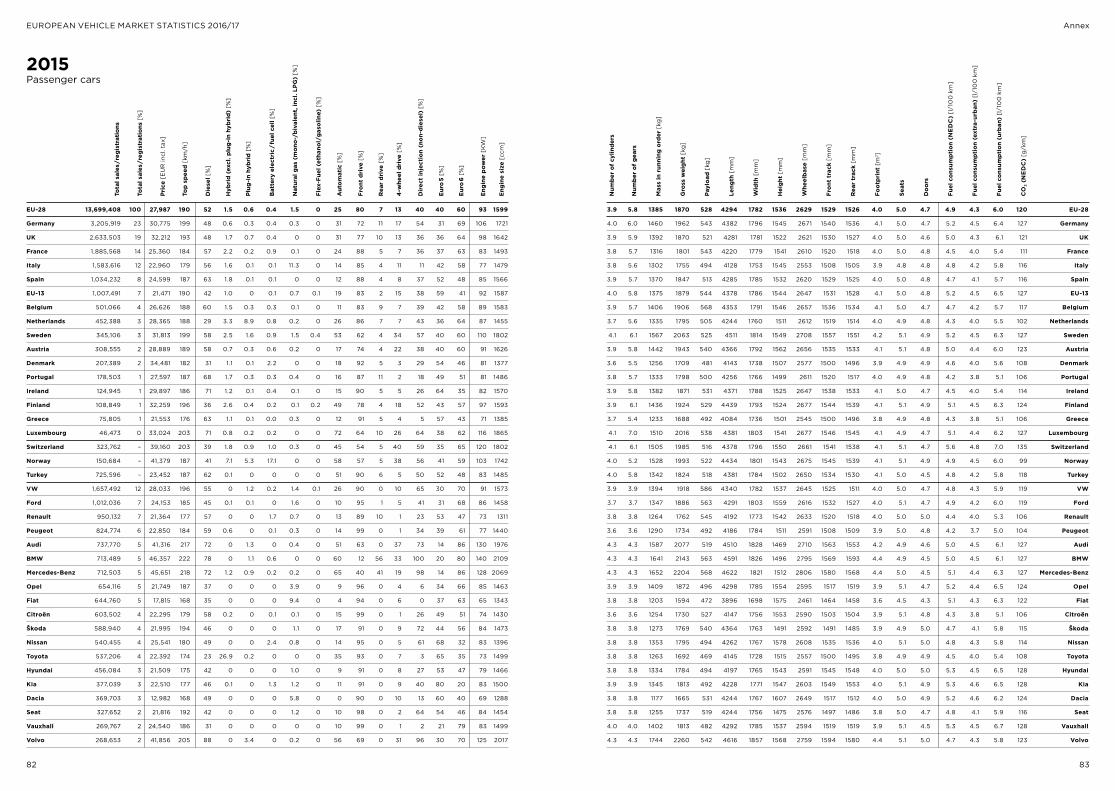
82 83
EUROPEAN VEHICLE MARKET STATISTICS 2016/17 Annex
2015Passenger cars
Payl
oad
[kg
]
Leng
th [
mm
]
Wid
th [
mm
]
Hei
ght
[mm
]
Whe
elba
se [
mm
]
Fron
t tr
ack
[mm
]
Rea
r tr
ack
[mm
]
Foot
prin
t [m
2 ]
Seat
s
Doo
rs
Fuel
con
sum
ptio
n (N
ED
C)
[l/1
00
km
]
Fuel
con
sum
ptio
n (e
xtra
-urb
an)
[l/1
00
km
]
Fuel
con
sum
ptio
n (u
rban
) [l
/10
0 k
m]
CO
2 (N
ED
C)
[g/k
m]
EU-28 13,699,408 100 27,987 190 52 1.5 0.6 0.4 1.5 0 25 80 7 13 40 40 60 93 1599
Germany 3,205,919 23 30,775 199 48 0.6 0.3 0.4 0.3 0 31 72 11 17 54 31 69 106 1721
UK 2,633,503 19 32,212 193 48 1.7 0.7 0.4 0 0 31 77 10 13 36 36 64 98 1642
France 1,885,568 14 25,360 184 57 2.2 0.2 0.9 0.1 0 24 88 5 7 36 37 63 83 1493
Italy 1,583,616 12 22,960 179 56 1.6 0.1 0.1 11.3 0 14 85 4 11 11 42 58 77 1479
Spain 1,034,232 8 24,599 187 63 1.8 0.1 0.1 0 0 12 88 4 8 37 52 48 85 1566
EU-13 1,007,491 7 21,471 190 42 1.0 0 0.1 0.7 0.1 19 83 2 15 38 59 41 92 1587
Belgium 501,066 4 26,626 188 60 1.5 0.3 0.3 0.1 0 11 83 9 7 39 42 58 89 1583
Netherlands 452,388 3 28,365 188 29 3.3 8.9 0.8 0.2 0 26 86 7 7 43 36 64 87 1455
Sweden 345,106 3 31,813 199 58 2.5 1.6 0.9 1.5 0.4 53 62 4 34 57 40 60 110 1802
Austria 308,555 2 28,889 189 58 0.7 0.3 0.6 0.2 0 17 74 4 22 38 40 60 91 1626
Denmark 207,389 2 34,481 182 31 1.1 0.1 2.2 0 0 18 92 5 3 29 54 46 81 1377
Portugal 178,503 1 27,597 187 68 1.7 0.3 0.3 0.4 0 16 87 11 2 18 49 51 81 1486
Ireland 124,945 1 29,897 186 71 1.2 0.1 0.4 0.1 0 15 90 5 5 26 64 35 82 1570
Finland 108,849 1 32,259 196 36 2.6 0.4 0.2 0.1 0.2 49 78 4 18 52 43 57 97 1593
Greece 75,805 1 21,553 176 63 1.1 0.1 0.0 0.3 0 12 91 5 4 5 57 43 71 1385
Luxembourg 46,473 0 33,024 203 71 0.8 0.2 0.2 0 0 72 64 10 26 64 38 62 116 1865
Switzerland 323,762 – 39,160 203 39 1.8 0.9 1.0 0.3 0 45 54 5 40 59 35 65 120 1802
Norway 150,684 – 41,379 187 41 7.1 5.3 17.1 0 0 58 57 5 38 56 41 59 103 1742
Turkey 725,596 – 23,452 187 62 0.1 0 0 0 0 51 90 6 5 50 52 48 83 1485
VW 1,657,492 12 28,033 196 55 0 1.2 0.2 1.4 0.1 26 90 0 10 65 30 70 91 1573
Ford 1,012,036 7 24,153 185 45 0.1 0.1 0 1.6 0 10 95 1 5 41 31 68 86 1458
Renault 950,132 7 21,364 177 57 0 0 1.7 0.7 0 13 89 10 1 23 53 47 73 1311
Peugeot 824,774 6 22,850 184 59 0.6 0 0.1 0.3 0 14 99 0 1 34 39 61 77 1440
Audi 737,770 5 41,316 217 72 0 1.3 0 0.4 0 51 63 0 37 73 14 86 130 1976
BMW 713,489 5 46,357 222 78 0 1.1 0.6 0 0 60 12 56 33 100 20 80 140 2109
Mercedes-Benz 712,503 5 45,651 218 72 1.2 0.9 0.2 0.2 0 65 40 41 19 98 14 86 128 2069
Opel 654,116 5 21,749 187 37 0 0 0 3.9 0 9 96 0 4 6 34 66 85 1463
Fiat 644,760 5 17,815 168 35 0 0 0 9.4 0 4 94 0 6 0 37 63 65 1343
Citroën 603,502 4 22,295 179 58 0.2 0 0.1 0.1 0 15 99 0 1 26 49 51 74 1430
Škoda 588,940 4 21,995 194 46 0 0 0 1.1 0 17 91 0 9 72 44 56 84 1473
Nissan 540,455 4 25,541 180 49 0 0 2.4 0.8 0 14 95 0 5 61 68 32 83 1396
Toyota 537,206 4 22,392 174 23 26.9 0.2 0 0 0 35 93 0 7 3 65 35 73 1499
Hyundai 456,084 3 21,509 175 42 0 0 0 1.0 0 9 91 0 8 27 53 47 79 1466
Kia 377,039 3 22,510 177 46 0.1 0 1.3 1.2 0 11 91 0 9 40 80 20 83 1500
Dacia 369,703 3 12,982 168 49 0 0 0 5.8 0 0 90 0 10 13 60 40 69 1288
Seat 327,652 2 21,816 192 42 0 0 0 1.2 0 10 98 0 2 64 54 46 84 1454
Vauxhall 269,767 2 24,540 186 31 0 0 0 0 0 10 99 0 1 2 21 79 83 1499
Volvo 268,653 2 41,856 205 88 0 3.4 0 0.2 0 56 69 0 31 96 30 70 125 2017
Tota
l sal
es/r
egis
trat
ions
Tota
l sal
es/r
egis
trat
ions
[%
]
Pric
e [E
UR
incl
. tax
]
Top
spee
d [k
m/h
]
Die
sel [
%]
Hyb
rid
(exc
l. pl
ug-i
n hy
brid
) [%
]
Plug
-in
hybr
id [
%]
Bat
tery
ele
ctri
c#/#f
uel c
ell [
%]
Nat
ural
gas
(m
ono-
/biv
alen
t, in
cl. L
PG)
[%]
Flex
-Fue
l (et
hano
l/ga
solin
e) [
%]
Aut
omat
ic [
%]
Fron
t dr
ive
[%]
Rea
r dr
ive
[%]
4-w
heel
dri
ve [
%]
Dir
ect
inje
ctio
n (n
on-d
iese
l) [
%]
Euro
#5 [
%]
Euro
#6 [
%]
Engi
ne p
ower
[K
W]
Engi
ne s
ize
[ccm
]
Num
ber
of c
ylin
ders
Num
ber
of g
ears
Mas
s in
run
ning
ord
er [
kg]
Gro
ss w
eigh
t [k
g]
3.9 5.8 1385 1870 528 4294 1782 1536 2629 1529 1526 4.0 5.0 4.7 4.9 4.3 6.0 120 EU-28 4.0 6.0 1460 1962 543 4382 1796 1545 2671 1540 1536 4.1 5.0 4.7 5.2 4.5 6.4 127 Germany
3.9 5.9 1392 1870 521 4281 1781 1522 2621 1530 1527 4.0 5.0 4.6 5.0 4.3 6.1 121 UK
3.8 5.7 1316 1801 543 4220 1779 1541 2610 1520 1518 4.0 5.0 4.8 4.5 4.0 5.4 111 France
3.8 5.6 1302 1755 494 4128 1753 1545 2553 1508 1505 3.9 4.8 4.8 4.8 4.2 5.8 116 Italy
3.9 5.7 1370 1847 513 4285 1785 1532 2620 1529 1525 4.0 5.0 4.8 4.7 4.1 5.7 116 Spain
4.0 5.8 1375 1879 544 4378 1786 1544 2647 1531 1528 4.1 5.0 4.8 5.2 4.5 6.5 127 EU-13
3.9 5.7 1406 1906 568 4353 1791 1546 2657 1536 1534 4.1 5.0 4.7 4.7 4.2 5.7 117 Belgium
3.7 5.6 1335 1795 505 4244 1760 1511 2612 1519 1514 4.0 4.9 4.8 4.3 4.0 5.5 102 Netherlands
4.1 6.1 1567 2063 525 4511 1814 1549 2708 1557 1551 4.2 5.1 4.9 5.2 4.5 6.3 127 Sweden
3.9 5.8 1442 1943 540 4366 1792 1562 2656 1535 1533 4.1 5.1 4.8 5.0 4.4 6.0 123 Austria
3.6 5.5 1256 1709 481 4143 1738 1507 2577 1500 1496 3.9 4.9 4.9 4.6 4.0 5.6 108 Denmark
3.8 5.7 1333 1798 500 4256 1766 1499 2611 1520 1517 4.0 4.9 4.8 4.2 3.8 5.1 106 Portugal
3.9 5.8 1382 1871 531 4371 1788 1525 2647 1538 1533 4.1 5.0 4.7 4.5 4.0 5.4 114 Ireland
3.9 6.1 1436 1924 529 4439 1793 1524 2677 1544 1539 4.1 5.1 4.9 5.1 4.5 6.3 124 Finland
3.7 5.4 1233 1688 492 4084 1736 1501 2545 1500 1496 3.8 4.9 4.8 4.3 3.8 5.1 106 Greece
4.1 7.0 1510 2016 538 4381 1803 1541 2677 1546 1545 4.1 4.9 4.7 5.1 4.4 6.2 127 Luxembourg
4.1 6.1 1505 1985 516 4378 1796 1550 2661 1541 1538 4.1 5.1 4.7 5.6 4.8 7.0 135 Switzerland
4.0 5.2 1528 1993 522 4434 1801 1543 2675 1545 1539 4.1 5.1 4.9 4.9 4.5 6.0 99 Norway
4.0 5.8 1342 1824 518 4381 1784 1502 2650 1534 1530 4.1 5.0 4.5 4.8 4.2 5.8 118 Turkey
3.9 3.9 1394 1918 586 4340 1782 1537 2645 1525 1511 4.0 5.0 4.7 4.8 4.3 5.9 119 VW
3.7 3.7 1347 1886 563 4291 1803 1559 2616 1532 1527 4.0 5.1 4.7 4.9 4.2 6.0 119 Ford
3.8 3.8 1264 1762 545 4192 1773 1542 2633 1520 1518 4.0 5.0 5.0 4.4 4.0 5.3 106 Renault
3.6 3.6 1290 1734 492 4186 1784 1511 2591 1508 1509 3.9 5.0 4.8 4.2 3.7 5.0 104 Peugeot
4.3 4.3 1587 2077 519 4510 1828 1469 2710 1563 1553 4.2 4.9 4.6 5.0 4.5 6.1 127 Audi
4.3 4.3 1641 2143 563 4591 1826 1496 2795 1569 1593 4.4 4.9 4.5 5.0 4.5 6.1 127 BMW
4.3 4.3 1652 2204 568 4622 1821 1512 2806 1580 1568 4.4 5.0 4.5 5.1 4.4 6.3 127 Mercedes-Benz
3.9 3.9 1409 1872 496 4298 1785 1554 2595 1517 1519 3.9 5.1 4.7 5.2 4.4 6.5 124 Opel 3.8 3.8 1203 1594 472 3896 1698 1575 2461 1464 1458 3.6 4.5 4.3 5.1 4.3 6.3 122 Fiat
3.6 3.6 1254 1730 527 4147 1756 1553 2590 1503 1504 3.9 5.1 4.8 4.3 3.8 5.1 106 Citroën
3.8 3.8 1273 1769 540 4364 1763 1491 2592 1491 1485 3.9 4.9 5.0 4.7 4.1 5.8 115 Škoda
3.8 3.8 1353 1795 494 4262 1767 1578 2608 1535 1536 4.0 5.1 5.0 4.8 4.3 5.8 114 Nissan
3.8 3.8 1263 1692 469 4145 1728 1515 2557 1500 1495 3.8 4.9 4.9 4.5 4.0 5.4 108 Toyota
3.8 3.8 1334 1784 494 4197 1765 1543 2591 1545 1548 4.0 5.0 5.0 5.3 4.5 6.5 128 Hyundai
3.9 3.9 1345 1813 492 4228 1771 1547 2603 1549 1553 4.0 5.1 4.9 5.3 4.6 6.5 128 Kia
3.8 3.8 1177 1665 531 4244 1767 1607 2649 1517 1512 4.0 5.0 4.9 5.2 4.6 6.2 124 Dacia
3.8 3.8 1255 1737 519 4244 1756 1475 2576 1497 1486 3.8 5.0 4.7 4.8 4.1 5.9 116 Seat
4.0 4.0 1402 1813 482 4292 1785 1537 2594 1519 1519 3.9 5.1 4.5 5.3 4.5 6.7 128 Vauxhall
4.3 4.3 1744 2260 542 4616 1857 1568 2759 1594 1580 4.4 5.1 5.0 4.7 4.3 5.8 123 Volvo
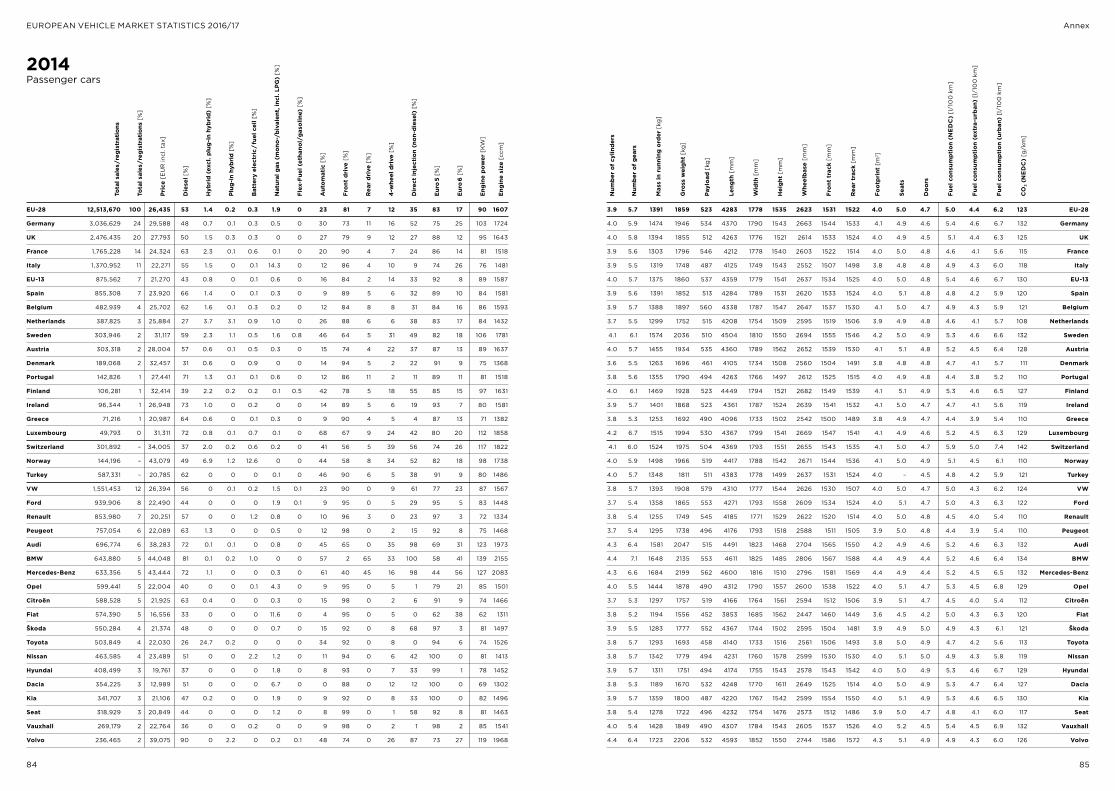
84 85
EUROPEAN VEHICLE MARKET STATISTICS 2016/17 Annex
2014Passenger cars
Payl
oad
[kg
]
Leng
th [
mm
]
Wid
th [
mm
]
Hei
ght
[mm
]
Whe
elba
se [
mm
]
Fron
t tr
ack
[mm
]
Rea
r tr
ack
[mm
]
Foot
prin
t [m
2 ]
Seat
s
Doo
rs
Fuel
con
sum
ptio
n (N
ED
C)
[l/1
00
km
]
Fuel
con
sum
ptio
n (e
xtra
-urb
an)
[l/1
00
km
]
Fuel
con
sum
ptio
n (u
rban
) [l
/10
0 k
m]
CO
2 (N
ED
C)
[g/k
m]
EU-28 12,513,670 100 26,435 53 1.4 0.2 0.3 1.9 0 23 81 7 12 35 83 17 90 1607
Germany 3,036,629 24 29,588 48 0.7 0.1 0.3 0.5 0 30 73 11 16 52 75 25 103 1724
UK 2,476,435 20 27,793 50 1.5 0.3 0.3 0 0 27 79 9 12 27 88 12 95 1643
France 1,765,228 14 24,324 63 2.3 0.1 0.6 0.1 0 20 90 4 7 24 86 14 81 1518
Italy 1,370,952 11 22,271 55 1.5 0 0.1 14.3 0 12 86 4 10 9 74 26 76 1481
EU-13 875,562 7 21,270 43 0.8 0 0.1 0.6 0 16 84 2 14 33 92 8 89 1587
Spain 855,308 7 23,920 66 1.4 0 0.1 0.3 0 9 89 5 6 32 89 10 84 1581
Belgium 482,939 4 25,702 62 1.6 0.1 0.3 0.2 0 12 84 8 8 31 84 16 86 1593
Netherlands 387,825 3 25,884 27 3.7 3.1 0.9 1.0 0 26 88 6 6 38 83 17 84 1432
Sweden 303,946 2 31,117 59 2.3 1.1 0.5 1.6 0.8 46 64 5 31 49 82 18 106 1781
Austria 303,318 2 28,004 57 0.6 0.1 0.5 0.3 0 15 74 4 22 37 87 13 89 1637
Denmark 189,068 2 32,457 31 0.6 0 0.9 0 0 14 94 5 2 22 91 9 75 1368
Portugal 142,826 1 27,441 71 1.3 0.1 0.1 0.6 0 12 86 11 2 11 89 11 81 1518
Finland 106,281 1 32,414 39 2.2 0.2 0.2 0.1 0.5 42 78 5 18 55 85 15 97 1631
Ireland 96,344 1 26,948 73 1.0 0 0.2 0 0 14 89 5 6 19 93 7 80 1581
Greece 71,216 1 20,987 64 0.6 0 0.1 0.3 0 9 90 4 5 4 87 13 71 1382
Luxembourg 49,793 0 31,311 72 0.8 0.1 0.7 0.1 0 68 67 9 24 42 80 20 112 1858
Switzerland 301,892 – 34,005 37 2.0 0.2 0.6 0.2 0 41 56 5 39 56 74 26 117 1822
Norway 144,196 – 43,079 49 6.9 1.2 12.6 0 0 44 58 8 34 52 82 18 98 1738
Turkey 587,331 – 20,785 62 0 0 0 0.1 0 46 90 6 5 38 91 9 80 1486
VW 1,551,453 12 26,394 56 0 0.1 0.2 1.5 0.1 23 90 0 9 61 77 23 87 1567
Ford 939,906 8 22,490 44 0 0 0 1.9 0.1 9 95 0 5 29 95 5 83 1448
Renault 853,980 7 20,251 57 0 0 1.2 0.8 0 10 96 3 0 23 97 3 72 1334
Peugeot 757,054 6 22,089 63 1.3 0 0 0.5 0 12 98 0 2 15 92 8 75 1468
Audi 696,774 6 38,283 72 0.1 0.1 0 0.8 0 45 65 0 35 98 69 31 123 1973
BMW 643,880 5 44,048 81 0.1 0.2 1.0 0 0 57 2 65 33 100 58 41 139 2155
Mercedes-Benz 633,356 5 43,444 72 1.1 0 0 0.3 0 61 40 45 16 98 44 56 127 2083
Opel 599,441 5 22,004 40 0 0 0.1 4.3 0 9 95 0 5 1 79 21 85 1501
Citroën 588,528 5 21,925 63 0.4 0 0 0.3 0 15 98 0 2 6 91 9 74 1466
Fiat 574,390 5 16,556 33 0 0 0 11.6 0 4 95 0 5 0 62 38 62 1311
Škoda 550,284 4 21,374 48 0 0 0 0.7 0 15 92 0 8 68 97 3 81 1497
Toyota 503,849 4 22,030 26 24.7 0.2 0 0 0 34 92 0 8 0 94 6 74 1526
Nissan 463,585 4 23,489 51 0 0 2.2 1.2 0 11 94 0 6 42 100 0 81 1413
Hyundai 408,499 3 19,761 37 0 0 0 1.8 0 8 93 0 7 33 99 1 78 1452
Dacia 354,225 3 12,989 51 0 0 0 6.7 0 0 88 0 12 12 100 0 69 1302
Kia 341,707 3 21,106 47 0.2 0 0 1.9 0 9 92 0 8 33 100 0 82 1496
Seat 318,929 3 20,849 44 0 0 0 1.2 0 8 99 0 1 58 92 8 81 1463
Vauxhall 269,179 2 22,764 36 0 0 0.2 0 0 9 98 0 2 1 98 2 85 1541
Volvo 236,465 2 39,075 90 0 2.2 0 0.2 0.1 48 74 0 26 87 73 27 119 1968
Tota
l sal
es/r
egis
trat
ions
Tota
l sal
es/r
egis
trat
ions
[%
]
Pric
e [E
UR
incl
. tax
]
Die
sel [
%]
Hyb
rid
(exc
l. pl
ug-i
n hy
brid
) [%
]
Plug
-in
hybr
id [
%]
Bat
tery
ele
ctri
c#/#f
uel c
ell [
%]
Nat
ural
gas
(m
ono-
/biv
alen
t, in
cl. L
PG)
[%]
Flex
-Fue
l (et
hano
l/ga
solin
e) [
%]
Aut
omat
ic [
%]
Fron
t dr
ive
[%]
Rea
r dr
ive
[%]
4-w
heel
dri
ve [
%]
Dir
ect
inje
ctio
n (n
on-d
iese
l) [
%]
Euro
#5 [
%]
Euro
#6 [
%]
Engi
ne p
ower
[K
W]
Engi
ne s
ize
[ccm
]
Num
ber
of c
ylin
ders
Num
ber
of g
ears
Mas
s in
run
ning
ord
er [
kg]
Gro
ss w
eigh
t [k
g]
3.9 5.7 1391 1859 523 4283 1778 1535 2623 1531 1522 4.0 5.0 4.7 5.0 4.4 6.2 123 EU-28
4.0 5.9 1474 1946 534 4370 1790 1543 2663 1544 1533 4.1 4.9 4.6 5.4 4.6 6.7 132 Germany
4.0 5.8 1394 1855 512 4263 1776 1521 2614 1533 1524 4.0 4.9 4.5 5.1 4.4 6.3 125 UK
3.9 5.6 1303 1796 546 4212 1778 1540 2603 1522 1514 4.0 5.0 4.8 4.6 4.1 5.6 115 France
3.9 5.5 1319 1748 487 4125 1749 1543 2552 1507 1498 3.8 4.8 4.8 4.9 4.3 6.0 118 Italy
4.0 5.7 1375 1860 537 4359 1779 1541 2637 1534 1525 4.0 5.0 4.8 5.4 4.6 6.7 130 EU-13
3.9 5.6 1391 1852 513 4284 1789 1531 2620 1533 1524 4.0 5.1 4.8 4.8 4.2 5.9 120 Spain
3.9 5.7 1388 1897 560 4338 1787 1547 2647 1537 1530 4.1 5.0 4.7 4.9 4.3 5.9 121 Belgium
3.7 5.5 1299 1752 515 4208 1754 1509 2595 1519 1506 3.9 4.9 4.8 4.6 4.1 5.7 108 Netherlands
4.1 6.1 1574 2036 510 4504 1810 1550 2694 1555 1546 4.2 5.0 4.9 5.3 4.6 6.6 132 Sweden
4.0 5.7 1455 1934 535 4360 1789 1562 2652 1539 1530 4.1 5.1 4.8 5.2 4.5 6.4 128 Austria
3.6 5.5 1263 1696 461 4105 1734 1508 2560 1504 1491 3.8 4.8 4.8 4.7 4.1 5.7 111 Denmark
3.8 5.6 1355 1790 494 4263 1766 1497 2612 1525 1515 4.0 4.9 4.8 4.4 3.8 5.2 110 Portugal
4.0 6.1 1469 1928 523 4449 1794 1521 2682 1549 1539 4.1 5.1 4.9 5.3 4.6 6.5 127 Finland
3.9 5.7 1401 1868 523 4361 1787 1524 2639 1541 1532 4.1 5.0 4.7 4.7 4.1 5.6 119 Ireland
3.8 5.3 1253 1692 490 4096 1733 1502 2542 1500 1489 3.8 4.9 4.7 4.4 3.9 5.4 110 Greece
4.2 6.7 1515 1994 530 4367 1799 1541 2669 1547 1541 4.1 4.9 4.6 5.2 4.5 6.3 129 Luxembourg
4.1 6.0 1524 1975 504 4369 1793 1551 2655 1543 1535 4.1 5.0 4.7 5.9 5.0 7.4 142 Switzerland
4.0 5.9 1498 1966 519 4417 1788 1542 2671 1544 1536 4.1 5.0 4.9 5.1 4.5 6.1 110 Norway
4.0 5.7 1348 1811 511 4383 1778 1499 2637 1531 1524 4.0 – 4.5 4.8 4.2 5.9 121 Turkey
3.8 5.7 1393 1908 579 4310 1777 1544 2626 1530 1507 4.0 5.0 4.7 5.0 4.3 6.2 124 VW
3.7 5.4 1358 1865 553 4271 1793 1558 2609 1534 1524 4.0 5.1 4.7 5.0 4.3 6.3 122 Ford
3.8 5.4 1255 1749 545 4185 1771 1529 2622 1520 1514 4.0 5.0 4.8 4.5 4.0 5.4 110 Renault
3.7 5.4 1295 1738 496 4176 1793 1518 2588 1511 1505 3.9 5.0 4.8 4.4 3.9 5.4 110 Peugeot
4.3 6.4 1581 2047 515 4491 1823 1468 2704 1565 1550 4.2 4.9 4.6 5.2 4.6 6.3 132 Audi
4.4 7.1 1648 2135 553 4611 1825 1485 2806 1567 1588 4.4 4.9 4.4 5.2 4.6 6.4 134 BMW
4.3 6.6 1684 2199 562 4600 1816 1510 2796 1581 1569 4.4 4.9 4.4 5.2 4.5 6.5 132 Mercedes-Benz
4.0 5.5 1444 1878 490 4312 1790 1557 2600 1538 1522 4.0 5.1 4.7 5.3 4.5 6.8 129 Opel
3.7 5.3 1297 1757 519 4166 1764 1561 2594 1512 1506 3.9 5.1 4.7 4.5 4.0 5.4 112 Citroën
3.8 5.2 1194 1556 452 3853 1685 1562 2447 1460 1449 3.6 4.5 4.2 5.0 4.3 6.3 120 Fiat
3.9 5.5 1283 1777 552 4367 1744 1502 2595 1504 1481 3.9 4.9 5.0 4.9 4.3 6.1 121 Škoda
3.8 5.7 1293 1693 458 4140 1733 1516 2561 1506 1493 3.8 5.0 4.9 4.7 4.2 5.6 113 Toyota
3.8 5.7 1342 1779 494 4231 1760 1578 2599 1530 1530 4.0 5.1 5.0 4.9 4.3 5.8 119 Nissan
3.9 5.7 1311 1751 494 4174 1755 1543 2578 1543 1542 4.0 5.0 4.9 5.3 4.6 6.7 129 Hyundai
3.8 5.3 1189 1670 532 4248 1770 1611 2649 1525 1514 4.0 5.0 4.9 5.3 4.7 6.4 127 Dacia
3.9 5.7 1359 1800 487 4220 1767 1542 2599 1554 1550 4.0 5.1 4.9 5.3 4.6 6.5 130 Kia
3.8 5.4 1278 1722 496 4232 1754 1476 2573 1512 1486 3.9 5.0 4.7 4.8 4.1 6.0 117 Seat
4.0 5.4 1428 1849 490 4307 1784 1543 2605 1537 1526 4.0 5.2 4.5 5.4 4.5 6.9 132 Vauxhall
4.4 6.4 1723 2206 532 4593 1852 1550 2744 1586 1572 4.3 5.1 4.9 4.9 4.3 6.0 126 Volvo

86 87
EUROPEAN VEHICLE MARKET STATISTICS 2016/17 Annex
2013Passenger cars
Payl
oad
[kg
]
Leng
th [
mm
]
Wid
th [
mm
]
Hei
ght
[mm
]
Whe
elba
se [
mm
]
Fron
t tr
ack
[mm
]
Rea
r tr
ack
[mm
]
Foot
prin
t [m
2 ]
Boo
t vo
lum
e [l
]
Seat
s
Doo
rs
Fuel
con
sum
ptio
n (N
ED
C)
[l/1
00
km
]
Fuel
con
sum
ptio
n (e
xtra
-urb
an)
[l/1
00
km
]
Fuel
con
sum
ptio
n (u
rban
) [l
/10
0 k
m]
CO
2 (N
ED
C)
[g/k
m]
EU-28 11,825,400 100 25,561 53 1.4 1.8 0 0.42 21 81 7 12 32 96 4 89 1616 4.0 10.5 16.4
Germany 2,952,257 25 28,870 48 0.8 0.4 0 0.25 29 73 11 15 49 93 7 101 1732 4.1 10.4 16.4
UK 2,264,737 19 25,533 50 1.3 0 0 0.16 25 79 10 11 27 98 2 93 1647 4.0 10.6 16.4
France 1,756,251 15 23,776 66 2.6 0.2 0 0.52 18 90 3 7 18 98 1 80 1543 3.9 10.5 16.5
Italy 1,286,716 11 21,730 54 1.1 14.0 0 0.09 12 85 5 10 10 90 10 76 1483 3.9 10.7 16.5
EU-13 780,691 7 20,404 43 0.6 0.3 0 0.04 13 84 2 14 29 98 2 88 1598 4.0 10.5 16.5
Spain 722,703 6 23,636 67 1.4 0 0 0.12 9 88 5 7 28 98 1 84 1600 3.9 10.5 16.5
Belgium 486,065 4 24,902 65 1.2 0 0 0.15 12 84 8 7 21 96 4 84 1600 4.0 10.6 16.5
Netherlands 417,024 4 26,013 25 5.7 0.6 0 5.43 27 87 6 7 36 97 2 82 1441 3.7 10.7 16.2
Austria 319,035 3 27,238 57 0.8 0.2 0 0.26 15 75 4 21 30 96 3 88 1639 4.0 10.4 16.4
Sweden 269,552 2 32,013 61 1.9 1.4 1.2 0.56 41 65 5 29 47 97 3 104 1784 4.1 10.6 16.5
Denmark 181,270 2 30,785 32 0.6 0 0 0.30 9 95 4 1 20 99 1 72 1359 3.6 10.5 16.5
Portugal 105,921 1 27,054 72 1.0 0.8 0 0.20 11 86 12 2 15 98 2 81 1525 3.9 10.6 16.3
Finland 103,493 1 31,472 37 2.2 0.1 0.4 0.21 37 79 5 16 50 97 3 95 1648 4.0 10.6 16.4
Ireland 74,367 1 24,743 72 0.8 0 0 0.06 13 89 6 4 17 99 1 80 1578 3.9 10.6 16.4
Greece 58,694 0 19,906 58 0.7 0.1 0 0.01 10 91 4 5 2 98 1 69 1363 3.8 10.8 17.0
Luxembourg 46,624 0 30,341 73 0.7 0 0 0.40 63 69 9 22 40 96 4 110 1861 4.2 10.6 16.3
Switzerland 307,846 – 32,195 37 2.2 0.3 0 0.57 38 59 5 36 50 92 8 113 1811 4.2 10.4 16.4
Norway 142,151 – 45,120 53 6.7 0 0 5.79 37 62 5 33 48 94 6 95 1721 4.0 10.8 16.2
VW 1,490,410 13 25,651 56 0.2 1.3 0.1 0.07 23 90 0 9 64 98 2 85 1570 3.9 10.2 16.6
Ford 893,840 8 21,857 45 0 1.2 0.1 0.01 8 96 0 4 55 100 0 82 1454 3.7 10.6 16.2
Renault 776,698 7 20,262 60 0 0.4 0 1.14 7 100 0 0 8 99 1 72 1368 3.9 9.7 15.8
Peugeot 711,165 6 21,188 61 2.4 0.6 0 0.05 11 97 0 3 8 100 0 74 1473 3.8 10.8 16.9
Audi 664,932 6 37,318 75 0.1 0 0 0 42 67 0 33 95 97 2 121 2001 4.4 10.0 16.4
BMW 612,994 5 41,704 81 0.1 0 0 0.21 53 0 70 30 96 90 10 135 2130 4.4 10.6 16.4
Mercedes-Benz 599,892 5 42,095 71 1.0 0 0 0.02 60 42 45 14 98 71 29 126 2107 4.3 10.4 16.1
Citroën 580,590 5 21,537 64 1.0 0.4 0 0.09 13 98 0 2 6 99 0 74 1484 3.8 10.8 17.1
Fiat 557,470 5 16,113 31 0 12.7 0 0 4 95 0 5 0 79 21 62 1317 3.8 10.9 17.1
Opel 546,115 5 21,779 41 0 4.1 0 0.51 8 95 0 5 2 97 2 84 1511 4.0 10.2 17.1
Toyota 488,535 4 21,768 26 22.8 0 0 0.88 33 91 1 8 3 100 0 76 1549 3.8 11.4 16.3
Škoda 485,062 4 20,077 46 0 0.2 0 0 12 92 0 8 63 100 0 78 1476 3.8 10.2 16.6
Nissan 405,766 3 22,957 51 0 2.1 0 1.52 10 91 0 8 9 99 0 84 1524 3.9 10.6 15.3
Hyundai 405,681 3 19,439 39 0 1.7 0 0 7 93 0 6 5 99 0 79 1476 4.0 10.5 16.8
Kia 337,465 3 20,228 45 0.2 1.1 0 0 9 92 0 8 25 100 0 81 1487 3.9 10.6 17.0
Dacia 283,475 2 12,647 52 0 5.2 0.2 0 0 89 0 11 0 100 0 68 1323 3.8 9.7 16.6
Seat 279,974 2 19,707 44 0 0.8 0 0 6 99 0 1 64 100 0 77 1445 3.8 10.3 16.5
Vauxhall 259,451 2 22,190 38 0 0 0 0.10 9 96 0 4 0 100 0 85 1549 4.0 10.6 17.2
Volvo 210,924 2 38,657 87 0 0.2 0.5 3.75 45 72 0 28 87 99 1 114 1962 4.6 12.6 16.4
Mini 147,661 1 23,395 45 0 0 0 0 18 87 0 13 27 95 4 90 1665 4.0 10.9 16.5
Tota
l sal
es/r
egis
trat
ions
Tota
l sal
es/r
egis
trat
ions
[%
]
Pric
e [E
UR
incl
. tax
]
Die
sel [
%]
Hyb
rid
excl
. PH
EV [
%]
Nat
ural
gas
(m
ono-
/biv
alen
t, in
cl. L
PG)
[%]
Flex
-Fue
l (et
hano
l/ga
solin
e) [
%]
Elec
tric
/fue
l cel
l inc
l. PH
EV [
%]
Aut
omat
ic [
%]
Fron
t dr
ive
[%]
Rea
r dr
ive
[%]
4-w
heel
dri
ve [
%]
Dir
ect
inje
ctio
n (n
on-d
iese
l) [
%]
Euro
#5 [
%]
Euro
#6 [
%]
Engi
ne p
ower
[K
W]
Engi
ne s
ize
[ccm
]
Num
ber
of c
ylin
ders
Com
pres
sion
rat
e (g
asol
ine)
Com
pres
sion
rat
e (d
iese
l)
Num
ber
of g
ears
Perf
orm
ance
0–1
00
km
/h (
gaso
line)
[s]
Perf
orm
ance
0–1
00
km
/h (
dies
el)
[s]
Mas
s in
run
ning
ord
er [
kg]
Gro
ss w
eigh
t [k
g]
5.7 11.8 10.8 1391 1857 518 4272 1776 1536 2616 1520 1517 4.0 386 5.0 4.7 5.2 4.5 6.4 127 EU-28
5.9 11.2 9.8 1469 1943 529 4357 1785 1545 2654 1529 1527 4.0 408 4.9 4.6 5.5 4.7 6.9 135 Germany
5.7 11.9 10.3 1398 1852 506 4251 1772 1520 2609 1525 1518 4.0 374 4.9 4.5 5.2 4.5 6.5 129 UK
5.6 12.3 11.6 1312 1798 535 4206 1775 1539 2598 1509 1507 3.9 371 5.0 4.7 4.7 4.1 5.8 118 France
5.5 13.1 11.6 1307 1742 484 4114 1744 1542 2546 1498 1496 3.8 344 4.8 4.7 5.1 4.4 6.3 121 Italy
5.6 11.8 10.9 1373 1863 538 4352 1776 1543 2629 1522 1518 4.0 425 5.0 4.8 5.5 4.7 6.9 134 EU-13
5.6 12.2 11.3 1398 1857 509 4285 1800 1529 2619 1524 1519 4.0 394 5.1 4.8 5.0 4.3 6.1 124 Spain
5.6 12.4 11.6 1398 1893 547 4325 1784 1548 2643 1523 1522 4.0 397 5.0 4.7 5.0 4.3 6.1 124 Belgium
5.6 11.8 11.2 1291 1746 513 4185 1750 1508 2587 1503 1502 3.9 347 4.8 4.7 4.7 4.2 5.9 109 Netherlands
5.7 12.4 11.0 1449 1929 530 4348 1784 1564 2644 1527 1525 4.0 403 5.1 4.8 5.3 4.6 6.6 132 Austria
5.9 11.0 10.2 1573 2042 518 4491 1808 1546 2699 1530 1545 4.2 405 5.0 4.7 5.4 4.7 6.7 135 Sweden
5.4 12.8 11.3 1268 1649 450 4055 1724 1506 2542 1562 1482 3.8 440 5.1 4.9 4.7 4.1 5.9 113 Denmark
5.5 12.9 11.2 1353 1794 489 4247 1762 1499 2604 1487 1513 4.0 326 4.8 4.7 4.5 3.9 5.5 114 Portugal
5.9 11.0 10.3 1450 1932 532 4436 1792 1527 2670 1540 1538 4.1 439 5.1 4.9 5.4 4.7 6.8 132 Finland
5.6 13.5 11.5 1393 1873 527 4367 1784 1511 2677 1517 1530 4.1 372 4.9 4.7 4.8 4.2 5.9 122 Ireland
5.3 13.7 14.2 1233 1663 478 4067 1729 1498 2530 1537 1462 3.6 436 5.1 4.8 4.5 3.9 5.6 112 Greece
6.6 9.3 9.0 1507 1987 520 4348 1794 1540 2648 1539 1543 4.2 427 5.0 4.7 5.3 4.6 6.5 133 Luxembourg
5.9 10.2 9.8 1511 1960 498 4354 1788 1551 2648 1530 1528 4.0 405 5.0 4.7 6.0 5.1 7.6 145 Switzerland
5.9 11.3 10.9 1484 1966 529 4413 1790 1547 2665 1540 1536 4.1 439 5.1 4.9 5.2 4.6 6.4 123 Norway
5.7 11.8 10.9 1399 1906 572 4295 1774 1548 2618 1515 1508 3.9 420 5.0 4.7 5.1 4.4 6.4 127 VW
5.5 12.6 11.2 1359 1856 545 4270 1788 1555 2607 1521 1520 4.0 353 5.1 4.7 5.0 4.3 6.3 123 Ford
5.4 12.4 12.1 1265 1761 543 4204 1776 1526 2620 1507 1503 3.9 359 5.0 4.7 4.5 4.0 5.5 112 Renault
5.4 12.3 11.8 1305 1749 494 4162 1795 1522 2586 1499 1497 3.9 363 5.0 4.7 4.7 4.0 5.7 115 Peugeot
6.3 8.7 8.9 1577 2042 514 4490 1823 1468 2704 1609 1552 4.3 429 4.8 4.6 5.3 4.7 6.4 135 Audi
6.9 8.0 8.4 1637 2111 537 4606 1821 1479 2802 1548 1578 4.4 453 4.9 4.5 5.3 4.6 6.5 136 BMW
6.5 8.4 9.0 1691 2212 559 4579 1812 1514 2781 1563 1569 4.3 467 4.9 4.5 5.5 4.7 6.9 139 Mercedes-Benz
5.3 12.6 12.7 1309 1759 503 4159 1768 1564 2579 1494 1498 3.8 356 5.0 4.7 4.7 4.1 5.8 118 Citroën
5.2 13.2 13.4 1163 1579 459 3870 1683 1561 2431 1449 1443 3.5 257 4.5 4.2 5.1 4.4 6.4 120 Fiat
5.5 12.5 11.4 1423 1862 490 4315 1794 1553 2605 1520 1522 3.9 373 5.1 4.6 5.4 4.6 6.9 131 Opel
5.6 12.3 10.7 1291 1700 458 4122 1733 1517 2559 1497 1493 3.8 347 5.0 4.8 4.8 4.3 5.9 115 Toyota
5.4 12.2 11.0 1274 1769 553 4331 1733 1509 2571 1493 1483 3.8 476 4.9 4.9 5.1 4.4 6.4 124 Škoda
5.5 12.2 11.6 1384 1835 500 4227 1756 1593 2599 1523 1527 4.0 343 5.3 5.0 5.5 4.7 6.8 135 Nissan
5.6 12.6 12.1 1326 1773 500 4193 1751 1546 2588 1552 1534 4.0 404 5.0 4.9 5.3 4.6 6.6 129 Hyundai
5.6 12.5 12.2 1349 1787 483 4214 1765 1537 2596 1547 1553 4.0 381 5.1 4.8 5.3 4.6 6.5 129 Kia
5.3 12.4 12.8 1184 1670 536 4237 1767 1616 2658 1493 1483 3.9 368 5.1 4.9 5.4 4.7 6.6 128 Dacia
5.4 11.1 11.1 1268 1705 488 4191 1740 1478 2559 1472 1467 3.8 425 5.0 4.7 4.9 4.2 6.1 119 Seat
5.5 12.7 11.0 1433 1881 498 4319 1784 1540 2617 1513 1514 3.9 333 5.2 4.6 5.5 4.6 7.0 134 Vauxhall
6.0 7.7 10.5 1698 2203 556 4586 1851 1538 2741 1589 1574 4.3 481 5.0 4.9 5.1 4.5 6.6 132 Volvo
6.0 9.9 10.4 1309 1645 387 3883 1724 1468 2521 1488 1501 3.8 244 4.2 3.6 5.3 4.6 6.6 130 Mini
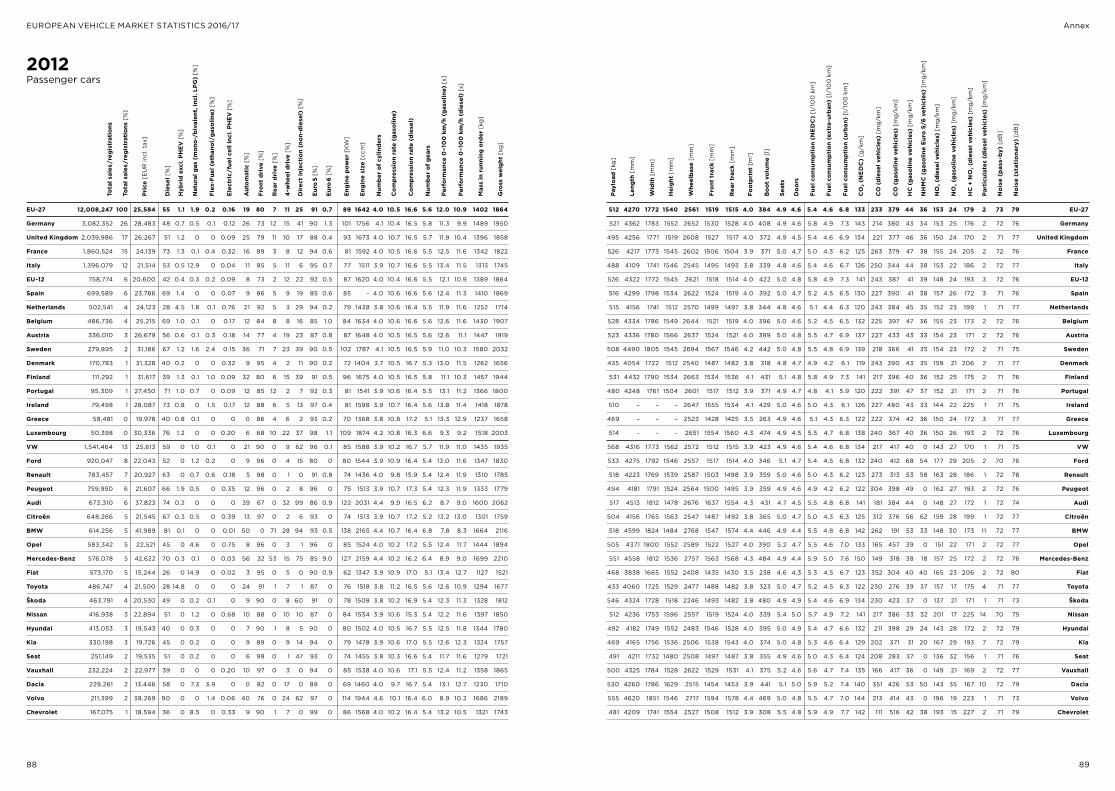
88 89
EUROPEAN VEHICLE MARKET STATISTICS 2016/17 Annex
2012Passenger cars
Payl
oad
[kg
]
Leng
th [
mm
]
Wid
th [
mm
]
Hei
ght
[mm
]
Whe
elba
se [
mm
]
Fron
t tr
ack
[mm
]
Rea
r tr
ack
[mm
]
Foot
prin
t [m
2 ]
Boo
t vo
lum
e [l
]
Seat
s
Doo
rs
Fuel
con
sum
ptio
n (N
ED
C)
[l/1
00
km
]
Fuel
con
sum
ptio
n (e
xtra
-urb
an)
[l/1
00
km
]
Fuel
con
sum
ptio
n (u
rban
) [l
/10
0 k
m]
CO
2 (N
ED
C)
[g/k
m]
CO
(di
esel
veh
icle
s) [
mg
/km
]
CO
(ga
solin
e ve
hicl
es)
[mg
/km
]
HC
(ga
solin
e ve
hicl
es)
[mg
/km
]
NH
MC
(ga
solin
e Eu
ro 5
/6 v
ehic
les)
[m
g/k
m]
NO
x (di
esel
veh
icle
s) [
mg
/km
]
NO
x (ga
solin
e ve
hicl
es)
[mg
/km
]
HC
+ N
Ox (
dies
el v
ehic
les)
[m
g/k
m]
Part
icul
ates
(di
esel
veh
icle
s) [
mg
/km
]
EU-27 12,008,247 100 25,584 55 1.1 1.9 0.2 0.16 19 80 7 11 25 91 0.7 89 1642 4.0 10.5 16.6 5.6 12.0 10.9 1402 1864
Germany 3,082,352 26 28,483 48 0.7 0.5 0.1 0.12 26 73 12 15 41 90 1.3 101 1756 4.1 10.4 16.5 5.8 11.3 9.9 1489 1950
United Kingdom 2,039,986 17 26,267 51 1.2 0 0 0.09 25 79 11 10 17 88 0.4 93 1673 4.0 10.7 16.5 5.7 11.9 10.4 1396 1858
France 1,860,524 15 24,139 73 1.3 0.1 0.4 0.32 16 89 3 8 12 94 0.6 81 1592 4.0 10.5 16.6 5.5 12.5 11.6 1342 1822
Italy 1,396,079 12 21,514 53 0.5 12.9 0 0.04 11 85 5 11 6 95 0.7 77 1511 3.9 10.7 16.6 5.5 13.4 11.5 1313 1745
EU-12 758,774 6 20,600 42 0.4 0.3 0.2 0.09 8 73 2 12 22 92 0.5 87 1620 4.0 10.4 16.6 5.5 12.1 10.9 1389 1864
Spain 699,589 6 23,786 69 1.4 0 0 0.07 9 86 5 9 19 85 0.6 85 – 4.0 10.6 16.6 5.6 12.4 11.3 1410 1869
Netherlands 502,541 4 24,123 28 4.5 1.8 0.1 0.76 21 92 5 3 29 94 0.2 79 1438 3.8 10.6 16.4 5.5 11.9 11.6 1252 1714
Belgium 486,736 4 25,215 69 1.0 0.1 0 0.17 12 84 8 8 16 85 1.0 84 1634 4.0 10.6 16.6 5.6 12.6 11.6 1430 1907
Austria 336,010 3 26,679 56 0.6 0.1 0.3 0.18 14 77 4 19 23 87 0.8 87 1648 4.0 10.5 16.5 5.6 12.6 11.1 1447 1919
Sweden 279,895 2 31,186 67 1.2 1.6 2.4 0.15 36 71 7 23 39 90 0.5 102 1787 4.1 10.5 16.5 5.9 11.0 10.3 1580 2032
Denmark 170,783 1 31,328 40 0.2 0 0 0.32 9 95 4 2 11 90 0.2 72 1404 3.7 10.5 16.7 5.3 13.0 11.5 1262 1656
Finland 111,292 1 31,617 39 1.3 0.1 1.0 0.09 32 80 6 15 39 91 0.5 96 1675 4.0 10.5 16.5 5.8 11.1 10.3 1457 1944
Portugal 95,309 1 27,450 71 1.0 0.7 0 0.09 12 85 12 2 7 92 0.3 81 1541 3.9 10.6 16.4 5.5 13.1 11.2 1366 1800
Ireland 79,498 1 28,087 73 0.8 0 1.5 0.17 12 88 6 5 13 97 0.4 81 1598 3.9 10.7 16.4 5.6 13.8 11.4 1418 1878
Greece 58,481 0 19,978 40 0.8 0.1 0 0 0 86 4 6 2 93 0.2 70 1368 3.8 10.8 17.2 5.1 13.3 12.9 1237 1658
Luxembourg 50,398 0 30,336 76 1.2 0 0 0.20 6 68 10 22 37 98 1.1 109 1874 4.2 10.8 16.3 6.6 9.3 9.2 1518 2003
VW 1,541,464 13 25,613 59 0 1.0 0.1 0 21 90 0 9 62 96 0.1 85 1588 3.9 10.2 16.7 5.7 11.9 11.0 1435 1935
Ford 920,047 8 22,043 52 0 1.2 0.2 0 9 96 0 4 15 80 0 80 1544 3.9 10.9 16.4 5.4 13.0 11.6 1347 1830
Renault 783,457 7 20,927 63 0 0.7 0.6 0.18 5 98 0 1 0 91 0.8 74 1436 4.0 9.8 15.9 5.4 12.4 11.9 1310 1785
Peugeot 759,950 6 21,607 66 1.9 0.5 0 0.35 12 96 0 2 8 96 0 75 1513 3.9 10.7 17.3 5.4 12.3 11.9 1333 1779
Audi 673,310 6 37,823 74 0.2 0 0 0 39 67 0 32 99 86 0.9 122 2031 4.4 9.9 16.5 6.2 8.7 9.0 1600 2062
Citroën 648,266 5 21,545 67 0.3 0.5 0 0.39 13 97 0 2 6 93 0 74 1513 3.9 10.7 17.2 5.2 13.2 13.0 1301 1759
BMW 614,256 5 41,989 81 0.1 0 0 0.01 50 0 71 28 94 93 0.5 138 2165 4.4 10.7 16.4 6.8 7.8 8.3 1664 2116
Opel 583,342 5 22,521 45 0 4.6 0 0.75 8 96 0 3 1 96 0 85 1524 4.0 10.2 17.2 5.5 12.4 11.7 1444 1894
Mercedes-Benz 576,078 5 42,622 70 0.3 0.1 0 0.03 56 32 53 15 75 85 9.0 127 2159 4.4 10.2 16.2 6.4 8.9 9.0 1699 2210
Fiat 573,170 5 15,244 26 0 14.9 0 0.02 3 95 0 5 0 90 0.9 62 1347 3.9 10.9 17.0 5.1 13.4 12.7 1127 1521
Toyota 486,747 4 21,500 28 14.8 0 0 0 24 91 1 7 1 87 0 76 1518 3.8 11.2 16.5 5.6 12.6 10.9 1294 1677
Škoda 463,791 4 20,530 49 0 0.2 0.1 0 9 90 0 8 60 91 0 78 1508 3.8 10.2 16.9 5.4 12.3 11.3 1328 1812
Nissan 416,938 3 22,894 51 0 1.2 0 0.68 10 88 0 10 10 87 0 84 1534 3.9 10.6 15.3 5.4 12.2 11.6 1397 1850
Hyundai 413,053 3 19,543 40 0 0.3 0 0 7 90 1 8 5 90 0 80 1502 4.0 10.5 16.7 5.5 12.5 11.8 1344 1780
Kia 330,198 3 19,726 45 0 0.2 0 0 9 89 0 9 14 94 0 79 1478 3.9 10.6 17.0 5.5 12.6 12.3 1324 1757
Seat 251,149 2 19,535 51 0 0.2 0 0 6 98 0 1 47 93 0 74 1455 3.8 10.3 16.6 5.4 11.7 11.6 1279 1721
Vauxhall 232,224 2 22,977 39 0 0 0 0.20 10 97 0 3 0 94 0 85 1538 4.0 10.6 17.1 5.5 12.4 11.2 1358 1865
Dacia 229,261 2 13,446 58 0 7.3 3.9 0 0 82 0 17 0 89 0 69 1460 4.0 9.7 16.7 5.4 13.1 12.7 1230 1710
Volvo 211,399 2 38,269 90 0 0 1.4 0.06 40 76 0 24 62 97 0 114 1944 4.6 10.1 16.4 6.0 8.9 10.2 1686 2189
Chevrolet 167,075 1 18,594 36 0 8.5 0 0.33 9 90 1 7 0 99 0 86 1568 4.0 10.2 16.4 5.4 13.2 10.5 1321 1743
No
ise
(pas
s-by
) [d
B]
No
ise
(sta
tio
nary
) [d
B]
Tota
l sal
es/r
egis
trat
ions
Tota
l sal
es/r
egis
trat
ions
[%
]
Pric
e [E
UR
incl
. tax
]
Die
sel [
%]
Hyb
rid
excl
. PH
EV [
%]
Nat
ural
gas
(m
ono-
/biv
alen
t, in
cl. L
PG)
[%]
Flex
-Fue
l (et
hano
l/ga
solin
e) [
%]
Elec
tric
/fue
l cel
l inc
l. PH
EV [
%]
Aut
omat
ic [
%]
Fron
t dr
ive
[%]
Rea
r dr
ive
[%]
4-w
heel
dri
ve [
%]
Engi
ne p
ower
[K
W]
Engi
ne s
ize
[ccm
]
Num
ber
of c
ylin
ders
Com
pres
sion
rat
e (g
asol
ine)
Com
pres
sion
rat
e (d
iese
l)
Num
ber
of g
ears
Perf
orm
ance
0–1
00
km
/h (
gaso
line)
[s]
Perf
orm
ance
0–1
00
km
/h (
dies
el)
[s]
Mas
s in
run
ning
ord
er [
kg]
Gro
ss w
eigh
t [k
g]
512 4270 1772 1540 2561 1519 1515 4.0 384 4.9 4.6 5.4 4.6 6.8 133 233 379 44 36 153 24 179 2 73 79 EU-27
521 4362 1783 1552 2652 1530 1528 4.0 408 4.9 4.6 5.8 4.9 7.3 143 214 380 43 34 153 25 176 2 72 76 Germany
495 4256 1771 1519 2608 1527 1517 4.0 372 4.9 4.5 5.4 4.6 6.9 134 221 377 46 36 150 24 170 2 71 77 United Kingdom
526 4217 1773 1545 2602 1506 1504 3.9 371 5.0 4.7 5.0 4.3 6.2 125 263 379 47 38 155 24 205 2 72 76 France
488 4109 1741 1546 2545 1495 1493 3.8 339 4.8 4.6 5.4 4.6 6.7 126 250 344 44 38 153 22 186 2 72 77 Italy
526 4322 1772 1545 2621 1518 1514 4.0 422 5.0 4.8 5.8 4.9 7.3 141 243 387 41 39 148 24 193 3 72 76 EU-12
516 4299 1798 1534 2622 1524 1519 4.0 392 5.0 4.7 5.2 4.5 6.5 130 227 390 41 38 157 26 172 3 71 76 Spain
515 4156 1741 1512 2570 1499 1497 3.8 344 4.8 4.6 5.1 4.4 6.3 120 243 384 45 35 152 23 199 1 71 77 Netherlands
528 4334 1786 1549 2644 1521 1519 4.0 396 5.0 4.6 5.2 4.5 6.5 132 225 397 47 36 155 23 173 2 72 76 Belgium
523 4336 1780 1566 2637 1524 1521 4.0 399 5.0 4.8 5.5 4.7 6.9 137 227 433 43 33 154 23 171 2 72 76 Austria
508 4490 1805 1545 2694 1567 1546 4.2 442 5.0 4.8 5.5 4.8 6.9 139 218 366 41 35 154 23 172 2 71 75 Sweden
435 4054 1722 1512 2540 1487 1482 3.8 318 4.8 4.7 4.9 4.2 6.1 119 243 390 43 35 159 21 206 2 71 77 Denmark
531 4432 1790 1534 2663 1534 1536 4.1 431 5.1 4.8 5.8 4.9 7.3 141 217 396 40 36 152 25 175 2 71 76 Finland
480 4248 1761 1504 2601 1517 1512 3.9 371 4.9 4.7 4.8 4.1 5.9 120 222 391 47 37 152 21 171 2 71 76 Portugal
510 – – – 2647 1555 1534 4.1 429 5.0 4.6 5.0 4.3 6.1 126 227 480 43 33 144 22 225 1 71 75 Ireland
469 – – – 2523 1428 1425 3.5 263 4.9 4.6 5.1 4.3 6.3 122 222 374 42 36 150 24 172 3 71 77 Greece
514 – – – 2651 1554 1560 4.3 474 4.9 4.5 5.5 4.7 6.8 138 240 367 40 36 150 26 193 2 72 76 Luxembourg
568 4316 1773 1562 2572 1512 1515 3.9 423 4.9 4.6 5.4 4.6 6.8 134 217 417 40 0 143 27 170 1 71 75 VW
533 4275 1792 1546 2557 1517 1514 4.0 346 5.1 4.7 5.4 4.5 6.8 132 240 412 68 54 177 29 205 2 70 76 Ford
518 4223 1769 1539 2587 1503 1498 3.9 359 5.0 4.6 5.0 4.3 6.2 123 273 313 53 58 163 28 186 1 72 78 Renault
494 4181 1791 1524 2564 1500 1495 3.9 359 4.9 4.6 4.9 4.2 6.2 122 304 398 49 0 162 27 193 2 72 76 Peugeot
517 4513 1812 1478 2676 1637 1554 4.3 431 4.7 4.5 5.5 4.8 6.8 141 181 384 44 0 148 27 172 1 72 74 Audi
504 4156 1765 1563 2547 1487 1492 3.8 365 5.0 4.7 5.0 4.3 6.3 125 312 376 56 62 159 28 199 1 72 77 Citroën
518 4599 1824 1484 2768 1547 1574 4.4 446 4.9 4.4 5.5 4.8 6.8 142 262 191 53 33 148 30 173 11 72 77 BMW
505 4371 1800 1552 2589 1522 1527 4.0 390 5.2 4.7 5.5 4.6 7.0 133 165 457 39 0 151 22 171 2 72 77 Opel
551 4558 1812 1536 2757 1563 1568 4.3 484 4.9 4.4 5.9 5.0 7.6 150 149 318 38 18 157 25 172 2 72 76 Mercedes-Benz
468 3838 1665 1552 2408 1435 1430 3.5 238 4.6 4.3 5.3 4.5 6.7 123 352 304 40 40 165 23 206 2 72 80 Fiat
433 4060 1725 1529 2477 1488 1482 3.8 323 5.0 4.7 5.2 4.5 6.3 122 230 276 39 37 157 17 175 4 71 77 Toyota
546 4324 1728 1518 2246 1493 1482 3.8 480 4.9 4.9 5.4 4.6 6.9 134 230 423 37 0 137 21 171 1 71 73 Škoda
512 4236 1753 1596 2557 1519 1524 4.0 339 5.4 5.0 5.7 4.9 7.2 141 217 386 33 32 201 17 225 14 70 75 Nissan
492 4182 1749 1552 2483 1546 1528 4.0 395 5.0 4.9 5.4 4.7 6.6 132 211 398 29 24 143 28 172 2 72 79 Hyundai
469 4165 1756 1536 2506 1538 1543 4.0 374 5.0 4.8 5.3 4.6 6.4 129 202 371 31 20 167 29 193 7 72 79 Kia
491 4211 1732 1480 2508 1497 1487 3.8 355 4.9 4.6 5.0 4.3 6.4 124 208 283 37 0 136 32 156 1 71 76 Seat
500 4325 1784 1528 2622 1529 1531 4.1 375 5.2 4.6 5.6 4.7 7.4 135 166 417 36 0 149 21 169 2 72 77 Vauxhall
530 4260 1786 1629 2515 1454 1453 3.9 441 5.1 5.0 5.9 5.2 7.4 140 351 426 53 50 143 35 167 10 72 79 Dacia
555 4620 1851 1546 2717 1594 1578 4.4 469 5.0 4.8 5.5 4.7 7.0 144 213 414 43 0 196 19 223 1 71 73 Volvo
481 4209 1741 1554 2527 1508 1512 3.9 308 5.5 4.8 5.9 4.9 7.7 142 111 516 42 38 193 15 227 2 71 79 Chevrolet
Dir
ect
inje
ctio
n (n
on-d
iese
l) [
%]
Euro
#5 [
%]
Euro
#6 [
%]
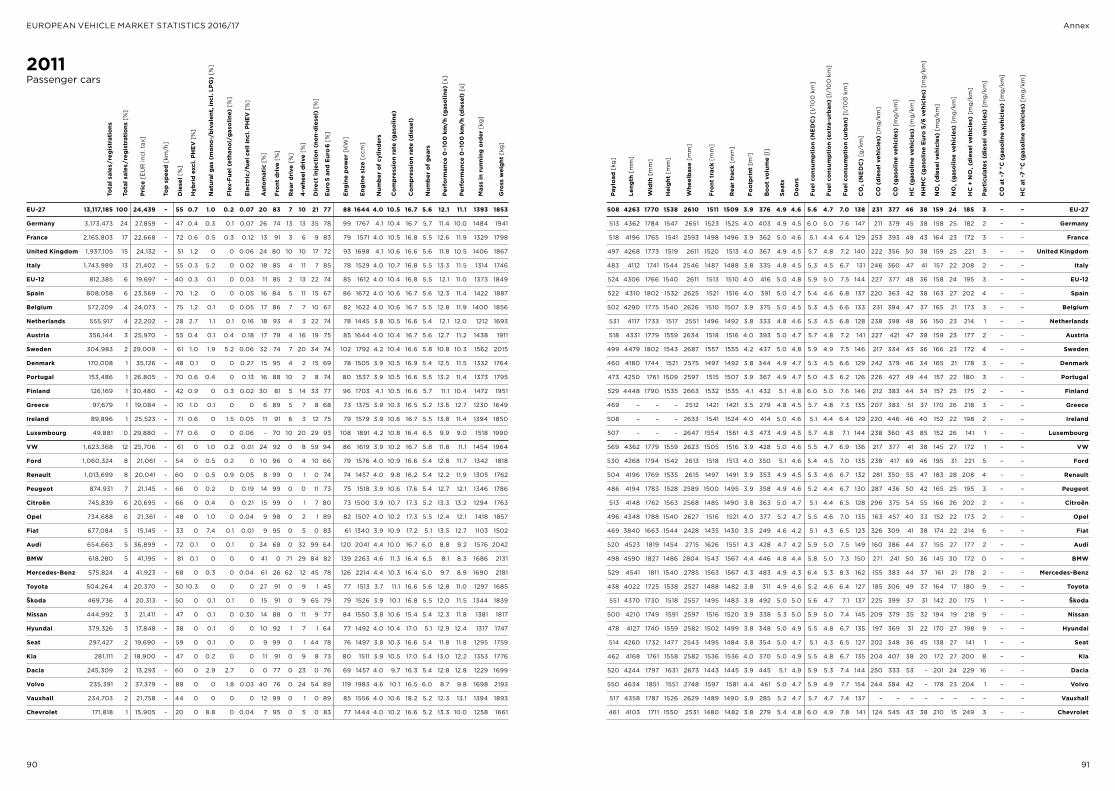
90 91
EUROPEAN VEHICLE MARKET STATISTICS 2016/17 Annex
2011Passenger cars
Payl
oad
[kg
]
Leng
th [
mm
]
Wid
th [
mm
]
Hei
ght
[mm
]
Whe
elba
se [
mm
]
Fron
t tr
ack
[mm
]
Rea
r tr
ack
[mm
]
Foot
prin
t [m
2 ]
Boo
t vo
lum
e [l
]
Seat
s
Doo
rs
Fuel
con
sum
ptio
n (N
ED
C)
[l/1
00
km
]
Fuel
con
sum
ptio
n (e
xtra
-urb
an)
[l/1
00
km
]
Fuel
con
sum
ptio
n (u
rban
) [l
/10
0 k
m]
CO
2 (N
ED
C)
[g/k
m]
CO
(di
esel
veh
icle
s) [
mg
/km
]
CO
(ga
solin
e ve
hicl
es)
[mg
/km
]
HC
(ga
solin
e ve
hicl
es)
[mg
/km
]
NH
MC
(ga
solin
e Eu
ro 5
/6 v
ehic
les)
[m
g/k
m]
NO
x (di
esel
veh
icle
s) [
mg
/km
]
NO
x (ga
solin
e ve
hicl
es)
[mg
/km
]
HC
+ N
Ox (
dies
el v
ehic
les)
[m
g/k
m]
Part
icul
ates
(di
esel
veh
icle
s) [
mg
/km
]
EU-27 13,117,185 100 24,439 – 55 0.7 1.0 0.2 0.07 20 83 7 10 21 77 88 1644 4.0 10.5 16.7 5.6 12.1 11.1 1393 1853
Germany 3,173,473 24 27,859 – 47 0.4 0.3 0.1 0.07 26 74 13 13 35 78 99 1767 4.1 10.4 16.7 5.7 11.4 10.0 1484 1941
France 2,165,803 17 22,668 – 72 0.6 0.5 0.3 0.12 13 91 3 6 9 83 79 1571 4.0 10.5 16.8 5.5 12.6 11.9 1329 1798
United Kingdom 1,937,105 15 24,132 – 51 1.2 0 0 0.06 24 80 10 10 17 72 93 1698 4.1 10.6 16.6 5.6 11.8 10.5 1406 1867
Italy 1,743,989 13 21,402 – 55 0.3 5.2 0 0.02 18 85 4 11 7 85 78 1529 4.0 10.7 16.8 5.5 13.3 11.5 1314 1746
EU-12 812,385 6 19,697 – 40 0.3 0.1 0 0.03 11 85 2 13 22 74 85 1612 4.0 10.4 16.8 5.5 12.1 11.0 1373 1849
Spain 808,058 6 23,569 – 70 1.2 0 0 0.05 16 84 5 11 15 67 86 1672 4.0 10.6 16.7 5.6 12.3 11.4 1422 1887
Belgium 572,209 4 24,073 – 75 1.2 0.1 0 0.05 17 86 7 7 10 67 82 1622 4.0 10.6 16.7 5.5 12.8 11.9 1400 1856
Netherlands 555,917 4 22,202 – 28 2.7 1.1 0.1 0.16 18 93 4 3 22 74 78 1445 3.8 10.5 16.6 5.4 12.1 12.0 1212 1693
Austria 356,144 3 25,970 – 55 0.4 0.1 0.4 0.18 17 79 4 16 19 75 85 1644 4.0 10.4 16.7 5.6 12.7 11.2 1438 1911
Sweden 304,983 2 29,009 – 61 1.0 1.9 5.2 0.06 32 74 7 20 34 74 102 1792 4.2 10.4 16.6 5.8 10.8 10.3 1562 2015
Denmark 170,008 1 35,126 – 48 0.1 0 0 0.27 15 95 4 2 15 69 78 1505 3.9 10.5 16.9 5.4 12.5 11.5 1332 1764
Portugal 153,486 1 26,805 – 70 0.6 0.4 0 0.13 16 88 10 2 8 74 80 1537 3.9 10.5 16.6 5.5 13.2 11.4 1373 1795
Finland 126,169 1 30,480 – 42 0.9 0 0.3 0.02 30 81 5 14 33 77 96 1703 4.1 10.5 16.6 5.7 11.1 10.4 1472 1951
Greece 97,679 1 19,084 – 10 1.0 0.1 0 0 6 89 5 7 8 68 73 1375 3.9 10.3 16.5 5.2 13.6 12.7 1230 1649
Ireland 89,896 1 25,523 – 71 0.6 0 1.5 0.05 11 91 6 3 12 75 79 1579 3.9 10.6 16.7 5.5 13.8 11.4 1394 1850
Luxembourg 49,881 0 29,880 – 77 0.6 0 0 0.06 – 70 10 20 29 93 108 1891 4.2 10.8 16.4 6.5 9.9 9.0 1518 1990
VW 1,623,368 12 25,706 – 61 0 1.0 0.2 0.01 24 92 0 8 59 94 86 1619 3.9 10.2 16.7 5.8 11.8 11.1 1454 1964
Ford 1,060,324 8 21,061 – 54 0 0.5 0.2 0 10 96 0 4 10 66 79 1576 4.0 10.9 16.6 5.4 12.8 11.7 1342 1818
Renault 1,013,699 8 20,041 – 60 0 0.5 0.9 0.05 8 99 0 1 0 74 74 1457 4.0 9.8 16.2 5.4 12.2 11.9 1305 1762
Peugeot 874,931 7 21,145 – 66 0 0.2 0 0.19 14 99 0 0 11 73 75 1518 3.9 10.6 17.6 5.4 12.7 12.1 1346 1786
Citroën 745,839 6 20,695 – 66 0 0.4 0 0.21 15 99 0 1 7 80 73 1500 3.9 10.7 17.3 5.2 13.3 13.2 1294 1763
Opel 734,688 6 21,361 – 48 0 1.0 0 0.04 9 98 0 2 1 89 82 1507 4.0 10.2 17.3 5.5 12.4 12.1 1418 1857
Fiat 677,084 5 15,145 – 33 0 7.4 0.1 0.01 9 95 0 5 0 83 61 1340 3.9 10.9 17.2 5.1 13.5 12.7 1103 1502
Audi 654,663 5 36,899 – 72 0.1 0 0.1 0 34 68 0 32 99 64 120 2041 4.4 10.0 16.7 6.0 8.8 9.2 1576 2042
BMW 618,280 5 41,195 – 81 0.1 0 0 0 41 0 71 29 84 82 139 2263 4.6 11.3 16.4 6.5 8.1 8.3 1686 2131
Mercedes-Benz 575,824 4 41,923 – 68 0 0.3 0 0.04 61 26 62 12 45 78 126 2214 4.4 10.3 16.4 6.0 9.7 8.9 1690 2181
Toyota 504,264 4 20,370 – 30 10.3 0 0 0 27 91 0 9 1 45 77 1513 3.7 11.1 16.6 5.6 12.8 11.0 1297 1685
Škoda 469,736 4 20,313 – 50 0 0.1 0.1 0 15 91 0 9 65 79 79 1526 3.9 10.1 16.8 5.5 12.0 11.5 1344 1839
Nissan 444,992 3 21,411 – 47 0 0.1 0 0.30 14 88 0 11 9 77 84 1550 3.8 10.6 15.4 5.4 12.3 11.8 1381 1817
Hyundai 379,326 3 17,848 – 38 0 0.1 0 0 10 92 1 7 1 64 77 1492 4.0 10.4 17.0 5.1 12.9 12.4 1317 1747
Seat 297,427 2 19,690 – 59 0 0.1 0 0 9 99 0 1 44 78 76 1497 3.8 10.3 16.6 5.4 11.8 11.8 1295 1759
Kia 281,111 2 18,900 – 47 0 0.2 0 0 11 91 0 9 8 73 80 1511 3.9 10.5 17.0 5.4 13.0 12.2 1353 1776
Dacia 245,309 2 13,293 – 60 0 2.9 2.7 0 0 77 0 23 0 76 69 1457 4.0 9.7 16.3 5.4 12.8 12.8 1229 1699
Volvo 235,391 2 37,379 – 88 0 0 1.8 0.03 40 76 0 24 54 89 119 1983 4.6 10.1 16.5 6.0 8.7 9.8 1698 2193
Vauxhall 234,703 2 21,758 – 44 0 0 0 0 12 99 0 1 0 89 85 1556 4.0 10.6 18.2 5.2 12.3 13.1 1394 1893
Chevrolet 171,818 1 15,905 – 20 0 8.8 0 0.04 7 95 0 5 0 83 77 1444 4.0 10.2 16.6 5.2 13.3 10.0 1258 1661
508 4263 1770 1538 2610 1511 1509 3.9 376 4.9 4.6 5.6 4.7 7.0 138 231 377 46 38 159 24 185 3 – – EU-27
513 4362 1784 1547 2651 1523 1525 4.0 403 4.9 4.5 6.0 5.0 7.6 147 211 379 45 38 158 25 182 2 – – Germany
518 4196 1765 1541 2593 1498 1496 3.9 362 5.0 4.6 5.1 4.4 6.4 129 253 393 48 43 164 23 172 3 – – France
497 4268 1773 1519 2611 1520 1513 4.0 367 4.9 4.5 5.7 4.8 7.2 140 222 356 50 38 159 25 221 3 – – United Kingdom
483 4112 1741 1544 2546 1487 1488 3.8 335 4.8 4.5 5.3 4.5 6.7 131 246 360 47 41 157 22 208 2 – – Italy
524 4306 1766 1540 2611 1513 1510 4.0 416 5.0 4.8 5.9 5.0 7.5 144 227 377 48 36 158 24 195 3 – – EU-12
522 4310 1802 1532 2625 1521 1516 4.0 391 5.0 4.7 5.4 4.6 6.8 137 220 363 42 38 163 27 202 4 – – Spain
502 4290 1775 1540 2626 1510 1507 3.9 375 5.0 4.5 5.3 4.5 6.6 133 231 394 47 37 165 21 173 3 – – Belgium
531 4117 1733 1517 2551 1496 1492 3.8 333 4.8 4.6 5.3 4.5 6.8 128 238 398 48 36 150 23 214 1 – – Netherlands
518 4331 1779 1559 2634 1518 1516 4.0 393 5.0 4.7 5.7 4.8 7.2 141 227 421 47 38 159 23 177 2 – – Austria
499 4479 1802 1543 2687 1557 1555 4.2 437 5.0 4.8 5.9 4.9 7.5 146 217 334 43 36 166 23 172 4 – – Sweden
460 4180 1744 1521 2575 1497 1492 3.8 344 4.9 4.7 5.3 4.5 6.6 129 242 379 46 34 165 21 178 3 – – Denmark
473 4250 1761 1509 2597 1515 1507 3.9 367 4.9 4.7 5.0 4.3 6.2 126 226 427 49 44 157 22 180 3 – – Portugal
529 4448 1790 1535 2663 1532 1535 4.1 432 5.1 4.8 6.0 5.0 7.6 146 212 383 44 34 157 25 175 2 – – Finland
469 – – – 2512 1421 1421 3.5 279 4.8 4.5 5.7 4.8 7.3 135 207 383 51 37 170 26 218 3 – – Greece
508 – – – 2633 1541 1524 4.0 414 5.0 4.6 5.1 4.4 6.4 129 220 446 46 40 152 22 198 2 – – Ireland
507 – – – 2647 1554 1561 4.3 473 4.9 4.5 5.7 4.8 7.1 144 238 360 43 85 152 26 141 1 – – Luxembourg
569 4362 1779 1559 2623 1505 1516 3.9 428 5.0 4.6 5.5 4.7 6.9 136 217 377 41 38 145 27 172 1 – – VW
530 4268 1794 1542 2613 1518 1513 4.0 350 5.1 4.6 5.4 4.5 7.0 135 238 417 69 46 195 31 221 5 – – Ford
504 4196 1769 1535 2615 1497 1491 3.9 353 4.9 4.5 5.3 4.6 6.7 132 281 350 55 47 183 28 208 4 – – Renault
486 4194 1783 1528 2589 1500 1495 3.9 358 4.9 4.6 5.2 4.4 6.7 130 287 436 50 42 165 25 195 3 – – Peugeot
513 4148 1762 1563 2568 1485 1490 3.8 363 5.0 4.7 5.1 4.4 6.5 128 296 375 54 55 166 26 202 2 – – Citroën
496 4348 1788 1540 2627 1516 1521 4.0 377 5.2 4.7 5.5 4.6 7.0 135 163 457 40 33 152 22 173 2 – – Opel
469 3840 1663 1544 2428 1435 1430 3.5 249 4.6 4.2 5.1 4.3 6.5 123 326 309 41 38 174 22 214 6 – – Fiat
520 4523 1819 1454 2715 1626 1551 4.3 428 4.7 4.2 5.9 5.0 7.5 149 160 386 44 37 155 27 177 2 – – Audi
498 4590 1827 1486 2804 1543 1567 4.4 446 4.8 4.4 5.8 5.0 7.3 150 271 241 50 36 145 30 172 0 – – BMW
529 4541 1811 1540 2785 1563 1567 4.3 483 4.9 4.3 6.4 5.3 8.3 162 155 383 44 37 161 21 178 2 – – Mercedes-Benz
438 4022 1725 1538 2527 1488 1482 3.8 311 4.9 4.6 5.2 4.6 6.4 127 185 306 49 37 164 17 180 9 – – Toyota
551 4370 1730 1518 2557 1495 1483 3.8 492 5.0 5.0 5.6 4.7 7.1 137 225 399 37 31 142 20 175 1 – – Škoda
500 4210 1749 1591 2597 1516 1520 3.9 338 5.3 5.0 5.9 5.0 7.4 145 209 379 35 32 194 19 218 9 – – Nissan
478 4127 1740 1559 2582 1502 1499 3.8 348 5.0 4.9 5.5 4.8 6.7 135 197 369 31 22 170 27 198 9 – – Hyundai
514 4260 1732 1477 2543 1495 1484 3.8 354 5.0 4.7 5.1 4.3 6.5 127 202 348 36 45 138 27 141 1 – – Seat
462 4168 1761 1558 2582 1536 1536 4.0 370 5.0 4.9 5.5 4.8 6.7 135 204 407 38 20 172 27 200 8 – – Kia
520 4244 1797 1631 2673 1443 1445 3.9 445 5.1 4.9 5.9 5.3 7.4 144 250 333 53 – 201 24 229 16 – – Dacia
550 4634 1851 1551 2748 1597 1581 4.4 461 5.0 4.7 5.9 4.9 7.7 154 244 384 42 – 178 23 204 1 – – Volvo
517 4358 1787 1526 2629 1489 1490 3.9 285 5.2 4.7 5.7 4.7 7.4 137 – – – – – – – – – – Vauxhall
461 4103 1711 1550 2531 1480 1482 3.8 279 5.4 4.8 6.0 4.9 7.8 141 124 545 43 38 210 15 249 3 – – Chevrolet
CO
at
-7 °
C (
gaso
line
vehi
cles
) [m
g/k
m]
HC
at
-7 °
C (
gaso
line
vehi
cles
) [m
g/k
m]
Tota
l sal
es/r
egis
trat
ions
Tota
l sal
es/r
egis
trat
ions
[%
]
Pric
e [E
UR
incl
. tax
]
Top
spee
d [k
m/h
]
Die
sel [
%]
Hyb
rid
excl
. PH
EV [
%]
Nat
ural
gas
(m
ono-
/biv
alen
t, in
cl. L
PG)
[%]
Flex
-Fue
l (et
hano
l/ga
solin
e) [
%]
Elec
tric
/fue
l cel
l inc
l. PH
EV [
%]
Aut
omat
ic [
%]
Fron
t dr
ive
[%]
Rea
r dr
ive
[%]
4-w
heel
dri
ve [
%]
Dir
ect
inje
ctio
n (n
on-d
iese
l) [
%]
Euro
#5 a
nd E
uro#
6 [%
]
Engi
ne p
ower
[K
W]
Engi
ne s
ize
[ccm
]
Num
ber
of c
ylin
ders
Com
pres
sion
rat
e (g
asol
ine)
Com
pres
sion
rat
e (d
iese
l)
Num
ber
of g
ears
Perf
orm
ance
0–1
00
km
/h (
gaso
line)
[s]
Perf
orm
ance
0–1
00
km
/h (
dies
el)
[s]
Mas
s in
run
ning
ord
er [
kg]
Gro
ss w
eigh
t [k
g]
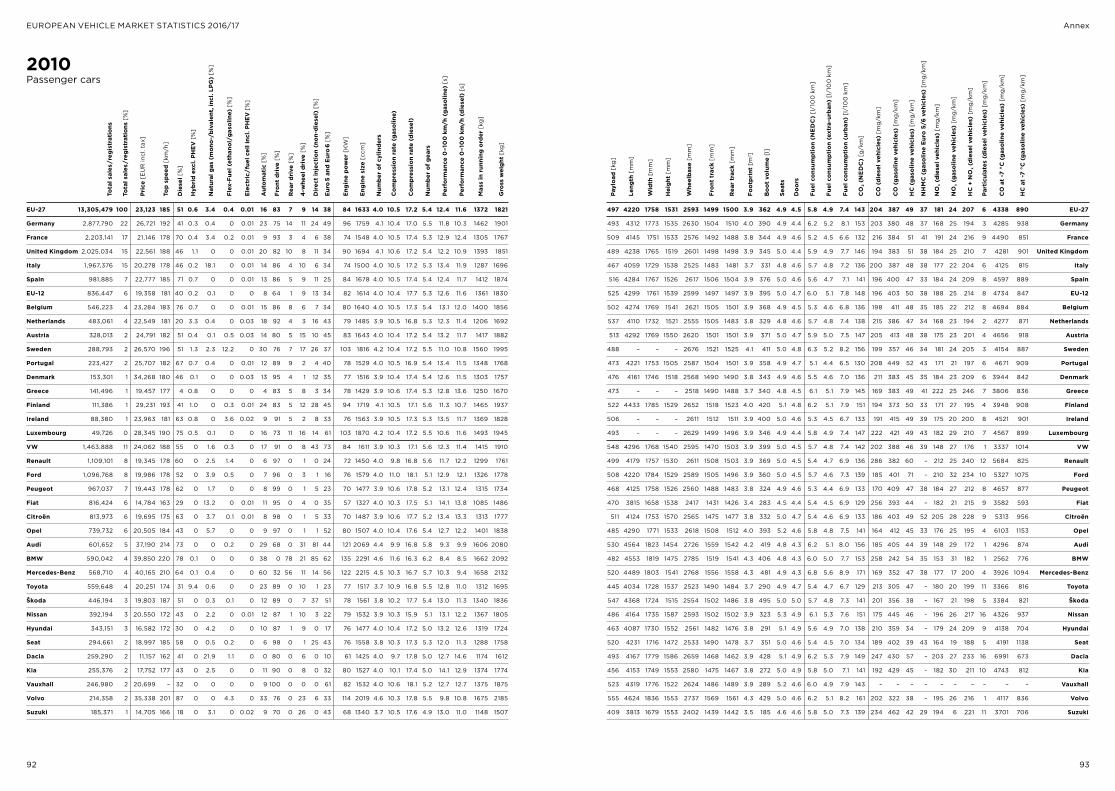
92 93
EUROPEAN VEHICLE MARKET STATISTICS 2016/17 Annex
2010Passenger cars
EU-27 13,305,479 100 23,123 185 51 0.6 3.4 0.4 0.01 16 83 7 9 14 38 84 1633 4.0 10.5 17.2 5.4 12.4 11.6 1372 1821
Germany 2,877,790 22 26,721 192 41 0.3 0.4 0 0.01 23 75 14 11 24 49 96 1759 4.1 10.4 17.0 5.5 11.8 10.3 1462 1901
France 2,203,141 17 21,146 178 70 0.4 3.4 0.2 0.01 9 93 3 4 6 38 74 1548 4.0 10.5 17.4 5.3 12.9 12.4 1305 1767
United Kingdom 2,025,034 15 22,561 188 46 1.1 0 0 0.01 20 82 10 8 11 34 90 1694 4.1 10.6 17.2 5.4 12.2 10.9 1393 1851
Italy 1,967,376 15 20,278 178 46 0.2 18.1 0 0.01 14 86 4 10 6 34 74 1500 4.0 10.5 17.2 5.3 13.4 11.9 1287 1696
Spain 981,885 7 22,777 185 71 0.7 0 0 0.01 13 86 5 9 11 25 84 1678 4.0 10.5 17.4 5.4 12.4 11.7 1412 1874
EU-12 836,447 6 19,358 181 40 0.2 0.1 0 0 8 64 1 9 13 34 82 1614 4.0 10.4 17.7 5.3 12.6 11.6 1361 1830
Belgium 546,223 4 23,284 183 76 0.7 0 0 0.01 15 86 8 6 7 34 80 1640 4.0 10.5 17.3 5.4 13.1 12.0 1400 1856
Netherlands 483,061 4 22,549 181 20 3.3 0.4 0 0.03 18 92 4 3 16 43 79 1485 3.9 10.5 16.8 5.3 12.3 11.4 1206 1692
Austria 328,013 2 24,791 182 51 0.4 0.1 0.5 0.03 14 80 5 15 10 45 83 1643 4.0 10.4 17.2 5.4 13.2 11.7 1417 1882
Sweden 288,793 2 26,570 196 51 1.3 2.3 12.2 0 30 76 7 17 26 37 103 1816 4.2 10.4 17.2 5.5 11.0 10.8 1560 1995
Portugal 223,427 2 25,707 182 67 0.7 0.4 0 0.01 12 89 9 2 4 40 78 1529 4.0 10.5 16.9 5.4 13.4 11.5 1348 1768
Denmark 153,301 1 34,268 180 46 0.1 0 0 0.03 13 95 4 1 12 35 77 1516 3.9 10.4 17.4 5.4 12.6 11.5 1303 1757
Greece 141,496 1 19,457 177 4 0.8 0 0 0 4 83 5 8 3 34 78 1429 3.9 10.6 17.4 5.3 12.8 13.6 1250 1670
Finland 111,386 1 29,231 193 41 1.0 0 0.3 0.01 24 83 5 12 28 45 94 1719 4.1 10.5 17.1 5.6 11.3 10.7 1465 1937
Ireland 88,380 1 23,963 181 63 0.8 0 3.6 0.02 9 91 5 2 8 33 76 1563 3.9 10.5 17.3 5.3 13.5 11.7 1369 1828
Luxembourg 49,726 0 28,345 190 75 0.5 0.1 0 0 16 73 11 16 14 61 103 1870 4.2 10.4 17.2 5.5 10.6 11.6 1493 1945
VW 1,463,888 11 24,062 188 55 0 1.6 0.3 0 17 91 0 8 43 73 84 1611 3.9 10.3 17.1 5.6 12.3 11.4 1415 1910
Renault 1,109,101 8 19,345 178 60 0 2.5 1.4 0 6 97 0 1 0 24 72 1450 4.0 9.8 16.8 5.6 11.7 12.2 1299 1761
Ford 1,096,768 8 19,986 178 52 0 3.9 0.5 0 7 96 0 3 1 16 76 1579 4.0 11.0 18.1 5.1 12.9 12.1 1326 1778
Peugeot 967,037 7 19,443 178 62 0 1.7 0 0 8 99 0 1 5 23 70 1477 3.9 10.6 17.8 5.2 13.1 12.4 1315 1734
Fiat 816,424 6 14,784 163 29 0 13.2 0 0.01 11 95 0 4 0 35 57 1327 4.0 10.3 17.5 5.1 14.1 13.8 1085 1486
Citroën 813,973 6 19,695 175 63 0 3.7 0.1 0.01 8 98 0 1 5 33 70 1487 3.9 10.6 17.7 5.2 13.4 13.3 1313 1777
Opel 739,732 6 20,505 184 43 0 5.7 0 0 9 97 0 1 1 52 80 1507 4.0 10.4 17.6 5.4 12.7 12.2 1401 1838
Audi 601,652 5 37,190 214 73 0 0 0.2 0 29 68 0 31 81 44 121 2069 4.4 9.9 16.8 5.8 9.3 9.9 1606 2080
BMW 590,042 4 39,850 220 78 0.1 0 0 0 38 0 78 21 85 62 135 2291 4.6 11.6 16.3 6.2 8.4 8.5 1662 2092
Mercedes-Benz 568,710 4 40,165 210 64 0.1 0.4 0 0 60 32 56 11 14 56 122 2215 4.5 10.3 16.7 5.7 10.3 9.4 1658 2132
Toyota 559,648 4 20,251 174 31 9.4 0.6 0 0 23 89 0 10 1 23 77 1517 3.7 10.9 16.8 5.5 12.8 11.0 1312 1695
Škoda 446,194 3 19,803 187 51 0 0.3 0.1 0 12 89 0 7 37 51 78 1561 3.8 10.2 17.7 5.4 13.0 11.3 1340 1836
Nissan 392,194 3 20,550 172 43 0 2.2 0 0.01 12 87 1 10 3 22 79 1532 3.9 10.3 15.9 5.1 13.1 12.2 1367 1805
Hyundai 343,151 3 16,582 172 30 0 4.2 0 0 10 87 1 9 0 17 76 1477 4.0 10.4 17.2 5.0 13.2 12.6 1319 1724
Seat 294,661 2 18,997 185 58 0 0.5 0.2 0 6 98 0 1 25 43 76 1558 3.8 10.3 17.3 5.3 12.0 11.3 1288 1758
Dacia 259,290 2 11,157 162 41 0 21.9 1.1 0 0 80 0 6 0 10 61 1425 4.0 9.7 17.8 5.0 12.7 14.6 1174 1612
Kia 255,376 2 17,752 177 43 0 2.5 0 0 11 90 0 8 0 32 80 1527 4.0 10.1 17.4 5.0 14.1 12.9 1374 1774
Vauxhall 246,980 2 20,699 – 32 0 0 0 0 9 100 0 0 0 61 82 1532 4.0 10.6 18.1 5.2 12.7 12.7 1375 1875
Volvo 214,358 2 35,338 201 87 0 0 4.3 0 33 76 0 23 6 33 114 2019 4.6 10.3 17.8 5.5 9.8 10.8 1675 2185
Suzuki 185,371 1 14,705 166 18 0 3.1 0 0.02 9 70 0 26 0 43 68 1340 3.7 10.5 17.6 4.9 13.0 11.0 1148 1507
497 4220 1758 1531 2593 1499 1500 3.9 362 4.9 4.5 5.8 4.9 7.4 143 204 387 49 37 181 24 207 6 4338 890 EU-27
493 4312 1773 1535 2630 1504 1510 4.0 390 4.9 4.4 6.2 5.2 8.1 153 203 380 48 37 168 25 194 3 4285 938 Germany
509 4145 1751 1533 2576 1492 1488 3.8 344 4.9 4.6 5.2 4.5 6.6 132 216 384 51 41 191 24 216 9 4490 851 France
489 4238 1765 1519 2601 1498 1498 3.9 345 5.0 4.4 5.9 4.9 7.7 146 194 383 51 38 184 25 210 7 4281 901 United Kingdom
467 4059 1729 1538 2525 1483 1481 3.7 331 4.8 4.6 5.7 4.8 7.2 136 200 387 48 38 177 22 204 6 4125 815 Italy
516 4284 1767 1526 2617 1506 1504 3.9 376 5.0 4.6 5.6 4.7 7.1 141 196 400 47 33 184 24 209 8 4597 889 Spain
525 4299 1761 1539 2599 1497 1497 3.9 395 5.0 4.7 6.0 5.1 7.8 148 196 403 50 38 188 25 214 8 4734 847 EU-12
502 4274 1769 1541 2621 1505 1501 3.9 368 4.9 4.5 5.3 4.6 6.8 136 198 411 48 35 185 22 212 8 4694 884 Belgium
537 4110 1732 1521 2555 1505 1483 3.8 329 4.8 4.6 5.7 4.8 7.4 138 215 386 47 34 168 23 194 2 4277 871 Netherlands
513 4292 1769 1550 2620 1501 1501 3.9 371 5.0 4.7 5.9 5.0 7.5 147 205 413 48 38 175 23 201 4 4656 918 Austria
488 – – – 2676 1521 1525 4.1 411 5.0 4.8 6.3 5.2 8.2 156 199 357 46 34 181 24 205 3 4154 887 Sweden
473 4221 1753 1505 2587 1504 1501 3.9 358 4.9 4.7 5.1 4.4 6.5 130 208 449 52 43 171 21 197 6 4671 909 Portugal
476 4161 1746 1518 2568 1490 1490 3.8 343 4.9 4.6 5.5 4.6 7.0 136 211 383 45 35 184 23 209 6 3944 842 Denmark
473 – – – 2518 1490 1488 3.7 340 4.8 4.5 6.1 5.1 7.9 145 169 383 49 41 222 25 246 7 3806 836 Greece
522 4433 1785 1529 2652 1518 1523 4.0 420 5.1 4.8 6.2 5.1 7.9 151 194 373 50 33 171 27 195 4 3948 908 Finland
506 – – – 2611 1512 1511 3.9 400 5.0 4.6 5.3 4.5 6.7 133 191 415 49 39 175 20 200 8 4521 901 Ireland
493 – – – 2629 1499 1496 3.9 346 4.9 4.4 5.8 4.9 7.4 147 222 421 49 43 182 29 210 7 4567 899 Luxembourg
548 4296 1768 1540 2595 1470 1503 3.9 399 5.0 4.5 5.7 4.8 7.4 142 202 388 46 39 148 27 176 1 3337 1014 VW
499 4179 1757 1530 2611 1508 1503 3.9 369 5.0 4.5 5.4 4.7 6.9 136 286 382 60 – 212 25 240 12 5684 825 Renault
508 4220 1784 1529 2589 1505 1496 3.9 360 5.0 4.5 5.7 4.6 7.3 139 185 401 71 – 210 32 234 10 5327 1075 Ford
468 4125 1758 1526 2560 1488 1483 3.8 324 4.9 4.6 5.3 4.4 6.9 133 170 409 47 38 184 27 212 8 4657 877 Peugeot
470 3815 1658 1538 2417 1431 1426 3.4 283 4.5 4.4 5.4 4.5 6.9 129 256 393 44 – 182 21 215 9 3582 593 Fiat
511 4124 1753 1570 2565 1475 1477 3.8 332 5.0 4.7 5.4 4.6 6.9 133 186 403 49 52 205 28 228 9 5313 956 Citroën
485 4290 1771 1533 2618 1508 1512 4.0 393 5.2 4.6 5.8 4.8 7.5 141 164 412 45 33 176 25 195 4 6103 1153 Opel
530 4564 1823 1454 2726 1559 1542 4.2 419 4.8 4.3 6.2 5.1 8.0 156 185 405 44 39 148 29 172 1 4296 874 Audi
482 4553 1819 1475 2785 1519 1541 4.3 406 4.8 4.3 6.0 5.0 7.7 153 258 242 54 35 153 31 182 1 2562 776 BMW
520 4489 1803 1541 2768 1556 1558 4.3 481 4.9 4.3 6.8 5.6 8.9 171 169 352 47 38 177 17 200 4 3926 1094 Mercedes-Benz
445 4034 1728 1537 2523 1490 1484 3.7 290 4.9 4.7 5.4 4.7 6.7 129 213 305 47 – 180 20 199 11 3366 816 Toyota
547 4368 1724 1515 2554 1502 1486 3.8 495 5.0 5.0 5.7 4.8 7.3 141 201 356 38 – 167 21 198 5 3384 821 Škoda
486 4164 1735 1587 2593 1502 1502 3.9 323 5.3 4.9 6.1 5.3 7.6 151 175 445 46 – 196 26 217 16 4326 937 Nissan
463 4087 1730 1552 2561 1482 1476 3.8 291 5.1 4.9 5.6 4.9 7.0 138 210 359 34 – 179 24 209 9 4138 704 Hyundai
520 4231 1716 1472 2533 1490 1478 3.7 351 5.0 4.6 5.4 4.5 7.0 134 189 402 39 43 164 19 188 5 4191 1138 Seat
493 4167 1779 1586 2659 1468 1462 3.9 428 5.1 4.9 6.2 5.3 7.9 149 247 430 57 – 203 27 233 16 6991 673 Dacia
456 4153 1749 1553 2580 1475 1467 3.8 272 5.0 4.9 5.8 5.0 7.1 141 192 429 45 – 182 30 211 10 4743 812 Kia
523 4319 1776 1522 2624 1486 1489 3.9 289 5.2 4.6 6.0 4.9 7.9 143 – – – – – – – – – – Vauxhall
555 4624 1836 1553 2737 1569 1561 4.3 429 5.0 4.6 6.2 5.1 8.2 161 202 322 38 – 195 26 216 1 4117 836 Volvo
409 3813 1679 1553 2402 1439 1442 3.5 185 4.6 4.6 5.8 5.0 7.3 139 234 462 42 29 194 6 221 11 3701 706 Suzuki
Tota
l sal
es/r
egis
trat
ions
Tota
l sal
es/r
egis
trat
ions
[%
]
Pric
e [E
UR
incl
. tax
]
Top
spee
d [k
m/h
]
Die
sel [
%]
Hyb
rid
excl
. PH
EV [
%]
Nat
ural
gas
(m
ono-
/biv
alen
t, in
cl. L
PG)
[%]
Flex
-Fue
l (et
hano
l/ga
solin
e) [
%]
Elec
tric
/fue
l cel
l inc
l. PH
EV [
%]
Aut
omat
ic [
%]
Fron
t dr
ive
[%]
Rea
r dr
ive
[%]
4-w
heel
dri
ve [
%]
Engi
ne p
ower
[K
W]
Engi
ne s
ize
[ccm
]
Num
ber
of c
ylin
ders
Com
pres
sion
rat
e (g
asol
ine)
Com
pres
sion
rat
e (d
iese
l)
Num
ber
of g
ears
Perf
orm
ance
0–1
00
km
/h (
gaso
line)
[s]
Perf
orm
ance
0–1
00
km
/h (
dies
el)
[s]
Mas
s in
run
ning
ord
er [
kg]
Gro
ss w
eigh
t [k
g]
Payl
oad
[kg
]
Leng
th [
mm
]
Wid
th [
mm
]
Hei
ght
[mm
]
Whe
elba
se [
mm
]
Fron
t tr
ack
[mm
]
Rea
r tr
ack
[mm
]
Foot
prin
t [m
2 ]
Boo
t vo
lum
e [l
]
Seat
s
Doo
rs
Fuel
con
sum
ptio
n (N
ED
C)
[l/1
00
km
]
Fuel
con
sum
ptio
n (e
xtra
-urb
an)
[l/1
00
km
]
Fuel
con
sum
ptio
n (u
rban
) [l
/10
0 k
m]
CO
2 (N
ED
C)
[g/k
m]
CO
(di
esel
veh
icle
s) [
mg
/km
]
CO
(ga
solin
e ve
hicl
es)
[mg
/km
]
HC
(ga
solin
e ve
hicl
es)
[mg
/km
]
NH
MC
(ga
solin
e Eu
ro 5
/6 v
ehic
les)
[m
g/k
m]
NO
x (di
esel
veh
icle
s) [
mg
/km
]
NO
x (ga
solin
e ve
hicl
es)
[mg
/km
]
HC
+ N
Ox (
dies
el v
ehic
les)
[m
g/k
m]
Part
icul
ates
(di
esel
veh
icle
s) [
mg
/km
]
CO
at
-7 °
C (
gaso
line
vehi
cles
) [m
g/k
m]
HC
at
-7 °
C (
gaso
line
vehi
cles
) [m
g/k
m]
Dir
ect
inje
ctio
n (n
on-d
iese
l) [
%]
Euro
#5 a
nd E
uro#
6 [%
]

94 95
EUROPEAN VEHICLE MARKET STATISTICS 2016/17 Annex
2009Passenger cars
EU-27 14,091,605 100 21,837 183 45 0.5 3.7 0.3 0 14 84 7 8 12 12 81 1619 4.0 10.5 17.7 5.3 12.6 11.6 1347 1790
Germany 3,789,564 27 23,749 186 30 0.2 0.3 0 0 18 82 10 8 17 18 87 1667 4.0 10.4 17.5 5.4 12.5 10.4 1399 1822
France 2,242,894 16 20,515 178 70 0.4 1.1 0.1 0 9 93 3 4 5 11 73 1548 4.0 10.5 17.8 5.3 13.2 12.4 1291 1748
Italy 2,165,081 15 19,667 178 42 0.3 21.6 0 0 11 87 4 9 4 11 72 1490 4.0 10.5 17.6 5.3 13.5 11.9 1262 1678
United Kingdom 1,988,957 14 20,118 188 42 0.7 0 0 0 17 83 9 7 10 10 88 1683 4.1 10.6 17.6 5.3 12.3 10.8 1364 1821
Spain 953,116 7 22,748 187 70 0.5 0 0.1 0 11 86 5 9 12 6 84 1710 4.0 10.5 17.8 5.4 12.2 11.5 1396 1861
EU-12 870,021 6 18,211 180 35 0.2 0.1 0 0 6 63 1 7 9 8 79 1595 4.0 10.4 18.0 5.2 12.8 11.5 1330 1793
Belgium 474,927 3 23,166 182 75 0.4 0 0 0 15 86 8 6 6 10 80 1671 4.0 10.5 17.8 5.3 13.2 12.2 1397 1865
Netherlands 387,279 3 25,067 184 20 4.2 0 0 0.01 18 90 5 4 16 15 82 1576 3.9 10.5 17.7 5.3 12.1 10.9 1241 1742
Austria 319,228 2 24,091 182 46 0.3 0.2 0.5 0.01 11 81 5 14 10 16 81 1649 4.0 10.5 17.6 5.3 13.2 11.6 1396 1859
Greece 220,454 2 22,181 183 3 0.8 0 0 0 7 73 7 15 9 19 87 1559 4.0 10.7 17.3 5.3 12.3 12.3 1315 1750
Sweden 212,229 2 23,051 197 41 1.4 2.9 18.4 0.01 26 79 7 14 30 7 104 1870 4.2 10.5 17.5 5.4 10.9 10.4 1548 1981
Portugal 160,909 1 25,670 182 67 0.7 0.3 0 0 13 88 9 3 6 13 78 1558 3.9 10.5 17.5 5.3 13.2 11.6 1338 1753
Denmark 111,965 1 34,988 182 45 0.1 0 0 0.07 10 94 4 2 13 13 79 1562 3.9 10.4 17.7 5.3 12.2 11.5 1316 1755
Finland 90,261 1 29,610 194 46 0.9 0.1 0.2 0 20 82 6 11 32 15 95 1783 4.1 10.4 17.6 5.5 11.1 10.7 1470 1946
Ireland 57,455 0 22,029 184 55 0.5 0 0.8 0 9 87 5 3 10 12 78 1608 3.9 10.5 17.4 5.3 13.0 11.5 1385 1855
Luxembourg 47,265 0 27,784 187 73 0.3 0.1 0 0 12 75 11 14 14 29 101 1875 4.2 10.5 17.9 5.4 11.4 11.8 1485 1936
VW 1,602,712 11 23,857 187 49 0 1.4 0.2 0 12 91 0 7 37 42 83 1669 3.9 10.3 18.1 5.5 12.6 11.3 1426 1929
Ford 1,270,907 9 19,119 178 48 0 2.6 0.6 0 5 96 0 3 0 2 74 1568 4.0 11.0 18.1 5.1 13.0 12.1 1318 1753
Renault 1,065,300 8 18,685 177 56 0 0.7 0.6 0 5 97 0 1 0 7 71 1449 4.0 9.9 17.5 5.4 12.1 12.4 1279 1737
Fiat 1,003,052 7 14,406 162 24 0 19.9 0 0.01 7 96 0 3 0 13 56 1321 4.0 10.2 17.7 5.1 14.1 13.9 1087 1489
Peugeot 972,341 7 18,161 177 55 0 2.2 0.1 0 5 98 0 1 4 4 68 1463 3.9 10.7 17.9 5.1 12.6 11.8 1302 1705
Citroën 855,937 6 19,283 174 60 0 1.8 0 0 7 98 0 1 1 4 68 1472 3.9 10.6 17.9 5.1 14.0 13.6 1307 1758
Opel 808,953 6 19,744 181 37 0 2.5 0 0 9 97 0 1 2 13 76 1492 3.9 10.6 17.7 5.3 13.4 12.5 1356 1796
Toyota 682,863 5 18,641 174 29 5.7 0 0 0 18 91 0 7 2 9 74 1463 3.7 10.7 17.1 5.3 13.4 10.8 1259 1646
Audi 591,381 4 36,927 215 70 0 0 0 0 28 69 0 30 83 21 123 2117 4.4 9.9 17.1 5.8 9.2 9.8 1618 2086
Mercedes-Benz 563,987 4 38,513 209 61 0.2 0.7 0 0 59 34 55 11 6 19 120 2208 4.5 10.3 17.3 5.7 10.4 9.5 1635 2103
BMW 554,332 4 39,250 222 72 0 0 0 0 41 0 80 19 84 21 134 2279 4.6 11.8 16.3 6.0 8.7 8.5 1638 2062
Škoda 465,765 3 17,664 180 36 0 0.4 0.2 0 6 93 0 4 14 6 71 1532 3.7 10.4 18.8 5.2 13.5 11.8 1282 1770
Nissan 360,701 3 20,193 174 38 0 2.6 0 0 13 85 0 11 0 6 80 1555 4.0 10.2 16.0 5.0 13.0 12.2 1361 1798
Hyundai 333,841 2 14,741 171 21 0 8.4 0 0 10 90 1 5 0 0 70 1408 4.0 10.4 17.4 4.9 13.2 12.6 1272 1657
Seat 310,670 2 17,703 183 51 0 0.8 0.1 0 4 98 0 1 15 7 74 1609 3.8 10.4 18.8 5.2 12.1 11.6 1265 1725
Kia 253,871 2 16,613 177 36 0 5.8 0 0 11 88 0 8 0 1 81 1560 4.0 10.1 17.5 5.0 14.2 12.3 1387 1778
Suzuki 241,053 2 14,758 167 21 0 1.5 0 0 9 70 0 24 0 20 67 1352 3.8 10.3 17.6 4.9 12.6 7.6 1164 1525
Vauxhall 237,732 2 18,219 – 29 0 0 0 0 8 99 0 1 0 16 79 1529 4.0 10.5 18.0 5.1 13.4 12.7 1330 1790
Dacia 235,780 2 9,841 163 24 0 15.6 0.2 0 0 83 0 0 0 0 58 1418 4.0 9.5 17.9 5.0 12.9 14.3 1164 1597
Volvo 191,174 1 33,049 200 78 0 0 9.5 0 29 75 0 24 0 4 112 2087 4.5 10.6 18.1 5.3 10.8 10.8 1638 2142
491 4186 1748 1526 2579 1496 1499 3.9 353 4.9 4.5 6.0 5.0 7.7 147 181 387 51 37 197 24 222 9 4516 888 EU-27
479 4230 1754 1530 2598 1492 1495 3.9 366 4.9 4.3 6.4 5.3 8.3 156 181 378 50 38 192 25 217 6 4456 922 Germany
502 4118 1742 1527 2565 1490 1482 3.8 339 4.9 4.5 5.3 4.5 6.7 134 194 401 52 31 202 23 227 12 5088 814 France
464 4025 1718 1533 2511 1487 1474 3.7 322 4.8 4.5 5.8 4.8 7.4 141 179 402 51 35 193 22 224 9 4414 819 Italy
492 4217 1759 1511 2591 1493 1493 3.9 342 4.9 4.4 6.1 5.0 7.9 151 163 378 53 36 200 24 217 9 4282 910 United Kingdom
509 4280 1758 1519 2615 1504 1502 3.9 369 5.0 4.6 5.7 4.8 7.4 145 177 394 51 34 197 24 222 10 4521 918 Spain
518 4273 1751 1530 2584 1488 1489 3.8 388 5.0 4.7 6.2 5.2 8.1 153 176 407 51 43 204 25 229 12 4876 832 EU-12
513 4275 1766 1542 2622 1507 1497 3.9 360 5.0 4.5 5.6 4.7 7.1 143 180 405 50 31 203 25 227 11 4857 881 Belgium
546 4168 1746 1522 2579 1578 1488 3.8 338 4.9 4.5 6.2 5.1 8.0 149 169 391 50 32 194 24 217 5 4377 883 Netherlands
512 4266 1760 1543 2608 1496 1496 3.9 362 5.0 4.6 6.1 5.1 7.9 152 176 396 49 39 195 23 219 7 4647 887 Austria
485 – – – 2551 1510 1507 3.8 365 4.8 4.3 6.7 5.5 8.7 158 149 386 52 37 232 25 219 6 3939 893 Greece
484 4464 1791 1528 2671 1518 1524 4.1 412 5.0 4.8 6.8 5.5 8.9 166 159 377 48 32 195 24 217 5 4218 901 Sweden
488 4212 1751 1503 2584 1499 1495 3.9 355 4.9 4.6 5.4 4.5 6.8 135 186 411 55 39 192 21 218 9 4503 896 Portugal
477 4181 1756 1517 2572 1488 1490 3.8 346 4.9 4.6 5.8 4.8 7.4 143 171 390 45 30 195 21 256 9 4369 834 Denmark
520 4456 1783 1526 2654 1511 1523 4.0 424 5.1 4.7 6.4 5.3 8.3 158 168 371 53 35 194 26 217 9 3960 925 Finland
520 – – – 2617 1512 1512 4.0 401 5.0 4.5 5.8 4.9 7.4 144 197 413 52 38 188 23 212 11 4451 957 Ireland
489 – – – 2623 1489 1484 3.9 333 4.9 4.3 6.0 5.0 7.7 153 196 389 50 39 204 28 230 10 4497 869 Luxembourg
551 4307 1770 1544 2603 1447 1505 3.9 407 5.0 4.5 6.2 5.1 8.0 152 187 322 48 38 172 30 201 4 3416 1067 VW
500 4204 1781 1521 2582 1503 1494 3.9 359 5.0 4.5 5.7 4.7 7.5 142 171 412 72 – 218 33 242 12 5270 1086 Ford
497 4132 1749 1525 2592 1498 1492 3.9 376 4.9 4.4 5.5 4.7 6.9 138 287 375 62 – 226 25 256 15 5956 803 Renault
459 3814 1657 1534 2413 1418 1412 3.4 262 4.5 4.4 5.6 4.7 7.1 134 233 439 45 – 189 20 218 10 4204 597 Fiat
453 4091 1747 1510 2549 1489 1482 3.8 293 4.9 4.5 5.4 4.5 7.0 135 114 393 52 47 197 26 218 11 4438 845 Peugeot
491 4129 1748 1572 2576 1470 1474 3.8 324 5.0 4.7 5.6 4.7 7.1 139 159 468 48 62 210 28 234 10 6640 922 Citroën
484 4242 1752 1527 2602 1495 1497 3.9 340 5.2 4.5 6.0 5.0 7.9 149 157 407 54 41 189 26 207 7 5098 996 Opel
442 3973 1720 1529 2503 1484 1477 3.7 278 4.9 4.5 5.4 4.8 6.7 132 180 348 52 – 185 18 202 13 3625 828 Toyota
529 4573 1823 1456 2727 1558 1542 4.2 421 4.8 4.3 6.4 5.3 8.4 163 152 407 44 39 164 28 187 2 4276 847 Audi
514 4467 1798 1540 2760 1553 1553 4.3 480 4.9 4.2 7.0 5.7 9.3 177 137 333 43 30 209 11 231 9 3391 1063 Mercedes-Benz
475 4530 1814 1469 2766 1507 1525 4.2 397 4.7 4.1 6.1 5.1 8.0 157 248 248 62 49 192 34 222 1 2816 808 BMW
541 4310 1701 1499 2533 1473 1466 3.7 449 5.0 5.0 6.1 5.0 8.0 149 137 328 42 – 191 21 217 11 3971 918 Škoda
483 4154 1731 1584 2592 1508 1507 3.9 345 5.3 4.8 6.3 5.4 7.9 156 183 424 48 – 198 28 219 15 4593 1038 Nissan
450 4000 1710 1540 2529 1478 1471 3.7 331 5.0 4.8 5.7 4.9 7.2 139 201 365 33 – 200 21 225 11 4209 702 Hyundai
510 4183 1690 1468 2522 1479 1466 3.7 323 5.0 4.5 5.7 4.7 7.5 142 191 364 38 29 188 19 217 9 3976 1126 Seat
457 4129 1738 1547 2570 1490 1483 3.8 233 5.0 4.9 6.0 5.2 7.5 148 211 466 49 205 28 234 14 4985 817 Kia
411 3808 1687 1556 2397 1441 1446 3.5 183 4.6 4.5 5.9 5.1 7.4 143 201 466 42 24 193 6 215 11 3857 682 Suzuki
528 4267 1758 1504 2603 1485 1484 3.9 305 5.1 4.5 6.2 5.0 8.1 152 – – – – – – – – – – Vauxhall
484 4169 1768 1573 2687 1480 1470 3.9 455 5.1 4.9 6.5 5.3 8.5 157 277 487 61 – 207 27 239 18 7736 659 Dacia
554 4612 1828 1543 2728 1555 1550 4.2 402 4.9 4.6 6.8 5.5 9.0 173 139 346 42 – 192 25 212 2 4237 979 Volvo
Tota
l sal
es/r
egis
trat
ions
Tota
l sal
es/r
egis
trat
ions
[%
]
Pric
e [E
UR
incl
. tax
]
Top
spee
d [k
m/h
]
Die
sel [
%]
Hyb
rid
excl
. PH
EV [
%]
Nat
ural
gas
(m
ono-
/biv
alen
t, in
cl. L
PG)
[%]
Flex
-Fue
l (et
hano
l/ga
solin
e) [
%]
Elec
tric
/fue
l cel
l inc
l. PH
EV [
%]
Aut
omat
ic [
%]
Fron
t dr
ive
[%]
Rea
r dr
ive
[%]
4-w
heel
dri
ve [
%]
Engi
ne p
ower
[K
W]
Engi
ne s
ize
[ccm
]
Num
ber
of c
ylin
ders
Com
pres
sion
rat
e (g
asol
ine)
Com
pres
sion
rat
e (d
iese
l)
Num
ber
of g
ears
Perf
orm
ance
0–1
00
km
/h (
gaso
line)
[s]
Perf
orm
ance
0–1
00
km
/h (
dies
el)
[s]
Mas
s in
run
ning
ord
er [
kg]
Gro
ss w
eigh
t [k
g]
Payl
oad
[kg
]
Leng
th [
mm
]
Wid
th [
mm
]
Hei
ght
[mm
]
Whe
elba
se [
mm
]
Fron
t tr
ack
[mm
]
Rea
r tr
ack
[mm
]
Foot
prin
t [m
2 ]
Boo
t vo
lum
e [l
]
Seat
s
Doo
rs
Fuel
con
sum
ptio
n (N
ED
C)
[l/1
00
km
]
Fuel
con
sum
ptio
n (e
xtra
-urb
an)
[l/1
00
km
]
Fuel
con
sum
ptio
n (u
rban
) [l
/10
0 k
m]
CO
2 (N
ED
C)
[g/k
m]
CO
(di
esel
veh
icle
s) [
mg
/km
]
CO
(ga
solin
e ve
hicl
es)
[mg
/km
]
HC
(ga
solin
e ve
hicl
es)
[mg
/km
]
NH
MC
(ga
solin
e Eu
ro 5
/6 v
ehic
les)
[m
g/k
m]
NO
x (di
esel
veh
icle
s) [
mg
/km
]
NO
x (ga
solin
e ve
hicl
es)
[mg
/km
]
HC
+ N
Ox (
dies
el v
ehic
les)
[m
g/k
m]
Part
icul
ates
(di
esel
veh
icle
s) [
mg
/km
]
CO
at
-7 °
C (
gaso
line
vehi
cles
) [m
g/k
m]
HC
at
-7 °
C (
gaso
line
vehi
cles
) [m
g/k
m]
Dir
ect
inje
ctio
n (n
on-d
iese
l) [
%]
Euro
#5 a
nd E
uro#
6 [%
]
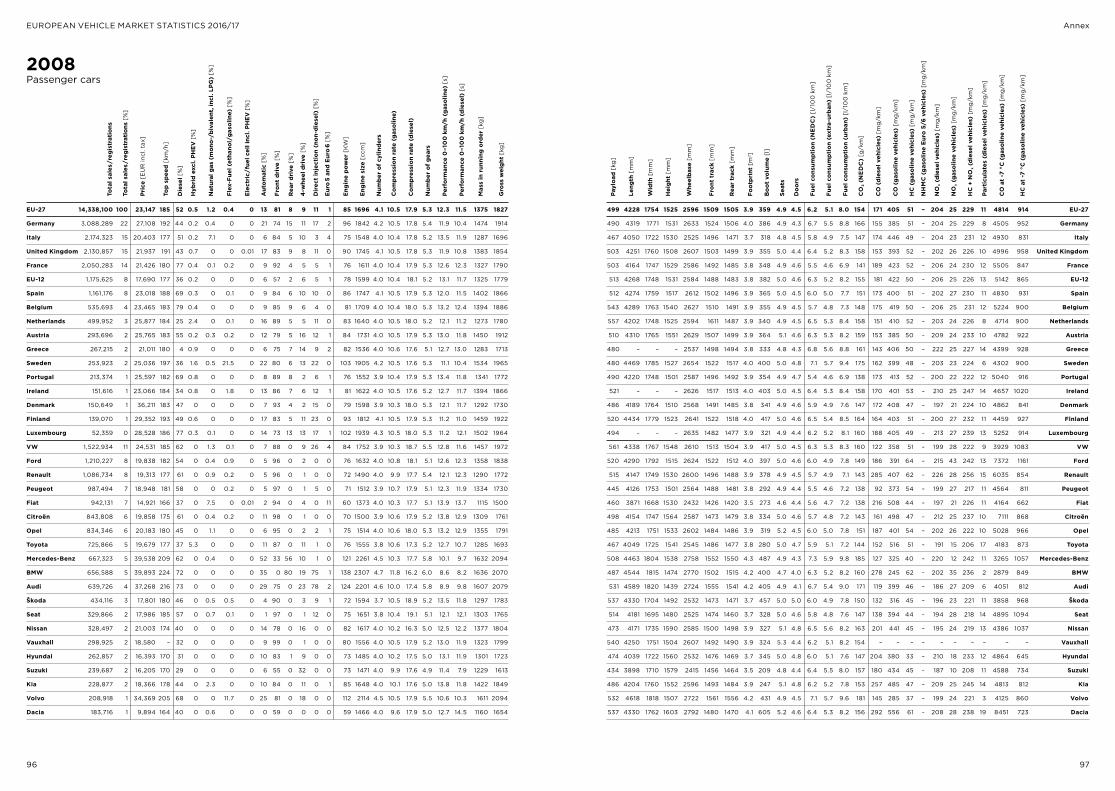
96 97
EUROPEAN VEHICLE MARKET STATISTICS 2016/17 Annex
2008Passenger cars
Tota
l sal
es/r
egis
trat
ions
Tota
l sal
es/r
egis
trat
ions
[%
]
Pric
e [E
UR
incl
. tax
]
Top
spee
d [k
m/h
]
Die
sel [
%]
Hyb
rid
excl
. PH
EV [
%]
Nat
ural
gas
(m
ono-
/biv
alen
t, in
cl. L
PG)
[%]
Flex
-Fue
l (et
hano
l/ga
solin
e) [
%]
Elec
tric
/fue
l cel
l inc
l. PH
EV [
%]
Aut
omat
ic [
%]
Fron
t dr
ive
[%]
Rea
r dr
ive
[%]
4-w
heel
dri
ve [
%]
Engi
ne p
ower
[K
W]
Engi
ne s
ize
[ccm
]
Num
ber
of c
ylin
ders
Com
pres
sion
rat
e (g
asol
ine)
Com
pres
sion
rat
e (d
iese
l)
Num
ber
of g
ears
Perf
orm
ance
0–1
00
km
/h (
gaso
line)
[s]
Perf
orm
ance
0–1
00
km
/h (
dies
el)
[s]
Mas
s in
run
ning
ord
er [
kg]
Gro
ss w
eigh
t [k
g]
EU-27 14,338,100 100 23,147 185 52 0.5 1.2 0.4 0 13 81 8 9 11 1 85 1696 4.1 10.5 17.9 5.3 12.3 11.5 1375 1827
Germany 3,088,289 22 27,108 192 44 0.2 0.4 0 0 21 74 15 11 17 2 96 1842 4.2 10.5 17.8 5.4 11.9 10.4 1474 1914
Italy 2,174,323 15 20,403 177 51 0.2 7.1 0 0 6 84 5 10 3 4 75 1548 4.0 10.4 17.8 5.2 13.5 11.9 1287 1696
United Kingdom 2,130,857 15 21,937 191 43 0.7 0 0 0.01 17 83 9 8 11 0 90 1745 4.1 10.5 17.8 5.3 11.9 10.8 1383 1854
France 2,050,283 14 21,426 180 77 0.4 0.1 0.2 0 9 92 4 5 5 1 76 1611 4.0 10.4 17.9 5.3 12.6 12.3 1327 1790
EU-12 1,175,625 8 17,690 177 36 0.2 0 0 0 6 57 2 6 5 1 78 1599 4.0 10.4 18.1 5.2 13.1 11.7 1325 1779
Spain 1,161,176 8 23,018 188 69 0.3 0 0.1 0 9 84 6 10 10 0 86 1747 4.1 10.5 17.9 5.3 12.0 11.5 1402 1866
Belgium 535,693 4 23,465 183 79 0.4 0 0 0 9 85 9 6 4 0 81 1709 4.0 10.4 18.0 5.3 13.2 12.4 1394 1886
Netherlands 499,952 3 25,877 184 25 2.4 0 0.1 0 16 89 5 5 11 0 83 1640 4.0 10.5 18.0 5.2 12.1 11.2 1273 1780
Austria 293,696 2 25,765 183 55 0.2 0.3 0.2 0 12 79 5 16 12 1 84 1731 4.0 10.5 17.9 5.3 13.0 11.8 1450 1912
Greece 267,215 2 21,011 180 4 0.9 0 0 0 6 75 7 14 9 2 82 1536 4.0 10.6 17.6 5.1 12.7 13.0 1283 1713
Sweden 253,923 2 25,036 197 36 1.6 0.5 21.5 0 22 80 6 13 22 0 103 1905 4.2 10.5 17.6 5.3 11.1 10.4 1534 1965
Portugal 213,374 1 25,597 182 69 0.8 0 0 0 8 89 8 2 6 1 76 1552 3.9 10.4 17.9 5.3 13.4 11.8 1341 1772
Ireland 151,616 1 23,066 184 34 0.8 0 1.8 0 13 86 7 6 12 1 81 1622 4.0 10.5 17.6 5.2 12.7 11.7 1394 1866
Denmark 150,649 1 36,211 183 47 0 0 0 0 7 93 4 2 15 0 79 1598 3.9 10.3 18.0 5.3 12.1 11.7 1292 1730
Finland 139,070 1 29,352 193 49 0.6 0 0 0 17 83 5 11 23 0 93 1812 4.1 10.5 17.9 5.3 11.2 11.0 1459 1922
Luxembourg 52,359 0 28,528 186 77 0.3 0.1 0 0 14 73 13 13 17 1 102 1939 4.3 10.5 18.0 5.3 11.2 12.1 1502 1964
VW 1,522,934 11 24,531 185 62 0 1.3 0.1 0 7 88 0 9 26 4 84 1752 3.9 10.3 18.7 5.5 12.8 11.6 1457 1972
Ford 1,210,227 8 19,838 182 54 0 0.4 0.9 0 5 96 0 2 0 0 76 1632 4.0 10.8 18.1 5.1 12.6 12.3 1358 1838
Renault 1,086,734 8 19,313 177 61 0 0.9 0.2 0 5 96 0 1 0 0 72 1490 4.0 9.9 17.7 5.4 12.1 12.3 1290 1772
Peugeot 987,494 7 18,948 181 58 0 0 0.2 0 5 97 0 1 5 0 71 1512 3.9 10.7 17.9 5.1 12.3 11.9 1334 1730
Fiat 942,131 7 14,921 166 37 0 7.5 0 0.01 2 94 0 4 0 11 60 1373 4.0 10.3 17.7 5.1 13.9 13.7 1115 1500
Citroën 843,808 6 19,858 175 61 0 0.4 0.2 0 11 98 0 1 0 0 70 1500 3.9 10.6 17.9 5.2 13.8 12.9 1309 1761
Opel 834,346 6 20,183 180 45 0 1.1 0 0 6 95 0 2 2 1 75 1514 4.0 10.6 18.0 5.3 13.2 12.9 1355 1791
Toyota 725,866 5 19,679 177 37 5.3 0 0 0 11 87 0 11 1 0 76 1555 3.8 10.6 17.3 5.2 12.7 10.7 1285 1693
Mercedes-Benz 667,323 5 39,538 209 62 0 0.4 0 0 52 33 56 10 1 0 121 2261 4.5 10.3 17.7 5.8 10.1 9.7 1632 2094
BMW 656,588 5 39,893 224 72 0 0 0 0 35 0 80 19 75 1 138 2307 4.7 11.8 16.2 6.0 8.6 8.2 1636 2070
Audi 639,726 4 37,268 216 73 0 0 0 0 29 75 0 23 78 2 124 2201 4.6 10.0 17.4 5.8 8.9 9.8 1607 2079
Škoda 434,116 3 17,801 180 46 0 0.5 0.5 0 4 90 0 3 9 1 72 1594 3.7 10.5 18.9 5.2 13.5 11.8 1297 1783
Seat 329,866 2 17,986 185 57 0 0.7 0.1 0 1 97 0 1 12 0 75 1651 3.8 10.4 19.1 5.1 12.1 12.1 1303 1765
Nissan 328,497 2 21,003 174 40 0 0 0 0 14 78 0 16 0 0 82 1617 4.0 10.2 16.3 5.0 12.5 12.2 1377 1804
Vauxhall 298,925 2 18,580 – 32 0 0 0 0 9 99 0 1 0 0 80 1556 4.0 10.5 17.9 5.2 13.0 11.9 1323 1799
Hyundai 262,857 2 16,393 170 31 0 0 0 0 10 83 1 9 0 0 73 1485 4.0 10.2 17.5 5.0 13.1 11.9 1301 1723
Suzuki 239,687 2 16,205 170 29 0 0 0 0 6 55 0 32 0 0 73 1471 4.0 9.9 17.6 4.9 11.4 7.9 1229 1613
Kia 228,877 2 18,366 178 44 0 2.3 0 0 10 84 0 11 0 1 85 1648 4.0 10.1 17.6 5.0 13.8 11.8 1422 1849
Volvo 208,918 1 34,369 205 68 0 0 11.7 0 25 81 0 18 0 0 112 2114 4.5 10.5 17.9 5.5 10.6 10.3 1611 2094
Dacia 183,716 1 9,894 164 40 0 0.6 0 0 0 59 0 0 0 0 59 1466 4.0 9.6 17.9 5.0 12.7 14.5 1160 1654
499 4228 1754 1525 2596 1509 1505 3.9 359 4.9 4.5 6.2 5.1 8.0 154 171 405 51 – 204 25 229 11 4814 914 EU-27
490 4319 1771 1531 2633 1524 1506 4.0 386 4.9 4.3 6.7 5.5 8.8 166 155 385 51 – 204 25 229 8 4505 952 Germany
467 4050 1722 1530 2525 1496 1471 3.7 318 4.8 4.5 5.8 4.9 7.5 147 174 446 49 – 204 23 231 12 4930 831 Italy
503 4251 1760 1508 2607 1503 1499 3.9 355 5.0 4.4 6.4 5.2 8.3 158 153 393 52 – 202 26 226 10 4996 958 United Kingdom
503 4164 1747 1529 2586 1492 1485 3.8 348 4.9 4.6 5.5 4.6 6.9 141 189 423 52 – 206 24 230 12 5505 847 France
513 4268 1748 1531 2584 1488 1483 3.8 382 5.0 4.6 6.3 5.2 8.2 155 181 422 50 – 206 25 226 13 5142 865 EU-12
512 4274 1759 1517 2612 1502 1496 3.9 365 5.0 4.5 6.0 5.0 7.7 151 173 400 51 – 202 27 230 11 4830 931 Spain
543 4289 1763 1540 2627 1510 1491 3.9 355 4.9 4.5 5.7 4.8 7.3 148 175 419 50 – 206 25 231 12 5224 900 Belgium
557 4202 1748 1525 2594 1611 1487 3.9 340 4.9 4.5 6.5 5.3 8.4 158 151 410 52 – 203 24 226 8 4714 900 Netherlands
510 4310 1765 1551 2629 1507 1499 3.9 364 5.1 4.6 6.3 5.3 8.2 159 153 385 50 – 209 24 233 10 4782 922 Austria
480 – – – 2537 1498 1494 3.8 333 4.8 4.3 6.8 5.6 8.8 161 143 406 50 – 222 25 227 14 4399 928 Greece
480 4469 1785 1527 2654 1522 1517 4.0 400 5.0 4.8 7.1 5.7 9.4 175 162 399 48 – 203 23 224 6 4302 900 Sweden
490 4220 1748 1501 2587 1496 1492 3.9 354 4.9 4.7 5.4 4.6 6.9 138 173 413 52 – 200 22 222 12 5040 916 Portugal
521 – – – 2626 1517 1513 4.0 403 5.0 4.5 6.4 5.3 8.4 158 170 401 53 – 210 25 247 14 4657 1020 Ireland
486 4189 1764 1510 2568 1491 1485 3.8 341 4.9 4.6 5.9 4.9 7.6 147 172 408 47 – 197 21 224 10 4862 841 Denmark
520 4434 1779 1523 2641 1522 1518 4.0 417 5.0 4.6 6.5 5.4 8.5 164 164 403 51 – 200 27 232 11 4459 927 Finland
494 – – – 2635 1482 1477 3.9 321 4.9 4.4 6.2 5.2 8.1 160 188 405 49 – 213 27 239 13 5252 914 Luxembourg
561 4338 1767 1548 2610 1513 1504 3.9 417 5.0 4.5 6.3 5.3 8.3 160 122 358 51 – 199 28 222 9 3929 1083 VW
520 4290 1792 1515 2624 1522 1512 4.0 397 5.0 4.6 6.0 4.9 7.8 149 186 391 64 – 215 43 242 13 7372 1161 Ford
515 4147 1749 1530 2600 1496 1488 3.9 378 4.9 4.5 5.7 4.9 7.1 143 285 407 62 – 226 28 256 15 6035 854 Renault
445 4126 1753 1501 2564 1488 1481 3.8 292 4.9 4.4 5.5 4.6 7.2 138 92 373 54 – 199 27 217 11 4564 811 Peugeot
460 3871 1668 1530 2432 1426 1420 3.5 273 4.6 4.4 5.6 4.7 7.2 138 216 508 44 – 197 21 226 11 4164 662 Fiat
498 4154 1747 1564 2587 1473 1479 3.8 334 5.0 4.6 5.7 4.8 7.2 143 161 498 47 – 212 25 237 10 7111 868 Citroën
485 4213 1751 1533 2602 1484 1486 3.9 319 5.2 4.5 6.0 5.0 7.8 151 187 401 54 – 202 26 222 10 5028 966 Opel
467 4049 1725 1541 2545 1486 1477 3.8 280 5.0 4.7 5.9 5.1 7.2 144 152 516 51 – 191 15 206 17 4183 873 Toyota
508 4463 1804 1538 2758 1552 1550 4.3 487 4.9 4.3 7.3 5.9 9.8 185 127 325 40 – 220 12 242 11 3265 1057 Mercedes-Benz
487 4544 1815 1474 2770 1502 1515 4.2 400 4.7 4.0 6.3 5.2 8.2 160 278 245 62 – 202 35 236 2 2879 849 BMW
531 4589 1820 1439 2724 1555 1541 4.2 405 4.9 4.1 6.7 5.4 9.0 171 119 399 46 – 186 27 209 6 4051 812 Audi
537 4330 1704 1492 2532 1473 1471 3.7 457 5.0 5.0 6.0 4.9 7.8 150 132 316 45 – 196 23 221 11 3858 968 Škoda
514 4181 1695 1480 2525 1474 1460 3.7 328 5.0 4.6 5.8 4.8 7.6 147 138 394 44 – 194 28 218 14 4895 1094 Seat
473 4171 1735 1590 2585 1500 1498 3.9 327 5.1 4.8 6.5 5.6 8.2 163 201 441 45 – 195 24 219 13 4386 1037 Nissan
540 4250 1751 1504 2607 1492 1490 3.9 324 5.3 4.4 6.2 5.1 8.2 154 – – – – – – – – – – Vauxhall
474 4039 1722 1560 2532 1476 1469 3.7 345 5.0 4.8 6.0 5.1 7.6 147 204 380 33 – 210 18 233 12 4864 645 Hyundai
434 3898 1710 1579 2415 1456 1464 3.5 209 4.8 4.4 6.4 5.5 8.0 157 180 434 45 – 187 10 208 11 4588 734 Suzuki
486 4204 1760 1552 2596 1493 1484 3.9 247 5.1 4.8 6.2 5.2 7.8 153 257 485 47 – 209 25 245 14 4813 812 Kia
532 4618 1818 1507 2722 1561 1556 4.2 431 4.9 4.5 7.1 5.7 9.6 181 145 285 37 – 199 24 221 3 4125 860 Volvo
537 4330 1762 1603 2792 1480 1470 4.1 605 5.2 4.6 6.4 5.3 8.2 156 292 556 61 – 208 28 238 19 8451 723 Dacia
Payl
oad
[kg
]
Leng
th [
mm
]
Wid
th [
mm
]
Hei
ght
[mm
]
Whe
elba
se [
mm
]
Fron
t tr
ack
[mm
]
Rea
r tr
ack
[mm
]
Foot
prin
t [m
2 ]
Boo
t vo
lum
e [l
]
Seat
s
Doo
rs
Fuel
con
sum
ptio
n (N
ED
C)
[l/1
00
km
]
Fuel
con
sum
ptio
n (e
xtra
-urb
an)
[l/1
00
km
]
Fuel
con
sum
ptio
n (u
rban
) [l
/10
0 k
m]
CO
2 (N
ED
C)
[g/k
m]
CO
(di
esel
veh
icle
s) [
mg
/km
]
CO
(ga
solin
e ve
hicl
es)
[mg
/km
]
HC
(ga
solin
e ve
hicl
es)
[mg
/km
]
NH
MC
(ga
solin
e Eu
ro 5
/6 v
ehic
les)
[m
g/k
m]
NO
x (di
esel
veh
icle
s) [
mg
/km
]
NO
x (ga
solin
e ve
hicl
es)
[mg
/km
]
HC
+ N
Ox (
dies
el v
ehic
les)
[m
g/k
m]
Part
icul
ates
(di
esel
veh
icle
s) [
mg
/km
]
CO
at
-7 °
C (
gaso
line
vehi
cles
) [m
g/k
m]
HC
at
-7 °
C (
gaso
line
vehi
cles
) [m
g/k
m]
Dir
ect
inje
ctio
n (n
on-d
iese
l) [
%]
Euro
#5 a
nd E
uro#
6 [%
]
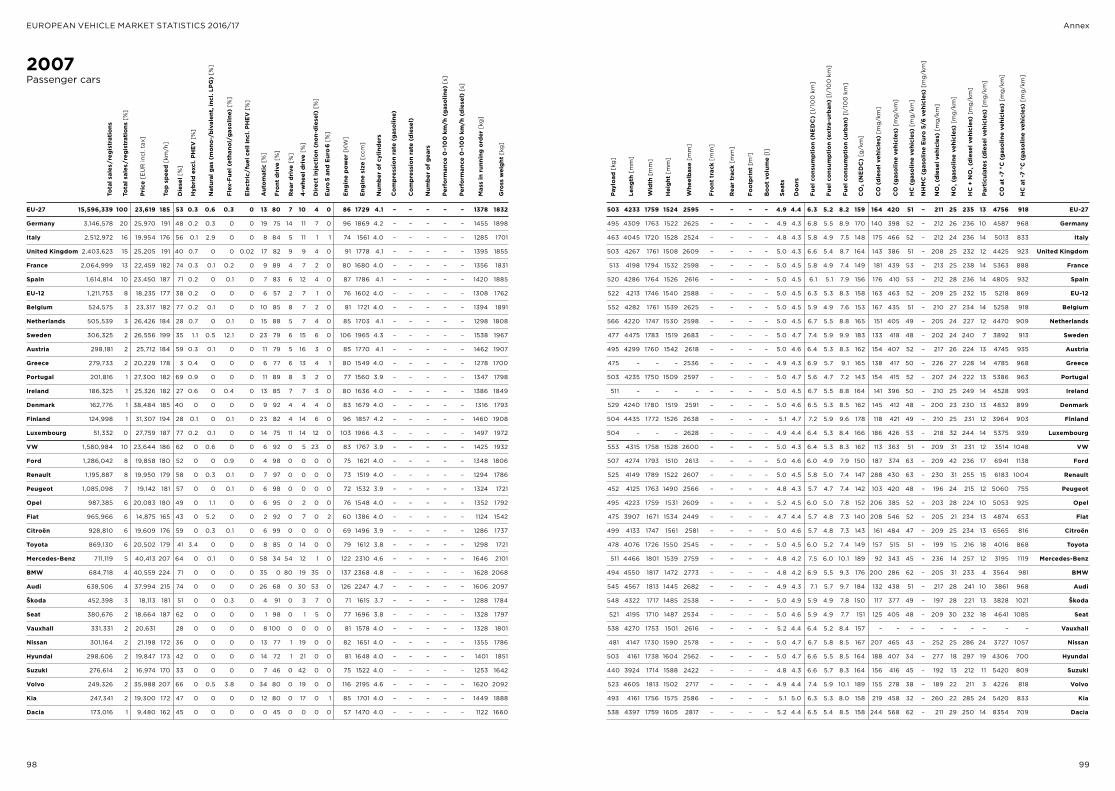
98 99
EUROPEAN VEHICLE MARKET STATISTICS 2016/17 Annex
2007Passenger cars
EU-27 15,596,339 100 23,619 185 53 0.3 0.6 0.3 0 13 80 7 10 4 0 86 1729 4.1 – – – – – 1378 1832
Germany 3,146,578 20 25,970 191 48 0.2 0.3 0 0 19 75 14 11 7 0 96 1869 4.2 – – – – – 1455 1898
Italy 2,512,972 16 19,954 176 56 0.1 2.9 0 0 8 84 5 11 1 1 74 1561 4.0 – – – – – 1285 1701
United Kingdom 2,403,623 15 25,205 191 40 0.7 0 0 0.02 17 82 9 9 4 0 91 1778 4.1 – – – – – 1395 1855
France 2,064,999 13 22,459 182 74 0.3 0.1 0.2 0 9 89 4 7 2 0 80 1680 4.0 – – – – – 1356 1831
Spain 1,614,814 10 23,450 187 71 0.2 0 0.1 0 7 83 6 12 4 0 87 1786 4.1 – – – – – 1420 1885
EU-12 1,211,753 8 18,235 177 38 0.2 0 0 0 6 57 2 7 1 0 76 1602 4.0 – – – – – 1308 1762
Belgium 524,575 3 23,317 182 77 0.2 0.1 0 0 10 85 8 7 2 0 81 1721 4.0 – – – – – 1394 1891
Netherlands 505,539 3 26,426 184 28 0.7 0 0.1 0 15 88 5 7 4 0 85 1703 4.1 – – – – – 1298 1808
Sweden 306,325 2 26,556 199 35 1.1 0.5 12.1 0 23 79 6 15 6 0 106 1965 4.3 – – – – – 1538 1967
Austria 298,181 2 25,712 184 59 0.3 0.1 0 0 11 79 5 16 3 0 85 1770 4.1 – – – – – 1462 1907
Greece 279,733 2 20,229 178 3 0.4 0 0 0 6 77 6 13 4 1 80 1549 4.0 – – – – – 1278 1700
Portugal 201,816 1 27,300 182 69 0.9 0 0 0 11 89 8 3 2 0 77 1560 3.9 – – – – – 1347 1798
Ireland 186,325 1 25,326 182 27 0.6 0 0.4 0 13 85 7 7 3 0 80 1636 4.0 – – – – – 1386 1849
Denmark 162,776 1 38,484 185 40 0 0 0 0 9 92 4 4 4 0 83 1679 4.0 – – – – – 1316 1793
Finland 124,998 1 31,307 194 28 0.1 0 0.1 0 23 82 4 14 6 0 96 1857 4.2 – – – – – 1460 1908
Luxembourg 51,332 0 27,759 187 77 0.2 0.1 0 0 14 75 11 14 12 0 103 1966 4.3 – – – – – 1497 1972
VW 1,580,984 10 23,644 186 62 0 0.6 0 0 6 92 0 5 23 0 83 1767 3.9 – – – – – 1425 1932
Ford 1,286,042 8 19,858 180 52 0 0 0.9 0 4 98 0 0 0 0 75 1621 4.0 – – – – – 1348 1806
Renault 1,195,887 8 19,950 179 58 0 0.3 0.1 0 7 97 0 0 0 0 73 1519 4.0 – – – – – 1294 1786
Peugeot 1,085,098 7 19,142 181 57 0 0 0.1 0 6 98 0 0 0 0 72 1532 3.9 – – – – – 1324 1721
Opel 987,385 6 20,083 180 49 0 1.1 0 0 6 95 0 2 0 0 76 1548 4.0 – – – – – 1352 1792
Fiat 965,966 6 14,875 165 43 0 5.2 0 0 2 92 0 7 0 2 60 1386 4.0 – – – – – 1124 1542
Citroën 928,810 6 19,609 176 59 0 0.3 0.1 0 6 99 0 0 0 0 69 1496 3.9 – – – – – 1286 1737
Toyota 869,130 6 20,502 179 41 3.4 0 0 0 8 85 0 14 0 0 79 1612 3.8 – – – – – 1298 1721
Mercedes-Benz 711,119 5 40,413 207 64 0 0.1 0 0 58 34 54 12 1 0 122 2310 4.6 – – – – – 1646 2101
BMW 684,718 4 40,559 224 71 0 0 0 0 35 0 80 19 35 0 137 2368 4.8 – – – – – 1628 2068
Audi 638,506 4 37,994 215 74 0 0 0 0 26 68 0 30 53 0 126 2247 4.7 – – – – – 1606 2097
Škoda 452,398 3 18,113 181 51 0 0 0.3 0 4 91 0 3 7 0 71 1615 3.7 – – – – – 1288 1784
Seat 380,676 2 18,664 187 62 0 0 0 0 1 98 0 1 5 0 77 1696 3.8 – – – – – 1328 1797
Vauxhall 331,331 2 20,631 28 0 0 0 0 8 100 0 0 0 0 81 1578 4.0 – – – – – 1328 1801
Nissan 301,164 2 21,198 172 36 0 0 0 0 13 77 1 19 0 0 82 1651 4.0 – – – – – 1355 1786
Hyundai 298,606 2 19,847 173 42 0 0 0 0 14 72 1 21 0 0 81 1648 4.0 – – – – – 1401 1851
Suzuki 276,614 2 16,974 170 33 0 0 0 0 7 46 0 42 0 0 75 1522 4.0 – – – – – 1253 1642
Volvo 249,326 2 35,988 207 66 0 0.5 3.8 0 34 80 0 19 0 0 116 2195 4.6 – – – – – 1620 2092
Kia 247,341 2 19,300 172 47 0 0 0 0 12 80 0 17 0 1 85 1701 4.0 – – – – – 1449 1888
Dacia 173,016 1 9,480 162 45 0 0 0 0 0 45 0 0 0 0 57 1470 4.0 – – – – – 1122 1660
503 4233 1759 1524 2595 – – – – 4.9 4.4 6.3 5.2 8.2 159 164 420 51 – 211 25 235 13 4756 918 EU-27
495 4309 1763 1522 2625 – – – – 4.9 4.3 6.8 5.5 8.9 170 140 398 52 – 212 26 236 10 4587 968 Germany
463 4045 1720 1528 2524 – – – – 4.8 4.3 5.8 4.9 7.5 148 175 466 52 – 212 24 236 14 5013 833 Italy
503 4267 1761 1508 2609 – – – – 5.0 4.3 6.6 5.4 8.7 164 143 386 51 – 208 25 232 12 4425 923 United Kingdom
513 4198 1794 1532 2598 – – – – 5.0 4.5 5.8 4.9 7.4 149 181 439 53 – 213 25 238 14 5363 888 France
520 4286 1764 1526 2616 – – – – 5.0 4.5 6.1 5.1 7.9 156 176 410 53 – 212 28 236 14 4805 932 Spain
522 4213 1746 1540 2588 – – – – 5.0 4.5 6.3 5.3 8.3 158 163 463 52 – 209 25 232 15 5218 869 EU-12
552 4282 1761 1539 2625 – – – – 5.0 4.5 5.9 4.9 7.6 153 167 435 51 – 210 27 234 14 5258 918 Belgium
566 4220 1747 1530 2598 – – – – 5.0 4.5 6.7 5.5 8.8 165 151 405 49 – 205 24 227 12 4470 909 Netherlands
477 4475 1783 1519 2683 – – – – 5.0 4.7 7.4 5.9 9.9 183 133 418 48 – 202 24 240 7 3892 913 Sweden
495 4299 1760 1542 2618 – – – – 5.0 4.6 6.4 5.3 8.3 162 154 407 52 – 217 26 224 13 4745 935 Austria
475 – – – 2536 – – – – 4.9 4.3 6.9 5.7 9.1 165 138 417 50 – 226 27 228 14 4785 968 Greece
503 4235 1750 1509 2597 – – – – 5.0 4.7 5.6 4.7 7.2 143 154 415 52 – 207 24 222 13 5386 963 Portugal
511 – – – – – – – – 5.0 4.5 6.7 5.5 8.8 164 141 396 50 – 210 25 249 14 4528 993 Ireland
529 4240 1780 1519 2591 – – – – 5.0 4.6 6.5 5.3 8.5 162 145 412 48 – 200 23 230 13 4832 899 Denmark
504 4435 1772 1526 2638 – – – – 5.1 4.7 7.2 5.9 9.6 178 118 421 49 – 210 25 231 12 3964 903 Finland
504 – – – 2628 – – – – 4.9 4.4 6.4 5.3 8.4 166 186 426 53 – 218 32 244 14 5375 939 Luxembourg
553 4315 1758 1528 2600 – – – – 5.0 4.3 6.4 5.3 8.3 162 113 363 51 – 209 31 231 12 3514 1048 VW
507 4274 1793 1510 2613 – – – – 5.0 4.6 6.0 4.9 7.9 150 187 374 63 – 209 42 236 17 6941 1138 Ford
525 4149 1789 1522 2607 – – – – 5.0 4.5 5.8 5.0 7.4 147 288 430 63 – 230 31 255 15 6183 1004 Renault
452 4125 1763 1490 2566 – – – – 4.8 4.3 5.7 4.7 7.4 142 103 420 48 – 196 24 215 12 5060 755 Peugeot
495 4223 1759 1531 2609 – – – – 5.2 4.5 6.0 5.0 7.8 152 206 385 52 – 203 28 224 10 5053 925 Opel
475 3907 1671 1534 2449 – – – – 4.7 4.4 5.7 4.8 7.3 140 208 546 52 – 205 21 234 13 4874 653 Fiat
499 4133 1747 1561 2581 – – – – 5.0 4.6 5.7 4.8 7.3 143 161 484 47 – 209 25 234 13 6565 816 Citroën
478 4076 1726 1550 2545 – – – – 5.0 4.5 6.0 5.2 7.4 149 157 515 51 – 199 15 216 18 4016 868 Toyota
511 4466 1801 1539 2759 – – – – 4.8 4.2 7.5 6.0 10.1 189 92 343 45 – 236 14 257 12 3195 1119 Mercedes-Benz
494 4550 1817 1472 2773 – – – – 4.8 4.2 6.9 5.5 9.3 176 200 286 62 – 205 31 233 4 3564 981 BMW
545 4567 1813 1445 2682 – – – – 4.9 4.3 7.1 5.7 9.7 184 132 438 51 – 217 28 241 10 3861 968 Audi
548 4322 1717 1485 2538 – – – – 5.0 4.9 5.9 4.9 7.8 150 117 377 49 – 197 28 221 13 3828 1021 Škoda
521 4195 1710 1487 2534 – – – – 5.0 4.6 5.9 4.9 7.7 151 125 405 48 – 209 30 232 18 4641 1085 Seat
538 4270 1753 1501 2616 – – – – 5.2 4.4 6.4 5.2 8.4 157 – – – – – – – – – – Vauxhall
481 4147 1730 1590 2578 – – – – 5.0 4.7 6.7 5.8 8.5 167 207 465 43 – 252 25 286 24 3727 1057 Nissan
503 4161 1738 1604 2562 – – – – 5.0 4.7 6.6 5.5 8.5 164 188 407 34 – 277 18 297 19 4306 700 Hyundai
440 3924 1714 1588 2422 – – – – 4.8 4.3 6.6 5.7 8.3 164 156 416 45 – 192 13 212 11 5420 809 Suzuki
523 4605 1813 1502 2717 – – – – 4.9 4.4 7.4 5.9 10.1 189 155 278 38 – 189 22 211 3 4226 818 Volvo
493 4161 1756 1575 2586 – – – – 5.1 5.0 6.3 5.3 8.0 158 219 458 32 – 260 22 285 24 5420 833 Kia
538 4397 1759 1605 2817 – – – – 5.2 4.4 6.5 5.4 8.5 158 244 568 62 – 211 29 250 14 8354 709 Dacia
Tota
l sal
es/r
egis
trat
ions
Tota
l sal
es/r
egis
trat
ions
[%
]
Pric
e [E
UR
incl
. tax
]
Top
spee
d [k
m/h
]
Die
sel [
%]
Hyb
rid
excl
. PH
EV [
%]
Nat
ural
gas
(m
ono-
/biv
alen
t, in
cl. L
PG)
[%]
Flex
-Fue
l (et
hano
l/ga
solin
e) [
%]
Elec
tric
/fue
l cel
l inc
l. PH
EV [
%]
Aut
omat
ic [
%]
Fron
t dr
ive
[%]
Rea
r dr
ive
[%]
4-w
heel
dri
ve [
%]
Engi
ne p
ower
[K
W]
Engi
ne s
ize
[ccm
]
Num
ber
of c
ylin
ders
Com
pres
sion
rat
e (g
asol
ine)
Com
pres
sion
rat
e (d
iese
l)
Num
ber
of g
ears
Perf
orm
ance
0–1
00
km
/h (
gaso
line)
[s]
Perf
orm
ance
0–1
00
km
/h (
dies
el)
[s]
Mas
s in
run
ning
ord
er [
kg]
Gro
ss w
eigh
t [k
g]
Payl
oad
[kg
]
Leng
th [
mm
]
Wid
th [
mm
]
Hei
ght
[mm
]
Whe
elba
se [
mm
]
Fron
t tr
ack
[mm
]
Rea
r tr
ack
[mm
]
Foot
prin
t [m
2 ]
Boo
t vo
lum
e [l
]
Seat
s
Doo
rs
Fuel
con
sum
ptio
n (N
ED
C)
[l/1
00
km
]
Fuel
con
sum
ptio
n (e
xtra
-urb
an)
[l/1
00
km
]
Fuel
con
sum
ptio
n (u
rban
) [l
/10
0 k
m]
CO
2 (N
ED
C)
[g/k
m]
CO
(di
esel
veh
icle
s) [
mg
/km
]
CO
(ga
solin
e ve
hicl
es)
[mg
/km
]
HC
(ga
solin
e ve
hicl
es)
[mg
/km
]
NH
MC
(ga
solin
e Eu
ro 5
/6 v
ehic
les)
[m
g/k
m]
NO
x (di
esel
veh
icle
s) [
mg
/km
]
NO
x (ga
solin
e ve
hicl
es)
[mg
/km
]
HC
+ N
Ox (
dies
el v
ehic
les)
[m
g/k
m]
Part
icul
ates
(di
esel
veh
icle
s) [
mg
/km
]
CO
at
-7 °
C (
gaso
line
vehi
cles
) [m
g/k
m]
HC
at
-7 °
C (
gaso
line
vehi
cles
) [m
g/k
m]
Dir
ect
inje
ctio
n (n
on-d
iese
l) [
%]
Euro
#5 a
nd E
uro#
6 [%
]

100 101
EUROPEAN VEHICLE MARKET STATISTICS 2016/17 Annex
2006Passenger cars
EU-27 15,443,071 100 22,969 184 51 0.2 0.3 0.2 0 12 82 7 9 4 0 84 1730 4.1 – – – – – 1366 1816
Germany 3,466,489 22 24,583 190 44 0.2 0.3 0 0 18 77 13 10 6 0 93.0 1859 4.2 – – – – – 1434 1881
Italy 2,354,141 15 19,826 176 59 0.1 1.1 0 0 8 85 5 10 1 0 74.1 1584 4.0 – – – – – 1297 1714
United Kingdom 2,344,407 15 24,555 189 38 0.4 0 0 0.01 17 82 9 9 3 0 89.0 1775 4.1 – – – – – 1382 1826
France 2,000,563 13 21,599 180 71 0.3 0.2 0 0 8 90 3 6 1 0 77.5 1666 4.0 – – – – – 1334 1796
Spain 1,634,489 11 22,531 186 70 0.1 0 0 0 6 85 5 9 3 0 84.1 1773 4.1 – – – – – 1395 1856
EU-12 1,047,967 7 17,646 175 34 0.1 0 0 0 5 61 2 5 1 0 72.6 1570 4.0 – – – – – 1277 1731
Belgium 526,113 3 22,447 181 74 0.2 0.1 0 0 10 86 8 6 1 0 78.5 1709 4.0 – – – – – 1368 1862
Netherlands 484,010 3 25,714 183 27 0.7 0 0.1 0 14 89 5 6 4 0 82.7 1696 4.1 – – – – – 1281 1789
Austria 308,595 2 25,245 182 62 0.2 0 0 0 11 81 5 14 3 0 82.6 1771 4.1 – – – – – 1452 1896
Sweden 282,475 2 25,879 199 20 1.0 1.3 9.1 0 22 81 6 14 8 0 105.1 1974 4.3 – – – – – 1514 1943
Greece 267,644 2 19,381 177 2 0.2 0 0 0 6 80 5 12 5 0 77.8 1540 4.0 – – – – – 1263 1684
Portugal 194,716 1 26,447 180 65 0.4 0 0 0 11 90 8 3 2 0 74.4 1536 3.9 – – – – – 1323 1768
Ireland 178,483 1 25,295 181 25 0.3 0 0 0 11 85 7 7 3 0 77.6 1623 4.0 – – – – – 1372 1834
Denmark 156,909 1 37,740 184 28 0 0 0 0 8 91 4 5 3 0 81.3 1682 4.0 – – – – – 1293 1776
Finland 145,233 1 29,846 192 20 0.1 0 0 0 20 85 4 11 6 0 92.7 1838 4.1 – – – – – 1423 1862
Luxembourg 50,837 0 26,400 185 77 0.2 0.1 0 0 13 76 11 13 8 0 99.7 1966 4.3 – – – – – 1480 1961
VW 1,640,165 11 22,992 185 60 0 0.3 0 0 5 94 0 4 25 0 81.8 1769 3.9 – – – – – 1412 1920
Renault 1,290,698 8 19,786 178 57 0 0.2 0 0 6 98 0 0 0 0 73.2 1537 4.0 – – – – – 1299 1774
Ford 1,263,774 8 19,241 181 49 0 0 0.7 0 6 99 0 0 0 0 73.9 1613 4.0 – – – – – 1322 1750
Peugeot 1,101,218 7 19,357 181 57 0 0 0 0 7 99 0 0 0 0 72.5 1559 4.0 – – – – – 1303 1716
Opel 1,009,540 7 19,877 181 47 0 0.6 0 0 5 99 0 0 0 0 76.0 1579 4.0 – – – – – 1347 1791
Citroën 903,184 6 18,385 175 54 0 0.1 0 0 4 99 0 0 0 0 66.1 1479 3.9 – – – – – 1231 1662
Fiat 893,934 6 14,335 162 43 0 2.6 0 0 2 92 0 7 0 0 58.4 1380 4.0 – – – – – 1130 1546
Toyota 849,620 6 20,643 179 40 2.5 0 0 0 8 84 0 15 0 0 79.8 1625 3.8 – – – – – 1300 1727
Mercedes-Benz 709,481 5 39,192 207 61 0 0 0 0 56 36 52 11 1 0 119.4 2327 4.7 – – – – – 1630 2078
BMW 663,988 4 38,552 219 67 0 0 0 0 29 0 82 18 2 0 129.7 2307 4.8 – – – – – 1606 2040
Audi 620,511 4 36,372 212 73 0 0 0 0 29 72 0 27 42 0 120.7 2223 4.6 – – – – – 1595 2096
Škoda 439,182 3 17,814 182 48 0 0 0 0 7 92 0 2 12 0 70.7 1620 3.8 – – – – – 1287 1791
Seat 383,985 2 17,903 185 62 0 0 0 0 4 99 0 0 3 0 75.1 1693 3.8 – – – – – 1312 1780
Nissan 321,378 2 20,071 173 29 0 0 0 0 10 78 1 20 0 0 78.2 1668 4.1 – – – – – 1288 1726
Hyundai 315,583 2 19,388 169 40 0 0 0 0 14 72 1 23 0 0 79.6 1675 4.0 – – – – – 1413 1869
Vauxhall 301,686 2 20,382 – 25 0 0 0 0 6 100 0 0 0 0 79.4 1578 4.0 – – – – – 1316 1772
Suzuki 249,985 2 16,842 167 32 0 0 0 0 7 45 0 41 0 0 73.7 1514 4.0 – – – – – 1248 1639
Kia 235,868 2 19,038 168 48 0 0 0 0 15 75 0 23 0 0 80.4 1767 4.0 – – – – – 1469 1898
Volvo 230,494 1 36,582 206 62 0 1.5 3.0 0 33 78 0 21 0 0 116.8 2220 4.7 – – – – – 1639 2115
Dacia 138,285 1 7,782 163 36 0 0 0 0 0 30 0 0 0 0 54.5 1450 4.0 – – – – – 1046 1544
501 4224 1759 1519 2591 – – – – 4.9 4.4 6.4 5.3 8.4 161 178 435 54 – 227 29 253 16 4774 942 EU-27
497 4296 1758 1519 2620 – – – – 4.9 4.4 6.9 5.6 9.1 172 147 411 54 – 220 29 244 13 4585 981 Germany
462 4058 1718 1528 2530 – – – – 4.8 4.4 5.9 4.9 7.6 149 188 474 55 – 230 27 254 18 5030 859 Italy
498 4248 1758 1504 2602 – – – – 5.0 4.4 6.7 5.5 8.9 167 155 422 54 – 225 26 249 14 4530 959 United Kingdom
511 4172 1822 1522 2587 – – – – 5.0 4.5 5.8 4.9 7.5 149 199 445 57 – 227 29 256 16 5577 940 France
519 4265 1753 1519 2608 – – – – 5.0 4.5 6.1 5.1 7.9 156 193 440 57 – 231 32 257 17 4996 947 Spain
520 4169 1733 1524 2573 – – – – 5.0 4.5 6.4 5.2 8.3 157 177 499 59 – 231 36 255 18 4911 884 EU-12
548 4260 1763 1534 2615 – – – – 4.9 4.4 6.0 5.0 7.7 154 178 451 52 – 235 29 260 18 5248 935 Belgium
561 4210 1738 1526 2593 – – – – 5.0 4.5 6.8 5.5 8.9 167 159 413 52 – 218 26 242 14 4481 935 Netherlands
494 4294 1755 1537 2614 – – – – 5.1 4.6 6.3 5.3 8.2 162 174 432 54 – 242 29 267 17 4937 921 Austria
478 4463 1773 1505 2656 – – – – 5.0 4.7 7.8 6.2 10.5 190 130 434 50 – 222 24 244 10 3600 943 Sweden
471 – – – 2529 – – – – 4.9 4.3 6.9 5.7 9.1 166 133 412 49 – 277 28 238 21 4944 941 Greece
497 4206 1738 1501 2589 – – – – 5.0 4.7 5.6 4.7 7.2 145 166 433 55 – 215 28 236 15 5124 899 Portugal
516 – – – – – – – – 5.0 4.5 6.7 5.5 8.9 165 156 420 50 – 227 27 300 16 4197 959 Ireland
535 4252 1770 1513 2586 – – – – 5.0 4.6 6.7 5.5 8.8 165 144 425 49 – 212 26 271 15 4694 921 Denmark
493 4417 1758 1511 2608 – – – – 5.1 4.7 7.4 6.0 9.8 180 127 447 50 – 250 25 251 19 4000 927 Finland
511 – – – 2624 – – – – 4.9 4.4 6.5 5.3 8.5 168 209 423 53 – 232 33 261 17 5015 941 Luxembourg
551 4307 1757 1526 2599 – – – – 5.0 4.4 6.4 5.3 8.4 163 132 395 54 – 213 36 237 15 3554 1006 VW
525 4152 1835 1521 2610 – – – – 5.1 4.5 5.9 5.0 7.5 148 302 410 67 – 250 35 282 18 6258 1044 Renault
487 4240 1785 1501 2595 – – – – 5.0 4.6 6.0 4.9 7.9 150 202 368 68 – 250 47 276 19 6753 1157 Ford
467 4138 1747 1487 2560 – – – – 4.8 4.2 5.8 4.8 7.6 145 120 461 54 – 198 26 220 9 5500 905 Peugeot
503 4226 1763 1530 2616 – – – – 5.3 4.6 6.1 5.0 7.9 154 193 354 48 – 198 30 217 15 4324 855 Opel
478 4072 1727 1537 2564 – – – – 4.8 4.5 5.6 4.7 7.2 141 185 494 48 – 218 27 247 14 6827 830 Citroën
482 3911 1668 1538 2456 – – – – 4.8 4.3 5.7 4.8 7.3 142 213 546 55 – 209 22 239 16 4959 636 Fiat
484 4101 1724 1553 2551 – – – – 5.1 4.5 6.1 5.3 7.6 152 158 481 49 – 204 14 223 21 3934 877 Toyota
499 4429 1793 1535 2745 – – – – 4.8 4.2 7.6 6.1 10.2 191 94 339 47 – 235 14 255 13 3041 1179 Mercedes-Benz
492 4535 1815 1466 2767 – – – – 4.9 4.4 7.3 5.7 10.0 187 165 332 57 – 211 27 237 9 4692 1051 BMW
552 4573 1809 1447 2685 – – – – 5.0 4.3 7.1 5.6 9.7 184 137 479 52 – 211 33 237 12 4056 1138 Audi
554 4348 1727 1462 2528 – – – – 5.0 4.9 6.0 4.9 7.9 151 86 488 54 – 226 29 245 20 3758 1030 Škoda
520 4174 1714 1481 2523 – – – – 5.0 4.5 5.9 4.9 7.8 151 115 350 62 – 215 40 237 20 3561 918 Seat
483 4085 1709 1569 2542 – – – – 5.0 4.4 6.8 5.8 8.6 168 363 607 49 – 447 32 513 41 4709 1355 Nissan
510 4153 1734 1614 2554 – – – – 5.0 4.7 6.8 5.7 8.8 169 222 368 31 – 367 22 397 29 5429 766 Hyundai
528 4237 1750 1494 2616 – – – – 5.2 4.5 6.4 5.2 8.5 157 – – – – – – – – – – Vauxhall
442 3908 1701 1596 2417 – – – – 4.8 4.3 6.7 5.7 8.4 166 163 441 43 – 207 15 228 13 5642 836 Suzuki
487 4149 1736 1585 2563 – – – – 5.1 4.9 6.6 5.5 8.6 167 288 515 38 – 370 21 398 42 5282 800 Kia
533 4629 1809 1504 2718 – – – – 5.1 4.6 7.6 6.1 10.4 193 164 212 36 – 227 21 252 8 3385 752 Volvo
521 4273 1743 1527 2631 – – – – 5.0 4.0 6.6 5.3 8.8 160 227 606 83 – 202 65 242 13 7741 667 Dacia
Tota
l sal
es/r
egis
trat
ions
Tota
l sal
es/r
egis
trat
ions
[%
]
Pric
e [E
UR
incl
. tax
]
Top
spee
d [k
m/h
]
Die
sel [
%]
Hyb
rid
excl
. PH
EV [
%]
Nat
ural
gas
(m
ono-
/biv
alen
t, in
cl. L
PG)
[%]
Flex
-Fue
l (et
hano
l/ga
solin
e) [
%]
Elec
tric
/fue
l cel
l inc
l. PH
EV [
%]
Aut
omat
ic [
%]
Fron
t dr
ive
[%]
Rea
r dr
ive
[%]
4-w
heel
dri
ve [
%]
Engi
ne p
ower
[K
W]
Engi
ne s
ize
[ccm
]
Num
ber
of c
ylin
ders
Com
pres
sion
rat
e (g
asol
ine)
Com
pres
sion
rat
e (d
iese
l)
Num
ber
of g
ears
Perf
orm
ance
0–1
00
km
/h (
gaso
line)
[s]
Perf
orm
ance
0–1
00
km
/h (
dies
el)
[s]
Mas
s in
run
ning
ord
er [
kg]
Gro
ss w
eigh
t [k
g]
Payl
oad
[kg
]
Leng
th [
mm
]
Wid
th [
mm
]
Hei
ght
[mm
]
Whe
elba
se [
mm
]
Fron
t tr
ack
[mm
]
Rea
r tr
ack
[mm
]
Foot
prin
t [m
2 ]
Boo
t vo
lum
e [l
]
Seat
s
Doo
rs
Fuel
con
sum
ptio
n (N
ED
C)
[l/1
00
km
]
Fuel
con
sum
ptio
n (e
xtra
-urb
an)
[l/1
00
km
]
Fuel
con
sum
ptio
n (u
rban
) [l
/10
0 k
m]
CO
2 (N
ED
C)
[g/k
m]
CO
(di
esel
veh
icle
s) [
mg
/km
]
CO
(ga
solin
e ve
hicl
es)
[mg
/km
]
HC
(ga
solin
e ve
hicl
es)
[mg
/km
]
NH
MC
(ga
solin
e Eu
ro 5
/6 v
ehic
les)
[m
g/k
m]
NO
x (di
esel
veh
icle
s) [
mg
/km
]
NO
x (ga
solin
e ve
hicl
es)
[mg
/km
]
HC
+ N
Ox (
dies
el v
ehic
les)
[m
g/k
m]
Part
icul
ates
(di
esel
veh
icle
s) [
mg
/km
]
CO
at
-7 °
C (
gaso
line
vehi
cles
) [m
g/k
m]
HC
at
-7 °
C (
gaso
line
vehi
cles
) [m
g/k
m]
Dir
ect
inje
ctio
n (n
on-d
iese
l) [
%]
Euro
#5 a
nd E
uro#
6 [%
]

102 103
EUROPEAN VEHICLE MARKET STATISTICS 2016/17 Annex
2005Passenger cars
EU-27 15,275,153 100 22,208 184 49 0.1 0.2 0 0 12 83 7 8 3 0 82 1732 4.1 – – – – – 1344 1798
Germany 3,340,708 22 23,612 189 43 0.1 0.2 0 0 19 77 14 9 5 0 91 1854 4.2 – – – – – 1406 1857
United Kingdom 2,439,251 16 23,784 188 37 0.2 0 0 0 16 82 9 9 3 0 87 1771 4.1 – – – – – 1360 1806
Italy 2,264,661 15 19,155 176 59 0 1.0 0 0.02 8 86 6 9 2 0 72 1586 4.0 – – – – – 1274 1694
France 2,067,789 14 21,086 180 69 0.1 0.1 0 0 8 90 3 6 1 0 76 1693 4.0 – – – – – 1323 1796
Spain 1,649,351 11 21,826 185 69 0.1 0 0 0 7 87 5 8 2 0 82 1783 4.1 – – – – – 1375 1837
EU-12 993,982 7 16,731 173 28 0 0 0 0 3 68 2 4 1 0 70 1551 4.0 – – – – – 1234 1683
Belgium 480,008 3 21,652 181 73 0.1 0.1 0 0 10 86 8 6 1 0 77 1721 4.0 – – – – – 1357 1840
Netherlands 465,196 3 25,461 184 27 0.6 0 0 0 14 89 5 6 4 0 82 1720 4.1 – – – – – 1281 1792
Austria 307,905 2 24,499 182 61 0.1 0 0 0 12 83 5 12 5 0 81 1797 4.1 – – – – – 1426 1867
Sweden 273,932 2 25,205 199 14 0.7 1.2 2.8 0 25 82 5 13 4 0 103 2001 4.4 – – – – – 1498 1940
Greece 269,705 2 19,149 178 1 0.1 0 0 0 5 81 6 10 5 0 76 1540 4.0 – – – – – 1256 1677
Portugal 206,488 1 25,520 179 64 0.4 0 0 0 7 90 7 3 1 0 72 1533 3.9 – – – – – 1310 1747
Ireland 171,742 1 24,358 181 22 0.2 0 0 0 10 87 6 7 1 0 76 1604 4.0 – – – – – 1334 1806
Denmark 148,178 1 35,328 183 25 0 0 0 0 7 95 3 3 3 0 79 1679 4.0 – – – – – 1277 1750
Finland 147,740 1 28,705 191 17 0 0 0 0 18 88 4 9 4 0 90 1814 4.1 – – – – – 1398 1845
Luxembourg 48,517 0 25,621 184 75 0.1 0 0 0 8 76 11 11 7 0 96 1964 4.3 – – – – – 1455 1941
VW 1,520,444 10 22,355 183 61 0 0 0 0 7 93 0 5 27 0 80 1771 4.0 – – – – – 1397 1909
Renault 1,473,299 10 19,679 176 56 0 0.1 0 0 6 98 0 0 0 0 72 1554 4.0 – – – – – 1283 1773
Ford 1,252,369 8 18,904 180 46 0 0.1 0.3 0 6 99 0 0 0 0 73 1606 4.0 – – – – – 1303 1731
Peugeot 1,121,268 7 19,909 182 59 0 0 0 0 8 99 0 0 0 0 74 1629 4.0 – – – – – 1309 1751
Opel 1,032,130 7 19,210 181 46 0 0.8 0 0 3 99 0 0 0 0 74 1593 4.0 – – – – – 1334 1779
Citroën 922,265 6 18,414 176 54 0 0 0 0 4 100 0 0 0 0 67 1550 4.0 – – – – – 1246 1685
Toyota 777,964 5 20,835 182 39 2.2 0 0 0 11 85 0 15 0 0 78 1651 4.0 – – – – – 1288 1725
Fiat 747,819 5 13,558 160 41 0 2.6 0 0 1 96 0 4 0 0 56 1382 4.0 – – – – – 1082 1472
Mercedes-Benz 687,786 5 36,606 209 56 0 0.1 0 0 52 33 61 6 0 0 114 2274 4.5 – – – – – 1579 2012
BMW 637,231 4 38,850 220 66 0 0 0 0 32 0 81 18 0 0 131 2352 4.9 – – – – – 1598 2045
Audi 598,553 4 33,831 213 71 0 0 0 0 24 78 0 21 33 0 114 2160 4.6 – – – – – 1538 2030
Škoda 411,603 3 17,677 180 47 0 0 0 0 8 94 0 2 9 0 68 1617 3.8 – – – – – 1296 1779
Seat 373,400 2 17,586 184 62 0 0 0 0 4 99 0 0 3 0 74 1708 3.9 – – – – – 1290 1765
Nissan 368,448 2 20,324 173 34 0 0 0 0 11 76 1 22 0 0 80 1742 4.1 – – – – – 1313 1774
Hyundai 327,264 2 17,508 166 35 0 0 0 0 15 77 1 20 0 0 73 1639 4.0 – – – – – 1358 1802
Vauxhall 317,359 2 19,812 26 0 0.1 0 0 8 100 0 0 0 1 75 1567 4.0 – – – – – 1290 1747
Kia 251,479 2 18,397 166 42 0 0 0 0 20 73 0 26 0 0 77 1771 4.0 – – – – – 1465 1894
Volvo 241,774 2 35,884 206 58 0 1.1 0.3 0 31 79 0 21 0 0 114 2230 4.7 – – – – – 1637 2114
Suzuki 234,936 2 14,682 160 23 0 0 0 0 7 56 0 35 0 0 67 1440 4.0 – – – – – 1146 1537
Dacia 116,267 1 7,116 163 5 0 0 0 0 0 20 0 0 0 0 57 1445 4.0 – – – – – 1031 1535
504 4206 1755 1516 2584 – – – – 4.9 4.4 6.5 5.3 8.5 162 197 447 59 – 290 32 319 23 4770 992 EU-27
505 4272 1751 1514 2612 – – – – 4.9 4.4 6.9 5.6 9.2 172 167 408 56 – 270 31 297 21 4385 1021 Germany
495 4234 1755 1501 2595 – – – – 5.0 4.3 6.8 5.6 9.1 169 195 472 64 – 304 34 325 24 4995 1041 United Kingdom
464 4031 1707 1525 2518 – – – – 4.8 4.4 5.9 4.9 7.6 150 207 494 61 – 292 31 335 24 5239 959 Italy
522 4161 1821 1527 2583 – – – – 5.0 4.5 5.9 5.0 7.7 152 215 452 63 – 295 34 320 23 5321 946 France
516 4249 1749 1513 2600 – – – – 5.0 4.5 6.1 5.0 8.0 157 205 456 61 – 294 35 323 23 4964 967 Spain
516 – – – 2554 – – – – 5.0 4.5 6.4 5.3 8.4 158 192 498 65 – 306 42 332 25 5252 897 EU-12
541 4248 1778 1530 2607 – – – – 5.0 4.4 6.0 5.0 7.8 155 198 479 60 – 311 31 339 25 4869 971 Belgium
564 4221 1735 1524 2596 – – – – 5.0 4.5 6.9 5.6 9.2 170 190 418 57 – 294 29 324 24 4584 979 Netherlands
492 4270 1748 1533 2604 – – – – 5.0 4.5 6.4 5.3 8.4 164 195 444 58 – 299 31 330 24 4613 989 Austria
486 4445 1767 1507 2648 – – – – 5.0 4.7 8.0 6.4 11.0 194 178 459 53 – 336 29 375 29 4349 1049 Sweden
474 – – – 2527 – – – – 4.9 4.3 7.0 5.7 9.3 168 175 440 53 – 351 31 286 29 5361 958 Greece
490 4193 1739 1495 2581 – – – – 4.9 4.7 5.7 4.7 7.3 146 191 460 61 – 262 33 300 20 4746 981 Portugal
523 – – – – – – – – 5.0 4.5 6.8 5.6 9.0 166 186 426 53 – 296 32 376 25 4598 1055 Ireland
527 4236 1747 1512 2579 – – – – 5.0 4.6 6.8 5.5 9.0 167 162 448 54 – 275 29 363 23 4717 948 Denmark
497 4413 1749 1506 2610 – – – – 5.1 4.6 7.4 6.0 9.9 180 172 456 56 – 335 30 329 30 4379 1023 Finland
512 – – – 2616 – – – – 4.9 4.4 6.5 5.3 8.6 168 226 440 56 – 328 33 356 25 4598 952 Luxembourg
560 4285 1753 1525 2597 – – – – 5.0 4.5 6.3 5.2 8.3 162 146 357 56 – 250 37 276 21 3407 1042 VW
536 4131 1838 1525 2599 – – – – 5.1 4.5 5.9 5.0 7.7 149 313 401 75 – 402 40 428 34 6086 1036 Renault
475 4227 1776 1485 2593 – – – – 5.0 4.5 6.1 5.0 8.1 152 209 368 69 – 314 45 340 24 6773 1159 Ford
496 4188 1727 1487 2574 – – – – 4.9 4.3 6.0 4.9 7.9 150 156 520 65 – 246 28 273 15 5141 843 Peugeot
494 4201 1761 1524 2615 – – – – 5.2 4.6 6.1 5.0 8.0 155 203 370 48 – 229 29 252 18 4342 872 Opel
488 4109 1732 1542 2574 – – – – 4.9 4.5 5.8 4.8 7.5 146 220 558 64 – 257 33 288 18 5655 789 Citroën
489 4129 1720 1553 2539 – – – – 5.1 4.4 6.5 5.5 8.2 161 190 449 47 – 263 18 286 27 3243 917 Toyota
484 3833 1658 1537 2434 – – – – 4.7 4.4 5.7 4.8 7.3 142 266 616 65 – 286 28 317 23 7422 935 Fiat
488 4376 1779 1511 2710 – – – – 4.7 4.0 7.4 5.9 10.1 186 118 333 47 – 277 17 299 19 2851 1185 Mercedes-Benz
510 4535 1807 1471 2765 – – – – 4.9 4.4 7.5 5.9 10.4 193 166 370 54 – 266 30 293 18 4814 1039 BMW
542 4533 1799 1435 2662 – – – – 4.9 4.4 6.9 5.4 9.5 178 155 492 56 – 219 33 247 15 4155 1230 Audi
536 4351 1728 1455 2524 – – – – 5.0 4.9 6.0 4.9 7.9 150 95 439 57 – 288 31 308 24 3510 1016 Škoda
523 4156 1728 1486 2518 – – – – 5.0 4.5 5.9 4.8 7.8 151 109 333 66 – 324 44 348 25 4224 1120 Seat
496 4122 1718 1571 2525 – – – – 5.0 4.4 6.9 5.8 8.8 171 376 675 57 – 451 37 512 41 5463 1345 Nissan
501 4115 1722 1592 2541 – – – – 5.0 4.6 6.9 5.8 9.0 172 243 391 31 – 436 18 478 37 6548 768 Hyundai
516 4188 1767 1488 2606 – – – – 5.2 4.5 6.4 5.2 8.6 159 – – – – – – – – – – Vauxhall
484 4168 1734 1586 2558 – – – – 5.0 4.9 6.8 5.6 8.9 172 315 516 40 – 447 27 483 54 5333 809 Kia
539 4627 1806 1503 2719 – – – – 5.1 4.7 7.8 6.2 10.7 196 207 261 42 – 375 25 413 29 3075 764 Volvo
439 3796 1650 1599 2364 – – – – 4.7 4.4 6.6 5.6 8.4 162 204 430 43 – 384 18 415 27 5934 806 Suzuki
534 4284 1740 1525 2630 – – – – 5.0 4.0 6.9 5.5 9.4 167 – 595 90 – – 76 – – 7579 683 Dacia
Tota
l sal
es/r
egis
trat
ions
Tota
l sal
es/r
egis
trat
ions
[%
]
Pric
e [E
UR
incl
. tax
]
Top
spee
d [k
m/h
]
Die
sel [
%]
Hyb
rid
excl
. PH
EV [
%]
Nat
ural
gas
(m
ono-
/biv
alen
t, in
cl. L
PG)
[%]
Flex
-Fue
l (et
hano
l/ga
solin
e) [
%]
Elec
tric
/fue
l cel
l inc
l. PH
EV [
%]
Aut
omat
ic [
%]
Fron
t dr
ive
[%]
Rea
r dr
ive
[%]
4-w
heel
dri
ve [
%]
Engi
ne p
ower
[K
W]
Engi
ne s
ize
[ccm
]
Num
ber
of c
ylin
ders
Com
pres
sion
rat
e (g
asol
ine)
Com
pres
sion
rat
e (d
iese
l)
Num
ber
of g
ears
Perf
orm
ance
0–1
00
km
/h (
gaso
line)
[s]
Perf
orm
ance
0–1
00
km
/h (
dies
el)
[s]
Mas
s in
run
ning
ord
er [
kg]
Gro
ss w
eigh
t [k
g]
Payl
oad
[kg
]
Leng
th [
mm
]
Wid
th [
mm
]
Hei
ght
[mm
]
Whe
elba
se [
mm
]
Fron
t tr
ack
[mm
]
Rea
r tr
ack
[mm
]
Foot
prin
t [m
2 ]
Boo
t vo
lum
e [l
]
Seat
s
Doo
rs
Fuel
con
sum
ptio
n (N
ED
C)
[l/1
00
km
]
Fuel
con
sum
ptio
n (e
xtra
-urb
an)
[l/1
00
km
]
Fuel
con
sum
ptio
n (u
rban
) [l
/10
0 k
m]
CO
2 (N
ED
C)
[g/k
m]
CO
(di
esel
veh
icle
s) [
mg
/km
]
CO
(ga
solin
e ve
hicl
es)
[mg
/km
]
HC
(ga
solin
e ve
hicl
es)
[mg
/km
]
NH
MC
(ga
solin
e Eu
ro 5
/6 v
ehic
les)
[m
g/k
m]
NO
x (di
esel
veh
icle
s) [
mg
/km
]
NO
x (ga
solin
e ve
hicl
es)
[mg
/km
]
HC
+ N
Ox (
dies
el v
ehic
les)
[m
g/k
m]
Part
icul
ates
(di
esel
veh
icle
s) [
mg
/km
]
CO
at
-7 °
C (
gaso
line
vehi
cles
) [m
g/k
m]
HC
at
-7 °
C (
gaso
line
vehi
cles
) [m
g/k
m]
Dir
ect
inje
ctio
n (n
on-d
iese
l) [
%]
Euro
#5 a
nd E
uro#
6 [%
]

104 105
EUROPEAN VEHICLE MARKET STATISTICS 2016/17 Annex
2004Passenger cars
EU-27 15,237,555 100 21,709 183 48 0.1 0.2 0 0 13 83 8 7 2 0 80 1735 4.1 – – – – – 1329 1776
Germany 3,266,678 21 24,154 190 44 0.1 0.2 0 0 21 75 17 8 3 0 89.5 1866 4.2 – – – – – 1415 1857
United Kingdom 2,566,845 17 22,894 186 32 0.1 0.1 0 0 15 83 9 9 2 0 83.6 1752 4.1 – – – – – 1332 1766
Italy 2,290,106 15 18,603 174 58 0 0.5 0 0 6 88 6 7 1 0 70.3 1592 4.0 – – – – – 1258 1668
France 2,013,709 13 20,764 180 69 0 0.1 0 0.02 8 91 4 6 1 0 75.4 1723 4.0 – – – – – 1310 1791
Spain 1,616,077 11 20,838 184 66 0 0 0 0 10 88 5 7 1 0 79.0 1782 4.1 – – – – – 1343 1800
EU-12 986,245 6 16,213 170 26 0 0 0 0 3 61 1 2 1 0 67.1 1491 4.0 – – – – – 1197 1656
Belgium 484,676 3 20,767 180 70 0 0 0 0 11 87 8 5 1 0 75.7 1735 4.1 – – – – – 1341 1812
Netherlands 483,883 3 24,372 182 25 0.2 0 0 0 14 90 5 5 3 0 80.2 1712 4.1 – – – – – 1265 1763
Austria 311,292 2 23,714 179 69 0 0 0 0 9 84 7 9 2 0 78.5 1808 4.1 – – – – – 1403 1863
Greece 289,750 2 18,447 178 3 0 0 0 0 4 82 5 10 2 0 74.1 1544 4.0 – – – – – 1235 1652
Sweden 264,154 2 25,080 200 12 0.3 2.0 0.1 0 24 82 5 12 1 0 103.3 1992 4.4 – – – – – 1490 1942
Portugal 197,584 1 24,142 177 57 0.2 0 0 0 9 91 7 2 0 0 69.4 1524 4.0 – – – – – 1273 1703
Ireland 154,136 1 24,014 180 19 0.2 0 0 0 9 88 6 6 0 0 73.8 1592 4.0 – – – – – 1310 1771
Finland 142,303 1 27,950 191 15 0 0 0 0 19 90 4 6 2 0 87.7 1803 4.1 – – – – – 1373 1807
Denmark 121,846 1 33,667 184 25 0 0 0 0 9 96 2 2 1 0 78.0 1691 4.1 – – – – – 1319 1739
Luxembourg 48,271 0 25,097 183 72 0 0 0 0 6 76 11 11 4 0 93.1 1961 4.3 – – – – – 1444 1920
Renault 1,563,715 10 19,616 177 59 0 0.1 0 0 6 98 0 0 0 0 72.6 1578 4.0 – – – – – 1282 1776
VW 1,462,371 10 22,265 183 62 0 0 0 0 10 93 0 5 21 0 78.5 1774 4.0 – – – – – 1386 1889
Ford 1,286,833 8 18,497 179 46 0 0.3 0 0 7 99 0 0 0 0 71.5 1618 4.0 – – – – – 1298 1705
Peugeot 1,185,983 8 18,826 181 54 0 0 0 0.03 7 99 0 0 0 0 71.6 1671 4.0 – – – – – 1273 1720
Opel 1,035,859 7 18,345 178 46 0 0.8 0 0 9 98 0 0 0 0 71.2 1606 4.0 – – – – – 1317 1755
Citroën 907,105 6 17,551 173 55 0 0 0 0.01 5 99 0 0 0 0 64.0 1585 4.0 – – – – – 1227 1664
Fiat 847,536 6 12,969 161 32 0 1.1 0 0 2 99 0 0 0 0 53.9 1355 4.0 – – – – – 1057 1477
Toyota 746,191 5 20,388 183 35 1.0 0 0 0 11 82 0 16 0 0 78.7 1670 4.0 – – – – – 1272 1709
Mercedes-Benz 685,992 5 38,283 214 59 0 0 0 0 54 20 74 6 0 0 113.8 2283 4.5 – – – – – 1609 2051
BMW 569,749 4 39,316 221 58 0 0 0 0 35 0 82 17 0 0 132.9 2468 5.2 – – – – – 1641 2063
Audi 546,281 4 32,834 210 69 0 0 0 0 24 79 0 19 17 0 110.5 2109 4.5 – – – – – 1498 1988
Škoda 393,811 3 16,978 178 44 0 0 0 0 7 79 0 1 1 0 66.3 1606 3.8 – – – – – 1262 1725
Seat 392,659 3 16,987 183 58 0 0 0 0 5 98 0 0 1 0 71.5 1669 3.9 – – – – – 1251 1716
Nissan 390,069 3 19,336 172 38 0 0 0 0 9 77 2 20 0 0 77.1 1722 4.0 – – – – – 1291 1746
Vauxhall 325,023 2 19,352 – 26 0 0.3 0 0 8 100 0 0 0 1 71.2 1575 4.0 – – – – – 1280 1732
Hyundai 315,226 2 16,390 165 34 0 0 0 0 12 79 1 17 0 0 70.1 1601 3.9 – – – – – 1332 1769
Volvo 242,885 2 34,467 207 52 0 0.8 0 0 33 80 0 19 0 0 116.3 2272 4.7 – – – – – 1630 2101
Suzuki 210,157 1 14,879 156 25 0 0 0 0 8 45 0 44 0 0 65.1 1453 4.0 – – – – – 1168 1547
Kia 175,274 1 17,547 166 38 0 0 0 0 23 81 0 18 0 0 76.1 1806 4.0 – – – – – 1481 1897
Dacia 61,833 0 – – 6 0 0 0 0 0 9 0 0 0 0 56.8 1446 4.0 – – – – – – 1538
498 4193 1746 1510 2578 – – – – 4.9 4.4 6.5 5.3 8.6 163 203 471 63 – 349 35 377 29 4613 1002 EU-27
496 4279 1743 1510 2611 – – – – 4.9 4.4 7.0 5.6 9.3 174 168 420 58 – 329 34 356 28 4148 1021 Germany
489 4208 1748 1495 2586 – – – – 5.0 4.3 7.0 5.6 9.3 172 216 484 70 – 383 39 383 32 4850 985 United Kingdom
460 4017 1699 1515 2513 – – – – 4.8 4.3 5.9 4.9 7.7 150 208 544 65 – 335 31 414 28 5728 1006 Italy
528 4153 1812 1522 2582 – – – – 5.0 4.5 6.0 5.0 7.8 153 223 472 67 – 354 38 362 28 4861 984 France
509 4222 1734 1502 2587 – – – – 5.0 4.4 6.2 5.1 8.1 158 211 474 65 – 354 37 382 29 4581 954 Spain
504 – – – 2525 – – – – 5.0 4.6 6.4 5.2 8.3 157 211 522 61 – 373 34 401 32 4751 973 EU-12
526 4227 1784 1522 2600 – – – – 5.0 4.4 6.1 5.0 7.9 156 208 496 62 – 364 35 392 30 4690 979 Belgium
554 4202 1724 1518 2588 – – – – 5.0 4.5 7.1 5.7 9.4 172 197 445 61 – 383 34 411 32 4733 982 Netherlands
510 4262 1735 1538 2602 – – – – 5.0 4.5 6.3 5.2 8.2 162 210 480 62 – 385 34 415 31 4642 964 Austria
468 – – – 2523 – – – – 4.9 4.3 7.0 5.7 9.3 168 249 525 65 – 426 36 403 38 5163 1027 Greece
493 4440 1758 1503 2649 – – – – 5.1 4.7 8.1 6.5 11.2 197 171 510 61 – 377 35 358 33 4295 1037 Sweden
486 4155 1733 1484 2564 – – – – 4.9 4.6 5.8 4.8 7.5 148 220 463 64 – 333 34 421 27 3984 986 Portugal
508 – – – 2582 – – – – 5.0 4.4 6.9 5.6 9.1 168 193 514 68 – 399 37 451 34 4385 940 Ireland
490 4393 1741 1497 2611 – – – – 5.0 4.6 7.5 6.0 10.1 181 179 473 60 – 384 37 411 32 4996 1042 Finland
482 4255 1721 1508 2580 – – – – 5.0 4.6 6.9 5.6 9.3 170 186 457 60 – 392 34 432 33 4958 1007 Denmark
504 – – – 2614 – – – – 4.9 4.3 6.6 5.4 8.8 169 232 511 61 – 366 36 392 28 4294 941 Luxembourg
539 4150 1825 1513 2603 – – – – 5.1 4.5 5.9 4.9 7.7 149 309 400 74 – 429 42 454 36 6056 1077 Renault
554 4267 1745 1518 2591 – – – – 5.0 4.5 6.3 5.2 8.2 160 122 340 59 – 304 39 327 25 3222 1102 VW
466 4203 1745 1481 2590 – – – – 4.9 4.5 6.2 5.0 8.3 155 168 388 70 – 369 45 394 31 5761 1008 Ford
496 4154 1717 1481 2568 – – – – 4.9 4.3 6.1 4.9 8.0 152 221 535 70 – 339 32 370 23 5114 805 Peugeot
485 4145 1745 1531 2608 – – – – 5.2 4.7 6.2 5.1 8.2 157 194 376 50 – 273 33 294 22 4184 907 Opel
484 4076 1721 1552 2565 – – – – 4.9 4.5 5.8 4.8 7.6 146 250 646 79 – 314 41 350 26 6546 683 Citroën
481 3834 1659 1527 2434 – – – – 4.8 4.3 5.7 4.8 7.4 141 329 656 68 – 321 29 357 27 7904 1028 Fiat
487 4124 1719 1549 2527 – – – – 5.1 4.4 6.7 5.6 8.5 165 193 496 51 – 342 27 363 30 2611 901 Toyota
501 4452 1775 1493 2722 – – – – 4.8 4.0 7.6 5.9 10.6 193 126 367 55 – 365 27 387 31 2249 1233 Mercedes-Benz
500 4559 1795 1466 2770 – – – – 4.9 4.1 7.9 6.2 10.9 201 168 456 56 – 343 30 377 27 4384 891 BMW
542 4476 1785 1436 2647 – – – – 4.9 4.1 6.9 5.4 9.4 177 179 493 58 – 298 35 331 26 4630 1197 Audi
512 4300 1707 1449 2505 – – – – 5.0 4.9 6.0 4.9 7.9 150 111 447 59 – 369 34 392 29 3614 1021 Škoda
513 4119 1719 1474 2502 – – – – 5.0 4.4 5.8 4.8 7.7 149 126 357 69 – 364 45 389 29 4183 1199 Seat
488 4107 1712 1561 2524 – – – – 5.0 4.4 6.7 5.7 8.6 169 356 687 60 – 432 40 486 39 7604 1106 Nissan
509 4164 1795 1498 2605 – – – – 5.3 4.5 6.7 5.4 9.0 165 – – – – – – – – – – Vauxhall
495 4099 1714 1575 2530 – – – – 5.0 4.6 6.9 5.8 9.0 171 217 399 32 – 452 17 479 39 6707 774 Hyundai
531 4627 1798 1492 2707 – – – – 5.1 4.6 8.0 6.3 11.1 201 227 489 70 – 414 38 443 35 1547 660 Volvo
435 3801 1646 1638 2347 – – – – 4.7 4.4 6.7 5.6 8.5 165 234 416 41 – 404 19 443 26 5067 691 Suzuki
475 4218 1732 1576 2559 – – – – 5.2 4.9 7.0 5.8 9.2 176 313 509 41 – 516 32 540 58 5436 785 Kia
– – – – 2630 – – – – 5.0 4.6 – – – – – – – – – – – – – – Dacia
Tota
l sal
es/r
egis
trat
ions
Tota
l sal
es/r
egis
trat
ions
[%
]
Pric
e [E
UR
incl
. tax
]
Top
spee
d [k
m/h
]
Die
sel [
%]
Hyb
rid
excl
. PH
EV [
%]
Nat
ural
gas
(m
ono-
/biv
alen
t, in
cl. L
PG)
[%]
Flex
-Fue
l (et
hano
l/ga
solin
e) [
%]
Elec
tric
/fue
l cel
l inc
l. PH
EV [
%]
Aut
omat
ic [
%]
Fron
t dr
ive
[%]
Rea
r dr
ive
[%]
4-w
heel
dri
ve [
%]
Engi
ne p
ower
[K
W]
Engi
ne s
ize
[ccm
]
Num
ber
of c
ylin
ders
Com
pres
sion
rat
e (g
asol
ine)
Com
pres
sion
rat
e (d
iese
l)
Num
ber
of g
ears
Perf
orm
ance
0–1
00
km
/h (
gaso
line)
[s]
Perf
orm
ance
0–1
00
km
/h (
dies
el)
[s]
Mas
s in
run
ning
ord
er [
kg]
Gro
ss w
eigh
t [k
g]
Payl
oad
[kg
]
Leng
th [
mm
]
Wid
th [
mm
]
Hei
ght
[mm
]
Whe
elba
se [
mm
]
Fron
t tr
ack
[mm
]
Rea
r tr
ack
[mm
]
Foot
prin
t [m
2 ]
Boo
t vo
lum
e [l
]
Seat
s
Doo
rs
Fuel
con
sum
ptio
n (N
ED
C)
[l/1
00
km
]
Fuel
con
sum
ptio
n (e
xtra
-urb
an)
[l/1
00
km
]
Fuel
con
sum
ptio
n (u
rban
) [l
/10
0 k
m]
CO
2 (N
ED
C)
[g/k
m]
CO
(di
esel
veh
icle
s) [
mg
/km
]
CO
(ga
solin
e ve
hicl
es)
[mg
/km
]
HC
(ga
solin
e ve
hicl
es)
[mg
/km
]
NH
MC
(ga
solin
e Eu
ro 5
/6 v
ehic
les)
[m
g/k
m]
NO
x (di
esel
veh
icle
s) [
mg
/km
]
NO
x (ga
solin
e ve
hicl
es)
[mg
/km
]
HC
+ N
Ox (
dies
el v
ehic
les)
[m
g/k
m]
Part
icul
ates
(di
esel
veh
icle
s) [
mg
/km
]
CO
at
-7 °
C (
gaso
line
vehi
cles
) [m
g/k
m]
HC
at
-7 °
C (
gaso
line
vehi
cles
) [m
g/k
m]
Dir
ect
inje
ctio
n (n
on-d
iese
l) [
%]
Euro
#5 a
nd E
uro#
6 [%
]
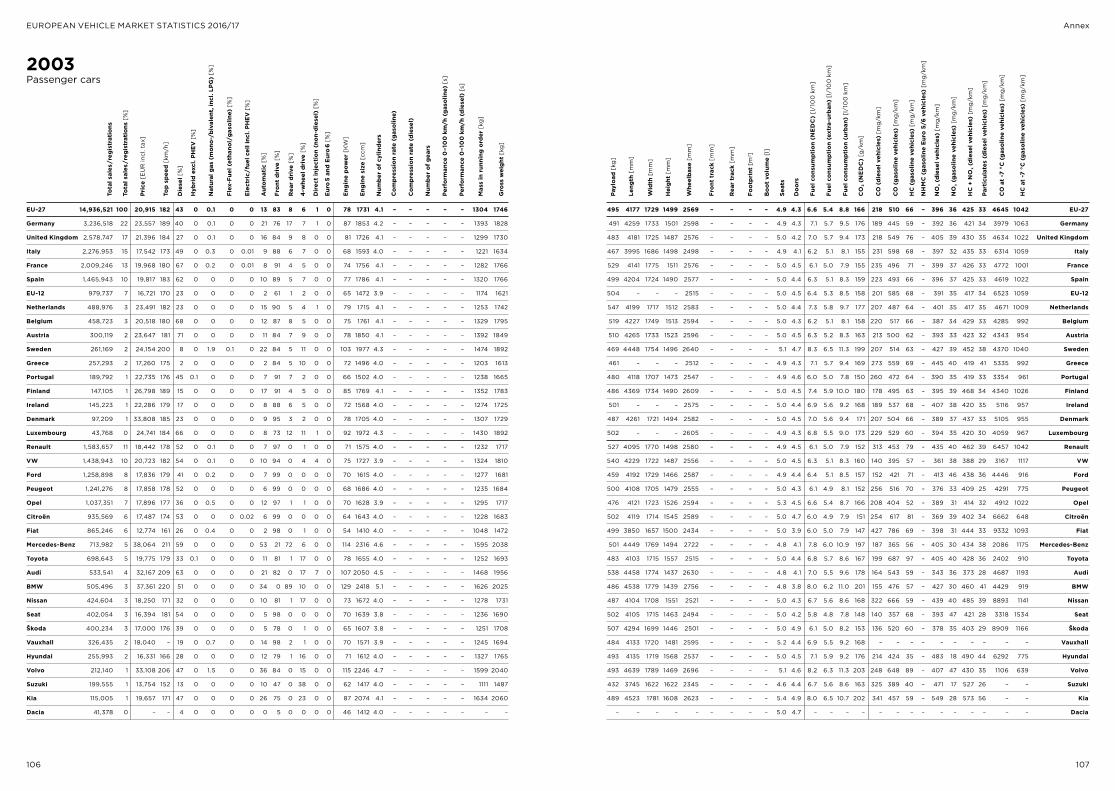
106 107
EUROPEAN VEHICLE MARKET STATISTICS 2016/17 Annex
2003Passenger cars
EU-27 14,936,521 100 20,915 182 43 0 0.1 0 0 13 83 8 6 1 0 78 1731 4.1 – – – – – 1304 1746
Germany 3,236,518 22 23,557 189 40 0 0.1 0 0 21 76 17 7 1 0 87 1853 4.2 – – – – – 1393 1828
United Kingdom 2,578,747 17 21,396 184 27 0 0.1 0 0 16 84 9 8 0 0 81 1726 4.1 – – – – – 1299 1730
Italy 2,276,953 15 17,542 173 49 0 0.3 0 0.01 9 88 6 7 0 0 68 1593 4.0 – – – – – 1221 1634
France 2,009,246 13 19,968 180 67 0 0.2 0 0.01 8 91 4 5 0 0 74 1756 4.1 – – – – – 1282 1766
Spain 1,465,943 10 19,817 183 62 0 0 0 0 10 89 5 7 0 0 77 1786 4.1 – – – – – 1320 1766
EU-12 979,737 7 16,721 170 23 0 0 0 0 2 61 1 2 0 0 65 1472 3.9 – – – – – 1174 1621
Netherlands 488,976 3 23,491 182 23 0 0 0 0 15 90 5 4 1 0 79 1715 4.1 – – – – – 1253 1742
Belgium 458,723 3 20,518 180 68 0 0 0 0 12 87 8 5 0 0 75 1761 4.1 – – – – – 1329 1795
Austria 300,119 2 23,647 181 71 0 0 0 0 11 84 7 9 0 0 78 1850 4.1 – – – – – 1392 1849
Sweden 261,169 2 24,154 200 8 0 1.9 0.1 0 22 84 5 11 0 0 103 1977 4.3 – – – – – 1474 1892
Greece 257,293 2 17,260 175 2 0 0 0 0 2 84 5 10 0 0 72 1496 4.0 – – – – – 1203 1613
Portugal 189,792 1 22,735 176 45 0.1 0 0 0 7 91 7 2 0 0 66 1502 4.0 – – – – – 1238 1665
Finland 147,105 1 26,798 189 15 0 0 0 0 17 91 4 5 0 0 85 1769 4.1 – – – – – 1352 1783
Ireland 145,223 1 22,286 179 17 0 0 0 0 8 88 6 5 0 0 72 1568 4.0 – – – – – 1274 1725
Denmark 97,209 1 33,808 185 23 0 0 0 0 9 95 3 2 0 0 78 1705 4.0 – – – – – 1307 1729
Luxembourg 43,768 0 24,741 184 66 0 0 0 0 8 73 12 11 1 0 92 1972 4.3 – – – – – 1430 1892
Renault 1,583,657 11 18,442 178 52 0 0.1 0 0 7 97 0 1 0 0 71 1575 4.0 – – – – – 1232 1717
VW 1,438,943 10 20,723 182 54 0 0.1 0 0 10 94 0 4 4 0 75 1727 3.9 – – – – – 1324 1810
Ford 1,258,898 8 17,836 179 41 0 0.2 0 0 7 99 0 0 0 0 70 1615 4.0 – – – – – 1277 1681
Peugeot 1,241,276 8 17,858 178 52 0 0 0 0 6 99 0 0 0 0 68 1686 4.0 – – – – – 1235 1684
Opel 1,037,351 7 17,896 177 36 0 0.5 0 0 12 97 1 1 0 0 70 1628 3.9 – – – – – 1295 1717
Citroën 935,569 6 17,487 174 53 0 0 0 0.02 6 99 0 0 0 0 64 1643 4.0 – – – – – 1228 1683
Fiat 865,246 6 12,774 161 26 0 0.4 0 0 2 98 0 1 0 0 54 1410 4.0 – – – – – 1048 1472
Mercedes-Benz 713,982 5 38,064 211 59 0 0 0 0 53 21 72 6 0 0 114 2316 4.6 – – – – – 1595 2038
Toyota 698,643 5 19,775 179 33 0.1 0 0 0 11 81 1 17 0 0 78 1655 4.0 – – – – – 1252 1693
Audi 533,541 4 32,167 209 63 0 0 0 0 21 82 0 17 7 0 107 2050 4.5 – – – – – 1468 1956
BMW 505,496 3 37,361 220 51 0 0 0 0 34 0 89 10 0 0 129 2418 5.1 – – – – – 1626 2025
Nissan 424,604 3 18,250 171 32 0 0 0 0 10 81 1 17 0 0 73 1672 4.0 – – – – – 1278 1731
Seat 402,054 3 16,394 181 54 0 0 0 0 5 98 0 0 0 0 70 1639 3.8 – – – – – 1236 1690
Škoda 400,234 3 17,000 176 39 0 0 0 0 5 78 0 1 0 0 65 1607 3.8 – – – – – 1251 1708
Vauxhall 326,435 2 18,040 – 19 0 0.7 0 0 14 98 2 1 0 0 70 1571 3.9 – – – – – 1245 1694
Hyundai 255,993 2 16,331 166 28 0 0 0 0 12 79 1 16 0 0 71 1612 4.0 – – – – – 1327 1765
Volvo 212,140 1 33,108 206 47 0 1.5 0 0 36 84 0 15 0 0 115 2246 4.7 – – – – – 1599 2040
Suzuki 199,555 1 13,754 152 13 0 0 0 0 10 47 0 38 0 0 62 1417 4.0 – – – – – 1111 1487
Kia 115,005 1 19,657 171 47 0 0 0 0 26 75 0 23 0 0 87 2074 4.1 – – – – – 1634 2060
Dacia 41,378 0 – – 4 0 0 0 0 0 5 0 0 0 0 46 1412 4.0 – – – – – – –
495 4177 1729 1499 2569 – – – – 4.9 4.3 6.6 5.4 8.8 166 218 510 66 – 396 36 425 33 4645 1042 EU-27
491 4259 1733 1501 2598 – – – – 4.9 4.3 7.1 5.7 9.5 176 189 445 59 – 392 36 421 34 3979 1063 Germany
483 4181 1725 1487 2576 – – – – 5.0 4.2 7.0 5.7 9.4 173 218 549 76 – 405 39 430 35 4634 1022 United Kingdom
467 3995 1686 1498 2498 – – – – 4.9 4.1 6.2 5.1 8.1 155 231 598 68 – 397 32 435 33 6314 1059 Italy
529 4141 1775 1511 2576 – – – – 5.0 4.5 6.1 5.0 7.9 155 235 496 71 – 399 37 426 33 4772 1001 France
499 4204 1724 1490 2577 – – – – 5.0 4.4 6.3 5.1 8.3 159 223 493 66 – 396 37 425 33 4619 1022 Spain
504 – – – 2515 – – – – 5.0 4.5 6.4 5.3 8.5 158 201 585 68 – 391 35 417 34 6523 1059 EU-12
547 4199 1717 1512 2583 – – – – 5.0 4.4 7.3 5.8 9.7 177 207 487 64 – 401 35 417 35 4671 1009 Netherlands
519 4227 1749 1513 2594 – – – – 5.0 4.3 6.2 5.1 8.1 158 220 517 66 – 387 34 429 33 4285 992 Belgium
510 4265 1733 1523 2596 – – – – 5.0 4.5 6.3 5.2 8.3 163 213 500 62 – 393 33 423 32 4343 954 Austria
469 4448 1754 1496 2640 – – – – 5.1 4.7 8.3 6.5 11.3 199 207 514 63 – 427 39 452 38 4370 1040 Sweden
461 – – – 2512 – – – – 4.9 4.3 7.1 5.7 9.4 169 273 559 69 – 445 40 419 41 5335 992 Greece
480 4118 1707 1473 2547 – – – – 4.9 4.6 6.0 5.0 7.8 150 260 472 64 – 390 35 419 33 3354 961 Portugal
486 4369 1734 1490 2609 – – – – 5.0 4.5 7.4 5.9 10.0 180 178 495 63 – 395 39 468 34 4340 1026 Finland
501 – – – 2575 – – – – 5.0 4.4 6.9 5.6 9.2 168 189 537 68 – 407 38 420 35 5116 957 Ireland
487 4261 1721 1494 2582 – – – – 5.0 4.5 7.0 5.6 9.4 171 207 504 66 – 389 37 437 33 5105 955 Denmark
502 – – – 2605 – – – – 4.9 4.3 6.8 5.5 9.0 173 229 529 60 – 394 35 420 30 4059 967 Luxembourg
527 4095 1770 1498 2580 – – – – 4.9 4.5 6.1 5.0 7.9 152 313 453 79 – 435 40 462 39 6457 1042 Renault
540 4229 1722 1487 2556 – – – – 5.0 4.5 6.3 5.1 8.3 160 140 395 57 – 361 38 388 29 3167 1117 VW
459 4192 1729 1466 2587 – – – – 4.9 4.4 6.4 5.1 8.5 157 152 421 71 – 413 46 438 36 4446 916 Ford
500 4108 1705 1479 2555 – – – – 5.0 4.3 6.1 4.9 8.1 152 256 516 70 – 376 33 409 25 4291 775 Peugeot
476 4121 1723 1526 2594 – – – – 5.3 4.5 6.6 5.4 8.7 166 208 404 52 – 389 31 414 32 4912 1022 Opel
502 4119 1714 1545 2589 – – – – 5.0 4.7 6.0 4.9 7.9 151 254 617 81 – 369 39 402 34 6662 648 Citroën
499 3850 1657 1500 2434 – – – – 5.0 3.9 6.0 5.0 7.9 147 427 786 69 – 398 31 444 33 9332 1093 Fiat
501 4449 1769 1494 2722 – – – – 4.8 4.1 7.8 6.0 10.9 197 187 365 56 – 405 30 434 38 2086 1175 Mercedes-Benz
483 4103 1715 1557 2515 – – – – 5.0 4.4 6.8 5.7 8.6 167 199 687 97 – 405 40 428 36 2402 910 Toyota
538 4458 1774 1437 2630 – – – – 4.8 4.1 7.0 5.5 9.6 178 164 543 59 – 343 36 373 28 4687 1193 Audi
486 4538 1779 1439 2756 – – – – 4.8 3.8 8.0 6.2 11.0 201 155 476 57 – 427 30 460 41 4429 919 BMW
487 4104 1708 1551 2521 – – – – 5.0 4.3 6.7 5.6 8.6 168 322 666 59 – 439 40 485 39 8893 1141 Nissan
502 4105 1715 1463 2494 – – – – 5.0 4.2 5.8 4.8 7.8 148 140 357 68 – 393 47 421 28 3318 1534 Seat
507 4294 1699 1446 2501 – – – – 5.0 4.9 6.1 5.0 8.2 153 136 520 60 – 378 35 403 29 8909 1166 Škoda
484 4133 1720 1481 2595 – – – – 5.2 4.4 6.9 5.5 9.2 168 – – – – – – – – – – Vauxhall
493 4135 1719 1568 2537 – – – – 5.0 4.5 7.1 5.9 9.2 176 214 424 35 – 483 18 490 44 6292 775 Hyundai
493 4639 1789 1469 2696 – – – – 5.1 4.6 8.2 6.3 11.3 203 248 648 89 – 407 47 430 35 1106 639 Volvo
432 3745 1622 1622 2345 – – – – 4.6 4.4 6.7 5.6 8.6 163 325 389 40 – 471 17 527 26 – – Suzuki
489 4523 1781 1608 2623 – – – – 5.4 4.9 8.0 6.5 10.7 202 341 457 59 – 549 28 573 56 – – Kia
– – – – – – – – – 5.0 4.7 – – – – – – – – – – – – – – Dacia
Tota
l sal
es/r
egis
trat
ions
Tota
l sal
es/r
egis
trat
ions
[%
]
Pric
e [E
UR
incl
. tax
]
Top
spee
d [k
m/h
]
Die
sel [
%]
Hyb
rid
excl
. PH
EV [
%]
Nat
ural
gas
(m
ono-
/biv
alen
t, in
cl. L
PG)
[%]
Flex
-Fue
l (et
hano
l/ga
solin
e) [
%]
Elec
tric
/fue
l cel
l inc
l. PH
EV [
%]
Aut
omat
ic [
%]
Fron
t dr
ive
[%]
Rea
r dr
ive
[%]
4-w
heel
dri
ve [
%]
Engi
ne p
ower
[K
W]
Engi
ne s
ize
[ccm
]
Num
ber
of c
ylin
ders
Com
pres
sion
rat
e (g
asol
ine)
Com
pres
sion
rat
e (d
iese
l)
Num
ber
of g
ears
Perf
orm
ance
0–1
00
km
/h (
gaso
line)
[s]
Perf
orm
ance
0–1
00
km
/h (
dies
el)
[s]
Mas
s in
run
ning
ord
er [
kg]
Gro
ss w
eigh
t [k
g]
Payl
oad
[kg
]
Leng
th [
mm
]
Wid
th [
mm
]
Hei
ght
[mm
]
Whe
elba
se [
mm
]
Fron
t tr
ack
[mm
]
Rea
r tr
ack
[mm
]
Foot
prin
t [m
2 ]
Boo
t vo
lum
e [l
]
Seat
s
Doo
rs
Fuel
con
sum
ptio
n (N
ED
C)
[l/1
00
km
]
Fuel
con
sum
ptio
n (e
xtra
-urb
an)
[l/1
00
km
]
Fuel
con
sum
ptio
n (u
rban
) [l
/10
0 k
m]
CO
2 (N
ED
C)
[g/k
m]
CO
(di
esel
veh
icle
s) [
mg
/km
]
CO
(ga
solin
e ve
hicl
es)
[mg
/km
]
HC
(ga
solin
e ve
hicl
es)
[mg
/km
]
NH
MC
(ga
solin
e Eu
ro 5
/6 v
ehic
les)
[m
g/k
m]
NO
x (di
esel
veh
icle
s) [
mg
/km
]
NO
x (ga
solin
e ve
hicl
es)
[mg
/km
]
HC
+ N
Ox (
dies
el v
ehic
les)
[m
g/k
m]
Part
icul
ates
(di
esel
veh
icle
s) [
mg
/km
]
CO
at
-7 °
C (
gaso
line
vehi
cles
) [m
g/k
m]
HC
at
-7 °
C (
gaso
line
vehi
cles
) [m
g/k
m]
Dir
ect
inje
ctio
n (n
on-d
iese
l) [
%]
Euro
#5 a
nd E
uro#
6 [%
]
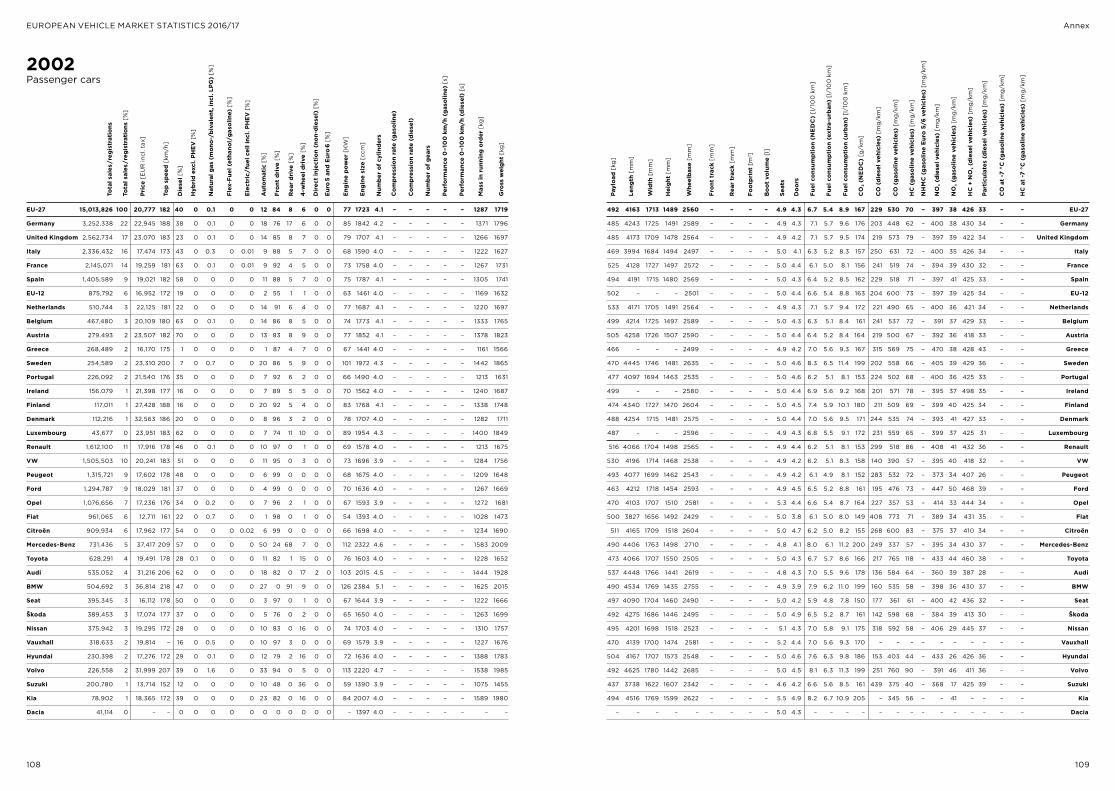
108 109
EUROPEAN VEHICLE MARKET STATISTICS 2016/17 Annex
2002Passenger cars
EU-27 15,013,826 100 20,777 182 40 0 0.1 0 0 12 84 8 6 0 0 77 1723 4.1 – – – – – 1287 1719
Germany 3,252,338 22 22,945 188 38 0 0.1 0 0 18 76 17 6 0 0 85 1842 4.2 – – – – – 1371 1796
United Kingdom 2,562,734 17 23,070 183 23 0 0.1 0 0 14 85 8 7 0 0 79 1707 4.1 – – – – – 1266 1697
Italy 2,336,432 16 17,474 173 43 0 0.3 0 0.01 9 88 5 7 0 0 68 1590 4.0 – – – – – 1222 1627
France 2,145,071 14 19,259 181 63 0 0.1 0 0.01 9 92 4 5 0 0 73 1758 4.0 – – – – – 1267 1731
Spain 1,405,589 9 19,021 182 58 0 0 0 0 11 88 5 7 0 0 75 1787 4.1 – – – – – 1305 1741
EU-12 875,792 6 16,952 172 19 0 0 0 0 2 55 1 1 0 0 63 1461 4.0 – – – – – 1169 1632
Netherlands 510,744 3 22,125 181 22 0 0 0 0 14 91 6 4 0 0 77 1687 4.1 – – – – – 1220 1697
Belgium 467,480 3 20,109 180 63 0 0.1 0 0 14 86 8 5 0 0 74 1773 4.1 – – – – – 1333 1765
Austria 279,493 2 23,507 182 70 0 0 0 0 13 83 8 9 0 0 77 1852 4.1 – – – – – 1378 1823
Greece 268,489 2 16,170 175 1 0 0 0 0 1 87 4 7 0 0 67 1441 4.0 – – – – – 1161 1566
Sweden 254,589 2 23,310 200 7 0 0.7 0 0 20 86 5 9 0 0 101 1972 4.3 – – – – – 1442 1865
Portugal 226,092 2 21,540 176 35 0 0 0 0 7 92 6 2 0 0 66 1490 4.0 – – – – – 1213 1631
Ireland 156,079 1 21,398 177 16 0 0 0 0 7 89 5 5 0 0 70 1562 4.0 – – – – – 1240 1687
Finland 117,011 1 27,428 188 16 0 0 0 0 20 92 5 4 0 0 83 1768 4.1 – – – – – 1338 1748
Denmark 112,216 1 32,563 186 20 0 0 0 0 8 96 3 2 0 0 78 1707 4.0 – – – – – 1282 1711
Luxembourg 43,677 0 23,951 183 62 0 0 0 0 7 74 11 10 0 0 89 1954 4.3 – – – – – 1400 1849
Renault 1,612,100 11 17,916 178 46 0 0.1 0 0 10 97 0 1 0 0 69 1578 4.0 – – – – – 1213 1675
VW 1,505,503 10 20,241 183 51 0 0 0 0 11 95 0 3 0 0 73 1696 3.9 – – – – – 1284 1756
Peugeot 1,315,721 9 17,602 178 48 0 0 0 0 6 99 0 0 0 0 68 1675 4.0 – – – – – 1209 1648
Ford 1,294,787 9 18,029 181 37 0 0 0 0 4 99 0 0 0 0 70 1636 4.0 – – – – – 1267 1669
Opel 1,076,656 7 17,236 176 34 0 0.2 0 0 7 96 2 1 0 0 67 1593 3.9 – – – – – 1272 1681
Fiat 961,065 6 12,711 161 22 0 0.7 0 0 1 98 0 1 0 0 54 1393 4.0 – – – – – 1028 1473
Citroën 909,934 6 17,962 177 54 0 0 0 0.02 6 99 0 0 0 0 66 1698 4.0 – – – – – 1234 1690
Mercedes-Benz 731,436 5 37,417 209 57 0 0 0 0 50 24 68 7 0 0 112 2322 4.6 – – – – – 1583 2009
Toyota 628,291 4 19,491 178 28 0.1 0 0 0 11 82 1 15 0 0 76 1603 4.0 – – – – – 1228 1652
Audi 535,052 4 31,216 206 62 0 0 0 0 18 82 0 17 2 0 103 2015 4.5 – – – – – 1444 1928
BMW 504,692 3 36,814 218 47 0 0 0 0 27 0 91 9 0 0 126 2384 5.1 – – – – – 1625 2015
Seat 395,345 3 16,112 178 50 0 0 0 0 3 97 0 1 0 0 67 1644 3.9 – – – – – 1222 1666
Škoda 389,453 3 17,074 177 37 0 0 0 0 5 76 0 2 0 0 65 1650 4.0 – – – – – 1263 1699
Nissan 375,942 3 19,295 172 28 0 0 0 0 10 83 0 16 0 0 74 1703 4.0 – – – – – 1310 1757
Vauxhall 318,633 2 19,814 – 16 0 0.5 0 0 10 97 3 0 0 0 69 1579 3.9 – – – – – 1227 1676
Hyundai 230,398 2 17,276 172 29 0 0.1 0 0 12 79 2 16 0 0 72 1636 4.0 – – – – – 1388 1783
Volvo 226,558 2 31,999 207 39 0 1.6 0 0 33 94 0 5 0 0 113 2220 4.7 – – – – – 1538 1985
Suzuki 200,780 1 13,714 152 12 0 0 0 0 10 48 0 36 0 0 59 1390 3.9 – – – – – 1075 1455
Kia 78,902 1 18,365 172 39 0 0 0 0 23 82 0 16 0 0 84 2007 4.0 – – – – – 1589 1980
Dacia 41,114 0 – – 0 0 0 0 0 0 0 0 0 0 0 – 1397 4.0 – – – – – – –
492 4163 1713 1489 2560 – – – – 4.9 4.3 6.7 5.4 8.9 167 229 530 70 – 397 38 426 33 – – EU-27
485 4243 1725 1491 2589 – – – – 4.9 4.3 7.1 5.7 9.6 176 203 448 62 – 400 38 430 34 – – Germany
485 4173 1709 1478 2564 – – – – 4.9 4.2 7.1 5.7 9.5 174 219 573 79 – 397 39 422 34 – – United Kingdom
469 3994 1684 1494 2497 – – – – 5.0 4.1 6.3 5.2 8.3 157 250 631 72 – 400 35 426 34 – – Italy
525 4128 1727 1497 2572 – – – – 5.0 4.4 6.1 5.0 8.1 156 241 519 74 – 394 39 430 32 – – France
494 4191 1715 1480 2569 – – – – 5.0 4.3 6.4 5.2 8.5 162 229 518 71 – 397 41 425 33 – – Spain
502 – – – 2501 – – – – 5.0 4.4 6.6 5.4 8.8 163 204 600 73 – 397 39 425 34 – – EU-12
533 4171 1705 1491 2564 – – – – 4.9 4.3 7.1 5.7 9.4 172 221 490 65 – 400 36 421 34 – – Netherlands
499 4214 1725 1497 2589 – – – – 5.0 4.3 6.3 5.1 8.4 161 241 537 72 – 391 37 429 33 – – Belgium
505 4258 1726 1507 2590 – – – – 5.0 4.4 6.4 5.2 8.4 164 219 500 67 – 392 36 418 33 – – Austria
466 – – – 2499 – – – – 4.9 4.2 7.0 5.6 9.3 167 315 569 75 – 470 38 428 43 – – Greece
470 4445 1746 1481 2635 – – – – 5.0 4.6 8.3 6.5 11.4 199 202 558 66 – 405 39 429 36 – – Sweden
477 4097 1694 1463 2535 – – – – 5.0 4.6 6.2 5.1 8.1 153 224 502 68 – 400 36 425 33 – – Portugal
499 – – – 2580 – – – – 5.0 4.4 6.9 5.6 9.2 168 201 571 78 – 395 37 498 35 – – Ireland
474 4340 1727 1470 2604 – – – – 5.0 4.5 7.4 5.9 10.1 180 211 509 69 – 399 40 425 34 – – Finland
488 4254 1715 1481 2575 – – – – 5.0 4.4 7.0 5.6 9.5 171 244 535 74 – 393 41 427 33 – – Denmark
487 – – – 2596 – – – – 4.9 4.3 6.8 5.5 9.1 172 231 559 65 – 399 37 425 31 – – Luxembourg
516 4066 1704 1498 2565 – – – – 4.9 4.4 6.2 5.1 8.1 153 299 518 86 – 408 41 432 36 – – Renault
530 4196 1714 1468 2538 – – – – 4.9 4.2 6.2 5.1 8.3 158 140 390 57 – 395 40 418 32 – – VW
493 4077 1699 1462 2543 – – – – 4.9 4.2 6.1 4.9 8.1 152 283 532 72 – 373 34 407 26 – – Peugeot
463 4212 1718 1454 2593 – – – – 4.9 4.5 6.5 5.2 8.8 161 195 476 73 – 447 50 468 39 – – Ford
470 4103 1707 1510 2581 – – – – 5.3 4.4 6.6 5.4 8.7 164 227 357 53 – 414 33 444 34 – – Opel
500 3827 1656 1492 2429 – – – – 5.0 3.8 6.1 5.0 8.0 149 408 773 71 – 389 34 431 35 – – Fiat
511 4165 1709 1518 2604 – – – – 5.0 4.7 6.2 5.0 8.2 155 268 600 83 – 375 37 410 34 – – Citroën
490 4406 1763 1498 2710 – – – – 4.8 4.1 8.0 6.1 11.2 200 249 337 57 – 395 34 430 37 – – Mercedes-Benz
473 4066 1707 1550 2505 – – – – 5.0 4.3 6.7 5.7 8.6 166 217 765 118 – 433 44 460 38 – – Toyota
537 4448 1766 1441 2619 – – – – 4.8 4.3 7.0 5.5 9.6 178 136 584 64 – 360 39 387 28 – – Audi
490 4534 1769 1435 2755 – – – – 4.9 3.9 7.9 6.2 11.0 199 160 535 58 – 398 36 430 37 – – BMW
497 4090 1704 1460 2490 – – – – 5.0 4.2 5.9 4.8 7.8 150 177 361 61 – 400 42 436 32 – – Seat
492 4275 1686 1446 2495 – – – – 5.0 4.9 6.5 5.2 8.7 161 142 598 68 – 384 39 413 30 – – Škoda
495 4201 1698 1518 2523 – – – – 5.1 4.3 7.0 5.8 9.1 175 318 592 58 – 406 29 445 37 – – Nissan
470 4139 1700 1474 2581 – – – – 5.2 4.4 7.0 5.6 9.3 170 – – – – – – – – – – Vauxhall
504 4167 1707 1573 2548 – – – – 5.0 4.6 7.6 6.3 9.8 186 153 403 44 – 433 26 426 36 – – Hyundai
492 4625 1780 1442 2685 – – – – 5.0 4.5 8.1 6.3 11.3 199 251 760 90 – 391 46 411 36 – – Volvo
437 3738 1622 1607 2342 – – – – 4.6 4.2 6.6 5.6 8.5 161 439 375 40 – 368 17 425 39 – – Suzuki
494 4516 1769 1599 2622 – – – – 5.5 4.9 8.2 6.7 10.9 205 – 345 56 – – 41 – – – – Kia
– – – – – – – – – 5.0 4.3 – – – – – – – – – – – – – – Dacia
Tota
l sal
es/r
egis
trat
ions
Tota
l sal
es/r
egis
trat
ions
[%
]
Pric
e [E
UR
incl
. tax
]
Top
spee
d [k
m/h
]
Die
sel [
%]
Hyb
rid
excl
. PH
EV [
%]
Nat
ural
gas
(m
ono-
/biv
alen
t, in
cl. L
PG)
[%]
Flex
-Fue
l (et
hano
l/ga
solin
e) [
%]
Elec
tric
/fue
l cel
l inc
l. PH
EV [
%]
Aut
omat
ic [
%]
Fron
t dr
ive
[%]
Rea
r dr
ive
[%]
4-w
heel
dri
ve [
%]
Engi
ne p
ower
[K
W]
Engi
ne s
ize
[ccm
]
Num
ber
of c
ylin
ders
Com
pres
sion
rat
e (g
asol
ine)
Com
pres
sion
rat
e (d
iese
l)
Num
ber
of g
ears
Perf
orm
ance
0–1
00
km
/h (
gaso
line)
[s]
Perf
orm
ance
0–1
00
km
/h (
dies
el)
[s]
Mas
s in
run
ning
ord
er [
kg]
Gro
ss w
eigh
t [k
g]
Payl
oad
[kg
]
Leng
th [
mm
]
Wid
th [
mm
]
Hei
ght
[mm
]
Whe
elba
se [
mm
]
Fron
t tr
ack
[mm
]
Rea
r tr
ack
[mm
]
Foot
prin
t [m
2 ]
Boo
t vo
lum
e [l
]
Seat
s
Doo
rs
Fuel
con
sum
ptio
n (N
ED
C)
[l/1
00
km
]
Fuel
con
sum
ptio
n (e
xtra
-urb
an)
[l/1
00
km
]
Fuel
con
sum
ptio
n (u
rban
) [l
/10
0 k
m]
CO
2 (N
ED
C)
[g/k
m]
CO
(di
esel
veh
icle
s) [
mg
/km
]
CO
(ga
solin
e ve
hicl
es)
[mg
/km
]
HC
(ga
solin
e ve
hicl
es)
[mg
/km
]
NH
MC
(ga
solin
e Eu
ro 5
/6 v
ehic
les)
[m
g/k
m]
NO
x (di
esel
veh
icle
s) [
mg
/km
]
NO
x (ga
solin
e ve
hicl
es)
[mg
/km
]
HC
+ N
Ox (
dies
el v
ehic
les)
[m
g/k
m]
Part
icul
ates
(di
esel
veh
icle
s) [
mg
/km
]
CO
at
-7 °
C (
gaso
line
vehi
cles
) [m
g/k
m]
HC
at
-7 °
C (
gaso
line
vehi
cles
) [m
g/k
m]
Dir
ect
inje
ctio
n (n
on-d
iese
l) [
%]
Euro
#5 a
nd E
uro#
6 [%
]
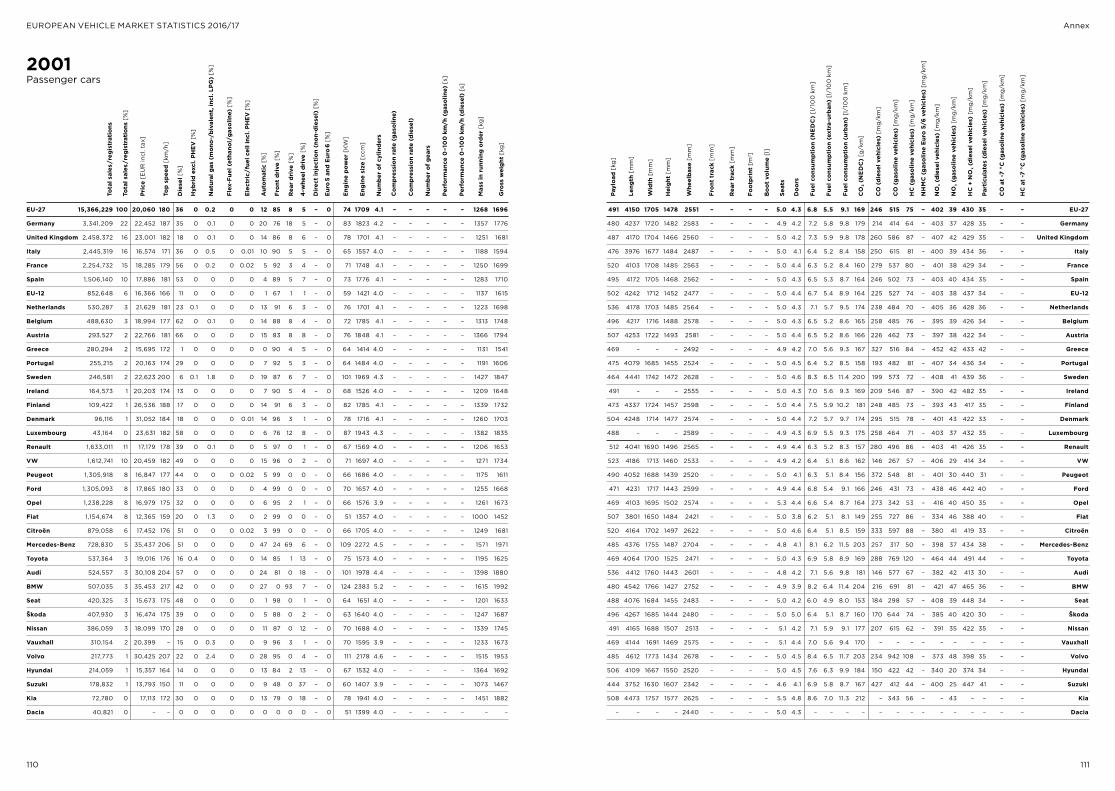
110 111
EUROPEAN VEHICLE MARKET STATISTICS 2016/17 Annex
2001Passenger cars
EU-27 15,366,229 100 20,060 180 36 0 0.2 0 0 12 85 8 5 – 0 74 1709 4.1 – – – – – 1268 1696
Germany 3,341,209 22 22,452 187 35 0 0.1 0 0 20 76 18 5 – 0 83 1823 4.2 – – – – – 1357 1776
United Kingdom 2,458,372 16 23,001 182 18 0 0.1 0 0 14 86 8 6 – 0 78 1701 4.1 – – – – – 1251 1681
Italy 2,445,319 16 16,574 171 36 0 0.5 0 0.01 10 90 5 5 – 0 65 1557 4.0 – – – – – 1188 1594
France 2,254,732 15 18,285 179 56 0 0.2 0 0.02 5 92 3 4 – 0 71 1748 4.1 – – – – – 1250 1699
Spain 1,506,140 10 17,886 181 53 0 0 0 0 4 89 5 7 – 0 73 1776 4.1 – – – – – 1283 1710
EU-12 852,648 6 16,366 166 11 0 0 0 0 1 67 1 1 – 0 59 1421 4.0 – – – – – 1137 1615
Netherlands 530,287 3 21,629 181 23 0.1 0 0 0 13 91 6 3 – 0 76 1701 4.1 – – – – – 1223 1698
Belgium 488,630 3 18,994 177 62 0 0.1 0 0 14 88 8 4 – 0 72 1785 4.1 – – – – – 1313 1748
Austria 293,527 2 22,766 181 66 0 0 0 0 15 83 8 8 – 0 76 1848 4.1 – – – – – 1366 1794
Greece 280,294 2 15,695 172 1 0 0 0 0 0 90 4 5 – 0 64 1414 4.0 – – – – – 1131 1541
Portugal 255,215 2 20,163 174 29 0 0 0 0 7 92 5 3 – 0 64 1484 4.0 – – – – – 1191 1606
Sweden 246,581 2 22,623 200 6 0.1 1.8 0 0 19 87 6 7 – 0 101 1969 4.3 – – – – – 1427 1847
Ireland 164,573 1 20,203 174 13 0 0 0 0 7 90 5 4 – 0 68 1526 4.0 – – – – – 1209 1648
Finland 109,422 1 26,536 188 17 0 0 0 0 14 91 6 3 – 0 82 1785 4.1 – – – – – 1339 1732
Denmark 96,116 1 31,052 184 18 0 0 0 0.01 14 96 3 1 – 0 78 1716 4.1 – – – – – 1260 1703
Luxembourg 43,164 0 23,631 182 58 0 0 0 0 6 76 12 8 – 0 87 1943 4.3 – – – – – 1382 1835
Renault 1,633,011 11 17,179 178 39 0 0.1 0 0 5 97 0 1 – 0 67 1569 4.0 – – – – – 1206 1653
VW 1,612,741 10 20,459 182 49 0 0 0 0 15 96 0 2 – 0 71 1697 4.0 – – – – – 1271 1734
Peugeot 1,305,918 8 16,847 177 44 0 0 0 0.02 5 99 0 0 – 0 66 1686 4.0 – – – – – 1175 1611
Ford 1,305,093 8 17,865 180 33 0 0 0 0 4 99 0 0 – 0 70 1657 4.0 – – – – – 1255 1668
Opel 1,238,228 8 16,979 175 32 0 0 0 0 6 95 2 1 – 0 66 1576 3.9 – – – – – 1261 1673
Fiat 1,154,674 8 12,365 159 20 0 1.3 0 0 2 99 0 0 – 0 51 1357 4.0 – – – – – 1000 1452
Citroën 879,058 6 17,452 176 51 0 0 0 0.02 3 99 0 0 – 0 66 1705 4.0 – – – – – 1249 1681
Mercedes-Benz 728,830 5 35,437 206 51 0 0 0 0 47 24 69 6 – 0 109 2272 4.5 – – – – – 1571 1971
Toyota 537,364 3 19,016 176 16 0.4 0 0 0 14 85 1 13 – 0 75 1573 4.0 – – – – – 1195 1625
Audi 524,557 3 30,108 204 57 0 0 0 0 24 81 0 18 – 0 101 1978 4.4 – – – – – 1398 1880
BMW 507,035 3 35,453 217 42 0 0 0 0 27 0 93 7 – 0 124 2383 5.2 – – – – – 1615 1992
Seat 420,325 3 15,673 175 48 0 0 0 0 1 98 0 1 – 0 64 1651 4.0 – – – – – 1201 1633
Škoda 407,930 3 16,474 175 39 0 0 0 0 5 88 0 2 – 0 63 1640 4.0 – – – – – 1247 1687
Nissan 386,059 3 18,099 170 28 0 0 0 0 11 87 0 12 – 0 70 1688 4.0 – – – – – 1339 1745
Vauxhall 310,154 2 20,399 – 15 0 0.3 0 0 9 96 3 1 – 0 70 1595 3.9 – – – – – 1233 1673
Volvo 217,773 1 30,425 207 22 0 2.4 0 0 28 95 0 4 – 0 111 2178 4.6 – – – – – 1515 1953
Hyundai 214,059 1 15,357 164 14 0 0 0 0 13 84 2 13 – 0 67 1532 4.0 – – – – – 1364 1692
Suzuki 178,832 1 13,793 150 11 0 0 0 0 9 48 0 37 – 0 60 1407 3.9 – – – – – 1073 1467
Kia 72,780 0 17,113 172 30 0 0 0 0 13 79 0 18 – 0 78 1941 4.0 – – – – – 1451 1882
Dacia 40,821 0 – – 0 0 0 0 0 0 0 0 0 – 0 51 1399 4.0 – – – – – – –
491 4150 1705 1478 2551 – – – – 5.0 4.3 6.8 5.5 9.1 169 246 515 75 – 402 39 430 35 – – EU-27
480 4237 1720 1482 2583 – – – – 4.9 4.2 7.2 5.8 9.8 179 214 414 64 – 403 37 428 35 – – Germany
487 4170 1704 1466 2560 – – – – 5.0 4.2 7.3 5.9 9.8 178 260 586 87 – 407 42 429 35 – – United Kingdom
476 3976 1677 1484 2487 – – – – 5.0 4.1 6.4 5.2 8.4 158 250 615 81 – 400 39 434 36 – – Italy
520 4103 1708 1485 2563 – – – – 5.0 4.4 6.3 5.2 8.4 160 279 537 80 – 401 38 429 34 – – France
495 4172 1705 1468 2562 – – – – 5.0 4.3 6.5 5.3 8.7 164 246 502 73 – 403 40 434 35 – – Spain
502 4242 1712 1452 2477 – – – – 5.0 4.4 6.7 5.4 8.9 164 225 527 74 – 403 38 437 34 – – EU-12
536 4178 1703 1485 2564 – – – – 5.0 4.3 7.1 5.7 9.5 174 238 484 70 – 405 36 428 36 – – Netherlands
496 4217 1716 1488 2578 – – – – 5.0 4.3 6.5 5.2 8.6 165 258 485 76 – 395 39 426 34 – – Belgium
507 4253 1722 1493 2581 – – – – 5.0 4.4 6.5 5.2 8.6 166 226 462 73 – 397 38 422 34 – – Austria
469 – – – 2492 – – – – 4.9 4.2 7.0 5.6 9.3 167 327 516 84 – 452 42 433 42 – – Greece
475 4079 1685 1455 2524 – – – – 5.0 4.5 6.4 5.2 8.5 158 193 482 81 – 407 34 436 34 – – Portugal
464 4441 1742 1472 2628 – – – – 5.0 4.6 8.3 6.5 11.4 200 199 573 72 – 408 41 439 36 – – Sweden
491 – – – 2555 – – – – 5.0 4.3 7.0 5.6 9.3 169 209 546 87 – 390 42 482 35 – – Ireland
473 4337 1724 1457 2598 – – – – 5.0 4.4 7.5 5.9 10.2 181 248 485 73 – 393 43 417 35 – – Finland
504 4248 1714 1477 2574 – – – – 5.0 4.4 7.2 5.7 9.7 174 295 515 78 – 401 43 422 33 – – Denmark
488 – – – 2589 – – – – 4.9 4.3 6.9 5.5 9.3 175 258 464 71 – 403 37 432 35 – – Luxembourg
512 4041 1690 1496 2565 – – – – 4.9 4.4 6.3 5.2 8.3 157 280 496 86 – 403 41 426 35 – – Renault
523 4186 1713 1460 2533 – – – – 4.9 4.2 6.4 5.1 8.6 162 146 267 57 – 406 29 414 34 – – VW
490 4052 1688 1439 2520 – – – – 5.0 4.1 6.3 5.1 8.4 156 372 548 81 – 401 30 440 31 – – Peugeot
471 4231 1717 1443 2599 – – – – 4.9 4.4 6.8 5.4 9.1 166 246 431 73 – 438 46 442 40 – – Ford
469 4103 1695 1502 2574 – – – – 5.3 4.4 6.6 5.4 8.7 164 273 342 53 – 416 40 450 35 – – Opel
507 3801 1650 1484 2421 – – – – 5.0 3.8 6.2 5.1 8.1 149 255 727 86 – 334 46 388 40 – – Fiat
520 4164 1702 1497 2622 – – – – 5.0 4.6 6.4 5.1 8.5 159 333 597 88 – 380 41 419 33 – – Citroën
485 4376 1755 1487 2704 – – – – 4.8 4.1 8.1 6.2 11.5 203 257 317 50 – 398 37 434 38 – – Mercedes-Benz
469 4064 1700 1525 2471 – – – – 5.0 4.3 6.9 5.8 8.9 169 288 769 120 – 464 44 491 44 – – Toyota
536 4412 1760 1443 2601 – – – – 4.8 4.2 7.1 5.6 9.8 181 146 577 67 – 382 42 413 30 – – Audi
480 4542 1766 1427 2752 – – – – 4.9 3.9 8.2 6.4 11.4 204 216 691 81 – 421 47 465 36 – – BMW
488 4076 1684 1455 2483 – – – – 5.0 4.2 6.0 4.9 8.0 153 184 298 57 – 408 39 448 34 – – Seat
496 4267 1685 1444 2480 – – – – 5.0 5.0 6.4 5.1 8.7 160 170 644 74 – 385 40 420 30 – – Škoda
491 4165 1688 1507 2513 – – – – 5.1 4.2 7.1 5.9 9.1 177 207 615 62 – 391 35 422 35 – – Nissan
469 4144 1691 1469 2575 – – – – 5.1 4.4 7.0 5.6 9.4 170 – – – – – – – – – – Vauxhall
485 4612 1773 1434 2678 – – – – 5.0 4.5 8.4 6.5 11.7 203 234 942 108 – 373 48 398 35 – – Volvo
506 4109 1667 1550 2520 – – – – 5.0 4.5 7.6 6.3 9.9 184 150 422 42 – 340 20 374 34 – – Hyundai
444 3752 1630 1607 2342 – – – – 4.6 4.1 6.9 5.8 8.7 167 427 412 44 – 400 25 447 41 – – Suzuki
508 4473 1757 1577 2625 – – – – 5.5 4.8 8.6 7.0 11.3 212 – 343 56 – – 43 – – – – Kia
– – – – 2440 – – – – 5.0 4.3 – – – – – – – – – – – – – – Dacia
Tota
l sal
es/r
egis
trat
ions
Tota
l sal
es/r
egis
trat
ions
[%
]
Pric
e [E
UR
incl
. tax
]
Top
spee
d [k
m/h
]
Die
sel [
%]
Hyb
rid
excl
. PH
EV [
%]
Nat
ural
gas
(m
ono-
/biv
alen
t, in
cl. L
PG)
[%]
Flex
-Fue
l (et
hano
l/ga
solin
e) [
%]
Elec
tric
/fue
l cel
l inc
l. PH
EV [
%]
Aut
omat
ic [
%]
Fron
t dr
ive
[%]
Rea
r dr
ive
[%]
4-w
heel
dri
ve [
%]
Engi
ne p
ower
[K
W]
Engi
ne s
ize
[ccm
]
Num
ber
of c
ylin
ders
Com
pres
sion
rat
e (g
asol
ine)
Com
pres
sion
rat
e (d
iese
l)
Num
ber
of g
ears
Perf
orm
ance
0–1
00
km
/h (
gaso
line)
[s]
Perf
orm
ance
0–1
00
km
/h (
dies
el)
[s]
Mas
s in
run
ning
ord
er [
kg]
Gro
ss w
eigh
t [k
g]
Payl
oad
[kg
]
Leng
th [
mm
]
Wid
th [
mm
]
Hei
ght
[mm
]
Whe
elba
se [
mm
]
Fron
t tr
ack
[mm
]
Rea
r tr
ack
[mm
]
Foot
prin
t [m
2 ]
Boo
t vo
lum
e [l
]
Seat
s
Doo
rs
Fuel
con
sum
ptio
n (N
ED
C)
[l/1
00
km
]
Fuel
con
sum
ptio
n (e
xtra
-urb
an)
[l/1
00
km
]
Fuel
con
sum
ptio
n (u
rban
) [l
/10
0 k
m]
CO
2 (N
ED
C)
[g/k
m]
CO
(di
esel
veh
icle
s) [
mg
/km
]
CO
(ga
solin
e ve
hicl
es)
[mg
/km
]
HC
(ga
solin
e ve
hicl
es)
[mg
/km
]
NH
MC
(ga
solin
e Eu
ro 5
/6 v
ehic
les)
[m
g/k
m]
NO
x (di
esel
veh
icle
s) [
mg
/km
]
NO
x (ga
solin
e ve
hicl
es)
[mg
/km
]
HC
+ N
Ox (
dies
el v
ehic
les)
[m
g/k
m]
Part
icul
ates
(di
esel
veh
icle
s) [
mg
/km
]
CO
at
-7 °
C (
gaso
line
vehi
cles
) [m
g/k
m]
HC
at
-7 °
C (
gaso
line
vehi
cles
) [m
g/k
m]
Dir
ect
inje
ctio
n (n
on-d
iese
l) [
%]
Euro
#5 a
nd E
uro#
6 [%
]
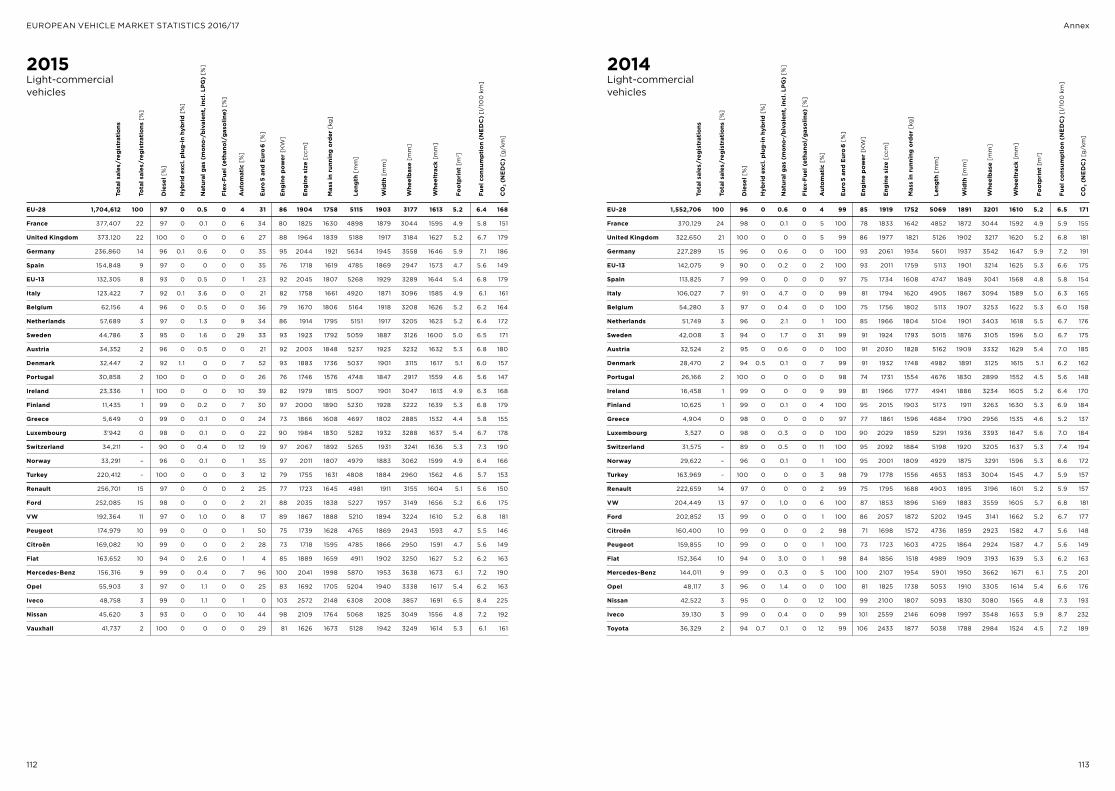
112 113
EUROPEAN VEHICLE MARKET STATISTICS 2016/17 Annex
2014Light-commercial vehicles
Leng
th [
mm
]
Wid
th [
mm
]
Whe
elba
se [
mm
]
Whe
eltr
ack
[mm
]
Foot
prin
t [m
2 ]
Fuel
con
sum
ptio
n (N
ED
C)
[l/1
00
km
]
CO
2 (N
ED
C)
[g/k
m]
Tota
l sal
es/r
egis
trat
ions
Tota
l sal
es/r
egis
trat
ions
[%
]
Die
sel [
%]
Hyb
rid
excl
. plu
g-in
hyb
rid
[%]
Nat
ural
gas
(m
ono-
/biv
alen
t, in
cl. L
PG)
[%]
Flex
-Fue
l (et
hano
l/ga
solin
e) [
%]
Euro
#5 a
nd E
uro#
6 [%
]
Aut
omat
ic [
%]
Engi
ne p
ower
[K
W]
Engi
ne s
ize
[ccm
]
Mas
s in
run
ning
ord
er [
kg]
EU-28 1,552,706 100 96 0 0.6 0 4 99 85 1919 1752 5069 1891 3201 1610 5.2 6.5 171
France 370,129 24 98 0 0.1 0 5 100 78 1833 1642 4852 1872 3044 1592 4.9 5.9 155
United Kingdom 322,650 21 100 0 0 0 5 99 86 1977 1821 5126 1902 3217 1620 5.2 6.8 181
Germany 227,289 15 96 0 0.6 0 0 100 93 2061 1934 5601 1937 3542 1647 5.9 7.2 191
EU-13 142,075 9 90 0 0.2 0 2 100 93 2011 1759 5113 1901 3214 1625 5.3 6.6 175
Spain 113,825 7 99 0 0 0 0 97 75 1734 1608 4747 1849 3041 1568 4.8 5.8 154
Italy 106,027 7 91 0 4.7 0 0 99 81 1794 1620 4905 1867 3094 1589 5.0 6.3 165
Belgium 54,280 3 97 0 0.4 0 0 100 75 1756 1802 5113 1907 3253 1622 5.3 6.0 158
Netherlands 51,749 3 96 0 2.1 0 1 100 85 1966 1804 5104 1901 3403 1618 5.5 6.7 176
Sweden 42,008 3 94 0 1.7 0 31 99 91 1924 1793 5015 1876 3105 1596 5.0 6.7 175
Austria 32,524 2 95 0 0.6 0 0 100 91 2030 1828 5162 1909 3332 1629 5.4 7.0 185
Denmark 28,470 2 94 0.5 0.1 0 7 99 91 1932 1748 4982 1891 3125 1615 5.1 6.2 162
Portugal 26,166 2 100 0 0 0 0 98 74 1731 1554 4676 1830 2899 1552 4.5 5.6 148
Ireland 16,458 1 99 0 0 0 9 99 81 1966 1777 4941 1886 3234 1605 5.2 6.4 170
Finland 10,625 1 99 0 0.1 0 4 100 95 2015 1903 5173 1911 3263 1630 5.3 6.9 184
Greece 4,904 0 98 0 0 0 0 97 77 1861 1596 4684 1790 2956 1535 4.6 5.2 137
Luxembourg 3,527 0 98 0 0.3 0 0 100 90 2029 1859 5291 1936 3393 1647 5.6 7.0 184
Switzerland 31,575 – 89 0 0.5 0 11 100 95 2092 1884 5198 1920 3205 1637 5.3 7.4 194
Norway 29,622 – 96 0 0.1 0 1 100 95 2001 1809 4929 1875 3291 1596 5.3 6.6 172
Turkey 163,969 – 100 0 0 0 3 98 79 1778 1556 4653 1853 3004 1545 4.7 5.9 157
Renault 222,659 14 97 0 0 0 2 99 75 1795 1688 4903 1895 3196 1601 5.2 5.9 157
VW 204,449 13 97 0 1.0 0 6 100 87 1853 1896 5169 1883 3559 1605 5.7 6.8 181
Ford 202,852 13 99 0 0 0 1 100 86 2057 1872 5202 1945 3141 1662 5.2 6.7 177
Citroën 160,400 10 99 0 0 0 2 98 71 1698 1572 4736 1859 2923 1582 4.7 5.6 148
Peugeot 159,855 10 99 0 0 0 1 100 73 1723 1603 4725 1864 2924 1587 4.7 5.6 149
Fiat 152,364 10 94 0 3.0 0 1 98 84 1856 1518 4989 1909 3193 1639 5.3 6.2 163
Mercedes-Benz 144,011 9 99 0 0.3 0 5 100 100 2107 1954 5901 1950 3662 1671 6.1 7.5 201
Opel 48,117 3 96 0 1.4 0 0 100 81 1825 1738 5053 1910 3305 1614 5.4 6.6 176
Nissan 42,522 3 95 0 0 0 12 100 99 2100 1807 5093 1830 3080 1565 4.8 7.3 193
Iveco 39,130 3 99 0 0.4 0 0 99 101 2559 2146 6098 1997 3548 1653 5.9 8.7 232
Toyota 36,329 2 94 0.7 0.1 0 12 99 106 2433 1877 5038 1788 2984 1524 4.5 7.2 189
2015Light-commercial vehicles
Leng
th [
mm
]
Wid
th [
mm
]
Whe
elba
se [
mm
]
Whe
eltr
ack
[mm
]
Foot
prin
t [m
2 ]
Fuel
con
sum
ptio
n (N
ED
C)
[l/1
00
km
]
CO
2 (N
ED
C)
[g/k
m]
Tota
l sal
es/r
egis
trat
ions
Tota
l sal
es/r
egis
trat
ions
[%
]
Die
sel [
%]
Hyb
rid
excl
. plu
g-in
hyb
rid
[%]
Nat
ural
gas
(m
ono-
/biv
alen
t, in
cl. L
PG)
[%]
Flex
-Fue
l (et
hano
l/ga
solin
e) [
%]
Euro
#5 a
nd E
uro#
6 [%
]
Aut
omat
ic [
%]
Engi
ne p
ower
[K
W]
Engi
ne s
ize
[ccm
]
Mas
s in
run
ning
ord
er [
kg]
EU-28 1,704,612 100 97 0 0.5 0 4 31 86 1904 1758 5115 1903 3177 1613 5.2 6.4 168
France 377,407 22 97 0 0.1 0 6 34 80 1825 1630 4898 1879 3044 1595 4.9 5.8 151
United Kingdom 373,120 22 100 0 0 0 6 27 88 1964 1839 5188 1917 3184 1627 5.2 6.7 179
Germany 236,860 14 96 0.1 0.6 0 0 35 95 2044 1921 5634 1945 3558 1646 5.9 7.1 186
Spain 154,848 9 97 0 0 0 0 35 76 1718 1619 4785 1869 2947 1573 4.7 5.6 149
EU-13 132,305 8 93 0 0.5 0 1 23 92 2045 1807 5268 1929 3289 1644 5.4 6.8 179
Italy 123,422 7 92 0.1 3.6 0 0 21 82 1758 1661 4920 1871 3096 1585 4.9 6.1 161
Belgium 62,156 4 96 0 0.5 0 0 36 79 1670 1806 5164 1918 3208 1626 5.2 6.2 164
Netherlands 57,689 3 97 0 1.3 0 9 34 86 1914 1795 5151 1917 3205 1623 5.2 6.4 172
Sweden 44,786 3 95 0 1.6 0 29 33 93 1923 1792 5059 1887 3126 1600 5.0 6.5 171
Austria 34,352 2 96 0 0.5 0 0 21 92 2003 1848 5237 1923 3232 1632 5.3 6.8 180
Denmark 32,447 2 92 1.1 0 0 7 52 93 1883 1736 5037 1901 3115 1617 5.1 6.0 157
Portugal 30,858 2 100 0 0 0 0 26 76 1746 1576 4748 1847 2917 1559 4.6 5.6 147
Ireland 23,336 1 100 0 0 0 10 39 82 1979 1815 5007 1901 3047 1613 4.9 6.3 168
Finland 11,435 1 99 0 0.2 0 7 30 97 2000 1890 5230 1928 3222 1639 5.3 6.8 179
Greece 5,649 0 99 0 0.1 0 0 24 73 1866 1608 4697 1802 2885 1532 4.4 5.8 155
Luxembourg 3'942 0 98 0 0.1 0 0 22 90 1984 1830 5282 1932 3288 1637 5.4 6.7 178
Switzerland 34,211 – 90 0 0.4 0 12 19 97 2067 1892 5265 1931 3241 1636 5.3 7.3 190
Norway 33,291 – 96 0 0.1 0 1 35 97 2011 1807 4979 1883 3062 1599 4.9 6.4 166
Turkey 220,412 – 100 0 0 0 3 12 79 1755 1631 4808 1884 2960 1562 4.6 5.7 153
Renault 256,701 15 97 0 0 0 2 25 77 1723 1645 4981 1911 3155 1604 5.1 5.6 150
Ford 252,085 15 98 0 0 0 2 21 88 2035 1838 5227 1957 3149 1656 5.2 6.6 175
VW 192,364 11 97 0 1.0 0 8 17 89 1867 1888 5210 1894 3224 1610 5.2 6.8 181
Peugeot 174,979 10 99 0 0 0 1 50 75 1739 1628 4765 1869 2943 1593 4.7 5.5 146
Citroën 169,082 10 99 0 0 0 2 28 73 1718 1595 4785 1866 2950 1591 4.7 5.6 149
Fiat 163,652 10 94 0 2.6 0 1 4 85 1889 1659 4911 1902 3250 1627 5.2 6.2 163
Mercedes-Benz 156,316 9 99 0 0.4 0 7 96 100 2041 1998 5870 1953 3638 1673 6.1 7.2 190
Opel 55,903 3 97 0 1.1 0 0 25 83 1692 1705 5204 1940 3338 1617 5.4 6.2 163
Iveco 48,758 3 99 0 1.1 0 1 0 103 2572 2148 6308 2008 3857 1691 6.5 8.4 225
Nissan 45,620 3 93 0 0 0 10 44 98 2109 1764 5068 1825 3049 1556 4.8 7.2 192
Vauxhall 41,737 2 100 0 0 0 0 29 81 1626 1673 5128 1942 3249 1614 5.3 6.1 161
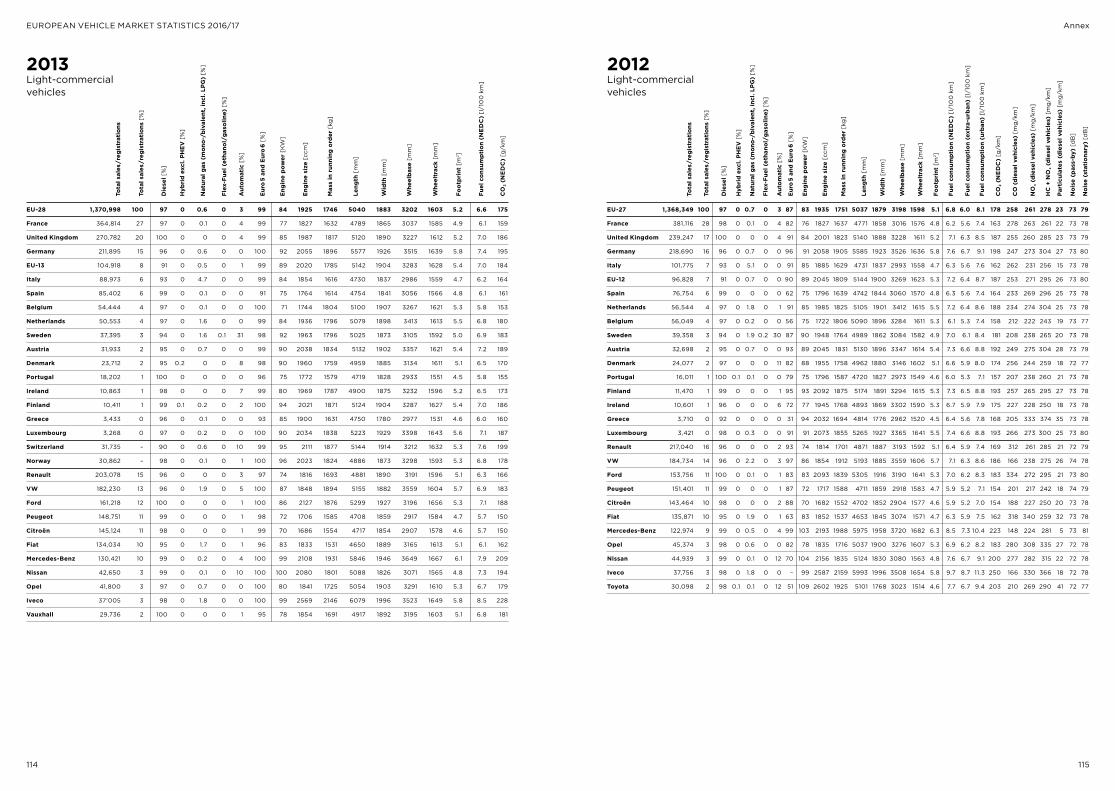
114 115
EUROPEAN VEHICLE MARKET STATISTICS 2016/17 Annex
2013Light-commercial vehicles
Leng
th [
mm
]
Wid
th [
mm
]
Whe
elba
se [
mm
]
Whe
eltr
ack
[mm
]
Foot
prin
t [m
2 ]
Fuel
con
sum
ptio
n (N
ED
C)
[l/1
00
km
]
CO
2 (N
ED
C)
[g/k
m]
Tota
l sal
es/r
egis
trat
ions
Tota
l sal
es/r
egis
trat
ions
[%
]
Die
sel [
%]
Hyb
rid
excl
. PH
EV [
%]
Nat
ural
gas
(m
ono-
/biv
alen
t, in
cl. L
PG)
[%]
Flex
-Fue
l (et
hano
l/ga
solin
e) [
%]
Euro
#5 a
nd E
uro#
6 [%
]
Aut
omat
ic [
%]
Engi
ne p
ower
[K
W]
Engi
ne s
ize
[ccm
]
Mas
s in
run
ning
ord
er [
kg]
EU-28 1,370,998 100 97 0 0.6 0 3 99 84 1925 1746 5040 1883 3202 1603 5.2 6.6 175
France 364,814 27 97 0 0.1 0 4 99 77 1827 1632 4789 1865 3037 1585 4.9 6.1 159
United Kingdom 270,782 20 100 0 0 0 4 99 85 1987 1817 5120 1890 3227 1612 5.2 7.0 186
Germany 211,895 15 96 0 0.6 0 0 100 92 2055 1896 5577 1926 3515 1639 5.8 7.4 195
EU-13 104,918 8 91 0 0.5 0 1 99 89 2020 1785 5142 1904 3283 1628 5.4 7.0 184
Italy 88,973 6 93 0 4.7 0 0 99 84 1854 1616 4730 1837 2986 1559 4.7 6.2 164
Spain 85,402 6 99 0 0.1 0 0 91 75 1764 1614 4754 1841 3056 1566 4.8 6.1 161
Belgium 54,444 4 97 0 0.1 0 0 100 71 1744 1804 5100 1907 3267 1621 5.3 5.8 153
Netherlands 50,553 4 97 0 1.6 0 0 99 84 1936 1796 5079 1898 3413 1613 5.5 6.8 180
Sweden 37,395 3 94 0 1.6 0.1 31 98 92 1963 1796 5025 1873 3105 1592 5.0 6.9 183
Austria 31,933 2 95 0 0.7 0 0 99 90 2038 1834 5132 1902 3357 1621 5.4 7.2 189
Denmark 23,712 2 95 0.2 0 0 8 98 90 1960 1759 4959 1885 3134 1611 5.1 6.5 170
Portugal 18,202 1 100 0 0 0 0 96 75 1772 1579 4719 1828 2933 1551 4.5 5.8 155
Ireland 10,863 1 98 0 0 0 7 99 80 1969 1787 4900 1875 3232 1596 5.2 6.5 173
Finland 10,411 1 99 0.1 0.2 0 2 100 94 2021 1871 5124 1904 3287 1627 5.4 7.0 186
Greece 3,433 0 96 0 0.1 0 0 93 85 1900 1631 4750 1780 2977 1531 4.6 6.0 160
Luxembourg 3,268 0 97 0 0.2 0 0 100 90 2034 1838 5223 1929 3398 1643 5.6 7.1 187
Switzerland 31,735 – 90 0 0.6 0 10 99 95 2111 1877 5144 1914 3212 1632 5.3 7.6 199
Norway 30,862 – 98 0 0.1 0 1 100 96 2023 1824 4886 1873 3298 1593 5.3 6.8 178
Renault 203,078 15 96 0 0 0 3 97 74 1816 1693 4881 1890 3191 1596 5.1 6.3 166
VW 182,230 13 96 0 1.9 0 5 100 87 1848 1894 5155 1882 3559 1604 5.7 6.9 183
Ford 161,218 12 100 0 0 0 1 100 86 2127 1876 5299 1927 3196 1656 5.3 7.1 188
Peugeot 148,751 11 99 0 0 0 1 98 72 1706 1585 4708 1859 2917 1584 4.7 5.7 150
Citroën 145,124 11 98 0 0 0 1 99 70 1686 1554 4717 1854 2907 1578 4.6 5.7 150
Fiat 134,034 10 95 0 1.7 0 1 96 83 1833 1531 4650 1889 3165 1613 5.1 6.1 162
Mercedes-Benz 130,421 10 99 0 0.2 0 4 100 99 2108 1931 5846 1946 3649 1667 6.1 7.9 209
Nissan 42,650 3 99 0 0.1 0 10 100 100 2080 1801 5088 1826 3071 1565 4.8 7.3 194
Opel 41,800 3 97 0 0.7 0 0 100 80 1841 1725 5054 1903 3291 1610 5.3 6.7 179
Iveco 37'005 3 98 0 1.8 0 0 100 99 2569 2146 6079 1996 3523 1649 5.8 8.5 228
Vauxhall 29,736 2 100 0 0 0 1 95 78 1854 1691 4917 1892 3195 1603 5.1 6.8 181
2012Light-commercial vehicles
Leng
th [
mm
]
Wid
th [
mm
]
Whe
elba
se [
mm
]
Whe
eltr
ack
[mm
]
Foot
prin
t [m
2 ]
Fuel
con
sum
ptio
n (N
ED
C)
[l/1
00
km
]
Fuel
con
sum
ptio
n (e
xtra
-urb
an)
[l/1
00
km
]
Fuel
con
sum
ptio
n (u
rban
) [l
/10
0 k
m]
CO
2 (N
ED
C)
[g/k
m]
CO
(di
esel
veh
icle
s) [
mg
/km
]
NO
x (di
esel
veh
icle
s) [
mg
/km
]
HC
+ N
Ox (
dies
el v
ehic
les)
[m
g/k
m]
Part
icul
ates
(di
esel
veh
icle
s) [
mg
/km
]
Noi
se (
pass
-by)
[d
B]
Noi
se (
stat
iona
ry)
[dB
]
Tota
l sal
es/r
egis
trat
ions
Tota
l sal
es/r
egis
trat
ions
[%
]
Die
sel [
%]
Hyb
rid
excl
. PH
EV [
%]
Nat
ural
gas
(m
ono-
/biv
alen
t, in
cl. L
PG)
[%]
Flex
-Fue
l (et
hano
l/ga
solin
e) [
%]
Euro
#5 a
nd E
uro#
6 [%
]
Aut
omat
ic [
%]
Engi
ne p
ower
[K
W]
Engi
ne s
ize
[ccm
]
Mas
s in
run
ning
ord
er [
kg]
EU-27 1,368,349 100 97 0 0.7 0 3 87 83 1935 1751 5037 1879 3198 1598 5.1 6.8 6.0 8.1 178 258 261 278 23 73 79
France 381,116 28 98 0 0.1 0 4 82 76 1827 1637 4771 1858 3016 1576 4.8 6.2 5.6 7.4 163 278 263 261 22 73 78
United Kingdom 239,247 17 100 0 0 0 4 91 84 2001 1823 5140 1888 3228 1611 5.2 7.1 6.3 8.5 187 255 260 285 23 73 79
Germany 218,690 16 96 0 0.7 0 0 96 91 2058 1905 5585 1923 3526 1636 5.8 7.6 6.7 9.1 198 247 273 304 27 73 80
Italy 101,775 7 93 0 5.1 0 0 91 85 1885 1629 4731 1837 2993 1558 4.7 6.3 5.6 7.6 162 262 231 256 15 73 78
EU-12 96,828 7 91 0 0.7 0 0 90 89 2045 1809 5144 1900 3269 1623 5.3 7.2 6.4 8.7 187 253 271 295 26 73 80
Spain 76,754 6 99 0 0 0 0 62 75 1796 1639 4742 1844 3060 1570 4.8 6.3 5.6 7.4 164 233 269 296 25 73 78
Netherlands 56,544 4 97 0 1.8 0 1 91 85 1985 1825 5105 1901 3412 1615 5.5 7.2 6.4 8.6 188 234 274 304 25 73 78
Belgium 56,049 4 97 0 0.2 0 0 56 75 1722 1806 5090 1896 3284 1611 5.3 6.1 5.3 7.4 158 212 222 243 19 73 77
Sweden 39,358 3 94 0 1.9 0.2 30 87 90 1948 1764 4989 1862 3084 1582 4.9 7.0 6.1 8.4 181 208 238 265 20 73 78
Austria 32,698 2 95 0 0.7 0 0 93 89 2045 1831 5130 1896 3347 1614 5.4 7.3 6.6 8.8 192 249 275 304 28 73 79
Denmark 24,077 2 97 0 0 0 11 82 88 1955 1758 4962 1880 3146 1602 5.1 6.6 5.9 8.0 174 256 244 259 18 72 77
Portugal 16,011 1 100 0.1 0.1 0 0 79 75 1796 1587 4720 1827 2973 1549 4.6 6.0 5.3 7.1 157 207 238 260 21 73 78
Finland 11,470 1 99 0 0 0 1 95 93 2092 1875 5174 1891 3294 1615 5.3 7.3 6.5 8.8 193 257 265 295 27 73 78
Ireland 10,601 1 96 0 0 0 6 72 77 1945 1768 4893 1869 3302 1590 5.3 6.7 5.9 7.9 175 227 228 250 18 73 78
Greece 3,710 0 92 0 0 0 0 31 94 2032 1694 4814 1776 2962 1520 4.5 6.4 5.6 7.8 168 205 333 374 35 73 78
Luxembourg 3,421 0 98 0 0.3 0 0 91 91 2073 1855 5265 1927 3365 1641 5.5 7.4 6.6 8.8 193 266 273 300 25 73 80
Renault 217,040 16 96 0 0 0 2 93 74 1814 1701 4871 1887 3193 1592 5.1 6.4 5.9 7.4 169 312 261 285 21 72 79
VW 184,734 14 96 0 2.2 0 3 97 86 1854 1912 5193 1885 3559 1606 5.7 7.1 6.3 8.6 186 166 238 275 26 74 78
Ford 153,756 11 100 0 0.1 0 1 83 83 2093 1839 5305 1916 3190 1641 5.3 7.0 6.2 8.3 183 334 272 295 21 73 80
Peugeot 151,401 11 99 0 0 0 1 87 72 1717 1588 4711 1859 2918 1583 4.7 5.9 5.2 7.1 154 201 217 242 18 74 79
Citroën 143,464 10 98 0 0 0 2 88 70 1682 1552 4702 1852 2904 1577 4.6 5.9 5.2 7.0 154 188 227 250 20 73 78
Fiat 135,871 10 95 0 1.9 0 1 63 83 1852 1537 4653 1845 3074 1571 4.7 6.3 5.9 7.5 162 318 340 259 32 73 78
Mercedes-Benz 122,974 9 99 0 0.5 0 4 99 103 2193 1988 5975 1958 3720 1682 6.3 8.5 7.3 10.4 223 148 224 281 5 73 81
Opel 45,374 3 98 0 0.6 0 0 82 78 1835 1716 5037 1900 3276 1607 5.3 6.9 6.2 8.2 183 280 308 335 27 72 78
Nissan 44,939 3 99 0 0.1 0 12 70 104 2156 1835 5124 1830 3080 1563 4.8 7.6 6.7 9.1 200 277 282 315 22 72 78
Iveco 37,756 3 98 0 1.8 0 0 – 99 2587 2159 5993 1996 3508 1654 5.8 9.7 8.7 11.3 250 166 330 366 18 72 78
Toyota 30,098 2 98 0.1 0.1 0 12 51 109 2602 1925 5101 1768 3023 1514 4.6 7.7 6.7 9.4 203 210 269 290 41 72 77
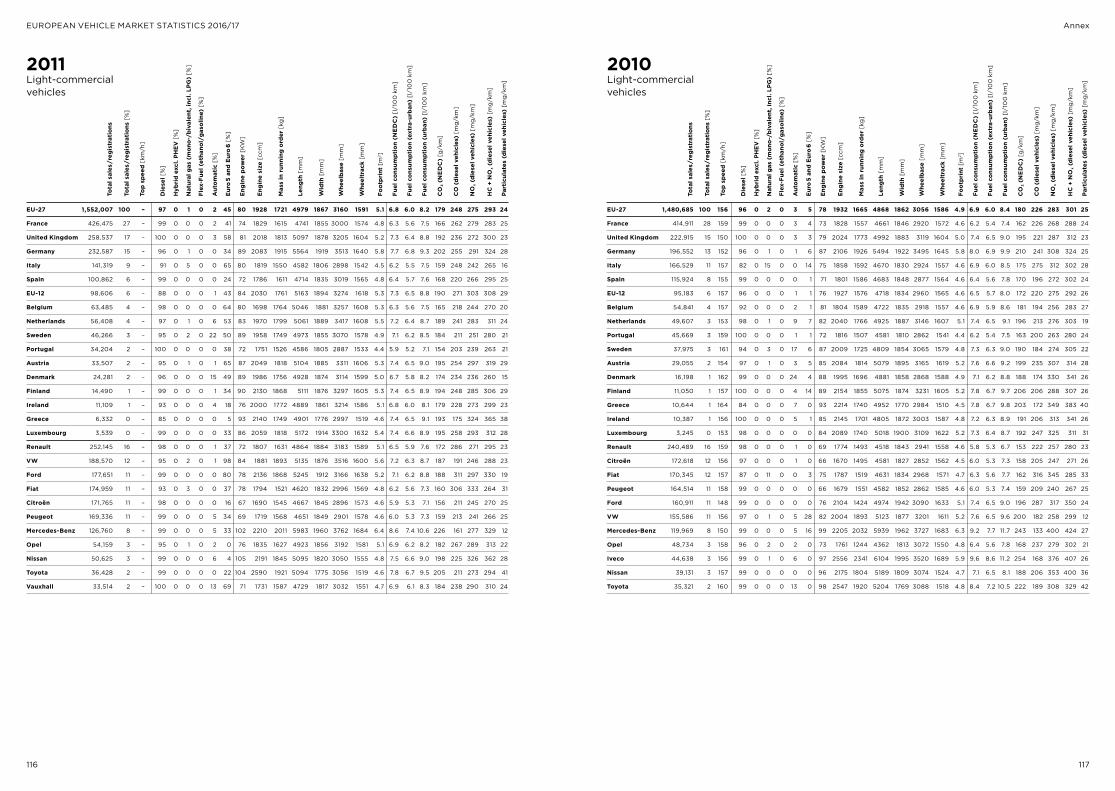
116 117
EUROPEAN VEHICLE MARKET STATISTICS 2016/17 Annex
2011Light-commercial vehicles
Leng
th [
mm
]
Wid
th [
mm
]
Whe
elba
se [
mm
]
Whe
eltr
ack
[mm
]
Foot
prin
t [m
2 ]
Fuel
con
sum
ptio
n (N
ED
C)
[l/1
00
km
]
Fuel
con
sum
ptio
n (e
xtra
-urb
an)
[l/1
00
km
]
Fuel
con
sum
ptio
n (u
rban
) [l
/10
0 k
m]
CO
2 (N
ED
C)
[g/k
m]
CO
(di
esel
veh
icle
s) [
mg
/km
]
NO
x (di
esel
veh
icle
s) [
mg
/km
]
HC
+ N
Ox (
dies
el v
ehic
les)
[m
g/k
m]
Part
icul
ates
(di
esel
veh
icle
s) [
mg
/km
]
Tota
l sal
es/r
egis
trat
ions
Tota
l sal
es/r
egis
trat
ions
[%
]
Top
spee
d [k
m/h
]
Die
sel [
%]
Hyb
rid
excl
. PH
EV [
%]
Nat
ural
gas
(m
ono-
/biv
alen
t, in
cl. L
PG)
[%]
Flex
-Fue
l (et
hano
l/ga
solin
e) [
%]
Euro
#5 a
nd E
uro#
6 [%
]
Aut
omat
ic [
%]
Engi
ne p
ower
[K
W]
Engi
ne s
ize
[ccm
]
Mas
s in
run
ning
ord
er [
kg]
EU-27 1,552,007 100 – 97 0 1 0 2 45 80 1928 1721 4979 1867 3160 1591 5.1 6.8 6.0 8.2 179 248 275 293 24
France 426,475 27 – 99 0 0 0 2 41 74 1829 1615 4741 1855 3000 1574 4.8 6.3 5.6 7.5 166 262 279 283 25
United Kingdom 258,537 17 – 100 0 0 0 3 58 81 2018 1813 5097 1878 3205 1604 5.2 7.3 6.4 8.8 192 236 272 300 23
Germany 232,587 15 – 96 0 1 0 0 34 89 2083 1915 5564 1919 3513 1640 5.8 7.7 6.8 9.3 202 255 291 324 28
Italy 141,319 9 – 91 0 5 0 0 65 80 1819 1550 4582 1806 2898 1542 4.5 6.2 5.5 7.5 159 248 242 265 16
Spain 100,862 6 – 99 0 0 0 0 24 72 1786 1611 4714 1835 3019 1565 4.8 6.4 5.7 7.6 168 220 266 295 25
EU-12 98,606 6 – 88 0 0 0 1 43 84 2030 1761 5163 1894 3274 1618 5.3 7.3 6.5 8.8 190 271 303 308 29
Belgium 63,485 4 – 98 0 0 0 0 64 80 1698 1764 5046 1881 3257 1608 5.3 6.3 5.6 7.5 165 218 244 270 20
Netherlands 56,408 4 – 97 0 1 0 6 53 83 1970 1799 5061 1889 3417 1608 5.5 7.2 6.4 8.7 189 241 283 311 24
Sweden 46,266 3 – 95 0 2 0 22 50 89 1958 1749 4973 1855 3070 1578 4.9 7.1 6.2 8.5 184 211 251 280 21
Portugal 34,204 2 – 100 0 0 0 0 38 72 1751 1526 4586 1805 2887 1533 4.4 5.9 5.2 7.1 154 203 239 263 21
Austria 33,507 2 – 95 0 1 0 1 65 87 2049 1818 5104 1885 3311 1606 5.3 7.4 6.5 9.0 195 254 297 319 29
Denmark 24,281 2 – 96 0 0 0 15 49 89 1986 1756 4928 1874 3114 1599 5.0 6.7 5.8 8.2 174 234 236 260 15
Finland 14,490 1 – 99 0 0 0 1 34 90 2130 1868 5111 1876 3297 1605 5.3 7.4 6.5 8.9 194 248 285 306 29
Ireland 11,109 1 – 93 0 0 0 4 18 76 2000 1772 4889 1861 3214 1586 5.1 6.8 6.0 8.1 179 228 273 299 23
Greece 6,332 0 – 85 0 0 0 0 5 93 2140 1749 4901 1776 2997 1519 4.6 7.4 6.5 9.1 193 175 324 365 38
Luxembourg 3,539 0 – 99 0 0 0 0 33 86 2059 1818 5172 1914 3300 1632 5.4 7.4 6.6 8.9 195 258 293 312 28
Renault 252,145 16 – 98 0 0 0 1 37 72 1807 1631 4864 1884 3183 1589 5.1 6.5 5.9 7.6 172 286 271 295 23
VW 188,570 12 – 95 0 2 0 1 98 84 1881 1893 5135 1876 3516 1600 5.6 7.2 6.3 8.7 187 191 246 288 23
Ford 177,651 11 – 99 0 0 0 0 80 78 2136 1868 5245 1912 3166 1638 5.2 7.1 6.2 8.8 188 311 297 330 19
Fiat 174,959 11 – 93 0 3 0 0 37 78 1794 1521 4620 1832 2996 1569 4.8 6.2 5.6 7.3 160 306 333 264 31
Citroën 171,765 11 – 98 0 0 0 0 16 67 1690 1545 4667 1845 2896 1573 4.6 5.9 5.3 7.1 156 211 245 270 25
Peugeot 169,336 11 – 99 0 0 0 5 34 69 1719 1568 4651 1849 2901 1578 4.6 6.0 5.3 7.3 159 213 241 266 25
Mercedes-Benz 126,760 8 – 99 0 0 0 5 33 102 2210 2011 5983 1960 3762 1684 6.4 8.6 7.4 10.6 226 161 277 329 12
Opel 54,159 3 – 95 0 1 0 2 0 76 1835 1627 4923 1856 3192 1581 5.1 6.9 6.2 8.2 182 267 289 313 22
Nissan 50,625 3 – 99 0 0 0 6 4 105 2191 1845 5095 1820 3050 1555 4.8 7.5 6.6 9.0 198 225 326 362 28
Toyota 36,428 2 – 99 0 0 0 0 22 104 2590 1921 5094 1775 3056 1519 4.6 7.8 6.7 9.5 205 211 273 294 41
Vauxhall 33,514 2 – 100 0 0 0 13 69 71 1731 1587 4729 1817 3032 1551 4.7 6.9 6.1 8.3 184 238 290 310 24
2010Light-commercial vehicles
Leng
th [
mm
]
Wid
th [
mm
]
Whe
elba
se [
mm
]
Whe
eltr
ack
[mm
]
Foot
prin
t [m
2 ]
Fuel
con
sum
ptio
n (N
ED
C)
[l/1
00
km
]
Fuel
con
sum
ptio
n (e
xtra
-urb
an)
[l/1
00
km
]
Fuel
con
sum
ptio
n (u
rban
) [l
/10
0 k
m]
CO
2 (N
ED
C)
[g/k
m]
CO
(di
esel
veh
icle
s) [
mg
/km
]
NO
x (di
esel
veh
icle
s) [
mg
/km
]
HC
+ N
Ox (
dies
el v
ehic
les)
[m
g/k
m]
Part
icul
ates
(di
esel
veh
icle
s) [
mg
/km
]
Tota
l sal
es/r
egis
trat
ions
Tota
l sal
es/r
egis
trat
ions
[%
]
Top
spee
d [k
m/h
]
Die
sel [
%]
Hyb
rid
excl
. PH
EV [
%]
Nat
ural
gas
(m
ono-
/biv
alen
t, in
cl. L
PG)
[%]
Flex
-Fue
l (et
hano
l/ga
solin
e) [
%]
Euro
#5 a
nd E
uro#
6 [%
]
Aut
omat
ic [
%]
Engi
ne p
ower
[K
W]
Engi
ne s
ize
[ccm
]
Mas
s in
run
ning
ord
er [
kg]
EU-27 1,480,685 100 156 96 0 2 0 3 5 78 1932 1665 4868 1862 3056 1586 4.9 6.9 6.0 8.4 180 226 283 301 25
France 414,911 28 159 99 0 0 0 3 4 73 1828 1557 4661 1846 2920 1572 4.6 6.2 5.4 7.4 162 226 268 288 24
United Kingdom 222,915 15 150 100 0 0 0 3 3 79 2024 1773 4992 1883 3119 1604 5.0 7.4 6.5 9.0 195 221 287 312 23
Germany 196,552 13 152 96 0 1 0 1 6 87 2106 1926 5494 1922 3495 1645 5.8 8.0 6.9 9.9 210 241 308 324 25
Italy 166,529 11 157 82 0 15 0 0 14 75 1858 1592 4670 1830 2924 1557 4.6 6.9 6.0 8.5 175 275 312 302 28
Spain 115,924 8 155 99 0 0 0 0 1 71 1801 1586 4683 1848 2877 1564 4.6 6.4 5.6 7.8 170 196 272 302 24
EU-12 95,183 6 157 96 0 0 0 1 1 76 1927 1576 4718 1834 2960 1565 4.6 6.5 5.7 8.0 172 220 275 292 26
Belgium 54,841 4 157 92 0 0 0 2 1 81 1804 1589 4722 1835 2918 1557 4.6 6.9 5.9 8.6 181 194 256 283 27
Netherlands 49,607 3 153 98 0 1 0 9 7 82 2040 1766 4925 1887 3146 1607 5.1 7.4 6.5 9.1 196 213 276 303 19
Portugal 45,669 3 159 100 0 0 0 1 1 72 1816 1507 4581 1810 2862 1541 4.4 6.2 5.4 7.5 163 200 263 280 24
Sweden 37,975 3 161 94 0 3 0 17 6 87 2009 1725 4809 1854 3065 1579 4.8 7.3 6.3 9.0 190 184 274 305 22
Austria 29,055 2 154 97 0 1 0 3 5 85 2084 1814 5079 1895 3165 1619 5.2 7.6 6.6 9.2 199 235 307 314 28
Denmark 16,198 1 162 99 0 0 0 24 4 88 1995 1696 4881 1858 2868 1588 4.9 7.1 6.2 8.8 188 174 330 341 26
Finland 11,050 1 157 100 0 0 0 4 14 89 2154 1855 5075 1874 3231 1605 5.2 7.8 6.7 9.7 206 206 288 307 26
Greece 10,644 1 164 84 0 0 0 7 0 93 2214 1740 4952 1770 2984 1510 4.5 7.8 6.7 9.8 203 172 349 383 40
Ireland 10,387 1 156 100 0 0 0 5 1 85 2145 1701 4805 1872 3003 1587 4.8 7.2 6.3 8.9 191 206 313 341 26
Luxembourg 3,245 0 153 98 0 0 0 0 0 84 2089 1740 5018 1900 3109 1622 5.2 7.3 6.4 8.7 192 247 325 311 31
Renault 240,489 16 159 98 0 0 0 1 0 69 1774 1493 4518 1843 2941 1558 4.6 5.8 5.3 6.7 153 222 257 280 23
Citroën 172,618 12 156 97 0 0 0 1 0 66 1670 1495 4581 1827 2852 1562 4.5 6.0 5.3 7.3 158 205 247 271 26
Fiat 170,345 12 157 87 0 11 0 0 3 75 1787 1519 4631 1834 2968 1571 4.7 6.3 5.6 7.7 162 316 345 285 33
Peugeot 164,514 11 158 99 0 0 0 0 0 66 1679 1551 4582 1852 2862 1585 4.6 6.0 5.3 7.4 159 209 240 267 25
Ford 160,911 11 148 99 0 0 0 0 0 76 2104 1424 4974 1942 3090 1633 5.1 7.4 6.5 9.0 196 287 317 350 24
VW 155,586 11 156 97 0 1 0 5 28 82 2004 1893 5123 1877 3201 1611 5.2 7.6 6.5 9.6 200 182 258 299 12
Mercedes-Benz 119,969 8 150 99 0 0 0 5 16 99 2205 2032 5939 1962 3727 1683 6.3 9.2 7.7 11.7 243 133 400 424 27
Opel 48,734 3 158 96 0 2 0 2 0 73 1761 1244 4362 1813 3072 1550 4.8 6.4 5.6 7.8 168 237 279 302 21
Iveco 44,638 3 156 99 0 1 0 6 0 97 2556 2341 6104 1995 3520 1689 5.9 9.6 8.6 11.2 254 168 376 407 26
Nissan 39,131 3 157 99 0 0 0 0 0 96 2175 1804 5189 1809 3074 1524 4.7 7.1 6.5 8.1 188 206 353 400 36
Toyota 35,321 2 160 99 0 0 0 13 0 98 2547 1920 5204 1769 3088 1518 4.8 8.4 7.2 10.5 222 189 308 329 42
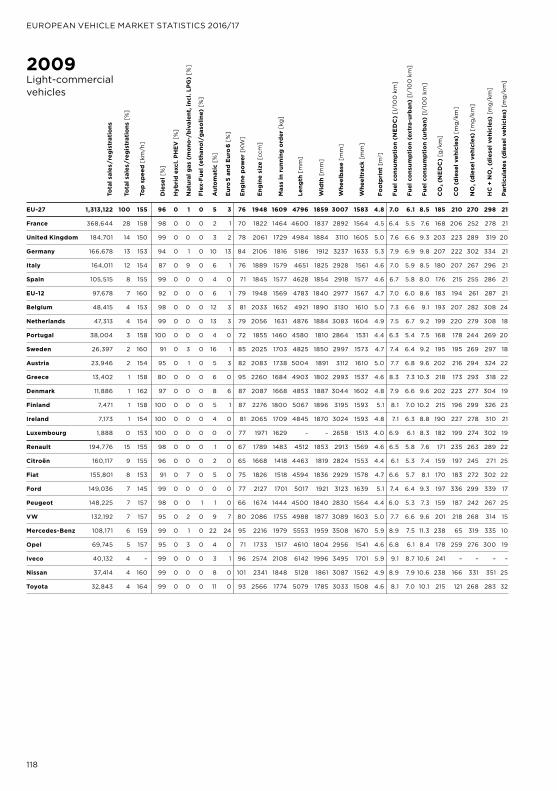
118
EUROPEAN VEHICLE MARKET STATISTICS 2016/17
2009Light-commercial vehicles
EU-27 1,313,122 100 155 96 0 1 0 5 3 76 1948 1609 4796 1859 3007 1583 4.8 7.0 6.1 8.5 185 210 270 298 21
France 368,644 28 158 98 0 0 0 2 1 70 1822 1464 4600 1837 2892 1564 4.5 6.4 5.5 7.6 168 206 252 278 21
United Kingdom 184,701 14 150 99 0 0 0 3 2 78 2061 1729 4984 1884 3110 1605 5.0 7.6 6.6 9.3 203 223 289 319 20
Germany 166,678 13 153 94 0 1 0 10 13 84 2106 1816 5186 1912 3237 1633 5.3 7.9 6.9 9.8 207 222 302 334 21
Italy 164,011 12 154 87 0 9 0 6 1 76 1889 1579 4651 1825 2928 1561 4.6 7.0 5.9 8.5 180 207 267 296 21
Spain 105,515 8 155 99 0 0 0 4 0 71 1845 1577 4628 1854 2918 1577 4.6 6.7 5.8 8.0 176 215 255 286 21
EU-12 97,678 7 160 92 0 0 0 6 1 79 1948 1569 4783 1840 2977 1567 4.7 7.0 6.0 8.6 183 194 261 287 21
Belgium 48,415 4 153 98 0 0 0 12 3 81 2033 1652 4921 1890 3130 1610 5.0 7.3 6.6 9.1 193 207 282 308 24
Netherlands 47,313 4 154 99 0 0 0 13 3 79 2056 1631 4876 1884 3083 1604 4.9 7.5 6.7 9.2 199 220 279 308 18
Portugal 38,004 3 158 100 0 0 0 4 0 72 1855 1460 4580 1810 2864 1531 4.4 6.3 5.4 7.5 168 178 244 269 20
Sweden 26,397 2 160 91 0 3 0 16 1 85 2025 1703 4825 1850 2997 1573 4.7 7.4 6.4 9.2 195 195 269 297 18
Austria 23,946 2 154 95 0 1 0 5 3 82 2083 1738 5004 1891 3112 1610 5.0 7.7 6.8 9.6 202 216 294 324 22
Greece 13,402 1 158 80 0 0 0 6 0 95 2260 1684 4903 1802 2993 1537 4.6 8.3 7.3 10.3 218 173 293 318 22
Denmark 11,886 1 162 97 0 0 0 8 6 87 2087 1668 4853 1887 3044 1602 4.8 7.9 6.6 9.6 202 223 277 304 19
Finland 7,471 1 158 100 0 0 0 5 1 87 2276 1800 5067 1896 3195 1593 5.1 8.1 7.0 10.2 215 196 299 326 23
Ireland 7,173 1 154 100 0 0 0 4 0 81 2065 1709 4845 1870 3024 1593 4.8 7.1 6.3 8.8 190 227 278 310 21
Luxembourg 1,888 0 153 100 0 0 0 0 0 77 1971 1629 – – 2658 1513 4.0 6.9 6.1 8.3 182 199 274 302 19 Renault 194,776 15 155 98 0 0 0 1 0 67 1789 1483 4512 1853 2913 1569 4.6 6.5 5.8 7.6 171 235 263 289 22
Citroën 160,117 9 155 96 0 0 0 2 0 65 1668 1418 4463 1819 2824 1553 4.4 6.1 5.3 7.4 159 197 245 271 25
Fiat 155,801 8 153 91 0 7 0 5 0 75 1826 1518 4594 1836 2929 1578 4.7 6.6 5.7 8.1 170 183 272 302 22
Ford 149,036 7 145 99 0 0 0 0 0 77 2127 1701 5017 1921 3123 1639 5.1 7.4 6.4 9.3 197 336 299 339 17
Peugeot 148,225 7 157 98 0 0 1 1 0 66 1674 1444 4500 1840 2830 1564 4.4 6.0 5.3 7.3 159 187 242 267 25
VW 132,192 7 157 95 0 2 0 9 7 80 2086 1755 4988 1877 3089 1603 5.0 7.7 6.6 9.6 201 218 268 314 15
Mercedes-Benz 108,171 6 159 99 0 1 0 22 24 95 2216 1979 5553 1959 3508 1670 5.9 8.9 7.5 11.3 238 65 319 335 10
Opel 69,745 5 157 95 0 3 0 4 0 71 1733 1517 4610 1804 2956 1541 4.6 6.8 6.1 8.4 178 259 276 300 19
Iveco 40,132 4 – 99 0 0 0 3 1 96 2574 2108 6142 1996 3495 1701 5.9 9.1 8.7 10.6 241 – – – –
Nissan 37,414 4 160 99 0 0 0 8 0 101 2341 1848 5128 1861 3087 1562 4.9 8.9 7.9 10.6 238 166 331 351 25
Toyota 32,843 4 164 99 0 0 0 11 0 93 2566 1774 5079 1785 3033 1508 4.6 8.1 7.0 10.1 215 121 268 283 32
Leng
th [
mm
]
Wid
th [
mm
]
Whe
elba
se [
mm
]
Whe
eltr
ack
[mm
]
Foot
prin
t [m
2 ]
Fuel
con
sum
ptio
n (N
ED
C)
[l/1
00
km
]
Fuel
con
sum
ptio
n (e
xtra
-urb
an)
[l/1
00
km
]
Fuel
con
sum
ptio
n (u
rban
) [l
/10
0 k
m]
CO
2 (N
ED
C)
[g/k
m]
CO
(di
esel
veh
icle
s) [
mg
/km
]
NO
x (di
esel
veh
icle
s) [
mg
/km
]
HC
+ N
Ox (
dies
el v
ehic
les)
[m
g/k
m]
Part
icul
ates
(di
esel
veh
icle
s) [
mg
/km
]
Tota
l sal
es/r
egis
trat
ions
Tota
l sal
es/r
egis
trat
ions
[%
]
Top
spee
d [k
m/h
]
Die
sel [
%]
Hyb
rid
excl
. PH
EV [
%]
Nat
ural
gas
(m
ono-
/biv
alen
t, in
cl. L
PG)
[%]
Flex
-Fue
l (et
hano
l/ga
solin
e) [
%]
Euro
#5 a
nd E
uro#
6 [%
]
Aut
omat
ic [
%]
Engi
ne p
ower
[K
W]
Engi
ne s
ize
[ccm
]
Mas
s in
run
ning
ord
er [
kg]
For additional information:International Council on Clean Transportation EuropeNeue Promenade 6, 10178 Berlin+49 (30) [email protected]
© 2016 International Council on Clean TransportationFunding for this work was generously provided by the ClimateWorks Foundation and the Stiftung Mercator
Edited by Dr. Peter Mock (ICCT Europe)Design and visualization by Hahn!+!Zimmermann, Bern
Printed on 100% recycled paper
An electronic version of this Pocketbook, including more detailed statistical data is available online: http://eupocketbook.theicct.org
EUROPEAN VEHICLE MARKET STATISTICS Pocketbook 2016/17
International Council on Clean Transportation EuropeNeue Promenade 610178 Berlin+49 (30) [email protected]
ICC
TE
urop
ean
Veh
icle
Mar
ket
Stat
isti
cs 2
016
/17