Embed Size (px)
Citation preview
Special EUROBAROMETER 324 “ EUROPEANS AND NUCLEAR SAFETY”
1
Special Eurobarometer 324
Europeans and Nuclear Safety Report
Fieldwork: September – October 2009
Publication: March 2010
This survey was requested by the Directorate-General for Energy and Transport and coordinated by the Directorate-General for Communication (“Research and Political Analysis” Unit) This document does not represent the point of view of the European Commission. The interpretations and opinions contained in it are solely those of the authors.
European Commission
Spe
cial
Eur
obar
omet
er 3
24 /
Wav
e 72
.2 –
TN
S O
pini
on &
Soc
ial
Special EUROBAROMETER 324 “ EUROPEANS AND NUCLEAR SAFETY”
2
SPECIAL Eurobarometer 324
EUROPEANS AND NUCLEAR SAFETY
CONDUCTED BY TNS OPINION & SOCIAL AT THE REQUEST OF DIRECTORATE GENERAL FOR ENERGY
AND TRANSPORT
SURVEY CO-ORDINATED BY DIRECTORATE GENERAL COMMUNICATION
TNS OPINION & SOCIAL Avenue Herrmann Debroux, 40
1160 Brussels Belgium
Special EUROBAROMETER 324 “ EUROPEANS AND NUCLEAR SAFETY”
3
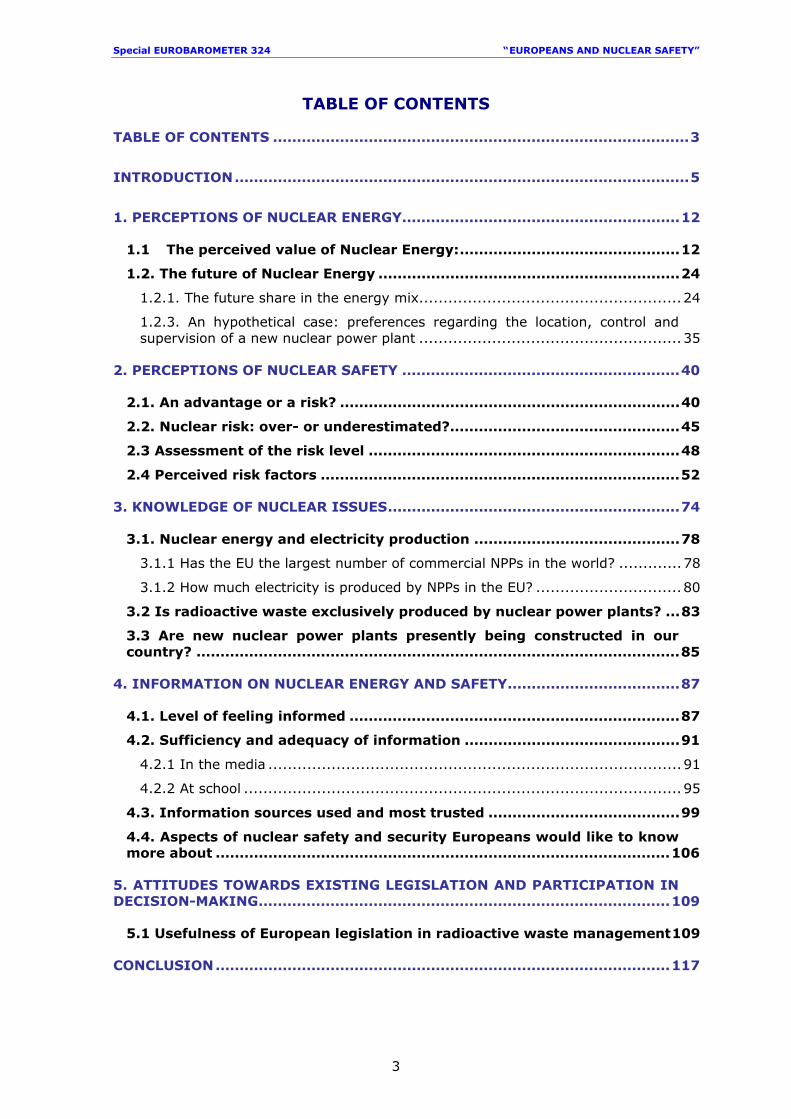
TABLE OF CONTENTS
TABLE OF CONTENTS .......................................................................................3
INTRODUCTION...............................................................................................5
1. PERCEPTIONS OF NUCLEAR ENERGY..........................................................12
1.1 The perceived value of Nuclear Energy:..............................................12 1.2. The future of Nuclear Energy ...............................................................24
1.2.1. The future share in the energy mix......................................................24 1.2.3. An hypothetical case: preferences regarding the location, control and supervision of a new nuclear power plant ......................................................35
2. PERCEPTIONS OF NUCLEAR SAFETY ..........................................................40
2.1. An advantage or a risk? .......................................................................40 2.2. Nuclear risk: over- or underestimated?................................................45 2.3 Assessment of the risk level .................................................................48 2.4 Perceived risk factors ...........................................................................52
3. KNOWLEDGE OF NUCLEAR ISSUES.............................................................74
3.1. Nuclear energy and electricity production ...........................................78 3.1.1 Has the EU the largest number of commercial NPPs in the world? .............78 3.1.2 How much electricity is produced by NPPs in the EU? ..............................80
3.2 Is radioactive waste exclusively produced by nuclear power plants? ...83 3.3 Are new nuclear power plants presently being constructed in our country? .....................................................................................................85
4. INFORMATION ON NUCLEAR ENERGY AND SAFETY....................................87
4.1. Level of feeling informed .....................................................................87 4.2. Sufficiency and adequacy of information .............................................91
4.2.1 In the media .....................................................................................91 4.2.2 At school ..........................................................................................95
4.3. Information sources used and most trusted ........................................99 4.4. Aspects of nuclear safety and security Europeans would like to know more about ...............................................................................................106
5. ATTITUDES TOWARDS EXISTING LEGISLATION AND PARTICIPATION IN DECISION-MAKING......................................................................................109
5.1 Usefulness of European legislation in radioactive waste management109
CONCLUSION...............................................................................................117
Special EUROBAROMETER 324 “ EUROPEANS AND NUCLEAR SAFETY”
4
ANNEXES
TECHNICAL SPECIFICATIONS ………………………………………………………….121 QUESTIONNAIRE ……………………………………………………………………………124 TABLES …………………………………………………………………………………………132
Special EUROBAROMETER 324 “ EUROPEANS AND NUCLEAR SAFETY”
5
INTRODUCTION Following the fuel crisis in 1973, the western countries realised that energy was
going to become one of the most challenging questions to be faced in the future. At
the beginning of the 21st century, recognition of this problematic issue has only
increased, especially now that climate change has become one of the most
important concerns of European citizens.
Highly dependent on external energy supply (mainly fossil fuels), whose safety has
been repeatedly threatened in the past years, EU energy policy objectives
(sustainability, competitiveness and safety) seem to have acquired renewed
importance within a context of strong economic downturn, highly volatile energy
prices and environmental crisis.
The energy challenges of the European Union are many. It is essential for the EU
to respond to:
a) An increasing energy demand1;
b) The need to diversify and ensure energy supply at reasonable prices2;
c) Meeting the commitments related to greenhouse gas emissions.
Nuclear energy is at the core of this ongoing debate.
Energy from nuclear fission currently represents around 14.6% of the primary
energy consumed in the European Union and 31% of the electricity generated.
Uranium, the fuel on which almost all nuclear energy is based, is found in a wide
range of countries, unlike oil or natural gas. For the Member States which have
recourse to it (15 out of the 27) it is the energy source with the least price
fluctuation and one of the lowest rates of CO2 production. European Member States
such as France or the United Kingdom have given new “fire up” to their nuclear
power programme in order to achieve efficiency, energy independence and
sustainability.
1 International Energy Agency forecasts that, 'if policies remain unchanged, world energy demand is projected to increase by over 50% between now and 2030'. 2 According to the International Energy Agency « Medium-Term Oil Market Report 2009 and the Natural Gas Market Report 2009”, oil prices are around half the level seen last year in July, when they peaked at USD 147, even though they have strengthened again recently, partly due to a perception that economic recovery may be just around the corner. The report warns against a too rapid rise of oil prices: http://www.iea.org/press/pressdetail.asp?PRESS_REL_ID=285
Special EUROBAROMETER 324 “ EUROPEANS AND NUCLEAR SAFETY”
6
However, the use of nuclear power is controversial. There is the acute influence of
risk perception: the Chernobyl episode has had a lasting effect on European public
opinion, which remains diffident in its attitudes to nuclear energy and fears the
possibility of new breaches of nuclear safety, notably those related to potential
terrorist attacks on nuclear power plants or malevolent use of nuclear material.
Citizens are also extremely sensitive to the unknown factors raised by the effects of
nuclear waste, whose management and disposal remain a complicated issue.
Finally, those arguing against the development of nuclear energy advance the issue
of cost-efficiency.
In any event, independently of the debate on its future, an extremely high level of
safety and exemplary transparency are prerequisites for the existence and
development of nuclear power. Moreover, as recently stated by the European
Economic and Social Committee3, “this worldwide renewal of interest raises the
issue of nuclear safety in new ways, in particular in relation to organisation and
monitoring”. Existing nuclear installations must be operated to strict safety
standards and radioactive waste must be managed in a safe and sustainable
manner. A number of European power plants are currently nearing the end of their
lifespan and will need to be decommissioned safely.
Furthermore it is necessary to ensure that nuclear materials are not misused and
that common standards are implemented in order to maintain high nuclear safety
standards across Europe.
In order to contribute to an open debate on the issue of nuclear energy, in 2007
the European Commission launched the European Nuclear Energy Forum (ENEF), a
platform aiming to promote broad discussion, free of any taboos, on issues of
transparency as well as the opportunities and risks of nuclear energy. ENEF gathers
all relevant stakeholders in the nuclear field: governments of the 27 EU Member
States, European Institutions including the European Parliament and the European
Economic and Social Committee, nuclear industry, electricity consumers and civil
society.
3In its opinion on the Proposal for a Council Directive (Euratom) setting up a community framework for nuclear safety, published last June: http://eescopinions.eesc.europa.eu/EESCopinionDocument.aspx?identifier=ces\ten\ten377\ces1030-2009_ac.doc&language=EN
Special EUROBAROMETER 324 “ EUROPEANS AND NUCLEAR SAFETY”
7
Against this background, Directorate General for Energy and Transport, Directorate
for Nuclear Energy launched this Eurobarometer study of European public opinion
on nuclear safety. It follows two former studies on radioactive waste carried out in
2005 and 2001 and one survey on nuclear safety conducted in October-November
2006. This survey covers both the wider theme of nuclear issues in general and the
topic of nuclear safety in particular.
This report consists of five chapters dealing with the following themes:
• General perception of nuclear issues: the value of nuclear energy, how
easily it can be replaced by renewable energy sources, and the future share
in the energy mix;
• Nuclear safety: risk perceptions of nuclear energy and nuclear power plants
in general and the importance of various risk factors;
• Knowledge of nuclear issues and nuclear safety;
• Information on nuclear energy and safety: people’s feeling of being
informed, whether there is sufficient information in the media and schools,
preferred information sources;
• Decision-making and participation: the level of decision-making and
willingness to participate.
A further insight into European public opinion on nuclear safety is gained by
examining the effects of three factors in more detail: general attitudes towards
nuclear energy, familiarity with nuclear issues and the impact of information.
The following questions reflecting these three factors are systematically cross-
tabulated with all questions:
1. General attitude towards nuclear power: QA1 When you think about nuclear
power, what first comes to mind? The advantages of nuclear power as an
energy source outweigh the risks it poses / The risks of nuclear power as
an energy source outweigh its advantages.
2. Personal experiences of nuclear power: QA2 Have you ever...? Visited a
nuclear power plant / Lived in an area close (within a 50 km radius) to a
nuclear power plant / Worked on nuclear energy issues or known
somebody working on them.
3. Feeling of being informed: QA5 How well informed do you think you are
about the safety of nuclear power plants?
Special EUROBAROMETER 324 “ EUROPEANS AND NUCLEAR SAFETY”
8
Linked to this are two additional background variables which have been introduced
in the course of the analysis: a re-grouping into countries that have nuclear power
plants (NPPs) in operation4 and countries that do not, and a review of the share
nuclear power represents in the total electricity production in a given country5.
These two variables can also be seen to reflect familiarity with nuclear issues.
Throughout this report we observe that all the above factors are intertwined and
have a considerable effect on European public opinion about nuclear power and
nuclear safety.
As far as Germany and Finland results’ are concerned, it should be noted that
nuclear debate has been considerably active during the past months, which seems
to have some influence especially from a trend point of view. On the one hand, ad
far as Germany is concerned, the debate of deciding Nuclear power plants lifetime
extension had recently come back to the country even if it had decided in the past
to phase-out its reactors: before the recent elections, both two parties that will
form the new government (CDU and FDP) had announced to vote for a life
extension of German nuclear power plants. On the other hand, Finland's fifth
nuclear power reactor is currently under construction. The Olkiluoto unit
construction started in March 2005 and it was supposed to be in operation in 2009.
Yet, delays have been encountered and the reactor is unlikely to be functioning
before 2012 or 2013. Beside the debate concerning fifth’s reactor scheduling and
over-cost, the four-party coalition seems to be divided about the possibility of
constructing three more nuclear reactors6. It should be noted that some trend
results evolved appreciably in other countries as well. This is the case of Austria
and where nuclear energy has historically been a controversial topic. As we know,
nuclear energy was rejected in the 1978 referendum7 organised under the growing
pressure against the plant of Zwentendorf and a draft project of law for the
regulation of nuclear energy in the country. Later on, on the 13th of July in 1999
the Austrian parliament agreed upon the “Constitutional Law in favor of a Nuclear-
free Austria”.
4 Countries that have NPPs: Belgium, the Czech Republic, Germany, Spain, France, Lithuania, Hungary, the Netherlands, Slovenia, Slovakia, Finland, Sweden, the United Kingdom, Bulgaria and Romania. Countries that do not have NPPs: Denmark, Estonia, Greece, Ireland, Italy, Cyprus, Latvia, Luxembourg, Malta, Austria, Poland and Portugal. It should be noted that Italy, Estonia and Poland are currently studying the possibility of building their first nuclear power plants. 5 According to IEA (International Energy Agency) figures: http://www.iea.org 6http://www.utilityweek.co.uk/news/uk/electricity/nuclear-debate-splits-politica.php 7In the referendum 50,5 % of the population voted against nuclear power in Austria.
Special EUROBAROMETER 324 “ EUROPEANS AND NUCLEAR SAFETY”
9
Recently, controversies have risen in the country related to the activity of nuclear
power plants near to its border8, which could partly explain a negative evolution in
some of the dimensions covered by the survey in 2009 compared to 2005. In other
countries mainly or totally dependent on energy imports, such as Cyprus, this
structural factor associated to the higher awareness of climate change effects seem
to have pushed opinions on nuclear energy towards a more positive pattern. In any
case, these changes will be properly commented trough the report when statically
significant (e.g. not related to sample sizes’ statistical error).
This survey was conducted in the 27 Member States. The fieldwork was carried out
between 11 September and 5 October 2009 by the TNS Opinion and Social
network. 26 470 European citizens were interviewed face-to-face. Further details of
the methodology of the survey can be found in the technical note in the annexes to
this report. That note specifies the interview method used, as well as the
confidence intervals.
8 Slovenian power plant in Krsko, where an incident triggered a Europe-wide alert last year;
Special EUROBAROMETER 324 “ EUROPEANS AND NUCLEAR SAFETY”
10
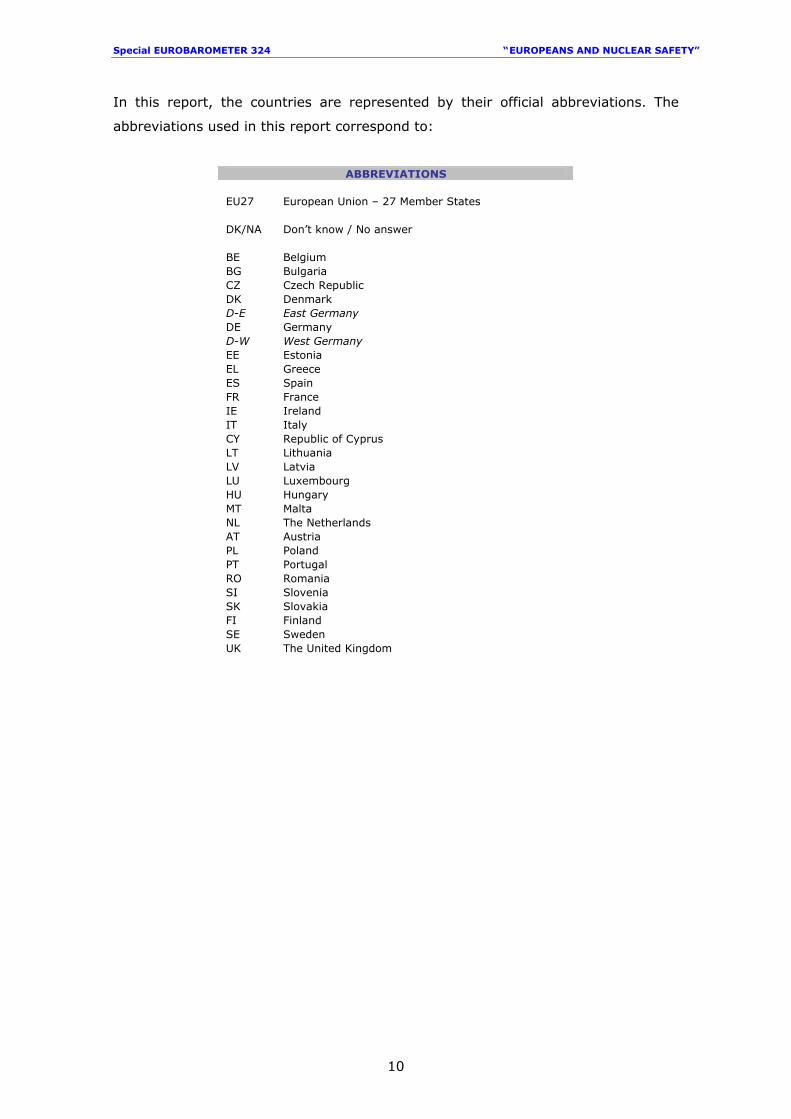
In this report, the countries are represented by their official abbreviations. The
abbreviations used in this report correspond to:
ABBREVIATIONS
EU27 European Union – 27 Member States DK/NA Don’t know / No answer BE Belgium BG Bulgaria CZ Czech Republic DK Denmark D-E East Germany DE Germany D-W West Germany EE Estonia EL Greece ES Spain FR France IE Ireland IT Italy CY Republic of Cyprus LT Lithuania LV Latvia LU Luxembourg HU Hungary MT Malta NL The Netherlands AT Austria PL Poland PT Portugal RO Romania SI Slovenia SK Slovakia FI Finland SE Sweden UK The United Kingdom
Special EUROBAROMETER 324 “ EUROPEANS AND NUCLEAR SAFETY”
11
EXECUTIVE SUMMARY
This special Eurobarometer survey on nuclear safety reveals:
European public opinion accepts the value of nuclear energy to some
extent, primarily as a mean of decreasing energy dependence, but
continues to consider that the current share of nuclear energy in the energy
mix should be maintained or reduced;
Opposition to further nuclear development is mostly related to risk
perception of nuclear energy: a majority still perceive nuclear energy
more as a threat than as a neutral source of energy both from a general and
personal perspective;
Although most interviewees believe that the risks related to nuclear energy
are underestimated. Their risk perceptions, measured through a
diverse range of potential situations, have remained stable since
2006. Lack of security to protect NPPs against terrorist attacks and the
disposal and management of radioactive waste remain the major dangers
associated with nuclear energy;
European citizens are extremely conscious of the importance of
safety and protection, as far as nuclear energy is concerned but most
feel ill-informed about nuclear safety issues related to nuclear power plants;
Knowledge and information are crucial in determining attitudes. While
Europeans mainly obtain information about nuclear issues from the
mass media, they consider this information to be insufficient. Not
surprisingly, citizens would like to know more about radioactive waste
management and environmental monitoring procedures;
A large majority of Europeans believe it would be useful to have
European legislation regulating nuclear waste management within
the European Union and their national territory.
Special EUROBAROMETER 324 “ EUROPEANS AND NUCLEAR SAFETY”
12
1. PERCEPTIONS OF NUCLEAR ENERGY
This first chapter gives an overview of European public opinion on nuclear energy.
It will deal with EU citizens’ perceptions of the value of nuclear energy and its
position in the share of energy sources in the future.
1.1 The perceived value of Nuclear Energy:
Source Questionnaire: QA129
- Europeans tend to recognise the value of nuclear energy. Perceptions
are stable compared to three years ago although forming an opinion
seems to be easier today -
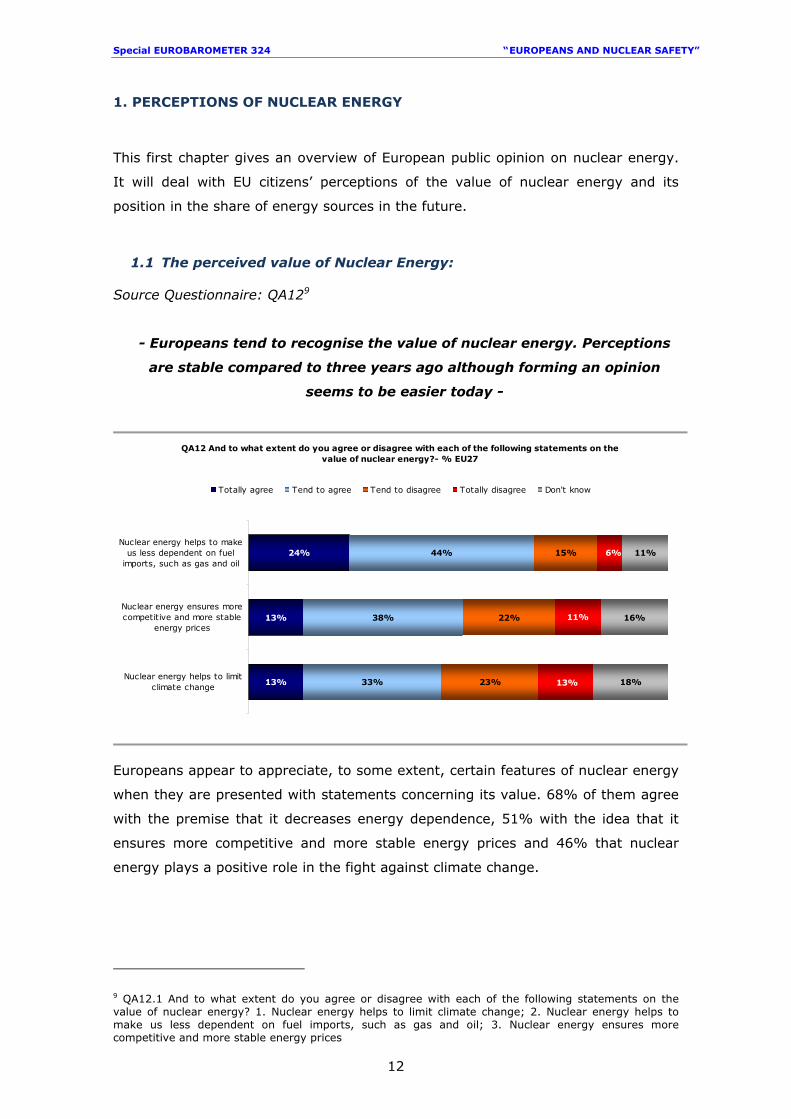
QA12 And to what extent do you agree or disagree with each of the following statements on the value of nuclear energy?- % EU27
13%
13%
24%
33%
38%
23%
22%
15%
18%
16%
11%44% 6%
11%
13%Nuclear energy helps to limit
climate change
Nuclear energy ensures morecompetitive and more stable
energy prices
Nuclear energy helps to makeus less dependent on fuel
imports, such as gas and oil
Totally agree Tend to agree Tend to disagree Totally disagree Don't know
Europeans appear to appreciate, to some extent, certain features of nuclear energy
when they are presented with statements concerning its value. 68% of them agree
with the premise that it decreases energy dependence, 51% with the idea that it
ensures more competitive and more stable energy prices and 46% that nuclear
energy plays a positive role in the fight against climate change.
9 QA12.1 And to what extent do you agree or disagree with each of the following statements on the value of nuclear energy? 1. Nuclear energy helps to limit climate change; 2. Nuclear energy helps to make us less dependent on fuel imports, such as gas and oil; 3. Nuclear energy ensures more competitive and more stable energy prices
Special EUROBAROMETER 324 “ EUROPEANS AND NUCLEAR SAFETY”
13
In all cases, Europeans who agree with the statements outnumber those who are of
the opposite view. A third of interviewees oppose the statement concerning the
stability of energy prices (33%) and a fifth (21%) disagree as far as reducing
energy dependence is concerned. With regard to positive effects on climate change,
36% of Europeans express their disagreement.
Levels of agreement with the three statements remain stable overall compared to
three years ago10 at the EU average level. However, significant evolutions can be
observed at national results and will be commented later on in the report. At the EU
level, decreases in the percentages of “don’t know” answers indicate, firstly that it
is now somewhat easier for citizens to form an opinion about these main features of
nuclear energy; secondly that higher awareness does not necessarily imply a more
positive opinion: when it comes to the possible impact of nuclear energy on limiting
climate change, the level of “don’t know” responses decreases by 5 points
compared to the previous survey, while opposition to the statement rises by 5
points.
7 Special Eurobarometer 271: “Europeans and nuclear safety”
Special EUROBAROMETER 324 “ EUROPEANS AND NUCLEAR SAFETY”
14
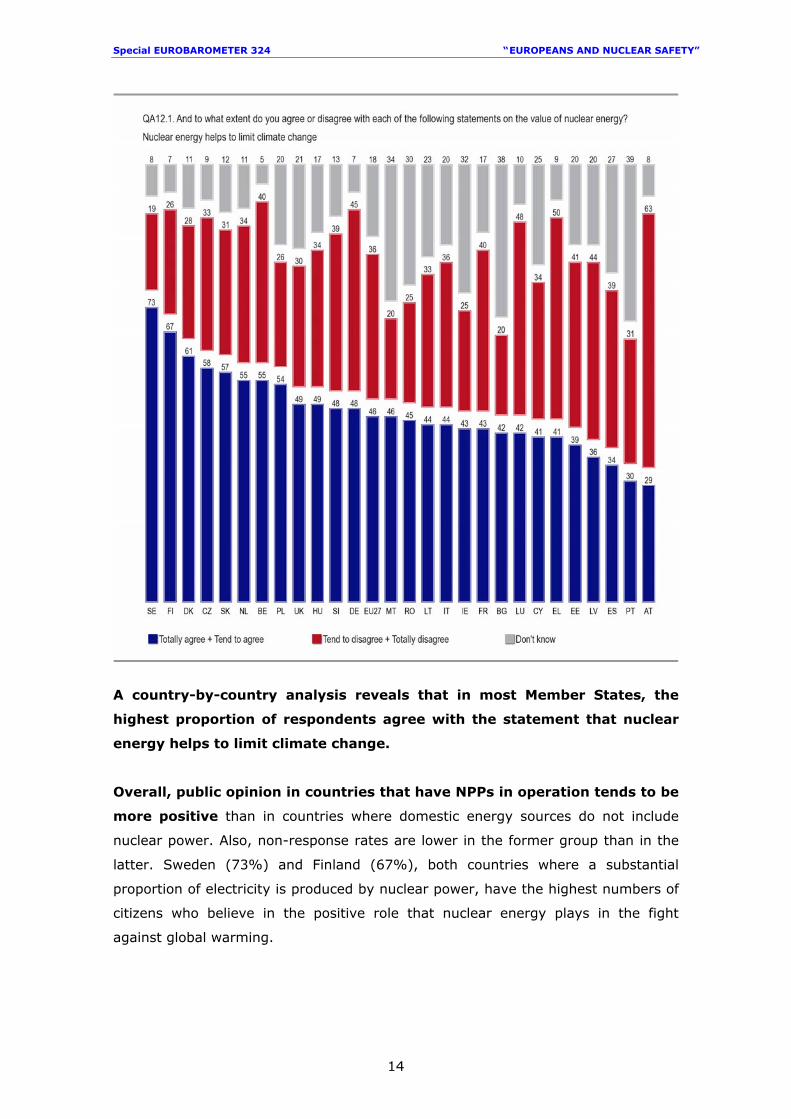
A country-by-country analysis reveals that in most Member States, the
highest proportion of respondents agree with the statement that nuclear
energy helps to limit climate change.
Overall, public opinion in countries that have NPPs in operation tends to be
more positive than in countries where domestic energy sources do not include
nuclear power. Also, non-response rates are lower in the former group than in the
latter. Sweden (73%) and Finland (67%), both countries where a substantial
proportion of electricity is produced by nuclear power, have the highest numbers of
citizens who believe in the positive role that nuclear energy plays in the fight
against global warming.
Special EUROBAROMETER 324 “ EUROPEANS AND NUCLEAR SAFETY”
15
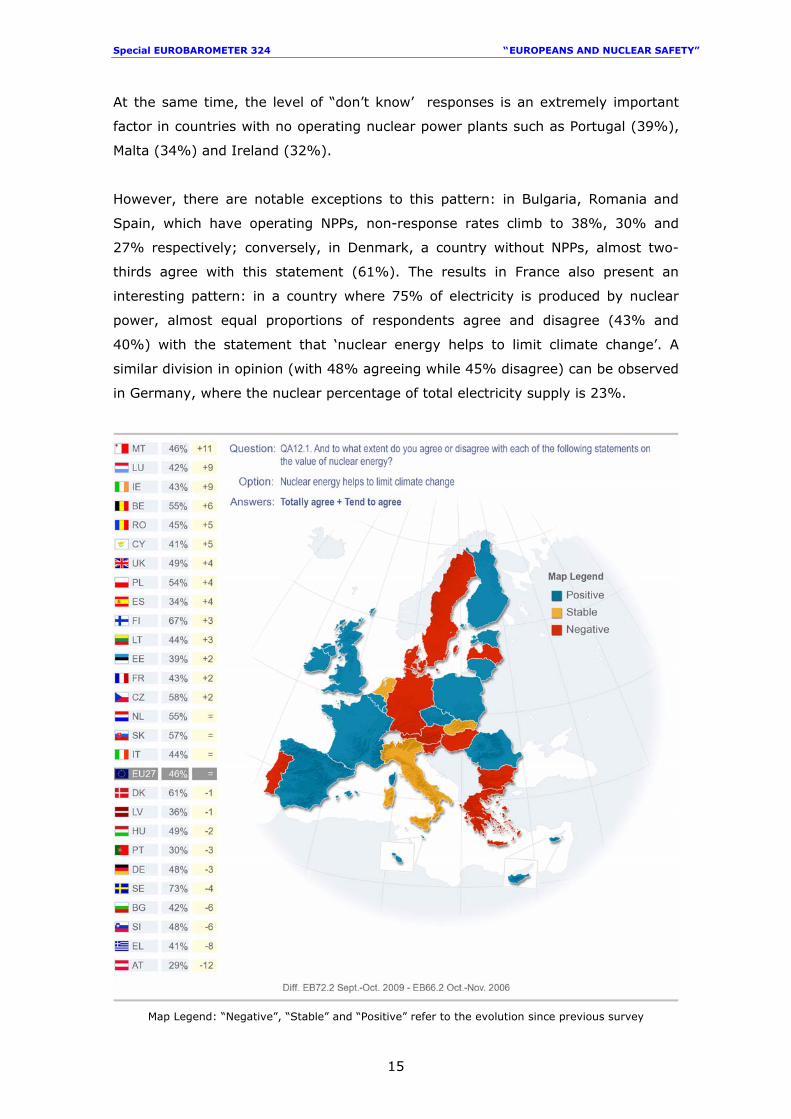
At the same time, the level of “don’t know’ responses is an extremely important
factor in countries with no operating nuclear power plants such as Portugal (39%),
Malta (34%) and Ireland (32%).
However, there are notable exceptions to this pattern: in Bulgaria, Romania and
Spain, which have operating NPPs, non-response rates climb to 38%, 30% and
27% respectively; conversely, in Denmark, a country without NPPs, almost two-
thirds agree with this statement (61%). The results in France also present an
interesting pattern: in a country where 75% of electricity is produced by nuclear
power, almost equal proportions of respondents agree and disagree (43% and
40%) with the statement that ‘nuclear energy helps to limit climate change’. A
similar division in opinion (with 48% agreeing while 45% disagree) can be observed
in Germany, where the nuclear percentage of total electricity supply is 23%.
Map Legend: “Negative”, “Stable” and “Positive” refer to the evolution since previous survey
Special EUROBAROMETER 324 “ EUROPEANS AND NUCLEAR SAFETY”
16
From a general perspective, disagreement with this statement is
somewhat higher than three years ago: in Luxembourg (48%, + 4 points) and
Latvia (44%, +7) a comparative majority disagree with this statement. Opposition
clearly outweighs agreement in Greece (50%, +7) and especially in Austria, where
almost two out of three citizens do not believe nuclear energy helps to fight climate
change (63%, +26).
A full comparative picture is nevertheless necessary in order get an accurate view
of the changes. Even if the EU11 average remains stable opinions have
moved compared to three years ago. Citizens in 14 countries are today more
incline to agree with the statement. It is the case especially in Malta (+11),
Luxembourg (+9), Ireland (+9) and Belgium (+6).
Agreement levels are stable in three countries (The Netherlands, Slovakia and
Italy) while they decrease in 11 member States, particularly in Austria (-12),
Greece (-8), Bulgaria and Slovenia (-6 in both cases).
11 In 2005, there were only 25 countries in the EU.
Special EUROBAROMETER 324 “ EUROPEANS AND NUCLEAR SAFETY”
17
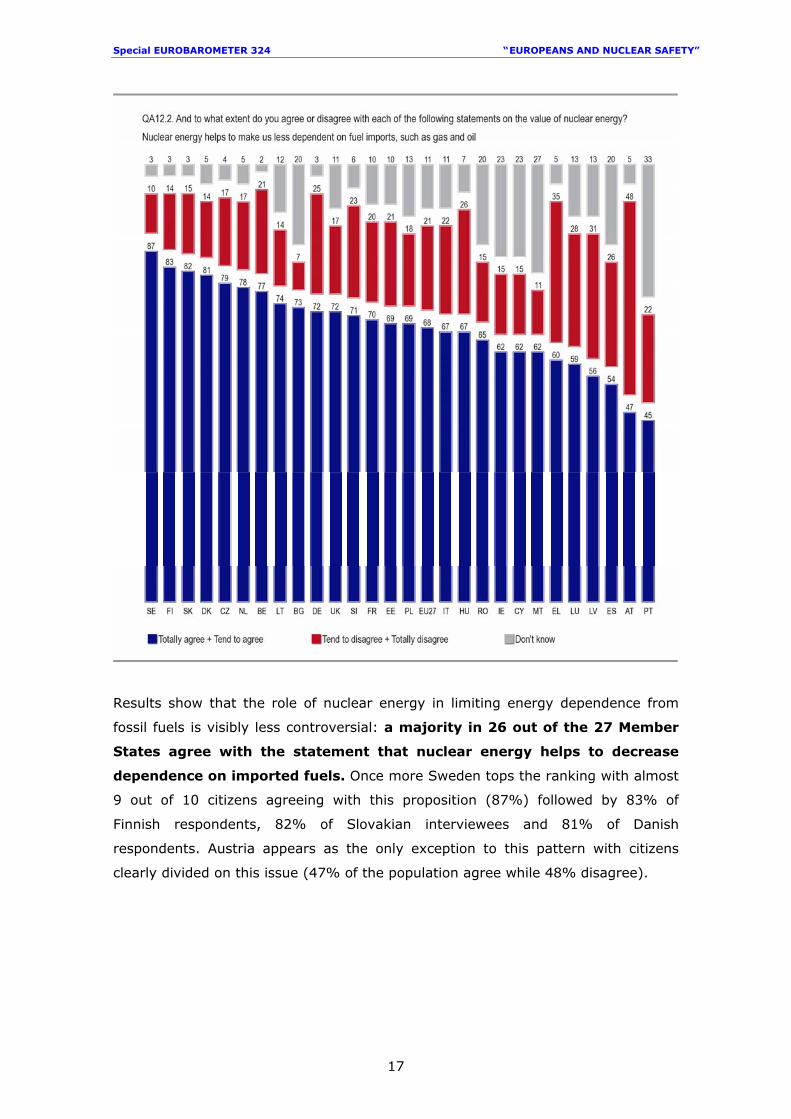
Results show that the role of nuclear energy in limiting energy dependence from
fossil fuels is visibly less controversial: a majority in 26 out of the 27 Member
States agree with the statement that nuclear energy helps to decrease
dependence on imported fuels. Once more Sweden tops the ranking with almost
9 out of 10 citizens agreeing with this proposition (87%) followed by 83% of
Finnish respondents, 82% of Slovakian interviewees and 81% of Danish
respondents. Austria appears as the only exception to this pattern with citizens
clearly divided on this issue (47% of the population agree while 48% disagree).
Special EUROBAROMETER 324 “ EUROPEANS AND NUCLEAR SAFETY”
18
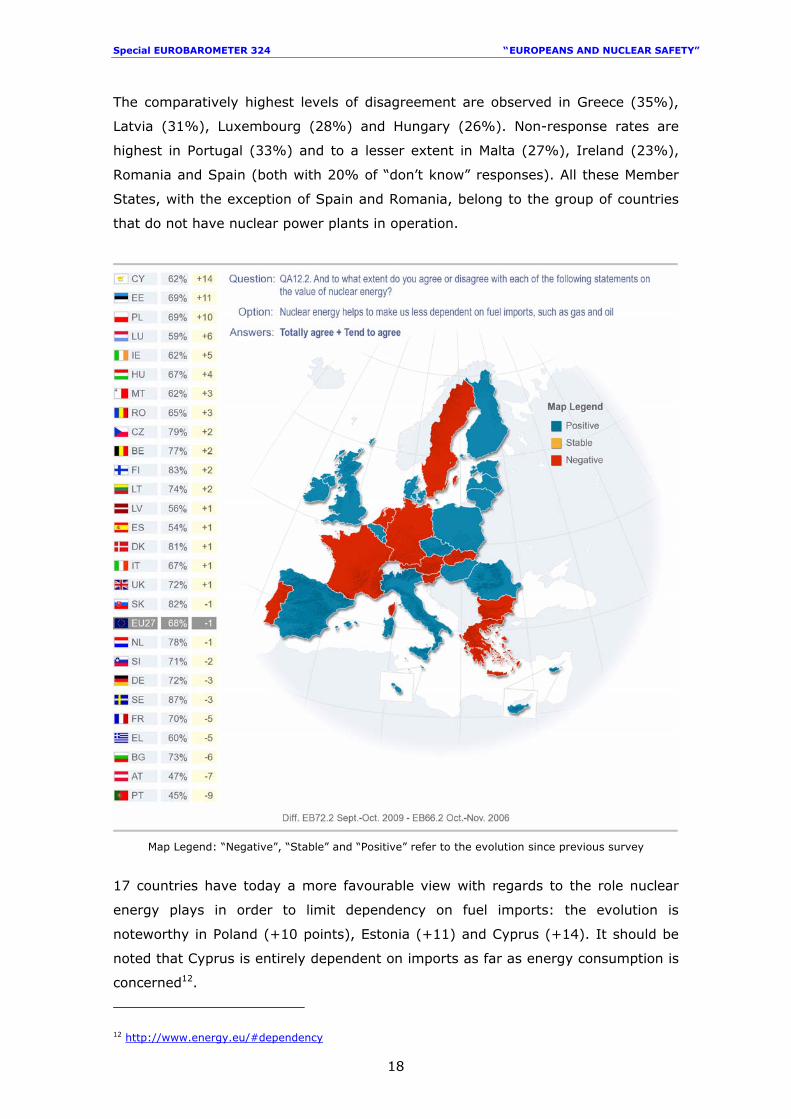
The comparatively highest levels of disagreement are observed in Greece (35%),
Latvia (31%), Luxembourg (28%) and Hungary (26%). Non-response rates are
highest in Portugal (33%) and to a lesser extent in Malta (27%), Ireland (23%),
Romania and Spain (both with 20% of “don’t know” responses). All these Member
States, with the exception of Spain and Romania, belong to the group of countries
that do not have nuclear power plants in operation.
Map Legend: “Negative”, “Stable” and “Positive” refer to the evolution since previous survey
17 countries have today a more favourable view with regards to the role nuclear
energy plays in order to limit dependency on fuel imports: the evolution is
noteworthy in Poland (+10 points), Estonia (+11) and Cyprus (+14). It should be
noted that Cyprus is entirely dependent on imports as far as energy consumption is
concerned12.
12 http://www.energy.eu/#dependency
Special EUROBAROMETER 324 “ EUROPEANS AND NUCLEAR SAFETY”
19
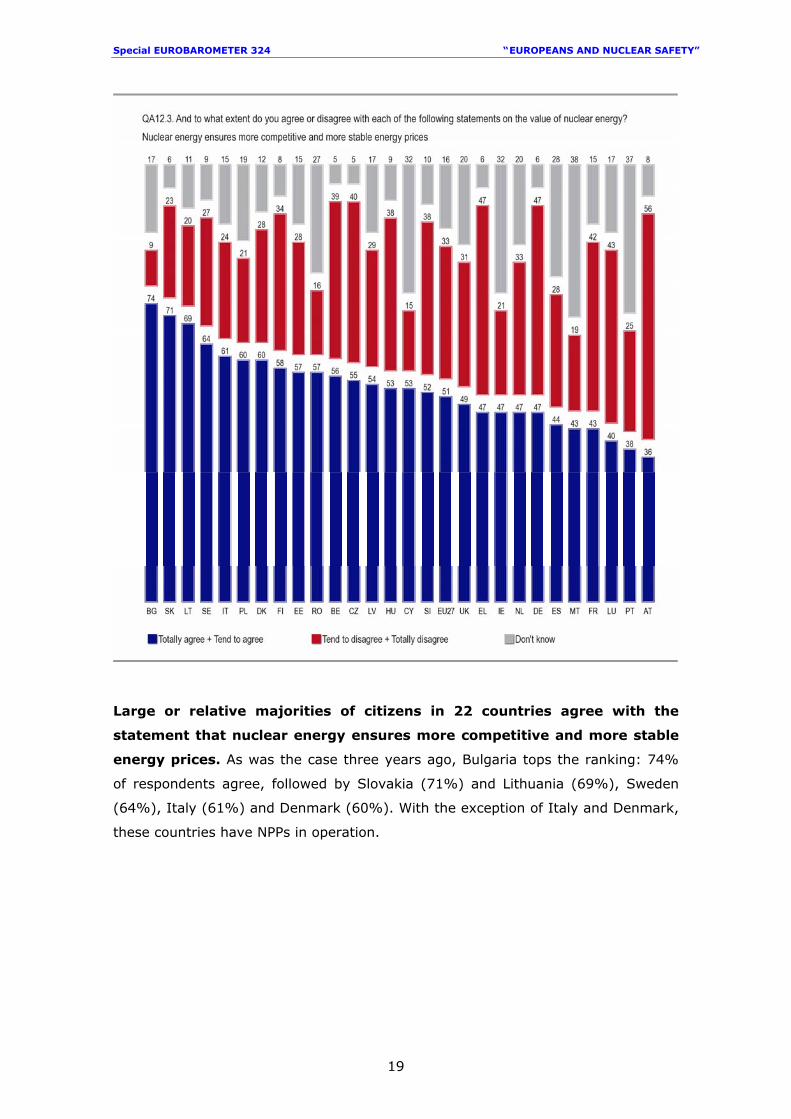
Large or relative majorities of citizens in 22 countries agree with the
statement that nuclear energy ensures more competitive and more stable
energy prices. As was the case three years ago, Bulgaria tops the ranking: 74%
of respondents agree, followed by Slovakia (71%) and Lithuania (69%), Sweden
(64%), Italy (61%) and Denmark (60%). With the exception of Italy and Denmark,
these countries have NPPs in operation.
Special EUROBAROMETER 324 “ EUROPEANS AND NUCLEAR SAFETY”
20
Once again Austria records the highest level of criticism, with almost six out of ten
citizens disagreeing with this statement (56%). Responses in Germany, Greece,
Luxembourg and France reveal a profound division within public opinion about the
subject, with equal or similar proportions of respondents agreeing and disagreeing
that nuclear energy contributes to energy price stability. The highest non-response
rates are found in Malta (38%), Portugal (37%), Cyprus and Ireland (32%), all
countries where domestic energy sources do not include nuclear power.
Results indicate that the pattern observed between countries with NPPs and those
without is not as clear here as with the two other statements. It is reasonable to
think that answers could also be influenced by the level of dependence each
country has on energy imports, especially in those cases where the Member State is
overwhelmingly dependent on one single supplier.
Special EUROBAROMETER 324 “ EUROPEANS AND NUCLEAR SAFETY”
21
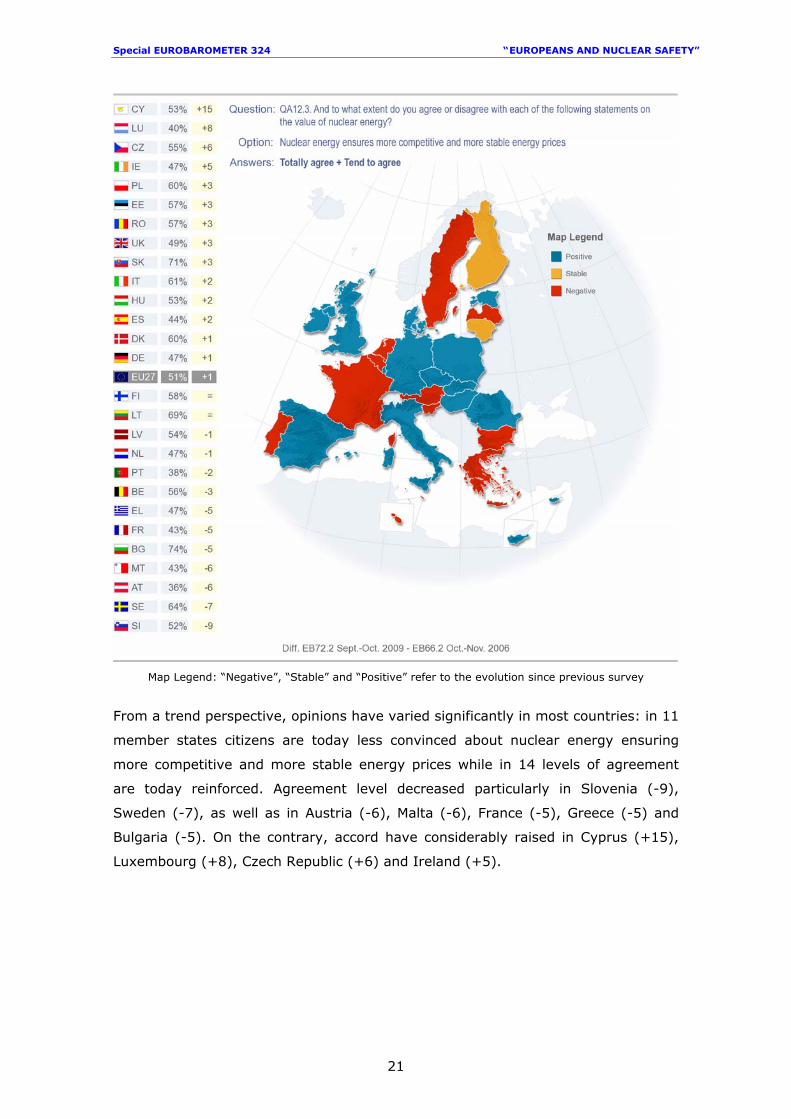
Map Legend: “Negative”, “Stable” and “Positive” refer to the evolution since previous survey
From a trend perspective, opinions have varied significantly in most countries: in 11
member states citizens are today less convinced about nuclear energy ensuring
more competitive and more stable energy prices while in 14 levels of agreement
are today reinforced. Agreement level decreased particularly in Slovenia (-9),
Sweden (-7), as well as in Austria (-6), Malta (-6), France (-5), Greece (-5) and
Bulgaria (-5). On the contrary, accord have considerably raised in Cyprus (+15),
Luxembourg (+8), Czech Republic (+6) and Ireland (+5).
Special EUROBAROMETER 324 “ EUROPEANS AND NUCLEAR SAFETY”
22
Agree Disagree DK Agree Disagree DK Agree Disagree DK
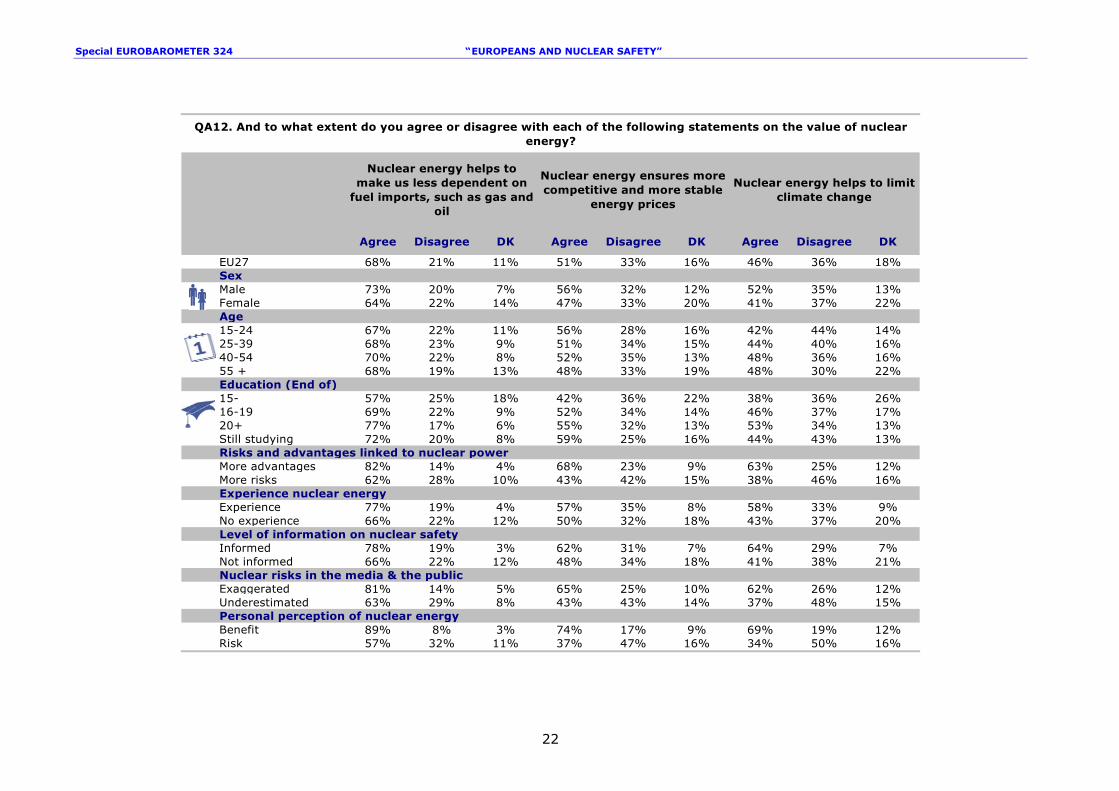
EU27 68% 21% 11% 51% 33% 16% 46% 36% 18%SexMale 73% 20% 7% 56% 32% 12% 52% 35% 13%Female 64% 22% 14% 47% 33% 20% 41% 37% 22%Age15-24 67% 22% 11% 56% 28% 16% 42% 44% 14%25-39 68% 23% 9% 51% 34% 15% 44% 40% 16%40-54 70% 22% 8% 52% 35% 13% 48% 36% 16%55 + 68% 19% 13% 48% 33% 19% 48% 30% 22%Education (End of)15- 57% 25% 18% 42% 36% 22% 38% 36% 26%16-19 69% 22% 9% 52% 34% 14% 46% 37% 17%20+ 77% 17% 6% 55% 32% 13% 53% 34% 13%Still studying 72% 20% 8% 59% 25% 16% 44% 43% 13%Risks and advantages linked to nuclear powerMore advantages 82% 14% 4% 68% 23% 9% 63% 25% 12%More risks 62% 28% 10% 43% 42% 15% 38% 46% 16%Experience nuclear energyExperience 77% 19% 4% 57% 35% 8% 58% 33% 9%No experience 66% 22% 12% 50% 32% 18% 43% 37% 20%Level of information on nuclear safetyInformed 78% 19% 3% 62% 31% 7% 64% 29% 7%Not informed 66% 22% 12% 48% 34% 18% 41% 38% 21%Nuclear risks in the media & the publicExaggerated 81% 14% 5% 65% 25% 10% 62% 26% 12%Underestimated 63% 29% 8% 43% 43% 14% 37% 48% 15%Personal perception of nuclear energyBenefit 89% 8% 3% 74% 17% 9% 69% 19% 12%Risk 57% 32% 11% 37% 47% 16% 34% 50% 16%
Nuclear energy helps to limit climate change
QA12. And to what extent do you agree or disagree with each of the following statements on the value of nuclear energy?
Nuclear energy helps to make us less dependent on
fuel imports, such as gas and oil
Nuclear energy ensures more competitive and more stable
energy prices
Special EUROBAROMETER 324 “ EUROPEANS AND NUCLEAR SAFETY”
23
The analysis by socio-demographic and attitudinal factors raises a clear
pattern that applies to all statements concerning the value of nuclear energy:
education and information together with risk perception (general and personally
speaking) play a major role and determine whether views of nuclear energy are
positive or negative.
More educated/more informed categories of the population are considerably
more likely to agree with each statement. This is true for males (who have a
significantly lower non-response rate than women), as well as for citizens with
better level of education and whose who consider themselves well-informed about
issues linked to nuclear safety. Personal experience of nuclear energy could be
included within this category of variables that determine a better/higher
understanding or information about the topic and consequently a higher level of
agreement with the three statements.
Perceptions of nuclear energy as a risk or an advantage, from a general or a
personal point of view, act in the same direction: a belief that nuclear energy’s
advantages outweigh its risks leads to levels of agreement that may be 30 points
higher than levels among those who have a negative opinion.
Socio-demographic breakdown by age produces asymmetrical results: fewer
respondents in the youngest age group agree with the statements concerning
nuclear energy’s positive impact on the fight against climate change and reduced
energy imports in comparison with their older counterparts, while more agree with
the statements about stable energy.
Special EUROBAROMETER 324 “ EUROPEANS AND NUCLEAR SAFETY”
24
1.2. The future of Nuclear Energy
1.2.1. The future share in the energy mix
Source Questionnaire: QA1513
- Most Europeans would either maintain or reduce the current level of
nuclear energy as a proportion of all energy sources -
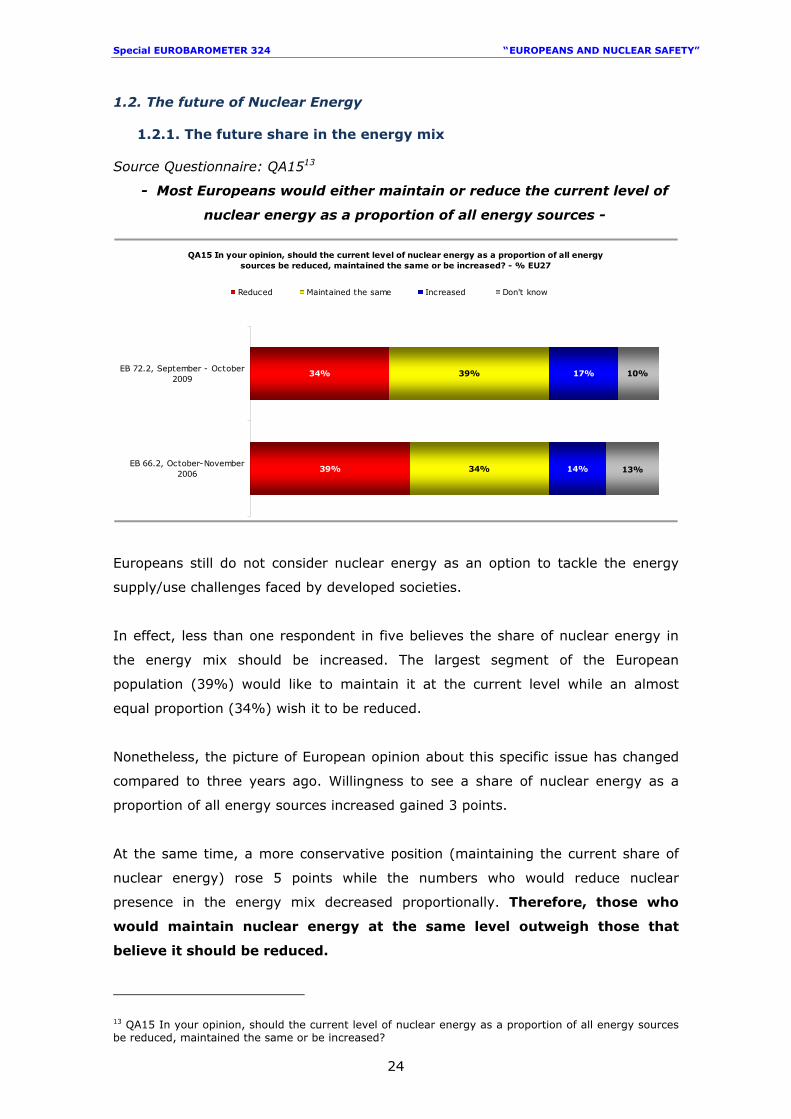
QA15 In your opinion, should the current level of nuclear energy as a proportion of all energy sources be reduced, maintained the same or be increased? - % EU27
39%
34%
34%
39%
14%
17% 10%
13%EB 66.2, October-November
2006
EB 72.2, September - October2009
Reduced Maintained the same Increased Don't know
Europeans still do not consider nuclear energy as an option to tackle the energy
supply/use challenges faced by developed societies.
In effect, less than one respondent in five believes the share of nuclear energy in
the energy mix should be increased. The largest segment of the European
population (39%) would like to maintain it at the current level while an almost
equal proportion (34%) wish it to be reduced.
Nonetheless, the picture of European opinion about this specific issue has changed
compared to three years ago. Willingness to see a share of nuclear energy as a
proportion of all energy sources increased gained 3 points.
At the same time, a more conservative position (maintaining the current share of
nuclear energy) rose 5 points while the numbers who would reduce nuclear
presence in the energy mix decreased proportionally. Therefore, those who
would maintain nuclear energy at the same level outweigh those that
believe it should be reduced.
13 QA15 In your opinion, should the current level of nuclear energy as a proportion of all energy sources be reduced, maintained the same or be increased?
Special EUROBAROMETER 324 “ EUROPEANS AND NUCLEAR SAFETY”
25
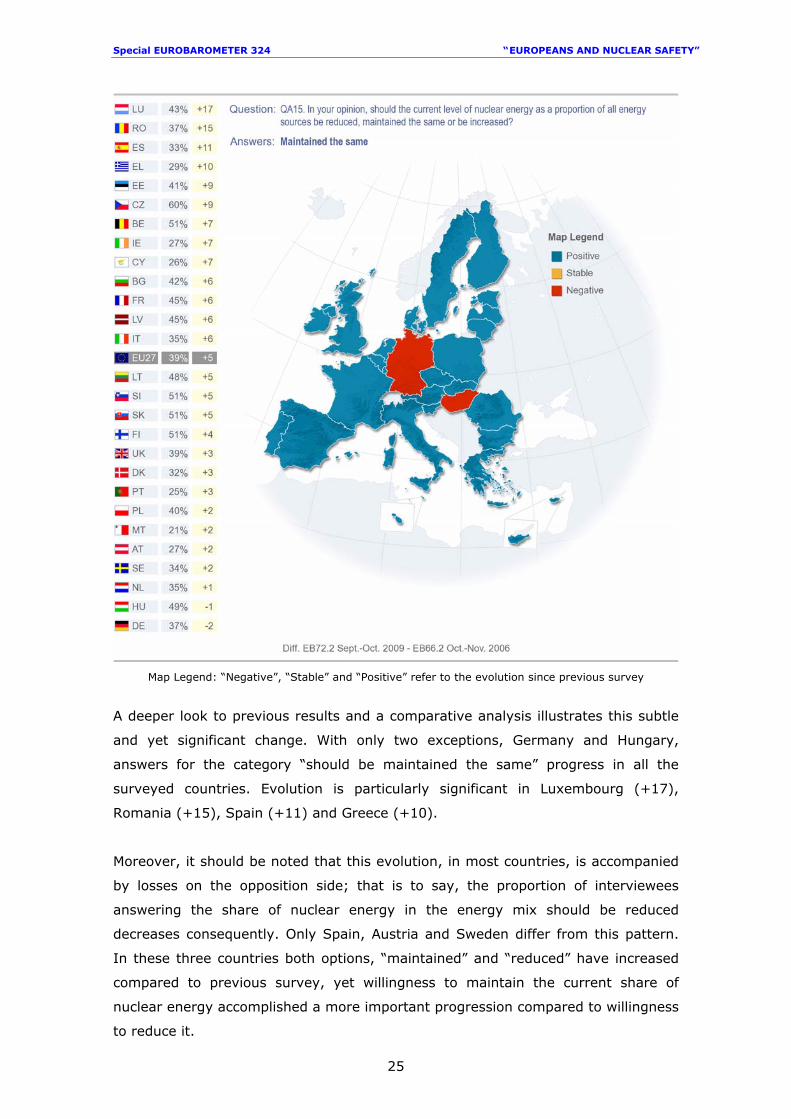
Map Legend: “Negative”, “Stable” and “Positive” refer to the evolution since previous survey
A deeper look to previous results and a comparative analysis illustrates this subtle
and yet significant change. With only two exceptions, Germany and Hungary,
answers for the category “should be maintained the same” progress in all the
surveyed countries. Evolution is particularly significant in Luxembourg (+17),
Romania (+15), Spain (+11) and Greece (+10).
Moreover, it should be noted that this evolution, in most countries, is accompanied
by losses on the opposition side; that is to say, the proportion of interviewees
answering the share of nuclear energy in the energy mix should be reduced
decreases consequently. Only Spain, Austria and Sweden differ from this pattern.
In these three countries both options, “maintained” and “reduced” have increased
compared to previous survey, yet willingness to maintain the current share of
nuclear energy accomplished a more important progression compared to willingness
to reduce it.
Special EUROBAROMETER 324 “ EUROPEANS AND NUCLEAR SAFETY”
26
It would be necessary to analyse future results to confirm whether these are only
subtle and passing variations, or whether, on the contrary, they are a sign of a
more profound change in the European mindset concerning nuclear energy.
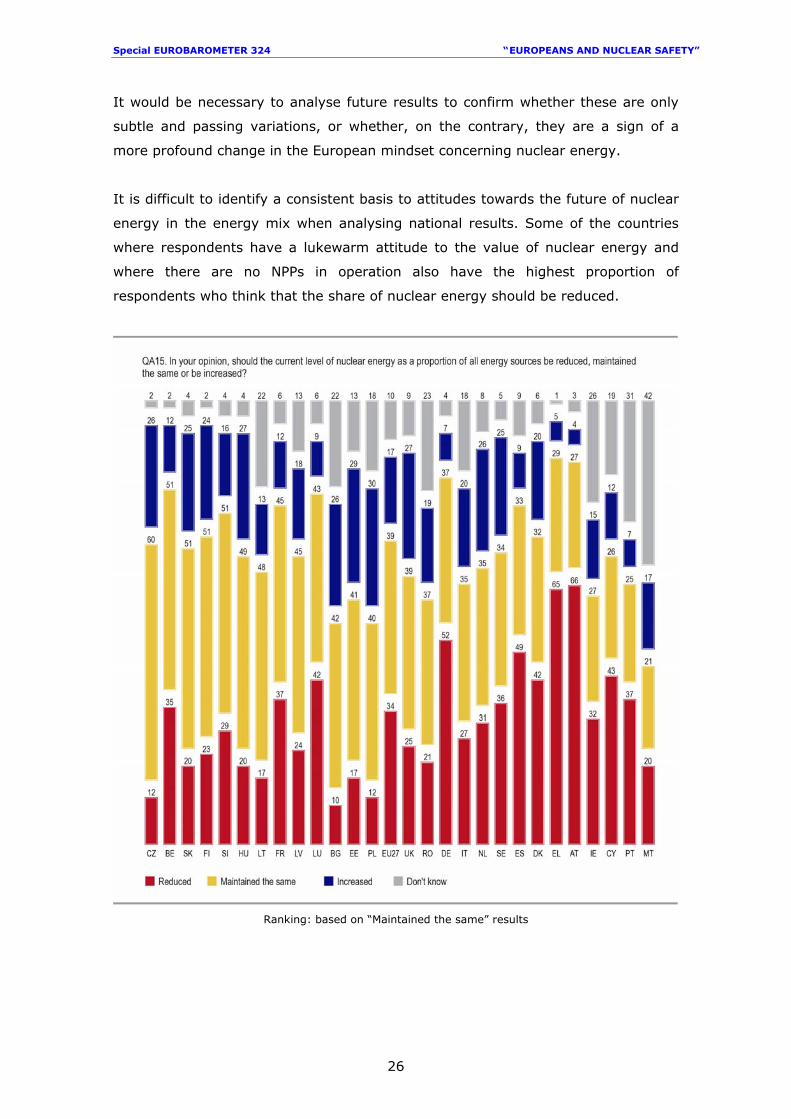
It is difficult to identify a consistent basis to attitudes towards the future of nuclear
energy in the energy mix when analysing national results. Some of the countries
where respondents have a lukewarm attitude to the value of nuclear energy and
where there are no NPPs in operation also have the highest proportion of
respondents who think that the share of nuclear energy should be reduced.
Ranking: based on “Maintained the same” results
Special EUROBAROMETER 324 “ EUROPEANS AND NUCLEAR SAFETY”
27
This is so in Greece (65%) and Austria (66%). Yet these countries are followed by
Member States such as Germany (52%) and Spain (49%), where nuclear power
plants are currently operating. Both have recently seen a reactivation of the debate
on prolonging the life of existing nuclear plants14. Finally, Danish responses offer a
fine example of this lack of coherent pattern: despite their above-average positive
perceptions of the value of nuclear energy, a relative majority (42%) believes the
proportion of nuclear energy in the energy mix should be decreased.
The highest proportions of citizens who say that the share of nuclear
energy should be increased are found in Poland (30%) and Estonia (29%).
It is worth noting that both countries have debated the possibility of building their
first nuclear power plants in recent years. Poland relies mostly on coal to meet its
energy needs, which are expected to rise by 80-90% by 2025. But coal does not
seem to be the best option if they are to comply fully with the Kyoto Protocol and
EU national allocation plan commitments. This is why the Polish energy policy has
shifted in the past 4 years towards nuclear energy. A resolution was adopted early
this year and by 2020 part of the electricity consumed should be generated by
NPPs15. Similarly, the Estonian Government is considering the possibility of building
the country’s first nuclear power plant.
These two countries are followed by Member States that already have functioning
NPPs like Hungary (27%), the United Kingdom (27%), Czech Republic (26%),
Bulgaria (26%) and the Netherlands (26%).
Large numbers of respondents who would like to maintain the proportion
of nuclear energy the same are also found in countries where NPPs are in
operation, namely Finland (51%), Belgium (51%), Slovenia (51%) and France
(45%). Results in France have undergone a significant evolution compared to 2006:
three years ago, a relative majority of French respondents (49%) preferred the
share of nuclear energy in the national energy mix to be reduced.
9 The Spanish government recently decided to extend the activity of the oldest NPP in its territory (Garoña); in Germany the issue played a major role in the latest general election. 15 FORATOM - Country Profile: Poland
Special EUROBAROMETER 324 “ EUROPEANS AND NUCLEAR SAFETY”
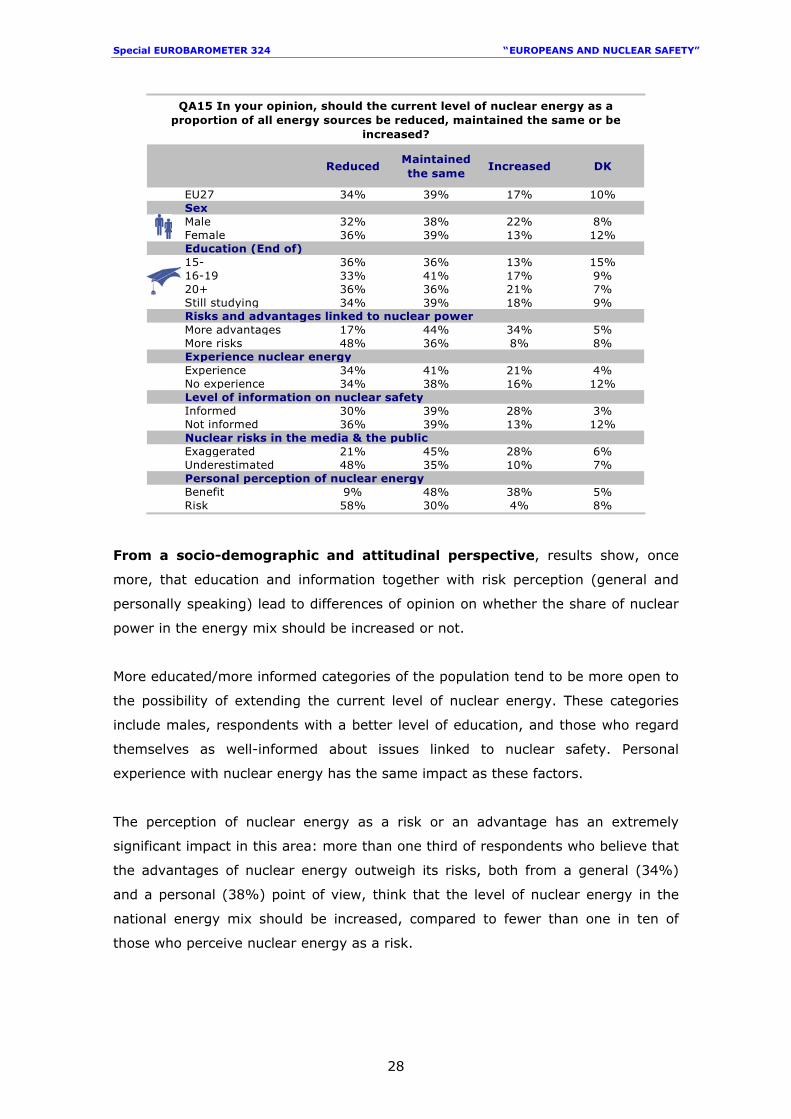
28
ReducedMaintained the same
Increased DK
EU27 34% 39% 17% 10%SexMale 32% 38% 22% 8%Female 36% 39% 13% 12%Education (End of)15- 36% 36% 13% 15%16-19 33% 41% 17% 9%20+ 36% 36% 21% 7%Still studying 34% 39% 18% 9%Risks and advantages linked to nuclear powerMore advantages 17% 44% 34% 5%More risks 48% 36% 8% 8%Experience nuclear energyExperience 34% 41% 21% 4%No experience 34% 38% 16% 12%Level of information on nuclear safetyInformed 30% 39% 28% 3%Not informed 36% 39% 13% 12%Nuclear risks in the media & the publicExaggerated 21% 45% 28% 6%Underestimated 48% 35% 10% 7%Personal perception of nuclear energyBenefit 9% 48% 38% 5%Risk 58% 30% 4% 8%
QA15 In your opinion, should the current level of nuclear energy as a proportion of all energy sources be reduced, maintained the same or be
increased?
From a socio-demographic and attitudinal perspective, results show, once
more, that education and information together with risk perception (general and
personally speaking) lead to differences of opinion on whether the share of nuclear
power in the energy mix should be increased or not.
More educated/more informed categories of the population tend to be more open to
the possibility of extending the current level of nuclear energy. These categories
include males, respondents with a better level of education, and those who regard
themselves as well-informed about issues linked to nuclear safety. Personal
experience with nuclear energy has the same impact as these factors.
The perception of nuclear energy as a risk or an advantage has an extremely
significant impact in this area: more than one third of respondents who believe that
the advantages of nuclear energy outweigh its risks, both from a general (34%)
and a personal (38%) point of view, think that the level of nuclear energy in the
national energy mix should be increased, compared to fewer than one in ten of
those who perceive nuclear energy as a risk.
Special EUROBAROMETER 324 “ EUROPEANS AND NUCLEAR SAFETY”
29
1.2.2. Arguments contributing to support or opposition to the lifetime
extension of existing nuclear plants
Source Questionnaire: QA13-QA1416
Opting to extend the lifetime of nuclear power plants has been an alternative to
ordering new nuclear units, especially in those countries which have operating NPPs
but which have renounced, or have not currently adopted, any plans for expansion.
The debate has also come to countries that had previously decided to phase out
their reactors, for example in Germany. Before the recent elections, both the
parties that will form the new government (CDU and FDP) had announced their
support for extending the lifetime of German nuclear power plants.
Beyond the impact of such a decision on a country’s overall nuclear energy
programme, extending the lifetime of nuclear power plants raises questions of
safety and risk that are a concern for the future or nuclear energy and that
profoundly interest public opinion.
Two questions were asked in order to measure the scope of the different arguments
for and against lifetime extensions of nuclear power plants. The analysis of these
questions confirms the importance of the safety argument when dealing
with support or opposition to the lifetime extension of existing nuclear
plants.
16 QA13 Among the following arguments, which ones could make you support lifetime extensions of nuclear power plants? (MULTIPLE ANSWERS POSSIBLE): Lifetime extensions can help to ensure more competitive electricity cost; Lifetime extensions will encourage the development of alternative energy sources; Lifetime extensions can be done if plants safely continue to satisfy national and international requirements; None/ you are opposed to such lifetime extensions of nuclear power plants (SPONTANEOUS); DK QA14 And among the following arguments, which ones could make you opposed to lifetime extensions of nuclear power plants? (MULTIPLE ANSWERS POSSIBLE): The economic benefits made by lifetime extensions will not be passed to European citizens; Lifetime extensions will likely diminish incentives to develop alternative energies; You would rather prefer building new nuclear power plants with the best available safety design; The technical upgrade made for lifetime extension cannot ensure an adequate level of safety; Other (SPONTANEOUS); None/ you are in favour of such lifetime extensions of nuclear power plants (SPONTANEOUS); DK
Special EUROBAROMETER 324 “ EUROPEANS AND NUCLEAR SAFETY”
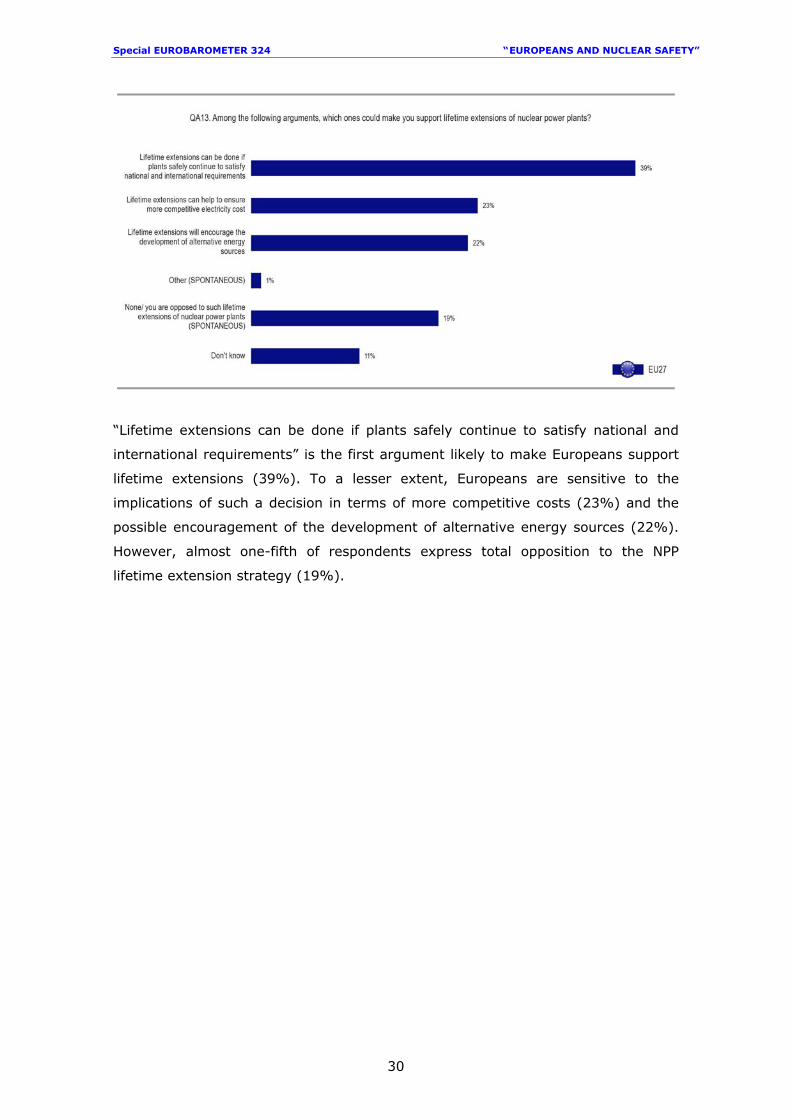
30
“Lifetime extensions can be done if plants safely continue to satisfy national and
international requirements” is the first argument likely to make Europeans support
lifetime extensions (39%). To a lesser extent, Europeans are sensitive to the
implications of such a decision in terms of more competitive costs (23%) and the
possible encouragement of the development of alternative energy sources (22%).
However, almost one-fifth of respondents express total opposition to the NPP
lifetime extension strategy (19%).
Special EUROBAROMETER 324 “ EUROPEANS AND NUCLEAR SAFETY”
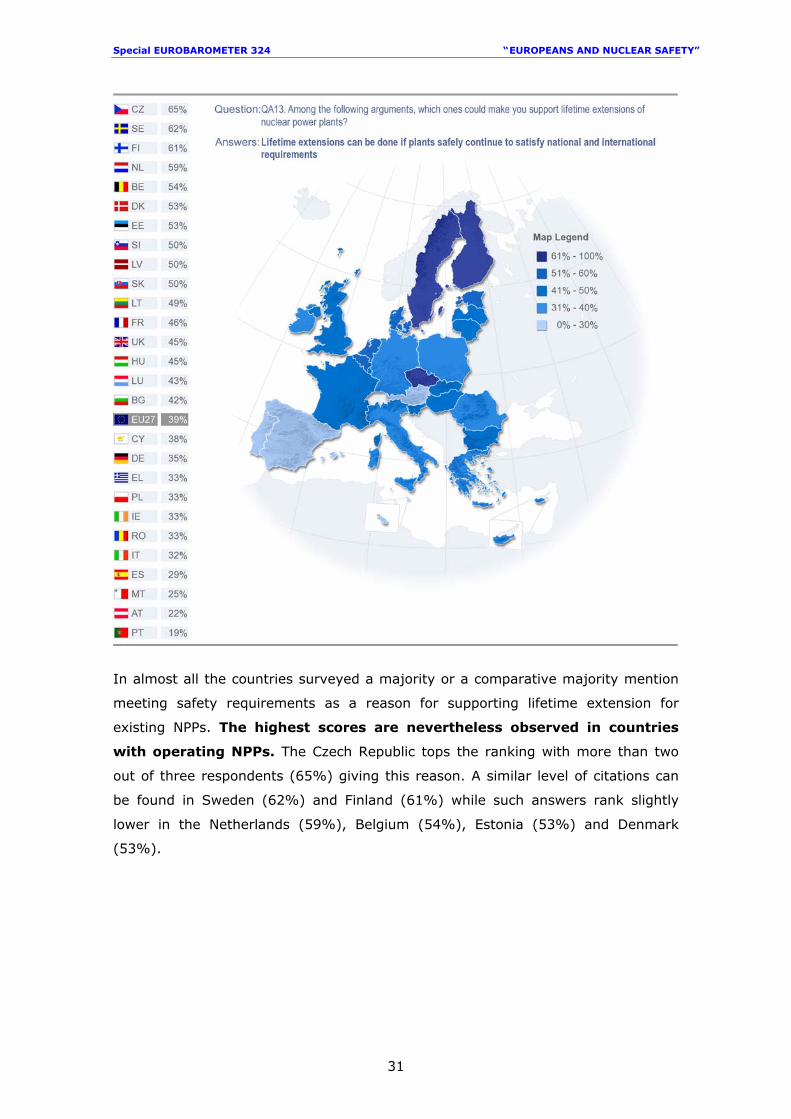
31
In almost all the countries surveyed a majority or a comparative majority mention
meeting safety requirements as a reason for supporting lifetime extension for
existing NPPs. The highest scores are nevertheless observed in countries
with operating NPPs. The Czech Republic tops the ranking with more than two
out of three respondents (65%) giving this reason. A similar level of citations can
be found in Sweden (62%) and Finland (61%) while such answers rank slightly
lower in the Netherlands (59%), Belgium (54%), Estonia (53%) and Denmark
(53%).
Special EUROBAROMETER 324 “ EUROPEANS AND NUCLEAR SAFETY”
32
Lif
eti
me e
xte
nsi
on
s ca
n b
e
do
ne if
pla
nts
safe
ly
con
tin
ue t
o s
ati
sfy n
ati
on
al
an
d in
tern
ati
on
al
req
uir
em
en
ts
Lif
eti
me e
xte
nsi
on
s ca
n
help
to
en
sure
mo
re
com
peti
tive e
lect
rici
ty c
ost
Lif
eti
me e
xte
nsi
on
s w
ill
en
cou
rag
e t
he d
evelo
pm
en
t of
alt
ern
ati
ve e
nerg
y
sou
rces
Oth
er
(SP
ON
TA
NE
OU
S)
No
ne/
yo
u a
re o
pp
ose
d t
o
such
lif
eti
me e
xte
nsi
on
s o
f n
ucl
ear
po
wer
pla
nts
(S
PO
NT
AN
EO
US
)
DK
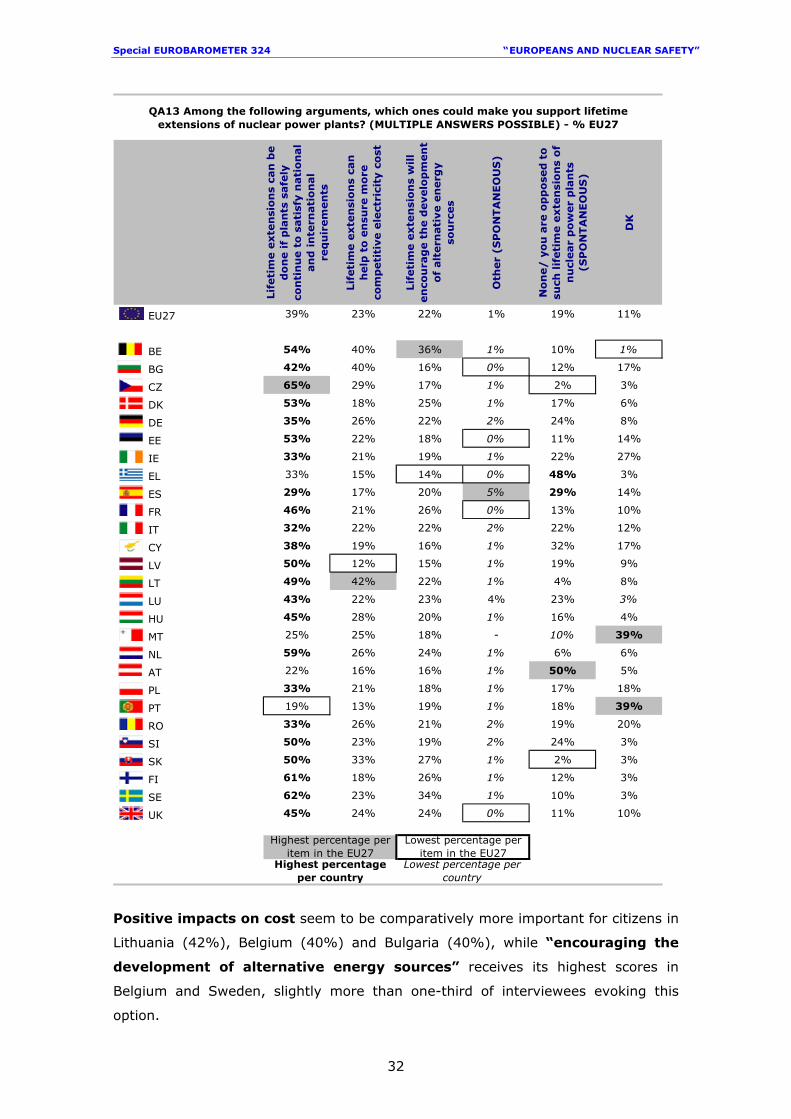
EU27 39% 23% 22% 1% 19% 11%
BE 54% 40% 36% 1% 10% 1%
BG 42% 40% 16% 0% 12% 17%
CZ 65% 29% 17% 1% 2% 3%
DK 53% 18% 25% 1% 17% 6%
DE 35% 26% 22% 2% 24% 8%
EE 53% 22% 18% 0% 11% 14%
IE 33% 21% 19% 1% 22% 27%
EL 33% 15% 14% 0% 48% 3%
ES 29% 17% 20% 5% 29% 14%
FR 46% 21% 26% 0% 13% 10%
IT 32% 22% 22% 2% 22% 12%
CY 38% 19% 16% 1% 32% 17%
LV 50% 12% 15% 1% 19% 9%
LT 49% 42% 22% 1% 4% 8%
LU 43% 22% 23% 4% 23% 3%
HU 45% 28% 20% 1% 16% 4%
MT 25% 25% 18% - 10% 39%
NL 59% 26% 24% 1% 6% 6%
AT 22% 16% 16% 1% 50% 5%
PL 33% 21% 18% 1% 17% 18%
PT 19% 13% 19% 1% 18% 39%
RO 33% 26% 21% 2% 19% 20%
SI 50% 23% 19% 2% 24% 3%
SK 50% 33% 27% 1% 2% 3%
FI 61% 18% 26% 1% 12% 3%
SE 62% 23% 34% 1% 10% 3%
UK 45% 24% 24% 0% 11% 10%
QA13 Among the following arguments, which ones could make you support lifetime extensions of nuclear power plants? (MULTIPLE ANSWERS POSSIBLE) - % EU27
Highest percentage per item in the EU27
Lowest percentage per item in the EU27
Highest percentage per country
Lowest percentage per country
Positive impacts on cost seem to be comparatively more important for citizens in
Lithuania (42%), Belgium (40%) and Bulgaria (40%), while “encouraging the
development of alternative energy sources” receives its highest scores in
Belgium and Sweden, slightly more than one-third of interviewees evoking this
option.
Special EUROBAROMETER 324 “ EUROPEANS AND NUCLEAR SAFETY”
33
Finally, we observe strong opposition to NPPs lifetime extension in countries with no
operating nuclear power plants: in Austria (50%), Greece (48%) and to a lesser
extent in Cyprus (32%), high proportions of respondents spontaneously express
their opposition to such lifetime extensions. A non-negligible proportion of
citizens who oppose this option can be found in Spain (29%) and Germany (24%),
two countries where this has been a matter of recent or current debate.
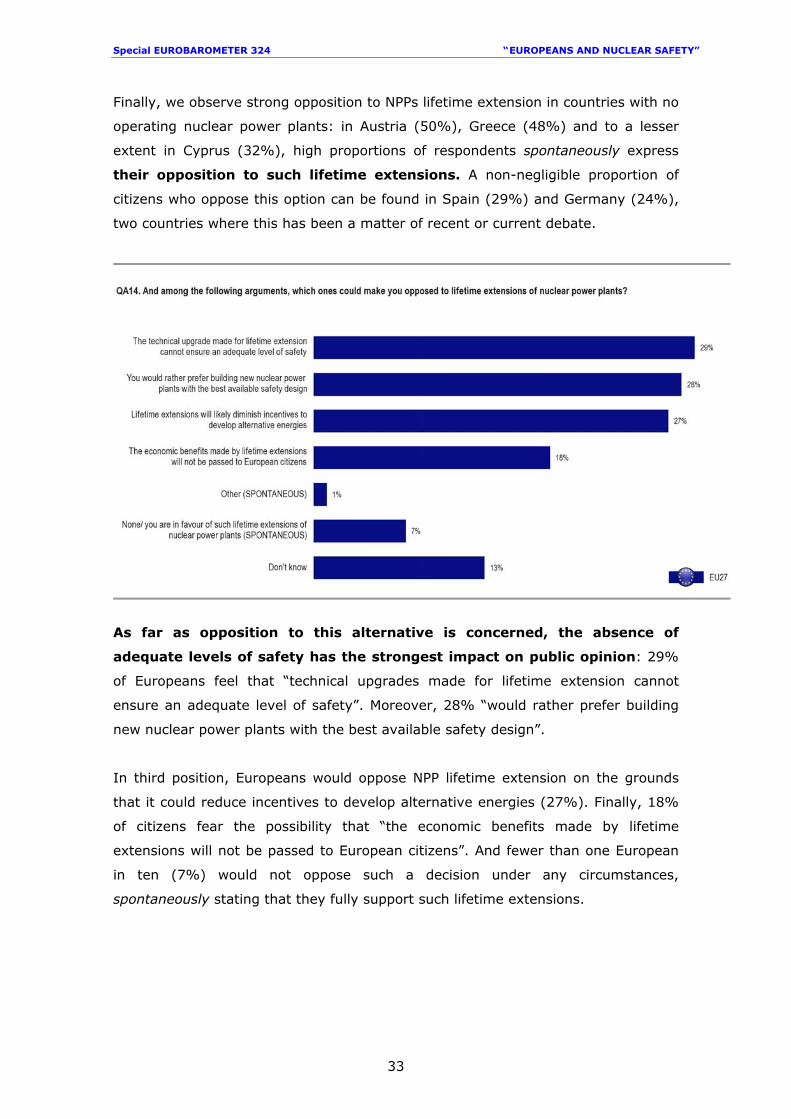
As far as opposition to this alternative is concerned, the absence of
adequate levels of safety has the strongest impact on public opinion: 29%
of Europeans feel that “technical upgrades made for lifetime extension cannot
ensure an adequate level of safety”. Moreover, 28% “would rather prefer building
new nuclear power plants with the best available safety design”.
In third position, Europeans would oppose NPP lifetime extension on the grounds
that it could reduce incentives to develop alternative energies (27%). Finally, 18%
of citizens fear the possibility that “the economic benefits made by lifetime
extensions will not be passed to European citizens”. And fewer than one European
in ten (7%) would not oppose such a decision under any circumstances,
spontaneously stating that they fully support such lifetime extensions.
Special EUROBAROMETER 324 “ EUROPEANS AND NUCLEAR SAFETY”
34
Th
e t
ech
nic
al u
pgra
de
made f
or
life
tim
e
exte
nsi
on
can
not
en
sure
an
adequ
ate
level of
safe
ty
You
wou
ld r
ath
er
pre
fer
bu
ildin
g n
ew
nu
clear
pow
er
pla
nts
wit
h t
he b
est
available
safe
ty d
esi
gn
Lif
eti
me e
xte
nsi
on
s w
ill
likely
dim
inis
h in
cen
tives
to d
evelo
p a
ltern
ati
ve
en
erg
ies
Th
e e
con
om
ic b
en
efi
ts
made b
y lif
eti
me
exte
nsi
on
s w
ill n
ot
be
pass
ed t
o E
uro
pean
ci
tizen
s
Oth
er
(SP
ON
TA
NEO
US
)
Non
e/ y
ou
are
in
favou
r of
such
lif
eti
me e
xte
nsi
on
s of
nu
clear
pow
er
pla
nts
(S
PO
NTA
NEO
US
)
DK
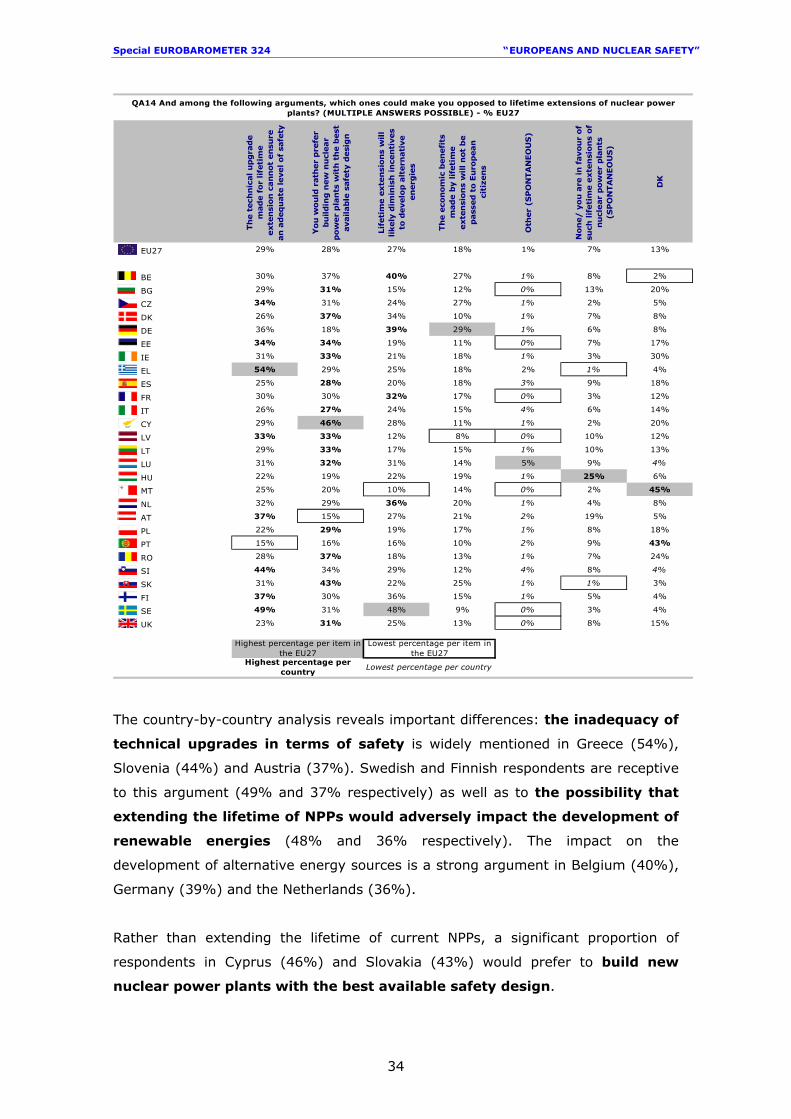
EU27 29% 28% 27% 18% 1% 7% 13%
BE 30% 37% 40% 27% 1% 8% 2%
BG 29% 31% 15% 12% 0% 13% 20%
CZ 34% 31% 24% 27% 1% 2% 5%
DK 26% 37% 34% 10% 1% 7% 8%
DE 36% 18% 39% 29% 1% 6% 8%
EE 34% 34% 19% 11% 0% 7% 17%
IE 31% 33% 21% 18% 1% 3% 30%
EL 54% 29% 25% 18% 2% 1% 4%
ES 25% 28% 20% 18% 3% 9% 18%
FR 30% 30% 32% 17% 0% 3% 12%
IT 26% 27% 24% 15% 4% 6% 14%
CY 29% 46% 28% 11% 1% 2% 20%
LV 33% 33% 12% 8% 0% 10% 12%
LT 29% 33% 17% 15% 1% 10% 13%
LU 31% 32% 31% 14% 5% 9% 4%
HU 22% 19% 22% 19% 1% 25% 6%
MT 25% 20% 10% 14% 0% 2% 45%
NL 32% 29% 36% 20% 1% 4% 8%
AT 37% 15% 27% 21% 2% 19% 5%
PL 22% 29% 19% 17% 1% 8% 18%
PT 15% 16% 16% 10% 2% 9% 43%
RO 28% 37% 18% 13% 1% 7% 24%
SI 44% 34% 29% 12% 4% 8% 4%
SK 31% 43% 22% 25% 1% 1% 3%
FI 37% 30% 36% 15% 1% 5% 4%
SE 49% 31% 48% 9% 0% 3% 4%
UK 23% 31% 25% 13% 0% 8% 15%
QA14 And among the following arguments, which ones could make you opposed to lifetime extensions of nuclear power plants? (MULTIPLE ANSWERS POSSIBLE) - % EU27
Highest percentage per item in the EU27
Lowest percentage per item in the EU27
Highest percentage per country
Lowest percentage per country
The country-by-country analysis reveals important differences: the inadequacy of
technical upgrades in terms of safety is widely mentioned in Greece (54%),
Slovenia (44%) and Austria (37%). Swedish and Finnish respondents are receptive
to this argument (49% and 37% respectively) as well as to the possibility that
extending the lifetime of NPPs would adversely impact the development of
renewable energies (48% and 36% respectively). The impact on the
development of alternative energy sources is a strong argument in Belgium (40%),
Germany (39%) and the Netherlands (36%).
Rather than extending the lifetime of current NPPs, a significant proportion of
respondents in Cyprus (46%) and Slovakia (43%) would prefer to build new
nuclear power plants with the best available safety design.
Special EUROBAROMETER 324 “ EUROPEANS AND NUCLEAR SAFETY”
35
This option was preferred by more than a third of interviewees in Romania (37%),
Denmark (37%) and Estonia (34%).
Finally, Hungary records a higher level of support for nuclear energy, with one
respondent in four spontaneously stating that no argument could make them
oppose since they are “in favour of such lifetime extensions of nuclear power
plants”.
1.2.3. An hypothetical case: preferences regarding the location, control
and supervision of a new nuclear power plant
Source Questionnaire: QA1717
Since safety and risk are major factors in determining support or opposition to
nuclear energy, this special Eurobarometer explores European public opinion in
more depth by confronting respondents with the hypothetical case of a new nuclear
power plant. Would they feel safer and would they prefer it to be controlled inside
or outside their own country? Would they prefer their own national supervision?
These are some of the questions the next paragraphs will consider.
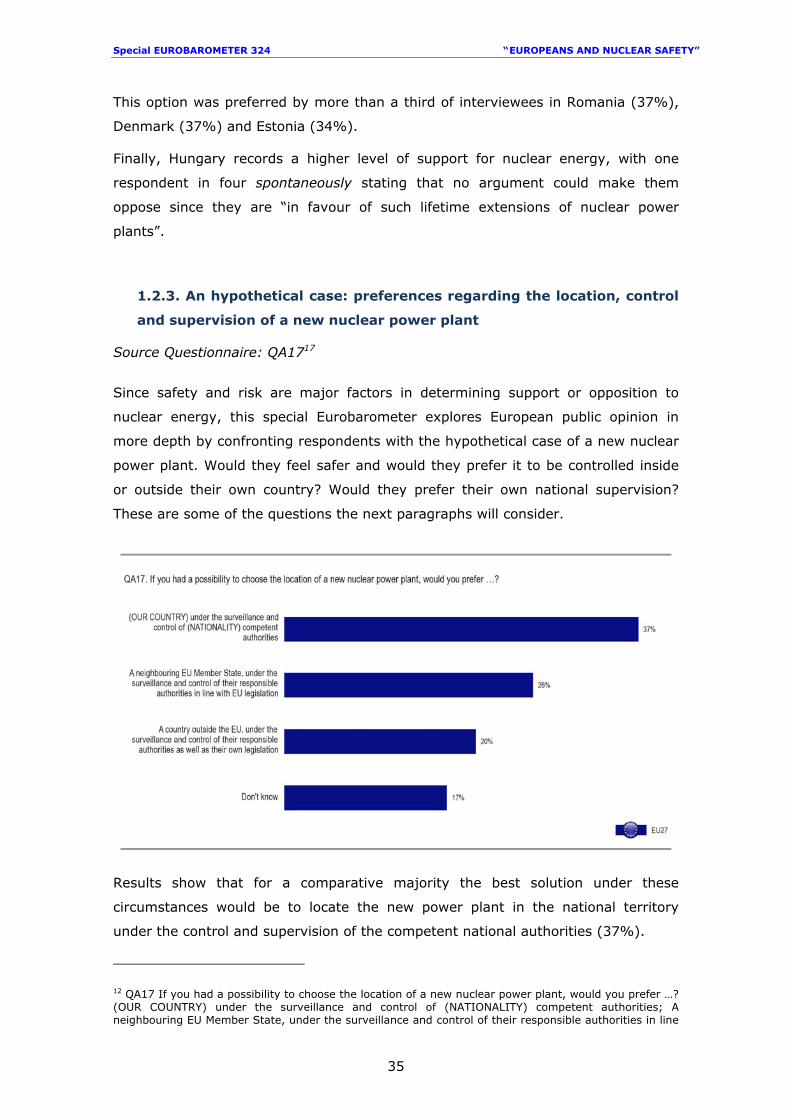
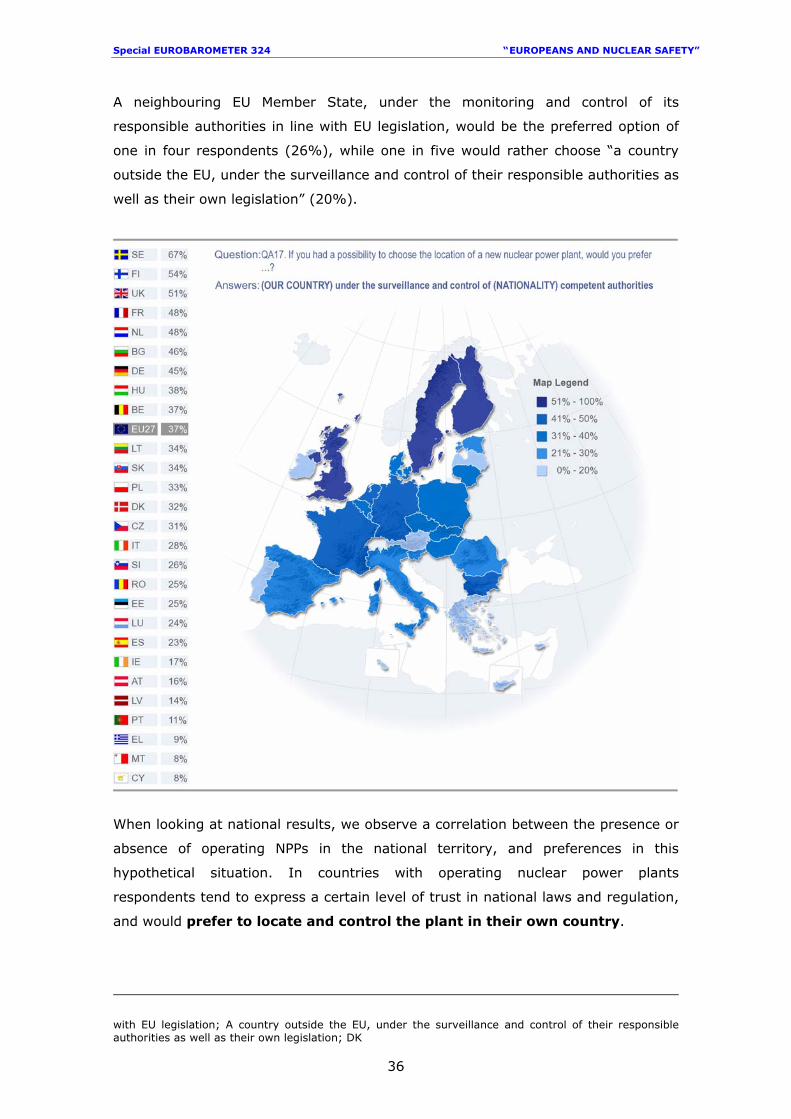
Results show that for a comparative majority the best solution under these
circumstances would be to locate the new power plant in the national territory
under the control and supervision of the competent national authorities (37%).
12 QA17 If you had a possibility to choose the location of a new nuclear power plant, would you prefer …? (OUR COUNTRY) under the surveillance and control of (NATIONALITY) competent authorities; A neighbouring EU Member State, under the surveillance and control of their responsible authorities in line
Special EUROBAROMETER 324 “ EUROPEANS AND NUCLEAR SAFETY”
36
A neighbouring EU Member State, under the monitoring and control of its
responsible authorities in line with EU legislation, would be the preferred option of
one in four respondents (26%), while one in five would rather choose “a country
outside the EU, under the surveillance and control of their responsible authorities as
well as their own legislation” (20%).
When looking at national results, we observe a correlation between the presence or
absence of operating NPPs in the national territory, and preferences in this
hypothetical situation. In countries with operating nuclear power plants
respondents tend to express a certain level of trust in national laws and regulation,
and would prefer to locate and control the plant in their own country.
with EU legislation; A country outside the EU, under the surveillance and control of their responsible authorities as well as their own legislation; DK
Special EUROBAROMETER 324 “ EUROPEANS AND NUCLEAR SAFETY”
37
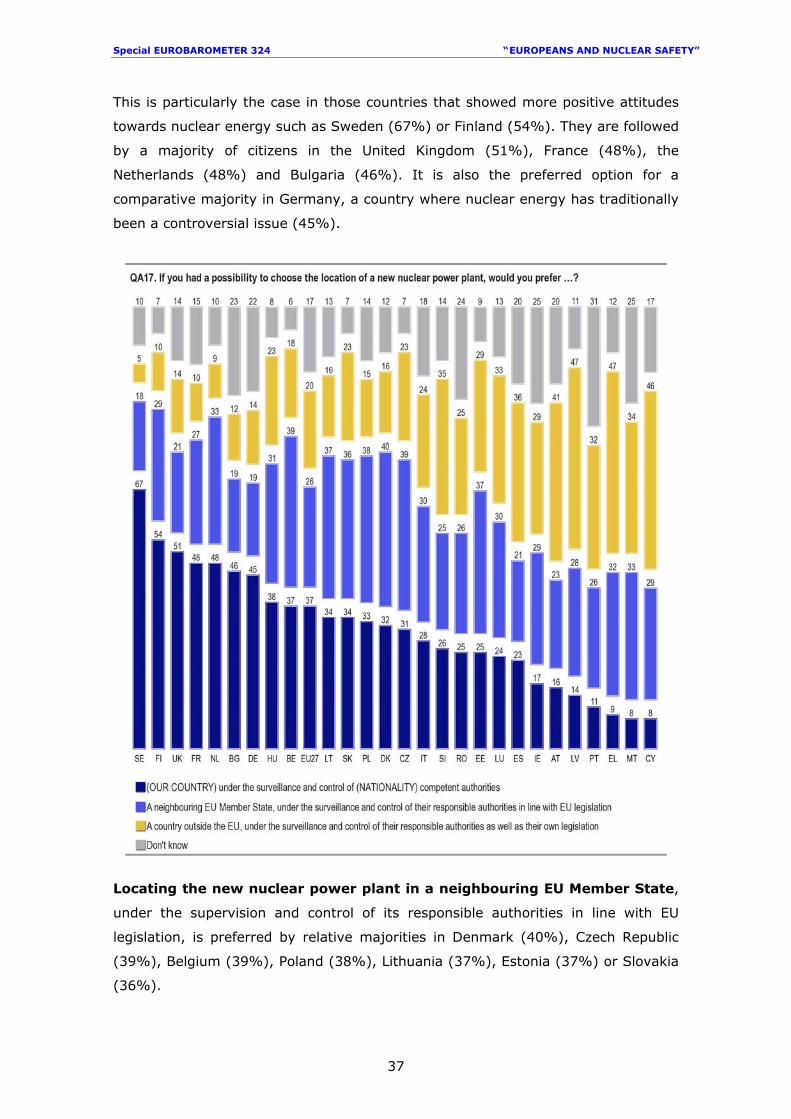
This is particularly the case in those countries that showed more positive attitudes
towards nuclear energy such as Sweden (67%) or Finland (54%). They are followed
by a majority of citizens in the United Kingdom (51%), France (48%), the
Netherlands (48%) and Bulgaria (46%). It is also the preferred option for a
comparative majority in Germany, a country where nuclear energy has traditionally
been a controversial issue (45%).
Locating the new nuclear power plant in a neighbouring EU Member State,
under the supervision and control of its responsible authorities in line with EU
legislation, is preferred by relative majorities in Denmark (40%), Czech Republic
(39%), Belgium (39%), Poland (38%), Lithuania (37%), Estonia (37%) or Slovakia
(36%).
Special EUROBAROMETER 324 “ EUROPEANS AND NUCLEAR SAFETY”
38
We find here a mix of countries where nuclear is absent from the current energy
mix, such as Denmark, countries that have operating NPPs (the Czech Republic,
Belgium, Lithuania and Slovakia) and countries that are currently considering the
possibility of building their first nuclear power plant (such as Estonia and Poland).
Respondents in Greece, Cyprus and Austria, countries with no NPPs and which
record a high level of opposition to nuclear energy, tend to prefer a country
outside the EU, under the supervision and control of the responsible
authorities and legislation of that country (47%, 46% and 41% respectively).
Relative majorities in Latvia (47%), Spain (36%) and Slovenia (35%), Malta (34%)
and Luxembourg (33%) also share this opinion.
Finally, the presence of operating NPPs in their country does not necessary mean
that respondents find it easy to express an opinion on the topic: though significant
levels of non-response are found in non-nuclear countries such as Portugal (31%),
Malta (25%) and Ireland (25%), the same can also be said for Romania (24%),
Bulgaria (23%), Germany (22%) and Spain (20%).
Special EUROBAROMETER 324 “ EUROPEANS AND NUCLEAR SAFETY”
39
(OUR COUNTRY) under the
surveillance and control of
(NATIONALITY) competent authorities
A neighbouring EU Member
State, under the surveillance and control of their
responsible authorities in line with EU legislation
A country outside the EU,
under the surveillance and control of their
responsible authorities as
well as their own legislation
DK
EU27 37% 26% 20% 17%SexMale 42% 25% 19% 14%Female 32% 28% 21% 19%Age15-24 31% 34% 23% 12%25-39 35% 28% 22% 15%40-54 39% 26% 18% 17%55 + 40% 23% 18% 19%Education (End of)15- 32% 22% 25% 21%16-19 38% 27% 20% 15%20+ 42% 26% 15% 17%Still studying 33% 36% 20% 11%Risks and advantages linked to nuclear powerMore advantages 53% 27% 11% 9%More risks 28% 28% 26% 18%Experience nuclear energyExperience 48% 25% 13% 14%No experience 34% 27% 22% 17%Level of information on nuclear safetyInformed 48% 27% 13% 12%Not informed 34% 27% 22% 17%Nuclear risks in the media & the publicExaggerated 50% 28% 14% 8%Underestimated 30% 27% 25% 18%Personal perception of nuclear energyBenefit 58% 27% 9% 6%Risk 25% 27% 28% 20%
QA17 If you had a possibility to choose the location of a new nuclear power plant, would you prefer …?
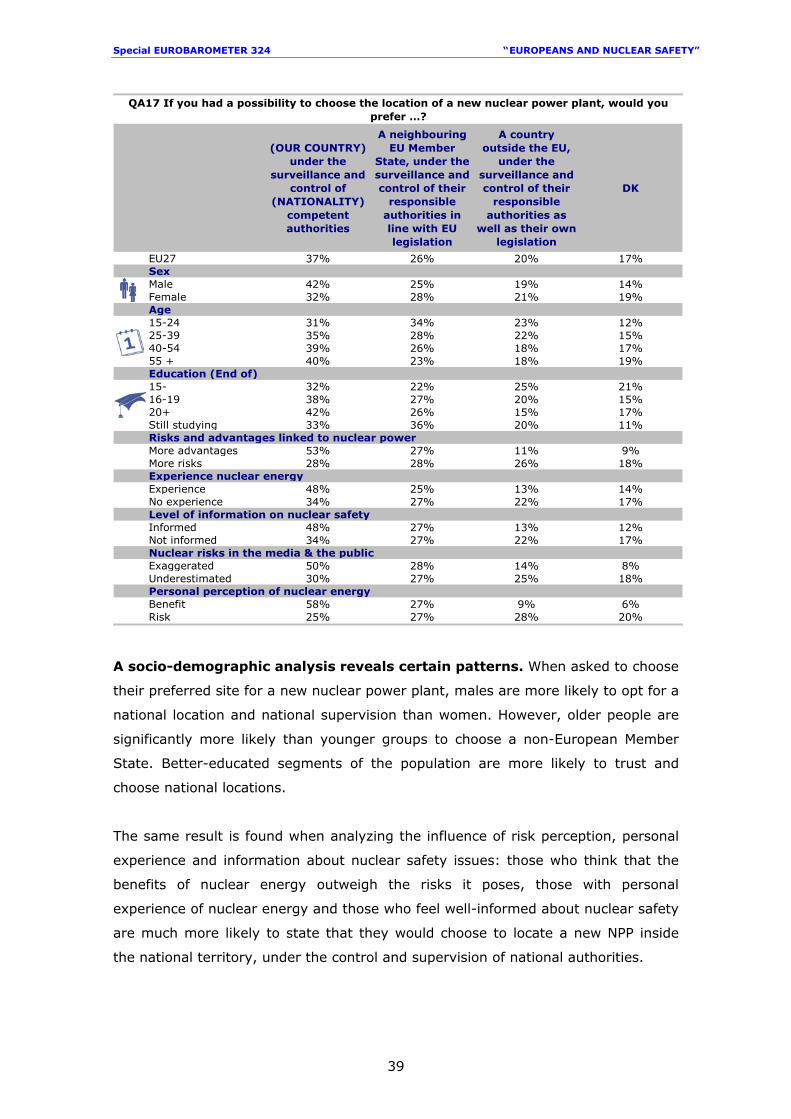
A socio-demographic analysis reveals certain patterns. When asked to choose
their preferred site for a new nuclear power plant, males are more likely to opt for a
national location and national supervision than women. However, older people are
significantly more likely than younger groups to choose a non-European Member
State. Better-educated segments of the population are more likely to trust and
choose national locations.
The same result is found when analyzing the influence of risk perception, personal
experience and information about nuclear safety issues: those who think that the
benefits of nuclear energy outweigh the risks it poses, those with personal
experience of nuclear energy and those who feel well-informed about nuclear safety
are much more likely to state that they would choose to locate a new NPP inside
the national territory, under the control and supervision of national authorities.
Special EUROBAROMETER 324 “ EUROPEANS AND NUCLEAR SAFETY”
40
2. PERCEPTIONS OF NUCLEAR SAFETY
In the first chapter we saw that to a certain extent Europeans attach positive
attributes to nuclear energy in terms of its beneficial effects on energy prices and
energy independence, or its contribution to the fight against climate change.
Despite this, one in three citizens would still like to reduce the share of nuclear
energy in the mix of energy sources.
The potential danger posed by nuclear power is usually behind people’s reluctance
to support it. We have already seen how this view can influence public opinion. This
second chapter takes the analysis one step further, asking EU citizens about their
perceptions of the risks they associate with nuclear energy.
2.1. An advantage or a risk?
Source Questionnaire: QA118
- Europeans continue to perceive nuclear power to be more of a risk than an advantage –
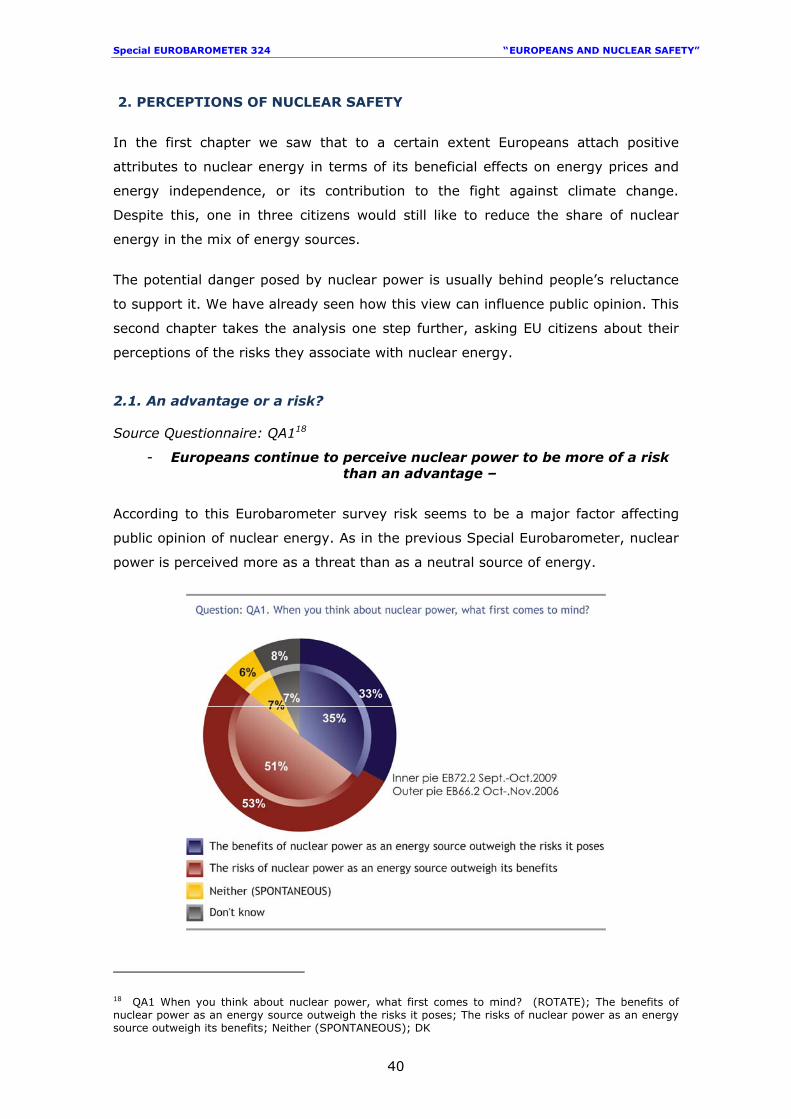
According to this Eurobarometer survey risk seems to be a major factor affecting
public opinion of nuclear energy. As in the previous Special Eurobarometer, nuclear
power is perceived more as a threat than as a neutral source of energy.
18 QA1 When you think about nuclear power, what first comes to mind? (ROTATE); The benefits of nuclear power as an energy source outweigh the risks it poses; The risks of nuclear power as an energy source outweigh its benefits; Neither (SPONTANEOUS); DK
Special EUROBAROMETER 324 “ EUROPEANS AND NUCLEAR SAFETY”
41
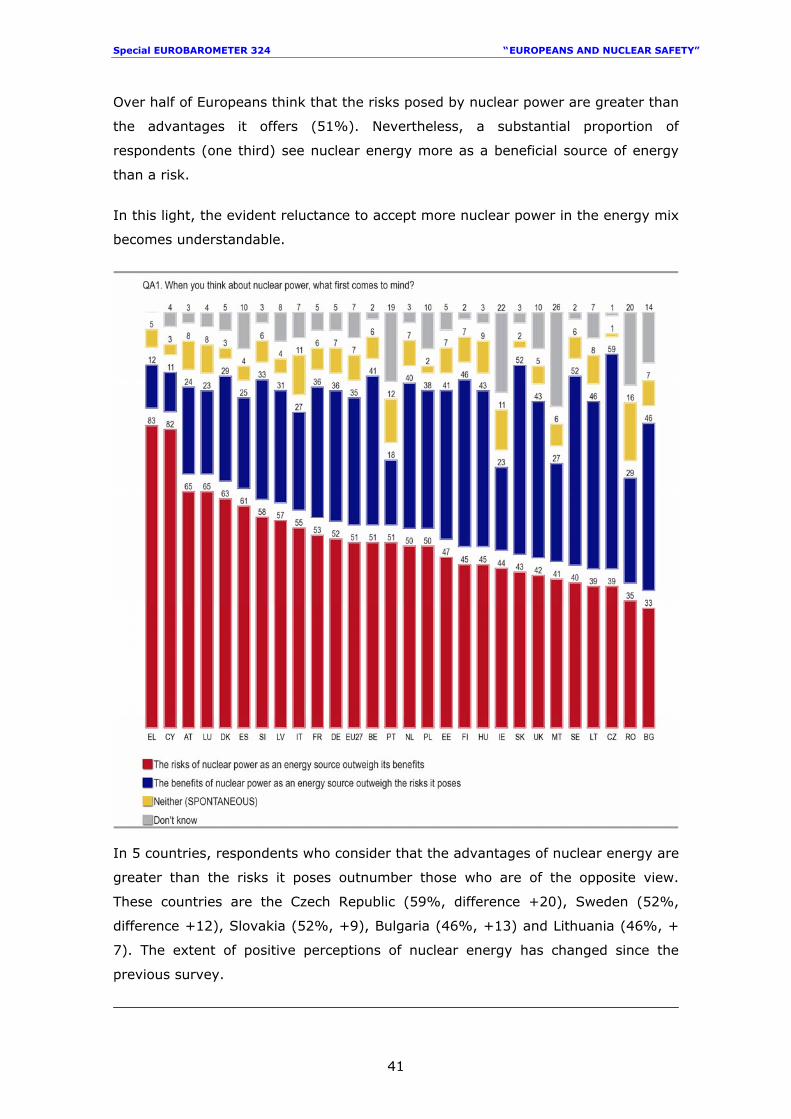
Over half of Europeans think that the risks posed by nuclear power are greater than
the advantages it offers (51%). Nevertheless, a substantial proportion of
respondents (one third) see nuclear energy more as a beneficial source of energy
than a risk.
In this light, the evident reluctance to accept more nuclear power in the energy mix
becomes understandable.
In 5 countries, respondents who consider that the advantages of nuclear energy are
greater than the risks it poses outnumber those who are of the opposite view.
These countries are the Czech Republic (59%, difference +20), Sweden (52%,
difference +12), Slovakia (52%, +9), Bulgaria (46%, +13) and Lithuania (46%, +
7). The extent of positive perceptions of nuclear energy has changed since the
previous survey.
Special EUROBAROMETER 324 “ EUROPEANS AND NUCLEAR SAFETY”
42
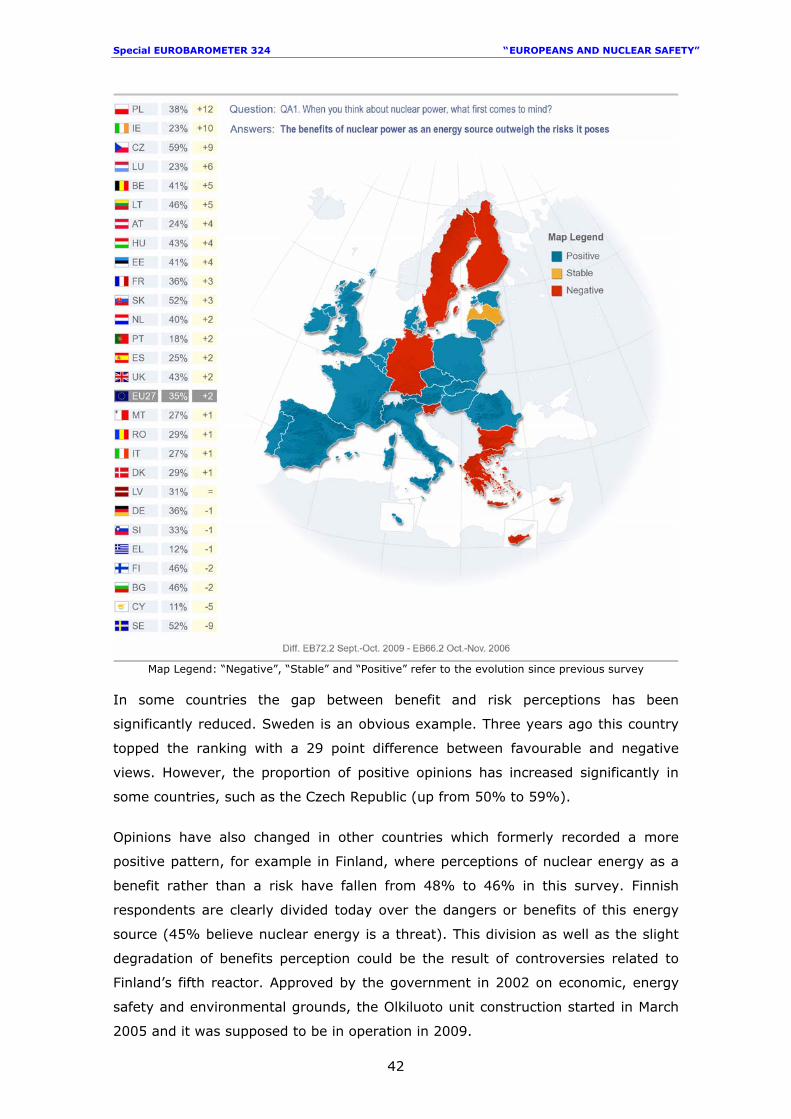
Map Legend: “Negative”, “Stable” and “Positive” refer to the evolution since previous survey
In some countries the gap between benefit and risk perceptions has been
significantly reduced. Sweden is an obvious example. Three years ago this country
topped the ranking with a 29 point difference between favourable and negative
views. However, the proportion of positive opinions has increased significantly in
some countries, such as the Czech Republic (up from 50% to 59%).
Opinions have also changed in other countries which formerly recorded a more
positive pattern, for example in Finland, where perceptions of nuclear energy as a
benefit rather than a risk have fallen from 48% to 46% in this survey. Finnish
respondents are clearly divided today over the dangers or benefits of this energy
source (45% believe nuclear energy is a threat). This division as well as the slight
degradation of benefits perception could be the result of controversies related to
Finland’s fifth reactor. Approved by the government in 2002 on economic, energy
safety and environmental grounds, the Olkiluoto unit construction started in March
2005 and it was supposed to be in operation in 2009.
Special EUROBAROMETER 324 “ EUROPEANS AND NUCLEAR SAFETY”
43
Yet, delays have been encountered and the reactor is expected to come into
operation in mid 2012 with a cost overrun reported to be Euros 1,5 billions19 .
A significant shift is also found in Estonia. Its population seems to be better
informed today than three years ago and the non-response rate has been
considerably reduced (from 14% to 5%). Yet in 2006 37% of Estonians had positive
perceptions of nuclear energy while 34% considered it more as a risk; this pattern
is now reversed: 41% hold a favourable view but 47% (+13) state that the risk of
nuclear power as an energy source outweighs its benefits.
The division of public opinion is very clear in Hungary and the United Kingdom. In
both countries 43% of respondents say that the benefits of nuclear energy
outweigh its risks compared to the 45% and 42% respectively who disagree.
In the remaining countries, a majority think that the risks of nuclear power as an
energy source are greater than its benefits, by margins which are highest in Greece
and Cyprus (+71), followed by Luxembourg (+42), Austria (+41), Spain (+36),
Denmark (+34) and Portugal (+33). There are also some variations within this
group of countries. The proportion of negative opinions has risen significantly in
Spain (from 55% to 61%). At the same time, it has fallen slightly in Luxembourg
and Austria.
At first glance the presence or absence of operating NPPs in a country seems to
affect public opinion; however, changes in the trend from 2006 to 2009 might also
be due to the high profile of nuclear energy in the public/mass media debates.
For example, public attention has recently been drawn to this issue in Finland and
Sweden: while Finland is building its fifth NPP, the Swedish coalition government
announced last February that it planned to repeal the act banning the construction
of new nuclear reactors20. Similarly, circumstances have recently raised the subject
of nuclear energy in Spain21 (discussions about lifetime extension of one of the
oldest NPPs, Garoña) and in Estonia22 (where the government is seriously
considering the possibility of building the country’s first NPP).
19 World Nuclear Association – “Nuclear Power in Finland”: http://www.world-nuclear.org/info/inf76.html 20 World Nuclear Association, « Nuclear Power in Sweden » : http://www.vaec.gov.vn/userfiles/file/Nuclear%20Power%20in%20Sweden%2010_2009.pdf 21 The Spanish Government announced this summer that a plan aiming to reform nuclear legislation will be presented this autumn. The plan should address the issue of the lifetime extension of existing NPPs : http://www.elpais.com/articulo/sociedad/Zapatero/anuncia/reforma/legislacion/nuclear/Espana/elpepusoc/20090705elpepusoc_1/Tes 22 On February 2006 the three Baltic States (Lithuania, Latvia and Estonia) agreed on the joint construction of a nuclear power plant (NPP) in Lithuania near Ignalina by 2015. See European Atomic Forum, “The nuclear relaunch in Europe”: www.foratom.org
Special EUROBAROMETER 324 “ EUROPEANS AND NUCLEAR SAFETY”
44
The risks of nuclear power as an energy source
outweigh its benefits
The benefits of nuclear power as an energy source
outweigh the risks it poses
Neither (SPONTANEOUS)
DK
EU27 51% 35% 7% 7%SexMale 47% 41% 7% 5%Female 55% 28% 7% 10%Education (End of)15- 53% 27% 8% 12%16-19 50% 36% 7% 7%20+ 51% 40% 5% 4%Still studying 50% 37% 6% 7%Experience nuclear energyExperience 44% 48% 5% 3%No experience 53% 31% 7% 9%Level of information on nuclear safetyInformed 42% 51% 5% 2%Not informed 54% 30% 7% 9%
QA1 When you think about nuclear power, what first comes to mind?
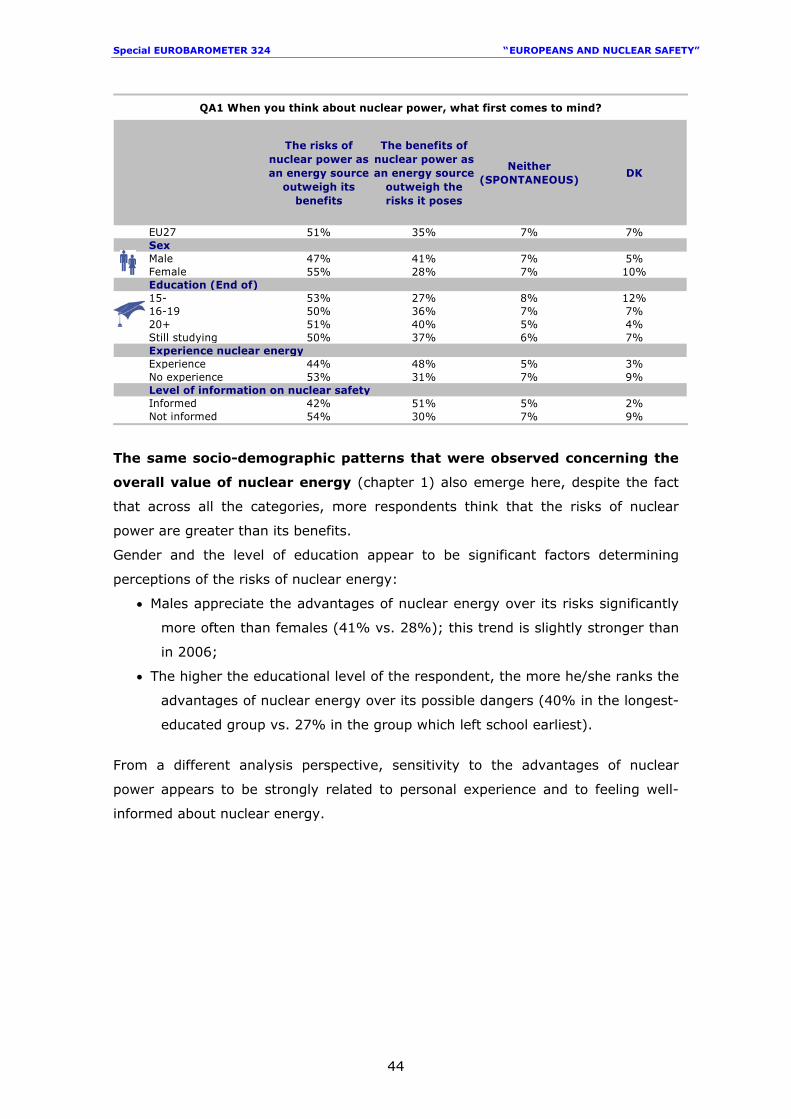
The same socio-demographic patterns that were observed concerning the
overall value of nuclear energy (chapter 1) also emerge here, despite the fact
that across all the categories, more respondents think that the risks of nuclear
power are greater than its benefits.
Gender and the level of education appear to be significant factors determining
perceptions of the risks of nuclear energy:
• Males appreciate the advantages of nuclear energy over its risks significantly
more often than females (41% vs. 28%); this trend is slightly stronger than
in 2006;
• The higher the educational level of the respondent, the more he/she ranks the
advantages of nuclear energy over its possible dangers (40% in the longest-
educated group vs. 27% in the group which left school earliest).
From a different analysis perspective, sensitivity to the advantages of nuclear
power appears to be strongly related to personal experience and to feeling well-
informed about nuclear energy.
Special EUROBAROMETER 324 “ EUROPEANS AND NUCLEAR SAFETY”
45
2.2. Nuclear risk: over- or underestimated?
Source Questionnaire: QA1023
Although the shock impact of an accident such as Chernobyl now lies far in the
past, answers to questions about perceptions of risks/benefits show that resistance,
distrust and threat continue to be associated with nuclear energy by a large
segment of European public opinion. How do Europeans feel about nuclear risk?
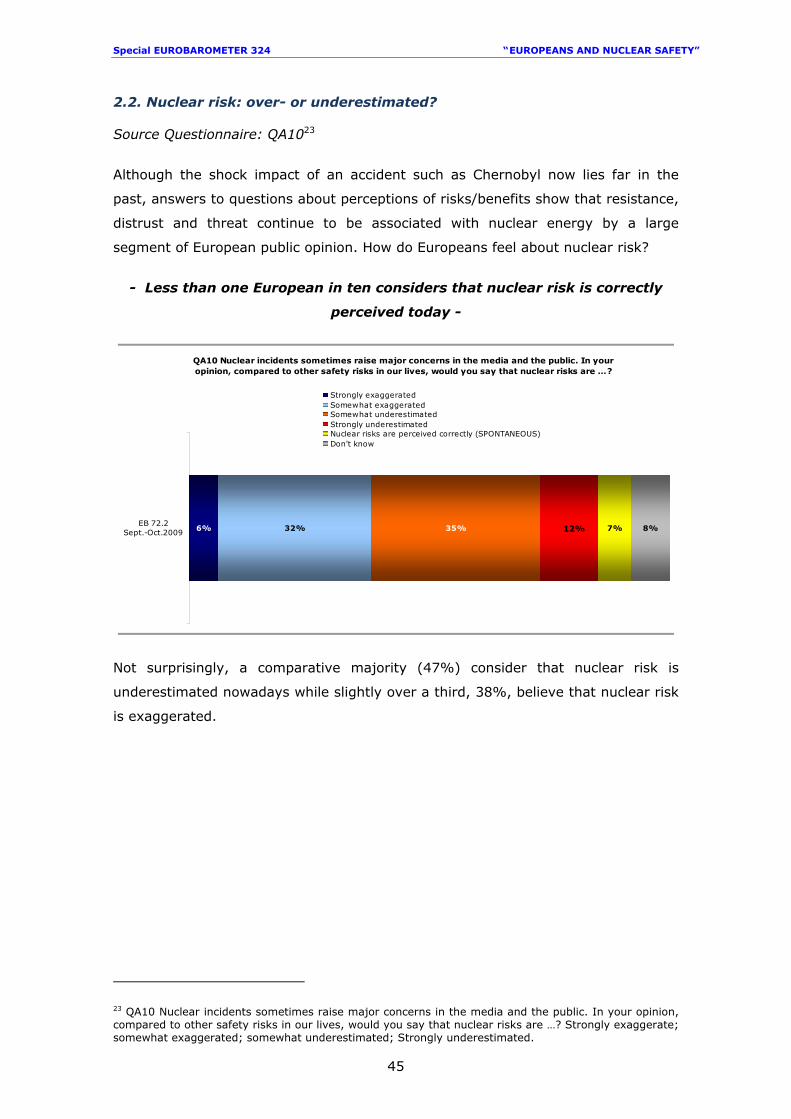
- Less than one European in ten considers that nuclear risk is correctly
perceived today -
QA10 Nuclear incidents sometimes raise major concerns in the media and the public. In your opinion, compared to other safety risks in our lives, would you say that nuclear risks are …?
6% 32% 35% 7% 8%12%EB 72.2
Sept.-Oct.2009
Strongly exaggeratedSomewhat exaggeratedSomewhat underestimatedStrongly underestimatedNuclear risks are perceived correctly (SPONTANEOUS)Don't know
Not surprisingly, a comparative majority (47%) consider that nuclear risk is
underestimated nowadays while slightly over a third, 38%, believe that nuclear risk
is exaggerated.
23 QA10 Nuclear incidents sometimes raise major concerns in the media and the public. In your opinion, compared to other safety risks in our lives, would you say that nuclear risks are …? Strongly exaggerate; somewhat exaggerated; somewhat underestimated; Strongly underestimated.
Special EUROBAROMETER 324 “ EUROPEANS AND NUCLEAR SAFETY”
46
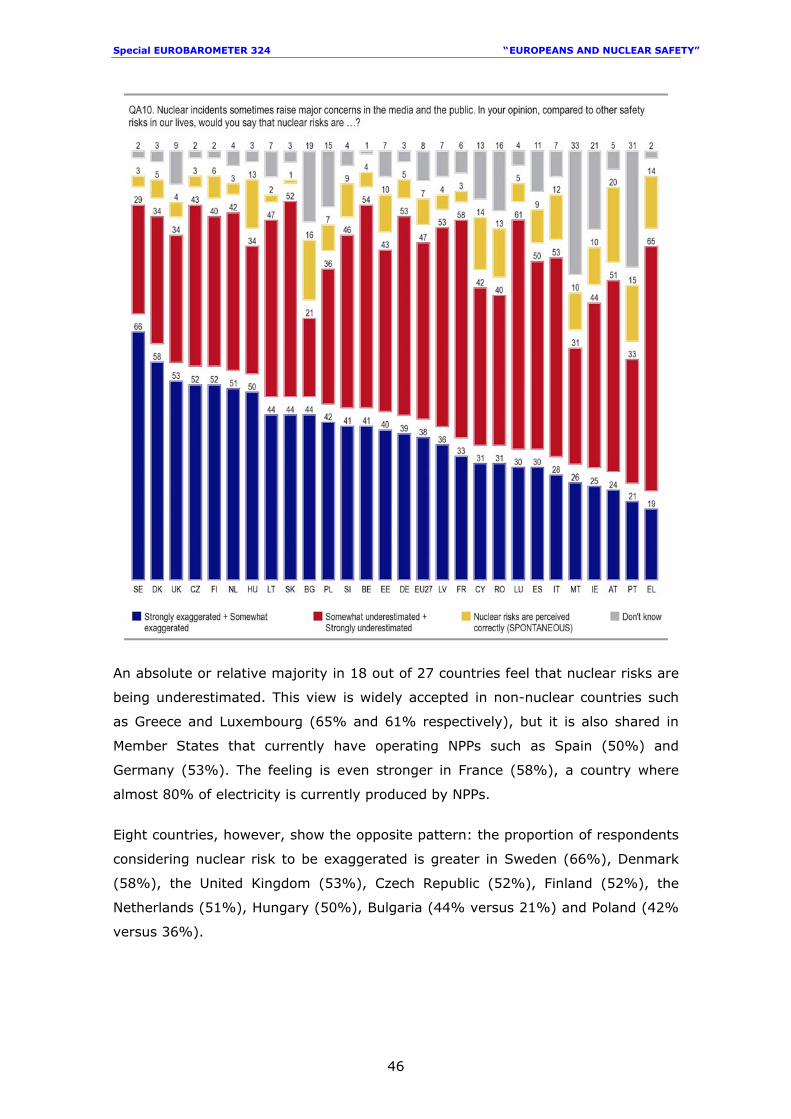
An absolute or relative majority in 18 out of 27 countries feel that nuclear risks are
being underestimated. This view is widely accepted in non-nuclear countries such
as Greece and Luxembourg (65% and 61% respectively), but it is also shared in
Member States that currently have operating NPPs such as Spain (50%) and
Germany (53%). The feeling is even stronger in France (58%), a country where
almost 80% of electricity is currently produced by NPPs.
Eight countries, however, show the opposite pattern: the proportion of respondents
considering nuclear risk to be exaggerated is greater in Sweden (66%), Denmark
(58%), the United Kingdom (53%), Czech Republic (52%), Finland (52%), the
Netherlands (51%), Hungary (50%), Bulgaria (44% versus 21%) and Poland (42%
versus 36%).
Special EUROBAROMETER 324 “ EUROPEANS AND NUCLEAR SAFETY”
47
Public opinion is more divided in Estonia (40% believe nuclear risks are
exaggerated while 43% think they are underestimated), Lithuania (44% compared
to 47%) and Slovenia (41% compared to 46%). Finally, non-response levels are
significant in Malta (33%), Portugal (31%) and, to a lesser extent, in Ireland
(21%). Yet among those who express an opinion, interviewees who think that
nuclear risk is underestimated outweigh the proportion of citizens holding the
opposite view.
Strongly exaggerated
Somewhat exaggerated
Somewhat underestimated
Strongly underestimated
Nuclear risks are perceived correctly
(SPONTANEOUS)
DK
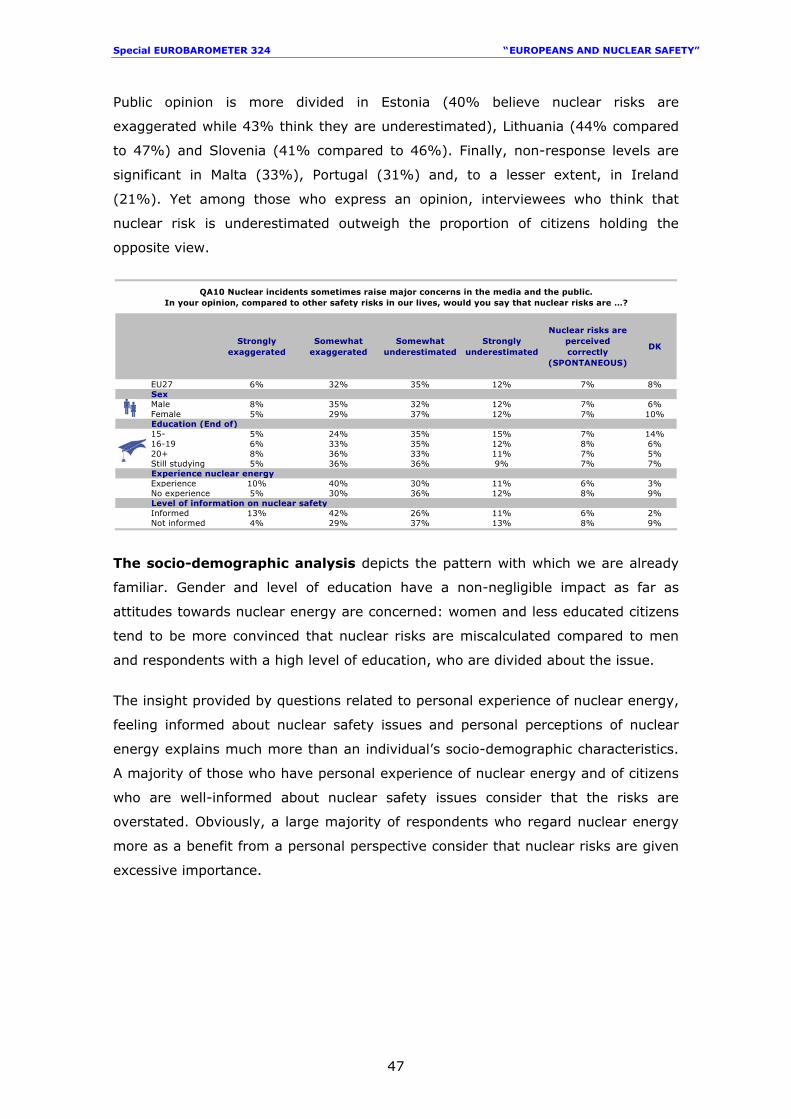
EU27 6% 32% 35% 12% 7% 8%SexMale 8% 35% 32% 12% 7% 6%Female 5% 29% 37% 12% 7% 10%Education (End of)15- 5% 24% 35% 15% 7% 14%16-19 6% 33% 35% 12% 8% 6%20+ 8% 36% 33% 11% 7% 5%Still studying 5% 36% 36% 9% 7% 7%Experience nuclear energyExperience 10% 40% 30% 11% 6% 3%No experience 5% 30% 36% 12% 8% 9%Level of information on nuclear safetyInformed 13% 42% 26% 11% 6% 2%Not informed 4% 29% 37% 13% 8% 9%
QA10 Nuclear incidents sometimes raise major concerns in the media and the public. In your opinion, compared to other safety risks in our lives, would you say that nuclear risks are …?
The socio-demographic analysis depicts the pattern with which we are already
familiar. Gender and level of education have a non-negligible impact as far as
attitudes towards nuclear energy are concerned: women and less educated citizens
tend to be more convinced that nuclear risks are miscalculated compared to men
and respondents with a high level of education, who are divided about the issue.
The insight provided by questions related to personal experience of nuclear energy,
feeling informed about nuclear safety issues and personal perceptions of nuclear
energy explains much more than an individual’s socio-demographic characteristics.
A majority of those who have personal experience of nuclear energy and of citizens
who are well-informed about nuclear safety issues consider that the risks are
overstated. Obviously, a large majority of respondents who regard nuclear energy
more as a benefit from a personal perspective consider that nuclear risks are given
excessive importance.
Special EUROBAROMETER 324 “ EUROPEANS AND NUCLEAR SAFETY”
48
2.3 Assessment of the risk level
Source Questionnaire: QA924
- Many Europeans are afraid of nuclear power plants but a substantial
proportion do not consider them to be a risk to them and their family -
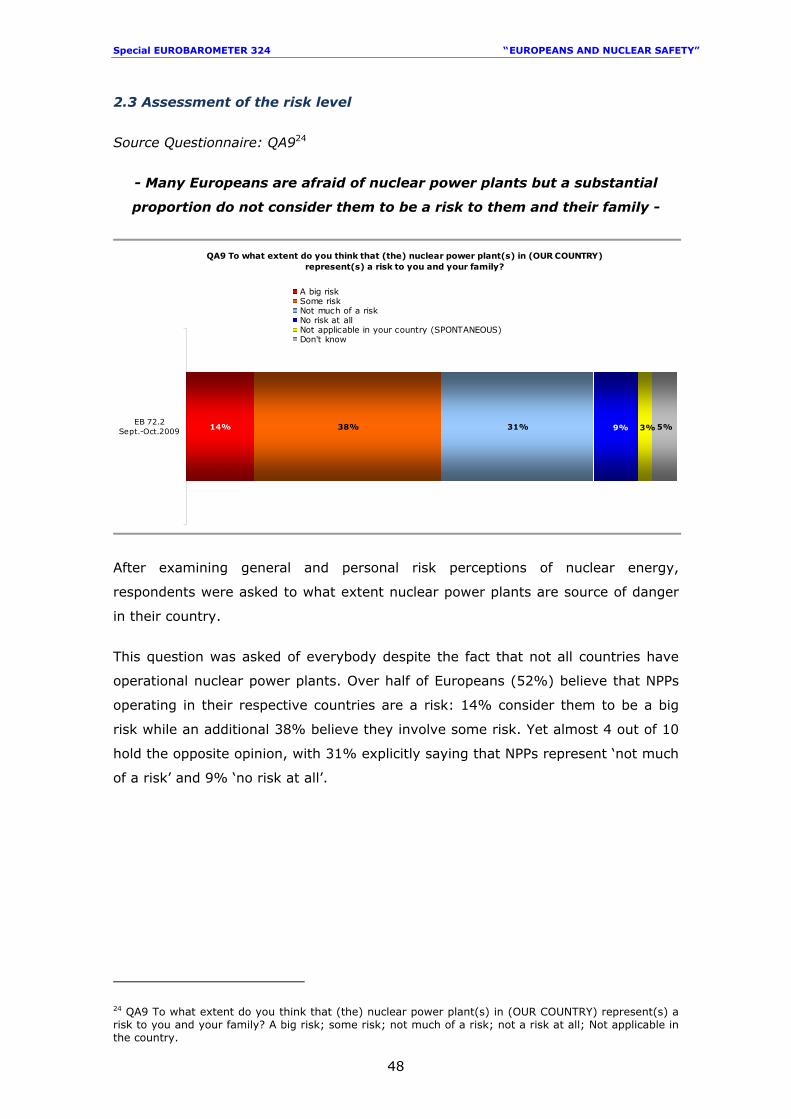
QA9 To what extent do you think that (the) nuclear power plant(s) in (OUR COUNTRY) represent(s) a risk to you and your family?
14% 38% 31% 5%9% 3%EB 72.2
Sept.-Oct.2009
A big riskSome riskNot much of a riskNo risk at allNot applicable in your country (SPONTANEOUS)Don't know
After examining general and personal risk perceptions of nuclear energy,
respondents were asked to what extent nuclear power plants are source of danger
in their country.
This question was asked of everybody despite the fact that not all countries have
operational nuclear power plants. Over half of Europeans (52%) believe that NPPs
operating in their respective countries are a risk: 14% consider them to be a big
risk while an additional 38% believe they involve some risk. Yet almost 4 out of 10
hold the opposite opinion, with 31% explicitly saying that NPPs represent ‘not much
of a risk’ and 9% ‘no risk at all’.
24 QA9 To what extent do you think that (the) nuclear power plant(s) in (OUR COUNTRY) represent(s) a risk to you and your family? A big risk; some risk; not much of a risk; not a risk at all; Not applicable in the country.
Special EUROBAROMETER 324 “ EUROPEANS AND NUCLEAR SAFETY”
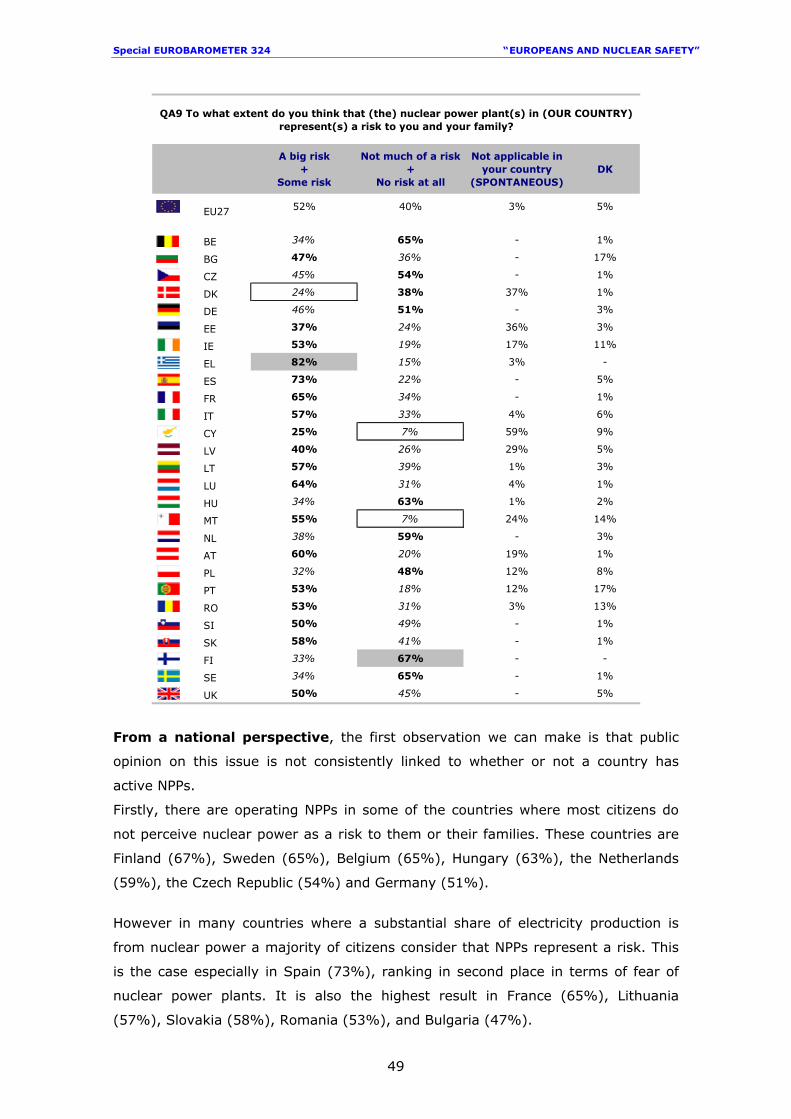
49
A big risk+
Some risk
Not much of a risk+
No risk at all
Not applicable in your country
(SPONTANEOUS)DK
EU27 52% 40% 3% 5%
BE 34% 65% - 1%
BG 47% 36% - 17%
CZ 45% 54% - 1%
DK 24% 38% 37% 1%
DE 46% 51% - 3%
EE 37% 24% 36% 3%
IE 53% 19% 17% 11%
EL 82% 15% 3% -
ES 73% 22% - 5%
FR 65% 34% - 1%
IT 57% 33% 4% 6%
CY 25% 7% 59% 9%
LV 40% 26% 29% 5%
LT 57% 39% 1% 3%
LU 64% 31% 4% 1%
HU 34% 63% 1% 2%
MT 55% 7% 24% 14%
NL 38% 59% - 3%
AT 60% 20% 19% 1%
PL 32% 48% 12% 8%
PT 53% 18% 12% 17%
RO 53% 31% 3% 13%
SI 50% 49% - 1%
SK 58% 41% - 1%
FI 33% 67% - -
SE 34% 65% - 1%
UK 50% 45% - 5%
QA9 To what extent do you think that (the) nuclear power plant(s) in (OUR COUNTRY) represent(s) a risk to you and your family?
From a national perspective, the first observation we can make is that public
opinion on this issue is not consistently linked to whether or not a country has
active NPPs.
Firstly, there are operating NPPs in some of the countries where most citizens do
not perceive nuclear power as a risk to them or their families. These countries are
Finland (67%), Sweden (65%), Belgium (65%), Hungary (63%), the Netherlands
(59%), the Czech Republic (54%) and Germany (51%).
However in many countries where a substantial share of electricity production is
from nuclear power a majority of citizens consider that NPPs represent a risk. This
is the case especially in Spain (73%), ranking in second place in terms of fear of
nuclear power plants. It is also the highest result in France (65%), Lithuania
(57%), Slovakia (58%), Romania (53%), and Bulgaria (47%).
Special EUROBAROMETER 324 “ EUROPEANS AND NUCLEAR SAFETY”
50
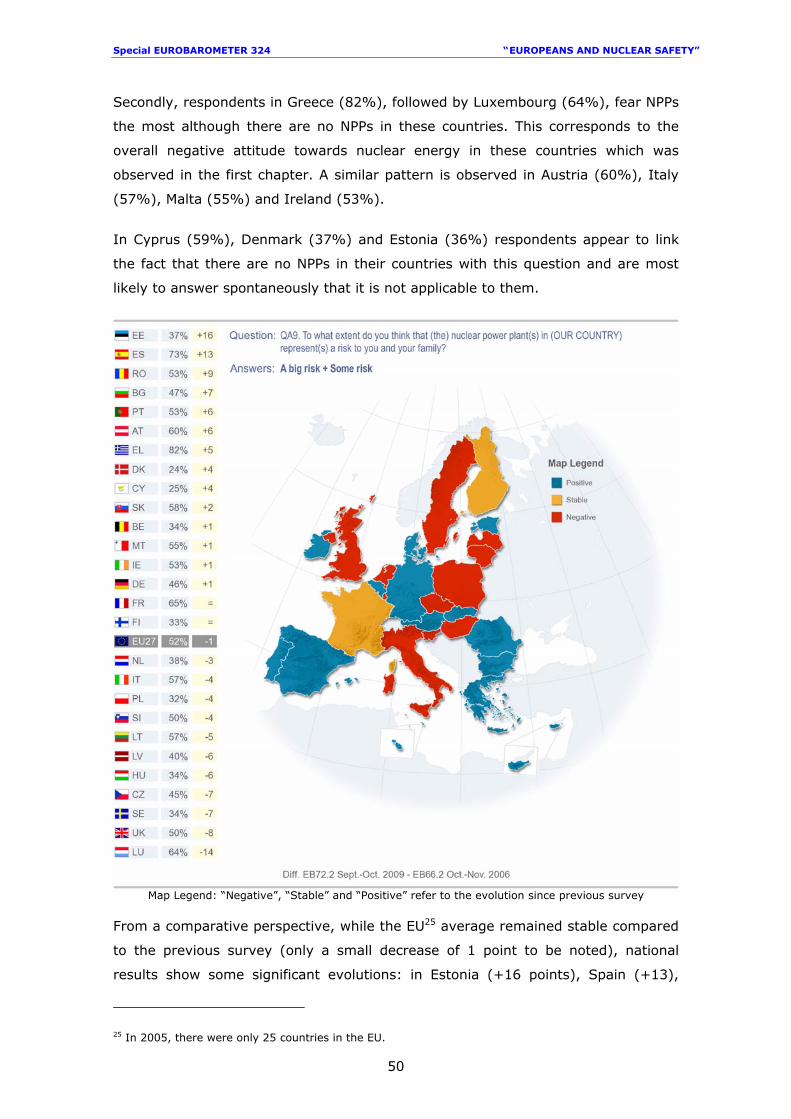
Secondly, respondents in Greece (82%), followed by Luxembourg (64%), fear NPPs
the most although there are no NPPs in these countries. This corresponds to the
overall negative attitude towards nuclear energy in these countries which was
observed in the first chapter. A similar pattern is observed in Austria (60%), Italy
(57%), Malta (55%) and Ireland (53%).
In Cyprus (59%), Denmark (37%) and Estonia (36%) respondents appear to link
the fact that there are no NPPs in their countries with this question and are most
likely to answer spontaneously that it is not applicable to them.
Map Legend: “Negative”, “Stable” and “Positive” refer to the evolution since previous survey
From a comparative perspective, while the EU25 average remained stable compared
to the previous survey (only a small decrease of 1 point to be noted), national
results show some significant evolutions: in Estonia (+16 points), Spain (+13),
25 In 2005, there were only 25 countries in the EU.
Special EUROBAROMETER 324 “ EUROPEANS AND NUCLEAR SAFETY”
51
Romania (+9), Bulgaria (+7) and in Portugal and Austria (+6 points both) the
perception of the risk is significantly higher than in 2006.
It is interesting to note that among those countries, Estonia, Portugal and Austria
do not have nuclear power plants. On the other side, the perception of the risk
decreased significantly in Luxembourg (-14), the United Kingdom (-8), Sweden (-
7), Czech Republic (-7), and Hungary and Latvia (-6 in both cases).
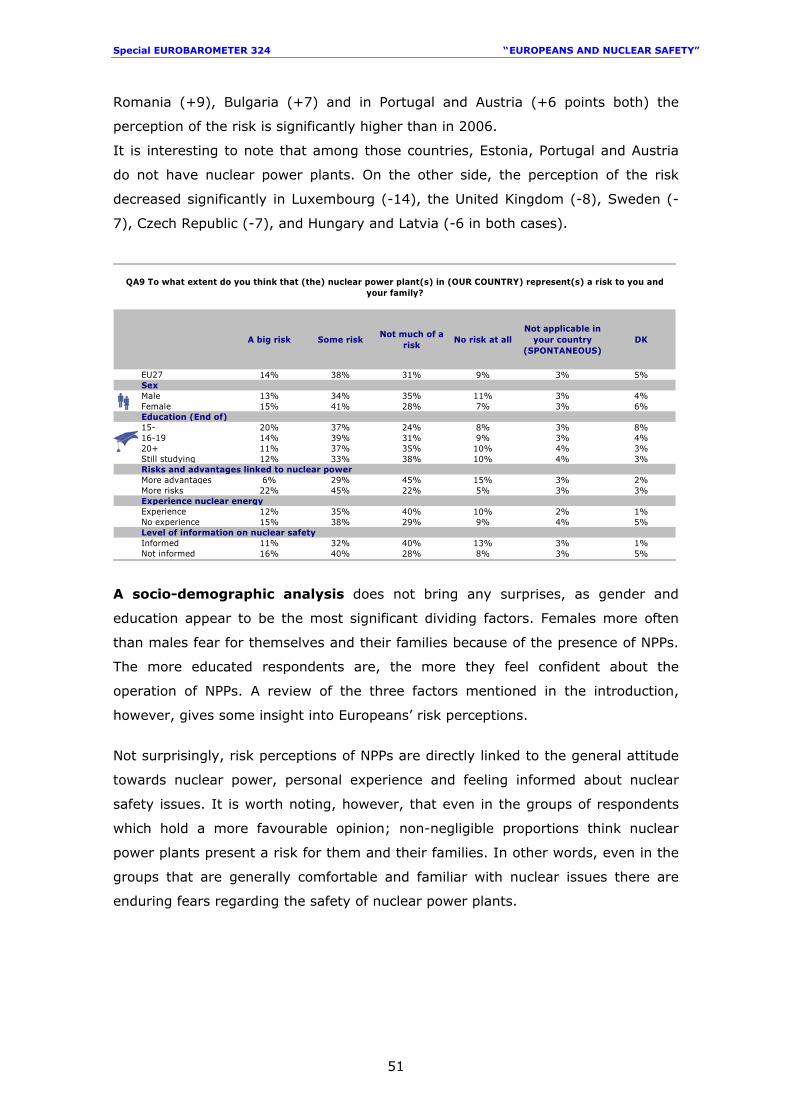
A big risk Some riskNot much of a
riskNo risk at all
Not applicable in your country
(SPONTANEOUS)DK
EU27 14% 38% 31% 9% 3% 5%SexMale 13% 34% 35% 11% 3% 4%Female 15% 41% 28% 7% 3% 6%Education (End of)15- 20% 37% 24% 8% 3% 8%16-19 14% 39% 31% 9% 3% 4%20+ 11% 37% 35% 10% 4% 3%Still studying 12% 33% 38% 10% 4% 3%Risks and advantages linked to nuclear powerMore advantages 6% 29% 45% 15% 3% 2%More risks 22% 45% 22% 5% 3% 3%Experience nuclear energyExperience 12% 35% 40% 10% 2% 1%No experience 15% 38% 29% 9% 4% 5%Level of information on nuclear safetyInformed 11% 32% 40% 13% 3% 1%Not informed 16% 40% 28% 8% 3% 5%
QA9 To what extent do you think that (the) nuclear power plant(s) in (OUR COUNTRY) represent(s) a risk to you and your family?
A socio-demographic analysis does not bring any surprises, as gender and
education appear to be the most significant dividing factors. Females more often
than males fear for themselves and their families because of the presence of NPPs.
The more educated respondents are, the more they feel confident about the
operation of NPPs. A review of the three factors mentioned in the introduction,
however, gives some insight into Europeans’ risk perceptions.
Not surprisingly, risk perceptions of NPPs are directly linked to the general attitude
towards nuclear power, personal experience and feeling informed about nuclear
safety issues. It is worth noting, however, that even in the groups of respondents
which hold a more favourable opinion; non-negligible proportions think nuclear
power plants present a risk for them and their families. In other words, even in the
groups that are generally comfortable and familiar with nuclear issues there are
enduring fears regarding the safety of nuclear power plants.
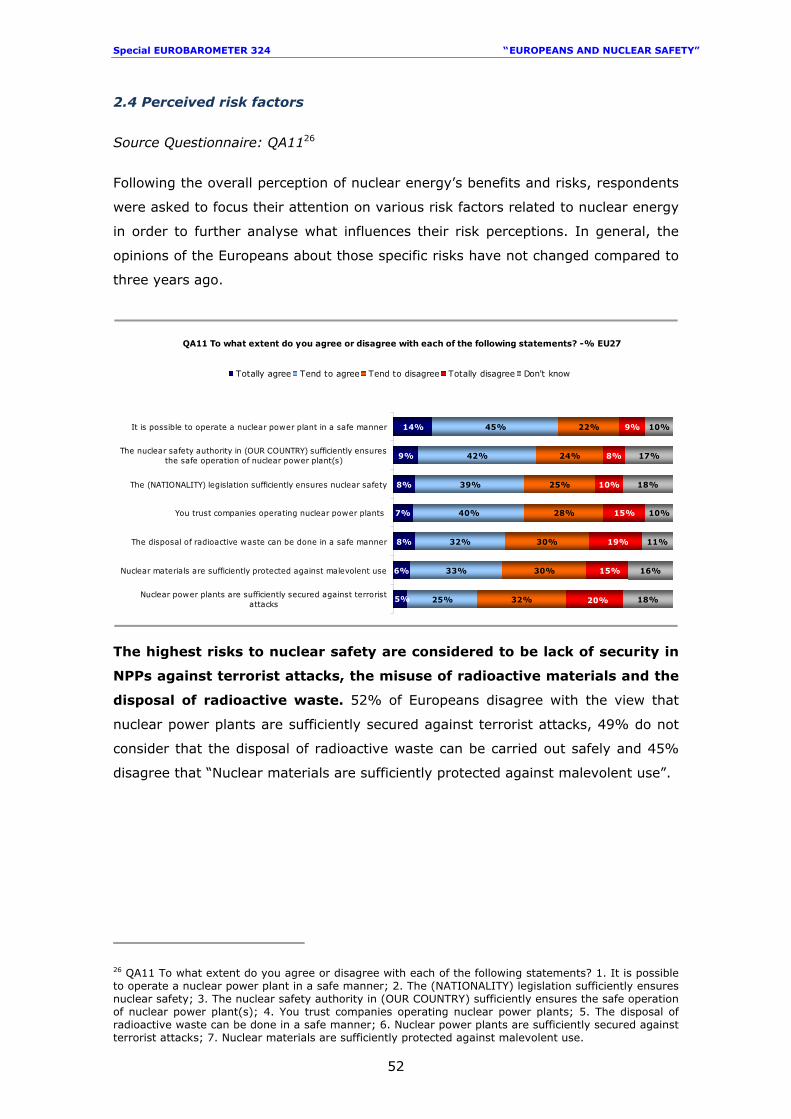
Special EUROBAROMETER 324 “ EUROPEANS AND NUCLEAR SAFETY”
52
2.4 Perceived risk factors
Source Questionnaire: QA1126
Following the overall perception of nuclear energy’s benefits and risks, respondents
were asked to focus their attention on various risk factors related to nuclear energy
in order to further analyse what influences their risk perceptions. In general, the
opinions of the Europeans about those specific risks have not changed compared to
three years ago.
QA11 To what extent do you agree or disagree with each of the following statements? -% EU27
6%
8%
7%
8%
9%
14%
25%
33%
40%
39%
42%
45%
32%
30%
30%
28%
25%
24%
22%
15%
10%
8%
9%
18%
16%
11%
10%
18%
17%
10%
5%
32%
20%
15%
19%
Nuclear power plants are sufficiently secured against terroristattacks
Nuclear materials are sufficiently protected against malevolent use
The disposal of radioactive waste can be done in a safe manner
You trust companies operating nuclear power plants
The (NATIONALITY) legislation sufficiently ensures nuclear safety
The nuclear safety authority in (OUR COUNTRY) sufficiently ensuresthe safe operation of nuclear power plant(s)
It is possible to operate a nuclear power plant in a safe manner
Totally agree Tend to agree Tend to disagree Totally disagree Don't know
The highest risks to nuclear safety are considered to be lack of security in
NPPs against terrorist attacks, the misuse of radioactive materials and the
disposal of radioactive waste. 52% of Europeans disagree with the view that
nuclear power plants are sufficiently secured against terrorist attacks, 49% do not
consider that the disposal of radioactive waste can be carried out safely and 45%
disagree that “Nuclear materials are sufficiently protected against malevolent use”.
26 QA11 To what extent do you agree or disagree with each of the following statements? 1. It is possible to operate a nuclear power plant in a safe manner; 2. The (NATIONALITY) legislation sufficiently ensures nuclear safety; 3. The nuclear safety authority in (OUR COUNTRY) sufficiently ensures the safe operation of nuclear power plant(s); 4. You trust companies operating nuclear power plants; 5. The disposal of radioactive waste can be done in a safe manner; 6. Nuclear power plants are sufficiently secured against terrorist attacks; 7. Nuclear materials are sufficiently protected against malevolent use.
Special EUROBAROMETER 324 “ EUROPEANS AND NUCLEAR SAFETY”
53
It should be noted that the threat of terrorism has been differently assessed in the
current questionnaire compared to the last time the survey was conducted. Three
years ago, the writing was written as follows “Terrorism is a major threat to nuclear
power plants”. This formulation focused more on the intrinsic danger of the threat
rather than on the level of safety of nuclear power plants. Not surprisingly, three years
ago citizens proved to be extremely “responsive” to this approach with 3 out of 4
agreeing with the sentence.
On the other hand, 59% believe it is possible to operate a nuclear power plant
in a safe manner and 51% trust their national nuclear safety authorities to
ensure the safe operation of NPPs. Similarly, Europeans tend to take a positive
rather than a negative stance when pondering whether national legislation
sufficiently ensures nuclear safety (47% agree while 35% take a negative
view).
Finally, even if opinions are most divided, citizens tend to trust companies
operating nuclear power plants (47% compared with 43% who disagree with
the statement).
In the case of the statements concerning national legislation (QA11.2) and the
nuclear safety authority (QA11.3) the relatively high non-response rates (18% and
17%) can be partly explained by their low relevance in countries that do not have
NPPs. This point is further discussed in the detailed analysis of these statements.
Against the background of renewed debate and discussion about nuclear energy a
comparative overview bears out the observation that the different risk factors have
remained almost completely stable since the previous survey conducted three years
ago. In other words, risk perception has not increased during this period.
In short, basic issues related to the functioning of NPPs, such as their safe
operation or who controls them, do not provoke fear to the same extent as the “by-
products” of nuclear energy production, namely radioactive waste, possible misuses
and the risk of a terrorist attack on NPPs.
In the following pages we will briefly describe the main results for each factor.
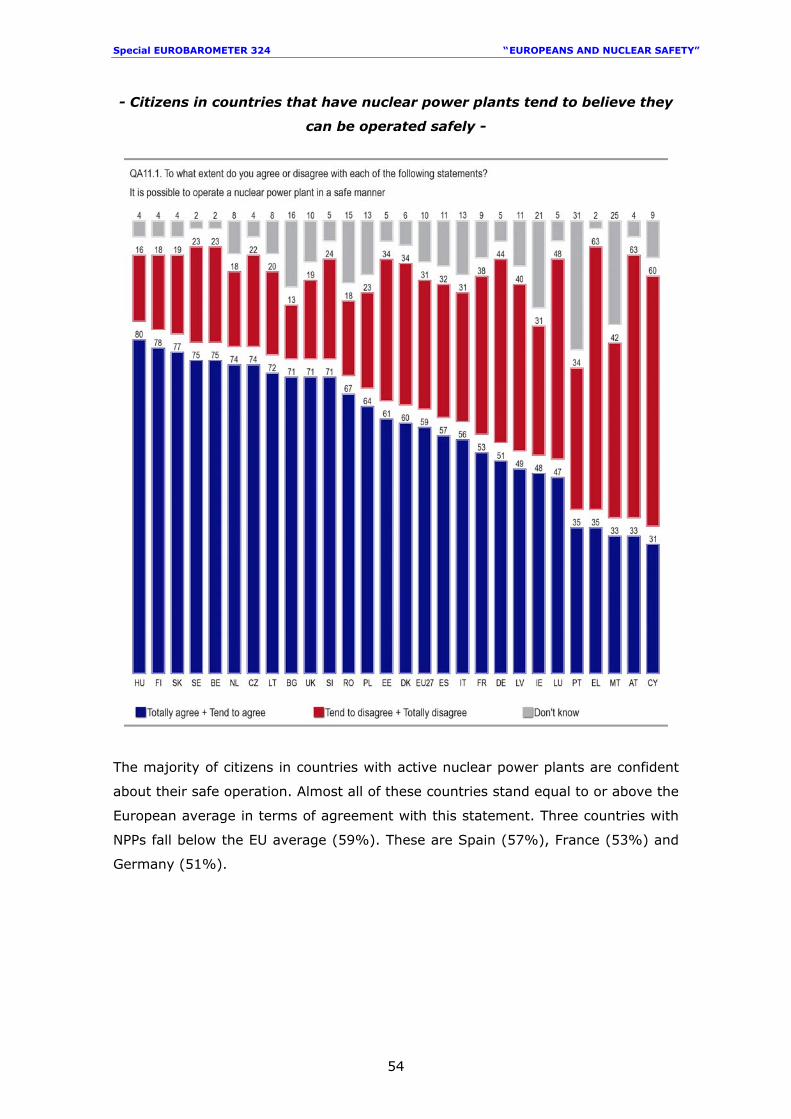
Special EUROBAROMETER 324 “ EUROPEANS AND NUCLEAR SAFETY”
54
- Citizens in countries that have nuclear power plants tend to believe they
can be operated safely -
The majority of citizens in countries with active nuclear power plants are confident
about their safe operation. Almost all of these countries stand equal to or above the
European average in terms of agreement with this statement. Three countries with
NPPs fall below the EU average (59%). These are Spain (57%), France (53%) and
Germany (51%).
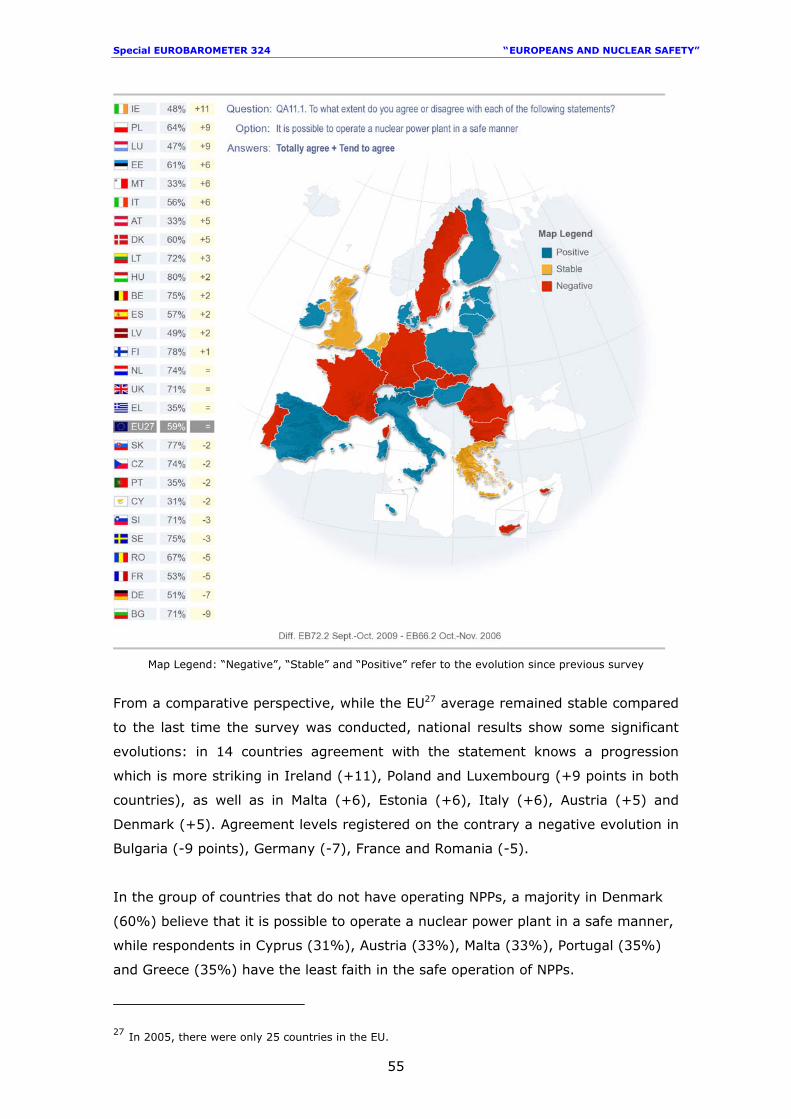
Special EUROBAROMETER 324 “ EUROPEANS AND NUCLEAR SAFETY”
55
Map Legend: “Negative”, “Stable” and “Positive” refer to the evolution since previous survey
From a comparative perspective, while the EU27 average remained stable compared
to the last time the survey was conducted, national results show some significant
evolutions: in 14 countries agreement with the statement knows a progression
which is more striking in Ireland (+11), Poland and Luxembourg (+9 points in both
countries), as well as in Malta (+6), Estonia (+6), Italy (+6), Austria (+5) and
Denmark (+5). Agreement levels registered on the contrary a negative evolution in
Bulgaria (-9 points), Germany (-7), France and Romania (-5).
In the group of countries that do not have operating NPPs, a majority in Denmark
(60%) believe that it is possible to operate a nuclear power plant in a safe manner,
while respondents in Cyprus (31%), Austria (33%), Malta (33%), Portugal (35%)
and Greece (35%) have the least faith in the safe operation of NPPs.
27 In 2005, there were only 25 countries in the EU.
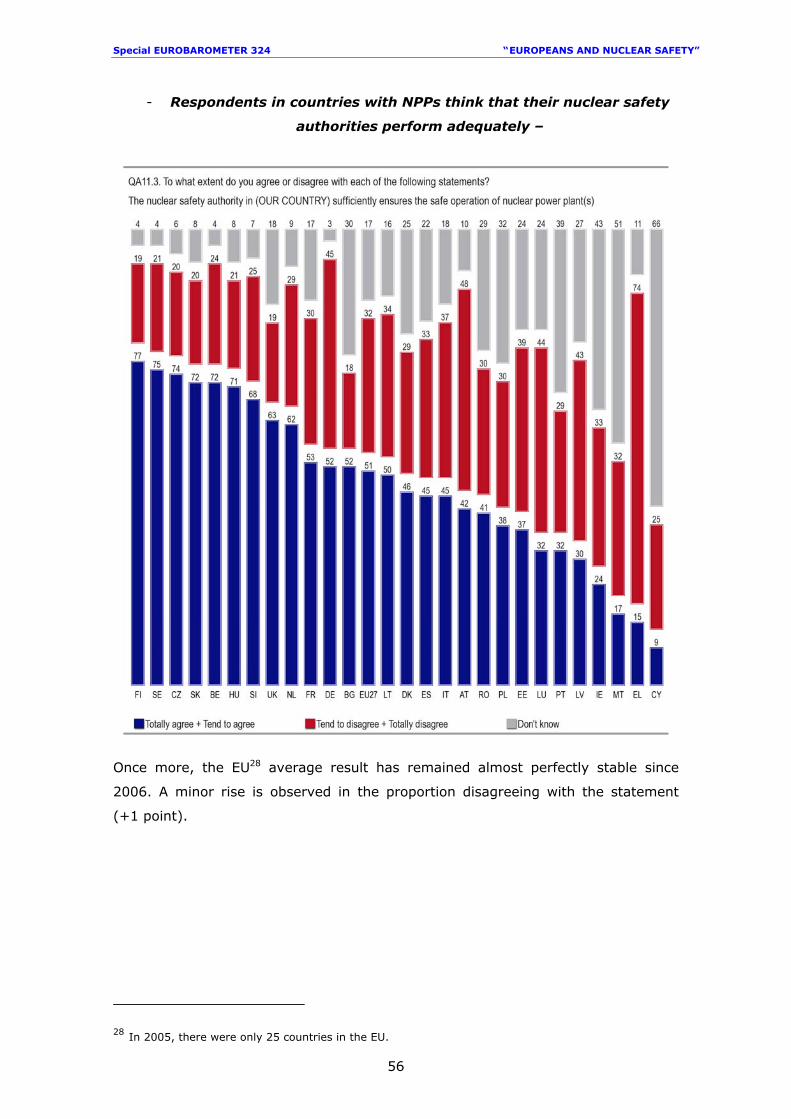
Special EUROBAROMETER 324 “ EUROPEANS AND NUCLEAR SAFETY”
56
- Respondents in countries with NPPs think that their nuclear safety
authorities perform adequately –
Once more, the EU28 average result has remained almost perfectly stable since
2006. A minor rise is observed in the proportion disagreeing with the statement
(+1 point).
28 In 2005, there were only 25 countries in the EU.
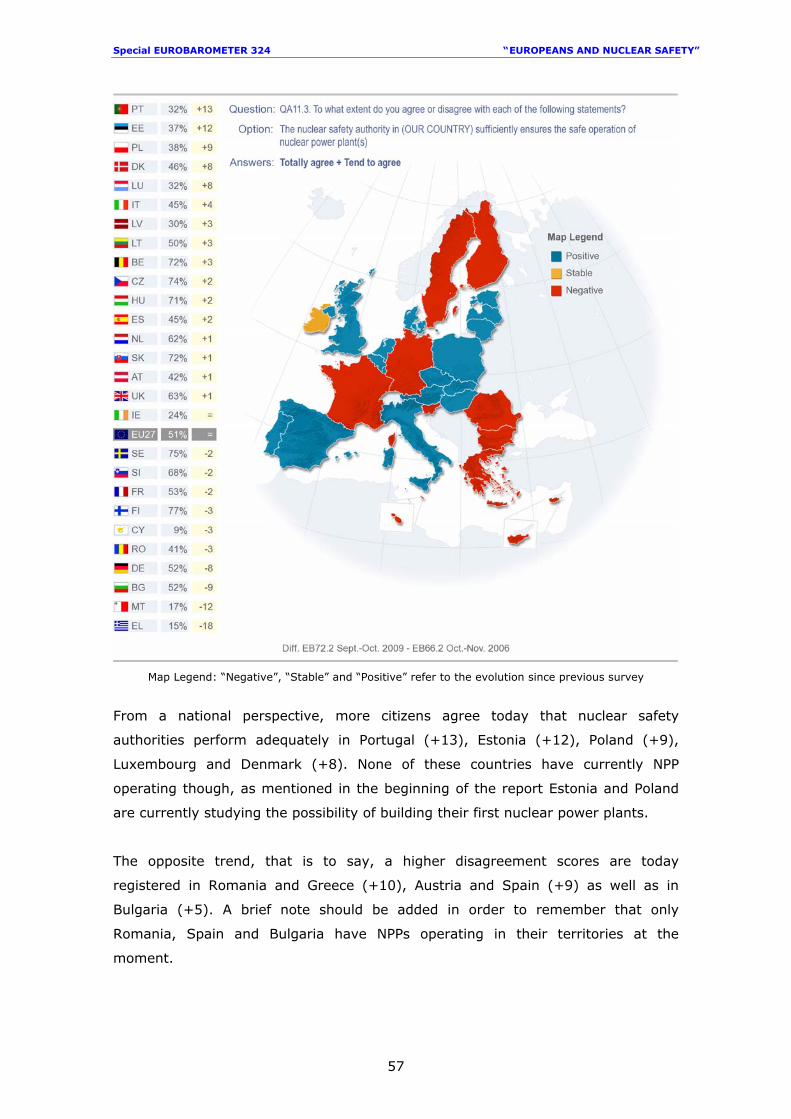
Special EUROBAROMETER 324 “ EUROPEANS AND NUCLEAR SAFETY”
57
Map Legend: “Negative”, “Stable” and “Positive” refer to the evolution since previous survey
From a national perspective, more citizens agree today that nuclear safety
authorities perform adequately in Portugal (+13), Estonia (+12), Poland (+9),
Luxembourg and Denmark (+8). None of these countries have currently NPP
operating though, as mentioned in the beginning of the report Estonia and Poland
are currently studying the possibility of building their first nuclear power plants.
The opposite trend, that is to say, a higher disagreement scores are today
registered in Romania and Greece (+10), Austria and Spain (+9) as well as in
Bulgaria (+5). A brief note should be added in order to remember that only
Romania, Spain and Bulgaria have NPPs operating in their territories at the
moment.
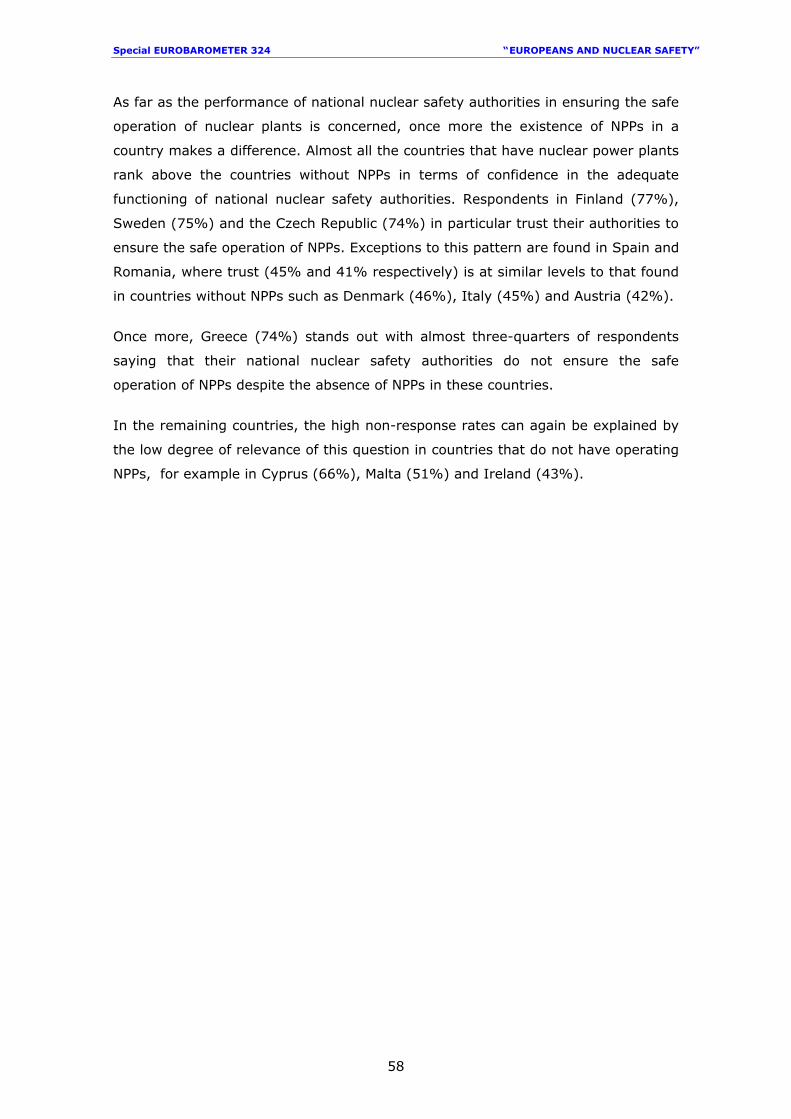
Special EUROBAROMETER 324 “ EUROPEANS AND NUCLEAR SAFETY”
58
As far as the performance of national nuclear safety authorities in ensuring the safe
operation of nuclear plants is concerned, once more the existence of NPPs in a
country makes a difference. Almost all the countries that have nuclear power plants
rank above the countries without NPPs in terms of confidence in the adequate
functioning of national nuclear safety authorities. Respondents in Finland (77%),
Sweden (75%) and the Czech Republic (74%) in particular trust their authorities to
ensure the safe operation of NPPs. Exceptions to this pattern are found in Spain and
Romania, where trust (45% and 41% respectively) is at similar levels to that found
in countries without NPPs such as Denmark (46%), Italy (45%) and Austria (42%).
Once more, Greece (74%) stands out with almost three-quarters of respondents
saying that their national nuclear safety authorities do not ensure the safe
operation of NPPs despite the absence of NPPs in these countries.
In the remaining countries, the high non-response rates can again be explained by
the low degree of relevance of this question in countries that do not have operating
NPPs, for example in Cyprus (66%), Malta (51%) and Ireland (43%).
Special EUROBAROMETER 324 “ EUROPEANS AND NUCLEAR SAFETY”
59
- Countries with existing NPPs tend to trust national legislation to
ensure nuclear safety –
In terms of the EU29 average, agreement with this statement has risen by one point
while no changes are observed in “disagreement” levels.
Responses regarding whether national legislation sufficiently ensures nuclear safety
are roughly divided depending on whether a country has NPPs or not. Citizens in
countries with NPPs tend to trust the legislation rather than doubt its adequacy.
Finland tops the ranking with 68% of respondents considering the legislation to be
sufficient for ensuring nuclear safety. This result has declined slightly since the
previous survey (-4 points).
29 In 2005, there were only 25 countries in the EU.
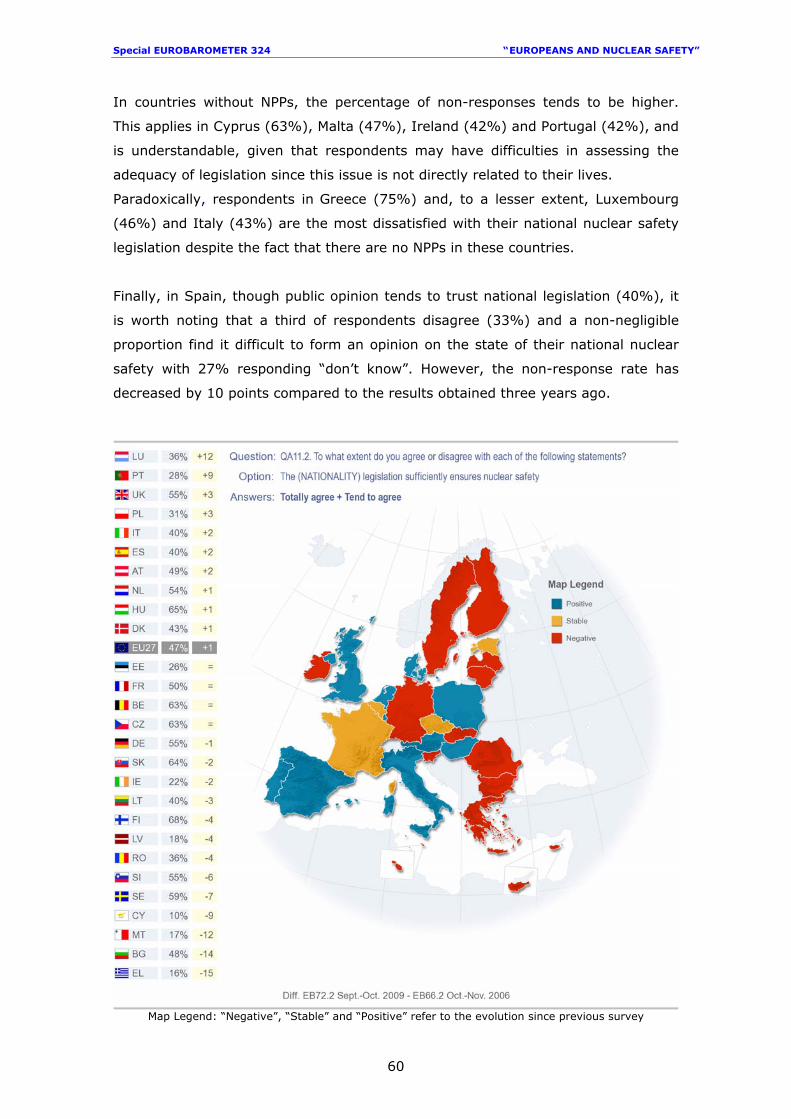
Special EUROBAROMETER 324 “ EUROPEANS AND NUCLEAR SAFETY”
60
In countries without NPPs, the percentage of non-responses tends to be higher.
This applies in Cyprus (63%), Malta (47%), Ireland (42%) and Portugal (42%), and
is understandable, given that respondents may have difficulties in assessing the
adequacy of legislation since this issue is not directly related to their lives.
Paradoxically, respondents in Greece (75%) and, to a lesser extent, Luxembourg
(46%) and Italy (43%) are the most dissatisfied with their national nuclear safety
legislation despite the fact that there are no NPPs in these countries.
Finally, in Spain, though public opinion tends to trust national legislation (40%), it
is worth noting that a third of respondents disagree (33%) and a non-negligible
proportion find it difficult to form an opinion on the state of their national nuclear
safety with 27% responding “don’t know”. However, the non-response rate has
decreased by 10 points compared to the results obtained three years ago.
Map Legend: “Negative”, “Stable” and “Positive” refer to the evolution since previous survey
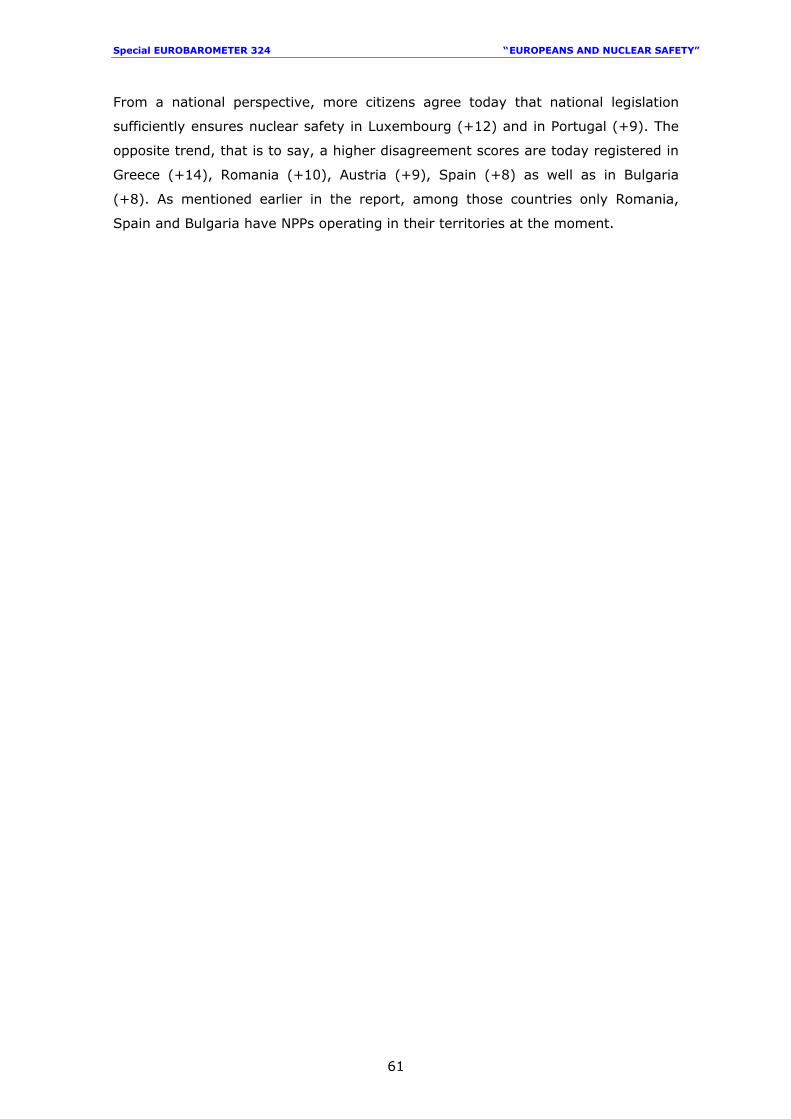
Special EUROBAROMETER 324 “ EUROPEANS AND NUCLEAR SAFETY”
61
From a national perspective, more citizens agree today that national legislation
sufficiently ensures nuclear safety in Luxembourg (+12) and in Portugal (+9). The
opposite trend, that is to say, a higher disagreement scores are today registered in
Greece (+14), Romania (+10), Austria (+9), Spain (+8) as well as in Bulgaria
(+8). As mentioned earlier in the report, among those countries only Romania,
Spain and Bulgaria have NPPs operating in their territories at the moment.
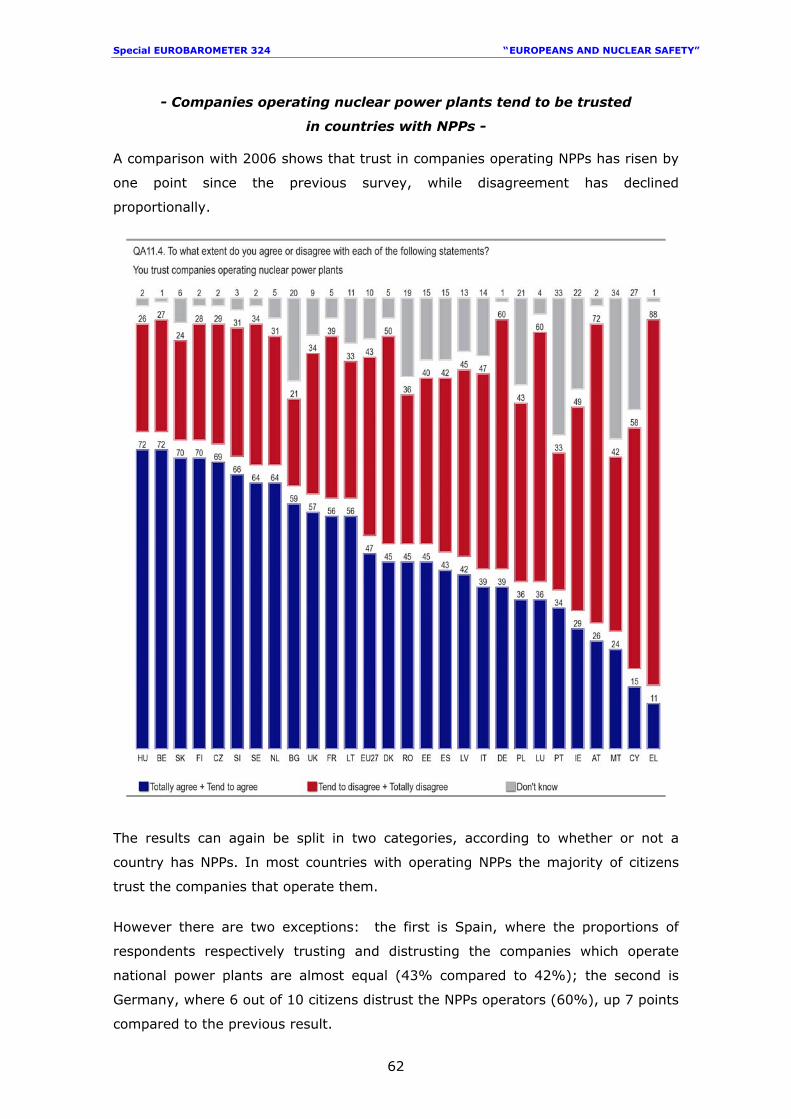
Special EUROBAROMETER 324 “ EUROPEANS AND NUCLEAR SAFETY”
62
- Companies operating nuclear power plants tend to be trusted
in countries with NPPs -
A comparison with 2006 shows that trust in companies operating NPPs has risen by
one point since the previous survey, while disagreement has declined
proportionally.
The results can again be split in two categories, according to whether or not a
country has NPPs. In most countries with operating NPPs the majority of citizens
trust the companies that operate them.
However there are two exceptions: the first is Spain, where the proportions of
respondents respectively trusting and distrusting the companies which operate
national power plants are almost equal (43% compared to 42%); the second is
Germany, where 6 out of 10 citizens distrust the NPPs operators (60%), up 7 points
compared to the previous result.
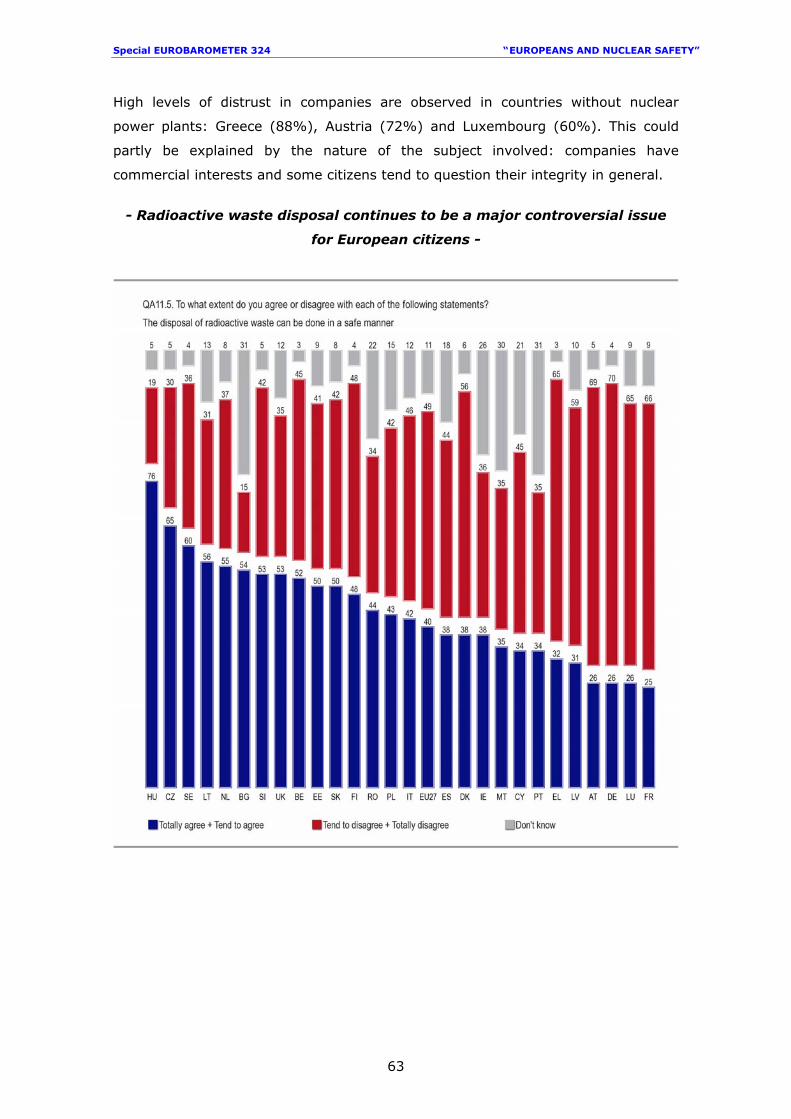
Special EUROBAROMETER 324 “ EUROPEANS AND NUCLEAR SAFETY”
63
High levels of distrust in companies are observed in countries without nuclear
power plants: Greece (88%), Austria (72%) and Luxembourg (60%). This could
partly be explained by the nature of the subject involved: companies have
commercial interests and some citizens tend to question their integrity in general.
- Radioactive waste disposal continues to be a major controversial issue
for European citizens -
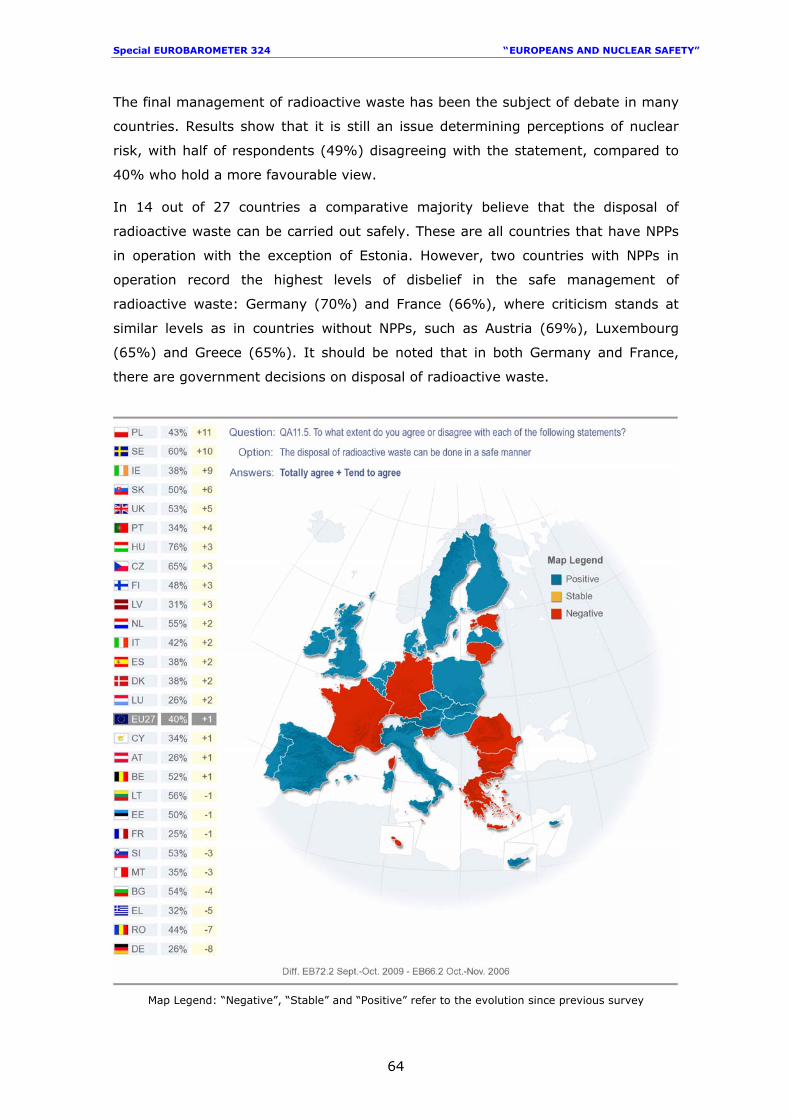
Special EUROBAROMETER 324 “ EUROPEANS AND NUCLEAR SAFETY”
64
The final management of radioactive waste has been the subject of debate in many
countries. Results show that it is still an issue determining perceptions of nuclear
risk, with half of respondents (49%) disagreeing with the statement, compared to
40% who hold a more favourable view.
In 14 out of 27 countries a comparative majority believe that the disposal of
radioactive waste can be carried out safely. These are all countries that have NPPs
in operation with the exception of Estonia. However, two countries with NPPs in
operation record the highest levels of disbelief in the safe management of
radioactive waste: Germany (70%) and France (66%), where criticism stands at
similar levels as in countries without NPPs, such as Austria (69%), Luxembourg
(65%) and Greece (65%). It should be noted that in both Germany and France,
there are government decisions on disposal of radioactive waste.
Map Legend: “Negative”, “Stable” and “Positive” refer to the evolution since previous survey
Special EUROBAROMETER 324 “ EUROPEANS AND NUCLEAR SAFETY”
65
At the EU average level, the pattern is stable compared with the last time the
question was asked, in October-November 2006, and only minor changes are
observed (disagreement is down 1 point while agreement with the statement has
increased proportionally). Though, from a national perspective, agreement raises in
Portugal and in the United Kingdom (+5 and +4 points respectively) but most
outstandingly in Slovakia (+6), Ireland (+9), Sweden (+10) and Poland (+11).
Disbelief seem on the contrary to be stronger in Spain (+7), Germany (+9) and
Romania (+13).
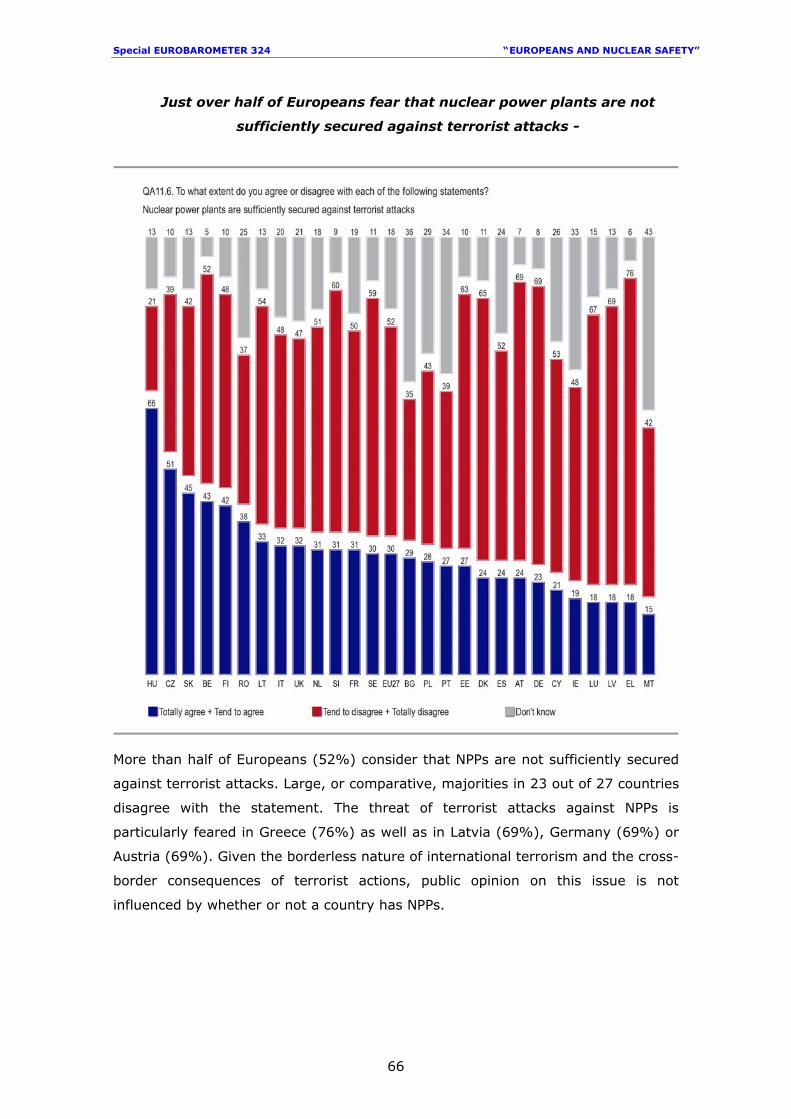
Special EUROBAROMETER 324 “ EUROPEANS AND NUCLEAR SAFETY”
66
Just over half of Europeans fear that nuclear power plants are not
sufficiently secured against terrorist attacks -
More than half of Europeans (52%) consider that NPPs are not sufficiently secured
against terrorist attacks. Large, or comparative, majorities in 23 out of 27 countries
disagree with the statement. The threat of terrorist attacks against NPPs is
particularly feared in Greece (76%) as well as in Latvia (69%), Germany (69%) or
Austria (69%). Given the borderless nature of international terrorism and the cross-
border consequences of terrorist actions, public opinion on this issue is not
influenced by whether or not a country has NPPs.
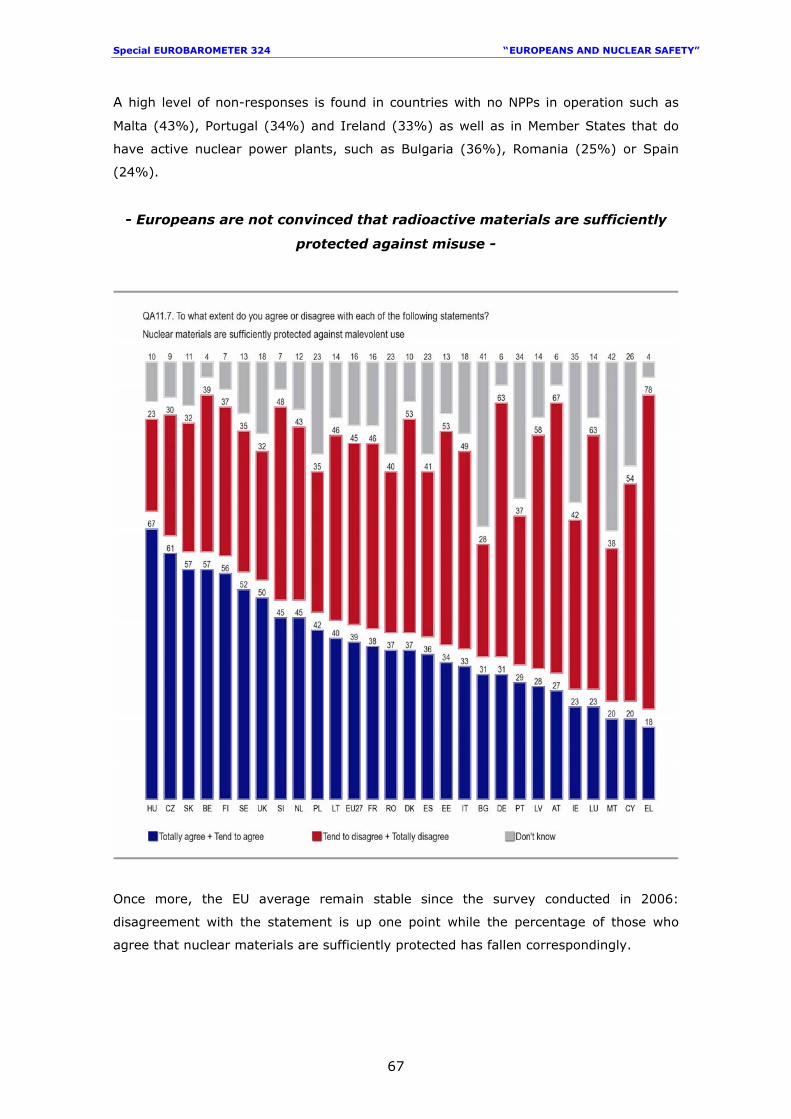
Special EUROBAROMETER 324 “ EUROPEANS AND NUCLEAR SAFETY”
67
A high level of non-responses is found in countries with no NPPs in operation such as
Malta (43%), Portugal (34%) and Ireland (33%) as well as in Member States that do
have active nuclear power plants, such as Bulgaria (36%), Romania (25%) or Spain
(24%).
- Europeans are not convinced that radioactive materials are sufficiently
protected against misuse -
Once more, the EU average remain stable since the survey conducted in 2006:
disagreement with the statement is up one point while the percentage of those who
agree that nuclear materials are sufficiently protected has fallen correspondingly.
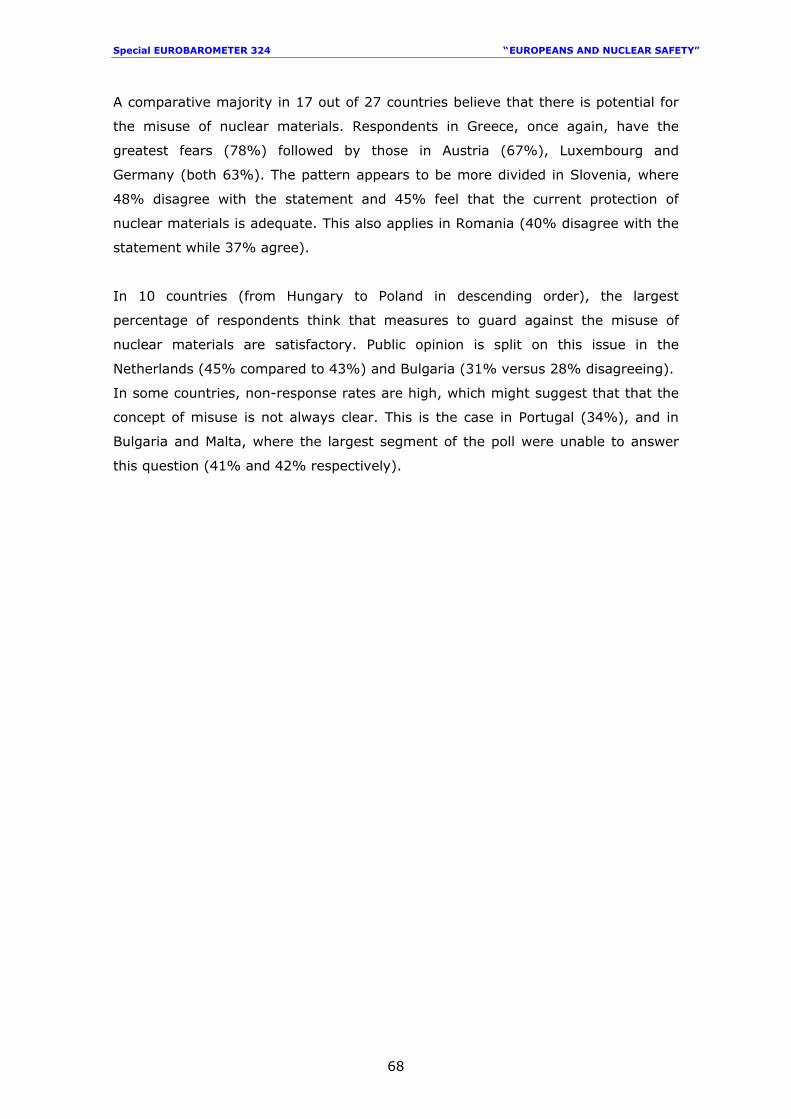
Special EUROBAROMETER 324 “ EUROPEANS AND NUCLEAR SAFETY”
68
A comparative majority in 17 out of 27 countries believe that there is potential for
the misuse of nuclear materials. Respondents in Greece, once again, have the
greatest fears (78%) followed by those in Austria (67%), Luxembourg and
Germany (both 63%). The pattern appears to be more divided in Slovenia, where
48% disagree with the statement and 45% feel that the current protection of
nuclear materials is adequate. This also applies in Romania (40% disagree with the
statement while 37% agree).
In 10 countries (from Hungary to Poland in descending order), the largest
percentage of respondents think that measures to guard against the misuse of
nuclear materials are satisfactory. Public opinion is split on this issue in the
Netherlands (45% compared to 43%) and Bulgaria (31% versus 28% disagreeing).
In some countries, non-response rates are high, which might suggest that that the
concept of misuse is not always clear. This is the case in Portugal (34%), and in
Bulgaria and Malta, where the largest segment of the poll were unable to answer
this question (41% and 42% respectively).
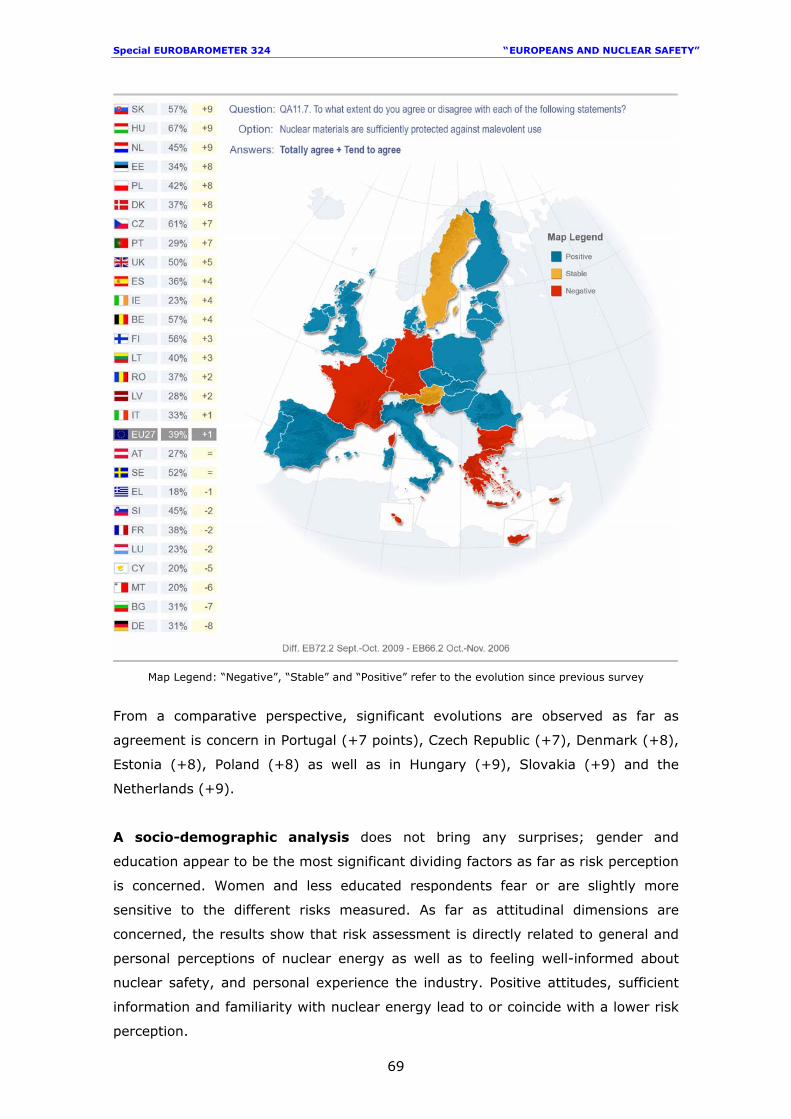
Special EUROBAROMETER 324 “ EUROPEANS AND NUCLEAR SAFETY”
69
Map Legend: “Negative”, “Stable” and “Positive” refer to the evolution since previous survey
From a comparative perspective, significant evolutions are observed as far as
agreement is concern in Portugal (+7 points), Czech Republic (+7), Denmark (+8),
Estonia (+8), Poland (+8) as well as in Hungary (+9), Slovakia (+9) and the
Netherlands (+9).
A socio-demographic analysis does not bring any surprises; gender and
education appear to be the most significant dividing factors as far as risk perception
is concerned. Women and less educated respondents fear or are slightly more
sensitive to the different risks measured. As far as attitudinal dimensions are
concerned, the results show that risk assessment is directly related to general and
personal perceptions of nuclear energy as well as to feeling well-informed about
nuclear safety, and personal experience the industry. Positive attitudes, sufficient
information and familiarity with nuclear energy lead to or coincide with a lower risk
perception.

Special EUROBAROMETER 324 “ EUROPEANS AND NUCLEAR SAFETY”
70
2.5 An advantage or a risk? Risk perception from a personal perspective
and taking all the information into account
Source Questionnaire: QA2030 In order to obtain a greater understanding of perceptions of nuclear energy, the
current Special Eurobarometer included a question assessing the issue of risk from
a personal point of view.
30 QA20. Personally, taking into account all that you know about this topic, thinking about you and your family, do you see nuclear energy more as a benefit or more as a risk?
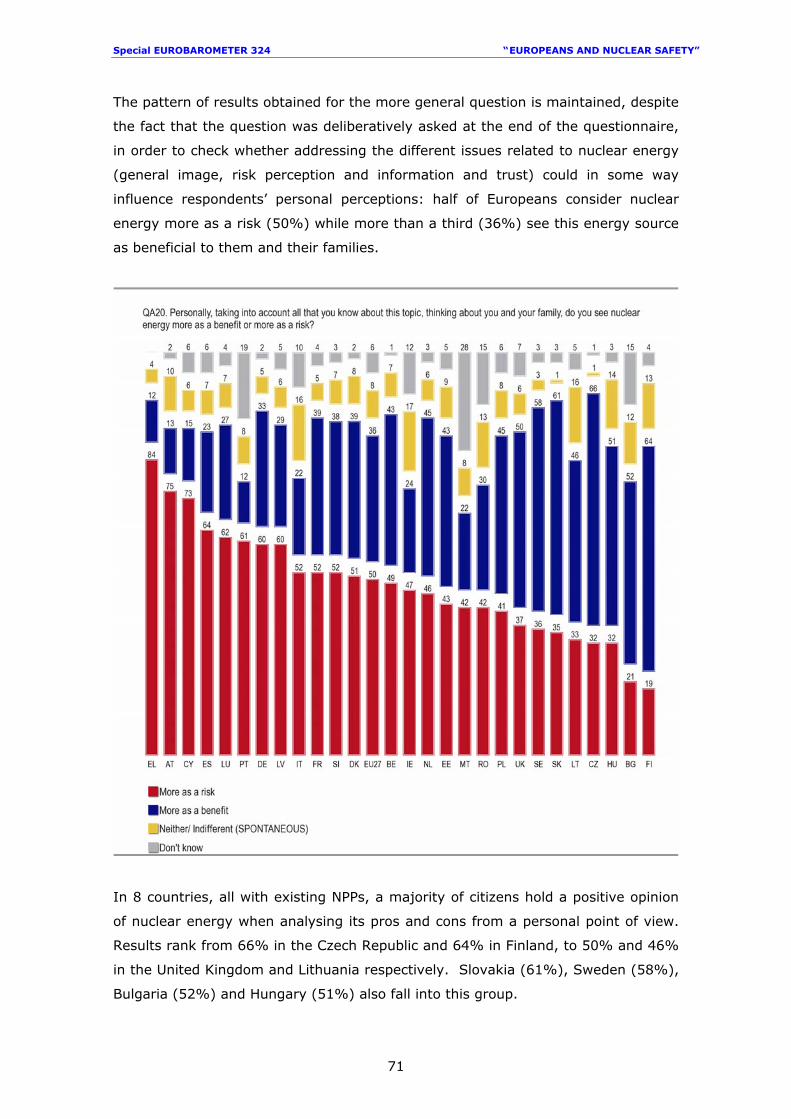
Special EUROBAROMETER 324 “ EUROPEANS AND NUCLEAR SAFETY”
71
The pattern of results obtained for the more general question is maintained, despite
the fact that the question was deliberatively asked at the end of the questionnaire,
in order to check whether addressing the different issues related to nuclear energy
(general image, risk perception and information and trust) could in some way
influence respondents’ personal perceptions: half of Europeans consider nuclear
energy more as a risk (50%) while more than a third (36%) see this energy source
as beneficial to them and their families.
In 8 countries, all with existing NPPs, a majority of citizens hold a positive opinion
of nuclear energy when analysing its pros and cons from a personal point of view.
Results rank from 66% in the Czech Republic and 64% in Finland, to 50% and 46%
in the United Kingdom and Lithuania respectively. Slovakia (61%), Sweden (58%),
Bulgaria (52%) and Hungary (51%) also fall into this group.
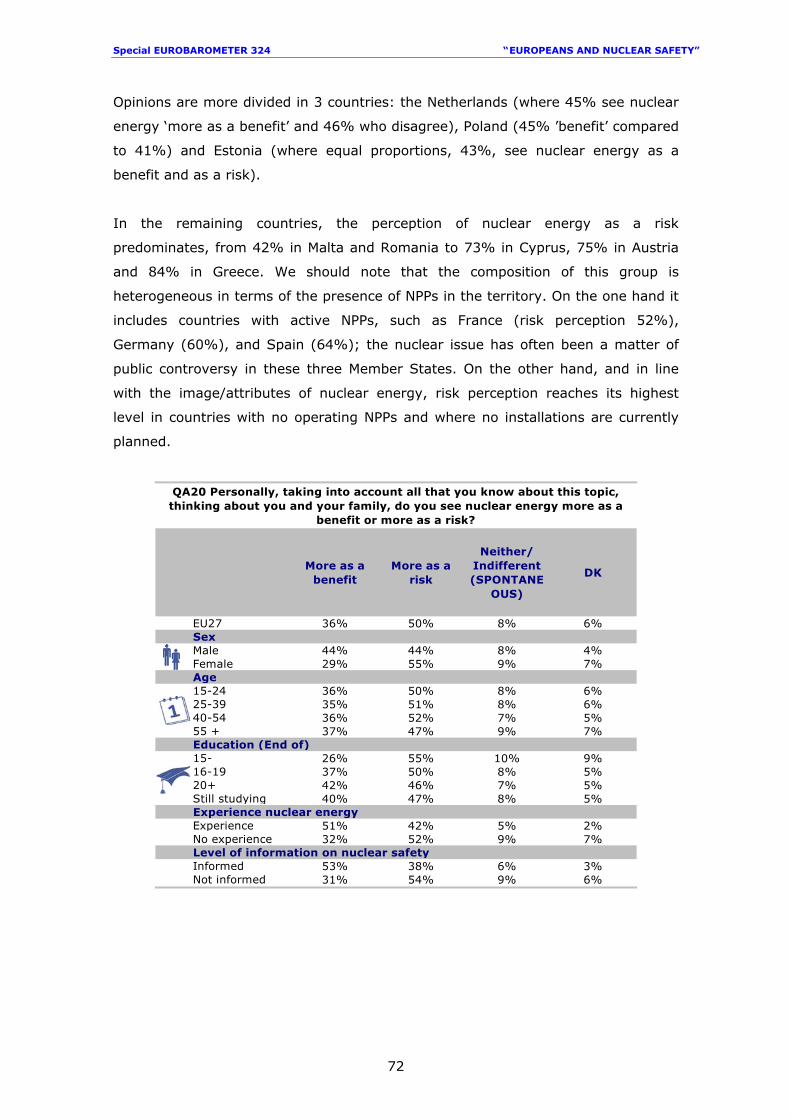
Special EUROBAROMETER 324 “ EUROPEANS AND NUCLEAR SAFETY”
72
Opinions are more divided in 3 countries: the Netherlands (where 45% see nuclear
energy ‘more as a benefit’ and 46% who disagree), Poland (45% ’benefit’ compared
to 41%) and Estonia (where equal proportions, 43%, see nuclear energy as a
benefit and as a risk).
In the remaining countries, the perception of nuclear energy as a risk
predominates, from 42% in Malta and Romania to 73% in Cyprus, 75% in Austria
and 84% in Greece. We should note that the composition of this group is
heterogeneous in terms of the presence of NPPs in the territory. On the one hand it
includes countries with active NPPs, such as France (risk perception 52%),
Germany (60%), and Spain (64%); the nuclear issue has often been a matter of
public controversy in these three Member States. On the other hand, and in line
with the image/attributes of nuclear energy, risk perception reaches its highest
level in countries with no operating NPPs and where no installations are currently
planned.
More as a benefit
More as a risk
Neither/ Indifferent (SPONTANE
OUS)
DK
EU27 36% 50% 8% 6%SexMale 44% 44% 8% 4%Female 29% 55% 9% 7%Age15-24 36% 50% 8% 6%25-39 35% 51% 8% 6%40-54 36% 52% 7% 5%55 + 37% 47% 9% 7%Education (End of)15- 26% 55% 10% 9%16-19 37% 50% 8% 5%20+ 42% 46% 7% 5%Still studying 40% 47% 8% 5%Experience nuclear energyExperience 51% 42% 5% 2%No experience 32% 52% 9% 7%Level of information on nuclear safetyInformed 53% 38% 6% 3%Not informed 31% 54% 9% 6%
QA20 Personally, taking into account all that you know about this topic, thinking about you and your family, do you see nuclear energy more as a
benefit or more as a risk?
Special EUROBAROMETER 324 “ EUROPEANS AND NUCLEAR SAFETY”
73
Some of the socio-demographic trends observed in previous chapters seem to be
stronger when citizens consider the risk or benefit of nuclear energy from a
personal point of view:
• While males are divided about the issue (with identical proportions, 44%,
seeing nuclear energy as a risk and as a benefit), females are less
ambiguous, and a majority (55%) hold a negative opinion.
• Differences by age are subtler. Concern is predominant in all four
categories, ranging from 50% in the youngest group to 47% among
respondents aged 55 and over. Yet in all the categories, slightly more
than a third of interviewees see nuclear energy ‘more as a benefit’.
• Education introduces a clearer divide, and the higher the educational
level of respondents, the more likely they are to value the advantages of
nuclear energy over the risks from a personal perspective (42% among
the longest- educated compared to 26% in the least educated group).
The results also confirm that personal experiences of nuclear issues and the sense
of being well-informed are factors which have an even stronger impact on public
opinion: the perception of nuclear energy ‘more as a benefit’ from a personal point
of view rises to 51% among respondents with some personal experience - including
those who have visited a NPP, those who leave nearby a plant and those who are
familiar with working on nuclear energy issues - and to 53% among respondents who
feel well-informed about nuclear safety issues. However, it should be noted that
even in these better-informed categories of the population, personal risk perception
remains at significant levels (42% among those with personal experience of nuclear
energy and 38% among the well-informed).
Special EUROBAROMETER 324 “ EUROPEANS AND NUCLEAR SAFETY”
74
3. KNOWLEDGE OF NUCLEAR ISSUES
This third chapter examines the actual knowledge of Europeans on issues related to
nuclear energy and the extent to which this appears to be linked to their opinions
and attitudes.
Source Questionnaire: QA431
- Europeans have an average level of knowledge of nuclear issues -
Respondents were presented with five factual statements about nuclear issues and
asked whether they think they are true or false as follows:
1. The EU has the largest number of commercial nuclear power stations (for
electricity production) in the world (true)
2. Nuclear power plants are the only producers of radioactive waste (false)
3. About a third of the electricity produced within the EU is produced by
nuclear power plants (true)
4. New nuclear power plants are presently being constructed in (OUR
COUNTRY) at this very moment (correct answer depends on country)
31 QA4 For each of the following statements please tell me whether you think it is true or false: 1) The EU has the largest number of commercial nuclear power stations (for electricity production) in the world 2) Nuclear power plants are the only producers of radioactive waste 3) About a third of the electricity produced within the EU is produced by nuclear power plants 4) New nuclear power plants are presently being constructed in (OUR COUNTRY) at this very moment
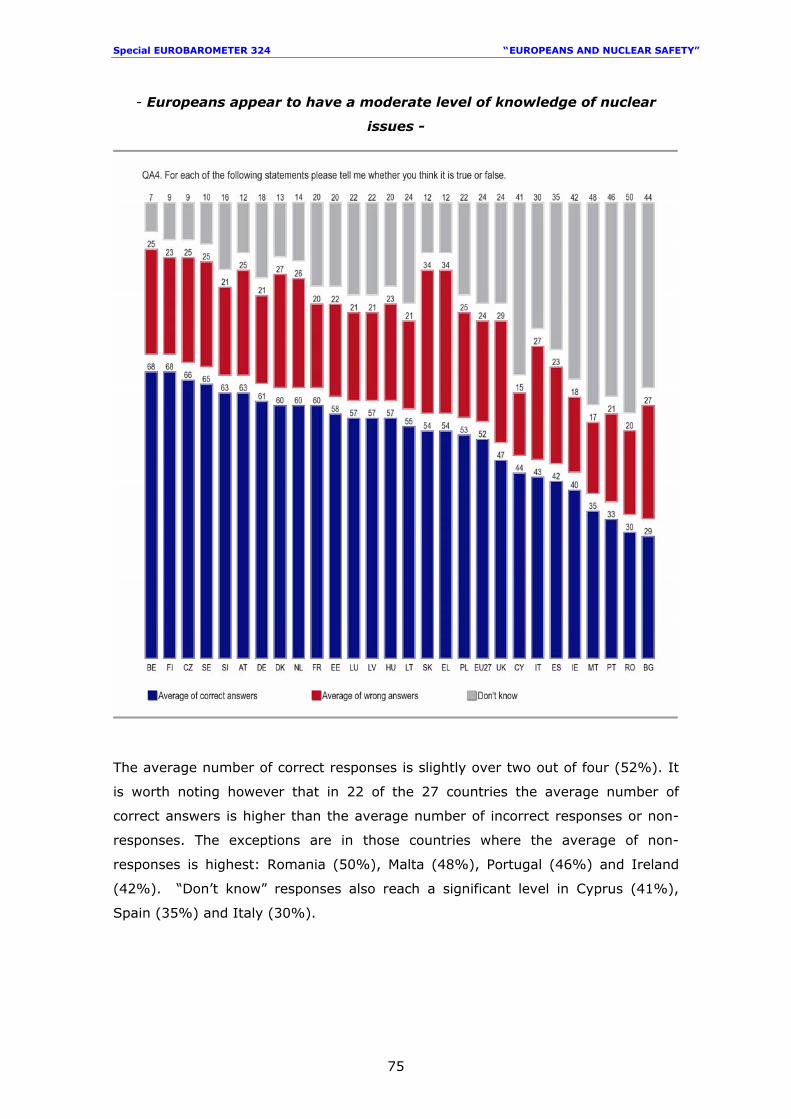
Special EUROBAROMETER 324 “ EUROPEANS AND NUCLEAR SAFETY”
75
- Europeans appear to have a moderate level of knowledge of nuclear
issues -
The average number of correct responses is slightly over two out of four (52%). It
is worth noting however that in 22 of the 27 countries the average number of
correct answers is higher than the average number of incorrect responses or non-
responses. The exceptions are in those countries where the average of non-
responses is highest: Romania (50%), Malta (48%), Portugal (46%) and Ireland
(42%). “Don’t know” responses also reach a significant level in Cyprus (41%),
Spain (35%) and Italy (30%).
Special EUROBAROMETER 324 “ EUROPEANS AND NUCLEAR SAFETY”
76
Whether or not a country has NPPs seems to have a certain bearing on its
citizens’ knowledge, though it is not the only factor. The first four countries
with the highest average of correct answers have nuclear power plants.
Respondents in Belgium, Finland and the Czech Republic answered close to 3 out of
4 questions correctly (68% in the first two countries and 66% in the third), followed
closely by interviewees in Sweden (65%).
Austria ranks just below these countries, with an average of 63% correct answers.
The country has no existing NPPs, but as is well known, the International Atomic
Energy Agency headquarters are located in Vienna.
This fact could partly explain the high awareness in Austria of issues related to
nuclear energy.
Results are also above the European average in Slovenia (63%), Germany (61%),
Denmark (60%), France (60%), the Netherlands (60%), Estonia (58%), Latvia
(57%), Luxembourg (57%), Hungary (57%) and Lithuania (55%).
Wrong answers are highest in Slovakia and Greece (34%) while non-responses
rates, as already mentioned, were highest in Romania, Malta, Portugal, Ireland, and
Bulgaria.
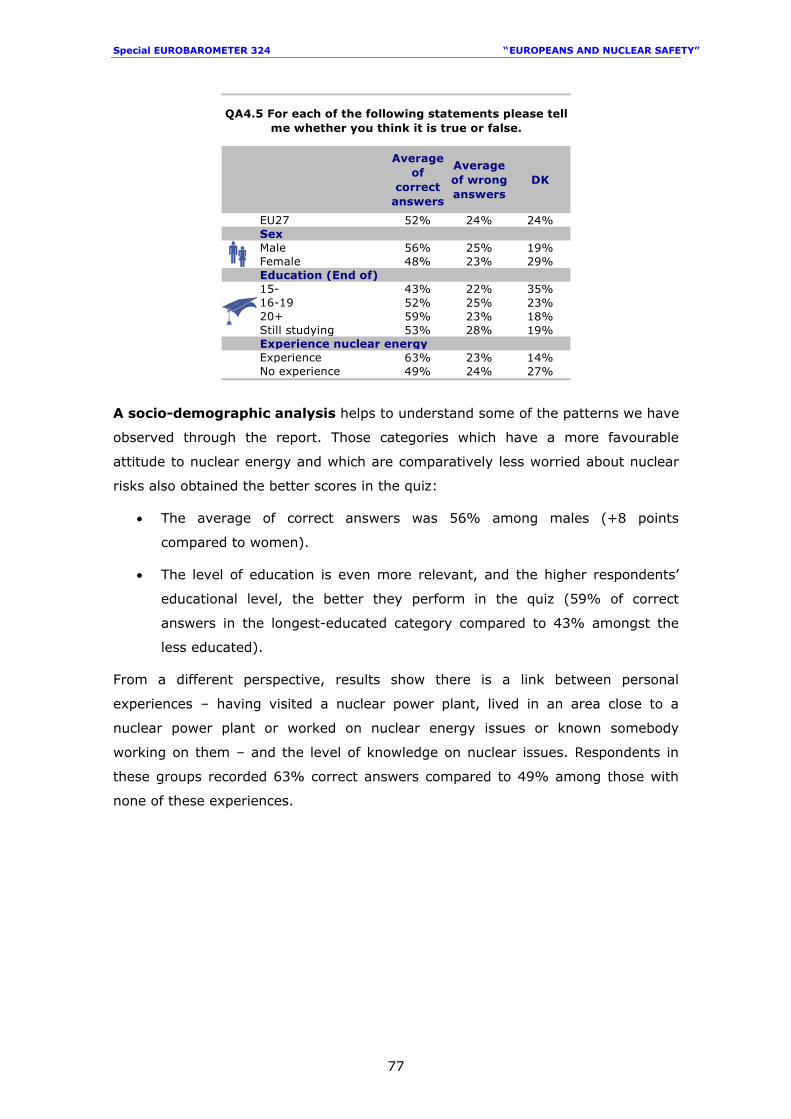
Special EUROBAROMETER 324 “ EUROPEANS AND NUCLEAR SAFETY”
77
Average of
correct answers
Average of wrong answers
DK
EU27 52% 24% 24%SexMale 56% 25% 19%Female 48% 23% 29%Education (End of)15- 43% 22% 35%16-19 52% 25% 23%20+ 59% 23% 18%Still studying 53% 28% 19%Experience nuclear energyExperience 63% 23% 14%No experience 49% 24% 27%
QA4.5 For each of the following statements please tell me whether you think it is true or false.
A socio-demographic analysis helps to understand some of the patterns we have
observed through the report. Those categories which have a more favourable
attitude to nuclear energy and which are comparatively less worried about nuclear
risks also obtained the better scores in the quiz:
• The average of correct answers was 56% among males (+8 points
compared to women).
• The level of education is even more relevant, and the higher respondents’
educational level, the better they perform in the quiz (59% of correct
answers in the longest-educated category compared to 43% amongst the
less educated).
From a different perspective, results show there is a link between personal
experiences – having visited a nuclear power plant, lived in an area close to a
nuclear power plant or worked on nuclear energy issues or known somebody
working on them – and the level of knowledge on nuclear issues. Respondents in
these groups recorded 63% correct answers compared to 49% among those with
none of these experiences.
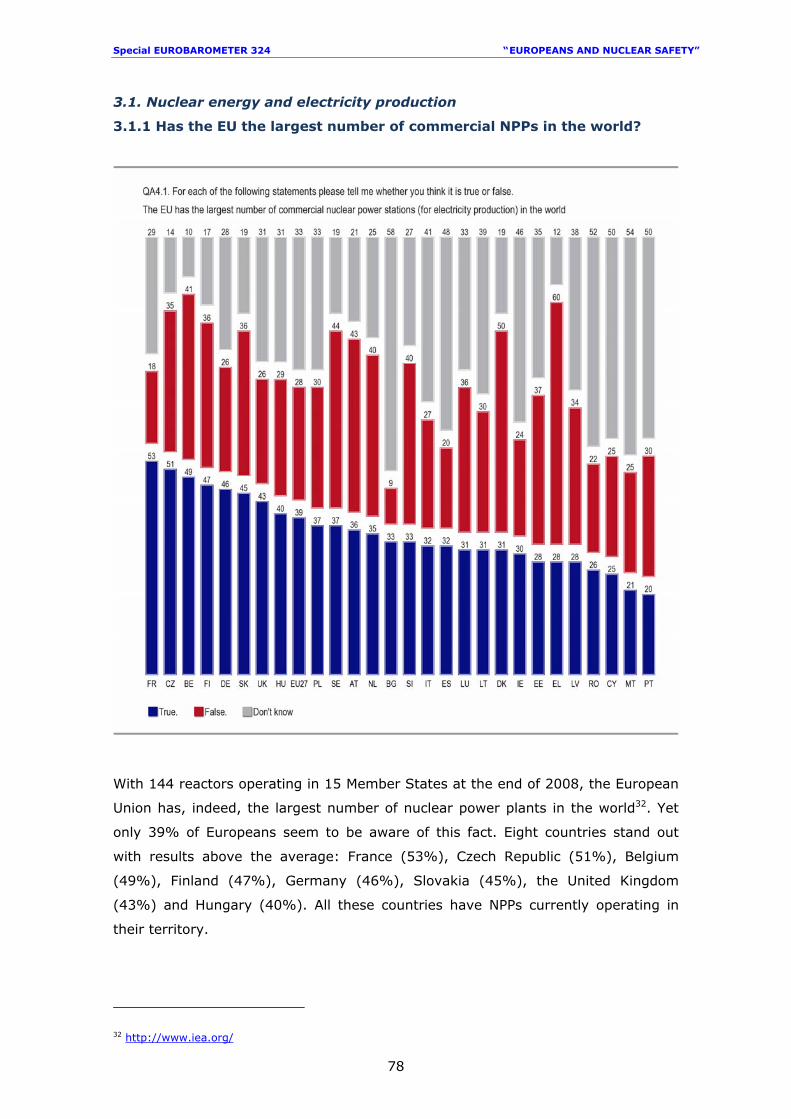
Special EUROBAROMETER 324 “ EUROPEANS AND NUCLEAR SAFETY”
78
3.1. Nuclear energy and electricity production
3.1.1 Has the EU the largest number of commercial NPPs in the world?
With 144 reactors operating in 15 Member States at the end of 2008, the European
Union has, indeed, the largest number of nuclear power plants in the world32. Yet
only 39% of Europeans seem to be aware of this fact. Eight countries stand out
with results above the average: France (53%), Czech Republic (51%), Belgium
(49%), Finland (47%), Germany (46%), Slovakia (45%), the United Kingdom
(43%) and Hungary (40%). All these countries have NPPs currently operating in
their territory.
32 http://www.iea.org/
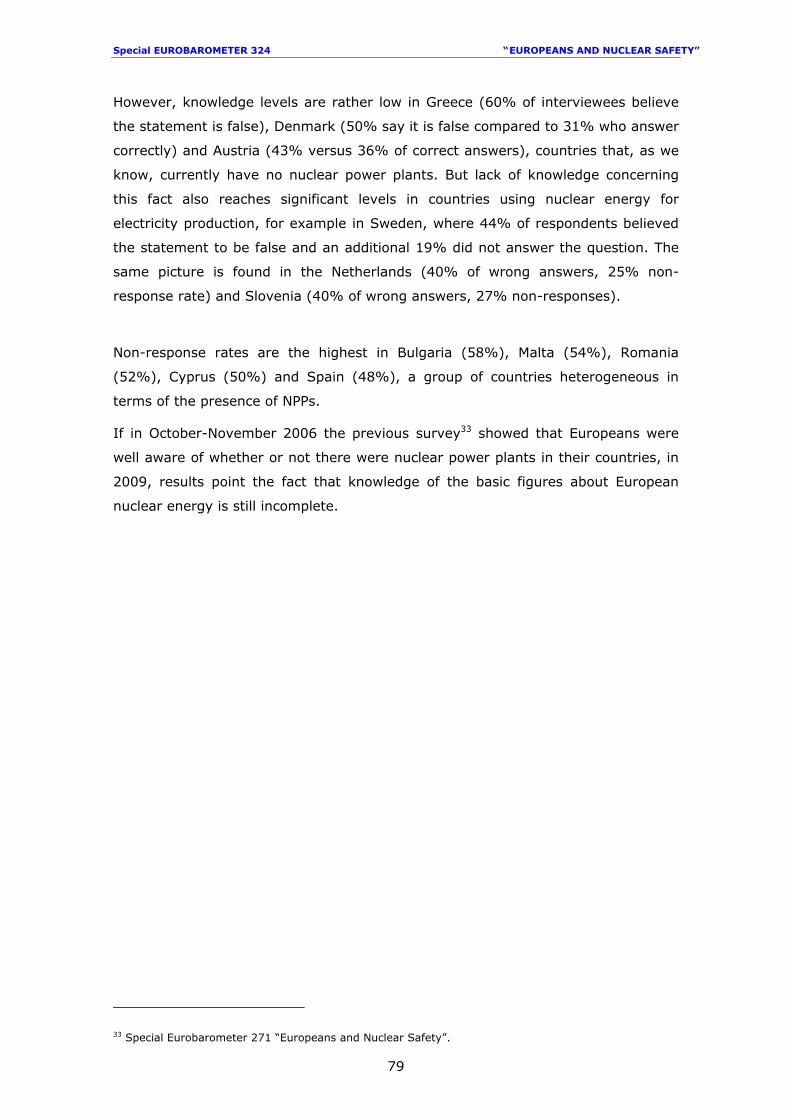
Special EUROBAROMETER 324 “ EUROPEANS AND NUCLEAR SAFETY”
79
However, knowledge levels are rather low in Greece (60% of interviewees believe
the statement is false), Denmark (50% say it is false compared to 31% who answer
correctly) and Austria (43% versus 36% of correct answers), countries that, as we
know, currently have no nuclear power plants. But lack of knowledge concerning
this fact also reaches significant levels in countries using nuclear energy for
electricity production, for example in Sweden, where 44% of respondents believed
the statement to be false and an additional 19% did not answer the question. The
same picture is found in the Netherlands (40% of wrong answers, 25% non-
response rate) and Slovenia (40% of wrong answers, 27% non-responses).
Non-response rates are the highest in Bulgaria (58%), Malta (54%), Romania
(52%), Cyprus (50%) and Spain (48%), a group of countries heterogeneous in
terms of the presence of NPPs.
If in October-November 2006 the previous survey33 showed that Europeans were
well aware of whether or not there were nuclear power plants in their countries, in
2009, results point the fact that knowledge of the basic figures about European
nuclear energy is still incomplete.
33 Special Eurobarometer 271 “Europeans and Nuclear Safety”.
Special EUROBAROMETER 324 “ EUROPEANS AND NUCLEAR SAFETY”
80
3.1.2 How much electricity is produced by NPPs in the EU?
Citizens seem to be slightly more aware of the fact that a third of the electricity
consumed in the European Union is produced through nuclear energy. When asked
whether this statement is true or false, more than half of Europeans answer
correctly (54%). However there are also significant percentages of wrong answers
(20%) and non-responses (26%).
Wide differences are observed between countries when it comes to knowledge of
the share of nuclear energy in total electricity production within the EU. In most
countries citizens are aware of the fact that about a third of electricity
used within the EU is produced by nuclear power.
Special EUROBAROMETER 324 “ EUROPEANS AND NUCLEAR SAFETY”
81
Nationally, however, the figures vary considerably, from 75% in Belgium to 22% in
Portugal, the only country where those who give the incorrect answer outnumber
those who give the correct answer.
These differences are again caused in principal by high levels of non-responses in
most of the countries. In seven countries, proportions of between 35% and 60% of
respondents are unable to answer this question. The non-response rate reaches its
highest level in Malta and Romania (57% and 56% respectively) but also remains
considerable in Bulgaria (54%), Cyprus (52%), Portugal (50%), Ireland (45%) and
Spain (37%). On average, non-response rates tend to be higher in countries that
do not have active NPPs.
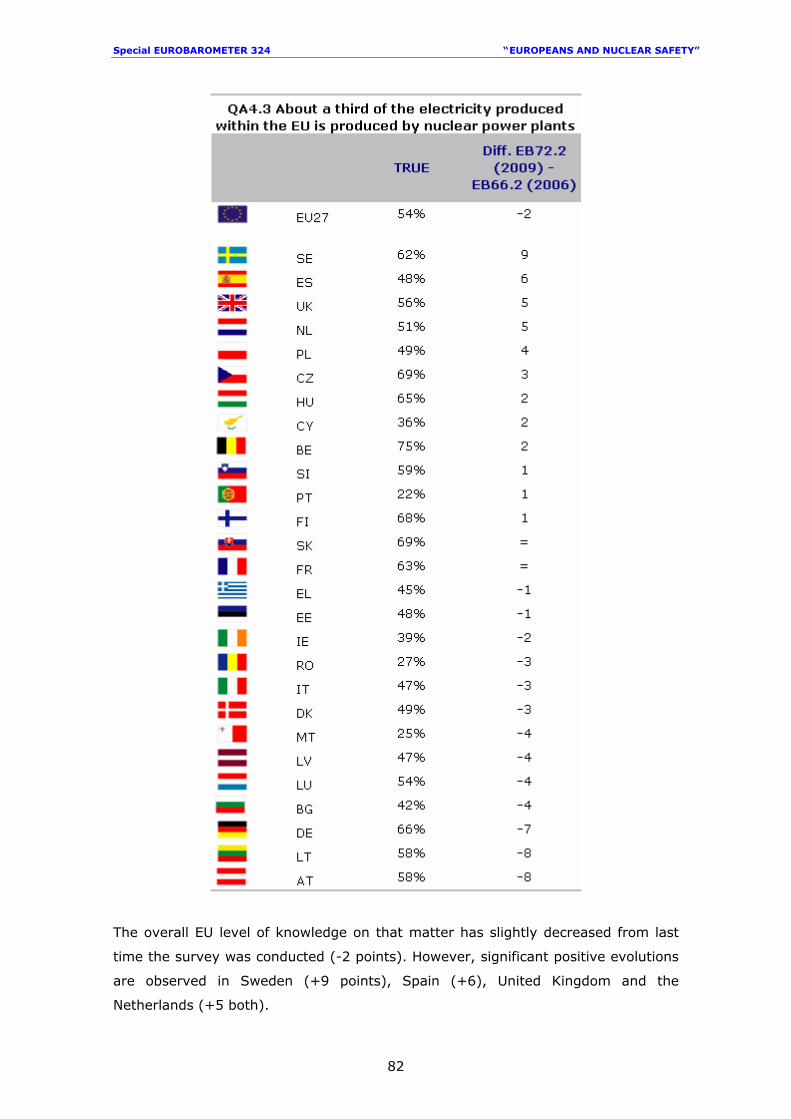
Special EUROBAROMETER 324 “ EUROPEANS AND NUCLEAR SAFETY”
82
The overall EU level of knowledge on that matter has slightly decreased from last
time the survey was conducted (-2 points). However, significant positive evolutions
are observed in Sweden (+9 points), Spain (+6), United Kingdom and the
Netherlands (+5 both).
Special EUROBAROMETER 324 “ EUROPEANS AND NUCLEAR SAFETY”
83
On the other side, the proportion of respondents knowing the correct answer has
significantly decreased in Austria (-8 points), Lithuania (-8) and Germany (-7).
Nevertheless, still a majority of respondents in those three countries know that a
third of the electricity consumed in the European Union is produced through nuclear
energy.
3.2 Is radioactive waste exclusively produced by nuclear power plants?
As we know, radioactive waste is unavoidable, non-recyclable and hazardous. It
requires careful management to ensure the adequate protection of humans and the
environment. The timescale over which such protection is required extends in the
case of nuclear waste well beyond the lifespan of current or forthcoming
generations. As we know, this issue arouses public mistrust and fear.
The current Special Eurobarometer measured knowledge of radioactive waste
through the statement “Nuclear power plants are the only producers of radioactive
waste”. While this kind of waste is usually the product of a nuclear process such as
nuclear fission, it may as well come from other sources, not directly connected with
the nuclear sector (hospitals, industries).
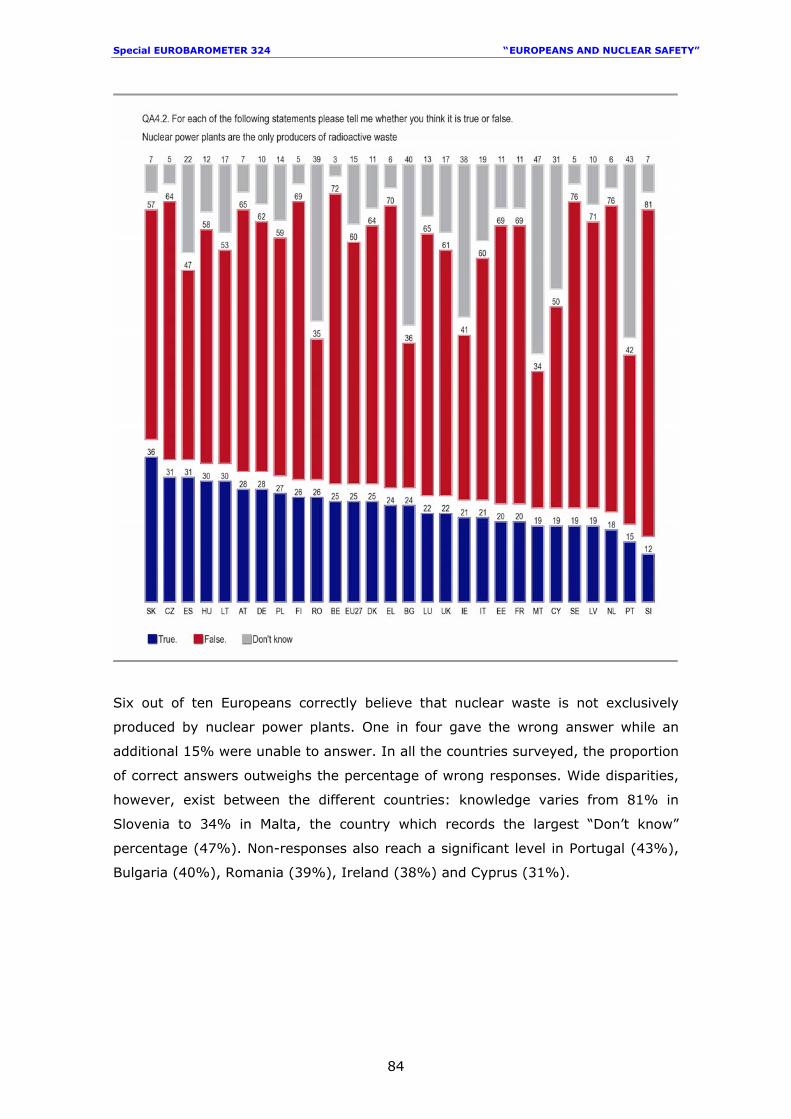
Special EUROBAROMETER 324 “ EUROPEANS AND NUCLEAR SAFETY”
84
Six out of ten Europeans correctly believe that nuclear waste is not exclusively
produced by nuclear power plants. One in four gave the wrong answer while an
additional 15% were unable to answer. In all the countries surveyed, the proportion
of correct answers outweighs the percentage of wrong responses. Wide disparities,
however, exist between the different countries: knowledge varies from 81% in
Slovenia to 34% in Malta, the country which records the largest “Don’t know”
percentage (47%). Non-responses also reach a significant level in Portugal (43%),
Bulgaria (40%), Romania (39%), Ireland (38%) and Cyprus (31%).
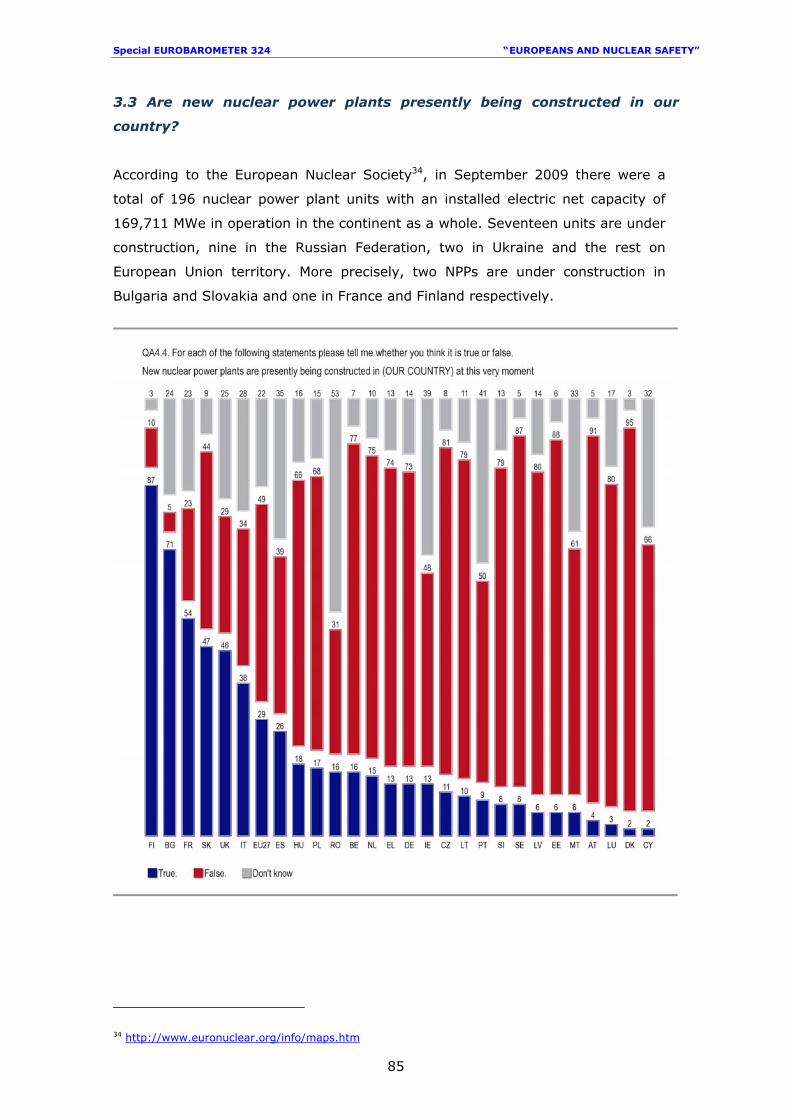
Special EUROBAROMETER 324 “ EUROPEANS AND NUCLEAR SAFETY”
85
3.3 Are new nuclear power plants presently being constructed in our
country?
According to the European Nuclear Society34, in September 2009 there were a
total of 196 nuclear power plant units with an installed electric net capacity of
169,711 MWe in operation in the continent as a whole. Seventeen units are under
construction, nine in the Russian Federation, two in Ukraine and the rest on
European Union territory. More precisely, two NPPs are under construction in
Bulgaria and Slovakia and one in France and Finland respectively.
34 http://www.euronuclear.org/info/maps.htm
Special EUROBAROMETER 324 “ EUROPEANS AND NUCLEAR SAFETY”
86
Most respondents in Finland, Bulgaria and France are aware of this fact. However,
the level of information differs from one country to the other: though 87% of
respondents in Finland answer the question correctly, this percentage is 16 points
lower in Bulgaria and slightly exceeds 50% in France (54%). Interviewees in
Slovakia seem to be somewhat confused about the situation of new NPPs in their
country; 47% give the correct answer but an almost equal proportion (44%)
believe it is untrue that NPPs are presently under construction.
In the United Kingdom, 46% of respondents believe that nuclear power plants are
under construction there, though this is not the case. The UK was actually the first
country to use nuclear energy to generate power for large-scale civilian use,
opening its first plant in 1956. The last new reactor was opened in 1995, and the
country has been steadily decommissioning its old plants, with many set to close by
2023. However, in 2008, the government gave the go-ahead for a new generation
of nuclear power stations, and discussions in order to identify the best sites for new
reactors, streamline the planning processes etc. are currently ongoing35. This could
explain why such a significant percentage of UK respondents think that the
construction of NPPs is a fact.
Non-response rates reach the highest level in Romania, where more than half of
respondents were unable to answer to the question (53%). “Don’t know”
responses were also very common in countries such as Portugal (41%), Ireland
(39%), Spain (35%), Malta and Cyprus (33% and 32% respectively).
35 http://news.bbc.co.uk/2/hi/europe/4713398.stm
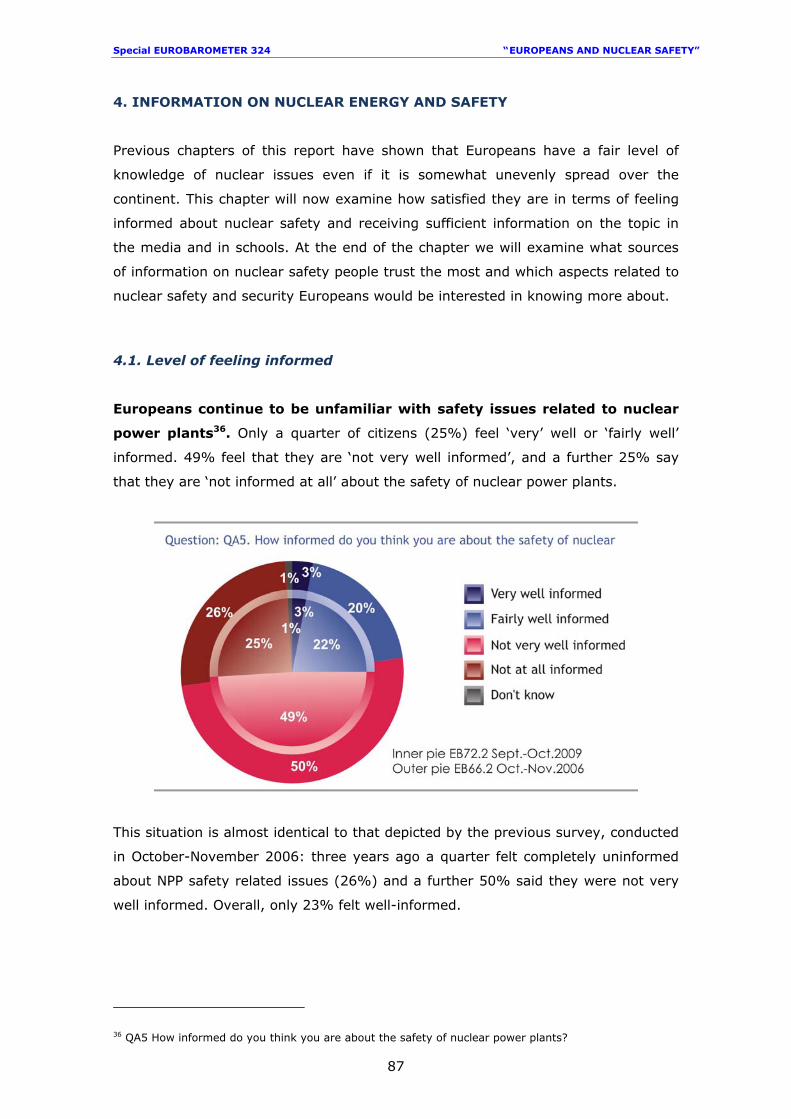
Special EUROBAROMETER 324 “ EUROPEANS AND NUCLEAR SAFETY”
87
4. INFORMATION ON NUCLEAR ENERGY AND SAFETY
Previous chapters of this report have shown that Europeans have a fair level of
knowledge of nuclear issues even if it is somewhat unevenly spread over the
continent. This chapter will now examine how satisfied they are in terms of feeling
informed about nuclear safety and receiving sufficient information on the topic in
the media and in schools. At the end of the chapter we will examine what sources
of information on nuclear safety people trust the most and which aspects related to
nuclear safety and security Europeans would be interested in knowing more about.
4.1. Level of feeling informed
Europeans continue to be unfamiliar with safety issues related to nuclear
power plants36. Only a quarter of citizens (25%) feel ‘very’ well or ‘fairly well’
informed. 49% feel that they are ‘not very well informed’, and a further 25% say
that they are ‘not informed at all’ about the safety of nuclear power plants.
This situation is almost identical to that depicted by the previous survey, conducted
in October-November 2006: three years ago a quarter felt completely uninformed
about NPP safety related issues (26%) and a further 50% said they were not very
well informed. Overall, only 23% felt well-informed.
36 QA5 How informed do you think you are about the safety of nuclear power plants?
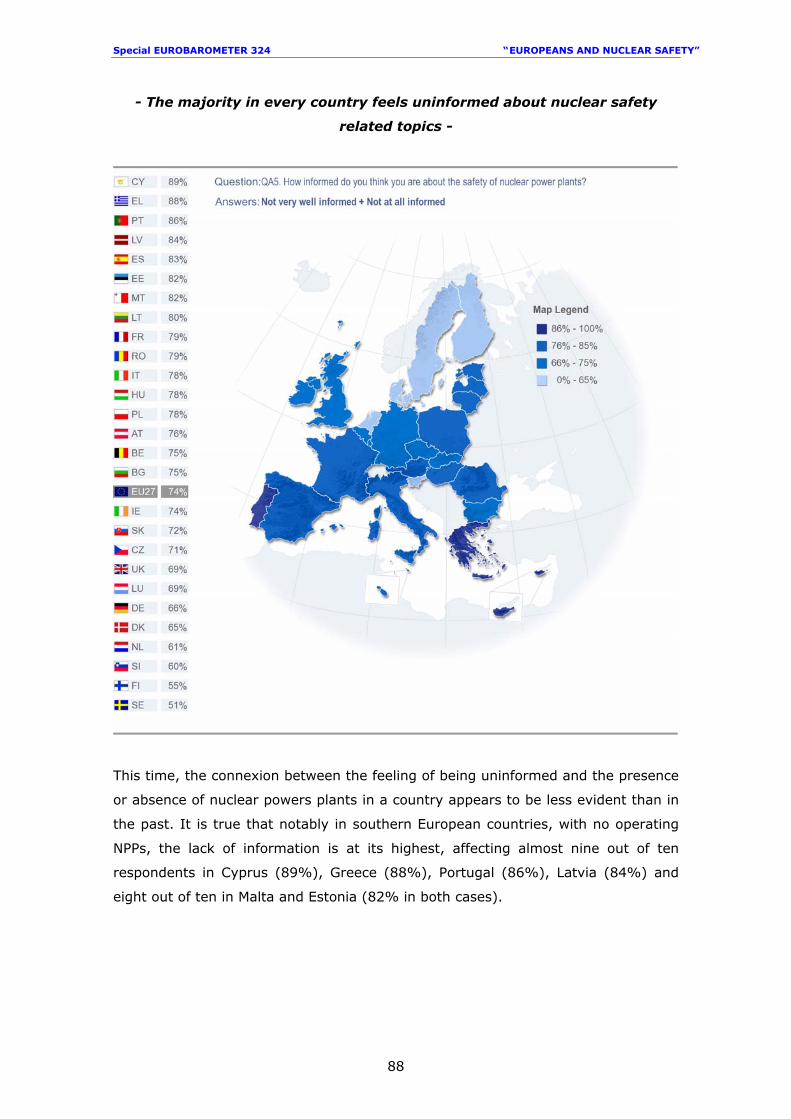
Special EUROBAROMETER 324 “ EUROPEANS AND NUCLEAR SAFETY”
88
- The majority in every country feels uninformed about nuclear safety
related topics -
This time, the connexion between the feeling of being uninformed and the presence
or absence of nuclear powers plants in a country appears to be less evident than in
the past. It is true that notably in southern European countries, with no operating
NPPs, the lack of information is at its highest, affecting almost nine out of ten
respondents in Cyprus (89%), Greece (88%), Portugal (86%), Latvia (84%) and
eight out of ten in Malta and Estonia (82% in both cases).
Special EUROBAROMETER 324 “ EUROPEANS AND NUCLEAR SAFETY”
89
Yet some countries with a significant nuclear energy presence in the energy mix are
not far behind: Spain (83% feel uninformed), Lithuania37 (80%), Romania and
France (both 79%), Hungary (78%), Belgium and Bulgaria (75% in both cases).
On the other end of the spectrum, the group of countries with the lowest number of
respondents who feel uninformed is led by Sweden (51%), Finland (55%) and
Slovenia (60%), followed by the Netherlands and Germany (61% and 66%
respectively), all countries where a significant share of electricity is produced by
NPPs. However, they are followed closely by Denmark (65%) and Luxembourg
(69%).
In any case it should be noted that even in Sweden, Finland and Slovenia the
proportion of respondents who feel uninformed outweighs the percentage of those
feeling sufficiently informed of nuclear safety issues. In all Member States, there is
a need for more information on this topic.
37 Lithuania operates one nuclear power plant - Ignalina NPP, which is located in the north eastern part of Lithuania, near the borders with Latvia and Belarus. http://www-pub.iaea.org/MTCD/publications/PDF/cnpp2009/countryprofiles/Lithuania/Lithuania2006.htm
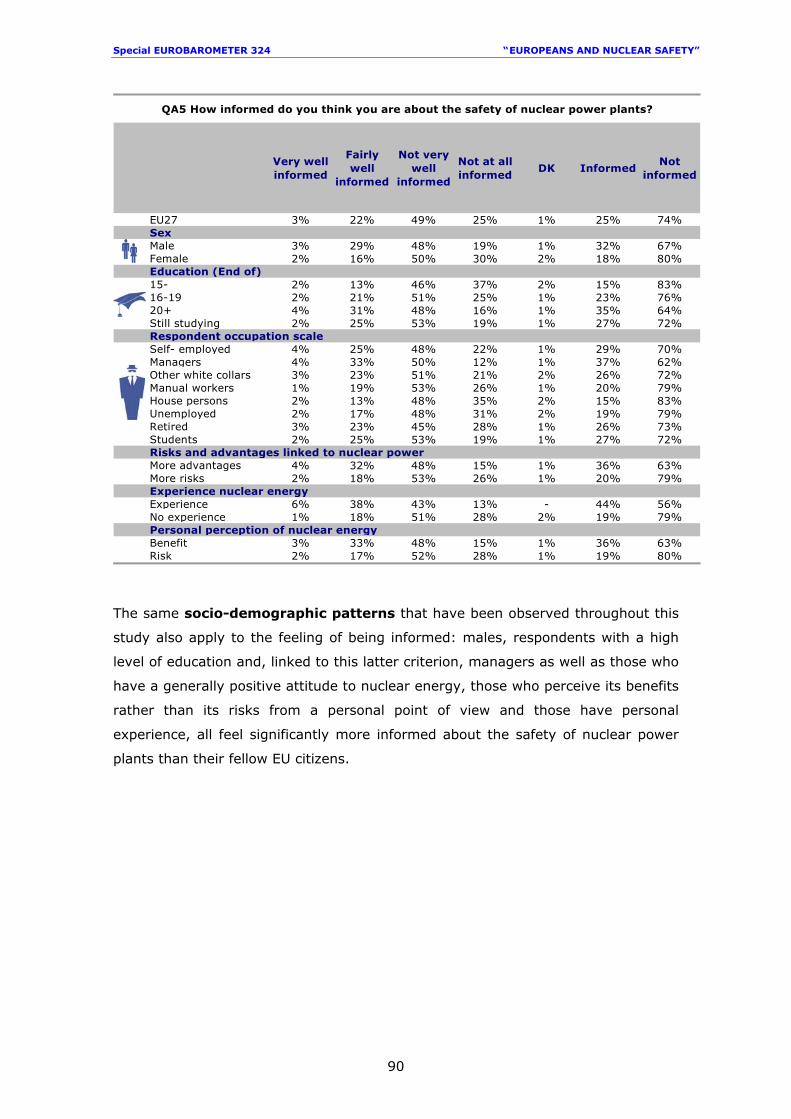
Special EUROBAROMETER 324 “ EUROPEANS AND NUCLEAR SAFETY”
90
Very well informed
Fairly well
informed
Not very well
informed
Not at all informed
DK InformedNot
informed
EU27 3% 22% 49% 25% 1% 25% 74%SexMale 3% 29% 48% 19% 1% 32% 67%Female 2% 16% 50% 30% 2% 18% 80%Education (End of)15- 2% 13% 46% 37% 2% 15% 83%16-19 2% 21% 51% 25% 1% 23% 76%20+ 4% 31% 48% 16% 1% 35% 64%Still studying 2% 25% 53% 19% 1% 27% 72%Respondent occupation scaleSelf- employed 4% 25% 48% 22% 1% 29% 70%Managers 4% 33% 50% 12% 1% 37% 62%Other white collars 3% 23% 51% 21% 2% 26% 72%Manual workers 1% 19% 53% 26% 1% 20% 79%House persons 2% 13% 48% 35% 2% 15% 83%Unemployed 2% 17% 48% 31% 2% 19% 79%Retired 3% 23% 45% 28% 1% 26% 73%Students 2% 25% 53% 19% 1% 27% 72%Risks and advantages linked to nuclear powerMore advantages 4% 32% 48% 15% 1% 36% 63%More risks 2% 18% 53% 26% 1% 20% 79%Experience nuclear energyExperience 6% 38% 43% 13% - 44% 56%No experience 1% 18% 51% 28% 2% 19% 79%Personal perception of nuclear energyBenefit 3% 33% 48% 15% 1% 36% 63%Risk 2% 17% 52% 28% 1% 19% 80%
QA5 How informed do you think you are about the safety of nuclear power plants?
The same socio-demographic patterns that have been observed throughout this
study also apply to the feeling of being informed: males, respondents with a high
level of education and, linked to this latter criterion, managers as well as those who
have a generally positive attitude to nuclear energy, those who perceive its benefits
rather than its risks from a personal point of view and those have personal
experience, all feel significantly more informed about the safety of nuclear power
plants than their fellow EU citizens.
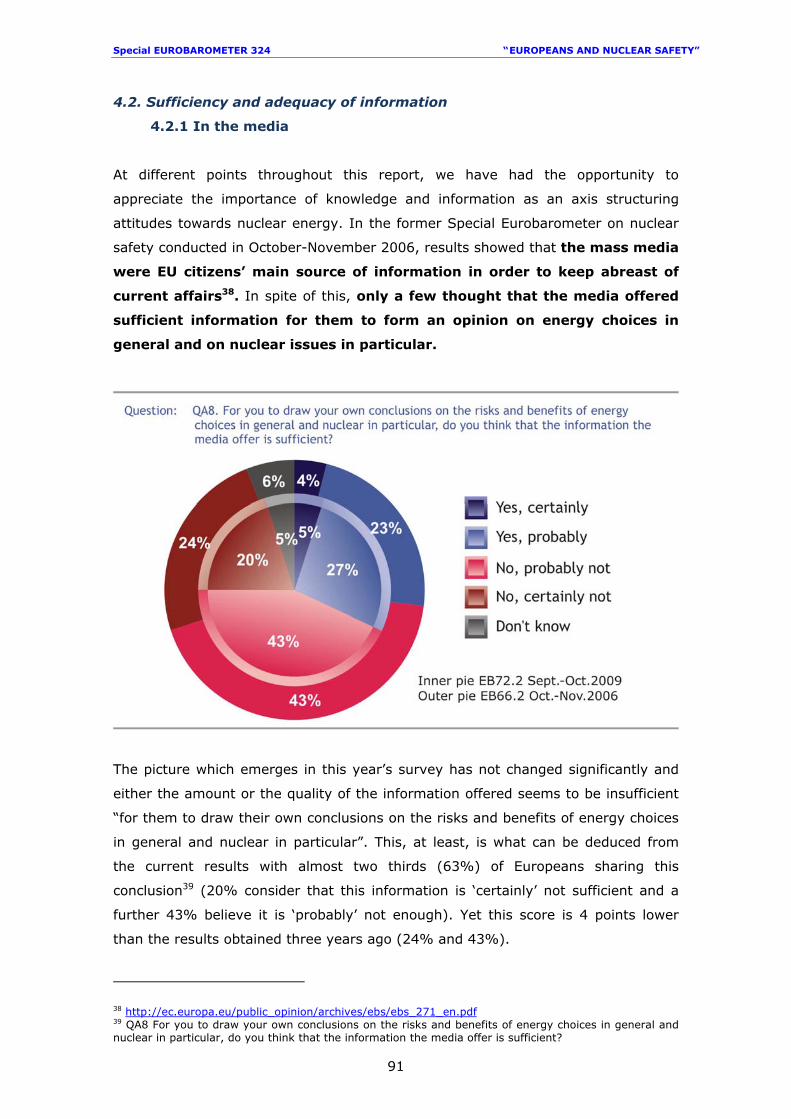
Special EUROBAROMETER 324 “ EUROPEANS AND NUCLEAR SAFETY”
91
4.2. Sufficiency and adequacy of information
4.2.1 In the media
At different points throughout this report, we have had the opportunity to
appreciate the importance of knowledge and information as an axis structuring
attitudes towards nuclear energy. In the former Special Eurobarometer on nuclear
safety conducted in October-November 2006, results showed that the mass media
were EU citizens’ main source of information in order to keep abreast of
current affairs38. In spite of this, only a few thought that the media offered
sufficient information for them to form an opinion on energy choices in
general and on nuclear issues in particular.
The picture which emerges in this year’s survey has not changed significantly and
either the amount or the quality of the information offered seems to be insufficient
“for them to draw their own conclusions on the risks and benefits of energy choices
in general and nuclear in particular”. This, at least, is what can be deduced from
the current results with almost two thirds (63%) of Europeans sharing this
conclusion39 (20% consider that this information is ‘certainly’ not sufficient and a
further 43% believe it is ‘probably’ not enough). Yet this score is 4 points lower
than the results obtained three years ago (24% and 43%).
38 http://ec.europa.eu/public_opinion/archives/ebs/ebs_271_en.pdf 39 QA8 For you to draw your own conclusions on the risks and benefits of energy choices in general and nuclear in particular, do you think that the information the media offer is sufficient?
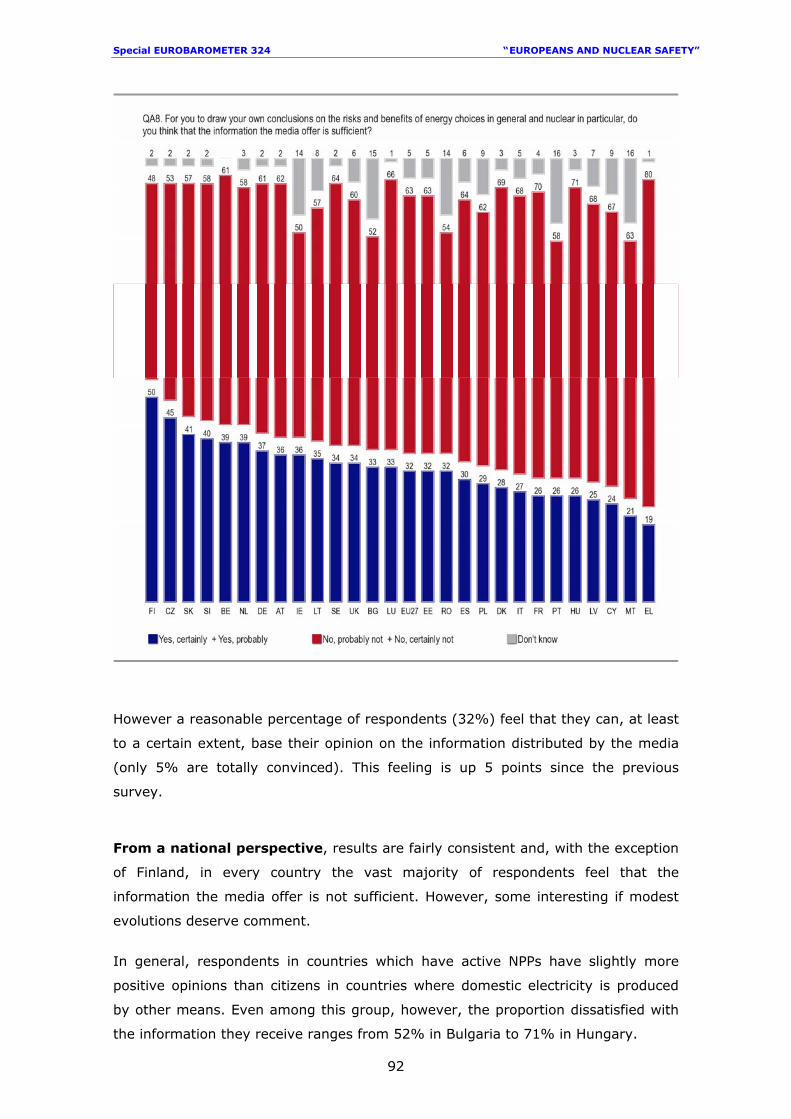
Special EUROBAROMETER 324 “ EUROPEANS AND NUCLEAR SAFETY”
92
However a reasonable percentage of respondents (32%) feel that they can, at least
to a certain extent, base their opinion on the information distributed by the media
(only 5% are totally convinced). This feeling is up 5 points since the previous
survey.
From a national perspective, results are fairly consistent and, with the exception
of Finland, in every country the vast majority of respondents feel that the
information the media offer is not sufficient. However, some interesting if modest
evolutions deserve comment.
In general, respondents in countries which have active NPPs have slightly more
positive opinions than citizens in countries where domestic electricity is produced
by other means. Even among this group, however, the proportion dissatisfied with
the information they receive ranges from 52% in Bulgaria to 71% in Hungary.
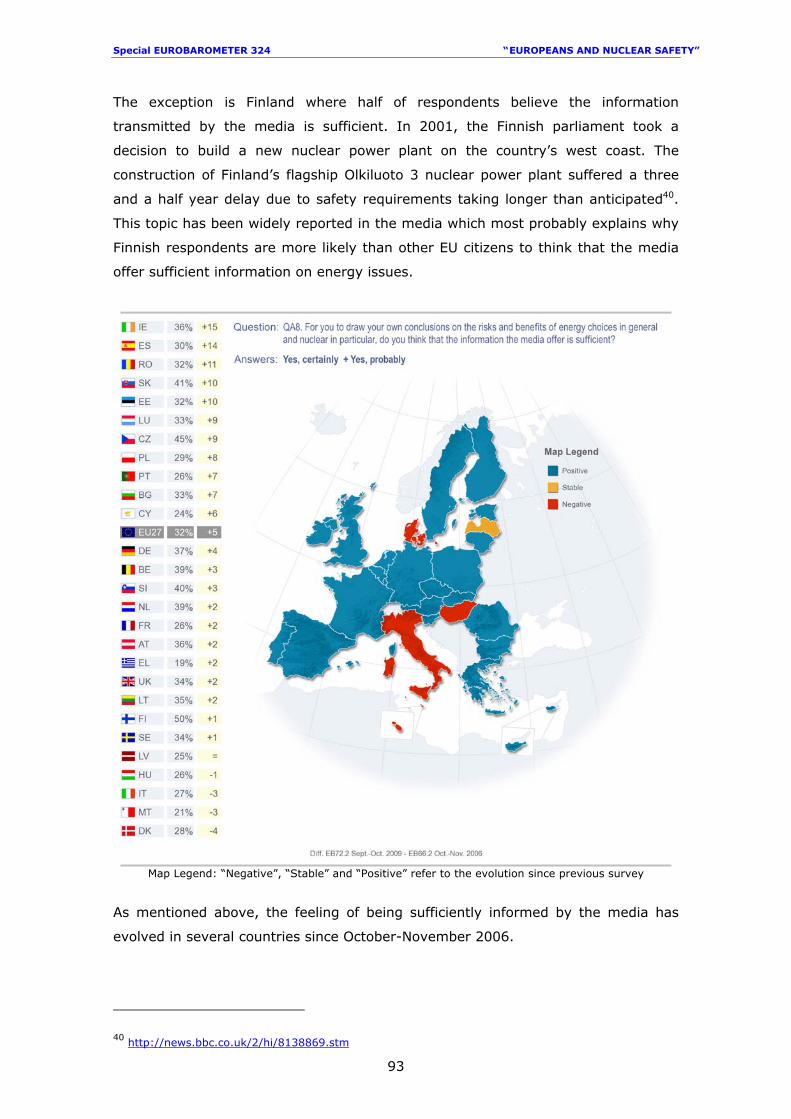
Special EUROBAROMETER 324 “ EUROPEANS AND NUCLEAR SAFETY”
93
The exception is Finland where half of respondents believe the information
transmitted by the media is sufficient. In 2001, the Finnish parliament took a
decision to build a new nuclear power plant on the country’s west coast. The
construction of Finland’s flagship Olkiluoto 3 nuclear power plant suffered a three
and a half year delay due to safety requirements taking longer than anticipated40.
This topic has been widely reported in the media which most probably explains why
Finnish respondents are more likely than other EU citizens to think that the media
offer sufficient information on energy issues.
Map Legend: “Negative”, “Stable” and “Positive” refer to the evolution since previous survey
As mentioned above, the feeling of being sufficiently informed by the media has
evolved in several countries since October-November 2006.
40 http://news.bbc.co.uk/2/hi/8138869.stm
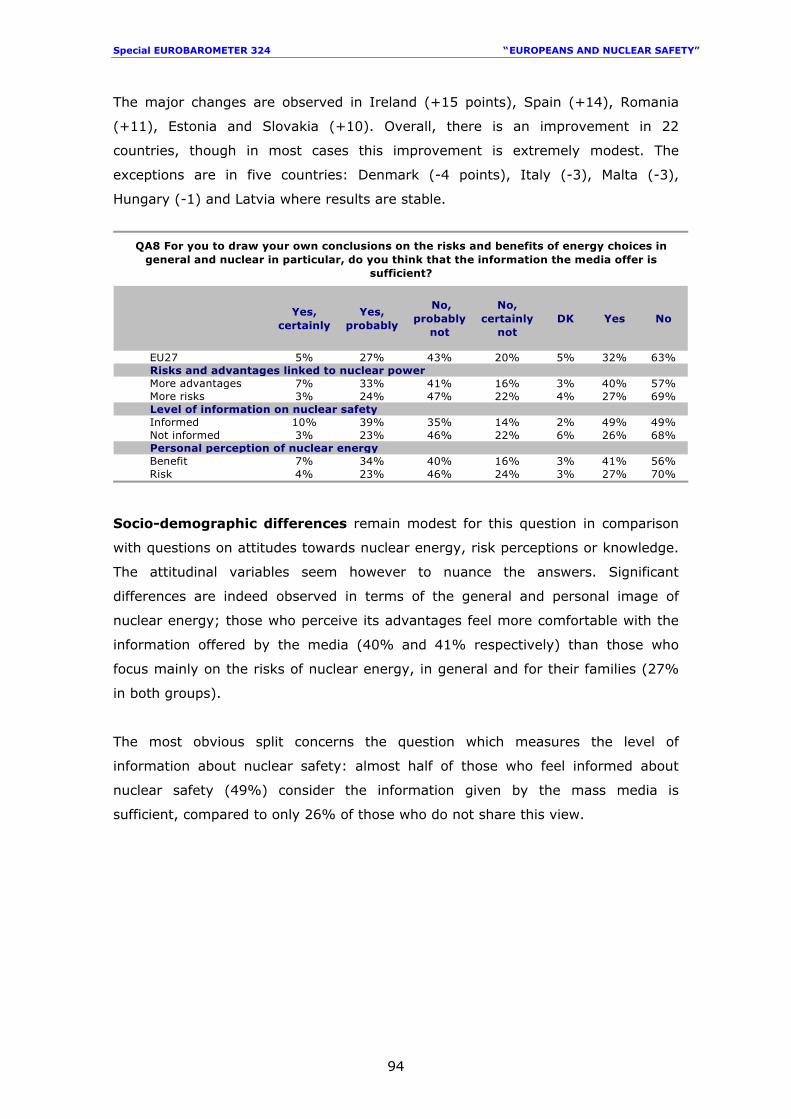
Special EUROBAROMETER 324 “ EUROPEANS AND NUCLEAR SAFETY”
94
The major changes are observed in Ireland (+15 points), Spain (+14), Romania
(+11), Estonia and Slovakia (+10). Overall, there is an improvement in 22
countries, though in most cases this improvement is extremely modest. The
exceptions are in five countries: Denmark (-4 points), Italy (-3), Malta (-3),
Hungary (-1) and Latvia where results are stable.
Yes, certainly
Yes, probably
No, probably
not
No, certainly
not DK Yes No
EU27 5% 27% 43% 20% 5% 32% 63%Risks and advantages linked to nuclear powerMore advantages 7% 33% 41% 16% 3% 40% 57%More risks 3% 24% 47% 22% 4% 27% 69%Level of information on nuclear safetyInformed 10% 39% 35% 14% 2% 49% 49%Not informed 3% 23% 46% 22% 6% 26% 68%Personal perception of nuclear energyBenefit 7% 34% 40% 16% 3% 41% 56%Risk 4% 23% 46% 24% 3% 27% 70%
QA8 For you to draw your own conclusions on the risks and benefits of energy choices in general and nuclear in particular, do you think that the information the media offer is
sufficient?
Socio-demographic differences remain modest for this question in comparison
with questions on attitudes towards nuclear energy, risk perceptions or knowledge.
The attitudinal variables seem however to nuance the answers. Significant
differences are indeed observed in terms of the general and personal image of
nuclear energy; those who perceive its advantages feel more comfortable with the
information offered by the media (40% and 41% respectively) than those who
focus mainly on the risks of nuclear energy, in general and for their families (27%
in both groups).
The most obvious split concerns the question which measures the level of
information about nuclear safety: almost half of those who feel informed about
nuclear safety (49%) consider the information given by the mass media is
sufficient, compared to only 26% of those who do not share this view.
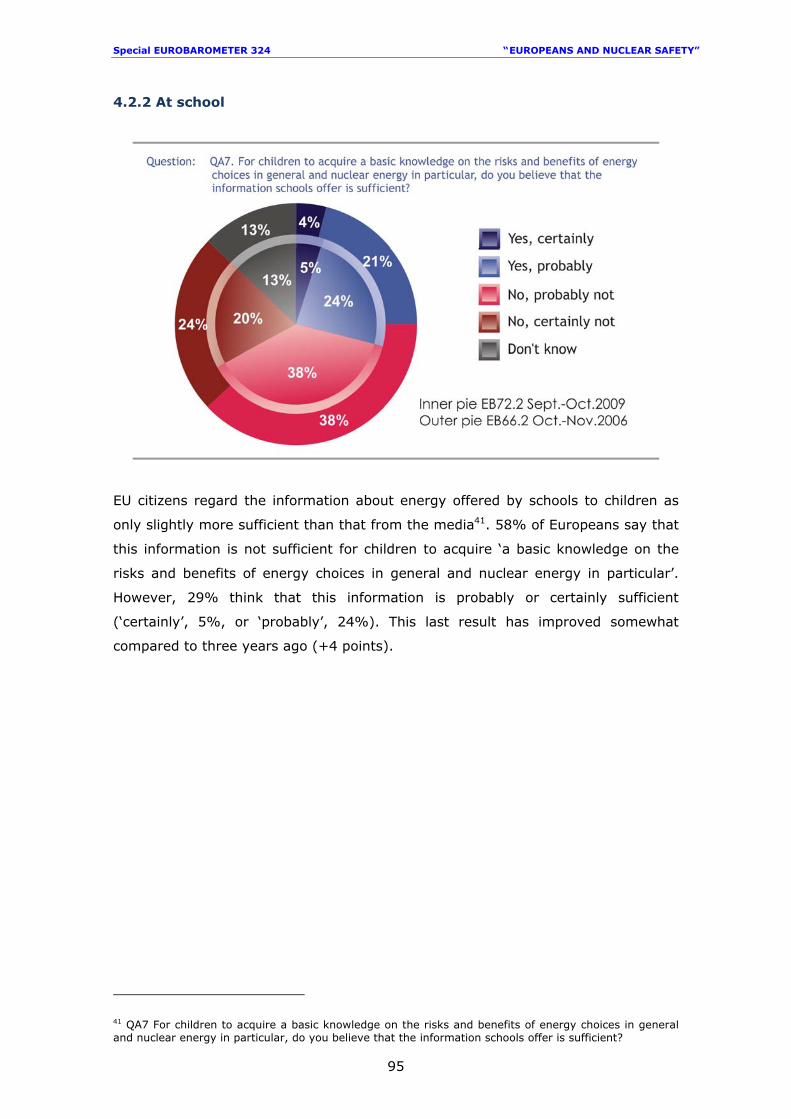
Special EUROBAROMETER 324 “ EUROPEANS AND NUCLEAR SAFETY”
95
4.2.2 At school
EU citizens regard the information about energy offered by schools to children as
only slightly more sufficient than that from the media41. 58% of Europeans say that
this information is not sufficient for children to acquire ‘a basic knowledge on the
risks and benefits of energy choices in general and nuclear energy in particular’.
However, 29% think that this information is probably or certainly sufficient
(‘certainly’, 5%, or ‘probably’, 24%). This last result has improved somewhat
compared to three years ago (+4 points).
41 QA7 For children to acquire a basic knowledge on the risks and benefits of energy choices in general and nuclear energy in particular, do you believe that the information schools offer is sufficient?
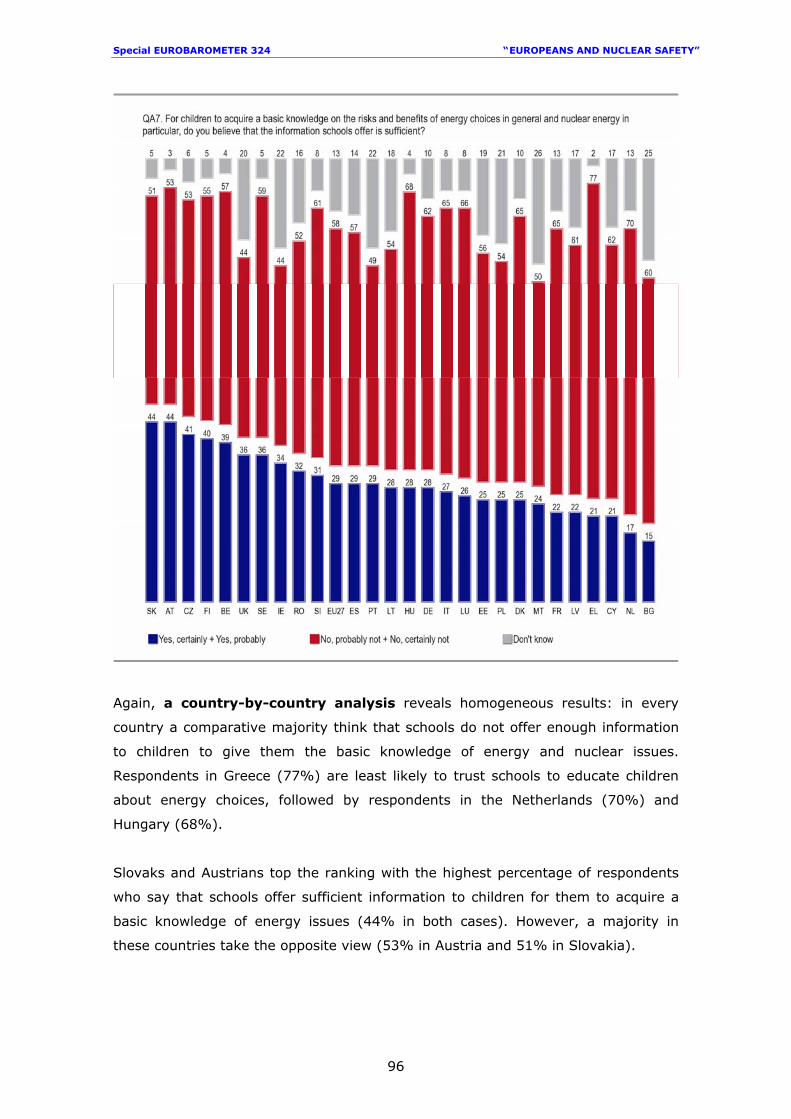
Special EUROBAROMETER 324 “ EUROPEANS AND NUCLEAR SAFETY”
96
Again, a country-by-country analysis reveals homogeneous results: in every
country a comparative majority think that schools do not offer enough information
to children to give them the basic knowledge of energy and nuclear issues.
Respondents in Greece (77%) are least likely to trust schools to educate children
about energy choices, followed by respondents in the Netherlands (70%) and
Hungary (68%).
Slovaks and Austrians top the ranking with the highest percentage of respondents
who say that schools offer sufficient information to children for them to acquire a
basic knowledge of energy issues (44% in both cases). However, a majority in
these countries take the opposite view (53% in Austria and 51% in Slovakia).
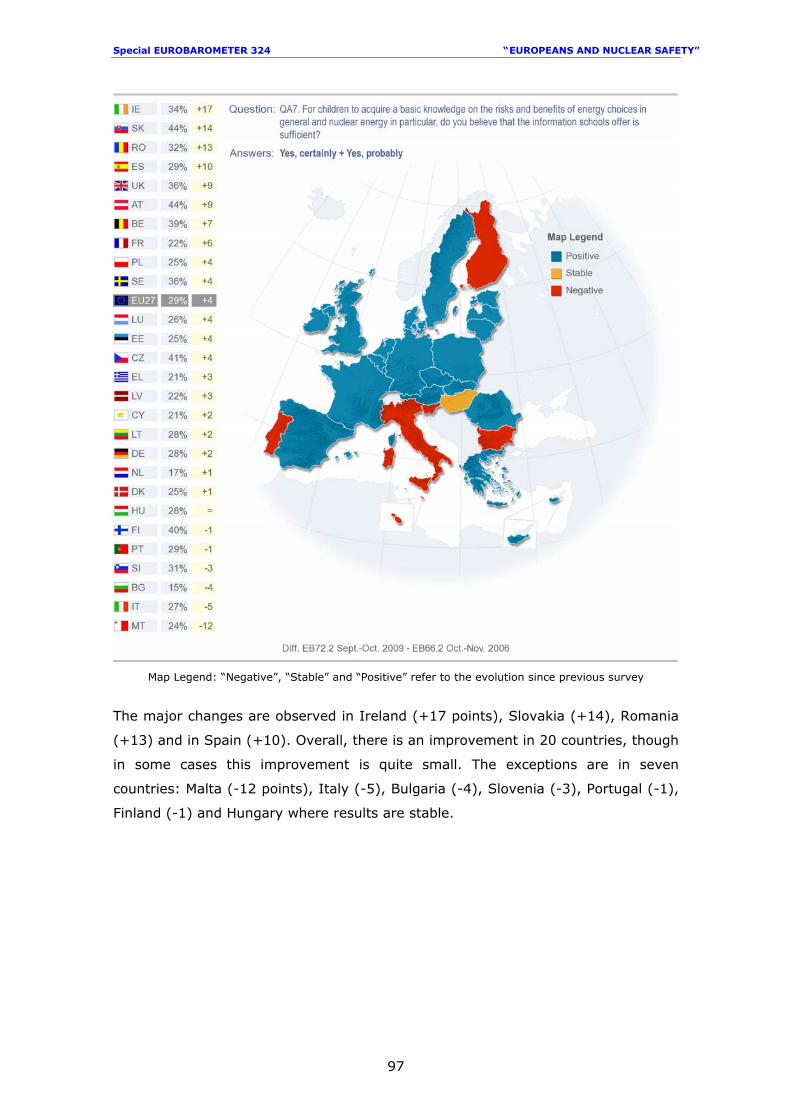
Special EUROBAROMETER 324 “ EUROPEANS AND NUCLEAR SAFETY”
97
Map Legend: “Negative”, “Stable” and “Positive” refer to the evolution since previous survey
The major changes are observed in Ireland (+17 points), Slovakia (+14), Romania
(+13) and in Spain (+10). Overall, there is an improvement in 20 countries, though
in some cases this improvement is quite small. The exceptions are in seven
countries: Malta (-12 points), Italy (-5), Bulgaria (-4), Slovenia (-3), Portugal (-1),
Finland (-1) and Hungary where results are stable.
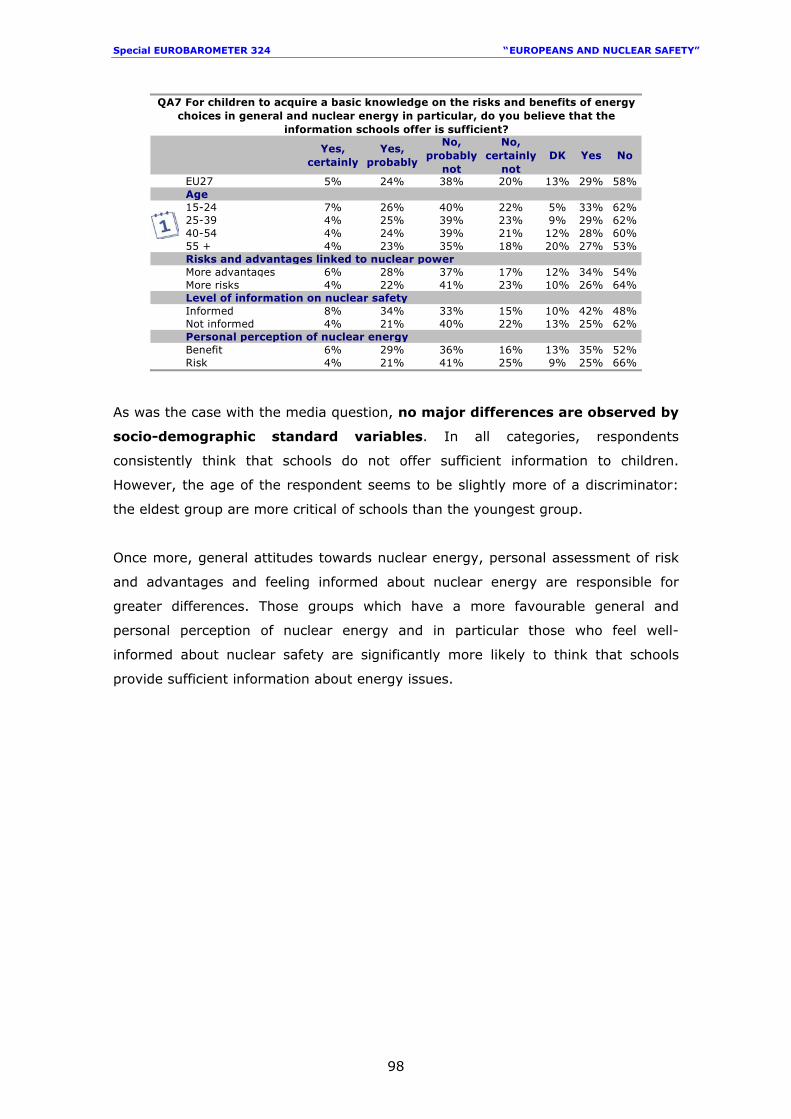
Special EUROBAROMETER 324 “ EUROPEANS AND NUCLEAR SAFETY”
98
Yes, certainly
Yes, probably
No, probably
not
No, certainly
notDK Yes No
EU27 5% 24% 38% 20% 13% 29% 58%Age15-24 7% 26% 40% 22% 5% 33% 62%25-39 4% 25% 39% 23% 9% 29% 62%40-54 4% 24% 39% 21% 12% 28% 60%55 + 4% 23% 35% 18% 20% 27% 53%Risks and advantages linked to nuclear powerMore advantages 6% 28% 37% 17% 12% 34% 54%More risks 4% 22% 41% 23% 10% 26% 64%Level of information on nuclear safetyInformed 8% 34% 33% 15% 10% 42% 48%Not informed 4% 21% 40% 22% 13% 25% 62%Personal perception of nuclear energyBenefit 6% 29% 36% 16% 13% 35% 52%Risk 4% 21% 41% 25% 9% 25% 66%
QA7 For children to acquire a basic knowledge on the risks and benefits of energy choices in general and nuclear energy in particular, do you believe that the
information schools offer is sufficient?
As was the case with the media question, no major differences are observed by
socio-demographic standard variables. In all categories, respondents
consistently think that schools do not offer sufficient information to children.
However, the age of the respondent seems to be slightly more of a discriminator:
the eldest group are more critical of schools than the youngest group.
Once more, general attitudes towards nuclear energy, personal assessment of risk
and advantages and feeling informed about nuclear energy are responsible for
greater differences. Those groups which have a more favourable general and
personal perception of nuclear energy and in particular those who feel well-
informed about nuclear safety are significantly more likely to think that schools
provide sufficient information about energy issues.
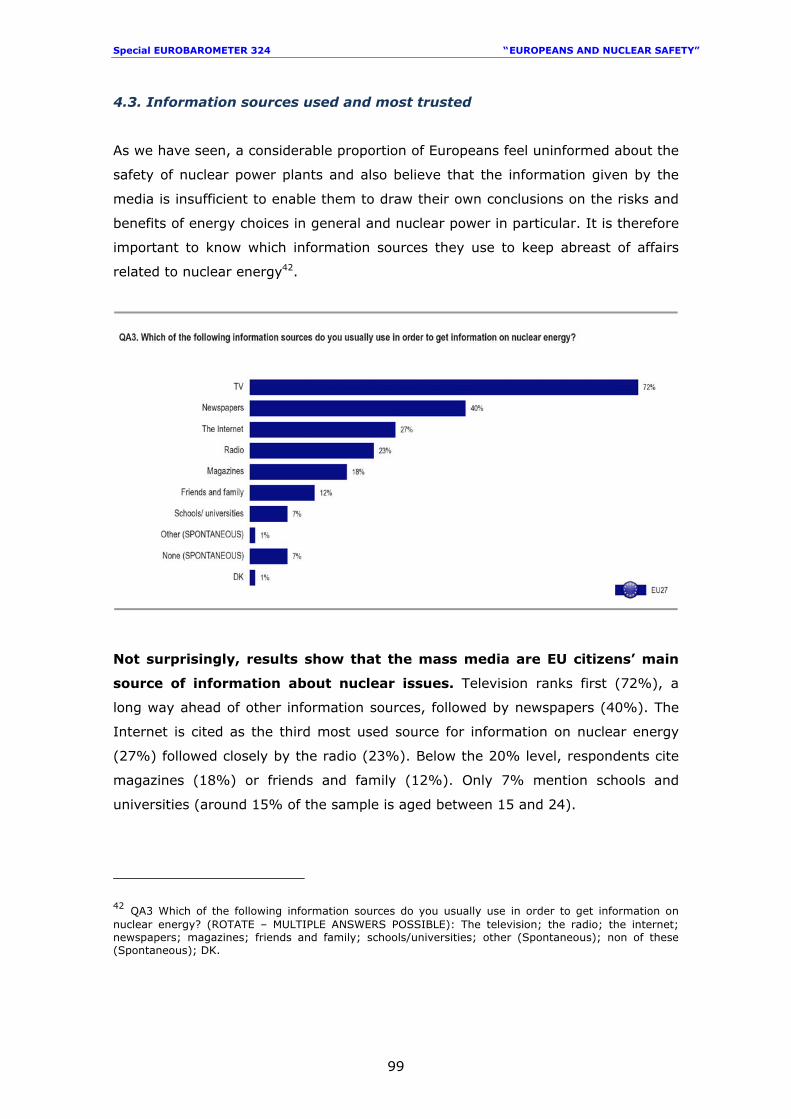
Special EUROBAROMETER 324 “ EUROPEANS AND NUCLEAR SAFETY”
99
4.3. Information sources used and most trusted
As we have seen, a considerable proportion of Europeans feel uninformed about the
safety of nuclear power plants and also believe that the information given by the
media is insufficient to enable them to draw their own conclusions on the risks and
benefits of energy choices in general and nuclear power in particular. It is therefore
important to know which information sources they use to keep abreast of affairs
related to nuclear energy42.
Not surprisingly, results show that the mass media are EU citizens’ main
source of information about nuclear issues. Television ranks first (72%), a
long way ahead of other information sources, followed by newspapers (40%). The
Internet is cited as the third most used source for information on nuclear energy
(27%) followed closely by the radio (23%). Below the 20% level, respondents cite
magazines (18%) or friends and family (12%). Only 7% mention schools and
universities (around 15% of the sample is aged between 15 and 24).
42 QA3 Which of the following information sources do you usually use in order to get information on nuclear energy? (ROTATE – MULTIPLE ANSWERS POSSIBLE): The television; the radio; the internet; newspapers; magazines; friends and family; schools/universities; other (Spontaneous); non of these (Spontaneous); DK.
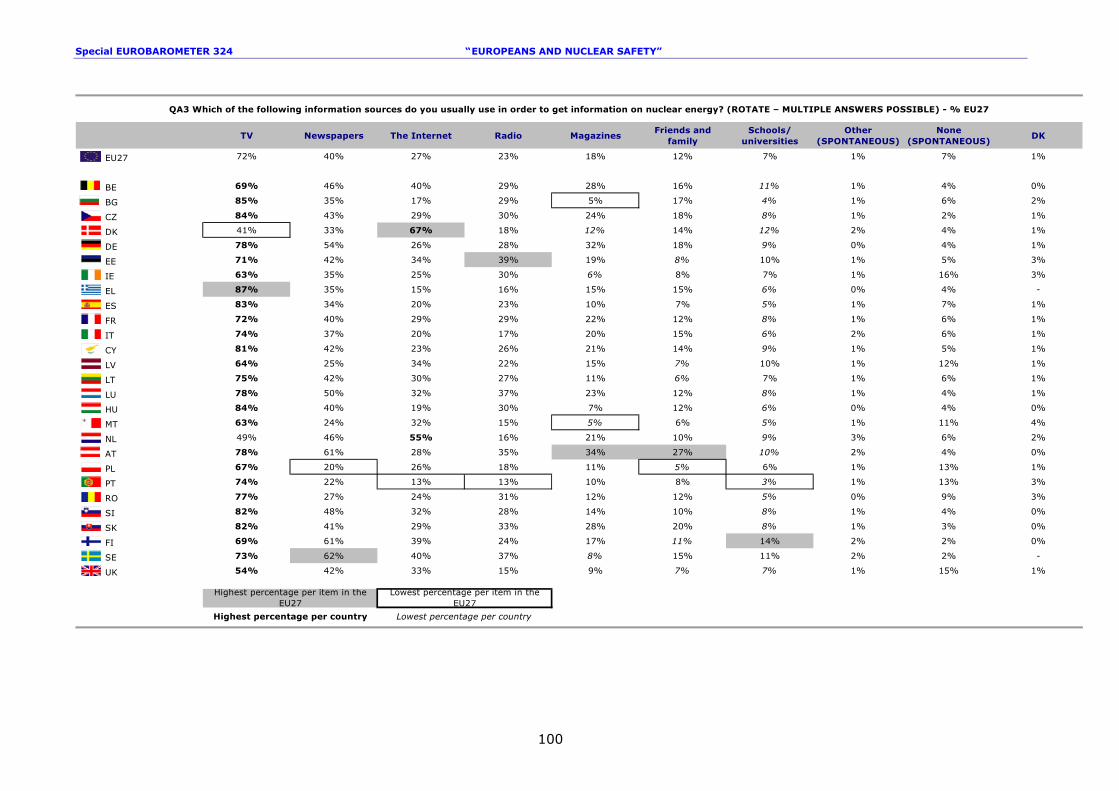
Special EUROBAROMETER 324 “ EUROPEANS AND NUCLEAR SAFETY”
100
TV Newspapers The Internet Radio MagazinesFriends and
familySchools/
universitiesOther
(SPONTANEOUS)None
(SPONTANEOUS)DK
EU27 72% 40% 27% 23% 18% 12% 7% 1% 7% 1%
BE 69% 46% 40% 29% 28% 16% 11% 1% 4% 0%
BG 85% 35% 17% 29% 5% 17% 4% 1% 6% 2%
CZ 84% 43% 29% 30% 24% 18% 8% 1% 2% 1%
DK 41% 33% 67% 18% 12% 14% 12% 2% 4% 1%
DE 78% 54% 26% 28% 32% 18% 9% 0% 4% 1%
EE 71% 42% 34% 39% 19% 8% 10% 1% 5% 3%
IE 63% 35% 25% 30% 6% 8% 7% 1% 16% 3%
EL 87% 35% 15% 16% 15% 15% 6% 0% 4% -
ES 83% 34% 20% 23% 10% 7% 5% 1% 7% 1%
FR 72% 40% 29% 29% 22% 12% 8% 1% 6% 1%
IT 74% 37% 20% 17% 20% 15% 6% 2% 6% 1%
CY 81% 42% 23% 26% 21% 14% 9% 1% 5% 1%
LV 64% 25% 34% 22% 15% 7% 10% 1% 12% 1%
LT 75% 42% 30% 27% 11% 6% 7% 1% 6% 1%
LU 78% 50% 32% 37% 23% 12% 8% 1% 4% 1%
HU 84% 40% 19% 30% 7% 12% 6% 0% 4% 0%
MT 63% 24% 32% 15% 5% 6% 5% 1% 11% 4%
NL 49% 46% 55% 16% 21% 10% 9% 3% 6% 2%
AT 78% 61% 28% 35% 34% 27% 10% 2% 4% 0%
PL 67% 20% 26% 18% 11% 5% 6% 1% 13% 1%
PT 74% 22% 13% 13% 10% 8% 3% 1% 13% 3%
RO 77% 27% 24% 31% 12% 12% 5% 0% 9% 3%
SI 82% 48% 32% 28% 14% 10% 8% 1% 4% 0%
SK 82% 41% 29% 33% 28% 20% 8% 1% 3% 0%
FI 69% 61% 39% 24% 17% 11% 14% 2% 2% 0%
SE 73% 62% 40% 37% 8% 15% 11% 2% 2% -
UK 54% 42% 33% 15% 9% 7% 7% 1% 15% 1%
QA3 Which of the following information sources do you usually use in order to get information on nuclear energy? (ROTATE – MULTIPLE ANSWERS POSSIBLE) - % EU27
Highest percentage per item in the EU27
Lowest percentage per item in the EU27
Highest percentage per country Lowest percentage per country
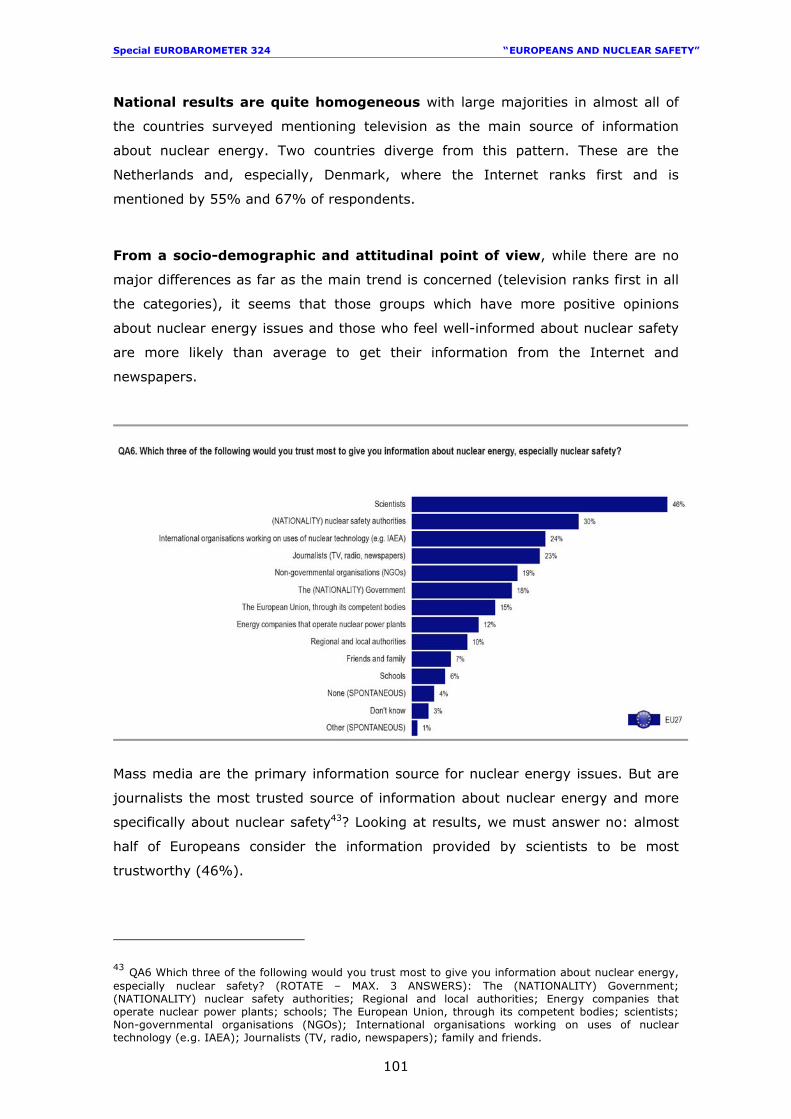
Special EUROBAROMETER 324 “ EUROPEANS AND NUCLEAR SAFETY”
101
National results are quite homogeneous with large majorities in almost all of
the countries surveyed mentioning television as the main source of information
about nuclear energy. Two countries diverge from this pattern. These are the
Netherlands and, especially, Denmark, where the Internet ranks first and is
mentioned by 55% and 67% of respondents.
From a socio-demographic and attitudinal point of view, while there are no
major differences as far as the main trend is concerned (television ranks first in all
the categories), it seems that those groups which have more positive opinions
about nuclear energy issues and those who feel well-informed about nuclear safety
are more likely than average to get their information from the Internet and
newspapers.
Mass media are the primary information source for nuclear energy issues. But are
journalists the most trusted source of information about nuclear energy and more
specifically about nuclear safety43? Looking at results, we must answer no: almost
half of Europeans consider the information provided by scientists to be most
trustworthy (46%).
43 QA6 Which three of the following would you trust most to give you information about nuclear energy, especially nuclear safety? (ROTATE – MAX. 3 ANSWERS): The (NATIONALITY) Government; (NATIONALITY) nuclear safety authorities; Regional and local authorities; Energy companies that operate nuclear power plants; schools; The European Union, through its competent bodies; scientists; Non-governmental organisations (NGOs); International organisations working on uses of nuclear technology (e.g. IAEA); Journalists (TV, radio, newspapers); family and friends.
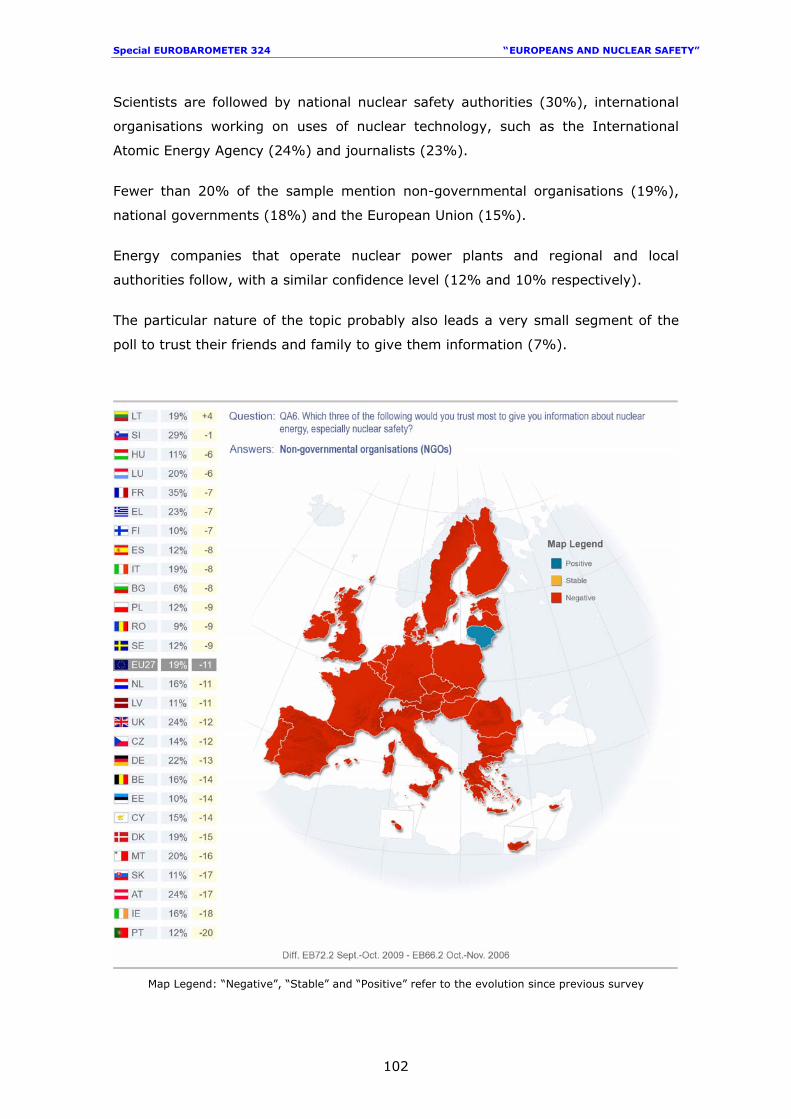
Special EUROBAROMETER 324 “ EUROPEANS AND NUCLEAR SAFETY”
102
Scientists are followed by national nuclear safety authorities (30%), international
organisations working on uses of nuclear technology, such as the International
Atomic Energy Agency (24%) and journalists (23%).
Fewer than 20% of the sample mention non-governmental organisations (19%),
national governments (18%) and the European Union (15%).
Energy companies that operate nuclear power plants and regional and local
authorities follow, with a similar confidence level (12% and 10% respectively).
The particular nature of the topic probably also leads a very small segment of the
poll to trust their friends and family to give them information (7%).
Map Legend: “Negative”, “Stable” and “Positive” refer to the evolution since previous survey
Special EUROBAROMETER 324 “ EUROPEANS AND NUCLEAR SAFETY”
103
Even though the question has been substantially modified since the previous survey
with the addition of new items44, it is interesting to compare the results: this
comparison shows a picture that remains stable overall since the Special
Eurobarometer conducted in 2006, with the sole exception of NGOs. While for the
other trend items the evolution varies from 0 to a maximum of +/-3 points (for
instance -3 points for journalists), the shift in trust in NGOs is more significant:
three years ago, they represented the second most trusted source of information
after scientists, mentioned by 30% of interviewees. More specifically, amongst
other, results dropped severely in Denmark (-15 points), in Malta (-16 points), in
Austria (-15 points), in Slovakia (-17 points), in Ireland (-18 points) or in Portugal
(-20 points). However, as already mentioned, these evolutions should be carefully
since the modifications introduced in the list of items could have influenced the
result.
44 There are two additions to the list of items: “schools” and “regional and local authorities”.
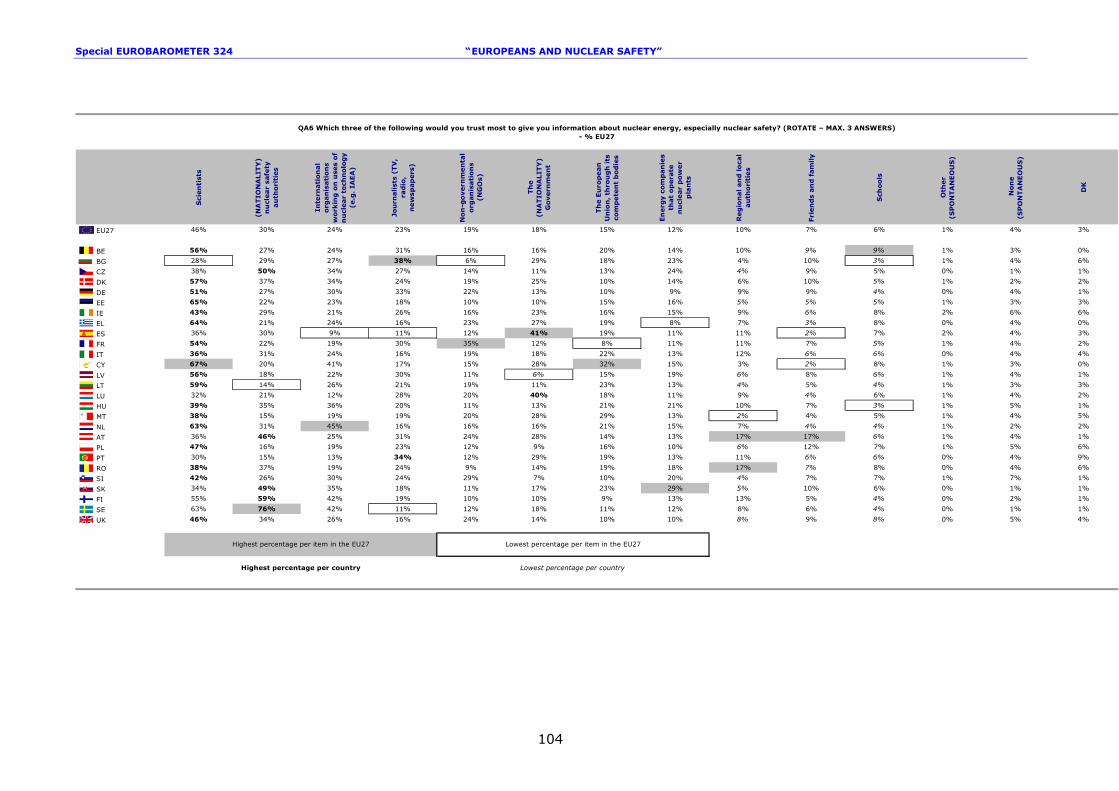
Special EUROBAROMETER 324 “ EUROPEANS AND NUCLEAR SAFETY”
104
Sci
en
tist
s
(NA
TIO
NA
LIT
Y)
nu
clear
safe
ty
au
tho
riti
es
Inte
rnati
on
al
org
an
isati
on
s
work
ing
on
use
s of
nu
clear
tech
nolo
gy
(e.g
. IA
EA
)
Jou
rnalist
s (T
V,
rad
io,
new
sp
ap
ers
)
No
n-g
overn
men
tal
org
an
isati
on
s
(NG
Os)
Th
e
(NA
TIO
NA
LIT
Y)
Govern
men
t
Th
e E
uro
pean
U
nio
n,
thro
ug
h its
co
mp
ete
nt
bod
ies
En
erg
y c
om
pan
ies
that
op
era
te
nu
clear
po
wer
pla
nts
Reg
ion
al an
d lo
cal
au
tho
riti
es
Fri
en
ds
an
d f
am
ily
Sch
ools
Oth
er
(SP
ON
TA
NE
OU
S)
Non
e
(SP
ON
TA
NE
OU
S)
DK
EU27 46% 30% 24% 23% 19% 18% 15% 12% 10% 7% 6% 1% 4% 3%
BE 56% 27% 24% 31% 16% 16% 20% 14% 10% 9% 9% 1% 3% 0%
BG 28% 29% 27% 38% 6% 29% 18% 23% 4% 10% 3% 1% 4% 6%
CZ 38% 50% 34% 27% 14% 11% 13% 24% 4% 9% 5% 0% 1% 1%
DK 57% 37% 34% 24% 19% 25% 10% 14% 6% 10% 5% 1% 2% 2%
DE 51% 27% 30% 33% 22% 13% 10% 9% 9% 9% 4% 0% 4% 1%
EE 65% 22% 23% 18% 10% 10% 15% 16% 5% 5% 5% 1% 3% 3%
IE 43% 29% 21% 26% 16% 23% 16% 15% 9% 6% 8% 2% 6% 6%
EL 64% 21% 24% 16% 23% 27% 19% 8% 7% 3% 8% 0% 4% 0%
ES 36% 30% 9% 11% 12% 41% 19% 11% 11% 2% 7% 2% 4% 3%
FR 54% 22% 19% 30% 35% 12% 8% 11% 11% 7% 5% 1% 4% 2%
IT 36% 31% 24% 16% 19% 18% 22% 13% 12% 6% 6% 0% 4% 4%
CY 67% 20% 41% 17% 15% 28% 32% 15% 3% 2% 8% 1% 3% 0%
LV 56% 18% 22% 30% 11% 6% 15% 19% 6% 8% 6% 1% 4% 1%
LT 59% 14% 26% 21% 19% 11% 23% 13% 4% 5% 4% 1% 3% 3%
LU 32% 21% 12% 28% 20% 40% 18% 11% 9% 4% 6% 1% 4% 2%
HU 39% 35% 36% 20% 11% 13% 21% 21% 10% 7% 3% 1% 5% 1%
MT 38% 15% 19% 19% 20% 28% 29% 13% 2% 4% 5% 1% 4% 5%
NL 63% 31% 45% 16% 16% 16% 21% 15% 7% 4% 4% 1% 2% 2%
AT 36% 46% 25% 31% 24% 28% 14% 13% 17% 17% 6% 1% 4% 1%
PL 47% 16% 19% 23% 12% 9% 16% 10% 6% 12% 7% 1% 5% 6%
PT 30% 15% 13% 34% 12% 29% 19% 13% 11% 6% 6% 0% 4% 9%
RO 38% 37% 19% 24% 9% 14% 19% 18% 17% 7% 8% 0% 4% 6%
SI 42% 26% 30% 24% 29% 7% 10% 20% 4% 7% 7% 1% 7% 1%
SK 34% 49% 35% 18% 11% 17% 23% 29% 5% 10% 6% 0% 1% 1%
FI 55% 59% 42% 19% 10% 10% 9% 13% 13% 5% 4% 0% 2% 1%
SE 63% 76% 42% 11% 12% 18% 11% 12% 8% 6% 4% 0% 1% 1%
UK 46% 34% 26% 16% 24% 14% 10% 10% 8% 9% 8% 0% 5% 4%
QA6 Which three of the following would you trust most to give you information about nuclear energy, especially nuclear safety? (ROTATE – MAX. 3 ANSWERS) - % EU27
Highest percentage per item in the EU27
Highest percentage per country
Lowest percentage per item in the EU27
Lowest percentage per country
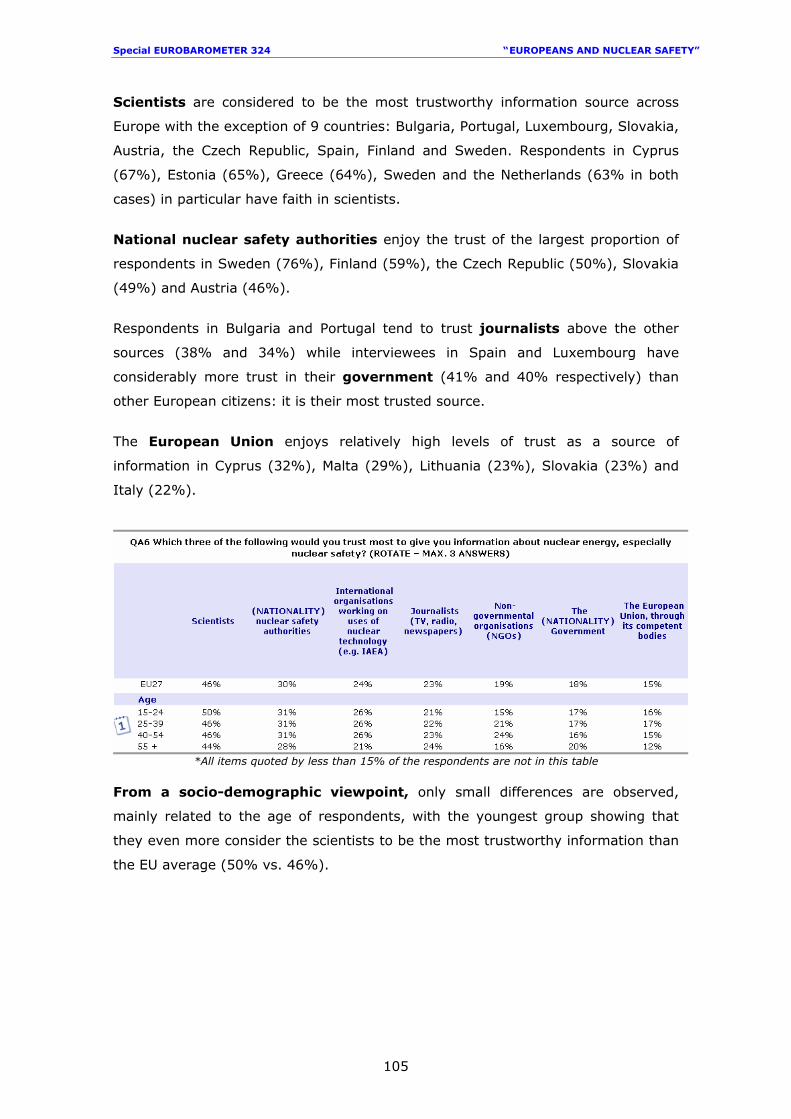
Special EUROBAROMETER 324 “ EUROPEANS AND NUCLEAR SAFETY”
105
Scientists are considered to be the most trustworthy information source across
Europe with the exception of 9 countries: Bulgaria, Portugal, Luxembourg, Slovakia,
Austria, the Czech Republic, Spain, Finland and Sweden. Respondents in Cyprus
(67%), Estonia (65%), Greece (64%), Sweden and the Netherlands (63% in both
cases) in particular have faith in scientists.
National nuclear safety authorities enjoy the trust of the largest proportion of
respondents in Sweden (76%), Finland (59%), the Czech Republic (50%), Slovakia
(49%) and Austria (46%).
Respondents in Bulgaria and Portugal tend to trust journalists above the other
sources (38% and 34%) while interviewees in Spain and Luxembourg have
considerably more trust in their government (41% and 40% respectively) than
other European citizens: it is their most trusted source.
The European Union enjoys relatively high levels of trust as a source of
information in Cyprus (32%), Malta (29%), Lithuania (23%), Slovakia (23%) and
Italy (22%).
*All items quoted by less than 15% of the respondents are not in this table
From a socio-demographic viewpoint, only small differences are observed,
mainly related to the age of respondents, with the youngest group showing that
they even more consider the scientists to be the most trustworthy information than
the EU average (50% vs. 46%).
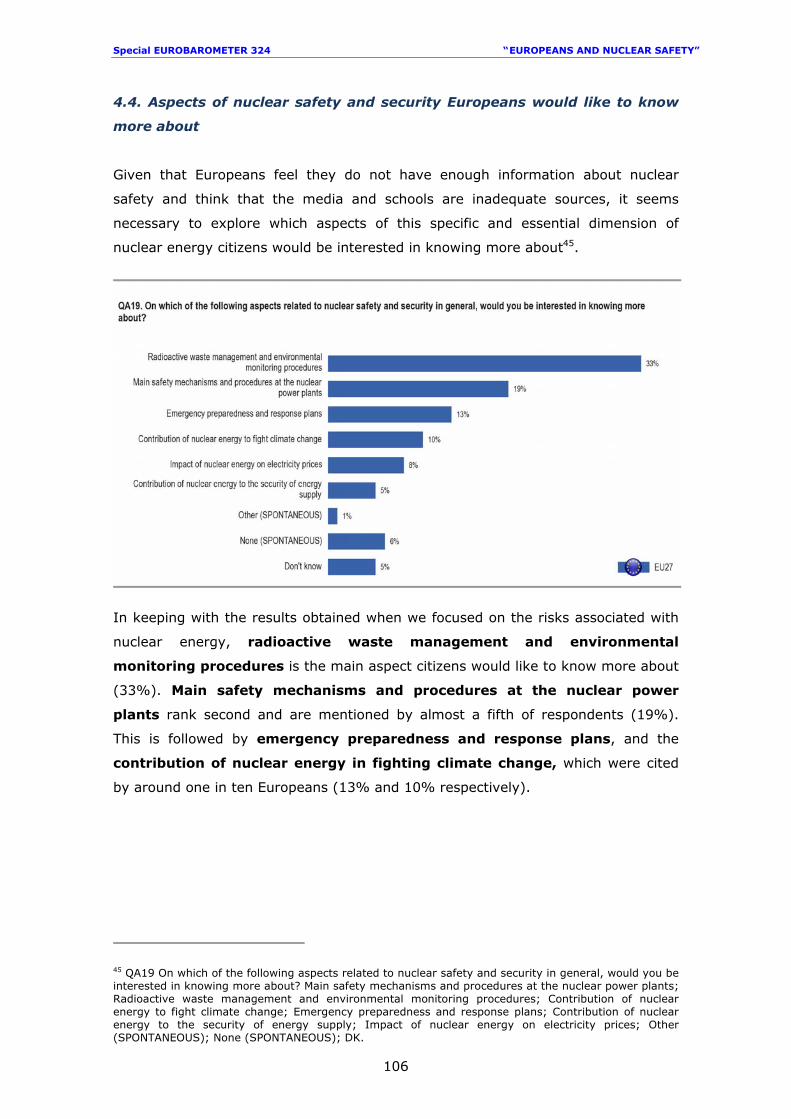
Special EUROBAROMETER 324 “ EUROPEANS AND NUCLEAR SAFETY”
106
4.4. Aspects of nuclear safety and security Europeans would like to know
more about
Given that Europeans feel they do not have enough information about nuclear
safety and think that the media and schools are inadequate sources, it seems
necessary to explore which aspects of this specific and essential dimension of
nuclear energy citizens would be interested in knowing more about45.
In keeping with the results obtained when we focused on the risks associated with
nuclear energy, radioactive waste management and environmental
monitoring procedures is the main aspect citizens would like to know more about
(33%). Main safety mechanisms and procedures at the nuclear power
plants rank second and are mentioned by almost a fifth of respondents (19%).
This is followed by emergency preparedness and response plans, and the
contribution of nuclear energy in fighting climate change, which were cited
by around one in ten Europeans (13% and 10% respectively).
45 QA19 On which of the following aspects related to nuclear safety and security in general, would you be interested in knowing more about? Main safety mechanisms and procedures at the nuclear power plants; Radioactive waste management and environmental monitoring procedures; Contribution of nuclear energy to fight climate change; Emergency preparedness and response plans; Contribution of nuclear energy to the security of energy supply; Impact of nuclear energy on electricity prices; Other (SPONTANEOUS); None (SPONTANEOUS); DK.
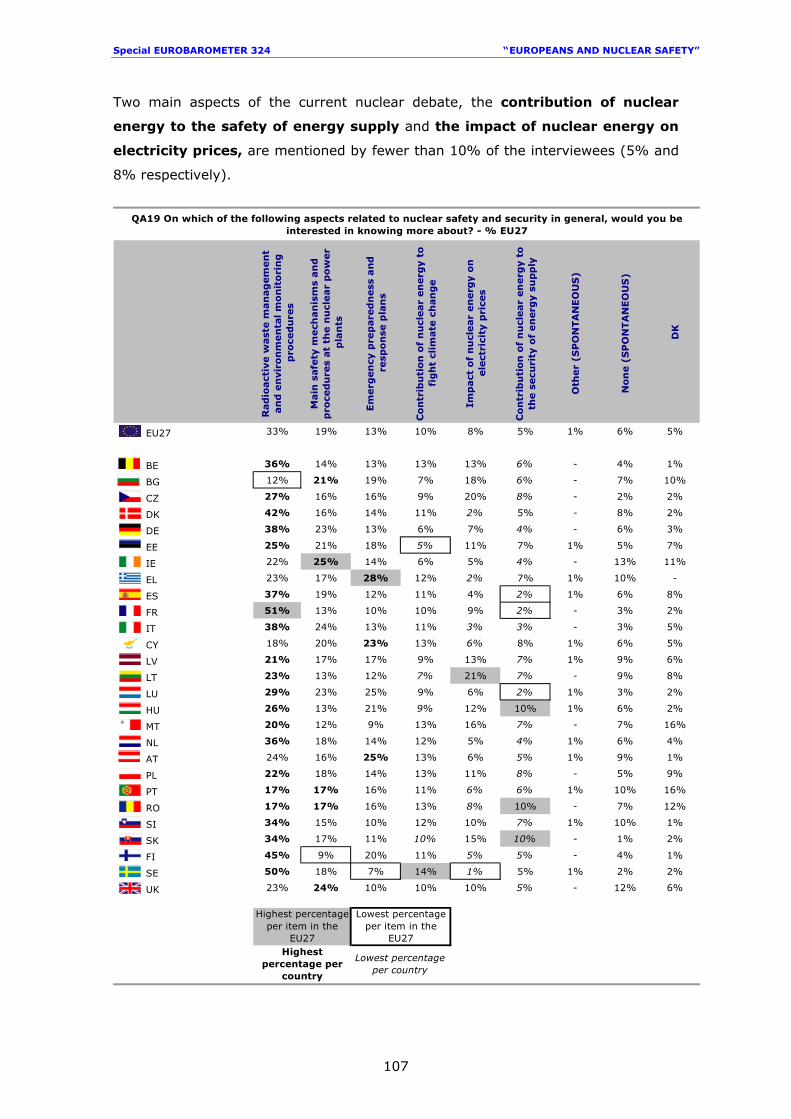
Special EUROBAROMETER 324 “ EUROPEANS AND NUCLEAR SAFETY”
107
Two main aspects of the current nuclear debate, the contribution of nuclear
energy to the safety of energy supply and the impact of nuclear energy on
electricity prices, are mentioned by fewer than 10% of the interviewees (5% and
8% respectively).
Rad
ioact
ive w
ast
e m
an
ag
em
en
t an
d e
nvir
on
men
tal m
on
ito
rin
g
pro
ced
ure
s
Main
safe
ty m
ech
an
ism
s an
d
pro
ced
ure
s at
the n
ucl
ear
po
wer
pla
nts
Em
erg
en
cy p
rep
are
dn
ess
an
d
resp
on
se p
lan
s
Co
ntr
ibu
tio
n o
f n
ucl
ear
en
erg
y t
o
fig
ht
clim
ate
ch
an
ge
Imp
act
of
nu
clear
en
erg
y o
n
ele
ctri
city
pri
ces
Co
ntr
ibu
tio
n o
f n
ucl
ear
en
erg
y t
o
the s
ecu
rity
of
en
erg
y s
up
ply
Oth
er
(SP
ON
TA
NE
OU
S)
No
ne (
SP
ON
TA
NEO
US
)
DK
EU27 33% 19% 13% 10% 8% 5% 1% 6% 5%
BE 36% 14% 13% 13% 13% 6% - 4% 1%
BG 12% 21% 19% 7% 18% 6% - 7% 10%
CZ 27% 16% 16% 9% 20% 8% - 2% 2%
DK 42% 16% 14% 11% 2% 5% - 8% 2%
DE 38% 23% 13% 6% 7% 4% - 6% 3%
EE 25% 21% 18% 5% 11% 7% 1% 5% 7%
IE 22% 25% 14% 6% 5% 4% - 13% 11%
EL 23% 17% 28% 12% 2% 7% 1% 10% -
ES 37% 19% 12% 11% 4% 2% 1% 6% 8%
FR 51% 13% 10% 10% 9% 2% - 3% 2%
IT 38% 24% 13% 11% 3% 3% - 3% 5%
CY 18% 20% 23% 13% 6% 8% 1% 6% 5%
LV 21% 17% 17% 9% 13% 7% 1% 9% 6%
LT 23% 13% 12% 7% 21% 7% - 9% 8%
LU 29% 23% 25% 9% 6% 2% 1% 3% 2%
HU 26% 13% 21% 9% 12% 10% 1% 6% 2%
MT 20% 12% 9% 13% 16% 7% - 7% 16%
NL 36% 18% 14% 12% 5% 4% 1% 6% 4%
AT 24% 16% 25% 13% 6% 5% 1% 9% 1%
PL 22% 18% 14% 13% 11% 8% - 5% 9%
PT 17% 17% 16% 11% 6% 6% 1% 10% 16%
RO 17% 17% 16% 13% 8% 10% - 7% 12%
SI 34% 15% 10% 12% 10% 7% 1% 10% 1%
SK 34% 17% 11% 10% 15% 10% - 1% 2%
FI 45% 9% 20% 11% 5% 5% - 4% 1%
SE 50% 18% 7% 14% 1% 5% 1% 2% 2%
UK 23% 24% 10% 10% 10% 5% - 12% 6%
QA19 On which of the following aspects related to nuclear safety and security in general, would you be interested in knowing more about? - % EU27
Highest percentage per item in the
EU27
Lowest percentage per item in the
EU27Highest
percentage per country
Lowest percentage per country
Special EUROBAROMETER 324 “ EUROPEANS AND NUCLEAR SAFETY”
108
In three countries which currently produce a significant share of the electricity
consumed through nuclear power plants, substantial numbers of respondents call
for information on radioactive waste management: these are France (51%),
Sweden (50%) and Finland (45%). As we already know, two of these, France and
Finland, are currently building new nuclear reactors46.
Respondents in Ireland (25%), the UK (24%), Italy (24%), Luxembourg and
Germany (23% in both cases) are more likely than average to say that they would
be interested in knowing more about main safety mechanisms and procedures
at nuclear power plants.
In four countries around a quarter of respondents say that they would like to get
further information about emergency preparedness and response plans: these
are Greece (28%), Austria (25%), Luxembourg (25%) and Cyprus (23%). None of
them currently have NPPs operating in their territory.
Finally, we observe that the safety of energy supply and price-related issues in
particular are comparatively important in countries with a high level of dependence
on external energy imports. It seems to be the case in the Czech Republic (20%)
and Lithuania (21%), as far as the impact of nuclear energy on price stability is
concerned.
46 Olkiluoto 3 in Finland and Flamanville in France
Special EUROBAROMETER 324 “ EUROPEANS AND NUCLEAR SAFETY”
109
5. ATTITUDES TOWARDS EXISTING LEGISLATION AND PARTICIPATION IN DECISION-MAKING
Throughout the report, the results have clearly shown that safety aspects
are of crucial importance against a background where the threat associated with
radioactive waste management appears to be one of the major drivers of reluctance
regarding nuclear energy.
The last chapter of the report will firstly review public opinion on the utility of
existing legislation in radioactive waste; afterwards it will assess the degree of
public participation in decision-making concerning nuclear safety and energy issues
in general.
5.1 Usefulness of European legislation in radioactive waste management
The management of radioactive waste has been addressed at the EU level through
a variety of legislative instruments, mainly for general radiation protection and
environmental matters. At present, however, it remains a national responsibility
with Community legislation only covering a small range of the issues involved, such
as the supervision and control of shipments of radioactive waste. The Commission
Report to the European Parliament and the Council, COM (2008) 542 final, which
gives an overview of the current status of the management of radioactive waste in
the EU, is expected to facilitate a relaunch of the discussion on European Union
legislation in this field47.
47 http://ec.europa.eu/energy/nuclear/waste_management/legislation_en.htm
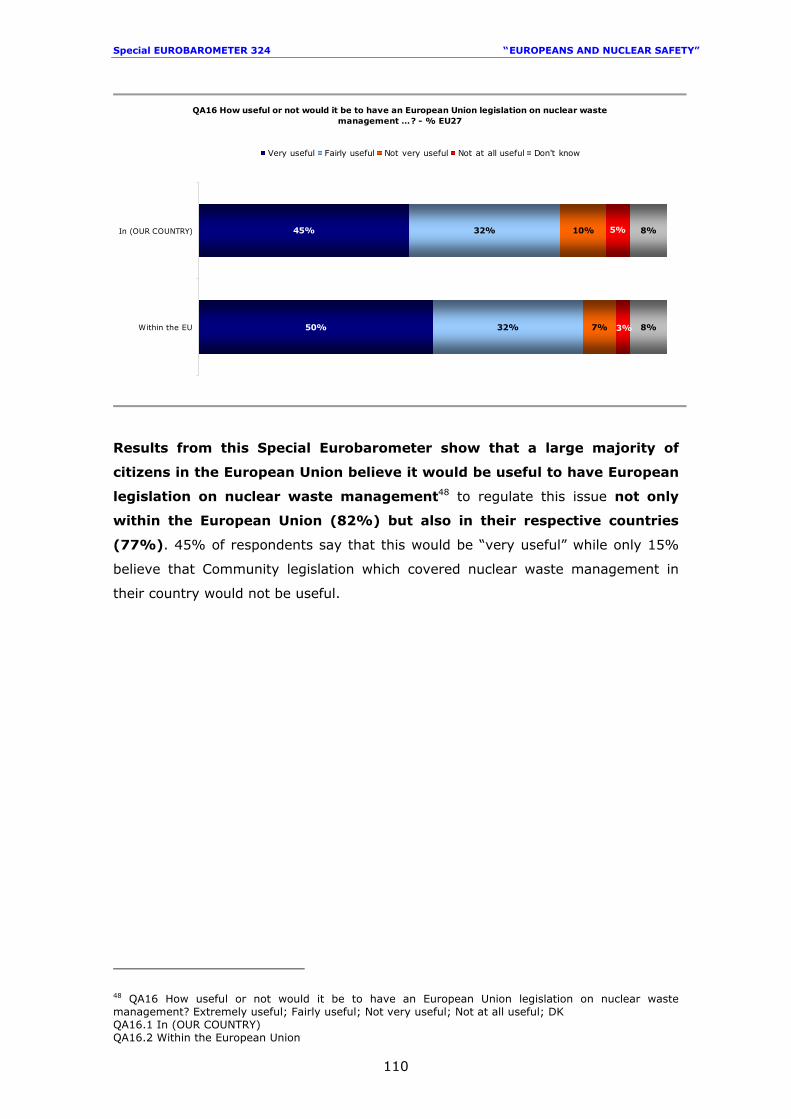
Special EUROBAROMETER 324 “ EUROPEANS AND NUCLEAR SAFETY”
110
QA16 How useful or not would it be to have an European Union legislation on nuclear waste management …? - % EU27
50%
45%
32%
32%
7%
10%
8%
8%5%
3%Within the EU
In (OUR COUNTRY)
Very useful Fairly useful Not very useful Not at all useful Don't know
Results from this Special Eurobarometer show that a large majority of
citizens in the European Union believe it would be useful to have European
legislation on nuclear waste management48 to regulate this issue not only
within the European Union (82%) but also in their respective countries
(77%). 45% of respondents say that this would be “very useful” while only 15%
believe that Community legislation which covered nuclear waste management in
their country would not be useful.
48 QA16 How useful or not would it be to have an European Union legislation on nuclear waste management? Extremely useful; Fairly useful; Not very useful; Not at all useful; DK QA16.1 In (OUR COUNTRY) QA16.2 Within the European Union
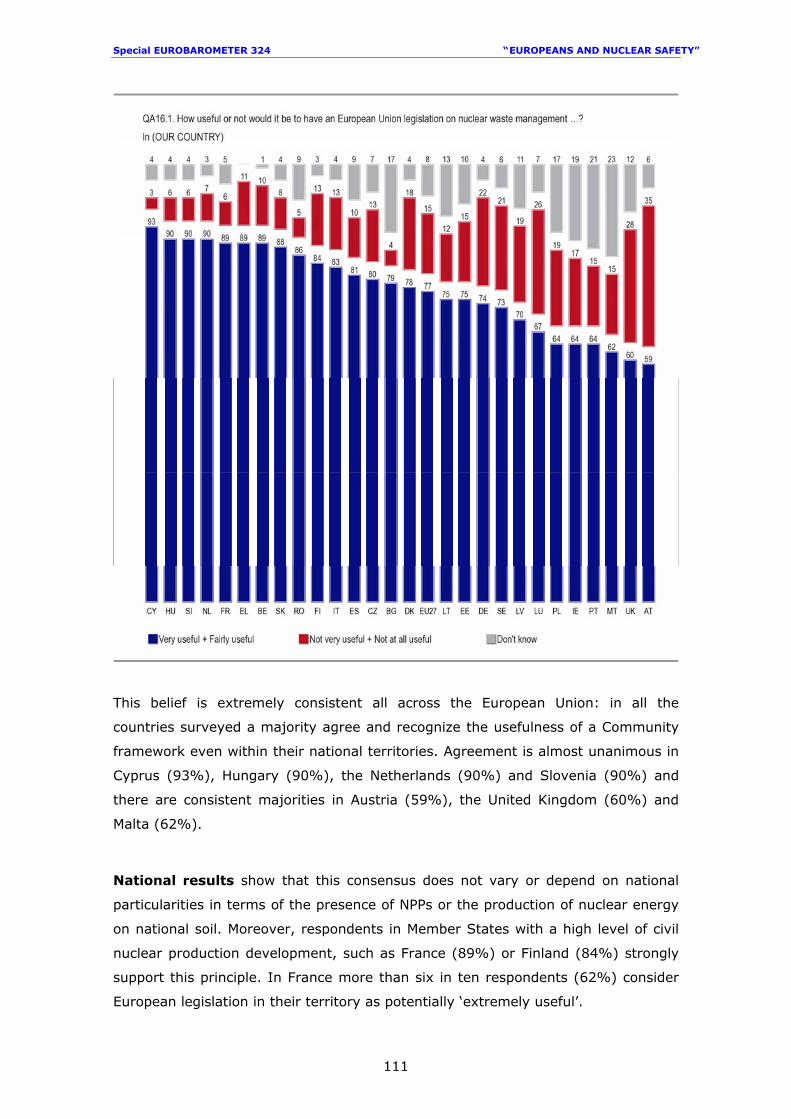
Special EUROBAROMETER 324 “ EUROPEANS AND NUCLEAR SAFETY”
111
This belief is extremely consistent all across the European Union: in all the
countries surveyed a majority agree and recognize the usefulness of a Community
framework even within their national territories. Agreement is almost unanimous in
Cyprus (93%), Hungary (90%), the Netherlands (90%) and Slovenia (90%) and
there are consistent majorities in Austria (59%), the United Kingdom (60%) and
Malta (62%).
National results show that this consensus does not vary or depend on national
particularities in terms of the presence of NPPs or the production of nuclear energy
on national soil. Moreover, respondents in Member States with a high level of civil
nuclear production development, such as France (89%) or Finland (84%) strongly
support this principle. In France more than six in ten respondents (62%) consider
European legislation in their territory as potentially ‘extremely useful’.
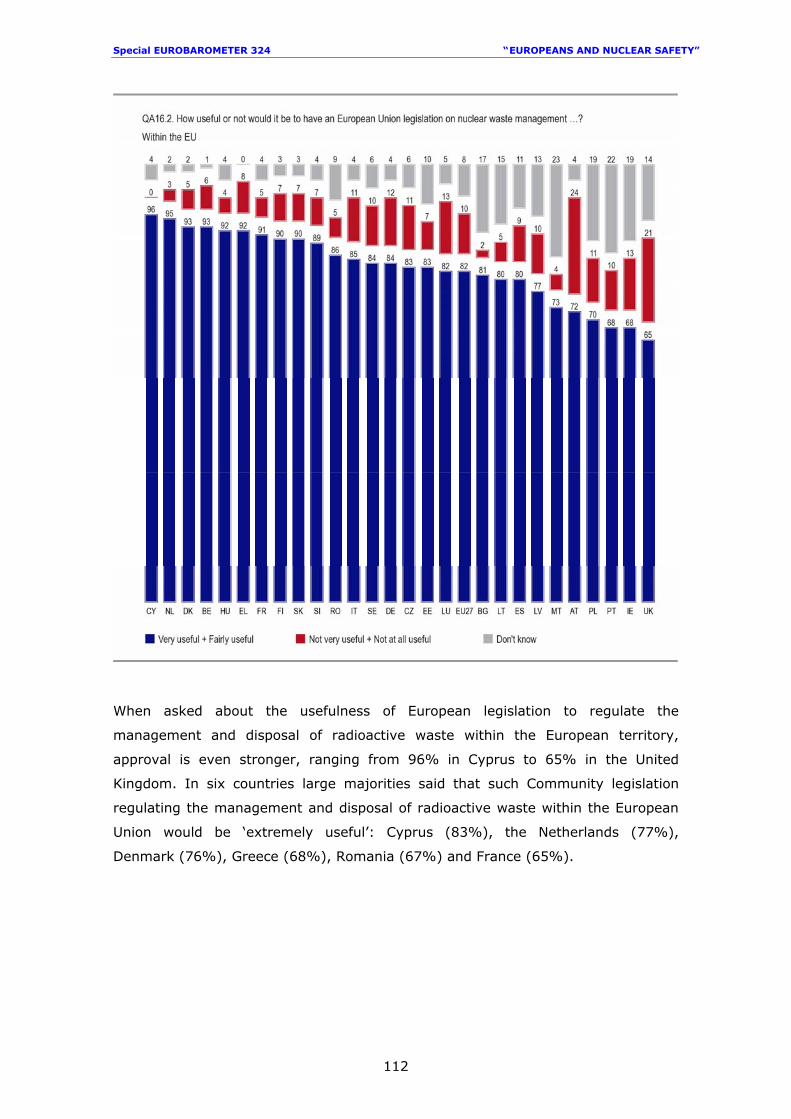
Special EUROBAROMETER 324 “ EUROPEANS AND NUCLEAR SAFETY”
112
When asked about the usefulness of European legislation to regulate the
management and disposal of radioactive waste within the European territory,
approval is even stronger, ranging from 96% in Cyprus to 65% in the United
Kingdom. In six countries large majorities said that such Community legislation
regulating the management and disposal of radioactive waste within the European
Union would be ‘extremely useful’: Cyprus (83%), the Netherlands (77%),
Denmark (76%), Greece (68%), Romania (67%) and France (65%).
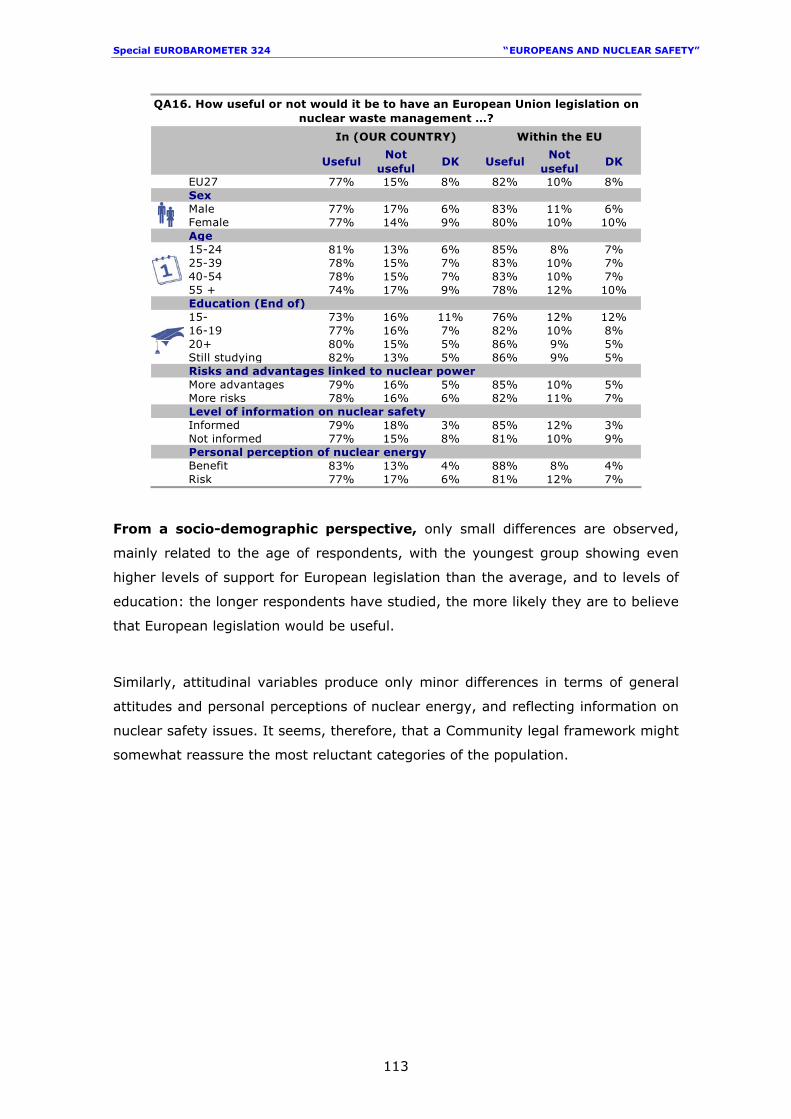
Special EUROBAROMETER 324 “ EUROPEANS AND NUCLEAR SAFETY”
113
UsefulNot
usefulDK Useful
Not useful
DK
EU27 77% 15% 8% 82% 10% 8%SexMale 77% 17% 6% 83% 11% 6%Female 77% 14% 9% 80% 10% 10%Age15-24 81% 13% 6% 85% 8% 7%25-39 78% 15% 7% 83% 10% 7%40-54 78% 15% 7% 83% 10% 7%55 + 74% 17% 9% 78% 12% 10%Education (End of)15- 73% 16% 11% 76% 12% 12%16-19 77% 16% 7% 82% 10% 8%20+ 80% 15% 5% 86% 9% 5%Still studying 82% 13% 5% 86% 9% 5%Risks and advantages linked to nuclear powerMore advantages 79% 16% 5% 85% 10% 5%More risks 78% 16% 6% 82% 11% 7%Level of information on nuclear safetyInformed 79% 18% 3% 85% 12% 3%Not informed 77% 15% 8% 81% 10% 9%Personal perception of nuclear energyBenefit 83% 13% 4% 88% 8% 4%Risk 77% 17% 6% 81% 12% 7%
In (OUR COUNTRY) Within the EU
QA16. How useful or not would it be to have an European Union legislation on nuclear waste management …?
From a socio-demographic perspective, only small differences are observed,
mainly related to the age of respondents, with the youngest group showing even
higher levels of support for European legislation than the average, and to levels of
education: the longer respondents have studied, the more likely they are to believe
that European legislation would be useful.
Similarly, attitudinal variables produce only minor differences in terms of general
attitudes and personal perceptions of nuclear energy, and reflecting information on
nuclear safety issues. It seems, therefore, that a Community legal framework might
somewhat reassure the most reluctant categories of the population.
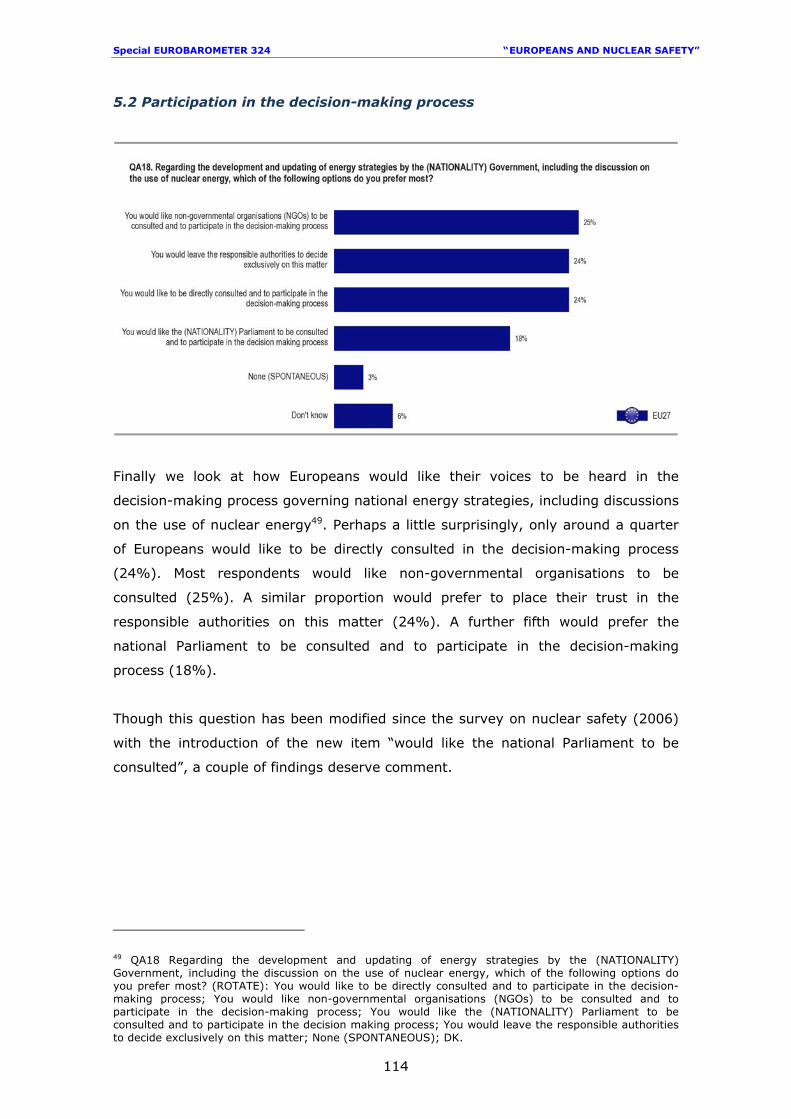
Special EUROBAROMETER 324 “ EUROPEANS AND NUCLEAR SAFETY”
114
5.2 Participation in the decision-making process
Finally we look at how Europeans would like their voices to be heard in the
decision-making process governing national energy strategies, including discussions
on the use of nuclear energy49. Perhaps a little surprisingly, only around a quarter
of Europeans would like to be directly consulted in the decision-making process
(24%). Most respondents would like non-governmental organisations to be
consulted (25%). A similar proportion would prefer to place their trust in the
responsible authorities on this matter (24%). A further fifth would prefer the
national Parliament to be consulted and to participate in the decision-making
process (18%).
Though this question has been modified since the survey on nuclear safety (2006)
with the introduction of the new item “would like the national Parliament to be
consulted”, a couple of findings deserve comment.
49 QA18 Regarding the development and updating of energy strategies by the (NATIONALITY) Government, including the discussion on the use of nuclear energy, which of the following options do you prefer most? (ROTATE): You would like to be directly consulted and to participate in the decision-making process; You would like non-governmental organisations (NGOs) to be consulted and to participate in the decision-making process; You would like the (NATIONALITY) Parliament to be consulted and to participate in the decision making process; You would leave the responsible authorities to decide exclusively on this matter; None (SPONTANEOUS); DK.
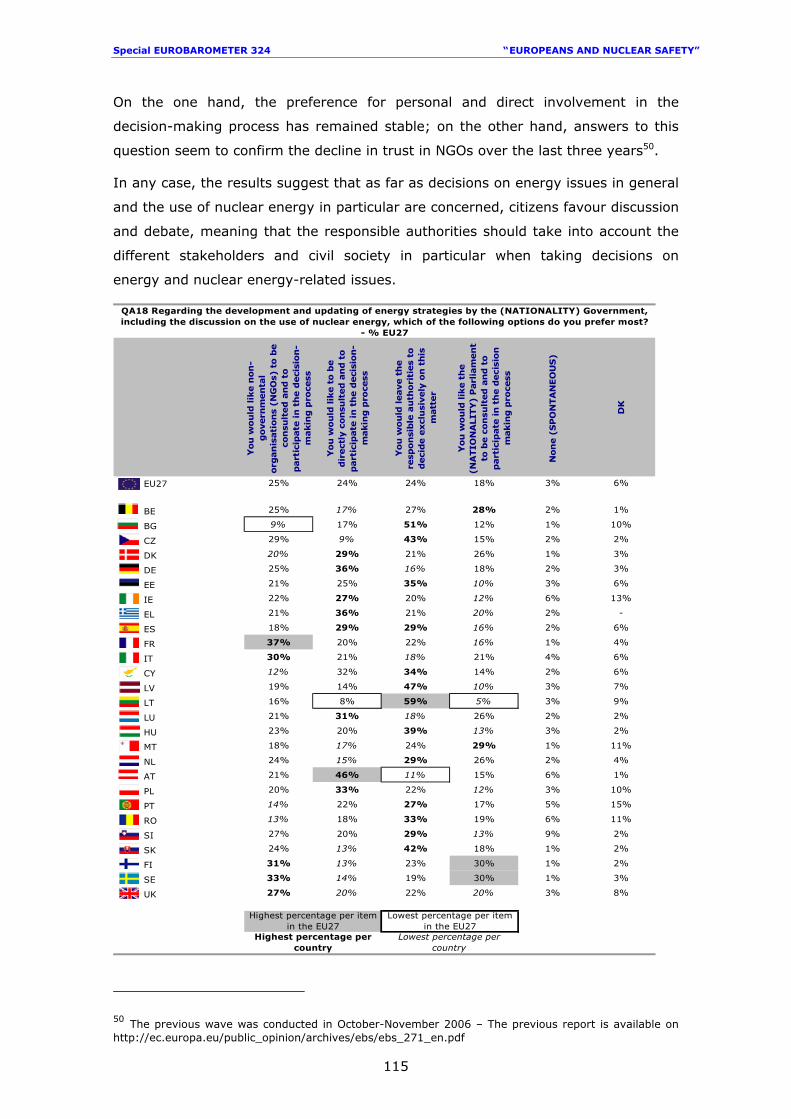
Special EUROBAROMETER 324 “ EUROPEANS AND NUCLEAR SAFETY”
115
On the one hand, the preference for personal and direct involvement in the
decision-making process has remained stable; on the other hand, answers to this
question seem to confirm the decline in trust in NGOs over the last three years50.
In any case, the results suggest that as far as decisions on energy issues in general
and the use of nuclear energy in particular are concerned, citizens favour discussion
and debate, meaning that the responsible authorities should take into account the
different stakeholders and civil society in particular when taking decisions on
energy and nuclear energy-related issues.
You
wou
ld lik
e n
on
-govern
men
tal
org
an
isati
ons
(NG
Os)
to b
e
con
sult
ed a
nd t
o
part
icip
ate
in
th
e d
eci
sion
-m
akin
g p
roce
ss
You
wou
ld lik
e t
o b
e
dir
ect
ly c
on
sult
ed a
nd t
o
part
icip
ate
in
th
e d
eci
sion
-m
akin
g p
roce
ss
You
wou
ld leave t
he
resp
on
sible
au
thori
ties
to
deci
de e
xcl
usi
vely
on
th
is
matt
er
You
wou
ld lik
e t
he
(NA
TIO
NA
LIT
Y)
Parl
iam
en
t to
be c
on
sult
ed a
nd t
o
part
icip
ate
in
th
e d
eci
sion
m
akin
g p
roce
ss
Non
e (
SP
ON
TA
NEO
US
)
DK
EU27 25% 24% 24% 18% 3% 6%
BE 25% 17% 27% 28% 2% 1%
BG 9% 17% 51% 12% 1% 10%
CZ 29% 9% 43% 15% 2% 2%
DK 20% 29% 21% 26% 1% 3%
DE 25% 36% 16% 18% 2% 3%
EE 21% 25% 35% 10% 3% 6%
IE 22% 27% 20% 12% 6% 13%
EL 21% 36% 21% 20% 2% -
ES 18% 29% 29% 16% 2% 6%
FR 37% 20% 22% 16% 1% 4%
IT 30% 21% 18% 21% 4% 6%
CY 12% 32% 34% 14% 2% 6%
LV 19% 14% 47% 10% 3% 7%
LT 16% 8% 59% 5% 3% 9%
LU 21% 31% 18% 26% 2% 2%
HU 23% 20% 39% 13% 3% 2%
MT 18% 17% 24% 29% 1% 11%
NL 24% 15% 29% 26% 2% 4%
AT 21% 46% 11% 15% 6% 1%
PL 20% 33% 22% 12% 3% 10%
PT 14% 22% 27% 17% 5% 15%
RO 13% 18% 33% 19% 6% 11%
SI 27% 20% 29% 13% 9% 2%
SK 24% 13% 42% 18% 1% 2%
FI 31% 13% 23% 30% 1% 2%
SE 33% 14% 19% 30% 1% 3%
UK 27% 20% 22% 20% 3% 8%
QA18 Regarding the development and updating of energy strategies by the (NATIONALITY) Government, including the discussion on the use of nuclear energy, which of the following options do you prefer most?
- % EU27
Highest percentage per item in the EU27
Lowest percentage per item in the EU27
Highest percentage per country
Lowest percentage per country
50 The previous wave was conducted in October-November 2006 – The previous report is available on http://ec.europa.eu/public_opinion/archives/ebs/ebs_271_en.pdf
Special EUROBAROMETER 324 “ EUROPEANS AND NUCLEAR SAFETY”
116
At national level, the preferred actors in the decision-making process vary
considerably. A comparative majority in Austria (46%), Germany (36%), Greece
(36%) and Poland (33%), would prefer to be consulted and heard directly in
the decision-making process.
In the case of Austria, the national background may explain this result51. In the
mid-sixties Austrian energy planners proposed to construct up to five NPPs by end
of the century in order to meet the country’s electricity demand. The decision to
build the first nuclear power plant was taken in 197152. The NPP was scheduled to
start operation in the summer of 1976, but was delayed until 1978. However, in
1976 a very intensive public and political debate about the use of nuclear power for
electricity production had begun. Because of this debate, the Austrian government
held a referendum on the issue. On 5 November 1978 Austrians voted by 50.47%
against the use of nuclear power for electricity production in Austria. Since this time
the use of nuclear power for electricity production in Austria has been prohibited by
law.
The participation of NGOs is cited particularly frequently in France (37%),
Sweden (33%), Finland (31%) and Italy (30%). National authorities, on the other
hand, have considerable support from respondents in Lithuania (59%), Bulgaria
(51%), Latvia (47%), the Czech Republic (43%), Slovakia (42%), Hungary (39%),
Estonia (35%), Cyprus (34%) and Romania (33%).
Finally, associating and involving the national Parliament in the debate on the
development and updating of energy strategies and on the use of nuclear energy is
most often cited in Finland (30%), Sweden (30%), Malta (29%), Belgium (28%),
Luxembourg and the Netherlands (26% in both cases).
51 http://www.euronuclear.org/e-news/e-news-18/austria.htm 52 The location of the power station was Zwentendorf, 60 km northwest of Vienna, on the river Danube.
Special EUROBAROMETER 324 “ EUROPEANS AND NUCLEAR SAFETY”
117
CONCLUSION
One of the side effects of the discussions about climate change is that the use of
nuclear power is currently being re-evaluated and signs of a possible nuclear
energy renaissance are visible worldwide. Yet nuclear energy continues to be a
controversial issue and a challenge from the point of view of public opinion,
especially because nuclear power often raises concerns about the associated risks.
Against the background of this current debate, it is extremely important to develop
a better understanding of the views of civil society on nuclear technologies, how
their risks are perceived, and how to establish effective communication between all
the stakeholders prior to decision-making.
Within this context, the following conclusions can be drawn from this
Eurobarometer survey:
• Europeans accept the value of nuclear energy to some extent,
primarily as a means of decreasing energy dependence, and, to a lesser
extent, as a means for nations to ensure more competitive and more
stable energy prices as well as a way to address the challenges
posed by climate change. Respondents in countries with operating NPPs
tend to be more positive, and it seems easier for them to express an opinion
on this topic.
• In spite of this fact, less than one-fifth of respondents believe that the
share of nuclear energy in the energy mix should be increased and a
majority would either maintain or reduce the current level of nuclear energy
as a proportion of all energy sources. National results do not show any
consistent basis to attitudes to the future of nuclear energy in the energy
mix, and the presence of currently active NPPs in a given country does not
necessarily mean that respondents are more positive. At the same time, the
highest proportions of citizens who say that the share of nuclear energy
should be increased are found in two countries without active NPPs (Poland
and Estonia).
Special EUROBAROMETER 324 “ EUROPEANS AND NUCLEAR SAFETY”
118
• This special Eurobarometer confirms the importance of the safety
argument when dealing with support or opposition to the lifetime
extension of existing nuclear plants: a relative majority of respondents
say that it can be done “if plants safely continue to satisfy national and
international requirements”. In parallel, Europeans frequently cite the fact
that “technical upgrades made for lifetime extension cannot ensure an
adequate level of safety” and even state that they would prefer to build new
nuclear power plants with the best available safety design.
• Risk looms large in the minds of European when they think about nuclear
energy. Over half of the interviewees still perceive nuclear energy
more as a threat than a neutral source of energy. However, a
substantial proportion (one third) see nuclear energy more as an
advantageous source of energy. The survey also reveals a slight positive
evolution since the previous Eurobarometer conducted in 2006: the gap
between perceptions of benefits and risks has reduced.
• When assessing the issue of risk from a personal point of view a similar
proportion of Europeans (one half) consider nuclear energy more as a risk.
• Europeans continue to feel that risks related to nuclear energy are not
correctly perceived: a majority in 18 countries believe that nuclear risks are
being miscalculated. However, in a context of renewed debate and
discussion about nuclear energy, a comparative overview reveals that
perceptions of the different risk factors have remained almost completely
stable since the previous survey conducted three years ago. In other words,
risk perception has not increased during this period.
• Many Europeans are still afraid of nuclear power plants but a substantial
percentage do not consider them to be a risk to them and their families.
The major risks are considered to be lack of security against
terrorist attacks in NPPs, the misuse of radioactive materials and the
disposal of radioactive waste. Respondents’ views do not seem to be
consistently linked to whether or not their country has active NPPs, though
they do appear to be related to general attitudes toward nuclear power,
personal experience and feeling informed about nuclear safety issues.
Special EUROBAROMETER 324 “ EUROPEANS AND NUCLEAR SAFETY”
119
• Europeans have a moderate level of knowledge of nuclear issues:
though few respondents knew that the European Union has the largest
number of nuclear power plants in the world, they were more aware that
nuclear waste is not exclusively produced by nuclear power plants.
• Similarly, Europeans continue to be unfamiliar with safety issues related to
nuclear power plants. Only a quarter of citizens feel ‘very well’ or
‘fairly well’ informed, compared with three in four who feel ‘not very well’,
or ‘not at all’ informed about the safety of nuclear power plants. This
situation is almost identical to the one depicted in the previous survey.
• Europeans are critical of the information offered in the media about
energy in general and nuclear energy in particular: almost two thirds
of the interviewees said that it is insufficient. Large majorities in almost all
of the countries surveyed mention television as the main source of
information on nuclear energy. When assessing the information about
energy and nuclear energy offered to children, EU citizens regard it as only
slightly more adequate than the information in the media.
• Radioactive waste management and environmental monitoring procedures
are the main aspects citizens would like to know more about. Scientists,
followed at a distance by national nuclear safety authorities and
international organisations working on uses of nuclear technology, are the
three most trusted sources of information.
• A large majority of citizens in the European Union think it would be
useful to have European legislation on nuclear waste management
regulating this issue not only within the European Union but also in
their respective countries.
• Only around one in four Europeans would like to be directly
consulted in the decision-making process regarding the development
and updating of energy strategies. An identical proportion would prefer
to leave the responsible authorities to decide exclusively on this matter and
an additional fifth would prefer the national Parliament to be consulted and
to participate in the decision making process. One in four interviewees would
like non-governmental organisations to be consulted.
• The results suggest that the public would like to see discussion and
debate about decisions on energy issues in general and the use of
nuclear energy in particular.

Special EUROBAROMETER 324 “ EUROPEANS AND NUCLEAR SAFETY”
120
ANNEXES
Special EUROBAROMETER 324 “ EUROPEANS AND NUCLEAR SAFETY”
121
TECHNICAL SPECIFICATIONS
Special EUROBAROMETER 324 “ EUROPEANS AND NUCLEAR SAFETY”
122
Between the 11th of September and the 5th of October 2009, TNS Opinion & Social,
a consortium created between TNS plc and TNS opinion, carried out wave 72.2 of
the EUROBAROMETER, on request of the EUROPEAN COMMISSION, Directorate-
General for Communication, “Research and Political Analysis”.
The SPECIAL EUROBAROMETER N°324 is part of the wave 72.2 and covers the
population of the respective nationalities of the European Union Member States,
resident in each of the Member States and aged 15 years and over. The basic sample
design applied in all states is a multi-stage, random (probability) one. In each
country, a number of sampling points was drawn with probability proportional to
population size (for a total coverage of the country) and to population density.
In order to do so, the sampling points were drawn systematically from each of the
"administrative regional units", after stratification by individual unit and type of area.
They thus represent the whole territory of the countries surveyed according to the
EUROSTAT NUTS II (or equivalent) and according to the distribution of the resident
population of the respective nationalities in terms of metropolitan, urban and rural
areas. In each of the selected sampling points, a starting address was drawn, at
random. Further addresses (every Nth address) were selected by standard "random
route" procedures, from the initial address. In each household, the respondent was
drawn, at random (following the "closest birthday rule"). All interviews were
conducted face-to-face in people's homes and in the appropriate national language.
As far as the data capture is concerned, CAPI (Computer Assisted Personal Interview)
was used in those countries where this technique was available.
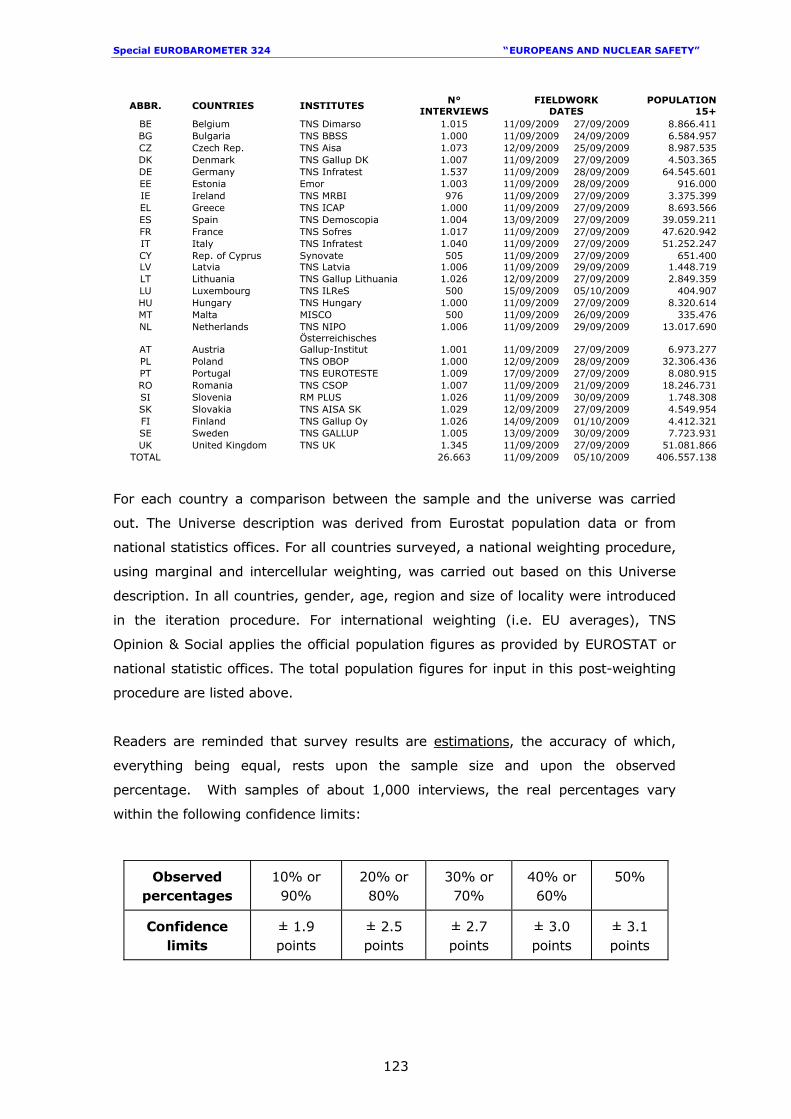
Special EUROBAROMETER 324 “ EUROPEANS AND NUCLEAR SAFETY”
123
For each country a comparison between the sample and the universe was carried
out. The Universe description was derived from Eurostat population data or from
national statistics offices. For all countries surveyed, a national weighting procedure,
using marginal and intercellular weighting, was carried out based on this Universe
description. In all countries, gender, age, region and size of locality were introduced
in the iteration procedure. For international weighting (i.e. EU averages), TNS
Opinion & Social applies the official population figures as provided by EUROSTAT or
national statistic offices. The total population figures for input in this post-weighting
procedure are listed above.
Readers are reminded that survey results are estimations, the accuracy of which,
everything being equal, rests upon the sample size and upon the observed
percentage. With samples of about 1,000 interviews, the real percentages vary
within the following confidence limits:
Observed percentages
10% or 90%
20% or 80%
30% or 70%
40% or 60%
50%
Confidence limits
± 1.9 points
± 2.5 points
± 2.7 points
± 3.0 points
± 3.1 points
ABBR. COUNTRIES INSTITUTES N°
INTERVIEWS FIELDWORK
DATES POPULATION
15+ BE Belgium TNS Dimarso 1.015 11/09/2009 27/09/2009 8.866.411 BG Bulgaria TNS BBSS 1.000 11/09/2009 24/09/2009 6.584.957 CZ Czech Rep. TNS Aisa 1.073 12/09/2009 25/09/2009 8.987.535 DK Denmark TNS Gallup DK 1.007 11/09/2009 27/09/2009 4.503.365 DE Germany TNS Infratest 1.537 11/09/2009 28/09/2009 64.545.601 EE Estonia Emor 1.003 11/09/2009 28/09/2009 916.000 IE Ireland TNS MRBI 976 11/09/2009 27/09/2009 3.375.399 EL Greece TNS ICAP 1.000 11/09/2009 27/09/2009 8.693.566 ES Spain TNS Demoscopia 1.004 13/09/2009 27/09/2009 39.059.211 FR France TNS Sofres 1.017 11/09/2009 27/09/2009 47.620.942 IT Italy TNS Infratest 1.040 11/09/2009 27/09/2009 51.252.247 CY Rep. of Cyprus Synovate 505 11/09/2009 27/09/2009 651.400 LV Latvia TNS Latvia 1.006 11/09/2009 29/09/2009 1.448.719 LT Lithuania TNS Gallup Lithuania 1.026 12/09/2009 27/09/2009 2.849.359 LU Luxembourg TNS ILReS 500 15/09/2009 05/10/2009 404.907 HU Hungary TNS Hungary 1.000 11/09/2009 27/09/2009 8.320.614 MT Malta MISCO 500 11/09/2009 26/09/2009 335.476 NL Netherlands TNS NIPO 1.006 11/09/2009 29/09/2009 13.017.690
AT Austria Österreichisches Gallup-Institut 1.001 11/09/2009 27/09/2009 6.973.277
PL Poland TNS OBOP 1.000 12/09/2009 28/09/2009 32.306.436 PT Portugal TNS EUROTESTE 1.009 17/09/2009 27/09/2009 8.080.915 RO Romania TNS CSOP 1.007 11/09/2009 21/09/2009 18.246.731 SI Slovenia RM PLUS 1.026 11/09/2009 30/09/2009 1.748.308 SK Slovakia TNS AISA SK 1.029 12/09/2009 27/09/2009 4.549.954 FI Finland TNS Gallup Oy 1.026 14/09/2009 01/10/2009 4.412.321 SE Sweden TNS GALLUP 1.005 13/09/2009 30/09/2009 7.723.931 UK United Kingdom TNS UK 1.345 11/09/2009 27/09/2009 51.081.866
TOTAL 26.663 11/09/2009 05/10/2009 406.557.138

Special EUROBAROMETER 324 “ EUROPEANS AND NUCLEAR SAFETY”
124
QUESTIONNAIRE
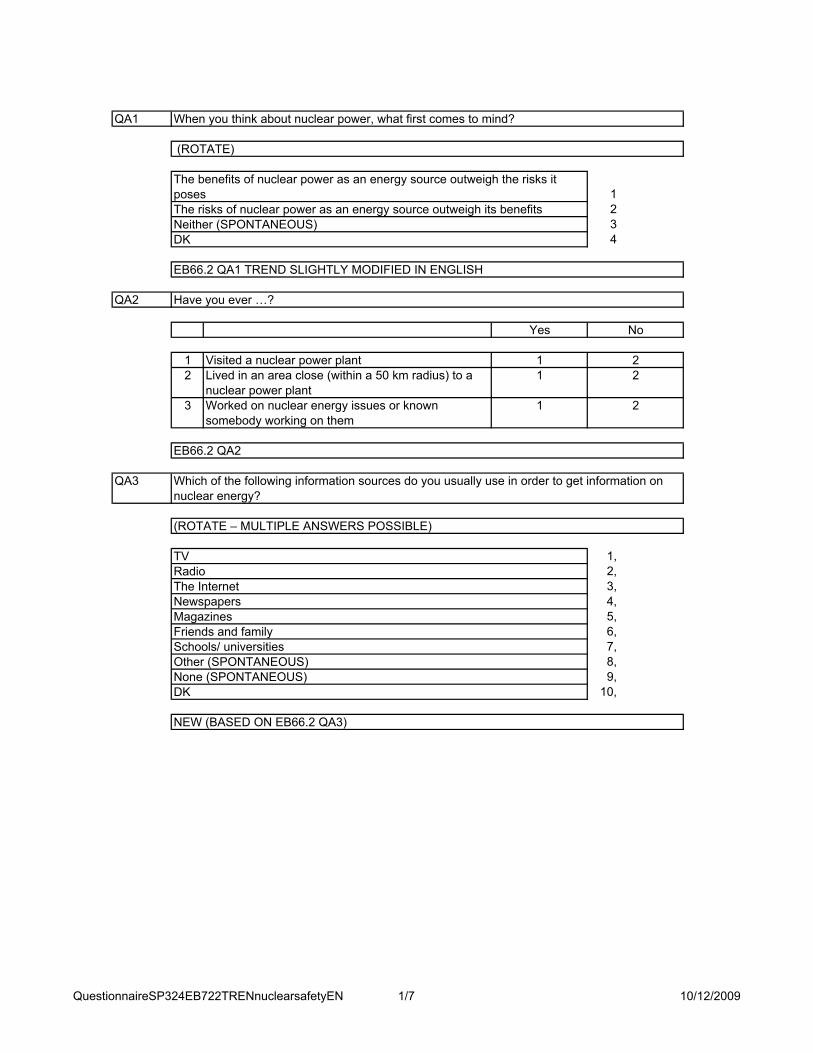
QA1
1234
QA2
12
3
QA3
1,2,3,4,5,6,7,8,9,
10,DK
NEW (BASED ON EB66.2 QA3)
Other (SPONTANEOUS)None (SPONTANEOUS)
Friends and familySchools/ universities
NewspapersMagazines
RadioThe Internet
(ROTATE – MULTIPLE ANSWERS POSSIBLE)
TV
EB66.2 QA2
Which of the following information sources do you usually use in order to get information on nuclear energy?
2
Worked on nuclear energy issues or known somebody working on them
1 2
Lived in an area close (within a 50 km radius) to a nuclear power plant
1
No
Visited a nuclear power plant 1 2
Yes
EB66.2 QA1 TREND SLIGHTLY MODIFIED IN ENGLISH
Have you ever …?
Neither (SPONTANEOUS)DK
The benefits of nuclear power as an energy source outweigh the risks it posesThe risks of nuclear power as an energy source outweigh its benefits
When you think about nuclear power, what first comes to mind?
(ROTATE)
QuestionnaireSP324EB722TRENnuclearsafetyEN 1/7 10/12/2009
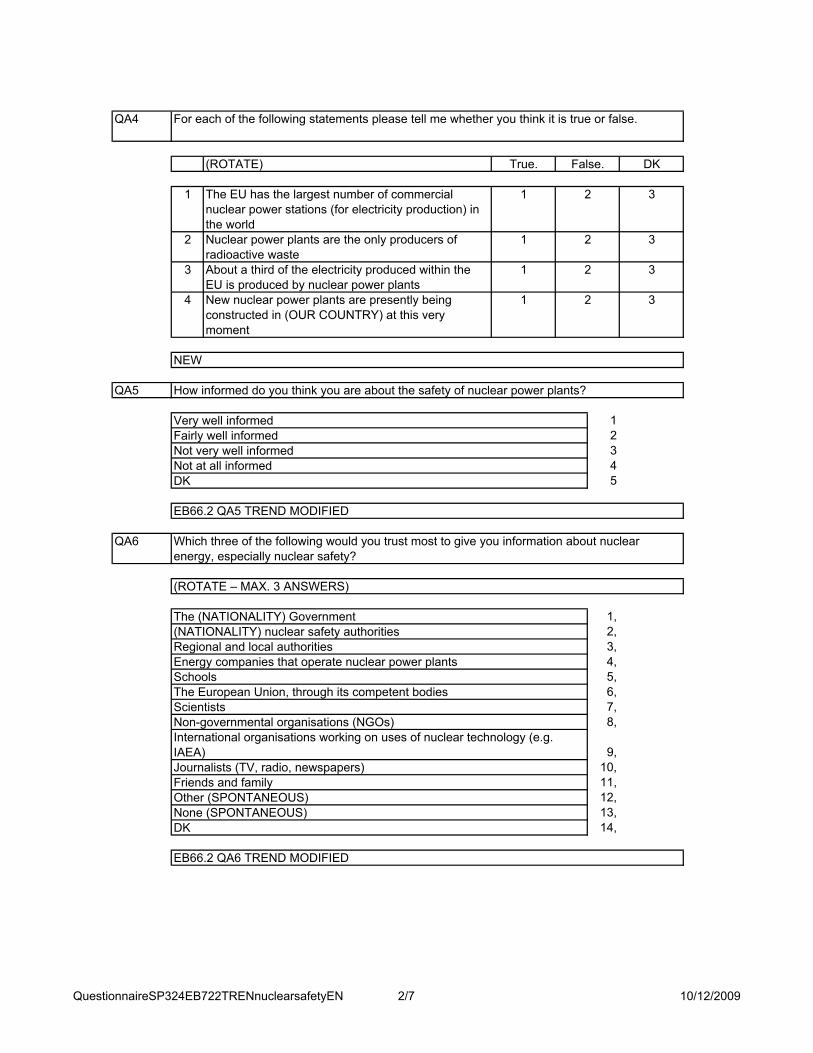
QA4
1
2
3
4
QA5
12345
QA6
1,2,3,4,5,6,7,8,
9,10,11,12,13,14,DK
EB66.2 QA6 TREND MODIFIED
Other (SPONTANEOUS)None (SPONTANEOUS)
Journalists (TV, radio, newspapers)Friends and family
Non-governmental organisations (NGOs)International organisations working on uses of nuclear technology (e.g. IAEA)
The European Union, through its competent bodiesScientists
Energy companies that operate nuclear power plantsSchools
(NATIONALITY) nuclear safety authorities Regional and local authorities
(ROTATE – MAX. 3 ANSWERS)
The (NATIONALITY) Government
EB66.2 QA5 TREND MODIFIED
Which three of the following would you trust most to give you information about nuclear energy, especially nuclear safety?
Not at all informedDK
Fairly well informedNot very well informed
How informed do you think you are about the safety of nuclear power plants?
Very well informed
3
NEW
New nuclear power plants are presently being constructed in (OUR COUNTRY) at this very moment
1 2
1 2 3
3
About a third of the electricity produced within the EU is produced by nuclear power plants
Nuclear power plants are the only producers of radioactive waste
1 2
1 2 3
DK
The EU has the largest number of commercial nuclear power stations (for electricity production) in the world
(ROTATE) True. False.
For each of the following statements please tell me whether you think it is true or false.
QuestionnaireSP324EB722TRENnuclearsafetyEN 2/7 10/12/2009
QA7
12345
QA8
12345
QA9
123456
QA10
123456DK
NEW
Strongly underestimatedNuclear risks are perceived correctly (SPONTANEOUS)
Somewhat exaggeratedSomewhat underestimated
Nuclear incidents sometimes raise major concerns in the media and the public. In your opinion, compared to other safety risks in our lives, would you say that nuclear risks are …?
Strongly exaggerated
DK
EB66.2 QA9
No risk at allNot applicable in your country (SPONTANEOUS)
Some riskNot much of a risk
To what extent do you think that (the) nuclear power plant(s) in (OUR COUNTRY) represent(s) a risk to you and your family?
A big risk
DK
EB66.2 QA8 TREND MODIFIED
No, probably not No, certainly not
Yes, certainly Yes, probably
EB66.2 QA7 TREND MODIFIED
For you to draw your own conclusions on the risks and benefits of energy choices in general and nuclear in particular, do you think that the information the media offer is sufficient?
No, certainly notDK
Yes, probablyNo, probably not
For children to acquire a basic knowledge on the risks and benefits of energy choices in general and nuclear energy in particular, do you believe that the information schools offer is sufficient?
Yes, certainly
QuestionnaireSP324EB722TRENnuclearsafetyEN 3/7 10/12/2009
QA11
1
2
3
4
5
6
7
QA12
1
2
3 3 4 5
EB66.2 QA11 TREND MODIFIED
Nuclear energy ensures more competitive and more stable energy prices
1 2
3 4 5Nuclear energy helps to make us less dependent on fuel imports, such as gas and oil
1 2
3 4 5Nuclear energy helps to limit climate change
1 2
Tend to disagree
Totally disagree
DK(ROTATE) Totally agree
Tend to agree
And to what extent do you agree or disagree with each of the following statements on the value of nuclear energy?
3 4 5
EB66.2 QA10 TREND MODIFIED
Nuclear materials are sufficiently protected against malevolent use
1 2
3 4 5Nuclear power plants are sufficiently secured against terrorist attacks
1 2
3 4 5The disposal of radioactive waste can be done in a safe manner
1 2
3 4 5You trust companies operating nuclear power plants
1 2
3 4 5The nuclear safety authority in (OUR COUNTRY) sufficiently ensures the safe operation of nuclear power plant(s)
1 2
3 4 5The (NATIONALITY) legislation sufficiently ensures nuclear safety
1 2
3 4 5It is possible to operate a nuclear power plant in a safe manner
1 2
Tend to disagree
Totally disagree
DK(ROTATE) Totally agree
Tend to agree
To what extent do you agree or disagree with each of the following statements?
QuestionnaireSP324EB722TRENnuclearsafetyEN 4/7 10/12/2009
QA13
1,
2,
3,4,
5,6,
QA14
1,
2,
3,
4,5,
6,7,DK
NEW
Other (SPONTANEOUS)None/ you are in favour of such lifetime extensions of nuclear power plants (SPONTANEOUS)
You would rather prefer building new nuclear power plants with the best available safety design The technical upgrade made for lifetime extension cannot ensure an adequate level of safety
The economic benefits made by lifetime extensions will not be passed to European citizensLifetime extensions will likely diminish incentives to develop alternative energies
And among the following arguments, which ones could make you opposed to lifetime extensions of nuclear power plants?
(MULTIPLE ANSWERS POSSIBLE)
DK
NEW
Other (SPONTANEOUS)None/ you are opposed to such lifetime extensions of nuclear power plants (SPONTANEOUS)
Lifetime extensions will encourage the development of alternative energy sourcesLifetime extensions can be done if plants safely continue to satisfy national and international requirements
(MULTIPLE ANSWERS POSSIBLE)
Lifetime extensions can help to ensure more competitive electricity cost
Existing nuclear power plants are normally designed for an operational lifetime of around 30-40 years. Through technical upgrades, this lifetime can be extended by 10 or even 20 years. Worldwide, national regulatory authorities have started to grant such lifetime extensions based on national safety criteria. Some people are rather for these lifetime extensions on nuclear power plants, some others are rather against.
Among the following arguments, which ones could make you support lifetime extensions of nuclear power plants?
QuestionnaireSP324EB722TRENnuclearsafetyEN 5/7 10/12/2009
QA15
1234
QA16
12
QA17
1
2
34DK
NEW
A neighbouring EU Member State, under the surveillance and control of their responsible authorities in line with EU legislationA country outside the EU, under the surveillance and control of their responsible authorities as well as their own legislation
If you had a possibility to choose the location of a new nuclear power plant, would you prefer …?
(OUR COUNTRY) under the surveillance and control of (NATIONALITY) competent authorities
3 4 5
NEW
Within the EU 1 23 4 5In (OUR COUNTRY) 1 2
Not very useful
Not at all useful
DK Very useful
Fairly useful
How useful or not would it be to have an European Union legislation on nuclear waste management …?
DK
EB66.2 QA13
Maintained the sameIncreased
In your opinion, should the current level of nuclear energy as a proportion of all energy sources be reduced, maintained the same or be increased?
Reduced
QuestionnaireSP324EB722TRENnuclearsafetyEN 6/7 10/12/2009
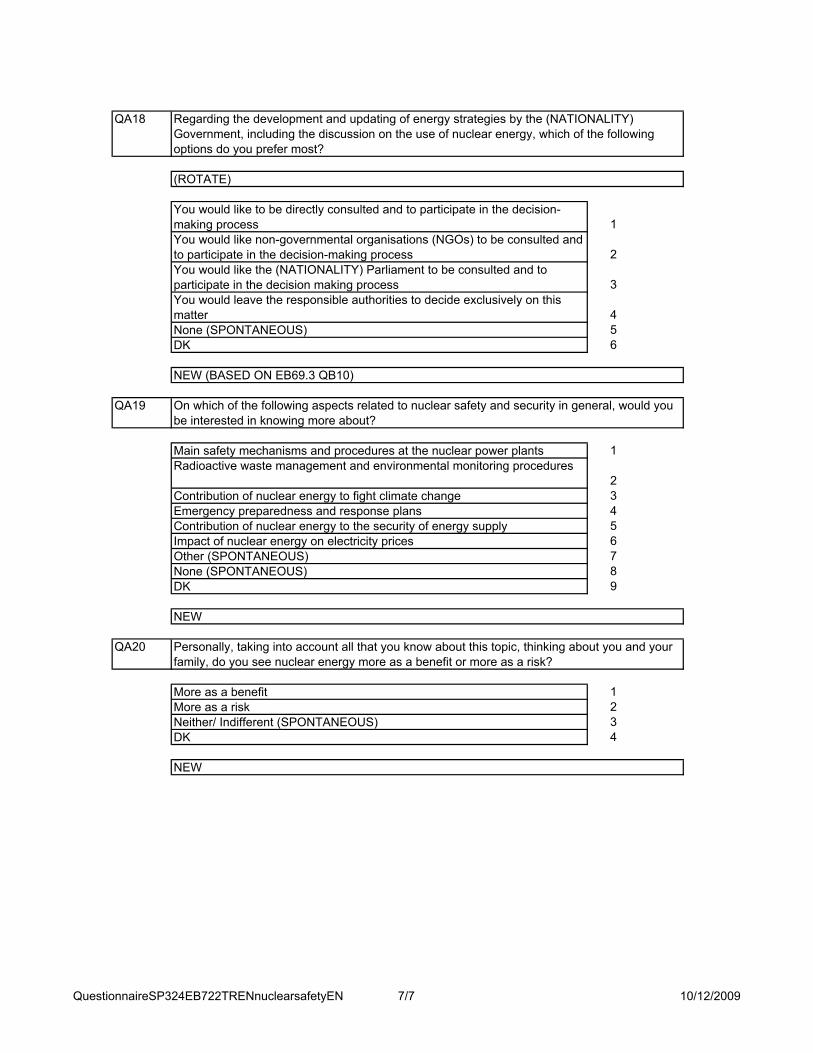
QA18
1
2
3
456
QA19
1
23456789
QA20
1234DK
NEW
More as a riskNeither/ Indifferent (SPONTANEOUS)
Personally, taking into account all that you know about this topic, thinking about you and your family, do you see nuclear energy more as a benefit or more as a risk?
More as a benefit
DK
NEW
Other (SPONTANEOUS)None (SPONTANEOUS)
Contribution of nuclear energy to the security of energy supplyImpact of nuclear energy on electricity prices
Contribution of nuclear energy to fight climate changeEmergency preparedness and response plans
Main safety mechanisms and procedures at the nuclear power plantsRadioactive waste management and environmental monitoring procedures
NEW (BASED ON EB69.3 QB10)
On which of the following aspects related to nuclear safety and security in general, would you be interested in knowing more about?
None (SPONTANEOUS)DK
You would like the (NATIONALITY) Parliament to be consulted and to participate in the decision making processYou would leave the responsible authorities to decide exclusively on this matter
You would like to be directly consulted and to participate in the decision-making processYou would like non-governmental organisations (NGOs) to be consulted and to participate in the decision-making process
Regarding the development and updating of energy strategies by the (NATIONALITY) Government, including the discussion on the use of nuclear energy, which of the following options do you prefer most?
(ROTATE)
QuestionnaireSP324EB722TRENnuclearsafetyEN 7/7 10/12/2009

Special EUROBAROMETER 324 “ EUROPEANS AND NUCLEAR SAFETY”
132
TABLES
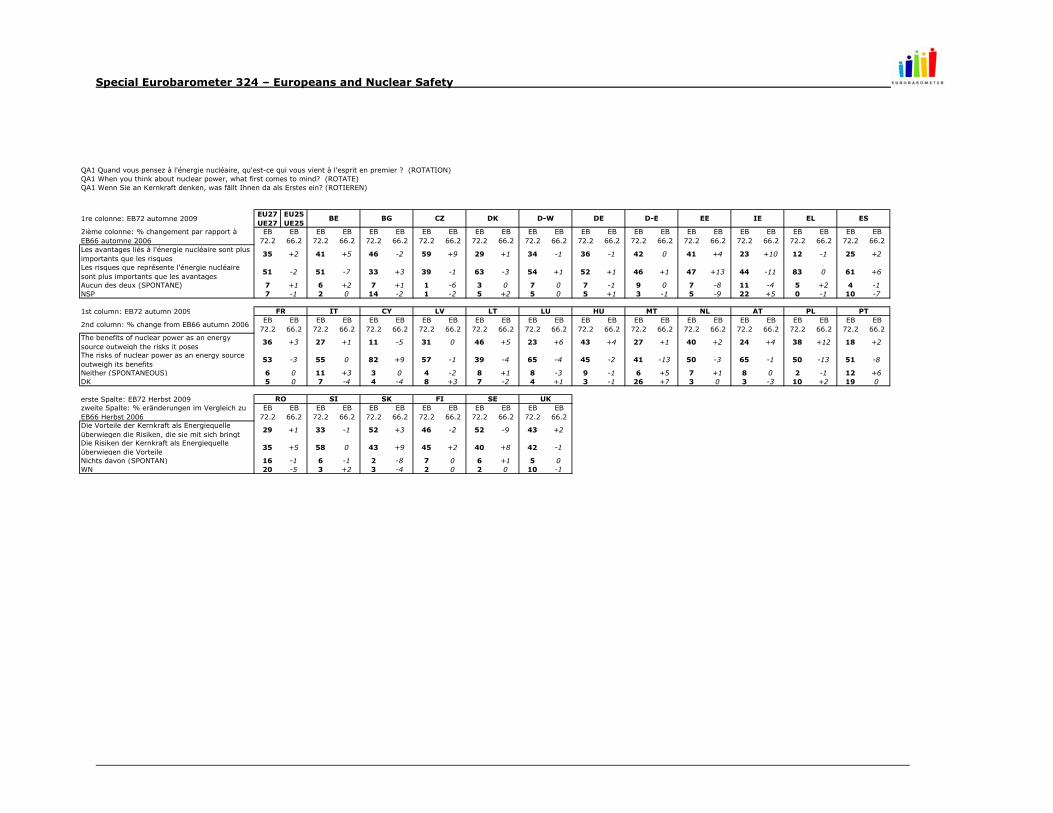
Special Eurobarometer 324 – Europeans and Nuclear Safety
1re colonne: EB72 automne 2009EU27 UE27
EU25 UE25
2ième colonne: % changement par rapport à EB66 automne 2006
EB72.2
EB66.2
EB72.2
EB66.2
EB72.2
EB66.2
EB72.2
EB66.2
EB72.2
EB66.2
EB72.2
EB66.2
EB72.2
EB66.2
EB72.2
EB66.2
EB72.2
EB66.2
EB72.2
EB66.2
EB72.2
EB66.2
EB72.2
EB66.2
Les avantages liés à l'énergie nucléaire sont plus importants que les risques
35 +2 41 +5 46 -2 59 +9 29 +1 34 -1 36 -1 42 0 41 +4 23 +10 12 -1 25 +2
Les risques que représente l'énergie nucléaire sont plus importants que les avantages
51 -2 51 -7 33 +3 39 -1 63 -3 54 +1 52 +1 46 +1 47 +13 44 -11 83 0 61 +6
Aucun des deux (SPONTANE) 7 +1 6 +2 7 +1 1 -6 3 0 7 0 7 -1 9 0 7 -8 11 -4 5 +2 4 -1NSP 7 -1 2 0 14 -2 1 -2 5 +2 5 0 5 +1 3 -1 5 -9 22 +5 0 -1 10 -7
1st column: EB72 autumn 2009
2nd column: % change from EB66 autumn 2006EB
72.2EB
66.2EB
72.2EB
66.2EB
72.2EB
66.2EB
72.2EB
66.2EB
72.2EB
66.2EB
72.2EB
66.2EB
72.2EB
66.2EB
72.2EB
66.2EB
72.2EB
66.2EB
72.2EB
66.2EB
72.2EB
66.2EB
72.2EB
66.2The benefits of nuclear power as an energy source outweigh the risks it poses
36 +3 27 +1 11 -5 31 0 46 +5 23 +6 43 +4 27 +1 40 +2 24 +4 38 +12 18 +2
The risks of nuclear power as an energy source outweigh its benefits
53 -3 55 0 82 +9 57 -1 39 -4 65 -4 45 -2 41 -13 50 -3 65 -1 50 -13 51 -8
Neither (SPONTANEOUS) 6 0 11 +3 3 0 4 -2 8 +1 8 -3 9 -1 6 +5 7 +1 8 0 2 -1 12 +6DK 5 0 7 -4 4 -4 8 +3 7 -2 4 +1 3 -1 26 +7 3 0 3 -3 10 +2 19 0
erste Spalte: EB72 Herbst 2009zweite Spalte: % eränderungen im Vergleich zu EB66 Herbst 2006
EB72.2
EB66.2
EB72.2
EB66.2
EB72.2
EB66.2
EB72.2
EB66.2
EB72.2
EB66.2
EB72.2
EB66.2
Die Vorteile der Kernkraft als Energiequelle überwiegen die Risiken, die sie mit sich bringt
29 +1 33 -1 52 +3 46 -2 52 -9 43 +2
Die Risiken der Kernkraft als Energiequelle überwiegen die Vorteile
35 +5 58 0 43 +9 45 +2 40 +8 42 -1
Nichts davon (SPONTAN) 16 -1 6 -1 2 -8 7 0 6 +1 5 0WN 20 -5 3 +2 3 -4 2 0 2 0 10 -1
QA1 Quand vous pensez à l'énergie nucléaire, qu'est-ce qui vous vient à l'esprit en premier ? (ROTATION)QA1 When you think about nuclear power, what first comes to mind? (ROTATE)QA1 Wenn Sie an Kernkraft denken, was fällt Ihnen da als Erstes ein? (ROTIEREN)
D-E EEBE BG CZ DK
LT LU HU
D-W DE
PT
RO SE
IE EL ES
FR IT CY LV MT NL AT PL
UKSI SK FI
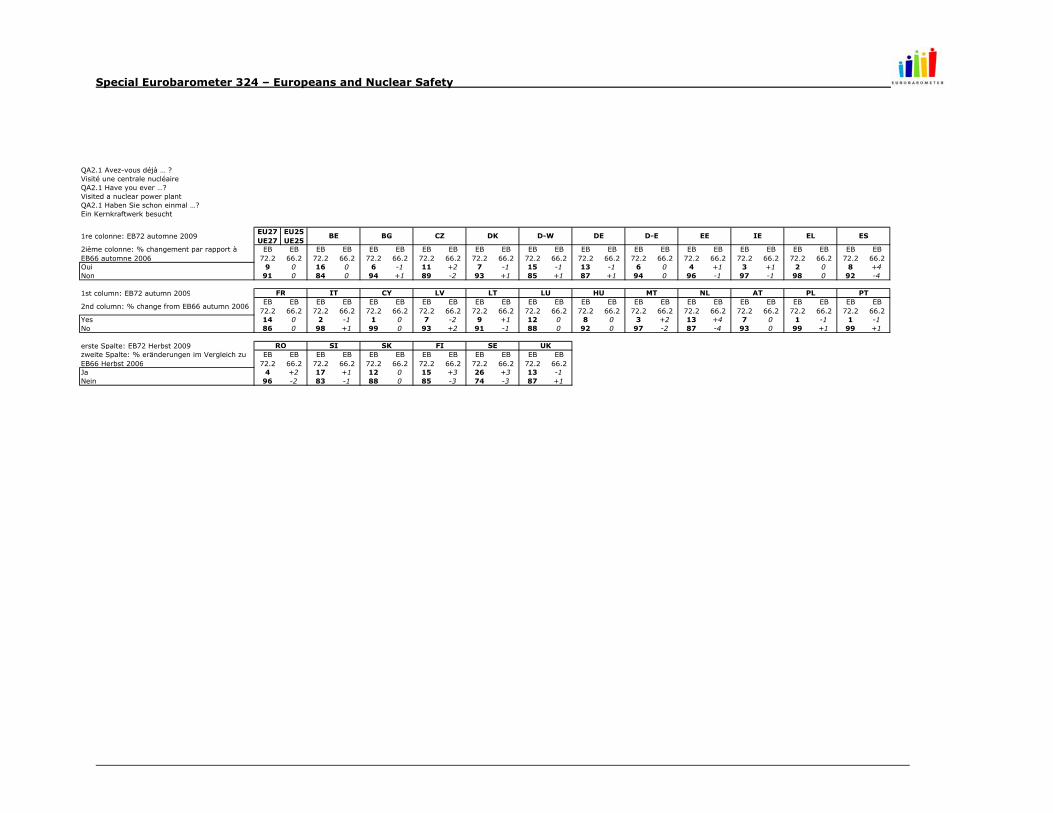
Special Eurobarometer 324 – Europeans and Nuclear Safety
1re colonne: EB72 automne 2009EU27 UE27
EU25 UE25
2ième colonne: % changement par rapport à EB66 automne 2006
EB72.2
EB66.2
EB72.2
EB66.2
EB72.2
EB66.2
EB72.2
EB66.2
EB72.2
EB66.2
EB72.2
EB66.2
EB72.2
EB66.2
EB72.2
EB66.2
EB72.2
EB66.2
EB72.2
EB66.2
EB72.2
EB66.2
EB72.2
EB66.2
Oui 9 0 16 0 6 -1 11 +2 7 -1 15 -1 13 -1 6 0 4 +1 3 +1 2 0 8 +4Non 91 0 84 0 94 +1 89 -2 93 +1 85 +1 87 +1 94 0 96 -1 97 -1 98 0 92 -4
1st column: EB72 autumn 2009
2nd column: % change from EB66 autumn 2006EB
72.2EB
66.2EB
72.2EB
66.2EB
72.2EB
66.2EB
72.2EB
66.2EB
72.2EB
66.2EB
72.2EB
66.2EB
72.2EB
66.2EB
72.2EB
66.2EB
72.2EB
66.2EB
72.2EB
66.2EB
72.2EB
66.2EB
72.2EB
66.2Yes 14 0 2 -1 1 0 7 -2 9 +1 12 0 8 0 3 +2 13 +4 7 0 1 -1 1 -1No 86 0 98 +1 99 0 93 +2 91 -1 88 0 92 0 97 -2 87 -4 93 0 99 +1 99 +1
erste Spalte: EB72 Herbst 2009zweite Spalte: % eränderungen im Vergleich zu EB66 Herbst 2006
EB72.2
EB66.2
EB72.2
EB66.2
EB72.2
EB66.2
EB72.2
EB66.2
EB72.2
EB66.2
EB72.2
EB66.2
Ja 4 +2 17 +1 12 0 15 +3 26 +3 13 -1Nein 96 -2 83 -1 88 0 85 -3 74 -3 87 +1
Visited a nuclear power plant
QA2.1 Avez-vous déjà … ? Visité une centrale nucléaireQA2.1 Have you ever …?
QA2.1 Haben Sie schon einmal …? Ein Kernkraftwerk besucht
D-E EEBE BG CZ DK
LT LU HU
D-W DE
PT
RO SE
IE EL ES
FR IT CY LV MT NL AT PL
UKSI SK FI

Special Eurobarometer 324 – Europeans and Nuclear Safety
1re colonne: EB72 automne 2009EU27 UE27
EU25 UE25
2ième colonne: % changement par rapport à EB66 automne 2006
EB72.2
EB66.2
EB72.2
EB66.2
EB72.2
EB66.2
EB72.2
EB66.2
EB72.2
EB66.2
EB72.2
EB66.2
EB72.2
EB66.2
EB72.2
EB66.2
EB72.2
EB66.2
EB72.2
EB66.2
EB72.2
EB66.2
EB72.2
EB66.2
Oui 11 -1 32 -1 3 -1 10 -3 29 -1 24 -4 20 -4 3 -4 2 0 2 0 1 0 5 +2Non 89 +1 68 +1 97 +1 90 +3 71 +1 76 +4 80 +4 97 +4 98 0 98 0 99 0 95 -2
1st column: EB72 autumn 2009
2nd column: % change from EB66 autumn 2006EB
72.2EB
66.2EB
72.2EB
66.2EB
72.2EB
66.2EB
72.2EB
66.2EB
72.2EB
66.2EB
72.2EB
66.2EB
72.2EB
66.2EB
72.2EB
66.2EB
72.2EB
66.2EB
72.2EB
66.2EB
72.2EB
66.2EB
72.2EB
66.2Yes 19 +1 4 0 0 0 9 -4 7 -1 44 -18 7 -1 3 +1 18 +1 4 +1 1 0 1 -1No 81 -1 96 0 100 0 91 +4 93 +1 56 +18 93 +1 97 -1 82 -1 96 -1 99 0 99 +1
erste Spalte: EB72 Herbst 2009zweite Spalte: % eränderungen im Vergleich zu EB66 Herbst 2006
EB72.2
EB66.2
EB72.2
EB66.2
EB72.2
EB66.2
EB72.2
EB66.2
EB72.2
EB66.2
EB72.2
EB66.2
Ja 3 0 10 0 19 +1 9 -1 18 0 12 -1Nein 97 0 90 0 81 -1 91 +1 82 0 88 +1
Lived in an area close (within a 50 km radius) to a nuclear power plant
QA2.2 Avez-vous déjà … ? Vécu dans une zone proche (dans un rayon de 50 km) d’une centrale nucléaireQA2.2 Have you ever …?
QA2.2 Haben Sie schon einmal …? In einer Gegend gewohnt, die in der Nähe (also im Umkreis von 50 km) eines Kernkraftwerks liegt
D-E EEBE BG CZ DK
LT LU HU
D-W DE
PT
RO SE
IE EL ES
FR IT CY LV MT NL AT PL
UKSI SK FI
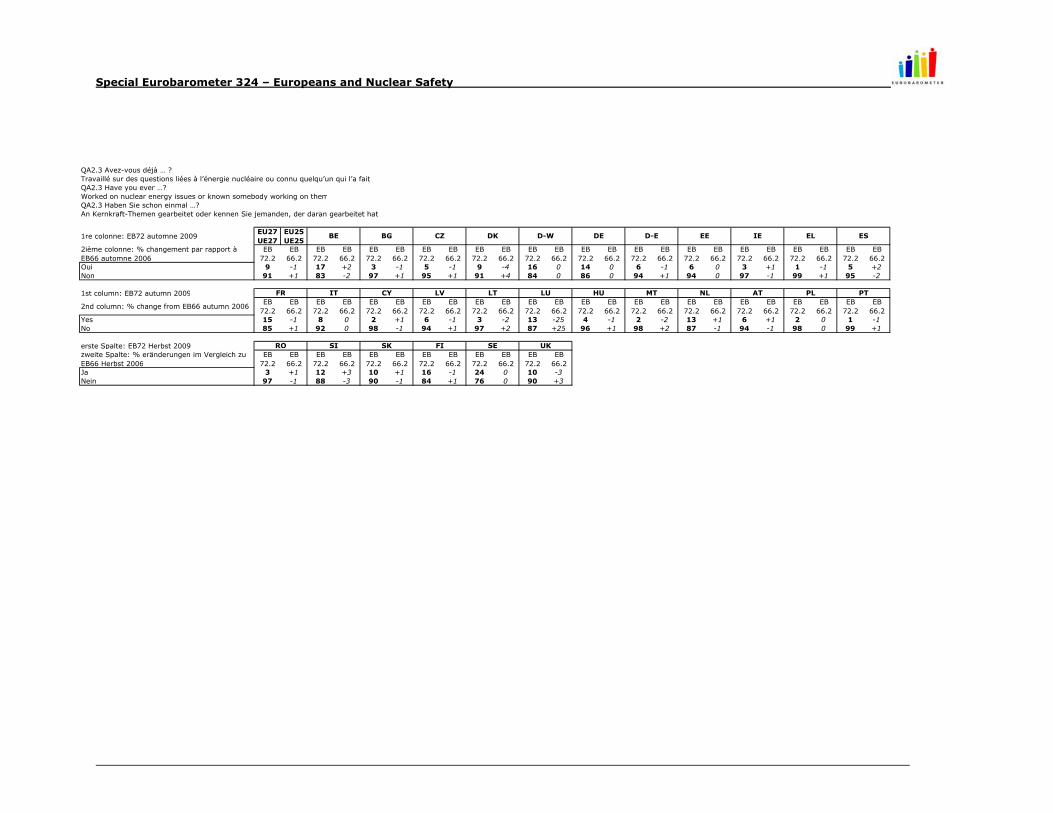
Special Eurobarometer 324 – Europeans and Nuclear Safety
1re colonne: EB72 automne 2009EU27 UE27
EU25 UE25
2ième colonne: % changement par rapport à EB66 automne 2006
EB72.2
EB66.2
EB72.2
EB66.2
EB72.2
EB66.2
EB72.2
EB66.2
EB72.2
EB66.2
EB72.2
EB66.2
EB72.2
EB66.2
EB72.2
EB66.2
EB72.2
EB66.2
EB72.2
EB66.2
EB72.2
EB66.2
EB72.2
EB66.2
Oui 9 -1 17 +2 3 -1 5 -1 9 -4 16 0 14 0 6 -1 6 0 3 +1 1 -1 5 +2Non 91 +1 83 -2 97 +1 95 +1 91 +4 84 0 86 0 94 +1 94 0 97 -1 99 +1 95 -2
1st column: EB72 autumn 2009
2nd column: % change from EB66 autumn 2006EB
72.2EB
66.2EB
72.2EB
66.2EB
72.2EB
66.2EB
72.2EB
66.2EB
72.2EB
66.2EB
72.2EB
66.2EB
72.2EB
66.2EB
72.2EB
66.2EB
72.2EB
66.2EB
72.2EB
66.2EB
72.2EB
66.2EB
72.2EB
66.2Yes 15 -1 8 0 2 +1 6 -1 3 -2 13 -25 4 -1 2 -2 13 +1 6 +1 2 0 1 -1No 85 +1 92 0 98 -1 94 +1 97 +2 87 +25 96 +1 98 +2 87 -1 94 -1 98 0 99 +1
erste Spalte: EB72 Herbst 2009zweite Spalte: % eränderungen im Vergleich zu EB66 Herbst 2006
EB72.2
EB66.2
EB72.2
EB66.2
EB72.2
EB66.2
EB72.2
EB66.2
EB72.2
EB66.2
EB72.2
EB66.2
Ja 3 +1 12 +3 10 +1 16 -1 24 0 10 -3Nein 97 -1 88 -3 90 -1 84 +1 76 0 90 +3
Worked on nuclear energy issues or known somebody working on them
QA2.3 Avez-vous déjà … ? Travaillé sur des questions liées à l’énergie nucléaire ou connu quelqu’un qui l’a faitQA2.3 Have you ever …?
QA2.3 Haben Sie schon einmal …? An Kernkraft-Themen gearbeitet oder kennen Sie jemanden, der daran gearbeitet hat
D-E EEBE BG CZ DK
LT LU HU
D-W DE
PT
RO SE
IE EL ES
FR IT CY LV MT NL AT PL
UKSI SK FI
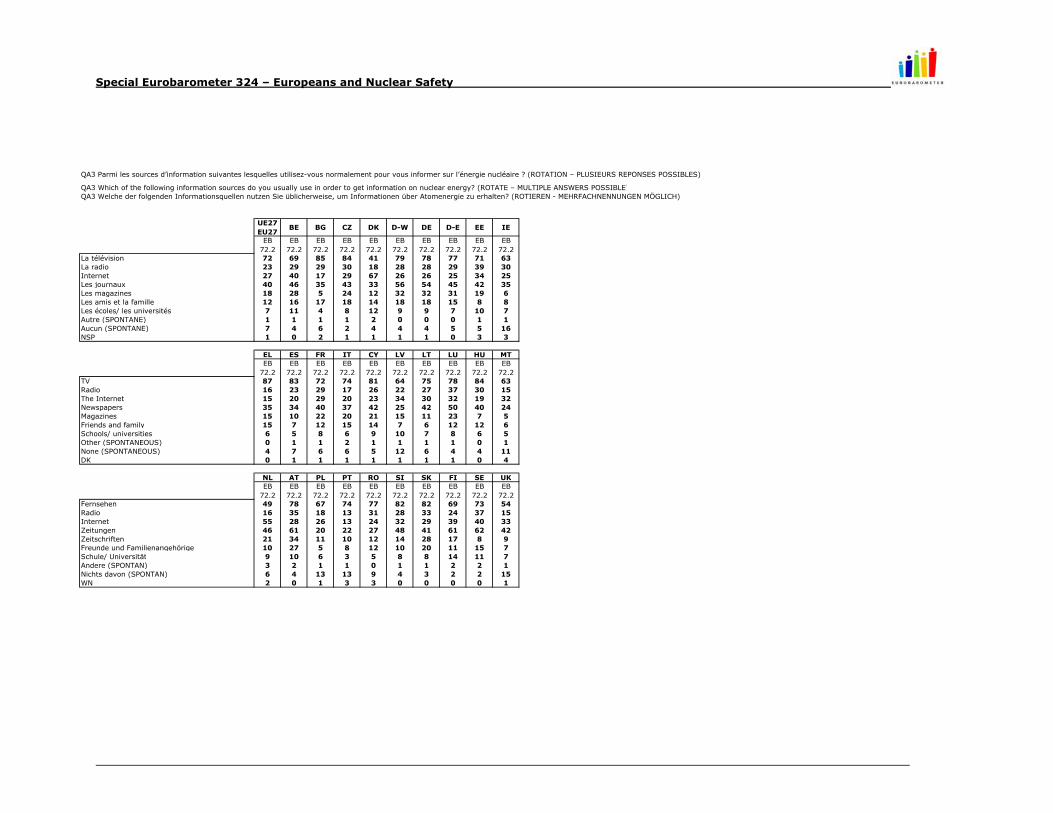
Special Eurobarometer 324 – Europeans and Nuclear Safety
UE27EU27
BE BG CZ DK D-W DE D-E EE IE
EB72.2
EB72.2
EB72.2
EB72.2
EB72.2
EB72.2
EB72.2
EB72.2
EB72.2
EB72.2
La télévision 72 69 85 84 41 79 78 77 71 63La radio 23 29 29 30 18 28 28 29 39 30Internet 27 40 17 29 67 26 26 25 34 25Les journaux 40 46 35 43 33 56 54 45 42 35Les magazines 18 28 5 24 12 32 32 31 19 6Les amis et la famille 12 16 17 18 14 18 18 15 8 8Les écoles/ les universités 7 11 4 8 12 9 9 7 10 7Autre (SPONTANE) 1 1 1 1 2 0 0 0 1 1Aucun (SPONTANE) 7 4 6 2 4 4 4 5 5 16NSP 1 0 2 1 1 1 1 0 3 3
EL ES FR IT CY LV LT LU HU MTEB
72.2EB
72.2EB
72.2EB
72.2EB
72.2EB
72.2EB
72.2EB
72.2EB
72.2EB
72.2TV 87 83 72 74 81 64 75 78 84 63Radio 16 23 29 17 26 22 27 37 30 15The Internet 15 20 29 20 23 34 30 32 19 32Newspapers 35 34 40 37 42 25 42 50 40 24Magazines 15 10 22 20 21 15 11 23 7 5Friends and family 15 7 12 15 14 7 6 12 12 6Schools/ universities 6 5 8 6 9 10 7 8 6 5Other (SPONTANEOUS) 0 1 1 2 1 1 1 1 0 1None (SPONTANEOUS) 4 7 6 6 5 12 6 4 4 11DK 0 1 1 1 1 1 1 1 0 4
NL AT PL PT RO SI SK FI SE UKEB
72.2EB
72.2EB
72.2EB
72.2EB
72.2EB
72.2EB
72.2EB
72.2EB
72.2EB
72.2Fernsehen 49 78 67 74 77 82 82 69 73 54Radio 16 35 18 13 31 28 33 24 37 15Internet 55 28 26 13 24 32 29 39 40 33Zeitungen 46 61 20 22 27 48 41 61 62 42Zeitschriften 21 34 11 10 12 14 28 17 8 9Freunde und Familienangehörige 10 27 5 8 12 10 20 11 15 7Schule/ Universität 9 10 6 3 5 8 8 14 11 7Andere (SPONTAN) 3 2 1 1 0 1 1 2 2 1Nichts davon (SPONTAN) 6 4 13 13 9 4 3 2 2 15WN 2 0 1 3 3 0 0 0 0 1
QA3 Parmi les sources d’information suivantes lesquelles utilisez-vous normalement pour vous informer sur l’énergie nucléaire ? (ROTATION – PLUSIEURS REPONSES POSSIBLES)
QA3 Which of the following information sources do you usually use in order to get information on nuclear energy? (ROTATE – MULTIPLE ANSWERS POSSIBLE)QA3 Welche der folgenden Informationsquellen nutzen Sie üblicherweise, um Informationen über Atomenergie zu erhalten? (ROTIEREN - MEHRFACHNENNUNGEN MÖGLICH)
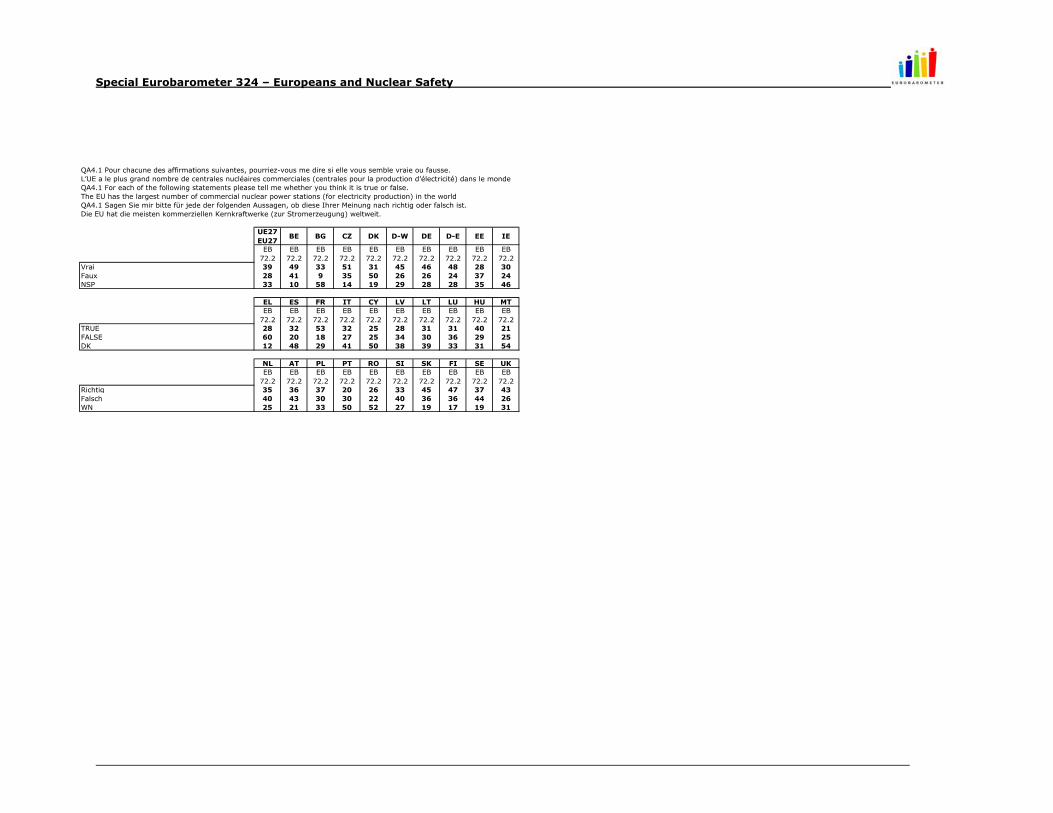
Special Eurobarometer 324 – Europeans and Nuclear Safety
UE27EU27
BE BG CZ DK D-W DE D-E EE IE
EB72.2
EB72.2
EB72.2
EB72.2
EB72.2
EB72.2
EB72.2
EB72.2
EB72.2
EB72.2
Vrai 39 49 33 51 31 45 46 48 28 30Faux 28 41 9 35 50 26 26 24 37 24NSP 33 10 58 14 19 29 28 28 35 46
EL ES FR IT CY LV LT LU HU MTEB
72.2EB
72.2EB
72.2EB
72.2EB
72.2EB
72.2EB
72.2EB
72.2EB
72.2EB
72.2TRUE 28 32 53 32 25 28 31 31 40 21FALSE 60 20 18 27 25 34 30 36 29 25DK 12 48 29 41 50 38 39 33 31 54
NL AT PL PT RO SI SK FI SE UKEB
72.2EB
72.2EB
72.2EB
72.2EB
72.2EB
72.2EB
72.2EB
72.2EB
72.2EB
72.2Richtig 35 36 37 20 26 33 45 47 37 43Falsch 40 43 30 30 22 40 36 36 44 26WN 25 21 33 50 52 27 19 17 19 31
The EU has the largest number of commercial nuclear power stations (for electricity production) in the world
QA4.1 Pour chacune des affirmations suivantes, pourriez-vous me dire si elle vous semble vraie ou fausse. L’UE a le plus grand nombre de centrales nucléaires commerciales (centrales pour la production d’électricité) dans le mondeQA4.1 For each of the following statements please tell me whether you think it is true or false.
QA4.1 Sagen Sie mir bitte für jede der folgenden Aussagen, ob diese Ihrer Meinung nach richtig oder falsch ist. Die EU hat die meisten kommerziellen Kernkraftwerke (zur Stromerzeugung) weltweit.
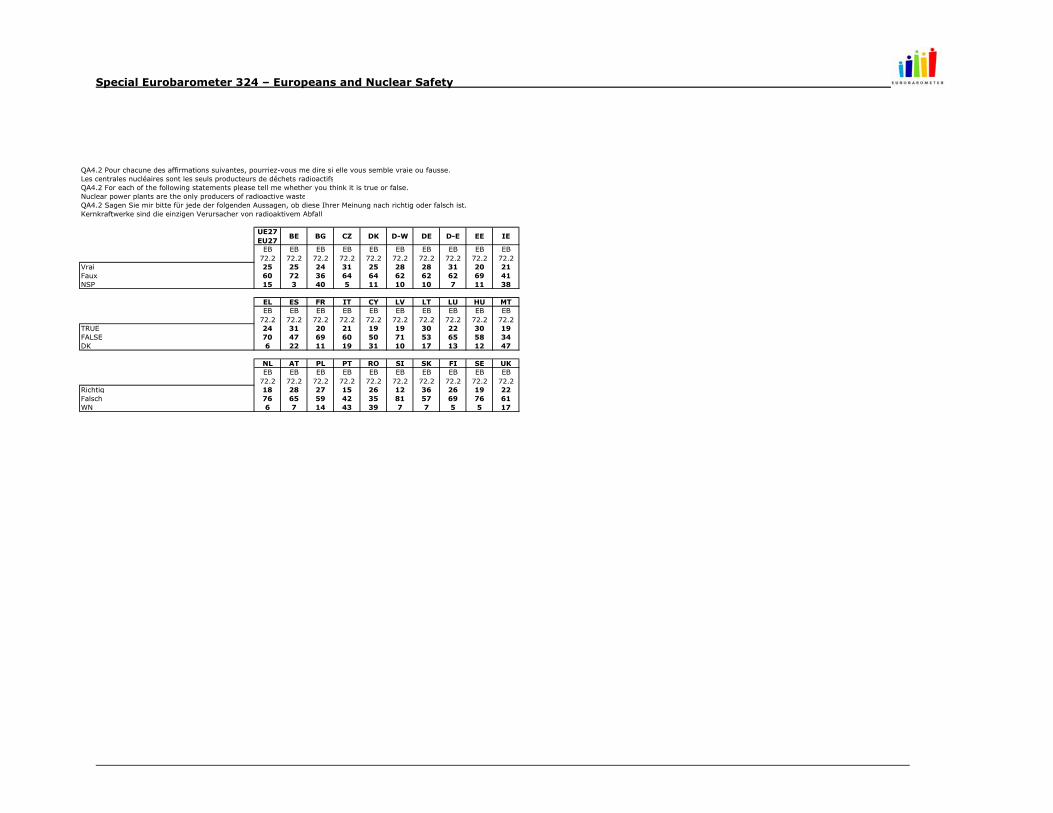
Special Eurobarometer 324 – Europeans and Nuclear Safety
UE27EU27
BE BG CZ DK D-W DE D-E EE IE
EB72.2
EB72.2
EB72.2
EB72.2
EB72.2
EB72.2
EB72.2
EB72.2
EB72.2
EB72.2
Vrai 25 25 24 31 25 28 28 31 20 21Faux 60 72 36 64 64 62 62 62 69 41NSP 15 3 40 5 11 10 10 7 11 38
EL ES FR IT CY LV LT LU HU MTEB
72.2EB
72.2EB
72.2EB
72.2EB
72.2EB
72.2EB
72.2EB
72.2EB
72.2EB
72.2TRUE 24 31 20 21 19 19 30 22 30 19FALSE 70 47 69 60 50 71 53 65 58 34DK 6 22 11 19 31 10 17 13 12 47
NL AT PL PT RO SI SK FI SE UKEB
72.2EB
72.2EB
72.2EB
72.2EB
72.2EB
72.2EB
72.2EB
72.2EB
72.2EB
72.2Richtig 18 28 27 15 26 12 36 26 19 22Falsch 76 65 59 42 35 81 57 69 76 61WN 6 7 14 43 39 7 7 5 5 17
Nuclear power plants are the only producers of radioactive waste
QA4.2 Pour chacune des affirmations suivantes, pourriez-vous me dire si elle vous semble vraie ou fausse. Les centrales nucléaires sont les seuls producteurs de déchets radioactifsQA4.2 For each of the following statements please tell me whether you think it is true or false.
QA4.2 Sagen Sie mir bitte für jede der folgenden Aussagen, ob diese Ihrer Meinung nach richtig oder falsch ist. Kernkraftwerke sind die einzigen Verursacher von radioaktivem Abfall
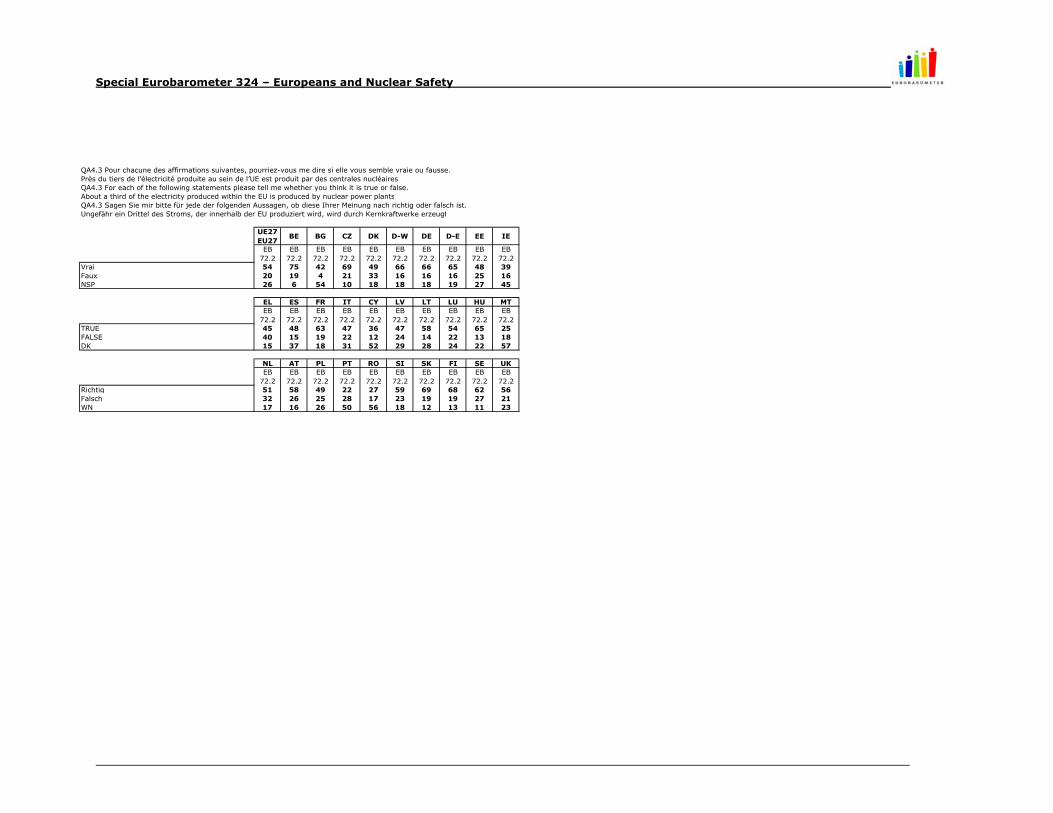
Special Eurobarometer 324 – Europeans and Nuclear Safety
UE27EU27
BE BG CZ DK D-W DE D-E EE IE
EB72.2
EB72.2
EB72.2
EB72.2
EB72.2
EB72.2
EB72.2
EB72.2
EB72.2
EB72.2
Vrai 54 75 42 69 49 66 66 65 48 39Faux 20 19 4 21 33 16 16 16 25 16NSP 26 6 54 10 18 18 18 19 27 45
EL ES FR IT CY LV LT LU HU MTEB
72.2EB
72.2EB
72.2EB
72.2EB
72.2EB
72.2EB
72.2EB
72.2EB
72.2EB
72.2TRUE 45 48 63 47 36 47 58 54 65 25FALSE 40 15 19 22 12 24 14 22 13 18DK 15 37 18 31 52 29 28 24 22 57
NL AT PL PT RO SI SK FI SE UKEB
72.2EB
72.2EB
72.2EB
72.2EB
72.2EB
72.2EB
72.2EB
72.2EB
72.2EB
72.2Richtig 51 58 49 22 27 59 69 68 62 56Falsch 32 26 25 28 17 23 19 19 27 21WN 17 16 26 50 56 18 12 13 11 23
About a third of the electricity produced within the EU is produced by nuclear power plants
QA4.3 Pour chacune des affirmations suivantes, pourriez-vous me dire si elle vous semble vraie ou fausse. Près du tiers de l’électricité produite au sein de l’UE est produit par des centrales nucléairesQA4.3 For each of the following statements please tell me whether you think it is true or false.
QA4.3 Sagen Sie mir bitte für jede der folgenden Aussagen, ob diese Ihrer Meinung nach richtig oder falsch ist. Ungefähr ein Drittel des Stroms, der innerhalb der EU produziert wird, wird durch Kernkraftwerke erzeugt
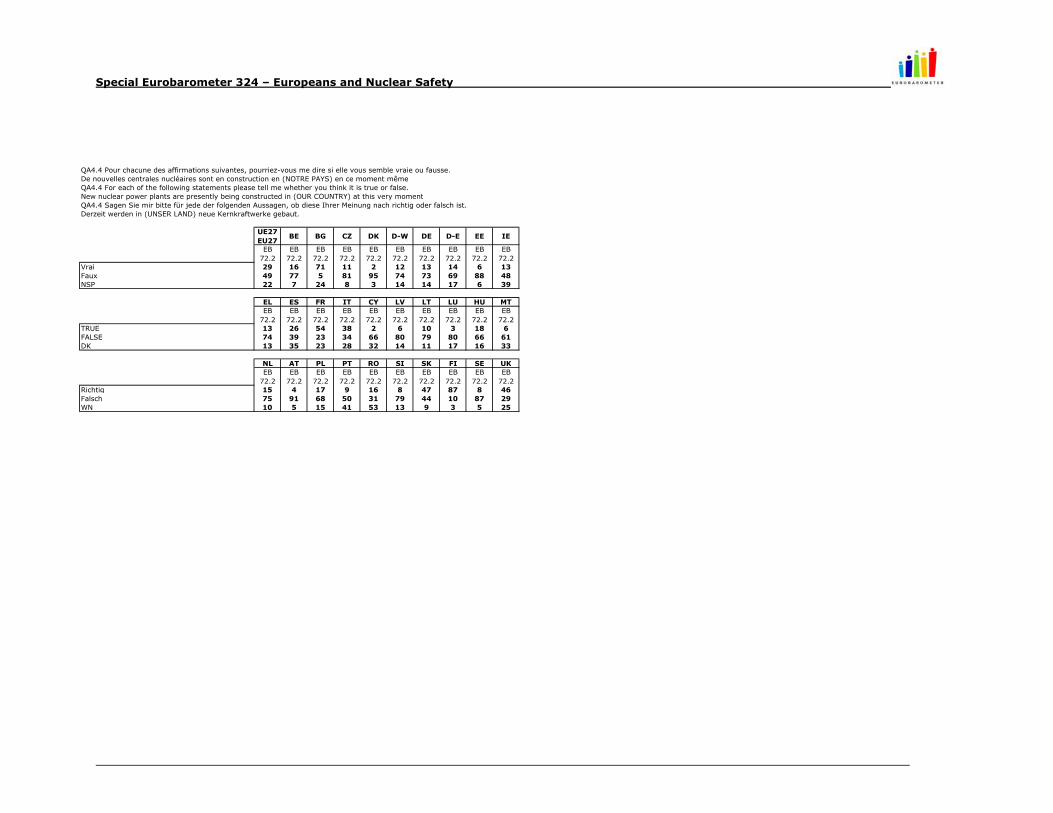
Special Eurobarometer 324 – Europeans and Nuclear Safety
UE27EU27
BE BG CZ DK D-W DE D-E EE IE
EB72.2
EB72.2
EB72.2
EB72.2
EB72.2
EB72.2
EB72.2
EB72.2
EB72.2
EB72.2
Vrai 29 16 71 11 2 12 13 14 6 13Faux 49 77 5 81 95 74 73 69 88 48NSP 22 7 24 8 3 14 14 17 6 39
EL ES FR IT CY LV LT LU HU MTEB
72.2EB
72.2EB
72.2EB
72.2EB
72.2EB
72.2EB
72.2EB
72.2EB
72.2EB
72.2TRUE 13 26 54 38 2 6 10 3 18 6FALSE 74 39 23 34 66 80 79 80 66 61DK 13 35 23 28 32 14 11 17 16 33
NL AT PL PT RO SI SK FI SE UKEB
72.2EB
72.2EB
72.2EB
72.2EB
72.2EB
72.2EB
72.2EB
72.2EB
72.2EB
72.2Richtig 15 4 17 9 16 8 47 87 8 46Falsch 75 91 68 50 31 79 44 10 87 29WN 10 5 15 41 53 13 9 3 5 25
New nuclear power plants are presently being constructed in (OUR COUNTRY) at this very moment
QA4.4 Pour chacune des affirmations suivantes, pourriez-vous me dire si elle vous semble vraie ou fausse. De nouvelles centrales nucléaires sont en construction en (NOTRE PAYS) en ce moment même QA4.4 For each of the following statements please tell me whether you think it is true or false.
QA4.4 Sagen Sie mir bitte für jede der folgenden Aussagen, ob diese Ihrer Meinung nach richtig oder falsch ist. Derzeit werden in (UNSER LAND) neue Kernkraftwerke gebaut.
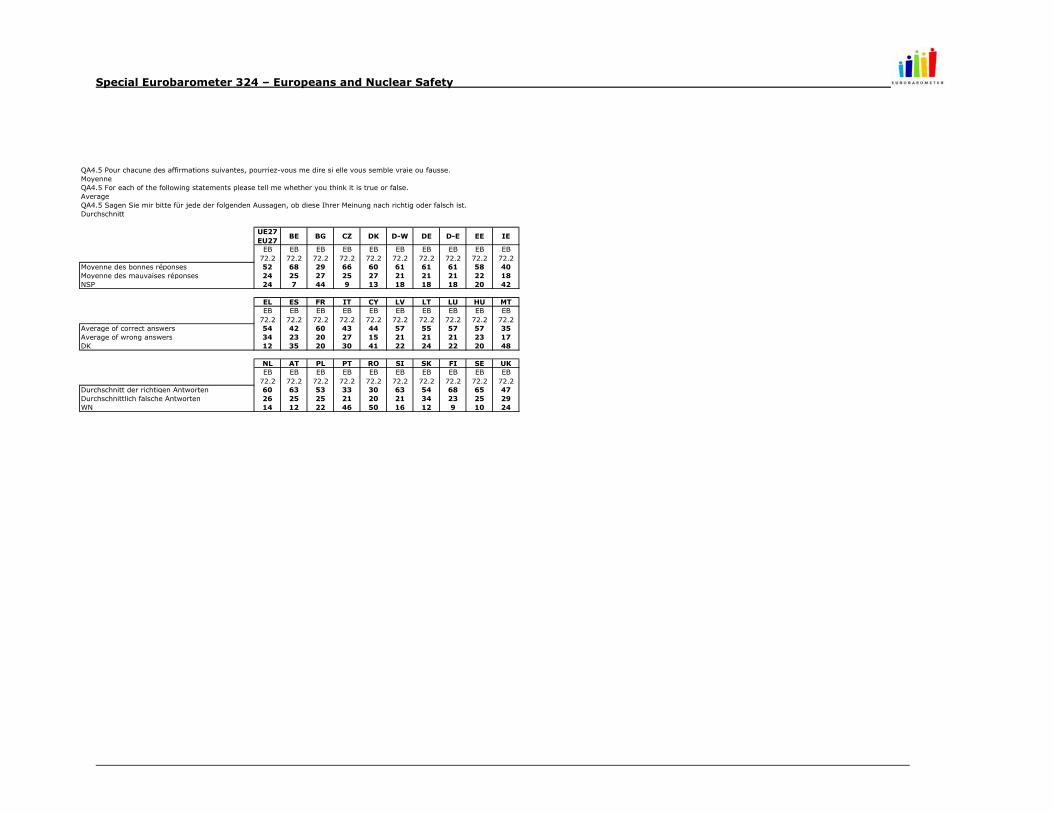
Special Eurobarometer 324 – Europeans and Nuclear Safety
UE27EU27
BE BG CZ DK D-W DE D-E EE IE
EB72.2
EB72.2
EB72.2
EB72.2
EB72.2
EB72.2
EB72.2
EB72.2
EB72.2
EB72.2
Moyenne des bonnes réponses 52 68 29 66 60 61 61 61 58 40Moyenne des mauvaises réponses 24 25 27 25 27 21 21 21 22 18NSP 24 7 44 9 13 18 18 18 20 42
EL ES FR IT CY LV LT LU HU MTEB
72.2EB
72.2EB
72.2EB
72.2EB
72.2EB
72.2EB
72.2EB
72.2EB
72.2EB
72.2Average of correct answers 54 42 60 43 44 57 55 57 57 35Average of wrong answers 34 23 20 27 15 21 21 21 23 17DK 12 35 20 30 41 22 24 22 20 48
NL AT PL PT RO SI SK FI SE UKEB
72.2EB
72.2EB
72.2EB
72.2EB
72.2EB
72.2EB
72.2EB
72.2EB
72.2EB
72.2Durchschnitt der richtigen Antworten 60 63 53 33 30 63 54 68 65 47Durchschnittlich falsche Antworten 26 25 25 21 20 21 34 23 25 29WN 14 12 22 46 50 16 12 9 10 24
Average
QA4.5 Pour chacune des affirmations suivantes, pourriez-vous me dire si elle vous semble vraie ou fausse. MoyenneQA4.5 For each of the following statements please tell me whether you think it is true or false.
QA4.5 Sagen Sie mir bitte für jede der folgenden Aussagen, ob diese Ihrer Meinung nach richtig oder falsch ist. Durchschnitt
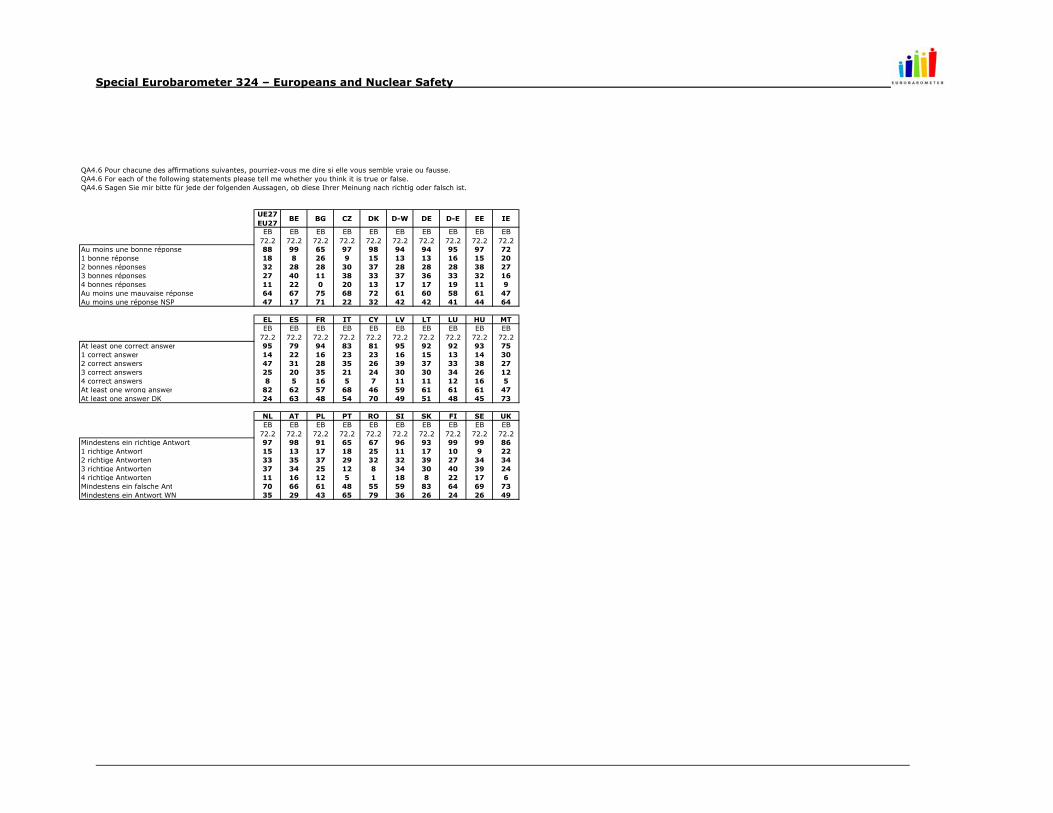
Special Eurobarometer 324 – Europeans and Nuclear Safety
UE27EU27
BE BG CZ DK D-W DE D-E EE IE
EB72.2
EB72.2
EB72.2
EB72.2
EB72.2
EB72.2
EB72.2
EB72.2
EB72.2
EB72.2
Au moins une bonne réponse 88 99 65 97 98 94 94 95 97 721 bonne réponse 18 8 26 9 15 13 13 16 15 202 bonnes réponses 32 28 28 30 37 28 28 28 38 273 bonnes réponses 27 40 11 38 33 37 36 33 32 164 bonnes réponses 11 22 0 20 13 17 17 19 11 9Au moins une mauvaise réponse 64 67 75 68 72 61 60 58 61 47Au moins une réponse NSP 47 17 71 22 32 42 42 41 44 64
EL ES FR IT CY LV LT LU HU MTEB
72.2EB
72.2EB
72.2EB
72.2EB
72.2EB
72.2EB
72.2EB
72.2EB
72.2EB
72.2At least one correct answer 95 79 94 83 81 95 92 92 93 751 correct answer 14 22 16 23 23 16 15 13 14 302 correct answers 47 31 28 35 26 39 37 33 38 273 correct answers 25 20 35 21 24 30 30 34 26 124 correct answers 8 5 16 5 7 11 11 12 16 5At least one wrong answer 82 62 57 68 46 59 61 61 61 47At least one answer DK 24 63 48 54 70 49 51 48 45 73
NL AT PL PT RO SI SK FI SE UKEB
72.2EB
72.2EB
72.2EB
72.2EB
72.2EB
72.2EB
72.2EB
72.2EB
72.2EB
72.2Mindestens ein richtige Antwort 97 98 91 65 67 96 93 99 99 861 richtige Antwort 15 13 17 18 25 11 17 10 9 222 richtige Antworten 33 35 37 29 32 32 39 27 34 343 richtige Antworten 37 34 25 12 8 34 30 40 39 244 richtige Antworten 11 16 12 5 1 18 8 22 17 6Mindestens ein falsche Ant 70 66 61 48 55 59 83 64 69 73Mindestens ein Antwort WN 35 29 43 65 79 36 26 24 26 49
QA4.6 Pour chacune des affirmations suivantes, pourriez-vous me dire si elle vous semble vraie ou fausse. QA4.6 For each of the following statements please tell me whether you think it is true or false. QA4.6 Sagen Sie mir bitte für jede der folgenden Aussagen, ob diese Ihrer Meinung nach richtig oder falsch ist.
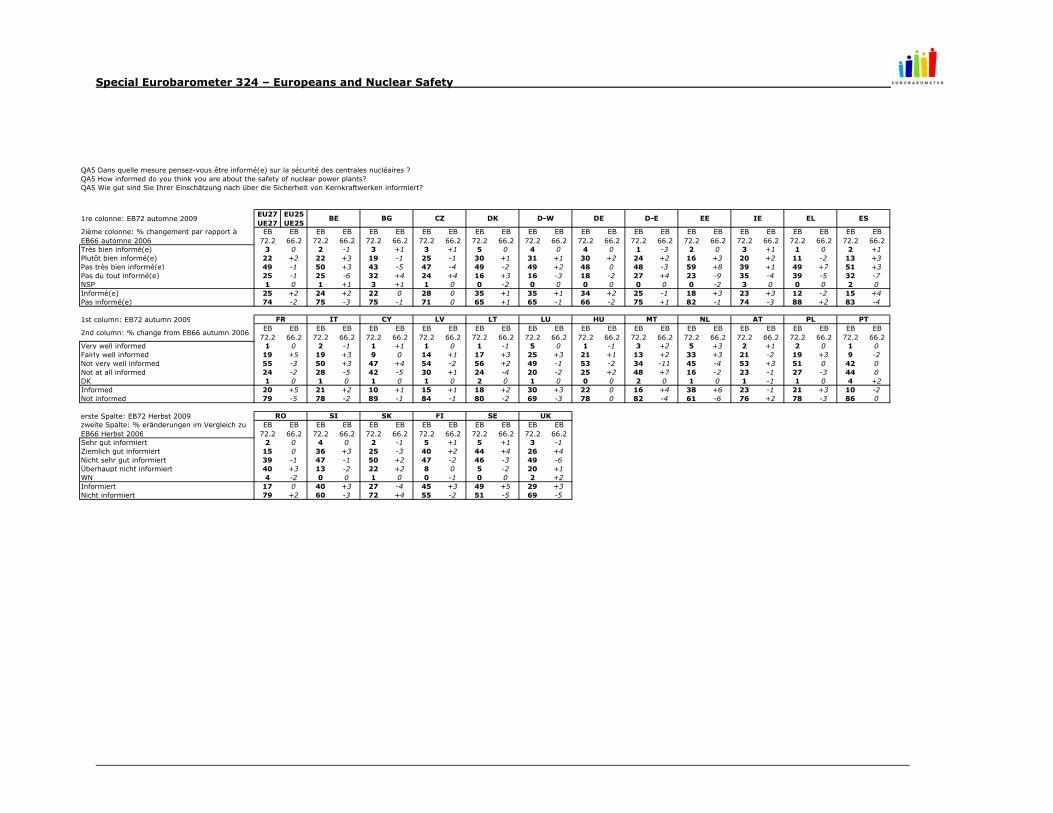
Special Eurobarometer 324 – Europeans and Nuclear Safety
1re colonne: EB72 automne 2009EU27 UE27
EU25 UE25
2ième colonne: % changement par rapport à EB66 automne 2006
EB72.2
EB66.2
EB72.2
EB66.2
EB72.2
EB66.2
EB72.2
EB66.2
EB72.2
EB66.2
EB72.2
EB66.2
EB72.2
EB66.2
EB72.2
EB66.2
EB72.2
EB66.2
EB72.2
EB66.2
EB72.2
EB66.2
EB72.2
EB66.2
Très bien informé(e) 3 0 2 -1 3 +1 3 +1 5 0 4 0 4 0 1 -3 2 0 3 +1 1 0 2 +1Plutôt bien informé(e) 22 +2 22 +3 19 -1 25 -1 30 +1 31 +1 30 +2 24 +2 16 +3 20 +2 11 -2 13 +3Pas très bien informé(e) 49 -1 50 +3 43 -5 47 -4 49 -2 49 +2 48 0 48 -3 59 +8 39 +1 49 +7 51 +3Pas du tout informé(e) 25 -1 25 -6 32 +4 24 +4 16 +3 16 -3 18 -2 27 +4 23 -9 35 -4 39 -5 32 -7NSP 1 0 1 +1 3 +1 1 0 0 -2 0 0 0 0 0 0 0 -2 3 0 0 0 2 0Informé(e) 25 +2 24 +2 22 0 28 0 35 +1 35 +1 34 +2 25 -1 18 +3 23 +3 12 -2 15 +4Pas informé(e) 74 -2 75 -3 75 -1 71 0 65 +1 65 -1 66 -2 75 +1 82 -1 74 -3 88 +2 83 -4
1st column: EB72 autumn 2009
2nd column: % change from EB66 autumn 2006EB
72.2EB
66.2EB
72.2EB
66.2EB
72.2EB
66.2EB
72.2EB
66.2EB
72.2EB
66.2EB
72.2EB
66.2EB
72.2EB
66.2EB
72.2EB
66.2EB
72.2EB
66.2EB
72.2EB
66.2EB
72.2EB
66.2EB
72.2EB
66.2Very well informed 1 0 2 -1 1 +1 1 0 1 -1 5 0 1 -1 3 +2 5 +3 2 +1 2 0 1 0Fairly well informed 19 +5 19 +3 9 0 14 +1 17 +3 25 +3 21 +1 13 +2 33 +3 21 -2 19 +3 9 -2Not very well informed 55 -3 50 +3 47 +4 54 -2 56 +2 49 -1 53 -2 34 -11 45 -4 53 +3 51 0 42 0Not at all informed 24 -2 28 -5 42 -5 30 +1 24 -4 20 -2 25 +2 48 +7 16 -2 23 -1 27 -3 44 0DK 1 0 1 0 1 0 1 0 2 0 1 0 0 0 2 0 1 0 1 -1 1 0 4 +2Informed 20 +5 21 +2 10 +1 15 +1 18 +2 30 +3 22 0 16 +4 38 +6 23 -1 21 +3 10 -2Not informed 79 -5 78 -2 89 -1 84 -1 80 -2 69 -3 78 0 82 -4 61 -6 76 +2 78 -3 86 0
erste Spalte: EB72 Herbst 2009zweite Spalte: % eränderungen im Vergleich zu EB66 Herbst 2006
EB72.2
EB66.2
EB72.2
EB66.2
EB72.2
EB66.2
EB72.2
EB66.2
EB72.2
EB66.2
EB72.2
EB66.2
Sehr gut informiert 2 0 4 0 2 -1 5 +1 5 +1 3 -1Ziemlich gut informiert 15 0 36 +3 25 -3 40 +2 44 +4 26 +4Nicht sehr gut informiert 39 -1 47 -1 50 +2 47 -2 46 -3 49 -6Überhaupt nicht informiert 40 +3 13 -2 22 +2 8 0 5 -2 20 +1WN 4 -2 0 0 1 0 0 -1 0 0 2 +2Informiert 17 0 40 +3 27 -4 45 +3 49 +5 29 +3Nicht informiert 79 +2 60 -3 72 +4 55 -2 51 -5 69 -5
QA5 Dans quelle mesure pensez-vous être informé(e) sur la sécurité des centrales nucléaires ? QA5 How informed do you think you are about the safety of nuclear power plants? QA5 Wie gut sind Sie Ihrer Einschätzung nach über die Sicherheit von Kernkraftwerken informiert?
D-E EEBE BG CZ DK
LT LU HU
D-W DE
PT
RO SE
IE EL ES
FR IT CY LV MT NL AT PL
UKSI SK FI
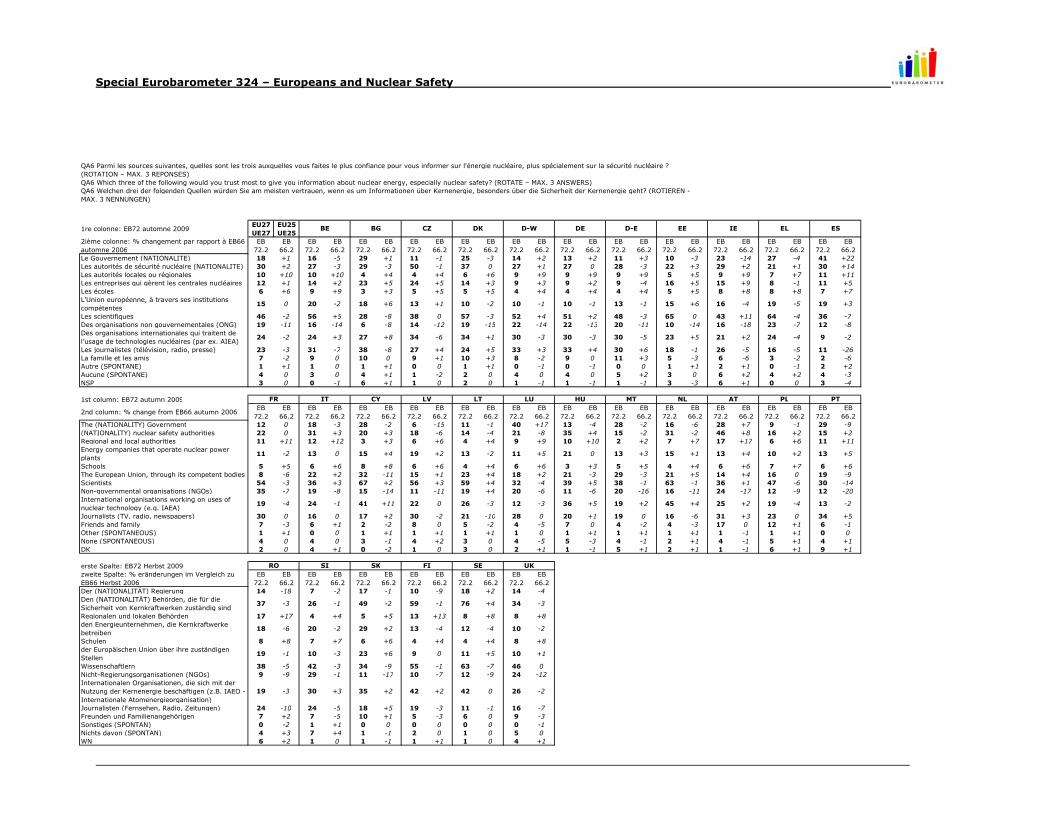
Special Eurobarometer 324 – Europeans and Nuclear Safety
1re colonne: EB72 automne 2009EU27 UE27
EU25 UE25
2ième colonne: % changement par rapport à EB66 automne 2006
EB72.2
EB66.2
EB72.2
EB66.2
EB72.2
EB66.2
EB72.2
EB66.2
EB72.2
EB66.2
EB72.2
EB66.2
EB72.2
EB66.2
EB72.2
EB66.2
EB72.2
EB66.2
EB72.2
EB66.2
EB72.2
EB66.2
EB72.2
EB66.2
Le Gouvernement (NATIONALITE) 18 +1 16 -5 29 +1 11 -1 25 -3 14 +2 13 +2 11 +3 10 -3 23 -14 27 -4 41 +22Les autorités de sécurité nucléaire (NATIONALITE) 30 +2 27 -3 29 -3 50 -1 37 0 27 +1 27 0 28 -3 22 +3 29 +2 21 +1 30 +14Les autorités locales ou régionales 10 +10 10 +10 4 +4 4 +4 6 +6 9 +9 9 +9 9 +9 5 +5 9 +9 7 +7 11 +11Les entreprises qui gèrent les centrales nucléaires 12 +1 14 +2 23 +5 24 +5 14 +3 9 +3 9 +2 9 -4 16 +5 15 +9 8 -1 11 +5Les écoles 6 +6 9 +9 3 +3 5 +5 5 +5 4 +4 4 +4 4 +4 5 +5 8 +8 8 +8 7 +7L’Union européenne, à travers ses institutions compétentes
15 0 20 -2 18 +6 13 +1 10 -2 10 -1 10 -1 13 -1 15 +6 16 -4 19 -5 19 +3
Les scientifiques 46 -2 56 +5 28 -8 38 0 57 -3 52 +4 51 +2 48 -3 65 0 43 +11 64 -4 36 -7Des organisations non gouvernementales (ONG) 19 -11 16 -14 6 -8 14 -12 19 -15 22 -14 22 -13 20 -11 10 -14 16 -18 23 -7 12 -8Des organisations internationales qui traitent de l’usage de technologies nucléaires (par ex. AIEA)
24 -2 24 +3 27 +8 34 -6 34 +1 30 -3 30 -3 30 -5 23 +5 21 +2 24 -4 9 -2
Les journalistes (télévision, radio, presse) 23 -3 31 -7 38 -8 27 +4 24 +5 33 +3 33 +4 30 +6 18 -1 26 -5 16 -5 11 -26La famille et les amis 7 -2 9 0 10 0 9 +1 10 +3 8 -2 9 0 11 +3 5 -3 6 -6 3 -2 2 -6Autre (SPONTANE) 1 +1 1 0 1 +1 0 0 1 +1 0 -1 0 -1 0 0 1 +1 2 +1 0 -1 2 +2Aucune (SPONTANE) 4 0 3 0 4 +1 1 -2 2 0 4 0 4 0 5 +2 3 0 6 +2 4 +2 4 -3NSP 3 0 0 -1 6 +1 1 0 2 0 1 -1 1 -1 1 -1 3 -3 6 +1 0 0 3 -4
1st column: EB72 autumn 2009
2nd column: % change from EB66 autumn 2006EB
72.2EB
66.2EB
72.2EB
66.2EB
72.2EB
66.2EB
72.2EB
66.2EB
72.2EB
66.2EB
72.2EB
66.2EB
72.2EB
66.2EB
72.2EB
66.2EB
72.2EB
66.2EB
72.2EB
66.2EB
72.2EB
66.2EB
72.2EB
66.2The (NATIONALITY) Government 12 0 18 -3 28 -2 6 -15 11 -1 40 +17 13 -4 28 -2 16 -6 28 +7 9 -1 29 -9(NATIONALITY) nuclear safety authorities 22 0 31 +3 20 +3 18 -6 14 -4 21 -8 35 +4 15 -2 31 -2 46 +8 16 +2 15 +2Regional and local authorities 11 +11 12 +12 3 +3 6 +6 4 +4 9 +9 10 +10 2 +2 7 +7 17 +17 6 +6 11 +11Energy companies that operate nuclear power plants
11 -2 13 0 15 +4 19 +2 13 -2 11 +5 21 0 13 +3 15 +1 13 +4 10 +2 13 +5
Schools 5 +5 6 +6 8 +8 6 +6 4 +4 6 +6 3 +3 5 +5 4 +4 6 +6 7 +7 6 +6The European Union, through its competent bodies 8 -6 22 +2 32 -11 15 +1 23 +4 18 +2 21 -3 29 -3 21 +5 14 +4 16 0 19 -9Scientists 54 -3 36 +3 67 +2 56 +3 59 +4 32 -4 39 +5 38 -1 63 -1 36 +1 47 -6 30 -14Non-governmental organisations (NGOs) 35 -7 19 -8 15 -14 11 -11 19 +4 20 -6 11 -6 20 -16 16 -11 24 -17 12 -9 12 -20International organisations working on uses of nuclear technology (e.g. IAEA)
19 -4 24 -1 41 +11 22 0 26 -3 12 -3 36 +5 19 +2 45 +4 25 +2 19 -4 13 -2
Journalists (TV, radio, newspapers) 30 0 16 0 17 +2 30 -2 21 -10 28 0 20 +1 19 0 16 -6 31 +3 23 0 34 +5Friends and family 7 -3 6 +1 2 -2 8 0 5 -2 4 -5 7 0 4 -2 4 -3 17 0 12 +1 6 -1Other (SPONTANEOUS) 1 +1 0 0 1 +1 1 +1 1 +1 1 0 1 +1 1 +1 1 +1 1 -1 1 +1 0 0None (SPONTANEOUS) 4 0 4 0 3 -1 4 +2 3 0 4 -5 5 -3 4 -1 2 +1 4 -1 5 +1 4 +1DK 2 0 4 +1 0 -2 1 0 3 0 2 +1 1 -1 5 +1 2 +1 1 -1 6 +1 9 +1
erste Spalte: EB72 Herbst 2009zweite Spalte: % eränderungen im Vergleich zu EB66 Herbst 2006
EB72.2
EB66.2
EB72.2
EB66.2
EB72.2
EB66.2
EB72.2
EB66.2
EB72.2
EB66.2
EB72.2
EB66.2
Der (NATIONALITÄT) Regierung 14 -18 7 -2 17 -1 10 -9 18 +2 14 -4Den (NATIONALITÄT) Behörden, die für die Sicherheit von Kernkraftwerken zuständig sind
37 -3 26 -1 49 -2 59 -1 76 +4 34 -3
Regionalen und lokalen Behörden 17 +17 4 +4 5 +5 13 +13 8 +8 8 +8den Energieunternehmen, die Kernkraftwerke betreiben
18 -6 20 -2 29 +2 13 -4 12 -4 10 -2
Schulen 8 +8 7 +7 6 +6 4 +4 4 +4 8 +8der Europäischen Union über ihre zuständigen Stellen
19 -1 10 -3 23 +6 9 0 11 +5 10 +1
Wissenschaftlern 38 -5 42 -3 34 -9 55 -1 63 -7 46 0Nicht-Regierungsorganisationen (NGOs) 9 -9 29 -1 11 -17 10 -7 12 -9 24 -12Internationalen Organisationen, die sich mit der Nutzung der Kernenergie beschäftigen (z.B. IAEO - Internationale Atomenergieorganisation)
19 -3 30 +3 35 +2 42 +2 42 0 26 -2
Journalisten (Fernsehen, Radio, Zeitungen) 24 -10 24 -5 18 +5 19 -3 11 -1 16 -7Freunden und Familienangehörigen 7 +2 7 -5 10 +1 5 -3 6 0 9 -3Sonstiges (SPONTAN) 0 -2 1 +1 0 0 0 0 0 0 0 -1Nichts davon (SPONTAN) 4 +3 7 +4 1 -1 2 0 1 0 5 0WN 6 +2 1 0 1 -1 1 +1 1 0 4 +1
BE BG CZ DK D-W DE
QA6 Parmi les sources suivantes, quelles sont les trois auxquelles vous faites le plus confiance pour vous informer sur l'énergie nucléaire, plus spécialement sur la sécurité nucléaire ? (ROTATION – MAX. 3 REPONSES)QA6 Which three of the following would you trust most to give you information about nuclear energy, especially nuclear safety? (ROTATE – MAX. 3 ANSWERS)QA6 Welchen drei der folgenden Quellen würden Sie am meisten vertrauen, wenn es um Informationen über Kernenergie, besonders über die Sicherheit der Kernenergie geht? (ROTIEREN - MAX. 3 NENNUNGEN)
ES
FR IT CY
D-E EE IE EL
PTLU
RO SE
LV LT PL
UKSI SK FI
HU MT NL AT
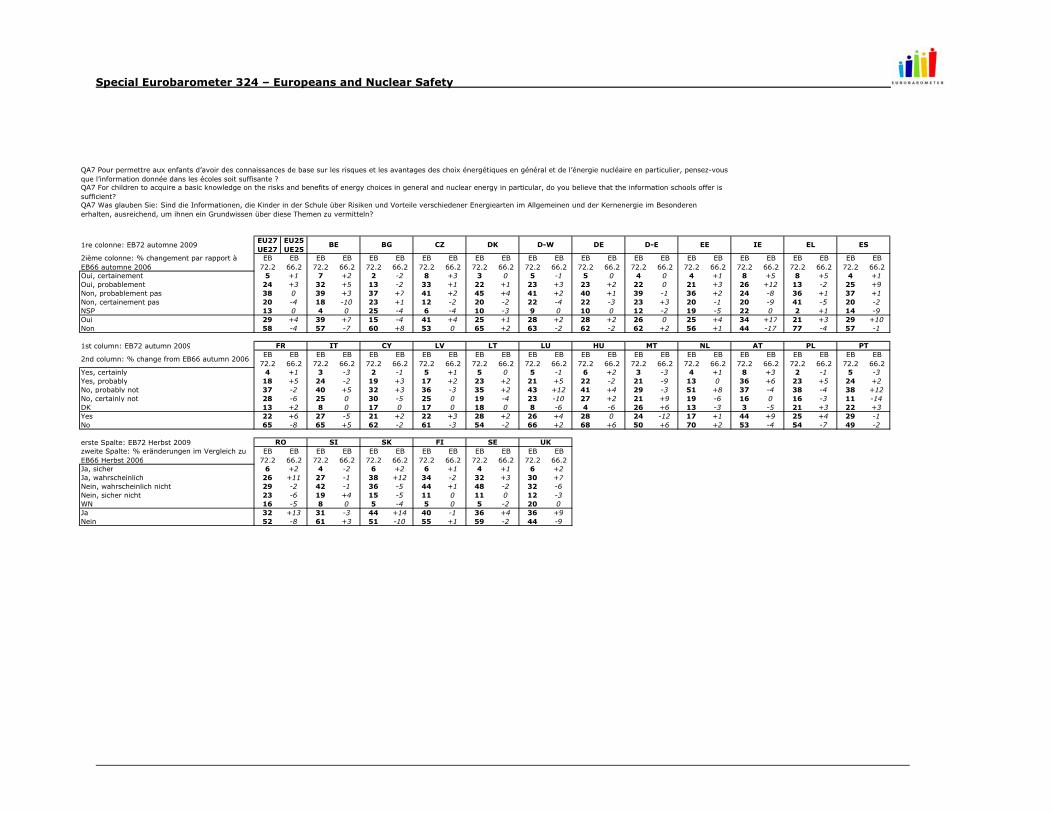
Special Eurobarometer 324 – Europeans and Nuclear Safety
1re colonne: EB72 automne 2009EU27 UE27
EU25 UE25
2ième colonne: % changement par rapport à EB66 automne 2006
EB72.2
EB66.2
EB72.2
EB66.2
EB72.2
EB66.2
EB72.2
EB66.2
EB72.2
EB66.2
EB72.2
EB66.2
EB72.2
EB66.2
EB72.2
EB66.2
EB72.2
EB66.2
EB72.2
EB66.2
EB72.2
EB66.2
EB72.2
EB66.2
Oui, certainement 5 +1 7 +2 2 -2 8 +3 3 0 5 -1 5 0 4 0 4 +1 8 +5 8 +5 4 +1Oui, probablement 24 +3 32 +5 13 -2 33 +1 22 +1 23 +3 23 +2 22 0 21 +3 26 +12 13 -2 25 +9Non, probablement pas 38 0 39 +3 37 +7 41 +2 45 +4 41 +2 40 +1 39 -1 36 +2 24 -8 36 +1 37 +1Non, certainement pas 20 -4 18 -10 23 +1 12 -2 20 -2 22 -4 22 -3 23 +3 20 -1 20 -9 41 -5 20 -2NSP 13 0 4 0 25 -4 6 -4 10 -3 9 0 10 0 12 -2 19 -5 22 0 2 +1 14 -9Oui 29 +4 39 +7 15 -4 41 +4 25 +1 28 +2 28 +2 26 0 25 +4 34 +17 21 +3 29 +10Non 58 -4 57 -7 60 +8 53 0 65 +2 63 -2 62 -2 62 +2 56 +1 44 -17 77 -4 57 -1
1st column: EB72 autumn 2009
2nd column: % change from EB66 autumn 2006EB
72.2EB
66.2EB
72.2EB
66.2EB
72.2EB
66.2EB
72.2EB
66.2EB
72.2EB
66.2EB
72.2EB
66.2EB
72.2EB
66.2EB
72.2EB
66.2EB
72.2EB
66.2EB
72.2EB
66.2EB
72.2EB
66.2EB
72.2EB
66.2Yes, certainly 4 +1 3 -3 2 -1 5 +1 5 0 5 -1 6 +2 3 -3 4 +1 8 +3 2 -1 5 -3Yes, probably 18 +5 24 -2 19 +3 17 +2 23 +2 21 +5 22 -2 21 -9 13 0 36 +6 23 +5 24 +2No, probably not 37 -2 40 +5 32 +3 36 -3 35 +2 43 +12 41 +4 29 -3 51 +8 37 -4 38 -4 38 +12No, certainly not 28 -6 25 0 30 -5 25 0 19 -4 23 -10 27 +2 21 +9 19 -6 16 0 16 -3 11 -14DK 13 +2 8 0 17 0 17 0 18 0 8 -6 4 -6 26 +6 13 -3 3 -5 21 +3 22 +3Yes 22 +6 27 -5 21 +2 22 +3 28 +2 26 +4 28 0 24 -12 17 +1 44 +9 25 +4 29 -1No 65 -8 65 +5 62 -2 61 -3 54 -2 66 +2 68 +6 50 +6 70 +2 53 -4 54 -7 49 -2
erste Spalte: EB72 Herbst 2009zweite Spalte: % eränderungen im Vergleich zu EB66 Herbst 2006
EB72.2
EB66.2
EB72.2
EB66.2
EB72.2
EB66.2
EB72.2
EB66.2
EB72.2
EB66.2
EB72.2
EB66.2
Ja, sicher 6 +2 4 -2 6 +2 6 +1 4 +1 6 +2Ja, wahrscheinlich 26 +11 27 -1 38 +12 34 -2 32 +3 30 +7Nein, wahrscheinlich nicht 29 -2 42 -1 36 -5 44 +1 48 -2 32 -6Nein, sicher nicht 23 -6 19 +4 15 -5 11 0 11 0 12 -3WN 16 -5 8 0 5 -4 5 0 5 -2 20 0Ja 32 +13 31 -3 44 +14 40 -1 36 +4 36 +9Nein 52 -8 61 +3 51 -10 55 +1 59 -2 44 -9
QA7 Pour permettre aux enfants d’avoir des connaissances de base sur les risques et les avantages des choix énergétiques en général et de l’énergie nucléaire en particulier, pensez-vous que l’information donnée dans les écoles soit suffisante ? QA7 For children to acquire a basic knowledge on the risks and benefits of energy choices in general and nuclear energy in particular, do you believe that the information schools offer is sufficient? QA7 Was glauben Sie: Sind die Informationen, die Kinder in der Schule über Risiken und Vorteile verschiedener Energiearten im Allgemeinen und der Kernenergie im Besonderen erhalten, ausreichend, um ihnen ein Grundwissen über diese Themen zu vermitteln?
D-E EEBE BG CZ DK
LT LU HU
D-W DE
PT
RO SE
IE EL ES
FR IT CY LV MT NL AT PL
UKSI SK FI
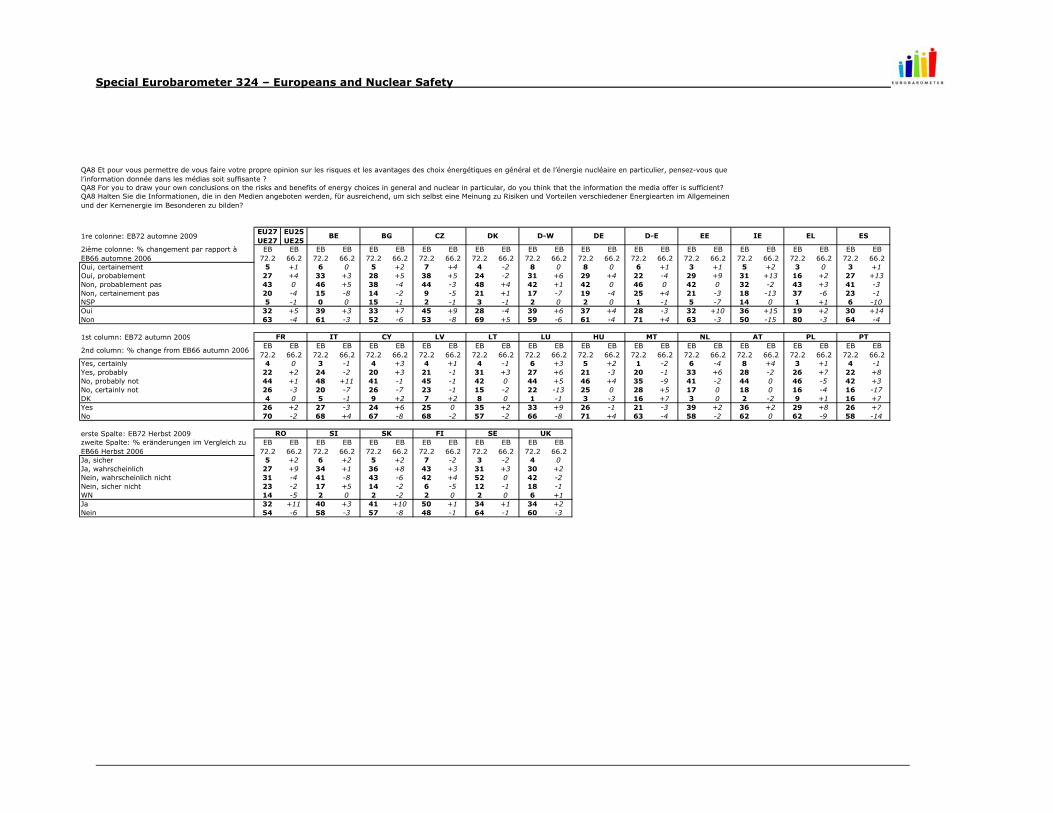
Special Eurobarometer 324 – Europeans and Nuclear Safety
1re colonne: EB72 automne 2009EU27 UE27
EU25 UE25
2ième colonne: % changement par rapport à EB66 automne 2006
EB72.2
EB66.2
EB72.2
EB66.2
EB72.2
EB66.2
EB72.2
EB66.2
EB72.2
EB66.2
EB72.2
EB66.2
EB72.2
EB66.2
EB72.2
EB66.2
EB72.2
EB66.2
EB72.2
EB66.2
EB72.2
EB66.2
EB72.2
EB66.2
Oui, certainement 5 +1 6 0 5 +2 7 +4 4 -2 8 0 8 0 6 +1 3 +1 5 +2 3 0 3 +1Oui, probablement 27 +4 33 +3 28 +5 38 +5 24 -2 31 +6 29 +4 22 -4 29 +9 31 +13 16 +2 27 +13Non, probablement pas 43 0 46 +5 38 -4 44 -3 48 +4 42 +1 42 0 46 0 42 0 32 -2 43 +3 41 -3Non, certainement pas 20 -4 15 -8 14 -2 9 -5 21 +1 17 -7 19 -4 25 +4 21 -3 18 -13 37 -6 23 -1NSP 5 -1 0 0 15 -1 2 -1 3 -1 2 0 2 0 1 -1 5 -7 14 0 1 +1 6 -10Oui 32 +5 39 +3 33 +7 45 +9 28 -4 39 +6 37 +4 28 -3 32 +10 36 +15 19 +2 30 +14Non 63 -4 61 -3 52 -6 53 -8 69 +5 59 -6 61 -4 71 +4 63 -3 50 -15 80 -3 64 -4
1st column: EB72 autumn 2009
2nd column: % change from EB66 autumn 2006EB
72.2EB
66.2EB
72.2EB
66.2EB
72.2EB
66.2EB
72.2EB
66.2EB
72.2EB
66.2EB
72.2EB
66.2EB
72.2EB
66.2EB
72.2EB
66.2EB
72.2EB
66.2EB
72.2EB
66.2EB
72.2EB
66.2EB
72.2EB
66.2Yes, certainly 4 0 3 -1 4 +3 4 +1 4 -1 6 +3 5 +2 1 -2 6 -4 8 +4 3 +1 4 -1Yes, probably 22 +2 24 -2 20 +3 21 -1 31 +3 27 +6 21 -3 20 -1 33 +6 28 -2 26 +7 22 +8No, probably not 44 +1 48 +11 41 -1 45 -1 42 0 44 +5 46 +4 35 -9 41 -2 44 0 46 -5 42 +3No, certainly not 26 -3 20 -7 26 -7 23 -1 15 -2 22 -13 25 0 28 +5 17 0 18 0 16 -4 16 -17DK 4 0 5 -1 9 +2 7 +2 8 0 1 -1 3 -3 16 +7 3 0 2 -2 9 +1 16 +7Yes 26 +2 27 -3 24 +6 25 0 35 +2 33 +9 26 -1 21 -3 39 +2 36 +2 29 +8 26 +7No 70 -2 68 +4 67 -8 68 -2 57 -2 66 -8 71 +4 63 -4 58 -2 62 0 62 -9 58 -14
erste Spalte: EB72 Herbst 2009zweite Spalte: % eränderungen im Vergleich zu EB66 Herbst 2006
EB72.2
EB66.2
EB72.2
EB66.2
EB72.2
EB66.2
EB72.2
EB66.2
EB72.2
EB66.2
EB72.2
EB66.2
Ja, sicher 5 +2 6 +2 5 +2 7 -2 3 -2 4 0Ja, wahrscheinlich 27 +9 34 +1 36 +8 43 +3 31 +3 30 +2Nein, wahrscheinlich nicht 31 -4 41 -8 43 -6 42 +4 52 0 42 -2Nein, sicher nicht 23 -2 17 +5 14 -2 6 -5 12 -1 18 -1WN 14 -5 2 0 2 -2 2 0 2 0 6 +1Ja 32 +11 40 +3 41 +10 50 +1 34 +1 34 +2Nein 54 -6 58 -3 57 -8 48 -1 64 -1 60 -3
QA8 Et pour vous permettre de vous faire votre propre opinion sur les risques et les avantages des choix énergétiques en général et de l’énergie nucléaire en particulier, pensez-vous que l’information donnée dans les médias soit suffisante ? QA8 For you to draw your own conclusions on the risks and benefits of energy choices in general and nuclear in particular, do you think that the information the media offer is sufficient? QA8 Halten Sie die Informationen, die in den Medien angeboten werden, für ausreichend, um sich selbst eine Meinung zu Risiken und Vorteilen verschiedener Energiearten im Allgemeinen und der Kernenergie im Besonderen zu bilden?
D-E EEBE BG CZ DK
LT LU HU
D-W DE
PT
RO SE
IE EL ES
FR IT CY LV MT NL AT PL
UKSI SK FI
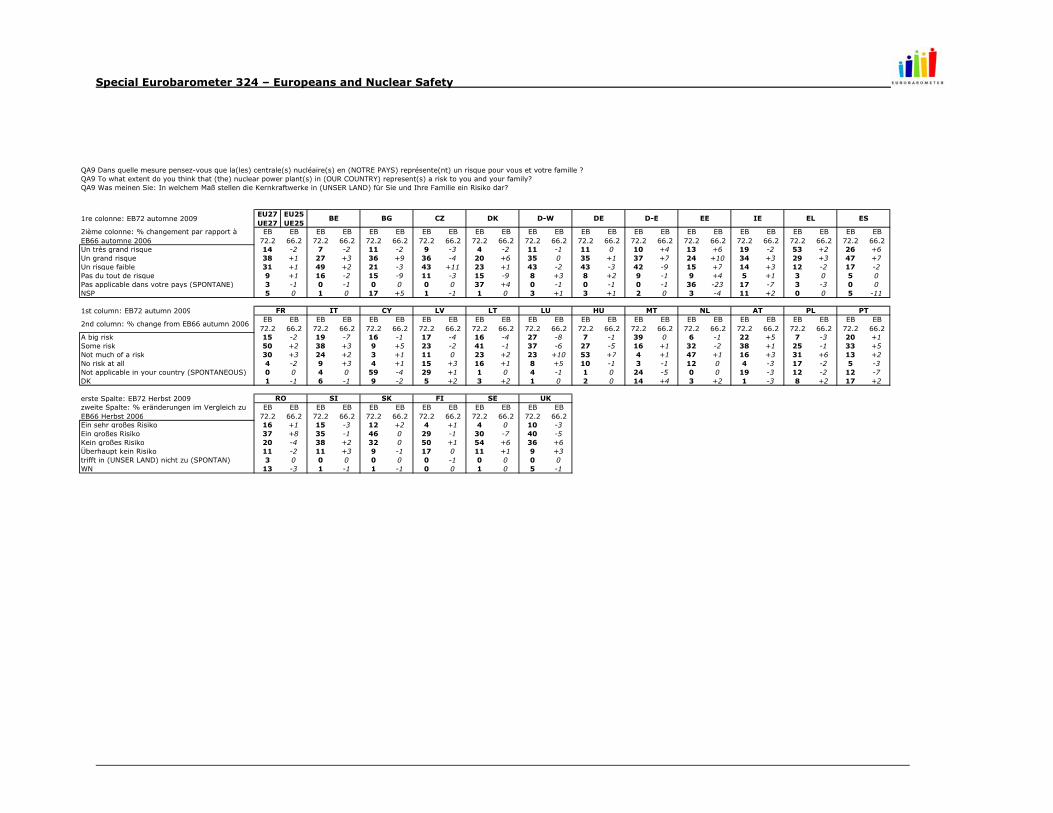
Special Eurobarometer 324 – Europeans and Nuclear Safety
1re colonne: EB72 automne 2009EU27 UE27
EU25 UE25
2ième colonne: % changement par rapport à EB66 automne 2006
EB72.2
EB66.2
EB72.2
EB66.2
EB72.2
EB66.2
EB72.2
EB66.2
EB72.2
EB66.2
EB72.2
EB66.2
EB72.2
EB66.2
EB72.2
EB66.2
EB72.2
EB66.2
EB72.2
EB66.2
EB72.2
EB66.2
EB72.2
EB66.2
Un très grand risque 14 -2 7 -2 11 -2 9 -3 4 -2 11 -1 11 0 10 +4 13 +6 19 -2 53 +2 26 +6Un grand risque 38 +1 27 +3 36 +9 36 -4 20 +6 35 0 35 +1 37 +7 24 +10 34 +3 29 +3 47 +7Un risque faible 31 +1 49 +2 21 -3 43 +11 23 +1 43 -2 43 -3 42 -9 15 +7 14 +3 12 -2 17 -2Pas du tout de risque 9 +1 16 -2 15 -9 11 -3 15 -9 8 +3 8 +2 9 -1 9 +4 5 +1 3 0 5 0Pas applicable dans votre pays (SPONTANE) 3 -1 0 -1 0 0 0 0 37 +4 0 -1 0 -1 0 -1 36 -23 17 -7 3 -3 0 0NSP 5 0 1 0 17 +5 1 -1 1 0 3 +1 3 +1 2 0 3 -4 11 +2 0 0 5 -11
1st column: EB72 autumn 2009
2nd column: % change from EB66 autumn 2006EB
72.2EB
66.2EB
72.2EB
66.2EB
72.2EB
66.2EB
72.2EB
66.2EB
72.2EB
66.2EB
72.2EB
66.2EB
72.2EB
66.2EB
72.2EB
66.2EB
72.2EB
66.2EB
72.2EB
66.2EB
72.2EB
66.2EB
72.2EB
66.2A big risk 15 -2 19 -7 16 -1 17 -4 16 -4 27 -8 7 -1 39 0 6 -1 22 +5 7 -3 20 +1Some risk 50 +2 38 +3 9 +5 23 -2 41 -1 37 -6 27 -5 16 +1 32 -2 38 +1 25 -1 33 +5Not much of a risk 30 +3 24 +2 3 +1 11 0 23 +2 23 +10 53 +7 4 +1 47 +1 16 +3 31 +6 13 +2No risk at all 4 -2 9 +3 4 +1 15 +3 16 +1 8 +5 10 -1 3 -1 12 0 4 -3 17 -2 5 -3Not applicable in your country (SPONTANEOUS) 0 0 4 0 59 -4 29 +1 1 0 4 -1 1 0 24 -5 0 0 19 -3 12 -2 12 -7DK 1 -1 6 -1 9 -2 5 +2 3 +2 1 0 2 0 14 +4 3 +2 1 -3 8 +2 17 +2
erste Spalte: EB72 Herbst 2009zweite Spalte: % eränderungen im Vergleich zu EB66 Herbst 2006
EB72.2
EB66.2
EB72.2
EB66.2
EB72.2
EB66.2
EB72.2
EB66.2
EB72.2
EB66.2
EB72.2
EB66.2
Ein sehr großes Risiko 16 +1 15 -3 12 +2 4 +1 4 0 10 -3Ein großes Risiko 37 +8 35 -1 46 0 29 -1 30 -7 40 -5Kein großes Risiko 20 -4 38 +2 32 0 50 +1 54 +6 36 +6Überhaupt kein Risiko 11 -2 11 +3 9 -1 17 0 11 +1 9 +3trifft in (UNSER LAND) nicht zu (SPONTAN) 3 0 0 0 0 0 0 -1 0 0 0 0WN 13 -3 1 -1 1 -1 0 0 1 0 5 -1
QA9 Dans quelle mesure pensez-vous que la(les) centrale(s) nucléaire(s) en (NOTRE PAYS) représente(nt) un risque pour vous et votre famille ? QA9 To what extent do you think that (the) nuclear power plant(s) in (OUR COUNTRY) represent(s) a risk to you and your family? QA9 Was meinen Sie: In welchem Maß stellen die Kernkraftwerke in (UNSER LAND) für Sie und Ihre Familie ein Risiko dar?
D-E EEBE BG CZ DK
LT LU HU
D-W DE
PT
RO SE
IE EL ES
FR IT CY LV MT NL AT PL
UKSI SK FI
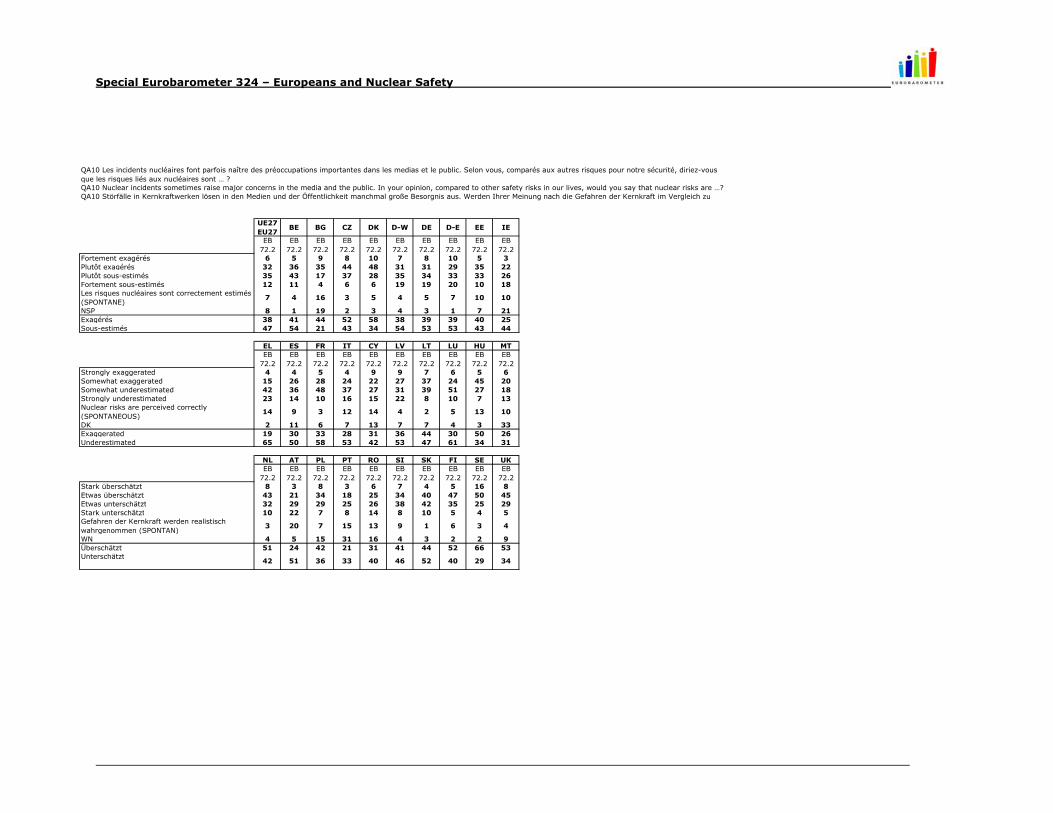
Special Eurobarometer 324 – Europeans and Nuclear Safety
UE27EU27
BE BG CZ DK D-W DE D-E EE IE
EB72.2
EB72.2
EB72.2
EB72.2
EB72.2
EB72.2
EB72.2
EB72.2
EB72.2
EB72.2
Fortement exagérés 6 5 9 8 10 7 8 10 5 3Plutôt exagérés 32 36 35 44 48 31 31 29 35 22Plutôt sous-estimés 35 43 17 37 28 35 34 33 33 26Fortement sous-estimés 12 11 4 6 6 19 19 20 10 18Les risques nucléaires sont correctement estimés (SPONTANE)
7 4 16 3 5 4 5 7 10 10
NSP 8 1 19 2 3 4 3 1 7 21Exagérés 38 41 44 52 58 38 39 39 40 25Sous-estimés 47 54 21 43 34 54 53 53 43 44
EL ES FR IT CY LV LT LU HU MTEB
72.2EB
72.2EB
72.2EB
72.2EB
72.2EB
72.2EB
72.2EB
72.2EB
72.2EB
72.2Strongly exaggerated 4 4 5 4 9 9 7 6 5 6Somewhat exaggerated 15 26 28 24 22 27 37 24 45 20Somewhat underestimated 42 36 48 37 27 31 39 51 27 18Strongly underestimated 23 14 10 16 15 22 8 10 7 13Nuclear risks are perceived correctly (SPONTANEOUS)
14 9 3 12 14 4 2 5 13 10
DK 2 11 6 7 13 7 7 4 3 33Exaggerated 19 30 33 28 31 36 44 30 50 26Underestimated 65 50 58 53 42 53 47 61 34 31
NL AT PL PT RO SI SK FI SE UKEB
72.2EB
72.2EB
72.2EB
72.2EB
72.2EB
72.2EB
72.2EB
72.2EB
72.2EB
72.2Stark überschätzt 8 3 8 3 6 7 4 5 16 8Etwas überschätzt 43 21 34 18 25 34 40 47 50 45Etwas unterschätzt 32 29 29 25 26 38 42 35 25 29Stark unterschätzt 10 22 7 8 14 8 10 5 4 5Gefahren der Kernkraft werden realistisch wahrgenommen (SPONTAN)
3 20 7 15 13 9 1 6 3 4
WN 4 5 15 31 16 4 3 2 2 9Überschätzt 51 24 42 21 31 41 44 52 66 53Unterschätzt
42 51 36 33 40 46 52 40 29 34
QA10 Les incidents nucléaires font parfois naître des préoccupations importantes dans les medias et le public. Selon vous, comparés aux autres risques pour notre sécurité, diriez-vous que les risques liés aux nucléaires sont … ? QA10 Nuclear incidents sometimes raise major concerns in the media and the public. In your opinion, compared to other safety risks in our lives, would you say that nuclear risks are …? QA10 Störfälle in Kernkraftwerken lösen in den Medien und der Öffentlichkeit manchmal große Besorgnis aus. Werden Ihrer Meinung nach die Gefahren der Kernkraft im Vergleich zu
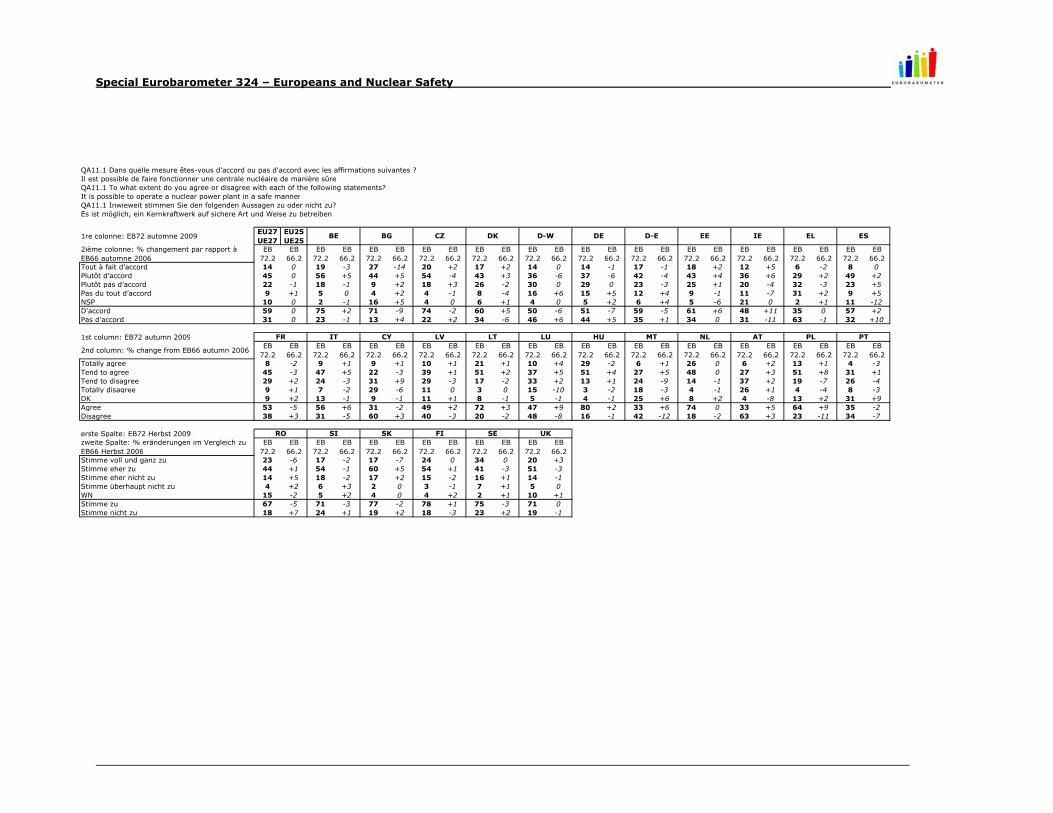
Special Eurobarometer 324 – Europeans and Nuclear Safety
1re colonne: EB72 automne 2009EU27 UE27
EU25 UE25
2ième colonne: % changement par rapport à EB66 automne 2006
EB72.2
EB66.2
EB72.2
EB66.2
EB72.2
EB66.2
EB72.2
EB66.2
EB72.2
EB66.2
EB72.2
EB66.2
EB72.2
EB66.2
EB72.2
EB66.2
EB72.2
EB66.2
EB72.2
EB66.2
EB72.2
EB66.2
EB72.2
EB66.2
Tout à fait d’accord 14 0 19 -3 27 -14 20 +2 17 +2 14 0 14 -1 17 -1 18 +2 12 +5 6 -2 8 0Plutôt d’accord 45 0 56 +5 44 +5 54 -4 43 +3 36 -6 37 -6 42 -4 43 +4 36 +6 29 +2 49 +2Plutôt pas d’accord 22 -1 18 -1 9 +2 18 +3 26 -2 30 0 29 0 23 -3 25 +1 20 -4 32 -3 23 +5Pas du tout d’accord 9 +1 5 0 4 +2 4 -1 8 -4 16 +6 15 +5 12 +4 9 -1 11 -7 31 +2 9 +5NSP 10 0 2 -1 16 +5 4 0 6 +1 4 0 5 +2 6 +4 5 -6 21 0 2 +1 11 -12D'accord 59 0 75 +2 71 -9 74 -2 60 +5 50 -6 51 -7 59 -5 61 +6 48 +11 35 0 57 +2Pas d'accord 31 0 23 -1 13 +4 22 +2 34 -6 46 +6 44 +5 35 +1 34 0 31 -11 63 -1 32 +10
1st column: EB72 autumn 2009
2nd column: % change from EB66 autumn 2006EB
72.2EB
66.2EB
72.2EB
66.2EB
72.2EB
66.2EB
72.2EB
66.2EB
72.2EB
66.2EB
72.2EB
66.2EB
72.2EB
66.2EB
72.2EB
66.2EB
72.2EB
66.2EB
72.2EB
66.2EB
72.2EB
66.2EB
72.2EB
66.2Totally agree 8 -2 9 +1 9 +1 10 +1 21 +1 10 +4 29 -2 6 +1 26 0 6 +2 13 +1 4 -3Tend to agree 45 -3 47 +5 22 -3 39 +1 51 +2 37 +5 51 +4 27 +5 48 0 27 +3 51 +8 31 +1Tend to disagree 29 +2 24 -3 31 +9 29 -3 17 -2 33 +2 13 +1 24 -9 14 -1 37 +2 19 -7 26 -4Totally disagree 9 +1 7 -2 29 -6 11 0 3 0 15 -10 3 -2 18 -3 4 -1 26 +1 4 -4 8 -3DK 9 +2 13 -1 9 -1 11 +1 8 -1 5 -1 4 -1 25 +6 8 +2 4 -8 13 +2 31 +9Agree 53 -5 56 +6 31 -2 49 +2 72 +3 47 +9 80 +2 33 +6 74 0 33 +5 64 +9 35 -2Disagree 38 +3 31 -5 60 +3 40 -3 20 -2 48 -8 16 -1 42 -12 18 -2 63 +3 23 -11 34 -7
erste Spalte: EB72 Herbst 2009zweite Spalte: % eränderungen im Vergleich zu EB66 Herbst 2006
EB72.2
EB66.2
EB72.2
EB66.2
EB72.2
EB66.2
EB72.2
EB66.2
EB72.2
EB66.2
EB72.2
EB66.2
Stimme voll und ganz zu 23 -6 17 -2 17 -7 24 0 34 0 20 +3Stimme eher zu 44 +1 54 -1 60 +5 54 +1 41 -3 51 -3Stimme eher nicht zu 14 +5 18 -2 17 +2 15 -2 16 +1 14 -1Stimme überhaupt nicht zu 4 +2 6 +3 2 0 3 -1 7 +1 5 0WN 15 -2 5 +2 4 0 4 +2 2 +1 10 +1Stimme zu 67 -5 71 -3 77 -2 78 +1 75 -3 71 0Stimme nicht zu 18 +7 24 +1 19 +2 18 -3 23 +2 19 -1
It is possible to operate a nuclear power plant in a safe manner
QA11.1 Dans quelle mesure êtes-vous d’accord ou pas d'accord avec les affirmations suivantes ? Il est possible de faire fonctionner une centrale nucléaire de manière sûreQA11.1 To what extent do you agree or disagree with each of the following statements?
QA11.1 Inwieweit stimmen Sie den folgenden Aussagen zu oder nicht zu? Es ist möglich, ein Kernkraftwerk auf sichere Art und Weise zu betreiben
D-E EEBE BG CZ DK
LT LU HU
D-W DE
PT
RO SE
IE EL ES
FR IT CY LV MT NL AT PL
UKSI SK FI
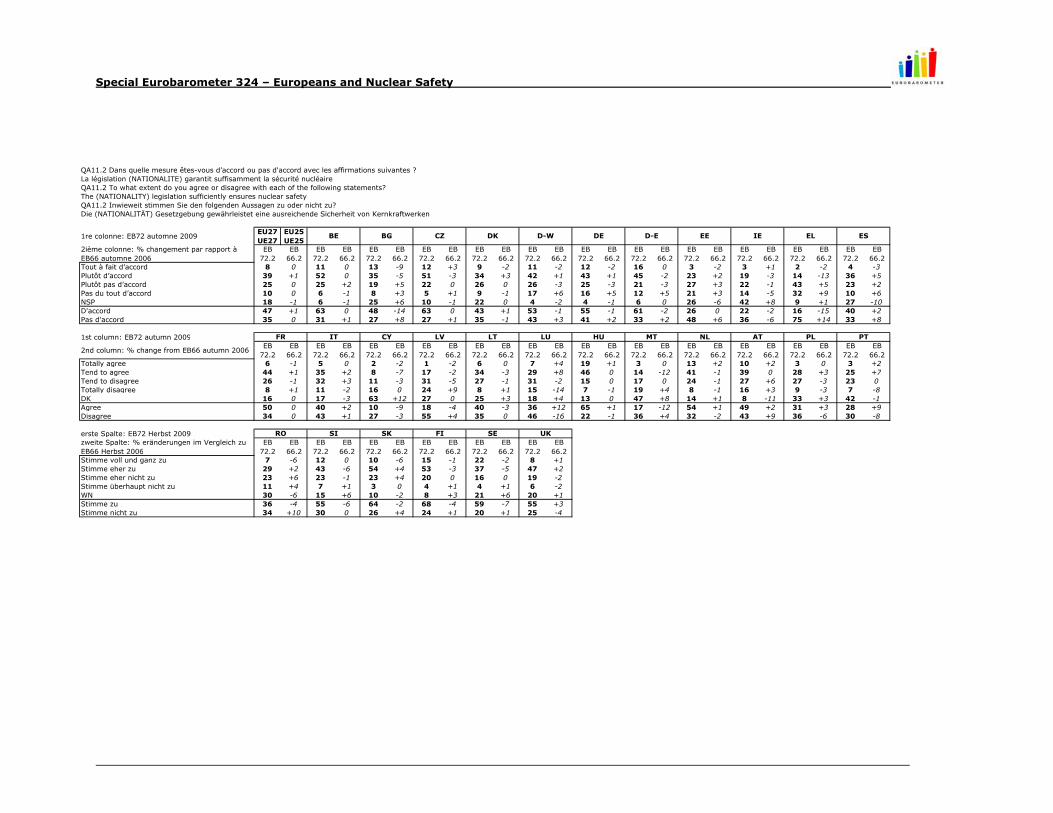
Special Eurobarometer 324 – Europeans and Nuclear Safety
1re colonne: EB72 automne 2009EU27 UE27
EU25 UE25
2ième colonne: % changement par rapport à EB66 automne 2006
EB72.2
EB66.2
EB72.2
EB66.2
EB72.2
EB66.2
EB72.2
EB66.2
EB72.2
EB66.2
EB72.2
EB66.2
EB72.2
EB66.2
EB72.2
EB66.2
EB72.2
EB66.2
EB72.2
EB66.2
EB72.2
EB66.2
EB72.2
EB66.2
Tout à fait d’accord 8 0 11 0 13 -9 12 +3 9 -2 11 -2 12 -2 16 0 3 -2 3 +1 2 -2 4 -3Plutôt d’accord 39 +1 52 0 35 -5 51 -3 34 +3 42 +1 43 +1 45 -2 23 +2 19 -3 14 -13 36 +5Plutôt pas d’accord 25 0 25 +2 19 +5 22 0 26 0 26 -3 25 -3 21 -3 27 +3 22 -1 43 +5 23 +2Pas du tout d’accord 10 0 6 -1 8 +3 5 +1 9 -1 17 +6 16 +5 12 +5 21 +3 14 -5 32 +9 10 +6NSP 18 -1 6 -1 25 +6 10 -1 22 0 4 -2 4 -1 6 0 26 -6 42 +8 9 +1 27 -10D'accord 47 +1 63 0 48 -14 63 0 43 +1 53 -1 55 -1 61 -2 26 0 22 -2 16 -15 40 +2Pas d'accord 35 0 31 +1 27 +8 27 +1 35 -1 43 +3 41 +2 33 +2 48 +6 36 -6 75 +14 33 +8
1st column: EB72 autumn 2009
2nd column: % change from EB66 autumn 2006EB
72.2EB
66.2EB
72.2EB
66.2EB
72.2EB
66.2EB
72.2EB
66.2EB
72.2EB
66.2EB
72.2EB
66.2EB
72.2EB
66.2EB
72.2EB
66.2EB
72.2EB
66.2EB
72.2EB
66.2EB
72.2EB
66.2EB
72.2EB
66.2Totally agree 6 -1 5 0 2 -2 1 -2 6 0 7 +4 19 +1 3 0 13 +2 10 +2 3 0 3 +2Tend to agree 44 +1 35 +2 8 -7 17 -2 34 -3 29 +8 46 0 14 -12 41 -1 39 0 28 +3 25 +7Tend to disagree 26 -1 32 +3 11 -3 31 -5 27 -1 31 -2 15 0 17 0 24 -1 27 +6 27 -3 23 0Totally disagree 8 +1 11 -2 16 0 24 +9 8 +1 15 -14 7 -1 19 +4 8 -1 16 +3 9 -3 7 -8DK 16 0 17 -3 63 +12 27 0 25 +3 18 +4 13 0 47 +8 14 +1 8 -11 33 +3 42 -1Agree 50 0 40 +2 10 -9 18 -4 40 -3 36 +12 65 +1 17 -12 54 +1 49 +2 31 +3 28 +9Disagree 34 0 43 +1 27 -3 55 +4 35 0 46 -16 22 -1 36 +4 32 -2 43 +9 36 -6 30 -8
erste Spalte: EB72 Herbst 2009zweite Spalte: % eränderungen im Vergleich zu EB66 Herbst 2006
EB72.2
EB66.2
EB72.2
EB66.2
EB72.2
EB66.2
EB72.2
EB66.2
EB72.2
EB66.2
EB72.2
EB66.2
Stimme voll und ganz zu 7 -6 12 0 10 -6 15 -1 22 -2 8 +1Stimme eher zu 29 +2 43 -6 54 +4 53 -3 37 -5 47 +2Stimme eher nicht zu 23 +6 23 -1 23 +4 20 0 16 0 19 -2Stimme überhaupt nicht zu 11 +4 7 +1 3 0 4 +1 4 +1 6 -2WN 30 -6 15 +6 10 -2 8 +3 21 +6 20 +1Stimme zu 36 -4 55 -6 64 -2 68 -4 59 -7 55 +3Stimme nicht zu 34 +10 30 0 26 +4 24 +1 20 +1 25 -4
The (NATIONALITY) legislation sufficiently ensures nuclear safety
QA11.2 Dans quelle mesure êtes-vous d’accord ou pas d'accord avec les affirmations suivantes ? La législation (NATIONALITE) garantit suffisamment la sécurité nucléaireQA11.2 To what extent do you agree or disagree with each of the following statements?
QA11.2 Inwieweit stimmen Sie den folgenden Aussagen zu oder nicht zu? Die (NATIONALITÄT) Gesetzgebung gewährleistet eine ausreichende Sicherheit von Kernkraftwerken
D-E EEBE BG CZ DK
LT LU HU
D-W DE
PT
RO SE
IE EL ES
FR IT CY LV MT NL AT PL
UKSI SK FI

Special Eurobarometer 324 – Europeans and Nuclear Safety
1re colonne: EB72 automne 2009EU27 UE27
EU25 UE25
2ième colonne: % changement par rapport à EB66 automne 2006
EB72.2
EB66.2
EB72.2
EB66.2
EB72.2
EB66.2
EB72.2
EB66.2
EB72.2
EB66.2
EB72.2
EB66.2
EB72.2
EB66.2
EB72.2
EB66.2
EB72.2
EB66.2
EB72.2
EB66.2
EB72.2
EB66.2
EB72.2
EB66.2
Tout à fait d’accord 9 0 12 -1 17 -5 15 +3 9 0 9 -4 10 -3 14 0 5 0 4 +1 1 -4 5 -1Plutôt d’accord 42 0 60 +4 35 -4 59 -1 37 +8 43 -3 42 -5 41 -10 32 +12 20 -1 14 -14 40 +3Plutôt pas d’accord 24 +1 20 0 13 +2 17 0 21 -1 31 +4 31 +5 29 +5 27 +7 20 +1 46 +8 24 +3Pas du tout d’accord 8 0 4 -1 5 +3 3 -1 8 -2 14 +5 14 +5 12 +4 12 -4 13 -4 28 +5 9 +6NSP 17 -1 4 -2 30 +4 6 -1 25 -5 3 -2 3 -2 4 +1 24 -15 43 +3 11 +5 22 -11D'accord 51 0 72 +3 52 -9 74 +2 46 +8 52 -7 52 -8 55 -10 37 +12 24 0 15 -18 45 +2Pas d'accord 32 +1 24 -1 18 +5 20 -1 29 -3 45 +9 45 +10 41 +9 39 +3 33 -3 74 +13 33 +9
1st column: EB72 autumn 2009
2nd column: % change from EB66 autumn 2006EB
72.2EB
66.2EB
72.2EB
66.2EB
72.2EB
66.2EB
72.2EB
66.2EB
72.2EB
66.2EB
72.2EB
66.2EB
72.2EB
66.2EB
72.2EB
66.2EB
72.2EB
66.2EB
72.2EB
66.2EB
72.2EB
66.2EB
72.2EB
66.2Totally agree 4 -1 6 0 1 -1 4 +1 8 +1 5 +2 20 +3 2 -1 14 +1 7 0 6 +2 3 +1Tend to agree 49 -1 39 +4 8 -2 26 +2 42 +2 27 +6 51 -1 15 -11 48 0 35 +1 32 +7 29 +12Tend to disagree 24 +1 29 +6 10 0 27 -3 27 -6 29 -1 17 +3 14 0 23 -2 30 +6 25 -1 22 -2Totally disagree 6 +1 8 -3 15 -2 16 +3 7 0 15 -15 4 -2 18 +1 6 -1 18 +3 5 -3 7 -7DK 17 0 18 -7 66 +5 27 -3 16 +3 24 +8 8 -3 51 +11 9 +2 10 -10 32 -5 39 -4Agree 53 -2 45 +4 9 -3 30 +3 50 +3 32 +8 71 +2 17 -12 62 +1 42 +1 38 +9 32 +13Disagree 30 +2 37 +3 25 -2 43 0 34 -6 44 -16 21 +1 32 +1 29 -3 48 +9 30 -4 29 -9
erste Spalte: EB72 Herbst 2009zweite Spalte: % eränderungen im Vergleich zu EB66 Herbst 2006
EB72.2
EB66.2
EB72.2
EB66.2
EB72.2
EB66.2
EB72.2
EB66.2
EB72.2
EB66.2
EB72.2
EB66.2
Stimme voll und ganz zu 9 -4 14 0 13 -4 20 -4 26 -6 11 +4Stimme eher zu 32 +1 54 -2 59 +5 57 +1 49 +4 52 -3Stimme eher nicht zu 23 +8 19 -1 18 +2 16 +2 16 +3 15 -2Stimme überhaupt nicht zu 7 +2 6 +3 2 0 3 0 5 +2 4 0WN 29 -7 7 0 8 -3 4 +1 4 -3 18 +1Stimme zu 41 -3 68 -2 72 +1 77 -3 75 -2 63 +1Stimme nicht zu 30 +10 25 +2 20 +2 19 +2 21 +5 19 -2
The nuclear safety authority in (OUR COUNTRY) sufficiently ensures the safe operation of nuclear power plant(s)
QA11.3 Dans quelle mesure êtes-vous d’accord ou pas d'accord avec les affirmations suivantes ? L’agence de sécurité nucléaire en (NOTRE PAYS) garantit de manière suffisante le fonctionnement sûr des centrales nucléairesQA11.3 To what extent do you agree or disagree with each of the following statements?
QA11.3 Inwieweit stimmen Sie den folgenden Aussagen zu oder nicht zu? Die in (UNSER LAND) für die Sicherheit der Atomkraftwerke zuständigen Behörden gewährleisten einen hinreichend sicheren Betrieb von Kernkraftwerken
D-E EEBE BG CZ DK
LT LU HU
D-W DE
PT
RO SE
IE EL ES
FR IT CY LV MT NL AT PL
UKSI SK FI

Special Eurobarometer 324 – Europeans and Nuclear Safety
1re colonne: EB72 automne 2009EU27 UE27
EU25 UE25
2ième colonne: % changement par rapport à EB66 automne 2006
EB72.2
EB66.2
EB72.2
EB66.2
EB72.2
EB66.2
EB72.2
EB66.2
EB72.2
EB66.2
EB72.2
EB66.2
EB72.2
EB66.2
EB72.2
EB66.2
EB72.2
EB66.2
EB72.2
EB66.2
EB72.2
EB66.2
EB72.2
EB66.2
Tout à fait d’accord 7 -1 13 -5 16 -8 13 +2 9 +2 6 -4 6 -4 9 -1 7 0 4 +2 1 0 4 -2Plutôt d’accord 40 +2 59 +4 43 +2 56 0 36 +12 33 -2 33 -2 31 -5 38 +9 25 +9 10 -5 39 +7Plutôt pas d’accord 28 -1 20 +2 13 -3 24 +1 34 -7 32 -1 32 -1 33 -1 26 +3 28 +4 43 0 28 0Pas du tout d’accord 15 0 7 -1 8 +3 5 -1 16 -7 28 +8 28 +8 25 +7 14 -5 21 -15 45 +5 14 +5NSP 10 0 1 0 20 +6 2 -2 5 0 1 -1 1 -1 2 0 15 -7 22 0 1 0 15 -10D'accord 47 +1 72 -1 59 -6 69 +2 45 +14 39 -6 39 -6 40 -6 45 +9 29 +11 11 -5 43 +5Pas d'accord 43 -1 27 +1 21 0 29 0 50 -14 60 +7 60 +7 58 +6 40 -2 49 -11 88 +5 42 +5
1st column: EB72 autumn 2009
2nd column: % change from EB66 autumn 2006EB
72.2EB
66.2EB
72.2EB
66.2EB
72.2EB
66.2EB
72.2EB
66.2EB
72.2EB
66.2EB
72.2EB
66.2EB
72.2EB
66.2EB
72.2EB
66.2EB
72.2EB
66.2EB
72.2EB
66.2EB
72.2EB
66.2EB
72.2EB
66.2Totally agree 6 -3 5 +1 3 -1 6 +1 9 -2 7 +4 20 -1 2 -2 15 -3 5 +1 4 +2 3 +1Tend to agree 50 -3 34 +2 12 -1 36 +5 47 +3 29 +7 52 +2 22 +3 49 +1 21 +3 32 +11 31 +6Tend to disagree 27 +2 35 +3 27 +4 31 -2 25 -2 32 +2 20 +4 22 -3 21 -2 36 0 33 -5 26 -5Totally disagree 12 +4 12 -6 31 -2 14 -2 8 +1 28 -13 6 -3 20 -15 10 +3 36 +1 10 -8 7 -9DK 5 0 14 0 27 0 13 -2 11 0 4 0 2 -2 34 +17 5 +1 2 -5 21 0 33 +7Agree 56 -6 39 +3 15 -2 42 +6 56 +1 36 +11 72 +1 24 +1 64 -2 26 +4 36 +13 34 +7Disagree 39 +6 47 -3 58 +2 45 -4 33 -1 60 -11 26 +1 42 -18 31 +1 72 +1 43 -13 33 -14
erste Spalte: EB72 Herbst 2009zweite Spalte: % eränderungen im Vergleich zu EB66 Herbst 2006
EB72.2
EB66.2
EB72.2
EB66.2
EB72.2
EB66.2
EB72.2
EB66.2
EB72.2
EB66.2
EB72.2
EB66.2
Stimme voll und ganz zu 9 -5 15 -2 13 -4 17 -1 22 -6 9 +2Stimme eher zu 36 0 51 -1 57 +7 53 +1 42 +2 48 +3Stimme eher nicht zu 25 +5 22 -1 20 -1 22 0 23 +2 25 -2Stimme überhaupt nicht zu 11 +3 9 +4 4 -2 6 +1 11 +2 9 -4WN 19 -3 3 0 6 0 2 -1 2 0 9 +1Stimme zu 45 -5 66 -3 70 +3 70 0 64 -4 57 +5Stimme nicht zu 36 +8 31 +3 24 -3 28 +1 34 +4 34 -6
You trust companies operating nuclear power plants
QA11.4 Dans quelle mesure êtes-vous d’accord ou pas d'accord avec les affirmations suivantes ? Vous faites confiance aux entreprises qui gèrent les centrales nucléaires QA11.4 To what extent do you agree or disagree with each of the following statements?
QA11.4 Inwieweit stimmen Sie den folgenden Aussagen zu oder nicht zu? Sie vertrauen den Unternehmen, die Kernkraftwerke betreiben
D-E EEBE BG CZ DK
LT LU HU
D-W DE
PT
RO SE
IE EL ES
FR IT CY LV MT NL AT PL
UKSI SK FI

Special Eurobarometer 324 – Europeans and Nuclear Safety
1re colonne: EB72 automne 2009EU27 UE27
EU25 UE25
2ième colonne: % changement par rapport à EB66 automne 2006
EB72.2
EB66.2
EB72.2
EB66.2
EB72.2
EB66.2
EB72.2
EB66.2
EB72.2
EB66.2
EB72.2
EB66.2
EB72.2
EB66.2
EB72.2
EB66.2
EB72.2
EB66.2
EB72.2
EB66.2
EB72.2
EB66.2
EB72.2
EB66.2
Tout à fait d’accord 8 0 10 -1 14 -8 17 +3 9 0 6 -3 6 -3 7 -3 14 0 6 +2 5 -1 5 0Plutôt d’accord 32 +1 42 +2 40 +4 48 0 29 +2 20 -2 20 -5 22 -13 36 -1 32 +7 27 -4 33 +2Plutôt pas d’accord 30 -2 30 +1 11 0 23 0 34 -3 30 -7 31 -6 33 -2 29 +5 18 -4 33 +1 27 -1Pas du tout d’accord 19 +1 15 -2 4 +2 7 0 22 0 40 +14 39 +15 32 +15 12 0 18 -6 32 +2 17 +8NSP 11 0 3 0 31 +2 5 -3 6 +1 4 -2 4 -1 6 +3 9 -4 26 +1 3 +2 18 -9D'accord 40 +1 52 +1 54 -4 65 +3 38 +2 26 -5 26 -8 29 -16 50 -1 38 +9 32 -5 38 +2Pas d'accord 49 -1 45 -1 15 +2 30 0 56 -3 70 +7 70 +9 65 +13 41 +5 36 -10 65 +3 44 +7
1st column: EB72 autumn 2009
2nd column: % change from EB66 autumn 2006EB
72.2EB
66.2EB
72.2EB
66.2EB
72.2EB
66.2EB
72.2EB
66.2EB
72.2EB
66.2EB
72.2EB
66.2EB
72.2EB
66.2EB
72.2EB
66.2EB
72.2EB
66.2EB
72.2EB
66.2EB
72.2EB
66.2EB
72.2EB
66.2Totally agree 2 -1 6 +1 8 0 9 +4 14 -1 6 +2 27 +1 6 -1 17 +1 4 0 7 +1 3 -1Tend to agree 23 0 36 +1 26 +1 22 -1 42 0 20 0 49 +2 29 -2 38 +1 22 +1 36 +10 31 +5Tend to disagree 41 -2 32 +1 24 +2 34 -2 24 0 34 +1 15 +1 21 -3 24 -4 34 -3 32 -1 25 -5Totally disagree 25 +3 14 -1 21 -5 25 +1 7 0 31 -2 4 -1 14 -4 13 +1 35 +7 10 -13 10 -7DK 9 0 12 -2 21 +2 10 -2 13 +1 9 -1 5 -3 30 +10 8 +1 5 -5 15 +3 31 +8Agree 25 -1 42 +2 34 +1 31 +3 56 -1 26 +2 76 +3 35 -3 55 +2 26 +1 43 +11 34 +4Disagree 66 +1 46 0 45 -3 59 -1 31 0 65 -1 19 0 35 -7 37 -3 69 +4 42 -14 35 -12
erste Spalte: EB72 Herbst 2009zweite Spalte: % eränderungen im Vergleich zu EB66 Herbst 2006
EB72.2
EB66.2
EB72.2
EB66.2
EB72.2
EB66.2
EB72.2
EB66.2
EB72.2
EB66.2
EB72.2
EB66.2
Stimme voll und ganz zu 11 -6 13 -1 10 0 10 0 22 +6 12 +4Stimme eher zu 33 -1 40 -2 40 +6 38 +3 38 +4 41 +1Stimme eher nicht zu 24 +8 28 -3 32 +1 31 -3 23 -5 24 -3Stimme überhaupt nicht zu 10 +5 14 +5 10 -2 17 0 13 -2 11 -3WN 22 -6 5 +1 8 -5 4 0 4 -3 12 +1Stimme zu 44 -7 53 -3 50 +6 48 +3 60 +10 53 +5Stimme nicht zu 34 +13 42 +2 42 -1 48 -3 36 -7 35 -6
The disposal of radioactive waste can be done in a safe manner
QA11.5 Dans quelle mesure êtes-vous d’accord ou pas d'accord avec les affirmations suivantes ? Le stockage de déchets radioactifs peut se faire de manière sûreQA11.5 To what extent do you agree or disagree with each of the following statements?
QA11.5 Inwieweit stimmen Sie den folgenden Aussagen zu oder nicht zu? Radioaktiver Abfall kann auf sichere Weise gelagert werden
D-E EEBE BG CZ DK
LT LU HU
D-W DE
PT
RO SE
IE EL ES
FR IT CY LV MT NL AT PL
UKSI SK FI
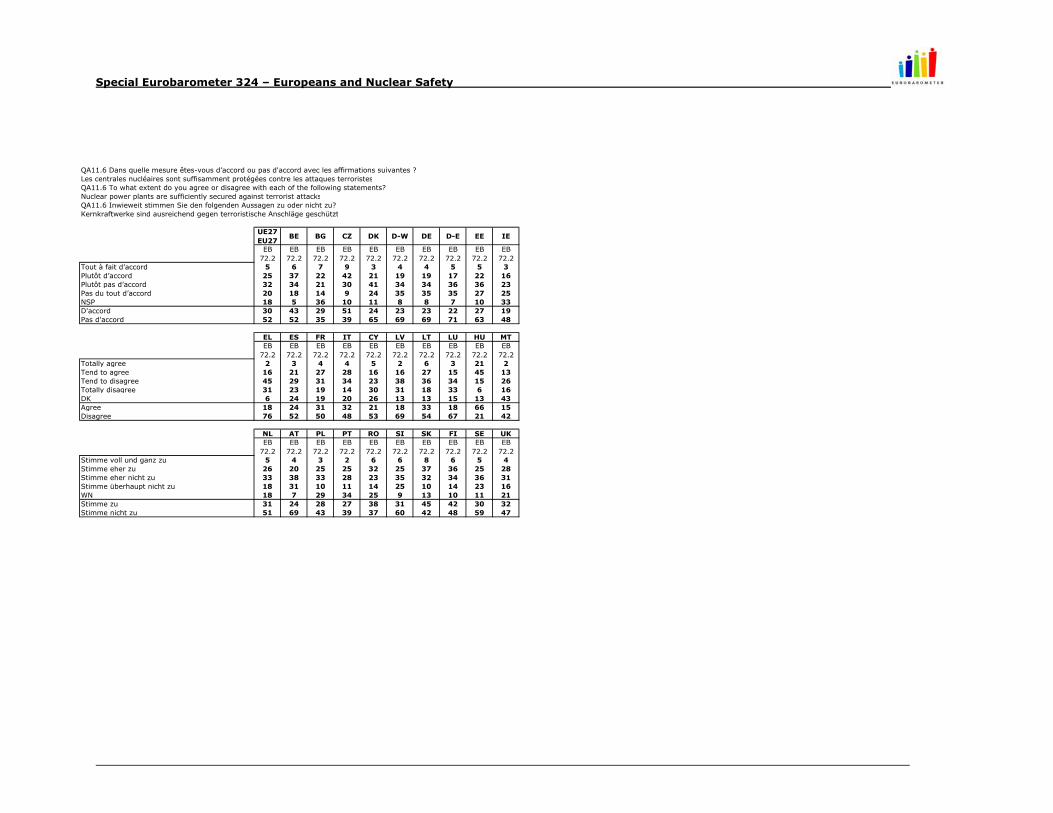
Special Eurobarometer 324 – Europeans and Nuclear Safety
UE27EU27
BE BG CZ DK D-W DE D-E EE IE
EB72.2
EB72.2
EB72.2
EB72.2
EB72.2
EB72.2
EB72.2
EB72.2
EB72.2
EB72.2
Tout à fait d’accord 5 6 7 9 3 4 4 5 5 3Plutôt d’accord 25 37 22 42 21 19 19 17 22 16Plutôt pas d’accord 32 34 21 30 41 34 34 36 36 23Pas du tout d’accord 20 18 14 9 24 35 35 35 27 25NSP 18 5 36 10 11 8 8 7 10 33D'accord 30 43 29 51 24 23 23 22 27 19Pas d'accord 52 52 35 39 65 69 69 71 63 48
EL ES FR IT CY LV LT LU HU MTEB
72.2EB
72.2EB
72.2EB
72.2EB
72.2EB
72.2EB
72.2EB
72.2EB
72.2EB
72.2Totally agree 2 3 4 4 5 2 6 3 21 2Tend to agree 16 21 27 28 16 16 27 15 45 13Tend to disagree 45 29 31 34 23 38 36 34 15 26Totally disagree 31 23 19 14 30 31 18 33 6 16DK 6 24 19 20 26 13 13 15 13 43Agree 18 24 31 32 21 18 33 18 66 15Disagree 76 52 50 48 53 69 54 67 21 42
NL AT PL PT RO SI SK FI SE UKEB
72.2EB
72.2EB
72.2EB
72.2EB
72.2EB
72.2EB
72.2EB
72.2EB
72.2EB
72.2Stimme voll und ganz zu 5 4 3 2 6 6 8 6 5 4Stimme eher zu 26 20 25 25 32 25 37 36 25 28Stimme eher nicht zu 33 38 33 28 23 35 32 34 36 31Stimme überhaupt nicht zu 18 31 10 11 14 25 10 14 23 16WN 18 7 29 34 25 9 13 10 11 21Stimme zu 31 24 28 27 38 31 45 42 30 32Stimme nicht zu 51 69 43 39 37 60 42 48 59 47
Nuclear power plants are sufficiently secured against terrorist attacks
QA11.6 Dans quelle mesure êtes-vous d’accord ou pas d'accord avec les affirmations suivantes ? Les centrales nucléaires sont suffisamment protégées contre les attaques terroristesQA11.6 To what extent do you agree or disagree with each of the following statements?
QA11.6 Inwieweit stimmen Sie den folgenden Aussagen zu oder nicht zu? Kernkraftwerke sind ausreichend gegen terroristische Anschläge geschützt
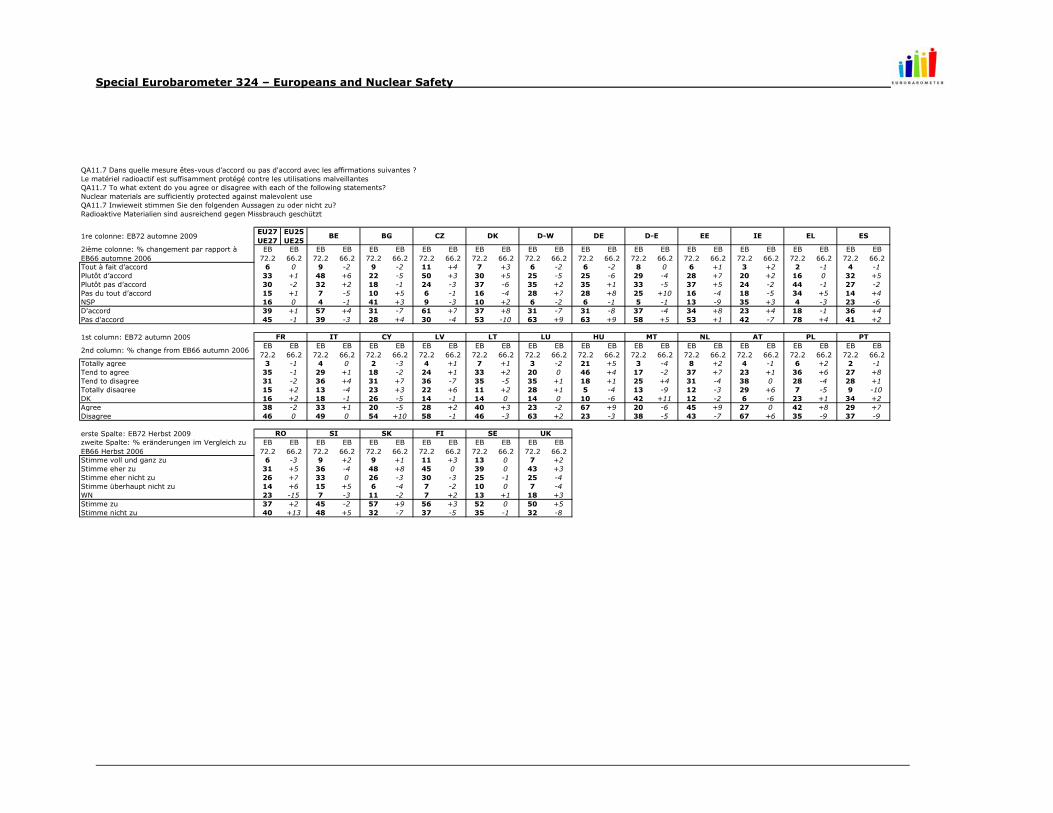
Special Eurobarometer 324 – Europeans and Nuclear Safety
1re colonne: EB72 automne 2009EU27 UE27
EU25 UE25
2ième colonne: % changement par rapport à EB66 automne 2006
EB72.2
EB66.2
EB72.2
EB66.2
EB72.2
EB66.2
EB72.2
EB66.2
EB72.2
EB66.2
EB72.2
EB66.2
EB72.2
EB66.2
EB72.2
EB66.2
EB72.2
EB66.2
EB72.2
EB66.2
EB72.2
EB66.2
EB72.2
EB66.2
Tout à fait d’accord 6 0 9 -2 9 -2 11 +4 7 +3 6 -2 6 -2 8 0 6 +1 3 +2 2 -1 4 -1Plutôt d’accord 33 +1 48 +6 22 -5 50 +3 30 +5 25 -5 25 -6 29 -4 28 +7 20 +2 16 0 32 +5Plutôt pas d’accord 30 -2 32 +2 18 -1 24 -3 37 -6 35 +2 35 +1 33 -5 37 +5 24 -2 44 -1 27 -2Pas du tout d’accord 15 +1 7 -5 10 +5 6 -1 16 -4 28 +7 28 +8 25 +10 16 -4 18 -5 34 +5 14 +4NSP 16 0 4 -1 41 +3 9 -3 10 +2 6 -2 6 -1 5 -1 13 -9 35 +3 4 -3 23 -6D'accord 39 +1 57 +4 31 -7 61 +7 37 +8 31 -7 31 -8 37 -4 34 +8 23 +4 18 -1 36 +4Pas d'accord 45 -1 39 -3 28 +4 30 -4 53 -10 63 +9 63 +9 58 +5 53 +1 42 -7 78 +4 41 +2
1st column: EB72 autumn 2009
2nd column: % change from EB66 autumn 2006EB
72.2EB
66.2EB
72.2EB
66.2EB
72.2EB
66.2EB
72.2EB
66.2EB
72.2EB
66.2EB
72.2EB
66.2EB
72.2EB
66.2EB
72.2EB
66.2EB
72.2EB
66.2EB
72.2EB
66.2EB
72.2EB
66.2EB
72.2EB
66.2Totally agree 3 -1 4 0 2 -3 4 +1 7 +1 3 -2 21 +5 3 -4 8 +2 4 -1 6 +2 2 -1Tend to agree 35 -1 29 +1 18 -2 24 +1 33 +2 20 0 46 +4 17 -2 37 +7 23 +1 36 +6 27 +8Tend to disagree 31 -2 36 +4 31 +7 36 -7 35 -5 35 +1 18 +1 25 +4 31 -4 38 0 28 -4 28 +1Totally disagree 15 +2 13 -4 23 +3 22 +6 11 +2 28 +1 5 -4 13 -9 12 -3 29 +6 7 -5 9 -10DK 16 +2 18 -1 26 -5 14 -1 14 0 14 0 10 -6 42 +11 12 -2 6 -6 23 +1 34 +2Agree 38 -2 33 +1 20 -5 28 +2 40 +3 23 -2 67 +9 20 -6 45 +9 27 0 42 +8 29 +7Disagree 46 0 49 0 54 +10 58 -1 46 -3 63 +2 23 -3 38 -5 43 -7 67 +6 35 -9 37 -9
erste Spalte: EB72 Herbst 2009zweite Spalte: % eränderungen im Vergleich zu EB66 Herbst 2006
EB72.2
EB66.2
EB72.2
EB66.2
EB72.2
EB66.2
EB72.2
EB66.2
EB72.2
EB66.2
EB72.2
EB66.2
Stimme voll und ganz zu 6 -3 9 +2 9 +1 11 +3 13 0 7 +2Stimme eher zu 31 +5 36 -4 48 +8 45 0 39 0 43 +3Stimme eher nicht zu 26 +7 33 0 26 -3 30 -3 25 -1 25 -4Stimme überhaupt nicht zu 14 +6 15 +5 6 -4 7 -2 10 0 7 -4WN 23 -15 7 -3 11 -2 7 +2 13 +1 18 +3Stimme zu 37 +2 45 -2 57 +9 56 +3 52 0 50 +5Stimme nicht zu 40 +13 48 +5 32 -7 37 -5 35 -1 32 -8
Nuclear materials are sufficiently protected against malevolent use
QA11.7 Dans quelle mesure êtes-vous d’accord ou pas d'accord avec les affirmations suivantes ? Le matériel radioactif est suffisamment protégé contre les utilisations malveillantesQA11.7 To what extent do you agree or disagree with each of the following statements?
QA11.7 Inwieweit stimmen Sie den folgenden Aussagen zu oder nicht zu? Radioaktive Materialien sind ausreichend gegen Missbrauch geschützt
D-E EEBE BG CZ DK
LT LU HU
D-W DE
PT
RO SE
IE EL ES
FR IT CY LV MT NL AT PL
UKSI SK FI
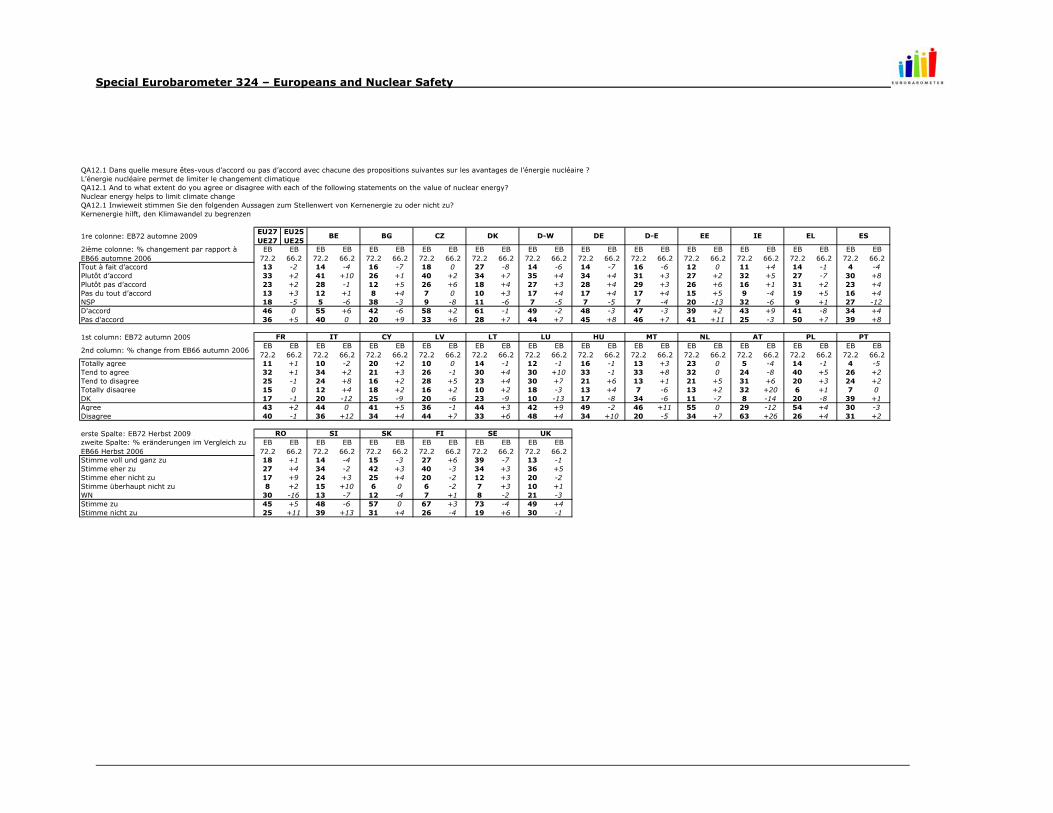
Special Eurobarometer 324 – Europeans and Nuclear Safety
1re colonne: EB72 automne 2009EU27 UE27
EU25 UE25
2ième colonne: % changement par rapport à EB66 automne 2006
EB72.2
EB66.2
EB72.2
EB66.2
EB72.2
EB66.2
EB72.2
EB66.2
EB72.2
EB66.2
EB72.2
EB66.2
EB72.2
EB66.2
EB72.2
EB66.2
EB72.2
EB66.2
EB72.2
EB66.2
EB72.2
EB66.2
EB72.2
EB66.2
Tout à fait d’accord 13 -2 14 -4 16 -7 18 0 27 -8 14 -6 14 -7 16 -6 12 0 11 +4 14 -1 4 -4Plutôt d’accord 33 +2 41 +10 26 +1 40 +2 34 +7 35 +4 34 +4 31 +3 27 +2 32 +5 27 -7 30 +8Plutôt pas d’accord 23 +2 28 -1 12 +5 26 +6 18 +4 27 +3 28 +4 29 +3 26 +6 16 +1 31 +2 23 +4Pas du tout d’accord 13 +3 12 +1 8 +4 7 0 10 +3 17 +4 17 +4 17 +4 15 +5 9 -4 19 +5 16 +4NSP 18 -5 5 -6 38 -3 9 -8 11 -6 7 -5 7 -5 7 -4 20 -13 32 -6 9 +1 27 -12D'accord 46 0 55 +6 42 -6 58 +2 61 -1 49 -2 48 -3 47 -3 39 +2 43 +9 41 -8 34 +4Pas d'accord 36 +5 40 0 20 +9 33 +6 28 +7 44 +7 45 +8 46 +7 41 +11 25 -3 50 +7 39 +8
1st column: EB72 autumn 2009
2nd column: % change from EB66 autumn 2006EB
72.2EB
66.2EB
72.2EB
66.2EB
72.2EB
66.2EB
72.2EB
66.2EB
72.2EB
66.2EB
72.2EB
66.2EB
72.2EB
66.2EB
72.2EB
66.2EB
72.2EB
66.2EB
72.2EB
66.2EB
72.2EB
66.2EB
72.2EB
66.2Totally agree 11 +1 10 -2 20 +2 10 0 14 -1 12 -1 16 -1 13 +3 23 0 5 -4 14 -1 4 -5Tend to agree 32 +1 34 +2 21 +3 26 -1 30 +4 30 +10 33 -1 33 +8 32 0 24 -8 40 +5 26 +2Tend to disagree 25 -1 24 +8 16 +2 28 +5 23 +4 30 +7 21 +6 13 +1 21 +5 31 +6 20 +3 24 +2Totally disagree 15 0 12 +4 18 +2 16 +2 10 +2 18 -3 13 +4 7 -6 13 +2 32 +20 6 +1 7 0DK 17 -1 20 -12 25 -9 20 -6 23 -9 10 -13 17 -8 34 -6 11 -7 8 -14 20 -8 39 +1Agree 43 +2 44 0 41 +5 36 -1 44 +3 42 +9 49 -2 46 +11 55 0 29 -12 54 +4 30 -3Disagree 40 -1 36 +12 34 +4 44 +7 33 +6 48 +4 34 +10 20 -5 34 +7 63 +26 26 +4 31 +2
erste Spalte: EB72 Herbst 2009zweite Spalte: % eränderungen im Vergleich zu EB66 Herbst 2006
EB72.2
EB66.2
EB72.2
EB66.2
EB72.2
EB66.2
EB72.2
EB66.2
EB72.2
EB66.2
EB72.2
EB66.2
Stimme voll und ganz zu 18 +1 14 -4 15 -3 27 +6 39 -7 13 -1Stimme eher zu 27 +4 34 -2 42 +3 40 -3 34 +3 36 +5Stimme eher nicht zu 17 +9 24 +3 25 +4 20 -2 12 +3 20 -2Stimme überhaupt nicht zu 8 +2 15 +10 6 0 6 -2 7 +3 10 +1WN 30 -16 13 -7 12 -4 7 +1 8 -2 21 -3Stimme zu 45 +5 48 -6 57 0 67 +3 73 -4 49 +4Stimme nicht zu 25 +11 39 +13 31 +4 26 -4 19 +6 30 -1
Nuclear energy helps to limit climate change
QA12.1 Dans quelle mesure êtes-vous d’accord ou pas d’accord avec chacune des propositions suivantes sur les avantages de l’énergie nucléaire ? L’énergie nucléaire permet de limiter le changement climatiqueQA12.1 And to what extent do you agree or disagree with each of the following statements on the value of nuclear energy?
QA12.1 Inwieweit stimmen Sie den folgenden Aussagen zum Stellenwert von Kernenergie zu oder nicht zu? Kernenergie hilft, den Klimawandel zu begrenzen
D-E EEBE BG CZ DK
LT LU HU
D-W DE
PT
RO SE
IE EL ES
FR IT CY LV MT NL AT PL
UKSI SK FI
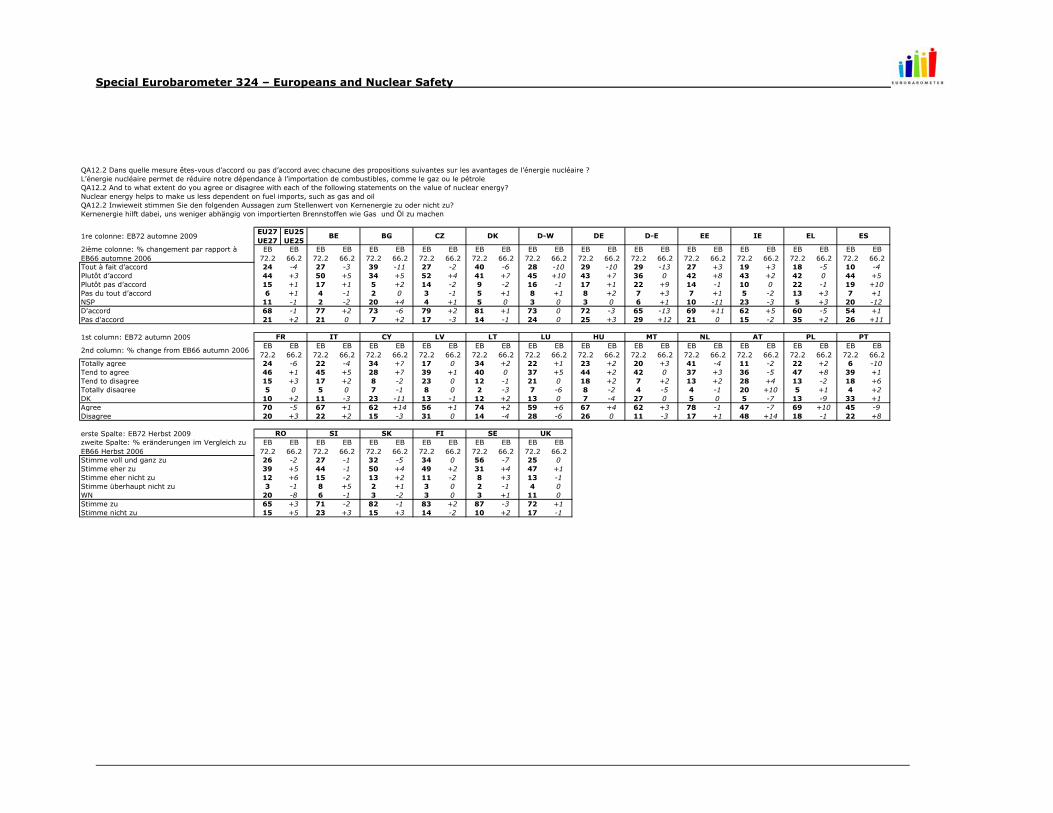
Special Eurobarometer 324 – Europeans and Nuclear Safety
1re colonne: EB72 automne 2009EU27 UE27
EU25 UE25
2ième colonne: % changement par rapport à EB66 automne 2006
EB72.2
EB66.2
EB72.2
EB66.2
EB72.2
EB66.2
EB72.2
EB66.2
EB72.2
EB66.2
EB72.2
EB66.2
EB72.2
EB66.2
EB72.2
EB66.2
EB72.2
EB66.2
EB72.2
EB66.2
EB72.2
EB66.2
EB72.2
EB66.2
Tout à fait d’accord 24 -4 27 -3 39 -11 27 -2 40 -6 28 -10 29 -10 29 -13 27 +3 19 +3 18 -5 10 -4Plutôt d’accord 44 +3 50 +5 34 +5 52 +4 41 +7 45 +10 43 +7 36 0 42 +8 43 +2 42 0 44 +5Plutôt pas d’accord 15 +1 17 +1 5 +2 14 -2 9 -2 16 -1 17 +1 22 +9 14 -1 10 0 22 -1 19 +10Pas du tout d’accord 6 +1 4 -1 2 0 3 -1 5 +1 8 +1 8 +2 7 +3 7 +1 5 -2 13 +3 7 +1NSP 11 -1 2 -2 20 +4 4 +1 5 0 3 0 3 0 6 +1 10 -11 23 -3 5 +3 20 -12D'accord 68 -1 77 +2 73 -6 79 +2 81 +1 73 0 72 -3 65 -13 69 +11 62 +5 60 -5 54 +1Pas d'accord 21 +2 21 0 7 +2 17 -3 14 -1 24 0 25 +3 29 +12 21 0 15 -2 35 +2 26 +11
1st column: EB72 autumn 2009
2nd column: % change from EB66 autumn 2006EB
72.2EB
66.2EB
72.2EB
66.2EB
72.2EB
66.2EB
72.2EB
66.2EB
72.2EB
66.2EB
72.2EB
66.2EB
72.2EB
66.2EB
72.2EB
66.2EB
72.2EB
66.2EB
72.2EB
66.2EB
72.2EB
66.2EB
72.2EB
66.2Totally agree 24 -6 22 -4 34 +7 17 0 34 +2 22 +1 23 +2 20 +3 41 -4 11 -2 22 +2 6 -10Tend to agree 46 +1 45 +5 28 +7 39 +1 40 0 37 +5 44 +2 42 0 37 +3 36 -5 47 +8 39 +1Tend to disagree 15 +3 17 +2 8 -2 23 0 12 -1 21 0 18 +2 7 +2 13 +2 28 +4 13 -2 18 +6Totally disagree 5 0 5 0 7 -1 8 0 2 -3 7 -6 8 -2 4 -5 4 -1 20 +10 5 +1 4 +2DK 10 +2 11 -3 23 -11 13 -1 12 +2 13 0 7 -4 27 0 5 0 5 -7 13 -9 33 +1Agree 70 -5 67 +1 62 +14 56 +1 74 +2 59 +6 67 +4 62 +3 78 -1 47 -7 69 +10 45 -9Disagree 20 +3 22 +2 15 -3 31 0 14 -4 28 -6 26 0 11 -3 17 +1 48 +14 18 -1 22 +8
erste Spalte: EB72 Herbst 2009zweite Spalte: % eränderungen im Vergleich zu EB66 Herbst 2006
EB72.2
EB66.2
EB72.2
EB66.2
EB72.2
EB66.2
EB72.2
EB66.2
EB72.2
EB66.2
EB72.2
EB66.2
Stimme voll und ganz zu 26 -2 27 -1 32 -5 34 0 56 -7 25 0Stimme eher zu 39 +5 44 -1 50 +4 49 +2 31 +4 47 +1Stimme eher nicht zu 12 +6 15 -2 13 +2 11 -2 8 +3 13 -1Stimme überhaupt nicht zu 3 -1 8 +5 2 +1 3 0 2 -1 4 0WN 20 -8 6 -1 3 -2 3 0 3 +1 11 0Stimme zu 65 +3 71 -2 82 -1 83 +2 87 -3 72 +1Stimme nicht zu 15 +5 23 +3 15 +3 14 -2 10 +2 17 -1
Nuclear energy helps to make us less dependent on fuel imports, such as gas and oil
QA12.2 Dans quelle mesure êtes-vous d’accord ou pas d’accord avec chacune des propositions suivantes sur les avantages de l’énergie nucléaire ? L’énergie nucléaire permet de réduire notre dépendance à l’importation de combustibles, comme le gaz ou le pétroleQA12.2 And to what extent do you agree or disagree with each of the following statements on the value of nuclear energy?
QA12.2 Inwieweit stimmen Sie den folgenden Aussagen zum Stellenwert von Kernenergie zu oder nicht zu? Kernenergie hilft dabei, uns weniger abhängig von importierten Brennstoffen wie Gas und Öl zu machen
D-E EEBE BG CZ DK
LT LU HU
D-W DE
PT
RO SE
IE EL ES
FR IT CY LV MT NL AT PL
UKSI SK FI
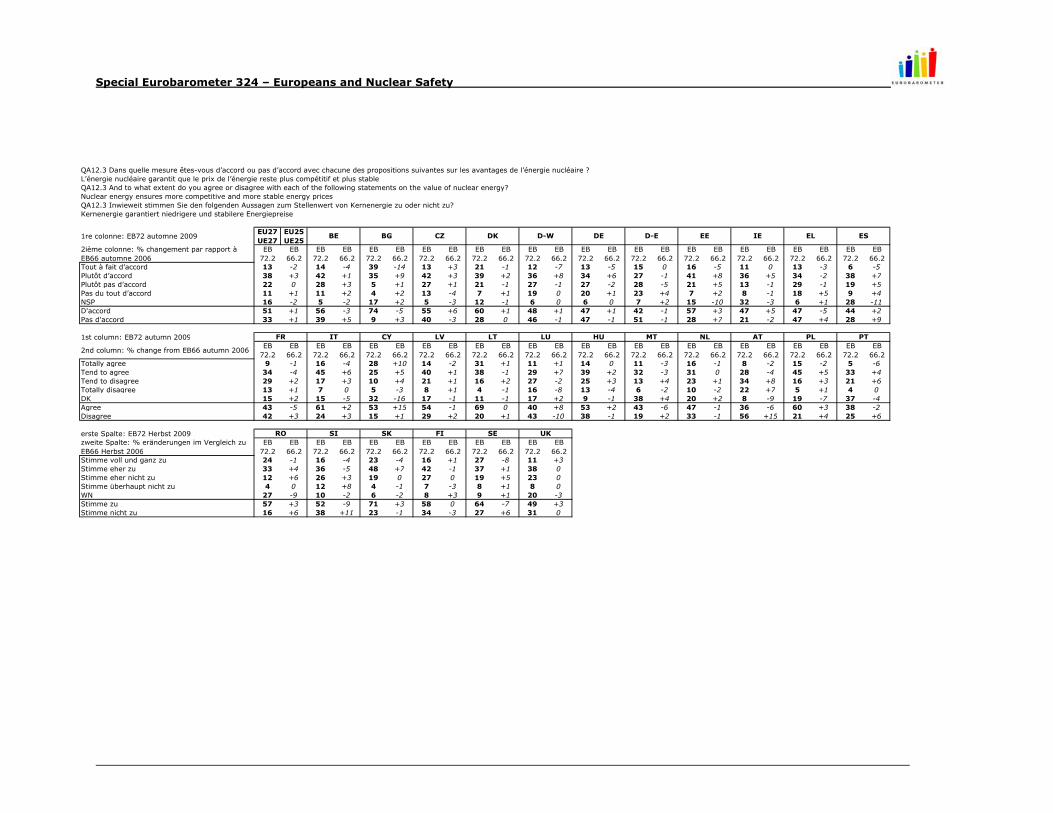
Special Eurobarometer 324 – Europeans and Nuclear Safety
1re colonne: EB72 automne 2009EU27 UE27
EU25 UE25
2ième colonne: % changement par rapport à EB66 automne 2006
EB72.2
EB66.2
EB72.2
EB66.2
EB72.2
EB66.2
EB72.2
EB66.2
EB72.2
EB66.2
EB72.2
EB66.2
EB72.2
EB66.2
EB72.2
EB66.2
EB72.2
EB66.2
EB72.2
EB66.2
EB72.2
EB66.2
EB72.2
EB66.2
Tout à fait d’accord 13 -2 14 -4 39 -14 13 +3 21 -1 12 -7 13 -5 15 0 16 -5 11 0 13 -3 6 -5Plutôt d’accord 38 +3 42 +1 35 +9 42 +3 39 +2 36 +8 34 +6 27 -1 41 +8 36 +5 34 -2 38 +7Plutôt pas d’accord 22 0 28 +3 5 +1 27 +1 21 -1 27 -1 27 -2 28 -5 21 +5 13 -1 29 -1 19 +5Pas du tout d’accord 11 +1 11 +2 4 +2 13 -4 7 +1 19 0 20 +1 23 +4 7 +2 8 -1 18 +5 9 +4NSP 16 -2 5 -2 17 +2 5 -3 12 -1 6 0 6 0 7 +2 15 -10 32 -3 6 +1 28 -11D'accord 51 +1 56 -3 74 -5 55 +6 60 +1 48 +1 47 +1 42 -1 57 +3 47 +5 47 -5 44 +2Pas d'accord 33 +1 39 +5 9 +3 40 -3 28 0 46 -1 47 -1 51 -1 28 +7 21 -2 47 +4 28 +9
1st column: EB72 autumn 2009
2nd column: % change from EB66 autumn 2006EB
72.2EB
66.2EB
72.2EB
66.2EB
72.2EB
66.2EB
72.2EB
66.2EB
72.2EB
66.2EB
72.2EB
66.2EB
72.2EB
66.2EB
72.2EB
66.2EB
72.2EB
66.2EB
72.2EB
66.2EB
72.2EB
66.2EB
72.2EB
66.2Totally agree 9 -1 16 -4 28 +10 14 -2 31 +1 11 +1 14 0 11 -3 16 -1 8 -2 15 -2 5 -6Tend to agree 34 -4 45 +6 25 +5 40 +1 38 -1 29 +7 39 +2 32 -3 31 0 28 -4 45 +5 33 +4Tend to disagree 29 +2 17 +3 10 +4 21 +1 16 +2 27 -2 25 +3 13 +4 23 +1 34 +8 16 +3 21 +6Totally disagree 13 +1 7 0 5 -3 8 +1 4 -1 16 -8 13 -4 6 -2 10 -2 22 +7 5 +1 4 0DK 15 +2 15 -5 32 -16 17 -1 11 -1 17 +2 9 -1 38 +4 20 +2 8 -9 19 -7 37 -4Agree 43 -5 61 +2 53 +15 54 -1 69 0 40 +8 53 +2 43 -6 47 -1 36 -6 60 +3 38 -2Disagree 42 +3 24 +3 15 +1 29 +2 20 +1 43 -10 38 -1 19 +2 33 -1 56 +15 21 +4 25 +6
erste Spalte: EB72 Herbst 2009zweite Spalte: % eränderungen im Vergleich zu EB66 Herbst 2006
EB72.2
EB66.2
EB72.2
EB66.2
EB72.2
EB66.2
EB72.2
EB66.2
EB72.2
EB66.2
EB72.2
EB66.2
Stimme voll und ganz zu 24 -1 16 -4 23 -4 16 +1 27 -8 11 +3Stimme eher zu 33 +4 36 -5 48 +7 42 -1 37 +1 38 0Stimme eher nicht zu 12 +6 26 +3 19 0 27 0 19 +5 23 0Stimme überhaupt nicht zu 4 0 12 +8 4 -1 7 -3 8 +1 8 0WN 27 -9 10 -2 6 -2 8 +3 9 +1 20 -3Stimme zu 57 +3 52 -9 71 +3 58 0 64 -7 49 +3Stimme nicht zu 16 +6 38 +11 23 -1 34 -3 27 +6 31 0
Nuclear energy ensures more competitive and more stable energy prices
QA12.3 Dans quelle mesure êtes-vous d’accord ou pas d’accord avec chacune des propositions suivantes sur les avantages de l’énergie nucléaire ? L’énergie nucléaire garantit que le prix de l’énergie reste plus compétitif et plus stableQA12.3 And to what extent do you agree or disagree with each of the following statements on the value of nuclear energy?
QA12.3 Inwieweit stimmen Sie den folgenden Aussagen zum Stellenwert von Kernenergie zu oder nicht zu? Kernenergie garantiert niedrigere und stabilere Energiepreise
D-E EEBE BG CZ DK
LT LU HU
D-W DE
PT
RO SE
IE EL ES
FR IT CY LV MT NL AT PL
UKSI SK FI
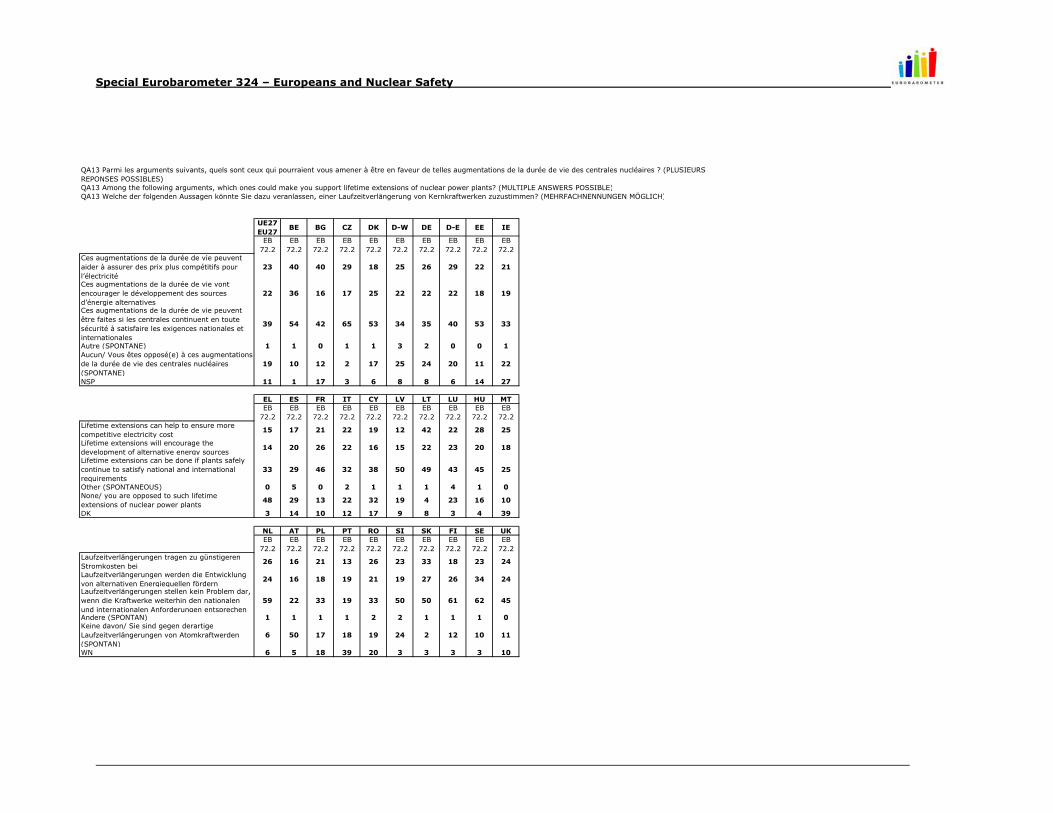
Special Eurobarometer 324 – Europeans and Nuclear Safety
UE27EU27
BE BG CZ DK D-W DE D-E EE IE
EB72.2
EB72.2
EB72.2
EB72.2
EB72.2
EB72.2
EB72.2
EB72.2
EB72.2
EB72.2
Ces augmentations de la durée de vie peuvent aider à assurer des prix plus compétitifs pour l’électricité
23 40 40 29 18 25 26 29 22 21
Ces augmentations de la durée de vie vont encourager le développement des sources d’énergie alternatives
22 36 16 17 25 22 22 22 18 19
Ces augmentations de la durée de vie peuvent être faites si les centrales continuent en toute sécurité à satisfaire les exigences nationales et internationales
39 54 42 65 53 34 35 40 53 33
Autre (SPONTANE) 1 1 0 1 1 3 2 0 0 1Aucun/ Vous êtes opposé(e) à ces augmentations de la durée de vie des centrales nucléaires (SPONTANE)
19 10 12 2 17 25 24 20 11 22
NSP 11 1 17 3 6 8 8 6 14 27
EL ES FR IT CY LV LT LU HU MTEB
72.2EB
72.2EB
72.2EB
72.2EB
72.2EB
72.2EB
72.2EB
72.2EB
72.2EB
72.2Lifetime extensions can help to ensure more competitive electricity cost
15 17 21 22 19 12 42 22 28 25
Lifetime extensions will encourage the development of alternative energy sources
14 20 26 22 16 15 22 23 20 18
Lifetime extensions can be done if plants safely continue to satisfy national and international requirements
33 29 46 32 38 50 49 43 45 25
Other (SPONTANEOUS) 0 5 0 2 1 1 1 4 1 0None/ you are opposed to such lifetime extensions of nuclear power plants
48 29 13 22 32 19 4 23 16 10
DK 3 14 10 12 17 9 8 3 4 39
NL AT PL PT RO SI SK FI SE UKEB
72.2EB
72.2EB
72.2EB
72.2EB
72.2EB
72.2EB
72.2EB
72.2EB
72.2EB
72.2Laufzeitverlängerungen tragen zu günstigeren Stromkosten bei
26 16 21 13 26 23 33 18 23 24
Laufzeitverlängerungen werden die Entwicklung von alternativen Energiequellen fördern
24 16 18 19 21 19 27 26 34 24
Laufzeitverlängerungen stellen kein Problem dar, wenn die Kraftwerke weiterhin den nationalen und internationalen Anforderungen entsprechen
59 22 33 19 33 50 50 61 62 45
Andere (SPONTAN) 1 1 1 1 2 2 1 1 1 0Keine davon/ Sie sind gegen derartige Laufzeitverlängerungen von Atomkraftwerden (SPONTAN)
6 50 17 18 19 24 2 12 10 11
WN 6 5 18 39 20 3 3 3 3 10
QA13 Parmi les arguments suivants, quels sont ceux qui pourraient vous amener à être en faveur de telles augmentations de la durée de vie des centrales nucléaires ? (PLUSIEURS REPONSES POSSIBLES)QA13 Among the following arguments, which ones could make you support lifetime extensions of nuclear power plants? (MULTIPLE ANSWERS POSSIBLE)QA13 Welche der folgenden Aussagen könnte Sie dazu veranlassen, einer Laufzeitverlängerung von Kernkraftwerken zuzustimmen? (MEHRFACHNENNUNGEN MÖGLICH)
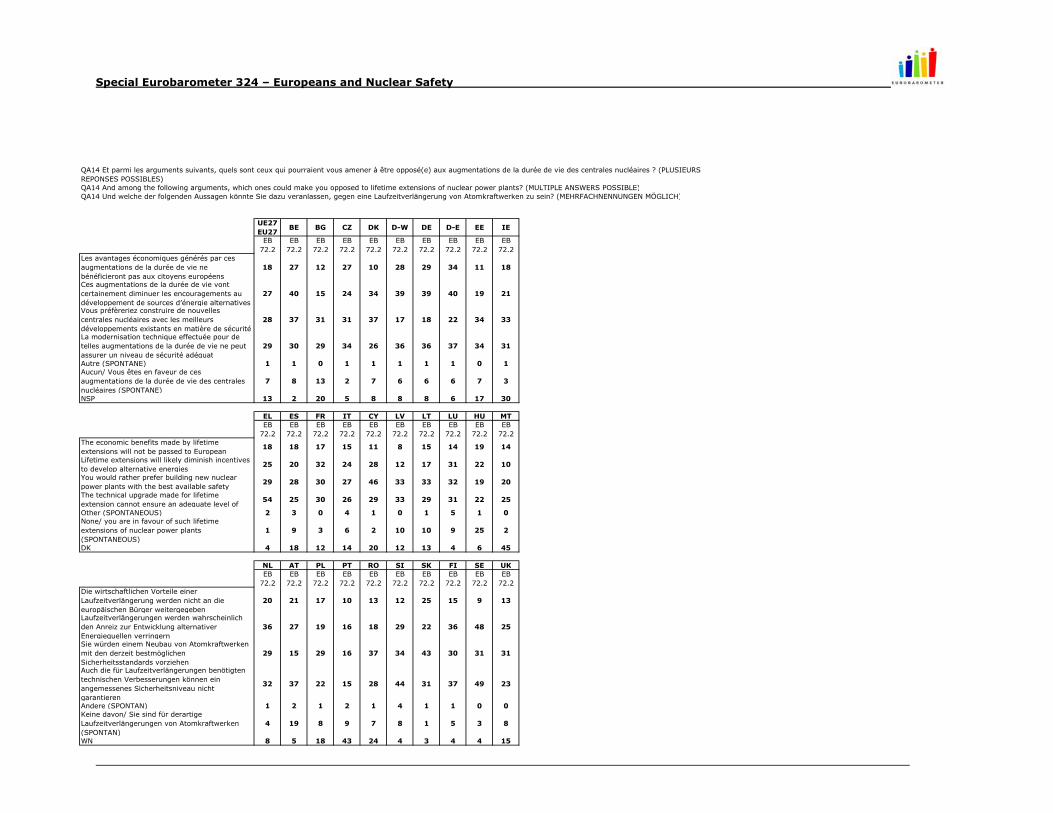
Special Eurobarometer 324 – Europeans and Nuclear Safety
UE27EU27
BE BG CZ DK D-W DE D-E EE IE
EB72.2
EB72.2
EB72.2
EB72.2
EB72.2
EB72.2
EB72.2
EB72.2
EB72.2
EB72.2
Les avantages économiques générés par ces augmentations de la durée de vie ne bénéficieront pas aux citoyens européens
18 27 12 27 10 28 29 34 11 18
Ces augmentations de la durée de vie vont certainement diminuer les encouragements au développement de sources d’énergie alternatives
27 40 15 24 34 39 39 40 19 21
Vous préfèreriez construire de nouvelles centrales nucléaires avec les meilleurs développements existants en matière de sécurité
28 37 31 31 37 17 18 22 34 33
La modernisation technique effectuée pour de telles augmentations de la durée de vie ne peut assurer un niveau de sécurité adéquat
29 30 29 34 26 36 36 37 34 31
Autre (SPONTANE) 1 1 0 1 1 1 1 1 0 1Aucun/ Vous êtes en faveur de ces augmentations de la durée de vie des centrales nucléaires (SPONTANE)
7 8 13 2 7 6 6 6 7 3
NSP 13 2 20 5 8 8 8 6 17 30
EL ES FR IT CY LV LT LU HU MTEB
72.2EB
72.2EB
72.2EB
72.2EB
72.2EB
72.2EB
72.2EB
72.2EB
72.2EB
72.2The economic benefits made by lifetime extensions will not be passed to European
18 18 17 15 11 8 15 14 19 14
Lifetime extensions will likely diminish incentives to develop alternative energies
25 20 32 24 28 12 17 31 22 10
You would rather prefer building new nuclear power plants with the best available safety
29 28 30 27 46 33 33 32 19 20
The technical upgrade made for lifetime extension cannot ensure an adequate level of
54 25 30 26 29 33 29 31 22 25
Other (SPONTANEOUS) 2 3 0 4 1 0 1 5 1 0None/ you are in favour of such lifetime extensions of nuclear power plants (SPONTANEOUS)
1 9 3 6 2 10 10 9 25 2
DK 4 18 12 14 20 12 13 4 6 45
NL AT PL PT RO SI SK FI SE UKEB
72.2EB
72.2EB
72.2EB
72.2EB
72.2EB
72.2EB
72.2EB
72.2EB
72.2EB
72.2Die wirtschaftlichen Vorteile einer Laufzeitverlängerung werden nicht an die europäischen Bürger weitergegeben
20 21 17 10 13 12 25 15 9 13
Laufzeitverlängerungen werden wahrscheinlich den Anreiz zur Entwicklung alternativer Energiequellen verringern
36 27 19 16 18 29 22 36 48 25
Sie würden einem Neubau von Atomkraftwerken mit den derzeit bestmöglichen Sicherheitsstandards vorziehen
29 15 29 16 37 34 43 30 31 31
Auch die für Laufzeitverlängerungen benötigten technischen Verbesserungen können ein angemessenes Sicherheitsniveau nicht garantieren
32 37 22 15 28 44 31 37 49 23
Andere (SPONTAN) 1 2 1 2 1 4 1 1 0 0Keine davon/ Sie sind für derartige Laufzeitverlängerungen von Atomkraftwerken (SPONTAN)
4 19 8 9 7 8 1 5 3 8
WN 8 5 18 43 24 4 3 4 4 15
QA14 Et parmi les arguments suivants, quels sont ceux qui pourraient vous amener à être opposé(e) aux augmentations de la durée de vie des centrales nucléaires ? (PLUSIEURS REPONSES POSSIBLES)QA14 And among the following arguments, which ones could make you opposed to lifetime extensions of nuclear power plants? (MULTIPLE ANSWERS POSSIBLE)QA14 Und welche der folgenden Aussagen könnte Sie dazu veranlassen, gegen eine Laufzeitverlängerung von Atomkraftwerken zu sein? (MEHRFACHNENNUNGEN MÖGLICH)
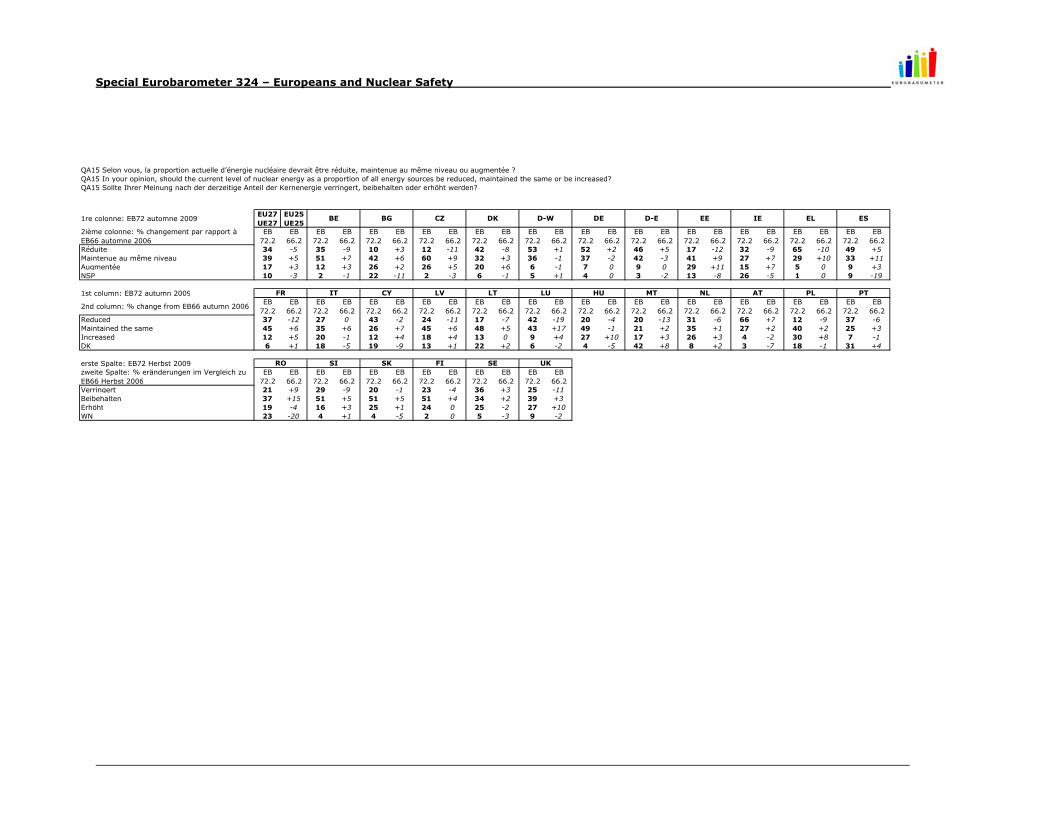
Special Eurobarometer 324 – Europeans and Nuclear Safety
1re colonne: EB72 automne 2009EU27 UE27
EU25 UE25
2ième colonne: % changement par rapport à EB66 automne 2006
EB72.2
EB66.2
EB72.2
EB66.2
EB72.2
EB66.2
EB72.2
EB66.2
EB72.2
EB66.2
EB72.2
EB66.2
EB72.2
EB66.2
EB72.2
EB66.2
EB72.2
EB66.2
EB72.2
EB66.2
EB72.2
EB66.2
EB72.2
EB66.2
Réduite 34 -5 35 -9 10 +3 12 -11 42 -8 53 +1 52 +2 46 +5 17 -12 32 -9 65 -10 49 +5Maintenue au même niveau 39 +5 51 +7 42 +6 60 +9 32 +3 36 -1 37 -2 42 -3 41 +9 27 +7 29 +10 33 +11Augmentée 17 +3 12 +3 26 +2 26 +5 20 +6 6 -1 7 0 9 0 29 +11 15 +7 5 0 9 +3NSP 10 -3 2 -1 22 -11 2 -3 6 -1 5 +1 4 0 3 -2 13 -8 26 -5 1 0 9 -19
1st column: EB72 autumn 2009
2nd column: % change from EB66 autumn 2006EB
72.2EB
66.2EB
72.2EB
66.2EB
72.2EB
66.2EB
72.2EB
66.2EB
72.2EB
66.2EB
72.2EB
66.2EB
72.2EB
66.2EB
72.2EB
66.2EB
72.2EB
66.2EB
72.2EB
66.2EB
72.2EB
66.2EB
72.2EB
66.2Reduced 37 -12 27 0 43 -2 24 -11 17 -7 42 -19 20 -4 20 -13 31 -6 66 +7 12 -9 37 -6Maintained the same 45 +6 35 +6 26 +7 45 +6 48 +5 43 +17 49 -1 21 +2 35 +1 27 +2 40 +2 25 +3Increased 12 +5 20 -1 12 +4 18 +4 13 0 9 +4 27 +10 17 +3 26 +3 4 -2 30 +8 7 -1DK 6 +1 18 -5 19 -9 13 +1 22 +2 6 -2 4 -5 42 +8 8 +2 3 -7 18 -1 31 +4
erste Spalte: EB72 Herbst 2009zweite Spalte: % eränderungen im Vergleich zu EB66 Herbst 2006
EB72.2
EB66.2
EB72.2
EB66.2
EB72.2
EB66.2
EB72.2
EB66.2
EB72.2
EB66.2
EB72.2
EB66.2
Verringert 21 +9 29 -9 20 -1 23 -4 36 +3 25 -11Beibehalten 37 +15 51 +5 51 +5 51 +4 34 +2 39 +3Erhöht 19 -4 16 +3 25 +1 24 0 25 -2 27 +10WN 23 -20 4 +1 4 -5 2 0 5 -3 9 -2
QA15 Selon vous, la proportion actuelle d’énergie nucléaire devrait être réduite, maintenue au même niveau ou augmentée ? QA15 In your opinion, should the current level of nuclear energy as a proportion of all energy sources be reduced, maintained the same or be increased? QA15 Sollte Ihrer Meinung nach der derzeitige Anteil der Kernenergie verringert, beibehalten oder erhöht werden?
D-E EEBE BG CZ DK
LT LU HU
D-W DE
PT
RO SE
IE EL ES
FR IT CY LV MT NL AT PL
UKSI SK FI

Special Eurobarometer 324 – Europeans and Nuclear Safety
UE27EU27
BE BG CZ DK D-W DE D-E EE IE
EB72.2
EB72.2
EB72.2
EB72.2
EB72.2
EB72.2
EB72.2
EB72.2
EB72.2
EB72.2
Très utile 45 52 56 34 60 44 45 52 45 34Assez utile 32 37 23 46 18 28 29 31 30 30Pas très utile 10 7 3 10 9 15 14 11 10 9Pas du tout utile 5 3 1 3 9 9 8 4 5 8NSP 8 1 17 7 4 4 4 2 10 19Utile 77 89 79 80 78 72 74 83 75 64Pas utile 15 10 4 13 18 24 22 15 15 17
EL ES FR IT CY LV LT LU HU MTEB
72.2EB
72.2EB
72.2EB
72.2EB
72.2EB
72.2EB
72.2EB
72.2EB
72.2EB
72.2 Very useful 66 45 62 50 81 37 37 40 56 35Fairly useful 23 36 27 33 12 33 38 27 34 27Not very useful 4 8 4 10 3 12 9 14 5 8Not at all useful 7 2 2 3 0 7 3 12 1 7DK 0 9 5 4 4 11 13 7 4 23Useful 89 81 89 83 93 70 75 67 90 62Not useful 11 10 6 13 3 19 12 26 6 15
NL AT PL PT RO SI SK FI SE UKEB
72.2EB
72.2EB
72.2EB
72.2EB
72.2EB
72.2EB
72.2EB
72.2EB
72.2EB
72.2Sehr nützlich 71 28 23 26 66 61 46 42 43 25Ziemlich nützlich 19 31 41 38 20 29 42 42 30 35Nicht sehr nützlich 4 18 15 12 4 5 7 10 14 17Überhaupt nicht nützlich 3 17 4 3 1 1 1 3 7 11WN 3 6 17 21 9 4 4 3 6 12Nützlich 90 59 64 64 86 90 88 84 73 60Nicht nützlich 7 35 19 15 5 6 8 13 21 28
In (OUR COUNTRY)
QA16.1 Dans quelle mesure serait-il utile ou pas d’avoir une législation de l’Union européenne sur la gestion des déchets nucléaires ... ? En (NOTRE PAYS)QA16.1 How useful or not would it be to have an European Union legislation on nuclear waste management …?
QA16.1 Wie nützlich wäre es Ihrer Meinung nach, eine Europäische Union-Regelung für die Entsorgung von Atommüll … zu haben? In (UNSER LAND)
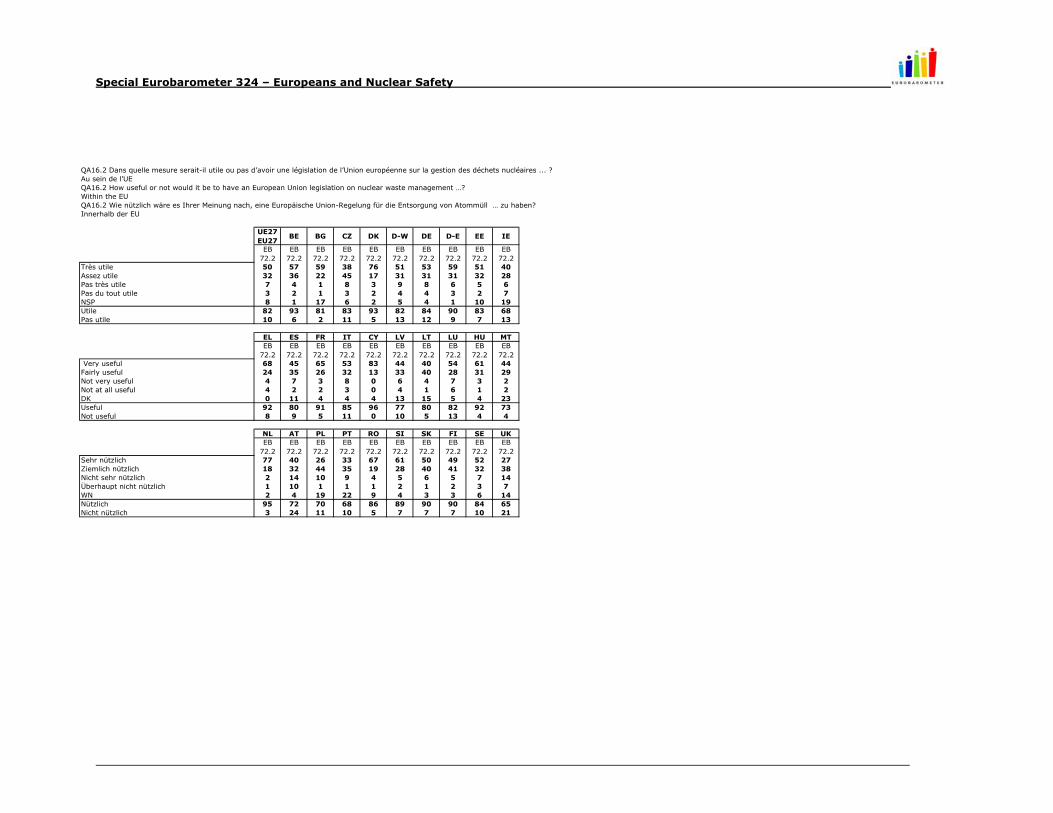
Special Eurobarometer 324 – Europeans and Nuclear Safety
UE27EU27
BE BG CZ DK D-W DE D-E EE IE
EB72.2
EB72.2
EB72.2
EB72.2
EB72.2
EB72.2
EB72.2
EB72.2
EB72.2
EB72.2
Très utile 50 57 59 38 76 51 53 59 51 40Assez utile 32 36 22 45 17 31 31 31 32 28Pas très utile 7 4 1 8 3 9 8 6 5 6Pas du tout utile 3 2 1 3 2 4 4 3 2 7NSP 8 1 17 6 2 5 4 1 10 19Utile 82 93 81 83 93 82 84 90 83 68Pas utile 10 6 2 11 5 13 12 9 7 13
EL ES FR IT CY LV LT LU HU MTEB
72.2EB
72.2EB
72.2EB
72.2EB
72.2EB
72.2EB
72.2EB
72.2EB
72.2EB
72.2 Very useful 68 45 65 53 83 44 40 54 61 44Fairly useful 24 35 26 32 13 33 40 28 31 29Not very useful 4 7 3 8 0 6 4 7 3 2Not at all useful 4 2 2 3 0 4 1 6 1 2DK 0 11 4 4 4 13 15 5 4 23Useful 92 80 91 85 96 77 80 82 92 73Not useful 8 9 5 11 0 10 5 13 4 4
NL AT PL PT RO SI SK FI SE UKEB
72.2EB
72.2EB
72.2EB
72.2EB
72.2EB
72.2EB
72.2EB
72.2EB
72.2EB
72.2Sehr nützlich 77 40 26 33 67 61 50 49 52 27Ziemlich nützlich 18 32 44 35 19 28 40 41 32 38Nicht sehr nützlich 2 14 10 9 4 5 6 5 7 14Überhaupt nicht nützlich 1 10 1 1 1 2 1 2 3 7WN 2 4 19 22 9 4 3 3 6 14Nützlich 95 72 70 68 86 89 90 90 84 65Nicht nützlich 3 24 11 10 5 7 7 7 10 21
Within the EU
QA16.2 Dans quelle mesure serait-il utile ou pas d’avoir une législation de l’Union européenne sur la gestion des déchets nucléaires ... ? Au sein de l’UEQA16.2 How useful or not would it be to have an European Union legislation on nuclear waste management …?
QA16.2 Wie nützlich wäre es Ihrer Meinung nach, eine Europäische Union-Regelung für die Entsorgung von Atommüll … zu haben? Innerhalb der EU
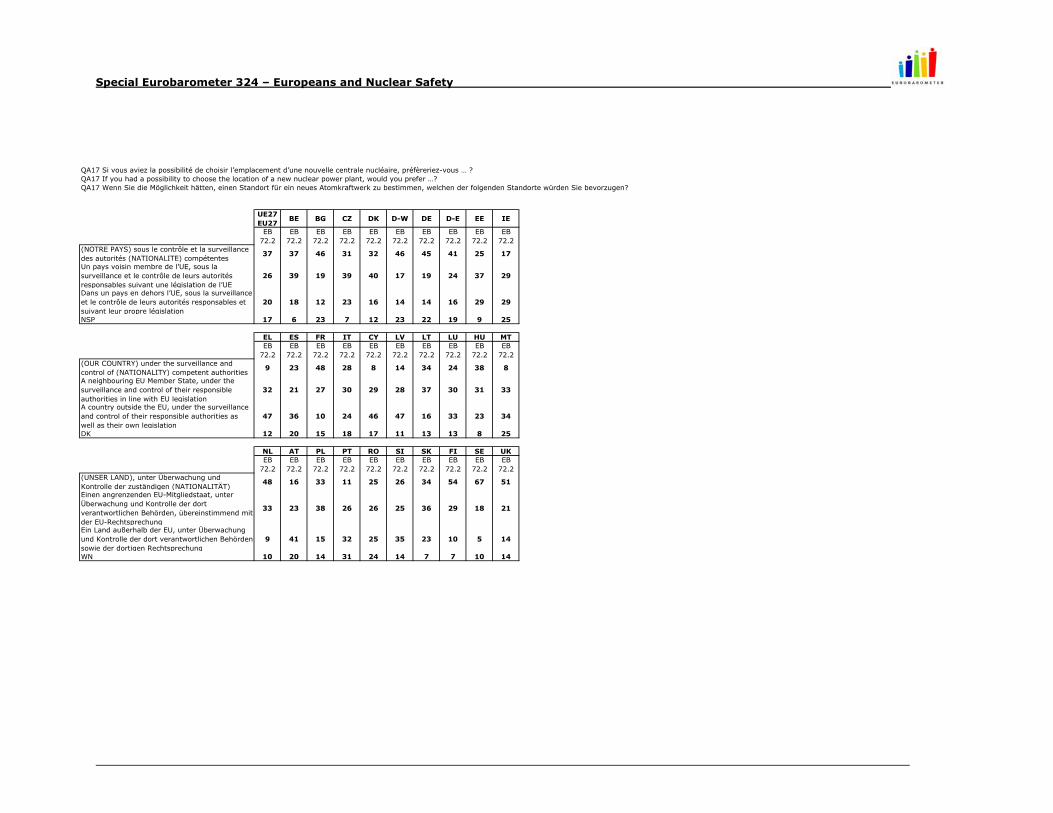
Special Eurobarometer 324 – Europeans and Nuclear Safety
UE27EU27
BE BG CZ DK D-W DE D-E EE IE
EB72.2
EB72.2
EB72.2
EB72.2
EB72.2
EB72.2
EB72.2
EB72.2
EB72.2
EB72.2
(NOTRE PAYS) sous le contrôle et la surveillance des autorités (NATIONALITE) compétentes
37 37 46 31 32 46 45 41 25 17
Un pays voisin membre de l’UE, sous la surveillance et le contrôle de leurs autorités responsables suivant une législation de l’UE
26 39 19 39 40 17 19 24 37 29
Dans un pays en dehors l’UE, sous la surveillance et le contrôle de leurs autorités responsables et suivant leur propre législation
20 18 12 23 16 14 14 16 29 29
NSP 17 6 23 7 12 23 22 19 9 25
EL ES FR IT CY LV LT LU HU MTEB
72.2EB
72.2EB
72.2EB
72.2EB
72.2EB
72.2EB
72.2EB
72.2EB
72.2EB
72.2(OUR COUNTRY) under the surveillance and control of (NATIONALITY) competent authorities
9 23 48 28 8 14 34 24 38 8
A neighbouring EU Member State, under the surveillance and control of their responsible authorities in line with EU legislation
32 21 27 30 29 28 37 30 31 33
A country outside the EU, under the surveillance and control of their responsible authorities as well as their own legislation
47 36 10 24 46 47 16 33 23 34
DK 12 20 15 18 17 11 13 13 8 25
NL AT PL PT RO SI SK FI SE UKEB
72.2EB
72.2EB
72.2EB
72.2EB
72.2EB
72.2EB
72.2EB
72.2EB
72.2EB
72.2(UNSER LAND), unter Überwachung und Kontrolle der zuständigen (NATIONALITÄT)
48 16 33 11 25 26 34 54 67 51
Einen angrenzenden EU-Mitgliedstaat, unter Überwachung und Kontrolle der dort verantwortlichen Behörden, übereinstimmend mit der EU-Rechtsprechung
33 23 38 26 26 25 36 29 18 21
Ein Land außerhalb der EU, unter Überwachung und Kontrolle der dort verantwortlichen Behörden sowie der dortigen Rechtsprechung
9 41 15 32 25 35 23 10 5 14
WN 10 20 14 31 24 14 7 7 10 14
QA17 Si vous aviez la possibilité de choisir l’emplacement d’une nouvelle centrale nucléaire, préfèreriez-vous … ? QA17 If you had a possibility to choose the location of a new nuclear power plant, would you prefer …? QA17 Wenn Sie die Möglichkeit hätten, einen Standort für ein neues Atomkraftwerk zu bestimmen, welchen der folgenden Standorte würden Sie bevorzugen?
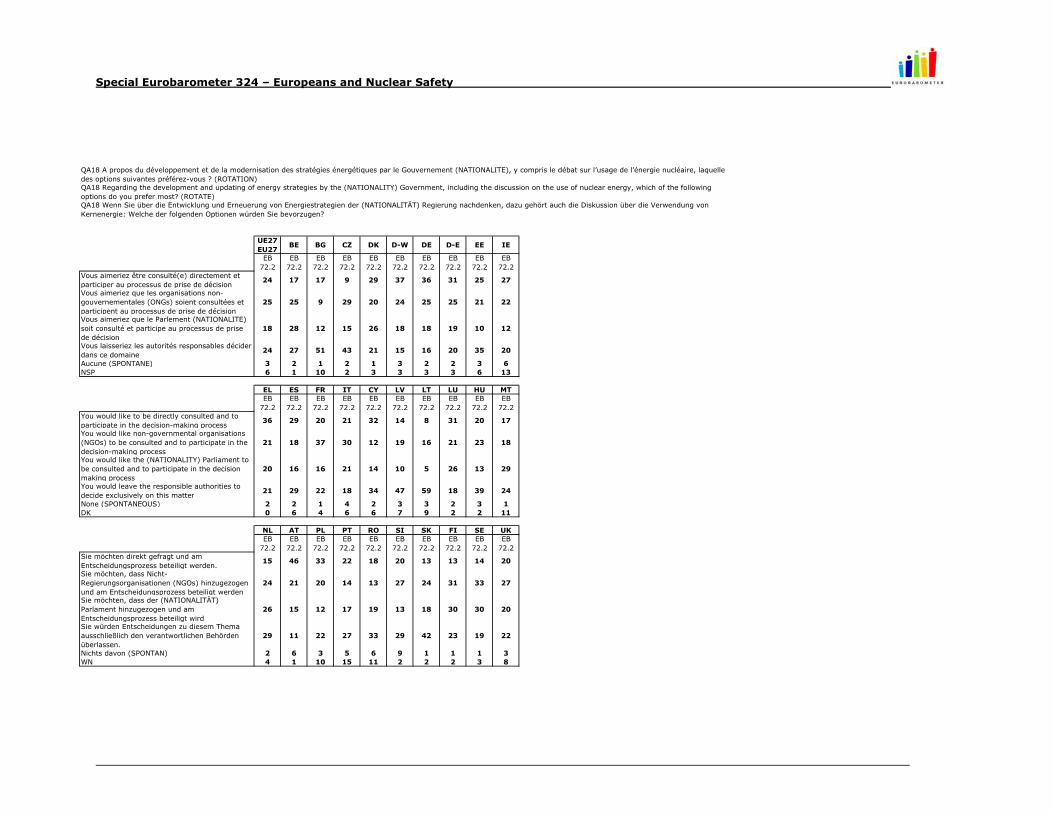
Special Eurobarometer 324 – Europeans and Nuclear Safety
UE27EU27
BE BG CZ DK D-W DE D-E EE IE
EB72.2
EB72.2
EB72.2
EB72.2
EB72.2
EB72.2
EB72.2
EB72.2
EB72.2
EB72.2
Vous aimeriez être consulté(e) directement et participer au processus de prise de décision
24 17 17 9 29 37 36 31 25 27
Vous aimeriez que les organisations non-gouvernementales (ONGs) soient consultées et participent au processus de prise de décision
25 25 9 29 20 24 25 25 21 22
Vous aimeriez que le Parlement (NATIONALITE) soit consulté et participe au processus de prise de décision
18 28 12 15 26 18 18 19 10 12
Vous laisseriez les autorités responsables décider dans ce domaine
24 27 51 43 21 15 16 20 35 20
Aucune (SPONTANE) 3 2 1 2 1 3 2 2 3 6NSP 6 1 10 2 3 3 3 3 6 13
EL ES FR IT CY LV LT LU HU MTEB
72.2EB
72.2EB
72.2EB
72.2EB
72.2EB
72.2EB
72.2EB
72.2EB
72.2EB
72.2You would like to be directly consulted and to participate in the decision-making process
36 29 20 21 32 14 8 31 20 17
You would like non-governmental organisations (NGOs) to be consulted and to participate in the decision-making process
21 18 37 30 12 19 16 21 23 18
You would like the (NATIONALITY) Parliament to be consulted and to participate in the decision making process
20 16 16 21 14 10 5 26 13 29
You would leave the responsible authorities to decide exclusively on this matter
21 29 22 18 34 47 59 18 39 24
None (SPONTANEOUS) 2 2 1 4 2 3 3 2 3 1DK 0 6 4 6 6 7 9 2 2 11
NL AT PL PT RO SI SK FI SE UKEB
72.2EB
72.2EB
72.2EB
72.2EB
72.2EB
72.2EB
72.2EB
72.2EB
72.2EB
72.2Sie möchten direkt gefragt und am Entscheidungsprozess beteiligt werden.
15 46 33 22 18 20 13 13 14 20
Sie möchten, dass Nicht-Regierungsorganisationen (NGOs) hinzugezogen und am Entscheidungsprozess beteiligt werden
24 21 20 14 13 27 24 31 33 27
Sie möchten, dass der (NATIONALITÄT) Parlament hinzugezogen und am Entscheidungsprozess beteiligt wird
26 15 12 17 19 13 18 30 30 20
Sie würden Entscheidungen zu diesem Thema ausschließlich den verantwortlichen Behörden überlassen.
29 11 22 27 33 29 42 23 19 22
Nichts davon (SPONTAN) 2 6 3 5 6 9 1 1 1 3WN 4 1 10 15 11 2 2 2 3 8
QA18 A propos du développement et de la modernisation des stratégies énergétiques par le Gouvernement (NATIONALITE), y compris le débat sur l’usage de l’énergie nucléaire, laquelle des options suivantes préférez-vous ? (ROTATION)QA18 Regarding the development and updating of energy strategies by the (NATIONALITY) Government, including the discussion on the use of nuclear energy, which of the following options do you prefer most? (ROTATE)QA18 Wenn Sie über die Entwicklung und Erneuerung von Energiestrategien der (NATIONALITÄT) Regierung nachdenken, dazu gehört auch die Diskussion über die Verwendung von Kernenergie: Welche der folgenden Optionen würden Sie bevorzugen?
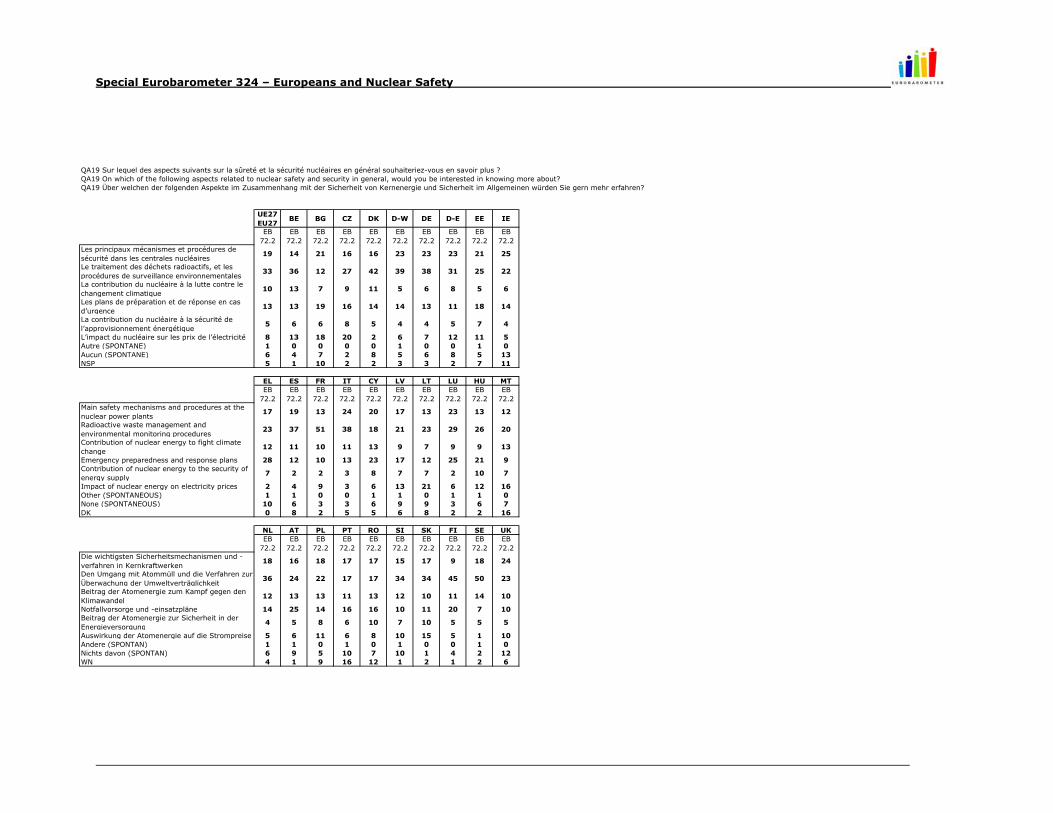
Special Eurobarometer 324 – Europeans and Nuclear Safety
UE27EU27
BE BG CZ DK D-W DE D-E EE IE
EB72.2
EB72.2
EB72.2
EB72.2
EB72.2
EB72.2
EB72.2
EB72.2
EB72.2
EB72.2
Les principaux mécanismes et procédures de sécurité dans les centrales nucléaires
19 14 21 16 16 23 23 23 21 25
Le traitement des déchets radioactifs, et les procédures de surveillance environnementales
33 36 12 27 42 39 38 31 25 22
La contribution du nucléaire à la lutte contre le changement climatique
10 13 7 9 11 5 6 8 5 6
Les plans de préparation et de réponse en cas d’urgence
13 13 19 16 14 14 13 11 18 14
La contribution du nucléaire à la sécurité de l’approvisionnement énergétique
5 6 6 8 5 4 4 5 7 4
L’impact du nucléaire sur les prix de l’électricité 8 13 18 20 2 6 7 12 11 5Autre (SPONTANE) 1 0 0 0 0 1 0 0 1 0Aucun (SPONTANE) 6 4 7 2 8 5 6 8 5 13NSP 5 1 10 2 2 3 3 2 7 11
EL ES FR IT CY LV LT LU HU MTEB
72.2EB
72.2EB
72.2EB
72.2EB
72.2EB
72.2EB
72.2EB
72.2EB
72.2EB
72.2Main safety mechanisms and procedures at the nuclear power plants
17 19 13 24 20 17 13 23 13 12
Radioactive waste management and environmental monitoring procedures
23 37 51 38 18 21 23 29 26 20
Contribution of nuclear energy to fight climate change
12 11 10 11 13 9 7 9 9 13
Emergency preparedness and response plans 28 12 10 13 23 17 12 25 21 9Contribution of nuclear energy to the security of energy supply
7 2 2 3 8 7 7 2 10 7
Impact of nuclear energy on electricity prices 2 4 9 3 6 13 21 6 12 16Other (SPONTANEOUS) 1 1 0 0 1 1 0 1 1 0None (SPONTANEOUS) 10 6 3 3 6 9 9 3 6 7DK 0 8 2 5 5 6 8 2 2 16
NL AT PL PT RO SI SK FI SE UKEB
72.2EB
72.2EB
72.2EB
72.2EB
72.2EB
72.2EB
72.2EB
72.2EB
72.2EB
72.2Die wichtigsten Sicherheitsmechanismen und -verfahren in Kernkraftwerken
18 16 18 17 17 15 17 9 18 24
Den Umgang mit Atommüll und die Verfahren zur Überwachung der Umweltverträglichkeit
36 24 22 17 17 34 34 45 50 23
Beitrag der Atomenergie zum Kampf gegen den Klimawandel
12 13 13 11 13 12 10 11 14 10
Notfallvorsorge und -einsatzpläne 14 25 14 16 16 10 11 20 7 10Beitrag der Atomenergie zur Sicherheit in der Energieversorgung
4 5 8 6 10 7 10 5 5 5
Auswirkung der Atomenergie auf die Strompreise 5 6 11 6 8 10 15 5 1 10Andere (SPONTAN) 1 1 0 1 0 1 0 0 1 0Nichts davon (SPONTAN) 6 9 5 10 7 10 1 4 2 12WN 4 1 9 16 12 1 2 1 2 6
QA19 Sur lequel des aspects suivants sur la sûreté et la sécurité nucléaires en général souhaiteriez-vous en savoir plus ? QA19 On which of the following aspects related to nuclear safety and security in general, would you be interested in knowing more about? QA19 Über welchen der folgenden Aspekte im Zusammenhang mit der Sicherheit von Kernenergie und Sicherheit im Allgemeinen würden Sie gern mehr erfahren?
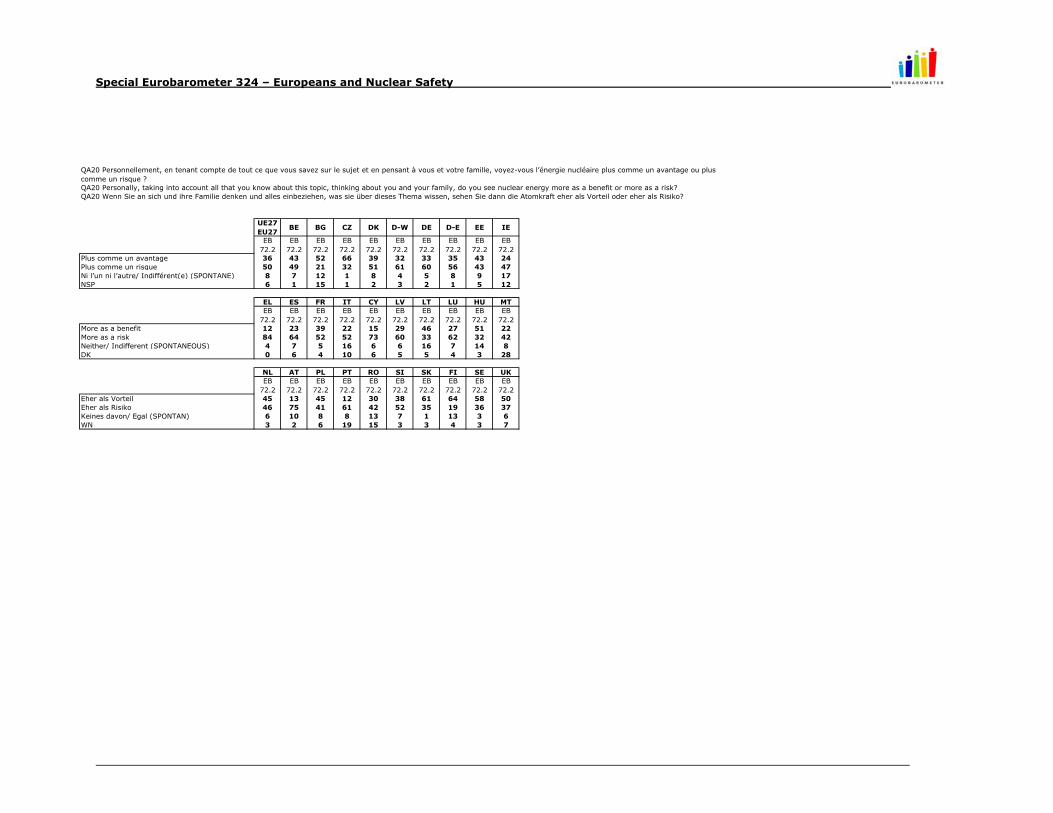
Special Eurobarometer 324 – Europeans and Nuclear Safety
UE27EU27
BE BG CZ DK D-W DE D-E EE IE
EB72.2
EB72.2
EB72.2
EB72.2
EB72.2
EB72.2
EB72.2
EB72.2
EB72.2
EB72.2
Plus comme un avantage 36 43 52 66 39 32 33 35 43 24Plus comme un risque 50 49 21 32 51 61 60 56 43 47Ni l’un ni l’autre/ Indifférent(e) (SPONTANE) 8 7 12 1 8 4 5 8 9 17NSP 6 1 15 1 2 3 2 1 5 12
EL ES FR IT CY LV LT LU HU MTEB
72.2EB
72.2EB
72.2EB
72.2EB
72.2EB
72.2EB
72.2EB
72.2EB
72.2EB
72.2More as a benefit 12 23 39 22 15 29 46 27 51 22More as a risk 84 64 52 52 73 60 33 62 32 42Neither/ Indifferent (SPONTANEOUS) 4 7 5 16 6 6 16 7 14 8DK 0 6 4 10 6 5 5 4 3 28
NL AT PL PT RO SI SK FI SE UKEB
72.2EB
72.2EB
72.2EB
72.2EB
72.2EB
72.2EB
72.2EB
72.2EB
72.2EB
72.2Eher als Vorteil 45 13 45 12 30 38 61 64 58 50Eher als Risiko 46 75 41 61 42 52 35 19 36 37Keines davon/ Egal (SPONTAN) 6 10 8 8 13 7 1 13 3 6WN 3 2 6 19 15 3 3 4 3 7
QA20 Personnellement, en tenant compte de tout ce que vous savez sur le sujet et en pensant à vous et votre famille, voyez-vous l’énergie nucléaire plus comme un avantage ou plus comme un risque ? QA20 Personally, taking into account all that you know about this topic, thinking about you and your family, do you see nuclear energy more as a benefit or more as a risk? QA20 Wenn Sie an sich und ihre Familie denken und alles einbeziehen, was sie über dieses Thema wissen, sehen Sie dann die Atomkraft eher als Vorteil oder eher als Risiko?