Embed Size (px)
Citation preview
Jean Bowering, Mary A. Morrison,Ruth L. Lowenberg and Nilda Tirado
Methods of evaluating dietary recall are comparedfor an EFNEP program in East Harlem.
~ Evaluating 24-Hour Dietary RecallssEARCH
SummaryTwenty-four hour recalls obtained by a nutritionist in an ob
stetrics clinic were evaluated according to severalprocedures basedeither on nutrient content estimates or food group composition.Highly significant correlations were obtained among the followingindices of dietary adequacy: number of nutrients meeting twothirds of the RDA, Total Food Group Score and Total EnergyIntake. Each of these indices was effective in monitoring changesoccurring with clinic counseling and paraprofessional aide intervention. When careful consideration was given to the role of different food groups in the diets of two ethnic groups, Puerto Ricansand black Americans, the intake of either milk or fruit and vegetables offered additional sensitive measures of dietary change inresponse to nutrition education.
Authoh Note: The Expanded Food and Nutrition EducationProgram (EFNEP) is a nationwide program ofnutrition educationfunded by the U.S. Department ofAgriculture and administered byland grant universities through local Cooperative Extension Associations. The Maternal and Infant Care Program (MIC) of theDepartment of Health, Education and Welfare is in cooperationwith the New York City Department of Health. Medical, nutritional and social services were provided jointly by the MIC Program and the Federal Extension Service, U.s. Department ofAgriculture.
We have previously reported on the effectiveness of nutritionaides from the EFNEP program in enhancing the nutritioneClucation component of a MIC obstetric clinic in a low incomearea of New York City (1). The main criterion used in assessingaide effectiveness was the improvement in the nutrient content ofwomen's diets during pregnancy. Assessment based on changesin nutrient intake may not always be the most useful way ofevaluating a nutrition education program because it gives nodirect information on food consumption practices and becauseexamination of intakes of individual nutrients is cumbersome.Consequently, we were interested in observing the degree towhich dietary change expressed in terms of food group consumption would reflect the changes in dietary adequacy based onnutrient intakes. Comparisons are presented both for describinginitial dietary status and for measuring change with assistancefrom paraprofessionals. We have also examined the interrelationships among diet and ethnic background, age, formal education, and length of residence in New York City.
It appears that the use of a fairly simple dietary assessmentprocedure based on the USDA Four Food Groups, and in someinstances, on intake of milk, fruit and vegetables is an appropriate means of documenting the improvement in diets of agroup of low-income pregnant women.
THE A UTHORS are, respectively, Assistant Professor and Professor, Division of Nutritional Sciences, Cornell University, Ithaca, NY 14853, and Extension Nutritionists, East Harlem NutritionProgram, 1692 LeXington Avenue, New York, NY 10029.
The study was conducted in the East Harlem area of NewYork City among 119 pregnant women. The group, whichranged in age from 14 to 44, included black Americans, Haitiansand Spanish-speaking women predominantly from Puerto Rico.Dietary data were obtained from 24-hour recalls taken in aMIC obstetric clinic by the nutritionist, who also counseled eachwoman about improving her diet. The recalls were coded andanalyzed both for the content of nine nutrients as indicatedpreviously (1) and for the contribution to the USDA Four FoodGroups (2).
The objectives of the present portion of the East Harlem studywere:
to compare various simple methods of assessing diets withmethods requiring calculations of nutrient intaketo determine which measures provided the best indicatorsof dietary improvement, and where appropriate, of aideinfluenceto identify non-nutritional factors related to dietary variablesto see which of the preceding observations were influencedby ethnic differences.
MethodsDietary data were obtained from pregnant women at three of
their visits to the obstetric clinic (1). The first recall was obtainedat the initial clinic visit prior to nutrition counseling, prescriptionof supplemental vitamins or iron, or assignment of an aide. Theinitial visit occurred during the first trimester of pregnancy for18%, the second trimester for 75% and the third trimester for 7%of the women. The second recall was taken from one to fourmonths after the first visit. The women were subdivided byethnicity into Puerto Rican (45%), black American (30%) and"Other" (25%). The group designated "Other" included womenfrom Haiti, and from South and Central America, and was obviously extremely heterogeneous. Each of the three groups wasfurther subdivided into a Control group which only receivednutrition counseling in the clinic and a Study group composed ofwomen who had home visits from EFNEP aides in addition tonutrition counseling in the clinic. EFNEP aides visited the women in their homes and reinforced the advice given to the women by the clinic nutritionist about their own diets and the dietsof their infants (1). The size of each group is given in Table 1.
Dietary AssessmentTable 1 shows the average intakes of foods in each of four
groups at each of the three clinic visits. A total score was alsocomputed for each patient based on the sum of the intakes forthe individual food groups. The food group score was based onUSDA recommendations for either pregnant or non-pregnantwomen (see Footnote 5 in Table 1 for calculations). At the firstclinic visit, the scores for each food group were similar amongStudy and Control patients except for the bread-cereals group.
20 Journal of Nutrition Education Vol. 9 No. I January-March 1977
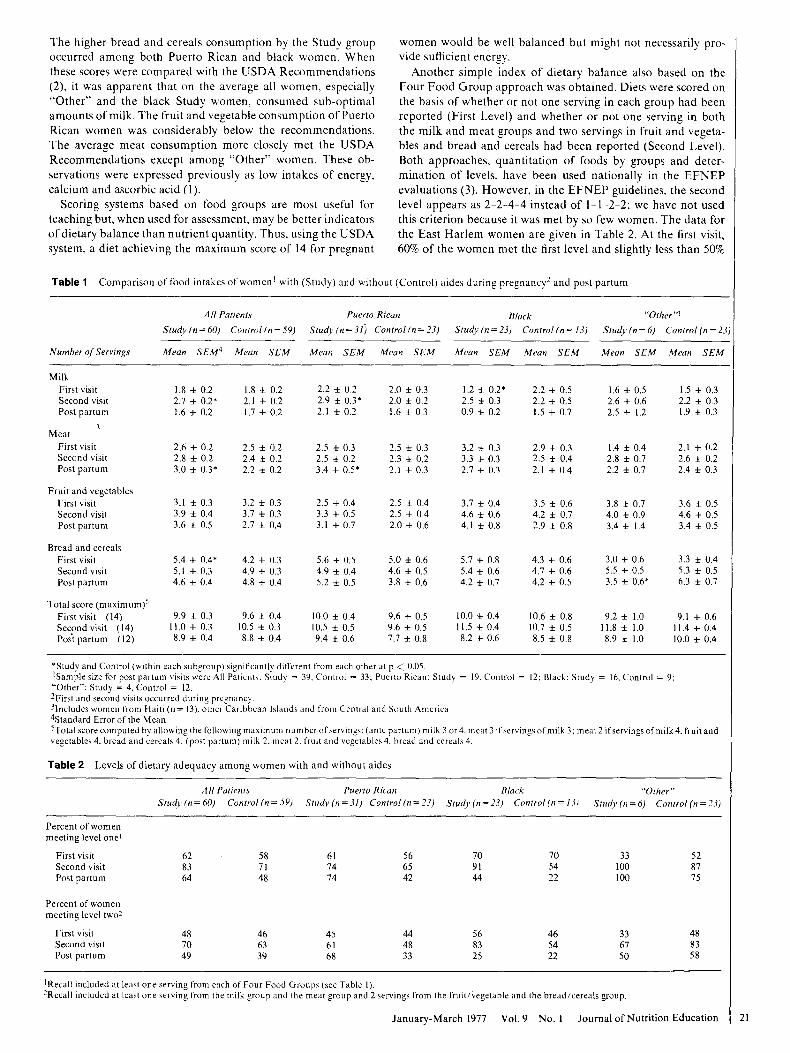
The higher bread and cereals consumption by the Study groupoccurred among both Puerto Rican and black women. Whenthese scores were compared with the USDA Recommendations(2), it was apparent that on the average all women, especially"Other" and the black Study women, consumed sub-optimalamounts of milk. The fruit and vegetable consumption of PuertoRican women was considerably below the recommendations.The average meat consumption more closely met the USDARecommendations except among "Other" women. These observations were expressed previously as low intakes of energy,calcium and ascorbic acid (1).
Scoring systems based on food groups are most useful forteaching but, when used for assessment, may be better indicatorsof dietary balance than nutrient quantity. Thus, using the USDAsystem, a diet achieving the maximum score of 14 for pregnant
women would be well balanced but might not necessarily provide sufficient energy.
Another simple index of dietary balance also based on theFour Food Group approach was obtained. Diets were scored onthe basis of whether or not one serving in each group had beenreported (First Level) and whether or not one serving in boththe milk and meat groups and two servings in fruit and vegetables and bread and cereals had been reported (Second Level).Both approaches, quantitation of foods by groups and determination of levels, have been used nationally in the EFNEPevaluations (3). However, in the EFNEP guidelines, the secondlevel appears as 2-2-4-4 instead of 1-1-2-2; we have not usedthis criterion because it was met by so few women. The data forthe East Harlem women are given in Table 2. At the first visit,60% of the women met the first level and slightly less than 50%
Table 1 Comparison of food intakes of women I with (Study) and without (Control) aides during pregnancy2 and post partum
All Patients Puerto Rican Black "Other'~
Study (n=60) Contro/(n=59) Study(n=31) Control(n=23) Study (n=23) Control (n= 13) Study (n=6) Control(n=23)
Number of Servings
MilkFirst visitSecond visitPost partum
MeatFirst visitSecond visitPost parturn
Fruit and vegetablesFirst visitSecond visitPost partum
Bread and cerealsFirst visitSecond visitPost partum
Total score (maximum)5First visit (14)Second visit (14)Pos't partum (12)
Mean SEM4
1.8 ± 0.22.7 ± 0.2'\.6 ± 0.2
2.6 ± 0.22.8 ± 0.23.0 ± 0.3'
3.1 ± 0.33.9 ± 0.43.6 ± 0.5
5.4 ± 0.4'5.1 ± 0.34.6 ± 0.4
9.9 ± 0.311.0 ± 0.38.9 ± 0.4
Mean SEM
1.8 ± 0.22.1 ± 0.21.7 ± 0.2
2.5 ± 0.22.4 ± 0.22.2 ± 0.2
3.2 ± 0.33.7 ± 0.32.7 ± 0.4
4.2 ± 0.34.9 ± 0.34.8 ± 0.4
9.6 ± 0.410.5 ± 0.38.8 ± 0.4
Mean SEM
2.2 ± 0.22.9 ± 0.3'2.1 ± 0.2
2.5 ± 0.32.5 ± 0.23.4 ± 0.5'
2.5 ± 0.43.3 ± 0.53.1 ± 0.7
5.6 ± 0.54.9 ± 0.45.2 ± 0.5
10.0 ± 0.410.5 ± 0.59.4 ± 0.6
Mean SEM
2.0 ± 0.32.0 ± 0.2\.6 ± 0.3
2.5 ± 0.32.3 ± 0.22.1 + 0.3
2.5 + 0.42.5 + 0.42.0 + 0.6
5.0 ± 0.64.6 ± 0.53.8 + 0.6
9.6 + 0.59.6 + 0.57.7 + 0.8
Mean SEM
\.2 + 0.2'2.5 + 0.30.9 ± 0.2
3.2 + 0.33.3 + 0.32.7 + 0.3
3.7 + 0.44.6 ± 0.64.1 ± 0.8
5.7 ± 0.85.4 ± 0.64.2 ± 0.7
10.0 ± 0.411.5 ± 0.48.2 + 0.6
Mean SEM
2.2 ± 0.52.2 ± 0.51.5 ± 0.7
2.9 + 0.32.5 ± 0.42.1 + 0.4
3.5 ± 0.64.2 + 0.72.9 ± 0.8
4.3 + 0.64.7 + 0.64.2 + 0.5
10.6 + 0.810.7 + 0.58.5 ± 0.8
Mean SEM
1.6 ± 0.52.6 + 0.62.5 + 1.2
1.4 + 0.42.8 ± 0.72.2 ± 0.7
3.8 + 0.74.0 ± 0.93.4 ± 1.4
3.0 ± 0.65.5 + 0.53.5 + 0.6'
9.2 + 1.011.8 ± 1.08.9 ± 1.0
Mean SEM
1.5 ± 0.32.2 ± 0.31.9 ± 0.3
2.1 ± 0.22.6 + 0.22.4 ± 0.3
3.6 + 0.54.6 + 0.53.4 ± 0.5
3.3 ± 0.45.3 ± 0.56.3 + 0.7
9.1 ± 0.611.4 ± 0.410.0 ± 0.4
'Study and Control (within each subgroup) significantly different from each other at p < 0.05.lSample size for post partum visits were All Patients: Study = 39. Control = 33; Puerto Rican: Study = 19. Control = 12; Black; Study = 16. Control = 9;"Other": Study = 4. Control = 12.2First and second visits occurred during pregnancy.3Includes women from Haiti (n = 13). other Caribhean Islands and from Central and South America4Stan dard Error of the MeanSTatal score computed by allowing the following maximum number of servings: (ante partum) milk 3 or 4. meat 3 ifservings of milk 3; meat 2 if servings of milk 4. fruit andvegetables 4. bread and cereals 4; (post partum) milk 2. meat 2. fruit and vegetahles 4. bread and cereals 4.
Table 2 Levels of dietary adequacy among women with and without aides
All PatientsStudy (n = 60) Control (n = 59)
Puerto RicanStudy (n =3l) Control (n =23)
BlackStudy (n = 23) Control(n= 131
"Other"Study (n = 6) Control (n = 23)
Percent of womenmeeting level one I
First visitSecond visitPost partum
Percent of womenmeeting level tw02
First visitSecond visitPost partum
628364
487049
587148
466339
617474
456168
566542
444833
709144
568325
705422
465422
33100100
336750
528775
488358
1Recall included at least one serving from each of Four Food Groups (see Table I).2Recall included at least one serving from the milk group and the meat group and 2 servings from the fruit/vegetable and the bread/cereals group.
January-March 1977 Vol. 9 No.1 Journal of Nutrition Education 21
met the second level. There were no differences in the proportion of Study and Control women meeting either level. Therewas a trend toward black women having the greatest percentageand "Other" women having the lowest percentage of the groupmeeting either level. At the second clinic visit, Study women,especially' in the Puerto Rican and black groups, showed moreimprovement than Control women. This simple assessment didnot appear to be influenced by ethnic differences.
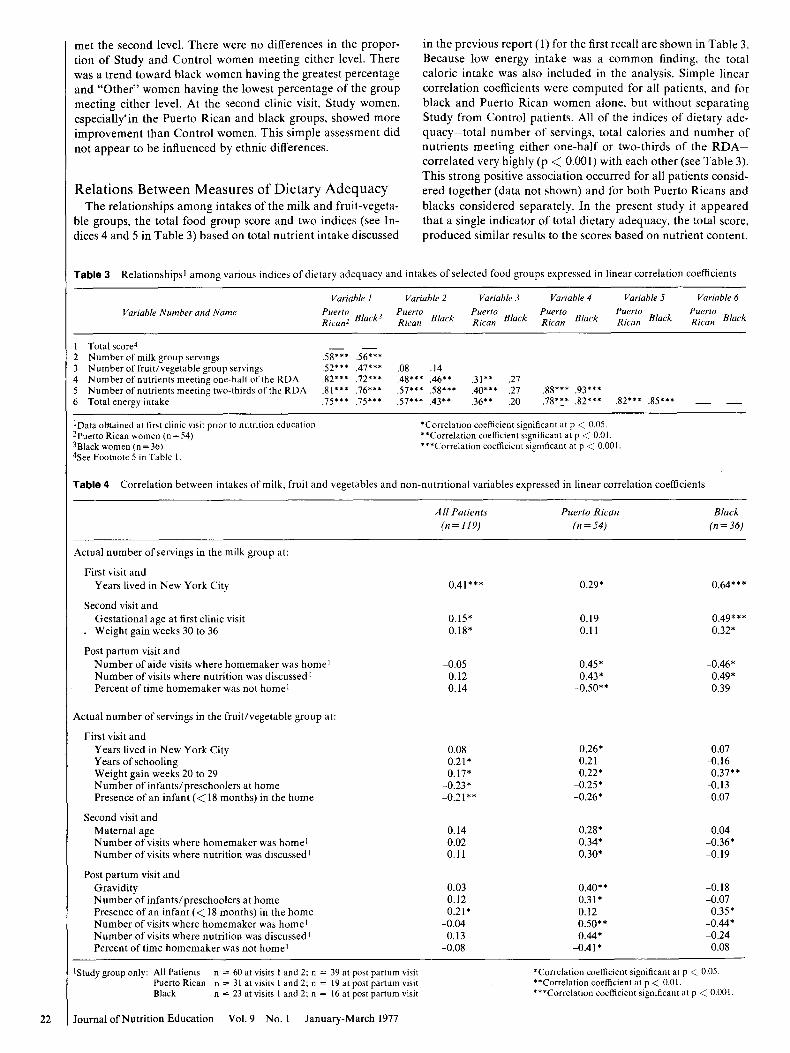
Relations Between Measures of Dietary AdequacyThe relationships among intakes of the milk and fruit-vegeta
ble groups, the total food group score and two indices (see Indices 4 and 5 in Table 3) based on total nutrient intake discussed
in the previous report (I) for the first recall are shown in Table 3.Because low energy intake was a common finding, the totalcaloric intake was also included in the analysis. Simple linearcorrelation coefficients were computed for all patients, and forblack and Puerto Rican women alone, but without separatingStudy from Control patients. All of the indices of dietary adequacy-total number of servings, total calories and number ofnutrients meeting either one-half or two-thirds of the RDAcorrelated very highly (p < 0.001) with each other (see Table 3).This strong positive association occurred for all patients considered together (data not shown) and for both Puerto Ricans andblacks considered separately. In the present study it appearedthat a single indicator of total dietary adequacy, the total score,produced similar results to the scores based on nutrient content.
Table 3 Relationships' among'various indices of dietary adequacy and intakes of selected food groups expressed in linear correlation coefficients
Variable Number and Name
Variable 1
Puerto Black3Rlcan2
Variable 2
PuertoRican Black
Variable 3
PuertoRican Black
Variable 4
PuertoRican Black
Variable 5PuertoRican Black
Variable 6
PuertoRican Black
I Total score4
2 Number of milk group servings3 Number offruit/vegetable group servings4 Number of nutrients meeting one-half of the RDA5 Number of nutrients meeting two-thirds of the RDA6 Total energy intake
IData oblained at lirst clinic visit prior to nutrition education2Puerto Rican women (n = 54)3Black women (n=36)4See Footnote 5 in Table I.
.58""" .56"""
.52""" .47"""
.82""" .n"""
.81""" .76"""
.75""" .75"""
.08 .14
.48""" .46"" .31"" .27
.57""" .58""" .40""" .27 .88""" .93"""
.57""" .43"" .36"" .20 .78"~" .82""" .82""" .85"""
"Correlation coefficient significant at p < 0.05.""Correlation coefficient significant at p < 0.0 I."""Correlation coefficient significant at p < 0.00 I.
Table 4 Correlation between intakes of milk, fruit and vegetables and non-nutritional variables expressed in linear correlation coefficients
A II Palients(n=1l9)
Puerto Rican(n = 54)
Black(n=36)
Actual number of servings in the milk group at:
First visit andYears lived in New York City
Second visit andGestational age at first clinic visit
. Weight gain weeks 30 to 36
Post partum visit andNumber of aide visits where homemaker was home!Number of visits where nutrition was discussed!Percent of time homemaker was not home l
Actual number of servings in the fruit/vegetable group at;
First visit andYears lived in New York CityYears of schoolingWeight gain weeks 20 to 29Number of infants/preschoolers at homePresence of an infant « 18 months) in the home
Second visit andMaternal ageNumber of visits where homemaker was home l
Number of visits where nutrition was discussed'
Post partum visit andGravidityNumber of infants/preschoolers at homePresence of an infant « 18 months) in the homeNumber of visits where homemaker was home'Number of visits where nutrition was discussed!Percent of time homemaker was not home'
IStudy group only: All Patients n = 60 at visits I and 2; n = 39 at post partum visitPuerto Rican n = 31 at visits I and 2; n = 19 at post partum visitBlack n = 23 at visits I and 2; n = 16 at post partum visit
22 Journal of Nutrition Education Vol. 9 No. I January-March 1977
0.41*** 0.29* 0.64*"*
0.15* 0.19 0.49"**0.18* 0.11 0.32*
-0.05 0.45" -0.46*0.12 0.43" -0.49*0.14 -0.50*" 0.39
0.08 0.26* -0.070.21* 0.21 -0.160.17* 0.22* 0.37**
-0.23* -0.25" -0.13-0.21 .. -0.26* -0.07
0.14 0.28* 0.040.Q2 0.34* -0.36"0.11 0.30" -0.19
0.03 0.40" -0.180.12 0.31* -0.070.21* 0.12 0.35*
-0.04 0.50" -0.44*0.13 0.44* -0.24
-0.08 -0.41* 0.08
"Correlation coefficient significant at p < 0.05.""Correlation coefficient at p < 0.01."""Correlation coefficient significant at p < 0.001.
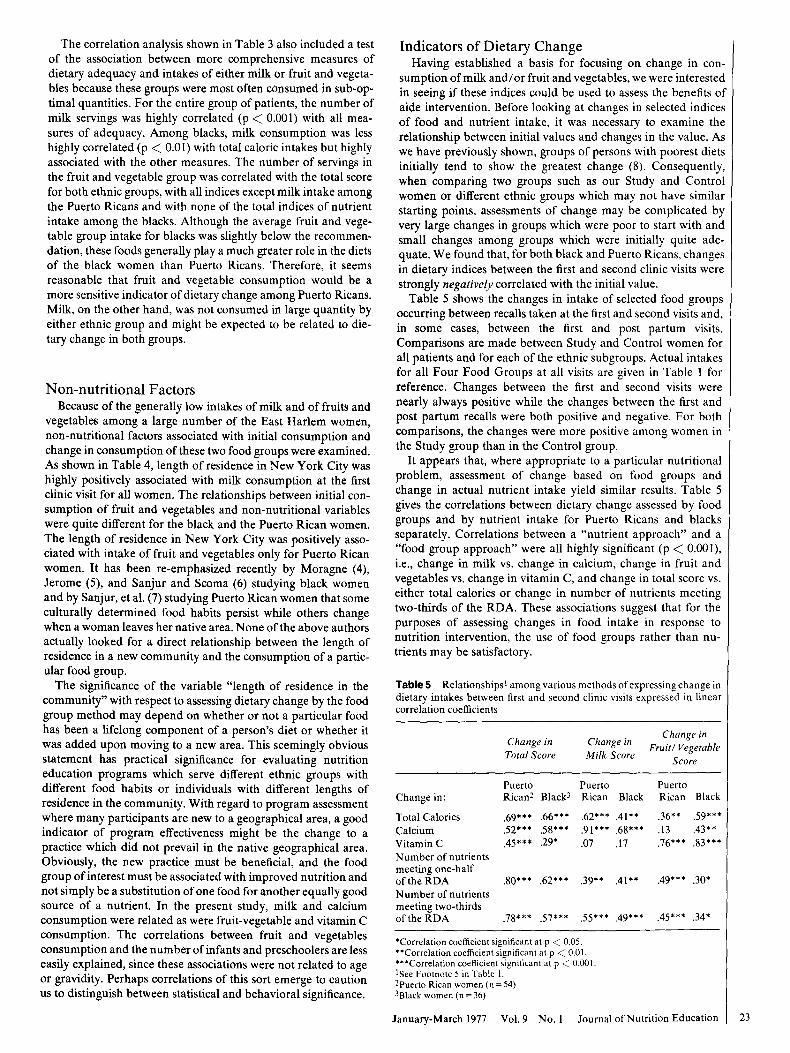
Table 5 Relationships! among various methods ofexpressing change indietary intakes between first and second clinic visits expressed in linearcorrelation coefficients
Puerto Puerto PuertoChange in: Rican2 Black3 Rican Black Rican Black
Total Calories .69*** .66*** .62*** AI** .36** .59***Calcium .52*** .58*** .91*** .68*** .13 A3**VitaminC .45*** .29* .07 .17 .76*** .83***Number of nutrientsmeeting one-half
AI** .49*** .30*of the RDA .80*** .62*** .39**Number of nutrientsmeeting two-thirds
.55*** .49*** .45*** .34*of the RDA .78*** .57***
Indicators of Dietary ChangeHaving established a basis for focusing on change in con
sumption of milk and/or fruit and vegetables, we were interestedin seeing if these indices could be used to assess the benefits ofaide intervention. Before looking at changes in selected indicesof food and nutrient intake, it was necessary to examine therelationship between initial values and changes in the value. Aswe have previously shown, groups of persons with poorest dietsinitially tend to show the greatest change (8). Consequently,when comparing two groups such as our Study and Controlwomen or different ethnic groups which may not have similarstarting points, assessments of change may be complicated byvery large changes in groups which were poor to start with andsmall changes among groups which were initially quite adequate. We found that, for both black and Puerto Ricans, changesin dietary indices between the first and second clinic visits werestrongly negatively correlated with the initial value.
Table 5 shows the changes in intake of selected food groupsoccurring between recalls taken at the first and second visits and,in some cases, between the first and post partum visits.Comparisons are made between Study and Control women forall patients and for each of the ethnic subgroups. Actual intakesfor all Four Food Groups at all visits are given in Table 1 forreference. Changes between the first and second visits werenearly always positive while the changes between the first andpost partum recalls were both positive and negative. For bothcomparisons, the changes were more positive among women inthe Study group than in the Control group.
It appears that, where appropriate to a particular nutritionalproblem, assessment of change based on food groups andchange in actual nutrient intake yield similar results. Table 5gives the correlations between dietary change assessed by foodgroups and by nutrient intake for Puerto Ricans and blacksseparately. Correlations between a "nutrient approach" and a"food group approach" were all highly significant (p < 0.001),i.e., change in milk vs. change in calcium, change in fruit andvegetables vs. change in vitamin C, and change in total score vs.either total calories or change in number of nutrients meetingtwo-thirds of the RDA. These associations suggest that for thepurposes of assessing changes in food intake in response tonutrition intervention, the use of food groups rather than nutrients may be satisfactory.
'Correlation coefficient significant at p < 0.05."Correlation coefficient significant at p < 0.01."'Correlation coefficient significant a! p < 0.001.ISee Footnote 5 in Table 1.2Puerto Rican women (n = 54)3Black women (n = 36)
Change inFruit/ Vegetable
Score
Change inMilk Score
Change inTotal Score
The correlation analysis shown in Table 3 also included a testof the association between more comprehensive measures ofdietary adequacy and intakes of either milk or fruit and vegetables because these groups were most often consumed in sub-optimal quantities. For the entire group of patients, the number ofmilk servings was highly correlated (p < 0.001) with all measures of adequacy. Among blacks, milk consumption was lesshighly correlated (p < 0.01) with total caloric intakes but highlyassociated with the other measures. The number of servings inthe fruit and vegetable group was correlated with the total scorefor both ethnic groups, with all indices except milk intake amongthe Puerto Ricans and with none of the total indices of nutrientintake among the blacks. Although the average fruit and vegetable group intake for blacks was slightly below the recommendation, these foods generally playa much greater role in the dietsof the black women than Puerto Ricans. Therefore, it seemsreasonable that fruit and vegetable consumption would be amore sensitive indicator of dietary change among Puerto Ricans.Milk, on the other hand, was not consumed in large quantity byeither ethnic group and might be expected to be related to dietary change in both groups.
Non-nutritional FactorsBecause of the generally low intakes of milk and of fruits and
vegetables among a large number of the East Harlem women,non-nutritional factors associated with initial consumption andchange in consumption of these two food groups were examined.As shown in Table 4, length of residence in New York City washighly positively associated with milk consumption at the firstclinic visit for all women. The relationships between initial consumption of fruit and vegetables and non-nutritional variableswere quite different for the black and the Puerto Rican women.The length of residence in New York City was positively associated with intake of fruit and vegetables only for Puerto Ricanwomen. It has been re-emphasized recently by Moragne (4),Jerome (5), and Sanjur and Scoma (6) studying black womenand by Sanjur, et a1. (7) studying Puerto Rican women that someculturally determined food habits persist while others changewhen a woman leaves her native area. None of the above authorsactually looked for a direct relationship between the length ofresidence in a new community and the consumption of a particular food group.
The significance of the variable "length of residence in thecommunity" with respect to assessing dietary change by the foodgroup method may depend on whether or not a particular foodhas been a lifelong component of a person's diet or whether itwas added upon moving to a new area. This seemingly obviousstatement has practical significance for evaluating nutritioneducation programs which serve different ethnic groups withdifferent food habits or individuals with different lengths ofresidence in the community. With regard to program assessmentwhere many participants are new to a geographical area, a goodindicator of program effectiveness might be the change to apractice which did not prevail in the native geographical area.Obviously, the new practice must be beneficial, and the foodgroup of interest must be associated with improved nutrition andnot simply be a substitution of one food for another equally goodsource of a nutrient. In the present study, milk and calciumconsumption were related as were fruit-vegetable and vitamin Cconsumption. The correlations between fruit and vegetablesconsumption and the number of infants and preschoolers are lesseasily explained, since these associations were not related to ageor gravidity. Perhaps correlations of this sort emerge to cautionus to distinguish between statistical and behavioral significance.
January-March 1977 Vol. 9 No. I Journal of Nutrition Education 23
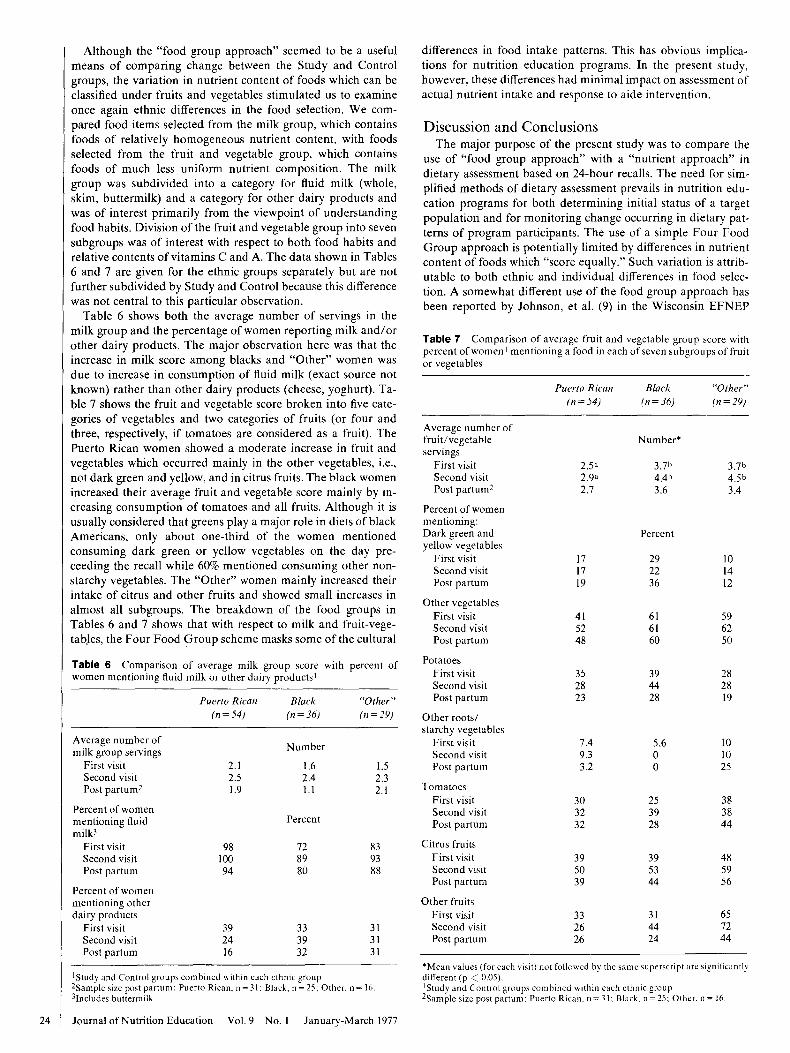
Table 6 Comparison of average milk group score with percent ofwomen mentioning fluid milk or other dairy products I
Although the "food group approach" seemed to be a usefulmeans of comparing change between the Study and Controlgroups, the variation in nutrient content of foods which can beclassified under fruits and vegetables stimulated us to examineonce again ethnic differences in the food selection. We compared food items selected from the milk group, which containsfoods of relatively homogeneous nutrient content, with foodsselected from the fruit and vegetable group, which containsfoods of much less uniform nutrient composition. The milkgroup was subdivided into a category for fluid milk (whole,skim, buttermilk) and a category for other dairy products andwas of interest primarily from the viewpoint of understandingfood habits. Division of the fruit and vegetable group into sevensUbgroups was of interest with respect to both food habits andrelative contents of vitamins C and A. The data shown in Tables6 and 7 are given for the ethnic groups separately but are notfurther subdivided by Study and Control because this differencewas not central to this particular observation.
Table 6 shows both the average number of servings in themilk group and the percentage of women reporting milk and/orother dairy products. The major observation here was that theincrease in milk score among blacks and "Other" women wasdue to increase in consumption of fluid milk (exact source notknown) rather than other dairy products (cheese, yoghurt). Table 7 shows the fruit and vegetable score broken into five categories of vegetables and two categories of fruits (or four andthree, respectively, if tomatoes are considered as a fruit). ThePuerto Rican women showed a moderate increase in fruit andvegetables which occurred mainly in the other vegetables, i.e.,not dark green and yellow, and in citrus fruits. The black womenincreased their average fruit and vegetable score mainly by increasing consumption of tomatoes and all fruits. Although it isusually considered that greens playa major role in diets of blackAmericans, only about one-third of the women mentionedconsuming dark green or yellow vegetables on the day preceeding the recall while 60% mentioned consuming other nonstarchy vegetables. The "Other" women mainly increased theirintake of citrus and other fruits and showed small increases inalmost all subgroups. The breakdown of the food groups inTables 6 and 7 shows that with respect to milk and fruit-vegetabJes, the Four Food Group scheme masks some of the cultural
Table 7 Comparison of average fruit and vegetable group score withpercent of women 1 mentioning a food in each of seven subgroups offruitor vegetables
differences in food intake patterns. This has obvious implications for nutrition education programs. In the present study,however, these differences had minimal impact on assessment ofactual nutrient intake and response to aide intervention.
101412
485956
3.7b
4.5 b
3.4
101025
282819
383844
596250
657244
"Other"(n = 29)
5.6oo
394428
3.7b
4.4b
3.6
292236
616160
314424
253928
395344
Black(n = 36)
Percent
Number'
415248
171719
2.5 a
2.9a
2.7
7.49.33.2
303232
352823
395039
332626
Puerto Rican(n=54)
Discussion and ConclusionsThe major purpose of the present study was to compare the
use of "food group approach" with a "nutrient approach" indietary assessment based on 24-hour recalls. The need for simplified methods of dietary assessment prevails in nutrition education programs for both determining initial status of a targetpopulation and for monitoring change occurring in dietary patterns of program participants. The use of a simple Four FoodGroup approach is potentially limited by differences in nutrientcontent of foods which "score equally." Such variation is attributable to both ethnic and individual differences in food selection. A somewhat different use of the food group approach hasbeen reported by Johnson, et al. (9) in the Wisconsin EFNEP
Average number offruit/vegetableservings
First visitSecond visitPost partum2
Percent of womenmentioning:Dark green andyellow vegetables
First visitSecond visitPost partum
Other vegetablesFirst visitSecond visitPost partum
PotatoesFirst visitSecond visitPost partum
Other roots!starchy vegetables
First visitSecond visitPost partum
TomatoesFirst visitSecond visitPost partum
Citrus fruitsFirst visitSecond visitPost partum
Other fruitsFirst visitSecond visitPost partum
1.52.32.1
313131
839388
"Other"(n = 29)
1.62.41.1
333932
728980
Percent
Number
Black(n = 36)
2.12.51.9
392416
9810094
Puerto Rican(n=54)
Average number ofmilk group servings
First visitSecond visitPost partum2
Percent of womenmentioning fluidmilk3
First visitSecond visitPost partum
Percent of womenmentioning otherdairy products
First visitSecond visitPost partum
IStudy and Control groups combined within each ethnic group2Samp1e size post partum: Puerto Rican. n = 31: Black. n = 25: Other. n = 16.3Inc1udes buttermilk
'Mean values (for each visit) not followed by the same superscript are significantlydifferent (p < 0.05).IStudy and Control groups combined within each ethnic group2Samp1e size post partum: Puerto Rican. n=31; Black. n~25; Other. n= 16.
24 Journal of Nutrition Education Vol. 9 No. I January-March 1977
program. This procedure does not require a computer and enables paraprofessionals to participate directly in nutritional assessment, but it was not available until after our study had beencompleted.
Nutrient analysis of dietary data obtained from a selectedgroup of pregnant women in East Harlem has shown a positiveeffect of EFNEP aides in supplementing and complementingnutrition advice given by a professional nutritionist (I). We havesubsequently shown that substitution of a dietary assessmentprocedure based on the USDA Four Foods Groups would haveyielded essentially the same conclusions with respect to initialdietary status and to the effect of aides. Selection of two of thefood groups, milk and fruit and vegetables, as a logical choice forpractical nutrition education and a focus for evaluation alsoproved effective but was more influenced by initial ethnic differences. Specifically, if attainment 0 f the goal of increasing fruitand vegetable intake as a means of increasing vitamin C intakehad been evaluated by change in the entire group of patients, thepositive role of the aides would not have been very impressive.However, when this observation was confined to the PuertoRican women, who as a group needed to improve their intake ofthis food group, the aide effect was quite pronounced. In contrast, the improvement in milk consumption among Study women was significantly greater than among Controls for the entiregroup of patients, because both black and Puerto Rican women"had room for improvement" and consequently improved. Thusin the prdsent study, changes in intake in at least two broadcategories of food, milk-milk products and fruit-vegetables,while showing ethnic differences in specific subgroups of foodsselected, were associated with changes in intakes of nutrientsmost commonly associated with those foods.
The emphasis on ethnic differences when evaluating groups ofpeople should not overshadow the emphasis on the individualand his/her food habits when undertaking nutrition education
programs or evaluating their progress. The strong positive relationship in the present study between length of residence in NewYork City and intake of milk, fruit and vegetables and moreadequate diets in general (1) points to an important factor inpreparing educational materials and in recruiting participantsfor a program. 0
AcknowledgementsThe authors would like to thank Valerie Gyrisco and Sara Lynn Parker
for assistance in data processing and Marjorie Washbon for help inpreparing the manuscript.
ReferencesI Bowering, J.. M. A. Morrison. R. L. Lowenberg and N. Tirado, Role
ofEFNEP aides in improving diets of pregnant women, J. Nutr. Ed.,8: 111,1976.
2 Anon., Daily Food Guide, U.S. Department of Agriculture,Consumer and Marketing Service, Agricultural Research Service.1966.
3 Anon., Impact of the Expanded Food and Nutrition Education Program on Low-Income Families: An In-Depth Analysis, AgriculturalEconomics Report No. 220, U.S. Department of Agriculture. Washington, D.C.. 1972.
4 Moragne, L., Influence of Household Differentiation on Food HabitsAmong Low-Income Urban Negro Families. Ph.D. Dissertation,Cornell University, 1969 (unpublished).
5 Jerome, N. W., Food Habits and Acculturation: Dietary Practicesand Nutrition of Families, Ph. D. Dissertation. University of Wisconsin, 1967 (unpublished).
6 Sanjur, D. and A. D. Scoma, Food habits of low-income children innorthern New York, J. Nutr. Ed .. 2:85,1971.
7 Sanjur, D., E. Romero. and M. Kira, Milk consumption patterns ofPuerto Rican preschool children in rural New York, Amer. J. Clin.Nutr., 24:1320,1971.
8 Bowering, J. and M. A. Morrison, East Harlem Nutrition EducationProgram: An Exploration of Dietary Practices, Cornell University,1973 (unpublished report).
9 Johnson, N. E., S. Nitzke and D. L. VandeBerg, A reporting systemfor nutrient adequacy. Home Econ. Res. J.. 2:210.1974.
College Nonvegetarians Vs. V.egetariansFood Habits and Knowledge
Diane M. Lindamood and Barbara E. Gunning
ABSTRACT
The purpose of this study was to: (I) study the dietary habitsand nutrition knowledge of college students enrolled at SanDiego State University, (2) determine the percentage of vegetarians in the population group studied, and (3) compare thedietary habits and nutrition knowledge of the nonvegetarianswith vegetarians.
A three-part questionnaire was mailed to randomly selectedstudents and distributed in various classes, at the campus generalstore and to friends of students contacted by the foregoingmethods. Parts 1,2, and 3 were completed and returned by 95,85, and 71 students, respectively. The percentage of each groupthat declared themselves to be vegetarians was 40, 41, and 45%,respectively.
Of the students surveyed, 69% could name the Four FoodGroups. Only 9%, however, knew the servings recommended foreach of the Four Food Groups. From one to three correctanswers regarding daily servings needed were given by 27% ofthe students; 64% of the students gave no correct answers or leftthis part unanswered. There was no significant difference
THE A UTHORS are, respectively, Consulting Dietitian andProfessor, School ofFamily Studies and Consumer Sciences, SanDiego State University, San Diego. Calif
between nonvegetarians and vegetarians in nutrition knowledge.Both groups answered 41% of the questions correctly.
When the dietary patterns of the nonvegetarians were compared with those of vegetarians, it was found that more nonvegetarians had diets with inadequate quantities of vegetables andfruits as specified in the Four Food Groups than did the vegetarians. More vegetarians had diets lacking in the protein group.Vegetarians reported slightly lower consumption of foods fromthe milk group and the bread and cereal group.
Twenty-eight students from the study group were picked atrandom and were interviewed to verify the accuracy of questionnaire data. Responses in the interview compared favorablywith those given on the student's questionnaire.
Results from this study do indicate a need for nutrition education for this age group. These students, both vegetarians andnonvegetarians, were found to have many misconceptions aboutnutrition. 0
NoteData are taken from a thesis. Nutritional Study of Nonvegetarians and
Vegetarians at San Diego State University. submitted by Diane M. Lindamood in partial fulfillment of the requirement for the degree of Masterof Science. San Diego State University, 1975. Thesis available throughinterlibrary loan at San Diego State University. 5402 College Avenue.Malcolm A. Love Library. San Diego. CA 92182.
January-March 1977 Vol. 9 No.1 Journal of Nutrition Education 25