Embed Size (px)
Citation preview
Evaluating Center Pivots in Evaluating Center Pivots in MissouriMissouri
Joe HenggelerJoe Henggeler
University of MissouriUniversity of Missouri
38th ANNUAL MISSOURI IRRIGATION CONFERENCE38th ANNUAL MISSOURI IRRIGATION CONFERENCEWednesday, Feb. 2, 2004Wednesday, Feb. 2, 2004
309 Hearnes Center, Columbia, MO309 Hearnes Center, Columbia, MO

Team Up!Team Up!
Irrigation SchedulingIrrigation Scheduling Proper fertigation (corn)Proper fertigation (corn) Testing center pivotsTesting center pivots
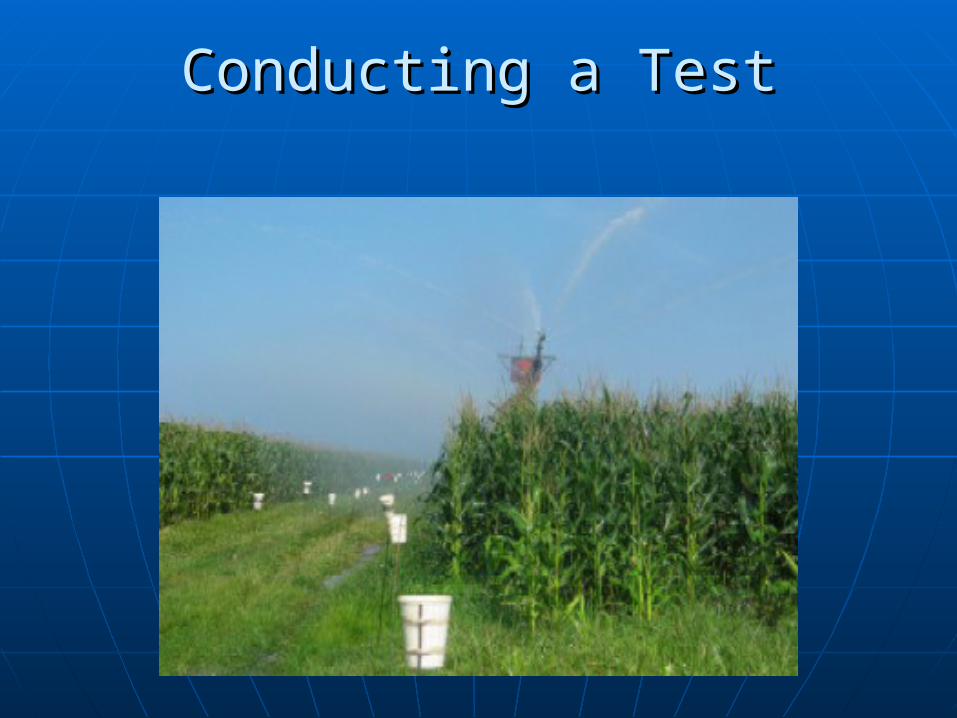
Conducting a TestConducting a Test
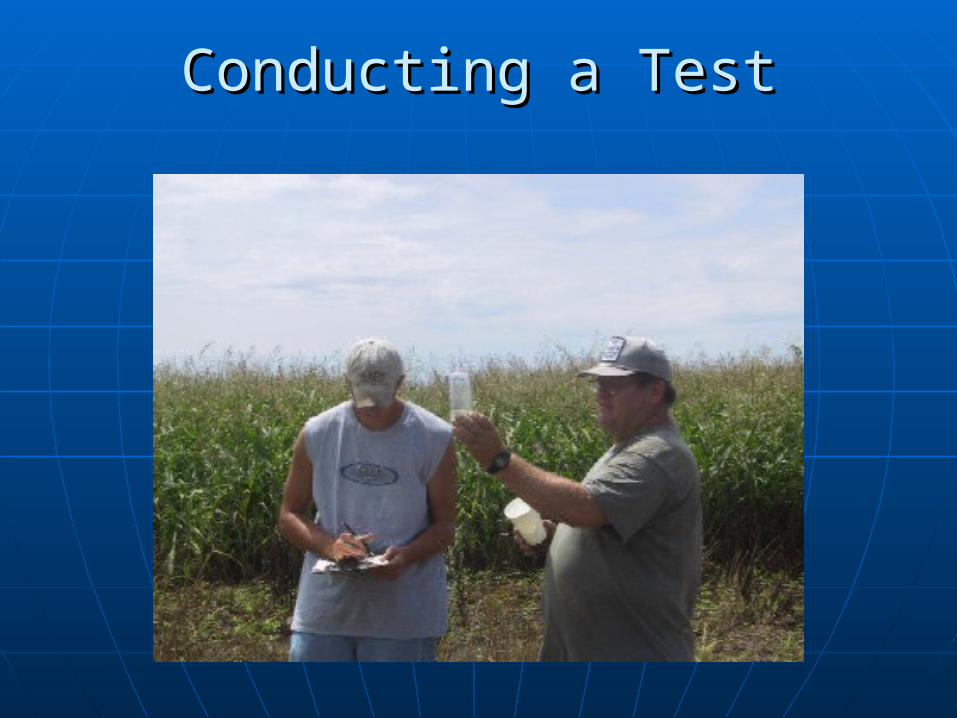
Conducting a TestConducting a Test
Conducting a TestConducting a Test
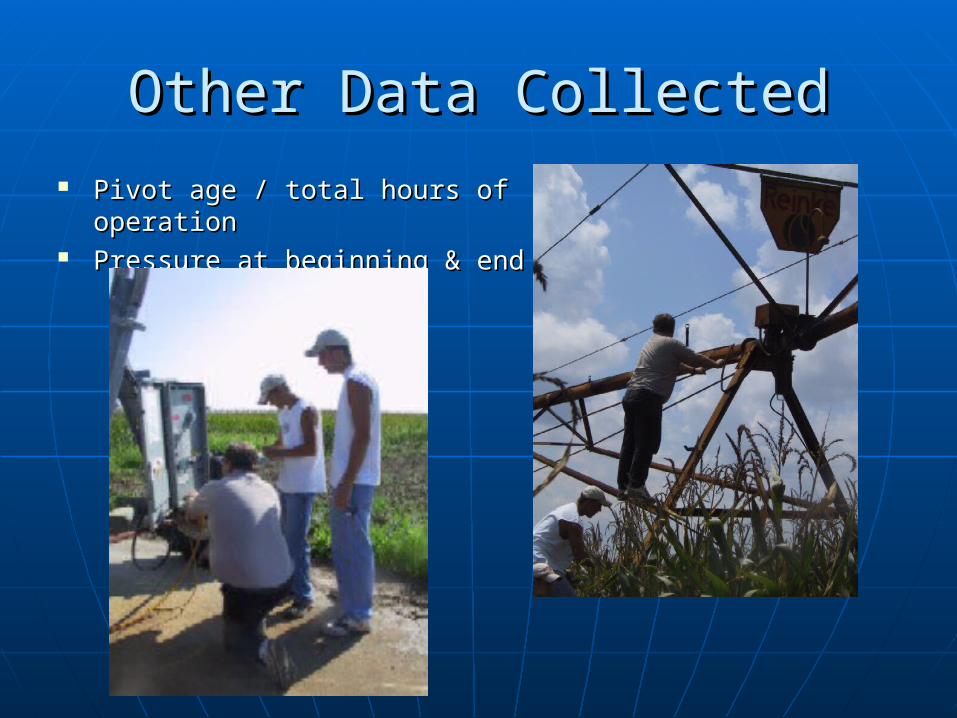
Other Data CollectedOther Data Collected Pivot age / total hours of operationPivot age / total hours of operation Pressure at beginning & endPressure at beginning & end
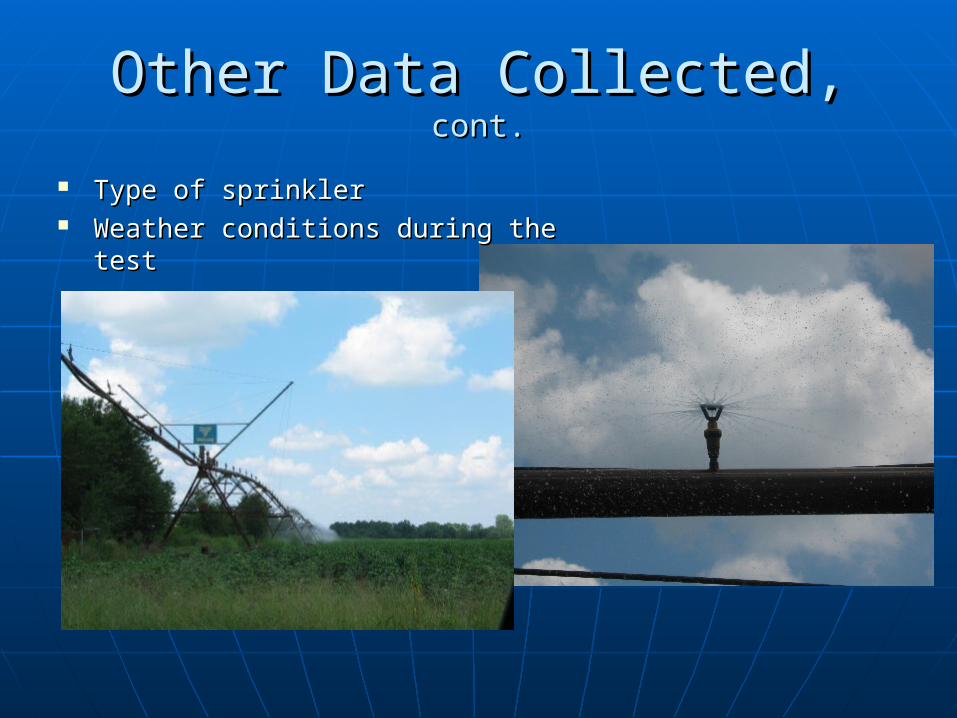
Other Data Collected, Other Data Collected, cont.cont.
Type of sprinklerType of sprinkler Weather conditions during the testWeather conditions during the test
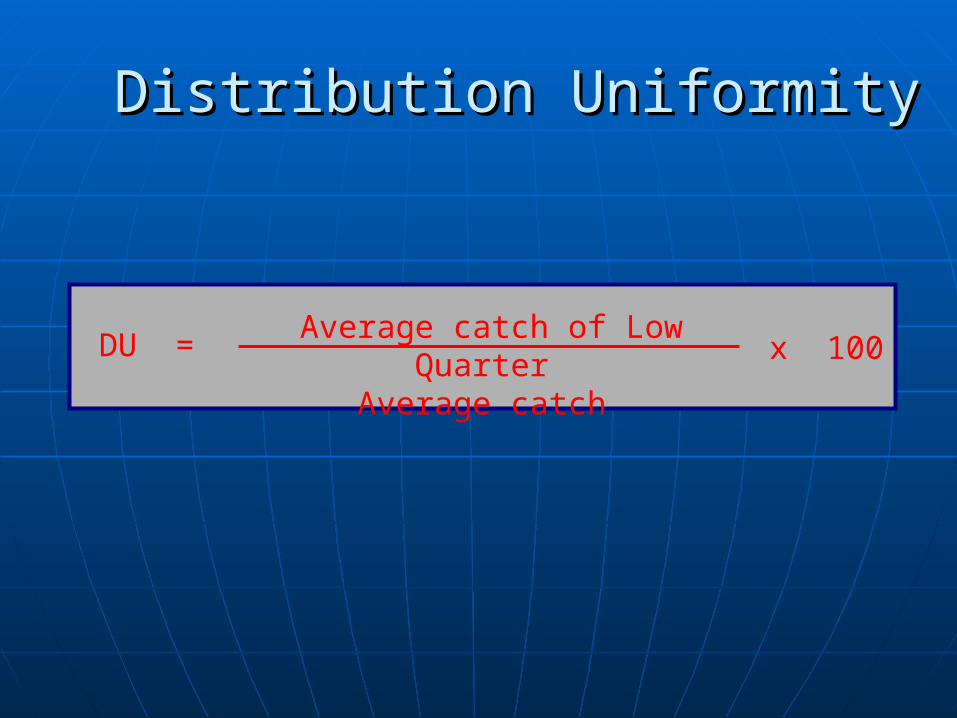
Distribution UniformityDistribution Uniformity
Average catch of Low QuarterAverage catch
DU =
x 100
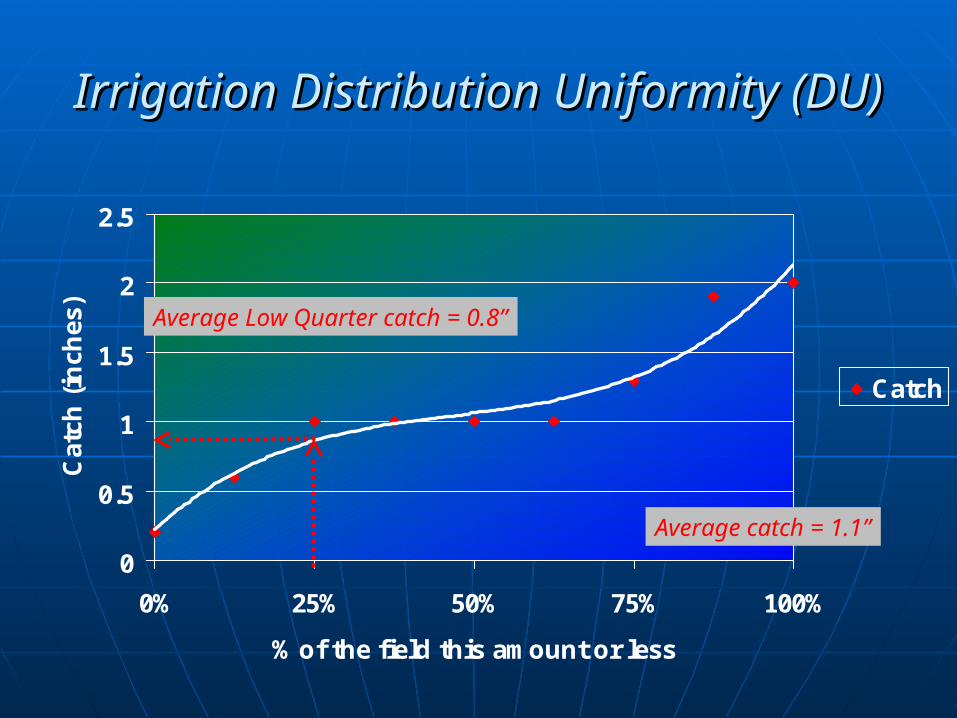
Irrigation Distribution Uniformity (DU)Irrigation Distribution Uniformity (DU)
0
0.5
1
1.5
2
2.5
0% 25% 50% 75% 100%
% of the field this amount or less
Cat
ch (
inch
es)
Catch
Average catch = 1.1”
Average Low Quarter catch = 0.8”
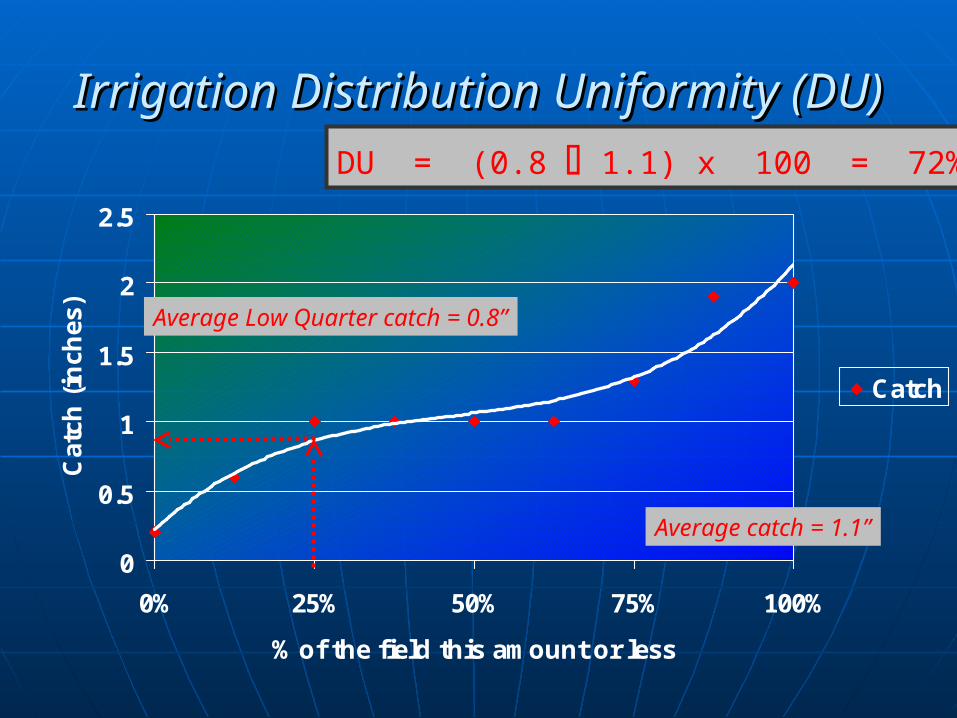
Irrigation Distribution Uniformity (DU)Irrigation Distribution Uniformity (DU)
0
0.5
1
1.5
2
2.5
0% 25% 50% 75% 100%
% of the field this amount or less
Cat
ch (
inch
es)
Catch
Average catch = 1.1”
Average Low Quarter catch = 0.8”
DU = (0.8 1.1) x 100 = 72%
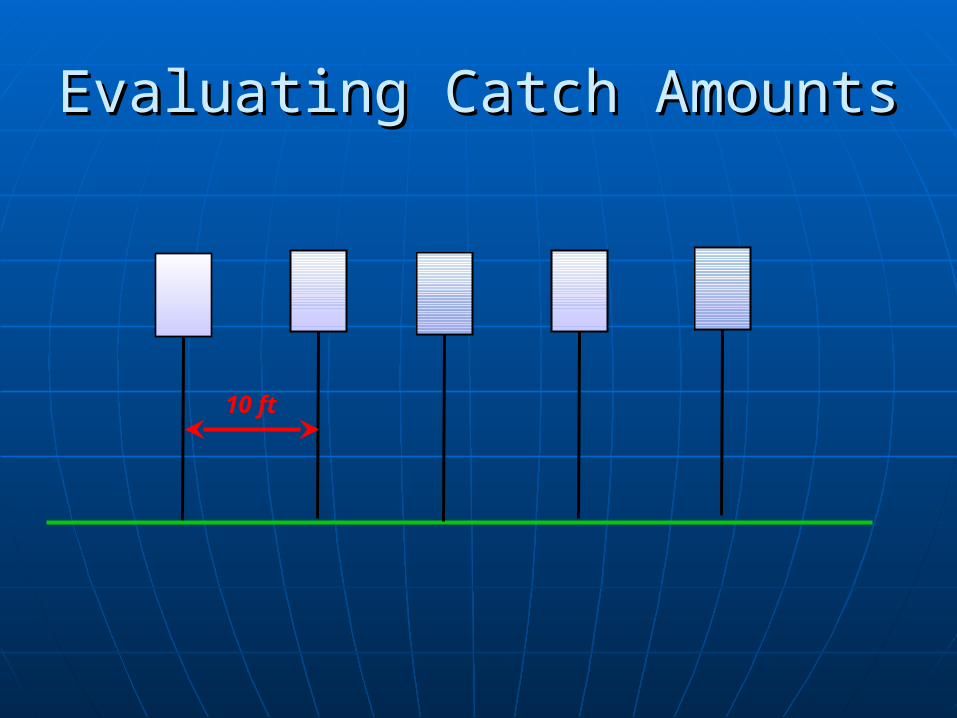
Evaluating Catch AmountsEvaluating Catch Amounts
10 ft
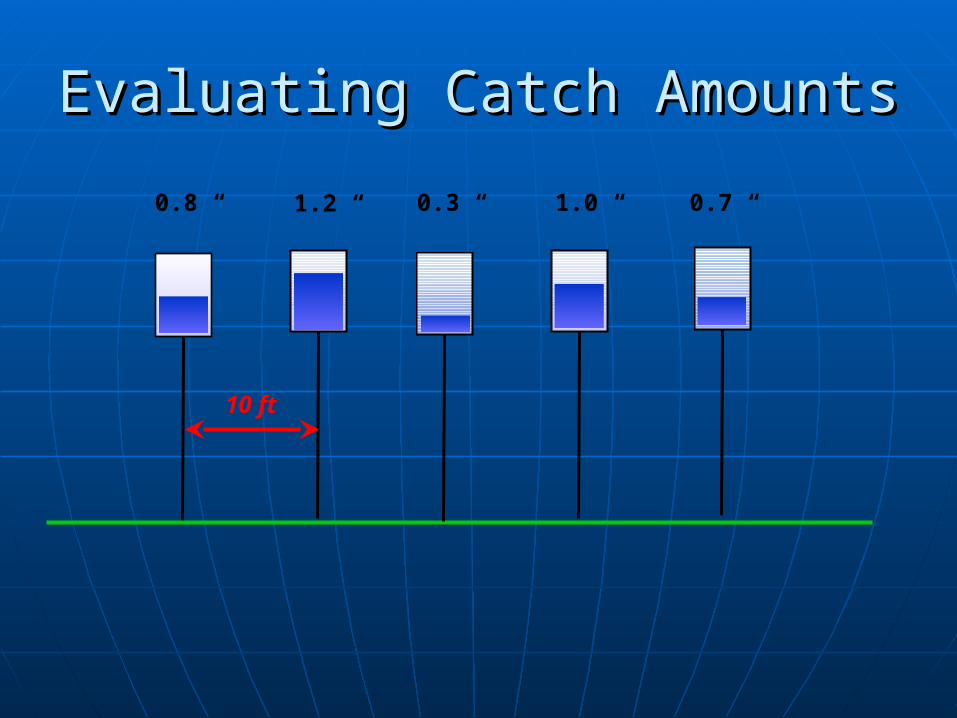
Evaluating Catch AmountsEvaluating Catch Amounts
0.8 “ 1.2 “ 0.3 “ 1.0 “ 0.7 “
10 ft
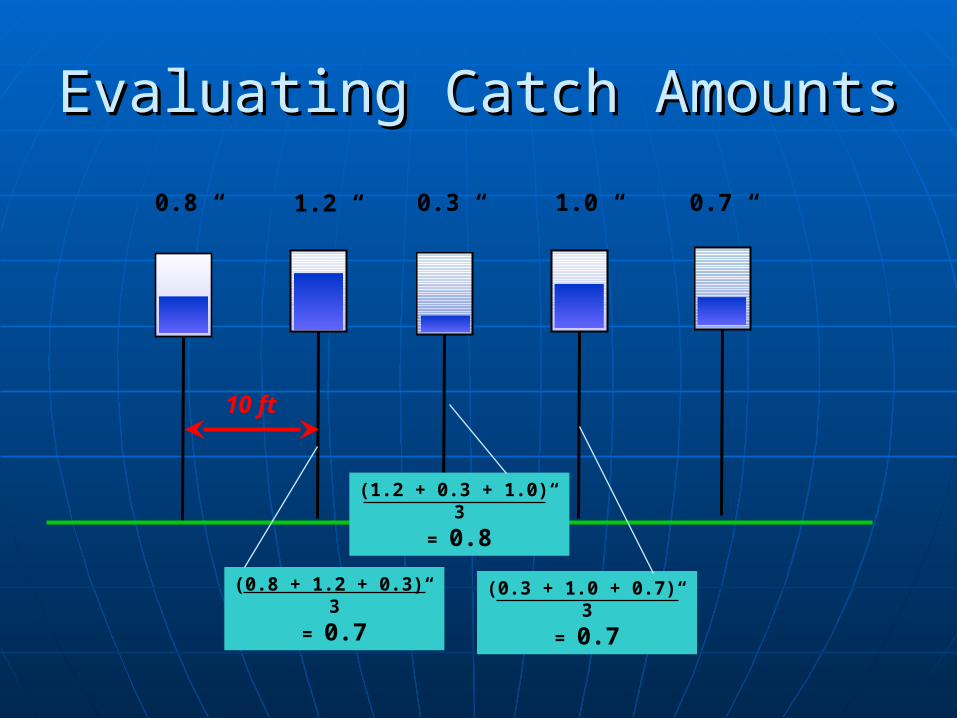
Evaluating Catch AmountsEvaluating Catch Amounts
0.8 “ 1.2 “ 0.3 “ 1.0 “ 0.7 “
(0.8 + 1.2 + 0.3)“3
= 0.7
10 ft
(0.3 + 1.0 + 0.7)“3
= 0.7
(1.2 + 0.3 + 1.0)“3
= 0.8

Lots of data !Lots of data !
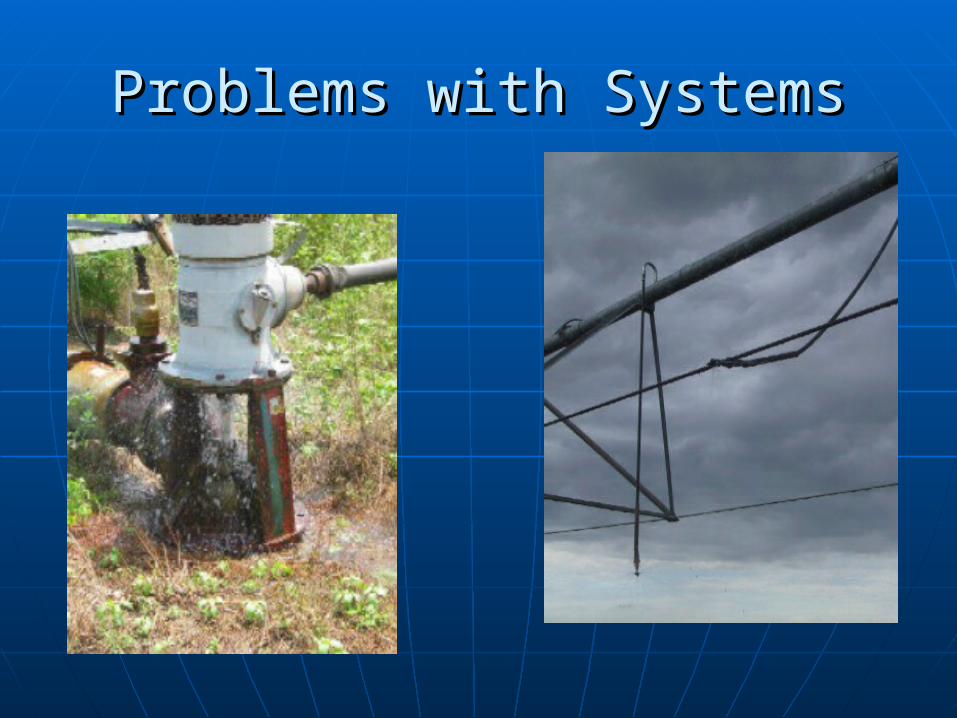
Problems with SystemsProblems with Systems
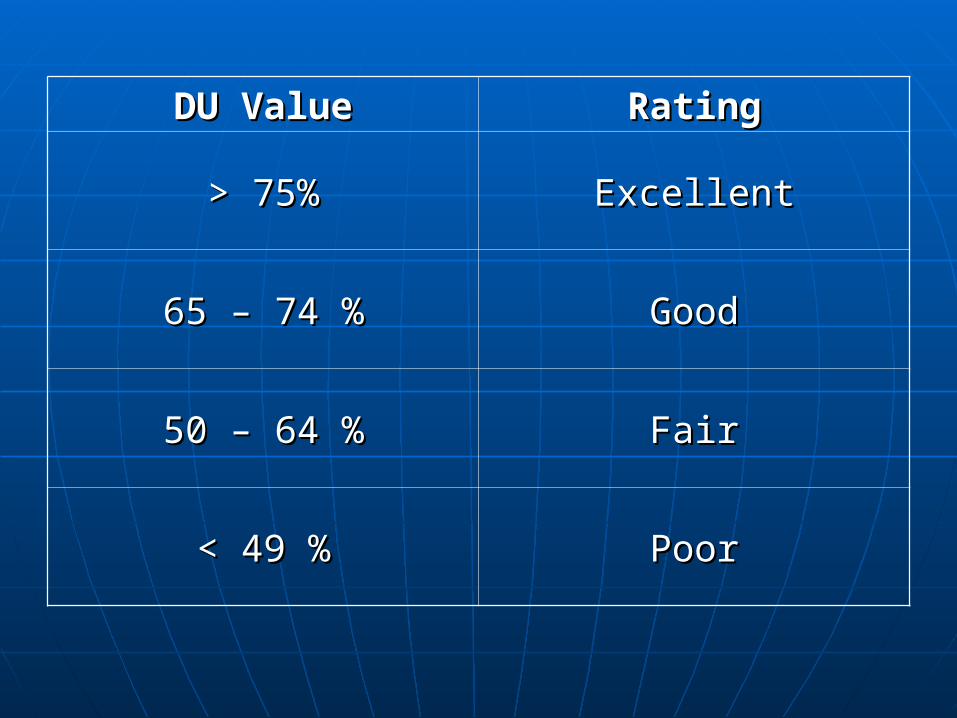
DU ValueDU Value RatingRating
> 75%> 75% ExcellentExcellent
65 – 74 %65 – 74 % GoodGood
50 – 64 %50 – 64 % FairFair
< 49 %< 49 % PoorPoor
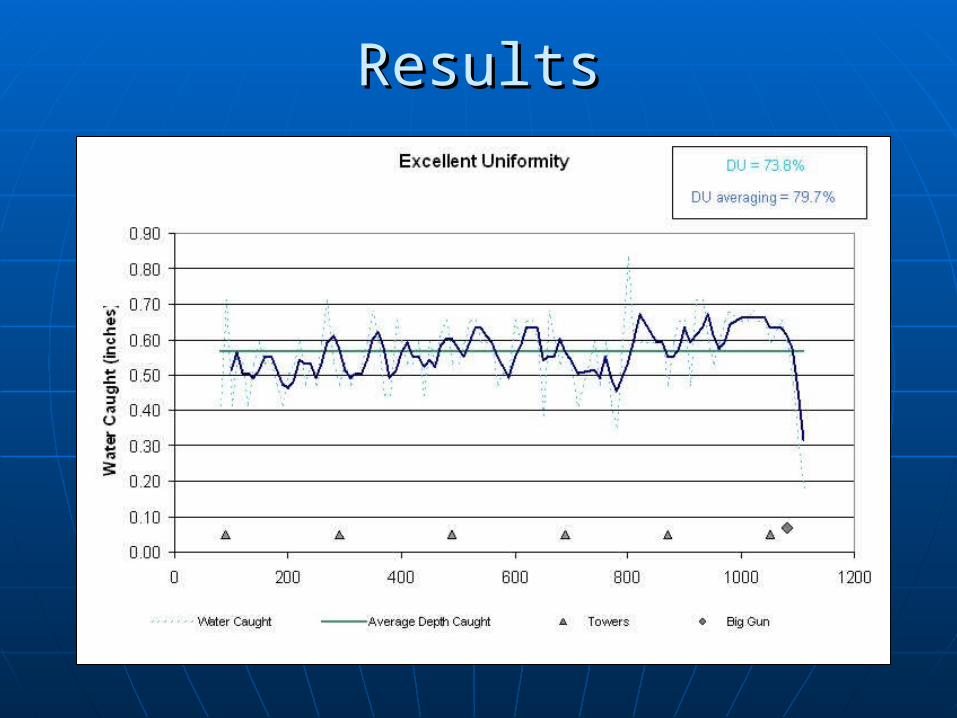
ResultsResults
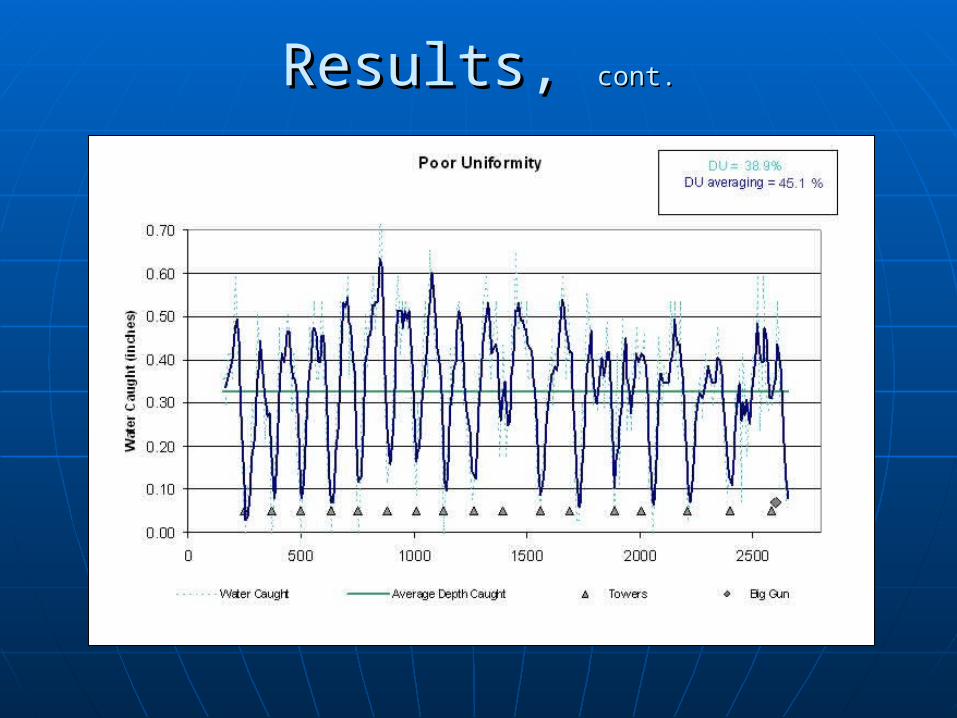
Results, Results, cont.cont.
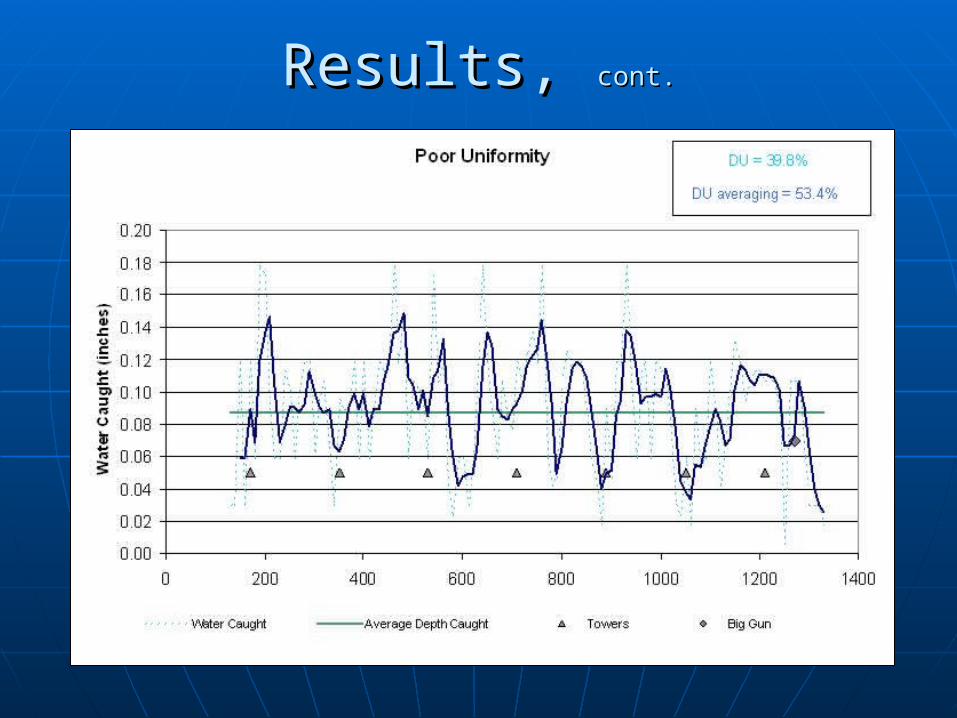
Results, Results, cont.cont.
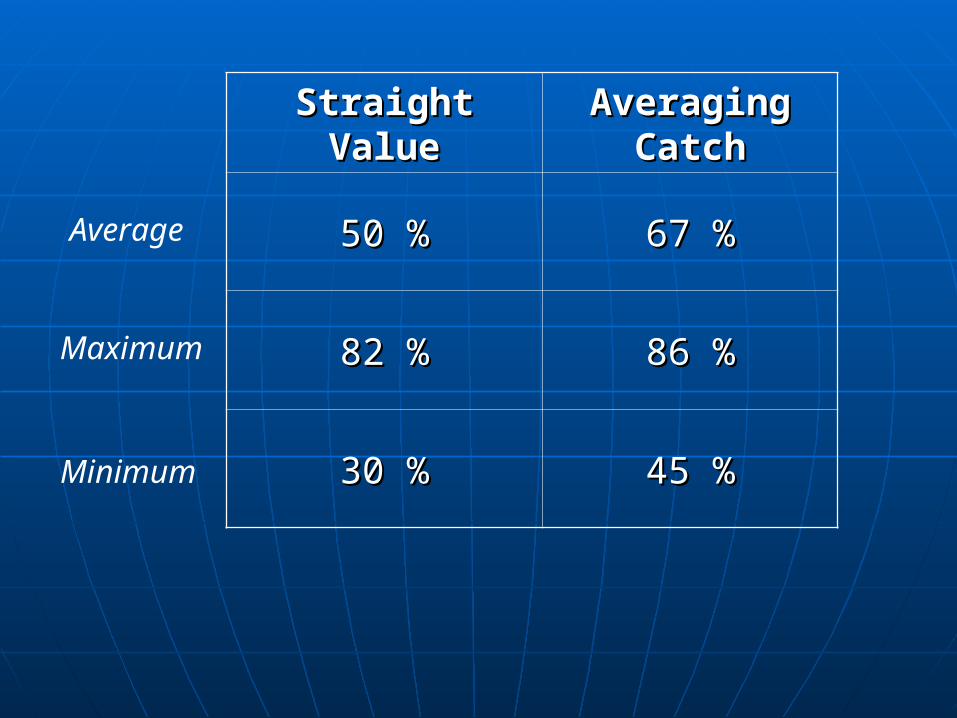
Straight Straight ValueValue
Averaging Averaging CatchCatch
50 %50 % 67 %67 %
82 %82 % 86 %86 %
30 %30 % 45 %45 %
Average
Maximum
Minimum
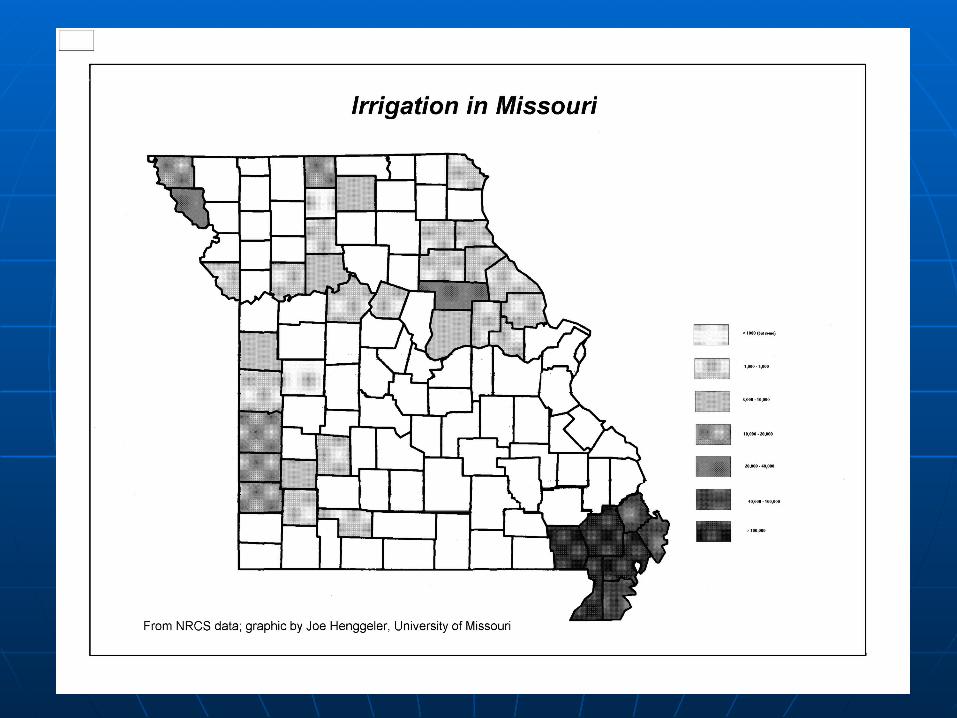
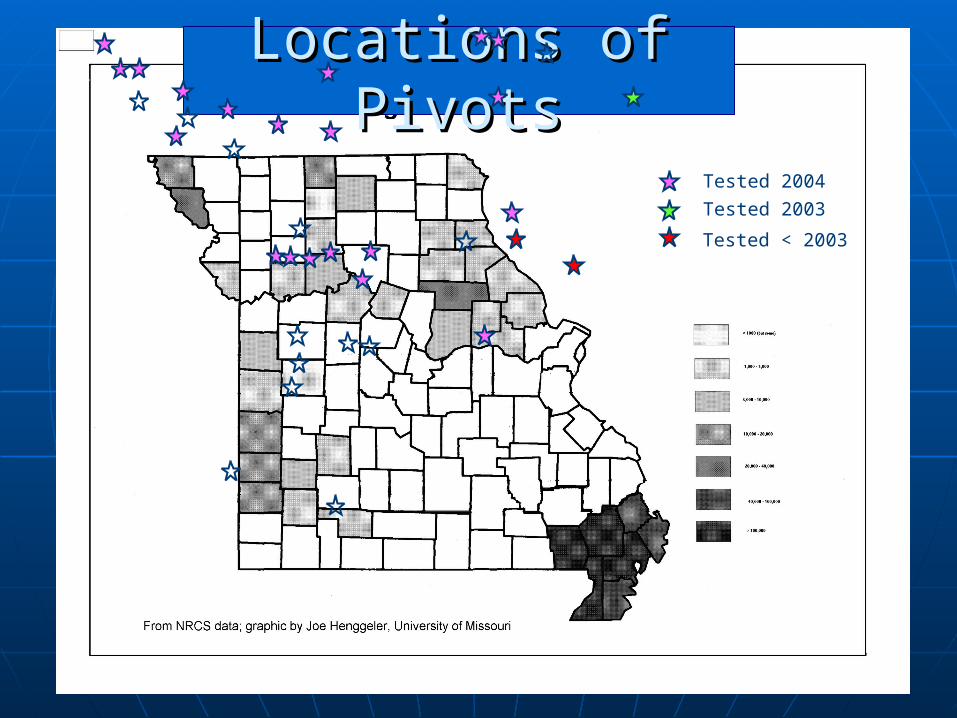
Locations of PivotsLocations of Pivots
Tested 2004
Tested 2003
Tested < 2003
The EndThe End
Joe HenggelerJoe HenggelerDelta Center Research CenterDelta Center Research Center
573-379-5431573-379-5431
[email protected]@missouri.edu