Embed Size (px)
Citation preview
Evaluating Language Statistics: The Ethnologue and Beyond
A report prepared for the UNESCO Institute for Statistics
John C. Paolillo School of Informatics, Indiana University
Assisted by Anupam Das
Department of Linguistics, Indiana University
March 31, 2006
0. Introduction How many languages are there in the world? In a region or a particular country? How many speakers does a given language have? Are there more speakers of English or Mandarin? How are the numbers of these speakers changing, in the world, in a country or on the Internet? Linguists are often asked questions such as these, whether by members of other disciplines, lay-people, or policy makers. Yet despite the interest in and obvious importance of these questions, they are not easy questions to answer, and there are few sources one can turn to for definitive answers. Since the early 1990s, new awareness of a number of language-related issues have foregrounded the need for good answers to these questions. On the one hand, there is the economic trend of globalization, which requires people from a variety of different countries, ethnicities, cultures and language backgrounds to communicate with one another. Globalization has been accompanied by claims about the economic importance of one language vis-a-vis another, and the importance of specific languages in global communication functions or for scientific and cultural exchange. Such discussions have led to re-evaluations of the status of many languages in a range of contexts, such as the role of English globally and in the European Union, and the role of Mandarin Chinese in the Pacific Rim and on the Internet. On the other hand, there is an increased social consciousness around the importance of language diversity in the development and maintenance of knowledge, cultural heritage, and human dignity, under the related causes of linguistic human rights and the protection of endangered languages. These social concerns raise new questions: when is a language endangered? When can it still be protected, and when is it already extinct beyond hope? How are the language rights of world’s citizens best served? And what can one expect for the evolution of the complex system represented by the world’s languages in all their contexts of use? In short, what will be the contribution of language to the next century of humanity’s existence? Questions such as these underscore the need for good sources of information about language statistics, and in particular, language population statistics, as the answer to all of these questions, whether asked in specific for a given locale or in general for the world as a whole, is likely to begin with an assessment of what is known about the affected populations. For this reason it is essential that we survey the available information about language populations and seek to evaluate its worth. In what ways is the existing information adequate for our needs? In what ways might it be improved? Are there countries of regions in which the information we have is better than others? If there are multiple sources of information, how well are these to be trusted? Are some sources more trustworthy than others? This report seeks to answer this latter set of questions, through a systematic evaluation of available information on language populations. Unfortunately, there are very few comprehensive sources of information about language populations at present. Consequently this report focuses principally on two different catalogues of language
information: (i) the Ethnologue, compiled by SIL International, and (ii) the Linguasphere, compiled by David Dalby of the School of Oriental and African Studies in London. Both catalogues have been actively compiled for more than 50 years, and both have reasonably recent activities, with dedicated websites and ongoing development. Of the two, the Ethnologue has more specific information about language populations, whereas the Linguasphere mainly is concerned with cataloging linguistic relatedness among different varieties of speech. This report is organized as follows. Section 1 describes the linguistic issues that define the context collecting, reporting and interpreting language statistics: the definition of the notion “language”, its relation to family relatedness and linguistic structure, the phenomenon of language death and disappearance and the process of linguistic fieldwork. Section 2 describes the main currently available sources of information in which comprehensive language statistics are presented. Subsections describe the Ethnologue and Linguasphere publications specifically, followed by a final subsection in which other sources of language statistics, in particular for endangered languages, are discussed. Section 3 presents an evaluation of currently available language statistics, focusing on data availability and currency, as reflected in the existing sources. Section 4 presents a global linguistic profile based on the existing language statistics, to ascertain what can be learned form this information, and what other sorts of information would be desirable. The fifth and final section suggests how the existing statistics might be developed and improved in the future.
1. Language statistics: the challenge
1.1. The notion of “language” Before one can discuss language statistics and the number of speakers of the world’s languages, one must define what one means by the word “language”. While we all think of a language as being a variety of speech which one can use to express oneself verbally and be understood, identifying the boundaries of a language — a crucial issue if languages are to be counted and their speakers enumerated — is not a trivial matter. People may mean many different things by “language”. For some, “language” means the linguistic form of a substantial literature. Such a definition is unsatisfactory for the simple reason that writing is only a few thousand years old while humanity, and the distinctly human attribute of speech, is far older. Further complicating the issue is that in some societies, including the Arabic-speaking world, Greece, the German-speaking part of Switzerland, and in many parts of India, written language employs a different linguistic system from everyday speech. Sometimes languages are regarded as associated with a particular nation or country, as if each nation had only one language. While nation states and other forms of nationalism have done much to spread particular languages, there is scarcely a country in the world citizens that speak a single language and most countries have tens and even hundreds of languages. Languages are also regarded as varieties of speech with a wider
currency than dialects: speakers of English, for example, may speak different dialects of their respective languages, depending on their locale; the speech of someone from the British Midlands is different from that of Newcastle, London, New York, Atlanta, Lagos, New Delhi, Port Moresby, Sydney, or Auckland. We nonetheless recognize all of these forms of speech as English. But again, there is a problem: many so-called “dialects” are in fact different languages. A common example is that of Chinese, for which Mandarin Chinese is the most widely known variety, and is the closest to the written form of Chinese, but whose varieties such as Cantonese, Fukkinese, Shanghai, Wu, and others, are actually related languages as different from one another as French, Italian, Portuguese, Romanian and Spanish. Because these languages are spoken in a single (although very large) country, and because they share a common writing system, there is a tendency to regard them as a single language, rather than the distinct language systems that they are. The situation for the English dialects is also unclear: many of the speakers of the different varieties of English listed would have a great deal of difficulty understanding one another (for example, Newcastle and Atlanta speakers of English). Moreover, the varieties of English spoken in each of those places is not a unitary thing; markedly different varieties of English can be found across socio-economic strata and ethnicities in all of these places. Furthermore, in West Africa and Port Moresby, language varieties exist that are quite clearly based on English, but which are highly divergent in structure from most other varieties of English. Linguists generally concur in treating these speech varieties, such as West African Creole English and New Ginea Tok Pisin, as languages unto themselves, even though all (standard) English-speaking people from the locale may find them intelligible. These situations are not unique to English and Chinese, but occur again and again in many situations, regardless of group size. At times these issues go unnoticed, but at other times they can develop into major concerns, as for example with the different varieties of Quiché and other Mayan languages spoken in Guatemala. Some members of the Mayan Academy have pressed for recognition of a only a single Mayan language, where others see as many as 56 distinct languages (Paul Lewis, personal communication Feb 27 2006). Likewise, we commonly refer to Arabic, as if it were one language across North Africa and Western Asia, and indeed there is a formal variety Modern Standard Arabic, which can be used in many countries, especially among educated people. The everyday spoken varieties are all quite different from one another and not in general mutually intelligible. Other standard languages, such as French, Spanish, and German in Europe, have similar relations to dialects that are not necessarily mutually intelligible with one another. The converse of this situation also occurs. Sometimes two groups may speak mutually intelligible varieties, but for various other reasons, see themselves as distinct. Serbian and Coratian are two names for language varieties that are very similar and until recently were referred to collectively as Serbo-Croatian. Similarly, Hindi and Urdu are written using distinct scripts and are treated as standard varieties in two different
countries, but for all intents and purposes, they represent mutually intelligible spoken varieties. Hindi and Urdu participate in another pattern, in which geographically neighboring varieties may be mutually intelligible, and mutually intelligible with local varieties of other languages, but varieties from opposite geographic extremes are not. Languages that may have some degree of intelligibility with Hindi-Urdu include Punjabi, Maithili, Nepali, and Bhojpuri, among others. All of these issues complicate the definition of “language” for statistical purposes. For linguists, two main principles are used to identify languages. First and foremost, a language is considered to be a collection of speech varieties that are mutually intelligible. The linguistic basis for this principle is that varieties that are mutually intelligible are likely to be structurally similar, even homogeneous. The second principle is group self-identification. If two groups of people see themselves as different people, and they identify those differences through language, then it may not be practical to recognize a single language for both groups. For large dialect chains, like those involving English, Chinese, Hindi-Urdu, Arabic, and most of the examples we have cited, application of this principle would require recognizing some distinct languages, e.g., at least among Standard English, West African Creole English and Tok Pisin, or among Hindi-Urdu and the structurally distinct Punjabi, Maithili, Nepali and Bhojpuri, or among several varieties of Arabic: Gulf, Cairene, Levantine, Moroccan, Tunisian etc. Ideally these distinctions would be established on the basis of intelligibility testing, a rigorous procedure in which speakers from different locales are tested for comprehension after listening to recordings of each other’s speech (Grimes 1995). This procedure is costly in time and resources, and is only used where necessary. Short of this, field interviews may be used, but these tend to address issues of group identification more than intelligibility, even under the most careful interview procedures. Finally, it is often difficult to part with traditional notions of language identity coming from outside of linguistic analysis. Literary tradition and political association may impose themselves in different ways on people’s understanding of language identity. For example, in the German-speaking parts of Europe, varieties of language spoken near the Dutch border may be linguistically closer to Dutch, but they are nonetheless considered dialects of German, and many speakers consider themselves to be German, rather than Dutch or any other national identity. And in the former Soviet republics of Azerbaijan, Kazakhstan, Turkmenistan and Uzbekistan, it is unclear how many Turkic languages would be recognized on the basis of mutual intelligibility, as these and other Turkic language varieties spoken in central Asia are mutually intelligible to some extent, but differences in the writing systems used (including Cyrillic, Roman and Arabic scripts) and political divisions dating back more than a century have led to separate identities among the people of these countries. Hence, when different speech varieties are called languages, and when people are grouped together and counted as speakers of a common language, it will often be for different reasons in different instances. Moreover, it will not always be clear in any given

instance on what basis one divides a particular people into different languages. Even the criteria themselves are not perfect. Mass media and education may overcome barriers to communication that would otherwise lead to lack of intelligibility on account of structural linguistic differences. Alternatively, people often find reason to regard others as different, even when their speech is mutually intelligible. Consequently, the enumeration of languages and their speakers is fraught with difficulty, and needs to be treated with caution.
1.2. Linguistic structure and relatedness The subject matter of linguistics concerns the variety and nature of human languages, their inner workings, structure and histories, and what those reveal about the nature of the humanity, socially, cognitively and biologically. For these reasons, linguists generally approach the identification of languages in taxonomic terms, by identifying language families. Hence, we group Catalan, French, Italian, Spanish, Portuguese, Romanian and Romansh together as Romance languages, recognizing their shared linguistic structure and common origin in Latin, the language of the Roman Empire that dominated Europe for several centuries. The Romance languages form one sub-family of the Indo-European family, which embraces Celtic, Germanic, Indo-Aryan and Slavic, among others, as additional sub-families. Each recognized grouping indicates a degree of shared structure and a common historical origin. Their relationship needs to be constructed from historical records, where available, and by careful comparison of word forms and other structural properties of language (the comparative method). Many times, written historical records are not available, in which cases we must rely on archaeological evidence to assist in dating the events that resulted in the current diversity of the family. In these circumstances, it is the most recently developed language families that have left the most evidence of their common origin, and which are most readily identified. Such families include Afro-Asiatic (primarily found in Northern Africa and Western Asia), Austro-Asiatic (Southeastern Asia), Indo-European (principally Europe, South and Central Asia, but now spread throughout the globe), and Niger-Congo (sub-Saharan Africa), among other, smaller families. There are generally acknowledged to be between as few as 16 (Comrie 1987) and as many as 108 (Gordon 1995) such family groups of languages still spoken in the world. Not all languages can be easily classified this way, and there are many isolated languages as well as languages of indeterminate status. For example, Japanese and Korean, in spite of superficial similarities, are rather different from each other and from other languages of Eastern Asia. Despite efforts to connect them with the Altaic family (including the Mongolian and Turkic languages of Central Asia), the Dravidian family (including languages of Southern India and the isolate Brahui from Pakistan), no proposed family affiliation for them has been widely accepted. Similarly, the languages of Papua New Guinea, the Andaman Islands, and the isolate Kusunda (spoken in Nepal, now possibly extinct) have been suggested to be related, but many linguists do not even accept a family relationship among the languages of the Andaman Islands or within
Papua New Guinea, and prefer to recognize several distinct families within those geographic groups. Generally these situations point to very old language communities, sometimes going back to the earliest known prehistoric expansions of humanity into such areas (Diamond 1997, 2005; Nichols 1992, 1998; Renfrew 1998). The communities in question may presently subsist (or have subsisted in the known past) on hunting and gathering using essentially Neolithic technologies. The wide dispersal of such languages, and their small numbers of speakers attests to the large extent of their original domain, and to their subsequent envelopment by newer and larger groups more recently. The distribution of languages and language families around the world thus tells an important story about the successive waves of human expansion throughout the habitable areas of the globe. The relatively recent global expansion of the historically European languages English, French, Portuguese, Russian and Spanish, under European colonization and North American economic, political and cultural influence, is only the most recent chapter in this story. Earlier expansions include the expansion of the Indo-Europeans beginning about 6000 BC from a homeland possibly in Western Asia into the South Asian subcontinent in the East, and most of Europe in the West; the Austronesian expansion from Southern China in about 3500 BC throughout Oceania and later to Easter Island, Hawaii, New Zealand and Madagascar; the Niger-Congo expansion from the Sahel throughout most of sub-Saharan Africa; and similar expansions of Amerindian languages in various historical phases from Northern through Southern America.
1.3. Language death and disappearance An equally important part of this story is the extinction of large numbers of speech varieties that existed before each such expansion. The most dramatic examples of language extinctions in recent history occurred in the Americas and Australia. At the time of Columbus, an unknown number of distinct languages, easily in the thousands, were spoken in the Americas. Today, as a result of wars, disease, and incorporation into the populations of European colonists, only a few hundred remain, and many of those remaining, especially in North America, are near extinction or in danger of being replaced by a European Language (Adelaar 1991, 2004; Cuaron and Lastra 1991; Dixon and Aikhenvald 1999; Kinkade 1991; Krauss 1992; Mithuun 1999; Zepeda and Hill 1991). In Australia, out of more than 200 languages at the time of European arrival, about 50 languages have died out in the last 100 years, and 130 more have very few speakers and are unlikely to survive much longer (Dixon 1991; Walsh 1991). In some places, languages have disappeared so long ago or so completely that little is known of them. Such is the case with the languages originally spoken in Tasmania for as much as 40,000 years, whose speakers all died, from warfare or disease, before much of their linguistic heritage could be recorded. Likewise, none of the remaining Pygmy groups of sub-Saharan Africa speak languages that appear to go back to their early occupation of the region. Instead, they speak languages brought in later from the Niger-Congo family originating in West Africa (Diamond 1997). Nothing is known today of the languages they might have spoken prior to that time.
The causes of language death and extinction are numerous (Wurm 1992), and may reflect deliberate human action, involving violence and coercion, or accidental circumstances, through contact with neighbors, absorbtion into other linguistic groups or natural causes. Generally, language loss is preceded by some sort of multilingualism, whether societal, through coexistence of different language varieties in the same geographic area, or individual, through individuals knowing more than one language. Both circumstances can lead to language shift, especially of one language has more speakers, a broader range of uses in the society, or greater economic power than the others. Over successive generations, individuals can come to see the advantage in using the larger, more powerful language, and so discontinue the use of their own languages. Most of the Native North American languages face precisely this problem. The impoverished means available to the approximately 100,000 speakers of Navajo on the reservations simply cannot compete with the affordances available to English-educated citizens of the metropolitan centers. Similarly, pidginization and creolization of languages have been suggested to be linked with language shift (Muhlhausler 1996). In this scenario, which is being played out in many places in Oceania, a simplified version of a major language, also called a pidgin language, serves initially to connect people into large economic trade networks. Later, parts of the population are drawn off to metropolitan or industrial centers (such as mines or plantations), where the pidgin becomes the primary language of shared communication. The relocated people then often inter-marry, possibly settle in a metropolitan area, and their offspring learn a creole based on the former pidgin language. The creole is typically regarded as a low-status form of speech, and so speakers who wish to advance economically in the metropolitan center may eventually give up the creole in favor of the standard language that gave rise to the pidgin in the first place, thereby completing the shift. Historically, the circumstances of creole language formation have often been extreme, as was the case in Surinam during its colonization, where the creoles Sranan and Saramaccan are spoken today. In the period between 1650 and 1815, approximately 200,000 Africans were brought into Surinam, but due to harsh conditions and low life expectancy (5-10 years), the population at the end of this period numbered only around 36,000 (Arends 1995; Postma 1990). Today, it is sometimes claimed that the conditions for creole genesis no longer operate. Yet if large language contact in the context of population dislocations, subjugation and high mortality are the necessary preconditions, one need only look to many of the world’s trouble spots to wonder if this is in fact true. Refugee and human rights crises gripping sub-Saharan Africa from East to West have all of these hallmarks, as do similar situations in Central, Southern and Southeastern Asia, and many of these are long-standing, lasting several generations. Whatever the mechanisms of language shift involved, linguists are in agreement that the past two centuries have been catastrophic for global linguistic diversity, and that this next century is likely to prove even more so. According to some estimates, as many as half of the world’s remaining languages may be extinct by the end of the present century (Krauss 1992), unless serious efforts are made to reverse the trend. This
impending unparalleled mass extinction of human heritage has been called the intellectual equivalent of an ecological catastrophe (Zepeda and Hill 1991). The notion of linguistic ecology and its explicit parallels with biology is more than a metaphor. It is a developing area of linguistic theory that contributes to understanding linguistic diversity in historical, typological, and ethnological terms (Dixon, 1997; Muhlhausler 1996; Nichols 1992; Dalby 2003), and in relation to local biodiversity (Maffi 2001).
1.4. Language statistics and linguistic fieldwork Language statistics are collected in a number of ways, depending on the purpose, resources available for their collection, and the nature of the entities collecting the statistics. Large compilations of language statistics are therefore heterogeneous, in comprising a body of statements gathered through different means. Unfortunately, a major consequence of this is that the statistics so gathered are often not readily comparable to one another, and it can be very difficult to know what sort of information one really has. A major source of language statistics, particularly on national and official languages, comes from official censuses conducted in the countries where those languages are spoken. The chief advantages of language statstics from censuses is that they are large , and regularly administered, making it possible to view large-scale compositions, global comparisons and longitudinal trends (Lieberson 1967). Nonetheless they also have many problems (Fasold 1984). First, national censuses often do not ask language questions at all. In such cases, it is sometimes possible to infer language populations from other information, such as ethnicity or religious affiliation, where that is known, but this is extremely hazardous as a general rule. Second, the nature of language questions when they are asked is not always the same from census to census. Subtle differences in the wording of language questions can lead to large differences in the results obtained. Moreover, when language questions are asked, they may be asked in ways that are not comparable from one year to the next, if the census is regularly revised. A typical change may involve the number and organization of language categories: languages may be added to or removed from census questions, leading to incomparable results from year to year. Sometimes the language populations reported turn out to be something else, such as ethnicities or religious groups. Finally, national governments often have vested interests in the outcomes of language questions on a census. For example, the establishment of educational or government services in particular languages may hinge on a particular outcome, or parties in the government are intent on maintaining the status and prestige of a national or official language. Census respondents, aware that their governments are potentially observing their responses, may under-report minority language use in such circumstances, leading to skewed results. Issues such as these have impeded the recognition of Spanish in the US, as illegal immigrants and undocumented workers from Latin America can lose their existing rights if their background and status were revealed via the census. A second source of language statistics comes from large-scale field surveys. This generally involves a group of linguists, anthropologists, other researchers and/or aid
workers organized by either a government, university or independent organization, traveling through a particular region of a country with the intention of surveying the languages used. This method is somewhat deeper than the census approach, in that it involves face-to-face encounters, where a census may not, and can afford to focus more specifically on language issues, as the purposes of the field survey allow. Through this method, alert researchers can often avoid the pitfalls of census statistics, that lead to under-reporting of minority languages. Nonetheless, linguistic field surveys are often more superficial than is necessary to fully confirm the identification of new languages, and the population estimates reported are often educated guesses formed by observing people in their native habitat. Furthermore, interactions with the local people may be mediated through government officials or agencies, leading to some of the same problems as the responses to a national census. If the researchers are members of a foreign or national metropolitan community, they may be ethnically distinct from the local inhabitants, and less likely to build the necessary trust in the short duration of the research to obtain reliable responses to some types of questions. Hence, field surveys are often a good starting point for future work in language identification and enumeration, but their identifications are necessarily more preliminary and incomplete than the detailed field research that ideally follows. The most valuable form of information about languages comes from in-depth linguistic fieldwork. Documenting the existence of a previously un-described language, or identifying its relation to other languages, is a time-consuming process. Ideally it is carried out on location in the area where the language in question is spoken, as this makes it easier to recruit speakers of the language to serve as linguistic informants who supply key information about the language, its words, judgments about appropriate sentence structure, and meanings of expressions. Alternatively, linguistic fieldwork may be carried out in a foreign context, such as in a research university, if one or more linguistic informants have already been recruited. Often, work of this sort is done with native speakers of the languages in question who are being trained as professional linguists, whether to benefit language restoration efforts in their communities, language policy and planning in the governments of their home countries, or their own intellectual goals. The linguistic informant may be either bilingual or monolingual; monolingual informants require more skill on the part of the field linguist, and in most areas multilingualism is common enough that one can so most linguistic fieldwork is done with multilingual informants. Nonetheless, the field linguist must typically be knowledgeable about other languages of the region, especially any related languages. On the one hand, s/he must be able to communicate with the informant, so that s/he can successfully elicit the words and expressions that will establish the structure of the language. On the other, s/he needs to be able to relate those forms, where possible, to those of other languages, so that it is clear in what ways the informant’s speech variety is distinct. Painstaking and systematic procedures must be followed, and common sources of error carefully avoided. Depending on the information being sought, the elicitation process can take anywhere from a few hours of work to several months or even years. The more different a speech variety is from known varieties, the more time is required to make a good
description. This alone explains why so little is known about so many languages. For example, from the Tasmanian languages, all that survive are a few word lists, as this is all that anyone had bothered to collect before the languages went extinct. In places of extreme linguistic diversity, such as Papua New Guinea, we often have only general descriptions provided by travelers and explorers in the region. At present, field linguistics is only a small part of the occupation of linguists. While many linguistics graduate programs require a component of training in linguistic fieldwork, this requirement is not universal, nor is it focused entirely on under-described languages. Linguistic field surveys are also rare, being complex to organize, and relatively expensive for their participants’ time and resources. And linguistics embraces a range of other questions, some of which involve field research of other types, so a large amount of linguistic fieldwork is actually focused on questions concerning large and well-described languages. This results in a shortage of trained researchers, resources and time focused on identifying and describing new and under-described languages. Since any one researcher may be involved in many projects, repeat visits to areas of past research may take place at intervals of twenty years or more. This is normally enough time for war, disease, political change or economic fortune to completely alter the scene one had witnessed earlier, many times reducing once-thriving language groups to the point of near extinction. Consequently, much of the information we have about smaller language groups is likely to be out of date. Promoting ongoing linguistic field research is one of the major challenges facing the collection of sound and useful language statistics.
2. Sources for language statistics At present there are very few sources of language statistics. Probably the best known is the Ethnologue, because of its publicly available web-based version. One can often type the name of a lesser-known language into a web-search engine, and have the Ethnologue page for that language returned as the first hit. The introduction of language statistical summaries in the fifteenth edition (Gordon 2005) has also made the Ethnologue a popular resource among researchers, marketers and others who desire information about the languages spoken in specific parts of the world. A second source of language statistics, also with web-accessible and print versions, is the Linguasphere (Dalby 2000). The Linguasphere is primarily intended as a comprehensive taxonomic classification of the world’s speech communities, and carries less in the way of actual population statistics (populations are proprted rounded to the nearest power of ten). At the same time, it classifies speech communities to a much finer degree than the Ethnologue, and hence provides an important point of comparison regarding language identifications. Finally there are a number of other linguistic academic references, which may deal with languages at a global or regional level. We will not undertake a comprehensive review of these here, but instead will survey a few of the more important ones.
2.1. The Ethnologue The Ethnologue can be described as a comprehensive catalogue of the known languages spoken in the world. It is currently in its fifteenth edition, available in a free web-based
form, and as hardcover or paperback volumes. It is published by SIL International (henceforth “SIL”), a non-governmental, non-profit organization focusing on issues of international language development. Other SIL projects include constructing bilingual dictionaries and other educational materials, developing literacy education programs, providing health information, and developing computer technologies for minority and unwritten languages. Many of these projects are undertaken in close cooperation with the local and national governments of the countries in which they work. SIL is closely associated with Wycliffe International, a Christian missionary organization dedicated to translating the Christian Bible into many of the world’s languages.
2.1.1. Background The Ethnologue was founded by R.S. Pittman in 1951 as an way to communicate with colleagues in SIL about language development projects. Its first edition was a ten-page informal (mimeographed) list of 46 language and language group names. As of its fifteenth edition, it has grown into a 1,269-page volume with over 100 pages of maps. To speak of the Ethnologue as a print volume is not entirely correct, however, because in actuality it is a database that is constantly being updated as new information arrives. The print versions (the paperback is different from the hardcover in that it is bound in two separate volumes) are just one presentation of the information in the database. The free web-based version of the Ethnologue is another presentation form of the same database, and there are yet other presentation forms that are used internally by SIL. SIL is probably the organization with the largest network of field linguists in the world. SIL linguists are engaged in research and language development projects in many regions of the world. SIL projects are probably most densely concentrated in three regions: Africa, South America and Southeastern Asia/Oceania, but SIL projects are underway on every continent. SIL field linguists are generally trained professionals, and typically possess graduate degrees from major US, British and Australian universities. At different times, SIL has run cooperative training programs with various US universities: the University of Oklahoma, the University of Oregon, the University of North Dakota and the University of Texas at Arlington. Many SIL fieldworkers have Masters degrees or certificates from these programs. SIL presently runs its own Graduate Institute of Applied Linguistics (GIAL) at its Dallas campus; the GIAL recently received accreditation as a US institution of higher education. The Ethnologue is in a unique position to draw upon this extensive network of trained linguists and globally diverse field experience, in reporting information about the world’s known languages. From time to time, controversy has erupted about SIL’s status as a Christian missionary organization, and its close association with Wycliffe International. This status was reflected in earlier editions of the Ethnologue in the form of a notation on specific language entries indicating “Bible translation need”; this notation is now no longer presented in the published versions of the Ethnologue. One source of potential controversies concerns differences of opinion with some non-missionary academic anthropologists and linguists regarding the ways academic humanists and social scientists should interact with the people of other countries and cultures. Some regard the objective
of missionary activity as one of fundamentally changing cultures into the mold of a dominant culture; hence such action undermines the basic premise of the language development projects undertaken by missionaries. Other controversies may arise because SIL operates in countries where both missionary activities and minority rights can be highly politically sensitive. As a consequence of both types of controversy, in the past SIL has found it necessary to terminate both language development programs in some countries and cooperative relationships with some US universities. These sorts of considerations may influence the way that some academic linguists regard the work of SIL, including the Ethnologue. Because of the SIL emphasis on academic linguistics, the Ethnologue’s definition of language matches fairly closely that used by most linguists. The Ethnologue applies three criteria in determining if two speech varieties are the same language: (i) if speakers of the two varieties mutually understand one another then there is strong reason to consider them the same language, (ii) if speakers of the two varieties do not necessarily understand one another but share a common literature, then there is still strong reason to consider them the same language, and (iii) if speakers of two varieties do mutually understand one another but have different, established ethnolinguistic identities, then there is strong reason to consider them different languages. Each decision is potentially reviewed individually, to make a judgment. The greatest danger here is a potential bias toward splitting ethnolinguistic groups into greater numbers of languages than would be otherwise recognized; the Ethnologue staff regularly receive inquiries about such decisions, particularly with respect to varieties of major European languages, such as Dutch (for recognizing Flemish as distinct), German (for recognizing Bavarian, Kölsch, Saxon and others as distinct) and Swedish (for recognizing Scanian as distinct). While these criticisms lead the Ethnologue staff to continually re-evaluate their identifications, they consider mutual intelligibility to lead to the most linguistically meaningful distinctions, and hence they regard it as the most important criterion in identifying distinct languages.
2.1.2. Structure The print version of the Ethnologue is organized into three main parts, plus introductory front matter and statistical summaries. Part I, Languages of the World, presents a comprehensive list of the world’s languages organized under five global regions (Africa, Americas, Asia, Europe, and Pacific) and individual countries within each region. Some assignment of countries to regions are inevitably somewhat arbitrary. For example, Russia spans the Eurasian land mass, but all of its languages, whether located East or West of the Urals, are listed in its entry under the European region (the maps of Russia are split between the corresponding Asian and European sections). Indonesia, Malaysia and the Philippines, are found the section on Asia, rather than the Pacific, which includes neighboring Australia and New Guinea, as well as New Zealand, Micronesia and the Polynesian islands. The information in this part corresponds generally to the organization and scope of the information found on the website under the country entries. The Ethnologue website (http://www.ethnologue.com/) adds additional functionality by presenting a page for each individual language entry, making it possible to find all of the
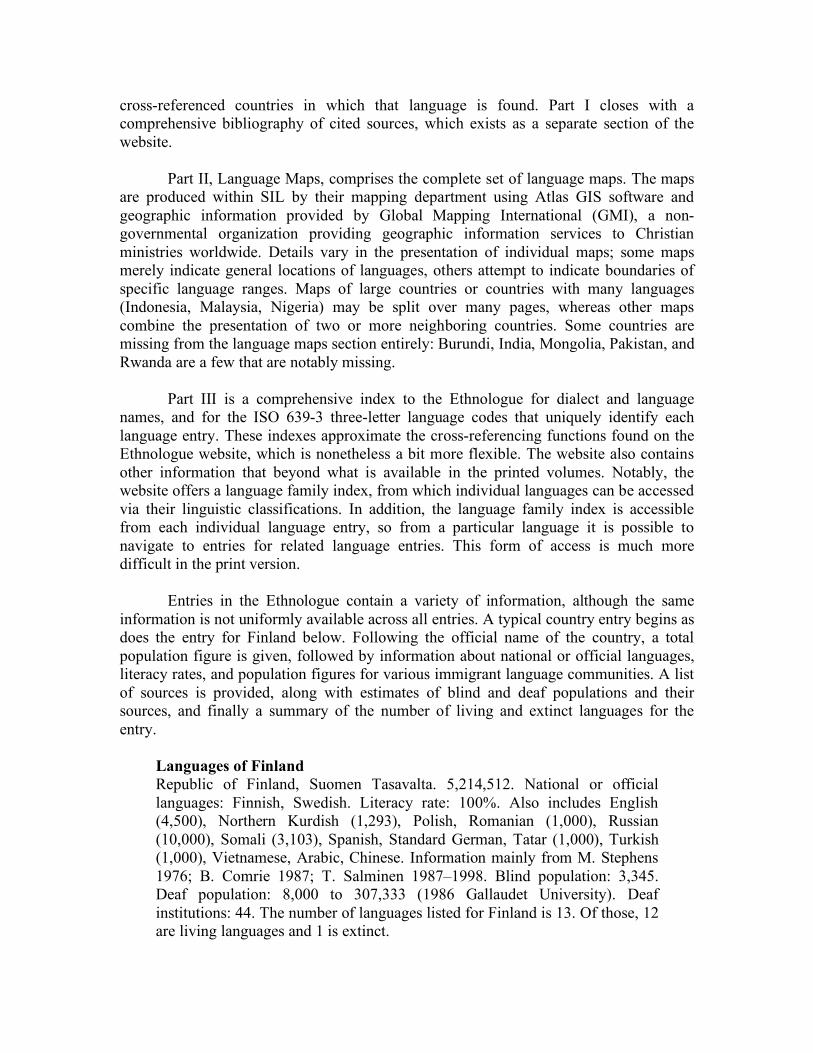
cross-referenced countries in which that language is found. Part I closes with a comprehensive bibliography of cited sources, which exists as a separate section of the website. Part II, Language Maps, comprises the complete set of language maps. The maps are produced within SIL by their mapping department using Atlas GIS software and geographic information provided by Global Mapping International (GMI), a non-governmental organization providing geographic information services to Christian ministries worldwide. Details vary in the presentation of individual maps; some maps merely indicate general locations of languages, others attempt to indicate boundaries of specific language ranges. Maps of large countries or countries with many languages (Indonesia, Malaysia, Nigeria) may be split over many pages, whereas other maps combine the presentation of two or more neighboring countries. Some countries are missing from the language maps section entirely: Burundi, India, Mongolia, Pakistan, and Rwanda are a few that are notably missing. Part III is a comprehensive index to the Ethnologue for dialect and language names, and for the ISO 639-3 three-letter language codes that uniquely identify each language entry. These indexes approximate the cross-referencing functions found on the Ethnologue website, which is nonetheless a bit more flexible. The website also contains other information that beyond what is available in the printed volumes. Notably, the website offers a language family index, from which individual languages can be accessed via their linguistic classifications. In addition, the language family index is accessible from each individual language entry, so from a particular language it is possible to navigate to entries for related language entries. This form of access is much more difficult in the print version. Entries in the Ethnologue contain a variety of information, although the same information is not uniformly available across all entries. A typical country entry begins as does the entry for Finland below. Following the official name of the country, a total population figure is given, followed by information about national or official languages, literacy rates, and population figures for various immigrant language communities. A list of sources is provided, along with estimates of blind and deaf populations and their sources, and finally a summary of the number of living and extinct languages for the entry.
Languages of Finland Republic of Finland, Suomen Tasavalta. 5,214,512. National or official languages: Finnish, Swedish. Literacy rate: 100%. Also includes English (4,500), Northern Kurdish (1,293), Polish, Romanian (1,000), Russian (10,000), Somali (3,103), Spanish, Standard German, Tatar (1,000), Turkish (1,000), Vietnamese, Arabic, Chinese. Information mainly from M. Stephens 1976; B. Comrie 1987; T. Salminen 1987–1998. Blind population: 3,345. Deaf population: 8,000 to 307,333 (1986 Gallaudet University). Deaf institutions: 44. The number of languages listed for Finland is 13. Of those, 12 are living languages and 1 is extinct.
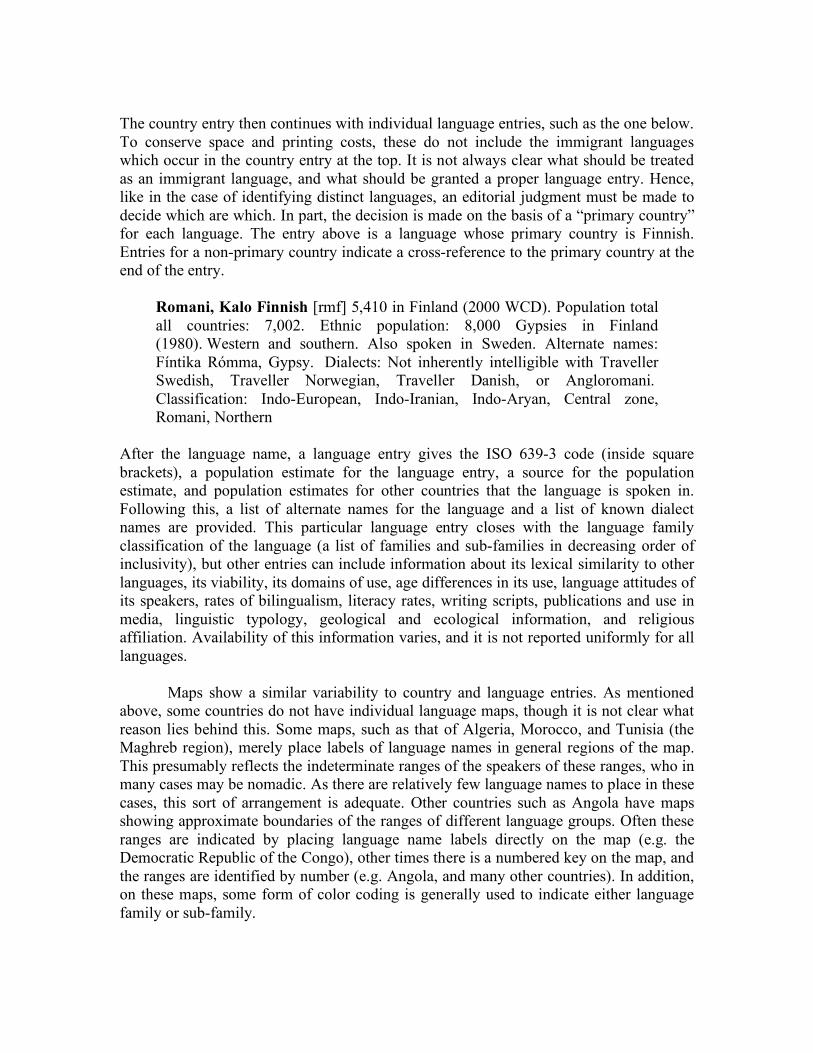
The country entry then continues with individual language entries, such as the one below. To conserve space and printing costs, these do not include the immigrant languages which occur in the country entry at the top. It is not always clear what should be treated as an immigrant language, and what should be granted a proper language entry. Hence, like in the case of identifying distinct languages, an editorial judgment must be made to decide which are which. In part, the decision is made on the basis of a “primary country” for each language. The entry above is a language whose primary country is Finnish. Entries for a non-primary country indicate a cross-reference to the primary country at the end of the entry.
Romani, Kalo Finnish [rmf] 5,410 in Finland (2000 WCD). Population total all countries: 7,002. Ethnic population: 8,000 Gypsies in Finland (1980). Western and southern. Also spoken in Sweden. Alternate names: Fíntika Rómma, Gypsy. Dialects: Not inherently intelligible with Traveller Swedish, Traveller Norwegian, Traveller Danish, or Angloromani. Classification: Indo-European, Indo-Iranian, Indo-Aryan, Central zone, Romani, Northern
After the language name, a language entry gives the ISO 639-3 code (inside square brackets), a population estimate for the language entry, a source for the population estimate, and population estimates for other countries that the language is spoken in. Following this, a list of alternate names for the language and a list of known dialect names are provided. This particular language entry closes with the language family classification of the language (a list of families and sub-families in decreasing order of inclusivity), but other entries can include information about its lexical similarity to other languages, its viability, its domains of use, age differences in its use, language attitudes of its speakers, rates of bilingualism, literacy rates, writing scripts, publications and use in media, linguistic typology, geological and ecological information, and religious affiliation. Availability of this information varies, and it is not reported uniformly for all languages. Maps show a similar variability to country and language entries. As mentioned above, some countries do not have individual language maps, though it is not clear what reason lies behind this. Some maps, such as that of Algeria, Morocco, and Tunisia (the Maghreb region), merely place labels of language names in general regions of the map. This presumably reflects the indeterminate ranges of the speakers of these ranges, who in many cases may be nomadic. As there are relatively few language names to place in these cases, this sort of arrangement is adequate. Other countries such as Angola have maps showing approximate boundaries of the ranges of different language groups. Often these ranges are indicated by placing language name labels directly on the map (e.g. the Democratic Republic of the Congo), other times there is a numbered key on the map, and the ranges are identified by number (e.g. Angola, and many other countries). In addition, on these maps, some form of color coding is generally used to indicate either language family or sub-family.
2.1.3. Source data As mentioned above, one of the key sources for Ethnologue data is SIL’s vast network of field linguists. However, SIL does not have the resources to place field linguists in all areas of the world; they concentrate their resources in areas where they currently have projects underway. This means that SIL has very little of its own information in many areas of the world, such as Central Asian Russia (as in the example discussed above). Hence, the Ethnologue must rely on other sources of information to identify, locate and enumerate speakers of languages in these areas. A number of its sources are from other academic linguists, including important linguistic surveys such as the Language Atlas of the Pacific Area (Wurm and Hattori 1981), and the Linguistic Survey of India (Grierson 1903-1928), general references and language family and area references such as the Cambridge Language Surveys book series (e.g. Holm 1989; Masica 1991; Shibatani 1990; although not all available titles in the series are cited, e.g., Dixon and Aikhenvald 1999; MacAulay 1992; Mithun 1999; Posner1996). Because these surveys are incomplete, infrequently updated and unavailable in some areas, this still leaves a patchwork of areas that need to be covered. Some of these areas can be covered by individual citations to academic linguistic publications on specific languages and locales. Other gaps are filled in typically from Christian missionary sources, such as the World Christian Database (WCD) and Operation World. Introduction of these sources for many citations in the fifteenth edition complicated the relationship between WCD and the Ethnologue, for the simple reason that WCD had previously cited the Ethnologue wherever possible for information about language populations, and the potential for circular citation made it harder for both to check and update their sources. Moreover, the specific information that language identifications and population estimates are based on in such sources are unlikely to be based on the professional linguistic field assessment of the information from SIL and other academic linguists. Rather, they are more likely based on the less formal assessments of Christian missionaries, churches, and aid workers (collectively referred to as “ministries”). They may even be based, directly or indirectly, on government reports, census figures or almanacs. In the end, the provenance of this information is far less certain than that of the census and academic sources. Some information, including population figures, is presented without a cited source for it. These appear to be cases where information was carried over from earlier editions of the Ethnologue, and there did not happen to be a citation in the earlier edition. Other times a citation year is given but no source. The Ethnologue editors have made a decision to provide information to the extent that it is known wherever possible. In their view, it is better to put out some form of population estimate, for example, even if it is old, out of date or from an unreliable source, if that is all that is available. By doing so, they are reporting as honestly as possible what they are able to ascertain about the status of a language and its speakers. They reason that this should stimulate dialogue with the users of the Ethnologue, who can respond either by suggesting other sources, or providing further information of their own, that can be cross-checked and potentially incorporated in future editions of the Ethnologue. In many cases this has had the desired effect.
2.1.4. ISO 639-3 While the Ethnologue was conceived for SIL’s internal purposes, and is primarily used for that today, with its publication on the web, it attained a visibility unlike what it had previously known. This visibility brought with it, among other things, an invitation from the International Standards Organization to participate in the standards process for ISO 639-3, a planned update for the earlier ISO 639-2 standard that libraries employ to identify languages for cataloging and other purposes. This standard was felt to be inadequate as it had a fixed number of languages (about 500), and no effective process for identifying and adding the large number of new languages that might be needed. Since the Ethnologue used a set of three-letter codes much like those of ISO 639-2, it seemed a natural choice for developing the new ISO 639-3. The result is a new draft standard, now undergoing the final approval process. The development of the ISO 639-3 draft standard, and its incorporation into the Ethnologue imposed a number of requirements on the Ethnologue system of identifying languages. First, the internal three-letter codes that the Ethnologue had previously used needed to be reconciled with the earlier ISO 639-2 standard. This meant changing a number of existing codes, to avoid conflicts. The remaining Ethnologue codes were then grafted onto ISO 639-2 to provide the additional codes needed for the ISO 639-3 draft. This has the effect of making the Ethnologue the default catalog for the ISO 639-3 standard. A second consequence of the standards process is that a new office needed to be organized to maintain the standard. This office is housed inside SIL, and is staffed by SIL, but its operation is separate from that of the Ethnologue, which submits its desired changes to the standards office just as any other user of the standard would. Presently, since the standard is still undergoing the approval process, there is a backlog of requests to be processed once the standard goes into effect. Requests that would otherwise have been made in the 15th edition were postponed so that the reconciliation of the Ethnologue’s earlier code system could be accomplished. This is probably one of the more significant changes in the Ethnologue editorial process since the 14th edition. A third consequence is that a set of codes for ancient and constructed languages, the LINGUIST codes (Aristar 2002a,b), was also affected by these changes. The relationship between the LINGUIST codes and the Ethnologue codes significantly predates the ISO 639-3 draft, and hence was designed to use part of the space no occupied by the ISO 639-3 standard, of which it is not formally a part. Since there were 235 ancient language codes and 34 constructed language codes before the development of the ISO 639-3 draft standard, there is a potential for serious maintenance issues.
2.1.5. Staff The Ethnologue editorial staff currently has three people, Raymond Gordon, editor in chief; Conrad Hurd, managing editor; and Paul Lewis editor; not all of whom are
assigned to the project full time. The Ethnologue shares space and resources with other SIL projects on the Dallas campus. While it is one of SIL’s most visible and well-known projects, it consumes a tiny fraction of SIL’s $150 million annual budget. Editorial policies must also fit within these resource constraints, when it comes to producing a printed volume or providing information services over the Internet. For example, there is no one in SIL assigned to the Ethnologue for the purpose of developing its web-based services — it shares maintenance of its website with SIL more generally — making development of new forms of web-based presentation unlikely.
2.2. The Linguasphere Register The Linguasphere Register is a comprehensive list of speech communities representing a career-spanning effort of David Dalby to provide a complete catalogue of the world’s speech communities and their relations to one another. Compilation of data that was eventually incorporated into the Linguasphere was begun by Dalby in the 1950s, and the Linguasphere Observatory, which now oversees the project, was founded in 1983. Preview editions of the Linguasphere register were published in 1997 (formally presented to the UNESCO Director-General) and 1998, and the framework edition was published in 2000. While both the Linguasphere Register and the Ethnologue both aim to be comprehensive catalogues of the world’s languages, the aims of the Linguasphere register are somewhat different, and this is reflected in both its structure and organization. First, it explicitly seeks to treat language and language varieties as a global system of communication (the “linguasphere”). This leads it to adopt the speech community as its smallest unit of analysis. A speech community is a group of people who are bound together by regular patterns and norms of communication. In the conception used by the Linguasphere Registry, speech communities constitute a hierarchy of specificity from individual locales at the lowest level up to the entire community of humanity. Since speech communities often cross national boundaries, the Linguasphere Register places less emphasis on the borders of countries than in the Ethnologue, in which border-area speech communities are split into separate entries under each country. The primary goal of the Linguasphere Register is to place all human speech communities into a comprehensive taxonomy of language varieties. Where most linguistic taxonomies, including that of the Ethnologue, emphasize historical (“genetic”) relationships among language varieties, the taxonomy used in the Linguasphere Register does not use historical origin as its sole organizing criterion. Instead, “sectors” and “zones” are established as the two outermost levels of classification. Both zones and sectors can pertain to either geographic region (e.g. “African geosector”, “East Sahel geozone”) or linguaitic family affiliation (“Afro-Asian phylosector”, “Semitic phylozone”). These two levels of classification are partly independent. Geosectors may contain either geozones or phylozones. In more traditional linguistic family classifications, phylozones within a common geosector would simply be treated as separate families without grouping them together with other families in any way. Phylosectors appear to only have phylozones within them, and do not contain geozones.
Presumably, this is because language family has already been accepted as the taxonomic principle for classifying these languages. Hence, the primary consideration in classifying any speech community cones down to its family relatedness to other languages, or its lack of established family relatedness. The inclusion of geographic classifications nonetheless permits the Linguasphere Register to recognize classifications of linguistically and geographically similar languages where a common historical antecedent cannot be established (e.g. the North America geosector, the Sepik Valley geozone). An advantage of this is that it becomes easier to navigate the taxonomy from the top-levels and work down to find a desired language or group. Each speech community listed in the Linguasphere Register is given a unique language code that identifies its place within the taxonomy. The sector and zone of each language are encoded in the two-digit prefix of each code. These sectors and zones are considered to be fixed, and not subject to future change. The remainder of the code is a sequence of up to six characters from the roman alphabet, the number of characters depending on the level of detail of classification of the speech community. The first three characters are upper case, and reflect the set, chain and net to which the speech community belongs, respectively. The remaining three are in lower-case and correspond to “outer language”, “inner language” and dialect, respectively. Outer and inner language represent terminology unique to the Linguasphere Register that are not widely current in linguistics, and they are not clearly defined in the register. Hence, the Linguasphere Register provides a maximum of eight levels of taxonomic classification. As an example of the Register’s classifications, consider English and English-based Creoles, which are placed, within the Germanic phylozone of the Indo-European Phylosector (52). The English net of speech communities is labeled 52-ABA, where the first A indicates English is part of a set with Norse (Scandanavian) and Frysk (Frisian), the B indicates it is part of a chain involving English and Anglo-Creoles, and the second A distinguishes the English net from the Anglo-Creole net, identified as 52-ABB. Within Anglo-Creole, Caribbean Anglo-Creole is recognized as an outer language (52-ABB-a), which has several inner languages (e.g. Gullah Creole 52-ABB-aa, Belizean Creole 52-ABB-ad, etc.) and dialects (e.g. belize-creole-urban 52-ABB-ada, belize-creole-vehicular 52-ABB-adb, etc.). The assignment of alphabetic symbols at each level is arbitrary, serving only to identify specific groups of speech communities as related or distinct. Entries in the Linguasphere Register are organized in five columns. The first column gives the taxonomic code for the speech community represented in the entry. The second gives the name of the speech community so classified. The third column gives alternative names and explanatory comments. The fourth indicates the geographic location of the speech community, and the fifth indicates the relative size of the speech community. Populations of the language groups are a secondary concern in the Linguasphere Register, and not generally given for all taxonomic levels of speech community identified. Typically, only figures of outer languages are given, although sometimes there are figures for inner languages. In addition, populations are merely given as a single digit (1 through 9) indicating the magnitude of the population of speakers as a
power of ten. The reason given for this is that it is often difficult to obtain accurate population figures (because, e.g. of the lack of good language questions in many national censuses), and the difficulty of defining the status of speakers of a language, especially second language speakers. The Linguasphere Registry, like the Ethnologue, is presented both as a set of print volumes and delivered electronically over the Internet. Unlike the Ethnologue, the whole of the information in the Linguasphere Registry is not viewable for free on the Internet. The website for the electronic version is split over three domains: www.linguasphere.org, www.linguasphere.net, and www.linguasphere.com. Each site has somewhat different information, e.g. the dot-com site has an order form for print and electronic access, while the dot-org and dot-net sites provide more background information and lack an ordering mechanism. The dot-org site provides samples from the Register for free download, which are Adobe PDF format documents. No equivalent to a database front-end is yet available for this data. The Linguasphere Register is currently maintained as a project of the Linguasphere Observatory, and international organization incorporated in Wales, France and India. It is unclear from the websites whether there has been significant activity in the organization since late 2004, but a number of projects including those involving the construction of language maps, are reported to be ongoing as of the last update.
2.3. Other sources of language statistics Apart from the two sources mentioned above, there are no other sources of language identification that aim to be comprehensive in their coverage. Hence, there are no other comprehensive sources of language statistics. All other sources fall into three general types: (i) general linguistics reference materials covering a variety of languages, (ii) language group and language family references, (iii) scholarship on endangered languages. We will not attempt a detailed review of these materials here. Examples of each of these categories of materials and descriptions of their contents follow.
2.3.1. General linguistics references Dalby, A. 2004. Dictionary of Languages: The Definitive Reference to More Than 400 Languages. New York: Columbia University Press.
This reference addresses primarily a non-specialist audience, with the intent of identifying the referents of a selection of language names. There are 400 entries, focusing primarily on the most populous languages, with some entries for more than one language (generally these are for language families or groups, whose total populations are substantial). Population figures are given as round numbers, typically in the tens of thousands, hundreds of thousands or millions. Entries generally provide 1-2 pp. of encyclopedic material describing the language(s) or speakers of the language(s), a map, and possibly some linguistic information such as grammatical forms, examples of peculiar linguistic features, tables of numerals, etc. Entries are
organized alphabetically by language name; there is an index that facilitates access to the data by country, but alternate names for the languages do not appear to be listed. There is no bibliography, although some entries do give bibliographic citations, so it is difficult to identify the sources of the information, their currency or accuracy.
Bright, W, ed. 1992. International Encyclopedia of Linguistics. Oxford: Oxford University Press. (Second edition, 2003, Frawley, W, ed.).
This is a general reference work primarily intended for specialists and students in linguistics. Alongside other information of interest to specialists, there are entries for individual languages and language families. There are 378 such entries in the first edition (the second edition was not available for examination as of this writing). Language family entries are followed by lists of languages and their estimated populations from the Ethnologue (the 11th edition is cited in the first edition of the IEL; 14th edition in the second edition of IEL). Language entries typically also give population figures, though sources for such figures may not be cited.
Comrie, B, ed. 1990. The World’s Major Languages. New York: Facts on File.
This is a general reference work intended for specialists and students in linguistics, focusing on relevant linguistic and historical description. What counts as a “major language” is a subjective matter (Preface, p. ix), decided on the basis of such criteria as number of speakers, official status of the languages within different countries, and the existence of long literary traditions. The book is organized into 48 chapters of varying specificity (divided into 12 sections based on language families). Population figures are often cited, but generally without source information, so the currency and accuracy of the population figures is uncertain.
Comrie, B; Matthews, S; and Polinsky, M, eds. 1997. The Atlas of Languages. New York: Facts on File.
This is a general reference intended for the lay-person. It is not so much an atlas as a series of short articles organized geographically and illustrated with maps. Numbers of languages are reported for different countries and regions, but the presentation is more didactic and less systematic than could be desired. There is no bibliography, and individual articles do not have bibliographic citations.
2.3.2. Language group and language family references Cambridge Language Surveys: This is a book series published by Cambridge University Press which publishes volumes addressing specific language families and language areas. Citations to relevant examples of this series follow. The series consists of sixteen titles published since at least 1980. Global coverage is extensive, but not yet complete; regions such as the Americas, Western Europe, East Asia and South Asia are reasonably well-covered, whereas Africa, Central Asia, Western Asia, Southeast Asia, and Oceania do not have titles addressing them yet. The volumes vary according to subject matter and author preference in their organization, some emphasizing linguistic structure and history (e.g.
Masica 1991; Mithun 1999), others adopting a more geographic approach (Adelaar 2004; Dixon and Aikhenvald, eds. 1999).
Examples Adelaar, W. 2004. Languages of the Andes. Cambridge: Cambridge University Press. Dixon, R. 1980. The Languages of Australia. Cambridge: Cambridge University Press. Dixon, R; and Aikhenvald, A. 1999. The Amazonian Languages. Cambridge: Cambridge
University Press. Holm, J. 1988. Pidgins and Creoles, Volume I: Theory and Structure. Cambridge: Cambridge
University Press. Holm, J. 1989. Pidgins and Creoles, Volume II: Reference Survey. Cambridge: Cambridge
University Press. MacAualy, D, ed. 1992. The Celtic Languages. Cambridge: Cambridge University Press. Masica, C. 1991. The Indo-Aryan Languages. Cambridge: Cambridge University Press. Mithun, M. 1999. The Languages of Native North America. Cambridge: Cambridge University
Press. Posner, R. 1996. The Romance Languages. Cambridge: Cambridge University Press. Shibatani, C. 1991. The Indo-Aryan Languages. Cambridge: Cambridge University Press.
Routledge Descriptive Grammars: This series originated as a series of book-length grammars oriented toward a questionnaire constructed by linguistic typologists (Comrie and Smith 1977). The aim was to stimulate linguists to provide comprehensive descriptions of languages that would be useful in developing theories of the relationship among the structural features of languages. Originally initiated as the Lingua Descriptive Series, the series was ultimately incorporated into Routledge Publications’ holdings in language and linguistics. The descriptive grammars are still produced, although they are not listed as a series on the publisher’s website. Generally, the series has favored national languages and languages of large national minorities in one or more countries (e.g. Kashmiri: Wali and Koul, 1997; Punjabi: Bhatia 1993) Individual grammars no longer explicitly orient toward the original questionnaire, although the typological function of the series is still primary. Introductory chapters of these volumes typically give population figures for the language(s), though these typically do not have sources cited, and it is difficult to assess their currency and accuracy.
Examples Bhatia, T. 1993. Punjabi: A Cognitive-Descriptive Grammar. London: Routledge. Matthews, S; and Yip, M. 1994. Cantonese: A Comprehensive Grammar. London: Routledge. Sridhar, S. 1991. Kannada Grammar. London: Routledge. Wali, K; and Koul, O. 1997. Kashmiri: A Cognitive-Descriptive Grammar. London: Routledge.
Languages of the World/Materials (LINCOM Descriptive Grammar Series): This series was started in the late 1980s by LINCOM Europa, an academic publisher specializing in small runs of books with an emphasis on language materials, including texts, dictionaries, technical terminology references, etc. The descriptive series was conceived along lines similar to those of the Routledge Descriptive Grammars, but with smaller, less expensive volumes. Hence, most of the grammars in this series are under 100 pages in length, and are paper bound. They are generally prepared to a high professional standard, and some appear to be the only definitive references on particular languages (e.g. Cain and Gair 2000). Titles often focus on under-described languages and minority communities (e.g. Tenser 2005). There are several hundred listed titles in the series (numbered 1 through
452, not all numbers being used), making this possibly the largest descriptive grammar series available. Again it is typical to find population sizes for languages in the introductory sections of the grammars, without any cited sources, so currency and accuracy of the information is uncertain.
Examples Cain, B; and Gair. J. 2000. Divehi (Maldivian). Languages of the World/Materials 63. Munich:
Lincom Europa. Gair. J; and Paolillo, J. 1997. Sinhala. Languages of the World/Materials 34. Munich: Lincom
Europa. Tenser, A. 2005. Lithuanian Romani. Languages of the World/Materials 452. Munich: Lincom
Europa. In addition to the works in each of these series, there are numerous potentially relevant academic linguistic publications not in any particular series. Those that are more useful to the goals of identifying and/or verifying language statistics are generally ones covering a geographic region or language area, e.g. Heine and Nurse eds. (2000) for Africa, Romaine ed. (1991) for Australia. Most of the available linguistic description, however, either focuses on grammatical and historical description (e.g. Edmondson and Solnit 1997 for the Kadai sub-family of Southeast Asian languages), or on local interactional patterns involving one or more languages (e.g. Auer, ed. 1998; Errington 1998; Kulick 1992; Milroy and Myusken, eds. 1995). While such works can be generally quite illuminating about the circumstances around particular languages, they share with the tend to report little information about the populations observed or described. Hence, linguistic academic scholarship makes a limited contribution to knowledge about language statistics.
2.3.3. Scholarship on endangered languages Scholarship on endangered languages differs from other types of academic linguistic scholarship in that, by nature, it has to be concerned with the populations of speakers described. A small number of publications in this area, notably Robins and Uhlenbeck (1991) and Wurm (2001), strive to be comprehensive, in that they try to cover all geographic areas of the world. As their focus is on languages that are endangered, the populations of all of the reported groups in this set of publications tend to be small. Strictly speaking it is not population size alone which is determinative of language endangerment, but the proportion of young people in the community of speakers that is learning the community language, as opposed to some outside-group language. Nonetheless this is more the case for small languages than for larger languages. A selection of these publications is described below. Hale, K; Krauss, M; Watahomigie, L; Yamamoto, A; Craig, C; Jeanne, L; and England, N. 1992. Endangered languages. Language, 68.1: 1-42.
This reference refers to a collection of short articles published as a single piece in the Journal Language, the primary organ of communication of the Linguistic Society of America. The authors are field linguists writing to raise consciousness among members of the field regarding the loss of linguistic diversity, at the
beginning of the most recent period of academic attention to the issue of language endangerment. Since the late 1950s, emphasis had shifted away from field linguistics in the major journals, particularly Language, and the publication of these articles served to bring attention back to field linguistics. At the time, there were also few publications directly addressing language endangerment, the term itself being a neologism. The articles remain highly cited, partly because one of them contained what was at the time regarded as the best estimate of the number of the world’s languages (given as 6,000), and the number of endangered languages (half are expected to be extinct at the end of the 21st century).1 Language statistics is not otherwise a major contribution of this set of articles.
Robins, R; and Uhlenbeck, E, eds. 1991. Endangered Languages. Oxford: Berg.
This publication consists of ten chapters from contributors, the first an article by S. Wurm describing the causes and circumstances of language endangerment, and the remaining chapters being country-based or regional surveys covering most of the areas of the world. Chapters vary in the level of detail they provide regarding the number and type of languages they report on and the nature of the information they provide. For example, Brenzinger, et al. (1991) focuses on language death, rather than endangerment per se, and presents data on the numbers and names of languages that have recently ceased to be spoken in various countries, whereas Adelaar (1991) reports language group sizes as well as names, on a per-country basis. Other chapters address demographic trends mostly in larger languages (e.g. Mahapatra 1991 on India), or address languages of a particular set of families only partly respective of location (e.g. Matisoff 1991, which looks at several Southeast Asian families, some of which have members in India). Using the lists of languages and populations is somewhat difficult as many times they do not appear in tables, but are listed in dense paragraphs, where it can be hard to find particular mentions of languages. The book also lacks an index that might help in this regard. This publication is important nonetheless as it was the first in the field of linguistics to provide concrete documentation of the endangerment of a number of languages.
Wurm, S, ed. 2001. Atlas of the World’s Languages in Danger of Disappearing (second edition, revised and enlarged). Barcelona: UNESCO Publications.
Originally published in 1996, this publication indicates locations, but not population sizes, for more than 1000 endangered, potentially endangered, or recently extinct languages, a staggering number, given that the number of living languages worldwide is generally given as being around 6000. This would mean that up to 1/6 of the worlds languages are presently in danger of disappearing within the next generation. The publication offers no population data, but provides detailed maps locating each of the listed languages. Among the revisions is an updated set of introductory materials about the subject of endangered languages, including a review of research since 1996. Table 1 lists the number of
1 This information turns out to have come from the 11th edition of the Ethnologue (Grimes and Grimes 1988).
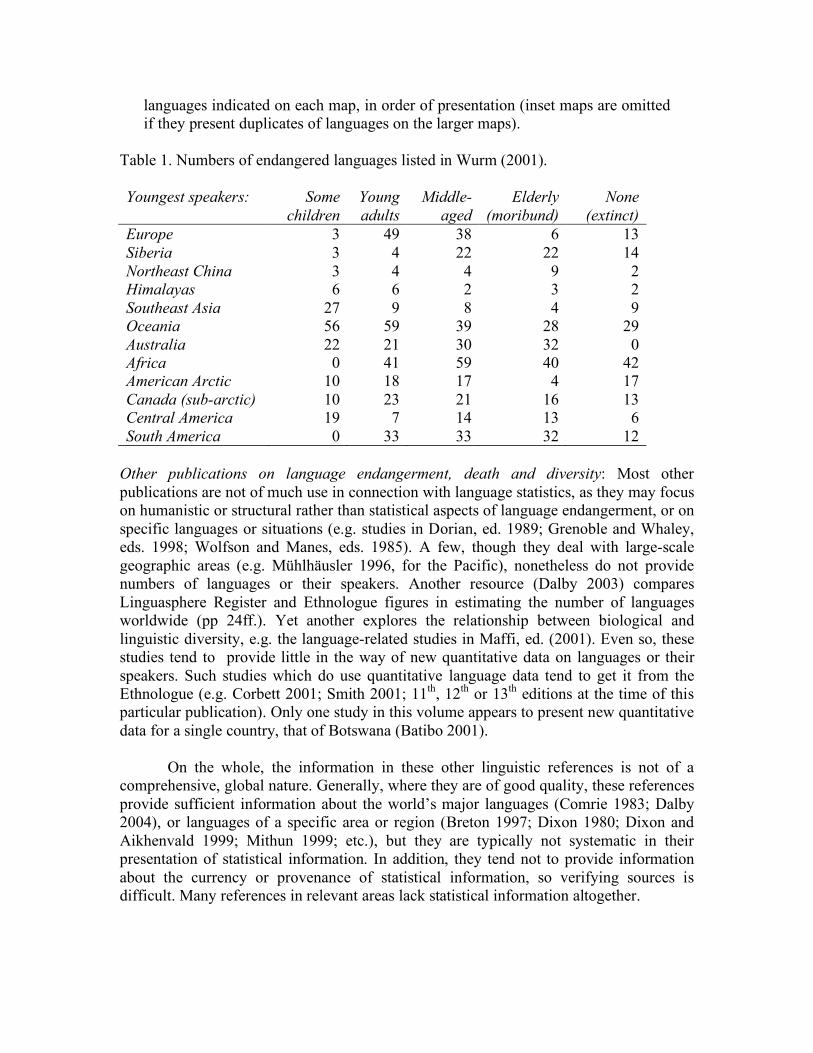
languages indicated on each map, in order of presentation (inset maps are omitted if they present duplicates of languages on the larger maps).
Table 1. Numbers of endangered languages listed in Wurm (2001). Youngest speakers:
Some children
Young adults
Middle-aged
Elderly (moribund)
None (extinct)
Europe 3 49 38 6 13 Siberia 3 4 22 22 14 Northeast China 3 4 4 9 2 Himalayas 6 6 2 3 2 Southeast Asia 27 9 8 4 9 Oceania 56 59 39 28 29 Australia 22 21 30 32 0 Africa 0 41 59 40 42 American Arctic 10 18 17 4 17 Canada (sub-arctic) 10 23 21 16 13 Central America 19 7 14 13 6 South America 0 33 33 32 12
Other publications on language endangerment, death and diversity: Most other publications are not of much use in connection with language statistics, as they may focus on humanistic or structural rather than statistical aspects of language endangerment, or on specific languages or situations (e.g. studies in Dorian, ed. 1989; Grenoble and Whaley, eds. 1998; Wolfson and Manes, eds. 1985). A few, though they deal with large-scale geographic areas (e.g. Mühlhäusler 1996, for the Pacific), nonetheless do not provide numbers of languages or their speakers. Another resource (Dalby 2003) compares Linguasphere Register and Ethnologue figures in estimating the number of languages worldwide (pp 24ff.). Yet another explores the relationship between biological and linguistic diversity, e.g. the language-related studies in Maffi, ed. (2001). Even so, these studies tend to provide little in the way of new quantitative data on languages or their speakers. Such studies which do use quantitative language data tend to get it from the Ethnologue (e.g. Corbett 2001; Smith 2001; 11th, 12th or 13th editions at the time of this particular publication). Only one study in this volume appears to present new quantitative data for a single country, that of Botswana (Batibo 2001). On the whole, the information in these other linguistic references is not of a comprehensive, global nature. Generally, where they are of good quality, these references provide sufficient information about the world’s major languages (Comrie 1983; Dalby 2004), or languages of a specific area or region (Breton 1997; Dixon 1980; Dixon and Aikhenvald 1999; Mithun 1999; etc.), but they are typically not systematic in their presentation of statistical information. In addition, they tend not to provide information about the currency or provenance of statistical information, so verifying sources is difficult. Many references in relevant areas lack statistical information altogether.
3. Evaluation of language statistics The Ethnologue provides extensive information on its sources of information both in the entries itself and in the bibliography. Hence, it is possible to get an idea of the nature of the information in the Ethnologue and the quality of its data. The Linguasphere Register does not provide the same kind of documentation within entries, but instead provides links to many of its sources on various pages of its website. Hence, we cannot evaluate the Linguasphere directly, but we can compare it to the Ethnologue to ascertain Of particular interest are the cited population figures, their source and the currency of the data represented. Also of interest are the methods by which the data were collected (through field linguistic survey, census, etc.). Finally, we should also be interested in what, if anything, we can learn from the statistics that are presented. By tabulating the statistics presented in different ways, and attempting to understand what they might tell us about language populations, diversity and endangerment, we can potentially learn about the gaps in the existing knowledge about languages and their speakers, as well as the nature of the sources of information that we do have. This section comprises an evaluation primarily of the Ethnologue, comparing at relevant points to the Linguasphere Register as well as other relevant references. The evaluation of language entries is conducted on two distinct sets of data. The first is a random sample of 2001 entries from the 15th edition of the Ethnologue, for which we can conduct a more in-depth investigation. The second data set is the complete set of language entries from the 14th edition of the Ethnologue, which was collected for an earlier project (Paolillo 2005). We also undertake a separate analysis of country entries and maps, from the 15th edition. The analysis of the language entries proceeds in three parts. First, in section 3.1 we investigate the cited sources for language entries, using summary counts of the different sources classified according to type. Second, we examine the currency of the data across language entries, by source, language family, country and region. Third, we investigate the language group sizes recorded in the Ethnologue using the same breakdowns as for currency, also comparing with the Linguasphere Register to examine the consistency across the two resources. We then consider location information in section 3.4, information about media, literatures and language use in section 3.5, followed by classification issues in section 3.6. A short summary in section 3.8 concludes this section of the report.
3.1. Sources and currency of data Our evaluation of the sources of the Ethnologue is based upon the random sample of 2001 language entries. We identified the population estimate for each entry, if present, and identified its source, and the year of the citation. We then classified each of the sources according to one of several types: SIL, academic, Government, World Christian Database, other Christian missionary, and other sources. When multiple sources were given for a single entry, we used only the most recent one to determine both source type and year. A number of entries had a date for a population figure, but no source. These were recorded as “not indicated”. Still others gave a population figure, but had no source
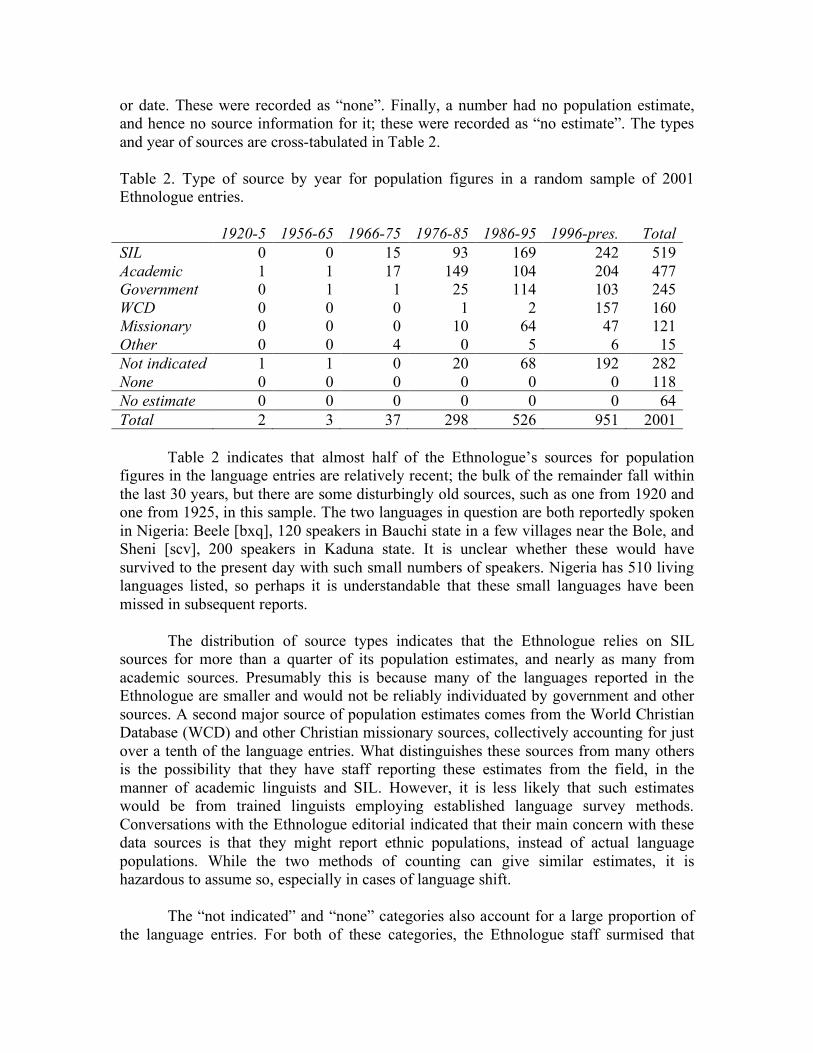
or date. These were recorded as “none”. Finally, a number had no population estimate, and hence no source information for it; these were recorded as “no estimate”. The types and year of sources are cross-tabulated in Table 2. Table 2. Type of source by year for population figures in a random sample of 2001 Ethnologue entries. 1920-5 1956-65 1966-75 1976-85 1986-95 1996-pres. Total SIL 0 0 15 93 169 242 519 Academic 1 1 17 149 104 204 477 Government 0 1 1 25 114 103 245 WCD 0 0 0 1 2 157 160 Missionary 0 0 0 10 64 47 121 Other 0 0 4 0 5 6 15 Not indicated 1 1 0 20 68 192 282 None 0 0 0 0 0 0 118 No estimate 0 0 0 0 0 0 64 Total 2 3 37 298 526 951 2001 Table 2 indicates that almost half of the Ethnologue’s sources for population figures in the language entries are relatively recent; the bulk of the remainder fall within the last 30 years, but there are some disturbingly old sources, such as one from 1920 and one from 1925, in this sample. The two languages in question are both reportedly spoken in Nigeria: Beele [bxq], 120 speakers in Bauchi state in a few villages near the Bole, and Sheni [scv], 200 speakers in Kaduna state. It is unclear whether these would have survived to the present day with such small numbers of speakers. Nigeria has 510 living languages listed, so perhaps it is understandable that these small languages have been missed in subsequent reports. The distribution of source types indicates that the Ethnologue relies on SIL sources for more than a quarter of its population estimates, and nearly as many from academic sources. Presumably this is because many of the languages reported in the Ethnologue are smaller and would not be reliably individuated by government and other sources. A second major source of population estimates comes from the World Christian Database (WCD) and other Christian missionary sources, collectively accounting for just over a tenth of the language entries. What distinguishes these sources from many others is the possibility that they have staff reporting these estimates from the field, in the manner of academic linguists and SIL. However, it is less likely that such estimates would be from trained linguists employing established language survey methods. Conversations with the Ethnologue editorial indicated that their main concern with these data sources is that they might report ethnic populations, instead of actual language populations. While the two methods of counting can give similar estimates, it is hazardous to assume so, especially in cases of language shift. The “not indicated” and “none” categories also account for a large proportion of the language entries. For both of these categories, the Ethnologue staff surmised that
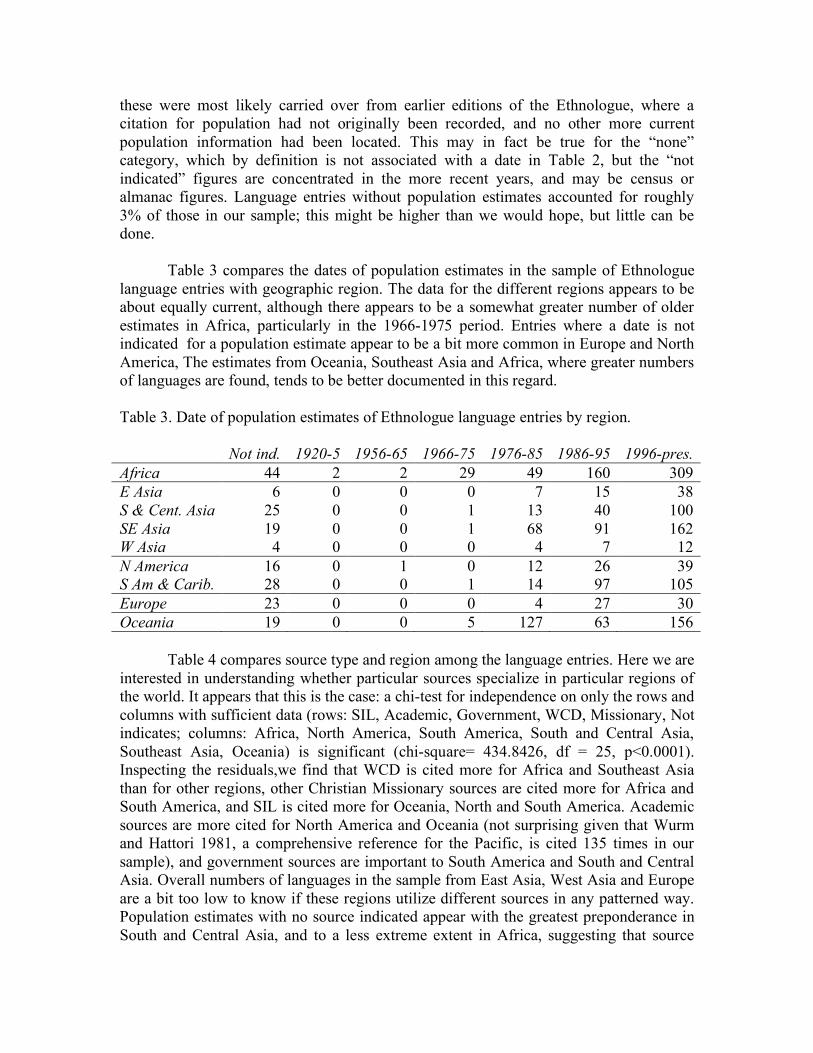
these were most likely carried over from earlier editions of the Ethnologue, where a citation for population had not originally been recorded, and no other more current population information had been located. This may in fact be true for the “none” category, which by definition is not associated with a date in Table 2, but the “not indicated” figures are concentrated in the more recent years, and may be census or almanac figures. Language entries without population estimates accounted for roughly 3% of those in our sample; this might be higher than we would hope, but little can be done. Table 3 compares the dates of population estimates in the sample of Ethnologue language entries with geographic region. The data for the different regions appears to be about equally current, although there appears to be a somewhat greater number of older estimates in Africa, particularly in the 1966-1975 period. Entries where a date is not indicated for a population estimate appear to be a bit more common in Europe and North America, The estimates from Oceania, Southeast Asia and Africa, where greater numbers of languages are found, tends to be better documented in this regard. Table 3. Date of population estimates of Ethnologue language entries by region. Not ind. 1920-5 1956-65 1966-75 1976-85 1986-95 1996-pres. Africa 44 2 2 29 49 160 309 E Asia 6 0 0 0 7 15 38 S & Cent. Asia 25 0 0 1 13 40 100 SE Asia 19 0 0 1 68 91 162 W Asia 4 0 0 0 4 7 12 N America 16 0 1 0 12 26 39 S Am & Carib. 28 0 0 1 14 97 105 Europe 23 0 0 0 4 27 30 Oceania 19 0 0 5 127 63 156 Table 4 compares source type and region among the language entries. Here we are interested in understanding whether particular sources specialize in particular regions of the world. It appears that this is the case: a chi-test for independence on only the rows and columns with sufficient data (rows: SIL, Academic, Government, WCD, Missionary, Not indicates; columns: Africa, North America, South America, South and Central Asia, Southeast Asia, Oceania) is significant (chi-square= 434.8426, df = 25, p<0.0001). Inspecting the residuals,we find that WCD is cited more for Africa and Southeast Asia than for other regions, other Christian Missionary sources are cited more for Africa and South America, and SIL is cited more for Oceania, North and South America. Academic sources are more cited for North America and Oceania (not surprising given that Wurm and Hattori 1981, a comprehensive reference for the Pacific, is cited 135 times in our sample), and government sources are important to South America and South and Central Asia. Overall numbers of languages in the sample from East Asia, West Asia and Europe are a bit too low to know if these regions utilize different sources in any patterned way. Population estimates with no source indicated appear with the greatest preponderance in South and Central Asia, and to a less extreme extent in Africa, suggesting that source
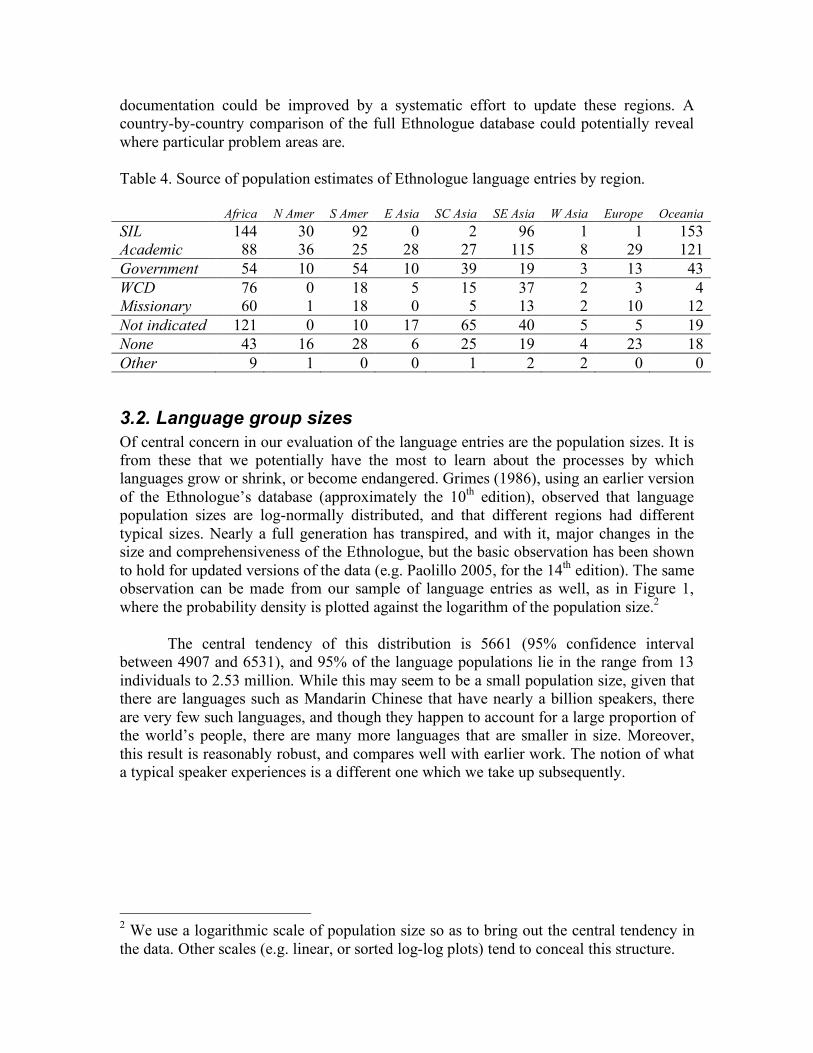
documentation could be improved by a systematic effort to update these regions. A country-by-country comparison of the full Ethnologue database could potentially reveal where particular problem areas are. Table 4. Source of population estimates of Ethnologue language entries by region. Africa N Amer S Amer E Asia SC Asia SE Asia W Asia Europe Oceania SIL 144 30 92 0 2 96 1 1 153 Academic 88 36 25 28 27 115 8 29 121 Government 54 10 54 10 39 19 3 13 43 WCD 76 0 18 5 15 37 2 3 4 Missionary 60 1 18 0 5 13 2 10 12 Not indicated 121 0 10 17 65 40 5 5 19 None 43 16 28 6 25 19 4 23 18 Other 9 1 0 0 1 2 2 0 0
3.2. Language group sizes Of central concern in our evaluation of the language entries are the population sizes. It is from these that we potentially have the most to learn about the processes by which languages grow or shrink, or become endangered. Grimes (1986), using an earlier version of the Ethnologue’s database (approximately the 10th edition), observed that language population sizes are log-normally distributed, and that different regions had different typical sizes. Nearly a full generation has transpired, and with it, major changes in the size and comprehensiveness of the Ethnologue, but the basic observation has been shown to hold for updated versions of the data (e.g. Paolillo 2005, for the 14th edition). The same observation can be made from our sample of language entries as well, as in Figure 1, where the probability density is plotted against the logarithm of the population size.2 The central tendency of this distribution is 5661 (95% confidence interval between 4907 and 6531), and 95% of the language populations lie in the range from 13 individuals to 2.53 million. While this may seem to be a small population size, given that there are languages such as Mandarin Chinese that have nearly a billion speakers, there are very few such languages, and though they happen to account for a large proportion of the world’s people, there are many more languages that are smaller in size. Moreover, this result is reasonably robust, and compares well with earlier work. The notion of what a typical speaker experiences is a different one which we take up subsequently.
2 We use a logarithmic scale of population size so as to bring out the central tendency in the data. Other scales (e.g. linear, or sorted log-log plots) tend to conceal this structure.
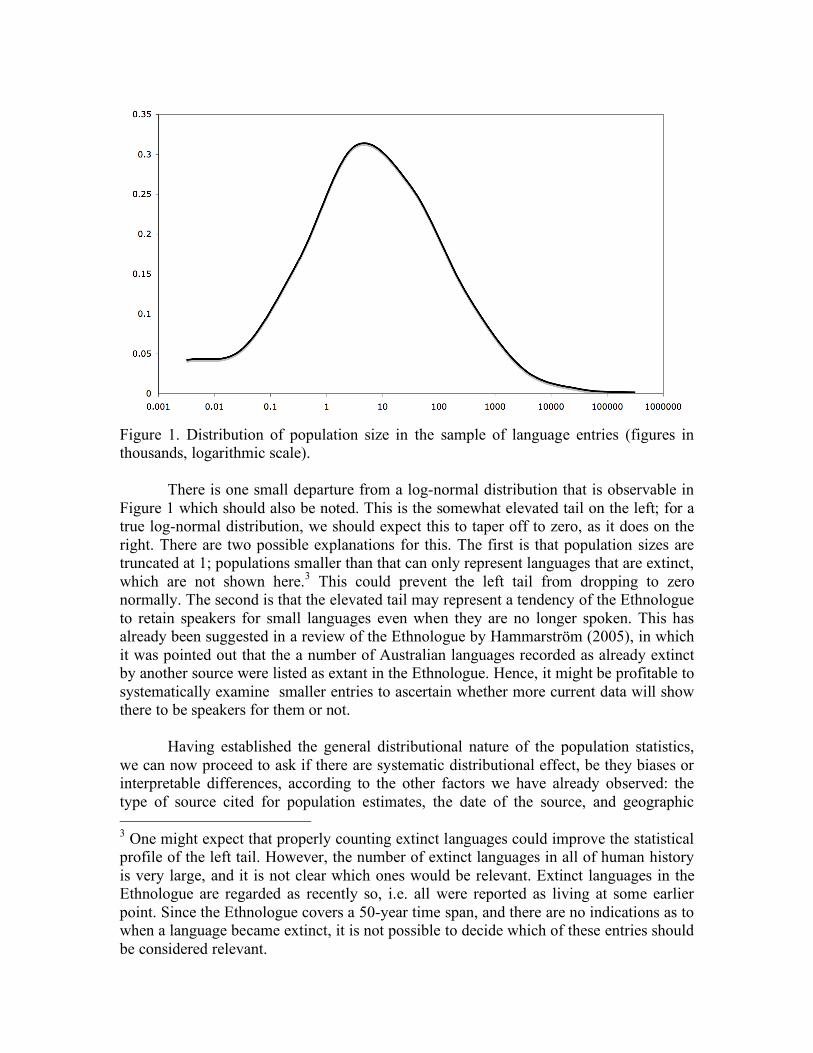
Figure 1. Distribution of population size in the sample of language entries (figures in thousands, logarithmic scale). There is one small departure from a log-normal distribution that is observable in Figure 1 which should also be noted. This is the somewhat elevated tail on the left; for a true log-normal distribution, we should expect this to taper off to zero, as it does on the right. There are two possible explanations for this. The first is that population sizes are truncated at 1; populations smaller than that can only represent languages that are extinct, which are not shown here.3 This could prevent the left tail from dropping to zero normally. The second is that the elevated tail may represent a tendency of the Ethnologue to retain speakers for small languages even when they are no longer spoken. This has already been suggested in a review of the Ethnologue by Hammarström (2005), in which it was pointed out that the a number of Australian languages recorded as already extinct by another source were listed as extant in the Ethnologue. Hence, it might be profitable to systematically examine smaller entries to ascertain whether more current data will show there to be speakers for them or not. Having established the general distributional nature of the population statistics, we can now proceed to ask if there are systematic distributional effect, be they biases or interpretable differences, according to the other factors we have already observed: the type of source cited for population estimates, the date of the source, and geographic 3 One might expect that properly counting extinct languages could improve the statistical profile of the left tail. However, the number of extinct languages in all of human history is very large, and it is not clear which ones would be relevant. Extinct languages in the Ethnologue are regarded as recently so, i.e. all were reported as living at some earlier point. Since the Ethnologue covers a 50-year time span, and there are no indications as to when a language became extinct, it is not possible to decide which of these entries should be considered relevant.
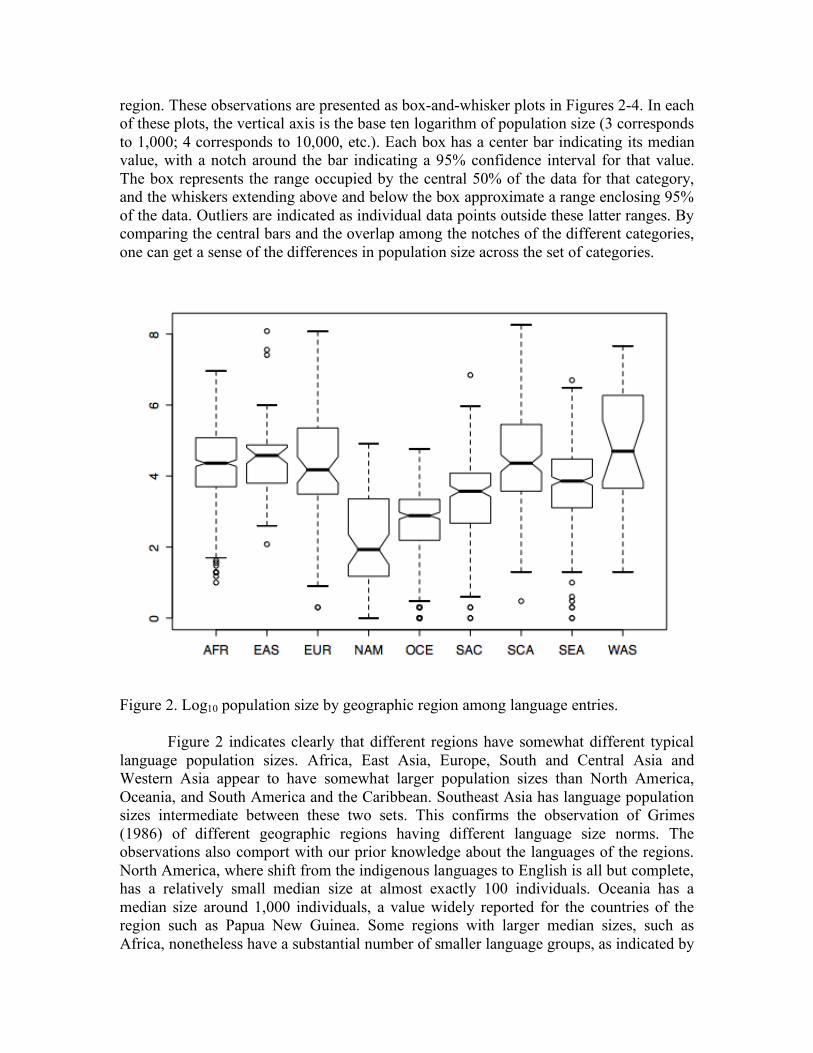
region. These observations are presented as box-and-whisker plots in Figures 2-4. In each of these plots, the vertical axis is the base ten logarithm of population size (3 corresponds to 1,000; 4 corresponds to 10,000, etc.). Each box has a center bar indicating its median value, with a notch around the bar indicating a 95% confidence interval for that value. The box represents the range occupied by the central 50% of the data for that category, and the whiskers extending above and below the box approximate a range enclosing 95% of the data. Outliers are indicated as individual data points outside these latter ranges. By comparing the central bars and the overlap among the notches of the different categories, one can get a sense of the differences in population size across the set of categories.
Figure 2. Log10 population size by geographic region among language entries. Figure 2 indicates clearly that different regions have somewhat different typical language population sizes. Africa, East Asia, Europe, South and Central Asia and Western Asia appear to have somewhat larger population sizes than North America, Oceania, and South America and the Caribbean. Southeast Asia has language population sizes intermediate between these two sets. This confirms the observation of Grimes (1986) of different geographic regions having different language size norms. The observations also comport with our prior knowledge about the languages of the regions. North America, where shift from the indigenous languages to English is all but complete, has a relatively small median size at almost exactly 100 individuals. Oceania has a median size around 1,000 individuals, a value widely reported for the countries of the region such as Papua New Guinea. Some regions with larger median sizes, such as Africa, nonetheless have a substantial number of smaller language groups, as indicated by
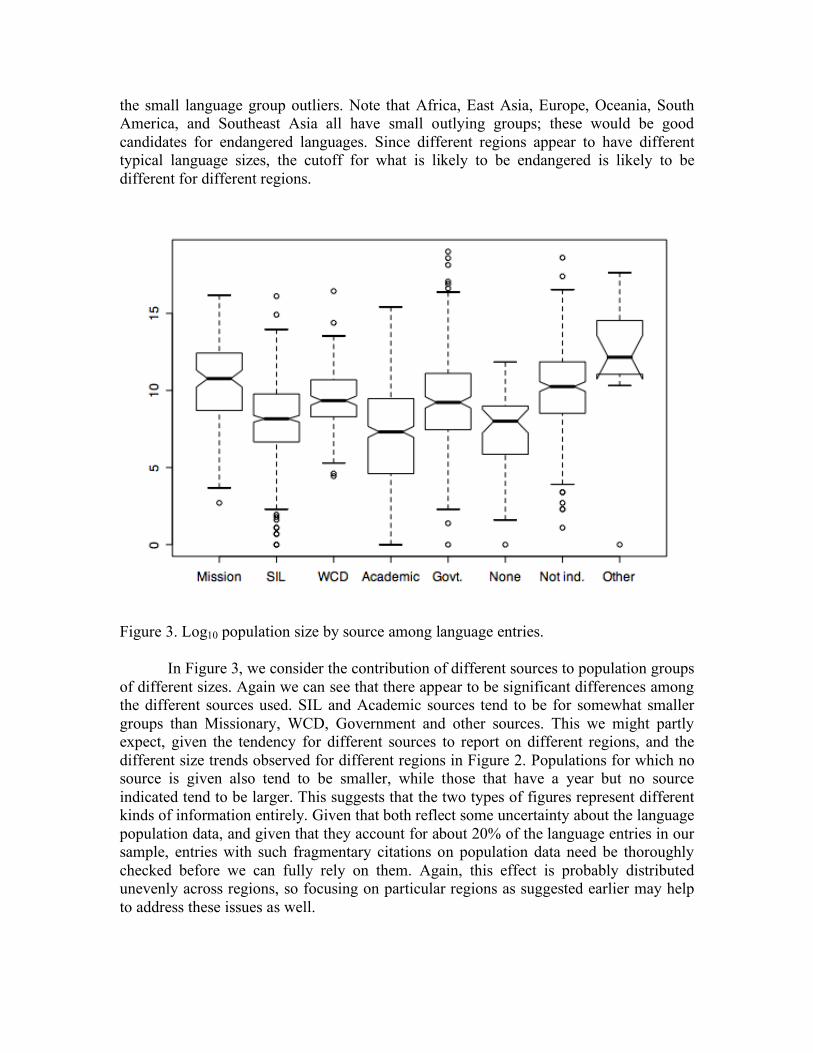
the small language group outliers. Note that Africa, East Asia, Europe, Oceania, South America, and Southeast Asia all have small outlying groups; these would be good candidates for endangered languages. Since different regions appear to have different typical language sizes, the cutoff for what is likely to be endangered is likely to be different for different regions.
Figure 3. Log10 population size by source among language entries. In Figure 3, we consider the contribution of different sources to population groups of different sizes. Again we can see that there appear to be significant differences among the different sources used. SIL and Academic sources tend to be for somewhat smaller groups than Missionary, WCD, Government and other sources. This we might partly expect, given the tendency for different sources to report on different regions, and the different size trends observed for different regions in Figure 2. Populations for which no source is given also tend to be smaller, while those that have a year but no source indicated tend to be larger. This suggests that the two types of figures represent different kinds of information entirely. Given that both reflect some uncertainty about the language population data, and given that they account for about 20% of the language entries in our sample, entries with such fragmentary citations on population data need be thoroughly checked before we can fully rely on them. Again, this effect is probably distributed unevenly across regions, so focusing on particular regions as suggested earlier may help to address these issues as well.
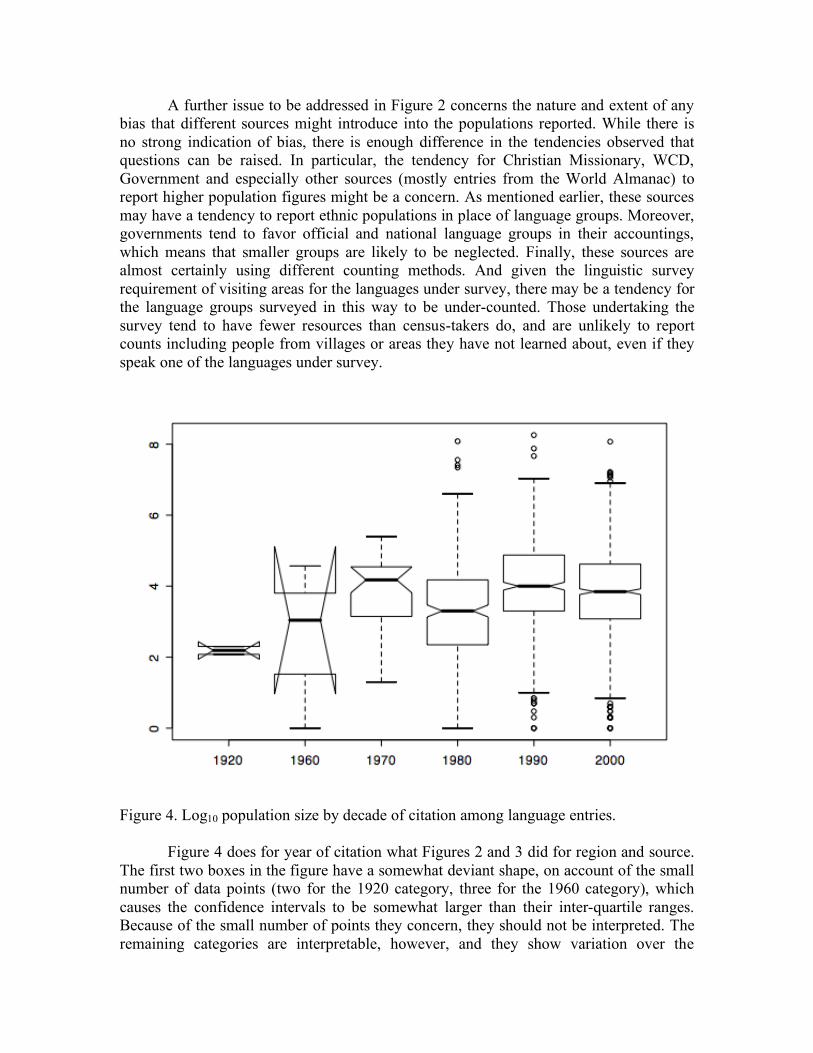
A further issue to be addressed in Figure 2 concerns the nature and extent of any bias that different sources might introduce into the populations reported. While there is no strong indication of bias, there is enough difference in the tendencies observed that questions can be raised. In particular, the tendency for Christian Missionary, WCD, Government and especially other sources (mostly entries from the World Almanac) to report higher population figures might be a concern. As mentioned earlier, these sources may have a tendency to report ethnic populations in place of language groups. Moreover, governments tend to favor official and national language groups in their accountings, which means that smaller groups are likely to be neglected. Finally, these sources are almost certainly using different counting methods. And given the linguistic survey requirement of visiting areas for the languages under survey, there may be a tendency for the language groups surveyed in this way to be under-counted. Those undertaking the survey tend to have fewer resources than census-takers do, and are unlikely to report counts including people from villages or areas they have not learned about, even if they speak one of the languages under survey.
Figure 4. Log10 population size by decade of citation among language entries. Figure 4 does for year of citation what Figures 2 and 3 did for region and source. The first two boxes in the figure have a somewhat deviant shape, on account of the small number of data points (two for the 1920 category, three for the 1960 category), which causes the confidence intervals to be somewhat larger than their inter-quartile ranges. Because of the small number of points they concern, they should not be interpreted. The remaining categories are interpretable, however, and they show variation over the
different decades of citation that is less extreme than that of region and source. The one category that appears to be somewhat distinct from the others is the decade centered on 1980, whose reported figures are somewhat smaller than the others. This may reflect the extensive use of Wurm and Hattori (1981), which is cited 135 times, or in 6.7% of the entries in our sample. While this is clearly an important reference, over-reliance on a single such reference, now a quarter-century old, should be avoided if possible. Newer sources of information about the languages cited in this and other publications of similar age should be sought.
3.3. Locations Location information for the Ethnologue’s language entries is found in its maps section. These can be studied for the information they contain and compared with other maps, from both linguistic atlases and other sources of geographic information.
3.4.1. Global and regional maps The very first map in the Ethnologue maps section (pp 674-5) is a global map of language locations. Each language is represented by a red dot, where the placement of the dot is intended to represent the geographic center of a living language population. In areas of high language density, such as equatorial Africa, the Himalayas, Southeast Asia, etc., the locations are fairly interpretable. In places of relative sparsity, it may be less so, as in North America, where the eastern coast is nearly devoid of any dots, or in Oceania, where several dots appear in the open ocean between islands where the corresponding languages are presumably spoken. The discrepancies are partly the fault of this form of presentation. Each language has been assigned a single geographic center, regardless of size, and regardless of how widely distributed its speakers may be. Consequently, heavily populated areas such as the New York city area, which have no languages primarily spoken there, with the possible exception of Yiddish, are simply empty spaces on this map. Moreover, languages whose center of population may have moved in the 20th century, such as Yiddish, are represented in their ancestral location(s), if at all. Finally, each language is represented as having a single location, when in fact, many have several discontiguous locations in which they are spoken (e.g. Romani, of which several varieties exist, all of which are spoken by minority enclaves in various countries in Europe). The idealization used for this map is hence misleading in certain ways. At the same time this map does communicate reasonably well where the main areas of linguistic diversity remain in the world. These areas lie primarily at or near equatorial latitudes on all continents, with the highest concentrations of points in Papua New Guinea, Southeast Asia, Western Africa, the Himalayan mountain range, and Southern Mexico. Other smaller concentrations of diversity can be found through the Andes in South America, Northern Australia, the Caucasus mountains, Southern China, the Southern Indian state of Kerala, etc.
Comparing this map with the maps of Wurm (2001) is quite revealing about the state of health of linguistic diversity, worldwide. The large number of points in Arctic North America, compared to the apparent sparsity of points in the same region of the Ethnologue map suggests that an unusually high proportion of those languages are endangered. Similar observations hold for most of the regions where points are sparse on the Ethnologue global map: Europe, Northeast China, Siberia, the Brazilian Amazon basin. One area that shows an unusually high concentration of endangered languages that is somewhat denser in the Ethnologue global map is Northern Australia. Other areas of rather dense language diversity, such as Papua New Guinea and the Himalayas, show surprisingly small numbers of endangered languages, given the number of languages spoken there. These are facts calling for some kind of explanation. It is possible that future surveys in the Himalayan region or in Papua New Guinea will show more endangered languages. Certainly there are forces operating in the latter region that would suggest a process of language shift is a concern for many individual groups (Kulick 1992; Mühlhäusler 1996). At the same time, the aggregate picture suggests greater language endangerment elsewhere. Another interpretation that can be made from this map, since languages are located on the map in their ancestral homes, is that the existing linguistic diversity in regions of low language location density, such as Australia, North America and Europe, comes from more recently relocated groups, i.e. immigrant populations, rather than from indigenous languages. This is an important fact that also requires careful study, although additional data, such as the language questions in the long form of the US census, will need to be brought to bear on it. One may also compare the Ethnologue global map and the endangered languages maps with locations of displaced persons. For example, the UNEP published a map locating displaced persons worldwide at the end of 2000, including those not under the protection of the UNHCR (Rekacewicz 2001). The most striking point of comparison is in the southern Sudan, where most of Sudan’s 134 living languages are found — 21 of which are endangered, according to Wurm (2001). Current estimates of the number of displaced persons and refugees in the Sudan run around 6 million. Clearly the threat to these languages of Sudan’s ongoing instability is very great. Other notable regions of concern are Angola, Southern Columbia, the Caucasus region, and Myanmar, all of which have islands of somewhat greater linguistic diversity than their surroundings, together with a disproportionate share of displaced persons. Hence internal displacement of people appears to be a major threat to many areas of local linguistic diversity. This examination illustrates that the global and regional maps of the Ethnologue are informative, although in a somewhat roundabout way. Locating modern, living languages in their ancestral home locations, while adequate for areas of relative linguistic diversity, does not reveal an accurate picture of the linguistic makeup of metropolitan areas, especially where one or more large languages are the primary varieties used. Dispersals of people from their ancestral homes, whether as immigrants, guest workers or refugees, are also important factors bearing on an accurate representation of linguistic geography.
3.4.2. Country maps Like the country entries in the Ethnologue, country maps are organized into five geographic regions: Africa, the Americas, Asia, Europe, and (Western) Pacific. Some assignments of countries to regions are arbitrary, and this shows quite clearly in the maps section, where countries such as Russia may be split across regions. The island of Papua New Guinea is also split between its Indonesian, Western side (Papua province, maps pp. 798-801) and its independent, Eastern side (Papua New Guinea, maps pp. 863-883; it is not clear why this area is mapped in so much more detail; there are roughly three times as many languages but six times as many maps). A summary of the available maps, by region and country appears in Table 5, where it is clear that the mapping information is much more complete for Africa and the Americas than it is for Asia, Europe and the Pacific. Ethnologue maps also differ in their specificity. Maps of most African countries show outlines indicating the ranges of the different languages. In most cases these shapes do not show overlap, but some maps (e.g. Mali pp. 706-7; Niger pp. 712-3) explicitly show overlap. Still other maps of African countries, especially in North Africa (Algeria, Morocco and Tunisia p. 677; Botswana p. 680; Egypt and Libya p. 693; Sudan p. 730) merely locate labels on the map without outlines, presumably at the center of their ranges. Labeling is also done differently on different maps, although generally a numbered key listing the language names is used, and the numbers are placed on the map instead of the names. It is not clear why the three-letter language codes are not used instead, as that would reduce the risk of ambiguity in locating entries pertaining to the languages drawn on the map. Not every language for a country has a location recorded on the corresponding map. For example, the country entry for Angola lists 42 languages, one of which is extinct, but the map indicates locations for only 36 languages. No indication is given for the location of the missing languages as they do not appear in the keys for that particular map. One can only note that it is missing by cross-checking the country entry and the corresponding map. Presumably languages missing from the appropriate maps represent a lack of available information (see mapping data, below). Some languages are located in ways that can be hard to accept. For example, Tuvin, a Turkic language spoken in Central Asian Russia near the Mongolian border, is represented as occupying four disconnected enclaves in the region 90-98°E and 50-53°N. The area in between these enclaves is connected by a large contiguous region indicated as Russian. Cross comparison with a standard atlas (Collins 2003) shows the Tuvin enclaves to be primarily around the Yenisey and other tributary rivers, including the main local urban center Kyzyl. Other urban areas within a radius of 400-500 miles appear to be the centers of other Turkic languages of the region (Northern and Southern Altai, Chulym, Khakas and Shor). No other centers of population exist that could potentially place Russian speakers of any density between the enclaves. While it is true that since Soviet times Russian bilingualism has been widespread in the region, it seems highly suspect
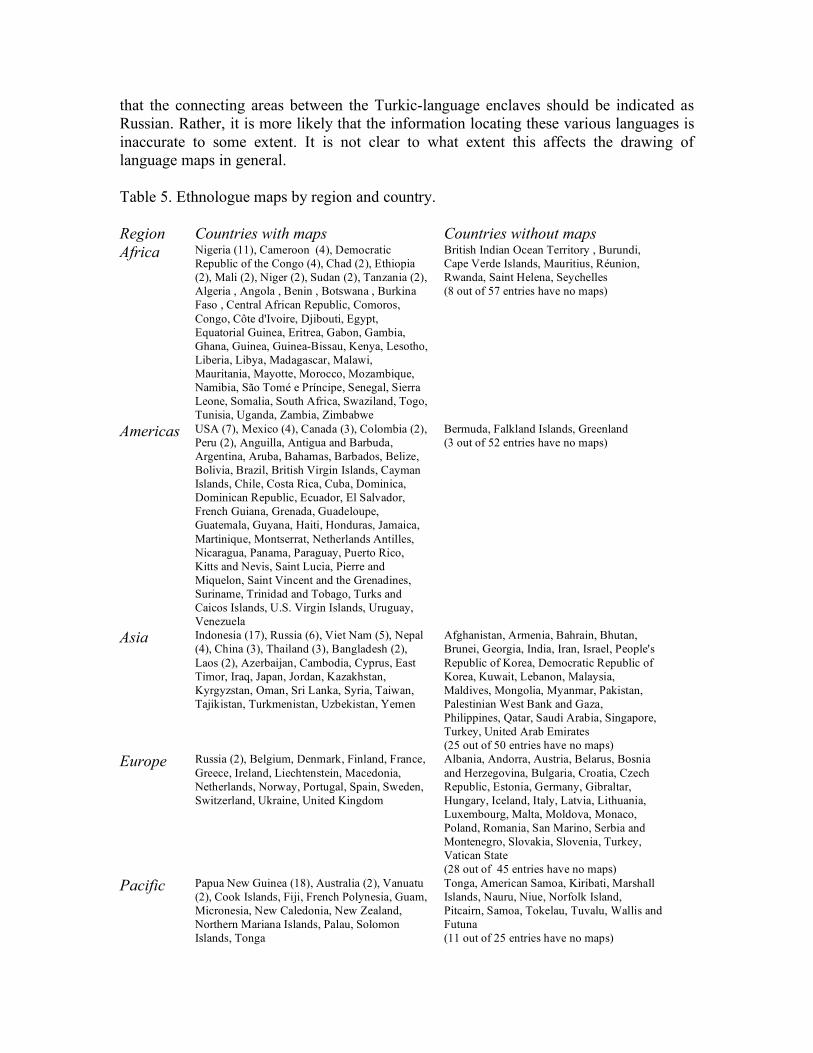
that the connecting areas between the Turkic-language enclaves should be indicated as Russian. Rather, it is more likely that the information locating these various languages is inaccurate to some extent. It is not clear to what extent this affects the drawing of language maps in general. Table 5. Ethnologue maps by region and country. Region Countries with maps Countries without maps Africa Nigeria (11), Cameroon (4), Democratic
Republic of the Congo (4), Chad (2), Ethiopia (2), Mali (2), Niger (2), Sudan (2), Tanzania (2), Algeria , Angola , Benin , Botswana , Burkina Faso , Central African Republic, Comoros, Congo, Côte d'Ivoire, Djibouti, Egypt, Equatorial Guinea, Eritrea, Gabon, Gambia, Ghana, Guinea, Guinea-Bissau, Kenya, Lesotho, Liberia, Libya, Madagascar, Malawi, Mauritania, Mayotte, Morocco, Mozambique, Namibia, São Tomé e Príncipe, Senegal, Sierra Leone, Somalia, South Africa, Swaziland, Togo, Tunisia, Uganda, Zambia, Zimbabwe
British Indian Ocean Territory , Burundi, Cape Verde Islands, Mauritius, Réunion, Rwanda, Saint Helena, Seychelles (8 out of 57 entries have no maps)
Americas USA (7), Mexico (4), Canada (3), Colombia (2), Peru (2), Anguilla, Antigua and Barbuda, Argentina, Aruba, Bahamas, Barbados, Belize, Bolivia, Brazil, British Virgin Islands, Cayman Islands, Chile, Costa Rica, Cuba, Dominica, Dominican Republic, Ecuador, El Salvador, French Guiana, Grenada, Guadeloupe, Guatemala, Guyana, Haiti, Honduras, Jamaica, Martinique, Montserrat, Netherlands Antilles, Nicaragua, Panama, Paraguay, Puerto Rico, Kitts and Nevis, Saint Lucia, Pierre and Miquelon, Saint Vincent and the Grenadines, Suriname, Trinidad and Tobago, Turks and Caicos Islands, U.S. Virgin Islands, Uruguay, Venezuela
Bermuda, Falkland Islands, Greenland (3 out of 52 entries have no maps)
Asia Indonesia (17), Russia (6), Viet Nam (5), Nepal (4), China (3), Thailand (3), Bangladesh (2), Laos (2), Azerbaijan, Cambodia, Cyprus, East Timor, Iraq, Japan, Jordan, Kazakhstan, Kyrgyzstan, Oman, Sri Lanka, Syria, Taiwan, Tajikistan, Turkmenistan, Uzbekistan, Yemen
Afghanistan, Armenia, Bahrain, Bhutan, Brunei, Georgia, India, Iran, Israel, People's Republic of Korea, Democratic Republic of Korea, Kuwait, Lebanon, Malaysia, Maldives, Mongolia, Myanmar, Pakistan, Palestinian West Bank and Gaza, Philippines, Qatar, Saudi Arabia, Singapore, Turkey, United Arab Emirates (25 out of 50 entries have no maps)
Europe Russia (2), Belgium, Denmark, Finland, France, Greece, Ireland, Liechtenstein, Macedonia, Netherlands, Norway, Portugal, Spain, Sweden, Switzerland, Ukraine, United Kingdom
Albania, Andorra, Austria, Belarus, Bosnia and Herzegovina, Bulgaria, Croatia, Czech Republic, Estonia, Germany, Gibraltar, Hungary, Iceland, Italy, Latvia, Lithuania, Luxembourg, Malta, Moldova, Monaco, Poland, Romania, San Marino, Serbia and Montenegro, Slovakia, Slovenia, Turkey, Vatican State (28 out of 45 entries have no maps)
Pacific Papua New Guinea (18), Australia (2), Vanuatu (2), Cook Islands, Fiji, French Polynesia, Guam, Micronesia, New Caledonia, New Zealand, Northern Mariana Islands, Palau, Solomon Islands, Tonga
Tonga, American Samoa, Kiribati, Marshall Islands, Nauru, Niue, Norfolk Island, Pitcairn, Samoa, Tokelau, Tuvalu, Wallis and Futuna (11 out of 25 entries have no maps)
3.4.3. Mapping data To fully evaluate the Ethnologue’s maps, one would need access to the map data and polygons from which the maps were drawn. It was not clear how to accomplish this when we began this evaluation, nor when we visited the SIL campus (SIL’s mapping department is a separate unit that we did not have the opportunity to meet with). We have since learned that the relevant data are available for purchase from Global Mapping International (GMI) as the “World Language Mapping System” (WLMS; http://www.gmi.org/wlms/). GMI is the Christian Evangelical organization whose mapping data SIL uses in preparing its own maps; apparently, they may have a data-sharing arrangement. Several interesting observations about the language mapping can be made from the information on the World Language Mapping System website. First, GMI includes what is essentially a copy of the Ethnologue’s main language entry table along with the language mapping data. This table is from the 14th edition, so changes to the 15th edition language entries are not reflected there. Moreover, if the Ethnologue’s maps in the 15th edition are in fact created from the same data marketed by GMI, then the maps would actually reflect the 14th edition of the Ethnologue. It is unclear if there are plans to synchronize these two data sources in future editions. Second, there are some points of difference between the GMI language mapping data and what appears in the Ethnologue. Most notably, GMI presents several sample maps for countries such as India that do not appear in the Ethnologue’s maps. It is possible that this information was not ready for use at the time that the 15th edition was prepared, and has since become available. It is also possible that the maps were excluded because of printing cost considerations. Third, it is unclear exactly who is responsible for the data in the language area outlines, and this influences how they should be interpreted. If the language outline data are SIL’s, then we have some assurance that they are tied to the linguistic fieldwork SIL conducts, at least in some cases. If they belong to GMI, then they are more difficult to assess. Given the possibility that some language population figures are really populations of ethnic groups, we have to wonder if the same is not true of some of the outlines. Taken together with the absence of large metropolitan languages, the many apparently idealized non-overlapping language areas, and the purported ancestral homeland status of the outlines, these doubts suggest that the maps are perhaps less realistic than we would like. For the purpose of guiding national and international language policies, high-quality maps would make a valuable contribution. Unfortunately, in many cases the Ethnologue maps are quite evidently limited in their ability to provide this information, and it is often impossible to know which maps provide useful information and which do not. The best language maps for language policy framers would be ones that provide information about current language populations, taking into account metropolitan and immigrant as well as indigenous languages.
GMI’s sources of geographic information otherwise appear to be ones that are widely used. Country outlines are adapted from the CIA World Data Bank II (WDB), which is in the public domain and widely used in GIS packages. In the WLMS, this material has been updated to some extent; the WDB has only a single outline for the old USSR, and lacks individual outlines for the former Soviet republics, such as Armenia, Azerbaijan, Belorussia, Estonia, Kazakhstan, Latvia, Lithuania, Tajikistan, Turkmenistan, etc. These are countries for which the GMI clearly has outlines available, as some of them appear in sample maps on the website. Other information, such as elevation data, etc., is obtained from sources like the US Geological Survey.
4. Toward a global profile of language statistics As a final step in our evaluation of language statistics, it is fitting that we should try to use the statistics as they might be used to inform language policy, at least in a general way. Only from doing this will we become aware of the full adequacies and inadequacies of the data, and what sorts of information we might want but don’t presently have. Hence, as an important step in assessing the value of the existing language statistics, we need to make use of it. The principal use of language population data in linguistics is the assessment of linguistic diversity. In an under-developed tradition going back to Greenberg (1956), population estimates are used to answer questions regarding how likely two people in a society are to be native speakers of the same language, to speak a language in common, etc. This generally proceeds by using the population statistics to compute one or more indices, such as Greenberg’s A, which is computed for . Grimes (1986) took this trend in a somewhat different direction by computing regional norms of language size. Of particular concern to Grimes was the possibility of identifying the “tipping point” for endangered languages that might cause them to be lost to future generations. However, nothing that followed from this has yet led to a generally accepted measure of the role of population size in language death. This latter concern suggests a related set of issues involving the dynamics of language populations. These questions are not well studied in the linguistics literature, but they are arguably a major reason for the desire to know about language statistics. That is, we want to know which languages are gaining speakers, and which are losing them? What will the linguistic makeup of the society look like in the future? And are there circumstances we should anticipate that will help us prevent the loss of linguistic and cultural knowledge among future generations? Among the few publications taking up these issues from a demographic and statistical perspective are two reports to the British Council on the future of Global English (Graddol 1997, 2005). The main purpose of these reports is to project the future demand for English as a Foreign Language teaching in the UK, and do not go far beyond those to other issues around the shifting balance of global languages. Minority languages play a small role in these considerations, and endangered ones even less. Questions about the overall composition of global linguistic diversity and its dynamics are addressed all too little, given their importance and widespread interest.
4.1. Language and population growth An approach to studying the dynamics of language populations may be suggested if we consider the chief result of Grimes (1986) more closely, that language populations within a geographic region are log-normally distributed. The log-normal distribution is required because of the extreme skewing by extremely large population values; this kind of skewing is typical in processes that have an underlying exponential growth characteristic, such as the distribution of wealth in a society. In terms of language populations, the exponential growth characteristic is simply the tendency for human and other biological populations to grow at an exponential rate. Over the last few centuries human population has been growing exponentially, doubling approximately every 40 years. At the same time, human population growth is not constant across societies and is subject to many constraining conditions. A view of language populations in terms of population biology could potentially shed light on these constraints. A second aspect of population biology relevant to language sizes concerns the linguistic family relations among languages. A small number of languages belonging to the just four families account for nearly 85% of the world’s population: Afro-Asiatic (Arabic, Hebrew, etc.), which is spread throughout Northern Africa and Western Asia; Austronesian (Malay, Indonesian, etc.), spread throughout Southeast Asia and Oceania; Indo-European (English, Spanish, Hindi, etc.), now spread globally, but prior to the era of colonization, from Europe through South and Central Asia; and Niger-Congo (Igbo, Swahili, Yoruba, etc.), spread throughout sub-Saharan Africa. These four families differ in their number of languages, their typical sizes and the extent and depth of their spread. Indo-European alone accounts for nearly 45% of the world’s population (Gordon 2005:17), from its origin near the Black Sea between the third and fifth millennia BCE (Dixon 1997; Watkins 1992), so its spread to nearly half of the world’s people took place in 6,000 years or less. Niger-Congo groups may have smaller ranges (in West Africa) or larger ones (e.g. Bantu languages extending East and South of the Congo to Southern Africa). The causes of language family growth and spread are not always clear, but Dixon (1997), borrowing from evolutionary biology, suggests that such linguistic family lineages illustrate the punctuated aspect of the principle of “punctuated equilibrium”. Chief candidates for punctuating events are the adoption of new technologies, new modes of food production or new crops, transportation, etc.: anything that could give a group of people a reproductive edge over other groups. Hence, historical interpretation could aid and be aided by examining the sizes of language populations. Equilibria occur in the absence of such forced changes, and are associated with smaller group size, more linguistic borrowing, and relatively unclear linguistic family lineages. Papua New Guinea and the Caucasus region are two examples of equilibria (“residual zones” in the terminology of Nichols 1992) that persist to the present day. Hence, smaller language populations suggest lower overall rates of growth, while larger language populations suggest greater growth. Greater numbers of languages in a family suggests a greater time span while fewer languages suggest a shallower time span. These tendencies allow one to sketch the different rates of growth of languages in
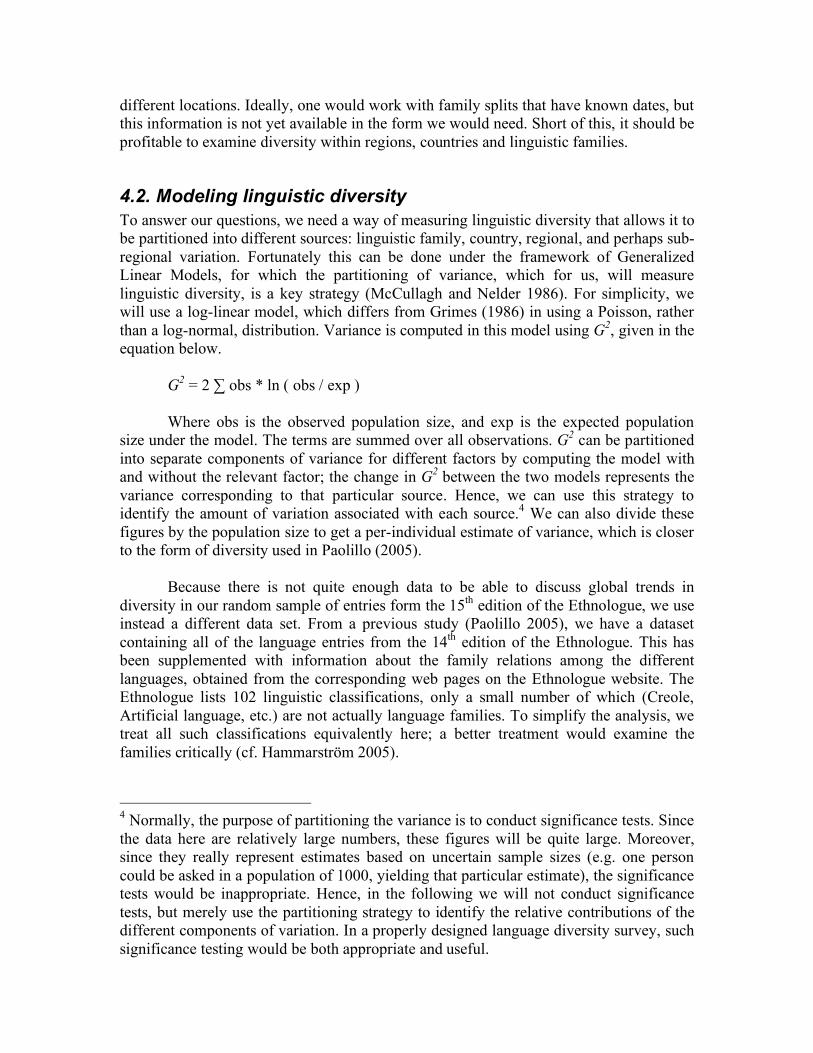
different locations. Ideally, one would work with family splits that have known dates, but this information is not yet available in the form we would need. Short of this, it should be profitable to examine diversity within regions, countries and linguistic families.
4.2. Modeling linguistic diversity To answer our questions, we need a way of measuring linguistic diversity that allows it to be partitioned into different sources: linguistic family, country, regional, and perhaps sub-regional variation. Fortunately this can be done under the framework of Generalized Linear Models, for which the partitioning of variance, which for us, will measure linguistic diversity, is a key strategy (McCullagh and Nelder 1986). For simplicity, we will use a log-linear model, which differs from Grimes (1986) in using a Poisson, rather than a log-normal, distribution. Variance is computed in this model using G2, given in the equation below. G2 = 2 ∑ obs * ln ( obs / exp ) Where obs is the observed population size, and exp is the expected population size under the model. The terms are summed over all observations. G2 can be partitioned into separate components of variance for different factors by computing the model with and without the relevant factor; the change in G2 between the two models represents the variance corresponding to that particular source. Hence, we can use this strategy to identify the amount of variation associated with each source.4 We can also divide these figures by the population size to get a per-individual estimate of variance, which is closer to the form of diversity used in Paolillo (2005). Because there is not quite enough data to be able to discuss global trends in diversity in our random sample of entries form the 15th edition of the Ethnologue, we use instead a different data set. From a previous study (Paolillo 2005), we have a dataset containing all of the language entries from the 14th edition of the Ethnologue. This has been supplemented with information about the family relations among the different languages, obtained from the corresponding web pages on the Ethnologue website. The Ethnologue lists 102 linguistic classifications, only a small number of which (Creole, Artificial language, etc.) are not actually language families. To simplify the analysis, we treat all such classifications equivalently here; a better treatment would examine the families critically (cf. Hammarström 2005).
4 Normally, the purpose of partitioning the variance is to conduct significance tests. Since the data here are relatively large numbers, these figures will be quite large. Moreover, since they really represent estimates based on uncertain sample sizes (e.g. one person could be asked in a population of 1000, yielding that particular estimate), the significance tests would be inappropriate. Hence, in the following we will not conduct significance tests, but merely use the partitioning strategy to identify the relative contributions of the different components of variation. In a properly designed language diversity survey, such significance testing would be both appropriate and useful.
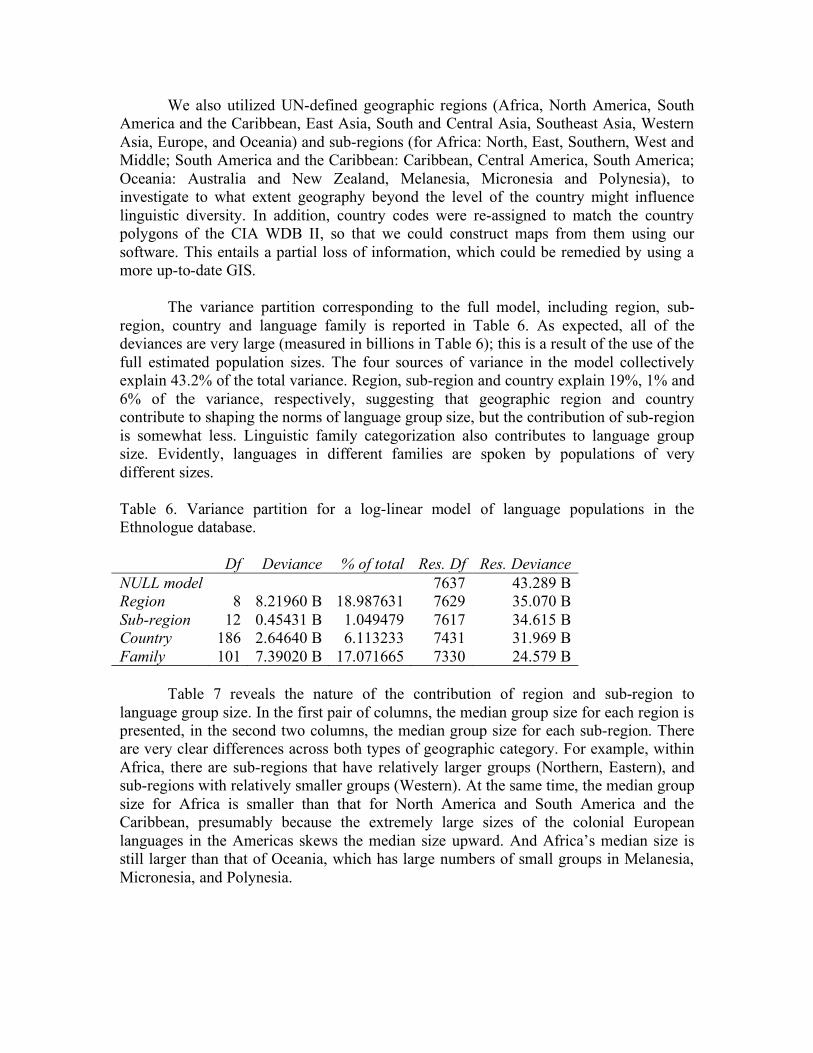
We also utilized UN-defined geographic regions (Africa, North America, South America and the Caribbean, East Asia, South and Central Asia, Southeast Asia, Western Asia, Europe, and Oceania) and sub-regions (for Africa: North, East, Southern, West and Middle; South America and the Caribbean: Caribbean, Central America, South America; Oceania: Australia and New Zealand, Melanesia, Micronesia and Polynesia), to investigate to what extent geography beyond the level of the country might influence linguistic diversity. In addition, country codes were re-assigned to match the country polygons of the CIA WDB II, so that we could construct maps from them using our software. This entails a partial loss of information, which could be remedied by using a more up-to-date GIS. The variance partition corresponding to the full model, including region, sub-region, country and language family is reported in Table 6. As expected, all of the deviances are very large (measured in billions in Table 6); this is a result of the use of the full estimated population sizes. The four sources of variance in the model collectively explain 43.2% of the total variance. Region, sub-region and country explain 19%, 1% and 6% of the variance, respectively, suggesting that geographic region and country contribute to shaping the norms of language group size, but the contribution of sub-region is somewhat less. Linguistic family categorization also contributes to language group size. Evidently, languages in different families are spoken by populations of very different sizes. Table 6. Variance partition for a log-linear model of language populations in the Ethnologue database. Df Deviance % of total Res. Df Res. Deviance NULL model 7637 43.289 B Region 8 8.21960 B 18.987631 7629 35.070 B Sub-region 12 0.45431 B 1.049479 7617 34.615 B Country 186 2.64640 B 6.113233 7431 31.969 B Family 101 7.39020 B 17.071665 7330 24.579 B Table 7 reveals the nature of the contribution of region and sub-region to language group size. In the first pair of columns, the median group size for each region is presented, in the second two columns, the median group size for each sub-region. There are very clear differences across both types of geographic category. For example, within Africa, there are sub-regions that have relatively larger groups (Northern, Eastern), and sub-regions with relatively smaller groups (Western). At the same time, the median group size for Africa is smaller than that for North America and South America and the Caribbean, presumably because the extremely large sizes of the colonial European languages in the Americas skews the median size upward. And Africa’s median size is still larger than that of Oceania, which has large numbers of small groups in Melanesia, Micronesia, and Polynesia.
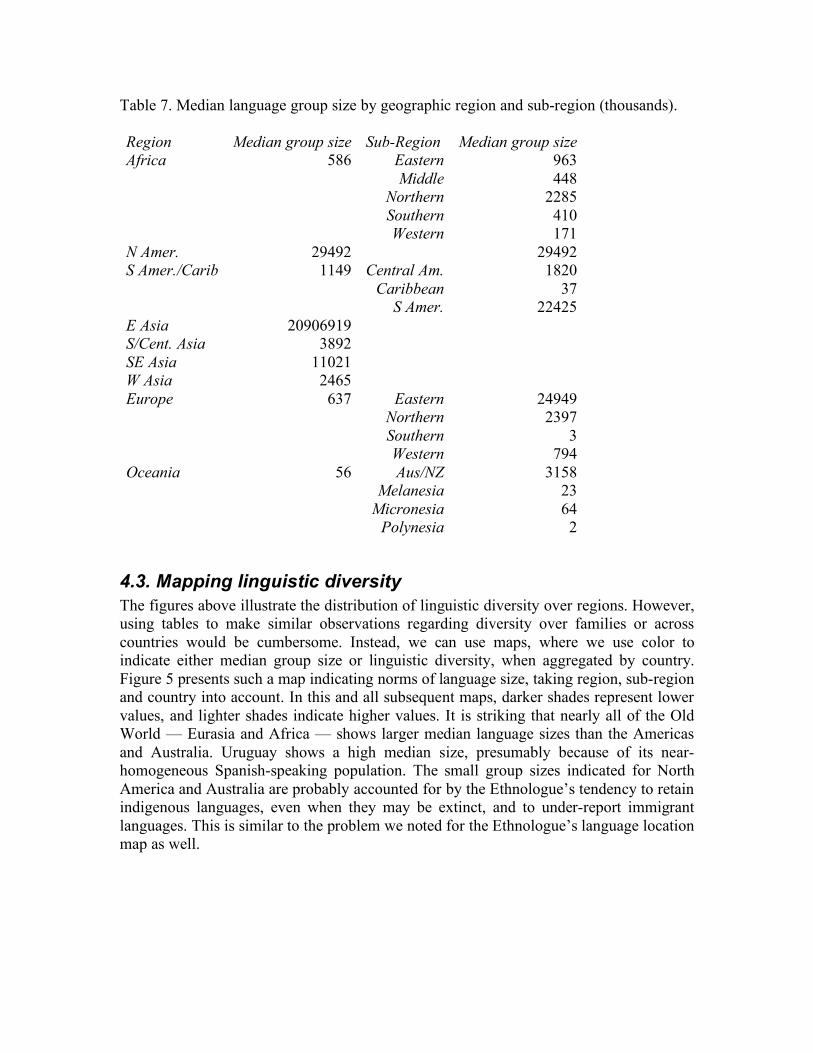
Table 7. Median language group size by geographic region and sub-region (thousands). Region Median group size Sub-Region Median group size Africa 586 Eastern 963 Middle 448 Northern 2285 Southern 410 Western 171 N Amer. 29492 29492 S Amer./Carib 1149 Central Am. 1820 Caribbean 37 S Amer. 22425 E Asia 20906919 S/Cent. Asia 3892 SE Asia 11021 W Asia 2465 Europe 637 Eastern 24949 Northern 2397 Southern 3 Western 794 Oceania 56 Aus/NZ 3158 Melanesia 23 Micronesia 64 Polynesia 2
4.3. Mapping linguistic diversity The figures above illustrate the distribution of linguistic diversity over regions. However, using tables to make similar observations regarding diversity over families or across countries would be cumbersome. Instead, we can use maps, where we use color to indicate either median group size or linguistic diversity, when aggregated by country. Figure 5 presents such a map indicating norms of language size, taking region, sub-region and country into account. In this and all subsequent maps, darker shades represent lower values, and lighter shades indicate higher values. It is striking that nearly all of the Old World — Eurasia and Africa — shows larger median language sizes than the Americas and Australia. Uruguay shows a high median size, presumably because of its near-homogeneous Spanish-speaking population. The small group sizes indicated for North America and Australia are probably accounted for by the Ethnologue’s tendency to retain indigenous languages, even when they may be extinct, and to under-report immigrant languages. This is similar to the problem we noted for the Ethnologue’s language location map as well.
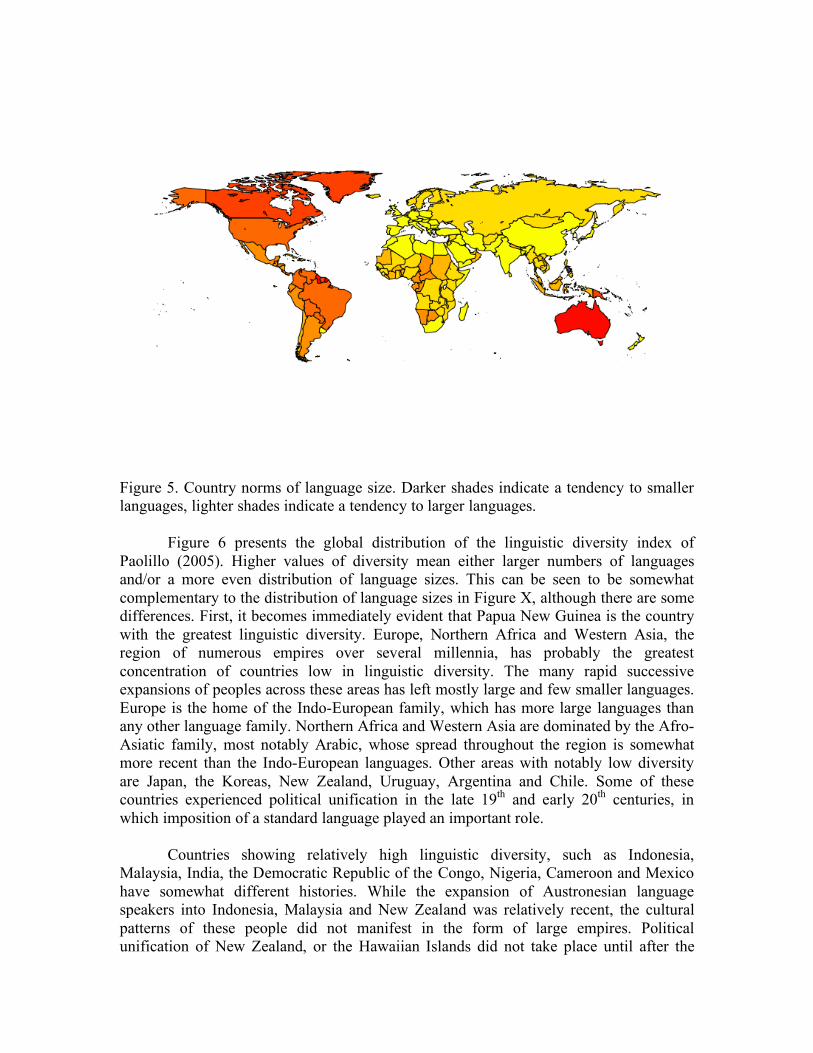
Figure 5. Country norms of language size. Darker shades indicate a tendency to smaller languages, lighter shades indicate a tendency to larger languages. Figure 6 presents the global distribution of the linguistic diversity index of Paolillo (2005). Higher values of diversity mean either larger numbers of languages and/or a more even distribution of language sizes. This can be seen to be somewhat complementary to the distribution of language sizes in Figure X, although there are some differences. First, it becomes immediately evident that Papua New Guinea is the country with the greatest linguistic diversity. Europe, Northern Africa and Western Asia, the region of numerous empires over several millennia, has probably the greatest concentration of countries low in linguistic diversity. The many rapid successive expansions of peoples across these areas has left mostly large and few smaller languages. Europe is the home of the Indo-European family, which has more large languages than any other language family. Northern Africa and Western Asia are dominated by the Afro-Asiatic family, most notably Arabic, whose spread throughout the region is somewhat more recent than the Indo-European languages. Other areas with notably low diversity are Japan, the Koreas, New Zealand, Uruguay, Argentina and Chile. Some of these countries experienced political unification in the late 19th and early 20th centuries, in which imposition of a standard language played an important role. Countries showing relatively high linguistic diversity, such as Indonesia, Malaysia, India, the Democratic Republic of the Congo, Nigeria, Cameroon and Mexico have somewhat different histories. While the expansion of Austronesian language speakers into Indonesia, Malaysia and New Zealand was relatively recent, the cultural patterns of these people did not manifest in the form of large empires. Political unification of New Zealand, or the Hawaiian Islands did not take place until after the
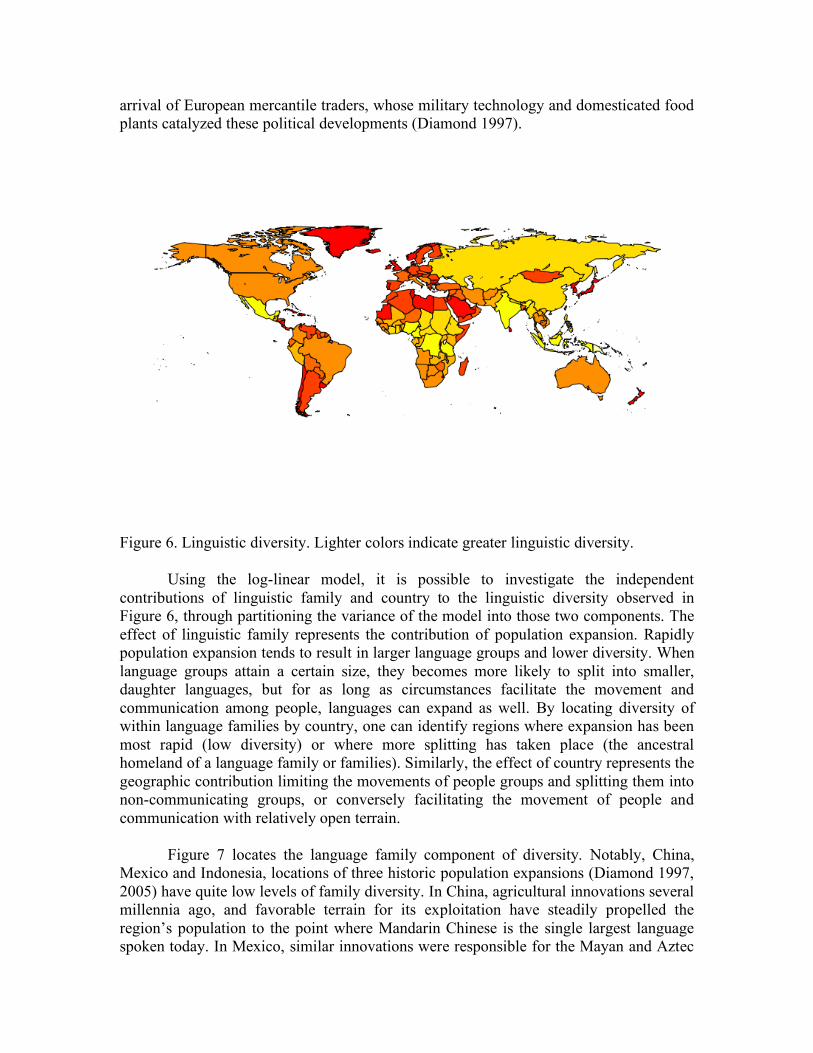
arrival of European mercantile traders, whose military technology and domesticated food plants catalyzed these political developments (Diamond 1997).
Figure 6. Linguistic diversity. Lighter colors indicate greater linguistic diversity. Using the log-linear model, it is possible to investigate the independent contributions of linguistic family and country to the linguistic diversity observed in Figure 6, through partitioning the variance of the model into those two components. The effect of linguistic family represents the contribution of population expansion. Rapidly population expansion tends to result in larger language groups and lower diversity. When language groups attain a certain size, they becomes more likely to split into smaller, daughter languages, but for as long as circumstances facilitate the movement and communication among people, languages can expand as well. By locating diversity of within language families by country, one can identify regions where expansion has been most rapid (low diversity) or where more splitting has taken place (the ancestral homeland of a language family or families). Similarly, the effect of country represents the geographic contribution limiting the movements of people groups and splitting them into non-communicating groups, or conversely facilitating the movement of people and communication with relatively open terrain. Figure 7 locates the language family component of diversity. Notably, China, Mexico and Indonesia, locations of three historic population expansions (Diamond 1997, 2005) have quite low levels of family diversity. In China, agricultural innovations several millennia ago, and favorable terrain for its exploitation have steadily propelled the region’s population to the point where Mandarin Chinese is the single largest language spoken today. In Mexico, similar innovations were responsible for the Mayan and Aztec
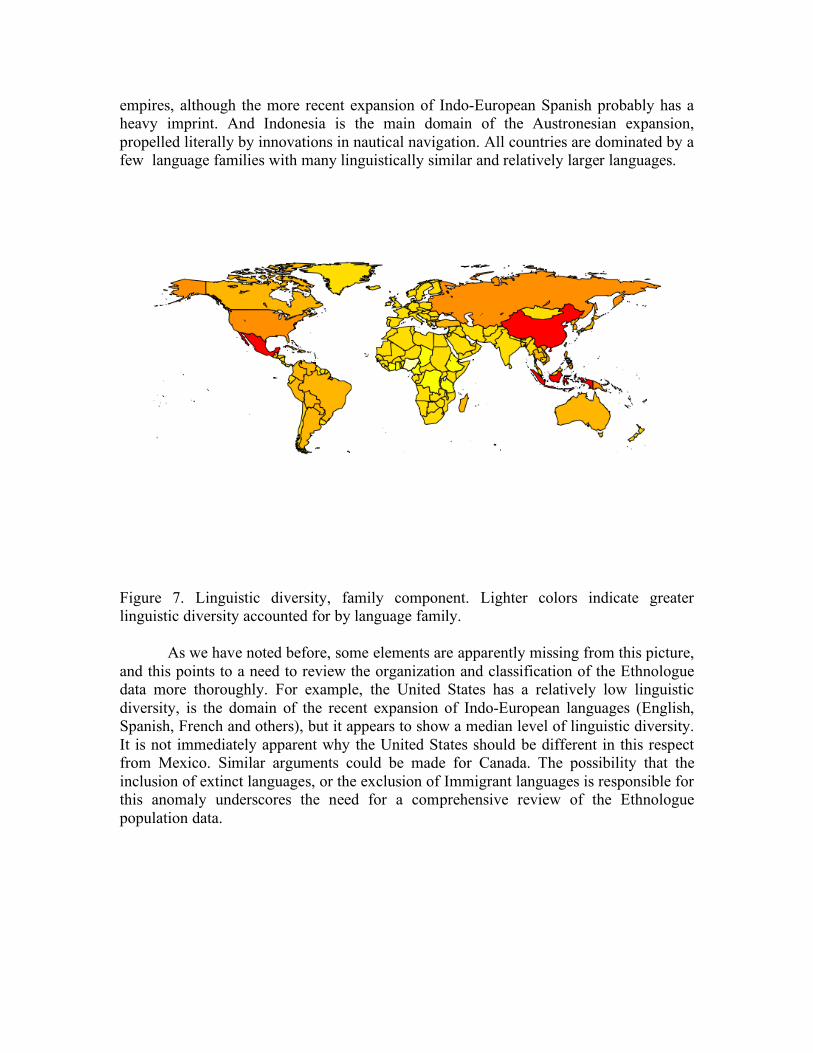
empires, although the more recent expansion of Indo-European Spanish probably has a heavy imprint. And Indonesia is the main domain of the Austronesian expansion, propelled literally by innovations in nautical navigation. All countries are dominated by a few language families with many linguistically similar and relatively larger languages.
Figure 7. Linguistic diversity, family component. Lighter colors indicate greater linguistic diversity accounted for by language family. As we have noted before, some elements are apparently missing from this picture, and this points to a need to review the organization and classification of the Ethnologue data more thoroughly. For example, the United States has a relatively low linguistic diversity, is the domain of the recent expansion of Indo-European languages (English, Spanish, French and others), but it appears to show a median level of linguistic diversity. It is not immediately apparent why the United States should be different in this respect from Mexico. Similar arguments could be made for Canada. The possibility that the inclusion of extinct languages, or the exclusion of Immigrant languages is responsible for this anomaly underscores the need for a comprehensive review of the Ethnologue population data.
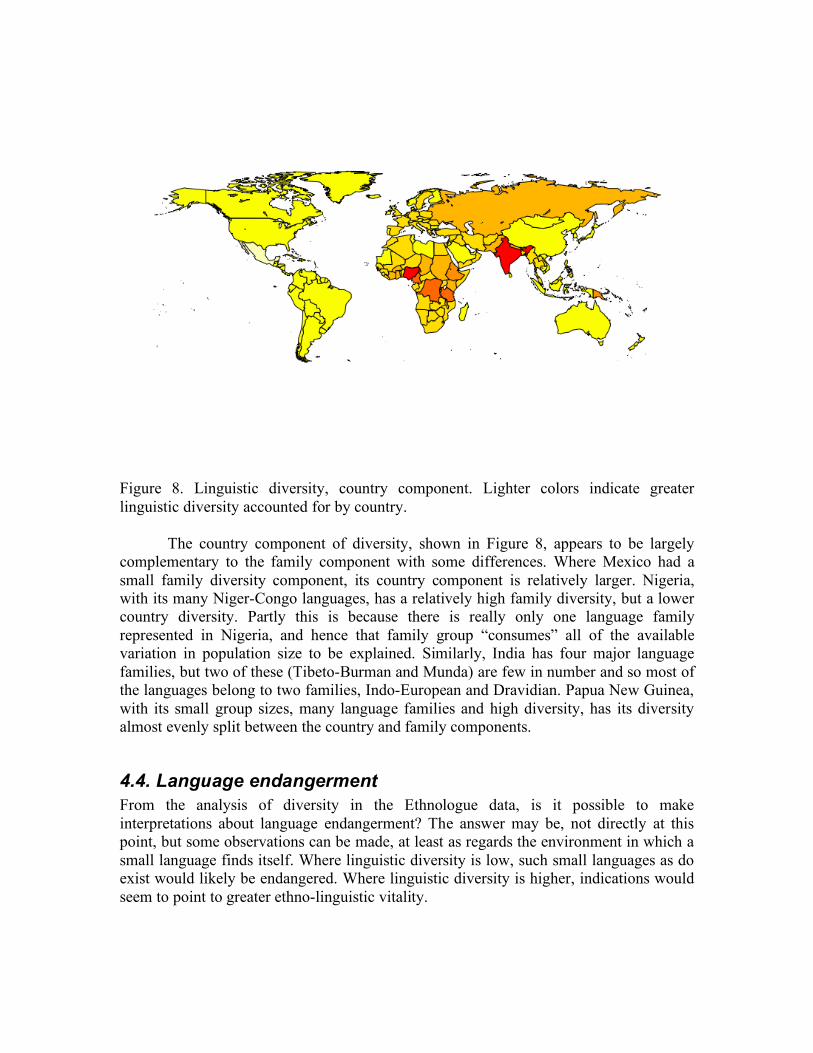
Figure 8. Linguistic diversity, country component. Lighter colors indicate greater linguistic diversity accounted for by country. The country component of diversity, shown in Figure 8, appears to be largely complementary to the family component with some differences. Where Mexico had a small family diversity component, its country component is relatively larger. Nigeria, with its many Niger-Congo languages, has a relatively high family diversity, but a lower country diversity. Partly this is because there is really only one language family represented in Nigeria, and hence that family group “consumes” all of the available variation in population size to be explained. Similarly, India has four major language families, but two of these (Tibeto-Burman and Munda) are few in number and so most of the languages belong to two families, Indo-European and Dravidian. Papua New Guinea, with its small group sizes, many language families and high diversity, has its diversity almost evenly split between the country and family components.
4.4. Language endangerment From the analysis of diversity in the Ethnologue data, is it possible to make interpretations about language endangerment? The answer may be, not directly at this point, but some observations can be made, at least as regards the environment in which a small language finds itself. Where linguistic diversity is low, such small languages as do exist would likely be endangered. Where linguistic diversity is higher, indications would seem to point to greater ethno-linguistic vitality.
At the same time we need to be cautious in this interpretation. Much may hinge upon the relative contributions of country diversity and family diversity. When languages exist in larger numbers among larger numbers of families, diversity is present both at the country level and at the family level. Such situations, like that of Papua New Guinea, represent the equilibrium situation of Dixon’s (1997) punctuated equilibrium model, in which, absent a punctuating event, relatively small languages thrive for relatively long periods of time. Alternatively, Nichols’ (1992) conception of a “residual zone” also applies, in which geography may assist the formation and preservation of smaller linguistic groups. Where family and country diversity are not in balance, other effects might be observed. For example, in Indonesia, country diversity is rather high, indicating many individual language groups, but family diversity is rather low, indicating a small number of families. Family linguistic similarity is frequently observed to facilitate multilingualism. It is, for example, far easier for a speaker of a Romance language such as Italian to learn several other Romance languages (e.g. Spanish, French, Portuguese, Romansch), than it is for a speaker of a Sino-Tibetan language like Mandarin Chinese to do the same. The Mandarin speaker has a comparative advantage in learning Hakka, Southern Min, Wu and other Sino-Tibetan languages. Hence, when country diversity is high but family diversity is low, multilingualism is facilitated. Under these circumstances, other influences conditioning language shift take on a greater importance. Is there a national language policy that promotes a single national language to the exclusion of all others? Is education in a national language required for normal advancement in life? And do economic circumstances undermine the means of subsistence of people around the country, forcing them to migrate to new locations? If so, and the national language is a related language, then it may be much easier to abandon a smaller local language, and even languages with otherwise large populations can become endangered. If some functions remain for the local language, this can lead to pseudo-death (Wurm 1991), in which vestiges of the language hang on beyond the point at which it can be said to be regularly spoken. What about the other possibility, that of low country diversity and higher family diversity? Here, indications are that the country has a larger number of families, but these families would be smaller and have fewer members. Hence, the facilitating conditions for multilingualism would not exist, at least insofar as language relatedness is concerned. Would that mean a greater likelihood of retaining smaller langauges? Not necessarily, as much would depend on the disposition of the larger language groups that depress country diversity. Are they expanding in their populations? Are they economically or politically dominant? If so, then smaller language groups would still experience pressure to defect to the larger groups. Full investigation of the language endangerment question needs to consider multiple time frames, and this points to something that is missing from the Ethnologue: there is no history of observations of population sizes of languages. Not only would this be useful in evaluating the population data for other purposes, it would be essential to
obtaining a clear picture of the population dynamics of languages. Many good models exist for working with such data, from the field of population biology, and the depth and value of what could be learned form their application would be enormous. Given the policy importance of language endangerment, global trends in language dominance, etc., this should be a high priority for future development of language statistics.
5. Recommendations for improving language statistics Our review of the Ethnologue language statistics has pointed to a number of strengths and weaknesses of the existing data. Among the various strengths of the Ethnologue, it is fairly comprehensive in its coverage. This comprehensiveness is creditable to the large network of professional linguists maintained by SIL, who are committed to obtaining the necessary information from remote regions where few others would be likely to go. The Ethnologue catalog itself is well-organized with a clear framework supporting the gathering of the necessary information. On the whole, information is documented fairly extensively, so that it is possible to check the sources for much of the information, or at least obvious where it is of a more doubtful quality. Its design is extensible in readily imagined ways — apart from SIL’s own plans to introduce information about subsistence modes and ecological habitats, an invaluable sort of information for studying dynamic aspects of language diversity as envisioned above — information about media types and use, cultural and religious practice, education, literacy and multilingualism are already supported or straightforward to incorporate into the existing structure. The Ethnologue has many weaknesses that are readily noted as well. The Ethnologue is surprisingly under-resourced, at least from the point of view of someone who has long used it and recognized its value. With a staff of only three, it is impossible for the Ethnologue to develop new sorts of presentation or services, or to conduct comprehensive updates. The ISO 639-3 draft process has absorbed a lot of the time that might have otherwise been spent on such projects, and has made it hard to keep pace with the discovery and verification of new languages. On top of this many aspects of the Ethnologue are slow to see updates, such as the case of the many Australian languages no believed extinct, still listed as living languages in the Ethnologue (Hammarström 2005). Finally there is a lack of any kind of historical perspective — perhaps more correctly, a lack of a coherent historical perspective, given the ranges of dates for cited language populations. These weaknesses are not crippling, but they diminish somewhat the value of the product from what it could be. The most obvious area in need of attention would be in the sources for various population figures. There is a clear need for a systematic update of the population information, made clear by the helpful policy of having cited sources wherever possible. Old sources should be systematically sought out and replaced with updated sources wherever possible. Over-reliance on certain sources, whether and academic source such as Wurm and Hattori (1981) or a Christian Missionary source such as WCD, should be curtailed as far as possible. At least by having more varied sources, it would be possible to avoid biases, such as the decay of information quality in a particular area, or the systematic substitution of ethnic populations for language populations. The means to
accomplish this are reasonably straightforward, but require some form of implementation by the Ethnologue editorial staff. Because it is a massive task, it would be good to work out a systematic procedure for promoting this goal, perhaps through supporting student assistants at the Ethnologue office, or through web-based submission procedures. Perhaps a more important point is that the lack of cited sources in some areas may indicate a problem that neither the Ethnologue nor SIL can cure. SIL, like other cited sources is regionally specialized, and to get more attention on regions where SIL lacks resources, and the Ethnologue must rely on less reliable sources requires participation from the broader scholarly community. What would help is to develop a more-or-less formal mechanism for drawing members of the scholarly community outside of SIL into the Ethnologue submission process. Since the editorship could be easily overwhelmed by excessive, unfiltered input, this should probably be done in a way that is external to SIL, but which SIL and the Ethnologue staff can nonetheless participate in and employ. One possible mechanism for maintaining such a network would be a Wiki, possibly hosted by the LinguistList (www.linguistlist.org), a non-profit portal for linguistics-related discussion and services, coordinated by Anthony Aristar (Wayne State University) and Helen Aristar-Dry (Eastern Michigan University). LinguistList has alread had past collaborations with SIL, and they maintain the code list for ancient and constructed languages, that extends the Ethnologue language codes. A further course of action would be to support activities for collecting language statistics outside of the Ethnologue altogether, such as through the Linguasphere Observatory, which has enjoyed UNESCO support in the past. From the material on the website and in the electronic versions of the Linguasphere Register, it does not appear that the Linguasphere is as well-developed as the Ethnologue is. Presently, there is no database, at least that is publicly accessible, and the information in each of the entries is minimal, and not generally documented. It is possible that this information exists in a not-generally accessible location, but this could not be verified. It would be useful to contact the Linguasphere Observatory to get more detail on their operations; we could not do this in the time frame we had available because we only learned of its existence late in the process. An issue with the usability of their data is the practice of recording populations in powers of ten, rather than in actual numbers. While this may be sufficient for the exploration of diversity undertaken in Section 4 above, it may not be satisfactory for other audiences who expect greater accuracy. A further area in which the language statistics data can be improved would be in incorporating statistics about various forms of language use in education, media etc. For example, various international market organizations maintain information about the trade of various media and entertainment commodities according to language, e.g. cinema, music, radio programming, educational materials. Such information would be useful to have when trying to assess ethnolinguistic vitality, threat to smaller groups, or trends in development. Making this information usable might be as simple as getting such organizations to adopt ISO 639-3, the language coding scheme based on Ethnologue’s language identification codes. This way, Ethnologue editorial staff would be freed of the responsibility of trying to seek out the information and enter it into their databases; users
could come along and have a clear way to synchronize the assets in the different database systems. Another area that could be improved, and this would be critical for understanding the situation with endangered languages, would be the tracking of displaced peoples. For example following the 1993 genocide in Rwanda, thousands of Rwandans fled to Kisangani, in the Democratic Republic of the Congo — there are no fewer than 20 language groups along that path, whose lives and livelihood would have potentially been affected by such a large movement of people. Displacement through war, slavery, colonization and population expansion have always played a role in language population dynamics. If we are to advance the understanding of social forces on the growth, loss or endangerment of languages, information about the number and direction of movement of displaced peoples would be invaluable. Such information is also important in various host countries around the world, when displaced people become refugees. The satisfactory and fair provision of refugee services depends on being aware of the language backgrounds of the refugees. Finally, the support of linguistic field work can play a key role in developing good-quality language statistics. In order that distinct languages be successfully distinguished from other languages, from ethnicities, and from dialects of the same language, field linguists need to be engaged in the process of collecting, developing and utilizing language statistics. Wherever possible, the conduct of field linguistics, and engagement of it towards the end of producing language statistics, needs to be encouraged. Bureaus such as the National Science Foundation of the United States have committed some resources to this end, namely by starting a program for the documentation of endangered languages. This program funds field linguists for write grammars and prepare educational materials for languages that might otherwise die out. This is a good start but it must be encouraged to go further for it to affect the development of language statistics. Linguists must be encouraged to take up language endangerment as a theoretical challenge, not only from the humanistic side, which predominates in literature in the area, but also from the perspective of large-scale movements, social changes, demographics and the statistical models that help us understand them. We need to engage questions about when and whether language revitalizations can work, and under what circumstances, so that we can plan appropriate interventions. Whatever encouragement, incentive or guidance UNESCO can offer in this direction to agencies such as the NSF, private aid foundations, etc., would be potentially useful. In sum, the language statistics available today in the form of the Ethnologue population counts are already good enough to be useful, and to guide us in learning about the global situation of language diversity. Many areas of needed improvement remain, however, and the overall order of the task of improving the state of language statistics remains very large. With sufficient resources and encouragement, SIL and the
community of academic linguists will engage with this task to bring about a better understanding of global linguistic diversity.
References Adelaar, W. 1991. The endangered languages problem: South America. In R. Robins and E. Uhlenbeck, eds., 45-92. Adelaar, W. 2004. The Languages of the Andes. Cambridge: Cambridge University Press. Arends, J. 1995. The socio-historical backgrounds of creoles. In J. Arends, P. Muysken and N. Smith, eds., 15-24. Arends, J; Muysken, P; and Smith, N, eds. 1995. Pidgins and Creoles: An Introduction. Amsterdam: Benjamins. Aristar, A. 2002. Managing LINGUIST Codes for Ancient and Constructed Languages. OLAC Working Group on Language Codes. http://www.language-archives.org/wg/language-codes/linguist-20020519.html Aristar, A. 2002. LINGUIST Codes for Ancient and Constructed Languages. OLAC Working Group on Language Codes. http://www.language-archives.org/wg/language-codes/linguist-20020219.html Auer, P, ed. 1998. Code-Switching in Conversation: Language, Interaction and Identity. London: Routledge. Bakker, P. 1995. Pidgins. In J. Arends, P. Muysken and N. Smith, eds., 25-40. Brensinger, M; Heine, B; and Somer, G. 1991. Language death in Africa. In R. Robins and E. Uhlenbeck, eds., 19-44. Breton. R. 1997. Atlas of the Languages and Ethnic Communities of South Asia. Walnut Creek, CA: Sage. Comrie, B, ed. 1990. The World’s Major Languages. Oxford: Oxford University Press. Comrie, B; Matthews, S; and Polinsky, M. 1997. The Atlas of Languages: The origin and Development of Languages Throughout the World. New York: Facts on File. Constable, P; and Simons, G. 2000. Language identification and IT: addressing problems of linguistic diversity on a global scale. SIL Electronic Working Papers (2000-001) http://www.sil.org/silewp/2000/001/SILEWP2000-001.pdf
Coulmas, F. 1996. The Blackwell Encyclopedia of Writing Systems. Oxford: Blackwell. Coulmas, F, ed. 1997. The Handbook of Sociolinguistics. Oxford: Blackwell. Cuaron, B; and Lastra, Y. 1991. Endangered languages in Mexico. In R. Robins and E. Uhlenbeck, eds., 93-134. Crystal, D. 2000. Language Death. Cambridge: Cambridge University Press. Crystal, D. 2003. English as a Global Language, Second Edition. Cambridge: Cambridge University Press. Dalby, A. 1998. Dictionary of Languages: The Definitive Reference to More Than 400 Languages. New York: Columbia University Press. Dalby, A. 2003. Language in Danger: The Loss of Linguistic Diversity and the Threat to our Future. New York: Columbia University Press. Dalby, D. 1999. The Linguasphere Register. Gwasg y Byd laith / Linguasphere Press. Diamond, J. 1997. Guns, Germs and Steel: The Fates of Human Societies. New York: W.W. Norton and Co. Diamond, J. 2005. Collapse: How Societies Choose to Fail or Succeed. New York: Penguin Books. Dixon, R. 1980. The Languages of Australia. Cambridge: Cambridge University Press. Dixon, R. 1991. The endangered languages of Australia, Indonesia and Oceania. In R. Robins and E. Uhlenbeck, eds., 229-256. Dixon, R. 1997. The Rise and Fall of Languages. Cambridge: Cambridge University Press. Dixon, R; and Aikhenvald, A. 1999. The Amazonian Languages. Cambridge: Cambridge University Press. Dorian, N, ed. 1989. Investigating Obsolescence: Studies in Language Contraction and Death. Cambridge: Cambridge University Press. Edmondson, J; and Solnit, D. 1997. Comparative Kadai: The Tai Branch. Dallas: SIL Publications and the University of Texas at Arlington. Eggington, W; and Wren, H. 1997. Language Policy: Dominant English, Pluralist Challenges. Amsterdam: Benjamins.
Errington, J. 1998. Shifting Languages: Identity and Interaction in Javanese Indonesia. Cambridge: Cambridge University Press. Fasold, R. 1984. The Sociolinguistics of Society. Oxford: Blackwell. Fasold, R. 1990. Sociolinguistics of Language. Oxford: Blackwell. Gordon, R, ed. 2005. Ethnologue: Languages of the World, Fifteenth Edition. Dallas: SIL International. Online version: http://www.ethnologue.com/. Graddol, D. 1999. The decline of the native speaker. In D. Graddol and U. Meinhof, 57-68. Graddol, D. 1997. The Future of English? A Guide to Forecasting the Popularity of English in the 21st Century. Plymouth: British Council. Graddol, D. 2005. English Next: Why global English may mean the end of ‘English as a Foreign Language’. Plymouth: British Council. Graddol, D; and Meinhof, U. 1999. English in a Changing World. Oxford: Catchline/AILA Review. Greenberg, J. 1956. The measurement of linguistic diversity. Language, 32(2): 109-15. Grenoble, L; and Whaley, L, eds. 1998. Endangered Languages: Current Issues and Future Prospects. Cambridge: Cambridge University Press. Grimes, B, ed. 2000. Ethnologue: Languages of the World, Fourteenth Edition. Dallas: SIL International. Online version: http://www.ethnologue.com/14/. Grimes, J. 1986. “Area norms of language size.” In B.F. Elson, ed., Language in global perspective: Papers in honor of the 50th anniversary of the Summer Institute of Linguistics, 1935-1985, pp.5-19. Dallas: Summer Institute of Linguistics. Grimes, J. 1995. Language Survey Reference Guide. Dallas: Summer Institute of Linguistics (SIL International). Hammarström, H. 2005. Review of the Ethnologue, 15th Ed., Raymond J. Gordon (ed.), SIL International, Dallas, 2005. LINGUIST LIST 16.2637 12 Sept 2005. Heine, B; and Nurse, D. 2000. African Languages: An Introduction. Cambridge: Cambridge University Press. Holm, J. 1989. Pidgins and Creoles, Volume I: Theory and Structure. Cambridge: Cambridge University Press.
Holm, J. 1989. Pidgins and Creoles, Volume II: Reference Survey. Cambridge: Cambridge University Press. Jablonski, N; and Aiello, L, eds. 1998. The Origin and Diversification of Language. Memoirs of the California Academy of Sciences, Number 24. San Francisco: The California Academy of Sciences. Kibrik, A. 1991. The problem of endangered languages in the USSR. In R. Robins and E. Uhlenbeck, eds., 257-273. Kindell, G; and Lewis, M, eds. 2000. Assessing Ethnolinguistic Vitality: Theory and Practice. Dallas: SIL Publications. Kinkade, M. Adelaar, W. 1991. The decline of Native Languages in Canada. In R. Robins and E. Uhlenbeck, eds., 157-176. Krauss, M. 1992. The world’s languages in crisis. Language, 61(1): 4-10. Kulick, D. 1992. Language Shift and Cultural Reproduction: Socialization, Self and Syncretism in a Papua New Guinean Village. Cambridge: Cambridge University Press. McArthur, T. 1998. The English Languages. Cambridge: Cambridge University Press. MacAulay, D. 1992. The Celtic Languages. Cambridge: Cambridge University Press. Maffi, L, ed. 2001. On Biocultural Diversity. Washington DC: Smithsonian Institution Press. Mahapatra, B. 1991. An appraisal of Indian languages. In R. Robins and E. Uhlenbeck, eds., 177-188. Masica, C. 1991. The Indo-Aryan Languages. Cambridge: Cambridge University Press. Matisoff, J. 1991. Endangered languages in mainland Southeast Asia. In R. Robins and E. Uhlenbeck, eds., 189-228. Maurais, J; and Morris, M, eds. 2003. Languages in a Globalising World. Cambridge: Cambridge University Press. McCullagh P; and Nelder J. 1989. Generalized Linear Models, second ed. Boca Raton: Chapman Hall/CRC Press. Milroy, L; and Muysken, P, eds. 1995. One Speaker, Two Languages: Cross-Disciplinary Perspectives on Code-Switching. Cambridge: Cambridge University Press.
Mithun, M. 1999. The Native Languages of North America. Cambridge: Cambridge University Press. Mühlhäusler, P. 1996. Linguistic Ecology: Language Change and Linguistic Imperialism in the Pacific Region. London: Routledge. Nettle, D. 1999. Linguistic Diversity. Oxford: Oxford University Press. Nettle, D; and Romaine, S. 2000. Vanishing Voices: The Extinction of the World’s Languages. Oxford: Oxford University Press. Nichols, J. 1992. Linguistic Diversity in Space and Time. Chicago: Chicago University Press. Nichols, J. 1998. The origin and dispersal of languages: Linguistic evidence. In N. Jablonski and L. Aiello, eds., 127-170. Paolillo, J. 2005. Language Diversity on the Internet. In S. Ellis, ed. Measuring Linguistic Diversity on the Internet, 43-89. Paris: UNESCO. Phillipson, R. 1992. Linguistic Imperialism. Oxford: Oxford University Press. Phillipson, R. 2003. English-Only Europe? Challenging Language Policy. London: Routledge. Posner, R. 1996. The Romance Languages. Cambridge: Cambridge University Press. Postma, J. 1990. The Dutch in the Atlantic Slave Trade, 1600-1815. Cambridge: Cambridge University Press. Rakecewicz, P. 2001. Exiled within their own country, map of displaced persons worldwide. UNEP (http://arctic.unep.net/index.cfm?issue=&type=1&data_id=23414) Renfrew, C. 1998. The origins of world linguistic diversity: An archaeological perspective. In N. Jablonski and L. Aiello, eds., 171-192. Robins, R; and Uhlenbeck, E, eds. 1991. Endangered Languages. Oxford: Berg. Romaine, S, ed. 1991. Language in Australia. Cambridge: Cambridge University Press. Schiffman, H. 1996. Linguistic Culture and Language Policy. London: Routledge. Trudgill, P; and Hannah, J. 1993. International English: A Guide to the Varieties of Standard English, Third Edition. London: Edward Arnold.
Walsh, M. 1991. Overview of indigenous languages of Australia. In S. Romaine, ed., 27-48. Watkins, C. 1992. Indo-European Languages. In Bright, W, ed., International Encyclopedia of Linguistics, Volume 2: 206-212. Oxford: Oxford University Press. Whitehouse, P; Usher, T; Ruhlen, M; and Wang, W. 2004. Kusunda: An Indo-Pacific language in Nepal. Proceedings of the National Academy of Sciences 101:5692-5695. Wolfson, N; and Manes, J. 1985. Language of Inequality. Berlin: Mouton. Woodard, R, ed. 2004. The Cambridge Encyclopedia of the World’s Ancient Languages. Cambridge: Cambridge University Press. Wurm, S. 1991. Language death and disappearance: Causes and Circumstances. In R. Robins and E. Uhlenbeck, eds., 1-18. Wurm S. 2001. Atlas of the World’s Languages in Danger of Disappearing. With Ian Heywarde, cartographer. Barcelona: UNESCO Publishing. Zepeda, O; and Hill, J. 1991. The condition of Native American Languages in the United States. In R. Robins and E. Uhlenbeck, eds., 135-156.