Embed Size (px)
Citation preview
International Journal of Scientific & Engineering Research, Volume 4, Issue 5, May-2013 956 ISSN 2229-5518
IJSER © 2013 http://www.ijser.org
Evaluating temperature and precipitation variability over Gujarat, India from 1957-2007
Aparna Rathore* and Yogesh T Jasrai
ABSTRACT The anthropogenic activities like industrialization, power production, deforestation, land use changes have all resulted into emissions of excess amounts of the greenhouse gases mainly carbon dioxide (CO2), nitrous oxide (N2O), methane (CH4), water vapour which have disturbed the normal energy balance of the Earth resulting into Enhanced greenhouse effect. This has caused the global mean temperature to rise by about 0.7°C and it is predicted that it will increase by 2-5°C by the year 2100. The rainfall has become more variable and the extreme events like cyclones, tsunamis, droughts, floods, heat and cold waves etc have also increased. All such climatic variability has a direct or indirect impact on the ecosystem involving plants, animals and humans. Climate change is likely to impact all the natural ecosystems as well as socio-economic systems. Climatic variability in terms of changes in temperature and precipitation pattern and their extremity pose a threat to the ecosystem and its services and therefore should be analysed in the past and present scenario to predict the future climate. In this paper past 50 years data of all IMD observatories in Gujarat state of India as obtained from IMD, Pune has been analyzed. The moving averages of maximum temperature during summer season and minimum temperature during winter season have been analysed and a significant increasing trend has been observed. The mean maximum temperature has been found to increase by 0.1°C and the mean maximum temperature has increased by 0.4°C over the past 50 years. Similarly the rainfall has also registered an increase in the past 50 years. Key words: Gujarat, climate, temperature, precipitation data INTRODUCTION Meteorological data compiled over the past century suggests that the earth is warming, but there are significant differences at regional level [13]. Over the last 100 years (1906-2005) the average temperature of the Earth’s surface has risen by 0.74±0.18°C [6,7,17] with two main periods of warming, between 1910 and 1945 and from 1976 onwards [21] and by 0.19°C per decade during 1979-1998 [10]. The rate of warming during the latter period has been approximately double that of the first and, thus, greater than at any other time during the last 1,000 years [21]. The IPCC predicts that, under business-as-usual scenarios mean temperatures worldwide will increase 1.4 to 5.8°C by 2100 as a result of growing GHG concentrations in the atmosphere [10,14]. The surface air temperature over India are going up at the rate of 0.4°C/hundred years particularly during the post monsoon and winter season [1]. Indian subcontinent has been predicted to experience an annual mean surface warming in the range between 3.5 and 5.5°C during 2080s [10]. • Aparna Rathore is currently pursuing PhD degree program in Botany
at Department of Botany, Gujarat University, Ahmedabad, Gujarat, India. Email: [email protected]
• Yogesh T Jasrai is currently Professor and Head, Department of Botany, Gujarat University, Ahmedabad, Gujarat, India.
The monsoons are becoming quite uncertain with periods of droughts and floods. The frequency, intensity and duration of rainfall are also likely to change, with increased production risks, especially in semi-arid and arid rain-fed production areas [9,15]. There are already changes in the monsoon pattern with floods in Maharashtra, Gujarat and Rajasthan and drought in the North-East [2]. India may experience between 5 and 25% decline in winter rainfall leading to droughts in the dry summer months. On the other hand the average summer monsoon over Indian subcontinent is bound to increase by 10-15%. The date of onset of monsoon has also become variable [10,16]. The present paper reports changes in the climatic parameters (temperature and rainfall) in Gujarat over five decades of independent India. MATERIAL AND METHOD Study Area Gujarat is in the extreme West part of India (Figure-1). It has tropical climate, namely sub-humid, arid and semi-arid spread over different regions of the state. North Gujarat region comprising of Kutch, part of Banaskantha, Mehsana and North Western part of Saurashtra have arid climate while the South Gujarat have sub-humid climate and in the rest of the state, semi-arid climate. Temperature varies from 6 to 45°C. Annual rainfall varies from 250 mm in the North-West and to more than 1500 mm in South Gujarat.
IJSER
International Journal of Scientific & Engineering Research, Volume 4, Issue 5, May-2013 957 ISSN 2229-5518
IJSER © 2013 http://www.ijser.org
Figure-1: The state of Gujarat showing the marked areas as the meteorological stations for which climatic data was
analysed from 1957-2007 Climatic Data Monthly temperature data (including monthly mean temperature, monthly minimum temperature and monthly maximum temperature), annual average minimum and maximum temperature and seasonal rainfall data for IMD observatories of Gujarat state, India, for the period 1957-2007 has been utilized for the analysis. Data Analysis The variability in various temperature parameters for selected observatories of Gujarat with complete climate data from 1957-2007 was studied. Seasonal rainfall data was also analyzed during the above period for various observatories. Thirty years and ten years moving averages [11,12] were also calculated for all parameters in order to deduce the extent of climatic variability in the past fifty years. The climatic data was procured from IMD, Pune. RESULT AND DISCUSSION The climatic data for various stations of Gujarat state for Maximum, Minimum and Mean temperature and annual rainfall was analysed. There is a significant and steady increasing trend in the past 50 years (Figure-2). The observed warming was predominantly due to an increase in maximum temperature and also due to a significant increase in minimum temperature during winter season as compared to day temperatures in summer (Figure-3 and 7).
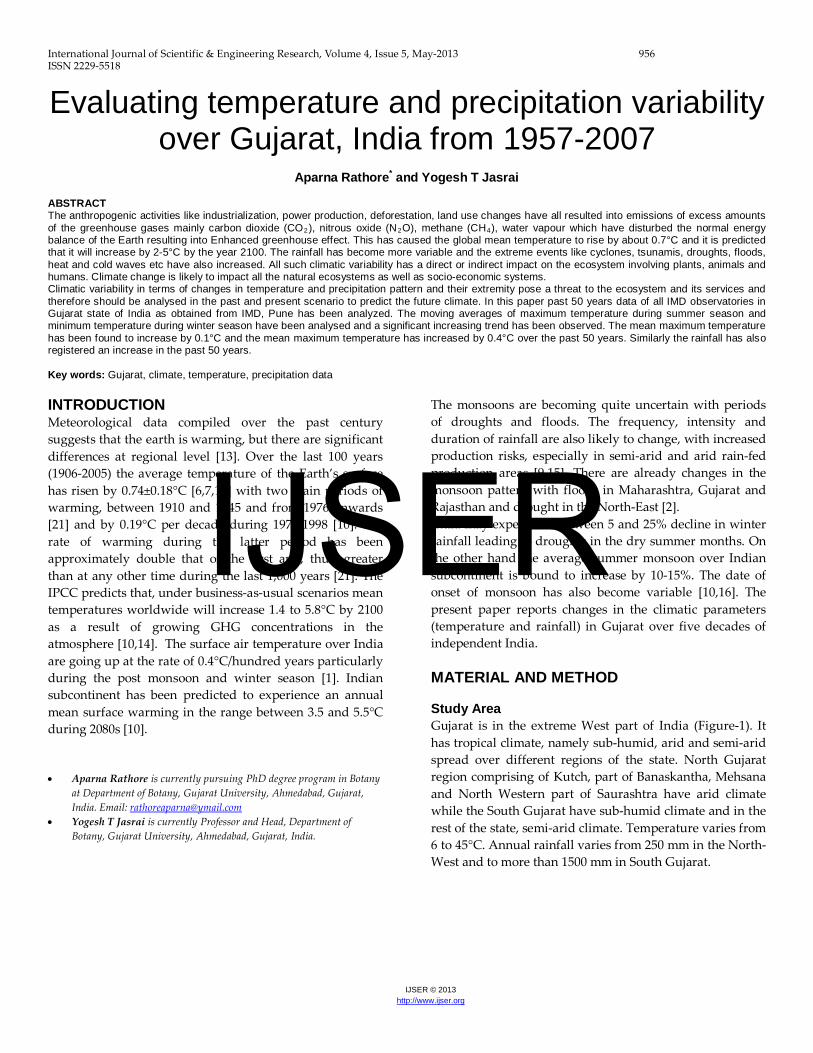
Figure-2: Increasing trend in the annual mean temperature of Gujarat
1. Average annual temperature of Gujarat The differences in average annual temperature revealed increasing trend in temperature during past 50 years (1957–2007) in Gujarat. The average annual temperature of Gujarat during 1957 was 26.8°C, which increased to 27.8°C by 2007, with an increase of about 1°C (Fig-2).
2. Minimum Temperature The annual average minimum temperature of Gujarat during 1957 was 20.8°C which increased to 22.0°C, which shows an increase in the minimum temperature of Gujarat by about 1.2°C (Fig-3). The annual average minimum temperature for winter months (November, December, January and February) of Gujarat has also increased by 1.28°C over the past 50 years (Fig-4).
Figure-3: Showing annual average minimum temperature of Gujarat
Decadal and 30 years moving averages of mean minimum temperature during winter season (November, December, January, February) was also studied for Gujarat state.
IJSER
International Journal of Scientific & Engineering Research, Volume 4, Issue 5, May-2013 958 ISSN 2229-5518
IJSER © 2013 http://www.ijser.org
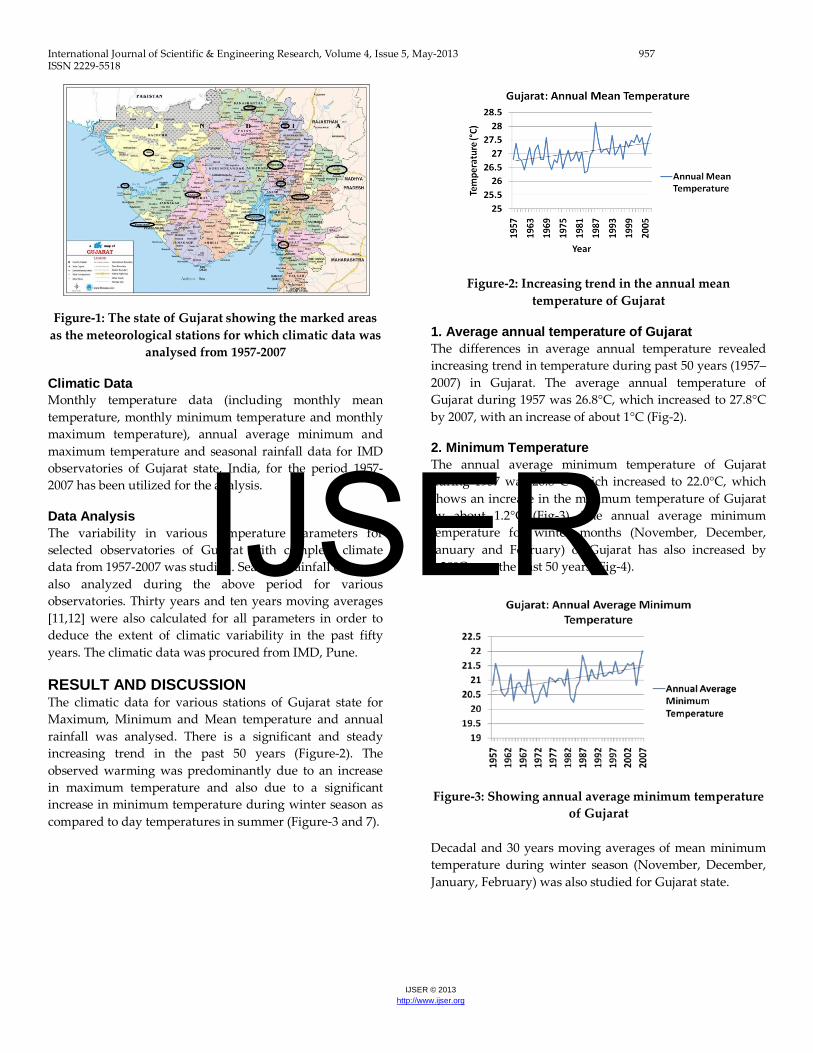
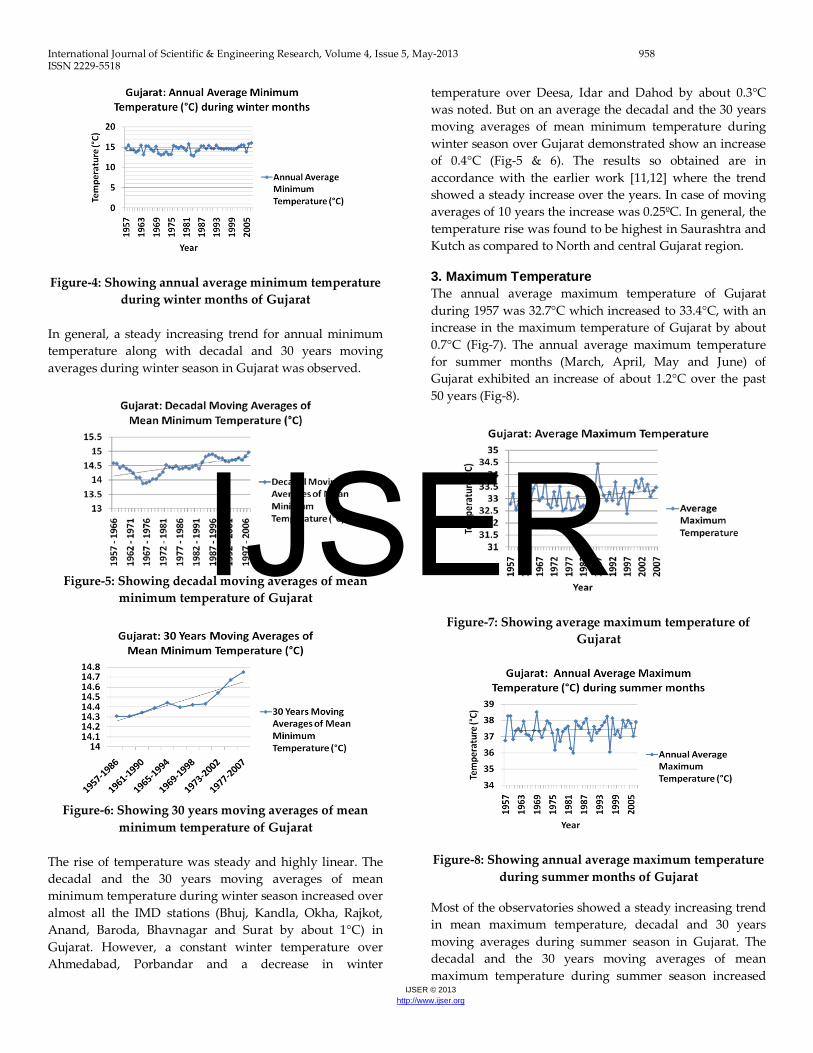
Figure-4: Showing annual average minimum temperature during winter months of Gujarat
In general, a steady increasing trend for annual minimum temperature along with decadal and 30 years moving averages during winter season in Gujarat was observed.
Figure-5: Showing decadal moving averages of mean
minimum temperature of Gujarat
Figure-6: Showing 30 years moving averages of mean
minimum temperature of Gujarat The rise of temperature was steady and highly linear. The decadal and the 30 years moving averages of mean minimum temperature during winter season increased over almost all the IMD stations (Bhuj, Kandla, Okha, Rajkot, Anand, Baroda, Bhavnagar and Surat by about 1°C) in Gujarat. However, a constant winter temperature over Ahmedabad, Porbandar and a decrease in winter
temperature over Deesa, Idar and Dahod by about 0.3°C was noted. But on an average the decadal and the 30 years moving averages of mean minimum temperature during winter season over Gujarat demonstrated show an increase of 0.4°C (Fig-5 & 6). The results so obtained are in accordance with the earlier work [11,12] where the trend showed a steady increase over the years. In case of moving averages of 10 years the increase was 0.25ºC. In general, the temperature rise was found to be highest in Saurashtra and Kutch as compared to North and central Gujarat region. 3. Maximum Temperature The annual average maximum temperature of Gujarat during 1957 was 32.7°C which increased to 33.4°C, with an increase in the maximum temperature of Gujarat by about 0.7°C (Fig-7). The annual average maximum temperature for summer months (March, April, May and June) of Gujarat exhibited an increase of about 1.2°C over the past 50 years (Fig-8).
Figure-7: Showing average maximum temperature of Gujarat
Figure-8: Showing annual average maximum temperature during summer months of Gujarat
Most of the observatories showed a steady increasing trend in mean maximum temperature, decadal and 30 years moving averages during summer season in Gujarat. The decadal and the 30 years moving averages of mean maximum temperature during summer season increased
IJSER
International Journal of Scientific & Engineering Research, Volume 4, Issue 5, May-2013 959 ISSN 2229-5518
IJSER © 2013 http://www.ijser.org
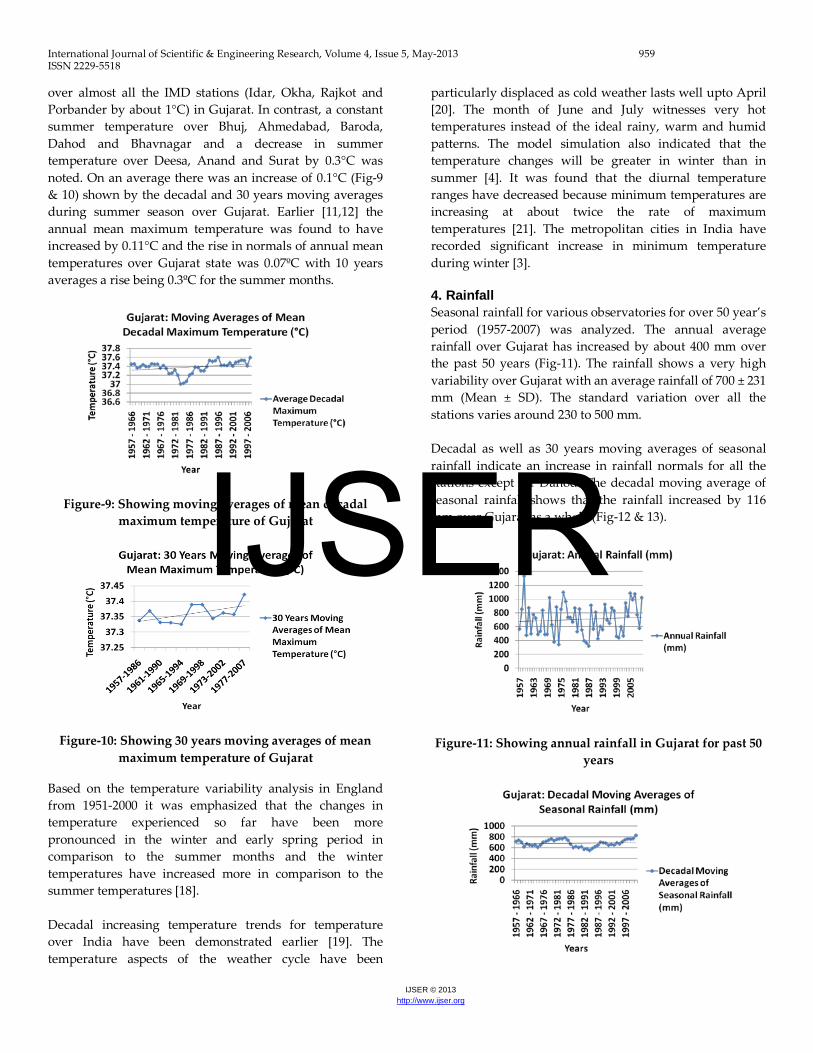
over almost all the IMD stations (Idar, Okha, Rajkot and Porbander by about 1°C) in Gujarat. In contrast, a constant summer temperature over Bhuj, Ahmedabad, Baroda, Dahod and Bhavnagar and a decrease in summer temperature over Deesa, Anand and Surat by 0.3°C was noted. On an average there was an increase of 0.1°C (Fig-9 & 10) shown by the decadal and 30 years moving averages during summer season over Gujarat. Earlier [11,12] the annual mean maximum temperature was found to have increased by 0.11°C and the rise in normals of annual mean temperatures over Gujarat state was 0.07ºC with 10 years averages a rise being 0.3ºC for the summer months.
Figure-9: Showing moving averages of mean decadal maximum temperature of Gujarat
Figure-10: Showing 30 years moving averages of mean maximum temperature of Gujarat
Based on the temperature variability analysis in England from 1951-2000 it was emphasized that the changes in temperature experienced so far have been more pronounced in the winter and early spring period in comparison to the summer months and the winter temperatures have increased more in comparison to the summer temperatures [18]. Decadal increasing temperature trends for temperature over India have been demonstrated earlier [19]. The temperature aspects of the weather cycle have been
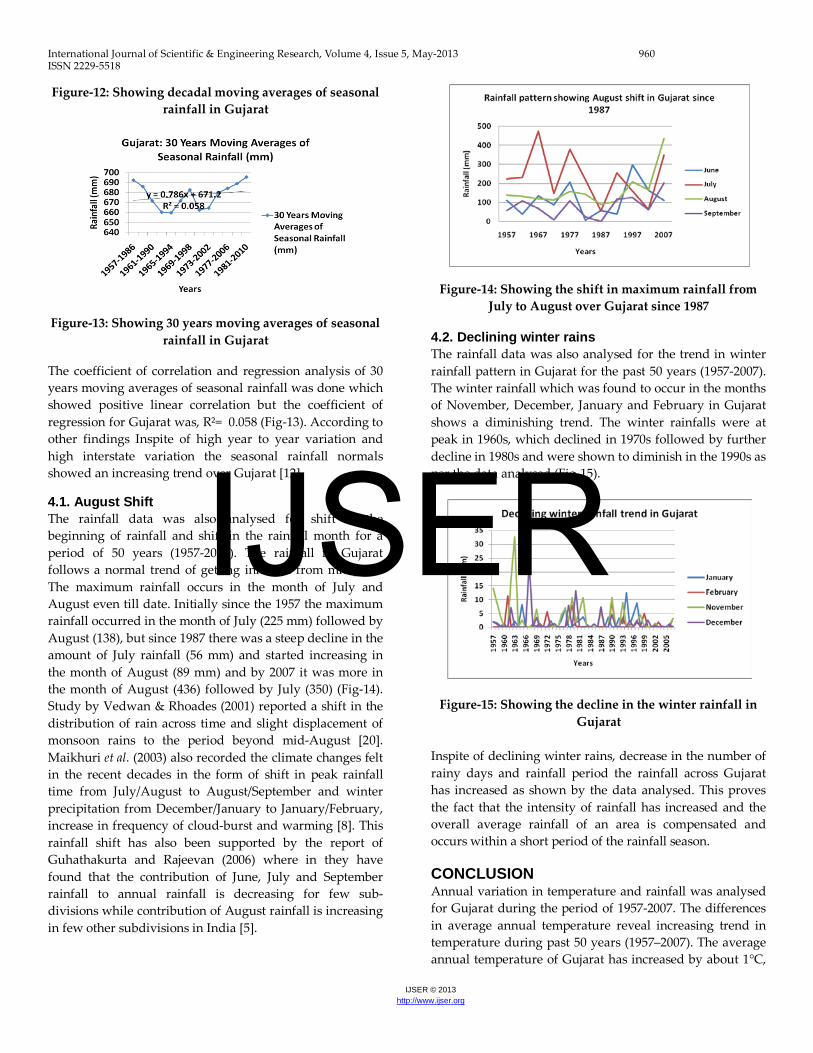
particularly displaced as cold weather lasts well upto April [20]. The month of June and July witnesses very hot temperatures instead of the ideal rainy, warm and humid patterns. The model simulation also indicated that the temperature changes will be greater in winter than in summer [4]. It was found that the diurnal temperature ranges have decreased because minimum temperatures are increasing at about twice the rate of maximum temperatures [21]. The metropolitan cities in India have recorded significant increase in minimum temperature during winter [3]. 4. Rainfall Seasonal rainfall for various observatories for over 50 year’s period (1957-2007) was analyzed. The annual average rainfall over Gujarat has increased by about 400 mm over the past 50 years (Fig-11). The rainfall shows a very high variability over Gujarat with an average rainfall of 700 ± 231 mm (Mean ± SD). The standard variation over all the stations varies around 230 to 500 mm. Decadal as well as 30 years moving averages of seasonal rainfall indicate an increase in rainfall normals for all the stations except for Dahod. The decadal moving average of seasonal rainfall shows that the rainfall increased by 116 mm over Gujarat as a whole (Fig-12 & 13).
Figure-11: Showing annual rainfall in Gujarat for past 50 years
IJSER
International Journal of Scientific & Engineering Research, Volume 4, Issue 5, May-2013 960 ISSN 2229-5518
IJSER © 2013 http://www.ijser.org
Figure-12: Showing decadal moving averages of seasonal rainfall in Gujarat
Figure-13: Showing 30 years moving averages of seasonal rainfall in Gujarat
The coefficient of correlation and regression analysis of 30 years moving averages of seasonal rainfall was done which showed positive linear correlation but the coefficient of regression for Gujarat was, R²= 0.058 (Fig-13). According to other findings Inspite of high year to year variation and high interstate variation the seasonal rainfall normals showed an increasing trend over Gujarat [12].
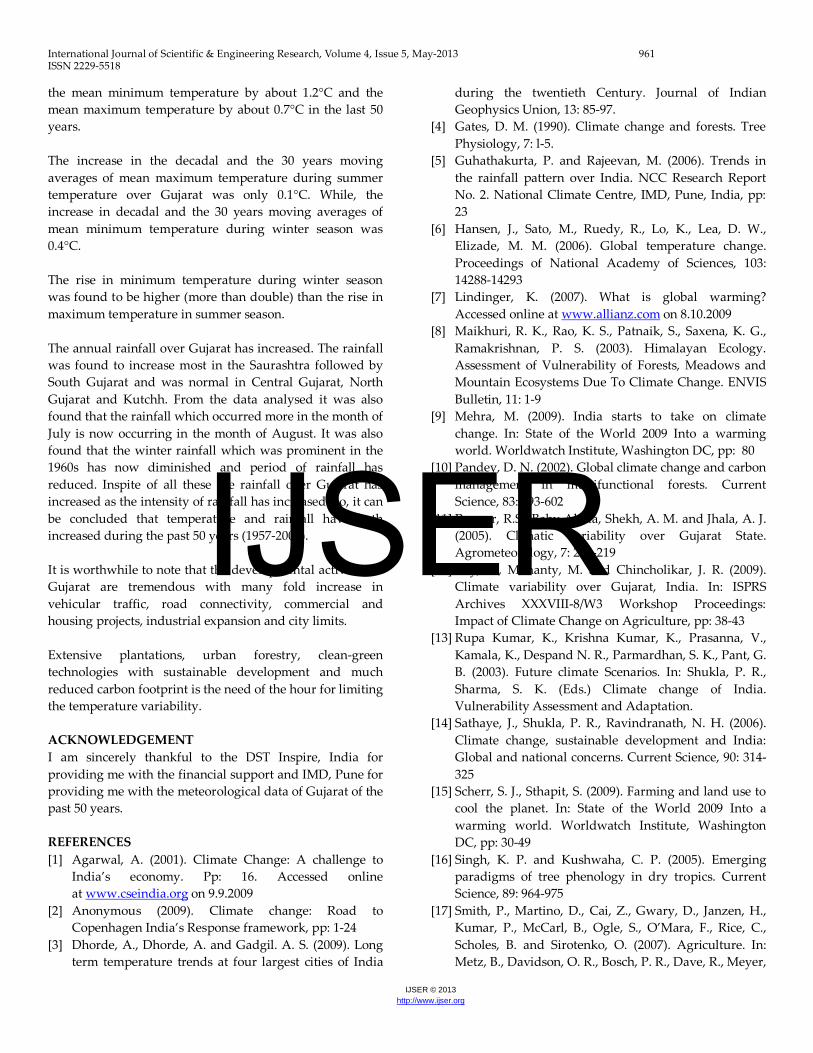
4.1. August Shift The rainfall data was also analysed for shift in the beginning of rainfall and shift in the rainfall month for a period of 50 years (1957-2007). The rainfall in Gujarat follows a normal trend of getting initiated from mid-June. The maximum rainfall occurs in the month of July and August even till date. Initially since the 1957 the maximum rainfall occurred in the month of July (225 mm) followed by August (138), but since 1987 there was a steep decline in the amount of July rainfall (56 mm) and started increasing in the month of August (89 mm) and by 2007 it was more in the month of August (436) followed by July (350) (Fig-14). Study by Vedwan & Rhoades (2001) reported a shift in the distribution of rain across time and slight displacement of monsoon rains to the period beyond mid-August [20]. Maikhuri et al. (2003) also recorded the climate changes felt in the recent decades in the form of shift in peak rainfall time from July/August to August/September and winter precipitation from December/January to January/February, increase in frequency of cloud-burst and warming [8]. This rainfall shift has also been supported by the report of Guhathakurta and Rajeevan (2006) where in they have found that the contribution of June, July and September rainfall to annual rainfall is decreasing for few sub-divisions while contribution of August rainfall is increasing in few other subdivisions in India [5].
Figure-14: Showing the shift in maximum rainfall from July to August over Gujarat since 1987
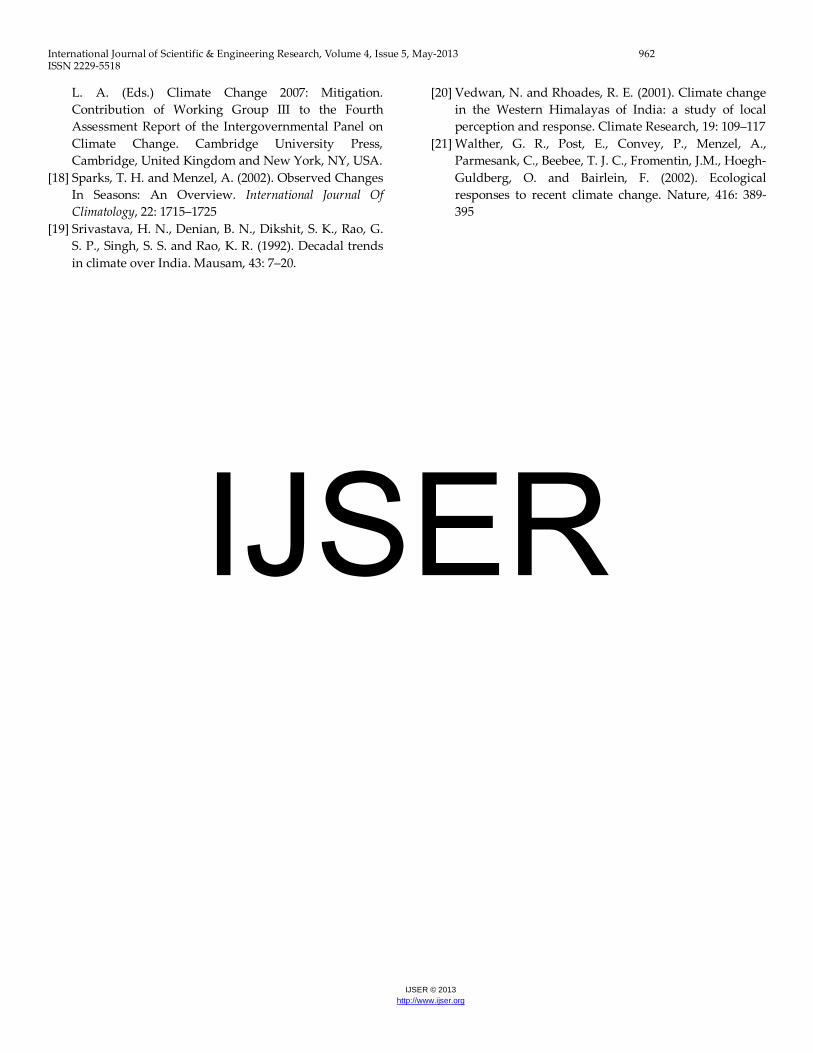
4.2. Declining winter rains The rainfall data was also analysed for the trend in winter rainfall pattern in Gujarat for the past 50 years (1957-2007). The winter rainfall which was found to occur in the months of November, December, January and February in Gujarat shows a diminishing trend. The winter rainfalls were at peak in 1960s, which declined in 1970s followed by further decline in 1980s and were shown to diminish in the 1990s as per the data analysed (Fig-15).
Figure-15: Showing the decline in the winter rainfall in Gujarat
Inspite of declining winter rains, decrease in the number of rainy days and rainfall period the rainfall across Gujarat has increased as shown by the data analysed. This proves the fact that the intensity of rainfall has increased and the overall average rainfall of an area is compensated and occurs within a short period of the rainfall season. CONCLUSION Annual variation in temperature and rainfall was analysed for Gujarat during the period of 1957-2007. The differences in average annual temperature reveal increasing trend in temperature during past 50 years (1957–2007). The average annual temperature of Gujarat has increased by about 1°C,
IJSER
International Journal of Scientific & Engineering Research, Volume 4, Issue 5, May-2013 961 ISSN 2229-5518
IJSER © 2013 http://www.ijser.org
the mean minimum temperature by about 1.2°C and the mean maximum temperature by about 0.7°C in the last 50 years. The increase in the decadal and the 30 years moving averages of mean maximum temperature during summer temperature over Gujarat was only 0.1°C. While, the increase in decadal and the 30 years moving averages of mean minimum temperature during winter season was 0.4°C. The rise in minimum temperature during winter season was found to be higher (more than double) than the rise in maximum temperature in summer season. The annual rainfall over Gujarat has increased. The rainfall was found to increase most in the Saurashtra followed by South Gujarat and was normal in Central Gujarat, North Gujarat and Kutchh. From the data analysed it was also found that the rainfall which occurred more in the month of July is now occurring in the month of August. It was also found that the winter rainfall which was prominent in the 1960s has now diminished and period of rainfall has reduced. Inspite of all these the rainfall over Gujarat has increased as the intensity of rainfall has increased. So, it can be concluded that temperature and rainfall have both increased during the past 50 years (1957-2007). It is worthwhile to note that the developmental activities in Gujarat are tremendous with many fold increase in vehicular traffic, road connectivity, commercial and housing projects, industrial expansion and city limits. Extensive plantations, urban forestry, clean-green technologies with sustainable development and much reduced carbon footprint is the need of the hour for limiting the temperature variability. ACKNOWLEDGEMENT I am sincerely thankful to the DST Inspire, India for providing me with the financial support and IMD, Pune for providing me with the meteorological data of Gujarat of the past 50 years. REFERENCES [1] Agarwal, A. (2001). Climate Change: A challenge to
India’s economy. Pp: 16. Accessed online at www.cseindia.org on 9.9.2009
[2] Anonymous (2009). Climate change: Road to Copenhagen India’s Response framework, pp: 1-24
[3] Dhorde, A., Dhorde, A. and Gadgil. A. S. (2009). Long term temperature trends at four largest cities of India
during the twentieth Century. Journal of Indian Geophysics Union, 13: 85-97.
[4] Gates, D. M. (1990). Climate change and forests. Tree Physiology, 7: l-5.
[5] Guhathakurta, P. and Rajeevan, M. (2006). Trends in the rainfall pattern over India. NCC Research Report No. 2. National Climate Centre, IMD, Pune, India, pp: 23
[6] Hansen, J., Sato, M., Ruedy, R., Lo, K., Lea, D. W., Elizade, M. M. (2006). Global temperature change. Proceedings of National Academy of Sciences, 103: 14288-14293
[7] Lindinger, K. (2007). What is global warming? Accessed online at www.allianz.com on 8.10.2009
[8] Maikhuri, R. K., Rao, K. S., Patnaik, S., Saxena, K. G., Ramakrishnan, P. S. (2003). Himalayan Ecology. Assessment of Vulnerability of Forests, Meadows and Mountain Ecosystems Due To Climate Change. ENVIS Bulletin, 11: 1-9
[9] Mehra, M. (2009). India starts to take on climate change. In: State of the World 2009 Into a warming world. Worldwatch Institute, Washington DC, pp: 80
[10] Pandey, D. N. (2002). Global climate change and carbon management in multifunctional forests. Current Science, 83: 593-602
[11] Parmar, R.S., Baby Akula, Shekh, A. M. and Jhala, A. J. (2005). Climatic variability over Gujarat State. Agrometeorology, 7: 214-219
[12] Ray, K., Mohanty, M. and Chincholikar, J. R. (2009). Climate variability over Gujarat, India. In: ISPRS Archives XXXVIII-8/W3 Workshop Proceedings: Impact of Climate Change on Agriculture, pp: 38-43
[13] Rupa Kumar, K., Krishna Kumar, K., Prasanna, V., Kamala, K., Despand N. R., Parmardhan, S. K., Pant, G. B. (2003). Future climate Scenarios. In: Shukla, P. R., Sharma, S. K. (Eds.) Climate change of India. Vulnerability Assessment and Adaptation.
[14] Sathaye, J., Shukla, P. R., Ravindranath, N. H. (2006). Climate change, sustainable development and India: Global and national concerns. Current Science, 90: 314-325
[15] Scherr, S. J., Sthapit, S. (2009). Farming and land use to cool the planet. In: State of the World 2009 Into a warming world. Worldwatch Institute, Washington DC, pp: 30-49
[16] Singh, K. P. and Kushwaha, C. P. (2005). Emerging paradigms of tree phenology in dry tropics. Current Science, 89: 964-975
[17] Smith, P., Martino, D., Cai, Z., Gwary, D., Janzen, H., Kumar, P., McCarl, B., Ogle, S., O’Mara, F., Rice, C., Scholes, B. and Sirotenko, O. (2007). Agriculture. In: Metz, B., Davidson, O. R., Bosch, P. R., Dave, R., Meyer,
IJSER
International Journal of Scientific & Engineering Research, Volume 4, Issue 5, May-2013 962 ISSN 2229-5518
IJSER © 2013 http://www.ijser.org
L. A. (Eds.) Climate Change 2007: Mitigation. Contribution of Working Group III to the Fourth Assessment Report of the Intergovernmental Panel on Climate Change. Cambridge University Press, Cambridge, United Kingdom and New York, NY, USA.
[18] Sparks, T. H. and Menzel, A. (2002). Observed Changes In Seasons: An Overview. International Journal Of Climatology, 22: 1715–1725
[19] Srivastava, H. N., Denian, B. N., Dikshit, S. K., Rao, G. S. P., Singh, S. S. and Rao, K. R. (1992). Decadal trends in climate over India. Mausam, 43: 7–20.
[20] Vedwan, N. and Rhoades, R. E. (2001). Climate change in the Western Himalayas of India: a study of local perception and response. Climate Research, 19: 109–117
[21] Walther, G. R., Post, E., Convey, P., Menzel, A., Parmesank, C., Beebee, T. J. C., Fromentin, J.M., Hoegh-Guldberg, O. and Bairlein, F. (2002). Ecological responses to recent climate change. Nature, 416: 389-395
IJSER