Embed Size (px)
Citation preview
36
EVALUATING TWO MODELS OF COLLABORATIVE TESTS IN AN ONLINE INTRODUCTORY STATISTICS COURSE1
AUÐBJÖRG BJÖRNSDÓTTIR
University of Akureyri [email protected]
JOAN GARFIELD
University of Minnesota [email protected]
MICHELLE EVERSON
The Ohio State University [email protected]
ABSTRACT
This study explored the use of two different types of collaborative tests in an online introductory statistics course. A study was designed and carried out to investigate three research questions: (1) What is the difference in students’ learning between using consensus and non-consensus collaborative tests in the online environment?, (2) What is the effect of using consensus and non-consensus collaborative tests on students’ attitudes towards statistics?, and (3) How does using a required consensus vs. a non-consensus approach on collaborative tests affect group discussions? Qualitative and quantitative methods were used for data analysis. While no significant difference was found between groups using the two collaborative testing formats, there was a noticeable increase in students’ attitudes across both formats towards learning statistics. This supports prior research on the benefits of using collaborative tests in face-to-face courses. Keywords: Statistics education research; Cooperative learning; Online learning
1. COLLABORATIVE ASSESSMENT OF STUDENT LEARNING
Collaborative learning has been advocated as an effective way to help students learn statistics (Roseth, Garfield, & Ben-Zvi, 2008). However, the aspect of collaborative assessment has not been examined in statistics courses. Implementing well-structured cooperative learning activities can enable students to be actively involved cognitively, physically, emotionally and psychologically in constructing their own knowledge (Johnson, Johnson & Smith, 1991). The literature in education provides compelling evidence for the use of collaboration in assessment as well as in learning. For example, exams, administrated collaboratively, can be used as teaching and learning tools that enhance the construction of knowledge (Giuliodori, Lujan, & DiCarlo, 2008). Collaborative exams and tests have been used successfully in the classroom setting (e.g., Ioannou & Artino, 2010; Zimbardo, Butler,
Statistics Education Research Journal, 14(1), 36-59, http://iase-web.org/Publications.php?p=SERJ International Association for Statistical Education (IASE/ISI), May, 2015
37
& Wolfe, 2003) and the effective use of collaborative learning methods in online courses has been reported in the literature on online education (Roberts, 2004). The focus of this paper is on a topic that has not yet been examined in the research literature: the use of collaborative assessment in an online college statistics course.
The study described in this paper attempted to explore the impact of using two different collaborative tests on students’ learning in an online introductory statistics course. Furthermore, the study examined how different formats of collaborative tests could be implemented in such a course.
2. REVIEW OF THE LITERATURE The effectiveness of cooperative learning has been well established by researchers and
confirmed by meta-analysis (e.g., Johnson, Johnson, & Holubec, 2008; Johnson, Johnson, & Stanne, 2000; Roseth, Johnson, & Johnson, 2008). Because there is not yet a set of studies on the topic of collaborative assessment in statistics courses, several areas of research were reviewed and integrated to provide the foundation for this study. These areas include collaborative learning of statistics, online learning of statistics, and collaborative testing in both face-to-face and online courses.
2.1. COLLABORATIVE LEARNING IN INTRODUCTORY COLLEGE
STATISTICS COURSES The use of active learning has been encouraged as an effective way to facilitate student
learning of statistics. For example, one of the Guidelines for Assessment and Instruction in Statistics Education is to Foster active learning in the classroom (ASA, 2005). One way to incorporate active learning is the use of collaborative learning in the classroom. The broadest definition of collaborative learning is when two or more people learn or attempt to learn something together (Dillenbourg, 1999). Collaborative learning has been used in the teaching of statistics with positive outcomes such as enhancing students’ learning of statistics concepts, helping students overcome some misconceptions about probability (see Shaughnessy’s 1977 study, as cited in Garfield, 1993), increasing students’ understanding of, for example, sampling methods (see Dietz’s 1993 study, as cited in Garfield, 1993), increasing attendance, class participation, office visits and improving students’ attitudes (see more in Garfield, 1993), and resulting in higher student achievement (Giraud, 1997; Keller & Steinhorst, 1995; Magel, 1998; Perkins & Saris, 2001; Potthast, 1999). Statistics education researchers have recommended practical ways to apply collaborative learning methods in statistics classrooms (Roseth, Garfield, & Ben-Zvi, 2008). 2.2. ONLINE/HYBRID VS. FACE-TO-FACE STATISTICS COURSES
Online education has flourished in the last two decades and has led to increased
enrollment in online courses in higher education in the United States (Allen & Seaman, 2011). This is a trend that is only expected to increase in the future.
Research in online statistics education has focused mostly on comparing online or hybrid courses to face-to-face courses. Results indicate no significant difference in students’ achievement between the two different formats (e.g., Bakker, 2009; Gunnarsson, 2001;
38
Hong, Lai & Holton, 2003; Kartha, 2006; Utts, Sommer, Acredolo, Maher, & Matthews, 2003; Ward, 2004) with the exception of one study where students taking the online course performed better than students taking the same course in the face-to-face environment (Dutton & Dutton, 2005). In comparison to students taking face-to-face courses, students taking online statistics courses have reported a more positive attitude towards the course (Gunnarsson, 2001; Suanpang, Petocz, & Kalceff, 2004; Ward, 2004). However, other studies have shown that students taking a hybrid course were less positive towards the course (Utts et al., 2003) and that males preferred the internet course more than females did (Johnson, Dasgupta, Zhang, & Evans, 2009). None of these studies explored the effectiveness of other important characteristics of the online format, such as assessments, assignments, and the learning and teaching methods used. Only one study was found that investigated the teaching method used in an online introductory statistics course (Kreiner, 2006). Kreiner implemented a mastery-based approach to teaching the online statistics course and found that students’ scores improved from a pre- to a post-test. This was considered evidence of the effectiveness of the teaching method used. Several publications (Everson, 2006; Mills & Raju, 2011; Tudor, 2006; Wisenbaker, 2003; Zhang, 2002) suggested successful ways to teach online statistics courses and stressed issues such as the importance of instructors’ and students’ interactions, using small-group discussions, providing detailed instruction regarding technology, assignments, and assessment, and organization of course content.
While many online classes have been fairly traditional in their methods (e.g., listening or watching audio or video lectures), some researchers and educators (e.g., Palloff & Pratt, 2007; Roberts, 2004) have advocated the use of collaborative learning in online education to increase active learning and improve student engagement and learning outcomes. To implement successful collaborative activities in online courses, instructors need to carefully plan and design the activities along with monitoring them as they take place (Palloff & Pratt, 2004). Frameworks to evaluate different aspects of collaborative learning in online courses have been designed and used (e.g., Pozzi, Manca, Persico, & Sarti, 2007; Weinberger & Fischer, 2006).
2.3. COLLABORATIVE ASSESSMENT
Collaborative testing occurs when students work together on an exam or assessment
(Lusk & Conklin, 2003). Different formats of collaborative testing have been used and reported, with the most common formats involving students working together in pairs or groups on a test and turning in either individual non-consensus answers (e.g., Breedlove, Burkett & Winfield, 2004; Kapitanoff, 2009; Lusk & Conklin, 2003) or group consensus answer sheets (e.g., Haberyan & Barnett, 2010; Helmericks, 1993; Hick, 2007), or requiring students to take the same test twice—first individually and then as a group—and turn in answers for both sections (e.g., Giuliodori et al., 2008; Ioannou & Artino, 2010; Rao, Collins & DiCarlo, 2002). The difference between the non-consensus versus the consensus format is that in the former, students need not agree on their answers. Although much research has been conducted on the effectiveness of collaborative learning (as the aforementioned meta-analyses make clear (e.g., Johnson et al., 2008; Johnson et al., 2000; Roseth, Johnson, & Johnson, 2008), evidence of the effectiveness of collaborative testing is sparse.
In a literature review on collaborative testing, Sandahl (2009) located nine studies from the field of nursing that involved the use of collaborative tests. Five of the studies reviewed
39
by Sandahl did not require a consensus among students regarding answers on the collaborative tests, but the remaining four studies did. All studies in Sandahl’s literature review revealed positive results in favor of collaborative learning and increased exam scores. Further, students reported experiencing less anxiety, increased learning, and improved peer relationships and thinking skills after collaborative testing. According to Sandahl, future research on collaborative testing could be improved by randomly assigning students to groups and including a control group (since none of the nine studies discussed above did include a control group). The focus should also be on group size, group formation, and the stability of groups over time, along with the effect of these characteristics on student learning, critical thinking skills, and group processing skills.
In addition to Sandhal’s (2009) literature review, 12 other studies were located that utilized collaborative exams at the university level. Different formats of collaborative testing were used in these 12 studies. The size of the student groups working on the collaborative exams ranged from 2 to 6 students per group; students working in pairs or groups of three were most common. Four studies (Haberyan & Barnett, 2010; Helmericks, 1993; Hick, 2007; Zimbardo et al., 2003) required students to reach a consensus regarding answers to questions on the tests. In those studies, only one answer sheet was submitted and everybody in the same group received the same grade. Four studies (Giuliodori et al., 2008; Ioannou & Artino, 2010; Rao et al., 2002; Simkin, 2005) had students turn in both individual and group answers for the same test. Nine of the studies (Breedlove et al., 2004; Giraud & Enders, 2000; Giuliodori et al., 2008; Haberyan & Barnett, 2010; Ioannou & Artino, 2010; Kapitanoff, 2009; Rao et al., 2002; Simkin, 2005; Zimbardo et al., 2003) used multiple-choice exams, and of those, four (Haberyan & Barnett, 2010; Kapitanoff, 2009; Rao et al., 2002; Simkin, 2005) also used other types of questions such as short-answer, essay or constructed response.
The only reported research regarding the use of collaborative testing in an online environment did not involve students working collaboratively on completing tests; instead, students worked independently and in groups on designing tests and rubrics used for grading the tests. This led to positive outcomes such as reduced surface learning and increased students’ perceived learning and interactions (Shen, Hiltz & Bieber, 2006, 2008).
Only two studies were found that have used collaborative tests in college-level introductory statistics courses, and both of those studies found no significant difference between testing methods when comparing scores from collaborative tests to scores from individual tests (Giraud & Enders, 1997; Helmericks, 1993). However, there was a significant difference in students’ positive attitudes towards the collaborative testing method in one study (Giraud & Enders, 2000), and in the other study, students strongly favored the method (Helmericks, 1993).
In the Giraud and Enders (2000) study, students received item stems without answer choices to discuss for 15 minutes, and they then received the complete test individually. By not providing the answer choices, students might have spent valuable time trying to figure out what the answer choices were instead of discussing the correct answers. The researcher did not address this and did not indicate why the instructor chose to use this format. The Helmericks’ (1993) study lacked clear research questions and information regarding the test types used in the study (e.g., multiple-choice, short-answer, etc.). Also, Helmericks did not use the same test for the control class that was taught the previous semester; the tests covered the same content, but did not have the same questions, and this makes it hard to justify a comparison of the two tests. The results from these two studies are not enough to determine if
40
the benefits of using collaborative testing reported by others (within other types of courses) apply also to the introductory statistics course. More research involving the use of collaborative testing within the introductory statistics classroom is needed in order to better determine if this is a suitable testing method to be used in that environment. 2.4. COLLABORATIVE ASSESSMENT IN INTRODUCTORY STATISTICS
Considering the recent increase in online enrollment (Allen & Seaman, 2011), one can
expect that more courses will be offered online and that more students will elect to take these courses. It is therefore important that more research takes place on using effective teaching methods and assessment in online statistics courses so that high quality courses grounded in empirical research on how to teach statistics and assess students’ learning can be offered. Research on using collaborative testing in online statistics courses would likely help us understand how we can better structure and teach such courses.
The literature reviewed here suggests that collaborative testing in face-to-face classrooms can help students’ learning, but when it comes to online settings, little is known about using collaborative testing and their different formats. The only reported online use of collaborative testing showed positive effects on students’ learning, but in that study, students worked together designing the test but completed the test individually (Shen et al., 2006, 2008).
Some unanswered questions remain regarding the implementation of collaborative tests in the face-to-face classroom such as which test format (consensus or non-consensus) works better. The effects of using collaborative tests in online courses, where students work together on a test, remain unknown. If we bear in mind that the use of collaborative methods in online courses has been encouraged and shown to be successful, one might expect positive effects on students’ learning when using collaborative tests in online courses. A study is needed to explore how to implement collaborative tests successfully in an online course and investigate the effect of different test formats on student learning. Rather than comparing collaborative assessment to individual assessment, the purpose of this study was to examine which of two methods, consensus and non-consensus of collaborative assessment, is more effective when it comes to student learning and attitudes toward statistics.
3. METHODOLOGY
Three research questions guided this study: (1) What is the difference between using consensus and non-consensus collaborative tests on students’ learning in the online environment?, (2) What is the effect of using consensus and non-consensus collaborative tests on students’ attitudes towards statistics?, and (3) How does using a required consensus vs. a non-consensus approach on collaborative tests affect group discussions? 3.1. OVERVIEW OF THE STUDY
This study included two online fall 2011 sections of a one-semester, three-credit,
introductory non-calculus statistics course offered by the Department of Educational Psychology at a mid-western university in the United States. The same instructor taught both sections. The consensus section had 32 students and the non-consensus section had 27.
41
The study employed multiple regression to explore the impact of using collaborative tests on students’ learning. To explore the effects of using collaborative tests on students’ attitudes towards statistics and the effect of using a required consensus vs. non-consensus approach on collaborative tests on group discussions, two different data analyses were used. The analyses consisted of descriptive statistics and t-tests, with the addition of a qualitative analysis that employed a four-dimensional framework (Pozzi et al., 2007) that measured participative, social, cognitive and teaching dimensions present in group discussion during the collaborative tests.
3.2. SETTING
Participants in the study consisted of 59 undergraduate students, 66% female and 34%
male. Students were enrolled in the course to complete the mathematical reasoning requirements for a Liberal Arts degree or a requirement for their particular major.
The online course was modified from the face-to-face version of the course in 2004. The original face-to-face version of the course was developed based on the Guidelines for the Assessment and Instruction in Statistics Education (ASA, 2005). This course was designed to develop students’ statistical literacy and their statistical thinking. It included collaborative learning activities such as discussion assignments and collaborative quizzes. Real data were used and students used technology as a way to develop their conceptual understanding of statistics. The course followed the Adapting and Implementing Innovative Material in Statistics (AIMS) curriculum that was designed through a NSF-funded project that developed lesson plans and activities based on innovative materials for introductory statistics courses aligned with the GAISE (AIMS Project, n.d.; Garfield, & Ben-Zvi, 2008; Garfield, delMas, & Zieffler, 2008).
Most of the activities and assessments (labs, midterm, collaborative tests, and final) used in the face-to-face course were adapted to the online environment, and, in addition, lecture notes were created. Assessments traditionally used in the face-to-face course came from the AIMS curriculum. Many of the items used for the midterm and on the collaborative tests came from the Assessment Resource Tools for Improving Statistical Thinking (ARTIST, 2006) online item database. The ARTIST online item database was created through a NSF-funded project for designing a variety of online assessment resources aimed at improving statistical thinking in the teaching of a first course in statistics.
The same instructor taught both sections of the course. The instructor had taught the course 12 times in the past 2.5 years. The two course sections were offered entirely online except for one optional face-to-face introductory meeting held at the start of the semester. In this face-to-face meeting, the instructor discussed course logistics, such as the syllabus, assignments, requirements, and how to navigate the WebVista course site. Slides from this meeting were made available to all enrolled students after the meeting. The online courses were taught using an asynchronous format, and they were taught within the course management system (CMS) WebVista (Version 8). WebVista allowed students to access learning materials and participate in learning activities through the Internet. All assignments, assessments, and communications in the course were administrated through WebVista. Individual assessments and assignments accounted for 58.63% of the overall grade in the course; the remaining portion of the grade was based on collaborative activities. Table 1 shows the percentage of the total grade for each individual and collaborative assessment used
42
in the course. A student-centered learning environment was created in WebVista, and learners were responsible for their own learning by creating and organizing information available to them in the CMS (Dabbagh & Bannan-Ritland, 2005).
Students were randomly assigned to two different sections of the course. The only difference in the two sections, the treatment, was the type of collaborative assessment used. The two sections of the course were constructed to be exactly the same in all other aspects: assigned readings, topics covered, and assignments (discussion assignments, labs, activities, article and graph critiques, midterm and final). In the consensus section, students turned in one collaborative test per group, while in non-consensus section, students discussed the tests with their group members but turned them in individually. Using a random number generator, the instructor randomly assigned each student who was enrolled in the online introductory statistics course to one of two different sections.
Table 1. Individual and collaborative assessment in percentage of total course grade
Individual assessment % Collaborative assessment % Pre-test 3.45 Group discussions 20.69 Lab assignments 20.69 Group tests 20.69 Midterm 12.07 Article critique 3.45 Graph critique 3.45 Final exam 12.07 Peer assessment 3.45
3.3. INSTRUMENTS
Five different assessment instruments were used to gather data to explore the impact on
students’ learning of using different collaborative tests in an online statistics course. Three of these instruments (collaborative tests, midterm exam, Final exam) were required and contributed to students’ grades in the course. All of these exams were used to measure students’ knowledge in statistics at different times in the course. The first exam was the pre-test, which was the Comprehensive Assessment of Important Outcomes in Statistics (CAOS), and this same exam was used as the Final exam. Two collaborative tests were administered before the Midterm exam and then one collaborative test was given after that. Two optional instruments were also administered as surveys for which students could receive extra credit.
Comprehensive Assessment of Important Outcomes in Statistics (CAOS) was used as a pre- and post-test to measure students’ prior knowledge in statistics and students’ learning at the end of the course. The CAOS test was designed to measure students’ statistical reasoning after completing a first course in statistics. The test focuses on statistical literacy and conceptual understanding (delMas, Garfield, Ooms, & Chance, 2007). The CAOS test includes 40 multiple-choice questions. Only 33 items were used on the pre- and post-test; the other seven were used on the Midterm exam. The CAOS post-test was used as the Final exam in the course. Students received 10 points for completing the pre-test regardless of score; each student’s score on the Final exam was computed based on number of correct items.
The Midterm exam was made up of seven items from the CAOS test (items that were not included on the pre- and final tests), 14 items from the ARTIST online item database, and
43
eight items that came from the AIMS curriculum that had been previously used in the course. The Midterm exam was worth 35 points and it included 29 items (19 multiple-choice and 10 open-ended items).
Collaborative tests accounted for 20% of the final grade in the course and each test was worth 20 points out of 290 available points. Each test consisted of 15 items representing three different difficulty levels, weighing from 1 to 2 points each. The instructor used selected items from the ARTIST online item database to develop the three collaborative tests. The three tests varied in terms of topic covered. They all include similar frequency of both multiple-choice and open-ended questions and levels of difficulty defined by items measuring statistical literacy, statistical reasoning, or statistical thinking. The grading of the collaborative tests was based on correctness and participation on the test. Students needed to provide individual answers to all questions and provide at least two meaningful comments (e.g., a question, answer or an explanation) regarding the content of the collaborative test to their group members in order to get full credit for participation. Each post was worth one-third of the total grade on the test and individual answers were required to receive the maximum points. As an example, if a test was worth a total of 15 points and a student provided only his or her individual answers and one comment rather than two, he or she would receive a score of 10 points, or two-thirds of the total 15 points (provided that all answers were correct).
Survey of Attitudes Toward Statistics (SATS-36) pre- and post-instruments were used to measure students’ attitudes towards statistics. The SATS-36 measures six attitude components: Affect, Cognitive component, Value, Difficulty, Interest, and Effort towards statistics. Scores from the SATS-36 have been carefully validated on postsecondary students taking statistics with a wide variety of characteristics in a large number of institutions both within and outside of the US (Schau, 2005). The instruments used included 53 items for the pre-survey and 46 items for the post-survey; 36 statements on both instruments included a 7-point response scale (strongly disagree, disagree, somewhat disagree, neither agree nor disagree, somewhat agree, agree, strongly agree). For the pre- and post-surveys, five statements were modified to better fit an online course. For example the original statement I plan to attend every statistics class session was changed to I plan to log into the course website two times a week. Two questions regarding students’ experiences taking online courses were added to the pre-SATS-36.
The Students’ Perception on Collaborative Tests (SPCT) instrument was used for students to evaluate their learning and test-taking styles, test anxiety, preparation, perceptions of freeloading, fairness of grading, and retention of information in regards to their experience taking the collaborative tests. The instructor developed the survey based on a literature review on collaborative testing. The survey included 20 items; 18 statement items on a 4-point Likert scale (strongly disagree to strongly agree) and 2 open-ended items. Between the two course sections, two statements were modified based on how the collaborative tests were administrated in each section.
Reliability Analysis of the Research Instruments
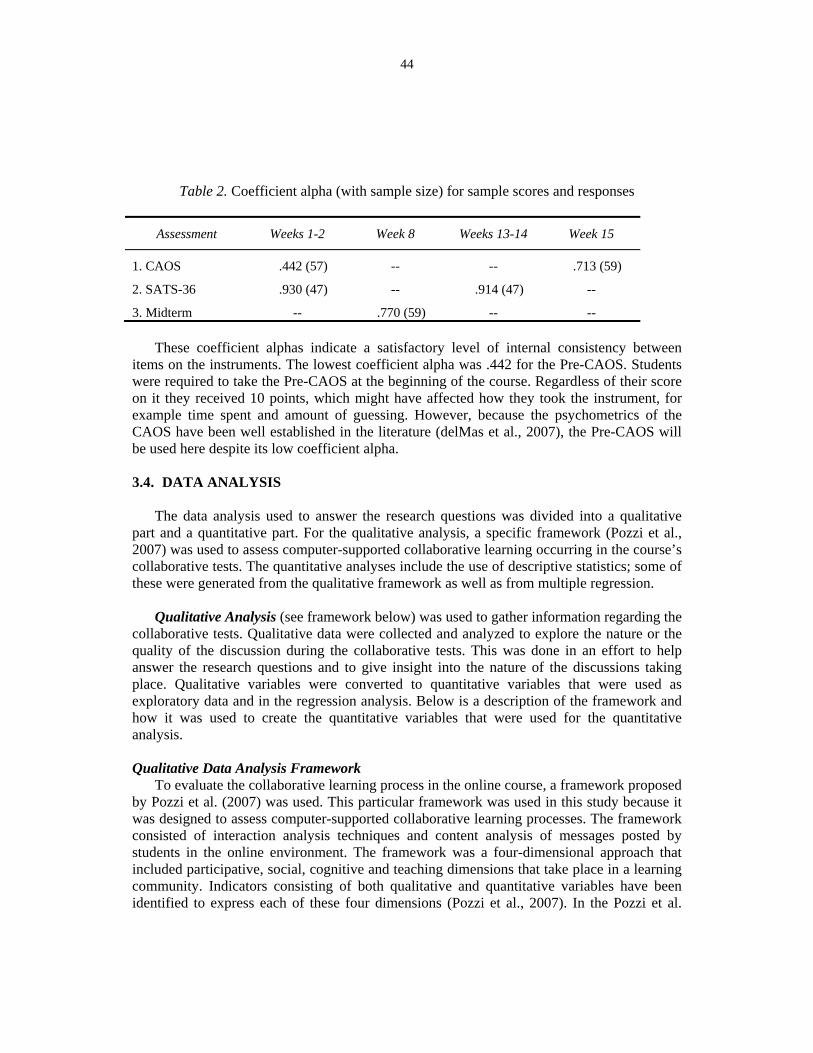
A reliability analysis was used to estimate the internal consistency of each instrument. Coefficient alpha (Cronbach, 1951) was used as a measure of reliability. Coefficient alpha values for the scores on CAOS, SATS-36 and the Midterm are reported in Table 2.
44
Table 2. Coefficient alpha (with sample size) for sample scores and responses
Assessment Weeks 1-2 Week 8 Weeks 13-14 Week 15
1. CAOS .442 (57) -- -- .713 (59)
2. SATS-36 .930 (47) -- .914 (47) --
3. Midterm -- .770 (59) -- --
These coefficient alphas indicate a satisfactory level of internal consistency between
items on the instruments. The lowest coefficient alpha was .442 for the Pre-CAOS. Students were required to take the Pre-CAOS at the beginning of the course. Regardless of their score on it they received 10 points, which might have affected how they took the instrument, for example time spent and amount of guessing. However, because the psychometrics of the CAOS have been well established in the literature (delMas et al., 2007), the Pre-CAOS will be used here despite its low coefficient alpha. 3.4. DATA ANALYSIS
The data analysis used to answer the research questions was divided into a qualitative
part and a quantitative part. For the qualitative analysis, a specific framework (Pozzi et al., 2007) was used to assess computer-supported collaborative learning occurring in the course’s collaborative tests. The quantitative analyses include the use of descriptive statistics; some of these were generated from the qualitative framework as well as from multiple regression.
Qualitative Analysis (see framework below) was used to gather information regarding the
collaborative tests. Qualitative data were collected and analyzed to explore the nature or the quality of the discussion during the collaborative tests. This was done in an effort to help answer the research questions and to give insight into the nature of the discussions taking place. Qualitative variables were converted to quantitative variables that were used as exploratory data and in the regression analysis. Below is a description of the framework and how it was used to create the quantitative variables that were used for the quantitative analysis.
Qualitative Data Analysis Framework
To evaluate the collaborative learning process in the online course, a framework proposed by Pozzi et al. (2007) was used. This particular framework was used in this study because it was designed to assess computer-supported collaborative learning processes. The framework consisted of interaction analysis techniques and content analysis of messages posted by students in the online environment. The framework was a four-dimensional approach that included participative, social, cognitive and teaching dimensions that take place in a learning community. Indicators consisting of both qualitative and quantitative variables have been identified to express each of these four dimensions (Pozzi et al., 2007). In the Pozzi et al.
45
framework, the focus can be on some or all of the dimensions at the same time depending on the research question under study. The indicators in that sense are not seen as stable; they may in fact vary in weight depending on the context and goals of the analysis. For example, when exploring the collaborative activity in a course, more focus would be on indicators related to the participation and the social dimensions (Manca, Persico, Pozzi, & Sarti, n.d.). Below, each dimension will be described.
The participative dimension was an important part of the monitoring process. It is a good indicator of students’ involvement in the course, and it provides information about who is participating and how much (Persico, Pozzi & Sarti, 2010; Pozzi et al., 2007). Quantitative data in the form of frequency of posts per student for each collaborative test was gathered for this dimension.
The social dimension measured the social presence of students in the course: to what extent participants were able to be, and be perceived by others as, “real” people in the medium being used, which in this case was the online course format (Persico et al., 2010; Pozzi et al., 2007).
The cognitive dimension was defined as “the extent to which learners are able to construct and confirm meaning through sustained reflection and discourse in a critical community of inquiry” (the Garrison et al. 2001 study as cited in Persico et al., 2010, p. 9). The cognitive dimension involved both individual and group knowledge building. First, by a personal explanation of content and expression of individual points, which leads to a collaborative discussion and negotiation where collective meaning and interpretations of reality were constructed (Manca et al., n.d.).
The teaching dimension was defined as “the design, facilitation, and direction of cognitive and social processes for the purpose of realizing personally meaningful and educationally worthwhile learning outcomes” (the Anderson et al. 2001 study, as cited in Pozzi et al., 2007, p. 174). It is seen as the binding element of building a learning community. Messages that provide guidance and instruction, facilitate discourse, and manage organizational matters are seen as including teaching presence. Teaching presence not only relates to instructors; it may also apply to students, for example, through group leadership (Persico et al., 2010; Pozzi et al., 2007).
During the collaborative tests, the two latter dimensions would be more geared to the content of the test, such as solving problems, discussing possible solutions and interpreting them. The social dimension is more related to the morale of the collaborative work. While the participative dimension is the simplest form of the four dimensions, it consists of all three dimensions and it is merely the frequency of posts for students. Dimension variables were created focusing on these three dimensions: cognitive, teaching, and social. Indicators from these dimensions were used since they were believed to be relevant to the research questions put forth. Because students were required to participate in discussion during the collaborative tests, only one indicator was used for the participative dimension. The other three dimensions were explored more to create variables that were used in the quantitative analysis. The unit of analysis was each post or message during the collaborative test.
46
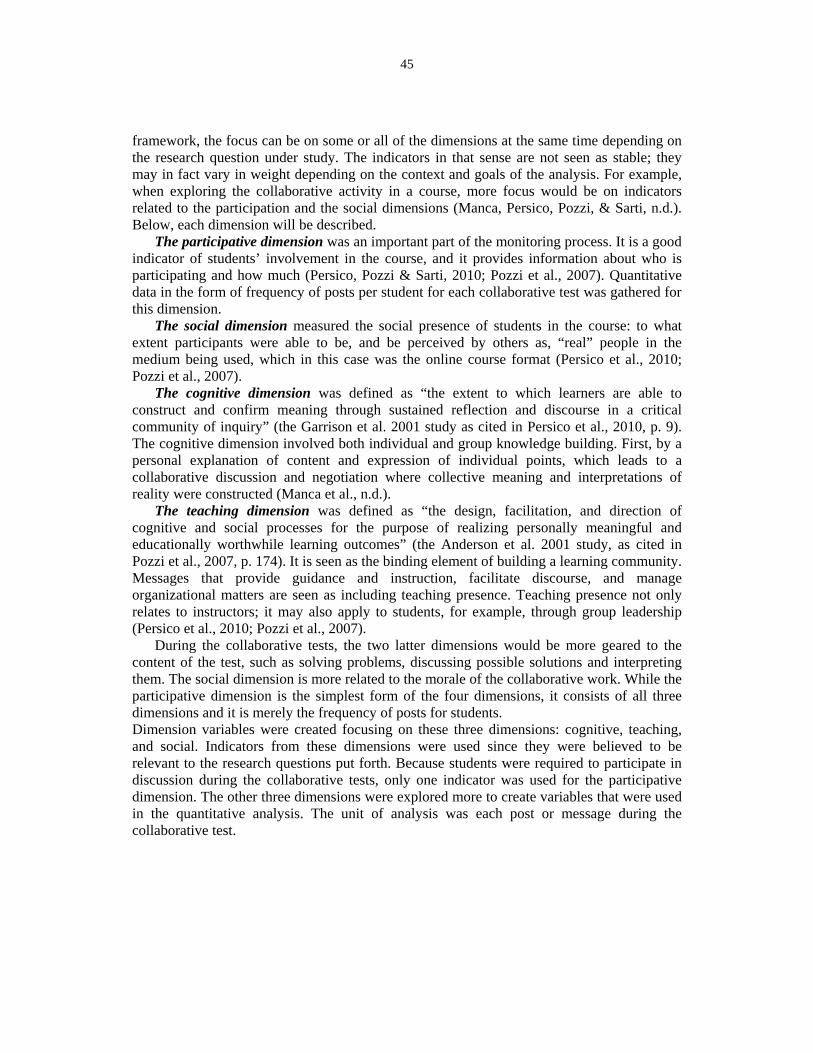
Table 3. Indicators for three dimensions and examples from the collaborative tests (adapted from Persico et al., 2010)
Dimensions /Indicators Data Example Social Affection
Expression of emotions, intimacy and personal anecdotes
“… I didn’t see anything that stuck out as far as changing goes Good job!”
Cohesion Vocatives, references to the group, and salutations
“Thanks Mary!”
Cognitive Revelation
Recognizing a problem, expressing puzzlement, and explaining a point of view
“...I too am confused about #8. I think the correct answer is actually B, I originally thought C. But, the correlation of +.8 is just as strong as the correlation of -.8.”
Exploration Expressing agreement or disagreement, sharing ideas and information, and negotiating
“The median is the equal point. The mean is the equal area point. The median and mean are very close together. Half of the fish – 39 – are between the median size of 25.295 in. and the 33.4 in., about 2 std dev. I am beginning to think that Stephanie and Emily are correct. Comments, please […] we want to get it right.”
Integration Linking ideas together, making synthesis and constructing solutions
“It’s A. Each time you flip a coin, you have 50/50 chance for heads or tails, so the mean of all coin flips is 50, and the shape of all coin flips is normal. The more times you flip a coin, the greater the “sample” of coin flips. Don’t forget the central Limit Theorem which states that the larger the sample size, the closer to the population mean the mean of the sample will be.”
Resolution Connecting to real-life applications and testing solutions.
I agree that this survey is biased towards those who watch CNN […] its definitely directed towards those who have internet access. There are quite a few Americans who cannot afford internet access […], and therefore would not be included in this study. Also, older citizens in the American population may not use the internet solely on the fact that they just don’t like newer technology. These people would be excluded as well”
Meta-reflection
Evaluating own knowledge, skills, limits, cognitive processes and planning, monitoring, or adjusting own cognitive processes
“…Thank you for contribution your answers. On question 4, I was torn between A or C. I ended up going with A, manly because the shape mimicked the original population. C also mimicked that shape but I ultimately went with A because the spread seemed to the smaller than in C. My line of thought is that the spread in the sample population would 6.404/2=3.202. Can you offer any insight […] I am not very confident in my choice. How did you decide on C? thanks”
47
The instructor coded all the messages for the three collaborative tests for the two
sections: the consensus section included 6 groups and the non-consensus section had 5 groups, yielding 33 tests and 753 messages overall. One of the teaching assistants helped validate the process by coding messages. The instructor met with the teaching assistant and explained the coding process, and together they coded two collaborative tests. Then, the teaching assistant coded three tests for a total of 46 messages individually. When the coding from the teaching assistant and the instructor were compared, it showed 77.1% agreement. The instructor and teaching assistant discussed their discrepancies and came to agreement with the coding.
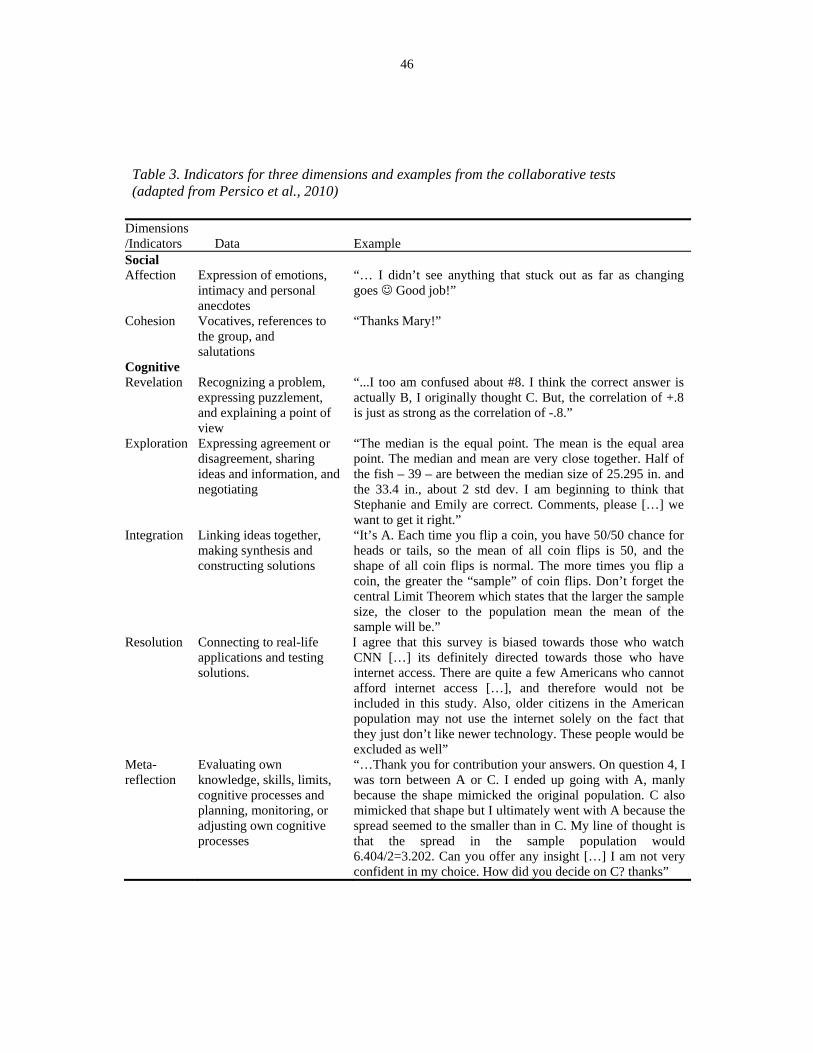
Quantitative variables were created for the three dimensions—cognitive, teaching, and social—and their 10 indicators. Proportions out of the total frequency of indicators for each student were computed for a total of 13 variables (one variable for each dimension and one variable for each indicator). Each indicator was weighted the same. Table 3 includes the three dimensions, the indicators, and message examples that were used in this study. The number of indicators per message varied from 0 to 3. When more than three indicators could be identified, the more salient three indicators were selected. Each post could have up to three indicators from all three dimensions (cognitive, teaching, social) combined.
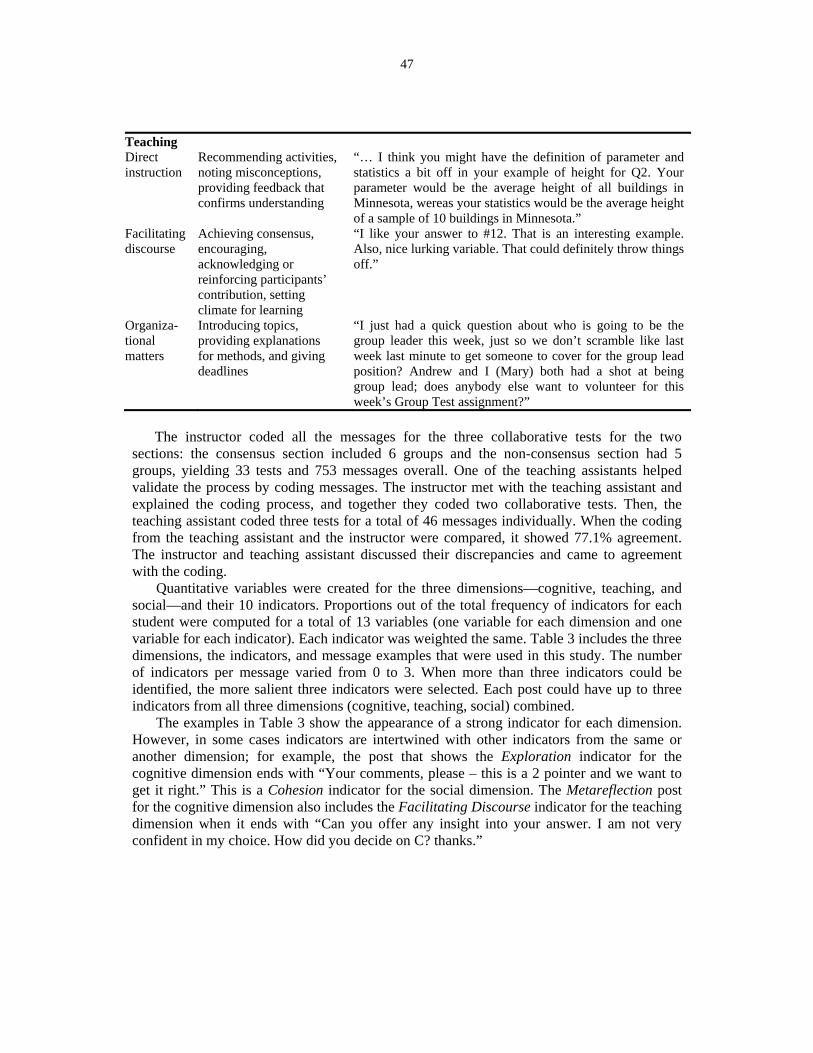
The examples in Table 3 show the appearance of a strong indicator for each dimension. However, in some cases indicators are intertwined with other indicators from the same or another dimension; for example, the post that shows the Exploration indicator for the cognitive dimension ends with “Your comments, please – this is a 2 pointer and we want to get it right.” This is a Cohesion indicator for the social dimension. The Metareflection post for the cognitive dimension also includes the Facilitating Discourse indicator for the teaching dimension when it ends with “Can you offer any insight into your answer. I am not very confident in my choice. How did you decide on C? thanks.”
Teaching Direct instruction
Recommending activities, noting misconceptions, providing feedback that confirms understanding
“… I think you might have the definition of parameter and statistics a bit off in your example of height for Q2. Your parameter would be the average height of all buildings in Minnesota, wereas your statistics would be the average height of a sample of 10 buildings in Minnesota.”
Facilitating discourse
Achieving consensus, encouraging, acknowledging or reinforcing participants’ contribution, setting climate for learning
“I like your answer to #12. That is an interesting example. Also, nice lurking variable. That could definitely throw things off.”
Organiza-tional matters
Introducing topics, providing explanations for methods, and giving deadlines
“I just had a quick question about who is going to be the group leader this week, just so we don’t scramble like last week last minute to get someone to cover for the group lead position? Andrew and I (Mary) both had a shot at being group lead; does anybody else want to volunteer for this week’s Group Test assignment?”
48
4. RESULTS The following four sections present the data analyses and results for each of the three
research questions put forth and an additional analysis from the SPCT instrument. Even though students had been randomly assigned to sections, chi-square analyses were
run to check if students enrolled in the two sections were similar in regard to the distributions of females and males and academic level (i.e., freshman, sophomore, junior, senior). When there was low count in some cells due to the small sample size, a Monte Carlo test was used to simulate a p-value using 10,000 replicates for the analysis (Field, 2005). Monte Carlo tests were used for the analysis of academic level. There was no difference in students’ academic
levels between the two sections (2 = 4.683, p = 0.338). The analysis also showed that the
number of female and male students in the two sections was similar (2 =1.04, df =1, p = 0.308). These analyses indicate that there is no evidence to believe that the random assignment to the two sections was not successful and therefore students in both sections were similar in terms of the demographic variables.
Two questions that were added to the pre-SATS-36 regarding students’ experience taking online courses revealed that significantly more students in the non-consensus section had
been enrolled in online courses before taking this course (2 = 5.562, df = 1, p = 0.018). To see if there was a difference in the number of online courses students had completed between sections, the nonparametric Mann-Whitney U test was used because the sample size was small and the distribution for the number of online courses students had completed was not normally distributed. There was a statistically significant difference between the number of online courses students had completed between two sections (U = 110, p = 0.000). The mean for the number of online courses students had completed before this course was higher for students in the non-consensus section (3.96) than for students in the consensus section (1.08). Forty-seven (79.6%) of the enrolled students completed the pre and post SATS-36 instruments.
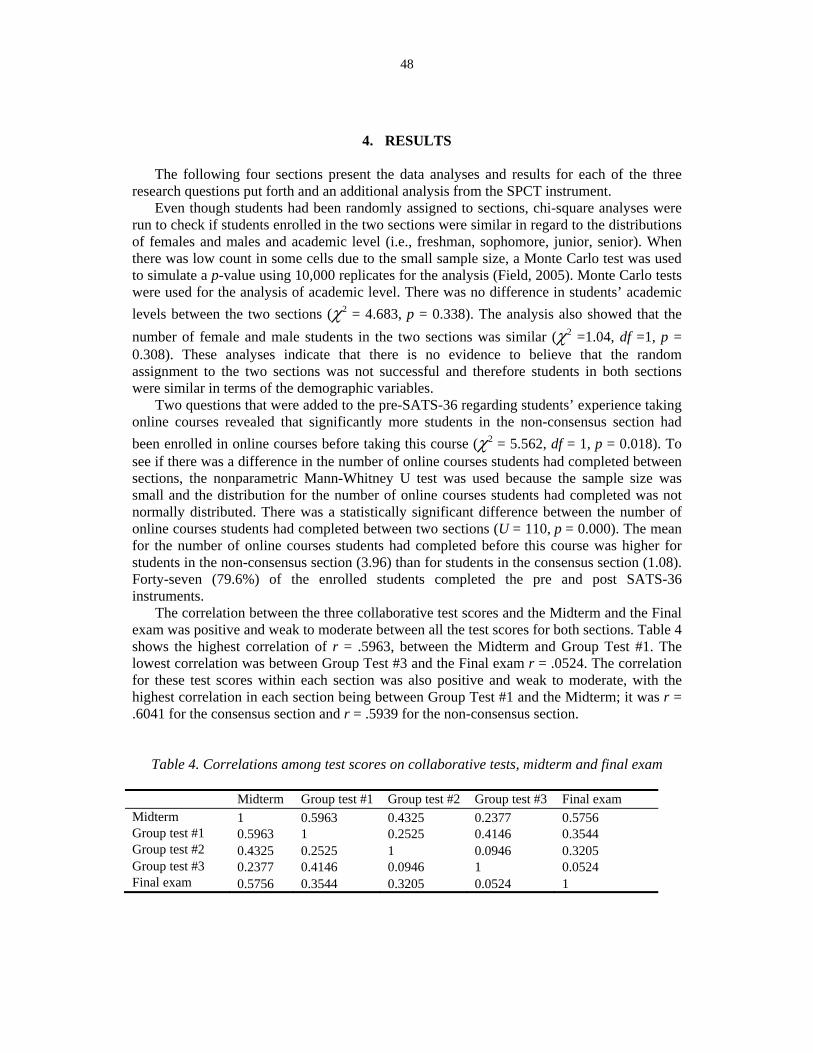
The correlation between the three collaborative test scores and the Midterm and the Final exam was positive and weak to moderate between all the test scores for both sections. Table 4 shows the highest correlation of r = .5963, between the Midterm and Group Test #1. The lowest correlation was between Group Test #3 and the Final exam r = .0524. The correlation for these test scores within each section was also positive and weak to moderate, with the highest correlation in each section being between Group Test #1 and the Midterm; it was r = .6041 for the consensus section and r = .5939 for the non-consensus section.
Table 4. Correlations among test scores on collaborative tests, midterm and final exam
Midterm Group test #1 Group test #2 Group test #3 Final exam Midterm 1 0.5963 0.4325 0.2377 0.5756 Group test #1 0.5963 1 0.2525 0.4146 0.3544 Group test #2 0.4325 0.2525 1 0.0946 0.3205 Group test #3 0.2377 0.4146 0.0946 1 0.0524 Final exam 0.5756 0.3544 0.3205 0.0524 1
49
4.1. DIFFERENCE BETWEEN CONSENSUS AND NON-CONSENSUS COLLABORATIVE TESTS ON STUDENTS’ LEARNING
To explore how using two different collaborative tests in an online statistics course
impacts students’ learning, the authors used a hierarchical multiple regression model. The Midterm exam score was the dependent variable in the first model. The possible predictor variables consisted of the two covariates (Section and Pre-test) and the three variables that measured the proportion of each type of posting (Teaching, Cognitive or Social) for the first and second group tests, both of which occurred prior to the Midterm exam. These latter three variables were named CLT1&2Discussion-Teaching, CLT1&2Discussion-Cognitive and CLT1&2Discussion-Social, respectively. Table 5 shows the results of the regression for the final model with the three independent variables that were used. The R2 for the model was 0.293. Section, Pre-test and CLT1&2Discussion-Social accounted for 29.3% of the variation in Midterm exam. The two independent variables Section and Pre-test had a positive relationship with Midterm exam. As expected, the partial regression coefficient for Pre-test was statistically significant (p < .05). An increase of one point on the Pre-test was associated with a ‘predicted’ increase of .455 points on the Midterm exam while controlling for the effect of Section and CLT1&2Discussion-Social. The relationship between CLT1&2Discussion-Social and Midterm exam was negative and statistically significant (p < .05); for students who had a higher frequency of social indicators on the first and second group test, the Midterm exam score tended to be lower. A one unit increase on the CLT1&Discussion-Social gave a predicted decrease of -7.505 points on the Midterm exam when the effects of Section and Pre-test were held constant. The relationship between Section and Midterm exam was positive and not statistically significant (p > .05).
The assumptions of linearity, homoscedasticity, normality, independence and multicollinearity were checked and verified for the model when using Midterm exam as the dependent variable. To test for interactions between the independent variables, the variables Section, Pre-test and CLT1&2Discussion-Social were mean-centered and a new regression model was built with the interaction terms included. Variables in the model ending with C were mean-centered (e.g., SectionC). Only 1 of the interaction terms SectionCxCLT1&2Discussion-SocialC was significant. The other two interaction terms SectionCxPre-testC and Pre-testCxCLT1&2Discussion-SocialC were non-significant. Because of this, an interaction model for the regression equation was created including the one significant interaction term. Table 6 includes the final results for the interaction model. The three mean-centered independent variables and the interaction term for the mean-centered variables SectionC and CLT1&2Discussion-SocialC accounted for R2 = 37.5% of the variation in Midterm exam. This is an increase of eight percentage points over the model without the interaction term. What is interesting here is that once the interaction term was added to the model, the CLT1&2Discussion-SocialC variable was no longer statistically significant (p > .05). It appears that the interaction of SectionC and CLT1&2Discussion-SocialC explains more of the variance in the dependent variable Midterm exam than CLT1&2Discussion-SocialC by itself.
50
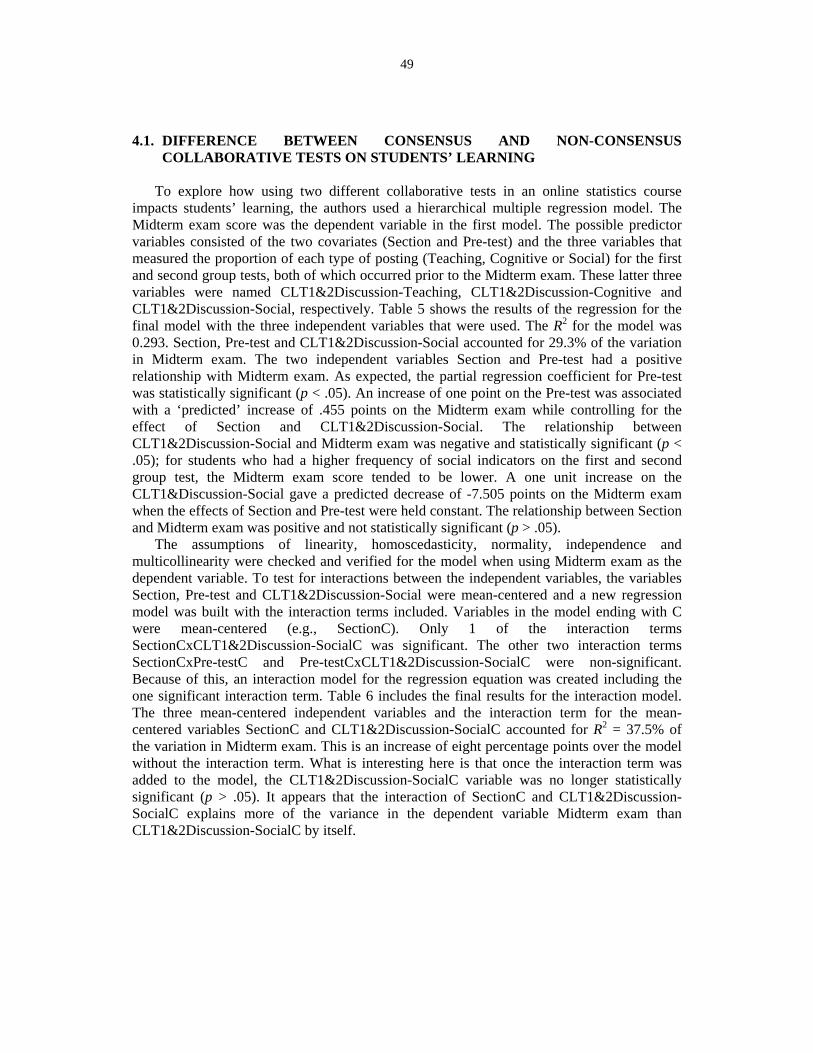
Table 5. Final multiple regression model with midterm exam as dependent variable
B SE B t p-value Constant 20.134 2.366 8.511 .000 Section 2.200 1.165 .222 1.888 .064 Pre-test 0.455 0.127 .410 3.570 .001* CLT1&2Discussion1-Social -7.505 3.058 -.289 -2.454 .017*
Note. R2= .293, *p <.05, **p <.001.
Table 6. Regression results for interaction model with midterm exam as dependent variable
B SE B t p-value Constant 26.357 0.554 47.558 .000 SectionC 1.929 1.110 .195 1.737 .088 Pre-testC 0.461 0.121 .416 3.815 .000** CLT1&2Discussion-SocialC -4.884 3.069 -.188 -1.592 .117 SectionCxCLT1&2Discussion-SocialC -16.124 6.124 -.302 -2.633 .011*
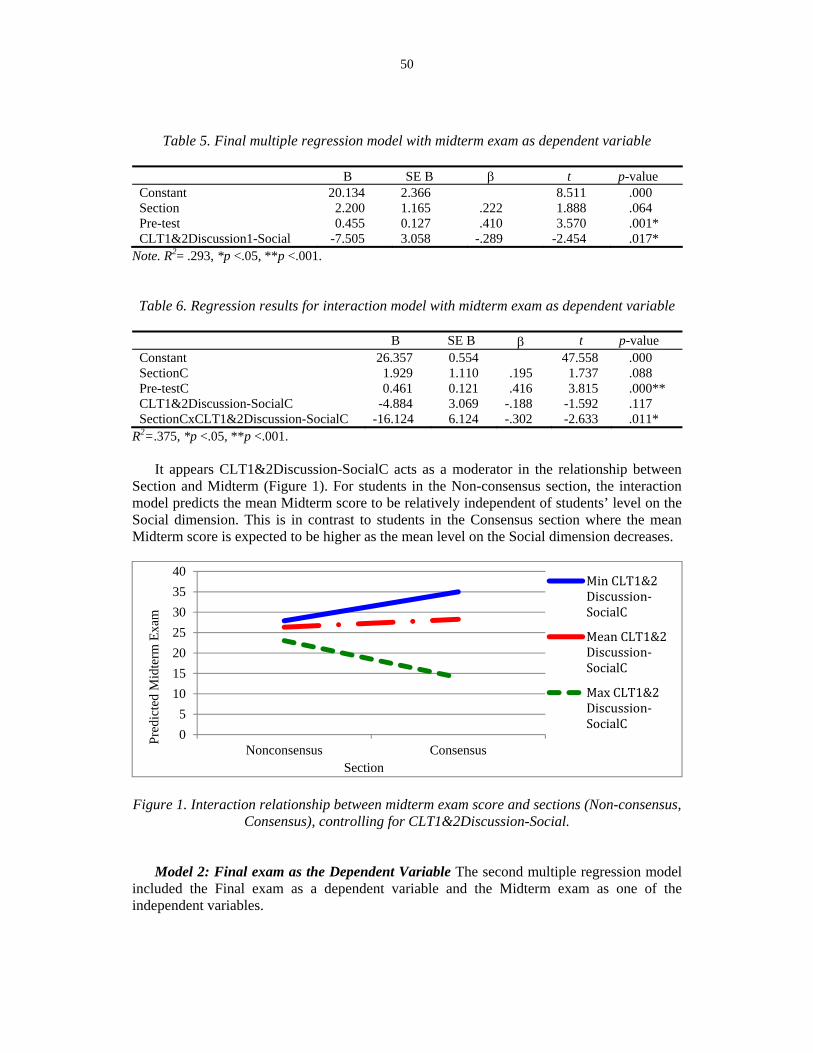
R2=.375, *p <.05, **p <.001. It appears CLT1&2Discussion-SocialC acts as a moderator in the relationship between
Section and Midterm (Figure 1). For students in the Non-consensus section, the interaction model predicts the mean Midterm score to be relatively independent of students’ level on the Social dimension. This is in contrast to students in the Consensus section where the mean Midterm score is expected to be higher as the mean level on the Social dimension decreases.
Figure 1. Interaction relationship between midterm exam score and sections (Non-consensus, Consensus), controlling for CLT1&2Discussion-Social.
Model 2: Final exam as the Dependent Variable The second multiple regression model included the Final exam as a dependent variable and the Midterm exam as one of the independent variables.
0
5
10
15
20
25
30
35
40
Nonconsensus Consensus
Pre
dict
ed M
idte
rm E
xam
Section
MinCLT1&2Discussion‐SocialC
MeanCLT1&2Discussion‐SocialC
MaxCLT1&2Discussion‐SocialC
51
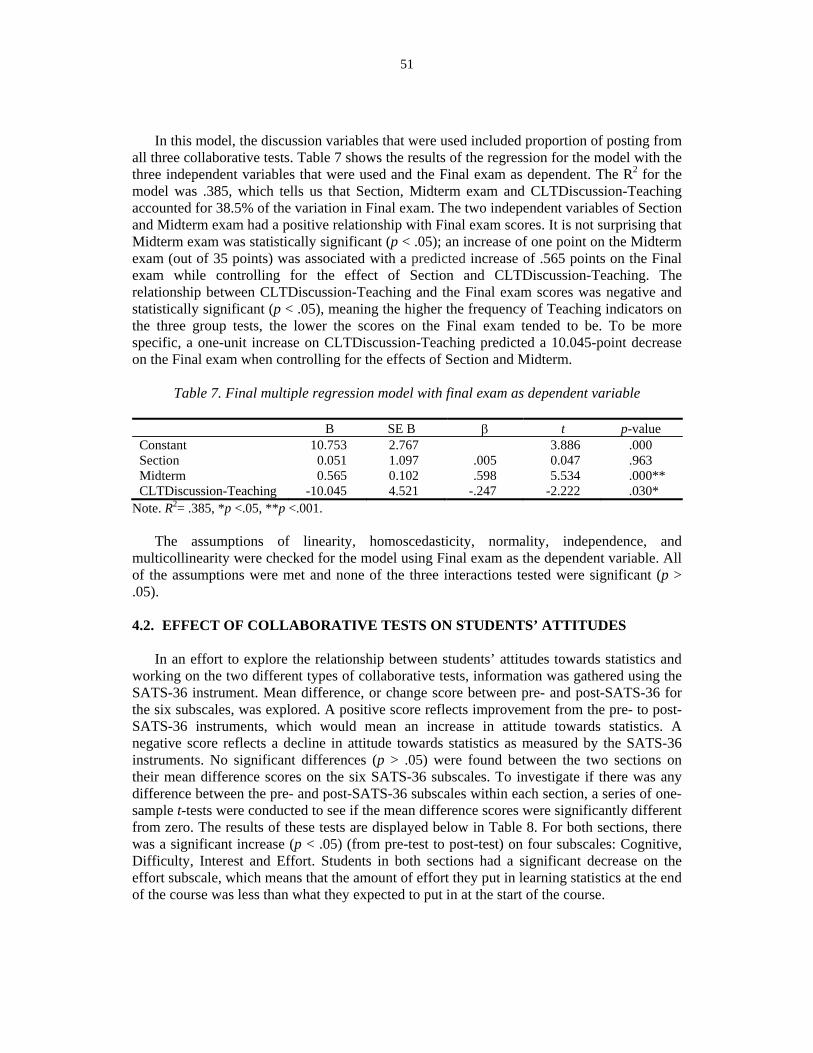
In this model, the discussion variables that were used included proportion of posting from all three collaborative tests. Table 7 shows the results of the regression for the model with the three independent variables that were used and the Final exam as dependent. The R2 for the model was .385, which tells us that Section, Midterm exam and CLTDiscussion-Teaching accounted for 38.5% of the variation in Final exam. The two independent variables of Section and Midterm exam had a positive relationship with Final exam scores. It is not surprising that Midterm exam was statistically significant (p < .05); an increase of one point on the Midterm exam (out of 35 points) was associated with a predicted increase of .565 points on the Final exam while controlling for the effect of Section and CLTDiscussion-Teaching. The relationship between CLTDiscussion-Teaching and the Final exam scores was negative and statistically significant (p < .05), meaning the higher the frequency of Teaching indicators on the three group tests, the lower the scores on the Final exam tended to be. To be more specific, a one-unit increase on CLTDiscussion-Teaching predicted a 10.045-point decrease on the Final exam when controlling for the effects of Section and Midterm.
Table 7. Final multiple regression model with final exam as dependent variable
B SE B t p-value Constant 10.753 2.767 3.886 .000 Section 0.051 1.097 .005 0.047 .963 Midterm 0.565 0.102 .598 5.534 .000** CLTDiscussion-Teaching -10.045 4.521 -.247 -2.222 .030*
Note. R2= .385, *p <.05, **p <.001. The assumptions of linearity, homoscedasticity, normality, independence, and
multicollinearity were checked for the model using Final exam as the dependent variable. All of the assumptions were met and none of the three interactions tested were significant (p > .05).
4.2. EFFECT OF COLLABORATIVE TESTS ON STUDENTS’ ATTITUDES
In an effort to explore the relationship between students’ attitudes towards statistics and
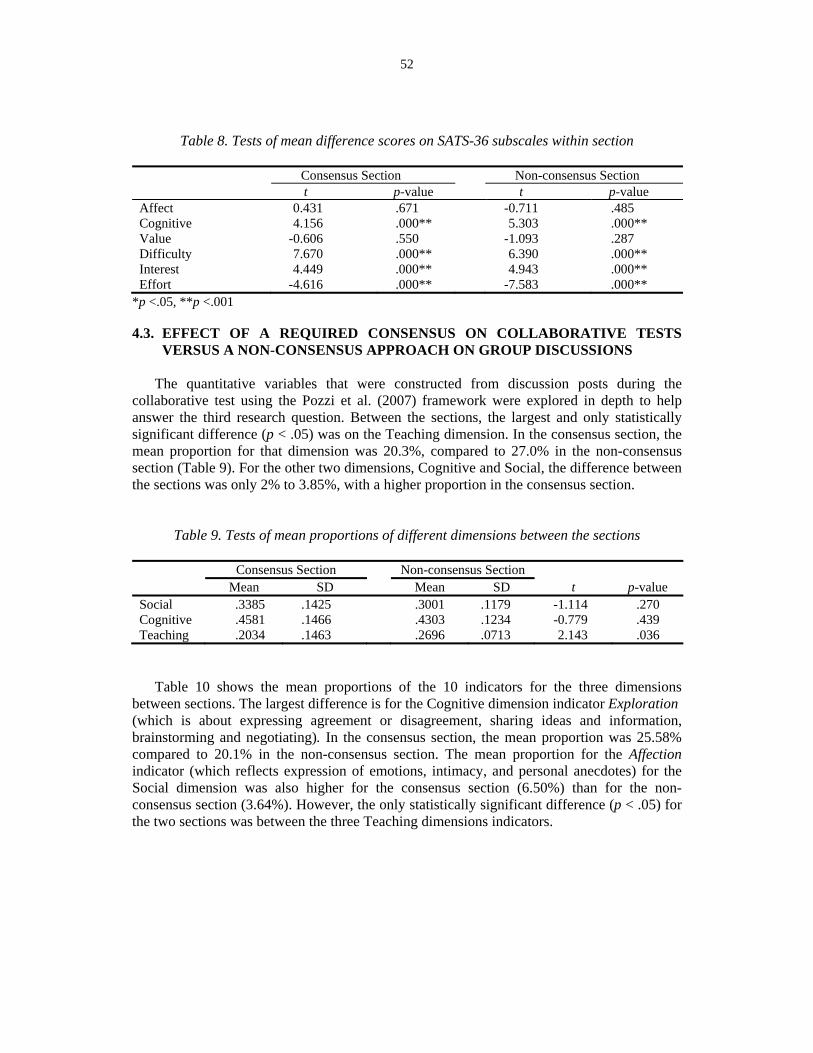
working on the two different types of collaborative tests, information was gathered using the SATS-36 instrument. Mean difference, or change score between pre- and post-SATS-36 for the six subscales, was explored. A positive score reflects improvement from the pre- to post-SATS-36 instruments, which would mean an increase in attitude towards statistics. A negative score reflects a decline in attitude towards statistics as measured by the SATS-36 instruments. No significant differences (p > .05) were found between the two sections on their mean difference scores on the six SATS-36 subscales. To investigate if there was any difference between the pre- and post-SATS-36 subscales within each section, a series of one-sample t-tests were conducted to see if the mean difference scores were significantly different from zero. The results of these tests are displayed below in Table 8. For both sections, there was a significant increase (p < .05) (from pre-test to post-test) on four subscales: Cognitive, Difficulty, Interest and Effort. Students in both sections had a significant decrease on the effort subscale, which means that the amount of effort they put in learning statistics at the end of the course was less than what they expected to put in at the start of the course.
52
Table 8. Tests of mean difference scores on SATS-36 subscales within section
Consensus Section Non-consensus Section t p-value t p-value Affect 0.431 .671 -0.711 .485 Cognitive 4.156 .000** 5.303 .000** Value -0.606 .550 -1.093 .287 Difficulty 7.670 .000** 6.390 .000** Interest 4.449 .000** 4.943 .000** Effort -4.616 .000** -7.583 .000**
*p <.05, **p <.001 4.3. EFFECT OF A REQUIRED CONSENSUS ON COLLABORATIVE TESTS
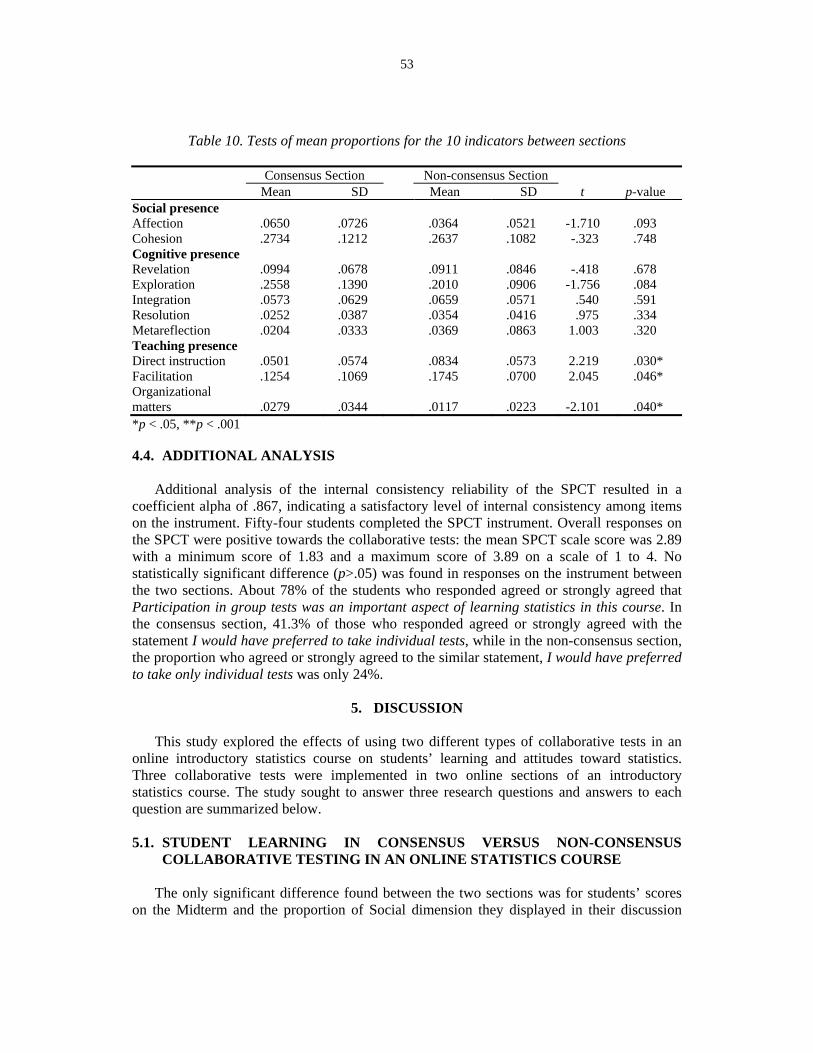
VERSUS A NON-CONSENSUS APPROACH ON GROUP DISCUSSIONS The quantitative variables that were constructed from discussion posts during the
collaborative test using the Pozzi et al. (2007) framework were explored in depth to help answer the third research question. Between the sections, the largest and only statistically significant difference (p < .05) was on the Teaching dimension. In the consensus section, the mean proportion for that dimension was 20.3%, compared to 27.0% in the non-consensus section (Table 9). For the other two dimensions, Cognitive and Social, the difference between the sections was only 2% to 3.85%, with a higher proportion in the consensus section.
Table 9. Tests of mean proportions of different dimensions between the sections
Consensus Section Non-consensus Section Mean SD Mean SD t p-value
Social .3385 .1425 .3001 .1179 -1.114 .270 Cognitive .4581 .1466 .4303 .1234 -0.779 .439 Teaching .2034 .1463 .2696 .0713 2.143 .036
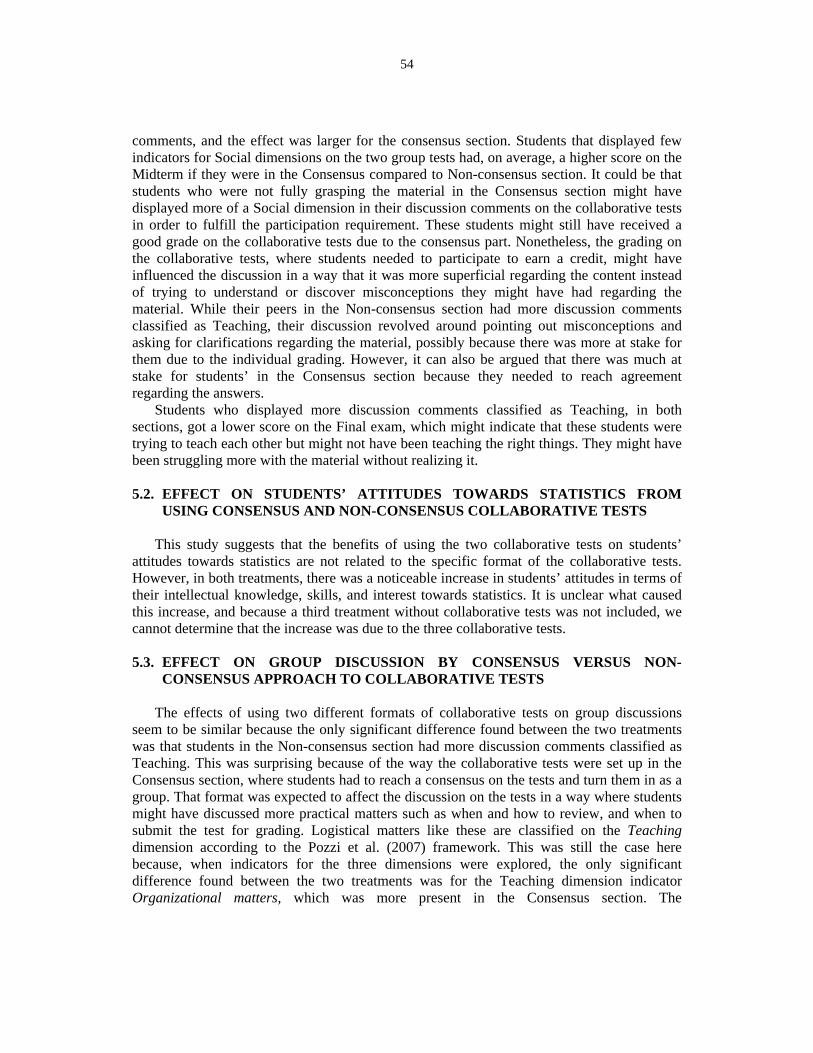
Table 10 shows the mean proportions of the 10 indicators for the three dimensions between sections. The largest difference is for the Cognitive dimension indicator Exploration (which is about expressing agreement or disagreement, sharing ideas and information, brainstorming and negotiating). In the consensus section, the mean proportion was 25.58% compared to 20.1% in the non-consensus section. The mean proportion for the Affection indicator (which reflects expression of emotions, intimacy, and personal anecdotes) for the Social dimension was also higher for the consensus section (6.50%) than for the non-consensus section (3.64%). However, the only statistically significant difference (p < .05) for the two sections was between the three Teaching dimensions indicators.
53
Table 10. Tests of mean proportions for the 10 indicators between sections
Consensus Section Non-consensus Section Mean SD Mean SD t p-value Social presence Affection .0650 .0726 .0364 .0521 -1.710 .093 Cohesion .2734 .1212 .2637 .1082 -.323 .748 Cognitive presence Revelation .0994 .0678 .0911 .0846 -.418 .678 Exploration .2558 .1390 .2010 .0906 -1.756 .084 Integration .0573 .0629 .0659 .0571 .540 .591 Resolution .0252 .0387 .0354 .0416 .975 .334 Metareflection .0204 .0333 .0369 .0863 1.003 .320 Teaching presence Direct instruction .0501 .0574 .0834 .0573 2.219 .030* Facilitation .1254 .1069 .1745 .0700 2.045 .046* Organizational matters .0279 .0344 .0117 .0223 -2.101 .040* *p < .05, **p < .001 4.4. ADDITIONAL ANALYSIS
Additional analysis of the internal consistency reliability of the SPCT resulted in a
coefficient alpha of .867, indicating a satisfactory level of internal consistency among items on the instrument. Fifty-four students completed the SPCT instrument. Overall responses on the SPCT were positive towards the collaborative tests: the mean SPCT scale score was 2.89 with a minimum score of 1.83 and a maximum score of 3.89 on a scale of 1 to 4. No statistically significant difference (p>.05) was found in responses on the instrument between the two sections. About 78% of the students who responded agreed or strongly agreed that Participation in group tests was an important aspect of learning statistics in this course. In the consensus section, 41.3% of those who responded agreed or strongly agreed with the statement I would have preferred to take individual tests, while in the non-consensus section, the proportion who agreed or strongly agreed to the similar statement, I would have preferred to take only individual tests was only 24%.
5. DISCUSSION
This study explored the effects of using two different types of collaborative tests in an
online introductory statistics course on students’ learning and attitudes toward statistics. Three collaborative tests were implemented in two online sections of an introductory statistics course. The study sought to answer three research questions and answers to each question are summarized below.
5.1. STUDENT LEARNING IN CONSENSUS VERSUS NON-CONSENSUS
COLLABORATIVE TESTING IN AN ONLINE STATISTICS COURSE The only significant difference found between the two sections was for students’ scores
on the Midterm and the proportion of Social dimension they displayed in their discussion
54
comments, and the effect was larger for the consensus section. Students that displayed few indicators for Social dimensions on the two group tests had, on average, a higher score on the Midterm if they were in the Consensus compared to Non-consensus section. It could be that students who were not fully grasping the material in the Consensus section might have displayed more of a Social dimension in their discussion comments on the collaborative tests in order to fulfill the participation requirement. These students might still have received a good grade on the collaborative tests due to the consensus part. Nonetheless, the grading on the collaborative tests, where students needed to participate to earn a credit, might have influenced the discussion in a way that it was more superficial regarding the content instead of trying to understand or discover misconceptions they might have had regarding the material. While their peers in the Non-consensus section had more discussion comments classified as Teaching, their discussion revolved around pointing out misconceptions and asking for clarifications regarding the material, possibly because there was more at stake for them due to the individual grading. However, it can also be argued that there was much at stake for students’ in the Consensus section because they needed to reach agreement regarding the answers.
Students who displayed more discussion comments classified as Teaching, in both sections, got a lower score on the Final exam, which might indicate that these students were trying to teach each other but might not have been teaching the right things. They might have been struggling more with the material without realizing it. 5.2. EFFECT ON STUDENTS’ ATTITUDES TOWARDS STATISTICS FROM
USING CONSENSUS AND NON-CONSENSUS COLLABORATIVE TESTS This study suggests that the benefits of using the two collaborative tests on students’
attitudes towards statistics are not related to the specific format of the collaborative tests. However, in both treatments, there was a noticeable increase in students’ attitudes in terms of their intellectual knowledge, skills, and interest towards statistics. It is unclear what caused this increase, and because a third treatment without collaborative tests was not included, we cannot determine that the increase was due to the three collaborative tests. 5.3. EFFECT ON GROUP DISCUSSION BY CONSENSUS VERSUS NON-
CONSENSUS APPROACH TO COLLABORATIVE TESTS The effects of using two different formats of collaborative tests on group discussions
seem to be similar because the only significant difference found between the two treatments was that students in the Non-consensus section had more discussion comments classified as Teaching. This was surprising because of the way the collaborative tests were set up in the Consensus section, where students had to reach a consensus on the tests and turn them in as a group. That format was expected to affect the discussion on the tests in a way where students might have discussed more practical matters such as when and how to review, and when to submit the test for grading. Logistical matters like these are classified on the Teaching dimension according to the Pozzi et al. (2007) framework. This was still the case here because, when indicators for the three dimensions were explored, the only significant difference found between the two treatments was for the Teaching dimension indicator Organizational matters, which was more present in the Consensus section. The
55
Organizational matters indicator is about introducing topics, providing explanations for methods and letting students know of deadlines. This difference does not come as a surprise because students in the Consensus section had to compile and turn in the collaborative tests together. There was more at stake in terms of logistics when it came to submitting the test for students in the Consensus section, compared to their peers in the Non-consensus section who turned in their tests individually.
5.4. LIMITATIONS
The study had limitations that affect the conclusions drawn from the results. One
limitation relates to the CAOS test, which was used to measure important student learning outcomes as a pre- and post-test. In this study, only 33 of the 40 items on CAOS were used in the pre- and post-tests. Not using all the items on the CAOS might have affected the reliability and validity of the measurements obtained using this instrument. While the results of the study may apply to other introductory statistics courses that also use collaborative learning as a regular method of teaching, implementing collaborative tests without also including other collaborative activities might produce different results. Including a control group that did not receive collaborative tests might have provided useful information on the comparative effect of using collaborative tests in that setting. Students’ familiarity with the online environment might have influenced the results. Although students were assigned randomly to treatments, students in the Non-consensus section, when compared to the Consensus section, reported more experience in taking online courses before taking this particular online course.
5.5. IMPLICATIONS FOR TEACHING ONLINE STATISTICS COURSES
This study suggests that the use of collaborative tests in online introductory statistics
courses might have a positive impact on students’ attitudes toward statistics. These results support the use of collaborative activities and assessments in online introductory statistics courses as well as in face-to-face courses. While this study did not show a significant difference between the two collaborative test formats, students reported a positive perception towards the collaborative tests. A majority of students in both treatments preferred to take collaborative tests. Considering what has been noted in the literature (Garfield & Ben-Zvi, 2008) about the views students hold about statistics courses being both difficult and unpleasant experiences, any effort that challenges these views should be carefully considered. Instructors of statistics should consider the use of collaborative tests in their online introductory courses, given the positive outcomes that were observed in this study, but they should keep in mind that the effects of the different formats of collaborative tests remain unclear. Much remains unknown about how collaborative tests affect learning, attitudes toward statistics, and the collaborative behavior of students.
The increase in students’ attitudes in terms of their intellectual knowledge, skills, and interest towards statistics might have been due to students’ experience working on collaborative tests or to the fact that students worked in collaborative groups throughout the semester; it is hard to know without including a third condition where there would be no collaboration on tests.
56
Instructors who wish to implement collaborative tests should consider issues regarding fairness in grading and how much collaborative test scores would contribute to students' overall course grade. In this study, in order to ensure that every student would participate in the collaborative test, the grading was based on correctness and students’ participation on the test. The collaborative tests accounted for 20.69% of the final grade, while individual assessment and assignments accounted for 58.63%.
5.6. IMPLICATIONS FOR FUTURE RESEARCH
With expected increased in enrollment in online courses (Allen & Seaman, 2011), the
need to conduct research on the online introductory statistics course is warranted. More courses, including statistics courses, will be offered online, and the need for effective quality teaching methods and assessment in these courses will increase. Many questions remain unanswered when it comes to teaching statistics online and using collaborative tests in online courses. These include the effects of using different test formats (e.g., having students take the same test twice—first individually and then as a group—and turn in answers for both sections), the appropriate group size, types of questions used and the effects on long-term retention of information after working on collaborative tests.
The online environment offers new ways of exploring both how statistics is taught and how collaborative tests are used. Applying some experimental design principles (e.g., randomizing to groups) can be more easily accomplished in an online course than a face-to-face course, and this can help minimize the effects of confounding variables such as the time the course is taught and the course instructor. Future research on using collaborative tests in online courses should, if possible, include a control group where there is no collaboration.
Although this study did not find a significant difference between the two different formats of collaborative tests, it contributes to the scarce literature on online introductory statistics courses. The results of the study suggest there are benefits to collaborative learning and testing in online introductory statistics courses: students had positive perceptions towards taking collaborative tests, and the majority of students preferred to take collaborative tests. There was also an improvement in students’ attitudes in terms of their intellectual knowledge, skills, and interest towards statistics, but it remains unclear just how much the collaborative tests affected student attitudes. More research focused on online introductory statistics courses is needed to support these findings and to help us better understand how we can structure and teach high quality statistics courses in the online environment.
REFERENCES
AIMS Project (n.d.). AIMS Project Adapting and Implementing Innovative Material in
Statistics. Retrieved May 15, 2011 from http://www.tc.umn.edu/~aims/ Allen, I. E., & Seaman, J. (2011). Learning on demand: Online education in the United
States, 2011. Retrieved from Sloan Consortium, Babson Survey Research Group website: http://www.onlinelearningsurvey.com/reports/goingthedistance.pdf
American Statistical Association (ASA). (2005). Guidelines for assessment and instruction in statistics education: College report. [Online: http://www.amstat.org/education/gaise/GAISECollege.htm ]
ARTIST (2006). Assessment Resource Tools For Improving Statistical Thinking.
57
Retrieved May 15, 2011 from https://apps3.cehd.umn.edu/artist/index.html Bakker, J. R. (2009). Web-based vs. classroom instruction of statistics (Unpublished doctoral
dissertation). The Ohio State University. Breedlove, W., Burkett, T., & Winfield, I. (2004). Collaborative testing and test
performance. Academic Exchange Quarterly, 8(3), 36–40. Cronbach L. J., (1951). Coefficient alpha and the internal structure of tests. Psychometrika,
16(3), 297–334. Dabbagh, N., & Bannan-Ritland, B. (2005). Online learning: Concepts, strategies, and
application. Columbus, OH: Pearson Merrill Prentice Hall. delMas, R., Garfield, J., Ooms, A., & Chance, B. (2007). Assessing students’ conceptual
understanding after a first course in statistics. Statistics Education Research Journal, 6(2), 28–58. [Online: http://iase-web.org/documents/SERJ/SERJ6(2)_delMas.pdf ]
Dillenbourg, P. (1999). What do you mean by collaborative learning? In P. Dillenbourg (Ed.), Collaborative-learning: Cognitive and computational approaches (pp. 1–19). Oxford, UK: Elsevier.
Dutton, J., & Dutton, M. (2005). Characteristics and performance of students in an online section of business statistics. Journal of Statistics Education, 13(3).
Everson, M. (2006). Group discussion in online statistics courses. ELearn Magazine, 2006(4).
Field, A. (2005). Discovering statistics using SPSS (2nd ed.). London, UK: Sage. Garfield, J. (1993). Teaching statistics using small-group cooperative learning. Journal of
Statistics Education, 1(1). Garfield, J. & Ben-Zvi, D. (2008). Developing students’ statistical reasoning: Connecting
research and teaching practice. Dordrecht, The Netherlands: Springer. Garfield, J., delMas, R., & Zieffler, A. (2008, June). AIMS: Adapting and implementing
innovative materials. A CAUSEway workshop presented at the University of Minnesota, Minneapolis, MN.
Giraud, G. (1997). Cooperative learning and statistics instruction. Journal of Statistics Education, 5(3).
Giraud, G., & Enders, C. (2000). The effects of repeated cooperative testing in an introductory statistics course. (ERIC Document Reproduction Service No. ED 445 103)
Giuliodori, M. J., Lujan, H. L., & DiCarlo, S. E. (2008). Collaborative group testing benefits high- and low-performing students. Advances in Physiology Education, 32(4), 274–278.
Gunnarsson, C. L. (2001). Student attitude and achievement in an online graduate statistics course (Unpublished doctoral dissertation). University of Cincinnati.
Haberyan, A., & Barnett, J. (2010). Collaborative testing and achievement: Are two heads really better than one? Journal of Instructional Psychology, 37(1), 32–41.
Helmericks, S. G. (1993). Collaborative testing in social statistics: Toward gemeinstat. Teaching Sociology, 21(3), 287–297.
Hicks, J. (2007). Students’ views of cooperative learning and group testing. Radiologic Technology, 78(4), 275–283.
Hong, K., Lai, K., & Holton, D. (2003). Students’ satisfaction and perceived learning with a web-based course. Educational Technology & Society, 6(1), 116–124.
Ioannou, A., & Artino, A. R. J. (2010). Learn more, stress less: Exploring the benefits of collaborative assessment. College Student Journal, 44(1), 189–199.
58
Johnson, H. D., Dasgupta, N., Zhang, H., & Evans, M. A. (2009), Internet approach versus lecture and lab-based approach for teaching an introductory statistical methods course: Students’ opinions. Teaching Statistics, 31(1), 21–26.
Johnson, D. W., Johnson, R. T., & Holubec, E. J. (2008). Cooperation in the classroom (8th ed.). Edina, MN: Interaction Book.
Johnson, D. W., Johnson, R. T., & Stanne, M. (2000). Cooperative learning methods: A meta-analysis. Retrieved December 1, 2010, from http://www.clcrc.com/pages/cl-methods.html
Johnson, D. W., Johnson, R. T., & Smith, K. A. (1991). Active learning: Cooperation in the college classroom. Edina, MN: Interaction Book.
Kapitanoff, S. H. (2009). Collaborative testing: Cognitive and interpersonal processes related to enhanced test performance. Active Learning in Higher Education, 10(1), 56-70.
Kartha, C. P. (2006). Learning business statistics: Online vs traditional. The Business Review, 5(1), 27–32.
Keller, C. M., & Steinhorst, R. K. (1995). Using small groups to promote active learning in the introductory statistics course: A report from the field. Journal of Statistics Education, 3(2).
Kreiner, D. S. (2006), A mastery-based approach to teaching statistics online. International Journal of Instructional Media, 33(1), 73–79.
Lusk, M., & Conklin, L. (2003). Collaborative testing to promote learning. Journal of Nursing Education, 42(3), 121–124.
Magel, R. C. (1998). Using cooperative learning in a large introductory statistics class. Journal of Statistics Education, 6(3).
Manca, S., Persico, D., Pozzi, F., & Sarti, L. (n.d.). A model to monitor and evaluate online collaborative learning processes. Retrieved December 10, 2010, from http://spaziofir.itd.cnr.it/CSCL/modello.htm
Mills, J. D., & Raju, D. (2011). Teaching statistics online: A decade’s review of the literature about what works. Journal of Statistics Education, 19(2), 1–28.
Palloff, R., & Pratt, K. (2004). Collaborating online: Learning together in community. San Francisco, CA: Jossey-Bass.
Palloff, R., & Pratt, K. (2007). Building online learning communities: Effective strategies for the virtual classroom (2nd ed.). San Francisco, CA: Jossey-Bass.
Perkins, D. V., & Saris, R. N. (2001). A ‘jigsaw classroom’ technique for undergraduate statistics courses. Teaching of Psychology, 28(2), 111–113.
Persico, D., Pozzi, F., & Sarti, L. (2010). Monitoring collaborative activities in computer supported collaborative learning. Distance Education, 31(1), 5–22.
Potthast, M. J. (1999). Outcomes of using small-group cooperative learning experiences in introductory statistics courses. College Student Journal, 33(1), 34–42.
Pozzi, F., Manca, S., Persico, D., & Sarti, L. (2007). A general framework for tracking and analysing learning processes in computer-supported collaborative learning environments. Innovations in Education & Teaching International, 44(2), 169–179.
Rao, S. P., Collins, H. L., & DiCarlo, S. E. (2002). Collaborative testing enhances student learning. Advances in Physiology Education, 26(1), 37–41.
Roberts, T. S. (Ed.). (2004). Online collaborative learning: Theory and practice. Hershey, PA: Information Science.
59
Roseth, C. J., Johnson, D. W., & Johnson, R. T. (2008). Promoting early adolescents' achievement and peer relationships: The effects of cooperative, competitive, and individualistic goal structures. Psychological Bulletin, 134(2), 223–246.
Roseth, C. J., Garfield, J. B., & Ben-Zvi, D. (2008). Collaboration in learning and teaching statistics. Journal of Statistics Education, 16(1), 1–15. [Online: http://www.amstat.org/publications/jse/v16n1/roseth.pdf ]
Sandahl, S. S. (2009). Collaborative testing as a learning strategy in nursing education: A review of the literature. Nursing Education Perspectives, 30(3), 171–175.
Schau, C. (2005). CS Consultants, LLC website. Retrieved May 1, 2011 from http://www.evaluationandstatistics.com
Shen, J., Hiltz, S. R., & Bieber, M. (2006). Collaborative online examinations: Impacts on interaction, learning, and student satisfaction. IEEE Transactions on Systems, Man and Cybernetics, Part A: Systems and Humans, 36(6), 1045–1053.
Shen, J., Hiltz, S. R., & Bieber, M. (2008). Learning strategies in online collaborative examinations. IEEE Transactions on Professional Communication, 51(1), 63–78.
Simkin, M. G. (2005). An experimental study of the effectiveness of collaborative testing in an entry-level computer programming class. Journal of Information Systems Education, 16(3), 273–280.
Suanpang, P., Petocz, P., & Kalceff, W. (2004). Student attitudes to learning business statistics: Comparison of online and traditional methods. Educational Technology & Society, 7(3), 9–20.
Tudor, G. E. (2006). Teaching introductory statistics online: Satisfying the students. Journal of Statistics Education, 14(3).
Utts, J., Sommer, B., Acredolo, C., Maher, M. W., & Matthews, H. R. (2003). A study comparing traditional and hybrid internet-based instruction in introductory statistics classes. Journal of Statistics Education, 11(3).
Ward, B. (2004). The best of both worlds: A hybrid statistics course. Journal of Statistics Education, 12(3).
Weinberger, A., & Fischer, F. (2006). A framework to analyze argumentative knowledge construction in computer-supported collaborative learning. Computers & Education, 46(1), 71–95.
Wisenbaker, J. (2003). Extending the journey toward a virtual introductory statistics course. Proceedings of the International Association for Statistical Education Satellite Conference, Berlin, Germany. [Online: http://iase-web.org/documents/papers/sat2003/Wisenbaker.pdf ]
Zhang, J. (2002). Teaching statistics on-line: Our experience and thoughts. Proceedings of the Sixth International Conference on Teaching Statistics, Cape Town, South Africa. [Online: http://iase-web.org/documents/papers/icots6/10_12_jz.pdf ]
Zimbardo, P. G., Butler, L. D., & Wolfe, V. A. (2003). Cooperative college examinations: More gain, less pain when students share information and grades. Journal of Experimental Education, 71(2), 101–125.
AUÐBJÖRG BJÖRNSDÓTTIR
UNIVERSITY OF AKUREYRI SÓLBORG VIÐ NORÐURSLÓÐ
600, AKUREYRI ICELAND